Table of Contents
UNITED STATES
SECURITIES AND EXCHANGE COMMISSION
Washington, D.C. 20549
FORM N-CSR
CERTIFIED SHAREHOLDER REPORT OF REGISTERED
MANAGEMENT INVESTMENT COMPANIES
Investment Company Act file number: 811-22167
Allianz Funds Multi-Strategy Trust
(Exact name of registrant as specified in charter)
1633 Broadway, New York, NY 10019
(Address of principal executive offices) (Zip code)
Lawrence G. Altadonna
1633 Broadway, New York, NY 10019
(Name and address of agent for service)
Registrant’s telephone number, including area code: 212-739-3371
Date of fiscal year end: September 30
Date of reporting period: March 31, 2017
Table of Contents
Item 1. Report to Shareholders

Allianz Multi-Strategy Funds
SHARE CLASSES A, C, R, P, INSTITUTIONAL, R6, ADMINISTRATIVE
Semiannual Report
March 31, 2017
AllianzGI Retirement 2020 Fund
AllianzGI Retirement 2025 Fund
AllianzGI Retirement 2030 Fund
AllianzGI Retirement 2035 Fund
AllianzGI Retirement 2040 Fund
AllianzGI Retirement 2045 Fund
AllianzGI Retirement 2050 Fund
AllianzGI Retirement 2055 Fund
AllianzGI Retirement Income Fund
AllianzGI Global Allocation Fund
AllianzGI Global Megatrends Fund
AllianzGI Best Styles Emerging Markets Equity Fund
AllianzGI Best Styles Global Equity Fund
AllianzGI Best Styles International Equity Fund
AllianzGI Best Styles U.S. Equity Fund
AllianzGI Convertible Fund
AllianzGI Emerging Markets Consumer Fund
AllianzGI Emerging Markets Debt Fund
AllianzGI Emerging Markets Small-Cap Fund
AllianzGI Europe Equity Dividend Fund
AllianzGI Global Dynamic Allocation Fund
AllianzGI Global Fundamental Strategy Fund
AllianzGI Global Sustainability Fund
AllianzGI Global Water Fund
AllianzGI High Yield Bond Fund
AllianzGI International Growth Fund
AllianzGI International Small-Cap Fund
AllianzGI Micro Cap Fund
AllianzGI Multi-Asset Real Return Fund
AllianzGI NFJ Emerging Markets Value Fund
AllianzGI NFJ Global Dividend Value Fund
AllianzGI NFJ International Small-Cap Value Fund
AllianzGI NFJ International Value II Fund
AllianzGI Short Duration High Income Fund
AllianzGI Structured Return Fund
AllianzGI U.S. Equity Hedged Fund
AllianzGI U.S. Small-Cap Growth Fund
AllianzGI Ultra Micro Cap Fund
This material is authorized for use only when preceded or accompanied by the current Allianz Multi-Strategy Funds prospectus. Investors should consider the investment objectives, risks, charges and expenses of each Fund carefully before investing. This and other information is contained in the Funds’ prospectuses and summary prospectuses. Please read the prospectus carefully before you invest or send money.

Receive this report electronically and eliminate paper mailings.
To enroll, go to http://us.allianzgi.com/edelivery.
Table of Contents
| 2–3 | Letter from the President | |||
| 4–132 | Fund Summaries | |||
| 133–134 | Important Information | |||
| 135–139 | Benchmark Descriptions | |||
| 140–199 | Schedules of Investments | |||
| 200–213 | Statements of Assets and Liabilities | |||
| 214–227 | Statements of Operations | |||
| 228–243 | Statements of Changes in Net Assets | |||
| 244–311 | Financial Highlights | |||
| 312–393 | Notes to Financial Statements | |||
| 394–395 | Matters Relating to the Trustees’ Consideration of the Investment Management and Sub-Advisory Agreements | |||
| 396–397 | Privacy Policy |
A Word About Risk: A fund may be subject to various risks as described in its prospectus. Some of those risks may include, but are not limited to, the following: derivatives risk, smaller company risk, non-US investment risk, focused investment risk and specific sector investment risks. Use of derivative instruments may involve certain costs and risks such as liquidity risk, interest rate risk, market risk, credit risk, counterparty risk, management risk and the risk that a fund is unable to close out a position when it is most advantageous to do so. Portfolios investing in derivatives could lose more than the principal amount invested in those instruments. Investing in foreign securities may entail risk due to foreign economic and political developments; this risk may be enhanced when investing in emerging markets. Smaller companies may be more volatile than larger companies and may entail more risk. Concentrating investments in individual sectors may add additional risk and additional volatility compared to a diversified equity portfolio. AllianzGI target-date funds seek to manage risk and return by blending two separately-managed portfolios: a return-generating portfolio for growth potential, and a defensive portfolio for principal protection. The balance grows increasingly defensive over time until the target date is reached, after which the Fund’s assets roll into a retirement income strategy. The principal values of the Funds are not guaranteed at any time, including the target date. Please refer to the Fund’s applicable current prospectus for complete details.
Table of Contents

Thomas J. Fuccillo
President & CEO
Dear Shareholder,
The US economy continued to expand, albeit at a fairly modest pace during the six-month period ended March 31, 2017. Economic expansions overseas were generally tepid. Against this backdrop, US and international equities generated solid results. In contrast, the global bond market produced weak results during the six-month period.
Six Months in Review
For the six-month period ended March 31, 2017, US stocks, as measured by the Standard & Poor’s 500 Index, gained 10.12%. Two measures of stock performance in developed international and global markets, the MSCI EAFE (Europe, Australasia and Far East) Index and the MSCI World Index, returned 6.48% and 8.35%, respectively, in dollar-denominated terms. Elsewhere, the MSCI Emerging Markets Index rose 6.80%. With respect to bonds, the Bloomberg Barclays US Credit Index declined 1.71%, whereas the Bloomberg Barclays Global High Yield Index rose 2.98%. The Bloomberg Barclays US Government Bond Index returned -3.07%, while the broader bond market index, as measured by the Bloomberg Barclays US Aggregate Bond Index, fell 2.18%. The Bloomberg Barclays Global Aggregate Bond Index returned -5.43%.
US gross domestic product (“GDP”), the value of goods and services produced in the country, the broadest measure of economic activity and the principal indicator of economic performance, expanded at a 3.5% annual pace during the third quarter of 2016. However, growth then decelerated, as GDP grew at a 2.1% annual pace during the fourth quarter of 2016. After the reporting period ended, the US Department of Commerce reported that first quarter 2017 GDP growth was an annual pace of 0.7%.
After remaining on hold at its first seven meetings in 2016, the US Federal Reserve (the “Fed”) raised interest rates 0.25% in December 2016 to a range between 0.50% and 0.75%. After remaining on hold at its first meeting in 2017, in March 2017 the Fed again raised rates 0.25% to a range between 0.75% and 1.00%. In the statement following the March meeting the Fed said, “The Committee expects that economic conditions will evolve in a manner that will warrant gradual increases in the federal funds rate; the federal funds rate is likely to remain, for some time, below levels that are expected to prevail in the longer run. However, the actual path of the federal funds rate will depend on the economic outlook as informed by incoming data.”
| 2 | March 31, 2017 | | Semiannual Report |
Table of Contents
Outlook
Looking ahead, we believe investors should expect muted growth as the US enters its late-cycle period, Japan struggles with its aging population and Europe suffers from the uncertainties related to“Brexit.” In our view, the US and European Union should ultimately avoid recessions, but remain mired in a relatively weak economic expansion. We expect the Fed to continue modestly increasing rates in 2017, prompting central banks in emerging markets to lower their rates as inflation falls. Elsewhere we predict the European Central Bank (“ECB”) and Bank of Japan should maintain their accommodative monetary policies. We believe we have passed peak global liquidity as central banks have pushed past negative interest rate policies to begin supporting government spending.
The tides of deregulation continued shifting in 2016, and nationalism and populism gained ground. Given the results from the November elections in the US and significant upcoming elections in Europe, politics should remain a key investment consideration. We also believe that monetary policy will become more political. As to where governments will spend the money their central banks print, we believe domestic infrastructure and defense spending will be the focus of many countries in the coming years.
Against this backdrop, we believe markets are increasingly susceptible to volatility as politics, geopolitics, divergent monetary policies and internal market structures all converge and evolve. We believe that navigating this sea of uncertainty requires a clear direction and an active management approach, with investors staying agile in their asset allocations, confident in their processes and thorough in their research.
On behalf of Allianz Global Investors U.S. LLC and NFJ Investment Group LLC, the sub-adviser to certain funds, thank you for investing with us. We encourage you to consult with your financial advisor and to visit our website, us.allianzgi.com, for additional information. We remain dedicated to serving your investment needs.
Sincerely,

Thomas J. Fuccillo
President & Chief Executive Officer
Past performance is no guarantee of future results. Unless otherwise noted, index returns reflect the reinvestment of income dividends and capital gains, if any, but do not reflect fees, brokerage commissions or other expenses of investing. It is not possible to invest directly in an index.
Receive this report electronically and eliminate paper mailings.
To enroll, go to http://us.allianzgi.com/edelivery.
| Semiannual Report | | March 31, 2017 | 3 |
Table of Contents
Unaudited
For the period of October 1, 2016 through March 31, 2017, as provided by the Multi-Asset US Group.
Fund Insights
For the six-month period ended March 31, 2017, Class A shares at net asset value (“NAV”) of the AllianzGI Target-Date Funds (the “Funds”) returned between 2.82% and 8.15% with longer dated Funds posting more favorable results. In terms of relative performance, all strategies outperformed their respective benchmarks (Morningstar Lifetime Moderate series) for the six-month period.
Market Overview
For the six-month period ending March 31, 2017, markets were dominated by the surprising outcome of the US presidential election relative to prevailing market expectations. The Trump victory ushered in a period of uncertainty regarding the magnitude and timing of future policy changes at the same time that it seemed to instill general optimism in market participants. The theme of reflation against the backdrop of supportive fiscal policy and stronger consumer demand percolated through markets for the period.
Throughout the first quarter, risk assets continued to outperform in a low volatility environment despite significant policy setbacks (including the failure to pass healthcare reform) and continued uncertainty about the future of US domestic and foreign policy. Moreover, global risk assets rallied in the context of the US Federal Reserve (the ‘‘Fed’’) hiking interest rates by 50 basis points in the period. Tighter Fed policy signaled a new regime of tighter global monetary policy in the future (even if the European Central Bank and Bank of Japan reiterated their current commitments to accommodative policies).
During the period, US stocks rallied in the aftermath of the election and continued to gain throughout the first quarter with US Small Cap stocks in particular leading the way: The Russell 2000 Index gained 11.5% and the Russell 2000 Value Index gained 13.9% outpacing larger stocks, which gained 10.1%, as measured by the Russell 1000 Index.
Global growth remained healthy as fundamental macro-economic data continued to either match or outperform economists’ expectations. During the first quarter, the gap between hard data and soft data, as measured by surveys of purchasing managers and consumers, widened substantially, revealing that much of what underpinned the rally in risk assets was associated with future expectations (as opposed to the current economic environment alone).
Optimistic assessments of global growth affected both developed and emerging markets: In broad terms, the MSCI All Country World Index returned 8.2% only slightly outpacing Emerging Markets, which returned 6.8%. Better economic data helped boost European equities for the period, despite persistent uncertainties about key elections in 2017 (in the Netherlands, France and Germany). For the period, the best performing stock markets were Spain and Italy, which returned 17.3% and 17.6% respectively (MSCI country indexes in USD).
Global Bonds declined for the period with the Bloomberg Barclays Global Aggregate Bond Index losing 5.4%. The long end of the US curve had the worst performance as long Treasuries (20+ years) lost 10.9% in the period due in part to a sharp initial increase in inflation expectations and a spike in yields. While the 10-year yield on US Treasuries initially increased by about 75 basis points from the election through mid-December, it remained relatively range bound for most of the first quarter, making US Treasuries one of the worst performing asset classes for the period. The Bloomberg Barclays US Aggregate Bond Index lost 2.2% for the period. Within fixed income, US High Yield was the best performer. Globally, Emerging Market hard currency debt outperformed developed market government bonds. Commodities, most notably precious metals and gold, were among the worst performing asset classes in the period.
Portfolio Review
Overweight positions to global equities provided tailwinds to performance, which were expressed by allocations to AllianzGI Global Dynamic Allocation and equity products featuring the Best Styles investment process. A strategic exposure to minimum volatility during the period was a detractor, as markets shifted to a risk-on environment following the US elections. The strategies benefited from below benchmark duration as yields rose in anticipation of a reflationary environment following the US election. Results further benefited from an overweight to corporate debt in the fixed income portion of the portfolio, as companies benefited from the anticipated fiscal reforms and improved global growth prospects.
At the end of the period, the portfolio maintained an underweight position in US government bonds (duration weighted) and an overweight to global equities including Emerging Markets, against a backdrop of favorable trend and fundamental views across risk assets.
Outlook
Looking ahead, we expect that global inflation will continue to steadily rise, in part attributable to firmer commodity prices and narrowing output gaps throughout developed markets. Emerging markets are expected to continue to post solid growth in the near term, providing opportunities for much needed structural reforms that will ultimately contribute to longer term stability. We expect the global economy will likely continue to benefit from debt-financed growth for the foreseeable future on the back of leveraged households and businesses. We expect monetary policy to continue to tighten in the US, albeit at a slow and measured pace, while global central bank liquidity will remain abundant at least through 2018.
However, risks abound, including increased political risks, most notably in Europe in light of the busy election calendar but also in key emerging markets. In addition, we believe charged rhetoric about protectionism and zero-sum interactions threaten to undermine longstanding commitments to global trade in goods and financial assets. Finally, we believe risks related to inflated expectations on the part of market participants as well as market complacency may potentially intensify should stocks reverse their recent rally.
| 4 | March 31, 2017 | | Semiannual Report |
Table of Contents
Unaudited
AllianzGI Target-Date Funds (cont’d)
As of the end of the period, we expect to remain overweight risk assets and underweight most sovereign bonds with the idea in mind that sovereigns are nearing the end of a secular bull market. We believe the reflationary economic environment persists for now as long as the possibility of US Fiscal stimulus remains and cyclical data continue to show signs of improvement. We maintain a positive outlook on emerging markets while recognizing that an unexpected slowdown in the US or other developed markets would have real and immediate implication for EM broadly. We remain vigilant in this low volatility environment and are focused on monitoring cyclical data and relative valuations across asset classes.
* The “Target-Date Funds” are the AllianzGI Retirement 2020 Fund, the AllianzGI Retirement 2025 Fund, the AllianzGI Retirement 2030 Fund, the AllianzGI Retirement 2035 Fund, the AllianzGI Retirement 2040 Fund, the AllianzGI Retirement 2045 Fund, the AllianzGI Retirement 2050 Fund, and the AllianzGI Retirement 2055 Fund.
Certain changes to the Target Date Funds’ investment strategy, benchmarks and portfolio management team became effective on October 1, 2016. Please see the prospectus for complete details.
| Semiannual Report | | March 31, 2017 | 5 |
Table of Contents
Unaudited
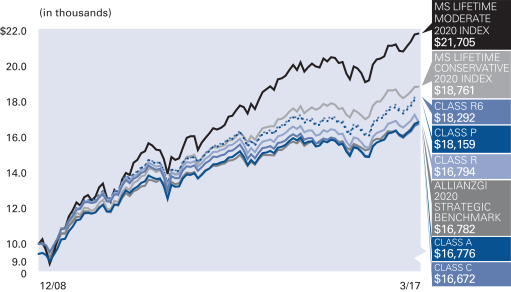
AllianzGI Retirement 2020 Fund
Average Annual Total Return for the period ended March 31, 2017
| 6 Month** | 1 Year | 5 Year | Since Inception† | |||||||||||||||
| AllianzGI Retirement 2020 Fund Class A | 2.82% | 8.72% | 3.93% | 7.20% | ||||||||||||||
| AllianzGI Retirement 2020 Fund Class A (adjusted) | –2.83% | 2.74% | 2.76% | 6.47% | |||||||||||||
| AllianzGI Retirement 2020 Fund Class C | 2.43% | 7.91% | 3.14% | 6.39% | ||||||||||||||
| AllianzGI Retirement 2020 Fund Class C (adjusted) | 1.43% | 6.91% | 3.14% | 6.39% | |||||||||||||
| AllianzGI Retirement 2020 Fund Class R | –0.37% | 5.22% | 2.96% | 6.48% | |||||||||||||
| AllianzGI Retirement 2020 Fund Class P | 2.95% | 9.08% | 4.24% | 7.50% | |||||||||||||
| AllianzGI Retirement 2020 Fund Class R6 | 3.02% | 9.14% | 4.33% | 7.59% | |||||||||||||
| AllianzGI Retirement 2020 Fund Administrative Class | 2.84% | 8.76% | 3.97% | 7.25% | ||||||||||||||
| Morningstar Lifetime Moderate 2020 Index* | 2.81% | 8.60% | 6.30% | 9.85% | |||||||||||||
| AllianzGI 2020 Strategic Benchmark* | 2.93% | 6.74% | 3.81% | 6.48% | |||||||||||||
| Morningstar Lifetime Conservative 2020 Index | 0.90% | 6.04% | 4.76% | 7.92% | |||||||||||||
| Lipper Mixed-Asset Target 2020 Funds Average | 3.07% | 8.24% | 5.57% | 8.60% | ||||||||||||||
† The Fund began operations on December 29, 2008. Benchmark return comparisons began on the fund inception date. Lipper performance comparisons began on December 31, 2008.
* The Morningstar Lifetime Moderate series replaced the Morningstar Lifetime Conservative series as the Target Date Funds’ primary benchmark, and the AllianzGI Strategic Benchmark replaced the Real Return Target series (white label) as the Target Date Funds’ secondary benchmark as of October 1, 2016 in connection with certain changes to the Target Date Funds’ investment strategies that took effect on October 1, 2016.
** Cumulative returns.
Performance quoted represents past performance and is no guarantee of future results. Current performance may be lower or higher than performance shown. For performance current to the most recent month-end, visit our website at us.allianzgi.com. Investment return and the principal value will fluctuate. Shares may be worth more or less than original cost when redeemed. The adjusted returns take into account the maximum initial sales charge of 5.50% on Class A shares and the contingent deferred sales charge (CDSC) of 1% on Class C shares, which may apply to shares redeemed during the first year of ownership. Returns do not reflect deduction of taxes that a shareholder would pay on fund distributions or redemption of fund shares. See pages 133 and 134 for more information. The Fund’s gross expense ratios are 1.26% for Class A shares, 2.01% for Class C shares, 1.51% for Class R shares, 0.86% for Class P shares, 0.76% for Class R6 shares, and 1.11% for Administrative Class shares. These ratios do not include an expense reduction, contractually guaranteed through at least January 31, 2020. The Fund’s expense ratios net of this reduction are 0.95% for Class A shares, 1.70% for Class C shares, 1.30% for Class R shares, 0.65% for Class P shares, 0.55% for Class R6 shares and 0.90% for Administrative Class shares. Expense ratio information is as of the Fund’s current prospectus dated February 1, 2017, as revised April 10, 2017.
Cumulative Returns Through March 31, 2017
Fund Allocation (as of March 31, 2017)
| AllianzGI Global Dynamic Allocation | 60.1% | |||||||
| AllianzGI Advanced Core Bond | 16.7% | |||||||
| AllianzGI Best Styles U.S. Equity | 11.3% | |||||||
| Vanguard Intermediate-Term Corporate Bond | 2.7% | |||||||
| AllianzGI Short Duration High Income | 2.1% | |||||||
| AllianzGI Emerging Markets Debt | 1.6% | |||||||
| AllianzGI Emerging Markets Small-Cap | 0.5% | |||||||
| Cash & Equivalents — Net | 5.0% | |||||||
| 6 | March 31, 2017 | | Semiannual Report |
Table of Contents
Unaudited
AllianzGI Retirement 2020 Fund (cont’d)
| Shareholder Expense Example | Actual Performance | |||||||||||
| Class A | Class C | Class R | Class P | Class R6 | Administrative Class | |||||||
| Beginning Account Value (10/1/16) | $1,000.00 | $1,000.00 | $1,000.00 | $1,000.00 | $1,000.00 | $1,000.00 | ||||||
| Ending Account Value (3/31/17) | $1,028.20 | $1,024.30 | $996.30 | $1,029.50 | $1,030.20 | $1,028.40 | ||||||
| Expenses Paid During Period | $1.87 | $5.65 | $3.58 | $0.35 | $— | $1.62 | ||||||
| Hypothetical Performance | ||||||||||||
| (5% return before expenses) | ||||||||||||
| Class A | Class C | Class R | Class P | Class R6 | Administrative Class | |||||||
| Beginning Account Value (10/1/16) | $1,000.00 | $1,000.00 | $1,000.00 | $1,000.00 | $1,000.00 | $1,000.00 | ||||||
| Ending Account Value (3/31/17) | $1,023.09 | $1,019.35 | $1,021.34 | $1,024.58 | $1,024.93 | $1,023.34 | ||||||
| Expenses Paid During Period | $1.87 | $5.64 | $3.63 | $0.35 | $— | $1.61 | ||||||
For each class of the Fund, expenses (net of fee waiver and reimbursement, if any) are equal to the annualized expense ratio for the class (0.37% for Class A, 1.12% for Class C, 0.72% for Class R, 0.07% for Class P, 0.00% for Class R6 and 0.32% for Administrative Class), multiplied by the average account value over the period, multiplied by 182/365. These expenses do not include the expenses of the investment companies in which the Fund invests, which are indirectly borne by Fund shareholders.
| Semiannual Report | | March 31, 2017 | 7 |
Table of Contents
Unaudited
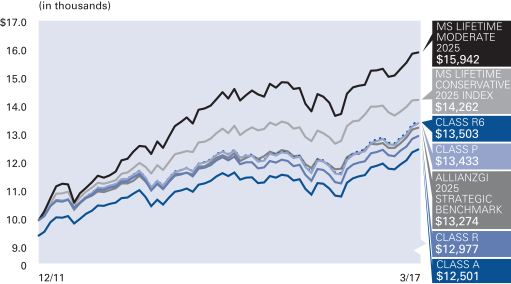
AllianzGI Retirement 2025 Fund
Average Annual Total Return for the period ended March 31, 2017
| 6 Month** | 1 Year | 5 Year | Since Inception† | |||||||||||||||
| AllianzGI Retirement 2025 Fund Class A | 4.15% | 10.40% | 4.40% | 5.44% | ||||||||||||||
| AllianzGI Retirement 2025 Fund Class A (adjusted) | –1.58% | 4.33% | 3.22% | 4.32% | |||||||||||||
| AllianzGI Retirement 2025 Fund Class R | 3.90% | 9.96% | 4.02% | 5.05% | |||||||||||||
| AllianzGI Retirement 2025 Fund Class P | 4.30% | 10.74% | 4.71% | 5.75% | |||||||||||||
| AllianzGI Retirement 2025 Fund Class R6 | 4.37% | 10.87% | 4.81% | 5.85% | |||||||||||||
| AllianzGI Retirement 2025 Fund Administrative Class | 4.18% | 10.42% | 4.43% | 5.47% | ||||||||||||||
| Morningstar Lifetime Moderate 2025 Index* | 3.75% | 10.09% | 7.15% | 9.23% | |||||||||||||
| AllianzGI 2025 Strategic Benchmark* | 4.27% | 8.50% | 4.43% | 5.51% | |||||||||||||
| Morningstar Lifetime Conservative 2025 Index | 1.42% | 7.02% | 5.42% | 6.95% | |||||||||||||
| Lipper Mixed-Asset Target 2025 Fundw Average | 4.17% | 9.79% | 6.77% | 8.13% | ||||||||||||||
† The Fund began operations on December 19, 2011. Benchmark return comparisons began on the fund inception date. Lipper performance comparisons began on December 31, 2011.
* The Morningstar Lifetime Moderate series replaced the Morningstar Lifetime Conservative series as the Target Date Funds’ primary benchmark, and the AllianzGI Strategic Benchmark replaced the Real Return Target series (white label) as the Target Date Funds’ secondary benchmark as of October 1, 2016 in connection with certain changes to the Target Date Funds’ investment strategies that took effect on October 1, 2016.
** Cumulative returns.
Performance quoted represents past performance and is no guarantee of future results. Current performance may be lower or higher than performance shown. For performance current to the most recent month-end, visit our website at us.allianzgi.com. Investment return and the principal value will fluctuate. Shares may be worth more or less than original cost when redeemed. The adjusted returns take into account the maximum initial sales charge of 5.50% on Class A shares. Returns do not reflect deduction of taxes that a shareholder would pay on fund distributions or redemption of fund shares. See pages 133 and 134 for more information. The Fund’s gross expense ratios are 1.29% for Class A shares, 1.54% for Class R shares, 0.89% for Class P shares, 0.79% for Class R6 shares and 1.14% for Administrative Class Shares. These ratios do not include an expense reduction, contractually guaranteed through at least January 31, 2020. The Fund’s expense ratios net of this reduction are 0.95% for Class A shares, 1.30% for Class R shares, 0.65% for Class P shares, 0.55% for Class R6 shares and 0.90% for Administrative Class shares. Expense ratio information is as of the Fund’s current prospectus dated February 1, 2017, as revised April 10, 2017.
Cumulative Returns Through March 31, 2017
Fund Allocation (as of March 31, 2017)
| AllianzGI Global Dynamic Allocation | 76.5% | |||
| AllianzGI Best Styles U.S. Equity | 10.0% | |||
| AllianzGI Advanced Core Bond | 7.5% | |||
| AllianzGI Emerging Markets Small-Cap | 0.5% | |||
| AllianzGI Emerging Markets Debt | 0.5% | |||
| AllianzGI Best Styles Global Equity | 0.1% | |||
| AllianzGI Short Duration High Income | 0.0% | * | ||
| Cash & Equivalents — Net | 4.9% |
* Less than 0.05%
| 8 | March 31, 2017 | | Semiannual Report |
Table of Contents
Unaudited
AllianzGI Retirement 2025 Fund (cont’d)
| Shareholder Expense Example | Actual Performance | |||||||||
| Class A | Class R | Class P | Class R6 | Administrative Class | ||||||
| Beginning Account Value (10/1/16) | $1,000.00 | $1,000.00 | $1,000.00 | $1,000.00 | $1,000.00 | |||||
| Ending Account Value (3/31/17) | $1,041.50 | $1,039.00 | $1,043.00 | $1,043.70 | $1,041.80 | |||||
| Expenses Paid During Period | $1.73 | $3.51 | $0.20 | $— | $1.48 | |||||
| Hypothetical Performance | ||||||||||
| (5% return before expenses) | ||||||||||
| Class A | Class R | Class P | Class R6 | Administrative Class | ||||||
| Beginning Account Value (10/1/16) | $1,000.00 | $1,000.00 | $1,000.00 | $1,000.00 | $1,000.00 | |||||
| Ending Account Value (3/31/17) | $1,023.24 | $1,021.49 | $1,024.73 | $1,024.93 | $1,023.49 | |||||
| Expenses Paid During Period | $1.72 | $3.48 | $0.20 | $— | $1.46 | |||||
For each class of the Fund, expenses (net of fee waiver and reimbursement, if any) are equal to the annualized expense ratio for the class (0.34% for Class A, 0.69% for Class R, 0.04% for Class P, 0.00% for Class R6 and 0.29% for Administrative Class), multiplied by the average account value over the period, multiplied by 182/365. These expenses do not include the expenses of the investment companies in which the Fund invests, which are indirectly borne by Fund shareholders.
| Semiannual Report | | March 31, 2017 | 9 |
Table of Contents
Unaudited
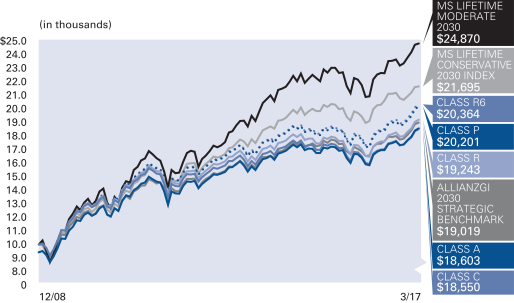
AllianzGI Retirement 2030 Fund
Average Annual Total Return for the period ended March 31, 2017
| 6 Month** | 1 Year | 5 Year | Since Inception† | |||||||||||||||
| AllianzGI Retirement 2030 Fund Class A | 5.52% | 11.79% | 4.89% | 8.55% | ||||||||||||||
| AllianzGI Retirement 2030 Fund Class A (adjusted) | –0.29% | 5.65% | 3.71% | 7.81% | |||||||||||||
| AllianzGI Retirement 2030 Fund Class C | 5.05% | 10.94% | 4.10% | 7.78% | ||||||||||||||
| AllianzGI Retirement 2030 Fund Class C (adjusted) | 4.05% | 9.94% | 4.10% | 7.78% | |||||||||||||
| AllianzGI Retirement 2030 Fund Class R | 5.30% | 11.39% | 4.52% | 8.25% | |||||||||||||
| AllianzGI Retirement 2030 Fund Class P | 5.64% | 12.17% | 5.21% | 8.89% | |||||||||||||
| AllianzGI Retirement 2030 Fund Class R6 | 5.70% | 12.28% | 5.31% | 9.00% | |||||||||||||
| AllianzGI Retirement 2030 Fund Administrative Class | 5.53% | 11.86% | 4.95% | 8.65% | ||||||||||||||
| Morningstar Lifetime Moderate 2030 Index* | 5.00% | 11.95% | 8.00% | 11.67% | |||||||||||||
| AllianzGI 2030 Strategic Benchmark* | 5.45% | 10.23% | 5.07% | 8.11% | |||||||||||||
| Morningstar Lifetime Conservative 2030 Index | 2.30% | 8.43% | 6.25% | 9.84% | |||||||||||||
| Lipper Mixed-Asset Target 2030 Funds Average | 5.05% | 11.36% | 7.09% | 10.20% | ||||||||||||||
† The Fund began operations on December 29, 2008. Benchmark return comparisons began on the fund inception date. Lipper performance comparisons began on December 31, 2008.
* The Morningstar Lifetime Moderate series replaced the Morningstar Lifetime Conservative series as the Target Date Funds’ primary benchmark, and the AllianzGI Strategic Benchmark replaced the Real Return Target series (white label) as the Target Date Funds’ secondary benchmark as of October 1, 2016 in connection with certain changes to the Target Date Funds’ investment strategies that took effect on October 1, 2016.
** Cumulative returns.
Performance quoted represents past performance and is no guarantee of future results. Current performance may be lower or higher than performance shown. For performance current to the most recent month-end, visit our website at us.allianzgi.com. Investment return and the principal value will fluctuate. Shares may be worth more or less than original cost when redeemed. The adjusted returns take into account the maximum initial sales charge of 5.50% on Class A shares and the contingent deferred sales charge (CDSC) of 1% on Class C shares, which may apply to shares redeemed during the first year of ownership. Returns do not reflect deduction of taxes that a shareholder would pay on fund distributions or redemption of fund shares. See pages 133 and 134 for more information. The Fund’s gross expense ratios are 1.24% for Class A shares, 1.99% for Class C shares, 1.49% for Class R shares, 0.84% for Class P shares, 0.74% for Class R6 shares and 1.09% for Administrative Class shares. These ratios do not include an expense reduction, contractually guaranteed through at least January 31, 2020. The Fund’s expense ratios net of this reduction are 0.95% for Class A shares, 1.70% for Class C shares, 1.30% for Class R shares, 0.65% for Class P shares, 0.55% for Class R6 shares and 0.90% for Administrative Class shares. Expense ratio information is as of the Fund’s current prospectus dated February 1, 2017, as revised April 10, 2017.
Cumulative Returns Through March 31, 2017
Fund Allocation (as of March 31, 2017)
| AllianzGI Global Dynamic Allocation | 73.3% | |||
| AllianzGI Best Styles U.S. Equity | 14.1% | |||
| AllianzGI Best Styles Global Equity | 7.7% | |||
| AllianzGI Emerging Markets Small-Cap | 1.1% | |||
| Cash & Equivalents — Net | 3.8% |
| 10 | March 31, 2017 | | Semiannual Report |
Table of Contents
Unaudited
AllianzGI Retirement 2030 Fund (cont’d)
| Shareholder Expense Example | Actual Performance | |||||||||||
| Class A | Class C | Class R | Class P | Class R6 | Administrative Class | |||||||
| Beginning Account Value (10/1/16) | $1,000.00 | $1,000.00 | $1,000.00 | $1,000.00 | $1,000.00 | $1,000.00 | ||||||
| Ending Account Value (3/31/17) | $1,055.20 | $1,050.50 | $1,053.00 | $1,056.40 | $1,057.00 | $1,055.30 | ||||||
| Expenses Paid During Period | $1.79 | $5.62 | $3.58 | $0.26 | $— | $1.54 | ||||||
| Hypothetical Performance | ||||||||||||
| (5% return before expenses) | ||||||||||||
| Class A | Class C | Class R | Class P | Class R6 | Administrative Class | |||||||
| Beginning Account Value (10/1/16) | $1,000.00 | $1,000.00 | $1,000.00 | $1,000.00 | $1,000.00 | $1,000.00 | ||||||
| Ending Account Value (3/31/17) | $1,023.19 | $1,019.45 | $1,021.44 | $1,024.68 | $1,024.93 | $1,023.44 | ||||||
| Expenses Paid During Period | $1.77 | $5.54 | $3.53 | $0.25 | $— | $1.51 | ||||||
For each class of the Fund, expenses (net of fee waiver and reimbursement, if any) are equal to the annualized expense ratio for the class (0.35% for Class A, 1.10% for Class C, 0.70% for Class R, 0.05% for Class P, 0.00% for Class R6 and 0.30% for Administrative Class), multiplied by the average account value over the period, multiplied by 182/365. These expenses do not include the expenses of the investment companies in which the Fund invests, which are indirectly borne by Fund shareholders.
| Semiannual Report | | March 31, 2017 | 11 |
Table of Contents
Unaudited
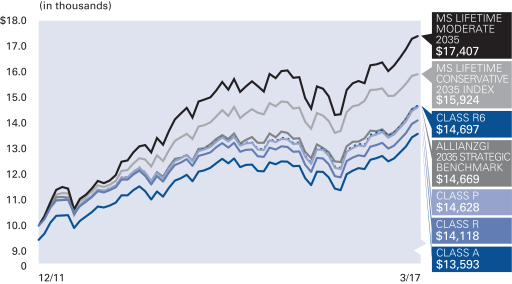
AllianzGI Retirement 2035 Fund
Average Annual Total Return for the period ended March 31, 2017
| 6 Month** | 1 Year | 5 Year | Since Inception† | |||||||||||||||
| AllianzGI Retirement 2035 Fund Class A | 6.82% | 13.15% | 5.50% | 7.13% | ||||||||||||||
| AllianzGI Retirement 2035 Fund Class A (adjusted) | 0.94% | 6.93% | 4.32% | 5.99% | |||||||||||||
| AllianzGI Retirement 2035 Fund Class R | 6.62% | 12.69% | 5.13% | 6.76% | |||||||||||||
| AllianzGI Retirement 2035 Fund Class P | 7.04% | 13.54% | 5.83% | 7.47% | |||||||||||||
| AllianzGI Retirement 2035 Fund Class R6 | 7.03% | 13.58% | 5.93% | 7.56% | |||||||||||||
| AllianzGI Retirement 2035 Fund Administrative Class | 6.86% | 13.23% | 5.55% | 7.19% | ||||||||||||||
| Morningstar Lifetime Moderate 2035 Index* | 6.23% | 13.71% | 8.61% | 11.07% | |||||||||||||
| AllianzGI 2035 Strategic Benchmark* | 6.56% | 11.92% | 5.69% | 7.52% | |||||||||||||
| Morningstar Lifetime Conservative 2035 Index | 3.55% | 10.29% | 7.13% | 9.21% | |||||||||||||
| Lipper Mixed-Asset Target 2035 Funds Average | 6.16% | 12.75% | 7.90% | 9.56% | ||||||||||||||
† The Fund began operations on December 19, 2011. Benchmark return comparisons began on the fund inception date. Lipper performance comparisons began on December 31, 2011.
* The Morningstar Lifetime Moderate series replaced the Morningstar Lifetime Conservative series as the Target Date Funds’ primary benchmark, and the AllianzGI Strategic Benchmark replaced the Real Return Target series (white label) as the Target Date Funds’ secondary benchmark as of October 1, 2016 in connection with certain changes to the Target Date Funds’ investment strategies that took effect on October 1, 2016.
** Cumulative returns.
Performance quoted represents past performance and is no guarantee of future results. Current performance may be lower or higher than performance shown. For performance current to the most recent month-end, visit our website at us.allianzgi.com. Investment return and the principal value will fluctuate. Shares may be worth more or less than original cost when redeemed. The adjusted returns take into account the maximum initial sales charge of 5.50% on Class A shares. Returns do not reflect deduction of taxes that a shareholder would pay on fund distributions or redemption of fund shares. See pages 133 and 134 for more information. The Fund’s gross expense ratios are 1.16% for Class A shares, 1.41% for Class R shares, 0.76% for Class P shares, 0.66% for Class R6 shares and 1.01% for Administrative Class shares. These ratios do not include an expense reduction, contractually guaranteed through at least January 31, 2020. The Fund’s expense ratios net of this reduction are 0.95% for Class A shares, 1.30% for Class R shares, 0.65% for Class P shares, 0.55% for Class R6 shares and 0.90% for Administrative Class shares. Expense ratio information is as of the Fund’s current prospectus dated February 1, 2017, as revised April 10, 2017.
Cumulative Returns Through March 31, 2017
Fund Allocation (as of March 31, 2017)
| AllianzGI Global Dynamic Allocation | 48.4% | |||
| AllianzGI Best Styles Global Equity | 29.5% | |||
| AllianzGI Best Styles U.S. Equity | 16.7% | |||
| AllianzGI Emerging Markets Small-Cap | 1.1% | |||
| Cash & Equivalents — Net | 4.3% |
| 12 | March 31, 2017 | | Semiannual Report |
Table of Contents
Unaudited
AllianzGI Retirement 2035 Fund (cont’d)
| Shareholder Expense Example | Actual Performance | |||||||||
| Class A | Class R | Class P | Class R6 | Administrative Class | ||||||
| Beginning Account Value (10/1/16) | $1,000.00 | $1,000.00 | $1,000.00 | $1,000.00 | $1,000.00 | |||||
| Ending Account Value (3/31/17) | $1,068.20 | $1,066.20 | $1,070.40 | $1,070.30 | $1,068.60 | |||||
| Expenses Paid During Period | $2.17 | $3.97 | $0.62 | $0.10 | $1.91 | |||||
| Hypothetical Performance | ||||||||||
| (5% return before expenses) | ||||||||||
| Class A | Class R | Class P | Class R6 | Administrative Class | ||||||
| Beginning Account Value (10/1/16) | $1,000.00 | $1,000.00 | $1,000.00 | $1,000.00 | $1,000.00 | |||||
| Ending Account Value (3/31/17) | $1,022.84 | $1,021.09 | $1,024.33 | $1,024.83 | $1,023.09 | |||||
| Expenses Paid During Period | $2.12 | $3.88 | $0.61 | $0.10 | $1.87 | |||||
For each class of the Fund, expenses (net of fee waiver and reimbursement, if any) are equal to the annualized expense ratio for the class (0.42% for Class A, 0.77% for Class R, 0.12% for Class P, 0.02% for Class R6 and 0.37% for Administrative Class), multiplied by the average account value over the period, multiplied by 182/365. These expenses do not include the expenses of the investment companies in which the Fund invests, which are indirectly borne by Fund shareholders.
| Semiannual Report | | March 31, 2017 | 13 |
Table of Contents
Unaudited
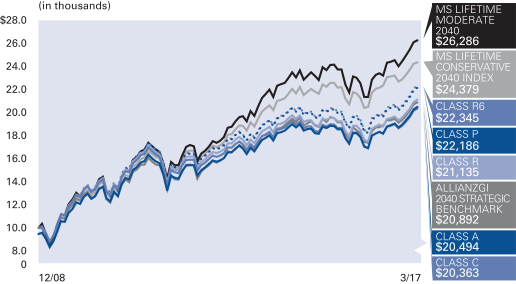
AllianzGI Retirement 2040 Fund
Average Annual Total Return for the period ended March 31, 2017
| 6 Month** | 1 Year | 5 Year | Since Inception† | |||||||||||||||
| AllianzGI Retirement 2040 Fund Class A | 7.55% | 13.88% | 5.83% | 9.83% | ||||||||||||||
| AllianzGI Retirement 2040 Fund Class A (adjusted) | 1.64% | 7.62% | 4.64% | 9.08% | |||||||||||||
| AllianzGI Retirement 2040 Fund Class C | 7.19% | 13.08% | 5.06% | 9.00% | ||||||||||||||
| AllianzGI Retirement 2040 Fund Class C (adjusted) | 6.19% | 12.08% | 5.06% | 9.00% | |||||||||||||
| AllianzGI Retirement 2040 Fund Class R | 7.40% | 13.53% | 5.49% | 9.49% | |||||||||||||
| AllianzGI Retirement 2040 Fund Class P | 7.80% | 14.25% | 6.17% | 10.14% | |||||||||||||
| AllianzGI Retirement 2040 Fund Class R6 | 7.82% | 14.33% | 6.26% | 10.23% | |||||||||||||
| AllianzGI Retirement 2040 Fund Administrative Class | 7.61% | 13.92% | 5.88% | 9.88% | ||||||||||||||
| Morningstar Lifetime Moderate 2040 Index* | 7.05% | 14.90% | 8.88% | 12.43% | |||||||||||||
| AllianzGI 2040 Strategic Benchmark* | 7.32% | 13.40% | 6.16% | 9.35% | |||||||||||||
| Morningstar Lifetime Conservative 2040 Index | 4.89% | 12.19% | 7.84% | 11.40% | |||||||||||||
| Lipper Mixed-Asset Target 2040 Funds Average | 6.49% | 13.47% | 7.92% | 10.95% | ||||||||||||||
† The Fund began operations on December 29, 2008. Benchmark return comparisons began on the fund inception date. Lipper performance comparisons began on December 31, 2008.
* The Morningstar Lifetime Moderate series replaced the Morningstar Lifetime Conservative series as the Target Date Funds’ primary benchmark, and the AllianzGI Strategic Benchmark replaced the Real Return Target series (white label) as the Target Date Funds’ secondary benchmark as of October 1, 2016 in connection with certain changes to the Target Date Funds’ investment strategies that took effect on October 1, 2016.
** Cumulative returns.
Performance quoted represents past performance and is no guarantee of future results. Current performance may be lower or higher than performance shown. For performance current to the most recent month-end, visit our website at us.allianzgi.com. Investment return and the principal value will fluctuate. Shares may be worth more or less than original cost when redeemed. The adjusted returns take into account the maximum initial sales charge of 5.50% on Class A shares and the contingent deferred sales charge (CDSC) of 1% on Class C shares, which may apply to shares redeemed during the first year of ownership. Returns do not reflect deduction of taxes that a shareholder would pay on fund distributions or redemption of fund shares. See pages 133 and 134 for more information. The Fund’s gross expense ratios are 1.11% for Class A shares, 1.86% for Class C shares, 1.36% for Class R shares, 0.71% for Class P shares, 0.61% for Class R6 shares and 0.96% for Administrative Class shares. These ratios do not include an expense reduction, contractually guaranteed through at least January 31, 2020. The Fund’s expense ratios net of this reduction are 0.95% for Class A shares, 1.70% for Class C shares, 1.30% for Class R shares, 0.65% for Class P shares, 0.55% for Class R6 shares and 0.90% for Administrative Class shares. Expense ratio information is as of the Fund’s current prospectus dated February 1, 2017, as revised April 10, 2017.
Cumulative Returns Through March 31, 2017
Fund Allocation (as of March 31, 2017)
| AllianzGI Best Styles Global Equity | 45.0% | |||
| AllianzGI Global Dynamic Allocation | 30.3% | |||
| AllianzGI Best Styles U.S. Equity | 19.2% | |||
| AllianzGI Emerging Markets Small-Cap | 1.1% | |||
| Cash & Equivalents — Net | 4.4% |
| 14 | March 31, 2017 | | Semiannual Report |
Table of Contents
Unaudited
AllianzGI Retirement 2040 Fund (cont’d)
| Shareholder Expense Example | Actual Performance | |||||||||||
| Class A | Class C | Class R | Class P | Class R6 | Administrative Class | |||||||
| Beginning Account Value (10/1/16) | $1,000.00 | $1,000.00 | $1,000.00 | $1,000.00 | $1,000.00 | $1,000.00 | ||||||
| Ending Account Value (3/31/17) | $1,075.50 | $1,071.90 | $1,074.00 | $1,078.00 | $1,078.20 | $1,076.10 | ||||||
| Expenses Paid During Period | $2.43 | $6.30 | $4.24 | $0.88 | $0.36 | $2.17 | ||||||
| Hypothetical Performance | ||||||||||||
| (5% return before expenses) | ||||||||||||
| Class A | Class C | Class R | Class P | Class R6 | Administrative Class | |||||||
| Beginning Account Value (10/1/16) | $1,000.00 | $1,000.00 | $1,000.00 | $1,000.00 | $1,000.00 | $1,000.00 | ||||||
| Ending Account Value (3/31/17) | $1,022.59 | $1,018.85 | $1,020.84 | $1,024.08 | $1,024.58 | $1,022.84 | ||||||
| Expenses Paid During Period | $2.37 | $6.14 | $4.13 | $0.86 | $0.35 | $2.12 | ||||||
For each class of the Fund, expenses (net of fee waiver and reimbursement, if any) are equal to the annualized expense ratio for the class (0.47% for Class A, 1.22% for Class C, 0.82% for Class R, 0.17% for Class P, 0.07% for Class R6 and 0.42% for Administrative Class), multiplied by the average account value over the period, multiplied by 182/365. These expenses do not include the expenses of the investment companies in which the Fund invests, which are indirectly borne by Fund shareholders.
| Semiannual Report | | March 31, 2017 | 15 |
Table of Contents
Unaudited
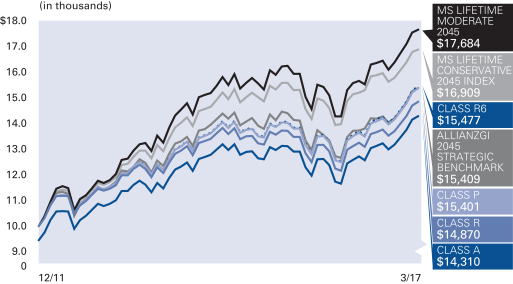
AllianzGI Retirement 2045 Fund
Average Annual Total Return for the period ended March 31, 2017
| 6 Month** | 1 Year | 5 Year | Since Inception† | |||||||||||||||
| AllianzGI Retirement 2045 Fund Class A | 8.06% | 14.86% | 6.22% | 8.17% | ||||||||||||||
| AllianzGI Retirement 2045 Fund Class A (adjusted) | 2.12% | 8.55% | 5.03% | 7.02% | |||||||||||||
| AllianzGI Retirement 2045 Fund Class R | 7.87% | 14.50% | 5.85% | 7.80% | |||||||||||||
| AllianzGI Retirement 2045 Fund Class P | 8.27% | 15.31% | 6.55% | 8.52% | |||||||||||||
| AllianzGI Retirement 2045 Fund Class R6 | 8.32% | 15.40% | 6.66% | 8.62% | |||||||||||||
| AllianzGI Retirement 2045 Fund Administrative Class | 8.07% | 14.92% | 6.25% | 8.20% | ||||||||||||||
| Morningstar Lifetime Moderate 2045 Index* | 7.37% | 15.40% | 8.87% | 11.40% | |||||||||||||
| AllianzGI 2045 Strategic Benchmark* | 7.74% | 14.27% | 6.33% | 8.53% | |||||||||||||
| Morningstar Lifetime Conservative 2045 Index | 5.80% | 13.51% | 8.15% | 10.46% | |||||||||||||
| Lipper Mixed-Asset Target 2045 Funds Average | 7.02% | 13.99% | 8.43% | 10.32% | ||||||||||||||
† The Fund began operations on December 19, 2011. Benchmark return comparisons began on the fund inception date. Lipper performance comparisons began on December 31, 2011.
* The Morningstar Lifetime Moderate series replaced the Morningstar Lifetime Conservative series as the Target Date Funds’ primary benchmark, and the AllianzGI Strategic Benchmark replaced the Real Return Target series (white label) as the Target Date Funds’ secondary benchmark as of October 1, 2016 in connection with certain changes to the Target Date Funds’ investment strategies that took effect on October 1, 2016.
** Cumulative returns.
Performance quoted represents past performance and is no guarantee of future results. Current performance may be lower or higher than performance shown. For performance current to the most recent month-end, visit our website at us.allianzgi.com. Investment return and the principal value will fluctuate. Shares may be worth more or less than original cost when redeemed. The adjusted returns take into account the maximum initial sales charge of 5.50% on Class A shares. Returns do not reflect deduction of taxes that a shareholder would pay on fund distributions or redemption of fund shares. See pages 133 and 134 for more information. The Fund’s gross expense ratios are 1.08% for Class A shares, 1.33% for Class R shares, 0.68% for Class P shares, 0.58% for Class R6 shares and 0.93% for Administrative Class shares. These ratios do not include an expense reduction, contractually guaranteed through at least January 31, 2020. The Fund’s expense ratios net of this reduction are 0.95% for Class A shares, 1.30% for Class R shares, 0.65% for Class P shares, 0.55% for Class R6 shares and 0.90% for Administrative Class shares. Expense ratio information is as of the Fund’s current prospectus dated February 1, 2017, as revised April 10, 2017.
Cumulative Returns Through March 31, 2017
Fund Allocation (as of March 31, 2017)
| AllianzGI Best Styles Global Equity | 53.2% | |||
| AllianzGI Global Dynamic Allocation | 20.6% | |||
| AllianzGI Best Styles U.S. Equity | 19.7% | |||
| AllianzGI Emerging Markets Small-Cap | 1.0% | |||
| Cash & Equivalents — Net | 5.5% |
| 16 | March 31, 2017 | | Semiannual Report |
Table of Contents
Unaudited
AllianzGI Retirement 2045 Fund (cont’d)
| Shareholder Expense Example | Actual Performance | |||||||||
| Class A | Class R | Class P | Class R6 | Administrative Class | ||||||
| Beginning Account Value (10/1/16) | $1,000.00 | $1,000.00 | $1,000.00 | $1,000.00 | $1,000.00 | |||||
| Ending Account Value (3/31/17) | $1,080.60 | $1,078.70 | $1,082.70 | $1,083.20 | $1,080.70 | |||||
| Expenses Paid During Period | $2.54 | $4.35 | $0.99 | $0.47 | $2.28 | |||||
| Hypothetical Performance | ||||||||||
| (5% return before expenses) | ||||||||||
| Class A | Class R | Class P | Class R6 | Administrative Class | ||||||
| Beginning Account Value (10/1/16) | $1,000.00 | $1,000.00 | $1,000.00 | $1,000.00 | $1,000.00 | |||||
| Ending Account Value (3/31/17) | $1,022.49 | $1,020.74 | $1,023.98 | $1,024.48 | $1,022.74 | |||||
| Expenses Paid During Period | $2.47 | $4.23 | $0.96 | $0.45 | $2.22 | |||||
For each class of the Fund, expenses (net of fee waiver and reimbursement, if any) are equal to the annualized expense ratio for the class (0.49% for Class A, 0.84% for Class R, 0.19% for Class P, 0.09% for Class R6 and 0.44% for Administrative Class), multiplied by the average account value over the period, multiplied by 182/365. These expenses do not include the expenses of the investment companies in which the Fund invests, which are indirectly borne by Fund shareholders.
| Semiannual Report | | March 31, 2017 | 17 |
Table of Contents
Unaudited
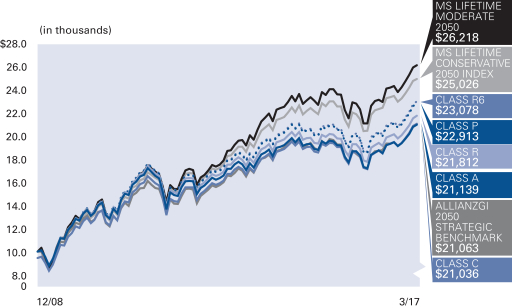
AllianzGI Retirement 2050 Fund
Average Annual Total Return for the period ended March 31, 2017
| 6 Month** | 1 Year | 5 Year | Since Inception† | |||||||||||||||
| AllianzGI Retirement 2050 Fund Class A | 8.15% | 14.96% | 6.25% | 10.24% | ||||||||||||||
| AllianzGI Retirement 2050 Fund Class A (adjusted) | 2.20% | 8.64% | 5.06% | 9.49% | |||||||||||||
| AllianzGI Retirement 2050 Fund Class C | 7.75% | 14.15% | 5.44% | 9.43% | ||||||||||||||
| AllianzGI Retirement 2050 Fund Class C (adjusted) | 6.75% | 13.15% | 5.44% | 9.43% | |||||||||||||
| AllianzGI Retirement 2050 Fund Class R | 7.91% | 14.49% | 5.87% | 9.91% | |||||||||||||
| AllianzGI Retirement 2050 Fund Class P | 8.32% | 15.36% | 6.57% | 10.56% | |||||||||||||
| AllianzGI Retirement 2050 Fund Class R6 | 8.39% | 15.53% | 6.67% | 10.67% | |||||||||||||
| AllianzGI Retirement 2050 Fund Administrative Class | 8.22% | 15.11% | 6.30% | 10.32% | ||||||||||||||
| Morningstar Lifetime Moderate 2050 Index* | 7.42% | 15.53% | 8.78% | 12.39% | |||||||||||||
| AllianzGI 2050 Strategic Benchmark* | 7.87% | 14.51% | 6.35% | 9.45% | |||||||||||||
| Morningstar Lifetime Conservative 2050 Index | 6.26% | 14.20% | 8.23% | 11.76% | |||||||||||||
| Lipper Mixed-Asset Target 2050 Funds Average | 6.90% | 14.17% | 8.29% | 11.15% | ||||||||||||||
† The Fund began operations on December 29, 2008. Benchmark return comparisons began on the fund inception date. Lipper performance comparisons began on December 31, 2008.
* The Morningstar Lifetime Moderate series replaced the Morningstar Lifetime Conservative series as the Target Date Funds’ primary benchmark, and the AllianzGI Strategic Benchmark replaced the Real Return Target series (white label) as the Target Date Funds’ secondary benchmark as of October 1, 2016 in connection with certain changes to the Target Date Funds’ investment strategies that took effect on October 1, 2016.
** Cumulative returns.
Performance quoted represents past performance and is no guarantee of future results. Current performance may be lower or higher than performance shown. For performance current to the most recent month-end, visit our website at us.allianzgi.com. Investment return and the principal value will fluctuate. Shares may be worth more or less than original cost when redeemed. The adjusted returns take into account the maximum initial sales charge of 5.50% on Class A shares and the contingent deferred sales charge (CDSC) of 1% on Class C shares, which may apply to shares redeemed during the first year of ownership. Returns do not reflect deduction of taxes that a shareholder would pay on fund distributions or redemption of fund shares. See pages 133 and 134 for more information. The Fund’s gross expense ratios are 1.07% for Class A shares, 1.82% for Class C shares, 1.32% for Class R shares, 0.67% for Class P shares, 0.57% for Class R6 shares and 0.92% for Administrative Class shares. These ratios do not include an expense reduction, contractually guaranteed through at least January 31, 2020. The Fund’s expense ratios net of this reduction are 0.95% for Class A shares, 1.70% for Class C shares, 1.30% for Class R shares, 0.65% for Class P shares, 0.55% for Class R6 shares and 0.90% for Administrative Class shares. Expense ratio information is as of the Fund’s current prospectus dated February 1, 2017, as revised April 10, 2017.
Cumulative Returns Through March 31, 2017
Fund Allocation (as of March 31, 2017)
| AllianzGI Best Styles Global Equity | 55.9% | |||
| AllianzGI Best Styles U.S. Equity | 20.3% | |||
| AllianzGI Global Dynamic Allocation | 17.8% | |||
| AllianzGI Emerging Markets Small-Cap | 1.0% | |||
| Cash & Equivalents — Net | 5.0% |
| 18 | March 31, 2017 | | Semiannual Report |
Table of Contents
Unaudited
AllianzGI Retirement 2050 Fund (cont’d)
| Shareholder Expense Example | Actual Performance | |||||||||||
| Class A | Class C | Class R | Class P | Class R6 | Administrative Class | |||||||
| Beginning Account Value (10/1/16) | $1,000.00 | $1,000.00 | $1,000.00 | $1,000.00 | $1,000.00 | $1,000.00 | ||||||
| Ending Account Value (3/31/17) | $1,081.50 | $1,077.50 | $1,079.10 | $1,083.20 | $1,083.90 | $1,082.20 | ||||||
| Expenses Paid During Period | $2.59 | $6.47 | $4.41 | $1.04 | $0.52 | $2.34 | ||||||
| Hypothetical Performance | ||||||||||||
| (5% return before expenses) | ||||||||||||
| Class A | Class C | Class R | Class P | Class R6 | Administrative Class | |||||||
| Beginning Account Value (10/1/16) | $1,000.00 | $1,000.00 | $1,000.00 | $1,000.00 | $1,000.00 | $1,000.00 | ||||||
| Ending Account Value (3/31/17) | $1,022.44 | $1,018.70 | $1,020.69 | $1,023.93 | $1,024.43 | $1,022.69 | ||||||
| Expenses Paid During Period | $2.52 | $6.29 | $4.28 | $1.01 | $0.50 | $2.27 | ||||||
For each class of the Fund, expenses (net of fee waiver and reimbursement, if any) are equal to the annualized expense ratio for the class (0.50% for Class A, 1.25% for Class C, 0.85% for Class R, 0.20% for Class P, 0.10% for Class R6 and 0.45% for Administrative Class), multiplied by the average account value over the period, multiplied by 182/365. These expenses do not include the expenses of the investment companies in which the Fund invests, which are indirectly borne by Fund shareholders.
| Semiannual Report | | March 31, 2017 | 19 |
Table of Contents
Unaudited
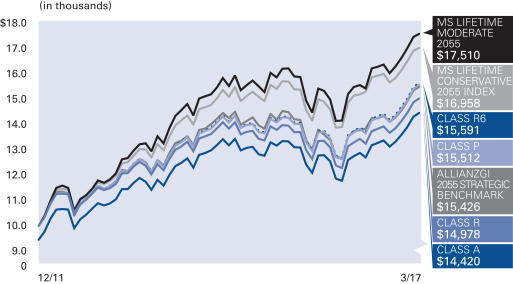
AllianzGI Retirement 2055 Fund
Average Annual Total Return for the period ended March 31, 2017
| 6 Month** | 1 Year | 5 Year | Since Inception† | |||||||||||||||
| AllianzGI Retirement 2055 Fund Class A | 8.09% | 14.64% | 6.24% | 8.33% | ||||||||||||||
| AllianzGI Retirement 2055 Fund Class A (adjusted) | 2.15% | 8.33% | 5.04% | 7.17% | |||||||||||||
| AllianzGI Retirement 2055 Fund Class R | 7.88% | 14.24% | 5.88% | 7.96% | |||||||||||||
| AllianzGI Retirement 2055 Fund Class P | 8.26% | 15.03% | 6.58% | 8.67% | |||||||||||||
| AllianzGI Retirement 2055 Fund Class R6 | 8.35% | 15.10% | 6.66% | 8.76% | |||||||||||||
| AllianzGI Retirement 2055 Fund Administrative Class | 8.15% | 14.75% | 6.29% | 8.37% | ||||||||||||||
| Morningstar Lifetime Moderate 2055 Index* | 7.40% | 15.57% | 8.65% | 11.19% | |||||||||||||
| AllianzGI 2055 Strategic Benchmark* | 7.87% | 14.51% | 6.35% | 8.55% | |||||||||||||
| Morningstar Lifetime Conservative 2055 Index | 6.37% | 14.44% | 8.17% | 10.52% | |||||||||||||
| Lipper Mixed-Asset Target 2055 Funds Average | 7.32% | 14.32% | 8.81% | 10.65% | ||||||||||||||
† The Fund began operations on December 19, 2011. Benchmark return comparisons began on the fund inception date. Lipper performance comparisons began on December 31, 2011.
* The Morningstar Lifetime Moderate series replaced the Morningstar Lifetime Conservative series as the Target Date Funds’ primary benchmark, and the AllianzGI Strategic Benchmark replaced the Real Return Target series (white label) as the Target Date Funds’ secondary benchmark as of October 1, 2016 in connection with certain changes to the Target Date Funds’ investment strategies that took effect on October 1, 2016.
** Cumulative returns.
Performance quoted represents past performance and is no guarantee of future results. Current performance may be lower or higher than performance shown. For performance current to the most recent month-end, visit our website at us.allianzgi.com. Investment return and the principal value will fluctuate. Shares may be worth more or less than original cost when redeemed. The adjusted returns take into account the maximum initial sales charge of 5.50% on Class A shares. Returns do not reflect deduction of taxes that a shareholder would pay on fund distributions or redemption of fund shares. See pages 133 and 134 for more information. The Fund’s gross expense ratios are 1.07% for Class A shares, 1.32% for Class R shares, 0.67% for Class P shares, 0.57% for Class R6 shares and 0.92% for Administrative Class shares. These ratios do not include an expense reduction, contractually guaranteed through at least January 31, 2020. The Fund’s expense ratios net of this reduction are 0.95% for Class A shares, 1.30% for Class R shares, 0.65% for Class P shares, 0.55% for Class R6 shares and 0.90% for Administrative Class shares. Expense ratio information is as of the Fund’s current prospectus dated February 1, 2017, as revised April 10, 2017.
Cumulative Returns Through March 31, 2017
Fund Allocation (as of March 31, 2017)
| AllianzGI Best Styles Global Equity | 55.6% | |||
| AllianzGI Best Styles U.S. Equity | 20.4% | |||
| AllianzGI Global Dynamic Allocation | 17.4% | |||
| AllianzGI Emerging Markets Small-Cap | 0.9% | |||
| Cash & Equivalents — Net | 5.7% |
| 20 | March 31, 2017 | | Semiannual Report |
Table of Contents
Unaudited
AllianzGI Retirement 2055 Fund (cont’d)
| Shareholder Expense Example | Actual Performance | |||||||||
| Class A | Class R | Class P | Class R6 | Administrative Class | ||||||
| Beginning Account Value (10/1/16) | $1,000.00 | $1,000.00 | $1,000.00 | $1,000.00 | $1,000.00 | |||||
| Ending Account Value (3/31/17) | $1,080.90 | $1,078.80 | $1,082.60 | $1,083.50 | $1,081.50 | |||||
| Expenses Paid During Period | $2.65 | $4.46 | $1.09 | $0.57 | $2.39 | |||||
| Hypothetical Performance | ||||||||||
| (5% return before expenses) | ||||||||||
| Class A | Class R | Class P | Class R6 | Administrative Class | ||||||
| Beginning Account Value (10/1/16) | $1,000.00 | $1,000.00 | $1,000.00 | $1,000.00 | $1,000.00 | |||||
| Ending Account Value (3/31/17) | $1,022.39 | $1,020.64 | $1,023.88 | $1,024.38 | $1,022.64 | |||||
| Expenses Paid During Period | $2.57 | $4.33 | $1.06 | $0.56 | $2.32 | |||||
For each class of the Fund, expenses (net of fee waiver and reimbursement, if any) are equal to the annualized expense ratio for the class (0.51% for Class A, 0.86% for Class R, 0.21% for Class P, 0.11% for Class R6 and 0.46% for Administrative Class), multiplied by the average account value over the period, multiplied by 182/365. These expenses do not include the expenses of the investment companies in which the Fund invests, which are indirectly borne by Fund shareholders.
| Semiannual Report | | March 31, 2017 | 21 |
Table of Contents
Unaudited
AllianzGI Retirement Income Fund
For the period of October 1, 2016 through March 31, 2017, as provided by the Multi-Asset US Group.
Fund Insights
For the six-month period ended March 31, 2017, Class A shares at net asset value (‘‘NAV’’) of the AllianzGI Retirement Income Fund (the “Fund”) returned 2.52%, outperforming the Bloomberg Barclay’s US Universal Bond Index (the “benchmark”), which returned -1.54%.
Market Overview
For the six-month period ending March 31, 2017, markets were dominated by the surprising outcome of the US presidential election relative to prevailing market expectations. The Trump victory ushered in a period of uncertainty regarding the magnitude and timing of future policy changes at the same time that it seemed to instill general optimism in market participants. The theme of reflation against the backdrop of supportive fiscal policy and stronger consumer demand percolated through markets for the period.
Throughout the first quarter, risk assets continued to outperform in a low volatility environment despite significant policy setbacks (including the failure to pass healthcare reform) and continued uncertainty about the future of US domestic and foreign policy. Moreover, global risk assets rallied in the context of the Federal Reserve (the ’’Fed’’) hiking interest rates by 50 basis points in the period. Tighter Fed policy signaled a new regime of tighter global monetary policy in the future (even if the European Central Bank and Bank of Japan reiterated their current commitments to accommodative policies).
During the period, US stocks rallied in the aftermath of the election and continued to gain throughout the first quarter with US Small Cap stocks in particular leading the way: The Russell 2000 Index gained 11.5% and the Russell 2000 Value Index gained 13.9% outpacing larger stocks, which gained 10.1%, as measured by the Russell 1000 Index.
Global growth remained healthy as fundamental macro-economic data continued to either match or outperform economists’ expectations. During the first quarter, the gap between hard data and soft data, as measured by surveys of purchasing managers and consumers widened substantially, revealing that much of what underpinned the rally in risk assets was associated with future expectations (as opposed to the current economic environment alone).
Optimistic assessments of global growth affected both developed and emerging markets: In broad terms, the MSCI All Country World Index returned 8.2% only slightly outpacing Emerging Markets (“EM”), which returned 6.8%. Better economic data, helped boost European equities for the period, despite persistent uncertainties about key elections in 2017 (in the Netherlands, France and Germany). For the period, the best performing stock markets were Spain and Italy, which returned 17.3% and 17.6% respectively (MSCI country indexes in USD).
Global Bonds declined for the period with the Bloomberg Barclays Global Aggregate Bond Index losing 5.4%. The long end of the US curve had the worst performance as long Treasuries (20+ years) lost 10.9% in the period due in part to a sharp initial increase in inflation expectations and a spike in yields. While the 10-year yield on US Treasuries initially increased by about 75 basis points from the election through mid-December, it remained relatively range bound for most of the first quarter, making US Treasuries one of the worst performing asset classes for the period. The Bloomberg Barclays US Aggregate Bond Index lost 2.2% for the period. Within fixed income, US High Yield was the best performer. Globally, Emerging Market hard currency debt outperformed developed market government bonds. Commodities, most notably precious metals and gold, were among the worst performing asset classes in the period.
Portfolio Review
Against a backdrop of favorable trend and fundamental views across risk assets, the portfolio expressed overweights to both US investment grade and high yield corporate bonds. Over the period, the Fund added an emphasis on higher yielding real estate investment trusts (“REITs”) while the emphasis on higher yielding credits was maintained. The emphasis on higher yielding issues contributed to results as reflected by the BofA Merrill Lynch High Yield Master II Index gaining 4.6% while the Bloomberg Barclays US Aggregate Bond Index conversely declined -2.2%.
At the end of the period, the portfolio maintained a positive view on risk assets including high yield bonds and higher yielding segments within US REITs.
Outlook
Looking ahead, we expect that global inflation will continue to steadily rise, in part attributable to firmer commodity prices and narrowing output gaps throughout developed markets. Emerging markets are expected to continue to post solid growth in the near term, providing opportunities for much needed structural reforms that will ultimately contribute to longer term stability. We expect the global economy will likely continue to benefit from debt-financed growth for the foreseeable future on the back of leveraged households and businesses. We expect monetary policy to continue to tighten in the US, albeit at a slow and measured pace, while global central bank liquidity will remain abundant at least through 2018.
However, risks abound, including increased political risks, most notably in Europe in light of the busy election calendar but also in key emerging markets. In addition, we believe charged rhetoric about protectionism and zero-sum interactions threaten to undermine longstanding commitments to global trade in goods and financial assets. Finally, we believe risks related to inflated expectations on the part of market participants as well as market complacency may potentially intensify should stocks reverse their recent rally.
As of the end of the period, we expect to remain overweight risk assets and underweight most sovereign bonds with the idea in mind that sovereigns are nearing the end of a secular bull market. We believe the “Reflation Trade” persists for now as long as the possibility of US Fiscal stimulus remains and cyclical data continue to show signs of improvement. We maintain a positive outlook on emerging markets while recognizing that an unexpected slowdown in the US or other developed markets would have real and immediate implication for EM broadly. We remain vigilant in this low volatility environment and are focused on monitoring cyclical data and relative valuations across asset classes.
Certain changes to the Fund’s investment strategy, benchmarks and portfolio management team became effective on October 1, 2016. Please see the prospectus for complete details.
| 22 | March 31, 2017 | | Semiannual Report |
Table of Contents
Unaudited
AllianzGI Retirement Income Fund (cont’d)
Average Annual Total Return for the period ended March 31, 2017
| 6 Month** | 1 Year | 5 Year | Since Inception† | |||||||||||||||
| AllianzGI Retirement Income Fund Class A | 2.52% | 9.75% | 4.08% | 7.00% | ||||||||||||||
| AllianzGI Retirement Income Fund Class A (adjusted) | –3.12% | 3.71% | 2.91% | 6.27% | |||||||||||||
| AllianzGI Retirement Income Fund Class C | 2.15% | 8.91% | 3.31% | 6.21% | ||||||||||||||
| AllianzGI Retirement Income Fund Class C (adjusted) | 1.15% | 7.91% | 3.31% | 6.21% | |||||||||||||
| AllianzGI Retirement Income Fund Class R | 2.39% | 9.43% | 3.73% | 6.67% | |||||||||||||
| AllianzGI Retirement Income Fund Class P | 2.70% | 10.13% | 4.42% | 7.30% | |||||||||||||
| AllianzGI Retirement Income Fund Class R6 | 2.76% | 10.22% | 4.51% | 7.41% | |||||||||||||
| AllianzGI Retirement Income Fund Administrative Class | 2.57% | 8.68% | 3.92% | 6.93% | ||||||||||||||
| Bloomberg Barclays US Universal Bond Index* | –1.54% | 1.92% | 2.83% | 4.60% | |||||||||||||
| AllianzGI Retirement Income Strategic Benchmark* | 0.98% | 4.47% | 2.96% | 5.38% | |||||||||||||
| MSCI World High Dividend Yield Index | 5.57% | 11.54% | 8.37% | 10.84% | |||||||||||||
| Morningstar Lifetime Conservative Income Index | 0.50% | 4.15% | 2.93% | 5.40% | |||||||||||||
| Lipper Mixed-Asset Target Today Funds Average | 1.79% | 6.09% | 3.95% | 6.58% | ||||||||||||||
† The Fund began operations on December 29, 2008. Benchmark return comparisons began on the fund inception date. Lipper performance comparisons began on December 31, 2008.
* The Bloomberg Barclays US Universal Bond Index replaced the Morningstar Lifetime Conservative Income Index as the Fund’s primary benchmark and the MSCI World High Dividend Yield Index and the AllianzGI Strategic Benchmark replaced the Real Return Target Today Index as the Fund’s secondary benchmarks as of October 1, 2016 in connection with certain changes to the Fund’s investment strategies that took effect on October 1, 2016.
** Cumulative returns.
Performance quoted represents past performance and is no guarantee of future results. Current performance may be lower or higher than performance shown. For performance current to the most recent month-end, visit our website at us.allianzgi.com. Investment return and the principal value will fluctuate. Shares may be worth more or less than original cost when redeemed. The adjusted returns take into account the maximum initial sales charge of 5.50% on Class A shares and the contingent deferred sales charge (CDSC) of 1% on Class C shares, which may apply to shares redeemed during the first year of ownership. Returns do not reflect deduction of taxes that a shareholder would pay on fund distributions or redemption of fund shares. See pages 133 and 134 for more information. The Fund’s gross expense ratios are 1.20% for Class A shares, 1.95% for Class C shares, 1.45% for Class R shares, 0.80% for Class P shares, 0.70% for Class R6 shares and 1.05% for Administrative Class shares. These ratios do not include an expense reduction, contractually guaranteed through at least January 31, 2020. The Fund’s expense ratios net of this reduction are 0.95% for Class A shares, 1.70% for Class C shares, 1.30% for Class R shares, 0.65% for Class P shares, 0.55% for Class R6 shares and 0.90% for Administrative Class shares. Expense ratio information is as of the Fund’s current prospectus dated February 1, 2017, as revised April 10, 2017.
| Semiannual Report | | March 31, 2017 | 23 |
Table of Contents
Unaudited
AllianzGI Retirement Income Fund (cont’d)
Cumulative Returns Through March 31, 2017
Fund Allocation (as of March 31, 2017)
| AllianzGI Short Duration High Income | 20.2% | |||
| PIMCO Income | 11.1% | |||
| AllianzGI High Yield Bond | 11.0% | |||
| AllianzGI NFJ Global Dividend Value | 10.1% | |||
| PIMCO Long-Term Credit | 8.1% | |||
| PIMCO Capital Securities and Financials | 6.1% | |||
| AllianzGI Emerging Markets Debt | 5.6% | |||
| Alerian MLP | 3.8% | |||
| Other | 21.4% | |||
| Cash & Equivalents — Net | 2.6% |
| Shareholder Expense Example | Actual Performance | |||||||||||
| Class A | Class C | Class R | Class P | Class R6 | Administrative Class | |||||||
| Beginning Account Value (10/1/16) | $1,000.00 | $1,000.00 | $1,000.00 | $1,000.00 | $1,000.00 | $1,000.00 | ||||||
| Ending Account Value (3/31/17) | $1,025.20 | $1,021.50 | $1,023.90 | $1,027.00 | $1,027.60 | $1,025.70 | ||||||
| Expenses Paid During Period | $1.62 | $5.39 | $3.38 | $0.10 | $0.01 | $1.36 | ||||||
| Hypothetical Performance | ||||||||||||
| (5% return before expenses) | ||||||||||||
| Class A | Class C | Class R | Class P | Class R6 | Administrative Class | |||||||
| Beginning Account Value (10/1/16) | $1,000.00 | $1,000.00 | $1,000.00 | $1,000.00 | $1,000.00 | $1,000.00 | ||||||
| Ending Account Value (3/31/17) | $1,023.34 | $1,019.60 | $1,021.59 | $1,024.83 | $1,024.92 | $1,023.59 | ||||||
| Expenses Paid During Period | $1.61 | $5.39 | $3.38 | $0.10 | $0.01 | $1.36 | ||||||
For each class of the Fund, expenses (net of fee waiver and reimbursement, if any) are equal to the annualized expense ratio for the class (0.32% for Class A, 1.07% for Class C, 0.67% for Class R, 0.02% for Class P, 0.00% for Class R6 and 0.27% for Administrative Class), multiplied by the average account value over the period, multiplied by 182/365. These expenses do not include the expenses of the investment companies in which the Fund invests, which are indirectly borne by Fund shareholders.
| 24 | March 31, 2017 | | Semiannual Report |
Table of Contents
(THIS PAGE INTENTIONALLY LEFT BLANK)
| Semiannual Report | | March 31, 2017 | 25 |
Table of Contents
Unaudited
AllianzGI Global Allocation Fund
For the period of October 1, 2016 through March 31, 2017, as provided by the Multi-Asset US Group.
Fund Insights
For the six-month period ended March 31, 2017, Class A shares at net asset value (‘‘NAV’’) of the AllianzGI Global Allocation Fund (the “Fund”) returned 3.88%, underperforming the 60% MSCI ACWI, 40% Bloomberg Barclays US Aggregate Bond Index (the “benchmark”), which returned 3.94%.
Market Overview
For the six-month period, markets were dominated by the surprising outcome of the US presidential election relative to prevailing market expectations. The Trump victory ushered in a period of uncertainty regarding the magnitude and timing of future policy changes at the same time that it seemed to instill general optimism in market participants. The theme of reflation against the backdrop of supportive fiscal policy and stronger consumer demand percolated through markets for the period.
Throughout the first quarter, risk assets continued to outperform in a low volatility environment despite significant policy setbacks (including the failure to pass healthcare reform) and continued uncertainty about the future of US domestic and foreign policy. Moreover, global risk assets rallied in the context of the Federal Reserve (the ‘‘Fed’’) raising interest rates by 50 basis points in the period. Tighter Fed policy signaled a new regime of tighter global monetary policy in the future (even if the European Central Bank and Bank of Japan reiterated their current commitments to accommodative policies).
During the period, US stocks rallied in the aftermath of the election and continued to gain throughout the first quarter with US Small Cap stocks in particular leading the way: The Russell 2000 Index gained 11.5% and the Russell 2000 Value Index gained 13.9% outpacing larger stocks, which gained 10.1%, as measured by the Russell 1000 Index.
Global growth remained healthy as fundamental macro-economic data continued to either match or outperform economists’ expectations. During the first quarter, the gap between hard data and soft data, as measured by surveys of purchasing managers and consumers, widened substantially, revealing that much of what underpinned the rally in risk assets was associated with future expectations (as opposed to the current economic environment alone).
Optimistic assessments of global growth affected both developed and emerging markets: In broad terms, the MSCI All Country World Index returned 8.2% only slightly outpacing Emerging Markets, which returned 6.8%. Better economic data helped boost European equities for the period despite persistent uncertainties about key elections in 2017 (in the Netherlands, France and Germany). For the period, the best performing stock markets were Spain and Italy, which returned 17.3% and 17.6% respectively (MSCI country indexes in USD).
Global Bonds declined for the period with the Bloomberg Barclays Global Aggregate Bond Index losing 5.4%. The long end of the US curve had the worst performance as long Treasuries (20+ years) lost 10.9% in the period due in part to a sharp initial increase in inflation expectations and a spike in yields. While the 10-year yield on US Treasuries initially increased by about 75 basis points from the election through mid-December, it remained relatively range bound for most of the first quarter, making US Treasuries one of the worst performing asset classes for the period. The Bloomberg Barclays US Aggregate Bond Index lost 2.2% for the period. Within fixed income, US High Yield was the best performer. Globally, Emerging Market hard currency debt outperformed developed market government bonds. Commodities, most notably precious metals and gold, were among the worst performing asset classes in the period.
Portfolio Review
Overweights to global equities provided a tailwind to performance during the period, particularly in North America, as the US equity market experienced strong performance following the US presidential election. The portfolio’s overweight to US Government debt detracted during the fourth quarter of 2016, as rates rallied sharply in the aftermath of the US election.
At the end of the period, the portfolio maintained an underweight position in US government bonds (duration weighted) and an overweight to global equities including Emerging Markets, against a backdrop of favorable trend and fundamental views across risk assets.
Outlook
Looking ahead, we expect that global inflation will continue to steadily rise, partly attributable to firmer commodity prices and narrowing output gaps throughout developed markets. Emerging markets are expected to continue to post solid growth in the near term, providing opportunities for much needed structural reforms that will ultimately contribute to longer term stability. We believe the global economy will likely continue to benefit from debt-financed growth for the foreseeable future on the back of leveraged households and businesses. We expect monetary policy to continue to tighten in the US, albeit at a slow and measured pace, while global central bank liquidity will remain abundant at least through 2018.
However, we believe that risks abound, including increased political risks, most notably in Europe in light of the busy election calendar, but also in key emerging markets. In addition, charged rhetoric about protectionism and zero-sum interactions may, in our opinion, threaten to undermine longstanding commitments to global trade in goods and financial assets. Finally, risks related to inflated expectations on the part of market participants as well as market complacency may potentially intensify should stocks reverse their recent rally.
As of the end of the period, we remain overweight risk assets and underweight most sovereign bonds with the idea in mind that sovereigns are nearing the end of a secular bull market. The “Reflation Trade” persists for now as long as the possibility of US fiscal stimulus remains and cyclical data continue to show signs of improvement. We maintain a positive outlook on emerging markets while recognizing that an unexpected slowdown in the US or other developed markets would have real and immediate implication for Emerging Markets (‘‘EM’’) broadly. We remain vigilant in this low volatility environment and are focused on monitoring cyclical data and relative valuations across asset classes.
| 26 | March 31, 2017 | | Semiannual Report |
Table of Contents
Unaudited
AllianzGI Global Allocation Fund (cont’d)
Average Annual Total Return for the period ended March 31, 2017
| 6 Month* | 1 Year | 5 Year | 10 Year | Since Inception† | ||||||||||||||||||
| AllianzGI Global Allocation Fund Class A | 3.88% | 7.23% | 4.87% | 3.97% | 5.52% | |||||||||||||||||
| AllianzGI Global Allocation Fund Class A (adjusted) | –1.83% | 1.33% | 3.69% | 3.38% | 5.19% | ||||||||||||||||
| AllianzGI Global Allocation Fund Class C | 3.55% | 6.37% | 4.10% | 3.20% | 4.73% | |||||||||||||||||
| AllianzGI Global Allocation Fund Class C (adjusted) | 2.55% | 5.37% | 4.10% | 3.20% | 4.73% | ||||||||||||||||
| AllianzGI Global Allocation Fund Class R | 3.87% | 7.04% | 4.70% | 3.75% | 5.28% | ||||||||||||||||
| AllianzGI Global Allocation Fund Class P | 4.13% | 7.60% | 5.13% | 4.21% | 5.75% | ||||||||||||||||
| AllianzGI Global Allocation Fund Institutional Class | 4.09% | 7.49% | 5.12% | 4.31% | 5.95% | ||||||||||||||||
| AllianzGI Global Allocation Fund Class R6 | 4.10% | 7.52% | 5.21% | 4.40% | 6.05% | ||||||||||||||||
| AllianzGI Global Allocation Fund Administrative Class | 3.96% | 7.22% | 4.88% | 4.00% | 5.56% | |||||||||||||||||
| MSCI ACWI | 8.18% | 15.04% | 8.37% | 4.00% | 5.70% | ||||||||||||||||
| 60% MSCI ACWI, 40% Bloomberg Barclays US Aggregate Bond Index | 3.94% | 9.02% | 6.09% | 4.48% | 5.68% | ||||||||||||||||
| Bloomberg Barclays US Aggregate Bond Index | –2.18% | 0.44% | 2.34% | 4.27% | 4.79% | ||||||||||||||||
| Lipper Alternative Global Macro Funds Average | 2.06% | 6.41% | 2.36% | 3.21% | 5.30% | |||||||||||||||||
† The Fund began operations on September 30,1998. Benchmark return comparisons began on the fund inception date. Lipper performance comparisons began on September 30,1998.
* Cumulative returns.
Performance quoted represents past performance and is no guarantee of future results. Current performance may be lower or higher than performance shown. For performance current to the most recent month-end, visit our website at us.allianzgi.com. Investment return and the principal value will fluctuate. Shares may be worth more or less than original cost when redeemed. The adjusted returns take into account the maximum sales charge of 5.50% on Class A shares and the contingent deferred sales charge (CDSC) of 1% on Class C shares, which may apply to shares redeemed during the first year of ownership. Returns do not reflect deduction of taxes that a shareholder would pay on fund distributions or redemption of fund shares. See pages 133 and 134 for more information. The Fund’s gross expense ratios are 1.56% for Class A shares, 2.33% for Class C shares, 1.76% for Class R shares, 1.26% for Class P shares, 1.35% for Institutional Class shares, 1.26% for Class R6 shares and 1.51% for Administrative Class shares. These ratios do not include an expense reduction, contractually guaranteed through at least January 31, 2018. The Fund’s expense ratios net of this reduction are 1.03% for Class A shares, 1.80% for Class C shares, 1.23% for Class R shares, 0.83% for Class P shares, 0.83% for Institutional Class shares, 0.73% for Class R6 shares and 0.98% for Administrative Class shares. Expense ratio information is as of the Fund’s current prospectus dated February 1, 2017, as revised April 10, 2017.
Cumulative Returns Through March 31, 2017
Fund Allocation (as of March 31, 2017)
| AllianzGI Best Styles Global Equity | 42.9% | |||
| AllianzGI Advanced Core Bond | 24.5% | |||
| AllianzGI Best Styles Global Managed Volatility | 10.6% | |||
| AllianzGI International Growth | 5.5% | |||
| AllianzGI Emerging Markets Debt | 4.3% | |||
| PIMCO Broad U.S. TIPS Index | 2.0% | |||
| AllianzGI Structured Return | 1.6% | |||
| AllianzGI Emerging Markets Small-Cap | 1.2% | |||
| Other | 1.8% | |||
| Cash & Equivalents — Net | 5.6% |
| Semiannual Report | | March 31, 2017 | 27 |
Table of Contents
Unaudited
AllianzGI Global Allocation Fund (cont’d)
| Shareholder Expense Example | Actual Performance | |||||||||||||
| Class A | Class C | Class R | Class P | Institutional Class | Class R6 | Administrative Class | ||||||||
| Beginning Account Value (10/1/16) | $1,000.00 | $1,000.00 | $1,000.00 | $1,000.00 | $1,000.00 | $1,000.00 | $1,000.00 | |||||||
| Ending Account Value (3/31/17) | $1,038.80 | $1,035.50 | $1,038.70 | $1,041.30 | $1,040.90 | $1,041.00 | $1,039.60 | |||||||
| Expenses Paid During Period | $3.05 | $6.85 | $4.02 | $1.48 | $1.93 | $1.43 | $2.70 | |||||||
| Hypothetical Performance | ||||||||||||||
| (5% return before expenses) | ||||||||||||||
| Class A | Class C | Class R | Class P | Institutional Class | Class R6 | Administrative Class | ||||||||
| Beginning Account Value (10/1/16) | $1,000.00 | $1,000.00 | $1,000.00 | $1,000.00 | $1,000.00 | $1,000.00 | $1,000.00 | |||||||
| Ending Account Value (3/31/17) | $1,021.94 | $1,018.20 | $1,020.99 | $1,023.49 | $1,023.04 | $1,023.54 | $1,022.29 | |||||||
| Expenses Paid During Period | $3.02 | $6.79 | $3.98 | $1.46 | $1.92 | $1.41 | $2.67 | |||||||
For each class of the Fund, expenses (net of fee waiver and reimbursement, if any) are equal to the annualized expense ratio for the class (0.60% for Class A, 1.35% for Class C, 0.79% for Class R, 0.29% for Class P, 0.38% for Institutional Class, 0.28% for Class R6 and 0.53% for Administrative Class), multiplied by the average account value over the period, multiplied by 182/365. These expenses do not include the expenses of the investment companies in which the Fund invests, which are indirectly borne by Fund shareholders.
| 28 | March 31, 2017 | | Semiannual Report |
Table of Contents
(THIS PAGE INTENTIONALLY LEFT BLANK)
| Semiannual Report | | March 31, 2017 | 29 |
Table of Contents
Unaudited
AllianzGI Global Megatrends Fund
For the period of October 1, 2016 through March 31, 2017, as provided by John Schroer, CFA, Portfolio Manager.
Fund Insights
For the six-month period ended March 31, 2017, Class A shares at net asset value (‘‘NAV’’) of the AllianzGI Global Megatrends Fund (the “Fund”) returned 3.24%, underperforming the MSCI ACWI (the “benchmark”), which returned 8.18%.
Market Overview
Global equities rallied strongly over the six-month period, with indices in the US and UK breaking previous record highs while many other markets reached multi-month peaks. In general, developed equity markets outperformed emerging markets, with Japan leading the advance as a weaker yen lifted prospects for the country’s exporters. In terms of sectors, financials delivered robust returns amid expectations that interest rates would rise faster than expected as a result of President Trump’s policies. Other growth-oriented sectors also performed well.
The period was characterized by gradually improving economic growth and rising inflation. The US Federal Reserve (the ‘‘Fed’’) raised US interest rates in December 2016 and March 2017 with expectations for at least two additional rate hikes in 2017. In contrast, in December 2016 the European Central Bank (‘‘ECB’’) extended its bond-buying program until at least the end of 2017, but reduced the size of its monthly bond purchases. Subsequently, rising inflation in the first quarter of 2017 led to speculation that the ECB would need to wind down these measures, with President Mario Draghi noting that battle against deflation had now been won. The Bank of England and Bank of Japan left monetary policy unchanged.
Portfolio Overview
The Fund is a thematic portfolio made up of five approximately equally weighted strategies or “sleeves”, providing exposure to technology, health sciences, global water, the emerging markets consumer, and global natural resources. The Fund underperformed its benchmark, as four out of its five sleeves trailed the broad global equity market.
The Technology sleeve posted strong double digits gains during the period and outperformed the benchmark. Technology stocks led the global equity rally, despite some weakness during the fourth quarter of 2016. Both the emerging market consumer and health sciences sleeves also posted positive returns during the period, however results trailed the benchmark.
The global water and global natural resources sleeves slid into negative territory. While water related securities performed well during the first quarter of 2017, performance suffered during the fourth quarter of 2016. This was due in part to the market’s reaction to a profit warning issued by one of its holdings. The global natural resources sleeve suffered from the drop in oil prices and the subsequent pull back in energy related stocks.
Outlook
Given the recent strong performance run in global equities in both developed and emerging markets, we believe that investors should not be surprised to see a near term pull back. However, we predict the prospect for solid first quarter earnings releases in the US in particular, where the Fund has its greatest exposure, remains a positive backdrop.
Equity market behavior has been heavily influenced by macroeconomic and political headlines, and recently the focus has shifted to geopolitical risks. Still, we believe fundamentals ultimately matter to share price performance. We believe that it is important to discern the difference between short term shifts in sentiment and actual changes in company fundamentals that could impact stock prices over the longer term.
We expect that rapid technological innovation, developments in healthcare and global energy, the emerging consumer class in developing economies and the increasing scarcity of clean water will remain powerful secular themes. In each segment of the Fund, we strive to find companies with under-appreciated company specific and industry fundamentals that can add value for our investors over the long-term, despite short-term market gyrations.
Average Annual Total Return for the period ended March 31, 2017
| 6 Month* | 1 Year | Since Inception† | ||||||||||||
| AllianzGI Global Megatrends Fund Class A | 3.24% | 15.14% | 4.05% | |||||||||||
| AllianzGI Global Megatrends Fund Class A (adjusted) | –2.44% | 8.81% | 1.36% | ||||||||||
| AllianzGI Global Megatrends Fund Class P | 3.31% | 15.28% | 4.23% | ||||||||||
| AllianzGI Global Megatrends Fund Institutional Class | 3.38% | 15.42% | 4.33% | ||||||||||
| MSCI ACWI | 8.18% | 15.04% | 5.97% | ||||||||||
| Lipper Global Multi-Cap Core Funds Average | 7.52% | 13.83% | 5.84% | |||||||||||
† The Fund began operations on February 2, 2015. Benchmark return comparisons began on the fund inception date. Lipper performance comparisons began on January 31, 2015.
* Cumulative returns.
Performance quoted represents past performance and is no guarantee of future results. Current performance may be lower or higher than performance shown. For performance current to the most recent month-end, visit our website at us.allianzgi.com. Investment return and the principal value will fluctuate. Shares may be worth more or less than original cost when redeemed. The adjusted returns take into account the maximum initial sales charge of 5.50% on Class A shares. Returns do not reflect deduction of taxes that a shareholder would pay on fund distributions or redemption of fund shares. See pages 133 and 134 for more information. The Fund’s gross expense ratios are 6.57% for Class A shares, 6.25% for Class P shares and 6.07% for Institutional Class shares. These ratios do not include an expense reduction, contractually guaranteed through at least January 31, 2018. The Fund’s expense ratios net of this reduction are 1.30% for Class A shares, 1.15% for Class P shares and 1.05% for Institutional Class shares. Expense ratio information is as of the Fund’s current prospectus dated February 1, 2017, as revised April 10, 2017.
| 30 | March 31, 2017 | | Semiannual Report |
Table of Contents
Unaudited
AllianzGI Global Megatrends Fund (cont’d)
Cumulative Returns Through March 31, 2017
Fund Allocation (as of March 31, 2017)
| AllianzGI Technology | 20.5% | |||
| AllianzGI Emerging Markets Consumer | 19.3% | |||
| AllianzGI Health Sciences | 19.1% | |||
| AllianzGI Global Natural Resources | 18.1% | |||
| AllianzGI Global Water | 17.4% | |||
| Cash & Equivalents — Net | 5.6% |
| Shareholder Expense Example | Actual Performance | |||||
| Class A | Class P | Institutional Class | ||||
| Beginning Account Value (10/1/16) | $1,000.00 | $1,000.00 | $1,000.00 | |||
| Ending Account Value (3/31/17) | $1,032.40 | $1,033.10 | $1,033.80 | |||
| Expenses Paid During Period | $0.86 | $0.10 | $— | |||
| Hypothetical Performance | ||||||
| (5% return before expenses) | ||||||
| Class A | Class P | Institutional Class | ||||
| Beginning Account Value (10/1/16) | $1,000.00 | $1,000.00 | $1,000.00 | |||
| Ending Account Value (3/31/17) | $1,024.08 | $1,024.83 | $1,024.93 | |||
| Expenses Paid During Period | $0.86 | $0.10 | $— | |||
For each class of the Fund, expenses (net of fee waiver and reimbursement, if any) are equal to the annualized expense ratio for the class (0.17% for Class A, 0.02% for Class P and 0.00% for Institutional Class), multiplied by the average account value over the period, multiplied by 182/365. These expenses do not include the expenses of the investment companies in which the Fund invests, which are indirectly borne by Fund shareholders.
| Semiannual Report | | March 31, 2017 | 31 |
Table of Contents
Unaudited
AllianzGI Best Styles Emerging Markets Equity Fund
For the period of October 1, 2016 through March 31, 2017, as provided by Christian McCormick, Senior Product Specialist.
Fund Insights
For the six-month period ended March 31, 2017, Class A shares at net asset value (‘‘NAV’’) of the AllianzGI Best Styles Emerging Markets Equity Fund (the “Fund”) returned 6.42%, underperforming the MSCI Emerging Markets Index (the “benchmark”), which returned 6.80%.
Market Overview
Emerging market equities rallied over 2016. For much of the period, they were supported by higher commodity prices and a weakening US dollar, although they retreated in the fourth quarter of the year as Donald Trump’s victory in the US election boosted the US dollar, raised fears of higher US interest rates and increased concerns over more protectionist policies. All three regions gained Q2-Q4, with Eastern Europe leading the advance, followed by Latin America and then Asia. Emerging market equities delivered double digit returns over the first quarter, outperforming their more developed counterparts amid signs of stronger global growth and a weaker US dollar.
Portfolio Review
The Best Styles strategies implement a well-diversified blend of the five long-term successful investment styles that includes value, momentum, earnings revisions, growth and quality. Over the trailing 12 months, the value style outperformed the benchmark by approximately 11%, delivering a rebound in relative performance after having been mostly stagnant since 2009. The majority of the performance came in the second half of 2016. Momentum and revisions were also positive, with stable growth and quality lagging.
The Best Styles strategy has only moderate leeway for sector allocation with a maximum deviation of 3% vs. the benchmark for active sector weightings. The overall contribution from active sector allocation was positive. Consumer discretionary and consumer staples delivered a combined 65 basis points of outperformance while energy detracted 17 basis points.
Best Styles holds a broad number of stocks to implement a well-diversified mix of investment styles and assigns a maximum active weighting of 1% to individual stocks. Individual stocks contributed positively during the period. Information technology stocks contributed a strong 200+ basis points of outperformance, led by Samsung. Financial stocks were also strong with Banco de Brasil leading the way. Material stocks were the only significant detractor at -70 basis points, with Vale subtracting 42 basis points.
Outlook
We expect that Best Styles will continue to be overweight in stocks with attractive valuation and stocks with positive momentum and positive revisions, in line with the longer term strategic investment style mix.
Average Annual Total Return for the period ended March 31, 2017
| 6 Month* | 1 Year | Since Inception† | ||||||||||||
| AllianzGI Best Styles Emerging Markets Equity Fund Class A | 6.42% | 18.28% | 2.52% | |||||||||||
| AllianzGI Best Styles Emerging Markets Equity Fund Class A (adjusted) | 0.57% | 11.78% | 0.03% | ||||||||||
| AllianzGI Best Styles Emerging Markets Equity Fund Class C | 5.95% | 17.37% | 1.74% | |||||||||||
| AllianzGI Best Styles Emerging Markets Equity Fund Class C (adjusted) | 4.96% | 16.37% | 1.74% | ||||||||||
| AllianzGI Best Styles Emerging Markets Equity Fund Class P | 6.46% | 18.41% | 2.68% | ||||||||||
| AllianzGI Best Styles Emerging Markets Equity Fund Institutional Class | 6.57% | 18.63% | 2.79% | ||||||||||
| AllianzGI Best Styles Emerging Markets Equity Fund Class R6 | 6.57% | 18.74% | 2.89% | ||||||||||
| MSCI Emerging Markets Index | 6.80% | 17.21% | 1.98% | ||||||||||
| Lipper Emerging Markets Funds Average | 5.66% | 16.23% | –0.51% | |||||||||||
† The Fund began operations on December 9, 2014. Benchmark return comparisons began on the fund inception date. Lipper performance comparisons began on November 30, 2014.
* Cumulative returns.
Performance quoted represents past performance and is no guarantee of future results. Current performance may be lower or higher than performance shown. For performance current to the most recent month-end, visit our website at us.allianzgi.com. Investment return and the principal value will fluctuate. Shares may be worth more or less than original cost when redeemed. The adjusted returns take into account the maximum initial sales charge of 5.50% on Class A shares and the contingent deferred sales charge (CDSC) of 1% on Class C shares, which may apply to shares redeemed during the first year of ownership. Returns do not reflect deduction of taxes that a shareholder would pay on fund distributions or redemption of fund shares. See pages 133 and 134 for more information. The Fund’s gross expense ratios are 4.30% for Class A shares, 5.13% for Class C shares, 3.65% for Class P shares, 3.66% for Institutional Class shares and 3.73% for Class R6 shares. These ratios do not include an expense reduction, contractually guaranteed through at least January 31, 2018. The Fund’s expense ratios net of this reduction are 0.85% for Class A shares, 1.60% for Class C shares, 0.70% for Class P shares, 0.60% for Institutional Class shares and 0.60% for Class R6 shares. Expense ratio information is as of the Fund’s current prospectus dated February 1, 2017, as revised April 10, 2017.
| 32 | March 31, 2017 | | Semiannual Report |
Table of Contents
Unaudited
AllianzGI Best Styles Emerging Markets Equity Fund (cont’d)
Cumulative Returns Through March 31, 2017
Country Allocation (as of March 31, 2017)
| China | 30.1% | |||
| Korea (Republic of) | 12.8% | |||
| Taiwan | 12.7% | |||
| Brazil | 8.9% | |||
| South Africa | 3.9% | |||
| Thailand | 2.9% | |||
| Russian Federation | 2.7% | |||
| Malaysia | 2.4% | |||
| Other | 9.5% | |||
| Cash & Equivalents — Net | 14.1% |
| Shareholder Expense Example | Actual Performance | |||||||||
| Class A | Class C | Class P | Institutional Class | Class R6 | ||||||
| Beginning Account Value (10/1/16) | $1,000.00 | $1,000.00 | $1,000.00 | $1,000.00 | $1,000.00 | |||||
| Ending Account Value (3/31/17) | $1,064.20 | $1,059.50 | $1,064.60 | $1,065.70 | $1,065.70 | |||||
| Expenses Paid During Period | $4.68 | $8.57 | $3.96 | $3.19 | $3.09 | |||||
| Hypothetical Performance | ||||||||||
| (5% return before expenses) | ||||||||||
| Class A | Class C | Class P | Institutional Class | Class R6 | ||||||
| Beginning Account Value (10/1/16) | $1,000.00 | $1,000.00 | $1,000.00 | $1,000.00 | $1,000.00 | |||||
| Ending Account Value (3/31/17) | $1,020.39 | $1,016.60 | $1,021.09 | $1,021.84 | $1,021.94 | |||||
| Expenses Paid During Period | $4.58 | $8.40 | $3.88 | $3.13 | $3.02 | |||||
For each class of the Fund, expenses (net of fee waiver and reimbursement, if any) are equal to the annualized expense ratio for the class (0.91% for Class A, 1.67% for Class C, 0.77% for Class P, 0.62% for Institutional Class and 0.60% for Class R6), multiplied by the average account value over the period, multiplied by 182/365.
| Semiannual Report | | March 31, 2017 | 33 |
Table of Contents
Unaudited
AllianzGI Best Styles Global Equity Fund
For the period of October 1, 2016 through March 31, 2017, as provided by Christian McCormick, Senior Product Specialist.
Fund Insights
For the six-month period ended March 31, 2017, Class A shares at net asset value (‘‘NAV’’) of the AllianzGI Best Styles Global Equity Fund (the “Fund”) returned 9.50%, outperforming the MSCI ACWI (the “benchmark”), which returned 8.18%.
Market Overview
Global equities closed 2016 with strong returns, despite suffering the worst start to a year in decades, as renewed fears about a slowdown in China and further declines in oil prices led to a significant sell-off in the first six weeks of 2016. Having recouped these losses, the UK’s unexpected vote in favor of leaving the EU led to another bout of weakness in late June. Shares prices recovered once more, ending the year with a Trump-inspired rally amid hopes of tax cuts and a more pro-growth policy stance. Global equities rallied over the first three months of 2017, buoyed by signs of strengthening growth and optimism over company earnings, although the rally faded towards the quarter end. In terms of monetary policy, the European Central Bank (“ECB”) and Bank of Japan continued with their easing policy, while the US Federal Reserve (the ‘‘Fed’’) raised interest rates in December by 25 basis points and then again in Q1 2017 by another 25 basis points, reflecting an improving macro-economic environment in the US.
Portfolio Review
The Best Styles strategies implement a well-diversified blend of the five long-term successful investment styles that include value, momentum, earnings revisions, growth and quality. Over the trailing 12 months, the value style outperformed the benchmark by approximately 8%, delivering a rebound in relative performance after having been mostly stagnant since 2009. The majority of the performance came in the second half of 2016. The other four investment styles had negative relative performance.
The Best Styles strategy has only moderate leeway for sector allocation with a maximum deviation of 3% vs. the benchmark for active sector weightings. The overall contribution from active sector allocation was neutral. Consumer discretionary was the largest relative contributor at +29 basis points, while the utilities allocation detracted 15 basis points. Country allocation effect was also neutral with no attribution of note.
Best Styles holds a broad number of stocks to implement a well-diversified mix of investment styles and assigns a maximum active weighting of 1% to individual stocks. Individual stocks contributed negatively during the period. Information technology stocks were the best performers, led by Activision Blizzard and Samsung, adding a combined 33 basis points of relative performance. Consumer discretionary stocks detracted 73 basis points of versus the benchmark, led by Amazon at -13 basis points.
Outlook
We expect that Best Styles will continue to be overweight in stocks with attractive valuations and stocks with positive momentum and revisions, in line with the longer term strategic investment style mix.
| 34 | March 31, 2017 | | Semiannual Report |
Table of Contents
Unaudited
AllianzGI Best Styles Global Equity Fund (cont’d)
Average Annual Total Return for the period ended March 31, 2017
| 6 Month* | 1 Year | Since Inception† | ||||||||||
| AllianzGI Best Styles Global Equity Fund Class A | 9.50% | 13.50% | 5.93% | |||||||||
| AllianzGI Best Styles Global Equity Fund Class A (adjusted) | 3.48% | 7.25% | 4.14% | ||||||||
| AllianzGI Best Styles Global Equity Fund Class C | 9.34% | 12.93% | 5.21% | |||||||||
| AllianzGI Best Styles Global Equity Fund Class C (adjusted) | 8.34% | 11.93% | 5.21% | ||||||||
| AllianzGI Best Styles Global Equity Fund Class P | 9.75% | 13.87% | 6.15% | ||||||||
| AllianzGI Best Styles Global Equity Fund Institutional Class | 9.81% | 13.88% | 6.23% | ||||||||
| AllianzGI Best Styles Global Equity Fund Class R6 | 9.85% | 14.04% | 6.33% | ||||||||
| MSCI ACWI | 8.18% | 15.04% | 5.59% | ||||||||
| Lipper Global Multi-Cap Value Average | 9.43% | 14.94% | 4.12% | |||||||||
† The Fund began operations on December 2, 2013. Benchmark return comparisons began on the fund inception date. Lipper performance comparisons began on November 30, 2013.
* Cumulative returns.
Performance quoted represents past performance and is no guarantee of future results. Current performance may be lower or higher than performance shown. For performance current to the most recent month-end, visit our website at us.allianzgi.com. Investment return and the principal value will fluctuate. Shares may be worth more or less than original cost when redeemed. The adjusted returns take into account the maximum initial sales charge of 5.50% on Class A shares and the contingent deferred sales charge (CDSC) of 1% on Class C shares, which may apply to shares redeemed during the first year of ownership. Returns do not reflect deduction of taxes that a shareholder would pay on fund distributions or redemption of fund shares. See pages 133 and 134 for more information. The Fund’s gross expense ratios are 0.79% for Class A shares, 1.49% for Class C shares, 0.62% for Class P shares, 0.51% for Institutional Class shares and 0.49% for Class R6 shares. These ratios do not include an expense reduction, contractually guaranteed through at least January 31, 2018. The Funds expense ratios net of this reduction are 0.70% for Class A shares, 1.40% for Class C shares, 0.50% for Class P shares, 0.40% for Institutional Class shares and 0.40% for Class R6 shares. Expense ratio information is as of the Fund’s current prospectus dated February 1, 2017, as revised April 10, 2017.
Cumulative Returns Through March 31, 2017
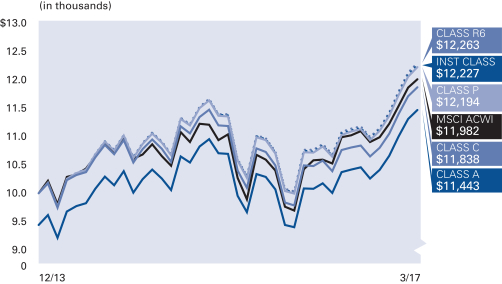
Country Allocation (as of March 31, 2017)
| United States | 50.7% | |||
| United Kingdom | 6.1% | |||
| Japan | 5.2% | |||
| Canada | 4.9% | |||
| China | 4.8% | |||
| France | 4.3% | |||
| Germany | 3.1% | |||
| Korea (Republic of) | 2.9% | |||
| Other | 16.3% | |||
| Cash & Equivalents —Net | 1.7% |
| Semiannual Report | | March 31, 2017 | 35 |
Table of Contents
Unaudited
AllianzGI Best Styles Global Equity Fund (cont’d)
| Shareholder Expense Example | Actual Performance | |||||||||
| Class A | Class C | Class P | Institutional Class | Class R6 | ||||||
| Beginning Account Value (10/1/16) | $1,000.00 | $1,000.00 | $1,000.00 | $1,000.00 | $1,000.00 | |||||
| Ending Account Value (3/31/17) | $1,095.00 | $1,093.40 | $1,097.50 | $1,098.10 | $1,098.50 | |||||
| Expenses Paid During Period | $3.92 | $7.25 | $2.98 | $2.30 | $2.09 | |||||
| Hypothetical Performance | ||||||||||
| (5% return before expenses) | ||||||||||
| Class A | Class C | Class P | Institutional Class | Class R6 | ||||||
| Beginning Account Value (10/1/16) | $1,000.00 | $1,000.00 | $1,000.00 | $1,000.00 | $1,000.00 | |||||
| Ending Account Value (3/31/17) | $1,021.19 | $1,018.00 | $1,022.09 | $1,022.74 | $1,022.94 | |||||
| Expenses Paid During Period | $3.78 | $6.99 | $2.87 | $2.22 | $2.02 | |||||
For each class of the Fund, expenses (net of fee waiver and reimbursement, if any) are equal to the annualized expense ratio for the class (0.75% for Class A, 1.39% for Class C, 0.57% for Class P, 0.44% for Institutional Class and 0.40% for Class R6), multiplied by the average account value over the period, multiplied by 182/365.
| 36 | March 31, 2017 | | Semiannual Report |
Table of Contents
(THIS PAGE INTENTIONALLY LEFT BLANK)
| Semiannual Report | | March 31, 2017 | 37 |
Table of Contents
Unaudited
AllianzGI Best Styles International Equity Fund
For the period of October 1, 2016 through March 31, 2017, as provided by Christian McCormick, Senior Product Specialist.
Fund Insights
For the six-month period ended March 31, 2017, Class A shares at net asset value (‘‘NAV’’) of the AllianzGI Best Styles International Equity Fund (the “Fund”) returned 8.11%, outperforming the MSCI EAFE Index (the “benchmark”), which returned 6.48%.
Market Overview
European equities ended a volatile year with moderate gains (in EUR terms). Losses in the first half of the year were offset by gains in latter half when the weak euro helped to lift the outlook for the region’s exporters. However, political tensions continue to weigh on equity markets in Europe with peripheral markets, such as Italy and Ireland, suffering losses, while core markets, like France and Germany, rallied. Returns in Italy were affected by continued issues with the country’s banks, while Ireland suffered due to its close economic links with the EU. European equities continued to rally into 2017, reaching 15-month highs amid signs of strengthening growth. In addition, the election result in the Netherlands helped diffuse some of the political uncertainty that had previously weighed on sentiment. Japanese equities rebounded in the closing months of the year, boosted by a sharp fall in the yen versus the US dollar following the US presidential election, and by stimulus measures from both the government and the Bank of Japan. Japanese equities were essentially flat however, in the first quarter of 2017.
Portfolio Review
The Best Styles strategies implement a well-diversified blend of the five long-term successful investment styles that include value, momentum, earnings revisions, growth and quality. Over the trailing 12 months, the value style outperformed the benchmark by approximately 8%, delivering a rebound in relative performance after having been mostly stagnant since 2009. The majority of the performance came in the second half of 2016. Japanese value stocks outperformed by 10% and European value stocks by 7%. The other four investment styles had negative relative performance.
The Best Styles strategy has only moderate leeway for sector allocation with a maximum deviation of 3% vs. the benchmark for active sector weightings. The overall contribution from active sector allocation was positive. Telecom was the largest relative contributor at +21 basis points, while there were no significant detractors from a sector context. Country allocation effect was also neutral with no attribution of note except Austria, which contributed +19 basis points of relative performance.
Best Styles holds a broad number of stocks to implement a well-diversified mix of investment styles and assigns a maximum active weighting of 1% to individual stocks. Individual stocks contributed negatively during the period. Consumer staples and materials stocks were particularly strong, contributing an approximately combined 200 basis points of outperformance. However, this was offset by consumer discretionary and industrials holdings, which essentially detracted the same amount at -170 basis points, led by Easyjet at -21 basis points.
Outlook
We expect that Best Styles will continue to be overweight in stocks with attractive valuation and stocks with positive momentum and revisions, in line with the longer term strategic investment style mix.
| 38 | March 31, 2017 | | Semiannual Report |
Table of Contents
Unaudited
AllianzGI Best Styles International Equity Fund (cont’d)
Average Annual Total Return for the period ended March 31, 2017
| 6 Month* | 1 Year | Since Inception† | ||||||||||||
| AllianzGI Best Styles International Equity Fund Class A | 8.11% | 10.66% | 1.73% | |||||||||||
| AllianzGI Best Styles International Equity Fund Class A (adjusted) | 2.16% | 4.57% | –0.73% | ||||||||||
| AllianzGI Best Styles International Equity Fund Class C | 7.70% | 9.87% | 0.98% | |||||||||||
| AllianzGI Best Styles International Equity Fund Class C (adjusted) | 6.72% | 8.87% | 0.98% | ||||||||||
| AllianzGI Best Styles International Equity Fund Class P | 8.23% | 10.80% | 1.89% | ||||||||||
| AllianzGI Best Styles International Equity Fund Institutional Class | 8.17% | 10.90% | 1.97% | ||||||||||
| AllianzGI Best Styles International Equity Fund R6 | 8.20% | 10.93% | 2.05% | ||||||||||
| MSCI EAFE Index | 6.48% | 11.67% | 2.27% | ||||||||||
| Lipper International Multi-Cap Value Funds Average | 8.07% | 13.20% | 1.25% | |||||||||||
† The Fund began operations on December 9, 2014. Benchmark return comparisons began on the fund inception date. Lipper performance comparisons began on November 30, 2014.
* Cumulative returns.
Performance quoted represents past performance and is no guarantee of future results. Current performance may be lower or higher than performance shown. For performance current to the most recent month-end, visit our website at us.allianzgi.com. Investment return and the principal value will fluctuate. Shares may be worth more or less than original cost when redeemed. The adjusted returns take into account the maximum initial sales charge of 5.50% on Class A shares and the contingent deferred sales charge (CDSC) of 1% on Class C shares, which may apply to shares redeemed during the first year of ownership. Returns do not reflect deduction of taxes that a shareholder would pay on fund distributions or redemption of fund shares. See pages 133 and 134 for more information. The Fund’s gross expense ratios are 1.24% for Class A shares, 2.02% for Class C shares, 0.95% for Class P shares, 1.00% for Institutional Class shares and 0.97% for Class R6 shares. These ratios do not include an expense reduction, contractually guaranteed through at least January 31, 2018. The Fund’s expense ratios net of this reduction are 0.70% for Class A shares, 1.45% for Class C shares, 0.55% for Class P shares, 0.45% for Institutional Class shares and 0.45% for Class R6 shares. Expense ratio information is as of the Fund’s current prospectus dated February 1, 2017, as revised April 10, 2017.
Cumulative Returns Through March 31, 2017

Country Allocation (as of March 31, 2017)
| ||||
| Japan | 23.4% | |||
| United Kingdom | 14.5% | |||
| France | 9.6% | |||
| Germany | 9.5% | |||
| Switzerland | 7.2% | |||
| Australia | 6.4% | |||
| Hong Kong | 3.7% | |||
| Italy | 3.3% | |||
| Other | 19.2% | |||
| Cash & Equivalents — Net | 3.2% | |||
| Semiannual Report | | March 31, 2017 | 39 |
Table of Contents
Unaudited
AllianzGI Best Styles International Equity Fund (cont’d)
| Shareholder Expense Example | Actual Performance | |||||||||
| Class A | Class C | Class P | Institutional Class | Class R6 | ||||||
| Beginning Account Value (10/1/16) | $1,000.00 | $1,000.00 | $1,000.00 | $1,000.00 | $1,000.00 | |||||
| Ending Account Value (3/31/17) | $1,081.10 | $1,077.00 | $1,082.30 | $1,081.70 | $1,082.00 | |||||
| Expenses Paid During Period | $4.00 | $7.87 | $3.22 | $2.70 | $2.39 | |||||
| Hypothetical Performance | ||||||||||
| (5% return before expenses) | ||||||||||
| Class A | Class C | Class P | Institutional Class | Class R6 | ||||||
| Beginning Account Value (10/1/16) | $1,000.00 | $1,000.00 | $1,000.00 | $1,000.00 | $1,000.00 | |||||
| Ending Account Value (3/31/17) | $1,021.09 | $1,017.35 | $1,021.84 | $1,022.34 | $1,022.64 | |||||
| Expenses Paid During Period | $3.88 | $7.64 | $3.13 | $2.62 | $2.32 | |||||
For each class of the Fund, expenses (net of fee waiver and reimbursement, if any) are equal to the annualized expense ratio for the class (0.77% for Class A, 1.52% for Class C, 0.62% for Class P, 0.52% for Institutional Class and 0.46% for Class R6), multiplied by the average account value over the period, multiplied by 182/365.
| 40 | March 31, 2017 | | Semiannual Report |
Table of Contents
(THIS PAGE INTENTIONALLY LEFT BLANK)
| Semiannual Report | | March 31, 2017 | 41 |
Table of Contents
Unaudited
AllianzGI Best Styles U.S. Equity Fund
For the period of October 1, 2016 through March 31, 2017, as provided by Christian McCormick, Senior Product Specialist.
Fund Insights
For the six-month period ended March 31, 2017, Class A shares at net asset value (“NAV”) of the AllianzGI Best Styles U.S. Equity Fund (the “Fund”) returned 10.63%, outperforming the S&P 500 Index (the “benchmark”), which returned 10.12%.
Market Overview
The benchmark touched a series of fresh highs after Donald Trump’s surprise presidential election victory raised hopes that corporate profit margins would be boosted by tax cuts and a greater focus on growth. While smaller companies, which tend to be more exposed to the domestic economy, underperformed their larger counterparts at the start of 2016, they later surged on hopes that the new administration would introduce higher infrastructure spending and other measures aimed at boosting the US economy. US equities posted their strongest quarterly gain in four years to start 2017. Shares were bolstered by signs of improving economic momentum, optimism over company earnings and by hopes that the new administration would introduce tax and regulatory reform. However, the rally appeared to fade towards the quarter end amid concerns about President Trump’s ability to implement his election promises. As widely expected, in March the US Federal Reserve (the “Fed”) raised interest rates by 25 basis points to a range of 0.75% to 1.0%. However, the US central bank did not change its “dot plot” projections of interest rates in 2017 and 2018, allaying concerns that it would be more aggressive in raising rates compared to its earlier forecast of two further rate rises this year.
Portfolio Review
The Best Styles strategies implement a well-diversified blend of the five long-term successful investment styles that include value, momentum, earnings revisions, growth and quality. Over the trailing 12 months, the value style outperformed the benchmark by approximately 5%, delivering a rebound in relative performance after having been mostly stagnant since 2009. The majority of the performance came in the second half of 2016. The other four investment styles had negative relative performance.
The Best Styles strategy has only moderate leeway for sector allocation with a maximum deviation of 3% vs. the benchmark for active sector weightings. The overall contribution from active sector allocation was positive. Information technology was the largest relative contributor at +49 basis points, but the financial sector was a significant detractor at -78 basis points. The financial sector was the top performer during the period and the Fund held an average underweight.
Best Styles holds a broad number of stocks to implement a well-diversified mix of investment styles and assigns a maximum active weighting of 1% to individual stocks. Individual stocks contributed negatively during the period. Consumer staples and healthcare stocks were the best performers, led by Coca Cola and Bristol Myers Squibb, adding a combined 17 basis points of relative performance. Consumer discretionary and energy stocks detracted an aggregate of 175 basis points versus the benchmark.
Outlook
We expect that Best Styles will continue to be overweight in stocks with attractive valuation and stocks with positive momentum and positive revisions, in line with the longer term strategic investment style mix.
| 42 | March 31, 2017 | | Semiannual Report |
Table of Contents
Unaudited
AllianzGI Best Styles U.S. Equity Fund (cont’d)
Average Annual Total Return for the period ended March 31, 2017
| 6 Month* | 1 Year | Since Inception† | ||||||||||||
| AllianzGI Best Styles U.S. Equity Fund Class A | 10.63% | 15.86% | 6.61% | |||||||||||
| AllianzGI Best Styles U.S. Equity Fund Class A (adjusted) | 4.55% | 9.48% | 4.05% | ||||||||||
| AllianzGI Best Styles U.S. Equity Fund Class C | 10.26% | 15.03% | 5.83% | |||||||||||
| AllianzGI Best Styles U.S. Equity Fund Class C (adjusted) | 9.26% | 14.03% | 5.83% | ||||||||||
| AllianzGI Best Styles U.S. Equity Fund Class P | 10.77% | 16.10% | 6.75% | ||||||||||
| AllianzGI Best Styles U.S. Equity Fund Institutional Class | 10.76% | 16.16% | 6.88% | ||||||||||
| AllianzGI Best Styles U.S. Equity Fund Class R6 | 10.87% | 16.26% | 6.98% | ||||||||||
| S&P 500 Index | 10.12% | 17.17% | 8.49% | ||||||||||
| Lipper Multi-Cap Core Funds Average | 9.50% | 15.84% | 5.79% | |||||||||||
† The Fund began operations on December 1, 2014. Benchmark return comparisons began on the fund inception date. Lipper performance comparisons began on November 30, 2014.
* Cumulative returns.
Performance quoted represents past performance and is no guarantee of future results. Current performance may be lower or higher than performance shown. For performance current to the most recent month-end, visit our website at us.allianzgi.com. Investment return and the principal value will fluctuate. Shares may be worth more or less than original cost when redeemed. The adjusted returns take into account the maximum initial sales charge of 5.50% on Class A shares and the contingent deferred sales charge (CDSC) of 1% on Class C shares, which may apply to shares redeemed during the first year of ownership. Returns do not reflect deduction of taxes that a shareholder would pay on fund distributions or redemption of fund shares. See pages 133 and 134 for more information. The Fund’s gross expense ratios are 0.93% for Class A shares, 1.61% for Class C shares, 0.70% for Class P shares, 0.73% for Institutional Class shares and 0.61% for Class R6 shares. These ratios do not include an expense reduction, contractually guaranteed through at least January 31, 2018. The Fund’s expense ratios net of this reduction are 0.65% for Class A shares, 1.40% for Class C shares, 0.50% for Class P shares, 0.50% for Institutional Class shares and 0.40% for Class R6 shares. Expense ratio information is as of the Fund’s current prospectus dated February 1, 2017, as revised April 10, 2017.
Cumulative Returns Through March 31, 2017
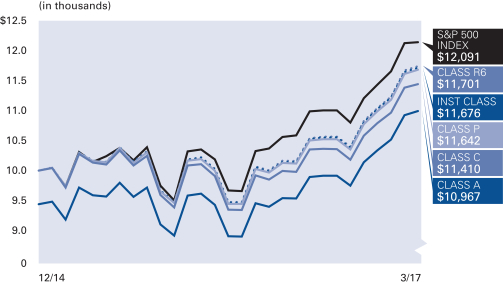
Industry Allocation (as of March 31, 2017)
| Semiconductors & Semiconductor Equipment | 6.6% | |||
| Oil, Gas & Consumable Fuels | 5.4% | |||
| Technology Hardware, Storage & Peripherals | 5.4% | |||
| Banks | 5.4% | |||
| Pharmaceuticals | 4.7% | |||
| Health Care Equipment & Supplies | 4.5% | |||
| Internet Software & Services | 4.2% | |||
| Health Care Providers & Services | 3.9% | |||
| Other | 59.8% | |||
| Cash & Equivalents — Net | 0.1% |
| Semiannual Report | | March 31, 2017 | 43 |
Table of Contents
Unaudited
AllianzGI Best Styles U.S. Equity Fund (cont’d)
| Shareholder Expense Example | Actual Performance | |||||||||
| Class A | Class C | Class P | Institutional Class | Class R6 | ||||||
| Beginning Account Value (10/1/16) | $1,000.00 | $1,000.00 | $1,000.00 | $1,000.00 | $1,000.00 | |||||
| Ending Account Value (3/31/17) | $1,106.30 | $1,102.60 | $1,107.70 | $1,107.60 | $1,108.70 | |||||
| Expenses Paid During Period | $3.68 | $7.65 | $3.00 | $2.63 | $2.10 | |||||
| Hypothetical Performance | ||||||||||
| (5% return before expenses) | ||||||||||
| Class A | Class C | Class P | Institutional Class | Class R6 | ||||||
| Beginning Account Value (10/1/16) | $1,000.00 | $1,000.00 | $1,000.00 | $1,000.00 | $1,000.00 | |||||
| Ending Account Value (3/31/17) | $1,021.44 | $1,017.65 | $1,022.09 | $1,022.44 | $1,022.94 | |||||
| Expenses Paid During Period | $3.53 | $7.34 | $2.87 | $2.52 | $2.02 | |||||
For each class of the Fund, expenses (net of fee waiver and reimbursement, if any) are equal to the annualized expense ratio for the class (0.70% for Class A, 1.46% for Class C, 0.57% for Class P, 0.50% for Institutional Class and 0.40% for Class R6), multiplied by the average account value over the period, multiplied by 182/365.
| 44 | March 31, 2017 | | Semiannual Report |
Table of Contents
(THIS PAGE INTENTIONALLY LEFT BLANK)
| Semiannual Report | | March 31, 2017 | 45 |
Table of Contents
Unaudited
AllianzGI Convertible Fund
For the period of October 1, 2016, through March 31, 2017, as provided by Doug Forsyth, CFA, Portfolio Manager.
Fund Insights
For the six-month period ended March 31, 2017, Class A shares at net asset value (“NAV”) of the AllianzGI Convertible Fund (the “Fund”) returned 5.74%, underperforming the BofA Merrill Lynch US Convertibles Index (the “benchmark”), which returned 7.51%.
Market Overview
The convertible market’s upward trajectory in 2016 continued into the fourth quarter. In contrast to 2016’s start to the year, the outset of 2017 began on much firmer footing.
Several factors influenced convertibles throughout the period, including constructive economic trends, corporate health, the US Federal Reserve (the “Fed”) rate decision and outlook, US elections and the new administration’s pro-growth agenda, sustained appetite for risk assets, and commodity price strength.
In the US, positive economic reports outnumbered weaker releases, indicating ongoing growth and supporting the market’s advance. Overall, the trend in economic data reinforced the favorable credit conditions for convertible bonds.
Operating performance for most convertible issuers met or exceeded expectations. According to Thomson Reuters I/B/E/S, of the companies in the S&P 500 Index, the majority reported earnings that were above analyst expectations. We believe these statistics provide additional proof of the underlying fundamental strength of the convertible-bond market.
The convertible market responded positively to the Fed’s rate decisions and commentary. The central bank hiked the Fed funds rate a quarter point in both December 2016 and in March 2017. On balance, a Fed that did not deviate from its gradual approach toward policy adjustments, and a highly accommodative environment outside the US, continued to help support the performance of risk assets.
The unexpected election of Donald Trump triggered a rotation into risk assets that persisted throughout the reporting period. Investor appetite centered on optimism around the President’s pro-growth agenda and anticipation of a more favorable corporate earnings backdrop predicated on positive tax reform, decreased regulation, and increased fiscal spending.
This sentiment was also evident at the sub-asset class level and resulted in performance dispersion among the different convertible bond structures. For example, equity-like convertibles outperformed total-return convertibles, which outperformed bond-like or busted convertibles.
Finally, improving industry dynamics helped lift the price of crude oil and aided in the stabilization of other commodity prices. These developments had a positive impact on many energy and materials companies.
Portfolio Review
The Fund gained along with the market for the six-month period, but performance lagged the benchmark return.
The attribution for the period included several positive single-name performers from a variety of industries. The majority of the portfolio’s issuers exceeded earnings expectations, which contributed to absolute performance during the period.
Sector allocations that helped relative performance in the period included financials, telecommunications and utilities. In both financials and utilities, an underweight had a positive impact on relative performance. In the telecommunications industry, issue selection was the source of strength.
The sector allocations that hurt relative performance during the period included technology, healthcare, and materials. In technology, an overweight was beneficial, but the positive impact was more than offset by issue selection. An overweight and a lower relative return detracted in healthcare. In materials, the Fund exhibited negative issue selection.
Outlook
Currently, US equity markets continue to record new all-time highs, volatility is near all-time lows and interest rates are trending higher on an improving economic outlook. Historically, these factors have been positive indicators for both economic and corporate earnings growth and supportive of investments in risk assets.
Further, we predict redemptions and maturities should decline over the next couple of years and if new issuance remains steady compared to the last couple of years, we believe the convertible market could grow significantly. We expect this would likely improve sector diversification as well as provide more balanced convertible opportunities.
| 46 | March 31, 2017 | | Semiannual Report |
Table of Contents
Unaudited
AllianzGI Convertible Fund (cont’d)
Average Annual Total Return for the period ended March 31, 2017
| 6 Month* | 1 Year | 5 Year | 10 Year | Since Inception† | ||||||||||||||||||
| AllianzGI Convertible Fund Class A | 5.74% | 14.34% | 8.13% | 7.46% | 9.85% | |||||||||||||||||
| AllianzGI Convertible Fund Class A (adjusted) | –0.07% | 8.05% | 6.91% | 6.85% | 9.59% | ||||||||||||||||
| AllianzGI Convertible Fund Class C | 5.42% | 13.57% | 7.35% | 6.68% | 9.04% | |||||||||||||||||
| AllianzGI Convertible Fund Class C (adjusted) | 4.42% | 12.57% | 7.35% | 6.68% | 9.04% | ||||||||||||||||
| AllianzGI Convertible Fund Class R | 5.53% | 13.81% | 7.69% | 7.11% | 9.54% | ||||||||||||||||
| AllianzGI Convertible Fund Class P | 5.93% | 14.65% | 8.39% | 7.70% | 10.09% | ||||||||||||||||
| AllianzGI Convertible Fund Institutional Class | 5.98% | 14.75% | 8.49% | 7.80% | 10.19% | ||||||||||||||||
| AllianzGI Convertible Fund Administrative Class | 5.84% | 14.48% | 8.22% | 7.51% | 9.87% | |||||||||||||||||
| BofA Merrill Lynch US Convertibles Index | 7.51% | 18.12% | 9.97% | 6.73% | 8.23% | ||||||||||||||||
| Lipper Convertible Securities Funds Average | 5.53% | 14.65% | 7.16% | 5.03% | 7.26% | |||||||||||||||||
† The Fund began operations on April 19,1993. Benchmark return comparisons began on the fund inception date. Lipper performance comparisons began on April 30,1993.
* Cumulative returns.
Performance quoted represents past performance and is no guarantee of future results. Current performance may be lower or higher than performance shown. For performance current to the most recent month-end, visit our website at us.allianzgi.com. Investment return and the principal value will fluctuate. Shares may be worth more or less than original cost when redeemed. The adjusted returns take into account the maximum initial sales charge of 5.50% on Class A shares and the contingent deferred sales charge (CDSC) of 1% on Class C shares, which may apply to shares redeemed during the first year of ownership. Returns do not reflect deduction of taxes that a shareholder would pay on fund distributions or redemption of fund shares. See pages 133 and 134 for more information. The Fund’s expense ratios are 0.99% for Class A shares, 1.71% for Class C shares, 1.43% for Class R shares, 0.73% for Class P shares, 0.67% for Institutional Class shares and 0.90% for Administrative Class shares. Expense ratio information is as of the Fund’s current prospectus dated February 1, 2017, as revised April 10, 2017.
Cumulative Returns Through March 31, 2017
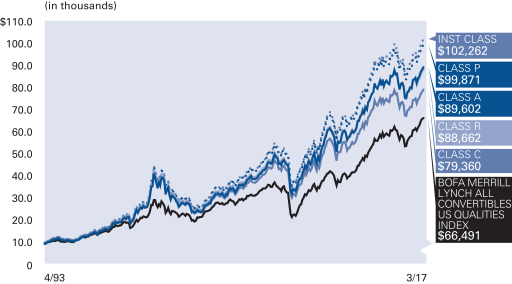
Industry Allocation (as of March 31, 2017)
| Semiconductors | 15.7% | |||
| Oil, Gas & Consumable Fuels | 8.4% | |||
| Media | 7.3% | |||
| Software | 6.8% | |||
| Internet | 5.8% | |||
| Healthcare-Products | 5.8% | |||
| Pharmaceuticals | 5.4% | |||
| Commercial Services | 5.2% | |||
| Other | 35.8% | |||
| Cash & Equivalents — Net | 3.8% |
| Semiannual Report | | March 31, 2017 | 47 |
S&P Ratings* (as of March 31, 2017)

* As a percentage of total investments. Bond ratings refer to the underlying holdings of the Fund and are categorized from highest to lowest credit quality using ratings provided by S&P Global Ratings (“S&P”). S&P’s ratings have been selected for several reasons, including the portfolio managers’ usage of S&P ratings methodology among other credit quality information in managing the Fund, access to background information and other materials provided by S&P, as well as the Funds’ considerations of industry practice. The Fund also displays S&P credit ratings information in materials provided in client presentations. Previous shareholder reports for the Fund displayed bond ratings provided by Moody’s. See “Important Information” for more detail on the selection of S&P for the Fund’s ratings presentation. Bonds not rated by S&P and bonds that do not currently have a rating available are designated in the chart above as “NR” and “NA”, respectively.
Table of Contents
Unaudited
AllianzGI Convertible Fund (cont’d)
| Shareholder Expense Example | Actual Performance | |||||||||||
| Class A | Class C | Class R | Class P | Institutional Class | Administrative Class | |||||||
| Beginning Account Value (10/1/16) | $1,000.00 | $1,000.00 | $1,000.00 | $1,000.00 | $1,000.00 | $1,000.00 | ||||||
| Ending Account Value (3/31/17) | $1,057.40 | $1,054.20 | $1,055.30 | $1,059.30 | $1,059.80 | $1,058.40 | ||||||
| Expenses Paid During Period | $5.33 | $8.86 | $7.58 | $3.85 | $3.49 | $4.67 | ||||||
| Hypothetical Performance | ||||||||||||
| (5% return before expenses) | ||||||||||||
| Class A | Class C | Class R | Class P | Institutional Class | Administrative Class | |||||||
| Beginning Account Value (10/1/16) | $1,000.00 | $1,000.00 | $1,000.00 | $1,000.00 | $1,000.00 | $1,000.00 | ||||||
| Ending Account Value (3/31/17) | $1,019.75 | $1,016.31 | $1,017.55 | $1,021.19 | $1,021.54 | $1,020.39 | ||||||
| Expenses Paid During Period | $5.24 | $8.70 | $7.44 | $3.78 | $3.43 | $4.58 | ||||||
For each class of the Fund, expenses are equal to the annualized expense ratio for the class (1.04% for Class A, 1.73% for Class C, 1.48% for Class R, 0.75% for Class P, 0.68% for Institutional Class and 0.91% for Administrative Class), multiplied by the average account value over the period, multiplied by 182/365.
| 48 | March 31, 2017 | | Semiannual Report |
Table of Contents
(THIS PAGE INTENTIONALLY LEFT BLANK)
| Semiannual Report | | March 31, 2017 | 49 |
Table of Contents
Unaudited
AllianzGI Emerging Markets Consumer Fund
For the period of October 1, 2016 through March 31, 2017, as provided by Lu Yu, CFA, CIPM, Portfolio Manager.
Fund Insights
For the six-month period ended March 31, 2017, Class A shares at net asset value (“NAV”) of the AllianzGI Emerging Markets Consumer Fund (the “Fund”) returned 5.02%, underperforming the MSCI Emerging Markets Index (the “benchmark”), which returned 6.80%.
Market Overview
During the reporting period, the macroeconomic environment continued to improve following a rebound in emerging market shares which began in early 2016, with positive sentiment driving investor flows to the asset class.
Initially, the benchmark was modestly positive in October 2016 as investors gravitated toward the attractive growth and valuation mix offered by emerging market shares. The unforeseen victory of President Trump in the November 2016 elections led market participants to telegraph a stronger US dollar, a greater likelihood of federal interest rate hikes, and concerns of more protectionist policies, which could slow growth in emerging markets. The rally was back on track with four consecutive monthly benchmark gains from December 2016 through March 2017, as emerging markets collectively outpaced their developed market peers due to robust growth expectations and currency strength.
During the reporting period, 18 of 23 emerging market countries advanced in terms of USD performance, led by double-digit gains in Poland, Chile, Russia and Brazil. Conversely, Egypt, the Philippines and Turkey were among the decliners due in part to country-specific geopolitical volatility. Sector performance for the benchmark was broadly higher, led by double-digit returns in materials and energy. Meanwhile, health care, consumer staples and real estate sectors each posted declines for the six-month period.
Portfolio Review
The Fund is strategically focused on local emerging markets consumption while avoiding hard-asset and export-oriented stocks, which do not capture the secular growth of the rising middle class. The Fund trailed the benchmark due primarily to asset allocation decisions, given the exclusion of pro-cyclical stocks, which were among the top performers for the benchmark.
During the reporting period, bottom-up stockpicking in industrials, information technology, telecommunication services and consumer discretionary was decidedly positive in each sector. Conversely, the exclusion of materials and energy - the two top performers for the benchmark - offset results, as did selections in financials and consumer staples. Country results were led by strong stock selection in Russia, followed by South Africa and emerging market-related investments in Japan. Conversely, more conservative stockpicking in Taiwan detracted from results followed by South Korea and China.
Outlook
We firmly believe emerging markets are at the beginning of an unrecognized bull market, with the asset flow and performance pendulum starting to swing back in their favor. In particular, we believe the forward-looking allocation mix targeted towards consumer-related growth in the asset class is likely to attract investors in the coming periods.
We predict that the combination of superior underlying growth rates and an expanding return on equity relative to developed markets, alongside a meaningful reduction in valuation, provides confidence that the turnaround is still in its early stages. Perhaps most importantly, analysts are upgrading earnings expectations in emerging markets for the first time in five years, which we predict is a signal that the market is beginning to give the asset class the certitude it deserves. A silver lining is that emerging market currencies have outperformed their developed market counterparts to begin 2017, providing a tailwind to many investors.
While asset flows have increased in eight of the last nine months, we believe the average investor remains underweight emerging market equities which could translate to future asset flows as the current level of skepticism is replaced with optimism. In addition, we believe the normalized market environment in the beginning of 2017 is increasingly led by idiosyncratic impacts rather than predominately sentiment and macroeconomic influences, which we believe should bode well for our bottom-up, behavioral finance-focused investment process.
| 50 | March 31, 2017 | | Semiannual Report |
Table of Contents
Unaudited
AllianzGI Emerging Markets Consumer Fund (cont’d)
Average Annual Total Return for the period ended March 31, 2017
| 6 Month* | 1 Year | Since Inception† | ||||||||||||
| AllianzGI Emerging Markets Consumer Fund Class A | 5.02% | 17.75% | –1.87% | |||||||||||
| AllianzGI Emerging Markets Consumer Fund Class A (adjusted) | –0.76% | 11.27% | –4.23% | ||||||||||
| AllianzGI Emerging Markets Consumer Fund Institutional Class | 5.23% | 18.29% | –1.50% | ||||||||||
| MSCI Emerging Markets Index | 6.80% | 17.21% | 1.09% | ||||||||||
| Lipper Emerging Markets Funds Average | 5.66% | 16.23% | –0.51% | |||||||||||
† The Fund began operations on December 1, 2014. Benchmark return comparisons began on the fund inception date. Lipper performance comparisons began on November 30, 2014.
* Cumulative returns.
Performance quoted represents past performance and is no guarantee of future results. Current performance may be lower or higher than performance shown. For performance current to the most recent month-end, visit our website at us.allianzgi.com. Investment return and the principal value will fluctuate. Shares may be worth more or less than original cost when redeemed. The adjusted returns take into account the maximum initial sales charge of 5.50% on Class A shares. Returns do not reflect deduction of taxes that a shareholder would pay on fund distributions or redemption of fund shares. See pages 133 and 134 for more information. The Fund’s gross expense ratios are 38.81% for class A shares and 2.00% for Institutional Class shares. These ratios do not include an expense reduction, contractually guaranteed through at least January 31, 2018. The Fund’s expense ratios net of this reduction are 1.56% for Class A shares and 1.21% for Institutional Class shares. Expense ratio information is as of the Fund’s current prospectus dated February 1, 2017, as revised April 10, 2017.
Cumulative Returns Through March 31, 2017
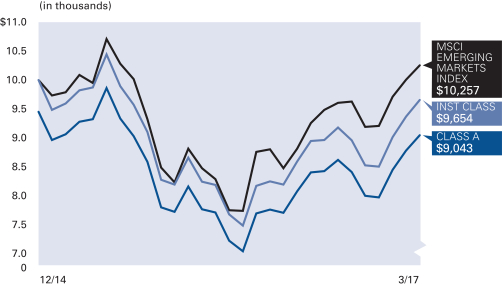
Country Allocation (as of March 31, 2017)
| China | 18.9% | |||
| Korea (Republic of) | 17.9% | |||
| Taiwan | 12.5% | |||
| Russian Federation | 6.8% | |||
| United States | 6.5% | |||
| Brazil | 6.5% | |||
| Hong Kong | 6.1% | |||
| South Africa | 5.1% | |||
| Other | 17.6% | |||
| Cash & Equivalents — Net | 2.1% |
| Semiannual Report | | March 31, 2017 | 51 |
Table of Contents
Unaudited
AllianzGI Emerging Markets Consumer Fund (cont’d)
| Shareholder Expense Example | Actual Performance | |||
| Class A | Institutional Class | |||
| Beginning Account Value (10/1/16) | $1,000.00 | $1,000.00 | ||
| Ending Account Value (3/31/17) | $1,050.20 | $1,052.30 | ||
| Expenses Paid During Period | $7.92 | $6.14 | ||
| Hypothetical Performance | ||||
| (5% return before expenses) | ||||
| Class A | Institutional Class | |||
| Beginning Account Value (10/1/16) | $1,000.00 | $1,000.00 | ||
| Ending Account Value (3/31/17) | $1,017.20 | $1,018.95 | ||
| Expenses Paid During Period | $7.80 | $6.04 | ||
For each class of the Fund, expenses (net of fee waiver and reimbursement, if any) are equal to the annualized expense ratio for the class (1.55% for Class A and 1.20% for Institutional Class), multiplied by the average account value over the period, multiplied by 182/365. These expenses do not include the expenses of the investment companies in which the Fund invests, which are indirectly borne by Fund shareholders.
| 52 | March 31, 2017 | | Semiannual Report |
Table of Contents
(THIS PAGE INTENTIONALLY LEFT BLANK)
| Semiannual Report | | March 31, 2017 | 53 |
Table of Contents
Unaudited
AllianzGI Emerging Markets Debt Fund
For the period of October 1, 2016 through March 31, 2017, as provided by the AllianzGI Emerging Markets Debt Team.
Fund Insights
For the six-month period ended March 31, 2017, Class A shares at net asset value (“NAV”) of the AllianzGI Emerging Markets Debt Fund (the “Fund”) returned 1.82%, outperforming the 40% JPM EMBI Global Diversified, 40% JPM CEMBI Broad Diversified, 20% JPM GBI-EM Diversified (the “benchmark”), which returned 0.55%.
Portfolio Review
Over the reporting period, the emerging markets hard currency sovereign debt universe posted a negative -0.31% return and hard currency corporate debt posted a positive +1.62% return. Relative to the US dollar, emerging markets local currencies saw a benign return of +0.01% for the period. Our weighting in local currencies throughout the reporting period averaged below 5%, but performed well, contributing +25 basis points to the portfolio’s returns. Our more conservative positioning reflected our view that technicals remained challenging in the Local Currencies and Foreign Exchange (“LCFX”) asset class leading up to US elections and through year end.
The net effect of the Trump election led to a –US$13bn knee-jerk outflow in fixed income Emerging Markets (“EM”) through November and the first three weeks of December 2016. Investors had seen healthy returns in 2016, and profit taking in the light of uncertainty was a natural position to take. As 2017 progressed, December’s federal interest rate hike was well absorbed, and optimism about growth stimulus in the US was on the rise. Interest in the emerging market asset class resumed.
The rebound in commodity prices added support, as oil found a new trading range in the $50-60/bbl. range; iron ore (IOE1) gained 54% and copper (HG1) rose 20% during the reporting period. Emerging markets were able to continue decoupling from developed markets and weather a +79 basis points steepening of the 10yr US Treasury yield curve. Sentiment was further supported as Chinese 4Q16 GDP came in at 6.8%, above expectations. Sovereign spreads on the Emerging Markets Bond Index Global Diversified (“EMBIG-D”) tightened by -26 basis points during the period, ending March at a spread of +310 basis points vs. US Treasury (“UST”).
Corporate assets outperformed even sovereigns, with the Corporate Emerging Markets Bond Index Broad Diversified (“CEMBI-BD”) tightening by -55 basis points to close Q117 at a spread of +261 basis points vs. UST (STW), at one point, touching tights not seen since 2007. Investors favored both the lower duration of this asset class and the positive technicals supporting it. Default rates in Emerging Market corporates are forecasted to be at 2.0% in 2017, below that of US High Yield, and there has been significant demand for new issuances, which has hit record pace this year. Even with substantial new issuances (US$120bn thus far, with $315bn forecast by JPMorgan (“JPM”) through year end), forward net issuances through year end is anticipated to be low at $18bn.
Within hard currency sovereigns, the more treasury sensitive investment grade component of the EMBIG-D suffered the brunt of the treasury widening, returning -1.80% during the period, whereas the high yield component benefited from renewed risk appetite and the higher yield cushion, returning +1.36%. On a regional basis, Latin America saw the poorest performance (-1.29%), due in part to concerns about North American Free Trade Agreement (“NAFTA”) trade renegotiations on the back Trump’s anti-trade rhetoric. Venezuela, too, saw an end-of-March wobble, in advance of maturing Petroleos de Venezuela (“PDVSA”) bonds, which were redeemed in April. Our portfolio benefited from owning these bonds. Asia was the next worst performer (-1.09%), similarly impacted by what have proven to be empty threats of labelling China a currency manipulator and other protectionist rhetoric from the US. Higher rated, more treasury sensitive countries in the region also suffered. Europe (-0.02%) was neutral in its contribution, with political issues in Turkey yielding the regions worst performance. Ukraine was the star performer, as its warrants were revalued up +25% by the market. Adding to gains in the region, early hopes that Russia might see more favorable treatment from the incoming US administration yielded the regions second highest returns. Africa (+1.88%), and the Middle East (+5.49%) were both buoyed by Chinese growth, adding to firmness in oil and commodities.
Portfolio Review
Within our portfolio the Corporate strategy produced the greatest alpha (+194 basis points), followed by the Momentum strategy (+50 basis points), the LCFX strategy (+25 basis points), and our Income strategy (+5 basis points). Sovereign holdings underperformed, detracting -26 basis points from returns, as did our Arbitrage strategy, which returned -10 basis points in the reporting period.
Within Corporates, Latin America (LATAM) was the outperformer, adding + 92 basis points of alpha, followed by Central Eastern Europe Middle East and Africa (“CEEMEA”), which returned +66 basis points during the month. Asia returned +36 basis points. Within LATAM, Brazilian commodity related names were the greatest contributors to returns. The only mildly negative performers were investment grade names, Coca-Cola Femsa in Mexico and Banco Santander in Chile, detracting a combined -1 basis points from performance. Oil and commodity credits dominated performance in CEEMEA, as well, with assets in Nigeria, Russia, and Kazakhstan leading the charge. Only a handful of credits in the portfolio saw negative performance, and none saw performance out of the -1 basis points range. Within our Asian holdings, high yielding credits in Indonesia performed best, with Indo Energy Finance, a coal producer, being the top performer.
Portfolio Review
During the reporting period, the Income Strategy contributed modestly to performance, adding +5 basis points of alpha, and our Arbitrage strategy had neutral performance owing to light positioning in a market where rising tides were lifting all boats. Performance from the Momentum strategy was led by holdings in Vedanta Resources plc, the largest mining and non-ferrous metals company in India, which added +35 basis points to returns. Positions in LATAM, spread across Argentina, Colombia, Mexico Guatemala, Trinidad & Tobago and Panama added a further +15 basis points to returns.
Barring the period of outflows and market weakness surrounding the US election cycle, we believe emerging markets have remained on a favorable spread tightening trend. Inflows to fixed income EM remain robust, totaling +$30.0bn. Of that, +$18.7bn has been in hard currency assets and +$11.3bn to local currency. Supply in the hard currency space has been well absorbed, with circa $61bn of sovereign and a record $120bn of corporate issuance coming to market. Net issuance figures were far lower and looking forward to year end, projected new issuance in sovereigns and corporates should total $19bn and $18bn, respectively (source: JPMorgan). We believe investors are now favoring LCFX positions over hard currency assets, given the relatively high carry and investment grade rating of the asset class. Recent inflows to that sub-asset class have been skewed toward non-traditional/ cross-over investors.
| 54 | March 31, 2017 | | Semiannual Report |
Table of Contents
Unaudited
AllianzGI Emerging Markets Debt Fund (cont’d)
As managers, we were able to capitalize on the distorted valuations stemming from volatility in commodities, elections and other idiosyncratic events impacting valuations in countries such as Brazil, Argentina, Venezuela, Russia and others throughout the reporting period. With the spread tightening following December’s widening, the market has reverted to a 10 year mean on the EMBIG-D sovereign benchmark. The Corporate CEMBI-BD index is currently trading at tights not seen since 2007. While it is hard to argue that there is room for significant spread tightening from here, we believe emerging market assets continue to offer attractive carry in a global environment devoid of yield. At present, growth in emerging markets continues to be roughly double that of developed markets.
Outlook
With markets trading at more ‘fully-priced’ levels, we believe that our flexible investment strategy provides us the greatest opportunities to capture alpha across the sub-asset classes in EM as and when pricing distortions occur. We expect that our strategy’s flexible duration offers protection in a rising rate environment. We believe dynamic management across all regions and sub-asset classes remains key to avoiding idiosyncratic surprises within the 68 countries we follow.
Average Annual Total Return for the period ended March 31, 2017
| 6 Month* | 1 Year | Since Inception† | ||||||||||||
| AllianzGI Emerging Markets Debt Fund Class A | 1.82% | 11.68% | 3.77% | |||||||||||
| AllianzGI Emerging Markets Debt Fund Class A (adjusted) | –1.99% | 7.49% | 2.22% | ||||||||||
| AllianzGI Emerging Markets Debt Fund Class C | 1.45% | 10.86% | 3.01% | |||||||||||
| AllianzGI Emerging Markets Debt Fund Class C (adjusted) | 0.46% | 9.86% | 3.01% | ||||||||||
| AllianzGI Emerging Markets Debt Fund Class P | 1.89% | 11.85% | 3.92% | ||||||||||
| AllianzGI Emerging Markets Debt Fund Institutional Class | 1.97% | 12.03% | 4.04% | ||||||||||
| 40% JPM EMBI Global Div, 40% JPM CEMBI Broad Div, 20% JPM GBI-EM Div Index | 0.55% | 8.20% | 3.46% | ||||||||||
| Lipper Emerging Market Hard Currency Debt Funds Average | 1.64% | 10.52% | 3.22% | |||||||||||
† The Fund began operations on September 15, 2014. Benchmark return comparisons began on the fund inception date. Lipper performance comparisons began on September 30, 2014.
* Cumulative returns
Performance quoted represents past performance and is no guarantee of future results. Current performance may be lower or higher than performance shown. For performance current to the most recent month-end, visit our website at us.allianzgi.com. Investment return and the principal value will fluctuate. Shares may be worth more or less than original cost when redeemed. The adjusted returns take into account the maximum initial sales charge of 3.75% on Class A shares and the contingent deferred sales charge (CDSC) of 1% on Class C shares, which may apply to shares redeemed during the first year of ownership. Returns do not reflect deduction of taxes that a shareholder would pay on fund distributions or redemption of fund shares. See pages 133 and 134 for more information. The Fund’s gross expense ratios are 1.68% for Class A shares, 2.34% for Class C shares, and 1.40% for Class P shares and 1.40% shares for Institutional Class shares. These ratios do not include an expense reduction, contractually guaranteed through at least January 31, 2018. The Fund’s expense ratios net of this reduction are 1.20% for Class A shares, 1.95% for Class C shares, 1.05% for Class P shares and 0.95% for Institutional Class shares. Expense ratio information is as of the Fund’s current prospectus dated February 1, 2017, as revised April 10, 2017.
Cumulative Returns Through March 31, 2017
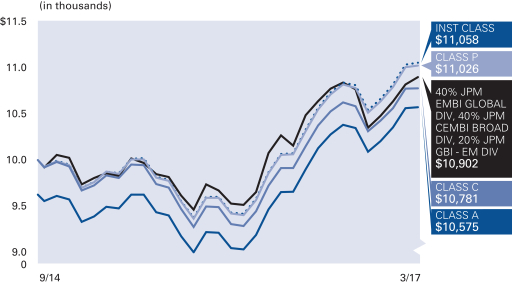
Country Allocation (as of March 31, 2017)
| Argentina | 7.3% | |||
| Russian Federation | 7.0% | |||
| Brazil | 5.9% | |||
| India | 5.8% | |||
| Turkey | 4.8% | |||
| Indonesia | 4.7% | |||
| Hong Kong | 4.4% | |||
| China | 4.3% | |||
| Other | 50.2% | |||
| Cash & Equivalents — Net | 5.6% |
| Semiannual Report | | March 31, 2017 | 55 |
Table of Contents
Unaudited
AllianzGI Emerging Markets Debt Fund (cont’d)
Moody’s Ratings* (as of March 31, 2017)
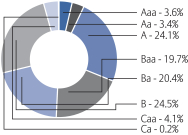
* As a percentage of total investments. Bond ratings refer to the underlying holdings of the Fund and are categorized from highest to lowest credit quality using ratings provided by Moody’s. Moody’s ratings have been selected for several reasons, including the access to information and materials provided by Moody’s, as well as the Fund’s consideration of industry practice. See “Important Information” for more detail on the selection of Moody’s for the Fund’s ratings presentation. Bonds not rated by Moody’s and bonds that do not currently have a rating available are designated in the chart above as “NR” and “NA”, respectively.
| Shareholder Expense Example | Actual Performance | |||||||
| Class A | Class C | Class P | Institutional Class | |||||
| Beginning Account Value (10/1/16) | $1,000.00 | $1,000.00 | $1,000.00 | $1,000.00 | ||||
| Ending Account Value (3/31/17) | $1,018.20 | $1,014.50 | $1,018.90 | $1,019.70 | ||||
| Expenses Paid During Period | $6.04 | $9.79 | $5.29 | $4.78 | ||||
| Hypothetical Performance | ||||||||
| (5% return before expenses) | ||||||||
| Class A | Class C | Class P | Institutional Class | |||||
| Beginning Account Value (10/1/16) | $1,000.00 | $1,000.00 | $1,000.00 | $1,000.00 | ||||
| Ending Account Value (3/31/17) | $1,018.95 | $1,015.21 | $1,019.70 | $1,020.19 | ||||
| Expenses Paid During Period | $6.04 | $9.80 | $5.29 | $4.78 | ||||
For each class of the Fund, expenses (net of fee waiver and reimbursement, if any) are equal to the annualized expense ratio for the class (1.20% for Class A, 1.95% for Class C, 1.05% for Class P and 0.95% for Institutional Class), multiplied by the average account value over the period, multiplied by 182/365.
| 56 | March 31, 2017 | | Semiannual Report |
Table of Contents
(THIS PAGE INTENTIONALLY LEFT BLANK)
| Semiannual Report | | March 31, 2017 | 57 |
Table of Contents
Unaudited
AllianzGI Emerging Markets Small-Cap Fund
For the period of October 1, 2016 through March 31, 2017, as provided by Jie Wei, CFA, Portfolio Manager
Fund Insights
For the six-month period ended March 31, 2017, Class A shares at net asset value (“NAV”) of the AllianzGI Emerging Markets Small-Cap Fund (the “Fund”) returned 10.30%, outperforming the MSCI Emerging Markets Small-Cap Index (the “benchmark”), which returned 5.98%.
Market Overview
During the reporting period, the macroeconomic environment continued to improve following a rebound in emerging market shares which began in early 2016, with positive sentiment driving investor flows to the asset class.
Initially, the benchmark was modestly positive in October as investors gravitated toward the attractive growth and valuation mix offered by emerging market shares. The unforeseen victory of President Trump in the November 2016 elections led market participants to telegraph a stronger US dollar, a greater likelihood of federal interest rate hikes, and concerns of more protectionist policies, which could slow growth in emerging markets. The rally was back on track with four consecutive monthly benchmark gains from December 2016 through March 2017, as emerging markets collectively outpaced their developed market peers due to robust growth expectations and currency strength. In this environment, emerging market small-cap equities modestly trailed their large-cap counterparts.
During the reporting period, 15 of the 22 emerging market small-cap countries posted positive results, led by strong gains in Russia, Poland and Greece. Conversely, Egypt, Turkey and United Arab Emirates were among the decliners due in part to country-specific geopolitical volatility. Sector results were broadly positive, led by strong results in energy, utilities, materials and information technology. Meanwhile, health care was the only sector laggard, positing a mid-single-digit decline during the reporting period.
Portfolio Review
The Fund seeks to benefit from the vast inefficiencies in emerging market small-cap equities. During the reporting period, the Fund outpaced the benchmark due to strong bottom-up stock picking.
During the reporting period, stock selection in information technology, energy, and utilities each topped the benchmark by a wide margin, as did the sizable underweight to health care – the worst performer for the benchmark. Conversely, materials and telecommunication services trailed the benchmark due to more conservative selections. Country performance was chiefly led by stock picking in China and South Korea. These results were offset by negative stock picking in India, followed more modest underperformance in the Philippines and Chile.
Outlook
We firmly believe emerging markets are at the beginning of an unrecognized bull market, with the asset flow and performance pendulum starting to swing back in their favor. In particular, We expect the high alpha potential in emerging market small-cap equities is likely to attract investors in the coming periods.
We believe the combination of superior underlying growth rates and an expanding return on equity relative to developed markets, alongside a meaningful reduction in valuation provides confidence that the turnaround is still in its early stages. Perhaps most importantly, analysts are upgrading earnings expectations in emerging markets for the first time in five years, which we predict is a signal that the market is beginning to give the asset class the certitude it deserves. A silver lining is that emerging market currencies have outperformed their developed market counterparts to begin 2017, providing what we expect will be a tailwind to many investors.
While asset flows have increased in eight of the last nine months, we believe the average investor remains underweight emerging market equities which could translate to future asset flows as the current level of skepticism is replaced with optimism. In addition, we believe the normalized market environment in the beginning of 2017 is increasingly led by idiosyncratic impacts rather than predominately sentiment and macroeconomic influences, which should bode well for our bottom-up, behavioral finance-focused investment process.
Average Annual Total Return for the period ended March 31, 2017
| 6 Month* | 1 Year | Since Inception† | ||||||||||||
| AllianzGI Emerging Markets Small-Cap Fund Class A | 10.30% | 18.68% | 5.43% | |||||||||||
| AllianzGI Emerging Markets Small-Cap Fund Class A (adjusted) | 4.23% | 12.15% | 2.90% | ||||||||||
| AllianzGI Emerging Markets Small-Cap Fund Institutuional Class | 10.56% | 19.04% | 5.78% | ||||||||||
| MSCI Emerging Markets Small-Cap Index | 5.98% | 14.49% | 2.58% | ||||||||||
| Lipper Emerging Markets Funds Average | 5.66% | 16.23% | –0.51% | |||||||||||
† The Fund began operations on December 1, 2014. Benchmark return comparisons began on the fund inception date. Lipper performance comparisons began on November 30, 2014.
* Cumulative returns.
Performance quoted represents past performance and is no guarantee of future results. Current performance may be lower or higher than performance shown. For performance current to the most recent month-end, visit our website at us.allianzgi.com. Investment return and the principal value will fluctuate. Shares may be worth more or less than original cost when redeemed. The adjusted returns take into account the maximum initial sales charge of 5.50% on Class A shares. Returns do not reflect deduction of taxes that a shareholder would pay on fund distributions or redemption of fund shares. See pages 133 and 134 for more information. The Fund’s gross expense ratios are 6.71% for Class A shares and 4.61% for Institutional Class shares. These ratios do not include an expense reduction, contractually guaranteed through at least January 31, 2018. The Fund’s expense ratios net of this reduction are 1.85% for Class A shares and 1.50% for Institutional Class shares. Expense ratio information is as of the Fund’s current prospectus dated February 1, 2017, as revised April 10, 2017.
| 58 | March 31, 2017 | | Semiannual Report |
Table of Contents
Unaudited
AllianzGI Emerging Markets Small-Cap Fund (cont’d)
Cumulative Returns Through March 31, 2017
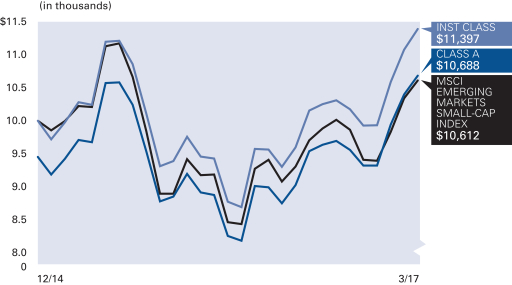
Country Allocation (as of March 31, 2017)
| China | 21.6% | |||||||
| Taiwan | 21.0% | |||||||
| Korea (Republic of) | 13.2% | |||||||
| India | 9.7% | |||||||
| Thailand | 4.4% | |||||||
| Turkey | 3.9% | |||||||
| Russian Federation | 3.9% | |||||||
| Poland | 3.8% | |||||||
| Other | 16.8% | |||||||
| Cash & Equivalents — Net | 1.7% |
| Shareholder Expense Example | Actual Performance | |||
| Class A | Institutional Class | |||
| Beginning Account Value (10/1/16) | $1,000.00 | $1,000.00 | ||
| Ending Account Value (3/31/17) | $1,103.00 | $1,105.60 | ||
| Expenses Paid During Period | $9.70 | $7.87 | ||
| Hypothetical Performance | ||||
| (5% return before expenses) | ||||
| Class A | Institutional Class | |||
| Beginning Account Value (10/1/16) | $1,000.00 | $1,000.00 | ||
| Ending Account Value (3/31/17) | $1,015.71 | $1,017.45 | ||
| Expenses Paid During Period | $9.30 | $7.54 | ||
For each class of the Fund, expenses (net of fee waiver and reimbursement, if any) are equal to the annualized expense ratio for the class (1.85% for Class A and 1.50% for Institutional Class), multiplied by the average account value over the period, multiplied by 182/365.
| Semiannual Report | | March 31, 2017 | 59 |
Table of Contents
Unaudited
AllianzGI Europe Equity Dividend Fund
For the period of October 1, 2016 through March 31, 2017, as provided by Christian McCormick, Senior European Inter-Regional Product Specialist.
Fund Insights
For the six-month period ended March 31, 2017, Class A shares at net asset value (“NAV”) of the AllianzGI Europe Equity Dividend Fund (the “Fund”) returned 3.65%, underperforming the MSCI Europe Index (Net) (the “benchmark”), which returned 7.01%.
Market Overview
Global equities closed 2016 with strong returns, despite suffering the worst start to a year in decades as renewed fears of a slowdown in China and a further decline in oil prices led to a significant sell-off in the first six weeks of 2016. Having recouped these losses, the UK’s unexpected vote in favor of leaving the European Union led to another bout of weakness in late June 2016. Shares prices recovered once more, ending the year with a Trump-inspired rally amid hopes of tax cuts and a more pro-growth policy stance. Global equities rallied over the first three months of 2017, buoyed by signs of strengthening growth and optimism over company earnings, although the rally faded towards the quarter end. In terms of monetary policy, the European Central Bank (“ECB”) and Bank of Japan continued their easing policy, while the US Federal Reserve (the “Fed”) raised rates in December by 25 basis points and then again in the first quarter of 2017 by another 25 basis points, reflecting an improving macro-economic environment in the US.
Portfolio Review
The European Equity Dividend strategy maintains its disciplined two-step philosophy of screening companies based on dividend yields at least 25% higher than the benchmark, and which have a history of paying dividends while increasing the payout ratio. In addition, the Portfolio Manager takes into account current valuations when considering entry and exit points of the European based stocks which meet the dividend criteria.
During the period, the Fund had a positive contribution from sectors, despite being overweight traditional dividend paying sectors such as telecoms and utilities, both of which had negative absolute performance. The overweight to Financials helped, but from a stock selection standpoint this was the Fund’s worst contributor as it was underweight some of the best performing banks, which do not necessarily have high dividend yields. SES Sa, a consumer discretionary stock and the second biggest holding over the period contributed negative 57 basis points to relative performance. Axa, a French insurance company, was the biggest positive holding, contributing a relative 37 basis points.
Country allocation contributed a positive 130 basis points of relative performance. However, stock selection was worse from a country standpoint relative to sectors. Stock selection in Spain and the United Kingdom drove the vast majority of the underperformance. Despite is small allocation, Norwegian stocks were the largest positive contributors.
Outlook
There are currently a number of reasons to have a positive view on European equity markets. Despite numerous headwinds, leading indicators and GDP growth have proven remarkably resilient. Europe is in a much earlier stage of the economic cycle as compared to the US, for example, as indicated by unemployment numbers. With further room for economic recovery and a pickup in global inflation, we believe European company profits might now see the long-awaited turn. Larger parts of the European equity markets remain amongst those parts of the global markets with the lowest valuations. Current investor positioning toward the region appears overly bearish. We believe Europe to be the most attractive region for income oriented investors.
| 60 | March 31, 2017 | | Semiannual Report |
Table of Contents
Unaudited
AllianzGI Europe Equity Dividend Fund (cont’d)
Average Annual Total Return for the period ended March 31, 2017
| 6 Month* | 1 Year | Since Inception† | ||||||||||||
| AllianzGI Europe Equity Dividend Fund Class A | 3.65% | 6.49% | 0.85% | |||||||||||
| AllianzGI Europe Equity Dividend Fund Class A (adjusted) | –2.05% | 0.63% | –1.76% | ||||||||||
| AllianzGI Europe Equity Dividend Fund Class C | 3.23% | 5.62% | 0.10% | |||||||||||
| AllianzGI Europe Equity Dividend Fund Class C (adjusted) | 2.23% | 4.62% | 0.10% | ||||||||||
| AllianzGI Europe Equity Dividend Fund Class P | 3.71% | 6.57% | 0.98% | ||||||||||
| AllianzGI Europe Equity Dividend Fund Institutional Class | 3.84% | 6.77% | 1.12% | ||||||||||
| MSCI Europe Index (Net) | 7.01% | 9.76% | 1.52% | ||||||||||
| Lipper International Equity Income Average | 4.80% | 10.36% | 1.66% | |||||||||||
† The Fund began operations on February 2, 2015. Benchmark return comparisons began on the fund inception date. Lipper performance comparisons began on January 31, 2015.
* Cumulative returns.
Performance quoted represents past performance and is no guarantee of future results. Current performance may be lower or higher than performance shown. For performance current to the most recent month-end, visit our website at us.allianzgi.com. Investment return and the principal value will fluctuate. Shares may be worth more or less than original cost when redeemed. The adjusted returns take into account the maximum initial sales charge of 5.50% on Class A shares and the contingent deferred sales charge (CDSC) of 1% on Class C shares, which may apply to shares redeemed during the first year of ownership. Returns do not reflect deduction of taxes that a shareholder would pay on fund distributions or redemption of fund shares. See pages 133 and 134 for more information. The Fund’s gross expense ratios are 9.51% for Class A shares, 10.14% for Class C shares, 9.11% for Class P shares and 9.07% for Institutional Class shares. These ratios do not include an expense reduction, contractually guaranteed through at least January 31, 2018. The Fund’s expense ratios net of this reduction are 1.20% for Class A shares, 1.95% for Class C shares, 1.05% for Class P shares and 0.95% for Institutional Class shares. Expense ratio information is as of the Fund’s current prospectus dated February 1, 2017, as revised April 10, 2017.
Cumulative Returns Through March 31, 2017
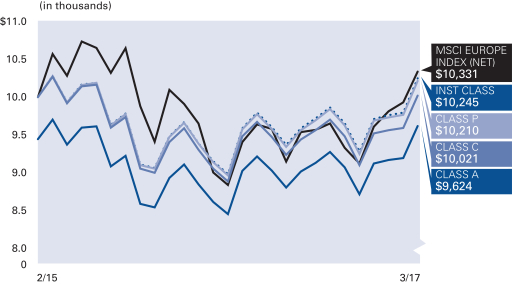
Country Allocation (as of March 31, 2017)
| United Kingdom | 27.8% | |||
| France | 19.4% | |||
| Germany | 15.4% | |||
| Spain | 12.0% | |||
| Netherlands | 6.8% | |||
| Norway | 5.0% | |||
| Switzerland | 3.9% | |||
| Italy | 2.6% | |||
| Other | 4.5% | |||
| Cash & Equivalents — Net | 2.6% |
| Semiannual Report | | March 31, 2017 | 61 |
Table of Contents
Unaudited
AllianzGI Europe Equity Dividend Fund (cont’d)
| Shareholder Expense Example | Actual Performance | |||||||
| Class A | Class C | Class P | Institutional Class | |||||
| Beginning Account Value (10/1/16) | $1,000.00 | $1,000.00 | $1,000.00 | $1,000.00 | ||||
| Ending Account Value (3/31/17) | $1,036.50 | $1,032.30 | $1,037.10 | $1,038.40 | ||||
| Expenses Paid During Period | $6.35 | $10.23 | $5.59 | $5.08 | ||||
| Hypothetical Performance | ||||||||
| (5% return before expenses) | ||||||||
| Class A | Class C | Class P | Institutional Class | |||||
| Beginning Account Value (10/1/16) | $1,000.00 | $1,000.00 | $1,000.00 | $1,000.00 | ||||
| Ending Account Value (3/31/17) | $1,018.70 | $1,014.86 | $1,019.45 | $1,019.95 | ||||
| Expenses Paid During Period | $6.29 | $10.15 | $5.54 | $5.04 | ||||
For each class of the Fund, expenses (net of fee waiver and reimbursement, if any) are equal to the annualized expense ratio for the class (1.25% for Class A, 2.02% for Class C, 1.10% for Class P and 1.00% for Institutional Class), multiplied by the average account value over the period, multiplied by 182/365.
| 62 | March 31, 2017 | | Semiannual Report |
Table of Contents
(THIS PAGE INTENTIONALLY LEFT BLANK)
| Semiannual Report | | March 31, 2017 | 63 |
Table of Contents
Unaudited
AllianzGI Global Dynamic Allocation Fund
For the period of October 1, 2016 through March 31, 2017, as provided by the Multi-Asset US Group.
Fund Insights
For the six-month period ended March 31, 2017, Class A shares at net asset value (“NAV”) of the AllianzGI Global Dynamic Allocation Fund (the “Fund”) returned 3.88%, underperforming the 60% MSCI ACWI, 40% Bloomberg Barclays US Aggregate Bond Index (the “benchmark”), which returned 3.94%.
Market Overview
For the six month period ending March 31, 2017, markets were dominated by the surprising outcome of the US presidential election relative to prevailing market expectations. The Trump victory ushered in a period of uncertainty regarding the magnitude and timing of future policy changes at the same time that it seemed to instill general optimism in market participants. The theme of reflation against the backdrop of supportive fiscal policy and stronger consumer demand percolated through markets for the period.
Throughout the first quarter, risk assets continued to outperform in a low volatility environment despite significant policy setbacks (including the failure to pass healthcare reform) and continued uncertainty about the future of US domestic and foreign policy. Moreover, global risk assets rallied in the context of the US Federal Reserve (the “Fed”) hiking interest rates by 50 basis points in the period. Tighter Fed policy signaled a new regime of tighter global monetary policy in the future (even though the European Central Bank and Bank of Japan reiterated their current commitments to accommodative policies).
During the period, US stocks rallied in the aftermath of the election and continued to gain throughout the first quarter with US Small Cap stocks in particular leading the way: The Russell 2000 Index gained 11.5% and the Russell 2000 Value Index gained 13.9% outpacing larger stocks, which gained 10.1%, as measured by the Russell 1000 Index.
Global growth remained healthy as fundamental macro-economic data continued to either match or outperform economists’ expectations. During the first quarter, the gap between hard data and soft data, as measured by surveys of purchasing managers and consumers, widened substantially, revealing that much of what underpinned the rally in risk assets was associated with future expectations (as opposed to the current economic environment alone).
Optimistic assessments of global growth affected both developed and emerging markets: In broad terms, the MSCI All Country World Index returned 8.2%, only slightly outpacing Emerging Markets, which returned 6.8%. Better economic data helped boost European equities for the period, despite persistent uncertainties about key elections in 2017 (in the Netherlands, France and Germany). For the period, the best performing stock markets were Spain and Italy, which returned 17.3% and 17.6% respectively (MSCI country indexes in USD).
Global Bonds declined for the period with the Bloomberg Barclays Global Aggregate Bond Index losing 5.4%. The long end of the US curve had the worst performance as long Treasuries (20+ years) lost 10.9% in the period due in part to a sharp initial increase in inflation expectations and a spike in yields. While the 10-year yield on US Treasuries initially increased by about 75 basis points from the election through mid-December, it remained relatively range bound for most of the first quarter, making US Treasuries one of the worst performing asset classes for the period. The Bloomberg Barclays US Aggregate Bond Index lost 2.2% for the period. Within fixed income, US High Yield was the best performer. Globally, Emerging Market hard currency debt outperformed developed market government bonds. Commodities, most notably precious metals and gold, were among the worst performing asset classes in the period.
Portfolio Review
Overweights to global equities provided a tailwind to performance during the period, particularly in North America. Both allocation and selection effects contributed within North American equity exposure, as US equities experienced strong performance following the US presidential election. Conversely, allocation effects within emerging market equities detracted during the six-month period, as the asset class experienced volatile returns following the US election before rallying over the first quarter.
From an investment perspective, we maintain our underweight position in US government bonds (duration weighted) and an overweight to global equities including Emerging Markets, against a backdrop of favorable trend and fundamental views across risk assets.
Outlook
Looking ahead, we expect that global inflation will continue to steadily rise, partly attributable to firmer commodity prices and narrowing output gaps throughout developed markets. Emerging markets are expected to continue to post solid growth in the near term, providing opportunities for much needed structural reforms that will ultimately contribute to longer term stability. The global economy will likely continue to benefit from debt-financed growth for the foreseeable future on the back of leveraged households and businesses. We expect monetary policy to continue to tighten in the US, albeit at a slow and measured pace, while global central bank liquidity will remain abundant at least through 2018.
However, risks abound, including increased political risks, most notably in Europe in light of the busy election calendar, but also in key emerging markets. In addition, charged rhetoric about protectionism and zero-sum interactions threaten to undermine longstanding commitments to global trade in goods and financial assets. Finally, risks related to inflated expectations on the part of market participants as well as market complacency may potentially intensify should stocks reverse their recent rally.
As of the end of the period, we remain overweight risk assets and underweight most sovereign bonds with the idea in mind that sovereigns are nearing the end of a secular bull market. The “Reflation Trade” persists for now as long as the possibility of US fiscal stimulus remains and cyclical data continue to show signs of improvement. We maintain a positive outlook on emerging markets while recognizing that an unexpected slowdown in the US or other developed markets would have real and immediate implication for emerging markets broadly. We remain vigilant in this low volatility environment and are focused on monitoring cyclical data and relative valuations across asset classes.
Certain changes to the Fund’s investment strategy and portfolio management team became effective on October 1, 2016. Please see the prospectus for complete details.
| 64 | March 31, 2017 | | Semiannual Report |
Table of Contents
Unaudited
AllianzGI Global Dynamic Allocation Fund (cont’d)
Average Annual Total Return for the period ended March 31, 2017
| 6 Month* | 1 Year | 5 Year | Since Inception† | |||||||||||||||
| AllianzGI Global Dynamic Allocation Fund Class A | 3.88% | 7.70% | 4.81% | 9.66% | ||||||||||||||
| AllianzGI Global Dynamic Allocation Fund Class A (adjusted) | –1.84% | 1.77% | 3.63% | 8.88% | |||||||||||||
| AllianzGI Global Dynamic Allocation Fund Class C | 3.44% | 6.81% | 4.00% | 8.84% | ||||||||||||||
| AllianzGI Global Dynamic Allocation Fund Class C (adjusted) | 2.44% | 5.81% | 4.00% | 8.84% | |||||||||||||
| AllianzGI Global Dynamic Allocation Fund Class R | 3.68% | 7.39% | 4.55% | 9.40% | |||||||||||||
| AllianzGI Global Dynamic Allocation Fund Class P | 3.91% | 7.85% | 4.97% | 9.86% | |||||||||||||
| AllianzGI Global Dynamic Allocation Fund Institutional Class | 3.99% | 7.98% | 5.09% | 9.97% | |||||||||||||
| AllianzGI Global Dynamic Allocation Fund Class R6 | 4.08% | 8.14% | 5.21% | 10.09% | |||||||||||||
| AllianzGI Global Dynamic Allocation Fund Administrative Class | 3.81% | 7.69% | 4.82% | 9.70% | ||||||||||||||
| MSCI ACWI | 8.18% | 15.04% | 8.37% | 11.72% | |||||||||||||
| Bloomberg Barclays US Aggregate Bond Index | –2.18% | 0.44% | 2.34% | 3.95% | |||||||||||||
| 60% MSCI ACWI, 40% Bloomberg Barclays US Aggregate Bond Index | 3.94% | 9.02% | 6.09% | 8.83% | |||||||||||||
| Lipper Alternative Global Macro Funds Average | 2.06% | 6.41% | 2.36% | 6.11% | ||||||||||||||
† The Fund began operations on April 27, 2009. Benchmark return comparisons began on the fund inception date. Lipper performance comparisons began on April 30, 2009.
* Cumulative returns.
Performance quoted represents past performance and is no guarantee of future results. Current performance may be lower or higher than performance shown. For performance current to the most recent month-end, visit our website at us.allianzgi.com. Investment return and the principal value will fluctuate. Shares may be worth more or less than original cost when redeemed. The adjusted returns take into account the maximum initial sales charge of 5.50% on Class A shares and the contingent deferred sales charge (CDSC) of 1% on Class C shares, which may apply to shares redeemed during the first year of ownership. Returns do not reflect deduction of taxes that a shareholder would pay on fund distributions or redemption of fund shares. See pages 133 and 134 for more information. The Fund’s gross expense ratios are 1.78% for Class A shares, 2.74% for Class C shares, 2.30% for Class R shares, 1.52% for Class P shares, 1.50% for Institutional Class shares, 1.41% for Class R6 shares and 1.94% for Administrative Class shares. These ratios do not include an expense reduction, contractually guaranteed through at least January 31, 2018. The Fund’s expense ratios net of this reduction are 1.02% for Class A shares, 1.79% for Class C shares, 1.39% for Class R shares, 0.85% for Class P shares, 0.75% for Institutional Class shares, 0.75% for Class R6 shares and 1.02% for Administrative Class shares. Expense ratio information is as of the Fund’s current prospectus dated February 1, 2017, as revised April 10, 2017.
Cumulative Returns Through March 31, 2017
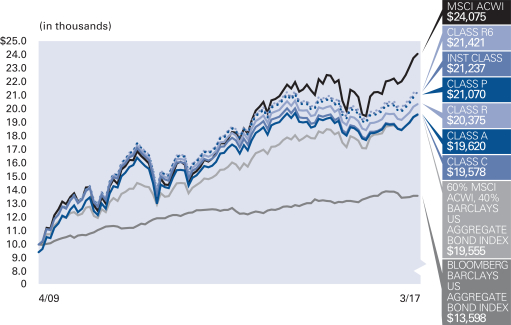
Country Allocation (as of March 31, 2017)
| United States | 63.9% | |||
| Canada | 3.8% | |||
| Japan | 3.3% | |||
| Supranational | 3.2% | |||
| United Kingdom | 2.9% | |||
| China | 2.2% | |||
| France | 2.0% | |||
| Korea (Republic of) | 1.8% | |||
| Other | 17.9% | |||
| Cash & Equivalents — Net | –1.0% |
| Semiannual Report | | March 31, 2017 | 65 |
Table of Contents
Unaudited
AllianzGI Global Dynamic Allocation Fund (cont’d)
| Shareholder Expense Example | Actual Performance | |||||||||||||
| Class A | Class C | Class R | Class P | Institutional Class | Class R6 | Administrative Class | ||||||||
| Beginning Account Value (10/1/16) | $1,000.00 | $1,000.00 | $1,000.00 | $1,000.00 | $1,000.00 | $1,000.00 | $1,000.00 | |||||||
| Ending Account Value (3/31/17) | $1,038.80 | $1,034.40 | $1,036.80 | $1,039.10 | $1,039.90 | $1,040.80 | $1,038.10 | |||||||
| Expenses Paid During Period | $5.34 | $9.13 | $6.86 | $4.32 | $4.02 | $3.56 | $5.23 | |||||||
| Hypothetical Performance | ||||||||||||||
| (5% return before expenses) | ||||||||||||||
| Class A | Class C | Class R | Class P | Institutional Class | Class R6 | Administrative Class | ||||||||
| Beginning Account Value (10/1/16) | $1,000.00 | $1,000.00 | $1,000.00 | $1,000.00 | $1,000.00 | $1,000.00 | $1,000.00 | |||||||
| Ending Account Value (3/31/17) | $1,019.70 | $1,015.96 | $1,018.20 | $1,020.69 | $1,020.99 | $1,021.44 | $1,019.80 | |||||||
| Expenses Paid During Period | $5.29 | $9.05 | $6.79 | $4.28 | $3.98 | $3.53 | $5.19 | |||||||
For each class of the Fund, expenses (net of fee waiver and reimbursement, if any) are equal to the annualized expense ratio for the class (1.05% for Class A, 1.80% for Class C, 1.35% for Class R, 0.85% for Class P, 0.79% for Institutional Class, 0.70% for Class R6 and 1.03% for Administrative Class), multiplied by the average account value over the period, multiplied by 182/365. These expenses do not include the expenses of the investment companies in which the Fund invests, which are indirectly borne by Fund shareholders.
| 66 | March 31, 2017 | | Semiannual Report |
Table of Contents
(THIS PAGE INTENTIONALLY LEFT BLANK)
| Semiannual Report | | March 31, 2017 | 67 |
Table of Contents
Unaudited
AllianzGI Global Fundamental Strategy Fund
For the period October 1, 2016 through March 31, 2017, as provided by Neil Dwane, Portfolio Manager.
Fund Insights
For the six-month period ended March 31, 2017, Class A shares at net asset value (“NAV”) of the AllianzGI Global Fundamental Strategy Fund (the “Fund”) returned 1.68%, outperforming the USD Overnight LIBOR (the “benchmark”), which returned 0.30%.
Market Overview
Global equities surged during this period, with indices in the US and UK breaking previous record highs, while many other markets reached multi-month peaks. Financials stocks delivered robust returns, as did other growth-oriented sectors. In contrast, energy lagged while traditional defensive sectors underperformed. Both US and European equities rallied in this period. European stocks reached levels last seen in 2015.
Emerging market equities rallied, but lagged against their more developed counterparts. Brazilian equities posted moderate returns in the fourth-quarter 2016, surging in the first-quarter 2017. We believe Mexico, after performing poorly in 2016 having been a main casualty of Trump’s surprise victory, is recovering strongly in 2017. Eastern European performance was lifted by robust returns from Poland, Turkey and Hungary, all delivering double-digit gains.
US bonds fell over the six-month period, with yields rising sharply after the presidential election result. European bonds recorded negative returns over the period. In December 2016, the European Central Bank extended the duration of monthly bond purchases until at least the end of 2017, but reduced the size of bond purchases to EUR 60 billion per month. Emerging market bonds ended the period with mixed returns having fallen sharply in the final quarter of 2016. 2017 saw a change in investor sentiment, helping emerging market bonds to rebound as the US dollar weakened.
Portfolio Review
In the fourth-quarter of 2016, we sold some developed market equities (Centrica, Cisco and BASF) and reduced our exposure to Microsoft, locking in good profits. We invested in Keyence, Aecom and Yamaha and increased exposure to Mobileye. This was a profitable move as Mobileye rose over 30% in March due to a takeover-bid from Intel. We locked in profit and sold our entire holdings. We invested in Warehouses de Pauw, bought Thales and sold our stake in Yara. In 2017, we divested ourselves of Amazon, GameStop Corp, Intel and Johnson & Johnson, earning good profits.
Within the fixed income allocation, emerging market debt performed well and we took profits in March bringing our exposure to Mexico, Brazil and Argentina back in line with our standard allocation.
Despite good performance in 2016, both Royal Dutch Shell and BP contributed negatively YTD. We remain constructive on oil as a longer-term investment theme.
“Inflation Protection & Real Assets” was another successful theme of the Fund. Vonovia outperformed and we increased our weight in the theme through reinvestment in another German real-estate company, Deutsche Wohnen and a purchase of Two Harbors Corporation, a US real estate investment trust. We also added to this theme via investments in inflation-linked bonds in Spain and Australia.
Outlook
Our investment philosophy is predicated on generating consistent, positive returns by investing in multiple sources of diversified alpha using a fundamental and unconstrained approach, largely independent of the macroeconomic environment. We remain committed to generating outperformance for our clients by focusing on fundamentals. Tactically, we remain slightly cautious, and have taken this opportunity to attempt to de-risk the portfolio. After President Trump failed to garner enough support among fellow Republicans to replace “Obamacare” with his intended legislation, there is growing concern regarding his ability to implement other key election promises. As such, we have attempted to position the portfolio more defensively by locking in a number of profits and reducing our exposure to risk assets, while increasing our weight in cash to protect the portfolio against a downside turn.
| 68 | March 31, 2017 | | Semiannual Report |
Table of Contents
Unaudited
AllianzGI Global Fundamental Strategy Fund (cont’d)
Average Annual Total Return for the period ended March 31, 2017
| 6 Month* | 1 Year | Since Inception† | ||||||||||
| AllianzGI Global Fundamental Strategy Fund Class A | 1.68% | 5.78% | 3.43% | |||||||||
| AllianzGI Global Fundamental Strategy Fund Class A (adjusted) | –3.91% | –0.04% | 1.88% | ||||||||
| AllianzGI Global Fundamental Strategy Fund Class C | 1.30% | 5.03% | 2.64% | |||||||||
| AllianzGI Global Fundamental Strategy Fund Class C (adjusted) | 0.32% | 4.03% | 2.64% | ||||||||
| AllianzGI Global Fundamental Strategy Fund Class P | 1.70% | 5.91% | 3.56% | ||||||||
| AllianzGI Global Fundamental Strategy Fund Institutional Class | 1.84% | 6.05% | 3.68% | ||||||||
| USD Overnight LIBOR | 0.30% | 0.51% | 0.24% | ||||||||
| 70% MSCI ACWI, 30% Bloomberg Barclays Global Aggregate Bond Index | 3.95% | 9.75% | 6.16% | ||||||||
| USD Overnight LIBOR + 4% | 2.35% | 4.67% | 4.39% | ||||||||
| Lipper Absolute Return Funds Average | 2.69% | 5.07% | 2.65% | |||||||||
† The Fund began operations on July 1, 2013. Benchmark return comparisons began on the fund inception date. Lipper performance comparisons began on June 30, 2013.
* Cumulative returns.
Performance quoted represents past performance and is no guarantee of future results. Current performance may be lower or higher than performance shown. For performance current to the most recent month-end, visit our website at us.allianzgi.com. Investment return and the principal value will fluctuate. Shares may be worth more or less than original cost when redeemed. The adjusted returns take into account the maximum initial sales charge of 5.50% on Class A shares and the contingent deferred sales charge (CDSC) of 1% on Class C shares, which may apply to shares redeemed during the first year of ownership. Returns do not reflect deduction of taxes that a shareholder would pay on fund distributions or redemption of fund shares. See pages 133 and 134 for more information. The Fund’s gross expense ratios are 2.28% for Class A shares, 2.99% for Class C shares, 1.97% for Class P shares and 1.94% for Institutional Class shares. These ratios do not include an expense reduction, contractually guaranteed through at least March 31, 2018. The Fund’s expense ratios net of this reduction are 1.12% for Class A shares, 1.87% for Class C shares, 0.97% for Class P shares and 0.87% for Institutional Class shares. Expense ratio information is as of the Fund’s current prospectus dated February 1, 2017, as revised April 10, 2017.
Cumulative Returns Through March 31, 2017
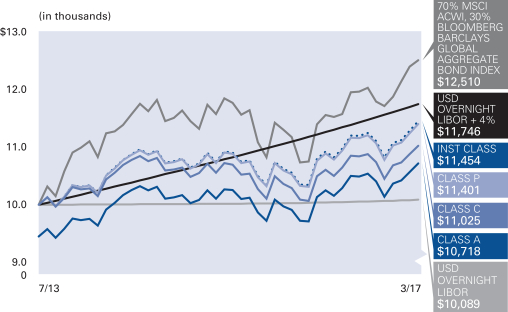
Country Allocation (as of March 31, 2017)
| United States | 27.2% | |||
| United Kingdom | 8.5% | |||
| Italy | 6.7% | |||
| Canada | 6.2% | |||
| Germany | 5.5% | |||
| Mexico | 4.1% | |||
| Supranational | 3.7% | |||
| Switzerland | 3.3% | |||
| Other | 25.7% | |||
| Cash & Equivalents — Net (including Options Purchased ) | 9.1% |
| Semiannual Report | | March 31, 2017 | 69 |
Table of Contents
Unaudited
AllianzGI Global Fundamental Strategy Fund (cont’d)
Moody’s Ratings* (as of March 31, 2017)
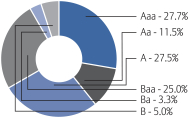
* As a percentage of fixed-income investments. Bond ratings refer to the underlying holdings of the Fund and are categorized from highest to lowest credit quality using ratings provided by Moody’s. Moody’s ratings have been selected for several reasons, including the access to information and materials provided by Moody’s, as well as the Fund’s consideration of industry practice. See “Important Information” for more detail on the selection of Moody’s for the Fund’s ratings presentation. Bonds not rated by Moody’s and bonds that do not currently have a rating available are designated in the chart above as “NR” and “NA”, respectively.
| Shareholder Expense Example | Actual Performance | |||||||
| Class A | Class C | Class P | Institutional Class | |||||
| Beginning Account Value (10/1/16) | $1,000.00 | $1,000.00 | $1,000.00 | $1,000.00 | ||||
| Ending Account Value (3/31/17) | $1,016.80 | $1,013.00 | $1,017.00 | $1,018.40 | ||||
| Expenses Paid During Period | $6.34 | $10.14 | $5.63 | $5.13 | ||||
| Hypothetical Performance | ||||||||
| (5% return before expenses) | ||||||||
| Class A | Class C | Class P | Institutional Class | |||||
| Beginning Account Value (10/1/16) | $1,000.00 | $1,000.00 | $1,000.00 | $1,000.00 | ||||
| Ending Account Value (3/31/17) | $1,018.65 | $1,014.86 | $1,019.35 | $1,019.85 | ||||
| Expenses Paid During Period | $6.34 | $10.15 | $5.64 | $5.14 | ||||
For each class of the Fund, expenses (net of fee waiver and reimbursement, if any) are equal to the annualized expense ratio for the class (1.26% for Class A, 2.02% for Class C, 1.12% for Class P and 1.02% for Institutional Class), multiplied by the average account value over the period, multiplied by 182/365. These expenses do not include the expenses of the investment companies in which the Fund invests, which are indirectly borne by Fund shareholders.
| 70 | March 31, 2017 | | Semiannual Report |
Table of Contents
(THIS PAGE INTENTIONALLY LEFT BLANK)
| Semiannual Report | | March 31, 2017 | 71 |
Table of Contents
Unaudited
AllianzGI Global Sustainability Fund
For the period of October 1, 2016 through March 31, 2017, as provided by the Global Equity Team.
Fund Insights
For the six-month period ended March 31, 2017, Class A shares at net asset value (“NAV”) of the AllianzGI Global Sustainability Fund (the “Fund”) returned 4.51%, underperforming the MSCI ACWI (the “benchmark”), which returned 8.18%.
Market Review
Global equities surged over the six-month period, with indices in the US and UK breaking previous record highs while many other markets reached multi-month peaks. Donald Trump’s victory in the US presidential election raised hopes that his pro-growth stance would boost company profits, outweighing fears about greater protectionism. In general, developed equity markets outperformed emerging markets, with Japan leading the advance as a weaker yen lifted the prospects of the country’s exporters.
In terms of sectors, financials stocks delivered robust returns amid expectations that interest rates would rise faster than expected as a result of President-elect Trump’s policies. In contrast, energy lagged as oil prices failed to build on earlier gains, while traditional defensive sectors, such as consumer staples, telecoms and utilities, underperformed, as did the newly-created real estate sector.
Global bonds fell over the six-month period, with yields in many markets touching multi-month highs. US bond yields jumped the most as President Trump’s policies were expected to result in higher inflation and an accelerated path of interest rate increases. Yields on European bonds also increased amid evidence that economic activity and inflation were strengthening. However, the upward movement in yields was less pronounced in Japan due to the Bank of Japan’s pledge to keep 10-year bond yields “around zero”.
In economic terms, the period was characterized by strengthening growth and rising inflation. The US Federal Reserve (the “Fed”) raised interest rates twice—in December 2016 and again in March 2017—taking the federal funds rate to 1.0%. In contrast, the European Central Bank (“ECB”) extended its bond-buying program in December until at least the end of 2017, but reduced the size of its monthly bond purchases. Subsequently, rising inflation in the first quarter of 2017 led to speculation that the ECB would need to wind down these measures, with President Mario Draghi noting that the battle against deflation had now been won. The Bank of England and Bank of Japan left monetary policy unchanged.
The US dollar strengthened significantly following Donald Trump’s surprise victory, approaching a 15-year high against its major trading partners. The Japanese yen, in particular, weakened. However, the Trump-inspired rally faded throughout the first quarter of 2017, causing the US dollar to give back some of its earlier gains.
Commodities delivered mixed returns. Oil prices initially strengthened following the news that OPEC had agreed to cut production, but later weakened amid signs of rising US supply. Elsewhere, a more optimistic growth outlook boosted prices for many industrials metals, such as copper, but gold lost ground.
Portfolio Review
The portfolio rose in absolute terms but underperformed the benchmark.
Our investment strategy of investing in attractively valued quality growth companies encountered headwinds in the fourth quarter as low quality value stocks rallied on hopes of stronger economic growth post the US elections, which led to higher inflation expectations and a rise in interest rates.
Financials were the largest detractor in relative performance terms, although Citigroup and American Express were among the top overall contributors. While our sector underweight was moderately negative, the bulk of the underperformance was a result of not owning some of the large US banks due to low returns on equity, compressed interest rate spreads, and an increasingly onerous regulatory regime. The banks that we do own, such as Citi and UBS, have clear paths to generating higher returns with Citi’s legacy book of distressed assets running off and UBS’s strategic decision to deemphasize its capital intensive investment banking activities and focus on growing its high margin private wealth management business. While the steepening of the yield curve, particularly in the US, will boost interest income for the banks, we question the quality of banks in general and will continue to be selective in owning them.
Industrials stock selection was negative as Nielsen Holdings declined due to weaker consumer purchasing and analytics demand from some consumer packaged goods customers. We view this as a short-term issue and the rest of the business remains strong, particularly in media audience measurement.
Overall, we have not made any major changes to the portfolio. We retain high conviction in the stocks that we own and believe the portfolio’s balanced risk profile in terms of sector and geographical exposure provides positive diversification benefits.
Outlook
The global economic indicators have continued to improve over the last few months. We believe this represents a favorable sign for equity investments. However, political risks in the US and Europe persist and attractive equity valuations become more difficult to find in several regions.
Low interest rates and the expansionary monetary policy of the Fed have helped to push US equity valuations to a comparatively high level. We predict this will reduce the return potential and might result in higher volatility. For now, equity prices are supported by healthy macro data, particularly for the labor market. Still, the economic cycle has reached a mature stage, which we believe suggests that a slowdown is more likely.
In Europe, favorable economic data have helped to keep equities largely insulated against political uncertainties and bond market volatility, but we expect further upside surprises are becoming increasingly unlikely. While equity valuations in Europe are roughly in line with the long-term average, we believe there is still attraction in individual countries.
| 72 | March 31, 2017 | | Semiannual Report |
Table of Contents
Unaudited
AllianzGI Global Sustainability Fund (cont’d)
The environment in China is now showing more stability and we predict that high-end spending will continue to grow at a healthy pace in 2017 as the country moves quickly towards a consumption-driven economy.
Our approach of investing in high return, reasonably valued, growth companies that can consistently grow earnings has added value to our clients’ portfolios over the long-term, and we believe it will continue to do so in the current low-return market environment.
Average Annual Total Return for the period ended March 31, 2017
| 6 Month* | 1 Year | Since Inception† | ||||||||||||
| AllianzGI Global Sustainability Fund Class A | 4.51% | 12.95% | 4.85% | |||||||||||
| AllianzGI Global Sustainability Fund Class A (adjusted) | –1.24% | 6.74% | 2.31% | ||||||||||
| AllianzGI Global Sustainability Fund Class P | 4.59% | 13.04% | 5.00% | ||||||||||
| AllianzGI Global Sustainability Fund Institutional Class | 4.63% | 13.16% | 5.09% | ||||||||||
| MSCI ACWI | 8.18% | 15.04% | 4.97% | ||||||||||
| Dow Jones Sustainability World Total Return Composite Net | 10.42% | 17.79% | 3.80% | ||||||||||
| Lipper Global Large-Cap Growth Funds Average | 6.63% | 12.83% | 4.76% | |||||||||||
† The Fund began operations on December 9, 2014. Benchmark return comparisons began on the fund inception date. Lipper performance comparisons began on November 30, 2014.
* Cumulative returns.
Performance quoted represents past performance and is no guarantee of future results. Current performance may be lower or higher than performance shown. For performance current to the most recent month-end, visit our website at us.allianzgi.com. Investment return and the principal value will fluctuate. Shares may be worth more or less than original cost when redeemed. The adjusted returns take into account the maximum initial sales charge of 5.50% on Class A shares. Returns do not reflect deduction of taxes that a shareholder would pay on fund distributions or redemption of fund shares. See pages 133 and 134 for more information. The Fund’s gross expense ratios are 21.49% for Class A shares, 2.94% for Class P shares and 1.95% for Institutional Class shares. These ratios do not include an expense reduction, contractually guaranteed through at least March 31, 2018. The Fund’s expense ratios net of this reduction are 1.09% for Class A shares, 0.94% for Class P shares and 0.84% for Institutional Class shares. Expense ratio information is as of the Fund’s current prospectus dated February 1, 2017, as revised April 10, 2017.
Cumulative Returns Through March 31, 2017

Country Allocation (as of March 31, 2017)
| United States | 50.9% | |||
| United Kingdom | 14.9% | |||
| Germany | 7.5% | |||
| Japan | 5.1% | |||
| Switzerland | 4.5% | |||
| Spain | 4.0% | |||
| Sweden | 3.5% | |||
| France | 2.8% | |||
| Other | 4.2% | |||
| Cash & Equivalents — Net | 2.6% |
| Semiannual Report | | March 31, 2017 | 73 |
Table of Contents
Unaudited
AllianzGI Global Sustainability Fund (cont’d)
| Shareholder Expense Example | Actual Performance | |||||
| Class A | Class P | Institutional Class | ||||
| Beginning Account Value (10/1/16) | $1,000.00 | $1,000.00 | $1,000.00 | |||
| Ending Account Value (3/31/17) | $1,045.10 | $1,045.90 | $1,046.30 | |||
| Expenses Paid During Period | $6.12 | $5.36 | $4.85 | |||
| Hypothetical Performance | ||||||
| (5% return before expenses) | ||||||
| Class A | Class P | Institutional Class | ||||
| Beginning Account Value (10/1/16) | $1,000.00 | $1,000.00 | $1,000.00 | |||
| Ending Account Value (3/31/17) | $1,018.95 | $1,019.70 | $1,020.19 | |||
| Expenses Paid During Period | $6.04 | $5.29 | $4.78 | |||
For each class of the Fund, expenses (net of fee waiver and reimbursement, if any) are equal to the annualized expense ratio for the class (1.20% for Class A, 1.05% for Class P and 0.95% for Institutional Class), multiplied by the average account value over the period, multiplied by 182/365.
| 74 | March 31, 2017 | | Semiannual Report |
Table of Contents
(THIS PAGE INTENTIONALLY LEFT BLANK)
| Semiannual Report | | March 31, 2017 | 75 |
Table of Contents
Unaudited
AllianzGI Global Water Fund
For the period of October 1, 2016 through March 31, 2017, as provided by Andreas Fruschki, CFA, Portfolio Manager.
Fund Insights
For the six-month period ended March 31, 2017, Class A shares at net asset value (“NAV”) of the AllianzGI Global Water Fund (the “Fund”) returned -1.94%, underperforming the S&P Global Water Index (the “benchmark”), which returned 2.59%.
Market Overview
Global equities rallied strongly over the six-month period, with indices in the US and UK breaking previous record highs, while many other markets reached multi-month peaks. In general, developed equity markets outperformed emerging markets, with Japan leading the advance as a weaker yen lifted prospects for the country’s exporters. In terms of sectors, financials delivered robust returns amid expectations that US Federal interest rates would rise faster than expected as a result of President Trump’s policies. Other growth-oriented sectors also performed well.
With respect to the water market, we saw water related securities pull back during the first half of the reporting period and recover during the first quarter of 2017. The pull back toward the end of 2016 was caused by weakness of many European water stocks, especially those in the UK following the UK’s referendum vote to leave the European Union (“BREXIT”). Water utility stocks were also hurt by rising bond yields in late 2016; however, we view this as a short term reaction as water utilities differ from traditional utilities in that they are growth stocks. Water securities rebounded during the second half of the reporting period as utilities corrected and investors rotated back toward growth areas of the market.
Portfolio Overview:
The Fund slightly underperformed the benchmark during the reporting period due mainly to struggles during the fourth quarter and the Fund’s focus on pure water related securities. The first half of the quarter was largely a value rally, as investors rotated away from growth areas of the market which include our growth oriented water related stocks. Prior to 2017, the portfolio was weighted toward European names which suffered as the US dollar appreciated. During the second half of the reporting period, we saw these trends begin to reverse and performance returned to positive territory.
The Fund offers pure exposure to the water market, in that 80% of its securities derive over half of their revenue from water related businesses. These pure names tended to underperform the less pure names in the benchmark, hurting relative performance. We remain focused on more pure play names; as we expect these names to benefit from the needed infrastructure spending in the water networks and the overall global water scarcity problem in the long term.
Outlook
Currently the water infrastructure theme remains intact and continues to gain attention and attract investments. It has started to increasingly include technology such as real-time monitoring and sensors in its networks.
Demand for better water infrastructure and clean, potable drinking water in emerging markets remains strong. We predict uncertainty over upcoming elections in Europe and BREXIT related discussions will likely create noise; however we expect this long term investment theme will remain intact. We believe that the US economy is in expansion mode and we expect corporates to invest in water equipment as they take on new projects. We predict the M&A market for utilities is also likely to open up and create new opportunities.
| 76 | March 31, 2017 | | Semiannual Report |
Table of Contents
Unaudited
AllianzGI Global Water Fund (cont’d)
Average Annual Total Return for the period ended March 31, 2017
| 6 Month* | 1 Year | 5 Year | Since Inception† | |||||||||||||||
| AllianzGI Global Water Fund Class A | –1.94% | 6.85% | 8.15% | 4.60% | ||||||||||||||
| AllianzGI Global Water Fund Class A (adjusted) | –7.34% | 0.97% | 6.94% | 3.94% | |||||||||||||
| AllianzGI Global Water Fund Class C | –2.31% | 6.08% | 7.31% | 3.81% | ||||||||||||||
| AllianzGI Global Water Fund Class C (adjusted) | –3.28% | 5.08% | 7.31% | 3.81% | |||||||||||||
| AllianzGI Global Water Fund Class P | –1.83% | 7.16% | 8.41% | 4.85% | |||||||||||||
| AllianzGI Global Water Fund Institutional Class | –1.77% | 7.20% | 8.49% | 4.93% | |||||||||||||
| MSCI ACWI | 8.18% | 15.04% | 8.37% | 4.59% | |||||||||||||
| S&P Global Water Index | 2.59% | 12.59% | 10.69% | 6.68% | |||||||||||||
| Lipper Global Natural Resources Funds Average | 2.83% | 16.76% | –2.78% | –4.37% | ||||||||||||||
† The Fund began operations on March 31, 2008. Benchmark return comparisons began on the fund inception date. Lipper performance comparisons began on March 31, 2008.
* Cumulative returns.
Performance quoted represents past performance and is no guarantee of future results. Current performance may be lower or higher than performance shown. For performance current to the most recent month-end, visit our website at us.allianzgi.com. Investment return and the principal value will fluctuate. Shares may be worth more or less than original cost when redeemed. The adjusted returns take into account the maximum initial sales charge of 5.50% on Class A shares and the contingent deferred sales charge (CDSC) of 1% on Class C shares, which may apply to shares redeemed during the first year of ownership. Returns do not reflect deduction of taxes that a shareholder would pay on fund distributions or redemption of fund shares. See pages 133 and 134 for more information. The Fund’s gross expense ratios are 1.49% for Class A shares, 2.25% for Class C shares 1.24% for Class P shares and 1.21% for Institutional Class shares. These ratios do not include an expense reduction contractually guaranteed through at least March 31, 2018. The Fund’s expense ratios net of this reduction are 1.27% for Class A shares, 2.03% for Class C shares, 1.02% for Class P shares, and 0.99% for Institutional Class shares. Expense ratio information is as of the Fund’s current prospectus dated February 1, 2017, as revised April 10, 2017.
Cumulative Returns Through March 31, 2017
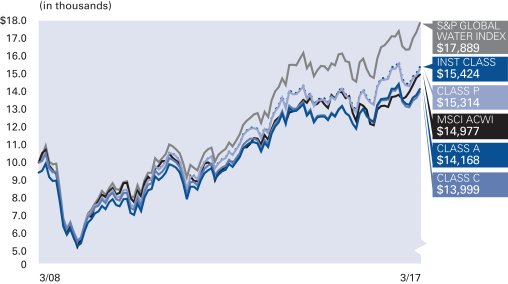
Country Allocation (as of March 31, 2017)
| United States | 36.1% | |||
| United Kingdom | 19.1% | |||
| Switzerland | 9.0% | |||
| France | 7.8% | |||
| China | 5.3% | |||
| Netherlands | 3.1% | |||
| Hong Kong | 3.0% | |||
| Finland | 2.9% | |||
| Other | 6.8% | |||
| Cash & Equivalents — Net | 6.9% |
| Semiannual Report | | March 31, 2017 | 77 |
Table of Contents
Unaudited
AllianzGI Global Water Fund (cont’d)
| Shareholder Expense Example | Actual Performance | |||||||
| Class A | Class C | Class P | Institutional Class | |||||
| Beginning Account Value (10/1/16) | $1,000.00 | $1,000.00 | $1,000.00 | $1,000.00 | ||||
| Ending Account Value (3/31/17) | $980.60 | $976.90 | $981.70 | $982.30 | ||||
| Expenses Paid During Period | $7.06 | $10.79 | $5.88 | $5.63 | ||||
| Hypothetical Performance | ||||||||
| (5% return before expenses) | ||||||||
| Class A | Class C | Class P | Institutional Class | |||||
| Beginning Account Value (10/1/16) | $1,000.00 | $1,000.00 | $1,000.00 | $1,000.00 | ||||
| Ending Account Value (3/31/17) | $1,017.80 | $1,014.01 | $1,019.00 | $1,019.25 | ||||
| Expenses Paid During Period | $7.19 | $11.00 | $5.99 | $5.74 | ||||
For each class of the Fund, expenses are equal to the annualized expense ratio for the class (1.43% for Class A, 2.19% for Class C, 1.19% for Class P and 1.14% for Institutional Class), multiplied by the average account value over the period, multiplied by 182/365.
| 78 | March 31, 2017 | | Semiannual Report |
Table of Contents
(THIS PAGE INTENTIONALLY LEFT BLANK)
| Semiannual Report | | March 31, 2017 | 79 |
Table of Contents
Unaudited
AllianzGI High Yield Bond Fund
For the period of October 1, 2016 through March 31, 2017, as provided by Doug Forsyth, Portfolio Manager.
Fund Insights
For the six-month period ended March 31, 2017, Class A Shares at net asset value (“NAV”) of the AllianzGI High Yield Bond Fund (the “Fund”) returned 4.04%, underperforming the BofA Merrill Lynch High Yield Master II Index (the “benchmark”), which returned 4.64%.
Market Overview
The high-yield market’s upward trajectory in 2016 continued into the fourth quarter with the asset class recording its fifth-highest annual return historically. In contrast to 2016’s start to the year, the outset of 2017 began on a much firmer footing.
Several factors influenced high-yield bonds throughout the period, including constructive economic trends, corporate health, the US Federal Reserve’s (the “Fed”) rate decision and outlook, US elections and the new administration’s pro-growth agenda, sustained appetite for risk assets and commodity price strength.
In the US, positive economic reports outnumbered weaker releases, indicating ongoing growth and supporting the market’s advance. Overall, the trend in economic data reinforced the favorable credit conditions for high-yield bonds.
Credit fundamentals for most high-yield issuers displayed sustained improvement. According to BofA Merrill Lynch, both top- and bottom-line growth continued to trend higher. Furthermore, leverage continued to decline and coverage ratios increased. These statistics provided additional proof of the underlying fundamental strength of the high-yield bond market and substantiated the decline in the default rate.
The high-yield market responded positively to the Fed’s interest rate decisions and commentary. The central bank hiked the Fed funds rate a quarter point in both December 2016 and in March 2017. On balance, a Fed that did not deviate from its gradual approach toward policy adjustments, and a highly accommodative environment outside the US, continued to help support the performance of risk assets.
The unexpected election of Donald Trump triggered a rotation into risk assets that persisted throughout the reporting period. Investor appetite centered on optimism around the President’s pro-growth agenda and anticipation of a more favorable corporate earnings backdrop, predicated on positive tax reform, decreased regulation and increased fiscal spending.
This sentiment was also evident at the sub-asset class level and resulted in performance dispersion among the credit-rating categories. For example, within high-yield, the lowest-quality, most distressed issues outperformed higher-quality bonds.
Finally, improving industry dynamics helped lift the price of crude oil and aided in the stabilization of other commodity prices. These developments had a positive impact on many energy and materials companies.
Portfolio Review
The Fund gained along with the market for the six-month period, but performance lagged the benchmark return.
An underweight in CCC-rated bonds held back relative returns as the lowest-quality, most deeply distressed bonds, continued to outperform. On the other hand, BB-rated bonds, the lowest-coupon/lowest-yield issues, underperformed the market.
Industry allocations that helped relative performance during the period included healthcare, chemicals and diversified financial services. In healthcare, an underweight was beneficial and issue selection was positive. In chemicals, issue selection drove relative performance and an overweight was additive. In financial services, the portfolio return exceeded the industry return.
Industry allocations that hurt relative performance during the period included aerospace/defense, energy and support-services. Issue selection detracted in aerospace/defense and support-services. In energy, the Fund’s return was higher than the peer group, but the benefit was offset by an underweight.
Outlook
Among fixed-income alternatives, we expect high-yield bonds should contribute from both a diversification and a relative-performance perspective. In 2017, we believe a coupon-like return can be achieved. We expect interest rates should not have a significant impact on the high-yield market given the relative average spread and dollar market price today. We believe the Fed path, earnings trends, commodity prices and global growth will all influence the outlook.
| 80 | March 31, 2017 | | Semiannual Report |
Table of Contents
Unaudited
AllianzGI High Yield Bond Fund (cont’d)
Average Annual Total Return for the period ended March 31, 2017
| 6 Month* | 1 Year | 5 Year | 10 Year | Since Inception† | ||||||||||||||||||
| AllianzGI High Yield Bond Fund Class A | 4.04% | 14.15% | 5.11% | 6.40% | 7.32% | |||||||||||||||||
| AllianzGI High Yield Bond Fund Class A (adjusted) | 0.14% | 9.87% | 4.31% | 6.00% | 7.13% | ||||||||||||||||
| AllianzGI High Yield Bond Fund Class C | 3.68% | 13.23% | 4.34% | 5.64% | 6.54% | |||||||||||||||||
| AllianzGI High Yield Bond Fund Class C (adjusted) | 2.68% | 12.23% | 4.34% | 5.64% | 6.54% | ||||||||||||||||
| AllianzGI High Yield Bond Fund Class R | 3.89% | 13.80% | 4.68% | 6.07% | 7.02% | ||||||||||||||||
| AllianzGI High Yield Bond Fund Class P | 4.25% | 14.44% | 5.39% | 6.64% | 7.52% | ||||||||||||||||
| AllianzGI High Yield Bond Fund Institutional Class | 4.26% | 14.41% | 5.44% | 6.82% | 7.79% | ||||||||||||||||
| AllianzGI High Yield Bond Fund Administrative Class | 4.10% | 13.96% | 4.97% | 6.35% | 7.30% | |||||||||||||||||
| BofA Merrill Lynch High Yield Master II Index | 4.64% | 16.88% | 6.85% | 7.35% | 7.26% | ||||||||||||||||
| Lipper High Yield Funds Average | 3.93% | 13.30% | 5.57% | 5.89% | 6.26% | |||||||||||||||||
† The Fund began operations on July 31, 1996. Benchmark return comparisons began on the fund inception date. Lipper performance comparisons began on July 31, 1996.
* Cumulative returns.
Performance quoted represents past performance and is no guarantee of future results. Current performance may be lower or higher than performance shown. For performance current to the most recent month-end, visit our website at us.allianzgi.com. Investment return and the principal value will fluctuate. Shares may be worth more or less than original cost when redeemed. The adjusted returns take into account the maximum initial sales charge of 3.75% on Class A shares and the contingent deferred sales charge (CDSC) of 1% on Class C shares, which may apply to shares redeemed during the first year of ownership. Returns do not reflect deduction of taxes that a shareholder would pay on fund distributions or redemption of fund shares. See pages 133 and 134 for more information. The Fund’s expense ratios are 0.98% for Class A shares, 1.71% for Class C shares, 1.34% for Class R shares, 0.69% for Class P shares, 0.66% for Institutional Class shares and 1.07% for Administrative Class shares. Expense ratio information is as of the Fund’s current prospectus dated February 1, 2017, as revised April 10, 2017.
Cumulative Returns Through March 31, 2017
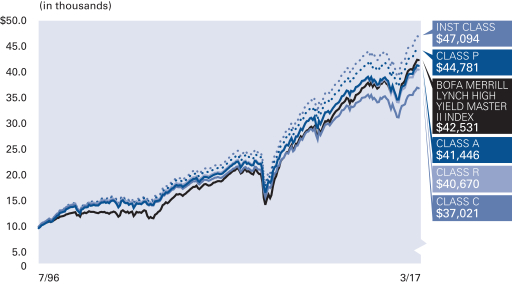
Industry Allocation (as of March 31, 2017)
| Telecommunications | 11.2% | |||
| Media | 8.5% | |||
| Oil, Gas & Consumable Fuels | 8.5% | |||
| Healthcare-Services | 5.2% | |||
| Diversified Financial Services | 4.8% | |||
| Software | 4.2% | |||
| Commercial Services | 4.0% | |||
| Chemicals | 3.6% | |||
| Other | 46.0% | |||
| Cash & Equivalents — Net | 4.0% |
| Semiannual Report | | March 31, 2017 | 81 |
Table of Contents
Unaudited
AllianzGI High Yield Bond Fund (cont’d)
S&P Ratings* (as of March 31, 2017)
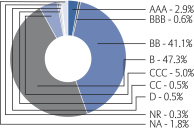
* As a percentage of total investments. Bond ratings refer to the underlying holdings of the Fund and are categorized from highest to lowest credit quality using ratings provided by S&P Global Ratings (“S&P”). S&P’s ratings have been selected for several reasons, including the portfolio managers’ usage of S&P ratings methodology among other credit quality information in managing the Fund, access to background information and other materials provided by S&P, as well as the Funds’ considerations of industry practice. The Fund also displays S&P credit ratings information in materials provided in client presentations. Previous shareholder reports for the Fund displayed bond ratings provided by Moody’s. See “Important Information” for more detail on the selection of S&P for the Fund’s ratings presentation. Bonds not rated by S&P and bonds that do not currently have a rating available are designated in the chart above as “NR” and “NA”, respectively.
| Shareholder Expense Example | Actual Performance | |||||||||||
| Class A | Class C | Class R | Class P | Institutional Class | Administrative Class | |||||||
| Beginning Account Value (10/1/16) | $1,000.00 | $1,000.00 | $1,000.00 | $1,000.00 | $1,000.00 | $1,000.00 | ||||||
| Ending Account Value (3/31/17) | $1,040.40 | $1,036.80 | $1,038.90 | $1,042.50 | $1,042.60 | $1,041.00 | ||||||
| Expenses Paid During Period | $5.09 | $8.58 | $7.17 | $3.51 | $3.26 | $4.38 | ||||||
| Hypothetical Performance | ||||||||||||
| (5% return before expenses) | ||||||||||||
| Class A | Class C | Class R | Class P | Institutional Class | Administrative Class | |||||||
| Beginning Account Value (10/1/16) | $1,000.00 | $1,000.00 | $1,000.00 | $1,000.00 | $1,000.00 | $1,000.00 | ||||||
| Ending Account Value (3/31/17) | $1,019.95 | $1,016.50 | $1,017.90 | $1,021.49 | $1,021.74 | $1,020.64 | ||||||
| Expenses Paid During Period | $5.04 | $8.50 | $7.09 | $3.48 | $3.23 | $4.33 | ||||||
For each class of the Fund, expenses are equal to the annualized expense ratio for the class (1.00% for Class A, 1.69% for Class C, 1.41% for Class R, 0.69% for Class P, 0.64% for Institutional Class and 0.86% for Administrative Class), multiplied by the average account value over the period, multiplied by 182/365.
| 82 | March 31, 2017 | | Semiannual Report |
Table of Contents
(THIS PAGE INTENTIONALLY LEFT BLANK)
| Semiannual Report | | March 31, 2017 | 83 |
Table of Contents
Unaudited
AllianzGI International Growth Fund
For the period of October 1, 2016 through March 31, 2017 as provided by Laura Villani, Product Specialist Associate, Equities.
Fund Insights
For the six-month period ended March 31, 2017, Class A shares at net asset value (“NAV”) of the AllianzGI International Growth Fund (the “Fund”) returned 0.92%, underperforming the MSCI ACWI ex USA Index (the “benchmark”), which returned 6.51% and underperforming the MSCI ACWI ex USA Growth Index , which returned 2.89%.
Market Overview
Global equities surged over the six-month period, with indices in the UK breaking previous record highs despite political uncertainty, while many other markets reached multi-month peaks. In general, developed equity markets outperformed emerging markets, with Japan leading the advance as a weaker yen lifted the prospects of the country’s exporters.
In terms of sectors, financials stocks delivered robust returns amid expectations that US Federal interest rates would rise faster than expected as a result of President Trump’s policies. Other growth-oriented sectors also performed well, including materials, industrials, consumer discretionary, and information technology. In contrast, energy lagged as oil prices failed to build on earlier gains, while traditional defensive sectors, such as consumer staples, telecoms and utilities, underperformed.
In economic terms, the period was characterized by strengthening growth and rising inflation. In December, the European Central Bank extended its bond-buying program until at least the end of 2017, but reduced the size of its monthly bond purchases. Meanwhile the Bank of England and Bank of Japan left monetary policy unchanged.
Portfolio Review
The International Growth Fund strategy maintains its strategy that takes a bottom-up approach to identifying structural growth, rather than chasing growth momentum. We believe that our focus on high quality businesses, displaying long term structural growth independent of the wider market, should shelter us to some extent from uncertainty in the markets.
During the period, the Fund saw negative contributions from both stock selection and sector allocation. While the overweight to the information technology sector certainly helped, this was outweighed by overweights to the consumer staples and health care sectors, which detracted from performance, along with the underweight to financials, which as previously mentioned, had a positive run. From a country perspective, stock selection in Switzerland and Canada contributed most positively, with Italy and Denmark detracting from performance. Both sector and country attributions are a result of the stock selection.
Restaurant Brands was the most supportive stock, with an active contribution of 41 basis points, followed by list of European stocks including Infineon, Richemont, ASML Holding and Kingspan. Meanwhile, Novo Nordisk, one of the Fund’s largest holdings and overweights, contributed -60 basis points to relative performance. Though health care stocks have had an especially difficult time recently with the continued uncertainty of the US health care system, we maintain our conviction in the stock.
Outlook
We take an increasingly constructive view on the European macro environment in particular, as an improvement in cyclical data, and a much awaited earnings recovery, overshadow the gradually subsiding political risk. Beyond Trump induced optimism, global markets are currently being supported by the continued loosening monetary conditions. China’s fiscal stimulus and a recovery of sales in wider Asia seen in the first quarter of 2017 was also positive. The most notable was the acceleration of growth in China to 6.9% over the recent quarter, which we believe could benefit many companies with exposure to China, providing further optimism.
Average Annual Total Return for the period ended March 31, 2017
| 6 Month* | 1 Year | Since Inception† | ||||||||||||
| AllianzGI International Growth Fund Class A | 0.92% | 9.05% | 5.04% | |||||||||||
| AllianzGI International Growth Fund Class A (adjusted) | –4.63% | 3.05% | 2.32% | ||||||||||
| AllianzGI International Growth Fund Institutional Class | 0.96% | 9.32% | 5.29% | ||||||||||
| MSCI ACWI ex USA Index | 6.51% | 13.13% | 2.69% | ||||||||||
| MSCI ACWI ex USA Growth Total Return | 2.89% | 9.63% | 3.07% | ||||||||||
| Lipper International Multi-Cap Growth Funds Average | 3.33% | 9.05% | 3.04% | |||||||||||
† The Fund began operations on February 2, 2015. Benchmark return comparisons began on the fund inception date. Lipper performance comparisons began on January 31, 2015.
* Cumulative returns
Performance quoted represents past performance and is no guarantee of future results. Current performance may be lower or higher than performance shown. For performance current to the most recent month-end, visit our website at us.allianzgi.com. Investment return and the principal value will fluctuate. Shares may be worth more or less than original cost when redeemed. The adjusted returns take into account the maximum initial sales charge of 5.50% on Class A Shares. Returns do not reflect deduction of taxes that a shareholder would pay on fund distributions or redemption of fund shares. See pages 133 and 134 for more information. The Fund’s gross expense ratios are 6.26% for Class A shares and 5.08% for Institutional Class shares. These ratios do not include an expense reduction, contractually guaranteed through at least March 31, 2018. The Fund’s expense ratios net of this reduction are 1.05% for Class A shares and 0.80% for Institutional Class shares. Expense ratio information is as of the Fund’s current prospectus dated February 1, 2017, as revised April 10, 2017.
| 84 | March 31, 2017 | | Semiannual Report |
Table of Contents
Unaudited
AllianzGI International Growth Fund (cont’d)
Cumulative Returns Through March 31, 2017
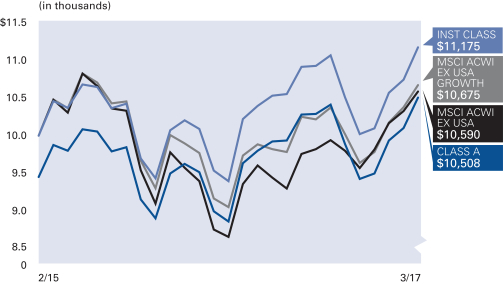
Country Allocation (as of March 31, 2017)
| United Kingdom | 13.5% | |||
| Germany | 11.2% | |||
| Canada | 9.7% | |||
| Sweden | 8.3% | |||
| Japan | 8.0% | |||
| Denmark | 7.7% | |||
| China | 7.4% | |||
| France | 5.0% | |||
| Other | 28.0% | |||
| Cash & Equivalents — Net | 1.2% |
| Shareholder Expense Example | Actual Performance | |||
| Class A | Institutional Class | |||
| Beginning Account Value (10/1/16) | $1,000.00 | $1,000.00 | ||
| Ending Account Value (3/31/17) | $1,009.20 | $1,009.60 | ||
| Expenses Paid During Period | $6.01 | $4.76 | ||
| Hypothetical Performance | ||||
| (5% return before expenses) | ||||
| Class A | Institutional Class | |||
| Beginning Account Value (10/1/16) | $1,000.00 | $1,000.00 | ||
| Ending Account Value (3/31/17) | $1,018.95 | $1,020.19 | ||
| Expenses Paid During Period | $6.04 | $4.78 | ||
For each class of the Fund, expenses (net of fee waiver and reimbursement, if any) are equal to the annualized expense ratio for the class (1.20% for Class A and 0.95% for Institutional Class), multiplied by the average account value over the period, multiplied by 182/365.
| Semiannual Report | | March 31, 2017 | 85 |
Table of Contents
Unaudited
AllianzGI International Small-Cap Fund
For the period of October 1, 2016 through March 31, 2017, as provided by Alexandra Russo, Product Specialist.
Fund Insights
For the six-month period ended March 31, 2017, Class A shares at net asset value (“NAV”) of the AllianzGI International Small-Cap Fund (the “Fund”) returned 0.71%, underperforming the MSCI World ex USA Small Cap Index (the “benchmark”), which returned 4.66%.
Market Overview
Global equities surged over the six-month period, with indices in the US and UK breaking previous record highs while many other markets reached multi-month peaks. Donald Trump’s surprise victory in the US presidential election raised hopes that his pro-growth stance would boost company profits, outweighing fears about greater protectionism. In general, developed equity markets outperformed emerging markets, with Japan leading the advance as a weaker yen lifted the prospects of the country’s exporters. Small caps were relatively in line with the global market.
In terms of sectors, financials stocks delivered robust returns amid expectations that US Federal interest rates would rise faster than expected as a result of President Trump’s policies. Other growth-oriented sectors also performed well, including materials, industrials and consumer discretionary companies, as did information technology. In contrast, energy lagged as oil prices failed to build on earlier gains, while traditional defensive sectors, such as consumer staples, telecommunications and utilities, underperformed, as did the newly-created real estate sector.
The period was characterized by gradually improving economic growth and rising inflation. The US Federal Reserve (the “Fed”) raised US interest rates in December 2016 and March 2017 with expectations for at least two additional rate hikes in 2017. In contrast, in December the European Central Bank (ECB) extended its bond-buying program until at least the end of 2017, but reduced the size of its monthly bond purchases. Subsequently, rising inflation in the first quarter of 2017 led to speculation that the ECB would need to wind down these measures, with President Mario Draghi noting that battle against deflation had now been won. The Bank of England and Bank of Japan left monetary policy unchanged.
Portfolio Review
Stock selection drove underperformance during the period while sector allocation was a modest contributor during the reporting period. In terms of sleeve performance, the Asia ex Japan sleeve slightly outperformed, where the Japanese and European portfolios lagged their relative regional benchmarks.
An overweight in information technology and an underweight to Real Estate helped performance as technology stocks led the first quarter rally and real estate names were hurt by rising interest rates. In contrast underweights to financials, healthcare and materials detracted from relative returns.
On an individual stock basis, the strongest contributors to relative returns included Ulvac, ams and Daifuku Co., while positions in Kyudenko Corp., Huhtamaki and Ambu detracted.
Outlook
Overall, we have a cyclical growth bias and believe in global economic acceleration. We have found our best ideas in industrials, technology and financials, and are underweight to neutral in the more defensive sectors such as consumer staples.
Currently, Central Banks are beginning to raise rates, coming off of negative to very low interest rates, as well as reduce Quantitative easing. Economic acceleration is underway and inflation is beginning to rise. We are looking to benefit from rising yields by being overweight financials and underweight real estate. The financials sector has been so unloved for so long that we are finding many businesses with improving profits at attractive valuations. We hope to also benefit from the potential of decreasing regulation in the financial sector, regulations that have been in place since the 2008 financial crisis.
We remain underweight in the UK due to our belief that rising inflation, caused by the currency depreciation, will slow consumer spending and so slow the economy as well as cause margin pressure to those companies that cannot pass the costs onto the consumer.
We generally intend to be overweight the disruptors while being underweight the disrupted (high street retailers, for example). This is classic stock picking of finding the winners and avoiding the value traps. We believe the disruptors tend to be spread across the market sectors, not just in technology. For the disrupted, the basic question is “If the internet had been invented first, would this business exist today? ” If the answer is “no” then perhaps that is all you need to know.
| 86 | March 31, 2017 | | Semiannual Report |
Table of Contents
Unaudited
AllianzGI International Small-Cap Fund (cont’d)
Average Annual Total Return for the period ended March 31, 2017
| 6 Month* | 1 Year | 5 Year | 10 Year | Since Inception† | ||||||||||||||||||
| AllianzGI International Small-Cap Fund Class A | 0.71% | 4.77% | 7.80% | 4.08% | 11.35% | |||||||||||||||||
| AllianzGI International Small-Cap Fund Class A (adjusted) | –4.83% | –0.99% | 6.59% | 3.49% | 11.02% | ||||||||||||||||
| AllianzGI International Small-Cap Fund Class C | 0.33% | 3.99% | 7.00% | 3.30% | 10.52% | |||||||||||||||||
| AllianzGI International Small-Cap Fund Class C (adjusted) | –0.67% | 2.99% | 7.00% | 3.30% | 10.52% | ||||||||||||||||
| AllianzGI International Small-Cap Fund Class R | 0.58% | 4.51% | 7.53% | 3.82% | 11.07% | ||||||||||||||||
| AllianzGI International Small-Cap Fund Class P | 0.80% | 4.95% | 7.97% | 4.30% | 11.66% | ||||||||||||||||
| AllianzGI International Small-Cap Fund Institutional Class | 0.83% | 5.01% | 8.05% | 4.41% | 11.76% | ||||||||||||||||
| AllianzGI International Small-Cap Fund Class R6 | 0.86% | 5.12% | 8.16% | 4.52% | 11.87% | ||||||||||||||||
| MSCI World ex USA Small Cap Index | 4.66% | 11.58% | 7.78% | 2.72% | 7.59% | ||||||||||||||||
| MSCI EAFE Small Cap Index | 4.89% | 10.99% | 9.20% | 3.03% | 7.69% | ||||||||||||||||
| Lipper International Small/Mid-Cap Growth Funds Average | 3.17% | 8.63% | 7.66% | 3.48% | 8.37% | |||||||||||||||||
† The Fund began operations on December 31, 1997. Benchmark return comparisons began on the fund inception date. Lipper performance comparisons began on December 31, 1997.
* Cumulative returns.
Performance quoted represents past performance and is no guarantee of future results. Current performance may be lower or higher than performance shown. For performance current to the most recent month-end, visit our website at us.allianzgi.com. Investment return and the principal value will fluctuate. Shares may be worth more or less than original cost when redeemed. The adjusted returns take into account the maximum initial sales charge of 5.50% on Class A shares and the contingent deferred sales charge (CDSC) of 1% on Class C shares, which may apply to shares redeemed during the first year of ownership. Returns do not reflect deduction of taxes that a shareholder would pay on fund distributions or redemption of fund shares. See pages 133 and 134 for more information. The Fund’s gross expense ratios are 1.68% for Class A shares, 2.54% for Class C shares, 2.17% for Class R shares, 1.44% for Class P shares, 1.48% for Institutional Class shares and 1.56% for Class R6 shares. These ratios do not include an expense reduction, contractually guaranteed through at least March 31, 2018. The Fund’s expense ratios net of this reduction are 1.25% for Class A shares, 2.08% for Class C shares, 1.59% for Class R shares, 1.10% for Class P shares, 1.07% for Institutional Class shares and 1.00% for Class R6 shares. Expense ratio information is as of the Fund’s current prospectus dated February 1, 2017, as revised April 10, 2017.
Cumulative Returns Through March 31, 2017
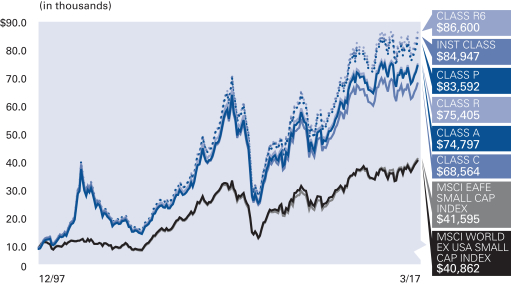
Country Allocation (as of March 31, 2017)
| Japan | 30.4% | |||
| Germany | 9.5% | |||
| United Kingdom | 8.9% | |||
| Sweden | 7.1% | |||
| France | 5.9% | |||
| Switzerland | 5.4% | |||
| Netherlands | 5.1% | |||
| Australia | 4.7% | |||
| Other | 19.2% | |||
| Cash & Equivalents — Net | 3.8% |
| Semiannual Report | | March 31, 2017 | 87 |
Table of Contents
Unaudited
AllianzGI International Small-Cap Fund (cont’d)
| Shareholder Expense Example | Actual Performance | |||||||||||
| Class A | Class C | Class R | Class P | Institutional Class | Class R6 | |||||||
| Beginning Account Value (10/1/16) | $1,000.00 | $1,000.00 | $1,000.00 | $1,000.00 | $1,000.00 | $1,000.00 | ||||||
| Ending Account Value (3/31/17) | $1,007.10 | $1,003.30 | $1,005.80 | $1,008.00 | $1,008.30 | $1,008.60 | ||||||
| Expenses Paid During Period | $7.16 | $10.94 | $8.50 | $6.31 | $6.01 | $5.56 | ||||||
| Hypothetical Performance | ||||||||||||
| (5% return before expenses) | ||||||||||||
| Class A | Class C | Class R | Class P | Institutional Class | Class R6 | |||||||
| Beginning Account Value (10/1/16) | $1,000.00 | $1,000.00 | $1,000.00 | $1,000.00 | $1,000.00 | $1,000.00 | ||||||
| Ending Account Value (3/31/17) | $1,017.80 | $1,014.01 | $1,016.45 | $1,018.65 | $1,018.95 | $1,019.40 | ||||||
| Expenses Paid During Period | $7.19 | $11.00 | $8.55 | $6.34 | $6.04 | $5.59 | ||||||
For each class of the Fund, expenses (net of fee waiver and reimbursement, if any) are equal to the annualized expense ratio for the class (1.43% for Class A, 2.19% for Class C, 1.70% for Class R, 1.26% for Class P, 1.20% for Institutional Class and 1.11% for Class R6), multiplied by the average account value over the period, multiplied by 182/365.
| 88 | March 31, 2017 | | Semiannual Report |
Table of Contents
(THIS PAGE INTENTIONALLY LEFT BLANK)
| Semiannual Report | | March 31, 2017 | 89 |
Table of Contents
Unaudited
AllianzGI Micro Cap Fund
For the period of October 1, 2016 through March 31, 2017, as provided by Robert Marren, Portfolio Manager.
Fund Insights
For the six-month period ended March 31, 2017, Class A Shares at net asset value (“NAV”) of the AllianzGI Micro Cap Fund (the “Fund”) returned 6.53%, outperforming the Russell Microcap Growth Index (the “benchmark”), which returned 4.13%.
Market Overview
US risk assets surged in the fourth quarter with equities posting some of the most robust gains. Although smaller-cap stocks were a beneficiary of this appetite for risk, the stock market rally was broad based with the S&P 500, Dow Jones Industrial Average, Russell 2000 and Nasdaq Composite Indexes recording new all-time highs in the period. Initially, equities declined during October 2016, but losses were quickly recovered after election results triggered a relentless rally that lasted into year-end.
This upward trend persisted through the remainder of the reporting period due to elevated sentiment, which in part, centered on continued optimism around President Trump’s policies and pro-growth agenda. Investor conviction was tested with the withdrawal of the health care bill and a decline in oil prices, but these events did little to shake their resolve as markets recovered into period end.
US equity markets responded favorably to the US Federal Reserve’s (the “Fed”) commentary and their decision to raise the Fed funds rate in December 2016 and again in March 2017. Outside of the US, global central banks maintained aggressive measures to stimulate their respective economies.
Corporate profits rose year-over-year the end of December 2016, and fourth-quarter fundamentals for most stocks displayed sustained improvement.
Finally, positive economic reports outnumbered weaker releases, indicating ongoing growth and supporting the market’s advance.
Against this backdrop, the Russell Microcap Index returned 10.47% and underperformed the Russell 2000 Index, which returned 11.52%. Within the microcap universe, growth-oriented stocks trailed value-oriented stocks. Specific to the benchmark, sector performance was predominantly positive. Among the more heavily weighted sectors, consumer discretionary, industrials and information technology were among the strongest-performing. In contrast, health care was the only sector to close with a loss, while the energy sector ended higher, underperforming the overall market.
Portfolio Review
The Fund outperformed its benchmark over the reporting period. From an attribution perspective, security selection drove relative outperformance, whereas asset weighting effects had a positive, but negligible impact. For example, stock picking was beneficial in health care, financials, materials and consumer staples among other sectors. Conversely, security selection was a source of weakness primarily in the information technology sector. Separately, an overweight in financials and underweight in health care helped relative performance, but the benefit was partially offset by underweights in utilities and real estate and an overweight in energy.
Outlook
The US economy is expected to expand at a moderate pace in 2017 and we believe the steepness of the Treasury yield curve confirms this notion. Outside of positive economic trends, we believe President Trump’s agenda could spur even faster economic growth. After bottoming in the second quarter, corporate profits accelerated into year-end, and based on bottom-up estimates, we predict they are poised to trend higher in 2017. Additionally, we believe the potential for decreased regulation, positive tax reform and increased fiscal spending could create what we expect to be the most favorable backdrop for corporate earnings in years. US monetary policy continues to be modestly accommodative with the Fed expected to take a gradual, measured approach toward adjustments. The Federal Open Market Committee is projecting two more interest rate hikes in 2017, signaling confidence in the US economy’s ability to grow.
| 90 | March 31, 2017 | | Semiannual Report |
Table of Contents
Unaudited
AllianzGI Micro Cap Fund (cont’d)
Average Annual Total Return for the period ended March 31, 2017
| 6 Month* | 1 Year | 5 Year | 10 Year | Since Inception† | ||||||||||||||||||
| AllianzGI Micro Cap Fund Class A | 6.53% | 24.83% | 11.93% | 7.36% | 11.17% | |||||||||||||||||
| AllianzGI Micro Cap Fund Class A (adjusted) | 0.67% | 17.97% | 10.67% | 6.76% | 10.88% | ||||||||||||||||
| AllianzGI Micro Cap Fund Class P | 6.49% | 24.89% | 12.06% | 7.54% | 11.39% | ||||||||||||||||
| AllianzGI Micro Cap Fund Institutional Class | 6.53% | 24.94% | 12.11% | 7.61% | 11.49% | ||||||||||||||||
| Russell Microcap Growth Index | 4.13% | 20.24% | 10.72% | 5.51% | 6.54% | ||||||||||||||||
| Lipper Small-Cap Growth Funds Average | 8.56% | 22.09% | 10.49% | 7.24% | 8.92% | |||||||||||||||||
† The Fund began operations on July 12, 1995. Benchmark return comparisons began on the fund inception date. Lipper performance comparisons began on June 30, 1995.
* Cumulative returns.
Performance quoted represents past performance and is no guarantee of future results. Current performance may be lower or higher than performance shown. For performance current to the most recent month-end, visit our website at us.allianzgi.com. Investment return and the principal value will fluctuate. Shares may be worth more or less than original cost when redeemed. The adjusted returns take into account the maximum initial sales charge of 5.50% on Class A shares. Returns do not reflect deduction of taxes that a shareholder would pay on fund distributions or redemption of fund shares. See pages 133 and 134 for more information. The Fund’s gross expense ratios are 2.16% for Class A shares, 1.91% for Class P shares and 1.85% for Institutional Class shares. This ratio does not include an expense reduction, contractually guaranteed through at least January 31, 2018. The Fund’s expense ratios net of this reduction are 1.62% for Class A shares, 1.54% for Class P shares and 1.54% for Institutional Class shares. Expense ratio information is as of the Fund’s current prospectus dated February 1, 2017, as revised April 10, 2017.
Cumulative Returns Through March 31, 2017
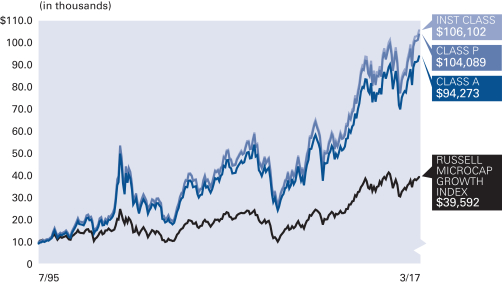
Industry Allocation (as of March 31, 2017)
| Biotechnology | 10.7% | |||
| Health Care Equipment & Supplies | 6.7% | |||
| Banks | 6.4% | |||
| Semiconductors & Semiconductor Equipment | 6.4% | |||
| Pharmaceuticals | 5.9% | |||
| Machinery | 5.7% | |||
| Internet Software & Services | 5.0% | |||
| Health Care Providers & Services | 3.7% | |||
| Other | 46.6% | |||
| Cash & Equivalents — Net | 2.9% |
| Semiannual Report | | March 31, 2017 | 91 |
Table of Contents
Unaudited
AllianzGI Micro Cap Fund (cont’d)
| Shareholder Expense Example | Actual Performance | |||||
| Class A | Class P | Institutional Class | ||||
| Beginning Account Value (10/1/16) | $1,000.00 | $1,000.00 | $1,000.00 | |||
| Ending Account Value (3/31/17) | $1,065.30 | $1,064.90 | $1,065.30 | |||
| Expenses Paid During Period | $8.34 | $7.93 | $7.93 | |||
| Hypothetical Performance | ||||||
| (5% return before expenses) | ||||||
| Class A | Class P | Institutional Class | ||||
| Beginning Account Value (10/1/16) | $1,000.00 | $1,000.00 | $1,000.00 | |||
| Ending Account Value (3/31/17) | $1,016.85 | $1,017.25 | $1,017.25 | |||
| Expenses Paid During Period | $8.15 | $7.75 | $7.75 | |||
For each class of the Fund, expenses (net of fee waiver and reimbursement, if any) are equal to the annualized expense ratio for the class (1.62% for Class A, 1.54% for Class P and 1.54% for Institutional Class), multiplied by the average account value over the period, multiplied by 182/365.
| 92 | March 31, 2017 | | Semiannual Report |
Table of Contents
(THIS PAGE INTENTIONALLY LEFT BLANK)
| Semiannual Report | | March 31, 2017 | 93 |
Table of Contents
Unaudited
AllianzGI Multi-Asset Real Return Fund
For the period of October 1, 2016 through March 31, 2017, as provided by the Multi-Asset US Group.
Fund Insights
For the six-month period ended March 31, 2017, Class A shares at net asset value (“NAV”) of the AllianzGI Multi-Asset Real Return Fund (the “Fund”) returned -2.40%, underperforming the Bloomberg Barclays US Government Inflation-Linked Bond Index (the “benchmark”), which returned -1.31%.
Market Overview
For the six month period ending March 31, 2017, markets were dominated by the surprising outcome of the US presidential election relative to prevailing market expectations. Trump’s victory ushered in a period of uncertainty regarding the magnitude and timing of future policy changes, while at the same time, it seemed to instill general optimism in market participants. The theme of reflation against the backdrop of supportive fiscal policy and stronger consumer demand, percolated through markets for the period.
Throughout the first quarter, risk assets continued to outperform in a low volatility environment despite significant policy setbacks, including the failure to pass healthcare reform and the continued uncertainty of future US domestic and foreign policy. Moreover, global risk assets rallied in the context of the US Federal Reserve (the “Fed”) raising interest rate by 50 basis points in the period. Tighter Fed policy signaled a new regime of tighter global monetary policy in the future (even though the European Central Bank and Bank of Japan reiterated their current commitments to accommodative policies).
During the period, US stocks rallied in the aftermath of the election and continued to gain throughout the first quarter, with US Small Cap stocks in particular leading the way: The Russell 2000 Index gained 11.5% and the Russell 2000 Value Index gained 13.9%, outpacing larger stocks, which gained 10.1%, as measured by the Russell 1000 Index.
Global growth remained healthy as fundamental macro-economic data continued to either match or outperform economists’ expectations. During the first quarter, the gap between hard data and soft data, as measured by surveys of purchasing managers and consumers widened substantially, revealing that much of what underpinned the rally in risk assets was associated with future expectations (as opposed to the current economic environment alone).
Optimistic assessments of global growth affected both developed and emerging markets. In broad terms, the MSCI ACWI returned 8.2%, only slightly outpacing Emerging Markets, which returned 6.8%. Better economic data helped boost European equities for the period, despite persistent uncertainties about key elections in 2017 (in the Netherlands, France and Germany). For the period, the best performing stock markets were Spain and Italy, which returned 17.3% and 17.6% respectively (MSCI country indexes in USD).
Global Bonds declined for the period with the Bloomberg Barclays Global Aggregate Bond Index losing 5.4%. The long end of the US curve had the worst performance as long Treasuries (20+ years) lost 10.9% in the period due, in part, to a sharp initial increase in inflation expectations and a spike in yields. While the 10-year yield on US Treasuries initially increased by about 75 basis points from the election through mid-December, it remained relatively range bound for most of the first quarter, making US Treasuries one of the worst performing asset classes for the period. The Bloomberg Barclays US Aggregate Bond Index lost 2.2% for the period. Within fixed income, US High Yield was the best performer. Globally, Emerging Market hard currency debt outperformed developed market government bonds. Commodities, most notably precious metals and gold, were among the worst performing asset classes in the period.
Portfolio Review:
Selection effects in commodity equities largely explain underperformance over the six-month period. Moderate negative allocation effects in commodities and real estate investment trusts (“REITs”) also detracted, as the portfolio was overweight commodities and underweight REITs for much of the period. This was partially offset by positive selection effects in TIPs, commodities, and positive allocation effects in commodity equities. Exposure to opportunistic assets including US equities and short duration high yield also contributed. Within opportunistic, allocations to emerging markets equities and debt detracted from performance.
At the end of the period, the portfolio was underweight TIPs, Commodity Equities, Commodities and REITs. Additionally, the portfolio had exposure to opportunistic assets, including emerging market bonds and equities, US high yield bonds and US equities. The portfolio had a long-USD versus EUR position and had a negative position in short-term Treasuries.
Outlook
Looking ahead, we expect that global inflation will continue to steadily rise, partly attributable to firmer commodity prices and narrowing output gaps throughout developed markets. Emerging markets are expected to continue to post solid growth in the near term, providing opportunities for much needed structural reforms that will ultimately contribute to longer term stability. We predict the global economy will likely continue to benefit from debt-financed growth for the foreseeable future on the back of leveraged households and businesses. We expect monetary policy to continue to tighten in the US, albeit at a slow and measured pace, while global central bank liquidity will remain abundant at least through 2018.
However, we believe that risks abound, including increased political risks, most notably in Europe in light of the busy election calendar but also in key emerging markets. In addition, we believe that charged rhetoric about protectionism and zero-sum interactions threaten to undermine longstanding commitments to global trade in goods and financial assets. Finally, we believe risks related to inflated expectations on the part of market participants as well as market complacency may potentially intensify should stocks reverse their recent rally.
As of the end of the period, we remain overweight risk assets and underweight most sovereign bonds, with the belief that sovereigns are nearing the end of a secular bull market. We believe the “Reflation Trade” persists for now as long as the possibility of US fiscal stimulus remains and cyclical data continue to show signs of improvement. We maintain a positive outlook on emerging markets, while recognizing that an unexpected slowdown in the US or other developed markets would have real and immediate implication for emerging markets broadly. We remain vigilant in this low volatility environment and are focused on monitoring cyclical data and relative valuations across asset classes.
| 94 | March 31, 2017 | | Semiannual Report |
Table of Contents
Unaudited
AllianzGI Multi-Asset Real Return Fund (cont’d)
Average Annual Total Return for the period ended March 31, 2017
| 6 Month** | 1 Year | Since Inception† | ||||||||||||
| AllianzGI Multi-Asset Real Return Fund Class A | –2.40% | 5.63% | –1.44% | |||||||||||
| AllianzGI Multi-Asset Real Return Fund Class A (adjusted) | –7.77% | –0.18% | –2.74% | ||||||||||
| AllianzGI Multi-Asset Real Return Fund Class C | –2.74% | 4.83% | –2.16% | |||||||||||
| AllianzGI Multi-Asset Real Return Fund Class C (adjusted) | –3.71% | 3.83% | –2.16% | ||||||||||
| AllianzGI Multi-Asset Real Return Fund Class P | –2.27% | 5.89% | –1.28% | ||||||||||
| AllianzGI Multi-Asset Real Return Fund Institutional Class | –2.26% | 5.96% | –1.19% | ||||||||||
| Bloomberg Barclays US Government Inflation-Linked Bond Index | –1.31% | 1.54% | –0.28% | ||||||||||
| Custom Real Asset Benchmark* | 0.99% | 7.53% | –0.52% | |||||||||||
| Lipper Alternative Global Macro Funds Average | 2.06% | 6.41% | 1.84% | |||||||||||
† The Fund began operations on December 17, 2012. Benchmark return comparisons began on the fund inception date. Lipper performance comparisons began on December 31, 2012.
* The Custom Real Asset Benchmark is comprised of 25% Dow Jones UBS Commodity Total Return Index, 25% MSCI World Real Estate Index, 25% Bloomberg Barclays US Government Inflation-Linked Bond Index, 6.25% DAX Global Agribusiness Index, 7.5% MSCI World Energy Index, 6.25% MSCI World Materials Index and 5% MSCI ACWI Industrials (equal-weighted) Index.
** Cumulative returns.
Performance quoted represents past performance and is no guarantee of future results. Current performance may be lower or higher than performance shown. For performance current to the most recent month-end, visit our website at us.allianzgi.com. Investment return and the principal value will fluctuate. Shares may be worth more or less than original cost when redeemed. The adjusted returns take into account the maximum initial sales charge of 5.50% on Class A shares and the contingent deferred sales charge (CDSC) of 1% on Class C shares, which may apply to shares redeemed during the first year of ownership. Returns do not reflect deduction of taxes that a shareholder would pay on fund distributions or redemption of fund shares. See pages 133 and 134 for more information. The Fund’s gross expense ratios are 8.55% for Class A shares, 8.89% for Class C shares, 7.84% for Class P shares and 7.79% for Institutional Class shares. These ratios do not include an expense reduction, contractually guaranteed through at least March 31, 2018. The Fund’s expense ratios net of this reduction are 1.21% for Class A shares, 1.96% for Class C shares, 1.06% for Class P shares and 0.96% for Institutional Class shares. Expense ratio information is as of the Fund’s current prospectus dated February 1, 2017, as revised April 10, 2017.
Cumulative Returns Through March 31, 2017
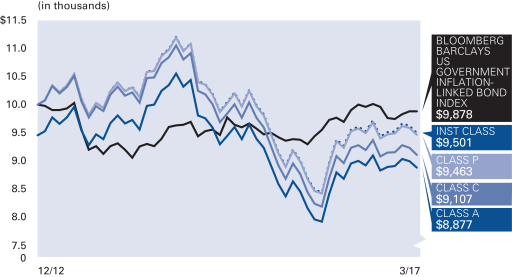
Asset Allocation (as of March 31, 2017)
| Mutual Funds | 49.4% | |||
| Exchange-Traded Funds | 19.5% | |||
| Common Stock | 15.4% | |||
| Cash & Equivalents — Net | 15.7% |
| Semiannual Report | | March 31, 2017 | 95 |
Table of Contents
Unaudited
AllianzGI Multi-Asset Real Return Fund (cont’d)
| Shareholder Expense Example | Actual Performance | |||||||
| Class A | Class C | Class P | Institutional Class | |||||
| Beginning Account Value (10/1/16) | $1,000.00 | $1,000.00 | $1,000.00 | $1,000.00 | ||||
| Ending Account Value (3/31/17) | $976.00 | $972.60 | $977.30 | $977.40 | ||||
| Expenses Paid During Period | $4.19 | $7.87 | $3.45 | $2.96 | ||||
| Hypothetical Performance | ||||||||
| (5% return before expenses) | ||||||||
| Class A | Class C | Class P | Institutional Class | |||||
| Beginning Account Value (10/1/16) | $1,000.00 | $1,000.00 | $1,000.00 | $1,000.00 | ||||
| Ending Account Value (3/31/17) | $1,020.69 | $1,016.95 | $1,021.44 | $1,021.94 | ||||
| Expenses Paid During Period | $4.28 | $8.05 | $3.53 | $3.02 | ||||
For each class of the Fund, expenses (net of fee waiver and reimbursement, if any) are equal to the annualized expense ratio for the class (0.85% for Class A, 1.60% for Class C, 0.70% for Class P and 0.60% for Institutional Class), multiplied by the average account value over the period, multiplied by 182/365. These expenses do not include the expenses of the investment companies in which the Fund invests, which are indirectly borne by Fund shareholders.
| 96 | March 31, 2017 | | Semiannual Report |
Table of Contents
(THIS PAGE INTENTIONALLY LEFT BLANK)
| Semiannual Report | | March 31, 2017 | 97 |
Table of Contents
Unaudited
AllianzGI NFJ Emerging Markets Value Fund
For the period of October 1, 2016 through March 31, 2017, as provided by Krysta Hill, Product Specialist Associate.
Fund Insights
For the six-month period ended March 31, 2017, Class A shares at net asset value (“NAV”) of the AllianzGI NFJ Emerging Markets Value Fund (the “Fund”) returned 7.80%, outperforming the MSCI Emerging Markets Index (the “benchmark”), which returned 6.80%.
Market Overview
Emerging market equities rallied over the six-month period, but lagged their more developed counterparts. This was mainly due to weak returns in the final quarter of 2016, when the strength of the US dollar and concerns over more protectionist policies weighed on sentiment. At a regional level, Latin American markets performed the best, followed by Eastern Europe and then Asia. While Brazilian equities posted moderate returns in the last three months of 2016, they surged in the first quarter of 2017, buoyed by two 75 basis point cuts in interest rates. Mexico also performed poorly in the closing months of 2016, being one of the main casualties of Trump’s surprise victory. However, it recovered strongly in early 2017, with the stock market hitting an all-time high as investors reacted positively to central bank measures to boost the peso and suppress inflation. Performance in Eastern Europe was lifted by robust returns from Poland, Turkey and Hungary, each of which delivered double-digit gains, helped by signs of economic improvement in Western Europe. Russian equities were among the major beneficiaries of the Trump victory, but gave back some of their gains in the first quarter of 2017 as oil prices weakened. It was a rollercoaster ride for Indian shares, which fell sharply in November after the government’s unexpected decision to withdraw 90% of its currency in circulation in an effort to tackle tax evasion. However, the market experienced a stronger start to 2017, helped by the news that India’s GDP had expanded at a better-than-expected annual rate of 7% in the final quarter of 2016. In terms of sectors, materials and energy stocks in the MSCI Emerging Markets Index climbed into the double digits, followed by robust gains in information technology and financials. In contrast, traditionally defensive sectors, such as health care, consumer staples, real estate and telecoms, underperformed.
Portfolio Review
The Fund’s relative outperformance versus the benchmark index was driven by robust stock selection. Country allocations had a moderately positive impact on relative performance while sector allocations modestly detracted during the trailing six-month period.
In terms of stock selection, Fund holdings in the consumer discretionary, information technology, energy and health care sectors were the largest contributors to performance. The Fund realized negative selection effects in just one sector—materials—over the reporting period.
From a sector allocation perspective, underweight positions in the consumer staples and telecom services sectors boosted relative performance results. Conversely, overweight exposures across the consumer discretionary and real estate sectors detracted from relative performance.
Selection by country was positive, particularly across China, India, Indonesia and Taiwan. In contract, holdings in South Korea and Mexico muted Fund performance during the reporting period.
Country allocation contributed to results, largely due to an overweight in Egypt and underweight in South Africa. This was somewhat offset by overweight positions across Hong Kong and Cambodia.
Sector and country weight deviations are a result of NFJ’s bottom-up investment process. On average during the reporting period, the Fund’s largest overweights relative to the benchmark index were in the utilities and consumer discretionary sectors. In contrast, the largest relative underweights were in the information technology and financials sectors.
Outlook
Emerging market equities soared 16.6% in the first 11 months of 2016, before pausing to examine the repercussions of a Donald Trump presidency. Thus far, many of the US President’s agenda items—tax and regulatory reform, infrastructure spending—paired with two recent interest rate hikes by the US Federal Reserve and the expectation of further increases in 2017, have seen US Treasury yields spike and the US dollar strengthen. Concerns that these structural forces may make the carry trade less compelling have yet to negatively impact equity returns.
As emerging markets investors look to juggle the consequences from today’s political machinations, better-than-expected GDP growth in China has somewhat ameliorated concerns for a ‘hard landing’ for the world’s second largest economy. China’s economy expanded 6.7% in 2016 overall, and 6.8% in the fourth quarter of 2016, boosted in part by public investment in infrastructure and a rise in bank lending. And while China may not always serve as the growth engine of tomorrow, it is worth noting that emerging countries have, in the past, often outperformed during periods of robust US growth. Further, should the Trump administration succeed in building out US infrastructure, we predict these efforts could spur demand for commodities, strengthen the standing of low cost producers of raw materials, and boost the prospects of many commodity-fueled emerging economies.
At NFJ, we target both attractively-valued stocks and dividend-paying companies to attempt to create portfolios of higher-quality equities that can help position investors for longer term outperformance and for downside protection during market drawdowns. We believe a focus on long term fundamental strength may benefit risk-on investors should today’s uncertainties fade amid favorable macroeconomic and political fallouts. Conversely, should risk become reality, causing earnings expectations—and thereby share prices—to appear stretched, we believe that managers focusing on higher-quality, dividend paying names offering downside protection may be most beneficial for clients. At NFJ, we expect our deep value, dividend-oriented process to strike this delicate balance for our investors.
| 98 | March 31, 2017 | | Semiannual Report |
Table of Contents
Unaudited
AllianzGI NFJ Emerging Markets Value Fund (cont’d)
Average Annual Total Return for the period ended March 31, 2017
| 6 Month* | 1 Year | Since Inception† | ||||||||||||
| AllianzGI NFJ Emerging Markets Value Fund Class A | 7.80% | 22.85% | 3.83% | |||||||||||
| AllianzGI NFJ Emerging Markets Value Fund Class A (adjusted) | 1.87% | 16.09% | 2.46% | ||||||||||
| AllianzGI NFJ Emerging Markets Value Fund Class C | 7.35% | 21.89% | 3.04% | |||||||||||
| AllianzGI NFJ Emerging Markets Value Fund Class C (adjusted) | 6.35% | 20.89% | 3.04% | ||||||||||
| AllianzGI NFJ Emerging Markets Value Fund Class P | 7.88% | 23.07% | 4.00% | ||||||||||
| AllianzGI NFJ Emerging Markets Value Fund Institutional Class | 7.89% | 23.14% | 4.08% | ||||||||||
| MSCI Emerging Markets Index | 6.80% | 17.21% | 0.32% | ||||||||||
| Lipper Emerging Markets Funds Average | 5.66% | 16.23% | 0.32% | |||||||||||
† The Fund began operations on December 18, 2012. Benchmark return comparisons began on the fund inception date. Lipper performance comparisons began on December 31, 2012.
* Cumulative returns
Performance quoted represents past performance and is no guarantee of future results. Current performance may be lower or higher than performance shown. For performance current to the most recent month-end, visit our website at us.allianzgi.com. Investment return and the principal value will fluctuate. Shares may be worth more or less than original cost when redeemed. The adjusted returns take into account the maximum initial sales charge of 5.50% on Class A shares and the contingent deferred sales charge (CDSC) of 1% on Class C shares, which may apply to shares redeemed during the first year of ownership. Returns do not reflect deduction of taxes that a shareholder would pay on fund distributions or redemption of fund shares. See pages 133 and 134 for more information. The Fund’s gross expense ratios are 7.79% for Class A shares, 7.96% for Class C shares, 7.42% for Class P shares and 6.93% for Institutional Class shares. These ratios do not include an expense reduction, contractually guaranteed through at least March 31, 2018. The Fund’s expense ratios net of this reduction are 1.14% for Class A shares, 1.89% for Class C shares, 0.98% for Class P shares and 0.89% for Institutional Class shares. Expense ratio information is as of the Fund’s current prospectus dated February 1, 2017, as revised April 10, 2017.
Cumulative Returns Through March 31, 2017
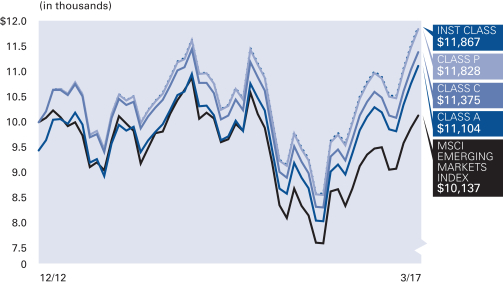
Country Allocation (as of March 31, 2017)
| China | 24.6% | |||
| Taiwan | 13.7% | |||
| Korea (Republic of) | 12.5% | |||
| India | 9.7% | |||
| Brazil | 6.3% | |||
| South Africa | 4.2% | |||
| Mexico | 3.6% | |||
| Malaysia | 3.3% | |||
| Other | 14.5% | |||
| Cash & Equivalents — Net | 7.6% |
| Semiannual Report | | March 31, 2017 | 99 |
Table of Contents
Unaudited
AllianzGI NFJ Emerging Markets Value Fund (cont’d)
| Shareholder Expense Example | Actual Performance | |||||||
| Class A | Class C | Class P | Institutional Class | |||||
| Beginning Account Value (10/1/16) | $1,000.00 | $1,000.00 | $1,000.00 | $1,000.00 | ||||
| Ending Account Value (3/31/17) | $1,078.00 | $1,073.50 | $1,078.80 | $1,078.90 | ||||
| Expenses Paid During Period | $7.15 | $10.86 | $6.17 | $5.75 | ||||
| Hypothetical Performance | ||||||||
| (5% return before expenses) | ||||||||
| Class A | Class C | Class P | Institutional Class | |||||
| Beginning Account Value (10/1/16) | $1,000.00 | $1,000.00 | $1,000.00 | $1,000.00 | ||||
| Ending Account Value (3/31/17) | $1,018.05 | $1,014.46 | $1,019.00 | $1,019.40 | ||||
| Expenses Paid During Period | $6.94 | $10.55 | $5.99 | $5.59 | ||||
For each class of the Fund, expenses (net of fee waiver and reimbursement, if any) are equal to the annualized expense ratio for the class (1.38% for Class A, 2.10% for Class C, 1.19% for Class P and 1.11% for Institutional Class), multiplied by the average account value over the period, multiplied by 182/365.
| 100 | March 31, 2017 | | Semiannual Report |
Table of Contents
(THIS PAGE INTENTIONALLY LEFT BLANK)
| Semiannual Report | | March 31, 2017 | 101 |
Table of Contents
Unaudited
AllianzGI NFJ Global Dividend Value Fund
For the period of October 1, 2016 through March 31, 2017, as provided by Krysta Hill, Product Specialist Associate.
Fund Insights
For the six-month period ended March 31, 2017, Class A shares at net asset value (“NAV”) of the AllianzGI NFJ Global Dividend Value Fund (the “Fund”) returned 7.66%, underperforming the MSCI ACWI (the “benchmark”), which returned 8.18%.
Market Overview
Global equities surged over the six-month period, with indices in the US and UK breaking previous record highs while many other markets reached multi-month peaks. Donald Trump’s surprise victory in the US presidential election raised hopes that his pro-growth stance would boost company profits, outweighing fears about greater protectionism. In general, developed equity markets outperformed emerging markets, with Japan leading the advance as a weaker yen lifted the prospects of the country’s exporters. In economic terms, the period was characterized by strengthening growth and rising inflation. The US Federal Reserve (the “Fed”) raised US interest rates twice—in December 2016 and again in March 2017—taking the federal funds rate to a range of 0.75% to 1.0%, with two further rate increases during 2017. In contrast, in December 2016 the European Central Bank (“ECB”) extended its bond-buying program until at least the end of 2017, but reduced the size of its monthly bond purchases. Subsequently, rising inflation in the first quarter of 2017 led to speculation that the ECB would need to wind down these measures, with President Mario Draghi noting that battle against deflation had now been won. The Bank of England and Bank of Japan left monetary policy unchanged. The US dollar strengthened significantly following Donald Trump’s surprise victory, approaching a 15-year high against its major trading partners. The Japanese yen, in particular, weakened. However, the Trump-inspired rally faded throughout the first quarter of 2017, causing the US dollar to give back some of its earlier gains. Commodities delivered mixed returns. Oil prices initially strengthened following the news that OPEC had agreed to cut production, but later weakened amid signs of rising US supply. Elsewhere, a more optimistic growth outlook boosted prices for many industrials metals, such as copper, but gold lost ground. In terms of sectors, financials stocks in the MSCI ACWI delivered robust returns amid expectations that US Federal interest rates would rise faster than expected as a result of President Trump’s policies. Other growth-oriented sectors also performed well, including information technology, materials, industrials and consumer discretionary companies. In contrast, energy lagged as oil prices failed to build on earlier gains, while traditionally defensive sectors, such as real estate, telecommunications, consumer staples, health care and utilities, underperformed.
Portfolio Review
The Fund’s relative performance versus the benchmark index was due to negative stock selection while regional allocations were positive and country allocations were neutral during the reporting period.
In terms of stock selection, the Fund’s holdings in the industrials and health care sectors contributed positively to performance during the reporting period but were overwhelmed by selection in the consumer discretionary, financials and energy sectors, which detracted from Fund returns.
Sector allocation overall contributed to relative performance, led by an overweight in financials and an underweight in real estate. Conversely, overweight positions in telecommunication services and energy detracted from the Fund’s relative returns during the reporting period.
Selection by country was modestly positive across the US, Japan and Germany, but was overwhelmed by negative selection across Spain, the UK and Norway.
Country allocation was effectively net neutral over the reporting period. The positive impact realized by the Fund’s overweight exposures in Chile and Spain was offset by overweights across the UK and Indonesia, which detracted from relative performance results.
Sector and country weight deviations are a result of NFJ’s bottom-up investment process. On average during the reporting period, the Fund’s largest overweights relative to the benchmark index were in the financials and telecommunication services sectors. In contrast, the largest relative underweights were in the materials and real estate sectors.
Outlook
The current macroeconomic and political backdrop highlights the complex and ambiguous market environment that investors face today. Europe’s election super-cycle has begun in earnest after Dutch voters largely rejected their populist, anti-European Union candidate in March. Looking ahead, elections in France and Germany are scheduled for April and September, respectively. Investors are also keeping a close watch on the UK as the country embarks on a two year process of divorcing from the EU. In other words, the events that we believe have the ability to drive the direction of markets in 2017 continue to dominate news headlines while their outcomes remain unknown.
Within the US, the Trump administration’s agenda continues to materialize. As the S&P 500 climbed into 2017, some indicators suggested froth as the index trades near 18x forward price-to-earnings, three turns above the 25-year average, but below highs reached in the late 90’s and early 2000’s, according to Bloomberg data. The direction of the market from here will partly hinge on how much patience investors have while waiting for broad tax reform, de-regulation and repatriation to emerge. Investors have the challenge of reconciling “hope vs. scope” for fiscal stimulus. While we predict a fiscal stimulus program is likely in the future, the early failure to pass the “Trumpcare” legislation could be an early indication for the administration’s policy outlook. Additionally, the Fed’s most recent move had long been priced in, but we expect the outlook for future monetary policy and the speed of interest rate rises in 2017/18 should keep the markets busy in the weeks to come. If stimulus efforts end up getting watered-down too much, we predict earnings and growth expectations may look stretched.
As the last few weeks of March have demonstrated, low volatility and particularly bullish sentiment can change quickly and lead to some turbulence in the market. The book titled “The Indomitable Investor”, by Steven M. Sears contends that investors with extraordinary long-term track records are inclined to focus on mitigating risk as much as—if not more than—maximizing returns. We agree. While different headline risks, fiscal policy delays and growth
| 102 | March 31, 2017 | | Semiannual Report |
Table of Contents
Unaudited
AllianzGI NFJ Global Dividend Value Fund (cont’d)
concerns have arisen, our core philosophy and approach to the markets have remained steadfast. We believe the abovementioned backdrop, in conjunction with looming political hurdles, favors active managers who can take advantage of major and revised policy announcements as well as shifts in sentiment. We predict that NFJ process-driven approach to low valuation investing should stand to benefit if progress towards rewarding fundamentals remains intact. Conversely, we believe that in a volatile environment where market movements are anything but certain, dividends can boost total return while removing some of the sting from capital losses if the market turns lower.
Average Annual Total Return for the period ended March 31, 2017
| 6 Month | * | 1 Year | 5 Year | Since Inception | † | |||||||||||||
| AllianzGI NFJ Global Dividend Value Fund Class A | 7.66% | 11.18% | 5.01% | 8.16% | ||||||||||||||
| AllianzGI NFJ Global Dividend Value Fund Class A (adjusted) | 1.74% | 5.07% | 3.83% | 7.38% | |||||||||||||
| AllianzGI NFJ Global Dividend Value Fund Class C | 7.24% | 10.36% | 4.19% | 7.33% | ||||||||||||||
| AllianzGI NFJ Global Dividend Value Fund Class C (adjusted) | 6.24% | 9.36% | 4.19% | 7.33% | |||||||||||||
| AllianzGI NFJ Global Dividend Value Fund Class P | 7.71% | 11.36% | 5.17% | 8.35% | |||||||||||||
| AllianzGI NFJ Global Dividend Value Fund Institutional Class | 7.83% | 11.52% | 5.28% | 8.45% | |||||||||||||
| MSCI ACWI | 8.18% | 15.04% | 8.37% | 10.39% | |||||||||||||
| Lipper Global Equity Income Funds Average | 5.36% | 10.04% | 7.08% | 9.26% |
† The Fund began operations on June 26, 2009. Benchmark return comparisons began on the fund inception date. Lipper performance comparisons began on June 30, 2009.
* Cumulative returns
Performance quoted represents past performance and is no guarantee of future results. Current performance may be lower or higher than performance shown. For performance current to the most recent month-end, visit our website at us.allianzgi.com. Investment return and the principal value will fluctuate. Shares may be worth more or less than original cost when redeemed. The adjusted returns take into account the maximum initial sales charge of 5.50% on Class A shares and the contingent deferred sales charge (CDSC) of 1% on Class C shares, which may apply to shares redeemed during the first year of ownership. Returns do not reflect deduction of taxes that a shareholder would pay on fund distributions or redemption of fund shares. See pages 133 and 134 for more information. The Fund’s gross expense ratios are 2.77% for Class A shares, 3.40% for Class C shares, 2.47% for Class P shares and 2.32% for Institutional Class shares. These ratios do not include an expense reduction, contractually guaranteed through at least January 31, 2018. The Fund’s expense ratios net of this reduction are 1.10% for Class A shares, 1.89% for Class C shares, 0.94% for Class P shares and 0.85% for Institutional Class shares. Expense ratio information is as of the Fund’s current prospectus dated February 1, 2017, as revised April 10, 2017.
Cumulative Returns Through March 31, 2017
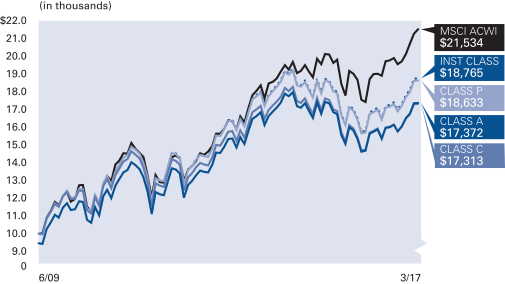
Country Allocation (as of March 31, 2017)
| United States | 54.2% | |||
| United Kingdom | 9.7% | |||
| Germany | 4.1% | |||
| China | 4.1% | |||
| Japan | 4.0% | |||
| Chile | 2.2% | |||
| Russian Federation | 2.1% | |||
| Spain | 2.1% | |||
| Other | 16.2% | |||
| Cash & Equivalents — Net | 1.3% |
| Semiannual Report | | March 31, 2017 | 103 |
Table of Contents
Unaudited
AllianzGI NFJ Global Dividend Value Fund (cont’d)
| Shareholder Expense Example | Actual Performance | |||||||
| Class A | Class C | Class P | Institutional Class | |||||
| Beginning Account Value (10/1/16) | $1,000.00 | $1,000.00 | $1,000.00 | $1,000.00 | ||||
| Ending Account Value (3/31/17) | $1,076.60 | $1,072.40 | $1,077.10 | $1,078.30 | ||||
| Expenses Paid During Period | $5.70 | $9.77 | $4.87 | $4.40 | ||||
| Hypothetical Performance | ||||||||
| (5% return before expenses) | ||||||||
| Class A | Class C | Class P | Institutional Class | |||||
| Beginning Account Value (10/1/16) | $1,000.00 | $1,000.00 | $1,000.00 | $1,000.00 | ||||
| Ending Account Value (3/31/17) | $1,019.45 | $1,015.51 | $1,020.24 | $1,020.69 | ||||
| Expenses Paid During Period | $5.54 | $9.50 | $4.73 | $4.28 | ||||
For each class of the Fund, expenses (net of fee waiver and reimbursement, if any) are equal to the annualized expense ratio for the class (1.10% for Class A, 1.89% for Class C, 0.94% for Class P and 0.85% for Institutional Class), multiplied by the average account value over the period, multiplied by 182/365.
| 104 | March 31, 2017 | | Semiannual Report |
Table of Contents
(THIS PAGE INTENTIONALLY LEFT BLANK)
| Semiannual Report | | March 31, 2017 | 105 |
Table of Contents
Unaudited
AllianzGI NFJ International Small-Cap Value Fund
For the period of October 1, 2016 through March 31, 2017, as provided by Krysta Hill, Product Specialist Associate.
Fund Insights
For the six-month period ended March 31, 2017, Class A shares at net asset value (“NAV”) of the AllianzGI NFJ International Small-Cap Value Fund (the “Fund”) returned 0.83%, underperforming the MSCI World ex USA Small Cap Index (the “benchmark”), which returned 4.66%.
Market Overview
International equities surged over the six-month period, with indices in the UK breaking previous record highs while many other markets reached multi-month peaks. In general, developed equity markets outperformed emerging markets, with countries across Europe and Japan leading the advance. Within the benchmark, Italy and Switzerland rose 10% or more, followed by strength from France, the Netherlands, Denmark, Belgium and Germany as optimism over improving growth helped investors overcome concerns about rising political risk. Japanese equities were lifted in part by a weaker yen, which boosted prospects for the country’s exporters. In December the European Central Bank (“ECB”) extended its bond-buying program until at least the end of 2017, but reduced the size of its monthly bond purchases. Subsequently, rising inflation in the first quarter of 2017 led to speculation that the ECB would need to wind down these measures, with President Mario Draghi noting that battle against deflation had now been won. The Bank of England and Bank of Japan left monetary policy unchanged. Commodities delivered mixed returns. Oil prices initially strengthened following the news that OPEC had agreed to cut production, but later weakened amid signs of rising US supply. Elsewhere, a more optimistic growth outlook boosted prices for many industrials metals, such as copper, but gold lost ground. In terms of sectors, information technology and financials stocks in the benchmark climbed 9%. Other growth-oriented sectors also performed well, including industrials and materials companies, in addition to utilities names. In contrast, many of the traditionally defensive sectors, such as real estate, consumer staples, health care and telecoms, underperformed
Portfolio Review
The Fund’s relative underperformance versus the benchmark index was largely due to negative stock selection, though country and sector allocations were also negative over the reporting period.
In terms of stock selection, Fund holdings in the energy and consumer staples sectors were the largest contributors to performance. However, these gains were overwhelmed by negative selection across the information technology, industrials and consumer discretionary sectors.
From a sector allocation perspective, an overweight in materials as well as an underweight in real estate boosted relative returns. Conversely, an overweight in consumer staples coupled with underweight positions in information technology and energy detracted from performance over the reporting period.
Selection by country was negative, led by holdings based in the UK, Japan and Sweden, which failed to keep pace with benchmark shares. The Fund realized gains from strong selection in Canada, Australia and Hong Kong-based holdings.
Country allocation was negative, as the Fund’s overweights in Taiwan and Hong Kong weighed on relative performance results. In contrast, an overweight in Greece and underweight in Canada aided relative performance over the reporting period.
Sector and country weight deviations are a result of NFJ’s bottom-up investment process. On average during the reporting period, the Fund’s largest overweights relative to the benchmark index were in the consumer staples and materials sectors. In contrast, the largest relative underweights were in the information technology and financials sectors.
Outlook
The current macroeconomic and political backdrop highlights the complex and ambiguous market environment that investors face today. Europe’s election super-cycle has begun in earnest after Dutch voters largely rejected their populist, anti-European Union (EU) candidate in March. Looking ahead, elections in France and Germany are scheduled for April and September, respectively. Investors are also keeping a close watch on the UK as the country embarks on a two year process of divorcing from the EU. In other words, the events that we believe have the ability to drive the direction of markets in 2017 continue to dominate news headlines while their outcomes remain unknown.
At NFJ, we target both attractively-valued stocks and dividend-paying companies to attempt to create portfolios of higher-quality equities that can help position investors for longer term outperformance and for downside protection during market drawdowns. Though such a strategy may not keep pace during sharply rising investment environments, we believe a focus on long term fundamental strength may benefit risk-on investors, venturing into equities, should today’s uncertainties fade amid favorable European election results. Conversely, should risk become reality, causing earnings expectations—and thereby share prices—to appear stretched, we believe that managers focusing on higher-quality, dividend paying names offering downside protection may be most beneficial for clients. At NFJ, we expect our deep value, dividend oriented process to strike this delicate balance for our investors.
| 106 | March 31, 2017 | | Semiannual Report |
Table of Contents
Unaudited
AllianzGI NFJ International Small-Cap Value Fund (cont’d)
Average Annual Total Return for the period ended March 31, 2017
| 6 Month* | 1 Year | Since Inception† | ||||||||||||
| AllianzGI NFJ International Small-Cap Value Fund Class A | 0.83% | 4.09% | 9.44% | |||||||||||
| AllianzGI NFJ International Small-Cap Value Fund Class A (adjusted) | –4.72% | –1.64% | 8.17% | ||||||||||
| AllianzGI NFJ International Small-Cap Value Fund Class C | 0.46% | 3.35% | 8.65% | |||||||||||
| AllianzGI NFJ International Small-Cap Value Fund Class C (adjusted) | –0.48% | 2.38% | 8.65% | ||||||||||
| AllianzGI NFJ International Small-Cap Value Fund Class P | 0.98% | 4.28% | 9.62% | ||||||||||
| AllianzGI NFJ International Small-Cap Value Fund Institutional Class | 1.02% | 4.43% | 9.74% | ||||||||||
| AllianzGI NFJ International Small-Cap Value Fund Class R6 | 1.01% | 4.54% | 9.84% | ||||||||||
| MSCI World ex USA Small Cap Index | 4.66% | 11.58% | 11.47% | ||||||||||
| Lipper International Small/Mid-Cap Core Funds Average | 5.56% | 11.66% | 9.32% | |||||||||||
† The Fund began operations on June 1, 2012. Benchmark return comparisons began on the fund inception date. Lipper performance comparisons began on May 31, 2012.
* Cumulative returns
Performance quoted represents past performance and is no guarantee of future results. Current performance may be lower or higher than performance shown. For performance current to the most recent month-end, visit our website at us.allianzgi.com. Investment return and the principal value will fluctuate. Shares may be worth more or less than original cost when redeemed. The adjusted returns take into account the maximum initial sales charge of 5.50% on Class A shares and the contingent deferred sales charge (CDSC) of 1% on Class C shares, which may apply to shares redeemed during the first year of ownership. Returns do not reflect deduction of taxes that a shareholder would pay on fund distributions or redemption of fund shares. See pages 133 and 134 for more information. The Fund’s gross expense ratios are 4.47% for Class A shares, 5.01% for Class C shares, 4.05% for Class P shares, 3.81% for Institutional Class shares and 4.89% for Class R6 shares. These ratios do not include an expense reduction, contractually guaranteed through at least January 31, 2018. The Fund’s expense ratios net of this reduction are 1.30% for Class A shares, 2.05% for Class C shares, 1.05% for Class P shares, 1.01% for Institutional Class shares and 0.95% for Class R6 shares. Expense ratio information is as of the Fund’s current prospectus dated February 1, 2017, as revised April 10, 2017.
Cumulative Returns Through March 31, 2017
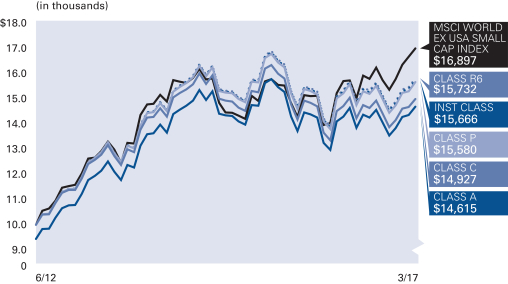
Country Allocation (as of March 31, 2017)
| Japan | 19.4% | |||
| United Kingdom | 13.6% | |||
| Canada | 6.7% | |||
| Sweden | 5.5% | |||
| Spain | 5.2% | |||
| Australia | 5.0% | |||
| Hong Kong | 4.9% | |||
| Finland | 3.1% | |||
| Other | 34.2% | |||
| Cash & Equivalents — Net | 2.4% |
| Semiannual Report | | March 31, 2017 | 107 |
Table of Contents
Unaudited
AllianzGI NFJ International Small-Cap Value Fund (cont’d)
| Shareholder Expense Example | Actual Performance | |||||||||
| Class A | Class C | Class P | Institutional Class | Class R6 | ||||||
| Beginning Account Value (10/1/16) | $1,000.00 | $1,000.00 | $1,000.00 | $1,000.00 | $1,000.00 | |||||
| Ending Account Value (3/31/17) | $1,008.30 | $1,004.60 | $1,009.80 | $1,010.20 | $1,010.10 | |||||
| Expenses Paid During Period | $6.51 | $10.25 | $5.61 | $5.21 | $4.76 | |||||
| Hypothetical Performance | ||||||||||
| (5% return before expenses) | ||||||||||
| Class A | Class C | Class P | Institutional Class | Class R6 | ||||||
| Beginning Account Value (10/1/16) | $1,000.00 | $1,000.00 | $1,000.00 | $1,000.00 | $1,000.00 | |||||
| Ending Account Value (3/31/17) | $1,018.45 | $1,014.71 | $1,019.35 | $1,019.75 | $1,020.19 | |||||
| Expenses Paid During Period | $6.54 | $10.30 | $5.64 | $5.24 | $4.78 | |||||
For each class of the Fund, expenses (net of fee waiver and reimbursement, if any) are equal to the annualized expense ratio for the class (1.30% for Class A, 2.05% for Class C, 1.12% for Class P, 1.04% for Institutional Class and 0.95% for Class R6), multiplied by the average account value over the period, multiplied by 182/365.
| 108 | March 31, 2017 | | Semiannual Report |
Table of Contents
(THIS PAGE INTENTIONALLY LEFT BLANK)
| Semiannual Report | | March 31, 2017 | 109 |
Table of Contents
Unaudited
AllianzGI NFJ International Value II Fund
For the period of October 1, 2016 through March 31, 2017, as provided by Krysta Hill, Product Specialist Associate.
Fund Insights
For the six-month period ended March 31, 2017, Class A shares at net asset value (“NAV”) of the AllianzGI NFJ International Value II Fund (the “Fund”) returned 5.02%, underperforming the MSCI EAFE Index (the “benchmark”), which returned 6.48%.
Market Overview
International equities surged over the six-month period, with indices in the UK breaking previous record highs while many other markets reached multi-month peaks. In general, developed equity markets outperformed emerging markets, with countries across Europe and Japan leading the advance. Within the benchmark, Italy, Spain, Austria, France and Germany rose 10% or more as optimism over strengthening growth helped investors overcome concerns about rising political risk. Japanese equities were lifted in part by a weaker yen, which boosted prospects for the country’s exporters. In December the European Central Bank (“ECB”) extended its bond-buying program until at least the end of 2017, but reduced the size of its monthly bond purchases. Subsequently, rising inflation in the first quarter of 2017 led to speculation that the ECB would need to wind down these measures, with President Mario Draghi noting that battle against deflation had now been won. The Bank of England and Bank of Japan left monetary policy unchanged. Commodities delivered mixed returns. Oil prices initially strengthened following the news that OPEC had agreed to cut production, but later weakened amid signs of rising US supply. Elsewhere, a more optimistic growth outlook boosted prices for many industrials metals, such as copper, but gold lost ground. In terms of sectors, financials stocks in the benchmark delivered robust returns amid expectations that interest rates would rise faster than expected as a result of President Trump’s policies. Other growth-oriented sectors also performed well, including materials, information technology and industrials companies, in addition to energy names. In contrast, traditionally defensive sectors, such as consumer staples, telecommunications, real estate, utilities and health care, underperformed.
Portfolio Review
The Fund’s relative underperformance versus the benchmark index was largely due to negative stock selection, though country allocations were also negative over the reporting period. Sector allocations modestly contributed to relative results over the reporting period.
In terms of stock selection, Fund holdings in the consumer staples sector outpaced benchmark shares, but those gains were overwhelmed by negative selection across the information technology, financials and materials sectors.
From a sector allocation perspective, underweight positions in consumer staples and real estate were primary performance contributors. Conversely, an overweight in telecommunication services and underweight in information technology somewhat detracted from Fund performance over the trailing six-month period.
Selection by country was negative due to holdings across the UK, Japan and the Netherlands, which failed to keep pace with benchmark shares. In contract, the Fund’s Hong Kong, Denmark and Ireland-based holdings boosted relative results.
Country allocations were negative due to the Fund’s overweight exposures in the off-benchmark countries of China and South Korea. Underweights in Switzerland and the UK contributed during the reporting period.
Sector and region weight deviations are a result of NFJ’s bottom-up investment process. On average during the reporting period, the Fund’s largest overweights relative to the benchmark index were in the financials and utilities sectors. In contrast, the largest relative underweights were in the consumer staples and health care sectors.
Outlook
The current macroeconomic and political backdrop highlights the complex and ambiguous market environment that investors face today. Europe’s election super-cycle has begun in earnest after Dutch voters largely rejected their populist, anti-European Union (EU) candidate in March. Looking ahead, elections in France and Germany are scheduled for April and September, respectively. Investors are also keeping a close watch on the UK as the country embarks on a two year process of divorcing from the EU. In other words, the events that we believe have the ability to drive the direction of markets in 2017 continue to dominate news headlines while their outcomes remain unknown.
At NFJ, we target both attractively-valued stocks and dividend-paying companies to attempt to create portfolios of higher-quality equities that can help position investors for longer term outperformance and for downside protection during market drawdowns. Though such a strategy may not keep pace during sharply rising investment environments, we believe a focus on long term fundamental strength may benefit risk-on investors, venturing into equities, should today’s uncertainties fade amid favorable European election results. Conversely, should risk become reality, causing earnings expectations—and thereby share prices—to appear stretched, we believe that managers focusing on higher-quality, dividend paying names offering downside protection may be most beneficial for clients. At NFJ, we expect our deep value, dividend oriented process to strike this delicate balance for our investors.
| 110 | March 31, 2017 | | Semiannual Report |
Table of Contents
Unaudited
AllianzGI NFJ International Value II Fund (cont’d)
Average Annual Total Return for the period ended March 31, 2017
| 6 Month* | 1 Year | 5 Year | Since Inception† | |||||||||||||||
| AllianzGI NFJ International Value II Fund Class A | 5.02% | 6.96% | 3.22% | 4.65% | ||||||||||||||
| AllianzGI NFJ International Value II Fund Class A (adjusted) | –0.75% | 1.08% | 2.06% | 3.55% | |||||||||||||
| AllianzGI NFJ International Value II Fund Class C | 4.63% | 6.13% | 2.43% | 3.85% | ||||||||||||||
| AllianzGI NFJ International Value II Fund Class C (adjusted) | 3.63% | 5.13% | 2.43% | 3.85% | |||||||||||||
| AllianzGI NFJ International Value II Fund Class P | 5.14% | 7.11% | 3.41% | 4.85% | |||||||||||||
| AllianzGI NFJ International Value II Fund Institutional Class | 5.14% | 7.17% | 3.49% | 4.93% | |||||||||||||
| MSCI EAFE Index | 6.48% | 11.67% | 5.83% | 7.26% | |||||||||||||
| Lipper International Multi-Cap Value Funds Average | 6.11% | 11.32% | 5.52% | 6.92% | ||||||||||||||
† The Fund began operations on December 1, 2011. Benchmark return comparisons began on the fund inception date. Lipper performance comparisons began on November 30, 2011.
* Cumulative returns
Performance quoted represents past performance and is no guarantee of future results. Current performance may be lower or higher than performance shown. For performance current to the most recent month-end, visit our website at us.allianzgi.com. Investment return and the principal value will fluctuate. Shares may be worth more or less than original cost when redeemed. The adjusted returns take into account the maximum initial sales charge of 5.50% on Class A shares and the contingent deferred sales charge (CDSC) of 1% on Class C shares, which may apply to shares redeemed during the first year of ownership. Returns do not reflect deduction of taxes that a shareholder would pay on fund distributions or redemption of fund shares. See pages 133 and 134 for more information. The Fund’s gross expense ratios are 1.82% for Class A shares, 2.58% for Class C shares, 1.54% for Class P shares and 1.45% for Institutional Class shares. These ratios do not include an expense reduction, contractually guaranteed through at least January 31, 2018. The Fund’s expense ratios net of this reduction are 1.15% for Class A shares, 1.90% for Class C shares, 0.95% for Class P shares and 0.90% for Institutional Class shares. Expense ratio information is as of the Fund’s current prospectus dated February 1, 2017, as revised April 10, 2017.
Cumulative Returns Through March 31, 2017
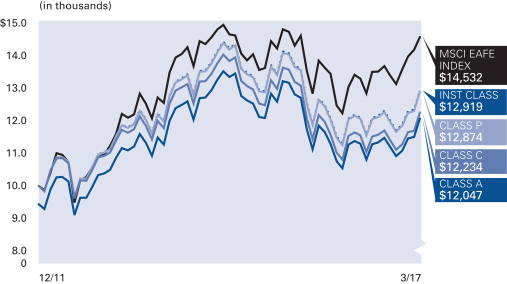
Country Allocation (as of March 31, 2017)
| Japan | 13.0% | |||
| United Kingdom | 10.7% | |||
| Canada | 8.4% | |||
| France | 8.1% | |||
| China | 6.6% | |||
| Hong Kong | 5.8% | |||
| Australia | 4.0% | |||
| Netherlands | 3.8% | |||
| Other | 30.1% | |||
| Cash & Equivalents — Net | 9.5% |
| Semiannual Report | | March 31, 2017 | 111 |
Table of Contents
Unaudited
AllianzGI NFJ International Value II Fund (cont’d)
| Shareholder Expense Example | Actual Performance | |||||||
| Class A | Class C | Class P | Institutional Class | |||||
| Beginning Account Value (10/1/16) | $1,000.00 | $1,000.00 | $1,000.00 | $1,000.00 | ||||
| Ending Account Value (3/31/17) | $1,050.20 | $1,046.30 | $1,051.40 | $1,051.40 | ||||
| Expenses Paid During Period | $5.88 | $9.69 | $4.86 | $4.60 | ||||
| Hypothetical Performance | ||||||||
| (5% return before expenses) | ||||||||
| Class A | Class C | Class P | Institutional Class | |||||
| Beginning Account Value (10/1/16) | $1,000.00 | $1,000.00 | $1,000.00 | $1,000.00 | ||||
| Ending Account Value (3/31/17) | $1,019.20 | $1,015.46 | $1,020.19 | $1,020.44 | ||||
| Expenses Paid During Period | $5.79 | $9.55 | $4.78 | $4.53 | ||||
For each class of the Fund, expenses (net of fee waiver and reimbursement, if any) are equal to the annualized expense ratio for the class (1.15% for Class A, 1.90% for Class C, 0.95% for Class P and 0.90% for Institutional Class), multiplied by the average account value over the period, multiplied by 182/365.
| 112 | March 31, 2017 | | Semiannual Report |
Table of Contents
(THIS PAGE INTENTIONALLY LEFT BLANK)
| Semiannual Report | | March 31, 2017 | 113 |
Table of Contents
Unaudited
AllianzGI Short Duration High Income Fund
For the period of October 1, 2016 through March 31, 2017, as provided by Doug Forsyth, Portfolio Manager.
Fund Insights
For the six-month period ended March 31, 2017, Class A Shares at net asset value (“NAV”) of the AllianzGI Short Duration High Income Fund (the “Fund”) returned 2.00%, outperforming the BofA Merrill Lynch 1-3 Year BB US Cash Pay High Yield Index (the “benchmark”), which returned 1.87%.
Market Overview
The high-yield market’s upward trajectory in 2016 continued into the fourth quarter of 2016 with the asset class recording its fifth-highest annual return historically. In contrast to 2016’s start to the year, the outset of 2017 began on a much firmer footing.
Several factors influenced high-yield bonds throughout the period, including constructive economic trends, corporate health, the US Federal Reserve’s (the “Fed”) rate decision and outlook, US elections and the new administration’s pro-growth agenda, sustained appetite for risk assets and commodity price strength.
In the US, positive economic reports outnumbered weaker releases, indicating ongoing growth and supporting the market’s advance. Overall, the trend in economic data reinforced the favorable credit conditions for high-yield bonds.
Credit fundamentals for most high-yield issuers displayed sustained improvement. According to BofA Merrill Lynch, both top- and bottom-line growth continued to trend higher. Furthermore, leverage continued to decline and coverage ratios increased. These statistics provided additional proof of the underlying fundamental strength of the high-yield bond market and substantiated the decline in the default rate.
The high-yield market responded positively to the Fed’s rate decisions and commentary. The central bank hiked the Fed funds rate a quarter point in both December 2016 and in March 2017. On balance, a Fed that did not deviate from its gradual approach toward policy adjustments, and a highly accommodative environment outside the US, continued to help support the performance of risk assets.
The unexpected election of Donald Trump triggered a rotation into risk assets that persisted throughout the reporting period. Investor appetite centered on optimism around the President’s pro-growth agenda and anticipation of a more favorable corporate earnings backdrop, predicated on positive tax reform, decreased regulation and increased fiscal spending.
This sentiment was also evident at the sub-asset class level and resulted in performance dispersion among the credit-rating categories. For example, within high-yield, the lowest-quality, most distressed issues outperformed higher-quality bonds.
Finally, improving industry dynamics helped lift the price of crude oil and aided in the stabilization of other commodity prices. These developments had a positive impact on many energy and materials companies.
Portfolio Review
The Fund return was positive and exceeded the performance of the benchmark. In contrast, core US bonds reported a negative return.
Industries that contributed meaningfully to performance in the period included issues in metals/mining ex steel, insurance and homebuilders/real estate followed by energy and support-services. Conversely, only one industry, healthcare, detracted from the Fund’s performance.
Issues sourced from the primary market were very minimal, while the vast majority of positions added were seasoned bonds sourced in the secondary market. Market volatility and temporary declines of bond prices in the late in the period created opportunities to purchase securities at very attractive prices. Purchases of bank loans were minimal given the lack of call protection and repricing risk in the loan market, and more attractive relative value was found in the bond market.
Outlook
Currently fixed income alternatives remain limited as core bonds continue to trade at meaningful premiums, carry significant duration risk and offer relatively low returns. We expect the Fund should continue to perform within expectations as a highly liquid, absolute return-focused solution designed to protect principal, while providing a stable source of income with lower or negative correlations to riskier assets.
| 114 | March 31, 2017 | | Semiannual Report |
Table of Contents
Unaudited
AllianzGI Short Duration High Income Fund (cont’d)
Average Annual Total Return for the period ended March 31, 2017
| 6 Month* | 1 Year | 5 Year | Since Inception† | |||||||||||||||
| AllianzGI Short Duration High Income Fund Class A | 2.00% | 9.39% | 4.44% | 5.22% | ||||||||||||||
| AllianzGI Short Duration High Income Fund Class A (adjusted) | –0.30% | 6.93% | 3.97% | 4.79% | |||||||||||||
| AllianzGI Short Duration High Income Fund Class C | 1.82% | 9.07% | 4.14% | 4.87% | ||||||||||||||
| AllianzGI Short Duration High Income Fund Class C (adjusted) | 0.83% | 8.07% | 4.14% | 4.87% | |||||||||||||
| AllianzGI Short Duration High Income Fund Class P | 2.13% | 9.54% | 4.63% | 5.40% | |||||||||||||
| AllianzGI Short Duration High Income Fund Institutional Class | 2.16% | 9.65% | 4.71% | 5.50% | |||||||||||||
| AllianzGI Short Duration High Income Fund Class R6 | 2.18% | 9.68% | 4.73% | 5.52% | |||||||||||||
| BofA Merrill Lynch 1-3 Year BB US Cash Pay High Yield Index | 1.87% | 7.19% | 4.90% | 5.87% | |||||||||||||
| Lipper High Yield Funds Average | 3.93% | 13.30% | 5.57% | 7.15% | ||||||||||||||
† The Fund began operations on October 3, 2011. Benchmark return comparisons began on the fund inception date. Lipper performance comparisons began on September 30, 2011.
* Cumulative returns
Performance quoted represents past performance and is no guarantee of future results. Current performance may be lower or higher than performance shown. For performance current to the most recent month-end, visit our website at us.allianzgi.com. Investment return and the principal value will fluctuate. Shares may be worth more or less than original cost when redeemed. The adjusted returns take into account the maximum initial sales charge of 2.25% on Class A shares and the contingent deferred sales charge (CDSC) of 1% on Class C shares, which may apply to shares redeemed during the first year of ownership. Returns do not reflect deduction of taxes that a shareholder would pay on fund distributions or redemption of fund shares. See pages 133 and 134 for more information. The Fund’s gross expense ratios are 0.85% for Class A shares, 1.13% for Class C shares, 0.66% for Class P shares, 0.58% for Institutional Class shares and 0.57% for Class R6 shares. The Class R6 shares ratio does not include an expense reduction contractually guaranteed through at least March 31, 2018. The Class R6 shares expense ratio net of this reduction are 0.57% for R6 Class shares. Expense ratio information is as of the Fund’s current prospectus dated February 1, 2017, as revised April 10, 2017.
Cumulative Returns Through March 31, 2017
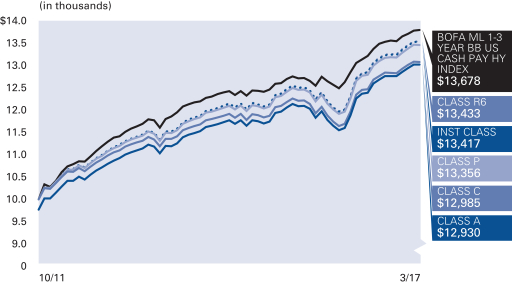
Industry Allocation (as of March 31, 2017)
| Retail | 9.7% | |||
| Telecommunications | 9.2% | |||
| Real Estate | 6.7% | |||
| Home Builders | 6.1% | |||
| Diversified Financial Services | 5.7% | |||
| Healthcare-Services | 4.1% | |||
| Commercial Services | 3.7% | |||
| Miscellaneous Manufacturing | 3.3% | |||
| Other | 43.6% | |||
| Cash & Equivalents — Net | 7.9% |
S&P Ratings** (as of March 31, 2017)
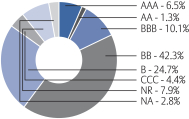
** As a percentage of total investments. Bond ratings refer to the underlying holdings of the Fund and are categorized from highest to lowest credit quality using ratings provided by S&P Global Ratings (“S&P”). S&P’s ratings have been selected for several reasons, including the portfolio managers’ usage of S&P ratings methodology among other credit quality information in managing the Fund, access to background information and other materials provided by S&P, as well as the Funds’ considerations of industry practice. The Fund also displays S&P credit ratings information in materials provided in client presentations. Previous shareholder reports for the Fund displayed bond ratings provided by Moody’s. See “Important Information” for more detail on the selection of S&P for the Fund’s ratings presentation. Bonds not rated by S&P and bonds that do not currently have a rating available are designated in the chart above as “NR” and “NA”, respectively.
| Semiannual Report | | March 31, 2017 | 115 |
Table of Contents
Unaudited
AllianzGI Short Duration High Income Fund (cont’d)
| Shareholder Expense Example | Actual Performance | |||||||||
| Class A | Class C | Class P | Institutional Class | Class R6 | ||||||
| Beginning Account Value* | $1,000.00 | $1,000.00 | $1,000.00 | $1,000.00 | $1,000.00 | |||||
| Ending Account Value (3/31/17) | $1,020.00 | $1,018.20 | $1,021.30 | $1,021.60 | $1,006.00 | |||||
| Expenses Paid During Period | $4.28 | $5.53 | $3.17 | $2.82 | $0.91 | |||||
| Hypothetical Performance | ||||||||||
| (5% return before expenses) | ||||||||||
| Class A | Class C | Class P | Institutional Class | Class R6 | ||||||
| Beginning Account Value (10/1/16) | $1,000.00 | $1,000.00 | $1,000.00 | $1,000.00 | $1,000.00 | |||||
| Ending Account Value (3/31/17) | $1,020.69 | $1,019.45 | $1,021.79 | $1,022.14 | $1,022.09 | |||||
| Expenses Paid During Period | $4.28 | $5.54 | $3.18 | $2.82 | $2.87 | |||||
*Class R6 commenced operations on February 1, 2017. The Actual expense example for Class R6 is based on the period since inception; the actual expense example for Class A, Class C, Class P and Institutional Class and the Hypothetical expense example are based on the period beginning October 1, 2016. If the Hypothetical expense example for Class R6 had been based on the period since inception, the Ending Account Value and Expenses Paid During the Period would have been: $1,007.04 and $0.91, respectively.
For each class of the Fund, expenses (net of fee waiver and reimbursement, if any) are equal to the annualized expense ratio for the class(0.85% for Class A, 1.10% for Class C, 0.63% for Class P, 0.56% for Institutional Class and 0.57% for Class R6), multiplied by the average account value over the period, multiplied by 182 (58 for Class R6)/365 for the Actual expense example and 182/365 for the Hypothetical expense example.
| 116 | March 31, 2017 | | Semiannual Report |
Table of Contents
(THIS PAGE INTENTIONALLY LEFT BLANK)
| Semiannual Report | | March 31, 2017 | 117 |
Table of Contents
Unaudited
AllianzGI Structured Return Fund
For the period of October 1, 2016 through March 31, 2017, as provided by Greg Tournant and Stephen Bond-Nelson, Co-Portfolio Managers.
Fund Insights
For the six-month period ended March 31, 2017, Class A shares at net asset value of the AllianzGI Structured Return Fund (the “Fund”) returned 2.43%, outperforming the BofA Merrill Lynch 3-Month US Treasury Bill Index (the “benchmark”), which returned 0.19%.
Market Overview
Structured Return navigated challenging market conditions from October 2016 through March 2017 to generate consistent, risk-controlled gains.
There were several short-lived market dislocations in 2016, which were coupled with historically low levels of implied volatility—how much option-market participants believe the equity market is going to fluctuate. The most notable event of the fourth quarter 2016 was the US Presidential Election. A steep overnight decline and rally occurred as investors digested the US presidential election outcome in a matter of hours, with the US equity market ultimately extending its gains. The S&P 500 Index—which is the underlying for the option contracts we trade -- reversed its negative start to the period and wound up advancing 3.82% for the quarter, bringing its annual gain to 11.96%.
The low levels of implied volatility persisted into the first quarter of 2017 amid another period of strong equity market growth. While the portfolio was able to perform well, returns were curtailed by extremely muted levels of implied volatility. The Volatility Index (“VIX”), which measures implied volatility of the S&P 500 Index, averaged 11.69 for the period, a quarterly average not seen since 2006.
Portfolio Review
Despite the challenging market environment, the Fund delivered positives returns every month from October 2016 through March 2017.
Class A Shares of the Fund gained 0.32% in October, profiting from range-bound spread positions but slightly curtailed by the negative mark-to-market impact of the month-end VIX spike. In November, the Fund realized slight gains from S&P 500 Index upside directional call spread positions during the equity market rally. The portfolio also profited from range-bound spreads and realized a mark-to-market recovery from October. The Fund returned 0.69% for the month. Equity markets continued to advance into December, punctuating a year of gains that exceeded many investors’ expectations, while the VIX fell back to the low teens. During the month the Fund realized gains from range-bound spread positions en route to a 0.25% return.
The Fund generated gains exclusively from range-bound spread positions in January given the flat market environment. Structured Return gained 0.51% net of fees in January as the S&P 500 Index climbed 1.90% for the month. In February, equities strengthened further, with the S&P 500 rising 3.97%. Its ascent at the end of the month was steep enough that the index approached a few S&P 500 Index call strikes. This prompted some upside restructuring, at a cost of approximately 20 basis points. Beyond the realized cost, the portfolio also experienced some negative mark-to-market with the index so close to our strikes. Still, the Fund was positive for the month, returning 0.25%.
With equity indexes steadying in March 2017, the portfolio delivered above-target gains. Range-bound spreads led the way, with performance also boosted by the mark-to-market recovery from positions that had been marked down expiring intact. We were somewhat remiss that the portfolio was unable to capture gains from directional positions that we had tactically constructed in advance of the widely anticipated vote on health care legislation. These positions would have benefited from an equity-market decline in the days and weeks following the scheduled March 23rd vote. Yet as has frequently been the case in recent quarters, the issue turned out to be a non-event for the equity and volatility indexes.
Outlook
With equity markets showing remarkable resilience and the VIX unable to sustain any increase, we will attempt to continue to position the portfolio with prudence, even if it means lower return expectations. The Fund’s performance target already presumes a low VIX, but if volatility were to remain exceptionally low all year, realistically we expect the portfolio to perform at the bottom end of its typical range or perhaps slightly lower.
That said, we are only one quarter into 2017, and anything can happen from here. There are certainly many potential geopolitical and economic news catalysts—the French election in May, for example—that could disrupt the current sanguine environment, even though in our view, nothing has thus far. We believe that one or two equity-market corrections over the course of the year, which is statistically typical, would be a welcome occurrence if the moves were to bring about a higher prevailing VIX level.
In the meantime, we remain focused on attempting to pursue gains responsibly. As always, we believe the Fund is positioned to perform through as wide a range of market scenarios as possible.
| 118 | March 31, 2017 | | Semiannual Report |
Table of Contents
Unaudited
AllianzGI Structured Return Fund (cont’d)
Average Annual Total Return for the period ended March 31, 2017
| 6 Month* | 1 Year | Since Inception† | ||||||||||||
| AllianzGI Structured Return Fund Class A | 2.43% | 5.22% | 4.40% | |||||||||||
| AllianzGI Structured Return Fund Class A (adjusted) | –3.20% | –0.57% | 3.04% | ||||||||||
| AllianzGI Structured Return Fund Class C | 2.01% | 4.39% | 3.61% | |||||||||||
| AllianzGI Structured Return Fund Class C (adjusted) | 1.02% | 3.39% | 3.61% | ||||||||||
| AllianzGI Structured Return Fund Class P | 2.54% | 5.40% | 4.57% | ||||||||||
| AllianzGI Structured Return Fund Institutional Class | 2.53% | 5.43% | 4.64% | ||||||||||
| AllianzGI Structured Return Fund Class R6 | 2.67% | 5.62% | 4.77% | ||||||||||
| BofA Merrill Lynch 3-Month US Treasury Bill Index | 0.19% | 0.36% | 0.14% | ||||||||||
| Lipper Absolute Return Funds Average | 2.69% | 5.07% | 2.71% | |||||||||||
† The Fund began operations on December 3, 2012. Benchmark return comparisons began on the fund inception date. Lipper performance comparisons began on November 30, 2012.
* Cumulative returns
Performance quoted represents past performance and is no guarantee of future results. Current performance may be lower or higher than performance shown. For performance current to the most recent month-end, visit our website at us.allianzgi.com. Investment return and the principal value will fluctuate. Shares may be worth more or less than original cost when redeemed. The adjusted returns take into account the maximum initial sales charge of 5.50% on Class A shares and the contingent deferred sales charge (CDSC) of 1% on Class C shares, which may apply to shares redeemed during the first year of ownership. Returns do not reflect deduction of taxes that a shareholder would pay on fund distributions or redemption of fund shares. See pages 133 and 134 for more information. The Fund’s gross expense ratios are 1.29% for Class A shares, 2.09% for Class C shares, 1.06% for Class P shares, 1.00% for Institutional Class shares and 0.98% for Class R6 shares. These ratios do not include an expense reduction, contractually guaranteed through at least January 31, 2018. The Fund’s expense ratios net of this reduction are 1.10% for Class A shares, 1.90% for Class C shares, 0.89% for Class P shares, 0.81% for Institutional Class shares and 0.79% for Class R6 shares. Expense ratio information is as of the Fund’s current prospectus dated February 1, 2017, as revised April 10, 2017.
Cumulative Returns Through March 31, 2017
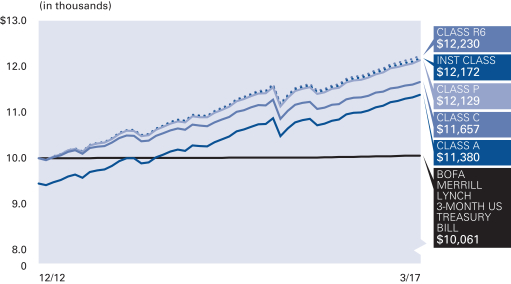
Asset Allocation (as of March 31, 2017)
| Exchange-Traded Funds | 90.0% | |||
| Cash & Equivalents — Net (including Options Purchased and Written) | 10.0% |
| Semiannual Report | | March 31, 2017 | 119 |
Table of Contents
Unaudited
AllianzGI Structured Return Fund (cont’d)
| Shareholder Expense Example | Actual Performance | |||||||||
| Class A | Class C | Class P | Institutional Class | Class R6 | ||||||
| Beginning Account Value* | $1,000.00 | $1,000.00 | $1,000.00 | $1,000.00 | $1,000.00 | |||||
| Ending Account Value (3/31/17) | $1,024.30 | $1,020.10 | $1,025.40 | $1,025.30 | $1,015.70 | |||||
| Expenses Paid During Period | $5.35 | $9.22 | $4.14 | $4.09 | $2.23 | |||||
| Hypothetical Performance | ||||||||||
| (5% return before expenses) | ||||||||||
| Class A | Class C | Class P | Institutional Class | Class R6 | ||||||
| Beginning Account Value (10/1/16) | $1,000.00 | $1,000.00 | $1,000.00 | $1,000.00 | $1,000.00 | |||||
| Ending Account Value (3/31/17) | $1,019.65 | $1,015.81 | $1,020.84 | $1,020.89 | $1,021.49 | |||||
| Expenses Paid During Period | $5.34 | $9.20 | $4.13 | $4.08 | $3.48 | |||||
* Class R6 commenced operations on December 2, 2016. The Actual expense example for Class R6 is based on the period since inception; the Actual expense example for Class A, Class C, Class P and Institutional Class and the Hypothetical expense example are based on the period beginning October 1, 2016. If the Hypothetical expense example for Class R6 had been based on the period since inception, the Ending Account Value and Expenses Paid During the Period would have been: $1,013.82 and $2.23, respectively.
For each class of the Fund, expenses (net of fee waiver and reimbursement, if any) are equal to the annualized expense ratio for the class (1.06% for Class A, 1.83% for Class C, 0.82% for Class P, 0.81% for Institutional Class and 0.69% for Class R6), multiplied by the average account value over the period, multiplied by 182 (117 for Class R6)/365 for the Actual expense example and 182/365 for the Hypothetical expense example. These expenses do not include the expenses of the investment companies in which the Fund invests, which are indirectly borne by Fund shareholders.
| 120 | March 31, 2017 | | Semiannual Report |
Table of Contents
(THIS PAGE INTENTIONALLY LEFT BLANK)
| Semiannual Report | | March 31, 2017 | 121 |
Table of Contents
Unaudited
AllianzGI U.S. Equity Hedged Fund
For the period of October 1, 2016 through March 31, 2017, as provided by Greg Tournant and Stephen Bond-Nelson, Co-Portfolio Managers.
Fund Insights
For the six-month period ended March 31, 2017, Class A shares at net asset value (“NAV”) of the AllianzGI U.S. Equity Hedged Fund (the “Fund”) returned 6.24%, underperforming the S&P 500 Index (the “benchmark”), which returned 10.12%
Market Overview
The Fund generated positive returns from October 2016 through March 2017 during a period of strong equity-market growth, while continually hedging against downside equity market risk.
The most notable highlight of the period was the steep overnight S&P 500 Index decline and rally in November 2016 as investors digested the US presidential election outcome in a matter of hours. In October, the S&P 500 snapped a seven-month positive streak, with weakness intensifying toward the end of the month on election uncertainty. Subsequently, on November 8th, the Donald Trump victory initially shocked markets—with the S&P 500 Index futures plunging 5% overnight—the maximum decline allowed by trading limits. But after just a few hours a strong reversal took hold, with the S&P 500 actually finishing the trading day in positive territory. From there, the US equity climb continued through the end of the year, bringing the S&P 500’s annual gain to 11.96%.
Equity markets continued their surge to start the new year, extending the post-election trend, with several major indexes climbing to record highs. The equities markets climbed for all three months in the first quarter, while implied volatility, represented by the Volatility Index (“VIX”), remained in the low teens. The equity market ascent was steepest in February, with the S&P 500 Index rising 3.97% for the month.
Portfolio Review
The Fund is a collar strategy that seeks to provide protection against downside equity-market moves while asymmetrically preserving the upside potential of the underlying passive equity portfolio. The Fund pursues this objective by purchasing laddered, long-duration equity index put options and selling short-duration index calls at strike distances that vary depending on the level of the VIX, a measure of S&P 500 option prices. The goal of this duration mismatch is for the short call positions to stay out of the way of rising equity markets while the longer-dated put positions continuously hedge the downside risk associated with Fund’s long S&P 500 exposure.
In October, the Fund returned -1.48%, as the portfolio’s long put positions helped cushion the S&P 500 Index decline. Then, as the S&P 500 Index rebounded in November, the portfolio’s short-duration calls, which had been written approximately 3% out of the money, enabled the Fund to meaningfully participate. The Fund returned 2.88% in November, outperforming other comparable collar strategies for the month. The Fund largely kept pace with the equity market advance in December, returning 1.49% for the month.
Moving into the new year, the fund’s short call strikes, which had been written approximately 3-4% out-of-the-money at position inception in the low-VIX environment, were able to accommodate January’s equity market gain. In February, the market ascent at the end of the month was steep enough that the index approached a few of our short call strikes, prompting some restructuring. However, the Fund still captured the majority of the equity market upside, returning 2.40% for the month. The Fund’s level of participation in the equity rally compared favorably among collar strategies as many funds struggled to keep pace with the two-month surge. As markets steadied in March, the Fund lagged, with a return of -0.41% for the month.
Outlook
So far the equity markets have shown remarkable resilience at the start of the year. Recent US equity market dislocations have been very short-lived, with the underlying market trend having tended to prevail over any short-term surprise.
That said, we are only one quarter into 2017, and anything can happen from here. There are certainly many potential geopolitical and economic news catalysts—the French election in May, for example—that could disrupt the current sanguine environment, even though we believe that nothing has thus far.
If a sharp decline by the S&P 500 were to occur, we believe the Fund is positioned to limit losses and control risk. It is our opinion that the reliability of the Fund’s long put program not only offers some protection of capital, but presumably also enables investors to take more risk in other parts of their portfolio.
Until the markets undergo a longer-lasting, more significant period of decline, we believe the Fund will not have an opportunity to demonstrate the full scope of its benefit. Yet even in a persistent bull market, it is our opinion that the Fund has shown it can provide solid capital appreciation and a reassuring risk profile.
| 122 | March 31, 2017 | | Semiannual Report |
Table of Contents
Unaudited
AllianzGI U.S. Equity Hedged Fund (cont’d)
Average Annual Total Return for the period ended March 31, 2017
| 6 Month* | 1 Year | Since Inception† | ||||||||||||
| AllianzGI U.S. Equity Hedged Fund Class A | 6.24% | 10.83% | 6.55% | |||||||||||
| AllianzGI U.S. Equity Hedged Fund Class A (adjusted) | 0.40% | 4.73% | 5.16% | ||||||||||
| AllianzGI U.S. Equity Hedged Fund Class C | 5.85% | 10.01% | 5.78% | |||||||||||
| AllianzGI U.S. Equity Hedged Fund Class C (adjusted) | 4.85% | 9.01% | 5.78% | ||||||||||
| AllianzGI U.S. Equity Hedged Fund Class P | 6.31% | 11.05% | 6.71% | ||||||||||
| AllianzGI U.S. Equity Hedged Fund Institutional Class | 6.36% | 11.09% | 6.83% | ||||||||||
| S&P 500 Index | 10.12% | 17.17% | 15.11% | ||||||||||
| Lipper Alternative Long/Short Equity Funds Average | 4.59% | 6.93% | 5.38% | |||||||||||
† The Fund began operations on December 3, 2012. Benchmark return comparisons began on the fund inception date. Lipper performance comparisons began on November 30, 2012.
* Cumulative returns
Performance quoted represents past performance and is no guarantee of future results. Current performance may be lower or higher than performance shown. For performance current to the most recent month-end, visit our website at us.allianzgi.com. Investment return and the principal value will fluctuate. Shares may be worth more or less than original cost when redeemed. The adjusted returns take into account the maximum initial sales charge of 5.50% on Class A shares and the contingent deferred sales charge (CDSC) of 1% on Class C shares, which may apply to shares redeemed during the first year of ownership. Returns do not reflect deduction of taxes that a shareholder would pay on fund distributions or redemption of fund shares. See pages 133 and 134 for more information. The Fund’s gross expense ratios are 3.72% for Class A shares, 4.46% for Class C shares, 3.38% for Class P shares and 3.18% for Institutional Class shares. These ratios do not include an expense reduction, contractually guaranteed through at least January 31, 2018. The Fund’s expense ratios net of this reduction are 1.34% for Class A shares, 2.09% for Class C shares, 1.19% for Class P shares and 1.09% for Institutional Class shares. Expense ratio information is as of the Fund’s current prospectus dated February 1, 2017, as revised April 10, 2017.
Cumulative Returns Through March 31, 2017
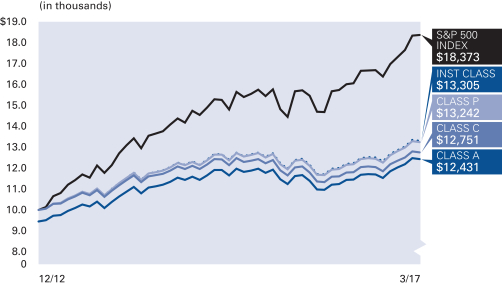
Asset Allocation (as of March 31, 2017)
| Exchange-Traded Funds | 76.7% | |||
| Cash & Equivalents — Net (including Options Purchased and Written) | 23.3% |
| Semiannual Report | | March 31, 2017 | 123 |
Table of Contents
Unaudited
AllianzGI U.S. Equity Hedged Fund (cont’d)
| Shareholder Expense Example | Actual Performance | |||||||
| Class A | Class C | Class P | Institutional Class | |||||
| Beginning Account Value (10/1/16) | $1,000.00 | $1,000.00 | $1,000.00 | $1,000.00 | ||||
| Ending Account Value (3/31/17) | $1,062.40 | $1,058.50 | $1,063.10 | $1,063.60 | ||||
| Expenses Paid During Period | $6.43 | $10.26 | $5.66 | $5.14 | ||||
| Hypothetical Performance | ||||||||
| (5% return before expenses) | ||||||||
| Class A | Class C | Class P | Institutional Class | |||||
| Beginning Account Value (10/1/16) | $1,000.00 | $1,000.00 | $1,000.00 | $1,000.00 | ||||
| Ending Account Value (3/31/17) | $1,018.70 | $1,014.96 | $1,019.45 | $1,019.95 | ||||
| Expenses Paid During Period | $6.29 | $10.05 | $5.54 | $5.04 | ||||
For each class of the Fund, expenses (net of fee waiver and reimbursement, if any) are equal to the annualized expense ratio for the class (1.25% for Class A, 2.00% for Class C, 1.10% for Class P and 1.00% for Institutional Class), multiplied by the average account value over the period, multiplied by 182/365. These expenses do not include the expenses of the investment companies in which the Fund invests, which are indirectly borne by Fund shareholders.
| 124 | March 31, 2017 | | Semiannual Report |
Table of Contents
(THIS PAGE INTENTIONALLY LEFT BLANK)
| Semiannual Report | | March 31, 2017 | 125 |
Table of Contents
Unaudited
AllianzGI U.S. Small-Cap Growth Fund
For the period of October 1, 2016 through March 31, 2017, as provided by Steven Lyford, Portfolio Manager.
Fund Insights
For the six-month period ended March 31, 2017, Class A Shares at net asset value (“NAV”) of the AllianzGI U.S. Small-Cap Growth Fund (the “Fund”) returned 8.20%, underperforming the Russell 2000 Growth Index (the “benchmark”), which returned 9.11%.
Market Overview
US risk assets surged in the fourth quarter, with equities posting some of the most robust gains. Although smaller-cap stocks were a beneficiary of this appetite for risk, the stock market rally was broad based with the S&P 500, Dow Jones Industrial Average, Russell 2000 and Nasdaq Composite Indexes recording new all-time highs in the period. Initially, equities declined during October 2016, but losses were quickly recovered after election results triggered a relentless rally that lasted into year-end.
This upward trend persisted through the remainder of the reporting period due to elevated sentiment, which in part, centered on continued optimism around President Trump’s policies and pro-growth agenda. Investor conviction was tested with the withdrawal of the health care bill and a decline in oil prices, but these events did little to shake their resolve as markets recovered into period end.
US equity markets responded favorably to the US Federal Reserve’s (the “Fed”) commentary and their decision to raise the Fed funds rate in December 2016 and again in March 2017. Outside of the US, global central banks maintained aggressive measures to stimulate their respective economies.
Corporate profits rose year-over-year at the end of December 2016, and fourth-quarter fundamentals for most stocks displayed sustained improvement.
Finally, positive economic reports outnumbered weaker releases, indicating ongoing growth and supporting the market’s advance.
Against this backdrop, the Russell 2000 Index returned 11.52% and outperformed the Russell 1000 Index, which returned 10.09%. Within the small cap universe, growth-oriented stocks underperformed value-oriented stocks. Specific to the benchmark, sector performance was predominantly positive. Financials, materials, and industrials were the strongest-performing sectors. In contrast, the energy sector declined and consumer staples, health care and real estate trailed the overall market.
Portfolio Review
The Fund underperformed its benchmark over the reporting period. From an attribution perspective, security selection was a positive contributor to relative performance, but the benefit was more than offset by asset weighting effects at the sector level. In particular, stock picking was additive in the information technology, healthcare, and energy sectors, followed by materials. Conversely, security selection in industrials, consumer discretionary and consumer staples detracted. Separately, overweights in energy and financials hurt relative performance, equalizing overall stock-picking strength.
Outlook
We expect, along with many others, the US economy to expand at a moderate pace in 2017 and we believe the steepness of the Treasury yield curve supports this notion. Outside of positive economic trends, we believe the President’s agenda could spur even faster economic growth. After bottoming in the second quarter, corporate profits accelerated into year-end, and, we believe, based on bottom-up estimates, are poised to trend higher in 2017. Additionally, we believe the potential for decreased regulation, positive tax reform and increased fiscal spending could create the most favorable backdrop for corporate earnings in years. US monetary policy continues to be modestly accommodative with the Fed expected to take a gradual, measured approach toward adjustments. The Federal Open Market Committee is projecting two more interest rate hikes in 2017, signaling its confidence in the US economy’s ability to grow.
| 126 | March 31, 2017 | | Semiannual Report |
Table of Contents
Unaudited
AllianzGI U.S. Small-Cap Growth Fund (cont’d)
Average Annual Total Return for the period ended March 31, 2017
| 6 Month* | 1 Year | 5 Year | 10 Year | Since Inception† | ||||||||||||||||||
| AllianzGI U.S. Small-Cap Growth Fund Class A | 8.20% | 17.14% | 7.41% | 5.60% | 7.03% | |||||||||||||||||
| AllianzGI U.S. Small-Cap Growth Fund Class A (adjusted) | 2.24% | 10.70% | 6.20% | 5.00% | 6.77% | ||||||||||||||||
| AllianzGI U.S. Small-Cap Growth Fund Class C | 7.66% | 16.11% | 6.57% | 4.80% | 6.22% | |||||||||||||||||
| AllianzGI U.S. Small-Cap Growth Fund Class C (adjusted) | 6.80% | 15.19% | 6.57% | 4.80% | 6.22% | ||||||||||||||||
| AllianzGI U.S. Small-Cap Growth Fund Class R | 8.01% | 16.80% | 7.16% | 5.35% | 6.77% | ||||||||||||||||
| AllianzGI U.S. Small-Cap Growth Fund Class P | 8.22% | 17.20% | 7.59% | 5.82% | 7.28% | ||||||||||||||||
| AllianzGI U.S. Small-Cap Growth Fund Institutional Class | 8.32% | 17.34% | 7.70% | 5.93% | 7.38% | ||||||||||||||||
| Russell 2000 Growth Index | 9.11% | 23.03% | 12.10% | 8.06% | 7.29% | ||||||||||||||||
| Lipper Small-Cap Growth Funds Average | 8.56% | 22.09% | 10.49% | 7.24% | 8.29% | |||||||||||||||||
† The Fund began operations on December 1, 1993. Benchmark return comparisons began on the fund inception date. Lipper performance comparisons began on September 30, 1993.
* Cumulative returns
Performance quoted represents past performance and is no guarantee of future results. Current performance may be lower or higher than performance shown. For performance current to the most recent month-end, visit our website at us.allianzgi.com. Investment return and the principal value will fluctuate. Shares may be worth more or less than original cost when redeemed. The adjusted returns take into account the maximum initial sales charge of 5.50% on Class A shares and the contingent deferred sales charge (CDSC) of 1% on Class C shares, which may apply to shares redeemed during the first year of ownership. Returns do not reflect deduction of taxes that a shareholder would pay on fund distributions or redemption of fund shares. See pages 133 and 134 for more information. The Fund’s gross expense ratios are 1.97% for Class A shares, 2.83% for Class C shares, 2.24% for Class R shares, 1.76% for Class P shares, 1.75% for Institutional Class shares and 1.46% for Class R6 shares. These ratios do not include an expense reduction, contractually guaranteed through at least January 31, 2018. The Fund’s expense ratios net of this reduction are 1.20% for Class A shares, 2.00% for Class C shares, 1.45% for Class R shares, 1.05% for Class P shares, 0.96% for Institutional Class shares and 0.95% for Class R6 shares. Expense ratio information is as of the Fund’s current prospectus dated February 1, 2017, as revised April 10, 2017.
Cumulative Returns Through March 31, 2017
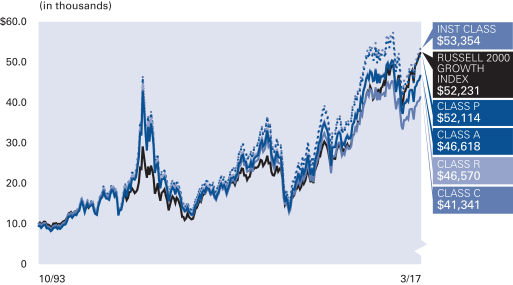
Industry Allocation (as of March 31, 2017)
| Semiconductors & Semiconductor Equipment | 7.2% | |||
| Health Care Equipment & Supplies | 7.0% | |||
| Banks | 6.8% | |||
| Internet Software & Services | 6.8% | |||
| Hotels, Restaurants & Leisure | 6.7% | |||
| Machinery | 5.1% | |||
| Biotechnology | 4.4% | |||
| Electronic Equipment, Instruments & Components | 4.1% | |||
| Other | 48.5% | |||
| Cash & Equivalents — Net | 3.4% |
| Semiannual Report | | March 31, 2017 | 127 |
Table of Contents
Unaudited
AllianzGI U.S. Small-Cap Growth Fund (cont’d)
| Shareholder Expense Example | Actual Performance | |||||||||
| Class A | Class C | Class R | Class P | Institutional Class | ||||||
| Beginning Account Value (10/1/16) | $1,000.00 | $1,000.00 | $1,000.00 | $1,000.00 | $1,000.00 | |||||
| Ending Account Value (3/31/17) | $1,082.00 | $1,076.60 | $1,080.10 | $1,082.20 | $1,083.20 | |||||
| Expenses Paid During Period | $6.23 | $10.35 | $7.52 | $5.45 | $4.99 | |||||
| Hypothetical Performance | ||||||||||
| (5% return before expenses) | ||||||||||
| Class A | Class C | Class R | Class P | Institutional Class | ||||||
| Beginning Account Value (10/1/16) | $1,000.00 | $1,000.00 | $1,000.00 | $1,000.00 | $1,000.00 | |||||
| Ending Account Value (3/31/17) | $1,018.95 | $1,014.96 | $1,017.70 | $1,019.70 | $1,020.14 | |||||
| Expenses Paid During Period | $6.04 | $10.05 | $7.29 | $5.29 | $4.84 | |||||
For each class of the Fund, expenses (net of fee waiver and reimbursement, if any) are equal to the annualized expense ratio for the class (1.20% for Class A, 2.00% for Class C, 1.45% for Class R, 1.05% for Class P and 0.96% for Institutional Class), multiplied by the average account value over the period, multiplied by 182/365.
| 128 | March 31, 2017 | | Semiannual Report |
Table of Contents
(THIS PAGE INTENTIONALLY LEFT BLANK)
| Semiannual Report | | March 31, 2017 | 129 |
Table of Contents
Unaudited
AllianzGI Ultra Micro Cap Fund
For the period of October 1, 2016 through March 31, 2017, as provided by Robert Marren, Portfolio Manager.
Fund Insights
For the six-month period ended March 31, 2017, Class A Shares at net asset value (“NAV”) of the AllianzGI Ultra Micro Cap Fund (the “Fund”) returned 6.21%, outperforming the Russell Microcap Growth Index (the “benchmark”), which returned 4.13%.
Market Overview
US risk assets surged in the fourth, quarter of 2016 with equities posting some of the most robust gains. Although smaller-cap stocks were a beneficiary of this appetite for risk, the stock market rally was broad based with the S&P 500, Dow Jones Industrial Average, Russell 2000 and Nasdaq Composite Indexes recording new all-time highs in the period. Initially, equities declined during October, but losses were quickly recovered after election results triggered a relentless rally that lasted into year-end.
This upward trend persisted through the remainder of the reporting period due to elevated sentiment, which in part, centered on continued optimism around President Trump’s policies and pro-growth agenda. Investor conviction was tested with the withdrawal of the health care bill and a decline in oil prices, but these events did little to shake their resolve as markets recovered into period end.
US equity markets responded favorably to the US Federal Reserve’s (the “Fed”) commentary and their decision to raise the Fed funds rate in December 2016 and again in March 2017. Outside of the US, global central banks maintained aggressive measures to stimulate their respective economies.
Corporate profits rose year-over-year at the end of December 2016, and fourth-quarter fundamentals for most stocks displayed sustained improvement.
Finally, positive economic reports outnumbered weaker releases, indicating ongoing growth and supporting the market’s advance.
Against this backdrop, the benchmark returned 10.47% and underperformed the Russell 2000 Index, which returned 11.52%. Within the microcap universe, growth-oriented stocks trailed value-oriented stocks. Specific to the benchmark, sector performance was predominantly positive. Among the more heavily weighted sectors, consumer discretionary, industrials and information technology were among the strongest-performing.. In contrast, health care was the only sector to close with a loss, while the energy sector ended higher, underperforming the overall market.
Portfolio Review
The Fund outperformed its benchmark over the reporting period. From an attribution perspective, security selection drove relative outperformance whereas asset weighting effects were neutral. For example, stock picking was beneficial in health care, followed by financials, materials and consumer staples among other sectors. Conversely, security selection was a source of weakness in the information technology and consumer discretionary sectors. Separately, an overweight in financials and an underweight in health care helped relative performance, but the benefit was partially offset by underweights in utilities, real estate and telecom services.
Outlook
We expect, along with many others, the US economy to expand at a moderate pace in 2017 and the steepness of the Treasury yield curve supports this notion. Outside of positive economic trends, we believe President Trump’s agenda could spur even faster economic growth. After bottoming in the second quarter, corporate profits accelerated into year-end, and based on bottom-up estimates, we believe they are poised to trend higher in 2017. Additionally, we believe the potential for decreased regulation, positive tax reform and increased fiscal spending could create the most favorable backdrop for corporate earnings in years. US monetary policy continues to be modestly accommodative with the Fed expected to take a gradual, measured approach toward adjustments. The Federal Open Market Committee is projecting two more interest rate hikes in 2017, signaling confidence in the US economy’s ability to grow.
| 130 | March 31, 2017 | | Semiannual Report |
Table of Contents
Unaudited
AllianzGI Ultra Micro Cap Fund (cont’d)
Average Annual Total Return for the period ended March 31, 2017
| 6 Month* | 1 Year | 5 Year | Since Inception† | |||||||||||||||
| AllianzGI Ultra Micro Cap Fund Class A | 6.21% | 19.87% | 10.73% | 11.56% | ||||||||||||||
| AllianzGI Ultra Micro Cap Fund Class A (adjusted) | 0.37% | 13.28% | 9.48% | 10.87% | |||||||||||||
| AllianzGI Ultra Micro Cap Fund Class P | 6.38% | 20.27% | 11.01% | 11.83% | |||||||||||||
| AllianzGI Ultra Micro Cap Fund Institutional Class | 6.37% | 20.28% | 10.99% | 11.89% | |||||||||||||
| Russell Microcap Growth Index | 4.13% | 20.24% | 10.72% | 7.80% | |||||||||||||
| Lipper Small-Cap Growth Funds Average | 8.56% | 22.09% | 10.49% | 8.49% | ||||||||||||||
† The Fund began operations on January 28, 2008. Benchmark return comparisons began on the fund inception date. Lipper performance comparisons began on January 31, 2008.
* Cumulative returns
Performance quoted represents past performance and is no guarantee of future results. Current performance may be lower or higher than performance shown. For performance current to the most recent month-end, visit our website at us.allianzgi.com. Investment return and the principal value will fluctuate. Shares may be worth more or less than original cost when redeemed. The adjusted returns take into account the maximum initial sales charge of 5.50% on Class A shares. Returns do not reflect deduction of taxes that a shareholder would pay on fund distributions or redemption of fund shares. See pages 133 and 134 for more information. The Fund’s expense ratios are 2.26% for Class A shares, 1.97% for Class P shares and 1.94% for Institutional Class shares. Expense ratio information is as of the Fund’s current prospectus dated February 1, 2017, as revised April 10, 2017.
Cumulative Returns Through March 31, 2017
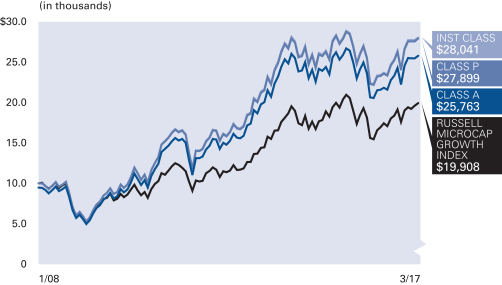
Industry Allocation (as of
March 31, 2017 )
| Biotechnology | 11.0% | |||
| Banks | 9.1% | |||
| Health Care Equipment & Supplies | 8.4% | |||
| Pharmaceuticals | 5.9% | |||
| Semiconductors & Semiconductor Equipment | 5.3% | |||
| Construction & Engineering | 5.0% | |||
| Internet Software & Services | 5.0% | |||
| Health Care Providers & Services | 4.2% | |||
| Other | 44.8% | |||
| Cash & Equivalents — Net | 1.3% |
| Semiannual Report | | March 31, 2017 | 131 |
Table of Contents
Unaudited
AllianzGI Ultra Micro Cap Fund (cont’d)
| Shareholder Expense Example | Actual Performance | |||||
| Class A | Class P | Institutional Class | ||||
| Beginning Account Value (10/1/16) | $1,000.00 | $1,000.00 | $1,000.00 | |||
| Ending Account Value (3/31/17) | $1,062.10 | $1,063.80 | $1,063.70 | |||
| Expenses Paid During Period | $12.34 | $10.65 | $10.65 | |||
| Hypothetical Performance | ||||||
| (5% return before expenses) | ||||||
| Class A | Class P | Institutional Class | ||||
| Beginning Account Value (10/1/16) | $1,000.00 | $1,000.00 | $1,000.00 | |||
| Ending Account Value (3/31/17) | $1,012.96 | $1,014.61 | $1,014.61 | |||
| Expenses Paid During Period | $12.04 | $10.40 | $10.40 | |||
For each class of the Fund, expenses are equal to the annualized expense ratio for the class (2.40% for Class A, 2.07% for Class P and 2.07% for Institutional Class), multiplied by the average account value over the period, multiplied by 182/365.
| 132 | March 31, 2017 | | Semiannual Report |
Table of Contents
Unaudited
Effective September 30, 2015, the Trust’s fiscal year end changed from November 30th to September 30th.
The inception date on each Fund Summary page is the inception date of the Fund’s oldest share class or classes. The AllianzGI Global Allocation Fund reorganized on May 4, 2009 when its predecessor merged into the Trust. The Global Allocation Fund’s shares were first offered in 9/98. On April 12, 2010, the following funds reorganized when their predecessors merged into series of the Trust (including fund’s inception date): AllianzGI Convertible Fund (4/93), AllianzGI High Yield Bond Fund (7/96), AllianzGI International Small-Cap Fund (12/97), AllianzGI U.S. Small-Cap Growth Fund (10/93), AllianzGI Micro Cap Fund (7/95), AllianzGI Ultra Micro Cap Fund (1/08). For each of the reorganized funds, Institutional Class is the oldest share class, except that for AllianzGI International Small-Cap Fund, the oldest share class of the predecessor fund merged into Class P.
The Target-Date Funds are designed to offer individual investors comprehensive asset allocation strategies tailored to the approximate date when they expect to begin withdrawing assets. The target date included in the Fund’s name does not necessarily represent the specific year an investor will begin withdrawing assets. It is intended only as a general guide. Each Fund follows a target asset allocation schedule that changes over time to help reduce portfolio risk, increasing its exposure to conservative investments as the target date approaches. The principal value of a Fund is not guaranteed at any time, including the target date. A Fund’s shareholders may experiences losses, including losses near, at or after the target year indicated in the Fund’s name.
Returns measure performance from the inception of the oldest share class to the present, so some returns predate the inception of the actual share class. Those returns are calculated by adjusting the returns of the oldest share class to reflect the indicated share class’s different operating expenses. Total return performance assumes that all dividend and capital gain distributions were reinvested on the payable date.
Class A shares are subject to an initial sales charge. Class C shares are subject to a 1% contingent deferred sales charge (“CDSC”) for shares redeemed in the first year. Class R shares are generally available only to 401(k) plans, 457 plans, employer sponsored 403(b) plans, profit sharing and money purchase pension plans, defined benefit plans, non-qualified deferred compensation plans and healthcare benefit funding plans. Class P shares are offered primarily through certain asset allocation, wrap fee and other similar programs offered by broker-dealers and other intermediaries. Institutional Class shares are offered primarily for direct investment by investors such as pension and profit sharing plans, employee benefit trusts, endowments, foundations, corporations and high net worth individuals. Administrative Class shares are offered primarily through employee benefit plan alliances, broker-dealers and other intermediaries. Class R6 shares are offered primarily for 401(k) plans, 457 plans, employer sponsored 403(b) plans, profit sharing and money purchase pension plans, defined benefit plans, non-qualified deferred
compensation plans, healthcare benefit funding plans and other specified benefit plans and accounts whereby the plan or the plan’s broker, dealer or other financial Intermediary has an agreement with the Distributor or the Investment Manager to utilize Class R6 shares In certain Investment products or programs.
Class D and Class B shares were converted into Class A shares on November 13, 2015 and December 4, 2015, respectively.
The Lipper Averages are calculated by Lipper, Inc. They are based on the total return performance, with distributions reinvested and operating expenses deducted, of funds included by Lipper in the stated category. Lipper does not take into account sales charges.
The Cumulative Returns charts for each Fund assume the initial investment was made on the first day of the Fund’s initial fiscal year. The charts reflect any sales load that would have applied at the time of purchase or any CDSC that would have applied if a full redemption occurred on the last business day of the most recent fiscal year. Results assume that all dividends and capital gain distributions were reinvested. They do not take into account the effect of taxes. The benchmark cumulative return began on the last day of the month of the respective Fund’s inception date.
Proxy Voting
The Funds’ Investment Manager and Sub-Adviser have adopted written proxy voting policies and procedures (the “Proxy Policy”) as required by Rule 206(4)-6 under the Investment Advisers Act of 1940. The Proxy Policy has been adopted by Allianz Funds Multi-Strategy Trust (the “Trust”) as the policies and procedures that the Investment Manager and Sub-Adviser, as applicable, will use when voting proxies on behalf of the Funds. Copies of the written Proxy Policy and the factors that the Investment Manager and Sub-Adviser may consider in determining how to vote proxies for each Fund, and information about how each Fund voted proxies relating to portfolio securities held during the most recent twelve-month period ended June 30, are available without charge, upon request, by calling 1-800-988-8380 (retail classes: A, C & R) or 1-800-498-5413 (Class P, R6, Institutional & Administrative classes), on the Allianz Global Investors Distributors LLC’s website at us.allianzgi.com, and on the Securities and Exchange Commission’s (“SEC”) website at http://www.sec.gov.
Form N-Q
The Trust files complete schedules of each Fund’s portfolio holdings with the SEC on Form N-Q for the first and third quarters of each fiscal year, which are available on the SEC’s website at http://www.sec.gov. A copy of the Trust’s Form N-Q is available without charge, upon request, by calling 1-800-988-8380 (retail classes: A, C & R) or 1-800-498-5413 (Class P, R6, Institutional & Administrative classes). In addition, the Trust’s Form N-Q may be reviewed and copied at the SEC’s Public Reference Room in Washington, DC. Information on the operation of the Public Reference Room may be obtained by calling 1-800-SEC-0330.
| Semiannual Report | | March 31, 2017 | 133 |
Table of Contents
Unaudited
Important Information (cont’d)
The following disclosure provides important information regarding each Fund’s Shareholder Expense Example, which appears on each Fund Summary page in this Semiannual Report. Please refer to this information when reviewing the Shareholder Expense Example for a Fund.
Shareholder Expense Example
Shareholders of a Fund incur two types of costs: (1) transaction costs; and (2) ongoing costs, including investment management fees; distribution and/or service (12b-1) fees and other Fund expenses. The Shareholder Expense Example is intended to help shareholders understand ongoing costs (in dollars) of investing in a Fund and to compare these costs with the ongoing costs of investing in other mutual funds. The Shareholder Expense Example is based on an investment of $1,000.00 invested at the beginning of the period, as indicated, and held for the entire period through March 31, 2017.
Actual Expenses
The information in the table under the heading “Actual Performance” provides information about actual account values and actual expenses. You may use the information in these columns, together with the amount you invested, to estimate the expenses that you paid over the period. Simply divide your account value by $1,000.00 (for example, an $8,600.00 account value divided by $1,000.00 = 8.6), then multiply the result by the number in the appropriate column for your share class, in the row entitled “Expenses Paid During Period”, to estimate the expenses you paid on your account during this period.
Hypothetical Example for Comparison Purposes
The information in the table under the heading “Hypothetical Performance (5% return before expenses)” provides information about hypothetical account values and hypothetical expenses based on a Fund’s actual expense ratio and an assumed rate of return of 5% per year before expenses, which is not the Fund’s actual return. The hypothetical account values and expenses may not be used to estimate the actual ending account balance or expenses you paid for the period. You may use this information to compare the ongoing costs of investing in a Fund and other funds. To do so, compare this 5% hypothetical example with the 5% hypothetical examples that appear in the shareholder reports of other funds.
Please note that the expenses shown in the table are meant to highlight your ongoing costs only and do not reflect any transactional costs. Therefore, the information under the heading “Hypothetical Performance (5% return before expenses)” is useful in comparing ongoing costs only, and will not help you determine the relative total costs of owning different funds. In addition, if these transactional costs were included, your costs would have been higher.
Shareholders may be subject to an annual fee of $15 for any accounts, including fiduciary accounts, with balances that fall below $1,000. This fee is not included in the shareholder expense example. If you are
subject to the fee, keep it in mind when you are estimating the ongoing expenses of investing in the Funds and when comparing the expenses of these Funds with other funds.
Credit Ratings
Bond ratings apply to the underlying holdings of a Fund and not the Fund itself and are divided into categories ranging from highest to lowest credit quality, determined for purposes of presentations in this report by using ratings provided by Moody’s Investors Service, Inc. (“Moody’s”) or in the case of AllianzGI Convertible Fund, AllianzGI High Yield Bond Fund and AllianzGI Short Duration High Income Fund, S&P Global Ratings (“S&P”).
Unless otherwise noted, presentations of credit ratings information in this report use ratings provided by Moody’s because of, among other reasons, the access to background information and other materials provided by Moody’s, as well as the Funds’ considerations of industry practice. With respect to AllianzGI Convertible Fund, AllianzGI High Yield Bond Fund and AllianzGI Short Duration High Income Fund, presentations of credit ratings information in this report use ratings provided by S&P because of, among other reasons, the applicable portfolio managers’ usage of S&P ratings methodology among other credit quality information in managing the respective portfolios, access to background information and other materials provided by S&P, as well as the Funds’ considerations of industry practice. The Funds also display S&P credit ratings information in materials provided in client presentations.
Bonds not rated by Moody’s or S&P, or bonds that do not have a rating available from Moody’s or S&P are designated as “NR” and “NA”, respectively. Credit quality ratings assigned by a rating agency are subjective opinions, not statements of fact, and are subject to change periodically, even as frequently as daily. Ratings assigned by Moody’s, S&P or another rating agency are not absolute standards of credit quality and do not evaluate market risk. Rating agencies may fail to make timely changes in credit ratings, and an issuer’s current financial condition may be better or worse than a rating indicates. In formulating investment decisions for the applicable Funds, Allianz Global Investors U.S. LLC develops its own analysis of the credit quality and risks associated with individual debt instruments, rather than relying exclusively on rating agencies or third-party research.
All the information on the Fund Summary pages, including Fund Insights, Average Annual Total Return Tables, Cumulative Return Charts, Shareholder Expense Examples and Allocation/Credit Rating Summaries is unaudited.
Allianz Global Investors Distributors LLC, 1633 Broadway, New York, NY, 10019, us.allianzgi.com, 1-800-988-8380 (retail classes: A, C & R) or 1-800-498-5413 (Class P, R6, Institutional & Administrative classes).
| 134 | March 31, 2017 | | Semiannual Report |
Table of Contents
Unaudited
Unless otherwise noted, index returns reflect the reinvestment of income dividends and capital gains, if any, but do not reflect fees, brokerage commissions or other expenses of investing. It is not possible to invest directly in an index.
Prior to November 1, 2006, performance data for the MSCI Indices was calculated gross of dividend tax withholding. Performance data presently shown for the Indices is net of dividend tax withholding. This recalculation results in lower performance for the Indices.
| Index | Description | |
| AllianzGI 2020 Strategic Benchmark, AllianzGI 2025 Strategic Benchmark, AllianzGI 2030 Strategic Benchmark, AllianzGI 2035 Strategic Benchmark, AllianzGI 2040 Strategic Benchmark, AllianzGI 2045 Strategic Benchmark, AllianzGI 2050 Strategic Benchmark and AllianzGI 2055 Strategic Benchmark | The AllianzGI 2020 Strategic Benchmark, AllianzGI 2025 Strategic Benchmark, AllianzGI 2030 Strategic Benchmark, AllianzGI 2035 Strategic Benchmark, AllianzGI 2040 Strategic Benchmark, AllianzGI 2045 Strategic Benchmark, AllianzGI 2050 Strategic Benchmark and AllianzGI 2055 Strategic Benchmark each represents the performance of a custom blended index developed by AllianzGI U.S. For periods prior to October 1, 2016, the blended benchmark is comprised of six underlying indices: Bloomberg Barclays US Treasury Bills 1-3 Month Index, Bloomberg Barclays US TIPS Index, Bloomberg Barclays US Aggregate Bond Index, Dow Jones US Select REIT Index, Bloomberg Commodity Index and MSCI ACWI Index. The proportion of these underlying indices reflected each Target Fund’s strategic glidepath since inception. For this period, the glidepath started with 90% weight to the Equity, REIT and Commodity Indices, and became more conservative to end at the target retirement date with 25% in these indices. Starting October 1, 2016, the blended benchmark is comprised of three underlying indices: MSCI USA Index, MSCI ACWI ex USA Index and Bloomberg Barclays US Aggregate Bond Index. The strategic weights to these indices reflect the glidepath which starts with a 93% weight to the Equity Indices, becoming more conservative to end 5 years past the target retirement date with 30% weight to the equity indices. | |
| AllianzGI Retirement Income Strategic Benchmark | The AllianzGI Retirement Income Strategic Benchmark represents the performance of a custom blended index developed by the Adviser. For periods prior to October 1, 2016, the blended benchmark is comprised of six underlying indices: 10% Bloomberg Barclays US Treasury Bills 1-3 Month Index, 25% Bloomberg Barclays US Treasury US TIPS Index, 40% Bloomberg Barclays US Aggregate Bond Index, 1.5% Dow Jones US Select REIT Index, 3% Bloomberg Commodity Index and 20.5% MSCI ACWI Index. Starting October 1, 2016, the blended benchmark is comprised of three underlying indices: 20% MSCI USA Index, 10% MSCI ACWI ex USA Index and 70% Bloomberg Barclays US Aggregate Bond Index. | |
| Bloomberg Barclays Global Aggregate Bond Index | The Bloomberg Barclays Global Aggregate Bond Index provides a broad-based measure of the global investment-grade fixed income markets. The three major components of this index are the U.S. Aggregate, the Pan-European Aggregate, and the Asian-Pacific Aggregate Indices. The index also includes Eurodollar and Euro-Yen corporate bonds, Canadian government, agency and corporate securities, and USD investment grade 144A securities. | |
| Bloomberg Barclays Global High Yield Index | The Bloomberg Barclays Global High Yield Index is a multi-currency flagship measure of the global high yield debt market. The index represents the union of the US High Yield, the Pan-European High Yield, and Emerging Markets (EM) Hard Currency High Yield Indices. | |
| Bloomberg Barclays US Aggregate Bond Index | The Bloomberg Barclays US Aggregate Bond Index represents securities that are SEC-registered, taxable, and dollar denominated. The index is composed of securities from the Bloomberg Barclays Capital Government/Credit Bond Index, Mortgage-Backed Securities Index, and Asset-Backed Securities Index. It is generally considered to be representative of the domestic, investment-grade, fixed-rate, taxable bond market. | |
| Bloomberg Barclays US Credit Index | The Bloomberg Barclays US Credit Index is the credit component of the US Government/Credit Index. It includes publicly issued US corporate and specified foreign debentures and secured notes that meet the specified maturity, liquidity and quality requirements. To qualify, bonds must be SEC-registered. | |
| Bloomberg Barclays US Government Bond Index | The Bloomberg Barclays US Government Bond Index is the US Government component of the US Government/Credit Index. It includes US dollar-denominated, fixed-rate, nominal US Treasuries and US agency debentures (securities issued by US government owned or government sponsored entities, and debt explicitly guaranteed by the US government. | |
| Semiannual Report | | March 31, 2017 | 135 |
Table of Contents
Unaudited
Benchmark Descriptions (cont’d)
| Index | Description | |
| Bloomberg Barclays US Government Inflation-Linked Bond Index | The Bloomberg Barclays US Government Inflation-Linked Bond Index measures the performance of the US Treasury Inflation Protected Securities (“TIPS”) market. The index includes TIPS with one or more years remaining maturity with total outstanding issue size of $500 million or more. | |
| Bloomberg Barclays US TIPS Index | The Bloomberg Barclays US Treasury US TIPS Index consists of Inflation-Protection securities issued by the US Treasury. | |
| Bloomberg Barclays US Treasury Bills 1-3 Month Index | The Bloomberg Barclays US Treasury Bills 1-3 Month Index includes US Treasury bills with a remaining maturity from 1 up to (but not including) 3 months. | |
| Bloomberg Barclays US Universal Bond Index | The Bloomberg Barclays US Universal Bond Index represents the union of the US Aggregate Index, the US High-Yield Corporate Index, the 144A Index, the Eurodollar Index, the Emerging Markets Index, and the non-ERISA portion of the CMBS Index. Municipal debt, private placements, and non-dollar-denominated issues are excluded from the Universal Index. The only constituent of the index that includes floating-rate debt is the Emerging Markets Index. | |
| Bloomberg Commodity Index | The Bloomberg Commodity Index is a broadly diversified commodity price index distributed by Bloomberg Indexes. | |
| BofA Merrill Lynch 1-3 Year BB US Cash Pay High Yield Index | The BofA Merrill Lynch 1-3 Year BB US Cash Pay High Yield Index is a subset of the BofA Merrill Lynch US Cash Pay High Yield Index, including all securities with a remaining term to final maturity less than 3 years and rated BB1 through BB3, inclusive. The BofA Merrill Lynch US Cash Pay High Yield Index tracks the performance of US dollar-denominated below investment grade corporate debt, currently in a coupon paying period, that is publicly issued in the US domestic market. | |
| BofA Merrill Lynch 3-Month US Treasury Bill Index | The BofA Merrill Lynch 3-Month US Treasury Bill Index tracks the performance of the 3-month US Treasury markets. | |
BofA Merrill Lynch US Convertibles Index | The BofA Merrill Lynch US Convertibles Index tracks the performance of publicly issued US dollar denominated convertible securities of US companies. | |
| BofA Merrill Lynch High Yield Master II Index | The BofA Merrill Lynch High Yield Master II Index is an unmanaged index consisting of US dollar-denominated bonds that are issued in countries having a BBB3 or higher debt rating with at least one year remaining until maturity. All bonds must have a credit rating below investment grade but not in default. | |
| Custom Real Asset Benchmark | The Custom Real Asset Benchmark represents the performance of a hypothetical index developed by AllianzGI U.S. This blended benchmark is comprised of seven underlying indices in the following proportions: 25% Dow Jones UBS Commodity Total Return Index, 25% MSCI World Real Estate Index, 25% Bloomberg Barclays US Government Inflation-Linked Bond Index, 6.25% DAX Global Agribusiness Index, 7.5% MSCI World Energy Index, 6.25% MSCI World Materials Index and 5% MSCI ACWI Industrials (equal-weighted) Index. The Dow Jones UBS Commodity Total Return Index tracks prices of futures contracts on physical commodities on the commodity markets. The MSCI World Real Estate Index is a free float-adjusted market capitalization index that consists of large and mid cap equity REITs across 23 Developed Markets (DM) countries, which generate a majority of their revenue and income from real estate rental and leasing operations. The Bloomberg Barclays US Government Inflation-Linked Bond Index measures the performance of the US Treasury Inflation Protected Securities (TIPS) market. The DAX Global Agribusiness Index replicates the performance of the largest and most liquid agribusiness companies. The MSCI World Energy Index is a component of the MSCI World Index and represents the energy securities defined by MSCI. The MSCI World Materials Index is a component of the MSCI World Index and represents the materials securities defined by MSCI. The MSCI ACWI Industrials (equal-weighted) Index is a component of the MSCI All Country World Index and represents the industrials securities defined by MSCI calculated equal-weighted. Performance data presently shown for MSCI and DAX Indexes is net of dividend tax withholding. It is not possible to invest directly in the blended benchmark or in the indices from which it is derived. | |
| 136 | March 31, 2017 | | Semiannual Report |
Table of Contents
| Index | Description | |
| Dow Jones Sustainability World Total Return Index | The Dow Jones Sustainability World Total Return Index tracks the performance of the top 10% of the 2500 largest companies in the S&P Global Broad Market Index that are the world’s sustainability leaders based on economic, environmental and social criteria. | |
| Dow Jones US Select REIT Index | The Dow Jones US Select REIT Index measures the performance of publicly traded REITs and REIT-like securities. | |
| JP Morgan Corporate Emerging Markets Broad Diversified Index (CEMBI) | The JP Morgan Corporate Emerging Markets Broad Index (CEMBI) tracks total returns of US dollar-denominated debt instruments issued by corporate entities in emerging market countries. Two variations are available: CEMBI Broad and CEMBI. The CEMBI Broad is the most comprehensive corporate benchmark followed by the CEMBI, which consists of an investable universe of corporate bonds. Both indices are also available in Diversified versions. | |
| JP Morgan Emerging Markets Bond Index Global (EMBI Global) | The JP Morgan Emerging Markets Bond Index Global (EMBI Global) tracks total returns for US dollar-denominated debt instruments issued by emerging market sovereign entities: Brady bonds, loans, Eurobonds. | |
| JP Morgan Emerging Markets Bond Index Global Diversified (EMBI Global Diversified) | The JP Morgan Emerging Markets Bond Index Global Diversified (EMBI Global Diversified) is a uniquely-weighted version of the EMBI Global. It limits the weights of those index countries with larger debt stocks by only including specified portions of these countries’ eligible current face amounts of debt outstanding. The countries covered in the EMBI Global Diversified are identical to those covered by the EMBI Global. | |
| JP Morgan Government Bond Index-Emerging Markets (GBI-EM) | The JP Morgan Government Bond Index-Emerging Markets (GBI-EM) is the first comprehensive, global local emerging markets index, and consists of regularly traded, liquid fixed-rate, domestic currency government bonds to which international investors can gain exposure. Variations of the index are available to allow investors to select the most appropriate benchmark for their objectives. | |
| Morningstar Lifetime Conservative Series: Morningstar Lifetime Conservative 2020, Morningstar Lifetime Conservative 2025, Morningstar Lifetime Conservative 2030, Morningstar Lifetime Conservative 2035, Morningstar Lifetime Conservative 2040, Morningstar Lifetime Conservative 2045, Morningstar Lifetime Conservative 2050, Morningstar Lifetime Conservative 2055 and Morningstar Lifetime Conservative Income | The Morningstar Lifetime Conservative 2020, Morningstar Lifetime Conservative 2025, Morningstar Lifetime Conservative 2030, Morningstar Lifetime Conservative 2035, Morningstar Lifetime Conservative 2040, Morningstar Lifetime Conservative 2045, Morningstar Lifetime Conservative 2050, Morningstar Lifetime Conservative 2055 and Morningstar Lifetime Conservative Income Indices each represents a portfolio of global equities, bonds and traditional inflation hedges such as commodities and TIPS. The portfolio is held in proportions appropriate for a US investor’s investment horizon until retirement. The conservative risk profile is for investors who are comfortable with below-average exposure to equity market volatility. | |
Morningstar Lifetime Moderate 2020, Morningstar Lifetime Moderate 2025, Morningstar Lifetime Moderate 2030, Morningstar Lifetime Moderate 2035, Morningstar Lifetime Moderate 2040, Morningstar Lifetime Moderate 2045, Morningstar Lifetime Moderate 2050 and Morningstar Lifetime Moderate 2055 | The Morningstar Lifetime Moderate 2020, Morningstar Lifetime Moderate 2025, Morningstar Lifetime Moderate 2030, Morningstar Lifetime Moderate 2035, Morningstar Lifetime Moderate 2040, Morningstar Lifetime Moderate 2045, Morningstar Lifetime Moderate 2050 and Morningstar Lifetime Moderate 2055 Indices each represents a portfolio of global equities, bonds and traditional inflation hedges such as commodities and TIPS. The portfolio is held in proportions appropriate for a U.S. investor’s investment horizon until retirement. The moderate risk profile is for investors who are comfortable with average exposure to equity market volatility. | |
| MSCI ACWI ex USA Growth Index | The MSCI ACWI ex USA Growth Index captures large and mid-cap securities exhibiting overall growth style characteristics across developed and emerging markets, excluding the United States. | |
| Semiannual Report | | March 31, 2017 | 137 |
Table of Contents
Unaudited
Benchmark Descriptions (cont’d)
| Index | Description | |
| MSCI ACWI ex USA Index | The MSCI ACWI ex USA Index captures large and mid cap representation across Developed Markets countries (excluding the US) and Emerging Markets countries. The index covers approximately 85% of the global equity opportunity set outside the US. | |
| MSCI All Country World Index (Also known as: MSCI AC World Index and MSCI ACWI) | The MSCI All Country World Index (ACWI) captures large and mid cap representation across Developed Markets and Emerging Markets countries. The index covers approximately 85% of the global investable equity opportunity set. | |
MSCI EAFE Index | The MSCI EAFE Index is an equity index which captures large and mid cap representation across Developed Markets countries around the world, excluding the US and Canada. The index covers approximately 85% of the free float-adjusted market capitalization in each country. | |
| MSCI EAFE Small Cap Index | The MSCI EAFE Small Cap Index is an equity index which captures small cap representation across Developed Markets countries around the world, excluding the US and Canada. | |
| MSCI Emerging Markets Index | The MSCI Emerging Markets Index captures large and mid cap representation across Emerging Markets countries. The index covers approximately 85% of the free float-adjusted market capitalization in each country. | |
| MSCI Emerging Markets Small Cap Index | The MSCI Emerging Markets Small Cap Index includes small cap representation across 23 Emerging Markets countries. The index covers approximately 14% of the free float-adjusted market capitalization in each country. The Small cap segment tends to capture more local economic and sector characteristics relative to larger Emerging Markets capitalization segments. | |
| MSCI Europe Index (Net) | The MSCI Europe Index (Net) ptures large and mid cap representation across Developed Markets countries in Europe. The index covers approximately 85% of the free float-adjusted market capitalization across the European Developed Markets equity universe. | |
MSCI USA Index | The MSCI USA Index is designed to measure the performance of the large and mid cap segments of the US market. The index covers approximately 85% of the free float-adjusted market capitalization in the US. | |
| MSCI World ex USA Small Cap Index | The MSCI World ex USA Small Cap Index captures small cap representation across Developed Markets countries excluding the United States. | |
MSCI World High Dividend Yield Index | The MSCI World High Dividend Yield Index is based on the MSCI World Index, its parent index, and includes large and mid cap stocks across 23 Developed Markets countries. The index is designed to reflect the performance of equities in the parent index (excluding REITs) with higher dividend income and quality characteristics than average dividend yields that are both sustainable and persistent. The index also applies quality screens and reviews 12-month past performance to omit stocks with potentially deteriorating fundamentals that could force them to cut or reduce dividends. Performance data shown for the index is net of dividend tax withholding. | |
| MSCI World Index | The MSCI World Index captures large and mid cap representation across Developed Markets countries. The index covers approximately 85% of the free float-adjusted market capitalization in each country. | |
MSCI World Real Estate Index | The MSCI World Real Estate Index is a free float-adjusted market capitalization index that consists of large and mid-cap equity across Developed Markets countries. All securities in the index are classified in the Real Estate Sector according to the Global Industry Classification Standard (GICS®). | |
| Russell 1000 Index | The Russell 1000 Index is an unmanaged index that consists of the 1,000 largest companies in the Russell 3000 Index and represents approximately 90% of the total market capitalization of the Russell 3000 Index. It is highly correlated with the S&P 500 Index. | |
| Russell 2000 Growth Index | The Russell 2000 Growth Index is an unmanaged index composed of those Russell 2000 Index companies with higher price-to-book ratios and higher forecasted growth values. | |
| 138 | March 31, 2017 | | Semiannual Report |
Table of Contents
| Index | Description | |
| Russell 2000 Index | The Russell 2000 Index measures the performance of the small cap segment of the US equity universe. The Russell 2000 Index is a subset of the Russell 3000 Index and represents approximately 10% of total market capitalization of that index. | |
| Russell 2000 Value Index | The Russell 2000 Value Index is an unmanaged index that measures the performance of those Russell 2000 Index companies with lower price-to-book ratios and lower forecasted growth values. | |
| Russell Microcap Growth Index | The Russell Microcap Growth Index measures the performance of the microcap growth segment of the US equity market. It includes those Russell Microcap Index companies with higher price-to-book ratios and higher forecasted growth values. | |
| Russell Microcap Index | The Russell Microcap Index measures the performance of the microcap segment of the US equity market. It makes up less than 3% of the US equity market. | |
| S&P 500 Index | The Standard & Poor’s 500 Index is an unmanaged market index generally considered representative of the stock market as a whole. The Index focuses on the large cap segment of the US equities market. | |
| S&P Global Water Index | The Standard & Poor’s Global Water Index is comprised of 50 of the largest publicly traded companies in water-related businesses that meet specific investability requirements. This index is designed to provide liquid exposure to the leading publicly-listed companies in the global water industry, from both developed markets and emerging markets. | |
| USD Overnight LIBOR | USD Overnight LIBOR (London Interbank Offered Rate) is the average interest rate at which leading banks in London borrow US dollar funds from one another with a maturity of one day (overnight). | |
| Semiannual Report | | March 31, 2017 | 139 |
Table of Contents
March 31, 2017 (Unaudited)
AllianzGI Retirement 2020 Fund
| Shares | Value | |||||||
| Mutual Funds (a)—92.3% | ||||||||
AllianzGI Advanced Core Bond | 604,895 | $8,904,061 | ||||||
AllianzGI Best Styles U.S. Equity (c) | 354,547 | 6,016,661 | ||||||
AllianzGI Emerging Markets Debt (b) | 57,073 | 833,841 | ||||||
AllianzGI Emerging Markets Small-Cap (b) | 17,765 | 291,168 | ||||||
AllianzGI Global Dynamic Allocation (c) | 1,685,522 | 32,092,332 | ||||||
AllianzGI Short Duration High Income (c) | 72,911 | 1,103,875 | ||||||
|
| |||||||
| Total Mutual Funds (cost—$47,962,469) | 49,241,938 | |||||||
|
| |||||||
| Exchange-Traded Funds—2.7% | ||||||||
Vanguard Intermediate-Term Corporate Bond (cost—$1,462,708) | 16,785 | 1,449,889 | ||||||
|
| |||||||
| Principal Amount (000s) | ||||||||
| Repurchase Agreements—4.4% | ||||||||
State Street Bank and Trust Co., dated 3/31/17, 0.09%, due 4/3/17, proceeds $2,349,018; collateralized by U.S. Treasury Notes, 2.25%, due 11/15/25, valued at $2,400,077 including accrued interest |
| |||||||
(cost—$2,349,000) | $2,349 | 2,349,000 | ||||||
|
| |||||||
| Total Investments (cost—$51,774,177)—99.4% | 53,040,827 | |||||||
|
| |||||||
| Other assets less liabilities (d)—0.6% | 305,540 | |||||||
|
| |||||||
| Net Assets—100.0% | $53,346,367 | |||||||
|
| |||||||
Notes to Schedule of Investments:
(a) Affiliated fund.
(b) Institutional Class share.
(c) Class R6 share.
(d) Includes net unrealized appreciation (depreciation) of other financial instruments. See Notes 7(b) and 7(c) in the Notes to Financial Statements.
AllianzGI Retirement 2025 Fund
| Shares | Value | |||||||
| Mutual Funds (a)—95.1% | ||||||||
AllianzGI Advanced Core Bond | 313,239 | $4,610,875 | ||||||
AllianzGI Best Styles Global Equity (c) | 1,325 | 22,435 | ||||||
AllianzGI Best Styles U.S. Equity (c) | 362,547 | 6,152,430 | ||||||
AllianzGI Emerging Markets Debt (b) | 21,196 | 309,674 | ||||||
AllianzGI Emerging Markets Small-Cap (b) | 19,074 | 312,627 | ||||||
AllianzGI Global Dynamic Allocation (c) | 2,463,985 | 46,914,271 | ||||||
AllianzGI Short Duration High Income (c) | 25 | 372 | ||||||
|
| |||||||
| Total Mutual Funds (cost—$56,453,495) | 58,322,684 | |||||||
|
| |||||||
| Principal Amount (000s) | ||||||||
| Repurchase Agreements—3.8% | ||||||||
State Street Bank and Trust Co., dated 3/31/17, 0.09%, due 4/3/17, proceeds $2,309,017; collateralized by U.S. Treasury Notes, 2.00%, due 11/25/26, valued at $2,355,660 including accrued interest |
| |||||||
(cost—$2,309,000) | $2,309 | 2,309,000 | ||||||
|
| |||||||
| Total Investments (cost—$58,762,495)—98.9% | 60,631,684 | |||||||
|
| |||||||
| Other assets less liabilities (d)—1.1% | 681,958 | |||||||
|
| |||||||
| Net Assets—100.0% | $61,313,642 | |||||||
|
| |||||||
Notes to Schedule of Investments:
(a) Affiliated fund.
(b) Institutional Class share.
(c) Class R6 share.
(d) Includes net unrealized appreciation (depreciation) of other financial instruments. See Notes 7(b) and 7(c) in the Notes to Financial Statements.
AllianzGI Retirement 2030 Fund
| Shares | Value | |||||||
| Mutual Funds (a)—96.2% | ||||||||
AllianzGI Best Styles Global Equity (c) | 296,671 | $5,022,638 | ||||||
AllianzGI Best Styles U.S. Equity (c) | 546,572 | 9,275,320 | ||||||
AllianzGI Emerging Markets Small-Cap (b) | 43,264 | 709,094 | ||||||
AllianzGI Global Dynamic Allocation (c) | 2,526,152 | 48,097,926 | ||||||
|
| |||||||
| Total Mutual Funds (cost—$60,166,617) | 63,104,978 | |||||||
|
| |||||||
| Principal Amount (000s) | ||||||||
| Repurchase Agreements—1.5% | ||||||||
State Street Bank and Trust Co., dated 3/31/17, 0.09%, due 4/3/17, proceeds $951,007; collateralized by U.S. Treasury Notes, 2.25%, due 11/15/25, valued at $973,004 including accrued interest |
| |||||||
(cost—$951,000) | $951 | 951,000 | ||||||
|
| |||||||
| Total Investments (cost—$61,117,617)—97.7% | 64,055,978 | |||||||
|
| |||||||
| Other assets less liabilities (d)—2.3% | 1,525,175 | |||||||
|
| |||||||
| Net Assets—100.0% | $65,581,153 | |||||||
|
| |||||||
Notes to Schedule of Investments:
(a) Affiliated fund.
(b) Institutional Class share.
(c) Class R6 share.
(d) Includes net unrealized appreciation (depreciation) of other financial instruments. See Notes 7(b) and 7(c) in the Notes to Financial Statements.
| 140 | Semiannual Report | | March 31, 2017 | | See accompanying Notes to Financial Statements |
Table of Contents
Schedule of Investments
March 31, 2017 (Unaudited)
AllianzGI Retirement 2035 Fund
| Shares | Value | |||||||
| Mutual Funds (a)— 95.7% | ||||||||
AllianzGI Best Styles Global Equity (c) | 900,956 | $15,253,177 | ||||||
AllianzGI Best Styles U.S. Equity (c) | 510,804 | 8,668,337 | ||||||
AllianzGI Emerging Markets Small-Cap (b) | 35,555 | 582,751 | ||||||
AllianzGI Global Dynamic Allocation (c) | 1,315,054 | 25,038,632 | ||||||
|
| |||||||
| Total Mutual Funds (cost—$46,675,114) | 49,542,897 | |||||||
|
| |||||||
| Principal Amount (000s) | ||||||||
| Repurchase Agreements—3.0% | ||||||||
State Street Bank and Trust Co., dated 3/31/17, 0.09%, due 4/3/17, proceeds $1,578,012; collateralized by U.S. Treasury Notes, 2.00%, due 11/25/26, valued at $1,612,534 including accrued interest |
| |||||||
(cost—$1,578,000) | $1,578 | 1,578,000 | ||||||
|
| |||||||
| Total Investments (cost—$48,253,114)—98.7% | 51,120,897 | |||||||
|
| |||||||
| Other assets less liabilities (d)—1.3% | 665,645 | |||||||
|
| |||||||
| Net Assets—100.0% | $51,786,542 | |||||||
|
| |||||||
Notes to Schedule of Investments:
(a) Affiliated fund.
(b) Institutional Class share.
(c) Class R6 share.
(d) Includes net unrealized appreciation (depreciation) of other financial instruments. See Notes 7(b) and 7(c) in the Notes to Financial Statements.
AllianzGI Retirement 2040 Fund
| Shares | Value | |||||||
| Mutual Funds (a)—95.6% | ||||||||
AllianzGI Best Styles Global Equity (c) | 1,261,778 | $21,361,904 | ||||||
AllianzGI Best Styles U.S. Equity (c) | 535,524 | 9,087,848 | ||||||
AllianzGI Emerging Markets Small-Cap (b) | 30,202 | 495,005 | ||||||
AllianzGI Global Dynamic Allocation (c) | 756,437 | 14,402,570 | ||||||
|
| |||||||
| Total Mutual Funds (cost—$42,352,240) | 45,347,327 | |||||||
|
| |||||||
| Principal Amount (000s) | ||||||||
| Repurchase Agreements—2.4% | ||||||||
State Street Bank and Trust Co., dated 3/31/17, 0.09%, due 4/3/17, proceeds $1,155,009; collateralized by U.S. Treasury Notes, 2.00%, due 11/25/26, valued at $1,180,258 including accrued interest |
| |||||||
(cost—$1,155,000) | $1,155 | 1,155,000 | ||||||
|
| |||||||
| Total Investments (cost—$43,507,240)—98.0% | 46,502,327 | |||||||
|
| |||||||
| Other assets less liabilities (d)—2.0% | 969,897 | |||||||
|
| |||||||
| Net Assets—100.0% | $47,472,224 | |||||||
|
| |||||||
Notes to Schedule of Investments:
(a) Affiliated fund.
(b) Institutional Class share.
(c) Class R6 share.
(d) Includes net unrealized appreciation (depreciation) of other financial instruments. See Notes 7(b) and 7(c) in the Notes to Financial Statements.
AllianzGI Retirement 2045 Fund
| Shares | Value | |||||||
| Mutual Funds (a)—94.5% | ||||||||
AllianzGI Best Styles Global Equity (c) | 933,014 | $15,795,921 | ||||||
AllianzGI Best Styles U.S. Equity (c) | 344,134 | 5,839,950 | ||||||
AllianzGI Emerging Markets Small-Cap (b) | 17,824 | 292,137 | ||||||
AllianzGI Global Dynamic Allocation (c) | 322,191 | 6,134,521 | ||||||
|
| |||||||
| Total Mutual Funds (cost—$26,113,824) | 28,062,529 | |||||||
|
| |||||||
| Principal Amount (000s) | ||||||||
| Repurchase Agreements—4.1% | ||||||||
State Street Bank and Trust Co., dated 3/31/17, 0.09%, due 4/3/17, proceeds $1,205,009; collateralized by U.S. Treasury Notes, 2.00%, due 11/25/26, valued at $1,233,686 including accrued interest |
| |||||||
(cost—$1,205,000) | $1,205 | 1,205,000 | ||||||
|
| |||||||
| Total Investments (cost—$27,318,824)—98.6% | 29,267,529 | |||||||
|
| |||||||
| Other assets less liabilities (d)—1.4% | 412,635 | |||||||
|
| |||||||
| Net Assets—100.0% | $29,680,164 | |||||||
|
| |||||||
Notes to Schedule of Investments:
(a) Affiliated fund.
(b) Institutional Class share.
(c) Class R6 share.
(d) Includes net unrealized appreciation (depreciation) of other financial instruments. See Notes 7(b) and 7(c) in the Notes to Financial Statements.
| See accompanying Notes to Financial Statements | | March 31, 2017 | | Semiannual Report | 141 |
Table of Contents
Schedule of Investments
March 31, 2017 (Unaudited)
AllianzGI Retirement 2050 Fund
| Shares | Value | |||||||
| Mutual Funds (a)—95.0% | ||||||||
AllianzGI Best Styles Global Equity (c) | 933,176 | $15,798,662 | ||||||
AllianzGI Best Styles U.S. Equity (c) | 337,684 | 5,730,489 | ||||||
AllianzGI Emerging Markets Small-Cap (b) | 17,132 | 280,788 | ||||||
AllianzGI Global Dynamic Allocation (c) | 263,477 | 5,016,602 | ||||||
|
| |||||||
| Total Mutual Funds (cost—$24,934,485) | 26,826,541 | |||||||
|
| |||||||
| Principal Amount (000s) | ||||||||
| Repurchase Agreements—4.8% | ||||||||
State Street Bank and Trust Co., dated 3/31/17, 0.09%, due 4/3/17, proceeds $1,353,010; collateralized by U.S. Treasury Notes, 2.00%, due 11/25/26, valued at $1,384,254 including accrued interest |
| |||||||
(cost—$1,353,000) | $1,353 | 1,353,000 | ||||||
|
| |||||||
| Total Investments (cost—$26,287,485)—99.8% | 28,179,541 | |||||||
|
| |||||||
| Other assets less liabilities (d)—0.2% | 59,589 | |||||||
|
| |||||||
| Net Assets—100.0% | $28,239,130 | |||||||
|
| |||||||
Notes to Schedule of Investments:
(a) Affiliated fund.
(b) Institutional Class share.
(c) Class R6 share.
(d) Includes net unrealized appreciation (depreciation) of other financial instruments. See Notes 7(b) and 7(c) in the Notes to Financial Statements.
AllianzGI Retirement 2055 Fund
| Shares | Value | |||||||
| Mutual Funds (a)—94.3% | ||||||||
AllianzGI Best Styles Global Equity (c) | 380,949 | $6,449,475 | ||||||
AllianzGI Best Styles U.S. Equity (c) | 139,133 | 2,361,090 | ||||||
AllianzGI Emerging Markets Small-Cap (b) | 6,087 | 99,772 | ||||||
AllianzGI Global Dynamic Allocation (c) | 106,175 | 2,021,564 | ||||||
|
| |||||||
| Total Mutual Funds (cost—$10,206,239) | 10,931,901 | |||||||
|
| |||||||
| Principal Amount (000s) | ||||||||
| Repurchase Agreements—3.8% | ||||||||
State Street Bank and Trust Co., dated 3/31/17, 0.09%, due 4/3/17, proceeds $440,003; collateralized by U.S. Treasury Notes, 2.00%, due 11/25/26, valued at $451,704 including accrued interest |
| |||||||
(cost—$440,000) | $440 | 440,000 | ||||||
|
| |||||||
| Total Investments (cost—$10,646,239)—98.1% | 11,371,901 | |||||||
|
| |||||||
| Other assets less liabilities (d)—1.9% | 216,690 | |||||||
|
| |||||||
| Net Assets—100.0% | $11,588,591 | |||||||
|
| |||||||
Notes to Schedule of Investments:
(a) Affiliated fund.
(b) Institutional Class share.
(c) Class R6 share.
(d) Includes net unrealized appreciation (depreciation) of other financial instruments. See Notes 7(b) and 7(c) in the Notes to Financial Statements.
AllianzGI Retirement Income Fund
| Shares | Value | |||||||
| Mutual Funds—77.5% | ||||||||
AllianzGI Emerging Markets Debt (b)(c) | 198,519 | $2,900,366 | ||||||
AllianzGI High Yield Bond (b)(c) | 643,225 | 5,743,999 | ||||||
AllianzGI NFJ Global Dividend Value (b)(c) | 324,512 | 5,279,810 | ||||||
AllianzGI Short Duration High Income (b)(d) | 696,003 | 10,537,486 | ||||||
Harvest Funds Intermediate Bond (c) | 170,557 | 1,732,862 | ||||||
PIMCO Capital Securities and Financials (b)(c) | 309,817 | 3,166,331 | ||||||
PIMCO Income (b)(c) | 474,317 | 5,805,642 | ||||||
PIMCO Long-Term Credit (b)(c) | 364,250 | 4,236,225 | ||||||
PIMCO Mortgage Opportunities (b)(c) | 95,367 | 1,046,177 | ||||||
|
| |||||||
| Total Mutual Funds (cost—$39,579,947) | 40,448,898 | |||||||
|
| |||||||
| Common Stock—16.1% | ||||||||
| Equity Real Estate Investment Trusts (REITs)—10.9% | ||||||||
Apple Hospitality REIT, Inc. | 7,519 | 143,613 | ||||||
Ascendas Real Estate Investment Trust | 87,700 | 157,928 | ||||||
AvalonBay Communities, Inc. | 766 | 140,638 | ||||||
Camden Property Trust | 1,886 | 151,748 | ||||||
Care Capital Properties, Inc. | 12,900 | 346,623 | ||||||
CBL & Associates Properties, Inc. | 39,779 | 379,492 | ||||||
Citycon Oyj | 66,707 | 157,903 | ||||||
Crown Castle International Corp. | 2,039 | 192,584 | ||||||
DDR Corp. | 11,510 | 144,220 | ||||||
EPR Properties | 3,090 | 227,517 | ||||||
Gaming and Leisure Properties, Inc. | 9,513 | 317,924 | ||||||
Hospitality Properties Trust | 4,790 | 151,029 | ||||||
Iron Mountain, Inc. | 4,293 | 153,131 | ||||||
Keppel | 235,400 | 176,695 | ||||||
Lexington Realty Trust | 13,857 | 138,293 | ||||||
Mapletree Industrial Trust | 226,400 | 288,089 | ||||||
Medical Properties Trust, Inc. | 13,375 | 172,404 | ||||||
MGM Growth Properties LLC, Class A | 5,783 | 156,430 | ||||||
Omega Healthcare Investors, Inc. | 7,022 | 231,656 | ||||||
Park Hotels & Resorts, Inc. | 10,108 | 259,472 | ||||||
Realty Income Corp. | 2,559 | 152,337 | ||||||
Select Income REIT | 11,324 | 292,046 | ||||||
Senior Housing Properties Trust | 11,562 | 234,130 | ||||||
Simon Property Group, Inc. | 878 | 151,042 | ||||||
Uniti Group, Inc. | 15,778 | 407,861 | ||||||
Washington Prime Group, Inc. | 18,400 | 159,896 | ||||||
WP Carey, Inc. | 3,372 | 209,806 | ||||||
|
| |||||||
| 5,694,507 | ||||||||
|
| |||||||
| Mortgage Real Estate Investment Trusts (REITs)—5.2% | ||||||||
AGNC Investment Corp. | 16,872 | 335,584 | ||||||
Annaly Capital Management, Inc. | 30,012 | 333,433 | ||||||
Apollo Commercial Real Estate Finance, Inc. | 18,080 | 340,085 | ||||||
Chimera Investment Corp. | 17,403 | 351,193 | ||||||
CYS Investments, Inc. | 42,662 | 339,163 | ||||||
| 142 | Semiannual Report | | March 31, 2017 | | See accompanying Notes to Financial Statements |
Table of Contents
Schedule of Investments
March 31, 2017 (Unaudited)
| Shares | Value | |||||||
New Residential Investment Corp. | 19,729 | $ | 334,998 | |||||
PennyMac Mortgage Investment Trust | 19,771 | 350,935 | ||||||
Two Harbors Investment Corp. | 36,067 | 345,883 | ||||||
|
| |||||||
| 2,731,274 | ||||||||
|
| |||||||
| Total Common Stock (cost—$8,235,513) | 8,425,781 | |||||||
|
| |||||||
| Exchange-Traded Funds—3.8% | ||||||||
Alerian MLP | 157,624 | 2,003,401 | ||||||
|
| |||||||
| Rights (e)—0.0% | ||||||||
| Food & Staples Retailing—0.0% | ||||||||
Safeway CVR—Casa Ley, expires 1/30/18 | 541 | 549 | ||||||
Safeway CVR—PDC, | 541 | 27 | ||||||
|
| |||||||
| Total Rights (cost—$576) | 576 | |||||||
|
| |||||||
| Principal Amount (000s) | ||||||||
| Repurchase Agreements—0.9% | ||||||||
State Street Bank and Trust Co., dated 3/31/17, 0.09%, due 4/3/17, proceeds $463,003; collateralized by U.S. Treasury Notes, 2.00%, due 11/25/26, valued at $475,989 including accrued interest |
| |||||||
(cost—$463,000) | $463 | 463,000 | ||||||
|
| |||||||
| Total Investments (cost—$50,247,351) (a)—98.3% | 51,341,656 | |||||||
|
| |||||||
| Other assets less liabilities (f)—1.7% | 872,892 | |||||||
|
| |||||||
| Net Assets—100.0% | $52,214,548 | |||||||
|
| |||||||
Notes to Schedule of Investments:
(a) Securities with an aggregate value of $603,920, representing 1.2% of net assets, were valued utilizing modeling tools provided by a third-party vendor. See Note 1(a) and Note 1(b) in the Notes to Financial Statements.
(b) Affiliated fund.
(c) Institutional Class share.
(d) Class R6 share.
(e) Non-income producing.
(f) Includes net unrealized appreciation (depreciation) of other financial instruments. See Notes 7(b) and 7(c) in the Notes to Financial Statements.
Glossary:
CVR—Contingent Value Rights
REIT—Real Estate Investment Trust
AllianzGI Global Allocation Fund
| Shares | Value | |||||||
| Mutual Funds (a)—91.3% | ||||||||
AllianzGI Advanced Core Bond | 7,596,318 | $111,817,802 | ||||||
AllianzGI Best Styles Global Equity (c) | 11,575,653 | 195,975,801 | ||||||
AllianzGI Best Styles Global Managed Volatility | 2,937,432 | 48,262,001 | ||||||
AllianzGI Emerging Markets Debt (b) | 1,354,310 | 19,786,470 | ||||||
AllianzGI Emerging Markets Small-Cap (b) | 342,371 | 5,611,461 | ||||||
AllianzGI High Yield Bond (b) | 353,900 | 3,160,331 | ||||||
AllianzGI International Growth (b) | 1,502,761 | 24,990,920 | ||||||
AllianzGI Structured Return (c) | 471,549 | 7,469,336 | ||||||
|
| |||||||
| Total Mutual Funds (cost—$385,486,545) | 417,074,122 | |||||||
|
| |||||||
| Exchange-Traded Funds—2.0% | ||||||||
PIMCO Broad U.S. TIPS Index (a) | 157,612 | 9,171,963 | ||||||
|
| |||||||
| Principal Amount (000s) | ||||||||
| U.S. Treasury Obligations—1.1% | ||||||||
U.S. Treasury Notes, | $5,000 | 5,140,430 | ||||||
|
| |||||||
| Repurchase Agreements—5.3% | ||||||||
State Street Bank and Trust Co., dated 3/31/17, 0.09%, due 4/3/17, proceeds $24,074,181; collateralized by U.S. Treasury Notes, 2.00%, due 11/25/26, valued at $24,557,144 |
| |||||||
(cost— | 24,074 | 24,074,000 | ||||||
|
| |||||||
| Total Investments (cost—$423,697,858)—99.7% | 455,460,515 | |||||||
|
| |||||||
| Other assets less liabilities (d)—0.3% | 1,421,510 | |||||||
|
| |||||||
| Net Assets—100.0% | $456,882,025 | |||||||
|
| |||||||
Notes to Schedule of Investments:
(a) Affiliated fund.
(b) Institutional Class share.
(c) Class R6 share.
(d) Includes net unrealized appreciation (depreciation) of other financial instruments. See Notes 7(b) and 7(c) in the Notes to Financial Statements.
Glossary:
TIPS—Treasury Inflation Protected Securities
AllianzGI Global Megatrends Fund
| Shares | Value | |||||||
| Mutual Funds (a)(b)—94.4% | ||||||||
AllianzGI Emerging Markets Consumer | 47,130 | $670,193 | ||||||
AllianzGI Global Natural Resources | 39,873 | 629,996 | ||||||
AllianzGI Global Water | 43,669 | 605,695 | ||||||
AllianzGI Health Sciences (c) | 22,122 | 662,987 | ||||||
AllianzGI Technology | 11,448 | 711,828 | ||||||
|
| |||||||
| Total Mutual Funds (cost—$3,263,137) | 3,280,699 | |||||||
|
| |||||||
| Principal Amount (000s) | ||||||||
| Repurchase Agreements—5.2% | ||||||||
State Street Bank and Trust Co., dated 3/31/17, 0.09%, due 4/3/17, proceeds $181,001; collateralized by U.S. Treasury Notes, 2.00%, due 11/25/26, valued at $189,424 including accrued interest |
| |||||||
(cost—$181,000) | $181 | 181,000 | ||||||
|
| |||||||
| Total Investments (cost—$3,444,137)—99.6% | 3,461,699 | |||||||
|
| |||||||
| Other assets less liabilities—0.4% | 15,008 | |||||||
|
| |||||||
| Net Assets—100.0% | $3,476,707 | |||||||
|
| |||||||
Notes to Schedule of Investments:
(a) Affiliated fund.
(b) Institutional Class share.
(c) Non-income producing.
| See accompanying Notes to Financial Statements | | March 31, 2017 | | Semiannual Report | 143 |
Table of Contents
Schedule of Investments
March 31, 2017 (Unaudited)
AllianzGI Best Styles Emerging Markets Equity Fund
| Shares | Value | |||||||
| Common Stock—80.8% | ||||||||
| Brazil—5.2% | ||||||||
Banco Bradesco S.A. | 3,400 | $34,808 | ||||||
Banco do Brasil S.A. | 8,100 | 87,375 | ||||||
Banco Santander Brasil S.A. UNIT | 1,700 | 15,015 | ||||||
BM&FBovespa S.A.—Bolsa de Valores Mercadorias e Futuros (b) | 657 | 4,048 | ||||||
Cia de Saneamento de Minas Gerais—COPASA | 1,200 | 16,942 | ||||||
Cosan Ltd., Class A | 5,471 | 46,722 | ||||||
Cosan S.A. Industria e Comercio | 3,900 | 48,411 | ||||||
JBS S.A. | 4,600 | 15,002 | ||||||
MRV Engenharia e Participacoes S.A. | 11,400 | 52,292 | ||||||
Sao Martinho S.A. | 1,200 | 6,624 | ||||||
|
| |||||||
| 327,239 | ||||||||
|
| |||||||
| China—30.1% | ||||||||
Agricultural Bank of China Ltd., Class H | 94,000 | 43,351 | ||||||
Alibaba Group Holding Ltd. ADR (e) | 1,690 | 182,233 | ||||||
BAIC Motor Corp., Ltd., Class H (a) | 7,000 | 7,956 | ||||||
Baidu, Inc. ADR (e) | 160 | 27,603 | ||||||
Bank of China Ltd., Class H | 158,000 | 78,570 | ||||||
Bank of Communications Co., Ltd., Class H | 84,000 | 65,387 | ||||||
BYD Electronic International Co., Ltd. | 8,500 | 11,811 | ||||||
China Biologic Products, Inc. (e) | 364 | 36,447 | ||||||
China Communications Services Corp., Ltd., Class H | 18,000 | 11,788 | ||||||
China Construction Bank Corp., Class H | 100,000 | 80,571 | ||||||
China Everbright Bank Co., Ltd., Class H | 47,000 | 22,987 | ||||||
China High Speed Transmission Equipment Group Co., Ltd. | 6,000 | 6,789 | ||||||
China Merchants Bank Co., Ltd., Class H | 24,000 | 63,513 | ||||||
China Minsheng Banking Corp., Ltd., Class H | 42,000 | 44,897 | ||||||
China Mobile Ltd. | 1,500 | 16,496 | ||||||
China Mobile Ltd. ADR | 752 | 41,533 | ||||||
China Petroleum & Chemical Corp., Class H | 114,000 | 92,792 | ||||||
China Power International Development Ltd. | 73,000 | 27,153 | ||||||
China Southern Airlines Co., Ltd., Class H | 10,000 | 6,926 | ||||||
Chinasoft International Ltd. (e) | 18,000 | 10,363 | ||||||
Chongqing Rural Commercial Bank Co., Ltd., Class H | 69,000 | 46,616 | ||||||
Geely Automobile Holdings Ltd. | 10,000 | 15,326 | ||||||
Guangzhou Automobile Group Co., Ltd., Class H | 32,000 | 51,251 | ||||||
Guangzhou R&F Properties Co., Ltd., Class H | 31,600 | 49,368 | ||||||
Hollysys Automation Technologies Ltd. | 563 | 9,532 | ||||||
Hua Hong Semiconductor Ltd. (a) | 7,000 | 9,828 | ||||||
Huaneng Renewables Corp., Ltd., Class H | 16,000 | 5,541 | ||||||
| Shares | Value | |||||||
Industrial & Commercial Bank of China Ltd., Class H | 213,000 | $ | 139,376 | |||||
NetEase, Inc. ADR | 360 | 102,240 | ||||||
Nexteer Automotive Group Ltd. | 19,000 | 28,040 | ||||||
Pou Sheng International Holdings Ltd. | 18,000 | 3,776 | ||||||
Shenzhen Expressway Co., Ltd., Class H | 26,000 | 23,568 | ||||||
Shenzhen Investment Ltd. | 22,000 | 9,860 | ||||||
Sichuan Expressway Co., Ltd., Class H | 14,000 | 5,912 | ||||||
Sinopec Shanghai Petrochemical Co., Ltd., Class H | 80,000 | 44,400 | ||||||
Sinopharm Group Co., Ltd., Class H | 10,000 | 46,425 | ||||||
Springland International Holdings Ltd. | 37,000 | 6,618 | ||||||
Tencent Holdings Ltd. | 9,650 | 278,012 | ||||||
Tianneng Power International Ltd. | 28,700 | 26,091 | ||||||
Tongda Group Holdings Ltd. | 50,000 | 17,715 | ||||||
Xinjiang Goldwind Science & Technology Co., Ltd., Class H | 9,800 | 14,759 | ||||||
XTEP International Holdings Ltd. | 16,500 | 6,498 | ||||||
Yuzhou Properties Co., Ltd. | 33,000 | 13,813 | ||||||
Zhejiang Expressway Co., Ltd., Class H | 20,000 | 26,161 | ||||||
Zhongsheng Group Holdings Ltd. | 12,500 | 18,605 | ||||||
|
| |||||||
| 1,878,497 | ||||||||
|
| |||||||
| Colombia—0.3% | ||||||||
Almacenes Exito S.A. | 1,161 | 6,187 | ||||||
Corp. Financiera Colombiana S.A. | 564 | 5,524 | ||||||
Grupo Aval Acciones y Valores S.A. | 717 | 5,858 | ||||||
|
| |||||||
| 17,569 | ||||||||
|
| |||||||
| Czech Republic—0.3% | ||||||||
Moneta Money Bank AS (a)(e) | 4,984 | 16,882 | ||||||
|
| |||||||
| Egypt—0.2% | ||||||||
Commercial International Bank Egypt SAE GDR | 2,199 | 9,632 | ||||||
|
| |||||||
| Hong Kong—1.0% | ||||||||
CIFI Holdings Group Co., Ltd. | 20,000 | 7,773 | ||||||
WH Group Ltd. (a) | 66,500 | 57,344 | ||||||
|
| |||||||
| 65,117 | ||||||||
|
| |||||||
| Hungary—0.7% | ||||||||
Magyar Telekom Telecommunications PLC | 8,154 | 13,524 | ||||||
MOL Hungarian Oil & Gas PLC | 253 | 17,323 | ||||||
OTP Bank PLC | 437 | 12,209 | ||||||
|
| |||||||
| 43,056 | ||||||||
|
| |||||||
| India—0.6% | ||||||||
Tata Motors Ltd. ADR | 718 | 25,597 | ||||||
Wipro Ltd. ADR | 1,367 | 13,984 | ||||||
|
| |||||||
| 39,581 | ||||||||
|
| |||||||
| Indonesia—0.7% | ||||||||
Adaro Energy Tbk PT | 54,300 | 7,132 | ||||||
Gudang Garam Tbk PT | 1,100 | 5,410 | ||||||
Telekomunikasi Indonesia Persero Tbk PT ADR | 999 | 31,139 | ||||||
|
| |||||||
| 43,681 | ||||||||
|
| |||||||
| Shares | Value | |||||||
| Korea (Republic of)—11.9% | ||||||||
Daelim Industrial Co., Ltd. | 424 | $ | 30,680 | |||||
Doosan Heavy Industries & Construction Co., Ltd. | 249 | 5,335 | ||||||
GS Holdings Corp. | 544 | 28,765 | ||||||
Hanil Cement Co., Ltd. | 83 | 7,496 | ||||||
Hanwha Chemical Corp. | 2,141 | 50,575 | ||||||
Hanwha General Insurance Co., Ltd. | 767 | 4,778 | ||||||
KB Financial Group, Inc. | 461 | 20,204 | ||||||
Korea Electric Power Corp. | 1,288 | 53,613 | ||||||
Korea Electric Power Corp. ADR | 3,038 | 62,978 | ||||||
Korea Petrochemical Ind Co., Ltd. | 115 | 25,202 | ||||||
LG Chem Ltd. (e) | 83 | 21,824 | ||||||
Lotte Chemical Corp. | 33 | 10,935 | ||||||
LS Corp. | 237 | 13,609 | ||||||
S&T Motiv Co., Ltd. | 144 | 6,384 | ||||||
S-Oil Corp. | 134 | 12,049 | ||||||
Samsung Electronics Co., Ltd. | 181 | 333,115 | ||||||
Samsung Electronics Co., Ltd. GDR | 35 | 32,140 | ||||||
Woori Bank (e) | 2,243 | 26,057 | ||||||
|
| |||||||
| 745,739 | ||||||||
|
| |||||||
| Malaysia—2.4% | ||||||||
AirAsia Bhd. | 68,000 | 48,243 | ||||||
Bermaz Auto Bhd. | 15,140 | 6,842 | ||||||
Hong Leong Financial Group Bhd. | 4,900 | 17,577 | ||||||
MISC Bhd. | 3,700 | 6,116 | ||||||
Sunway Bhd. | 7,500 | 5,503 | ||||||
Tenaga Nasional Bhd. | 13,600 | 42,147 | ||||||
Top Glove Corp. Bhd. | 19,300 | 21,457 | ||||||
|
| |||||||
| 147,885 | ||||||||
|
| |||||||
| Mexico—1.8% | ||||||||
Alpek S.A.B de C.V. (e) | 9,000 | 9,999 | ||||||
Grupo Aeroportuario del Pacifico S.A.B de C.V., Class B | 2,600 | 25,250 | ||||||
Grupo Lala S.A.B de C.V. | 3,300 | 5,989 | ||||||
Industrias Bachoco S.A.B de C.V. ADR | 806 | 43,588 | ||||||
Industrias Bachoco S.A.B de C.V., Ser. B | 1,500 | 6,779 | ||||||
Vitro S.A.B de C.V., Ser. A | 5,600 | 21,763 | ||||||
|
| |||||||
| 113,368 | ||||||||
|
| |||||||
| Norway—0.2% | ||||||||
Bakkafrost P/F | 351 | 10,857 | ||||||
|
| |||||||
| Philippines—0.1% | ||||||||
DMCI Holdings, Inc. | 23,600 | 5,361 | ||||||
San Miguel Corp. | 1,350 | 2,798 | ||||||
|
| |||||||
| 8,159 | ||||||||
|
| |||||||
| Russian Federation—2.7% | ||||||||
LUKOIL PJSC ADR | 344 | 18,253 | ||||||
Magnitogorsk Iron & Steel OJSC GDR | 444 | 3,772 | ||||||
MegaFon PJSC GDR | 700 | 8,197 | ||||||
MMC Norilsk Nickel PJSC ADR | 403 | 6,323 | ||||||
Mobile TeleSystems PJSC ADR | 6,475 | 71,419 | ||||||
RusHydro PJSC | 5,912 | 9,577 | ||||||
Severstal PJSC GDR | 348 | 5,009 | ||||||
United Co. RUSAL PLC | 16,000 | 8,335 | ||||||
X5 Retail Group NV GDR (e) | 1,158 | 38,967 | ||||||
|
| |||||||
| 169,852 | ||||||||
|
| |||||||
| Singapore—0.2% | ||||||||
Accordia Golf Trust UNIT | 4,600 | 2,417 | ||||||
Croesus Retail Trust UNIT | 4,200 | 2,672 | ||||||
| 144 | Semiannual Report | | March 31, 2017 | | See accompanying Notes to Financial Statements |
Table of Contents
Schedule of Investments
March 31, 2017 (Unaudited)
| Shares | Value | |||||||
Wing Tai Holdings Ltd. | 6,500 | $ | 8,757 | |||||
|
| |||||||
| 13,846 | ||||||||
|
| |||||||
| South Africa—3.9% | ||||||||
AVI Ltd. | 3,606 | 26,609 | ||||||
Clicks Group Ltd. | 2,581 | 24,588 | ||||||
Fortress Income Fund Ltd., Class A | 5,234 | 6,550 | ||||||
Investec Ltd. | 1,341 | 9,134 | ||||||
Liberty Holdings Ltd. | 4,895 | 39,371 | ||||||
Naspers Ltd., Class N | 127 | 21,884 | ||||||
Raubex Group Ltd. | 3,582 | 6,814 | ||||||
Redefine Properties Ltd. REIT | 6,604 | 5,414 | ||||||
Sappi Ltd. | 6,148 | 41,647 | ||||||
SPAR Group Ltd. | 1,306 | 16,944 | ||||||
Super Group Ltd. (e) | 3,534 | 9,375 | ||||||
Tiger Brands Ltd. | 875 | 26,105 | ||||||
Tsogo Sun Holdings Ltd. | 3,201 | 6,577 | ||||||
|
| |||||||
| 241,012 | ||||||||
|
| |||||||
| Taiwan—12.7% | ||||||||
Accton Technology Corp. | 7,000 | 15,434 | ||||||
AmTRAN Technology Co., Ltd. | 9,000 | 6,558 | ||||||
Chicony Power Technology Co., Ltd. | 5,000 | 8,017 | ||||||
China Motor Corp. | 11,000 | 10,080 | ||||||
Elite Material Co., Ltd. | 13,000 | 50,553 | ||||||
First Financial Holding Co., Ltd. | 42,000 | 25,608 | ||||||
Formosa Chemicals & Fibre Corp. | 12,000 | 37,332 | ||||||
Grape King Bio Ltd. | 2,000 | 12,583 | ||||||
Hon Hai Precision Industry Co., Ltd. | 21,210 | 63,611 | ||||||
Hon Hai Precision Industry Co., Ltd. GDR | 1,521 | 9,324 | ||||||
Inventec Corp. | 8,000 | 5,998 | ||||||
King Yuan Electronics Co., Ltd. | 15,000 | 13,843 | ||||||
Lite-On Technology Corp. | 26,439 | 45,572 | ||||||
Mitac Holdings Corp. | 22,437 | 24,924 | ||||||
Powertech Technology, Inc. | 6,800 | 19,788 | ||||||
Sinbon Electronics Co., Ltd. | 5,479 | 13,454 | ||||||
Taiwan Cooperative Financial Holding Co., Ltd. | 28,000 | 13,936 | ||||||
Taiwan Semiconductor Manufacturing Co., Ltd. | 49,000 | 307,261 | ||||||
Taiwan Semiconductor Manufacturing Co., Ltd. ADR | 173 | 5,681 | ||||||
Tong Yang Industry Co., Ltd. | 3,000 | 5,211 | ||||||
Tripod Technology Corp. | 3,000 | 8,452 | ||||||
United Microelectronics Corp. | 36,000 | 14,440 | ||||||
Win Semiconductors Corp. | 9,100 | 40,497 | ||||||
Wistron Corp. | 39,482 | 36,177 | ||||||
|
| |||||||
| 794,334 | ||||||||
|
| |||||||
| Thailand—2.9% | ||||||||
Airports of Thailand PCL (d) | 35,000 | 39,981 | ||||||
GFPT PCL (d) | 5,400 | 2,893 | ||||||
PTT Global Chemical PCL (d) | 9,300 | 19,823 | ||||||
PTT PCL (d) | 6,200 | 69,824 | ||||||
Siam Cement PCL | 1,250 | 19,642 | ||||||
Thai Union Group PCL (d) | 2,600 | 1,620 | ||||||
Thanachart Capital PCL (d) | 11,500 | 16,139 | ||||||
Tisco Financial Group PCL (d) | 6,100 | 12,741 | ||||||
|
| |||||||
| 182,663 | ||||||||
|
| |||||||
| Turkey—2.4% | ||||||||
Akbank TAS | 13,323 | 31,280 | ||||||
Arcelik AS | 2,506 | 15,634 | ||||||
BIM Birlesik Magazalar AS | 1,140 | 17,529 | ||||||
Petkim Petrokimya Holding AS | 6,745 | 9,412 | ||||||
Tofas Turk Otomobil Fabrikasi AS | 3,122 | 23,392 | ||||||
Trakya Cam Sanayii AS | 7,788 | 6,774 | ||||||
Turkiye Vakiflar Bankasi Tao | 28,847 | 42,563 | ||||||
|
| |||||||
| 146,584 | ||||||||
|
| |||||||
| Shares | Value | |||||||
| United States—0.5% | ||||||||
First BanCorp (e) | 5,027 | $ | 28,403 | |||||
|
| |||||||
| Total Common Stock (cost-$4,317,931) | 5,043,956 | |||||||
|
| |||||||
| Preferred Stock—5.1% | ||||||||
| Brazil—3.7% | ||||||||
Banco Bradesco S.A. | 4,912 | 50,805 | ||||||
Banco do Estado do Rio Grande do Sul S.A., Class B | 3,100 | 14,972 | ||||||
Braskem S.A., Class A | 600 | 6,085 | ||||||
Cia de Gas de Sao Paulo—COMGAS, Class A | 500 | 7,455 | ||||||
Cia de Transmissao de Energia Eletrica Paulista | 1,400 | 29,122 | ||||||
Metalurgica Gerdau S.A. (e) | 3,100 | 4,902 | ||||||
Petroleo Brasileiro S.A. (e) | 10,400 | 48,137 | ||||||
Telefonica Brasil S.A. (e) | 4,700 | 70,186 | ||||||
|
| |||||||
| 231,664 | ||||||||
|
| |||||||
| Colombia—0.5% | ||||||||
Banco Davivienda S.A. | 2,951 | 30,711 | ||||||
|
| |||||||
| Korea (Republic of)—0.9% | ||||||||
Samsung Electronics Co., Ltd. | 40 | 57,296 | ||||||
|
| |||||||
| Total Preferred Stock (cost—$259,989) | 319,671 | |||||||
|
| |||||||
| Principal Amount (000s) | ||||||||
| Repurchase Agreements—9.3% | ||||||||
State Street Bank and Trust Co., dated 3/31/17, 0.09%, due 4/3/17, proceeds $579,004; collateralized by U.S. Treasury Notes, 2.25%, due 11/15/25, valued at $593,782 including accrued interest |
| |||||||
(cost—$579,000) | $579 | 579,000 | ||||||
|
| |||||||
| Total Investments (cost—$5,156,920) (c)—95.2% | 5,942,627 | |||||||
|
| |||||||
| Other assets less liabilities (f)—4.8% | 301,044 | |||||||
|
| |||||||
| Net Assets—100.0% | $6,243,671 | |||||||
|
| |||||||
Notes to Schedule of Investments:
(a) 144A—Exempt from registration under Rule 144A of the Securities Act of 1933. These securities may be resold in transactions exempt from registration, typically only to qualified institutional buyers. Securities with an aggregate value of $92,010, representing 1.5% of net assets.
(b) When-issued or delayed-delivery. To be settled/delivered after March 31, 2017.
(c) Securities with an aggregate value of $3,624,463, representing 58.1% of net assets, were valued utilizing modeling tools provided by a third-party vendor. See Note 1(a) and Note 1(b) in the Notes to Financial Statements.
(d) Fair-Valued—Securities with an aggregate value of $163,021, representing 2.6% of net assets. See Note 1(a) and Note 1(b) in the Notes to Financial Statements.
(e) Non-income producing.
(f) Includes net unrealized appreciation (depreciation) of other financial instruments. See Notes 7(b) and 7(c) in the Notes to Financial Statements.
Glossary:
ADR—American Depositary Receipt
GDR—Global Depositary Receipt
REIT—Real Estate Investment Trust
UNIT—More than one class of securities traded together.
| See accompanying Notes to Financial Statements | | March 31, 2017 | | Semiannual Report | 145 |
Table of Contents
Schedule of Investments
March 31, 2017 (Unaudited)
The industry classification of portfolio holdings and other assets less liabilities shown as a percentage of net assets were as follows:
Banks | 17.6% | |||
Internet Software & Services | 9.5% | |||
Technology Hardware, Storage & Peripherals | 8.6% | |||
Semiconductors & Semiconductor Equipment | 6.6% | |||
Oil, Gas & Consumable Fuels | 6.2% | |||
Chemicals | 3.8% | |||
Food Products | 3.3% | |||
Electric Utilities | 3.2% | |||
Electronic Equipment, Instruments & Components | 2.8% | |||
Wireless Telecommunication Services | 2.2% | |||
Automobiles | 2.1% | |||
Diversified Telecommunication Services | 2.0% | |||
Transportation Infrastructure | 1.9% | |||
Food & Staples Retailing | 1.7% | |||
Real Estate Management & Development | 1.6% | |||
Household Durables | 1.2% | |||
Auto Components | 1.1% | |||
Airlines | 0.9% | |||
Electrical Equipment | 0.8% | |||
Health Care Providers & Services | 0.7% | |||
Insurance | 0.7% | |||
Paper & Forest Products | 0.7% | |||
Specialty Retail | 0.6% | |||
Construction & Engineering | 0.6% | |||
Biotechnology | 0.6% | |||
Independent Power Producers & Energy Traders | 0.5% | |||
Metals & Mining | 0.5% | |||
Communications Equipment | 0.4% | |||
Construction Materials | 0.4% | |||
IT Services | 0.4% | |||
Media | 0.3% | |||
Containers & Packaging | 0.3% | |||
Health Care Equipment & Supplies | 0.3% | |||
Water Utilities | 0.3% | |||
Capital Markets | 0.2% | |||
Personal Products | 0.2% | |||
Equity Real Estate Investment Trusts (REITs) | 0.2% | |||
Hotels, Restaurants & Leisure | 0.1% | |||
Industrial Conglomerates | 0.1% | |||
Gas Utilities | 0.1% | |||
Building Products | 0.1% | |||
Multi-line Retail | 0.1% | |||
Textiles, Apparel & Luxury Goods | 0.1% | |||
Marine | 0.1% | |||
Diversified Financial Services | 0.1% | |||
Tobacco | 0.1% | |||
Repurchase Agreements | 9.3% | |||
Other assets less liabilities | 4.8% | |||
|
| |||
| 100.0% | ||||
|
|
AllianzGI Best Styles Global Equity Fund
| Shares | Value | |||||||
| Common Stock—97.4% | ||||||||
| Argentina—0.1% | ||||||||
Grupo Financiero Galicia S.A. ADR | 9,635 | $364,781 | ||||||
|
| |||||||
| Australia—1.2% | ||||||||
Bapcor Ltd. | 79,775 | 355,270 | ||||||
BlueScope Steel Ltd. | 94,876 | 889,437 | ||||||
CSR Ltd. | 126,062 | 434,128 | ||||||
Downer EDI Ltd. | 67,453 | 298,504 | ||||||
Evolution Mining Ltd. | 267,753 | 430,455 | ||||||
Fortescue Metals Group Ltd. | 107,988 | 514,364 | ||||||
Harvey Norman Holdings Ltd. | 90,213 | 312,028 | ||||||
Investa Office Fund REIT | 115,380 | 418,891 | ||||||
Macquarie Group Ltd. | 8,608 | 593,062 | ||||||
Metcash Ltd. (d) | 340,126 | 641,512 | ||||||
Myer Holdings Ltd. | 687,658 | 638,274 | ||||||
Northern Star Resources Ltd. | 131,855 | 409,852 | ||||||
Qantas Airways Ltd. | 57,884 | 172,022 | ||||||
Retail Food Group Ltd. | 135,827 | 553,013 | ||||||
Southern Cross Media Group Ltd. | 217,415 | 232,426 | ||||||
Star Entertainment Group Ltd. | 78,014 | 325,955 | ||||||
Tassal Group Ltd. | 56,842 | 196,715 | ||||||
Vicinity Centres REIT | 59,084 | 127,800 | ||||||
Westpac Banking Corp. | 20,000 | 534,646 | ||||||
WPP AUNZ Ltd. | 441,600 | 387,990 | ||||||
|
| |||||||
| 8,466,344 | ||||||||
|
| |||||||
| Austria—0.4% | ||||||||
BUWOG AG (d) | 15,209 | 383,269 | ||||||
Erste Group Bank AG (d) | 20,368 | 663,221 | ||||||
EVN AG | 29,087 | 370,847 | ||||||
OMV AG | 20,317 | 800,678 | ||||||
Porr AG | 8,692 | 322,873 | ||||||
Voestalpine AG | 9,429 | 370,827 | ||||||
|
| |||||||
| 2,911,715 | ||||||||
|
| |||||||
| Belgium—0.3% | ||||||||
D’ieteren S.A. | 7,725 | 361,456 | ||||||
KBC Group NV | 10,981 | 727,963 | ||||||
Solvay S.A. | 5,592 | 682,281 | ||||||
Warehouses De Pauw CVA REIT | 2,245 | 208,761 | ||||||
|
| |||||||
| 1,980,461 | ||||||||
|
| |||||||
| Brazil—0.4% | ||||||||
Cia de Saneamento de Minas Gerais—COPASA | 24,000 | 338,849 | ||||||
JBS S.A. | 132,600 | 432,456 | ||||||
MRV Engenharia e Participacoes S.A. | 54,000 | 247,697 | ||||||
Qualicorp S.A. | 251,200 | 1,656,960 | ||||||
Sao Martinho S.A. | 59,700 | 329,526 | ||||||
|
| |||||||
| 3,005,488 | ||||||||
|
| |||||||
| Canada—4.9% | ||||||||
Alimentation Couche-Tard, Inc., Class B | 10,463 | 472,698 | ||||||
Artis Real Estate Investment Trust REIT | 17,787 | 176,954 | ||||||
Atco Ltd., Class I | 16,877 | 656,247 | ||||||
Bank of Montreal | 30,824 | 2,302,326 | ||||||
Bank of Nova Scotia | 22,425 | 1,311,926 | ||||||
BCE, Inc. | 11,156 | 493,939 | ||||||
Canadian Imperial Bank of Commerce | 23,728 | 2,046,013 | ||||||
Canadian Tire Corp., Ltd., Class A | 13,427 | 1,595,065 | ||||||
| Shares | Value | |||||||
Canfor Pulp Products, Inc. | 18,173 | $ | 165,215 | |||||
Celestica, Inc. (d) | 27,159 | 394,973 | ||||||
CGI Group, Inc., Class A (d) | 12,519 | 599,850 | ||||||
Chorus Aviation, Inc. | 33,260 | 187,578 | ||||||
Cogeco Communications, Inc. | 18,707 | 999,460 | ||||||
ECN Capital Corp. | 42,149 | 113,784 | ||||||
Enercare, Inc. | 26,347 | 411,495 | ||||||
Exchange Income Corp. | 25,552 | 750,122 | ||||||
Fortis, Inc. | 29,945 | 992,350 | ||||||
Genworth MI Canada, Inc. | 18,321 | 506,571 | ||||||
George Weston Ltd. | 6,454 | 563,114 | ||||||
High Liner Foods, Inc. | 22,958 | 311,608 | ||||||
Intertape Polymer Group, Inc. | 19,526 | 343,285 | ||||||
Kirkland Lake Gold Ltd. (d) | 75,378 | 556,046 | ||||||
Laurentian Bank of Canada | 43,852 | 1,931,354 | ||||||
Linamar Corp. | 31,655 | 1,439,870 | ||||||
Loblaw Cos., Ltd. | 11,029 | 598,453 | ||||||
Lucara Diamond Corp. | 165,833 | 385,325 | ||||||
Magna International, Inc. | 13,234 | 571,117 | ||||||
Manulife Financial Corp. | 42,536 | 754,539 | ||||||
Martinrea International, Inc. | 22,134 | 171,766 | ||||||
Medical Facilities Corp. | 54,858 | 760,261 | ||||||
Metro, Inc. | 34,212 | 1,050,916 | ||||||
National Bank of Canada | 17,173 | 721,089 | ||||||
Open Text Corp. | 6,716 | 228,269 | ||||||
Power Financial Corp. | 11,386 | 301,121 | ||||||
Royal Bank of Canada | 32,834 | 2,392,214 | ||||||
Sun Life Financial, Inc. | 47,132 | 1,721,044 | ||||||
Tahoe Resources, Inc. | 34,896 | 280,249 | ||||||
TFI International, Inc. | 9,473 | 221,180 | ||||||
Toronto-Dominion Bank | 56,924 | 2,851,230 | ||||||
TransCanada Corp. | 29,929 | 1,381,165 | ||||||
Transcontinental, Inc., Class A | 72,887 | 1,347,191 | ||||||
WestJet Airlines Ltd. | 41,576 | 712,812 | ||||||
|
| |||||||
| 35,771,784 | ||||||||
|
| |||||||
| Chile—0.2% | ||||||||
Cencosud S.A. | 262,619 | 804,761 | ||||||
Enel Chile S.A. | 8,618,023 | 953,386 | ||||||
|
| |||||||
| 1,758,147 | ||||||||
|
| |||||||
| China—4.8% | ||||||||
AAC Technologies Holdings, Inc. | 30,600 | 358,296 | ||||||
Agile Group Holdings Ltd. | 512,909 | 444,577 | ||||||
Agricultural Bank of China Ltd., Class H | 850,000 | 392,001 | ||||||
Air China Ltd., Class H | 419,653 | 339,796 | ||||||
Alibaba Group Holding Ltd. ADR (d) | 34,429 | 3,712,479 | ||||||
Bank of Chongqing Co., Ltd., Class H | 801,500 | 693,801 | ||||||
Bank of Communications Co., Ltd., Class H | 1,013,961 | 789,283 | ||||||
Beijing Enterprises Holdings Ltd. | 310,500 | 1,607,105 | ||||||
BYD Electronic International Co., Ltd. | 401,682 | 558,162 | ||||||
China Communications Construction Co., Ltd., Class H | 281,000 | 396,644 | ||||||
China Communications Services Corp., Ltd., Class H | 285,597 | 187,039 | ||||||
China Construction Bank Corp., Class H | 2,527,188 | 2,036,174 | ||||||
| 146 | Semiannual Report | | March 31, 2017 | | See accompanying Notes to Financial Statements |
Table of Contents
Schedule of Investments
March 31, 2017 (Unaudited)
| Shares | Value | |||||||
China High Speed Transmission Equipment Group Co., Ltd. | 180,880 | $ | 204,659 | |||||
China Lumena New Materials Corp. (c)(d) | 60,228 | 1,162 | ||||||
China Merchants Bank Co., Ltd., Class H | 147,656 | 390,752 | ||||||
China Petroleum & Chemical Corp., Class H | 2,964,200 | 2,412,757 | ||||||
China Railway Construction Corp., Ltd., Class H | 221,484 | 314,295 | ||||||
China Southern Airlines Co., Ltd., Class H | 2,066,846 | 1,431,488 | ||||||
China Zhongwang Holdings Ltd. | 831,200 | 373,505 | ||||||
Chongqing Rural Commercial Bank Co., Ltd., Class H | 220,512 | 148,975 | ||||||
EVA Precision Industrial Holdings Ltd. | 687,764 | 110,719 | ||||||
Great Wall Motor Co., Ltd., Class H | 263,740 | 300,583 | ||||||
Guangzhou Automobile Group Co., Ltd., Class H | 1,540,565 | 2,467,378 | ||||||
Guangzhou R&F Properties Co., Ltd., Class H | 97,919 | 152,977 | ||||||
Industrial & Commercial Bank of China Ltd., Class H | 2,506,000 | 1,639,797 | ||||||
Ju Teng International Holdings Ltd. | 161,256 | 66,190 | ||||||
KWG Property Holding Ltd. | 184,094 | 133,406 | ||||||
Lee & Man Paper Manufacturing Ltd. | 289,483 | 221,416 | ||||||
Minth Group Ltd. | 50,685 | 204,366 | ||||||
NetEase, Inc. ADR | 11,155 | 3,168,020 | ||||||
Nexteer Automotive Group Ltd. | 282,000 | 416,171 | ||||||
Pou Sheng International Holdings Ltd. | 2,193,000 | 460,098 | ||||||
Shanghai Pharmaceuticals Holding Co., Ltd., Class H | 282,389 | 739,749 | ||||||
Shenzhen Expressway Co., Ltd., Class H | 291,426 | 264,162 | ||||||
Sinopec Shanghai Petrochemical Co., Ltd., Class H | 794,620 | 441,014 | ||||||
Sinopharm Group Co., Ltd., Class H | 162,079 | 752,447 | ||||||
Skyworth Digital Holdings Ltd. | 854,848 | 563,587 | ||||||
Tencent Holdings Ltd. | 109,619 | 3,158,069 | ||||||
Tianneng Power International Ltd. | 374,000 | 339,995 | ||||||
Travelsky Technology Ltd., Class H | 345,000 | 815,194 | ||||||
Yum China Holdings, Inc. (d) | 14,776 | 401,907 | ||||||
Yuzhou Properties Co., Ltd. | 2,363,708 | 989,396 | ||||||
Zhejiang Expressway Co., Ltd., Class H | 143,770 | 188,056 | ||||||
|
| |||||||
| 34,787,647 | ||||||||
|
| |||||||
| Colombia—0.1% | ||||||||
Almacenes Exito S.A. | 67,834 | 361,469 | ||||||
|
| |||||||
| Czech Republic—0.1% | ||||||||
Moneta Money Bank AS (a)(d) | 120,421 | 407,902 | ||||||
| Shares | Value | |||||||
Philip Morris CR AS | 676 | $ | 362,153 | |||||
|
| |||||||
| 770,055 | ||||||||
|
| |||||||
| Denmark—0.4% | ||||||||
Danske Bank A/S | 40,551 | 1,382,623 | ||||||
Dfds A/S | 19,504 | 1,071,569 | ||||||
Schouw & Co. AB | 2,886 | 264,493 | ||||||
Spar Nord Bank A/S | 30,466 | 337,216 | ||||||
|
| |||||||
| 3,055,901 | ||||||||
|
| |||||||
| Finland—0.3% | ||||||||
Cramo Oyj | 13,987 | 319,018 | ||||||
Metsa Board Oyj | 14,603 | 90,230 | ||||||
Oriola KD Oyj, Class B | 23,820 | 100,964 | ||||||
Stora Enso Oyj, Class R | 58,090 | 686,868 | ||||||
UPM-Kymmene Oyj | 50,901 | 1,195,107 | ||||||
|
| |||||||
| 2,392,187 | ||||||||
|
| |||||||
| France—4.3% | ||||||||
Air France-KLM (d) | 120,042 | 908,061 | ||||||
Alten S.A. | 3,089 | 236,869 | ||||||
APERAM S.A. | 1,739 | 86,704 | ||||||
Arkema S.A. | 15,181 | 1,494,430 | ||||||
Atos SE | 17,852 | 2,206,159 | ||||||
AXA S.A. | 85,415 | 2,206,762 | ||||||
BNP Paribas S.A. | 22,292 | 1,483,400 | ||||||
Boiron S.A. | 1,068 | 97,532 | ||||||
Capgemini S.A. | 12,720 | 1,174,127 | ||||||
Cie Generale des Etablissements Michelin | 9,464 | 1,150,044 | ||||||
CNP Assurances | 37,867 | 770,042 | ||||||
Eiffage S.A. | 20,695 | 1,619,577 | ||||||
Faurecia | 14,690 | 697,463 | ||||||
IPSOS | 10,839 | 336,485 | ||||||
MGI Coutier | 11,754 | 407,523 | ||||||
Orange S.A. | 117,110 | 1,818,200 | ||||||
Peugeot S.A. (d) | 52,457 | 1,054,254 | ||||||
Rallye S.A. | 17,823 | 360,878 | ||||||
Renault S.A. | 10,780 | 936,482 | ||||||
Sanofi | 28,316 | 2,559,630 | ||||||
Societe Generale S.A. | 26,843 | 1,360,009 | ||||||
Teleperformance | 5,944 | 641,768 | ||||||
Thales S.A. | 6,654 | 642,750 | ||||||
Total S.A. | 106,761 | 5,398,198 | ||||||
Ubisoft Entertainment S.A. (d) | 3,835 | 163,560 | ||||||
Valeo S.A. | 14,514 | 965,496 | ||||||
Vinci S.A. | 7,792 | 618,752 | ||||||
|
| |||||||
| 31,395,155 | ||||||||
|
| |||||||
| Germany—3.1% | ||||||||
BASF SE | 10,000 | 990,136 | ||||||
Bayer AG | 24,056 | 2,771,574 | ||||||
Bayerische Motoren Werke AG | 9,530 | 869,534 | ||||||
Bechtle AG | 1,821 | 197,622 | ||||||
Daimler AG | 14,949 | 1,103,229 | ||||||
Deutsche Lufthansa AG | 52,981 | 859,503 | ||||||
Deutsche Post AG | 39,008 | 1,334,990 | ||||||
Deutsche Telekom AG | 49,370 | 865,092 | ||||||
Fresenius SE & Co. KGaA | 22,339 | 1,795,071 | ||||||
Hannover Rueck SE | 8,964 | 1,032,936 | ||||||
Indus Holding AG | 4,304 | 277,962 | ||||||
KION Group AG | 3,231 | 210,898 | ||||||
Merck KGaA | 5,978 | 681,212 | ||||||
METRO AG | 34,252 | 1,094,439 | ||||||
Muenchener Rueckversicherungs-Gesellschaft AG in Muenchen | 4,000 | 783,009 | ||||||
Rheinmetall AG | 4,316 | 361,835 | ||||||
Siemens AG | 27,420 | 3,755,777 | ||||||
Sixt SE | 1,264 | 65,071 | ||||||
Software AG | 8,152 | 322,033 | ||||||
STADA Arzneimittel AG | 9,262 | 567,272 | ||||||
| Shares | Value | |||||||
Takkt AG | 15,040 | $ | 348,891 | |||||
Talanx AG (d) | 37,997 | 1,339,662 | ||||||
Uniper SE (d) | 49,955 | 839,574 | ||||||
|
| |||||||
| 22,467,322 | ||||||||
|
| |||||||
| Greece—0.3% | ||||||||
FF Group (d) | 35,765 | 683,197 | ||||||
JUMBO S.A. | 46,117 | 727,141 | ||||||
Motor Oil Hellas Corinth Refineries S.A. | 24,008 | 409,600 | ||||||
|
| |||||||
| 1,819,938 | ||||||||
|
| |||||||
| Hong Kong—0.3% | ||||||||
Dah Sing Banking Group Ltd. | 55,177 | 108,769 | ||||||
Dah Sing Financial Holdings Ltd. | 48,960 | 373,011 | ||||||
IT Ltd. | 832,000 | 360,796 | ||||||
Kerry Properties Ltd. | 42,257 | 146,575 | ||||||
WH Group Ltd. (a) | 985,000 | 849,385 | ||||||
Xinyi Glass Holdings Ltd. (d) | 553,708 | 487,717 | ||||||
|
| |||||||
| 2,326,253 | ||||||||
|
| |||||||
| India—0.1% | ||||||||
Tata Motors Ltd. ADR | 22,712 | 809,683 | ||||||
|
| |||||||
| Indonesia—0.7% | ||||||||
Bank Danamon Indonesia Tbk PT | 2,788,700 | 984,208 | ||||||
Bank Negara Indonesia Persero Tbk PT | 3,643,145 | 1,771,209 | ||||||
Indofood CBP Sukses Makmur Tbk PT | 699,518 | 427,854 | ||||||
Indofood Sukses Makmur Tbk PT | 679,021 | 407,748 | ||||||
Telekomunikasi Indonesia Persero Tbk PT | 4,157,394 | 1,292,305 | ||||||
|
| |||||||
| 4,883,324 | ||||||||
|
| |||||||
| Ireland—0.4% | ||||||||
Medtronic PLC | 22,501 | 1,812,681 | ||||||
Smurfit Kappa Group PLC | 30,577 | 807,986 | ||||||
|
| |||||||
| 2,620,667 | ||||||||
|
| |||||||
| Israel—0.3% | ||||||||
El Al Israel Airlines | 467,377 | 344,227 | ||||||
Israel Corp., Ltd. (d) | 4,283 | 800,052 | ||||||
Nice Ltd. | 10,855 | 736,905 | ||||||
|
| |||||||
| 1,881,184 | ||||||||
|
| |||||||
| Italy—0.9% | ||||||||
ACEA SpA | 28,048 | 381,800 | ||||||
Enav SpA (a)(d) | 97,963 | 397,906 | ||||||
Enel SpA | 208,829 | 982,637 | ||||||
Intesa Sanpaolo SpA | 394,853 | 1,074,041 | ||||||
Iren SpA | 181,416 | 376,618 | ||||||
Mediobanca SpA | 22,673 | 204,426 | ||||||
OVS SpA (a) | 65,655 | 407,637 | ||||||
Poste Italiane SpA (a) | 213,793 | 1,424,037 | ||||||
Recordati SpA | 30,838 | 1,045,169 | ||||||
Unipol Gruppo Finanziario SpA | 89,662 | 370,235 | ||||||
|
| |||||||
| 6,664,506 | ||||||||
|
| |||||||
| Japan—5.2% | ||||||||
Adastria Co., Ltd. | 13,300 | 331,638 | ||||||
Aida Engineering Ltd. | 4,858 | 43,206 | ||||||
BML, Inc. | 9,423 | 208,228 | ||||||
Capcom Co., Ltd. | 11,852 | 232,419 | ||||||
Concordia Financial Group Ltd. | 91,314 | 423,341 | ||||||
Daito Trust Construction Co., Ltd. | 7,295 | 1,003,038 | ||||||
Daiwa House Industry Co., Ltd. | 12,046 | 346,250 | ||||||
| See accompanying Notes to Financial Statements | | March 31, 2017 | | Semiannual Report | 147 |
Table of Contents
Schedule of Investments
March 31, 2017 (Unaudited)
| Shares | Value | |||||||
Exedy Corp. | 5,926 | $ | 169,733 | |||||
Foster Electric Co., Ltd. | 18,000 | 308,986 | ||||||
Idemitsu Kosan Co., Ltd. | 22,829 | 794,660 | ||||||
Iida Group Holdings Co., Ltd. | 37,800 | 581,691 | ||||||
ITOCHU Corp. | 144,823 | 2,061,751 | ||||||
Japan Airlines Co., Ltd. | 28,783 | 913,858 | ||||||
Maeda Corp. | 66,057 | 585,660 | ||||||
Marubeni Corp. | 264,100 | 1,631,329 | ||||||
Matsumotokiyoshi Holdings Co., Ltd. | 7,286 | 347,084 | ||||||
Mazda Motor Corp. | 88,800 | 1,281,818 | ||||||
Mitsubishi Chemical Holdings Corp. | 102,194 | 793,427 | ||||||
Mitsubishi Corp. | 88,600 | 1,920,190 | ||||||
Mitsubishi Gas Chemical Co., Inc. | 9,229 | 192,225 | ||||||
Mitsubishi UFJ Financial Group, Inc. | 608,515 | 3,833,137 | ||||||
Mitsuboshi Belting Ltd. | 4,858 | 45,160 | ||||||
Mitsui & Co., Ltd. | 125,800 | 1,826,870 | ||||||
Mitsui Engineering & Shipbuilding Co., Ltd. | 246,000 | 381,905 | ||||||
Mizuho Financial Group, Inc. | 345,825 | 634,788 | ||||||
Nippon Paper Industries Co., Ltd. | 21,857 | 393,446 | ||||||
Nippon Telegraph & Telephone Corp. | 57,848 | 2,473,194 | ||||||
Nissan Motor Co., Ltd. | 226,341 | 2,182,466 | ||||||
Nomura Real Estate Holdings, Inc. | 18,943 | 302,297 | ||||||
NuFlare Technology, Inc. | 6,900 | 420,033 | ||||||
ORIX Corp. | 190,599 | 2,828,972 | ||||||
Paramount Bed Holdings Co., Ltd. | 7,869 | 316,216 | ||||||
Raito Kogyo Co., Ltd. | 53,137 | 541,471 | ||||||
Rengo Co., Ltd. | 46,629 | 270,095 | ||||||
Sanyo Special Steel Co., Ltd. | 31,086 | 165,397 | ||||||
Sapporo Holdings Ltd. | 15,640 | 422,806 | ||||||
SCREEN Holdings Co., Ltd. | 7,189 | 530,480 | ||||||
Sekisui House Ltd. | 38,177 | 629,492 | ||||||
SKY Perfect JSAT Holdings, Inc. | 72,200 | 306,155 | ||||||
Sojitz Corp. | 155,816 | 391,554 | ||||||
Sompo Holdings, Inc. | 13,115 | 481,824 | ||||||
Sumitomo Forestry Co., Ltd. | 26,520 | 404,217 | ||||||
Sumitomo Mitsui Trust Holdings, Inc. | 16,515 | 572,276 | ||||||
Sumitomo Osaka Cement Co., Ltd. | 67,028 | 279,523 | ||||||
Tokyo Seimitsu Co., Ltd. | 11,700 | 369,429 | ||||||
Toyota Motor Corp. | 29,749 | 1,614,711 | ||||||
West Japan Railway Co. | 9,035 | 589,205 | ||||||
Yokohama Rubber Co., Ltd. | 33,903 | 664,460 | ||||||
|
| |||||||
| 38,042,111 | ||||||||
|
| |||||||
| Korea (Republic of)—2.5% | ||||||||
Hankook Tire Co., Ltd. | 12,719 | 620,305 | ||||||
Hanwha Chemical Corp. | 62,769 | 1,482,745 | ||||||
Hyosung Corp. | 2,894 | 350,699 | ||||||
Hyundai Mipo Dockyard Co., Ltd. (d) | 3,487 | 276,590 | ||||||
KB Financial Group, Inc. | 22,952 | 1,005,905 | ||||||
KB Insurance Co., Ltd. | 8,723 | 210,567 | ||||||
Kia Motors Corp. | 14,472 | 479,641 | ||||||
Korea Electric Power Corp. | 21,071 | 877,087 | ||||||
Korea Gas Corp. (d) | 4,024 | 161,940 | ||||||
Korea Petrochemical Ind Co., Ltd. | 3,623 | 793,980 | ||||||
KT&G Corp. | 4,091 | 356,677 | ||||||
LG Corp. | 8,562 | 537,806 | ||||||
LG Display Co., Ltd. | 8,513 | 230,534 | ||||||
LG Electronics, Inc. | 7,421 | 450,822 | ||||||
Lotte Chemical Corp. | 1,771 | 586,857 | ||||||
LS Corp. | 15,220 | 873,979 | ||||||
| Shares | Value | |||||||
POSCO | 7,516 | $ | 1,952,100 | |||||
S&T Motiv Co., Ltd. | 2,515 | 111,493 | ||||||
S-Oil Corp. | 7,659 | 688,658 | ||||||
Samsung Electronics Co., Ltd. GDR | 4,256 | 3,904,880 | ||||||
SK Innovation Co., Ltd. | 9,167 | 1,365,946 | ||||||
Tongyang Life Insurance Co., Ltd. | 20,122 | 184,307 | ||||||
Woori Bank (d) | 53,982 | 627,111 | ||||||
|
| |||||||
| 18,130,629 | ||||||||
|
| |||||||
| Malaysia—0.4% | ||||||||
AirAsia Bhd. | 1,114,400 | 790,613 | ||||||
CIMB Group Holdings Bhd. | 716,000 | 901,137 | ||||||
MISC Bhd. | 186,100 | 307,639 | ||||||
Tenaga Nasional Bhd. | 403,200 | 1,249,536 | ||||||
|
| |||||||
| 3,248,925 | ||||||||
|
| |||||||
| Mexico—0.2% | ||||||||
Alfa S.A.B de C.V., Class A | 235,181 | 343,559 | ||||||
Grupo Aeroportuario del Pacifico S.A.B de C.V. ADR | 1,609 | 156,234 | ||||||
Industrias Bachoco S.A.B de C.V. ADR | 14,466 | 782,321 | ||||||
|
| |||||||
| 1,282,114 | ||||||||
|
| |||||||
| Morocco—0.0% | ||||||||
Douja Promotion Groupe Addoha S.A. | 81,476 | 348,786 | ||||||
|
| |||||||
| Netherlands—0.9% | ||||||||
Accell Group | 15,057 | 412,011 | ||||||
AerCap Holdings NV (d) | 19,930 | 916,182 | ||||||
ASR Nederland NV (d) | 29,326 | 835,901 | ||||||
BE Semiconductor Industries NV | 8,186 | 333,525 | ||||||
ING Groep NV | 182,012 | 2,749,157 | ||||||
Koninklijke Ahold Delhaize NV (d) | 26,124 | 558,265 | ||||||
NN Group NV | 13,693 | 444,709 | ||||||
Philips Lighting NV (a)(d) | 13,460 | 384,968 | ||||||
|
| |||||||
| 6,634,718 | ||||||||
|
| |||||||
| New Zealand—0.3% | ||||||||
Air New Zealand Ltd. | 556,399 | 959,487 | ||||||
Metlifecare Ltd. | 184,365 | 791,905 | ||||||
Summerset Group Holdings Ltd. | 105,998 | 384,103 | ||||||
|
| |||||||
| 2,135,495 | ||||||||
|
| |||||||
| Norway—0.6% | ||||||||
Austevoll Seafood ASA | 37,439 | 274,818 | ||||||
Bakkafrost P/F | 17,743 | 548,807 | ||||||
Leroy Seafood Group ASA | 4,525 | 198,166 | ||||||
Marine Harvest ASA (d) | 27,411 | 418,138 | ||||||
Orkla ASA | 152,806 | 1,368,849 | ||||||
Salmar ASA | 26,060 | 561,955 | ||||||
Sparebank 1 Nord Norge | 55,713 | 358,499 | ||||||
SpareBank 1 SMN | 62,734 | 485,874 | ||||||
Stolt-Nielsen Ltd. | 13,957 | 237,325 | ||||||
Veidekke ASA | 18,831 | 248,097 | ||||||
|
| |||||||
| 4,700,528 | ||||||||
|
| |||||||
| Peru—0.1% | ||||||||
Cia de Minas Buenaventura SAA ADR | 69,857 | 841,078 | ||||||
|
| |||||||
| Philippines—0.1% | ||||||||
Globe Telecom, Inc. | 7,525 | 304,750 | ||||||
Security Bank Corp. | 172,690 | 695,122 | ||||||
|
| |||||||
| 999,872 | ||||||||
|
| |||||||
| Russian Federation—0.1% | ||||||||
Magnitogorsk Iron & Steel OJSC GDR | 52,138 | 443,694 | ||||||
| Shares | Value | |||||||
Sistema PJSC FC GDR | 20,373 | $ | 182,338 | |||||
Surgutneftegas OJSC ADR | 22,741 | 116,686 | ||||||
|
| |||||||
| 742,718 | ||||||||
|
| |||||||
| Singapore—0.6% | ||||||||
Accordia Golf Trust UNIT | 1,532,900 | 805,434 | ||||||
DBS Group Holdings Ltd. | 95,900 | 1,328,397 | ||||||
Japfa Ltd. | 957,400 | 557,562 | ||||||
Jardine Cycle & Carriage Ltd. | 26,300 | 823,765 | ||||||
QAF Ltd. | 361,800 | 360,804 | ||||||
Singapore Airlines Ltd. | 67,700 | 487,332 | ||||||
|
| |||||||
| 4,363,294 | ||||||||
|
| |||||||
| South Africa—0.4% | ||||||||
Gold Fields Ltd. | 207,257 | 722,213 | ||||||
Murray & Roberts Holdings Ltd. | 414,761 | 476,088 | ||||||
Sappi Ltd. | 87,974 | 595,950 | ||||||
Sibanye Gold Ltd. ADR | 51,392 | 452,764 | ||||||
SPAR Group Ltd. | 13,425 | 174,171 | ||||||
Super Group Ltd. (d) | 85,529 | 226,887 | ||||||
|
| |||||||
| 2,648,073 | ||||||||
|
| |||||||
| Spain—1.1% | ||||||||
ACS Actividades de Construccion y Servicios S.A. | 25,700 | 873,610 | ||||||
Amadeus IT Group S.A. | 25,052 | 1,269,348 | ||||||
Bankinter S.A. | 98,154 | 823,039 | ||||||
Ebro Foods S.A. | 17,407 | 351,721 | ||||||
Faes Farma S.A. | 95,322 | 339,776 | ||||||
International Consolidated Airlines Group S.A. | 129,713 | 859,652 | ||||||
Repsol S.A. | 114,674 | 1,776,633 | ||||||
Telefonica S.A. | 122,998 | 1,376,757 | ||||||
|
| |||||||
| 7,670,536 | ||||||||
|
| |||||||
| Sweden—0.7% | ||||||||
Bilia AB Class A | 27,323 | 563,752 | ||||||
BillerudKorsnas AB | 6,777 | 109,201 | ||||||
Bure Equity AB | 30,978 | 338,531 | ||||||
Castellum AB | 39,496 | 523,501 | ||||||
Granges AB | 35,416 | 323,683 | ||||||
Holmen AB, Class B | 13,026 | 506,809 | ||||||
Humana AB (d) | 86,436 | 699,348 | ||||||
Klovern AB, Class B | 327,914 | 326,387 | ||||||
Loomis AB, Class B | 7,026 | 222,163 | ||||||
Peab AB | 7,203 | 68,705 | ||||||
Scandic Hotels Group AB (a)(d) | 41,201 | 433,412 | ||||||
Svenska Cellulosa AB SCA, Class B | 19,222 | 619,454 | ||||||
|
| |||||||
| 4,734,946 | ||||||||
|
| |||||||
| Switzerland—0.7% | ||||||||
Bell AG | 1,592 | 659,576 | ||||||
BKW AG | 14,011 | 757,446 | ||||||
Bobst Group S.A. | 10,363 | 955,066 | ||||||
Georg Fischer AG | 1,019 | 926,482 | ||||||
Kudelski S.A. | 20,215 | 330,827 | ||||||
Lonza Group AG (d) | 4,733 | 894,637 | ||||||
Swiss Prime Site AG (d) | 7,652 | 673,745 | ||||||
Swiss Re AG | 2,000 | 179,632 | ||||||
|
| |||||||
| 5,377,411 | ||||||||
|
| |||||||
| Taiwan—1.8% | ||||||||
Accton Technology Corp. | 599,000 | 1,320,715 | ||||||
AU Optronics Corp. | 1,933,000 | 752,970 | ||||||
Compeq Manufacturing Co., Ltd. | 1,328,000 | 960,436 | ||||||
Eva Airways Corp. | 741,000 | 393,158 | ||||||
Hon Hai Precision Industry Co., Ltd. | 240,000 | 719,781 | ||||||
| 148 | Semiannual Report | | March 31, 2017 | | See accompanying Notes to Financial Statements |
Table of Contents
Schedule of Investments
March 31, 2017 (Unaudited)
| Shares | Value | |||||||
Lite-On Technology Corp. | 426,000 | $ | 734,279 | |||||
Micro-Star International Co., Ltd. | 245,000 | 570,148 | ||||||
Pegatron Corp. | 521,000 | 1,542,339 | ||||||
Powertech Technology, Inc. | 266,000 | 774,076 | ||||||
Taiwan Semiconductor Manufacturing Co., Ltd. | 848,000 | 5,317,497 | ||||||
|
| |||||||
| 13,085,399 | ||||||||
|
| |||||||
| Thailand—0.7% | ||||||||
Bangkok Bank PCL | 143,500 | 757,945 | ||||||
IRPC PCL (c) | 1,072,100 | 160,692 | ||||||
Kiatnakin Bank PCL (c) | 406,000 | 821,302 | ||||||
PTT Global Chemical PCL (c) | 276,900 | 590,222 | ||||||
PTT PCL (c) | 84,700 | 953,893 | ||||||
Siam Cement PCL | 78,250 | 1,229,582 | ||||||
Thai Oil PCL (c) | 351,000 | 771,286 | ||||||
|
| |||||||
| 5,284,922 | ||||||||
|
| |||||||
| Turkey—0.6% | ||||||||
Akbank TAS | 341,722 | 802,306 | ||||||
Arcelik AS | 119,121 | 743,141 | ||||||
Cimsa Cimento Sanayi VE Ticaret AS | 33,740 | 143,471 | ||||||
Dogus Otomotiv Servis ve Ticaret AS | 30,908 | 71,893 | ||||||
Emlak Konut Gayrimenkul Yatirim Ortakligi AS REIT | 813,467 | 649,096 | ||||||
Eregli Demir ve Celik Fabrikalari TAS | 229,846 | 373,249 | ||||||
Haci Omer Sabanci Holding AS | 185,544 | 510,502 | ||||||
Tekfen Holding AS | 150,312 | 357,727 | ||||||
Tofas Turk Otomobil Fabrikasi AS | 22,979 | 172,172 | ||||||
Tupras Turkiye Petrol Rafinerileri AS | 1,992 | 49,489 | ||||||
Turk Hava Yollari AO (d) | 226,363 | 340,722 | ||||||
Turkiye Vakiflar Bankasi Tao | 234,134 | 345,460 | ||||||
|
| |||||||
| 4,559,228 | ||||||||
|
| |||||||
| United Kingdom—6.1% | ||||||||
3i Group PLC | 75,329 | 707,268 | ||||||
Anglo American PLC (d) | 122,990 | 1,879,164 | ||||||
Ashtead Group PLC | 11,028 | 228,272 | ||||||
Beazley PLC | 34,522 | 184,854 | ||||||
Bellway PLC | 17,481 | 592,304 | ||||||
Berkeley Group Holdings PLC | 7,865 | 316,248 | ||||||
British American Tobacco PLC | 66,607 | 4,419,109 | ||||||
Carillion PLC | 121,079 | 337,790 | ||||||
Carnival PLC | 29,760 | 1,705,776 | ||||||
Centamin PLC | 97,019 | 209,879 | ||||||
Compass Group PLC | 85,401 | 1,612,389 | ||||||
Diageo PLC | 63,924 | 1,830,476 | ||||||
DS Smith PLC | 118,678 | 645,667 | ||||||
easyJet PLC | 38,483 | 494,766 | ||||||
Firstgroup PLC (d) | 503,161 | 832,337 | ||||||
Galliford Try PLC | 25,032 | 462,352 | ||||||
GlaxoSmithKline PLC | 133,694 | 2,779,892 | ||||||
Greene King PLC | 27,183 | 238,615 | ||||||
Greggs PLC | 19,987 | 261,057 | ||||||
Hostelworld Group PLC (a) | 124,219 | 378,191 | ||||||
IG Group Holdings PLC | 56,006 | 349,093 | ||||||
Imperial Brands PLC | 43,862 | 2,125,713 | ||||||
Informa PLC | 131,239 | 1,072,727 | ||||||
Intermediate Capital Group PLC | 23,998 | 212,576 | ||||||
| Shares | Value | |||||||
International Game Technology PLC | 17,974 | $ | 425,984 | |||||
Interserve PLC | 41,422 | 115,472 | ||||||
J Sainsbury PLC | 204,406 | 677,030 | ||||||
Keller Group PLC | 79,111 | 900,919 | ||||||
Micro Focus International PLC | 5,981 | 170,604 | ||||||
Mitie Group PLC | 213,609 | 593,873 | ||||||
National Express Group PLC | 229,342 | 1,034,434 | ||||||
Northgate PLC | 55,978 | 385,742 | ||||||
Paragon Group of Cos. PLC | 37,241 | 194,942 | ||||||
Pendragon PLC | 889,736 | 390,163 | ||||||
Plus500 Ltd. | 78,058 | 410,755 | ||||||
RELX PLC | 48,919 | 957,744 | ||||||
Royal Dutch Shell PLC, Class A | 66,305 | 1,745,704 | ||||||
Royal Dutch Shell PLC, Class B | 197,290 | 5,423,385 | ||||||
Royal Mail PLC | 71,147 | 378,932 | ||||||
Shire PLC | 31,885 | 1,857,847 | ||||||
Tate & Lyle PLC | 165,292 | 1,583,932 | ||||||
Taylor Wimpey PLC | 236,256 | 571,452 | ||||||
Trinity Mirror PLC | 129,269 | 186,725 | ||||||
Virgin Money Holdings UK PLC | 30,806 | 123,741 | ||||||
WPP PLC | 112,477 | 2,465,392 | ||||||
|
| |||||||
| 44,471,287 | ||||||||
|
| |||||||
| United States—50.7% | ||||||||
AbbVie, Inc. | 50,605 | 3,297,422 | ||||||
ACCO Brands Corp. (d) | 36,821 | 484,196 | ||||||
Activision Blizzard, Inc. | 90,610 | 4,517,815 | ||||||
Adeptus Health, Inc., Class A (d) | 3,661 | 6,590 | ||||||
Advanced Energy Industries, Inc. (d) | 8,842 | 606,208 | ||||||
Aetna, Inc. | 13,334 | 1,700,752 | ||||||
Aflac, Inc. | 18,706 | 1,354,689 | ||||||
AG Mortgage Investment Trust, Inc. REIT | 21,316 | 384,754 | ||||||
AGNC Investment Corp. REIT | 32,497 | 646,365 | ||||||
Air Lease Corp. | 15,734 | 609,692 | ||||||
Aircastle Ltd. | 24,382 | 588,338 | ||||||
Alaska Air Group, Inc. | 24,246 | 2,235,966 | ||||||
Alere, Inc. (d) | 6,987 | 277,594 | ||||||
Allscripts Healthcare Solutions, Inc. (d) | 64,885 | 822,742 | ||||||
Allstate Corp. | 6,958 | 567,007 | ||||||
Ally Financial, Inc. | 26,708 | 542,974 | ||||||
Alphabet, Inc., Class A (d) | 4,587 | 3,888,859 | ||||||
Alphabet, Inc., Class C (d) | 4,693 | 3,893,125 | ||||||
Altria Group, Inc. | 63,570 | 4,540,169 | ||||||
AMAG Pharmaceuticals, Inc. (d) | 19,069 | 430,006 | ||||||
Amazon.com, Inc. (d) | 4,684 | 4,152,553 | ||||||
Amdocs Ltd. | 29,021 | 1,769,991 | ||||||
Ameren Corp. | 4,714 | 257,337 | ||||||
American Eagle Outfitters, Inc. | 14,424 | 202,369 | ||||||
American Electric Power Co., Inc. | 18,555 | 1,245,597 | ||||||
American Financial Group, Inc. | 16,867 | 1,609,449 | ||||||
American Outdoor Brands Corp. (d) | 15,270 | 302,499 | ||||||
AmerisourceBergen Corp. | 24,461 | 2,164,798 | ||||||
Amgen, Inc. | 27,150 | 4,454,500 | ||||||
AMN Healthcare Services, Inc. (d) | 10,240 | 415,744 | ||||||
Anthem, Inc. | 10,432 | 1,725,244 | ||||||
Anworth Mortgage Asset Corp. REIT | 28,465 | 157,981 | ||||||
Apollo Commercial Real Estate Finance, Inc. REIT | 14,461 | 272,011 | ||||||
| Shares | Value | |||||||
Apple, Inc. | 57,407 | $ | 8,247,090 | |||||
Applied Materials, Inc. | 79,419 | 3,089,399 | ||||||
Archer-Daniels-Midland Co. | 39,490 | 1,818,120 | ||||||
Ares Commercial Real Estate Corp. REIT | 15,302 | 204,741 | ||||||
ARMOUR Residential REIT, Inc. | 12,726 | 289,007 | ||||||
Arrow Electronics, Inc. (d) | 10,168 | 746,433 | ||||||
Aspen Insurance Holdings Ltd. | 13,000 | 676,650 | ||||||
AT&T, Inc. | 170,179 | 7,070,937 | ||||||
Banc of California, Inc. | 24,028 | 497,380 | ||||||
Bank of America Corp. | 219,054 | 5,167,484 | ||||||
Baxter International, Inc. | 23,242 | 1,205,330 | ||||||
Becton Dickinson and Co. | 8,130 | 1,491,367 | ||||||
BGC Partners, Inc., Class A | 78,656 | 893,532 | ||||||
Big Lots, Inc. | 7,612 | 370,552 | ||||||
Booz Allen Hamilton Holding Corp. | 20,056 | 709,782 | ||||||
Boston Scientific Corp. (d) | 55,169 | 1,372,053 | ||||||
Briggs & Stratton Corp. | 15,211 | 341,487 | ||||||
Broadcom Ltd. | 17,162 | 3,757,792 | ||||||
CA, Inc. | 39,899 | 1,265,596 | ||||||
CACI International, Inc., Class A (d) | 3,878 | 454,889 | ||||||
Capital One Financial Corp. | 11,044 | 957,073 | ||||||
Carlisle Cos., Inc. | 11,777 | 1,253,191 | ||||||
CDW Corp. | 13,465 | 777,065 | ||||||
Centene Corp. (d) | 4,856 | 346,039 | ||||||
CenterPoint Energy, Inc. | 15,509 | 427,583 | ||||||
CenterState Banks, Inc. | 14,820 | 383,838 | ||||||
Central Garden & Pet Co., Class A (d) | 5,941 | 206,272 | ||||||
CenturyLink, Inc. | 38,332 | 903,485 | ||||||
Charles River Laboratories International, Inc. (d) | 6,914 | 621,914 | ||||||
Chemical Financial Corp. | 8,383 | 428,790 | ||||||
Chevron Corp. | 41,322 | 4,436,743 | ||||||
Chimera Investment Corp. REIT | 21,716 | 438,229 | ||||||
Chubb Ltd. | 10,621 | 1,447,111 | ||||||
Cigna Corp. | 8,888 | 1,302,003 | ||||||
Cirrus Logic, Inc. (d) | 11,974 | 726,702 | ||||||
Cisco Systems, Inc. | 119,230 | 4,029,974 | ||||||
Citigroup, Inc. | 88,849 | 5,314,947 | ||||||
Citrix Systems, Inc. (d) | 12,835 | 1,070,311 | ||||||
CNA Financial Corp. | 9,413 | 415,772 | ||||||
Coherent, Inc. (d) | 3,634 | 747,296 | ||||||
Comcast Corp., Class A | 108,088 | 4,063,028 | ||||||
Conduent, Inc. (d) | 25,515 | 428,142 | ||||||
Consolidated Edison, Inc. | 22,027 | 1,710,617 | ||||||
Convergys Corp. | 51,815 | 1,095,887 | ||||||
Cooper Cos., Inc. | 2,777 | 555,095 | ||||||
Cooper-Standard Holdings, Inc. (d) | 3,938 | 436,842 | ||||||
Copa Holdings S.A., Class A | 2,240 | 251,440 | ||||||
Corning, Inc. | 80,111 | 2,162,997 | ||||||
CR Bard, Inc. | 2,840 | 705,854 | ||||||
Cracker Barrel Old Country Store, Inc. | 1,475 | 234,894 | ||||||
Crane Co. | 4,224 | 316,082 | ||||||
CSX Corp. | 35,360 | 1,646,008 | ||||||
CVS Health Corp. | 41,785 | 3,280,122 | ||||||
CYS Investments, Inc. REIT | 44,110 | 350,675 | ||||||
Danaher Corp. | 28,223 | 2,413,913 | ||||||
Darden Restaurants, Inc. | 10,102 | 845,234 | ||||||
Dean Foods Co. | 30,238 | 594,479 | ||||||
Dell Technologies, Inc., Class V (d) | 3,752 | 240,428 | ||||||
Delta Air Lines, Inc. | 13,286 | 610,625 | ||||||
Deluxe Corp. | 12,027 | 867,989 | ||||||
DHT Holdings, Inc. | 73,798 | 329,877 | ||||||
Dick’s Sporting Goods, Inc. | 13,254 | 644,940 | ||||||
Dow Chemical Co. | 38,073 | 2,419,158 | ||||||
| See accompanying Notes to Financial Statements | | March 31, 2017 | | Semiannual Report | 149 |
Table of Contents
Schedule of Investments
March 31, 2017 (Unaudited)
| Shares | Value | |||||||
DR Horton, Inc. | 35,521 | $ | 1,183,205 | |||||
Dr. Pepper Snapple Group, Inc. | 5,000 | 489,600 | ||||||
DuPont Fabros Technology, Inc. REIT | 5,750 | 285,143 | ||||||
Dynex Capital, Inc. REIT | 26,094 | 185,006 | ||||||
E*TRADE Financial Corp. (d) | 14,639 | 510,755 | ||||||
Eastman Chemical Co. | 17,386 | 1,404,789 | ||||||
Edison International | 5,110 | 406,807 | ||||||
Electronic Arts, Inc. (d) | 4,060 | 363,451 | ||||||
Energizer Holdings, Inc. | 7,554 | 421,135 | ||||||
Entergy Corp. | 16,952 | 1,287,674 | ||||||
Enterprise Financial Services Corp. | 7,656 | 324,614 | ||||||
Entertainment One Ltd. | 70,288 | 215,404 | ||||||
Euronet Worldwide, Inc. (d) | 5,000 | 427,600 | ||||||
Everest Re Group Ltd. | 2,864 | 669,632 | ||||||
Exelon Corp. | 55,496 | 1,996,746 | ||||||
Express, Inc. (d) | 20,715 | 188,714 | ||||||
Exxon Mobil Corp. | 59,639 | 4,890,994 | ||||||
Facebook, Inc., Class A (d) | 58,434 | 8,300,550 | ||||||
Fidelity National Information Services, Inc. | 17,886 | 1,424,083 | ||||||
First American Financial Corp. | 13,716 | 538,764 | ||||||
FirstEnergy Corp. | 26,631 | 847,398 | ||||||
Flex Ltd. (d) | 48,164 | 809,155 | ||||||
Foot Locker, Inc. | 17,610 | 1,317,404 | ||||||
Ford Motor Co. | 97,018 | 1,129,290 | ||||||
Fresh Del Monte Produce, Inc. | 9,834 | 582,468 | ||||||
General Electric Co. | 103,312 | 3,078,698 | ||||||
General Motors Co. | 48,494 | 1,714,748 | ||||||
Gilead Sciences, Inc. | 18,888 | 1,282,873 | ||||||
Global Brass & Copper Holdings, Inc. | 9,672 | 332,717 | ||||||
Global Payments, Inc. | 6,483 | 523,048 | ||||||
Goldman Sachs Group, Inc. | 8,582 | 1,971,457 | ||||||
Goodyear Tire & Rubber Co. | 54,244 | 1,952,784 | ||||||
Great Western Bancorp, Inc. | 6,840 | 290,084 | ||||||
Hanover Insurance Group, Inc. | 7,976 | 718,319 | ||||||
Hartford Financial Services Group, Inc. | 18,093 | 869,731 | ||||||
Hawaiian Holdings, Inc. (d) | 5,075 | 235,734 | ||||||
HCA Holdings, Inc. (d) | 10,427 | 927,899 | ||||||
Helmerich & Payne, Inc. | 14,378 | 957,143 | ||||||
Hewlett Packard Enterprise Co. | 77,341 | 1,832,982 | ||||||
Hill-Rom Holdings, Inc. | 5,957 | 420,564 | ||||||
Hologic, Inc. (d) | 14,082 | 599,189 | ||||||
Home Depot, Inc. | 32,296 | 4,742,022 | ||||||
Huntington Bancshares, Inc. | 50,904 | 681,605 | ||||||
Huntington Ingalls Industries, Inc. | 7,200 | 1,441,728 | ||||||
INC Research Holdings, Inc., Class A (d) | 6,637 | 304,306 | ||||||
Ingredion, Inc. | 18,718 | 2,254,209 | ||||||
Integra LifeSciences Holdings Corp. (d) | 9,040 | 380,855 | ||||||
Intel Corp. | 113,136 | 4,080,816 | ||||||
International Business Machines Corp. | 10,407 | 1,812,275 | ||||||
International Paper Co. | 9,609 | 487,945 | ||||||
Intuitive Surgical, Inc. (d) | 2,815 | 2,157,613 | ||||||
Invesco Mortgage Capital, Inc. REIT | 25,075 | 386,656 | ||||||
Jack in the Box, Inc. | 7,154 | 727,705 | ||||||
JetBlue Airways Corp. (d) | 20,776 | 428,193 | ||||||
JM Smucker Co. | 8,608 | 1,128,337 | ||||||
Johnson & Johnson | 55,333 | 6,891,725 | ||||||
Johnson Controls International PLC | 63,751 | 2,685,192 | ||||||
JPMorgan Chase & Co. | 91,547 | 8,041,488 | ||||||
| Shares | Value | |||||||
Juniper Networks, Inc. | 22,521 | $ | 626,759 | |||||
KAR Auction Services, Inc. | 15,175 | 662,692 | ||||||
Knoll, Inc. | 2,884 | 68,668 | ||||||
Kohl’s Corp. | 20,270 | 806,949 | ||||||
Kraton Corp. (d) | 8,685 | 268,540 | ||||||
Kroger Co. | 27,815 | 820,264 | ||||||
Laboratory Corp. of America Holdings (d) | 10,391 | 1,490,797 | ||||||
Lam Research Corp. | 27,906 | 3,582,014 | ||||||
Lear Corp. | 16,297 | 2,307,329 | ||||||
LifePoint Health, Inc. (d) | 11,480 | 751,940 | ||||||
Lincoln National Corp. | 30,109 | 1,970,634 | ||||||
LogMeIn, Inc. | 2,205 | 214,988 | ||||||
Lumentum Holdings, Inc. (d) | 11,171 | 595,973 | ||||||
LyondellBasell Industries NV, Class A | 19,945 | 1,818,785 | ||||||
Macy’s, Inc. | 41,755 | 1,237,618 | ||||||
Maiden Holdings Ltd. | 21,491 | 300,874 | ||||||
Mallinckrodt PLC (d) | 27,565 | 1,228,572 | ||||||
Marathon Petroleum Corp. | 24,291 | 1,227,667 | ||||||
Marriott Vacations Worldwide Corp. | 6,236 | 623,163 | ||||||
Masimo Corp. (d) | 8,823 | 822,833 | ||||||
McDonald’s Corp. | 21,236 | 2,752,398 | ||||||
McKesson Corp. | 16,474 | 2,442,435 | ||||||
Mercer International, Inc. | 16,904 | 197,777 | ||||||
Merck & Co., Inc. | 34,489 | 2,191,431 | ||||||
MetLife, Inc. | 14,000 | 739,480 | ||||||
MFA Financial, Inc. REIT | 51,080 | 412,726 | ||||||
Micron Technology, Inc. (d) | 97,090 | 2,805,901 | ||||||
Microsoft Corp. | 50,474 | 3,324,218 | ||||||
MKS Instruments, Inc. | 6,915 | 475,406 | ||||||
Mohawk Industries, Inc. (d) | 2,363 | 542,285 | ||||||
Morgan Stanley | 55,742 | 2,387,987 | ||||||
MTGE Investment Corp. REIT | 17,166 | 287,531 | ||||||
Murphy Oil Corp. | 25,966 | 742,368 | ||||||
Net 1 UEPS Technologies, Inc. (d) | 28,727 | 351,331 | ||||||
NETGEAR, Inc. (d) | 6,804 | 337,138 | ||||||
NeuStar, Inc., Class A (d) | 16,438 | 544,920 | ||||||
New Residential Investment Corp. REIT | 20,697 | 351,435 | ||||||
Newell Brands, Inc. | 36,087 | 1,702,224 | ||||||
Newfield Exploration Co. (d) | 20,578 | 759,534 | ||||||
Northrop Grumman Corp. | 8,676 | 2,063,500 | ||||||
NVIDIA Corp. | 7,089 | 772,205 | ||||||
Omega Protein Corp. | 30,745 | 616,437 | ||||||
On Assignment, Inc. (d) | 2,190 | 106,281 | ||||||
ON Semiconductor Corp. (d) | 51,588 | 799,098 | ||||||
ONE Gas, Inc. | 4,669 | 315,624 | ||||||
Owens Corning | 14,604 | 896,247 | ||||||
Pfizer, Inc. | 140,459 | 4,805,102 | ||||||
PG&E Corp. | 19,084 | 1,266,414 | ||||||
Pinnacle Foods, Inc. | 39,223 | 2,269,835 | ||||||
Pioneer Natural Resources Co. | 4,835 | 900,422 | ||||||
Pitney Bowes, Inc. | 16,135 | 211,530 | ||||||
PNC Financial Services Group, Inc. | 21,439 | 2,577,825 | ||||||
Principal Financial Group, Inc. | 26,450 | 1,669,259 | ||||||
Provident Financial Services, Inc. | 8,585 | 221,922 | ||||||
Prudential Financial, Inc. | 16,691 | 1,780,596 | ||||||
Public Service Enterprise Group, Inc. | 24,481 | 1,085,732 | ||||||
PVH Corp. | 16,133 | 1,669,282 | ||||||
Qorvo, Inc. (d) | 10,520 | 721,251 | ||||||
Quest Diagnostics, Inc. | 10,881 | 1,068,405 | ||||||
Quintiles IMS Holdings, Inc. (d) | 11,969 | 963,864 | ||||||
| Shares | Value | |||||||
Reinsurance Group of America, Inc. | 7,386 | $ | 937,874 | |||||
Reliance Steel & Aluminum Co. | 3,998 | 319,920 | ||||||
Revlon, Inc., Class A (d) | 11,793 | 328,435 | ||||||
Reynolds American, Inc. | 43,823 | 2,761,725 | ||||||
Royal Caribbean Cruises Ltd. | 12,590 | 1,235,205 | ||||||
Rudolph Technologies, Inc. (d) | 14,645 | 328,048 | ||||||
Sanmina Corp. (d) | 37,485 | 1,521,891 | ||||||
Sinclair Broadcast Group, Inc. Class A | 13,623 | 551,731 | ||||||
Skyworks Solutions, Inc. | 31,506 | 3,086,958 | ||||||
Snap-on, Inc. | 2,318 | 390,977 | ||||||
Southern Co. | 28,608 | 1,424,106 | ||||||
Southwest Airlines Co. | 8,359 | 449,380 | ||||||
Southwestern Energy Co. (d) | 146,319 | 1,195,426 | ||||||
SpartanNash Co. | 4,909 | 171,766 | ||||||
Spirit AeroSystems Holdings, Inc., Class A | 21,345 | 1,236,302 | ||||||
Stanley Black & Decker, Inc. | 17,522 | 2,328,148 | ||||||
Staples, Inc. | 82,467 | 723,236 | ||||||
Stoneridge, Inc. (d) | 13,107 | 237,761 | ||||||
Stryker Corp. | 5,385 | 708,935 | ||||||
SunTrust Banks, Inc. | 52,106 | 2,881,462 | ||||||
Superior Industries International, Inc. | 34,076 | 863,827 | ||||||
Sykes Enterprises, Inc. (d) | 4,989 | 146,677 | ||||||
Sysco Corp. | 22,667 | 1,176,871 | ||||||
Teleflex, Inc. | 4,638 | 898,520 | ||||||
Tenet Healthcare Corp. (d) | 45,175 | 800,049 | ||||||
Tesoro Corp. | 17,991 | 1,458,350 | ||||||
Texas Instruments, Inc. | 13,816 | 1,113,017 | ||||||
Texas Roadhouse, Inc. | 13,049 | 581,072 | ||||||
Thermo Fisher Scientific, Inc. | 15,101 | 2,319,514 | ||||||
Thor Industries, Inc. | 7,152 | 687,522 | ||||||
Time Warner, Inc. | 22,598 | 2,208,051 | ||||||
TiVo Corp. | 18,489 | 346,669 | ||||||
Tower International, Inc. | 9,675 | 262,193 | ||||||
Travelers Cos., Inc. | 7,000 | 843,780 | ||||||
Tyson Foods, Inc., Class A | 40,105 | 2,474,880 | ||||||
Union Bankshares Corp. | 10,698 | 376,356 | ||||||
United Continental Holdings, Inc. (d) | 5,874 | 414,939 | ||||||
UnitedHealth Group, Inc. | 25,279 | 4,146,009 | ||||||
Universal Health Services, Inc., Class B | 4,864 | 605,325 | ||||||
Unum Group | 32,891 | 1,542,259 | ||||||
Vail Resorts, Inc. | 1,727 | 331,411 | ||||||
Valero Energy Corp. | 33,979 | 2,252,468 | ||||||
VCA, Inc. (d) | 4,075 | 372,863 | ||||||
Verizon Communications, Inc. | 128,498 | 6,264,277 | ||||||
Vishay Intertechnology, Inc. | 27,556 | 453,296 | ||||||
Wal-Mart Stores, Inc. | 30,762 | 2,217,325 | ||||||
Waste Management, Inc. | 30,079 | 2,193,361 | ||||||
WellCare Health Plans, Inc. (d) | 2,564 | 359,498 | ||||||
Wells Fargo & Co. | 45,890 | 2,554,237 | ||||||
Western Digital Corp. | 19,153 | 1,580,697 | ||||||
Whirlpool Corp. | 4,060 | 695,600 | ||||||
Xerox Corp. | 127,578 | 936,423 | ||||||
Xperi Corp. | 10,536 | 357,697 | ||||||
Yum! Brands, Inc. | 14,776 | 944,186 | ||||||
Zimmer Biomet Holdings, Inc. | 11,217 | 1,369,708 | ||||||
|
| |||||||
| 369,299,270 | ||||||||
|
| |||||||
| Total Common Stock (cost—$633,895,293) | 709,095,351 | |||||||
|
| |||||||
| 150 | Semiannual Report | | March 31, 2017 | | See accompanying Notes to Financial Statements |
Table of Contents
Schedule of Investments
March 31, 2017 (Unaudited)
| Shares | Value | |||||||
| Preferred Stock—0.9% | ||||||||
| Brazil—0.4% | ||||||||
Banco Bradesco S.A. | 75,852 | $ | 784,542 | |||||
Braskem S.A., Class A | 20,000 | 202,837 | ||||||
Cia Paranaense de Energia | 31,300 | 327,337 | ||||||
Itau Unibanco Holding S.A. | 118,023 | 1,428,822 | ||||||
|
| |||||||
| 2,743,538 | ||||||||
|
| |||||||
| Colombia—0.1% | ||||||||
Banco Davivienda S.A. | 67,696 | 704,514 | ||||||
|
| |||||||
| Korea (Republic of)—0.4% | ||||||||
Samsung Electronics Co., Ltd. | 2,223 | 3,184,202 | ||||||
|
| |||||||
| Total Preferred Stock (cost—$4,906,599) | 6,632,254 | |||||||
|
| |||||||
| Rights—0.0% | ||||||||
| Australia—0.0% | ||||||||
Downer EDI Ltd., strike price AUD 5.95, | 26,981 | 248 | ||||||
|
| |||||||
| Principal Amount (000s) | ||||||||
| Repurchase Agreements—0.9% | ||||||||
State Street Bank and Trust Co., dated 3/31/17, 0.09%, due 4/3/17, proceeds $6,511,049; collateralized by U.S. Treasury Notes, 2.25%, due 11/15/25, valued at $6,641,377 including accrued interest |
| |||||||
(cost—$6,511,000) | $6,511 | 6,511,000 | ||||||
|
| |||||||
| Total Investments (cost—$645,312,892) (b)—99.2% | 722,238,853 | |||||||
|
| |||||||
| Other assets less liabilities (e)—0.8% | 5,892,858 | |||||||
|
| |||||||
| Net Assets-100.0% | $728,131,711 | |||||||
|
| |||||||
Notes to Schedule of Investments:
(a) 144A—Exempt from registration under Rule 144A of the Securities Act of 1933. These securities may be resold in transactions exempt from registration, typically only to qualified institutional buyers. Securities with an aggregate value of $4,683,438, representing 0.6% of net assets.
(b) Securities with an aggregate value of $262,032,182, representing 36.0% of net assets, were valued utilizing modeling tools provided by a third-party vendor. See Note 1(a) and Note 1(b) in the Notes to Financial Statements.
(c) Fair-Valued—Securities with an aggregate value of $3,298,557, representing 0.5% of net assets. See Note 1(a) and Note 1(b) in the Notes to Financial Statements.
(d) Non-income producing.
(e) Includes net unrealized appreciation (depreciation) of other financial instruments. See Notes 7(b) and 7(c) in the Notes to Financial Statements.
Glossary:
ADR—American Depositary Receipt
AUD—Australian Dollar
GDR—Global Depositary Receipt
REIT—Real Estate Investment Trust
UNIT—More than one class of securities traded together.
The industry classification of portfolio holdings and other assets less liabilities shown as a percentage of net assets were as follows:
Banks | 11.1% | |||
Oil, Gas & Consumable Fuels | 5.8% | |||
Semiconductors & Semiconductor Equipment | 4.7% | |||
Insurance | 4.4% | |||
Health Care Providers & Services | 3.9% | |||
Internet Software & Services | 3.6% | |||
Pharmaceuticals | 3.6% | |||
Diversified Telecommunication Services | 3.1% | |||
Food Products | 3.1% | |||
Technology Hardware, Storage & Peripherals | 3.0% | |||
Health Care Equipment & Supplies | 2.4% | |||
IT Services | 2.4% | |||
Automobiles | 2.3% | |||
Food & Staples Retailing | 2.2% | |||
Airlines | 2.1% | |||
Chemicals | 2.1% | |||
Electric Utilities | 2.1% | |||
Hotels, Restaurants & Leisure | 2.0% | |||
Tobacco | 2.0% | |||
Auto Components | 2.0% | |||
Media | 1.8% | |||
Software | 1.8% | |||
Metals & Mining | 1.6% | |||
Specialty Retail | 1.6% | |||
Biotechnology | 1.6% |
Industrial Conglomerates | 1.5% | |||
Electronic Equipment, Instruments & Components | 1.5% | |||
Trading Companies & Distributors | 1.4% | |||
Household Durables | 1.3% | |||
Construction & Engineering | 1.1% | |||
Capital Markets | 1.1% | |||
Communications Equipment | 1.0% | |||
Commercial Services & Supplies | 1.0% | |||
Machinery | 0.9% | |||
Real Estate Management & Development | 0.8% | |||
Aerospace & Defense | 0.7% | |||
Life Sciences Tools & Services | 0.7% | |||
Multi-line Retail | 0.7% | |||
Multi-Utilities | 0.7% | |||
Internet & Catalog Retail | 0.7% | |||
Road & Rail | 0.7% | |||
Mortgage Real Estate Investment Trusts (REITs) | 0.6% | |||
Paper & Forest Products | 0.6% | |||
Diversified Financial Services | 0.5% | |||
Building Products | 0.5% | |||
Beverages | 0.4% | |||
Containers & Packaging | 0.4% | |||
Construction Materials | 0.3% | |||
Textiles, Apparel & Luxury Goods | 0.3% | |||
Equity Real Estate Investment Trusts (REITs) | 0.3% | |||
Air Freight & Logistics | 0.2% | |||
Professional Services | 0.2% | |||
Marine | 0.2% | |||
Distributors | 0.2% | |||
Consumer Finance | 0.2% | |||
Electrical Equipment | 0.2% | |||
Household Products | 0.2% | |||
Transportation Infrastructure | 0.1% | |||
Energy Equipment & Services | 0.1% | |||
Thrifts & Mortgage Finance | 0.1% | |||
Independent Power Producers & Energy Traders | 0.1% | |||
Health Care Technology | 0.1% | |||
Wireless Telecommunication Services | 0.1% | |||
Gas Utilities | 0.1% | |||
Leisure Equipment & Products | 0.1% | |||
Diversified Consumer Services | 0.1% | |||
Water Utilities | 0.0% | |||
Personal Products | 0.0% | |||
Leisure Products | 0.0% | |||
Repurchase Agreements | 0.9% | |||
Other assets less liabilities | 0.8% | |||
|
| |||
| 100.0% | ||||
|
|
| See accompanying Notes to Financial Statements | | March 31, 2017 | | Semiannual Report | 151 |
Table of Contents
Schedule of Investments
March 31, 2017 (Unaudited)
AllianzGI Best Styles International Equity Fund
| Shares | Value | |||||||
| Common Stock—95.6% | ||||||||
| Australia—6.4% | ||||||||
Aristocrat Leisure Ltd. | 4,832 | $66,326 | ||||||
Asaleo Care Ltd. | 53,367 | 71,767 | ||||||
Australian Pharmaceutical Industries Ltd. | 53,515 | 83,400 | ||||||
Bank of Queensland Ltd. | 9,008 | 83,622 | ||||||
Bapcor Ltd. | 5,706 | 25,411 | ||||||
BlueScope Steel Ltd. | 7,649 | 71,707 | ||||||
Caltex Australia Ltd. | 4,832 | 108,873 | ||||||
Collins Foods Ltd. | 20,614 | 81,884 | ||||||
Commonwealth Bank of Australia | 701 | 45,968 | ||||||
Estia Health Ltd. | 24,789 | 58,499 | ||||||
Fortescue Metals Group Ltd. | 31,765 | 151,302 | ||||||
Harvey Norman Holdings Ltd. | 34,025 | 117,685 | ||||||
Japara Healthcare Ltd. | 47,323 | 72,653 | ||||||
Macquarie Group Ltd. | 2,435 | 167,763 | ||||||
McMillan Shakespeare Ltd. | 7,546 | 76,206 | ||||||
Metcash Ltd. (d) | 27,010 | 50,944 | ||||||
Myer Holdings Ltd. | 16,957 | 15,739 | ||||||
OZ Minerals Ltd. | 11,735 | 70,208 | ||||||
Qantas Airways Ltd. | 28,424 | 84,472 | ||||||
Select Harvests Ltd. | 18,149 | 81,488 | ||||||
Spotless Group Holdings Ltd. | 44,145 | 36,574 | ||||||
Star Entertainment Group Ltd. | 5,483 | 22,909 | ||||||
Treasury Wine Estates Ltd. | 14,946 | 139,620 | ||||||
Westpac Banking Corp. | 10,798 | 288,655 | ||||||
|
| |||||||
| 2,073,675 | ||||||||
|
| |||||||
| Austria—1.7% | ||||||||
Austria Technologie & Systemtechnik AG | 4,147 | 45,419 | ||||||
Erste Group Bank AG (d) | 4,358 | 141,905 | ||||||
Lenzing AG | 502 | 84,427 | ||||||
Mayr Melnhof Karton AG | 307 | 35,781 | ||||||
OMV AG | 951 | 37,478 | ||||||
Porr AG | 2,237 | 83,095 | ||||||
Telekom Austria AG (d) | 282 | 1,922 | ||||||
Voestalpine AG | 3,215 | 126,441 | ||||||
|
| |||||||
| 556,468 | ||||||||
|
| |||||||
| Belgium—0.8% | ||||||||
AGFA-Gevaert NV (d) | 8,409 | 41,149 | ||||||
Euronav NV | 6,856 | 54,753 | ||||||
UCB S.A. | 1,361 | 105,570 | ||||||
Warehouses De Pauw CVA REIT | 474 | 44,077 | ||||||
|
| |||||||
| 245,549 | ||||||||
|
| |||||||
| China—1.7% | ||||||||
AAC Technologies Holdings, Inc. | 11,500 | 134,654 | ||||||
Agricultural Bank of China Ltd., Class H | 139,000 | 64,103 | ||||||
Bank of China Ltd., Class H | 191,000 | 94,981 | ||||||
China Construction Bank Corp., Class H | 116,000 | 93,462 | ||||||
Huadian Power International Corp., Ltd., Class H | 50,000 | 21,303 | ||||||
Industrial & Commercial Bank of China Ltd., Class H | 166,000 | 108,622 | ||||||
Minth Group Ltd. | 12,000 | 48,385 | ||||||
|
| |||||||
| 565,510 | ||||||||
|
| |||||||
| Denmark—1.0% | ||||||||
Alm Brand A/S | 10,188 | 82,567 | ||||||
Danske Bank A/S | 5,884 | 200,620 | ||||||
Schouw & Co. AB | 595 | 54,530 | ||||||
|
| |||||||
| 337,717 | ||||||||
|
| |||||||
| Shares | Value | |||||||
| Finland—0.8% | ||||||||
Metsa Board Oyj | 5,259 | $ | 32,495 | |||||
Neste Oyj | 1,565 | 61,196 | ||||||
UPM-Kymmene Oyj | 6,655 | 156,253 | ||||||
|
| |||||||
| 249,944 | ||||||||
|
| |||||||
| France—9.6% | ||||||||
Alten S.A. | 1,121 | 85,960 | ||||||
Altran Technologies S.A. (d) | 4,651 | 78,206 | ||||||
APERAM S.A. | 679 | 33,854 | ||||||
Arkema S.A. | 1,335 | 131,418 | ||||||
Atos SE | 1,477 | 182,528 | ||||||
AXA S.A. | 8,545 | 220,767 | ||||||
BNP Paribas S.A. | 4,520 | 300,779 | ||||||
Bouygues S.A. | 2,285 | 92,873 | ||||||
Capgemini S.A. | 718 | 66,275 | ||||||
Cie Generale des Etablissements Michelin | 1,441 | 175,107 | ||||||
Electricite de France S.A. | 6,920 | 58,145 | ||||||
Elior Group (a) | 1,614 | 36,568 | ||||||
Engie S.A. | 16,466 | 232,691 | ||||||
Lagardere SCA | 815 | 23,973 | ||||||
Natixis S.A. | 6,376 | 39,252 | ||||||
Orange S.A. | 10,012 | 155,442 | ||||||
Renault S.A. | 760 | 66,023 | ||||||
Sanofi | 3,321 | 300,202 | ||||||
SCOR SE | 3,234 | 122,223 | ||||||
Total S.A. | 9,510 | 480,858 | ||||||
Valeo S.A. | 1,184 | 78,762 | ||||||
Vinci S.A. | 2,028 | 161,041 | ||||||
|
| |||||||
| 3,122,947 | ||||||||
|
| |||||||
| Germany—8.3% | ||||||||
adidas AG | 1,465 | 278,690 | ||||||
BASF SE | 1,368 | 135,451 | ||||||
Bayer AG | 2,434 | 280,430 | ||||||
Covestro AG (a) | 2,185 | 168,330 | ||||||
Daimler AG | 2,103 | 155,200 | ||||||
Deutsche Post AG | 5,455 | 186,689 | ||||||
Deutsche Telekom AG | 4,821 | 84,477 | ||||||
Deutsche Wohnen AG | 2,454 | 80,814 | ||||||
Evonik Industries AG | 3,571 | 116,395 | ||||||
Fresenius SE & Co. KGaA | 2,305 | 185,220 | ||||||
Hannover Rueck SE | 1,060 | 122,145 | ||||||
HeidelbergCement AG | 1,363 | 127,642 | ||||||
K&S AG | 309 | 7,182 | ||||||
Merck KGaA | 1,626 | 185,288 | ||||||
Muenchener Rueckversicherungs-Gesellschaft AG in Muenchen | 1,142 | 223,549 | ||||||
Siemens AG | 1,246 | 170,667 | ||||||
TUI AG | 3,341 | 46,207 | ||||||
Volkswagen AG | 220 | 32,870 | ||||||
Wuestenrot & Wuerttembergische AG | 3,255 | 64,575 | ||||||
Zalando SE (a)(d) | 1,251 | 50,562 | ||||||
|
| |||||||
| 2,702,383 | ||||||||
|
| |||||||
| Greece—0.5% | ||||||||
Hellenic Petroleum S.A. (d) | 16,280 | 89,275 | ||||||
Mytilineos Holdings S.A. (d) | 5,418 | 41,012 | ||||||
Tsakos Energy Navigation Ltd. | 7,558 | 36,203 | ||||||
|
| |||||||
| 166,490 | ||||||||
|
| |||||||
| Hong Kong—3.7% | ||||||||
BOC Hong Kong Holdings Ltd. | 31,500 | 128,751 | ||||||
Cathay Pacific Airways Ltd. | 42,000 | 60,973 | ||||||
Cheung Kong Property Holdings Ltd. | 25,000 | 168,646 | ||||||
CK Hutchison Holdings Ltd. | 20,920 | 257,565 | ||||||
CLP Holdings Ltd. | 8,500 | 88,982 | ||||||
| Shares | Value | |||||||
Kerry Properties Ltd. | 24,000 | $ | 83,248 | |||||
Man Wah Holdings Ltd. | 122,800 | 97,540 | ||||||
Shun Tak Holdings Ltd. | 160,000 | 56,652 | ||||||
Swire Pacific Ltd., Class A | 3,000 | 29,986 | ||||||
WH Group Ltd. (a) | 174,000 | 150,044 | ||||||
Wheelock & Co., Ltd. | 4,000 | 31,641 | ||||||
Xinyi Glass Holdings Ltd. (d) | 44,000 | 38,756 | ||||||
|
| |||||||
| 1,192,784 | ||||||||
|
| |||||||
| Indonesia—0.1% | ||||||||
Telekomunikasi Indonesia Persero Tbk PT | 121,900 | 37,892 | ||||||
|
| |||||||
| Ireland—0.8% | ||||||||
CRH PLC | 4,886 | 172,081 | ||||||
Smurfit Kappa Group PLC | 2,488 | 66,304 | ||||||
Total Produce PLC | 2,856 | 5,941 | ||||||
|
| |||||||
| 244,326 | ||||||||
|
| |||||||
| Israel—0.7% | ||||||||
Bank Hapoalim BM | 15,201 | 92,638 | ||||||
Teva Pharmaceutical Industries Ltd. | 3,580 | 117,074 | ||||||
|
| |||||||
| 209,712 | ||||||||
|
| |||||||
| Italy—3.3% | ||||||||
Assicurazioni Generali SpA | 9,472 | 150,284 | ||||||
Enel SpA | 61,636 | 290,026 | ||||||
EXOR NV | 3,217 | 166,344 | ||||||
Intesa Sanpaolo SpA | 70,375 | 191,427 | ||||||
Mediobanca SpA | 14,860 | 133,982 | ||||||
Rizzoli Corriere Della Sera Mediagroup SpA (d) | 2,741 | 3,453 | ||||||
Societa Cattolica di Assicurazioni SCRL | 10,493 | 84,067 | ||||||
UniCredit SpA | 2,697 | 41,575 | ||||||
|
| |||||||
| 1,061,158 | ||||||||
|
| |||||||
| Japan—23.4% | ||||||||
Alfresa Holdings Corp. | 1,800 | 31,291 | ||||||
AOI Electronics Co., Ltd. | 3,200 | 98,037 | ||||||
Aoyama Trading Co., Ltd. | 1,000 | 34,390 | ||||||
Astellas Pharma, Inc. | 17,000 | 224,212 | ||||||
Chubu Electric Power Co., Inc. | 6,800 | 91,344 | ||||||
CKD Corp. | 5,500 | 69,732 | ||||||
Dai Nippon Printing Co., Ltd. | 10,000 | 108,214 | ||||||
Daiichi Sankyo Co., Ltd. | 6,800 | 153,415 | ||||||
Daikin Industries Ltd. | 1,500 | 151,257 | ||||||
DCM Holdings Co., Ltd. | 1,800 | 16,643 | ||||||
FUJIFILM Holdings Corp. | 3,400 | 133,273 | ||||||
Heiwado Co., Ltd. | 3,000 | 72,944 | ||||||
Hirata Corp. | 300 | 24,364 | ||||||
Hitachi High-Technologies Corp. | 1,300 | 53,105 | ||||||
Hitachi Ltd. | 28,000 | 152,033 | ||||||
Hokuhoku Financial Group, Inc. | 5,200 | 81,636 | ||||||
Idemitsu Kosan Co., Ltd. | 4,200 | 146,199 | ||||||
ITOCHU Corp. | 10,900 | 155,176 | ||||||
J Front Retailing Co., Ltd. | 3,600 | 53,475 | ||||||
Japan Airlines Co., Ltd. | 3,400 | 107,950 | ||||||
JX Holdings, Inc. | 22,800 | 112,257 | ||||||
Kato Sangyo Co., Ltd. | 1,400 | 36,058 | ||||||
KDDI Corp. | 10,300 | 270,898 | ||||||
Marubeni Corp. | 23,400 | 144,540 | ||||||
Marudai Food Co., Ltd. | 17,000 | 74,529 | ||||||
Medipal Holdings Corp. | 3,100 | 48,708 | ||||||
Megmilk Snow Brand Co., Ltd. | 1,600 | 44,110 | ||||||
Mitsubishi Chemical Holdings Corp. | 21,400 | 166,148 | ||||||
Mitsubishi Gas Chemical Co., Inc. | 7,900 | 164,544 | ||||||
| 152 | Semiannual Report | | March 31, 2017 | | See accompanying Notes to Financial Statements |
Table of Contents
Schedule of Investments
March 31, 2017 (Unaudited)
| Shares | Value | |||||||
Mitsubishi Heavy Industries Ltd. | 5,000 | $ | 20,119 | |||||
Mitsubishi Materials Corp. | 3,500 | 106,235 | ||||||
Mitsubishi Tanabe Pharma Corp. | 4,500 | 93,956 | ||||||
Mitsubishi UFJ Financial Group, Inc. | 47,700 | 300,470 | ||||||
Mitsui & Co., Ltd. | 12,300 | 178,621 | ||||||
Mixi, Inc. | 800 | 38,697 | ||||||
Nippon Electric Glass Co., Ltd. | 10,000 | 60,577 | ||||||
Nippon Flour Mills Co., Ltd. | 6,500 | 96,216 | ||||||
Nippon Telegraph & Telephone Corp. | 6,400 | 273,621 | ||||||
Nissan Motor Co., Ltd. | 24,700 | 238,167 | ||||||
Nisshin Oillio Group Ltd. | 18,000 | 102,628 | ||||||
NTT DOCOMO, Inc. | 11,700 | 273,221 | ||||||
Oki Electric Industry Co., Ltd. | 3,100 | 44,672 | ||||||
Okinawa Cellular Telephone Co. | 2,600 | 84,277 | ||||||
ORIX Corp. | 9,800 | 145,457 | ||||||
Otsuka Holdings Co., Ltd. | 3,100 | 140,307 | ||||||
Ricoh Co., Ltd. (d) | 10,300 | 84,965 | ||||||
Seino Holdings Co., Ltd. | 6,000 | 67,565 | ||||||
Shindengen Electric Manufacturing Co., Ltd. | 9,000 | 37,765 | ||||||
Sojitz Corp. | 5,600 | 14,072 | ||||||
Sompo Holdings, Inc. | 4,300 | 157,975 | ||||||
Stella Chemifa Corp. | 600 | 17,125 | ||||||
Sumitomo Corp. | 13,100 | 176,730 | ||||||
Sumitomo Dainippon Pharma Co., Ltd. | 2,700 | 44,678 | ||||||
Sumitomo Electric Industries Ltd. | 10,000 | 166,234 | ||||||
Sumitomo Forestry Co., Ltd. | 4,200 | 64,016 | ||||||
Sumitomo Mitsui Financial Group, Inc. | 4,500 | 163,794 | ||||||
Sumitomo Rubber Industries Ltd. | 2,400 | 40,949 | ||||||
Suzuken Co., Ltd. | 2,300 | 75,581 | ||||||
Taisei Corp. | 14,000 | 102,384 | ||||||
Taisho Pharmaceutical Holdings Co., Ltd. | 200 | 16,285 | ||||||
Teijin Ltd. | 5,900 | 111,406 | ||||||
Toho Holdings Co., Ltd. | 2,700 | 56,665 | ||||||
Tohoku Electric Power Co., Inc. | 6,600 | 89,653 | ||||||
Tokyo Electron Ltd. | 400 | 43,791 | ||||||
TonenGeneral Sekiyu KK (c) | 3,000 | 37,616 | ||||||
Toridoll Holdings Corp. | 1,400 | 30,442 | ||||||
Towa Corp. | 1,400 | 25,061 | ||||||
Toyoda Gosei Co., Ltd. | 1,600 | 40,808 | ||||||
Toyota Motor Corp. | 5,500 | 298,528 | ||||||
Tsumura & Co. | 1,800 | 56,576 | ||||||
V Technology Co., Ltd. | 600 | 92,508 | ||||||
Valor Holdings Co., Ltd. | 1,300 | 30,758 | ||||||
Warabeya Nichiyo Holdings Co., Ltd. | 3,400 | 79,071 | ||||||
West Japan Railway Co. | 1,400 | 91,299 | ||||||
Yokohama Reito Co., Ltd. | 7,400 | 73,657 | ||||||
|
| |||||||
| 7,605,680 | ||||||||
|
| |||||||
| Korea (Republic of)—1.5% | ||||||||
Hana Financial Group, Inc. | 2,141 | 70,649 | ||||||
Hyundai Mobis Co., Ltd. | 148 | 31,838 | ||||||
Kia Motors Corp. | 913 | 30,259 | ||||||
Korea Electric Power Corp. | 2,268 | 94,406 | ||||||
POSCO | 248 | 64,412 | ||||||
Samsung Electronics Co., Ltd. GDR | 171 | 157,024 | ||||||
SK Innovation Co., Ltd. | 307 | 45,745 | ||||||
|
| |||||||
| 494,333 | ||||||||
|
| |||||||
| Netherlands—1.5% | ||||||||
Accell Group | 1,591 | 43,535 | ||||||
AerCap Holdings NV (d) | 1,118 | 51,395 | ||||||
BinckBank NV | 10,055 | 51,346 | ||||||
| Shares | Value | |||||||
Heineken Holding NV | 1,112 | $ | 88,326 | |||||
ING Groep NV | 6,006 | 90,716 | ||||||
NN Group NV | 3,384 | 109,903 | ||||||
Unilever NV | 1,218 | 60,511 | ||||||
|
| |||||||
| 495,732 | ||||||||
|
| |||||||
| New Zealand—1.4% | ||||||||
Air New Zealand Ltd. | 34,028 | 58,680 | ||||||
EBOS Group Ltd. | 12,982 | 165,970 | ||||||
Fletcher Building Ltd. | 3,729 | 21,723 | ||||||
Fonterra Co-operative Group Ltd. UNIT | 25,064 | 106,473 | ||||||
Infratil Ltd. | 31,884 | 65,041 | ||||||
New Zealand Refining Co., Ltd. | 29,024 | 48,405 | ||||||
|
| |||||||
| 466,292 | ||||||||
|
| |||||||
| Norway—1.3% | ||||||||
Austevoll Seafood ASA | 1,075 | 7,891 | ||||||
Avance Gas Holding Ltd. (a) | 19,848 | 65,187 | ||||||
Bakkafrost P/F | 1,887 | 58,367 | ||||||
DNB ASA | 5,629 | 89,380 | ||||||
Leroy Seafood Group ASA | 330 | 14,452 | ||||||
Marine Harvest ASA (d) | 2,491 | 37,999 | ||||||
Orkla ASA | 3,848 | 34,471 | ||||||
Yara International ASA | 3,199 | 123,218 | ||||||
|
| |||||||
| 430,965 | ||||||||
|
| |||||||
| Portugal—0.4% | ||||||||
EDP—Energias de Portugal S.A. | 15,128 | 51,150 | ||||||
Galp Energia SGPS S.A. | 3,662 | 55,543 | ||||||
Jeronimo Martins SGPS S.A. | 1,901 | 33,969 | ||||||
|
| |||||||
| 140,662 | ||||||||
|
| |||||||
| Russian Federation—0.1% | ||||||||
Rosneft Oil Co. PJSC GDR | 8,252 | 47,010 | ||||||
|
| |||||||
| Singapore—0.3% | ||||||||
Keppel Corp., Ltd. | 4,100 | 20,337 | ||||||
QAF Ltd. | 89,500 | 89,253 | ||||||
|
| |||||||
| 109,590 | ||||||||
|
| |||||||
| South Africa—0.0% | ||||||||
Steinhoff International Holdings NV | 1,302 | 6,228 | ||||||
|
| |||||||
| Spain—3.0% | ||||||||
Aena S.A. (a) | 860 | 135,931 | ||||||
Amadeus IT Group S.A. | 1,405 | 71,189 | ||||||
Banco Santander S.A. | 19,230 | 117,713 | ||||||
CIE Automotive S.A. | 5,432 | 107,042 | ||||||
Iberdrola S.A. | 22,218 | 158,745 | ||||||
International Consolidated Airlines Group S.A. | 18,858 | 124,978 | ||||||
Repsol S.A. | 11,692 | 181,143 | ||||||
Telefonica S.A. | 6,378 | 71,391 | ||||||
|
| |||||||
| 968,132 | ||||||||
|
| |||||||
| Sweden—1.1% | ||||||||
Coor Service Management Holding AB (a) | 13,820 | 83,008 | ||||||
ICA Gruppen AB | 80 | 2,729 | ||||||
Loomis AB, Class B | 2,241 | 70,861 | ||||||
Mycronic AB | 5,206 | 53,321 | ||||||
Nobina AB (a) | 15,280 | 90,804 | ||||||
SAS AB (d) | 27,184 | 43,279 | ||||||
|
| |||||||
| 344,002 | ||||||||
|
| |||||||
| Switzerland—7.2% | ||||||||
Baloise Holding AG | 944 | 129,717 | ||||||
Bobst Group S.A. | 1,040 | 95,848 | ||||||
Geberit AG | 278 | 119,793 | ||||||
Lonza Group AG (d) | 795 | 150,272 | ||||||
Nestle S.A. | 4,858 | 372,860 | ||||||
Novartis AG | 3,521 | 261,461 | ||||||
Partners Group Holding AG | 129 | 69,326 | ||||||
Roche Holding AG | 829 | 212,003 | ||||||
| Shares | Value | |||||||
Swiss Life Holding AG (d) | 498 | $ | 160,586 | |||||
Swiss Re AG | 2,505 | 224,989 | ||||||
UBS Group AG | 16,849 | 269,325 | ||||||
Zurich Insurance Group AG (d) | 1,039 | 277,268 | ||||||
|
| |||||||
| 2,343,448 | ||||||||
|
| |||||||
| Taiwan—0.4% | ||||||||
Compeq Manufacturing Co., Ltd. | 30,000 | 21,697 | ||||||
Formosa Petrochemical Corp. | 6,000 | 20,958 | ||||||
Taiwan Semiconductor Manufacturing Co., Ltd. | 12,000 | 75,247 | ||||||
|
| |||||||
| 117,902 | ||||||||
|
| |||||||
| Turkey—0.1% | ||||||||
Soda Sanayii AS | 26,808 | 44,883 | ||||||
|
| |||||||
| United Kingdom—14.5% | ||||||||
3i Group PLC | 17,818 | 167,294 | ||||||
Anglo American PLC (d) | 12,925 | 197,481 | ||||||
Barratt Developments PLC | 14,310 | 98,024 | ||||||
Bellway PLC | 54 | 1,830 | ||||||
Berkeley Group Holdings PLC | 242 | 9,731 | ||||||
Bovis Homes Group PLC | 1,265 | 13,408 | ||||||
BP PLC | 25,691 | 147,880 | ||||||
British American Tobacco PLC | 4,171 | 276,729 | ||||||
BT Group PLC | 10,867 | 43,393 | ||||||
Carillion PLC | 21,105 | 58,879 | ||||||
Carnival PLC | 879 | 50,382 | ||||||
Coca-Cola HBC AG (d) | 2,832 | 73,111 | ||||||
Compass Group PLC | 13,461 | 254,146 | ||||||
Conviviality PLC | 5,695 | 19,444 | ||||||
Cranswick PLC | 754 | 24,175 | ||||||
Dart Group PLC | 11,995 | 77,547 | ||||||
Direct Line Insurance Group PLC | 21,291 | 92,634 | ||||||
Equiniti Group PLC (a) | 32,419 | 79,611 | ||||||
Fiat Chrysler Automobiles NV (d) | 935 | 10,215 | ||||||
Firstgroup PLC (d) | 44,834 | 74,165 | ||||||
Fresnillo PLC | 1,680 | 32,734 | ||||||
Galliford Try PLC | 4,232 | 78,167 | ||||||
GlaxoSmithKline PLC | 4,720 | 98,143 | ||||||
Greggs PLC | 3,746 | 48,928 | ||||||
HSBC Holdings PLC | 35,523 | 289,756 | ||||||
J Sainsbury PLC | 34,788 | 115,224 | ||||||
Legal & General Group PLC | 4,828 | 14,950 | ||||||
Lloyds Banking Group PLC | 114,332 | 95,088 | ||||||
Lookers PLC | 46,839 | 75,263 | ||||||
Marks & Spencer Group PLC | 18,754 | 79,215 | ||||||
Marston’s PLC | 10,226 | 17,202 | ||||||
McBride PLC Class B (d) | 945 | 2,344 | ||||||
McCarthy & Stone PLC (a) | 30,837 | 72,908 | ||||||
Micro Focus International PLC | 1,309 | 37,338 | ||||||
National Express Group PLC | 19,456 | 87,755 | ||||||
Northgate PLC | 19,067 | 131,390 | ||||||
Novae Group PLC | 9,409 | 74,563 | ||||||
OneSavings Bank PLC | 16,831 | 85,236 | ||||||
Pendragon PLC | 192,293 | 84,323 | ||||||
Persimmon PLC | 914 | 23,980 | ||||||
Reckitt Benckiser Group PLC | 720 | 65,730 | ||||||
Royal Dutch Shell PLC, Class A | 22,758 | 599,862 | ||||||
Royal Mail PLC | 20,449 | 108,912 | ||||||
Shawbrook Group PLC (a)(d) | 17,127 | 72,808 | ||||||
Shire PLC | 1,981 | 115,427 | ||||||
TP ICAP PLC | 15,715 | 91,457 | ||||||
U & I Group PLC | 31,776 | 66,586 | ||||||
Vodafone Group PLC | 41,616 | 108,451 | ||||||
WPP PLC | 7,352 | 161,149 | ||||||
|
| |||||||
| 4,704,968 | ||||||||
|
| |||||||
| Total Common Stock (cost—$29,223,053) | 31,086,382 | |||||||
|
| |||||||
| See accompanying Notes to Financial Statements | | March 31, 2017 | | Semiannual Report | 153 |
Table of Contents
Schedule of Investments
March 31, 2017 (Unaudited)
| Shares | Value | |||||||
| Preferred Stock—1.2% | ||||||||
| Germany—1.2% | ||||||||
Henkel AG & Co. KGaA | 1,216 | $ | 155,861 | |||||
Volkswagen AG | 1,529 | 222,898 | ||||||
|
| |||||||
| Total Preferred Stock (cost—$331,359) | 378,759 | |||||||
|
| |||||||
| Principal Amount (000s) | ||||||||
| Repurchase Agreements—1.3% | ||||||||
State Street Bank and Trust Co., dated 3/31/17, 0.09%, due 4/3/17, proceeds $412,003; collateralized by U.S. Treasury Notes, 2.25%, due 11/15/25, valued at $424,130 including accrued interest |
| |||||||
(cost—$412,000) | $412 | 412,000 | ||||||
|
| |||||||
| Total Investments (cost—$29,966,412) (b)—98.1% | 31,877,141 | |||||||
|
| |||||||
| Other assets less liabilities (e)—1.9% | 621,734 | |||||||
|
| |||||||
| Net Assets—100.0% | $32,498,875 | |||||||
|
| |||||||
Notes to Schedule of Investments:
(a) 144A—Exempt from registration under Rule 144A of the Securities Act of 1933. These securities may be resold in transactions exempt from registration, typically only to qualified institutional buyers. Securities with an aggregate value of $1,005,761, representing 3.1% of net assets.
(b) Securities with an aggregate value of $29,384,519, representing 90.4% of net assets, were valued utilizing modeling tools provided by a third-party vendor. See Note 1(a) and Note 1(b) in the Notes to Financial Statements.
(c) Fair-Valued—Security with a value of $37,616, representing 0.1% of net assets. See Note 1(a) and Note 1(b) in the Notes to Financial Statements.
(d) Non-income producing.
(e) Includes net unrealized appreciation (depreciation) of other financial instruments. See Notes 7(b) and 7(c) in the Notes to Financial Statements.
Glossary:
GDR—Global Depositary Receipt
REIT—Real Estate Investment Trust
UNIT—More than one class of securities traded together.
The industry classification of portfolio holdings and other assets less liabilities shown as a percentage of net assets were as follows:
Banks | 10.5% | |||
Oil, Gas & Consumable Fuels | 7.3% | |||
Insurance | 7.1% | |||
Pharmaceuticals | 7.0% | |||
Food Products | 4.4% | |||
Chemicals | 3.9% | |||
Automobiles | 3.2% | |||
Electric Utilities | 3.0% | |||
Metals & Mining | 2.6% | |||
Capital Markets | 2.5% | |||
Health Care Providers & Services | 2.4% | |||
Wireless Telecommunication Services | 2.3% | |||
Auto Components | 2.2% | |||
Trading Companies & Distributors | 2.2% | |||
Diversified Telecommunication Services | 2.1% | |||
Electronic Equipment, Instruments & Components | 2.0% | |||
Hotels, Restaurants & Leisure | 1.9% | |||
Construction & Engineering | 1.8% | |||
IT Services | 1.7% | |||
Airlines | 1.7% | |||
Industrial Conglomerates | 1.7% | |||
Road & Rail | 1.7% | |||
Food & Staples Retailing | 1.5% | |||
Real Estate Management & Development | 1.4% | |||
Household Durables | 1.2% | |||
Technology Hardware, Storage & Peripherals | 1.2% | |||
Construction Materials | 1.0% | |||
Diversified Financial Services | 1.0% | |||
Beverages | 0.9% | |||
Commercial Services & Supplies | 0.9% | |||
Air Freight & Logistics | 0.9% | |||
Semiconductors & Semiconductor Equipment | 0.9% | |||
Textiles, Apparel & Luxury Goods | 0.9% | |||
Tobacco | 0.9% | |||
Building Products | 0.8% | |||
Multi-line Retail | 0.8% | |||
Multi-Utilities | 0.7% | |||
Household Products | 0.7% | |||
Specialty Retail | 0.7% | |||
Machinery | 0.6% | |||
Paper & Forest Products | 0.6% | |||
Media | 0.6% | |||
Life Sciences Tools & Services | 0.5% | |||
Transportation Infrastructure | 0.4% | |||
Personal Products | 0.4% | |||
Biotechnology | 0.4% | |||
Containers & Packaging | 0.3% | |||
Thrifts & Mortgage Finance | 0.3% | |||
Professional Services | 0.2% | |||
Internet & Catalog Retail | 0.2% | |||
Equity Real Estate Investment Trusts (REITs) | 0.1% | |||
Leisure Equipment & Products | 0.1% | |||
Health Care Technology | 0.1% | |||
Internet Software & Services | 0.1% | |||
Software | 0.1% | |||
Distributors | 0.1% | |||
Independent Power Producers & Energy Traders | 0.1% | |||
Repurchase Agreements | 1.3% | |||
Other assets less liabilities | 1.9% | |||
|
| |||
| 100.0% | ||||
|
|
AllianzGI Best Styles U.S. Equity Fund
| Shares | Value | |||||||
| Common Stock—99.9% | ||||||||
| Aerospace & Defense—2.4% | ||||||||
Huntington Ingalls Industries, Inc. | 2,766 | $553,864 | ||||||
Lockheed Martin Corp. | 2,436 | 651,874 | ||||||
Northrop Grumman Corp. | 3,376 | 802,948 | ||||||
Raytheon Co. | 5,625 | 857,812 | ||||||
|
| |||||||
| 2,866,498 | ||||||||
|
| |||||||
| Air Freight & Logistics—0.8% | ||||||||
Air Transport Services Group, Inc. (a) | 1,320 | 21,186 | ||||||
United Parcel Service, Inc., Class B | 8,966 | 962,052 | ||||||
|
| |||||||
| 983,238 | ||||||||
|
| |||||||
| Airlines—1.4% | ||||||||
Alaska Air Group, Inc. | 8,116 | 748,458 | ||||||
American Airlines Group, Inc. | 1,008 | 42,638 | ||||||
Delta Air Lines, Inc. | 16,426 | 754,939 | ||||||
Exchange Income Corp. | 614 | 18,025 | ||||||
SkyWest, Inc. | 5,066 | 173,510 | ||||||
|
| |||||||
| 1,737,570 | ||||||||
|
| |||||||
| Auto Components—0.9% | ||||||||
Delphi Automotive PLC | 4,667 | 375,647 | ||||||
Lear Corp. | 2,692 | 381,133 | ||||||
Magna International, Inc. | 7,787 | 336,050 | ||||||
Superior Industries International, Inc. | 679 | 17,213 | ||||||
|
| |||||||
| 1,110,043 | ||||||||
|
| |||||||
| Automobiles—1.1% | ||||||||
Ford Motor Co. | 52,191 | 607,503 | ||||||
General Motors Co. | 19,892 | 703,381 | ||||||
|
| |||||||
| 1,310,884 | ||||||||
|
| |||||||
| Banks—5.4% | ||||||||
Banc of California, Inc. | 10,992 | 227,534 | ||||||
Bank of America Corp. | 33,290 | 785,311 | ||||||
Citigroup, Inc. | 20,958 | 1,253,707 | ||||||
Huntington Bancshares, Inc. | 16,687 | 223,439 | ||||||
JPMorgan Chase & Co. | 22,598 | 1,985,008 | ||||||
Regions Financial Corp. | 47,937 | 696,525 | ||||||
SunTrust Banks, Inc. | 9,216 | 509,645 | ||||||
Wells Fargo & Co. | 14,407 | 801,894 | ||||||
|
| |||||||
| 6,483,063 | ||||||||
|
| |||||||
| Beverages—1.1% | ||||||||
Coca-Cola Co. | 7,776 | 330,014 | ||||||
Dr. Pepper Snapple Group, Inc. | 6,895 | 675,158 | ||||||
MGP Ingredients, Inc. | 820 | 44,469 | ||||||
PepsiCo, Inc. | 2,569 | 287,368 | ||||||
|
| |||||||
| 1,337,009 | ||||||||
|
| |||||||
| Biotechnology—2.7% | ||||||||
AbbVie, Inc. | 15,247 | 993,494 | ||||||
Amgen, Inc. | 7,997 | 1,312,068 | ||||||
Biogen, Inc. (a) | 477 | 130,421 | ||||||
Bioverativ, Inc. (a) | 238 | 12,961 | ||||||
Gilead Sciences, Inc. | 10,168 | 690,611 | ||||||
United Therapeutics Corp. (a) | 312 | 42,239 | ||||||
Xencor, Inc. (a) | 843 | 20,165 | ||||||
|
| |||||||
| 3,201,959 | ||||||||
|
| |||||||
| Building Products—0.1% | ||||||||
Builders FirstSource, Inc. (a) | 525 | 7,822 | ||||||
Griffon Corp. | 747 | 18,414 | ||||||
Universal Forest Products, Inc. | 799 | 78,733 | ||||||
|
| |||||||
| 104,969 | ||||||||
|
| |||||||
| 154 | Semiannual Report | | March 31, 2017 | | See accompanying Notes to Financial Statements |
Table of Contents
Schedule of Investments
March 31, 2017 (Unaudited)
| Shares | Value | |||||||
| Capital Markets—1.8% | ||||||||
Goldman Sachs Group, Inc. | 2,590 | $ | 594,975 | |||||
Morgan Stanley | 22,106 | 947,021 | ||||||
Morningstar, Inc. | 96 | 7,546 | ||||||
Nasdaq, Inc. | 2,560 | 177,792 | ||||||
S&P Global, Inc. | 3,303 | 431,834 | ||||||
|
| |||||||
| 2,159,168 | ||||||||
|
| |||||||
| Chemicals—1.6% | ||||||||
CF Industries Holdings, Inc. | 1,956 | 57,409 | ||||||
Dow Chemical Co. | 18,470 | 1,173,584 | ||||||
Innospec, Inc. | 192 | 12,432 | ||||||
LyondellBasell Industries NV, Class A | 7,796 | 710,917 | ||||||
|
| |||||||
| 1,954,342 | ||||||||
|
| |||||||
| Commercial Services & Supplies—2.0% | ||||||||
Cintas Corp. | 5,354 | 677,495 | ||||||
Copart, Inc. (a) | 3,492 | 216,260 | ||||||
KAR Auction Services, Inc. | 7,984 | 348,661 | ||||||
Republic Services, Inc. | 10,194 | 640,285 | ||||||
Transcontinental, Inc., Class A | 728 | 13,456 | ||||||
Waste Management, Inc. | 6,242 | 455,167 | ||||||
|
| |||||||
| 2,351,324 | ||||||||
|
| |||||||
| Communications Equipment—1.2% | ||||||||
Cisco Systems, Inc. | 36,629 | 1,238,060 | ||||||
Finisar Corp. (a) | 5,285 | 144,492 | ||||||
|
| |||||||
| 1,382,552 | ||||||||
|
| |||||||
| Construction & Engineering—0.1% | ||||||||
Aecon Group, Inc. | 581 | 7,501 | ||||||
WSP Global, Inc. | 1,287 | 45,457 | ||||||
|
| |||||||
| 52,958 | ||||||||
|
| |||||||
| Construction Materials—0.5% | ||||||||
Vulcan Materials Co. | 5,102 | 614,689 | ||||||
|
| |||||||
| Consumer Finance—0.4% | ||||||||
Capital One Financial Corp. | 2,659 | 230,429 | ||||||
Credit Acceptance Corp. (a) | 1,172 | 233,708 | ||||||
Santander Consumer USA Holdings, Inc. (a) | 440 | 5,861 | ||||||
|
| |||||||
| 469,998 | ||||||||
|
| |||||||
| Containers & Packaging—0.8% | ||||||||
CCL Industries, Inc., Class B | 1,500 | 327,262 | ||||||
Packaging Corp. of America | 6,890 | 631,262 | ||||||
Sonoco Products Co. | 97 | 5,133 | ||||||
|
| |||||||
| 963,657 | ||||||||
|
| |||||||
| Diversified Consumer Services—0.1% | ||||||||
Capella Education Co. | 626 | 53,226 | ||||||
Career Education Corp. (a) | 1,419 | 12,345 | ||||||
Enercare, Inc. | 2,384 | 37,234 | ||||||
Regis Corp. (a) | 618 | 7,243 | ||||||
|
| |||||||
| 110,048 | ||||||||
|
| |||||||
| Diversified Financial Services—1.2% | ||||||||
Berkshire Hathaway, Inc., Class B (a) | 8,812 | 1,468,784 | ||||||
|
| |||||||
| Diversified Telecommunication Services—2.7% | ||||||||
AT&T, Inc. | 36,932 | 1,534,525 | ||||||
BCE, Inc. | 3,906 | 172,941 | ||||||
CenturyLink, Inc. | 21,494 | 506,613 | ||||||
Verizon Communications, Inc. | 21,042 | 1,025,797 | ||||||
|
| |||||||
| 3,239,876 | ||||||||
|
| |||||||
| Electric Utilities—1.9% | ||||||||
American Electric Power Co., Inc. | 3,335 | 223,878 | ||||||
Duke Energy Corp. | 7,072 | 579,975 | ||||||
Entergy Corp. | 5,332 | 405,019 | ||||||
Exelon Corp. | 6,883 | 247,650 | ||||||
| Shares | Value | |||||||
FirstEnergy Corp. | 4,260 | $ | 135,553 | |||||
NextEra Energy, Inc. | 4,953 | 635,817 | ||||||
|
| |||||||
| 2,227,892 | ||||||||
|
| |||||||
| Electrical Equipment—0.0% | ||||||||
General Cable Corp. | 549 | 9,855 | ||||||
|
| |||||||
| Electronic Equipment, Instruments & Components—1.6% | ||||||||
Arrow Electronics, Inc. (a) | 2,895 | 212,522 | ||||||
Avnet, Inc. | 122 | 5,583 | ||||||
Benchmark Electronics, Inc. (a) | 372 | 11,830 | ||||||
CDW Corp. | 8,557 | 493,824 | ||||||
Corning, Inc. | 11,605 | 313,335 | ||||||
TE Connectivity Ltd. | 8,646 | 644,559 | ||||||
Tech Data Corp. (a) | 1,920 | 180,288 | ||||||
|
| |||||||
| 1,861,941 | ||||||||
|
| |||||||
| Energy Equipment & Services—0.5% | ||||||||
Helmerich & Payne, Inc. | 2,233 | 148,651 | ||||||
Noble Corp. PLC | 26,524 | 164,184 | ||||||
Schlumberger Ltd. | 3,423 | 267,336 | ||||||
|
| |||||||
| 580,171 | ||||||||
|
| |||||||
| Equity Real Estate Investment Trusts (REITs)—1.3% | ||||||||
CareTrust REIT, Inc. | 1,328 | 22,337 | ||||||
Crown Castle International Corp. | 6,348 | 599,569 | ||||||
Duke Realty Corp. | 13,567 | 356,405 | ||||||
Equinix, Inc. | 508 | 203,388 | ||||||
Equity LifeStyle Properties, Inc. | 2,340 | 180,320 | ||||||
Gaming and Leisure Properties, Inc. | 1,815 | 60,657 | ||||||
Milestone Apartments Real Estate Investment Trust | 918 | 14,897 | ||||||
Monmouth Real Estate Investment Corp. | 948 | 13,528 | ||||||
New Senior Investment Group, Inc. | 1,702 | 17,360 | ||||||
STORE Capital Corp. | 1,635 | 39,044 | ||||||
|
| |||||||
| 1,507,505 | ||||||||
|
| |||||||
| Food & Staples Retailing—1.4% | ||||||||
CVS Health Corp. | 54 | 4,239 | ||||||
Empire Co., Ltd. | 9,991 | 152,662 | ||||||
SpartanNash Co. | 4,165 | 145,733 | ||||||
Sysco Corp. | 13,768 | 714,835 | ||||||
Wal-Mart Stores, Inc. | 4,837 | 348,651 | ||||||
Walgreens Boots Alliance, Inc. | 3,220 | 267,421 | ||||||
|
| |||||||
| 1,633,541 | ||||||||
|
| |||||||
| Food Products—2.2% | ||||||||
Archer-Daniels-Midland Co. | 14,749 | 679,044 | ||||||
Bunge Ltd. | 2,198 | 174,214 | ||||||
Cal-Maine Foods, Inc. (a) | 4,434 | 163,171 | ||||||
Ingredion, Inc. | 4,510 | 543,139 | ||||||
Pilgrim’s Pride Corp. | 7,024 | 158,075 | ||||||
Sanderson Farms, Inc. | 1,994 | 207,057 | ||||||
Saputo, Inc. | 3,938 | 135,891 | ||||||
Tyson Foods, Inc., Class A | 9,748 | 601,549 | ||||||
|
| |||||||
| 2,662,140 | ||||||||
|
| |||||||
| Gas Utilities—0.1% | ||||||||
Atmos Energy Corp. | 2,123 | 167,696 | ||||||
|
| |||||||
| Health Care Equipment & Supplies—4.5% | ||||||||
Align Technology, Inc. (a) | 3,521 | 403,894 | ||||||
Anika Therapeutics, Inc. (a) | 767 | 33,318 | ||||||
Baxter International, Inc. | 1,765 | 91,533 | ||||||
Becton Dickinson and Co. | 2,084 | 382,289 | ||||||
Boston Scientific Corp. (a) | 11,285 | 280,658 | ||||||
Danaher Corp. | 6,698 | 572,880 | ||||||
| Shares | Value | |||||||
Hologic, Inc. (a) | 204 | $ | 8,680 | |||||
IDEXX Laboratories, Inc. (a) | 2,131 | 329,474 | ||||||
Intuitive Surgical, Inc. (a) | 540 | 413,894 | ||||||
Medtronic PLC | 13,330 | 1,073,865 | ||||||
ResMed, Inc. | 6,213 | 447,149 | ||||||
Stryker Corp. | 6,671 | 878,237 | ||||||
Teleflex, Inc. | 2,719 | 526,752 | ||||||
|
| |||||||
| 5,442,623 | ||||||||
|
| |||||||
| Health Care Providers & Services—3.9% | ||||||||
Aetna, Inc. | 6,434 | 820,657 | ||||||
AMN Healthcare Services, Inc. (a) | 1,047 | 42,508 | ||||||
Anthem, Inc. | 5,530 | 914,551 | ||||||
Cardinal Health, Inc. | 3,514 | 286,567 | ||||||
LHC Group, Inc. (a) | 372 | 20,051 | ||||||
McKesson Corp. | 1,090 | 161,603 | ||||||
MEDNAX, Inc. (a) | 852 | 59,112 | ||||||
Quest Diagnostics, Inc. | 7,143 | 701,371 | ||||||
UnitedHealth Group, Inc. | 8,588 | 1,408,518 | ||||||
Universal Health Services, Inc., Class B | 1,756 | 218,534 | ||||||
|
| |||||||
| 4,633,472 | ||||||||
|
| |||||||
| Hotels, Restaurants & Leisure—3.2% | ||||||||
Cracker Barrel Old Country Store, Inc. | 932 | 148,421 | ||||||
Darden Restaurants, Inc. | 7,297 | 610,540 | ||||||
Domino’s Pizza, Inc. | 2,694 | 496,504 | ||||||
Las Vegas Sands Corp. | 3,712 | 211,844 | ||||||
Marriott Vacations Worldwide Corp. | 812 | 81,143 | ||||||
McDonald’s Corp. | 9,644 | 1,249,959 | ||||||
Restaurant Brands International, Inc. | 1,109 | 61,816 | ||||||
Royal Caribbean Cruises Ltd. | 2,242 | 219,963 | ||||||
Starbucks Corp. | 9,891 | 577,535 | ||||||
Yum! Brands, Inc. | 3,558 | 227,356 | ||||||
|
| |||||||
| 3,885,081 | ||||||||
|
| |||||||
| Household Durables—0.1% | ||||||||
Garmin Ltd. | 2,886 | 147,504 | ||||||
LGI Homes, Inc. (a) | 277 | 9,393 | ||||||
|
| |||||||
| 156,897 | ||||||||
|
| |||||||
| Household Products—0.9% | ||||||||
Procter & Gamble Co. | 8,215 | 738,118 | ||||||
Spectrum Brands Holdings, Inc. | 2,190 | 304,432 | ||||||
|
| |||||||
| 1,042,550 | ||||||||
|
| |||||||
| Industrial Conglomerates—0.8% | ||||||||
3M Co. | 1,116 | 213,524 | ||||||
General Electric Co. | 24,293 | 723,932 | ||||||
|
| |||||||
| 937,456 | ||||||||
|
| |||||||
| Insurance—3.5% | ||||||||
AmTrust Financial Services, Inc. | 6,460 | 119,252 | ||||||
Argo Group International Holdings Ltd. | 234 | 15,865 | ||||||
Aspen Insurance Holdings Ltd. | 4,529 | 235,735 | ||||||
Axis Capital Holdings Ltd. | 641 | 42,966 | ||||||
Everest Re Group Ltd. | 2,647 | 618,895 | ||||||
Hartford Financial Services Group, Inc. | 203 | 9,758 | ||||||
Lincoln National Corp. | 3,414 | 223,446 | ||||||
MetLife, Inc. | 16,697 | 881,936 | ||||||
Progressive Corp. | 7,713 | 302,195 | ||||||
Prudential Financial, Inc. | 8,240 | 879,043 | ||||||
Travelers Cos., Inc. | 4,198 | 506,027 | ||||||
United Fire Group, Inc. | 226 | 9,666 | ||||||
Universal Insurance Holdings, Inc. | 15,011 | 367,770 | ||||||
|
| |||||||
| 4,212,554 | ||||||||
|
| |||||||
| See accompanying Notes to Financial Statements | | March 31, 2017 | | Semiannual Report | 155 |
Table of Contents
Schedule of Investments
March 31, 2017 (Unaudited)
| Shares | Value | |||||||
| Internet & Catalog Retail—1.6% | ||||||||
Amazon.com, Inc. (a) | 2,082 | $ | 1,845,776 | |||||
Nutrisystem, Inc. | 1,667 | 92,519 | ||||||
|
| |||||||
| 1,938,295 | ||||||||
|
| |||||||
| Internet Software & Services—4.2% | ||||||||
Alphabet, Inc., Class A (a) | 1,245 | 1,055,511 | ||||||
Alphabet, Inc., Class C (a) | 1,176 | 975,563 | ||||||
Facebook, Inc., Class A (a) | 20,982 | 2,980,493 | ||||||
Five9, Inc. (a) | 3,988 | 65,642 | ||||||
|
| |||||||
| 5,077,209 | ||||||||
|
| |||||||
| IT Services—3.1% | ||||||||
Accenture PLC, Class A | 8,592 | 1,030,009 | ||||||
Amdocs Ltd. | 4,529 | 276,224 | ||||||
Broadridge Financial Solutions, Inc. | 8,645 | 587,428 | ||||||
Convergys Corp. | 321 | 6,789 | ||||||
DH Corp. | 1,181 | 22,415 | ||||||
Global Payments, Inc. | 9,205 | 742,659 | ||||||
International Business Machines Corp. | 1,556 | 270,962 | ||||||
Jack Henry & Associates, Inc. | 682 | 63,494 | ||||||
Visa, Inc., Class A | 3,708 | 329,530 | ||||||
Western Union Co. | 21,843 | 444,505 | ||||||
|
| |||||||
| 3,774,015 | ||||||||
|
| |||||||
| Leisure Equipment & Products—0.2% | ||||||||
Mattel, Inc. | 11,102 | 284,322 | ||||||
|
| |||||||
| Leisure Products—0.3% | ||||||||
American Outdoor Brands Corp. (a) | 16,706 | 330,946 | ||||||
|
| |||||||
| Life Sciences Tools & Services—0.0% | ||||||||
Pacific Biosciences of California, Inc. (a) | 9,208 | 47,605 | ||||||
|
| |||||||
| Machinery—1.4% | ||||||||
American Railcar Industries, Inc. | 1,455 | 59,800 | ||||||
Briggs & Stratton Corp. | 3,252 | 73,007 | ||||||
ESCO Technologies, Inc. | 496 | 28,818 | ||||||
Greenbrier Cos., Inc. | 4,378 | 188,692 | ||||||
Illinois Tool Works, Inc. | 6,001 | 794,952 | ||||||
Trinity Industries, Inc. | 4,222 | 112,094 | ||||||
Xylem, Inc. | 9,148 | 459,413 | ||||||
|
| |||||||
| 1,716,776 | ||||||||
|
| |||||||
| Media—1.6% | ||||||||
Comcast Corp., Class A | 34,635 | 1,301,930 | ||||||
Interpublic Group of Cos., Inc. | 8,027 | 197,223 | ||||||
New Media Investment Group, Inc. | 1,050 | 14,921 | ||||||
Shaw Communications, Inc., Class B | 6,734 | 139,607 | ||||||
Walt Disney Co. | 2,411 | 273,383 | ||||||
|
| |||||||
| 1,927,064 | ||||||||
|
| |||||||
| Metals & Mining—0.0% | ||||||||
OceanaGold Corp. | 9,229 | 27,343 | ||||||
|
| |||||||
| Mortgage Real Estate Investment Trusts (REITs)—0.9% | ||||||||
AGNC Investment Corp. | 16,318 | 324,565 | ||||||
Annaly Capital Management, Inc. | 16,405 | 182,260 | ||||||
Apollo Commercial Real Estate Finance, Inc. | 5,780 | 108,722 | ||||||
ARMOUR Residential REIT, Inc. | 6,794 | 154,292 | ||||||
Capstead Mortgage Corp. | 4,902 | 51,667 | ||||||
Chimera Investment Corp. | 8,819 | 177,967 | ||||||
CYS Investments, Inc. | 6,119 | 48,646 | ||||||
MFA Financial, Inc. | 6,451 | 52,124 | ||||||
New York Mortgage Trust, Inc. | 2,737 | 16,887 | ||||||
|
| |||||||
| 1,117,130 | ||||||||
|
| |||||||
| Shares | Value | |||||||
| Multi-line Retail—0.4% | ||||||||
Canadian Tire Corp., Ltd., Class A | 1,083 | $ | 128,655 | |||||
Ollie’s Bargain Outlet Holdings, Inc. (a) | 2,141 | 71,723 | ||||||
Target Corp. | 3,935 | 217,173 | ||||||
|
| |||||||
| 417,551 | ||||||||
|
| |||||||
| Multi-Utilities—0.6% | ||||||||
Ameren Corp. | 4,433 | 241,997 | ||||||
CenterPoint Energy, Inc. | 1,416 | 39,039 | ||||||
Public Service Enterprise Group, Inc. | 5,012 | 222,282 | ||||||
SCANA Corp. | 3,536 | 231,078 | ||||||
|
| |||||||
| 734,396 | ||||||||
|
| |||||||
| Oil, Gas & Consumable Fuels—5.4% | ||||||||
Bonavista Energy Corp. | 3,551 | 9,239 | ||||||
Chevron Corp. | 9,284 | 996,823 | ||||||
Crescent Point Energy Corp. | 416 | 4,501 | ||||||
Enbridge Income Fund Holdings, Inc. | 1,109 | 27,645 | ||||||
Exxon Mobil Corp. | 19,985 | 1,638,970 | ||||||
Marathon Petroleum Corp. | 14,014 | 708,268 | ||||||
Nordic American Tankers Ltd. | 13,091 | 107,084 | ||||||
ONEOK, Inc. | 2,184 | 121,081 | ||||||
Parsley Energy, Inc., Class A (a) | 12,675 | 412,064 | ||||||
Phillips 66 | 9,459 | 749,342 | ||||||
Pioneer Natural Resources Co. | 1,738 | 323,668 | ||||||
Scorpio Tankers, Inc. | 46,367 | 205,869 | ||||||
Seven Generations Energy Ltd., Class A (a) | 3,068 | 56,061 | ||||||
Tesoro Corp. | 4,382 | 355,205 | ||||||
Valero Energy Corp. | 11,938 | 791,370 | ||||||
|
| |||||||
| 6,507,190 | ||||||||
|
| |||||||
| Paper & Forest Products—0.2% | ||||||||
Domtar Corp. | 5,653 | 206,448 | ||||||
Schweitzer-Mauduit International, Inc. | 922 | 38,189 | ||||||
|
| |||||||
| 244,637 | ||||||||
|
| |||||||
| Personal Products—0.0% | ||||||||
USANA Health Sciences, Inc. (a) | 108 | 6,221 | ||||||
|
| |||||||
| Pharmaceuticals—4.7% | ||||||||
Allergan PLC | 4,745 | 1,133,676 | ||||||
Johnson & Johnson | 19,314 | 2,405,559 | ||||||
Merck & Co., Inc. | 6,611 | 420,063 | ||||||
Pfizer, Inc. | 49,206 | 1,683,337 | ||||||
Theravance Biopharma, Inc. (a) | 1,270 | 46,761 | ||||||
|
| |||||||
| 5,689,396 | ||||||||
|
| |||||||
| Professional Services—0.0% | ||||||||
Kelly Services, Inc., Class A | 494 | 10,799 | ||||||
|
| |||||||
| Real Estate Management & Development—0.0% | ||||||||
Marcus & Millichap, Inc. (a) | 390 | 9,586 | ||||||
|
| |||||||
| Road & Rail—0.6% | ||||||||
Union Pacific Corp. | 6,781 | 718,243 | ||||||
|
| |||||||
| Semiconductors & Semiconductor Equipment—6.6% | ||||||||
Applied Materials, Inc. | 25,932 | 1,008,755 | ||||||
Broadcom Ltd. | 5,064 | 1,108,813 | ||||||
Brooks Automation, Inc. | 1,079 | 24,170 | ||||||
Cabot Microelectronics Corp. | 3,396 | 260,168 | ||||||
Cirrus Logic, Inc. (a) | 7,696 | 467,070 | ||||||
Intel Corp. | 40,174 | 1,449,076 | ||||||
KLA-Tencor Corp. | 8,500 | 808,095 | ||||||
Lam Research Corp. | 2,121 | 272,252 | ||||||
MaxLinear, Inc., Class A (a) | 539 | 15,119 | ||||||
| Shares | Value | |||||||
Micron Technology, Inc. (a) | 11,315 | $ | 327,003 | |||||
NVIDIA Corp. | 7,596 | 827,432 | ||||||
Photronics, Inc. (a) | 1,202 | 12,861 | ||||||
QUALCOMM, Inc. | 6,333 | 363,134 | ||||||
Skyworks Solutions, Inc. | 4,256 | 417,003 | ||||||
Texas Instruments, Inc. | 7,755 | 624,743 | ||||||
|
| |||||||
| 7,985,694 | ||||||||
|
| |||||||
| Software—2.9% | ||||||||
Activision Blizzard, Inc. | 14,032 | 699,636 | ||||||
CA, Inc. | 330 | 10,468 | ||||||
Electronic Arts, Inc. (a) | 1,013 | 90,684 | ||||||
Microsoft Corp. | 32,241 | 2,123,392 | ||||||
Open Text Corp. | 1,930 | 65,598 | ||||||
Oracle Corp. | 1,674 | 74,677 | ||||||
Symantec Corp. | 14,102 | 432,649 | ||||||
Synopsys, Inc. (a) | 129 | 9,305 | ||||||
|
| |||||||
| 3,506,409 | ||||||||
|
| |||||||
| Specialty Retail—3.2% | ||||||||
Best Buy Co., Inc. | 426 | 20,938 | ||||||
Finish Line, Inc., Class A | 2,462 | 35,034 | ||||||
Foot Locker, Inc. | 2,440 | 182,536 | ||||||
Home Depot, Inc. | 11,150 | 1,637,155 | ||||||
L Brands, Inc. | 5,428 | 255,659 | ||||||
Lowe’s Cos., Inc. | 3,410 | 280,336 | ||||||
Staples, Inc. | 18,944 | 166,139 | ||||||
TJX Cos., Inc. | 8,560 | 676,925 | ||||||
Ulta Salon Cosmetics & Fragrance, Inc. (a) | 2,202 | 628,076 | ||||||
|
| |||||||
| 3,882,798 | ||||||||
|
| |||||||
| Technology Hardware, Storage & Peripherals—5.4% | ||||||||
Apple, Inc. | 31,911 | 4,584,334 | ||||||
Hewlett Packard Enterprise Co. | 24,807 | 587,926 | ||||||
HP, Inc. | 46,206 | 826,164 | ||||||
Western Digital Corp. | 6,153 | 507,807 | ||||||
|
| |||||||
| 6,506,231 | ||||||||
|
| |||||||
| Thrifts & Mortgage Finance—0.0% | ||||||||
Meta Financial Group, Inc. | 207 | 18,320 | ||||||
Oritani Financial Corp. | 673 | 11,441 | ||||||
Walker & Dunlop, Inc. (a) | 228 | 9,505 | ||||||
|
| |||||||
| 39,266 | ||||||||
|
| |||||||
| Tobacco—1.9% | ||||||||
Altria Group, Inc. | 18,508 | 1,321,841 | ||||||
Philip Morris International, Inc. | 2,265 | 255,718 | ||||||
Reynolds American, Inc. | 11,676 | 735,822 | ||||||
|
| |||||||
| 2,313,381 | ||||||||
|
| |||||||
| Trading Companies & Distributors—0.2% | ||||||||
GATX Corp. | 3,506 | 213,726 | ||||||
Textainer Group Holdings Ltd. (a) | 1,134 | 17,350 | ||||||
|
| |||||||
| 231,076 | ||||||||
|
| |||||||
| Water Utilities—0.3% | ||||||||
American Water Works Co., Inc. | 4,066 | 316,213 | ||||||
|
| |||||||
| Total Common Stock (cost—$108,959,028) | 120,223,795 | |||||||
|
| |||||||
| Rights (a)— 0.0% | ||||||||
| Food & Staples Retailing—0.0% | ||||||||
Safeway CVR—Casa Ley, expires 1/30/18 | 5,723 | 5,808 | ||||||
Safeway CVR—PDC, expires 1/30/17 | 5,723 | 280 | ||||||
|
| |||||||
| Total Rights (cost—$6,067) | 6,088 | |||||||
|
| |||||||
| 156 | Semiannual Report | | March 31, 2017 | | See accompanying Notes to Financial Statements |
Table of Contents
Schedule of Investments
March 31, 2017 (Unaudited)
| Principal Amount (000s) | Value | |||||||
| Repurchase Agreements—0.1% | ||||||||
State Street Bank and Trust Co., dated 3/31/17, 0.09%, due 4/3/17, proceeds $161,001; collateralized by U.S. Treasury Notes, 2.25%, due 11/15/25, valued at $164,662 including accrued interest |
| |||||||
(cost—$161,000) | $161 | $ | 161,000 | |||||
|
| |||||||
| Total Investments (cost—$109,126,095)—100.0% | 120,390,883 | |||||||
|
| |||||||
| Other assets less liabilities—0.0% | 45,292 | |||||||
|
| |||||||
| Net Assets—100.0% | $120,436,175 | |||||||
|
| |||||||
Notes to Schedule of Investments:
(a) Non-income producing.
Glossary:
CVR—Contingent Value Rights
REIT—Real Estate Investment Trust
AllianzGI Convertible Fund
Principal (000s) | Value | |||||||
| Convertible Bonds—80.4% | ||||||||
| Aerospace & Defense—1.1% | ||||||||
Aerojet Rocketdyne Holdings, Inc. (a)(b), |
| |||||||
2.25%, 12/15/23 | $11,875 | $12,862,109 | ||||||
|
| |||||||
| Auto Components—0.7% | ||||||||
Meritor, Inc., |
| |||||||
7.875%, 3/1/26 | 4,770 | 8,359,425 | ||||||
|
| |||||||
| Auto Manufacturers—2.4% | ||||||||
Tesla, Inc., |
| |||||||
0.25%, 3/1/19 | 20,505 | 20,581,894 | ||||||
2.375%, 3/15/22 | 6,575 | 6,883,203 | ||||||
|
| |||||||
| 27,465,097 | ||||||||
|
| |||||||
| Biotechnology—1.3% | ||||||||
Ionis Pharmaceuticals, Inc., |
| |||||||
1.00%, 11/15/21 | 7,615 | 7,353,234 | ||||||
Medicines Co., |
| |||||||
2.50%, 1/15/22 | 1,095 | 1,731,469 | ||||||
2.75%, 7/15/23 (a)(b) | 4,800 | 5,808,000 | ||||||
|
| |||||||
| 14,892,703 | ||||||||
|
| |||||||
| Building Materials—0.1% | ||||||||
Cemex S.A.B de C.V., |
| |||||||
3.72%, 3/15/20 | 840 | 952,875 | ||||||
|
| |||||||
| Chemicals—0.7% | ||||||||
RPM International, Inc., |
| |||||||
2.25%, 12/15/20 | 6,740 | 8,142,763 | ||||||
|
| |||||||
| Commercial Services—5.2% | ||||||||
Cardtronics, Inc., |
| |||||||
1.00%, 12/1/20 | 10,725 | 11,656,734 | ||||||
Euronet Worldwide, Inc., |
| |||||||
1.50%, 10/1/44 | 8,355 | 10,605,628 | ||||||
Live Nation Entertainment, Inc., |
| |||||||
2.50%, 5/15/19 | 12,855 | 14,003,916 | ||||||
Macquarie Infrastructure Corp., |
| |||||||
2.875%, 7/15/19 | 11,700 | 13,140,563 | ||||||
Square, Inc. (a)(b), |
| |||||||
0.375%, 3/1/22 | 10,390 | 10,831,575 | ||||||
|
| |||||||
| 60,238,416 | ||||||||
|
| |||||||
| Computers—1.9% | ||||||||
Electronics For Imaging, Inc., |
| |||||||
0.75%, 9/1/19 | 9,880 | 10,756,850 | ||||||
Lumentum Holdings, Inc. (a)(b), |
| |||||||
0.25%, 3/15/24 | 10,090 | 11,275,575 | ||||||
|
| |||||||
| 22,032,425 | ||||||||
|
| |||||||
| Diversified Financial Services—1.1% | ||||||||
Blackhawk Network Holdings, Inc. (a)(b), |
| |||||||
1.50%, 1/15/22 | 11,830 | 12,680,281 | ||||||
|
| |||||||
| Electrical Equipment—0.4% | ||||||||
General Cable Corp., |
| |||||||
4.50%, 11/15/29 | 6,110 | 4,761,981 | ||||||
|
| |||||||
| Electronics—1.0% | ||||||||
OSI Systems, Inc. (a)(b), |
| |||||||
1.25%, 9/1/22 | 11,970 | 11,431,350 | ||||||
|
| |||||||
| Engineering & Construction—1.0% | ||||||||
Tutor Perini Corp. (a)(b), |
| |||||||
2.875%, 6/15/21 | 9,650 | 12,068,531 | ||||||
|
| |||||||
| Healthcare-Products—5.8% | ||||||||
Hologic, Inc., |
| |||||||
2.00%, 3/1/42 | 11,525 | 16,077,375 | ||||||
Nevro Corp., |
| |||||||
1.75%, 6/1/21 | 8,335 | 10,127,025 | ||||||
NuVasive, Inc., |
| |||||||
2.25%, 3/15/21 | 8,500 | 11,634,375 | ||||||
Principal (000s) | Value | |||||||
Repligen Corp., |
| |||||||
2.125%, 6/1/21 | $ | 1,820 | $ | 2,331,875 | ||||
Spectranetics Corp., |
| |||||||
2.625%, 6/1/34 | 11,855 | 13,566,566 | ||||||
Wright Medical Group, Inc., |
| |||||||
2.00%, 2/15/20 | 11,025 | 13,202,437 | ||||||
|
| |||||||
| 66,939,653 | ||||||||
|
| |||||||
| Healthcare-Services—2.8% | ||||||||
Anthem, Inc., |
| |||||||
2.75%, 10/15/42 | 9,710 | 22,217,694 | ||||||
Tivity Health, Inc., |
| |||||||
1.50%, 7/1/18 | 6,425 | 9,906,547 | ||||||
|
| |||||||
| 32,124,241 | ||||||||
|
| |||||||
| Insurance—1.4% | ||||||||
HCI Group, Inc. (a)(b), |
| |||||||
4.25%, 3/1/37 | 5,715 | 5,539,978 | ||||||
MGIC Investment Corp., |
| |||||||
2.00%, 4/1/20 | 7,325 | 10,676,224 | ||||||
|
| |||||||
| 16,216,202 | ||||||||
|
| |||||||
| Internet—5.8% | ||||||||
Ctrip.com International Ltd. (a)(b), |
| |||||||
1.25%, 9/15/22 | 12,615 | 13,119,600 | ||||||
Priceline Group, Inc., |
| |||||||
0.35%, 6/15/20 | 16,430 | 23,474,363 | ||||||
1.00%, 3/15/18 | 4,340 | 8,191,750 | ||||||
VeriSign, Inc., |
| |||||||
4.452%, 8/15/37 | 6,515 | 16,666,184 | ||||||
Zillow Group, Inc. (a)(b), |
| |||||||
2.00%, 12/1/21 | 5,680 | 5,662,250 | ||||||
|
| |||||||
| 67,114,147 | ||||||||
|
| |||||||
| Iron/Steel—0.4% | ||||||||
AK Steel Corp., |
| |||||||
5.00%, 11/15/19 | 2,905 | 4,622,581 | ||||||
|
| |||||||
| IT Services—0.9% | ||||||||
GS Finance Corp. (Fidelity National Information Services, Inc.) (e), zero |
| |||||||
coupon, 6/5/23 | 10,525 | 10,375,124 | ||||||
|
| |||||||
| Media—7.3% | ||||||||
DISH Network Corp. (a)(b), |
| |||||||
3.375%, 8/15/26 | 18,965 | 23,006,916 | ||||||
Liberty Interactive LLC (a)(b), |
| |||||||
1.75%, 9/30/46 | 15,585 | 17,601,309 | ||||||
Liberty Media Corp-Liberty Formula |
| |||||||
1.00%, 1/30/23 | 10,980 | 12,126,038 | ||||||
Liberty Media Corp., |
| |||||||
1.375%, 10/15/23 | 12,445 | 14,132,853 | ||||||
2.25%, 9/30/46 (a)(b) | 16,270 | 17,612,275 | ||||||
|
| |||||||
| 84,479,391 | ||||||||
|
| |||||||
| Metal Fabricate/Hardware—0.7% | ||||||||
RTI International Metals, Inc., |
| |||||||
1.625%, 10/15/19 | 7,400 | 8,630,250 | ||||||
|
| |||||||
| Mining—0.8% | ||||||||
Royal Gold, Inc., |
| |||||||
2.875%, 6/15/19 | 9,095 | 9,652,069 | ||||||
|
| |||||||
| Oil, Gas & Consumable Fuels—6.7% | ||||||||
Alon USA Energy, Inc., |
| |||||||
3.00%, 9/15/18 | 8,815 | 9,702,009 | ||||||
Chesapeake Energy Corp. (a)(b), |
| |||||||
5.50%, 9/15/26 | 12,335 | 12,836,109 | ||||||
Ensco Jersey Finance Ltd. (a)(b), |
| |||||||
3.00%, 1/31/24 | 1,300 | 1,271,563 | ||||||
Nabors Industries, Inc. (a)(b), |
| |||||||
0.75%, 1/15/24 | 17,565 | 16,500,122 | ||||||
Oasis Petroleum, Inc., |
| |||||||
2.625%, 9/15/23 | 10,785 | 14,573,231 | ||||||
| See accompanying Notes to Financial Statements | | March 31, 2017 | | Semiannual Report | 157 |
Table of Contents
Schedule of Investments
March 31, 2017 (Unaudited)
Principal (000s) | Value | |||||||
PDC Energy, Inc., |
| |||||||
1.125%, 9/15/21 | $ | 11,605 | $ | 11,945,897 | ||||
Weatherford International Ltd., |
| |||||||
5.875%, 7/1/21 | 8,810 | 11,337,369 | ||||||
|
| |||||||
| 78,166,300 | ||||||||
|
| |||||||
| Pharmaceuticals—3.1% | ||||||||
Clovis Oncology, Inc., |
| |||||||
2.50%, 9/15/21 | 6,715 | 8,679,138 | ||||||
Ironwood Pharmaceuticals, Inc., |
| |||||||
2.25%, 6/15/22 | 8,040 | 10,034,925 | ||||||
Jazz Investments I Ltd., |
| |||||||
1.875%, 8/15/21 | 7,490 | 8,018,981 | ||||||
Pacira Pharmaceuticals, Inc. (a)(b), |
| |||||||
2.375%, 4/1/22 | 8,980 | 9,344,812 | ||||||
|
| |||||||
| 36,077,856 | ||||||||
|
| |||||||
| Pipelines—0.8% | ||||||||
Cheniere Energy, Inc., |
| |||||||
4.25%, 3/15/45 | 12,820 | 8,781,700 | ||||||
|
| |||||||
| Retail—0.7% | ||||||||
RH (a)(b), | 5,815 | 5,248,037 | ||||||
zero coupon, 7/15/20 | 3,150 | 2,671,594 | ||||||
|
| |||||||
| 7,919,631 | ||||||||
|
| |||||||
| Semiconductors—15.7% | ||||||||
Advanced Micro Devices, Inc., |
| |||||||
2.125%, 9/1/26 | 5,590 | 11,054,225 | ||||||
Cypress Semiconductor Corp. (a)(b), |
| |||||||
4.50%, 1/15/22 | 10,525 | 12,899,703 | ||||||
Inphi Corp. (a)(b), |
| |||||||
0.75%, 9/1/21 | 11,445 | 12,718,256 | ||||||
Integrated Device Technology, Inc., |
| |||||||
0.875%, 11/15/22 | 10,500 | 10,545,938 | ||||||
Intel Corp., |
| |||||||
3.25%, 8/1/39 | 10,880 | 19,026,455 | ||||||
Lam Research Corp., |
| |||||||
1.25%, 5/15/18 | 8,830 | 18,747,194 | ||||||
Microchip Technology, Inc., |
| |||||||
1.625%, 2/15/25 | 4,855 | 6,985,131 | ||||||
1.625%, 2/15/27 (a)(b) | 16,095 | 16,386,722 | ||||||
Micron Technology, Inc., |
| |||||||
2.125%, 2/15/33, Ser. F | 3,440 | 9,193,400 | ||||||
3.00%, 11/15/43, Ser. G | 20,260 | 22,805,163 | ||||||
Novellus Systems, Inc., |
| |||||||
2.625%, 5/15/41 | 1,060 | 4,025,350 | ||||||
NVIDIA Corp., |
| |||||||
1.00%, 12/1/18 | 1,895 | 10,259,056 | ||||||
ON Semiconductor Corp. (a)(b), |
| |||||||
1.625%, 10/15/23 | 9,150 | 9,533,156 | ||||||
Teradyne, Inc. (a)(b), |
| |||||||
1.25%, 12/15/23 | 11,470 | 13,412,731 | ||||||
Veeco Instruments, Inc., |
| |||||||
2.70%, 1/15/23 | 5,035 | 5,280,456 | ||||||
|
| |||||||
| 182,872,936 | ||||||||
|
| |||||||
| Software—6.8% | ||||||||
BroadSoft, Inc., |
| |||||||
1.00%, 9/1/22 | 8,035 | 9,642,000 | ||||||
Citrix Systems, Inc., |
| |||||||
0.50%, 4/15/19 | 12,600 | 15,844,500 | ||||||
Nice Systems, Inc. (a)(b), |
| |||||||
1.25%, 1/15/24 | 8,700 | 9,091,500 | ||||||
Proofpoint, Inc., |
| |||||||
0.75%, 6/15/20 | 9,405 | 10,751,091 | ||||||
Salesforce.com, Inc., |
| |||||||
0.25%, 4/1/18 | 7,920 | 10,226,700 | ||||||
ServiceNow, Inc., | ||||||||
zero coupon, 11/1/18 | 9,225 | 11,911,781 | ||||||
Take-Two Interactive Software, Inc., |
| |||||||
1.00%, 7/1/18 | 4,065 | 11,206,697 | ||||||
|
| |||||||
| 78,674,269 | ||||||||
|
| |||||||
Principal (000s) | Value | |||||||
| Telecommunications—2.9% | ||||||||
Finisar Corp., | ||||||||
0.50%, 12/15/33 | $ | 1,230 | $ | 1,385,288 | ||||
0.50%, 12/15/36 (a)(b) | 9,735 | 9,515,963 | ||||||
InterDigital, Inc., | ||||||||
1.50%, 3/1/20 | 8,365 | 10,932,009 | ||||||
Viavi Solutions, Inc., |
| |||||||
0.625%, 8/15/33 | 10,555 | 11,795,212 | ||||||
1.00%, 3/1/24 (a)(b) | 580 | 611,175 | ||||||
|
| |||||||
| 34,239,647 | ||||||||
|
| |||||||
| Transportation—0.9% | ||||||||
Greenbrier Cos., Inc. (a)(b), |
| |||||||
2.875%, 2/1/24 | 10,465 | 10,739,706 | ||||||
|
| |||||||
| Total Convertible Bonds (cost—$811,521,447) | 933,513,659 | |||||||
|
| |||||||
| Shares | ||||||||
| Convertible Preferred Stock—15.4% | ||||||||
| Banks—2.9% | ||||||||
Bank of America Corp., Ser. L (c), |
| |||||||
7.25% | 15,420 | 18,427,825 | ||||||
Wells Fargo & Co., Ser. L (c), |
| |||||||
7.50% | 12,690 | 15,735,600 | ||||||
|
| |||||||
| 34,163,425 | ||||||||
|
| |||||||
| Computers—0.8% | ||||||||
NCR Corp., PIK (c), |
| |||||||
5.50% | 5,400 | 9,098,568 | ||||||
|
| |||||||
| Electric Utilities—1.3% | ||||||||
NextEra Energy, Inc., |
| |||||||
6.123%, 9/1/19 | 259,425 | 13,230,675 | ||||||
6.371%, 9/1/18 | 33,685 | 2,033,900 | ||||||
|
| |||||||
| 15,264,575 | ||||||||
|
| |||||||
| Electronic Equipment, Instruments & Components—0.5% | ||||||||
Belden, Inc., |
| |||||||
6.75%, 7/15/19 | 64,365 | 6,243,405 | ||||||
|
| |||||||
| Equity Real Estate Investment Trusts (REITs)—1.2% | ||||||||
American Tower Corp., |
| |||||||
5.25%, 5/15/17, Ser. A | 90,910 | 10,383,740 | ||||||
5.50%, 2/15/18 | 27,765 | 3,101,351 | ||||||
|
| |||||||
| 13,485,091 | ||||||||
|
| |||||||
| Food & Beverage—1.1% | ||||||||
Post Holdings, Inc., |
| |||||||
2.50% (c) | 14,360 | 2,368,502 | ||||||
5.25%, 6/1/17 | 72,375 | 10,931,882 | ||||||
|
| |||||||
| 13,300,384 | ||||||||
|
| |||||||
| Food Products—1.3% | ||||||||
Bunge Ltd. (c), |
| |||||||
4.875% | 146,110 | 15,706,825 | ||||||
|
| |||||||
| Investment Companies—1.0% | ||||||||
Mandatory Exchangeable Trust (a)(b), |
| |||||||
5.75%, 6/3/19 | 85,900 | 11,130,493 | ||||||
|
| |||||||
| Oil, Gas & Consumable Fuels—1.7% | ||||||||
Kinder Morgan, Inc., Ser. A, |
| |||||||
9.75%, 10/26/18 | 162,315 | 8,096,272 | ||||||
WPX Energy, Inc., Ser. A, |
| |||||||
6.25%, 7/31/18 | 191,920 | 11,599,645 | ||||||
|
| |||||||
| 19,695,917 | ||||||||
|
| |||||||
| Pharmaceuticals—2.3% | ||||||||
Allergan PLC, Ser. A, |
| |||||||
5.50%, 3/1/18 | 31,290 | 26,589,616 | ||||||
|
| |||||||
Shares | Value | |||||||
| Wireless Telecommunication Services—1.3% | ||||||||
T-Mobile U.S., Inc., |
| |||||||
5.50%, 12/15/17 | 138,290 | $ | 14,632,465 | |||||
|
| |||||||
| Total Convertible Preferred Stock (cost—$152,154,394) | 179,310,764 | |||||||
|
| |||||||
| Common Stock—0.4% | ||||||||
| Biotechnology—0.4% | ||||||||
Incyte Corp. (d) | 39,085 | 5,224,492 | ||||||
|
| |||||||
| Principal Amount (000s) | ||||||||
| Repurchase Agreements—4.4% | ||||||||
State Street Bank and Trust Co., dated 3/31/17, 0.09%, due 4/3/17, proceeds $50,654,380; collateralized by U.S. Treasury Notes, 2.00%, due 11/25/26, valued at $51,669,085 including accrued interest |
| |||||||
(cost—$50,654,000) | $50,654 | 50,654,000 | ||||||
|
| |||||||
| Total Investments (cost—$1,016,823,037)—100.6% | 1,168,702,915 | |||||||
|
| |||||||
| Liabilities in excess of other assets—(0.6)% | (7,006,621 | ) | ||||||
|
| |||||||
| Net Assets—100.0% | $1,161,696,294 | |||||||
|
| |||||||
Notes to Schedule of Investments:
(a) Private Placement—Restricted as to resale and may not have a readily available market. Securities with an aggregate value of $325,537,429, representing 28.0% of net assets.
(b) 144A—Exempt from registration under Rule 144A of the Securities Act of 1933. These securities may be resold in transactions exempt from registration, typically only to qualified institutional buyers. Securities with an aggregate value of $325,537,429, representing 28.0% of net assets.
(c) Perpetual maturity. The date shown, if any, is the next call date.
(d) Non-income producing.
(e) Securities exchangeable or convertible into securities of an entity different than the issuer or structured by the issuer to provide exposure to securities of an entity different than the issuer (synthetic convertible securities). Such entity is identified in the parenthetical.
Glossary:
PIK—Payment-in-Kind
REIT—Real Estate Investment Trust
| 158 | Semiannual Report | | March 31, 2017 | | See accompanying Notes to Financial Statements |
Table of Contents
Schedule of Investments
March 31, 2017 (Unaudited)
AllianzGI Emerging Markets Consumer Fund
| Shares | Value | |||||||
| Common Stock—96.9% | ||||||||
| Brazil—6.5% | ||||||||
Banco do Brasil S.A. | 42,300 | $456,293 | ||||||
Banco Santander Brasil S.A. ADR | 11,600 | 102,312 | ||||||
Itau Unibanco Holding S.A. ADR | 35,700 | 430,899 | ||||||
Magazine Luiza S.A. (d) | 1,600 | 90,513 | ||||||
MRV Engenharia e Participacoes S.A. | 129,000 | 591,720 | ||||||
Porto Seguro S.A. | 17,400 | 157,904 | ||||||
Qualicorp S.A. | 71,600 | 472,287 | ||||||
Sao Martinho S.A. | 22,200 | 122,538 | ||||||
Smiles S.A. | 7,800 | 157,963 | ||||||
|
| |||||||
| 2,582,429 | ||||||||
|
| |||||||
| China—18.9% | ||||||||
BAIC Motor Corp., Ltd., Class H (a) | 61,000 | 69,332 | ||||||
BYD Electronic International Co., Ltd. | 90,000 | 125,061 | ||||||
China Merchants Bank Co., Ltd., Class H | 496,500 | 1,313,922 | ||||||
China Minsheng Banking Corp., Ltd., Class H | 958,000 | 1,024,068 | ||||||
China Southern Airlines Co., Ltd., Class H | 220,000 | 152,371 | ||||||
Geely Automobile Holdings Ltd. | 210,000 | 321,837 | ||||||
Great Wall Motor Co., Ltd., Class H | 932,500 | 1,062,766 | ||||||
Hisense Kelon Electrical Holdings Co., Ltd., Class H | 56,000 | 82,227 | ||||||
NetEase, Inc. ADR | 2,395 | 680,180 | ||||||
New Oriental Education & Technology Group, Inc. ADR (d) | 2,600 | 156,988 | ||||||
Shanghai Pharmaceuticals Holding Co., Ltd., Class H | 141,300 | 370,151 | ||||||
Skyworth Digital Holdings Ltd. | 186,000 | 122,627 | ||||||
Tencent Holdings Ltd. | 64,400 | 1,855,332 | ||||||
Tianneng Power International Ltd. | 222,000 | 201,815 | ||||||
|
| |||||||
| 7,538,677 | ||||||||
|
| |||||||
| France—0.6% | ||||||||
Christian Dior SE | 1,098 | 254,876 | ||||||
|
| |||||||
| Greece—0.2% | ||||||||
OPAP S.A. | 6,764 | 62,949 | ||||||
|
| |||||||
| Hong Kong—6.1% | ||||||||
Hang Seng Bank Ltd. | 44,500 | 902,748 | ||||||
Man Wah Holdings Ltd. | 483,600 | 384,123 | ||||||
SJM Holdings Ltd. | 190,000 | 154,642 | ||||||
United Laboratories International Holdings Ltd. (d) | 88,000 | 57,423 | ||||||
VTech Holdings Ltd. | 7,900 | 94,453 | ||||||
WH Group Ltd. (a) | 662,000 | 570,856 | ||||||
Xinyi Glass Holdings Ltd. (d) | 118,000 | 103,937 | ||||||
Yue Yuen Industrial Holdings Ltd. | 45,000 | 176,834 | ||||||
|
| |||||||
| 2,445,016 | ||||||||
|
| |||||||
| Hungary—1.5% | ||||||||
Richter Gedeon Nyrt | 26,462 | 600,998 | ||||||
|
| |||||||
| India—3.5% | ||||||||
Apollo Tyres Ltd. (d) | 67,996 | 218,242 | ||||||
DCB Bank Ltd. (d) | 62,387 | 164,014 | ||||||
| Shares | Value | |||||||
Hero MotoCorp Ltd. | 7,664 | $ | 380,259 | |||||
Indiabulls Housing Finance Ltd. | 29,735 | 457,167 | ||||||
Manappuram Finance Ltd. | 86,827 | 131,570 | ||||||
Max Financial Services Ltd. | 6,764 | 60,307 | ||||||
|
| |||||||
| 1,411,559 | ||||||||
|
| |||||||
| Indonesia—0.8% | ||||||||
Telekomunikasi Indonesia Persero Tbk PT ADR | 10,400 | 324,168 | ||||||
|
| |||||||
| Japan—4.7% | ||||||||
Suzuki Motor Corp. | 23,100 | 959,429 | ||||||
Yamaha Motor Co., Ltd. | 37,100 | 893,246 | ||||||
|
| |||||||
| 1,852,675 | ||||||||
|
| |||||||
| Korea (Republic of)—17.9% | ||||||||
KB Financial Group, Inc. | 20,510 | 898,881 | ||||||
KT Corp. | 23,723 | 677,160 | ||||||
LG Electronics, Inc. | 4,613 | 280,237 | ||||||
LG Uplus Corp. | 41,750 | 534,331 | ||||||
Samsung Card Co., Ltd. | 2,835 | 99,435 | ||||||
Samsung Electronics Co., Ltd. | 1,308 | 2,407,262 | ||||||
Shinhan Financial Group Co., Ltd. | 31,335 | 1,305,637 | ||||||
SK Telecom Co., Ltd. | 3,742 | 845,506 | ||||||
SL Corp. | 3,885 | 67,396 | ||||||
|
| |||||||
| 7,115,845 | ||||||||
|
| |||||||
| Malaysia—0.7% | ||||||||
AirAsia Bhd. | 382,100 | 271,082 | ||||||
|
| |||||||
| Russian Federation—6.8% | ||||||||
Aeroflot PJSC (c)(d) | 357,600 | 1,065,648 | ||||||
Mobile TeleSystems PJSC ADR | 138,330 | 1,525,780 | ||||||
X5 Retail Group NV GDR (d) | 3,471 | 116,799 | ||||||
|
| |||||||
| 2,708,227 | ||||||||
|
| |||||||
| South Africa—5.1% | ||||||||
AVI Ltd. | 18,672 | 137,783 | ||||||
Standard Bank Group Ltd. | 74,621 | 800,200 | ||||||
Telkom S.A. SOC Ltd. | 60,826 | 340,167 | ||||||
Tiger Brands Ltd. | 5,421 | 161,735 | ||||||
Vodacom Group Ltd. | 53,349 | 603,896 | ||||||
|
| |||||||
| 2,043,781 | ||||||||
|
| |||||||
| Taiwan—12.5% | ||||||||
Asustek Computer, Inc. | 28,000 | 276,841 | ||||||
CTBC Financial Holding Co., Ltd. | 311,000 | 192,150 | ||||||
First Financial Holding Co., Ltd. | 593,000 | 361,554 | ||||||
Fubon Financial Holding Co., Ltd. | 220,000 | 358,830 | ||||||
Getac Technology Corp. | 94,000 | 135,063 | ||||||
Lite-On Technology Corp. | 564,297 | 972,656 | ||||||
Pou Chen Corp. | 538,000 | 744,594 | ||||||
Qisda Corp. | 379,000 | 219,835 | ||||||
St Shine Optical Co., Ltd. | 14,000 | 284,110 | ||||||
Uni-President Enterprises Corp. | 50,000 | 93,737 | ||||||
Wistron Corp. | 1,456,298 | 1,334,386 | ||||||
|
| |||||||
| 4,973,756 | ||||||||
|
| |||||||
| Thailand—3.6% | ||||||||
Krung Thai Bank PCL (c) | 387,800 | 230,246 | ||||||
Thai Union Group PCL NVDR | 586,700 | 365,459 | ||||||
Thanachart Capital PCL (c) | 476,200 | 668,311 | ||||||
| Shares | Value | |||||||
Tisco Financial Group PCL (c) | 71,300 | $ | 148,924 | |||||
|
| |||||||
| 1,412,940 | ||||||||
|
| |||||||
| Turkey—1.0% | ||||||||
Turkiye Garanti Bankasi AS | 105,248 | 256,659 | ||||||
Vestel Elektronik Sanayi ve Ticaret AS (d) | 79,553 | 152,216 | ||||||
|
| |||||||
| 408,875 | ||||||||
|
| |||||||
| United States—6.5% | ||||||||
Copa Holdings S.A., Class A | 2,500 | 280,625 | ||||||
Lear Corp. | 8,010 | 1,134,056 | ||||||
Mettler-Toledo International, Inc. (d) | 1,600 | 766,256 | ||||||
Reinsurance Group of America, Inc. | 3,300 | 419,034 | ||||||
|
| |||||||
| 2,599,971 | ||||||||
|
| |||||||
| Total Common Stock (cost—$32,417,643) | 38,607,824 | |||||||
|
| |||||||
| Preferred Stock—0.7% | ||||||||
| Germany—0.7% | ||||||||
Henkel AG & Co. KGaA | ||||||||
(cost—$296,196) | 2,290 | 293,521 | ||||||
|
| |||||||
| Equity-Linked Security—0.3% | ||||||||
| India—0.3% | ||||||||
CLSA Global Markets PTE Ltd., Apollo Tyres, Ltd., expires 10/7/19 | ||||||||
(cost—$89,767) | 35,727 | 115,041 | ||||||
|
| |||||||
| Principal Amount (000s) | ||||||||
| Repurchase Agreements—1.7% | ||||||||
State Street Bank and Trust Co., dated 3/31/17, 0.09%, due 4/3/17, proceeds $675,005; collateralized by U.S. Treasury Notes, 2.25%, due 11/15/25, valued at $688,588 including accrued interest |
| |||||||
(cost—$675,000) | $675 | 675,000 | ||||||
|
| |||||||
| Total Investments (cost—$33,478,606) (b)—99.6% | 39,691,386 | |||||||
|
| |||||||
| Other assets less liabilities—0.4% | 147,275 | |||||||
|
| |||||||
| Net Assets—100.0% | $39,838,661 | |||||||
|
| |||||||
| See accompanying Notes to Financial Statements | | March 31, 2017 | | Semiannual Report | 159 |
Table of Contents
Schedule of Investments
March 31, 2017 (Unaudited)
Notes to Schedule of Investments:
(a) 144A—Exempt from registration under Rule 144A of the Securities Act of 1933. These securities may be resold in transactions exempt from registration, typically only to qualified institutional buyers. Securities with an aggregate value of $640,188, representing 1.6% of net assets.
(b) Securities with an aggregate value of $28,256,555, representing 70.9% of net assets, were valued utilizing modeling tools provided by a third-party vendor. See Note 1(a) and Note 1(b) in the Notes to Financial Statements.
(c) Fair-Valued—Securities with an aggregate value of $2,113,129, representing 5.3% of net assets. See Note 1(a) and Note 1(b) in the Notes to Financial Statements.
(d) Non-income producing.
Glossary:
ADR—American Depositary Receipt
GDR—Global Depositary Receipt
NVDR—Non-Voting Depository Receipt
The industry classification of portfolio holdings and other assets less liabilities shown as a percentage of net assets were as follows:
Banks | 23.2% | |||
Technology Hardware, Storage & Peripherals | 13.4% | |||
Automobiles | 9.3% | |||
Wireless Telecommunication Services | 7.5% | |||
Internet Software & Services | 6.4% | |||
Diversified Telecommunication Services | 4.7% | |||
Auto Components | 4.6% | |||
Airlines | 4.4% | |||
Household Durables | 4.1% | |||
Food Products | 3.6% | |||
Textiles, Apparel & Luxury Goods | 3.0% | |||
Health Care Providers & Services | 2.1% | |||
Life Sciences Tools & Services | 1.9% | |||
Pharmaceuticals | 1.7% | |||
Insurance | 1.6% | |||
Thrifts & Mortgage Finance | 1.1% | |||
Diversified Financial Services | 0.9% | |||
Household Products | 0.7% | |||
Health Care Equipment & Supplies | 0.7% | |||
Consumer Finance | 0.6% | |||
Communications Equipment | 0.6% | |||
Hotels, Restaurants & Leisure | 0.5% | |||
Media | 0.4% | |||
Diversified Consumer Services | 0.4% | |||
Food & Staples Retailing | 0.3% | |||
Multi-line Retail | 0.2% | |||
Repurchase Agreements | 1.7% | |||
Other assets less liabilities | 0.4% | |||
|
| |||
| 100.0% | ||||
|
|
AllianzGI Emerging Markets Debt Fund
Principal Amount (000s) | Value | |||||||||||
| Corporate Bonds & Notes—60.7% | ||||||||||||
| Argentina—3.3% | ||||||||||||
Aeropuertos Argentina 2000 S.A. (a)(b), |
| |||||||||||
6.875%, 2/1/27 | $ | 200 | $207,000 | |||||||||
Arcor SAIC (a)(b), |
| |||||||||||
6.00%, 7/6/23 | 350 | 372,750 | ||||||||||
Banco Supervielle S.A. (a)(b)(d), |
| |||||||||||
24.438%, 8/9/20 | ARS | 4,500 | 305,241 | |||||||||
Cablevision S.A. (a)(b), |
| |||||||||||
6.50%, 6/15/21 | $ | 150 | 158,400 | |||||||||
Empresa Distribuidora Y Comercializadora Norte, |
| |||||||||||
9.75%, 10/25/22 | 300 | 330,654 | ||||||||||
|
| |||||||||||
| 1,374,045 | ||||||||||||
|
| |||||||||||
| Azerbaijan—1.7% | ||||||||||||
International Bank of Azerbaijan OJSC, |
| |||||||||||
5.625%, 6/11/19 | 700 | 700,612 | ||||||||||
|
| |||||||||||
| Brazil—5.0% | ||||||||||||
BRF S.A., | ||||||||||||
2.75%, 6/3/22 | € | 200 | 212,998 | |||||||||
GTL Trade Finance, Inc., |
| |||||||||||
7.25%, 4/16/44 | $ | 300 | 296,250 | |||||||||
Odebrecht Offshore Drilling Finance Ltd., |
| |||||||||||
6.75%, 10/1/22 | 248 | 93,026 | ||||||||||
Petrobras Global Finance BV, |
| |||||||||||
8.375%, 5/23/21 | 350 | 396,813 | ||||||||||
Vale S.A., | ||||||||||||
5.625%, 9/11/42 | 400 | 379,920 | ||||||||||
Votorantim Cimentos S.A., |
| |||||||||||
7.25%, 4/5/41 | 700 | 715,750 | ||||||||||
|
| |||||||||||
| 2,094,757 | ||||||||||||
|
| |||||||||||
| Chile—1.1% | ||||||||||||
Banco Santander Chile (a)(b), |
| |||||||||||
3.875%, 9/20/22 | 220 | 228,387 | ||||||||||
Corp. Nacional del Cobre de Chile, |
| |||||||||||
4.50%, 8/13/23 | 200 | 214,709 | ||||||||||
|
| |||||||||||
| 443,096 | ||||||||||||
|
| |||||||||||
| China—4.3% | ||||||||||||
Agile Group Holdings Ltd. (c)(d), |
| |||||||||||
8.25%, 7/18/18 | 200 | 207,046 | ||||||||||
Baoxin Auto Finance I Ltd. (c)(d), |
| |||||||||||
8.75%, 12/15/19 | 200 | 209,972 | ||||||||||
Bright Galaxy International Ltd., |
| |||||||||||
3.375%, 11/3/21 | 400 | 392,657 | ||||||||||
Century Master Investment Co., Ltd., |
| |||||||||||
4.75%, 9/19/18 | 200 | 206,342 | ||||||||||
Modern Land China Co., Ltd., |
| |||||||||||
6.875%, 10/20/19 | 200 | 201,990 | ||||||||||
Sinopec Group Overseas Development 2015 Ltd., |
| |||||||||||
3.25%, 4/28/25 | 400 | 390,770 | ||||||||||
State Grid Overseas Investment 2016 Ltd. (a)(b), |
| |||||||||||
2.875%, 5/18/26 | 200 | 192,617 | ||||||||||
|
| |||||||||||
| 1,801,394 | ||||||||||||
|
| |||||||||||
| Colombia—2.2% | ||||||||||||
Banco GNB Sudameris S.A. (a)(b), |
| |||||||||||
6.50%, 4/3/27 | 300 | 304,785 | ||||||||||
Ecopetrol S.A., | ||||||||||||
5.375%, 6/26/26 | 600 | 615,180 | ||||||||||
|
| |||||||||||
| 919,965 | ||||||||||||
|
| |||||||||||
| Costa Rica—0.7% | ||||||||||||
Banco de Costa Rica, | ||||||||||||
5.25%, 8/12/18 | 300 | 305,493 | ||||||||||
|
| |||||||||||
| El Salvador—1.0% | ||||||||||||
AES El Salvador Trust II, |
| |||||||||||
6.75%, 3/28/23 | 250 | 233,125 | ||||||||||
Principal Amount (000s) | Value | |||||||||||
6.75%, 3/28/23 (a)(b) | $ | 210 | $ | 195,825 | ||||||||
|
| |||||||||||
| 428,950 | ||||||||||||
|
| |||||||||||
| Guatemala—2.1% | ||||||||||||
Central American Bottling Corp. (a)(b), |
| |||||||||||
5.75%, 1/31/27 | 150 | 155,844 | ||||||||||
Comcel Trust via Comunicaciones Celulares S.A., |
| |||||||||||
6.875%, 2/6/24 | 500 | 521,000 | ||||||||||
6.875%, 2/6/24 (a)(b) | 203 | 211,526 | ||||||||||
|
| |||||||||||
| 888,370 | ||||||||||||
|
| |||||||||||
| Hong Kong—4.4% | ||||||||||||
Chinalco Capital Holdings Ltd., |
| |||||||||||
4.00%, 8/25/21 | 400 | 397,435 | ||||||||||
CLP Power HK Finance Ltd. (c)(d), |
| |||||||||||
4.25%, 11/7/19 | 406 | 416,625 | ||||||||||
FWD Ltd. (c)(d), |
| |||||||||||
6.25%, 1/24/22 | 200 | 210,153 | ||||||||||
Noble Group Ltd., |
| |||||||||||
6.75%, 1/29/20 | 200 | 193,200 | ||||||||||
PCCW Capital No 4 Ltd., |
| |||||||||||
5.75%, 4/17/22 | 400 | 439,509 | ||||||||||
United Photovoltaics Group Ltd., |
| |||||||||||
8.25%, 1/25/20 | 200 | 207,499 | ||||||||||
|
| |||||||||||
| 1,864,421 | ||||||||||||
|
| |||||||||||
| India—5.8% | ||||||||||||
Adani Ports & Special Economic Zone Ltd., |
| |||||||||||
3.50%, 7/29/20 | 400 | 403,115 | ||||||||||
Export-Import Bank of India, |
| |||||||||||
4.00%, 1/14/23 | 409 | 423,156 | ||||||||||
GCX Ltd., | ||||||||||||
7.00%, 8/1/19 | 200 | 204,994 | ||||||||||
Vedanta Resources PLC, |
| |||||||||||
8.25%, 6/7/21 | 1,300 | 1,400,100 | ||||||||||
|
| |||||||||||
| 2,431,365 | ||||||||||||
|
| |||||||||||
| Indonesia—3.2% | ||||||||||||
Alam Synergy Pte Ltd., | ||||||||||||
6.95%, 3/27/20 | 200 | 206,000 | ||||||||||
Gajah Tunggal Tbk PT, | ||||||||||||
7.75%, 2/6/18 | 200 | 191,000 | ||||||||||
Indo Energy Finance BV, | ||||||||||||
7.00%, 5/7/18 | 400 | 402,000 | ||||||||||
PB International BV, | ||||||||||||
7.625%, 1/26/22 | 200 | 207,491 | ||||||||||
Pertamina Persero PT, | ||||||||||||
4.875%, 5/3/22 | 304 | 322,830 | ||||||||||
|
| |||||||||||
| 1,329,321 | ||||||||||||
|
| |||||||||||
| Kazakhstan—1.4% | ||||||||||||
Tengizchevroil Finance Co. International Ltd. (a)(b), |
| |||||||||||
4.00%, 8/15/26 | 300 | 288,213 | ||||||||||
Zhaikmunai LLP, | ||||||||||||
7.125%, 11/13/19 | 300 | 293,592 | ||||||||||
|
| |||||||||||
| 581,805 | ||||||||||||
|
| |||||||||||
| Malaysia—1.0% | ||||||||||||
Gohl Capital Ltd., | ||||||||||||
4.25%, 1/24/27 | 400 | 404,361 | ||||||||||
|
| |||||||||||
| Mauritius—0.5% | ||||||||||||
HTA Group Ltd. (a)(b), | ||||||||||||
9.125%, 3/8/22 | 200 | 199,040 | ||||||||||
|
| |||||||||||
| Mexico—2.0% | ||||||||||||
BBVA Bancomer S.A., | ||||||||||||
7.25%, 4/22/20 | 192 | 211,622 | ||||||||||
Coca-Cola Femsa S.A.B de C.V., |
| |||||||||||
3.875%, 11/26/23 | 194 | 200,090 | ||||||||||
Comision Federal de Electricidad, |
| |||||||||||
4.875%, 1/15/24 | 221 | 228,404 | ||||||||||
| 160 | Semiannual Report | | March 31, 2017 | | See accompanying Notes to Financial Statements |
Table of Contents
Schedule of Investments
March 31, 2017 (Unaudited)
Principal Amount (000s) | Value | |||||||||||
Mexico City Airport Trust (a)(b), |
| |||||||||||
4.25%, 10/31/26 | $ | 200 | $ | 203,250 | ||||||||
|
| |||||||||||
| 843,366 | ||||||||||||
|
| |||||||||||
| Nigeria—1.6% | ||||||||||||
First Bank of Nigeria Ltd. via FBN Finance Co. BV, (converts to FRN on 7/23/19) (a)(b)(d), |
| |||||||||||
8.00%, 7/23/21 | 251 | 211,550 | ||||||||||
GTB Finance BV (a)(b), | ||||||||||||
6.00%, 11/8/18 | 201 | 206,261 | ||||||||||
Zenith Bank PLC (a)(b), | ||||||||||||
6.25%, 4/22/19 | 250 | 252,400 | ||||||||||
|
| |||||||||||
| 670,211 | ||||||||||||
|
| |||||||||||
| Panama—1.2% | ||||||||||||
Global Bank Corp., | ||||||||||||
4.50%, 10/20/21 (a)(b) | 200 | 198,600 | ||||||||||
5.125%, 10/30/19 | 300 | 309,150 | ||||||||||
|
| |||||||||||
| 507,750 | ||||||||||||
|
| |||||||||||
| Peru—0.5% | ||||||||||||
Corp. Financiera de Desarrollo S.A., |
| |||||||||||
4.75%, 2/8/22 | 207 | 220,714 | ||||||||||
|
| |||||||||||
| Philippines—0.6% | ||||||||||||
Power Sector Assets & Liabilities Management Corp., |
| |||||||||||
7.39%, 12/2/24 | 200 | 255,868 | ||||||||||
|
| |||||||||||
| Qatar—0.7% | ||||||||||||
Ras Laffan Liquefied Natural Gas Co., Ltd. III (a)(b), |
| |||||||||||
6.332%, 9/30/27 | 250 | 287,500 | ||||||||||
|
| |||||||||||
| Russian Federation—6.0% | ||||||||||||
Credit Bank of Moscow via CBOM Finance PLC (a)(b)(d), |
| |||||||||||
7.50%, 10/5/27 | 200 | 204,500 | ||||||||||
EuroChem Mineral & Chemical Co. Via Eurochem Global Investments DAC (a)(b), |
| |||||||||||
3.80%, 4/12/20 | 500 | 501,464 | ||||||||||
Evraz Group SA (a)(b), | ||||||||||||
5.375%, 3/20/23 | 200 | 201,000 | ||||||||||
Gazprom OAO Via Gaz Capital S.A. (a)(b), |
| |||||||||||
4.95%, 3/23/27 | 500 | 498,990 | ||||||||||
Lukoil International Finance BV (a)(b), |
| |||||||||||
4.75%, 11/2/26 | 500 | 508,600 | ||||||||||
Sberbank of Russia Via SB Capital S.A. (a)(b), |
| |||||||||||
5.25%, 5/23/23 | 224 | 231,097 | ||||||||||
VimpelCom Holdings BV, | ||||||||||||
5.95%, 2/13/23 | 350 | 373,625 | ||||||||||
|
| |||||||||||
| 2,519,276 | ||||||||||||
|
| |||||||||||
| South Africa—1.5% | ||||||||||||
Gold Fields Orogen Holdings BVI Ltd. (a)(b), |
| |||||||||||
4.875%, 10/7/20 | 400 | 404,000 | ||||||||||
Myriad International Holdings BV, |
| |||||||||||
5.50%, 7/21/25 | 200 | 208,200 | ||||||||||
|
| |||||||||||
| 612,200 | ||||||||||||
|
| |||||||||||
| Thailand—1.0% | ||||||||||||
PTT Exploration & Production PCL (c)(d), |
| |||||||||||
4.875%, 6/18/19 | 400 | 410,060 | ||||||||||
|
| |||||||||||
| Trinidad And Tobago—1.1% | ||||||||||||
Petroleum Co. of Trinidad & Tobago Ltd., |
| |||||||||||
9.75%, 8/14/19 | 450 | 477,450 | ||||||||||
|
| |||||||||||
| Turkey—4.0% | ||||||||||||
Akbank TAS (a)(b), | ||||||||||||
3.875%, 10/24/17 | 250 | 252,126 | ||||||||||
Global Liman Isletmeleri (a)(b), |
| |||||||||||
8.125%, 11/14/21 | 300 | 308,226 | ||||||||||
KOC Holding AS (a)(b), | ||||||||||||
5.25%, 3/15/23 | 300 | 304,618 | ||||||||||
Principal Amount (000s) | Value | |||||||||||
Turk Telekomunikasyon AS, |
| |||||||||||
4.875%, 6/19/24 | $ | 200 | $ | 193,332 | ||||||||
Yapi ve Kredi Bankasi AS (a)(b), |
| |||||||||||
5.75%, 2/24/22 | 200 | 199,267 | ||||||||||
Yasar Holding AS (a)(b), | ||||||||||||
8.875%, 5/6/20 | 400 | 413,750 | ||||||||||
|
| |||||||||||
| 1,671,319 | ||||||||||||
|
| |||||||||||
| United Arab Emirates—0.2% | ||||||||||||
Dolphin Energy Ltd. (a)(b), |
| |||||||||||
5.888%, 6/15/19 | 73 | 76,675 | ||||||||||
|
| |||||||||||
| United Kingdom—0.4% | ||||||||||||
Genel Energy Finance PLC (b), |
| |||||||||||
7.50%, 5/14/19 | 200 | 160,000 | ||||||||||
|
| |||||||||||
| Venezuela—2.2% | ||||||||||||
Petroleos de Venezuela S.A., |
| |||||||||||
5.25%, 4/12/17 | 200 | 191,300 | ||||||||||
6.00%, 5/16/24 | 1,000 | 368,500 | ||||||||||
8.50%, 10/27/20 | 500 | 375,000 | ||||||||||
|
| |||||||||||
| 934,800 | ||||||||||||
|
| |||||||||||
| Total Corporate Bonds & Notes (cost—$24,517,070) | 25,414,184 | |||||||||||
|
| |||||||||||
| Sovereign Debt Obligations—33.7% | ||||||||||||
| Angola—0.5% | ||||||||||||
Angolan Government International Bond (a)(b), |
| |||||||||||
9.50%, 11/12/25 | 200 | 206,790 | ||||||||||
|
| |||||||||||
| Argentina—4.0% | ||||||||||||
Argentine Republic Government International Bond, |
| |||||||||||
5.625%, 1/26/22 (a)(b) | 250 | 256,312 | ||||||||||
7.50%, 4/22/26 (a)(b) | 150 | 159,525 | ||||||||||
8.28%, 12/31/33 | 561 | 591,660 | ||||||||||
Provincia de Cordoba, | ||||||||||||
7.125%, 6/10/21 (a)(b) | 250 | 259,810 | ||||||||||
12.375%, 8/17/17 | 127 | 130,908 | ||||||||||
Provincia de la Rioja (a)(b), |
| |||||||||||
9.75%, 2/24/25 | 250 | 255,660 | ||||||||||
|
| |||||||||||
| 1,653,875 | ||||||||||||
|
| |||||||||||
| Azerbaijan—0.9% | ||||||||||||
Republic of Azerbaijan International Bond, |
| |||||||||||
4.75%, 3/18/24 | 375 | 378,327 | ||||||||||
|
| |||||||||||
| Brazil—0.9% | ||||||||||||
Brazilian Government International Bond, |
| |||||||||||
4.25%, 1/7/25 | 400 | 394,500 | ||||||||||
|
| |||||||||||
| Cameroon—0.5% | ||||||||||||
Republic of Cameroon International Bond (a)(b), |
| |||||||||||
9.50%, 11/19/25 | 200 | 227,142 | ||||||||||
|
| |||||||||||
| Colombia—0.7% | ||||||||||||
Colombia Government International Bond, |
| |||||||||||
2.625%, 3/15/23 | 300 | 289,125 | ||||||||||
|
| |||||||||||
| Croatia—1.3% | ||||||||||||
Croatia Government International Bond, |
| |||||||||||
5.50%, 4/4/23 | 501 | 540,744 | ||||||||||
|
| |||||||||||
| Egypt—0.5% | ||||||||||||
Egypt Government International Bond (a)(b), |
| |||||||||||
6.125%, 1/31/22 | 200 | 208,375 | ||||||||||
|
| |||||||||||
| Ethiopia—0.7% | ||||||||||||
Ethiopia International Bond, |
| |||||||||||
6.625%, 12/11/24 | 300 | 288,987 | ||||||||||
|
| |||||||||||
| Guatemala—0.4% | ||||||||||||
Guatemala Government Bond (a)(b), |
| |||||||||||
4.50%, 5/3/26 | 150 | 149,652 | ||||||||||
|
| |||||||||||
Principal Amount (000s) | Value | |||||||||||
| Honduras—0.4% | ||||||||||||
Honduras Government International Bond (a)(b), |
| |||||||||||
6.25%, 1/19/27 | $ | 150 | $ | 152,568 | ||||||||
|
| |||||||||||
| Hungary—1.5% | ||||||||||||
Hungary Government International Bond, |
| |||||||||||
5.375%, 2/21/23 | 396 | 436,774 | ||||||||||
6.25%, 1/29/20 | 185 | 202,958 | ||||||||||
|
| |||||||||||
| 639,732 | ||||||||||||
|
| |||||||||||
| Indonesia—1.5% | ||||||||||||
Indonesia Government International Bond, |
| |||||||||||
4.125%, 1/15/25 | 300 | 308,697 | ||||||||||
4.625%, 4/15/43 (a)(b) | 300 | 302,910 | ||||||||||
|
| |||||||||||
| 611,607 | ||||||||||||
|
| |||||||||||
| Iraq—0.5% | ||||||||||||
Iraq International Bond, | ||||||||||||
5.80%, 1/15/28 | 250 | 221,256 | ||||||||||
|
| |||||||||||
| Ivory Coast—1.1% | ||||||||||||
Ivory Coast Government International Bond, |
| |||||||||||
5.375%, 7/23/24 | 500 | 477,537 | ||||||||||
|
| |||||||||||
| Jamaica—1.0% | ||||||||||||
Jamaica Government International Bond, |
| |||||||||||
6.75%, 4/28/28 | 200 | 222,638 | ||||||||||
8.00%, 3/15/39 | 150 | 172,595 | ||||||||||
|
| |||||||||||
| 395,233 | ||||||||||||
|
| |||||||||||
| Kenya—0.5% | ||||||||||||
Kenya Government International Bond, |
| |||||||||||
5.875%, 6/24/19 | 200 | 207,721 | ||||||||||
|
| |||||||||||
| Kuwait—1.9% | ||||||||||||
Kuwait International Government Bond (a)(b), |
| |||||||||||
2.75%, 3/20/22 | 300 | 300,810 | ||||||||||
3.50%, 3/20/27 | 500 | 505,987 | ||||||||||
|
| |||||||||||
| 806,797 | ||||||||||||
|
| |||||||||||
| Mexico—0.5% | ||||||||||||
Mexico Government International Bond, |
| |||||||||||
3.60%, 1/30/25 | 200 | 200,000 | ||||||||||
|
| |||||||||||
| Morocco—0.7% | ||||||||||||
Morocco Government International Bond, |
| |||||||||||
3.50%, 6/19/24 | € | 250 | 289,025 | |||||||||
|
| |||||||||||
| Namibia—0.5% | ||||||||||||
Namibia International Bonds (a)(b), |
| |||||||||||
5.25%, 10/29/25 | $ | 200 | 202,290 | |||||||||
|
| |||||||||||
| Nigeria—1.3% | ||||||||||||
Nigeria Government International Bond, |
| |||||||||||
6.75%, 1/28/21 | 300 | 314,040 | ||||||||||
7.875%, 2/16/32 (a)(b) | 200 | 209,120 | ||||||||||
|
| |||||||||||
| 523,160 | ||||||||||||
|
| |||||||||||
| Oman—0.5% | ||||||||||||
Oman Government International Bond (a)(b), |
| |||||||||||
3.875%, 3/8/22 | 200 | 202,560 | ||||||||||
|
| |||||||||||
| Panama—1.1% | ||||||||||||
Panama Government International Bond, |
| |||||||||||
3.75%, 3/16/25 | 450 | 460,688 | ||||||||||
|
| |||||||||||
| Paraguay—0.5% | ||||||||||||
Paraguay Government International Bond, |
| |||||||||||
6.10%, 8/11/44 | 207 | 223,043 | ||||||||||
|
| |||||||||||
| Peru—0.5% | ||||||||||||
Peruvian Government International Bond, |
| |||||||||||
4.125%, 8/25/27 | 200 | 216,000 | ||||||||||
|
| |||||||||||
| Philippines—0.6% | ||||||||||||
Philippine Government International Bond, |
| |||||||||||
3.95%, 1/20/40 | 250 | 257,962 | ||||||||||
|
| |||||||||||
| See accompanying Notes to Financial Statements | | March 31, 2017 | | Semiannual Report | 161 |
Table of Contents
Schedule of Investments
March 31, 2017 (Unaudited)
Principal Amount (000s) | Value | |||||||||||
| Romania—0.5% | ||||||||||||
Romanian Government International Bond, |
| |||||||||||
4.375%, 8/22/23 | $ | 200 | $ | 211,401 | ||||||||
|
| |||||||||||
| Russian Federation—1.0% | ||||||||||||
Russian Federation Bond, |
| |||||||||||
4.875%, 9/16/23 | 400 | 429,416 | ||||||||||
|
| |||||||||||
| South Africa—1.3% | ||||||||||||
Republic of South Africa Government Bond, |
| |||||||||||
6.75%, 3/31/21 | ZAR | 7,500 | 537,968 | |||||||||
|
| |||||||||||
| Sri Lanka—0.7% | ||||||||||||
Sri Lanka Government International Bond, |
| |||||||||||
5.875%, 7/25/22 | $ | 300 | 308,561 | |||||||||
|
| |||||||||||
| Trinidad And Tobago—0.7% | ||||||||||||
Trinidad & Tobago Government International Bond (a)(b), |
| |||||||||||
4.50%, 8/4/26 | 300 | 299,427 | ||||||||||
|
| |||||||||||
| Turkey—0.8% | ||||||||||||
Turkey Government International Bond, |
| |||||||||||
4.875%, 4/16/43 | 400 | 344,070 | ||||||||||
|
| |||||||||||
| Ukraine—0.9% | ||||||||||||
Ukraine Government International Bond (a)(b), |
| |||||||||||
zero coupon, 5/31/40 (d) | 115 | 43,068 | ||||||||||
7.75%, 9/1/20 | 150 | 150,006 | ||||||||||
7.75%, 9/1/23 | 200 | 189,484 | ||||||||||
|
| |||||||||||
| 382,558 | ||||||||||||
|
| |||||||||||
| United Arab Emirates—0.7% | ||||||||||||
IPIC GMTN Ltd. (a)(b), | ||||||||||||
5.00%, 11/15/20 | 253 | 274,189 | ||||||||||
|
| |||||||||||
| Uruguay—0.7% | ||||||||||||
Uruguay Government International Bond, |
| |||||||||||
4.375%, 10/27/27 | 284 | 298,168 | ||||||||||
|
| |||||||||||
| Venezuela—0.9% | ||||||||||||
Venezuela Government International Bond, |
| |||||||||||
6.00%, 12/9/20 | 750 | 372,375 | ||||||||||
|
| |||||||||||
| Vietnam—0.5% | ||||||||||||
Vietnam Government International Bond, |
| |||||||||||
4.80%, 11/19/24 | 200 | 204,059 | ||||||||||
|
| |||||||||||
| Total Sovereign Debt Obligations (cost—$13,806,630) | 14,086,888 | |||||||||||
|
| |||||||||||
| Repurchase Agreements—3.5% | ||||||||||||
State Street Bank and Trust Co.,dated 3/31/17, 0.09%, due 4/3/17, proceeds $1,455,011; collateralized by U.S. Treasury Notes, 2.25%, due 11/15/25, valued at $1,486,950 including accrued interest |
| |||||||||||
(cost—$1,455,000) | 1,455 | 1,455,000 | ||||||||||
|
| |||||||||||
| Total Investments (cost—$39,778,700)—97.9% | 40,956,072 | |||||||||||
|
| |||||||||||
| Other assets less liabilities (e)—2.1% | 881,932 | |||||||||||
|
| |||||||||||
| Net Assets—100.0% | $41,838,004 | |||||||||||
|
| |||||||||||
Notes to Schedule of Investments:
(a) Private Placement—Restricted as to resale and may not have a readily available market. Securities with an aggregate value of $12,839,187, representing 30.7% of net assets.
(b) 144A—Exempt from registration under Rule 144A of the Securities Act of 1933. These securities may be resold in transactions exempt from registration, typically only to qualified institutional buyers. Securities with an aggregate value of $12,999,187, representing 31.1% of net assets.
(c) Perpetual maturity. The date shown, if any, is the next call date. For Corporate Bonds & Notes the interest rate is fixed until the first call date and variable thereafter.
(d) Variable or Floating Rate Security—Securities with an interest rate that changes periodically. The interest rate disclosed reflects the rate in effect on March 31, 2017.
(e) Includes net unrealized appreciation (depreciation) of other financial instruments. See Notes 7(b) and 7(c) in the Notes to Financial Statements.
Glossary:
ARS—Argentine Peso
€—Euro
FRN—Floating Rate Note
ZAR—South African Rand
The industry classification of portfolio holdings and other assets less liabilities shown as a percentage of net assets were as follows:
Sovereign Debt Obligations | 33.7% | |||
Oil, Gas & Consumable Fuels | 13.7% | |||
Banks | 9.6% | |||
Mining | 5.8% | |||
Telecommunications | 5.1% | |||
Electric Utilities | 3.8% | |||
Diversified Financial Services | 2.6% | |||
Food & Beverage | 2.2% | |||
Holding Companies-Diversified | 2.2% | |||
Iron/Steel | 2.1% | |||
Building Materials | 1.7% | |||
Commercial Services | 1.7% | |||
Engineering & Construction | 1.5% | |||
Banking | 1.2% | |||
Chemicals | 1.2% | |||
Real Estate | 1.0% | |||
Lodging | 1.0% | |||
Coal | 1.0% | |||
Media | 0.9% | |||
Insurance | 0.5% | |||
Specialty Retail | 0.5% | |||
Energy-Alternate Sources | 0.5% | |||
Apparel & Textiles | 0.5% | |||
Auto Components | 0.4% | |||
Repurchase Agreements | 3.5% | |||
Other assets less liabilities | 2.1% | |||
|
| |||
| 100.0% | ||||
|
|
| 162 | Semiannual Report | | March 31, 2017 | | See accompanying Notes to Financial Statements |
Table of Contents
Schedule of Investments
March 31, 2017 (Unaudited)
AllianzGI Emerging Markets Small-Cap Fund
| Shares | Value | |||||||
| Common Stock—98.2% | ||||||||
| Brazil—1.5% | ||||||||
Cia de Saneamento de Minas Gerais—COPASA | 9,219 | $130,160 | ||||||
Cia Paranaense de Energia | 2,700 | 22,320 | ||||||
Cosan Ltd., Class A | 2,000 | 17,080 | ||||||
MRV Engenharia e Participacoes S.A. | 3,200 | 14,679 | ||||||
Qualicorp S.A. | 2,900 | 19,129 | ||||||
|
| |||||||
| 203,368 | ||||||||
|
| |||||||
| Chile—1.1% | ||||||||
CAP S.A. | 12,741 | 149,928 | ||||||
|
| |||||||
| China—21.6% | ||||||||
BAIC Motor Corp., Ltd., Class H (a) | 212,000 | 240,959 | ||||||
China Agri-Industries Holdings Ltd. (d) | 139,000 | 69,937 | ||||||
China Lesso Group Holdings Ltd. | 206,000 | 174,241 | ||||||
China Shineway Pharmaceutical Group Ltd. | 15,000 | 16,415 | ||||||
China Suntien Green Energy Corp. Ltd., Class H | 264,000 | 51,003 | ||||||
China Yuchai International Ltd. | 1,300 | 24,063 | ||||||
Concord New Energy Group Ltd. | 340,000 | 17,080 | ||||||
Fufeng Group Ltd. | 199,000 | 160,408 | ||||||
Great Wall Motor Co., Ltd., Class H | 35,000 | 39,889 | ||||||
Guangzhou Automobile Group Co., Ltd., Class H | 74,000 | 118,519 | ||||||
Hisense Kelon Electrical Holdings Co., Ltd., Class H | 170,000 | 249,617 | ||||||
Hopewell Highway Infrastructure Ltd. | 114,500 | 61,739 | ||||||
Hua Hong Semiconductor Ltd. (a) | 13,000 | 18,253 | ||||||
K Wah International Holdings Ltd. | 215,000 | 142,838 | ||||||
Kingboard Chemical Holdings Ltd. | 101,000 | 373,149 | ||||||
Kingboard Laminates Holdings Ltd. | 314,000 | 407,506 | ||||||
Lee & Man Paper Manufacturing Ltd. | 224,000 | 171,330 | ||||||
PW Medtech Group Ltd. (d) | 111,000 | 27,285 | ||||||
Texhong Textile Group Ltd. | 15,000 | 20,120 | ||||||
Tiangong International Co., Ltd. | 148,000 | 16,588 | ||||||
Tianjin Development Holdings Ltd. | 204,000 | 104,295 | ||||||
Tianneng Power International Ltd. | 54,000 | 49,090 | ||||||
Weiqiao Textile Co., Class H (c) | 57,000 | 40,982 | ||||||
Xingda International Holdings Ltd. | 276,000 | 120,784 | ||||||
Yuexiu Property Co., Ltd. | 400,000 | 67,958 | ||||||
Yuexiu Real Estate Investment Trust REIT | 317,000 | 186,910 | ||||||
|
| |||||||
| 2,970,958 | ||||||||
|
| |||||||
| Colombia—0.3% | ||||||||
Avianca Holdings S.A. ADR | 4,900 | 37,779 | ||||||
|
| |||||||
| Czech Republic—0.1% | ||||||||
Philip Morris CR AS | 28 | 15,000 | ||||||
|
| |||||||
| Shares | Value | |||||||
| Greece—3.0% | ||||||||
Hellenic Petroleum S.A. (d) | 6,883 | $ | 37,744 | |||||
Motor Oil Hellas Corinth Refineries S.A. | 15,962 | 272,328 | ||||||
Mytilineos Holdings S.A. (d) | 12,778 | 96,725 | ||||||
|
| |||||||
| 406,797 | ||||||||
|
| |||||||
| Hong Kong—2.0% | ||||||||
Champion REIT | 106,000 | 64,940 | ||||||
Langham Hospitality Investments and Langham Hospitality Investments Ltd. UNIT | 79,500 | 33,559 | ||||||
Regal Real Estate Investment Trust REIT | 57,000 | 16,290 | ||||||
Television Broadcasts Ltd. | 13,300 | 53,738 | ||||||
Xinyi Glass Holdings Ltd. (d) | 126,000 | 110,983 | ||||||
|
| |||||||
| 279,510 | ||||||||
|
| |||||||
| Hungary—1.1% | ||||||||
Magyar Telekom Telecommunications PLC | 91,590 | 151,907 | ||||||
|
| |||||||
| India—9.7% | ||||||||
Apollo Tyres Ltd. (d) | 10,426 | 33,464 | ||||||
Bajaj Holdings & Investment Ltd. | 581 | 19,415 | ||||||
Balrampur Chini Mills Ltd. | 25,501 | 56,769 | ||||||
CESC Ltd. | 5,958 | 77,259 | ||||||
Claris Lifesciences Ltd. (d) | 3,123 | 15,534 | ||||||
Eros International Media Ltd. (d) | 9,017 | 38,107 | ||||||
Escorts Ltd. (d) | 6,940 | 57,515 | ||||||
Gujarat Alkalies & Chemicals Ltd. | 4,887 | 30,676 | ||||||
IDFC Ltd. (d) | 257,326 | 215,977 | ||||||
Indraprastha Gas Ltd. | 3,405 | 53,353 | ||||||
Jindal Stainless Hisar Ltd. (d) | 12,880 | 28,174 | ||||||
Manappuram Finance Ltd. | 163,838 | 248,266 | ||||||
National Aluminium Co., Ltd. (d) | 35,276 | 41,558 | ||||||
Reliance Infrastructure Ltd. (d) | 13,467 | 117,624 | ||||||
Tamil Nadu Newsprint & Papers Ltd. | 17,344 | 83,884 | ||||||
Tata Coffee Ltd. | 12,937 | 25,042 | ||||||
Uflex Ltd. (d) | 27,112 | 116,299 | ||||||
Vardhman Textiles Ltd. (d) | 3,283 | 65,981 | ||||||
|
| |||||||
| 1,324,897 | ||||||||
|
| |||||||
| Indonesia—2.1% | ||||||||
Adaro Energy Tbk PT | 230,500 | 30,277 | ||||||
Indo Tambangraya Megah Tbk PT | 121,800 | 184,649 | ||||||
Japfa Comfeed Indonesia Tbk PT | 562,600 | 65,236 | ||||||
|
| |||||||
| 280,162 | ||||||||
|
| |||||||
| Korea (Republic of)—13.2% | ||||||||
Aekyung Petrochemical Co., Ltd. | 9,620 | 107,511 | ||||||
Baiksan Co., Ltd. | 9,201 | 71,910 | ||||||
Daehan Steel Co., Ltd. | 7,019 | 70,610 | ||||||
Dongkuk Industries Co., Ltd. | 5,482 | 23,823 | ||||||
Dongwha Pharm Co., Ltd. | 3,742 | 30,423 | ||||||
Dongwon Development Co., Ltd. | 4,926 | 18,941 | ||||||
F&F Co., Ltd. | 4,372 | 103,780 | ||||||
Hanjin Heavy Industries & Construction Co., Ltd. (d) | 12,178 | 42,270 | ||||||
Hansol Paper Co., Ltd. | 9,990 | 170,178 | ||||||
| Shares | Value | |||||||
Hanwha Corp. | 2,630 | $ | 84,441 | |||||
Huvis Corp. | 2,671 | 17,838 | ||||||
Hwa Shin Co., Ltd. | 7,544 | 43,511 | ||||||
Hyundai Engineering Plastics Co., Ltd. | 9,784 | 73,829 | ||||||
INTOPS Co., Ltd. | 1,436 | 14,318 | ||||||
Korea United Pharm, Inc. | 2,832 | 46,470 | ||||||
KPX Chemical Co., Ltd. | 346 | 18,435 | ||||||
Kwangju Bank | 10,509 | 103,333 | ||||||
LG Uplus Corp. | 5,290 | 67,703 | ||||||
Moorim P&P Co., Ltd. | 4,537 | 16,752 | ||||||
NEPES Corp. (d) | 3,243 | 31,775 | ||||||
Poongsan Corp. | 5,452 | 190,762 | ||||||
Pyeong Hwa Automotive Co., Ltd. | 1,639 | 22,136 | ||||||
SEAH Steel Corp. | 1,413 | 120,232 | ||||||
Seoyon E—Hwa Co., Ltd. | 1,792 | 22,921 | ||||||
Silicon Works Co., Ltd. | 2,167 | 59,392 | ||||||
SL Corp. | 3,366 | 58,392 | ||||||
Sungwoo Hitech Co., Ltd. | 15,630 | 104,684 | ||||||
Taekwang Industrial Co., Ltd. | 28 | 22,784 | ||||||
Taeyoung Engineering & Construction Co., Ltd. (d) | 10,163 | 53,336 | ||||||
|
| |||||||
| 1,812,490 | ||||||||
|
| |||||||
| Malaysia—1.1% | ||||||||
George Kent Malaysia Bhd. | 25,100 | 22,346 | ||||||
Ta Ann Holdings Bhd. | 62,300 | 52,509 | ||||||
Unisem M Bhd. | 114,800 | 81,454 | ||||||
|
| |||||||
| 156,309 | ||||||||
|
| |||||||
| Philippines—1.3% | ||||||||
Cebu Air, Inc. | 75,950 | 142,137 | ||||||
First Philippine Holdings Corp. | 21,020 | 30,079 | ||||||
|
| |||||||
| 172,216 | ||||||||
|
| |||||||
| Poland—3.8% | ||||||||
Enea S.A. (d) | 29,225 | 83,296 | ||||||
Kernel Holding S.A. | 12,437 | 224,055 | ||||||
Stalprodukt S.A. | 337 | 50,793 | ||||||
Tauron Polska Energia S.A. (d) | 197,363 | 168,635 | ||||||
|
| |||||||
| 526,779 | ||||||||
|
| |||||||
| Russian Federation—3.9% | ||||||||
Acron PJSC (c) | 252 | 14,800 | ||||||
Federal Grid Co. Unified Energy System PJSC | 8,960,000 | 28,648 | ||||||
IDGC of Centre PJSC (c) | 2,085,457 | 14,556 | ||||||
Inter RAO UES PJSC (c) | 4,662,814 | 332,086 | ||||||
M Video PJSC (c) | 8,126 | 54,119 | ||||||
Sistema PJSC FC | 234,600 | 92,990 | ||||||
|
| |||||||
| 537,199 | ||||||||
|
| |||||||
| South Africa—2.9% | ||||||||
Adcock Ingram Holdings Ltd. | 5,448 | 25,278 | ||||||
Aeci Ltd. | 21,505 | 184,812 | ||||||
Astral Foods Ltd. | 1,294 | 15,133 | ||||||
Exxaro Resources Ltd. | 11,773 | 103,406 | ||||||
Merafe Resources Ltd. | 423,120 | 52,668 | ||||||
Raubex Group Ltd. | 7,553 | 14,367 | ||||||
|
| |||||||
| 395,664 | ||||||||
|
| |||||||
| Taiwan—21.0% | ||||||||
Ability Enterprise Co., Ltd. | 105,583 | 65,242 | ||||||
Alpha Networks, Inc. | 265,000 | 206,130 | ||||||
China Motor Corp. | 100,000 | 91,634 | ||||||
Chipbond Technology Corp. | 224,000 | 358,197 | ||||||
| See accompanying Notes to Financial Statements | | March 31, 2017 | | Semiannual Report | 163 |
Table of Contents
Schedule of Investments
March 31, 2017 (Unaudited)
Shares | Value | |||||||
Coretronic Corp. | 53,600 | $ | 78,769 | |||||
Everlight Electronics Co., Ltd. | 60,000 | 96,104 | ||||||
Faraday Technology Corp. | 27,000 | 33,370 | ||||||
FocalTech Systems Co., Ltd. | 134,000 | 178,664 | ||||||
Gigabyte Technology Co., Ltd. | 41,000 | 56,619 | ||||||
Grand Pacific Petrochemical | 187,000 | 129,999 | ||||||
Greatek Electronics, Inc. | 37,000 | 50,727 | ||||||
Huaku Development Co., Ltd. | 86,000 | 198,059 | ||||||
Huang Hsiang Construction Corp. | 30,000 | 45,181 | ||||||
Lite-On Technology Corp. | 46,189 | 79,614 | ||||||
Powertech Technology, Inc. | 79,000 | 229,895 | ||||||
Radiant Opto-Electronics Corp. | 36,000 | 75,708 | ||||||
Sampo Corp. | 85,000 | 53,932 | ||||||
Sigurd Microelectronics Corp. | 72,000 | 65,726 | ||||||
Sinmag Equipment Corp. | 15,000 | 68,763 | ||||||
Sirtec International Co., Ltd. | 12,000 | 18,398 | ||||||
Syncmold Enterprise Corp. | 103,000 | 227,370 | ||||||
Tripod Technology Corp. | 126,000 | 354,995 | ||||||
TXC Corp. | 86,000 | 123,017 | ||||||
|
| |||||||
| 2,886,113 | ||||||||
|
| |||||||
| Thailand—4.4% | ||||||||
Bangchak Petroleum PCL NVDR | 224,900 | 216,019 | ||||||
CPN Retail Growth Leasehold Property Fund UNIT | 122,600 | 68,146 | ||||||
Esso Thailand PCL NVDR (d) | 74,700 | 23,914 | ||||||
Hana Microelectronics PCL | 12,000 | 16,413 | ||||||
KGI Securities Thailand PCL (c) | 520,800 | 63,656 | ||||||
Thai Oil PCL NVDR | 18,500 | 40,652 | ||||||
Thai Vegetable Oil PCL NVDR | 154,100 | 150,232 | ||||||
Thai Wah PCL Class F (c) | 90,000 | 30,650 | ||||||
|
| |||||||
| 609,682 | ||||||||
|
| |||||||
| Turkey—3.9% | ||||||||
Aygaz AS | 15,769 | 63,835 | ||||||
Eregli Demir ve Celik Fabrikalari TAS | 15,047 | 24,435 | ||||||
Soda Sanayii AS | 59,494 | 99,607 | ||||||
Trakya Cam Sanayii AS | 405,753 | 352,947 | ||||||
|
| |||||||
| 540,824 | ||||||||
|
| |||||||
| United Arab Emirates—0.2% | ||||||||
RAK Properties PJSC (d) | 163,610 | 28,066 | ||||||
|
| |||||||
| Total Common Stock (cost—$11,445,621) | 13,485,648 | |||||||
|
| |||||||
| Preferred Stock—0.1% | ||||||||
| Brazil—0.1% | ||||||||
Cia Ferro Ligas da Bahia—FERBASA | 5,600 | 19,015 | ||||||
|
| |||||||
| Principal Amount (000s) | Value | |||||||
| Repurchase Agreements—1.8% | ||||||||
State Street Bank and Trust Co., dated 3/31/17, 0.09%, due 4/3/17, proceeds $243,002; collateralized by U.S. Treasury Notes, 2.25%, due 11/15/25, valued at $249,488 including accrued interest |
| |||||||
(cost—$243,000) | $243 | $ | 243,000 | |||||
|
| |||||||
| Total Investments (cost—$11,706,771) (b)—100.1% | 13,747,663 | |||||||
|
| |||||||
| Liabilities in excess of other assets—(0.1)% | (8,433 | ) | ||||||
|
| |||||||
| Net Assets—100.0% | $13,739,230 | |||||||
|
| |||||||
Notes to Schedule of Investments:
(a) 144A—Exempt from registration under Rule 144A of the Securities Act of 1933. These securities may be resold in transactions exempt from registration, typically only to qualified institutional buyers. Securities with an aggregate value of $259,212, representing 1.9% of net assets.
(b) Securities with an aggregate value of $11,246,679, representing 81.9% of net assets, were valued utilizing modeling tools provided by a third-party vendor. See Note 1(a) and Note 1(b) in the Notes to Financial Statements.
(c) Fair-Valued—Securities with an aggregate value of $550,849, representing 4.0% of net assets. See Note 1(a) and Note 1(b) in the Notes to Financial Statements.
(d) Non-income producing.
Glossary:
ADR—American Depositary Receipt
NVDR—Non-Voting Depository Receipt
REIT—Real Estate Investment Trust
UNIT—More than one class of securities traded together.
The industry classification of portfolio holdings and liabilities in excess of other assets shown as a percentage of net assets were as follows:
Electronic Equipment, Instruments & Components | 10.1% | |||
Semiconductors & Semiconductor Equipment | 9.3% | |||
Oil, Gas & Consumable Fuels | 7.1% | |||
Electric Utilities | 6.4% | |||
Chemicals | 6.2% | |||
Metals & Mining | 5.6% | |||
Auto Components | 4.7% | |||
Food Products | 4.6% | |||
Real Estate Management & Development | 3.9% | |||
Building Products | 3.8% | |||
Paper & Forest Products | 3.6% | |||
Automobiles | 3.6% | |||
Machinery | 3.2% | |||
Household Durables | 2.8% | |||
Equity Real Estate Investment Trusts (REITs) | 2.4% | |||
Textiles, Apparel & Luxury Goods | 2.3% | |||
Consumer Finance | 1.8% | |||
Diversified Financial Services | 1.7% | |||
Diversified Telecommunication Services | 1.6% | |||
Communications Equipment | 1.5% | |||
Airlines | 1.3% | |||
Technology Hardware, Storage & Peripherals | 1.0% | |||
Pharmaceuticals | 1.0% | |||
Water Utilities | 0.9% | |||
Gas Utilities | 0.9% | |||
Containers & Packaging | 0.8% | |||
Multi-Utilities | 0.8% | |||
Banks | 0.8% | |||
Industrial Conglomerates | 0.7% | |||
Wireless Telecommunication Services | 0.7% | |||
Media | 0.7% | |||
Construction & Engineering | 0.6% | |||
Capital Markets | 0.5% | |||
Transportation Infrastructure | 0.5% | |||
Specialty Retail | 0.4% | |||
Health Care Equipment & Supplies | 0.2% | �� | ||
Health Care Providers & Services | 0.1% | |||
Iron/Steel | 0.1% | |||
Tobacco | 0.1% | |||
Repurchase Agreements | 1.8% | |||
Liabilities in excess of other assets | (0.1)% | |||
|
| |||
| 100.0% | ||||
|
|
| 164 | Semiannual Report | | March 31, 2017 | | See accompanying Notes to Financial Statements |
Table of Contents
Schedule of Investments
March 31, 2017 (Unaudited)
AllianzGI Europe Equity Dividend Fund
| Shares | Value | |||||||
| Common Stock—97.4% | ||||||||
| Belgium—0.2% | ||||||||
EVS Broadcast Equipment S.A. | 300 | $11,440 | ||||||
|
| |||||||
| Finland—1.6% | ||||||||
Nokian Renkaat Oyj | 2,520 | 105,179 | ||||||
|
| |||||||
| France—19.4% | ||||||||
AXA S.A. | 12,290 | 317,521 | ||||||
Coface S.A. | 9,390 | 70,548 | ||||||
Natixis S.A. | 17,790 | 109,518 | ||||||
SCOR SE | 5,065 | 191,422 | ||||||
SES S.A. | 14,106 | 327,950 | ||||||
Total S.A. | 3,740 | 189,107 | ||||||
Vivendi S.A. | 4,970 | 96,411 | ||||||
|
| |||||||
| 1,302,477 | ||||||||
|
| |||||||
| Germany—15.4% | ||||||||
Daimler AG | 1,650 | 121,769 | ||||||
Drillisch AG | 3,710 | 188,726 | ||||||
Freenet AG | 7,349 | 238,885 | ||||||
Muenchener Rueckversicherungs-Gesellschaft AG in Muenchen | 1,540 | 301,458 | ||||||
ProSiebenSat.1 Media SE | 1,140 | 50,480 | ||||||
TUI AG | 9,530 | 131,804 | ||||||
|
| |||||||
| 1,033,122 | ||||||||
|
| |||||||
| Italy—2.6% | ||||||||
Atlantia SpA | 6,780 | 174,898 | ||||||
|
| |||||||
| Netherlands—6.8% | ||||||||
ABN AMRO Group NV (a) | 2,650 | 64,259 | ||||||
ING Groep NV | 13,450 | 203,152 | ||||||
Koninklijke KPN NV | 63,920 | 192,170 | ||||||
|
| |||||||
| 459,581 | ||||||||
|
| |||||||
| Norway—5.0% | ||||||||
Statoil ASA | 5,030 | 86,458 | ||||||
Telenor ASA | 5,350 | 89,000 | ||||||
Yara International ASA | 4,070 | 156,767 | ||||||
|
| |||||||
| 332,225 | ||||||||
|
| |||||||
| Portugal—0.4% | ||||||||
CTT-Correios de Portugal S.A. | 4,740 | 25,865 | ||||||
|
| |||||||
| Spain—12.0% | ||||||||
Cia de Distribucion Integral Logista Holdings S.A. | 9,730 | 225,854 | ||||||
Enagas S.A. | 5,550 | 143,986 | ||||||
Ferrovial S.A. | 10,949 | 218,842 | ||||||
Iberdrola S.A. | 30,590 | 218,562 | ||||||
|
| |||||||
| 807,244 | ||||||||
|
| |||||||
| Sweden—2.3% | ||||||||
Nordea Bank AB | 8,600 | 98,116 | ||||||
Swedbank AB, Class A | 2,560 | 59,234 | ||||||
|
| |||||||
| 157,350 | ||||||||
|
| |||||||
| Switzerland—3.9% | ||||||||
Sunrise Communications Group AG (a)(c) | 3,506 | 264,145 | ||||||
|
| |||||||
| United Kingdom—27.8% | ||||||||
Admiral Group PLC | 2,520 | 62,791 | ||||||
Ashmore Group PLC | 22,060 | 97,674 | ||||||
AstraZeneca PLC | 1,260 | 77,474 | ||||||
BP PLC | 42,200 | 242,908 | ||||||
BT Group PLC | 25,450 | 101,625 | ||||||
Centrica PLC | 35,800 | 97,483 | ||||||
GlaxoSmithKline PLC | 10,540 | 219,157 | ||||||
HSBC Holdings PLC | 19,700 | 160,690 | ||||||
IG Group Holdings PLC | 12,459 | 77,659 | ||||||
Imperial Brands PLC | 5,030 | 243,772 | ||||||
Next PLC | 640 | 34,622 | ||||||
| Shares | Value | |||||||
Royal Dutch Shell PLC, Class A | 11,960 | $ | 314,887 | |||||
TP ICAP PLC | 5,704 | 33,196 | ||||||
Vodafone Group PLC | 40,930 | 106,663 | ||||||
|
| |||||||
| 1,870,601 | ||||||||
|
| |||||||
| Total Common Stock (cost—$6,359,498) | 6,544,127 | |||||||
|
| |||||||
| Principal Amount (000s) | ||||||||
| Repurchase Agreements—3.1% | ||||||||
State Street Bank and Trust Co., dated 3/31/17, 0.09%, due 4/3/17, proceeds $207,002; collateralized by U.S. Treasury Notes, 2.00%, due 11/15/26, valued at $213,709 including accrued interest |
| |||||||
(cost—$207,000) | $207 | 207,000 | ||||||
|
| |||||||
| Total Investments (cost—$6,566,498) (b)—100.5% | 6,751,127 | |||||||
|
| |||||||
| Liabilities in excess of other assets—(0.5)% | (31,226 | ) | ||||||
|
| |||||||
| Net Assets—100.0% | $6,719,901 | |||||||
|
| |||||||
Notes to Schedule of Investments:
(a) 144A—Exempt from registration under Rule 144A of the Securities Act of 1933. These securities may be resold in transactions exempt from registration, typically only to qualified institutional buyers. Securities with an aggregate value of $328,404, representing 4.9% of net assets.
(b) Securities with an aggregate value of $6,499,491, representing 96.7% of net assets, were valued utilizing modeling tools provided by a third-party vendor. See Note 1(a) and Note 1(b) in the Notes to Financial Statements.
(c) Non-income producing.
The industry classification of portfolio holdings and liabilities in excess of other assets shown as a percentage of net assets were as follows:
Oil, Gas & Consumable Fuels | 14.5% | |||
Insurance | 14.0% | |||
Banks | 10.3% | |||
Diversified Telecommunication Services | 9.6% | |||
Wireless Telecommunication Services | 8.0% | |||
Media | 7.1% | |||
Pharmaceuticals | 4.4% | |||
Air Freight & Logistics | 3.7% | |||
Tobacco | 3.6% | |||
Construction & Engineering | 3.3% | |||
Electric Utilities | 3.3% | |||
Capital Markets | 3.1% | |||
Transportation Infrastructure | 2.6% | |||
Chemicals | 2.3% | |||
Hotels, Restaurants & Leisure | 2.0% | |||
Automobiles | 1.8% | |||
Auto Components | 1.6% | |||
Multi-Utilities | 1.5% | |||
Multi-line Retail | 0.5% | |||
Communications Equipment | 0.2% | |||
Repurchase Agreements | 3.1% | |||
Liabilities in excess of other assets | (0.5)% | |||
|
| |||
| 100.0% | ||||
|
|
| See accompanying Notes to Financial Statements | | March 31, 2017 | | Semiannual Report | 165 |
Table of Contents
Schedule of Investments
March 31, 2017 (Unaudited)
AllianzGI Global Dynamic Allocation Fund
| Shares | Value | |||||||
| Common Stock—47.7% | ||||||||
| Argentina—0.0% | ||||||||
Grupo Financiero Galicia S.A. ADR | 1,335 | $50,543 | ||||||
|
| |||||||
| Australia—0.7% | ||||||||
Automotive Holdings Group Ltd. | 3,630 | 11,421 | ||||||
Bapcor Ltd. | 11,055 | 49,232 | ||||||
BlueScope Steel Ltd. | 14,980 | 140,433 | ||||||
Breville Group Ltd. | 1,323 | 10,441 | ||||||
Brickworks Ltd. | 2,030 | 22,770 | ||||||
Cochlear Ltd. | 655 | 67,663 | ||||||
CSR Ltd. | 21,445 | 73,852 | ||||||
Downer EDI Ltd. | 11,474 | 50,777 | ||||||
Evolution Mining Ltd. | 37,108 | 59,657 | ||||||
Fortescue Metals Group Ltd. | 15,366 | 73,191 | ||||||
Harvey Norman Holdings Ltd. | 30,937 | 107,005 | ||||||
Investa Office Fund REIT | 19,628 | 71,260 | ||||||
Macquarie Group Ltd. | 1,378 | 94,940 | ||||||
Metcash Ltd. (f) | 47,137 | 88,905 | ||||||
Myer Holdings Ltd. | 95,301 | 88,457 | ||||||
Northern Star Resources Ltd. | 18,273 | 56,799 | ||||||
Qantas Airways Ltd. | 12,671 | 37,656 | ||||||
Regis Resources Ltd. | 15,795 | 39,905 | ||||||
Retail Food Group Ltd. | 18,824 | 76,641 | ||||||
Saracen Mineral Holdings Ltd. (f) | 12,327 | 9,289 | ||||||
Southern Cross Media Group Ltd. | 37,800 | 40,410 | ||||||
St. Barbara Ltd. (f) | 16,786 | 30,578 | ||||||
Star Entertainment Group Ltd. | 13,271 | 55,448 | ||||||
Stockland REIT | 800 | 2,837 | ||||||
Tassal Group Ltd. | 13,323 | 46,107 | ||||||
Vicinity Centres REIT | 1,738 | 3,759 | ||||||
Wesfarmers Ltd. | 3,009 | 103,594 | ||||||
Westpac Banking Corp. | 3,245 | 86,746 | ||||||
WPP AUNZ Ltd. | 61,200 | 53,770 | ||||||
|
| |||||||
| 1,653,543 | ||||||||
|
| |||||||
| Austria—0.2% | ||||||||
BUWOG AG (f) | 3,484 | 87,797 | ||||||
Erste Group Bank AG (f) | 2,823 | 91,922 | ||||||
EVN AG | 4,031 | 51,394 | ||||||
Flughafen Wien AG | 322 | 10,166 | ||||||
OMV AG | 2,816 | 110,977 | ||||||
Porr AG | 1,204 | 44,724 | ||||||
Telekom Austria AG (f) | 921 | 6,276 | ||||||
Voestalpine AG | 1,604 | 63,083 | ||||||
|
| |||||||
| 466,339 | ||||||||
|
| |||||||
| Belgium—0.1% | ||||||||
D’ieteren S.A. | 1,070 | 50,066 | ||||||
Elia System Operator S.A. | 448 | 23,599 | ||||||
Groupe Bruxelles Lambert S.A. | 756 | 68,609 | ||||||
KBC Group NV | 1,521 | 100,832 | ||||||
Solvay S.A. | 775 | 94,558 | ||||||
Warehouses De Pauw CVA REIT | 311 | 28,920 | ||||||
|
| |||||||
| 366,584 | ||||||||
|
| |||||||
| Bermuda—0.0% | ||||||||
Genpact Ltd. | 1,410 | 34,911 | ||||||
Textainer Group Holdings Ltd. (f) | 963 | 14,734 | ||||||
|
| |||||||
| 49,645 | ||||||||
|
| |||||||
| Brazil—0.2% | ||||||||
Cia de Saneamento de Minas Gerais—COPASA | 3,300 | 46,592 | ||||||
JBS S.A. | 18,300 | 59,683 | ||||||
| Shares | Value | |||||||
MRV Engenharia e Participacoes S.A. | 4,500 | $ | 20,641 | |||||
Qualicorp S.A. | 34,800 | 229,547 | ||||||
Sao Martinho S.A. | 8,200 | 45,262 | ||||||
|
| |||||||
| 401,725 | ||||||||
|
| |||||||
| Canada—2.3% | ||||||||
Aecon Group, Inc. | 489 | 6,314 | ||||||
AG Growth International, Inc. | 322 | 12,245 | ||||||
Alimentation Couche-Tard, Inc., Class B | 1,450 | 65,508 | ||||||
Artis Real Estate Investment Trust REIT | 523 | 5,203 | ||||||
Atco Ltd., Class I | 2,338 | 90,911 | ||||||
Bank of Montreal | 4,893 | 365,471 | ||||||
Bank of Nova Scotia | 3,107 | 181,768 | ||||||
BCE, Inc. | 5,452 | 241,391 | ||||||
Bonavista Energy Corp. | 3,032 | 7,889 | ||||||
Canadian Imperial Bank of Commerce | 4,019 | 346,549 | ||||||
Canadian Real Estate Investment Trust REIT | 523 | 19,066 | ||||||
Canadian Tire Corp., Ltd., Class A | 2,414 | 286,772 | ||||||
Canfor Pulp Products, Inc. | 534 | 4,855 | ||||||
Cascades, Inc. | 1,386 | 14,289 | ||||||
Celestica, Inc. (f) | 3,763 | 54,725 | ||||||
CGI Group, Inc., Class A (f) | 1,734 | 83,085 | ||||||
Chorus Aviation, Inc. | 4,609 | 25,993 | ||||||
Cogeco Communications, Inc. | 3,146 | 168,082 | ||||||
Crescent Point Energy Corp. | 346 | 3,744 | ||||||
Dorel Industries, Inc., Class B | 291 | 6,941 | ||||||
ECN Capital Corp. | 1,240 | 3,347 | ||||||
Enercare, Inc. | 3,651 | 57,022 | ||||||
Exchange Income Corp. | 3,541 | 103,952 | ||||||
Fortis, Inc. | 4,150 | 137,527 | ||||||
Genworth MI Canada, Inc. | 2,539 | 70,203 | ||||||
George Weston Ltd. | 1,738 | 151,641 | ||||||
Great-West Lifeco, Inc. | 943 | 26,130 | ||||||
High Liner Foods, Inc. | 3,181 | 43,176 | ||||||
Intact Financial Corp. | 345 | 24,537 | ||||||
Intertape Polymer Group, Inc. | 2,706 | 47,574 | ||||||
Killam Apartment REIT | 761 | 7,256 | ||||||
Kirkland Lake Gold Ltd. (f) | 10,446 | 77,058 | ||||||
Laurentian Bank of Canada | 7,772 | 342,299 | ||||||
Linamar Corp. | 4,387 | 199,549 | ||||||
Loblaw Cos., Ltd. | 1,528 | 82,912 | ||||||
Lucara Diamond Corp. | 22,982 | 53,400 | ||||||
Magna International, Inc. | 1,835 | 79,190 | ||||||
Manulife Financial Corp. | 5,894 | 104,553 | ||||||
Martinrea International, Inc. | 1,349 | 10,469 | ||||||
Medical Facilities Corp. | 7,602 | 105,354 | ||||||
Metro, Inc. | 4,741 | 145,633 | ||||||
Milestone Apartments Real Estate Investment Trust | 2,736 | 44,398 | ||||||
National Bank of Canada | 2,379 | 99,893 | ||||||
NorthWest Healthcare Properties Real Estate Investment Trust | 1,343 | 10,654 | ||||||
Open Text Corp. | 930 | 31,610 | ||||||
Power Corp. of Canada | 2,594 | 60,937 | ||||||
Power Financial Corp. | 1,577 | 41,706 | ||||||
Pure Industrial Real Estate Trust | 8,947 | 40,972 | ||||||
Raging River Exploration, Inc. (f) | 990 | 6,946 | ||||||
Rogers Sugar, Inc. | 1,566 | 7,360 | ||||||
Royal Bank of Canada | 4,550 | 331,503 | ||||||
Saputo, Inc. | 1,980 | 68,325 | ||||||
Stantec, Inc. | 411 | 10,666 | ||||||
| Shares | Value | |||||||
Sun Life Financial, Inc. | 6,531 | $ | 238,482 | |||||
Tahoe Resources, Inc. | 4,836 | 38,838 | ||||||
TELUS Corp. | 331 | 10,745 | ||||||
TFI International, Inc. | 1,312 | 30,633 | ||||||
Toronto-Dominion Bank | 7,889 | 395,147 | ||||||
TransCanada Corp. | 4,147 | 191,376 | ||||||
Transcontinental, Inc., Class A | 10,902 | 201,505 | ||||||
Waste Connections, Inc. | 834 | 73,575 | ||||||
WestJet Airlines Ltd. | 5,761 | 98,771 | ||||||
|
| |||||||
| 5,897,625 | ||||||||
|
| |||||||
| Chile—0.1% | ||||||||
Cencosud S.A. | 36,395 | 111,528 | ||||||
Enel Chile S.A. | 1,543,401 | 170,742 | ||||||
|
| |||||||
| 282,270 | ||||||||
|
| |||||||
| China—2.0% | ||||||||
AAC Technologies Holdings, Inc. | 4,900 | 57,374 | ||||||
Agile Group Holdings Ltd. | 87,091 | 75,488 | ||||||
Agricultural Bank of China Ltd., Class H | 117,000 | 53,958 | ||||||
Air China Ltd., Class H | 70,347 | 56,960 | ||||||
Alibaba Group Holding Ltd. ADR (f) | 3,377 | 364,142 | ||||||
Bank of Chongqing Co., Ltd., Class H | 111,000 | 96,085 | ||||||
Bank of Communications Co., Ltd., Class H | 156,039 | 121,463 | ||||||
Beijing Enterprises Holdings Ltd. | 43,000 | 222,562 | ||||||
BYD Electronic International Co., Ltd. | 68,318 | 94,932 | ||||||
China Communications Construction Co., Ltd., Class H | 38,000 | 53,639 | ||||||
China Communications Services Corp., Ltd., Class H | 48,403 | 31,699 | ||||||
China Construction Bank Corp., Class H | 483,064 | 389,208 | ||||||
China Dongxiang Group Co., Ltd. | 43,117 | 8,270 | ||||||
China Evergrande Group | 25,483 | 23,628 | ||||||
China High Speed Transmission Equipment Group Co., Ltd. | �� | 25,120 | 28,422 | |||||
China Lumena New Materials Corp. (e)(f) | 1,772 | 34 | ||||||
China Merchants Bank Co., Ltd., Class H | 24,844 | 65,746 | ||||||
China Mobile Ltd. | 1,500 | 16,496 | ||||||
China Petroleum & Chemical Corp., Class H | 411,800 | 335,191 | ||||||
China Railway Construction Corp., Ltd., Class H | 37,516 | 53,237 | ||||||
China Southern Airlines Co., Ltd., Class H | 285,154 | 197,496 | ||||||
China Zhongwang Holdings Ltd. | 114,800 | 51,586 | ||||||
Chongqing Rural Commercial Bank Co., Ltd., Class H | 6,488 | 4,383 | ||||||
EVA Precision Industrial Holdings Ltd. | 20,236 | 3,258 | ||||||
Great Wall Motor Co., Ltd., Class H | 44,760 | 51,013 | ||||||
Guangzhou Automobile Group Co., Ltd., Class H | 213,435 | 341,839 | ||||||
| 166 | Semiannual Report | | March 31, 2017 | | See accompanying Notes to Financial Statements |
Table of Contents
Schedule of Investments
March 31, 2017 (Unaudited)
| Shares | Value | |||||||
Guangzhou R&F Properties Co., Ltd., Class H | 2,881 | $ | 4,501 | |||||
Industrial & Commercial Bank of China Ltd., Class H | 347,000 | 227,059 | ||||||
Jiangsu Expressway Co., Ltd., Class H | 5,189 | 7,454 | ||||||
Ju Teng International Holdings Ltd. | 4,744 | 1,947 | ||||||
KWG Property Holding Ltd. | 25,906 | 18,773 | ||||||
Lee & Man Paper Manufacturing Ltd. | 48,517 | 37,109 | ||||||
Longfor Properties Co., Ltd. | 10,845 | 17,854 | ||||||
Minth Group Ltd. | 7,315 | 29,495 | ||||||
NetEase, Inc. ADR | 1,318 | 374,312 | ||||||
Nexteer Automotive Group Ltd. | 39,000 | 57,556 | ||||||
Orient Securities Co., Ltd., Class H (b)(f) | 21,600 | 21,074 | ||||||
Postal Savings Bank of China Co., Ltd., Class H (b)(f) | 67,000 | 41,469 | ||||||
Pou Sheng International Holdings Ltd. | 303,000 | 63,570 | ||||||
Shanghai Pharmaceuticals Holding Co., Ltd., Class H | 39,111 | 102,456 | ||||||
Shenzhen Expressway Co., Ltd., Class H | 64,274 | 58,261 | ||||||
Sinopec Shanghai Petrochemical Co., Ltd., Class H | 133,380 | 74,026 | ||||||
Sinopharm Group Co., Ltd., Class H | 24,721 | 114,767 | ||||||
Skyworth Digital Holdings Ltd. | 145,152 | 95,696 | ||||||
Tencent Holdings Ltd. | 15,281 | 440,238 | ||||||
Tianneng Power International Ltd. | 78,342 | 71,219 | ||||||
Tong Ren Tang Technologies Co., Ltd., Class H | 2,726 | 4,842 | ||||||
Travelsky Technology Ltd., Class H | 47,000 | 111,055 | ||||||
XTEP International Holdings Ltd. | 7,651 | 3,013 | ||||||
Yum China Holdings, Inc. (f) | 2,047 | 55,678 | ||||||
Yuzhou Properties Co., Ltd. | 420,088 | 175,840 | ||||||
Zhejiang Expressway Co., Ltd., Class H | 24,230 | 31,694 | ||||||
|
| |||||||
| 5,039,067 | ||||||||
|
| |||||||
| Colombia—0.0% | ||||||||
Almacenes Exito S.A. | 9,400 | 50,090 | ||||||
Corp. Financiera Colombiana S.A. | 346 | 3,389 | ||||||
|
| |||||||
| 53,479 | ||||||||
|
| |||||||
| Czech Republic—0.0% | ||||||||
Moneta Money Bank AS (b)(f) | 20,485 | 69,389 | ||||||
O2 Czech Republic AS | 444 | 4,960 | ||||||
Philip Morris CR AS | 93 | 49,823 | ||||||
|
| |||||||
| 124,172 | ||||||||
|
| |||||||
| Denmark—0.2% | ||||||||
Danske Bank A/S | 5,620 | 191,619 | ||||||
Dfds A/S | 3,005 | 165,098 | ||||||
Matas A/S | 443 | 6,292 | ||||||
Schouw & Co. AB | 490 | 44,907 | ||||||
Solar A/S, Class B | 111 | 6,128 | ||||||
Spar Nord Bank A/S | 5,473 | 60,579 | ||||||
|
| |||||||
| 474,623 | ||||||||
|
| |||||||
| Finland—0.2% | ||||||||
Cramo Oyj | 1,938 | 44,202 | ||||||
Metsa Board Oyj | 429 | 2,651 | ||||||
| Shares | Value | |||||||
Neste Oyj | 1,826 | $ | 71,402 | |||||
Oriola KD Oyj, Class B | 700 | 2,967 | ||||||
Stora Enso Oyj, Class R | 8,051 | 95,196 | ||||||
UPM-Kymmene Oyj | 7,055 | 165,645 | ||||||
|
| |||||||
| 382,063 | ||||||||
|
| |||||||
| France—1.9% | ||||||||
Air France-KLM (f) | 16,636 | 125,843 | ||||||
Alten S.A. | 525 | 40,258 | ||||||
APERAM S.A. | 51 | 2,543 | ||||||
Arkema S.A. | 2,103 | 207,021 | ||||||
Atos SE | 3,127 | 386,436 | ||||||
AXA S.A. | 12,427 | 321,061 | ||||||
BNP Paribas S.A. | 3,090 | 205,621 | ||||||
Boiron S.A. | 31 | 2,831 | ||||||
Capgemini S.A. | 1,959 | 180,827 | ||||||
Cegereal S.A. REIT | 793 | 31,352 | ||||||
Cie Generale des Etablissements Michelin | 1,311 | 159,310 | ||||||
CNP Assurances | 5,248 | 106,720 | ||||||
Eiffage S.A. | 2,926 | 228,987 | ||||||
Faurecia | 2,499 | 118,649 | ||||||
IPSOS | 1,502 | 46,628 | ||||||
MGI Coutier | 1,628 | 56,444 | ||||||
Nexity S.A. (f) | 654 | 32,153 | ||||||
Orange S.A. | 16,230 | 251,980 | ||||||
Peugeot S.A. (f) | 7,269 | 146,089 | ||||||
Rallye S.A. | 2,470 | 50,012 | ||||||
Renault S.A. | 1,493 | 129,700 | ||||||
Rubis SCA | 40 | 3,916 | ||||||
Sanofi | 3,796 | 343,140 | ||||||
SCOR SE | 1,702 | 64,324 | ||||||
SEB S.A. | 425 | 59,363 | ||||||
Societe Generale S.A. | 2,975 | 150,729 | ||||||
Sodexo S.A. | 708 | 83,187 | ||||||
Teleperformance | 1,402 | 151,373 | ||||||
Thales S.A. | 1,754 | 169,429 | ||||||
Total S.A. | 13,008 | 657,729 | ||||||
Ubisoft Entertainment S.A. (f) | 112 | 4,777 | ||||||
Valeo S.A. | 2,236 | 148,743 | ||||||
Vinci S.A. | 2,692 | 213,768 | ||||||
|
| |||||||
| 4,880,943 | ||||||||
|
| |||||||
| Germany—1.2% | ||||||||
BASF SE | 1,386 | 137,233 | ||||||
Bayer AG | 3,334 | 384,122 | ||||||
Bayerische Motoren Werke AG | 1,321 | 120,530 | ||||||
Bechtle AG | 309 | 33,534 | ||||||
Daimler AG | 2,072 | 152,913 | ||||||
Deutsche Lufthansa AG | 7,343 | 119,124 | ||||||
Deutsche Post AG | 5,407 | 185,047 | ||||||
Deutsche Telekom AG | 6,842 | 119,890 | ||||||
Fresenius SE & Co. KGaA | 568 | 45,642 | ||||||
Hannover Rueck SE | 1,381 | 159,135 | ||||||
Indus Holding AG | 732 | 47,274 | ||||||
KION Group AG | 549 | 35,835 | ||||||
Merck KGaA | 829 | 94,467 | ||||||
METRO AG | 4,100 | 131,005 | ||||||
Muenchener Rueckversicherungs-Gesellschaft AG in Muenchen | 627 | 122,737 | ||||||
Rheinmetall AG | 734 | 61,535 | ||||||
Rhoen Klinikum AG | 883 | 24,086 | ||||||
Siemens AG | 3,801 | 520,631 | ||||||
Sixt SE | 37 | 1,905 | ||||||
Software AG | 1,386 | 54,752 | ||||||
STADA Arzneimittel AG | 1,575 | 96,464 | ||||||
Takkt AG | 2,084 | 48,344 | ||||||
Talanx AG (f) | 6,243 | 220,110 | ||||||
TLG Immobilien AG | 467 | 9,093 | ||||||
Uniper SE (f) | 6,923 | 116,352 | ||||||
| Shares | Value | |||||||
WCM Beteiligungs & Grundbesitz AG (f) | 1,866 | $ | 6,095 | |||||
|
| |||||||
| 3,047,855 | ||||||||
|
| |||||||
| Greece—0.1% | ||||||||
FF Group (f) | 4,956 | 94,671 | ||||||
JUMBO S.A. | 6,391 | 100,769 | ||||||
Motor Oil Hellas Corinth Refineries S.A. | 3,327 | 56,762 | ||||||
|
| |||||||
| 252,202 | ||||||||
|
| |||||||
| Hong Kong—0.3% | ||||||||
Cathay Pacific Airways Ltd. | 1,543 | 2,240 | ||||||
CK Hutchison Holdings Ltd. | 1,297 | 15,968 | ||||||
CLP Holdings Ltd. | 26,281 | 275,122 | ||||||
Dah Sing Banking Group Ltd. | 1,623 | 3,199 | ||||||
Dah Sing Financial Holdings Ltd. | 8,240 | 62,778 | ||||||
Fairwood Holdings Ltd. | 3,500 | 14,076 | ||||||
Hang Seng Bank Ltd. | 900 | 18,258 | ||||||
IT Ltd. | 114,000 | 49,436 | ||||||
Kerry Properties Ltd. | 1,243 | 4,311 | ||||||
Link REIT | 6,492 | 45,501 | ||||||
Swire Pacific Ltd., Class A | 5,156 | 51,536 | ||||||
WH Group Ltd. (b) | 221,500 | 191,004 | ||||||
Xinyi Glass Holdings Ltd. (f) | 92,292 | 81,293 | ||||||
Yue Yuen Industrial Holdings Ltd. | 698 | 2,743 | ||||||
|
| |||||||
| 817,465 | ||||||||
|
| |||||||
| Hungary—0.0% | ||||||||
Magyar Telekom Telecommunications PLC | 9,493 | 15,745 | ||||||
MOL Hungarian Oil & Gas PLC | 928 | 63,541 | ||||||
Richter Gedeon Nyrt | 1,358 | 30,842 | ||||||
|
| |||||||
| 110,128 | ||||||||
|
| |||||||
| India—0.1% | ||||||||
Tata Motors Ltd. ADR | 5,278 | 188,161 | ||||||
|
| |||||||
| Indonesia—0.3% | ||||||||
Bank Danamon Indonesia Tbk PT | 386,400 | 136,371 | ||||||
Bank Negara Indonesia Persero Tbk PT | 504,955 | 245,497 | ||||||
Indofood CBP Sukses Makmur Tbk PT | 118,982 | 72,774 | ||||||
Indofood Sukses Makmur Tbk PT | 115,479 | 69,344 | ||||||
Telekomunikasi Indonesia Persero Tbk PT | 1,121,606 | 348,646 | ||||||
|
| |||||||
| 872,632 | ||||||||
|
| |||||||
| Ireland—0.2% | ||||||||
Irish Residential Properties REIT PLC | 5,191 | 6,867 | ||||||
Medtronic PLC | 3,119 | 251,267 | ||||||
Origin Enterprises PLC | 2,219 | 15,773 | ||||||
Smurfit Kappa Group PLC | 4,238 | 111,987 | ||||||
|
| |||||||
| 385,894 | ||||||||
|
| |||||||
| Israel—0.2% | ||||||||
Bank Hapoalim BM | 13,914 | 84,794 | ||||||
Bank Leumi Le-Israel BM (f) | 7,134 | 31,495 | ||||||
El Al Israel Airlines | 64,772 | 47,705 | ||||||
Elbit Systems Ltd. | 285 | 32,599 | ||||||
Israel Corp., Ltd. (f) | 593 | 110,771 | ||||||
Mizrahi Tefahot Bank Ltd. | 3,079 | 52,188 | ||||||
Nice Ltd. | 1,504 | 102,101 | ||||||
|
| |||||||
| 461,653 | ||||||||
|
| |||||||
| See accompanying Notes to Financial Statements | | March 31, 2017 | | Semiannual Report | 167 |
Table of Contents
Schedule of Investments
March 31, 2017 (Unaudited)
| Shares | Value | |||||||
| Italy—0.4% | ||||||||
ACEA SpA | 3,887 | $ | 52,911 | |||||
Enav SpA (b)(f) | 13,576 | 55,143 | ||||||
Enel SpA | 32,176 | 151,403 | ||||||
Fila SpA | 543 | 9,558 | ||||||
Intesa Sanpaolo SpA | 54,722 | 148,850 | ||||||
Iren SpA | 30,861 | 64,067 | ||||||
Mediobanca SpA | 3,142 | 28,329 | ||||||
OVS SpA (b) | 9,099 | 56,494 | ||||||
Poste Italiane SpA (b) | 29,629 | 197,354 | ||||||
Recordati SpA | 4,274 | 144,855 | ||||||
Societa Iniziative Autostradali e Servizi SpA | 1,209 | 11,543 | ||||||
Unipol Gruppo Finanziario SpA | 15,252 | 62,979 | ||||||
|
| |||||||
| 983,486 | ||||||||
|
| |||||||
| Japan—3.2% | ||||||||
Adastria Co., Ltd. | 1,800 | 44,883 | ||||||
ADEKA Corp. | 26 | 380 | ||||||
Aida Engineering Ltd. | 142 | 1,263 | ||||||
Alpen Co., Ltd. | 385 | 6,706 | ||||||
ANA Holdings, Inc. | 39,457 | 120,679 | ||||||
Aoyama Trading Co., Ltd. | 911 | 31,329 | ||||||
Astellas Pharma, Inc. | 10,792 | 142,335 | ||||||
Bandai Namco Holdings, Inc. | 1,400 | 41,966 | ||||||
BML, Inc. | 1,795 | 39,666 | ||||||
Canon, Inc. | 1,410 | 44,032 | ||||||
Capcom Co., Ltd. | 1,948 | 38,200 | ||||||
Concordia Financial Group Ltd. | 15,486 | 71,795 | ||||||
Daiichi Sankyo Co., Ltd. | 3,047 | 68,744 | ||||||
Daito Pharmaceutical Co., Ltd. | 152 | 3,062 | ||||||
Daito Trust Construction Co., Ltd. | 1,105 | 151,934 | ||||||
Daiwa House Industry Co., Ltd. | 1,954 | 56,166 | ||||||
DCM Holdings Co., Ltd. | 3,825 | 35,367 | ||||||
Doshisha Co., Ltd. | 385 | 7,145 | ||||||
Doutor Nichires Holdings Co., Ltd. | 651 | 12,748 | ||||||
DTS Corp. | 399 | 10,004 | ||||||
DyDo Group Holdings, Inc. | 326 | 15,264 | ||||||
EDION Corp. | 1,673 | 15,425 | ||||||
Exedy Corp. | 174 | 4,984 | ||||||
Foster Electric Co., Ltd. | 2,400 | 41,198 | ||||||
Fuji Media Holdings, Inc. | 2,295 | 31,804 | ||||||
Fuji Oil Holdings, Inc. | 1,916 | 44,939 | ||||||
Fuji Soft, Inc. | 272 | 6,969 | ||||||
FUJIFILM Holdings Corp. | 2,921 | 114,497 | ||||||
Fukuyama Transporting Co., Ltd. | 2,726 | 16,358 | ||||||
Geo Holdings Corp. | 1,536 | 16,894 | ||||||
Hankyu Hanshin Holdings, Inc. | 1,670 | 54,494 | ||||||
Heiwa Corp. | 1,403 | 34,969 | ||||||
Hogy Medical Co., Ltd. | 139 | 8,755 | ||||||
Honeys Holdings Co., Ltd. | 39 | 390 | ||||||
Idemitsu Kosan Co., Ltd. | 3,171 | 110,380 | ||||||
Iida Group Holdings Co., Ltd. | 5,200 | 80,021 | ||||||
ITOCHU Corp. | 19,977 | 284,400 | ||||||
Japan Airlines Co., Ltd. | 7,237 | 229,774 | ||||||
Kagome Co., Ltd. | 1,800 | 46,873 | ||||||
Kajima Corp. | 11,000 | 71,952 | ||||||
Kato Sangyo Co., Ltd. | 146 | 3,760 | ||||||
KOMEDA Holdings Co., Ltd. (f) | 900 | 14,506 | ||||||
Kyowa Exeo Corp. | 2,900 | 42,102 | ||||||
LaSalle Logiport REIT | 24 | 22,239 | ||||||
Maeda Corp. | 10,943 | 97,020 | ||||||
Marubeni Corp. | 36,600 | 226,076 | ||||||
Matsumotokiyoshi Holdings Co., Ltd. | 1,214 | 57,831 | ||||||
| Shares | Value | |||||||
Mazda Motor Corp. | 12,300 | $ | 177,549 | |||||
Mitsubishi Chemical Holdings Corp. | 14,206 | 110,294 | ||||||
Mitsubishi Corp. | 12,200 | 264,405 | ||||||
Mitsubishi Gas Chemical Co., Inc. | 271 | 5,644 | ||||||
Mitsubishi Shokuhin Co., Ltd. | 259 | 8,047 | ||||||
Mitsubishi Tanabe Pharma Corp. | 6,286 | 131,246 | ||||||
Mitsubishi UFJ Financial Group, Inc. | 84,385 | 531,555 | ||||||
Mitsuboshi Belting Ltd. | 142 | 1,320 | ||||||
Mitsui & Co., Ltd. | 17,400 | 252,683 | ||||||
Mitsui Engineering & Shipbuilding Co., Ltd. | 34,000 | 52,784 | ||||||
Mizuho Financial Group, Inc. | 47,975 | 88,062 | ||||||
NEC Networks & System Integration Corp. | 765 | 14,817 | ||||||
Nichias Corp. | 1,396 | 14,059 | ||||||
Nifco, Inc. | 146 | 7,338 | ||||||
Nihon Unisys Ltd. | 2,921 | 39,969 | ||||||
Nippon Flour Mills Co., Ltd. | 898 | 13,293 | ||||||
Nippon Paper Industries Co., Ltd. | 5,672 | 102,101 | ||||||
NIPPON REIT Investment Corp. | 10 | 25,981 | ||||||
Nippon Telegraph & Telephone Corp. | 10,808 | 462,078 | ||||||
Nissan Motor Co., Ltd. | 31,459 | 303,340 | ||||||
Nisshin Oillio Group Ltd. | 1,462 | 8,336 | ||||||
Nomura Real Estate Holdings, Inc. | 3,157 | 50,380 | ||||||
NTT Data Corp. | 1,543 | 73,272 | ||||||
NTT DOCOMO, Inc. | 10,743 | 250,873 | ||||||
NuFlare Technology, Inc. | 900 | 54,787 | ||||||
Obayashi Corp. | 2,927 | 27,446 | ||||||
Okamura Corp. | 1,031 | 9,170 | ||||||
ORIX Corp. | 26,501 | 393,342 | ||||||
Pacific Industrial Co., Ltd. | 224 | 3,192 | ||||||
Paramount Bed Holdings Co., Ltd. | 1,331 | 53,486 | ||||||
Prima Meat Packers Ltd. | 1,462 | 6,473 | ||||||
Raito Kogyo Co., Ltd. | 10,626 | 108,280 | ||||||
Recruit Holdings Co., Ltd. | 1,300 | 66,489 | ||||||
Rengo Co., Ltd. | 7,871 | 45,592 | ||||||
Right On Co., Ltd. | 1,157 | 9,999 | ||||||
S Foods, Inc. | 972 | 28,284 | ||||||
Sakata INX Corp. | 898 | 12,393 | ||||||
Sanyo Chemical Industries Ltd. | 139 | 5,847 | ||||||
Sanyo Special Steel Co., Ltd. | 914 | 4,863 | ||||||
Sapporo Holdings Ltd. | 2,660 | 71,909 | ||||||
Sawai Pharmaceutical Co., Ltd. | 525 | 28,503 | ||||||
SCREEN Holdings Co., Ltd. | 1,211 | 89,360 | ||||||
Sekisui House Ltd. | 9,423 | 155,374 | ||||||
Senko Co., Ltd. | 1,796 | 11,597 | ||||||
Shiga Bank Ltd. | 1,396 | 7,164 | ||||||
SKY Perfect JSAT Holdings, Inc. | 10,000 | 42,404 | ||||||
Sojitz Corp. | 26,484 | 66,552 | ||||||
Sompo Holdings, Inc. | 2,185 | 80,273 | ||||||
Stella Chemifa Corp. | 911 | 26,002 | ||||||
Sumitomo Dainippon Pharma Co., Ltd. | 3,368 | 55,732 | ||||||
Sumitomo Forestry Co., Ltd. | 4,480 | 68,284 | ||||||
Sumitomo Mitsui Trust Holdings, Inc. | 2,385 | 82,645 | ||||||
Sumitomo Osaka Cement Co., Ltd. | 10,972 | 45,756 | ||||||
Taisho Pharmaceutical Holdings Co., Ltd. | 200 | 16,285 | ||||||
Takasago Thermal Engineering Co., Ltd. | 397 | 5,600 | ||||||
| Shares | Value | |||||||
Takeda Pharmaceutical Co., Ltd. | 1,543 | $ | 72,640 | |||||
Tokyo Electron Ltd. | 300 | 32,843 | ||||||
Tokyo Seimitsu Co., Ltd. | 1,600 | 50,520 | ||||||
Toppan Printing Co., Ltd. | 5,321 | 54,387 | ||||||
Toray Industries, Inc. | 3,726 | 33,162 | ||||||
Toshiba Plant Systems & Services Corp. | 2,000 | 29,272 | ||||||
Towa Pharmaceutical Co., Ltd. | 138 | 7,005 | ||||||
Toyo Construction Co., Ltd. | 911 | 3,275 | ||||||
Toyota Motor Corp. | 4,151 | 225,307 | ||||||
Tv Tokyo Holdings Corp. | 266 | 6,093 | ||||||
Ulvac, Inc. | 205 | 9,582 | ||||||
Unipres Corp. | 317 | 6,632 | ||||||
Wacoal Holdings Corp. | 1,396 | 17,246 | ||||||
West Japan Railway Co. | 2,666 | 173,859 | ||||||
Yokohama Rubber Co., Ltd. | 5,697 | 111,655 | ||||||
Yorozu Corp. | 259 | 3,989 | ||||||
Yoshinoya Holdings Co., Ltd. | 2,175 | 31,639 | ||||||
Yurtec Corp. | 132 | 909 | ||||||
|
| |||||||
| 8,164,802 | ||||||||
|
| |||||||
| Korea (Republic of)—1.4% | ||||||||
CJ Hellovision Co., Ltd. | 889 | 8,071 | ||||||
Daekyo Co., Ltd. | 777 | 5,593 | ||||||
Easy Bio, Inc. | 2,176 | 11,767 | ||||||
Hankook Tire Co., Ltd. | 1,763 | 85,981 | ||||||
Hansol Paper Co., Ltd. | 477 | 8,126 | ||||||
Hanwha Chemical Corp. | 8,699 | 205,490 | ||||||
Hyosung Corp. | 492 | 59,621 | ||||||
Hyundai Engineering Plastics Co., Ltd. | 864 | 6,520 | ||||||
Hyundai Mipo Dockyard Co., Ltd. (f) | 593 | 47,037 | ||||||
Hyundai Motor Co. | 668 | 94,142 | ||||||
KB Financial Group, Inc. | 3,536 | 154,970 | ||||||
KB Insurance Co., Ltd. | 1,483 | 35,799 | ||||||
KC Tech Co., Ltd. | 174 | 2,140 | ||||||
Kia Motors Corp. | 3,057 | 101,317 | ||||||
Korea Electric Power Corp. | 3,246 | 135,116 | ||||||
Korea Gas Corp. (f) | 684 | 27,527 | ||||||
Korea Petrochemical Ind Co., Ltd. | 502 | 110,013 | ||||||
KT Corp. | 221 | 6,308 | ||||||
KT&G Corp. | 2,293 | 199,917 | ||||||
Kukdo Chemical Co., Ltd. | 130 | 5,728 | ||||||
LG Corp. | 1,456 | 91,456 | ||||||
LG Display Co., Ltd. | 1,180 | 31,955 | ||||||
LG Electronics, Inc. | 1,262 | 76,666 | ||||||
Lotte Chemical Corp. | 245 | 81,186 | ||||||
LS Corp. | 2,109 | 121,105 | ||||||
Macquarie Korea Infrastructure Fund | 3,073 | 22,863 | ||||||
POSCO | 1,041 | 270,375 | ||||||
S-Oil Corp. | 1,302 | 117,069 | ||||||
Samjin Pharmaceutical Co., Ltd. | 530 | 15,380 | ||||||
Samsung Electronics Co., Ltd. | 70 | 128,829 | ||||||
Samsung Electronics Co., Ltd. GDR | 857 | 786,297 | ||||||
Samyang Holdings Corp. | 89 | 9,829 | ||||||
SK Innovation Co., Ltd. | 1,680 | 250,332 | ||||||
Tongyang Life Insurance Co., Ltd. | 3,423 | 31,353 | ||||||
Ubiquoss Holdings, Inc. | 442 | 2,845 | ||||||
Ubiquoss, Inc. (f) | 140 | 3,061 | ||||||
Woori Bank (f) | 7,482 | 86,919 | ||||||
|
| |||||||
| 3,438,703 | ||||||||
|
| |||||||
| Luxembourg—0.0% | ||||||||
RTL Group S.A. | 698 | 56,161 | ||||||
|
| |||||||
| 168 | Semiannual Report | | March 31, 2017 | | See accompanying Notes to Financial Statements |
Table of Contents
Schedule of Investments
March 31, 2017 (Unaudited)
| Shares | Value | |||||||
| Malaysia—0.2% | ||||||||
AirAsia Bhd. | 154,400 | $ | 109,540 | |||||
CIMB Group Holdings Bhd. | 99,200 | 124,850 | ||||||
KNM Group Bhd. (f) | 31,700 | 2,149 | ||||||
Maxis Bhd. | 3,200 | 4,656 | ||||||
MISC Bhd. | 43,900 | 72,570 | ||||||
Supermax Corp. Bhd. | 20,100 | 9,044 | ||||||
Tenaga Nasional Bhd. | 82,500 | 255,672 | ||||||
|
| |||||||
| 578,481 | ||||||||
|
| |||||||
| Mexico—0.1% | ||||||||
Alfa S.A.B de C.V., Class A | 32,519 | 47,505 | ||||||
Grupo Aeroportuario del Pacifico S.A.B de C.V. ADR | 47 | 4,564 | ||||||
Grupo Lala S.A.B de C.V. | 4,496 | 8,160 | ||||||
Industrias Bachoco S.A.B de C.V. ADR | 2,004 | 108,376 | ||||||
|
| |||||||
| 168,605 | ||||||||
|
| |||||||
| Morocco—0.0% | ||||||||
Douja Promotion Groupe Addoha S.A. | 14,722 | 63,022 | ||||||
Maroc Telecom | 747 | 10,204 | ||||||
|
| |||||||
| 73,226 | ||||||||
|
| |||||||
| Netherlands—0.4% | ||||||||
Accell Group | 2,086 | 57,080 | ||||||
AerCap Holdings NV (f) | 2,762 | 126,969 | ||||||
ASR Nederland NV (f) | 4,064 | 115,839 | ||||||
BE Semiconductor Industries NV | 1,392 | 56,715 | ||||||
ING Groep NV | 22,635 | 341,885 | ||||||
Koninklijke Ahold Delhaize NV (f) | 3,620 | 77,359 | ||||||
NN Group NV | 4,438 | 144,133 | ||||||
Philips Lighting NV (b)(f) | 1,865 | 53,341 | ||||||
Vastned Retail NV REIT | 232 | 8,774 | ||||||
|
| |||||||
| 982,095 | ||||||||
|
| |||||||
| New Zealand—0.2% | ||||||||
Air New Zealand Ltd. | 96,568 | 166,528 | ||||||
Arvida Group Ltd. | 9,216 | 8,201 | ||||||
Auckland International Airport Ltd. | 11,498 | 54,444 | ||||||
Fonterra Co-operative Group Ltd. UNIT | 2,607 | 11,075 | ||||||
Kiwi Property Group Ltd. | 1,458 | 1,456 | ||||||
Metlifecare Ltd. | 25,550 | 109,745 | ||||||
Summerset Group Holdings Ltd. | 20,375 | 73,832 | ||||||
Tourism Holdings Ltd. | 3,164 | 8,317 | ||||||
|
| |||||||
| 433,598 | ||||||||
|
| |||||||
| Norway—0.3% | ||||||||
Austevoll Seafood ASA | 5,188 | 38,082 | ||||||
Avance Gas Holding Ltd. (b) | 97 | 319 | ||||||
Bakkafrost P/F | 2,733 | 84,534 | ||||||
Gjensidige Forsikring ASA | 1,492 | 22,729 | ||||||
Leroy Seafood Group ASA | 627 | 27,459 | ||||||
Marine Harvest ASA (f) | 5,368 | 81,885 | ||||||
Orkla ASA | 28,110 | 251,812 | ||||||
Salmar ASA | 4,015 | 86,579 | ||||||
Sparebank 1 Nord Norge | 7,721 | 49,683 | ||||||
SpareBank 1 SMN | 10,672 | 82,654 | ||||||
Stolt-Nielsen Ltd. | 2,374 | 40,368 | ||||||
Telenor ASA | 195 | 3,244 | ||||||
Veidekke ASA | 3,203 | 42,199 | ||||||
|
| |||||||
| 811,547 | ||||||||
|
| |||||||
| Peru—0.0% | ||||||||
Cia de Minas Buenaventura SAA ADR | 9,681 | 116,559 | ||||||
|
| |||||||
| Philippines—0.1% | ||||||||
Aboitiz Equity Ventures, Inc. | 4,940 | 7,330 | ||||||
BDO Unibank, Inc. | 3,040 | 7,125 | ||||||
| Shares | Value | |||||||
Globe Telecom, Inc. | 1,025 | $ | 41,511 | |||||
Security Bank Corp. | 23,930 | 96,324 | ||||||
|
| |||||||
| 152,290 | ||||||||
|
| |||||||
| Poland—0.0% | ||||||||
Asseco Poland S.A. | 501 | 6,860 | ||||||
Ciech S.A. | 570 | 11,498 | ||||||
Polski Koncern Naftowy Orlen S.A. | 2,278 | 57,456 | ||||||
|
| |||||||
| 75,814 | ||||||||
|
| |||||||
| Portugal—0.0% | ||||||||
Jeronimo Martins SGPS S.A. | 2,169 | 38,758 | ||||||
|
| |||||||
| Russian Federation—0.0% | ||||||||
Magnitogorsk Iron & Steel OJSC GDR | 7,225 | 61,485 | ||||||
PhosAgro PJSC GDR | 1,266 | 18,483 | ||||||
Sistema PJSC FC GDR | 3,465 | 31,012 | ||||||
Surgutneftegas OJSC ADR | 669 | 3,433 | ||||||
|
| |||||||
| 114,413 | ||||||||
|
| |||||||
| Singapore—0.4% | ||||||||
Accordia Golf Trust UNIT | 224,900 | 118,170 | ||||||
BOC Aviation Ltd. (b) | 5,400 | 28,810 | ||||||
DBS Group Holdings Ltd. | 17,600 | 243,793 | ||||||
Fortune Real Estate Investment Trust REIT | 11,000 | 12,318 | ||||||
Frasers Logistics & Industrial Trust REIT | 37,400 | 26,334 | ||||||
Japfa Ltd. | 132,600 | 77,222 | ||||||
Jardine Cycle & Carriage Ltd. | 3,600 | 112,759 | ||||||
Keppel DC REIT | 13,600 | 11,666 | ||||||
Mapletree Industrial Trust REIT | 9,000 | 11,452 | ||||||
QAF Ltd. | 50,100 | 49,962 | ||||||
SATS Ltd. | 22,000 | 76,749 | ||||||
Sheng Siong Group Ltd. | 23,700 | 16,010 | ||||||
Singapore Airlines Ltd. | 27,000 | 194,357 | ||||||
Sino Grandness Food Industry Group Ltd. | 25,900 | 4,442 | ||||||
Venture Corp., Ltd. | 6,700 | 54,937 | ||||||
|
| |||||||
| 1,038,981 | ||||||||
|
| |||||||
| South Africa—0.2% | ||||||||
Gold Fields Ltd. | 28,723 | 100,089 | ||||||
Harmony Gold Mining Co., Ltd. | 9,724 | 23,615 | ||||||
Murray & Roberts Holdings Ltd. | 57,481 | 65,980 | ||||||
Sappi Ltd. | 14,965 | 101,375 | ||||||
Sibanye Gold Ltd. ADR | 7,122 | 62,745 | ||||||
SPAR Group Ltd. | 2,283 | 29,619 | ||||||
Super Group Ltd. (f) | 14,549 | 38,595 | ||||||
Tsogo Sun Holdings Ltd. | 8,257 | 16,964 | ||||||
|
| |||||||
| 438,982 | ||||||||
|
| |||||||
| Spain—0.4% | ||||||||
ACS Actividades de Construccion y Servicios S.A. | 3,959 | 134,577 | ||||||
Amadeus IT Group S.A. | 3,472 | 175,921 | ||||||
Axiare Patrimonio SOCIMI S.A. REIT | 221 | 3,298 | ||||||
Bankinter S.A. | 13,602 | 114,055 | ||||||
Ebro Foods S.A. | 4,741 | 95,796 | ||||||
Faes Farma S.A. | 13,210 | 47,087 | ||||||
International Consolidated Airlines Group S.A. | 17,977 | 119,140 | ||||||
Lar Espana Real Estate Socimi S.A. REIT | 137 | 1,055 | ||||||
Repsol S.A. | 14,752 | 228,551 | ||||||
Telefonica S.A. | 18,951 | 212,125 | ||||||
|
| |||||||
| 1,131,605 | ||||||||
|
| |||||||
| Shares | Value | |||||||
| Sweden—0.3% | ||||||||
Bilia AB Class A | 3,787 | $ | 78,137 | |||||
BillerudKorsnas AB | 199 | 3,207 | ||||||
Bure Equity AB | 4,293 | 46,914 | ||||||
Castellum AB | 6,718 | 89,044 | ||||||
Cloetta AB, Class B | 2,397 | 9,470 | ||||||
Granges AB | 4,908 | 44,856 | ||||||
Holmen AB, Class B | 2,215 | 86,180 | ||||||
Humana AB (f) | 11,979 | 96,921 | ||||||
Klovern AB, Class B | 45,445 | 45,233 | ||||||
Loomis AB, Class B | 1,195 | 37,786 | ||||||
Peab AB | 211 | 2,013 | ||||||
Scandic Hotels Group AB (b)(f) | 5,709 | 60,056 | ||||||
Svenska Cellulosa AB SCA, Class B | 2,664 | 85,851 | ||||||
|
| |||||||
| 685,668 | ||||||||
|
| |||||||
| Switzerland—0.6% | ||||||||
Bachem Holding AG, Class B | 326 | 38,572 | ||||||
Baloise Holding AG | 473 | 64,996 | ||||||
Banque Cantonale Vaudoise | 29 | 20,007 | ||||||
Bell AG | 220 | 91,147 | ||||||
BKW AG | 2,086 | 112,771 | ||||||
Bobst Group S.A. | 1,436 | 132,343 | ||||||
Cembra Money Bank AG (f) | 50 | 4,134 | ||||||
Emmi AG (f) | 21 | 14,303 | ||||||
Garmin Ltd. | 1,401 | 71,605 | ||||||
Georg Fischer AG | 157 | 142,745 | ||||||
Intershop Holding AG | 17 | 8,452 | ||||||
Komax Holding AG | 100 | 24,310 | ||||||
Kudelski S.A. | 3,234 | 52,926 | ||||||
Lonza Group AG (f) | 656 | 123,998 | ||||||
Nestle S.A. | 1,053 | 80,820 | ||||||
Partners Group Holding AG | 147 | 79,000 | ||||||
Schweiter Technologies AG | 8 | 8,873 | ||||||
Siegfried Holding AG (f) | 47 | 12,375 | ||||||
Swiss Life Holding AG (f) | 226 | 72,877 | ||||||
Swiss Prime Site AG (f) | 1,061 | 93,419 | ||||||
Swiss Re AG | 2,638 | 236,935 | ||||||
Valora Holding AG | 75 | 25,926 | ||||||
|
| |||||||
| 1,512,534 | ||||||||
|
| |||||||
| Taiwan—0.9% | ||||||||
Accton Technology Corp. | 28,000 | 61,736 | ||||||
Arcadyan Technology Corp. | 9,000 | 17,944 | ||||||
Asia Vital Components Co., Ltd. | 12,000 | 10,344 | ||||||
Chang Hwa Commercial Bank Ltd. | 14,000 | 8,532 | ||||||
Cheng Uei Precision Industry Co., Ltd. | 5,000 | 6,475 | ||||||
Chin-Poon Industrial Co., Ltd. | 7,000 | 14,235 | ||||||
China Airlines Ltd. | 56,000 | 19,469 | ||||||
China Metal Products | 8,000 | 8,185 | ||||||
China Motor Corp. | 10,000 | 9,163 | ||||||
Chunghwa Telecom Co., Ltd. | 69,000 | 234,316 | ||||||
Compeq Manufacturing Co., Ltd. | 154,000 | 111,376 | ||||||
Elite Material Co., Ltd. | 15,000 | 58,331 | ||||||
Eva Airways Corp. | 102,000 | 54,119 | ||||||
Farglory Land Development Co., Ltd. | 18,000 | 24,350 | ||||||
First Financial Holding Co., Ltd. | 108,000 | 65,848 | ||||||
Formosa Petrochemical Corp. | 41,000 | 143,214 | ||||||
Formosa Plastics Corp. | 9,000 | 26,838 | ||||||
Getac Technology Corp. | 18,000 | 25,863 | ||||||
Gintech Energy Corp. (f) | 6,000 | 3,500 | ||||||
Grape King Bio Ltd. | 2,000 | 12,583 | ||||||
Hon Hai Precision Industry Co., Ltd. | 60,000 | 179,945 | ||||||
| See accompanying Notes to Financial Statements | | March 31, 2017 | | Semiannual Report | 169 |
Table of Contents
Schedule of Investments
March 31, 2017 (Unaudited)
| Shares | Value | |||||||
Hua Nan Financial Holdings Co., Ltd. | 16,000 | $ | 8,937 | |||||
King Yuan Electronics Co., Ltd. | 28,000 | 25,840 | ||||||
Kinsus Interconnect Technology Corp. | 6,000 | 15,858 | ||||||
Lite-On Technology Corp. | 39,000 | 67,223 | ||||||
Micro-Star International Co., Ltd. | 41,000 | 95,412 | ||||||
Powertech Technology, Inc. | 52,000 | 151,323 | ||||||
Sercomm Corp. | 11,000 | 27,557 | ||||||
Shin Zu Shing Co., Ltd. | 3,000 | 8,482 | ||||||
Sinbon Electronics Co., Ltd. | 13,000 | 31,923 | ||||||
Sitronix Technology Corp. | 3,000 | 9,748 | ||||||
Taiwan Business Bank | 79,000 | 21,869 | ||||||
Taiwan Hon Chuan Enterprise Co., Ltd. | 5,000 | 9,688 | ||||||
Taiwan Semiconductor Manufacturing Co., Ltd. | 98,000 | 614,522 | ||||||
TXC Corp. | 15,000 | 21,456 | ||||||
Wistron NeWeb Corp. | 5,000 | 14,057 | ||||||
WT Microelectronics Co., Ltd. | 6,000 | 8,772 | ||||||
Yageo Corp. | 3,000 | 8,177 | ||||||
|
| |||||||
| 2,237,210 | ||||||||
|
| |||||||
| Thailand—0.3% | ||||||||
Bangkok Bank PCL | 31,800 | 169,552 | ||||||
Charoen Pokphand Foods PCL (e) | 72,000 | 58,151 | ||||||
IRPC PCL (e) | 182,300 | 27,324 | ||||||
Kiatnakin Bank PCL (e) | 56,200 | 113,688 | ||||||
PTT Global Chemical PCL (e) | 47,100 | 100,395 | ||||||
Siam Cement PCL | 14,100 | 221,560 | ||||||
Sri Trang Agro-Industry PCL (e) | 8,200 | 4,581 | ||||||
Thai Oil PCL (e) | 14,800 | 32,521 | ||||||
|
| |||||||
| 727,772 | ||||||||
|
| |||||||
| Turkey—0.3% | ||||||||
Akbank TAS | 47,358 | 111,189 | ||||||
Arcelik AS | 16,508 | 102,986 | ||||||
Cimsa Cimento Sanayi VE Ticaret AS | 5,739 | 24,404 | ||||||
Dogus Otomotiv Servis ve Ticaret AS | 909 | 2,114 | ||||||
Emlak Konut Gayrimenkul Yatirim Ortakligi AS REIT | 125,337 | 100,011 | ||||||
Eregli Demir ve Celik Fabrikalari TAS | 39,100 | 63,495 | ||||||
Haci Omer Sabanci Holding AS | 31,564 | 86,844 | ||||||
Tekfen Holding AS | 25,570 | 60,854 | ||||||
Tofas Turk Otomobil Fabrikasi AS | 3,185 | 23,864 | ||||||
Tupras Turkiye Petrol Rafinerileri AS | 58 | 1,441 | ||||||
Turk Hava Yollari AO (f) | 38,508 | 57,962 | ||||||
Turkiye Vakiflar Bankasi Tao | 39,830 | 58,768 | ||||||
|
| |||||||
| 693,932 | ||||||||
|
| |||||||
| United Kingdom—2.6% | ||||||||
3i Group PLC | 10,440 | 98,022 | ||||||
Anglo American PLC (f) | 17,044 | 260,415 | ||||||
Ashtead Group PLC | 1,876 | 38,832 | ||||||
Assura PLC REIT | 9,065 | 6,570 | ||||||
Beazley PLC | 4,784 | 25,617 | ||||||
Bellway PLC | 2,973 | 100,733 | ||||||
Berkeley Group Holdings PLC | 1,337 | 53,760 | ||||||
British American Tobacco PLC | 9,724 | 645,149 | ||||||
Burford Capital Ltd. | 1,427 | 13,767 | ||||||
Carillion PLC | 16,780 | 46,813 | ||||||
| Shares | Value | |||||||
Carnival PLC | 4,124 | $ | 236,378 | |||||
Centamin PLC | 16,504 | 35,703 | ||||||
Compass Group PLC | 20,328 | 383,797 | ||||||
Diageo PLC | 8,860 | 253,708 | ||||||
DS Smith PLC | 16,448 | 89,485 | ||||||
easyJet PLC | 6,546 | 84,160 | ||||||
Firstgroup PLC (f) | 69,732 | 115,352 | ||||||
Galliford Try PLC | 4,258 | 78,647 | ||||||
Gamma Communications PLC | 2,555 | 15,718 | ||||||
GlaxoSmithKline PLC | 18,528 | 385,252 | ||||||
Greene King PLC | 4,624 | 40,590 | ||||||
Greggs PLC | 3,400 | 44,409 | ||||||
Hostelworld Group PLC (b) | 17,215 | 52,412 | ||||||
HSBC Holdings PLC | 4,245 | 34,626 | ||||||
IG Group Holdings PLC | 7,761 | 48,375 | ||||||
Imperial Brands PLC | 8,367 | 405,495 | ||||||
Informa PLC | 20,221 | 165,283 | ||||||
Intermediate Capital Group PLC | 4,082 | 36,159 | ||||||
International Game Technology PLC | 2,490 | 59,013 | ||||||
Interserve PLC | 5,740 | 16,001 | ||||||
J Sainsbury PLC | 28,329 | 93,831 | ||||||
Johnson Service Group PLC | 5,867 | 8,692 | ||||||
Keller Group PLC | 10,963 | 124,847 | ||||||
Marston’s PLC | 5,162 | 8,683 | ||||||
Micro Focus International PLC | 175 | 4,992 | ||||||
Mitie Group PLC | 29,603 | 82,302 | ||||||
National Express Group PLC | 31,785 | 143,364 | ||||||
Northgate PLC | 9,796 | 67,504 | ||||||
Novae Group PLC | 676 | 5,357 | ||||||
Paragon Group of Cos. PLC | 5,161 | 27,016 | ||||||
Pendragon PLC | 123,307 | 54,072 | ||||||
Plus500 Ltd. | 10,817 | 56,921 | ||||||
Primary Health Properties PLC REIT | 4,727 | 6,544 | ||||||
RELX PLC | 7,537 | 147,561 | ||||||
Royal Dutch Shell PLC, Class A | 9,190 | 241,958 | ||||||
Royal Dutch Shell PLC, Class B | 25,148 | 691,304 | ||||||
Royal Mail PLC | 12,103 | 64,461 | ||||||
RSA Insurance Group PLC | 2,453 | 18,015 | ||||||
Shire PLC | 4,418 | 257,424 | ||||||
Tate & Lyle PLC | 12,907 | 123,683 | ||||||
Taylor Wimpey PLC | 40,190 | 97,211 | ||||||
Trinity Mirror PLC | 3,803 | 5,493 | ||||||
Virgin Money Holdings UK PLC | 906 | 3,639 | ||||||
Wizz Air Holdings PLC (b)(f) | 349 | 7,165 | ||||||
WPP PLC | 16,147 | 353,927 | ||||||
|
| |||||||
| 6,566,207 | ||||||||
|
| |||||||
| United States—25.1% | ||||||||
AbbVie, Inc. | 8,846 | 576,405 | ||||||
Accenture PLC, Class A | 1,230 | 147,452 | ||||||
ACCO Brands Corp. (f) | 5,102 | 67,091 | ||||||
Activision Blizzard, Inc. | 12,557 | 626,092 | ||||||
Adeptus Health, Inc., Class A (f) | 107 | 193 | ||||||
Advanced Energy Industries, Inc. (f) | 1,225 | 83,986 | ||||||
Aetna, Inc. | 2,957 | 377,165 | ||||||
Aflac, Inc. | 3,899 | 282,366 | ||||||
AG Mortgage Investment Trust, Inc. REIT | 5,201 | 93,878 | ||||||
AGNC Investment Corp. REIT | 11,764 | 233,986 | ||||||
Agree Realty Corp. REIT | 822 | 39,423 | ||||||
Air Lease Corp. | 2,180 | 84,475 | ||||||
Air Methods Corp. (f) | 163 | 7,009 | ||||||
Aircastle Ltd. | 3,379 | 81,535 | ||||||
Alaska Air Group, Inc. | 3,361 | 309,951 | ||||||
| Shares | Value | |||||||
Alere, Inc. (f) | 968 | $ | 38,459 | |||||
Align Technology, Inc. (f) | 595 | 68,252 | ||||||
Allscripts Healthcare Solutions, Inc. (f) | 8,992 | 114,019 | ||||||
Allstate Corp. | 964 | 78,556 | ||||||
Ally Financial, Inc. | 3,701 | 75,241 | ||||||
Alphabet, Inc., Class A (f) | 691 | 585,830 | ||||||
Alphabet, Inc., Class C (f) | 692 | 574,056 | ||||||
Altria Group, Inc. | 12,996 | 928,174 | ||||||
AMAG Pharmaceuticals, Inc. (f) | 2,642 | 59,577 | ||||||
Amazon.com, Inc. (f) | 605 | 536,357 | ||||||
Amdocs Ltd. | 4,023 | 245,363 | ||||||
Ameren Corp. | 654 | 35,702 | ||||||
American Eagle Outfitters, Inc. | 4,467 | 62,672 | ||||||
American Electric Power Co., Inc. | 3,805 | 255,430 | ||||||
American Financial Group, Inc. | 2,994 | 285,687 | ||||||
American Outdoor Brands Corp. (f) | 2,116 | 41,918 | ||||||
American Public Education, Inc. (f) | 293 | 6,710 | ||||||
AmerisourceBergen Corp. | 3,606 | 319,131 | ||||||
Amgen, Inc. | 4,613 | 756,855 | ||||||
AMN Healthcare Services, Inc. (f) | 1,419 | 57,611 | ||||||
AngioDynamics, Inc. (f) | 1,997 | 34,648 | ||||||
Annaly Capital Management, Inc. REIT | 28,707 | 318,935 | ||||||
Anthem, Inc. | 2,068 | 342,006 | ||||||
Anworth Mortgage Asset Corp. REIT | 9,736 | 54,035 | ||||||
AO Smith Corp. | 162 | 8,288 | ||||||
Apollo Commercial Real Estate Finance, Inc. REIT | 4,976 | 93,599 | ||||||
Apollo Investment Corp. | 906 | 5,943 | ||||||
Apple, Inc. | 7,430 | 1,067,394 | ||||||
Applied Materials, Inc. | 8,216 | 319,602 | ||||||
Archer-Daniels-Midland Co. | 5,473 | 251,977 | ||||||
Ares Commercial Real Estate Corp. REIT | 4,087 | 54,684 | ||||||
ARMOUR Residential REIT, Inc. | 3,264 | 74,125 | ||||||
Arrow Electronics, Inc. (f) | 1,380 | 101,306 | ||||||
Aspen Insurance Holdings Ltd. | 1,802 | 93,794 | ||||||
AT&T, Inc. | 30,527 | 1,268,397 | ||||||
Atmos Energy Corp. | 836 | 66,036 | ||||||
Atwood Oceanics, Inc. (f) | 489 | 4,660 | ||||||
Automatic Data Processing, Inc. | 2,037 | 208,568 | ||||||
AutoZone, Inc. (f) | 238 | 172,086 | ||||||
AvalonBay Communities, Inc. REIT | 185 | 33,966 | ||||||
Avery Dennison Corp. | 113 | 9,108 | ||||||
AVX Corp. | 1,003 | 16,429 | ||||||
Axis Capital Holdings Ltd. | 2,004 | 134,328 | ||||||
Banc of California, Inc. | 3,329 | 68,910 | ||||||
Bank of America Corp. | 13,501 | 318,489 | ||||||
Baxter International, Inc. | 6,557 | 340,046 | ||||||
Becton Dickinson and Co. | 1,115 | 204,536 | ||||||
Bemis Co., Inc. | 10 | 489 | ||||||
Berkshire Hathaway, Inc., Class B (f) | 2,448 | 408,033 | ||||||
BGC Partners, Inc., Class A | 10,900 | 123,824 | ||||||
Big Lots, Inc. | 1,054 | 51,309 | ||||||
Blackstone Mortgage Trust, Inc., Class A REIT | 1,589 | 49,195 | ||||||
Booz Allen Hamilton Holding Corp. | 2,779 | 98,349 | ||||||
Boston Scientific Corp. (f) | 7,645 | 190,131 | ||||||
Briggs & Stratton Corp. | 1,364 | 30,622 | ||||||
| 170 | Semiannual Report | | March 31, 2017 | | See accompanying Notes to Financial Statements |
Table of Contents
Schedule of Investments
March 31, 2017 (Unaudited)
| Shares | Value | |||||||
Brixmor Property Group, Inc. REIT | 256 | $ | 5,494 | |||||
Broadcom Ltd. | 2,378 | 520,687 | ||||||
Brocade Communications Systems, Inc. | 17,462 | 217,926 | ||||||
Builders FirstSource, Inc. (f) | 442 | 6,586 | ||||||
CA, Inc. | 7,679 | 243,578 | ||||||
CACI International, Inc., Class A (f) | 537 | 62,990 | ||||||
Cadence Design Systems, Inc. (f) | 364 | 11,430 | ||||||
Cambrex Corp. (f) | 115 | 6,331 | ||||||
Capital One Financial Corp. | 1,383 | 119,851 | ||||||
Capitol Federal Financial, Inc. | 2,995 | 43,817 | ||||||
Capstead Mortgage Corp. REIT | 3,269 | 34,455 | ||||||
Cardinal Health, Inc. | 1,118 | 91,173 | ||||||
CareTrust REIT, Inc. | 2,720 | 45,750 | ||||||
Carlisle Cos., Inc. | 1,632 | 173,661 | ||||||
Carriage Services, Inc. | 425 | 11,526 | ||||||
Cavium, Inc. (f) | 83 | 5,948 | ||||||
CDW Corp. | 1,867 | 107,745 | ||||||
Centene Corp. (f) | 672 | 47,887 | ||||||
CenterPoint Energy, Inc. | 3,786 | 104,380 | ||||||
CenterState Banks, Inc. | 2,053 | 53,173 | ||||||
Central Garden & Pet Co., Class A (f) | 823 | 28,575 | ||||||
CenturyLink, Inc. | 8,021 | 189,055 | ||||||
Charles River Laboratories International, Inc. (f) | 958 | 86,172 | ||||||
Chemical Financial Corp. | 1,161 | 59,385 | ||||||
Chevron Corp. | 5,322 | 571,423 | ||||||
Chimera Investment Corp. REIT | 6,073 | 122,553 | ||||||
Chubb Ltd. | 2,814 | 383,407 | ||||||
Cigna Corp. | 1,231 | 180,329 | ||||||
Cincinnati Financial Corp. | 1,127 | 81,448 | ||||||
Cirrus Logic, Inc. (f) | 1,660 | 100,745 | ||||||
Cisco Systems, Inc. | 22,072 | 746,034 | ||||||
Citigroup, Inc. | 11,068 | 662,088 | ||||||
Citrix Systems, Inc. (f) | 1,778 | 148,267 | ||||||
Clorox Co. | 1,884 | 254,020 | ||||||
CME Group, Inc. | 795 | 94,446 | ||||||
CMS Energy Corp. | 1,791 | 80,129 | ||||||
CNA Financial Corp. | 1,304 | 57,598 | ||||||
Coherent, Inc. (f) | 503 | 103,437 | ||||||
Colgate-Palmolive Co. | 990 | 72,458 | ||||||
Columbus McKinnon Corp. | 242 | 6,006 | ||||||
Comcast Corp., Class A | 14,980 | 563,098 | ||||||
Commercial Metals Co. | 336 | 6,428 | ||||||
Computer Sciences Corp. | 970 | 66,940 | ||||||
Conduent, Inc. (f) | 3,536 | 59,334 | ||||||
Consolidated Edison, Inc. | 7,290 | 566,141 | ||||||
Convergys Corp. | 8,038 | 170,004 | ||||||
Cooper Cos., Inc. | 778 | 155,514 | ||||||
Cooper-Standard Holdings, Inc. (f) | 545 | 60,457 | ||||||
Copa Holdings S.A., Class A | 310 | 34,798 | ||||||
Corning, Inc. | 11,102 | 299,754 | ||||||
CR Bard, Inc. | 393 | 97,676 | ||||||
Cracker Barrel Old Country Store, Inc. | 205 | 32,646 | ||||||
Crane Co. | 585 | 43,776 | ||||||
CSX Corp. | 4,900 | 228,095 | ||||||
CVS Health Corp. | 2,605 | 204,492 | ||||||
CYS Investments, Inc. REIT | 9,316 | 74,062 | ||||||
Danaher Corp. | 3,911 | 334,508 | ||||||
Darden Restaurants, Inc. | 2,341 | 195,871 | ||||||
DaVita, Inc. (f) | 167 | 11,351 | ||||||
Dean Foods Co. | 4,190 | 82,375 | ||||||
Dell Technologies, Inc., Class V (f) | 519 | 33,258 | ||||||
Delta Air Lines, Inc. | 1,842 | 84,658 | ||||||
Deluxe Corp. | 1,666 | 120,235 | ||||||
| Shares | Value | |||||||
DHT Holdings, Inc. | 10,227 | $ | 45,715 | |||||
Dick’s Sporting Goods, Inc. | 1,836 | 89,340 | ||||||
Dime Community Bancshares, Inc. | 279 | 5,664 | ||||||
DineEquity, Inc. | 424 | 23,074 | ||||||
Dominion Resources, Inc. | 60 | 4,654 | ||||||
Domino’s Pizza, Inc. | 357 | 65,795 | ||||||
Dow Chemical Co. | 5,277 | 335,301 | ||||||
DR Horton, Inc. | 1,844 | 61,424 | ||||||
Dr. Pepper Snapple Group, Inc. | 1,652 | 161,764 | ||||||
DTE Energy Co. | 1,183 | 120,796 | ||||||
Duke Energy Corp. | 3,615 | 296,466 | ||||||
DuPont Fabros Technology, Inc. REIT | 1,866 | 92,535 | ||||||
Dynex Capital, Inc. REIT | 4,936 | 34,996 | ||||||
E*TRADE Financial Corp. (f) | 2,028 | 70,757 | ||||||
Eastman Chemical Co. | 2,409 | 194,647 | ||||||
Edison International | 708 | 56,364 | ||||||
Electronic Arts, Inc. (f) | 562 | 50,310 | ||||||
Energizer Holdings, Inc. | 1,046 | 58,314 | ||||||
Ennis, Inc. | 1,258 | 21,386 | ||||||
Ensign Group, Inc. | 368 | 6,918 | ||||||
Entergy Corp. | 2,408 | 182,912 | ||||||
Enterprise Financial Services Corp. | 1,061 | 44,986 | ||||||
Entertainment One Ltd. | 9,741 | 29,852 | ||||||
Equinix, Inc. REIT | 7 | 2,803 | ||||||
Equity LifeStyle Properties, Inc. REIT | 797 | 61,417 | ||||||
Ethan Allen Interiors, Inc. | 257 | 7,877 | ||||||
Euronet Worldwide, Inc. (f) | 692 | 59,180 | ||||||
Everest Re Group Ltd. | 1,263 | 295,302 | ||||||
Exelon Corp. | 7,691 | 276,722 | ||||||
Express Scripts Holding Co. (f) | 1,330 | 87,660 | ||||||
Express, Inc. (f) | 2,870 | 26,146 | ||||||
Exxon Mobil Corp. | 8,900 | 729,889 | ||||||
Facebook, Inc., Class A (f) | 7,506 | 1,066,227 | ||||||
Federal Agricultural Mortgage Corp., Class C | 128 | 7,369 | ||||||
Fidelity & Guaranty Life | 1,465 | 40,727 | ||||||
Fidelity National Information Services, Inc. | 2,478 | 197,298 | ||||||
First American Financial Corp. | 1,900 | 74,632 | ||||||
First Busey Corp. | 355 | 10,437 | ||||||
First Merchants Corp. | 156 | 6,134 | ||||||
First NBC Bank Holding Co. (f) | 1,041 | 4,164 | ||||||
FirstEnergy Corp. | 6,334 | 201,548 | ||||||
Flex Ltd. (f) | 6,674 | 112,123 | ||||||
Foot Locker, Inc. | 2,445 | 182,910 | ||||||
Ford Motor Co. | 14,448 | 168,175 | ||||||
Fresh Del Monte Produce, Inc. | 1,362 | 80,671 | ||||||
GameStop Corp., Class A | 303 | 6,833 | ||||||
General Electric Co. | 13,943 | 415,501 | ||||||
General Mills, Inc. | 4,308 | 254,215 | ||||||
General Motors Co. | 6,721 | 237,655 | ||||||
German American Bancorp, Inc. | 45 | 2,130 | ||||||
Getty Realty Corp. REIT | 489 | 12,357 | ||||||
Gilead Sciences, Inc. | 4,013 | 272,563 | ||||||
Global Brass & Copper Holdings, Inc. | 1,340 | 46,096 | ||||||
Global Payments, Inc. | 899 | 72,531 | ||||||
Goldman Sachs Group, Inc. | 522 | 119,914 | ||||||
Goodyear Tire & Rubber Co. | 7,517 | 270,612 | ||||||
Great Western Bancorp, Inc. | 947 | 40,162 | ||||||
Group 1 Automotive, Inc. | 127 | 9,408 | ||||||
Hanover Insurance Group, Inc. | 1,549 | 139,503 | ||||||
Hartford Financial Services Group, Inc. | 2,507 | 120,511 | ||||||
| Shares | Value | |||||||
Hawaiian Holdings, Inc. (f) | 703 | $ | 32,654 | |||||
HCA Holdings, Inc. (f) | 2,293 | 204,054 | ||||||
Henry Schein, Inc. (f) | 37 | 6,289 | ||||||
Hewlett Packard Enterprise Co. | 14,631 | 346,755 | ||||||
Hill-Rom Holdings, Inc. | 825 | 58,245 | ||||||
Hologic, Inc. (f) | 1,951 | 83,015 | ||||||
Home Depot, Inc. | 4,147 | 608,904 | ||||||
Horizon Pharma PLC (f) | 462 | 6,828 | ||||||
Huntington Bancshares, Inc. | 11,832 | 158,430 | ||||||
Huntington Ingalls Industries, Inc. | 1,076 | 215,458 | ||||||
INC Research Holdings, Inc., Class A (f) | 919 | 42,136 | ||||||
Independence Realty Trust, Inc. REIT | 1,312 | 12,293 | ||||||
Ingles Markets, Inc., Class A | 157 | 6,775 | ||||||
Ingredion, Inc. | 3,157 | 380,198 | ||||||
Insight Enterprises, Inc. (f) | 12 | 493 | ||||||
Integra LifeSciences Holdings Corp. (f) | 1,252 | 52,747 | ||||||
Intel Corp. | 21,105 | 761,257 | ||||||
International Business Machines Corp. | 1,442 | 251,110 | ||||||
International Paper Co. | 1,331 | 67,588 | ||||||
Intuitive Surgical, Inc. (f) | 745 | 571,020 | ||||||
Invesco Ltd. | 257 | 7,872 | ||||||
Invesco Mortgage Capital, Inc. REIT | 4,105 | 63,299 | ||||||
Jack in the Box, Inc. | 991 | 100,805 | ||||||
JetBlue Airways Corp. (f) | 2,879 | 59,336 | ||||||
JM Smucker Co. | 1,192 | 156,247 | ||||||
John B Sanfilippo & Son, Inc. | 57 | 4,172 | ||||||
Johnson & Johnson | 11,808 | 1,470,686 | ||||||
Johnson Controls International PLC | 10,444 | 439,901 | ||||||
Jones Lang LaSalle, Inc. | 57 | 6,353 | ||||||
JPMorgan Chase & Co. | 11,483 | 1,008,667 | ||||||
Juniper Networks, Inc. | 3,121 | 86,857 | ||||||
KAR Auction Services, Inc. | 2,104 | 91,882 | ||||||
Kellogg Co. | 315 | 22,872 | ||||||
Kelly Services, Inc., Class A | 415 | 9,072 | ||||||
Kimberly-Clark Corp. | 1,523 | 200,472 | ||||||
Knoll, Inc. | 364 | 8,667 | ||||||
Kohl’s Corp. | 2,809 | 111,826 | ||||||
Kraton Corp. (f) | 1,203 | 37,197 | ||||||
Kroger Co. | 3,854 | 113,654 | ||||||
Laboratory Corp. of America Holdings (f) | 2,738 | 392,821 | ||||||
Lam Research Corp. | 3,867 | 496,368 | ||||||
Lear Corp. | 2,258 | 319,688 | ||||||
LifePoint Health, Inc. (f) | 1,590 | 104,145 | ||||||
Lincoln National Corp. | 4,172 | 273,057 | ||||||
LogMeIn, Inc. | 305 | 29,738 | ||||||
Lumentum Holdings, Inc. (f) | 1,548 | 82,586 | ||||||
LyondellBasell Industries NV, Class A | 2,765 | 252,140 | ||||||
Macy’s, Inc. | 5,786 | 171,497 | ||||||
Maiden Holdings Ltd. | 2,978 | 41,692 | ||||||
MainSource Financial Group, Inc. | 316 | 10,406 | ||||||
Mallinckrodt PLC (f) | 3,820 | 170,257 | ||||||
Manhattan Associates, Inc. (f) | 85 | 4,424 | ||||||
Marathon Petroleum Corp. | 3,367 | 170,168 | ||||||
Marcus & Millichap, Inc. (f) | 324 | 7,964 | ||||||
Marriott Vacations Worldwide Corp. | 864 | 86,340 | ||||||
Masimo Corp. (f) | 1,222 | 113,964 | ||||||
McDonald’s Corp. | 5,840 | 756,922 | ||||||
McKesson Corp. | 2,283 | 338,478 | ||||||
MedEquities Realty Trust, Inc. REIT | 2,912 | 32,644 | ||||||
Mercer International, Inc. | 2,342 | 27,401 | ||||||
| See accompanying Notes to Financial Statements | | March 31, 2017 | | Semiannual Report | 171 |
Table of Contents
Schedule of Investments
March 31, 2017 (Unaudited)
| Shares | Value | |||||||
Merck & Co., Inc. | 4,945 | $ | 314,205 | |||||
MetLife, Inc. | 1,941 | 102,524 | ||||||
MFA Financial, Inc. REIT | 11,428 | 92,338 | ||||||
Micron Technology, Inc. (f) | 11,543 | 333,593 | ||||||
Microsoft Corp. | 7,952 | 523,719 | ||||||
Mid-America Apartment Communities, Inc. REIT | 657 | 66,843 | ||||||
MKS Instruments, Inc. | 958 | 65,862 | ||||||
Mohawk Industries, Inc. (f) | 327 | 75,043 | ||||||
Monmouth Real Estate Investment Corp. REIT | 839 | 11,973 | ||||||
Morgan Stanley | 7,726 | 330,982 | ||||||
Morningstar, Inc. | 74 | 5,816 | ||||||
Motorola Solutions, Inc. | 903 | 77,857 | ||||||
MTGE Investment Corp. REIT | 4,585 | 76,799 | ||||||
Multi-Color Corp. | 114 | 8,094 | ||||||
Murphy Oil Corp. | 3,598 | 102,867 | ||||||
Nasdaq, Inc. | 142 | 9,862 | ||||||
Natus Medical, Inc. (f) | 310 | 12,168 | ||||||
Navigators Group, Inc. | 180 | 9,774 | ||||||
Net 1 UEPS Technologies, Inc. (f) | 4,606 | 56,331 | ||||||
NETGEAR, Inc. (f) | 942 | 46,676 | ||||||
NeuStar, Inc., Class A (f) | 2,278 | 75,516 | ||||||
New Residential Investment Corp. REIT | 2,868 | 48,699 | ||||||
Newell Brands, Inc. | 5,001 | 235,897 | ||||||
Newfield Exploration Co. (f) | 2,851 | 105,230 | ||||||
NextEra Energy, Inc. | 1,127 | 144,673 | ||||||
Northfield Bancorp, Inc. | 664 | 11,965 | ||||||
Northrop Grumman Corp. | 1,203 | 286,122 | ||||||
Nuance Communications, Inc. (f) | 635 | 10,992 | ||||||
NVIDIA Corp. | 982 | 106,969 | ||||||
NVR, Inc. (f) | 12 | 25,283 | ||||||
Old Republic International Corp. | 887 | 18,166 | ||||||
Omega Protein Corp. | 5,185 | 103,959 | ||||||
Omnicell, Inc. (f) | 287 | 11,667 | ||||||
Omnicom Group, Inc. | 1,025 | 88,365 | ||||||
On Assignment, Inc. (f) | 64 | 3,106 | ||||||
ON Semiconductor Corp. (f) | 7,149 | 110,738 | ||||||
ONE Gas, Inc. | 647 | 43,737 | ||||||
Orchid Island Capital, Inc. REIT | 4,244 | 42,398 | ||||||
Oritani Financial Corp. | 1,996 | 33,932 | ||||||
Owens & Minor, Inc. | 965 | 33,389 | ||||||
Owens Corning | 2,023 | 124,152 | ||||||
Paychex, Inc. | 1,249 | 73,566 | ||||||
PepsiCo, Inc. | 543 | 60,740 | ||||||
PetMed Express, Inc. | 1,333 | 26,847 | ||||||
Pfizer, Inc. | 19,466 | 665,932 | ||||||
PG&E Corp. | 4,687 | 311,029 | ||||||
Pinnacle Foods, Inc. | 6,507 | 376,560 | ||||||
Pinnacle West Capital Corp. | 830 | 69,205 | ||||||
Pitney Bowes, Inc. | 2,236 | 29,314 | ||||||
PNC Financial Services Group, Inc. | 2,971 | 357,233 | ||||||
Pool Corp. | 84 | 10,024 | ||||||
Priceline Group, Inc. (f) | 7 | 12,460 | ||||||
Principal Financial Group, Inc. | 3,665 | 231,298 | ||||||
Procter & Gamble Co. | 1,593 | 143,131 | ||||||
Progressive Corp. | 2,498 | 97,872 | ||||||
Provident Financial Services, Inc. | 1,189 | 30,736 | ||||||
Prudential Financial, Inc. | 1,967 | 209,840 | ||||||
Public Service Enterprise Group, Inc. | 3,393 | 150,480 | ||||||
PVH Corp. | 2,235 | 231,255 | ||||||
Qorvo, Inc. (f) | 1,457 | 99,892 | ||||||
Quest Diagnostics, Inc. | 2,264 | 222,302 | ||||||
Quintiles IMS Holdings, Inc. (f) | 1,658 | 133,519 | ||||||
Regis Corp. (f) | 520 | 6,094 | ||||||
| Shares | Value | |||||||
Reinsurance Group of America, Inc. | 1,023 | $ | 129,901 | |||||
Reliance Steel & Aluminum Co. | 554 | 44,331 | ||||||
Republic Services, Inc. | 4,150 | 260,661 | ||||||
Revlon, Inc., Class A (f) | 1,634 | 45,507 | ||||||
Reynolds American, Inc. | 8,280 | 521,806 | ||||||
Ross Stores, Inc. | 1,657 | 109,147 | ||||||
Royal Caribbean Cruises Ltd. | 758 | 74,367 | ||||||
Rudolph Technologies, Inc. (f) | 2,029 | 45,450 | ||||||
Sanmina Corp. (f) | 5,194 | 210,876 | ||||||
Santander Consumer USA Holdings, Inc. (f) | 369 | 4,915 | ||||||
Sinclair Broadcast Group, Inc. Class A | 1,887 | 76,423 | ||||||
Skyworks Solutions, Inc. | 3,298 | 323,138 | ||||||
Snap-on, Inc. | 322 | 54,312 | ||||||
Sonoco Products Co. | 180 | 9,526 | ||||||
Southern Co. | 13,415 | 667,799 | ||||||
Southwest Airlines Co. | 1,159 | 62,308 | ||||||
Southwestern Energy Co. (f) | 20,278 | 165,671 | ||||||
SpartanNash Co. | 681 | 23,828 | ||||||
Spirit AeroSystems Holdings, Inc., Class A | 2,958 | 171,327 | ||||||
Spirit Realty Capital, Inc. REIT | 6,096 | 61,752 | ||||||
SS&C Technologies Holdings, Inc. | 231 | 8,177 | ||||||
Stanley Black & Decker, Inc. | 2,428 | 322,608 | ||||||
Staples, Inc. | 11,428 | 100,224 | ||||||
State National Cos., Inc. | 535 | 7,704 | ||||||
Stoneridge, Inc. (f) | 1,816 | 32,942 | ||||||
Stryker Corp. | 2,336 | 307,534 | ||||||
SunTrust Banks, Inc. | 8,912 | 492,834 | ||||||
Superior Industries International, Inc. | 4,722 | 119,703 | ||||||
Sykes Enterprises, Inc. (f) | 146 | 4,292 | ||||||
Symantec Corp. | 1,528 | 46,879 | ||||||
Sysco Corp. | 3,142 | 163,133 | ||||||
Target Corp. | 3,121 | 172,248 | ||||||
Teleflex, Inc. | 1,035 | 200,511 | ||||||
Tenet Healthcare Corp. (f) | 6,260 | 110,865 | ||||||
Tesoro Corp. | 2,493 | 202,083 | ||||||
Texas Roadhouse, Inc. | 1,808 | 80,510 | ||||||
Thermo Fisher Scientific, Inc. | 2,092 | 321,331 | ||||||
Thor Industries, Inc. | 991 | 95,265 | ||||||
Time Warner, Inc. | 3,131 | 305,930 | ||||||
TiVo Corp. | 2,562 | 48,037 | ||||||
TJX Cos., Inc. | 111 | 8,778 | ||||||
Tower International, Inc. | 1,340 | 36,314 | ||||||
Towne Bank | 649 | 21,028 | ||||||
Travelers Cos., Inc. | 2,546 | 306,895 | ||||||
Trico Bancshares | 235 | 8,350 | ||||||
Triple-S Management Corp., Class B (f) | 792 | 13,915 | ||||||
Two Harbors Investment Corp. REIT | 1,694 | 16,245 | ||||||
Tyson Foods, Inc., Class A | 5,365 | 331,074 | ||||||
Ulta Salon Cosmetics & Fragrance, Inc. (f) | 268 | 76,442 | ||||||
Union Bankshares Corp. | 1,482 | 52,137 | ||||||
United Continental Holdings, Inc. (f) | 814 | 57,501 | ||||||
United Financial Bancorp, Inc. | 467 | 7,944 | ||||||
United Fire Group, Inc. | 185 | 7,912 | ||||||
UnitedHealth Group, Inc. | 4,945 | 811,029 | ||||||
Universal Health Services, Inc., Class B | 675 | 84,004 | ||||||
Unum Group | 6,137 | 287,764 | ||||||
Vail Resorts, Inc. | 595 | 114,180 | ||||||
Valero Energy Corp. | 4,710 | 312,226 | ||||||
Validus Holdings Ltd. | 844 | 47,593 | ||||||
VCA, Inc. (f) | 564 | 51,606 | ||||||
| Shares | Value | |||||||
Verizon Communications, Inc. | 21,922 | $ | 1,068,697 | |||||
Vishay Intertechnology, Inc. | 3,818 | 62,806 | ||||||
Wal-Mart Stores, Inc. | 3,208 | 231,233 | ||||||
Walker & Dunlop, Inc. (f) | 188 | 7,838 | ||||||
Waste Management, Inc. | 8,443 | 615,664 | ||||||
Waterstone Financial, Inc. | 720 | 13,140 | ||||||
WEC Energy Group, Inc. | 3,748 | 227,241 | ||||||
WellCare Health Plans, Inc. (f) | 355 | 49,775 | ||||||
Wells Fargo & Co. | 6,360 | 353,998 | ||||||
Westar Energy, Inc. | 1,528 | 82,925 | ||||||
Western Digital Corp. | 1,276 | 105,308 | ||||||
Whirlpool Corp. | 809 | 138,606 | ||||||
Windstream Holdings, Inc. | 1,474 | 8,033 | ||||||
World Acceptance Corp. (f) | 89 | 4,608 | ||||||
Xcel Energy, Inc. | 5,042 | 224,117 | ||||||
Xerox Corp. | 17,680 | 129,771 | ||||||
XL Group Ltd. | 1,769 | 70,512 | ||||||
Xperi Corp. | 1,460 | 49,567 | ||||||
Xylem, Inc. | 1,385 | 69,555 | ||||||
Yum! Brands, Inc. | 2,047 | 130,803 | ||||||
Zimmer Biomet Holdings, Inc. | 1,554 | 189,759 | ||||||
|
| |||||||
| 63,974,404 | ||||||||
|
| |||||||
| Total Common Stock (cost—$112,889,722) | 121,454,444 | |||||||
|
| |||||||
| Principal Amount (000s) | ||||||||
| U.S. Treasury Obligations—24.7% | ||||||||
U.S. Treasury Bonds, |
| |||||||
3.125%, 2/15/43 | $1,276 | 1,301,345 | ||||||
4.375%, 5/15/41 | 1,341 | 1,669,963 | ||||||
4.50%, 2/15/36 | 1,200 | 1,521,961 | ||||||
5.25%, 2/15/29 | 140 | 179,520 | ||||||
6.875%, 8/15/25 | 125 | 168,601 | ||||||
U.S. Treasury Notes, |
| |||||||
0.625%, 8/31/17 | 1,500 | 1,498,593 | ||||||
0.625%, 9/30/17 | 3,000 | 2,996,016 | ||||||
0.75%, 10/31/17 | 3,000 | 2,996,718 | ||||||
0.75%, 1/31/18 | 5,000 | 4,988,280 | ||||||
0.75%, 2/28/18 | 5,192 | 5,177,499 | ||||||
0.875%, 1/15/18 | 5,000 | 4,994,530 | ||||||
0.875%, 3/31/18 | 5,000 | 4,990,330 | ||||||
0.875%, 9/15/19 | 10,000 | 9,876,960 | ||||||
1.00%, 6/30/19 | 10,300 | 10,227,179 | ||||||
1.125%, 9/30/21 | 2,000 | 1,934,844 | ||||||
1.375%, 9/30/23 | 2,100 | 1,998,446 | ||||||
1.50%, 2/28/19 | 1,620 | 1,627,721 | ||||||
1.50%, 8/15/26 | 700 | 647,610 | ||||||
1.875%, 10/31/17 | 218 | 219,137 | ||||||
2.00%, 9/30/20 | 1,000 | 1,011,758 | ||||||
2.00%, 7/31/22 | 1,800 | 1,799,438 | ||||||
2.25%, 7/31/18 | 980 | 994,222 | ||||||
|
| |||||||
| Total U.S. Treasury Obligations (cost—$63,358,609) | 62,820,671 | |||||||
|
| |||||||
| Corporate Bonds & Notes—9.2% | ||||||||
| Australia—0.2% | ||||||||
Westpac Banking Corp., |
| |||||||
2.80%, 1/11/22 | 500 | 503,281 | ||||||
|
| |||||||
| Canada—1.3% | ||||||||
Bank of Montreal, |
| |||||||
1.90%, 8/27/21 | 400 | 389,828 | ||||||
Bank of Nova Scotia, |
| |||||||
1.85%, 4/14/20 | 1,000 | 990,597 | ||||||
| 172 | Semiannual Report | | March 31, 2017 | | See accompanying Notes to Financial Statements |
Table of Contents
Schedule of Investments
March 31, 2017 (Unaudited)
| Principal Amount (000s) | Value | |||||||
Potash Corp. of Saskatchewan, Inc., |
| |||||||
4.00%, 12/15/26 | $ | 300 | $ | 307,699 | ||||
Royal Bank of Canada, |
| |||||||
2.00%, 10/1/18 | 1,000 | 1,005,050 | ||||||
2.125%, 3/2/20 | 300 | 300,223 | ||||||
Toronto-Dominion Bank, |
| |||||||
1.80%, 7/13/21 | 400 | 389,400 | ||||||
|
| |||||||
| 3,382,797 | ||||||||
|
| |||||||
| China—0.2% | ||||||||
Sinopec Group Overseas Development 2012 Ltd., |
| |||||||
2.75%, 5/17/17 | 500 | 500,736 | ||||||
|
| |||||||
| France—0.1% | ||||||||
Electricite de France S.A. (a)(b), |
| |||||||
4.875%, 1/22/44 | 300 | 299,196 | ||||||
|
| |||||||
| Germany—0.2% | ||||||||
KFW, |
| |||||||
1.25%, 9/30/19 | 400 | 396,254 | ||||||
|
| |||||||
| Spain—0.3% | ||||||||
Banco Bilbao Vizcaya Argentaria S.A., |
| |||||||
3.00%, 10/20/20 | 400 | 405,399 | ||||||
Telefonica Emisiones SAU, |
| |||||||
4.103%, 3/8/27 | 300 | 302,557 | ||||||
|
| |||||||
| 707,956 | ||||||||
|
| |||||||
| Switzerland—0.1% | ||||||||
Novartis Capital Corp., |
| |||||||
1.80%, 2/14/20 | 300 | 300,384 | ||||||
|
| |||||||
| United Kingdom—0.3% | ||||||||
Barclays PLC, |
| |||||||
4.375%, 1/12/26 | 400 | 406,121 | ||||||
BP Capital Markets PLC, |
| |||||||
2.315%, 2/13/20 | 300 | 302,597 | ||||||
3.119%, 5/4/26 | 100 | 97,965 | ||||||
|
| |||||||
| 806,683 | ||||||||
|
| |||||||
| United States—6.5% | ||||||||
Abbott Laboratories, |
| |||||||
4.90%, 11/30/46 | 500 | 520,450 | ||||||
Allstate Corp., |
| |||||||
3.28%, 12/15/26 | 400 | 402,378 | ||||||
American Honda Finance Corp., |
| |||||||
2.00%, 2/14/20 | 300 | 301,056 | ||||||
Apple, Inc., |
| |||||||
3.35%, 2/9/27 | 300 | 303,172 | ||||||
3.85%, 8/4/46 | 200 | 190,877 | ||||||
AT&T, Inc., |
| |||||||
3.80%, 3/15/22 | 300 | 310,624 | ||||||
4.25%, 3/1/27 | 300 | 304,965 | ||||||
Bank of New York Mellon Corp., |
| |||||||
2.60%, 2/7/22 | 300 | 300,459 | ||||||
Boeing Co., |
| |||||||
2.125%, 3/1/22 | 180 | 177,991 | ||||||
Citigroup, Inc., |
| |||||||
2.45%, 1/10/20 | 500 | 502,520 | ||||||
8.125%, 7/15/39 | 400 | 589,370 | ||||||
CNH Industrial Capital LLC, |
| |||||||
4.875%, 4/1/21 | 500 | 526,250 | ||||||
Comcast Corp., |
| |||||||
2.75%, 3/1/23 | 400 | 398,814 | ||||||
Commonwealth Edison Co., |
| |||||||
2.55%, 6/15/26 | 400 | 380,682 | ||||||
CSX Corp., |
| |||||||
2.60%, 11/1/26 | 500 | 469,820 | ||||||
Discovery Communications LLC, |
| |||||||
3.80%, 3/13/24 | 200 | 197,967 | ||||||
Dow Chemical Co., |
| |||||||
7.375%, 11/1/29 | 400 | 543,213 | ||||||
Dr. Pepper Snapple Group, Inc., |
| |||||||
4.42%, 12/15/46 | 300 | 302,203 | ||||||
| Principal Amount (000s) | Value | |||||||
Duke Energy Carolinas LLC, |
| |||||||
2.50%, 3/15/23 | $ | 100 | $ | 99,074 | ||||
FedEx Corp., |
| |||||||
4.10%, 4/15/43 | 400 | 371,398 | ||||||
4.55%, 4/1/46 | 300 | 301,327 | ||||||
Ford Motor Co., |
| |||||||
5.291%, 12/8/46 | 300 | 301,508 | ||||||
Goldman Sachs Group, Inc., |
| |||||||
2.55%, 10/23/19 | 400 | 403,856 | ||||||
Home Depot, Inc., |
| |||||||
2.00%, 4/1/21 | 400 | 398,369 | ||||||
Honeywell International, Inc., |
| |||||||
1.85%, 11/1/21 | 100 | 98,101 | ||||||
International Business Machines Corp., |
| |||||||
1.80%, 5/17/19 | 500 | 502,315 | ||||||
Johnson & Johnson, |
| |||||||
2.95%, 3/3/27 | 300 | 300,327 | ||||||
JPMorgan Chase & Co., |
| |||||||
2.972%, 1/15/23 | 500 | 499,889 | ||||||
3.625%, 5/13/24 | 400 | 408,981 | ||||||
Microsoft Corp., |
| |||||||
1.10%, 8/8/19 | 600 | 593,596 | ||||||
3.30%, 2/6/27 | 400 | 406,948 | ||||||
Morgan Stanley, |
| |||||||
2.50%, 4/21/21 | 400 | 398,182 | ||||||
Oracle Corp., |
| |||||||
3.85%, 7/15/36 | 200 | 196,221 | ||||||
Pacific Gas & Electric Co., |
| |||||||
4.00%, 12/1/46 | 300 | 297,507 | ||||||
PepsiCo, Inc., |
| |||||||
1.50%, 2/22/19 | 400 | 400,120 | ||||||
Pfizer, Inc., |
| |||||||
1.95%, 6/3/21 | 200 | 198,898 | ||||||
Philip Morris International, Inc., |
| |||||||
2.00%, 2/21/20 | 300 | 299,404 | ||||||
2.125%, 5/10/23 | 400 | 381,734 | ||||||
Toyota Motor Credit Corp., |
| |||||||
1.90%, 4/8/21 | 400 | 394,209 | ||||||
2.25%, 10/18/23 | 250 | 241,759 | ||||||
United Technologies Corp., |
| |||||||
1.95%, 11/1/21 | 500 | 490,403 | ||||||
Verizon Communications, Inc., |
| |||||||
4.125%, 8/15/46 | 200 | 173,210 | ||||||
Walt Disney Co., |
| |||||||
2.30%, 2/12/21 | 400 | 403,305 | ||||||
2.45%, 3/4/22 | 200 | 200,576 | ||||||
Wells Fargo & Co., |
| |||||||
2.10%, 7/26/21 | 400 | 392,313 | ||||||
Wells Fargo Bank N.A., |
| |||||||
2.15%, 12/6/19 | 500 | 502,004 | ||||||
|
| |||||||
| 16,378,345 | ||||||||
|
| |||||||
| Total Corporate Bonds & Notes (cost—$23,599,235) | 23,275,632 | |||||||
|
| |||||||
| U.S. Government Agency Securities—7.6% | ||||||||
Fannie Mae, MBS, TBA (c), |
| |||||||
2.50%, 4/18/32, 15 Year | 690 | 690,270 | ||||||
3.00%, 4/18/32, 15 Year | 650 | 666,402 | ||||||
3.00%, 4/13/47, 30 Year | 1,970 | 1,953,840 | ||||||
3.50%, 4/18/32, 15 Year | 440 | 457,823 | ||||||
3.50%, 4/13/47, 30 Year | 2,000 | 2,046,094 | ||||||
4.00%, 4/13/47, 30 Year | 1,270 | 1,332,210 | ||||||
4.50%, 4/13/47, 30 Year | 520 | 557,680 | ||||||
5.00%, 4/13/47, 30 Year | 240 | 262,261 | ||||||
5.50%, 4/13/47, 30 Year | 330 | 366,605 | ||||||
Freddie Mac, |
| |||||||
1.00%, 6/29/17 | 218 | 218,078 | ||||||
2.50%, 4/18/32 MBS, TBA, 15 Year (c) | 520 | 520,355 | ||||||
3.00%, 4/18/32 MBS, TBA, 15 Year (c) | 450 | 461,457 | ||||||
| Principal Amount (000s) | Value | |||||||
3.00%, 4/13/47 MBS, TBA, 30 Year (c) | $ | 1,310 | $ | 1,297,821 | ||||
3.50%, 4/18/32 MBS, TBA, 15 Year (c) | 240 | 249,955 | ||||||
3.50%, 4/13/47 MBS, TBA, 30 Year (c) | 1,290 | 1,319,478 | ||||||
4.00%, 4/13/47 MBS, TBA, 30 Year (c) | 710 | 744,834 | ||||||
4.50%, 4/13/47 MBS, TBA, 30 Year (c) | 300 | 321,521 | ||||||
5.00%, 4/13/47 MBS, TBA, 30 Year (c) | 160 | 174,231 | ||||||
5.50%, 4/13/47 MBS, TBA, 30 Year (c) | 170 | 188,609 | ||||||
Ginnie Mae, MBS, TBA, 30 Year (c), |
| |||||||
3.00%, 4/20/47 | 1,730 | 1,745,273 | ||||||
3.50%, 4/20/47 | 1,940 | 2,011,462 | ||||||
4.00%, 4/20/47 | 890 | 940,132 | ||||||
4.50%, 4/20/47 | 770 | 822,306 | ||||||
|
| |||||||
| Total U.S. Government Agency Securities (cost—$19,244,771) | 19,348,697 | |||||||
|
| |||||||
| Shares | ||||||||
| Exchange-Traded Funds—6.1% | ||||||||
iShares iBoxx $ High Yield Corporate Bond | 58,700 | 5,152,686 | ||||||
iShares JPMorgan USD Emerging Markets Bond | 90,000 | 10,233,000 | ||||||
|
| |||||||
| Total Exchange-Traded Funds (cost—$15,209,611) | 15,385,686 | |||||||
|
| |||||||
| Principal Amount (000s) | ||||||||
| Sovereign Debt Obligations—5.4% | ||||||||
| Argentina—0.1% | ||||||||
Argentine Republic Government International Bond, |
| |||||||
6.25%, 4/22/19 | $300 | 317,550 | ||||||
|
| |||||||
| Brazil—0.1% | ||||||||
Brazilian Government International Bond, |
| |||||||
4.25%, 1/7/25 | 250 | 246,563 | ||||||
|
| |||||||
| Canada—0.2% | ||||||||
Province of Ontario Canada, |
| |||||||
1.25%, 6/17/19 | 500 | 494,889 | ||||||
|
| |||||||
| Croatia—0.1% | ||||||||
Croatia Government International Bond, |
| |||||||
6.75%, 11/5/19 | 300 | 327,048 | ||||||
|
| |||||||
| Indonesia—0.1% | ||||||||
Indonesia Government International Bond, |
| |||||||
11.625%, 3/4/19 | 300 | 355,143 | ||||||
|
| |||||||
| Japan—0.1% | ||||||||
Japan Bank for International Cooperation, |
| |||||||
1.50%, 7/21/21 | 300 | 288,078 | ||||||
|
| |||||||
| Korea (Republic of)—0.2% | ||||||||
Export-Import Bank of Korea, |
| |||||||
1.75%, 5/26/19 | 500 | 497,484 | ||||||
Korea Development Bank, |
| |||||||
3.00%, 1/13/26 | 100 | 99,809 | ||||||
|
| |||||||
| 597,293 | ||||||||
|
| |||||||
| Latvia—0.2% | ||||||||
Latvia Government International Bond, |
| |||||||
2.75%, 1/12/20 | 500 | 507,448 | ||||||
|
| |||||||
| See accompanying Notes to Financial Statements | | March 31, 2017 | | Semiannual Report | 173 |
Table of Contents
Schedule of Investments
March 31, 2017 (Unaudited)
| Principal Amount (000s) | Value | |||||||
| Lithuania—0.2% | ||||||||
Lithuania Government International Bond, |
| |||||||
5.125%, 9/14/17 | $ | 500 | $ | 508,750 | ||||
|
| |||||||
| Mexico—0.1% | ||||||||
Mexico Government International Bond, |
| |||||||
4.125%, 1/21/26 | 300 | 309,150 | ||||||
|
| |||||||
| Panama—0.3% | ||||||||
Panama Government International Bond, |
| |||||||
7.125%, 1/29/26 | 500 | 633,125 | ||||||
|
| |||||||
| Poland—0.2% | ||||||||
Poland Government International Bond, |
| |||||||
6.375%, 7/15/19 | 500 | 549,063 | ||||||
|
| |||||||
| Russian Federation—0.2% | ||||||||
Russian Federation Bond, |
| |||||||
4.50%, 4/4/22 | 400 | 425,081 | ||||||
|
| |||||||
| Supranational—3.2% | ||||||||
Corp. Andina de Fomento, |
| |||||||
4.375%, 6/15/22 | 500 | 534,055 | ||||||
Council of Europe Development Bank, |
| |||||||
1.00%, 2/4/19 | 500 | 495,138 | ||||||
1.625%, 3/16/21 | 500 | 491,213 | ||||||
European Bank for Reconstruction & Development, |
| |||||||
1.75%, 6/14/19 | 500 | 501,210 | ||||||
European Investment Bank, |
| |||||||
1.00%, 3/15/18 | 5,000 | 4,989,675 | ||||||
International Finance Corp., |
| |||||||
1.75%, 9/16/19 | 500 | 502,298 | ||||||
Nordic Investment Bank, |
| |||||||
1.25%, 8/2/21 | 500 | 483,516 | ||||||
|
| |||||||
| 7,997,105 | ||||||||
|
| |||||||
| Turkey—0.1% | ||||||||
Turkey Government International Bond, |
| |||||||
4.875%, 10/9/26 | 250 | 241,301 | ||||||
|
| |||||||
| Total Sovereign Debt Obligations (cost—$13,915,150) | 13,797,587 | |||||||
|
| |||||||
| Shares | ||||||||
| Preferred Stock—0.3% | ||||||||
| Brazil—0.1% | ||||||||
Banco Bradesco S.A. | 10,500 | 108,602 | ||||||
Braskem S.A., Class A | 2,700 | 27,383 | ||||||
Cia Paranaense de Energia | 4,300 | 44,970 | ||||||
Itau Unibanco Holding S.A. | 11,640 | 140,917 | ||||||
|
| |||||||
| 321,872 | ||||||||
|
| |||||||
| Colombia—0.0% | ||||||||
Banco Davivienda S.A. | 9,381 | 97,629 | ||||||
Grupo Aval Acciones y Valores S.A. | 9,215 | 3,750 | ||||||
|
| |||||||
| 101,379 | ||||||||
|
| |||||||
| Korea (Republic of)—0.2% | ||||||||
Samsung Electronics Co., Ltd. | 309 | 442,608 | ||||||
|
| |||||||
| Total Preferred Stock (cost—$741,545) | 865,859 | |||||||
|
| |||||||
| Rights (f)— 0.0% | ||||||||
| Australia—0.0% | ||||||||
Downer EDI Ltd., strike price AUD 5.95, expires 4/11/17 | 4,589 | 42 | ||||||
|
| |||||||
Shares | Value | |||||||
| United States—0.0% | ||||||||
Safeway CVR—Casa Ley, expires 1/30/18 | 4,893 | $ | 4,966 | |||||
Safeway CVR—PDC, expires 1/30/17 | 4,893 | 239 | ||||||
|
| |||||||
| 5,205 | ||||||||
|
| |||||||
| Total Rights (cost—$5,205) | 5,247 | |||||||
|
| |||||||
| Principal Amount (000s) | ||||||||
| Repurchase Agreements—7.7% | ||||||||
State Street Bank and Trust Co., dated 3/31/17, 0.09%, due 4/3/17, proceeds $19,483,146; collateralized by U.S. Treasury Notes, 2.00%, due 11/25/26, valued at $19,874,967 including accrued interest |
| |||||||
(cost—$19,483,000) | $19,483 | 19,483,000 | ||||||
|
| |||||||
| Total Investments (cost—$268,446,848) (d)—108.7% | 276,436,823 | |||||||
|
| |||||||
| Liabilities in excess of other assets (g)—(8.7)% | (22,042,498 | ) | ||||||
|
| |||||||
| Net Assets—100.0% | $254,394,325 | |||||||
|
| |||||||
Notes to Schedule of Investments:
(a) Private Placement—Restricted as to resale and may not have a readily available market. Security with a value of $299,196, representing 0.1% of net assets.
(b) 144A—Exempt from registration under Rule 144A of the Securities Act of 1933. These securities may be resold in transactions exempt from registration, typically only to qualified institutional buyers. Securities with an aggregate value of $1,133,226, representing 0.4% of net assets.
(c) When-issued or delayed-delivery. To be settled/delivered after March 31, 2017.
(d) Securities with an aggregate value of $44,975,253, representing 17.7% of net assets, were valued utilizing modeling tools provided by a third-party vendor. See Note 1(a) and Note 1(b) in the Notes to Financial Statements.
(e) Fair-Valued—Securities with an aggregate value of $336,694, representing 0.1% of net assets. See Note 1(a) and Note 1(b) in the Notes to Financial Statements.
(f) Non-income producing.
(g) Includes net unrealized appreciation (depreciation) of other financial instruments. See Notes 7(b) and 7(c) in the Notes to Financial Statements.
Glossary:
ADR—American Depositary Receipt
AUD—Australian Dollar
CVR—Contingent Value Rights
GDR—Global Depositary Receipt
MBS—Mortgage-Backed Securities
REIT—Real Estate Investment Trust
TBA—To Be Announced
UNIT—More than one class of securities traded together.
The industry classification of portfolio holdings and liabilities in excess of other assets shown as a percentage of net assets were as follows:
U.S. Treasury Obligations | 24.7% | |||
U.S. Government Agency Securities | 7.6% | |||
Banks | 7.5% | |||
Exchange-Traded Funds | 6.1% | |||
Sovereign Debt Obligations | 5.4% | |||
Insurance | 2.6% | |||
Oil, Gas & Consumable Fuels | 2.6% | |||
Pharmaceuticals | 2.2% | |||
Electric Utilities | 2.0% | |||
Health Care Providers & Services | 1.9% | |||
Semiconductors & Semiconductor Equipment | 1.8% | |||
Diversified Telecommunication Services | 1.8% | |||
Food Products | 1.7% | |||
IT Services | 1.4% | |||
Technology Hardware, Storage & Peripherals | 1.4% | |||
Health Care Equipment & Supplies | 1.4% | |||
Internet Software & Services | 1.4% | |||
Media | 1.3% | |||
Software | 1.3% | |||
Chemicals | 1.2% | |||
Hotels, Restaurants & Leisure | 1.2% | |||
Tobacco | 1.1% | |||
Airlines | 1.0% | |||
Automobiles | 1.0% | |||
Specialty Retail | 0.8% | |||
Food & Staples Retailing | 0.8% | |||
Auto Components | 0.8% | |||
Biotechnology | 0.8% | |||
Metals & Mining | 0.7% | |||
Commercial Services & Supplies | 0.7% | |||
Electronic Equipment, Instruments & Components | 0.7% | |||
Industrial Conglomerates | 0.6% | |||
Household Durables | 0.6% | |||
Mortgage Real Estate Investment Trusts (REITs) | 0.6% | |||
Construction & Engineering | 0.6% | |||
Aerospace & Defense | 0.6% | |||
Trading Companies & Distributors | 0.6% | |||
Multi-Utilities | 0.6% | |||
Communications Equipment | 0.6% | |||
Banking | 0.6% | |||
Auto Manufacturers | 0.5% | |||
Capital Markets | 0.5% | |||
Transportation | 0.4% | |||
Real Estate Management & Development | 0.4% | |||
Telecommunications | 0.4% | |||
Equity Real Estate Investment Trusts (REITs) | 0.4% | |||
Machinery | 0.4% | |||
Diversified Financial Services | 0.4% | |||
Multi-line Retail | 0.4% | |||
Road & Rail | 0.3% | |||
Household Products | 0.3% | |||
Life Sciences Tools & Services | 0.3% | |||
Food & Beverage | 0.3% | |||
Agriculture | 0.3% | |||
Internet & Catalog Retail | 0.3% | |||
Paper & Forest Products | 0.2% | |||
Building Products | 0.2% |
| 174 | Semiannual Report | | March 31, 2017 | | See accompanying Notes to Financial Statements |
Table of Contents
Schedule of Investments
March 31, 2017 (Unaudited)
Beverages | 0.2% | |||
Machinery-Diversified | 0.2% | |||
Healthcare-Products | 0.2% | |||
Containers & Packaging | 0.2% | |||
Retail | 0.2% | |||
Construction Materials | 0.2% | |||
Professional Services | 0.2% | |||
Wireless Telecommunication Services | 0.1% | |||
Textiles, Apparel & Luxury Goods | 0.1% | |||
Transportation Infrastructure | 0.1% | |||
Marine | 0.1% | |||
Thrifts & Mortgage Finance | 0.1% | |||
Air Freight & Logistics | 0.1% | |||
Distributors | 0.1% | |||
Consumer Finance | 0.1% | |||
Electrical Equipment | 0.1% | |||
Computers | 0.1% | |||
Gas Utilities | 0.1% | |||
Leisure Equipment & Products | 0.1% | |||
Health Care Technology | 0.1% | |||
Independent Power Producers & Energy Traders | 0.0% | |||
Electronics | 0.0% | |||
Diversified Consumer Services | 0.0% | |||
Personal Products | 0.0% | |||
Water Utilities | 0.0% | |||
Leisure Products | 0.0% | |||
Energy Equipment & Services | 0.0% | |||
Repurchase Agreements | 7.7% | |||
Liabilities in excess of other assets | (8.7)% | |||
|
| |||
| 100.0% | ||||
|
|
AllianzGI Global Fundamental Strategy Fund
| Shares | Value | |||||||||
| Common Stock—36.2% | ||||||||||
| Belgium—2.8% | ||||||||||
bpost S.A. | 6,900 | $161,886 | ||||||||
Warehouses De Pauw CVA REIT | 3,200 | 297,566 | ||||||||
|
| |||||||||
| 459,452 | ||||||||||
|
| |||||||||
| China—2.8% | ||||||||||
Baidu, Inc. ADR (i) | 850 | 146,642 | ||||||||
Midea Group Co., Ltd., Class A | 33,400 | 161,408 | ||||||||
Zhengzhou Yutong Bus Co., Ltd., Class A | 48,300 | 150,637 | ||||||||
|
| |||||||||
| 458,687 | ||||||||||
|
| |||||||||
| France—2.0% | ||||||||||
Thales S.A. | 3,284 | 317,221 | ||||||||
|
| |||||||||
| Germany—5.5% | ||||||||||
Deutsche Wohnen AG | 4,800 | 158,071 | ||||||||
Muenchener Rueckversicherungs-Gesellschaft AG in Muenchen | 900 | 176,177 | ||||||||
SAP SE | 1,823 | 178,851 | ||||||||
Vonovia SE | 10,700 | 376,981 | ||||||||
|
| |||||||||
| 890,080 | ||||||||||
|
| |||||||||
| Hong Kong—1.0% | ||||||||||
HKT Trust & HKT Ltd. UNIT | 120,700 | 156,243 | ||||||||
|
| |||||||||
| Indonesia—1.0% | ||||||||||
Astra International Tbk PT | 260,000 | 168,287 | ||||||||
|
| |||||||||
| Japan—1.9% | ||||||||||
Keyence Corp. | 400 | 160,469 | ||||||||
Suzuki Motor Corp. | 3,500 | 145,368 | ||||||||
|
| |||||||||
| 305,837 | ||||||||||
|
| |||||||||
| Netherlands—0.9% | ||||||||||
Wereldhave NV REIT | 3,100 | 136,495 | ||||||||
|
| |||||||||
| United Kingdom—8.5% | ||||||||||
Admiral Group PLC | 7,200 | 179,402 | ||||||||
BP PLC | 55,710 | 320,673 | ||||||||
Imperial Brands PLC | 2,900 | 140,545 | ||||||||
ITM Power PLC (i) | 500,000 | 111,978 | ||||||||
Randgold Resources Ltd. | 1,284 | 112,196 | ||||||||
Reckitt Benckiser Group PLC | 1,800 | 164,325 | ||||||||
Royal Dutch Shell PLC, Class A | 13,200 | 347,929 | ||||||||
|
| |||||||||
| 1,377,048 | ||||||||||
|
| |||||||||
| United States—9.8% | ||||||||||
AECOM (i) | 8,250 | 293,618 | ||||||||
Cisco Systems, Inc. (e) | 2,500 | 84,500 | ||||||||
General Electric Co. (e) | 5,100 | 151,980 | ||||||||
International Business Machines Corp. | 1,000 | 174,140 | ||||||||
Leidos Holdings, Inc. | 5,900 | 301,726 | ||||||||
Microsoft Corp. (e) | 1,636 | 107,747 | ||||||||
Philip Morris International, Inc. | 1,300 | 146,770 | ||||||||
Two Harbors Investment Corp. REIT | 34,000 | 326,060 | ||||||||
|
| |||||||||
| 1,586,541 | ||||||||||
|
| |||||||||
| Total Common Stock (cost—$5,489,156) | 5,855,891 | |||||||||
|
| |||||||||
| Principal Amount (000s) | Value | |||||||||||
| Sovereign Debt Obligations—28.7% | ||||||||||||
| Argentina—2.0% | ||||||||||||
Argentine Republic Government International Bond (a)(b), |
| |||||||||||
7.50%, 4/22/26 | $ | 300 | $ | 319,050 | ||||||||
|
| |||||||||||
| Australia—2.6% | ||||||||||||
Australia Government Bond, Ser. 25-CI (d), |
| |||||||||||
3.00%, 9/20/25 | AUD | 400 | 429,735 | |||||||||
|
| |||||||||||
| Brazil—1.8% | ||||||||||||
Brazil Notas do Tesouro Nacional, Ser. F, |
| |||||||||||
10.00%, 1/1/27 | BRL | 900 | 287,554 | |||||||||
|
| |||||||||||
| Canada—6.2% | ||||||||||||
Province of Ontario Canada, |
| |||||||||||
2.00%, 9/27/18 | $ | 1,000 | 1,005,309 | |||||||||
|
| |||||||||||
| Indonesia—1.8% | ||||||||||||
Indonesia Treasury Bond, |
| |||||||||||
8.375%, 9/15/26 | IDR | 3,500,000 | 285,899 | |||||||||
|
| |||||||||||
| Italy—6.7% | ||||||||||||
Italy Buoni Poliennali Del Tesoro (d), |
| |||||||||||
1.65%, 4/23/20 | € | 442 | 493,977 | |||||||||
3.10%, 9/15/26 | 468 | 587,503 | ||||||||||
|
| |||||||||||
| 1,081,480 | ||||||||||||
|
| |||||||||||
| Mexico—1.5% | ||||||||||||
Mexican Bonos, Ser. M, |
| |||||||||||
6.50%, 6/9/22 | MXN | 4,700 | 246,648 | |||||||||
|
| |||||||||||
| Spain—2.4% | ||||||||||||
Spain Government Inflation Linked Bond (b)(d), |
| |||||||||||
1.00%, 11/30/30 | € | 350 | 382,683 | |||||||||
|
| |||||||||||
| Supranational—3.7% | ||||||||||||
Inter-American Development Bank, |
| |||||||||||
1.00%, 7/14/17 | $ | 600 | 599,908 | |||||||||
|
| |||||||||||
| Total Sovereign Debt Obligations (cost—$4,872,342) | 4,638,266 | |||||||||||
|
| |||||||||||
| Corporate Bonds & Notes—16.9% | ||||||||||||
| Brazil—0.7% | ||||||||||||
Petrobras Global Finance BV, |
| |||||||||||
4.375%, 5/20/23 | 130 | 123,500 | ||||||||||
|
| |||||||||||
| Mexico—2.6% | ||||||||||||
Controladora Mabe S.A. de C.V. (a)(b), |
| |||||||||||
7.875%, 10/28/19 | 200 | 219,724 | ||||||||||
Petroleos Mexicanos, |
| |||||||||||
6.625%, 6/15/35 | 190 | 197,410 | ||||||||||
|
| |||||||||||
| 417,134 | ||||||||||||
|
| |||||||||||
| Switzerland—3.3% | ||||||||||||
Credit Suisse AG, |
| |||||||||||
5.30%, 8/13/19 | 500 | 536,277 | ||||||||||
|
| |||||||||||
| United States—10.3% | ||||||||||||
AT&T, Inc., |
| |||||||||||
5.80%, 2/15/19 | 500 | 534,119 | ||||||||||
HSBC USA, Inc., |
| |||||||||||
1.625%, 1/16/18 | 500 | 499,748 | ||||||||||
Oracle Corp., |
| |||||||||||
5.75%, 4/15/18 | 600 | 626,443 | ||||||||||
|
| |||||||||||
| 1,660,310 | ||||||||||||
|
| |||||||||||
| Total Corporate Bonds & Notes (cost—$2,679,654) | 2,737,221 | |||||||||||
|
| |||||||||||
| U.S. Treasury Obligations (d)— 3.9% | ||||||||||||
U.S. Treasury Inflation Indexed Bonds, |
| |||||||||||
2.125%, 2/15/40 | 337 | 425,884 | ||||||||||
| See accompanying Notes to Financial Statements | | March 31, 2017 | | Semiannual Report | 175 |
Table of Contents
Schedule of Investments
March 31, 2017 (Unaudited)
| Principal Amount (000s) | Value | |||||||||||
3.625%, 4/15/28 | $ | 150 | $ | 199,783 | ||||||||
|
| |||||||||||
| Total U.S. Treasury Obligations (cost—$630,864) | 625,667 | |||||||||||
|
| |||||||||||
| Shares | ||||||||||||
| Mutual Funds (f)—3.2% | ||||||||||||
AllianzGI Best Styles Emerging Markets Equity (h) | 23,342 | 337,761 | ||||||||||
AllianzGI NFJ Emerging Markets Value (g) | 11,108 | 172,389 | ||||||||||
|
| |||||||||||
| Total Mutual Funds (cost—$498,354) | 510,150 | |||||||||||
|
| |||||||||||
| Exchange-Traded Funds—2.0% | ||||||||||||
iShares MSCI India | 10,400 | 327,444 | ||||||||||
|
| |||||||||||
| Principal Amount (000s) | ||||||||||||
| Repurchase Agreements—4.8% | ||||||||||||
State Street Bank and Trust Co., dated 3/31/17, 0.09%, due 4/3/17, proceeds $780,006; collateralized by U.S. Treasury Notes, 2.00%, due 11/25/26, valued at $796,553 including accrued interest |
| |||||||||||
(cost—$780,000) | $780 | 780,000 | ||||||||||
|
| |||||||||||
| Contracts | ||||||||||||
| Options Purchased (i)(k)— 0.2% | ||||||||||||
| Call Options—0.2% | ||||||||||||
S&P 500 Index, | 18 | 18,180 | ||||||||||
Sanofi, | 50 | 14,855 | ||||||||||
|
| |||||||||||
| Total Options Purchased (cost—$31,904) | 33,035 | |||||||||||
|
| |||||||||||
| Total Investments (cost—$15,295,588) (c)—95.9% | 15,507,674 | |||||||||||
|
| |||||||||||
| Other assets less liabilities (j)—4.1% | 660,573 | |||||||||||
|
| |||||||||||
| Net Assets—100.0% | $16,168,247 | |||||||||||
|
| |||||||||||
Notes to Schedule of Investments:
(a) Private Placement—Restricted as to resale and may not have a readily available market. Securities with an aggregate value of $538,774, representing 3.3% of net assets.
(b) 144A—Exempt from registration under Rule 144A of the Securities Act of 1933. These securities may be resold in transactions exempt from registration, typically only to qualified institutional buyers. Securities with an aggregate value of $921,457, representing 5.7% of net assets.
(c) Securities with an aggregate value of $3,854,487, representing 23.8% of net assets, were valued utilizing modeling tools provided by a third-party vendor. See Note 1(a) and Note 1(b) in the Notes to Financial Statements.
(d) Inflationary Bonds—Principal amount of security is adjusted for inflation/deflation.
(e) All or partial amount segregated for the benefit of the counterparty as collateral for options written. There were no options written outstanding at March 31, 2017, however the Fund had securities segregated as collateral for any transactions in the future.
(f) Affiliated fund.
(g) Institutional Class share.
(h) Class R6 share.
(i) Non-income producing.
(j) Includes net unrealized appreciation (depreciation) of other financial instruments. See Notes 7(b) and 7(c) in the Notes to Financial Statements.
(k) Exchange traded—Chicago Board Options Exchange.
Glossary:
ADR—American Depositary Receipt
AUD—Australian Dollar
BRL—Brazilian Real
€—Euro
IDR—Indonesian Rupiah
MSCI—Morgan Stanley Capital International
MXN—Mexican Peso
REIT—Real Estate Investment Trust
UNIT—More than one class of securities traded together.
The industry classification of portfolio holdings and other assets less liabilities shown as a percentage of net assets were as follows:
Sovereign Debt Obligations | 28.7% | |||
Banks | 6.4% | |||
Oil, Gas & Consumable Fuels | 6.1% | |||
Software | 5.7% | |||
U.S. Treasury Obligations | 3.9% | |||
Real Estate Management & Development | 3.3% | |||
Telecommunications | 3.3% | |||
Mutual Funds | 3.2% | |||
IT Services | 2.9% | |||
Equity Real Estate Investment Trusts (REITs) | 2.7% | |||
Insurance | 2.2% | |||
Exchange-Traded Funds | 2.0% | |||
Mortgage Real Estate Investment Trusts (REITs) | 2.0% | |||
Aerospace & Defense | 2.0% | |||
Automobiles | 1.9% | |||
Construction & Engineering | 1.8% | |||
Tobacco | 1.8% | |||
Household Products/Wares | 1.4% | |||
Household Products | 1.0% | |||
Air Freight & Logistics | 1.0% | |||
Household Durables | 1.0% | |||
Electronic Equipment, Instruments & Components | 1.0% | |||
Diversified Telecommunication Services | 1.0% | |||
Industrial Conglomerates | 0.9% | |||
Machinery | 0.9% | |||
Internet Software & Services | 0.9% | |||
Metals & Mining | 0.7% | |||
Electrical Equipment | 0.7% | |||
Communications Equipment | 0.5% | |||
Repurchase Agreements | 4.8% | |||
Options Purchased | 0.2% | |||
Other assets less liabilities | 4.1% | |||
|
| |||
| 100.0% | ||||
|
|
| 176 | Semiannual Report | | March 31, 2017 | | See accompanying Notes to Financial Statements |
Table of Contents
Schedule of Investments
March 31, 2017 (Unaudited)
AllianzGI Global Sustainability Fund
| Shares | Value | |||||||
| Common Stock—96.2% | ||||||||
| Australia—2.0% | ||||||||
Australia & New Zealand Banking Group Ltd. | 20,809 | $505,256 | ||||||
|
| |||||||
| Canada—1.1% | ||||||||
Gibson Energy, Inc. | 18,200 | 261,398 | ||||||
|
| |||||||
| Denmark—1.1% | ||||||||
Novo Nordisk A/S, Class B | 8,012 | 275,124 | ||||||
|
| |||||||
| France—2.8% | ||||||||
BNP Paribas S.A. | 5,758 | 383,161 | ||||||
Bureau Veritas S.A. | 14,603 | 307,810 | ||||||
|
| |||||||
| 690,971 | ||||||||
|
| |||||||
| Germany—6.3% | ||||||||
adidas AG | 2,797 | 532,079 | ||||||
Muenchener Rueckversicherungs-Gesellschaft AG in Muenchen | 2,751 | 538,514 | ||||||
SAP SE | 4,828 | 473,665 | ||||||
|
| |||||||
| 1,544,258 | ||||||||
|
| |||||||
| Japan—5.1% | ||||||||
Astellas Pharma, Inc. | 18,400 | 242,676 | ||||||
Daikin Industries Ltd. | 6,100 | 615,113 | ||||||
Keyence Corp. | 1,000 | 401,173 | ||||||
|
| |||||||
| 1,258,962 | ||||||||
|
| |||||||
| Spain—4.0% | ||||||||
Amadeus IT Group S.A. | 11,142 | 564,549 | ||||||
Industria de Diseno Textil S.A. | 12,012 | 423,021 | ||||||
|
| |||||||
| 987,570 | ||||||||
|
| |||||||
| Sweden—3.5% | ||||||||
Atlas Copco AB, Class A | 14,793 | 521,439 | ||||||
Skandinaviska Enskilda Banken AB, Class A | 31,341 | 348,265 | ||||||
|
| |||||||
| 869,704 | ||||||||
|
| |||||||
| Switzerland—4.5% | ||||||||
Nestle S.A. | 3,687 | 282,984 | ||||||
Roche Holding AG | 2,145 | 548,549 | ||||||
UBS Group AG | 17,521 | 280,066 | ||||||
|
| |||||||
| 1,111,599 | ||||||||
|
| |||||||
| United Kingdom—14.9% | ||||||||
AstraZeneca PLC | 5,848 | 359,576 | ||||||
Nielsen Holdings PLC | 5,301 | 218,984 | ||||||
Prudential PLC | 33,225 | 701,822 | ||||||
Reckitt Benckiser Group PLC | 5,410 | 493,888 | ||||||
Royal Dutch Shell PLC, Class B | 12,747 | 350,408 | ||||||
Unilever PLC | 15,018 | 740,797 | ||||||
Vodafone Group PLC | 147,825 | 385,230 | ||||||
WPP PLC | 19,124 | 419,180 | ||||||
|
| |||||||
| 3,669,885 | ||||||||
|
| |||||||
| United States—50.9% | ||||||||
Accenture PLC, Class A | 4,035 | 483,716 | ||||||
Agilent Technologies, Inc. | 9,601 | 507,605 | ||||||
Alphabet, Inc., Class A (b) | 783 | 663,827 | ||||||
American Express Co. | 8,331 | 659,065 | ||||||
Apple, Inc. | 4,289 | 616,158 | ||||||
Biogen, Inc. (b) | 841 | 229,946 | ||||||
Citigroup, Inc. | 10,187 | 609,386 | ||||||
Colgate-Palmolive Co. | 5,938 | 434,602 | ||||||
Eaton Corp. PLC | 6,231 | 462,029 | ||||||
Ecolab, Inc. | 3,434 | 430,418 | ||||||
EOG Resources, Inc. | 4,811 | 469,313 | ||||||
Estee Lauder Cos., Inc., Class A | 5,631 | 477,453 | ||||||
Intel Corp. | 7,292 | 263,023 | ||||||
| Shares | Value | |||||||
International Flavors & Fragrances, Inc. | 3,723 | $ | 493,409 | |||||
Intuit, Inc. | 3,858 | 447,490 | ||||||
Johnson & Johnson | 5,088 | 633,710 | ||||||
Microsoft Corp. | 9,128 | 601,170 | ||||||
Mondelez International, Inc., Class A | 9,842 | 423,993 | ||||||
Priceline Group, Inc. (b) | 302 | 537,551 | ||||||
S&P Global, Inc. | 3,777 | 493,805 | ||||||
Schlumberger Ltd. | 4,912 | 383,627 | ||||||
Starbucks Corp. | 9,954 | 581,214 | ||||||
Visa, Inc., Class A | 9,999 | 888,611 | ||||||
WW Grainger, Inc. | 1,552 | 361,244 | ||||||
Xylem, Inc. | 8,255 | 414,566 | ||||||
|
| |||||||
| 12,566,931 | ||||||||
|
| |||||||
| Total Common Stock (cost—$21,283,571) | 23,741,658 | |||||||
|
| |||||||
| Preferred Stock—1.2% | ||||||||
| Germany—1.2% | ||||||||
Henkel AG & Co. KGaA (cost—$253,180) | 2,321 | 297,494 | ||||||
|
| |||||||
| Principal Amount (000s) | ||||||||
| Repurchase Agreements—2.4% | ||||||||
State Street Bank and Trust Co., dated 3/31/17, 0.09%, due 4/3/17, proceeds $603,005; collateralized by U.S. Treasury Notes, 2.25%, due 11/15/25, valued at $618,731 including accrued interest |
| |||||||
(cost—$603,000) | $603 | 603,000 | ||||||
|
| |||||||
| Total Investments (cost—$22,139,751) (a)—99.8% | 24,642,152 | |||||||
|
| |||||||
| Other assets less liabilities—0.2% | 47,949 | |||||||
|
| |||||||
| Net Assets—100.0% | $24,690,101 | |||||||
|
| |||||||
Notes to Schedule of Investments:
(a) Securities with an aggregate value of $10,991,839, representing 44.5% of net assets, were valued utilizing modeling tools provided by a third-party vendor. See Note 1(a) and Note 1(b) in the Notes to Financial Statements.
(b) Non-income producing.
The industry classification of portfolio holdings and other assets less liabilities shown as a percentage of net assets were as follows:
Pharmaceuticals | 8.3% | |||
IT Services | 7.8% | |||
Banks | 7.5% | |||
Software | 6.2% | |||
Insurance | 5.0% | |||
Household Products | 5.0% | |||
Personal Products | 4.9% | |||
Oil, Gas & Consumable Fuels | 4.4% | |||
Machinery | 3.8% | |||
Chemicals | 3.7% | |||
Capital Markets | 3.1% | |||
Food Products | 2.9% | |||
Internet Software & Services | 2.7% | |||
Consumer Finance | 2.7% | |||
Technology Hardware, Storage & Peripherals | 2.5% | |||
Building Products | 2.5% | |||
Hotels, Restaurants & Leisure | 2.3% | |||
Internet & Catalog Retail | 2.2% | |||
Textiles, Apparel & Luxury Goods | 2.2% | |||
Professional Services | 2.1% | |||
Life Sciences Tools & Services | 2.1% | |||
Electrical Equipment | 1.9% | |||
Specialty Retail | 1.7% | |||
Media | 1.7% | |||
Electronic Equipment, Instruments & Components | 1.6% | |||
Wireless Telecommunication Services | 1.6% | |||
Energy Equipment & Services | 1.5% | |||
Trading Companies & Distributors | 1.5% | |||
Semiconductors & Semiconductor Equipment | 1.1% | |||
Biotechnology | 0.9% | |||
Repurchase Agreements | 2.4% | |||
Other assets less liabilities | 0.2% | |||
|
| |||
| 100.0% | ||||
|
|
| See accompanying Notes to Financial Statements | | March 31, 2017 | | Semiannual Report | 177 |
Table of Contents
Schedule of Investments
March 31, 2017 (Unaudited)
AllianzGI Global Water Fund
Shares | Value | |||||||
| Common Stock—93.1% | ||||||||
| Austria—1.5% | ||||||||
Wienerberger AG | 378,222 | $8,013,712 | ||||||
|
| |||||||
| Brazil—1.1% | ||||||||
Cia de Saneamento Basico do Estado de Sao Paulo ADR | 565,412 | 5,885,939 | ||||||
|
| |||||||
| Canada—1.4% | ||||||||
Stantec, Inc. | 293,175 | 7,607,978 | ||||||
|
| |||||||
| China—5.3% | ||||||||
China Everbright International Ltd. | 7,500,000 | 10,100,319 | ||||||
Guangdong Investment Ltd. | 13,236,000 | 18,873,482 | ||||||
|
| |||||||
| 28,973,801 | ||||||||
|
| |||||||
| Finland—2.9% | ||||||||
Uponor Oyj | 580,665 | 10,287,484 | ||||||
Wartsila Oyj Abp | 102,153 | 5,461,399 | ||||||
|
| |||||||
| 15,748,883 | ||||||||
|
| |||||||
| France—7.8% | ||||||||
Suez | 1,390,292 | 21,941,675 | ||||||
Veolia Environnement S.A. | 1,110,310 | 20,820,386 | ||||||
|
| |||||||
| 42,762,061 | ||||||||
|
| |||||||
| Germany—2.0% | ||||||||
GEA Group AG | 256,505 | 10,897,229 | ||||||
|
| |||||||
| Hong Kong—3.0% | ||||||||
Beijing Enterprises Water Group Ltd. (b) | 22,282,000 | 16,517,285 | ||||||
|
| |||||||
| Italy—0.8% | ||||||||
ACEA SpA | 335,755 | 4,570,420 | ||||||
|
| |||||||
| Netherlands—3.1% | ||||||||
Aalberts Industries NV | 393,478 | 14,667,129 | ||||||
Arcadis NV | 137,000 | 2,157,833 | ||||||
|
| |||||||
| 16,824,962 | ||||||||
|
| |||||||
| Switzerland—9.0% | ||||||||
Belimo Holding AG | 793 | 2,770,928 | ||||||
Geberit AG | 107,947 | 46,515,513 | ||||||
|
| |||||||
| 49,286,441 | ||||||||
|
| |||||||
| United Kingdom—19.1% | ||||||||
Halma PLC | 1,243,968 | 15,962,817 | ||||||
Pennon Group PLC | 2,202,736 | 24,332,457 | ||||||
Pentair PLC | 348,308 | 21,866,776 | ||||||
Severn Trent PLC | 1,056,360 | 31,510,212 | ||||||
United Utilities Group PLC | 874,138 | 10,883,872 | ||||||
|
| |||||||
| 104,556,134 | ||||||||
|
| |||||||
| United States—36.1% | ||||||||
American Water Works Co., Inc. | 634,898 | 49,376,017 | ||||||
Badger Meter, Inc. | 154,209 | 5,667,181 | ||||||
Danaher Corp. | 312,239 | 26,705,802 | ||||||
Franklin Electric Co., Inc. | 307,068 | 13,219,277 | ||||||
HD Supply Holdings, Inc. (b) | 125,564 | 5,163,819 | ||||||
IDEX Corp. | 292,965 | 27,395,157 | ||||||
Mueller Water Products, Inc., Class A | 1,127,530 | 13,327,405 | ||||||
Rexnord Corp. (b) | 465,000 | 10,732,200 | ||||||
Watts Water Technologies, Inc., Class A | 152,673 | 9,519,162 | ||||||
Shares | Value | |||||||
Xylem, Inc. | 724,678 | $ | 36,393,329 | |||||
|
| |||||||
| 197,499,349 | ||||||||
|
| |||||||
| Total Common Stock (cost—$443,773,741) | 509,144,194 | |||||||
|
| |||||||
| Principal Amount (000s) | ||||||||
| Repurchase Agreements—6.8% | ||||||||
State Street Bank and Trust Co., dated 3/31/17, 0.09%, due 4/3/17, proceeds $37,405,281; collateralized by U.S. Treasury Notes, 2.00%, due 11/25/26, valued at $38,156,828 including accrued interest |
| |||||||
(cost—$37,405,000) | $37,405 | 37,405,000 | ||||||
|
| |||||||
| Total Investments (cost—$481,178,741) (a)—99.9% | 546,549,194 | |||||||
|
| |||||||
| Other assets less liabilities—0.1% | 363,578 | |||||||
|
| |||||||
| Net Assets—100.0% | $546,912,772 | |||||||
|
| |||||||
Notes to Schedule of Investments:
(a) Securities with an aggregate value of $268,942,804, representing 49.2% of net assets, were valued utilizing modeling tools provided by a third-party vendor. See Note 1(a) and Note 1(b) in the Notes to Financial Statements.
(b) Non-income producing.
Glossary:
ADR—American Depositary Receipt
The industry classification of portfolio holdings and other assets less liabilities shown as a percentage of net assets were as follows:
Machinery | 29.9% | |||
Water Utilities | 28.8% | |||
Building Products | 10.9% | |||
Multi-Utilities | 8.6% | |||
Health Care Equipment & Supplies | 4.9% | |||
Electronic Equipment, Instruments & Components | 4.0% | |||
Commercial Services & Supplies | 1.8% | |||
Construction Materials | 1.5% | |||
Professional Services | 1.4% | |||
Trading Companies & Distributors | 0.9% | |||
Construction & Engineering | 0.4% | |||
Repurchase Agreements | 6.8% | |||
Other assets less liabilities | 0.1% | |||
|
| |||
| 100.0% | ||||
|
|
AllianzGI High Yield Bond Fund
| Principal Amount (000s) | Value | |||||||
| Corporate Bonds & Notes—94.0% | ||||||||
| Aerospace & Defense—2.1% | ||||||||
KLX, Inc. (a)(b), | ||||||||
5.875%, 12/1/22 | $2,265 | $2,344,275 | ||||||
Kratos Defense & Security Solutions, Inc., |
| |||||||
7.00%, 5/15/19 | 2,448 | 2,460,240 | ||||||
TransDigm, Inc., | ||||||||
6.50%, 5/15/25 | 2,230 | 2,255,087 | ||||||
|
| |||||||
| 7,059,602 | ||||||||
|
| |||||||
| Auto Components—2.2% | ||||||||
American Axle & Manufacturing, Inc., |
| |||||||
6.625%, 10/15/22 | 1,990 | 2,059,650 | ||||||
Commercial Vehicle Group, Inc., |
| |||||||
7.875%, 4/15/19 | 3,278 | 3,286,195 | ||||||
Goodyear Tire & Rubber Co., | ||||||||
5.125%, 11/15/23 | 2,000 | 2,086,250 | ||||||
|
| |||||||
| 7,432,095 | ||||||||
|
| |||||||
| Auto Manufacturers—0.8% | ||||||||
Navistar International Corp., | ||||||||
8.25%, 11/1/21 | 2,790 | 2,803,922 | ||||||
|
| |||||||
| Banks—1.0% | ||||||||
CIT Group, Inc., | ||||||||
5.00%, 8/15/22 | 645 | 676,844 | ||||||
Royal Bank of Scotland Group PLC, |
| |||||||
5.125%, 5/28/24 | 2,625 | 2,658,143 | ||||||
|
| |||||||
| 3,334,987 | ||||||||
|
| |||||||
| Building Materials—0.6% | ||||||||
Builders FirstSource, Inc. (a)(b), |
| |||||||
5.625%, 9/1/24 | 2,120 | 2,159,750 | ||||||
|
| |||||||
| Chemicals—3.6% | ||||||||
Chemours Co., | ||||||||
7.00%, 5/15/25 | 2,370 | 2,563,155 | ||||||
Kraton Polymers LLC (a)(b), | ||||||||
7.00%, 4/15/25 | 1,330 | 1,353,275 | ||||||
Platform Specialty Products Corp. (a)(b), |
| |||||||
6.50%, 2/1/22 | 3,505 | 3,653,962 | ||||||
Tronox Finance LLC (a)(b), | ||||||||
7.50%, 3/15/22 | 2,305 | 2,385,675 | ||||||
Univar USA, Inc. (a)(b), | ||||||||
6.75%, 7/15/23 | 2,135 | 2,225,738 | ||||||
|
| |||||||
| 12,181,805 | ||||||||
|
| |||||||
| Commercial Services—4.0% | ||||||||
Cardtronics, Inc., | ||||||||
5.125%, 8/1/22 | 1,440 | 1,465,200 | ||||||
5.50%, 5/1/25 (a)(b) | 820 | 832,300 | ||||||
Cenveo Corp. (a)(b), | ||||||||
6.00%, 5/15/24 | 2,299 | 2,011,625 | ||||||
Gartner, Inc. (a)(b), | ||||||||
5.125%, 4/1/25 | 1,285 | 1,312,306 | ||||||
Hertz Corp., | ||||||||
5.50%, 10/15/24 (a)(b) | 635 | 554,831 | ||||||
6.75%, 4/15/19 | 55 | 55,138 | ||||||
RR Donnelley & Sons Co., |
| |||||||
6.00%, 4/1/24 | 2,125 | 1,989,531 | ||||||
7.00%, 2/15/22 | 2,055 | 2,096,100 | ||||||
United Rentals North America, Inc., |
| |||||||
5.50%, 7/15/25 | 3,100 | 3,204,625 | ||||||
|
| |||||||
| 13,521,656 | ||||||||
|
| |||||||
| Computers—1.8% | ||||||||
Diamond 1 Finance Corp. (a)(b), |
| |||||||
7.125%, 6/15/24 | 2,445 | 2,704,197 | ||||||
Harland Clarke Holdings Corp. (a)(b), |
| |||||||
9.25%, 3/1/21 | 2,450 | 2,391,812 | ||||||
Western Digital Corp., | ||||||||
10.50%, 4/1/24 | 1,025 | 1,209,500 | ||||||
|
| |||||||
| 6,305,509 | ||||||||
|
| |||||||
| 178 | Semiannual Report | | March 31, 2017 | | See accompanying Notes to Financial Statements |
Table of Contents
Schedule of Investments
March 31, 2017 (Unaudited)
| Principal Amount (000s) | Value | |||||||
| Containers & Packaging—0.1% | ||||||||
Owens-Brockway Glass Container, Inc. (a)(b), |
| |||||||
5.00%, 1/15/22 | $ | 385 | $ | 397,513 | ||||
|
| |||||||
| Distribution/Wholesale—2.0% | ||||||||
H&E Equipment Services, Inc., |
| |||||||
7.00%, 9/1/22 | 2,255 | 2,376,206 | ||||||
HD Supply, Inc. (a)(b), |
| |||||||
5.75%, 4/15/24 | 1,190 | 1,254,617 | ||||||
Park-Ohio Industries, Inc., |
| |||||||
8.125%, 4/1/21 | 3,165 | 3,266,502 | ||||||
|
| |||||||
| 6,897,325 | ||||||||
|
| |||||||
| Diversified Financial Services—4.8% | ||||||||
Ally Financial, Inc., |
| |||||||
5.75%, 11/20/25 | 2,345 | 2,409,487 | ||||||
8.00%, 3/15/20 | 1,805 | 2,030,625 | ||||||
Community Choice Financial, Inc., |
| |||||||
10.75%, 5/1/19 | 2,060 | 1,787,050 | ||||||
Energizer Holdings, Inc. (a)(b), |
| |||||||
5.50%, 6/15/25 | 2,250 | 2,300,625 | ||||||
Nationstar Mortgage LLC, |
| |||||||
7.875%, 10/1/20 | 1,725 | 1,789,687 | ||||||
9.625%, 5/1/19 | 1,000 | 1,028,125 | ||||||
Navient Corp., |
| |||||||
6.625%, 7/26/21 | 2,045 | 2,121,687 | ||||||
7.25%, 9/25/23 | 1,330 | 1,343,300 | ||||||
Springleaf Finance Corp., |
| |||||||
6.90%, 12/15/17 | 365 | 375,841 | ||||||
8.25%, 10/1/23 | 1,170 | 1,238,738 | ||||||
|
| |||||||
| 16,425,165 | ||||||||
|
| |||||||
| Electric Utilities—0.7% | ||||||||
NRG Energy, Inc., |
| |||||||
6.25%, 5/1/24 | 2,400 | 2,404,500 | ||||||
|
| |||||||
| Electrical Equipment—0.0% | ||||||||
Anixter, Inc., |
| |||||||
5.125%, 10/1/21 | 100 | 104,500 | ||||||
|
| |||||||
| Electronics—0.6% | ||||||||
Kemet Corp., |
| |||||||
10.50%, 5/1/18 | 2,059 | 2,069,552 | ||||||
|
| |||||||
| Engineering & Construction—0.9% | ||||||||
AECOM, |
| |||||||
5.875%, 10/15/24 | 2,755 | 2,940,963 | ||||||
|
| |||||||
| Entertainment—2.4% | ||||||||
AMC Entertainment Holdings, Inc. (a)(b), |
| |||||||
6.125%, 5/15/27 | 1,640 | 1,658,450 | ||||||
Cedar Fair L.P., |
| |||||||
5.375%, 6/1/24 | 3,145 | 3,239,350 | ||||||
International Game Technology PLC (a)(b), |
| |||||||
6.25%, 2/15/22 | 3,190 | 3,421,275 | ||||||
|
| |||||||
| 8,319,075 | ||||||||
|
| |||||||
| Equity Real Estate Investment Trusts (REITs)—0.2% | ||||||||
CyrusOne L.P. (a)(b), |
| |||||||
5.00%, 3/15/24 | 260 | 267,800 | ||||||
5.375%, 3/15/27 | 385 | 389,813 | ||||||
|
| |||||||
| 657,613 | ||||||||
|
| |||||||
| Food & Beverage—1.5% | ||||||||
Albertsons Cos. LLC (a)(b), |
| |||||||
6.625%, 6/15/24 | 750 | 768,750 | ||||||
Lamb Weston Holdings, Inc. (a)(b), |
| |||||||
4.875%, 11/1/26 | 1,605 | 1,641,113 | ||||||
Post Holdings, Inc. (a)(b), |
| |||||||
5.75%, 3/1/27 | 2,075 | 2,080,187 | ||||||
7.75%, 3/15/24 | 625 | 692,319 | ||||||
|
| |||||||
| 5,182,369 | ||||||||
|
| |||||||
| Principal Amount (000s) | Value | |||||||
| Healthcare-Products—1.8% | ||||||||
Hill-Rom Holdings, Inc. (a)(b), |
| |||||||
5.00%, 2/15/25 | $ | 985 | $ | 986,231 | ||||
Hologic, Inc. (a)(b), |
| |||||||
5.25%, 7/15/22 | 2,245 | 2,362,863 | ||||||
Teleflex, Inc., |
| |||||||
5.25%, 6/15/24 | 2,855 | 2,926,375 | ||||||
|
| |||||||
| 6,275,469 | ||||||||
|
| |||||||
| Healthcare-Services—5.2% | ||||||||
Centene Corp., |
| |||||||
4.75%, 1/15/25 | 1,170 | 1,179,512 | ||||||
Community Health Systems, Inc., |
| |||||||
6.25%, 3/31/23 | 650 | 665,438 | ||||||
7.125%, 7/15/20 | 1,990 | 1,830,800 | ||||||
DaVita, Inc., |
| |||||||
5.125%, 7/15/24 | 2,810 | 2,843,369 | ||||||
Envision Healthcare Corp. (a)(b), |
| |||||||
5.125%, 7/1/22 | 1,900 | 1,943,339 | ||||||
6.25%, 12/1/24 | 935 | 984,087 | ||||||
HCA, Inc., |
| |||||||
7.50%, 2/15/22 | 2,500 | 2,865,625 | ||||||
Kindred Healthcare, Inc., |
| |||||||
6.375%, 4/15/22 | 1,803 | 1,688,059 | ||||||
8.75%, 1/15/23 | 1,235 | 1,242,719 | ||||||
Tenet Healthcare Corp., |
| |||||||
8.125%, 4/1/22 | 2,335 | 2,445,912 | ||||||
|
| |||||||
| 17,688,860 | ||||||||
|
| |||||||
| Home Builders—2.5% | ||||||||
Beazer Homes USA, Inc. (a)(b), |
| |||||||
8.75%, 3/15/22 | 1,830 | 2,008,425 | ||||||
Brookfield Residential Properties, Inc. (a)(b), |
| |||||||
6.50%, 12/15/20 | 1,665 | 1,729,519 | ||||||
CalAtlantic Group, Inc., |
| |||||||
5.875%, 11/15/24 | 2,150 | 2,265,562 | ||||||
KB Home, |
| |||||||
8.00%, 3/15/20 | 2,105 | 2,347,075 | ||||||
|
| |||||||
| 8,350,581 | ||||||||
|
| |||||||
| Household Products/Wares—0.9% | ||||||||
Spectrum Brands, Inc., |
| |||||||
5.75%, 7/15/25 | 2,750 | 2,921,875 | ||||||
|
| |||||||
| Insurance—0.6% | ||||||||
CNO Financial Group, Inc., |
| |||||||
5.25%, 5/30/25 | 2,060 | 2,123,098 | ||||||
|
| |||||||
| Internet—0.8% | ||||||||
Symantec Corp. (a)(b), |
| |||||||
5.00%, 4/15/25 | 1,290 | 1,321,553 | ||||||
Zayo Group LLC (a)(b), |
| |||||||
5.75%, 1/15/27 | 1,260 | 1,332,198 | ||||||
|
| |||||||
| 2,653,751 | ||||||||
|
| |||||||
| Internet & Catalog Retail—0.8% | ||||||||
Netflix, Inc., |
| |||||||
5.875%, 2/15/25 | 2,420 | 2,607,550 | ||||||
|
| |||||||
| Iron/Steel—2.4% | ||||||||
AK Steel Corp., |
| |||||||
7.00%, 3/15/27 | 545 | 545,681 | ||||||
7.50%, 7/15/23 | 1,395 | 1,520,550 | ||||||
8.375%, 4/1/22 | 675 | 704,109 | ||||||
ArcelorMittal, |
| |||||||
10.60%, 6/1/19 | 1,315 | 1,551,832 | ||||||
Steel Dynamics, Inc., |
| |||||||
5.50%, 10/1/24 | 830 | 869,425 | ||||||
United States Steel Corp. (a)(b), |
| |||||||
8.375%, 7/1/21 | 2,580 | 2,870,250 | ||||||
|
| |||||||
| 8,061,847 | ||||||||
|
| |||||||
| Principal Amount (000s) | Value | |||||||
| Lodging—1.2% | ||||||||
MGM Resorts International, |
| |||||||
6.625%, 12/15/21 | $ | 2,000 | $ | 2,220,000 | ||||
Wynn Las Vegas LLC (a)(b), |
| |||||||
5.50%, 3/1/25 | 1,685 | 1,716,594 | ||||||
|
| |||||||
| 3,936,594 | ||||||||
|
| |||||||
| Machinery-Construction & Mining—0.5% | ||||||||
Terex Corp. (a)(b), |
| |||||||
5.625%, 2/1/25 | 1,640 | 1,666,650 | ||||||
|
| |||||||
| Machinery-Diversified—0.6% | ||||||||
Zebra Technologies Corp., |
| |||||||
7.25%, 10/15/22 | 1,930 | 2,091,638 | ||||||
|
| |||||||
| Media—6.7% | ||||||||
CCO Holdings LLC, |
| |||||||
5.125%, 5/1/27 (a)(b) | 560 | 565,250 | ||||||
5.50%, 5/1/26 (a)(b) | 2,005 | 2,080,188 | ||||||
5.75%, 1/15/24 | 2,070 | 2,157,975 | ||||||
Clear Channel Worldwide Holdings, Inc., Ser. B, |
| |||||||
6.50%, 11/15/22 | 2,195 | 2,289,648 | ||||||
CSC Holdings LLC, |
| |||||||
6.75%, 11/15/21 | 2,360 | 2,565,025 | ||||||
DISH DBS Corp., |
| |||||||
5.875%, 7/15/22 | 3,000 | 3,159,360 | ||||||
Gray Television, Inc. (a)(b), |
| |||||||
5.875%, 7/15/26 | 2,605 | 2,657,100 | ||||||
LIN Television Corp., |
| |||||||
5.875%, 11/15/22 | 1,930 | 2,007,200 | ||||||
LiveStyle, Inc. (a)(b)(c)(e), |
| |||||||
9.625%, 2/1/19 | 2,761 | 27,610 | ||||||
McClatchy Co., |
| |||||||
9.00%, 12/15/22 | 2,410 | 2,512,425 | ||||||
Nexstar Broadcasting, Inc. (a)(b), |
| |||||||
5.625%, 8/1/24 | 2,795 | 2,843,912 | ||||||
|
| |||||||
| 22,865,693 | ||||||||
|
| |||||||
| Mining—3.1% | ||||||||
Alcoa Nederland Holding BV (a)(b), |
| |||||||
6.75%, 9/30/24 | 1,800 | 1,939,500 | ||||||
7.00%, 9/30/26 | 535 | 584,488 | ||||||
Freeport-McMoRan, Inc., |
| |||||||
3.55%, 3/1/22 | 2,785 | 2,597,012 | ||||||
Hudbay Minerals, Inc. (a)(b), |
| |||||||
7.25%, 1/15/23 | 385 | 410,025 | ||||||
7.625%, 1/15/25 | 1,330 | 1,449,700 | ||||||
Joseph T. Ryerson & Son, Inc. (a)(b), |
| |||||||
11.00%, 5/15/22 | 2,515 | 2,835,662 | ||||||
Teck Resources Ltd. (a)(b), |
| |||||||
8.00%, 6/1/21 | 375 | 408,281 | ||||||
8.50%, 6/1/24 | 375 | 433,594 | ||||||
|
| |||||||
| 10,658,262 | ||||||||
|
| |||||||
| Miscellaneous Manufacturing—1.0% | ||||||||
Koppers, Inc. (a)(b), |
| |||||||
6.00%, 2/15/25 | 1,180 | 1,221,300 | ||||||
Trinseo Materials Operating SCA (a)(b), |
| |||||||
6.75%, 5/1/22 | 1,995 | 2,107,219 | ||||||
|
| |||||||
| 3,328,519 | ||||||||
|
| |||||||
| Oil, Gas & Consumable Fuels—8.5% | ||||||||
Callon Petroleum Co. (a)(b), |
| |||||||
6.125%, 10/1/24 | 1,155 | 1,206,975 | ||||||
Calumet Specialty Products Partners L.P., |
| |||||||
6.50%, 4/15/21 | 1,935 | 1,647,169 | ||||||
Carrizo Oil & Gas, Inc., |
| |||||||
6.25%, 4/15/23 | 1,735 | 1,748,012 | ||||||
Chesapeake Energy Corp., |
| |||||||
6.625%, 8/15/20 | 2,185 | 2,193,194 | ||||||
8.00%, 1/15/25 (a)(b) | 910 | 913,413 | ||||||
| See accompanying Notes to Financial Statements | | March 31, 2017 | | Semiannual Report | 179 |
Table of Contents
Schedule of Investments
March 31, 2017 (Unaudited)
| Principal Amount (000s) | Value | |||||||
Continental Resources, Inc., |
| |||||||
5.00%, 9/15/22 | $ | 2,125 | $ | 2,154,219 | ||||
CVR Refining LLC, |
| |||||||
6.50%, 11/1/22 | 1,575 | 1,594,687 | ||||||
EP Energy LLC, |
| |||||||
9.375%, 5/1/20 | 3,140 | 2,975,150 | ||||||
Oasis Petroleum, Inc., |
| |||||||
6.875%, 3/15/22 | 3,225 | 3,313,687 | ||||||
Range Resources Corp., |
| |||||||
4.875%, 5/15/25 | 2,730 | 2,627,625 | ||||||
Rice Energy, Inc., |
| |||||||
6.25%, 5/1/22 | 2,920 | 3,022,200 | ||||||
Sanchez Energy Corp., |
| |||||||
6.125%, 1/15/23 | 3,060 | 2,853,450 | ||||||
Sunoco L.P., |
| |||||||
6.375%, 4/1/23 | 1,805 | 1,841,100 | ||||||
Weatherford International Ltd., |
| |||||||
8.25%, 6/15/23 | 890 | 970,100 | ||||||
|
| |||||||
| 29,060,981 | ||||||||
|
| |||||||
| Paper & Forest Products—0.6% | ||||||||
Mercer International, Inc., |
| |||||||
7.75%, 12/1/22 | 1,825 | 1,962,423 | ||||||
|
| |||||||
| Pharmaceuticals—2.0% | ||||||||
Endo Finance LLC (a)(b), |
| |||||||
5.375%, 1/15/23 | 2,915 | 2,530,570 | ||||||
Horizon Pharma, Inc., |
| |||||||
6.625%, 5/1/23 | 2,655 | 2,615,175 | ||||||
Valeant Pharmaceuticals International, Inc. (a)(b), |
| |||||||
6.125%, 4/15/25 | 1,315 | 1,017,481 | ||||||
7.50%, 7/15/21 | 720 | 633,600 | ||||||
|
| |||||||
| 6,796,826 | ||||||||
|
| |||||||
| Pipelines—1.6% | ||||||||
Crestwood Midstream Partners L.P. (a)(b), |
| |||||||
5.75%, 4/1/25 | 910 | 931,613 | ||||||
Energy Transfer Equity L.P., |
| |||||||
5.875%, 1/15/24 | 670 | 715,225 | ||||||
Sabine Pass Liquefaction LLC, |
| |||||||
5.75%, 5/15/24 | 1,944 | 2,121,948 | ||||||
Tesoro Logistics L.P., |
| |||||||
6.25%, 10/15/22 | 1,605 | 1,703,306 | ||||||
|
| |||||||
| 5,472,092 | ||||||||
|
| |||||||
| Real Estate—2.3% | ||||||||
Equinix, Inc., |
| |||||||
5.375%, 1/1/22 | 1,660 | 1,755,450 | ||||||
iStar, Inc., |
| |||||||
7.125%, 2/15/18 | 720 | 747,900 | ||||||
Kennedy-Wilson, Inc., |
| |||||||
5.875%, 4/1/24 | 2,481 | 2,552,329 | ||||||
Uniti Group, Inc., |
| |||||||
8.25%, 10/15/23 | 2,740 | 2,904,400 | ||||||
|
| |||||||
| 7,960,079 | ||||||||
|
| |||||||
| Retail—1.1% | ||||||||
Conn’s, Inc., |
| |||||||
7.25%, 7/15/22 | 1,605 | 1,360,237 | ||||||
Dollar Tree, Inc., |
| |||||||
5.75%, 3/1/23 | 2,165 | 2,316,550 | ||||||
|
| |||||||
| 3,676,787 | ||||||||
|
| |||||||
| Semiconductors—3.4% | ||||||||
Advanced Micro Devices, Inc., |
| |||||||
7.50%, 8/15/22 | 2,008 | 2,233,900 | ||||||
Amkor Technology, Inc., |
| |||||||
6.375%, 10/1/22 | 2,000 | 2,072,500 | ||||||
Micron Technology, Inc., |
| |||||||
5.875%, 2/15/22 | 3,000 | 3,146,250 | ||||||
Qorvo, Inc., |
| |||||||
7.00%, 12/1/25 | 2,000 | 2,220,000 | ||||||
Sensata Technologies BV (a)(b), |
| |||||||
5.625%, 11/1/24 | 1,785 | 1,867,556 | ||||||
|
| |||||||
| 11,540,206 | ||||||||
|
| |||||||
| Principal Amount (000s) | Value | |||||||
| Semiconductors & Semiconductor Equipment—0.2% | ||||||||
Microsemi Corp. (a)(b), |
| |||||||
9.125%, 4/15/23 | $ | 570 | $ | 657,638 | ||||
|
| |||||||
| Software—4.2% | ||||||||
Camelot Finance S.A. (a)(b), |
| |||||||
7.875%, 10/15/24 | 1,300 | 1,381,237 | ||||||
First Data Corp. (a)(b), |
| |||||||
7.00%, 12/1/23 | 2,635 | 2,832,625 | ||||||
j2 Cloud Services LLC, |
| |||||||
8.00%, 8/1/20 | 2,780 | 2,875,562 | ||||||
MSCI, Inc. (a)(b), |
| |||||||
5.25%, 11/15/24 | 1,950 | 2,062,125 | ||||||
Open Text Corp. (a)(b), |
| |||||||
5.625%, 1/15/23 | 3,280 | 3,427,600 | ||||||
SS&C Technologies Holdings, Inc., |
| |||||||
5.875%, 7/15/23 | 1,590 | 1,689,375 | ||||||
|
| |||||||
| 14,268,524 | ||||||||
|
| |||||||
| Specialty Retail—0.5% | ||||||||
L Brands, Inc., |
| |||||||
6.875%, 11/1/35 | 1,625 | 1,576,250 | ||||||
|
| |||||||
| Telecommunications—11.2% | ||||||||
CenturyLink, Inc., |
| |||||||
7.50%, 4/1/24 | 2,550 | 2,702,209 | ||||||
Cincinnati Bell, Inc. (a)(b), |
| |||||||
7.00%, 7/15/24 | 1,710 | 1,797,638 | ||||||
CommScope Technologies LLC (a)(b), |
| |||||||
5.00%, 3/15/27 | 1,040 | 1,040,988 | ||||||
6.00%, 6/15/25 | 1,890 | 1,989,225 | ||||||
Consolidated Communications, Inc., |
| |||||||
6.50%, 10/1/22 | 3,020 | 2,914,300 | ||||||
Frontier Communications Corp., |
| |||||||
10.50%, 9/15/22 | 2,370 | 2,411,475 | ||||||
GTT Escrow Corp. (a)(b), |
| |||||||
7.875%, 12/31/24 | 1,240 | 1,289,600 | ||||||
Hughes Satellite Systems Corp., |
| |||||||
7.625%, 6/15/21 | 2,675 | 2,959,219 | ||||||
Intelsat Jackson Holdings S.A., |
| |||||||
7.25%, 4/1/19 | 1,655 | 1,586,731 | ||||||
Level 3 Financing, Inc., |
| |||||||
5.375%, 5/1/25 | 3,180 | 3,243,600 | ||||||
Sprint Communications, Inc., |
| |||||||
6.00%, 11/15/22 | 2,465 | 2,526,625 | ||||||
11.50%, 11/15/21 | 3,515 | 4,428,900 | ||||||
T-Mobile USA, Inc., |
| |||||||
6.625%, 4/1/23 | 1,160 | 1,240,829 | ||||||
6.836%, 4/28/23 | 2,135 | 2,289,788 | ||||||
West Corp. (a)(b), |
| |||||||
5.375%, 7/15/22 | 2,825 | 2,786,156 | ||||||
Windstream Services LLC, |
| |||||||
7.50%, 6/1/22 | 3,000 | 2,925,000 | ||||||
|
| |||||||
| 38,132,283 | ||||||||
|
| |||||||
| Transportation—1.0% | ||||||||
Erickson, Inc. (c), |
| |||||||
8.25%, 5/1/20 | 2,301 | 69,030 | ||||||
XPO Logistics, Inc. (a)(b), |
| |||||||
6.125%, 9/1/23 | 780 | 814,125 | ||||||
6.50%, 6/15/22 | 2,270 | 2,392,012 | ||||||
|
| |||||||
| 3,275,167 | ||||||||
|
| |||||||
| Total Corporate Bonds & Notes (cost—$313,392,424) | 319,807,544 | |||||||
|
| |||||||
| Shares | ||||||||
| Preferred Stock (a)(d)(f)— 1.8% | ||||||||
| Media—1.8% | ||||||||
LiveStyle, Inc. Ser. A | 6,269 | 626,900 | ||||||
Shares | Value | |||||||
LiveStyle, Inc. Ser. B | 57,581 | $ | 5,625,664 | |||||
|
| |||||||
| Total Preferred Stock (cost—$6,259,719) | 6,252,564 | |||||||
|
| |||||||
| Common Stock—0.2% | ||||||||
| Advertising—0.2% | ||||||||
Affinion Group Holdings, Inc. Class A (a)(d)(e)(f) (acquisition cost—$769,740; purchased 11/9/15-11/12/15) | 43,401 | 684,868 | ||||||
|
| |||||||
| Media—0.0% | ||||||||
LiveStyle, Inc. (a)(d)(f) | 67,983 | 7 | ||||||
|
| |||||||
| Total Common Stock (cost—$769,739) | 684,875 | |||||||
|
| |||||||
| Units | ||||||||
| Warrants (a)(d)(f)— 0.0% | ||||||||
| Commercial Services—0.0% | ||||||||
Cenveo Corp., strike price $12.00, expires 6/10/24 | 243,090 | 46,061 | ||||||
|
| |||||||
| Media—0.0% | ||||||||
LiveStyle, Inc. Ser. C, expires 11/30/21 | 14,500 | 1 | ||||||
|
| |||||||
| Total Warrants (cost—$67,409) | 46,062 | |||||||
|
| |||||||
| Principal Amount (000s) | ||||||||
| Repurchase Agreements—2.9% | ||||||||
State Street Bank and Trust Co., dated 3/31/17, 0.09%, due 4/3/17, proceeds $9,774,073; collateralized by U.S. Treasury Notes, 2.00%, due 11/25/26, valued at $9,971,483 including accrued interest |
| |||||||
(cost—$9,774,000) | $9,774 | 9,774,000 | ||||||
|
| |||||||
| Total Investments (cost—$330,263,291)—98.9% | 336,565,045 | |||||||
|
| |||||||
| Other assets less liabilities—1.1% | 3,756,047 | |||||||
|
| |||||||
| Net Assets—100.0% | $340,321,092 | |||||||
|
| |||||||
| 180 | Semiannual Report | | March 31, 2017 | | See accompanying Notes to Financial Statements |
Table of Contents
Schedule of Investments
March 31, 2017 (Unaudited)
Notes to Schedule of Investments:
(a) Private Placement—Restricted as to resale and may not have a readily available market. Securities with an aggregate value of $115,843,424, representing 34.0% of net assets.
(b) 144A—Exempt from registration under Rule 144A of the Securities Act of 1933. These securities may be resold in transactions exempt from registration, typically only to qualified institutional buyers. Securities with an aggregate value of $108,859,923, representing 32.0% of net assets.
(c) In default.
(d) Fair-Valued—Securities with an aggregate value of $6,983,501, representing 2.1% of net assets. See Note 1(a) and Note 1(b) in the Notes to Financial Statements.
(e) Restricted. The aggregate acquisition cost of such securities is $3,557,553. The aggregate value is $712,478, representing 0.2% of net assets.
(f) Non-income producing.
AllianzGI International Growth Fund
| Shares | Value | |||||||
| Common Stock—98.8% | ||||||||
| Australia—1.9% | ||||||||
CSL Ltd. | 3,645 | $348,993 | ||||||
SEEK Ltd. | 15,551 | 189,068 | ||||||
|
| |||||||
| 538,061 | ||||||||
|
| |||||||
| Brazil—4.7% | ||||||||
Ambev S.A. | 41,055 | 239,201 | ||||||
Lojas Renner S.A. | 30,265 | 268,756 | ||||||
Odontoprev S.A. | 65,133 | 235,100 | ||||||
Raia Drogasil S.A. | 19,904 | 373,017 | ||||||
WEG S.A. | 43,986 | 244,476 | ||||||
|
| |||||||
| 1,360,550 | ||||||||
|
| |||||||
| Canada—9.7% | ||||||||
Alimentation Couche-Tard, Inc., Class B | 17,217 | 777,830 | ||||||
Canadian National Railway Co. | 8,370 | 617,813 | ||||||
Constellation Software, Inc. | 1,362 | 669,299 | ||||||
Restaurant Brands International, Inc. | 12,983 | 723,225 | ||||||
|
| |||||||
| 2,788,167 | ||||||||
|
| |||||||
| China—7.4% | ||||||||
Alibaba Group Holding Ltd. ADR (c) | 6,399 | 690,004 | ||||||
Baidu, Inc. ADR (c) | 3,210 | 553,789 | ||||||
Tencent Holdings Ltd. | 31,062 | 894,881 | ||||||
|
| |||||||
| 2,138,674 | ||||||||
|
| |||||||
| Denmark—7.7% | ||||||||
Ambu A/S, Class B | 8,539 | 366,864 | ||||||
Coloplast A/S, Class B | 4,519 | 352,914 | ||||||
DSV A/S | 13,897 | 718,796 | ||||||
Novo Nordisk A/S, Class B | 22,775 | 782,069 | ||||||
|
| |||||||
| 2,220,643 | ||||||||
|
| |||||||
| France—5.0% | ||||||||
Dassault Systemes | 4,039 | 349,340 | ||||||
Ingenico Group S.A. | 4,968 | 468,563 | ||||||
Legrand S.A. | 4,370 | 263,063 | ||||||
Societe BIC S.A. | 2,929 | 364,912 | ||||||
|
| |||||||
| 1,445,878 | ||||||||
|
| |||||||
| Germany—11.2% | ||||||||
Bechtle AG | 3,566 | 386,996 | ||||||
Fresenius SE & Co. KGaA | 4,692 | 377,030 | ||||||
Infineon Technologies AG | 40,716 | 833,348 | ||||||
SAP SE | 12,158 | 1,192,796 | ||||||
Scout24 AG (a)(c) | 12,779 | 426,654 | ||||||
|
| |||||||
| 3,216,824 | ||||||||
|
| |||||||
| Hong Kong—1.8% | ||||||||
AIA Group Ltd. | 81,802 | 516,331 | ||||||
|
| |||||||
| India—1.1% | ||||||||
HDFC Bank Ltd. ADR | 4,201 | 315,999 | ||||||
|
| |||||||
| Indonesia—1.7% | ||||||||
Ace Hardware Indonesia Tbk PT | 3,617,314 | 223,877 | ||||||
Bank Central Asia Tbk PT | 204,723 | 254,194 | ||||||
|
| |||||||
| 478,071 | ||||||||
|
| |||||||
| Ireland—1.6% | ||||||||
Kingspan Group PLC | 14,375 | 458,601 | ||||||
|
| |||||||
| Japan—8.0% | ||||||||
Hoshizaki Corp. | 4,606 | 364,067 | ||||||
Keyence Corp. | 2,100 | 842,463 | ||||||
Nippon Paint Holdings Co., Ltd. | 11,740 | 410,040 | ||||||
Sundrug Co., Ltd. | 11,888 | 399,970 | ||||||
Sysmex Corp. | 4,430 | 269,526 | ||||||
|
| |||||||
| 2,286,066 | ||||||||
|
| |||||||
| Shares | Value | |||||||
| Korea (Republic of)—1.7% | ||||||||
LG Household & Health Care Ltd. | 657 | $ | 476,627 | |||||
|
| |||||||
| Luxembourg—1.2% | ||||||||
Samsonite International S.A. | 97,040 | 352,882 | ||||||
|
| |||||||
| Mexico—1.0% | ||||||||
Fomento Economico Mexicano S.A.B de C.V. UNIT | 32,992 | 292,945 | ||||||
|
| |||||||
| Netherlands—2.9% | ||||||||
ASML Holding NV | 3,787 | 502,508 | ||||||
GrandVision NV (a) | 13,500 | 330,309 | ||||||
|
| |||||||
| 832,817 | ||||||||
|
| |||||||
| Philippines—1.6% | ||||||||
Jollibee Foods Corp. | 42,047 | 165,452 | ||||||
Universal Robina Corp. | 86,456 | 281,711 | ||||||
|
| |||||||
| 447,163 | ||||||||
|
| |||||||
| Spain—3.0% | ||||||||
Amadeus IT Group S.A. | 9,985 | 505,925 | ||||||
Industria de Diseno Textil S.A. | 10,275 | 361,850 | ||||||
|
| |||||||
| 867,775 | ||||||||
|
| |||||||
| Sweden—8.3% | ||||||||
Assa Abloy AB, Class B | 22,746 | 467,605 | ||||||
Atlas Copco AB, Class A | 11,796 | 415,798 | ||||||
Elekta AB, Class B | 27,031 | 264,047 | ||||||
Hexagon AB, Class B | 12,979 | 520,909 | ||||||
Hexpol AB | 49,133 | 503,787 | ||||||
Trelleborg AB, Class B | 10,577 | 226,439 | ||||||
|
| |||||||
| 2,398,585 | ||||||||
|
| |||||||
| Switzerland—3.8% | ||||||||
Cie Financiere Richemont S.A. | 5,102 | 403,375 | ||||||
Partners Group Holding AG | 632 | 339,645 | ||||||
Roche Holding AG | 1,335 | 341,405 | ||||||
|
| |||||||
| 1,084,425 | ||||||||
|
| |||||||
| United Kingdom—13.5% | ||||||||
British American Tobacco PLC | 13,434 | 891,293 | ||||||
DCC PLC | 4,362 | 383,997 | ||||||
Diageo PLC | 11,606 | 332,340 | ||||||
Prudential PLC | 17,742 | 374,770 | ||||||
Reckitt Benckiser Group PLC | 9,660 | 881,878 | ||||||
Rotork PLC | 67,952 | 207,132 | ||||||
Shire PLC | 6,130 | 357,177 | ||||||
Unilever PLC | 9,482 | 467,721 | ||||||
|
| |||||||
| 3,896,308 | ||||||||
|
| |||||||
| Total Common Stock (cost—$27,345,111) | 28,413,392 | |||||||
|
| |||||||
| Principal Amount (000s) | ||||||||
| Repurchase Agreements—1.0% | ||||||||
State Street Bank and Trust Co., dated 3/31/17, 0.09%, due 4/3/17, proceeds $294,002; collateralized by U.S. Treasury Notes, 2.00%, due 11/15/26, valued at $301,136 including accrued interest |
| |||||||
(cost—$294,000) | $294 | 294,000 | ||||||
|
| |||||||
| Total Investments (cost—$27,639,111) (b)—99.8% | 28,707,392 | |||||||
|
| |||||||
| Other assets less liabilities—0.2% | 56,627 | |||||||
|
| |||||||
| Net Assets—100.0% | $28,764,019 | |||||||
|
| |||||||
| See accompanying Notes to Financial Statements | | March 31, 2017 | | Semiannual Report | 181 |
Table of Contents
Schedule of Investments
March 31, 2017 (Unaudited)
Notes to Schedule of Investments:
(a) 144A—Exempt from registration under Rule 144A of the Securities Act of 1933. These securities may be resold in transactions exempt from registration, typically only to qualified institutional buyers. Securities with an aggregate value of $756,963, representing 2.6% of net assets.
(b) Securities with an aggregate value of $21,953,337, representing 76.3% of net assets, were valued utilizing modeling tools provided by a third-party vendor. See Note 1(a) and Note 1(b) in the Notes to Financial Statements.
(c) Non-income producing.
Glossary:
ADR—American Depositary Receipt
UNIT—More than one class of securities traded together.
The industry classification of portfolio holdings and other assets less liabilities shown as a percentage of net assets were as follows:
Internet Software & Services | 8.9% | |||
Software | 7.7% | |||
Electronic Equipment, Instruments & Components | 6.4% | |||
Food & Staples Retailing | 5.4% | |||
Machinery | 5.1% | |||
Road & Rail | 4.6% | |||
Semiconductors & Semiconductor Equipment | 4.6% | |||
Health Care Equipment & Supplies | 4.4% | |||
Pharmaceuticals | 3.9% | |||
Personal Products | 3.3% | |||
Building Products | 3.2% | |||
Specialty Retail | 3.2% | |||
Chemicals | 3.2% | |||
IT Services | 3.1% | |||
Tobacco | 3.1% | |||
Insurance | 3.1% | |||
Hotels, Restaurants & Leisure | 3.1% | |||
Household Products | 3.1% | |||
Beverages | 3.0% | |||
Textiles, Apparel & Luxury Goods | 2.6% | |||
Biotechnology | 2.4% | |||
Health Care Providers & Services | 2.1% | |||
Banks | 2.0% | |||
Industrial Conglomerates | 1.3% | |||
Commercial Services & Supplies | 1.3% | |||
Capital Markets | 1.2% | |||
Food Products | 1.0% | |||
Multi-line Retail | 0.9% | |||
Electrical Equipment | 0.9% | |||
Professional Services | 0.7% | |||
Repurchase Agreements | 1.0% | |||
Other assets less liabilities | 0.2% | |||
|
| |||
| 100.0% | ||||
|
|
AllianzGI International Small-Cap Fund
| Shares | Value | |||||||
| Common Stock—94.4% | ||||||||
| Australia—4.7% | ||||||||
Adelaide Brighton Ltd. | 85,325 | $370,002 | ||||||
Boral Ltd. | 113,385 | 505,491 | ||||||
Challenger Ltd. | 74,814 | 717,053 | ||||||
Downer EDI Ltd. | 51,500 | 227,907 | ||||||
Incitec Pivot Ltd. | 110,700 | 317,814 | ||||||
Independence Group NL | 77,400 | 211,708 | ||||||
Mantra Group Ltd. | 158,236 | 352,889 | ||||||
McMillan Shakespeare Ltd. | 62,901 | 635,230 | ||||||
Sandfire Resources NL | 72,700 | 353,972 | ||||||
Santos Ltd. (c) | 210,540 | 610,969 | ||||||
|
| |||||||
| 4,303,035 | ||||||||
|
| |||||||
| Austria—2.4% | ||||||||
Schoeller-Bleckmann Oilfield Equipment AG | 11,418 | 796,422 | ||||||
Wienerberger AG | 65,727 | 1,392,614 | ||||||
|
| |||||||
| 2,189,036 | ||||||||
|
| |||||||
| China—2.7% | ||||||||
China Everbright International Ltd. | 308,000 | 414,786 | ||||||
China State Construction International Holdings Ltd. | 376,000 | 673,053 | ||||||
Nexteer Automotive Group Ltd. | 544,000 | 802,825 | ||||||
Sunny Optical Technology Group Co., Ltd. | 52,000 | 380,555 | ||||||
YY, Inc. ADR (c) | 4,770 | 219,945 | ||||||
|
| |||||||
| 2,491,164 | ||||||||
|
| |||||||
| Denmark—2.7% | ||||||||
Ambu A/S, Class B | 23,958 | 1,029,315 | ||||||
SimCorp A/S | 23,903 | 1,439,609 | ||||||
|
| |||||||
| 2,468,924 | ||||||||
|
| |||||||
| Finland—2.6% | ||||||||
Huhtamaki Oyj | 31,495 | 1,120,783 | ||||||
Outotec Oyj (c) | 209,767 | 1,272,201 | ||||||
|
| |||||||
| 2,392,984 | ||||||||
|
| |||||||
| France—5.9% | ||||||||
APERAM S.A. | 29,037 | 1,447,737 | ||||||
Korian S.A. | 39,923 | 1,207,607 | ||||||
Nexity S.A. (c) | 27,311 | 1,342,704 | ||||||
Sartorius Stedim Biotech | 20,941 | 1,410,419 | ||||||
|
| |||||||
| 5,408,467 | ||||||||
|
| |||||||
| Germany—7.7% | ||||||||
Aareal Bank AG | 37,062 | 1,432,863 | ||||||
Bechtle AG | 12,613 | 1,368,810 | ||||||
CANCOM SE | 24,290 | 1,372,159 | ||||||
Deutsche Pfandbriefbank AG (a) | 145,283 | 1,807,341 | ||||||
Hella KGaA Hueck & Co. | 24,608 | 1,090,371 | ||||||
|
| |||||||
| 7,071,544 | ||||||||
|
| |||||||
| Hong Kong—0.8% | ||||||||
Johnson Electric Holdings Ltd. | 28,000 | 83,648 | ||||||
Techtronic Industries Co., Ltd. | 174,500 | 706,425 | ||||||
|
| |||||||
| 790,073 | ||||||||
|
| |||||||
| Indonesia—0.9% | ||||||||
Jasa Marga Persero Tbk PT | 1,244,000 | 431,297 | ||||||
Waskita Beton Precast Tbk PT (c) | 9,754,100 | 366,180 | ||||||
|
| |||||||
| 797,477 | ||||||||
|
| |||||||
| Ireland—1.8% | ||||||||
Kingspan Group PLC | 51,860 | 1,654,471 | ||||||
|
| |||||||
| Shares | Value | |||||||
| Italy—1.5% | ||||||||
De’ Longhi SpA | 49,021 | $ | 1,425,286 | |||||
|
| |||||||
| Japan—30.4% | ||||||||
Aica Kogyo Co., Ltd. | 25,400 | 671,584 | ||||||
Bandai Namco Holdings, Inc. | 17,000 | 509,586 | ||||||
Daifuku Co., Ltd. | 74,400 | 1,860,848 | ||||||
Disco Corp. | 11,000 | 1,679,638 | ||||||
Fujitsu General Ltd. | 101,000 | 2,006,382 | ||||||
Gunma Bank Ltd. | 246,273 | 1,284,788 | ||||||
Hoshizaki Corp. | 14,300 | 1,130,299 | ||||||
Lion Corp. | 109,000 | 1,964,401 | ||||||
MISUMI Group, Inc. | 81,900 | 1,486,839 | ||||||
Mitsubishi Materials Corp. | 26,900 | 816,493 | ||||||
Mitsubishi UFJ Lease & Finance Co., Ltd. | 291,100 | 1,454,748 | ||||||
Morinaga Milk Industry Co., Ltd. | 155,000 | 1,153,889 | ||||||
NGK Spark Plug Co., Ltd. (c) | 59,600 | 1,366,713 | ||||||
Pigeon Corp. | 17,100 | 548,685 | ||||||
Rengo Co., Ltd. | 173,100 | 1,002,668 | ||||||
Ryohin Keikaku Co., Ltd. | 4,900 | 1,077,145 | ||||||
Sanwa Holdings Corp. | 102,900 | 965,851 | ||||||
Siix Corp. | 9,800 | 396,271 | ||||||
Start Today Co., Ltd. | 24,900 | 553,371 | ||||||
Sumco Corp. | 34,100 | 569,614 | ||||||
Teijin Ltd. | 74,200 | 1,401,077 | ||||||
Temp Holdings Co., Ltd. | 93,100 | 1,745,618 | ||||||
Ulvac, Inc. | 35,300 | 1,649,941 | ||||||
W-Scope Corp. (c) | 43,600 | 643,601 | ||||||
|
| |||||||
| 27,940,050 | ||||||||
|
| |||||||
| Korea (Republic of)—0.4% | ||||||||
Dongbu Insurance Co., Ltd. | 6,947 | 397,664 | ||||||
|
| |||||||
| Netherlands—5.1% | ||||||||
Aalberts Industries NV | 45,984 | 1,714,082 | ||||||
Flow Traders (a) | 39,275 | 1,236,567 | ||||||
IMCD Group NV | 35,730 | 1,756,420 | ||||||
|
| |||||||
| 4,707,069 | ||||||||
|
| |||||||
| Philippines—0.5% | ||||||||
Cosco Capital, Inc. | 2,726,100 | 460,607 | ||||||
|
| |||||||
| Spain—1.6% | ||||||||
Melia Hotels International S.A. | 105,140 | 1,445,744 | ||||||
|
| |||||||
| Sweden—7.1% | ||||||||
AAK AB | 20,493 | 1,348,975 | ||||||
Fastighets AB Balder, Class B (c) | 48,730 | 1,016,188 | ||||||
Indutrade AB | 21,269 | 405,080 | ||||||
JM AB | 31,115 | 982,578 | ||||||
NetEnt AB (c) | 143,970 | 1,155,545 | ||||||
Nibe Industrier AB, Class B | 199,488 | 1,594,546 | ||||||
|
| |||||||
| 6,502,912 | ||||||||
|
| |||||||
| Switzerland—5.4% | ||||||||
ams AG | 31,210 | 1,685,974 | ||||||
Georg Fischer AG | 1,958 | 1,780,228 | ||||||
Interroll Holding AG | 1,354 | 1,553,778 | ||||||
|
| |||||||
| 5,019,980 | ||||||||
|
| |||||||
| Taiwan—1.3% | ||||||||
Ennoconn Corp. | 35,063 | 458,250 | ||||||
Sinbon Electronics Co., Ltd. | 202,940 | 498,345 | ||||||
Tong Yang Industry Co., Ltd. | 114,000 | 198,013 | ||||||
Tung Thih Electronic Co., Ltd. | 9,000 | 77,567 | ||||||
|
| |||||||
| 1,232,175 | ||||||||
|
| |||||||
| 182 | Semiannual Report | | March 31, 2017 | | See accompanying Notes to Financial Statements |
Table of Contents
Schedule of Investments
March 31, 2017 (Unaudited)
| Shares | Value | |||||||
| United Kingdom—8.9% | ||||||||
ASOS PLC (c) | 21,591 | $ | 1,632,790 | |||||
Auto Trader Group PLC (a) | 223,901 | 1,098,876 | ||||||
Genus PLC | 38,904 | 840,814 | ||||||
Intermediate Capital Group PLC | 174,488 | 1,545,624 | ||||||
RPC Group PLC | 68,407 | 669,432 | ||||||
Senior PLC | 146,074 | 376,857 | ||||||
Spectris PLC | 33,258 | 1,039,823 | ||||||
Tullow Oil PLC (c) | 330,757 | 975,629 | ||||||
|
| |||||||
| 8,179,845 | ||||||||
|
| |||||||
| Total Common Stock (cost—$72,864,657) | 86,878,507 | |||||||
|
| |||||||
| Preferred Stock—1.8% | ||||||||
| Germany—1.8% | ||||||||
Jungheinrich AG | ||||||||
(cost—$1,534,979) | 49,272 | 1,635,374 | ||||||
|
| |||||||
| Principal Amount (000s) | ||||||||
| Repurchase Agreements—4.6% | ||||||||
State Street Bank and Trust Co., dated 3/31/17, 0.09%, due 4/3/17, proceeds $4,218,032; collateralized by U.S. Treasury Notes, 2.00%, due 11/25/26, valued at $4,303,329 including accrued interest |
| |||||||
(cost—$4,218,000) | $4,218 | 4,218,000 | ||||||
|
| |||||||
| Total Investments (cost—$78,617,636) (b)—100.8% | 92,731,881 | |||||||
|
| |||||||
| Liabilities in excess of other assets (d)—(0.8)% | (717,295 | ) | ||||||
|
| |||||||
| Net Assets—100.0% | $92,014,586 | |||||||
|
| |||||||
Notes to Schedule of Investments:
(a) 144A—Exempt from registration under Rule 144A of the Securities Act of 1933. These securities may be resold in transactions exempt from registration, typically only to qualified institutional buyers. Securities with an aggregate value of $4,142,784, representing 4.5% of net assets.
(b) Securities with an aggregate value of $81,259,918, representing 88.3% of net assets, were valued utilizing modeling tools provided by a third-party vendor. See Note 1(a) and Note 1(b) in the Notes to Financial Statements.
(c) Non-income producing.
(d) Includes net unrealized appreciation (depreciation) of other financial instruments. See Notes 7(b) and 7(c) in the Notes to Financial Statements.
Glossary:
ADR—American Depositary Receipt
The industry classification of portfolio holdings and liabilities in excess of other assets shown as a percentage of net assets were as follows:
Machinery | 10.5% | |||
Semiconductors & Semiconductor Equipment | 6.1% | |||
Household Durables | 5.6% | |||
Building Products | 5.3% | |||
Metals & Mining | 4.5% | |||
Trading Companies & Distributors | 4.0% | |||
Auto Components | 3.8% | |||
Thrifts & Mortgage Finance | 3.5% | |||
Containers & Packaging | 3.0% | |||
Capital Markets | 3.0% | |||
IT Services | 3.0% | |||
Construction Materials | 2.9% | |||
Household Products | 2.7% | |||
Food Products | 2.7% | |||
Internet Software & Services | 2.7% | |||
Health Care Equipment & Supplies | 2.6% | |||
Professional Services | 2.6% | |||
Chemicals | 2.6% | |||
Real Estate Management & Development | 2.6% | |||
Electronic Equipment, Instruments & Components | 2.5% | |||
Internet & Catalog Retail | 2.4% | |||
Diversified Financial Services | 2.4% | |||
Hotels, Restaurants & Leisure | 1.9% | |||
Oil, Gas & Consumable Fuels | 1.7% | |||
Software | 1.6% | |||
Banks | 1.4% | |||
Health Care Providers & Services | 1.3% | |||
Multi-line Retail | 1.2% | |||
Biotechnology | 0.9% | |||
Energy Equipment & Services | 0.9% | |||
Construction & Engineering | 0.7% | |||
Commercial Services & Supplies | 0.7% | |||
Leisure Equipment & Products | 0.5% | |||
Food & Staples Retailing | 0.5% | |||
Technology Hardware, Storage & Peripherals | 0.5% | |||
Transportation Infrastructure | 0.5% | |||
Insurance | 0.4% | |||
Aerospace & Defense | 0.4% | |||
Electrical Equipment | 0.1% | |||
Repurchase Agreements | 4.6% | |||
Liabilities in excess of other assets | (0.8)% | |||
|
| |||
| 100.0% | ||||
|
|
AllianzGI Micro Cap Fund
| Shares | Value | |||||||
| Common Stock—97.1% | ||||||||
| Air Freight & Logistics—0.4% | ||||||||
Echo Global Logistics, Inc. (a) | 7,627 | $162,836 | ||||||
|
| |||||||
| Auto Components—2.5% | ||||||||
Modine Manufacturing Co. (a) | 22,915 | 279,563 | ||||||
Motorcar Parts of America, Inc. (a) | 10,239 | 314,644 | ||||||
Tower International, Inc. | 11,156 | 302,328 | ||||||
|
| |||||||
| 896,535 | ||||||||
|
| |||||||
| Banks—6.4% | ||||||||
CU Bancorp (a) | 6,896 | 273,426 | ||||||
Franklin Financial Network, Inc. (a) | 8,611 | 333,676 | ||||||
National Commerce Corp. (a) | 3,851 | 140,947 | ||||||
Pacific Premier Bancorp, Inc. (a) | 14,676 | 565,760 | ||||||
Preferred Bank | 4,357 | 233,797 | ||||||
Seacoast Banking Corp. of Florida (a) | 19,691 | 472,190 | ||||||
Stonegate Bank | 6,703 | 315,644 | ||||||
|
| |||||||
| 2,335,440 | ||||||||
|
| |||||||
| Beverages—2.2% | ||||||||
Craft Brew Alliance, Inc. (a) | 8,902 | 118,842 | ||||||
MGP Ingredients, Inc. | 6,900 | 374,187 | ||||||
Primo Water Corp. (a) | 21,924 | 297,728 | ||||||
|
| |||||||
| 790,757 | ||||||||
|
| |||||||
| Biotechnology—10.7% | ||||||||
Abeona Therapeutics, Inc. (a) | 10,482 | 52,410 | ||||||
Adamas Pharmaceuticals, Inc. (a) | 4,230 | 74,025 | ||||||
Advaxis, Inc. (a) | 13,192 | 107,779 | ||||||
Agenus, Inc. (a) | 21,215 | 79,981 | ||||||
BioCryst Pharmaceuticals, Inc. (a) | 10,963 | 92,089 | ||||||
BioSpecifics Technologies Corp. (a) | 4,864 | 266,547 | ||||||
Blueprint Medicines Corp. (a) | 4,929 | 197,111 | ||||||
Cara Therapeutics, Inc. (a) | 10,906 | 200,561 | ||||||
Concert Pharmaceuticals, Inc. (a) | 10,829 | 184,743 | ||||||
Corbus Pharmaceuticals Holdings, Inc. (a) | 8,079 | 66,652 | ||||||
Curis, Inc. (a) | 24,517 | 68,157 | ||||||
Cytokinetics, Inc. (a) | 7,264 | 93,342 | ||||||
Dynavax Technologies Corp. (a) | 9,596 | 57,096 | ||||||
Eagle Pharmaceuticals, Inc. (a) | 3,100 | 257,114 | ||||||
Flexion Therapeutics, Inc. (a) | 10,503 | 282,636 | ||||||
Heron Therapeutics, Inc. (a) | 7,496 | 112,440 | ||||||
Immunomedics, Inc. (a) | 17,938 | 116,059 | ||||||
Inovio Pharmaceuticals, Inc. (a) | 17,730 | 117,373 | ||||||
La Jolla Pharmaceutical Co. (a) | 7,697 | 229,755 | ||||||
Lion Biotechnologies, Inc. (a) | 17,740 | 132,163 | ||||||
MacroGenics, Inc. (a) | 7,023 | 130,628 | ||||||
Pfenex, Inc. (a) | 11,719 | 68,087 | ||||||
Progenics Pharmaceuticals, Inc. (a) | 18,471 | 174,366 | ||||||
Repligen Corp. (a) | 9,954 | 350,381 | ||||||
Synergy Pharmaceuticals, Inc. (a) | 43,153 | 201,093 | ||||||
Vanda Pharmaceuticals, Inc. (a) | 12,957 | 181,398 | ||||||
|
| |||||||
| 3,893,986 | ||||||||
|
| |||||||
| Building Products—2.1% | ||||||||
Patrick Industries, Inc. (a) | 7,691 | 545,292 | ||||||
PGT Innovations, Inc. (a) | 19,251 | 206,948 | ||||||
|
| |||||||
| 752,240 | ||||||||
|
| |||||||
| See accompanying Notes to Financial Statements | | March 31, 2017 | | Semiannual Report | 183 |
Table of Contents
Schedule of Investments
March 31, 2017 (Unaudited)
| Shares | Value | |||||||
| Chemicals—2.3% | ||||||||
American Vanguard Corp. | 16,928 | $ | 281,005 | |||||
Flotek Industries, Inc. (a) | 14,553 | 186,133 | ||||||
Koppers Holdings, Inc. (a) | 8,277 | 350,531 | ||||||
|
| |||||||
| 817,669 | ||||||||
|
| |||||||
| Commercial Services & Supplies—0.6% | ||||||||
Hudson Technologies, Inc. (a) | 35,316 | 233,086 | ||||||
|
| |||||||
| Communications Equipment—1.9% | ||||||||
EMCORE Corp. | 26,368 | 237,312 | ||||||
Oclaro, Inc. (a) | 30,036 | 294,953 | ||||||
ShoreTel, Inc. (a) | 26,058 | 160,257 | ||||||
|
| |||||||
| 692,522 | ||||||||
|
| |||||||
| Construction & Engineering—2.8% | ||||||||
Argan, Inc. | 6,452 | 426,800 | ||||||
Comfort Systems USA, Inc. | 7,402 | 271,283 | ||||||
NV5 Global, Inc. (a) | 8,846 | 332,610 | ||||||
|
| |||||||
| 1,030,693 | ||||||||
|
| |||||||
| Construction Materials—1.3% | ||||||||
U.S. Concrete, Inc. (a) | 7,045 | 454,755 | ||||||
|
| |||||||
| Diversified Consumer Services—1.0% | ||||||||
Carriage Services, Inc. | 12,925 | 350,526 | ||||||
|
| |||||||
| Electronic Equipment, Instruments & Components—1.8% | ||||||||
ePlus, Inc. (a) | 2,958 | 399,478 | ||||||
Mesa Laboratories, Inc. | 2,063 | 253,130 | ||||||
|
| |||||||
| 652,608 | ||||||||
|
| |||||||
| Food Products—1.1% | ||||||||
John B Sanfilippo & Son, Inc. | 5,351 | 391,640 | ||||||
|
| |||||||
| Health Care Equipment & Supplies—6.7% | ||||||||
AtriCure, Inc. (a) | 12,614 | 241,558 | ||||||
AxoGen, Inc. (a) | 23,260 | 243,067 | ||||||
CryoLife, Inc. (a) | 13,973 | 232,650 | ||||||
Cutera, Inc. (a) | 3,075 | 63,653 | ||||||
GenMark Diagnostics, Inc. (a) | 22,344 | 286,450 | ||||||
Inogen, Inc. (a) | 6,258 | 485,370 | ||||||
LeMaitre Vascular, Inc. | 20,633 | 508,191 | ||||||
Surmodics, Inc. (a) | 8,634 | 207,648 | ||||||
Tactile Systems Technology, Inc. (a) | 9,362 | 177,410 | ||||||
|
| |||||||
| 2,445,997 | ||||||||
|
| |||||||
| Health Care Providers & Services—3.7% | ||||||||
Aceto Corp. | 13,079 | 206,779 | ||||||
BioTelemetry, Inc. (a) | 24,398 | 706,322 | ||||||
Cross Country Healthcare, Inc. (a) | 21,778 | 312,732 | ||||||
RadNet, Inc. (a) | 22,531 | 132,933 | ||||||
|
| |||||||
| 1,358,766 | ||||||||
|
| |||||||
| Health Care Technology—1.8% | ||||||||
HealthStream, Inc. (a) | 7,094 | 171,887 | ||||||
Vocera Communications, Inc. (a) | 18,789 | 466,531 | ||||||
|
| |||||||
| 638,418 | ||||||||
|
| |||||||
| Hotels, Restaurants & Leisure—2.9% | ||||||||
Carrols Restaurant Group, Inc. (a) | 29,871 | 422,675 | ||||||
Chuy’s Holdings, Inc. (a) | 6,747 | 201,061 | ||||||
Eldorado Resorts, Inc. (a) | 22,728 | 430,127 | ||||||
|
| |||||||
| 1,053,863 | ||||||||
|
| |||||||
| Household Durables—1.6% | ||||||||
LGI Homes, Inc. (a) | 9,117 | 309,157 | ||||||
M/I Homes, Inc. (a) | 10,867 | 266,242 | ||||||
|
| |||||||
| 575,399 | ||||||||
|
| |||||||
| Household Products—0.5% | ||||||||
Orchids Paper Products Co. | 7,512 | 180,288 | ||||||
|
| |||||||
| Shares | Value | |||||||
| Insurance—0.2% | ||||||||
Atlas Financial Holdings, Inc. (a) | 5,328 | $ | 72,727 | |||||
|
| |||||||
| Internet & Catalog Retail—2.6% | ||||||||
Duluth Holdings, Inc., Class B (a) | 9,551 | 203,341 | ||||||
Nutrisystem, Inc. | 13,051 | 724,330 | ||||||
|
| |||||||
| 927,671 | ||||||||
|
| |||||||
| Internet Software & Services—5.0% | ||||||||
Amber Road, Inc. (a) | 33,531 | 258,859 | ||||||
Autobytel, Inc. (a) | 16,112 | 201,883 | ||||||
Five9, Inc. (a) | 29,713 | 489,076 | ||||||
GTT Communications, Inc. (a) | 13,084 | 318,596 | ||||||
Instructure, Inc. (a) | 12,161 | 284,568 | ||||||
Xactly Corp. (a) | 20,908 | 248,805 | ||||||
|
| |||||||
| 1,801,787 | ||||||||
|
| |||||||
| IT Services—1.6% | ||||||||
Hackett Group, Inc. | 18,368 | 357,992 | ||||||
Planet Payment, Inc. (a) | 60,386 | 240,336 | ||||||
|
| |||||||
| 598,328 | ||||||||
|
| |||||||
| Leisure Equipment & Products—1.0% | ||||||||
Nautilus, Inc. (a) | 19,467 | 355,273 | ||||||
|
| |||||||
| Life Sciences Tools & Services—1.8% | ||||||||
Albany Molecular Research, Inc. (a) | 17,372 | 243,729 | ||||||
NeoGenomics, Inc. (a) | 54,239 | 427,946 | ||||||
|
| |||||||
| 671,675 | ||||||||
|
| |||||||
| Machinery—5.7% | ||||||||
Energy Recovery, Inc. (a) | 15,405 | 128,170 | ||||||
Global Brass & Copper Holdings, Inc. | 6,322 | 217,477 | ||||||
Kadant, Inc. | 5,512 | 327,137 | ||||||
Kornit Digital Ltd. (a) | 19,184 | 366,414 | ||||||
Lydall, Inc. (a) | 8,095 | 433,892 | ||||||
NN, Inc. | 12,326 | 310,615 | ||||||
Titan International, Inc. | 29,402 | 304,017 | ||||||
|
| |||||||
| 2,087,722 | ||||||||
|
| |||||||
| Media—0.6% | ||||||||
Entravision Communications Corp., Class A | 35,767 | 221,755 | ||||||
|
| |||||||
| Oil, Gas & Consumable Fuels—3.1% | ||||||||
Aegean Marine Petroleum Network, Inc. | 25,378 | 305,805 | ||||||
Bill Barrett Corp. (a) | 20,896 | 95,077 | ||||||
Evolution Petroleum Corp. | 24,953 | 199,624 | ||||||
Ring Energy, Inc. (a) | 24,859 | 268,974 | ||||||
Sanchez Energy Corp. (a) | 28,326 | 270,230 | ||||||
|
| |||||||
| 1,139,710 | ||||||||
|
| |||||||
| Pharmaceuticals—5.9% | ||||||||
Amphastar Pharmaceuticals, Inc. (a) | 10,929 | 158,471 | ||||||
ANI Pharmaceuticals, Inc. (a) | 6,198 | 306,863 | ||||||
Corcept Therapeutics, Inc. (a) | 18,263 | 200,162 | ||||||
Dermira, Inc. (a) | 6,805 | 232,119 | ||||||
Intersect ENT, Inc. (a) | 11,853 | 203,279 | ||||||
Omeros Corp. (a) | 15,129 | 228,750 | ||||||
Paratek Pharmaceuticals, Inc. (a) | 4,260 | 82,005 | ||||||
Revance Therapeutics, Inc. (a) | 4,539 | 94,411 | ||||||
Supernus Pharmaceuticals, Inc. (a) | 9,861 | 308,649 | ||||||
Teligent, Inc. (a) | 39,850 | 311,229 | ||||||
|
| |||||||
| 2,125,938 | ||||||||
|
| |||||||
| Professional Services—1.3% | ||||||||
GP Strategies Corp. (a) | 8,410 | 212,773 | ||||||
Kforce, Inc. | 10,871 | 258,186 | ||||||
|
| |||||||
| 470,959 | ||||||||
|
| |||||||
| Shares | Value | |||||||
| Road & Rail—0.3% | ||||||||
Celadon Group, Inc. | 17,792 | $ | 116,538 | |||||
|
| |||||||
| Semiconductors & Semiconductor Equipment—6.4% | ||||||||
AXT, Inc. (a) | 37,083 | 215,081 | ||||||
CEVA, Inc. (a) | 11,325 | 402,037 | ||||||
CyberOptics Corp. (a) | 8,058 | 209,105 | ||||||
FormFactor, Inc. (a) | 25,189 | 298,490 | ||||||
Ichor Holdings Ltd. (a) | 14,897 | 295,407 | ||||||
Impinj, Inc. (a) | 9,139 | 276,638 | ||||||
NeoPhotonics Corp. (a) | 23,493 | 211,672 | ||||||
PDF Solutions, Inc. (a) | 17,669 | 399,673 | ||||||
|
| |||||||
| 2,308,103 | ||||||||
|
| |||||||
| Software—2.5% | ||||||||
Model N, Inc. (a) | 18,847 | 196,951 | ||||||
PROS Holdings, Inc. (a) | 8,407 | 203,365 | ||||||
Silver Spring Networks, Inc. (a) | 22,877 | 258,281 | ||||||
Telenav, Inc. (a) | 29,179 | 252,399 | ||||||
|
| |||||||
| 910,996 | ||||||||
|
| |||||||
| Specialty Retail—0.4% | ||||||||
Shoe Carnival, Inc. | 6,390 | 157,002 | ||||||
|
| |||||||
| Technology Hardware, Storage & Peripherals—0.5% | ||||||||
USA Technologies, Inc. (a) | 45,187 | 192,045 | ||||||
|
| |||||||
| Thrifts & Mortgage Finance—2.8% | ||||||||
First Defiance Financial Corp. | 6,655 | 329,489 | ||||||
LendingTree, Inc. (a) | 2,274 | 285,046 | ||||||
Meridian Bancorp, Inc. | 21,792 | 398,793 | ||||||
|
| |||||||
| 1,013,328 | ||||||||
|
| |||||||
| Wireless Telecommunication Services—1.1% | ||||||||
Boingo Wireless, Inc. (a) | 30,229 | 392,675 | ||||||
|
| |||||||
| Total Common Stock (cost—$26,611,977) | 35,272,256 | |||||||
|
| |||||||
| Principal Amount (000s) | ||||||||
| Repurchase Agreements—3.3% | ||||||||
State Street Bank and Trust Co., dated 3/31/17, 0.09%, due 4/3/17, proceeds $1,216,009; collateralized by U.S. Treasury Notes, 2.00%, due 11/15/26, valued at $1,243,400 including accrued interest |
| |||||||
(cost—$1,216,000) | $1,216 | 1,216,000 | ||||||
|
| |||||||
| Total Investments (cost—$27,827,977)—100.4% | 36,488,256 | |||||||
|
| |||||||
| Liabilities in excess of other assets—(0.4)% | (157,647 | ) | ||||||
|
| |||||||
| Net Assets—100.0% | $36,330,609 | |||||||
|
| |||||||
Notes to Schedule of Investments:
(a) Non-income producing.
| 184 | Semiannual Report | | March 31, 2017 | | See accompanying Notes to Financial Statements |
Table of Contents
Schedule of Investments
March 31, 2017 (Unaudited)
AllianzGI Multi-Asset Real Return Fund
| Shares | Value | |||||||
| Mutual Funds (b)—49.4% | ||||||||
AllianzGI Global Natural Resources (c) | 61,547 | $972,444 | ||||||
AllianzGI Short Duration High Income (d) | 8,199 | 124,128 | ||||||
PIMCO Commodity RealReturn Strategy (c) | 135,391 | 946,380 | ||||||
|
| |||||||
| Total Mutual Funds (cost—$2,131,756) | 2,042,952 | |||||||
|
| |||||||
| Exchange-Traded Funds—19.5% | ||||||||
iShares iBoxx $ High Yield Corporate Bond | 901 | 79,090 | ||||||
iShares JPMorgan USD Emerging Markets Bond | 1,259 | 143,148 | ||||||
PIMCO 1-5 Year U.S. TIPS Index (b) | 3,802 | 200,859 | ||||||
PIMCO Broad U.S. TIPS Index (b) | 6,559 | 381,690 | ||||||
|
| |||||||
| Total Exchange-Traded Funds (cost—$793,483) | 804,787 | |||||||
|
| |||||||
| Common Stock—15.4% | ||||||||
| Australia—1.9% | ||||||||
Dexus Property Group REIT | 1,115 | 8,322 | ||||||
Goodman Group REIT | 1,464 | 8,656 | ||||||
GPT Group REIT | 1,482 | 5,833 | ||||||
LendLease Group UNIT | 454 | 5,400 | ||||||
Mirvac Group REIT | 3,061 | 5,121 | ||||||
Scentre Group REIT | 4,455 | 14,605 | ||||||
Stockland REIT | 1,965 | 6,968 | ||||||
Vicinity Centres REIT | 5,627 | 12,171 | ||||||
Westfield Corp. REIT | 1,625 | 11,023 | ||||||
|
| |||||||
| 78,099 | ||||||||
|
| |||||||
| Austria—0.1% | ||||||||
BUWOG AG (e) | 101 | 2,545 | ||||||
|
| |||||||
| Canada—0.2% | ||||||||
Brookfield Business Partners L.P. UNIT | 14 | 347 | ||||||
First Capital Realty, Inc. | 157 | 2,365 | ||||||
H&R Real Estate Investment Trust REIT | 114 | 1,977 | ||||||
RioCan Real Estate Investment Trust REIT | 131 | 2,581 | ||||||
|
| |||||||
| 7,270 | ||||||||
|
| |||||||
| France—0.8% | ||||||||
Fonciere Des Regions REIT | 25 | 2,084 | ||||||
Gecina S.A. REIT | 29 | 3,932 | ||||||
ICADE REIT | 28 | 2,048 | ||||||
Klepierre REIT | 182 | 7,071 | ||||||
Unibail-Rodamco SE REIT | 81 | 18,887 | ||||||
|
| |||||||
| 34,022 | ||||||||
|
| |||||||
| Germany—0.6% | ||||||||
Deutsche Wohnen AG | 279 | 9,188 | ||||||
Vonovia SE | 382 | 13,458 | ||||||
|
| |||||||
| 22,646 | ||||||||
|
| |||||||
| Hong Kong—2.5% | ||||||||
Cheung Kong Property Holdings Ltd. | 2,263 | 15,266 | ||||||
Hang Lung Properties Ltd. | 1,878 | 4,882 | ||||||
Henderson Land Development Co., Ltd. | 1,064 | 6,598 | ||||||
Hysan Development Co., Ltd. | 541 | 2,454 | ||||||
Kerry Properties Ltd. | 548 | 1,901 | ||||||
Link REIT | 1,900 | 13,317 | ||||||
| Shares | Value | |||||||
New World Development Co., Ltd. | 5,440 | $ | 6,703 | |||||
Sino Land Co., Ltd. | 3,271 | 5,736 | ||||||
Sun Hung Kai Properties Ltd. | 1,464 | 21,521 | ||||||
Swire Pacific Ltd., Class A | 493 | 4,928 | ||||||
Swire Properties Ltd. | 986 | 3,160 | ||||||
Wharf Holdings Ltd. | 1,136 | 9,763 | ||||||
Wheelock & Co., Ltd. | 856 | 6,771 | ||||||
|
| |||||||
| 103,000 | ||||||||
|
| |||||||
| Japan—2.6% | ||||||||
Aeon Mall Co., Ltd. | 130 | 2,051 | ||||||
Daito Trust Construction Co., Ltd. | 61 | 8,387 | ||||||
Daiwa House Industry Co., Ltd. | 500 | 14,372 | ||||||
Hulic Co., Ltd. | 325 | 3,068 | ||||||
Japan Prime Realty Investment Corp. REIT | 1 | 3,879 | ||||||
Japan Real Estate Investment Corp. REIT | 1 | 5,308 | ||||||
Japan Retail Fund Investment Corp. REIT | 2 | 3,925 | ||||||
Mitsubishi Estate Co., Ltd. | 1,048 | 19,102 | ||||||
Mitsui Fudosan Co., Ltd. | 796 | 16,996 | ||||||
Nippon Building Fund, Inc. REIT | 1 | 5,482 | ||||||
Nippon Prologis REIT, Inc. REIT | 1 | 2,168 | ||||||
Nomura Real Estate Holdings, Inc. | 106 | 1,692 | ||||||
Nomura Real Estate Master Fund, Inc. | 3 | 4,666 | ||||||
NTT Urban Development Corp. | 200 | 1,744 | ||||||
Sumitomo Realty & Development Co., Ltd. | 303 | 7,870 | ||||||
Tokyo Tatemono Co., Ltd. | 200 | 2,644 | ||||||
Tokyu Fudosan Holdings Corp. | 431 | 2,346 | ||||||
United Urban Investment Corp. REIT | 2 | 3,075 | ||||||
|
| |||||||
| 108,775 | ||||||||
|
| |||||||
| Singapore—0.6% | ||||||||
Ascendas Real Estate Investment Trust REIT | 1,722 | 3,101 | ||||||
CapitaLand Commercial Trust REIT | 1,729 | 1,909 | ||||||
CapitaLand Ltd. | 2,115 | 5,490 | ||||||
CapitaLand Mall Trust REIT | 2,670 | 3,759 | ||||||
City Developments Ltd. | 342 | 2,492 | ||||||
Global Logistic Properties Ltd. | 2,200 | 4,372 | ||||||
Suntec Real Estate Investment Trust REIT | 1,997 | 2,556 | ||||||
UOL Group Ltd. | 395 | 1,968 | ||||||
|
| |||||||
| 25,647 | ||||||||
|
| |||||||
| Switzerland—0.1% | ||||||||
Swiss Prime Site AG (e) | 56 | 4,931 | ||||||
|
| |||||||
| United Kingdom—0.6% | ||||||||
British Land Co. PLC REIT | 803 | 6,138 | ||||||
Hammerson PLC REIT | 644 | 4,605 | ||||||
Intu Properties PLC REIT | 777 | 2,719 | ||||||
Land Securities Group PLC REIT | 659 | 8,752 | ||||||
Segro PLC REIT | 620 | 3,545 | ||||||
|
| |||||||
| 25,759 | ||||||||
|
| |||||||
| United States—5.4% | ||||||||
American Tower Corp. REIT | 178 | 21,634 | ||||||
AvalonBay Communities, Inc. REIT | 55 | 10,098 | ||||||
Boston Properties, Inc. REIT | 64 | 8,474 | ||||||
Brixmor Property Group, Inc. REIT | 74 | 1,588 | ||||||
Camden Property Trust REIT | 37 | 2,977 | ||||||
CBRE Group, Inc., Class A (e) | 124 | 4,314 | ||||||
| Shares | Value | |||||||
Crown Castle International Corp. | 141 | $ | 13,317 | |||||
Digital Realty Trust, Inc. REIT | 57 | 6,064 | ||||||
Duke Realty Corp. REIT | 145 | 3,809 | ||||||
Equinix, Inc. REIT | 25 | 10,009 | ||||||
Equity Residential REIT | 153 | 9,520 | ||||||
Essex Property Trust, Inc. REIT | 27 | 6,251 | ||||||
Extra Space Storage, Inc. REIT | 46 | 3,422 | ||||||
Federal Realty Investment Trust REIT | 29 | 3,872 | ||||||
GGP, Inc. | 242 | 5,610 | ||||||
HCP, Inc. REIT | 192 | 6,006 | ||||||
Host Hotels & Resorts, Inc. REIT | 320 | 5,971 | ||||||
Iron Mountain, Inc. | 81 | 2,889 | ||||||
Jones Lang LaSalle, Inc. | 19 | 2,118 | ||||||
Kimco Realty Corp. REIT | 172 | 3,799 | ||||||
Liberty Property Trust REIT | 64 | 2,467 | ||||||
Macerich Co. REIT | 57 | 3,671 | ||||||
Prologis, Inc. REIT | 221 | 11,466 | ||||||
Public Storage REIT | 61 | 13,354 | ||||||
Realogy Holdings Corp. | 59 | 1,758 | ||||||
Realty Income Corp. REIT | 99 | 5,893 | ||||||
Regency Centers Corp. REIT | 34 | 2,257 | ||||||
Simon Property Group, Inc. REIT | 130 | 22,364 | ||||||
SL Green Realty Corp. REIT | 42 | 4,478 | ||||||
UDR, Inc. REIT | 107 | 3,880 | ||||||
Ventas, Inc. REIT | 137 | 8,910 | ||||||
VEREIT, Inc. REIT | 386 | 3,277 | ||||||
Vornado Realty Trust REIT | 71 | 7,122 | ||||||
|
| |||||||
| 222,639 | ||||||||
|
| |||||||
| Total Common Stock (cost—$575,721) | 635,333 | |||||||
|
| |||||||
| Principal Amount (000s) | ||||||||
| Repurchase Agreements—20.5% | ||||||||
State Street Bank and Trust Co., dated 3/31/17, 0.09%, due 4/3/17, proceeds $849,006; collateralized by U.S. Treasury Notes, 2.00%, due 8/15/25, valued at $867,035 including accrued interest |
| |||||||
(cost—$849,000) | $849 | 849,000 | ||||||
|
| |||||||
| Total Investments (cost—$4,349,960) (a)—104.8% | 4,332,072 | |||||||
|
| |||||||
| Liabilities in excess of other assets (f)—(4.8)% | (198,663 | ) | ||||||
|
| |||||||
| Net Assets—100.0% | $4,133,409 | |||||||
|
| |||||||
| See accompanying Notes to Financial Statements | | March 31, 2017 | | Semiannual Report | 185 |
Table of Contents
Schedule of Investments
March 31, 2017 (Unaudited)
Notes to Schedule of Investments:
(a) Securities with an aggregate value of $405,424, representing 9.8% of net assets, were valued utilizing modeling tools provided by a third-party vendor. See Note 1(a) and Note 1(b) in the Notes to Financial Statements.
(b) Affiliated fund.
(c) Institutional Class share.
(d) Class R6 share.
(e) Non-income producing.
(f) Includes net unrealized appreciation (depreciation) of other financial instruments. See Notes 7(b) and 7(c) in the Notes to Financial Statements.
Glossary:
REIT—Real Estate Investment Trust
TIPS—Treasury Inflation Protected Securities
UNIT—More than one class of securities traded together.
The industry classification of portfolio holdings and liabilities in excess of other assets shown as a percentage of net assets were as follows:
Mutual Funds | 49.4% | |||
Exchange-Traded Funds | 19.5% | |||
Equity Real Estate Investment Trusts (REITs) | 9.8% | |||
Real Estate Management & Development | 5.6% | |||
Construction & Engineering | 0.0% | |||
Repurchase Agreements | 20.5% | |||
Liabilities in excess of other assets | (4.8)% | |||
|
| |||
| 100.0% | ||||
|
|
AllianzGI NFJ Emerging Markets Value Fund
| Shares | Value | |||||||
| Common Stock—87.0% | ||||||||
| Brazil—5.6% | ||||||||
BM&FBovespa | 9,573 | $58,984 | ||||||
CVC Brasil Operadora e Agencia de Viagens S.A. | 18,600 | 171,705 | ||||||
Equatorial Energia S.A. (e) | 9,400 | 176,524 | ||||||
Estacio Participacoes S.A. | 31,700 | 160,697 | ||||||
FPC Par Corretora de Seguros S.A. | 30,600 | 173,497 | ||||||
Qualicorp S.A. | 26,500 | 174,799 | ||||||
Sao Martinho S.A. | 29,303 | 161,744 | ||||||
Smiles S.A. | 7,100 | 143,787 | ||||||
Transmissora Alianca de Energia Eletrica S.A. UNIT | 22,900 | 167,877 | ||||||
|
| |||||||
| 1,389,614 | ||||||||
|
| |||||||
| Chile—1.3% | ||||||||
Enel Americas S.A. | 818,363 | 170,460 | ||||||
Enel Chile S.A. | 1,431,105 | 158,319 | ||||||
|
| |||||||
| 328,779 | ||||||||
|
| |||||||
| China—23.2% | ||||||||
Agricultural Bank of China Ltd., Class H | 361,000 | 166,485 | ||||||
Bank of China Ltd., Class H | 329,000 | 163,606 | ||||||
Bank of Communications Co., Ltd., Class H | 203,000 | 158,018 | ||||||
Bank of Nanjing Co., Ltd., Class A | 93,900 | 163,684 | ||||||
BYD Electronic International Co., Ltd. | 132,000 | 183,422 | ||||||
China Communications Services Corp., Ltd., Class H | 250,000 | 163,727 | ||||||
China Construction Bank Corp., Class H | 201,000 | 161,947 | ||||||
China Lesso Group Holdings Ltd. | 198,000 | 167,474 | ||||||
China Merchants Bank Co., Ltd., Class H | 60,100 | 159,047 | ||||||
China State Construction Engineering Corp., Ltd., Class A | 122,100 | 163,038 | ||||||
China Water Affairs Group Ltd. | 240,000 | 158,133 | ||||||
Chongqing Rural Commercial Bank Co., Ltd., Class H | 243,000 | 164,168 | ||||||
CSC Financial Co., Ltd., Class H (a)(e) | 168,000 | 154,895 | ||||||
Guangdong Provincial Expressway Development Co., Ltd., Class B | 238,920 | 174,925 | ||||||
Hua Hong Semiconductor Ltd. (a) | 123,000 | 172,701 | ||||||
Huaxia Bank Co., Ltd., Class A | 101,300 | 165,983 | ||||||
Huayu Automotive Systems Co., Ltd., Class A | 66,200 | 175,116 | ||||||
Industrial & Commercial Bank of China Ltd., Class H | 254,000 | 166,205 | ||||||
Kingboard Laminates Holdings Ltd. | 140,000 | 181,690 | ||||||
Lee & Man Paper Manufacturing Ltd. | 211,000 | 161,387 | ||||||
Minth Group Ltd. | 41,000 | 165,316 | ||||||
| Shares | Value | |||||||
Nexteer Automotive Group Ltd. | 113,000 | $ | 166,763 | |||||
Nine Dragons Paper Holdings Ltd. | 152,000 | 163,528 | ||||||
PICC Property & Casualty Co., Ltd., Class H | 93,000 | 143,539 | ||||||
Qingdao Port International Co., Ltd., Class H (a) | 284,000 | 157,972 | ||||||
SAIC Motor Corp., Ltd., Class A | 45,944 | 169,230 | ||||||
Shandong Hi-Speed Co., Ltd., Class A | 162,400 | 166,858 | ||||||
Shanghai Pharmaceuticals Holding Co., Ltd., Class H | 61,600 | 161,368 | ||||||
Shanghai Pudong Development Bank Co., Ltd., Class A | 69,220 | 160,842 | ||||||
Shenzhen Expressway Co., Ltd., Class H | 182,000 | 164,973 | ||||||
Sihuan Pharmaceutical Holdings Group Ltd. | 442,000 | 167,912 | ||||||
Sinopec Shanghai Petrochemical Co., Ltd., Class H | 288,000 | 159,840 | ||||||
Sinopharm Group Co., Ltd., Class H | 34,800 | 161,558 | ||||||
Texhong Textile Group Ltd. | 120,500 | 161,628 | ||||||
Zhejiang Expressway Co., Ltd., Class H | 136,000 | 177,892 | ||||||
|
| |||||||
| 5,774,870 | ||||||||
|
| |||||||
| Czech Republic—0.7% | ||||||||
Philip Morris CR AS | 302 | 161,790 | ||||||
|
| |||||||
| Hong Kong—1.3% | ||||||||
Man Wah Holdings Ltd. | 192,000 | 152,505 | ||||||
Xinyi Glass Holdings Ltd. (e) | 180,000 | 158,548 | ||||||
|
| |||||||
| 311,053 | ||||||||
|
| |||||||
| India—9.7% | ||||||||
Bharat Petroleum Corp., Ltd. | 16,311 | 163,154 | ||||||
Great Eastern Shipping Co., Ltd. | 28,440 | 183,212 | ||||||
Hindustan Petroleum Corp., Ltd. | 20,727 | 167,917 | ||||||
Indiabulls Housing Finance Ltd. | 11,709 | 180,023 | ||||||
Indian Oil Corp., Ltd. | 28,778 | 171,532 | ||||||
JK Tyre & Industries Ltd. (e) | 84,116 | 171,776 | ||||||
JM Financial Ltd. | 129,662 | 176,218 | ||||||
Mphasis Ltd. | 18,683 | 166,863 | ||||||
Power Grid Corp. of India Ltd. | 54,230 | 164,754 | ||||||
Redington India Ltd. | 99,723 | 168,931 | ||||||
Reliance Capital Ltd. (e) | 18,855 | 178,630 | ||||||
Rural Electrification Corp., Ltd. | 63,640 | 177,463 | ||||||
Vardhman Textiles Ltd. (e) | 8,390 | 168,620 | ||||||
Zensar Technologies Ltd. | 11,417 | 162,690 | ||||||
|
| |||||||
| 2,401,783 | ||||||||
|
| |||||||
| Indonesia—2.0% | ||||||||
Bank Negara Indonesia Persero Tbk PT | 341,400 | 165,980 | ||||||
Bank Rakyat Indonesia Persero Tbk PT | 172,000 | 167,480 | ||||||
Bank Tabungan Negara Persero Tbk PT | 952,500 | 162,268 | ||||||
|
| |||||||
| 495,728 | ||||||||
|
| |||||||
| Korea (Republic of)—10.6% | ||||||||
Dongbu Insurance Co., Ltd. | 2,460 | 140,817 | ||||||
Hyosung Corp. | 1,392 | 168,685 | ||||||
| 186 | Semiannual Report | | March 31, 2017 | | See accompanying Notes to Financial Statements |
Table of Contents
Schedule of Investments
March 31, 2017 (Unaudited)
| Shares | Value | |||||||
Hyundai Development Co. | 4,470 | $ | 162,605 | |||||
Hyundai Marine & Fire Insurance Co., Ltd. | 5,525 | 172,929 | ||||||
KC Tech Co., Ltd. | 13,480 | 165,815 | ||||||
Korea Asset In Trust Co., Ltd. (e) | 20,660 | 158,880 | ||||||
KT&G Corp. | 1,882 | 164,084 | ||||||
Kwangju Bank | 17,480 | 171,877 | ||||||
LG Uplus Corp. | 12,730 | 162,923 | ||||||
Lotte Chemical Corp. | 495 | 164,028 | ||||||
Meritz Fire & Marine Insurance Co., Ltd. | 11,880 | 169,939 | ||||||
Samsung Electronics Co., Ltd. | 89 | 163,797 | ||||||
Samyang Corp. | 1,780 | 154,716 | ||||||
SFA Engineering Corp. | 2,720 | 176,201 | ||||||
Shinhan Financial Group Co., Ltd. | 3,960 | 165,001 | ||||||
SK Hynix, Inc. | 3,860 | 174,345 | ||||||
|
| |||||||
| 2,636,642 | ||||||||
|
| |||||||
| Malaysia—3.3% | ||||||||
Aeon Credit Service M Bhd. | 45,600 | 164,915 | ||||||
Lingkaran Trans Kota Holdings Bhd. | 120,900 | 164,460 | ||||||
Padini Holdings Bhd. | 248,000 | 168,117 | ||||||
Tenaga Nasional Bhd. | 52,300 | 162,080 | ||||||
Unisem M Bhd. | 239,800 | 170,144 | ||||||
|
| |||||||
| 829,716 | ||||||||
|
| |||||||
| Mexico—3.6% | ||||||||
Concentradora Hipotecaria SAPI de C.V. REIT | 146,000 | 175,304 | ||||||
Macquarie Mexico Real Estate Management S.A. de C.V. REIT (e) | 163,400 | 183,279 | ||||||
OHL Mexico S.A.B de C.V. | 130,000 | 183,728 | ||||||
PLA Administradora Industrial S de RL de C.V. REIT (e) | 104,300 | 170,192 | ||||||
Prologis Property Mexico S.A. de C.V. REIT (e) | 108,700 | 186,370 | ||||||
|
| |||||||
| 898,873 | ||||||||
|
| |||||||
| Philippines—0.7% | ||||||||
Manila Water Co., Inc. | 263,700 | 161,831 | ||||||
|
| |||||||
| Poland—0.7% | ||||||||
Polskie Gornictwo Naftowe i Gazownictwo S.A. | 110,384 | 164,705 | ||||||
|
| |||||||
| Russian Federation—2.5% | ||||||||
Gazprom Neft PJSC ADR | 9,376 | 168,674 | ||||||
Lukoil PJSC (d) | 3,087 | 163,333 | ||||||
Moscow Exchange PJSC (d) | 65,947 | 130,575 | ||||||
Rosneft Oil Co. PJSC GDR | 29,985 | 170,615 | ||||||
|
| |||||||
| 633,197 | ||||||||
|
| |||||||
| Singapore—0.6% | ||||||||
Japfa Ltd. | 271,100 | 157,881 | ||||||
|
| |||||||
| South Africa—4.2% | ||||||||
Assore Ltd. | 7,741 | 141,033 | ||||||
Mondi Ltd. | 6,820 | 162,674 | ||||||
Peregrine Holdings Ltd. | 76,877 | 158,016 | ||||||
S.A. Corporate Real Estate Ltd. REIT | 319,278 | 130,888 | ||||||
SPAR Group Ltd. | 10,666 | 138,377 | ||||||
Telkom S.A. SOC Ltd. | 29,289 | 163,798 | ||||||
Vukile Property Fund Ltd. REIT | 104,895 | 150,506 | ||||||
|
| |||||||
| 1,045,292 | ||||||||
|
| |||||||
| Taiwan—13.7% | ||||||||
Chin-Poon Industrial Co., Ltd. | 81,000 | 164,716 | ||||||
China Life Insurance Co., Ltd. | 146,000 | 144,380 | ||||||
Coretronic Corp. | 115,200 | 169,295 | ||||||
| Shares | Value | |||||||
Elite Material Co., Ltd. | 42,000 | $ | 163,326 | |||||
Getac Technology Corp. | 114,000 | 163,799 | ||||||
Gigabyte Technology Co., Ltd. | 117,000 | 161,572 | ||||||
Greatek Electronics, Inc. | 120,000 | 164,520 | ||||||
Green Seal Holding Ltd. | 30,500 | 166,335 | ||||||
Hon Hai Precision Industry Co., Ltd. GDR | 28,709 | 175,986 | ||||||
King Yuan Electronics Co., Ltd. | 168,000 | 155,037 | ||||||
King’s Town Bank Co., Ltd. | 175,000 | 173,919 | ||||||
Kung Long Batteries Industrial Co., Ltd. | 32,000 | 166,121 | ||||||
Lite-On Technology Corp. | 96,767 | 166,793 | ||||||
Micro-Star International Co., Ltd. | 50,000 | 116,357 | ||||||
Pegatron Corp. | 60,000 | 177,621 | ||||||
Primax Electronics Ltd. | 105,000 | 172,186 | ||||||
Sercomm Corp. | 62,000 | 155,322 | ||||||
Sinbon Electronics Co., Ltd. | 31,000 | 76,124 | ||||||
Taiwan Semiconductor Manufacturing Co., Ltd. | 27,000 | 169,307 | ||||||
Topco Scientific Co., Ltd. | 23,000 | 75,028 | ||||||
Tripod Technology Corp. | 60,000 | 169,046 | ||||||
Yageo Corp. | 60,814 | 165,757 | ||||||
|
| |||||||
| 3,412,547 | ||||||||
|
| |||||||
| Thailand—1.3% | ||||||||
Kiatnakin Bank PCL NVDR | 84,300 | 170,532 | ||||||
PTT PCL NVDR | 14,300 | 161,045 | ||||||
|
| |||||||
| 331,577 | ||||||||
|
| |||||||
| Turkey—2.0% | ||||||||
Aygaz AS | 41,520 | 168,077 | ||||||
Selcuk Ecza Deposu Ticaret ve Sanayi AS | 174,411 | 160,281 | ||||||
Soda Sanayii AS | 100,547 | 168,339 | ||||||
|
| |||||||
| 496,697 | ||||||||
|
| |||||||
| Total Common Stock (cost—$19,753,895) | 21,632,575 | |||||||
|
| |||||||
| Preferred Stock—3.3% | ||||||||
| Brazil—0.7% | ||||||||
Alpargatas S.A. | 45,500 | 178,767 | ||||||
|
| |||||||
| Korea (Republic of)—1.9% | ||||||||
LG Household & Health Care Ltd. | 308 | 140,512 | ||||||
Samsung Electronics Co., Ltd. | 115 | 164,725 | ||||||
SK Innovation Co., Ltd. | 2,010 | 183,346 | ||||||
|
| |||||||
| 488,583 | ||||||||
|
| |||||||
| Russian Federation—0.7% | ||||||||
Tatneft OAO (d) | 46,061 | 166,741 | ||||||
|
| |||||||
| Total Preferred Stock (cost—$706,078) | 834,091 | |||||||
|
| |||||||
| Equity-Linked Securities—1.4% | ||||||||
| China—1.4% | ||||||||
Merrill Lynch International & Co., |
| |||||||
Gree Electric Appliances, Inc., Class A, expires 8/31/18 | 33,564 | 154,394 | ||||||
expires 7/21/20 | 4,651 | 21,395 | ||||||
Midea Group Co., Ltd. Class A, expires 9/14/21 | 34,093 | 165,010 | ||||||
|
| |||||||
| Total Equity-Linked Securities (cost—$264,481) | 340,799 | |||||||
|
| |||||||
| Shares | Value | |||||||
| Exchange-Traded Funds—0.7% | ||||||||
iShares MSCI Emerging Markets Index | 4,200 | $ | 165,438 | |||||
|
| |||||||
| Principal Amount (000s) | ||||||||
| Repurchase Agreements—2.9% | ||||||||
State Street Bank and Trust Co., dated 3/31/17, 0.09%, due 4/3/17, proceeds $712,005; collateralized by U.S. Treasury Notes, 2.00%, due 11/25/26, valued at $728,555 including accrued interest |
| |||||||
(cost—$712,000) | $712 | 712,000 | ||||||
|
| |||||||
| Total Investments (cost—$21,595,326) (c)—95.3% | 23,684,903 | |||||||
|
| |||||||
| Other assets less liabilities (f)—4.7% | 1,177,473 | |||||||
|
| |||||||
| Net Assets—100.0% | $24,862,376 | |||||||
|
| |||||||
Notes to Schedule of Investments:
(a) 144A—Exempt from registration under Rule 144A of the Securities Act of 1933. These securities may be resold in transactions exempt from registration, typically only to qualified institutional buyers. Securities with an aggregate value of $485,568, representing 2.0% of net assets.
(b) When-issued or delayed-delivery. To be settled/delivered after March 31, 2017.
(c) Securities with an aggregate value of $16,793,637, representing 67.5% of net assets, were valued utilizing modeling tools provided by a third-party vendor. See Note 1(a) and Note 1(b) in the Notes to Financial Statements.
(d) Fair-Valued—Securities with an aggregate value of $460,649, representing 1.9% of net assets. See Note 1(a) and Note 1(b) in the Notes to Financial Statements.
(e) Non-income producing.
(f) Includes net unrealized appreciation (depreciation) of other financial instruments. See Notes 7(b) and 7(c) in the Notes to Financial Statements.
Glossary:
ADR—American Depositary Receipt
GDR—Global Depositary Receipt
MSCI—Morgan Stanley Capital International
NVDR—Non-Voting Depository Receipt
REIT—Real Estate Investment Trust
UNIT—More than one class of securities traded together.
| See accompanying Notes to Financial Statements | | March 31, 2017 | | Semiannual Report | 187 |
Table of Contents
Schedule of Investments
March 31, 2017 (Unaudited)
The industry classification of portfolio holdings and other assets less liabilities shown as a percentage of net assets were as follows:
Banks | 11.3% | |||
Oil, Gas & Consumable Fuels | 7.5% | |||
Electronic Equipment, Instruments & Components | 6.5% | |||
Technology Hardware, Storage & Peripherals | 5.2% | |||
Semiconductors & Semiconductor Equipment | 5.0% | |||
Transportation Infrastructure | 4.8% | |||
Equity Real Estate Investment Trusts (REITs) | 4.6% | |||
Electric Utilities | 4.0% | |||
Insurance | 3.8% | |||
Auto Components | 3.4% | |||
Chemicals | 3.3% | |||
Capital Markets | 2.7% | |||
Health Care Providers & Services | 2.6% | |||
Textiles, Apparel & Luxury Goods | 2.0% | |||
Household Durables | 2.0% | |||
Diversified Telecommunication Services | 2.0% | |||
Paper & Forest Products | 1.9% | |||
Food Products | 1.9% | |||
Diversified Financial Services | 1.4% | |||
Communications Equipment | 1.4% | |||
Tobacco | 1.3% | |||
Construction & Engineering | 1.3% | |||
Water Utilities | 1.3% | |||
Thrifts & Mortgage Finance | 0.7% | |||
Hotels, Restaurants & Leisure | 0.7% | |||
Automobiles | 0.7% | |||
Specialty Retail | 0.7% | |||
Gas Utilities | 0.7% | |||
Pharmaceuticals | 0.7% | |||
Building Products | 0.7% | |||
IT Services | 0.7% | |||
Electrical Equipment | 0.7% | |||
Exchange-Traded Funds | 0.7% | |||
Consumer Finance | 0.7% | |||
Software | 0.6% | |||
Diversified Consumer Services | 0.6% | |||
Media | 0.6% | |||
Metals & Mining | 0.6% | |||
Personal Products | 0.6% | |||
Food & Staples Retailing | 0.5% | |||
Repurchase Agreements | 2.9% | |||
Other assets less liabilities | 4.7% | |||
|
| |||
| 100.0% | ||||
|
|
AllianzGI NFJ Global Dividend Value Fund
| Shares | Value | |||||||
| Common Stock—98.7% | ||||||||
| Australia—2.0% | ||||||||
Australia & New Zealand Banking Group Ltd. | 15,923 | $386,621 | ||||||
|
| |||||||
| Canada—1.9% | ||||||||
Toronto-Dominion Bank | 7,200 | 360,648 | ||||||
|
| |||||||
| Chile—2.2% | ||||||||
Itau CorpBanca ADR | 30,900 | 419,622 | ||||||
|
| |||||||
| China—4.1% | ||||||||
China Construction Bank Corp., Class H | 485,000 | 390,768 | ||||||
China Mobile Ltd. | 34,600 | 380,514 | ||||||
|
| |||||||
| 771,282 | ||||||||
|
| |||||||
| France—2.1% | ||||||||
Capgemini S.A. | 4,255 | 392,760 | ||||||
|
| |||||||
| Germany—4.1% | ||||||||
Bayer AG | 3,382 | 389,652 | ||||||
Siemens AG | 2,893 | 396,260 | ||||||
|
| |||||||
| 785,912 | ||||||||
|
| |||||||
| Japan—4.0% | ||||||||
ITOCHU Corp. | 26,300 | 374,416 | ||||||
Mizuho Financial Group, Inc. | 205,700 | 377,578 | ||||||
|
| |||||||
| 751,994 | ||||||||
|
| |||||||
| Korea (Republic of)—2.1% | ||||||||
SK Telecom Co., Ltd. | 1,751 | 395,639 | ||||||
|
| |||||||
| Netherlands—2.1% | ||||||||
Royal Dutch Shell PLC, Class A ADR | 7,400 | 390,202 | ||||||
|
| |||||||
| Norway—1.9% | ||||||||
Marine Harvest ASA (b) | 23,295 | 355,351 | ||||||
|
| |||||||
| Russian Federation—2.1% | ||||||||
LUKOIL PJSC ADR | 7,500 | 397,950 | ||||||
|
| |||||||
| Spain—2.1% | ||||||||
Enagas S.A. | 15,272 | 396,209 | ||||||
|
| |||||||
| Switzerland—2.0% | ||||||||
Swiss Re AG | 4,257 | 382,347 | ||||||
|
| |||||||
| Taiwan—2.1% | ||||||||
Hon Hai Precision Industry Co., Ltd. GDR | 64,589 | 395,930 | ||||||
|
| |||||||
| United Kingdom—9.7% | ||||||||
BAE Systems PLC | 48,229 | 388,157 | ||||||
Direct Line Insurance Group PLC | 92,128 | 400,834 | ||||||
Greene King PLC | 29,965 | 263,035 | ||||||
Imperial Brands PLC | 8,164 | 395,657 | ||||||
WPP PLC | 18,225 | 399,475 | ||||||
|
| |||||||
| 1,847,158 | ||||||||
|
| |||||||
| United States—54.2% | ||||||||
A Schulman, Inc. | 10,500 | 330,225 | ||||||
AbbVie, Inc. | 5,800 | 377,928 | ||||||
Apple, Inc. | 2,700 | 387,882 | ||||||
AT&T, Inc. | 9,000 | 373,950 | ||||||
CA, Inc. | 10,900 | 345,748 | ||||||
Carnival Corp. | 6,700 | 394,697 | ||||||
CBS Corp., Class B | 5,500 | 381,480 | ||||||
Cisco Systems, Inc. | 20,700 | 699,660 | ||||||
Exxon Mobil Corp. | 4,600 | 377,246 | ||||||
General Motors Co. | 10,200 | 360,672 | ||||||
Honeywell International, Inc. | 2,900 | 362,123 | ||||||
Intel Corp. | 10,500 | 378,735 | ||||||
| Shares | Value | |||||||
International Business Machines Corp. | 4,000 | $ | 696,560 | |||||
Johnson & Johnson | 3,000 | 373,650 | ||||||
JPMorgan Chase & Co. | 4,100 | 360,144 | ||||||
Nabors Industries Ltd. | 28,114 | 367,450 | ||||||
Pfizer, Inc. | 11,100 | 379,731 | ||||||
PNC Financial Services Group, Inc. | 2,900 | 348,696 | ||||||
PPL Corp. | 10,400 | 388,856 | ||||||
Quest Diagnostics, Inc. | 3,800 | 373,122 | ||||||
Travelers Cos., Inc. | 3,000 | 361,620 | ||||||
U.S. Bancorp | 6,800 | 350,200 | ||||||
United Technologies Corp. | 3,300 | 370,293 | ||||||
Verizon Communications, Inc. | 7,600 | 370,500 | ||||||
Wal-Mart Stores, Inc. | 5,400 | 389,232 | ||||||
Wells Fargo & Co. | 6,400 | 356,224 | ||||||
|
| |||||||
| 10,256,624 | ||||||||
|
| |||||||
| Total Common Stock (cost—$17,398,702) | 18,686,249 | |||||||
|
| |||||||
| Principal Amount (000s) | ||||||||
| Repurchase Agreements—1.2% | ||||||||
State Street Bank and Trust Co., dated 3/31/17, 0.09%, due 4/3/17, proceeds $231,002; collateralized by U.S. Treasury Notes, 2.00%, due 11/25/26, valued at $237,994 including accrued interest |
| |||||||
(cost—$231,000) | $231 | 231,000 | ||||||
|
| |||||||
| Total Investments (cost—$17,629,702) (a)—99.9% | 18,917,249 | |||||||
|
| |||||||
| Other assets less liabilities—0.1% | 16,798 | |||||||
|
| |||||||
| Net Assets—100.0% | $18,934,047 | |||||||
|
| |||||||
Notes to Schedule of Investments:
(a) Securities with an aggregate value of $6,465,273, representing 34.1% of net assets, were valued utilizing modeling tools provided by a third-party vendor. See Note 1(a) and Note 1(b) in the Notes to Financial Statements.
(b) Non-income producing.
Glossary:
ADR—American Depositary Receipt
GDR—Global Depositary Receipt
| 188 | Semiannual Report | | March 31, 2017 | | See accompanying Notes to Financial Statements |
Table of Contents
Schedule of Investments
March 31, 2017 (Unaudited)
The industry classification of portfolio holdings and other assets less liabilities shown as a percentage of net assets were as follows:
Banks | 17.7% | |||
Oil, Gas & Consumable Fuels | 8.2% | |||
Insurance | 6.0% | |||
Pharmaceuticals | 6.0% | |||
IT Services | 5.8% | |||
Media | 4.1% | |||
Wireless Telecommunication Services | 4.1% | |||
Aerospace & Defense | 4.0% | |||
Industrial Conglomerates | 4.0% | |||
Diversified Telecommunication Services | 3.9% | |||
Communications Equipment | 3.7% | |||
Hotels, Restaurants & Leisure | 3.5% | |||
Electronic Equipment, Instruments & Components | 2.1% | |||
Tobacco | 2.1% | |||
Food & Staples Retailing | 2.1% | |||
Electric Utilities | 2.1% | |||
Technology Hardware, Storage & Peripherals | 2.1% | |||
Semiconductors & Semiconductor Equipment | 2.0% | |||
Biotechnology | 2.0% | |||
Trading Companies & Distributors | 2.0% | |||
Health Care Providers & Services | 2.0% | |||
Energy Equipment & Services | 1.9% | |||
Automobiles | 1.9% | |||
Food Products | 1.9% | |||
Software | 1.8% | |||
Chemicals | 1.7% | |||
Repurchase Agreements | 1.2% | |||
Other assets less liabilities | 0.1% | |||
|
| |||
| 100.0% | ||||
|
|
AllianzGI NFJ International Small-Cap Value Fund
| Shares | Value | |||||||
| Common Stock—97.6% | ||||||||
| Australia—5.0% | ||||||||
Abacus Property Group REIT | 16,196 | $40,077 | ||||||
Beach Energy Ltd. | 61,100 | 37,317 | ||||||
CSR Ltd. | 10,380 | 35,746 | ||||||
GrainCorp Ltd., Class A | 5,216 | 36,238 | ||||||
Pact Group Holdings Ltd. | 9,565 | 51,138 | ||||||
Sandfire Resources NL | 6,800 | 33,109 | ||||||
|
| |||||||
| 233,625 | ||||||||
|
| |||||||
| Austria—1.0% | ||||||||
Mayr Melnhof Karton AG | 417 | 48,602 | ||||||
|
| |||||||
| Belgium—2.7% | ||||||||
Befimmo S.A. REIT | 852 | 48,442 | ||||||
D’ieteren S.A. | 760 | 35,561 | ||||||
Ontex Group NV | 1,285 | 41,241 | ||||||
|
| |||||||
| 125,244 | ||||||||
|
| |||||||
| Brazil—1.9% | ||||||||
Multiplus S.A. | 3,700 | 42,548 | ||||||
Qualicorp S.A. | 6,900 | 45,514 | ||||||
|
| |||||||
| 88,062 | ||||||||
|
| |||||||
| Canada—6.7% | ||||||||
Canfor Pulp Products, Inc. | 5,475 | 49,775 | ||||||
Cogeco, Inc. | 1,090 | 48,818 | ||||||
Enbridge Income Fund Holdings, Inc. | 1,866 | 46,515 | ||||||
Linamar Corp. | 889 | 40,437 | ||||||
Magellan Aerospace Corp. | 2,565 | 37,708 | ||||||
Martinrea International, Inc. | 5,505 | 42,720 | ||||||
Transcontinental, Inc., Class A | 2,658 | 49,129 | ||||||
|
| |||||||
| 315,102 | ||||||||
|
| |||||||
| Chile—0.9% | ||||||||
Vina Concha y Toro S.A. ADR | 1,200 | 40,800 | ||||||
|
| |||||||
| China—2.3% | ||||||||
China Water Affairs Group Ltd. | 56,000 | 36,898 | ||||||
Lee & Man Paper Manufacturing Ltd. | 36,000 | 27,535 | ||||||
Sinopec Kantons Holdings Ltd. | 80,000 | 43,469 | ||||||
|
| |||||||
| 107,902 | ||||||||
|
| |||||||
| Denmark—2.0% | ||||||||
Dfds A/S | 847 | 46,535 | ||||||
Scandinavian Tobacco Group A/S, Class A (a) | 2,639 | 46,130 | ||||||
|
| |||||||
| 92,665 | ||||||||
|
| |||||||
| Finland—3.1% | ||||||||
Cramo Oyj | 1,400 | 31,931 | ||||||
Lassila & Tikanoja Oyj | 2,315 | 45,417 | ||||||
Munksjo Oyj (c) | 2,248 | 33,430 | ||||||
Valmet Oyj | 2,200 | 34,151 | ||||||
|
| |||||||
| 144,929 | ||||||||
|
| |||||||
| France—2.7% | ||||||||
Alten S.A. | 514 | 39,414 | ||||||
Euronext NV (a) | 943 | 41,119 | ||||||
Rubis SCA | 472 | 46,213 | ||||||
|
| |||||||
| 126,746 | ||||||||
|
| |||||||
| Germany—0.8% | ||||||||
Duerr AG | 400 | 35,694 | ||||||
|
| |||||||
| Greece—1.0% | ||||||||
Motor Oil Hellas Corinth Refineries S.A. | 2,765 | 47,174 | ||||||
|
| |||||||
| Hong Kong—4.9% | ||||||||
First Pacific Co., Ltd. | 68,100 | 49,498 | ||||||
Giordano International Ltd. | 84,000 | 45,628 | ||||||
| Shares | Value | |||||||
Johnson Electric Holdings Ltd. | 13,000 | $ | 38,837 | |||||
Man Wah Holdings Ltd. | 62,400 | 49,564 | ||||||
Xinyi Glass Holdings Ltd. (c) | 54,000 | 47,564 | ||||||
|
| |||||||
| 231,091 | ||||||||
|
| |||||||
| Indonesia—0.8% | ||||||||
Adaro Energy Tbk PT | 277,200 | 36,411 | ||||||
|
| |||||||
| Italy—1.2% | ||||||||
A2A SpA | 36,621 | 55,317 | ||||||
|
| |||||||
| Japan—19.4% | ||||||||
Aichi Corp. | 4,200 | 32,434 | ||||||
Dowa Holdings Co., Ltd. | 4,000 | 28,779 | ||||||
Dynam Japan Holdings Co., Ltd. | 29,200 | 51,808 | ||||||
Fujitec Co., Ltd. | 4,100 | 45,181 | ||||||
Fukushima Industries Corp. | 1,400 | 48,939 | ||||||
Heiwado Co., Ltd. | 1,700 | 41,335 | ||||||
Medipal Holdings Corp. | 2,800 | 43,994 | ||||||
Mitsubishi Shokuhin Co., Ltd. | 1,500 | 46,604 | ||||||
Nippo Corp. | 2,000 | 38,021 | ||||||
Nohmi Bosai Ltd. | 3,400 | 46,812 | ||||||
Paramount Bed Holdings Co., Ltd. | 1,100 | 44,204 | ||||||
Raito Kogyo Co., Ltd. | 3,400 | 34,646 | ||||||
Sakata INX Corp. | 3,000 | 41,400 | ||||||
Sankyu, Inc. | 7,000 | 42,577 | ||||||
Sapporo Holdings Ltd. | 1,800 | 48,661 | ||||||
Shiga Bank Ltd. | 6,000 | 30,792 | ||||||
Shizuoka Gas Co., Ltd. | 5,300 | 36,127 | ||||||
Sotetsu Holdings, Inc. | 8,800 | 40,906 | ||||||
T-Gaia Corp. | 2,500 | 43,062 | ||||||
Toho Holdings Co., Ltd. | 1,800 | 37,777 | ||||||
Toshiba Plant Systems & Services Corp. | 2,800 | 40,981 | ||||||
Trancom Co., Ltd. | 800 | 41,470 | ||||||
|
| |||||||
| 906,510 | ||||||||
|
| |||||||
| Korea (Republic of)—0.8% | ||||||||
Hyundai Development Co. | 975 | 35,468 | ||||||
|
| |||||||
| Mexico—1.0% | ||||||||
Ternium S.A. ADR | 1,800 | 47,016 | ||||||
|
| |||||||
| Netherlands—3.1% | ||||||||
Aalberts Industries NV | 1,394 | 51,962 | ||||||
Philips Lighting NV (a)(c) | 1,700 | 48,622 | ||||||
Refresco Group NV (a) | 2,884 | 43,841 | ||||||
|
| |||||||
| 144,425 | ||||||||
|
| |||||||
| New Zealand—0.9% | ||||||||
Goodman Property Trust REIT | 48,146 | 40,665 | ||||||
|
| |||||||
| Norway—1.5% | ||||||||
Borregaard ASA | 3,750 | 42,046 | ||||||
Grieg Seafood ASA | 3,732 | 27,978 | ||||||
|
| |||||||
| 70,024 | ||||||||
|
| |||||||
| Philippines—0.9% | ||||||||
Manila Water Co., Inc. | 71,500 | 43,879 | ||||||
|
| |||||||
| Poland—0.9% | ||||||||
Asseco Poland S.A. | 2,971 | 40,680 | ||||||
|
| |||||||
| Singapore—2.9% | ||||||||
Keppel DC REIT | 43,000 | 36,885 | ||||||
Lippo Malls Indonesia Retail Trust REIT | 161,000 | 45,462 | ||||||
Mapletree Industrial Trust REIT | 40,500 | 51,535 | ||||||
|
| |||||||
| 133,882 | ||||||||
|
| |||||||
| South Africa—0.8% | ||||||||
Reunert Ltd. | 6,600 | 35,418 | ||||||
|
| |||||||
| See accompanying Notes to Financial Statements | | March 31, 2017 | | Semiannual Report | 189 |
Table of Contents
Schedule of Investments
March 31, 2017 (Unaudited)
| Shares | Value | |||||||
| Spain—5.2% | ||||||||
Bolsas y Mercados Espanoles SHMSF S.A. | 1,188 | $ | 39,378 | |||||
Cia de Distribucion Integral Logista Holdings S.A. | 1,857 | 43,105 | ||||||
CIE Automotive S.A. | 2,568 | 50,604 | ||||||
Ebro Foods S.A. | 1,700 | 34,350 | ||||||
Grupo Catalana Occidente S.A. | 1,207 | 42,823 | ||||||
Lar Espana Real Estate Socimi S.A. REIT | 4,562 | 35,138 | ||||||
|
| |||||||
| 245,398 | ||||||||
|
| |||||||
| Sweden—5.5% | ||||||||
Cloetta AB, Class B | 10,817 | 42,734 | ||||||
Dios Fastigheter AB | 6,637 | 32,563 | ||||||
Granges AB | 4,143 | 37,865 | ||||||
Intrum Justitia AB | 1,352 | 50,470 | ||||||
Loomis AB, Class B | 1,424 | 45,027 | ||||||
Rezidor Hotel Group AB | 12,900 | 49,235 | ||||||
|
| |||||||
| 257,894 | ||||||||
|
| |||||||
| Switzerland—1.0% | ||||||||
Cembra Money Bank AG (c) | 577 | 47,702 | ||||||
|
| |||||||
| Taiwan—2.2% | ||||||||
Cleanaway Co., Ltd. | 9,000 | 51,319 | ||||||
Namchow Chemical Industrial Co., Ltd. | 25,000 | 51,007 | ||||||
|
| |||||||
| 102,326 | ||||||||
|
| |||||||
| United Kingdom—13.6% | ||||||||
Bellway PLC | 1,100 | 37,271 | ||||||
Berendsen PLC | 3,250 | 29,784 | ||||||
BGEO Group PLC | 941 | 37,838 | ||||||
Computacenter PLC | 4,325 | 40,397 | ||||||
Consort Medical PLC | 3,310 | 42,964 | ||||||
Go-Ahead Group PLC | 1,205 | 26,022 | ||||||
Hill & Smith Holdings PLC | 3,008 | 47,938 | ||||||
KCOM Group PLC | 34,177 | 38,538 | ||||||
Marston’s PLC | 22,212 | 37,364 | ||||||
OneSavings Bank PLC | 8,800 | 44,565 | ||||||
PayPoint PLC | 3,234 | 41,425 | ||||||
Polypipe Group PLC | 11,261 | 53,662 | ||||||
Ricardo PLC | 3,300 | 35,992 | ||||||
RPC Group PLC | 3,850 | 37,676 | ||||||
Synthomer PLC | 8,154 | 48,598 | ||||||
Tyman PLC | 9,100 | 36,797 | ||||||
|
| |||||||
| 636,831 | ||||||||
|
| |||||||
| United States—0.9% | ||||||||
Travelport Worldwide Ltd. | 3,500 | 41,195 | ||||||
|
| |||||||
| Total Investments (cost—$4,270,032) (b)—97.6% | 4,558,677 | |||||||
|
| |||||||
| Other assets less liabilities—2.4% | 113,270 | |||||||
|
| |||||||
| Net Assets—100.0% | $4,671,947 | |||||||
|
| |||||||
Notes to Schedule of Investments:
(a) 144A—Exempt from registration under Rule 144A of the Securities Act of 1933. These securities may be resold in transactions exempt from registration, typically only to qualified institutional buyers. Securities with an aggregate value of $179,712, representing 3.8% of net assets.
(b) Securities with an aggregate value of $3,218,847, representing 68.9% of net assets, were valued utilizing modeling tools provided by a third-party vendor. See Note 1(a) and Note 1(b) in the Notes to Financial Statements.
(c) Non-income producing.
Glossary:
ADR—American Depositary Receipt
REIT—Real Estate Investment Trust
The industry classification of portfolio holdings and other assets less liabilities shown as a percentage of net assets were as follows:
Commercial Services & Supplies | 6.7% | |||
Equity Real Estate Investment Trusts (REITs) | 6.4% | |||
Machinery | 5.3% | |||
Oil, Gas & Consumable Fuels | 4.5% | |||
Metals & Mining | 4.2% | |||
Food Products | 4.1% | |||
Auto Components | 3.9% | |||
Road & Rail | 3.2% | |||
Construction & Engineering | 3.2% | |||
Hotels, Restaurants & Leisure | 3.0% | |||
Containers & Packaging | 2.9% | |||
Beverages | 2.8% | |||
Chemicals | 2.8% | |||
Health Care Providers & Services | 2.7% | |||
IT Services | 2.6% | |||
Paper & Forest Products | 2.4% | |||
Media | 1.9% | |||
Building Products | 1.9% | |||
Specialty Retail | 1.9% | |||
Food & Staples Retailing | 1.9% | |||
Electrical Equipment | 1.9% | |||
Health Care Equipment & Supplies | 1.9% | |||
Household Durables | 1.9% | |||
Gas Utilities | 1.8% | |||
Water Utilities | 1.7% | |||
Capital Markets | 1.7% | |||
Banks | 1.5% | |||
Multi-Utilities | 1.2% | |||
Diversified Financial Services | 1.1% | |||
Consumer Finance | 1.0% | |||
Electronic Equipment, Instruments & Components | 1.0% | |||
Marine | 1.0% | |||
Tobacco | 1.0% | |||
Thrifts & Mortgage Finance | 0.9% | |||
Air Freight & Logistics | 0.9% | |||
Insurance | 0.9% | |||
Personal Products | 0.9% | |||
Software | 0.9% | |||
Diversified Telecommunication Services | 0.8% | |||
Aerospace & Defense | 0.8% | |||
Professional Services | 0.8% | |||
Construction Materials | 0.8% | |||
Distributors | 0.8% | |||
Industrial Conglomerates | 0.7% | |||
Real Estate Management & Development | 0.7% | |||
Trading Companies & Distributors | 0.7% | |||
Other assets less liabilities | 2.4% | |||
|
| |||
| 100.0% | ||||
|
|
| 190 | Semiannual Report | | March 31, 2017 | | See accompanying Notes to Financial Statements |
Table of Contents
Schedule of Investments
March 31, 2017 (Unaudited)
AllianzGI NFJ International Value II Fund
| Shares | Value | |||||||
| Common Stock—90.5% | ||||||||
| Australia—4.0% | ||||||||
Coca-Cola Amatil Ltd. | 1,754 | $14,501 | ||||||
Macquarie Group Ltd. | 185 | 12,746 | ||||||
Wesfarmers Ltd. | 462 | 15,906 | ||||||
|
| |||||||
| 43,153 | ||||||||
|
| |||||||
| Brazil—1.8% | ||||||||
BB Seguridade Participacoes S.A. ADR | 1,100 | 10,274 | ||||||
Embraer S.A. ADR | 400 | 8,832 | ||||||
|
| |||||||
| 19,106 | ||||||||
|
| |||||||
| Canada—8.4% | ||||||||
Canadian Pacific Railway Ltd. | 100 | 14,692 | ||||||
Cogeco Communications, Inc. | 185 | 9,884 | ||||||
Enbridge Income Fund Holdings, Inc. | 370 | 9,223 | ||||||
Magna International, Inc. | 200 | 8,632 | ||||||
Manulife Financial Corp. | 554 | 9,828 | ||||||
Open Text Corp. | 400 | 13,604 | ||||||
Power Financial Corp. | 370 | 9,785 | ||||||
Toronto-Dominion Bank | 300 | 15,027 | ||||||
|
| |||||||
| 90,675 | ||||||||
|
| |||||||
| Chile—1.2% | ||||||||
Enersis Americas S.A. ADR | 1,200 | 12,468 | ||||||
|
| |||||||
| China—6.6% | ||||||||
Beijing Enterprises Holdings Ltd. | 2,000 | 10,352 | ||||||
China Construction Bank Corp., Class H | 15,200 | 12,247 | ||||||
China Mobile Ltd. | 800 | 8,798 | ||||||
China Resources Land Ltd. | 4,000 | 10,818 | ||||||
PICC Property & Casualty Co., Ltd., Class H | 6,000 | 9,261 | ||||||
Shanghai Pharmaceuticals Holding Co., Ltd., Class H | 3,000 | 7,859 | ||||||
Sinopec Shanghai Petrochemical Co., Ltd. ADR | 200 | 11,152 | ||||||
|
| |||||||
| 70,487 | ||||||||
|
| |||||||
| Colombia—1.1% | ||||||||
Bancolombia S.A. ADR | 300 | 11,961 | ||||||
|
| |||||||
| Denmark—2.1% | ||||||||
Danske Bank A/S | 370 | 12,616 | ||||||
Scandinavian Tobacco Group A/S, Class A (a) | 542 | 9,474 | ||||||
|
| |||||||
| 22,090 | ||||||||
|
| |||||||
| France—8.1% | ||||||||
AXA S.A. | 277 | 7,156 | ||||||
BNP Paribas S.A. | 185 | 12,311 | ||||||
Capgemini S.A. | 93 | 8,584 | ||||||
Christian Dior SE | 85 | 19,731 | ||||||
Cie Generale des Etablissements Michelin | 93 | 11,301 | ||||||
CNP Assurances | 554 | 11,266 | ||||||
Euronext NV (a) | 185 | 8,067 | ||||||
Renault S.A. | 93 | 8,079 | ||||||
|
| |||||||
| 86,495 | ||||||||
|
| |||||||
| Germany—3.3% | ||||||||
Bayer AG | 93 | 10,715 | ||||||
Freenet AG | 370 | 12,027 | ||||||
Siemens AG | 93 | 12,738 | ||||||
|
| |||||||
| 35,480 | ||||||||
|
| |||||||
| Hong Kong—5.8% | ||||||||
BOC Hong Kong Holdings Ltd. | 3,300 | 13,488 | ||||||
CK Hutchison Holdings Ltd. | 1,000 | 12,312 | ||||||
First Pacific Co., Ltd. | 16,100 | 11,702 | ||||||
| Shares | Value | |||||||
NWS Holdings Ltd. | 8,000 | $ | 14,606 | |||||
WH Group Ltd. (a) | 12,000 | 10,348 | ||||||
|
| |||||||
| 62,456 | ||||||||
|
| |||||||
| Ireland—2.4% | ||||||||
CRH PLC | 340 | 11,981 | ||||||
Smurfit Kappa Group PLC | 509 | 13,450 | ||||||
|
| |||||||
| 25,431 | ||||||||
|
| |||||||
| Israel—1.9% | ||||||||
Bank Hapoalim BM | 1,860 | 11,335 | ||||||
Teva Pharmaceutical Industries Ltd. ADR | 300 | 9,627 | ||||||
|
| |||||||
| 20,962 | ||||||||
|
| |||||||
| Italy—1.7% | ||||||||
Enel SpA | 1,385 | 6,517 | ||||||
Prysmian SpA | 462 | 12,214 | ||||||
|
| |||||||
| 18,731 | ||||||||
|
| |||||||
| Japan—13.0% | ||||||||
Astellas Pharma, Inc. | 900 | 11,870 | ||||||
Bandai Namco Holdings, Inc. | 400 | 11,990 | ||||||
Mitsubishi Electric Corp. | 800 | 11,527 | ||||||
Mitsubishi Shokuhin Co., Ltd. | 500 | 15,535 | ||||||
Mitsubishi UFJ Financial Group, Inc. | 2,100 | 13,228 | ||||||
Nippo Corp. | 1,000 | 19,011 | ||||||
Nippon Telegraph & Telephone Corp. | 400 | 17,101 | ||||||
Nissan Motor Co., Ltd. | 1,400 | 13,499 | ||||||
T&D Holdings, Inc. | 900 | 13,045 | ||||||
West Japan Railway Co. | 200 | 13,043 | ||||||
|
| |||||||
| 139,849 | ||||||||
|
| |||||||
| Korea (Republic of)—0.6% | ||||||||
Korea Electric Power Corp. ADR | 300 | 6,219 | ||||||
|
| |||||||
| Malaysia—1.1% | ||||||||
Tenaga Nasional Bhd. | 3,700 | 11,467 | ||||||
|
| |||||||
| Netherlands—3.8% | ||||||||
Coca-Cola European Partners PLC | 400 | 15,076 | ||||||
ING Groep NV | 924 | 13,956 | ||||||
Wolters Kluwer NV | 277 | 11,496 | ||||||
|
| |||||||
| 40,528 | ||||||||
|
| |||||||
| Norway—1.0% | ||||||||
Telenor ASA | 647 | 10,763 | ||||||
|
| |||||||
| Philippines—1.0% | ||||||||
Manila Water Co., Inc. | 17,100 | 10,494 | ||||||
|
| |||||||
| Russian Federation—1.0% | ||||||||
LUKOIL PJSC ADR | 200 | 10,612 | ||||||
|
| |||||||
| Singapore—0.9% | ||||||||
Mapletree Industrial Trust REIT | 7,500 | 9,544 | ||||||
|
| |||||||
| South Africa—1.8% | ||||||||
Nedbank Group Ltd. | 579 | 10,404 | ||||||
Sasol Ltd. ADR | 300 | 8,820 | ||||||
|
| |||||||
| 19,224 | ||||||||
|
| |||||||
| Spain—1.1% | ||||||||
Mapfre S.A. | 3,600 | 12,330 | ||||||
|
| |||||||
| Sweden—0.7% | ||||||||
Electrolux AB, Ser. B | 277 | 7,690 | ||||||
|
| |||||||
| Switzerland—2.4% | ||||||||
Baloise Holding AG | 93 | 12,779 | ||||||
Pargesa Holding S.A. | 185 | 13,076 | ||||||
|
| |||||||
| 25,855 | ||||||||
|
| |||||||
| Shares | Value | |||||||
| Taiwan—1.2% | ||||||||
Taiwan Semiconductor Manufacturing Co., Ltd. ADR | 400 | $ | 13,136 | |||||
|
| |||||||
| Turkey—0.9% | ||||||||
KOC Holding AS ADR | 470 | 9,969 | ||||||
|
| |||||||
| United Kingdom—10.7% | ||||||||
3i Group PLC | 1,016 | 9,539 | ||||||
Babcock International Group PLC | 647 | 7,149 | ||||||
BAE Systems PLC | 1,385 | 11,147 | ||||||
BT Group PLC | 924 | 3,690 | ||||||
Imperial Brands PLC | 277 | 13,424 | ||||||
Johnson Matthey PLC | 275 | 10,610 | ||||||
Mondi PLC | 462 | 11,163 | ||||||
Old Mutual PLC | 3,047 | 7,668 | ||||||
Royal Dutch Shell PLC, Class A | 554 | 14,603 | ||||||
Shire PLC ADR | 80 | 13,938 | ||||||
Wolseley PLC | 185 | 11,648 | ||||||
|
| |||||||
| 114,579 | ||||||||
|
| |||||||
| United States—0.9% | ||||||||
Travelport Worldwide Ltd. | 800 | 9,416 | ||||||
|
| |||||||
| Total Investments (cost—$965,861) (b)—90.5% | 971,170 | |||||||
|
| |||||||
| Other assets less liabilities—9.5% | 102,232 | |||||||
|
| |||||||
| Net Assets—100.0% | $1,073,402 | |||||||
|
| |||||||
Notes to Schedule of Investments:
(a) 144A—Exempt from registration under Rule 144A of the Securities Act of 1933. These securities may be resold in transactions exempt from registration, typically only to qualified institutional buyers. Securities with an aggregate value of $27,889, representing 2.6% of net assets.
(b) Securities with an aggregate value of $706,071, representing 65.8% of net assets, were valued utilizing modeling tools provided by a third-party vendor. See Note 1(a) and Note 1(b) in the Notes to Financial Statements.
Glossary:
ADR—American Depositary Receipt
REIT—Real Estate Investment Trust
| See accompanying Notes to Financial Statements | | March 31, 2017 | | Semiannual Report | 191 |
Table of Contents
Schedule of Investments
March 31, 2017 (Unaudited)
The industry classification of portfolio holdings and other assets less liabilities shown as a percentage of net assets were as follows:
Banks | 11.8% | |||
Insurance | 9.6% | |||
Industrial Conglomerates | 5.6% | |||
Electric Utilities | 3.4% | |||
Oil, Gas & Consumable Fuels | 3.2% | |||
Pharmaceuticals | 3.0% | |||
Diversified Telecommunication Services | 2.9% | |||
Food & Staples Retailing | 2.9% | |||
Chemicals | 2.9% | |||
Capital Markets | 2.8% | |||
Beverages | 2.8% | |||
Road & Rail | 2.6% | |||
Diversified Financial Services | 2.3% | |||
Electrical Equipment | 2.2% | |||
Tobacco | 2.1% | |||
Automobiles | 2.0% | |||
Wireless Telecommunication Services | 1.9% | |||
Aerospace & Defense | 1.9% | |||
Auto Components | 1.9% | |||
Textiles, Apparel & Luxury Goods | 1.8% | |||
Construction & Engineering | 1.8% | |||
IT Services | 1.7% | |||
Biotechnology | 1.3% | |||
Software | 1.3% | |||
Containers & Packaging | 1.3% | |||
Semiconductors & Semiconductor Equipment | 1.2% | |||
Leisure Equipment & Products | 1.1% | |||
Construction Materials | 1.1% | |||
Trading Companies & Distributors | 1.1% | |||
Professional Services | 1.1% | |||
Paper & Forest Products | 1.0% | |||
Real Estate Management & Development | 1.0% | |||
Water Utilities | 1.0% | |||
Food Products | 1.0% | |||
Media | 0.9% | |||
Equity Real Estate Investment Trusts (REITs) | 0.9% | |||
Health Care Providers & Services | 0.7% | |||
Household Durables | 0.7% | |||
Commercial Services & Supplies | 0.7% | |||
Other assets less liabilities | 9.5% | |||
|
| |||
| 100.0% | ||||
|
|
AllianzGI Short Duration High Income Fund
| Principal Amount (000s) | Value | |||||||
| Corporate Bonds & Notes—84.3% | ||||||||
| Aerospace & Defense—2.0% | ||||||||
Arconic, Inc., |
| |||||||
6.50%, 6/15/18 | $2,000 | $2,102,500 | ||||||
6.75%, 7/15/18 | 30,605 | 32,372,439 | ||||||
|
| |||||||
| 34,474,939 | ||||||||
|
| |||||||
| Auto Components—2.9% | ||||||||
American Axle & Manufacturing, Inc., |
| |||||||
5.125%, 2/15/19 | 4,916 | 4,991,088 | ||||||
6.25%, 3/15/21 | 39,855 | 41,050,650 | ||||||
Dana, Inc., |
| |||||||
5.375%, 9/15/21 | 3,784 | 3,935,360 | ||||||
|
| |||||||
| 49,977,098 | ||||||||
|
| |||||||
| Auto Manufacturers—2.9% | ||||||||
Ford Motor Credit Co. LLC, |
| |||||||
2.262%, 3/28/19 | 5,050 | 5,064,559 | ||||||
2.597%, 11/4/19 | 17,096 | 17,197,482 | ||||||
2.681%, 1/9/20 | 15,000 | 15,108,210 | ||||||
General Motors Co., |
| |||||||
3.50%, 10/2/18 | 7,750 | 7,915,462 | ||||||
General Motors Financial Co., Inc., |
| |||||||
3.25%, 5/15/18 | 1,060 | 1,074,805 | ||||||
4.75%, 8/15/17 | 1,980 | 2,001,715 | ||||||
6.75%, 6/1/18 | 325 | 342,898 | ||||||
|
| |||||||
| 48,705,131 | ||||||||
|
| |||||||
| Banks—2.6% | ||||||||
CIT Group, Inc., |
| |||||||
4.25%, 8/15/17 | 7,750 | 7,827,500 | ||||||
5.00%, 5/15/17 | 1,400 | 1,404,620 | ||||||
6.625%, 4/1/18 (a)(c) | 32,942 | 34,383,212 | ||||||
|
| |||||||
| 43,615,332 | ||||||||
|
| |||||||
| Coal—1.1% | ||||||||
Cloud Peak Energy Resources LLC, |
| |||||||
12.00%, 11/1/21 | 18,086 | 19,578,095 | ||||||
|
| |||||||
| Commercial Services—3.7% | ||||||||
APX Group, Inc., |
| |||||||
6.375%, 12/1/19 | 27,661 | 28,594,559 | ||||||
7.875%, 12/1/22 (a)(c) | 28,068 | 30,453,780 | ||||||
7.875%, 12/1/22 | 3,800 | 4,123,000 | ||||||
|
| |||||||
| 63,171,339 | ||||||||
|
| |||||||
| Containers & Packaging—1.6% | ||||||||
Ball Corp., |
| |||||||
4.375%, 12/15/20 | 6,500 | 6,833,125 | ||||||
Berry Plastics Corp., |
| |||||||
6.00%, 10/15/22 | 17,405 | 18,471,056 | ||||||
Owens-Brockway Glass Container, Inc. (a)(c), |
| |||||||
5.00%, 1/15/22 | 2,550 | 2,632,875 | ||||||
|
| |||||||
| 27,937,056 | ||||||||
|
| |||||||
| Distribution/Wholesale—1.6% | ||||||||
HD Supply, Inc. (a)(c), |
| |||||||
5.25%, 12/15/21 | 25,471 | 26,871,905 | ||||||
|
| |||||||
| Diversified Financial Services—5.7% | ||||||||
Aircastle Ltd., |
| |||||||
4.625%, 12/15/18 | 9,540 | 9,885,825 | ||||||
Alliance Data Systems Corp. (a)(c), |
| |||||||
5.25%, 12/1/17 | 33,785 | 34,334,006 | ||||||
Ally Financial, Inc., |
| |||||||
3.25%, 11/5/18 | 9,575 | 9,664,813 | ||||||
Fly Leasing Ltd., |
| |||||||
6.375%, 10/15/21 | 7,825 | 8,079,313 | ||||||
6.75%, 12/15/20 | 13,469 | 14,159,286 | ||||||
| Principal Amount (000s) | Value | |||||||
GE Capital International Funding Co. Unlimited Co., |
| |||||||
2.342%, 11/15/20 | $ | 10,000 | $ | 10,043,780 | ||||
International Lease Finance Corp., |
| |||||||
5.875%, 4/1/19 | 3,000 | 3,198,591 | ||||||
6.25%, 5/15/19 | 6,295 | 6,785,620 | ||||||
|
| |||||||
| 96,151,234 | ||||||||
|
| |||||||
| Electric Utilities—0.6% | ||||||||
AES Corp. (f), | ||||||||
4.055%, 6/1/19 | 7,434 | 7,452,585 | ||||||
Calpine Corp. (a)(c), | ||||||||
6.00%, 1/15/22 | 3,000 | 3,138,750 | ||||||
|
| |||||||
| 10,591,335 | ||||||||
|
| |||||||
| Engineering & Construction—0.9% | ||||||||
SBA Communications Corp., |
| |||||||
4.875%, 7/15/22 | 14,667 | 14,923,673 | ||||||
|
| |||||||
| Environmental Services—1.3% | ||||||||
Clean Harbors, Inc., | ||||||||
5.125%, 6/1/21 | 13,763 | 14,055,464 | ||||||
5.25%, 8/1/20 | 8,688 | 8,844,384 | ||||||
|
| |||||||
| 22,899,848 | ||||||||
|
| |||||||
| Food & Beverage—1.7% | ||||||||
Bumble Bee Holdings, Inc. (a)(c), |
| |||||||
9.00%, 12/15/17 | 30,007 | 29,331,842 | ||||||
|
| |||||||
| Healthcare-Products—1.2% | ||||||||
Hologic, Inc. (a)(c), | ||||||||
5.25%, 7/15/22 | 19,156 | 20,161,690 | ||||||
|
| |||||||
| Healthcare-Services—4.1% | ||||||||
DaVita, Inc., | ||||||||
5.75%, 8/15/22 | 47,929 | 49,786,249 | ||||||
Fresenius Medical Care U.S. Finance II, Inc. (a)(c), |
| |||||||
5.625%, 7/31/19 | 14,135 | 15,000,769 | ||||||
Fresenius Medical Care U.S. Finance, Inc. (a)(c), |
| |||||||
5.75%, 2/15/21 | 4,425 | 4,812,187 | ||||||
|
| |||||||
| 69,599,205 | ||||||||
|
| |||||||
| Holding Companies-Diversified—2.6% | ||||||||
Nielsen Co. Luxembourg Sarl (a)(c), |
| |||||||
5.50%, 10/1/21 | 41,848 | 43,574,230 | ||||||
|
| |||||||
| Home Builders—6.1% | ||||||||
Brookfield Residential Properties, Inc. (a)(c), |
| |||||||
6.50%, 12/15/20 | 27,088 | 28,137,660 | ||||||
Lennar Corp., | ||||||||
4.125%, 1/15/22 | 6,000 | 6,074,940 | ||||||
4.50%, 6/15/19 | 7,900 | 8,156,750 | ||||||
4.50%, 11/15/19 | 2,569 | 2,655,704 | ||||||
MDC Holdings, Inc., | ||||||||
5.625%, 2/1/20 | 1,500 | 1,604,063 | ||||||
Meritage Homes Corp., | ||||||||
4.50%, 3/1/18 | 1,182 | 1,208,595 | ||||||
Taylor Morrison Communities, Inc. (a)(c), |
| |||||||
5.25%, 4/15/21 | 17,806 | 18,429,210 | ||||||
TRI Pointe Group, Inc., | ||||||||
4.375%, 6/15/19 | 15,010 | 15,422,775 | ||||||
4.875%, 7/1/21 | 20,849 | 21,526,592 | ||||||
|
| |||||||
| 103,216,289 | ||||||||
|
| |||||||
| Iron/Steel—0.1% | ||||||||
Commercial Metals Co., |
| |||||||
6.50%, 7/15/17 | 1,000 | 1,012,500 | ||||||
|
| |||||||
| Lodging—0.7% | ||||||||
MGM Resorts International, |
| |||||||
5.25%, 3/31/20 | 10,766 | 11,358,130 | ||||||
|
| |||||||
| 192 | Semiannual Report | | March 31, 2017 | | See accompanying Notes to Financial Statements |
Table of Contents
Schedule of Investments
March 31, 2017 (Unaudited)
| Principal Amount (000s) | Value | |||||||
| Machinery-Diversified—0.7% | ||||||||
Case New Holland Industrial, Inc., |
| |||||||
7.875%, 12/1/17 | $ | 6,250 | $ | 6,492,188 | ||||
CNH Industrial Capital LLC, |
| |||||||
3.375%, 7/15/19 | 5,000 | 5,068,750 | ||||||
|
| |||||||
| 11,560,938 | ||||||||
|
| |||||||
| Media—2.8% | ||||||||
CCO Holdings LLC, | ||||||||
5.25%, 9/30/22 | 9,450 | 9,828,000 | ||||||
CSC Holdings LLC, | ||||||||
7.625%, 7/15/18 | 3,407 | 3,624,196 | ||||||
7.875%, 2/15/18 | 1,743 | 1,821,435 | ||||||
Sinclair Television Group, Inc., |
| |||||||
5.375%, 4/1/21 | 15,135 | 15,513,375 | ||||||
Univision Communications, Inc. (a)(c), |
| |||||||
6.75%, 9/15/22 | 15,891 | 16,729,092 | ||||||
|
| |||||||
| 47,516,098 | ||||||||
|
| |||||||
| Miscellaneous Manufacturing—3.3% | ||||||||
General Electric Co., | ||||||||
4.65%, 10/17/21 | 10,000 | 10,982,310 | ||||||
LSB Industries, Inc. (e), |
| |||||||
8.50%, 8/1/19 | 45,946 | 44,797,350 | ||||||
|
| |||||||
| 55,779,660 | ||||||||
|
| |||||||
| Oil, Gas & Consumable Fuels—0.7% | ||||||||
Sunoco L.P., | ||||||||
6.25%, 4/15/21 | 11,485 | 11,772,125 | ||||||
|
| |||||||
| Pharmaceuticals—2.9% | ||||||||
Valeant Pharmaceuticals International, Inc. (a)(c), |
| |||||||
7.00%, 10/1/20 | 53,251 | 48,724,665 | ||||||
|
| |||||||
| Pipelines—2.5% | ||||||||
Sabine Pass Liquefaction LLC (e), |
| |||||||
5.625%, 2/1/21 | 39,622 | 42,722,263 | ||||||
|
| |||||||
| Real Estate—6.7% | ||||||||
DuPont Fabros Technology L.P., |
| |||||||
5.875%, 9/15/21 | 31,880 | 33,175,125 | ||||||
Equinix, Inc., | ||||||||
5.375%, 1/1/22 | 12,550 | 13,271,625 | ||||||
Iron Mountain, Inc. (a)(c), |
| |||||||
4.375%, 6/1/21 | 11,250 | 11,587,500 | ||||||
6.00%, 10/1/20 | 28,263 | 29,676,150 | ||||||
Realogy Group LLC (a)(c), |
| |||||||
5.25%, 12/1/21 | 24,330 | 25,424,850 | ||||||
|
| |||||||
| 113,135,250 | ||||||||
|
| |||||||
| Retail—9.7% | ||||||||
1011778 BC ULC (a)(c), |
| |||||||
4.625%, 1/15/22 | 20,393 | 20,928,316 | ||||||
Dollar Tree, Inc., | ||||||||
5.25%, 3/1/20 | 11,875 | 12,248,469 | ||||||
GameStop Corp. (a)(c), |
| |||||||
5.50%, 10/1/19 | 8,690 | 8,874,663 | ||||||
6.75%, 3/15/21 | 46,575 | 47,739,375 | ||||||
Michaels Stores, Inc. (a)(c), |
| |||||||
5.875%, 12/15/20 | 18,580 | 19,126,066 | ||||||
Sally Holdings LLC, | ||||||||
5.75%, 6/1/22 | 53,062 | 54,852,842 | ||||||
|
| |||||||
| 163,769,731 | ||||||||
|
| |||||||
| Software—2.4% | ||||||||
ACI Worldwide, Inc. (a)(c), |
| |||||||
6.375%, 8/15/20 | 12,700 | 13,049,250 | ||||||
First Data Corp. (a)(c), |
| |||||||
5.375%, 8/15/23 | 7,000 | 7,306,250 | ||||||
j2 Cloud Services LLC, |
| |||||||
8.00%, 8/1/20 | 19,090 | 19,746,219 | ||||||
|
| |||||||
| 40,101,719 | ||||||||
|
| |||||||
| Principal Amount (000s) | Value | |||||||
| Telecommunications—9.2% | ||||||||
Hughes Satellite Systems Corp., |
| |||||||
7.625%, 6/15/21 | $ | 19,355 | $ | 21,411,469 | ||||
T-Mobile USA, Inc., | ||||||||
6.125%, 1/15/22 | 5,000 | 5,293,750 | ||||||
6.542%, 4/28/20 | 46,444 | 47,430,935 | ||||||
Verizon Communications, Inc., |
| |||||||
4.50%, 9/15/20 | 35,185 | 37,547,321 | ||||||
ViaSat, Inc., |
| |||||||
6.875%, 6/15/20 | 25,411 | 25,998,629 | ||||||
West Corp. (a)(c), |
| |||||||
4.75%, 7/15/21 | 18,000 | 18,360,000 | ||||||
|
| |||||||
| 156,042,104 | ||||||||
|
| |||||||
| Total Corporate Bonds & Notes (cost—$1,426,622,903) | 1,428,275,424 | |||||||
|
| |||||||
| Senior Loans (a)(b)— 7.8% | ||||||||
| Commercial Services & Supplies—3.2% | ||||||||
Asurion LLC, |
| |||||||
4.232%, 8/4/22, Term B4 | 7,175 | 7,223,904 | ||||||
8.50%, 3/3/21, 2nd Lien (d) | 47,000 | 47,558,125 | ||||||
|
| |||||||
| 54,782,029 | ||||||||
|
| |||||||
| Independent Power Producers & Energy Traders—1.1% | ||||||||
Calpine Corp., Term Loan B5, |
| |||||||
3.90%, 1/15/24 | 18,735 | 18,837,517 | ||||||
|
| |||||||
| Insurance—0.5% | ||||||||
Lonestar Intermediate Super Holdings, LLC, PIK, Term Loan B, |
| |||||||
10.00%, 8/31/21 | 9,000 | 9,352,503 | ||||||
|
| |||||||
| IT Services—0.2% | ||||||||
First Data Corp., USD 2016 Repriced Term Loan C5, |
| |||||||
3.984%, 7/10/22 | 3,061 | 3,089,622 | ||||||
|
| |||||||
| Media—0.3% | ||||||||
Univision Communications Inc., Term Loan C5, |
| |||||||
3.75%, 3/15/24 | 4,992 | 4,963,222 | ||||||
|
| |||||||
| Specialty Retail—2.5% | ||||||||
PetSmart, Inc., Term Loan B2, |
| |||||||
4.02%, 3/10/22 | 43,734 | 41,940,810 | ||||||
|
| |||||||
| Total Senior Loans (cost—$133,572,208) | 132,965,703 | |||||||
|
| |||||||
| Repurchase Agreements—6.4% | ||||||||
State Street Bank and Trust Co., dated 3/31/17, 0.09%, due 4/3/17, proceeds $108,067,811; collateralized by U.S. Treasury Notes, 2.00%, due 11/25/26, valued at $110,230,296 including accrued interest |
| |||||||
(cost— | 108,067 | 108,067,000 | ||||||
|
| |||||||
| Total Investments (cost— $1,668,262,111)—98.5% | 1,669,308,127 | |||||||
|
| |||||||
| Other assets less liabilities—1.5% | 25,541,464 | |||||||
|
| |||||||
| Net Assets—100.0% | $1,694,849,591 | |||||||
|
| |||||||
Notes to Schedule of Investments:
(a) Private Placement—Restricted as to resale and may not have a readily available market. Securities with an aggregate value of $691,753,996, representing 40.8% of net assets.
(b) These securities generally pay interest at rates which are periodically pre-determined by reference to a base lending rate plus a premium. These base lending rates are generally either the lending rate offered by one or more major European banks, such as the “LIBOR” or the prime rate offered by one or more major United States banks, or the certificate of deposit rate. These securities are generally considered to be restricted as the Fund is ordinarily contractually obligated to receive approval from the Agent bank and/or borrower prior to disposition. Remaining maturities of senior loans may be less than the stated maturities shown as a result of contractual or optional payments by the borrower. Such prepayments cannot be predicted with certainty. The interest rate disclosed reflects the rate in effect on March 31, 2017.
(c) 144A—Exempt from registration under Rule 144A of the Securities Act of 1933. These securities may be resold in transactions exempt from registration, typically only to qualified institutional buyers. Securities with an aggregate value of $558,788,293, representing 33.0% of net assets.
(d) When-issued or delayed-delivery. To be settled/delivered after March 31, 2017.
(e) Step Bond—Coupon is a fixed rate for an initial period then resets at a specific date and rate.
(f) Variable or Floating Rate Security—Security with an interest rate that changes periodically. The interest rate disclosed reflects the rate in effect on March 31, 2017.
Glossary:
PIK—Payment-in-Kind
| See accompanying Notes to Financial Statements | | March 31, 2017 | | Semiannual Report | 193 |
Table of Contents
Schedule of Investments
March 31, 2017 (Unaudited)
AllianzGI Structured Return Fund
| Shares | Value | |||||||
| Exchange-Traded Funds—90.0% | ||||||||
SPDR S&P 500 (a) | 1,459,000 | $343,944,660 | ||||||
|
| |||||||
| Principal Amount (000s) | ||||||||
| Repurchase Agreements—15.3% | ||||||||
State Street Bank and Trust Co., dated 3/31/17, 0.09%, due 4/3/17, proceeds $58,560,439; collateralized by U.S. Treasury Notes, 2.00%, due 8/15/25, valued at $59,732,889 including accrued interest |
| |||||||
(cost— | $58,560 | 58,560,000 | ||||||
|
| |||||||
| Contracts | ||||||||
| Options Purchased (b)(c)—0.1% | ||||||||
| Call Options—0.0% | ||||||||
CBOE SPX Volatility Index, | 57 | 361 | ||||||
strike price $18.00, expires 4/5/17 | 28 | 178 | ||||||
strike price $19.00, expires 4/5/17 | 66 | 495 | ||||||
strike price $20.00, expires 4/5/17 | 101 | 1,010 | ||||||
strike price $21.00, expires 4/5/17 | 325 | 2,437 | ||||||
strike price $20.00, expires 4/12/17 | 312 | 3,539 | ||||||
S&P 500 Index, | 95 | 1,028 | ||||||
strike price $2,700.00, expires 4/7/17 | 216 | 2,141 | ||||||
strike price $2,700.00, expires 4/13/17 | 259 | 1,643 | ||||||
strike price $2,800.00, expires 4/13/17 | 95 | 603 | ||||||
strike price $2,700.00, expires 4/21/17 | 180 | 1,142 | ||||||
strike price $2,800.00, expires 4/21/17 | 89 | 587 | ||||||
strike price $2,750.00, expires 4/28/17 | 237 | 1,106 | ||||||
|
| |||||||
| 16,270 | ||||||||
|
| |||||||
| Put Options—0.1% | ||||||||
S&P 500 Index, | 75 | 1,351 | ||||||
strike price $2,000.00, expires 4/5/17 | 350 | 4,058 | ||||||
strike price $2,100.00, expires 4/5/17 | 50 | 362 | ||||||
strike price $2,300.00, expires 4/5/17 | 50 | 2,750 | ||||||
strike price $2,315.00, expires 4/5/17 | 70 | 5,250 | ||||||
strike price $1,450.00, expires 4/7/17 | 19 | 220 | ||||||
strike price $1,550.00, expires 4/7/17 | 18 | 135 | ||||||
strike price $1,600.00, expires 4/7/17 | 475 | 4,750 | ||||||
strike price $1,650.00, expires 4/7/17 | 175 | 1,312 | ||||||
strike price $1,800.00, expires 4/7/17 | 60 | 600 | ||||||
strike price $2,325.00, expires 4/7/17 | 50 | 10,250 | ||||||
| Contracts | Value | |||||||
strike price $2,355.00, expires 4/7/17 | 35 | $ | 24,500 | |||||
strike price $2,000.00, expires 4/10/17 | 75 | 476 | ||||||
strike price $2,305.00, expires 4/10/17 | 100 | 17,000 | ||||||
strike price $1,400.00, expires 4/13/17 | 38 | 441 | ||||||
strike price $1,500.00, expires 4/13/17 | 120 | 900 | ||||||
strike price $1,600.00, expires 4/13/17 | 251 | 3,137 | ||||||
strike price $1,650.00, expires 4/13/17 | 270 | 6,750 | ||||||
strike price $1,900.00, expires 4/13/17 | 350 | 3,500 | ||||||
strike price $2,325.00, expires 4/13/17 | 50 | 24,000 | ||||||
strike price $2,340.00, expires 4/13/17 | 15 | 10,800 | ||||||
strike price $1,375.00, expires 4/21/17 | 62 | 620 | ||||||
strike price $1,400.00, expires 4/21/17 | 200 | 4,000 | ||||||
strike price $1,425.00, expires 4/21/17 | 19 | 220 | ||||||
strike price $1,450.00, expires 4/21/17 | 36 | 597 | ||||||
strike price $1,500.00, expires 4/21/17 | 70 | 525 | ||||||
strike price $1,600.00, expires 4/21/17 | 229 | 2,290 | ||||||
strike price $1,625.00, expires 4/21/17 | 555 | 4,162 | ||||||
strike price $1,650.00, expires 4/21/17 | 88 | 998 | ||||||
strike price $1,700.00, expires 4/21/17 | 100 | 750 | ||||||
strike price $2,275.00, expires 4/21/17 | 50 | 17,500 | ||||||
strike price $2,300.00, expires 4/21/17 | 35 | 18,200 | ||||||
strike price $1,350.00, expires 4/28/17 | 19 | 216 | ||||||
strike price $1,400.00, expires 4/28/17 | 140 | 1,400 | ||||||
strike price $1,450.00, expires 4/28/17 | 39 | 488 | ||||||
strike price $1,500.00, expires 4/28/17 | 151 | 1,133 | ||||||
strike price $1,625.00, expires 4/28/17 | 149 | 1,490 | ||||||
strike price $1,650.00, expires 4/28/17 | 195 | 3,412 | ||||||
strike price $1,700.00, expires 4/28/17 | 328 | 6,560 | ||||||
strike price $2,325.00, expires 4/28/17 | 50 | 70,000 | ||||||
strike price $1,500.00, expires 5/5/17 | 100 | 1,000 | ||||||
strike price $1,550.00, expires 5/5/17 | 100 | 1,000 | ||||||
strike price $2,300.00, expires 5/5/17 | 50 | 61,500 | ||||||
strike price $1,500.00, expires 5/12/17 | 200 | 2,000 | ||||||
strike price $2,280.00, expires 5/12/17 | 50 | 63,000 | ||||||
|
| |||||||
| 385,603 | ||||||||
|
| |||||||
| Total Options Purchased (cost—$796,446) | 401,873 | |||||||
|
| |||||||
| Total Investments, before options written (cost—$403,373,550)—105.4% | 402,906,533 | |||||||
|
| |||||||
| Contracts | Value | |||||||
| Options Written (b)(c)— (3.1)% | ||||||||
| Call Options—(2.9)% | ||||||||
CBOE SPX Volatility Index, | ||||||||
strike price $14.50, expires 4/5/17 | 50 | $ | (500 | ) | ||||
strike price $15.00, expires 4/5/17 | 150 | (1,125 | ) | |||||
strike price $14.50, expires 4/12/17 | 50 | (1,875 | ) | |||||
strike price $15.00, expires 4/12/17 | 250 | (6,875 | ) | |||||
strike price $14.50, expires 4/19/17 | 200 | (11,000 | ) | |||||
strike price $15.00, expires 4/19/17 | 150 | (7,125 | ) | |||||
strike price $16.00, expires 4/19/17 | 250 | (9,375 | ) | |||||
strike price $15.00, expires 4/26/17 | 350 | (21,875 | ) | |||||
strike price $16.00, expires 4/26/17 | 100 | (4,750 | ) | |||||
strike price $17.00, expires 4/26/17 | 50 | (1,875 | ) | |||||
S&P 500 Index, | ||||||||
strike price $2,290.00, expires 4/7/17 | 76 | (555,940 | ) | |||||
strike price $2,305.00, expires 4/7/17 | 95 | (555,275 | ) | |||||
strike price $2,310.00, expires 4/7/17 | 140 | (751,100 | ) | |||||
strike price $2,470.00, expires 4/7/17 | 107 | (802 | ) | |||||
strike price $2,490.00, expires 4/7/17 | 115 | (863 | ) | |||||
strike price $2,280.00, expires 4/13/17 | 86 | (725,410 | ) | |||||
strike price $2,290.00, expires 4/13/17 | 173 | (1,293,175 | ) | |||||
strike price $2,325.00, expires 4/13/17 | 95 | (401,375 | ) | |||||
strike price $2,270.00, expires 4/21/17 | 180 | (1,727,100 | ) | |||||
strike price $2,295.00, expires 4/21/17 | 140 | (1,014,300 | ) | |||||
strike price $2,315.00, expires 4/21/17 | 89 | (485,495 | ) | |||||
strike price $2,250.00, expires 4/28/17 | 149 | (1,761,925 | ) | |||||
strike price $2,285.00, expires 4/28/17 | 88 | (756,360 | ) | |||||
strike price $2,300.00, expires 4/28/17 | 148 | (1,076,700 | ) | |||||
|
| |||||||
| (11,172,195 | ) | |||||||
|
| |||||||
| Put Options—(0.2)% | ||||||||
S&P 500 Index, | ||||||||
strike price $2,250.00, expires 4/5/17 | 105 | (2,625 | ) | |||||
strike price $2,255.00, expires 4/5/17 | 100 | (2,500 | ) | |||||
strike price $2,275.00, expires 4/7/17 | 108 | (6,480 | ) | |||||
strike price $2,280.00, expires 4/7/17 | 100 | (6,500 | ) | |||||
strike price $2,285.00, expires 4/7/17 | 107 | (7,490 | ) | |||||
strike price $2,315.00, expires 4/7/17 | 70 | (10,150 | ) | |||||
strike price $2,265.00, expires 4/10/17 | 150 | (12,000 | ) | |||||
strike price $2,265.00, expires 4/13/17 | 109 | (16,895 | ) | |||||
| 194 | Semiannual Report | | March 31, 2017 | | See accompanying Notes to Financial Statements |
Table of Contents
Schedule of Investments
March 31, 2017 (Unaudited)
| Contracts | Value | |||||||
strike price $2,270.00, expires 4/13/17 | 100 | $ | (16,500 | ) | ||||
strike price $2,290.00, expires 4/13/17 | 30 | (6,750 | ) | |||||
strike price $2,305.00, expires 4/13/17 | 108 | (32,400 | ) | |||||
strike price $2,230.00, expires 4/21/17 | 100 | (20,500 | ) | |||||
strike price $2,235.00, expires 4/21/17 | 70 | (15,050 | ) | |||||
strike price $2,250.00, expires 4/21/17 | 75 | (19,125 | ) | |||||
strike price $2,260.00, expires 4/21/17 | 110 | (31,350 | ) | |||||
strike price $2,265.00, expires 4/21/17 | 110 | (34,100 | ) | |||||
strike price $2,215.00, expires 4/28/17 | 75 | (28,500 | ) | |||||
strike price $2,260.00, expires 4/28/17 | 100 | (60,000 | ) | |||||
strike price $2,265.00, expires 4/28/17 | 111 | (71,040 | ) | |||||
strike price $2,280.00, expires 4/28/17 | 110 | (83,600 | ) | |||||
strike price $2,220.00, expires 5/5/17 | 50 | (26,500 | ) | |||||
strike price $2,235.00, expires 5/5/17 | 100 | (61,000 | ) | |||||
strike price $2,175.00, expires 5/12/17 | 50 | (24,000 | ) | |||||
strike price $2,215.00, expires 5/12/17 | 100 | (67,000 | ) | |||||
|
| |||||||
| (662,055 | ) | |||||||
|
| |||||||
| Total Options Written (premiums received— $13,948,275) | (11,834,250 | ) | ||||||
|
| |||||||
| Total Investments, net of options written (cost— $389,425,275)—102.3% | 391,072,283 | |||||||
|
| |||||||
| Other liabilities in excess of other assets—(2.3)% | (8,668,398 | ) | ||||||
|
| |||||||
| Net Assets—100.0% | $382,403,885 | |||||||
|
| |||||||
Notes to Schedule of Investments:
(a) All or partial amount segregated for the benefit of the counterparty as collateral for options written.
(b) Non-income producing.
(c) Exchange traded-Chicago Board Options Exchange.
Glossary:
CBOE—Chicago Board Options Exchange
AllianzGI U.S. Equity Hedged Fund
| Shares | Value | |||||||
| Exchange-Traded Funds—76.7% | ||||||||
SPDR S&P 500 (a) (cost—$3,311,125) | 16,000 | $3,771,840 | ||||||
|
| |||||||
| Principal Amount (000s) | ||||||||
| Repurchase Agreements—7.8% | ||||||||
State Street Bank and Trust Co., dated 3/31/17, 0.09%, due 4/3/17, proceeds $382,003; collateralized by U.S. Treasury Notes, 2.00%, due 8/15/25, valued at $389,679 including accrued interest |
| |||||||
(cost—$382,000) | $382 | 382,000 | ||||||
|
| |||||||
| Contracts | ||||||||
| Options Purchased (b)(c)—0.7% | ||||||||
| Call Options—0.0% | ||||||||
S&P 500 Index, | 19 | 121 | ||||||
|
| |||||||
| Put Options—0.7% | ||||||||
S&P 500 Index, | 5 | 50 | ||||||
strike price $1,700.00, expires 4/7/17 | 3 | 30 | ||||||
strike price $2,315.00, expires 4/7/17 | 5 | 725 | ||||||
strike price $2,325.00, expires 4/7/17 | 3 | 615 | ||||||
strike price $1,600.00, expires 4/13/17 | 5 | 62 | ||||||
strike price $2,300.00, expires 4/13/17 | 5 | 1,350 | ||||||
strike price $1,875.00, expires 6/16/17 | 5 | 975 | ||||||
strike price $2,025.00, expires 9/29/17 | 5 | 9,450 | ||||||
strike price $1,975.00, expires 12/29/17 | 4 | 10,900 | ||||||
strike price $2,025.00, expires 1/19/18 | 3 | 10,605 | ||||||
|
| |||||||
| 34,762 | ||||||||
|
| |||||||
| Total Options Purchased (cost—$145,756) | 34,883 | |||||||
|
| |||||||
| Total Investments, before options written (cost—$3,838,881)—85.2% | 4,188,723 | |||||||
|
| |||||||
| Options Written (b)(c)—(0.1)% | ||||||||
| Call Options—(0.0)% | ||||||||
S&P 500 Index, | 16 | (320 | ) | |||||
|
| |||||||
| Put Options—(0.1)% | ||||||||
S&P 500 Index, | 10 | (500 | ) | |||||
strike price $2,285.00, expires 4/7/17 | 6 | (420 | ) | |||||
strike price $2,250.00, expires 4/13/17 | 10 | (1,300 | ) | |||||
|
| |||||||
| (2,220 | ) | |||||||
|
| |||||||
| Total Options Written (premiums received—$29,546) | (2,540 | ) | ||||||
|
| |||||||
| Value | ||||||||
| Total Investments, net of options written (cost—$3,809,335)—85.1% | $ | 4,186,183 | ||||||
|
| |||||||
| Other assets less other liabilities—14.9% | 734,301 | |||||||
|
| |||||||
| Net Assets—100.0% | $4,920,484 | |||||||
|
| |||||||
Notes to Schedule of Investments:
(a) All or partial amount segregated for the benefit of the counterparty as collateral for options written.
(b) Non-income producing.
(c) Exchange traded-Chicago Board Options Exchange.
| See accompanying Notes to Financial Statements | | March 31, 2017 | | Semiannual Report | 195 |
Table of Contents
Schedule of Investments
March 31, 2017 (Unaudited)
AllianzGI U.S. Small-Cap Growth Fund
| Shares | Value | |||||||
| Common Stock—96.6% | ||||||||
| Aerospace & Defense—1.0% | ||||||||
AAR Corp. | 4,893 | $164,552 | ||||||
|
| |||||||
| Air Freight & Logistics—1.1% | ||||||||
Air Transport Services Group, Inc. (a) | 11,078 | 177,802 | ||||||
|
| |||||||
| Airlines—1.0% | ||||||||
SkyWest, Inc. | 5,080 | 173,990 | ||||||
|
| |||||||
| Auto Components—3.2% | ||||||||
Cooper-Standard Holdings, Inc. (a) | 1,318 | 146,206 | ||||||
Modine Manufacturing Co. (a) | 12,411 | 151,414 | ||||||
Tenneco, Inc. | 3,931 | 245,373 | ||||||
|
| |||||||
| 542,993 | ||||||||
|
| |||||||
| Banks—6.8% | ||||||||
Ameris Bancorp | 4,179 | 192,652 | ||||||
CenterState Banks, Inc. | 6,925 | 179,358 | ||||||
Pacific Premier Bancorp, Inc. (a) | 4,464 | 172,087 | ||||||
Sterling Bancorp | 10,302 | 244,157 | ||||||
Texas Capital Bancshares, Inc. (a) | 2,273 | 189,682 | ||||||
Western Alliance Bancorp (a) | 3,714 | 182,320 | ||||||
|
| |||||||
| 1,160,256 | ||||||||
|
| |||||||
| Beverages—1.4% | ||||||||
National Beverage Corp. | 2,737 | 231,359 | ||||||
|
| |||||||
| Biotechnology—4.4% | ||||||||
Bluebird Bio, Inc. (a) | 395 | 35,905 | ||||||
Clovis Oncology, Inc. (a) | 700 | 44,569 | ||||||
Exact Sciences Corp. (a) | 6,647 | 157,002 | ||||||
Flexion Therapeutics, Inc. (a) | 3,960 | 106,564 | ||||||
Halozyme Therapeutics, Inc. (a) | 3,646 | 47,252 | ||||||
Kite Pharma, Inc. (a) | 543 | 42,620 | ||||||
Prothena Corp. PLC (a) | 902 | 50,323 | ||||||
Repligen Corp. (a) | 3,064 | 107,853 | ||||||
Sage Therapeutics, Inc. (a) | 863 | 61,333 | ||||||
Sarepta Therapeutics, Inc. (a) | 1,569 | 46,442 | ||||||
Ultragenyx Pharmaceutical, Inc. (a) | 647 | 43,854 | ||||||
|
| |||||||
| 743,717 | ||||||||
|
| |||||||
| Building Products—1.8% | ||||||||
Gibraltar Industries, Inc. (a) | 3,267 | 134,600 | ||||||
Patrick Industries, Inc. (a) | 2,442 | 173,138 | ||||||
|
| |||||||
| 307,738 | ||||||||
|
| |||||||
| Chemicals—2.1% | ||||||||
Koppers Holdings, Inc. (a) | 3,842 | 162,709 | ||||||
Olin Corp. | 5,937 | 195,149 | ||||||
|
| |||||||
| 357,858 | ||||||||
|
| |||||||
| Communications Equipment—1.8% | ||||||||
Lumentum Holdings, Inc. (a) | 2,859 | 152,527 | ||||||
Oclaro, Inc. (a) | 14,845 | 145,778 | ||||||
|
| |||||||
| 298,305 | ||||||||
|
| |||||||
| Construction & Engineering—2.2% | ||||||||
Granite Construction, Inc. | 4,172 | 209,393 | ||||||
MasTec, Inc. (a) | 4,120 | 165,006 | ||||||
|
| |||||||
| 374,399 | ||||||||
|
| |||||||
| Containers & Packaging—0.8% | ||||||||
Berry Plastics Group, Inc. (a) | 2,760 | 134,053 | ||||||
|
| |||||||
| Diversified Consumer Services—1.0% | ||||||||
Bright Horizons Family Solutions, Inc. (a) | 2,408 | 174,556 | ||||||
|
| |||||||
| Shares | Value | |||||||
| Electronic Equipment, Instruments & Components—4.1% | ||||||||
Belden, Inc. | 2,254 | $ | 155,954 | |||||
Coherent, Inc. (a) | 1,220 | 250,881 | ||||||
Itron, Inc. (a) | 2,359 | 143,191 | ||||||
Rogers Corp. (a) | 1,726 | 148,212 | ||||||
|
| |||||||
| 698,238 | ||||||||
|
| |||||||
| Energy Equipment & Services—1.1% | ||||||||
U.S. Silica Holdings, Inc. | 3,911 | 187,689 | ||||||
|
| |||||||
| Equity Real Estate Investment Trusts (REITs)—1.3% | ||||||||
DuPont Fabros Technology, Inc. | 4,332 | 214,824 | ||||||
|
| |||||||
| Food Products—0.6% | ||||||||
Hostess Brands, Inc. (a) | 6,754 | 107,186 | ||||||
|
| |||||||
| Health Care Equipment & Supplies—7.0% | ||||||||
Cantel Medical Corp. | 2,472 | 198,007 | ||||||
Hill-Rom Holdings, Inc. | 2,025 | 142,965 | ||||||
Inogen, Inc. (a) | 1,945 | 150,854 | ||||||
Insulet Corp. (a) | 3,551 | 153,013 | ||||||
LeMaitre Vascular, Inc. | 4,584 | 112,904 | ||||||
Nevro Corp. (a) | 1,365 | 127,900 | ||||||
Penumbra, Inc. (a) | 2,275 | 189,849 | ||||||
West Pharmaceutical Services, Inc. | 1,485 | 121,191 | ||||||
|
| |||||||
| 1,196,683 | ||||||||
|
| |||||||
| Health Care Providers & Services—0.9% | ||||||||
Teladoc, Inc. (a) | 5,967 | 149,175 | ||||||
|
| |||||||
| Health Care Technology—1.5% | ||||||||
Vocera Communications, Inc. (a) | 10,290 | 255,501 | ||||||
|
| |||||||
| Hotels, Restaurants & Leisure—6.7% | ||||||||
Buffalo Wild Wings, Inc. (a) | 669 | 102,190 | ||||||
Churchill Downs, Inc. | 983 | 156,149 | ||||||
Dave & Buster’s Entertainment, Inc. (a) | 4,376 | 267,330 | ||||||
Eldorado Resorts, Inc. (a) | 10,987 | 207,929 | ||||||
Jack in the Box, Inc. | 2,218 | 225,615 | ||||||
Texas Roadhouse, Inc. | 4,074 | 181,415 | ||||||
|
| |||||||
| 1,140,628 | ||||||||
|
| |||||||
| Household Durables—2.1% | ||||||||
Cavco Industries, Inc. (a) | 1,145 | 133,278 | ||||||
Installed Building Products, Inc. (a) | 2,908 | 153,397 | ||||||
William Lyon Homes, Class A (a) | 3,506 | 72,294 | ||||||
|
| |||||||
| 358,969 | ||||||||
|
| |||||||
| Insurance—1.8% | ||||||||
AMERISAFE, Inc. | 2,431 | 157,772 | ||||||
Primerica, Inc. | 1,830 | 150,426 | ||||||
|
| |||||||
| 308,198 | ||||||||
|
| |||||||
| Internet & Catalog Retail—0.8% | ||||||||
Etsy, Inc. (a) | 13,529 | 143,813 | ||||||
|
| |||||||
| Internet Software & Services—6.8% | ||||||||
Cornerstone OnDemand, Inc. (a) | 2,486 | 96,681 | ||||||
Five9, Inc. (a) | 8,792 | 144,716 | ||||||
GTT Communications, Inc. (a) | 5,623 | 136,920 | ||||||
j2 Global, Inc. | 1,309 | 109,838 | ||||||
LogMeIn, Inc. | 1,229 | 119,827 | ||||||
MINDBODY, Inc., Class A (a) | 5,625 | 154,406 | ||||||
Pandora Media, Inc. (a) | 8,320 | 98,259 | ||||||
TrueCar, Inc. (a) | 10,631 | 164,462 | ||||||
Yelp, Inc. (a) | 4,057 | 132,867 | ||||||
|
| |||||||
| 1,157,976 | ||||||||
|
| |||||||
| Shares | Value | |||||||
| Life Sciences Tools & Services—2.1% | ||||||||
NeoGenomics, Inc. (a) | 15,650 | $ | 123,478 | |||||
PRA Health Sciences, Inc. (a) | 3,507 | 228,762 | ||||||
|
| |||||||
| 352,240 | ||||||||
|
| |||||||
| Machinery—5.1% | ||||||||
Douglas Dynamics, Inc. | 3,135 | 96,088 | ||||||
Energy Recovery, Inc. (a) | 4,869 | 40,510 | ||||||
Global Brass & Copper Holdings, Inc. | 4,582 | 157,621 | ||||||
John Bean Technologies Corp. | 2,047 | 180,033 | ||||||
Kornit Digital Ltd. (a) | 10,212 | 195,049 | ||||||
Woodward, Inc. | 2,940 | 199,685 | ||||||
|
| |||||||
| 868,986 | ||||||||
|
| |||||||
| Metals & Mining—0.7% | ||||||||
Cliffs Natural Resources, Inc. (a) | 13,862 | 113,807 | ||||||
|
| |||||||
| Oil, Gas & Consumable Fuels—2.8% | ||||||||
Aegean Marine Petroleum Network, Inc. | 13,391 | 161,361 | ||||||
Callon Petroleum Co. (a) | 14,979 | 197,124 | ||||||
Oasis Petroleum, Inc. (a) | 8,259 | 117,773 | ||||||
|
| |||||||
| 476,258 | ||||||||
|
| |||||||
| Paper & Forest Products—0.9% | ||||||||
Louisiana-Pacific Corp. (a) | 6,001 | 148,945 | ||||||
|
| |||||||
| Pharmaceuticals—2.0% | ||||||||
Prestige Brands Holdings, Inc. (a) | 2,219 | 123,288 | ||||||
Supernus Pharmaceuticals, Inc. (a) | 6,827 | 213,685 | ||||||
|
| |||||||
| 336,973 | ||||||||
|
| |||||||
| Professional Services—1.2% | ||||||||
WageWorks, Inc. (a) | 2,781 | 201,066 | ||||||
|
| |||||||
| Road & Rail—1.2% | ||||||||
Saia, Inc. (a) | 2,404 | 106,497 | ||||||
Swift Transportation Co. (a) | 4,955 | 101,776 | ||||||
|
| |||||||
| 208,273 | ||||||||
|
| |||||||
| Semiconductors & Semiconductor Equipment—7.2% | ||||||||
Cavium, Inc. (a) | 3,058 | 219,136 | ||||||
Cirrus Logic, Inc. (a) | 1,560 | 94,676 | ||||||
Entegris, Inc. (a) | 5,390 | 126,126 | ||||||
FormFactor, Inc. (a) | 14,585 | 172,832 | ||||||
Ichor Holdings Ltd. (a) | 9,710 | 192,549 | ||||||
Impinj, Inc. (a) | 4,217 | 127,649 | ||||||
Inphi Corp. (a) | 2,008 | 98,031 | ||||||
Microsemi Corp. (a) | 3,658 | 188,497 | ||||||
|
| |||||||
| 1,219,496 | ||||||||
|
| |||||||
| Software—4.0% | ||||||||
Fair Isaac Corp. | 1,506 | 194,199 | ||||||
RealPage, Inc. (a) | 4,890 | 170,661 | ||||||
Take-Two Interactive Software, Inc. (a) | 5,286 | 313,301 | ||||||
|
| |||||||
| 678,161 | ||||||||
|
| |||||||
| Specialty Retail—1.4% | ||||||||
Children’s Place, Inc. | 1,992 | 239,140 | ||||||
|
| |||||||
| Thrifts & Mortgage Finance—1.7% | ||||||||
Essent Group Ltd. (a) | 7,892 | 285,454 | ||||||
|
| |||||||
| Trading Companies & Distributors—3.0% | ||||||||
Air Lease Corp. | 5,673 | 219,829 | ||||||
Univar, Inc. (a) | 5,658 | 173,474 | ||||||
WESCO International, Inc. (a) | 1,713 | 119,139 | ||||||
|
| |||||||
| 512,442 | ||||||||
|
| |||||||
| Total Common Stock (cost—$13,442,955) | 16,401,699 | |||||||
|
| |||||||
| 196 | Semiannual Report | | March 31, 2017 | | See accompanying Notes to Financial Statements |
Table of Contents
Schedule of Investments
March 31, 2017 (Unaudited)
| Principal Amount (000s) | Value | |||||||
| Repurchase Agreements—3.4% | ||||||||
State Street Bank and Trust Co., dated 3/31/17, 0.09%, due 4/3/17, proceeds $581,004; collateralized by U.S. Treasury Notes, 2.00%, due 11/25/26, valued at $597,415 including accrued interest |
| |||||||
(cost—$581,000) | $581 | $ | 581,000 | |||||
|
| |||||||
| Total Investments (cost—$14,023,955)—100.0% | 16,982,699 | |||||||
|
| |||||||
| Other assets less liabilities—0.0% | 2,563 | |||||||
|
| |||||||
| Net Assets—100.0% | $16,985,262 | |||||||
|
| |||||||
Notes to Schedule of Investments:
(a) Non-income producing.
AllianzGI Ultra Micro Cap Fund
| Shares | Value | |||||||
| Common Stock—98.7% | ||||||||
| Aerospace & Defense—0.7% | ||||||||
Ducommun, Inc. (a) | 9,814 | $282,545 | ||||||
|
| |||||||
| Auto Components—1.0% | ||||||||
Motorcar Parts of America, Inc. (a) | 13,622 | 418,604 | ||||||
|
| |||||||
| Banks—9.1% | ||||||||
Allegiance Bancshares, Inc. (a) | 9,389 | 349,271 | ||||||
Atlantic Capital Bancshares, Inc. (a) | 16,701 | 316,484 | ||||||
Franklin Financial Network, Inc. (a) | 16,491 | 639,026 | ||||||
Heritage Commerce Corp. | 34,327 | 484,011 | ||||||
National Commerce Corp. (a) | 5,531 | 202,435 | ||||||
Park Sterling Corp. | 40,643 | 500,315 | ||||||
Preferred Bank | 11,654 | 625,354 | ||||||
Triumph Bancorp, Inc. (a) | 12,804 | 330,343 | ||||||
Veritex Holdings, Inc. (a) | 13,145 | 369,637 | ||||||
|
| |||||||
| 3,816,876 | ||||||||
|
| |||||||
| Beverages—1.2% | ||||||||
Craft Brew Alliance, Inc. (a) | 10,414 | 139,027 | ||||||
Primo Water Corp. (a) | 27,097 | 367,977 | ||||||
|
| |||||||
| 507,004 | ||||||||
|
| |||||||
| Biotechnology—11.0% | ||||||||
Abeona Therapeutics, Inc. (a) | 16,726 | 83,630 | ||||||
Adamas Pharmaceuticals, Inc. (a) | 8,157 | 142,747 | ||||||
Advaxis, Inc. (a) | 16,080 | 131,374 | ||||||
Agenus, Inc. (a) | 28,222 | 106,397 | ||||||
Bellicum Pharmaceuticals, Inc. (a) | 7,274 | 89,761 | ||||||
BioCryst Pharmaceuticals, Inc. (a) | 12,523 | 105,193 | ||||||
BioSpecifics Technologies Corp. (a) | 6,245 | 342,226 | ||||||
Cara Therapeutics, Inc. (a) | 12,647 | 232,578 | ||||||
Concert Pharmaceuticals, Inc. (a) | 13,632 | 232,562 | ||||||
Corbus Pharmaceuticals Holdings, Inc. (a) | 10,174 | 83,935 | ||||||
Curis, Inc. (a) | 33,967 | 94,428 | ||||||
Cytokinetics, Inc. (a) | 9,919 | 127,459 | ||||||
Eagle Pharmaceuticals, Inc. (a) | 4,218 | 349,841 | ||||||
Flexion Therapeutics, Inc. (a) | 13,104 | 352,629 | ||||||
Immunomedics, Inc. (a) | 21,662 | 140,153 | ||||||
Inovio Pharmaceuticals, Inc. (a) | 17,742 | 117,452 | ||||||
Invitae Corp. (a) | 11,694 | 129,336 | ||||||
La Jolla Pharmaceutical Co. (a) | 10,105 | 301,634 | ||||||
Lion Biotechnologies, Inc. (a) | 19,531 | 145,506 | ||||||
Pfenex, Inc. (a) | 18,389 | 106,840 | ||||||
Progenics Pharmaceuticals, Inc. (a) | 23,327 | 220,207 | ||||||
Repligen Corp. (a) | 16,314 | 574,253 | ||||||
Synergy Pharmaceuticals, Inc. (a) | 40,313 | 187,859 | ||||||
Trevena, Inc. (a) | 12,188 | 44,730 | ||||||
Vanda Pharmaceuticals, Inc. (a) | 11,208 | 156,912 | ||||||
|
| |||||||
| 4,599,642 | ||||||||
|
| |||||||
| Building Products—1.5% | ||||||||
Patrick Industries, Inc. (a) | 8,929 | 633,066 | ||||||
|
| |||||||
| Chemicals—1.5% | ||||||||
American Vanguard Corp. | 22,190 | 368,354 | ||||||
LSB Industries, Inc. (a) | 27,154 | 254,705 | ||||||
|
| |||||||
| 623,059 | ||||||||
|
| |||||||
| Shares | Value | |||||||
| Commercial Services & Supplies—0.7% | ||||||||
Hudson Technologies, Inc. (a) | 44,138 | $ | 291,311 | |||||
|
| |||||||
| Communications Equipment—1.2% | ||||||||
EMCORE Corp. | 33,356 | 300,204 | ||||||
ShoreTel, Inc. (a) | 31,496 | 193,700 | ||||||
|
| |||||||
| 493,904 | ||||||||
|
| |||||||
| Construction & Engineering—5.0% | ||||||||
Argan, Inc. | 7,618 | 503,931 | ||||||
IES Holdings, Inc. (a) | 21,377 | 386,924 | ||||||
Layne Christensen Co. (a) | 36,014 | 318,364 | ||||||
Northwest Pipe Co. (a) | 17,729 | 278,522 | ||||||
NV5 Global, Inc. (a) | 16,133 | 606,601 | ||||||
|
| |||||||
| 2,094,342 | ||||||||
|
| |||||||
| Construction Materials—1.3% | ||||||||
U.S. Concrete, Inc. (a) | 8,259 | 533,118 | ||||||
|
| |||||||
| Diversified Consumer Services—1.6% | ||||||||
Carriage Services, Inc. | 25,293 | 685,946 | ||||||
|
| |||||||
| Electrical Equipment—0.9% | ||||||||
LSI Industries, Inc. | 36,514 | 368,426 | ||||||
|
| |||||||
| Electronic Equipment, Instruments & Components—2.4% | ||||||||
ePlus, Inc. (a) | 3,359 | 453,633 | ||||||
Mesa Laboratories, Inc. | 2,358 | 289,327 | ||||||
Radisys Corp. (a) | 63,405 | 253,620 | ||||||
|
| |||||||
| 996,580 | ||||||||
|
| |||||||
| Energy Equipment & Services—0.6% | ||||||||
Independence Contract Drilling, Inc. (a) | 46,684 | 257,229 | ||||||
|
| |||||||
| Food Products—1.7% | ||||||||
John B Sanfilippo & Son, Inc. | 9,517 | 696,549 | ||||||
|
| |||||||
| Health Care Equipment & Supplies—8.4% | ||||||||
AtriCure, Inc. (a) | 18,279 | 350,043 | ||||||
AxoGen, Inc. (a) | 29,682 | 310,177 | ||||||
CryoLife, Inc. (a) | 18,959 | 315,667 | ||||||
Cutera, Inc. (a) | 14,448 | 299,074 | ||||||
GenMark Diagnostics, Inc. (a) | 27,000 | 346,140 | ||||||
Inogen, Inc. (a) | 4,186 | 324,666 | ||||||
LeMaitre Vascular, Inc. | 31,443 | 774,441 | ||||||
Obalon Therapeutics, Inc. (a) | 23,821 | 254,647 | ||||||
Surmodics, Inc. (a) | 13,349 | 321,043 | ||||||
Tactile Systems Technology, Inc. (a) | 12,462 | 236,155 | ||||||
|
| |||||||
| 3,532,053 | ||||||||
|
| |||||||
| Health Care Providers & Services—4.2% | ||||||||
Aceto Corp. | 18,015 | 284,817 | ||||||
BioTelemetry, Inc. (a) | 28,984 | 839,087 | ||||||
Cross Country Healthcare, Inc. (a) | 31,283 | 449,224 | ||||||
RadNet, Inc. (a) | 32,869 | 193,927 | ||||||
|
| |||||||
| 1,767,055 | ||||||||
|
| |||||||
| Health Care Technology—1.4% | ||||||||
Vocera Communications, Inc. (a) | 23,403 | 581,097 | ||||||
|
| |||||||
| Hotels, Restaurants & Leisure—3.1% | ||||||||
Carrols Restaurant Group, Inc. (a) | 41,198 | 582,952 | ||||||
Eldorado Resorts, Inc. (a) | 26,596 | 503,329 | ||||||
Red Lion Hotels Corp. (a) | 31,881 | 224,761 | ||||||
|
| |||||||
| 1,311,042 | ||||||||
|
| |||||||
| Household Durables—1.9% | ||||||||
Century Communities, Inc. (a) | 18,004 | 457,301 | ||||||
LGI Homes, Inc. (a) | 10,491 | 355,750 | ||||||
|
| |||||||
| 813,051 | ||||||||
|
| |||||||
| See accompanying Notes to Financial Statements | | March 31, 2017 | | Semiannual Report | 197 |
Table of Contents
Schedule of Investments
March 31, 2017 (Unaudited)
| Shares | Value | |||||||
| Household Products—0.5% | ||||||||
Orchids Paper Products Co. | 8,977 | $ | 215,448 | |||||
|
| |||||||
| Insurance—0.2% | ||||||||
Atlas Financial Holdings, Inc. (a) | 6,171 | 84,234 | ||||||
|
| |||||||
| Internet Software & Services—5.0% | ||||||||
Amber Road, Inc. (a) | 44,787 | 345,755 | ||||||
Autobytel, Inc. (a) | 18,739 | 234,800 | ||||||
Five9, Inc. (a) | 36,711 | 604,263 | ||||||
GTT Communications, Inc. (a) | 16,542 | 402,798 | ||||||
Reis, Inc. | 9,161 | 163,982 | ||||||
Xactly Corp. (a) | 26,791 | 318,813 | ||||||
|
| |||||||
| 2,070,411 | ||||||||
|
| |||||||
| IT Services—2.9% | ||||||||
Hackett Group, Inc. | 35,253 | 687,081 | ||||||
NCI, Inc., Class A (a) | 14,078 | 211,874 | ||||||
Planet Payment, Inc. (a) | 82,406 | 327,976 | ||||||
|
| |||||||
| 1,226,931 | ||||||||
|
| |||||||
| Leisure Equipment & Products—1.2% | ||||||||
Nautilus, Inc. (a) | 26,872 | 490,414 | ||||||
|
| |||||||
| Life Sciences Tools & Services—2.4% | ||||||||
Albany Molecular Research, Inc. (a) | 31,442 | 441,131 | ||||||
NeoGenomics, Inc. (a) | 70,562 | 556,734 | ||||||
|
| |||||||
| 997,865 | ||||||||
|
| |||||||
| Machinery—2.6% | ||||||||
DMC Global, Inc. | 29,774 | 369,198 | ||||||
Gencor Industries, Inc. (a) | 22,644 | 338,528 | ||||||
NN, Inc. | 14,778 | 372,405 | ||||||
|
| |||||||
| 1,080,131 | ||||||||
|
| |||||||
| Media—1.3% | ||||||||
Entravision Communications Corp., Class A | 44,980 | 278,876 | ||||||
Reading International, Inc., Class A (a) | 16,690 | 259,363 | ||||||
|
| |||||||
| 538,239 | ||||||||
|
| |||||||
| Oil, Gas & Consumable Fuels—3.0% | ||||||||
Aegean Marine Petroleum Network, Inc. | 31,337 | 377,611 | ||||||
Bill Barrett Corp. (a) | 24,616 | 112,003 | ||||||
Evolution Petroleum Corp. | 42,020 | 336,160 | ||||||
Ring Energy, Inc. (a) | 39,773 | 430,344 | ||||||
|
| |||||||
| 1,256,118 | ||||||||
|
| |||||||
| Pharmaceuticals—5.9% | ||||||||
ANI Pharmaceuticals, Inc. (a) | 8,544 | 423,013 | ||||||
Heska Corp. (a) | 7,912 | 830,602 | ||||||
Intersect ENT, Inc. (a) | 13,327 | 228,558 | ||||||
Paratek Pharmaceuticals, Inc. (a) | 5,362 | 103,219 | ||||||
Revance Therapeutics, Inc. (a) | 5,511 | 114,629 | ||||||
Supernus Pharmaceuticals, Inc. (a) | 10,236 | 320,387 | ||||||
Teligent, Inc. (a) | 56,056 | 437,797 | ||||||
|
| |||||||
| 2,458,205 | ||||||||
|
| |||||||
| Professional Services—0.8% | ||||||||
GP Strategies Corp. (a) | 13,506 | 341,702 | ||||||
|
| |||||||
| Road & Rail—0.8% | ||||||||
Celadon Group, Inc. | 17,404 | 113,996 | ||||||
Covenant Transportation Group, Inc., Class A (a) | 12,310 | 231,428 | ||||||
|
| |||||||
| 345,424 | ||||||||
|
| |||||||
| Semiconductors & Semiconductor Equipment—5.3% | ||||||||
AXT, Inc. (a) | 58,298 | 338,128 | ||||||
| Shares | Value | |||||||
CEVA, Inc. (a) | 12,883 | $ | 457,347 | |||||
CyberOptics Corp. (a) | 10,203 | 264,768 | ||||||
FormFactor, Inc. (a) | 31,025 | 367,646 | ||||||
Impinj, Inc. (a) | 10,801 | 326,946 | ||||||
PDF Solutions, Inc. (a) | 21,060 | 476,377 | ||||||
|
| |||||||
| 2,231,212 | ||||||||
|
| |||||||
| Software—3.8% | ||||||||
Exa Corp. (a) | 22,064 | 280,213 | ||||||
Model N, Inc. (a) | 22,969 | 240,026 | ||||||
Park City Group, Inc. (a) | 29,915 | 369,450 | ||||||
QAD, Inc., Class A | 11,058 | 307,965 | ||||||
Telenav, Inc. (a) | 43,280 | 374,372 | ||||||
|
| |||||||
| 1,572,026 | ||||||||
|
| |||||||
| Technology Hardware, Storage & Peripherals—0.9% | ||||||||
USA Technologies, Inc. (a) | 91,105 | 387,196 | ||||||
|
| |||||||
| Thrifts & Mortgage Finance—0.6% | ||||||||
LendingTree, Inc. (a) | 1,857 | 232,775 | ||||||
|
| |||||||
| Wireless Telecommunication Services—1.1% | ||||||||
Boingo Wireless, Inc. (a) | 35,732 | 464,159 | ||||||
|
| |||||||
| Total Common Stock (cost—$27,886,090) | 41,294,989 | |||||||
|
| |||||||
| Principal Amount (000s) | ||||||||
| Repurchase Agreements—1.9% | ||||||||
State Street Bank and Trust Co., dated 3/31/17, 0.09%, due 4/3/17, proceeds $811,006; collateralized by U.S. Treasury Notes, 2.00%, due 8/15/25, valued at $828,067 including accrued interest |
| |||||||
(cost—$811,000) | $811 | 811,000 | ||||||
|
| |||||||
| Total Investments (cost—$28,697,090)—100.6% | 42,105,989 | |||||||
|
| |||||||
| Liabilities in excess of other assets—(0.6)% | (260,410 | ) | ||||||
|
| |||||||
| Net Assets—100.0% | $41,845,579 | |||||||
|
| |||||||
Notes to Schedule of Investments:
(a) Non-income producing.
| 198 | Semiannual Report | | March 31, 2017 | | See accompanying Notes to Financial Statements |
Table of Contents
(THIS PAGE INTENTIONALLY LEFT BLANK)
| See accompanying Notes to Financial Statements | | March 31, 2017 | | Semiannual Report | 199 |
Table of Contents
Statements of Assets and Liabilities
March 31, 2017 (Unaudited)
| AllianzGI Retirement 2020 | AllianzGI Retirement 2025 | AllianzGI Retirement 2030 | AllianzGI Retirement 2035 | AllianzGI Retirement 2040 | ||||||||||||||||||||
| Assets: | ||||||||||||||||||||||||
| Investments, at value | $ | 1,449,889 | $ | — | $ | — | $ | — | $ | — | ||||||||||||||
| Investments in Affiliates, at value | 49,241,938 | 58,322,684 | 63,104,978 | 49,542,897 | 45,347,327 | |||||||||||||||||||
| Repurchase agreements, at value | 2,349,000 | 2,309,000 | 951,000 | 1,578,000 | 1,155,000 | |||||||||||||||||||
| Cash | 132 | 561 | 750 | 619 | 701 | |||||||||||||||||||
| Foreign currency, at value | — | — | — | — | — | |||||||||||||||||||
| Deposits with brokers for derivatives collateral | 352,367 | 690,682 | 716,407 | 683,164 | 662,294 | |||||||||||||||||||
| Receivable for variation margin on futures contracts | 22,802 | 12,818 | 24,877 | 32,237 | 36,270 | |||||||||||||||||||
| Receivable for Fund shares sold | 10,936 | 40,055 | 29,030 | 14,849 | 18,209 | |||||||||||||||||||
| Dividends and interest receivable (net of foreign withholding taxes) | 6 | 6 | 2 | 4 | 3 | |||||||||||||||||||
| Receivable for investments sold | — | — | — | — | — | |||||||||||||||||||
| Receivable for investments in Affiliates sold | — | — | 834,429 | — | 390,310 | |||||||||||||||||||
| Dividends receivable from Affiliates | — | — | — | — | — | |||||||||||||||||||
| Receivable from Investment Manager | — | — | 1,245 | — | — | |||||||||||||||||||
| Uninvested Cash — Trustees Deferred Compensation Plan (see Note 5) | 832 | 907 | 944 | 755 | 636 | |||||||||||||||||||
| Investments in Affiliated Funds — Trustees Deferred Compensation Plan (see Note 5) | 2,755 | 2,604 | 3,923 | 5,434 | 2,011 | |||||||||||||||||||
| Prepaid expenses and other assets | — | — | — | — | — | |||||||||||||||||||
Total Assets | 53,430,657 | 61,379,317 | 65,667,585 | 51,857,959 | 47,612,761 | |||||||||||||||||||
| Liabilities: | ||||||||||||||||||||||||
| Payable for investments purchased | — | — | — | — | — | |||||||||||||||||||
| Payable for investments in Affiliates purchased | — | — | — | — | — | |||||||||||||||||||
| Payable for Fund shares redeemed | 39,739 | 3,003 | 17,898 | 1,901 | 76,166 | |||||||||||||||||||
| Payable for variation margin on futures contracts | 30,809 | 54,135 | 60,599 | 56,122 | 54,721 | |||||||||||||||||||
| Administration fees payable | 6,674 | 3,094 | — | 4,740 | 5,111 | |||||||||||||||||||
| Trustees Deferred Compensation Plan payable (see Note 5) | 3,587 | 3,511 | 4,867 | 6,189 | 2,647 | |||||||||||||||||||
| Servicing fees payable | 2,810 | 1,552 | 1,949 | 1,948 | 1,109 | |||||||||||||||||||
| Distribution fees payable | 671 | 380 | 1,119 | 517 | 501 | |||||||||||||||||||
| Investment management fees payable | — | — | — | — | 282 | |||||||||||||||||||
| Accrued expenses and other liabilities | — | — | — | — | — | |||||||||||||||||||
Total Liabilities | 84,290 | 65,675 | 86,432 | 71,417 | 140,537 | |||||||||||||||||||
| Net Assets | $ | 53,346,367 | $ | 61,313,642 | $ | 65,581,153 | $ | 51,786,542 | $ | 47,472,224 | ||||||||||||||
| 200 | Semiannual Report | | March 31, 2017 | | See accompanying Notes to Financial Statements |
Table of Contents
| AllianzGI Retirement 2045 | AllianzGI Retirement 2050 | AllianzGI Retirement 2055 | AllianzGI Retirement Income | AllianzGI Global Allocation | AllianzGI Global Megatrends | AllianzGI Best Styles Emerging Markets Equity | ||||||||||||||||||||||||
| $ | — | $ | — | $ | — | $ | 12,162,620 | $ | 5,140,430 | $ | — | $ | 5,363,627 | |||||||||||||||||
| 28,062,529 | 26,826,541 | 10,931,901 | 38,716,036 | 426,246,085 | 3,280,699 | — | ||||||||||||||||||||||||
| 1,205,000 | 1,353,000 | 440,000 | 463,000 | 24,074,000 | 181,000 | 579,000 | ||||||||||||||||||||||||
| 768 | 834 | 501 | 132 | 633 | 559 | 160 | ||||||||||||||||||||||||
| — | — | — | 1,966 | — | — | 159,427 | ||||||||||||||||||||||||
| 419,727 | 391,147 | 202,214 | 884,587 | 1,707,393 | — | 68,505 | ||||||||||||||||||||||||
| 24,971 |
| 24,141 | 10,852 | 87,356 | 382,918 | — | 2,420 | ||||||||||||||||||||||
| 21,893 | 23,858 | 18,273 | 2,861 | 623,830 | — | — | ||||||||||||||||||||||||
| 3 |
| 3 | 1 | 103,191 | 17,153 | — | 13,943 | ||||||||||||||||||||||
| — | — | — | — | — | — | 11,210 | ||||||||||||||||||||||||
| — | — | — | — | — | — | — | ||||||||||||||||||||||||
| — | — | — | 49,633 | — | — | — | ||||||||||||||||||||||||
| — | — | — | 511 | — | 12,484 | 34,140 | ||||||||||||||||||||||||
| 374 |
| 339 | 118 | 529 | 5,628 | 45 | 109 | ||||||||||||||||||||||
| 1,323 |
| 2,313 | 742 | 7,781 | 16,600 | 1,856 | 450 | ||||||||||||||||||||||
| — | — | — | — | 60,723 | 30,578 | 47,775 | ||||||||||||||||||||||||
| 29,736,588 | 28,622,176 | 11,604,602 | 52,480,203 | 458,275,393 | 3,507,221 | 6,280,766 | ||||||||||||||||||||||||
| — | — | — | — | — | — | 4,094 | ||||||||||||||||||||||||
| — | 343,185 | — | 49,637 | — | — | — | ||||||||||||||||||||||||
| 18,831 | 1,267 | 2,281 | 42,641 | 423,006 | — | — | ||||||||||||||||||||||||
| 30,781 | 30,780 | 10,531 | 159,695 | 693,570 | — | — | ||||||||||||||||||||||||
| 3,375 | 2,959 | 1,275 | — | — | — | — | ||||||||||||||||||||||||
| 1,697 |
| 2,652 | 860 | 8,310 | 22,228 | 1,901 | 559 | ||||||||||||||||||||||
| 889 | 706 | 372 | 2,782 | 18,098 | 10 | 7 | ||||||||||||||||||||||||
| 270 | 625 | 255 | 2,590 | 26,192 | — | 9 | ||||||||||||||||||||||||
| 581 | 872 | 437 | — | 69,352 | — | — | ||||||||||||||||||||||||
| — | — | — | — | 140,922 | 28,603 | 32,426 | ||||||||||||||||||||||||
| 56,424 | 383,046 | 16,011 | 265,655 | 1,393,368 | 30,514 | 37,095 | ||||||||||||||||||||||||
| $ | 29,680,164 | $ | 28,239,130 | $ | 11,588,591 | $ | 52,214,548 | $ | 456,882,025 | $ | 3,476,707 | $ | 6,243,671 | |||||||||||||||||
| See accompanying Notes to Financial Statements | | March 31, 2017 | | Semiannual Report | 201 |
Table of Contents
Statements of Assets and Liabilities (cont’d)
March 31, 2017 (Unaudited)
| AllianzGI Retirement 2020 | AllianzGI Retirement 2025 | AllianzGI Retirement 2030 | AllianzGI Retirement 2035 | AllianzGI Retirement 2040 | ||||||||||||||||||||
| Net Assets Consist of: | ||||||||||||||||||||||||
| Paid-in-capital | $ | 52,534,194 | $ | 59,145,875 | $ | 62,143,516 | $ | 48,464,460 | $ | 44,235,672 | ||||||||||||||
| Undistributed (dividends in excess of) net investment income | 36,800 | (45,915 | ) | (52,527 | ) | (117,911 | ) | (139,380 | ) | |||||||||||||||
| Accumulated net realized gain (loss) | (482,176 | ) | 386,084 | 585,540 | 595,019 | 398,073 | ||||||||||||||||||
| Net unrealized appreciation | 1,257,549 | 1,827,598 | 2,904,624 | 2,844,974 | 2,977,859 | |||||||||||||||||||
| Net Assets | $ | 53,346,367 | $ | 61,313,642 | $ | 65,581,153 | $ | 51,786,542 | $ | 47,472,224 | ||||||||||||||
| Cost of Investments | $ | 1,462,708 | $ | — | $ | — | $ | — | $ | — | ||||||||||||||
| Cost of Investments in Affiliates | $ | 47,962,469 | $ | 56,453,495 | $ | 60,166,617 | $ | 46,675,114 | $ | 42,352,240 | ||||||||||||||
| Cost of Repurchase Agreements | $ | 2,349,000 | $ | 2,309,000 | $ | 951,000 | $ | 1,578,000 | $ | 1,155,000 | ||||||||||||||
| Cost of Foreign Currency | $ | — | $ | — | $ | — | $ | — | $ | — | ||||||||||||||
| Net Assets: | ||||||||||||||||||||||||
| Class A | $ | 12,835,253 | $ | 7,164,913 | $ | 8,127,247 | $ | 7,861,965 | $ | 4,733,578 | ||||||||||||||
| Class C | 422,738 | — | 740,298 | — | 123,324 | |||||||||||||||||||
| Class R | 1,275 | 203,367 | 443,592 | 659,153 | 366,471 | |||||||||||||||||||
| Class P | 21,842,483 | 35,004,658 | 34,205,377 | 30,663,691 | 22,425,881 | |||||||||||||||||||
| Institutional Class | — | — | — | — | — | |||||||||||||||||||
| Class R6 | 17,655,994 | 18,281,447 | 20,811,192 | 11,813,608 | 19,453,639 | |||||||||||||||||||
| Administrative Class | 588,624 | 659,257 | 1,253,447 | 788,125 | 369,331 | |||||||||||||||||||
| Shares Issued and Outstanding: | �� | |||||||||||||||||||||||
| Class A | 666,790 | 413,989 | 390,920 | 426,254 | 222,292 | |||||||||||||||||||
| Class C | 22,047 | — | 35,959 | — | 5,837 | |||||||||||||||||||
| Class R | 68 | 11,853 | 21,419 | 35,914 | 17,405 | |||||||||||||||||||
| Class P | 1,125,608 | 2,025,413 | 1,629,653 | 1,656,122 | 1,049,464 | |||||||||||||||||||
| Institutional Class | — | — | — | — | — | |||||||||||||||||||
| Class R6 | 908,707 | 1,056,750 | 989,241 | 637,117 | 908,463 | |||||||||||||||||||
| Administrative Class | 30,377 | 38,081 | 59,805 | 42,620 | 17,352 | |||||||||||||||||||
| Net Asset Value and Redemption Price Per Share:* | ||||||||||||||||||||||||
| Class A | $ | 19.25 | $ | 17.31 | $ | 20.79 | $ | 18.44 | $ | 21.29 | ||||||||||||||
| Class C | 19.17 | — | 20.59 | — | 21.13 | |||||||||||||||||||
| Class R | 18.76 | 17.16 | 20.71 | 18.35 | 21.06 | |||||||||||||||||||
| Class P | 19.41 | 17.28 | 20.99 | 18.52 | 21.37 | |||||||||||||||||||
| Institutional Class | — | — | — | — | — | |||||||||||||||||||
| Class R6 | 19.43 | 17.30 | 21.04 | 18.54 | 21.41 | |||||||||||||||||||
| Administrative Class | 19.38 | 17.31 | 20.96 | 18.49 | 21.28 | |||||||||||||||||||
| * | Net asset value and redemption price per share may not recalculate exactly due to rounding. |
| 202 | Semiannual Report | | March 31, 2017 | | See accompanying Notes to Financial Statements |
Table of Contents
| AllianzGI Retirement 2045 | AllianzGI Retirement 2050 | AllianzGI Retirement 2055 | AllianzGI Retirement Income | AllianzGI Global Allocation | AllianzGI Global Megatrends | AllianzGI Best Styles Emerging Markets Equity | ||||||||||||||||||||||||
| $ | 27,645,946 | $ | 26,237,889 | $ | 10,863,203 | $ | 51,462,651 | $ | 426,113,619 | $ | 3,428,758 | $ | 5,573,508 | |||||||||||||||||
| (96,206 | ) | (95,289 | ) | (35,184 | ) | 192,496 | (1,966,357 | ) | (42,571 | ) | (64,139 | ) | |||||||||||||||||
| 186,109 | 210,655 | 33,964 | (463,638 | ) | 1,271,237 | 72,958 | (61,617 | ) | ||||||||||||||||||||||
| 1,944,315 | 1,885,875 | 726,608 | 1,023,039 | 31,463,526 | 17,562 | 795,919 | ||||||||||||||||||||||||
| $ | 29,680,164 | $ | 28,239,130 | $ | 11,588,591 | $ | 52,214,548 | $ | 456,882,025 | $ | 3,476,707 | $ | 6,243,671 | |||||||||||||||||
| $ | — | $ | — | $ | — | $ | 11,944,060 | $ | 5,135,304 | $ | — | $ | 4,577,920 | |||||||||||||||||
| $ | 26,113,824 | $ | 24,934,485 | $ | 10,206,239 | $ | 37,840,291 | $ | 394,488,554 | $ | 3,263,137 | $ | — | |||||||||||||||||
| $ | 1,205,000 | $ | 1,353,000 | $ | 440,000 | $ | 463,000 | $ | 24,074,000 | $ | 181,000 | $ | 579,000 | |||||||||||||||||
| $ | — | $ | — | $ | — | $ | 1,959 | $ | — | $ | — | $ | 152,239 | |||||||||||||||||
| $ | 4,107,235 | $ | 3,097,118 | $ | 1,691,665 | $ | 9,785,691 | $ | 43,884,980 | $ | 47,898 | $ | 18,465 | |||||||||||||||||
| — | 168,647 | — | 3,128,434 | 40,169,046 | — | 14,500 | ||||||||||||||||||||||||
| 138,893 | 95,582 | 85,791 | 124,197 | 18,707 | — | — | ||||||||||||||||||||||||
| 14,018,567 | 10,572,921 | 4,713,519 | 16,125,292 | 2,840,087 | 10,937 | 10,629 | ||||||||||||||||||||||||
| — | — | — | — | 70,436,186 | 3,417,872 | 74,309 | ||||||||||||||||||||||||
| 10,808,412 | 13,585,201 | 4,749,068 | 21,407,680 | 299,508,838 | — | 6,125,768 | ||||||||||||||||||||||||
| 607,057 | 719,661 | 348,548 | 1,643,254 | 24,181 | — | — | ||||||||||||||||||||||||
| 220,915 | 149,669 | 94,888 | 536,227 | 3,820,322 | 3,168 | 1,283 | ||||||||||||||||||||||||
| — | 8,269 | — | 171,436 | 3,454,647 | — | 1,010 | ||||||||||||||||||||||||
| 7,541 | 4,652 | 4,841 | 6,533 | 1,644 | — | — | ||||||||||||||||||||||||
| 752,994 | 507,272 | 262,611 | 875,066 | 248,486 | 722 | 736 | ||||||||||||||||||||||||
| — | — | — | — | 6,228,546 | 225,195 | 5,150 | ||||||||||||||||||||||||
| 579,045 | 649,450 | 263,566 | 1,190,179 | 26,545,516 | — | 423,290 | ||||||||||||||||||||||||
| 32,790 | 34,674 | 19,518 | 88,676 | 2,056 | — | — | ||||||||||||||||||||||||
| $ | 18.59 | $ | 20.69 | $ | 17.83 | $ | 18.25 | $ | 11.49 | $ | 15.12 | $ | 14.39 | |||||||||||||||||
| — | 20.39 | — | 18.25 | 11.63 | — | 14.35 | ||||||||||||||||||||||||
| 18.42 | 20.54 | 17.72 | 19.01 | 11.38 | — | — | ||||||||||||||||||||||||
| 18.62 | 20.84 | 17.95 | 18.43 | 11.43 | 15.15 | 14.44 | ||||||||||||||||||||||||
| — | — | — | — | 11.31 | 15.18 | 14.43 | ||||||||||||||||||||||||
| 18.67 | 20.92 | 18.02 | 17.99 | 11.28 | — | 14.47 | ||||||||||||||||||||||||
| 18.51 | 20.76 | 17.86 | 18.53 | 11.76 | — | — | ||||||||||||||||||||||||
| See accompanying Notes to Financial Statements | | March 31, 2017 | | Semiannual Report | 203 |
Table of Contents
Statements of Assets and Liabilities (cont’d)
March 31, 2017 (Unaudited)
| AllianzGI Best Styles Global Equity | AllianzGI Best Styles International Equity | AllianzGI Best Styles U.S. Equity | AllianzGI Convertible | AllianzGI Emerging Markets Consumer | ||||||||||||||||||||
| Assets: | ||||||||||||||||||||||||
| Investments, at value | $ | 715,727,853 | $ | 31,465,141 | $ | 120,229,883 | $ | 1,118,048,915 | $ | 39,016,386 | ||||||||||||||
| Investments in Affiliates, at value | — | — | — | — | — | |||||||||||||||||||
| Repurchase agreements, at value | 6,511,000 | 412,000 | 161,000 | 50,654,000 | 675,000 | |||||||||||||||||||
| Cash | 1,034,067 | 727 | 362 | 627,025 | 494 | |||||||||||||||||||
| Foreign currency, at value | 2,133,475 | 189,929 | 642 | — | 41,918 | |||||||||||||||||||
| Unrealized appreciation of forward foreign currency contracts | — | — | — | — | — | |||||||||||||||||||
| Dividends and interest receivable (net of foreign withholding taxes) | 2,065,204 | 164,887 | 134,574 | 3,320,739 | 160,556 | |||||||||||||||||||
| Receivable for investments sold | — | — | — | 11,807,939 | — | |||||||||||||||||||
| Deposits with brokers for derivatives collateral | 2,239,434 | 154,222 | 114,129 | — | — | |||||||||||||||||||
| Receivable for Fund shares sold | 302,263 | 2,593 | 143,166 | 403,244 | — | |||||||||||||||||||
| Receivable from Investment Manager | — | 15,281 | — | — | — | |||||||||||||||||||
| Tax reclaims receivable | 166,024 | 85,628 | — | 2,362 | 1,735 | |||||||||||||||||||
| Uninvested Cash — Trustees Deferred Compensation Plan (see Note 5) | 6,905 | 765 | 1,332 | 26,039 | 420 | |||||||||||||||||||
| Investments in Affiliated Funds — Trustees Deferred Compensation Plan (see Note 5) | 19,161 | 2,660 | 3,589 | 72,805 | 1,283 | |||||||||||||||||||
| Receivable for variation margin on futures contracts | 96,492 | 13,144 | — | — | — | |||||||||||||||||||
| Prepaid expenses and other assets | 45,747 | 48,450 | 48,547 | 82,208 | 20,003 | |||||||||||||||||||
Total Assets | 730,347,625 | 32,555,427 | 120,837,224 | 1,185,045,276 | 39,917,795 | |||||||||||||||||||
| Liabilities: | ||||||||||||||||||||||||
| Payable for investments purchased | — | — | — | 21,420,387 | — | |||||||||||||||||||
| Payable for Fund shares redeemed | 1,932,524 | — | 334,429 | 675,856 | — | |||||||||||||||||||
| Payable for TBA investments purchased | — | — | — | — | — | |||||||||||||||||||
| Payable for variation margin on futures contracts | 41,607 | — | — | — | — | |||||||||||||||||||
| Investment management fees payable | 172,450 | — | 14,321 | 568,368 | 10,893 | |||||||||||||||||||
| Distribution fees payable | 13 | 10 | 13 | 36,486 | — | |||||||||||||||||||
| Servicing fees payable | 252 | 6 | 111 | 30,254 | 14 | |||||||||||||||||||
| Unrealized depreciation of forward foreign currency contracts | — | — | — | — | — | |||||||||||||||||||
| Trustees Deferred Compensation Plan payable (see Note 5) | 26,066 | 3,425 | 4,921 | 98,844 | 1,703 | |||||||||||||||||||
| Accrued expenses and other liabilities | 43,002 | 53,111 | 47,254 | 518,787 | 66,524 | |||||||||||||||||||
Total Liabilities | 2,215,914 | 56,552 | 401,049 | 23,348,982 | 79,134 | |||||||||||||||||||
| Net Assets | $ | 728,131,711 | $ | 32,498,875 | $ | 120,436,175 | $ | 1,161,696,294 | $ | 39,838,661 | ||||||||||||||
| 204 | Semiannual Report | | March 31, 2017 | | See accompanying Notes to Financial Statements |
Table of Contents
| AllianzGI Emerging Markets Debt | AllianzGI Emerging Markets Small-Cap | AllianzGI Europe Equity Dividend | AllianzGI Global Dynamic Allocation | AllianzGI Global Fundamental Strategy | AllianzGI Global Sustainability | AllianzGI Global Water | ||||||||||||||||||||||||
| $ | 39,501,072 | $ | 13,504,663 | $ | 6,544,127 | $ | 256,953,823 | $ | 14,217,524 | $ | 24,039,152 | $ | 509,144,194 | |||||||||||||||||
| — | — | — | — | 510,150 | — | — | ||||||||||||||||||||||||
| 1,455,000 | 243,000 | 207,000 | 19,483,000 | 780,000 | 603,000 | 37,405,000 | ||||||||||||||||||||||||
| 8,902 | 355 | 155 | 143,785 | 746 | 107 | 382 | ||||||||||||||||||||||||
| 251,163 | 14,209 | 7,441 | 92,325 | 20,751 | 197 | 5 | ||||||||||||||||||||||||
| 6,451 |
| — | — | — | 23,455 | — | — | ||||||||||||||||||||||
| 610,592 |
| 48,732 | 18,213 | 753,918 | 91,164 | 48,634 | 373,293 | ||||||||||||||||||||||
| 253,908 | — | — | 5,296 | — | — | 634,324 | ||||||||||||||||||||||||
| 295,474 |
| — | — | 723,863 | 507,896 | — | — | ||||||||||||||||||||||
| — | 961 | 5,000 | 37,017 | — | 2,750 | 1,142,421 | ||||||||||||||||||||||||
| — | 5,867 | 22,717 | 92,015 | 4,361 | — | — | ||||||||||||||||||||||||
| — | — | 4,679 | 15,192 | 14,074 | 16,566 | 647,803 | ||||||||||||||||||||||||
| 528 |
| 143 | 61 | 1,383 | 270 | 227 | 6,349 | ||||||||||||||||||||||
| 1,486 |
| 413 | 519 | 3,131 | 1,123 | 680 | 17,405 | ||||||||||||||||||||||
| — |
| — | — | 1,203,133 | 34,408 | — | — | ||||||||||||||||||||||
| 27,105 | 19,557 | 38,694 | 71,684 | 20,302 | 26,640 | 56,216 | ||||||||||||||||||||||||
| 42,411,681 | 13,837,900 | 6,848,606 | 279,579,565 | 16,226,224 | 24,737,953 | 549,427,392 | ||||||||||||||||||||||||
| 500,000 | — | — | 4,990,616 | — | — | — | ||||||||||||||||||||||||
| — | — | 67,883 | 508,473 | — | 347 | 1,621,197 | ||||||||||||||||||||||||
| — | — | — | 19,026,606 | — | — | — | ||||||||||||||||||||||||
| — |
| — | — | 519,445 | — | — | — | ||||||||||||||||||||||
| 12,971 | — | — | — | — | 1,519 | 433,548 | ||||||||||||||||||||||||
| 61 | — | 21 | 1,045 | 9 | — | 54,368 | ||||||||||||||||||||||||
| 46 | 18 | 28 | 1,371 | 18 | 31 | 55,545 | ||||||||||||||||||||||||
| — |
| — | — | — | 7,053 | — | — | ||||||||||||||||||||||
| 2,014 |
| 556 | 580 | 4,514 | 1,393 | 907 | 23,754 | ||||||||||||||||||||||
| 58,585 | 98,096 | 60,193 | 133,170 | 49,504 | 45,048 | 326,208 | ||||||||||||||||||||||||
| 573,677 | 98,670 | 128,705 | 25,185,240 | 57,977 | 47,852 | 2,514,620 | ||||||||||||||||||||||||
| $ | 41,838,004 | $ | 13,739,230 | $ | 6,719,901 | $ | 254,394,325 | $ | 16,168,247 | $ | 24,690,101 | $ | 546,912,772 | |||||||||||||||||
| See accompanying Notes to Financial Statements | | March 31, 2017 | | Semiannual Report | 205 |
Table of Contents
Statements of Assets and Liabilities (cont’d)
March 31, 2017 (Unaudited)
| AllianzGI Best Styles Global Equity | AllianzGI Best Styles International Equity | AllianzGI Best Styles U.S. Equity | AllianzGI Convertible | AllianzGI Emerging Markets Consumer | ||||||||||||||||||||
| Net Assets Consist of: | ||||||||||||||||||||||||
| Paid-in-capital | $ | 635,715,770 | $ | 33,703,445 | $ | 107,019,138 | $ | 1,014,600,721 | $ | 35,486,887 | ||||||||||||||
| Undistributed (dividends in excess of) net investment income | 4,566,291 | (22,579 | ) | 585,303 | (1,682,321 | ) | 72,399 | |||||||||||||||||
| Accumulated net realized gain (loss) | 10,759,425 | (3,104,919 | ) | 1,580,539 | (3,101,984 | ) | (1,940,598 | ) | ||||||||||||||||
| Net unrealized appreciation | 77,090,225 | 1,922,928 | 11,251,195 | 151,879,878 | 6,219,973 | |||||||||||||||||||
| Net Assets | $ | 728,131,711 | $ | 32,498,875 | $ | 120,436,175 | $ | 1,161,696,294 | $ | 39,838,661 | ||||||||||||||
| Cost of Investments | $ | 638,801,892 | $ | 29,554,412 | $ | 108,965,095 | $ | 966,169,037 | $ | 32,803,606 | ||||||||||||||
| Cost of Investments in Affiliates | $ | — | $ | — | $ | — | $ | — | $ | — | ||||||||||||||
| Cost of Repurchase Agreements | $ | 6,511,000 | $ | 412,000 | $ | 161,000 | $ | 50,654,000 | $ | 675,000 | ||||||||||||||
| Cost of Foreign Currency | $ | 2,027,478 | $ | 187,980 | $ | 640 | $ | — | $ | 42,044 | ||||||||||||||
| Net Assets: | ||||||||||||||||||||||||
| Class A | $ | 1,201,885 | $ | 13,144 | $ | 506,390 | $ | 82,872,852 | $ | 65,113 | ||||||||||||||
| Class C | 21,223 | 16,598 | 21,377 | 55,023,401 | — | |||||||||||||||||||
| Class R | — | — | — | 963,469 | — | |||||||||||||||||||
| Class P | 3,250,486 | 10,445 | 60,262 | 78,322,097 | — | |||||||||||||||||||
| Institutional Class | 2,167,862 | 38,802 | 119,008 | 943,185,980 | 39,773,548 | |||||||||||||||||||
| Class R6 | 721,490,255 | 32,419,886 | 119,729,138 | — | — | |||||||||||||||||||
| Administrative Class | — | — | — | 1,328,495 | — | |||||||||||||||||||
| Shares Issued and Outstanding: | ||||||||||||||||||||||||
| Class A | 70,704 | 942 | 30,020 | 2,567,004 | 4,603 | |||||||||||||||||||
| Class C | 1,266 | 1,196 | 1,275 | 1,699,531 | — | |||||||||||||||||||
| Class R | — | — | — | 29,975 | — | |||||||||||||||||||
| Class P | 191,575 | 749 | 3,570 | 2,447,323 | — | |||||||||||||||||||
| Institutional Class | 128,781 | 2,778 | 7,038 | 29,549,578 | 2,797,864 | |||||||||||||||||||
| Class R6 | 42,610,222 | 2,323,976 | 7,055,175 | — | — | |||||||||||||||||||
| Administrative Class | — | — | — | 41,355 | — | |||||||||||||||||||
| Net Asset Value and Redemption Price Per Share:* | ||||||||||||||||||||||||
| Class A | $ | 17.00 | $ | 13.95 | $ | 16.87 | $ | 32.28 | $ | 14.15 | ||||||||||||||
| Class C | 16.77 | 13.87 | 16.77 | 32.38 | — | |||||||||||||||||||
| Class R | — | — | — | 32.14 | — | |||||||||||||||||||
| Class P | 16.97 | 13.95 | 16.88 | 32.00 | — | |||||||||||||||||||
| Institutional Class | 16.83 | 13.97 | 16.91 | 31.92 | 14.22 | |||||||||||||||||||
| Class R6 | 16.93 | 13.95 | 16.97 | — | — | |||||||||||||||||||
| Administrative Class | — | — | — | 32.12 | — | |||||||||||||||||||
| * | Net asset value and redemption price per share may not recalculate exactly due to rounding. |
| 206 | Semiannual Report | | March 31, 2017 | | See accompanying Notes to Financial Statements |
Table of Contents
| AllianzGI Emerging Markets Debt | AllianzGI Emerging Markets Small-Cap | AllianzGI Europe Equity Dividend | AllianzGI Global Dynamic Allocation | AllianzGI Global Fundamental Strategy | AllianzGI Global Sustainability | AllianzGI Global Water | ||||||||||||||||||||||||
| $ | 41,810,232 | $ | 12,934,054 | $ | 6,743,916 | $ | 243,620,294 | $ | 16,144,367 | $ | 21,927,277 | $ | 478,653,390 | |||||||||||||||||
| (290,022 | ) | (202,619 | ) | 69,351 | 462,155 | (608,031 | ) | 105,153 | (961,499 | ) | |||||||||||||||||||
| (860,810 | ) | (1,018,934 | ) | (277,786 | ) | 1,615,139 | 370,001 | 155,916 | 3,901,019 | |||||||||||||||||||||
| 1,178,604 | 2,026,729 | 184,420 | 8,696,737 | 261,910 | 2,501,755 | 65,319,862 | ||||||||||||||||||||||||
| $ | 41,838,004 | $ | 13,739,230 | $ | 6,719,901 | $ | 254,394,325 | $ | 16,168,247 | $ | 24,690,101 | $ | 546,912,772 | |||||||||||||||||
| $ | 38,323,700 | $ | 11,463,771 | $ | 6,359,498 | $ | 248,963,848 | $ | 14,017,234 | $ | 21,536,751 | $ | 443,773,741 | |||||||||||||||||
| $ | — | $ | — | $ | — | $ | — | $ | 498,354 | $ | — | $ | — | |||||||||||||||||
| $ | 1,455,000 | $ | 243,000 | $ | 207,000 | $ | 19,483,000 | $ | 780,000 | $ | 603,000 | $ | 37,405,000 | |||||||||||||||||
| $ | 256,288 | $ | 13,968 | $ | 7,407 | $ | 88,266 | $ | 20,835 | $ | 197 | $ | 6 | |||||||||||||||||
| $ | 122,369 | $ | 86,288 | $ | 154,104 | $ | 4,175,535 | $ | 72,055 | $ | 150,053 | $ | 174,586,388 | |||||||||||||||||
| 93,190 | — | 33,970 | 1,003,817 | 14,067 | — | 86,182,708 | ||||||||||||||||||||||||
| — | — | — | 190,839 | — | — | — | ||||||||||||||||||||||||
| 11,029 | — | 10,215 | 10,975,400 | 11,402 | 17,851 | 190,680,590 | ||||||||||||||||||||||||
| 41,611,416 | 13,652,942 | 6,521,612 | 34,408,687 | 16,070,723 | 24,522,197 | 95,463,086 | ||||||||||||||||||||||||
| — | — | — | 203,619,224 | — | — | — | ||||||||||||||||||||||||
| — | — | — | 20,823 | — | — | — | ||||||||||||||||||||||||
| 8,345 | 5,164 | 10,598 | 219,470 | 4,833 | 9,191 | 12,433,132 | ||||||||||||||||||||||||
| 6,325 | — | 2,350 | 53,795 | 943 | — | 6,390,320 | ||||||||||||||||||||||||
| — | — | — | 10,096 | — | — | — | ||||||||||||||||||||||||
| 754 | — | 698 | 578,423 | 760 | 1,084 | 13,525,409 | ||||||||||||||||||||||||
| 2,847,774 | 833,087 | 446,748 | 1,802,867 | 1,066,718 | 1,489,964 | 6,883,852 | ||||||||||||||||||||||||
| — | — | — | 10,696,862 | — | — | — | ||||||||||||||||||||||||
| — | — | — | 1,093 | — | — | — | ||||||||||||||||||||||||
| $ | 14.66 | $ | 16.71 | $ | 14.54 | $ | 19.03 | $ | 14.91 | $ | 16.33 | $ | 14.04 | |||||||||||||||||
| 14.73 | — | 14.45 | 18.66 | 14.92 | — | 13.49 | ||||||||||||||||||||||||
| — | — | — | 18.90 | — | — | — | ||||||||||||||||||||||||
| 14.63 | — | 14.62 | 18.97 | 15.01 | 16.47 | 14.10 | ||||||||||||||||||||||||
| 14.61 | 16.39 | 14.60 | 19.09 | 15.07 | 16.46 | 13.87 | ||||||||||||||||||||||||
| — | — | — | 19.04 | — | — | — | ||||||||||||||||||||||||
| — | — | — | 19.05 | — | — | — | ||||||||||||||||||||||||
| See accompanying Notes to Financial Statements | | March 31, 2017 | | Semiannual Report | 207 |
Table of Contents
Statements of Assets and Liabilities (cont’d)
March 31, 2017 (Unaudited)
| AllianzGI High Yield Bond | AllianzGI International Growth | AllianzGI International Small-Cap | AllianzGI Micro Cap | AllianzGI | ||||||||||||||||||||
| Assets: | ||||||||||||||||||||||||
| Investments, at value | $ | 326,791,045 | $ | 28,413,392 | $ | 88,513,881 | $ | 35,272,256 | $ | 857,571 | ||||||||||||||
| Investments in Affiliates, at value | — | — | — | — | 2,625,501 | |||||||||||||||||||
| Repurchase agreements, at value | 9,774,000 | 294,000 | 4,218,000 | 1,216,000 | 849,000 | |||||||||||||||||||
| Cash | 160 | 2,651 | 597 | 27 | 545 | |||||||||||||||||||
| Foreign currency, at value | — | 3,884 | 106,863 | — | 10,107 | |||||||||||||||||||
| Dividends and interest receivable (net of foreign withholding taxes) | 6,029,230 | 57,774 | 252,059 | 5,040 | 2,068 | |||||||||||||||||||
| Receivable for investments sold | 306,489 | — | 53,983 | 25,754 | — | |||||||||||||||||||
| Deposits with brokers for derivatives collateral | — | — | — | — | 48,629 | |||||||||||||||||||
| Receivable for Fund shares sold | 180,254 | — | 52,339 | 4,894 | — | |||||||||||||||||||
| Receivable from Investment Manager | — | — | — | — | 16,004 | |||||||||||||||||||
| Tax reclaims receivable | — | 9,239 | 84,865 | — | 15 | |||||||||||||||||||
| Uninvested Cash — Trustees Deferred Compensation Plan (see Note 5) | 5,129 | 153 | 1,484 | 571 | 60 | |||||||||||||||||||
| Investments in Affiliated Funds — Trustees Deferred Compensation Plan (see Note 5) | 14,576 | 1,097 | 4,259 | 7,456 | 263 | |||||||||||||||||||
| Receivable for variation margin on futures contracts | — | — | — | — | 11,743 | |||||||||||||||||||
| Prepaid expenses and other assets | 70,584 | 22,731 | 61,314 | 31,721 | 34,567 | |||||||||||||||||||
Total Assets | 343,171,467 | 28,804,921 | 93,349,644 | 36,563,719 | 4,456,073 | |||||||||||||||||||
| Liabilities: | ||||||||||||||||||||||||
| Payable for investments purchased | 2,015,481 | — | 480,153 | 74,905 | 143,482 | |||||||||||||||||||
| Payable for investments in Affiliates purchased | — | — | — | — | 124,891 | |||||||||||||||||||
| Payable for Fund shares redeemed | 557,079 | — | 636,724 | 64,441 | 6,600 | |||||||||||||||||||
| Payable for variation margin on futures contracts | — | — | — | — | 3,091 | |||||||||||||||||||
| Options written, at value | — | — | — | — | — | |||||||||||||||||||
| Investment management fees payable | 137,270 | 2,332 | 52,850 | 26,914 | — | |||||||||||||||||||
| Distribution fees payable | 8,438 | — | 1,501 | — | 43 | |||||||||||||||||||
| Servicing fees payable | 14,987 | 11 | 1,771 | 595 | 156 | |||||||||||||||||||
| Unrealized depreciation of forward foreign currency contracts | — | — | 764 | — | — | |||||||||||||||||||
| Trustees Deferred Compensation Plan payable (see Note 5) | 19,705 | 1,250 | 5,743 | 8,027 | 323 | |||||||||||||||||||
| Accrued expenses and other liabilities | 97,415 | 37,309 | 155,552 | 58,228 | 44,078 | |||||||||||||||||||
Total Liabilities | 2,850,375 | 40,902 | 1,335,058 | 233,110 | 322,664 | |||||||||||||||||||
| Net Assets | $ | 340,321,092 | $ | 28,764,019 | $ | 92,014,586 | $ | 36,330,609 | $ | 4,133,409 | ||||||||||||||
| 208 | Semiannual Report | | March 31, 2017 | | See accompanying Notes to Financial Statements |
Table of Contents
| AllianzGI NFJ Emerging Markets Value | AllianzGI NFJ Global Dividend Value | AllianzGI NFJ International Small-Cap Value | AllianzGI NFJ International Value II | AllianzGI Short Duration High Income | AllianzGI Structured Return | AllianzGI U.S. Equity Hedged | ||||||||||||||||||||||||
| $ | 22,972,903 | $ | 18,686,249 | $ | 4,558,677 | $ | 971,170 | $ | 1,561,241,127 | $ | 344,346,533 | $ | 3,806,723 | |||||||||||||||||
| — | — | — | — | — | — | — | ||||||||||||||||||||||||
| 712,000 | 231,000 | — | — | 108,067,000 | 58,560,000 | 382,000 | ||||||||||||||||||||||||
| 886 | 565 | 20,471 | 67,504 | 30,213 | 280 | 647 | ||||||||||||||||||||||||
| 317,688 | 6,576 | 66,887 | 474 | — | — | — | ||||||||||||||||||||||||
| 72,965 |
| 48,041 | 11,786 | 4,610 | 22,824,120 | 1,283,279 | 19,630 | ||||||||||||||||||||||
| 346,949 | — | — | — | 13,173,027 | 22,445,166 | 707,190 | ||||||||||||||||||||||||
| — | — | — | — | — | 3,232,810 | 637 | ||||||||||||||||||||||||
| 938,753 | 750 | — | — | 6,918,641 | 1,824,246 | — | ||||||||||||||||||||||||
| 17,380 | 5,355 | 21,555 | 20,132 | — | — | 13,786 | ||||||||||||||||||||||||
| — | 9,797 | 8,686 | 32,150 | — | — | — | ||||||||||||||||||||||||
| 172 |
| 338 | 161 | 512 | 16,818 | 2,844 | 135 | ||||||||||||||||||||||
| 520 |
| 2,120 | 633 | 1,588 | 44,052 | 7,410 | 873 | ||||||||||||||||||||||
| — |
| — | — | — | — | — | — | ||||||||||||||||||||||
| 34,958 | 19,146 | 24,403 | 33,563 | 79,951 | 58,557 | 34,230 | ||||||||||||||||||||||||
| 25,415,174 | 19,009,937 | 4,713,259 | 1,131,703 | 1,712,394,949 | 431,761,125 | 4,965,851 | ||||||||||||||||||||||||
| 393,298 | — | — | — | 13,648,576 | 36,330,483 | 109 | ||||||||||||||||||||||||
| — | — | — | — | — | — | — | ||||||||||||||||||||||||
| 37,116 | 9,359 | 11,368 | — | 2,746,526 | 958,924 | — | ||||||||||||||||||||||||
| — | — | — | — | — | — | — | ||||||||||||||||||||||||
| — | — | — | — | — | 11,834,250 | 2,540 | ||||||||||||||||||||||||
| — | — | — | — | 658,445 | 148,148 | — | ||||||||||||||||||||||||
| 158 | 2,942 | 462 | 83 | 31,092 | 9,343 | 168 | ||||||||||||||||||||||||
| 774 | 1,773 | 437 | 74 | 74,095 | 25,539 | 185 | ||||||||||||||||||||||||
| 470 |
| — | — | — | — | — | — | ||||||||||||||||||||||
| 692 |
| 2,458 | 794 | 2,100 | 60,870 | 10,254 | 1,008 | ||||||||||||||||||||||
| 120,290 | 59,358 | 28,251 | 56,044 | 325,754 | 40,299 | 41,357 | ||||||||||||||||||||||||
| 552,798 | 75,890 | 41,312 | 58,301 | 17,545,358 | 49,357,240 | 45,367 | ||||||||||||||||||||||||
| $ | 24,862,376 | $ | 18,934,047 | $ | 4,671,947 | $ | 1,073,402 | $ | 1,694,849,591 | $ | 382,403,885 | $ | 4,920,484 | |||||||||||||||||
| See accompanying Notes to Financial Statements | | March 31, 2017 | | Semiannual Report | 209 |
Table of Contents
Statements of Assets and Liabilities (cont’d)
March 31, 2017 (Unaudited)
| AllianzGI High Yield Bond | AllianzGI International Growth | AllianzGI International Small-Cap | AllianzGI Micro Cap | AllianzGI | ||||||||||||||||||||
| Net Assets Consist of: | ||||||||||||||||||||||||
| Paid-in-capital | $ | 367,777,409 | $ | 27,915,004 | $ | 79,724,192 | $ | 29,872,113 | $ | 4,849,424 | ||||||||||||||
| Undistributed (dividends in excess of) net investment income | (1,741,751 | ) | (592 | ) | (541,800 | ) | (514,453 | ) | 6,930 | |||||||||||||||
| Accumulated net realized gain (loss) | (32,016,320 | ) | (219,312 | ) | (1,274,433 | ) | (1,687,330 | ) | (710,180 | ) | ||||||||||||||
| Net unrealized appreciation (depreciation) | 6,301,754 | 1,068,919 | 14,106,627 | 8,660,279 | (12,765 | ) | ||||||||||||||||||
| Net Assets | $ | 340,321,092 | $ | 28,764,019 | $ | 92,014,586 | $ | 36,330,609 | $ | 4,133,409 | ||||||||||||||
| Cost of Investments | $ | 320,489,291 | $ | 27,345,111 | $ | 74,399,636 | $ | 26,611,977 | $ | 797,024 | ||||||||||||||
| Cost of Investments in Affiliates | $ | — | $ | — | $ | — | $ | — | $ | 2,703,936 | ||||||||||||||
| Cost of Repurchase Agreements | $ | 9,774,000 | $ | 294,000 | $ | 4,218,000 | $ | 1,216,000 | $ | 849,000 | ||||||||||||||
| Cost of Foreign Currency | $ | — | $ | 3,825 | $ | 105,550 | $ | — | $ | 10,210 | ||||||||||||||
| Premiums Received for Options Written | $ | — | $ | — | $ | — | $ | — | $ | — | ||||||||||||||
| Net Assets: | ||||||||||||||||||||||||
| Class A | $ | 56,000,782 | $ | 51,804 | $ | 5,318,547 | $ | 2,787,404 | $ | 673,077 | ||||||||||||||
| Class C | 12,364,333 | — | 2,278,130 | — | 61,067 | |||||||||||||||||||
| Class R | 1,234,334 | — | 117,970 | — | — | |||||||||||||||||||
| Class P | 52,868,915 | — | 44,450,919 | 1,809,217 | 9,460 | |||||||||||||||||||
| Institutional Class | 216,303,862 | 28,712,215 | 25,576,555 | 31,733,988 | 3,389,805 | |||||||||||||||||||
| Class R6 | — | — | 14,272,465 | — | — | |||||||||||||||||||
| Administrative Class | 1,548,866 | — | — | — | — | |||||||||||||||||||
| Shares Issued and Outstanding: | ||||||||||||||||||||||||
| Class A | 6,057,409 | 3,137 | 154,279 | 196,057 | 51,285 | |||||||||||||||||||
| Class C | 1,339,478 | — | 67,754 | — | 4,643 | |||||||||||||||||||
| Class R | 138,894 | — | 3,478 | — | — | |||||||||||||||||||
| Class P | 5,940,069 | — | 1,286,073 | 126,575 | 713 | |||||||||||||||||||
| Institutional Class | 24,229,316 | 1,726,034 | 713,849 | 2,208,785 | 254,808 | |||||||||||||||||||
| Class R6 | — | — | 397,977 | — | — | |||||||||||||||||||
| Administrative Class | 176,178 | — | — | — | — | |||||||||||||||||||
| Net Asset Value and Redemption Price Per Share:* | ||||||||||||||||||||||||
| Class A | $ | 9.25 | $ | 16.52 | $ | 34.47 | $ | 14.22 | $ | 13.12 | ||||||||||||||
| Class C | 9.23 | — | 33.62 | — | 13.15 | |||||||||||||||||||
| Class R | 8.89 | — | 33.92 | — | — | |||||||||||||||||||
| Class P | 8.90 | — | 34.56 | 14.29 | 13.27 | |||||||||||||||||||
| Institutional Class | 8.93 | 16.63 | 35.83 | 14.37 | 13.30 | |||||||||||||||||||
| Class R6 | — | — | 35.86 | — | — | |||||||||||||||||||
| Administrative Class | 8.79 | — | — | — | — | |||||||||||||||||||
| * | Net asset value and redemption price per share may not recalculate exactly due to rounding. |
| 210 | Semiannual Report | | March 31, 2017 | | See accompanying Notes to Financial Statements |
Table of Contents
| AllianzGI NFJ Emerging Markets Value | AllianzGI NFJ Global Dividend Value | AllianzGI NFJ International Small-Cap Value | AllianzGI NFJ International Value II | AllianzGI Short Duration High Income | AllianzGI Structured Return | AllianzGI U.S. Equity Hedged | ||||||||||||||||||||||||
| $ | 24,210,123 | $ | 19,747,796 | $ | 5,187,072 | $ | 8,224,826 | $ | 1,742,953,736 | $ | 376,224,547 | $ | 5,322,176 | |||||||||||||||||
| (37,416 | ) | 35,874 | (18,154 | ) | (93,269 | ) | (16,065,535 | ) | 491,123 | 19,816 | |||||||||||||||||||
| (1,366,462 | ) | (2,137,859 | ) | (784,933 | ) | (7,061,303 | ) | (33,084,626 | ) | 4,041,207 | (798,356 | ) | ||||||||||||||||||
| 2,056,131 | 1,288,236 | 287,962 | 3,148 | 1,046,016 | 1,647,008 | 376,848 | ||||||||||||||||||||||||
| $ | 24,862,376 | $ | 18,934,047 | $ | 4,671,947 | $ | 1,073,402 | $ | 1,694,849,591 | $ | 382,403,885 | $ | 4,920,484 | |||||||||||||||||
| $ | 20,883,326 | $ | 17,398,702 | $ | 4,270,032 | $ | 965,861 | $ | 1,560,195,111 | $ | 344,813,550 | $ | 3,456,881 | |||||||||||||||||
| $ | — | $ | — | $ | — | $ | — | $ | — | $ | — | $ | — | |||||||||||||||||
| $ | 712,000 | $ | 231,000 | $ | — | $ | — | $ | 108,067,000 | $ | 58,560,000 | $ | 382,000 | |||||||||||||||||
| $ | 316,756 | $ | 6,545 | $ | 66,372 | $ | 472 | $ | — | $ | — | $ | — | |||||||||||||||||
| $ | — | $ | — | $ | — | $ | — | $ | — | $ | 13,948,275 | $ | 29,546 | |||||||||||||||||
| $ | 4,812,969 | $ | 3,598,685 | $ | 1,253,323 | $ | 215,343 | $ | 196,277,478 | $ | 102,742,536 | $ | 603,105 | |||||||||||||||||
| 335,009 | 4,529,686 | 728,534 | 132,556 | 146,287,683 | 14,765,401 | 265,760 | ||||||||||||||||||||||||
| — | — | — | — | — | — | — | ||||||||||||||||||||||||
| 14,103,024 | 1,868,773 | 103,388 | 163,408 | 868,683,354 | 90,582,000 | 18,274 | ||||||||||||||||||||||||
| 5,611,374 | 8,936,903 | 1,309,687 | 562,095 | 402,499,426 | 135,839,483 | 4,033,345 | ||||||||||||||||||||||||
| — | — | 1,277,015 | — | 81,101,650 | 38,474,465 | — | ||||||||||||||||||||||||
| — | — | — | — | — | — | — | ||||||||||||||||||||||||
| 315,260 | 217,842 | 70,677 | 13,171 | 12,932,815 | 6,498,841 | 35,537 | ||||||||||||||||||||||||
| 21,840 | 282,938 | 43,017 | 8,146 | 9,655,163 | 962,011 | 16,269 | ||||||||||||||||||||||||
| — | — | — | — | — | — | — | ||||||||||||||||||||||||
| 930,446 | 113,993 | 6,029 | 9,895 | 57,418,334 | 5,735,982 | 1,089 | ||||||||||||||||||||||||
| 361,523 | 549,408 | 73,602 | 34,244 | 26,587,126 | 8,521,173 | 236,317 | ||||||||||||||||||||||||
| — | — | 75,051 | — | 5,357,514 | 2,429,254 | — | ||||||||||||||||||||||||
| — | — | — | — | — | — | — | ||||||||||||||||||||||||
| $ | 15.27 | $ | 16.52 | $ | 17.73 | $ | 16.35 | $ | 15.18 | $ | 15.81 | $ | 16.97 | |||||||||||||||||
| 15.34 | 16.01 | 16.94 | 16.27 | 15.15 | 15.35 | 16.34 | ||||||||||||||||||||||||
| — | — | — | — | — | — | — | ||||||||||||||||||||||||
| 15.16 | 16.39 | 17.15 | 16.51 | 15.13 | 15.79 | 16.79 | ||||||||||||||||||||||||
| 15.52 | 16.27 | 17.79 | 16.41 | 15.14 | 15.94 | 17.07 | ||||||||||||||||||||||||
| — | — | 17.02 | — | 15.14 | 15.84 | — | ||||||||||||||||||||||||
| — | — | — | — | — | — | — | ||||||||||||||||||||||||
| See accompanying Notes to Financial Statements | | March 31, 2017 | | Semiannual Report | 211 |
Table of Contents
Statements of Assets and Liabilities (cont’d)
March 31, 2017 (Unaudited)
| AllianzGI U.S. Small-Cap Growth | AllianzGI Ultra Micro Cap | |||||||
| Assets: | ||||||||
| Investments, at value | $ | 16,401,699 | $ | 41,294,989 | ||||
| Repurchase agreements, at value | 581,000 | 811,000 | ||||||
| Cash | 585 | 699 | ||||||
| Dividends and interest receivable (net of foreign withholding taxes) | 4,569 | 5,904 | ||||||
| Receivable for investments sold | — | 63,172 | ||||||
| Receivable for Fund shares sold | 587 | 280 | ||||||
| Receivable from Investment Manager | 8,439 | — | ||||||
| Uninvested Cash — Trustees Deferred Compensation Plan (see Note 5) | 392 | 962 | ||||||
| Investments in Affiliated Funds — Trustees Deferred Compensation Plan (see Note 5) | 616 | 7,117 | ||||||
| Prepaid expenses and other assets | 45,432 | 33,372 | ||||||
Total Assets | 17,043,319 | 42,217,495 | ||||||
| Liabilities: | ||||||||
| Payable for investments purchased | — | 179,984 | ||||||
| Payable for Fund shares redeemed | — | 52,331 | ||||||
| Investment management fees payable | — | 53,369 | ||||||
| Distribution fees payable | 313 | — | ||||||
| Servicing fees payable | 256 | 3,089 | ||||||
| Trustees Deferred Compensation Plan payable (see Note 5) | 1,008 | 8,079 | ||||||
| Accrued expenses and other liabilities | 56,480 | 75,064 | ||||||
Total Liabilities | 58,057 | 371,916 | ||||||
| Net Assets | $ | 16,985,262 | $ | 41,845,579 | ||||
| Net Assets Consist of: | ||||||||
| Paid-in-capital | $ | 14,666,748 | $ | 26,109,466 | ||||
| Dividends in excess of net investment income | (227,903 | ) | (1,088,955 | ) | ||||
| Accumulated net realized gain (loss) | (412,327 | ) | 3,416,169 | |||||
| Net unrealized appreciation | 2,958,744 | 13,408,899 | ||||||
| Net Assets | $ | 16,985,262 | $ | 41,845,579 | ||||
| Cost of Investments | $ | 13,442,955 | $ | 27,886,090 | ||||
| Cost of Repurchase Agreements | $ | 581,000 | $ | 811,000 | ||||
| 212 | Semiannual Report | | March 31, 2017 | | See accompanying Notes to Financial Statements |
Table of Contents
| AllianzGI U.S. Small-Cap Growth | AllianzGI Ultra Micro Cap | |||||||
| Net Assets: | ||||||||
| Class A | $ | 610,142 | $ | 14,163,132 | ||||
| Class C | 447,964 | — | ||||||
| Class R | 128,535 | — | ||||||
| Class P | 666,060 | 6,859,098 | ||||||
| Institutional Class | 15,132,561 | 20,823,349 | ||||||
| Shares Issued and Outstanding: | ||||||||
| Class A | 51,337 | 662,854 | ||||||
| Class C | 40,511 | — | ||||||
| Class R | 11,047 | — | ||||||
| Class P | 54,959 | 316,829 | ||||||
| Institutional Class | 1,237,819 | 959,762 | ||||||
| Net Asset Value and Redemption Price Per Share:* | ||||||||
| Class A | $ | 11.89 | $ | 21.37 | ||||
| Class C | 11.06 | — | ||||||
| Class R | 11.64 | — | ||||||
| Class P | 12.12 | 21.65 | ||||||
| Institutional Class | 12.23 | 21.70 | ||||||
| * | Net asset value and redemption price per share may not recalculate exactly due to rounding. |
| See accompanying Notes to Financial Statements | | March 31, 2017 | | Semiannual Report | 213 |
Table of Contents
Six Months ended March 31, 2017 (Unaudited)
| AllianzGI Retirement 2020 | AllianzGI Retirement 2025 | AllianzGI Retirement 2030 | AllianzGI Retirement 2035 | AllianzGI | ||||||||||||||||||||
| Investment Income: | ||||||||||||||||||||||||
| Dividends from investments in Affiliates | $ | 529,334 | $ | 439,093 | $ | 456,599 | $ | 527,887 | $ | 546,635 | ||||||||||||||
| Dividends, net of foreign withholding taxes* | 26,984 | 1,159 | — | — | — | |||||||||||||||||||
| Contribution from Investment Manager (see Note 6) | 2,023 | 4,177 | 4,445 | — | — | |||||||||||||||||||
| Interest | 468 | 402 | 429 | 313 | 311 | |||||||||||||||||||
Total Investment Income | 558,809 | 444,831 | 461,473 | 528,200 | 546,946 | |||||||||||||||||||
| Expenses: | ||||||||||||||||||||||||
| Investment management | 13,188 | 14,290 | 15,913 | 12,915 | 11,177 | |||||||||||||||||||
| Administration | 43,024 | 41,596 | 46,513 | 41,504 | 29,562 | |||||||||||||||||||
| Distribution — Class C | 1,576 | — | 2,615 | — | 481 | |||||||||||||||||||
| Distribution — Class R | 459 | 888 | 2,402 | 1,762 | 1,773 | |||||||||||||||||||
| Servicing — Class A | 16,051 | 8,608 | 9,522 | 11,244 | 5,375 | |||||||||||||||||||
| Servicing — Class C | 525 | — | 872 | — | 160 | |||||||||||||||||||
| Servicing — Class R | 459 | 888 | 2,402 | 1,762 | 1,773 | |||||||||||||||||||
| Distribution and/or servicing — Administrative Class | 663 | 700 | 1,572 | 860 | 440 | |||||||||||||||||||
| Sub-transfer agent — Class A | — | — | — | — | — | |||||||||||||||||||
| Sub-transfer agent — Class C | — | — | — | — | — | |||||||||||||||||||
| Sub-transfer agent — Institutional Class | — | — | — | — | — | |||||||||||||||||||
| Legal | 433 | 472 | 505 | 403 | 343 | |||||||||||||||||||
| Trustees | — | — | — | — | — | |||||||||||||||||||
| Custodian and accounting agent | — | — | — | — | — | |||||||||||||||||||
| Shareholder communications | — | — | — | — | — | |||||||||||||||||||
| Transfer agent | — | — | — | — | — | |||||||||||||||||||
| Insurance | — | — | — | — | — | |||||||||||||||||||
| Audit and tax services | — | — | — | — | — | |||||||||||||||||||
| Registration | — | — | — | — | — | |||||||||||||||||||
| Recoupment | — | — | — | — | — | |||||||||||||||||||
| Line of credit commitment | 469 | 509 | 556 | 446 | 381 | |||||||||||||||||||
| Miscellaneous | 658 | 708 | 828 | 761 | 682 | |||||||||||||||||||
Total Expenses | 77,505 | 68,659 | 83,700 | 71,657 | 52,147 | |||||||||||||||||||
Less: Fee Waiver/Reimbursement from Investment Manager | (39,988 | ) | (46,174 | ) | (48,785 | ) | (26,325 | ) | (9,947 | ) | ||||||||||||||
Net Expenses | 37,517 | 22,485 | 34,915 | 45,332 | 42,200 | |||||||||||||||||||
| Net Investment Income | 521,292 | 422,346 | 426,558 | 482,868 | 504,746 | |||||||||||||||||||
| 214 | Semiannual Report | | March 31, 2017 | | See accompanying Notes to Financial Statements |
Table of Contents
| AllianzGI Retirement 2045 | AllianzGI Retirement 2050 | AllianzGI Retirement 2055 | AllianzGI Retirement Income | AllianzGI Global Allocation | AllianzGI Global Megatrends | AllianzGI Best Styles Emerging Markets Equity | ||||||||||||||||||||||||
| $ | 352,706 | $ | 347,043 | $ | 123,412 | $ | 978,922 | $ | 8,303,791 | $ | 17,011 | $ | — | |||||||||||||||||
| — | — | — | 393,646 | — | — | 36,193 | ||||||||||||||||||||||||
| — | — | — | 7,739 | — | 1,271 | — | ||||||||||||||||||||||||
| 180 | 183 | 80 | 212 | 15,753 | 17 | 69 | ||||||||||||||||||||||||
| 352,886 | 347,226 | 123,492 | 1,380,519 | 8,319,544 | 18,299 | 36,262 | ||||||||||||||||||||||||
| 6,664 | 6,461 | 2,390 | 12,822 | 1,571,796 | — | 11,512 | ||||||||||||||||||||||||
| 18,925 | 15,832 | 6,473 | 39,081 | — | — | — | ||||||||||||||||||||||||
| — | 578 | — | 12,187 | 157,921 | — | 50 | ||||||||||||||||||||||||
| 662 | 783 | 380 | 519 | 22 | — | — | ||||||||||||||||||||||||
| 4,753 | 2,649 | 1,524 | 12,579 | 60,902 | 54 | 16 | ||||||||||||||||||||||||
| — | 193 | — | 4,062 | 52,640 | — | 17 | ||||||||||||||||||||||||
| 662 | 783 | 380 | 519 | 22 | — | — | ||||||||||||||||||||||||
| 605 | 836 | 392 | 1,267 | 33 | — | — | ||||||||||||||||||||||||
| — | — | — | — | 17,331 | 7 | — | ||||||||||||||||||||||||
| — | — | — | — | 14,311 | — | — | ||||||||||||||||||||||||
| — | — | — | — | 34,039 | 4 | — | ||||||||||||||||||||||||
| 209 | 181 | 62 | 397 | 28,168 | 4,202 | 4,649 | ||||||||||||||||||||||||
| — | — | — | — | 24,199 | 162 | 469 | ||||||||||||||||||||||||
| — | — | — | — | 39,975 | 20,235 | 105,942 | ||||||||||||||||||||||||
| — | — | — | — | 22,462 | 4,778 | 5,400 | ||||||||||||||||||||||||
| — | — | — | — | 37,199 | 2,263 | 3,316 | ||||||||||||||||||||||||
| — | — | — | — | 8,588 | 2,457 | 2,625 | ||||||||||||||||||||||||
| — | — | — | — | 20,461 | 16,981 | 19,343 | ||||||||||||||||||||||||
| — | — | — | — | 50,459 | 21,341 | 36,087 | ||||||||||||||||||||||||
| — | — | 279 | — | — | — | — | ||||||||||||||||||||||||
| 230 | 207 | 72 | 439 | 3,939 | 27 | 79 | ||||||||||||||||||||||||
| 385 | 343 | 93 | 1,284 | 11,149 | 1,176 | 2,505 | ||||||||||||||||||||||||
| 33,095 | 28,846 | 12,045 | 85,156 | 2,155,616 | 73,687 | 192,010 | ||||||||||||||||||||||||
| (3,827 | ) | (1,661 | ) | (566 | ) | (46,499 | ) | (1,180,986 | ) | (73,623 | ) | (174,560 | ) | ||||||||||||||||
| 29,268 | 27,185 | 11,479 | 38,657 | 974,630 | 64 | 17,450 | ||||||||||||||||||||||||
| 323,618 | 320,041 | 112,013 | 1,341,862 | 7,344,914 | 18,235 | 18,812 | ||||||||||||||||||||||||
| See accompanying Notes to Financial Statements | | March 31, 2017 | | Semiannual Report | 215 |
Table of Contents
Statements of Operations (cont’d)
Six Months ended March 31, 2017 (Unaudited)
| AllianzGI Retirement 2020 | AllianzGI Retirement 2025 | AllianzGI Retirement 2030 | AllianzGI Retirement 2035 | AllianzGI | ||||||||||||||||||||
| Realized and Change in Unrealized Gain (Loss): | ||||||||||||||||||||||||
| Net realized gain (loss) on: | ||||||||||||||||||||||||
Investments | $ | 72,374 | $ | 95,711 | $ | 109,354 | $ | 78,708 | $ | 93,168 | ||||||||||||||
Investments in Affiliates | 1,146,018 | 1,689,516 | 1,937,436 | 1,346,141 | 951,185 | |||||||||||||||||||
Futures contracts | (23,714 | ) | 184,145 | 149,670 | 182,743 | 109,285 | ||||||||||||||||||
Foreign currency transactions | (216 | ) | (176 | ) | 98 | (178 | ) | (185 | ) | |||||||||||||||
| Net capital gain distributions received from underlying Affiliated funds | 92,145 | 55,759 | 31,351 | 95,812 | 120,791 | |||||||||||||||||||
| Net capital gain distributions received from underlying funds | — | — | — | — | — | |||||||||||||||||||
| Net change in unrealized appreciation/depreciation of: | ||||||||||||||||||||||||
Investments | (112,298 | ) | (114,111 | ) | (117,776 | ) | (85,864 | ) | (102,184 | ) | ||||||||||||||
Investments in Affiliates | (164,342 | ) | 194,340 | 1,052,224 | 1,458,641 | 1,759,410 | ||||||||||||||||||
Futures contracts | 1,264 | (33,155 | ) | (24,617 | ) | (15,352 | ) | (8,007 | ) | |||||||||||||||
Foreign currency transactions | (1,094 | ) | (274 | ) | 1,985 | 1,076 | 1,223 | |||||||||||||||||
| Net realized and change in unrealized gain (loss) | 1,010,137 | 2,071,755 | 3,139,725 | 3,061,727 | 2,924,686 | |||||||||||||||||||
| Net Increase in Net Assets Resulting from Investment Operations | $ | 1,531,429 | $ | 2,494,101 | $ | 3,566,283 | $ | 3,544,595 | $ | 3,429,432 | ||||||||||||||
| * Foreign withholding taxes | $ | — | $ | — | $ | — | $ | — | $ | — | ||||||||||||||
| 216 | Semiannual Report | | March 31, 2017 | | See accompanying Notes to Financial Statements |
Table of Contents
| AllianzGI Retirement 2045 | AllianzGI Retirement 2050 | AllianzGI Retirement 2055 | AllianzGI Retirement Income | AllianzGI Global Allocation | AllianzGI Global Megatrends | AllianzGI Best Styles Emerging Markets Equity | ||||||||||||||||||||||||
| $ | 47,162 | $ | 43,681 | $ | 16,909 | $ | 308,928 | $ | (449,378 | ) | $ | — | $ | 722,022 | ||||||||||||||||
| 637,394 | 469,223 | 257,098 | 884,247 | 1,095,287 | — | — | ||||||||||||||||||||||||
| 22,627 | 31,685 | 12,597 | (643,353 | ) | 107,839 | — | 3,147 | |||||||||||||||||||||||
| (41 | ) | (71 | ) | (13 | ) | (3,790 | ) | (48,808 | ) | — | (937 | ) | ||||||||||||||||||
| 84,242 |
| 84,125 | 29,893 | 29,364 | 2,582,734 | 33,945 | — | ||||||||||||||||||||||
| — |
| — | — | 24,178 | — | — | — | ||||||||||||||||||||||
| (52,570 | ) | (48,701 | ) | (18,586 | ) | (62,251 | ) | 5,126 | — | (330,577 | ) | |||||||||||||||||||
| 1,078,383 | 1,256,853 | 389,749 | (502,171 | ) | 6,981,843 | 60,376 | — | |||||||||||||||||||||||
| 3,215 | 2,362 | 3,101 | (56,235 | ) | (537,449 | ) | — | 13,510 | ||||||||||||||||||||||
| 1,420 | 458 | 625 | 1,073 | 7,819 | — | (4,353 | ) | |||||||||||||||||||||||
| 1,821,832 | 1,839,615 | 691,373 | (20,010 | ) | 9,745,013 | 94,321 | 402,812 | |||||||||||||||||||||||
| $ | 2,145,450 | $ | 2,159,656 | $ | 803,386 | $ | 1,321,852 | $ | 17,089,927 | $ | 112,556 | $ | 421,624 | |||||||||||||||||
| $ | — | $ | — | $ | — | $ | 817 | $ | — | $ | — | $ | 5,908 | |||||||||||||||||
| See accompanying Notes to Financial Statements | | March 31, 2017 | | Semiannual Report | 217 |
Table of Contents
Statements of Operations (cont’d)
Six Months ended March 31, 2017 (Unaudited)
| AllianzGI Best Styles Global Equity | AllianzGI Best Styles International Equity | AllianzGI Best Styles U.S. Equity | AllianzGI Convertible | AllianzGI Emerging Markets Consumer | ||||||||||||||||||||
| Investment Income: | ||||||||||||||||||||||||
| Interest, net of foreign withholding taxes* | $ | 3,500 | $ | 42 | $ | 771 | $ | 10,183,348 | $ | 94 | ||||||||||||||
| Dividends, net of foreign withholding taxes* | 7,376,579 | 337,824 | 1,133,813 | 5,487,563 | 365,549 | |||||||||||||||||||
| Dividends from investments in Affiliates | — | — | — | — | — | |||||||||||||||||||
| Miscellaneous | 17 | — | — | — | — | |||||||||||||||||||
Total Investment Income | 7,380,096 | 337,866 | 1,134,584 | 15,670,911 | 365,643 | |||||||||||||||||||
| Expenses: | ||||||||||||||||||||||||
| Investment management | 1,041,810 | 47,385 | 150,560 | 3,934,980 | 170,428 | |||||||||||||||||||
| Distribution — Class C | 46 | 58 | 46 | 223,229 | — | |||||||||||||||||||
| Distribution — Class R | — | — | — | 1,256 | — | |||||||||||||||||||
| Administrative servicing — Class P | 1,435 | — | 29 | 41,666 | — | |||||||||||||||||||
| Servicing — Class A | 5,972 | 15 | 417 | 257,191 | 66 | |||||||||||||||||||
| Servicing — Class C | 15 | 19 | 15 | 74,410 | — | |||||||||||||||||||
| Servicing — Class R | — | — | — | 1,256 | — | |||||||||||||||||||
| Distribution and/or servicing — Administrative Class | — | — | — | 1,701 | — | |||||||||||||||||||
| Sub-transfer agent — Class A | 6,593 | — | 5 | 140,822 | 6,384 | |||||||||||||||||||
| Sub-transfer agent — Class C | — | — | — | 24,304 | — | |||||||||||||||||||
| Sub-transfer agent — Class R | — | — | — | 1,626 | — | |||||||||||||||||||
| Sub-transfer agent — Institutional Class | 639 | — | 582 | 164,523 | 258 | |||||||||||||||||||
| Sub-transfer agent — Administrative Class | — | — | — | 50 | — | |||||||||||||||||||
| Legal | 23,728 | 7,494 | 9,943 | 66,031 | 6,315 | |||||||||||||||||||
| Trustees | 32,726 | 2,777 | 5,136 | 82,999 | 2,061 | |||||||||||||||||||
| Audit and tax services | 17,917 | 17,995 | 19,364 | 37,288 | 21,418 | |||||||||||||||||||
| Registration | 44,694 | 36,510 | 36,139 | 61,735 | 14,803 | |||||||||||||||||||
| Custodian and accounting agent | 199,325 | 110,096 | 49,189 | 100,928 | 90,769 | |||||||||||||||||||
| Shareholder communications | 20,159 | 6,986 | 7,736 | 109,012 | 5,961 | |||||||||||||||||||
| Transfer agent | 14,717 | 4,295 | 5,191 | 42,153 | 3,093 | |||||||||||||||||||
| Excise tax | — | — | — | — | — | |||||||||||||||||||
| Recoupment | 1,158 | — | — | — | — | |||||||||||||||||||
| Insurance | 9,649 | 3,565 | 3,758 | 22,149 | 3,041 | |||||||||||||||||||
| Line of credit commitment | 5,429 | 447 | 836 | 12,506 | 344 | |||||||||||||||||||
| Miscellaneous | 11,465 | 3,341 | 3,781 | 29,734 | 2,140 | |||||||||||||||||||
Total Expenses | 1,437,477 | 240,983 | 292,727 | 5,431,549 | 327,081 | |||||||||||||||||||
Less: Fee Waiver/Reimbursement from Investment Manager | (29,862 | ) | (168,976 | ) | (90,482 | ) | — | (99,407 | ) | |||||||||||||||
Net Expenses | 1,407,615 | 72,007 | 202,245 | 5,431,549 | 227,674 | |||||||||||||||||||
| Net Investment Income (Loss) | 5,972,481 | 265,859 | 932,339 | 10,239,362 | 137,969 | |||||||||||||||||||
| 218 | Semiannual Report | | March 31, 2017 | | See accompanying Notes to Financial Statements |
Table of Contents
| AllianzGI Emerging Markets Debt | AllianzGI Emerging Markets Small-Cap | AllianzGI Europe Equity Dividend | AllianzGI Global Dynamic Allocation | AllianzGI Global Fundamental Strategy | AllianzGI Global Sustainability | AllianzGI Global Water | ||||||||||||||||||||||||
| $ | 1,331,161 | $ | 31 | $ | 35 | $ | 628,076 | $ | 128,192 | $ | 122 | $ | 5,637 | |||||||||||||||||
| — | 65,737 | 132,548 | 1,453,324 | 76,710 | 219,503 | 3,030,388 | ||||||||||||||||||||||||
| — | — | — | 7,975 | 18,335 | — | — | ||||||||||||||||||||||||
| — | — | — | — | — | — | — | ||||||||||||||||||||||||
| 1,331,161 | 65,768 | 132,583 | 2,089,375 | 223,237 | 219,625 | 3,036,025 | ||||||||||||||||||||||||
| 156,472 | 74,812 | 25,173 | 826,986 | 58,947 | 91,433 | 2,439,520 | ||||||||||||||||||||||||
| 358 | — | 84 | 3,721 | 51 | — | 318,881 | ||||||||||||||||||||||||
| — | — | — | 209 | — | — | — | ||||||||||||||||||||||||
| — | — | — | 2,118 | — | — | 72,208 | ||||||||||||||||||||||||
| 167 | 115 | 82 | 6,138 | 131 | 156 | 257,828 | ||||||||||||||||||||||||
| 119 | — | 28 | 1,240 | 17 | — | 106,294 | ||||||||||||||||||||||||
| — | — | — | 209 | — | — | — | ||||||||||||||||||||||||
| — | — | — | 25 | — | — | — | ||||||||||||||||||||||||
| 88 | 5,606 | 13 | 1,108 | — | 6,004 | 94,278 | ||||||||||||||||||||||||
| 18 | — | — | 329 | — | — | 43,315 | ||||||||||||||||||||||||
| — | — | — | 147 | — | — | — | ||||||||||||||||||||||||
| 193 | 751 | 186 | 4,053 | 260 | 20 | 17,214 | ||||||||||||||||||||||||
| — | — | — | — | — | — | — | ||||||||||||||||||||||||
| 9,355 | 5,516 | 4,683 | 17,467 | 8,585 | 4,714 | 23,622 | ||||||||||||||||||||||||
| 2,135 | 556 | 264 | 8,688 | 888 | 1,113 | 25,356 | ||||||||||||||||||||||||
| 26,876 | 23,417 | 18,470 | 16,464 | 18,472 | 18,636 | 25,456 | ||||||||||||||||||||||||
| 27,761 | 13,867 | 27,055 | 48,154 | 23,858 | 19,554 | 42,382 | ||||||||||||||||||||||||
| 41,533 | 90,816 | 92,564 | 291,659 | 41,552 | 38,901 | 116,469 | ||||||||||||||||||||||||
| 6,414 | 5,325 | 5,039 | 12,623 | 5,542 | 5,043 | 84,740 | ||||||||||||||||||||||||
| 3,842 | 1,988 | 3,081 | 9,462 | 3,158 | 2,587 | 28,643 | ||||||||||||||||||||||||
| — | — | 2,850 | — | — | — | — | ||||||||||||||||||||||||
| — | — | — | — | — | — | — | ||||||||||||||||||||||||
| 3,186 | 2,560 | 2,465 | 3,217 | 2,717 | 2,771 | 7,929 | ||||||||||||||||||||||||
| 349 | 107 | 49 | 1,198 | 133 | 191 | 4,281 | ||||||||||||||||||||||||
| 3,649 | 1,829 | 2,478 | 9,135 | 3,945 | 2,011 | 6,214 | ||||||||||||||||||||||||
| 282,515 | 227,265 | 184,564 | 1,264,350 | 168,256 | 193,134 | 3,714,630 | ||||||||||||||||||||||||
| (83,253 | ) | (133,482 | ) | (151,574 | ) | (401,031 | ) | (88,130 | ) | (84,204 | ) | — | |||||||||||||||||
| 199,262 | 93,783 | 32,990 | 863,319 | 80,126 | 108,930 | 3,714,630 | ||||||||||||||||||||||||
| 1,131,899 | (28,015 | ) | 99,593 | 1,226,056 | 143,111 | 110,695 | (678,605 | ) | ||||||||||||||||||||||
| See accompanying Notes to Financial Statements | | March 31, 2017 | | Semiannual Report | 219 |
Table of Contents
Statements of Operations (cont’d)
Six Months ended March 31, 2017 (Unaudited)
| AllianzGI Best Styles Global Equity | AllianzGI Best Styles International Equity | AllianzGI Best Styles U.S. Equity | AllianzGI Convertible | AllianzGI Emerging Markets Consumer | ||||||||||||||||||||
| Realized and Change in Unrealized Gain (Loss): | ||||||||||||||||||||||||
| Net realized gain (loss) on: | ||||||||||||||||||||||||
Investments | $ | 11,960,367 | $ | (636,740 | ) | $ | 1,345,559 | $ | 86,076,572 | $ | 868,676 | |||||||||||||
Investments in Affiliates | — | — | — | — | — | |||||||||||||||||||
Futures contracts | 254,848 | (12,635 | ) | 545,472 | — | — | ||||||||||||||||||
Options written | — | — | — | — | — | |||||||||||||||||||
Swaps | — | — | — | — | — | |||||||||||||||||||
Foreign currency transactions | (239,195 | ) | (62,768 | ) | (543 | ) | — | (8,184 | ) | |||||||||||||||
| Net change in unrealized appreciation/depreciation of: | ||||||||||||||||||||||||
Investments | 48,137,446 | 2,886,043 | 7,675,719 | (17,946,366 | ) | 892,499 | ||||||||||||||||||
Investments in Affiliates | — | — | — | — | — | |||||||||||||||||||
Futures contracts | (82,398 | ) | 12,997 | (88,800 | ) | — | — | |||||||||||||||||
Options written | — | — | — | — | — | |||||||||||||||||||
Swaps | — | — | — | — | — | |||||||||||||||||||
Foreign currency transactions | 147,251 | 5,304 | 11 | — | 8,610 | |||||||||||||||||||
| Net realized and change in unrealized gain (loss) | 60,178,319 | 2,192,201 | 9,477,418 | 68,130,206 | 1,761,601 | |||||||||||||||||||
| Net Increase (Decrease) in Net Assets Resulting from Investment Operations | $ | 66,150,800 | $ | 2,458,060 | $ | 10,409,757 | $ | 78,369,568 | $ | 1,899,570 | ||||||||||||||
| * Foreign withholding taxes | $ | 427,990 | $ | 33,916 | $ | 2,722 | $ | — | $ | 51,775 | ||||||||||||||
| 220 | Semiannual Report | | March 31, 2017 | | See accompanying Notes to Financial Statements |
Table of Contents
| AllianzGI Emerging Markets Debt | AllianzGI Emerging Markets Small-Cap | AllianzGI Europe Equity Dividend | AllianzGI Global Dynamic Allocation | AllianzGI Global Fundamental Strategy | AllianzGI Global Sustainability | AllianzGI Global Water | ||||||||||||||||||||||||
| $ | 461,286 | $ | 293,723 | $ | (142,983 | ) | $ | (1,065,408 | ) | $ | 306,166 | $ | 179,433 | $ | 7,752,907 | |||||||||||||||
| — | — | — | 854,359 | — | — | — | ||||||||||||||||||||||||
| 20,287 | — | — | 2,122,612 | (35,879 | ) | — | — | |||||||||||||||||||||||
| 11,711 | — | — | — | 40,740 | — | — | ||||||||||||||||||||||||
| (24,151 | ) | — | — | — | — | — | — | |||||||||||||||||||||||
| 21,358 | (6,729 | ) | (1,840 | ) | 5,113 | 140,239 | (4,090 | ) | (106,213 | ) | ||||||||||||||||||||
| (911,295 | ) | 1,029,328 | 293,559 | 7,884,821 | (368,312 | ) | 957,865 | (15,978,666 | ) | |||||||||||||||||||||
| — | — | — | (949,529 | ) | 11,796 | — | — | |||||||||||||||||||||||
| — | — | — | 596,932 | 60,437 | — | — | ||||||||||||||||||||||||
| — | — | — | — | (12,984 | ) | — | — | |||||||||||||||||||||||
| (54,273 | ) | — | — | — | — | — | — | |||||||||||||||||||||||
| 11,340 | 1,429 | (185 | ) | 21,443 | (3,229 | ) | (790 | ) | (7,386 | ) | ||||||||||||||||||||
| (463,737 | ) | 1,317,751 | 148,551 | 9,470,343 | 138,974 | 1,132,418 | (8,339,358 | ) | ||||||||||||||||||||||
$ | 668,162 |
| $ | 1,289,736 |
| $ | 248,144 | $ | 10,696,399 | $ | 282,085 | $ | 1,243,113 | $ | (9,017,963 | ) | ||||||||||||||
| $ | 175 | $ | 11,293 | $ | 9,371 | $ | 67,212 | $ | 5,228 | $ | 10,309 | $ | 62,927 | |||||||||||||||||
| See accompanying Notes to Financial Statements | | March 31, 2017 | | Semiannual Report | 221 |
Table of Contents
Statements of Operations (cont’d)
Six Months ended March 31, 2017 (Unaudited)
| AllianzGI High Yield Bond | AllianzGI International Growth | AllianzGI International Small-Cap | AllianzGI Micro Cap | AllianzGI Multi-Asset Real Return | ||||||||||||||||||||
| Investment Income: | ||||||||||||||||||||||||
| Interest | $ | 11,373,243 | $ | 37 | $ | 376 | $ | 162 | $ | 57 | ||||||||||||||
| Dividends, net of foreign withholding taxes* | — | 149,136 | 392,434 | 65,126 | 18,290 | |||||||||||||||||||
| Dividends from investments in Affiliates | — | — | — | — | 24,386 | |||||||||||||||||||
| Miscellaneous | 141,004 | — | 74 | — | — | |||||||||||||||||||
Total Investment Income | 11,514,247 | 149,173 | 392,884 | 65,288 | 42,733 | |||||||||||||||||||
| Expenses: | ||||||||||||||||||||||||
| Investment management | 850,618 | 107,528 | 437,685 | 217,946 | 14,697 | |||||||||||||||||||
| Distribution — Class C | 50,835 | — | 9,552 | — | 276 | |||||||||||||||||||
| Distribution — Class R | 1,601 | — | 160 | — | — | |||||||||||||||||||
| Administrative servicing — Class P | 22,193 | — | — | 649 | — | |||||||||||||||||||
| Servicing — Class A | 73,591 | 60 | 10,433 | 3,929 | 623 | |||||||||||||||||||
| Servicing — Class C | 16,945 | — | 3,184 | — | 92 | |||||||||||||||||||
| Servicing — Class R | 1,601 | — | 160 | — | — | |||||||||||||||||||
| Distribution and/or servicing — Administrative Class | 2,320 | — | — | — | — | |||||||||||||||||||
| Sub-transfer agent — Class A | 40,857 | 30 | 6,775 | 2,221 | 69 | |||||||||||||||||||
| Sub-transfer agent — Class C | 5,688 | — | 1,415 | — | 18 | |||||||||||||||||||
| Sub-transfer agent — Class R | 1,942 | — | 174 | — | — | |||||||||||||||||||
| Sub-transfer agent — Institutional Class | 38,229 | 53 | 15,937 | 14,047 | 215 | |||||||||||||||||||
| Legal | 21,634 | 4,191 | 8,014 | 5,289 | 5,248 | |||||||||||||||||||
| Trustees | 18,754 | 769 | 4,505 | 1,787 | 201 | |||||||||||||||||||
| Audit and tax services | 26,181 | 19,343 | 20,521 | 18,831 | 16,896 | |||||||||||||||||||
| Registration | 47,456 | 16,706 | 39,580 | 18,900 | 24,483 | |||||||||||||||||||
| Custodian and accounting agent | 44,175 | 46,337 | 113,249 | 35,592 | 42,503 | |||||||||||||||||||
| Shareholder communications | 30,711 | 5,018 | 9,385 | 6,763 | 4,963 | |||||||||||||||||||
| Transfer agent | 21,075 | 1,976 | 11,504 | 4,707 | 3,026 | |||||||||||||||||||
| Excise tax | 2,969 | — | — | — | — | |||||||||||||||||||
| Recoupment | — | — | — | — | — | |||||||||||||||||||
| Insurance | 7,372 | 2,460 | 3,923 | 3,024 | 2,463 | |||||||||||||||||||
| Line of credit commitment | 3,098 | 157 | 778 | 297 | 32 | |||||||||||||||||||
| Miscellaneous | 10,115 | 2,906 | 3,597 | 3,443 | 2,529 | |||||||||||||||||||
Total Expenses | 1,339,960 | 207,534 | 700,531 | 337,425 | 118,334 | |||||||||||||||||||
Less: Fee Waiver/Reimbursement from Investment Manager | — | (79,596 | ) | (147,553 | ) | (67,362 | ) | (105,548 | ) | |||||||||||||||
Net Expenses | 1,339,960 | 127,938 | 552,978 | 270,063 | 12,786 | |||||||||||||||||||
| Net Investment Income (Loss) | 10,174,287 | 21,235 | (160,094 | ) | (204,775 | ) | 29,947 | |||||||||||||||||
| 222 | Semiannual Report | | March 31, 2017 | | See accompanying Notes to Financial Statements |
Table of Contents
| AllianzGI NFJ Emerging Markets Value | AllianzGI NFJ Global Dividend Value | AllianzGI NFJ International Small-Cap Value | AllianzGI NFJ International Value II | AllianzGI Short Duration High Income | AllianzGI Structured Return | AllianzGI U.S. Equity Hedged | ||||||||||||||||||||||||
| $ | 138 | $ | 78 | $ | 4 | $ | 203 | $ | 35,722,483 | $ | 10,324 | $ | 41 | |||||||||||||||||
| 222,634 | 311,812 | 60,189 | 184,441 | — | 2,111,056 | 47,537 | ||||||||||||||||||||||||
| — | — | — | — | — | — | — | ||||||||||||||||||||||||
| — | — | — | — | 182,136 | 665 | 2 | ||||||||||||||||||||||||
| 222,772 | 311,890 | 60,193 | 184,644 | 35,904,619 | 2,122,045 | 47,580 | ||||||||||||||||||||||||
| 79,090 | 84,233 | 24,797 | 113,748 | 3,478,615 | 951,916 | 17,627 | ||||||||||||||||||||||||
| 582 | 18,477 | 3,007 | 765 | 175,885 | 52,220 | 1,001 | ||||||||||||||||||||||||
| — | — | — | — | — | — | — | ||||||||||||||||||||||||
| 2,022 | 389 | 29 | 75 | 273,338 | 21,114 | — | ||||||||||||||||||||||||
| 6,148 | 4,876 | 2,620 | 287 | 278,419 | 134,919 | 765 | ||||||||||||||||||||||||
| 194 | 6,159 | 1,002 | 255 | 175,885 | 17,407 | 334 | ||||||||||||||||||||||||
| — | — | — | — | — | — | — | ||||||||||||||||||||||||
| — | — | — | — | — | — | — | ||||||||||||||||||||||||
| 5,218 | 7,461 | 8,568 | 189 | 66,425 | 38,314 | 4,111 | ||||||||||||||||||||||||
| 40 | 2,073 | 610 | 88 | 38,793 | 4,870 | 125 | ||||||||||||||||||||||||
| — | — | — | — | — | — | — | ||||||||||||||||||||||||
| 2,159 | 663 | 584 | 725 | 41,022 | 22,010 | 1,304 | ||||||||||||||||||||||||
| 4,889 | 6,102 | 5,131 | 5,845 | 44,622 | 23,780 | 4,756 | ||||||||||||||||||||||||
| 709 | 947 | 492 | 1,772 | 63,261 | 13,816 | 269 | ||||||||||||||||||||||||
| 29,687 | 18,541 | 15,999 | 20,026 | 19,325 | 18,330 | 15,251 | ||||||||||||||||||||||||
| 24,878 | 24,083 | 30,547 | 24,621 | 71,505 | 53,982 | 24,827 | ||||||||||||||||||||||||
| 139,240 | 38,984 | 61,209 | 62,595 | 75,934 | 74,297 | 34,847 | ||||||||||||||||||||||||
| 6,467 | 6,320 | 5,775 | 5,981 | 71,639 | 44,106 | 5,449 | ||||||||||||||||||||||||
| 3,465 | 4,618 | 4,284 | 3,607 | 55,140 | 28,635 | 3,263 | ||||||||||||||||||||||||
| — | — | — | — | — | — | — | ||||||||||||||||||||||||
| — | — | — | — | 5,264 | 53,802 | — | ||||||||||||||||||||||||
| 2,560 | 2,653 | 2,633 | 3,105 | 15,545 | 4,990 | 2,548 | ||||||||||||||||||||||||
| 113 | 152 | 75 | 320 | 11,240 | 2,422 | 50 | ||||||||||||||||||||||||
| 5,116 | 3,367 | 3,117 | 3,494 | 23,655 | 4,952 | 2,776 | ||||||||||||||||||||||||
| 312,577 | 230,098 | 170,479 | 247,498 | 4,985,512 | 1,565,882 | 119,303 | ||||||||||||||||||||||||
| (198,750 | ) | (109,601 | ) | (133,898 | ) | (117,782 | ) | (2,477 | ) | (88,613 | ) | | (91,965 | ) | ||||||||||||||||
| 113,827 | 120,497 | 36,581 | 129,716 | 4,983,035 | 1,477,269 | 27,338 | ||||||||||||||||||||||||
| 108,945 | 191,393 | 23,612 | 54,928 | 30,921,584 | 644,776 | 20,242 | ||||||||||||||||||||||||
| See accompanying Notes to Financial Statements | | March 31, 2017 | | Semiannual Report | 223 |
Table of Contents
Statements of Operations (cont’d)
Six Months ended March 31, 2017 (Unaudited)
| AllianzGI High Yield Bond | AllianzGI International Growth | AllianzGI International Small-Cap | AllianzGI Cap | AllianzGI Multi-Asset Real Return | ||||||||||||||||||||
| Realized and Change in Unrealized Gain (Loss): | ||||||||||||||||||||||||
| Net realized gain (loss) on: | ||||||||||||||||||||||||
Investments | $ | (1,223,564 | ) | $ | (103,622 | ) | $ | 2,385,808 | $ | 1,438,608 | $ | 31,985 | ||||||||||||
Investments in Affiliates | — | — | — | — | (197,934 | ) | ||||||||||||||||||
Futures contracts | — | — | — | — | 19,818 | |||||||||||||||||||
Options written | — | — | — | — | — | |||||||||||||||||||
Foreign currency transactions | — | (3,295 | ) | (27,868 | ) | — | (125 | ) | ||||||||||||||||
| Payments from Affiliates (See Note 13) | — | — | — | — | — | |||||||||||||||||||
| Net change in unrealized appreciation/depreciation of: | ||||||||||||||||||||||||
Investments | 5,288,453 | 367,562 | (1,669,667 | ) | 960,725 | (102,154 | ) | |||||||||||||||||
Investments in Affiliates | — | — | — | — | 132,322 | |||||||||||||||||||
Futures contracts | — | — | — | — | 9,468 | |||||||||||||||||||
Options written | — | — | — | — | — | |||||||||||||||||||
Unfunded loan commitments | 49,286 | — | — | — | — | |||||||||||||||||||
Foreign currency transactions | — | 639 | (6,807 | ) | — | (459 | ) | |||||||||||||||||
| Net realized and change in unrealized gain (loss) | 4,114,175 | 261,284 | 681,466 | 2,399,333 | (107,079 | ) | ||||||||||||||||||
| Net Increase (Decrease) in Net Assets Resulting from Investment Operations | $ | 14,288,462 | $ | 282,519 | $ | 521,372 | $ | 2,194,558 | $ | (77,132 | ) | |||||||||||||
| *Foreign withholding taxes | $ | — | $ | 15,114 | $ | 38,357 | $ | — | $ | 498 | ||||||||||||||
| 224 | Semiannual Report | | March 31, 2017 | | See accompanying Notes to Financial Statements |
Table of Contents
| AllianzGI NFJ Emerging Markets Value | AllianzGI NFJ Global Dividend Value | AllianzGI NFJ International Small-Cap Value | AllianzGI NFJ International Value II | AllianzGI Short Duration High Income | AllianzGI Structured Return | AllianzGI U.S. Equity Hedged | ||||||||||||||||||||||||
| $ | 382,820 | $ | 626,301 | $ | (36,646 | ) | $ | 188,473 | $ | 952,138 | $ | 20,711,259 | $ | (210,521 | ) | |||||||||||||||
| — | — | — | — | — | — | �� | ||||||||||||||||||||||||
| — | — | — | — | — | — | — | ||||||||||||||||||||||||
| — | — | — | — | — | (16,296,308 | ) | 176,122 | |||||||||||||||||||||||
| (27,057 | ) | (11,370 | ) | (10,462 | ) | (73,183 | ) | — | — | — | ||||||||||||||||||||
| 299 | — | — | 30,285 | — | — | — | ||||||||||||||||||||||||
| 1,052,138 | 813,728 | (163,088 | ) | (527,171 | ) | (1,983,105 | ) | 169,327 | 345,392 | |||||||||||||||||||||
| — | — | — | — | — | — | — | ||||||||||||||||||||||||
| — | — | — | — | — | — | — | ||||||||||||||||||||||||
| — | — | — | — | — | 2,535,261 | (28,110 | ) | |||||||||||||||||||||||
| — | — | — | — | — | — | — | ||||||||||||||||||||||||
| 2,965 | 672 | 663 | (871 | ) | — | — | — | |||||||||||||||||||||||
| 1,411,165 | 1,429,331 | (209,533 | ) | (382,467 | ) | (1,030,967 | ) | 7,119,539 | 282,883 | |||||||||||||||||||||
| $ | 1,520,110 | $ | 1,620,724 | $ | (185,921 | ) | $ | (327,539 | ) | $ | 29,890,617 | $ | 7,764,315 | $ | 303,125 | |||||||||||||||
| $ | 25,368 | $ | 12,975 | $ | 6,628 | $ | 20,196 | $ | — | $ | — | $ | — | |||||||||||||||||
| See accompanying Notes to Financial Statements | | March 31, 2017 | | Semiannual Report | 225 |
Table of Contents
Statements of Operations (cont’d)
Six Months ended March 31, 2017 (Unaudited)
| AllianzGI U.S. Small-Cap Growth | AllianzGI Ultra Micro Cap | |||||||
| Investment Income: | ||||||||
| Interest | $ | 78 | $ | 97 | ||||
| Dividends, net of foreign withholding taxes* | 39,052 | 106,865 | ||||||
Total Investment Income | 39,130 | 106,962 | ||||||
| Expenses: | ||||||||
| Investment management | 66,725 | 334,681 | ||||||
| Distribution — Class C | 1,761 | — | ||||||
| Distribution — Class R | 100 | — | ||||||
| Administrative servicing — Class P | 229 | 2,311 | ||||||
| Servicing — Class A | 1,189 | 21,060 | ||||||
| Servicing — Class C | 587 | — | ||||||
| Servicing — Class R | 100 | — | ||||||
| Sub-transfer agent — Class A | 4,362 | 14,934 | ||||||
| Sub-transfer agent — Class C | 374 | — | ||||||
| Sub-transfer agent — Institutional Class | 8,017 | 10,697 | ||||||
| Legal | 5,970 | 5,951 | ||||||
| Trustees | 1,059 | 2,339 | ||||||
| Audit and tax services | 15,600 | 18,832 | ||||||
| Registration | 28,797 | 21,274 | ||||||
| Custodian and accounting agent | 39,742 | 35,762 | ||||||
| Shareholder communications | 5,665 | 8,698 | ||||||
| Transfer agent | 6,071 | 6,131 | ||||||
| Excise tax | — | 631 | ||||||
| Insurance | 2,807 | 3,272 | ||||||
| Line of credit commitment | 171 | 397 | ||||||
| Miscellaneous | 2,982 | 3,745 | ||||||
Total Expenses | 192,308 | 490,715 | ||||||
Less: Fee Waiver/Reimbursement from Investment Manager | (108,076 | ) | — | |||||
Net Expenses | 84,232 | 490,715 | ||||||
| Net Investment Loss | (45,102 | ) | (383,753 | ) | ||||
| Realized and Change in Unrealized Gain (Loss): | ||||||||
| Net realized gain on Investments | 2,407,771 | 4,037,772 | ||||||
| Net change in unrealized appreciation/depreciation of investments | (1,203,533 | ) | (947,089 | ) | ||||
| Net realized and change in unrealized gain | 1,204,238 | 3,090,683 | ||||||
| Net Increase in Net Assets Resulting from Investment Operations | $ | 1,159,136 | $ | 2,706,930 | ||||
| * Foreign withholding taxes | $ | 132 | $ | — | ||||
| 226 | Semiannual Report | | March 31, 2017 | | See accompanying Notes to Financial Statements |
Table of Contents
(THIS PAGE INTENTIONALLY LEFT BLANK)
| See accompanying Notes to Financial Statements | | March 31, 2017 | | Semiannual Report | 227 |
Table of Contents
Statements of Changes in Net Assets
| AllianzGI Retirement 2020 | AllianzGI Retirement 2025 | |||||||||||||||||||
| Six Months ended March 31, 2017 (Unaudited) | Year ended September 30, 2016 | Six Months ended March 31, 2017 (Unaudited) | Year ended September 30, 2016 | |||||||||||||||||
| Increase (Decrease) in Net Assets from: | ||||||||||||||||||||
Investment Operations: | ||||||||||||||||||||
| Net investment income | $ | 521,292 | $ | 1,566,950 | $ | 422,346 | $ | 1,653,428 | ||||||||||||
| Net realized gain (loss) | 1,286,607 | (38,259 | ) | 2,024,955 | 51,690 | |||||||||||||||
| Net change in unrealized appreciation/depreciation | (276,470 | ) | 4,103,248 | 46,800 | 4,707,268 | |||||||||||||||
| Net increase in net assets resulting from investment operations | 1,531,429 | 5,631,939 | 2,494,101 | 6,412,386 | ||||||||||||||||
| Dividends and Distributions to Shareholders from: | ||||||||||||||||||||
| Net investment income: | ||||||||||||||||||||
Class A | (314,038 | ) | (595,528 | ) | (122,193 | ) | (563,042 | ) | ||||||||||||
Class C | (8,548 | ) | (7,610 | ) | — | — | ||||||||||||||
Class R | (9,351 | ) | (20,395 | ) | (18,282 | ) | (22,099 | ) | ||||||||||||
Class P | (724,018 | ) | (797,874 | ) | (951,555 | ) | (1,080,525 | ) | ||||||||||||
Class R6 | (368,801 | ) | (436,891 | ) | (348,228 | ) | (382,398 | ) | ||||||||||||
Administrative Class | (14,448 | ) | (59,872 | ) | (12,039 | ) | (40,396 | ) | ||||||||||||
| Net realized capital gains: | ||||||||||||||||||||
Class A | — | — | (5,755 | ) | — | |||||||||||||||
Class C | — | — | — | — | ||||||||||||||||
Class R | — | — | (754 | ) | — | |||||||||||||||
Class P | — | — | (30,725 | ) | — | |||||||||||||||
Class R6 | — | — | (10,972 | ) | — | |||||||||||||||
Administrative Class | — | — | (496 | ) | — | |||||||||||||||
| Total dividends and distributions to shareholders | (1,439,204 | ) | (1,918,170 | ) | (1,500,999 | ) | (2,088,460 | ) | ||||||||||||
| Fund Share Transactions: | ||||||||||||||||||||
| Net proceeds from the sale of shares | 9,276,652 | 11,998,663 | 9,726,387 | 13,883,221 | ||||||||||||||||
| Issued in reinvestment of dividends and distributions | 1,435,551 | 1,917,422 | 1,486,604 | 2,064,577 | ||||||||||||||||
| Cost of shares redeemed | (10,759,928 | ) | (31,476,088 | ) | (6,143,876 | ) | (33,447,703 | ) | ||||||||||||
| Net increase (decrease) from Fund share transactions | (47,725 | ) | (17,560,003 | ) | 5,069,115 | (17,499,905 | ) | |||||||||||||
| Total increase (decrease) in net assets | 44,500 | (13,846,234 | ) | 6,062,217 | (13,175,979 | ) | ||||||||||||||
| Net Assets: | ||||||||||||||||||||
| Beginning of period | 53,301,867 | 67,148,101 | 55,251,425 | 68,427,404 | ||||||||||||||||
| End of period* | $ | 53,346,367 | $ | 53,301,867 | $ | 61,313,642 | $ | 55,251,425 | ||||||||||||
* Including undistributed (dividends in excess of) net investment income of: | $ | 36,800 | $ | 954,712 | $ | (45,915 | ) | $ | 984,036 | |||||||||||
| 228 | Semiannual Report | | March 31, 2017 | | See accompanying Notes to Financial Statements |
Table of Contents
| AllianzGI Retirement 2030 | AllianzGI Retirement 2035 | AllianzGI Retirement 2040 | ||||||||||||||||||||||||
| Six Months ended March 31, 2017 (Unaudited) | Year ended September 30, 2016 | Six Months ended March 31, 2017 (Unaudited) | Year ended September 30, 2016 | Six Months ended March 31, 2017 (Unaudited) | Year ended September 30, 2016 | |||||||||||||||||||||
| $ | 426,558 | $ | 1,564,351 | $ | 482,868 | $ | 949,692 | $ | 504,746 | $ | 664,544 | |||||||||||||||
| 2,227,909 | (140,434 | ) | 1,703,226 | 76,608 | 1,274,244 | 401,680 | ||||||||||||||||||||
| 911,816 | 5,092,166 | 1,358,501 | 4,198,593 | 1,650,442 | 3,487,610 | |||||||||||||||||||||
| 3,566,283 | 6,516,083 | 3,544,595 | 5,224,893 | 3,429,432 | 4,553,834 | |||||||||||||||||||||
| (128,752 | ) | (446,854 | ) | (167,435 | ) | (341,963 | ) | (72,360 | ) | (164,686 | ) | |||||||||||||||
| (9,740 | ) | (13,670 | ) | — | — | (1,802 | ) | (2,949 | ) | |||||||||||||||||
| (42,799 | ) | (55,314 | ) | (30,051 | ) | (36,323 | ) | (33,676 | ) | (26,667 | ) | |||||||||||||||
| (812,248 | ) | (940,472 | ) | (734,209 | ) | (810,229 | ) | (547,161 | ) | (439,848 | ) | |||||||||||||||
| (420,128 | ) | (429,074 | ) | (241,355 | ) | (184,982 | ) | (408,413 | ) | (319,410 | ) | |||||||||||||||
| (25,169 | ) | (56,360 | ) | (14,178 | ) | (19,510 | ) | (7,153 | ) | (11,823 | ) | |||||||||||||||
| (27,656 | ) | — | (43,348 | ) | — | (72,948 | ) | (10,892 | ) | |||||||||||||||||
| (2,597 | ) | — | — | — | (2,318 | ) | (265 | ) | ||||||||||||||||||
| (8,838 | ) | — | (8,219 | ) | — | (30,988 | ) | (1,774 | ) | |||||||||||||||||
| (126,596 | ) | — | (149,417 | ) | — | (388,536 | ) | (22,364 | ) | |||||||||||||||||
| (63,529 | ) | — | (46,996 | ) | — | (280,126 | ) | (15,802 | ) | |||||||||||||||||
| (4,716 | ) | — | (3,283 | ) | — | (6,053 | ) | (667 | ) | |||||||||||||||||
| (1,672,768 | ) | (1,941,744 | ) | (1,438,491 | ) | (1,393,007 | ) | (1,851,534 | ) | (1,017,147 | ) | |||||||||||||||
| 8,542,915 | 16,200,938 | 7,001,341 | 11,823,510 | 7,554,896 | 12,003,864 | |||||||||||||||||||||
| 1,653,530 | 1,917,937 | 1,421,045 | 1,371,559 | 1,838,433 | 1,011,803 | |||||||||||||||||||||
| (8,609,251 | ) | (29,171,828 | ) | (9,388,297 | ) | (20,805,948 | ) | (6,193,500 | ) | (18,642,360 | ) | |||||||||||||||
| 1,587,194 | (11,052,953 | ) | (965,911 | ) | (7,610,879 | ) | 3,199,829 | (5,626,693 | ) | |||||||||||||||||
| 3,480,709 | (6,478,614 | ) | 1,140,193 | (3,778,993 | ) | 4,777,727 | (2,090,006 | ) | ||||||||||||||||||
| 62,100,444 | 68,579,058 | 50,646,349 | 54,425,342 | 42,694,497 | 44,784,503 | |||||||||||||||||||||
| $ | 65,581,153 | $ | 62,100,444 | $ | 51,786,542 | $ | 50,646,349 | $ | 47,472,224 | $ | 42,694,497 | |||||||||||||||
| $ | (52,527 | ) | $ | 959,751 | $ | (117,911 | ) | $ | 586,449 | $ | (139,380 | ) | $ | 426,439 | ||||||||||||
| See accompanying Notes to Financial Statements | | March 31, 2017 | | Semiannual Report | 229 |
Table of Contents
Statements of Changes in Net Assets (cont’d)
| AllianzGI Retirement 2045 | AllianzGI Retirement 2050 | |||||||||||||||||||
| Six Months ended March 31, 2017 (Unaudited) | Year ended September 30, 2016 | Six Months ended March 31, 2017 (Unaudited) | Year ended September 30, 2016 | |||||||||||||||||
| Increase (Decrease) in Net Assets from: | ||||||||||||||||||||
Investment Operations: | ||||||||||||||||||||
| Net investment income | $ | 323,618 | $ | 333,237 | $ | 320,041 | $ | 302,760 | ||||||||||||
| Net realized gain | 791,384 | 384,262 | 628,643 | 477,920 | ||||||||||||||||
| Net change in unrealized appreciation/depreciation | 1,030,448 | 2,148,093 | 1,210,972 | 1,701,960 | ||||||||||||||||
| Net increase in net assets resulting from investment operations | 2,145,450 | 2,865,592 | 2,159,656 | 2,482,640 | ||||||||||||||||
| Dividends and Distributions to Shareholders from: | ||||||||||||||||||||
| Net investment income: | ||||||||||||||||||||
Class A | (66,804 | ) | (132,040 | ) | (38,744 | ) | (29,146 | ) | ||||||||||||
Class C | — | — | (2,598 | ) | (1,452 | ) | ||||||||||||||
Class R | (13,061 | ) | (9,256 | ) | (16,335 | ) | (7,962 | ) | ||||||||||||
Class P | (339,225 | ) | (263,806 | ) | (288,099 | ) | (150,657 | ) | ||||||||||||
Institutional Class | — | — | — | — | ||||||||||||||||
Class R6 | (221,167 | ) | (99,028 | ) | (298,199 | ) | (159,817 | ) | ||||||||||||
Administrative Class | (13,206 | ) | (8,009 | ) | (15,717 | ) | (10,166 | ) | ||||||||||||
| Net realized capital gains: | ||||||||||||||||||||
Class A | (106,108 | ) | (16,362 | ) | (48,414 | ) | (45,712 | ) | ||||||||||||
Class C | — | — | (4,166 | ) | (3,074 | ) | ||||||||||||||
Class R | (19,230 | ) | (1,228 | ) | (21,175 | ) | (12,276 | ) | ||||||||||||
Class P | (390,158 | ) | (26,141 | ) | (291,836 | ) | (152,187 | ) | ||||||||||||
Institutional Class | — | — | — | — | ||||||||||||||||
Class R6 | (243,478 | ) | (9,548 | ) | (291,783 | ) | (158,510 | ) | ||||||||||||
Administrative Class | (15,955 | ) | (880 | ) | (17,726 | ) | (11,725 | ) | ||||||||||||
| Total dividends and distributions to shareholders | (1,428,392 | ) | (566,298 | ) | (1,334,792 | ) | (742,684 | ) | ||||||||||||
| Fund Share Transactions: | ||||||||||||||||||||
| Net proceeds from the sale of shares | 5,352,263 | 9,554,648 | 6,546,110 | 8,337,155 | ||||||||||||||||
| Issued in reorganization | — | — | — | — | ||||||||||||||||
| Issued in reinvestment of dividends and distributions | 1,426,631 | 565,752 | 1,332,075 | 741,136 | ||||||||||||||||
| Cost of shares redeemed | (3,235,680 | ) | (12,044,535 | ) | (4,173,794 | ) | (9,397,563 | ) | ||||||||||||
| Net increase (decrease) from Fund share transactions | 3,543,214 | (1,924,135 | ) | 3,704,391 | (319,272 | ) | ||||||||||||||
| Total increase (decrease) in net assets | 4,260,272 | 375,159 | 4,529,255 | 1,420,684 | ||||||||||||||||
| Net Assets: | ||||||||||||||||||||
| Beginning of period | 25,419,892 | 25,044,733 | 23,709,875 | 22,289,191 | ||||||||||||||||
| End of period* | $ | 29,680,164 | $ | 25,419,892 | $ | 28,239,130 | $ | 23,709,875 | ||||||||||||
* Including undistributed (dividends in excess of) net investment income of: | $ | (96,206 | ) | $ | 233,639 | $ | (95,289 | ) | $ | 244,362 | ||||||||||
| 230 | Semiannual Report | | March 31, 2017 | | See accompanying Notes to Financial Statements |
Table of Contents
| AllianzGI Retirement 2055 | AllianzGI Retirement Income | AllianzGI Global Allocation | ||||||||||||||||||||||||
| Six Months ended March 31, 2017 (Unaudited) | Year ended September 30, 2016 | Six Months ended March 31, 2017 (Unaudited) | Year ended September 30, 2016 | Six Months ended March 31, 2017 (Unaudited) | Year ended September 30, 2016 | |||||||||||||||||||||
| $ | 112,013 | $ | 88,282 | $ | 1,341,862 | $ | 1,177,185 | $ | 7,344,914 | $ | 2,257,729 | |||||||||||||||
| 316,484 | 36,215 | 599,574 | 21,929 | 3,287,674 | 112,430 | |||||||||||||||||||||
| 374,889 | 587,542 | (619,584 | ) | 1,620,563 | 6,457,339 | 30,727,432 | ||||||||||||||||||||
| 803,386 | 712,039 | 1,321,852 | 2,819,677 | 17,089,927 | 33,097,591 | |||||||||||||||||||||
| (20,979 | ) | (18,484 | ) | (227,509 | ) | (296,174 | ) | (681,686 | ) | (467,965 | ) | |||||||||||||||
| — | — | (44,516 | ) | (98,276 | ) | (326,548 | ) | (178,791 | ) | |||||||||||||||||
| (6,391 | ) | (3,771 | ) | (6,322 | ) | (10,524 | ) | (310 | ) | (82 | ) | |||||||||||||||
| (91,959 | ) | (40,910 | ) | (437,111 | ) | (361,607 | ) | (54,788 | ) | (15,338 | ) | |||||||||||||||
| — | — | — | — | (1,501,582 | ) | (492,766 | ) | |||||||||||||||||||
| (79,203 | ) | (59,101 | ) | (526,549 | ) | (515,328 | ) | (6,893,543 | ) | (1,905,490 | ) | |||||||||||||||
| (6,244 | ) | (4,367 | ) | (27,728 | ) | (5,406 | ) | (423 | ) | (144 | ) | |||||||||||||||
| (23,081 | ) | (14,741 | ) | (51,561 | ) | (20,804 | ) | — | (3,168,468 | ) | ||||||||||||||||
| — | — | (16,672 | ) | (12,996 | ) | — | (1,840,892 | ) | ||||||||||||||||||
| (7,752 | ) | (3,317 | ) | (2,534 | ) | (914 | ) | — | (595 | ) | ||||||||||||||||
| (84,131 | ) | (26,664 | ) | (86,955 | ) | (22,536 | ) | — | (94,329 | ) | ||||||||||||||||
| — | — | — | — | — | (2,766,629 | ) | ||||||||||||||||||||
| (70,689 | ) | (37,888 | ) | (96,314 | ) | (32,297 | ) | — | (3,407,957 | ) | ||||||||||||||||
| (6,450 | ) | (3,167 | ) | (4,003 | ) | (101 | ) | — | (936 | ) | ||||||||||||||||
| (396,879 | ) | (212,410 | ) | (1,527,774 | ) | (1,376,963 | ) | (9,458,880 | ) | (14,340,382 | ) | |||||||||||||||
| 4,001,763 | 4,981,130 | 8,781,165 | 11,341,857 | 29,686,948 | 255,847,490 | |||||||||||||||||||||
| — | — | — | 25,393,128 | — | — | |||||||||||||||||||||
| 395,032 | 210,850 | 1,510,794 | 1,370,323 | 9,268,854 | 12,131,894 | |||||||||||||||||||||
| (1,337,458 | ) | (3,754,195 | ) | (8,961,587 | ) | (12,159,806 | ) | (83,370,075 | ) | (103,374,685 | ) | |||||||||||||||
| 3,059,337 | 1,437,785 | 1,330,372 | 25,945,502 | (44,414,273 | ) | 164,604,699 | ||||||||||||||||||||
| 3,465,844 | 1,937,414 | 1,124,450 | 27,388,216 | (36,783,226 | ) | 183,361,908 | ||||||||||||||||||||
| 8,122,747 | 6,185,333 | 51,090,098 | 23,701,882 | 493,665,251 | 310,303,343 | |||||||||||||||||||||
| $ | 11,588,591 | $ | 8,122,747 | $ | 52,214,548 | $ | 51,090,098 | $ | 456,882,025 | $ | 493,665,251 | |||||||||||||||
| $ | (35,184 | ) | $ | 57,579 | $ | 192,496 | $ | 120,369 | $ | (1,966,357 | ) | $ | 147,609 | |||||||||||||
| See accompanying Notes to Financial Statements | | March 31, 2017 | | Semiannual Report | 231 |
Table of Contents
Statements of Changes in Net Assets (cont’d)
| AllianzGI Global Megatrends | AllianzGI Best Styles Emerging Markets Equity | |||||||||||||||||||
| Six Months ended March 31, 2017 (Unaudited) | Year ended September 30, 2016 | Six Months ended March 31, 2017 (Unaudited) | Year ended September 30, 2016 | |||||||||||||||||
| Increase (Decrease) in Net Assets from: | ||||||||||||||||||||
Investment Operations: | ||||||||||||||||||||
| Net investment income | $ | 18,235 | $ | 13,603 | $ | 18,812 | $ | 227,044 | ||||||||||||
| Net realized gain (loss) | 33,945 | 205,262 | 724,232 | (754,886 | ) | |||||||||||||||
| Net change in unrealized appreciation/depreciation | 60,376 | 190,534 | (321,420 | ) | 2,212,273 | |||||||||||||||
Net increase in net assets resulting from investment operations | 112,556 | 409,399 | 421,624 | 1,684,431 | ||||||||||||||||
| Dividends and Distributions to Shareholders from: | ||||||||||||||||||||
| Net investment income: | ||||||||||||||||||||
Class A | (197 | ) | (226 | ) | (651 | ) | — | |||||||||||||
Class C | — | — | (747 | ) | — | |||||||||||||||
Class P | (52 | ) | (582 | ) | (580 | ) | (112 | ) | ||||||||||||
Institutional Class | (15,876 | ) | (59,505 | ) | (590 | ) | (131 | ) | ||||||||||||
Class R6 | — | — | (307,036 | ) | (146,646 | ) | ||||||||||||||
| Net realized capital gains: | ||||||||||||||||||||
Class A | — | (1,962 | ) | — | — | |||||||||||||||
Class C | — | — | — | — | ||||||||||||||||
Class P | — | (541 | ) | — | (290 | ) | ||||||||||||||
Institutional Class | — | (163,746 | ) | — | (175 | ) | ||||||||||||||
Class R6 | — | — | — | (159,787 | ) | |||||||||||||||
| Total dividends and distributions to shareholders | (16,125 | ) | (226,562 | ) | (309,604 | ) | (307,141 | ) | ||||||||||||
| Fund Share Transactions: | ||||||||||||||||||||
| Net proceeds from the sale of shares | 119,717 | 62,726 | 686,425 | 8,341,700 | ||||||||||||||||
| Issued in reinvestment of dividends and distributions | 16,125 | 226,562 | 309,604 | 307,141 | ||||||||||||||||
| Cost of shares redeemed | (9,758 | ) | (30,027 | ) | (7,350,202 | ) | (2,302,292 | ) | ||||||||||||
| Net increase (decrease) from Fund share transactions | 126,084 | 259,261 | (6,354,173 | ) | 6,346,549 | |||||||||||||||
| Total increase (decrease) in net assets | 222,515 | 442,098 | (6,242,153 | ) | 7,723,839 | |||||||||||||||
| Net Assets: | ||||||||||||||||||||
| Beginning of period | 3,254,192 | 2,812,094 | 12,485,824 | 4,761,985 | ||||||||||||||||
| End of period* | $ | 3,476,707 | $ | 3,254,192 | $ | 6,243,671 | $ | 12,485,824 | ||||||||||||
* Including undistributed (dividends in excess of) net investment income of: | $ | (42,571 | ) | $ | (44,681 | ) | $ | (64,139 | ) | $ | 226,653 | |||||||||
| 232 | Semiannual Report | | March 31, 2017 | | See accompanying Notes to Financial Statements |
Table of Contents
AllianzGI Best Styles Global Equity | AllianzGI Best Styles International Equity | AllianzGI Best Styles U.S. Equity | ||||||||||||||||||||||||
| Six Months ended March 31, 2017 (Unaudited) | Year ended September 30, 2016 | Six Months ended March 31, 2017 (Unaudited) | Year ended September 30, 2016 | Six Months ended March 31, 2017 (Unaudited) | Year ended September 30, 2016 | |||||||||||||||||||||
| $ | 5,972,481 | $ | 11,255,030 | $ | 265,859 | $ | 2,379,255 | $ | 932,339 | $ | 1,626,523 | |||||||||||||||
| 11,976,020 | 3,866,684 | (712,143 | ) | (2,029,391 | ) | 1,890,488 | 192,407 | |||||||||||||||||||
| 48,202,299 | 37,903,153 | 2,904,344 | 3,440,766 | 7,586,930 | 9,005,225 | |||||||||||||||||||||
| 66,150,800 | 53,024,867 | 2,458,060 | 3,790,630 | 10,409,757 | 10,824,155 | |||||||||||||||||||||
| (1 | ) | (352,595 | ) | (1,126 | ) | — | (7,605 | ) | — | |||||||||||||||||
| (119 | ) | — | (1,403 | ) | — | (148 | ) | — | ||||||||||||||||||
| (44,609 | ) | (19,413 | ) | (898 | ) | (83 | ) | (820 | ) | (747 | ) | |||||||||||||||
| (36,612 | ) | (6,010 | ) | (3,340 | ) | (91 | ) | (1,298 | ) | (31,072 | ) | |||||||||||||||
| (11,685,716 | ) | (2,676,511 | ) | (2,758,648 | ) | (866,206 | ) | (1,625,434 | ) | (1,143,821 | ) | |||||||||||||||
| (8,127 | ) | — | — | — | — | — | ||||||||||||||||||||
| (63 | ) | — | — | — | — | — | ||||||||||||||||||||
| (18,049 | ) | — | — | (86 | ) | — | (180 | ) | ||||||||||||||||||
| (13,335 | ) | — | — | (86 | ) | — | (6,993 | ) | ||||||||||||||||||
| (4,036,289 | ) | — | — | (628,971 | ) | — | (286,791 | ) | ||||||||||||||||||
| (15,842,920 | ) | (3,054,529 | ) | (2,765,415 | ) | (1,495,523 | ) | (1,635,305 | ) | (1,469,604 | ) | |||||||||||||||
| 213,972,756 | 346,693,541 | 1,961,396 | 44,372,099 | 61,566,001 | 48,999,773 | |||||||||||||||||||||
| 15,823,164 | 2,700,966 | 2,765,415 | 1,495,523 | 1,634,905 | 1,469,000 | |||||||||||||||||||||
| (153,546,257 | ) | (84,811,079 | ) | (43,082,050 | ) | (33,229,337 | ) | (52,614,078 | ) | (47,000,194 | ) | |||||||||||||||
| 76,249,663 | 264,583,428 | (38,355,239 | ) | 12,638,285 | 10,586,828 | 3,468,579 | ||||||||||||||||||||
| 126,557,543 | 314,553,766 | (38,662,594 | ) | 14,933,392 | 19,361,280 | 12,823,130 | ||||||||||||||||||||
| 601,574,168 | 287,020,402 | 71,161,469 | 56,228,077 | 101,074,895 | 88,251,765 | |||||||||||||||||||||
| $ | 728,131,711 | $ | 601,574,168 | $ | 32,498,875 | $ | 71,161,469 | $ | 120,436,175 | $ | 101,074,895 | |||||||||||||||
| $ | 4,566,291 | $ | 10,360,867 | $ | (22,579 | ) | $ | 2,476,977 | $ | 585,303 | $ | 1,288,269 | ||||||||||||||
| See accompanying Notes to Financial Statements | | March 31, 2017 | | Semiannual Report | 233 |
Table of Contents
Statements of Changes in Net Assets (cont’d)
| AllianzGI Convertible | AllianzGI Emerging Markets Consumer | |||||||||||||||||||
| Six Months ended March 31, 2017 (Unaudited) | Year ended September 30, 2016 | Six Months ended March 31, 2017 (Unaudited) | Year ended September 30, 2016 | |||||||||||||||||
| Increase (Decrease) in Net Assets from: | ||||||||||||||||||||
Investment Operations: | ||||||||||||||||||||
| Net investment income (loss) | $ | 10,239,362 | $ | 42,569,269 | $ | 137,969 | $ | 443,801 | ||||||||||||
| Net realized gain (loss) | 86,076,572 | (73,490,377 | ) | 860,492 | (1,553,693 | ) | ||||||||||||||
| Net change in unrealized appreciation/depreciation | (17,946,366 | ) | 133,546,884 | 901,109 | 6,811,029 | |||||||||||||||
| Net increase in net assets resulting from investment operations | 78,369,568 | 102,625,776 | 1,899,570 | 5,701,137 | ||||||||||||||||
| Dividends and Distributions to Shareholders from: | ||||||||||||||||||||
| Net investment income: | ||||||||||||||||||||
Class A | (3,247,820 | ) | (5,896,331 | ) | (440 | ) | (183 | ) | ||||||||||||
Class C | (904,950 | ) | (544,144 | ) | — | — | ||||||||||||||
Class R | (16,392 | ) | (19,531 | ) | — | — | ||||||||||||||
Class P | (1,716,876 | ) | (2,825,989 | ) | — | — | ||||||||||||||
Institutional Class | (21,501,646 | ) | (31,697,379 | ) | (458,572 | ) | (103,157 | ) | ||||||||||||
Administrative Class | (27,745 | ) | (34,432 | ) | — | — | ||||||||||||||
| Net realized capital gains: | ||||||||||||||||||||
Class A | — | (33,068,126 | ) | — | — | |||||||||||||||
Class C | — | (7,505,117 | ) | — | — | |||||||||||||||
Class R | — | (124,747 | ) | — | — | |||||||||||||||
Class P | — | (11,746,459 | ) | — | — | |||||||||||||||
Institutional Class | — | (110,785,553 | ) | — | — | |||||||||||||||
Administrative Class | — | (152,922 | ) | — | — | |||||||||||||||
| Total dividends and distributions to shareholders | (27,415,429 | ) | (204,400,730 | ) | (459,012 | ) | (103,340 | ) | ||||||||||||
| Fund Share Transactions: | ||||||||||||||||||||
| Net proceeds from the sale of shares | 48,077,974 | 244,769,331 | 5,238,949 | 28,268,747 | ||||||||||||||||
| Issued in reinvestment of dividends and distributions | 13,463,380 | 126,464,875 | 306,003 | 87,870 | ||||||||||||||||
| Cost of shares redeemed | (459,380,315 | ) | (980,825,900 | ) | (11,825,081 | ) | (4,904,364 | ) | ||||||||||||
| Net increase (decrease) from Fund share transactions | (397,838,961 | ) | (609,591,694 | ) | (6,280,129 | ) | 23,452,253 | |||||||||||||
| Total increase (decrease) in net assets | (346,884,822 | ) | (711,366,648 | ) | (4,839,571 | ) | 29,050,050 | |||||||||||||
| Net Assets: | ||||||||||||||||||||
| Beginning of period | 1,508,581,116 | 2,219,947,764 | 44,678,232 | 15,628,182 | ||||||||||||||||
| End of period* | $ | 1,161,696,294 | $ | 1,508,581,116 | $ | 39,838,661 | $ | 44,678,232 | ||||||||||||
* Including undistributed (dividends in excess of) net investment income of: | $ | (1,682,321 | ) | $ | 15,493,746 | $ | 72,399 | $ | 393,442 | |||||||||||
| 234 | Semiannual Report | | March 31, 2017 | | See accompanying Notes to Financial Statements |
Table of Contents
AllianzGI Emerging Markets Debt | AllianzGI Emerging Markets Small-Cap | AllianzGI Europe Equity Dividend | ||||||||||||||||||||||||
| Six Months ended March 31, 2017 (Unaudited) | Year ended September 30, 2016 | Six Months ended March 31, 2017 (Unaudited) | Year ended September 30, 2016 | Six Months ended March 31, 2017 (Unaudited) | Year ended September 30, 2016 | |||||||||||||||||||||
| $ | 1,131,899 | $ | 1,880,984 | $ | (28,015 | ) | $ | 184,324 | $ | 99,593 | $ | 138,765 | ||||||||||||||
| 490,491 | (271,486 | ) | 286,994 | (1,035,540 | ) | (144,823 | ) | (23,444 | ) | |||||||||||||||||
| (954,228 | ) | 4,137,601 | 1,030,757 | 1,666,074 | 293,374 | 157,530 | ||||||||||||||||||||
| 668,162 | 5,747,099 | 1,289,736 | 814,858 | 248,144 | 272,851 | |||||||||||||||||||||
| (4,044 | ) | (4,625 | ) | (1 | ) | (9,645 | ) | (1,764 | ) | (1,113 | ) | |||||||||||||||
| (2,805 | ) | (2,090 | ) | — | — | (455 | ) | (316 | ) | |||||||||||||||||
| — | — | — | — | — | — | |||||||||||||||||||||
| (393 | ) | (464 | ) | — | — | (188 | ) | (278 | ) | |||||||||||||||||
| (1,503,038 | ) | (1,801,169 | ) | (364,500 | ) | (79,256 | ) | (123,578 | ) | (130,128 | ) | |||||||||||||||
| — | — | — | — | — | — | |||||||||||||||||||||
| — | — | — | — | — | — | |||||||||||||||||||||
| — | — | — | — | — | — | |||||||||||||||||||||
| — | — | — | — | — | — | |||||||||||||||||||||
| — | — | — | — | — | — | |||||||||||||||||||||
| — | — | — | — | — | — | |||||||||||||||||||||
| — | — | — | — | — | — | |||||||||||||||||||||
| (1,510,280 | ) | (1,808,348 | ) | (364,501 | ) | (88,901 | ) | (125,985 | ) | (131,835 | ) | |||||||||||||||
| 4,726,087 | 22,212,763 | 1,088,512 | 7,653,373 | 334,043 | 3,337,194 | |||||||||||||||||||||
| 1,509,781 | 1,808,016 | 364,501 | 88,901 | 125,985 | 131,835 | |||||||||||||||||||||
| (7,168,691 | ) | (12,931,857 | ) | (2,073,328 | ) | (3,576,086 | ) | (209,398 | ) | (219,963 | ) | |||||||||||||||
| (932,823 | ) | 11,088,922 | (620,315 | ) | 4,166,188 | 250,630 | 3,249,066 | |||||||||||||||||||
| (1,774,941 | ) | 15,027,673 | 304,920 | 4,892,145 | 372,789 | 3,390,082 | ||||||||||||||||||||
| 43,612,945 | 28,585,272 | 13,434,310 | 8,542,165 | 6,347,112 | 2,957,030 | |||||||||||||||||||||
| $ | 41,838,004 | $ | 43,612,945 | $ | 13,739,230 | $ | 13,434,310 | $ | 6,719,901 | $ | 6,347,112 | |||||||||||||||
| $ | (290,022 | ) | $ | 88,359 | $ | (202,619 | ) | $ | 189,897 | $ | 69,351 | $ | 95,743 | |||||||||||||
| See accompanying Notes to Financial Statements | | March 31, 2017 | | Semiannual Report | 235 |
Table of Contents
Statements of Changes in Net Assets (cont’d)
| AllianzGI Global Dynamic Allocation | AllianzGI Global Fundamental Strategy | |||||||||||||||||||
| Six Months ended March 31, 2017 (Unaudited) | Year ended September 30, 2016 | Six Months ended March 31, 2017 (Unaudited) | Year ended September 30, 2016 | |||||||||||||||||
| Increase (Decrease) in Net Assets from: | ||||||||||||||||||||
Investment Operations: | ||||||||||||||||||||
| Net investment income (loss) | $ | 1,226,056 | $ | 416,529 | $ | 143,111 | $ | 386,522 | ||||||||||||
| Net realized gain (loss) | 1,916,676 | (173,488 | ) | 451,266 | (382,281 | ) | ||||||||||||||
| Net change in unrealized appreciation/depreciation | 7,553,667 | 1,410,312 | (312,292 | ) | 1,490,200 | |||||||||||||||
Net increase (decrease) in net assets resulting from investment operations | 10,696,399 | 1,653,353 | 282,085 | 1,494,441 | ||||||||||||||||
| Dividends and Distributions to Shareholders from: | ||||||||||||||||||||
| Net investment income: | ||||||||||||||||||||
Class A | (2 | ) | (35,715 | ) | (3,055 | ) | (7,081 | ) | ||||||||||||
Class C | (2 | ) | (299 | ) | (267 | ) | (299 | ) | ||||||||||||
Class D† | — | — | — | — | ||||||||||||||||
Class R | — | # | (1,110 | ) | — | — | ||||||||||||||
Class P | (58,830 | ) | (587 | ) | (271 | ) | (398 | ) | ||||||||||||
Institutional Class | (21,336 | ) | (306,026 | ) | (365,717 | ) | (752,175 | ) | ||||||||||||
Class R6 | (887,497 | ) | — | — | — | |||||||||||||||
Administrative Class | — | # | (150 | ) | — | — | ||||||||||||||
| Net realized capital gains: | ||||||||||||||||||||
Class A | — | (44,679 | ) | (1,806 | ) | (1,029 | ) | |||||||||||||
Class C | — | (17,578 | ) | (182 | ) | (61 | ) | |||||||||||||
Class R | — | (2,463 | ) | — | — | |||||||||||||||
Class P | — | (823 | ) | (146 | ) | (62 | ) | |||||||||||||
Institutional Class | — | (333,608 | ) | (206,259 | ) | (115,372 | ) | |||||||||||||
Administrative Class | — | (298 | ) | — | — | |||||||||||||||
| Total dividends and distributions to shareholders | (967,667 | ) | (743,336 | ) | (577,703 | ) | (876,477 | ) | ||||||||||||
| Fund Share Transactions: | ||||||||||||||||||||
| Net proceeds from the sale of shares | 224,176,781 | 59,468,302 | 137,936 | 390,979 | ||||||||||||||||
| Issued in reinvestment of dividends and distributions | 967,667 | 739,603 | 577,703 | 876,464 | ||||||||||||||||
| Cost of shares redeemed | (33,822,048 | ) | (15,310,215 | ) | (252,335 | ) | (5,403,824 | ) | ||||||||||||
| Net increase (decrease) from Fund share transactions | 191,322,400 | 44,897,690 | 463,304 | 4,136,381 | ||||||||||||||||
| Total increase (decrease) in net assets | 201,051,132 | 45,807,707 | 167,686 | (3,518,417 | ) | |||||||||||||||
| Net Assets: | ||||||||||||||||||||
| Beginning of period | 53,343,193 | 7,535,486 | 16,000,561 | 19,518,978 | ||||||||||||||||
| End of period* | $ | 254,394,325 | $ | 53,343,193 | $ | 16,168,247 | $ | 16,000,561 | ||||||||||||
* Including undistributed (dividends in excess of) net investment income of: | $ | 462,155 | $ | 203,766 | $ | (608,031 | ) | $ | 381,832 | |||||||||||
| † | Class D shares converted to Class A shares at the close of business on November 13, 2015. See Note12(a) in Notes to Financial Statements. |
| # | Actual amount rounds to less than $1. |
| 236 | Semiannual Report | | March 31, 2017 | | See accompanying Notes to Financial Statements |
Table of Contents
AllianzGI Global Sustainability | AllianzGI Global Water | AllianzGI High Yield Bond | ||||||||||||||||||||||||
| Six Months ended March 31, 2017 (Unaudited) | Year ended September 30, 2016 | Six Months ended March 31, 2017 (Unaudited) | Year ended September 30, 2016 | Six Months ended March 31, 2017 (Unaudited) | Year ended September 30, 2016 | |||||||||||||||||||||
| $ | 110,695 | $ | 234,441 | $ | (678,605 | ) | $ | 2,213,362 | $ | 10,174,287 | $ | 21,349,081 | ||||||||||||||
| 175,343 | 40,628 | 7,646,694 | 3,460,884 | (1,223,564 | ) | (20,425,942 | ) | |||||||||||||||||||
| 957,075 | 1,734,696 | (15,986,052 | ) | 73,362,133 | 5,337,739 | 32,134,897 | ||||||||||||||||||||
| 1,243,113 | 2,009,765 | (9,017,963 | ) | 79,036,379 | 14,288,462 | 33,058,036 | ||||||||||||||||||||
| (1,050 | ) | (863 | ) | (789,589 | ) | (360,797 | ) | (1,629,270 | ) | (3,538,852 | ) | |||||||||||||||
| — | — | (64 | ) | (61 | ) | (325,471 | ) | (841,872 | ) | |||||||||||||||||
| — | — | — | — | — | (179,229 | ) | ||||||||||||||||||||
| — | — | — | — | (34,374 | ) | (74,154 | ) | |||||||||||||||||||
| (86 | ) | (86 | ) | (754,192 | ) | (380,771 | ) | (1,633,610 | ) | (3,815,179 | ) | |||||||||||||||
| (232,687 | ) | (28,973 | ) | (626,991 | ) | (216,258 | ) | (6,765,578 | ) | (14,017,373 | ) | |||||||||||||||
| — | — | — | — | — | — | |||||||||||||||||||||
| — | — | — | — | (54,910 | ) | (127,620 | ) | |||||||||||||||||||
| (240 | ) | — | (1,387,866 | ) | (272,544 | ) | — | — | ||||||||||||||||||
| — | — | (545,689 | ) | (126,665 | ) | — | — | |||||||||||||||||||
| — | — | — | — | — | — | |||||||||||||||||||||
| (20 | ) | — | (783,556 | ) | (146,928 | ) | — | — | ||||||||||||||||||
| (45,540 | ) | — | (456,756 | ) | (61,596 | ) | — | — | ||||||||||||||||||
| — | — | — | — | — | — | |||||||||||||||||||||
| (279,623 | ) | (29,922 | ) | (5,344,703 | ) | (1,565,620 | ) | (10,443,213 | ) | (22,594,279 | ) | |||||||||||||||
| 3,858,748 | 17,389,176 | 170,728,026 | 238,288,669 | 128,371,804 | 273,213,485 | |||||||||||||||||||||
| 279,623 | 29,922 | 4,160,836 | 1,105,269 | 9,984,520 | 21,533,926 | |||||||||||||||||||||
| (1,157,899 | ) | (1,550,321 | ) | (137,508,282 | ) | (136,008,943 | ) | (162,622,217 | ) | (268,748,335 | ) | |||||||||||||||
| 2,980,472 | 15,868,777 | 37,380,580 | 103,384,995 | (24,265,893 | ) | 25,999,076 | ||||||||||||||||||||
| 3,943,962 | 17,848,620 | 23,017,914 | 180,855,754 | (20,420,644 | ) | 36,462,833 | ||||||||||||||||||||
| 20,746,139 | 2,897,519 | 523,894,858 | 343,039,104 | 360,741,736 | 324,278,903 | |||||||||||||||||||||
| $ | 24,690,101 | $ | 20,746,139 | $ | 546,912,772 | $ | 523,894,858 | $ | 340,321,092 | $ | 360,741,736 | |||||||||||||||
| $ | 105,153 | $ | 228,281 | $ | (961,499 | ) | $ | 1,887,942 | $ | (1,741,751 | ) | $ | (1,472,825 | ) | ||||||||||||
| See accompanying Notes to Financial Statements | | March 31, 2017 | | Semiannual Report | 237 |
Table of Contents
Statements of Changes in Net Assets (cont’d)
| AllianzGI International Growth | AllianzGI International Small-Cap | |||||||||||||||||||
| Six Months ended March 31, 2017 (Unaudited) | Year ended September 30, 2016 | Six Months ended March 31, 2017 (Unaudited) | Year ended September 30, 2016 | |||||||||||||||||
| Increase (Decrease) in Net Assets from: | ||||||||||||||||||||
Investment Operations: | ||||||||||||||||||||
| Net investment income (loss) | $ | 21,235 | $ | 29,165 | $ | (160,094 | ) | $ | 442,834 | |||||||||||
| Net realized gain (loss) | (106,917 | ) | (122,738 | ) | 2,357,940 | (2,691,708 | ) | |||||||||||||
| Net change in unrealized appreciation/depreciation | 368,201 | 885,239 | (1,676,474 | ) | 5,674,777 | |||||||||||||||
Net increase (decrease) in net assets resulting from investment operations | 282,519 | 791,666 | 521,372 | 3,425,903 | ||||||||||||||||
| Dividends and Distributions to Shareholders from: | ||||||||||||||||||||
| Net investment income: | ||||||||||||||||||||
Class A | (1 | ) | (382 | ) | (80,265 | ) | (149,275 | ) | ||||||||||||
Class C | — | — | (18,676 | ) | (19,686 | ) | ||||||||||||||
Class R | — | — | (1,374 | ) | (591 | ) | ||||||||||||||
Class P | — | — | (403,029 | ) | (234,787 | ) | ||||||||||||||
Institutional Class | (29,197 | ) | (20,891 | ) | (225,723 | ) | (354,831 | ) | ||||||||||||
Class R6 | — | — | (147,555 | ) | — | |||||||||||||||
| Net realized capital gains: | ||||||||||||||||||||
Class A | — | — | — | (727,377 | ) | |||||||||||||||
Class C | — | — | — | (140,483 | ) | |||||||||||||||
Class R | — | — | — | (4,705 | ) | |||||||||||||||
Class P | — | — | — | (1,616,911 | ) | |||||||||||||||
Institutional Class | — | — | — | (2,670,300 | ) | |||||||||||||||
| Total dividends and distributions to shareholders | (29,198 | ) | (21,273 | ) | (876,622 | ) | (5,918,946 | ) | ||||||||||||
| Fund Share Transactions: | ||||||||||||||||||||
| Net proceeds from the sale of shares | 197,103 | 24,930,150 | 17,930,587 | 71,511,297 | ||||||||||||||||
| Issued in reinvestment of dividends and distributions | 29,198 | 21,273 | 846,217 | 5,547,080 | ||||||||||||||||
| Cost of shares redeemed | (152,520 | ) | (169,556 | ) | (28,041,197 | ) | (85,484,282 | ) | ||||||||||||
| Net increase (decrease) from Fund share transactions | 73,781 | 24,781,867 | (9,264,393 | ) | (8,425,905 | ) | ||||||||||||||
| Total increase (decrease) in net assets | 327,102 | 25,552,260 | (9,619,643 | ) | (10,918,948 | ) | ||||||||||||||
| Net Assets: | ||||||||||||||||||||
| Beginning of period | 28,436,917 | 2,884,657 | 101,634,229 | 112,553,177 | ||||||||||||||||
| End of period* | $ | 28,764,019 | $ | 28,436,917 | $ | 92,014,586 | $ | 101,634,229 | ||||||||||||
* Including undistributed (dividends in excess of) net investment income of: | $ | (592 | ) | $ | 7,371 | $ | (541,800 | ) | $ | 494,916 | ||||||||||
| 238 | Semiannual Report | | March 31, 2017 | | See accompanying Notes to Financial Statements |
Table of Contents
| AllianzGI Micro Cap | AllianzGI Multi-Asset Real Return | AllianzGI NFJ Emerging Markets Value | ||||||||||||||||||||||||
| Six Months ended March 31, 2017 (Unaudited) | Year ended September 30, 2016 | Six Months ended March 31, 2017 (Unaudited) | Year ended September 30, 2016 | Six Months ended March 31, 2017 (Unaudited) | Year ended September 30, 2016 | |||||||||||||||||||||
| $ | (204,775 | ) | $ | (466,608 | ) | $ | 29,947 | $ | 43,840 | $ | 108,945 | $ | 267,418 | |||||||||||||
| 1,438,608 | 2,502,822 | (146,256 | ) | (362,838 | ) | 356,062 | (1,208,498 | ) | ||||||||||||||||||
| 960,725 | 1,762,113 | 39,177 | 611,281 | 1,055,103 | 2,334,598 | |||||||||||||||||||||
| 2,194,558 | 3,798,327 | (77,132 | ) | 292,283 | 1,520,110 | 1,393,518 | ||||||||||||||||||||
| — | — | (11,681 | ) | (2,941 | ) | (37,041 | ) | (44,592 | ) | |||||||||||||||||
| — | — | (288 | ) | (800 | ) | (1 | ) | (2,414 | ) | |||||||||||||||||
| — | — | — | — | — | — | |||||||||||||||||||||
| — | — | (118 | ) | (201 | ) | (187,814 | ) | (3,152 | ) | |||||||||||||||||
| — | — | (44,638 | ) | (64,521 | ) | (24,435 | ) | (231,048 | ) | |||||||||||||||||
| — | — | — | — | — | — | |||||||||||||||||||||
| (308,524 | ) | (697,207 | ) | — | — | — | — | |||||||||||||||||||
| — | — | — | — | — | — | |||||||||||||||||||||
| — | — | — | — | — | — | |||||||||||||||||||||
| (116,680 | ) | (133,274 | ) | — | — | — | — | |||||||||||||||||||
| (2,920,919 | ) | (1,893,315 | ) | — | — | — | — | |||||||||||||||||||
| (3,346,123 | ) | (2,723,796 | ) | (56,725 | ) | (68,463 | ) | (249,291 | ) | (281,206 | ) | |||||||||||||||
| 4,834,925 | 8,269,136 | 712,853 | 382,166 | 31,766,381 | 3,136,026 | |||||||||||||||||||||
| 3,336,639 | 2,718,464 | 56,725 | 68,463 | 249,291 | 281,206 | |||||||||||||||||||||
| (6,134,220 | ) | (28,761,188 | ) | (188,384 | ) | (1,522,703 | ) | (17,186,855 | ) | (3,771,411 | ) | |||||||||||||||
| 2,037,344 | (17,773,588 | ) | 581,194 | (1,072,074 | ) | 14,828,817 | (354,179 | ) | ||||||||||||||||||
| 885,779 | (16,699,057 | ) | 447,337 | (848,254 | ) | 16,099,636 | 758,133 | |||||||||||||||||||
| 35,444,830 | 52,143,887 | 3,686,072 | 4,534,326 | 8,762,740 | 8,004,607 | |||||||||||||||||||||
| $ | 36,330,609 | $ | 35,444,830 | $ | 4,133,409 | $ | 3,686,072 | $ | 24,862,376 | $ | 8,762,740 | |||||||||||||||
| $ | (514,453 | ) | $ | (309,678 | ) | $ | 6,930 | $ | 33,708 | $ | (37,416 | ) | $ | 102,930 | ||||||||||||
| See accompanying Notes to Financial Statements | | March 31, 2017 | | Semiannual Report | 239 |
Table of Contents
Statements of Changes in Net Assets (cont’d)
| AllianzGI NFJ Global Dividend Value | AllianzGI NFJ International Small-Cap Value | |||||||||||||||||||
| Six Months ended March 31, 2017 (Unaudited) | Year ended September 30, 2016 | Six Months ended March 31, 2017 (Unaudited) | Year ended September 30, 2016 | |||||||||||||||||
| Increase (Decrease) in Net Assets from: | ||||||||||||||||||||
Investment Operations: | ||||||||||||||||||||
| Net investment income | $ | 191,393 | $ | 413,010 | $ | 23,612 | $ | 279,122 | ||||||||||||
| Net realized gain (loss) | 614,931 | (2,361,752 | ) | (47,108 | ) | (733,813 | ) | |||||||||||||
| Net change in unrealized appreciation/depreciation | 814,400 | 3,131,810 | (162,425 | ) | 1,322,622 | |||||||||||||||
Net increase (decrease) in net assets resulting from investment operations | 1,620,724 | 1,183,068 | (185,921 | ) | 867,931 | |||||||||||||||
| Dividends and Distributions to Shareholders from: | ||||||||||||||||||||
| Net investment income: | ||||||||||||||||||||
Class A | (29,825 | ) | (137,180 | ) | (52,747 | ) | (161,276 | ) | ||||||||||||
Class C | (30,961 | ) | (201,282 | ) | (47,236 | ) | (37,634 | ) | ||||||||||||
Class D† | — | — | — | — | ||||||||||||||||
Class P | (19,279 | ) | (41,830 | ) | (4,723 | ) | (2,868 | ) | ||||||||||||
Institutional Class | (95,683 | ) | (242,171 | ) | (86,365 | ) | (164,431 | ) | ||||||||||||
Class R6 | — | — | (123,590 | ) | (479 | ) | ||||||||||||||
| Net realized capital gains: | ||||||||||||||||||||
Class A | — | (575,075 | ) | — | (91,565 | ) | ||||||||||||||
Class C | — | (543,193 | ) | — | (26,789 | ) | ||||||||||||||
Class P | — | (113,118 | ) | — | (1,001 | ) | ||||||||||||||
Institutional Class | — | (1,026,877 | ) | — | (116,929 | ) | ||||||||||||||
Class R6 | — | — | — | (205 | ) | |||||||||||||||
| Total dividends and distributions to shareholders | (175,748 | ) | (2,880,726 | ) | (314,661 | ) | (603,177 | ) | ||||||||||||
| Fund Share Transactions: | ||||||||||||||||||||
| Net proceeds from the sale of shares | 10,479,194 | 3,721,831 | 417,425 | 10,473,798 | ||||||||||||||||
| Issued in reinvestment of dividends and distributions | 173,767 | 2,777,118 | 313,688 | 600,370 | ||||||||||||||||
| Cost of shares redeemed | (7,135,581 | ) | (13,265,714 | ) | (7,508,725 | ) | (11,730,760 | ) | ||||||||||||
| Net increase (decrease) from Fund share transactions | 3,517,380 | (6,766,765 | ) | (6,777,612 | ) | (656,592 | ) | |||||||||||||
| Total increase (decrease) in net assets | 4,962,356 | (8,464,423 | ) | (7,278,194 | ) | (391,838 | ) | |||||||||||||
| Net Assets: | ||||||||||||||||||||
| Beginning of period | 13,971,691 | 22,436,114 | 11,950,141 | 12,341,979 | ||||||||||||||||
| End of period* | $ | 18,934,047 | $ | 13,971,691 | $ | 4,671,947 | $ | 11,950,141 | ||||||||||||
* Including undistributed (dividends in excess of) net investment income of: | $ | 35,874 | $ | 20,229 | $ | (18,154 | ) | $ | 272,895 | |||||||||||
| † | Class D shares converted to Class A shares at the close of business on November 13, 2015. |
| 240 | Semiannual Report | | March 31, 2017 | | See accompanying Notes to Financial Statements |
Table of Contents
| AllianzGI NFJ International Value II | AllianzGI Short Duration High Income | AllianzGI Structured Return | ||||||||||||||||||||||||
| Six Months ended March 31, 2017 (Unaudited) | Year ended September 30, 2016 | Six Months ended March 31, 2017 (Unaudited) | Year ended September 30, 2016 | Six Months ended March 31, 2017 (Unaudited) | Year ended September 30, 2016 | |||||||||||||||||||||
| $ | 54,928 | $ | 1,143,353 | $ | 30,921,584 | $ | 50,716,435 | $ | 644,776 | $ | 1,603,871 | |||||||||||||||
| 145,575 | (5,928,573 | ) | 952,138 | (15,926,496 | ) | 4,414,951 | 5,941,364 | |||||||||||||||||||
| (528,042 | ) | 6,231,160 | (1,983,105 | ) | 43,895,976 | 2,704,588 | 404,100 | |||||||||||||||||||
| (327,539 | ) | 1,445,940 | 29,890,617 | 78,685,915 | 7,764,315 | 7,949,335 | |||||||||||||||||||
| (1,487 | ) | (8,556 | ) | (5,996,763 | ) | (10,590,036 | ) | (451,149 | ) | (176,625 | ) | |||||||||||||||
| (1,302 | ) | (3,758 | ) | (3,672,191 | ) | (5,945,656 | ) | (9 | ) | (26,324 | ) | |||||||||||||||
| — | — | — | (118,879 | ) | — | — | ||||||||||||||||||||
| (1,145 | ) | (7,572 | ) | (19,072,136 | ) | (21,309,437 | ) | (255,992 | ) | (30,878 | ) | |||||||||||||||
| (236,277 | ) | (1,312,530 | ) | (11,580,389 | ) | (22,448,609 | ) | (445,419 | ) | (345,012 | ) | |||||||||||||||
| — | — | (183,771 | ) | — | (430,190 | ) | — | |||||||||||||||||||
| — | — | — | — | (2,431,302 | ) | (283,648 | ) | |||||||||||||||||||
| — | — | — | — | (318,922 | ) | (53,864 | ) | |||||||||||||||||||
| — | — | — | — | (667,014 | ) | (22,778 | ) | |||||||||||||||||||
| — | — | — | — | (2,447,379 | ) | (534,089 | ) | |||||||||||||||||||
| — | — | — | — | (836,737 | ) | — | ||||||||||||||||||||
| (240,211 | ) | (1,332,416 | ) | (40,505,250 | ) | (60,412,617 | ) | (8,284,113 | ) | (1,473,218 | ) | |||||||||||||||
| 60,176 | 731,750 | 781,901,976 | 886,369,043 | 211,361,926 | 289,603,948 | |||||||||||||||||||||
| 240,211 | 1,332,416 | 35,660,931 | 51,669,532 | 8,240,525 | 1,472,510 | |||||||||||||||||||||
| (43,069,588 | ) | (1,326,763 | ) | (445,617,342 | ) | (693,711,108 | ) | (113,012,047 | ) | (98,080,857 | ) | |||||||||||||||
| (42,769,201 | ) | 737,403 | 371,945,565 | 244,327,467 | 106,590,404 | 192,995,601 | ||||||||||||||||||||
| (43,336,951 | ) | 850,927 | 361,330,932 | 262,600,765 | 106,070,606 | 199,471,718 | ||||||||||||||||||||
| 44,410,353 | 43,559,426 | 1,333,518,659 | 1,070,917,894 | 276,333,279 | 76,861,561 | |||||||||||||||||||||
| $ | 1,073,402 | $ | 44,410,353 | $ | 1,694,849,591 | $ | 1,333,518,659 | $ | 382,403,885 | $ | 276,333,279 | |||||||||||||||
$ | (93,269 | ) | $ | 92,014 | $ | (16,065,535 | ) | $ | (6,481,869 | ) | $ | 491,123 | $ | 1,429,106 | ||||||||||||
| See accompanying Notes to Financial Statements | | March 31, 2017 | | Semiannual Report | 241 |
Table of Contents
Statements of Changes in Net Assets (cont’d)
| AllianzGI U.S. Equity Hedged | AllianzGI U.S. Small-Cap Growth | |||||||||||||||||||
| Six Months ended March 31, 2017 (Unaudited) | Year ended September 30, 2016 | Six Months ended March 31, 2017 (Unaudited) | Year ended September 30, 2016 | |||||||||||||||||
| Increase (Decrease) in Net Assets from: | ||||||||||||||||||||
Investment Operations: | ||||||||||||||||||||
| Net investment income (loss) | $ | 20,242 | $ | 58,176 | $ | (45,102 | ) | $ | (165,509 | ) | ||||||||||
| Net realized gain (loss) | (34,399 | ) | (837,767 | ) | 2,407,771 | 1,024,453 | ||||||||||||||
| Net change in unrealized appreciation/depreciation | 317,282 | 1,152,266 | (1,203,533 | ) | (53,519 | ) | ||||||||||||||
Net increase in net assets resulting from investment operations | 303,125 | 372,675 | 1,159,136 | 805,425 | ||||||||||||||||
| Dividends and Distributions to Shareholders from: | ||||||||||||||||||||
| Net investment income: | ||||||||||||||||||||
Class A | (8,562 | ) | (16,120 | ) | — | — | ||||||||||||||
Class C | (2,502 | ) | (6,391 | ) | — | — | ||||||||||||||
Class P | (428 | ) | (313 | ) | — | — | ||||||||||||||
Institutional Class | (46,862 | ) | (138,687 | ) | — | — | ||||||||||||||
| Net realized capital gains: | ||||||||||||||||||||
Class A | — | — | (170,611 | ) | (253,462 | ) | ||||||||||||||
Class C | — | — | (101,338 | ) | (48,431 | ) | ||||||||||||||
Class R | — | — | (3,969 | ) | (1,567 | ) | ||||||||||||||
Class P | — | — | (124,490 | ) | (22,583 | ) | ||||||||||||||
Institutional Class | — | — | (2,884,758 | ) | (1,846,506 | ) | ||||||||||||||
| Total dividends and distributions to shareholders | (58,354 | ) | (161,511 | ) | (3,285,166 | ) | (2,172,549 | ) | ||||||||||||
| Fund Share Transactions: | ||||||||||||||||||||
| Net proceeds from the sale of shares | 382,343 | 1,528,997 | 2,641,907 | 5,404,951 | ||||||||||||||||
| Issued in reinvestment of dividends and distributions | 58,354 | 161,511 | 3,265,541 | 1,965,824 | ||||||||||||||||
| Cost of shares redeemed | (1,416,620 | ) | (10,873,059 | ) | (10,415,650 | ) | (19,143,775 | ) | ||||||||||||
| Net decrease from Fund share transactions | (975,923 | ) | (9,182,551 | ) | (4,508,202 | ) | (11,773,000 | ) | ||||||||||||
| Total decrease in net assets | (731,152 | ) | (8,971,387 | ) | (6,634,232 | ) | (13,140,124 | ) | ||||||||||||
| Net Assets: | ||||||||||||||||||||
| Beginning of period | 5,651,636 | 14,623,023 | 23,619,494 | 36,759,618 | ||||||||||||||||
| End of period* | $ | 4,920,484 | $ | 5,651,636 | $ | 16,985,262 | $ | 23,619,494 | ||||||||||||
* Including undistributed (dividends in excess of) net investment income of: | $ | 19,816 | $ | 57,928 | $ | (227,903 | ) | $ | (182,801 | ) | ||||||||||
| 242 | Semiannual Report | | March 31, 2017 | | See accompanying Notes to Financial Statements |
Table of Contents
| AllianzGI Ultra Micro Cap | ||||||||||
| Six Months ended March 31, 2017 (Unaudited) | Year ended September 30, 2016 | |||||||||
| $ | (383,753 | ) | $ | (1,067,614 | ) | |||||
| 4,037,772 | 4,921,545 | |||||||||
| (947,089 | ) | (2,310,398 | ) | |||||||
| 2,706,930 | 1,543,533 | |||||||||
| — | — | |||||||||
| — | — | |||||||||
| — | — | |||||||||
| — | — | |||||||||
| (1,391,792 | ) | (3,400,965 | ) | |||||||
| — | — | |||||||||
| — | — | |||||||||
| (447,225 | ) | (652,144 | ) | |||||||
| (1,792,480 | ) | (3,098,107 | ) | |||||||
| (3,631,497 | ) | (7,151,216 | ) | |||||||
| 4,970,753 | 6,892,032 | |||||||||
| 3,563,191 | 7,063,080 | |||||||||
| (13,923,170 | ) | (52,638,177 | ) | |||||||
| (5,389,226 | ) | (38,683,065 | ) | |||||||
| (6,313,793 | ) | (44,290,748 | ) | |||||||
| 48,159,372 | 92,450,120 | |||||||||
| $ | 41,845,579 | $ | 48,159,372 | |||||||
| $ | (1,088,955 | ) | $ | (705,202 | ) | |||||
| See accompanying Notes to Financial Statements | | March 31, 2017 | | Semiannual Report | 243 |
Table of Contents
For a Share Outstanding for the Period ended:
| Net Asset Value, Beginning of Period | Net Investment Income(a) | Net Realized | Total from Investment Operations | Dividends from Net Investment Income | Distributions from Net Realized Capital Gains | |||||||||||||||||||||||
| AllianzGI Retirement 2020: | ||||||||||||||||||||||||||||
| Class A | ||||||||||||||||||||||||||||
3/31/2017+ | $ | 19.20 | $ | 0.17 | $ | 0.34 | $ | 0.51 | $ | (0.46 | ) | $ | — | |||||||||||||||
9/30/2016 | 18.09 | 0.46 | 1.23 | 1.69 | (0.58 | ) | — | |||||||||||||||||||||
12/1/2014 - 9/30/2015# | 19.72 | 0.46 | (1.45 | ) | (0.99 | ) | (0.56 | ) | (0.08 | ) | ||||||||||||||||||
11/30/2014 | 19.32 | 0.41 | 0.37 | 0.78 | (0.38 | ) | — | |||||||||||||||||||||
11/30/2013 | 19.15 | 0.49 | 0.21 | 0.70 | (0.48 | ) | (0.05 | ) | ||||||||||||||||||||
11/30/2012 | 18.82 | 0.44 | 1.34 | 1.78 | (0.70 | ) | (0.75 | ) | ||||||||||||||||||||
11/30/2011 | 19.43 | 0.49 | 0.04 | 0.53 | (0.83 | ) | (0.31 | ) | ||||||||||||||||||||
| Class C | ||||||||||||||||||||||||||||
3/31/2017+ | $ | 19.10 | $ | 0.10 | $ | 0.35 | $ | 0.45 | $ | (0.38 | ) | $ | — | |||||||||||||||
9/30/2016 | 18.02 | 0.31 | 1.22 | 1.53 | (0.45 | ) | — | |||||||||||||||||||||
12/1/2014 - 9/30/2015# | 19.60 | 0.36 | (1.47 | ) | (1.11 | ) | (0.39 | ) | (0.08 | ) | ||||||||||||||||||
11/30/2014 | 19.16 | 0.27 | 0.35 | 0.62 | (0.18 | ) | — | |||||||||||||||||||||
11/30/2013 | 18.78 | 0.31 | 0.26 | 0.57 | (0.14 | ) | (0.05 | ) | ||||||||||||||||||||
11/30/2012 | 18.53 | 0.37 | 1.23 | 1.60 | (0.60 | ) | (0.75 | ) | ||||||||||||||||||||
11/30/2011 | 19.21 | 0.30 | 0.09 | 0.39 | (0.76 | ) | (0.31 | ) | ||||||||||||||||||||
| Class R | ||||||||||||||||||||||||||||
3/31/2017+ | $ | 19.21 | $ | 0.16 | $ | (0.23 | ) | $ | (0.07 | ) | $ | (0.38 | ) | $ | — | |||||||||||||
9/30/2016 | 18.10 | 0.40 | 1.22 | 1.62 | (0.51 | ) | — | |||||||||||||||||||||
12/1/2014 - 9/30/2015# | 19.70 | 0.39 | (1.43 | ) | (1.04 | ) | (0.48 | ) | (0.08 | ) | ||||||||||||||||||
11/30/2014 | 19.27 | 0.35 | 0.36 | 0.71 | (0.28 | ) | — | |||||||||||||||||||||
11/30/2013 | 19.14 | 0.43 | 0.21 | 0.64 | (0.46 | ) | (0.05 | ) | ||||||||||||||||||||
11/30/2012 | 18.81 | 0.18 | 1.54 | 1.72 | (0.64 | ) | (0.75 | ) | ||||||||||||||||||||
11/30/2011 | 19.40 | 0.53 | (0.05 | ) | 0.48 | (0.76 | ) | (0.31 | ) | |||||||||||||||||||
| Class P | ||||||||||||||||||||||||||||
3/31/2017+ | $ | 19.41 | $ | 0.20 | $ | 0.35 | $ | 0.55 | $ | (0.55 | ) | $ | — | |||||||||||||||
9/30/2016 | 18.34 | 0.52 | 1.24 | 1.76 | (0.69 | ) | — | |||||||||||||||||||||
12/1/2014 - 9/30/2015# | 19.98 | 0.46 | (1.42 | ) | (0.96 | ) | (0.60 | ) | (0.08 | ) | ||||||||||||||||||
11/30/2014 | 19.53 | 0.47 | 0.38 | 0.85 | (0.40 | ) | — | |||||||||||||||||||||
11/30/2013 | 19.30 | 0.47 | 0.30 | 0.77 | (0.49 | ) | (0.05 | ) | ||||||||||||||||||||
11/30/2012 | 18.94 | 0.37 | 1.47 | 1.84 | (0.73 | ) | (0.75 | ) | ||||||||||||||||||||
11/30/2011 | 19.51 | 0.42 | 0.16 | 0.58 | (0.84 | ) | (0.31 | ) | ||||||||||||||||||||
| Class R6 | ||||||||||||||||||||||||||||
3/31/2017+ | $ | 19.43 | $ | 0.20 | $ | 0.37 | $ | 0.57 | $ | (0.57 | ) | $ | — | |||||||||||||||
9/30/2016 | 18.37 | 0.54 | 1.23 | 1.77 | (0.71 | ) | — | |||||||||||||||||||||
12/1/2014 - 9/30/2015# | 20.01 | 0.51 | (1.45 | ) | (0.94 | ) | (0.62 | ) | (0.08 | ) | ||||||||||||||||||
11/30/2014 | 19.57 | 0.51 | 0.35 | 0.86 | (0.42 | ) | — | |||||||||||||||||||||
11/30/2013 | 19.32 | 0.58 | 0.21 | 0.79 | (0.49 | ) | (0.05 | ) | ||||||||||||||||||||
11/30/2012 | 18.96 | 0.55 | 1.31 | 1.86 | (0.75 | ) | (0.75 | ) | ||||||||||||||||||||
11/30/2011 | 19.53 | 0.64 | (0.04 | ) | 0.60 | (0.86 | ) | (0.31 | ) | |||||||||||||||||||
| Administrative Class | ||||||||||||||||||||||||||||
3/31/2017+ | $ | 19.28 | $ | 0.21 | $ | 0.32 | $ | 0.53 | $ | (0.43 | ) | $ | — | |||||||||||||||
9/30/2016 | 18.22 | 0.51 | 1.18 | 1.69 | (0.63 | ) | — | |||||||||||||||||||||
12/1/2014 - 9/30/2015# | 19.84 | 0.87 | (1.86 | ) | (0.99 | ) | (0.55 | ) | (0.08 | ) | ||||||||||||||||||
11/30/2014 | 19.42 | 0.43 | 0.36 | 0.79 | (0.37 | ) | — | |||||||||||||||||||||
11/30/2013 | 19.25 | 0.24 | 0.47 | 0.71 | (0.49 | ) | (0.05 | ) | ||||||||||||||||||||
11/30/2012 | 18.90 | 0.51 | 1.28 | 1.79 | (0.69 | ) | (0.75 | ) | ||||||||||||||||||||
11/30/2011 | 19.48 | 0.59 | (0.05 | ) | 0.54 | (0.81 | ) | (0.31 | ) | |||||||||||||||||||
| + | Unaudited |
| # | Fiscal year end changed from November 30th to September 30th. |
| (a) | Calculated on average shares outstanding during the period. |
| (b) | Total return is calculated assuming a purchase of a share on the first day of the period and a sale of a share on the last day of each period reported. Dividends and distributions, if any, are assumed, for purposes of this calculation, to be reinvested. Total return does not reflect sales charges and includes the effect of fee waivers and reimbursements. Total return may reflect adjustments to conform to U.S. GAAP. Total return for a period of less than one year is not annualized. |
| 244 | Semiannual Report | | March 31, 2017 | | See accompanying Notes to Financial Statements |
Table of Contents
Total Dividends and Distributions | Net Asset Value, End of Period | Total Return (b) | Net Assets, End of Period (000s) | Ratio of Expenses to Assets with Fee Waiver/ | Ratio of Expenses to Assets without Fee Waiver/ | Ratio of Net to Average | Portfolio Turnover Rate | |||||||||||||||||||||||||||
| $ | (0.46 | ) | $ | 19.25 | 2.77 | % | $ | 12,835 | 0.37 | %(d) | 0.61 | %(d) | 1.75 | %(d) | 123 | % | ||||||||||||||||||
| (0.58 | ) | 19.20 | 9.57 | 12,715 | 0.48 | 0.60 | 2.51 | 106 | ||||||||||||||||||||||||||
| (0.64 | ) | 18.09 | (5.13 | ) | 30,401 | 0.47 | (d)(e) | 0.62 | (d)(e) | 2.93 | (d)(e) | 144 | ||||||||||||||||||||||
| (0.38 | ) | 19.72 | 4.11 | 34,624 | 0.42 | 0.60 | 2.08 | 89 | ||||||||||||||||||||||||||
| (0.53 | ) | 19.32 | 3.75 | 9,102 | 0.40 | 0.60 | 2.60 | 86 | ||||||||||||||||||||||||||
| (1.45 | ) | 19.15 | 10.23 | 985 | 0.38 | 0.60 | 2.40 | 55 | ||||||||||||||||||||||||||
| (1.14 | ) | 18.82 | 2.82 | 351 | 0.48 | 2.71 | 2.56 | 56 | ||||||||||||||||||||||||||
| $ | (0.38 | ) | $ | 19.17 | 2.43 | % | $ | 423 | 1.12 | %(d) | 1.36 | %(d) | 1.03 | %(d) | 123 | % | ||||||||||||||||||
| (0.45 | ) | 19.10 | 8.68 | 408 | 1.23 | 1.35 | 1.71 | 106 | ||||||||||||||||||||||||||
| (0.47 | ) | 18.02 | (5.72 | ) | 327 | 1.22 | (d)(e) | 1.37 | (d)(e) | 2.28 | (d)(e) | 144 | ||||||||||||||||||||||
| (0.18 | ) | 19.60 | 3.29 | 468 | 1.17 | 1.35 | 1.39 | 89 | ||||||||||||||||||||||||||
| (0.19 | ) | 19.16 | 3.02 | 438 | 1.15 | 1.35 | 1.64 | 86 | ||||||||||||||||||||||||||
| (1.35 | ) | 18.78 | 9.29 | 364 | 1.13 | 1.35 | 2.07 | 55 | ||||||||||||||||||||||||||
| (1.07 | ) | 18.53 | 2.07 | 669 | 1.23 | 3.40 | 1.61 | 56 | ||||||||||||||||||||||||||
| $ | (0.38 | ) | $ | 18.76 | (0.37 | )% | $ | 1 | 0.72 | %(d) | 0.86 | %(d) | 1.70 | %(d) | 123 | % | ||||||||||||||||||
| (0.51 | ) | 19.21 | 9.12 | 649 | 0.83 | 0.85 | 2.18 | 106 | ||||||||||||||||||||||||||
| (0.56 | ) | 18.10 | (5.39 | ) | 1,043 | 0.82 | (d)(e) | 0.87 | (d)(e) | 2.49 | (d)(e) | 144 | ||||||||||||||||||||||
| (0.28 | ) | 19.70 | 3.72 | 1,008 | 0.77 | 0.85 | 1.81 | 89 | ||||||||||||||||||||||||||
| (0.51 | ) | 19.27 | 3.40 | 1,022 | 0.75 | 0.85 | 2.26 | 86 | ||||||||||||||||||||||||||
| (1.39 | ) | 19.14 | 9.84 | 938 | 0.73 | 0.85 | 0.97 | 55 | ||||||||||||||||||||||||||
| (1.07 | ) | 18.81 | 2.57 | 14 | 0.77 | 3.09 | 2.77 | 56 | ||||||||||||||||||||||||||
| $ | (0.55 | ) | $ | 19.41 | 2.95 | % | $ | 21,842 | 0.07 | %(d) | 0.21 | %(d) | 2.06 | %(d) | 123 | % | ||||||||||||||||||
| (0.69 | ) | 19.41 | 9.88 | 25,879 | 0.18 | 0.20 | 2.82 | 106 | ||||||||||||||||||||||||||
| (0.68 | ) | 18.34 | (4.89 | ) | 21,193 | 0.17 | (d)(e) | 0.22 | (d)(e) | 2.91 | (d)(e) | 144 | ||||||||||||||||||||||
| (0.40 | ) | 19.98 | 4.43 | 12,665 | 0.12 | 0.20 | 2.38 | 89 | ||||||||||||||||||||||||||
| (0.54 | ) | 19.53 | 4.06 | 7,643 | 0.10 | 0.20 | 2.44 | 86 | ||||||||||||||||||||||||||
| (1.48 | ) | 19.30 | 10.55 | 5,323 | 0.08 | 0.20 | 1.95 | 55 | ||||||||||||||||||||||||||
| (1.15 | ) | 18.94 | 3.07 | 42 | 0.17 | 1.39 | 2.24 | 56 | ||||||||||||||||||||||||||
| $ | (0.57 | ) | $ | 19.43 | 3.02 | % | $ | 17,656 | — | %(d)(f) | 0.11 | %(d) | 2.07 | %(d) | 123 | % | ||||||||||||||||||
| (0.71 | ) | 19.43 | 9.94 | 13,274 | 0.08 | 0.10 | 2.93 | 106 | ||||||||||||||||||||||||||
| (0.70 | ) | 18.37 | (4.82 | ) | 11,847 | 0.07 | (d)(e) | 0.12 | (d)(e) | 3.22 | (d)(e) | 144 | ||||||||||||||||||||||
| (0.42 | ) | 20.01 | 4.48 | 5,574 | 0.02 | 0.10 | 2.59 | 89 | ||||||||||||||||||||||||||
| (0.54 | ) | 19.57 | 4.19 | 7,457 | — | 0.12 | 3.00 | 86 | ||||||||||||||||||||||||||
| (1.50 | ) | 19.32 | 10.62 | 7,708 | — | (f) | 0.15 | 2.98 | 55 | |||||||||||||||||||||||||
| (1.17 | ) | 18.96 | 3.16 | 5,157 | 0.17 | 2.51 | 3.34 | 56 | ||||||||||||||||||||||||||
| $ | (0.43 | ) | $ | 19.38 | 2.84 | % | $ | 589 | 0.32 | %(d) | 0.46 | %(d) | 2.18 | %(d) | 123 | % | ||||||||||||||||||
| (0.63 | ) | 19.28 | 9.55 | 377 | 0.43 | 0.45 | 2.76 | 106 | ||||||||||||||||||||||||||
| (0.63 | ) | 18.22 | (5.09 | ) | 1,747 | 0.41 | (d)(e) | 0.46 | (d)(e) | 5.41 | (d)(e) | 144 | ||||||||||||||||||||||
| (0.37 | ) | 19.84 | 4.15 | 7,974 | 0.37 | 0.45 | 2.19 | 89 | ||||||||||||||||||||||||||
| (0.54 | ) | 19.42 | 3.79 | 7,210 | 0.35 | 0.45 | 1.27 | 86 | ||||||||||||||||||||||||||
| (1.44 | ) | 19.25 | 10.20 | 15 | 0.33 | 0.45 | 2.73 | 55 | ||||||||||||||||||||||||||
| (1.12 | ) | 18.90 | 2.87 | 14 | 0.44 | 2.78 | 3.09 | 56 | ||||||||||||||||||||||||||
| (c) | Does not include expenses of the investment companies in which the Fund invests. |
| (d) | Annualized, unless otherwise noted. |
| (e) | Certain expenses incurred by the Fund were not annualized. |
| (f) | See Note 6 in the Notes to Financial Statements. |
| See accompanying Notes to Financial Statements | | March 31, 2017 | | Semiannual Report | 245 |
Table of Contents
Financial Highlights (cont’d)
For a Share Outstanding for the Period ended:
| Net Asset Value, Beginning of Period | Net Investment Income (a) | Net Realized | Total from Investment Operations | Dividends from Net Investment Income | Distributions from Net Realized Capital Gains | |||||||||||||||||||||||
| AllianzGI Retirement 2025: | ||||||||||||||||||||||||||||
| Class A | ||||||||||||||||||||||||||||
3/31/2017+ | $ | 16.95 | $ | 0.10 | $ | 0.59 | $ | 0.69 | $ | (0.32 | ) | $ | (0.01 | ) | ||||||||||||||
9/30/2016 | 15.89 | 0.40 | 1.16 | 1.56 | (0.50 | ) | — | |||||||||||||||||||||
12/1/2014 - 9/30/2015# | 17.30 | 0.41 | (1.31 | ) | (0.90 | ) | (0.50 | ) | (0.01 | ) | ||||||||||||||||||
11/30/2014 | 16.92 | 0.37 | 0.33 | 0.70 | (0.32 | ) | — | |||||||||||||||||||||
11/30/2013 | 16.63 | 0.41 | 0.32 | 0.73 | (0.40 | ) | (0.04 | ) | ||||||||||||||||||||
12/19/2011* - 11/30/2012 | 15.00 | 0.34 | 1.43 | 1.77 | (0.14 | ) | — | |||||||||||||||||||||
| Class R | ||||||||||||||||||||||||||||
3/31/2017+ | $ | 16.89 | $ | 0.09 | $ | 0.55 | $ | 0.64 | $ | (0.36 | ) | $ | (0.01 | ) | ||||||||||||||
9/30/2016 | 15.83 | 0.34 | 1.16 | 1.50 | (0.44 | ) | — | |||||||||||||||||||||
12/1/2014 - 9/30/2015# | 17.21 | 0.34 | (1.29 | ) | (0.95 | ) | (0.42 | ) | (0.01 | ) | ||||||||||||||||||
11/30/2014 | 16.84 | 0.32 | 0.32 | 0.64 | (0.27 | ) | — | |||||||||||||||||||||
11/30/2013 | 16.57 | 0.48 | 0.19 | 0.67 | (0.36 | ) | (0.04 | ) | ||||||||||||||||||||
12/19/2011* - 11/30/2012 | 15.00 | 0.18 | 1.53 | 1.71 | (0.14 | ) | — | |||||||||||||||||||||
| Class P | ||||||||||||||||||||||||||||
3/31/2017+ | $ | 17.05 | $ | 0.13 | $ | 0.57 | $ | 0.70 | $ | (0.46 | ) | $ | (0.01 | ) | ||||||||||||||
9/30/2016 | 16.01 | 0.44 | 1.19 | 1.63 | (0.59 | ) | — | |||||||||||||||||||||
12/1/2014 - 9/30/2015# | 17.43 | 0.38 | (1.24 | ) | (0.86 | ) | (0.55 | ) | (0.01 | ) | ||||||||||||||||||
11/30/2014 | 17.02 | 0.40 | 0.35 | 0.75 | (0.34 | ) | — | |||||||||||||||||||||
11/30/2013 | 16.67 | 0.48 | 0.31 | 0.79 | (0.40 | ) | (0.04 | ) | ||||||||||||||||||||
12/19/2011* - 11/30/2012 | 15.00 | 0.38 | 1.44 | 1.82 | (0.15 | ) | — | |||||||||||||||||||||
| Class R6 | ||||||||||||||||||||||||||||
3/31/2017+ | $ | 17.07 | $ | 0.13 | $ | 0.58 | $ | 0.71 | $ | (0.47 | ) | $ | (0.01 | ) | ||||||||||||||
9/30/2016 | 16.03 | 0.45 | 1.19 | 1.64 | (0.60 | ) | — | |||||||||||||||||||||
12/1/2014 - 9/30/2015# | 17.45 | 0.45 | (1.30 | ) | (0.85 | ) | (0.56 | ) | (0.01 | ) | ||||||||||||||||||
11/30/2014 | 17.04 | 0.44 | 0.33 | 0.77 | (0.36 | ) | — | |||||||||||||||||||||
11/30/2013 | 16.68 | 0.50 | 0.30 | 0.80 | (0.40 | ) | (0.04 | ) | ||||||||||||||||||||
12/19/2011* - 11/30/2012 | 15.00 | 0.45 | 1.38 | 1.83 | (0.15 | ) | — | |||||||||||||||||||||
| Administrative Class | ||||||||||||||||||||||||||||
3/31/2017+ | $ | 17.00 | $ | 0.11 | $ | 0.57 | $ | 0.68 | $ | (0.36 | ) | $ | (0.01 | ) | ||||||||||||||
9/30/2016 | 15.96 | 0.41 | 1.17 | 1.58 | (0.54 | ) | — | |||||||||||||||||||||
12/1/2014 - 9/30/2015# | 17.37 | 1.16 | (2.06 | ) | (0.90 | ) | (0.50 | ) | (0.01 | ) | ||||||||||||||||||
11/30/2014 | 16.98 | 0.38 | 0.33 | 0.71 | (0.32 | ) | — | |||||||||||||||||||||
11/30/2013 | 16.62 | 0.20 | 0.55 | 0.75 | (0.35 | ) | (0.04 | ) | ||||||||||||||||||||
12/19/2011* - 11/30/2012 | 15.00 | 0.41 | 1.35 | 1.76 | (0.14 | ) | — | |||||||||||||||||||||
| + | Unaudited |
| # | Fiscal year end changed from November 30th to September 30th. |
| * | Commencement of operations. |
| (a) | Calculated on average shares outstanding during the period. |
| (b) | Total return is calculated assuming a purchase of a share on the first day of the period and a sale of a share on the last day of each period reported. Dividends and distributions, if any, are assumed, for purposes of this calculation, to be reinvested. Total return does not reflect sales charges and includes the effect of fee waivers and reimbursements. Total return may reflect adjustments to conform to U.S. GAAP. Total return for a period of less than one year is not annualized. |
| 246 | Semiannual Report | | March 31, 2017 | | See accompanying Notes to Financial Statements |
Table of Contents
| Total Dividends and Distributions | Net Asset Value, End of Period | Total Return (b) | Net Assets, End of Period (000s) | Ratio of Expenses to Average Net Assets with Fee Waiver/ Reimbursement (c) | Ratio of Expenses to Average Net Assets without Fee Waiver/ Reimbursement (c) | Ratio of Net Investment Income to Average Net Assets (c) | Portfolio Turnover Rate | |||||||||||||||||||||||||||
| $ | (0.33 | ) | $ | 17.31 | 4.15 | % | $ | 7,166 | 0.34 | %(d) | 0.61 | %(d) | 1.17 | %(d) | 123 | % | ||||||||||||||||||
| (0.50 | ) | 16.95 | 10.02 | 6,663 | 0.48 | 0.60 | 2.48 | 115 | ||||||||||||||||||||||||||
| (0.51 | ) | 15.89 | (5.28 | ) | 26,916 | 0.45 | (d)(e) | 0.62 | (d)(e) | 2.98 | (d)(e) | 147 | ||||||||||||||||||||||
| (0.32 | ) | 17.30 | 4.22 | 31,358 | 0.41 | 0.60 | 2.16 | 93 | ||||||||||||||||||||||||||
| (0.44 | ) | 16.92 | 4.54 | 13,058 | 0.40 | 0.60 | 2.48 | 76 | ||||||||||||||||||||||||||
| (0.14 | ) | 16.63 | 11.86 | 335 | 0.38 | (d) | 0.60 | (d) | 2.22 | (d) | 55 | |||||||||||||||||||||||
| $ | (0.37 | ) | $ | 17.16 | 3.90 | % | $ | 203 | 0.69 | %(d) | 0.86 | %(d) | 1.11 | %(d) | 123 | % | ||||||||||||||||||
| (0.44 | ) | 16.89 | 9.67 | 835 | 0.83 | 0.85 | 2.08 | 115 | ||||||||||||||||||||||||||
| (0.43 | ) | 15.83 | (5.59 | ) | 1,066 | 0.80 | (d)(e) | 0.87 | (d)(e) | 2.43 | (d)(e) | 147 | ||||||||||||||||||||||
| (0.27 | ) | 17.21 | 3.83 | 1,004 | 0.76 | 0.85 | 1.89 | 93 | ||||||||||||||||||||||||||
| (0.40 | ) | 16.84 | 4.16 | 753 | 0.75 | 0.85 | 2.88 | 76 | ||||||||||||||||||||||||||
| (0.14 | ) | 16.57 | 11.51 | 1,284 | 0.73 | (d) | 0.85 | (d) | 1.19 | (d) | 55 | |||||||||||||||||||||||
| $ | (0.47 | ) | $ | 17.28 | 4.25 | % | $ | 35,005 | 0.04 | %(d) | 0.21 | %(d) | 1.53 | %(d) | 123 | % | ||||||||||||||||||
| (0.59 | ) | 17.05 | 10.43 | 34,729 | 0.18 | 0.20 | 2.70 | 115 | ||||||||||||||||||||||||||
| (0.56 | ) | 16.01 | (5.04 | ) | 29,233 | 0.15 | (d)(e) | 0.22 | (d)(e) | 2.71 | (d)(e) | 147 | ||||||||||||||||||||||
| (0.34 | ) | 17.43 | 4.49 | 13,866 | 0.11 | 0.20 | 2.32 | 93 | ||||||||||||||||||||||||||
| (0.44 | ) | 17.02 | 4.84 | 4,336 | 0.10 | 0.20 | 2.88 | 76 | ||||||||||||||||||||||||||
| (0.15 | ) | 16.67 | 12.21 | 3,873 | 0.08 | (d) | 0.20 | (d) | 2.47 | (d) | 55 | |||||||||||||||||||||||
| $ | (0.48 | ) | $ | 17.30 | 4.31 | % | $ | 18,281 | — | %(d)(f) | 0.11 | %(d) | 1.51 | %(d) | 123 | % | ||||||||||||||||||
| (0.60 | ) | 17.07 | 10.55 | 12,439 | 0.08 | 0.10 | 2.78 | 115 | ||||||||||||||||||||||||||
| (0.57 | ) | 16.03 | (4.97 | ) | 10,047 | 0.05 | (d)(e) | 0.12 | (d)(e) | 3.25 | (d)(e) | 147 | ||||||||||||||||||||||
| (0.36 | ) | 17.45 | 4.60 | 6,745 | 0.01 | 0.10 | 2.54 | 93 | ||||||||||||||||||||||||||
| (0.44 | ) | 17.04 | 4.93 | 5,058 | — | 0.12 | 3.02 | 76 | ||||||||||||||||||||||||||
| (0.15 | ) | 16.68 | 12.28 | 5,375 | — | (d)(f) | 0.15 | (d) | 2.94 | (d) | 55 | |||||||||||||||||||||||
| $ | (0.37 | ) | $ | 17.31 | 4.12 | % | $ | 659 | 0.29 | %(d) | 0.46 | %(d) | 1.31 | %(d) | 123 | % | ||||||||||||||||||
| (0.54 | ) | 17.00 | 10.12 | 585 | 0.43 | 0.45 | 2.56 | 115 | ||||||||||||||||||||||||||
| (0.51 | ) | 15.96 | (5.26 | ) | 1,165 | 0.39 | (d)(e) | 0.46 | (d)(e) | 8.16 | (d)(e) | 147 | ||||||||||||||||||||||
| (0.32 | ) | 17.37 | 4.26 | 12,135 | 0.36 | 0.45 | 2.23 | 93 | ||||||||||||||||||||||||||
| (0.39 | ) | 16.98 | 4.60 | 10,606 | 0.35 | 0.45 | 1.23 | 76 | ||||||||||||||||||||||||||
| (0.14 | ) | 16.62 | 11.86 | 11 | 0.33 | (d) | 0.45 | (d) | 2.72 | (d) | 55 | |||||||||||||||||||||||
| (c) | Does not include expenses of the investment companies in which the Fund invests. |
| (d) | Annualized, unless otherwise noted. |
| (e) | Certain expenses incurred by the Fund were not annualized. |
| (f) | See Note 6 in the Notes to Financial Statements. |
| See accompanying Notes to Financial Statements | | March 31, 2017 | | Semiannual Report | 247 |
Table of Contents
Financial Highlights (cont’d)
For a Share Outstanding for the Period ended:
Net Asset | Net Investment Income (a) | Net Realized and Change in Unrealized Gain (Loss) | Total from Investment Operations | Dividends from Net Investment Income | Distributions from Net Realized Capital Gains | |||||||||||||||||||||||
| AllianzGI Retirement 2030: | ||||||||||||||||||||||||||||
| Class A | ||||||||||||||||||||||||||||
3/31/2017+ | $ | 20.14 | $ | 0.11 | $ | 0.97 | $ | 1.08 | $ | (0.35 | ) | $ | (0.08 | ) | ||||||||||||||
9/30/2016 | 18.84 | 0.44 | 1.39 | 1.83 | (0.53 | ) | — | |||||||||||||||||||||
12/1/2014 - 9/30/2015# | 21.05 | 0.50 | (1.75 | ) | (1.25 | ) | (0.69 | ) | (0.27 | ) | ||||||||||||||||||
11/30/2014 | 20.66 | 0.48 | 0.38 | 0.86 | (0.47 | ) | — | |||||||||||||||||||||
11/30/2013 | 19.80 | 0.52 | 0.92 | 1.44 | (0.54 | ) | (0.04 | ) | ||||||||||||||||||||
11/30/2012 | 19.77 | 0.29 | 1.61 | 1.90 | (0.70 | ) | (1.17 | ) | ||||||||||||||||||||
11/30/2011 | 20.78 | 0.50 | (0.10 | ) | 0.40 | (0.85 | ) | (0.56 | ) | |||||||||||||||||||
| Class C | ||||||||||||||||||||||||||||
3/31/2017+ | $ | 19.96 | $ | 0.03 | $ | 0.96 | $ | 0.99 | $ | (0.28 | ) | $ | (0.08 | ) | ||||||||||||||
9/30/2016 | 18.70 | 0.27 | 1.41 | 1.68 | (0.42 | ) | — | |||||||||||||||||||||
12/1/2014 - 9/30/2015# | 20.83 | 0.36 | (1.72 | ) | (1.36 | ) | (0.50 | ) | (0.27 | ) | ||||||||||||||||||
11/30/2014 | 20.42 | 0.33 | 0.36 | 0.69 | (0.28 | ) | — | |||||||||||||||||||||
11/30/2013 | 19.53 | 0.35 | 0.93 | 1.28 | (0.35 | ) | (0.04 | ) | ||||||||||||||||||||
11/30/2012 | 19.51 | 0.43 | 1.30 | 1.73 | (0.54 | ) | (1.17 | ) | ||||||||||||||||||||
11/30/2011 | 20.59 | 0.37 | (0.09 | ) | 0.28 | (0.80 | ) | (0.56 | ) | |||||||||||||||||||
| Class R | ||||||||||||||||||||||||||||
3/31/2017+ | $ | 20.11 | $ | 0.11 | $ | 0.93 | $ | 1.04 | $ | (0.36 | ) | $ | (0.08 | ) | ||||||||||||||
9/30/2016 | 18.89 | 0.36 | 1.40 | 1.76 | (0.54 | ) | — | |||||||||||||||||||||
12/1/2014 - 9/30/2015# | 21.07 | 0.42 | (1.72 | ) | (1.30 | ) | (0.61 | ) | (0.27 | ) | ||||||||||||||||||
11/30/2014 | 20.65 | 0.41 | 0.37 | 0.78 | (0.36 | ) | — | |||||||||||||||||||||
11/30/2013 | 19.85 | 0.46 | 0.91 | 1.37 | (0.53 | ) | (0.04 | ) | ||||||||||||||||||||
11/30/2012 | 19.81 | 0.18 | 1.67 | 1.85 | (0.64 | ) | (1.17 | ) | ||||||||||||||||||||
11/30/2011 | 20.80 | 0.52 | (0.15 | ) | 0.37 | (0.80 | ) | (0.56 | ) | |||||||||||||||||||
| Class P | ||||||||||||||||||||||||||||
3/31/2017+ | $ | 20.43 | $ | 0.14 | $ | 0.98 | $ | 1.12 | $ | (0.48 | ) | $ | (0.08 | ) | ||||||||||||||
9/30/2016 | 19.14 | 0.48 | 1.44 | 1.92 | (0.63 | ) | — | |||||||||||||||||||||
12/1/2014 - 9/30/2015# | 21.37 | 0.47 | (1.69 | ) | (1.22 | ) | (0.74 | ) | (0.27 | ) | ||||||||||||||||||
11/30/2014 | 20.93 | 0.51 | 0.43 | 0.94 | (0.50 | ) | — | |||||||||||||||||||||
11/30/2013 | 20.02 | 0.51 | 1.00 | 1.51 | (0.56 | ) | (0.04 | ) | ||||||||||||||||||||
11/30/2012 | 19.95 | 0.41 | 1.57 | 1.98 | (0.74 | ) | (1.17 | ) | ||||||||||||||||||||
11/30/2011 | 20.92 | 0.58 | (0.12 | ) | 0.46 | (0.87 | ) | (0.56 | ) | |||||||||||||||||||
| Class R6 | ||||||||||||||||||||||||||||
3/31/2017+ | $ | 20.48 | $ | 0.15 | $ | 0.99 | $ | 1.14 | $ | (0.50 | ) | $ | (0.08 | ) | ||||||||||||||
9/30/2016 | 19.19 | 0.50 | 1.44 | 1.94 | (0.65 | ) | — | |||||||||||||||||||||
12/1/2014 - 9/30/2015# | 21.42 | 0.54 | (1.74 | ) | (1.20 | ) | (0.76 | ) | (0.27 | ) | ||||||||||||||||||
11/30/2014 | 20.98 | 0.59 | 0.36 | 0.95 | (0.51 | ) | — | |||||||||||||||||||||
11/30/2013 | 20.04 | 0.62 | 0.92 | 1.54 | (0.56 | ) | (0.04 | ) | ||||||||||||||||||||
11/30/2012 | 19.97 | 0.61 | 1.38 | 1.99 | (0.75 | ) | (1.17 | ) | ||||||||||||||||||||
11/30/2011 | 20.94 | 0.62 | (0.14 | ) | 0.48 | (0.89 | ) | (0.56 | ) | |||||||||||||||||||
| Administrative Class | ||||||||||||||||||||||||||||
3/31/2017+ | $ | 20.34 | $ | 0.12 | $ | 0.98 | $ | 1.10 | $ | (0.40 | ) | $ | (0.08 | ) | ||||||||||||||
9/30/2016 | 19.06 | 0.45 | 1.41 | 1.86 | (0.58 | ) | — | |||||||||||||||||||||
12/1/2014 - 9/30/2015# | 21.28 | 1.21 | (2.47 | ) | (1.26 | ) | (0.69 | ) | (0.27 | ) | ||||||||||||||||||
11/30/2014 | 20.87 | 0.50 | 0.38 | 0.88 | (0.47 | ) | — | |||||||||||||||||||||
11/30/2013 | 19.96 | 0.26 | 1.21 | 1.47 | (0.52 | ) | (0.04 | ) | ||||||||||||||||||||
11/30/2012 | 19.91 | 0.57 | 1.35 | 1.92 | (0.70 | ) | (1.17 | ) | ||||||||||||||||||||
11/30/2011 | 20.88 | 0.58 | (0.14 | ) | 0.44 | (0.85 | ) | (0.56 | ) | |||||||||||||||||||
| + | Unaudited |
| # | Fiscal year end changed from November 30th to September 30th. |
| (a) | Calculated on average shares outstanding during the period. |
| (b) | Total return is calculated assuming a purchase of a share on the first day of the period and a sale of a share on the last day of each period reported. Dividends and distributions, if any, are assumed, for purposes of this calculation, to be reinvested. Total return does not reflect sales charges and includes the effect of fee waivers and reimbursements. Total return may reflect adjustments to conform to U.S. GAAP. Total return for a period of less than one year is not annualized. |
| 248 | Semiannual Report | | March 31, 2017 | | See accompanying Notes to Financial Statements |
Table of Contents
| Total Dividends and Distributions | Net Asset Value, End of Period | Total Return (b) | Net Assets, End of Period (000s) | Ratio of Expenses to Average Net Assets with Fee Waiver/ Reimbursement (c) | Ratio of Expenses to Average Net Assets without Fee Waiver/ Reimbursement (c) | Ratio of Net Investment Income to Average Net Assets (c) | Portfolio Turnover Rate | |||||||||||||||||||||||||||
| $ | (0.43 | ) | $ | 20.79 | 5.47 | % | $ | 8,127 | 0.35 | %(d) | 0.61 | %(d) | 1.05 | %(d) | 115 | % | ||||||||||||||||||
| (0.53 | ) | 20.14 | 9.91 | 7,473 | 0.47 | 0.60 | 2.26 | 105 | ||||||||||||||||||||||||||
| (0.96 | ) | 18.84 | (6.16 | ) | 22,695 | 0.42 | (d)(e) | 0.62 | (d)(e) | 3.01 | (d)(e) | 147 | ||||||||||||||||||||||
| (0.47 | ) | 21.05 | 4.26 | 25,487 | 0.39 | 0.60 | 2.28 | 93 | ||||||||||||||||||||||||||
| (0.58 | ) | 20.66 | 7.48 | 10,080 | 0.35 | 0.60 | 2.58 | 79 | ||||||||||||||||||||||||||
| (1.87 | ) | 19.80 | 10.68 | 10,692 | 0.29 | 0.60 | 1.48 | 47 | ||||||||||||||||||||||||||
| (1.41 | ) | 19.77 | 1.76 | 460 | 0.45 | 2.50 | 2.43 | 52 | ||||||||||||||||||||||||||
| $ | (0.36 | ) | $ | 20.59 | 5.05 | % | $ | 741 | 1.10 | %(d) | 1.36 | %(d) | 0.28 | %(d) | 115 | % | ||||||||||||||||||
| (0.42 | ) | 19.96 | 9.11 | 696 | 1.22 | 1.35 | 1.44 | 105 | ||||||||||||||||||||||||||
| (0.77 | ) | 18.70 | (6.72 | ) | 608 | 1.17 | (d)(e) | 1.37 | (d)(e) | 2.19 | (d)(e) | 147 | ||||||||||||||||||||||
| (0.28 | ) | 20.83 | 3.43 | 680 | 1.14 | 1.35 | 1.59 | 93 | ||||||||||||||||||||||||||
| (0.39 | ) | 20.42 | 6.63 | 736 | 1.10 | 1.35 | 1.77 | 79 | ||||||||||||||||||||||||||
| (1.71 | ) | 19.53 | 9.80 | 605 | 1.04 | 1.35 | 2.26 | 47 | ||||||||||||||||||||||||||
| (1.36 | ) | 19.51 | 1.20 | 654 | 1.21 | 3.34 | 1.84 | 52 | ||||||||||||||||||||||||||
| $ | (0.44 | ) | $ | 20.71 | 5.30 | % | $ | 444 | 0.70 | %(d) | 0.86 | %(d) | 1.06 | %(d) | 115 | % | ||||||||||||||||||
| (0.54 | ) | 20.11 | 9.48 | 2,295 | 0.82 | 0.85 | 1.87 | 105 | ||||||||||||||||||||||||||
| (0.88 | ) | 18.89 | (6.38 | ) | 1,445 | 0.77 | (d)(e) | 0.87 | (d)(e) | 2.49 | (d)(e) | 147 | ||||||||||||||||||||||
| (0.36 | ) | 21.07 | 3.85 | 1,420 | 0.74 | 0.85 | 1.94 | 93 | ||||||||||||||||||||||||||
| (0.57 | ) | 20.65 | 7.09 | 1,199 | 0.70 | 0.85 | 2.28 | 79 | ||||||||||||||||||||||||||
| (1.81 | ) | 19.85 | 10.23 | 1,103 | 0.64 | 0.85 | 0.95 | 47 | ||||||||||||||||||||||||||
| (1.36 | ) | 19.81 | 1.66 | 14 | 0.74 | 2.82 | 2.54 | 52 | ||||||||||||||||||||||||||
| $ | (0.56 | ) | $ | 20.99 | 5.64 | % | $ | 34,205 | 0.05 | %(d) | 0.21 | %(d) | 1.39 | %(d) | 115 | % | ||||||||||||||||||
| (0.63 | ) | 20.43 | 10.25 | 33,628 | 0.17 | 0.20 | 2.49 | 105 | ||||||||||||||||||||||||||
| (1.01 | ) | 19.14 | (5.91 | ) | 28,597 | 0.12 | (d)(e) | 0.22 | (d)(e) | 2.80 | (d)(e) | 147 | ||||||||||||||||||||||
| (0.50 | ) | 21.37 | 4.58 | 17,741 | 0.09 | 0.20 | 2.42 | 93 | ||||||||||||||||||||||||||
| (0.60 | ) | 20.93 | 7.77 | 7,748 | 0.05 | 0.20 | 2.54 | 79 | ||||||||||||||||||||||||||
| (1.91 | ) | 20.02 | 10.97 | 5,103 | — | (f) | 0.20 | 2.06 | 47 | |||||||||||||||||||||||||
| (1.43 | ) | 19.95 | 2.13 | 19 | 0.22 | 2.27 | 2.84 | 52 | ||||||||||||||||||||||||||
| $ | (0.58 | ) | $ | 21.04 | 5.70 | % | $ | 20,811 | — | %(d)(f) | 0.11 | %(d) | 1.45 | %(d) | 115 | % | ||||||||||||||||||
| (0.65 | ) | 20.48 | 10.34 | 16,758 | 0.07 | 0.10 | 2.54 | 105 | ||||||||||||||||||||||||||
| (1.03 | ) | 19.19 | (5.81 | ) | 12,883 | 0.02 | (d)(e) | 0.12 | (d)(e) | 3.19 | (d)(e) | 147 | ||||||||||||||||||||||
| (0.51 | ) | 21.42 | 4.63 | 8,752 | — | (f) | 0.10 | 2.79 | 93 | |||||||||||||||||||||||||
| (0.60 | ) | 20.98 | 7.87 | 10,854 | — | (f) | 0.12 | 3.05 | 79 | |||||||||||||||||||||||||
| (1.92 | ) | 20.04 | 11.07 | 9,182 | — | (f) | 0.15 | 3.14 | 47 | |||||||||||||||||||||||||
| (1.45 | ) | 19.97 | 2.23 | 5,813 | 0.13 | 2.24 | 3.04 | 52 | ||||||||||||||||||||||||||
| $ | (0.48 | ) | $ | 20.96 | 5.53 | % | $ | 1,253 | 0.30 | %(d) | 0.46 | %(d) | 1.16 | %(d) | 115 | % | ||||||||||||||||||
| (0.58 | ) | 20.34 | 9.96 | 1,250 | 0.42 | 0.45 | 2.33 | 105 | ||||||||||||||||||||||||||
| (0.96 | ) | 19.06 | (6.11 | ) | 1,817 | 0.36 | (d)(e) | 0.46 | (d)(e) | 7.07 | (d)(e) | 147 | ||||||||||||||||||||||
| (0.47 | ) | 21.28 | 4.29 | 9,586 | 0.34 | 0.45 | 2.37 | 93 | ||||||||||||||||||||||||||
| (0.56 | ) | 20.87 | 7.55 | 8,939 | 0.30 | 0.45 | 1.29 | 79 | ||||||||||||||||||||||||||
| (1.87 | ) | 19.96 | 10.60 | 16 | 0.24 | 0.45 | 2.95 | 47 | ||||||||||||||||||||||||||
| (1.41 | ) | 19.91 | 1.99 | 15 | 0.41 | 2.52 | 2.85 | 52 | ||||||||||||||||||||||||||
| (c) | Does not include expenses of the investment companies in which the Fund invests. |
| (d) | Annualized, unless otherwise noted. |
| (e) | Certain expenses incurred by the Fund were not annualized. |
| (f) | See Note 6 in the Notes to Financial Statements. |
| See accompanying Notes to Financial Statements | | March 31, 2017 | | Semiannual Report | 249 |
Table of Contents
Financial Highlights (cont’d)
For a Share Outstanding for the Period ended:
| Net Asset Value, Beginning of Period | Net Investment Income (a) | Net Realized and Change in Unrealized Gain (Loss) | Total from Investment Operations | Dividends from Net Investment Income | Distributions | |||||||||||||||||||||||||
| AllianzGI Retirement 2035: | ||||||||||||||||||||||||||||||
| Class A | ||||||||||||||||||||||||||||||
3/31/2017+ | $ | 17.69 | $ | 0.14 | $ | 1.04 | $ | 1.18 | $ | (0.34 | ) | $ | (0.09 | ) | ||||||||||||||||
9/30/2016 | 16.52 | 0.28 | 1.32 | 1.60 | (0.43 | ) | — | |||||||||||||||||||||||
12/1/2014 - 9/30/2015# | 18.49 | 0.43 | (1.58 | ) | (1.15 | ) | (0.61 | ) | (0.21 | ) | ||||||||||||||||||||
11/30/2014 | 18.09 | 0.41 | 0.39 | 0.80 | (0.40 | ) | — | |||||||||||||||||||||||
11/30/2013 | 16.94 | 0.43 | 1.20 | 1.63 | (0.42 | ) | (0.06 | ) | ||||||||||||||||||||||
12/19/2011* - 11/30/2012 | 15.00 | 0.37 | 1.74 | 2.11 | (0.17 | ) | — | |||||||||||||||||||||||
| Class R | ||||||||||||||||||||||||||||||
3/31/2017+ | $ | 17.62 | $ | 0.15 | $ | 0.99 | $ | 1.14 | $ | (0.32 | ) | $ | (0.09 | ) | ||||||||||||||||
9/30/2016 | 16.48 | 0.22 | 1.31 | 1.53 | (0.39 | ) | — | |||||||||||||||||||||||
12/1/2014 - 9/30/2015# | 18.43 | 0.30 | (1.50 | ) | (1.20 | ) | (0.54 | ) | (0.21 | ) | ||||||||||||||||||||
11/30/2014 | 18.00 | 0.35 | 0.38 | 0.73 | (0.30 | ) | — | |||||||||||||||||||||||
11/30/2013 | 16.89 | 0.41 | 1.15 | 1.56 | (0.39 | ) | (0.06 | ) | ||||||||||||||||||||||
12/19/2011* - 11/30/2012 | 15.00 | 0.16 | 1.90 | 2.06 | (0.17 | ) | — | |||||||||||||||||||||||
| Class P | ||||||||||||||||||||||||||||||
3/31/2017+ | $ | 17.82 | $ | 0.17 | $ | 1.06 | $ | 1.23 | $ | (0.44 | ) | $ | (0.09 | ) | ||||||||||||||||
9/30/2016 | 16.67 | 0.33 | 1.33 | 1.66 | (0.51 | ) | — | |||||||||||||||||||||||
12/1/2014 - 9/30/2015# | 18.65 | 0.38 | (1.50 | ) | (1.12 | ) | (0.65 | ) | (0.21 | ) | ||||||||||||||||||||
11/30/2014 | 18.20 | 0.43 | 0.43 | 0.86 | (0.41 | ) | — | |||||||||||||||||||||||
11/30/2013 | 16.99 | 0.49 | 1.20 | 1.69 | (0.42 | ) | (0.06 | ) | ||||||||||||||||||||||
12/19/2011* - 11/30/2012 | 15.00 | 0.38 | 1.79 | 2.17 | (0.18 | ) | — | |||||||||||||||||||||||
| Class R6 | ||||||||||||||||||||||||||||||
3/31/2017+ | $ | 17.86 | $ | 0.17 | $ | 1.06 | $ | 1.23 | $ | (0.46 | ) | $ | (0.09 | ) | ||||||||||||||||
9/30/2016 | 16.70 | 0.33 | 1.35 | 1.68 | (0.52 | ) | — | |||||||||||||||||||||||
12/1/2014 - 9/30/2015# | 18.68 | 0.48 | (1.58 | ) | (1.10 | ) | (0.67 | ) | (0.21 | ) | ||||||||||||||||||||
11/30/2014 | 18.23 | 0.49 | 0.38 | 0.87 | (0.42 | ) | — | |||||||||||||||||||||||
11/30/2013 | 17.00 | 0.54 | 1.17 | 1.71 | (0.42 | ) | (0.06 | ) | ||||||||||||||||||||||
12/19/2011* - 11/30/2012 | 15.00 | 0.46 | 1.72 | 2.18 | (0.18 | ) | — | |||||||||||||||||||||||
| Administrative Class | ||||||||||||||||||||||||||||||
3/31/2017+ | $ | 17.77 | $ | 0.15 | $ | 1.04 | $ | 1.19 | $ | (0.38 | ) | $ | (0.09 | ) | ||||||||||||||||
9/30/2016 | 16.60 | 0.29 | 1.33 | 1.62 | (0.45 | ) | — | |||||||||||||||||||||||
12/1/2014 - 9/30/2015# | 18.58 | 1.63 | (2.79 | ) | (1.16 | ) | (0.61 | ) | (0.21 | ) | ||||||||||||||||||||
11/30/2014 | 18.15 | 0.43 | 0.39 | 0.82 | (0.39 | ) | — | |||||||||||||||||||||||
11/30/2013 | 16.94 | 0.22 | 1.43 | 1.65 | (0.38 | ) | (0.06 | ) | ||||||||||||||||||||||
12/19/2011* - 11/30/2012 | 15.00 | 0.42 | 1.69 | 2.11 | (0.17 | ) | — | |||||||||||||||||||||||
| + | Unaudited |
| # | Fiscal year end changed from November 30th to September 30th. |
| * | Commencement of operations. |
| (a) | Calculated on average shares outstanding during the period. |
| (b) | Total return is calculated assuming a purchase of a share on the first day of the period and a sale of a share on the last day of each period reported. Dividends and distributions, if any, are assumed, for purposes of this calculation, to be reinvested. Total return does not reflect sales charges and includes the effect of fee waivers and reimbursements. Total return may reflect adjustments to conform to U.S. GAAP. Total return for a period of less than one year is not annualized. |
| (c) | Does not include expenses of the investment companies in which the Fund invests. |
| (d) | Annualized, unless otherwise noted. |
| (e) | Certain expenses incurred by the Fund were not annualized. |
| (f) | Less than 0.01%. |
| (g) | See Note 6 in the Notes to Financial Statements. |
| 250 | Semiannual Report | | March 31, 2017 | | See accompanying Notes to Financial Statements |
Table of Contents
| Total Dividends and Distributions | Net Asset Value, End of Period | Total Return (b) | Net Assets, End of Period (000s) | Ratio of Expenses to Average Net Assets with Fee Waiver/ Reimbursement (c) | Ratio of Expenses to Average Net Assets without Fee Waiver/ Reimbursement (c) | Ratio of Net Investment Income to Average Net Assets (c) | Portfolio Turnover Rate | |||||||||||||||||||||||||||
| $ | (0.43 | ) | $ | 18.44 | 6.82 | % | $ | 7,862 | 0.42 | %(d) | 0.61 | %(d) | 1.59 | %(d) | 111 | % | ||||||||||||||||||
| (0.43 | ) | 17.69 | 9.83 | 9,173 | 0.50 | 0.60 | 1.66 | 97 | ||||||||||||||||||||||||||
| (0.82 | ) | 16.52 | (6.46 | ) | 19,205 | 0.41 | (d)(e) | 0.61 | (d)(e) | 2.93 | (d)(e) | 138 | ||||||||||||||||||||||
| (0.40 | ) | 18.49 | 4.49 | 20,351 | 0.39 | 0.60 | 2.27 | 90 | ||||||||||||||||||||||||||
| (0.48 | ) | 18.09 | 9.83 | 6,939 | 0.35 | 0.60 | 2.48 | 67 | ||||||||||||||||||||||||||
| (0.17 | ) | 16.94 | 14.23 | 104 | 0.30 | (d) | 0.60 | (d) | 2.36 | (d) | 38 | |||||||||||||||||||||||
| $ | (0.41 | ) | $ | 18.35 | 6.62 | % | $ | 659 | 0.77 | %(d) | 0.86 | %(d) | 1.65 | %(d) | 111 | % | ||||||||||||||||||
| (0.39 | ) | 17.62 | 9.45 | 1,575 | 0.85 | 0.85 | 1.30 | 97 | ||||||||||||||||||||||||||
| (0.75 | ) | 16.48 | (6.76 | ) | 1,600 | 0.76 | (d)(e) | 0.87 | (d)(e) | 2.07 | (d)(e) | 138 | ||||||||||||||||||||||
| (0.30 | ) | 18.43 | 4.14 | 1,089 | 0.74 | 0.85 | 1.93 | 90 | ||||||||||||||||||||||||||
| (0.45 | ) | 18.00 | 9.46 | 961 | 0.70 | 0.85 | 2.38 | 67 | ||||||||||||||||||||||||||
| (0.17 | ) | 16.89 | 13.88 | 893 | 0.65 | (d) | 0.85 | (d) | 1.04 | (d) | 38 | |||||||||||||||||||||||
| $ | (0.53 | ) | $ | 18.52 | 7.04 | % | $ | 30,664 | 0.12 | %(d) | 0.21 | %(d) | 1.94 | %(d) | 111 | % | ||||||||||||||||||
| (0.51 | ) | 17.82 | 10.13 | 29,994 | 0.20 | 0.20 | 1.96 | 97 | ||||||||||||||||||||||||||
| (0.86 | ) | 16.67 | (6.23 | ) | 26,729 | 0.11 | (d)(e) | 0.21 | (d)(e) | 2.58 | (d)(e) | 138 | ||||||||||||||||||||||
| (0.41 | ) | 18.65 | 4.84 | 14,105 | 0.09 | 0.20 | 2.32 | 90 | ||||||||||||||||||||||||||
| (0.48 | ) | 18.20 | 10.19 | 5,333 | 0.05 | 0.20 | 2.83 | 67 | ||||||||||||||||||||||||||
| (0.18 | ) | 16.99 | 14.58 | 4,090 | —(d | ) | 0.20 | (d) | 2.43 | (d) | 38 | |||||||||||||||||||||||
| $ | (0.55 | ) | $ | 18.54 | 7.03 | % | $ | 11,814 | 0.02 | %(d) | 0.11 | %(d) | 1.95 | %(d) | 111 | % | ||||||||||||||||||
| (0.52 | ) | 17.86 | 10.29 | 9,265 | 0.10 | 0.10 | 1.94 | 97 | ||||||||||||||||||||||||||
| (0.88 | ) | 16.70 | (6.15 | ) | 6,172 | —(d | )(e)(f) | 0.12 | (d)(e) | 3.22 | (d)(e) | 138 | ||||||||||||||||||||||
| (0.42 | ) | 18.68 | 4.89 | 6,587 | —(g | ) | 0.10 | 2.66 | 90 | |||||||||||||||||||||||||
| (0.48 | ) | 18.23 | 10.24 | 5,850 | —(g | ) | 0.12 | 3.10 | 67 | |||||||||||||||||||||||||
| (0.18 | ) | 17.00 | 14.65 | 5,132 | —(d | )(g) | 0.15 | (d) | 3.00 | (d) | 38 | |||||||||||||||||||||||
| $ | (0.47 | ) | $ | 18.49 | 6.86 | % | $ | 788 | 0.37 | %(d) | 0.46 | %(d) | 1.64 | %(d) | 111 | % | ||||||||||||||||||
| (0.45 | ) | 17.77 | 9.93 | 639 | 0.45 | 0.45 | 1.74 | 97 | ||||||||||||||||||||||||||
| (0.82 | ) | 16.60 | (6.50 | ) | 719 | 0.35 | (d)(e) | 0.46 | (d)(e) | 10.75 | (d)(e) | 138 | ||||||||||||||||||||||
| (0.39 | ) | 18.58 | 4.60 | 11,550 | 0.34 | 0.45 | 2.33 | 90 | ||||||||||||||||||||||||||
| (0.44 | ) | 18.15 | 9.95 | 10,427 | 0.30 | 0.45 | 1.29 | 67 | ||||||||||||||||||||||||||
| (0.17 | ) | 16.94 | 14.23 | 12 | 0.25 | (d) | 0.45 | (d) | 2.76 | (d) | 38 | |||||||||||||||||||||||
| See accompanying Notes to Financial Statements | | March 31, 2017 | | Semiannual Report | 251 |
Table of Contents
Financial Highlights (cont’d)
For a Share Outstanding for the Period ended:
| Net Asset Value, Beginning of Period | Net Investment Income (a) | Net Realized in Unrealized | Total from Investment Operations | Dividends | Distributions from Net Realized Capital Gains | |||||||||||||||||||||||
| AllianzGI Retirement 2040: | ||||||||||||||||||||||||||||
| Class A | ||||||||||||||||||||||||||||
3/31/2017+ | $ | 20.51 | $ | 0.20 | $ | 1.32 | $ | 1.52 | $ | (0.37 | ) | $ | (0.37 | ) | ||||||||||||||
9/30/2016 | 19.04 | 0.27 | 1.61 | 1.88 | (0.38 | ) | (0.03 | ) | ||||||||||||||||||||
12/1/2014 - 9/30/2015# | 21.91 | 0.49 | (1.94 | ) | (1.45 | ) | (0.83 | ) | (0.59 | ) | ||||||||||||||||||
11/30/2014 | 21.45 | 0.48 | 0.50 | 0.98 | (0.51 | ) | (0.01 | ) | ||||||||||||||||||||
11/30/2013 | 19.71 | 0.49 | 1.82 | 2.31 | (0.53 | ) | (0.04 | ) | ||||||||||||||||||||
11/30/2012 | 20.22 | 0.29 | 1.61 | 1.90 | (0.69 | ) | (1.72 | ) | ||||||||||||||||||||
11/30/2011 | 21.88 | 0.52 | (0.27 | ) | 0.25 | (0.97 | ) | (0.94 | ) | |||||||||||||||||||
| Class C | ||||||||||||||||||||||||||||
3/31/2017+ | $ | 20.36 | $ | 0.13 | $ | 1.30 | $ | 1.43 | $ | (0.29 | ) | $ | (0.37 | ) | ||||||||||||||
9/30/2016 | 18.94 | 0.19 | 1.54 | 1.73 | (0.28 | ) | (0.03 | ) | ||||||||||||||||||||
12/1/2014 - 9/30/2015# | 21.68 | 0.38 | (1.94 | ) | (1.56 | ) | (0.59 | ) | (0.59 | ) | ||||||||||||||||||
11/30/2014 | 21.21 | 0.33 | 0.48 | 0.81 | (0.33 | ) | (0.01 | ) | ||||||||||||||||||||
11/30/2013 | 19.53 | 0.34 | 1.80 | 2.14 | (0.42 | ) | (0.04 | ) | ||||||||||||||||||||
11/30/2012 | 20.07 | 0.31 | 1.43 | 1.74 | (0.56 | ) | (1.72 | ) | ||||||||||||||||||||
11/30/2011 | 21.65 | 0.27 | (0.18 | ) | 0.09 | (0.73 | ) | (0.94 | ) | |||||||||||||||||||
| Class R | ||||||||||||||||||||||||||||
3/31/2017+ | $ | 20.37 | $ | 0.23 | $ | 1.23 | $ | 1.46 | $ | (0.40 | ) | $ | (0.37 | ) | ||||||||||||||
9/30/2016 | 18.97 | 0.18 | 1.63 | 1.81 | (0.38 | ) | (0.03 | ) | ||||||||||||||||||||
12/1/2014 - 9/30/2015# | 21.80 | 0.42 | (1.91 | ) | (1.49 | ) | (0.75 | ) | (0.59 | ) | ||||||||||||||||||
11/30/2014 | 21.31 | 0.41 | 0.49 | 0.90 | (0.40 | ) | (0.01 | ) | ||||||||||||||||||||
11/30/2013 | 19.63 | 0.44 | 1.80 | 2.24 | (0.52 | ) | (0.04 | ) | ||||||||||||||||||||
11/30/2012 | 20.16 | 0.16 | 1.66 | 1.82 | (0.63 | ) | (1.72 | ) | ||||||||||||||||||||
11/30/2011 | 21.85 | 0.56 | (0.36 | ) | 0.20 | (0.95 | ) | (0.94 | ) | |||||||||||||||||||
| Class P | ||||||||||||||||||||||||||||
3/31/2017+ | $ | 20.70 | $ | 0.24 | $ | 1.32 | $ | 1.56 | $ | (0.52 | ) | $ | (0.37 | ) | ||||||||||||||
9/30/2016 | 19.26 | 0.32 | 1.65 | 1.97 | (0.50 | ) | (0.03 | ) | ||||||||||||||||||||
12/1/2014 - 9/30/2015# | 22.15 | 0.46 | (1.87 | ) | (1.41 | ) | (0.89 | ) | (0.59 | ) | ||||||||||||||||||
11/30/2014 | 21.63 | 0.50 | 0.56 | 1.06 | (0.53 | ) | (0.01 | ) | ||||||||||||||||||||
11/30/2013 | 19.82 | 0.49 | 1.90 | 2.39 | (0.54 | ) | (0.04 | ) | ||||||||||||||||||||
11/30/2012 | 20.31 | 0.39 | 1.57 | 1.96 | (0.73 | ) | (1.72 | ) | ||||||||||||||||||||
11/30/2011 | 21.97 | 0.67 | (0.36 | ) | 0.31 | (1.03 | ) | (0.94 | ) | |||||||||||||||||||
| Class R6 | ||||||||||||||||||||||||||||
3/31/2017+ | $ | 20.75 | $ | 0.24 | $ | 1.33 | $ | 1.57 | $ | (0.54 | ) | $ | (0.37 | ) | ||||||||||||||
9/30/2016 | 19.30 | 0.33 | 1.66 | 1.99 | (0.51 | ) | (0.03 | ) | ||||||||||||||||||||
12/1/2014 - 9/30/2015# | 22.19 | 0.53 | (1.92 | ) | (1.39 | ) | (0.91 | ) | (0.59 | ) | ||||||||||||||||||
11/30/2014 | 21.66 | 0.61 | 0.47 | 1.08 | (0.54 | ) | (0.01 | ) | ||||||||||||||||||||
11/30/2013 | 19.83 | 0.60 | 1.81 | 2.41 | (0.54 | ) | (0.04 | ) | ||||||||||||||||||||
11/30/2012 | 20.33 | 0.56 | 1.41 | 1.97 | (0.75 | ) | (1.72 | ) | ||||||||||||||||||||
11/30/2011 | 22.00 | 0.68 | (0.36 | ) | 0.32 | (1.05 | ) | (0.94 | ) | |||||||||||||||||||
| Administrative Class | ||||||||||||||||||||||||||||
3/31/2017+ | $ | 20.57 | $ | 0.20 | $ | 1.32 | $ | 1.52 | $ | (0.44 | ) | $ | (0.37 | ) | ||||||||||||||
9/30/2016 | 19.14 | 0.31 | 1.60 | 1.91 | (0.45 | ) | (0.03 | ) | ||||||||||||||||||||
12/1/2014 - 9/30/2015# | 22.02 | 1.71 | (3.16 | ) | (1.45 | ) | (0.84 | ) | (0.59 | ) | ||||||||||||||||||
11/30/2014 | 21.53 | 0.50 | 0.49 | 0.99 | (0.49 | ) | (0.01 | ) | ||||||||||||||||||||
11/30/2013 | 19.75 | 0.26 | 2.07 | 2.33 | (0.51 | ) | (0.04 | ) | ||||||||||||||||||||
11/30/2012 | 20.26 | 0.52 | 1.38 | 1.90 | (0.69 | ) | (1.72 | ) | ||||||||||||||||||||
11/30/2011 | 21.93 | 0.63 | (0.36 | ) | 0.27 | (1.00 | ) | (0.94 | ) | |||||||||||||||||||
| + | Unaudited |
| # | Fiscal year end changed from November 30th to September 30th. |
| (a) | Calculated on average shares outstanding during the period. |
| (b) | Total return is calculated assuming a purchase of a share on the first day of the period and a sale of a share on the last day of each period reported. Dividends and distributions, if any, are assumed, for purposes of this calculation, to be reinvested. Total return does not reflect sales charges and includes the effect of fee waivers and reimbursements. Total return may reflect adjustments to conform to U.S. GAAP. Total return for a period of less than one year is not annualized. |
| 252 | Semiannual Report | | March 31, 2017 | | See accompanying Notes to Financial Statements |
Table of Contents
| Total Dividends and Distributions | Net Asset Value, End of Period | Total Return (b) | Net Assets, End of Period (000s) | Ratio of Expenses to Average Net Assets with Fee Waiver/ Reimbursement (c) | Ratio of Expenses to Average Net Assets without Fee Waiver/ Reimbursement (c) | Ratio of Net Investment Income to Average Net Assets (c) | Portfolio Turnover Rate | |||||||||||||||||||||||||||
| $ | (0.74 | ) | $ | 21.29 | 7.61 | % | $ | 4,734 | 0.47 | %(d) | 0.61 | %(d) | 1.89 | %(d) | 101 | % | ||||||||||||||||||
| (0.41 | ) | 20.51 | 9.99 | 4,106 | 0.51 | 0.60 | 1.36 | 101 | ||||||||||||||||||||||||||
| (1.42 | ) | 19.04 | (6.99 | ) | 13,551 | 0.37 | (d)(e) | 0.60 | (d)(e) | 2.87 | (d)(e) | 143 | ||||||||||||||||||||||
| (0.52 | ) | 21.91 | 4.65 | 16,631 | 0.38 | 0.60 | 2.22 | 84 | ||||||||||||||||||||||||||
| (0.57 | ) | 21.45 | 12.11 | 5,513 | 0.35 | 0.60 | 2.40 | 61 | ||||||||||||||||||||||||||
| (2.41 | ) | 19.71 | 10.61 | 1,915 | 0.28 | 0.60 | 1.52 | 45 | ||||||||||||||||||||||||||
| (1.91 | ) | 20.22 | 0.81 | 151 | 0.42 | 2.96 | 2.42 | 53 | ||||||||||||||||||||||||||
| $ | (0.66 | ) | $ | 21.13 | 7.19 | % | $ | 123 | 1.22 | %(d) | 1.36 | %(d) | 1.27 | %(d) | 101 | % | ||||||||||||||||||
| (0.31 | ) | 20.36 | 9.20 | 126 | 1.26 | 1.35 | 0.99 | 101 | ||||||||||||||||||||||||||
| (1.18 | ) | 18.94 | (7.54 | ) | 202 | 1.12 | (d)(e) | 1.35 | (d)(e) | 2.22 | (d)(e) | 143 | ||||||||||||||||||||||
| (0.34 | ) | 21.68 | 3.90 | 269 | 1.13 | 1.35 | 1.51 | 84 | ||||||||||||||||||||||||||
| (0.46 | ) | 21.21 | 11.20 | 317 | 1.10 | 1.35 | 1.66 | 61 | ||||||||||||||||||||||||||
| (2.28 | ) | 19.53 | 9.80 | 195 | 1.03 | 1.35 | 1.66 | 45 | ||||||||||||||||||||||||||
| (1.67 | ) | 20.07 | 0.07 | 87 | 1.15 | 3.56 | 1.30 | 53 | ||||||||||||||||||||||||||
| $ | (0.77 | ) | $ | 21.06 | 7.40 | % | $ | 366 | 0.82 | %(d) | 0.86 | %(d) | 2.19 | %(d) | 101 | % | ||||||||||||||||||
| (0.41 | ) | 20.37 | 9.64 | 1,648 | 0.86 | 0.86 | 0.94 | 101 | ||||||||||||||||||||||||||
| (1.34 | ) | 18.97 | (7.22 | ) | 1,272 | 0.72 | (d)(e) | 0.85 | (d)(e) | 2.48 | (d)(e) | 143 | ||||||||||||||||||||||
| (0.41 | ) | 21.80 | 4.31 | 1,343 | 0.73 | 0.85 | 1.88 | 84 | ||||||||||||||||||||||||||
| (0.56 | ) | 21.31 | 11.70 | 1,167 | 0.70 | 0.85 | 2.15 | 61 | ||||||||||||||||||||||||||
| (2.35 | ) | 19.63 | 10.24 | 848 | 0.63 | 0.85 | 0.87 | 45 | ||||||||||||||||||||||||||
| (1.89 | ) | 20.16 | 0.54 | 15 | 0.70 | 3.22 | 2.63 | 53 | ||||||||||||||||||||||||||
| $ | (0.89 | ) | $ | 21.37 | 7.80 | % | $ | 22,426 | 0.17 | %(d) | 0.21 | %(d) | 2.32 | %(d) | 101 | % | ||||||||||||||||||
| (0.53 | ) | 20.70 | 10.36 | 20,628 | 0.21 | 0.21 | 1.61 | 101 | ||||||||||||||||||||||||||
| (1.48 | ) | 19.26 | (6.76 | ) | 16,997 | 0.07 | (d)(e) | 0.20 | (d)(e) | 2.67 | (d)(e) | 143 | ||||||||||||||||||||||
| (0.54 | ) | 22.15 | 4.99 | 11,734 | 0.08 | 0.20 | 2.27 | 84 | ||||||||||||||||||||||||||
| (0.58 | ) | 21.63 | 12.42 | 4,704 | 0.05 | 0.20 | 2.37 | 61 | ||||||||||||||||||||||||||
| (2.45 | ) | 19.82 | 10.99 | 2,343 | — | (f) | 0.20 | 2.00 | 45 | |||||||||||||||||||||||||
| (1.97 | ) | 20.31 | 1.06 | 15 | 0.21 | 2.75 | 3.11 | 53 | ||||||||||||||||||||||||||
| $ | (0.91 | ) | $ | 21.41 | 7.82 | % | $ | 19,454 | 0.07 | %(d) | 0.11 | %(d) | 2.29 | %(d) | 101 | % | ||||||||||||||||||
| (0.54 | ) | 20.75 | 10.47 | 15,812 | 0.11 | 0.11 | 1.65 | 101 | ||||||||||||||||||||||||||
| (1.50 | ) | 19.30 | (6.67 | ) | 12,053 | — | (d)(e)(f) | 0.10 | (d)(e) | 3.09 | (d)(e) | 143 | ||||||||||||||||||||||
| (0.55 | ) | 22.19 | 5.09 | 8,071 | — | (f) | 0.10 | 2.78 | 84 | |||||||||||||||||||||||||
| (0.58 | ) | 21.66 | 12.51 | 9,939 | — | (f) | 0.12 | 2.93 | 61 | |||||||||||||||||||||||||
| (2.47 | ) | 19.83 | 11.04 | 7,782 | — | (f) | 0.15 | 2.95 | 45 | |||||||||||||||||||||||||
| (1.99 | ) | 20.33 | 1.11 | 5,315 | 0.10 | 2.65 | 3.15 | 53 | ||||||||||||||||||||||||||
| $ | (0.81 | ) | $ | 21.28 | 7.61 | % | $ | 369 | 0.42 | %(d) | 0.46 | %(d) | 1.99 | %(d) | 101 | % | ||||||||||||||||||
| (0.48 | ) | 20.57 | 10.09 | 374 | 0.46 | 0.46 | 1.58 | 101 | ||||||||||||||||||||||||||
| (1.43 | ) | 19.14 | (7.00 | ) | 488 | 0.32 | (d)(e) | 0.45 | (d)(e) | 9.63 | (d)(e) | 143 | ||||||||||||||||||||||
| (0.50 | ) | 22.02 | 4.72 | 5,278 | 0.33 | 0.45 | 2.31 | 84 | ||||||||||||||||||||||||||
| (0.55 | ) | 21.53 | 12.13 | 5,054 | 0.30 | 0.45 | 1.27 | 61 | ||||||||||||||||||||||||||
| (2.41 | ) | 19.75 | 10.67 | 17 | 0.23 | 0.45 | 2.72 | 45 | ||||||||||||||||||||||||||
| (1.94 | ) | 20.26 | 0.87 | 15 | 0.38 | 2.93 | 2.94 | 53 | ||||||||||||||||||||||||||
| (c) | Does not include expenses of the investment companies in which the Fund invests. |
| (d) | Annualized, unless otherwise noted. |
| (e) | Certain expenses incurred by the Fund were not annualized. |
| (f) | See Note 6 in the Notes to Financial Statements. |
| See accompanying Notes to Financial Statements | | March 31, 2017 | | Semiannual Report | 253 |
Table of Contents
Financial Highlights (cont’d)
For a Share Outstanding for the Period ended:
| Net Asset Value, Beginning of Period | Net Investment Income (a) | Net Realized | Total from Investment Operations | Dividends from Net Investment Income | Distributions from Net Realized Capital Gains | |||||||||||||||||||||||
| AllianzGI Retirement 2045: | ||||||||||||||||||||||||||||
| Class A | ||||||||||||||||||||||||||||
3/31/2017+ | $ | 18.07 | $ | 0.19 | $ | 1.21 | $ | 1.40 | $ | (0.34 | ) | $ | (0.54 | ) | ||||||||||||||
9/30/2016 | 16.71 | 0.20 | 1.54 | 1.74 | (0.34 | ) | (0.04 | ) | ||||||||||||||||||||
12/1/2014 - 9/30/2015# | 19.09 | 0.41 | (1.75 | ) | (1.34 | ) | (0.70 | ) | (0.34 | ) | ||||||||||||||||||
11/30/2014 | 18.67 | 0.41 | 0.49 | 0.90 | (0.45 | ) | (0.03 | ) | ||||||||||||||||||||
11/30/2013 | 17.02 | 0.41 | 1.79 | 2.20 | (0.46 | ) | (0.09 | ) | ||||||||||||||||||||
12/19/2011* - 11/30/2012 | 15.00 | 0.32 | 1.92 | 2.24 | (0.22 | ) | — | |||||||||||||||||||||
| Class R | ||||||||||||||||||||||||||||
3/31/2017+ | $ | 17.97 | $ | 0.22 | $ | 1.14 | $ | 1.36 | $ | (0.37 | ) | $ | (0.54 | ) | ||||||||||||||
9/30/2016 | 16.65 | 0.13 | 1.55 | 1.68 | (0.32 | ) | (0.04 | ) | ||||||||||||||||||||
12/1/2014 - 9/30/2015# | 19.01 | 0.36 | (1.74 | ) | (1.38 | ) | (0.64 | ) | (0.34 | ) | ||||||||||||||||||
11/30/2014 | 18.57 | 0.34 | 0.49 | 0.83 | (0.36 | ) | (0.03 | ) | ||||||||||||||||||||
11/30/2013 | 16.96 | 0.38 | 1.75 | 2.13 | (0.43 | ) | (0.09 | ) | ||||||||||||||||||||
12/19/2011* - 11/30/2012 | 15.00 | 0.16 | 2.02 | 2.18 | (0.22 | ) | — | |||||||||||||||||||||
| Class P | ||||||||||||||||||||||||||||
3/31/2017+ | $ | 18.19 | $ | 0.23 | $ | 1.21 | $ | 1.44 | $ | (0.47 | ) | $ | (0.54 | ) | ||||||||||||||
9/30/2016 | 16.84 | 0.26 | 1.56 | 1.82 | (0.43 | ) | (0.04 | ) | ||||||||||||||||||||
12/1/2014 - 9/30/2015# | 19.24 | 0.43 | (1.74 | ) | (1.31 | ) | (0.75 | ) | (0.34 | ) | ||||||||||||||||||
11/30/2014 | 18.77 | 0.40 | 0.57 | 0.97 | (0.47 | ) | (0.03 | ) | ||||||||||||||||||||
11/30/2013 | 17.06 | 0.47 | 1.79 | 2.26 | (0.46 | ) | (0.09 | ) | ||||||||||||||||||||
12/19/2011* - 11/30/2012 | 15.00 | 0.39 | 1.89 | 2.28 | (0.22 | ) | — | |||||||||||||||||||||
| Class R6 | ||||||||||||||||||||||||||||
3/31/2017+ | $ | 18.25 | $ | 0.23 | $ | 1.22 | $ | 1.45 | $ | (0.49 | ) | $ | (0.54 | ) | ||||||||||||||
9/30/2016 | 16.89 | 0.22 | 1.62 | 1.84 | (0.44 | ) | (0.04 | ) | ||||||||||||||||||||
12/1/2014 - 9/30/2015# | 19.28 | 0.65 | (1.94 | ) | (1.29 | ) | (0.76 | ) | (0.34 | ) | ||||||||||||||||||
11/30/2014 | 18.80 | 0.49 | 0.49 | 0.98 | (0.47 | ) | (0.03 | ) | ||||||||||||||||||||
11/30/2013 | 17.07 | 0.52 | 1.76 | 2.28 | (0.46 | ) | (0.09 | ) | ||||||||||||||||||||
12/19/2011* - 11/30/2012 | 15.00 | 0.50 | 1.79 | 2.29 | (0.22 | ) | — | |||||||||||||||||||||
| Administrative Class | ||||||||||||||||||||||||||||
3/31/2017+ | $ | 18.10 | $ | 0.23 | $ | 1.17 | $ | 1.40 | $ | (0.45 | ) | $ | (0.54 | ) | ||||||||||||||
9/30/2016 | 16.76 | 0.22 | 1.55 | 1.77 | (0.39 | ) | (0.04 | ) | ||||||||||||||||||||
12/1/2014 - 9/30/2015# | 19.15 | 1.22 | (2.56 | ) | (1.34 | ) | (0.71 | ) | (0.34 | ) | ||||||||||||||||||
11/30/2014 | 18.71 | 0.42 | 0.49 | 0.91 | (0.44 | ) | (0.03 | ) | ||||||||||||||||||||
11/30/2013 | 17.01 | 0.22 | 1.99 | 2.21 | (0.42 | ) | (0.09 | ) | ||||||||||||||||||||
12/19/2011* - 11/30/2012 | 15.00 | 0.44 | 1.79 | 2.23 | (0.22 | ) | — | |||||||||||||||||||||
| + | Unaudited |
| # | Fiscal year end changed from November 30th to September 30th. |
| * | Commencement of operations. |
| (a) | Calculated on average shares outstanding during the period. |
| (b) | Total return is calculated assuming a purchase of a share on the first day of the period and a sale of a share on the last day of each period reported. Dividends and distributions, if any, are assumed, for purposes of this calculation, to be reinvested. Total return does not reflect sales charges and includes the effect of fee waivers and reimbursements. Total return may reflect adjustments to conform to U.S. GAAP. Total return for a period of less than one year is not annualized. |
| (c) | Does not include expenses of the investment companies in which the Fund invests. |
| (d) | Annualized, unless otherwise noted. |
| (e) | Certain expenses incurred by the Fund were not annualized. |
| (f) | See Note 6 in the Notes to Financial Statements. |
| 254 | Semiannual Report | | March 31, 2017 | | See accompanying Notes to Financial Statements |
Table of Contents
| Total Dividends and Distributions | Net Asset Value, End of Period | Total Return (b) | Net Assets, End of Period (000s) | Ratio of Average Net Assets with Fee Waiver/ | Ratio of Average Net Assets without Fee Waiver/ | Ratio of Net Investment Income to Average Net Assets (c) | Portfolio Turnover Rate | |||||||||||||||||||||||||||
| $ | (0.88 | ) | $ | 18.59 | 8.06 | % | $ | 4,107 | 0.49 | %(d) | 0.61 | %(d) | 2.04 | %(d) | 97 | % | ||||||||||||||||||
| (0.38 | ) | 18.07 | 10.55 | 3,753 | 0.51 | 0.60 | 1.17 | 103 | ||||||||||||||||||||||||||
| (1.04 | ) | 16.71 | (7.35 | ) | 10,022 | 0.37 | (d)(e) | 0.61 | (d)(e) | 2.74 | (d)(e) | 149 | ||||||||||||||||||||||
| (0.48 | ) | 19.09 | 4.89 | 10,080 | 0.37 | 0.60 | 2.17 | 69 | ||||||||||||||||||||||||||
| (0.55 | ) | 18.67 | 13.33 | 4,313 | 0.33 | 0.60 | 2.31 | 51 | ||||||||||||||||||||||||||
| (0.22 | ) | 17.02 | 15.09 | 61 | 0.29 | (d) | 0.60 | (d) | 2.08 | (d) | 38 | |||||||||||||||||||||||
| $ | (0.91 | ) | $ | 18.42 | 7.87 | % | $ | 139 | 0.84 | %(d) | 0.86 | %(d) | 2.43 | %(d) | 97 | % | ||||||||||||||||||
| (0.36 | ) | 17.97 | 10.20 | 625 | 0.86 | 0.86 | 0.78 | 103 | ||||||||||||||||||||||||||
| (0.98 | ) | 16.65 | (7.59 | ) | 464 | 0.72 | (d)(e) | 0.86 | (d)(e) | 2.38 | (d)(e) | 149 | ||||||||||||||||||||||
| (0.39 | ) | 19.01 | 4.52 | 449 | 0.72 | 0.85 | 1.82 | 69 | ||||||||||||||||||||||||||
| (0.52 | ) | 18.57 | 12.94 | 356 | 0.68 | 0.85 | 2.17 | 51 | ||||||||||||||||||||||||||
| (0.22 | ) | 16.96 | 14.67 | 293 | 0.64 | (d) | 0.85 | (d) | 1.07 | (d) | 38 | |||||||||||||||||||||||
| $ | (1.01 | ) | $ | 18.62 | 8.27 | % | $ | 14,019 | 0.19 | %(d) | 0.21 | %(d) | 2.49 | %(d) | 97 | % | ||||||||||||||||||
| (0.47 | ) | 18.19 | 10.95 | 12,764 | 0.21 | 0.21 | 1.49 | 103 | ||||||||||||||||||||||||||
| (1.09 | ) | 16.84 | (7.15 | ) | 10,650 | 0.07 | (d)(e) | 0.21 | (d)(e) | 2.88 | (d)(e) | 149 | ||||||||||||||||||||||
| (0.50 | ) | 19.24 | 5.26 | 8,793 | 0.07 | 0.20 | 2.10 | 69 | ||||||||||||||||||||||||||
| (0.55 | ) | 18.77 | 13.68 | 2,286 | 0.03 | 0.20 | 2.63 | 51 | ||||||||||||||||||||||||||
| (0.22 | ) | 17.06 | 15.37 | 1,584 | — | (d)(f) | 0.20 | (d) | 2.46 | (d) | 38 | |||||||||||||||||||||||
| $ | (1.03 | ) | $ | 18.67 | 8.32 | % | $ | 10,808 | 0.09 | %(d) | 0.11 | %(d) | 2.49 | %(d) | 97 | % | ||||||||||||||||||
| (0.48 | ) | 18.25 | 11.06 | 7,919 | 0.11 | 0.11 | 1.25 | 103 | ||||||||||||||||||||||||||
| (1.10 | ) | 16.89 | (7.02 | ) | 3,563 | — | (d)(e)(f) | 0.10 | (d)(e) | 4.23 | (d)(e) | 149 | ||||||||||||||||||||||
| (0.50 | ) | 19.28 | 5.33 | 5,477 | — | (f) | 0.10 | 2.55 | 69 | |||||||||||||||||||||||||
| (0.55 | ) | 18.80 | 13.80 | 4,587 | — | (f) | 0.12 | 2.91 | 51 | |||||||||||||||||||||||||
| (0.22 | ) | 17.07 | 15.44 | 3,733 | — | (d)(f) | 0.15 | (d) | 3.23 | (d) | 38 | |||||||||||||||||||||||
| $ | (0.99 | ) | $ | 18.51 | 8.07 | % | $ | 607 | 0.44 | %(d) | 0.46 | %(d) | 2.56 | %(d) | 97 | % | ||||||||||||||||||
| (0.43 | ) | 18.10 | 10.67 | 359 | 0.46 | 0.46 | 1.27 | 103 | ||||||||||||||||||||||||||
| (1.05 | ) | 16.76 | (7.37 | ) | 346 | 0.32 | (d)(e) | 0.46 | (d)(e) | 7.95 | (d)(e) | 149 | ||||||||||||||||||||||
| (0.47 | ) | 19.15 | 4.95 | 1,763 | 0.32 | 0.45 | 2.24 | 69 | ||||||||||||||||||||||||||
| (0.51 | ) | 18.71 | 13.40 | 1,542 | 0.28 | 0.45 | 1.23 | 51 | ||||||||||||||||||||||||||
| (0.22 | ) | 17.01 | 15.02 | 12 | 0.24 | (d) | 0.45 | (d) | 2.84 | (d) | 38 | |||||||||||||||||||||||
| See accompanying Notes to Financial Statements | | March 31, 2017 | | Semiannual Report | 255 |
Table of Contents
Financial Highlights (cont’d)
For a Share Outstanding for the Period ended:
| Net Asset Value, Beginning of Period | Net Investment Income (a) | Net Realized | Total from Investment Operations | Dividends from Net Investment Income | Distributions from Net Realized Capital Gains | |||||||||||||||||||||||
| AllianzGI Retirement 2050: | ||||||||||||||||||||||||||||
| Class A | ||||||||||||||||||||||||||||
3/31/2017+ | $ | 20.10 | $ | 0.18 | $ | 1.40 | $ | 1.58 | $ | (0.44 | ) | $ | (0.55 | ) | ||||||||||||||
9/30/2016 | 18.72 | 0.20 | 1.78 | 1.98 | (0.23 | ) | (0.37 | ) | ||||||||||||||||||||
12/1/2014 - 9/30/2015# | 21.87 | 0.44 | (2.04 | ) | (1.60 | ) | (0.87 | ) | (0.68 | ) | ||||||||||||||||||
11/30/2014 | 21.55 | 0.44 | 0.58 | 1.02 | (0.57 | ) | (0.13 | ) | ||||||||||||||||||||
11/30/2013 | 19.48 | 0.42 | 2.32 | 2.74 | (0.60 | ) | (0.07 | ) | ||||||||||||||||||||
11/30/2012 | 20.16 | 0.28 | 1.59 | 1.87 | (0.76 | ) | (1.79 | ) | ||||||||||||||||||||
11/30/2011 | 22.00 | 0.61 | (0.34 | ) | 0.27 | (1.09 | ) | (1.02 | ) | |||||||||||||||||||
| Class C | ||||||||||||||||||||||||||||
3/31/2017+ | $ | 19.80 | $ | 0.15 | $ | 1.33 | $ | 1.48 | $ | (0.34 | ) | $ | (0.55 | ) | ||||||||||||||
9/30/2016 | 18.52 | 0.11 | 1.71 | 1.82 | (0.17 | ) | (0.37 | ) | ||||||||||||||||||||
12/1/2014 - 9/30/2015# | 21.62 | 0.31 | (2.03 | ) | (1.72 | ) | (0.70 | ) | (0.68 | ) | ||||||||||||||||||
11/30/2014 | 21.34 | 0.30 | 0.55 | 0.85 | (0.44 | ) | (0.13 | ) | ||||||||||||||||||||
11/30/2013 | 19.25 | 0.30 | 2.27 | 2.57 | (0.41 | ) | (0.07 | ) | ||||||||||||||||||||
11/30/2012 | 19.92 | 0.27 | 1.44 | 1.71 | (0.59 | ) | (1.79 | ) | ||||||||||||||||||||
11/30/2011 | 21.85 | 0.44 | (0.34 | ) | 0.10 | (1.01 | ) | (1.02 | ) | |||||||||||||||||||
| Class R | ||||||||||||||||||||||||||||
3/31/2017+ | $ | 19.99 | $ | 0.26 | $ | 1.26 | $ | 1.52 | $ | (0.42 | ) | $ | (0.55 | ) | ||||||||||||||
9/30/2016 | 18.68 | 0.15 | 1.76 | 1.91 | (0.23 | ) | (0.37 | ) | ||||||||||||||||||||
12/1/2014 - 9/30/2015# | 21.80 | 0.37 | (2.03 | ) | (1.66 | ) | (0.78 | ) | (0.68 | ) | ||||||||||||||||||
11/30/2014 | 21.46 | 0.39 | 0.53 | 0.92 | (0.45 | ) | (0.13 | ) | ||||||||||||||||||||
11/30/2013 | 19.47 | 0.37 | 2.29 | 2.66 | (0.60 | ) | (0.07 | ) | ||||||||||||||||||||
11/30/2012 | 20.12 | 0.18 | 1.64 | 1.82 | (0.68 | ) | (1.79 | ) | ||||||||||||||||||||
11/30/2011 | 21.97 | 0.58 | (0.37 | ) | 0.21 | (1.04 | ) | (1.02 | ) | |||||||||||||||||||
| Class P | ||||||||||||||||||||||||||||
3/31/2017+ | $ | 20.31 | $ | 0.26 | $ | 1.36 | $ | 1.62 | $ | (0.54 | ) | $ | (0.55 | ) | ||||||||||||||
9/30/2016 | 18.97 | 0.27 | 1.80 | 2.07 | (0.36 | ) | (0.37 | ) | ||||||||||||||||||||
12/1/2014 - 9/30/2015# | 22.14 | 0.47 | (2.04 | ) | (1.57 | ) | (0.92 | ) | (0.68 | ) | ||||||||||||||||||
11/30/2014 | 21.77 | 0.45 | 0.64 | 1.09 | (0.59 | ) | (0.13 | ) | ||||||||||||||||||||
11/30/2013 | 19.64 | 0.48 | 2.35 | 2.83 | (0.63 | ) | (0.07 | ) | ||||||||||||||||||||
11/30/2012 | 20.27 | 0.38 | 1.56 | 1.94 | (0.78 | ) | (1.79 | ) | ||||||||||||||||||||
11/30/2011 | 22.10 | 0.69 | (0.39 | ) | 0.30 | (1.11 | ) | (1.02 | ) | |||||||||||||||||||
| Class R6 | ||||||||||||||||||||||||||||
3/31/2017+ | $ | 20.39 | $ | 0.26 | $ | 1.38 | $ | 1.64 | $ | (0.56 | ) | $ | (0.55 | ) | ||||||||||||||
9/30/2016 | 19.03 | 0.30 | 1.79 | 2.09 | (0.36 | ) | (0.37 | ) | ||||||||||||||||||||
12/1/2014 - 9/30/2015# | 22.20 | 0.57 | (2.13 | ) | (1.56 | ) | (0.93 | ) | (0.68 | ) | ||||||||||||||||||
11/30/2014 | 21.80 | 0.57 | 0.55 | 1.12 | (0.59 | ) | (0.13 | ) | ||||||||||||||||||||
11/30/2013 | 19.66 | 0.55 | 2.29 | 2.84 | (0.63 | ) | (0.07 | ) | ||||||||||||||||||||
11/30/2012 | 20.30 | 0.58 | 1.38 | 1.96 | (0.81 | ) | (1.79 | ) | ||||||||||||||||||||
11/30/2011 | 22.12 | 0.69 | (0.35 | ) | 0.34 | (1.14 | ) | (1.02 | ) | |||||||||||||||||||
| Administrative Class | ||||||||||||||||||||||||||||
3/31/2017+ | $ | 20.20 | $ | 0.23 | $ | 1.37 | $ | 1.60 | $ | (0.49 | ) | $ | (0.55 | ) | ||||||||||||||
9/30/2016 | 18.87 | 0.24 | 1.77 | 2.01 | (0.31 | ) | (0.37 | ) | ||||||||||||||||||||
12/1/2014 - 9/30/2015# | 22.03 | 0.80 | (2.42 | ) | (1.62 | ) | (0.86 | ) | (0.68 | ) | ||||||||||||||||||
11/30/2014 | 21.69 | 0.49 | 0.54 | 1.03 | (0.56 | ) | (0.13 | ) | ||||||||||||||||||||
11/30/2013 | 19.58 | 0.22 | 2.55 | 2.77 | (0.59 | ) | (0.07 | ) | ||||||||||||||||||||
11/30/2012 | 20.23 | 0.53 | 1.36 | 1.89 | (0.75 | ) | (1.79 | ) | ||||||||||||||||||||
11/30/2011 | 22.06 | 0.65 | (0.38 | ) | 0.27 | (1.08 | ) | (1.02 | ) | |||||||||||||||||||
| + | Unaudited |
| # | Fiscal year end changed from November 30th to September 30th. |
| (a) | Calculated on average shares outstanding during the period. |
| (b) | Total return is calculated assuming a purchase of a share on the first day of the period and a sale of a share on the last day of each period reported. Dividends and distributions, if any, are assumed, for purposes of this calculation, to be reinvested. Total return does not reflect sales charges and includes the effect of fee waivers and reimbursements. Total return may reflect adjustments to conform to U.S. GAAP. Total return for a period of less than one year is not annualized. |
| 256 | Semiannual Report | | March 31, 2017 | | See accompanying Notes to Financial Statements |
Table of Contents
| Total Dividends and Distributions | Net Asset Value, End of Period | Total Return (b) | Net Assets, End of Period (000s) | Ratio of Expenses to Assets with Fee Waiver/ | Ratio of Expenses to Assets without Fee Waiver/ | Ratio of Net to Average | Portfolio Turnover Rate | |||||||||||||||||||||||||||
| $ | (0.99 | ) | $ | 20.69 | 8.15 | % | $ | 3,096 | 0.50 | %(d) | 0.61 | %(d) | 1.84 | %(d) | 98 | % | ||||||||||||||||||
| (0.60 | ) | 20.10 | 10.74 | 1,633 | 0.50 | 0.60 | 1.03 | 89 | ||||||||||||||||||||||||||
| (1.55 | ) | 18.72 | (7.79 | ) | 4,863 | 0.34 | (d)(e) | 0.61 | (d)(e) | 2.62 | (d)(e) | 147 | ||||||||||||||||||||||
| (0.70 | ) | 21.87 | 4.85 | 4,772 | 0.35 | 0.60 | 2.02 | 78 | ||||||||||||||||||||||||||
| (0.67 | ) | 21.55 | 14.50 | 1,014 | 0.30 | 0.60 | 2.08 | 54 | ||||||||||||||||||||||||||
| (2.55 | ) | 19.48 | 10.64 | 1,371 | 0.26 | 0.60 | 1.45 | 47 | ||||||||||||||||||||||||||
| (2.11 | ) | 20.16 | 0.80 | 71 | 0.41 | 2.92 | 2.85 | 51 | ||||||||||||||||||||||||||
| $ | (0.89 | ) | $ | 20.39 | 7.75 | % | $ | 169 | 1.25 | %(d) | 1.36 | %(d) | 1.47 | %(d) | 98 | % | ||||||||||||||||||
| (0.54 | ) | 19.80 | 9.96 | 145 | 1.25 | 1.35 | 0.56 | 89 | ||||||||||||||||||||||||||
| (1.38 | ) | 18.52 | (8.40 | ) | 148 | 1.09 | (d)(e) | 1.36 | (d)(e) | 1.83 | (d)(e) | 147 | ||||||||||||||||||||||
| (0.57 | ) | 21.62 | 4.08 | 138 | 1.10 | 1.35 | 1.38 | 78 | ||||||||||||||||||||||||||
| (0.48 | ) | 21.34 | 13.64 | 119 | 1.05 | 1.35 | 1.48 | 54 | ||||||||||||||||||||||||||
| (2.38 | ) | 19.25 | 9.78 | 60 | 1.01 | 1.35 | 1.44 | 47 | ||||||||||||||||||||||||||
| (2.03 | ) | 19.92 | (0.01 | ) | 48 | 1.17 | 3.70 | 2.09 | 51 | |||||||||||||||||||||||||
| $ | (0.97 | ) | $ | 20.54 | 7.91 | % | $ | 96 | 0.85 | %(d) | 0.86 | %(d) | 2.58 | %(d) | 98 | % | ||||||||||||||||||
| (0.60 | ) | 19.99 | 10.41 | 740 | 0.85 | 0.85 | 0.80 | 89 | ||||||||||||||||||||||||||
| (1.46 | ) | 18.68 | (8.07 | ) | 608 | 0.69 | (d)(e) | 0.86 | (d)(e) | 2.20 | (d)(e) | 147 | ||||||||||||||||||||||
| (0.58 | ) | 21.80 | 4.41 | 584 | 0.70 | 0.85 | 1.79 | 78 | ||||||||||||||||||||||||||
| (0.67 | ) | 21.46 | 14.11 | 497 | 0.65 | 0.85 | 1.85 | 54 | ||||||||||||||||||||||||||
| (2.47 | ) | 19.47 | 10.30 | 359 | 0.61 | 0.85 | 0.96 | 47 | ||||||||||||||||||||||||||
| (2.06 | ) | 20.12 | 0.51 | 17 | 0.69 | 3.21 | 2.71 | 51 | ||||||||||||||||||||||||||
| $ | (1.09 | ) | $ | 20.84 | 8.32 | % | $ | 10,573 | 0.20 | %(d) | 0.21 | %(d) | 2.56 | %(d) | 98 | % | ||||||||||||||||||
| (0.73 | ) | 20.31 | 11.12 | 10,021 | 0.20 | 0.20 | 1.42 | 89 | ||||||||||||||||||||||||||
| (1.60 | ) | 18.97 | (7.55 | ) | 7,750 | 0.04 | (d)(e) | 0.21 | (d)(e) | 2.74 | (d)(e) | 147 | ||||||||||||||||||||||
| (0.72 | ) | 22.14 | 5.13 | 5,234 | 0.05 | 0.20 | 2.06 | 78 | ||||||||||||||||||||||||||
| (0.70 | ) | 21.77 | 14.90 | 1,397 | — | 0.20 | 2.34 | 54 | ||||||||||||||||||||||||||
| (2.57 | ) | 19.64 | 11.00 | 762 | — | (f) | 0.20 | 1.98 | 47 | |||||||||||||||||||||||||
| (2.13 | ) | 20.27 | 0.96 | 15 | 0.19 | 2.75 | 3.21 | 51 | ||||||||||||||||||||||||||
| $ | (1.11 | ) | $ | 20.92 | 8.39 | % | $ | 13,585 | 0.10 | %(d) | 0.11 | %(d) | 2.53 | %(d) | 98 | % | ||||||||||||||||||
| (0.73 | ) | 20.39 | 11.23 | 10,525 | 0.10 | 0.10 | 1.54 | 89 | ||||||||||||||||||||||||||
| (1.61 | ) | 19.03 | (7.49 | ) | 8,110 | — | (d)(e)(f) | 0.10 | (d)(e) | 3.31 | (d)(e) | 147 | ||||||||||||||||||||||
| (0.72 | ) | 22.20 | 5.27 | 9,227 | — | (f) | 0.10 | 2.58 | 78 | |||||||||||||||||||||||||
| (0.70 | ) | 21.80 | 14.94 | 8,935 | — | (f) | 0.12 | 2.68 | 54 | |||||||||||||||||||||||||
| (2.60 | ) | 19.66 | 11.06 | 6,431 | — | (f) | 0.15 | 3.03 | 47 | |||||||||||||||||||||||||
| (2.16 | ) | 20.30 | 1.11 | 5,149 | 0.09 | 2.65 | 3.22 | 51 | ||||||||||||||||||||||||||
| $ | (1.04 | ) | $ | 20.76 | 8.22 | % | $ | 720 | 0.45 | %(d) | 0.46 | %(d) | 2.30 | %(d) | 98 | % | ||||||||||||||||||
| (0.68 | ) | 20.20 | 10.87 | 646 | 0.45 | 0.45 | 1.23 | 89 | ||||||||||||||||||||||||||
| (1.54 | ) | 18.87 | (7.80 | ) | 605 | 0.29 | (d)(e) | 0.46 | (d)(e) | 4.66 | (d)(e) | 147 | ||||||||||||||||||||||
| (0.69 | ) | 22.03 | 4.87 | 1,245 | 0.30 | 0.45 | 2.25 | 78 | ||||||||||||||||||||||||||
| (0.66 | ) | 21.69 | 14.66 | 1,194 | 0.25 | 0.45 | 1.07 | 54 | ||||||||||||||||||||||||||
| (2.54 | ) | 19.58 | 10.62 | 17 | 0.21 | 0.45 | 2.77 | 47 | ||||||||||||||||||||||||||
| (2.10 | ) | 20.23 | 0.82 | 15 | 0.37 | 2.93 | 3.04 | 51 | ||||||||||||||||||||||||||
| (c) | Does not include expenses of the investment companies in which the Fund invests. |
| (d) | Annualized, unless otherwise noted. |
| (e) | Certain expenses incurred by the Fund were not annualized. |
| (f) | See Note 6 in the Notes to Financial Statements. |
| See accompanying Notes to Financial Statements | | March 31, 2017 | | Semiannual Report | 257 |
Table of Contents
Financial Highlights (cont’d)
For a Share Outstanding for the Period ended:
| Net Asset Value, Beginning of Period | Net Investment Income (a) | Net Realized and Change in Unrealized Gain (Loss) | Total from Investment Operations | Dividends from Net Investment Income | Distributions from Net Realized Capital Gains | |||||||||||||||||||||||
| AllianzGI Retirement 2055: | ||||||||||||||||||||||||||||
| Class A | ||||||||||||||||||||||||||||
3/31/2017+ | $ | 17.17 | $ | 0.17 | $ | 1.18 | $ | 1.35 | $ | (0.33 | ) | $ | (0.36 | ) | ||||||||||||||
9/30/2016 | 16.02 | 0.17 | 1.49 | 1.66 | (0.28 | ) | (0.23 | ) | ||||||||||||||||||||
12/1/2014 - 9/30/2015# | 18.70 | 0.33 | (1.69 | ) | (1.36 | ) | (0.76 | ) | (0.56 | ) | ||||||||||||||||||
11/30/2014 | 18.51 | 0.39 | 0.50 | 0.89 | (0.49 | ) | (0.21 | ) | ||||||||||||||||||||
11/30/2013 | 17.02 | 0.26 | 2.11 | 2.37 | (0.59 | ) | (0.29 | ) | ||||||||||||||||||||
12/19/2011* - 11/30/2012 | 15.00 | 0.44 | 1.80 | 2.24 | (0.22 | ) | — | |||||||||||||||||||||
| Class R | ||||||||||||||||||||||||||||
3/31/2017+ | $ | 17.07 | $ | 0.21 | $ | 1.10 | $ | 1.31 | $ | (0.30 | ) | $ | (0.36 | ) | ||||||||||||||
9/30/2016 | 15.97 | 0.10 | 1.48 | 1.58 | (0.25 | ) | (0.23 | ) | ||||||||||||||||||||
12/1/2014 - 9/30/2015# | 18.63 | 0.26 | (1.66 | ) | (1.40 | ) | (0.70 | ) | (0.56 | ) | ||||||||||||||||||
11/30/2014 | 18.42 | 0.30 | 0.53 | 0.83 | (0.41 | ) | (0.21 | ) | ||||||||||||||||||||
11/30/2013 | 16.97 | 0.30 | 2.00 | 2.30 | (0.56 | ) | (0.29 | ) | ||||||||||||||||||||
12/19/2011* - 11/30/2012 | 15.00 | 0.31 | 1.88 | 2.19 | (0.22 | ) | — | |||||||||||||||||||||
| Class P | ||||||||||||||||||||||||||||
3/31/2017+ | $ | 17.32 | $ | 0.21 | $ | 1.17 | $ | 1.38 | $ | (0.39 | ) | $ | (0.36 | ) | ||||||||||||||
9/30/2016 | 16.17 | 0.20 | 1.52 | 1.72 | (0.34 | ) | (0.23 | ) | ||||||||||||||||||||
12/1/2014 - 9/30/2015# | 18.85 | 0.35 | (1.68 | ) | (1.33 | ) | (0.79 | ) | (0.56 | ) | ||||||||||||||||||
11/30/2014 | 18.61 | 0.38 | 0.57 | 0.95 | (0.50 | ) | (0.21 | ) | ||||||||||||||||||||
11/30/2013 | 17.08 | 0.34 | 2.09 | 2.43 | (0.61 | ) | (0.29 | ) | ||||||||||||||||||||
12/19/2011* - 11/30/2012 | 15.00 | 0.43 | 1.87 | 2.30 | (0.22 | ) | — | |||||||||||||||||||||
| Class R6 | ||||||||||||||||||||||||||||
3/31/2017+ | $ | 17.38 | $ | 0.21 | $ | 1.19 | $ | 1.40 | $ | (0.40 | ) | $ | (0.36 | ) | ||||||||||||||
9/30/2016 | 16.22 | 0.26 | 1.48 | 1.74 | (0.35 | ) | (0.23 | ) | ||||||||||||||||||||
12/1/2014 - 9/30/2015# | 18.90 | 0.46 | (1.78 | ) | (1.32 | ) | (0.80 | ) | (0.56 | ) | ||||||||||||||||||
11/30/2014 | 18.64 | 0.47 | 0.50 | 0.97 | (0.50 | ) | (0.21 | ) | ||||||||||||||||||||
11/30/2013 | 17.09 | 0.49 | 1.96 | 2.45 | (0.61 | ) | (0.29 | ) | ||||||||||||||||||||
12/19/2011* - 11/30/2012 | 15.00 | 0.50 | 1.81 | 2.31 | (0.22 | ) | — | |||||||||||||||||||||
| Administrative Class | ||||||||||||||||||||||||||||
3/31/2017+ | $ | 17.21 | $ | 0.19 | $ | 1.17 | $ | 1.36 | $ | (0.35 | ) | $ | (0.36 | ) | ||||||||||||||
9/30/2016 | 16.08 | 0.18 | 1.49 | 1.67 | (0.31 | ) | (0.23 | ) | ||||||||||||||||||||
12/1/2014 - 9/30/2015# | 18.76 | 0.62 | (1.98 | ) | (1.36 | ) | (0.76 | ) | (0.56 | ) | ||||||||||||||||||
11/30/2014 | 18.55 | 0.38 | 0.52 | 0.90 | (0.48 | ) | (0.21 | ) | ||||||||||||||||||||
11/30/2013 | 17.03 | 0.22 | 2.16 | 2.38 | (0.57 | ) | (0.29 | ) | ||||||||||||||||||||
12/19/2011* - 11/30/2012 | 15.00 | 0.44 | 1.81 | 2.25 | (0.22 | ) | — | |||||||||||||||||||||
| + | Unaudited |
| # | Fiscal year end changed from November 30th to September 30th. |
| * | Commencement of operations. |
| (a) | Calculated on average shares outstanding during the period. |
| (b) | Total return is calculated assuming a purchase of a share on the first day of the period and a sale of a share on the last day of each period reported. Dividends and distributions, if any, are assumed, for purposes of this calculation, to be reinvested. Total return does not reflect sales charges and includes the effect of fee waivers and reimbursements. Total return may reflect adjustments to conform to U.S. GAAP. Total return for a period of less than one year is not annualized. |
| (c) | Does not include expenses of the investment companies in which the Fund invests. |
| (d) | Annualized, unless otherwise noted. |
| (e) | Certain expenses incurred by the Fund were not annualized. |
| (f) | See Note 6 in the Notes to Financial Statements. |
| 258 | Semiannual Report | | March 31, 2017 | | See accompanying Notes to Financial Statements |
Table of Contents
| Total Dividends and Distributions | Net Asset Value, End of Period | Total Return (b) | Net Assets, End of Period (000s) | Ratio of Expenses to Assets with Fee Waiver/ | Ratio of Expenses to Assets without Fee Waiver/ | Ratio of Net Investment Income to Average Net Assets (c) | Portfolio Turnover Rate | |||||||||||||||||||||||||||
| $ | (0.69 | ) | $ | 17.83 | 8.09 | % | $ | 1,691 | 0.51 | %(d) | 0.60 | %(d) | 1.94 | %(d) | 86 | % | ||||||||||||||||||
| (0.51 | ) | 17.17 | 10.52 | 1,036 | 0.51 | 0.60 | 1.02 | 92 | ||||||||||||||||||||||||||
| (1.32 | ) | 16.02 | (7.75 | ) | 1,399 | 0.34 | (d)(e) | 0.60 | (d)(e) | 2.26 | (d)(e) | 153 | ||||||||||||||||||||||
| (0.70 | ) | 18.70 | 4.96 | 1,089 | 0.35 | 0.60 | 2.11 | 74 | ||||||||||||||||||||||||||
| (0.88 | ) | 18.51 | 14.59 | 135 | 0.30 | 0.60 | 1.52 | 41 | ||||||||||||||||||||||||||
| (0.22 | ) | 17.02 | 15.10 | 11 | 0.27 | (d) | 0.60 | (d) | 2.82 | (d) | 31 | |||||||||||||||||||||||
| $ | (0.66 | ) | $ | 17.72 | 7.88 | % | $ | 86 | 0.86 | %(d) | 0.86 | %(d) | 2.39 | %(d) | 86 | % | ||||||||||||||||||
| (0.48 | ) | 17.07 | 10.06 | 350 | 0.86 | 0.86 | 0.64 | 92 | ||||||||||||||||||||||||||
| (1.26 | ) | 15.97 | (7.98 | ) | 217 | 0.69 | (d)(e) | 0.85 | (d)(e) | 1.78 | (d)(e) | 153 | ||||||||||||||||||||||
| (0.62 | ) | 18.63 | 4.61 | 144 | 0.70 | 0.85 | 1.61 | 74 | ||||||||||||||||||||||||||
| (0.85 | ) | 18.42 | 14.22 | 72 | 0.65 | 0.85 | 1.75 | 41 | ||||||||||||||||||||||||||
| (0.22 | ) | 16.97 | 14.75 | 39 | 0.62 | (d) | 0.85 | (d) | 1.99 | (d) | 31 | |||||||||||||||||||||||
| $ | (0.75 | ) | $ | 17.95 | 8.26 | % | $ | 4,714 | 0.21 | %(d) | 0.21 | %(d) | 2.43 | %(d) | 86 | % | ||||||||||||||||||
| (0.57 | ) | 17.32 | 10.84 | 3,457 | 0.21 | 0.21 | 1.21 | 92 | ||||||||||||||||||||||||||
| (1.35 | ) | 16.17 | (7.51 | ) | 1,762 | 0.04 | (d)(e) | 0.20 | (d)(e) | 2.42 | (d)(e) | 153 | ||||||||||||||||||||||
| (0.71 | ) | 18.85 | 5.27 | 1,362 | 0.05 | 0.20 | 2.04 | 74 | ||||||||||||||||||||||||||
| (0.90 | ) | 18.61 | 14.88 | 240 | — | 0.20 | 1.96 | 41 | ||||||||||||||||||||||||||
| (0.22 | ) | 17.08 | 15.52 | 59 | — | (d)(f) | 0.20 | (d) | 2.77 | (d) | 31 | |||||||||||||||||||||||
| $ | (0.76 | ) | $ | 18.02 | 8.35 | % | $ | 4,749 | 0.11 | %(d) | 0.11 | %(d) | 2.39 | %(d) | 86 | % | ||||||||||||||||||
| (0.58 | ) | 17.38 | 10.91 | 2,982 | 0.11 | 0.11 | 1.60 | 92 | ||||||||||||||||||||||||||
| (1.36 | ) | 16.22 | (7.45 | ) | 2,591 | — | (d)(e)(f) | 0.10 | (d)(e) | 3.09 | (d)(e) | 153 | ||||||||||||||||||||||
| (0.71 | ) | 18.90 | 5.37 | 4,934 | — | (f) | 0.10 | 2.52 | 74 | |||||||||||||||||||||||||
| (0.90 | ) | 18.64 | 15.06 | 4,388 | — | (f) | 0.12 | 2.77 | 41 | |||||||||||||||||||||||||
| (0.22 | ) | 17.09 | 15.52 | 3,509 | — | (d)(f) | 0.15 | (d) | 3.21 | (d) | 31 | |||||||||||||||||||||||
| $ | (0.71 | ) | $ | 17.86 | 8.15 | % | $ | 349 | 0.46 | %(d) | 0.46 | %(d) | 2.21 | %(d) | 86 | % | ||||||||||||||||||
| (0.54 | ) | 17.21 | 10.54 | 298 | 0.46 | 0.46 | 1.10 | 92 | ||||||||||||||||||||||||||
| (1.32 | ) | 16.08 | (7.75 | ) | 216 | 0.29 | (d)(e) | 0.45 | (d)(e) | 4.23 | (d)(e) | 153 | ||||||||||||||||||||||
| (0.69 | ) | 18.76 | 5.00 | 357 | 0.30 | 0.45 | 2.06 | 74 | ||||||||||||||||||||||||||
| (0.86 | ) | 18.55 | 14.67 | 221 | 0.25 | 0.45 | 1.22 | 41 | ||||||||||||||||||||||||||
| (0.22 | ) | 17.03 | 15.17 | 11 | 0.22 | (d) | 0.46 | (d) | 2.87 | (d) | 31 | |||||||||||||||||||||||
| See accompanying Notes to Financial Statements | | March 31, 2017 | | Semiannual Report | 259 |
Table of Contents
Financial Highlights (cont’d)
For a Share Outstanding for the Period ended:
| Net Asset Value, Beginning of Period | Net Investment Income (a) | Net Realized | Total from Investment Operations | Dividends from Net Investment Income | Distributions from Net Realized Capital Gains | |||||||||||||||||||||||
| AllianzGI Retirement Income: | ||||||||||||||||||||||||||||
| Class A | ||||||||||||||||||||||||||||
3/31/2017+ | $ | 18.31 | $ | 0.45 | $ | — | $ | 0.45 | $ | (0.42 | ) | $ | (0.09 | ) | ||||||||||||||
9/30/2016 | 17.34 | 0.75 | 1.09 | 1.84 | (0.80 | ) | (0.07 | ) | ||||||||||||||||||||
12/1/2014 - 9/30/2015# | 19.35 | 0.48 | (1.32 | ) | (0.84 | ) | (0.67 | ) | (0.50 | ) | ||||||||||||||||||
11/30/2014 | 18.96 | 0.42 | 0.31 | 0.73 | (0.34 | ) | — | |||||||||||||||||||||
11/30/2013 | 19.20 | 0.50 | 0.03 | 0.53 | (0.66 | ) | (0.08 | ) | ||||||||||||||||||||
11/30/2012 | 18.27 | 0.48 | 1.23 | 1.71 | (0.58 | ) | (0.20 | ) | ||||||||||||||||||||
11/30/2011 | 18.52 | 0.37 | 0.25 | 0.62 | (0.67 | ) | (0.20 | ) | ||||||||||||||||||||
| Class C | ||||||||||||||||||||||||||||
3/31/2017+ | $ | 18.21 | $ | 0.38 | $ | — | $ | 0.38 | $ | (0.25 | ) | $ | (0.09 | ) | ||||||||||||||
9/30/2016 | 17.16 | 0.66 | 1.04 | 1.70 | (0.58 | ) | (0.07 | ) | ||||||||||||||||||||
12/1/2014 - 9/30/2015# | 19.14 | 0.38 | (1.33 | ) | (0.95 | ) | (0.53 | ) | (0.50 | ) | ||||||||||||||||||
11/30/2014 | 18.76 | 0.27 | 0.31 | 0.58 | (0.20 | ) | — | |||||||||||||||||||||
11/30/2013 | 18.99 | 0.37 | 0.01 | 0.38 | (0.50 | ) | (0.08 | ) | ||||||||||||||||||||
11/30/2012 | 18.09 | 0.31 | 1.24 | 1.55 | (0.45 | ) | (0.20 | ) | ||||||||||||||||||||
11/30/2011 | 18.36 | 0.27 | 0.21 | 0.48 | (0.55 | ) | (0.20 | ) | ||||||||||||||||||||
| Class R | ||||||||||||||||||||||||||||
3/31/2017+ | $ | 18.97 | $ | 0.40 | $ | 0.04 | $ | 0.44 | $ | (0.31 | ) | $ | (0.09 | ) | ||||||||||||||
9/30/2016 | 17.92 | 0.73 | 1.11 | 1.84 | (0.72 | ) | (0.07 | ) | ||||||||||||||||||||
12/1/2014 - 9/30/2015# | 19.95 | 0.44 | (1.36 | ) | (0.92 | ) | (0.61 | ) | (0.50 | ) | ||||||||||||||||||
11/30/2014 | 19.53 | 0.36 | 0.33 | 0.69 | (0.27 | ) | — | |||||||||||||||||||||
11/30/2013 | 19.74 | 0.46 | 0.01 | 0.47 | (0.57 | ) | (0.08 | ) | ||||||||||||||||||||
11/30/2012 | 18.77 | 0.24 | 1.45 | 1.69 | (0.52 | ) | (0.20 | ) | ||||||||||||||||||||
11/30/2011 | 18.73 | 0.53 | 0.05 | 0.58 | (0.34 | ) | (0.20 | ) | ||||||||||||||||||||
| Class P | ||||||||||||||||||||||||||||
3/31/2017+ | $ | 18.51 | $ | 0.48 | $ | — | $ | 0.48 | $ | (0.47 | ) | $ | (0.09 | ) | ||||||||||||||
9/30/2016 | 17.58 | 0.83 | 1.09 | 1.92 | (0.92 | ) | (0.07 | ) | ||||||||||||||||||||
12/1/2014 - 9/30/2015# | 19.61 | 0.51 | (1.31 | ) | (0.80 | ) | (0.73 | ) | (0.50 | ) | ||||||||||||||||||
11/30/2014 | 19.20 | 0.47 | 0.34 | 0.81 | (0.40 | ) | — | |||||||||||||||||||||
11/30/2013 | 19.44 | 0.46 | 0.13 | 0.59 | (0.72 | ) | (0.08 | ) | ||||||||||||||||||||
11/30/2012 | 18.49 | 0.32 | 1.48 | 1.80 | (0.65 | ) | (0.20 | ) | ||||||||||||||||||||
11/30/2011 | 18.41 | 0.63 | 0.03 | 0.66 | (0.38 | ) | (0.20 | ) | ||||||||||||||||||||
| Class R6 | ||||||||||||||||||||||||||||
3/31/2017+ | $ | 18.08 | $ | 0.49 | $ | (0.01 | ) | $ | 0.48 | $ | (0.48 | ) | $ | (0.09 | ) | |||||||||||||
9/30/2016 | 17.21 | 0.82 | 1.07 | 1.89 | (0.95 | ) | (0.07 | ) | ||||||||||||||||||||
12/1/2014 - 9/30/2015# | 19.23 | 0.56 | (1.33 | ) | (0.77 | ) | (0.75 | ) | (0.50 | ) | ||||||||||||||||||
11/30/2014 | 18.83 | 0.49 | 0.33 | 0.82 | (0.42 | ) | — | |||||||||||||||||||||
11/30/2013 | 19.08 | 0.56 | 0.03 | 0.59 | (0.73 | ) | (0.08 | ) | ||||||||||||||||||||
11/30/2012 | 18.16 | 0.49 | 1.28 | 1.77 | (0.65 | ) | (0.20 | ) | ||||||||||||||||||||
11/30/2011 | 18.40 | 0.65 | 0.02 | 0.67 | (0.71 | ) | (0.20 | ) | ||||||||||||||||||||
| Administrative Class | ||||||||||||||||||||||||||||
3/31/2017+ | $ | 18.61 | $ | 0.51 | $ | (0.05 | ) | $ | 0.46 | $ | (0.45 | ) | $ | (0.09 | ) | |||||||||||||
9/30/2016 | 17.60 | 0.75 | 0.94 | 1.69 | (0.61 | ) | (0.07 | ) | ||||||||||||||||||||
12/1/2014 - 9/30/2015# | 19.56 | 1.70 | (2.55 | ) | (0.85 | ) | (0.61 | ) | (0.50 | ) | ||||||||||||||||||
11/30/2014 | 19.15 | 0.43 | 0.33 | 0.76 | (0.35 | ) | — | |||||||||||||||||||||
11/30/2013 | 19.41 | 0.22 | 0.32 | 0.54 | (0.69 | ) | (0.08 | ) | ||||||||||||||||||||
11/30/2012 | 18.46 | 0.49 | 1.26 | 1.75 | (0.60 | ) | (0.20 | ) | ||||||||||||||||||||
11/30/2011 | 18.40 | 0.59 | 0.03 | 0.62 | (0.36 | ) | (0.20 | ) | ||||||||||||||||||||
| + | Unaudited |
| # | Fiscal year end changed from November 30th to September 30th. |
| (a) | Calculated on average shares outstanding during the period. |
| (b) | Total return is calculated assuming a purchase of a share on the first day of the period and a sale of a share on the last day of each period reported. Dividends and distributions, if any, are assumed, for purposes of this calculation, to be reinvested. Total return does not reflect sales charges and includes the effect of fee waivers and reimbursements. Total return may reflect adjustments to conform to U.S. GAAP. Total return for a period of less than one year is not annualized. |
| 260 | Semiannual Report | | March 31, 2017 | | See accompanying Notes to Financial Statements |
Table of Contents
| Distributions from Return of Capital | Total Dividends and Distributions | Net Asset Value, End of Period | Total Return (b) | Net Assets, End of Period (000s) | Ratio of Expenses to Assets with Fee Waiver/ | Ratio of Expenses to Assets without Fee Waiver/ | Ratio of Net to Average | Portfolio Turnover Rate | ||||||||||||||||||||||||||||||
| $ | — | $ | (0.51 | ) | $ | 18.25 | 2.52 | % | $ | 9,787 | 0.32 | %(d) | 0.61 | %(d) | 5.00 | %(d) | 86 | % | ||||||||||||||||||||
| — | (0.87 | ) | 18.31 | 10.97 | 10,140 | 0.40 | 0.60 | 4.25 | 116 | |||||||||||||||||||||||||||||
| — | (1.17 | ) | 17.34 | (4.53 | ) | 6,006 | 0.44 | (d)(e) | 0.62 | (d)(e) | 3.15 | (d)(e) | 179 | |||||||||||||||||||||||||
| — | (0.34 | ) | 19.35 | 3.88 | 6,324 | 0.40 | 0.60 | 2.18 | 101 | |||||||||||||||||||||||||||||
| (0.03 | ) | (0.77 | ) | 18.96 | 2.78 | 4,326 | 0.39 | 0.60 | 2.64 | 81 | ||||||||||||||||||||||||||||
| — | (0.78 | ) | 19.20 | 9.68 | 4,891 | 0.40 | 0.60 | 2.57 | 51 | |||||||||||||||||||||||||||||
| — | (0.87 | ) | 18.27 | 3.45 | 4,427 | 0.46 | 1.60 | 2.01 | 74 | |||||||||||||||||||||||||||||
| $ | — | $ | (0.34 | ) | $ | 18.25 | 2.15 | % | $ | 3,128 | 1.07 | %(d) | 1.36 | %(d) | 4.24 | %(d) | 86 | % | ||||||||||||||||||||
| — | (0.65 | ) | 18.21 | 10.16 | 3,361 | 1.15 | 1.35 | 3.75 | 116 | |||||||||||||||||||||||||||||
| — | (1.03 | ) | 17.16 | (5.16 | ) | 2,988 | 1.19 | (d)(e) | 1.37 | (d)(e) | 2.49 | (d)(e) | 179 | |||||||||||||||||||||||||
| — | (0.20 | ) | 19.14 | 3.12 | 3,984 | 1.15 | 1.35 | 1.42 | 101 | |||||||||||||||||||||||||||||
| (0.03 | ) | (0.61 | ) | 18.76 | 2.03 | 4,359 | 1.14 | 1.35 | 1.99 | 81 | ||||||||||||||||||||||||||||
| — | (0.65 | ) | 18.99 | 8.84 | 6,935 | 1.15 | 1.35 | 1.70 | 51 | |||||||||||||||||||||||||||||
| — | (0.75 | ) | 18.09 | 2.71 | 5,820 | 1.22 | 2.48 | 1.50 | 74 | |||||||||||||||||||||||||||||
| $ | — | $ | (0.40 | ) | $ | 19.01 | 2.39 | % | $ | 124 | 0.67 | %(d) | 0.86 | %(d) | 4.24 | %(d) | 86 | % | ||||||||||||||||||||
| — | (0.79 | ) | 18.97 | 10.59 | 519 | 0.75 | 0.85 | 4.00 | 116 | |||||||||||||||||||||||||||||
| — | (1.11 | ) | 17.92 | (4.83 | ) | 238 | 0.79 | (d)(e) | 0.87 | (d)(e) | 2.78 | (d)(e) | 179 | |||||||||||||||||||||||||
| — | (0.27 | ) | 19.95 | 3.55 | 215 | 0.75 | 0.85 | 1.80 | 101 | |||||||||||||||||||||||||||||
| (0.03 | ) | (0.68 | ) | 19.53 | 2.46 | 152 | 0.74 | 0.85 | 2.36 | 81 | ||||||||||||||||||||||||||||
| — | (0.72 | ) | 19.74 | 9.28 | 183 | 0.75 | 0.85 | 1.29 | 51 | |||||||||||||||||||||||||||||
| — | (0.54 | ) | 18.77 | 3.18 | 17 | 0.76 | 4.59 | 2.82 | 74 | |||||||||||||||||||||||||||||
| $ | — | $ | (0.56 | ) | $ | 18.43 | 2.70 | % | $ | 16,125 | 0.02 | %(d) | 0.21 | %(d) | 5.28 | %(d) | 86 | % | ||||||||||||||||||||
| — | (0.99 | ) | 18.51 | 11.32 | 17,120 | 0.10 | 0.20 | 4.63 | 116 | |||||||||||||||||||||||||||||
| — | (1.23 | ) | 17.58 | (4.31 | ) | 5,450 | 0.14 | (d)(e) | 0.22 | (d)(e) | 3.31 | (d)(e) | 179 | |||||||||||||||||||||||||
| — | (0.40 | ) | 19.61 | 4.23 | 6,349 | 0.11 | 0.21 | 2.39 | 101 | |||||||||||||||||||||||||||||
| (0.03 | ) | (0.83 | ) | 19.20 | 3.12 | 4,427 | 0.09 | (f) | 0.20 | 2.42 | 81 | |||||||||||||||||||||||||||
| — | (0.85 | ) | 19.44 | 10.05 | 4,751 | 0.10 | 0.20 | 1.71 | 51 | |||||||||||||||||||||||||||||
| — | (0.58 | ) | 18.49 | 3.69 | 14 | 0.26 | 4.47 | 3.38 | 74 | |||||||||||||||||||||||||||||
| $ | — | $ | (0.57 | ) | $ | 17.99 | 2.76 | % | $ | 21,408 | — | %(d)(f) | 0.11 | %(d) | 5.49 | %(d) | 86 | % | ||||||||||||||||||||
| — | (1.02 | ) | 18.08 | 11.40 | 19,128 | — | 0.10 | 4.70 | 116 | |||||||||||||||||||||||||||||
| — | (1.25 | ) | 17.21 | (4.23 | ) | 8,058 | 0.04 | (d)(e) | 0.12 | (d)(e) | 3.69 | (d)(e) | 179 | |||||||||||||||||||||||||
| — | (0.42 | ) | 19.23 | 4.36 | 9,496 | — | (f)(g) | 0.10 | 2.56 | 101 | ||||||||||||||||||||||||||||
| (0.03 | ) | (0.84 | ) | 18.83 | 3.23 | 9,487 | — | (f) | 0.12 | 2.96 | 81 | |||||||||||||||||||||||||||
| — | (0.85 | ) | 19.08 | 10.11 | 11,294 | — | 0.15 | 2.64 | 51 | |||||||||||||||||||||||||||||
| — | (0.91 | ) | 18.16 | 3.77 | 4,904 | 0.16 | 1.81 | 3.53 | 74 | |||||||||||||||||||||||||||||
| $ | — | $ | (0.54 | ) | $ | 18.53 | 2.57 | % | $ | 1,643 | 0.27 | %(d) | 0.46 | %(d) | 5.56 | %(d) | 86 | % | ||||||||||||||||||||
| — | (0.68 | ) | 18.61 | 9.87 | 822 | 0.35 | 0.45 | 4.13 | 116 | |||||||||||||||||||||||||||||
| — | (1.11 | ) | 17.60 | (4.53 | ) | 24 | 0.37 | (d)(e) | 0.45 | (d)(e) | 10.47 | (d)(e) | 179 | |||||||||||||||||||||||||
| — | (0.35 | ) | 19.56 | 3.97 | 2,001 | 0.35 | 0.45 | 2.20 | 101 | |||||||||||||||||||||||||||||
| (0.03 | ) | (0.80 | ) | 19.15 | 2.92 | 2,461 | 0.34 | 0.45 | 1.16 | 81 | ||||||||||||||||||||||||||||
| — | (0.80 | ) | 19.41 | 9.71 | 15 | 0.35 | 0.45 | 2.59 | 51 | |||||||||||||||||||||||||||||
| — | (0.56 | ) | 18.46 | 3.49 | 14 | 0.44 | 4.65 | 3.21 | 74 | |||||||||||||||||||||||||||||
| (c) | Does not include expenses of the investment companies in which the Fund invests. |
| (d) | Annualized, unless otherwise noted. |
| (e) | Certain expenses incurred by the Fund were not annualized. |
| (f) | See Note 6 in the Notes to Financial Statements. |
| (g) | Less than 0.01%. |
| See accompanying Notes to Financial Statements | | March 31, 2017 | | Semiannual Report | 261 |
Table of Contents
Financial Highlights (cont’d)
For a Share Outstanding for the Period ended:
Net Asset | Net Investment Income (Loss) (a) | Net Realized and Change in Unrealized Gain (Loss) | Total from Investment Operations | Dividends from Net Investment Income | Distributions from Net Realized Capital Gains | |||||||||||||||||||||||
| AllianzGI Global Allocation: | ||||||||||||||||||||||||||||
| Class A | ||||||||||||||||||||||||||||
3/31/2017+ | $ | 11.23 | $ | 0.16 | $ | 0.27 | $ | 0.43 | $ | (0.17 | ) | $ | — | |||||||||||||||
9/30/2016 | 10.98 | 0.07 | 0.63 | 0.70 | (0.05 | ) | (0.40 | ) | ||||||||||||||||||||
12/1/2014 - 9/30/2015# | 12.18 | 0.25 | (0.89 | ) | (0.64 | ) | (0.42 | ) | (0.14 | ) | ||||||||||||||||||
11/30/2014 | 11.90 | 0.30 | 0.25 | 0.55 | (0.27 | ) | — | |||||||||||||||||||||
11/30/2013 | 11.07 | 0.31 | 0.95 | 1.26 | (0.43 | ) | — | |||||||||||||||||||||
11/30/2012 | 10.30 | 0.25 | 0.84 | 1.09 | (0.32 | ) | — | |||||||||||||||||||||
11/30/2011 | 10.58 | 0.25 | (0.14 | ) | 0.11 | (0.39 | ) | — | ||||||||||||||||||||
| Class C | ||||||||||||||||||||||||||||
3/31/2017+ | $ | 11.32 | $ | 0.13 | $ | 0.27 | $ | 0.40 | $ | (0.09 | ) | $ | — | |||||||||||||||
9/30/2016 | 11.13 | (0.01 | ) | 0.63 | 0.62 | (0.03 | ) | (0.40 | ) | |||||||||||||||||||
12/1/2014 - 9/30/2015# | 12.33 | 0.18 | (0.91 | ) | (0.73 | ) | (0.33 | ) | (0.14 | ) | ||||||||||||||||||
11/30/2014 | 12.04 | 0.22 | 0.24 | 0.46 | (0.17 | ) | — | |||||||||||||||||||||
11/30/2013 | 11.19 | 0.23 | 0.96 | 1.19 | (0.34 | ) | — | |||||||||||||||||||||
11/30/2012 | 10.41 | 0.17 | 0.85 | 1.02 | (0.24 | ) | — | |||||||||||||||||||||
11/30/2011 | 10.69 | 0.18 | (0.16 | ) | 0.02 | (0.30 | ) | — | ||||||||||||||||||||
| Class R | ||||||||||||||||||||||||||||
3/31/2017+ | $ | 11.15 | $ | 0.16 | $ | 0.26 | $ | 0.42 | $ | (0.19 | ) | $ | — | |||||||||||||||
9/30/2016 | 10.93 | 0.05 | 0.62 | 0.67 | (0.05 | ) | (0.40 | ) | ||||||||||||||||||||
12/1/2014 - 9/30/2015# | 12.13 | 0.22 | (0.88 | ) | (0.66 | ) | (0.40 | ) | (0.14 | ) | ||||||||||||||||||
11/30/2014 | 11.84 | 0.28 | 0.26 | 0.54 | (0.25 | ) | — | |||||||||||||||||||||
11/30/2013 | 11.02 | 0.28 | 0.95 | 1.23 | (0.41 | ) | — | |||||||||||||||||||||
11/30/2012 | 10.26 | 0.21 | 0.84 | 1.05 | (0.29 | ) | — | |||||||||||||||||||||
11/30/2011 | 10.54 | 0.23 | (0.15 | ) | 0.08 | (0.36 | ) | — | ||||||||||||||||||||
| Class P | ||||||||||||||||||||||||||||
3/31/2017+ | $ | 11.24 | $ | 0.21 | $ | 0.24 | $ | 0.45 | $ | (0.26 | ) | $ | — | |||||||||||||||
9/30/2016 | 10.98 | 0.12 | 0.61 | 0.73 | (0.07 | ) | (0.40 | ) | ||||||||||||||||||||
12/1/2014 - 9/30/2015# | 12.19 | 0.25 | (0.87 | ) | (0.62 | ) | (0.45 | ) | (0.14 | ) | ||||||||||||||||||
11/30/2014 | 11.90 | 0.32 | 0.26 | 0.58 | (0.29 | ) | — | |||||||||||||||||||||
11/30/2013 | 11.07 | 0.32 | 0.96 | 1.28 | (0.45 | ) | — | |||||||||||||||||||||
11/30/2012 | 10.28 | 0.29 | 0.81 | 1.10 | (0.31 | ) | — | |||||||||||||||||||||
11/30/2011 | 10.56 | 0.27 | (0.14 | ) | 0.13 | (0.41 | ) | — | ||||||||||||||||||||
| + | Unaudited |
| # | Fiscal year end changed from November 30th to September 30th. |
| * | Commencement of operations. |
| (a) | Calculated on average shares outstanding during the period. |
| (b) | Total return is calculated assuming a purchase of a share on the first day of the period and a sale of a share on the last day of each period reported. Dividends and distributions, if any, are assumed, for purposes of this calculation, to be reinvested. Total return does not reflect sales charges and includes the effect of fee waivers and reimbursements. Total return may reflect adjustments to conform to U.S. GAAP. Total return for a period of less than one year is not annualized. |
| (c) | Does not include expenses of the investment companies in which the Fund invests. |
| (d) | Annualized, unless otherwise noted. |
| (e) | Certain expenses incurred by the Fund were not annualized. |
| 262 | Semiannual Report | | March 31, 2017 | | See accompanying Notes to Financial Statements |
Table of Contents
| Total Dividends and Distributions | Net Asset Value, End of Period | Total Return (b) | Net Assets, End of Period (000s) | Ratio of Expenses to Average Net Assets with Fee Waiver/ Reimbursement (c) | Ratio of Expenses to Average Net Assets without Fee Waiver/ Reimbursement (c) | Ratio of Net Investment Income (Loss) to Average Net Assets (c) | Portfolio Turnover Rate | |||||||||||||||||||||||||||
| $ | (0.17 | ) | $ | 11.49 | 3.88 | % | $ | 43,885 | 0.60 | %(d) | 1.13 | %(d) | 2.88 | %(d) | 6 | % | ||||||||||||||||||
| (0.45 | ) | 11.23 | 6.55 | 84,852 | 0.60 | 1.13 | 0.68 | 57 | ||||||||||||||||||||||||||
| (0.56 | ) | 10.98 | (5.45 | ) | 88,132 | 0.55 | (d)(e) | 1.30 | (d)(e) | 2.52 | (d)(e) | 113 | ||||||||||||||||||||||
| (0.27 | ) | 12.18 | 4.62 | 65,499 | 0.40 | 1.34 | 2.48 | 48 | ||||||||||||||||||||||||||
| (0.43 | ) | 11.90 | 11.79 | 69,565 | 0.41 | 1.36 | 2.68 | 45 | ||||||||||||||||||||||||||
| (0.32 | ) | 11.07 | 10.64 | 70,312 | 0.43 | 1.38 | 2.32 | 57 | ||||||||||||||||||||||||||
| (0.39 | ) | 10.30 | 0.95 | 73,816 | 0.47 | 1.35 | 2.32 | 64 | ||||||||||||||||||||||||||
| $ | (0.09 | ) | $ | 11.63 | 3.55 | % | $ | 40,169 | 1.35 | %(d) | 1.88 | %(d) | 2.37 | %(d) | 6 | % | ||||||||||||||||||
| (0.43 | ) | 11.32 | 5.72 | 46,387 | 1.38 | 1.90 | (0.06 | ) | 57 | |||||||||||||||||||||||||
| (0.47 | ) | 11.13 | (6.07 | ) | 51,322 | 1.29 | (d)(e) | 2.04 | (d)(e) | 1.78 | (d)(e) | 113 | ||||||||||||||||||||||
| (0.17 | ) | 12.33 | 3.88 | 62,275 | 1.13 | 2.08 | 1.78 | 48 | ||||||||||||||||||||||||||
| (0.34 | ) | 12.04 | 10.81 | 68,756 | 1.14 | 2.10 | 1.98 | 45 | ||||||||||||||||||||||||||
| (0.24 | ) | 11.19 | 9.90 | 71,375 | 1.18 | 2.11 | 1.59 | 57 | ||||||||||||||||||||||||||
| (0.30 | ) | 10.41 | 0.15 | 78,367 | 1.22 | 2.09 | 1.64 | 64 | ||||||||||||||||||||||||||
| $ | (0.19 | ) | $ | 11.38 | 3.87 | % | $ | 19 | 0.79 | %(d) | 1.32 | %(d) | 2.94 | %(d) | 6 | % | ||||||||||||||||||
| (0.45 | ) | 11.15 | 6.25 | 17 | 0.81 | 1.33 | 0.45 | 57 | ||||||||||||||||||||||||||
| (0.54 | ) | 10.93 | (5.61 | ) | 16 | 0.72 | (d)(e) | 1.50 | (d)(e) | 2.23 | (d)(e) | 113 | ||||||||||||||||||||||
| (0.25 | ) | 12.13 | 4.57 | 17 | 0.56 | 1.53 | 2.32 | 48 | ||||||||||||||||||||||||||
| (0.41 | ) | 11.84 | 11.44 | 17 | 0.59 | 1.54 | 2.42 | 45 | ||||||||||||||||||||||||||
| (0.29 | ) | 11.02 | 10.44 | 15 | 0.67 | 1.56 | 2.02 | 57 | ||||||||||||||||||||||||||
| (0.36 | ) | 10.26 | 0.73 | 14 | 0.72 | 1.59 | 2.11 | 64 | ||||||||||||||||||||||||||
| $ | (0.26 | ) | $ | 11.43 | 4.13 | % | $ | 2,840 | 0.29 | %(d) | 0.81 | %(d) | 3.72 | %(d) | 6 | % | ||||||||||||||||||
| (0.47 | ) | 11.24 | 6.78 | 1,901 | 0.30 | 0.83 | 1.10 | 57 | ||||||||||||||||||||||||||
| (0.59 | ) | 10.98 | (5.30 | ) | 2,069 | 0.33 | (d)(e) | 1.06 | (d)(e) | 2.52 | (d)(e) | 113 | ||||||||||||||||||||||
| (0.29 | ) | 12.19 | 4.96 | 2,139 | 0.16 | 1.12 | 2.68 | 48 | ||||||||||||||||||||||||||
| (0.45 | ) | 11.90 | 11.92 | 1,960 | 0.19 | 1.13 | 2.81 | 45 | ||||||||||||||||||||||||||
| (0.31 | ) | 11.07 | 10.91 | 1,340 | 0.25 | 1.37 | 2.75 | 57 | ||||||||||||||||||||||||||
| (0.41 | ) | 10.28 | 1.13 | 1,996 | 0.27 | 1.22 | 2.52 | 64 | ||||||||||||||||||||||||||
| See accompanying Notes to Financial Statements | | March 31, 2017 | | Semiannual Report | 263 |
Table of Contents
Financial Highlights (cont’d)
For a Share Outstanding for the Period ended:
Net Asset | Net Investment Income (Loss) (a) | Net Realized and Change in Unrealized Gain (Loss) | Total from Investment Operations | Dividends from Net Investment Income | Distributions from Net Realized Capital Gains | |||||||||||||||||||||||
| AllianzGI Global Allocation (cont’d) | ||||||||||||||||||||||||||||
| Institutional Class | ||||||||||||||||||||||||||||
3/31/2017+ | $ | 11.11 | $ | 0.19 | $ | 0.25 | $ | 0.44 | $ | (0.24 | ) | $ | — | |||||||||||||||
9/30/2016 | 10.86 | 0.10 | 0.61 | 0.71 | (0.06 | ) | (0.40 | ) | ||||||||||||||||||||
12/1/2014 - 9/30/2015# | 12.07 | 0.25 | (0.87 | ) | (0.62 | ) | (0.45 | ) | (0.14 | ) | ||||||||||||||||||
11/30/2014 | 11.78 | 0.32 | 0.27 | 0.59 | (0.30 | ) | — | |||||||||||||||||||||
11/30/2013 | 10.97 | 0.32 | 0.95 | 1.27 | (0.46 | ) | — | |||||||||||||||||||||
11/30/2012 | 10.21 | 0.26 | 0.84 | 1.10 | (0.34 | ) | — | |||||||||||||||||||||
11/30/2011 | 10.48 | 0.27 | (0.13 | ) | 0.14 | (0.41 | ) | — | ||||||||||||||||||||
| Class R6 | ||||||||||||||||||||||||||||
3/31/2017+ | $ | 11.10 | $ | 0.19 | $ | 0.25 | $ | 0.44 | $ | (0.26 | ) | $ | — | |||||||||||||||
9/30/2016 | 10.85 | 0.05 | 0.67 | 0.72 | (0.07 | ) | (0.40 | ) | ||||||||||||||||||||
9/8/2015* - 9/30/2015# | 11.01 | 0.01 | (0.13 | ) | (0.12 | ) | (0.04 | ) | — | |||||||||||||||||||
| Administrative Class | ||||||||||||||||||||||||||||
3/31/2017+ | $ | 11.52 | $ | 0.18 | $ | 0.27 | $ | 0.45 | $ | (0.21 | ) | $ | — | |||||||||||||||
9/30/2016 | 11.25 | 0.08 | 0.64 | 0.72 | (0.05 | ) | (0.40 | ) | ||||||||||||||||||||
12/1/2014 - 9/30/2015# | 12.47 | 0.23 | (0.89 | ) | (0.66 | ) | (0.42 | ) | (0.14 | ) | ||||||||||||||||||
11/30/2014 | 12.17 | 0.30 | 0.27 | 0.57 | (0.27 | ) | — | |||||||||||||||||||||
11/30/2013 | 11.30 | 0.43 | 0.85 | 1.28 | (0.41 | ) | — | |||||||||||||||||||||
11/30/2012 | 10.51 | 0.26 | 0.84 | 1.10 | (0.31 | ) | — | |||||||||||||||||||||
11/30/2011 | 10.78 | 0.13 | (0.01 | ) | 0.12 | (0.39 | ) | — | ||||||||||||||||||||
| + | Unaudited |
| # | Fiscal year end changed from November 30th to September 30th. |
| * | Commencement of operations. |
| (a) | Calculated on average shares outstanding during the period. |
| (b) | Total return is calculated assuming a purchase of a share on the first day of the period and a sale of a share on the last day of each period reported. Dividends and distributions, if any, are assumed, for purposes of this calculation, to be reinvested. Total return does not reflect sales charges and includes the effect of fee waivers and reimbursements. Total return may reflect adjustments to conform to U.S. GAAP. Total return for a period of less than one year is not annualized. |
| (c) | Does not include expenses of the investment companies in which the Fund invests. |
| (d) | Annualized, unless otherwise noted. |
| (e) | Certain expenses incurred by the Fund were not annualized. |
| 264 | Semiannual Report | | March 31, 2017 | | See accompanying Notes to Financial Statements |
Table of Contents
| Total Dividends and Distributions | Net Asset Value, End of Period | Total Return (b) | Net Assets, End of Period (000s) | Ratio of Expenses to Average Net Assets with Fee Waiver/ Reimbursement (c) | Ratio of Expenses to Average Net Assets without Fee Waiver/ Reimbursement (c) | Ratio of Net Investment Income (Loss) to Average Net Assets (c) | Portfolio Turnover Rate | |||||||||||||||||||||||||||
| $ | (0.24 | ) | $ | 11.31 | 4.09 | % | $ | 70,436 | 0.38 | %(d) | 0.91 | %(d) | 3.37 | %(d) | 6 | % | ||||||||||||||||||
| (0.46 | ) | 11.11 | 6.72 | 68,709 | 0.40 | 0.92 | 0.89 | 57 | ||||||||||||||||||||||||||
| (0.59 | ) | 10.86 | (5.34 | ) | 74,024 | 0.32 | (d)(e) | 1.07 | (d)(e) | 2.58 | (d)(e) | 113 | ||||||||||||||||||||||
| (0.30 | ) | 12.07 | 5.01 | 74,957 | 0.16 | 1.11 | 2.69 | 48 | ||||||||||||||||||||||||||
| (0.46 | ) | 11.78 | 11.90 | 68,675 | 0.16 | 1.11 | 2.81 | 45 | ||||||||||||||||||||||||||
| (0.34 | ) | 10.97 | 11.01 | 57,357 | 0.15 | 1.14 | 2.47 | 57 | ||||||||||||||||||||||||||
| (0.41 | ) | 10.21 | 1.31 | 47,916 | 0.16 | 1.12 | 2.50 | 64 | ||||||||||||||||||||||||||
| $ | (0.26 | ) | $ | 11.28 | 4.10 | % | $ | 299,509 | 0.28 | %(d) | 0.81 | %(d) | 3.44 | %(d) | 6 | % | ||||||||||||||||||
| (0.47 | ) | 11.10 | 6.81 | 291,767 | 0.30 | 0.83 | 0.48 | 57 | ||||||||||||||||||||||||||
| (0.04 | ) | 10.85 | (1.14 | ) | 91,912 | 0.30 | (d)(e) | 1.31 | (d)(e) | 2.07 | (d)(e) | 113 | ||||||||||||||||||||||
| $ | (0.21 | ) | $ | 11.76 | 3.96 | % | $ | 24 | 0.53 | %(d) | 1.06 | %(d) | 3.07 | %(d) | 6 | % | ||||||||||||||||||
| (0.45 | ) | 11.52 | 6.58 | 32 | 0.56 | 1.08 | 0.67 | 57 | ||||||||||||||||||||||||||
| (0.56 | ) | 11.25 | (5.50 | ) | 27 | 0.57 | (d)(e) | 1.23 | (d)(e) | 2.35 | (d)(e) | 113 | ||||||||||||||||||||||
| (0.27 | ) | 12.47 | 4.68 | 33 | 0.41 | 1.27 | 2.45 | 48 | ||||||||||||||||||||||||||
| (0.41 | ) | 12.17 | 11.59 | 24 | 0.41 | 1.48 | 3.73 | 45 | ||||||||||||||||||||||||||
| (0.31 | ) | 11.30 | 10.70 | 1,653 | 0.40 | 1.42 | 2.35 | 57 | ||||||||||||||||||||||||||
| (0.39 | ) | 10.51 | 1.05 | 1,649 | 0.41 | 1.36 | 1.19 | 64 | ||||||||||||||||||||||||||
| See accompanying Notes to Financial Statements | | March 31, 2017 | | Semiannual Report | 265 |
Table of Contents
Financial Highlights (cont’d)
For a Share Outstanding for the Period ended:
Net Asset | Net Investment Income (Loss) (a) | Net Realized and Change in Unrealized Gain (Loss) | Total from Investment Operations | Dividends from Net Investment Income | Distributions from Net Realized Capital Gains | |||||||||||||||||||||||
| AllianzGI Global Megatrends: | ||||||||||||||||||||||||||||
| Class A | ||||||||||||||||||||||||||||
3/31/2017+ | $ | 14.71 | $ | 0.07 | $ | 0.40 | $ | 0.47 | $ | (0.06 | ) | $ | — | |||||||||||||||
9/30/2016 | 13.84 | 0.01 | 1.94 | 1.95 | (0.28 | ) | (0.80 | ) | ||||||||||||||||||||
2/2/2015* - 9/30/2015# | 15.00 | (0.02 | ) | (1.14 | ) | (1.16 | ) | — | — | |||||||||||||||||||
| Class P | ||||||||||||||||||||||||||||
3/31/2017+ | $ | 14.74 | $ | 0.07 | $ | 0.41 | $ | 0.48 | $ | (0.07 | ) | $ | — | |||||||||||||||
9/30/2016 | 13.86 | 0.08 | 1.89 | 1.97 | (0.29 | ) | (0.80 | ) | ||||||||||||||||||||
2/2/2015* - 9/30/2015# | 15.00 | — | (1.14 | ) | (1.14 | ) | — | — | ||||||||||||||||||||
| Institutional Class | ||||||||||||||||||||||||||||
3/31/2017+ | $ | 14.76 | $ | 0.08 | $ | 0.41 | $ | 0.49 | $ | (0.07 | ) | $ | — | |||||||||||||||
9/30/2016 | 13.87 | 0.07 | 1.91 | 1.98 | (0.29 | ) | (0.80 | ) | ||||||||||||||||||||
2/2/2015* - 9/30/2015# | 15.00 | 0.01 | (1.14 | ) | (1.13 | ) | — | — | ||||||||||||||||||||
| + | Unaudited |
| * | Commencement of operations. |
| # | Fiscal year end changed from November 30th to September 30th. |
| (a) | Calculated on average shares outstanding during the period. |
| (b) | Total return is calculated assuming a purchase of a share on the first day of the period and a sale of a share on the last day of each period reported. Dividends and distributions, if any, are assumed, for purposes of this calculation, to be reinvested. Total return does not reflect sales charges and includes the effect of fee waivers and reimbursements. Total return may reflect adjustments to conform to U.S. GAAP. Total return for a period of less than one year is not annualized. |
| (c) | Does not include expenses of the investment companies in which the Fund invests. |
| (d) | Annualized, unless otherwise noted. |
| (e) | Certain expenses incurred by the Fund were not annualized. |
| (f) | See Note 6 in the Notes to Financial Statements. |
| 266 | Semiannual Report | | March 31, 2017 | | See accompanying Notes to Financial Statements |
Table of Contents
| Total Dividends and Distributions | Net Asset Value, End of Period | Total Return (b) | Net Assets, End of Period (000s) | Ratio of Expenses to Average Net Assets with Fee Waiver/ Reimbursement (c) | Ratio of Expenses to Average Net Assets without Fee Waiver/ Reimbursement (c) | Ratio of Net to Average Net Assets (c) | Portfolio Turnover Rate | |||||||||||||||||||||||||||
| $ | (0.06 | ) | $ | 15.12 | 3.24 | % | $ | 48 | 0.17 | %(d) | 4.85 | %(d) | 0.94 | %(d) | — | % | ||||||||||||||||||
| (1.08 | ) | 14.71 | 14.36 | 39 | 0.13 | 5.99 | 0.07 | 5 | ||||||||||||||||||||||||||
| — | 13.84 | (7.73 | ) | 9 | 0.15 | (d)(e) | 6.65 | (d)(e) | (0.15 | )(d)(e) | — | |||||||||||||||||||||||
| $ | (0.07 | ) | $ | 15.15 | 3.31 | % | $ | 11 | 0.02 | %(d) | 4.54 | %(d) | 1.03 | %(d) | — | % | ||||||||||||||||||
| (1.09 | ) | 14.74 | 14.55 | 11 | — | (f) | 6.70 | 0.61 | 5 | |||||||||||||||||||||||||
| — | 13.86 | (7.60 | ) | 27 | — | (d)(e) | 6.86 | (d)(e) | — | (d)(e) | — | |||||||||||||||||||||||
| $ | (0.07 | ) | $ | 15.18 | 3.38 | % | $ | 3,418 | — | %(d)(f) | 4.55 | %(d) | 1.13 | %(d) | — | % | ||||||||||||||||||
| (1.09 | ) | 14.76 | 14.61 | 3,204 | — | (f) | 5.84 | 0.46 | 5 | |||||||||||||||||||||||||
| — | 13.87 | (7.53 | ) | 2,776 | — | (d)(e)(f) | 6.40 | (d)(e) | 0.10 | (d)(e) | — | |||||||||||||||||||||||
| See accompanying Notes to Financial Statements | | March 31, 2017 | | Semiannual Report | 267 |
Table of Contents
Financial Highlights (cont’d)
For a Share Outstanding for the Period ended:
| Net Asset Value, Beginning of Period | Net Investment Income (Loss) (a) | Net Realized and Change in Unrealized Gain (Loss) | Total from Investment Operations | Dividends from Net Investment Income | Distributions from Net Realized Capital Gains | |||||||||||||||||||||||
| AllianzGI Best Styles Emerging Markets Equity: | ||||||||||||||||||||||||||||
| Class A | ||||||||||||||||||||||||||||
3/31/2017+ | $ | 14.44 | $ | 0.02 | $ | 0.78 | $ | 0.80 | $ | (0.85 | ) | $ | — | |||||||||||||||
4/26/2016* - 9/30/2016 | 13.08 | 0.18 | 1.18 | 1.36 | — | — | ||||||||||||||||||||||
| Class C | ||||||||||||||||||||||||||||
3/31/2017+ | $ | 14.40 | $ | (0.03 | ) | $ | 0.77 | $ | 0.74 | $ | (0.79 | ) | $ | — | ||||||||||||||
4/26/2016* - 9/30/2016 | 13.08 | 0.12 | 1.20 | 1.32 | — | — | ||||||||||||||||||||||
| Class P | ||||||||||||||||||||||||||||
3/31/2017+ | $ | 14.47 | $ | 0.03 | $ | 0.78 | $ | 0.81 | $ | (0.84 | ) | $ | — | |||||||||||||||
9/30/2016 | 12.75 | 0.22 | 1.93 | 2.15 | (0.17 | ) | (0.26 | ) | ||||||||||||||||||||
12/9/2014* - 9/30/2015# | 15.00 | 0.34 | (2.59 | ) | (2.25 | ) | — | (f) | — | |||||||||||||||||||
| Institutional Class | ||||||||||||||||||||||||||||
3/31/2017+ | $ | 14.46 | $ | 0.05 | $ | 0.77 | $ | 0.82 | $ | (0.85 | ) | $ | — | |||||||||||||||
9/30/2016 | 12.76 | 0.25 | 1.90 | 2.15 | (0.19 | ) | (0.26 | ) | ||||||||||||||||||||
12/9/2014* - 9/30/2015# | 15.00 | 0.36 | (2.60 | ) | (2.24 | ) | — | (f) | — | |||||||||||||||||||
| Class R6 | ||||||||||||||||||||||||||||
3/31/2017+ | $ | 14.44 | $ | 0.05 | $ | 0.78 | $ | 0.83 | $ | (0.80 | ) | $ | — | |||||||||||||||
9/30/2016 | 12.77 | 0.30 | 1.87 | 2.17 | (0.24 | ) | (0.26 | ) | ||||||||||||||||||||
12/9/2014* - 9/30/2015# | 15.00 | 0.37 | (2.60 | ) | (2.23 | ) | — | (f) | — | |||||||||||||||||||
| AllianzGI Best Styles Global Equity: | ||||||||||||||||||||||||||||
| Class A | ||||||||||||||||||||||||||||
3/31/2017+ | $ | 15.62 | $ | 0.07 | $ | 1.41 | $ | 1.48 | $ | — | (f) | $ | (0.10 | ) | ||||||||||||||
9/30/2016 | 14.60 | 0.28 | 0.89 | 1.17 | (0.15 | ) | — | |||||||||||||||||||||
12/1/2014 - 9/30/2015# | 16.57 | 0.52 | (1.65 | ) | (1.13 | ) | (0.43 | ) | (0.41 | ) | ||||||||||||||||||
9/2/2014* - 11/30/2014 | 16.51 | 0.05 | 0.01 | 0.06 | — | — | ||||||||||||||||||||||
| Class C | ||||||||||||||||||||||||||||
3/31/2017+ | $ | 15.61 | $ | 0.08 | $ | 1.36 | $ | 1.44 | $ | (0.18 | ) | $ | (0.10 | ) | ||||||||||||||
4/26/2016* - 9/30/2016 | 15.29 | 0.11 | 0.21 | 0.32 | — | — | ||||||||||||||||||||||
| Class P | ||||||||||||||||||||||||||||
3/31/2017+ | $ | 15.79 | $ | 0.13 | $ | 1.39 | $ | 1.52 | $ | (0.24 | ) | $ | (0.10 | ) | ||||||||||||||
9/30/2016 | 14.68 | 0.32 | 0.89 | 1.21 | (0.10 | ) | — | |||||||||||||||||||||
12/22/2014* - 9/30/2015# | 15.68 | 0.27 | (1.27 | ) | (1.00 | ) | —(f | ) | — | (f) | ||||||||||||||||||
| Institutional Class | ||||||||||||||||||||||||||||
3/31/2017+ | $ | 15.68 | $ | 0.13 | $ | 1.38 | $ | 1.51 | $ | (0.26 | ) | $ | (0.10 | ) | ||||||||||||||
9/30/2016 | 14.63 | 0.37 | 0.84 | 1.21 | (0.16 | ) | — | |||||||||||||||||||||
12/1/2014 - 9/30/2015# | 16.58 | 0.28 | (1.38 | ) | (1.10 | ) | (0.44 | ) | (0.41 | ) | ||||||||||||||||||
9/2/2014* - 11/30/2014 | 16.51 | 0.06 | 0.01 | 0.07 | — | — | ||||||||||||||||||||||
| Class R6 | ||||||||||||||||||||||||||||
3/31/2017+ | $ | 15.78 | $ | 0.14 | $ | 1.39 | $ | 1.53 | $ | (0.28 | ) | $ | (0.10 | ) | ||||||||||||||
9/30/2016 | 14.70 | 0.37 | 0.86 | 1.23 | (0.15 | ) | — | |||||||||||||||||||||
12/1/2014 - 9/30/2015# | 16.58 | 0.31 | (1.40 | ) | (1.09 | ) | (0.38 | ) | (0.41 | ) | ||||||||||||||||||
12/2/2013* - 11/30/2014 | 15.00 | 0.38 | 1.20 | 1.58 | — | — | ||||||||||||||||||||||
| + | Unaudited |
| * | Commencement of operations. |
| # | Fiscal year end changed from November 30th to September 30th. |
| (a) | Calculated on average shares outstanding during the period. |
| (b) | Total return is calculated assuming a purchase of a share on the first day of the period and a sale of a share on the last day of each period reported. Dividends and distributions, if any, are assumed, for purposes of this calculation, to be reinvested. Total return does not reflect sales charges and includes the effect of fee waivers and reimbursements. Total return may reflect adjustments to conform to U.S. GAAP. Total return for a period of less than one year is not annualized. |
| 268 | Semiannual Report | | March 31, 2017 | | See accompanying Notes to Financial Statements |
Table of Contents
Total Dividends and Distributions | Net Asset Value, End of Period | Total Return (b) | Net Assets, End of Period (000s) | Ratio of Expenses to Average Net Assets with Fee Waiver/ Reimbursement | Ratio of Expenses to Average Net Assets without Fee Waiver/ Reimbursement | Ratio of Net Investment Income (Loss) to Average Net Assets | Portfolio Turnover Rate | |||||||||||||||||||||||||||
| $ | (0.85 | ) | $ | 14.39 | 6.42 | % | $ | 18 | 0.91 | %(c) | 7.23 | %(c) | 0.32 | %(c) | 37 | % | ||||||||||||||||||
| — | 14.44 | 10.40 | 11 | 0.95 | (c) | 4.30 | (c) | 3.03 | (c) | 95 | ||||||||||||||||||||||||
| $ | (0.79 | ) | $ | 14.35 | 5.95 | % | $ | 15 | 1.67 | %(c) | 7.84 | %(c) | (0.49 | )%(c) | 37 | % | ||||||||||||||||||
| — | 14.40 | 10.09 | 14 | 1.70 | (c) | 5.13 | (c) | 2.08 | (c) | 95 | ||||||||||||||||||||||||
| $ | (0.84 | ) | $ | 14.44 | 6.46 | % | $ | 11 | 0.77 | %(c) | 6.84 | %(c) | 0.41 | %(c) | 37 | % | ||||||||||||||||||
| (0.43 | ) | 14.47 | (e) | 17.42 | (e) | 10 | 0.80 | 3.94 | 1.72 | 95 | ||||||||||||||||||||||||
| — | (f) | 12.75 | (14.98 | ) | 8 | 0.80 | (c)(d) | 5.81 | (c)(d) | 2.88 | (c)(d) | 29 | ||||||||||||||||||||||
| $ | (0.85 | ) | $ | 14.43 | 6.57 | % | $ | 74 | 0.62 | %(c) | 7.58 | %(c) | 0.68 | %(c) | 37 | % | ||||||||||||||||||
| (0.45 | ) | 14.46 | (e) | 17.52 | (e) | 10 | 0.70 | 3.89 | 1.97 | 95 | ||||||||||||||||||||||||
| — | (f) | 12.76 | (14.91 | ) | 9 | 0.70 | (c)(d) | 5.82 | (c)(d) | 2.98 | (c)(d) | 29 | ||||||||||||||||||||||
| $ | (0.80 | ) | $ | 14.47 | 6.57 | % | $ | 6,126 | 0.60 | %(c) | 6.66 | %(c) | 0.66 | %(c) | 37 | % | ||||||||||||||||||
| (0.50 | ) | 14.44 | (e) | 17.66 | (e) | 12,441 | 0.60 | 3.88 | 2.34 | 95 | ||||||||||||||||||||||||
| — | (f) | 12.77 | (14.84 | ) | 4,745 | 0.60 | (c)(d) | 5.79 | (c)(d) | 3.13 | (c)(d) | 29 | ||||||||||||||||||||||
| $ | (0.10 | ) | $ | 17.00 | 9.50 | % | $ | 1,203 | 0.75 | %(c) | 0.91 | %(c) | 0.84 | %(c) | 30 | % | ||||||||||||||||||
| (0.15 | ) | 15.62 | 8.09 | 36,257 | 0.75 | 0.79 | 1.88 | 70 | ||||||||||||||||||||||||||
| (0.84 | ) | 14.60 | (7.13 | ) | 32,383 | 0.75 | (c)(d) | 1.22 | (c)(d) | 4.64 | (c)(d) | 35 | ||||||||||||||||||||||
| — | 16.57 | 0.36 | 10 | 0.75 | (c) | 2.53 | (c) | 1.31 | (c) | 76 | ||||||||||||||||||||||||
| $ | (0.28 | ) | $ | 16.77 | 9.34 | % | $ | 21 | 1.39 | %(c) | 1.39 | %(c) | 0.99 | %(c) | 30 | % | ||||||||||||||||||
| — | 15.61 | 2.09 | 10 | 1.49 | (c) | 1.49 | (c) | 1.68 | (c) | 70 | ||||||||||||||||||||||||
| $ | (0.34 | ) | $ | 16.97 | 9.75 | % | $ | 3,250 | 0.57 | %(c) | 0.57 | %(c) | 1.61 | %(c) | 30 | % | ||||||||||||||||||
| (0.10 | ) | 15.79 | 8.28 | 2,851 | 0.60 | 0.62 | 2.13 | 70 | ||||||||||||||||||||||||||
| —(f | ) | 14.68 | (6.35 | ) | 4,069 | 0.61 | (c)(d) | 0.69 | (c)(d) | 2.20 | (c)(d) | 35 | ||||||||||||||||||||||
| $ | (0.36 | ) | $ | 16.83 | 9.81 | % | $ | 2,168 | 0.44 | %(c) | 0.49 | %(c) | 1.65 | %(c) | 30 | % | ||||||||||||||||||
| (0.16 | ) | 15.68 | 8.31 | 2,390 | 0.50 | 0.51 | 2.44 | 70 | ||||||||||||||||||||||||||
| (0.85 | ) | 14.63 | (6.92 | ) | 366 | 0.51 | (c)(d) | 0.68 | (c)(d) | 2.17 | (c)(d) | 35 | ||||||||||||||||||||||
| — | 16.58 | 0.42 | 10 | 0.50 | (c) | 2.27 | (c) | 1.56 | (c) | 76 | ||||||||||||||||||||||||
| $ | (0.38 | ) | $ | 16.93 | 9.85 | % | $ | 721,490 | 0.40 | %(c) | 0.41 | %(c) | 1.73 | %(c) | 30 | % | ||||||||||||||||||
| (0.15 | ) | 15.78 | 8.41 | 560,066 | 0.40 | 0.49 | 2.42 | 70 | ||||||||||||||||||||||||||
| (0.79 | ) | 14.70 | (6.83 | ) | 250,203 | 0.40 | (c)(d) | 0.70 | (c)(d) | 2.39 | (c)(d) | 35 | ||||||||||||||||||||||
| — | 16.58 | 10.53 | 33,422 | 0.40 | (c) | 1.80 | (c) | 2.40 | (c) | 76 | ||||||||||||||||||||||||
| (c) | Annualized, unless otherwise noted. |
| (d) | Certain expenses incurred by the Fund were not annualized. |
| (e) | Payments from Affiliates increased the end of period net asset value and total return by less than $0.01 and 0.01%, respectively. |
| (f) | Actual amount rounds to less than $(0.01) per share. |
| See accompanying Notes to Financial Statements | | March 31, 2017 | | Semiannual Report | 269 |
Table of Contents
Financial Highlights (cont’d)
For a Share Outstanding for the Period ended:
| Net Asset Value, Beginning of Period | Net Investment Income (a) | Net Realized and Change in Unrealized Gain (Loss) | Total from Investment Operations | Dividends | Distributions from Net Realized Capital Gains | |||||||||||||||||||||||
| AllianzGI Best Styles International Equity: | ||||||||||||||||||||||||||||
| Class A | ||||||||||||||||||||||||||||
3/31/2017+ | $ | 14.21 | $ | 0.10 | $ | 0.96 | $ | 1.06 | $ | (1.32 | ) | $ | — | |||||||||||||||
4/26/2016* - 9/30/2016 | 14.20 | 0.23 | (0.22 | ) | 0.01 | — | — | |||||||||||||||||||||
| Class C | ||||||||||||||||||||||||||||
3/31/2017+ | $ | 14.16 | $ | 0.05 | $ | 0.95 | $ | 1.00 | $ | (1.29 | ) | $ | — | |||||||||||||||
4/26/2016* - 9/30/2016 | 14.20 | 0.17 | (0.21 | ) | (0.04 | ) | — | — | ||||||||||||||||||||
| Class P | ||||||||||||||||||||||||||||
3/31/2017+ | $ | 14.21 | $ | 0.11 | $ | 0.95 | $ | 1.06 | $ | (1.32 | ) | $ | — | |||||||||||||||
9/30/2016 | 13.83 | 0.40 | 0.23 | 0.63 | (0.12 | ) | (0.13 | ) | ||||||||||||||||||||
12/9/2014* - 9/30/2015# | 15.00 | 0.37 | (1.53 | ) | (1.16 | ) | (0.01 | ) | — | |||||||||||||||||||
| Institutional Class | ||||||||||||||||||||||||||||
3/31/2017+ | $ | 14.22 | $ | 0.12 | $ | 0.96 | $ | 1.08 | $ | (1.33 | ) | $ | — | |||||||||||||||
9/30/2016 | 13.84 | 0.48 | 0.16 | 0.64 | (0.13 | ) | (0.13 | ) | ||||||||||||||||||||
12/9/2014* - 9/30/2015# | 15.00 | 0.38 | (1.53 | ) | (1.15 | ) | (0.01 | ) | — | |||||||||||||||||||
| Class R6 | ||||||||||||||||||||||||||||
3/31/2017+ | $ | 14.20 | $ | 0.12 | $ | 0.96 | $ | 1.08 | $ | (1.33 | ) | $ | — | |||||||||||||||
9/30/2016 | 13.85 | 0.45 | 0.21 | 0.66 | (0.18 | ) | (0.13 | ) | ||||||||||||||||||||
12/9/2014* - 9/30/2015# | 15.00 | 0.40 | (1.54 | ) | (1.14 | ) | (0.01 | ) | — | |||||||||||||||||||
| AllianzGI Best Styles U.S. Equity: | ||||||||||||||||||||||||||||
| Class A | ||||||||||||||||||||||||||||
3/31/2017+ | $ | 15.47 | $ | 0.12 | $ | 1.51 | $ | 1.63 | $ | (0.23 | ) | $ | — | |||||||||||||||
4/26/2016* - 9/30/2016 | 14.91 | 0.11 | 0.45 | 0.56 | — | — | ||||||||||||||||||||||
| Class C | ||||||||||||||||||||||||||||
3/31/2017+ | $ | 15.42 | $ | 0.06 | $ | 1.51 | $ | 1.57 | $ | (0.22 | ) | $ | — | |||||||||||||||
4/26/2016* - 9/30/2016 | 14.91 | 0.06 | 0.45 | 0.51 | — | — | ||||||||||||||||||||||
| Class P | ||||||||||||||||||||||||||||
3/31/2017+ | $ | 15.46 | $ | 0.13 | $ | 1.52 | $ | 1.65 | $ | (0.23 | ) | $ | — | |||||||||||||||
9/30/2016 | 14.19 | 0.24 | 1.30 | 1.54 | (0.22 | ) | (0.05 | ) | ||||||||||||||||||||
12/1/2014* - 9/30/2015# | 15.00 | 0.18 | (0.97 | ) | (0.79 | ) | (0.02 | ) | — | |||||||||||||||||||
| Institutional Class | ||||||||||||||||||||||||||||
3/31/2017+ | $ | 15.49 | $ | 0.13 | $ | 1.52 | $ | 1.65 | $ | (0.23 | ) | $ | — | |||||||||||||||
9/30/2016 | 14.20 | 0.25 | 1.32 | 1.57 | (0.23 | ) | (0.05 | ) | ||||||||||||||||||||
12/1/2014* - 9/30/2015# | 15.00 | 0.18 | (0.96 | ) | (0.78 | ) | (0.02 | ) | — | |||||||||||||||||||
| Class R6 | ||||||||||||||||||||||||||||
3/31/2017+ | $ | 15.53 | $ | 0.15 | $ | 1.53 | $ | 1.68 | $ | (0.24 | ) | $ | — | |||||||||||||||
9/30/2016 | 14.21 | 0.27 | 1.31 | 1.58 | (0.21 | ) | (0.05 | ) | ||||||||||||||||||||
12/1/2014* - 9/30/2015# | 15.00 | 0.20 | (0.97 | ) | (0.77 | ) | (0.02 | ) | — | |||||||||||||||||||
| + | Unaudited |
| * | Commencement of operations. |
| # | Fiscal year end changed from November 30th to September 30th. |
| (a) | Calculated on average shares outstanding during the period. |
| 270 | Semiannual Report | | March 31, 2017 | | See accompanying Notes to Financial Statements |
Table of Contents
| Total Dividends and Distributions | Net Asset Value, End of Period | Total Return (b) | Net Assets, End of Period (000s) | Ratio of Fee Waiver/ | Ratio of Expenses to | Ratio of Net to Average | Portfolio Turnover Rate | |||||||||||||||||||||||||||
| $ | (1.32 | ) | $ | 13.95 | 8.19 | % | $ | 13 | 0.77 | %(c) | 1.83 | %(c) | 1.45 | %(c) | 22 | % | ||||||||||||||||||
| — | 14.21 | 0.07 | 12 | 0.80 | (c) | 1.24 | (c) | 3.88 | (c) | 103 | ||||||||||||||||||||||||
| $ | (1.29 | ) | $ | 13.87 | 7.77 | % | $ | 17 | 1.52 | %(c) | 2.56 | %(c) | 0.70 | %(c) | 22 | % | ||||||||||||||||||
| — | 14.16 | (0.28 | ) | 15 | 1.55 | (c) | 2.02 | (c) | 2.79 | (c) | 103 | |||||||||||||||||||||||
| $ | (1.32 | ) | $ | 13.95 | 8.23 | % | $ | 10 | 0.62 | %(c) | 1.56 | %(c) | 1.60 | %(c) | 22 | % | ||||||||||||||||||
| (0.25 | ) | 14.21 | 4.57 | 10 | 0.65 | 0.97 | 2.87 | 103 | ||||||||||||||||||||||||||
| (0.01 | ) | 13.83 | (7.74 | ) | 9 | 0.65 | (c)(d) | 2.06 | (c)(d) | 2.99 | (c)(d) | 29 | ||||||||||||||||||||||
| $ | (1.33 | ) | $ | 13.97 | 8.32 | % | $ | 39 | 0.52 | %(c) | 1.57 | %(c) | 1.70 | %(c) | 22 | % | ||||||||||||||||||
| (0.26 | ) | 14.22 | 4.66 | 36 | 0.55 | 1.01 | 3.49 | 103 | ||||||||||||||||||||||||||
| (0.01 | ) | 13.84 | (7.66 | ) | 9 | 0.55 | (c)(d) | 2.06 | (c)(d) | 3.09 | (c)(d) | 29 | ||||||||||||||||||||||
| $ | (1.33 | ) | $ | 13.95 | 8.35 | % | $ | 32,420 | 0.46 | %(c) | 1.52 | %(c) | 1.68 | %(c) | 22 | % | ||||||||||||||||||
| (0.31 | ) | 14.20 | 4.74 | 71,088 | 0.45 | 0.99 | 3.25 | 103 | ||||||||||||||||||||||||||
| (0.01 | ) | 13.85 | (7.59 | ) | 56,210 | 0.45 | (c)(d) | 1.62 | (c)(d) | 3.31 | (c)(d) | 29 | ||||||||||||||||||||||
| $ | (0.23 | ) | $ | 16.87 | 10.63 | % | $ | 507 | 0.70 | %(c) | 0.82 | %(c) | 1.53 | %(c) | 55 | % | ||||||||||||||||||
| — | 15.47 | 3.76 | 47 | 0.75 | (c) | 0.93 | (c) | 1.75 | (c) | 64 | ||||||||||||||||||||||||
| $ | (0.22 | ) | $ | 16.77 | 10.26 | % | $ | 21 | 1.46 | %(c) | 1.57 | %(c) | 0.78 | %(c) | 55 | % | ||||||||||||||||||
| — | 15.42 | 3.42 | 10 | 1.50 | (c) | 1.61 | (c) | 0.88 | (c) | 64 | ||||||||||||||||||||||||
| $ | (0.23 | ) | $ | 16.88 | 10.77 | % | $ | 60 | 0.57 | %(c) | 0.69 | %(c) | 1.64 | %(c) | 55 | % | ||||||||||||||||||
| (0.27 | ) | 15.46 | 10.95 | 54 | 0.60 | 0.71 | 1.63 | 64 | ||||||||||||||||||||||||||
| (0.02 | ) | 14.19 | (5.27 | ) | 25 | 0.60 | (c)(d) | 1.32 | (c)(d) | 1.40 | (c)(d) | 51 | ||||||||||||||||||||||
| $ | (0.23 | ) | $ | 16.91 | 10.76 | % | $ | 119 | 0.50 | %(c) | 1.85 | %(c) | 1.67 | %(c) | 55 | % | ||||||||||||||||||
| (0.28 | ) | 15.49 | 11.20 | 86 | 0.50 | 0.75 | 1.72 | 64 | ||||||||||||||||||||||||||
| (0.02 | ) | 14.20 | (5.20 | ) | 1,771 | 0.50 | (c)(d) | 1.45 | (c)(d) | 1.51 | (c)(d) | 51 | ||||||||||||||||||||||
| $ | (0.24 | ) | $ | 16.97 | 10.87 | % | $ | 119,729 | 0.40 | %(c) | 0.58 | %(c) | 1.86 | %(c) | 55 | % | ||||||||||||||||||
| (0.26 | ) | 15.53 | 11.23 | 100,878 | 0.40 | 0.62 | 1.80 | 64 | ||||||||||||||||||||||||||
| (0.02 | ) | 14.21 | (5.12 | ) | 86,456 | 0.40 | (c)(d) | 0.74 | (c)(d) | 1.63 | (c)(d) | 51 | ||||||||||||||||||||||
| (b) | Total return is calculated assuming a purchase of a share on the first day of the period and a sale of a share on the last day of each period reported. Dividends and distributions, if any, are assumed, for purposes of this calculation, to be reinvested. Total return does not reflect sales charges and includes the effect of fee waivers and reimbursements. Total return may reflect adjustments to conform to U.S. GAAP. Total return for a period of less than one year is not annualized. |
| (c) | Annualized, unless otherwise noted. |
| (d) | Certain expenses incurred by the Fund were not annualized. |
| See accompanying Notes to Financial Statements | | March 31, 2017 | | Semiannual Report | 271 |
Table of Contents
Financial Highlights (cont’d)
For a Share Outstanding for the Period ended:
Net Asset | Net Investment Income (a) | Net Realized and Change in Unrealized Gain (Loss) | Total from Investment Operations | Dividends from Net Investment Income | Distributions from Net Realized Capital Gains | |||||||||||||||||||||||
| AllianzGI Convertible: | ||||||||||||||||||||||||||||
| Class A | ||||||||||||||||||||||||||||
3/31/2017+ | $ | 31.02 | $ | 0.19 | $ | 1.58 | $ | 1.77 | $ | (0.51 | ) | $ | — | |||||||||||||||
9/30/2016 | 32.13 | 0.64 | 1.29 | 1.93 | (0.53 | ) | (2.51 | ) | ||||||||||||||||||||
12/1/2014 - 9/30/2015# | 36.54 | 0.31 | (1.88 | ) | (1.57 | ) | (0.55 | ) | (2.29 | ) | ||||||||||||||||||
11/30/2014 | 34.91 | 0.39 | 2.81 | 3.20 | (0.73 | ) | (0.84 | ) | ||||||||||||||||||||
11/30/2013 | 28.27 | 0.54 | 6.59 | 7.13 | (0.49 | ) | — | |||||||||||||||||||||
11/30/2012 | 28.11 | 0.53 | 1.95 | 2.48 | (0.75 | ) | (1.57 | ) | ||||||||||||||||||||
11/30/2011 | 28.21 | 0.55 | 0.01 | 0.56 | (0.66 | ) | — | |||||||||||||||||||||
| Class C | ||||||||||||||||||||||||||||
3/31/2017+ | $ | 31.19 | $ | 0.08 | $ | 1.61 | $ | 1.69 | $ | (0.50 | ) | $ | — | |||||||||||||||
9/30/2016 | 32.20 | 0.42 | 1.30 | 1.72 | (0.22 | ) | (2.51 | ) | ||||||||||||||||||||
12/1/2014 - 9/30/2015# | 36.55 | 0.10 | (1.88 | ) | (1.78 | ) | (0.28 | ) | (2.29 | ) | ||||||||||||||||||
11/30/2014 | 34.93 | 0.13 | 2.80 | 2.93 | (0.47 | ) | (0.84 | ) | ||||||||||||||||||||
11/30/2013 | 28.30 | 0.30 | 6.60 | 6.90 | (0.27 | ) | — | |||||||||||||||||||||
11/30/2012 | 28.15 | 0.32 | 1.96 | 2.28 | (0.56 | ) | (1.57 | ) | ||||||||||||||||||||
11/30/2011 | 28.30 | 0.34 | 0.03 | 0.37 | (0.52 | ) | — | |||||||||||||||||||||
| Class R | ||||||||||||||||||||||||||||
3/31/2017+ | $ | 30.97 | $ | 0.12 | $ | 1.59 | $ | 1.71 | $ | (0.54 | ) | $ | — | |||||||||||||||
9/30/2016 | 32.08 | 0.52 | 1.27 | 1.79 | (0.39 | ) | (2.51 | ) | ||||||||||||||||||||
12/1/2014 - 9/30/2015# | 36.45 | 0.20 | (1.87 | ) | (1.67 | ) | (0.41 | ) | (2.29 | ) | ||||||||||||||||||
11/30/2014 | 34.87 | 0.26 | 2.81 | 3.07 | (0.65 | ) | (0.84 | ) | ||||||||||||||||||||
11/30/2013 | 28.20 | 0.34 | 6.61 | 6.95 | (0.28 | ) | — | |||||||||||||||||||||
11/30/2012 | 28.08 | 0.43 | 1.95 | 2.38 | (0.69 | ) | (1.57 | ) | ||||||||||||||||||||
11/30/2011 | 28.17 | 0.48 | 0.02 | 0.50 | (0.59 | ) | — | |||||||||||||||||||||
| Class P | ||||||||||||||||||||||||||||
3/31/2017+ | $ | 30.84 | $ | 0.24 | $ | 1.58 | $ | 1.82 | $ | (0.66 | ) | $ | — | |||||||||||||||
9/30/2016 | 32.07 | 0.72 | 1.27 | 1.99 | (0.71 | ) | (2.51 | ) | ||||||||||||||||||||
12/1/2014 - 9/30/2015# | 36.47 | 0.39 | (1.87 | ) | (1.48 | ) | (0.63 | ) | (2.29 | ) | ||||||||||||||||||
11/30/2014 | 34.84 | 0.47 | 2.80 | 3.27 | (0.80 | ) | (0.84 | ) | ||||||||||||||||||||
11/30/2013 | 28.20 | 0.63 | 6.55 | 7.18 | (0.54 | ) | — | |||||||||||||||||||||
11/30/2012 | 28.04 | 0.58 | 1.94 | 2.52 | (0.79 | ) | (1.57 | ) | ||||||||||||||||||||
11/30/2011 | 28.12 | 0.60 | 0.01 | 0.61 | (0.69 | ) | — | |||||||||||||||||||||
| Institutional Class | ||||||||||||||||||||||||||||
3/31/2017+ | $ | 30.76 | $ | 0.25 | $ | 1.58 | $ | 1.83 | $ | (0.67 | ) | $ | — | |||||||||||||||
9/30/2016 | 32.02 | 0.74 | 1.26 | 2.00 | (0.75 | ) | (2.51 | ) | ||||||||||||||||||||
12/1/2014 - 9/30/2015# | 36.42 | 0.40 | (1.86 | ) | (1.46 | ) | (0.65 | ) | (2.29 | ) | ||||||||||||||||||
11/30/2014 | 34.80 | 0.50 | 2.79 | 3.29 | (0.83 | ) | (0.84 | ) | ||||||||||||||||||||
11/30/2013 | 28.16 | 0.61 | 6.59 | 7.20 | (0.56 | ) | — | |||||||||||||||||||||
11/30/2012 | 28.00 | 0.62 | 1.94 | 2.56 | (0.83 | ) | (1.57 | ) | ||||||||||||||||||||
11/30/2011 | 28.08 | 0.63 | 0.01 | 0.64 | (0.72 | ) | — | |||||||||||||||||||||
| Administrative Class | ||||||||||||||||||||||||||||
3/31/2017+ | $ | 30.96 | $ | 0.21 | $ | 1.59 | $ | 1.80 | $ | (0.64 | ) | $ | — | |||||||||||||||
9/30/2016 | 32.14 | 0.66 | 1.29 | 1.95 | (0.62 | ) | (2.51 | ) | ||||||||||||||||||||
12/1/2014 - 9/30/2015# | 36.54 | 0.33 | (1.88 | ) | (1.55 | ) | (0.56 | ) | (2.29 | ) | ||||||||||||||||||
11/30/2014 | 34.84 | 0.43 | 2.79 | 3.22 | (0.68 | ) | (0.84 | ) | ||||||||||||||||||||
11/30/2013 | 28.20 | 0.53 | 6.59 | 7.12 | (0.48 | ) | — | |||||||||||||||||||||
11/30/2012 | 28.04 | 0.55 | 1.94 | 2.49 | (0.76 | ) | (1.57 | ) | ||||||||||||||||||||
11/30/2011 | 28.14 | 0.55 | 0.01 | 0.56 | (0.66 | ) | — | |||||||||||||||||||||
| + | Unaudited |
| # | Fiscal year end changed from November 30th to September 30th. |
| (a) | Calculated on average shares outstanding during the period. |
| (b) | Total return is calculated assuming a purchase of a share on the first day of the period and a sale of a share on the last day of each period reported. Dividends and distributions, if any, are assumed, for purposes of this calculation, to be reinvested. Total return does not reflect sales charges and includes the effect of fee waivers and reimbursements. Total return may reflect adjustments to conform to U.S. GAAP. Total return for a period of less than one year is not annualized. |
| 272 | Semiannual Report | | March 31, 2017 | | See accompanying Notes to Financial Statements |
Table of Contents
| Total Dividends and Distributions | Net Asset Value, End of Period | Total Return (b) | Net Assets, End of Period (000s) | Ratio of Expenses to Average Net Assets with Fee Waiver/ Reimbursement | Ratio of Expenses to Average Net Assets without Fee Waiver/ Reimbursement | Ratio of Net Investment Income to Average Net Assets | Portfolio Turnover Rate | |||||||||||||||||||||||||||
| $ | (0.51 | ) | $ | 32.28 | 5.78 | % | $ | 82,873 | 1.04 | %(c) | 1.04 | %(c) | 1.20 | %(c) | 61 | % | ||||||||||||||||||
| (3.04 | ) | 31.02 | 6.42 | 259,711 | 0.99 | 0.99 | 2.12 | 101 | ||||||||||||||||||||||||||
| (2.84 | ) | 32.13 | (4.56 | ) | 465,080 | 0.98 | (c)(d) | 0.98 | (c)(d) | 1.08 | (c)(d) | 73 | ||||||||||||||||||||||
| (1.57 | ) | 36.54 | (e) | 9.47 | (e) | 483,863 | 0.97 | 0.97 | 1.09 | 94 | ||||||||||||||||||||||||
| (0.49 | ) | 34.91 | 25.49 | 319,778 | 0.96 | 0.96 | 1.67 | 81 | ||||||||||||||||||||||||||
| (2.32 | ) | 28.27 | 9.64 | 94,347 | 1.01 | 1.01 | 1.91 | 108 | ||||||||||||||||||||||||||
| (0.66 | ) | 28.11 | 1.95 | 64,857 | 0.97 | 0.97 | 1.89 | 129 | ||||||||||||||||||||||||||
| $ | (0.50 | ) | $ | 32.38 | 5.46 | % | $ | 55,023 | 1.73 | %(c) | 1.73 | %(c) | 0.54 | %(c) | 61 | % | ||||||||||||||||||
| (2.73 | ) | 31.19 | 5.65 | 67,423 | 1.71 | 1.71 | 1.40 | 101 | ||||||||||||||||||||||||||
| (2.57 | ) | 32.20 | (5.11 | ) | 101,326 | 1.71 | (c)(d) | 1.71 | (c)(d) | 0.34 | (c)(d) | 73 | ||||||||||||||||||||||
| (1.31 | ) | 36.55 | (e) | 8.66 | (e) | 127,201 | 1.70 | 1.70 | 0.36 | 94 | ||||||||||||||||||||||||
| (0.27 | ) | 34.93 | 24.55 | 113,799 | 1.70 | 1.70 | 0.94 | 81 | ||||||||||||||||||||||||||
| (2.13 | ) | 28.30 | 8.81 | 36,917 | 1.76 | 1.76 | 1.16 | 108 | ||||||||||||||||||||||||||
| (0.52 | ) | 28.15 | 1.26 | 27,465 | 1.74 | 1.74 | 1.17 | 129 | ||||||||||||||||||||||||||
| $ | (0.54 | ) | $ | 32.14 | 5.56 | % | $ | 963 | 1.48 | %(c) | 1.48 | %(c) | 0.80 | %(c) | 61 | % | ||||||||||||||||||
| (2.90 | ) | 30.97 | 5.95 | 1,145 | 1.43 | 1.43 | 1.73 | 101 | ||||||||||||||||||||||||||
| (2.70 | ) | 32.08 | (4.82 | ) | 1,592 | 1.36 | (c)(d) | 1.36 | (c)(d) | 0.70 | (c)(d) | 73 | ||||||||||||||||||||||
| (1.49 | ) | 36.45 | (e) | 9.10 | (e) | 1,440 | 1.30 | 1.30 | 0.74 | 94 | ||||||||||||||||||||||||
| (0.28 | ) | 34.87 | 24.86 | 394 | 1.51 | 1.51 | 1.06 | 81 | ||||||||||||||||||||||||||
| (2.26 | ) | 28.20 | 9.25 | 210 | 1.36 | 1.36 | 1.58 | 108 | ||||||||||||||||||||||||||
| (0.59 | ) | 28.08 | 1.76 | 37 | 1.22 | 1.22 | 1.67 | 129 | ||||||||||||||||||||||||||
| $ | (0.66 | ) | $ | 32.00 | 5.96 | % | $ | 78,322 | 0.75 | %(c) | 0.75 | %(c) | 1.52 | %(c) | 61 | % | ||||||||||||||||||
| (3.22 | ) | 30.84 | 6.67 | 88,900 | 0.73 | 0.73 | 2.38 | 101 | ||||||||||||||||||||||||||
| (2.92 | ) | 32.07 | (4.32 | ) | 160,998 | 0.69 | (c)(d) | 0.69 | (c)(d) | 1.36 | (c)(d) | 73 | ||||||||||||||||||||||
| (1.64 | ) | 36.47 | (e) | 9.71 | (e) | 224,860 | 0.74 | 0.74 | 1.32 | 94 | ||||||||||||||||||||||||
| (0.54 | ) | 34.84 | 25.76 | 251,377 | 0.75 | 0.75 | 1.96 | 81 | ||||||||||||||||||||||||||
| (2.36 | ) | 28.20 | 9.84 | 53,368 | 0.80 | 0.86 | 2.12 | 108 | ||||||||||||||||||||||||||
| (0.69 | ) | 28.04 | 2.14 | 37,551 | 0.80 | 0.83 | 2.07 | 129 | ||||||||||||||||||||||||||
| $ | (0.67 | ) | $ | 31.92 | 6.02 | % | $ | 943,186 | 0.68 | %(c) | 0.68 | %(c) | 1.59 | %(c) | 61 | % | ||||||||||||||||||
| (3.26 | ) | 30.76 | 6.73 | 1,089,974 | 0.67 | 0.67 | 2.47 | 101 | ||||||||||||||||||||||||||
| (2.94 | ) | 32.02 | (4.27 | ) | 1,428,098 | 0.66 | (c)(d) | 0.66 | (c)(d) | 1.40 | (c)(d) | 73 | ||||||||||||||||||||||
| (1.67 | ) | 36.42 | (e) | 9.79 | (e) | 1,781,193 | 0.65 | 0.65 | 1.41 | 94 | ||||||||||||||||||||||||
| (0.56 | ) | 34.80 | 25.88 | 1,583,824 | 0.65 | 0.65 | 1.93 | 81 | ||||||||||||||||||||||||||
| (2.40 | ) | 28.16 | 10.00 | 804,646 | 0.67 | 0.67 | 2.26 | 108 | ||||||||||||||||||||||||||
| (0.72 | ) | 28.00 | 2.24 | 521,854 | 0.70 | 0.70 | 2.16 | 129 | ||||||||||||||||||||||||||
| $ | (0.64 | ) | $ | 32.12 | 5.87 | % | $ | 1,329 | 0.91 | %(c) | 0.91 | %(c) | 1.37 | %(c) | 61 | % | ||||||||||||||||||
| (3.13 | ) | 30.96 | 6.52 | 1,428 | 0.90 | 0.90 | 2.20 | 101 | ||||||||||||||||||||||||||
| (2.85 | ) | 32.14 | (4.49 | ) | 1,998 | 0.89 | (c)(d) | 0.89 | (c)(d) | 1.15 | (c)(d) | 73 | ||||||||||||||||||||||
| (1.52 | ) | 36.54 | (e) | 9.57 | (e) | 3,783 | 0.89 | 0.89 | 1.22 | 94 | ||||||||||||||||||||||||
| (0.48 | ) | 34.84 | 25.55 | 12,951 | 0.90 | 0.90 | 1.65 | 81 | ||||||||||||||||||||||||||
| (2.33 | ) | 28.20 | 9.70 | 2,199 | 0.92 | 0.92 | 2.00 | 108 | ||||||||||||||||||||||||||
| (0.66 | ) | 28.04 | 2.00 | 1,352 | 0.97 | 0.97 | 1.90 | 129 | ||||||||||||||||||||||||||
| (c) | Annualized, unless otherwise noted. |
| (d) | Certain expenses incurred by the Fund were not annualized. |
| (e) | Payments from Affiliates increased the end of period net asset value and total return by less than $0.01 and 0.01%, respectively. |
| See accompanying Notes to Financial Statements | | March 31, 2017 | | Semiannual Report | 273 |
Table of Contents
Financial Highlights (cont’d)
For a Share Outstanding for the Period ended:
| Net Asset Value, Beginning of Period | Net Investment Income (a) | Net Realized and Change in Unrealized Gain (Loss) | Total from Investment Operations |
Dividends | ||||||||||||||||||||
| AllianzGI Emerging Markets Consumer: | ||||||||||||||||||||||||
| Class A | ||||||||||||||||||||||||
3/31/2017+ | $ | 13.60 | $ | 0.03 | $ | 0.64 | $ | 0.67 | $ | (0.12 | ) | |||||||||||||
9/30/2016 | 12.24 | 0.11 | 1.31 | 1.42 | (0.06 | ) | ||||||||||||||||||
12/1/2014* - 9/30/2015# | 15.00 | 0.13 | (2.89 | ) | (2.76 | ) | — | |||||||||||||||||
| Institutional Class | ||||||||||||||||||||||||
3/31/2017+ | $ | 13.68 | $ | 0.05 | $ | 0.64 | $ | 0.69 | $ | (0.15 | ) | |||||||||||||
9/30/2016 | 12.28 | 0.19 | 1.28 | 1.47 | (0.07 | ) | ||||||||||||||||||
12/1/2014* - 9/30/2015# | 15.00 | 0.13 | (2.85 | ) | (2.72 | ) | — | |||||||||||||||||
| AllianzGI Emerging Markets Debt: | ||||||||||||||||||||||||
| Class A | ||||||||||||||||||||||||
3/31/2017+ | $ | 14.89 | $ | 0.38 | $ | (0.12 | ) | $ | 0.26 | $ | (0.49 | ) | ||||||||||||
9/30/2016 | 13.51 | 0.71 | 1.32 | 2.03 | (0.65 | ) | ||||||||||||||||||
12/1/2014 - 9/30/2015# | 14.92 | 0.47 | (1.35 | ) | (0.88 | ) | (0.53 | ) | ||||||||||||||||
9/15/2014* - 11/30/2014 | 15.00 | 0.11 | (0.19 | ) | (0.08 | ) | — | |||||||||||||||||
| Class C | ||||||||||||||||||||||||
3/31/2017+ | $ | 14.96 | $ | 0.33 | $ | (0.13 | ) | $ | 0.20 | $ | (0.43 | ) | ||||||||||||
9/30/2016 | 13.51 | 0.61 | 1.32 | 1.93 | (0.48 | ) | ||||||||||||||||||
12/1/2014 - 9/30/2015# | 14.90 | 0.39 | (1.36 | ) | (0.97 | ) | (0.42 | ) | ||||||||||||||||
9/15/2014* - 11/30/2014 | 15.00 | 0.09 | (0.19 | ) | (0.10 | ) | — | |||||||||||||||||
| Class P | ||||||||||||||||||||||||
3/31/2017+ | $ | 14.90 | $ | 0.39 | $ | (0.12 | ) | $ | 0.27 | $ | (0.54 | ) | ||||||||||||
9/30/2016 | 13.51 | 0.70 | 1.35 | 2.05 | (0.66 | ) | ||||||||||||||||||
12/1/2014 - 9/30/2015# | 14.92 | 0.49 | (1.34 | ) | (0.85 | ) | (0.56 | ) | ||||||||||||||||
9/15/2014* - 11/30/2014 | 15.00 | 0.12 | (0.20 | ) | (0.08 | ) | — | |||||||||||||||||
| Institutional Class | ||||||||||||||||||||||||
3/31/2017+ | $ | 14.88 | $ | 0.40 | $ | (0.12 | ) | $ | 0.28 | $ | (0.55 | ) | ||||||||||||
9/30/2016 | 13.51 | 0.72 | 1.34 | 2.06 | (0.69 | ) | ||||||||||||||||||
12/1/2014 - 9/30/2015# | 14.93 | 0.50 | (1.35 | ) | (0.85 | ) | (0.57 | ) | ||||||||||||||||
9/15/2014* - 11/30/2014 | 15.00 | 0.12 | (0.19 | ) | (0.07 | ) | — | |||||||||||||||||
| + | Unaudited |
| * | Commencement of operations. |
| # | Fiscal year end changed from November 30th to September 30th. |
| (a) | Calculated on average shares outstanding during the period. |
| (b) | Total return is calculated assuming a purchase of a share on the first day of the period and a sale of a share on the last day of each period reported. Dividends and distributions, if any, are assumed, for purposes of this calculation, to be reinvested. Total return does not reflect sales charges and includes the effect of fee waivers and reimbursements. Total return may reflect adjustments to conform to U.S. GAAP. Total return for a period of less than one year is not annualized. |
| (c) | Annualized, unless otherwise noted. |
| (d) | Certain expenses incurred by the Fund were not annualized. |
| 274 | Semiannual Report | | March 31, 2017 | | See accompanying Notes to Financial Statements |
Table of Contents
| Net Asset Value, End of Period | Total Return (b) | Net Assets, End of Period (000s) | Ratio of Expenses to Average Net Assets with Fee Waiver/ Reimbursement | Ratio of Expenses to Average Net Assets without Fee Waiver/ Reimbursement | Ratio of Net Investment Income to Average Net Assets | Portfolio Turnover Rate | ||||||||||||||||||||||||
| $ | 14.15 | 5.02 | % | $ | 65 | 1.55 | %(c) | 26.28 | %(c) | 0.45 | %(c) | 67 | % | |||||||||||||||||
| 13.60 | 11.67 | 48 | 1.58 | 38.88 | 0.90 | 91 | ||||||||||||||||||||||||
| 12.24 | (18.40 | ) | 37 | 1.65 | (c)(d) | 9.30 | (c)(d) | 1.15 | (c)(d) | 77 | ||||||||||||||||||||
| $ | 14.22 | 5.23 | % | $ | 39,774 | 1.20 | %(c) | 1.69 | %(c) | 0.73 | %(c) | 67 | % | |||||||||||||||||
| 13.68 | 12.06 | 44,630 | 1.22 | 2.04 | 1.49 | 91 | ||||||||||||||||||||||||
| 12.28 | (18.13 | ) | 15,591 | 1.30 | (c)(d) | 3.55 | (c)(d) | 1.14 | (c)(d) | 77 | ||||||||||||||||||||
| $ | 14.66 | 1.82 | % | $ | 123 | 1.20 | %(c) | 1.72 | %(c) | 5.10 | %(c) | 38 | % | |||||||||||||||||
| 14.89 | 15.39 | 175 | 1.20 | 1.68 | 5.01 | 123 | ||||||||||||||||||||||||
| 13.51 | (6.00 | ) | 9 | 1.23 | (c)(d) | 2.32 | (c)(d) | 3.97 | (c)(d) | 125 | ||||||||||||||||||||
| 14.92 | (0.53 | ) | 10 | 1.20 | (c) | 2.51 | (c) | 3.65 | (c) | 27 | ||||||||||||||||||||
| $ | 14.73 | 1.45 | % | $ | 93 | 1.95 | %(c) | 2.39 | %(c) | 4.43 | %(c) | 38 | % | |||||||||||||||||
| 14.96 | 14.56 | 109 | 1.95 | 2.34 | 4.28 | 123 | ||||||||||||||||||||||||
| 13.51 | (6.61 | ) | 9 | 1.98 | (c)(d) | 3.06 | (c)(d) | 3.23 | (c)(d) | 125 | ||||||||||||||||||||
| 14.90 | (0.67 | ) | 10 | 1.95 | (c) | 3.25 | (c) | 2.90 | (c) | 27 | ||||||||||||||||||||
| $ | 14.63 | 1.89 | % | $ | 11 | 1.05 | %(c) | 1.33 | %(c) | 5.34 | %(c) | 38 | % | |||||||||||||||||
| 14.90 | 15.57 | 11 | 1.05 | 1.40 | 5.02 | 123 | ||||||||||||||||||||||||
| 13.51 | (5.86 | ) | 10 | 1.08 | (c)(d) | 2.06 | (c)(d) | 4.12 | (c)(d) | 125 | ||||||||||||||||||||
| 14.92 | (0.53 | ) | 10 | 1.05 | (c) | 2.25 | (c) | 3.80 | (c) | 27 | ||||||||||||||||||||
| $ | 14.61 | 1.97 | % | $ | 41,611 | 0.95 | %(c) | 1.35 | %(c) | 5.43 | %(c) | 38 | % | |||||||||||||||||
| 14.88 | 15.67 | 43,318 | 0.95 | 1.40 | 5.15 | 123 | ||||||||||||||||||||||||
| 13.51 | (5.82 | ) | 28,557 | 0.97 | (c)(d) | 2.07 | (c)(d) | 4.22 | (c)(d) | 125 | ||||||||||||||||||||
| 14.93 | (0.47 | ) | 29,856 | 0.95 | (c) | 2.28 | (c) | 3.91 | (c) | 27 | ||||||||||||||||||||
| See accompanying Notes to Financial Statements | | March 31, 2017 | | Semiannual Report | 275 |
Table of Contents
Financial Highlights (cont’d)
For a Share Outstanding for the Period ended:
Net Asset | Net Investment Income (Loss) (a) | Net Realized and Change in Unrealized Gain (Loss) | Total from Investment Operations | Dividends from Net Investment Income | ||||||||||||||||||||
| AllianzGI Emerging Markets Small-Cap: | ||||||||||||||||||||||||
| Class A | ||||||||||||||||||||||||
3/31/2017+ | $ | 15.15 | $ | (0.06 | ) | $ | 1.62 | $ | 1.56 | $ | — | (c) | ||||||||||||
9/30/2016 | 14.04 | 0.16 | 1.16 | 1.32 | (0.21 | ) | ||||||||||||||||||
12/1/2014* - 9/30/2015# | 15.00 | 0.26 | (1.22 | ) | (0.96 | ) | — | (c) | ||||||||||||||||
| Institutional Class | ||||||||||||||||||||||||
3/31/2017+ | $ | 15.30 | $ | (0.03 | ) | $ | 1.57 | $ | 1.54 | $ | (0.45 | ) | ||||||||||||
9/30/2016 | 14.08 | 0.30 | 1.06 | 1.36 | (0.14 | ) | ||||||||||||||||||
12/1/2014* - 9/30/2015# | 15.00 | 0.22 | (1.14 | ) | (0.92 | ) | — | (c) | ||||||||||||||||
| AllianzGI Europe Equity Dividend: | ||||||||||||||||||||||||
| Class A | ||||||||||||||||||||||||
3/31/2017+ | $ | 14.32 | $ | 0.24 | $ | 0.27 | $ | 0.51 | $ | (0.29 | ) | |||||||||||||
9/30/2016 | 13.59 | 0.53 | 0.60 | 1.13 | (0.40 | ) | ||||||||||||||||||
2/2/2015* - 9/30/2015# | 15.00 | 0.37 | (1.78 | ) | (1.41 | ) | — | |||||||||||||||||
| Class C | ||||||||||||||||||||||||
3/31/2017+ | $ | 14.24 | $ | 0.16 | $ | 0.29 | $ | 0.45 | $ | (0.24 | ) | |||||||||||||
9/30/2016 | 13.52 | 0.43 | 0.60 | 1.03 | (0.31 | ) | ||||||||||||||||||
2/2/2015* - 9/30/2015# | 15.00 | 0.28 | (1.76 | ) | (1.48 | ) | — | |||||||||||||||||
| Class P | ||||||||||||||||||||||||
3/31/2017+ | $ | 14.37 | $ | 0.22 | $ | 0.30 | $ | 0.52 | $ | (0.27 | ) | |||||||||||||
9/30/2016 | 13.60 | 0.44 | 0.72 | 1.16 | (0.39 | ) | ||||||||||||||||||
2/2/2015* - 9/30/2015# | 15.00 | 0.40 | (1.80 | ) | (1.40 | ) | — | |||||||||||||||||
| Institutional Class | ||||||||||||||||||||||||
3/31/2017+ | $ | 14.34 | $ | 0.22 | $ | 0.32 | $ | 0.54 | $ | (0.28 | ) | |||||||||||||
9/30/2016 | 13.61 | 0.55 | 0.62 | 1.17 | (0.44 | ) | ||||||||||||||||||
2/2/2015* - 9/30/2015# | 15.00 | 0.39 | (1.78 | ) | (1.39 | ) | — | |||||||||||||||||
| + | Unaudited |
| * | Commencement of operations. |
| # | Fiscal year end changed from November 30th to September 30th. |
| (a) | Calculated on average shares outstanding during the period. |
| (b) | Total return is calculated assuming a purchase of a share on the first day of the period and a sale of a share on the last day of each period reported. Dividends and distributions, if any, are assumed, for purposes of this calculation, to be reinvested. Total return does not reflect sales charges and includes the effect of fee waivers and reimbursements. Total return may reflect adjustments to conform to U.S. GAAP. Total return for a period of less than one year is not annualized. |
| (c) | Actual amount rounds to less than $(0.01) per share. |
| (d) | Annualized, unless otherwise noted. |
| (e) | Certain expenses incurred by the Fund were not annualized. |
| 276 | Semiannual Report | | March 31, 2017 | | See accompanying Notes to Financial Statements |
Table of Contents
| Net Asset Value, End of Period | Total Return (b) | Net Assets, End of Period (000s) | Ratio of Expenses to Average Net Assets with Fee Waiver/ Reimbursement | Ratio of Expenses to Average Net Assets without Fee Waiver/ Reimbursement | Ratio of Net Investment Income (Loss) to Average Net Assets | Portfolio Turnover Rate | ||||||||||||||||||||||||
| $ | 16.71 | 10.30 | % | $ | 86 | 1.85 | %(d) | 16.00 | %(d) | (0.83 | )%(d) | 57 | % | |||||||||||||||||
| 15.15 | 9.54 | 67 | 1.85 | 6.84 | 1.14 | 147 | ||||||||||||||||||||||||
| 14.04 | (6.39 | ) | 621 | 1.85 | (d)(e) | 9.40 | (d)(e) | 2.12 | (d)(e) | 103 | ||||||||||||||||||||
| $ | 16.39 | 10.56 | % | $ | 13,653 | 1.50 | %(d) | 3.55 | %(d) | (0.45 | )%(d) | 57 | % | |||||||||||||||||
| 15.30 | 9.80 | 13,367 | 1.50 | 4.72 | 2.08 | 147 | ||||||||||||||||||||||||
| 14.08 | (6.11 | ) | 7,921 | 1.50 | (d)(e) | 7.77 | (d)(e) | 1.78 | (d)(e) | 103 | ||||||||||||||||||||
| $ | 14.54 | 3.65 | % | $ | 154 | 1.25 | %(d)(e) | 6.18 | %(d)(e) | 3.41 | %(d)(e) | 29 | % | |||||||||||||||||
| 14.32 | 8.45 | 49 | 1.21 | 10.11 | 3.81 | 35 | ||||||||||||||||||||||||
| 13.59 | (9.40 | ) | 9 | 1.20 | (d)(e) | 11.69 | (d)(e) | 3.86 | (d)(e) | 16 | ||||||||||||||||||||
| $ | 14.45 | 3.23 | % | $ | 34 | 2.02 | %(d)(e) | 6.87 | %(d)(e) | 2.38 | %(d)(e) | 29 | % | |||||||||||||||||
| 14.24 | 7.70 | 15 | 1.96 | 11.04 | 3.10 | 35 | ||||||||||||||||||||||||
| 13.52 | (9.87 | ) | 11 | 1.95 | (d)(e) | 11.78 | (d)(e) | 2.93 | (d)(e) | 16 | ||||||||||||||||||||
| $ | 14.62 | 3.71 | % | $ | 10 | �� | 1.10 | %(d)(e) | 5.80 | %(d)(e) | 3.07 | %(d)(e) | 29 | % | ||||||||||||||||
| 14.37 | 8.59 | 10 | 1.05 | 10.71 | 3.13 | 35 | ||||||||||||||||||||||||
| 13.60 | (9.33 | ) | 22 | 1.05 | (d)(e) | 11.62 | (d)(e) | 4.12 | (d)(e) | 16 | ||||||||||||||||||||
| $ | 14.60 | 3.84 | % | $ | 6,522 | 1.00 | %(d)(e) | 5.81 | %(d)(e) | 3.17 | %(d)(e) | 29 | % | |||||||||||||||||
| 14.34 | 8.73 | 6,273 | 0.95 | 9.97 | 3.90 | 35 | ||||||||||||||||||||||||
| 13.61 | (9.27 | ) | 2,915 | 0.95 | (d)(e) | 11.18 | (d)(e) | 4.00 | (d)(e) | 16 | ||||||||||||||||||||
| See accompanying Notes to Financial Statements | | March 31, 2017 | | Semiannual Report | 277 |
Table of Contents
Financial Highlights (cont’d)
For a Share Outstanding for the Period ended:
Net Asset | Net Investment Income (Loss) (a) | Net Realized and Change in Unrealized Gain (Loss) | Total from Investment Operations | Dividends from Net Investment Income | Distributions from Net Realized Capital Gains | |||||||||||||||||||||||
| AllianzGI Global Dynamic Allocation: | ||||||||||||||||||||||||||||
| Class A | ||||||||||||||||||||||||||||
3/31/2017+ | $ | 18.32 | $ | 0.07 | $ | 0.64 | $ | 0.71 | $ | — | (d) | $ | — | |||||||||||||||
9/30/2016 | 17.99 | 0.17 | 0.66 | 0.83 | (0.22 | ) | (0.28 | ) | ||||||||||||||||||||
12/1/2014 - 9/30/2015# | 21.93 | 0.39 | (1.43 | ) | (1.04 | ) | (0.81 | ) | (2.09 | ) | ||||||||||||||||||
11/30/2014 | 24.70 | 0.44 | 0.31 | 0.75 | (0.66 | ) | (2.86 | ) | ||||||||||||||||||||
11/30/2013 | 22.04 | 0.42 | 3.07 | 3.49 | (0.61 | ) | (0.22 | ) | ||||||||||||||||||||
11/30/2012 | 20.72 | 0.51 | 1.71 | 2.22 | (0.59 | ) | (0.31 | ) | ||||||||||||||||||||
11/30/2011 | 22.03 | 0.45 | (0.33 | ) | 0.12 | (0.91 | ) | (0.52 | ) | |||||||||||||||||||
| Class C | ||||||||||||||||||||||||||||
3/31/2017+ | $ | 18.05 | $ | — | (d) | $ | 0.61 | $ | 0.61 | $ | — | (d) | $ | — | ||||||||||||||
9/30/2016 | 17.63 | 0.08 | 0.62 | 0.70 | — | (d) | (0.28 | ) | ||||||||||||||||||||
12/1/2014 - 9/30/2015# | 21.52 | 0.30 | (1.45 | ) | (1.15 | ) | (0.65 | ) | (2.09 | ) | ||||||||||||||||||
11/30/2014 | 24.28 | 0.25 | 0.32 | 0.57 | (0.47 | ) | (2.86 | ) | ||||||||||||||||||||
11/30/2013 | 21.71 | 0.30 | 2.97 | 3.27 | (0.48 | ) | (0.22 | ) | ||||||||||||||||||||
11/30/2012 | 20.49 | 0.30 | 1.74 | 2.04 | (0.51 | ) | (0.31 | ) | ||||||||||||||||||||
11/30/2011 | 21.81 | 0.24 | (0.28 | ) | (0.04 | ) | (0.76 | ) | (0.52 | ) | ||||||||||||||||||
| Class R | ||||||||||||||||||||||||||||
3/31/2017+ | $ | 18.23 | $ | 0.04 | $ | 0.63 | $ | 0.67 | $ | — | (d) | $ | — | |||||||||||||||
9/30/2016 | 17.84 | 0.16 | 0.63 | 0.79 | (0.12 | ) | (0.28 | ) | ||||||||||||||||||||
12/1/2014 - 9/30/2015# | 21.79 | 0.36 | (1.45 | ) | (1.09 | ) | (0.77 | ) | (2.09 | ) | ||||||||||||||||||
11/30/2014 | 24.62 | 0.40 | 0.30 | 0.70 | (0.67 | ) | (2.86 | ) | ||||||||||||||||||||
11/30/2013 | 21.90 | 0.23 | 3.20 | 3.43 | (0.49 | ) | (0.22 | ) | ||||||||||||||||||||
11/30/2012 | 20.73 | 0.39 | 1.77 | 2.16 | (0.68 | ) | (0.31 | ) | ||||||||||||||||||||
11/30/2011 | 22.01 | 0.40 | (0.34 | ) | 0.06 | (0.82 | ) | (0.52 | ) | |||||||||||||||||||
| Class P | ||||||||||||||||||||||||||||
3/31/2017+ | $ | 18.36 | $ | 0.08 | $ | 0.63 | $ | 0.71 | $ | (0.10 | ) | $ | — | |||||||||||||||
9/30/2016 | 17.97 | 0.16 | 0.71 | 0.87 | (0.20 | ) | (0.28 | ) | ||||||||||||||||||||
12/1/2014 - 9/30/2015# | 21.94 | 0.40 | (1.42 | ) | (1.02 | ) | (0.86 | ) | (2.09 | ) | ||||||||||||||||||
11/30/2014 | 24.71 | 0.46 | 0.33 | 0.79 | (0.70 | ) | (2.86 | ) | ||||||||||||||||||||
11/30/2013 | 22.08 | 0.38 | 3.14 | 3.52 | (0.67 | ) | (0.22 | ) | ||||||||||||||||||||
11/30/2012 | 20.85 | 0.49 | 1.77 | 2.26 | (0.72 | ) | (0.31 | ) | ||||||||||||||||||||
11/30/2011 | 22.12 | 0.63 | (0.48 | ) | 0.15 | (0.90 | ) | (0.52 | ) | |||||||||||||||||||
| Institutional Class | ||||||||||||||||||||||||||||
3/31/2017+ | $ | 18.37 | $ | 0.09 | $ | 0.64 | $ | 0.73 | $ | (0.01 | ) | $ | — | |||||||||||||||
9/30/2016 | 18.02 | 0.23 | 0.65 | 0.88 | (0.25 | ) | (0.28 | ) | ||||||||||||||||||||
12/1/2014 - 9/30/2015# | 22.00 | 0.36 | (1.37 | ) | (1.01 | ) | (0.88 | ) | (2.09 | ) | ||||||||||||||||||
11/30/2014 | 24.74 | 0.48 | 0.34 | 0.82 | (0.70 | ) | (2.86 | ) | ||||||||||||||||||||
11/30/2013 | 22.10 | 0.56 | 2.99 | 3.55 | (0.69 | ) | (0.22 | ) | ||||||||||||||||||||
11/30/2012 | 20.87 | 0.51 | 1.78 | 2.29 | (0.75 | ) | (0.31 | ) | ||||||||||||||||||||
11/30/2011 | 22.14 | 0.65 | (0.48 | ) | 0.17 | (0.92 | ) | (0.52 | ) | |||||||||||||||||||
| Class R6 | ||||||||||||||||||||||||||||
3/31/2017+ | $ | 18.38 | $ | 0.10 | $ | 0.65 | $ | 0.75 | $ | (0.09 | ) | $ | — | |||||||||||||||
2/1/2016* - 9/30/2016 | 17.30 | 0.09 | 0.99 | 1.08 | — | — | ||||||||||||||||||||||
| Administrative Class | ||||||||||||||||||||||||||||
3/31/2017+ | $ | 18.35 | $ | 0.07 | $ | 0.63 | $ | 0.70 | $ | — | (d) | $ | — | |||||||||||||||
9/30/2016 | 17.93 | 0.21 | 0.63 | 0.84 | (0.14 | ) | (0.28 | ) | ||||||||||||||||||||
12/1/2014 - 9/30/2015# | 21.90 | 0.42 | (1.46 | ) | (1.04 | ) | (0.84 | ) | (2.09 | ) | ||||||||||||||||||
11/30/2014 | 24.67 | 0.42 | 0.33 | 0.75 | (0.66 | ) | (2.86 | ) | ||||||||||||||||||||
11/30/2013 | 22.04 | 0.48 | 3.01 | 3.49 | (0.64 | ) | (0.22 | ) | ||||||||||||||||||||
11/30/2012 | 20.81 | 0.46 | 1.77 | 2.23 | (0.69 | ) | (0.31 | ) | ||||||||||||||||||||
11/30/2011 | 22.08 | 0.59 | (0.47 | ) | 0.12 | (0.87 | ) | (0.52 | ) | |||||||||||||||||||
| + | Unaudited |
| # | Fiscal year end changed from November 30th to September 30th. |
| * | Commencement of operations. |
| (a) | Calculated on average shares outstanding during the period. |
| (b) | Total return is calculated assuming a purchase of a share on the first day of the period and a sale of a share on the last day of each period reported. Dividends and distributions, if any, are assumed, for purposes of this calculation, to be reinvested. Total return does not reflect sales charges and includes the effect of fee waivers and reimbursements. Total return may reflect adjustments to conform to U.S. GAAP. Total return for a period of less than one year is not annualized. |
| 278 | Semiannual Report | | March 31, 2017 | | See accompanying Notes to Financial Statements |
Table of Contents
| Total Dividends and Distributions | Net Asset Value, End of Period | Total Return (b) | Net Assets, End of Period (000s) | Ratio of Expenses to Average Net Assets with Fee Waiver/ Reimbursement (c) | Ratio of Expenses to Average Net Assets without Fee Waiver/ Reimbursement (c) | Ratio of Net Investment Income (Loss) to Average Net Assets (c) | Portfolio Turnover Rate | |||||||||||||||||||||||||||
| $ | — | (d) | $ | 19.03 | 3.88 | % | $ | 4,175 | 1.05 | %(e) | 1.32 | %(e) | 0.75 | %(e) | 120 | % | ||||||||||||||||||
| (0.50 | ) | 18.32 | 4.69 | 5,198 | 0.76 | 1.73 | 0.96 | 79 | ||||||||||||||||||||||||||
| (2.90 | ) | 17.99 | (5.30 | ) | 1,324 | 0.63 | (e)(f) | 4.38 | (e)(f) | 2.46 | (e)(f) | 121 | ||||||||||||||||||||||
| (3.52 | ) | 21.93 | 3.40 | 1,042 | 0.40 | 4.53 | 2.00 | 62 | ||||||||||||||||||||||||||
| (0.83 | ) | 24.70 | 16.42 | 1,344 | 0.40 | 3.84 | 1.82 | 101 | ||||||||||||||||||||||||||
| (0.90 | ) | 22.04 | 11.17 | 841 | 0.41 | 4.12 | 2.40 | 51 | ||||||||||||||||||||||||||
| (1.43 | ) | 20.72 | 0.17 | 1,283 | 0.47 | 3.23 | 2.02 | 85 | ||||||||||||||||||||||||||
| $ | — | (d) | $ | 18.66 | 3.38 | % | $ | 1,004 | 1.80 | %(e) | 2.11 | %(e) | (0.02 | )%(e) | 120 | % | ||||||||||||||||||
| (0.28 | ) | 18.05 | 4.02 | 1,029 | 1.49 | 2.69 | 0.45 | 79 | ||||||||||||||||||||||||||
| (2.74 | ) | 17.63 | (5.95 | ) | 1,194 | 1.37 | (e)(f) | 5.05 | (e)(f) | 1.90 | (e)(f) | 121 | ||||||||||||||||||||||
| (3.33 | ) | 21.52 | 2.57 | 1,346 | 1.18 | 5.31 | 1.16 | 62 | ||||||||||||||||||||||||||
| (0.70 | ) | 24.28 | 15.52 | 1,455 | 1.18 | 4.53 | 1.33 | 101 | ||||||||||||||||||||||||||
| (0.82 | ) | 21.71 | 10.34 | 1,277 | 1.18 | 4.65 | 1.44 | 51 | ||||||||||||||||||||||||||
| (1.28 | ) | 20.49 | (0.53 | ) | 1,241 | 1.20 | 4.46 | 1.13 | 85 | |||||||||||||||||||||||||
| $ | — | (d) | $ | 18.90 | 3.68 | % | $ | 191 | 1.35 | %(e) | 1.74 | %(e) | 0.45 | %(e) | 120 | % | ||||||||||||||||||
| (0.40 | ) | 18.23 | 4.50 | 159 | 1.01 | 2.25 | 0.90 | 79 | ||||||||||||||||||||||||||
| (2.86 | ) | 17.84 | (5.55 | ) | 152 | 0.87 | (e)(f) | 4.80 | (e)(f) | 2.27 | (e)(f) | 121 | ||||||||||||||||||||||
| (3.53 | ) | 21.79 | 3.17 | 145 | 0.63 | 4.99 | 1.79 | 62 | ||||||||||||||||||||||||||
| (0.71 | ) | 24.62 | 16.13 | 111 | 0.63 | 4.28 | 1.00 | 101 | ||||||||||||||||||||||||||
| (0.99 | ) | 21.90 | 10.89 | 38 | 0.65 | 4.16 | 1.87 | 51 | ||||||||||||||||||||||||||
| (1.34 | ) | 20.73 | (0.08 | ) | 36 | 0.71 | 3.90 | 1.84 | 85 | |||||||||||||||||||||||||
| $ | (0.10 | ) | $ | 18.97 | 3.91 | % | $ | 10,975 | 0.85 | %(e) | 1.24 | %(e) | 0.93 | %(e) | 120 | % | ||||||||||||||||||
| (0.48 | ) | 18.36 | 4.89 | 186 | 0.61 | 1.47 | 0.90 | 79 | ||||||||||||||||||||||||||
| (2.95 | ) | 17.97 | (5.19 | ) | 53 | 0.47 | (e)(f) | 4.07 | (e)(f) | 2.53 | (e)(f) | 121 | ||||||||||||||||||||||
| (3.56 | ) | 21.94 | 3.57 | 43 | 0.23 | 4.40 | 2.06 | 62 | ||||||||||||||||||||||||||
| (0.89 | ) | 24.71 | 16.62 | 41 | 0.23 | 3.76 | 1.65 | 101 | ||||||||||||||||||||||||||
| (1.03 | ) | 22.08 | 11.35 | 17 | 0.23 | 3.67 | 2.32 | 51 | ||||||||||||||||||||||||||
| (1.42 | ) | 20.85 | 0.34 | 15 | 0.27 | 3.26 | 2.84 | 85 | ||||||||||||||||||||||||||
| $ | (0.01 | ) | $ | 19.09 | 3.99 | % | $ | 34,409 | 0.79 | %(e) | 1.06 | %(e) | 1.00 | %(e) | 120 | % | ||||||||||||||||||
| (0.53 | ) | 18.37 | 4.98 | 37,722 | 0.51 | 1.45 | 1.27 | 79 | ||||||||||||||||||||||||||
| (2.97 | ) | 18.02 | (5.12 | ) | 4,714 | 0.39 | (e)(f) | 4.10 | (e)(f) | 2.27 | (e)(f) | 121 | ||||||||||||||||||||||
| (3.56 | ) | 22.00 | 3.69 | 3,401 | 0.13 | 4.30 | 2.16 | 62 | ||||||||||||||||||||||||||
| (0.91 | ) | 24.74 | 16.71 | 3,296 | 0.13 | 3.48 | 2.43 | 101 | ||||||||||||||||||||||||||
| (1.06 | ) | 22.10 | 11.51 | 5,008 | 0.13 | 3.84 | 2.42 | 51 | ||||||||||||||||||||||||||
| (1.44 | ) | 20.87 | 0.43 | 4,483 | 0.17 | 3.16 | 2.95 | 85 | ||||||||||||||||||||||||||
| $ | (0.09 | ) | $ | 19.04 | 4.08 | % | $ | 203,619 | 0.70 | %(e) | 1.05 | %(e) | 1.06 | %(e) | 120 | % | ||||||||||||||||||
| — | 18.38 | 6.24 | 9,029 | 0.36 | (e) | 1.36 | (e) | 0.77 | (e) | 79 | ||||||||||||||||||||||||
| $ | — | (d) | $ | 19.05 | 3.81 | % | $ | 21 | 1.03 | %(e) | 1.30 | %(e) | 0.76 | %(e) | 120 | % | ||||||||||||||||||
| (0.42 | ) | 18.35 | 4.73 | 20 | 0.76 | 1.89 | 1.15 | 79 | ||||||||||||||||||||||||||
| (2.93 | ) | 17.93 | (5.29 | ) | 19 | 0.61 | (e)(f) | 4.29 | (e)(f) | 2.64 | (e)(f) | 121 | ||||||||||||||||||||||
| (3.52 | ) | 21.90 | 3.38 | 26 | 0.38 | 4.55 | 1.90 | 62 | ||||||||||||||||||||||||||
| (0.86 | ) | 24.67 | 16.48 | 20 | 0.38 | 3.79 | 2.09 | 101 | ||||||||||||||||||||||||||
| (1.00 | ) | 22.04 | 11.20 | 17 | 0.38 | 3.82 | 2.17 | 51 | ||||||||||||||||||||||||||
| (1.39 | ) | 20.81 | 0.20 | 15 | 0.42 | 3.41 | 2.69 | 85 | ||||||||||||||||||||||||||
| (c) | Does not include expenses of the investment companies in which the Fund invests. |
| (d) | Actual amount rounds to less than $(0.01) per share. |
| (e) | Annualized, unless otherwise noted. |
| (f) | Certain expenses incurred by the Fund were not annualized. |
| See accompanying Notes to Financial Statements | | March 31, 2017 | | Semiannual Report | 279 |
Table of Contents
Financial Highlights (cont’d)
For a Share Outstanding for the Period ended:
Net Asset Value, Beginning of Period | Net Investment Income (a) | Net Realized and Change in Unrealized Gain (Loss) | Total from Investment | Dividends from Net Investment Income | Distributions from Net Realized Capital | |||||||||||||||||||||||
| AllianzGI Global Fundamental Strategy: | ||||||||||||||||||||||||||||
| Class A | ||||||||||||||||||||||||||||
3/31/2017+ | $ | 15.21 | $ | 0.12 | $ | 0.11 | $ | 0.23 | $ | (0.33 | ) | $ | (0.20 | ) | ||||||||||||||
9/30/2016 | 14.71 | 0.25 | 0.95 | 1.20 | (0.61 | ) | (0.09 | ) | ||||||||||||||||||||
12/1/2014 - 9/30/2015# | 15.95 | 0.17 | (0.85 | ) | (0.68 | ) | (0.56 | ) | — | |||||||||||||||||||
11/30/2014 | 15.45 | 0.26 | 0.42 | 0.68 | (0.12 | ) | (0.06 | ) | ||||||||||||||||||||
7/1/2013* - 11/30/2013 | 15.00 | 0.06 | 0.39 | 0.45 | — | — | ||||||||||||||||||||||
| Class C | ||||||||||||||||||||||||||||
3/31/2017+ | $ | 15.23 | $ | 0.06 | $ | 0.12 | $ | 0.18 | $ | (0.29 | ) | $ | (0.20 | ) | ||||||||||||||
9/30/2016 | 14.66 | 0.15 | 0.94 | 1.09 | (0.43 | ) | (0.09 | ) | ||||||||||||||||||||
12/1/2014 - 9/30/2015# | 15.84 | 0.10 | (0.88 | ) | (0.78 | ) | (0.40 | ) | — | |||||||||||||||||||
11/30/2014 | 15.40 | 0.14 | 0.42 | 0.56 | (0.06 | ) | (0.06 | ) | ||||||||||||||||||||
7/1/2013* - 11/30/2013 | 15.00 | 0.01 | 0.39 | 0.40 | — | — | ||||||||||||||||||||||
| Class P | ||||||||||||||||||||||||||||
3/31/2017+ | $ | 15.34 | $ | 0.13 | $ | 0.11 | $ | 0.24 | $ | (0.37 | ) | $ | (0.20 | ) | ||||||||||||||
9/30/2016 | 14.77 | 0.28 | 0.94 | 1.22 | (0.56 | ) | (0.09 | ) | ||||||||||||||||||||
12/1/2014 - 9/30/2015# | 15.98 | 0.21 | (0.88 | ) | (0.67 | ) | (0.54 | ) | — | |||||||||||||||||||
11/30/2014 | 15.46 | 0.28 | 0.43 | 0.71 | (0.13 | ) | (0.06 | ) | ||||||||||||||||||||
7/1/2013* - 11/30/2013 | 15.00 | 0.07 | 0.39 | 0.46 | — | — | ||||||||||||||||||||||
| Institutional Class | ||||||||||||||||||||||||||||
3/31/2017+ | $ | 15.36 | $ | 0.14 | $ | 0.12 | $ | 0.26 | $ | (0.35 | ) | $ | (0.20 | ) | ||||||||||||||
9/30/2016 | 14.78 | 0.31 | 0.93 | 1.24 | (0.57 | ) | (0.09 | ) | ||||||||||||||||||||
12/1/2014 - 9/30/2015# | 15.99 | 0.22 | (0.88 | ) | (0.66 | ) | (0.55 | ) | — | |||||||||||||||||||
11/30/2014 | 15.47 | 0.30 | 0.42 | 0.72 | (0.14 | ) | (0.06 | ) | ||||||||||||||||||||
7/1/2013* - 11/30/2013 | 15.00 | 0.08 | 0.39 | 0.47 | — | — | ||||||||||||||||||||||
| + | Unaudited |
| # | Fiscal year end changed from November 30th to September 30th. |
| * | Commencement of operations. |
| (a) | Calculated on average shares outstanding during the period. |
| (b) | Total return is calculated assuming a purchase of a share on the first day of the period and a sale of a share on the last day of each period reported. Dividends and distributions, if any, are assumed, for purposes of this calculation, to be reinvested. Total return does not reflect sales charges and includes the effect of fee waivers and reimbursements. Total return may reflect adjustments to conform to U.S. GAAP. Total return for a period of less than one year is not annualized. |
| (c) | Annualized, unless otherwise noted. |
| (d) | Certain expenses incurred by the Fund were not annualized. |
| (e) | Payments from Affiliates increased the end of period net asset value and total return by less than $0.01 and 0.01%, respectively. |
| 280 | Semiannual Report | | March 31, 2017 | | See accompanying Notes to Financial Statements |
Table of Contents
Total Dividends and Distributions | Net Asset Value, End of Period | Total Return (b) | Net Assets, End of Period (000s) | Ratio of Expenses to Average Net Assets with Fee Waiver/ Reimbursement | Ratio of Expenses to Average Net Assets without Fee Waiver/ Reimbursement | Ratio of Net Investment Income to Average Net Assets | Portfolio Turnover Rate | |||||||||||||||||||||||||||
| $ | (0.53 | ) | $ | 14.91 | 1.68 | % | $ | 72 | 1.26 | %(c) | 2.38 | %(c) | 1.60 | %(c) | 23 | % | ||||||||||||||||||
| (0.70 | ) | 15.21 | 8.46 | 134 | 1.25 | 2.27 | 1.71 | 37 | ||||||||||||||||||||||||||
| (0.56 | ) | 14.71 | (4.37 | ) | 140 | 1.25 | (c)(d) | 2.29 | (c)(d) | 1.37 | (c)(d) | 16 | ||||||||||||||||||||||
| (0.18 | ) | 15.95 | (e) | 4.45 | (e) | 16 | 1.25 | 2.36 | 1.62 | 28 | ||||||||||||||||||||||||
| — | 15.45 | 3.00 | 10 | 1.25 | (c) | 2.41 | (c) | 0.96 | (c) | 2 | ||||||||||||||||||||||||
| $ | (0.49 | ) | $ | 14.92 | 1.30 | % | $ | 14 | 2.02 | %(c) | 3.13 | %(c) | 0.83 | %(c) | 23 | % | ||||||||||||||||||
| (0.52 | ) | 15.23 | 7.64 | 14 | 2.00 | 2.98 | 1.01 | 37 | ||||||||||||||||||||||||||
| (0.40 | ) | 14.66 | (5.03 | ) | 10 | 2.00 | (c)(d) | 2.8 | 1(c)(d) | 0.75 | (c)(d) | 16 | ||||||||||||||||||||||
| (0.12 | ) | 15.84 | (e) | 3.69 | (e) | 11 | 2.00 | 3.14 | 0.88 | 28 | ||||||||||||||||||||||||
| — | 15.40 | 2.67 | 10 | 2.00 | (c) | 3.16 | (c) | 0.21 | (c) | 2 | ||||||||||||||||||||||||
| $ | (0.57 | ) | $ | 15.01 | 1.70 | % | $ | 11 | 1.12 | %(c) | 2.11 | %(c) | 1.71 | %(c) | 23 | % | ||||||||||||||||||
| (0.65 | ) | 15.34 | 8.59 | 11 | 1.10 | 1.96 | 1.92 | 37 | ||||||||||||||||||||||||||
| (0.54 | ) | 14.77 | (4.31 | ) | 10 | 1.10 | (c)(d) | 1.82 | (c)(d) | 1.66 | (c)(d) | 16 | ||||||||||||||||||||||
| (0.19 | ) | 15.98 | (e) | 4.66 | (e) | 11 | 1.10 | 2.14 | 1.79 | 28 | ||||||||||||||||||||||||
| — | 15.46 | 3.07 | 10 | 1.10 | (c) | 2.16 | (c) | 1.12 | (c) | 2 | ||||||||||||||||||||||||
| $ | (0.55 | ) | $ | 15.07 | 1.84 | % | $ | 16,071 | 1.02 | %(c) | 2.14 | %(c) | 1.82 | %(c) | 23 | % | ||||||||||||||||||
| (0.66 | ) | 15.36 | 8.69 | 15,842 | 1.00 | 1.93 | 2.07 | 37 | ||||||||||||||||||||||||||
| (0.55 | ) | 14.78 | (4.20 | ) | 19,317 | 1.00 | (c)(d) | 1.80 | (c)(d) | 1.76 | (c)(d) | 16 | ||||||||||||||||||||||
| (0.20 | ) | 15.99 | (e) | 4.72 | (e) | 22,115 | 1.00 | 2.15 | 1.90 | 28 | ||||||||||||||||||||||||
| — | 15.47 | 3.13 | 20,682 | 1.00 | (c) | 2.14 | (c) | 1.23 | (c) | 2 | ||||||||||||||||||||||||
| See accompanying Notes to Financial Statements | | March 31, 2017 | | Semiannual Report | 281 |
Table of Contents
Financial Highlights (cont’d)
For a Share Outstanding for the Period ended:
Net Asset | Net Investment Income (Loss) (a) | Net Realized and Change in Unrealized Gain (Loss) | Total from Investment Operations | Dividends from Net Investment Income | Distributions from Net Realized Capital Gains | |||||||||||||||||||||||
| AllianzGI Global Sustainability: | ||||||||||||||||||||||||||||
| Class A | ||||||||||||||||||||||||||||
3/31/2017+ | $ | 15.80 | $ | 0.06 | $ | 0.64 | $ | 0.70 | $ | (0.14 | ) | $ | (0.03 | ) | ||||||||||||||
9/30/2016 | 14.10 | 0.14 | 1.76 | 1.90 | (0.20 | ) | — | |||||||||||||||||||||
12/9/2014* - 9/30/2015# | 15.00 | 0.11 | (1.01 | ) | (0.90 | ) | — | — | ||||||||||||||||||||
| Class P | ||||||||||||||||||||||||||||
3/31/2017+ | $ | 15.91 | $ | 0.08 | $ | 0.64 | $ | 0.72 | $ | (0.13 | ) | $ | (0.03 | ) | ||||||||||||||
9/30/2016 | 14.12 | 0.17 | 1.75 | 1.92 | (0.13 | ) | — | |||||||||||||||||||||
12/9/2014* - 9/30/2015# | 15.00 | 0.15 | (1.03 | ) | (0.88 | ) | — | — | ||||||||||||||||||||
| Institutional Class | ||||||||||||||||||||||||||||
3/31/2017+ | $ | 15.92 | $ | 0.08 | $ | 0.64 | $ | 0.72 | $ | (0.15 | ) | $ | (0.03 | ) | ||||||||||||||
9/30/2016 | 14.13 | 0.22 | 1.71 | 1.93 | (0.14 | ) | — | |||||||||||||||||||||
12/9/2014* - 9/30/2015# | 15.00 | 0.16 | (1.03 | ) | (0.87 | ) | — | — | ||||||||||||||||||||
| AllianzGI Global Water: | ||||||||||||||||||||||||||||
| Class A | ||||||||||||||||||||||||||||
3/31/2017+ | $ | 14.46 | $ | (0.02 | ) | $ | (0.27 | ) | $ | (0.29 | ) | $ | (0.05 | ) | $ | (0.08 | ) | |||||||||||
9/30/2016 | 11.99 | 0.08 | 2.44 | 2.52 | (0.03 | ) | (0.02 | ) | ||||||||||||||||||||
12/1/2014 - 9/30/2015# | 12.70 | 0.06 | (0.74 | ) | (0.68 | ) | (0.03 | ) | — | |||||||||||||||||||
11/30/2014 | 12.41 | 0.07 | 0.25 | 0.32 | (0.03 | ) | — | |||||||||||||||||||||
11/30/2013 | 10.26 | 0.07 | 2.20 | 2.27 | (0.12 | ) | — | |||||||||||||||||||||
11/30/2012 | 8.89 | 0.12 | 1.30 | 1.42 | (0.05 | ) | — | |||||||||||||||||||||
11/30/2011 | 8.75 | 0.06 | 0.08 | 0.14 | — | (e) | — | |||||||||||||||||||||
| Class C | ||||||||||||||||||||||||||||
3/31/2017+ | $ | 13.90 | $ | (0.07 | ) | $ | (0.26 | ) | $ | (0.33 | ) | $ | — | (e) | $ | (0.08 | ) | |||||||||||
9/30/2016 | 11.59 | (0.02 | ) | 2.35 | 2.33 | — | (e) | (0.02 | ) | |||||||||||||||||||
12/1/2014 - 9/30/2015# | 12.33 | (0.02 | ) | (0.72 | ) | (0.74 | ) | — | (e) | — | ||||||||||||||||||
11/30/2014 | 12.11 | (0.03 | ) | 0.25 | 0.22 | — | (e) | — | ||||||||||||||||||||
11/30/2013 | 10.02 | (0.02 | ) | 2.16 | 2.14 | (0.05 | ) | — | ||||||||||||||||||||
11/30/2012 | 8.70 | 0.05 | 1.27 | 1.32 | — | (e) | — | |||||||||||||||||||||
11/30/2011 | 8.62 | (0.01 | ) | 0.09 | 0.08 | — | (e) | — | ||||||||||||||||||||
| Class P | ||||||||||||||||||||||||||||
3/31/2017+ | $ | 14.54 | $ | — | (e) | $ | (0.28 | ) | $ | (0.28 | ) | $ | (0.08 | ) | $ | (0.08 | ) | |||||||||||
9/30/2016 | 12.05 | 0.11 | 2.45 | 2.56 | (0.05 | ) | (0.02 | ) | ||||||||||||||||||||
12/1/2014 - 9/30/2015# | 12.80 | 0.09 | (0.75 | ) | (0.66 | ) | (0.09 | ) | — | |||||||||||||||||||
11/30/2014 | 12.49 | 0.09 | 0.27 | 0.36 | (0.05 | ) | — | |||||||||||||||||||||
11/30/2013 | 10.30 | 0.09 | 2.21 | 2.30 | (0.11 | ) | — | |||||||||||||||||||||
11/30/2012 | 8.93 | 0.14 | 1.30 | 1.44 | (0.07 | ) | — | |||||||||||||||||||||
11/30/2011 | 8.77 | 0.07 | 0.09 | 0.16 | — | (e) | — | |||||||||||||||||||||
| Institutional Class | ||||||||||||||||||||||||||||
3/31/2017+ | $ | 14.33 | $ | — | (f) | $ | (0.27 | ) | $ | (0.27 | ) | $ | (0.11 | ) | $ | (0.08 | ) | |||||||||||
9/30/2016 | 11.90 | 0.11 | 2.41 | 2.52 | (0.07 | ) | (0.02 | ) | ||||||||||||||||||||
12/1/2014 - 9/30/2015# | 12.61 | 0.09 | (0.73 | ) | (0.64 | ) | (0.07 | ) | — | |||||||||||||||||||
11/30/2014 | 12.37 | 0.11 | 0.24 | 0.35 | (0.11 | ) | — | |||||||||||||||||||||
11/30/2013 | 10.25 | 0.09 | 2.21 | 2.30 | (0.18 | ) | — | |||||||||||||||||||||
11/30/2012 | 8.88 | 0.12 | 1.32 | 1.44 | (0.07 | ) | — | |||||||||||||||||||||
11/30/2011 | 8.71 | 0.08 | 0.09 | 0.17 | — | (e) | — | |||||||||||||||||||||
| + | Unaudited |
| * | Commencement of operations. |
| # | Fiscal year end changed from November 30th to September 30th. |
| (a) | Calculated on average shares outstanding during the period. |
| (b) | Total return is calculated assuming a purchase of a share on the first day of the period and a sale of a share on the last day of each period reported. Dividends and distributions, if any, are assumed, for purposes of this calculation, to be reinvested. Total return does not reflect sales charges and includes the effect of fee waivers and reimbursements. Total return may reflect adjustments to conform to U.S. GAAP. Total return for a period of less than one year is not annualized. |
| 282 | Semiannual Report | | March 31, 2017 | | See accompanying Notes to Financial Statements |
Table of Contents
| Total Dividends and Distributions | Net Asset Value, End of Period | Total Return (b) | Net Assets, End of Period (000s) | Ratio of Expenses to Average Net Assets with Fee Waiver/ Reimbursement | Ratio of Expenses to Average Net Assets without Fee Waiver/ Reimbursement | Ratio of Net Investment Income (Loss) to Average Net Assets | Portfolio Turnover Rate | |||||||||||||||||||||||||||
| $ | (0.17 | ) | $ | 16.33 | 4.51 | % | $ | 150 | 1.20 | %(c) | 11.50 | %(c) | 0.78 | %(c) | 8 | % | ||||||||||||||||||
| (0.20 | ) | 15.80 | 13.54 | 125 | 1.20 | 21.93 | 0.94 | 20 | ||||||||||||||||||||||||||
| — | 14.10 | (6.00 | ) | 62 | 1.20 | (c)(d) | 15.36 | (c)(d) | 0.89 | (c)(d) | 25 | |||||||||||||||||||||||
| $ | (0.16 | ) | $ | 16.47 | 4.59 | % | $ | 18 | 1.05 | %(c) | 1.63 | %(c) | 1.04 | %(c) | 8 | % | ||||||||||||||||||
| (0.13 | ) | 15.91 | 13.67 | 11 | 1.05 | 3.44 | 1.15 | 20 | ||||||||||||||||||||||||||
| — | 14.12 | (5.87 | ) | 9 | 1.05 | (c)(d) | 8.70 | (c)(d) | 1.22 | (c)(d) | 25 | |||||||||||||||||||||||
| $ | (0.18 | ) | $ | 16.46 | 4.63 | % | $ | 24,522 | 0.95 | %(c) | 1.64 | %(c) | 0.97 | %(c) | 8 | % | ||||||||||||||||||
| (0.14 | ) | 15.92 | 13.77 | 20,610 | 0.95 | 2.04 | 1.47 | 20 | ||||||||||||||||||||||||||
| — | 14.13 | (5.80 | ) | 2,826 | 0.95 | (c)(d) | 8.70 | (c)(d) | 1.32 | (c)(d) | 25 | |||||||||||||||||||||||
| $ | (0.13 | ) | $ | 14.04 | (1.94 | )% | $ | 174,586 | 1.43 | %(c) | 1.43 | %(c) | (0.25 | )%(c) | 16 | % | ||||||||||||||||||
| (0.05 | ) | 14.46 | 21.06 | 237,785 | 1.49 | 1.49 | 0.62 | 55 | ||||||||||||||||||||||||||
| (0.03 | ) | 11.99 | (5.37 | ) | 128,465 | 1.44 | (c)(d) | 1.44 | (c)(d) | 0.58 | (c)(d) | 66 | ||||||||||||||||||||||
| — | 12.70 | 2.57 | 138,219 | 1.46 | 1.46 | 0.55 | 28 | |||||||||||||||||||||||||||
| (0.12 | ) | 12.41 | 22.31 | 118,252 | 1.54 | 1.54 | 0.63 | 28 | ||||||||||||||||||||||||||
| (0.05 | ) | 10.26 | 16.12 | 59,611 | 1.57 | 1.60 | 1.27 | 73 | ||||||||||||||||||||||||||
| — | 8.89 | 1.62 | 27,101 | 1.68 | 1.68 | 0.60 | 73 | |||||||||||||||||||||||||||
| $ | (0.08 | ) | $ | 13.49 | (2.31 | )% | $ | 86,183 | 2.19 | %(c) | 2.19 | %(c) | (1.01 | )%(c) | 16 | % | ||||||||||||||||||
| (0.02 | ) | 13.90 | 20.13 | 92,028 | 2.25 | 2.25 | (0.18 | ) | 55 | |||||||||||||||||||||||||
| — | 11.59 | (6.00 | ) | 69,700 | 2.23 | (c)(d) | 2.23 | (c)(d) | (0.21 | )(c)(d) | 66 | |||||||||||||||||||||||
| — | 12.33 | 1.82 | 77,082 | 2.23 | 2.23 | (0.26 | ) | 28 | ||||||||||||||||||||||||||
| (0.05 | ) | 12.11 | 21.41 | 51,767 | 2.33 | 2.33 | (0.18 | ) | 28 | |||||||||||||||||||||||||
| — | 10.02 | 15.17 | 25,870 | 2.33 | 2.41 | 0.48 | 73 | |||||||||||||||||||||||||||
| — | 8.70 | 0.93 | 20,842 | 2.44 | 2.44 | (0.15 | ) | 73 | ||||||||||||||||||||||||||
| $ | (0.16 | ) | $ | 14.10 | (1.83 | )% | $ | 190,681 | 1.19 | %(c) | 1.19 | %(c) | (0.01 | )%(c) | 16 | % | ||||||||||||||||||
| (0.07 | ) | 14.54 | 21.37 | 125,532 | 1.24 | 1.24 | 0.82 | 55 | ||||||||||||||||||||||||||
| (0.09 | ) | 12.05 | (5.17 | ) | 82,847 | 1.16 | (c)(d) | 1.16 | (c)(d) | 0.84 | (c)(d) | 66 | ||||||||||||||||||||||
| (0.05 | ) | 12.80 | 2.87 | 84,835 | 1.21 | 1.21 | 0.67 | 28 | ||||||||||||||||||||||||||
| (0.11 | ) | 12.49 | 22.58 | 42,448 | 1.34 | 1.34 | 0.81 | 28 | ||||||||||||||||||||||||||
| (0.07 | ) | 10.30 | 16.22 | 16,820 | 1.41 | 1.47 | 1.49 | 73 | ||||||||||||||||||||||||||
| — | 8.93 | 1.85 | 16,118 | 1.49 | 1.52 | 0.79 | 73 | |||||||||||||||||||||||||||
| $ | (0.19 | ) | $ | 13.87 | (1.77 | )% | $ | 95,463 | 1.14 | %(c) | 1.14 | %(c) | 0.04 | %(c) | 16 | % | ||||||||||||||||||
| (0.09 | ) | 14.33 | 21.32 | 68,550 | 1.21 | 1.21 | 0.86 | 55 | ||||||||||||||||||||||||||
| (0.07 | ) | 11.90 | (5.08 | ) | 30,004 | 1.17 | (c)(d) | 1.17 | (c)(d) | 0.87 | (c)(d) | 66 | ||||||||||||||||||||||
| (0.11 | ) | 12.61 | 2.82 | 23,685 | 1.15 | 1.15 | 0.84 | 28 | ||||||||||||||||||||||||||
| (0.18 | ) | 12.37 | 22.77 | 14,429 | 1.19 | 1.19 | 0.77 | 28 | ||||||||||||||||||||||||||
| (0.07 | ) | 10.25 | 16.44 | 3,105 | 1.29 | 1.29 | 1.28 | 73 | ||||||||||||||||||||||||||
| — | 8.88 | 1.99 | 1,267 | 1.37 | 1.39 | 0.91 | 73 | |||||||||||||||||||||||||||
| (c) | Annualized, unless otherwise noted. |
| (d) | Certain expenses incurred by the Fund were not annualized. |
| (e) | Actual amount rounds to less than $(0.01) per share. |
| (f) | Actual amount rounds to less than $0.01 per share. |
| See accompanying Notes to Financial Statements | | March 31, 2017 | | Semiannual Report | 283 |
Table of Contents
Financial Highlights (cont’d)
For a Share Outstanding for the Period ended:
Net Asset | Net Investment Income (a) | Net Realized and Change in Unrealized Gain (Loss) | Total from Investment Operations | Dividends from Net Investment Income | Distributions from Net Realized Capital Gains | |||||||||||||||||||||||
| AllianzGI High Yield Bond: | ||||||||||||||||||||||||||||
| Class A | ||||||||||||||||||||||||||||
3/31/2017+ | $ | 9.14 | $ | 0.25 | $ | 0.11 | $ | 0.36 | $ | (0.25 | ) | $ | — | |||||||||||||||
9/30/2016 | 8.92 | 0.53 | 0.24 | 0.77 | (0.55 | ) | — | |||||||||||||||||||||
12/1/2014 - 9/30/2015# | 9.85 | 0.47 | (0.91 | ) | (0.44 | ) | (0.49 | ) | — | |||||||||||||||||||
11/30/2014 | 10.36 | 0.61 | (0.36 | ) | 0.25 | (0.67 | ) | (0.09 | ) | |||||||||||||||||||
11/30/2013 | 10.16 | 0.67 | 0.22 | 0.89 | (0.68 | ) | (0.01 | ) | ||||||||||||||||||||
11/30/2012 | 9.69 | 0.72 | 0.61 | 1.33 | (0.73 | ) | (0.13 | ) | ||||||||||||||||||||
11/30/2011 | 10.03 | 0.72 | (0.28 | ) | 0.44 | (0.78 | ) | — | ||||||||||||||||||||
| Class C | ||||||||||||||||||||||||||||
3/31/2017+ | $ | 9.12 | $ | 0.22 | $ | 0.11 | $ | 0.33 | $ | (0.22 | ) | $ | — | |||||||||||||||
9/30/2016 | 8.90 | 0.46 | 0.24 | 0.70 | (0.48 | ) | — | |||||||||||||||||||||
12/1/2014 - 9/30/2015# | 9.83 | 0.42 | (0.91 | ) | (0.49 | ) | (0.44 | ) | — | |||||||||||||||||||
11/30/2014 | 10.35 | 0.54 | (0.37 | ) | 0.17 | (0.60 | ) | (0.09 | ) | |||||||||||||||||||
11/30/2013 | 10.15 | 0.59 | 0.22 | 0.81 | (0.60 | ) | (0.01 | ) | ||||||||||||||||||||
11/30/2012 | 9.68 | 0.64 | 0.62 | 1.26 | (0.66 | ) | (0.13 | ) | ||||||||||||||||||||
11/30/2011 | 10.02 | 0.65 | (0.29 | ) | 0.36 | (0.70 | ) | — | ||||||||||||||||||||
| Class R | ||||||||||||||||||||||||||||
3/31/2017+ | $ | 8.79 | $ | 0.22 | $ | 0.12 | $ | 0.34 | $ | (0.24 | ) | $ | — | |||||||||||||||
9/30/2016 | 8.61 | 0.48 | 0.22 | 0.70 | (0.52 | ) | — | |||||||||||||||||||||
12/1/2014 - 9/30/2015# | 9.53 | 0.43 | (0.90 | ) | (0.47 | ) | (0.45 | ) | — | |||||||||||||||||||
11/30/2014 | 10.05 | 0.54 | (0.34 | ) | 0.20 | (0.63 | ) | (0.09 | ) | |||||||||||||||||||
11/30/2013 | 9.88 | 0.63 | 0.21 | 0.84 | (0.66 | ) | (0.01 | ) | ||||||||||||||||||||
11/30/2012 | 9.45 | 0.67 | 0.60 | 1.27 | (0.71 | ) | (0.13 | ) | ||||||||||||||||||||
11/30/2011 | 9.80 | 0.68 | (0.28 | ) | 0.40 | (0.75 | ) | — | ||||||||||||||||||||
| Class P | ||||||||||||||||||||||||||||
3/31/2017+ | $ | 8.80 | $ | 0.26 | $ | 0.11 | $ | 0.37 | $ | (0.27 | ) | $ | — | |||||||||||||||
9/30/2016 | 8.62 | 0.53 | 0.23 | 0.76 | (0.58 | ) | — | |||||||||||||||||||||
12/1/2014 - 9/30/2015# | 9.53 | 0.49 | (0.88 | ) | (0.39 | ) | (0.52 | ) | — | |||||||||||||||||||
11/30/2014 | 10.05 | 0.62 | (0.35 | ) | 0.27 | (0.70 | ) | (0.09 | ) | |||||||||||||||||||
11/30/2013 | 9.87 | 0.66 | 0.23 | 0.89 | (0.70 | ) | (0.01 | ) | ||||||||||||||||||||
11/30/2012 | 9.44 | 0.72 | 0.58 | 1.30 | (0.74 | ) | (0.13 | ) | ||||||||||||||||||||
11/30/2011 | 9.78 | 0.72 | (0.27 | ) | 0.45 | (0.79 | ) | — | ||||||||||||||||||||
| Institutional Class | ||||||||||||||||||||||||||||
3/31/2017+ | $ | 8.83 | $ | 0.26 | $ | 0.11 | $ | 0.37 | $ | (0.27 | ) | $ | — | |||||||||||||||
9/30/2016 | 8.64 | 0.53 | 0.24 | 0.77 | (0.58 | ) | — | |||||||||||||||||||||
12/1/2014 - 9/30/2015# | 9.55 | 0.49 | (0.88 | ) | (0.39 | ) | (0.52 | ) | — | |||||||||||||||||||
11/30/2014 | 10.08 | 0.62 | (0.35 | ) | 0.27 | (0.71 | ) | (0.09 | ) | |||||||||||||||||||
11/30/2013 | 9.90 | 0.68 | 0.22 | 0.90 | (0.71 | ) | (0.01 | ) | ||||||||||||||||||||
11/30/2012 | 9.46 | 0.73 | 0.60 | 1.33 | (0.76 | ) | (0.13 | ) | ||||||||||||||||||||
11/30/2011 | 9.80 | 0.76 | (0.30 | ) | 0.46 | (0.80 | ) | — | ||||||||||||||||||||
| Administrative Class | ||||||||||||||||||||||||||||
3/31/2017+ | $ | 8.70 | $ | 0.25 | $ | 0.10 | $ | 0.35 | $ | (0.26 | ) | $ | — | |||||||||||||||
9/30/2016 | 8.52 | 0.50 | 0.22 | 0.72 | (0.54 | ) | — | |||||||||||||||||||||
12/1/2014 - 9/30/2015# | 9.51 | 0.46 | (0.94 | ) | (0.48 | ) | (0.51 | ) | — | |||||||||||||||||||
11/30/2014 | 10.04 | 0.59 | (0.36 | ) | 0.23 | (0.67 | ) | (0.09 | ) | |||||||||||||||||||
11/30/2013 | 9.87 | 0.65 | 0.22 | 0.87 | (0.69 | ) | (0.01 | ) | ||||||||||||||||||||
11/30/2012 | 9.43 | 0.70 | 0.61 | 1.31 | (0.74 | ) | (0.13 | ) | ||||||||||||||||||||
11/30/2011 | 9.78 | 0.72 | (0.30 | ) | 0.42 | (0.77 | ) | — | ||||||||||||||||||||
| + | Unaudited |
| # | Fiscal year end changed from November 30th to September 30th. |
| (a) | Calculated on average shares outstanding during the period. |
| (b) | Total return is calculated assuming a purchase of a share on the first day of the period and a sale of a share on the last day of each period reported. Dividends and distributions, if any, are assumed, for purposes of this calculation, to be reinvested. Total return does not reflect sales charges and includes the effect of fee waivers and reimbursements. Total return may reflect adjustments to conform to U.S. GAAP. Total return for a period of less than one year is not annualized. |
| (c) | Annualized, unless otherwise noted. |
| (d) | Certain expenses incurred by the Fund were not annualized. |
| (e) | Payments from Affiliates increased the end of period net asset value and total return by less than $0.01 and 0.01%, respectively. |
| 284 | Semiannual Report | | March 31, 2017 | | See accompanying Notes to Financial Statements |
Table of Contents
Total Dividends and Distributions | Net Asset Value, End of Period | Total Return (b) | Net Assets, End of Period (000s) | Ratio of Fee Waiver/ | Ratio of Expenses to Assets without Fee Waiver/ | Ratio of Net Investment Income to Average Net Assets | Portfolio Turnover Rate | |||||||||||||||||||||||||||
| $ | (0.25 | ) | $ | 9.25 | 4.04 | % | $ | 56,001 | 1.00 | %(c)(d) | 1.00 | %(c)(d) | 5.49 | %(c)(d) | 21 | % | ||||||||||||||||||
| (0.55 | ) | 9.14 | 9.08 | 58,004 | 0.98 | 0.98 | 6.02 | 59 | ||||||||||||||||||||||||||
| (0.49 | ) | 8.92 | (4.72 | ) | 34,151 | 1.03 | (c)(d) | 1.03 | (c)(d) | 5.88 | (c)(d) | 47 | ||||||||||||||||||||||
| (0.76 | ) | 9.85 | (e) | 2.39 | (e) | 76,274 | 0.94 | 0.94 | 5.93 | 66 | ||||||||||||||||||||||||
| (0.69 | ) | 10.36 | 8.98 | 73,920 | 0.91 | 0.91 | 6.49 | 67 | ||||||||||||||||||||||||||
| (0.86 | ) | 10.16 | 14.34 | 109,668 | 0.89 | 0.90 | 7.21 | 86 | ||||||||||||||||||||||||||
| (0.78 | ) | 9.69 | 4.29 | 61,339 | 1.05 | 1.05 | 7.19 | 168 | ||||||||||||||||||||||||||
| $ | (0.22 | ) | $ | 9.23 | 3.68 | % | $ | 12,364 | 1.69 | %(c)(d) | 1.69 | %(c)(d) | 4.80 | %(c)(d) | 21 | % | ||||||||||||||||||
| (0.48 | ) | 9.12 | 8.32 | 14,815 | 1.71 | 1.71 | 5.28 | 59 | ||||||||||||||||||||||||||
| (0.44 | ) | 8.90 | (5.24 | ) | 17,866 | 1.68 | (c)(d) | 1.68 | (c)(d) | 5.24 | (c)(d) | 47 | ||||||||||||||||||||||
| (0.69 | ) | 9.83 | (e) | 1.57 | (e) | 23,249 | 1.68 | 1.68 | 5.23 | 66 | ||||||||||||||||||||||||
| (0.61 | ) | 10.35 | 8.14 | 27,525 | 1.70 | 1.70 | 5.68 | 67 | ||||||||||||||||||||||||||
| (0.79 | ) | 10.15 | 13.54 | 30,692 | 1.68 | 1.68 | 6.43 | 86 | ||||||||||||||||||||||||||
| (0.70 | ) | 9.68 | 3.53 | 12,443 | 1.82 | 1.87 | 6.56 | 168 | ||||||||||||||||||||||||||
| $ | (0.24 | ) | $ | 8.89 | 3.89 | % | $ | 1,234 | 1.41 | %(c)(d) | 1.41 | %(c)(d) | 5.08 | %(c)(d) | 21 | % | ||||||||||||||||||
| (0.52 | ) | 8.79 | 8.62 | 1,310 | 1.34 | 1.34 | 5.65 | 59 | ||||||||||||||||||||||||||
| (0.45 | ) | 8.61 | (5.20 | ) | 1,126 | 1.46 | (c)(d) | 1.46 | (c)(d) | 5.47 | (c)(d) | 47 | ||||||||||||||||||||||
| (0.72 | ) | 9.53 | (e) | 1.91 | (e) | 2,823 | 1.43 | 1.45 | 5.48 | 66 | ||||||||||||||||||||||||
| (0.67 | ) | 10.05 | 8.72 | 2,851 | 1.15 | 1.32 | 6.24 | 67 | ||||||||||||||||||||||||||
| (0.84 | ) | 9.88 | 14.05 | 2,111 | 1.15 | 1.25 | 6.95 | 86 | ||||||||||||||||||||||||||
| (0.75 | ) | 9.45 | 4.02 | 342 | 1.33 | 1.37 | 7.23 | 168 | ||||||||||||||||||||||||||
| $ | (0.27 | ) | $ | 8.90 | 4.25 | % | $ | 52,869 | 0.69 | %(c)(d) | 0.69 | %(c)(d) | 5.80 | %(c)(d) | 21 | % | ||||||||||||||||||
| (0.58 | ) | 8.80 | 9.31 | 57,378 | 0.69 | 0.69 | 6.30 | 59 | ||||||||||||||||||||||||||
| (0.52 | ) | 8.62 | (4.36 | ) | 63,324 | 0.64 | (c)(d) | 0.64 | (c)(d) | 6.29 | (c)(d) | 47 | ||||||||||||||||||||||
| (0.79 | ) | 9.53 | (e) | 2.63 | (e) | 47,385 | 0.71 | 0.71 | 6.21 | 66 | ||||||||||||||||||||||||
| (0.71 | ) | 10.05 | 9.27 | 77,649 | 0.74 | 0.74 | 6.64 | 67 | ||||||||||||||||||||||||||
| (0.87 | ) | 9.87 | 14.48 | 19,497 | 0.74 | 0.79 | 7.39 | 86 | ||||||||||||||||||||||||||
| (0.79 | ) | 9.44 | 4.57 | 11,096 | 0.88 | 0.88 | 7.49 | 168 | ||||||||||||||||||||||||||
| $ | (0.27 | ) | $ | 8.93 | 4.26 | % | $ | 216,304 | 0.64 | %(c)(d) | 0.64 | %(c)(d) | 5.85 | %(c)(d) | 21 | % | ||||||||||||||||||
| (0.58 | ) | 8.83 | 9.41 | 227,149 | 0.66 | 0.66 | 6.31 | 59 | ||||||||||||||||||||||||||
| (0.52 | ) | 8.64 | (4.32 | ) | 173,030 | 0.63 | (c)(d) | 0.63 | (c)(d) | 6.29 | (c)(d) | 47 | ||||||||||||||||||||||
| (0.80 | ) | 9.55 | (e) | 2.59 | (e) | 163,567 | 0.64 | 0.64 | 6.27 | 66 | ||||||||||||||||||||||||
| (0.72 | ) | 10.08 | 9.35 | 139,306 | 0.62 | 0.62 | 6.76 | 67 | ||||||||||||||||||||||||||
| (0.89 | ) | 9.90 | 14.68 | 121,362 | 0.63 | 0.63 | 7.47 | 86 | ||||||||||||||||||||||||||
| (0.80 | ) | 9.46 | 4.66 | 70,174 | 0.61 | 0.77 | 7.65 | 168 | ||||||||||||||||||||||||||
| $ | (0.26 | ) | $ | 8.79 | 4.10 | % | $ | 1,549 | 0.86 | %(c)(d) | 0.86 | %(c)(d) | 5.65 | %(c)(d) | 21 | % | ||||||||||||||||||
| (0.54 | ) | 8.70 | 8.97 | 2,086 | 1.07 | 1.07 | 5.94 | 59 | ||||||||||||||||||||||||||
| (0.51 | ) | 8.52 | (5.30 | ) | 2,073 | 0.98 | (c)(d) | 0.98 | (c)(d) | 5.90 | (c)(d) | 47 | ||||||||||||||||||||||
| (0.76 | ) | 9.51 | (e) | 2.27 | (e) | 34,714 | 0.97 | 0.97 | 5.93 | 66 | ||||||||||||||||||||||||
| (0.70 | ) | 10.04 | 9.02 | 32,789 | 0.90 | 0.91 | 6.49 | 67 | ||||||||||||||||||||||||||
| (0.87 | ) | 9.87 | 14.54 | 27,274 | 0.90 | 1.14 | 8.92 | 86 | ||||||||||||||||||||||||||
| (0.77 | ) | 9.43 | 4.27 | 11 | 1.03 | 1.03 | 7.25 | 168 | ||||||||||||||||||||||||||
| See accompanying Notes to Financial Statements | | March 31, 2017 | | Semiannual Report | 285 |
Table of Contents
Financial Highlights (cont’d)
For a Share Outstanding for the Period ended:
| Net Asset Value, Beginning of Period | Net Investment Income (Loss) (a) | Net Realized | Total from Investment Operations | Dividends from Net Investment Income | ||||||||||||||||||||
| AllianzGI International Growth: | ||||||||||||||||||||||||
| Class A | ||||||||||||||||||||||||
3/31/2017+ | $ | 16.37 | $ | (0.01 | ) | $ | 0.16 | $ | 0.15 | $ | — | (c) | ||||||||||||
9/30/2016 | 14.13 | 0.09 | 2.29 | 2.38 | (0.14 | ) | ||||||||||||||||||
2/2/2015* - 9/30/2015# | 15.00 | 0.11 | (0.98 | ) | (0.87 | ) | — | |||||||||||||||||
| Institutional Class | ||||||||||||||||||||||||
3/31/2017+ | $ | 16.49 | $ | 0.01 | $ | 0.15 | $ | 0.16 | $ | (0.02 | ) | |||||||||||||
9/30/2016 | 14.15 | 0.11 | 2.33 | 2.44 | (0.10 | ) | ||||||||||||||||||
2/2/2015* - 9/30/2015# | 15.00 | 0.14 | (0.99 | ) | (0.85 | ) | — | |||||||||||||||||
| + | Unaudited |
| * | Commencement of operations. |
| # | Fiscal year end changed from November 30th to September 30th. |
| (a) | Calculated on average shares outstanding during the period. |
| (b) | Total return is calculated assuming a purchase of a share on the first day of the period and a sale of a share on the last day of each period reported. Dividends and distributions, if any, are assumed, for purposes of this calculation, to be reinvested. Total return does not reflect sales charges and includes the effect of fee waivers and reimbursements. Total return may reflect adjustments to conform to U.S. GAAP. Total return for a period of less than one year is not annualized. |
| (c) | Actual amount rounds to less than $(0.01) per share. |
| (d) | Annualized, unless otherwise noted. |
| (e) | Certain expenses incurred by the Fund were not annualized. |
| 286 | Semiannual Report | | March 31, 2017 | | See accompanying Notes to Financial Statements |
Table of Contents
| Net Asset Value, End of Period | Total Return (b) | Net Assets, End of Period (000s) | Ratio of Expenses to Average Net Assets with Fee Waiver/ Reimbursement | Ratio of Expenses to Average Net Assets without Fee Waiver/ Reimbursement | Ratio of Net Investment Income (Loss) to Average Net Assets | Portfolio Turnover Rate | ||||||||||||||||||||||||
| $ | 16.52 | 0.92 | % | $ | 52 | 1.20 | %(d) | 1.92 | %(d) | (0.09 | )%(d) | 10 | % | |||||||||||||||||
| 16.37 | 16.97 | 51 | 1.20 | 6.68 | 0.60 | 20 | ||||||||||||||||||||||||
| 14.13 | (5.80 | ) | 10 | 1.20 | (d)(e) | 8.22 | (d)(e) | 1.12 | (d)(e) | 3 | ||||||||||||||||||||
| $ | 16.63 | 0.96 | % | $ | 28,712 | 0.95 | %(d) | 1.54 | %(d) | 0.16 | %(d) | 10 | % | |||||||||||||||||
| 16.49 | 17.34 | 28,386 | 0.95 | 5.77 | 0.75 | 20 | ||||||||||||||||||||||||
| 14.15 | (5.67 | ) | 2,874 | 0.95 | (d)(e) | 7.99 | (d)(e) | 1.38 | (d)(e) | 3 | ||||||||||||||||||||
| See accompanying Notes to Financial Statements | | March 31, 2017 | | Semiannual Report | 287 |
Table of Contents
Financial Highlights (cont’d)
For a Share Outstanding for the Period ended:
| Net Asset Value, Beginning of Period | Net Investment Income (Loss) (a) | Net Realized | Total from Investment Operations | Dividends from Net Investment Income | Distributions from Net Realized Capital Gains | |||||||||||||||||||||||
| AllianzGI International Small-Cap: | ||||||||||||||||||||||||||||
| Class A | ||||||||||||||||||||||||||||
3/31/2017+ | $ | 34.57 | $ | (0.12 | ) | $ | 0.33 | $ | 0.21 | $ | (0.31 | ) | $ | — | ||||||||||||||
9/30/2016 | 34.53 | 0.10 | 1.67 | 1.77 | (0.28 | ) | (1.45 | ) | ||||||||||||||||||||
12/1/2014 - 9/30/2015# | 35.77 | 0.26 | 2.24 | 2.50 | (0.14 | ) | (3.60 | ) | ||||||||||||||||||||
11/30/2014 | 42.30 | 0.09 | (2.41 | ) | (2.32 | ) | (0.64 | ) | (3.57 | ) | ||||||||||||||||||
11/30/2013 | 31.89 | 0.09 | 10.32 | 10.41 | — | (e) | — | |||||||||||||||||||||
11/30/2012 | 28.31 | 0.16 | 4.06 | 4.22 | (0.64 | ) | — | |||||||||||||||||||||
11/30/2011 | 31.36 | 0.12 | (2.56 | ) | (2.44 | ) | (0.61 | ) | — | |||||||||||||||||||
| Class C | ||||||||||||||||||||||||||||
3/31/2017+ | $ | 33.78 | $ | (0.22 | ) | $ | 0.31 | $ | 0.09 | $ | (0.25 | ) | $ | — | ||||||||||||||
9/30/2016 | 33.94 | (0.12 | ) | 1.61 | 1.49 | (0.20 | ) | (1.45 | ) | |||||||||||||||||||
12/1/2014 - 9/30/2015# | 35.33 | 0.06 | 2.18 | 2.24 | (0.03 | ) | (3.60 | ) | ||||||||||||||||||||
11/30/2014 | 41.78 | (0.18 | ) | (2.39 | ) | (2.57 | ) | (0.31 | ) | (3.57 | ) | |||||||||||||||||
11/30/2013 | 31.75 | (0.17 | ) | 10.22 | 10.05 | (0.02 | ) | — | ||||||||||||||||||||
11/30/2012 | 28.01 | (0.07 | ) | 4.04 | 3.97 | (0.23 | ) | — | ||||||||||||||||||||
11/30/2011 | 31.22 | 0.06 | (2.72 | ) | (2.66 | ) | (0.55 | ) | — | |||||||||||||||||||
| Class R | ||||||||||||||||||||||||||||
3/31/2017+ | $ | 34.07 | $ | (0.14 | ) | $ | 0.31 | $ | 0.17 | $ | (0.32 | ) | $ | — | ||||||||||||||
9/30/2016 | 34.03 | 0.03 | 1.63 | 1.66 | (0.17 | ) | (1.45 | ) | ||||||||||||||||||||
12/1/2014 - 9/30/2015# | 35.30 | 0.16 | 2.23 | 2.39 | (0.06 | ) | (3.60 | ) | ||||||||||||||||||||
11/30/2014 | 42.23 | 0.07 | (2.47 | ) | (2.40 | ) | (0.96 | ) | (3.57 | ) | ||||||||||||||||||
11/30/2013 | 32.25 | 0.02 | 10.32 | 10.34 | (0.36 | ) | — | |||||||||||||||||||||
11/30/2012 | 28.27 | 0.08 | 4.10 | 4.18 | (0.20 | ) | — | |||||||||||||||||||||
11/30/2011 | 31.32 | 0.16 | (2.70 | ) | (2.54 | ) | (0.51 | ) | — | |||||||||||||||||||
| Class P | ||||||||||||||||||||||||||||
3/31/2017+ | $ | 34.66 | $ | (0.05 | ) | $ | 0.29 | $ | 0.24 | $ | (0.34 | ) | $ | — | ||||||||||||||
9/30/2016 | 34.49 | 0.18 | 1.64 | 1.82 | (0.20 | ) | (1.45 | ) | ||||||||||||||||||||
12/1/2014 - 9/30/2015# | 35.65 | 0.28 | 2.25 | 2.53 | (0.09 | ) | (3.60 | ) | ||||||||||||||||||||
11/30/2014 | 41.97 | 0.16 | (2.41 | ) | (2.25 | ) | (0.50 | ) | (3.57 | ) | ||||||||||||||||||
11/30/2013 | 31.92 | 0.16 | 10.24 | 10.40 | (0.35 | ) | — | |||||||||||||||||||||
11/30/2012 | 27.86 | 0.20 | 4.05 | 4.25 | (0.19 | ) | — | |||||||||||||||||||||
11/30/2011 | 30.35 | 0.30 | (2.67 | ) | (2.37 | ) | (0.12 | ) | — | |||||||||||||||||||
| Institutional Class | ||||||||||||||||||||||||||||
3/31/2017+ | $ | 35.91 | $ | (0.05 | ) | $ | 0.31 | $ | 0.26 | $ | (0.34 | ) | $ | — | ||||||||||||||
9/30/2016 | 35.65 | 0.10 | 1.81 | 1.91 | (0.20 | ) | (1.45 | ) | ||||||||||||||||||||
12/1/2014 - 9/30/2015# | 36.68 | 0.29 | 2.34 | 2.63 | (0.06 | ) | (3.60 | ) | ||||||||||||||||||||
11/30/2014 | 42.94 | 0.21 | (2.49 | ) | (2.28 | ) | (0.41 | ) | (3.57 | ) | ||||||||||||||||||
11/30/2013 | 32.60 | 0.17 | 10.48 | 10.65 | (0.31 | ) | — | |||||||||||||||||||||
11/30/2012 | 28.58 | 0.24 | 4.15 | 4.39 | (0.37 | ) | — | |||||||||||||||||||||
11/30/2011 | 31.45 | 0.37 | (2.74 | ) | (2.37 | ) | (0.50 | ) | — | |||||||||||||||||||
| Class R6 | ||||||||||||||||||||||||||||
3/31/2017+ | $ | 35.94 | $ | (0.04 | ) | $ | 0.31 | $ | 0.27 | $ | (0.35 | ) | $ | — | ||||||||||||||
2/1/2016* - 9/30/2016 | 33.52 | 0.34 | 2.08 | 2.42 | — | — | ||||||||||||||||||||||
| + | Unaudited |
| # | Fiscal year end changed from November 30th to September 30th. |
| * | Commencement of operations. |
| (a) | Calculated on average shares outstanding during the period. |
| (b) | Total return is calculated assuming a purchase of a share on the first day of the period and a sale of a share on the last day of each period reported. Dividends and distributions, if any, are assumed, for purposes of this calculation, to be reinvested. Total return does not reflect sales charges and includes the effect of fee waivers and reimbursements. Total return may reflect adjustments to conform to U.S. GAAP. Total return for a period of less than one year is not annualized. |
| 288 | Semiannual Report | | March 31, 2017 | | See accompanying Notes to Financial Statements |
Table of Contents
| Total Dividends and Distributions | Net Asset Value, End of Period | Total Return (b) | Net Assets, End of Period (000s) | Ratio of Expenses to Average Net Assets with Fee Waiver/ Reimbursement | Ratio of Expenses to Average Net Assets without Fee Waiver/ Reimbursement | Ratio of Net Investment Income (Loss) to Average Net Assets | Portfolio Turnover Rate | |||||||||||||||||||||||||||
| $ | (0.31 | ) | $ | 34.47 | 0.71 | % | $ | 5,319 | 1.43 | %(c) | 1.90 | %(c) | (0.75 | )%(c) | 36 | % | ||||||||||||||||||
| (1.73 | ) | 34.57 | 5.07 | 13,524 | 1.45 | 1.68 | 0.30 | 76 | ||||||||||||||||||||||||||
| (3.74 | ) | 34.53 | 7.83 | 11,816 | 1.45 | (c)(d) | 1.63 | (c)(d) | 0.88 | (c)(d) | 39 | |||||||||||||||||||||||
| (4.21 | ) | 35.77 | (5.84 | ) | 5,290 | 1.45 | 1.76 | 0.23 | 77 | |||||||||||||||||||||||||
| — | (e) | 42.30 | 32.64 | 4,569 | 1.45 | 1.83 | 0.23 | 92 | ||||||||||||||||||||||||||
| (0.64 | ) | 31.89 | 15.13 | 2,773 | 1.50 | 1.76 | 0.53 | 117 | ||||||||||||||||||||||||||
| (0.61 | ) | 28.31 | (8.03 | ) | 4,103 | 1.60 | 1.83 | 0.40 | 66 | |||||||||||||||||||||||||
| $ | (0.25 | ) | $ | 33.62 | 0.33 | % | $ | 2,278 | 2.19 | %(c) | 2.60 | %(c) | (1.39 | )%(c) | 36 | % | ||||||||||||||||||
| (1.65 | ) | 33.78 | 4.30 | 3,232 | 2.19 | 2.54 | (0.35 | ) | 76 | |||||||||||||||||||||||||
| (3.63 | ) | 33.94 | 7.14 | 2,837 | 2.19 | (c)(d) | 2.42 | (c)(d) | 0.20 | (c)(d) | 39 | |||||||||||||||||||||||
| (3.88 | ) | 35.33 | (6.52 | ) | 1,135 | 2.19 | 2.45 | (0.47 | ) | 77 | ||||||||||||||||||||||||
| (0.02 | ) | 41.78 | 31.67 | 702 | 2.20 | 2.43 | (0.46 | ) | 92 | |||||||||||||||||||||||||
| (0.23 | ) | 31.75 | 14.26 | 531 | 2.26 | 2.37 | (0.24 | ) | 117 | |||||||||||||||||||||||||
| (0.55 | ) | 28.01 | (8.75 | ) | 455 | 2.34 | 2.86 | 0.19 | 66 | |||||||||||||||||||||||||
| $ | (0.32 | ) | $ | 33.92 | 0.58 | % | $ | 118 | 1.70 | %(c) | 2.27 | %(c) | (0.87 | )%(c) | 36 | % | ||||||||||||||||||
| (1.62 | ) | 34.07 | 4.81 | 130 | 1.70 | 2.17 | 0.09 | 76 | ||||||||||||||||||||||||||
| (3.66 | ) | 34.03 | 7.60 | 100 | 1.70 | (c)(d) | 2.09 | (c)(d) | 0.57 | (c)(d) | 39 | |||||||||||||||||||||||
| (4.53 | ) | 35.30 | (6.06 | ) | 73 | 1.70 | 2.10 | 0.19 | 77 | |||||||||||||||||||||||||
| (0.36 | ) | 42.23 | 32.29 | 27 | 1.70 | 1.96 | 0.05 | 92 | ||||||||||||||||||||||||||
| (0.20 | ) | 32.25 | 14.86 | 12 | 1.74 | 1.90 | 0.26 | 117 | ||||||||||||||||||||||||||
| (0.51 | ) | 28.27 | (8.32 | ) | 10 | 1.82 | 1.84 | 0.51 | 66 | |||||||||||||||||||||||||
| $ | (0.34 | ) | $ | 34.56 | 0.80 | % | $ | 44,451 | 1.26 | %(c) | 1.49 | %(c) | (0.32 | )%(c) | 36 | % | ||||||||||||||||||
| (1.65 | ) | 34.66 | 5.25 | 40,183 | 1.28 | 1.44 | 0.54 | 76 | ||||||||||||||||||||||||||
| (3.69 | ) | 34.49 | 7.96 | 36,377 | 1.28 | (c)(d) | 1.37 | (c)(d) | 0.97 | (c)(d) | 39 | |||||||||||||||||||||||
| (4.07 | ) | 35.65 | (5.68 | ) | 27,882 | 1.29 | 1.54 | 0.41 | 77 | |||||||||||||||||||||||||
| (0.35 | ) | 41.97 | 32.86 | 33,574 | 1.30 | 1.52 | 0.45 | 92 | ||||||||||||||||||||||||||
| (0.19 | ) | 31.92 | 15.32 | 28,996 | 1.31 | 1.52 | 0.68 | 117 | ||||||||||||||||||||||||||
| (0.12 | ) | 27.86 | (7.86 | ) | 34,772 | 1.32 | 1.47 | 0.95 | 66 | |||||||||||||||||||||||||
| $ | (0.34 | ) | $ | 35.83 | 0.83 | % | $ | 25,577 | 1.20 | %(c) | 1.63 | %(c) | (0.27 | )%(c) | 36 | % | ||||||||||||||||||
| (1.65 | ) | 35.91 | 5.31 | 29,031 | 1.21 | 1.48 | 0.28 | 76 | ||||||||||||||||||||||||||
| (3.66 | ) | 35.65 | 8.04 | 59,061 | 1.21 | (c)(d) | 1.39 | (c)(d) | 0.97 | (c)(d) | 39 | |||||||||||||||||||||||
| (3.98 | ) | 36.68 | (5.61 | ) | 55,743 | 1.21 | 1.46 | 0.53 | 77 | |||||||||||||||||||||||||
| (0.31 | ) | 42.94 | 32.96 | 71,875 | 1.21 | 1.44 | 0.46 | 92 | ||||||||||||||||||||||||||
| (0.37 | ) | 32.60 | 15.50 | 88,301 | 1.20 | 1.38 | 0.80 | 117 | ||||||||||||||||||||||||||
| (0.50 | ) | 28.58 | (7.74 | ) | 84,026 | 1.20 | 1.34 | 1.14 | 66 | |||||||||||||||||||||||||
| $ | (0.35 | ) | $ | 35.86 | 0.86 | % | $ | 14,272 | 1.11 | %(c) | 1.49 | %(c) | (0.24 | )%(c) | 36 | % | ||||||||||||||||||
| — | 35.94 | 7.22 | 15,534 | 1.11 | (c) | 1.56 | (c) | 1.48 | (c) | 76 | ||||||||||||||||||||||||
| (c) | Annualized, unless otherwise noted. |
| (d) | Certain expenses incurred by the Fund were not annualized. |
| (e) | Actual amount rounds to less than $(0.01) per share. |
| See accompanying Notes to Financial Statements | | March 31, 2017 | | Semiannual Report | 289 |
Table of Contents
Financial Highlights (cont’d)
For a Share Outstanding for the Period ended:
| Net Asset Value, Beginning of Period | Net Investment Income (Loss) (a) | Net Realized and Change in Unrealized Gain (Loss) | Total from Investment Operations | Dividends from Net Investment Income | Distributions from Net Realized Capital Gains | |||||||||||||||||||||||
| AllianzGI Micro Cap: | ||||||||||||||||||||||||||||
| Class A | ||||||||||||||||||||||||||||
3/31/2017+ | $ | 14.73 | $ | (0.09 | ) | $ | 1.00 | $ | 0.91 | $ | — | $ | (1.42 | ) | ||||||||||||||
9/30/2016 | 13.99 | (0.18 | ) | 1.75 | 1.57 | — | (0.83 | ) | ||||||||||||||||||||
12/1/2014 - 9/30/2015# | 14.88 | (0.17 | ) | 0.54 | 0.37 | — | (1.26 | ) | ||||||||||||||||||||
11/30/2014 | 16.06 | (0.21 | ) | — | (e) | (0.21 | ) | — | (0.97 | ) | ||||||||||||||||||
11/30/2013 | 11.62 | (0.20 | ) | 5.57 | 5.37 | — | (0.93 | ) | ||||||||||||||||||||
12/19/2011* - 11/30/2012 | 9.84 | (0.07 | ) | 1.85 | 1.78 | — | — | |||||||||||||||||||||
| Class P | ||||||||||||||||||||||||||||
3/31/2017+ | $ | 14.80 | $ | (0.08 | ) | $ | 0.99 | $ | 0.91 | $ | — | $ | (1.42 | ) | ||||||||||||||
9/30/2016 | 14.05 | (0.16 | ) | 1.74 | 1.58 | — | (0.83 | ) | ||||||||||||||||||||
12/1/2014 - 9/30/2015# | 14.92 | (0.16 | ) | 0.55 | 0.39 | — | (1.26 | ) | ||||||||||||||||||||
11/30/2014 | 16.08 | (0.19 | ) | — | (e) | (0.19 | ) | — | (0.97 | ) | ||||||||||||||||||
11/30/2013 | 11.61 | (0.17 | ) | 5.57 | 5.40 | — | (0.93 | ) | ||||||||||||||||||||
11/30/2012 | 12.20 | (0.10 | ) | 1.47 | 1.37 | — | (1.96 | ) | ||||||||||||||||||||
12/27/2010* - 11/30/2011 | 14.20 | (0.15 | ) | (1.64 | ) | (1.79 | ) | — | (0.21 | ) | ||||||||||||||||||
| Institutional Class | ||||||||||||||||||||||||||||
3/31/2017+ | $ | 14.87 | $ | (0.08 | ) | $ | 1.00 | $ | 0.92 | $ | — | $ | (1.42 | ) | ||||||||||||||
9/30/2016 | 14.11 | (0.16 | ) | 1.75 | 1.59 | — | (0.83 | ) | ||||||||||||||||||||
12/1/2014 - 9/30/2015# | 14.99 | (0.16 | ) | 0.54 | 0.38 | — | (1.26 | ) | ||||||||||||||||||||
11/30/2014 | 16.15 | (0.19 | ) | — | (e) | (0.19 | ) | — | (0.97 | ) | ||||||||||||||||||
11/30/2013 | 11.65 | (0.15 | ) | 5.58 | 5.43 | — | (0.93 | ) | ||||||||||||||||||||
11/30/2012 | 12.22 | (0.10 | ) | 1.49 | 1.39 | — | (1.96 | ) | ||||||||||||||||||||
11/30/2011 | 13.80 | (0.17 | ) | (0.16 | ) | (0.33 | ) | — | (1.25 | ) | ||||||||||||||||||
| + | Unaudited |
| # | Fiscal year end changed from November 30th to September 30th. |
| * | Commencement of operations. |
| (a) | Calculated on average shares outstanding during the period. |
| (b) | Total return is calculated assuming a purchase of a share on the first day of the period and a sale of a share on the last day of each period reported. Dividends and distributions, if any, are assumed, for purposes of this calculation, to be reinvested. Total return does not reflect sales charges and includes the effect of fee waivers and reimbursements. Total return may reflect adjustments to conform to U.S. GAAP. Total return for a period of less than one year is not annualized. |
| (c) | Annualized, unless otherwise noted. |
| (d) | Certain expenses incurred by the Fund were not annualized. |
| (e) | Actual amount rounds to less than $0.01 per share. |
| 290 | Semiannual Report | | March 31, 2017 | | See accompanying Notes to Financial Statements |
Table of Contents
| Total Dividends and Distributions | Net Asset Value, End of Period | Total Return (b) | Net Assets, End of Period (000s) | Ratio of Expenses to Average Net Assets with Fee Waiver/ Reimbursement | Ratio of Expenses to Average Net Assets without Fee Waiver/ Reimbursement | Ratio of Net Investment Income (Loss) to Average Net Assets | Portfolio Turnover Rate | |||||||||||||||||||||||||||
| $ | (1.42 | ) | $ | 14.22 | 6.53 | % | $ | 2,788 | 1.62 | %(c) | 2.20 | %(c) | (1.25 | )%(c) | 15 | % | ||||||||||||||||||
| (0.83 | ) | 14.73 | 11.47 | 3,388 | 1.62 | 2.16 | (1.26 | ) | 39 | |||||||||||||||||||||||||
| (1.26 | ) | 13.99 | 2.77 | 15,305 | 1.62 | (c)(d) | 2.07 | (c)(d) | (1.35 | )(c)(d) | 55 | |||||||||||||||||||||||
| (0.97 | ) | 14.88 | (1.11 | ) | 4,684 | 1.66 | 2.10 | (1.40 | ) | 48 | ||||||||||||||||||||||||
| (0.93 | ) | 16.06 | 50.11 | 1,065 | 1.80 | 2.07 | (1.45 | ) | 63 | |||||||||||||||||||||||||
| — | 11.62 | 18.09 | 135 | 1.82 | (c) | 2.18 | (c) | (0.62 | )(c) | 62 | ||||||||||||||||||||||||
| $ | (1.42 | ) | $ | 14.29 | 6.49 | % | $ | 1,809 | 1.54 | %(c) | 1.92 | %(c) | (1.16 | )%(c) | 15 | % | ||||||||||||||||||
| (0.83 | ) | 14.80 | 11.50 | 1,289 | 1.54 | 1.85 | (1.17 | ) | 39 | |||||||||||||||||||||||||
| (1.26 | ) | 14.05 | 2.91 | 2,264 | 1.51 | (c)(d) | 1.80 | (c)(d) | (1.24 | )(c)(d) | 55 | |||||||||||||||||||||||
| (0.97 | ) | 14.92 | (0.98 | ) | 1,550 | 1.52 | 1.81 | (1.21 | ) | 48 | ||||||||||||||||||||||||
| (0.93 | ) | 16.08 | 50.42 | 2,192 | 1.63 | 1.90 | (1.25 | ) | 63 | |||||||||||||||||||||||||
| (1.96 | ) | 11.61 | 13.90 | 332 | 1.65 | 1.99 | (0.85 | ) | 62 | |||||||||||||||||||||||||
| (0.21 | ) | 12.20 | (12.43 | ) | 426 | 1.65 | (c) | 1.85 | (c) | (1.35 | )(c) | 74 | ||||||||||||||||||||||
| $ | (1.42 | ) | $ | 14.37 | 6.53 | % | $ | 31,734 | 1.54 | %(c) | 1.91 | %(c) | (1.17 | )%(c) | 15 | % | ||||||||||||||||||
| (0.83 | ) | 14.87 | 11.53 | 30,768 | 1.54 | 1.91 | (1.17 | ) | 39 | |||||||||||||||||||||||||
| (1.26 | ) | 14.11 | 2.83 | 34,575 | 1.54 | (c)(d) | 1.80 | (c)(d) | (1.26 | )(c)(d) | 55 | |||||||||||||||||||||||
| (0.97 | ) | 14.99 | (0.97 | ) | 33,513 | 1.54 | 1.80 | (1.25 | ) | 48 | ||||||||||||||||||||||||
| (0.93 | ) | 16.15 | 50.51 | 41,713 | 1.54 | 2.01 | (1.10 | ) | 63 | |||||||||||||||||||||||||
| (1.96 | ) | 11.65 | 14.09 | 27,343 | 1.54 | 1.84 | (0.90 | ) | 62 | |||||||||||||||||||||||||
| (1.25 | ) | 12.22 | (2.88 | ) | 46,514 | 1.54 | 1.65 | (1.24 | ) | 74 | ||||||||||||||||||||||||
| See accompanying Notes to Financial Statements | | March 31, 2017 | | Semiannual Report | 291 |
Table of Contents
Financial Highlights (cont’d)
For a Share Outstanding for the Period ended:
| Net Asset Value, Beginning of Period | Net Investment Income (Loss) (a) | Net Realized and Change in Unrealized Gain (Loss) | Total from Investment Operations | Dividends from Net Investment Income | Distributions from Net Realized Capital Gains | |||||||||||||||||||||||
| AllianzGI Multi-Asset Real Return: | ||||||||||||||||||||||||||||
| Class A | ||||||||||||||||||||||||||||
3/31/2017+ | $ | 13.68 | $ | 0.11 | $ | (0.44 | ) | $ | (0.33 | ) | $ | (0.23 | ) | $ | — | |||||||||||||
9/30/2016 | 12.85 | 0.14 | 0.96 | 1.10 | (0.27 | ) | — | |||||||||||||||||||||
12/1/2014 - 9/30/2015# | 14.91 | 0.13 | (2.01 | ) | (1.88 | ) | (0.18 | ) | — | |||||||||||||||||||
11/30/2014 | 15.34 | 0.14 | (0.26 | ) | (0.12 | ) | (0.23 | ) | (0.08 | ) | ||||||||||||||||||
12/17/2012* - 11/30/2013 | 15.00 | 0.12 | 0.22 | 0.34 | — | — | ||||||||||||||||||||||
| Class C | ||||||||||||||||||||||||||||
3/31/2017+ | $ | 13.57 | $ | 0.04 | $ | (0.41 | ) | $ | (0.37 | ) | $ | (0.05 | ) | $ | — | |||||||||||||
9/30/2016 | 12.71 | 0.04 | 0.95 | 0.99 | (0.13 | ) | — | |||||||||||||||||||||
12/1/2014 - 9/30/2015# | 14.74 | 0.03 | (1.98 | ) | (1.95 | ) | (0.08 | ) | — | |||||||||||||||||||
11/30/2014 | 15.24 | 0.03 | (0.25 | ) | (0.22 | ) | (0.20 | ) | (0.08 | ) | ||||||||||||||||||
12/17/2012* - 11/30/2013 | 15.00 | (0.03 | ) | 0.27 | 0.24 | — | — | |||||||||||||||||||||
| Class P | ||||||||||||||||||||||||||||
3/31/2017+ | $ | 13.75 | $ | 0.09 | $ | (0.40 | ) | $ | (0.31 | ) | $ | (0.17 | ) | $ | — | |||||||||||||
9/30/2016 | 12.92 | 0.16 | 0.96 | 1.12 | (0.29 | ) | — | |||||||||||||||||||||
12/1/2014 - 9/30/2015# | 14.96 | 0.15 | (2.02 | ) | (1.87 | ) | (0.17 | ) | — | |||||||||||||||||||
11/30/2014 | 15.36 | 0.18 | (0.27 | ) | (0.09 | ) | (0.23 | ) | (0.08 | ) | ||||||||||||||||||
12/17/2012* - 11/30/2013 | 15.00 | 0.16 | 0.20 | 0.36 | — | — | ||||||||||||||||||||||
| Institutional Class | ||||||||||||||||||||||||||||
3/31/2017+ | $ | 13.79 | $ | 0.10 | $ | (0.41 | ) | $ | (0.31 | ) | $ | (0.18 | ) | $ | — | |||||||||||||
9/30/2016 | 12.92 | 0.16 | 0.98 | 1.14 | (0.27 | ) | — | |||||||||||||||||||||
12/1/2014 - 9/30/2015# | 14.97 | 0.15 | (2.01 | ) | (1.86 | ) | (0.19 | ) | — | |||||||||||||||||||
11/30/2014 | 15.37 | 0.19 | (0.26 | ) | (0.07 | ) | (0.25 | ) | (0.08 | ) | ||||||||||||||||||
12/17/2012* - 11/30/2013 | 15.00 | 0.18 | 0.19 | 0.37 | — | — | ||||||||||||||||||||||
| + | Unaudited |
| # | Fiscal year end changed from November 30th to September 30th. |
| * | Commencement of operations. |
| (a) | Calculated on average shares outstanding during the period. |
| (b) | Total return is calculated assuming a purchase of a share on the first day of the period and a sale of a share on the last day of each period reported. Dividends and distributions, if any, are assumed, for purposes of this calculation, to be reinvested. Total return does not reflect sales charges and includes the effect of fee waivers and reimbursements. Total return may reflect adjustments to conform to U.S. GAAP. Total return for a period of less than one year is not annualized. |
| (c) | Annualized, unless otherwise noted. |
| (d) | Certain expenses incurred by the Fund were not annualized. |
| (e) | Does not include expenses of the investment companies in which the Fund invests. |
| 292 | Semiannual Report | | March 31, 2017 | | See accompanying Notes to Financial Statements |
Table of Contents
| Total Dividends and Distributions | Net Asset Value, End of Period | Total Return (b) | Net Assets, End of Period (000s) | Ratio of Expenses to Average Net Assets with Fee Waiver/ Reimbursement | Ratio of Expenses to Average Net Assets without Fee Waiver/ Reimbursement | Ratio of Net Investment Income (Loss) to Average Net Assets | Portfolio Turnover Rate | |||||||||||||||||||||||||||
| $ | (0.23 | ) | $ | 13.12 | (2.40 | )% | $ | 673 | 0.85 | %(c)(e) | 6.32 | %(c)(e) | 1.60 | %(c)(e) | 54 | % | ||||||||||||||||||
| (0.27 | ) | 13.68 | 8.74 | 180 | 0.85 | (e) | 8.02 | (e) | 1.06 | (e) | 60 | |||||||||||||||||||||||
| (0.18 | ) | 12.85 | (12.73 | ) | 133 | 0.85 | (c)(d)(e) | 5.33 | (c)(d)(e) | 1.11 | (c)(d)(e) | 63 | ||||||||||||||||||||||
| (0.31 | ) | 14.91 | (0.81 | ) | 143 | 0.85 | (e) | 4.61 | (e) | 0.90 | (e) | 41 | ||||||||||||||||||||||
| — | 15.34 | 2.27 | 45 | 0.86 | (c)(e) | 8.42 | (c)(e) | 0.83 | (c)(e) | 46 | ||||||||||||||||||||||||
| $ | (0.05 | ) | $ | 13.15 | (2.74 | )% | $ | 61 | 1.60 | %(c)(e) | 7.00 | %(c)(e) | 0.54 | %(c)(e) | 54 | % | ||||||||||||||||||
| (0.13 | ) | 13.57 | 7.90 | 80 | 1.60 | (e) | 8.36 | (e) | 0.32 | (e) | 60 | |||||||||||||||||||||||
| (0.08 | ) | 12.71 | (13.28 | ) | 77 | 1.60 | (c)(d)(e) | 5.90 | (c)(d)(e) | 0.25 | (c)(d)(e) | 63 | ||||||||||||||||||||||
| (0.28 | ) | 14.74 | (1.50 | ) | 114 | 1.60 | (e) | 5.46 | (e) | 0.21 | (e) | 41 | ||||||||||||||||||||||
| — | 15.24 | 1.60 | 81 | 1.60 | (c)(e) | 9.55 | (c)(e) | (0.17 | )(c)(e) | 46 | ||||||||||||||||||||||||
| $ | (0.17 | ) | $ | 13.27 | (2.27 | )% | $ | 9 | 0.70 | %(c)(e) | 5.95 | %(c)(e) | 1.42 | %(c)(e) | 54 | % | ||||||||||||||||||
| (0.29 | ) | 13.75 | 8.93 | 10 | 0.70 | (e) | 7.31 | (e) | 1.22 | (e) | 60 | |||||||||||||||||||||||
| (0.17 | ) | 12.92 | (12.64 | ) | 9 | 0.70 | (c)(d)(e) | 4.99 | (c)(d)(e) | 1.24 | (c)(d)(e) | 63 | ||||||||||||||||||||||
| (0.31 | ) | 14.96 | (0.64 | ) | 10 | 0.70 | (e) | 4.50 | (e) | 1.14 | (e) | 41 | ||||||||||||||||||||||
| — | 15.36 | 2.40 | 10 | 0.71 | (c)(e) | 7.75 | (c)(e) | 1.11 | (c)(e) | 46 | ||||||||||||||||||||||||
| $ | (0.18 | ) | $ | 13.30 | (2.26 | )% | $ | 3,390 | 0.60 | %(c)(e) | 5.98 | %(c)(e) | 1.54 | %(c)(e) | 54 | % | ||||||||||||||||||
| (0.27 | ) | 13.79 | 9.04 | 3,416 | 0.60 | (e) | 7.26 | (e) | 1.26 | (e) | 60 | |||||||||||||||||||||||
| (0.19 | ) | 12.92 | (12.58 | ) | 4,294 | 0.60 | (c)(d)(e) | 4.91 | (c)(d)(e) | 1.24 | (c)(d)(e) | 63 | ||||||||||||||||||||||
| (0.33 | ) | 14.97 | (0.50 | ) | 6,034 | 0.60 | (e) | 4.48 | (e) | 1.22 | (e) | 41 | ||||||||||||||||||||||
| — | 15.37 | 2.47 | 5,155 | 0.61 | (c)(e) | 7.74 | (c)(e) | 1.21 | (c)(e) | 46 | ||||||||||||||||||||||||
| See accompanying Notes to Financial Statements | | March 31, 2017 | | Semiannual Report | 293 |
Table of Contents
Financial Highlights (cont’d)
For a Share Outstanding for the Period ended:
| Net Asset Value, Beginning of Period | Net Investment Income (a) | Net Realized | Total from Investment Operations | Dividends from Net Investment Income | Distributions from Net Realized Capital Gains | |||||||||||||||||||||||
| AllianzGI NFJ Emerging Markets Value: | ||||||||||||||||||||||||||||
| Class A | ||||||||||||||||||||||||||||
3/31/2017+ | $ | 14.31 | $ | 0.06 | $ | 1.05 | $ | 1.11 | $ | (0.15 | ) | $ | — | |||||||||||||||
9/30/2016 | 12.34 | 0.47 | 1.90 | 2.37 | (0.40 | ) | — | |||||||||||||||||||||
12/1/2014 - 9/30/2015# | 15.45 | 0.49 | (2.74 | ) | (2.25 | ) | (0.62 | ) | (0.24 | ) | ||||||||||||||||||
11/30/2014 | 15.42 | 0.37 | 0.08 | 0.45 | (0.42 | ) | — | |||||||||||||||||||||
12/18/2012* - 11/30/2013 | 15.00 | 0.35 | 0.27 | 0.62 | (0.20 | ) | — | |||||||||||||||||||||
| Class C | ||||||||||||||||||||||||||||
3/31/2017+ | $ | 14.29 | $ | 0.03 | $ | 1.02 | $ | 1.05 | $ | — | (f) | $ | — | |||||||||||||||
9/30/2016 | 12.31 | 0.32 | 1.96 | 2.28 | (0.30 | ) | — | |||||||||||||||||||||
12/1/2014 - 9/30/2015# | 15.40 | 0.36 | (2.68 | ) | (2.32 | ) | (0.53 | ) | (0.24 | ) | ||||||||||||||||||
11/30/2014 | 15.35 | 0.28 | 0.05 | 0.33 | (0.28 | ) | — | |||||||||||||||||||||
12/18/2012* - 11/30/2013 | 15.00 | 0.14 | 0.36 | 0.50 | (0.15 | ) | — | |||||||||||||||||||||
| Class P | ||||||||||||||||||||||||||||
3/31/2017+ | $ | 14.31 | $ | 0.10 | $ | 0.99 | $ | 1.09 | $ | (0.24 | ) | $ | — | |||||||||||||||
9/30/2016 | 12.46 | 0.62 | 1.80 | 2.42 | (0.57 | ) | — | |||||||||||||||||||||
12/1/2014 - 9/30/2015# | 15.56 | 0.49 | (2.74 | ) | (2.25 | ) | (0.61 | ) | (0.24 | ) | ||||||||||||||||||
11/30/2014 | 15.45 | 0.43 | 0.05 | 0.48 | (0.37 | ) | — | |||||||||||||||||||||
12/18/2012* - 11/30/2013 | 15.00 | 0.36 | 0.27 | 0.63 | (0.18 | ) | — | |||||||||||||||||||||
| Institutional Class | ||||||||||||||||||||||||||||
3/31/2017+ | $ | 14.46 | $ | 0.08 | $ | 1.05 | $ | 1.13 | $ | (0.07 | ) | $ | — | |||||||||||||||
9/30/2016 | 12.47 | 0.43 | 2.01 | 2.44 | (0.45 | ) | — | |||||||||||||||||||||
12/1/2014 - 9/30/2015# | 15.57 | 0.51 | (2.74 | ) | (2.23 | ) | (0.63 | ) | (0.24 | ) | ||||||||||||||||||
11/30/2014 | 15.46 | 0.46 | 0.03 | 0.49 | (0.38 | ) | — | |||||||||||||||||||||
12/18/2012* - 11/30/2013 | 15.00 | 0.39 | 0.26 | 0.65 | (0.19 | ) | — | |||||||||||||||||||||
| + | Unaudited |
| # | Fiscal year end changed from November 30th to September 30th. |
| * | Commencement of operations. |
| (a) | Calculated on average shares outstanding during the period. |
| (b) | Total return is calculated assuming a purchase of a share on the first day of the period and a sale of a share on the last day of each period reported. Dividends and distributions, if any, are assumed, for purposes of this calculation, to be reinvested. Total return does not reflect sales charges and includes the effect of fee waivers and reimbursements. Total return may reflect adjustments to conform to U.S. GAAP. Total return for a period of less than one year is not annualized. |
| (c) | Payments from Affiliates increased the end of period net asset value and total return by less than $0.01 and 0.01%, respectively. |
| (d) | Annualized, unless otherwise noted. |
| (e) | Certain expenses incurred by the Fund were not annualized. |
| (f) | Actual amount rounds to less than $(0.01) per share. |
| 294 | Semiannual Report | | March 31, 2017 | | See accompanying Notes to Financial Statements |
Table of Contents
Total Dividends and | Net Asset Value, End of Period | Total Return (b) | Net Assets, (000s) | Ratio of Expenses to | Ratio of Assets without | Ratio of Net Net Assets | Portfolio Turnover Rate | |||||||||||||||||||||||||||
| $ | (0.15 | ) | $ | 15.27 | (c) | 7.87 | %(c) | $ | 4,813 | 1.38 | %(d) | 3.63 | %(d) | 0.79 | %(d) | 56 | % | |||||||||||||||||
| (0.40 | ) | 14.31 | (c) | 19.57 | (c) | 2,141 | 1.39 | 7.84 | 3.62 | 104 | ||||||||||||||||||||||||
| (0.86 | ) | 12.34 | (15.12 | ) | 207 | 1.55 | (d)(e) | 6.55 | (d)(e) | 4.13 | (d)(e) | 93 | ||||||||||||||||||||||
| (0.42 | ) | 15.45 | 2.94 | 110 | 1.55 | 4.86 | 2.33 | 85 | ||||||||||||||||||||||||||
| (0.20 | ) | 15.42 | 4.14 | 19 | 1.55 | (d) | 17.07 | (d) | 2.41 | (d) | 67 | |||||||||||||||||||||||
| $ | — | (f) | $ | 15.34 | (c) | 7.35 | %(c) | $ | 335 | 2.10 | %(d) | 4.25 | %(d) | 0.46 | %(d) | 56 | % | |||||||||||||||||
| (0.30 | ) | 14.29 | (c) | 18.80 | (c) | 113 | 2.16 | 8.01 | 2.49 | 104 | ||||||||||||||||||||||||
| (0.77 | ) | 12.31 | (15.62 | ) | 104 | 2.30 | (d)(e) | 7.39 | (d)(e) | 3.12 | (d)(e) | 93 | ||||||||||||||||||||||
| (0.28 | ) | 15.40 | 2.19 | 73 | 2.30 | 5.60 | 1.82 | 85 | ||||||||||||||||||||||||||
| (0.15 | ) | 15.35 | 3.40 | 25 | 2.30 | (d) | 19.41 | (d) | 1.00 | (d) | 67 | |||||||||||||||||||||||
| $ | (0.24 | ) | $ | 15.16 | (c) | 7.88 | %(c) | $ | 14,103 | 1.19 | %(d) | 3.17 | %(d) | 1.44 | %(d) | 56 | % | |||||||||||||||||
| (0.57 | ) | 14.31 | (c) | 19.95 | (c) | 139 | 1.20 | 7.47 | 4.67 | 104 | ||||||||||||||||||||||||
| (0.85 | ) | 12.46 | (15.03 | ) | 9 | 1.39 | (d)(e) | 5.87 | (d)(e) | 4.12 | (d)(e) | 93 | ||||||||||||||||||||||
| (0.37 | ) | 15.56 | 3.13 | 11 | 1.39 | 4.64 | 2.77 | 85 | ||||||||||||||||||||||||||
| (0.18 | ) | 15.45 | 4.25 | 11 | 1.41 | (d) | 7.72 | (d) | 2.49 | (d) | 67 | |||||||||||||||||||||||
| $ | (0.07 | ) | $ | 15.52 | (c) | 7.89 | %(c) | $ | 5,611 | 1.11 | %(d) | 3.39 | %(d) | 1.11 | %(d) | 56 | % | |||||||||||||||||
| (0.45 | ) | 14.46 | (c) | 19.95 | (c) | 6,370 | 1.17 | 6.98 | 3.35 | 104 | ||||||||||||||||||||||||
| (0.87 | ) | 12.47 | (14.91 | ) | 6,688 | 1.30 | (d)(e) | 5.93 | (d)(e) | 4.25 | (d)(e) | 93 | ||||||||||||||||||||||
| (0.38 | ) | 15.57 | 3.18 | 7,889 | 1.30 | 4.63 | 2.96 | 85 | ||||||||||||||||||||||||||
| (0.19 | ) | 15.46 | 4.38 | 6,470 | 1.30 | (d) | 7.78 | (d) | 2.70 | (d) | 67 | |||||||||||||||||||||||
| See accompanying Notes to Financial Statements | | March 31, 2017 | | Semiannual Report | 295 |
Table of Contents
Financial Highlights (cont’d)
For a Share Outstanding for the Period ended:
Net Asset Value, of Period | Net Investment Income (a) | Net Realized | Total from Investment Operations | Dividends from Net Investment Income | Distributions from Net Realized Capital Gains | |||||||||||||||||||||||
| AllianzGI NFJ Global Dividend Value: | ||||||||||||||||||||||||||||
| Class A | ||||||||||||||||||||||||||||
3/31/2017+ | $ | 15.47 | $ | 0.15 | $ | 1.04 | $ | 1.19 | $ | (0.14 | ) | $ | — | |||||||||||||||
9/30/2016 | 16.68 | 0.43 | 0.67 | 1.10 | (0.47 | ) | (1.84 | ) | ||||||||||||||||||||
12/1/2014 - 9/30/2015# | 21.40 | 0.44 | (3.06 | ) | (2.62 | ) | (0.60 | ) | (1.50 | ) | ||||||||||||||||||
11/30/2014 | 22.08 | 0.61 | 0.30 | 0.91 | (0.55 | ) | (1.04 | ) | ||||||||||||||||||||
11/30/2013 | 18.27 | 0.54 | 3.75 | 4.29 | (0.44 | ) | (0.04 | ) | ||||||||||||||||||||
11/30/2012 | 17.35 | 0.56 | 1.10 | 1.66 | (0.40 | ) | (0.34 | ) | ||||||||||||||||||||
11/30/2011 | 17.91 | 0.55 | (0.19 | ) | 0.36 | (0.64 | ) | (0.28 | ) | |||||||||||||||||||
| Class C | ||||||||||||||||||||||||||||
3/31/2017+ | $ | 15.03 | $ | 0.09 | $ | 1.00 | $ | 1.09 | $ | (0.11 | ) | $ | — | |||||||||||||||
9/30/2016 | 16.46 | 0.31 | 0.65 | 0.96 | (0.55 | ) | (1.84 | ) | ||||||||||||||||||||
12/1/2014 - 9/30/2015# | 21.13 | 0.31 | (3.03 | ) | (2.72 | ) | (0.45 | ) | (1.50 | ) | ||||||||||||||||||
11/30/2014 | 21.82 | 0.43 | 0.31 | 0.74 | (0.39 | ) | (1.04 | ) | ||||||||||||||||||||
11/30/2013 | 18.05 | 0.37 | 3.72 | 4.09 | (0.28 | ) | (0.04 | ) | ||||||||||||||||||||
11/30/2012 | 17.19 | 0.42 | 1.07 | 1.49 | (0.29 | ) | (0.34 | ) | ||||||||||||||||||||
11/30/2011 | 17.76 | 0.43 | (0.20 | ) | 0.23 | (0.52 | ) | (0.28 | ) | |||||||||||||||||||
| Class P | ||||||||||||||||||||||||||||
3/31/2017+ | $ | 15.38 | $ | 0.16 | $ | 1.03 | $ | 1.19 | $ | (0.18 | ) | $ | — | |||||||||||||||
9/30/2016 | 16.81 | 0.45 | 0.67 | 1.12 | (0.71 | ) | (1.84 | ) | ||||||||||||||||||||
12/1/2014 - 9/30/2015# | 21.53 | 0.47 | (3.08 | ) | (2.61 | ) | (0.61 | ) | (1.50 | ) | ||||||||||||||||||
11/30/2014 | 22.21 | 0.65 | 0.30 | 0.95 | (0.59 | ) | (1.04 | ) | ||||||||||||||||||||
11/30/2013 | 18.36 | 0.57 | 3.78 | 4.35 | (0.46 | ) | (0.04 | ) | ||||||||||||||||||||
11/30/2012 | 17.45 | 0.60 | 1.10 | 1.70 | (0.45 | ) | (0.34 | ) | ||||||||||||||||||||
11/30/2011 | 17.82 | 0.42 | (0.02 | ) | 0.40 | (0.49 | ) | (0.28 | ) | |||||||||||||||||||
| Institutional Class | ||||||||||||||||||||||||||||
3/31/2017+ | $ | 15.24 | $ | 0.16 | $ | 1.03 | $ | 1.19 | $ | (0.16 | ) | $ | — | |||||||||||||||
9/30/2016 | 16.62 | 0.43 | 0.69 | 1.12 | (0.66 | ) | (1.84 | ) | ||||||||||||||||||||
12/1/2014 - 9/30/2015# | 21.30 | 0.45 | (3.03 | ) | (2.58 | ) | (0.60 | ) | (1.50 | ) | ||||||||||||||||||
11/30/2014 | 21.98 | 0.66 | 0.30 | 0.96 | (0.60 | ) | (1.04 | ) | ||||||||||||||||||||
11/30/2013 | 18.18 | 0.60 | 3.73 | 4.33 | (0.49 | ) | (0.04 | ) | ||||||||||||||||||||
11/30/2012 | 17.29 | 0.60 | 1.09 | 1.69 | (0.46 | ) | (0.34 | ) | ||||||||||||||||||||
11/30/2011 | 17.83 | 0.64 | (0.21 | ) | 0.43 | (0.69 | ) | (0.28 | ) | |||||||||||||||||||
| + | Unaudited |
| # | Fiscal year end changed from November 30th to September 30th. |
| (a) | Calculated on average shares outstanding during the period. |
| (b) | Total return is calculated assuming a purchase of a share on the first day of the period and a sale of a share on the last day of each period reported. Dividends and distributions, if any, are assumed, for purposes of this calculation, to be reinvested. Total return does not reflect sales charges and includes the effect of fee waivers and reimbursements. Total return may reflect adjustments to conform to U.S. GAAP. Total return for a period of less than one year is not annualized. |
| (c) | Annualized, unless otherwise noted. |
| (d) | Certain expenses incurred by the Fund were not annualized. |
| 296 | Semiannual Report | | March 31, 2017 | | See accompanying Notes to Financial Statements |
Table of Contents
Total Dividends and Distributions | Net Asset Value, End | Total Return (b) | Net Assets, End of Period (000s) | Ratio of Expenses to Fee Waiver/ | Ratio of Expenses to Assets without Fee Waiver/ | Ratio of Net Investment to Average | Portfolio Turnover Rate | |||||||||||||||||||||||||||
| $ | (0.14 | ) | $ | 16.52 | 7.66 | % | $ | 3,599 | 1.10 | %(c) | 2.44 | %(c) | 1.91 | %(c) | 43 | % | ||||||||||||||||||
| (2.31 | ) | 15.47 | 7.18 | 4,020 | 1.15 | 2.77 | 2.75 | 52 | ||||||||||||||||||||||||||
| (2.10 | ) | 16.68 | (13.26 | ) | 4,791 | 1.20 | (c)(d) | 1.72 | (c)(d) | 2.70 | (c)(d) | 38 | ||||||||||||||||||||||
| (1.59 | ) | 21.40 | 4.32 | 11,999 | 1.20 | 1.46 | 2.82 | 49 | ||||||||||||||||||||||||||
| (0.48 | ) | 22.08 | 23.80 | 10,705 | 1.21 | 1.51 | 2.68 | 43 | ||||||||||||||||||||||||||
| (0.74 | ) | 18.27 | 9.98 | 7,355 | 1.32 | 1.71 | 3.13 | 41 | ||||||||||||||||||||||||||
| (0.92 | ) | 17.35 | 1.85 | 6,821 | 1.50 | 1.92 | 3.01 | 66 | ||||||||||||||||||||||||||
| $ | (0.11 | ) | $ | 16.01 | 7.24 | % | $ | 4,530 | 1.89 | %(c) | 2.89 | %(c) | 1.12 | %(c) | 43 | % | ||||||||||||||||||
| (2.39 | ) | 15.03 | 6.37 | 5,249 | 1.94 | 3.40 | 2.03 | 52 | ||||||||||||||||||||||||||
| (1.95 | ) | 16.46 | (13.86 | ) | 5,036 | 1.99 | (c)(d) | 2.56 | (c)(d) | 1.95 | (c)(d) | 38 | ||||||||||||||||||||||
| (1.43 | ) | 21.13 | 3.52 | 5,587 | 1.99 | 2.22 | 2.03 | 49 | ||||||||||||||||||||||||||
| (0.32 | ) | 21.82 | 22.88 | 5,720 | 2.00 | 2.27 | 1.83 | 43 | ||||||||||||||||||||||||||
| (0.63 | ) | 18.05 | 9.03 | 3,948 | 2.07 | 2.46 | 2.34 | 41 | ||||||||||||||||||||||||||
| (0.80 | ) | 17.19 | 1.12 | 3,020 | 2.25 | 2.71 | 2.39 | 66 | ||||||||||||||||||||||||||
| $ | (0.18 | ) | $ | 16.39 | 7.71 | % | $ | 1,869 | 0.94 | %(c) | 1.97 | %(c) | 2.07 | %(c) | 43 | % | ||||||||||||||||||
| (2.55 | ) | 15.38 | 7.35 | 770 | 1.00 | 2.47 | 2.86 | 52 | ||||||||||||||||||||||||||
| (2.11 | ) | 16.81 | (13.13 | ) | 1,123 | 1.04 | (c)(d) | 1.44 | (c)(d) | 2.88 | (c)(d) | 38 | ||||||||||||||||||||||
| (1.63 | ) | 21.53 | 4.48 | 1,811 | 1.04 | 1.28 | 2.99 | 49 | ||||||||||||||||||||||||||
| (0.50 | ) | 22.21 | 24.06 | 1,685 | 1.05 | 1.32 | 2.77 | 43 | ||||||||||||||||||||||||||
| (0.79 | ) | 18.36 | 10.11 | 1,089 | 1.12 | 1.51 | 3.32 | 41 | ||||||||||||||||||||||||||
| (0.77 | ) | 17.45 | 2.13 | 718 | 1.30 | 1.99 | 2.41 | 66 | ||||||||||||||||||||||||||
| $ | (0.16 | ) | $ | 16.27 | 7.83 | % | $ | 8,936 | 0.85 | %(c) | 1.81 | %(c) | 2.07 | %(c) | 43 | % | ||||||||||||||||||
| (2.50 | ) | 15.24 | 7.42 | 3,933 | 0.92 | 2.32 | 2.72 | 52 | ||||||||||||||||||||||||||
| (2.10 | ) | 16.62 | (13.10 | ) | 10,709 | 0.95 | (c)(d) | 1.40 | (c)(d) | 2.76 | (c)(d) | 38 | ||||||||||||||||||||||
| (1.64 | ) | 21.30 | 4.58 | 42,981 | 0.95 | 1.18 | 3.08 | 49 | ||||||||||||||||||||||||||
| (0.53 | ) | 21.98 | 24.16 | 51,318 | 0.96 | 1.21 | 2.96 | 43 | ||||||||||||||||||||||||||
| (0.80 | ) | 18.18 | 10.19 | 39,215 | 1.02 | 1.40 | 3.38 | 41 | ||||||||||||||||||||||||||
| (0.97 | ) | 17.29 | 2.21 | 20,556 | 1.20 | 1.68 | 3.51 | 66 | ||||||||||||||||||||||||||
| See accompanying Notes to Financial Statements | | March 31, 2017 | | Semiannual Report | 297 |
Table of Contents
Financial Highlights (cont’d)
For a Share Outstanding for the Period ended:
| Net Asset Value, Beginning of Period | Net Investment Income (a) | Net Realized | Total from Investment Operations | Dividends from Net Investment Income | Distributions from Net Realized Capital Gains | |||||||||||||||||||||||
| AllianzGI NFJ International Small-Cap Value: | ||||||||||||||||||||||||||||
| Class A | ||||||||||||||||||||||||||||
3/31/2017+ | $ | 18.19 | $ | 0.05 | $ | 0.05 | $ | 0.10 | $ | (0.56 | ) | $ | — | |||||||||||||||
9/30/2016 | 18.19 | 0.46 | 0.61 | 1.07 | (0.68 | ) | (0.39 | ) | ||||||||||||||||||||
12/1/2014 - 9/30/2015# | 21.37 | 0.40 | (1.22 | ) | (0.82 | ) | (0.57 | ) | (1.79 | ) | ||||||||||||||||||
11/30/2014 | 21.06 | 0.39 | 0.62 | 1.01 | (0.26 | ) | (0.44 | ) | ||||||||||||||||||||
11/30/2013 | 17.10 | 0.35 | 4.03 | 4.38 | (0.33 | ) | (0.09 | ) | ||||||||||||||||||||
6/1/2012* - 11/30/2012 | 15.00 | 0.07 | 2.03 | 2.10 | — | — | ||||||||||||||||||||||
| Class C | ||||||||||||||||||||||||||||
3/31/2017+ | $ | 17.90 | $ | 0.01 | $ | — | $ | 0.01 | $ | (0.97 | ) | $ | — | |||||||||||||||
9/30/2016 | 17.91 | 0.26 | 0.66 | 0.92 | (0.54 | ) | (0.39 | ) | ||||||||||||||||||||
12/1/2014 - 9/30/2015# | 21.11 | 0.28 | (1.21 | ) | (0.93 | ) | (0.48 | ) | (1.79 | ) | ||||||||||||||||||
11/30/2014 | 21.04 | 0.23 | 0.63 | 0.86 | (0.35 | ) | (0.44 | ) | ||||||||||||||||||||
11/30/2013 | 17.04 | 0.16 | 4.09 | 4.25 | (0.16 | ) | (0.09 | ) | ||||||||||||||||||||
6/1/2012* - 11/30/2012 | 15.00 | 0.09 | 1.95 | 2.04 | — | — | ||||||||||||||||||||||
| Class P | ||||||||||||||||||||||||||||
3/31/2017+ | $ | 18.33 | $ | 0.12 | $ | (0.05 | ) | $ | 0.07 | $ | (1.25 | ) | $ | — | ||||||||||||||
9/30/2016 | 18.40 | 0.46 | 0.63 | 1.09 | (0.77 | ) | (0.39 | ) | ||||||||||||||||||||
12/1/2014 - 9/30/2015# | 21.70 | 0.46 | (1.27 | ) | (0.81 | ) | (0.70 | ) | (1.79 | ) | ||||||||||||||||||
11/30/2014 | 21.27 | 0.44 | 0.62 | 1.06 | (0.19 | ) | (0.44 | ) | ||||||||||||||||||||
11/30/2013 | 17.11 | 0.39 | 4.05 | 4.44 | (0.19 | ) | (0.09 | ) | ||||||||||||||||||||
6/1/2012* - 11/30/2012 | 15.00 | 0.16 | 1.95 | 2.11 | — | — | ||||||||||||||||||||||
| Institutional Class | ||||||||||||||||||||||||||||
3/31/2017+ | $ | 18.69 | $ | 0.10 | $ | — | $ | 0.10 | $ | (1.00 | ) | $ | — | |||||||||||||||
9/30/2016 | 18.49 | 0.42 | 0.71 | 1.13 | (0.54 | ) | (0.39 | ) | ||||||||||||||||||||
12/1/2014 - 9/30/2015# | 21.59 | 0.46 | (1.25 | ) | (0.79 | ) | (0.52 | ) | (1.79 | ) | ||||||||||||||||||
11/30/2014 | 21.28 | 0.45 | 0.63 | 1.08 | (0.33 | ) | (0.44 | ) | ||||||||||||||||||||
11/30/2013 | 17.12 | 0.43 | 4.03 | 4.46 | (0.21 | ) | (0.09 | ) | ||||||||||||||||||||
6/1/2012* - 11/30/2012 | 15.00 | 0.17 | 1.95 | 2.12 | — | — | ||||||||||||||||||||||
| Class R6 | ||||||||||||||||||||||||||||
3/31/2017+ | $ | 18.35 | $ | 0.11 | $ | (0.03 | ) | $ | 0.08 | $ | (1.41 | ) | $ | — | ||||||||||||||
9/30/2016 | 18.49 | 0.52 | 0.62 | 1.14 | (0.89 | ) | (0.39 | ) | ||||||||||||||||||||
9/8/2015* - 9/30/2015# | 19.04 | 0.04 | (0.59 | ) | (0.55 | ) | — | — | ||||||||||||||||||||
| + | Unaudited |
| # | Fiscal year end changed from November 30th to September 30th. |
| * | Commencement of operations. |
| (a) | Calculated on average shares outstanding during the period. |
| (b) | Total return is calculated assuming a purchase of a share on the first day of the period and a sale of a share on the last day of each period reported. Dividends and distributions, if any, are assumed, for purposes of this calculation, to be reinvested. Total return does not reflect sales charges and includes the effect of fee waivers and reimbursements. Total return may reflect adjustments to conform to U.S. GAAP. Total return for a period of less than one year is not annualized. |
| (c) | Annualized, unless otherwise noted. |
| (d) | Certain expenses incurred by the Fund were not annualized. |
| 298 | Semiannual Report | | March 31, 2017 | | See accompanying Notes to Financial Statements |
Table of Contents
| Total Dividends and Distributions | Net Asset Value, End of Period | Total Return (b) | Net Assets, End of Period (000s) | Ratio of Expenses to Average Net Assets with Fee Waiver/ Reimbursement | Ratio of Expenses to Average Net Assets without Fee Waiver/ Reimbursement | Ratio of Net to Average | Portfolio Turnover Rate | |||||||||||||||||||||||||||
| $ | (0.56 | ) | $ | 17.73 | 0.77 | % | $ | 1,253 | 1.30 | %(c) | 5.92 | %(c) | 0.51 | %(c) | 18 | % | ||||||||||||||||||
| (1.07 | ) | 18.19 | 6.04 | 7,397 | 1.30 | 4.50 | 2.62 | 95 | ||||||||||||||||||||||||||
| (2.36 | ) | 18.19 | (4.14 | ) | 1,657 | 1.46 | (c)(d) | 3.08 | (c)(d) | 2.43 | (c)(d) | 74 | ||||||||||||||||||||||
| (0.70 | ) | 21.37 | 4.98 | 2,736 | 1.45 | 2.64 | 1.80 | 76 | ||||||||||||||||||||||||||
| (0.42 | ) | 21.06 | 26.08 | 2,272 | 1.45 | 4.81 | 1.81 | 50 | ||||||||||||||||||||||||||
| — | 17.10 | 14.00 | 1,049 | 1.45 | (c) | 4.22 | (c) | 0.82 | (c) | 19 | ||||||||||||||||||||||||
| $ | (0.97 | ) | $ | 16.94 | 0.46 | % | $ | 729 | 2.05 | %(c) | 6.72 | %(c) | 0.13 | %(c) | 18 | % | ||||||||||||||||||
| (0.93 | ) | 17.90 | 5.26 | 928 | 2.07 | 5.04 | 1.49 | 95 | ||||||||||||||||||||||||||
| (2.27 | ) | 17.91 | (4.78 | ) | 1,250 | 2.21 | (c)(d) | 3.91 | (c)(d) | 1.73 | (c)(d) | 74 | ||||||||||||||||||||||
| (0.79 | ) | 21.11 | 4.24 | 1,340 | 2.20 | 3.40 | 1.07 | 76 | ||||||||||||||||||||||||||
| (0.25 | ) | 21.04 | 25.20 | 521 | 2.20 | 5.66 | 0.80 | 50 | ||||||||||||||||||||||||||
| — | 17.04 | 13.60 | 11 | 2.20 | (c) | 9.92 | (c) | 1.08 | (c) | 19 | ||||||||||||||||||||||||
| $ | (1.25 | ) | $ | 17.15 | 0.92 | % | $ | 103 | 1.12 | %(c) | 5.75 | %(c) | 1.42 | %(c) | 18 | % | ||||||||||||||||||
| (1.16 | ) | 18.33 | 6.14 | 69 | 1.16 | 4.08 | 2.58 | 95 | ||||||||||||||||||||||||||
| (2.49 | ) | 18.40 | (4.03 | ) | 47 | 1.31 | (c)(d) | 2.92 | (c)(d) | 2.74 | (c)(d) | 74 | ||||||||||||||||||||||
| (0.63 | ) | 21.70 | 5.17 | 39 | 1.30 | 2.39 | 1.98 | 76 | ||||||||||||||||||||||||||
| (0.28 | ) | 21.27 | 26.28 | 14 | 1.31 | 4.63 | 2.04 | 50 | ||||||||||||||||||||||||||
| — | 17.11 | 14.07 | 12 | 1.30 | (c) | 8.92 | (c) | 1.98 | (c) | 19 | ||||||||||||||||||||||||
| $ | (1.00 | ) | $ | 17.79 | 0.97 | % | $ | 1,310 | 1.04 | %(c) | 5.58 | %(c) | 1.13 | %(c) | 18 | % | ||||||||||||||||||
| (0.93 | ) | 18.69 | 6.25 | 1,889 | 1.08 | 3.84 | 2.29 | 95 | ||||||||||||||||||||||||||
| (2.31 | ) | 18.49 | (3.92 | ) | 6,832 | 1.21 | (c)(d) | 2.82 | (c)(d) | 2.75 | (c)(d) | 74 | ||||||||||||||||||||||
| (0.77 | ) | 21.59 | 5.27 | 13,979 | 1.20 | 2.31 | 2.03 | 76 | ||||||||||||||||||||||||||
| (0.30 | ) | 21.28 | 26.40 | 11,873 | 1.21 | 4.66 | 2.22 | 50 | ||||||||||||||||||||||||||
| — | 17.12 | 14.13 | 3,551 | 1.20 | (c) | 8.90 | (c) | 2.08 | (c) | 19 | ||||||||||||||||||||||||
| $ | (1.41 | ) | $ | 17.02 | 1.01 | % | $ | 1,277 | 0.95 | %(c) | 5.51 | %(c) | 1.28 | %(c) | 18 | % | ||||||||||||||||||
| (1.28 | ) | 18.35 | 6.41 | 1,667 | 0.95 | 4.92 | 2.90 | 95 | ||||||||||||||||||||||||||
| — | 18.49 | (2.89 | ) | 10 | 1.10 | (c)(d) | 3.29 | (c)(d) | 3.68 | (c)(d) | 74 | |||||||||||||||||||||||
| See accompanying Notes to Financial Statements | | March 31, 2017 | | Semiannual Report | 299 |
Table of Contents
Financial Highlights (cont’d)
For a Share Outstanding for the Period ended:
| Net Asset Value, Beginning of Period | Net Investment Income (Loss) (a) | Net Realized and Change in Unrealized Gain (Loss) | Total from Investment Operations | Dividends from Net Investment Income | Distributions from Net Realized Capital Gains | |||||||||||||||||||||||
| AllianzGI NFJ International Value II: | ||||||||||||||||||||||||||||
| Class A | ||||||||||||||||||||||||||||
3/31/2017+ | $ | 15.68 | $ | 0.04 | $ | 0.74 | $ | 0.78 | $ | (0.11 | ) | $ | — | |||||||||||||||
9/30/2016 | 15.65 | 0.38 | 0.10 | 0.48 | (0.45 | ) | — | |||||||||||||||||||||
12/1/2014 - 9/30/2015# | 17.99 | 0.35 | (2.31 | ) | (1.96 | ) | (0.32 | ) | (0.06 | ) | ||||||||||||||||||
11/30/2014 | 19.17 | 0.47 | (0.44 | ) | 0.03 | (0.56 | ) | (0.65 | ) | |||||||||||||||||||
11/30/2013 | 16.36 | 0.34 | 2.71 | 3.05 | (0.22 | ) | (0.02 | ) | ||||||||||||||||||||
*11/30/2012 | 15.00 | 0.29 | 1.33 | 1.62 | (0.26 | ) | — | |||||||||||||||||||||
| Class C | ||||||||||||||||||||||||||||
3/31/2017+ | $ | 15.64 | $ | (0.02 | ) | $ | 0.74 | $ | 0.72 | $ | (0.09 | ) | $ | — | ||||||||||||||
9/30/2016 | 15.53 | 0.29 | 0.06 | 0.35 | (0.24 | ) | — | |||||||||||||||||||||
12/1/2014 - 9/30/2015# | 17.82 | 0.22 | (2.27 | ) | (2.05 | ) | (0.18 | ) | (0.06 | ) | ||||||||||||||||||
11/30/2014 | 19.04 | 0.32 | (0.43 | ) | (0.11 | ) | (0.46 | ) | (0.65 | ) | ||||||||||||||||||
11/30/2013 | 16.32 | 0.18 | 2.73 | 2.91 | (0.17 | ) | (0.02 | ) | ||||||||||||||||||||
*11/30/2012 | 15.00 | 0.22 | 1.28 | 1.50 | (0.18 | ) | — | |||||||||||||||||||||
| Class P | ||||||||||||||||||||||||||||
3/31/2017+ | $ | 15.83 | $ | 0.06 | $ | 0.74 | $ | 0.80 | $ | (0.12 | ) | $ | — | |||||||||||||||
9/30/2016 | 15.65 | 0.40 | 0.11 | 0.51 | (0.33 | ) | — | |||||||||||||||||||||
12/1/2014 - 9/30/2015# | 17.99 | 0.39 | (2.32 | ) | (1.93 | ) | (0.35 | ) | (0.06 | ) | ||||||||||||||||||
11/30/2014 | 19.24 | 0.38 | (0.32 | ) | 0.06 | (0.66 | ) | (0.65 | ) | |||||||||||||||||||
11/30/2013 | 16.38 | 0.36 | 2.73 | 3.09 | (0.21 | ) | (0.02 | ) | ||||||||||||||||||||
*11/30/2012 | 15.00 | 0.38 | 1.28 | 1.66 | (0.28 | ) | — | |||||||||||||||||||||
| Institutional Class | ||||||||||||||||||||||||||||
3/31/2017+ | $ | 15.73 | $ | 0.03 | $ | 0.77 | $ | 0.80 | $ | (0.12 | ) | $ | — | |||||||||||||||
9/30/2016 | 15.69 | 0.41 | 0.11 | 0.52 | (0.48 | ) | — | |||||||||||||||||||||
12/1/2014 - 9/30/2015# | 18.03 | 0.38 | (2.31 | ) | (1.93 | ) | (0.35 | ) | (0.06 | ) | ||||||||||||||||||
11/30/2014 | 19.26 | 0.57 | (0.50 | ) | 0.07 | (0.65 | ) | (0.65 | ) | |||||||||||||||||||
11/30/2013 | 16.38 | 0.36 | 2.76 | 3.12 | (0.22 | ) | (0.02 | ) | ||||||||||||||||||||
*11/30/2012 | 15.00 | 0.39 | 1.29 | 1.68 | (0.30 | ) | — | |||||||||||||||||||||
| + | Unaudited |
| # | Fiscal year end changed from November 30th to September 30th. |
| * | Commencement of operations. |
| (a) | Calculated on average shares outstanding during the period. |
| (b) | Total return is calculated assuming a purchase of a share on the first day of the period and a sale of a share on the last day of each period reported. Dividends and distributions, if any, are assumed, for purposes of this calculation, to be reinvested. Total return does not reflect sales charges and includes the effect of fee waivers and reimbursements. Total return may reflect adjustments to conform to U.S. GAAP. Total return for a period of less than one year is not annualized. |
| (c) | Payments from Affiliates increased the end of period net asset value (“NAV”) and total return by $0.48 and 3.08%, respectively, for Class A, $0.45 and 2.90%, respectively, for Class C, $0.46 and 2.93%, respectively, for Class P and $0.45 and 2.89%, respectively for Institutional Class. If the Affiliates had not made these payments, the end of period NAV and total return would have been $15.87 and 1.94%, respectively, for Class A, $15.82 and 1.73%, respectively, for Class C, $16.05 and 2.21%, respectively, for Class P and $15.96 and 2.25%, respectively for Institutional Class. |
| (d) | Annualized, unless otherwise noted. |
| (e) | Certain expenses incurred by the Fund were not annualized. |
| 300 | Semiannual Report | | March 31, 2017 | | See accompanying Notes to Financial Statements |
Table of Contents
| Total Dividends and Distributions | Net Asset Value, End of Period | Total Return (b) | Net Assets, End of Period (000s) | Ratio of Fee Waiver/ | Ratio of Expenses to Average Net Assets without Fee Waiver/ Reimbursement | Ratio of Net Investment Income (Loss) to Average Net Assets | Portfolio Turnover Rate | |||||||||||||||||||||||||||
| $ | (0.11 | ) | $ | 16.35 | (c) | 5.02 | %(c) | $ | 215 | 1.15 | %(d) | 4.69 | %(d) | 0.53 | %(d) | 36 | % | |||||||||||||||||
| (0.45 | ) | 15.68 | 3.16 | 266 | 1.18 | 1.82 | 2.47 | 48 | ||||||||||||||||||||||||||
| (0.38 | ) | 15.65 | (11.10 | ) | 257 | 1.20 | (d)(e) | 1.76 | (d)(e) | 2.39 | (d)(e) | 43 | ||||||||||||||||||||||
| (1.21 | ) | 17.99 | 0.25 | 167 | 1.20 | 2.46 | 2.53 | 34 | ||||||||||||||||||||||||||
| (0.24 | ) | 19.17 | 18.89 | 75 | 1.23 | 7.16 | 1.93 | 20 | ||||||||||||||||||||||||||
| (0.26 | ) | 16.36 | 10.99 | 49 | 1.30 | (d) | 10.98 | (d) | 1.89 | (d) | 22 | |||||||||||||||||||||||
| $ | (0.09 | ) | $ | 16.27 | (c) | 4.63 | %(c) | $ | 133 | 1.90 | %(d) | 4.49 | %(d) | (0.30 | )%(d) | 36 | % | |||||||||||||||||
| (0.24 | ) | 15.64 | 2.35 | 243 | 1.92 | 2.58 | 1.91 | 48 | ||||||||||||||||||||||||||
| (0.24 | ) | 15.53 | (11.66 | ) | 118 | 1.95 | (d)(e) | 2.49 | (d)(e) | 1.53 | (d)(e) | 43 | ||||||||||||||||||||||
| (1.11 | ) | 17.82 | (0.53 | ) | 79 | 1.95 | 3.23 | 1.76 | 34 | |||||||||||||||||||||||||
| (0.19 | ) | 19.04 | 18.02 | 47 | 1.97 | 8.26 | 1.02 | 20 | ||||||||||||||||||||||||||
| (0.18 | ) | 16.32 | 10.17 | 11 | 2.05 | (d) | 10.82 | (d) | 1.45 | (d) | 22 | |||||||||||||||||||||||
| $ | (0.12 | ) | $ | 16.51 | (c) | 5.14 | %(c) | $ | 163 | 0.95 | %(d) | 4.70 | %(d) | 0.77 | %(d) | 36 | % | |||||||||||||||||
| (0.33 | ) | 15.83 | 3.30 | 154 | 0.98 | 1.54 | 2.53 | 48 | ||||||||||||||||||||||||||
| (0.41 | ) | 15.65 | (10.93 | ) | 577 | 1.00 | (d)(e) | 1.42 | (d)(e) | 2.64 | (d)(e) | 43 | ||||||||||||||||||||||
| (1.31 | ) | 17.99 | 0.40 | 118 | 1.01 | 2.11 | 2.08 | 34 | ||||||||||||||||||||||||||
| (0.23 | ) | 19.24 | 19.10 | 13 | 1.05 | 6.87 | 2.05 | 20 | ||||||||||||||||||||||||||
| (0.28 | ) | 16.38 | 11.28 | 11 | 1.05 | (d) | 9.92 | (d) | 2.45 | (d) | 22 | |||||||||||||||||||||||
| $ | (0.12 | ) | $ | 16.41 | (c) | 5.14 | %(c) | $ | 562 | 0.90 | %(d) | 1.68 | %(d) | 0.39 | %(d) | 36 | % | |||||||||||||||||
| (0.48 | ) | 15.73 | 3.42 | 43,747 | 0.93 | 1.45 | 2.63 | 48 | ||||||||||||||||||||||||||
| (0.41 | ) | 15.69 | (10.91 | ) | 42,593 | 0.95 | (d)(e) | 1.40 | (d)(e) | 2.59 | (d)(e) | 43 | ||||||||||||||||||||||
| (1.30 | ) | 18.03 | 0.45 | 38,983 | 0.95 | 1.78 | 3.05 | 34 | ||||||||||||||||||||||||||
| (0.24 | ) | 19.26 | 19.25 | 4,170 | 0.95 | 6.77 | 2.06 | 20 | ||||||||||||||||||||||||||
| (0.30 | ) | 16.38 | 11.36 | 4,396 | 0.95 | (d) | 9.93 | (d) | 2.50 | (d) | 22 | |||||||||||||||||||||||
| See accompanying Notes to Financial Statements | | March 31, 2017 | | Semiannual Report | 301 |
Table of Contents
Financial Highlights (cont’d)
For a Share Outstanding for the Period ended:
| Net Asset Value, Beginning of Period | Net Investment Income (a) |
Net Realized | Total from Investment Operations | Dividends from Net Investment Income | Distributions from Net Realized Capital Gains | |||||||||||||||||||||||
| AllianzGI Short Duration High Income: | ||||||||||||||||||||||||||||
| Class A | ||||||||||||||||||||||||||||
3/31/2017+ | $ | 15.29 | $ | 0.31 | $ | (0.01 | ) | $ | 0.30 | $ | (0.41 | ) | $ | — | ||||||||||||||
9/30/2016 | 15.04 | 0.72 | 0.38 | 1.10 | (0.85 | ) | — | |||||||||||||||||||||
12/1/2014 - 9/30/2015# | 15.59 | 0.57 | (0.46 | ) | 0.11 | (0.66 | ) | — | ||||||||||||||||||||
11/30/2014 | 15.92 | 0.64 | (0.23 | ) | 0.41 | (0.74 | ) | — | ||||||||||||||||||||
11/30/2013 | 15.97 | 0.63 | 0.09 | 0.72 | (0.76 | ) | (0.01 | ) | ||||||||||||||||||||
11/30/2012 | 15.32 | 0.64 | 0.68 | 1.32 | (0.67 | ) | — | |||||||||||||||||||||
10/3/2011* - 11/30/2011 | 15.00 | 0.12 | 0.25 | 0.37 | (0.05 | ) | — | |||||||||||||||||||||
| Class C | ||||||||||||||||||||||||||||
3/31/2017+ | $ | 15.27 | $ | 0.29 | $ | (0.02 | ) | $ | 0.27 | $ | (0.39 | ) | $ | — | ||||||||||||||
9/30/2016 | 15.00 | 0.68 | 0.38 | 1.06 | (0.79 | ) | — | |||||||||||||||||||||
12/1/2014 - 9/30/2015# | 15.56 | 0.53 | (0.46 | ) | 0.07 | (0.63 | ) | — | ||||||||||||||||||||
11/30/2014 | 15.89 | 0.60 | (0.23 | ) | 0.37 | (0.70 | ) | — | ||||||||||||||||||||
11/30/2013 | 15.94 | 0.59 | 0.09 | 0.68 | (0.72 | ) | (0.01 | ) | ||||||||||||||||||||
11/30/2012 | 15.31 | 0.58 | 0.64 | 1.22 | (0.59 | ) | — | |||||||||||||||||||||
10/3/2011* - 11/30/2011 | 15.00 | 0.10 | 0.25 | 0.35 | (0.04 | ) | — | |||||||||||||||||||||
| Class P | ||||||||||||||||||||||||||||
3/31/2017+ | $ | 15.24 | $ | 0.33 | $ | (0.01 | ) | $ | 0.32 | $ | (0.43 | ) | $ | — | ||||||||||||||
9/30/2016 | 15.03 | 0.74 | 0.38 | 1.12 | (0.91 | ) | — | |||||||||||||||||||||
12/1/2014 - 9/30/2015# | 15.58 | 0.60 | (0.47 | ) | 0.13 | (0.68 | ) | — | ||||||||||||||||||||
11/30/2014 | 15.92 | 0.66 | (0.23 | ) | 0.43 | (0.77 | ) | — | ||||||||||||||||||||
11/30/2013 | 15.96 | 0.66 | 0.10 | 0.76 | (0.79 | ) | (0.01 | ) | ||||||||||||||||||||
11/30/2012 | 15.32 | 0.66 | 0.68 | 1.34 | (0.70 | ) | — | |||||||||||||||||||||
10/3/2011* - 11/30/2011 | 15.00 | 0.10 | 0.28 | 0.38 | (0.06 | ) | — | |||||||||||||||||||||
| Institutional Class | ||||||||||||||||||||||||||||
3/31/2017+ | $ | 15.25 | $ | 0.33 | $ | (0.01 | ) | $ | 0.32 | $ | (0.43 | ) | $ | — | ||||||||||||||
9/30/2016 | 15.05 | 0.76 | 0.37 | 1.13 | (0.93 | ) | — | |||||||||||||||||||||
12/1/2014 - 9/30/2015# | 15.60 | 0.60 | (0.45 | ) | 0.15 | (0.70 | ) | — | ||||||||||||||||||||
11/30/2014 | 15.94 | 0.68 | (0.24 | ) | 0.44 | (0.78 | ) | — | ||||||||||||||||||||
11/30/2013 | 15.99 | 0.67 | 0.09 | 0.76 | (0.80 | ) | (0.01 | ) | ||||||||||||||||||||
11/30/2012 | 15.32 | 0.70 | 0.67 | 1.37 | (0.70 | ) | — | |||||||||||||||||||||
10/3/2011* - 11/30/2011 | 15.00 | 0.11 | 0.27 | 0.38 | (0.06 | ) | — | |||||||||||||||||||||
| Class R6 | ||||||||||||||||||||||||||||
2/1/2017* - 3/31/2017+ | $ | 15.18 | $ | 0.11 | $ | (0.02 | ) | $ | 0.09 | $ | (0.13 | ) | $ | — | ||||||||||||||
| + | Unaudited |
| # | Fiscal year end changed from November 30th to September 30th. |
| * | Commencement of operations. |
| (a) | Calculated on average shares outstanding during the period. |
| (b) | Total return is calculated assuming a purchase of a share on the first day of the period and a sale of a share on the last day of each period reported. Dividends and distributions, if any, are assumed, for purposes of this calculation, to be reinvested. Total return does not reflect sales charges and includes the effect of fee waivers and reimbursements. Total return may reflect adjustments to conform to U.S. GAAP. Total return for a period of less than one year is not annualized. |
| (c) | Annualized, unless otherwise noted. |
| (d) | Certain expenses incurred by the Fund were not annualized. |
| 302 | Semiannual Report | | March 31, 2017 | | See accompanying Notes to Financial Statements |
Table of Contents
| Total Dividends and Distributions | Net Asset Value, End of Period | Total Return (b) | Net Assets, End of Period (000s) | Ratio of Expenses to Average Net Assets with Fee Waiver/ Reimbursement | Ratio of Expenses to Average Net Assets without Fee Waiver/ Reimbursement | Ratio of Net to Average | Portfolio Turnover Rate | |||||||||||||||||||||||||||
| $ | (0.41 | ) | $ | 15.18 | 2.00 | % | $ | 196,278 | 0.85 | %(c) | 0.85 | %(c) | 4.10 | %(c) | 49 | % | ||||||||||||||||||
| (0.85 | ) | 15.29 | 7.65 | 226,149 | 0.85 | 0.85 | 4.85 | 63 | ||||||||||||||||||||||||||
| (0.66 | ) | 15.04 | 0.67 | 164,978 | 0.86 | (c)(d) | 0.86 | (c)(d) | 4.44 | (c)(d) | 65 | |||||||||||||||||||||||
| (0.74 | ) | 15.59 | 2.60 | 163,070 | 0.85 | 0.88 | 4.01 | 94 | ||||||||||||||||||||||||||
| (0.77 | ) | 15.92 | 4.60 | 168,536 | 0.85 | 0.90 | 3.98 | 63 | ||||||||||||||||||||||||||
| (0.67 | ) | 15.97 | 8.78 | 80,995 | 0.89 | 1.09 | 4.09 | 51 | ||||||||||||||||||||||||||
| (0.05 | ) | 15.32 | 2.50 | 532 | 0.95 | (c) | 2.99 | (c) | 4.97 | (c) | 10 | |||||||||||||||||||||||
| $ | (0.39 | ) | $ | 15.15 | 1.82 | % | $ | 146,288 | 1.10 | %(c) | 1.10 | %(c) | 3.85 | %(c) | 49 | % | ||||||||||||||||||
| (0.79 | ) | 15.27 | 7.42 | 132,649 | 1.13 | 1.13 | 4.58 | 63 | ||||||||||||||||||||||||||
| (0.63 | ) | 15.00 | 0.38 | 100,557 | 1.15 | (c)(d) | 1.15 | (c)(d) | 4.15 | (c)(d) | 65 | |||||||||||||||||||||||
| (0.70 | ) | 15.56 | 2.38 | 89,801 | 1.10 | 1.13 | 3.78 | 94 | ||||||||||||||||||||||||||
| (0.73 | ) | 15.89 | 4.36 | 63,680 | 1.10 | 1.16 | 3.74 | 63 | ||||||||||||||||||||||||||
| (0.59 | ) | 15.94 | 8.18 | 28,567 | 1.29 | 1.50 | 3.73 | 51 | ||||||||||||||||||||||||||
| (0.04 | ) | 15.31 | 2.36 | 1,245 | 1.70 | (c) | 3.72 | (c) | 4.26 | (c) | 10 | |||||||||||||||||||||||
| $ | (0.43 | ) | $ | 15.13 | 2.13 | % | $ | 868,683 | 0.63 | %(c) | 0.63 | %(c) | 4.33 | %(c) | 49 | % | ||||||||||||||||||
| (0.91 | ) | 15.24 | 7.84 | 554,281 | 0.66 | 0.66 | 4.97 | 63 | ||||||||||||||||||||||||||
| (0.68 | ) | 15.03 | 0.83 | 330,431 | 0.64 | (c)(d) | 0.64 | (c)(d) | 4.65 | (c)(d) | 65 | |||||||||||||||||||||||
| (0.77 | ) | 15.58 | 2.74 | 248,345 | 0.70 | 0.70 | 4.20 | 94 | ||||||||||||||||||||||||||
| (0.80 | ) | 15.92 | 4.83 | 121,747 | 0.70 | 0.71 | 4.14 | 63 | ||||||||||||||||||||||||||
| (0.70 | ) | 15.96 | 8.91 | 52,932 | 0.70 | 0.92 | 4.24 | 51 | ||||||||||||||||||||||||||
| (0.06 | ) | 15.32 | 2.50 | 10 | 0.70 | (c) | 2.84 | (c) | 4.22 | (c) | 10 | |||||||||||||||||||||||
| $ | (0.43 | ) | $ | 15.14 | 2.16 | % | $ | 402,499 | 0.56 | %(c) | 0.56 | %(c) | 4.37 | %(c) | 49 | % | ||||||||||||||||||
| (0.93 | ) | 15.25 | 7.90 | 420,440 | 0.58 | 0.58 | 5.10 | 63 | ||||||||||||||||||||||||||
| (0.70 | ) | 15.05 | 0.91 | 445,473 | 0.60 | (c)(d) | 0.60 | (c)(d) | 4.70 | (c)(d) | 65 | |||||||||||||||||||||||
| (0.78 | ) | 15.60 | 2.81 | 225,643 | 0.60 | 0.60 | 4.28 | 94 | ||||||||||||||||||||||||||
| (0.81 | ) | 15.94 | 4.87 | 179,676 | 0.61 | 0.61 | 4.23 | 63 | ||||||||||||||||||||||||||
| (0.70 | ) | 15.99 | 9.13 | 38,247 | 0.60 | 0.89 | 4.48 | 51 | ||||||||||||||||||||||||||
| (0.06 | ) | 15.32 | 2.52 | 8,055 | 0.60 | (c) | 2.72 | (c) | 4.58 | (c) | 10 | |||||||||||||||||||||||
| $ | (0.13 | ) | $ | 15.14 | 0.60 | % | $ | 81,102 | 0.57 | %(c) | 0.63 | %(c) | 5.12 | %(c) | 49 | % | ||||||||||||||||||
| See accompanying Notes to Financial Statements | | March 31, 2017 | | Semiannual Report | 303 |
Table of Contents
Financial Highlights (cont’d)
For a Share Outstanding for the Period ended:
| Net Asset Value, Beginning of Period | Net | Net Realized and Change in Unrealized Gain (Loss) | Total from Investment Operations | Dividends from Net Investment Income | Distributions from Net Realized Capital Gains | |||||||||||||||||||||||
| AllianzGI Structured Return: | ||||||||||||||||||||||||||||
| Class A | ||||||||||||||||||||||||||||
3/31/2017+ | $ | 15.85 | $ | 0.01 | $ | 0.37 | $ | 0.38 | $ | (0.06 | ) | $ | (0.36 | ) | ||||||||||||||
9/30/2016 | 15.47 | 0.15 | 0.51 | 0.66 | (0.10 | ) | (0.18 | ) | ||||||||||||||||||||
12/1/2014 - 9/30/2015# | 15.64 | 0.16 | 0.28 | 0.44 | — | (e) | (0.61 | ) | ||||||||||||||||||||
11/30/2014 | 15.87 | (0.12 | ) | 0.65 | 0.53 | — | (0.76 | ) | ||||||||||||||||||||
12/3/2012* - 11/30/2013 | 15.00 | (0.28 | ) | 1.15 | 0.87 | — | — | |||||||||||||||||||||
| Class C | ||||||||||||||||||||||||||||
3/31/2017+ | $ | 15.39 | $ | (0.04) | $ | 0.36 | $ | 0.32 | $ | — | (e) | $ | (0.36 | ) | ||||||||||||||
9/30/2016 | 15.12 | 0.02 | 0.51 | 0.53 | (0.08 | ) | (0.18 | ) | ||||||||||||||||||||
12/1/2014 - 9/30/2015# | 15.39 | 0.09 | 0.25 | 0.34 | — | (e) | (0.61 | ) | ||||||||||||||||||||
11/30/2014 | 15.73 | (0.25 | ) | 0.67 | 0.42 | — | (0.76 | ) | ||||||||||||||||||||
12/3/2012* - 11/30/2013 | 15.00 | (0.39 | ) | 1.12 | 0.73 | — | — | |||||||||||||||||||||
| Class P | ||||||||||||||||||||||||||||
3/31/2017+ | $ | 15.87 | $ | 0.08 | $ | 0.32 | $ | 0.40 | $ | (0.12 | ) | $ | (0.36 | ) | ||||||||||||||
9/30/2016 | 15.53 | 0.17 | 0.53 | 0.70 | (0.18 | ) | (0.18 | ) | ||||||||||||||||||||
12/1/2014 - 9/30/2015# | 15.69 | 0.21 | 0.24 | 0.45 | — | (e) | (0.61 | ) | ||||||||||||||||||||
11/30/2014 | 15.89 | (0.15 | ) | 0.71 | 0.56 | — | (0.76 | ) | ||||||||||||||||||||
12/3/2012* - 11/30/2013 | 15.00 | (0.26 | ) | 1.15 | 0.89 | — | — | |||||||||||||||||||||
| Institutional Class | ||||||||||||||||||||||||||||
3/31/2017+ | $ | 15.96 | $ | 0.03 | $ | 0.37 | $ | 0.40 | $ | (0.06 | ) | $ | (0.36 | ) | ||||||||||||||
9/30/2016 | 15.54 | 0.19 | 0.52 | 0.71 | (0.11 | ) | (0.18 | ) | ||||||||||||||||||||
12/1/2014 - 9/30/2015# | 15.72 | 0.22 | 0.24 | 0.46 | (0.03 | ) | (0.61 | ) | ||||||||||||||||||||
11/30/2014 | 15.90 | (0.08 | ) | 0.66 | 0.58 | — | (0.76 | ) | ||||||||||||||||||||
12/3/2012* - 11/30/2013 | 15.00 | (0.24 | ) | 1.14 | 0.90 | — | — | |||||||||||||||||||||
| Class R6 | ||||||||||||||||||||||||||||
12/2/2016* - 3/31/2017+ | $ | 16.13 | $ | 0.07 | $ | 0.18 | $ | 0.25 | $ | (0.18 | ) | $ | (0.36 | ) | ||||||||||||||
| + | Unaudited |
| # | Fiscal year end changed from November 30th to September 30th. |
| * | Commencement of operations. |
| (a) | Calculated on average shares outstanding during the period. |
| (b) | Total return is calculated assuming a purchase of a share on the first day of the period and a sale of a share on the last day of each period reported. Dividends and distributions, if any, are assumed, for purposes of this calculation, to be reinvested. Total return does not reflect sales charges and includes the effect of fee waivers and reimbursements. Total return may reflect adjustments to conform to U.S. GAAP. Total return for a period of less than one year is not annualized. |
| (c) | Annualized, unless otherwise noted. |
| (d) | Does not include expenses of the investment companies in which the Fund invests. |
| (e) | Actual amount rounds to less than $(0.01) per share. |
| (f) | Certain expenses incurred by the Fund were not annualized. |
| 304 | Semiannual Report | | March 31, 2017 | | See accompanying Notes to Financial Statements |
Table of Contents
| Total Dividends and Distributions | Net Asset Value, End of Period | Total Return (b) | Net Assets, End of Period (000s) | Ratio of Expenses to Average Net Assets with Fee Waiver/ Reimbursement | Ratio of Expenses to Average Net Assets without Fee Waiver/ Reimbursement | Ratio of Net Investment Income (Loss) to Average Net Assets | Portfolio Turnover Rate | |||||||||||||||||||||||||||
| $ | (0.42 | ) | $ | 15.81 | 2.43 | % | $ | 102,743 | 1.06 | %(c)(d) | 1.12 | %(c)(d) | 0.14 | %(c)(d) | 327 | % | ||||||||||||||||||
| (0.28 | ) | 15.85 | 4.32 | 96,870 | 1.15 | (d) | 1.17 | (d) | 0.95 | (d) | 500 | |||||||||||||||||||||||
| (0.61 | ) | 15.47 | 2.93 | 8,014 | 1.15 | (c)(d)(f) | 1.58 | (c)(d)(f) | 1.28 | (c)(d)(f) | 34 | |||||||||||||||||||||||
| (0.76 | ) | 15.64 | 3.52 | 2,551 | 1.52 | 4.22 | (0.75 | ) | 229 | |||||||||||||||||||||||||
| — | 15.87 | 5.80 | 517 | 1.90 | (c) | 7.34 | (c) | (1.86 | )(c) | — | ||||||||||||||||||||||||
| $ | (0.36 | ) | $ | 15.35 | 2.08 | % | $ | 14,765 | 1.83 | %(c)(d) | 1.86 | %(c)(d) | (0.56 | )%(c)(d) | 327 | % | ||||||||||||||||||
| (0.26 | ) | 15.39 | 3.52 | 12,605 | 1.90 | (d) | 1.97 | (d) | 0.10 | (d) | 500 | |||||||||||||||||||||||
| (0.61 | ) | 15.12 | 2.31 | 3,803 | 1.90 | (c)(d)(f) | 2.09 | (c)(d)(f) | 0.70 | (c)(d)(f) | 34 | |||||||||||||||||||||||
| (0.76 | ) | 15.39 | 2.82 | 138 | 2.31 | 4.74 | (1.64 | ) | 229 | |||||||||||||||||||||||||
| — | 15.73 | 4.87 | 74 | 2.65 | (c) | 6.91 | (c) | (2.60 | )(c) | — | ||||||||||||||||||||||||
| $ | (0.48 | ) | $ | 15.79 | 2.54 | % | $ | 90,582 | 0.82 | %(c)(d) | 0.88 | %(c)(d) | 1.00 | %(c)(d) | 327 | % | ||||||||||||||||||
| (0.36 | ) | 15.87 | 4.55 | 20,664 | 0.96 | (d) | 0.96 | (d) | 1.11 | (d) | 500 | |||||||||||||||||||||||
| (0.61 | ) | 15.53 | 2.99 | 503 | 1.00 | (c)(d)(f) | 1.16 | (c)(d)(f) | 1.67 | (c)(d)(f) | 34 | |||||||||||||||||||||||
| (0.76 | ) | 15.69 | 3.72 | 37 | 1.50 | 3.73 | (1.00 | ) | 229 | |||||||||||||||||||||||||
| — | 15.89 | 5.93 | 61 | 1.75 | (c) | 5.97 | (c) | (1.69 | )(c) | — | ||||||||||||||||||||||||
| $ | (0.42 | ) | $ | 15.94 | 2.53 | % | $ | 135,840 | 0.81 | %(c)(d) | 0.85 | %(c)(d) | 0.38 | %(c)(d) | 327 | % | ||||||||||||||||||
| (0.29 | ) | 15.96 | 4.60 | 146,194 | 0.90 | (d) | 0.90 | (d) | 1.21 | (d) | 500 | |||||||||||||||||||||||
| (0.64 | ) | 15.54 | 3.08 | 55,028 | 0.90 | (c)(d)(f) | 1.22 | (c)(d)(f) | 1.71 | (c)(d)(f) | 34 | |||||||||||||||||||||||
| (0.76 | ) | 15.72 | 3.84 | 15,142 | 1.28 | 3.65 | (0.54 | ) | 229 | |||||||||||||||||||||||||
| — | 15.90 | 6.00 | 7,978 | 1.65 | (c) | 5.64 | (c) | (1.60 | )(c) | — | ||||||||||||||||||||||||
| $ | (0.54 | ) | $ | 15.84 | 1.57 | % | $ | 38,474 | 0.69 | %(c)(d) | 0.79 | %(c)(d) | 1.34 | %(c)(d) | 327 | % | ||||||||||||||||||
| See accompanying Notes to Financial Statements | | March 31, 2017 | | Semiannual Report | 305 |
Table of Contents
Financial Highlights (cont’d)
For a Share Outstanding for the Period ended:
| Net Asset Value, Beginning of Period | Net | Net Realized and Change in Unrealized Gain (Loss) | Total from Investment Operations | Dividends from Net Investment Income | Distributions from Net Realized Capital Gains | |||||||||||||||||||||||
| AllianzGI U.S. Equity Hedged: | ||||||||||||||||||||||||||||
| Class A | ||||||||||||||||||||||||||||
3/31/2017+ | $ | 16.20 | $ | 0.06 | $ | 0.95 | $ | 1.01 | $ | (0.24 | ) | $ | — | |||||||||||||||
9/30/2016 | 15.79 | 0.11 | 0.53 | 0.64 | (0.23 | ) | — | |||||||||||||||||||||
12/1/2014 - 9/30/2015# | 17.74 | 0.14 | (1.09 | ) | (0.95 | ) | (0.02 | ) | (0.98 | ) | ||||||||||||||||||
11/30/2014 | 17.26 | 0.12 | 1.45 | 1.57 | (0.15 | ) | (0.94 | ) | ||||||||||||||||||||
12/3/2012* - 11/30/2013 | 15.00 | 0.12 | 2.14 | 2.26 | — | — | ||||||||||||||||||||||
| Class C | ||||||||||||||||||||||||||||
3/31/2017+ | $ | 15.59 | $ | (0.01 | ) | $ | 0.92 | $ | 0.91 | $ | (0.16 | ) | $ | — | ||||||||||||||
9/30/2016 | 15.43 | 0.01 | 0.51 | 0.52 | (0.36 | ) | — | |||||||||||||||||||||
12/1/2014 - 9/30/2015# | 17.45 | 0.05 | (1.09 | ) | (1.04 | ) | — | (e) | (0.98 | ) | ||||||||||||||||||
11/30/2014 | 17.14 | (0.01 | ) | 1.44 | 1.43 | (0.18 | ) | (0.94 | ) | |||||||||||||||||||
12/3/2012* - 11/30/2013 | 15.00 | — | (e) | 2.14 | 2.14 | — | — | |||||||||||||||||||||
| Class P | ||||||||||||||||||||||||||||
3/31/2017+ | $ | 16.18 | $ | 0.09 | $ | 0.92 | $ | 1.01 | $ | (0.40 | ) | $ | — | |||||||||||||||
9/30/2016 | 15.92 | 0.14 | 0.54 | 0.68 | (0.42 | ) | — | |||||||||||||||||||||
12/1/2014 - 9/30/2015# | 17.90 | 0.15 | (1.10 | ) | (0.95 | ) | (0.05 | ) | (0.98 | ) | ||||||||||||||||||
11/30/2014 | 17.29 | 0.15 | 1.47 | 1.62 | (0.07 | ) | (0.94 | ) | ||||||||||||||||||||
12/3/2012* - 11/30/2013 | 15.00 | 0.15 | 2.14 | 2.29 | — | — | ||||||||||||||||||||||
| Institutional Class | ||||||||||||||||||||||||||||
3/31/2017+ | $ | 16.24 | $ | 0.07 | $ | 0.96 | $ | 1.03 | $ | (0.20 | ) | $ | — | |||||||||||||||
9/30/2016 | 15.86 | 0.11 | 0.59 | 0.70 | (0.32 | ) | — | |||||||||||||||||||||
12/1/2014 - 9/30/2015# | 17.89 | 0.18 | (1.11 | ) | (0.93 | ) | (0.12 | ) | (0.98 | ) | ||||||||||||||||||
11/30/2014 | 17.31 | 0.17 | 1.46 | 1.63 | (0.11 | ) | (0.94 | ) | ||||||||||||||||||||
12/3/2012* - 11/30/2013 | 15.00 | 0.17 | 2.14 | 2.31 | — | — | ||||||||||||||||||||||
| + | Unaudited |
| # | Fiscal year end changed from November 30th to September 30th. |
| * | Commencement of operations. |
| (a) | Calculated on average shares outstanding during the period. |
| (b) | Total return is calculated assuming a purchase of a share on the first day of the period and a sale of a share on the last day of each period reported. Dividends and distributions, if any, are assumed, for purposes of this calculation, to be reinvested. Total return does not reflect sales charges and includes the effect of fee waivers and reimbursements. Total return may reflect adjustments to conform to U.S. GAAP. Total return for a period of less than one year is not annualized. |
| (c) | Annualized, unless otherwise noted. |
| (d) | Does not include expenses of the investment companies in which the Fund invests. |
| (e) | Actual amount rounds to less than $(0.01) per share. |
| (f) | Certain expenses incurred by the Fund were not annualized. |
| (g) | Payments from Affiliates increased the end of period net asset value and total return by less than $0.01 and 0.01%, respectively. |
| 306 | Semiannual Report | | March 31, 2017 | | See accompanying Notes to Financial Statements |
Table of Contents
| Total Dividends and Distributions | Net Asset Value, End of Period | Total Return (b) | Net Assets, End of Period (000s) | Ratio of Expenses to Average Net Assets with Fee Waiver/ Reimbursement | Ratio of Expenses to Average Net Assets without Fee Waiver/ Reimbursement | Ratio of Net Investment Income (Loss) to Average Net Assets | Portfolio Turnover Rate | |||||||||||||||||||||||||||
| $ | (0.24 | ) | $ | 16.97 | 6.24 | % | $ | 603 | 1.25 | %(c)(d) | 6.06 | %(c)(d) | 0.69 | %(c)(d) | — | % | ||||||||||||||||||
| (0.23 | ) | 16.20 | (g) | 4.11 | (g) | 624 | 1.25 | (d) | 3.63 | (d) | 0.70 | (d) | 6 | |||||||||||||||||||||
| (1.00 | ) | 15.79 | (5.68 | ) | 1,067 | 1.26 | (c)(d)(f) | 2.31 | (c)(d)(f) | 0.98 | (c)(d)(f) | 98 | ||||||||||||||||||||||
| (1.09 | ) | 17.74 | (g) | 9.57 | (g) | 1,491 | 1.25 | 3.70 | 0.70 | 5 | ||||||||||||||||||||||||
| — | 17.26 | 15.07 | 1,416 | 1.25 | (c) | 9.81 | (c) | 0.74 | (c) | 6 | ||||||||||||||||||||||||
| $ | (0.16 | ) | $ | 16.34 | 5.85 | % | $ | 266 | 2.00 | %(c)(d) | 5.55 | %(c)(d) | (0.10 | )%(c)(d) | — | % | ||||||||||||||||||
| (0.36 | ) | 15.59 | (g) | 3.42 | (g) | 271 | 2.00 | (d) | 4.37 | (d) | 0.06 | (d) | 6 | |||||||||||||||||||||
| (0.98 | ) | 15.43 | (6.31 | ) | 280 | 2.01 | (c)(d)(f) | 2.93 | (c)(d)(f) | 0.36 | (c)(d)(f) | 98 | ||||||||||||||||||||||
| (1.12 | ) | 17.45 | (g) | 8.78 | (g) | 180 | 2.00 | 4.48 | (0.05 | ) | 5 | |||||||||||||||||||||||
| — | 17.14 | 14.27 | 122 | 2.00 | (c) | 11.10 | (c) | (0.01 | )(c) | 6 | ||||||||||||||||||||||||
| $ | (0.40 | ) | $ | 16.79 | 6.31 | % | $ | 18 | 1.10 | %(c)(d) | 4.54 | %(c)(d) | 1.13 | %(c)(d) | — | % | ||||||||||||||||||
| (0.42 | ) | 16.18 | (g) | 4.31 | (g) | 12 | 1.10 | (d) | 3.29 | (d) | 0.91 | (d) | 6 | |||||||||||||||||||||
| (1.03 | ) | 15.92 | (5.62 | ) | 12 | 1.11 | (c)(d)(f) | 1.91 | (c)(d)(f) | 1.06 | (c)(d)(f) | 98 | ||||||||||||||||||||||
| (1.01 | ) | 17.90 | (g) | 9.77 | (g) | 13 | 1.10 | 3.38 | 0.85 | 5 | ||||||||||||||||||||||||
| — | 17.29 | 15.27 | 12 | 1.11 | (c) | 8.71 | (c) | 0.96 | (c) | 6 | ||||||||||||||||||||||||
| $ | (0.20 | ) | $ | 17.07 | 6.36 | % | $ | 4,033 | 1.00 | %(c)(d) | 4.49 | %(c)(d) | 0.88 | %(c)(d) | — | % | ||||||||||||||||||
| (0.32 | ) | 16.24 | (g) | 4.45 | (g) | 4,745 | 1.00 | (d) | 3.09 | (d) | 0.68 | (d) | 6 | |||||||||||||||||||||
| (1.10 | ) | 15.86 | (5.55 | ) | 12,973 | 1.01 | (c)(d)(f) | 1.98 | (c)(d)(f) | 1.27 | (c)(d)(f) | 98 | ||||||||||||||||||||||
| (1.05 | ) | 17.89 | (g) | 9.87 | (g) | 12,678 | 1.00 | 3.04 | 1.00 | 5 | ||||||||||||||||||||||||
| — | 17.31 | 15.40 | 5,395 | 1.00 | (c) | 8.82 | (c) | 1.05 | (c) | 6 | ||||||||||||||||||||||||
| See accompanying Notes to Financial Statements | | March 31, 2017 | | Semiannual Report | 307 |
Table of Contents
Financial Highlights (cont’d)
For a Share Outstanding for the Period ended:
| Net Asset Value, Beginning of Period | Net Investment Loss (a) | Net Realized and Change in Unrealized Gain (Loss) | Total from Investment Operations | Distributions from Net Realized Capital Gains | Net Asset Value, End of Period | |||||||||||||||||||||||
| AllianzGI U.S. Small-Cap Growth: | ||||||||||||||||||||||||||||
| Class A | ||||||||||||||||||||||||||||
3/31/2017+ | $ | 13.62 | $ | (0.05 | ) | $ | 1.06 | $ | 1.01 | $ | (2.74 | ) | $ | 11.89 | ||||||||||||||
9/30/2016 | 14.61 | (0.11 | ) | 0.29 | 0.18 | (1.17 | ) | 13.62 | ||||||||||||||||||||
12/1/2014 - 9/30/2015# | 17.45 | (0.12 | ) | (1.21 | ) | (1.33 | ) | (1.51 | ) | 14.61 | ||||||||||||||||||
11/30/2014 | 19.09 | (0.19 | ) | 0.36 | 0.17 | (1.81 | ) | 17.45 | ||||||||||||||||||||
11/30/2013 | 13.25 | (0.15 | ) | 6.27 | 6.12 | (0.28 | ) | 19.09 | ||||||||||||||||||||
11/30/2012 | 13.34 | (0.08 | ) | 0.98 | 0.90 | (0.99 | ) | 13.25 | ||||||||||||||||||||
12/20/2010* - 11/30/2011 | 13.77 | (0.11 | ) | (0.32 | ) | (0.43 | ) | — | 13.34 | |||||||||||||||||||
| Class C | ||||||||||||||||||||||||||||
3/31/2017+ | $ | 12.91 | $ | (0.09 | ) | $ | 0.98 | $ | 0.89 | $ | (2.74 | ) | $ | 11.06 | ||||||||||||||
9/30/2016 | 14.02 | (0.20 | ) | 0.26 | 0.06 | (1.17 | ) | 12.91 | ||||||||||||||||||||
12/1/2014 - 9/30/2015# | 16.90 | (0.22 | ) | (1.15 | ) | (1.37 | ) | (1.51 | ) | 14.02 | ||||||||||||||||||
11/30/2014 | 18.68 | (0.31 | ) | 0.34 | 0.03 | (1.81 | ) | 16.90 | ||||||||||||||||||||
11/30/2013 | 13.07 | (0.25 | ) | 6.14 | 5.89 | (0.28 | ) | 18.68 | ||||||||||||||||||||
11/30/2012 | 13.25 | (0.18 | ) | 0.99 | 0.81 | (0.99 | ) | 13.07 | ||||||||||||||||||||
12/20/2010* - 11/30/2011 | 13.77 | (0.22 | ) | (0.30 | ) | (0.52 | ) | — | 13.25 | |||||||||||||||||||
| Class R | ||||||||||||||||||||||||||||
3/31/2017+ | $ | 13.41 | $ | (0.06 | ) | $ | 1.03 | $ | 0.97 | $ | (2.74 | ) | $ | 11.64 | ||||||||||||||
9/30/2016 | 14.44 | (0.14 | ) | 0.28 | 0.14 | (1.17 | ) | 13.41 | ||||||||||||||||||||
12/1/2014 - 9/30/2015# | 17.29 | (0.15 | ) | (1.19 | ) | (1.34 | ) | (1.51 | ) | 14.44 | ||||||||||||||||||
11/30/2014 | 18.98 | (0.22 | ) | 0.34 | 0.12 | (1.81 | ) | 17.29 | ||||||||||||||||||||
11/30/2013 | 13.19 | (0.17 | ) | 6.24 | 6.07 | (0.28 | ) | 18.98 | ||||||||||||||||||||
11/30/2012 | 13.31 | (0.11 | ) | 0.98 | 0.87 | (0.99 | ) | 13.19 | ||||||||||||||||||||
12/20/2010* - 11/30/2011 | 13.77 | (0.15 | ) | (0.31 | ) | (0.46 | ) | — | 13.31 | |||||||||||||||||||
| Class P | ||||||||||||||||||||||||||||
3/31/2017+ | $ | 13.83 | $ | (0.04 | ) | $ | 1.07 | $ | 1.03 | $ | (2.74 | ) | $ | 12.12 | ||||||||||||||
9/30/2016 | 14.81 | (0.09 | ) | 0.28 | 0.19 | (1.17 | ) | 13.83 | ||||||||||||||||||||
12/1/2014 - 9/30/2015# | 17.64 | (0.10 | ) | (1.22 | ) | (1.32 | ) | (1.51 | ) | 14.81 | ||||||||||||||||||
11/30/2014 | 19.25 | (0.15 | ) | 0.35 | 0.20 | (1.81 | ) | 17.64 | ||||||||||||||||||||
11/30/2013 | 13.32 | (0.11 | ) | 6.32 | 6.21 | (0.28 | ) | 19.25 | ||||||||||||||||||||
11/30/2012 | 13.37 | (0.04 | ) | 0.98 | 0.94 | (0.99 | ) | 13.32 | ||||||||||||||||||||
12/20/2010* - 11/30/2011 | 13.77 | (0.09 | ) | (0.31 | ) | (0.40 | ) | — | 13.37 | |||||||||||||||||||
| Institutional Class | ||||||||||||||||||||||||||||
3/31/2017+ | $ | 13.92 | $ | (0.03 | ) | $ | 1.08 | $ | 1.05 | $ | (2.74 | ) | $ | 12.23 | ||||||||||||||
9/30/2016 | 14.88 | (0.08 | ) | 0.29 | 0.21 | (1.17 | ) | 13.92 | ||||||||||||||||||||
12/1/2014 - 9/30/2015# | 17.71 | (0.09 | ) | (1.23 | ) | (1.32 | ) | (1.51 | ) | 14.88 | ||||||||||||||||||
11/30/2014 | 19.30 | (0.14 | ) | 0.36 | 0.22 | (1.81 | ) | 17.71 | ||||||||||||||||||||
11/30/2013 | 13.35 | (0.08 | ) | 6.31 | 6.23 | (0.28 | ) | 19.30 | ||||||||||||||||||||
11/30/2012 | 13.39 | (0.04 | ) | 0.99 | 0.95 | (0.99 | ) | 13.35 | ||||||||||||||||||||
11/30/2011 | 12.84 | (0.07 | ) | 0.62 | 0.55 | — | 13.39 | |||||||||||||||||||||
| + | Unaudited |
| # | Fiscal year end changed from November 30th to September 30th. |
| * | Commencement of operations. |
| (a) | Calculated on average shares outstanding during the period. |
| (b) | Total return is calculated assuming a purchase of a share on the first day of the period and a sale of a share on the last day of each period reported. Dividends and distributions, if any, are assumed, for purposes of this calculation, to be reinvested. Total return does not reflect sales charges and includes the effect of fee waivers and reimbursements. Total return may reflect adjustments to conform to U.S. GAAP. Total return for a period of less than one year is not annualized. |
| 308 | Semiannual Report | | March 31, 2017 | | See accompanying Notes to Financial Statements |
Table of Contents
| Total Return (b) | Net Assets, End of Period (000s) | Ratio of Fee Waiver/ | Ratio of Expenses to Average Net Assets without Fee Waiver/ Reimbursement | Ratio of Net Investment Loss to Average Net Assets | Portfolio Turnover Rate | |||||||||||||||||||||
| 8.20 | % | $ | 610 | 1.20 | %(c) | 3.16 | %(c) | (0.80 | )%(c) | 52 | % | |||||||||||||||
| 1.09 | 3,430 | 1.30 | 2.07 | (0.80 | ) | 120 | ||||||||||||||||||||
| (8.17 | ) | 3,057 | 1.40 | (c)(d) | 1.75 | (c)(d) | (0.86 | )(c)(d) | 79 | |||||||||||||||||
| 1.31 | 3,277 | 1.44 | 1.89 | (1.05 | ) | 69 | ||||||||||||||||||||
| 47.16 | 4,971 | 1.50 | 1.91 | (0.90 | ) | 81 | ||||||||||||||||||||
| 7.67 | 1,359 | 1.50 | 2.45 | (0.59 | ) | 92 | ||||||||||||||||||||
| (3.12 | ) | 837 | 1.50 | (c) | 2.70 | (c) | (0.92 | )(c) | 111 | |||||||||||||||||
| 7.66 | % | $ | 448 | 2.00 | %(c) | 3.27 | %(c) | (1.53 | )%(c) | 52 | % | |||||||||||||||
| 0.23 | 537 | 2.10 | 2.93 | (1.60 | ) | 120 | ||||||||||||||||||||
| (8.72 | ) | 634 | 2.20 | (c)(d) | 2.59 | (c)(d) | (1.66 | )(c)(d) | 79 | |||||||||||||||||
| 0.53 | 661 | 2.20 | 2.69 | (1.81 | ) | 69 | ||||||||||||||||||||
| 46.03 | 606 | 2.21 | 2.73 | (1.57 | ) | 81 | ||||||||||||||||||||
| 6.99 | 228 | 2.22 | 3.16 | (1.35 | ) | 92 | ||||||||||||||||||||
| (3.78 | ) | 134 | 2.25 | (c) | 3.04 | (c) | (1.60 | )(c) | 111 | |||||||||||||||||
| 8.01 | % | $ | 129 | 1.45 | %(c) | 2.65 | %(c) | (1.05 | )%(c) | 52 | % | |||||||||||||||
| 0.81 | 19 | 1.55 | 2.34 | (1.06 | ) | 120 | ||||||||||||||||||||
| (8.32 | ) | 22 | 1.65 | (c)(d) | 2.03 | (c)(d) | (1.10 | )(c)(d) | 79 | |||||||||||||||||
| 1.03 | 29 | 1.66 | 2.20 | (1.26 | ) | 69 | ||||||||||||||||||||
| 46.99 | 26 | 1.67 | 2.16 | (1.03 | ) | 81 | ||||||||||||||||||||
| 7.44 | 10 | 1.70 | 2.60 | (0.84 | ) | 92 | ||||||||||||||||||||
| (3.34 | ) | 10 | 1.75 | (c) | 2.50 | (c) | (1.14 | )(c) | 111 | |||||||||||||||||
| 8.22 | % | $ | 666 | 1.05 | %(c) | 2.24 | %(c) | (0.59 | )%(c) | 52 | % | |||||||||||||||
| 1.15 | 230 | 1.16 | 1.86 | (0.64 | ) | 120 | ||||||||||||||||||||
| (8.01 | ) | 272 | 1.25 | (c)(d) | 1.55 | (c)(d) | (0.72 | )(c)(d) | 79 | |||||||||||||||||
| 1.47 | 214 | 1.25 | 1.76 | (0.84 | ) | 69 | ||||||||||||||||||||
| 47.60 | 110 | 1.25 | 1.74 | (0.69 | ) | 81 | ||||||||||||||||||||
| 7.97 | 19 | 1.25 | 2.25 | (0.27 | ) | 92 | ||||||||||||||||||||
| (2.90 | ) | 15 | 1.25 | (c) | 2.13 | (c) | (0.65 | )(c) | 111 | |||||||||||||||||
| 8.32 | % | $ | 15,132 | 0.96 | %(c) | 2.22 | %(c) | (0.49 | )%(c) | 52 | % | |||||||||||||||
| 1.28 | 19,403 | 1.07 | 1.85 | (0.58 | ) | 120 | ||||||||||||||||||||
| (7.98 | ) | 32,670 | 1.16 | (c)(d) | 1.53 | (c)(d) | (0.62 | )(c)(d) | 79 | |||||||||||||||||
| 1.57 | 33,231 | 1.16 | 1.66 | (0.76 | ) | 69 | ||||||||||||||||||||
| 47.64 | 29,116 | 1.16 | 1.69 | (0.48 | ) | 81 | ||||||||||||||||||||
| 8.05 | 20,140 | 1.15 | 2.09 | (0.29 | ) | 92 | ||||||||||||||||||||
| 4.28 | 20,862 | 1.15 | 1.99 | (0.53 | ) | 111 | ||||||||||||||||||||
| (c) | Annualized, unless otherwise noted. |
| (d) | Certain expenses incurred by the Fund were not annualized. |
| See accompanying Notes to Financial Statements | | March 31, 2017 | | Semiannual Report | 309 |
Table of Contents
Financial Highlights (cont’d)
For a Share Outstanding for the Period ended:
| Net Asset Value, Beginning of Period | Net Investment Loss (a) | Net Realized | Total from Investment Operations | Distributions from Net Realized Capital Gains | Net Asset Value, End of Period | |||||||||||||||||||||||
| AllianzGI Ultra Micro Cap: | ||||||||||||||||||||||||||||
| Class A | ||||||||||||||||||||||||||||
3/31/2017+ | $ | 21.85 | $ | (0.20 | ) | $ | 1.51 | $ | 1.31 | $ | (1.79 | ) | $ | 21.37 | ||||||||||||||
9/30/2016 | 22.58 | (0.38 | ) | 1.64 | 1.26 | (1.99 | ) | 21.85 | ||||||||||||||||||||
12/1/2014 - 9/30/2015# | 23.75 | (0.35 | ) | (0.61 | ) | (0.96 | ) | (0.21 | ) | 22.58 | ||||||||||||||||||
11/30/2014 | 24.34 | (0.44 | ) | (0.04 | ) | (0.48 | ) | (0.11 | ) | 23.75 | ||||||||||||||||||
11/30/2013 | 15.53 | (0.29 | ) | 9.11 | 8.82 | (0.01 | ) | 24.34 | ||||||||||||||||||||
12/19/2011* - 11/30/2012 | 12.82 | (0.14 | ) | 2.85 | 2.71 | — | 15.53 | |||||||||||||||||||||
| Class P | ||||||||||||||||||||||||||||
3/31/2017+ | $ | 22.08 | $ | (0.17 | ) | $ | 1.53 | $ | 1.36 | $ | (1.79 | ) | $ | 21.65 | ||||||||||||||
9/30/2016 | 22.74 | (0.32 | ) | 1.65 | 1.33 | (1.99 | ) | 22.08 | ||||||||||||||||||||
12/1/2014 - 9/30/2015# | 23.86 | (0.30 | ) | (0.61 | ) | (0.91 | ) | (0.21 | ) | 22.74 | ||||||||||||||||||
11/30/2014 | 24.40 | (0.39 | ) | (0.04 | ) | (0.43 | ) | (0.11 | ) | 23.86 | ||||||||||||||||||
11/30/2013 | 15.54 | (0.24 | ) | 9.11 | 8.87 | (0.01 | ) | 24.40 | ||||||||||||||||||||
11/30/2012 | 13.26 | (0.20 | ) | 2.71 | 2.51 | (0.23 | ) | 15.54 | ||||||||||||||||||||
12/27/2010* - 11/30/2011 | 13.80 | (0.29 | ) | (0.22 | ) | (0.51 | ) | (0.03 | ) | 13.26 | ||||||||||||||||||
| Institutional Class | ||||||||||||||||||||||||||||
3/31/2017+ | $ | 22.13 | $ | (0.17 | ) | $ | 1.53 | $ | 1.36 | $ | (1.79 | ) | $ | 21.70 | ||||||||||||||
9/30/2016 | 22.77 | (0.32 | ) | 1.67 | 1.35 | (1.99 | ) | 22.13 | ||||||||||||||||||||
12/1/2014 - 9/30/2015# | 23.93 | (0.34 | ) | (0.61 | ) | (0.95 | ) | (0.21 | ) | 22.77 | ||||||||||||||||||
11/30/2014 | 24.49 | (0.40 | ) | (0.05 | ) | (0.45 | ) | (0.11 | ) | 23.93 | ||||||||||||||||||
11/30/2013 | 15.59 | (0.26 | ) | 9.17 | 8.91 | (0.01 | ) | 24.49 | ||||||||||||||||||||
11/30/2012 | 13.29 | (0.19 | ) | 2.72 | 2.53 | (0.23 | ) | 15.59 | ||||||||||||||||||||
11/30/2011 | 13.25 | (0.29 | ) | 1.08 | 0.79 | (0.75 | ) | 13.29 | ||||||||||||||||||||
| + | Unaudited |
| # | Fiscal year end changed from November 30th to September 30th. |
| * | Commencement of operations. |
| (a) | Calculated on average shares outstanding during the period. |
| (b) | Total return is calculated assuming a purchase of a share on the first day of the period and a sale of a share on the last day of each period reported. Dividends and distributions, if any, are assumed, for purposes of this calculation, to be reinvested. Total return does not reflect sales charges and includes the effect of fee waivers and reimbursements. Total return may reflect adjustments to conform to U.S. GAAP. Total return for a period of less than one year is not annualized. |
| (c) | Annualized, unless otherwise noted. |
| (d) | Certain expenses incurred by the Fund were not annualized. |
| 310 | Semiannual Report | | March 31, 2017 | | See accompanying Notes to Financial Statements |
Table of Contents
| Total Return (b) | Net Assets, End of Period (000s) | Ratio of Expenses to Average Net Assets with Fee Waiver/ Reimbursement | Ratio of Expenses to Average Net Assets without Fee Waiver/ Reimbursement | Ratio of Net Investment Loss to Average Net Assets | Portfolio Turnover Rate | |||||||||||||||||||||
| 6.21 | % | $ | 14,163 | 2.40 | %(c)(d) | 2.40 | %(c)(d) | (1.92 | )%(c)(d) | 16 | % | |||||||||||||||
| 5.73 | 19,312 | 2.26 | 2.26 | (1.83 | ) | 32 | ||||||||||||||||||||
| (4.08 | ) | 41,119 | 2.08 | (c)(d) | 2.08 | (c)(d) | (1.70 | )(c)(d) | 43 | |||||||||||||||||
| (1.98 | ) | 53,192 | 2.16 | 2.16 | (1.81 | ) | 66 | |||||||||||||||||||
| 56.82 | 61,525 | 2.20 | 2.30 | (1.41 | ) | 59 | ||||||||||||||||||||
| 21.14 | 6,862 | 2.36 | (c) | 3.36 | (c) | (0.96 | )(c) | 114 | ||||||||||||||||||
| 6.38 | % | $ | 6,859 | 2.07 | %(c)(d) | 2.07 | %(c)(d) | (1.60 | )%(c)(d) | 16 | % | |||||||||||||||
| 6.02 | 5,343 | 1.97 | 1.97 | (1.54 | ) | 32 | ||||||||||||||||||||
| (3.84 | ) | 7,710 | 1.81 | (c)(d) | 1.81 | (c)(d) | (1.42 | )(c)(d) | 43 | |||||||||||||||||
| (1.77 | ) | 10,561 | 1.94 | 1.94 | (1.67 | ) | 66 | |||||||||||||||||||
| 57.10 | 858 | 2.01 | 2.07 | (1.19 | ) | 59 | ||||||||||||||||||||
| 19.26 | 252 | 2.18 | 3.08 | (1.38 | ) | 114 | ||||||||||||||||||||
| (3.64 | ) | 230 | 2.41 | (c) | 3.48 | (c) | (2.23 | )(c) | 101 | |||||||||||||||||
| 6.37 | % | $ | 20,824 | 2.07 | %(c)(d) | 2.07 | %(c)(d) | (1.60 | )%(c)(d) | 16 | % | |||||||||||||||
| 6.10 | 23,504 | 1.94 | 1.94 | (1.52 | ) | 32 | ||||||||||||||||||||
| (4.00 | ) | 43,621 | 1.97 | (c)(d) | 1.97 | (c)(d) | (1.60 | )(c)(d) | 43 | |||||||||||||||||
| (1.84 | ) | 49,525 | 2.00 | 2.00 | (1.65 | ) | 66 | |||||||||||||||||||
| 57.18 | 62,641 | 2.00 | 2.00 | (1.24 | ) | 59 | ||||||||||||||||||||
| 19.37 | 9,296 | 2.08 | 3.15 | (1.32 | ) | 114 | ||||||||||||||||||||
| 6.04 | 9,757 | 2.24 | 3.53 | (2.06 | ) | 101 | ||||||||||||||||||||
| See accompanying Notes to Financial Statements | | March 31, 2017 | | Semiannual Report | 311 |
Table of Contents
March 31, 2017 (Unaudited)
| 1. | ORGANIZATION AND SIGNIFICANT ACCOUNTING POLICIES |
Allianz Funds Multi-Strategy Trust (the “Trust”) is registered under the Investment Company Act of 1940, as amended, (the “1940 Act”), as an open-end registered investment management company organized as a Massachusetts business trust and accordingly, follows the investment company accounting and reporting guidance of the Financial Accounting Standards Board (“FASB”) Accounting Standards Codification Topic 946 Financial Services-Investment Companies. As of March 31, 2017, the Trust consisted of thirty-eight separate investment series (each a “Fund” and together the “Funds”). Allianz Global Investors U.S. LLC (“AllianzGI U.S.” or the “Investment Manager”) serves as the Funds’ Investment Manager and NFJ Investment Group LLC (“NFJ” or the “Sub-Adviser”), an affiliate of the Investment Manager serves as sub-adviser to certain Funds. On October 1, 2016, Allianz Global Investors Fund Management LLC (“AGIFM”), previously the Funds’ investment manager, merged with and into AllianzGI U.S., previously sub-adviser to certain Funds. In connection with this merger, AllianzGI U.S. succeeded AGIFM as the investment manager of the Funds and NFJ Investment Group LLC continued to serve as a sub-adviser to certain Funds. Following the merger, all Funds for which AllianzGI U.S. served as sub-adviser on September 30, 2016, no longer have a sub-adviser. The merger did not result in any personnel changes and otherwise had no practical effect on the management of the Funds. AllianzGI U.S. and NFJ are indirect, wholly-owned subsidiaries of Allianz Asset Management of America L.P. (“AAM”). AAM is an indirect, wholly-owned subsidiary of Allianz SE, a publicly traded European insurance and financial services company. Currently, the Trust may offer up to seven classes of shares to new and existing investors: A, C, R, P, Institutional, R6 and Administrative. Shares of AllianzGI Convertible are currently not available for purchase by any new investor, and shareholders of other series of the Trust or series of Allianz Funds are no longer permitted to exchange any of their shares for shares of AllianzGI Convertible, with certain exceptions.
The following Funds sold and issued shares of beneficial interest to Allianz Funds Investments, Inc. (“AFI”) during the period ended March 31, 2017 and year ended September 30, 2016. AFI is an indirect, wholly-owned subsidiary of Allianz SE.
| AllianzGI Best Styles Emerging Markets Equity | ||||||||||||
| Class | Date | Shares | Amount | |||||||||
A | 4/26/16 | 765 | $ | 10,000 | ||||||||
C | 4/26/16 | 765 | 10,000 | |||||||||
Totals | 1,530 | $ | 20,000 | |||||||||
| AllianzGI Best Styles Global Equity | ||||||||||||
| Class | Date | Shares | Amount | |||||||||
C | 4/26/16 | 654 | $ | 10,000 | ||||||||
| AllianzGI Best Styles International Equity | ||||||||||||
| Class | Date | Shares | Amount | |||||||||
A | 4/26/16 | 704 | $ | 10,000 | ||||||||
C | 4/26/16 | 704 | 10,000 | |||||||||
Totals | 1,408 | $ | 20,000 | |||||||||
| AllianzGI Best Styles U.S. Equity | ||||||||||||
| Class | Date | Shares | Amount | |||||||||
A | 4/26/16 | 671 | $ | 10,000 | ||||||||
C | 4/26/16 | 671 | 10,000 | |||||||||
Totals | 1,342 | $ | 20,000 | |||||||||
| AllianzGI Global Dynamic Allocation | ||||||||||||
| Class | Date | Shares | Amount | |||||||||
R6 | 2/1/16 | 578 | $ | 10,000 | ||||||||
| AllianzGI International Small-Cap | ||||||||||||
| Class | Date | Shares | Amount | |||||||||
R6 | 2/1/16 | 298 | $ | 10,000 | ||||||||
| AllianzGI Short Duration High Income | ||||||||||||
| Class | Date | Shares | Amount | |||||||||
R6 | 2/1/17 | 659 | $ | 10,000 | ||||||||
| AllianzGI Structured Return | ||||||||||||
| Class | Date | Shares | Amount | |||||||||
R6 | 12/2/16 | 620 | $ | 10,000 | ||||||||
The investment objective of each Fund is disclosed below. There can be no assurance that the Funds will meet their stated objectives.
| Investment Objective | ||
| AllianzGI Retirement 2020 | The Funds seek capital growth and preservation consistent with its asset allocation as the target date in the Fund name approaches, and thereafter current income and, secondarily, capital appreciation. | |
| AllianzGI Retirement 2025 | ||
| AllianzGI Retirement 2030 | ||
| AllianzGI Retirement 2035 | ||
| AllianzGI Retirement 2040 | ||
| AllianzGI Retirement 2045 | ||
| AllianzGI Retirement 2050 | ||
| AllianzGI Retirement 2055 | ||
| AllianzGI Retirement Income | The Fund seeks current income, and secondarily, capital appreciation. | |
| AllianzGI Global Allocation | The Fund seeks after-inflation capital appreciation and current income. |
| 312 | March 31, 2017 | | Semiannual Report |
Table of Contents
| Investment Objective | ||
| AllianzGI Global Megatrends | The Funds seek long-term capital appreciation. | |
| AllianzGI Best Styles Emerging Markets Equity | ||
| AllianzGI Best Styles Global Equity | ||
| AllianzGI Best Styles International Equity | ||
| AllianzGI Best Styles U.S. Equity | ||
| AllianzGI Emerging Markets Consumer | ||
| AllianzGI Emerging Markets Small-Cap | ||
| AllianzGI Europe Equity Dividend | ||
| AllianzGI Global Dynamic Allocation | ||
| AllianzGI Global Sustainability | ||
| AllianzGI Global Water | ||
| AllianzGI International Growth | ||
| AllianzGI NFJ Emerging Markets Value | ||
| AllianzGI NFJ International Small-Cap Value | ||
| AllianzGI NFJ International Value II | ||
| AllianzGI Structured Return | ||
| AllianzGI Convertible | The Fund seeks maximum total return, consisting of capital appreciation and current income. | |
| AllianzGI Emerging Markets Debt | The Fund seeks long-term capital appreciation and current income. | |
| AllianzGI Global Fundamental Strategy | The Fund seeks to generate positive real absolute returns through a complete market cycle (rolling 3-year period) by investing in broad range of global asset classes. | |
| AllianzGI High Yield Bond | The Fund seeks a high level of current income and capital growth. | |
| AllianzGI International Small-Cap | The Funds seek maximum long-term capital appreciation. | |
| AllianzGI Micro Cap | ||
| AllianzGI U.S. Small-Cap Growth | ||
| AllianzGI Ultra Micro Cap | ||
| AllianzGI NFJ Global Dividend Value | The Fund seeks long-term growth of capital and income. | |
| AllianzGI Multi-Asset Real Return | The Fund seeks long-term capital appreciation emphasizing inflation-adjusted returns. | |
| AllianzGI Short Duration High Income | The Fund seeks a high level of current income with lower volatility than the broader high yield market. | |
| AllianzGI U.S. Equity Hedged | The Fund seeks capital appreciation, with added emphasis on the protection of capital during unfavorable market conditions. |
The preparation of the Funds’ financial statements in accordance with accounting principles generally accepted in the United States of America (“U.S. GAAP”) requires the Funds’ management to make estimates and assumptions that affect the reported amounts and disclosures in each Fund’s financial statements. Actual results could differ from those estimates.
In the normal course of business, the Funds enter into contracts that contain a variety of representations that provide general indemnifications. The Funds’ maximum exposure under these arrangements is unknown as this would involve future claims that may be made against the Funds that have not yet occurred.
In October 2016, the U.S. Securities and Exchange Commission (“SEC”) adopted new rules and forms, and amendments to certain current rules and forms, to modernize reporting and disclosure of information by registered investment companies. The amendments to
Regulation S-X will require standardized, enhanced disclosure about derivatives in investment company financial statements, and will also change the rules governing the form and content of such financial statements. The amendments to Regulation S-X take effect on August 1, 2017. At this time, management is assessing the anticipated impact of these regulatory developments.
The following is a summary of significant accounting policies consistently followed by the Funds:
(a) Valuation of Investments. Portfolio securities and other financial instruments for which market quotations are readily available are stated at market value. Market value is generally determined on the basis of official closing prices, last reported sales prices, or if no sales or closing prices are reported, on the basis of quotes obtained from a quotation reporting system, established market makers, or independent pricing services. Investments in mutual funds are valued
| Semiannual Report | | March 31, 2017 | 313 |
Table of Contents
Notes to Financial Statements (cont’d)
March 31, 2017 (Unaudited)
at the net asset value per share (“NAV”) as reported on each business day. The Funds’ investments are valued daily using prices supplied by an independent pricing service or broker/dealer quotations, or by using the last sale or settlement price on the exchange that is the primary market for such securities, or the mean between the last bid and ask quotations. The market value for NASDAQ Global Market and NASDAQ Capital Market securities may also be calculated using the NASDAQ Official Closing Price instead of the last reported sales price. Independent pricing services use information provided by market makers or estimates of market values obtained from yield data relating to investments or securities with similar characteristics. Exchange traded futures are valued at the price determined by the relevant exchange. Securities purchased on a when-issued or delayed-delivery basis are marked to market daily until settlement at the forward settlement date.
The Board of Trustees of each Fund (together, the “Board”) has adopted procedures for valuing portfolio securities and other financial instruments in circumstances where market quotations are not readily available (including in cases where available market quotations are deemed to be unreliable), and has delegated primary responsibility for applying the valuation methods to the Investment Manager. The Trust’s Valuation Committee was established by the Board to oversee the implementation of the Funds’ valuation methods and to make fair value determinations on behalf of the Board, as necessary. The Investment Manager monitors the continued appropriateness of methods applied and identifies circumstances and events that may require fair valuation. The Investment Manager determines if adjustments should be made in light of market changes, events affecting the issuer or other factors. If the Investment Manager determines that a valuation method may no longer be appropriate, another valuation method previously approved by the Trust’s Valuation Committee may be selected or the Trust’s Valuation Committee will be convened to consider the matter and take any appropriate action in accordance with procedures adopted by the Board. The Board shall review and ratify the appropriateness of the valuation methods and these methods may be amended or supplemented from time to time by the Trust’s Valuation Committee.
Synthetic convertible securities are valued based on quotations obtained from unaffiliated brokers who are the principal market-makers in such securities. Such valuations are derived by the brokers from proprietary models which are generally based on readily available market information including valuations of the common stock underlying the synthetic security.
Short-term debt instruments maturing in 60 days or less are valued at amortized cost, if their original term to maturity was 60 days or less, or by amortizing premiums or discounts based on their value on the 61st day prior to maturity, if the original term to maturity exceeded 60 days.
Investments initially valued in currencies other than the U.S. dollar are converted to the U.S. dollar using exchange rates obtained from pricing services. As a result, the NAV of each share class of a Fund may
be affected by changes in the value of currencies in relation to the U.S. dollar. The value of securities traded in markets outside the United States or denominated in currencies other than the U.S. dollar may be affected significantly on a day that the New York Stock Exchange (“NYSE”) is closed.
The prices used by the Funds to value investments may differ from the value that would be realized if the investments were sold, and these differences could be material to the Funds’ financial statements. The NAV of each share class of a Fund is normally determined as of the close of regular trading (normally, 4:00 p.m. Eastern Time) on the NYSE on each day the NYSE is open for business.
The prices of certain portfolio securities or financial instruments may be determined at a time prior to the close of regular trading on the NYSE. When fair-valuing the securities, the Funds may, among other things, consider significant events (which may be considered to include changes in the value of U.S. securities or securities indices) that occur after the close of the relevant market and before the time the NAV of each share class of a Fund is calculated. With respect to certain foreign securities, the Funds may fair-value securities using modeling tools provided by third-party vendors. The Funds have retained a statistical research service to assist in determining the fair value of foreign securities. This service utilizes statistics and programs based on historical performance of markets and other economic data to assist in making fair value estimates. Fair value estimates used by the Funds for foreign securities may differ from the value realized from the sale of those securities and the difference could be material to the financial statements. Fair value pricing may require subjective determinations about the value of a security or other assets, and fair values used to determine the NAV of each share class of a Fund may differ from quoted or published prices, or from prices that are used by others, for the same investments. In addition, the use of fair value pricing may not always result in adjustments to the prices of securities or other assets held by a Fund.
(b) Fair Value Measurements. Fair value is defined as the price that would be received to sell an asset or paid to transfer a liability (i.e., the “exit price”) in an orderly transaction between market participants. The three levels of the fair value hierarchy are described below:
| ∎ | Level 1—quoted prices in active markets for identical investments that the Funds have the ability to access |
| ∎ | Level 2—valuations based on other significant observable inputs, which may include, but are not limited to, quoted prices for similar assets or liabilities, interest rates, yield curves, volatilities, prepayment speeds, loss severities, credit risks and default rates or other market corroborated inputs |
| ∎ | Level 3—valuations based on significant unobservable inputs (including the Investment Manager’s or Trust’s Valuation Committee’s own assumptions and securities whose price was determined by using a single broker’s quote) |
The valuation techniques used by the Funds to measure fair value during the six months ended March 31, 2017 were intended to maximize the use of observable inputs and to minimize the use of unobservable inputs.
| 314 | March 31, 2017 | | Semiannual Report |
Table of Contents
The Funds’ policy is to recognize transfers between levels at the end of the reporting period. An investment asset’s or liability’s level within the fair value hierarchy is based on the lowest level input, individually or in aggregate, that is significant to the fair value measurement. The objective of fair value measurement remains the same even when there is a significant decrease in the volume and level of activity for an asset or liability and regardless of the valuation techniques used. Investments categorized as Level 1 or 2 as of period end may have been transferred between Levels 1 and 2 since the prior period due to changes in the valuation method utilized in valuing the investments.
The inputs or methodology used for valuing securities are not necessarily an indication of the risk associated with investing in those securities. The following are certain inputs and techniques that the Funds generally use to evaluate how to classify each major category of assets and liabilities within Level 2 and Level 3, in accordance with U.S. GAAP.
Equity Securities (Common and Preferred Stock and Warrants)—Equity securities traded in inactive markets and certain foreign equity securities are valued using inputs which include broker-dealer quotes, recently executed transactions adjusted for changes in the benchmark index, or evaluated price quotes received from independent pricing services that take into account the integrity of the market sector and issuer, the individual characteristics of the security, and information received from broker-dealers and other market sources pertaining to the issuer or security. To the extent that these inputs are observable, the values of equity securities are categorized as Level 2. To the extent that these inputs are unobservable, the values are categorized as Level 3.
U.S. Treasury Obligations—U.S. Treasury obligations are valued by independent pricing services based on pricing models that evaluate the mean between the most recently quoted bid and ask price. The models also take into consideration data received from active market makers and broker-dealers, yield curves, and the spread over comparable U.S. Treasury issues. The spreads change daily in response to market conditions and are generally obtained from the new issue market and broker-dealer sources. To the extent that these inputs are observable, the values of U.S. Treasury obligations are categorized as Level 2. To the extent that these inputs are unobservable, the values are categorized as Level 3.
Government Sponsored Enterprise and Mortgage-Backed Securities—Government sponsored enterprise and mortgage-backed securities are valued by independent pricing services using pricing models based on inputs that include issuer type, coupon, cash flows, mortgage prepayment projection tables and Adjustable Rate Mortgage evaluations that incorporate index data, periodic life caps and the next coupon reset date. To the extent that these inputs are observable, the values of government sponsored enterprise and mortgage-backed securities are categorized as Level 2. To the extent that these inputs are unobservable, the values are categorized as Level 3.
Sovereign Debt Obligations—Sovereign debt obligations are valued by independent pricing services based on discounted cash flow
models that incorporate option adjusted spreads along with benchmark curves and credit spreads. In addition, international bond markets are monitored regularly for information pertaining to the issuer and/or the specific issue. To the extent that these inputs are observable, the values of sovereign debt obligations are categorized as Level 2. To the extent that these inputs are unobservable, the values are categorized as Level 3.
Corporate Bonds & Notes—Corporate bonds & notes are generally comprised of two main categories: investment grade bonds and high yield bonds. Investment grade bonds are valued by independent pricing services using various inputs and techniques, which include broker-dealer quotations, live trading levels, recently executed transactions in securities of the issuer or comparable issuers, and option adjusted spread models that include base curve and spread curve inputs. Adjustments to individual bonds can be applied to recognize trading differences compared to other bonds issued by the same issuer. High yield bonds are valued by independent pricing services based primarily on broker-dealer quotations from relevant market makers and recently executed transactions in securities of the issuer or comparable issuers. The broker-dealer quotations received are supported by credit analysis of the issuer that takes into consideration credit quality assessments, daily trading activity, and the activity of the underlying equities, listed bonds and sector-specific trends. To the extent that these inputs are observable, the values of corporate bonds & notes are categorized as Level 2. To the extent that these inputs are unobservable, the values are categorized as Level 3.
Convertible Bonds—Convertible bonds are valued by independent pricing services based on various inputs and techniques, which include broker-dealer quotations from relevant market makers and recently executed transactions in securities of the issuer or comparable issuers. The broker-dealer quotations received are supported by credit analysis of the issuer that takes into consideration credit quality assessments, daily trading activity, and the activity of the underlying equities, listed bonds and sector-specific trends. To the extent that these inputs are observable, the values of convertible bonds are categorized as Level 2. To the extent that these inputs are unobservable, the values are categorized as Level 3.
Option Contracts—Option contracts traded over-the-counter (“OTC”) and FLexible EXchange (“FLEX”) options are valued by independent pricing services based on pricing models that incorporate various inputs such as interest rates, credit spreads, currency exchange rates and volatility measurements for in-the-money, at-the-money, and out-of-the-money contracts based on a given strike price. To the extent that these inputs are observable, the values of OTC and FLEX option contracts are categorized as Level 2. To the extent that these inputs are unobservable, the values are categorized as Level 3.
Forward Foreign Currency Contracts—Forward foreign currency contracts are valued by independent pricing services using various inputs and techniques, which include broker-dealer quotations, actual trading information and foreign currency exchange rates gathered from leading market makers and foreign currency exchange trading
| Semiannual Report | | March 31, 2017 | 315 |
Table of Contents
Notes to Financial Statements (cont’d)
March 31, 2017 (Unaudited)
centers throughout the world. To the extent that these inputs are observable, the values of forward foreign currency contracts are categorized as Level 2. To the extent that these inputs are unobservable, the values are categorized as Level 3.
Senior Loans—Senior Loans generally are valued by independent pricing services based on the average of quoted prices received from
multiple dealers or valued relative to other benchmark securities when broker-dealer quotes are unavailable. These quoted prices are based on interest rates, yield curves, option adjusted spreads, credit spreads and/or other criteria. To the extent that these inputs are observable, the values of Senior Loans are categorized as Level 2. To the extent that these inputs are unobservable, the values are categorized as Level 3.
A summary of the inputs used at March 31, 2017 in valuing each Fund’s assets and liabilities is listed below (refer to the Schedules of Investments and Notes 7(b) and 7(c) for more detailed information on Investments in Securities and Other Financial Instruments):
| AllianzGI Retirement 2020: | ||||||||||||||||
| Investments in Securities – Assets | Level 1– Quoted Prices | Level 2– Other Significant Observable Inputs | Level 3– Significant Unobservable Inputs | Value at 3/31/17 | ||||||||||||
Mutual Funds | $ | 49,241,938 | — | — | $ | 49,241,938 | ||||||||||
Exchange-Traded Funds | 1,449,889 | — | — | 1,449,889 | ||||||||||||
Repurchase Agreements | — | $ | 2,349,000 | — | 2,349,000 | |||||||||||
| 50,691,827 | 2,349,000 | — | 53,040,827 | |||||||||||||
Other Financial Instruments* – Assets | ||||||||||||||||
Foreign Exchange Contracts | 6,686 | — | — | 6,686 | ||||||||||||
Interest Rate Contracts | 16,116 | — | — | 16,116 | ||||||||||||
| 22,802 | — | — | 22,802 | |||||||||||||
Other Financial Instruments* – Liabilities | ||||||||||||||||
Foreign Exchange Contracts | (24,273 | ) | — | — | (24,273 | ) | ||||||||||
Market Price | (6,536 | ) | — | — | (6,536 | ) | ||||||||||
| (30,809 | ) | — | — | (30,809 | ) | |||||||||||
Totals | $ | 50,683,820 | $ | 2,349,000 | — | $ | 53,032,820 | |||||||||
| AllianzGI Retirement 2025: | ||||||||||||||||
| Investments in Securities – Assets | Level 1– Quoted Prices | Level 2– Other Significant Observable Inputs | Level 3– Significant Unobservable Inputs | Value at 3/31/17 | ||||||||||||
Mutual Funds | $ | 58,322,684 | — | — | $ | 58,322,684 | ||||||||||
Repurchase Agreements | — | $ | 2,309,000 | — | 2,309,000 | |||||||||||
| 58,322,684 | 2,309,000 | — | 60,631,684 | |||||||||||||
Other Financial Instruments* – Assets | ||||||||||||||||
Foreign Exchange Contracts | 8,024 | — | — | 8,024 | ||||||||||||
Market Price | 4,794 | — | — | 4,794 | ||||||||||||
| 12,818 | — | — | 12,818 | |||||||||||||
Other Financial Instruments* – Liabilities | ||||||||||||||||
Foreign Exchange Contracts | (30,045 | ) | — | — | (30,045 | ) | ||||||||||
Market Price | (24,090 | ) | — | — | (24,090 | ) | ||||||||||
| (54,135 | ) | — | — | (54,135 | ) | |||||||||||
Totals | $ | 58,281,367 | $ | 2,309,000 | — | $ | 60,590,367 | |||||||||
| 316 | March 31, 2017 | | Semiannual Report |
Table of Contents
| AllianzGI Retirement 2030: | ||||||||||||||||
| Investments in Securities – Assets | Level 1– Quoted Prices | Level 2– Other Significant Observable Inputs | Level 3– Significant | Value at 3/31/17 | ||||||||||||
Mutual Funds | $ | 63,104,978 | — | — | $ | 63,104,978 | ||||||||||
Repurchase Agreements | — | $ | 951,000 | — | 951,000 | |||||||||||
| 63,104,978 | 951,000 | — | 64,055,978 | |||||||||||||
Other Financial Instruments* – Assets | ||||||||||||||||
Foreign Exchange Contracts | 10,698 | — | — | 10,698 | ||||||||||||
Market Price | 14,179 | — | — | 14,179 | ||||||||||||
| 24,877 | — | — | 24,877 | |||||||||||||
Other Financial Instruments* – Liabilities | ||||||||||||||||
Foreign Exchange Contracts | (41,586 | ) | — | — | (41,586 | ) | ||||||||||
Market Price | (19,013 | ) | — | — | (19,013 | ) | ||||||||||
| (60,599 | ) | — | — | (60,599 | ) | |||||||||||
Totals | $ | 63,069,256 | $ | 951,000 | — | $ | 64,020,256 | |||||||||
| AllianzGI Retirement 2035: | ||||||||||||||||
| Investments in Securities – Assets | Level 1– Quoted Prices | Level 2– Other Significant Observable Inputs | Level 3– Significant | Value at 3/31/17 | ||||||||||||
Mutual Funds | $ | 49,542,897 | — | — | $ | 49,542,897 | ||||||||||
Repurchase Agreements | — | $ | 1,578,000 | — | 1,578,000 | |||||||||||
| 49,542,897 | 1,578,000 | — | 51,120,897 | |||||||||||||
Other Financial Instruments* – Assets | ||||||||||||||||
Foreign Exchange Contracts | 9,361 | — | — | 9,361 | ||||||||||||
Market Price | 22,876 | — | — | 22,876 | ||||||||||||
| 32,237 | — | — | 32,237 | |||||||||||||
Other Financial Instruments* – Liabilities | ||||||||||||||||
Foreign Exchange Contracts | (38,105 | ) | — | — | (38,105 | ) | ||||||||||
Market Price | (18,017 | ) | — | — | (18,017 | ) | ||||||||||
| (56,122 | ) | — | — | (56,122 | ) | |||||||||||
Totals | $ | 49,519,012 | $ | 1,578,000 | — | $ | 51,097,012 | |||||||||
| AllianzGI Retirement 2040: | ||||||||||||||||
| Investments in Securities – Assets | Level 1– Quoted Prices | Level 2– Other Significant Observable Inputs | Level 3– Significant | Value at 3/31/17 | ||||||||||||
Mutual Funds | $ | 45,347,327 | — | — | $ | 45,347,327 | ||||||||||
Repurchase Agreements | — | $ | 1,155,000 | — | 1,155,000 | |||||||||||
| 45,347,327 | 1,155,000 | — | 46,502,327 | |||||||||||||
Other Financial Instruments* – Assets | ||||||||||||||||
Foreign Exchange Contracts | 9,361 | — | — | 9,361 | ||||||||||||
Market Price | 26,909 | — | — | 26,909 | ||||||||||||
| 36,270 | — | — | 36,270 | |||||||||||||
Other Financial Instruments* – Liabilities | ||||||||||||||||
Foreign Exchange Contracts | (38,105 | ) | — | — | (38,105 | ) | ||||||||||
Market Price | (16,616 | ) | — | — | (16,616 | ) | ||||||||||
| (54,721 | ) | — | — | (54,721 | ) | |||||||||||
Totals | $ | 45,328,876 | $ | 1,155,000 | — | $ | 46,483,876 | |||||||||
| Semiannual Report | | March 31, 2017 | 317 |
Table of Contents
Notes to Financial Statements (cont’d)
March 31, 2017 (Unaudited)
| AllianzGI Retirement 2045: | ||||||||||||||||
| Investments in Securities – Assets | Level 1– Quoted Prices | Level 2– Other Significant Observable Inputs | Level 3– Significant | Value at 3/31/17 | ||||||||||||
Mutual Funds | $ | 28,062,529 | — | — | $ | 28,062,529 | ||||||||||
Repurchase Agreements | — | $ | 1,205,000 | — | 1,205,000 | |||||||||||
| 28,062,529 | 1,205,000 | — | 29,267,529 | |||||||||||||
Other Financial Instruments* – Assets | ||||||||||||||||
Foreign Exchange Contracts | 5,349 | — | — | 5,349 | ||||||||||||
Market Price | 19,622 | — | — | 19,622 | ||||||||||||
| 24,971 | — | — | 24,971 | |||||||||||||
Other Financial Instruments* – Liabilities | ||||||||||||||||
Foreign Exchange Contracts | (20,793 | ) | — | — | (20,793 | ) | ||||||||||
Market Price | (9,988 | ) | — | — | (9,988 | ) | ||||||||||
| (30,781 | ) | — | — | (30,781 | ) | |||||||||||
Totals | $ | 28,056,719 | $ | 1,205,000 | — | $ | 29,261,719 | |||||||||
| AllianzGI Retirement 2050: | ||||||||||||||||
| Investments in Securities – Assets | Level 1– Quoted Prices | Level 2– Other Significant Observable Inputs | Level 3– Significant | Value at 3/31/17 | ||||||||||||
Mutual Funds | $ | 26,826,541 | — | — | $ | 26,826,541 | ||||||||||
Repurchase Agreements | — | $ | 1,353,000 | — | 1,353,000 | |||||||||||
| 26,826,541 | 1,353,000 | — | 28,179,541 | |||||||||||||
Other Financial Instruments* – Assets | ||||||||||||||||
Foreign Exchange Contracts | 5,349 | — | — | 5,349 | ||||||||||||
Market Price | 18,792 | — | — | 18,792 | ||||||||||||
| 24,141 | — | — | 24,141 | |||||||||||||
Other Financial Instruments* – Liabilities | ||||||||||||||||
Foreign Exchange Contracts | (20,793 | ) | — | — | (20,793 | ) | ||||||||||
Market Price | (9,987 | ) | — | — | (9,987 | ) | ||||||||||
| (30,780 | ) | — | — | (30,780 | ) | |||||||||||
Totals | $ | 26,819,902 | $ | 1,353,000 | — | $ | 28,172,902 | |||||||||
| AllianzGI Retirement 2055: | ||||||||||||||||
| Investments in Securities – Assets | Level 1– Quoted Prices | Level 2– Other Significant Observable Inputs | Level 3– Significant | Value at 3/31/17 | ||||||||||||
Mutual Funds | $ | 10,931,901 | — | — | $ | 10,931,901 | ||||||||||
Repurchase Agreements | — | $ | 440,000 | — | 440,000 | |||||||||||
| 10,931,901 | 440,000 | — | 11,371,901 | |||||||||||||
Other Financial Instruments* – Assets | ||||||||||||||||
Foreign Exchange Contracts | 2,675 | — | — | 2,675 | ||||||||||||
Market Price | 8,177 | — | — | 8,177 | ||||||||||||
| 10,852 | — | — | 10,852 | |||||||||||||
Other Financial Instruments* – Liabilities | ||||||||||||||||
Foreign Exchange Contracts | (5,771 | ) | — | — | (5,771 | ) | ||||||||||
Market Price | (4,760 | ) | — | — | (4,760 | ) | ||||||||||
| (10,531 | ) | — | — | (10,531 | ) | |||||||||||
Totals | $ | 10,932,222 | $ | 440,000 | — | $ | 11,372,222 | |||||||||
| 318 | March 31, 2017 | | Semiannual Report |
Table of Contents
| AllianzGI Retirement Income: | ||||||||||||||||
| Investments in Securities – Assets | Level 1– Quoted Prices | Level 2– Other Significant Observable Inputs | Level 3– Significant | Value at 3/31/17 | ||||||||||||
Mutual Funds | $ | 40,448,898 | — | — | $ | 40,448,898 | ||||||||||
Common Stock: | ||||||||||||||||
Equity Real Estate Investment Trusts (REITs) | 5,090,587 | $ | 603,920 | — | 5,694,507 | |||||||||||
Mortgage Real Estate Investment Trusts (REITs) | 2,731,274 | — | — | 2,731,274 | ||||||||||||
Exchange-Traded Funds | 2,003,401 | — | — | 2,003,401 | ||||||||||||
Rights | — | 576 | — | 576 | ||||||||||||
Repurchase Agreements | — | 463,000 | — | 463,000 | ||||||||||||
| 50,274,160 | 1,067,496 | — | 51,341,656 | |||||||||||||
Other Financial Instruments* – Assets | ||||||||||||||||
Interest Rate Contracts | 31,103 | — | — | 31,103 | ||||||||||||
Market Price | 56,253 | — | — | 56,253 | ||||||||||||
| 87,356 | — | — | 87,356 | |||||||||||||
Other Financial Instruments* – Liabilities | ||||||||||||||||
Foreign Exchange Contracts | (51,152 | ) | — | — | (51,152 | ) | ||||||||||
Market Price | (108,543 | ) | — | — | (108,543 | ) | ||||||||||
| (159,695 | ) | — | — | (159,695 | ) | |||||||||||
Totals | $ | 50,201,821 | $ | 1,067,496 | — | $ | 51,269,317 | |||||||||
| AllianzGI Global Allocation: | ||||||||||||||||
| Investments in Securities – Assets | Level 1– Quoted Prices | Level 2– Other Significant | Level 3– Significant | Value at 3/31/17 | ||||||||||||
Mutual Funds | $ | 417,074,122 | — | — | $ | 417,074,122 | ||||||||||
Exchange-Traded Funds | 9,171,963 | — | — | 9,171,963 | ||||||||||||
U.S. Treasury Obligations | — | $ | 5,140,430 | — | 5,140,430 | |||||||||||
Repurchase Agreements | — | 24,074,000 | — | 24,074,000 | ||||||||||||
| 426,246,085 | 29,214,430 | — | 455,460,515 | |||||||||||||
Other Financial Instruments* – Assets | ||||||||||||||||
Foreign Exchange Contracts | 76,400 | — | — | 76,400 | ||||||||||||
Interest Rate Contracts | 159,297 | — | — | 159,297 | ||||||||||||
Market Price | 147,221 | — | — | 147,221 | ||||||||||||
| 382,918 | — | — | 382,918 | |||||||||||||
Other Financial Instruments* – Liabilities | ||||||||||||||||
Foreign Exchange Contracts | (503,836 | ) | — | — | (503,836 | ) | ||||||||||
Interest Rate Contracts | (11,895 | ) | — | — | (11,895 | ) | ||||||||||
Market Price | (177,839 | ) | — | — | (177,839 | ) | ||||||||||
| (693,570 | ) | — | — | (693,570 | ) | |||||||||||
Totals | $ | 425,935,433 | $ | 29,214,430 | — | $ | 455,149,863 | |||||||||
| AllianzGI Global Megatrends: | ||||||||||||||||
| Investments in Securities – Assets | Level 1– Quoted Prices | Level 2– Other Significant | Level 3– Significant | Value at 3/31/17 | ||||||||||||
Mutual Funds | $ | 3,280,699 | — | — | $ | 3,280,699 | ||||||||||
Repurchase Agreements | — | $ | 181,000 | — | 181,000 | |||||||||||
Totals | $ | 3,280,699 | $ | 181,000 | — | $ | 3,461,699 | |||||||||
| Semiannual Report | | March 31, 2017 | 319 |
Table of Contents
Notes to Financial Statements (cont’d)
March 31, 2017 (Unaudited)
| AllianzGI Best Styles Emerging Markets Equity: | ||||||||||||||||
| Investments in Securities – Assets | Level 1– Quoted Prices | Level 2– Other Significant | Level 3– Significant | Value at 3/31/17 | ||||||||||||
Common Stock: | ||||||||||||||||
China | $ | 406,206 | $ | 1,472,291 | — | $ | 1,878,497 | |||||||||
Hong Kong | — | 65,117 | — | 65,117 | ||||||||||||
Hungary | — | 43,056 | — | 43,056 | ||||||||||||
Indonesia | 31,139 | 12,542 | — | 43,681 | ||||||||||||
Korea (Republic of) | 70,474 | 675,265 | — | 745,739 | ||||||||||||
Malaysia | 28,299 | 119,586 | — | 147,885 | ||||||||||||
Norway | — | 10,857 | — | 10,857 | ||||||||||||
Philippines | 2,798 | 5,361 | — | 8,159 | ||||||||||||
Russian Federation | 152,736 | 17,116 | — | 169,852 | ||||||||||||
Singapore | 5,089 | 8,757 | — | 13,846 | ||||||||||||
South Africa | 49,348 | 191,664 | — | 241,012 | ||||||||||||
Taiwan | 15,005 | 779,329 | — | 794,334 | ||||||||||||
Thailand | — | 19,642 | $ | 163,021 | 182,663 | |||||||||||
Turkey | — | 146,584 | — | 146,584 | ||||||||||||
All Other | 552,674 | — | — | 552,674 | ||||||||||||
Preferred Stock: | ||||||||||||||||
Korea (Republic of) | — | 57,296 | — | 57,296 | ||||||||||||
All Other | 262,375 | — | — | 262,375 | ||||||||||||
Repurchase Agreements | — | 579,000 | — | 579,000 | ||||||||||||
| 1,576,143 | 4,203,463 | 163,021 | 5,942,627 | |||||||||||||
Other Financial Instruments* – Assets | ||||||||||||||||
Market Price | 2,420 | — | — | 2,420 | ||||||||||||
Totals | $ | 1,578,563 | $ | 4,203,463 | $ | 163,021 | $ | 5,945,047 | ||||||||
| AllianzGI Best Styles Global Equity: | ||||||||||||||||
| Investments in Securities – Assets | Level 1– Quoted Prices | Level 2– Other Significant | Level 3– Significant | Value at 3/31/17 | ||||||||||||
Common Stock: | ||||||||||||||||
Australia | $ | 387,990 | $ | 8,078,354 | — | $ | 8,466,344 | |||||||||
Austria | 322,873 | 2,588,842 | — | 2,911,715 | ||||||||||||
Belgium | — | 1,980,461 | — | 1,980,461 | ||||||||||||
China | 7,282,406 | 27,504,079 | $ | 1,162 | 34,787,647 | |||||||||||
Denmark | — | 3,055,901 | — | 3,055,901 | ||||||||||||
Finland | 319,018 | 2,073,169 | — | 2,392,187 | ||||||||||||
France | 1,341,755 | 30,053,400 | — | 31,395,155 | ||||||||||||
Germany | 348,891 | 22,118,431 | — | 22,467,322 | ||||||||||||
Greece | 727,141 | 1,092,797 | — | 1,819,938 | ||||||||||||
Hong Kong | — | 2,326,253 | — | 2,326,253 | ||||||||||||
Indonesia | — | 4,883,324 | — | 4,883,324 | ||||||||||||
Israel | 344,227 | 1,536,957 | — | 1,881,184 | ||||||||||||
Italy | 2,211,224 | 4,453,282 | — | 6,664,506 | ||||||||||||
Japan | — | 38,042,111 | — | 38,042,111 | ||||||||||||
Korea (Republic of) | 4,261,557 | 13,869,072 | — | 18,130,629 | ||||||||||||
Malaysia | — | 3,248,925 | — | 3,248,925 | ||||||||||||
Morocco | — | 348,786 | — | 348,786 | ||||||||||||
Netherlands | 1,713,161 | 4,921,557 | — | 6,634,718 | ||||||||||||
New Zealand | 959,487 | 1,176,008 | — | 2,135,495 | ||||||||||||
| 320 | March 31, 2017 | | Semiannual Report |
Table of Contents
| AllianzGI Best Styles Global Equity (cont’d) | ||||||||||||||||
| Investments in Securities – Assets | Level 1– Quoted Prices | Level 2– Other Significant | Level 3– Significant | Value at 3/31/17 | ||||||||||||
Norway | $ | 1,081,698 | $ | 3,618,830 | — | $ | 4,700,528 | |||||||||
Philippines | 304,750 | 695,122 | — | 999,872 | ||||||||||||
Russian Federation | 626,032 | 116,686 | — | 742,718 | ||||||||||||
Singapore | 1,166,238 | 3,197,056 | — | 4,363,294 | ||||||||||||
South Africa | 1,155,739 | 1,492,334 | — | 2,648,073 | ||||||||||||
Spain | — | 7,670,536 | — | 7,670,536 | ||||||||||||
Sweden | 699,348 | 4,035,598 | — | 4,734,946 | ||||||||||||
Switzerland | 757,446 | 4,619,965 | — | 5,377,411 | ||||||||||||
Taiwan | — | 13,085,399 | — | 13,085,399 | ||||||||||||
Thailand | — | 1,987,527 | $ | 3,297,395 | 5,284,922 | |||||||||||
Turkey | — | 4,559,228 | — | 4,559,228 | ||||||||||||
United Kingdom | 4,053,297 | 40,417,990 | — | 44,471,287 | ||||||||||||
All Other | 416,884,536 | — | — | 416,884,536 | ||||||||||||
Preferred Stock: | ||||||||||||||||
Korea (Republic of) | — | 3,184,202 | — | 3,184,202 | ||||||||||||
All Other | 3,448,052 | — | — | 3,448,052 | ||||||||||||
Rights | 248 | — | — | 248 | ||||||||||||
Repurchase Agreements | — | 6,511,000 | — | 6,511,000 | ||||||||||||
| 450,397,114 | 268,543,182 | 3,298,557 | 722,238,853 | |||||||||||||
Other Financial Instruments* – Assets | ||||||||||||||||
Market Price | 96,492 | — | — | 96,492 | ||||||||||||
Other Financial Instruments* – Liabilities | ||||||||||||||||
Market Price | (41,607 | ) | — | — | (41,607 | ) | ||||||||||
Totals | $ | 450,451,999 | $ | 268,543,182 | $ | 3,298,557 | $ | 722,293,738 | ||||||||
| AllianzGI Best Styles International Equity: | ||||||||||||||||
| Investments in Securities – Assets | Level 1– Quoted Prices | Level 2– Other Significant Observable Inputs | Level 3– Significant | Value at 3/31/17 | ||||||||||||
Common Stock: | ||||||||||||||||
Austria | $ | 169,444 | $ | 387,024 | — | $ | 556,468 | |||||||||
Belgium | 41,149 | 204,400 | — | 245,549 | ||||||||||||
France | 85,960 | 3,036,987 | — | 3,122,947 | ||||||||||||
Greece | 36,203 | 130,287 | — | 166,490 | ||||||||||||
Ireland | 5,941 | 238,385 | — | 244,326 | ||||||||||||
Italy | 87,520 | 973,638 | — | 1,061,158 | ||||||||||||
Japan | — | 7,568,064 | $ | 37,616 | 7,605,680 | |||||||||||
Netherlands | 155,441 | 340,291 | — | 495,732 | ||||||||||||
New Zealand | 230,194 | 236,098 | — | 466,292 | ||||||||||||
Norway | 65,187 | 365,778 | — | 430,965 | ||||||||||||
Singapore | 89,253 | 20,337 | ��� | 109,590 | ||||||||||||
Sweden | 90,804 | 253,198 | — | 344,002 | ||||||||||||
United Kingdom | 985,910 | 3,719,058 | — | 4,704,968 | ||||||||||||
All Other | — | 11,532,215 | — | 11,532,215 | ||||||||||||
Preferred Stock | — | 378,759 | — | 378,759 | ||||||||||||
Repurchase Agreements | — | 412,000 | — | 412,000 | ||||||||||||
| 2,043,006 | 29,796,519 | 37,616 | 31,877,141 | |||||||||||||
Other Financial Instruments* – Assets | ||||||||||||||||
Market Price | 13,144 | — | — | 13,144 | ||||||||||||
Totals | $ | 2,056,150 | $ | 29,796,519 | $ | 37,616 | $ | 31,890,285 | ||||||||
| Semiannual Report | | March 31, 2017 | 321 |
Table of Contents
Notes to Financial Statements (cont’d)
March 31, 2017 (Unaudited)
| AllianzGI Best Styles U.S. Equity: | ||||||||||||||||
| Investments in Securities – Assets | Level 1– Quoted Prices | Level 2– Other Significant Observable Inputs | Level 3– Significant | Value at 3/31/17 | ||||||||||||
Common Stock | $ | 120,223,795 | — | — | $ | 120,223,795 | ||||||||||
Rights | — | $ | 6,088 | — | 6,088 | |||||||||||
Repurchase Agreements | — | 161,000 | — | 161,000 | ||||||||||||
Totals | $ | 120,223,795 | $ | 167,088 | — | $ | 120,390,883 | |||||||||
| AllianzGI Convertible: | ||||||||||||||||
| Investments in Securities – Assets | Level 1– Quoted Prices | Level 2– Other Significant Observable Inputs | Level 3– Significant | Value at 3/31/17 | ||||||||||||
Convertible Bonds: | ||||||||||||||||
IT Services | — | — | $ | 10,375,124 | $ | 10,375,124 | ||||||||||
All Other | — | $ | 923,138,535 | — | 923,138,535 | |||||||||||
Convertible Preferred Stock: | ||||||||||||||||
Computers | — | 9,098,568 | — | 9,098,568 | ||||||||||||
Food & Beverage | — | 13,300,384 | — | 13,300,384 | ||||||||||||
Food Products | — | 15,706,825 | — | 15,706,825 | ||||||||||||
Investment Companies | — | 11,130,493 | — | 11,130,493 | ||||||||||||
All Other | $ | 130,074,494 | — | — | 130,074,494 | |||||||||||
Common Stock | 5,224,492 | — | — | 5,224,492 | ||||||||||||
Repurchase Agreements | — | 50,654,000 | — | 50,654,000 | ||||||||||||
Totals | $ | 135,298,986 | $ | 1,023,028,805 | $ | 10,375,124 | $ | 1,168,702,915 | ||||||||
| AllianzGI Emerging Markets Consumer: | ||||||||||||||||
| Investments in Securities – Assets | Level 1– Quoted Prices | Level 2– Other Significant Observable Inputs | Level 3– Significant | Value at 3/31/17 | ||||||||||||
Common Stock: | ||||||||||||||||
Brazil | $ | 2,582,429 | — | — | $ | 2,582,429 | ||||||||||
China | 837,168 | $ | 6,701,509 | — | 7,538,677 | |||||||||||
Indonesia | 324,168 | — | — | 324,168 | ||||||||||||
Korea (Republic of) | 67,396 | 7,048,449 | — | 7,115,845 | ||||||||||||
Russian Federation | 1,642,579 | — | $ | 1,065,648 | 2,708,227 | |||||||||||
South Africa | 477,950 | 1,565,831 | — | 2,043,781 | ||||||||||||
Thailand | — | 365,459 | 1,047,481 | 1,412,940 | ||||||||||||
United States | 2,599,971 | — | — | 2,599,971 | ||||||||||||
All Other | — | 12,281,786 | — | 12,281,786 | ||||||||||||
Preferred Stock | — | 293,521 | — | 293,521 | ||||||||||||
Equity-Linked Security | — | 115,041 | — | 115,041 | ||||||||||||
Repurchase Agreements | — | 675,000 | — | 675,000 | ||||||||||||
Totals | $ | 8,531,661 | $ | 29,046,596 | $ | 2,113,129 | $ | 39,691,386 | ||||||||
| 322 | March 31, 2017 | | Semiannual Report |
Table of Contents
| AllianzGI Emerging Markets Debt: | ||||||||||||||||
| Investments in Securities – Assets | Level 1– Quoted Prices | Level 2– Other Significant Observable Inputs | Level 3– Significant | Value at 3/31/17 | ||||||||||||
Corporate Bonds & Notes | — | $ | 25,414,184 | — | $ | 25,414,184 | ||||||||||
Sovereign Debt Obligations | — | 14,086,888 | — | 14,086,888 | ||||||||||||
Repurchase Agreements | — | 1,455,000 | — | 1,455,000 | ||||||||||||
| — | 40,956,072 | — | 40,956,072 | |||||||||||||
Other Financial Instruments* – Assets | ||||||||||||||||
Foreign Exchange Contracts | — | 6,451 | — | 6,451 | ||||||||||||
Totals | — | $ | 40,962,523 | — | $ | 40,962,523 | ||||||||||
| AllianzGI Emerging Markets Small-Cap: | ||||||||||||||||
| Investments in Securities – Assets | Level 1– Quoted Prices | Level 2– Other Significant Observable Inputs | Level 3– Significant | Value at 3/31/17 | ||||||||||||
Common Stock: | ||||||||||||||||
Brazil | $ | 203,368 | — | — | $ | 203,368 | ||||||||||
Chile | 149,928 | — | — | 149,928 | ||||||||||||
China | 24,063 | $ | 2,905,913 | $ | 40,982 | 2,970,958 | ||||||||||
Colombia | 37,779 | — | — | 37,779 | ||||||||||||
Czech Republic | 15,000 | — | — | 15,000 | ||||||||||||
Hong Kong | 53,738 | 225,772 | — | 279,510 | ||||||||||||
India | 65,981 | 1,258,916 | — | 1,324,897 | ||||||||||||
Korea (Republic of) | 467,501 | 1,344,989 | — | 1,812,490 | ||||||||||||
Malaysia | 156,309 | — | — | 156,309 | ||||||||||||
Philippines | 172,216 | — | — | 172,216 | ||||||||||||
Russian Federation | — | 121,638 | 415,561 | 537,199 | ||||||||||||
South Africa | 107,446 | 288,218 | — | 395,664 | ||||||||||||
Thailand | 234,791 | 280,585 | 94,306 | 609,682 | ||||||||||||
All Other | — | 4,820,648 | — | 4,820,648 | ||||||||||||
Preferred Stock | 19,015 | — | — | 19,015 | ||||||||||||
Repurchase Agreements | — | 243,000 | — | 243,000 | ||||||||||||
Totals | $ | 1,707,135 | $ | 11,489,679 | $ | 550,849 | $ | 13,747,663 | ||||||||
| AllianzGI Europe Equity Dividend: | ||||||||||||||||
| Investments in Securities – Assets | Level 1– Quoted Prices | Level 2– Other Significant Observable Inputs | Level 3– Significant | Value at 3/31/17 | ||||||||||||
Common Stock: | ||||||||||||||||
Belgium | $ | 11,440 | — | — | $ | 11,440 | ||||||||||
United Kingdom | 33,196 | $ | 1,837,405 | — | 1,870,601 | |||||||||||
All Other | — | 4,662,086 | — | 4,662,086 | ||||||||||||
Repurchase Agreements | — | 207,000 | — | 207,000 | ||||||||||||
Totals | $ | 44,636 | $ | 6,706,491 | — | $ | 6,751,127 | |||||||||
| Semiannual Report | | March 31, 2017 | 323 |
Table of Contents
Notes to Financial Statements (cont’d)
March 31, 2017 (Unaudited)
| AllianzGI Global Dynamic Allocation: | ||||||||||||||||
| Investments in Securities – Assets | Level 1– Quoted Prices | Level 2– Other Significant Observable Inputs | Level 3– Significant | Value at 3/31/17 | ||||||||||||
Common Stock: | ||||||||||||||||
Australia | $ | 53,770 | $ | 1,599,773 | — | $ | 1,653,543 | |||||||||
Austria | 61,166 | 405,173 | — | 466,339 | ||||||||||||
Belgium | — | 366,584 | — | 366,584 | ||||||||||||
China | 794,132 | 4,244,901 | $ | 34 | 5,039,067 | |||||||||||
Denmark | 6,128 | 468,495 | — | 474,623 | ||||||||||||
Finland | 44,202 | 337,861 | — | 382,063 | ||||||||||||
France | 256,847 | 4,624,096 | — | 4,880,943 | ||||||||||||
Germany | 48,344 | 2,999,511 | — | 3,047,855 | ||||||||||||
Greece | 100,769 | 151,433 | — | 252,202 | ||||||||||||
Hong Kong | — | 817,465 | — | 817,465 | ||||||||||||
Hungary | — | 110,128 | — | 110,128 | ||||||||||||
Indonesia | — | 872,632 | — | 872,632 | ||||||||||||
Israel | 47,705 | 413,948 | — | 461,653 | ||||||||||||
Italy | 339,428 | 644,058 | — | 983,486 | ||||||||||||
Japan | — | 8,164,802 | — | 8,164,802 | ||||||||||||
Korea (Republic of) | 1,027,560 | 2,411,143 | — | 3,438,703 | ||||||||||||
Luxembourg | — | 56,161 | — | 56,161 | ||||||||||||
Malaysia | — | 578,481 | — | 578,481 | ||||||||||||
Morocco | 10,204 | 63,022 | — | 73,226 | ||||||||||||
Netherlands | 246,164 | 735,931 | — | 982,095 | ||||||||||||
New Zealand | 187,376 | 246,222 | — | 433,598 | ||||||||||||
Norway | 173,024 | 638,523 | — | 811,547 | ||||||||||||
Philippines | 48,841 | 103,449 | — | 152,290 | ||||||||||||
Poland | 18,358 | 57,456 | — | 75,814 | ||||||||||||
Portugal | — | 38,758 | — | 38,758 | ||||||||||||
Russian Federation | 110,980 | 3,433 | — | 114,413 | ||||||||||||
Singapore | 168,132 | 870,849 | — | 1,038,981 | ||||||||||||
South Africa | 167,320 | 271,662 | — | 438,982 | ||||||||||||
Spain | 4,353 | 1,127,252 | — | 1,131,605 | ||||||||||||
Sweden | 106,391 | 579,277 | — | 685,668 | ||||||||||||
Switzerland | 251,937 | 1,260,597 | — | 1,512,534 | ||||||||||||
Taiwan | — | 2,237,210 | — | 2,237,210 | ||||||||||||
Thailand | — | 391,112 | 336,660 | 727,772 | ||||||||||||
Turkey | — | 693,932 | — | 693,932 | ||||||||||||
United Kingdom | 618,892 | 5,947,315 | — | 6,566,207 | ||||||||||||
All Other | 71,693,082 | — | — | 71,693,082 | ||||||||||||
U.S. Treasury Obligations | — | 62,820,671 | — | 62,820,671 | ||||||||||||
Corporate Bonds & Notes | — | 23,275,632 | — | 23,275,632 | ||||||||||||
U.S. Government Agency Securities | — | 19,348,697 | — | 19,348,697 | ||||||||||||
Exchange-Traded Funds | 15,385,686 | — | — | 15,385,686 | ||||||||||||
Sovereign Debt Obligations | — | 13,797,587 | — | 13,797,587 | ||||||||||||
Preferred Stock: | ||||||||||||||||
Brazil | 321,872 | — | — | 321,872 | ||||||||||||
Colombia | 101,379 | — | — | 101,379 | ||||||||||||
Korea (Republic of) | — | 442,608 | — | 442,608 | ||||||||||||
| 324 | March 31, 2017 | | Semiannual Report |
Table of Contents
| AllianzGI Global Dynamic Allocation (cont’d) | ||||||||||||||||
| Investments in Securities – Assets | Level 1– Quoted Prices | Level 2– Other Significant Observable Inputs | Level 3– Significant | Value at 3/31/17 | ||||||||||||
Rights: | ||||||||||||||||
Australia | $ | 42 | — | — | $ | 42 | ||||||||||
United States | — | $ | 5,205 | — | 5,205 | |||||||||||
Repurchase Agreements | — | 19,483,000 | — | 19,483,000 | ||||||||||||
| 92,394,084 | 183,706,045 | $ | 336,694 | 276,436,823 | ||||||||||||
Other Financial Instruments* – Assets | ||||||||||||||||
Interest Rate Contracts | 128,486 | — | — | 128,486 | ||||||||||||
Market Price | 1,074,647 | — | — | 1,074,647 | ||||||||||||
| 1,203,133 | — | — | 1,203,133 | |||||||||||||
Other Financial Instruments* – Liabilities | ||||||||||||||||
Foreign Exchange Contracts | (158,545 | ) | — | — | (158,545 | ) | ||||||||||
Interest Rate Contracts | (24,684 | ) | — | — | (24,684 | ) | ||||||||||
Market Price | (336,216 | ) | — | — | (336,216 | ) | ||||||||||
| (519,445 | ) | — | — | (519,445 | ) | |||||||||||
Totals | $ | 93,077,772 | $ | 183,706,045 | $ | 336,694 | $ | 277,120,511 | ||||||||
| AllianzGI Global Fundamental Strategy: | ||||||||||||||||
| Investments in Securities – Assets | Level 1– Quoted Prices | Level 2– Other Significant Observable Inputs | Level 3– Significant Unobservable Inputs | Value at 3/31/17 | ||||||||||||
Common Stock: | ||||||||||||||||
China | $ | 146,642 | $ | 312,045 | — | $ | 458,687 | |||||||||
Hong Kong | 156,243 | — | — | 156,243 | ||||||||||||
United Kingdom | 111,978 | 1,265,070 | — | 1,377,048 | ||||||||||||
United States | 1,586,541 | — | — | 1,586,541 | ||||||||||||
All Other | — | 2,277,372 | — | 2,277,372 | ||||||||||||
Sovereign Debt Obligations | — | 4,638,266 | — | 4,638,266 | ||||||||||||
Corporate Bonds & Notes | — | 2,737,221 | — | 2,737,221 | ||||||||||||
U.S. Treasury Obligations | — | 625,667 | — | 625,667 | ||||||||||||
Mutual Funds | 510,150 | — | — | 510,150 | ||||||||||||
Exchange-Traded Funds | 327,444 | — | — | 327,444 | ||||||||||||
Repurchase Agreements | — | 780,000 | — | 780,000 | ||||||||||||
Options Purchased: |
| |||||||||||||||
Market Price | 33,035 | — | — | 33,035 | ||||||||||||
| 2,872,033 | 12,635,641 | — | 15,507,674 | |||||||||||||
Other Financial Instruments* – Assets |
| |||||||||||||||
Foreign Exchange Contracts | — | 23,455 | — | 23,455 | ||||||||||||
Interest Rate Contracts | 1,186 | — | — | 1,186 | ||||||||||||
Market Price | 33,222 | — | — | 33,222 | ||||||||||||
| 34,408 | 23,455 | — | 57,863 | |||||||||||||
Other Financial Instruments* – Liabilities |
| |||||||||||||||
Foreign Exchange Contracts | — | (7,053 | ) | — | (7,053 | ) | ||||||||||
Totals | $ | 2,906,441 | $ | 12,652,043 | — | $ | 15,558,484 | |||||||||
| Semiannual Report | | March 31, 2017 | 325 |
Table of Contents
Notes to Financial Statements (cont’d)
March 31, 2017 (Unaudited)
| AllianzGI Global Sustainability: | ||||||||||||||||
| Investments in Securities – Assets | Level 1– Quoted Prices | Level 2– Other Significant Observable Inputs | Level 3– Significant Unobservable Inputs | Value at 3/31/17 | ||||||||||||
Common Stock: |
| |||||||||||||||
Australia | — | $ | 505,256 | — | $ | 505,256 | ||||||||||
Denmark | — | 275,124 | — | 275,124 | ||||||||||||
France | — | 690,971 | — | 690,971 | ||||||||||||
Germany | — | 1,544,258 | — | 1,544,258 | ||||||||||||
Japan | — | 1,258,962 | — | 1,258,962 | ||||||||||||
Spain | — | 987,570 | — | 987,570 | ||||||||||||
Sweden | — | 869,704 | — | 869,704 | ||||||||||||
Switzerland | — | 1,111,599 | — | 1,111,599 | ||||||||||||
United Kingdom | $ | 218,984 | 3,450,901 | — | 3,669,885 | |||||||||||
All Other | 12,828,329 | — | — | 12,828,329 | ||||||||||||
Preferred Stock | — | 297,494 | — | 297,494 | ||||||||||||
Repurchase Agreements | — | 603,000 | — | 603,000 | ||||||||||||
Totals | $ | 13,047,313 | $ | 11,594,839 | — | $ | 24,642,152 | |||||||||
| AllianzGI Global Water: | ||||||||||||||||
| Investments in Securities – Assets | Level 1– Quoted Prices | Level 2– Other Significant Observable Inputs | Level 3– Significant Unobservable Inputs | Value at 3/31/17 | ||||||||||||
Common Stock: |
| |||||||||||||||
Austria | — | $ | 8,013,712 | — | $ | 8,013,712 | ||||||||||
China | — | 28,973,801 | — | 28,973,801 | ||||||||||||
Finland | — | 15,748,883 | — | 15,748,883 | ||||||||||||
France | — | 42,762,061 | — | 42,762,061 | ||||||||||||
Germany | — | 10,897,229 | — | 10,897,229 | ||||||||||||
Hong Kong | — | 16,517,285 | — | 16,517,285 | ||||||||||||
Netherlands | — | 16,824,962 | — | 16,824,962 | ||||||||||||
Switzerland | $ | 2,770,928 | 46,515,513 | — | 49,286,441 | |||||||||||
United Kingdom | 21,866,776 | 82,689,358 | — | 104,556,134 | ||||||||||||
All Other | 215,563,686 | — | — | 215,563,686 | ||||||||||||
Repurchase Agreements | — | 37,405,000 | — | 37,405,000 | ||||||||||||
Totals | $ | 240,201,390 | $ | 306,347,804 | — | $ | 546,549,194 | |||||||||
| AllianzGI High Yield Bond: | ||||||||||||||||
| Investments in Securities – Assets | Level 1– Quoted Prices | Level 2– Other Significant Observable Inputs | Level 3– Significant Unobservable Inputs | Value at 3/31/17 | ||||||||||||
Corporate Bonds & Notes | — | $ | 319,807,544 | — | $ | 319,807,544 | ||||||||||
Preferred Stock | — | — | $ | 6,252,564 | 6,252,564 | |||||||||||
Common Stock | — | — | 684,875 | 684,875 | ||||||||||||
Warrants | — | — | 46,062 | 46,062 | ||||||||||||
Repurchase Agreements | — | 9,774,000 | — | 9,774,000 | ||||||||||||
Totals | — | $ | 329,581,544 | $ | 6,983,501 | $ | 336,565,045 | |||||||||
| 326 | March 31, 2017 | | Semiannual Report |
Table of Contents
| AllianzGI International Growth: | ||||||||||||||||
| Investments in Securities – Assets | Level 1– Quoted Prices | Level 2– Other Significant Observable Inputs | Level 3– Significant Unobservable Inputs | Value at 3/31/17 | ||||||||||||
Common Stock: |
| |||||||||||||||
Brazil | $ | 1,360,550 | — | — | $ | 1,360,550 | ||||||||||
Canada | 2,788,167 | — | — | 2,788,167 | ||||||||||||
China | 1,243,793 | $ | 894,881 | — | 2,138,674 | |||||||||||
India | 315,999 | — | — | 315,999 | ||||||||||||
Ireland | 458,601 | — | — | 458,601 | ||||||||||||
Mexico | 292,945 | — | — | 292,945 | ||||||||||||
All Other | — | 21,058,456 | — | 21,058,456 | ||||||||||||
Repurchase Agreements | — | 294,000 | — | 294,000 | ||||||||||||
Totals | $ | 6,460,055 | $ | 22,247,337 | — | $ | 28,707,392 | |||||||||
| AllianzGI International Small-Cap: | ||||||||||||||||
| Investments in Securities – Assets | Level 1– Quoted Prices | Level 2– Other Significant Observable Inputs | Level 3– Significant Unobservable Inputs | Value at 3/31/17 | ||||||||||||
Common Stock: |
| |||||||||||||||
China | $ | 219,945 | $ | 2,271,219 | — | $ | 2,491,164 | |||||||||
Denmark | 1,439,609 | 1,029,315 | — | 2,468,924 | ||||||||||||
France | 1,342,704 | 4,065,763 | — | 5,408,467 | ||||||||||||
Ireland | 1,654,471 | — | — | 1,654,471 | ||||||||||||
Netherlands | 1,756,420 | 2,950,649 | — | 4,707,069 | ||||||||||||
United Kingdom | 840,814 | 7,339,031 | — | 8,179,845 | ||||||||||||
All Other | — | 61,968,567 | — | 61,968,567 | ||||||||||||
Preferred Stock | — | 1,635,374 | — | 1,635,374 | ||||||||||||
Repurchase Agreements | — | 4,218,000 | — | 4,218,000 | ||||||||||||
| 7,253,963 | 85,477,918 | — | 92,731,881 | |||||||||||||
Other Financial Instruments* – Liabilities | ||||||||||||||||
Foreign Exchange Contracts | — | (764 | ) | — | (764 | ) | ||||||||||
Totals | $ | 7,253,963 | $ | 85,477,154 | — | $ | 92,731,117 | |||||||||
| AllianzGI Micro Cap: | ||||||||||||||||
| Investments in Securities – Assets | Level 1– Quoted Prices | Level 2– Other Significant Observable Inputs | Level 3– Significant Unobservable Inputs | Value at 3/31/17 | ||||||||||||
Common Stock | $ | 35,272,256 | — | — | $ | 35,272,256 | ||||||||||
Repurchase Agreements | — | $ | 1,216,000 | — | 1,216,000 | |||||||||||
Totals | $ | 35,272,256 | $ | 1,216,000 | — | $ | 36,488,256 | |||||||||
| AllianzGI Multi-Asset Real Return: | ||||||||||||||||
| Investments in Securities – Assets | Level 1– Quoted Prices | Level 2– Other Significant Observable Inputs | Level 3– Significant Unobservable Inputs | Value at 3/31/17 | ||||||||||||
Mutual Funds | $ | 2,042,952 | — | — | $ | 2,042,952 | ||||||||||
Exchange-Traded Funds | 804,787 | — | — | 804,787 | ||||||||||||
Common Stock: | ||||||||||||||||
Canada | 7,270 | — | — | 7,270 | ||||||||||||
United States | 222,639 | — | — | 222,639 | ||||||||||||
All Other | — | $ | 405,424 | — | 405,424 | |||||||||||
Repurchase Agreements | — | 849,000 | — | 849,000 | ||||||||||||
| 3,077,648 | 1,254,424 | — | 4,332,072 | |||||||||||||
| Semiannual Report | | March 31, 2017 | 327 |
Table of Contents
Notes to Financial Statements (cont’d)
March 31, 2017 (Unaudited)
| AllianzGI Multi-Asset Real Return (cont’d) | ||||||||||||||||
| Investments in Securities – Assets | Level 1– Quoted Prices | Level 2– Other Significant Observable Inputs | Level 3– Significant Unobservable Inputs | Value at 3/31/17 | ||||||||||||
Other Financial Instruments* – Assets | ||||||||||||||||
Market Price | $ | 11,743 | — | — | $ | 11,743 | ||||||||||
Other Financial Instruments* – Liabilities | ||||||||||||||||
Foreign Exchange Contracts | (1,403 | ) | — | — | (1,403 | ) | ||||||||||
Interest Rate Contracts | (66 | ) | — | — | (66 | ) | ||||||||||
Market Price | (1,622 | ) | — | — | (1,622 | ) | ||||||||||
| (3,091 | ) | — | — | (3,091 | ) | |||||||||||
Totals | $ | 3,086,300 | $ | 1,254,424 | — | $ | 4,340,724 | |||||||||
| AllianzGI NFJ Emerging Markets Value: | ||||||||||||||||
| Investments in Securities – Assets | Level 1– Quoted Prices | Level 2– Other Significant Observable Inputs | Level 3– Significant Unobservable Inputs | Value at 3/31/17 | ||||||||||||
Common Stock: | ||||||||||||||||
Brazil | $ | 1,389,614 | — | — | $ | 1,389,614 | ||||||||||
Chile | 158,319 | $ | 170,460 | — | 328,779 | |||||||||||
Czech Republic | 161,790 | — | — | 161,790 | ||||||||||||
India | 337,551 | 2,064,232 | — | 2,401,783 | ||||||||||||
Korea (Republic of) | 322,964 | 2,313,678 | — | 2,636,642 | ||||||||||||
Malaysia | 502,721 | 326,995 | — | 829,716 | ||||||||||||
Mexico | 898,873 | — | — | 898,873 | ||||||||||||
Russian Federation | 339,289 | — | $ | 293,908 | 633,197 | |||||||||||
South Africa | 586,225 | 459,067 | — | 1,045,292 | ||||||||||||
Taiwan | 175,986 | 3,236,561 | — | 3,412,547 | ||||||||||||
Turkey | 160,281 | 336,416 | — | 496,697 | ||||||||||||
All Other | — | 7,397,645 | — | 7,397,645 | ||||||||||||
Preferred Stock: | ||||||||||||||||
Brazil | 178,767 | — | — | 178,767 | ||||||||||||
Russian Federation | — | — | 166,741 | 166,741 | ||||||||||||
All Other | — | 488,583 | — | 488,583 | ||||||||||||
Equity-Linked Securities | — | 340,799 | — | 340,799 | ||||||||||||
Exchange-Traded Funds | 165,438 | — | — | 165,438 | ||||||||||||
Repurchase Agreements | — | 712,000 | — | 712,000 | ||||||||||||
| 5,377,818 | 17,846,436 | 460,649 | 23,684,903 | |||||||||||||
Other Financial Instruments* – Liabilities | ||||||||||||||||
Foreign Exchange Contracts | — | (470 | ) | — | (470 | ) | ||||||||||
Totals | $ | 5,377,818 | $ | 17,845,966 | $ | 460,649 | $ | 23,684,433 | ||||||||
| AllianzGI NFJ Global Dividend Value: | ||||||||||||||||
| Investments in Securities – Assets | Level 1– Quoted Prices | Level 2– Other Significant Observable Inputs | Level 3– Significant Unobservable Inputs | Value at 3/31/17 | ||||||||||||
Common Stock: | ||||||||||||||||
Australia | — | $ | 386,621 | — | $ | 386,621 | ||||||||||
China | — | 771,282 | — | 771,282 | ||||||||||||
France | — | 392,760 | — | 392,760 | ||||||||||||
Germany | — | 785,912 | — | 785,912 | ||||||||||||
Japan | — | 751,994 | — | 751,994 | ||||||||||||
Korea (Republic of) | — | 395,639 | — | 395,639 | ||||||||||||
Norway | — | 355,351 | — | 355,351 | ||||||||||||
| 328 | March 31, 2017 | | Semiannual Report |
Table of Contents
| AllianzGI NFJ Global Dividend Value (cont’d) | ||||||||||||||||
| Investments in Securities – Assets | Level 1– Quoted Prices | Level 2– Other Significant Observable Inputs | Level 3– Significant Unobservable Inputs | Value at 3/31/17 | ||||||||||||
Spain | — | $ | 396,209 | — | $ | 396,209 | ||||||||||
Switzerland | — | 382,347 | — | 382,347 | ||||||||||||
United Kingdom | — | 1,847,158 | — | 1,847,158 | ||||||||||||
All Other | $ | 12,220,976 | — | — | 12,220,976 | |||||||||||
Repurchase Agreements | — | 231,000 | — | 231,000 | ||||||||||||
Totals | $ | 12,220,976 | $ | 6,696,273 | — | $ | 18,917,249 | |||||||||
| AllianzGI NFJ International Small-Cap Value: | ||||||||||||||||
| Investments in Securities – Assets | Level 1– Quoted Prices | Level 2– Other Significant Observable Inputs | Level 3– Significant Unobservable Inputs | Value at 3/31/17 | ||||||||||||
Common Stock: | ||||||||||||||||
Brazil | $ | 88,062 | — | — | $ | 88,062 | ||||||||||
Canada | 315,102 | — | — | 315,102 | ||||||||||||
Chile | 40,800 | — | — | 40,800 | ||||||||||||
Denmark | 46,130 | $ | 46,535 | — | 92,665 | |||||||||||
Finland | 110,778 | 34,151 | — | 144,929 | ||||||||||||
France | 39,414 | 87,332 | — | 126,746 | ||||||||||||
Mexico | 47,016 | — | — | 47,016 | ||||||||||||
Netherlands | 48,622 | 95,803 | — | 144,425 | ||||||||||||
Poland | 40,680 | — | — | 40,680 | ||||||||||||
Singapore | 45,462 | 88,420 | — | 133,882 | ||||||||||||
Spain | 35,138 | 210,260 | — | 245,398 | ||||||||||||
Sweden | 142,439 | 115,455 | — | 257,894 | ||||||||||||
United Kingdom | 298,992 | 337,839 | — | 636,831 | ||||||||||||
United States | 41,195 | — | — | 41,195 | ||||||||||||
All Other | — | 2,203,052 | — | 2,203,052 | ||||||||||||
Totals | $ | 1,339,830 | $ | 3,218,847 | — | $ | 4,558,677 | |||||||||
| AllianzGI NFJ International Value II: | ||||||||||||||||
| Investments in Securities – Assets | Level 1– Quoted Prices | Level 2– Other Significant Observable Inputs | Level 3– Significant Unobservable Inputs | Value at 3/31/17 | ||||||||||||
Common Stock: | ||||||||||||||||
Brazil | $ | 19,106 | — | — | $ | 19,106 | ||||||||||
Canada | 90,675 | — | — | 90,675 | ||||||||||||
Chile | 12,468 | — | — | 12,468 | ||||||||||||
China | 11,152 | $ | 59,335 | — | 70,487 | |||||||||||
Colombia | 11,961 | — | — | 11,961 | ||||||||||||
Denmark | 9,474 | 12,616 | — | 22,090 | ||||||||||||
Ireland | 13,450 | 11,981 | — | 25,431 | ||||||||||||
Israel | 9,627 | 11,335 | — | 20,962 | ||||||||||||
Korea (Republic of) | 6,219 | — | — | 6,219 | ||||||||||||
Netherlands | 15,076 | 25,452 | — | 40,528 | ||||||||||||
Russian Federation | 10,612 | — | — | 10,612 | ||||||||||||
South Africa | 8,820 | 10,404 | — | 19,224 | ||||||||||||
Taiwan | 13,136 | — | — | 13,136 | ||||||||||||
Turkey | 9,969 | — | — | 9,969 | ||||||||||||
United Kingdom | 13,938 | 100,641 | — | 114,579 | ||||||||||||
United States | 9,416 | — | — | 9,416 | ||||||||||||
All Other | — | 474,307 | — | 474,307 | ||||||||||||
Totals | $ | 265,099 | $ | 706,071 | — | $ | 971,170 | |||||||||
| Semiannual Report | | March 31, 2017 | 329 |
Table of Contents
Notes to Financial Statements (cont’d)
March 31, 2017 (Unaudited)
| AllianzGI Short Duration High Income: | ||||||||||||||||
| Investments in Securities – Assets | Level 1– Quoted Prices | Level 2– Other Significant Observable Inputs | Level 3– Significant Unobservable Inputs | Value at 3/31/17 | ||||||||||||
Corporate Bonds & Notes | — | $ | 1,428,275,424 | — | $ | 1,428,275,424 | ||||||||||
Senior Loans | — | 132,965,703 | — | 132,965,703 | ||||||||||||
Repurchase Agreements | — | 108,067,000 | — | 108,067,000 | ||||||||||||
Totals | — | $ | 1,669,308,127 | — | $ | 1,669,308,127 | ||||||||||
| AllianzGI Structured Return: | ||||||||||||||||
| Investments in Securities – Assets | Level 1– Quoted Prices | Level 2– Other Significant | Level 3– Significant | Value at 3/31/17 | ||||||||||||
Exchange-Traded Funds | $ | 343,944,660 | — | — | $ | 343,944,660 | ||||||||||
Repurchase Agreements | — | $ | 58,560,000 | — | 58,560,000 | |||||||||||
Options Purchased: | ||||||||||||||||
Market Price | 401,873 | — | — | 401,873 | ||||||||||||
| 344,346,533 | 58,560,000 | — | 402,906,533 | |||||||||||||
Investments in Securities – Liabilities | ||||||||||||||||
Options Written: | ||||||||||||||||
Market Price | (11,834,250 | ) | — | — | (11,834,250 | ) | ||||||||||
Totals | $ | 332,512,283 | $ | 58,560,000 | — | $ | 391,072,283 | |||||||||
| AllianzGI U.S. Equity Hedged: | ||||||||||||||||
| Investments in Securities – Assets | Level 1– Quoted Prices | Level 2– Other Significant | Level 3– Significant | Value at 3/31/17 | ||||||||||||
Exchange-Traded Funds | $ | 3,771,840 | — | — | $ | 3,771,840 | ||||||||||
Repurchase Agreements | — | $ | 382,000 | — | 382,000 | |||||||||||
Options Purchased: | ||||||||||||||||
Market Price | 34,883 | — | — | 34,883 | ||||||||||||
| 3,806,723 | 382,000 | — | 4,188,723 | |||||||||||||
Investments in Securities – Liabilities | ||||||||||||||||
Options Written: | ||||||||||||||||
Market Price | (2,540 | ) | — | — | (2,540 | ) | ||||||||||
Totals | $ | 3,804,183 | $ | 382,000 | — | $ | 4,186,183 | |||||||||
| AllianzGI U.S. Small-Cap Growth: | ||||||||||||||||
| Investments in Securities – Assets | Level 1– Quoted Prices | Level 2– Other Significant | Level 3– Significant | Value at 3/31/17 | ||||||||||||
Common Stock | $ | 16,401,699 | — | — | $ | 16,401,699 | ||||||||||
Repurchase Agreements | — | $ | 581,000 | — | 581,000 | |||||||||||
Totals | $ | 16,401,699 | $ | 581,000 | — | $ | 16,982,699 | |||||||||
| AllianzGI Ultra Micro Cap: | ||||||||||||||||
| Investments in Securities – Assets | Level 1– Quoted Prices | Level 2– Other Significant Observable Inputs | Level 3– Significant | Value at 3/31/17 | ||||||||||||
Common Stock | $ | 41,294,989 | — | — | $ | 41,294,989 | ||||||||||
Repurchase Agreements | — | $ | 811,000 | — | 811,000 | |||||||||||
Totals | $ | 41,294,989 | $ | 811,000 | — | $ | 42,105,989 | |||||||||
| 330 | March 31, 2017 | | Semiannual Report |
Table of Contents
At March 31, 2017, the following Funds had transfers between Levels 1 and 2:
| Transfers | ||||||||
| Level 1 to Level 2(a) | Level 2 to Level 1(b) | |||||||
AllianzGI Best Styles Emerging Markets Equity | $ | 165,252 | $ | 73,206 | ||||
AllianzGI Best Styles Global Equity | 5,274,949 | 5,065,289 | ||||||
AllianzGI Best Styles International Equity | 204,537 | 717,679 | ||||||
AllianzGI Emerging Markets Consumer | — | 407,563 | ||||||
AllianzGI Emerging Markets Small-Cap | 305,887 | 719,732 | ||||||
AllianzGI International Small-Cap | 1,553,778 | 2,782,313 | ||||||
AllianzGI NFJ Emerging Markets Value | 322,931 | 648,532 | ||||||
AllianzGI NFJ International Small-Cap Value | 187,276 | 293,334 | ||||||
AllianzGI NFJ International Value II | 11,467 | 9,474 | ||||||
| (a) | This transfer was a result of securities trading outside the U.S. whose values were not adjusted by the application of a modeling tool at September 30, 2016, which was applied on March 31, 2017. |
| (b) | This transfer was a result of securities trading outside the U.S. whose values were adjusted by the application of a modeling tool at September 30, 2016, which was not applied on March 31, 2017. |
A roll forward of fair value measurements using significant unobservable inputs (Level 3) for the six months ended March 31, 2017, was as follows:
| AllianzGI Best Styles Emerging Markets Equity: | ||||||||||||||||||||||||||||||||||||
| Investments in Securities – Assets | Beginning Balance 9/30/16 | Purchases | Sales | Accrued Discount (Premiums) | Net Realized Gain (Loss) | Net Change in Unrealized Appreciation/ Depreciation | Transfers into Level 3 | Transfers out of Level 3 | Ending Balance 3/31/17 | |||||||||||||||||||||||||||
Common Stock: | ||||||||||||||||||||||||||||||||||||
China | $ | 11,105 | — | $ | (1,417 | ) | — | $ | (9,898 | ) | $ | 210 | — | — | — | |||||||||||||||||||||
Thailand | 275,544 | $ | 137,182 | (266,413 | ) | — | 5,508 | 11,200 | — | — | $ | 163,021 | ||||||||||||||||||||||||
Totals | $ | 286,649 | $ | 137,182 | $ | (267,830 | ) | — | $ | (4,390 | ) | $ | 11,410 | — | — | $ | 163,021 | |||||||||||||||||||
| AllianzGI Best Styles Global Equity: | ||||||||||||||||||||||||||||||||||||
| Investments in Securities – Assets | Beginning Balance 9/30/16 | Purchases | Sales | Accrued Discount (Premiums) | Net Realized Gain (Loss) | Net Change in Unrealized Appreciation/ Depreciation | Transfers into Level 3 | Transfers out of Level 3 | Ending Balance 3/31/17 | |||||||||||||||||||||||||||
Common Stock: | ||||||||||||||||||||||||||||||||||||
China | $ | 1,199 | — | $ | (35 | ) | — | $ | (340 | ) | $ | 338 | — | — | $ | 1,162 | ||||||||||||||||||||
Thailand | 2,114,630 | $ | 2,290,828 | (1,520,147 | ) | — | 94,951 | 317,133 | — | — | 3,297,395 | |||||||||||||||||||||||||
Totals | $ | 2,115,829 | $ | 2,290,828 | $ | (1,520,182 | ) | — | $ | 94,611 | $ | 317,471 | — | — | $ | 3,298,557 | ||||||||||||||||||||
| AllianzGI Best Styles International Equity: | ||||||||||||||||||||||||||||||||||||
| Investments in Securities – Assets | Beginning Balance 9/30/16 | Purchases | Sales | Accrued Discount (Premiums) | Net Realized Gain (Loss) | Net Change in Unrealized Appreciation/ Depreciation | Transfers into Level 3** | Transfers out of Level 3 | Ending Balance 3/31/17 | |||||||||||||||||||||||||||
Common Stock: | ||||||||||||||||||||||||||||||||||||
Japan | — | — | — | — | — | — | $ | 37,616 | — | $ | 37,616 | |||||||||||||||||||||||||
United Kingdom | $ | 1,753 | — | $ | (1,684 | ) | — | $ | (277 | ) | $ | 208 | — | — | — | |||||||||||||||||||||
Totals | $ | 1,753 | — | $ | (1,684 | ) | — | $ | (277 | ) | $ | 208 | $ | 37,616 | — | $ | 37,616 | |||||||||||||||||||
| Semiannual Report | | March 31, 2017 | 331 |
Table of Contents
Notes to Financial Statements (cont’d)
March 31, 2017 (Unaudited)
| AllianzGI Convertible: | ||||||||||||||||||||||||||||||||||||
| Investments in Securities – Assets | Beginning Balance 9/30/16 | Purchases | Sales | Accrued Discount (Premiums) | Net Realized Gain (Loss) | Net Change in Unrealized Appreciation/ Depreciation | Transfers into Level 3 | Transfers out of Level 3 | Ending Balance 3/31/17 | |||||||||||||||||||||||||||
Convertible Bonds: |
| |||||||||||||||||||||||||||||||||||
Food & Beverage | $ | 9,864,793 | $ | 1,221,529 | $ | (11,139,977 | ) | — | $ | (126,552 | ) | $ | 180,207 | — | — | — | ||||||||||||||||||||
IT Services | 10,184,892 | 3,282,178 | (2,863,495 | ) | $ | 284 | (26,505 | ) | (202,230 | ) | — | — | $ | 10,375,124 | ||||||||||||||||||||||
Totals | $ | 20,049,685 | $ | 4,503,707 | $ | (14,003,472 | ) | $ | 284 | $ | (153,057 | ) | $ | (22,023 | ) | — | — | $ | 10,375,124 | |||||||||||||||||
| AllianzGI Emerging Markets Consumer: | ||||||||||||||||||||||||||||||||||||
| Investments in Securities – Assets | Beginning Balance 9/30/16 | Purchases | Sales | Accrued Discount (Premiums) | Net Realized Gain (Loss) | Net Change in Unrealized Appreciation/ Depreciation | Transfers into Level 3 | Transfers out of Level 3 | Ending Balance 3/31/17 | |||||||||||||||||||||||||||
Common Stock: |
| |||||||||||||||||||||||||||||||||||
Russian Federation | $ | 579,790 | $ | 263,558 | $ | (166,997 | ) | — | $ | 18,665 | $ | 370,632 | — | — | $ | 1,065,648 | ||||||||||||||||||||
Thailand | 1,124,290 | 585,746 | (800,788 | ) | — | 50,727 | 87,506 | — | — | 1,047,481 | ||||||||||||||||||||||||||
Totals | $ | 1,704,080 | $ | 849,304 | $ | (967,785 | ) | — | $ | 69,392 | $ | 458,138 | — | — | $ | 2,113,129 | ||||||||||||||||||||
| AllianzGI Emerging Markets Small-Cap: | ||||||||||||||||||||||||||||||||||||
| Investments in Securities – Assets | Beginning Balance 9/30/16 | Purchases | Sales | Accrued Discount (Premiums) | Net Realized Gain (Loss) | Net Change in Unrealized Appreciation/ Depreciation | Transfers into Level 3*** | Transfers out of Level 3 | Ending Balance 3/31/17 | |||||||||||||||||||||||||||
Common Stock: |
| |||||||||||||||||||||||||||||||||||
China | — | — | — | — | — | — | $ | 40,982 | — | $ | 40,982 | |||||||||||||||||||||||||
Russian Federation | $ | 41,249 | $ | 331,143 | $ | (37,566 | ) | — | $ | 4,216 | $ | 76,519 | — | — | 415,561 | |||||||||||||||||||||
Thailand | — | 88,073 | — | — | — | 6,233 | — | — | 94,306 | |||||||||||||||||||||||||||
Preferred Stock: |
| |||||||||||||||||||||||||||||||||||
Russian Federation | 110,379 | — | (85,964 | ) | — | (5,978 | ) | (18,437 | ) | — | — | — | ||||||||||||||||||||||||
Totals | $ | 151,628 | $ | 419,216 | $ | (123,530 | ) | — | $ | (1,762 | ) | $ | 64,315 | $ | 40,982 | — | $ | 550,849 | ||||||||||||||||||
| AllianzGI Global Dynamic Allocation: | ||||||||||||||||||||||||||||||||||||
| Investments in Securities – Assets | Beginning Balance 9/30/16 | Purchases | Sales | Accrued Discount (Premiums) | Net Realized Gain (Loss) | Net Change in Unrealized Appreciation/ Depreciation | Transfers into Level 3 | Transfers out of Level 3 | Ending Balance 3/31/17 | |||||||||||||||||||||||||||
Common Stock: |
| |||||||||||||||||||||||||||||||||||
China | — | $ | 34 | — | — | — | — | — | — | $ | 34 | |||||||||||||||||||||||||
Thailand | — | 477,241 | $ | (180,221 | ) | — | $ | (7,277 | ) | $ | 46,917 | — | — | 336,660 | ||||||||||||||||||||||
Totals | — | $ | 477,275 | $ | (180,221 | ) | — | $ | (7,277 | ) | $ | 46,917 | — | — | $ | 336,694 | ||||||||||||||||||||
| AllianzGI High Yield Bond: | ||||||||||||||||||||||||||||||||||||
| Investments in Securities – Assets | Beginning Balance 9/30/16 | Purchases | Sales | Accrued Discount (Premiums) | Net Realized Gain (Loss) | Net Change in Unrealized Appreciation/ Depreciation | Transfers into Level 3 | Transfers out of Level 3 | Ending Balance 3/31/17 | |||||||||||||||||||||||||||
Corporate Bonds & Notes: | ||||||||||||||||||||||||||||||||||||
Oil, Gas & Consumable Fuels | $ | 760,320 | — | $ | (654,186 | ) | $ | 908 | $ | 266,024 | $ | (373,066 | ) | — | — | — | ||||||||||||||||||||
Senior Loans | 4,837,520 | $ | 844,989 | # | (6,259,719 | ) † | — | — | 577,210 | — | — | — | ||||||||||||||||||||||||
Preferred Stock | — | 6,259,719 | † | — | — | — | (7,155 | ) | — | — | $ | 6,252,564 | ||||||||||||||||||||||||
| 332 | March 31, 2017 | | Semiannual Report |
Table of Contents
| AllianzGI High Yield Bond (cont’d) | ||||||||||||||||||||||||||||||||||||
| Investments in Securities – Assets | Beginning Balance 9/30/16 | Purchases | Sales | Accrued Discount (Premiums) | Net Realized Gain (Loss) | Net Change in Unrealized Appreciation/ Depreciation | Transfers into Level 3 | Transfers out of Level 3 | Ending Balance 3/31/17 | |||||||||||||||||||||||||||
Common Stock: | ||||||||||||||||||||||||||||||||||||
Advertising | $ | 897,099 | — | — | — | — | $ | (212,231 | ) | — | — | $ | 684,868 | |||||||||||||||||||||||
Media | — | — | † | — | — | — | 7 | — | — | 7 | ||||||||||||||||||||||||||
Warrants: | ||||||||||||||||||||||||||||||||||||
Commercial Services | 72,615 | — | — | — | — | (26,554 | ) | — | — | 46,061 | ||||||||||||||||||||||||||
Media | — | — | † | — | — | — | 1 | — | — | 1 | ||||||||||||||||||||||||||
| 6,567,554 | $ | 7,104,708 | $ | (6,913,905 | ) | $ | 908 | $ | 266,024 | (41,788 | ) | — | — | 6,983,501 | ||||||||||||||||||||||
Other Financial Instruments* – Liabilities | ||||||||||||||||||||||||||||||||||||
Unrealized depreciation of unfunded loan commitment | (49,286 | ) | — | ## | — | — | — | 49,286 | — | — | — | |||||||||||||||||||||||||
Totals | $ | 6,518,268 | $ | 7,104,708 | $ | (6,913,905 | ) | $ | 908 | $ | 266,024 | $ | 7,498 | — | — | $ | 6,983,501 | |||||||||||||||||||
| AllianzGI NFJ Emerging Markets Value: | ||||||||||||||||||||||||||||||||||||
| Investments in Securities – Assets | Beginning Balance 9/30/16 | Purchases | Sales | Accrued Discount (Premiums) | Net Realized Gain (Loss) | Net Change in Unrealized Appreciation/ Depreciation | Transfers into Level 3 | Transfers out of Level 3 | Ending Balance 3/31/17 | |||||||||||||||||||||||||||
Common Stock: | ||||||||||||||||||||||||||||||||||||
Russian Federation | $ | 249,359 | $ | 392,353 | $ | (398,905 | ) | — | $ | 73,340 | $ | (22,239 | ) | — | — | $ | 293,908 | |||||||||||||||||||
Preferred Stock: | ||||||||||||||||||||||||||||||||||||
Russian Federation | 18,688 | 164,489 | (45,252 | ) | — | 9,337 | 19,479 | — | — | 166,741 | ||||||||||||||||||||||||||
Totals | $ | 268,047 | $ | 556,842 | $ | (444,157 | ) | — | $ | 82,677 | $ | (2,760 | ) | — | — | $ | 460,649 | |||||||||||||||||||
The following tables present additional information about valuation techniques and inputs used for investments that are measured at fair value and categorized within Level 3 at March 31, 2017:
| AllianzGI Best Styles Emerging Markets Equity: | ||||||||||||
| Investments in Securities – Assets | Ending Balance at 3/31/17 | Valuation Technique Used | Unobservable Inputs | Input Values | ||||||||
Common Stock | $ | 163,021 | Value of Foreign Security Traded on Foreign Exchange | Price of Non-Resident Shares on Foreign Exchange | THB 18.41-386.99 | |||||||
| AllianzGI Best Styles Global Equity: | ||||||||||||
| Investments in Securities – Assets | Ending Balance at 3/31/17 | Valuation Technique Used | Unobservable Inputs | Input Values | ||||||||
Common Stock | $ | 3,297,395 | Value of Foreign Security Traded on Foreign Exchange | Price of Non-Resident Shares on Foreign Exchange | THB 5.15-386.99 | |||||||
| $ | 1,162 | Discount on Publicly Traded Quote | Discount Applied to Last Exchange Price | HKD 0.15 (88% discount) | ||||||||
| AllianzGI Best Styles International Equity: | ||||||||||||
| Investments in Securities – Assets | Ending Balance at 3/31/17 | Valuation Technique Used | Unobservable Inputs | Input Values | ||||||||
Common Stock | $ | 37,616 | Fundamental Analytical Data Relating to the Investment | Price of Stock | JPY 1,395.93 | |||||||
| AllianzGI Convertible: | ||||||||||||
| Investments in Securities – Assets | Ending Balance at 3/31/17 | Valuation Technique Used | Unobservable Inputs | Input Values | ||||||||
Convertible Bonds | $ | 10,375,124 | Third-Party Pricing Vendor | Single Broker Quote | $ 98.576 | |||||||
| Semiannual Report | | March 31, 2017 | 333 |
Table of Contents
Notes to Financial Statements (cont’d)
March 31, 2017 (Unaudited)
| AllianzGI Emerging Markets Consumer: | ||||||||||||
| Investments in Securities – Assets | Ending Balance at 3/31/17 | Valuation Technique Used | Unobservable Inputs | Input Values | ||||||||
Common Stock | $ | 1,065,648 | Value of Foreign Security Traded on Foreign Exchange | Price of Non-Resident Shares on Foreign Exchange | $ | 2.98 | ||||||
| $ | 1,047,481 | Value of Foreign Security Traded on Foreign Exchange | Price of Non-Resident Shares on Foreign Exchange | THB 20.40-71.77 | ||||||||
| AllianzGI Emerging Markets Small-Cap: | ||||||||||||
| Investments in Securities – Assets | Ending Balance at 3/31/17 | Valuation Technique Used | Unobservable Inputs | Input Values | ||||||||
Common Stock | $ | 40,982 | Last Exchange-Traded Price | Trading Volume | HKD 5.58 | |||||||
| $ | 415,561 | Value of Foreign Security Traded on Foreign Exchange | Price of Non-Resident Shares on Foreign Exchange | $ | 0.00698-$58.73 | |||||||
| $ | 94,306 | Value of Foreign Security Traded on Foreign Exchange | Price of Non-Resident Shares on Foreign Exchange | THB 4.20-11.70 | ||||||||
| AllianzGI Global Dynamic Allocation: | ||||||||||||
| Investments in Securities – Assets | Ending Balance at 3/31/17 | Valuation Technique Used | Unobservable Inputs | Input Values | ||||||||
Common Stock | $ | 34 | Discount on Publicly Traded Quote | Discount Applied to Last Exchange Price | HKD 0.15 (88% discount) | |||||||
| $ | 336,660 | Value of Foreign Security Traded on Foreign Exchange | Price of Non-Resident Shares on Foreign Exchange | THB 5.15-75.51 | ||||||||
| AllianzGI High Yield Bond: | ||||||||||||
| Investments in Securities – Assets | Ending Balance at 3/31/17 | Valuation Technique Used | Unobservable Inputs | Input Values | ||||||||
Preferred Stock | $ | 6,252,564 | Model Price | Proprietary Data Used in Model | $ | 97.70-$100.00 | ||||||
Common Stock | $ | 684,875 | Model Price | Proprietary Data Used in Model | $ | 0.0001-$15.78 | ||||||
Warrants | $ | 46,061 | Fundamental Analytical Data Relating to the Investment | Price of Warrant | $ | 0.189481 | ||||||
| $ | 1 | Model Price | Proprietary Data Used in Model | $ | 0.0001 | |||||||
| AllianzGI NFJ Emerging Markets Value: | ||||||||||||
| Investments in Securities – Assets | Ending Balance at 3/31/17 | Valuation Technique Used | Unobservable Inputs | Input Values | ||||||||
Common Stock | $ | 293,908 | Value of Foreign Security Traded on Foreign Exchange | Price of Non-Resident Shares on Foreign Exchange | $ | 1.98-$52.91 | ||||||
Preferred Stock | $ | 166,741 | Value of Foreign Security Traded on Foreign Exchange | Price of Non-Resident Shares on Foreign Exchange | $ | 3.62 | ||||||
HKD–Hong Kong Dollar
JPY–Japanese Yen
THB–Thai Baht
| * | Other financial instruments are derivatives, such as futures contracts, forward foreign currency contracts, and unfunded loan commitment which are valued at the unrealized appreciation (depreciation) of the instrument. |
| ** | Transferred out of Level 2 into Level 3 because trading was halted and Trust’s Valuation Committee recommended a price using fundamental analytical data relating to the investment. |
| *** | Transferred out of Level 2 into Level 3 because trading was halted and Trust’s Valuation Committee recommended the last traded price. |
| † | Removed or issued via reorganization. |
| # | PIK payments and funding of unfunded loan commitment. |
| ## | Unfunded loan commitment was funded. |
| 334 | March 31, 2017 | | Semiannual Report |
Table of Contents
The net change in unrealized appreciation/depreciation of Level 3 investments which the following Funds held at March 31, 2017 was:
AllianzGI Best Styles Emerging Markets Equity | $ | 20,622 | ||
AllianzGI Best Styles Global Equity | 497,202 | |||
AllianzGI Best Styles International Equity | 7,193 | |||
AllianzGI Convertible | 175,662 | |||
AllianzGI Emerging Markets Consumer | 571,219 | |||
AllianzGI Emerging Markets Small-Cap | 87,964 | |||
AllianzGI Global Dynamic Allocation | 46,917 | |||
AllianzGI High Yield Bond | (245,932 | ) | ||
AllianzGI NFJ Emerging Markets Value | 44,635 |
Net realized gain (loss) and net change in unrealized appreciation/depreciation are reflected on the Statements of Operations.
(c) Investment Transactions and Investment Income. Investment transactions are accounted for on the trade date. Securities purchased and sold on a when-issued or delayed-delivery basis may be settled a month or more after the trade date. Realized gains and losses on investments are determined on an identified cost basis. Interest income adjusted for the accretion of discounts and amortization of premiums is recorded on an accrual basis. Discounts or premiums on debt securities purchased are accreted or amortized, respectively, to interest income. Conversion premium is not amortized. Dividend income is recorded on the ex-dividend date, except for certain dividends from foreign securities where the ex-dividend date may have passed, and then are recorded as soon after the ex-dividend date as the Funds, using reasonable diligence, become aware of such dividends. Payments received on synthetic convertible securities are generally included in dividends. Dividend and interest income on the Statements of Operations are shown net of any foreign taxes withheld on income from foreign securities. Payments received from real estate investment trust securities may be comprised of dividends, realized gains and return of capital. The payment may initially be recorded as dividend income and may subsequently be reclassified as realized gains and/or return of capital upon receipt of information from the issuer. Payments considered return of capital reduce the cost basis of the respective security. Distributions, if any, in excess of the cost basis of a security are recognized as capital gains. Dividends from underlying funds are recorded as dividend income, while capital gain distributions are recorded as net capital gain distributions received from underlying funds on the Statements of Operations. Facility fees and other fees (such as origination fees) received on settlement date are amortized as income over the expected term of the senior loan. Facility fees and other fees received after settlement date relating to senior loans, commitment fees received relating to unfunded purchase or lending commitments and consent fees relating to corporate actions are recorded as miscellaneous income upon receipt. Expenses are recorded on an accrual basis and such expenses exclude those of the underlying funds. Expenses of the underlying funds are reflected in the net asset values of those funds.
(d) Federal Income Taxes. The Funds intend to distribute all of their taxable income and to comply with the other requirements of
Subchapter M of the U.S. Internal Revenue Code of 1986, as amended, applicable to regulated investment companies. Accordingly, no provision for U.S. federal income taxes is required. The Funds may be subject to excise tax based on distributions to shareholders.
Accounting for uncertainty in income taxes establishes for all entities, including pass-through entities such as the Funds, a minimum threshold for financial statement recognition of the benefit of positions taken in filing tax returns (including whether an entity is taxable in a particular jurisdiction), and requires certain expanded tax disclosures. In accordance with provisions set forth under U.S. GAAP, the Investment Manager has reviewed the Funds’ tax positions for all open tax years. As of March 31, 2017, the Funds have recorded no liability for net unrecognized tax benefits relating to uncertain income tax positions they have taken. The Funds’ federal income tax returns for the prior three years, as applicable, remain subject to examination by the Internal Revenue Service.
(e) Dividends and Distributions to Shareholders. The Funds (except AllianzGI Retirement Income, AllianzGI Global Allocation, AllianzGI Convertible, AllianzGI Emerging Markets Debt, AllianzGI Europe Equity Dividend, AllianzGI High Yield Bond, AllianzGI NFJ Emerging Markets Value, AllianzGI NFJ Global Dividend Value, AllianzGI NFJ International Value II and AllianzGI Short Duration High Income) declare dividends and distributions from net investment income and net realized capital gains, if any, annually. AllianzGI Global Allocation, AllianzGI Convertible, AllianzGI Emerging Markets Debt, AllianzGI Europe Equity Dividend, AllianzGI NFJ Emerging Markets Value, AllianzGI NFJ Global Dividend Value and AllianzGI NFJ International Value II declare dividends from net investment income quarterly and distributions from net realized capital gains, if any, annually. AllianzGI High Yield Bond and AllianzGI Short Duration High Income declare dividends from net investment income monthly and distributions from net realized capital gains, if any, annually. Through March 2017, AllianzGI Retirement Income declared dividends from net investment income quarterly. Commencing in April 2017, AllianzGI Retirement Income declares dividends from net investment income and/or distributions from short-term capital gains monthly. Net realized capital gains, if any, will continue to be distributed annually by the Fund. The Funds record dividends and distributions to their respective shareholders on the ex-dividend date. The amount of dividends from net investment income and distributions from net realized capital gains is determined in accordance with federal income tax regulations, which may differ from U.S. GAAP. These “book-tax” differences are considered either temporary or permanent in nature. To the extent these differences are permanent in nature, such amounts are reclassified within the capital accounts based on their federal income tax treatment; temporary differences do not require reclassification. To the extent dividends and/or distributions exceed current and accumulated earnings and profits for federal income tax purposes, they are reported as dividends and/or distributions to shareholders from return of capital.
| Semiannual Report | | March 31, 2017 | 335 |
Table of Contents
Notes to Financial Statements (cont’d)
March 31, 2017 (Unaudited)
(f) Multi-Class Operations. Each class offered by the Trust has equal rights as to assets and voting privileges (except that shareholders of a class have exclusive voting rights regarding any matter relating solely to that class of shares). Income, non-class specific expenses, and realized and unrealized capital gains and losses of each Fund are allocated daily to each class of shares based on the relative net assets of each class. Class specific expenses, where applicable, include administration, administrative servicing, distribution, recoupment, servicing and sub-transfer agent fees.
(g) Foreign Currency Translation. The Funds’ accounting records are maintained in U.S. dollars as follows: (1) the foreign currency market values of investments and other assets and liabilities denominated in foreign currencies are translated at the prevailing exchange rate at the end of the period; and (2) purchases and sales, income and expenses are translated at the prevailing exchange rate on the respective dates of such transactions. The resulting net foreign currency gain (loss) is included in the Funds’ Statements of Operations.
The Funds do not generally isolate that portion of the results of operations arising as a result of changes in foreign currency exchange rates from the fluctuations arising from changes in the market prices of securities. Accordingly, such foreign currency gain (loss) is included in net realized and unrealized gain (loss) on investments. However, the Funds do isolate the effect of fluctuations in foreign currency exchange rates when determining the gain (loss) upon the sale or maturity of foreign currency denominated debt obligations pursuant to U.S. federal income tax regulations; such amount is categorized as foreign currency gain (loss) for both financial reporting and income tax reporting purposes.
(h) Repurchase Agreements. The Funds are parties to Master Repurchase Agreements (“Master Repo Agreements”) with select counterparties. The Master Repo Agreements maintain provisions for initiation, income payments, events of default, and maintenance of collateral.
The Funds enter into transactions, under the Master Repo Agreements, with their custodian bank or securities brokerage firms whereby they purchase securities under agreements to resell such securities at an agreed upon price and date (“repurchase agreements”). The Funds, through their custodian, take possession of securities collateralizing the repurchase agreement. Such agreements are carried at the contract amount in the financial statements, which is considered to represent fair value. Collateral pledged (the securities received), which consists primarily of U.S. government obligations and asset-backed securities, is held by the custodian bank for the benefit of the Funds until maturity of the repurchase agreement. Provisions of the repurchase agreements and the procedures adopted by the Funds require that the market value of the collateral, including accrued interest thereon, be sufficient in the event of default by the counterparty. If the counterparty defaults under the Master Repo Agreements, and the value of the collateral declines or if the counterparty enters an insolvency proceeding, realization of the
collateral by the Funds may be delayed or limited. The gross values are included in the Funds’ Schedules of Investments. The value of the related collateral exceeded the value of the repurchase agreements at March 31, 2017.
(i) Equity-Linked Securities. Certain Funds invest in equity-linked securities such as participatory notes (“P-Notes”). P-Notes are used to gain exposure to issuers in certain countries with a costly or lengthy registration process. They are generally traded over-the-counter and constitute general unsecured contractual obligations of the banks or broker-dealers that issue them. Generally, banks and broker-dealers associated with non-U.S.-based brokerage firms buy securities listed on certain foreign exchanges and then issue P-Notes which are designed to replicate the performance of certain issuers and markets. To the extent that the Funds invest in equity-linked securities whose return corresponds to the performance of a foreign securities index or one or more foreign stocks, investing in equity-linked securities will involve risks similar to the risks of investing in foreign securities. In addition, the Funds bear the risk that the issuer of an equity-linked security may default on its obligation under the terms of the arrangement with the counterparty.
(j) Warrants. The Funds may receive warrants. Warrants are securities that are usually issued together with a debt security or preferred stock and that give the holder the right to buy a proportionate amount of common stock at a specified price. Warrants may be freely transferable and are often traded on major exchanges. Warrants normally have a life that is measured in years and entitle the holder to buy common stock of a company at a price that is usually higher than the market price at the time the warrant is issued. Warrants may entail greater risks than certain other types of investments. Generally, warrants do not carry the right to receive dividends or exercise voting rights with respect to the underlying securities, and they do not represent any rights in the assets of the issuer. In addition, their value does not necessarily change with the value of the underlying securities, and they cease to have value if they are not exercised on or before their expiration date. If the market price of the underlying stock does not exceed the exercise price during the life of the warrant, the warrant will expire worthless. Warrants may increase the potential profit or loss to be realized from the investment as compared with investing the same amount in the underlying securities. Similarly, the percentage increase or decrease in the value of an equity security warrant may be greater than the percentage increase or decrease in the value of the underlying common stock. Warrants may relate to the purchase of equity or debt securities. Debt obligations with warrants attached to purchase equity securities have many characteristics of convertible securities and their prices may, to some degree, reflect the performance of the underlying stock. Debt obligations also may be issued with warrants attached to purchase additional debt securities at the same coupon rate. A decline in interest rates would permit a Fund to sell such warrants at a profit. If interest rates rise, these warrants would generally expire with no value.
(k) Rights. The Funds may receive rights. A right is a privilege granted to existing shareholders of a corporation to subscribe for
| 336 | March 31, 2017 | | Semiannual Report |
Table of Contents
shares of a new issue of common stock before it is issued. Rights normally have a short life, usually two to four weeks, are freely transferable and entitle the holder to buy the new common stock at a lower price than the public offering price. Rights may entail greater risks than certain other types of investments. Generally, rights do not carry the right to receive dividends or exercise voting rights with respect to the underlying securities, and they do not represent any rights in the assets of the issuer. In addition, their value does not necessarily change with the value of the underlying securities, and they cease to have value if they are not exercised on or before their expiration date. If the market price of the underlying stock does not exceed the exercise price during the life of the right, the right will expire worthless. Rights may increase the potential profit or loss to be realized from the investment as compared with investing the same amount in the underlying securities.
(l) Senior Loans. The Funds may purchase assignments of, and participations in, Senior Loans originated, negotiated and structured by a U.S. or foreign commercial bank, insurance company, finance company or other financial institution for a lending syndicate of financial institutions (the “Lender”). When purchasing an assignment, the Funds succeed to all the rights and obligations under the loan agreement with the same rights and obligations as the assigning Lender. Assignments may, however, be arranged through private negotiations between potential assignees and potential assignors, and the rights and obligations acquired by the purchaser of an assignment may differ from, and be more limited than, those held by the assigning Lender. The Funds may also enter into lending arrangements involving unfunded loan commitments, which are contractual obligations for future funding. Unfunded loan commitments may include revolving credit facilities, which may obligate the Funds to supply additional cash to the borrower on demand. Unfunded loan commitments represent a future obligation in full, even though a percentage of the principal amounts may never be utilized by the borrower.
Certain Funds may purchase the securities of distressed companies (including assignments or direct investments), including companies engaged in restructurings or bankruptcy proceedings. Investments in distressed companies may include senior obligations of an issuer issued in connection with a restructuring under Chapter 11 of the U.S. Bankruptcy Code (commonly known as “debtor-in-possession” or “DIP” financings). Debtor-in-possession financings generally allow the issuer to continue its operations while reorganizing. Such financings constitute senior liens on unencumbered collateral (i.e., collateral not subject to other creditors’ claims). There is risk that the issuer under a debtor-in-possession financing will not emerge from Chapter 11 and be forced to liquidate its assets under Chapter 7 of the U.S. Bankruptcy Code. In the event of liquidation, the Funds’ only recourse would be against the collateral securing the debtor-in-possession financing.
(m) Payment In-Kind Securities. The Funds may invest in, payment in-kind securities, which are debt or preferred stock securities that require or permit payment of interest in the form of additional securities. Payment in-kind securities allow the issuer to avoid or delay the need to generate cash to meet current interest payments and, as a
result, may involve greater risk than securities that pay interest currently or in cash.
(n) U.S. Government Agencies or Government-Sponsored Enterprises. Securities issued by U.S. Government agencies or government-sponsored enterprises may not be guaranteed by the U.S. Treasury. The Government National Mortgage Association (“GNMA” or “Ginnie Mae”), a wholly-owned U.S. Government corporation, is authorized to guarantee, with the full faith and credit of the U.S. Government, the timely payment of principal and interest on securities issued by institutions approved by GNMA and backed by pools of mortgages insured by the Federal Housing Administration or guaranteed by the Department of Veterans Affairs. Government-related guarantors not backed by the full faith and credit of the U.S. Government include the Federal National Mortgage Association (“FNMA” or “Fannie Mae”) and the Federal Home Loan Mortgage Corporation (“FHLMC” or “Freddie Mac”). Pass-through securities issued by FNMA are guaranteed as to timely payment of principal and interest by FNMA, but are not backed by the full faith and credit of the U.S. Government. FHLMC guarantees the timely payment of interest and ultimate collection of principal, but its participation certificates are not backed by the full faith and credit of the U.S. Government.
(o) Exchange-Traded Funds. Certain Funds may invest in exchange-traded funds (“ETFs”), which typically are index-based investment companies that hold substantially all of their assets in securities representing their specific index, but may also be actively-managed investment companies. Shares of ETFs trade throughout the day on an exchange and represent an investment in a portfolio of securities and other assets. As a shareholder of another investment company, the Funds would bear their pro rata portion of the other investment company’s expenses, including advisory fees, in addition to the expenses the Funds bear directly in connection with their own operations.
(p) Inflation-Indexed Bonds. Certain Funds may invest in inflation-indexed bonds. Inflation-indexed bonds are fixed income securities whose principal value is periodically adjusted to the rate of inflation. The interest rate on these bonds is generally fixed at issuance at a rate lower than typical bonds. Over the life of an inflation-indexed bond, however, interest will be paid based on a principal value which is adjusted for inflation.
(q) Convertible Securities. Certain Funds’ may invest a portion of their assets in convertible securities. Although convertible securities derive part of their value from that of the securities into which they are convertible, they are not considered derivative financial instruments. However, certain of the Funds’ investments in convertible securities include features which render them sensitive to price changes in their underlying securities. The value of structured/synthetic convertible securities can be affected by interest rate changes and credit risks of the issuer. Such securities may be structured in ways that limit their potential for capital appreciation and the entire value of the security may be at risk of loss depending on the performance of the underlying equity security. Consequently, the Funds are exposed to greater
| Semiannual Report | | March 31, 2017 | 337 |
Table of Contents
Notes to Financial Statements (cont’d)
March 31, 2017 (Unaudited)
downside risk than traditional convertible securities, but typically still less than that of the underlying stock.
(r) When-Issued/Delayed-Delivery Transactions. When-issued or delayed-delivery transactions involve a commitment to purchase or sell securities for a predetermined price or yield, with payment and delivery taking place beyond the customary settlement period. When delayed-delivery purchases are outstanding, the Funds will set aside and maintain until the settlement date in a designated account, liquid assets in an amount sufficient to meet the purchase price. When purchasing a security on a delayed-delivery basis, the Funds assume the rights and risks of ownership of the security, including the risk of price and yield fluctuations; consequently, such fluctuations are taken into account when determining the NAV. The Funds may dispose of or renegotiate a delayed-delivery transaction after it is entered into, and may sell when-issued securities before they are delivered, which may result in a realized gain or loss. When a security is sold on a delayed-delivery basis, the Funds do not participate in future gains and losses with respect to the security.
(s) Contingent Value Rights. A Fund may invest in contingent value rights (“CVRs”). A CVR gives the holder the right to receive an amount (which may be a fixed amount or determined by a formula) in the event that a specified corporate action, business milestone, or other trigger occurs (or does not occur) which is often subject to an expiration date. CVRs often are awarded to shareholders in the context of a corporate acquisition or major restructuring. For example, shareholders of an acquired company may receive a CVR that enables them to receive additional shares of the acquiring company in the event that the acquiring company’s share price falls below a certain level by a specified date. Risks associated with the use of CVRs are generally similar to risks associated with the use of options, such as the risk that the required trigger does not (or does) occur prior to a CVR’s expiration, causing the CVR to expire with no value. CVRs also present illiquidity risk, as they may not be registered securities or may otherwise be non-transferable or difficult to transfer, as well as counterparty risk and credit risk. Further, because CVRs are valued based on the likelihood of the occurrence of a trigger, valuation often requires modeling and judgment, which increases the risk of mispricing or improper valuation.
(t) Restricted Securities. The Funds are permitted to invest in securities that are subject to legal or contractual restrictions on resale. These securities generally may be resold in transactions exempt from registration or to the public if the securities are registered. Disposal of these securities may involve time consuming negotiations and expenses, and prompt sale at an acceptable price may be difficult.
(u) Organizational and Offering Costs. Organizational costs are expensed at the inception of the Fund. Offering costs are amortized over a twelve-month period from the inception of the Fund.
(v) Loan Interest Expense. Loan interest expense relates to amounts borrowed under the credit facility (See Note 15). Loan interest expense is recorded as it is incurred.
| 2. | PRINCIPAL RISKS |
In the normal course of business, the Funds trade financial instruments and enter into financial transactions where risk of potential loss exists due to, among other things, changes in the market (market risk) or failure of the other party to a transaction to perform (counterparty risk). The Funds are also exposed to other risks such as, but not limited to, interest rate, foreign currency, credit and leverage risks.
Interest rate risk is the risk that fixed income securities’ valuations will change because of changes in interest rates. During periods of rising nominal interest rates, the values of fixed income instruments are generally expected to decline. Conversely, during periods of declining nominal interest rates, the values of fixed income instruments are generally expected to rise. A nominal interest rate can be described as the sum of a real interest rate and an expected inflation rate. Fixed income securities with longer durations tend to be more sensitive to changes in interest rates, usually making them more volatile than securities with shorter durations. Duration is used primarily as a measure of the sensitivity of a fixed income security’s market price to interest rate (i.e. yield) movements. Interest rate changes can be sudden and unpredictable, and the Funds may lose money as a result of movements in interest rates. High-yield or junk bonds are subject to greater levels of credit and liquidity risk, may be speculative and may decline in value due to increase in interest rates or an issuer’s deterioration or default. The Funds may not be able to hedge against changes in interest rates or may choose not to do so for cost or other reasons. In addition, any hedges may not work as intended.
Variable and floating rate securities generally are less sensitive to interest rate changes but may decline in value if their interest rates do not rise as much, or as quickly, as interest rates in general. Conversely, floating rate securities will not generally increase in value if interest rates decline. Inverse floating rate securities may decrease in value if interest rates increase. Inverse floating rate securities may also exhibit greater price volatility than a fixed rate obligation with similar credit quality. When the Funds hold variable or floating rate securities, a decrease (or, in the case of inverse floating rate securities, an increase) in market interest rates will adversely affect the income received from such securities and the NAV of the Funds’ shares.
The Funds are exposed to credit risk, which is the risk of losing money if the issuer or guarantor of a fixed income security is unable or unwilling, or is perceived (whether by market participants, rating agencies, pricing services or otherwise) as unable or unwilling, to make timely principal and/or interest payments, or to otherwise honor its obligations. Securities are subject to varying degrees of credit risk, which are often reflected in credit ratings.
To the extent the Funds directly invest in foreign currencies or in securities that trade in, and receive revenues in, foreign currencies, or in derivatives that provide exposure to foreign currencies, they will be subject to the risk that those currencies will decline in value relative to the U.S. dollar, or, in the case of hedging positions, that the U.S. dollar will decline in value relative to the currency being hedged. Currency rates in foreign countries may fluctuate significantly over short periods of time for a number of reasons, including economic growth, inflation,
| 338 | March 31, 2017 | | Semiannual Report |
Table of Contents
changes in interest rates, intervention (or the failure to intervene) by U.S. or foreign governments, central banks or supranational entities such as the International Monetary Fund, or the imposition of currency controls or other political developments in the United States or abroad. As a result, the Funds’ investments in foreign currency-denominated securities may reduce the returns of the Funds. The local emerging market currencies in which the fund may be invested may experience substantially greater volatility against the U.S. dollar than the major convertible currencies in developed countries.
The Funds are subject to elements of risk not typically associated with investments in the U.S., due to concentrated investments in foreign issuers located in a specific country or region. Such concentrations will subject the Funds to additional risks resulting from future political or economic conditions in such country or region and the possible imposition of adverse governmental laws or currency exchange restrictions affecting such country or region, which could cause the securities and their markets to be less liquid and prices more volatile than those of comparable U.S. companies.
The market values of securities may decline due to general market conditions (market risk) which are not specifically related to a particular company, such as real or perceived adverse economic conditions, changes in the general outlook for corporate earnings, changes in interest or currency rates, adverse changes to credit markets or adverse investor sentiment. They may also decline due to factors that affect a particular industry or industries, such as labor shortages or increased production costs and competitive conditions within an industry. Equity securities and equity-related investments generally have greater market price volatility than fixed income securities, although under certain market conditions fixed income securities may have comparable or greater price volatility. Credit ratings downgrades may also negatively affect securities held by the Funds. Even when markets perform well, there is no assurance that the investments held by the Funds will increase in value along with the broader market. In addition, market risk includes the risk that geopolitical events will disrupt the economy on a national or global level.
The Funds are exposed to counterparty risk, or the risk that an institution or other entity with which the Funds have unsettled or open transactions will default. The potential loss to the Funds could exceed the value of the financial assets recorded in the Funds’ financial statements. Financial assets, which potentially expose the Funds to counterparty risk, consist principally of cash due from counterparties and investments. The Investment Adviser and the Sub-Adviser, where applicable, seek to minimize the Funds’ counterparty risk by performing reviews of each counterparty and by minimizing concentration of counterparty risk by undertaking transactions with multiple customers and counterparties on recognized and reputable exchanges. Delivery of securities sold is only made once the Funds have received payment. Payment is made on a purchase once the securities have been delivered by the counterparty. The trade will fail if either party fails to meet its obligation.
The Funds are exposed to risks associated with leverage. Leverage may cause the value of the Funds’ shares to be more volatile than if the Funds did not use leverage. This is because leverage tends to
exaggerate the effect of any increase or decrease in the value of the Funds’ portfolio securities. The Funds may engage in transactions or purchase instruments that give rise to forms of leverage. In addition, to the extent the Funds employ leverage, dividend and interest costs may not be recovered by any appreciation of the securities purchased with the leverage proceeds and could exceed the Funds’ investment returns, resulting in greater losses.
The Funds may hold defaulted securities that may involve special considerations including bankruptcy proceedings, other regulatory and legal restrictions affecting the Funds’ ability to trade, and the availability of prices from independent pricing services or dealer quotations. Defaulted securities are often illiquid and may not be actively traded. Sale of securities in bankrupt companies at an acceptable price may be difficult and differences compared to the value of the securities used by the Funds could be material. A Fund may incur additional expenses to the extent it is required to seek recovery upon a portfolio security’s default in the payment of principal or interest. In any bankruptcy proceeding relating to a defaulted investment, a Fund may lose its entire investment or may be required to accept cash or securities with a value substantially less than its original investment.
The Funds are party to International Swaps and Derivatives Association, Inc. Master Agreements (“ISDA Master Agreements”) with select counterparties that govern transactions, over-the-counter derivatives and foreign exchange contracts entered into by the Funds and those counterparties. The ISDA Master Agreements contain provisions for general obligations, representations, agreements, collateral and events of default or termination. Events of termination include conditions that may entitle counterparties to elect to terminate early and cause settlement of all outstanding transactions under the applicable ISDA Master Agreement. Any election to terminate early could be material to the financial statements of the Funds.
The considerations and factors surrounding the settlement of certain purchases and sales made on a delayed-delivery basis are governed by Master Securities Forward Transaction Agreements (“Master Forward Agreements”) between the Funds and select counterparties. The Master Forward Agreements maintain provisions for, among other things, initiation and confirmation, payment and transfer, events of default, termination, and maintenance of collateral.
The counterparty risk associated with certain contracts may be reduced by master netting arrangements to the extent that if an event of default occurs, all amounts with the counterparty are terminated and settled on a net basis. The Funds’ overall exposure to counterparty risk with respect to transactions subject to master netting arrangements can change substantially within a short period, as it is affected by each transaction subject to the arrangement.
| 3. | UNDERLYING FUNDS AND OTHER ACQUIRED FUNDS RISK |
AllianzGI Retirement 2020, AllianzGI Retirement 2025, AllianzGI Retirement 2030, AllianzGI Retirement 2035, AllianzGI Retirement 2040, AllianzGI Retirement 2045, AllianzGI Retirement 2050, AllianzGI
| Semiannual Report | | March 31, 2017 | 339 |
Table of Contents
Notes to Financial Statements (cont’d)
March 31, 2017 (Unaudited)
Retirement 2055 and AllianzGI Retirement Income (collectively the “Target Date Funds”) and AllianzGI Global Megatrends intend to invest their assets primarily in series of Allianz Funds, Allianz Funds Multi-Strategy Trust, AllianzGI Institutional Multi-Series Trust, PIMCO Equity Series, PIMCO Funds, PIMCO ETF Trust or other affiliated and non-affiliated funds created in the future (together, “Underlying Funds”). AllianzGI Global Allocation, AllianzGI Emerging Markets Debt, AllianzGI Global Fundamental Strategy and AllianzGI Multi-Asset Real Return may invest their assets partially, significantly or primarily in Underlying Funds. The Funds may also invest a portion of their assets in unaffiliated ETFs and mutual funds and pooled vehicles (together, “Other Acquired Funds”). AllianzGI Global Dynamic Allocation, AllianzGI Structured Return and AllianzGI U.S. Equity Hedged expect to achieve their exposure to equity securities by investing in Other Acquired Funds. Accordingly, the investment performance of the Funds depends upon a favorable allocation among the Underlying Funds and Other Acquired Funds as well as the ability of the Underlying Funds and Other Acquired Funds to achieve their objectives. There can be no assurance that the investment objective of any Underlying Fund or Other Acquired Fund will be achieved. The risks associated with investing in each Fund are closely related to the risks associated with the securities and other investments held by the Underlying Funds and Other Acquired Funds.
Investing in the Underlying Funds and Other Acquired Funds involves certain additional expenses and tax results that would not be present in a direct investment in the Underlying Funds or Other Acquired Funds. Each Fund’s net asset value will fluctuate in response to changes in the net asset values of the Underlying Funds and Other Acquired Funds in which it invests. The extent to which the investment performance and risks associated with each Fund correlate to those of a particular Underlying Fund or Other Acquired Fund will depend upon the extent to which each Fund’s assets are allocated from time to time for investment in the Underlying Fund or Other Acquired Fund, which will vary. Each of the Structured Return Fund’s, the U.S. Equity Hedged Fund’s, the Target Funds’, Global Megatrends Fund’s, Global Allocation Fund’s, Multi-Asset Real Return Fund’s and Global Fundamental Strategy Fund’s investment in a particular Underlying Fund or Other Acquired Fund, as applicable may exceed 25% of its assets and the Global Dynamic Allocation Fund may invest significantly in Other Acquired Funds. To the extent that such Fund invests a significant portion of its assets in an Underlying Fund, or Other Acquired Fund will be particularly sensitive to the risks associated with that Underlying Fund or Other Acquired Fund.
| 4. | FINANCIAL DERIVATIVE INSTRUMENTS |
Disclosure about derivatives and hedging activities requires qualitative disclosure regarding objectives and strategies for using derivatives, quantitative disclosure about fair value amounts of gains and losses on derivatives, and disclosure about credit-risk-related contingent features in derivative agreements. The disclosure requirements distinguish between derivatives which are accounted for as “hedges”, and those that do not qualify for such accounting. Although the Funds at times use derivatives for hedging purposes, the Funds reflect derivatives at fair value and recognize changes in fair value through the Funds’ Statements of Operations, and such derivatives do not qualify for hedge accounting treatment.
Option Transactions. The Funds purchase put and call options on securities and indices for hedging purposes, risk management purposes or otherwise as part of their investment strategies. The risks associated with purchasing an option include the risk that the Funds pay a premium whether or not the option is exercised. Additionally, the Funds bear the risk of loss of premiums and changes in market value should the counterparty not perform under the contract. Put and call options purchased are accounted for in the same manner as portfolio securities. The cost of securities acquired through the exercise of call options is increased by the premiums paid. The proceeds from securities sold through the exercise of put options are decreased by the premiums paid.
The Funds may write (sell) put and call options on securities and indices to earn premiums, for hedging purposes, risk management purposes or otherwise as part of their investment strategies. When an option is written, the premium received is recorded as an asset with an equal liability that is subsequently marked to market to reflect the market value of the option written. These liabilities, if any, are reflected as options written in the Funds’ Statements of Assets and Liabilities. Premiums received from writing options which expire unexercised are recorded on the expiration date as a realized gain. The difference between the premium received and the amount paid on effecting a closing purchase transaction, including brokerage commissions, is also treated as a realized gain, or if the premium is less than the amount paid for the closing purchase transaction, as a realized loss. If a call option written is exercised, the premium is added to the proceeds from the sale of the underlying security in determining whether there has been a realized gain or loss. If a put option written is exercised, the premium reduces the cost basis of the security. In writing an option, the Funds bear the market risk of an unfavorable change in the price of the security underlying the written option. Exercise of a written option could result in the Funds purchasing a security at a price different from its current market value.
Futures Contracts. The Funds use futures contracts to manage their exposure to the securities markets or the movements in interest rates and currency values. A futures contract is an agreement between two parties to buy and sell a financial instrument at a set price on a future date. Upon entering into such a contract, the Funds are required to pledge to the broker an amount of cash or securities equal to the minimum “initial margin” requirements of the exchange. Pursuant to the contracts, the Funds agree to receive from or pay to the broker an amount of cash or securities equal to the daily fluctuation in the value of the contracts. Such receipts or payments are known as “variation margin” and are recorded by the Funds as unrealized appreciation or depreciation. When the contracts are closed, the Funds record a realized gain or loss equal to the difference between the value of the contracts at the time they were opened and the value at the time they were closed. Any unrealized appreciation or depreciation recorded is simultaneously reversed. The use of futures transactions involves various risks, including the risk of an imperfect correlation in the movements in the price of futures contracts, interest rates and underlying hedging assets, and possible inability or unwillingness of counterparties to meet the terms of their contracts.
Swap Agreements. Swap agreements are bilaterally negotiated agreements between the Funds and a counterparty to exchange or
| 340 | March 31, 2017 | | Semiannual Report |
Table of Contents
swap investment cash flows, assets, foreign currencies or market or event-linked returns at specified, future intervals. Swap agreements may be privately negotiated in the over-the-counter market (“OTC swaps”) or may be executed in a multilateral or other trade facility platform, such as a registered commodities exchange (“centrally cleared swaps”). The Funds may enter into credit default, cross-currency, interest rate, total return, variance and other forms of swap agreements in order, among other things, manage their exposure to credit, currency and interest rate risk. In connection with these agreements, securities or cash may be identified as collateral or margin in accordance with the terms of the respective swap agreements to provide assets of value and recourse in the event of default or bankruptcy/insolvency.
OTC swap payments received or made at the beginning of the measurement period, if any, are reflected as such on the Funds’ Statements of Assets and Liabilities and represent payments made or received upon entering into the swap agreement to compensate for differences between the stated terms of the swap agreement and prevailing market conditions (credit spreads, currency exchange rates, interest rates, and other relevant factors). These upfront payments are recorded as realized gains or losses on the Funds’ Statements of Operations upon termination or maturity of the swap. A liquidation payment received or made at the termination of the swap is recorded as realized gain or loss on the Funds’ Statements of Operations. Net periodic payments received or paid by the Funds are included as part of realized gains or losses on the Funds’ Statements of Operations. Changes in market value, if any, are reflected as a component of net changes in unrealized appreciation/depreciation on the Funds’ Statements of Operations.
Entering into these agreements involves, to varying degrees, elements of credit, legal, market and documentation risk in excess of the amounts recognized on the Funds’ Statements of Assets and Liabilities. Such risks include the possibility that there will be no liquid market for these agreements, that the counterparties to the agreements may default on their obligation to perform or disagree as to the meaning of contractual terms in the agreements and that there may be unfavorable changes in interest rates.
Credit Default Swap Agreements. Credit default swap agreements involve one party (referred to as the buyer of protection) making a stream of payments to another party (the seller of protection) in exchange for the right to receive a specified return in the event of a default or other credit event for the referenced entity, obligation or index. As the sellers of protection on credit default swap agreements, the Funds will generally receive from the buyer of protection a fixed rate of income throughout the term of the swap provided that there is no credit event. As the sellers, the Funds would effectively add leverage to their investment portfolios because, in addition to their total net assets, the Funds would be subject to investment exposure on the notional amount of the swap.
If the Funds are sellers of protection and a credit event occurs, as defined under the terms of that particular swap agreement, a Fund
will either (i) pay to the buyer of protection an amount equal to the notional amount of the swap and take delivery of the referenced obligation, other deliverable obligations or underlying securities comprising the referenced index or (ii) pay a net settlement amount in the form of cash or securities equal to the notional amount of the swap less the recovery value of the referenced obligation or underlying securities comprising the referenced index. If the Funds are buyers of protection and a credit event occurs, as defined under the terms of that particular swap agreement, a Fund will either (i) receive from the seller of protection an amount equal to the notional amount of the swap and deliver the referenced obligation, other deliverable obligations or underlying securities comprising the referenced index or (ii) receive a net settlement amount in the form of cash or securities equal to the notional amount of the swap less the recovery value of the referenced obligation or underlying securities comprising the referenced index. Recovery values are assumed by market makers considering either industry standard recovery rates or entity specific factors and considerations until a credit event occurs. If a credit event has occurred, the recovery value is determined by a facilitated auction whereby a minimum number of allowable broker bids, together with a specified valuation method, are used to calculate the settlement value.
Credit default swap agreements on corporate or sovereign issues involve one party making a stream of payments to another party in exchange for the right to receive a specified return in the event of a default or other credit event. If a credit event occurs and cash settlement is not elected, a variety of other deliverable obligations may be delivered in lieu of the specific referenced obligation. The ability to deliver other obligations may result in a cheapest-to-deliver option (the buyer of protection’s right to choose the deliverable obligation with the lowest value following a credit event). The Funds use credit default swaps on corporate or sovereign issues to provide a measure of protection against defaults of the issuers (i.e., to reduce risk where the Funds own or have exposure to the referenced obligation) or to take an active long or short position with respect to the likelihood of a particular issuer’s default.
Implied credit spreads, represented in absolute terms, utilized in determining the market value of credit default swap agreements on corporate or sovereign issues, serve as an indicator of the current status of the payment/performance risk, and represent the likelihood or risk of default for the credit derivative. The implied credit spread of a particular referenced entity reflects the cost of buying/selling protection and may include upfront payments required to be made to enter into the agreement. For credit default swap agreements on asset-backed securities and credit indices, the quoted market prices and resulting values serve as the indicator of the current status of the payment/performance risk. Wider credit spreads and increasing market values, in absolute terms when compared to the notional amount of the swap, represent a deterioration of the referenced entity’s credit soundness and a greater likelihood or risk of default or other credit event occurring as defined under the terms of the agreement.
| Semiannual Report | | March 31, 2017 | 341 |
Table of Contents
Notes to Financial Statements (cont’d)
March 31, 2017 (Unaudited)
The maximum potential amount of future payments (undiscounted) that the Funds as sellers of protection could be required to make under a credit default swap agreement would be an amount equal to the notional amount of the agreement. These potential amounts would be partially offset by any recovery values of the respective referenced obligations, upfront payments received upon entering into the agreement, or net amounts received from the settlement of buy protection credit default swap agreements entered into by the Funds for the same referenced entity or entities.
There were no swap agreements outstanding at March 31, 2017.
Forward Foreign Currency Contracts. A forward foreign currency contract is an agreement between two parties to buy and sell a currency at a set exchange rate on a future date. The Funds enter into forward foreign currency contracts for the purpose of hedging against foreign currency risk arising from the investment or anticipated
investment in securities denominated in foreign currencies. The Funds also enter into these contracts for purposes of increasing exposure to a foreign currency or shifting exposure to foreign currency fluctuations from one country to another. The market value of a forward foreign currency contract fluctuates with changes in foreign currency exchange rates. All commitments are marked to market daily at the applicable exchange rates and any resulting unrealized appreciation or depreciation is recorded. Realized gains or losses are recorded at the time the forward contract matures or by delivery of the currency. Risks may arise upon entering into these contracts from the potential inability of counterparties to meet the terms of their contracts and from unanticipated movements in the value of a foreign currency relative to the U.S. dollar. In addition, these contracts may involve market risk in excess of the unrealized appreciation (depreciation) reflected in the Funds’ Statements of Assets and Liabilities.
The following is a summary of the Funds’ derivatives categorized by risk exposure.
The effect of derivatives on the Statements of Assets and Liabilities at March 31, 2017:
| AllianzGI Retirement 2020: | ||||||||||||||||
| Location | Market Price | Interest Rate Contracts | Foreign Exchange Contracts | Total | ||||||||||||
Asset derivatives: | ||||||||||||||||
Receivable for variation margin on futures contracts* | — | $ | 16,116 | $ | 6,686 | $ | 22,802 | |||||||||
Liability derivatives: | ||||||||||||||||
Payable for variation margin on futures contracts* | $ | (6,536 | ) | — | $ | (24,273 | ) | $ | (30,809 | ) | ||||||
| * | Included in net unrealized depreciation of $8,007 on futures contracts as reported in Note 7(b). |
| AllianzGI Retirement 2025: | ||||||||||||
| Location | Market Price | Foreign Exchange Contracts | Total | |||||||||
Asset derivatives: | ||||||||||||
Receivable for variation margin on futures contracts* | $ | 4,794 | $ | 8,024 | $ | 12,818 | ||||||
Liability derivatives: | ||||||||||||
Payable for variation margin on futures contracts* | $ | (24,090 | ) | $ | (30,045 | ) | $ | (54,135 | ) | |||
| * | Included in net unrealized depreciation of $41,317 on futures contracts as reported in Note 7(b). |
| AllianzGI Retirement 2030: | ||||||||||||
| Location | Market Price | Foreign Exchange Contracts | Total | |||||||||
Asset derivatives: | ||||||||||||
Receivable for variation margin on futures contracts* | $ | 14,179 | $ | 10,698 | $ | 24,877 | ||||||
Liability derivatives: | ||||||||||||
Payable for variation margin on futures contracts* | $ | (19,013 | ) | $ | (41,586 | ) | $ | (60,599 | ) | |||
| * | Included in net unrealized depreciation of $35,722 on futures contracts as reported in Note 7(b). |
| 342 | March 31, 2017 | | Semiannual Report |
Table of Contents
| AllianzGI Retirement 2035: | ||||||||||||
| Location | Market Price | �� | Foreign Exchange Contracts | Total | ||||||||
Asset derivatives: | ||||||||||||
Receivable for variation margin on futures contracts* | $ | 22,876 | $ | 9,361 | $ | 32,237 | ||||||
Liability derivatives: | ||||||||||||
Payable for variation margin on futures contracts* | $ | (18,017 | ) | $ | (38,105 | ) | $ | (56,122 | ) | |||
| * | Included in net unrealized depreciation of $23,885 on futures contracts as reported in Note 7(b). |
| AllianzGI Retirement 2040: | ||||||||||||
| Location | Market Price | Foreign Exchange Contracts | Total | |||||||||
Asset derivatives: | ||||||||||||
Receivable for variation margin on futures contracts* | $ | 26,909 | $ | 9,361 | $ | 36,270 | ||||||
Liability derivatives: | ||||||||||||
Payable for variation margin on futures contracts* | $ | (16,616 | ) | $ | (38,105 | ) | $ | (54,721 | ) | |||
| * | Included in net unrealized depreciation of $18,451 on futures contracts as reported in Note 7(b). |
| AllianzGI Retirement 2045: | ||||||||||||
| Location | Market Price | Foreign Exchange Contracts | Total | |||||||||
Asset derivatives: | ||||||||||||
Receivable for variation margin on futures contracts* | $ | 19,622 | $ | 5,349 | $ | 24,971 | ||||||
Liability derivatives: | ||||||||||||
Payable for variation margin on futures contracts* | $ | (9,988 | ) | $ | (20,793 | ) | $ | (30,781 | ) | |||
| * | Included in net unrealized depreciation of $5,810 on futures contracts as reported in Note 7(b). |
| AllianzGI Retirement 2050: | ||||||||||||
| Location | Market Price | Foreign Exchange Contracts | Total | |||||||||
Asset derivatives: | ||||||||||||
Receivable for variation margin on futures contracts* | $ | 18,792 | $ | 5,349 | $ | 24,141 | ||||||
Liability derivatives: | ||||||||||||
Payable for variation margin on futures contracts* | $ | (9,987 | ) | $ | (20,793 | ) | $ | (30,780 | ) | |||
| * | Included in net unrealized depreciation of $6,639 on futures contracts as reported in Note 7(b). |
| AllianzGI Retirement 2055: | ||||||||||||
| Location | Market Price | Foreign Exchange Contracts | Total | |||||||||
Asset derivatives: | ||||||||||||
Receivable for variation margin on futures contracts* | $ | 8,177 | $ | 2,675 | $ | 10,852 | ||||||
Liability derivatives: | ||||||||||||
Payable for variation margin on futures contracts* | $ | (4,760 | ) | $ | (5,771 | ) | $ | (10,531 | ) | |||
| * | Included in net unrealized appreciation of $321 on futures contracts as reported in Note 7(b). |
| Semiannual Report | | March 31, 2017 | 343 |
Table of Contents
Notes to Financial Statements (cont’d)
March 31, 2017 (Unaudited)
| AllianzGI Retirement Income: | ||||||||||||||||
| Location | Market Price | Interest Rate Contracts | Foreign Exchange Contracts | Total | ||||||||||||
Asset derivatives: | ||||||||||||||||
Receivable for variation margin on futures contracts* | $ | 56,253 | $ | 31,103 | — | $ | 87,356 | |||||||||
Liability derivatives: | ||||||||||||||||
Payable for variation margin on futures contracts* | $ | (108,543 | ) | — | $ | (51,152 | ) | $ | (159,695 | ) | ||||||
| * | Included in net unrealized depreciation of $72,339 on futures contracts as reported in Note 7(b). |
| AllianzGI Global Allocation: | ||||||||||||||||
| Location | Market Price | Interest Rate Contracts | Foreign Exchange Contracts | Total | ||||||||||||
Asset derivatives: | ||||||||||||||||
Receivable for variation margin on futures contracts* | $ | 147,221 | $ | 159,297 | $ | 76,400 | $ | 382,918 | ||||||||
Liability derivatives: | ||||||||||||||||
Payable for variation margin on futures contracts* | $ | (177,839 | ) | $ | (11,895 | ) | $ | (503,836 | ) | $ | (693,570 | ) | ||||
| * | Included in net unrealized depreciation of $310,652 on futures contracts as reported in Note 7(b). |
| AllianzGI Best Styles Emerging Markets Equity: | ||||
| Location | Market Price | |||
Asset derivatives: | ||||
Receivable for variation margin on futures contracts* | $ | 2,420 | ||
| * | Included in net unrealized appreciation of $2,420 on futures contracts as reported in Note 7(b). |
| AllianzGI Best Styles Global Equity: | ||||
| Location | Market Price | |||
Asset derivatives: | ||||
Receivable for variation margin on futures contracts* | $ | 96,492 | ||
Liability derivatives: | ||||
Payable for variation margin on futures contracts* | $ | (41,607 | ) | |
| * | Included in net unrealized appreciation of $54,885 on futures contracts as reported in Note 7(b). |
| AllianzGI Best Styles International Equity: | ||||
| Location | Market Price | |||
Asset derivatives: | ||||
Receivable for variation margin on futures contracts* | $ | 13,144 | ||
| * | Included in net unrealized appreciation of $13,144 on futures contracts as reported in Note 7(b). |
| AllianzGI Emerging Markets Debt: | ||||
| Location | Foreign Exchange Contracts | |||
Asset derivatives: | ||||
Unrealized appreciation of forward foreign currency contracts | $ | 6,451 | ||
| AllianzGI Global Dynamic Allocation: | ||||||||||||||||
| Location | Market Price | Interest Rate Contracts | Foreign Exchange Contracts | Total | ||||||||||||
Asset derivatives: | ||||||||||||||||
Receivable for variation margin on futures contracts* | $ | 1,074,647 | $ | 128,486 | — | $ | 1,203,133 | |||||||||
Liability derivatives: | ||||||||||||||||
Payable for variation margin on futures contracts* | $ | (336,216 | ) | $ | (24,684 | ) | $ | (158,545 | ) | $ | (519,445 | ) | ||||
| * | Included in net unrealized appreciation of $683,688 on futures contracts as reported in Note 7(b). |
| 344 | March 31, 2017 | | Semiannual Report |
Table of Contents
| AllianzGI Global Fundamental Strategy: | ||||||||||||||||
| Location | Market Price | Interest Rate Contracts | Foreign Exchange Contracts | Total | ||||||||||||
Asset derivatives: | ||||||||||||||||
Investments, at value (options purchased) | $ | 33,035 | — | — | $ | 33,035 | ||||||||||
Receivable for variation margin on futures contracts* | 33,222 | $ | 1,186 | — | 34,408 | |||||||||||
Unrealized appreciation of forward foreign currency contracts | — | — | $ | 23,455 | 23,455 | |||||||||||
Total asset derivatives | $ | 66,257 | $ | 1,186 | $ | 23,455 | $ | 90,898 | ||||||||
Liability derivatives: | ||||||||||||||||
Unrealized depreciation of forward foreign currency contracts | — | — | $ | (7,053 | ) | $ | (7,053 | ) | ||||||||
| * | Included in net unrealized appreciation of $34,408 on futures contracts as reported in Note 7(b). |
| AllianzGI International Small-Cap: | ||||
| Location | Foreign Exchange Contracts | |||
Liability derivatives: | ||||
Unrealized depreciation of forward foreign currency contracts | $ | (764 | ) | |
| AllianzGI Multi-Asset Real Return: | ||||||||||||||||
| Location | Market Price | Interest Rate Contracts | Foreign Exchange Contracts | Total | ||||||||||||
Asset derivatives: | ||||||||||||||||
Receivable for variation margin on futures contracts* | $ | 11,743 | — | — | $ | 11,743 | ||||||||||
Liability derivatives: | ||||||||||||||||
Payable for variation margin on futures contracts* | $ | (1,622 | ) | $ | (66 | ) | $ | (1,403 | ) | $ | (3,091 | ) | ||||
| * | Included in net unrealized appreciation of $8,652 on futures contracts as reported in Note 7(b). |
| AllianzGI NFJ Emerging Markets Value: | ||||
| Location | Foreign Exchange Contracts | |||
Liability derivatives: | ||||
Unrealized depreciation of forward foreign currency contracts | $ | (470 | ) | |
| AllianzGI Structured Return: | ||||
| Location | Market Price | |||
Asset derivatives: | ||||
Investments, at value (options purchased) | $ | 401,873 | ||
Liability derivatives: | ||||
Options written, at value | $ | (11,834,250 | ) | |
| AllianzGI U.S. Equity Hedged: | ||||
| Location | Market Price | |||
Asset derivatives: | ||||
Investments, at value (options purchased) | $ | 34,883 | ||
Liability derivatives: | ||||
Options written, at value | $ | (2,540 | ) | |
| Semiannual Report | | March 31, 2017 | 345 |
Table of Contents
Notes to Financial Statements (cont’d)
March 31, 2017 (Unaudited)
The effect of derivatives on the Statements of Operations for the six months ended March 31, 2017:
| AllianzGI Retirement 2020: | ||||||||||||||||
| Location | Market Price | Interest Rate Contracts | Foreign Exchange Contracts | Total | ||||||||||||
Net realized gain(loss) on: | ||||||||||||||||
Futures contracts | $ | 147,918 | $ | (198,952 | ) | $ | 27,320 | $ | (23,714 | ) | ||||||
Net change in unrealized appreciation/depreciation of: | ||||||||||||||||
Futures contracts | $ | (1,724 | ) | $ | 20,575 | $ | (17,587 | ) | $ | 1,264 | ||||||
| AllianzGI Retirement 2025: | ||||||||||||||||
| Location | Market Price | Interest Rate Contracts | Foreign Exchange Contracts | Total | ||||||||||||
Net realized gain(loss) on: | ||||||||||||||||
Futures contracts | $ | 267,847 | $ | (117,158 | ) | $ | 33,456 | $ | 184,145 | |||||||
Net change in unrealized appreciation/depreciation of: | ||||||||||||||||
Futures contracts | $ | (14,450 | ) | $ | 3,316 | $ | (22,021 | ) | $ | (33,155 | ) | |||||
| AllianzGI Retirement 2030: | ||||||||||||||||
| Location | Market Price | Interest Rate Contracts | Foreign Exchange Contracts | Total | ||||||||||||
Net realized gain(loss) on: | ||||||||||||||||
Futures contracts | $ | 183,112 | $ | (79,209 | ) | $ | 45,767 | $ | 149,670 | |||||||
Net change in unrealized appreciation/depreciation of: | ||||||||||||||||
Futures contracts | $ | 3,084 | $ | 3,187 | $ | (30,888 | ) | $ | (24,617 | ) | ||||||
| AllianzGI Retirement 2035: | ||||||||||||||||
| Location | Market Price | Interest Rate Contracts | Foreign Exchange Contracts | Total | ||||||||||||
Net realized gain on: | ||||||||||||||||
Futures contracts | $ | 124,793 | $ | 16,588 | $ | 41,362 | $ | 182,743 | ||||||||
Net change in unrealized appreciation/depreciation of: | ||||||||||||||||
Futures contracts | $ | 11,699 | $ | 1,693 | $ | (28,744 | ) | $ | (15,352 | ) | ||||||
| AllianzGI Retirement 2040: | ||||||||||||||||
| Location | Market Price | Interest Rate Contracts | Foreign Exchange Contracts | Total | ||||||||||||
Net realized gain on: | ||||||||||||||||
Futures contracts | $ | 57,374 | $ | 10,592 | $ | 41,319 | $ | 109,285 | ||||||||
Net change in unrealized appreciation/depreciation of: | ||||||||||||||||
Futures contracts | $ | 18,529 | $ | 2,208 | $ | (28,744 | ) | $ | (8,007 | ) | ||||||
| AllianzGI Retirement 2045: | ||||||||||||||||
| Location | Market Price | Interest Rate Contracts | Foreign Exchange Contracts | Total | ||||||||||||
Net realized gain(loss) on: | ||||||||||||||||
Futures contracts | $ | (5,344 | ) | $ | 5,106 | $ | 22,865 | $ | 22,627 | |||||||
Net change in unrealized appreciation/depreciation of: | ||||||||||||||||
Futures contracts | $ | 17,534 | $ | 1,125 | $ | (15,444 | ) | $ | 3,215 | |||||||
| 346 | March 31, 2017 | | Semiannual Report |
Table of Contents
| AllianzGI Retirement 2050: | ||||||||||||||||
| Location | Market Price | Interest Rate Contracts | Foreign Exchange Contracts | Total | ||||||||||||
Net realized gain on: | ||||||||||||||||
Futures contracts | $ | 3,714 | $ | 5,106 | $ | 22,865 | $ | 31,685 | ||||||||
Net change in unrealized appreciation/depreciation of: | ||||||||||||||||
Futures contracts | $ | 16,680 | $ | 1,126 | $ | (15,444 | ) | $ | 2,362 | |||||||
| AllianzGI Retirement 2055: | ||||||||||||||||
| Location | Market Price | Interest Rate Contracts | Foreign Exchange Contracts | Total | ||||||||||||
Net realized gain on: | ||||||||||||||||
Futures contracts | $ | 2,005 | $ | 3,033 | $ | 7,559 | $ | 12,597 | ||||||||
Net change in unrealized appreciation/depreciation of: | ||||||||||||||||
Futures contracts | $ | 5,677 | $ | 520 | $ | (3,096 | ) | $ | 3,101 | |||||||
| AllianzGI Retirement Income: | ||||||||||||||||
| Location | Market Price | Interest Rate Contracts | Foreign Exchange Contracts | Total | ||||||||||||
Net realized gain(loss) on: | ||||||||||||||||
Futures contracts | $ | (129,813 | ) | $ | (604,783 | ) | $ | 91,243 | $ | (643,353 | ) | |||||
Foreign currency transaction (forward currency contracts) | — | — | 1,573 | 1,573 | ||||||||||||
Total net realized gain(loss) | $ | (129,813 | ) | $ | (604,783 | ) | $ | 92,816 | $ | (641,780 | ) | |||||
Net change in unrealized appreciation/depreciation of: | ||||||||||||||||
Futures contracts | $ | (52,290 | ) | $ | 47,207 | $ | (51,152 | ) | $ | (56,235 | ) | |||||
| AllianzGI Global Allocation: | ||||||||||||||||
| Location | Market Price | Interest Contracts | Foreign Exchange Contracts | Total | ||||||||||||
Net realized gain(loss) on: | ||||||||||||||||
Futures contracts | $ | 1,578,567 | $ | (2,916,944 | ) | $ | 1,446,216 | $ | 107,839 | |||||||
Net change in unrealized appreciation/depreciation of: | ||||||||||||||||
Futures contracts | $ | (104,252 | ) | 378,697 | $ | (811,894 | ) | $ | (537,449 | ) | ||||||
| AllianzGI Best Styles Emerging Markets Equity: | ||||||||||||
| Location | Market Price | Foreign Exchange Contracts | Total | |||||||||
Net realized gain on: | ||||||||||||
Futures contracts | $ | 3,147 | — | $ | 3,147 | |||||||
Foreign currency transaction (forward currency contracts) | — | $ | 6,022 | 6,022 | ||||||||
Total net realized gain | $ | 3,147 | $ | 6,022 | $ | 9,169 | ||||||
Net change in unrealized appreciation/depreciation of: | ||||||||||||
Futures contracts | $ | 13,510 | — | $ | 13,510 | |||||||
Foreign currency transaction (forward currency contracts) | — | $ | 86 | 86 | ||||||||
Total net change in unrealized appreciation/depreciation | $ | 13,510 | $ | 86 | $ | 13,596 | ||||||
| Semiannual Report | | March 31, 2017 | 347 |
Table of Contents
Notes to Financial Statements (cont’d)
March 31, 2017 (Unaudited)
| AllianzGI Best Styles Global Equity: | ||||||||||||
| Location | Market Price | Foreign Exchange Contracts | Total | |||||||||
Net realized gain on: | ||||||||||||
Futures contracts | $ | 254,848 | — | $ | 254,848 | |||||||
Foreign currency transaction (forward currency contracts) | — | $ | 61,621 | 61,621 | ||||||||
Total net realized gain | $ | 254,848 | $ | 61,621 | $ | 316,469 | ||||||
Net change in unrealized appreciation/depreciation of: | ||||||||||||
Futures contracts | $ | (82,398 | ) | — | $ | (82,398 | ) | |||||
Foreign currency transaction (forward currency contracts) | — | $ | (3,942 | ) | (3,942 | ) | ||||||
Total net change in unrealized appreciation/depreciation | $ | (82,398 | ) | $ | (3,942 | ) | $ | (86,340 | ) | |||
| AllianzGI Best Styles International Equity: | ||||||||||||
| Location | Market Price | Foreign Exchange Contracts | Total | |||||||||
Net realized gain(loss) on: | ||||||||||||
Futures contracts | $ | (12,635 | ) | — | $ | (12,635 | ) | |||||
Foreign currency transaction (forward currency contracts) | — | $ | 2,620 | 2,620 | ||||||||
Total net realized gain(loss) | $ | (12,635 | ) | $ | 2,620 | $ | (10,015 | ) | ||||
Net change in unrealized appreciation/depreciation of: | ||||||||||||
Futures contracts | $ | 12,997 | — | $ | 12,997 | |||||||
| AllianzGI Best Styles U.S. Equity: | ||||||||||||
| Location | Market Price | Foreign Exchange Contracts | Total | |||||||||
Net realized gain on: | ||||||||||||
Futures contracts | $ | 545,472 | — | $ | 545,472 | |||||||
Foreign currency transaction (forward currency contracts) | — | $ | 261 | 261 | ||||||||
Total net realized gain | $ | 545,472 | $ | 261 | $ | 545,733 | ||||||
Net change in unrealized appreciation/depreciation of: | ||||||||||||
Futures contracts | $ | (88,800 | ) | — | $ | (88,800 | ) | |||||
| AllianzGI Emerging Markets Consumer: | ||||
| Location | Foreign Exchange Contracts | |||
Net realized gain on: | ||||
Foreign currency transaction (forward currency contracts) | $ | 21,830 | ||
Net change in unrealized appreciation/depreciation of: | ||||
Foreign currency transaction (forward currency contracts) | $ | (431 | ) | |
| 348 | March 31, 2017 | | Semiannual Report |
Table of Contents
| AllianzGI Emerging Markets Debt: | ||||||||||||||||
| Location | Interest Rate Contracts | Credit Contracts | Foreign Exchange Contracts | Total | ||||||||||||
Net realized gain(loss) on: | ||||||||||||||||
Futures contracts | $ | 20,287 | — | — | $ | 20,287 | ||||||||||
Swaps | — | $ | (24,151 | ) | — | (24,151 | ) | |||||||||
Options written | — | — | $ | 11,711 | 11,711 | |||||||||||
Foreign currency transaction (forward currency contracts) | — | — | 20,823 | 20,823 | ||||||||||||
Total net realized gain(loss) | $ | 20,287 | $ | (24,151 | ) | $ | 32,534 | $ | 28,670 | |||||||
Net change in unrealized appreciation/depreciation of: | ||||||||||||||||
Swaps | — | $ | (54,273 | ) | — | $ | (54,273 | ) | ||||||||
Foreign currency transaction (forward currency contracts) | — | — | $ | 22,692 | 22,692 | |||||||||||
Total net change in unrealized appreciation/depreciation | — | $ | (54,273 | ) | $ | 22,692 | $ | (31,581 | ) | |||||||
| AllianzGI Emerging Markets Small-Cap: | ||||
| Location | Foreign Exchange Contracts | |||
Net realized loss on: | ||||
Foreign currency transaction (forward currency contracts) | $ | (7,115 | ) | |
| AllianzGI Global Dynamic Allocation: | ||||||||||||||||
| Location | Market Price | Interest Rate Contracts | Foreign Exchange Contracts | Total | ||||||||||||
Net realized gain on: | ||||||||||||||||
Futures contracts | $ | 1,567,668 | $ | 245,064 | $ | 309,880 | $ | 2,122,612 | ||||||||
Foreign currency transaction (forward currency contracts) | — | — | 8,835 | 8,835 | ||||||||||||
Total net realized gain | $ | 1,567,668 | $ | 245,064 | $ | 318,715 | $ | 2,131,447 | ||||||||
Net change in unrealized appreciation/depreciation of: | ||||||||||||||||
Futures contracts | $ | 666,719 | $ | 122,644 | $ | (192,431 | ) | $ | 596,932 | |||||||
| AllianzGI Global Fundamental Strategy: | ||||||||||||||||
| Location | Market Price | Interest Rate Contracts | Foreign Exchange Contracts | Total | ||||||||||||
Net realized gain(loss) on: | ||||||||||||||||
Investments (options purchased) | $ | 5,138 | — | $ | (10,164 | ) | $ | (5,026 | ) | |||||||
Futures contracts | (34,310 | ) | $ | (1,569 | ) | — | (35,879 | ) | ||||||||
Options written | 40,740 | — | — | 40,740 | ||||||||||||
Foreign currency transaction (forward currency contracts) | — | — | $ | 145,728 | 145,728 | |||||||||||
Total net realized gain(loss) | $ | 11,568 | $ | (1,569 | ) | $ | 135,564 | $ | 145,563 | |||||||
Net change in unrealized appreciation/depreciation of: | ||||||||||||||||
Investments (options purchased) | $ | 7,076 | — | 9,975 | $ | 17,051 | ||||||||||
Options written | (12,984 | ) | — | — | (12,984 | ) | ||||||||||
Futures contracts | 52,574 | $ | 7,863 | — | 60,437 | |||||||||||
Foreign currency transaction (forward currency contracts) | — | — | $ | (2,498 | ) | (2,498 | ) | |||||||||
Total net change in unrealized appreciation/depreciation | $ | 46,666 | $ | 7,863 | $ | 7,477 | $ | 62,006 | ||||||||
| Semiannual Report | | March 31, 2017 | 349 |
Table of Contents
Notes to Financial Statements (cont’d)
March 31, 2017 (Unaudited)
| AllianzGI Global Sustainability: | ||||
| Location | Foreign Exchange Contracts | |||
Net realized gain on: | ||||
Foreign currency transaction (forward currency contracts) | $ | 408 | ||
| AllianzGI Global Water: | ||||
| Location | Foreign Exchange Contracts | |||
Net realized loss on: | ||||
Foreign currency transaction (forward currency contracts) | $ | (13,959 | ) | |
| AllianzGI International Growth: | ||||
| Location | Foreign Exchange Contracts | |||
Net realized gain on: | ||||
Foreign currency transaction (forward currency contracts) | $ | 1,652 | ||
| AllianzGI International Small-Cap: | ||||
| Location | Foreign Exchange Contracts | |||
Net realized gain on: | ||||
Foreign currency transaction (forward currency contracts) | $ | 12,244 | ||
Net change in unrealized appreciation/depreciation of: | ||||
Foreign currency transaction (forward currency contracts) | $ | (764 | ) | |
| AllianzGI Multi-Asset Real Return: | ||||||||||||||||
| Location | Market Price | Interest Rate Contracts | Foreign Exchange Contracts | Total | ||||||||||||
Net realized gain on: | ||||||||||||||||
Futures contracts | $ | 15,956 | $ | 555 | $ | 3,307 | $ | 19,818 | ||||||||
Net change in unrealized appreciation/depreciation of: | ||||||||||||||||
Futures contracts | $ | 10,611 | $ | 260 | $ | (1,403 | ) | $ | 9,468 | |||||||
| AllianzGI NFJ Emerging Markets Value: | ||||
| Location | Foreign Exchange Contracts | |||
Net realized gain on: | ||||
Foreign currency transaction (forward currency contracts) | $ | 1,902 | ||
Net change in unrealized appreciation/depreciation of: | ||||
Foreign currency transaction (forward currency contracts) | $ | (497 | ) | |
| AllianzGI NFJ Global Dividend Value: | ||||
| Location | Foreign Exchange Contracts | |||
Net realized gain on: | ||||
Foreign currency transaction (forward currency contracts) | $ | 1,165 | ||
Net change in unrealized appreciation/depreciation of: | ||||
Foreign currency transaction (forward currency contracts) | $ | (12 | ) | |
| AllianzGI NFJ International Small-Cap Value: | ||||
| Location | Foreign Exchange Contracts | |||
Net realized gain on: | ||||
Foreign currency transaction (forward currency contracts) | $ | 992 | ||
Net change in unrealized appreciation/depreciation of: | ||||
Foreign currency transaction (forward currency contracts) | $ | (1,122 | ) | |
| AllianzGI NFJ International Value II: | ||||
| Location | Foreign Exchange Contracts | |||
Net realized gain on: | ||||
Foreign currency transaction (forward currency contracts) | $ | 12,770 | ||
| AllianzGI Structured Return: | ||||
| Location | Market Price | |||
Net realized loss on: | ||||
Investments (options purchased) | $ | (3,913,179 | ) | |
Options written | (16,296,308 | ) | ||
Total net realized loss | $ | (20,209,487 | ) | |
Net change in unrealized appreciation/depreciation of: | ||||
Investments (options purchased) | $ | (158,739 | ) | |
Options written | 2,535,261 | |||
Total net change in unrealized appreciation/depreciation | $ | 2,376,522 | ||
| 350 | March 31, 2017 | | Semiannual Report |
Table of Contents
| AllianzGI U.S. Equity Hedged: | ||||
| Location | Market Price | |||
Net realized gain(loss) on: | ||||
Investments (options purchased) | $ | (380,890 | ) | |
Options written | 176,122 | |||
Total net realized loss | $ | (204,768 | ) | |
Net change in unrealized appreciation/depreciation of: | ||||
Investments (options purchased) | $ | 117,153 | ||
Options written | (28,110 | ) | ||
Total net change in unrealized appreciation/depreciation | $ | 89,043 | ||
The average volume (based on the open positions at each month-end) of derivative activity for the six months ended March 31, 2017:
Options Contracts(1) | Options Contracts(1) | Forward Foreign Currency Contracts(2) | Futures Contracts(1) | Credit Default Swap Agreements | ||||||||||||||||||||||||||||
| Purchased | Sold | Long | Short | Buy | Sell | |||||||||||||||||||||||||||
AllianzGI Retirement 2020 | — | — | — | — | 47 | 33 | — | — | ||||||||||||||||||||||||
AllianzGI Retirement 2025 | — | — | — | — | 57 | 40 | — | — | ||||||||||||||||||||||||
AllianzGI Retirement 2030 | — | — | — | — | 69 | 51 | — | — | ||||||||||||||||||||||||
AllianzGI Retirement 2035 | — | — | — | — | 60 | 46 | — | — | ||||||||||||||||||||||||
AllianzGI Retirement 2040 | — | — | — | — | 53 | 41 | — | — | ||||||||||||||||||||||||
AllianzGI Retirement 2045 | — | — | — | — | 31 | 25 | — | — | ||||||||||||||||||||||||
AllianzGI Retirement 2050 | — | — | — | — | 30 | 23 | — | — | ||||||||||||||||||||||||
AllianzGI Retirement 2055 | — | — | — | — | 13 | 8 | — | — | ||||||||||||||||||||||||
AllianzGI Retirement Income | — | — | $ | 7,260 | — | 108 | 89 | — | — | |||||||||||||||||||||||
AllianzGI Global Allocation | — | — | — | — | 799 | 320 | — | — | ||||||||||||||||||||||||
AllianzGI Best Styles Emerging Markets Equity | — | — | 6,186 | $ | 25,679 | 30 | — | — | — | |||||||||||||||||||||||
AllianzGI Best Styles Global Equity | — | — | 340,670 | 3,342 | 401 | — | — | — | ||||||||||||||||||||||||
AllianzGI Best Styles International Equity | — | — | — | † | — | † | 3 | — | — | — | ||||||||||||||||||||||
AllianzGI Best Styles U.S. Equity | — | — | — | † | — | † | 50 | — | — | — | ||||||||||||||||||||||
AllianzGI Emerging Markets Consumer | — | — | 228,200 | 78,511 | — | — | — | — | ||||||||||||||||||||||||
AllianzGI Emerging Markets Debt | — | 3,000 | 136,593 | 291,252 | — | — | † | $ | 1,874,849 | $ | 1,828,571 | |||||||||||||||||||||
AllianzGI Emerging Markets Small-Cap | — | — | — | † | — | † | — | — | — | — | ||||||||||||||||||||||
AllianzGI Global Dynamic Allocation | — | — | 143,515 | 121,904 | 684 | 215 | — | — | ||||||||||||||||||||||||
AllianzGI Global Fundamental Strategy | 384 | 313 | 341,238 | 2,168,107 | 36 | 22 | — | — | ||||||||||||||||||||||||
AllianzGI Global Sustainability | — | — | — | † | — | † | — | — | — | — | ||||||||||||||||||||||
AllianzGI Global Water | — | — | — | † | — | † | — | — | — | — | ||||||||||||||||||||||
AllianzGI International Growth | — | — | — | † | — | † | — | — | — | — | ||||||||||||||||||||||
AllianzGI International Small-Cap | — | — | 123,188 | 263,776 | — | — | — | — | ||||||||||||||||||||||||
AllianzGI Multi-Asset Real Return | — | — | — | — | 9 | 4 | — | — | ||||||||||||||||||||||||
AllianzGI NFJ Emerging Markets Value | — | — | 23,589 | 27,054 | — | — | — | — | ||||||||||||||||||||||||
AllianzGI NFJ Global Dividend Value | — | — | — | † | 10,611 | — | — | — | — | |||||||||||||||||||||||
AllianzGI NFJ International Small-Cap Value | — | — | 30,578 | 51,073 | — | — | — | — | ||||||||||||||||||||||||
AllianzGI NFJ International Value II | — | — | — | † | — | † | — | — | — | — | ||||||||||||||||||||||
AllianzGI Structured Return | 4,991 | 3,419 | — | — | — | — | — | — | ||||||||||||||||||||||||
AllianzGI U.S. Equity Hedged | 89 | 62 | — | — | — | — | — | — | ||||||||||||||||||||||||
| † | Fund had derivative activity during the period but it did not have open positions at any month-end in the period. |
| (1) | Number of contracts |
| (2) | U.S. $ value on origination date |
| Semiannual Report | | March 31, 2017 | 351 |
Table of Contents
Notes to Financial Statements (cont’d)
March 31, 2017 (Unaudited)
The following tables present by counterparty, the Funds’ derivative assets and liabilities net of related collateral held by the Funds at March 31, 2017 which has not been offset in the Statements of Assets and Liabilities, but would be available for offset to the extent of a default by the counterparty to the transaction.
Financial Assets and Derivative Assets, and Collateral Received at March 31, 2017:
| AllianzGI Emerging Markets Debt: | ||||||||||||||||
| Gross Amounts Not Offset in the Statement of Assets and Liabilities | ||||||||||||||||
| Counterparty | Gross Asset Derivatives Presented in Statement of Assets and Liabilities | Financial Instrument/ Derivative Offset | Cash Collateral Received | Net Amount | ||||||||||||
Foreign Currency Exchange Contracts |
| |||||||||||||||
State Street Bank | $ | 6,451 | — | — | $ | 6,451 | ||||||||||
| AllianzGI Global Fundamental Strategy: | ||||||||||||||||
| Gross Amounts Not Offset in the Statement of Assets and Liabilities | ||||||||||||||||
| Counterparty | Gross Asset Derivatives Presented in Statement of Assets and Liabilities | Financial Instrument/ Derivative Offset | Cash Collateral Received | Net Amount | ||||||||||||
Foreign Currency Exchange Contracts |
| |||||||||||||||
State Street Bank | $ | 23,455 | $ | (7,053 | ) | — | $ | 16,402 | ||||||||
Financial Liabilities and Derivative Liabilities, and Collateral Received (Pledged) at March 31, 2017:
| AllianzGI Global Fundamental Strategy: | ||||||||||||||||
| Gross Amounts Not Offset in the Statement of Assets and Liabilities | ||||||||||||||||
| Counterparty | Gross Liability Derivatives Presented in Statement of Assets and Liabilities | Financial Instrument/ Derivative Offset | Cash Collateral Received (Pledged) | Net Amount | ||||||||||||
Foreign Currency Exchange Contracts |
| |||||||||||||||
State Street Bank | $ | 7,053 | $ | (7,053 | ) | — | — | |||||||||
| AllianzGI International Small-Cap: | ||||||||||||||||
| Gross Amounts Not Offset in the Statement of Assets and Liabilities | ||||||||||||||||
| Counterparty | Gross Liability Derivatives Presented in Statement of Assets and Liabilities | Financial Instrument/ Derivative Offset | Cash Collateral Received (Pledged) | Net Amount | ||||||||||||
Foreign Currency Exchange Contracts |
| |||||||||||||||
Northern Trust Company | $ | 764 | — | — | $ | 764 | ||||||||||
| AllianzGI NFJ Emerging Markets Value: | ||||||||||||||||
| Gross Amounts Not Offset in the Statement of Assets and Liabilities | ||||||||||||||||
| Counterparty | Gross Liability Derivatives Presented in Statement of Assets and Liabilities | Financial Instrument/ Derivative Offset | Cash Collateral Received (Pledged) | Net Amount | ||||||||||||
Foreign Currency Exchange Contracts |
| |||||||||||||||
Northern Trust Company | $ | 470 | — | — | $ | 470 | ||||||||||
| 352 | March 31, 2017 | | Semiannual Report |
Table of Contents
| 5. | INVESTMENT MANAGER/ADMINISTRATOR/DISTRIBUTOR FEES/ DEFERRED COMPENSATION |
Investment Management Fee. During the reporting period, each Fund had an Investment Management Agreement (for the purpose of this section, collectively the “Agreements”) with the Investment Manager. Subject to the supervision of the Trust’s Board, the Investment Manager was responsible for managing, either directly or through others selected by it, each Fund’s investment activities, business affairs and administrative matters. Pursuant to the Agreements, the Investment Manager received an annual fee, payable monthly (net of any fee waivers, reimbursements and recoupment), at an annual rate of each Fund’s average daily net assets (the “Investment Management Fee”).
The Investment Manager had retained the Sub-Adviser to manage the investments of certain Funds. Subject to the supervision of the Investment Manager, the Sub-Adviser was responsible for making all of the investment decisions for the Funds for which they serve as sub-adviser. The Investment Manager, not the applicable Funds, paid a portion of the fees it received as Investment Manager to the Sub-Adviser, as applicable in return for its services.
| Sub-Adviser | Funds | |
NFJ | AllianzGI NFJ Emerging Markets Value, AllianzGI NFJ Global Dividend Value, AllianzGI NFJ International Small-Cap Value, AllianzGI NFJ International Value II |
Effective October 1, 2016, AGIFM merged with and into AllianzGI U.S. by means of a statutory merger, with AllianzGI U.S. succeeding by operation of law to the advisory business of AGIFM under the Investment Management Agreement with each Fund. The sub- advisory relationship between AGIFM and AllianzGI U.S. terminated upon consummation of the merger. The merger did not result in any change to the substantive terms of the Agreements, which continued in effect following the merger with AllianzGI U.S. as the counterparty instead of AGIFM. The merger also did not result in any change to the manner in which investment advisory services are provided under the Agreements, the personnel responsible for providing investment advisory services to the Funds pursuant to the Agreements or the personnel ultimately responsible for overseeing the provision of such services.
Administration Fee. The Investment Manager provided administrative services to the Target Date Funds and also paid for the cost of most third-party administrative services required by the Target Date Funds, and in return it received from each share class of each Target Date Fund a monthly administration fee based on each share class’ average daily net assets (the “Administration Fee”).
The Investment Management Fee and Administration Fee for all classes are charged at an annual rate as indicated in the following table:
| All Classes | Class A,C and R | Class P and Administrative | Class R6 | |||||||||||||||||
| Management Fee | Effective Management Fee | Administration | ||||||||||||||||||
AllianzGI Retirement 2020 | 0.05 | % | 0.05 | % | 0.30 | % | 0.15 | % | 0.05 | % | ||||||||||
AllianzGI Retirement 2025 | 0.05 | 0.05 | 0.30 | 0.15 | 0.05 | |||||||||||||||
AllianzGI Retirement 2030 | 0.05 | 0.05 | 0.30 | 0.15 | 0.05 | |||||||||||||||
AllianzGI Retirement 2035 | 0.05 | 0.05 | 0.30 | 0.15 | 0.05 | |||||||||||||||
AllianzGI Retirement 2040 | 0.05 | 0.05 | 0.30 | 0.15 | 0.05 | |||||||||||||||
AllianzGI Retirement 2045 | 0.05 | 0.05 | 0.30 | 0.15 | 0.05 | |||||||||||||||
AllianzGI Retirement 2050 | 0.05 | 0.05 | 0.30 | 0.15 | 0.05 | |||||||||||||||
AllianzGI Retirement 2055 | 0.05 | 0.05 | 0.30 | 0.15 | 0.05 | |||||||||||||||
AllianzGI Retirement Income | 0.05 | 0.05 | 0.30 | 0.15 | 0.05 | |||||||||||||||
AllianzGI Global Allocation | 0.70 | * | 0.17 | N/A | N/A | N/A | ||||||||||||||
AllianzGI Global Megatrends | 0.00 | 0.00 | N/A | N/A | N/A | |||||||||||||||
AllianzGI Best Styles Emerging Markets Equity | 0.40 | 0.40 | N/A | N/A | N/A | |||||||||||||||
AllianzGI Best Styles Global Equity | 0.30 | 0.30 | N/A | N/A | N/A | |||||||||||||||
AllianzGI Best Styles International Equity | 0.30 | 0.30 | N/A | N/A | N/A | |||||||||||||||
AllianzGI Best Styles U.S. Equity | 0.30 | 0.30 | N/A | N/A | N/A | |||||||||||||||
AllianzGI Convertible | 0.57 | 0.57 | N/A | N/A | N/A | |||||||||||||||
AllianzGI Emerging Markets Consumer | 0.90 | 0.90 | N/A | N/A | N/A | |||||||||||||||
AllianzGI Emerging Markets Debt | 0.75 | 0.75 | N/A | N/A | N/A | |||||||||||||||
AllianzGI Emerging Markets Small-Cap | 1.20 | 1.20 | N/A | N/A | N/A | |||||||||||||||
AllianzGI Europe Equity Dividend | 0.80 | 0.80 | N/A | N/A | N/A | |||||||||||||||
| Semiannual Report | | March 31, 2017 | 353 |
Table of Contents
\\
Notes to Financial Statements (cont’d)
March 31, 2017 (Unaudited)
| All Classes | Class A,C and R | Class P and Administrative | Class R6 | |||||||||||||||||
| Management Fee | Effective Management Fee | Administration | ||||||||||||||||||
AllianzGI Global Dynamic Allocation | 0.70 | %* | 0.68 | % | N/A | N/A | N/A | |||||||||||||
AllianzGI Global Fundamental Strategy | 0.75 | † | 0.75 | N/A | N/A | N/A | ||||||||||||||
AllianzGI Global Sustainability | 0.80 | † | 0.80 | N/A | N/A | N/A | ||||||||||||||
AllianzGI Global Water | 0.95 | † | 0.95 | N/A | N/A | N/A | ||||||||||||||
AllianzGI High Yield Bond | 0.48 | 0.48 | N/A | N/A | N/A | |||||||||||||||
AllianzGI International Growth | 0.80 | † | 0.80 | N/A | N/A | N/A | ||||||||||||||
AllianzGI International Small-Cap | 1.00 | † | 1.00 | N/A | N/A | N/A | ||||||||||||||
AllianzGI Micro Cap | 1.25 | 1.25 | N/A | N/A | N/A | |||||||||||||||
AllianzGI Multi-Asset Real Return | 0.75 | † | 0.75 | N/A | N/A | N/A | ||||||||||||||
AllianzGI NFJ Emerging Markets Value | 0.85 | † | 0.85 | N/A | N/A | N/A | ||||||||||||||
AllianzGI NFJ Global Dividend Value | 0.80 | * | 0.70 | N/A | N/A | N/A | ||||||||||||||
AllianzGI NFJ International Small-Cap Value | 0.85 | 0.85 | N/A | N/A | N/A | |||||||||||||||
AllianzGI NFJ International Value II | 0.80 | * | 0.75 | N/A | N/A | N/A | ||||||||||||||
AllianzGI Short Duration High Income | 0.48 | 0.48 | N/A | N/A | N/A | |||||||||||||||
AllianzGI Structured Return | 0.60 | 0.60 | N/A | N/A | N/A | |||||||||||||||
AllianzGI U.S. Equity Hedged | 0.70 | 0.70 | N/A | N/A | N/A | |||||||||||||||
AllianzGI U.S. Small-Cap Growth | 0.80 | 0.80 | N/A | N/A | N/A | |||||||||||||||
AllianzGI Ultra Micro Cap | 1.50 | 1.50 | N/A | N/A | N/A | |||||||||||||||
| * | See Note 6 for management fee waivers. |
| † | See Note 17 for updates to the Funds’ management fees and waivers that became effective subsequent to March 31, 2017. |
Distribution and Servicing Fees. Allianz Global Investors Distributors LLC (the “Distributor”), an affiliate of AAM, the Investment Manager and the Sub-Adviser, serves as the distributor of the Funds’ shares pursuant to separate Distribution Servicing Plans for Class A, C and R. The Distributor, for each of the Funds, receives (i) servicing fees of 0.25% of the average daily net assets of each of Class A, C and R in connection with services rendered to shareholders of each class and the maintenance of shareholder accounts, and (ii) distribution fees of 0.75% of the average daily net assets of Class C (with the exception for AllianzGI Short Duration High Income which is 0.25%) and 0.25% of average daily net assets of Class R in connection with the distribution of Class C and R shares.
Pursuant to the Distribution and Servicing Plans adopted by the A, C and R classes, the Funds compensate the Distributor for services provided and expenses incurred in connection with assistance rendered in the sale of shares and services rendered to shareholders and for maintenance of shareholder accounts.
Pursuant to the Distribution Plan for the Administrative Class shares, the Funds are permitted to reimburse the Distributor out of the Administrative Class’ assets of each Fund offering Administrative Class shares, in an amount up to 0.25% on an annual basis of the average net assets of the Administrative Class, for payments made to financial intermediaries that provide services in connection with the distribution of shares or administration plans or programs that use fund shares as their funding medium. Unreimbursed costs may be
carried forward for reimbursement for up to twelve months beyond the date in which they are incurred, subject always to the limit that no more than 0.25% of the average daily net assets attributable to the Administrative Class may be expensed.
The Distributor also receives the proceeds of the initial sales charges paid by the shareholders upon the purchase of Class A shares and contingent deferred sales charges (“CDSC”) paid by the shareholders upon certain redemptions of Class A and C shares. For the six months ended March 31, 2017, the Distributor received $148,069, representing commissions (sales charges) and CDSC from the Funds.
Deferred Compensation. Trustees do not currently receive any pension or retirement benefits from the Trust. The Trust has adopted a deferred compensation plan (the “Plan”) for the Trustees, which permits the Trustees to defer their receipt of compensation from the Trust, at their election, in accordance with the terms of the Plan. Under the Plan, each Trustee may elect not to receive all or a portion of his or her fees from the Trust on a current basis but to receive in a subsequent period chosen by the Trustee an amount equal to the value of such compensation if such compensation had been invested in one or more series of the Trust or Allianz Funds selected by the Trustees from and after the normal payment dates for such compensation. The deferred compensation program is structured such that the Trust remains in substantially the same financial position whether Trustee fees are paid when earned or deferred.
| 354 | March 31, 2017 | | Semiannual Report |
Table of Contents
| 6. | EXPENSE LIMITATION AND RECOUPMENT |
The Trust and the Investment Manager have entered into Expense Limitation and Management Fee Waiver Agreements as indicated below:
| Expense Limitation | ||||||||||||||||||||||||||||||||
| Management Fee Waiver | Class A | Class C | Class R | Class P | Institutional Class | Class R6 | Administrative Class | |||||||||||||||||||||||||
AllianzGI Retirement 2020(2) | N/A | 0.95 | % | 1.70 | % | 1.30 | % | 0.65 | % | N/A | 0.55 | %* | 0.90 | % | ||||||||||||||||||
AllianzGI Retirement 2025(2) | N/A | 0.95 | N/A | 1.30 | 0.65 | N/A | 0.55 | * | 0.90 | |||||||||||||||||||||||
AllianzGI Retirement 2030(2) | N/A | 0.95 | 1.70 | 1.30 | 0.65 | N/A | 0.55 | * | 0.90 | |||||||||||||||||||||||
AllianzGI Retirement 2035(2) | N/A | 0.95 | N/A | 1.30 | 0.65 | N/A | 0.55 | 0.90 | ||||||||||||||||||||||||
AllianzGI Retirement 2040(2) | N/A | 0.95 | 1.70 | 1.30 | 0.65 | N/A | 0.55 | 0.90 | ||||||||||||||||||||||||
AllianzGI Retirement 2045(2) | N/A | 0.95 | N/A | 1.30 | 0.65 | N/A | 0.55 | 0.90 | ||||||||||||||||||||||||
AllianzGI Retirement 2050(2) | N/A | 0.95 | 1.70 | 1.30 | 0.65 | N/A | 0.55 | 0.90 | ||||||||||||||||||||||||
AllianzGI Retirement 2055(2) | N/A | 0.95 | N/A | 1.30 | 0.65 | N/A | 0.55 | 0.90 | ||||||||||||||||||||||||
AllianzGI Retirement Income(2) | N/A | 0.95 | 1.70 | 1.30 | 0.65 | N/A | 0.55 | * | 0.90 | |||||||||||||||||||||||
AllianzGI Global Allocation(1)(3) | 0.55 | % | 0.60 | 1.37 | 0.80 | 0.40 | 0.40 | % | 0.30 | 0.55 | ||||||||||||||||||||||
AllianzGI Global Megatrends(4) | N/A | 1.30 | N/A | N/A | 1.15 | 1.05 | * | N/A | N/A | |||||||||||||||||||||||
AllianzGI Best Styles Emerging Markets Equity(5) | N/A | 0.85 | 1.60 | N/A | 0.70 | 0.60 | 0.60 | N/A | ||||||||||||||||||||||||
AllianzGI Best Styles Global Equity(5) | N/A | 0.70 | 1.40 | N/A | 0.50 | 0.40 | 0.40 | N/A | ||||||||||||||||||||||||
AllianzGI Best Styles International Equity(5) | N/A | 0.70 | 1.45 | N/A | 0.55 | 0.45 | 0.45 | N/A | ||||||||||||||||||||||||
AllianzGI Best Styles U.S. Equity(5) | N/A | 0.65 | 1.40 | N/A | 0.50 | 0.50 | 0.40 | N/A | ||||||||||||||||||||||||
AllianzGI Convertible | N/A | N/A | N/A | N/A | N/A | N/A | N/A | N/A | ||||||||||||||||||||||||
AllianzGI Emerging Markets Consumer(6) | N/A | 1.55 | N/A | N/A | N/A | 1.20 | N/A | N/A | ||||||||||||||||||||||||
AllianzGI Emerging Markets Debt(5) | N/A | 1.20 | 1.95 | N/A | 1.05 | 0.95 | N/A | N/A | ||||||||||||||||||||||||
AllianzGI Emerging Markets Small-Cap(5) | N/A | 1.85 | N/A | N/A | N/A | 1.50 | N/A | N/A | ||||||||||||||||||||||||
AllianzGI Europe Equity Dividend(5) | N/A | 1.20 | 1.95 | N/A | 1.05 | 0.95 | N/A | N/A | ||||||||||||||||||||||||
AllianzGI Global Dynamic Allocation(1)(3) | 0.55 | 0.97 | 1.74 | 1.34 | 0.80 | 0.70 | 0.70 | 0.97 | ||||||||||||||||||||||||
AllianzGI Global Fundamental Strategy(6)† | N/A | 1.25 | 2.00 | N/A | 1.10 | 1.00 | N/A | N/A | ||||||||||||||||||||||||
AllianzGI Global Sustainability(5)† | N/A | 1.20 | N/A | N/A | 1.05 | 0.95 | N/A | N/A | ||||||||||||||||||||||||
AllianzGI Global Water† | N/A | N/A | N/A | N/A | N/A | N/A | N/A | N/A | ||||||||||||||||||||||||
AllianzGI High Yield Bond | N/A | N/A | N/A | N/A | N/A | N/A | N/A | N/A | ||||||||||||||||||||||||
AllianzGI International Growth(5)† | N/A | 1.20 | N/A | N/A | N/A | 0.95 | N/A | N/A | ||||||||||||||||||||||||
AllianzGI International Small-Cap(5)† | N/A | 1.36 | 2.19 | 1.70 | 1.21 | 1.18 | 1.11 | N/A | ||||||||||||||||||||||||
AllianzGI Micro Cap(5) | N/A | 1.62 | N/A | N/A | 1.54 | 1.54 | N/A | N/A | ||||||||||||||||||||||||
AllianzGI Multi-Asset Real Return(6)† | N/A | 0.85 | 1.60 | N/A | 0.70 | 0.60 | N/A | N/A | ||||||||||||||||||||||||
AllianzGI NFJ Emerging Markets Value(5)† | N/A | 1.34 | 2.09 | N/A | 1.18 | 1.09 | N/A | N/A | ||||||||||||||||||||||||
AllianzGI NFJ Global Dividend Value(7) | 0.10 | 1.10 | 1.89 | N/A | 0.94 | 0.85 | N/A | N/A | ||||||||||||||||||||||||
AllianzGI NFJ International Small-Cap Value(5) | N/A | 1.30 | 2.05 | N/A | 1.05 | 1.01 | 0.95 | N/A | ||||||||||||||||||||||||
AllianzGI NFJ International Value II(8) | 0.05 | 1.15 | 1.90 | N/A | 0.95 | 0.90 | N/A | N/A | ||||||||||||||||||||||||
AllianzGI Short Duration High Income(5) | N/A | N/A | N/A | N/A | N/A | N/A | 0.57 | N/A | ||||||||||||||||||||||||
AllianzGI Structured Return(6) | N/A | 0.98 | 1.78 | N/A | 0.77 | 0.69 | 0.67 | N/A | ||||||||||||||||||||||||
AllianzGI U.S. Equity Hedged(6) | N/A | 1.25 | 2.00 | N/A | 1.10 | 1.00 | N/A | N/A | ||||||||||||||||||||||||
AllianzGI U.S. Small-Cap Growth(5) | N/A | 1.20 | 2.00 | 1.45 | 1.05 | 0.96 | 0.95 | N/A | ||||||||||||||||||||||||
AllianzGI Ultra Micro Cap | N/A | N/A | N/A | N/A | N/A | N/A | N/A | N/A | ||||||||||||||||||||||||
| † | See Note 17 for updates to the Funds’ management fees and waivers and updates to certain Expense Limitation Agreements that became effective subsequent to March 31, 2017. |
| (1) | The Investment Manager has contractually agreed to irrevocably waive a portion of its management fee equal to 0.55% of the average daily net assets of each applicable Fund that are attributable to investments in either Underlying Funds or Other Acquired Funds. This waiver with respect to investments in Underlying Funds and Other Acquired Funds for which the Investment Manager or an affiliated person thereof serves as investment adviser, is terminable only by the Board of Trustees of the Trust, and the waiver with respect to investments in unaffiliated Other Acquired Funds will continue through at least January 31, 2018. AllianzGI Global Dynamic Allocation no longer invests significantly in Underlying Funds or Other Acquired Funds for which the Investment Manager or an affiliated person serves as investment adviser but may invest in unaffiliated Other Acquired Funds. |
| Semiannual Report | | March 31, 2017 | 355 |
Table of Contents
Notes to Financial Statements (cont’d)
March 31, 2017 (Unaudited)
| (2) | The Investment Manager has contractually agreed, until January 31, 2020, to irrevocably waive its management and administrative fees and reimburse any additional Other Expenses or Acquired Fund Fees and Expenses, to the extent that Total Annual Fund Operating Expenses after Expense Reductions, excluding, interest, taxes, and extraordinary expenses, exceed the rates noted in the table above based on the Fund’s average net assets attributable to each share class. Under the Expense Limitation Agreement, the Investment Manager may recoup waived or reimbursed amounts for three years, provided total expenses, including such recoupment, do not exceed the annual expense limit in effect at the time of such waiver or reimbursement. The Expense Limitation Agreement is terminable by the Trust upon 90 days’ prior written notice to the Investment Manager or at any time by mutual agreement of the parties. |
| (3) | Effective February 1, 2017, the Investment Manager has contractually agreed, until January 31, 2018, to irrevocably waive its management fee, or reimburse the Fund, to the extent that, after the application of the fee waiver described in footnote (1) above, Total Annual Fund Operating Expenses, excluding interest, tax, and extraordinary expenses, Acquired Fund Fees and Expenses and certain credits and other expenses, exceed the rates noted in the table above based on the Fund’s average net assets attributable to each share class. Under the Expense Limitation Agreement, the Investment Manager may recoup waived or reimbursed amounts for three years, provided total expenses, including such recoupment, do not exceed the annual expense limit in effect at the time of such waiver/reimbursement or recoupment. The Expense Limitation Agreement is terminable by the Trust upon 90 days’ prior written notice to the Investment Manager or at any time by mutual agreement of the parties. |
| (4) | Effective February 1, 2017, the Investment Manager has contractually agreed, until January 31, 2018, to reimburse Other Expenses or Acquired Fund Fees and Expenses, to the extent that Total Annual Fund Operating Expenses after Expense Reductions, excluding, interest, tax, and extraordinary expenses, exceed the rates noted in the table above based on the Fund’s average net assets attributable to each share class. Under the Expense Limitation Agreement, the Investment Manager may recoup waived or reimbursed amounts for three years, provided total expenses, including such recoupment, do not exceed the annual expense limit in effect at the time of such waiver/reimbursement or recoupment. The Expense Limitation Agreement is terminable by the Trust upon 90 days’ prior written notice to the Investment Manager or at any time by mutual agreement of the parties. |
| (5) | Effective February 1, 2017, the Investment Manager has contractually agreed to irrevocably waive its management fee and/or reimburse the Fund through January 31, 2018 to the extent that Total Annual Fund Operating Expenses, excluding interest, tax, and extraordinary expenses, and certain credits and other expenses, exceed the rates noted in the table above based upon the Fund’s average net assets attributable to each share class. Under the Expense Limitation Agreement, the Investment Manager may recoup waived or reimbursed amounts for three years, provided total expenses, including such recoupment, do not exceed the annual expense limit in effect at the time of such waiver/reimbursement or recoupment. The Expense Limitation Agreement is terminable by the Trust upon 90 days’ prior written notice to the Investment Manager or at any time by mutual agreement of the parties. |
| (6) | Effective February 1, 2017, the Investment Manager has contractually agreed to irrevocably waive its management fee and/or reimburse the Fund through January 31, 2018 to the extent that Total Annual Fund Operating Expenses excluding interest, tax, and extraordinary expenses, Acquired Fund Fees and Expenses, and certain credits and other expenses, exceed the rates noted in the table above based upon the Fund’s average net assets attributable to each share class. Under the Expense Limitation Agreement, the Investment Manager may recoup waived or reimbursed amounts for three years, provided total expenses, including such recoupment, do not exceed the annual expense limit in effect at the time of such waiver/reimbursement or recoupment. The Expense Limitation Agreement is terminable by the Trust upon 90 days’ prior written notice to the Investment Manager or at any time by mutual agreement of the parties. |
| (7) | Effective February 1, 2017, the Investment Manager has contractually agreed to irrevocably waive its management fee and/or reimburse the Fund through January 31, 2018 to the extent that Total Annual Fund Operating Expenses, excluding interest, taxes, and extraordinary expenses, and certain credits and other expenses, exceed the rates noted in the table above based upon the Fund’s average net assets attributable to each share class. Under the Expense Limitation Agreement, the Investment Manager may recoup waived or reimbursed amounts for three years, provided total expenses, including such recoupment, do not exceed the annual expense limit in effect at the time of such waiver/reimbursement or recoupment. The Expense Limitation Agreement is terminable by the Trust upon 90 days’ prior written notice to the Investment Manager or at any time by mutual agreement of the parties. Effective April 1, 2017, the Investment Manager has agreed to a temporary waiver of a portion of the investment management fee, which reduces the annual percentage rate from 0.80% to 0.70% through March 31, 2018. Amounts waived pursuant to each of the temporary investment management fee waivers described in the preceding sentences of this paragraph are separate from and would not be included with the amounts subject to potential recoupment under the Expense Limitation Agreement. |
| (8) | Effective February 1, 2017, the Investment Manager has contractually agreed to irrevocably waive its management fee and/or reimburse the Fund through January 31, 2018 to the extent that Total Annual Fund Operating Expenses, excluding interest, tax, and extraordinary expenses, and certain credits and other expenses, exceed the rates noted in the table above based upon the Fund’s average net assets attributable to each share class. Under the Expense Limitation Agreement, the Investment Manager may recoup waived or reimbursed amounts for three years, provided total expenses, including such recoupment, do not exceed the annual expense limit in effect at the time of such waiver/reimbursement or recoupment. The Expense Limitation Agreement is terminable by the Trust upon 90 days’ prior written notice to the Investment Manager or at any time by mutual agreement of the parties. Effective April 1, 2017, the Investment Manager has agreed to a temporary waiver of a portion of the investment management fee, which reduces the annual percentage rate from 0.80% to 0.75% through March 31, 2018. Amounts waived pursuant to each of the temporary investment management fee waivers described in the preceding sentences of this paragraph are separate from and would not be included with the amounts subject to potential recoupment under the Expense Limitation Agreement. |
| * | As a result of reimbursing expenses inclusive of acquired fund fees and expenses, the Investment Manager reimbursed amounts in excess of the respective share class’ operating expenses. The aggregate excess reimbursement of each share class is accounted for as “Contribution from Investment Manager” on the Statements of Operations. |
The Investment Manager, per the expense limitation agreements, may recoup waived/reimbursed amounts for a period of up to three years, provided total expenses, including such recoupment, do not exceed the annual expense limit in effect at the time of such waiver/reimbursement. During the six months ended March 31, 2017, the Investment Manager recouped a total of $60,503 from the Funds as disclosed on the Statements of Operations. The following represents the amounts that still can be recouped by the Investment Manager as of March 31, 2017.
| Unrecouped Expenses Waived/Reimbursed through Fiscal Period or Year ended | ||||||||||||||||
| 11/30/2014 | 9/30/2015 | 9/30/2016 | Totals | |||||||||||||
AllianzGI Retirement 2020 | $ | 67,722 | $ | 54,591 | $ | 32,277 | $ | 154,590 | ||||||||
AllianzGI Retirement 2025 | 77,250 | 64,766 | 30,952 | 172,968 | ||||||||||||
AllianzGI Retirement 2030 | 85,969 | 76,424 | 36,276 | 198,669 | ||||||||||||
AllianzGI Retirement 2035 | 66,529 | 66,388 | 14,422 | 147,339 | ||||||||||||
AllianzGI Retirement 2040 | 62,942 | 60,282 | 8,160 | 131,384 | ||||||||||||
AllianzGI Retirement 2045 | 38,602 | 38,645 | 6,546 | 83,793 | ||||||||||||
AllianzGI Retirement 2050 | 31,926 | 34,200 | 3,046 | 69,172 | ||||||||||||
| 356 | March 31, 2017 | | Semiannual Report |
Table of Contents
| Unrecouped Expenses Waived/Reimbursed through Fiscal Period or Year ended | ||||||||||||||||
| 11/30/2014 | 9/30/2015 | 9/30/2016 | Totals | |||||||||||||
AllianzGI Retirement 2055 | $ | 10,220 | $ | 11,552 | $ | 1,064 | $ | 22,836 | ||||||||
AllianzGI Retirement Income | 39,055 | 25,007 | 35,990 | 100,052 | ||||||||||||
AllianzGI Global Allocation | 516,476 | 326,730 | — | 843,206 | ||||||||||||
AllianzGI Global Megatrends | — | 150,527 | 176,202 | 326,729 | ||||||||||||
AllianzGI Best Styles Emerging Markets Equity | — | 236,953 | 318,110 | 555,063 | ||||||||||||
AllianzGI Best Styles Global Equity | 457,122 | 265,504 | 416,897 | 1,139,523 | ||||||||||||
AllianzGI Best Styles International Equity | — | 342,608 | 394,405 | 737,013 | ||||||||||||
AllianzGI Best Styles U.S. Equity | — | 184,303 | 195,811 | 380,114 | ||||||||||||
AllianzGI Emerging Markets Consumer | — | 244,097 | 257,727 | 501,824 | ||||||||||||
AllianzGI Emerging Markets Debt | 217,381 | 305,163 | 162,697 | 685,241 | ||||||||||||
AllianzGI Emerging Markets Small-Cap | — | 293,821 | 305,798 | 599,619 | ||||||||||||
AllianzGI Europe Equity Dividend | — | 230,355 | 321,812 | 552,167 | ||||||||||||
AllianzGI Global Dynamic Allocation | 217,360 | 204,882 | 199,996 | 622,238 | ||||||||||||
AllianzGI Global Fundamental Strategy | 249,637 | 153,697 | 173,706 | 577,040 | ||||||||||||
AllianzGI Global Sustainability | — | 202,111 | 190,206 | 392,317 | ||||||||||||
AllianzGI High Yield Bond | 508 | — | — | 508 | ||||||||||||
AllianzGI International Growth | — | 161,358 | 187,039 | 348,397 | ||||||||||||
AllianzGI International Small-Cap | 260,803 | 141,751 | 258,005 | 660,559 | ||||||||||||
AllianzGI Micro Cap | 117,388 | 115,570 | 153,921 | 386,879 | ||||||||||||
AllianzGI Multi-Asset Real Return | 239,165 | 206,099 | 238,005 | 683,269 | ||||||||||||
AllianzGI NFJ Emerging Markets Value | 262,863 | 303,098 | 465,793 | 1,031,754 | ||||||||||||
AllianzGI NFJ Global Dividend Value | 170,631 | 170,807 | 236,356 | 577,794 | ||||||||||||
AllianzGI NFJ International Small-Cap Value | 228,563 | 214,424 | 349,447 | 792,434 | ||||||||||||
AllianzGI NFJ International Value II | 235,983 | 181,260 | 219,533 | 636,776 | ||||||||||||
AllianzGI Short Duration High Income | 69,290 | 10,170 | — | 79,460 | ||||||||||||
AllianzGI Structured Return | 301,109 | 88,615 | 16,609 | 406,333 | ||||||||||||
AllianzGI U.S. Equity Hedged | 200,633 | 129,361 | 188,026 | 518,020 | ||||||||||||
AllianzGI U.S. Small-Cap Growth | 177,424 | 132,180 | 206,354 | 515,958 | ||||||||||||
| 7. | INVESTMENTS IN SECURITIES |
For the six months ended March 31, 2017, purchases and sales of investments, other than short-term securities and U.S. government obligations were:
| Purchases | Sales | |||||||
AllianzGI Retirement 2020 | $ | 60,865,540 | $ | 64,696,600 | ||||
AllianzGI Retirement 2025 | 66,346,779 | 67,326,952 | ||||||
AllianzGI Retirement 2030 | 69,045,206 | 73,872,242 | ||||||
AllianzGI Retirement 2035 | 53,612,448 | 60,294,403 | ||||||
AllianzGI Retirement 2040 | 42,368,432 | 45,399,921 | ||||||
AllianzGI Retirement 2045 | 24,389,917 | 25,944,861 | ||||||
AllianzGI Retirement 2050 | 23,925,946 | 23,824,105 | ||||||
AllianzGI Retirement 2055 | 9,321,980 | 7,695,148 | ||||||
AllianzGI Retirement Income | 42,707,746 | 45,680,452 | ||||||
AllianzGI Global Allocation | 21,074,964 | 78,133,877 | ||||||
AllianzGI Global Megatrends | 50,955 | — | ||||||
AllianzGI Best Styles Emerging Markets Equity | 2,178,211 | 8,832,376 | ||||||
| Purchases | Sales | |||||||
AllianzGI Best Styles Global Equity | $ | 276,274,652 | $ | 200,383,600 | ||||
AllianzGI Best Styles International Equity | 7,935,518 | 48,212,097 | ||||||
AllianzGI Best Styles U.S. Equity | 71,635,670 | 53,632,057 | ||||||
AllianzGI Convertible | 804,287,071 | 1,223,388,879 | ||||||
AllianzGI Emerging Markets Consumer | 25,039,662 | 30,331,307 | ||||||
AllianzGI Emerging Markets Debt | 14,829,605 | 15,474,470 | ||||||
AllianzGI Emerging Markets Small-Cap | 7,047,417 | 7,786,603 | ||||||
AllianzGI Europe Equity Dividend | 2,498,505 | 1,794,843 | ||||||
AllianzGI Global Dynamic Allocation | 234,180,596 | 113,764,455 | ||||||
AllianzGI Global Fundamental Strategy | 4,401,331 | 3,116,536 | ||||||
AllianzGI Global Sustainability | 4,632,491 | 1,879,897 | ||||||
AllianzGI Global Water | 95,241,481 | 78,652,694 | ||||||
| Semiannual Report | | March 31, 2017 | 357 |
Table of Contents
Notes to Financial Statements (cont’d)
March 31, 2017 (Unaudited)
| Purchases | Sales | |||||||
AllianzGI High Yield Bond | $ | 71,737,630 | $ | 98,263,391 | ||||
AllianzGI International Growth | 2,631,985 | 2,667,414 | ||||||
AllianzGI International Small-Cap | 31,421,949 | 42,611,549 | ||||||
AllianzGI Micro Cap | 5,092,589 | 7,004,701 | ||||||
AllianzGI Multi-Asset Real Return | 2,051,014 | 1,964,556 | ||||||
AllianzGI NFJ Emerging Markets Value | 23,477,944 | 9,995,821 | ||||||
AllianzGI NFJ Global Dividend Value | 12,117,618 | 8,709,231 | ||||||
AllianzGI NFJ International Small-Cap Value | 1,089,876 | 8,072,043 | ||||||
AllianzGI NFJ International Value II | 9,370,705 | 51,819,235 | ||||||
AllianzGI Short Duration High Income | 999,413,975 | 664,755,258 | ||||||
| Purchases | Sales | |||||||
AllianzGI Structured Return | $ | 991,191,265 | $ | 916,185,510 | ||||
AllianzGI U.S. Equity Hedged | — | 2,034,271 | ||||||
AllianzGI U.S. Small-Cap Growth | 8,820,646 | 16,920,828 | ||||||
AllianzGI Ultra Micro Cap | 6,908,571 | 16,823,962 | ||||||
Purchases and sales in U.S. government obligations were:
| Purchases | Sales | |||||||
AllianzGI Global Allocation | $ | 5,149,219 | — | |||||
AllianzGI Global Dynamic Allocation | 185,826,551 | $ | 120,236,150 | |||||
AllianzGI Global Fundamental Strategy | 199,669 | — | ||||||
(a) Transactions in options written for the six months ended March 31, 2017:
| AllianzGI Emerging Markets Debt: | ||||||||
| Contracts | Premiums | |||||||
Options outstanding, September 30, 2016 | — | — | ||||||
Options written | 7,000 | $ | 11,711 | |||||
Options expired | (7,000 | ) | (11,711 | ) | ||||
Options outstanding, March 31, 2017 | — | $ | — | |||||
| AllianzGI Global Fundamental Strategy: | ||||||||
| Contracts | Premiums | |||||||
Options outstanding, September 30, 2016 | 95 | $ | 32,367 | |||||
Options written | 1,708 | 36,951 | ||||||
Options terminated in closing transactions | (1,280 | ) | (29,003 | ) | ||||
Options expired | (523 | ) | (40,315 | ) | ||||
Options outstanding, March 31, 2017 | — | $ | — | |||||
| AllianzGI Structured Return: | ||||||||
| Contracts | Premiums | |||||||
Options outstanding, September 30, 2016 | 2,975 | $ | 12,753,884 | |||||
Options written | 24,192 | 86,713,204 | ||||||
Options terminated in closing transactions | (9,191 | ) | (78,666,677 | ) | ||||
Options expired | (12,447 | ) | (6,852,136 | ) | ||||
Options outstanding, March 31, 2017 | 5,529 | $ | 13,948,275 | |||||
| AllianzGI U.S. Equity Hedged: | ||||||||
| Contracts | Premiums | |||||||
Options outstanding, September 30, 2016 | 80 | $ | 85,669 | |||||
Options written | 350 | 252,165 | ||||||
Options terminated in closing transactions | (89 | ) | (54,321 | ) | ||||
Options expired | (299 | ) | (253,967 | ) | ||||
Options outstanding, March 31, 2017 | 42 | $ | 29,546 | |||||
(b) Futures contracts outstanding at March 31, 2017:
| AllianzGI Retirement 2020: | ||||||||||||||||
| Type | Contracts | Market Value (000s) | Expiration Date | Unrealized Appreciation (Depreciation) | ||||||||||||
Long: Australian Dollar | 5 | $ | 382 | 6/19/17 | $ | 6,686 | ||||||||||
Euro-BTP | 4 | 558 | 6/8/17 | 3,772 | ||||||||||||
Ultra U.S. Treasury Bond | 16 | 2,142 | 6/21/17 | 12,344 | ||||||||||||
Short: British Pound | (8 | ) | (628 | ) | 6/19/17 | (18,322 | ) | |||||||||
Euro Currency | (5 | ) | (670 | ) | 6/19/17 | (5,951 | ) | |||||||||
Mini MSCI EAFE Index | (5 | ) | (446 | ) | 6/16/17 | (6,536 | ) | |||||||||
| $ | (8,007 | ) | ||||||||||||||
| 358 | March 31, 2017 | | Semiannual Report |
Table of Contents
| AllianzGI Retirement 2025: | ||||||||||||||||
| Type | Contracts | MarketValue (000s) | Expiration Date | Unrealized Appreciation (Depreciation) | ||||||||||||
Long: Australian Dollar | 6 | $ | 458 | 6/19/17 | $ | 8,024 | ||||||||||
E-mini S&P 500 Index | 21 | 2,477 | 6/16/17 | (9,805 | ) | |||||||||||
Euro STOXX 50 Index | 5 | 183 | 6/16/17 | 4,794 | ||||||||||||
TOPIX Index | 1 | 136 | 6/8/17 | (2,519 | ) | |||||||||||
Short: British Pound | (10 | ) | (785 | ) | 6/19/17 | (22,903 | ) | |||||||||
Euro Currency | (6 | ) | (804 | ) | 6/19/17 | (7,142 | ) | |||||||||
Mini MSCI EAFE Index | (9 | ) | (802 | ) | 6/16/17 | (11,766 | ) | |||||||||
| $ | (41,317 | ) | ||||||||||||||
| AllianzGI Retirement 2030: | ||||||||||||||||
| Type | Contracts | Market Value (000s) | Expiration Date | Unrealized Appreciation (Depreciation) | ||||||||||||
Long: Australian Dollar | 8 | $ | 611 | 6/19/17 | $ | 10,698 | ||||||||||
E-mini S&P 500 Index | 22 | 2,595 | 6/16/17 | (10,272 | ) | |||||||||||
Euro STOXX 50 Index | 10 | 365 | 6/16/17 | 8,350 | ||||||||||||
Mini MSCI Emerging Markets Index | 5 | 240 | 6/16/17 | 5,289 | ||||||||||||
TOPIX Index | 2 | 272 | 6/8/17 | (3,512 | ) | |||||||||||
Short: British Pound | (14 | ) | (1,099 | ) | 6/19/17 | (32,064 | ) | |||||||||
Euro Currency | (8 | ) | (1,072 | ) | 6/19/17 | (9,522 | ) | |||||||||
FTSE 100 Index | (3 | ) | (273 | ) | 6/16/17 | 540 | ||||||||||
Mini MSCI EAFE Index | (4 | ) | (356 | ) | 6/16/17 | (5,229 | ) | |||||||||
| $ | (35,722 | ) | ||||||||||||||
| AllianzGI Retirement 2035: | ||||||||||||||||
| Type | Contracts | Market Value (000s) | Expiration Date | Unrealized Appreciation (Depreciation) | ||||||||||||
Long: Australian Dollar | 7 | $ | 534 | 6/19/17 | $ | 9,361 | ||||||||||
E-mini S&P 500 Index | 14 | 1,651 | 6/16/17 | (6,537 | ) | |||||||||||
Euro STOXX 50 Index | 17 | 621 | 6/16/17 | 13,514 | ||||||||||||
Mini MSCI Emerging Markets Index | 8 | 385 | 6/16/17 | 8,461 | ||||||||||||
TOPIX Index | 3 | 408 | 6/8/17 | (7,558 | ) | |||||||||||
Short: British Pound | (13 | ) | (1,020 | ) | 6/19/17 | (29,773 | ) | |||||||||
Euro Currency | (7 | ) | (938 | ) | 6/19/17 | (8,332 | ) | |||||||||
FTSE 100 Index | (5 | ) | (456 | ) | 6/16/17 | 901 | ||||||||||
Mini MSCI EAFE Index | (3 | ) | (267 | ) | 6/16/17 | (3,922 | ) | |||||||||
| $ | (23,885 | ) | ||||||||||||||
| AllianzGI Retirement 2040: | ||||||||||||||||
| Type | Contracts | Market Value (000s) | Expiration Date | Unrealized Appreciation (Depreciation) | ||||||||||||
Long: Australian Dollar | 7 | $ | 534 | 6/19/17 | $ | 9,361 | ||||||||||
E-mini S&P 500 Index | 11 | 1,297 | 6/16/17 | (5,136 | ) | |||||||||||
Euro STOXX 50 Index | 19 | 694 | 6/16/17 | 15,432 | ||||||||||||
Mini MSCI Emerging Markets Index | 10 | 481 | 6/16/17 | 10,577 | ||||||||||||
TOPIX Index | 3 | 408 | 6/8/17 | (7,558 | ) | |||||||||||
Short: British Pound | (13 | ) | (1,020 | ) | 6/19/17 | (29,773 | ) | |||||||||
Euro Currency | (7 | ) | (938 | ) | 6/19/17 | (8,332 | ) | |||||||||
FTSE 100 Index | (5 | ) | (456 | ) | 6/16/17 | 900 | ||||||||||
Mini MSCI EAFE Index | (3 | ) | (267 | ) | 6/16/17 | (3,922 | ) | |||||||||
| $ | (18,451 | ) | ||||||||||||||
| Semiannual Report | | March 31, 2017 | 359 |
Table of Contents
Notes to Financial Statements (cont’d)
March 31, 2017 (Unaudited)
| AllianzGI Retirement 2045: | ||||||||||||||||
| Type | Contracts | Market Value (000s) | Expiration Date | Unrealized Appreciation (Depreciation) | ||||||||||||
Long: Australian Dollar | 4 | $ | 305 | 6/19/17 | $ | 5,349 | ||||||||||
E-mini S&P 500 Index | 5 | 590 | 6/16/17 | (2,334 | ) | |||||||||||
Euro STOXX 50 Index | 16 | 585 | 6/16/17 | 12,555 | ||||||||||||
Mini MSCI Emerging Markets Index | 6 | 288 | 6/16/17 | 6,346 | ||||||||||||
TOPIX Index | 2 | 272 | 6/8/17 | (5,039 | ) | |||||||||||
Short: British Pound | (7 | ) | (549 | ) | 6/19/17 | (16,032 | ) | |||||||||
Euro Currency | (4 | ) | (536 | ) | 6/19/17 | (4,761 | ) | |||||||||
FTSE 100 Index | (4 | ) | (365 | ) | 6/16/17 | 721 | ||||||||||
Mini MSCI EAFE Index | (2 | ) | (178 | ) | 6/16/17 | (2,615 | ) | |||||||||
| $ | (5,810 | ) | ||||||||||||||
| AllianzGI Retirement 2050: | ||||||||||||||||
| Type | Contracts | Market Value (000s) | Expiration Date | Unrealized Appreciation (Depreciation) | ||||||||||||
Long: Australian Dollar | 4 | $ | 305 | 6/19/17 | $ | 5,349 | ||||||||||
E-mini S&P 500 Index | 5 | 590 | 6/16/17 | (2,334 | ) | |||||||||||
Euro STOXX 50 Index | 15 | 548 | 6/16/17 | 11,906 | ||||||||||||
Mini MSCI Emerging Markets Index | 6 | 288 | 6/16/17 | 6,346 | ||||||||||||
TOPIX Index | 2 | 272 | 6/8/17 | (5,039 | ) | |||||||||||
Short: British Pound | (7 | ) | (549 | ) | 6/19/17 | (16,032 | ) | |||||||||
Euro Currency | (4 | ) | (536 | ) | 6/19/17 | (4,761 | ) | |||||||||
FTSE 100 Index | (3 | ) | (273 | ) | 6/16/17 | 540 | ||||||||||
Mini MSCI EAFE Index | (2 | ) | (178 | ) | 6/16/17 | (2,614 | ) | |||||||||
| $ | (6,639 | ) | ||||||||||||||
| AllianzGI Retirement 2055: | ||||||||||||||||
| Type | Contracts | Market Value (000s) | Expiration Date | Unrealized Appreciation (Depreciation) | ||||||||||||
Long: Australian Dollar | 2 | $ | 153 | 6/19/17 | $ | 2,675 | ||||||||||
E-mini S&P 500 Index | 2 | 236 | 6/16/17 | (934 | ) | |||||||||||
Euro STOXX 50 Index | 6 | 219 | 6/16/17 | 4,824 | ||||||||||||
Mini MSCI Emerging Markets Index | 3 | 144 | 6/16/17 | 3,173 | ||||||||||||
TOPIX Index | 1 | 136 | 6/8/17 | (2,519 | ) | |||||||||||
Short: British Pound | (2 | ) | (157 | ) | 6/19/17 | (4,581 | ) | |||||||||
Euro Currency | (1 | ) | (134 | ) | 6/19/17 | (1,190 | ) | |||||||||
FTSE 100 Index | (1 | ) | (91 | ) | 6/16/17 | 180 | ||||||||||
Mini MSCI EAFE Index | (1 | ) | (89 | ) | 6/16/17 | (1,307 | ) | |||||||||
| $ | 321 | |||||||||||||||
| 360 | March 31, 2017 | | Semiannual Report |
Table of Contents
| AllianzGI Retirement Income: | ||||||||||||||||
| Type | Contracts | Market Value (000s) | Expiration Date | Unrealized Appreciation (Depreciation) | ||||||||||||
Long: Euro STOXX 600 Index | 78 | $ | 1,563 | 6/16/17 | $ | 27,906 | ||||||||||
Euro-Bund | 9 | 1,550 | 6/8/17 | 186 | ||||||||||||
Mini MSCI Emerging Markets Index | 54 | 2,596 | 6/16/17 | 27,295 | ||||||||||||
TOPIX Index | 7 | 951 | 6/8/17 | (17,635 | ) | |||||||||||
Ultra U.S. Treasury Bond | 10 | 1,606 | 6/21/17 | 30,917 | ||||||||||||
Short: Canadian Dollar | (43 | ) | (3,239 | ) | 6/20/17 | (39,249 | ) | |||||||||
Dow Jones U.S. Real Estate Index | (102 | ) | (3,168 | ) | 6/16/17 | (90,908 | ) | |||||||||
E-mini S&P 500 Index | (7 | ) | (826 | ) | 6/16/17 | 1,052 | ||||||||||
Euro Currency | (10 | ) | (1,340 | ) | 6/19/17 | (11,903 | ) | |||||||||
| $ | (72,339 | ) | ||||||||||||||
| AllianzGI Global Allocation: | ||||||||||||||||
| Type | Contracts | Market Value (000s) | Expiration Date | Unrealized Appreciation (Depreciation) | ||||||||||||
Long: 2-Year Treasury Note | 48 | $ | 10,390 | 6/30/17 | $ | 7,415 | ||||||||||
5-Year Treasury Note | 60 | 7,064 | 6/30/17 | 8,798 | ||||||||||||
Australian Dollar | 69 | 5,269 | 6/19/17 | 76,400 | ||||||||||||
E-mini S&P 500 Index | 215 | 25,361 | 6/16/17 | (43,948 | ) | |||||||||||
FTSE 100 Index | 38 | 3,464 | 6/16/17 | (12,438 | ) | |||||||||||
Long Gilt | 93 | 14,865 | 6/28/17 | 143,084 | ||||||||||||
Mini DAX European Index | 61 | 4,012 | 6/16/17 | 90,210 | ||||||||||||
Mini MSCI Emerging Markets Index | 95 | 4,567 | 6/16/17 | 44,430 | ||||||||||||
Russell 2000 Mini Index | 59 | 4,084 | 6/16/17 | 12,581 | ||||||||||||
TOPIX Index | 45 | 6,113 | 6/8/17 | (121,453 | ) | |||||||||||
Short: 10-Year Treasury Note | (35 | ) | (4,360 | ) | 6/21/17 | (11,895 | ) | |||||||||
British Pound | (156 | ) | (12,242 | ) | 6/19/17 | (359,231 | ) | |||||||||
Canadian Dollar | (90 | ) | (6,780 | ) | 6/20/17 | (85,298 | ) | |||||||||
Euro Currency | (41 | ) | (5,495 | ) | 6/19/17 | (59,307 | ) | |||||||||
| $ | (310,652 | ) | ||||||||||||||
| AllianzGI Best Styles Emerging Markets Equity: | ||||||||||||||||
| Type | Contracts | Market Value (000s) | Expiration Date | Unrealized Appreciation | ||||||||||||
Long: SGX Nifty 50 Index | 25 | $ | 460 | 4/27/17 | $ | 2,420 | ||||||||||
| AllianzGI Best Styles Global Equity: | ||||||||||||||||
| Type | Contracts | Market Value (000s) | Expiration Date | Unrealized Appreciation (Depreciation) | ||||||||||||
Long: E-mini S&P 500 Index | 17 | $ | 2,005 | 6/16/17 | $ | (17,015 | ) | |||||||||
Mini MSCI Emerging Markets Index | 51 | 2,452 | 6/16/17 | 35,157 | ||||||||||||
MSCI Europe Index | 165 | 3,655 | 6/16/17 | 61,335 | ||||||||||||
TOPIX Index | 6 | 815 | 6/8/17 | (24,592 | ) | |||||||||||
| $ | 54,885 | |||||||||||||||
| Semiannual Report | | March 31, 2017 | 361 |
Table of Contents
Notes to Financial Statements (cont’d)
March 31, 2017 (Unaudited)
| AllianzGI Best Styles International Equity: | ||||||||||||||||
| Type | Contracts | Market Value (000s) | Expiration Date | Unrealized Appreciation | ||||||||||||
Long: Mini MSCI EAFE Index | 7 | $ | 624 | 6/16/17 | $ | 13,144 | ||||||||||
| AllianzGI Global Dynamic Allocation: | ||||||||||||||||
| Type | Contracts | Market Value (000s) | Expiration Date | Unrealized Appreciation (Depreciation) | ||||||||||||
Long: E-mini S&P 500 Index | 122 | $ | 14,391 | 6/16/17 | $ | (76,483 | ) | |||||||||
Euro STOXX 50 Index | 286 | 10,453 | 6/16/17 | 349,450 | ||||||||||||
Long Gilt | 85 | 13,587 | 6/28/17 | 128,486 | ||||||||||||
Mini MSCI EAFE Index | 150 | 13,365 | 6/16/17 | 299,653 | ||||||||||||
Mini MSCI Emerging Markets Index | 193 | 9,277 | 6/16/17 | 253,889 | ||||||||||||
Russell 2000 Mini Index | 125 | 8,652 | 6/16/17 | 171,655 | ||||||||||||
TOPIX Index | 76 | 10,325 | 6/8/17 | (259,733 | ) | |||||||||||
Short: 10-Year Treasury Note | (6 | ) | (747 | ) | 6/21/17 | (2,051 | ) | |||||||||
2-Year Treasury Note | (89 | ) | (19,264 | ) | 6/30/17 | (16,844 | ) | |||||||||
5-Year Treasury Note | (17 | ) | (2,001 | ) | 6/30/17 | (2,687 | ) | |||||||||
British Pound | (70 | ) | (5,493 | ) | 6/19/17 | (119,374 | ) | |||||||||
Euro Currency | (44 | ) | (5,897 | ) | 6/19/17 | (39,171 | ) | |||||||||
Ultra U.S. Treasury Bond | (4 | ) | (643 | ) | 6/21/17 | (3,102 | ) | |||||||||
| $ | 683,688 | |||||||||||||||
| AllianzGI Global Fundamental Strategy: | ||||||||||||||||
| Type | Contracts | Market Value (000s) | Expiration Date | Unrealized Appreciation | ||||||||||||
Long: Euro STOXX 50 Index | 31 | $ | 1,133 | 6/16/17 | $ | 23,106 | ||||||||||
Hang Seng China Enterprises Index | 4 | 14 | 6/18/18 | 129 | ||||||||||||
Hang Seng Index | 3 | 18 | 12/28/17 | 3,728 | ||||||||||||
Short: E-mini S&P 500 Index | (32 | ) | (3,775 | ) | 6/16/17 | 6,259 | ||||||||||
Euro-Bund | (8 | ) | (1,377 | ) | 6/8/17 | 1,186 | ||||||||||
| $ | 34,408 | |||||||||||||||
| AllianzGI Multi-Asset Real Return: | ||||||||||||||||
| Type | Contracts | Market Value (000s) | Expiration Date | Unrealized Appreciation (Depreciation) | ||||||||||||
Long: Dow Jones U.S. Real Estate Index | 11 | $ | 342 | 6/16/17 | $ | 9,617 | ||||||||||
E-mini S&P 500 Index | 2 | 236 | 6/16/17 | (1,622 | ) | |||||||||||
Mini MSCI Emerging Markets Index | 4 | 192 | 6/16/17 | 2,126 | ||||||||||||
Short: 2-Year Treasury Note | (2 | ) | (433 | ) | 6/30/17 | (66 | ) | |||||||||
Euro Currency | (1 | ) | (134 | ) | 6/19/17 | (1,403 | ) | |||||||||
| $ | 8,652 | |||||||||||||||
(c) Forward foreign currency contracts outstanding at March 31, 2017:
| AllianzGI Emerging Markets Debt: | ||||||||||||||||
| Counterparty | U.S.$ Value on Origination Date | U.S.$ Value March 31, 2017 | Unrealized Appreciation | |||||||||||||
Sold: | ||||||||||||||||
720,000 Euro settling 6/14/17 | State Street Bank | $ | 777,095 | $ | 770,644 | $ | 6,451 | |||||||||
| 362 | March 31, 2017 | | Semiannual Report |
Table of Contents
| AllianzGI Global Fundamental Strategy: | ||||||||||||||||
| Counterparty | U.S.$ Value on Origination Date | U.S.$ Value March 31, 2017 | Unrealized Appreciation (Depreciation) | |||||||||||||
Purchased: | ||||||||||||||||
23,000,000 Indian Rupee settling 7/14/17 | State Street Bank | $ | 326,010 | $ | 349,465 | $ | 23,455 | |||||||||
Sold: |
| |||||||||||||||
2,000,000 Euro settling 5/31/17 | State Street Bank | 2,132,109 | 2,139,162 | (7,053 | ) | |||||||||||
| $ | 16,402 | |||||||||||||||
| AllianzGI International Small-Cap: | ||||||||||||||||
| Counterparty | U.S.$ Value on Origination Date | U.S.$ Value March 31, 2017 | Unrealized Depreciation | |||||||||||||
Purchased: | ||||||||||||||||
17,374,416 Japanese Yen settling 4/3/17 | Northern Trust Company | $ | 156,826 | $ | 156,062 | $ | (764 | ) | ||||||||
| AllianzGI NFJ Emerging Markets Value: | ||||||||||||||||
| Counterparty | U.S.$ Value on Origination Date | U.S.$ Value March 31, 2017 | Unrealized Depreciation | |||||||||||||
Purchased: | ||||||||||||||||
651,949 Mexican Peso settling 4/5/17 | Northern Trust Company | $ | 34,849 | $ | 34,817 | $ | (32 | ) | ||||||||
6,585 Singapore Dollar settling 4/4/17 | Northern Trust Company | 4,722 | 4,708 | (14 | ) | |||||||||||
87,876 South African Rand settling 4/3/17 | Northern Trust Company | 6,794 | 6,550 | (244 | ) | |||||||||||
51,221 South African Rand settling 4/4/17 | Northern Trust Company | 3,981 | 3,818 | (163 | ) | |||||||||||
47,655 South African Rand settling 4/5/17 | Northern Trust Company | 3,565 | 3,551 | (14 | ) | |||||||||||
Sold: | ||||||||||||||||
26,349 Mexican Peso settling 4/4/17 | Northern Trust Company | 1,404 | 1,407 | (3 | ) | |||||||||||
| $ | (470 | ) | ||||||||||||||
At March 31, 2017, the following Funds pledged cash as collateral for derivatives:
| Collateral | ||||
AllianzGI Retirement 2020 | $ | 352,367 | ||
AllianzGI Retirement 2025 | 690,682 | |||
AllianzGI Retirement 2030 | 716,407 | |||
AllianzGI Retirement 2035 | 683,164 | |||
AllianzGI Retirement 2040 | 662,294 | |||
AllianzGI Retirement 2045 | 419,727 | |||
AllianzGI Retirement 2050 | 391,147 | |||
AllianzGI Retirement 2055 | 202,214 | |||
AllianzGI Retirement Income | 884,587 | |||
AllianzGI Global Allocation | 1,707,393 | |||
AllianzGI Best Styles Emerging Markets Equity | 68,505 | |||
AllianzGI Best Styles Global Equity | 2,239,434 | |||
AllianzGI Best Styles International Equity | 154,222 | |||
AllianzGI Best Styles U.S. Equity | 114,129 | |||
AllianzGI Emerging Markets Debt | 295,474 | |||
AllianzGI Global Dynamic Allocation | 723,863 | |||
AllianzGI Global Fundamental Strategy | 507,896 | |||
AllianzGI Multi-Asset Real Return | 48,629 | |||
AllianzGI Structured Return | 3,232,810 | |||
AllianzGI U.S. Equity Hedged | 637 | |||
| Semiannual Report | | March 31, 2017 | 363 |
Table of Contents
Notes to Financial Statements (cont’d)
March 31, 2017 (Unaudited)
At March 31, 2017, AllianzGI Global Dynamic Allocation held U.S. Treasury Obligations valued at $101,269 as collateral for TBA securities. Securities held as collateral will not be pledged and are not reflected in the Schedule of Investments.
Glossary:
EAFE —Europe, Australasia and Far East
FTSE —Financial Times Stock Exchange
MSCI —Morgan Stanley Capital International
SGX —Singapore Exchange
TOPIX —Tokyo Stock Price Index
| 8. | INCOME TAX INFORMATION |
At March 31, 2017, the aggregate cost basis and the net unrealized appreciation (depreciation) of investments (before options written) for federal income tax purposes were:
| Federal Tax Cost Basis(1) | Unrealized Appreciation | Unrealized Depreciation | Net Unrealized Appreciation (Depreciation) | |||||||||||||
AllianzGI Retirement 2020 | $ | 51,864,556 | $ | 1,427,768 | $ | 251,497 | $ | 1,176,271 | ||||||||
AllianzGI Retirement 2025 | 58,765,825 | 1,997,501 | 131,642 | 1,865,859 | ||||||||||||
AllianzGI Retirement 2030 | 61,136,139 | 2,919,839 | — | 2,919,839 | ||||||||||||
AllianzGI Retirement 2035 | 48,280,340 | 2,840,557 | — | 2,840,557 | ||||||||||||
AllianzGI Retirement 2040 | 43,533,195 | 2,969,132 | — | 2,969,132 | ||||||||||||
AllianzGI Retirement 2045 | 27,332,547 | 1,934,982 | — | 1,934,982 | ||||||||||||
AllianzGI Retirement 2050 | 26,307,042 | 1,872,499 | — | 1,872,499 | ||||||||||||
AllianzGI Retirement 2055 | 10,680,468 | 691,433 | — | 691,433 | ||||||||||||
AllianzGI Retirement Income | 50,545,240 | 1,054,300 | 257,884 | 796,416 | ||||||||||||
AllianzGI Global Allocation | 424,155,534 | 33,680,057 | 2,375,076 | 31,304,981 | ||||||||||||
AllianzGI Global Megatrends | 3,447,884 | 110,481 | 96,666 | 13,815 | ||||||||||||
AllianzGI Best Styles Emerging Markets Equity | 5,176,903 | 845,833 | 80,109 | 765,724 | ||||||||||||
AllianzGI Best Styles Global Equity | 646,314,889 | 89,028,215 | 13,104,251 | 75,923,964 | ||||||||||||
AllianzGI Best Styles International Equity | 30,098,321 | 3,259,291 | 1,480,471 | 1,778,820 | ||||||||||||
AllianzGI Best Styles U.S. Equity | 109,248,595 | 13,020,279 | 1,877,991 | 11,142,288 | ||||||||||||
AllianzGI Convertible | 1,020,073,876 | 152,706,281 | 4,077,242 | 148,629,039 | ||||||||||||
AllianzGI Emerging Markets Consumer | 33,858,988 | 6,064,778 | 232,380 | 5,832,398 | ||||||||||||
AllianzGI Emerging Markets Debt | 39,921,902 | 1,544,127 | 509,957 | 1,034,170 | ||||||||||||
AllianzGI Emerging Markets Small-Cap | 11,731,180 | 2,148,976 | 132,493 | 2,016,483 | ||||||||||||
AllianzGI Europe Equity Dividend | 6,590,862 | 328,375 | 168,110 | 160,265 | ||||||||||||
AllianzGI Global Dynamic Allocation | 268,636,794 | 11,003,636 | 3,203,607 | 7,800,029 | ||||||||||||
AllianzGI Global Fundamental Strategy | 15,533,379 | 590,959 | 616,664 | (25,705 | ) | |||||||||||
AllianzGI Global Sustainability | 22,147,103 | 2,859,226 | 364,177 | 2,495,049 | ||||||||||||
AllianzGI Global Water | 482,421,657 | 74,220,761 | 10,093,224 | 64,127,537 | ||||||||||||
AllianzGI High Yield Bond | 331,884,275 | 12,610,641 | 7,929,871 | 4,680,770 | ||||||||||||
AllianzGI International Growth | 27,655,121 | 1,954,016 | 901,745 | 1,052,271 | ||||||||||||
AllianzGI International Small-Cap | 78,681,943 | 16,898,458 | 2,848,520 | 14,049,938 | ||||||||||||
AllianzGI Micro Cap | 28,113,683 | 10,081,014 | 1,706,441 | 8,374,573 | ||||||||||||
AllianzGI Multi-Asset Real Return | 4,561,003 | 102,089 | 331,020 | (228,931 | ) | |||||||||||
AllianzGI NFJ Emerging Markets Value | 21,754,477 | 2,137,648 | 207,222 | 1,930,426 | ||||||||||||
AllianzGI NFJ Global Dividend Value | 17,988,467 | 1,260,095 | 331,313 | 928,782 | ||||||||||||
AllianzGI NFJ International Small-Cap Value | 4,308,603 | 430,185 | 180,111 | 250,074 | ||||||||||||
AllianzGI NFJ International Value II | 1,015,157 | 27,032 | 71,019 | (43,987 | ) | |||||||||||
AllianzGI Short Duration High Income | 1,677,280,387 | 7,265,265 | 15,237,525 | (7,972,260 | ) | |||||||||||
AllianzGI Structured Return | 403,373,550 | 2,802 | 469,819 | (467,017 | ) | |||||||||||
AllianzGI U.S. Equity Hedged | 3,838,881 | 460,716 | 110,874 | 349,842 | ||||||||||||
AllianzGI U.S. Small-Cap Growth | 14,048,775 | 3,220,629 | 286,705 | 2,933,924 | ||||||||||||
AllianzGI Ultra Micro Cap | 29,109,635 | 14,178,835 | 1,182,481 | 12,996,354 | ||||||||||||
| (1) | Differences, if any, between book and tax cost basis are primarily attributable to wash sale loss deferrals and differing treatment of bond premium amortization. |
| 364 | March 31, 2017 | | Semiannual Report |
Table of Contents
(THIS PAGE INTENTIONALLY LEFT BLANK)
| Semiannual Report | | March 31, 2017 | 365 |
Table of Contents
Notes to Financial Statements (cont’d)
March 31, 2017 (Unaudited)
| 9. | SHARES OF BENEFICIAL INTEREST |
The Trust may issue an unlimited number of shares of beneficial interest with $0.0001 par value. Changes in shares of beneficial interest were as follows:
| AllianzGI Retirement 2020 | AllianzGI Retirement 2025 | |||||||||||||||||||||||||||||||||||
| Six Months ended March 31, 2017 (unaudited) | Year ended September 30, 2016 | Six Months ended March 31, 2017 (unaudited) | Year ended September 30, 2016 | |||||||||||||||||||||||||||||||||
| Shares | Amount | Shares | Amount | Shares | Amount | Shares | Amount | |||||||||||||||||||||||||||||
Shares sold: | ||||||||||||||||||||||||||||||||||||
Class A | 50,821 | $ | 961,648 | 185,700 | $ | 3,378,804 | 33,922 | $ | 576,752 | 270,591 | $ | 4,384,891 | ||||||||||||||||||||||||
Class A — from Class D(a) | — | — | 31,682 | 582,312 | — | — | — | — | ||||||||||||||||||||||||||||
Class C | 3,808 | 71,148 | 5,143 | 93,840 | — | — | — | — | ||||||||||||||||||||||||||||
Class D | — | — | 32 | 600 | — | — | — | — | ||||||||||||||||||||||||||||
Class R | 1,215 | 22,971 | 12,746 | 234,527 | 3,865 | 64,490 | 9,066 | 145,265 | ||||||||||||||||||||||||||||
Class P | 74,754 | 1,430,619 | 240,104 | 4,437,324 | 136,314 | 2,302,322 | 363,614 | 5,898,065 | ||||||||||||||||||||||||||||
Class R6 | 339,616 | 6,502,018 | 162,393 | 3,017,255 | 392,332 | 6,638,602 | 198,051 | 3,206,913 | ||||||||||||||||||||||||||||
Administrative Class | 15,067 | 288,248 | 13,781 | 254,001 | 8,448 | 144,221 | 15,513 | 248,087 | ||||||||||||||||||||||||||||
Issued in reinvestment of dividends and distributions: |
| |||||||||||||||||||||||||||||||||||
Class A | 16,725 | 310,415 | 33,310 | 594,910 | 7,078 | 117,498 | 34,415 | 543,416 | ||||||||||||||||||||||||||||
Class C | 461 | 8,548 | 426 | 7,610 | — | — | — | — | ||||||||||||||||||||||||||||
Class R | 500 | 9,321 | 1,130 | 20,265 | 915 | 15,091 | 1,131 | 17,842 | ||||||||||||||||||||||||||||
Class P | 38,718 | 724,018 | 44,277 | 797,874 | 59,281 | 982,280 | 68,215 | 1,080,525 | ||||||||||||||||||||||||||||
Class R6 | 19,701 | 368,801 | 24,231 | 436,891 | 21,665 | 359,200 | 24,126 | 382,398 | ||||||||||||||||||||||||||||
Administrative Class | 773 | 14,448 | 3,337 | 59,872 | 755 | 12,535 | 2,552 | 40,396 | ||||||||||||||||||||||||||||
Cost of shares redeemed: |
| |||||||||||||||||||||||||||||||||||
Class A | (63,141 | ) | (1,191,872 | ) | (1,268,820 | ) | (23,656,591 | ) | (20,032 | ) | (339,249 | ) | (1,606,439 | ) | (26,523,016 | ) | ||||||||||||||||||||
Class C | (3,601 | ) | (68,315 | ) | (2,357 | ) | (43,858 | ) | — | — | — | — | ||||||||||||||||||||||||
Class D | — | — | (935 | ) | (17,595 | ) | — | — | — | — | ||||||||||||||||||||||||||
Class D — to | — | — | (31,478 | ) | (582,312 | ) | — | — | — | — | ||||||||||||||||||||||||||
Class R | (35,436 | ) | (678,423 | ) | (37,700 | ) | (694,122 | ) | (42,375 | ) | (720,533 | ) | (28,084 | ) | (451,307 | ) | ||||||||||||||||||||
Class P | (321,305 | ) | (6,169,366 | ) | (106,622 | ) | (1,953,673 | ) | (207,478 | ) | (3,531,148 | ) | (220,490 | ) | (3,554,339 | ) | ||||||||||||||||||||
Class R6 | (133,637 | ) | (2,555,609 | ) | (148,581 | ) | (2,763,846 | ) | (86,100 | ) | (1,459,656 | ) | (120,092 | ) | (1,975,353 | ) | ||||||||||||||||||||
Administrative Class | (5,008 | ) | (96,343 | ) | (93,490 | ) | (1,764,091 | ) | (5,564 | ) | (93,290 | ) | (56,624 | ) | (943,688 | ) | ||||||||||||||||||||
Net increase (decrease) resulting from Fund share transactions | 31 | $ | (47,725 | ) | (931,691 | ) | $ | (17,560,003 | ) | 303,026 | $ | 5,069,115 | (1,044,455 | ) | $ | (17,499,905 | ) | |||||||||||||||||||
| (a) | Class D shares converted to Class A shares at the close of business on November 13, 2015. See Note 12(a). |
| 366 | March 31, 2017 | | Semiannual Report |
Table of Contents
| AllianzGI Retirement 2030 | AllianzGI Retirement 2035 | AllianzGI Retirement 2040 | ||||||||||||||||||||||||||||||||||||||||||||||||
| Six Months ended March 31, 2017 (unaudited) | Year ended September 30, 2016 | Six Months ended March 31, 2017 (unaudited) | Year ended September 30, 2016 | Six Months ended March 31, 2017 (unaudited) | Year ended September 30, 2016 | |||||||||||||||||||||||||||||||||||||||||||||
| Shares | Amount | Shares | Amount | Shares | Amount | Shares | Amount | Shares | Amount | Shares | Amount | |||||||||||||||||||||||||||||||||||||||
| 45,307 | $ | 924,634 | 270,215 | $ | 5,199,457 | 46,163 | $ | 838,525 | 185,394 | $ | 3,125,958 | 31,934 | $ | 670,504 | 121,009 | $ | 2,379,037 | |||||||||||||||||||||||||||||||||
| — | — | 28,638 | 552,431 | — | — | — | — | — | — | 11,576 | 226,889 | |||||||||||||||||||||||||||||||||||||||
| 2,774 | 55,530 | 6,863 | 131,089 | — | — | — | — | 321 | 6,567 | 803 | 15,416 | |||||||||||||||||||||||||||||||||||||||
| — | — | 977 | 18,955 | — | — | — | — | — | — | 14 | 291 | |||||||||||||||||||||||||||||||||||||||
| 7,359 | 147,250 | 40,564 | 787,474 | 6,963 | 122,705 | 20,065 | 336,764 | 7,228 | 146,881 | 16,036 | 308,507 | |||||||||||||||||||||||||||||||||||||||
| 124,603 | 2,548,594 | 228,404 | 4,450,667 | 129,570 | 2,340,240 | 249,111 | 4,207,686 | 131,208 | 2,711,855 | 191,646 | 3,737,937 | |||||||||||||||||||||||||||||||||||||||
| 227,211 | 4,666,644 | 250,789 | 4,832,395 | 185,575 | 3,334,357 | 235,027 | 4,006,012 | 191,583 | 3,989,803 | 267,817 | 5,225,071 | |||||||||||||||||||||||||||||||||||||||
| 9,747 | 200,263 | 11,846 | 228,470 | 20,214 | 365,514 | 8,689 | 147,090 | 1,413 | 29,286 | 5,677 | 110,716 | |||||||||||||||||||||||||||||||||||||||
| 7,285 | 144,388 | 22,860 | 431,590 | 11,790 | 206,201 | 20,021 | 333,945 | 7,063 | 142,180 | 8,944 | 174,143 | |||||||||||||||||||||||||||||||||||||||
| 627 | 12,337 | 726 | 13,670 | — | — | — | — | 206 | 4,120 | 165 | 3,214 | |||||||||||||||||||||||||||||||||||||||
| 2,247 | 44,419 | 2,473 | 46,771 | 1,458 | 25,406 | 1,374 | 22,893 | 2,744 | 54,691 | 1,266 | 24,533 | |||||||||||||||||||||||||||||||||||||||
| 46,942 | 938,844 | 49,188 | 940,472 | 50,349 | 883,626 | 48,314 | 810,229 | 46,345 | 935,697 | 23,582 | 462,211 | |||||||||||||||||||||||||||||||||||||||
| 24,135 | 483,657 | 22,406 | 429,074 | 16,412 | 288,351 | 11,017 | 184,982 | 34,052 | 688,539 | 17,076 | 335,212 | |||||||||||||||||||||||||||||||||||||||
| 1,496 | 29,885 | 2,955 | 56,360 | 996 | 17,461 | 1,165 | 19,510 | 656 | 13,206 | 640 | 12,490 | |||||||||||||||||||||||||||||||||||||||
| (32,731 | ) | (657,917 | ) | (1,155,016 | ) | (22,592,350 | ) | (150,215 | ) | (2,721,386 | ) | (849,560 | ) | (14,682,569 | ) | (16,883 | ) | (351,248 | ) | (652,979 | ) | (13,091,396 | ) | |||||||||||||||||||||||||||
| (2,316 | ) | (46,309 | ) | (5,207 | ) | (98,101 | ) | — | — | — | — | (857 | ) | (17,841 | ) | (5,475 | ) | (101,104 | ) | |||||||||||||||||||||||||||||||
| — | — | (668 | ) | (13,136 | ) | — | — | — | — | — | — | (60 | ) | (1,218 | ) | |||||||||||||||||||||||||||||||||||
| — | — | (28,464 | ) | (552,431 | ) | — | — | — | — | — | — | (11,553 | ) | (226,889 | ) | |||||||||||||||||||||||||||||||||||
| (102,304 | ) | (2,094,525 | ) | (5,422 | ) | (104,272 | ) | (61,892 | ) | (1,123,277 | ) | (29,105 | ) | (496,270 | ) | (73,475 | ) | (1,530,854 | ) | (3,470 | ) | (68,855 | ) | |||||||||||||||||||||||||||
| (187,925 | ) | (3,894,371 | ) | (125,371 | ) | (2,430,023 | ) | (206,751 | ) | (3,771,254 | ) | (218,306 | ) | (3,667,518 | ) | (124,432 | ) | (2,596,343 | ) | (101,246 | ) | (1,968,393 | ) | |||||||||||||||||||||||||||
| (80,366 | ) | (1,650,199 | ) | (126,214 | ) | (2,409,257 | ) | (83,652 | ) | (1,509,560 | ) | (96,907 | ) | (1,662,964 | ) | (79,044 | ) | (1,639,240 | ) | (147,449 | ) | (2,915,838 | ) | |||||||||||||||||||||||||||
| (12,902 | ) | (265,930 | ) | (48,668 | ) | (972,258 | ) | (14,555 | ) | (262,820 | ) | (17,205 | ) | (296,627 | ) | (2,899 | ) | (57,974 | ) | (13,647 | ) | (268,667 | ) | |||||||||||||||||||||||||||
| 81,189 |
| $ | 1,587,194 | (556,126 | ) | $ | (11,052,953 | ) | (47,575 | ) | $ | (965,911 | ) | (430,906 | ) | $ | (7,610,879 | ) | 157,163 | $ | 3,199,829 | (269,628 | ) | $ | (5,626,693 | ) | |||||||||||||||||||||||
| Semiannual Report | | March 31, 2017 | 367 |
Table of Contents
Notes to Financial Statements (cont’d)
March 31, 2017 (Unaudited)
| AllianzGI Retirement 2045 | AllianzGI Retirement 2050 | |||||||||||||||||||||||||||||||||||
| Six Months ended March 31, 2017 (unaudited) | Year ended September 30, 2016 | Six Months ended March 31, 2017 (unaudited) | Year ended September 30, 2016 | |||||||||||||||||||||||||||||||||
| Shares | Amount | Shares | Amount | Shares | Amount | Shares | Amount | |||||||||||||||||||||||||||||
Shares sold: | ||||||||||||||||||||||||||||||||||||
Class A | 23,431 | $ | 426,984 | 116,343 | $ | 1,997,806 | 84,150 | $ | 1,685,672 | 52,288 | $ | 1,002,188 | ||||||||||||||||||||||||
Class A — from Class D(a) | — | — | — | — | — | — | 10,929 | 211,250 | ||||||||||||||||||||||||||||
Class C | — | — | — | — | 603 | 11,913 | 1,333 | 24,980 | ||||||||||||||||||||||||||||
Class D | — | — | — | — | — | — | 29 | 577 | ||||||||||||||||||||||||||||
Class R | 5,024 | 89,999 | 8,404 | 142,434 | 3,386 | 67,298 | 6,796 | 128,075 | ||||||||||||||||||||||||||||
Class P | 77,556 | 1,412,875 | 156,390 | 2,675,197 | 84,209 | 1,712,039 | 128,452 | 2,469,929 | ||||||||||||||||||||||||||||
Institutional Class | — | — | — | — | — | — | — | — | ||||||||||||||||||||||||||||
Class R6 | 174,926 | 3,199,538 | 265,783 | 4,535,309 | 147,721 | 3,010,055 | 221,888 | 4,274,526 | ||||||||||||||||||||||||||||
Administrative Class | 12,098 | 222,867 | 11,764 | 203,902 | 2,905 | 59,133 | 11,579 | 225,630 | ||||||||||||||||||||||||||||
Issued in reinvestment of dividends and distributions: |
| |||||||||||||||||||||||||||||||||||
Class A | 9,827 | 172,359 | 8,654 | 148,152 | 4,463 | 87,120 | 3,923 | 74,690 | ||||||||||||||||||||||||||||
Class C | — | — | — | — | 351 | 6,764 | 240 | 4,526 | ||||||||||||||||||||||||||||
Class R | 1,786 | 31,083 | 597 | 10,189 | 1,794 | 34,831 | 993 | 18,858 | ||||||||||||||||||||||||||||
Class P | 41,537 | 729,383 | 16,867 | 289,947 | 29,513 | 579,935 | 15,781 | 302,844 | ||||||||||||||||||||||||||||
Institutional Class | — | — | — | — | — | — | — | — | ||||||||||||||||||||||||||||
Class R6 | 26,400 | 464,645 | 6,302 | 108,576 | 29,933 | 589,982 | 16,536 | 318,327 | ||||||||||||||||||||||||||||
Administrative Class | 1,669 | 29,161 | 519 | 8,888 | 1,708 | 33,443 | 1,145 | 21,891 | ||||||||||||||||||||||||||||
Issued in reorganization (See Note 12(b)): | ||||||||||||||||||||||||||||||||||||
Class A | — | — | — | — | — | — | — | — | ||||||||||||||||||||||||||||
Class C | — | — | — | — | — | — | — | — | ||||||||||||||||||||||||||||
Class R | — | — | — | — | — | — | — | — | ||||||||||||||||||||||||||||
Class P | — | — | — | — | — | — | — | — | ||||||||||||||||||||||||||||
Class R6 | — | — | — | — | — | — | — | — | ||||||||||||||||||||||||||||
Administrative Class | — | — | — | — | — | — | — | — | ||||||||||||||||||||||||||||
Cost of shares redeemed: | ||||||||||||||||||||||||||||||||||||
Class A | (20,015 | ) | (360,787 | ) | (517,019 | ) | (9,141,921 | ) | (20,167 | ) | (403,918 | ) | (245,723 | ) | (4,845,274 | ) | ||||||||||||||||||||
Class B | — | — | — | — | — | — | — | — | ||||||||||||||||||||||||||||
Class B — to Class A(a) | — | — | — | — | — | — | — | — | ||||||||||||||||||||||||||||
Class C | — | — | — | — | — | — | (2,249 | ) | (40,416 | ) | ||||||||||||||||||||||||||
Class D | — | — | — | — | — | — | (51 | ) | (1,009 | ) | ||||||||||||||||||||||||||
Class D — to Class A(a) | — | — | — | — | — | — | (10,876 | ) | (211,250 | ) | ||||||||||||||||||||||||||
Class R | (34,067 | ) | (620,016 | ) | (2,081 | ) | (35,686 | ) | (37,541 | ) | (763,370 | ) | (3,287 | ) | (62,213 | ) | ||||||||||||||||||||
Class P | (67,695 | ) | (1,225,176 | ) | (103,927 | ) | (1,777,549 | ) | (99,920 | ) | (2,060,513 | ) | (59,383 | ) | (1,144,686 | ) | ||||||||||||||||||||
Institutional Class | — | — | — | — | — | — | — | — | ||||||||||||||||||||||||||||
Class R6 | (56,192 | ) | (1,015,445 | ) | (49,174 | ) | (860,982 | ) | (44,496 | ) | (907,583 | ) | (148,380 | ) | (2,841,302 | ) | ||||||||||||||||||||
Administrative Class | (788 | ) | (14,256 | ) | (13,126 | ) | (228,397 | ) | (1,900 | ) | (38,410 | ) | (12,845 | ) | (251,413 | ) | ||||||||||||||||||||
Net increase (decrease) resulting from Fund share transactions | 195,497 | $ | 3,543,214 | (93,704 | ) | $ | (1,924,135 | ) | 186,712 | $ | 3,704,391 | (10,882 | ) | $ | (319,272 | ) | ||||||||||||||||||||
| * | Actual amount rounds to less than one share. |
| (a) | Class B shares and Class D shares converted to Class A shares at the close of business on December 4, 2015 and November 13, 2015, respectively. See Note 12(a). |
| 368 | March 31, 2017 | | Semiannual Report |
Table of Contents
| AllianzGI Retirement 2055 | AllianzGI Retirement Income | AllianzGI Global Allocation | ||||||||||||||||||||||||||||||||||||||||||||||||
| Six Months ended March 31, 2017 (unaudited) | Year ended September 30, 2016 | Six Months ended March 31, 2017 (unaudited) | Year ended September 30, 2016 | Six Months ended March 31, 2017 (unaudited) | Year ended September 30, 2016 | |||||||||||||||||||||||||||||||||||||||||||||
| Shares | Amount | Shares | Amount | Shares | Amount | Shares | Amount | Shares | Amount | Shares | Amount | |||||||||||||||||||||||||||||||||||||||
| 51,568 | $ | 896,089 | 45,853 | $ | 750,310 | 57,537 | $ | 1,038,936 | 205,919 | $ | 3,597,722 | 143,201 | $ | 1,588,027 | 1,258,326 | $ | 13,764,338 | |||||||||||||||||||||||||||||||||
| — | — | — | — | — | — | 53,324 | 939,041 | — | — | 245,248 | 2,744,859 | |||||||||||||||||||||||||||||||||||||||
| — | — | — | — | 8,569 | 154,151 | 37,507 | 655,941 | 94,696 | 1,069,684 | 483,902 | 5,417,634 | |||||||||||||||||||||||||||||||||||||||
| — | — | — | — | — | — | 6 | 105 | — | — | 303 | 3,398 | |||||||||||||||||||||||||||||||||||||||
| 4,439 | 75,548 | 8,801 | 142,167 | 1,100 | 20,589 | 863 | 15,783 | 47 | 521 | — | — | |||||||||||||||||||||||||||||||||||||||
| 70,515 | 1,228,538 | 116,671 | 1,910,606 | 164,741 | 3,031,009 | 105,551 | 1,885,119 | 117,102 | 1,316,107 | 127,103 | 1,394,515 | |||||||||||||||||||||||||||||||||||||||
| — | — | — | — | — | — | — | — | 448,545 | 4,970,254 | 1,969,961 | 21,171,094 | |||||||||||||||||||||||||||||||||||||||
| 99,973 | 1,748,453 | 126,822 | 2,060,659 | 207,407 | 3,700,945 | 198,727 | 3,442,068 | 1,876,503 | 20,742,055 | 20,202,793 | 211,348,642 | |||||||||||||||||||||||||||||||||||||||
| 3,046 | 53,135 | 7,076 | 117,388 | 45,290 | 835,535 | 43,290 | 806,078 | 27 | 300 | 273 | 3,010 | |||||||||||||||||||||||||||||||||||||||
| 2,569 | 43,179 | 1,992 | 32,498 | 14,762 | 263,873 | 17,758 | 310,759 | 52,559 | 585,202 | 171,061 | 1,860,917 | |||||||||||||||||||||||||||||||||||||||
| — | — | — | — | 3,418 | 61,188 | 6,430 | 111,228 | 24,037 | 271,392 | 150,416 | 1,657,957 | |||||||||||||||||||||||||||||||||||||||
| 788 | 13,177 | 385 | 6,255 | 383 | 7,073 | 611 | 11,062 | 28 | 310 | 63 | 677 | |||||||||||||||||||||||||||||||||||||||
| 10,413 | 176,090 | 4,115 | 67,574 | 29,047 | 524,066 | 21,665 | 384,143 | 1,484 | 16,402 | 3,776 | 41,086 | |||||||||||||||||||||||||||||||||||||||
| — | — | — | — | — | — | — | — | 137,298 | 1,501,582 | 302,668 | 3,256,730 | |||||||||||||||||||||||||||||||||||||||
| 8,828 | 149,892 | 5,889 | 96,989 | 35,347 | 622,863 | 31,697 | 547,624 | 631,591 | 6,893,543 | 494,642 | 5,313,447 | |||||||||||||||||||||||||||||||||||||||
| 754 | 12,694 | 461 | 7,534 | 1,744 | 31,731 | 298 | 5,507 | 37 | 423 | 97 | 1,080 | |||||||||||||||||||||||||||||||||||||||
| — | — | — | — | — | — | 312,671 | 5,719,824 | — | — | — | — | |||||||||||||||||||||||||||||||||||||||
| — | — | — | — | — | — | 34,386 | 624,955 | — | — | — | — | |||||||||||||||||||||||||||||||||||||||
| — | — | — | — | — | — | 13,577 | 257,297 | — | — | — | — | |||||||||||||||||||||||||||||||||||||||
| — | — | — | — | — | — | 537,171 | 9,937,497 | — | — | — | — | |||||||||||||||||||||||||||||||||||||||
| — | — | — | — | — | — | 488,918 | 8,836,954 | — | — | — | — | |||||||||||||||||||||||||||||||||||||||
| — | — | — | — | — | — | 892 | 16,601 | — | — | — | — | |||||||||||||||||||||||||||||||||||||||
| (19,593 | ) | (338,792 | ) | (74,780 | ) | (1,254,604 | ) | (89,947 | ) | (1,632,472 | ) | (382,145 | ) | (6,828,659 | ) | (3,933,878 | ) | (43,661,202 | ) | (2,143,432 | ) | (23,530,676 | ) | |||||||||||||||||||||||||||
| — | — | — | — | — | — | — | — | — | — | (8,090 | ) | (92,948 | ) | |||||||||||||||||||||||||||||||||||||
| — | — | — | — | — | — | — | — | — | — | (35,082 | ) | (408,147 | ) | |||||||||||||||||||||||||||||||||||||
| — | — | — | — | (25,122 | ) | (453,527 | ) | (67,854 | ) | (1,176,280 | ) | (762,122 | ) | (8,569,701 | ) | (1,146,348 | ) | (12,646,191 | ) | |||||||||||||||||||||||||||||||
| — | — | — | — | — | — | (788 | ) | (14,091 | ) | — | — | (1,893 | ) | (21,601 | ) | |||||||||||||||||||||||||||||||||||
| — | — | — | — | — | — | (53,027 | ) | (939,041 | ) | — | — | (210,299 | ) | (2,336,712 | ) | |||||||||||||||||||||||||||||||||||
| (20,905 | ) | (365,488 | ) | (2,253 | ) | (36,922 | ) | (22,297 | ) | (419,536 | ) | (991 | ) | (18,156 | ) | — | * | (2 | ) | — | — | |||||||||||||||||||||||||||||
| (17,888 | ) | (312,065 | ) | (30,144 | ) | (496,932 | ) | (243,553 | ) | (4,440,341 | ) | (49,537 | ) | (882,495 | ) | (39,212 | ) | (437,237 | ) | (150,267 | ) | (1,620,232 | ) | |||||||||||||||||||||||||||
| — | — | — | — | — | — | — | — | (539,932 | ) | (5,966,608 | ) | (2,904,873 | ) | (31,264,603 | ) | |||||||||||||||||||||||||||||||||||
| (16,775 | ) | (293,428 | ) | (120,939 | ) | (1,903,531 | ) | (110,375 | ) | (1,969,850 | ) | (129,768 | ) | (2,270,297 | ) | (2,240,601 | ) | (24,726,778 | ) | (2,888,653 | ) | (31,453,575 | ) | |||||||||||||||||||||||||||
| (1,599 | ) | (27,685 | ) | (3,679 | ) | (62,206 | ) | (2,496 | ) | (45,861 | ) | (1,700 | ) | (30,787 | ) | (747 | ) | (8,547 | ) | — | — | |||||||||||||||||||||||||||||
| 176,133 |
| $ | 3,059,337 | 86,270 | $ | 1,437,785 | 75,555 | $ | 1,330,372 | 1,425,451 | $ | 25,945,502 | (3,989,337 | ) | $ | (44,414,273 | ) | 15,921,695 | $ | 164,604,699 | |||||||||||||||||||||||||||||
| Semiannual Report | | March 31, 2017 | 369 |
Table of Contents
Notes to Financial Statements (cont’d)
March 31, 2017 (Unaudited)
| AllianzGI Global Megatrends | AllianzGI Best Styles Emerging Markets Equity | |||||||||||||||||||||||||||||||||||
| Six Months ended March 31, 2017 (unaudited) | Year ended September 30, 2016 | Six Months ended March 31, 2017 (unaudited) | Year ended September 30, 2016 | |||||||||||||||||||||||||||||||||
| Shares | Amount | Shares | Amount | Shares | Amount | Shares | Amount | |||||||||||||||||||||||||||||
Shares sold: | ||||||||||||||||||||||||||||||||||||
Class A | 552 | $ | 7,818 | 2,568 | $ | 37,390 | 466 | $ | 6,533 | 765 | # | $ | 10,000 | # | ||||||||||||||||||||||
Class C | — | — | — | — | 7 | 100 | 943 | # | 12,433 | # | ||||||||||||||||||||||||||
Class P | — | — | — | — | — | — | 441 | 6,168 | ||||||||||||||||||||||||||||
Institutional Class | 7,516 | 111,899 | 1,666 | 25,336 | 4,411 | 60,000 | — | — | ||||||||||||||||||||||||||||
Class R6 | — | — | — | — | 43,255 | 619,792 | 636,490 | 8,313,099 | ||||||||||||||||||||||||||||
Issued in reinvestment of dividends and distributions: | ||||||||||||||||||||||||||||||||||||
Class A | 14 | 197 | 152 | 2,188 | 52 | 651 | — | — | ||||||||||||||||||||||||||||
Class C | — | — | — | — | 60 | 747 | — | — | ||||||||||||||||||||||||||||
Class P | 4 | 52 | 78 | 1,123 | 46 | 580 | 32 | 402 | ||||||||||||||||||||||||||||
Institutional Class | 1,124 | 15,876 | 15,496 | 223,251 | 47 | 590 | 25 | 306 | ||||||||||||||||||||||||||||
Class R6 | — | — | — | — | 24,368 | 307,036 | 24,745 | 306,433 | ||||||||||||||||||||||||||||
Cost of shares redeemed: | ||||||||||||||||||||||||||||||||||||
Class A | (70 | ) | (986 | ) | (715 | ) | (10,433 | ) | — | — | — | — | ||||||||||||||||||||||||
Class P | — | — | (1,319 | ) | (16,774 | ) | — | — | (450 | ) | (5,473 | ) | ||||||||||||||||||||||||
Institutional Class | (607 | ) | (8,772 | ) | (190 | ) | (2,820 | ) | — | — | — | — | ||||||||||||||||||||||||
Class R6 | — | — | — | — | (506,013 | ) | (7,350,202 | ) | (171,139 | ) | (2,296,819 | ) | ||||||||||||||||||||||||
Net increase (decrease) resulting from Fund share transactions | 8,533 | $ | 126,084 | 17,736 | $ | 259,261 | (433,301 | ) | $ | (6,354,173 | ) | 491,852 | $ | 6,346,549 | ||||||||||||||||||||||
| # | For the period April 26, 2016 (commencement of share class) through September 30, 2016. “Shares sold” includes shares sold to AFI. |
| * | Actual amount rounds to less than one share. |
| 370 | March 31, 2017 | | Semiannual Report |
Table of Contents
| AllianzGI Best Styles Global Equity | AllianzGI Best Styles International Equity | AllianzGI Best Styles U.S. Equity | ||||||||||||||||||||||||||||||||||||||||||||||||
| Six Months ended March 31, 2017 (unaudited) | Year ended September 30, 2016 | Six Months ended March 31, 2017 (unaudited) | Year ended September 30, 2016 | Six Months ended March 31, 2017 (unaudited) | Year ended September 30, 2016 | |||||||||||||||||||||||||||||||||||||||||||||
| Shares | Amount | Shares | Amount | Shares | Amount | Shares | Amount | Shares | Amount | Shares | Amount | |||||||||||||||||||||||||||||||||||||||
| 52,688 | $ | 839,563 | 590,836 | $ | 8,845,877 | — | * | $ | 1 | 855 | # | $ | 12,114 | # | 30,518 | $ | 484,854 | 2,999 | #$ | 45,904 | # | |||||||||||||||||||||||||||||
| 600 | 10,000 | 654 | # | 10,000 | # | — | — | 1,087 | # | 15,170 | # | 595 | 9,956 | 671 | # | 10,000 | # | |||||||||||||||||||||||||||||||||
| 120,531 | 1,944,574 | 196,154 | 3,023,093 | — | — | — | — | 25 | 400 | 3,576 | 53,488 | |||||||||||||||||||||||||||||||||||||||
| 3,040 | 48,575 | 157,585 | 2,405,197 | — | — | 1,840 | 25,000 | 2,374 | 39,413 | 14,029 | 208,087 | |||||||||||||||||||||||||||||||||||||||
| 13,361,329 | 211,130,044 | 22,997,671 | 332,409,374 | 144,046 | 1,961,395 | 3,197,325 | 44,319,815 | 3,818,749 | 61,031,378 | 3,311,737 | 48,682,294 | |||||||||||||||||||||||||||||||||||||||
| 396 | 6,286 | 749 | 11,238 | 87 | 1,126 | — | — | 474 | 7,605 | — | — | |||||||||||||||||||||||||||||||||||||||
| 12 | 182 | — | — | 109 | 1,403 | — | — | 9 | 148 | — | — | |||||||||||||||||||||||||||||||||||||||
| 2,814 | 44,744 | 1,118 | 16,931 | 70 | 898 | 12 | 169 | 26 | 420 | 32 | 479 | |||||||||||||||||||||||||||||||||||||||
| 3,166 | 49,947 | 400 | 6,010 | 259 | 3,340 | 12 | 177 | 81 | 1,298 | 2,572 | 37,909 | |||||||||||||||||||||||||||||||||||||||
| 991,083 | 15,722,005 | 176,375 | 2,666,787 | 213,848 | 2,758,648 | 105,129 | 1,495,177 | 100,771 | 1,625,434 | 96,799 | 1,430,612 | |||||||||||||||||||||||||||||||||||||||
| (2,304,064 | ) | (35,380,833 | ) | (488,344 | ) | (7,333,979 | ) | — | — | — | — | (3,971 | ) | (63,984 | ) | — | — | |||||||||||||||||||||||||||||||||
| (112,380 | ) | (1,806,472 | ) | (293,820 | ) | (4,509,247 | ) | — | — | — | — | — | — | (1,860 | ) | (27,344 | ) | |||||||||||||||||||||||||||||||||
| (29,822 | ) | (473,700 | ) | (30,593 | ) | (469,715 | ) | — | — | — | — | (953 | ) | (15,547 | ) | (135,691 | ) | (2,027,680 | ) | |||||||||||||||||||||||||||||||
| (7,230,013 | ) | (115,885,252 | ) | (4,710,562 | ) | (72,498,138 | ) | (3,039,127 | ) | (43,082,050 | ) | (2,354,642 | ) | (33,229,337 | ) | (3,358,208 | ) | (52,534,547 | ) | (2,999,293 | ) | (44,945,170 | ) | |||||||||||||||||||||||||||
| 4,859,380 | $ | 76,249,663 | 18,598,223 | $ | 264,583,428 | (2,680,708 | ) | $ | (38,355,239 | ) | 951,618 | $ | 12,638,285 | 590,490 | $ | 10,586,828 | 295,571 | $ | 3,468,579 | |||||||||||||||||||||||||||||||
| Semiannual Report | | March 31, 2017 | 371 |
Table of Contents
Notes to Financial Statements (cont’d)
March 31, 2017 (Unaudited)
| AllianzGI Convertible | AllianzGI Emerging Markets Consumer | |||||||||||||||||||||||||||||||||||
| Six Months ended March 31, 2017 (unaudited) | Year ended September 30, 2016 | Six Months ended March 31, 2017 (unaudited) | Year ended September 30, 2016 | |||||||||||||||||||||||||||||||||
| Shares | Amount | Shares | Amount | Shares | Amount | Shares | Amount | |||||||||||||||||||||||||||||
Shares sold: | ||||||||||||||||||||||||||||||||||||
Class A | 370,656 | $ | 11,566,882 | 1,531,316 | $ | 46,173,012 | 1,023 | $ | 13,437 | 555 | $ | 7,500 | ||||||||||||||||||||||||
Class A — from Class D(a) | — | — | 1,723,800 | 56,402,720 | — | — | — | — | ||||||||||||||||||||||||||||
Class C | 12,672 | 395,595 | 132,991 | 4,059,015 | — | — | — | — | ||||||||||||||||||||||||||||
Class D | — | — | 16,113 | 532,542 | — | — | — | — | ||||||||||||||||||||||||||||
Class R | 2,236 | 69,366 | 13,567 | 418,156 | — | — | — | — | ||||||||||||||||||||||||||||
Class P | 813,790 | 25,648,943 | 1,254,856 | 37,431,109 | — | — | — | — | ||||||||||||||||||||||||||||
Institutional Class | 332,370 | 10,388,119 | 3,359,105 | 99,691,590 | 395,774 | 5,225,512 | 2,369,591 | 28,261,247 | ||||||||||||||||||||||||||||
Administrative Class | 288 | 9,069 | 2,101 | 61,187 | — | — | — | — | ||||||||||||||||||||||||||||
Issued in reinvestment of dividends and distributions: |
| |||||||||||||||||||||||||||||||||||
Class A | 100,736 | 3,139,357 | 1,225,232 | 36,986,370 | 36 | 440 | 15 | 183 | ||||||||||||||||||||||||||||
Class C | 21,069 | 664,589 | 176,853 | 5,351,091 | — | — | — | — | ||||||||||||||||||||||||||||
Class R | 381 | 11,940 | 4,002 | 120,497 | — | — | — | — | ||||||||||||||||||||||||||||
Class P | 42,895 | 1,337,966 | 376,019 | 11,321,169 | — | — | — | — | ||||||||||||||||||||||||||||
Institutional Class | 266,098 | 8,281,783 | 2,413,864 | 72,498,394 | 24,662 | 305,563 | 7,182 | 87,687 | ||||||||||||||||||||||||||||
Administrative Class | 886 | 27,745 | 6,206 | 187,354 | — | — | — | — | ||||||||||||||||||||||||||||
Cost of shares redeemed: | ||||||||||||||||||||||||||||||||||||
Class A | (6,277,703 | ) | (199,681,713 | ) | (10,581,513 | ) | (323,954,096 | ) | (21 | ) | (262 | ) | (11 | ) | (138 | ) | ||||||||||||||||||||
Class C | (496,146 | ) | (15,513,181 | ) | (1,294,526 | ) | (38,777,874 | ) | — | — | — | — | ||||||||||||||||||||||||
Class D | — | — | (186,106 | ) | (6,206,021 | ) | — | — | — | — | ||||||||||||||||||||||||||
Class D — to Class A(a) | — | — | (1,723,742 | ) | (56,402,720 | ) | — | — | — | — | ||||||||||||||||||||||||||
Class R | (9,614 | ) | (295,476 | ) | (30,225 | ) | (917,177 | ) | — | — | — | — | ||||||||||||||||||||||||
Class P | (1,291,674 | ) | (40,526,098 | ) | (3,768,674 | ) | (112,023,904 | ) | — | — | — | — | ||||||||||||||||||||||||
Institutional Class | (6,481,780 | ) | (203,178,841 | ) | (14,942,295 | ) | (441,849,138 | ) | (885,437 | ) | (11,824,819 | ) | (383,339 | ) | (4,904,226 | ) | ||||||||||||||||||||
Administrative Class | (5,935 | ) | (185,006 | ) | (24,360 | ) | (694,970 | ) | — | — | — | — | ||||||||||||||||||||||||
Net increase (decrease) resulting from Fund share transactions | (12,598,775 | ) | $ | (397,838,961 | ) | (20,315,416 | ) | $ | (609,591,694 | ) | (463,963 | ) | $ | (6,280,129 | ) | 1,993,993 | $ | 23,452,253 | ||||||||||||||||||
| * | Actual amount rounds to less than one share. |
| (a) | Class D shares converted to Class A shares at the close of business on November 13, 2015. See Note 12(a). |
| 372 | March 31, 2017 | | Semiannual Report |
Table of Contents
| AllianzGI Emerging Markets Debt | AllianzGI Emerging Markets Small-Cap | AllianzGI Europe Equity Dividend | ||||||||||||||||||||||||||||||||||||||||||||||||
| Six Months ended March 31, 2017 (unaudited) | Year ended September 30, 2016 | Six Months ended March 31, 2017 (unaudited) | Year ended September 30, 2016 | Six Months ended March 31, 2017 (unaudited) | Year ended September 30, 2016 | |||||||||||||||||||||||||||||||||||||||||||||
| Shares | Amount | Shares | Amount | Shares | Amount | Shares | Amount | Shares | Amount | Shares | Amount | |||||||||||||||||||||||||||||||||||||||
| 4,360 | $ | 63,345 | 12,399 | $ | 169,373 | 8,823 | $ | 128,000 | 120,388 | $ | 1,632,190 | 8,323 | $ | 118,821 | 2,798 | $ | 39,026 | |||||||||||||||||||||||||||||||||
| — | — | — | — | — | — | — | — | — | — | — | — | |||||||||||||||||||||||||||||||||||||||
| 201 | 3,000 | 7,195 | 101,259 | — | — | — | — | 1,298 | 18,000 | 222 | 3,000 | |||||||||||||||||||||||||||||||||||||||
| — | — | — | — | — | — | — | — | — | — | — | — | |||||||||||||||||||||||||||||||||||||||
| — | — | — | — | — | — | — | — | — | — | — | — | |||||||||||||||||||||||||||||||||||||||
| — | — | — | — | — | — | — | — | — | — | — | — | |||||||||||||||||||||||||||||||||||||||
| 314,852 | 4,659,742 | 1,573,379 | 21,942,131 | 61,846 | 960,512 | 403,606 | 6,021,183 | 14,017 | 197,222 | 228,261 | 3,295,168 | |||||||||||||||||||||||||||||||||||||||
| — | — | — | — | — | — | — | — | — | — | — | — | |||||||||||||||||||||||||||||||||||||||
| 246 | 3,545 | 300 | 4,293 | — | * | 1 | 709 | 9,645 | 125 | 1,764 | 79 | 1,113 | ||||||||||||||||||||||||||||||||||||||
| 194 | 2,805 | 144 | 2,090 | — | — | — | — | 32 | 455 | 23 | 316 | |||||||||||||||||||||||||||||||||||||||
| — | — | — | — | — | — | — | — | — | — | — | — | |||||||||||||||||||||||||||||||||||||||
| 28 | 393 | 33 | 464 | — | — | — | — | 13 | 188 | 20 | 278 | |||||||||||||||||||||||||||||||||||||||
| 104,856 | 1,503,038 | 128,316 | 1,801,169 | 25,796 | 364,500 | 5,781 | 79,256 | 8,751 | 123,578 | 9,243 | 130,128 | |||||||||||||||||||||||||||||||||||||||
| — | — | — | — | — | — | — | — | — | — | — | — | |||||||||||||||||||||||||||||||||||||||
| (7,994 | ) | (116,111 | ) | (1,658 | ) | (23,500 | ) | (8,080 | ) | (119,065 | ) | (160,903 | ) | (2,212,661 | ) | (1,325 | ) | (18,618 | ) | (69 | ) | (978 | ) | |||||||||||||||||||||||||||
| (1,355 | ) | (20,166 | ) | (741 | ) | (10,677 | ) | — | — | — | — | (7 | ) | (99 | ) | — | — | |||||||||||||||||||||||||||||||||
| — | — | — | — | — | — | — | — | — | — | — | — | |||||||||||||||||||||||||||||||||||||||
| — | — | — | — | — | — | — | — | — | — | — | — | |||||||||||||||||||||||||||||||||||||||
| — | — | — | — | — | — | — | — | — | — | — | — | |||||||||||||||||||||||||||||||||||||||
| — | — | — | — | — | — | — | — | — | — | (963 | ) | (12,643 | ) | |||||||||||||||||||||||||||||||||||||
| (483,408 | ) | (7,032,414 | ) | (903,760 | ) | (12,897,680 | ) | (127,987 | ) | (1,954,263 | ) | (98,677 | ) | (1,363,425 | ) | (13,318 | ) | (190,681 | ) | (14,379 | ) | (206,342 | ) | |||||||||||||||||||||||||||
| — | — | — | — | — | — | — | — | — | — | — | — | |||||||||||||||||||||||||||||||||||||||
| (68,020 | ) | $ | (932,823 | ) | 815,607 | $ | 11,088,922 | (39,602 | ) | $ | (620,315 | ) | 270,904 | $ | 4,166,188 | 17,909 | $ | 250,630 | 225,235 | $ | 3,249,066 | |||||||||||||||||||||||||||||
| Semiannual Report | | March 31, 2017 | 373 |
Table of Contents
Notes to Financial Statements (cont’d)
March 31, 2017 (Unaudited)
| AllianzGI Global Dynamic Allocation | AllianzGI Global Fundamental Strategy | |||||||||||||||||||||||||||||||||||
| Six Months ended March 31, 2017 (unaudited) | Year ended September 30, 2016 | Six Months ended March 31, 2017 (unaudited) | Year ended September 30, 2016 | |||||||||||||||||||||||||||||||||
| Shares | Amount | Shares | Amount | Shares | Amount | Shares | Amount | |||||||||||||||||||||||||||||
Shares sold: | ||||||||||||||||||||||||||||||||||||
Class A | 62,026 | $ | 1,145,086 | 431,782 | $ | 7,682,907 | 393 | $ | 5,799 | 6,389 | $ | 90,929 | ||||||||||||||||||||||||
Class A — from Class D(a) | — | — | 4,509 | 82,248 | — | — | 2,778 | 41,695 | ||||||||||||||||||||||||||||
Class C | 5,490 | 99,835 | 17,805 | 312,339 | — | — | 197 | 2,986 | ||||||||||||||||||||||||||||
Class D | — | — | 137 | 2,515 | — | — | 66 | 1,000 | ||||||||||||||||||||||||||||
Class R | 1,481 | 27,391 | 1,857 | 33,210 | — | — | — | — | ||||||||||||||||||||||||||||
Class P | 567,934 | 10,170,757 | 9,044 | 160,000 | — | — | — | — | ||||||||||||||||||||||||||||
Institutional Class | 150,248 | 2,766,737 | 2,337,409 | 42,401,794 | 8,793 | 132,137 | 16,865 | 254,369 | ||||||||||||||||||||||||||||
Class R6 | 11,455,610 | 209,966,975 | 492,480 | # | 8,793,289 | # | — | — | — | — | ||||||||||||||||||||||||||
Administrative Class | — | — | — | — | — | — | — | — | ||||||||||||||||||||||||||||
Issued in reinvestment of dividends and distributions: |
| |||||||||||||||||||||||||||||||||||
Class A | — | * | 2 | 4,276 | 76,662 | 338 | 4,861 | 564 | 8,097 | |||||||||||||||||||||||||||
Class C | — | * | 2 | 1,007 | 17,877 | 31 | 449 | 25 | 360 | |||||||||||||||||||||||||||
Class D(a) | — | — | — | — | — | — | — | — | ||||||||||||||||||||||||||||
Class R | — | * | — | † | 200 | 3,573 | — | — | — | — | ||||||||||||||||||||||||||
Class P | 3,236 | 58,830 | 79 | 1,410 | 29 | 417 | 32 | 460 | ||||||||||||||||||||||||||||
Institutional Class | 1,167 | 21,336 | 35,654 | 639,633 | 39,329 | 571,976 | 59,967 | 867,547 | ||||||||||||||||||||||||||||
Class R6 | 48,683 | 887,497 | — | # | — | # | — | — | — | — | ||||||||||||||||||||||||||
Administrative Class | — | * | — | † | 25 | 448 | — | — | — | — | ||||||||||||||||||||||||||
Cost of shares redeemed: | ||||||||||||||||||||||||||||||||||||
Class A | (126,240 | ) | (2,337,436 | ) | (230,495 | ) | (4,118,087 | ) | (4,692 | ) | (67,754 | ) | (10,472 | ) | (149,122 | ) | ||||||||||||||||||||
Class C | (8,705 | ) | (158,348 | ) | (29,495 | ) | (521,173 | ) | — | — | — | — | ||||||||||||||||||||||||
Class D | — | — | — | — | — | — | (98 | ) | (1,549 | ) | ||||||||||||||||||||||||||
Class D — to Class A(a) | — | — | (4,531 | ) | (82,248 | ) | — | — | (2,680 | ) | (41,695 | ) | ||||||||||||||||||||||||
Class R | (101 | ) | (1,838 | ) | (1,887 | ) | (33,964 | ) | — | — | — | — | ||||||||||||||||||||||||
Class P | (2,896 | ) | (54,957 | ) | (1,930 | ) | (34,679 | ) | — | — | — | — | ||||||||||||||||||||||||
Institutional Class | (402,021 | ) | (7,354,979 | ) | (581,264 | ) | (10,495,075 | ) | (12,563 | ) | (184,581 | ) | (352,839 | ) | (5,211,458 | ) | ||||||||||||||||||||
Class R6 | (1,298,557 | ) | (23,914,490 | ) | (1,354 | )# | (24,989 | )# | — | — | — | — | ||||||||||||||||||||||||
Administrative Class | — | — | — | — | — | — | — | — | ||||||||||||||||||||||||||||
Net increase (decrease) resulting from Fund share transactions | 10,457,355 | $ | 191,322,400 | 2,485,308 | $ | 44,897,690 | 31,658 | $ | 463,304 | (279,206 | ) | $ | (4,136,381 | ) | ||||||||||||||||||||||
| # | For the period February 1, 2016 (commencement of share class) through September 30, 2016. “Shares sold” include shares sold to AFI. |
| * | Actual amount rounds to less than one share. |
| † | Actual amount rounds to less than $1. |
| (a) | Class D shares converted to Class A shares at the close of business on November 13, 2015. See Note12(a). |
| 374 | March 31, 2017 | | Semiannual Report |
Table of Contents
| AllianzGI Global Sustainability | AllianzGI Global Water | AllianzGI High Yield Bond | ||||||||||||||||||||||||||||||||||||||||||||||||
| Six Months ended March 31, 2017 (unaudited) | Year ended September 30, 2016 | Six Months ended March 31, 2017 (unaudited) | Year ended September 30, 2016 | Six Months ended March 31, 2017 (unaudited) | Year ended September 30, 2016 | |||||||||||||||||||||||||||||||||||||||||||||
| Shares | Amount | Shares | Amount | Shares | Amount | Shares | Amount | Shares | Amount | Shares | Amount | |||||||||||||||||||||||||||||||||||||||
| 2,052 | $ | 32,808 | 3,462 | $ | 53,040 | 2,627,152 | $ | 35,570,195 | 7,071,358 | $ | 94,298,974 | 1,315,235 | $ | 12,075,287 | 2,281,772 | $ | 19,944,590 | |||||||||||||||||||||||||||||||||
| — | — | — | — | — | — | 2,269,510 | 28,595,829 | — | — | 3,657,229 | 32,732,201 | |||||||||||||||||||||||||||||||||||||||
| — | — | — | — | 583,887 | 7,587,986 | 1,628,793 | 21,007,338 | 73,890 | 675,711 | 376,422 | 3,298,793 | |||||||||||||||||||||||||||||||||||||||
| — | — | — | — | — | — | 83,423 | 1,054,329 | — | — | 372,481 | 3,279,750 | |||||||||||||||||||||||||||||||||||||||
| — | — | — | — | — | — | — | — | 41,325 | 362,326 | 127,364 | 1,089,885 | |||||||||||||||||||||||||||||||||||||||
| 404 | 6,561 | — | — | 6,881,455 | 93,024,791 | 4,092,255 | 54,699,054 | 625,443 | 5,563,364 | 2,865,115 | 23,937,130 | |||||||||||||||||||||||||||||||||||||||
| 247,854 | 3,819,379 | 1,190,317 | 17,336,136 | 2,584,029 | 34,545,054 | 2,903,048 | 38,633,145 | 12,359,860 | 109,341,600 | 22,252,597 | 188,374,957 | |||||||||||||||||||||||||||||||||||||||
| — | — | — | — | — | — | — | — | — | — | — | — | |||||||||||||||||||||||||||||||||||||||
| — | — | — | — | — | — | — | — | 40,598 | 353,516 | 66,265 | 556,179 | |||||||||||||||||||||||||||||||||||||||
| 85 | 1,290 | 59 | 863 | 142,511 | 1,875,321 | 40,036 | 510,450 | 168,028 | 1,538,859 | 387,305 | 3,360,077 | |||||||||||||||||||||||||||||||||||||||
| — | — | — | — | 30,215 | 381,618 | 6,307 | 78,080 | 31,555 | 288,648 | 84,432 | 732,669 | |||||||||||||||||||||||||||||||||||||||
| — | — | — | — | — | — | — | — | — | — | 20,317 | 178,994 | |||||||||||||||||||||||||||||||||||||||
| — | — | — | — | — | — | — | — | 1,786 | 15,726 | 3,151 | 26,451 | |||||||||||||||||||||||||||||||||||||||
| 7 | 106 | 6 | 86 | 66,753 | 881,850 | 19,294 | 246,508 | 178,818 | 1,577,406 | 425,356 | 3,573,754 | |||||||||||||||||||||||||||||||||||||||
| 18,115 | 278,227 | 1,960 | 28,973 | 78,608 | 1,022,047 | 21,478 | 270,231 | 736,526 | 6,509,233 | 1,605,049 | 13,534,361 | |||||||||||||||||||||||||||||||||||||||
| — | — | — | — | — | — | — | — | — | — | — | — | |||||||||||||||||||||||||||||||||||||||
| — | — | — | — | — | — | — | — | 6,273 | 54,648 | 15,401 | 127,620 | |||||||||||||||||||||||||||||||||||||||
| (894 | ) | (14,026 | ) | — | — | (6,776,747 | ) | (91,171,682 | ) | (3,651,200 | ) | (48,308,147 | ) | (1,774,785 | ) | (16,354,981 | ) | (3,807,268 | ) | (33,113,333 | ) | |||||||||||||||||||||||||||||
| — | — | — | — | (845,652 | ) | (10,982,485 | ) | (1,027,517 | ) | (13,128,907 | ) | (390,190 | ) | (3,572,533 | ) | (843,397 | ) | (7,311,901 | ) | |||||||||||||||||||||||||||||||
| — | — | — | — | — | — | (485,542 | ) | (6,153,974 | ) | — | — | (404,947 | ) | (3,540,018 | ) | |||||||||||||||||||||||||||||||||||
| — | — | — | — | — | — | (2,278,824 | ) | (28,595,829 | ) | — | — | (3,775,079 | ) | (32,732,201 | ) | |||||||||||||||||||||||||||||||||||
| — | — | — | — | — | — | — | — | (53,215 | ) | (468,763 | ) | (112,298 | ) | (961,068 | ) | |||||||||||||||||||||||||||||||||||
| — | — | — | — | (2,057,103 | ) | (27,923,218 | ) | (2,351,589 | ) | (30,973,331 | ) | (1,381,013 | ) | (12,176,825 | ) | (4,121,876 | ) | (34,550,596 | ) | |||||||||||||||||||||||||||||||
| (70,799 | ) | (1,143,873 | ) | (97,483 | ) | (1,550,321 | ) | (561,696 | ) | (7,430,897 | ) | (664,076 | ) | (8,848,755 | ) | (14,588,738 | ) | (129,083,837 | ) | (18,164,061 | ) | (155,833,055 | ) | |||||||||||||||||||||||||||
| — | — | — | — | — | — | — | — | — | — | — | — | |||||||||||||||||||||||||||||||||||||||
| — | — | — | — | — | — | — | — | (110,330 | ) | (965,278 | ) | (85,267 | ) | (706,163 | ) | |||||||||||||||||||||||||||||||||||
| | 196,824 |
| $ | 2,980,472 | 1,098,321 | $ | 15,868,777 | 2,753,412 | $ | 37,380,580 | 7,676,754 | $ | 103,384,995 | (2,718,934 | ) | $ | (24,265,893 | ) | 3,226,063 | $ | 25,999,076 | |||||||||||||||||||||||||||||
| Semiannual Report | | March 31, 2017 | 375 |
Table of Contents
Notes to Financial Statements (cont’d)
March 31, 2017 (Unaudited)
| AllianzGI International Growth | AllianzGI International Small-Cap | |||||||||||||||||||||||||||||||||||
| Six Months ended March 31, 2017 (unaudited) | Year ended September 30, 2016 | Six Months ended March 31, 2017 (unaudited) | Year ended September 30, 2016 | |||||||||||||||||||||||||||||||||
| Shares | Amount | Shares | Amount | Shares | Amount | Shares | Amount | |||||||||||||||||||||||||||||
Shares sold: | ||||||||||||||||||||||||||||||||||||
Class A | 38 | $ | 585 | 12,975 | $ | 207,712 | 13,453 | $ | 446,361 | 267,496 | $ | 9,215,892 | ||||||||||||||||||||||||
Class A — from Class D(a) | — | — | — | — | — | — | 138,078 | 4,962,527 | ||||||||||||||||||||||||||||
Class C | — | — | — | — | 3,014 | 97,900 | 44,139 | 1,501,000 | ||||||||||||||||||||||||||||
Class D | — | — | — | — | — | — | 71,682 | 2,606,512 | ||||||||||||||||||||||||||||
Class R | — | — | — | — | 640 | 20,869 | 2,387 | 77,945 | ||||||||||||||||||||||||||||
Class P | — | — | — | — | 295,658 | 9,843,135 | 387,606 | 13,200,964 | ||||||||||||||||||||||||||||
Institutional Class | 12,538 | 196,518 | 1,516,963 | 24,722,438 | 186,716 | 6,473,930 | 659,430 | 23,268,284 | ||||||||||||||||||||||||||||
Class R6 | — | — | — | — | 30,568 | 1,048,392 | 473,415 | # | 16,678,173 | # | ||||||||||||||||||||||||||
Issued in reinvestment of dividends and distributions: |
| |||||||||||||||||||||||||||||||||||
Class A | — | * | 1 | 26 | 382 | 2,339 | 73,368 | 20,279 | 712,490 | |||||||||||||||||||||||||||
Class C | — | — | — | — | 545 | 16,705 | 4,213 | 145,323 | ||||||||||||||||||||||||||||
Class R | — | — | — | — | 44 | 1,374 | 153 | 5,296 | ||||||||||||||||||||||||||||
Class P | — | — | — | — | 12,138 | 381,492 | 47,306 | 1,662,355 | ||||||||||||||||||||||||||||
Institutional Class | 1,973 | 29,197 | 1,403 | 20,891 | 6,928 | 225,723 | 83,072 | 3,021,616 | ||||||||||||||||||||||||||||
Class R6 | — | — | — | — | 4,526 | 147,555 | — | — | ||||||||||||||||||||||||||||
Cost of shares redeemed: |
| |||||||||||||||||||||||||||||||||||
Class A | (1 | ) | (12 | ) | (10,633 | ) | (169,556 | ) | (252,713 | ) | (8,492,265 | ) | (376,839 | ) | (12,357,095 | ) | ||||||||||||||||||||
Class C | — | — | — | — | (31,488 | ) | (1,002,352 | ) | (36,241 | ) | (1,188,517 | ) | ||||||||||||||||||||||||
Class D | — | — | — | — | — | — | (2,884 | ) | (105,933 | ) | ||||||||||||||||||||||||||
Class D — to Class A(a) | — | — | — | — | — | — | (136,357 | ) | (4,962,527 | ) | ||||||||||||||||||||||||||
Class R | — | — | — | — | (1,022 | ) | (33,087 | ) | (1,674 | ) | (54,708 | ) | ||||||||||||||||||||||||
Class P | — | — | — | — | (180,940 | ) | (5,977,461 | ) | (330,306 | ) | (10,956,731 | ) | ||||||||||||||||||||||||
Institutional Class | (10,000 | ) | (152,508 | ) | — | — | (288,225 | ) | (10,164,713 | ) | (1,590,889 | ) | (54,430,536 | ) | ||||||||||||||||||||||
Class R6 | — | — | — | — | (69,363 | ) | (2,371,319 | ) | (41,169 | )# | (1,428,235 | )# | ||||||||||||||||||||||||
Net increase (decrease) resulting from Fund share transactions | 4,548 | $ | 73,781 | 1,520,734 | $ | 24,781,867 | (267,182 | ) | $ | (9,264,393 | ) | (317,103 | ) | $ | (8,425,905 | ) | ||||||||||||||||||||
| # | For the period February 1, 2016 (commencement of share class) through September 30, 2016. “Shares sold” include shares sold to AFI. |
| * | Actual amount rounds to less than one share. |
| (a) | Class D shares converted to Class A shares at the close of business on November 13, 2015. See Note12(a). |
| 376 | March 31, 2017 | | Semiannual Report |
Table of Contents
| AllianzGI Micro Cap | AllianzGI Multi-Asset Real Return | AllianzGI NFJ Emerging Markets Value | ||||||||||||||||||||||||||||||||||||||||||||||||
| Six Months ended March 31, 2017 (unaudited) | Year ended September 30, 2016 | Six Months ended March 31, 2017 (unaudited) | Year ended September 30, 2016 | Six Months ended March 31, 2017 (unaudited) | Year ended September 30, 2016 | |||||||||||||||||||||||||||||||||||||||||||||
| Shares | Amount | Shares | Amount | Shares | Amount | Shares | Amount | Shares | Amount | Shares | Amount | |||||||||||||||||||||||||||||||||||||||
| 11,967 | $ | 168,746 | 99,578 | $ | 1,387,174 | 37,871 | $ | 502,831 | 5,475 | $ | 72,789 | 1,074,695 | $ | 15,369,116 | 70,367 | $ | 960,640 | |||||||||||||||||||||||||||||||||
| — | — | — | — | — | — | 1,661 | 21,309 | — | — | 80,849 | 1,044,575 | |||||||||||||||||||||||||||||||||||||||
| — | — | — | — | 60 | 786 | 98 | 1,236 | 14,925 | 218,366 | 1,534 | 18,353 | |||||||||||||||||||||||||||||||||||||||
| — | — | — | — | — | — | — | — | — | — | 125 | 1,670 | |||||||||||||||||||||||||||||||||||||||
| — | — | — | — | — | — | — | — | — | — | — | — | |||||||||||||||||||||||||||||||||||||||
| 59,249 | 839,255 | 85,267 | 1,180,306 | — | — | — | — | 948,796 | 12,986,487 | 8,761 | 112,860 | |||||||||||||||||||||||||||||||||||||||
| 268,000 | 3,826,924 | 432,837 | 5,701,656 | 15,694 | 209,236 | 22,925 | 286,832 | 217,313 | 3,192,412 | 78,666 | 997,928 | |||||||||||||||||||||||||||||||||||||||
| — | — | — | — | — | — | — | — | — | — | — | — | |||||||||||||||||||||||||||||||||||||||
| 21,951 | 301,824 | 49,331 | 693,095 | 890 | 11,681 | 238 | 2,941 | 2,777 | 37,041 | 3,379 | 44,592 | |||||||||||||||||||||||||||||||||||||||
| — | — | — | — | 22 | 288 | 65 | 800 | — | * | 1 | 184 | 2,414 | ||||||||||||||||||||||||||||||||||||||
| — | — | — | — | — | — | — | — | — | — | — | — | |||||||||||||||||||||||||||||||||||||||
| 8,443 | 116,680 | 9,445 | 133,274 | 9 | 118 | 16 | 201 | 14,185 | 187,814 | 235 | 3,152 | |||||||||||||||||||||||||||||||||||||||
| 210,089 | 2,918,135 | 133,528 | 1,892,095 | 3,359 | 44,638 | 5,187 | 64,521 | 1,802 | 24,435 | 17,658 | 231,048 | |||||||||||||||||||||||||||||||||||||||
| — | — | — | — | — | — | — | — | — | — | — | — | |||||||||||||||||||||||||||||||||||||||
| (67,841 | ) | (955,150 | ) | (1,012,593 | ) | (13,621,553 | ) | (614 | ) | (8,205 | ) | (4,579 | ) | (59,248 | ) | (911,808 | ) | (12,417,417 | ) | (21,768 | ) | (273,152 | ) | |||||||||||||||||||||||||||
| — | — | — | — | (1,368 | ) | (18,248 | ) | (307 | ) | (3,992 | ) | (958 | ) | (14,104 | ) | (2,250 | ) | (29,339 | ) | |||||||||||||||||||||||||||||||
| — | — | — | — | — | — | (1 | ) | (10 | ) | — | — | (87 | ) | (1,178 | ) | |||||||||||||||||||||||||||||||||||
| — | — | — | — | — | — | (1,652 | ) | (21,309 | ) | — | — | (80,065 | ) | (1,044,575 | ) | |||||||||||||||||||||||||||||||||||
| — | — | — | — | — | — | — | — | — | — | — | — | |||||||||||||||||||||||||||||||||||||||
| (28,227 | ) | (398,945 | ) | (168,787 | ) | (2,165,757 | ) | — | — | — | — | (42,265 | ) | (580,227 | ) | — | — | |||||||||||||||||||||||||||||||||
| (339,137 | ) | (4,780,125 | ) | (947,470 | ) | (12,973,878 | ) | (11,958 | ) | (161,931 | ) | (112,650 | ) | (1,438,144 | ) | (298,087 | ) | (4,175,107 | ) | (192,165 | ) | (2,423,167 | ) | |||||||||||||||||||||||||||
| — | — | — | — | — | — | — | — | — | — | — | — | |||||||||||||||||||||||||||||||||||||||
| 144,494 | $ | 2,037,344 | (1,318,864 | ) | $ | (17,773,588 | ) | 43,965 | $ | 581,194 | (83,524 | ) | $ | (1,072,074 | ) | 1,021,375 | $ | 14,828,817 | (34,577 | ) | $ | (354,179 | ) | |||||||||||||||||||||||||||
| Semiannual Report | | March 31, 2017 | 377 |
Table of Contents
Notes to Financial Statements (cont’d)
March 31, 2017 (Unaudited)
| AllianzGI NFJ Global Dividend Value | AllianzGI NFJ International Small-Cap Value | |||||||||||||||||||||||||||||||||||
| Six Months ended March 31, 2017 (unaudited) | Year ended September 30, 2016 | Six Months ended March 31, 2017 (unaudited) | Year ended September 30, 2016 | |||||||||||||||||||||||||||||||||
| Shares | Amount | Shares | Amount | Shares | Amount | Shares | Amount | |||||||||||||||||||||||||||||
Shares sold: | ||||||||||||||||||||||||||||||||||||
Class A | 6,986 | $ | 111,242 | 21,877 | $ | 352,453 | 1,100 | $ | 19,224 | 323,062 | $ | 5,481,731 | ||||||||||||||||||||||||
Class A - from Class D(a) | — | — | 38,580 | 658,941 | — | — | 137,320 | 2,570,636 | ||||||||||||||||||||||||||||
Class C | 16,744 | 252,500 | 120,462 | 1,829,101 | 306 | 5,100 | 3,472 | 62,883 | ||||||||||||||||||||||||||||
Class D | — | — | 66 | 1,186 | — | — | 1,450 | 27,614 | ||||||||||||||||||||||||||||
Class P | 84,913 | 1,407,158 | 9,100 | 146,029 | 4,670 | 78,549 | 5,325 | 95,506 | ||||||||||||||||||||||||||||
Institutional Class | 572,422 | 8,708,294 | 48,137 | 734,121 | 8,917 | 157,110 | 36,987 | 687,315 | ||||||||||||||||||||||||||||
Class R6 | — | — | — | — | 9,482 | 157,442 | 90,957 | 1,548,113 | ||||||||||||||||||||||||||||
Issued in reinvestment of dividends and distributions: | ||||||||||||||||||||||||||||||||||||
Class A | 1,755 | 29,134 | 45,349 | 691,487 | 3,144 | 51,774 | 13,961 | 250,034 | ||||||||||||||||||||||||||||
Class C | 1,869 | 30,071 | 47,926 | 716,397 | 2,997 | 47,236 | 3,637 | 64,423 | ||||||||||||||||||||||||||||
Class D(a) | — | — | — | — | — | — | — | — | ||||||||||||||||||||||||||||
Class P | 1,146 | 18,879 | 9,108 | 139,440 | 297 | 4,723 | 215 | 3,869 | ||||||||||||||||||||||||||||
Institutional Class | 5,916 | 95,683 | 81,154 | 1,229,794 | 5,231 | 86,365 | 15,338 | 281,360 | ||||||||||||||||||||||||||||
Class R6 | — | — | — | — | 7,827 | 123,590 | 38 | 684 | ||||||||||||||||||||||||||||
Cost of shares redeemed: | ||||||||||||||||||||||||||||||||||||
Class A | (50,783 | ) | (823,567 | ) | (133,152 | ) | (2,057,548 | ) | (340,216 | ) | (5,995,124 | ) | (158,749 | ) | (2,684,645 | ) | ||||||||||||||||||||
Class C | (84,892 | ) | (1,308,832 | ) | (125,068 | ) | (1,929,998 | ) | (12,112 | ) | (201,145 | ) | (25,091 | ) | (443,892 | ) | ||||||||||||||||||||
Class D | — | — | (7,946 | ) | (141,496 | ) | — | — | (4,072 | ) | (77,582 | ) | ||||||||||||||||||||||||
Class D - to Class A(a) | — | — | (38,075 | ) | (658,941 | ) | — | — | (137,204 | ) | (2,570,636 | ) | ||||||||||||||||||||||||
Class P | (22,113 | ) | (343,914 | ) | (35,015 | ) | (541,071 | ) | (2,710 | ) | (44,656 | ) | (4,338 | ) | (78,346 | ) | ||||||||||||||||||||
Institutional Class | (287,002 | ) | (4,659,268 | ) | (515,464 | ) | (7,936,660 | ) | (41,596 | ) | (722,483 | ) | (320,861 | ) | (5,863,507 | ) | ||||||||||||||||||||
Class R6 | — | — | — | — | (33,105 | ) | (545,317 | ) | (673 | ) | (12,152 | ) | ||||||||||||||||||||||||
Net increase (decrease) resulting from Fund share transactions | 246,961 | $ | 3,517,380 | (432,961 | ) | $ | (6,766,765 | ) | (385,768 | ) | $ | (6,777,612 | ) | (19,226 | ) | $ | (656,592 | ) | ||||||||||||||||||
| (a) | Class D shares converted to Class A shares at the close of business on November 13, 2015. See Note12(a). |
| # | For the period February 1, 2017 (commencement of share class) through March 31, 2017. “Shares sold” includes shares sold to AFI. |
| ## | For the period December 2, 2016 (commencement of share class) through March 31, 2017. “Shares sold” includes shares sold to AFI. |
| 378 | March 31, 2017 | | Semiannual Report |
Table of Contents
| AllianzGI NFJ International Value II | AllianzGI Short Duration High Income | AllianzGI Structured Return | ||||||||||||||||||||||||||||||||||||||||||||||||
| Six Months ended March 31, 2017 (unaudited) | Year ended September 30, 2016 | Six Months ended March 31, 2017 (unaudited) | Year ended September 30, 2016 | Six Months ended March 31, 2017 (unaudited) | Year ended September 30, 2016 | |||||||||||||||||||||||||||||||||||||||||||||
| Shares | Amount | Shares | Amount | Shares | Amount | Shares | Amount | Shares | Amount | Shares | Amount | |||||||||||||||||||||||||||||||||||||||
| 706 | $ | 11,036 | 10,407 | $ | 162,517 | 4,208,184 | $ | 64,040,807 | 8,066,034 | $ | 120,397,029 | 2,730,125 | $ | 43,125,772 | 5,732,665 | $ | 88,838,356 | |||||||||||||||||||||||||||||||||
| — | — | 950 | 15,297 | — | — | 2,008,883 | 30,093,068 | — | — | 1,001,795 | 15,547,861 | |||||||||||||||||||||||||||||||||||||||
| 1,991 | 29,614 | 9,587 | 152,730 | 2,255,975 | 34,291,966 | 4,211,094 | 62,647,448 | 254,459 | 3,906,241 | 676,801 | 10,233,815 | |||||||||||||||||||||||||||||||||||||||
| — | — | 61 | 1,000 | — | — | 80,405 | 1,217,635 | — | — | 395,471 | 6,153,143 | |||||||||||||||||||||||||||||||||||||||
| 931 | 14,632 | 2,527 | 38,002 | 27,966,847 | 424,186,912 | 27,278,086 | 407,955,965 | 5,074,587 | 79,890,501 | 1,539,925 | 23,913,890 | |||||||||||||||||||||||||||||||||||||||
| 318 | 4,894 | 22,602 | 362,204 | 11,717,454 | 177,799,842 | 17,985,668 | 264,057,898 | 2,919,558 | 46,449,703 | 9,286,641 | 144,916,883 | |||||||||||||||||||||||||||||||||||||||
| — | — | — | — | 5,401,958 | # | 81,582,449 | # | — | — | 2,349,396 | ## | 37,989,709 | ## | — | — | |||||||||||||||||||||||||||||||||||
| 100 | 1,487 | 560 | 8,556 | 353,985 | 5,373,413 | 620,166 | 9,163,611 | 183,601 | 2,875,300 | 29,569 | 459,565 | |||||||||||||||||||||||||||||||||||||||
| 88 | 1,302 | 250 | 3,758 | 200,805 | 3,042,879 | 322,695 | 4,762,336 | 20,935 | 317,799 | 5,283 | 80,188 | |||||||||||||||||||||||||||||||||||||||
| — | — | — | — | — | — | 7,747 | 117,286 | — | — | — | — | |||||||||||||||||||||||||||||||||||||||
| 76 | 1,145 | 484 | 7,572 | 1,083,071 | 16,382,656 | 1,143,214 | 16,950,662 | 58,661 | 919,019 | 3,446 | 53,656 | |||||||||||||||||||||||||||||||||||||||
| 15,804 | 236,277 | 85,390 | 1,312,530 | 705,364 | 10,678,212 | 1,402,275 | 20,675,637 | 181,425 | 2,861,480 | 56,251 | 879,101 | |||||||||||||||||||||||||||||||||||||||
| — | — | — | — | 12,150 | # | 183,771 | # | — | — | 80,499 | ## | 1,266,927 | ## | — | — | |||||||||||||||||||||||||||||||||||
| (4,611 | ) | (71,276 | ) | (11,384 | ) | (177,578 | ) | (6,421,133 | ) | (97,865,647 | ) | (6,873,111 | ) | (101,390,782 | ) | (2,526,539 | ) | (39,823,375 | ) | (1,170,515 | ) | (18,210,906 | ) | |||||||||||||||||||||||||||
| (9,470 | ) | (144,529 | ) | (1,909 | ) | (29,974 | ) | (1,491,202 | ) | (22,644,981 | ) | (2,546,839 | ) | (37,467,504 | ) | (132,169 | ) | (2,024,575 | ) | (114,860 | ) | (1,728,222 | ) | |||||||||||||||||||||||||||
| — | — | — | — | — | — | (40,050 | ) | (606,496 | ) | — | — | (6,595 | ) | (102,772 | ) | |||||||||||||||||||||||||||||||||||
| — | — | (948 | ) | (15,297 | ) | — | — | (2,008,266 | ) | (30,093,068 | ) | — | — | (1,007,802 | ) | (15,547,861 | ) | |||||||||||||||||||||||||||||||||
| (859 | ) | (13,145 | ) | (30,111 | ) | (474,954 | ) | (7,992,626 | ) | (121,227,482 | ) | (14,043,307 | ) | (207,454,211 | ) | (699,377 | ) | (11,039,500 | ) | (273,609 | ) | (4,251,365 | ) | |||||||||||||||||||||||||||
| (2,763,085 | ) | (42,840,638 | ) | (41,146 | ) | (628,960 | ) | (13,401,058 | ) | (203,020,017 | ) | (21,427,623 | ) | (316,699,047 | ) | (3,739,412 | ) | (60,114,472 | ) | (3,723,857 | ) | (58,239,731 | ) | |||||||||||||||||||||||||||
| — | — | — | — | (56,594 | )# | (859,215 | )# | — | — | (641 | )## | (10,125 | )## | — | — | |||||||||||||||||||||||||||||||||||
| (2,758,011 | ) | $ | (42,769,201 | ) | 47,320 | $ | 737,403 | 24,543,180 | $ | 371,945,565 | 16,187,071 | $ | 244,327,467 | 6,755,108 | $ | 106,590,404 | 12,430,609 | $ | 192,995,601 | ||||||||||||||||||||||||||||||
| Semiannual Report | | March 31, 2017 | 379 |
Table of Contents
Notes to Financial Statements (cont’d)
March 31, 2017 (Unaudited)
| AllianzGI U.S. Equity Hedged | AllianzGI U.S. Small-Cap Growth | |||||||||||||||||||||||||||||||||||
| Six Months ended March 31, 2017 (unaudited) | Year ended September 30, 2016 | Six Months ended March 31, 2017 (unaudited) | Year ended September 30, 2016 | |||||||||||||||||||||||||||||||||
| Shares | Amount | Shares | Amount | Shares | Amount | Shares | Amount | |||||||||||||||||||||||||||||
Shares sold: | ||||||||||||||||||||||||||||||||||||
Class A | 2,509 | $ | 41,238 | 6,481 | $ | 104,102 | 27,115 | $ | 371,338 | 86,805 | $ | 1,142,215 | ||||||||||||||||||||||||
Class A - from Class D(a) | — | — | 18,094 | 290,224 | — | — | 5,639 | 85,651 | ||||||||||||||||||||||||||||
Class C | 1,414 | 22,050 | 10,872 | 158,411 | 3,456 | 43,619 | 8,283 | 99,391 | ||||||||||||||||||||||||||||
Class D | — | — | 8 | 125 | — | — | 67 | 1,003 | ||||||||||||||||||||||||||||
Class R | — | — | — | — | 11,601 | 130,173 | — | — | ||||||||||||||||||||||||||||
Class P | 300 | 5,000 | — | — | 30,193 | 436,624 | 8,593 | 116,475 | ||||||||||||||||||||||||||||
Institutional Class | 18,606 | 314,055 | 61,029 | 976,135 | 132,045 | 1,660,153 | 305,805 | 3,960,216 | ||||||||||||||||||||||||||||
Issued in reinvestment of dividends and distributions: |
| |||||||||||||||||||||||||||||||||||
Class A | 519 | 8,562 | 1,016 | 16,120 | 14,799 | 169,449 | 4,435 | 61,647 | ||||||||||||||||||||||||||||
Class C | 157 | 2,502 | 416 | 6,391 | 8,530 | 91,100 | 3,045 | 40,382 | ||||||||||||||||||||||||||||
Class R | — | — | — | — | 354 | 3,969 | 115 | 1,567 | ||||||||||||||||||||||||||||
Class P | 26 | 428 | 20 | 313 | 10,668 | 124,490 | 1,251 | 17,638 | ||||||||||||||||||||||||||||
Institutional Class | 2,825 | 46,862 | 8,739 | 138,687 | 244,395 | 2,876,533 | 129,992 | 1,844,590 | ||||||||||||||||||||||||||||
Cost of shares redeemed: | ||||||||||||||||||||||||||||||||||||
Class A | (6,018 | ) | (100,090 | ) | (54,662 | ) | (851,192 | ) | (242,446 | ) | (3,107,629 | ) | (54,248 | ) | (714,554 | ) | ||||||||||||||||||||
Class C | (2,702 | ) | (42,843 | ) | (12,040 | ) | (180,563 | ) | (13,124 | ) | (154,296 | ) | (14,873 | ) | (197,936 | ) | ||||||||||||||||||||
Class D | — | — | (361 | ) | (5,766 | ) | — | — | (1,620 | ) | (25,241 | ) | ||||||||||||||||||||||||
Class D - to Class A(a) | — | — | (18,165 | ) | (290,224 | ) | — | — | (5,631 | ) | (85,651 | ) | ||||||||||||||||||||||||
Class R | — | — | — | — | (2,359 | ) | (26,065 | ) | (207 | ) | (3,083 | ) | ||||||||||||||||||||||||
Class P | (7 | ) | (120 | ) | — | — | (2,529 | ) | (30,275 | ) | (11,588 | ) | (153,758 | ) | ||||||||||||||||||||||
Institutional Class | (77,249 | ) | (1,273,567 | ) | (595,332 | ) | (9,545,314 | ) | (531,974 | ) | (7,097,385 | ) | (1,237,569 | ) | (17,963,552 | ) | ||||||||||||||||||||
Net decrease resulting from Fund share transactions | (59,620 | ) | $ | (975,923 | ) | (573,885 | ) | $ | (9,182,551 | ) | (309,276 | ) | $ | (4,508,202 | ) | (771,706 | ) | $ | (11,773,000 | ) | ||||||||||||||||
| (a) | Class D shares converted to Class A shares at the close of business on November 13, 2015. See Note12(a). |
| 380 | March 31, 2017 | | Semiannual Report |
Table of Contents
| AllianzGI Ultra Micro Cap | ||||||||||||||||||
| �� | Six Months ended March 31, 2017 (unaudited) | Year ended September 30, 2016 | ||||||||||||||||
| Shares | Amount | Shares | Amount | |||||||||||||||
| 24,583 | $ | 528,259 | 58,852 | $ | 1,217,532 | |||||||||||||
| — | — | — | — | |||||||||||||||
| — | — | — | — | |||||||||||||||
| — | — | — | — | |||||||||||||||
| — | — | — | — | |||||||||||||||
| 103,422 | 2,208,933 | 46,141 | 917,330 | |||||||||||||||
| 103,448 | 2,233,561 | 232,834 | 4,757,170 | |||||||||||||||
| 63,450 | 1,323,561 | 154,216 | 3,315,653 | |||||||||||||||
| — | — | — | — | |||||||||||||||
| — | — | — | — | |||||||||||||||
| 21,175 | 447,225 | 30,083 | 651,902 | |||||||||||||||
| 84,708 | 1,792,405 | 142,585 | 3,095,525 | |||||||||||||||
| (308,864 | ) | (6,563,557 | ) | (1,150,186 | ) | (23,134,130 | ) | |||||||||||
| — | — | — | — | |||||||||||||||
| — | — | — | — | |||||||||||||||
| — | — | — | — | |||||||||||||||
| — | — | — | — | |||||||||||||||
| (49,692 | ) | (1,080,280 | ) | (173,412 | ) | (3,468,896 | ) | |||||||||||
| (290,498 | ) | (6,279,333 | ) | (1,228,680 | ) | (26,035,151 | ) | |||||||||||
| (248,268 | ) | $ | (5,389,226 | ) | (1,887,567 | ) | $ | (38,683,065 | ) | ||||||||
| Semiannual Report | | March 31, 2017 | 381 |
Table of Contents
Notes to Financial Statements (cont’d)
March 31, 2017 (Unaudited)
| 10. | SIGNIFICANT ACCOUNT HOLDERS |
From time to time, a Fund may have a concentration of shareholders, which may include the Investment Manager or affiliates of the Investment Manager, holding a significant percentage of shares outstanding. Investment activities of these shareholders could have a material impact to a Fund.
At March 31, 2017, the significant account-holders, owners of 5% or greater of each respective Fund’s outstanding shares were as follows:
| Unaffiliated | Affiliated Approximate Ownership | |||||||||||||||||||||||||||||||||||||||||||
| Number of Account Holders | Approximate Ownership | AFI | AllianzGI 2020 | AllianzGI 2025 | AllianzGI 2030 | AllianzGI 2035 | AllianzGI 2040 | AllianzGI Retirement Income | AllianzGI Global Allocation | AllianzGI Global Fundamental Strategy | ||||||||||||||||||||||||||||||||||
AllianzGI Retirement 2020 | 6 | 81 | % | — | — | — | — | — | — | — | — | — | ||||||||||||||||||||||||||||||||
AllianzGI Retirement 2025 | 4 | 76 | % | — | — | — | — | — | — | — | — | — | ||||||||||||||||||||||||||||||||
AllianzGI Retirement 2030 | 3 | 65 | % | — | — | — | — | — | — | — | — | — | ||||||||||||||||||||||||||||||||
AllianzGI Retirement 2035 | 3 | 71 | % | — | — | — | — | — | — | — | — | — | ||||||||||||||||||||||||||||||||
AllianzGI Retirement 2040 | 4 | 72 | % | — | — | — | — | — | — | — | — | — | ||||||||||||||||||||||||||||||||
AllianzGI Retirement 2045 | 4 | 68 | % | — | — | — | — | — | — | — | — | — | ||||||||||||||||||||||||||||||||
AllianzGI Retirement 2050 | 4 | 70 | % | — | — | — | — | — | — | — | — | — | ||||||||||||||||||||||||||||||||
AllianzGI Retirement 2055 | 5 | 70 | % | — | — | — | — | — | — | — | — | — | ||||||||||||||||||||||||||||||||
AllianzGI Retirement Income | 6 | 65 | % | — | — | — | — | — | — | — | — | — | ||||||||||||||||||||||||||||||||
AllianzGI Global Allocation | 4 | 80 | % | — | — | — | — | — | — | — | — | — | ||||||||||||||||||||||||||||||||
AllianzGI Global Megatrends | — | — | 95 | % | — | — | — | — | — | — | — | — | ||||||||||||||||||||||||||||||||
AllianzGI Best Styles Emerging Markets Equity | 1 | 7 | % | 86 | % | — | — | — | — | — | — | — | 5 | % | ||||||||||||||||||||||||||||||
AllianzGI Best Styles Global Equity | 3 | 56 | % | — | — | — | — | — | — | — | 27 | % | — | |||||||||||||||||||||||||||||||
AllianzGI Best Styles International Equity | 4 | 99 | % | — | — | — | — | — | — | — | — | — | ||||||||||||||||||||||||||||||||
AllianzGI Best Styles U.S. Equity | 3 | 51 | % | — | 5 | % | 5 | % | 8 | % | 7 | % | 8 | % | — | — | — | |||||||||||||||||||||||||||
AllianzGI Convertible | 4 | 65 | % | — | — | — | — | — | — | — | — | — | ||||||||||||||||||||||||||||||||
AllianzGI Emerging Markets Consumer | 7 | 92 | % | — | — | — | — | — | — | — | — | — | ||||||||||||||||||||||||||||||||
AllianzGI Emerging Markets Debt | — | — | 41 | % | — | — | — | — | — | 7 | % | 47 | % | — | ||||||||||||||||||||||||||||||
AllianzGI Emerging Markets Small-Cap | 1 | 11 | % | 25 | % | — | — | 5 | % | — | — | — | 41 | % | — | |||||||||||||||||||||||||||||
AllianzGI Europe Equity Dividend | 1 | 44 | % | 46 | % | — | — | — | — | — | — | — | — | |||||||||||||||||||||||||||||||
AllianzGI Global Dynamic Allocation | 2 | 20 | % | — | 13 | % | 18 | % | 19 | % | 10 | % | 6 | % | — | — | — | |||||||||||||||||||||||||||
AllianzGI Global Fundamental Strategy | — | — | 96 | % | — | — | — | — | — | — | — | — | ||||||||||||||||||||||||||||||||
AllianzGI Global Sustainability | 2 | 96 | % | — | — | — | — | — | — | — | — | — | ||||||||||||||||||||||||||||||||
AllianzGI Global Water | 8 | 83 | % | — | — | — | — | — | — | — | — | — | ||||||||||||||||||||||||||||||||
AllianzGI High Yield Bond | 4 | 73 | % | — | — | — | — | — | — | — | — | — | ||||||||||||||||||||||||||||||||
AllianzGI International Growth | — | — | 12 | % | — | — | — | — | — | — | 87 | % | — | |||||||||||||||||||||||||||||||
AllianzGI International Small-Cap | 3 | 70 | % | — | — | — | — | — | — | — | — | — | ||||||||||||||||||||||||||||||||
AllianzGI Micro Cap | 4 | 84 | % | — | — | — | — | — | — | — | — | — | ||||||||||||||||||||||||||||||||
AllianzGI Multi-Asset Real Return | 2 | 27 | % | 68 | % | — | — | — | — | — | — | — | — | |||||||||||||||||||||||||||||||
AllianzGI NFJ Emerging Markets Value | 4 | 96 | % | — | — | — | — | — | — | — | — | — | ||||||||||||||||||||||||||||||||
AllianzGI NFJ Global Dividend Value | 4 | 49 | % | — | — | — | — | — | — | 28 | % | — | — | |||||||||||||||||||||||||||||||
AllianzGI NFJ International Small-Cap Value | 4 | 91 | % | — | — | — | — | — | — | — | — | — | ||||||||||||||||||||||||||||||||
AllianzGI NFJ International Value II | 4 | 87 | % | — | — | — | — | — | — | — | — | — | ||||||||||||||||||||||||||||||||
AllianzGI Short Duration High Income | 7 | 74 | % | — | — | — | — | — | — | — | — | — | ||||||||||||||||||||||||||||||||
AllianzGI Structured Return | 5 | 83 | % | — | — | — | — | — | — | — | — | — | ||||||||||||||||||||||||||||||||
AllianzGI U.S. Equity Hedged | 3 | 56 | % | 37 | % | — | — | — | — | — | — | — | — | |||||||||||||||||||||||||||||||
AllianzGI U.S. Small-Cap Growth | 1 | 85 | % | — | — | — | — | — | — | — | — | — | ||||||||||||||||||||||||||||||||
AllianzGI Ultra Micro Cap | 4 | 75 | % | — | — | — | — | — | — | — | — | — | ||||||||||||||||||||||||||||||||
| 382 | March 31, 2017 | | Semiannual Report |
Table of Contents
| 11. | AFFILIATED TRANSACTIONS |
The following tables show the transactions in and earnings from affiliates for the six months ended March 31, 2017:
| AllianzGI Retirement 2020: | ||||||||||||||||||||||||||||||||
| Market Value 9/30/2016 | Purchases at Cost | Proceeds from Sales | Unrealized Appreciation (Depreciation) | Market Value 3/31/2017 | Dividend Income | Net Realized Gain (Loss) | Net Capital Gain Distributions Received | |||||||||||||||||||||||||
AllianzGI Advanced Core Bond | $ | 6,357,222 | $ | 4,577,563 | $ | 1,592,408 | $ | (228,371 | ) | $ | 8,904,061 | $ | 237,604 | $ | (20,401 | ) | $ | 92,145 | ||||||||||||||
AllianzGI Best Styles Emerging Markets Equity | 741,345 | — | 746,479 | — | — | — | 74,443 | — | ||||||||||||||||||||||||
AllianzGI Best Styles Global Managed Volatility | 1,546,091 | — | 1,525,555 | — | — | — | 13,691 | — | ||||||||||||||||||||||||
AllianzGI Best Styles International Equity | 3,108,265 | — | 3,106,077 | — | — | — | 3,115 | — | ||||||||||||||||||||||||
AllianzGI Best Styles U.S. Equity | 5,180,561 | 7,181,815 | 6,586,750 | 248,946 | 6,016,661 | 88,631 | 297,362 | — | ||||||||||||||||||||||||
AllianzGI Emerging Markets Consumer | 849,418 | — | 855,627 | — | — | — | (13,386 | ) | — | |||||||||||||||||||||||
AllianzGI Emerging Markets Debt | — | 844,147 | — | (10,306 | ) | 833,841 | 23,587 | — | — | |||||||||||||||||||||||
AllianzGI Emerging Markets Small-Cap | — | 273,738 | — | 17,430 | 291,168 | 7,793 | — | — | ||||||||||||||||||||||||
AllianzGI Focused Growth | 541,194 | — | 540,371 | — | — | — | (4,124 | ) | — | |||||||||||||||||||||||
AllianzGI Global Dynamic Allocation | — | 45,413,095 | 14,494,513 | 1,215,588 | 32,092,332 | 146,371 | (41,838 | ) | — | |||||||||||||||||||||||
AllianzGI Global Natural Resources | 815,462 | — | 824,439 | — | — | — | 100,511 | — | ||||||||||||||||||||||||
AllianzGI High Yield Bond | 1,862,834 | — | 1,869,163 | — | — | — | 80,632 | — | ||||||||||||||||||||||||
AllianzGI International Small-Cap | 534,813 | — | 536,004 | — | — | — | 19,375 | — | ||||||||||||||||||||||||
AllianzGI Mid-Cap | 536,861 | — | 532,864 | — | — | — | 55,788 | — | ||||||||||||||||||||||||
AllianzGI Short Duration High Income | 4,777,977 | 38,642 | 3,724,227 | 36,182 | 1,103,875 | 21,610 | (2,860 | ) | — | |||||||||||||||||||||||
AllianzGI Structured Return | 1,331,901 | — | 1,333,570 | — | — | — | 62,720 | — | ||||||||||||||||||||||||
PIMCO Broad U.S. TIPS Index | 7,660,485 | — | 7,648,521 | — | — | — | 375,822 | — | ||||||||||||||||||||||||
PIMCO Capital Securities and Financials | 1,059,393 | — | 1,063,652 | — | — | — | 8,494 | — | ||||||||||||||||||||||||
PIMCO Income | 5,088,034 | — | 5,092,253 | — | — | 2,422 | 93,207 | — | ||||||||||||||||||||||||
PIMCO Mortgage Opportunities | 2,674,143 | — | 2,671,749 | — | — | 711 | 36,381 | — | ||||||||||||||||||||||||
PIMCO Senior Floating Rate | 1,758,374 | — | 1,758,374 | — | — | 605 | 7,086 | — | ||||||||||||||||||||||||
Totals | $ | 46,424,373 | $ | 58,329,000 | $ | 56,502,596 | $ | 1,279,469 | $ | 49,241,938 | $ | 529,334 | $ | 1,146,018 | $ | 92,145 | ||||||||||||||||
| AllianzGI Retirement 2025: | ||||||||||||||||||||||||||||||||
| Market Value 9/30/2016 | Purchases at Cost | Proceeds from Sales | Unrealized Appreciation (Depreciation) | Market Value 3/31/2017 | Dividend Income | Net Realized Gain (Loss) | Net Capital Gain Distributions Received | |||||||||||||||||||||||||
AllianzGI Advanced Core Bond | $ | 6,034,341 | $ | 4,183,844 | $ | 5,392,284 | $ | (129,784 | ) | $ | 4,610,875 | $ | 140,372 | $ | 78,864 | $ | 55,633 | |||||||||||||||
AllianzGI Best Styles Emerging Markets Equity | 822,685 | — | 828,382 | — | — | — | 83,969 | — | ||||||||||||||||||||||||
AllianzGI Best Styles Global Equity | — | 4,136,262 | 4,224,882 | 1,521 | 22,435 | 364 | 109,534 | 126 | ||||||||||||||||||||||||
AllianzGI Best Styles Global Managed Volatility | 1,633,117 | — | 1,611,425 | — | — | — | 14,462 | — | ||||||||||||||||||||||||
AllianzGI Best Styles International Equity | 4,054,948 | — | 4,052,095 | — | — | — | 33,229 | — | ||||||||||||||||||||||||
AllianzGI Best Styles U.S. Equity | 6,728,823 | 7,033,242 | 7,884,209 | 254,235 | 6,152,430 | 81,473 | 515,686 | — | ||||||||||||||||||||||||
AllianzGI Emerging Markets Consumer | 1,123,306 | — | 1,131,517 | — | — | — | (16,411 | ) | — | |||||||||||||||||||||||
AllianzGI Emerging Markets Debt | — | 311,531 | — | (1,857 | ) | 309,674 | 4,047 | — | — | |||||||||||||||||||||||
AllianzGI Emerging Markets Small-Cap | — | 293,712 | — | 18,915 | 312,627 | 8,367 | — | — | ||||||||||||||||||||||||
| Semiannual Report | | March 31, 2017 | 383 |
Table of Contents
Notes to Financial Statements (cont’d)
March 31, 2017 (Unaudited)
| AllianzGI Retirement 2025: (cont’d) | ||||||||||||||||||||||||||||||||
| Market Value 9/30/2016 | Purchases at Cost | Proceeds from Sales | Unrealized Appreciation (Depreciation) | Market Value 3/31/2017 | Dividend Income | Net Realized Gain (Loss) | Net Capital Gain Distributions Received | |||||||||||||||||||||||||
AllianzGI Focused Growth | $ | 953,665 | — | $ | 952,214 | — | — | — | $ | 66,099 | — | |||||||||||||||||||||
AllianzGI Global Dynamic Allocation | — | $ | 49,831,509 | 4,601,784 | $ | 1,726,134 | $ | 46,914,271 | $ | 196,268 | (41,588 | ) | — | |||||||||||||||||||
AllianzGI Global Natural Resources | 1,143,436 | — | 1,156,025 | — | — | — | 112,064 | — | ||||||||||||||||||||||||
AllianzGI High Yield Bond | 1,929,487 | — | 1,936,043 | — | — | — | 156,305 | — | ||||||||||||||||||||||||
AllianzGI International Small-Cap | 831,177 | — | 833,029 | — | — | — | 11,798 | — | ||||||||||||||||||||||||
AllianzGI Mid-Cap | 834,504 | — | 828,292 | — | — | — | 59,610 | — | ||||||||||||||||||||||||
AllianzGI NFJ Mid-Cap Value | 277,719 | — | 276,896 | — | — | — | 20,667 | — | ||||||||||||||||||||||||
AllianzGI Short Duration High Income | 4,948,403 | 4,607 | 4,962,729 | 25 | 372 | 4,607 | 48,982 | — | ||||||||||||||||||||||||
AllianzGI Structured Return | 1,379,741 | — | 1,381,470 | — | — | — | 64,856 | — | ||||||||||||||||||||||||
PIMCO Broad U.S. TIPS Index | 5,509,531 | — | 5,500,927 | — | — | — | 284,108 | — | ||||||||||||||||||||||||
PIMCO Capital Securities and Financials | 1,097,015 | — | 1,101,425 | — | — | — | 9,199 | — | ||||||||||||||||||||||||
PIMCO Income | 4,994,425 | — | 4,998,566 | — | — | 2,378 | 38,536 | — | ||||||||||||||||||||||||
PIMCO Mortgage Opportunities | 2,220,748 | — | 2,218,760 | — | — | 591 | 32,209 | — | ||||||||||||||||||||||||
PIMCO Senior Floating Rate | 1,821,544 | — | 1,821,544 | — | — | 626 | 7,338 | — | ||||||||||||||||||||||||
Totals | $ | 48,338,615 | $ | 65,794,707 | $ | 57,694,498 | $ | 1,869,189 | $ | 58,322,684 | $ | 439,093 | $ | 1,689,516 | $ | 55,759 | ||||||||||||||||
| AllianzGI Retirement 2030: | ||||||||||||||||||||||||||||||||
| Market Value 9/30/2016 | Purchases at Cost | Proceeds from Sales | Unrealized Appreciation | Market Value 3/31/2017 | Dividend Income | Net Realized Gain (Loss) | Net Capital Gain Distributions Received | |||||||||||||||||||||||||
AllianzGI Advanced Core Bond | $ | 5,866,443 | — | $ | 5,840,303 | — | — | — | $ | 132,772 | — | |||||||||||||||||||||
AllianzGI Best Styles Emerging Markets Equity | 679,035 | — | 683,737 | — | — | — | 84,043 | — | ||||||||||||||||||||||||
AllianzGI Best Styles Global Equity | — | $ | 13,914,094 | 9,493,033 | $ | 341,172 | $ | 5,022,638 | $ | 90,950 | 260,405 | $ | 31,351 | |||||||||||||||||||
AllianzGI Best Styles Global Managed Volatility | 1,860,396 | — | 1,835,685 | — | — | — | 16,474 | — | ||||||||||||||||||||||||
AllianzGI Best Styles International Equity | 5,696,209 | — | 5,692,200 | — | — | — | (26,178 | ) | — | |||||||||||||||||||||||
AllianzGI Best Styles U.S. Equity | 9,899,679 | 6,854,703 | 7,989,729 | 768,750 | 9,275,320 | 132,796 | 246,773 | — | ||||||||||||||||||||||||
AllianzGI Emerging Markets Consumer | 1,265,648 | — | 1,274,900 | — | — | — | (30,089 | ) | — | |||||||||||||||||||||||
AllianzGI Emerging Markets Small-Cap | 690,783 | 43,549 | 74,970 | 23,055 | 709,094 | 18,978 | (6,163 | ) | — | |||||||||||||||||||||||
AllianzGI Focused Growth | 1,033,725 | — | 1,032,153 | — | — | — | 52,780 | — | ||||||||||||||||||||||||
AllianzGI Global Dynamic Allocation | — | 48,232,861 | 1,976,297 | 1,805,384 | 48,097,926 | 210,757 | 35,978 | — | ||||||||||||||||||||||||
AllianzGI Global Natural Resources | 1,251,989 | — | 1,265,773 | — | — | — | 122,111 | — | ||||||||||||||||||||||||
AllianzGI High Yield Bond | 2,481,757 | — | 2,490,189 | — | — | — | 153,050 | — | ||||||||||||||||||||||||
AllianzGI International Small-Cap | 1,246,185 | — | 1,248,961 | — | — | — | 42,371 | — | ||||||||||||||||||||||||
AllianzGI Mid-Cap | 939,866 | — | 932,869 | — | — | — | 61,219 | — | ||||||||||||||||||||||||
AllianzGI NFJ Mid-Cap Value | 624,621 | — | 622,771 | — | — | — | 202,070 | — | ||||||||||||||||||||||||
AllianzGI Short Duration High Income | 5,260,119 | — | 5,273,916 | — | — | — | 70,214 | — | ||||||||||||||||||||||||
AllianzGI Structured Return | 1,552,396 | — | 1,554,341 | — | — | — | 72,065 | — | ||||||||||||||||||||||||
AllianzGI U.S. Small-Cap Growth | 726,442 | — | 724,876 | — | — | — | 50,590 | — | ||||||||||||||||||||||||
PIMCO Broad U.S. TIPS Index | 4,960,887 | — | 4,953,139 | — | — | — | 258,854 | — | ||||||||||||||||||||||||
PIMCO Capital Securities and Financials | 926,172 | — | 929,895 | — | — | — | 5,973 | — | ||||||||||||||||||||||||
PIMCO Income | 4,369,487 | — | 4,373,110 | — | — | 2,080 | 105,997 | — | ||||||||||||||||||||||||
PIMCO Mortgage Opportunities | 1,252,584 | — | 1,251,463 | — | — | 333 | 17,867 | — | ||||||||||||||||||||||||
PIMCO Senior Floating Rate | 2,049,660 | — | 2,049,661 | — | — | 705 | 8,260 | — | ||||||||||||||||||||||||
Totals | $ | 54,634,083 | $ | 69,045,207 | $ | 63,563,971 | $ | 2,938,361 | $ | 63,104,978 | $ | 456,599 | $ | 1,937,436 | $ | 31,351 | ||||||||||||||||
| 384 | March 31, 2017 | | Semiannual Report |
Table of Contents
| AllianzGI Retirement 2035: | ||||||||||||||||||||||||||||||||
| Market Value 9/30/2016 | Purchases at Cost | Proceeds from Sales | Unrealized Appreciation | Market Value 3/31/2017 | Dividend Income | Net Realized Gain (Loss) | Net Capital Gain Distributions Received | |||||||||||||||||||||||||
AllianzGI Advanced Core Bond | $ | 3,781,376 | — | $ | 3,764,527 | — | — | — | $ | 79,148 | — | |||||||||||||||||||||
AllianzGI Best Styles Emerging Markets Equity | 705,476 | — | 710,361 | — | — | — | 73,365 | — | ||||||||||||||||||||||||
AllianzGI Best Styles Global Equity | — | $ | 21,855,758 | 7,850,010 | $ | 1,036,099 | $ | 15,253,177 | $ | 269,854 | 211,330 | $ | 95,812 | |||||||||||||||||||
AllianzGI Best Styles Global Managed Volatility | 1,498,644 | — | 1,478,737 | — | — | — | 13,271 | — | ||||||||||||||||||||||||
AllianzGI Best Styles International Equity | 6,410,706 | — | 6,406,194 | — | — | — | (64,350 | ) | — | |||||||||||||||||||||||
AllianzGI Best Styles U.S. Equity | 9,760,604 | 5,950,153 | 7,606,775 | 844,901 | 8,668,337 | 128,029 | 147,315 | — | ||||||||||||||||||||||||
AllianzGI Emerging Markets Consumer | 1,060,875 | — | 1,068,630 | — | — | — | (24,845 | ) | — | |||||||||||||||||||||||
AllianzGI Emerging Markets Small-Cap | 881,957 | 38,114 | 381,322 | 39,389 | 582,751 | 15,596 | (22,553 | ) | — | |||||||||||||||||||||||
AllianzGI Focused Growth | 1,608,627 | — | 1,606,180 | — | — | — | 90,134 | — | ||||||||||||||||||||||||
AllianzGI Global Dynamic Allocation | — | 25,768,424 | 1,692,185 | 947,394 | 25,038,632 | 112,470 | 14,999 | — | ||||||||||||||||||||||||
AllianzGI Global Natural Resources | 1,276,235 | — | 1,290,285 | — | — | — | 80,087 | — | ||||||||||||||||||||||||
AllianzGI High Yield Bond | 2,025,682 | — | 2,032,564 | — | — | — | 132,679 | — | ||||||||||||||||||||||||
AllianzGI International Small-Cap | 1,271,382 | — | 1,274,214 | — | — | — | 42,958 | — | ||||||||||||||||||||||||
AllianzGI Mid-Cap | 765,915 | — | 760,213 | — | — | — | 46,615 | — | ||||||||||||||||||||||||
AllianzGI NFJ Mid-Cap Value | 509,781 | — | 508,271 | — | — | — | 170,326 | — | ||||||||||||||||||||||||
AllianzGI Short Duration High Income | 2,020,714 | — | 2,026,014 | — | — | — | 21,688 | — | ||||||||||||||||||||||||
AllianzGI Structured Return | 861,689 | — | 862,768 | — | — | — | 45,352 | — | ||||||||||||||||||||||||
AllianzGI U.S. Small-Cap Growth | 1,085,242 | — | 1,082,903 | — | — | — | (3,215 | ) | — | |||||||||||||||||||||||
PIMCO Broad U.S. TIPS Index | 3,796,650 | — | 3,790,720 | — | — | — | 198,037 | — | ||||||||||||||||||||||||
PIMCO Capital Securities and Financials | 504,071 | — | 506,098 | — | — | — | 4,813 | — | ||||||||||||||||||||||||
PIMCO Income | 2,292,740 | — | 2,294,641 | — | — | 1,091 | 67,650 | — | ||||||||||||||||||||||||
PIMCO Mortgage Opportunities | 1,022,424 | — | 1,021,509 | — | — | 272 | 14,594 | — | ||||||||||||||||||||||||
PIMCO Senior Floating Rate | 1,673,034 | — | 1,673,034 | — | — | 575 | 6,743 | — | ||||||||||||||||||||||||
Totals | $ | 44,813,824 | $ | 53,612,449 | $ | 51,688,155 | $ | 2,867,783 | $ | 49,542,897 | $ | 527,887 | $ | 1,346,141 | $ | 95,812 | ||||||||||||||||
| AllianzGI Retirement 2040: | ||||||||||||||||||||||||||||||||
| Market Value 9/30/2016 | Purchases at Cost | Proceeds from Sales | Unrealized Appreciation | Market Value 3/31/2017 | Dividend Income | Net Realized Gain (Loss) | Net Capital Gain Distributions Received | |||||||||||||||||||||||||
AllianzGI Advanced Core Bond | $ | 2,972,295 | — | $ | 2,959,051 | — | — | — | $ | 53,212 | — | |||||||||||||||||||||
AllianzGI Best Styles Emerging Markets Equity | 1,019,548 | — | 1,026,609 | — | — | — | 117,618 | — | ||||||||||||||||||||||||
AllianzGI Best Styles Global Equity | — | $ | 24,254,884 | 4,451,032 | $ | 1,450,875 | $ | 21,361,904 | $ | 350,422 | 107,177 | $ | 120,791 | |||||||||||||||||||
AllianzGI Best Styles Global Managed Volatility | 1,249,144 | — | 1,232,552 | — | — | — | 11,061 | — | ||||||||||||||||||||||||
AllianzGI Best Styles International Equity | 7,184,127 | — | 7,179,071 | — | — | — | (74,588 | ) | — | |||||||||||||||||||||||
AllianzGI Best Styles U.S. Equity | 9,907,161 | 3,773,651 | 5,195,554 | 991,389 | 9,087,848 | 121,630 | 78,723 | — | ||||||||||||||||||||||||
AllianzGI Emerging Markets Consumer | 893,559 | — | 900,091 | — | — | — | (13,137 | ) | — | |||||||||||||||||||||||
AllianzGI Emerging Markets Small-Cap | 931,785 | 35,163 | 511,169 | 28,316 | 495,005 | 13,248 | (25,031 | ) | — | |||||||||||||||||||||||
AllianzGI Focused Growth | 1,867,192 | — | 1,864,351 | — | — | — | 101,714 | — | ||||||||||||||||||||||||
AllianzGI Global Dynamic Allocation | — | 14,304,734 | 434,987 | 524,507 | 14,402,570 | 60,666 | 8,316 | — | ||||||||||||||||||||||||
AllianzGI Global Natural Resources | 1,075,147 | — | 1,086,983 | — | — | — | 102,881 | — | ||||||||||||||||||||||||
AllianzGI High Yield Bond | 1,919,505 | — | 1,926,027 | — | — | — | 120,297 | — | ||||||||||||||||||||||||
AllianzGI International Small-Cap | 1,071,184 | — | 1,073,570 | — | — | — | 36,982 | — | ||||||||||||||||||||||||
AllianzGI Mid-Cap | 1,290,334 | — | 1,280,729 | — | — | — | 53,233 | — | ||||||||||||||||||||||||
AllianzGI NFJ Mid-Cap Value | 858,827 | — | 856,283 | — | — | — | 243,346 | — | ||||||||||||||||||||||||
| Semiannual Report | | March 31, 2017 | 385 |
Table of Contents
Notes to Financial Statements (cont’d)
March 31, 2017 (Unaudited)
| AllianzGI Retirement 2040: (cont’d) | ||||||||||||||||||||||||||||||||
| Market Value 9/30/2016 | Purchases at Cost | Proceeds from Sales | Unrealized Appreciation | Market Value 3/31/2017 | Dividend Income | Net Realized Gain (Loss) | Net Capital Gain Distributions Received | |||||||||||||||||||||||||
AllianzGI U.S. Small-Cap Growth | $ | 1,212,547 | — | $ | 1,209,934 | — | — | — | $ | (111,458 | ) | — | ||||||||||||||||||||
PIMCO Broad U.S. TIPS Index | 2,345,092 | — | 2,341,430 | — | — | — | 129,286 | — | ||||||||||||||||||||||||
PIMCO Mortgage Opportunities | 308,165 | — | 307,889 | — | — | 82 | 4,669 | — | ||||||||||||||||||||||||
PIMCO Senior Floating Rate | 1,707,537 | — | 1,707,537 | — | — | 587 | 6,884 | — | ||||||||||||||||||||||||
Totals | $ | 37,813,149 | $ | 42,368,432 | $ | 37,544,849 | $ | 2,995,087 | $ | 45,347,327 | $ | 546,635 | $ | 951,185 | $ | 120,791 | ||||||||||||||||
| AllianzGI Retirement 2045: | ||||||||||||||||||||||||||||||||
| Market Value 9/30/2016 | Purchases at Cost | Proceeds from Sales | Unrealized Appreciation | Market Value 3/31/2017 | Dividend Income | Net Realized Gain (Loss) | Net Capital Gain Distributions Received | |||||||||||||||||||||||||
AllianzGI Advanced Core Bond | $ | 885,272 | — | $ | 881,328 | — | — | — | $ | 2,342 | — | |||||||||||||||||||||
AllianzGI Best Styles Emerging Markets Equity | 708,000 | — | 712,903 | — | — | — | 82,214 | — | ||||||||||||||||||||||||
AllianzGI Best Styles Global Equity | — | $ | 16,614,201 | 1,898,515 | $ | 1,032,810 | $ | 15,795,921 | $ | 244,390 | 47,425 | $ | 84,242 | |||||||||||||||||||
AllianzGI Best Styles Global Managed Volatility | 762,067 | — | 751,945 | — | — | — | 6,748 | — | ||||||||||||||||||||||||
AllianzGI Best Styles International Equity | 4,623,390 | — | 4,620,136 | — | — | — | (20,092 | ) | — | |||||||||||||||||||||||
AllianzGI Best Styles U.S. Equity | 6,831,671 | 1,845,144 | 3,236,207 | 670,540 | 5,839,950 | 75,584 | 43,878 | — | ||||||||||||||||||||||||
AllianzGI Emerging Markets Consumer | 633,703 | — | 638,336 | — | — | — | (7,389 | ) | — | |||||||||||||||||||||||
AllianzGI Emerging Markets Small-Cap | 562,619 | 18,509 | 312,218 | 22,897 | 292,137 | 7,818 | (13,635 | ) | — | |||||||||||||||||||||||
AllianzGI Focused Growth | 1,431,402 | — | 1,429,225 | — | — | — | 77,184 | — | ||||||||||||||||||||||||
AllianzGI Global Dynamic Allocation | — | 5,912,063 | — | 222,458 | 6,134,521 | 24,476 | — | — | ||||||||||||||||||||||||
AllianzGI Global Natural Resources | 640,347 | — | 647,397 | — | — | — | 44,645 | — | ||||||||||||||||||||||||
AllianzGI High Yield Bond | 1,143,903 | — | 1,147,790 | — | — | — | 83,644 | — | ||||||||||||||||||||||||
AllianzGI International Small-Cap | 765,777 | — | 767,483 | — | — | — | 22,853 | — | ||||||||||||||||||||||||
AllianzGI Mid-Cap | 1,025,277 | — | 1,017,645 | — | — | — | 48,683 | — | ||||||||||||||||||||||||
AllianzGI NFJ Mid-Cap Value | 895,645 | — | 892,992 | — | — | — | 216,525 | — | ||||||||||||||||||||||||
AllianzGI U.S. Small-Cap Growth | 872,394 | — | 870,514 | — | — | — | (2,786 | ) | — | |||||||||||||||||||||||
PIMCO Mortgage Opportunities | 4,706 | — | 4,706 | — | — | — | 29 | — | ||||||||||||||||||||||||
PIMCO Senior Floating Rate | 1,272,475 | — | 1,272,474 | — | — | 438 | 5,126 | — | ||||||||||||||||||||||||
Totals | $ | 23,058,648 | $ | 24,389,917 | $ | 21,101,814 | $ | 1,948,705 | $ | 28,062,529 | $ | 352,706 | $ | 637,394 | $ | 84,242 | ||||||||||||||||
| AllianzGI Retirement 2050: | ||||||||||||||||||||||||||||||||
| Market Value 9/30/2016 | Purchases at Cost | Proceeds from Sales | Unrealized Appreciation | Market Value 3/31/2017 | Dividend Income | Net Realized Gain (Loss) | Net Capital Gain Distributions Received | |||||||||||||||||||||||||
AllianzGI Advanced Core Bond | $ | 460,467 | — | $ | 458,415 | — | — | — | $ | (3,682 | ) | — | ||||||||||||||||||||
AllianzGI Best Styles Emerging Markets Equity | 751,867 | — | 757,074 | — | — | — | 79,181 | — | ||||||||||||||||||||||||
AllianzGI Best Styles Global Equity | — | $ | 16,649,084 | 1,947,159 | $ | 1,046,275 | $ | 15,798,662 | $ | 244,053 | 50,462 | $ | 84,125 | |||||||||||||||||||
AllianzGI Best Styles Global Managed Volatility | 707,807 | — | 698,406 | — | — | — | 5,835 | — | ||||||||||||||||||||||||
AllianzGI Best Styles International Equity | 4,403,115 | — | 4,400,016 | — | — | — | (49,642 | ) | — | |||||||||||||||||||||||
AllianzGI Best Styles U.S. Equity | 5,770,251 | 2,233,723 | 2,693,264 | 639,450 | 5,730,489 | 74,503 | 41,905 | — | ||||||||||||||||||||||||
AllianzGI Emerging Markets Consumer | 682,888 | — | 687,880 | — | — | — | (11,517 | ) | — | |||||||||||||||||||||||
AllianzGI Emerging Markets Small-Cap | 465,535 | 25,136 | 231,626 | 16,088 | 280,788 | 7,515 | (12,368 | ) | — | |||||||||||||||||||||||
AllianzGI Focused Growth | 1,257,389 | — | 1,255,477 | — | — | — | 68,317 | — | ||||||||||||||||||||||||
AllianzGI Global Dynamic Allocation | — | 5,018,002 | 195,205 | 190,243 | 5,016,602 | 20,485 | 3,562 | — | ||||||||||||||||||||||||
AllianzGI Global Natural Resources | 594,510 | — | 601,055 | — | — | — | 72,602 | — | ||||||||||||||||||||||||
| 386 | March 31, 2017 | | Semiannual Report |
Table of Contents
| AllianzGI Retirement 2050: (cont’d) | ||||||||||||||||||||||||||||||||
| Market Value 9/30/2016 | Purchases at Cost | Proceeds from Sales | Unrealized Appreciation | Market Value 3/31/2017 | Dividend Income | Net Realized Gain (Loss) | Net Capital Gain Distributions Received | |||||||||||||||||||||||||
AllianzGI High Yield Bond | $ | 1,180,146 | — | $ | 1,184,155 | — | — | — | $ | 82,641 | — | |||||||||||||||||||||
AllianzGI International Small-Cap | 710,893 | — | 712,477 | — | — | — | 22,432 | — | ||||||||||||||||||||||||
AllianzGI Mid-Cap | 954,433 | — | 947,328 | — | — | — | 37,345 | — | ||||||||||||||||||||||||
AllianzGI NFJ Mid-Cap Value | 950,082 | — | 947,267 | — | — | — | 147,006 | — | ||||||||||||||||||||||||
AllianzGI U.S. Small-Cap Growth | 730,315 | — | 728,741 | — | — | — | (68,057 | ) | — | |||||||||||||||||||||||
PIMCO Broad U.S. TIPS Index | 235,981 | — | 235,613 | — | — | — | (2,530 | ) | — | |||||||||||||||||||||||
PIMCO Mortgage Opportunities | 4,003 | — | 4,003 | — | — | — | 25 | — | ||||||||||||||||||||||||
PIMCO Senior Floating Rate | 1,417,142 | — | 1,417,142 | — | — | 487 | 5,706 | — | ||||||||||||||||||||||||
Totals | $ | 21,276,824 | $ | 23,925,945 | $ | 20,102,303 | $ | 1,892,056 | $ | 26,826,541 | $ | 347,043 | $ | 469,223 | $ | 84,125 | ||||||||||||||||
| AllianzGI Retirement 2055: | ||||||||||||||||||||||||||||||||
| Market Value 9/30/2016 | Purchases at Cost | Proceeds from Sales | Unrealized Appreciation | Market Value 3/31/2017 | Dividend Income | Net Realized Gain (Loss) | Net Capital Gain Distributions Received | |||||||||||||||||||||||||
AllianzGI Advanced Core Bond | $ | 158,534 | — | $ | 157,828 | — | — | — | $ | (1,224 | ) | — | ||||||||||||||||||||
AllianzGI Best Styles Emerging Markets Equity | 300,416 | — | 302,496 | — | — | — | 46,598 | — | ||||||||||||||||||||||||
AllianzGI Best Styles Global Equity | — | $ | 6,362,971 | 324,721 | $ | 403,074 | $ | 6,449,475 | $ | 86,722 | 8,151 | $ | 29,893 | |||||||||||||||||||
AllianzGI Best Styles Global Managed Volatility | 241,639 | — | 238,430 | — | — | — | 1,570 | — | ||||||||||||||||||||||||
AllianzGI Best Styles International Equity | 1,480,747 | — | 1,479,705 | — | — | — | (4,127 | ) | — | |||||||||||||||||||||||
AllianzGI Best Styles U.S. Equity | 1,929,916 | 1,001,272 | 725,925 | 240,660 | 2,361,090 | 26,475 | 8,252 | — | ||||||||||||||||||||||||
AllianzGI Emerging Markets Consumer | 202,892 | — | 204,375 | — | — | — | (4,053 | ) | — | |||||||||||||||||||||||
AllianzGI Emerging Markets Small-Cap | 156,206 | 10,829 | 74,938 | 7,273 | 99,772 | 2,670 | (2,693 | ) | — | |||||||||||||||||||||||
AllianzGI Focused Growth | 428,631 | — | 427,979 | — | — | — | 23,081 | — | ||||||||||||||||||||||||
AllianzGI Global Dynamic Allocation | — | 1,946,909 | — | 74,655 | 2,021,564 | 7,280 | — | — | ||||||||||||||||||||||||
AllianzGI Global Natural Resources | 210,342 | — | 212,657 | — | — | — | 26,282 | — | ||||||||||||||||||||||||
AllianzGI High Yield Bond | 394,579 | — | 395,919 | — | — | — | 30,711 | — | ||||||||||||||||||||||||
AllianzGI International Small-Cap | 243,498 | — | 244,040 | — | — | — | 13,047 | — | ||||||||||||||||||||||||
AllianzGI Mid-Cap | 322,663 | — | 320,261 | — | — | — | 25,839 | — | ||||||||||||||||||||||||
AllianzGI NFJ Mid-Cap Value | 320,748 | — | 319,798 | — | — | — | 81,777 | — | ||||||||||||||||||||||||
AllianzGI U.S. Small-Cap Growth | 240,415 | — | 239,897 | — | — | — | (3,277 | ) | — | |||||||||||||||||||||||
PIMCO Investment Grade Corporate Bond | 131,818 | — | 131,196 | — | — | 40 | 2,700 | — | ||||||||||||||||||||||||
PIMCO Mortgage Opportunities | 219,113 | — | 218,917 | — | — | 58 | 2,528 | — | ||||||||||||||||||||||||
PIMCO Senior Floating Rate | 487,091 | — | 487,091 | — | — | 167 | 1,936 | — | ||||||||||||||||||||||||
Totals | $ | 7,469,248 | $ | 9,321,981 | $ | 6,506,173 | $ | 725,662 | $ | 10,931,901 | $ | 123,412 | $ | 257,098 | $ | 29,893 | ||||||||||||||||
| AllianzGI Retirement Income: | ||||||||||||||||||||||||||||||||
| Market Value 9/30/2016 | Purchases at Cost | Proceeds from Sales | Unrealized Appreciation (Depreciation) | Market Value 3/31/2017 | Dividend Income | Net Realized Gain (Loss) | Net Capital Gain Distributions Received | |||||||||||||||||||||||||
AllianzGI Advanced Core Bond | $ | 2,536,721 | $ | 1,121,403 | $ | 3,470,055 | — | — | $ | 46,539 | $ | (86,305 | ) | $ | 29,364 | |||||||||||||||||
AllianzGI Best Styles Emerging Markets Equity | 505,039 | — | 508,536 | — | — | — | 56,073 | — | ||||||||||||||||||||||||
AllianzGI Best Styles Global Managed Volatility | 592,885 | — | 585,010 | — | — | — | 5,250 | — | ||||||||||||||||||||||||
AllianzGI Best Styles International Equity | 2,246,505 | — | 2,244,924 | — | — | — | 20,090 | — | ||||||||||||||||||||||||
AllianzGI Best Styles U.S. Equity | 4,523,145 | — | 4,511,495 | — | — | — | 283,873 | — | ||||||||||||||||||||||||
AllianzGI Emerging Markets Consumer | 661,794 | — | 666,632 | — | — | — | (495 | ) | — | |||||||||||||||||||||||
| Semiannual Report | | March 31, 2017 | 387 |
Table of Contents
Notes to Financial Statements (cont’d)
March 31, 2017 (Unaudited)
| AllianzGI Retirement Income: (cont’d) | ||||||||||||||||||||||||||||||||
| Market Value 9/30/2016 | Purchases at Cost | Proceeds from Sales | Unrealized Appreciation (Depreciation) | Market Value 3/31/2017 | Dividend Income | Net Realized Gain (Loss) | Net Capital Gain Distributions Received | |||||||||||||||||||||||||
AllianzGI Emerging Markets Debt | — | $ | 3,215,190 | $ | 268,878 | $ | (40,349 | ) | $ | 2,900,366 | $ | 110,492 | $ | (5,597 | ) | — | ||||||||||||||||
AllianzGI Global Natural Resources | 295,605 | — | 298,860 | — | — | — | 52,936 | — | ||||||||||||||||||||||||
AllianzGI High Yield Bond | 3,236,398 | 4,099,076 | 1,646,672 | 234,653 | 5,743,999 | 194,509 | (1,397 | ) | — | |||||||||||||||||||||||
AllianzGI International Small-Cap | 171,512 | — | 171,894 | — | — | — | 6,464 | — | ||||||||||||||||||||||||
AllianzGI Mid-Cap | 169,683 | — | 168,420 | — | — | — | 15,158 | — | ||||||||||||||||||||||||
AllianzGI NFJ Global Dividend Value | — | 8,520,310 | 3,858,030 | 355,405 | 5,279,810 | 58,416 | 262,125 | — | ||||||||||||||||||||||||
AllianzGI Short Duration High Income | 10,769,225 | 539,331 | 918,397 | (2,896 | ) | 10,537,486 | 201,159 | (17,764 | ) | — | ||||||||||||||||||||||
AllianzGI Structured Return | 471,610 | — | 472,201 | — | — | — | 22,902 | — | ||||||||||||||||||||||||
PIMCO Capital Securities and Financials | 2,540,003 | 3,497,458 | 2,921,857 | 55,748 | 3,166,331 | 79,158 | (3,830 | ) | — | |||||||||||||||||||||||
PIMCO Emerging Markets Bond | 1,325,558 | — | 1,325,558 | — | — | 636 | 162,024 | — | ||||||||||||||||||||||||
PIMCO Income | 7,698,932 | 163,519 | 2,142,264 | 376,937 | 5,805,642 | 163,519 | (4,829 | ) | — | |||||||||||||||||||||||
PIMCO Investment Grade Corporate Bond | 3,449,272 | — | 3,432,987 | — | — | 1,040 | 65,423 | — | ||||||||||||||||||||||||
PIMCO Long-Term Credit | — | 4,346,628 | — | (110,403 | ) | 4,236,225 | 96,506 | — | — | |||||||||||||||||||||||
PIMCO Mortgage Opportunities | 2,563,133 | 1,788,756 | 3,312,098 | 6,650 | 1,046,177 | 10,206 | 37,391 | — | ||||||||||||||||||||||||
PIMCO Mortgage-Backed Securities | — | 1,773,216 | 1,778,617 | — | — | 15,942 | 5,401 | — | ||||||||||||||||||||||||
PIMCO Senior Floating Rate | 2,325,249 | — | 2,325,249 | — | — | 800 | 9,354 | — | ||||||||||||||||||||||||
Totals | $ | 46,082,269 | $ | 29,064,887 | $ | 37,028,634 | $ | 875,745 | $ | 38,716,036 | $ | 978,922 | $ | 884,247 | $ | 29,364 | ||||||||||||||||
| AllianzGI Global Allocation: | ||||||||||||||||||||||||||||||||
| Market Value 9/30/2016 | Purchases at Cost | Proceeds from Sales | Unrealized Appreciation (Depreciation) | Market Value 3/31/2017 | Dividend Income | Net Realized Gain | Net Capital Gain Distributions Received | |||||||||||||||||||||||||
AllianzGI Advanced Core Bond | $ | 124,987,803 | $ | 4,304,285 | $ | 10,200,000 | $ | (2,366,287 | ) | $ | 111,817,802 | $ | 3,082,578 | $ | 280,794 | $ | 1,221,707 | |||||||||||||||
AllianzGI Best Styles Global Equity | 224,131,214 | 4,279,929 | 46,039,098 | 27,370,410 | 195,975,801 | 3,182,809 | 402,434 | 1,097,120 | ||||||||||||||||||||||||
AllianzGI Best Styles Global Managed Volatility | 52,822,080 | 986,439 | 7,220,295 | 4,169,732 | 48,262,001 | 884,910 | 210,300 | 101,529 | ||||||||||||||||||||||||
AllianzGI Emerging Markets Debt | 21,008,835 | 721,152 | 1,600,000 | 969,691 | 19,786,470 | 721,152 | 59,457 | — | ||||||||||||||||||||||||
AllianzGI Emerging Markets Small-Cap | 5,075,661 | 150,180 | — | 435,381 | 5,611,461 | 150,180 | — | — | ||||||||||||||||||||||||
AllianzGI High Yield Bond | 5,438,839 | 143,335 | 2,484,978 | 169,827 | 3,160,331 | 143,335 | 115,701 | — | ||||||||||||||||||||||||
AllianzGI International Growth | 24,752,236 | 25,398 | — | 498,485 | 24,990,920 | 25,398 | — | — | ||||||||||||||||||||||||
AllianzGI Structured Return | 7,281,102 | 245,862 | — | 340,338 | 7,469,336 | 83,483 | — | 162,378 | ||||||||||||||||||||||||
PIMCO Broad U.S. TIPS Index | 10,179,477 | — | 820,499 | 169,954 | 9,171,963 | 29,946 | 26,601 | — | ||||||||||||||||||||||||
Totals | $ | 475,677,247 | $ | 10,856,580 | $ | 68,364,870 | $ | 31,757,531 | $ | 426,246,085 | $ | 8,303,791 | $ | 1,095,287 | $ | 2,582,734 | ||||||||||||||||
| AllianzGI Global Megatrends: | ||||||||||||||||||||||||||||||||
| Market Value 9/30/2016 | Purchases at Cost | Proceeds from Sales | Unrealized Appreciation (Depreciation) | Market Value 3/31/2017 | Dividend Income | Net Realized Gain (Loss) | Net Capital Gain Distributions Received | |||||||||||||||||||||||||
AllianzGI Emerging Markets Consumer | $ | 636,864 | $ | 7,136 | — | $ | 970 | $ | 670,193 | $ | 7,136 | — | — | |||||||||||||||||||
AllianzGI Global Natural Resources | 646,851 | 5,143 | — | (40,551 | ) | 629,996 | 5,143 | — | — | |||||||||||||||||||||||
AllianzGI Global Water | 616,638 | 8,298 | — | 57,101 | 605,695 | 4,732 | — | $ | 3,567 | |||||||||||||||||||||||
AllianzGI Health Sciences | 632,017 | — | — | (56,115 | ) | 662,987 | — | — | — | |||||||||||||||||||||||
AllianzGI Technology | 636,997 | 30,378 | — | 56,157 | 711,828 | — | — | 30,378 | ||||||||||||||||||||||||
Totals | $ | 3,169,367 | $ | 50,955 | — | $ | 17,562 | $ | 3,280,699 | $ | 17,011 | — | $ | 33,945 | ||||||||||||||||||
| 388 | March 31, 2017 | | Semiannual Report |
Table of Contents
| AllianzGI Global Dynamic Allocation: | ||||||||||||||||||||||||||||
| Market Value 9/30/2016 | Purchases at Cost | Proceeds from Sales | Unrealized Appreciation (Depreciation) | Market Value 3/31/2017 | Dividend Income | Net Realized Gain (Loss) | ||||||||||||||||||||||
AllianzGI Advanced Core Bond | $ | 1,462,836 | — | $ | 1,461,905 | — | — | — | $ | 41,855 | ||||||||||||||||||
AllianzGI Best Styles Emerging Markets Equity | 1,002,891 | — | 1,008,447 | — | — | — | 30,835 | |||||||||||||||||||||
AllianzGI Best Styles Global Equity | 16,573,444 | — | 16,541,935 | — | — | — | 427,093 | |||||||||||||||||||||
AllianzGI Best Styles Global Managed Volatility | 4,834,573 | — | 4,813,168 | — | — | — | 220,170 | |||||||||||||||||||||
AllianzGI Best Styles International Equity | 2,124,582 | — | 2,118,602 | — | — | — | (62,014 | ) | ||||||||||||||||||||
AllianzGI Best Styles U.S. Equity | 4,345,934 | — | 4,334,740 | — | — | — | 84,201 | |||||||||||||||||||||
PIMCO Income | 761,767 | — | 761,767 | — | — | $ | 121 | 15,819 | ||||||||||||||||||||
PIMCO Investment Grade Corporate Bond | 2,495,390 | $ | 7,389 | 2,474,489 | — | — | 7,649 | 56,348 | ||||||||||||||||||||
PIMCO Mortgage Opportunities | 755,564 | — | 755,564 | — | — | 67 | 13,788 | |||||||||||||||||||||
PIMCO Mortgage-Backed Securities | 1,516,105 | — | 1,514,688 | — | — | 138 | 26,264 | |||||||||||||||||||||
Totals | $ | 35,873,086 | $ | 7,389 | $ | 35,785,305 | — | — | $ | 7,975 | $ | 854,359 | ||||||||||||||||
| AllianzGI Global Fundamental Strategy: | ||||||||||||||||||||||||||||
| Market Value 9/30/2016 | Purchases at Cost | Proceeds from Sales | Unrealized Appreciation | Market Value 3/31/2017 | Dividend Income | Net Realized Gain (Loss) | ||||||||||||||||||||||
AllianzGI Best Styles Emerging Markets Equity | — | $ | 337,570 | — | $ | 191 | $ | 337,761 | $ | 17,557 | — | |||||||||||||||||
AllianzGI NFJ Emerging Markets Value | — | 160,784 | — | 11,605 | 172,389 | 778 | — | |||||||||||||||||||||
Totals | — | $ | 498,354 | — | $ | 11,796 | $ | 510,150 | $ | 18,335 | — | |||||||||||||||||
| AllianzGI Multi-Asset Real Return: | ||||||||||||||||||||||||||||
| Market Value 9/30/2016 | Purchases at Cost | Proceeds from Sales | Unrealized Appreciation (Depreciation) | Market Value 3/31/2017 | Dividend Income | Net Realized Gain (Loss) | ||||||||||||||||||||||
AllianzGI Global Natural Resources | $ | 1,011,131 | $ | 187,991 | $ | 185,957 | $ | (24,582 | ) | $ | 972,444 | $ | 9,122 | $ | (6,171 | ) | ||||||||||||
AllianzGI Short Duration High Income | 73,248 | 219,882 | 106,596 | 247 | 124,128 | 4,026 | (322 | ) | ||||||||||||||||||||
PIMCO 1-5 Year U.S. TIPS Index | — | 199,091 | — | 1,768 | 200,859 | — | — | |||||||||||||||||||||
PIMCO Broad U.S. TIPS Index | 436,530 | 475,297 | 516,704 | 8,602 | 381,690 | 1,976 | (4,422 | ) | ||||||||||||||||||||
PIMCO Commodity RealReturn Strategy | 774,840 | 517,954 | 333,312 | (64,470 | ) | 946,380 | 9,262 | (187,019 | ) | |||||||||||||||||||
Totals | $ | 2,295,749 | $ | 1,600,215 | $ | 1,142,569 | $ | (78,435 | ) | $ | 2,625,501 | $ | 24,386 | $ | (197,934 | ) | ||||||||||||
| 12. | FUND EVENTS |
(a) Share Class Conversion
Effective November 13, 2015, Class D shares of each Fund were converted into Class A shares of the same Fund. The Class D conversion was effected on the basis of the relative net asset values of the Class D and Class A shares involved and, following the conversion, each Fund ceased to have any Class D shares authorized or outstanding. Effective December 4, 2015, Class B shares of AllianzGI Global Allocation were converted into Class A shares of the same Fund. The Class B conversion was effected on the basis of the relative net asset values of the Class B and Class A shares involved and, following the conversion, AllianzGI Global Allocation ceased to have any Class B shares authorized or outstanding.
(b) Reorganization
Prior to the opening of business on August 29, 2016, AllianzGI Retirement Income Fund (the “Survivor Fund”) acquired all assets and liabilities of AllianzGI Retirement 2015 (the “Target Fund”). The purpose of the transaction was to combine the Funds since the Target Fund was at the end of its glidepath. The glidepath represents the shifting of Strategic Equity Component allocations over time and shows how the Fund’s asset mix becomes more conservative as the
target date approaches and passes. The acquisition was accomplished by a tax-free exchange of shares of the Target Fund, value at $25,393,211 in total, for shares of the Survivor Fund as follows:
| Shares of Target Fund | Share of Survivor Fund | |||||||
Class A | 301,729 | 312,671 | ||||||
Class C | 33,036 | 34,386 | ||||||
Class R | 13,496 | 13,577 | ||||||
Class P | 521,618 | 537,171 | ||||||
Class R6 | 463,621 | 488,918 | ||||||
Administrative Class | 874 | 892 | ||||||
The investment portfolio of the Target Fund, with a fair value of $25,379,723 and identified cost of $24,593,833 at August 26, 2016, was the principal asset acquired by the Survivor Fund. For financial reporting purposes, assets received and shares issued by the Survivor Fund were recorded at fair value; however, the cost basis of the investments received from the Target Fund was carried forward to align ongoing reporting of the Survivor Fund’s realized and unrealized gains and losses with amounts distributable to shareholders for tax
| Semiannual Report | | March 31, 2017 | 389 |
Table of Contents
Notes to Financial Statements (cont’d)
March 31, 2017 (Unaudited)
purposes. Immediately prior to the merger, the Survivor Fund’s net assets were $27,520,178 and net assets after the merger were $53,034,616. The Target Fund’s unrealized appreciation at acquisition date was $785,890.
Assuming the acquisition had been completed on October 1, 2015, the beginning of the annual reporting period of the Survivor Fund, the Survivor Fund’s pro forma results of operations for the year ended September 30, 2016, would have been as follows:
Net investment income | $ | 1,932,889 | * | |
Net realized and unrealized gain on investments | $ | 1,545,476 | ** | |
Net increase in net assets resulting from operations | $ | 3,478,365 |
| * | $1,177,184 as reported, plus $751,187 of the Target Fund premerger and a $4,518 adjustment to increase fee waiver/reimbursement from Investment Manager. |
| ** | $1,642,493 as reported, plus $(97,017) of the Target Fund premerger. |
Because both the Survivor Fund and the Target Fund continuously sold and redeemed shares throughout the period, it is not practicable to provide pro-forma information on a per-share basis.
Because the combined investment portfolios have been managed as a single integrated portfolio since the acquisition was completed, it is also not practicable to separate the amounts of revenue and earnings of the Target Fund that have been included in the Survivor Fund’s Statement of Operations since August 29, 2016.
See Note 9 for the changes in shares outstanding for the Survivor Fund during the year ended September 30, 2016.
(c) Investment Manager Merger
On September 30, 2016, Allianz Global Investors Fund Management LLC (“AGIFM”) and AllianzGI U.S served as the Funds’ investment manager and sub-adviser of certain Funds, respectively. On October 1, 2016, AGIFM merged with and into AllianzGI U.S. (the “Merger”). Following the Merger, AllianzGI U.S. assumed the services and responsibilities previously provided by AGIFM as investment manager of the Funds, and all the Funds for which AllianzGI U.S. served as sub-adviser on September 30, 2016 ceased to have a sub-adviser. AGIFM was, prior to the Merger, an indirect, wholly-owned subsidiary of AAM. The merger did not result in any change to the substantive
terms of the Agreements, which continued in effect following the merger with AllianzGI U.S. as the counterparty instead of AGIFM. The merger also did not result in any change to the manner in which investment advisory services are provided under the Agreements, the personnel responsible for providing investment advisory services to the Funds pursuant to the Agreements or the personnel ultimately responsible for overseeing the provision of such services.
(d) Investment Strategy Changes
As of October 1, 2016, certain changes to the Target Funds, including a new fee structure, adoption of the dynamic multi-asset plus (“DMAP”) investment strategy, more moderate glidepath, corresponding new benchmarks and changes to the portfolio management team, went into effect. Effective October 1, 2016, among other changes, the Target Date Funds utilize a DMAP investment strategy, investing primarily in four Allianz-sponsored underlying funds (AllianzGI Best Styles Global Equity, AllianzGI Best Styles U.S. Equity, AllianzGI Advanced Core Bond and AllianzGI Global Dynamic Allocation) and Retirement Income Fund utilizes a combination of active allocation between asset classes and the use of both actively managed and passive strategies within those asset classes, incorporating investments in Underlying Funds and Other Acquired Funds (each as defined in the Fund’s prospectus dated February 1, 2017, as amended April 10, 2017), as well as exchange-traded funds, exchange-traded notes, and derivative instruments.
Additionally, as of October 1, 2016, changes to the investment strategy and portfolio management team of the AllianzGI Global Dynamic Allocation Fund and the investment strategy of the AllianzGI Global Allocation Fund went into effect. Effective October 1, 2016, among other changes, AllianzGI Global Dynamic Allocation Fund transitioned from a fund of funds to a direct-investing fund and no longer invests significantly in Underlying Funds or Other Acquired Funds (as defined in the Fund’s prospectus dated February 1, 2017, as amended April 10, 2017) for which AllianzGI U.S. or an affiliated person serves as investment adviser but may invest in unaffiliated Other Acquired Funds. As of October 1, 2016, AllianzGI Global Allocation Fund’s maximum allocation to its Opportunistic Component (as defined in the Fund’s prospectus dated February 1, 2017, as amended April 10, 2017) increased from 10% of the Fund’s total assets to 20% of the Fund’s total assets.
(e) Expense Limitation Changes
The following Funds revised their expense limitation rates during the six months ended March 31, 2017. The expense limitation rates in effect during the period (except as noted in the tables below) and at March 31, 2017 for all the Funds are disclosed in Note 6.
| Expense Limitation (10/1/16-12/4/16) | ||||||||||||||||
| Class A | Class C | Class P | Institutional Class | |||||||||||||
AllianzGI Structured Return | 1.15 | % | 1.90 | % | 1.00 | % | 0.90 | % | ||||||||
| Expense Limitation (12/5/16-1/31/17) | ||||||||||||||||||||
| Class A | Class C | Class P | Institutional Class | Class R6 | ||||||||||||||||
AllianzGI Structured Return | 1.05 | % | 1.80 | % | 0.90 | % | 0.80 | % | 0.70 | % | ||||||||||
| 390 | March 31, 2017 | | Semiannual Report |
Table of Contents
| Expense Limitation (10/1/16-1/31/17) | ||||||||||||||||||||||||||||
| Class A | Class C | Class R | Class P | Institutional Class | Class R6 | Administrative Class | ||||||||||||||||||||||
AllianzGI Global Allocation | 0.64 | % | 1.38 | % | 0.81 | % | 0.41 | % | 0.40 | % | 0.30 | % | 0.65 | % | ||||||||||||||
AllianzGI Best Styles Emerging Markets Equity | 0.95 | % | 1.70 | % | N/A | 0.80 | % | 0.70 | % | 0.60 | % | N/A | ||||||||||||||||
AllianzGI Best Styles Global Equity | 0.75 | % | 1.50 | % | N/A | 0.60 | % | 0.50 | % | 0.40 | % | N/A | ||||||||||||||||
AllianzGI Best Styles International Equity | 0.80 | % | 1.55 | % | N/A | 0.65 | % | 0.55 | % | 0.45 | % | N/A | ||||||||||||||||
AllianzGI Best Styles U.S. Equity | 0.75 | % | 1.50 | % | N/A | 0.60 | % | 0.50 | % | 0.40 | % | N/A | ||||||||||||||||
AllianzGI Global Dynamic Allocation | 1.10 | % | 1.83 | % | 1.35 | % | 0.95 | % | 0.85 | % | 0.70 | % | 1.10 | % | ||||||||||||||
AllianzGI International Small-Cap | 1.45 | % | 2.19 | % | 1.70 | % | 1.28 | % | 1.21 | % | 1.10 | % | N/A | |||||||||||||||
AllianzGI NFJ International Small-Cap Value | 1.30 | % | 2.05 | % | N/A | 1.15 | % | 1.05 | % | 0.95 | % | N/A | ||||||||||||||||
(f) Fund Liquidation
On January 30, 2017, the AllianzGI China Equity Fund liquidated as a series of the Trust.
(g) New Share Classes
Effective December 2, 2016, AllianzGI Structured Return began offering Class R6 shares.
Effective February 1, 2017, AllianzGI Short Duration High Income began offering Class R6 shares.
Effective February 1, 2017, every Fund of the Trust registered Class T shares; however Class T shares currently are not available for purchase.
| 13. | PAYMENTS FROM AFFILIATES |
During the six months ended March 31, 2017, NFJ reimbursed AllianzGI NFJ Emerging Markets Value $299 and AllianzGI U.S. reimbursed AllianzGI NFJ International Value II $30,285 for realized losses resulting from trading errors.
During the year ended September 30, 2016, AllianzGI U.S. reimbursed AllianzGI Best Styles Emerging Markets Equity, AllianzGI U.S. Equity Hedged and AllianzGI NFJ Emerging Markets Value $1,397, $254 and $203, respectively, and NFJ reimbursed AllianzGI NFJ Emerging Markets Value $41 for realized losses resulting from trading errors.
| 14. | IN-KIND TRANSACTIONS |
During the six months ended March 31, 2017, AllianzGI Best Styles Global Equity, AllianzGI Best Styles U.S. Equity and AllianzGI U.S. Small-Cap Growth transferred securities and cash to its shareholders in connection with redemption in-kind transactions. These transactions were treated as a sale of securities for U.S. GAAP, and the resulting gains and losses as shown in the table below were recognized based on the market value of the securities on the date of the transfers. For tax purposes, no gains or losses were recognized. The realized gains and losses from the redemptions in-kind are netted and recorded as net realized gain on investments on the Statements of Operations. The number of shares redeemed in-kind and redemption value as shown in the table below are included in the “Cost of shares redeemed” in Note 9.
During the six months ended March 31, 2017, AllianzGI Global Dynamic Allocation accepted securities from its shareholders in connection with subscription in-kind transactions. For financial reporting and tax purposes, the cost basis of contributed securities is equal to the market value of the securities on the date of contribution. The Fund sold 3,838,197 shares of Class R6 in-kind with a subscription value of $70,264,752. The number of shares sold and subscription value are included in “Shares sold” in Note 9.
| Shares Redeemed In-Kind | Redemption Value | Realized Gains | Realized Losses | |||||||||||||
AllianzGI Best Styles Global Equity (Class R6) | 1,002,664 | $ | 15,791,959 | $ | 1,133,858 | $ | 438,244 | |||||||||
AllianzGI Best Styles U.S. Equity (Class R6) | 2,918,758 | 45,202,958 | 3,028,405 | 1,558,720 | ||||||||||||
AllianzGI U.S. Small-Cap Growth (Institutional Class) | 348,578 | 4,841,742 | 770,593 | 124,702 | ||||||||||||
| 15. | BORROWINGS |
During a portion of the reporting period, the Trust was party to a credit agreement (the “Northern Trust Agreement”), among the Trust, Allianz Funds, AllianzGI Institutional Multi-Series Trust and Premier Multi-Series VIT, as borrowers (collectively, the “AllianzGI Borrowers” and each series thereof, an “AllianzGI Borrower Fund”), and Northern Trust Company, as lender, for a committed line of credit. The Northern Trust Agreement permitted the AllianzGI Borrowers to borrow up to $200 million in aggregate, subject to (i) a requirement that each AllianzGI Borrower Fund’s asset coverage with respect to senior securities representing indebtedness be 300% or higher, and
(ii) certain other limitations and conditions. Each AllianzGI Borrower Fund paid interest on any amounts borrowed under the facility at the greater of (i) the federal funds overnight rate plus 1.00% or (ii) 1.50%, subject to upward adjustment when any past-due payments are outstanding. The AllianzGI Borrowers also paid a usage fee at an annualized rate of 0.15% on undrawn amounts, allocated pro rata among the AllianzGI Borrower Funds on the basis of net assets.
The Northern Trust Agreement had an original maturity date of July 29, 2016, which was extended by 90 days and expired on October 27, 2016.
| Semiannual Report | | March 31, 2017 | 391 |
Table of Contents
Notes to Financial Statements (cont’d)
March 31, 2017 (Unaudited)
On October 27, 2016, the Trust entered into a credit agreement (the “State Street Agreement”), among the Trust, Allianz Funds, AllianzGI Institutional Multi-Series Trust and Premier Multi-Series VIT, as borrowers (collectively, the “AllianzGI Borrowers” and each series thereof, an “AllianzGI Borrower Fund”), and State Street Bank and Trust Company, as agent and lender, for a committed line of credit. The State Street Agreement replaced a preexisting credit agreement with the Northern Trust Company. The State Street Agreement has a 364 day term through October 26, 2017 and permits the AllianzGI Borrowers to borrow up to $200 million in aggregate, subject to (i) a requirement that each AllianzGI Borrower Fund’s asset coverage with respect to senior securities representing indebtedness be 300% or higher, and (ii) certain other limitations and conditions. Each AllianzGI Borrower Fund will pay interest on any amounts borrowed under the facility at a rate per annum equal to 1.25% plus the higher of the then-current federal funds overnight rate or the one-month LIBOR rate, subject to upward adjustment when any past due payments are outstanding. The AllianzGI Borrowers will also pay a usage fee at an annualized rate of 0.25% on undrawn amounts, allocated pro rata among the AllianzGI Borrower Funds on the basis of net assets. Amounts borrowed may be repaid and reborrowed on a revolving basis during the term of the facility.
The Funds did not utilize either line of credit during the six months ended March 31, 2017.
| 16. | RELATED PARTY TRANSACTIONS |
The Investment Manager is a related party. Fees payable to this party are disclosed in Note 5 and the accrued related party fee amounts are disclosed on the Statements of Assets and Liabilities.
Certain Funds are permitted to purchase or sell securities from or to certain related affiliated funds under specified conditions outlined in procedures adopted by the Board. The procedures have been designed to ensure that any purchase or sale of securities by the Funds from or to another fund or portfolio that are, or could be, considered an affiliate by virtue of having a common investment adviser (or affiliated investment advisers), common Trustees and/or common officers comply with Rule 17a-7 of the 1940 Act. Further, as defined under the procedures, each transaction is effected at the current market price.
During the six months ended March 31, 2017, the following Fund engaged in sales of securities pursuant to Rule 17a-7 of the 1940 Act:
| Purchases | Sales | |||||||
AllianzGI Convertible | — | $ | 41,987,844 | |||||
| 17. | SUBSEQUENT EVENTS |
In preparing these financial statements, the Funds’ management has evaluated events and transactions for potential recognition or disclosure through the date the financial statements were issued.
Effective April 1, 2017, for AllianzGI Global Fundamental Strategy, the Investment Manager has contractually agreed to a temporary waiver
of a portion of the investment management fee, which reduces the annual percentage rate from 0.75% to 0.61% through March 31, 2018. Additionally, the expense limitation for each share class was reduced by 0.14% through March 31, 2018.
Effective April 1, 2017, for AllianzGI Global Sustainability, the Investment Manager has contractually agreed to a temporary waiver of a portion of the investment management fee, which reduces the annual percentage rate from 0.80% to 0.69% through March 31, 2018. Additionally, the expense limitation for each share class was reduced by 0.11% through March 31, 2018.
Effective April 1, 2017, for AllianzGI Global Water, the Investment Manager has contractually agreed to a temporary waiver of a portion of the investment management fee, which reduces the annual percentage rate from 0.95% to 0.73% through March 31, 2018.
Effective April 1, 2017, for AllianzGI International Growth, the Investment Manager has contractually agreed to observe a permanent reduction in the investment management fee, which reduces the annual percentage rate from 0.80% to 0.70%. Additionally, the expense limitation for each share class was reduced by 0.15% through March 31, 2018.
Effective April 1, 2017, for AllianzGI International Small-Cap, the Investment Manager has contractually agreed to a temporary waiver of a portion of the investment management fee, which reduces the annual percentage rate from 1.00% to 0.89% through March 31, 2018. Additionally, the expense limitation for each share class was reduced by 0.11% through March 31, 2018.
Effective April 1, 2017, for AllianzGI Multi-Asset Real Return, the Investment Manager has contractually agreed to a temporary waiver of a portion of the investment management fee, which reduces the annual percentage rate from 0.75% to 0.58% through March 31, 2018. Additionally, the expense limitation for each share class was reduced by 0.17% through March 31, 2018.
Effective April 1, 2017, for AllianzGI NFJ Emerging Market Value, the Investment Manager has contractually agreed to a temporary waiver of a portion of the investment management fee, which reduces the annual percentage rate from 0.85% to 0.65% through March 31, 2018. Additionally, the expense limitation for each share class was reduced by 0.20% through March 31, 2018.
Amounts waived pursuant to each of the temporary investment management fee waivers described in the preceding sentences are separate from and would not be included with the amounts subject to potential recoupment under the Expense Limitation Agreement.
AllianzGI Retirement Income has revised its dividend payment frequency from quarterly to monthly effective with shareholders of record date April 19, 2017 and dividends declared and paid on April 20, 2017. Also, in addition to dividends from net investment income the Fund may now distribute short-term capital gains.
| 392 | March 31, 2017 | | Semiannual Report |
Table of Contents
On April 20, 2017, the following Funds declared per-share net investment income dividends to shareholders, payable April 20, 2017 to shareholders of record on April 19, 2017.
| Class A | Class C | Class R | Class P | Institutional Class | Class R6 | Administrative Class | ||||||||||||||||||||||
AllianzGI Retirement Income | $ | 0.07051 | $ | 0.05921 | $ | 0.06477 | $ | 0.07497 | N/A | $ | 0.07546 | $ | 0.07114 | |||||||||||||||
AllianzGI High Yield Bond | $ | 0.04117 | $ | 0.03715 | $ | 0.03952 | $ | 0.04554 | $ | 0.04500 | N/A | $ | 0.04436 | |||||||||||||||
AllianzGI Short Duration High Income | $ | 0.06000 | $ | 0.05742 | N/A | $ | 0.06390 | $ | 0.06456 | $ | 0.06432 | N/A | ||||||||||||||||
On May 3, 2017, the AllianzGI Global High Yield Fund commenced operations as a series of the Trust, offering Class P and Institutional Class shares. The Fund seeks total return with a controlled level of portfolio risk. The Fund will seek to achieve its investment objective by
investing primarily in actively traded global fixed income securities, including fixed and floating rate corporate, government and government agency debt securities.
On May 18, 2017, the following Funds declared per-share net investment income dividends to shareholders, payable May 18, 2017 to shareholders of record on May 17, 2017.
| Class A | Class C | Class R | Class P | Institutional Class | Class R6 | Administrative Class | ||||||||||||||||||||||
AllianzGI Retirement Income | $ | 0.07065 | $ | 0.05902 | $ | 0.06476 | $ | 0.07531 | N/A | $ | 0.07571 | $ | 0.07134 | |||||||||||||||
AllianzGI High Yield Bond | $ | 0.04105 | $ | 0.03679 | $ | 0.03771 | $ | 0.04551 | $ | 0.04500 | N/A | $ | 0.04401 | |||||||||||||||
AllianzGI Short Duration High Income | $ | 0.05500 | $ | 0.05229 | N/A | $ | 0.05904 | $ | 0.05957 | $ | 0.05956 | N/A | ||||||||||||||||
| Semiannual Report | | March 31, 2017 | 393 |
Table of Contents
Unaudited
Matters Relating to the Trustees’ Consideration of the Investment Management and Sub-Advisory Agreements
The Investment Company Act of 1940, as amended, requires that both the full Board of Trustees (the “Board” or the “Trustees”) and a majority of the Trustees who are not interested persons of the Trust (the “Independent Trustees”), voting separately, initially approve the investment management agreement for a new fund.
At an in-person meeting held on March 22, 2017, the Board and the Independent Trustees unanimously approved, for an initial 2-year term, the Trust’s Amended and Restated Investment Management Agreement (the “Investment Management Agreement”) with Allianz Global Investors U.S. LLC (the “Investment Manager”) on behalf of AllianzGI Global High Yield Fund (the “New Fund”), a new series of the Trust. The New Fund commenced operations on May 3, 2017.
The material factors and conclusions that formed the basis of these approvals for the New Fund are discussed below.
The Independent Trustees were assisted in their evaluation of the Investment Management Agreement and the factors that they deemed to be material, including those factors described below, by independent legal counsel, from whom they received separate legal advice and with whom they met separately from Fund management during their contract review meeting.
In connection with their deliberations regarding the proposed approval of the New Fund Investment Management Agreement, the Trustees, including the Independent Trustees considered such information and factors as they believed, in light of the legal advice furnished to them and their own business judgment, to be relevant. As described below, the Trustees considered the nature, quality and extent of the various investment management, administrative and other services to be performed by AllianzGI U.S., the New Fund’s investment manager (the “Investment Manager”), under the Investment Management Agreement.
In connection with their deliberations, the Trustees received and relied upon materials provided by the Investment Manager including, among other items: (i) information compiled from Morningstar Direct (“Morningstar”), an independent third party, on the investment performance for various time periods, including annualized return performance information for certain time periods, of a group of funds with investment classifications and/or objectives comparable to those proposed for the New Fund, (ii) information on the New Fund’s management fees and other anticipated expenses and information compiled from Morningstar on the management fees and other expenses of comparable funds, (iii) information regarding the investment performance and fees for other funds and accounts managed by the Investment Manager or an affiliate, including institutional and separate accounts, with similar investment objective(s) and policies to those of the New Fund, (iv) an estimate of the profitability to the Investment Manager from its relationship with the New Fund during its first year, (v) descriptions of various functions to be performed by the Investment Manager for the New Fund, such as portfolio management, compliance monitoring and portfolio
trading practices, and (vi) information regarding the overall organization and business functions of the Investment Manager, including, without limitation, information regarding senior management, portfolio managers and other personnel proposed to provide investment management, administrative and other services to the New Fund.
The Trustees’ conclusions as to the approval of the Investment Management Agreement were based on a comprehensive consideration of all information provided to the Trustees and were not the result of any single factor. Some of the factors that figured particularly in the Trustees’ deliberations are described below, although individual Trustees may have evaluated the information presented differently from one another, giving different weights to various factors. The Trustees also took into account that AllianzGI U.S. had proposed to observe certain advisory fee waivers and/or expense limitations for the New Fund. The Trustees also considered the risk profile of the New Fund.
As part of their review, the Trustees examined the ability of the Investment Manager to provide high-quality investment management and other services to the New Fund. Among other information, the Trustees considered the investment philosophy and research and decision making processes of the Investment Manager and its affiliates, taking into account that the New Fund would be managed by personnel of Rogge Global Partners Limited (“Rogge”), a recently acquired affiliate of the Investment Manager, acting in their capacities as “associates persons” of the Investment Manager. The Trustees considered, among other information, the experience of key advisory personnel of Rogge and the Investment Manager who would be responsible for portfolio management of the New Fund; the ability of the Investment Manager to attract and retain capable personnel; and the capability of the senior management and staff of the Investment Manager. In addition, the Trustees reviewed the quality of the Investment Manager’s expected services with respect to regulatory compliance and ability to comply with the investment and compliance policies and procedures of the New Fund; the nature, extent and quality of certain administrative services the Investment Manager would be responsible for providing to the New Fund; and conditions that might affect the Investment Manager’s ability to provide high quality services to the New Fund in the future under the Investment Management Agreement, including the Investment Manager’s financial condition and operational stability. The Trustees also considered the historical investment performance information of accounts managed by Rogge in the global high yield strategy to be used for the New Fund. Based on the foregoing, the Trustees concluded that the Investment Manager and Rogge’s investment process, research capabilities and philosophy were well-suited to the New Fund, given the New Fund’s investment objectives and policies, and that the Investment Manager would be able to meet any reasonably foreseeable obligations under the Investment Management Agreement.
| 394 | March 31, 2017 | | Semiannual Report |
Table of Contents
In assessing the reasonableness of the New Fund’s proposed fees and expenses under the Investment Management Agreement, the Trustees considered, among other information, the New Fund’s proposed management fee and its expected net expense ratio as a percentage of anticipated average daily net assets, taking into account the management fee waiver and/or expense limitation arrangements that the Investment Manager would observe, and the advisory fees and net expense ratios of peer groups of funds based on information provided by Morningstar.
The Trustees considered how the net expense ratio of the New Fund was expected to compare to its Morningstar peers, and considered comparisons of the New Fund’s proposed management fee with the advisory fees of the peer funds compiled from Morningstar. The Trustees noted that the proposed management fees and estimated net expense ratio for Institutional Class shares of the New Fund were lower than both the average and median for Institutional Class shares of funds in the Morningstar peer group.
The Trustees also considered the management fees charged by the Investment Manager to other funds and accounts with similar investment strategies to the New Fund.
The Trustees also considered the estimated profitability to the Investment Manager from its relationship with the New Fund and noted that such profitability was expected to be negative for the New Fund’s first year of operations based on average net asset assumptions.
The Trustees considered the extent to which the Investment Manager may realize economies of scale or other efficiencies in managing and supporting the New Fund. The Trustees took into account that, as an open-end investment company, the New Fund intends to raise additional assets, so as the assets of the New Fund increase over time, certain economies of scale and other efficiencies may be realized through spreading certain fixed costs over a larger asset base or across a variety of products and services. In this regard, they also took into account the management fee waiver and/or expense limitation arrangements proposed to be observed by the Investment Manager for the New Fund.
Additionally, the Trustees considered so-called “fall-out benefits” to the Investment Manager and its affiliates, such as reputational value derived from serving as investment manager to the New Fund.
After reviewing these and other factors described herein, the Trustees concluded, within the context of their overall conclusions regarding the Investment Management Agreement, that the proposed fees payable under the Investment Management Agreement represent reasonable compensation in light of the nature, extent and quality of the services to be provided by the Investment Manager and should be approved for an initial two-year period. After further discussion, and based on their evaluation of factors they deemed to be material, including those factors described above, the Trustees, including the Independent Trustees, unanimously concluded that the initial approval of the Investment Management Agreement was in the interests of the New Fund and its shareholders and should be approved.
| Semiannual Report | | March 31, 2017 | 395 |
Table of Contents
Unaudited
Privacy Policy
Please read this Policy carefully. It gives you important information about how Allianz Global Investors U.S. and its U.S. affiliates (“AllianzGI US,” “we” or “us”) handle non-public personal information (“Personal Information”) that we may receive about you. It applies to all of our past, present and future clients and shareholders of AllianzGI US and the funds and accounts it manages, advises, sub-advises, administers or distributes, and will continue to apply when you are no longer a client or shareholder. As used throughout this Policy, “AllianzGI US” means Allianz Global Investors U.S. LLC, Allianz Global Investors Distributors LLC, NFJ Investment Group LLC and the family of registered and unregistered funds managed by one or more of these firms. AllianzGI US is part of a global investment management group, and the privacy policies of other Allianz Global Investors entities outside of the United States may have provisions in their policies that differ from this Privacy Policy. Please refer to the website of the specific non-US Allianz Global Investors entity for its policy on privacy.
We Care about Your Privacy
We consider your privacy to be a fundamental aspect of our relationship with you, and we strive to maintain the confidentiality, integrity and security of your Personal Information. To ensure your privacy, we have developed policies that are designed to protect your Personal Information while allowing your needs to be served.
Information We May Collect
In the course of providing you with products and services, we may obtain Personal Information about you, which may come from sources such as account application and other forms, from other written, electronic, or verbal communications, from account transactions, from a brokerage or financial advisory firm, financial advisor or consultant, and/or from information you provide on our website.
You are not required to supply any of the Personal Information that we may request. However, failure to do so may result in us being unable to open and maintain your account, or to provide services to you.
How Your Information Is Shared
We do not disclose your Personal Information to anyone for marketing purposes. We disclose your Personal Information only to those service providers, affiliated and non-affiliated, who need the information for everyday business purposes, such as to respond to your inquiries, to perform services, and/or to service and maintain your account. This applies to all of the categories of Personal Information we collect about you. The affiliated and non-affiliated service providers who receive your Personal Information also may use it to process your transactions, provide you with materials (including preparing and mailing prospectuses and shareholder reports and gathering shareholder proxies), and provide you with account statements and other materials relating to your account. These service providers provide services at our direction, and under their agreements with us, are required to keep your Personal Information confidential and to use it only for providing the contractually required services. Our service providers may not use your Personal Information to market products and services to you except in conformance with applicable laws and regulations. We also may provide your Personal Information to your respective brokerage or financial advisory firm, custodian, and/or to your financial advisor or consultant.
In addition, we reserve the right to disclose or report Personal Information to non-affiliated third parties, in limited circumstances, where we believe in good faith that disclosure is required under law, to cooperate with regulators or law enforcement authorities or pursuant to other legal process, or to protect our rights or property, including to enforce our Privacy Policy or other agreements with you. Personal Information collected by us may also be transferred as part of a corporate sale, restructuring, bankruptcy, or other transfer of assets.
Security of Your Information
We maintain your Personal Information for as long as necessary for legitimate business purposes or otherwise as required by law. In maintaining this information, we have implemented appropriate procedures that are designed to restrict access to your Personal Information only to those who need to know that information in order to provide products and/or services to you. In addition, we have implemented physical, electronic and procedural safeguards to help protect your Personal Information.
Privacy and the Internet
The Personal Information that you provide through our website, as applicable, is handled in the same way as the Personal Information that you provide by any other means, as described above. This section of the Policy gives you additional information about the way in which Personal Information that is obtained online is handled.
| ∎ | Online Enrollment, Account Access and Transactions: When you visit our website, you can visit pages that are open to the general public, or, where available, log into protected pages to enroll online, access information about your account, or conduct certain transactions. Access to the |
| 396 | March 31, 2017 | | Semiannual Report |
Table of Contents
Unaudited
Privacy Policy (cont’d)
| secure pages of our website is permitted only after you have created a User ID and Password. The User ID and Password must be supplied each time you want to access your account information online. This information serves to verify your identity. When you enter Personal Information into our website (including your Social Security Number or Taxpayer Identification Number and your password) to enroll or access your account online, you will log into secure pages. By using our website, you consent to this Privacy Policy and to the use of your Personal Information in accordance with the practices described in this Policy. If you provide Personal Information to effect transactions on our website, a record of the transactions you have performed while on the site is retained by us. For additional terms and conditions governing your use of our website, please refer to the Investor Mutual Fund Access — Disclaimer which is incorporated herein by reference and is available on our website. |
| ∎ | Cookies and Similar Technologies: Cookies are small text files stored in your computer’s hard drive when you visit certain web pages. Cookies and similar technologies help us to provide customized services and information. We use these technologies on our website to improve our website and services, including to evaluate the effectiveness of our site, and to enhance the site user experience. Because an industry-standard Do-Not-Track protocol is not yet established, our website will continue to operate as described in this Privacy Policy and will not be affected by any Do-Not-Track signals from any browser. |
Changes to Our Privacy Policy
We may modify this Privacy Policy from time-to-time to reflect changes in related practices and procedures, or applicable laws and regulations. If we make changes, we will notify you on our website and the revised Policy will become effective immediately upon posting to our website. We also will provide account owners with a copy of our Privacy Policy annually. We encourage you to visit our website periodically to remain up to date on our Privacy Policy. You acknowledge that by using our website after we have posted changes to this Privacy Policy, you are agreeing to the terms of the Privacy Policy as modified.
Obtaining Additional Information
If you have any questions about this Privacy Policy or our privacy related practices in the United States, you may contact us via our dedicated email at PrivacyUS@allianzgi.com.
| Semiannual Report | | March 31, 2017 | 397 |
Table of Contents
Allianz Multi-Strategy Funds
Trustees
Davey S. Scoon
Chairman of the Board of Trustees
Barbara R. Claussen
Deborah A. DeCotis
F. Ford Drummond
A. Douglas Eu
Bradford K. Gallagher
James A. Jacobson
Hans W. Kertess
James S. MacLeod
William B. Ogden, IV
Alan Rappaport
Officers
Thomas J. Fuccillo
President & Chief Executive Officer
Lawrence G. Altadonna
Treasurer, Principal Financial & Accounting Officer
Angela Borreggine
Chief Legal Officer & Secretary
Thomas L. Harter
Chief Compliance Officer
Scott Whisten
Assistant Treasurer
Richard J. Cochran
Assistant Treasurer
Orhan Dzemaili
Assistant Treasurer
Debra Rubano
Assistant Secretary
Paul Koo(1)
Assistant Secretary
Morley D. Campbell(2)
Assistant Secretary
Thomas W. Oliver(2)
Assistant Secretary
Investment Manager
Allianz Global Investors U.S. LLC
1633 Broadway
New York, NY 10019
Sub-Adviser
NFJ Investment Group LLC
2100 Ross Avenue, Suite 700
Dallas, TX 75201
Distributor
Allianz Global Investors Distributors LLC
1633 Broadway
New York, NY 10019
Custodian & Accounting Agent
State Street Bank & Trust Co.
801 Pennsylvania Avenue
Kansas City, MO 64105
Shareholder Servicing and Transfer Agents
Boston Financial Data Services, Inc.
(Class A, Class C and Class R shares)
P.O. Box 8050
Boston, MA 02266-8050
(Class P, Institutional Class, Class R6 and Administrative Class shares)
330 West 9th Street, 5th Floor
Kansas City, MO 64105
Independent Registered Public Accounting Firm
PricewaterhouseCoopers LLP
300 Madison Avenue
New York, NY 10017
Legal Counsel
Ropes & Gray LLP
Prudential Tower
800 Boylston Street
Boston, MA 02199
This report, including the financial information herein, is transmitted to the shareholders of the Funds for their information. It is not a prospectus, circular or representation intended for use in the purchase of shares of each Fund or any securities mentioned in this report.
The Financial information included herein is taken from the records of the Funds without examination by an independent registered public accounting firm, who did not express an opinion herein.
For Account Information
Contact your financial adviser, or if you receive account statements directly from Allianz Global Investors, you can also call (800) 988-8380 for Class A, C and R shares or (800) 498-5413 for Class P, Institutional, R6 and Administrative shares. Telephone representatives are available Monday-Friday 8:30 am to 6:00 pm Eastern Time. Or visit our website, us.allianzgi.com.
| (1) | Paul Koo is Assistant Secretary of the Trust with a limited authority to open, maintain and close certain custodial and trading accounts for all series of the Trust. |
| (2) | Morley D. Campbell and Thomas W. Oliver are Assistant Secretaries of the Trust with a limited authority to open, maintain and close certain custodial and training accounts for the AllianzGI NFJ Emerging Markets Value Fund. |
Table of Contents
About Allianz Global Investors
Understand. Act. This two-word philosophy is at the core of what we do. To stand out as the investment partner our clients trust, we listen closely to understand their needs, then act decisively to deliver solutions. We are a diversified active investment manager with a strong parent company, a culture of risk management and more than $535 billion in AUM. With 25 offices worldwide and over 600 investment professionals, we provide global investment and research capabilities with consultative local delivery.*
For more information about any of our investment solutions or client services, call your financial advisor or visit us.allianzgi.com.
Investors should consider the investment objectives, risks, charges and expenses of the above mentioned Funds carefully before investing. This and other information is contained in the Fund’s prospectus, which may be obtained by contacting your financial advisor, by visiting us.allianzgi.com or by calling 1-800-988-8380 (retail classes: A, C & R) or 1-800-498-5413 (Class P, Class R6, Institutional & Administrative classes). Please read the prospectus carefully before you invest or send money.
* Data as of March 31, 2017; investment professionals as of September 30, 2016.
Allianz Global Investors U.S. LLC serves as the investment manager for the Allianz Funds and the Allianz Multi-Strategy Funds. Allianz Funds and the Allianz Multi-Strategy Funds are distributed by Allianz Global Investors Distributors LLC. © 2016. For information about any product, contact your financial advisor.
us.allianzgi.com
Receive this report electronically and eliminate paper mailings.
To enroll, go to us.allianzgi.com/edelivery
| AZ750SA_033117 |
132732
Table of Contents
| ITEM 2. | CODE OF ETHICS |
| (a) | Not required in this filing. |
| ITEM 3. | AUDIT COMMITTEE FINANCIAL EXPERT |
Not required in this filing.
| ITEM 4. | PRINCIPAL ACCOUNTANT FEES AND SERVICES |
Not required in this filing.
| ITEM 5. | AUDIT COMMITTEE OF LISTED REGISTRANT |
Disclosure not required for open-end management investment companies.
| ITEM 6. | SCHEDULE OF INVESTMENTS |
| (a) | Schedule of Investments is included as part of the report to shareholders filed under Item 1 of this form. |
| (b) | Not applicable. |
| ITEM 7. | DISCLOSURE OF PROXY VOTING POLICIES AND PROCEDURES FOR CLOSED-END MANAGEMENT INVESTMENT COMPANIES |
Disclosure not required for open-end management investment companies.
| ITEM 8. | PORTFOLIO MANAGERS OF CLOSED-END MANAGEMENT INVESTMENT COMPANIES |
Disclosure not required for open-end management investment companies.
| ITEM 9. | PURCHASES OF EQUITY SECURITIES BY CLOSED-END MANAGEMENT INVESTMENT COMPANY AND AFFILIATED COMPANIES. |
Disclosure not required for open-end management investment companies.
| ITEM 10. | SUBMISSION OF MATTERS TO A VOTE OF SECURITY HOLDERS |
There were no material changes to the procedures by which shareholders may recommend nominees to the Fund’s Board of Trustees since the Fund’s last provided disclosure in response to this item.
| ITEM 11. | CONTROLS AND PROCEDURES |
| (a) | The registrant’s President & Chief Executive Officer and Treasurer, Principal Financial & Accounting Officer have concluded that the registrant’s disclosure controls and procedures (as defined in Rule 30a-3(c) under the Act (17 CFR 270.30a-3(c))), are effective based on their evaluation of these controls and procedures as of a date within 90 days of the filing date of this document. |
| (b) | There were no significant changes in the registrant’s internal control over financial reporting (as defined in Rule 30a-3(d) under the Act (17 CFR 270.30a-3(d))) that occurred during the second fiscal quarter of the period covered by this report that has materially affected, or is reasonably likely to materially affect, the registrant’s internal control over financial reporting. |
Table of Contents
| ITEM 12. | EXHIBITS |
(a) (1) Not required in this filing.
(a) (2) Exhibit 99.302 Cert. — Certification pursuant to Section 302 of the Sarbanes-Oxley Act of 2002
(a) (3) Not applicable
(b) Exhibit 99.906 Cert. — Certification pursuant to Section 906 of the Sarbanes-Oxley Act of 2002
Table of Contents
Signatures
Pursuant to the requirements of the Securities Exchange Act of 1934 and the Investment Company Act of 1940, the registrant has duly caused this report to be signed on its behalf by the undersigned, thereunto duly authorized.
| Allianz Funds Multi-Strategy Trust | ||
| By: | /s/ Thomas J. Fuccillo | |
| Thomas J. Fuccillo | ||
| President & Chief Executive Officer | ||
| Date: | June 2, 2017 | |
| By: | /s/ Lawrence G. Altadonna | |
| Lawrence G. Altadonna | ||
Treasurer, Principal Financial & Accounting Officer | ||
| Date: | June 2, 2017 | |
Pursuant to the requirements of the Securities Exchange Act of 1934 and the Investment Company Act of 1940, this report has been signed below by the following persons on behalf of the registrant and in the capacities and on the dates indicated.
| By: | /s/ Thomas J. Fuccillo | |
| Thomas J. Fuccillo | ||
| President & Chief Executive Officer | ||
| Date: | June 2, 2017 | |
| By: | /s/ Lawrence G. Altadonna | |
| Lawrence G. Altadonna | ||
Treasurer, Principal Financial & Accounting Officer | ||
| Date: | June 2, 2017 | |