UNITED STATES
SECURITIES AND EXCHANGE COMMISSION
Washington, D.C. 20549
FORMN-CSR
CERTIFIED SHAREHOLDER REPORT OF REGISTERED
MANAGEMENT INVESTMENT COMPANIES
Investment Company Act file number:811-22167
Allianz Funds Multi-Strategy Trust
(Exact name of registrant as specified in charter)
1633 Broadway, New York, NY 10019
(Address of principal executive offices) (Zip code)
Scott Whisten
1633 Broadway, New York, NY 10019
(Name and address of agent for service)
Registrant’s telephone number, including area code:212-739-3367
Date of fiscal year end: September 30
Date of reporting period: March 31, 2020
Item 1. Report to Shareholders

Allianz Funds
Multi-Strategy Trust
SHARE CLASSES A, C, R, P, INSTITUTIONAL, R6, ADMINISTRATIVE
Semiannual Report
March 31, 2020
AllianzGI Retirement 2020 Fund
AllianzGI Retirement 2025 Fund
AllianzGI Retirement 2030 Fund
AllianzGI Retirement 2035 Fund
AllianzGI Retirement 2040 Fund
AllianzGI Retirement 2045 Fund
AllianzGI Retirement 2050 Fund
AllianzGI Retirement 2055 Fund
AllianzGI Multi Asset Income Fund
AllianzGI Best Styles Global Equity Fund
AllianzGI Best Styles U.S. Equity Fund
AllianzGI Convertible Fund
AllianzGI Core Bond Fund
AllianzGI Core Plus Bond Fund
AllianzGI Emerging Markets Consumer Fund
AllianzGI Emerging Markets Small-Cap Fund
AllianzGI Emerging Markets SRI Debt Fund
AllianzGI Emerging Markets Value Fund (formerly AllianzGI NFJ Emerging Markets Value Fund)
AllianzGI Floating Rate Note Fund
AllianzGI Global Allocation Fund
AllianzGI Global Dynamic Allocation Fund
AllianzGI Global High Yield Fund
AllianzGI Global Sustainability Fund
AllianzGI Green Bond Fund
AllianzGI High Yield Bond Fund
AllianzGI International Small-Cap Fund
AllianzGI Micro Cap Fund
AllianzGI PerformanceFee Managed Futures Strategy Fund
AllianzGI PerformanceFee Structured US Equity Fund
AllianzGI PerformanceFee Structured US Fixed Income Fund
AllianzGI Preferred Securities and Income Fund
AllianzGI Short Duration High Income Fund
AllianzGI Short Term Bond Fund
AllianzGI Structured Return Fund
AllianzGI U.S. Equity Hedged Fund
AllianzGI Ultra Micro Cap Fund
AllianzGI Water Fund (formerly AllianzGI Global Water Fund)
This material is authorized for use only when preceded or accompanied by the current Allianz Funds Multi-Strategy Trust prospectus. Investors should consider the investment objectives, risks, charges and expenses of each Fund carefully before investing. This and other information is contained in the Funds’ prospectuses and summary prospectuses. Please read the prospectus carefully before you invest.
Beginning on January 1, 2021, as permitted by regulations adopted by the U.S. Securities and Exchange Commission, paper copies of shareholder reports will no longer be sent by mail, unless you specifically request paper copies of the reports. Instead, the reports will be made available on the Funds’ website (us.allianzgi.com), and you will be notified by mail each time a report is posted and provided with a website link to access the report.
If you already elected to receive shareholder reports electronically, you will not be affected by this change and you need not take any action. You may elect to receive shareholder reports and other communications from a Fund electronically anytime by contacting your financial intermediary (such as a broker-dealer or bank) or, if you are a direct investor, by enrolling at us.allianzgi.com/edelivery.
If you prefer to receive paper copies of your shareholder reports after January 1, 2021, direct investors may inform a Fund at any time. If you invest through a financial intermediary, you should contact your financial intermediary directly. Paper copies are provided free of charge and your election to receive reports in paper will apply to all funds held with the fund complex if you invest directly with a Fund or all funds held in your account if you invest through your financial intermediary.

Receive this report electronically and eliminate paper mailings.
To enroll, go to us.allianzgi.com/edelivery.
Table of Contents
A Word About Risk:A fund may be subject to various risks as described in its prospectus. Some of those risks may include, but are not limited to, the following: derivatives risk, smaller company risk, non-US investment risk, focused investment risk and specific sector investment risks. Use of derivative instruments may involve certain costs and risks such as liquidity risk, interest rate risk, market risk, credit risk, counterparty risk, management risk and the risk that a fund is unable to close out a position when it is most advantageous to do so. Portfolios investing in derivatives could lose more than the principal amount invested in those instruments. Investing in foreign securities may entail risk due to foreign economic and political developments; this risk may be enhanced when investing in emerging markets. Smaller companies may be more volatile than larger companies and may entail more risk. Concentrating investments in individual sectors may add additional risk and additional volatility compared to a diversified equity portfolio. AllianzGI target-date funds seek to manage risk and return by blending two separately-managed portfolios: a return-generating portfolio for growth potential, and a defensive portfolio for principal protection. The balance grows increasingly defensive over time until the target date is reached, after which the Fund’s assets roll into a retirement income strategy. The principal values of the Funds are not guaranteed at any time, including the target date. Please refer to each Fund’s applicable current prospectus for complete details.
Letter from the President

Thomas J. Fuccillo
President & CEO
Dear Shareholder,
The lengthy US expansion appears to be in jeopardy, as activity came to a virtual halt in many areas of the economy toward the end of the six-month fiscal reporting period ended March 31, 2020. This was largely due to the rapid spread of the novel coronavirus (“COVID-19”) and its impact on global growth. Against this backdrop, global equities fell sharply. Meanwhile, the overall US bond market rallied sharply as investor risk aversion increased.
Six Months in Review
During the reporting period, US stocks, as measured by the Standard & Poor’s 500 Index, returned -12.31%. Two measures of stock performance in developed international and global markets, the MSCI EAFE (Europe, Australasia and Far East) Index (net) and the MSCI World Index (net), returned -16.52% and -14.30%, respectively, in dollar-denominated terms. Elsewhere, the MSCI Emerging Markets Index (net) returned -14.55%. With respect to the bond market, the Bloomberg Barclays US Credit Index returned -2.13%, whereas the Bloomberg Barclays Global High Yield Index returned -12.05%. The Bloomberg Barclays US Government Bond Index returned 2.68%, while the broader bond market index, as measured by the Bloomberg Barclays US Aggregate Bond Index, gained 3.33%. The Bloomberg Barclays Global Aggregate Index returned 2.50%.
Turning to the US economy, gross domestic product (“GDP”), the value of goods and services produced in the country, the broadest measure of economic activity and the principal indicator of economic performance, expanded at a 2.1% annual pace during each of the third and fourth quarters of 2019. The US Department of Commerce’s initial reading for first quarter 2020 GDP growth — released after the reporting period ended — was -4.8%. This marked the steepest quarterly decline since the fourth quarter of 2008.
The US Federal Reserve (the “Fed”) took a number of aggressive actions during the reporting period in an attempt to support the economy and keep the market functioning properly in the wake of COVID-19. First, on October 30, 2019, the Fed reduced the federal funds rate to a range between 1.50% and 1.75%. Second, on March 3, 2020, the Fed lowered the federal funds rate to a range between 1.00% and 1.25%. Then, on March 15, the Fed lowered the federal funds rate to a range between 0.00% and 0.25%. Finally, on March 23, the Fed said, “It has become clear that our economy will face severe disruptions … Aggressive efforts must be taken across the public and private sectors to limit the losses to jobs and incomes and to promote a swift recovery once the disruptions abate.” Such aggressive efforts included essentially unlimited purchases of Treasury securities and agency mortgages. Also in March 2020, the US government passed a $2 trillion fiscal stimulus bill to aid the economy.
| | | | | | |
| 2 | | March 31, 2020 | | | Semiannual Report | | |
Outlook
As of this writing, there is much uncertainty regarding the global economy given the spread of COVID-19. This has resulted in periods of elevated market volatility and a “flight to quality.” We have already seen mass quarantines, supply disruptions and market liquidity issues — all of which present headwinds on the global economy. In this environment, we believe investors should aim to keep their portfolios on track by having conviction and actively managing risk.
In addition to COVID-19, major political developments, including US President Donald Trump’s bid for a second term in office, warrant careful monitoring. In our view, this could contribute to wide “risk-on/risk-off” movements as sentiment swings between “riskier” and perceived “safer” asset classes. We expect low beta returns for the overall market, which makes pursuing alpha — in excess of market returns — all the more important.
In our view, central banks will remain a major market driver in 2020, even as their efforts to spark economic growth become less effective and today’s ultra-low interest rates provide less room to maneuver. Rates have been negative in Europe and Japan for some time, and the Fed has aggressively lowered rates amid weakening economic growth. Facing dwindling options, we believe central banks will likely continue offering additional stimulus with limited effect. Governments may need to shoulder some of the burden by increasing spending, reducing taxes or both.
On behalf of Allianz Global Investors U.S. LLC, the Funds’ investment adviser, thank you for investing with us. We encourage you to consult with your financial advisor and to visit our website, us.allianzgi.com, for additional information. We remain dedicated to serving your investment needs.
Sincerely,

Thomas J. Fuccillo
Trustee, President & Chief Executive Officer
Past performance is no guarantee of future results. Unless otherwise noted, index returns reflect the reinvestment of income dividends and capital gains, if any, but do not reflect fees, brokerage commissions or other expenses of investing. It is not possible to invest directly in an index.
Receive this report electronically and eliminate paper mailings.
To enroll, go to us.allianzgi.com/edelivery.
| | | | | | |
| | Semiannual Report | | | March 31, 2020 | | 3 |
Unaudited
AllianzGI Target-Date Funds*
For the period of October 1, 2019 through March 31, 2020, as provided by the Multi-Asset US Group.
Fund Insights
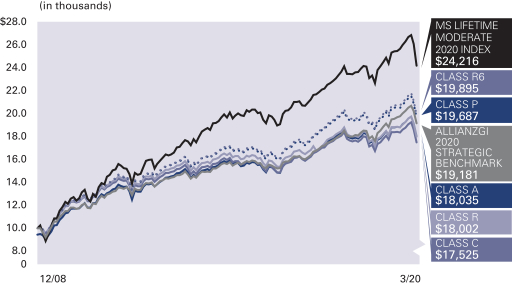
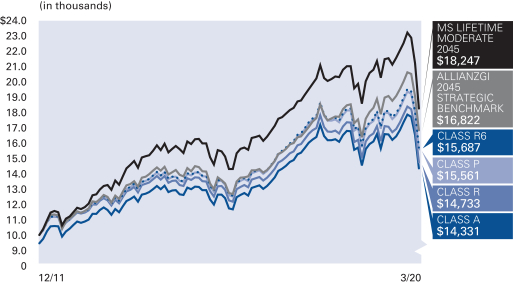
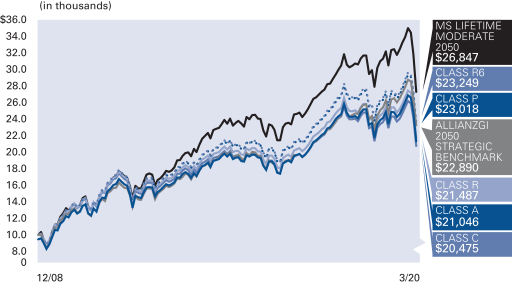
For the six-month period ended March 31, 2020, Class A shares at net asset value (“NAV”) of the AllianzGI Target-Date Funds (collectively, the “Funds” and each a “Fund”) returned between -4.22% and -13.73%, with shorter-dated Funds posting more favorable results. In terms of relative performance, all strategies outperformed their respective benchmarks (Morningstar Lifetime Moderate series) for the six-month period.
Market Overview
Global equities ratcheted steadily higher from the beginning of the reporting period until mid-February 2020, with sentiment lifted by growing optimism over a “phase one” trade deal between the US and China and better-than-expected corporate earnings. However, growing concerns about the impact of the novel coronavirus outbreak (“COVID-19”) led to a steep correction in February 2020, with the sell-off gathering pace in March 2020, as a growing number of countries imposed travel restrictions and lockdown measures. Global equities suffered their worst quarter since the 2008 financial crisis in the first quarter of 2020, with many markets entering an official bear market, defined as a decline of at least 20% from a recent peak.
Global government bond yields trended higher in the fourth quarter of 2019 amid growing optimism over the outlook for global growth, but tumbled in 2020 on growing speculation that the COVID-19 pandemic would force central banks to slash interest rates and reinstate asset-purchase programs. In the US, the 10-year Treasury yield closed the period around 100 basis points lower, while 10-year yields in the UK fell just over 10 basis points. However, German Bund yields rose slightly and peripheral euro-zone yields rose even more. Japanese government bonds also increased modestly. Meanwhile, corporate bonds fell sharply as the deteriorating economic outlook led to fears of rising downgrades and defaults.
Hopes that the global economy may be over the worst of the trade-related slowdown were dashed as the COVID-19 outbreak spread beyond China, forcing countries to impose travel restrictions and draconian quarantine measures. Flash estimates of purchasing managers’ indices for March 2020 revealed the impact that COVID-19 was having on the global economy. In the US, the purchasing managers’ composite index fell to an 11-year low while the composite survey for the euro zone fell to a record low. Elsewhere, Chinese industrial production plunged 13.5% over the first two months of the year, compared to the same period in 2019, and retail sales plummeted by 20.5% on a year-on-year basis. In response, central banks lowered interest rates and reinstated asset-purchase programs, but in general these measures failed to reassure financial markets. Instead, governments were forced to shoulder the burden for supporting economies, with many announcing massive fiscal measures.
In the currency markets, the period saw significant swings. The British pound was one of the strongest currencies in the final quarter of 2019, boosted by news that the UK had secured a Withdrawal Agreement with the EU, but lost the majority of these gains during the first quarter of 2020. Elsewhere, the US dollar, euro and Japanese yen all jostled for supremacy throughout the six-month reporting period, while many emerging market currencies weakened.
Portfolio Review
The Funds entered the year with an overweight to global equities and benefited from the overweight position against a backdrop of easing trade tensions supported risk assets into the year’s end. Selection effects in the international equity portion of the Funds further contributed, along with an overweight to corporate bonds, conversely, positions in the Japanese yen and Italian government bonds detracted modestly. In the first quarter of 2020, the Funds benefited from their less aggressive structure as compared to the external benchmarks. As compared to their internal strategic benchmarks, the overweight to equities across the Funds was the primary detractor as markets turned over toward the end of February 2020. The equity overweight was reduced in early March 2020, and was an underweight by mid-month. The underweight position by mid-month contributed to limiting the Funds’ participation in the market declines during the latter portion of the month. In addition to adjusting the Funds’ overall equity exposure, fixed income exposure which was overweight going into the month remained an overweight, further helping to mitigate losses as markets continued to sell-off during the period. The Funds remained defensively positioned into the period end, with an underweight to global equities, and an overweight to duration.
Outlook
The COVID-19 pandemic and severe disruptions in the oil market created a simultaneous supply and demand shock for a late-cycle global economy. One consequence is that economies are increasingly vulnerable to exogenous shocks that can exacerbate existing imbalances. As such, we maintain a cautious economic outlook and now expect a global recession in the next few months. We believe that the shape and magnitude of the anticipated recession will depend to an extent on the negative spillover from financial markets in holding back the real economy. The inflection point in financial markets in the context of the current crisis—in contrast to previous financial crises—will depend, in our opinion, on an array of factors, including (1) how the COVID-19 public health crisis unfolds and ultimately stabilizes; (2) continued credible intervention on the part of governments and public policy; (3) stabilization of corporate and macroeconomic data and (4) adjustment of valuations to recession-like levels.
Against this backdrop, we continue to see elevated risks of additional corrections in risky asset markets in the near term before a sustainable turnaround is achieved. Therefore, unless we see a very strong V-shaped recovery in markets and the economy, we expect to maintain our defensive positioning based on our trend-based and fundamental indicators. We believe that this will position us to be prepared for a persistent downturn in the near term. Of course, if the market rally at quarter-end following the very substantial fiscal package and the series of supports announced by the US Federal Reserve should persist, we will reincorporate risk back into the portfolios accordingly.
* The “Target-Date Funds” are the AllianzGI Retirement 2020 Fund, the AllianzGI Retirement 2025 Fund, the AllianzGI Retirement 2030 Fund, the AllianzGI Retirement 2035 Fund, the AllianzGI Retirement 2040 Fund, the AllianzGI Retirement 2045 Fund, the AllianzGI Retirement 2050 Fund, and the AllianzGI Retirement 2055 Fund.
| | | | | | |
| 4 | | March 31, 2020 | | | Semiannual Report | | |
Unaudited
AllianzGI Retirement 2020 Fund
Average Annual Total Return for the period ended March 31, 2020
| | | | | | | | | | | | | | | | | | | | | | |
| | | | | | |
| | | | | 6 Month* | | | 1 Year | | | 5 Year | | | 10 Year | | | Since Inception† | |
| | | AllianzGI Retirement 2020 Fund Class A | | | –4.22% | | | | –0.83% | | | | 2.88% | | | | 4.17% | | | | 5.91% | |
| | AllianzGI Retirement 2020 Fund Class A (adjusted) | | | –9.49% | | | | –6.28% | | | | 1.72% | | | | 3.58% | | | | 5.38% | |
| | | AllianzGI Retirement 2020 Fund Class C | | | –4.59% | | | | –1.63% | | | | 2.10% | | | | 3.38% | | | | 5.11% | |
| | AllianzGI Retirement 2020 Fund Class C (adjusted) | | | –5.42% | | | | –2.48% | | | | 2.10% | | | | 3.38% | | | | 5.11% | |
| | AllianzGI Retirement 2020 Fund Class R | | | –4.37% | | | | –1.22% | | | | 2.07% | | | | 3.59% | | | | 5.36% | |
| | AllianzGI Retirement 2020 Fund Class P | | | –4.07% | | | | –0.59% | | | | 3.18% | | | | 4.46% | | | | 6.20% | |
| | AllianzGI Retirement 2020 Fund Class R6 | | | –4.05% | | | | –0.47% | | | | 3.27% | | | | 4.56% | | | | 6.30% | |
| | | AllianzGI Retirement 2020 Fund Administrative Class | | | –4.17% | | | | –0.80% | | | | 2.90% | | | | 4.20% | | | | 5.95% | |
| | Morningstar Lifetime Moderate 2020 Index | | | –5.79% | | | | –1.31% | | | | 3.72% | | | | 6.29% | | | | 8.18% | |
| | AllianzGI 2020 Strategic Benchmark | | | –3.16% | | | | 1.69% | | | | 3.96% | | | | 4.77% | | | | 5.96% | |
| | | Lipper Mixed-Asset Target 2020 Funds Average | | | –6.85% | | | | –3.19% | | | | 2.58% | | | | 5.30% | | | | 7.17% | |
* Cumulative return
† The Fund began operations on December 29, 2008. Benchmark return comparisons began on the fund inception date. Lipper performance comparisons began on December 31, 2008.
Performance quoted represents past performance and is no guarantee of future results. Current performance may be lower or higher than performance shown. For performance current to the most recent month-end, visit our website at us.allianzgi.com. Investment return and the principal value will fluctuate. Shares may be worth more or less than original cost when redeemed.The adjusted returns take into account the maximum initial sales charge of 5.50% on Class A shares and the contingent deferred sales charge (CDSC) of 1% on Class C shares, which may apply to shares redeemed during the first year of ownership. Returns do not reflect deduction of taxes that a shareholder would pay on fund distributions or redemption of fund shares. See pages 107 and 108 for more information. The Fund’s gross expense ratios, which include the Acquired Fund Fees and Expenses, are 1.16% for Class A shares, 1.91% for Class C shares, 1.41% for Class R shares, 0.76% for Class P shares, 0.66% for Class R6 shares and 1.01% for Administrative Class shares. These ratios do not include an expense reduction, contractually guaranteed through at least January 31, 2021. The Fund’s expense ratios net of this reduction, which include the Acquired Fund Fees and Expenses, are 0.95% for Class A shares, 1.70% for Class C shares, 1.30% for Class R shares, 0.65% for Class P shares, 0.55% for Class R6 shares and 0.90% for Administrative Class shares. Expense ratio information is as of the Fund’s current prospectus dated February 1, 2020, as further revised or supplemented from time to time.
Cumulative Returns Through March 31, 2020
Fund Allocation (as of March 31, 2020 )
| | | | |
| |
| AllianzGI Global Dynamic Allocation | | | 70.4% | |
| |
| AllianzGI Core Bond | | | 29.2% | |
| |
| AllianzGI Emerging Markets Small-Cap | | | 0.6% | |
| |
| Cash & Equivalents — Net | | | -0.2% | |
| | | | | | |
| | Semiannual Report | | | March 31, 2020 | | 5 |
Unaudited
AllianzGI Retirement 2020 Fund (cont’d)
| | | | | | | | | | | | |
| |
| Shareholder Expense Example | | Actual Performance |
| | | Class A | | Class C | | Class R | | Class P | | Class R6 | | Administrative
Class |
| | | | | | |
| Beginning Account Value (10/1/19) | | $1,000.00 | | $1,000.00 | | $1,000.00 | | $1,000.00 | | $1,000.00 | | $1,000.00 |
| | | | | | |
| Ending Account Value (3/31/20) | | $957.80 | | $954.10 | | $956.30 | | $959.30 | | $959.50 | | $958.30 |
| | | | | | |
| Expenses Paid During Period | | $1.81 | | $5.47 | | $3.52 | | $0.34 | | $0.01 | | $1.57 |
| | | | | | | | | | | | | |
| |
| | | Hypothetical Performance |
| | | (5% return before expenses) |
| | | Class A | | Class C | | Class R | | Class P | | Class R6 | | Administrative
Class |
| | | | | | |
| Beginning Account Value (10/1/19) | | $1,000.00 | | $1,000.00 | | $1,000.00 | | $1,000.00 | | $1,000.00 | | $1,000.00 |
| | | | | | |
| Ending Account Value (3/31/20) | | $1,023.15 | | $1,019.40 | | $1,021.40 | | $1,024.65 | | $1,024.99 | | $1,023.40 |
| | | | | | |
| Expenses Paid During Period | | $1.87 | | $5.65 | | $3.64 | | $0.35 | | $0.01 | | $1.62 |
For each class of the Fund, expenses (net of fee waiver and reimbursement, if any) are equal to the annualized expense ratio for the class (0.37% for Class A, 1.12% for Class C, 0.72% for Class R, 0.07% for Class P, less than 0.005% for Class R6 and 0.32% for Administrative Class), multiplied by the average account value over the period, multiplied by 183/366. These expenses do not include the expenses of the investment companies in which the Fund invests, which are indirectly borne by Fund shareholders.
| | | | | | |
| 6 | | March 31, 2020 | | | Semiannual Report | | |
Unaudited
AllianzGI Retirement 2025 Fund
Average Annual Total Return for the period ended March 31, 2020
| | | | | | | | | | | | | | | | | | |
| | | | | |
| | | | | 6 Month* | | | 1 Year | | | 5 Year | | | Since Inception† | |
| | | AllianzGI Retirement 2025 Fund Class A | | | –6.46% | | | | –3.92% | | | | 2.78% | | | | 4.12% | |
| | AllianzGI Retirement 2025 Fund Class A (adjusted) | | | –11.60% | | | | –9.20% | | | | 1.62% | | | | 3.41% | |
| | AllianzGI Retirement 2025 Fund Class R | | | –6.65% | | | | –4.26% | | | | 2.41% | | | | 3.75% | |
| | AllianzGI Retirement 2025 Fund Class P | | | –6.36% | | | | –3.75% | | | | 3.08% | | | | 4.43% | |
| | AllianzGI Retirement 2025 Fund Class R6 | | | –6.32% | | | | –3.55% | | | | 3.20% | | | | 4.53% | |
| | | AllianzGI Retirement 2025 Fund Administrative Class | | | –6.45% | | | | –3.86% | | | | 2.84% | | | | 4.17% | |
| | Morningstar Lifetime Moderate 2025 Index | | | –7.25% | | | | –2.76% | | | | 3.80% | | | | 7.15% | |
| | AllianzGI 2025 Strategic Benchmark | | | –5.35% | | | | –0.77% | | | | 4.02% | | | | 5.05% | |
| | | Lipper Mixed-Asset Target 2025 Funds Average | | | –7.92% | | | | –4.24% | | | | 2.84% | | | | 6.05% | |
* Cumulative return
† The Fund began operations on December 19, 2011. Benchmark return comparisons began on the fund inception date. Lipper performance comparisons began on December 31, 2011.
Performance quoted represents past performance and is no guarantee of future results. Current performance may be lower or higher than performance shown. For performance current to the most recent month-end, visit our website at us.allianzgi.com. Investment return and the principal value will fluctuate. Shares may be worth more or less than original cost when redeemed.The adjusted returns take into account the maximum initial sales charge of 5.50% on Class A shares. Returns do not reflect deduction of taxes that a shareholder would pay on fund distributions or redemption of fund shares. See pages 107 and 108 for more information. The Fund’s gross expense ratios, which include the Acquired Fund Fees and Expenses, are 1.20% for Class A shares, 1.45% for Class R shares, 0.80% for Class P shares, 0.70% for Class R6 shares and 1.05% for Administrative Class shares. These ratios do not include an expense reduction, contractually guaranteed through at least January 31, 2021. The Fund’s expense ratios net of this reduction, which include the Acquired Fund Fees and Expenses, are 0.95% for Class A shares, 1.30% for Class R shares, 0.65% for Class P shares, 0.55% for Class R6 shares and 0.90% for Administrative Class shares. Expense ratio information is as of the Fund’s current prospectus dated February 1, 2020, as further revised or supplemented from time to time.
Cumulative Returns Through March 31, 2020

Fund Allocation (as of March 31, 2020)
| | | | |
| |
| AllianzGI Global Dynamic Allocation | | | 90.3% | |
| |
| AllianzGI Core Bond | | | 4.0% | |
| |
| AllianzGI Emerging Markets Small-Cap | | | 0.6% | |
| |
| Cash & Equivalents — Net | | | 5.1% | |
| | | | | | |
| | Semiannual Report | | | March 31, 2020 | | 7 |
Unaudited
AllianzGI Retirement 2025 Fund (cont’d)
| | | | | | | | | | |
| |
| Shareholder Expense Example | | Actual Performance |
| | | Class A | | Class R | | Class P | | Class R6 | | Administrative
Class |
| | | | | |
| Beginning Account Value (10/1/19) | | $1,000.00 | | $1,000.00 | | $1,000.00 | | $1,000.00 | | $1,000.00 |
| | | | | |
| Ending Account Value (3/31/20) | | $935.40 | | $933.50 | | $936.40 | | $936.80 | | $935.50 |
| | | | | |
| Expenses Paid During Period | | $1.50 | | $3.19 | | $0.05 | | $0.01 | | $1.26 |
| | | | | | | | | | | |
| |
| | | Hypothetical Performance |
| | | (5% return before expenses) |
| | | Class A | | Class R | | Class P | | Class R6 | | Administrative
Class |
| | | | | |
| Beginning Account Value (10/1/19) | | $1,000.00 | | $1,000.00 | | $1,000.00 | | $1,000.00 | | $1,000.00 |
| | | | | |
| Ending Account Value (3/31/20) | | $1,023.45 | | $1,021.70 | | $1,024.95 | | $1,024.99 | | $1,023.70 |
| | | | | |
| Expenses Paid During Period | | $1.57 | | $3.34 | | $0.05 | | $0.01 | | $1.32 |
For each class of the Fund, expenses (net of fee waiver and reimbursement, if any) are equal to the annualized expense ratio for the class (0.31% for Class A, 0.66% for Class R, 0.01% for Class P, less than 0.005% for Class R6 and 0.26% for Administrative Class), multiplied by the average account value over the period, multiplied by 183/366. These expenses do not include the expenses of the investment companies in which the Fund invests, which are indirectly borne by Fund shareholders.
| | | | | | |
| 8 | | March 31, 2020 | | | Semiannual Report | | |
Unaudited
AllianzGI Retirement 2030 Fund
Average Annual Total Return for the period ended March 31, 2020
| | | | | | | | | | | | | | | | | | | | | | |
| | | | | | |
| | | | | 6 Month* | | | 1 Year | | | 5 Year | | | 10 Year | | | Since Inception† | |
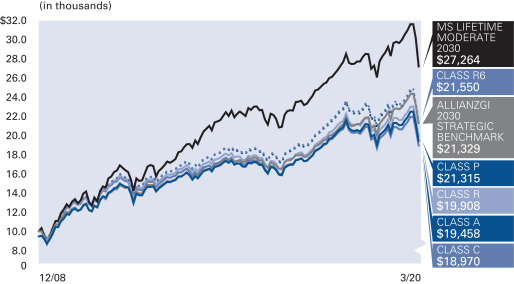
| | | AllianzGI Retirement 2030 Fund Class A | | | –8.00% | | | | –5.78% | | | | 2.62% | | | | 4.37% | | | | 6.63% | |
| | AllianzGI Retirement 2030 Fund Class A (adjusted) | | | –13.06% | | | | –10.96% | | | | 1.46% | | | | 3.79% | | �� | | 6.09% | |
| | | AllianzGI Retirement 2030 Fund Class C | | | –8.33% | | | | –6.46% | | | | 1.85% | | | | 3.60% | | | | 5.86% | |
| | AllianzGI Retirement 2030 Fund Class C (adjusted) | | | –9.10% | | | | –7.25% | | | | 1.85% | | | | 3.60% | | | | 5.86% | |
| | AllianzGI Retirement 2030 Fund Class R | | | –8.17% | | | | –6.14% | | | | 2.25% | | | | 4.03% | | | | 6.31% | |
| | AllianzGI Retirement 2030 Fund Class P | | | –7.88% | | | | –5.50% | | | | 2.92% | | | | 4.68% | | | | 6.96% | |
| | AllianzGI Retirement 2030 Fund Class R6 | | | –7.82% | | | | –5.36% | | | | 3.03% | | | | 4.78% | | | | 7.06% | |
| | | AllianzGI Retirement 2030 Fund Administrative Class | | | –7.97% | | | | –5.68% | | | | 2.68% | | | | 4.44% | | | | 6.72% | |
| | Morningstar Lifetime Moderate 2030 Index | | | –9.41% | | | | –5.14% | | | | 3.72% | | | | 6.95% | | | | 9.32% | |
| | AllianzGI 2030 Strategic Benchmark | | | –7.40% | | | | –3.07% | | | | 4.00% | | | | 5.26% | | | | 6.97% | |
| | | Lipper Mixed–Asset Target 2030 Funds Average | | | –9.56% | | | | –6.05% | | | | 2.84% | | | | 6.00% | | | | 8.13% | |
* Cumulative return
† The Fund began operations on December 29, 2008. Benchmark return comparisons began on the fund inception date. Lipper performance comparisons began on December 31, 2008.
Performance quoted represents past performance and is no guarantee of future results. Current performance may be lower or higher than performance shown. For performance current to the most recent month-end, visit our website at us.allianzgi.com. Investment return and the principal value will fluctuate. Shares may be worth more or less than original cost when redeemed.The adjusted returns take into account the maximum initial sales charge of 5.50% on Class A shares and the contingent deferred sales charge (CDSC) of 1% on Class C shares, which may apply to shares redeemed during the first year of ownership. Returns do not reflect deduction of taxes that a shareholder would pay on fund distributions or redemption of fund shares. See pages 107 and 108 for more information. The Fund’s gross expense ratios, which include the Acquired Fund Fees and Expenses, are 1.21% for Class A shares, 1.96% for Class C shares, 1.46% for Class R shares, 0.81% for Class P shares, 0.71% for Class R6 shares and 1.06% for Administrative Class shares. These ratios do not include an expense reduction, contractually guaranteed through at least January 31, 2021. The Fund’s expense ratios net of this reduction, which include the Acquired Fund Fees and Expenses, are 0.95% for Class A shares, 1.70% for Class C shares, 1.30% for Class R shares, 0.65% for Class P shares, 0.55% for Class R6 shares and 0.90% for Administrative Class shares. Expense ratio information is as of the Fund’s current prospectus dated February 1, 2020, as further revised or supplemented from time to time.
Cumulative Returns Through March 31, 2020
Fund Allocation (as of March 31, 2020)
| | | | |
| |
| AllianzGI Global Dynamic Allocation | | | 89.0% | |
| |
| AllianzGI Best Styles U.S. Equity | | | 3.0% | |
| |
| AllianzGI International Growth | | | 2.1% | |
| |
| AllianzGI Best Styles Global Managed Volatility | | | 1.6% | |
| |
| AllianzGI Mid-Cap | | | 0.6% | |
| |
| AllianzGI Global Small-Cap Opportunities | | | 0.4% | |
| |
| Cash & Equivalents — Net | | | 3.3% | |
| | | | | | |
| | Semiannual Report | | | March 31, 2020 | | 9 |
Unaudited
AllianzGI Retirement 2030 Fund (cont’d)
| | | | | | | | | | | | |
| |
| Shareholder Expense Example | | Actual Performance |
| | | Class A | | Class C | | Class R | | Class P | | Class R6 | | Administrative
Class |
| | | | | | |
| Beginning Account Value (10/1/19) | | $1,000.00 | | $1,000.00 | | $1,000.00 | | $1,000.00 | | $1,000.00 | | $1,000.00 |
| | | | | | |
| Ending Account Value (3/31/20) | | $920.00 | | $916.70 | | $918.30 | | $921.20 | | $921.80 | | $920.30 |
| | | | | | |
| Expenses Paid During Period | | $1.39 | | $4.98 | | $3.07 | | $0.01 | | $0.01 | | $1.15 |
| | | | | | | | | | | | | |
| |
| | | Hypothetical Performance |
| | | (5% return before expenses) |
| | | Class A | | Class C | | Class R | | Class P | | Class R6 | | Administrative
Class |
| | | | | | |
| Beginning Account Value (10/1/19) | | $1,000.00 | | $1,000.00 | | $1,000.00 | | $1,000.00 | | $1,000.00 | | $1,000.00 |
| | | | | | |
| Ending Account Value (3/31/20) | | $1,023.55 | | $1,019.80 | | $1,021.80 | | $1,024.99 | | $1,024.99 | | $1,023.80 |
| | | | | | |
| Expenses Paid During Period | | $1.47 | | $5.25 | | $3.23 | | $0.01 | | $0.01 | | $1.21 |
For each class of the Fund, expenses (net of fee waiver and reimbursement, if any) are equal to the annualized expense ratio for the class (0.29% for Class A, 1.04% for Class C, 0.64% for Class R, less than 0.005% for Class P, less than 0.005% for Class R6 and 0.24% for Administrative Class), multiplied by the average account value over the period, multiplied by 183/366. These expenses do not include the expenses of the investment companies in which the Fund invests, which are indirectly borne by Fund shareholders.
| | | | | | |
| 10 | | March 31, 2020 | | | Semiannual Report | | |
Unaudited
AllianzGI Retirement 2035 Fund
Average Annual Total Return for the period ended March 31, 2020
| | | | | | | | | | | | | | | | | | |
| | | | | |
| | | | | 6 Month* | | | 1 Year | | | 5 Year | | | Since Inception† | |
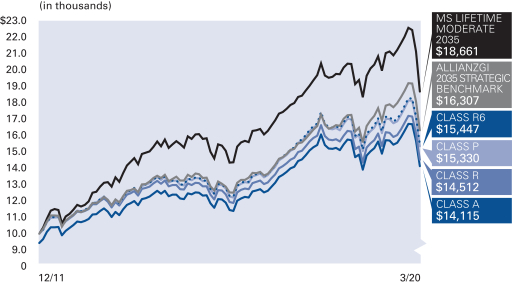
| | | AllianzGI Retirement 2035 Fund Class A | | | –9.16% | | | | –7.24% | | | | 2.62% | | | | 4.97% | |
| | AllianzGI Retirement 2035 Fund Class A (adjusted) | | | –14.16% | | | | –12.35% | | | | 1.47% | | | | 4.25% | |
| | AllianzGI Retirement 2035 Fund Class R | | | –9.30% | | | | –7.53% | | | | 2.27% | | | | 4.61% | |
| | AllianzGI Retirement 2035 Fund Class P | | | –9.00% | | | | –6.88% | | | | 2.95% | | | | 5.30% | |
| | AllianzGI Retirement 2035 Fund Class R6 | | | –8.99% | | | | –6.87% | | | | 3.03% | | | | 5.39% | |
| | | AllianzGI Retirement 2035 Fund Administrative Class | | | –9.09% | | | | –7.13% | | | | 2.68% | | | | 5.02% | |
| | Morningstar Lifetime Moderate 2035 Index | | | –11.96% | | | | –8.08% | | | | 3.43% | | | | 7.82% | |
| | AllianzGI 2035 Strategic Benchmark | | | –9.16% | | | | –5.04% | | | | 3.92% | | | | 6.08% | |
| | | Lipper Mixed-Asset Target 2035 Funds Average | | | –11.33% | | | | –7.98% | | | | 2.84% | | | | 6.73% | |
* Cumulative return
† The Fund began operations on December 19, 2011. Benchmark return comparisons began on the fund inception date. Lipper performance comparisons began on December 31, 2011.
Performance quoted represents past performance and is no guarantee of future results. Current performance may be lower or higher than performance shown. For performance current to the most recent month-end, visit our website at us.allianzgi.com. Investment return and the principal value will fluctuate. Shares may be worth more or less than original cost when redeemed.The adjusted returns take into account the maximum initial sales charge of 5.50% on Class A shares.Returns do not reflect deduction of taxes that a shareholder would pay on fund distributions or redemption of fund shares. See pages 107 and 108 for more information. The Fund’s gross expense, which include the Acquired Fund Fees and Expenses, ratios are 1.14% for Class A shares, 1.39% for Class R shares, 0.74% for Class P shares, 0.64% for Class R6 shares and 0.99% for Administrative Class shares. These ratios do not include an expense reduction, contractually guaranteed through at least January 31, 2021. The Fund’s expense ratios net of this reduction, which include the Acquired Fund Fees and Expenses, are 0.95% for Class A shares, 1.30% for Class R shares, 0.65% for Class P shares, 0.55% for Class R6 shares and 0.90% for Administrative Class shares. Expense ratio information is as of the Fund’s current prospectus dated February 1, 2020, as further revised or supplemented from time to time.
Cumulative Returns Through March 31, 2020
Fund Allocation (as of March 31, 2020)
| | | | |
| |
| AllianzGI Global Dynamic Allocation | | | 63.2% | |
| |
| AllianzGI Best Styles U.S. Equity | | | 10.2% | |
| |
| AllianzGI International Growth | | | 5.9% | |
| |
| AllianzGI Best Styles Global Managed Volatility | | | 5.0% | |
| |
| AllianzGI Focused Growth | | | 2.3% | |
| |
| AllianzGI Mid-Cap | | | 2.2% | |
| |
| AllianzGI Small-Cap | | | 1.4% | |
| |
| AllianzGI Mid-Cap Value | | | 1.3% | |
| |
| Other | | | 2.2% | |
| |
| Cash & Equivalents — Net | | | 6.3% | |
| | | | | | |
| | Semiannual Report | | | March 31, 2020 | | 11 |
Unaudited
AllianzGI Retirement 2035 Fund (cont’d)
| | | | | | | | | | |
| |
| Shareholder Expense Example | | Actual Performance |
| | | Class A | | Class R | | Class P | | Class R6 | | Administrative
Class |
| | | | | |
| Beginning Account Value (10/1/19) | | $1,000.00 | | $1,000.00 | | $1,000.00 | | $1,000.00 | | $1,000.00 |
| | | | | |
| Ending Account Value (3/31/20) | | $908.40 | | $907.00 | | $910.00 | | $910.10 | | $909.10 |
| | | | | |
| Expenses Paid During Period | | $1.53 | | $3.19 | | $0.10 | | $0.01 | | $1.29 |
| | | | | | | | | | | |
| |
| | | Hypothetical Performance |
| | | (5% return before expenses) |
| | | Class A | | Class R | | Class P | | Class R6 | | Administrative
Class |
| | | | | |
| Beginning Account Value (10/1/19) | | $1,000.00 | | $1,000.00 | | $1,000.00 | | $1,000.00 | | $1,000.00 |
| | | | | |
| Ending Account Value (3/31/20) | | $1,023.40 | | $1,021.65 | | $1,024.90 | | $1,024.99 | | $1,023.65 |
| | | | | |
| Expenses Paid During Period | | $1.62 | | $3.39 | | $0.10 | | $0.01 | | $1.37 |
For each class of the Fund, expenses (net of fee waiver and reimbursement, if any) are equal to the annualized expense ratio for the class (0.32% for Class A, 0.67% for Class R, 0.02% for Class P, less than 0.01% for Class R6 and 0.27% for Administrative Class), multiplied by the average account value over the period, multiplied by 183/366. These expenses do not include the expenses of the investment companies in which the Fund invests, which are indirectly borne by Fund shareholders.
| | | | | | |
| 12 | | March 31, 2020 | | | Semiannual Report | | |
Unaudited
AllianzGI Retirement 2040 Fund
Average Annual Total Return for the period ended March 31, 2020
| | | | | | | | | | | | | | | | | | | | | | |
| | | | | | |
| | | | | 6 Month* | | | 1 Year | | | 5 Year | | | 10 Year | | | Since Inception† | |
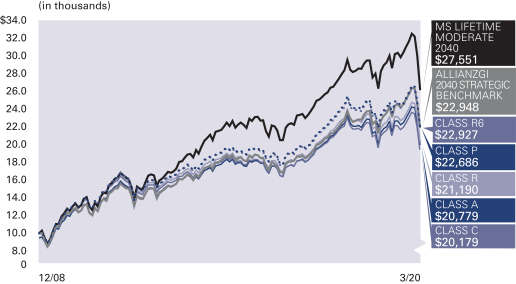
| | | AllianzGI Retirement 2040 Fund Class A | | | –11.54% | | | | –9.69% | | | | 2.18% | | | | 4.53% | | | | 7.25% | |
| | AllianzGI Retirement 2040 Fund Class A (adjusted) | | | –16.41% | | | | –14.66% | | | | 1.03% | | | | 3.94% | | | | 6.71% | |
| | | AllianzGI Retirement 2040 Fund Class C | | | –11.88% | | | | –10.38% | | | | 1.41% | | | | 3.74% | | | | 6.44% | |
| | AllianzGI Retirement 2040 Fund Class C (adjusted) | | | –12.66% | | | | –11.18% | | | | 1.41% | | | | 3.74% | | | | 6.44% | |
| | AllianzGI Retirement 2040 Fund Class R | | | –11.72% | | | | –10.03% | | | | 1.81% | | | | 4.18% | | | | 6.90% | |
| | AllianzGI Retirement 2040 Fund Class P | | | –11.42% | | | | –9.40% | | | | 2.48% | | | | 4.83% | | | | 7.55% | |
| | AllianzGI Retirement 2040 Fund Class R6 | | | –11.36% | | | | –9.34% | | | | 2.59% | | | | 4.93% | | | | 7.65% | |
| | | AllianzGI Retirement 2040 Fund Administrative Class | | | –11.56% | | | | –9.66% | | | | 2.22% | | | | 4.57% | | | | 7.29% | |
| | Morningstar Lifetime Moderate 2040 Index | | | –14.08% | | | | –10.59% | | | | 3.06% | | | | 6.84% | | | | 9.42% | |
| | AllianzGI 2040 Strategic Benchmark | | | –10.89% | | | | –6.98% | | | | 3.64% | | | | 5.50% | | | | 7.67% | |
| | | Lipper Mixed-Asset Target 2040 Funds Average | | | –12.64% | | | | –9.51% | | | | 2.59% | | | | 6.21% | | | | 8.45% | |
* Cumulative return
† The Fund began operations on December 29, 2008. Benchmark return comparisons began on the fund inception date. Lipper performance comparisons began on December 31, 2008.
Performance quoted represents past performance and is no guarantee of future results. Current performance may be lower or higher than performance shown. For performance current to the most recent month-end, visit our website at us.allianzgi.com. Investment return and the principal value will fluctuate. Shares may be worth more or less than original cost when redeemed.The adjusted returns take into account the maximum initial sales charge of 5.50% on Class A shares and the contingent deferred sales charge (CDSC) of 1% on Class C shares, which may apply to shares redeemed during the first year of ownership. Returns do not reflect deduction of taxes that a shareholder would pay on fund distributions or redemption of fund shares. See pages 107 and 108 for more information. The Fund’s gross expense ratios, which include the Acquired Fund Fees and Expenses, are 1.09% for Class A shares, 1.84% for Class C shares, 1.34% for Class R shares, 0.69% for Class P shares, 0.59% for Class R6 shares and 0.94% for Administrative Class shares. These ratios do not include an expense reduction, contractually guaranteed through at least January 31, 2021. The Fund’s expense ratios net of this reduction, which include the Acquired Fund Fees and Expenses, are 0.95% for Class A shares, 1.70% for Class C shares, 1.30% for Class R shares, 0.65% for Class P shares, 0.55% for Class R6 shares and 0.90% for Administrative Class shares. Expense ratio information is as of the Fund’s current prospectus dated February 1, 2020, as further revised or supplemented from time to time.
Cumulative Returns Through March 31, 2020
Fund Allocation (as of March 31, 2020)
| | | | |
| |
| AllianzGI Global Dynamic Allocation | | | 40.7% | |
| |
| AllianzGI Best Styles U.S. Equity | | | 13.6% | |
| |
| AllianzGI International Growth | | | 10.6% | |
| |
| AllianzGI Best Styles Global Managed Volatility | | | 9.7% | |
| |
| AllianzGI Best Styles Global Equity | | | 7.5% | |
| |
| AllianzGI Focused Growth | | | 3.2% | |
| |
| AllianzGI Mid-Cap | | | 3.2% | |
| |
| AllianzGI Mid-Cap Value | | | 2.5% | |
| |
| Other | | | 5.5% | |
| |
| Cash & Equivalents — Net | | | 3.5% | |
| | | | | | |
| | Semiannual Report | | | March 31, 2020 | | 13 |
Unaudited
AllianzGI Retirement 2040 Fund (cont’d)
| | | | | | | | | | | | |
| |
| Shareholder Expense Example | | Actual Performance |
| | | Class A | | Class C | | Class R | | Class P | | Class R6 | | Administrative
Class |
| | | | | | |
| Beginning Account Value (10/1/19) | | $1,000.00 | | $1,000.00 | | $1,000.00 | | $1,000.00 | | $1,000.00 | | $1,000.00 |
| | | | | | |
| Ending Account Value (3/31/20) | | $884.60 | | $881.20 | | $882.80 | | $885.80 | | $886.40 | | $884.40 |
| | | | | | |
| Expenses Paid During Period | | $1.70 | | $5.22 | | $3.34 | | $0.28 | | $0.01 | | $1.46 |
| | | | | | | | | | | | | |
| |
| | | Hypothetical Performance |
| | | (5% return before expenses) |
| | | Class A | | Class C | | Class R | | Class P | | Class R6 | | Administrative
Class |
| | | | | | |
| Beginning Account Value (10/1/19) | | $1,000.00 | | $1,000.00 | | $1,000.00 | | $1,000.00 | | $1,000.00 | | $1,000.00 |
| | | | | | |
| Ending Account Value (3/31/20) | | $1,023.20 | | $1,019.45 | | $1,021.45 | | $1,024.70 | | $1,024.99 | | $1,023.45 |
| | | | | | |
| Expenses Paid During Period | | $1.82 | | $5.60 | | $3.59 | | $0.30 | | $0.01 | | $1.57 |
For each class of the Fund, expenses (net of fee waiver and reimbursement, if any) are equal to the annualized expense ratio for the class (0.36% for Class A, 1.11% for Class C, 0.71% for Class R, 0.06% for Class P, less than 0.01% for Class R6 and 0.31% for Administrative Class), multiplied by the average account value over the period, multiplied by 183/366. These expenses do not include the expenses of the investment companies in which the Fund invests, which are indirectly borne by Fund shareholders.
| | | | | | |
| 14 | | March 31, 2020 | | | Semiannual Report | | |
Unaudited
AllianzGI Retirement 2045 Fund
Average Annual Total Return for the period ended March 31, 2020
| | | | | | | | | | | | | | | | | | |
| | | | | |
| | | | | 6 Month* | | | 1 Year | | | 5 Year | | | Since Inception† | |
| | | AllianzGI Retirement 2045 Fund Class A | | | –12.71% | | | | –10.97% | | | | 1.99% | | | | 5.15% | |
| | AllianzGI Retirement 2045 Fund Class A (adjusted) | | | –17.51% | | | | –15.86% | | | | 0.85% | | | | 4.44% | |
| | AllianzGI Retirement 2045 Fund Class R | | | –12.89% | | | | –11.32% | | | | 1.64% | | | | 4.79% | |
| | AllianzGI Retirement 2045 Fund Class P | | | –12.57% | | | | –10.72% | | | | 2.31% | | | | 5.48% | |
| | AllianzGI Retirement 2045 Fund Class R6 | | | –12.52% | | | | –10.58% | | | | 2.44% | | | | 5.59% | |
| | | AllianzGI Retirement 2045 Fund Administrative Class | | | –12.71% | | | | –10.95% | | | | 2.06% | | | | 5.20% | |
| | Morningstar Lifetime Moderate 2045 Index | | | –15.32% | | | | –12.09% | | | | 2.76% | | | | 7.53% | |
| | AllianzGI 2045 Strategic Benchmark | | | –11.77% | | | | –7.97% | | | | 3.53% | | | | 6.48% | |
| | | Lipper Mixed-Asset Target 2045 Funds Average | | | –13.69% | | | | –10.61% | | | | 2.59% | | | | 6.87% | |
* Cumulative return
† The Fund began operations on December 19, 2011. Benchmark return comparisons began on the fund inception date. Lipper performance comparisons began on December 31, 2011.
Performance quoted represents past performance and is no guarantee of future results. Current performance may be lower or higher than performance shown. For performance current to the most recent month-end, visit our website at us.allianzgi.com. Investment return and the principal value will fluctuate. Shares may be worth more or less than original cost when redeemed.The adjusted returns take into account the maximum initial sales charge of 5.50% on Class A shares.Returns do not reflect deduction of taxes that a shareholder would pay on fund distributions or redemption of fund shares. See pages 107 and 108 for more information. The Fund’s gross expense ratios, which include the Acquired Fund Fees and Expenses, are 1.06% for Class A shares, 1.31% for Class R shares, 0.66% for Class P shares, 0.56% for Class R6 shares and 0.91% for Administrative Class shares. These ratios do not include an expense reduction, contractually guaranteed through at least January 31, 2021. The Fund’s expense ratios net of this reduction, which include the Acquired Fund Fees and Expenses, are 0.95% for Class A shares, 1.30% for Class R shares, 0.65% for Class P shares, 0.55% for Class R6 shares and 0.90% for Administrative Class shares. Expense ratio information is as of the Fund’s current prospectus dated February 1, 2020, as further revised or supplemented from time to time.
Cumulative Returns Through March 31, 2020
Fund Allocation (as of March 31, 2020)
| | | | |
| |
| AllianzGI Global Dynamic Allocation | | | 26.0% | |
| |
| AllianzGI Best Styles U.S. Equity | | | 13.2% | |
| |
| AllianzGI Best Styles Global Managed Volatility | | | 12.9% | |
| |
| AllianzGI International Growth | | | 12.5% | |
| |
| AllianzGI Best Styles Global Equity | | | 10.6% | |
| |
| AllianzGI Focused Growth | | | 4.0% | |
| |
| AllianzGI Mid-Cap | | | 4.0% | |
| |
| AllianzGI Global Small-Cap Opportunities | | | 2.9% | |
| |
| Other | | | 6.4% | |
| |
| Cash & Equivalents — Net | | | 7.5% | |
| | | | | | |
| | Semiannual Report | | | March 31, 2020 | | 15 |
Unaudited
AllianzGI Retirement 2045 Fund (cont’d)
| | | | | | | | | | |
| |
| Shareholder Expense Example | | Actual Performance |
| | | Class A | | Class R | | Class P | | Class R6 | | Administrative
Class |
| | | | | |
| Beginning Account Value (10/1/19) | | $1,000.00 | | $1,000.00 | | $1,000.00 | | $1,000.00 | | $1,000.00 |
| | | | | |
| Ending Account Value (3/31/20) | | $872.90 | | $871.10 | | $874.30 | | $874.80 | | $872.90 |
| | | | | |
| Expenses Paid During Period | | $1.78 | | $3.41 | | $0.37 | | $0.01 | | $1.55 |
| | | | | | | | | | | |
| |
| | | Hypothetical Performance |
| | | (5% return before expenses) |
| | | Class A | | Class R | | Class P | | Class R6 | | Administrative
Class |
| | | | | |
| Beginning Account Value (10/1/19) | | $1,000.00 | | $1,000.00 | | $1,000.00 | | $1,000.00 | | $1,000.00 |
| | | | | |
| Ending Account Value (3/31/20) | | $1,023.10 | | $1,021.35 | | $1,024.60 | | $1,024.99 | | $1,023.35 |
| | | | | |
| Expenses Paid During Period | | $1.92 | | $3.69 | | $0.40 | | $0.01 | | $1.67 |
For each class of the Fund, expenses (net of fee waiver and reimbursement, if any) are equal to the annualized expense ratio for the class (0.38% for Class A, 0.73% for Class R, 0.08% for Class P, less than 0.005% for Class R6 and 0.33% for Administrative Class), multiplied by the average account value over the period, multiplied by 183/366. These expenses do not include the expenses of the investment companies in which the Fund invests, which are indirectly borne by Fund shareholders.
| | | | | | |
| 16 | | March 31, 2020 | | | Semiannual Report | | |
Unaudited
AllianzGI Retirement 2050 Fund
Average Annual Total Return for the period ended March 31, 2020
| | | | | | | | | | | | | | | | | | | | | | |
| | | | | | |
| | | | | 6 Month* | | | 1 Year | | | 5 Year | | | 10 Year | | | Since Inception† | |
| | | AllianzGI Retirement 2050 Fund Class A | | | –13.27% | | | | –11.41% | | | | 1.84% | | | | 4.65% | | | | 7.37% | |
| | AllianzGI Retirement 2050 Fund Class A (adjusted) | | | –18.04% | | | | –16.28% | | | | 0.69% | | | | 4.06% | | | | 6.83% | |
| | | AllianzGI Retirement 2050 Fund Class C | | | –13.62% | | | | –12.12% | | | | 1.08% | | | | 3.86% | | | | 6.58% | |
| | AllianzGI Retirement 2050 Fund Class C (adjusted) | | | –14.41% | | | | –12.93% | | | | 1.08% | | | | 3.86% | | | | 6.58% | |
| | AllianzGI Retirement 2050 Fund Class R | | | –13.42% | | | | –11.73% | | | | 1.47% | | | | 4.30% | | | | 7.04% | |
| | AllianzGI Retirement 2050 Fund Class P | | | –13.13% | | | | –11.14% | | | | 2.15% | | | | 4.95% | | | | 7.69% | |
| | AllianzGI Retirement 2050 Fund Class R6 | | | –13.08% | | | | –11.06% | | | | 2.26% | | | | 5.05% | | | | 7.79% | |
| | | AllianzGI Retirement 2050 Fund Administrative Class | | | –13.27% | | | | –11.41% | | | | 1.89% | | | | 4.70% | | | | 7.43% | |
| | Morningstar Lifetime Moderate 2050 Index | | | –15.80% | | | | –12.71% | | | | 2.59% | | | | 6.50% | | | | 9.17% | |
| | AllianzGI 2050 Strategic Benchmark | | | –12.29% | | | | –8.54% | | | | 3.45% | | | | 5.46% | | | | 7.64% | |
| | | Lipper Mixed-Asset Target 2050+ Funds Average | | | –13.99% | | | | –10.96% | | | | 2.47% | | | | 6.26% | | | | 8.44% | |
* Cumulative return
† The Fund began operations on December 29, 2008. Benchmark return comparisons began on the fund inception date. Lipper performance comparisons began on December 31, 2008.
Performance quoted represents past performance and is no guarantee of future results. Current performance may be lower or higher than performance shown. For performance current to the most recent month-end, visit our website at us.allianzgi.com. Investment return and the principal value will fluctuate. Shares may be worth more or less than original cost when redeemed.The adjusted returns take into account the maximum initial sales charge of 5.50% on Class A shares and the contingent deferred sales charge (CDSC) of 1% on Class C shares, which may apply to shares redeemed during the first year of ownership. Returns do not reflect deduction of taxes that a shareholder would pay on fund distributions or redemption of fund shares. See pages 107 and 108 for more information. The Fund’s gross expense ratios, which includes the Acquired Fund Fees and Expenses, are 1.05% for Class A shares, 1.80% for Class C shares, 1.30% for Class R shares, 0.65% for Class P shares, 0.55% for Class R6 shares and 0.90% for Administrative Class shares. These ratios do not include an expense reduction, contractually guaranteed through at least January 31, 2021. The Fund’s expense ratios net of this reduction, which includes the Acquired Fund Fees and Expenses, are 0.95% for Class A shares, 1.70% for Class C shares, 1.30% for Class R shares, 0.65% for Class P shares, 0.55% for Class R6 shares and 0.90% for Administrative Class shares. Expense ratio information is as of the Fund’s current prospectus dated February 1, 2020, as further revised or supplemented from time to time.
Cumulative Returns Through March 31, 2020
Fund Allocation (as of March 31, 2020)
| | | | |
| |
| AllianzGI Global Dynamic Allocation | | | 18.8% | |
| |
| AllianzGI Best Styles U.S. Equity | | | 17.0% | |
| |
| AllianzGI Best Styles Global Equity | | | 12.3% | |
| |
| AllianzGI International Growth | | | 12.3% | |
| |
| AllianzGI Best Styles Global Managed Volatility | | | 11.8% | |
| |
| AllianzGI Focused Growth | | | 5.0% | |
| |
| AllianzGIMid-Cap | | | 4.8% | |
| |
| AllianzGIMid-Cap Value | | | 4.1% | |
| |
| Other | | | 9.9% | |
| |
| Cash & Equivalents — Net | | | 4.0% | |
| | | | | | |
| | Semiannual Report | | | March 31, 2020 | | 17 |
Unaudited
AllianzGI Retirement 2050 Fund (cont’d)
| | | | | | | | | | | | |
| |
| Shareholder Expense Example | | Actual Performance |
| | | Class A | | Class C | | Class R | | Class P | | Class R6 | | Administrative
Class |
| | | | | | |
| Beginning Account Value (10/1/19) | | $1,000.00 | | $1,000.00 | | $1,000.00 | | $1,000.00 | | $1,000.00 | | $1,000.00 |
| | | | | | |
| Ending Account Value (3/31/20) | | $867.30 | | $863.80 | | $865.80 | | $868.70 | | $869.20 | | $867.30 |
| | | | | | |
| Expenses Paid During Period | | $ 1.87 | | $ 5.36 | | $ 3.50 | | $ 0.47 | | $ 0.01 | | $ 1.63 |
| | | | | | | | | | | | | |
| |
| | | Hypothetical Performance |
| | | (5% return before expenses) |
| | | Class A | | Class C | | Class R | | Class P | | Class R6 | | Administrative
Class |
| | | | | | |
| Beginning Account Value (10/1/19) | | $1,000.00 | | $1,000.00 | | $1,000.00 | | $1,000.00 | | $1,000.00 | | $1,000.00 |
| | | | | | |
| Ending Account Value (3/31/20) | | $1,023.00 | | $1,019.25 | | $1,021.25 | | $1,024.50 | | $1,024.99 | | $1,023.25 |
| | | | | | |
| Expenses Paid During Period | | $ 2.02 | | $ 5.81 | | $ 3.79 | | $ 0.51 | | $ 0.01 | | $ 1.77 |
For each class of the Fund, expenses (net of fee waiver and reimbursement, if any) are equal to the annualized expense ratio for the class (0.40% for Class A, 1.15% for Class C, 0.75% for Class R, 0.10% for Class P, less than 0.005% for Class R6 and 0.35% for Administrative Class), multiplied by the average account value over the period, multiplied by 183/366. These expenses do not include the expenses of the investment companies in which the Fund invests, which are indirectly borne by Fund shareholders.
| | | | | | |
| 18 | | March 31, 2020 | | | Semiannual Report | | |
Unaudited
AllianzGI Retirement 2055 Fund
Average Annual Total Return for the period ended March 31, 2020
| | | | | | | | | | | | | | | | | | |
| | | | | |
| | | | | 6 Month* | | | 1 Year | | | 5 Year | | | Since Inception† | |
| | | AllianzGI Retirement 2055 Fund Class A | | | –13.73% | | | | –11.89% | | | | 1.70% | | | | 5.12% | |
| | AllianzGI Retirement 2055 Fund Class A (adjusted) | | | –18.47% | | | | –16.74% | | | | 0.55% | | | | 4.40% | |
| | AllianzGI Retirement 2055 Fund Class R | | | –13.88% | | | | –12.24% | | | | 1.34% | | | | 4.76% | |
| | AllianzGI Retirement 2055 Fund Class P | | | –13.44% | | | | –11.52% | | | | 2.05% | | | | 5.47% | |
| | AllianzGI Retirement 2055 Fund Class R6 | | | –13.55% | | | | –11.54% | | | | 2.11% | | | | 5.55% | |
| | | AllianzGI Retirement 2055 Fund Administrative Class | | | –13.69% | | | | –11.85% | | | | 1.75% | | | | 5.17% | |
| | Morningstar Lifetime Moderate 2055 Index | | | –15.99% | | | | –12.97% | | | | 2.49% | | | | 7.26% | |
| | AllianzGI 2055 Strategic Benchmark | | | –12.29% | | | | –8.54% | | | | 3.45% | | | | 6.44% | |
| | | Lipper Mixed-Asset Target 2055+ Funds Average | | | –14.17% | | | | –11.15% | | | | 2.58% | | | | 7.06% | |
* Cumulative return
† The Fund began operations on December 19, 2011. Benchmark return comparisons began on the fund inception date. Lipper performance comparisons began on December 31, 2011.
Performance quoted represents past performance and is no guarantee of future results. Current performance may be lower or higher than performance shown. For performance current to the most recent month-end, visit our website at us.allianzgi.com. Investment return and the principal value will fluctuate. Shares may be worth more or less than original cost when redeemed.The adjusted returns take into account the maximum initial sales charge of 5.50% on Class A shares. Returns do not reflect deduction of taxes that a shareholder would pay on fund distributions or redemption of fund shares. See pages 107 and 108 for more information. The Fund’s gross expense ratios, which include the Acquired Fund Fees and Expenses, are 1.04% for Class A shares, 1.29% for Class R shares, 0.64% for Class P shares, 0.54% for Class R6 shares and 0.89% for Administrative Class shares. These ratios do not include an expense reduction, contractually guaranteed through at least January 31, 2021. The Fund’s expense ratios net of this reduction, which include the Acquired Fund Fees and Expenses, are 0.95% for Class A shares, 1.30% for Class R shares, 0.65% for Class P shares, 0.55% for Class R6 shares and 0.90% for Administrative Class shares. Expense ratio information is as of the Fund’s current prospectus dated February 1, 2020, as further revised or supplemented from time to time.
Cumulative Returns Through March 31, 2020

Fund Allocation (as of March 31, 2020)
| | | | |
| |
| AllianzGI Global Dynamic Allocation | | | 19.0% | |
| |
| AllianzGI Best Styles U.S. Equity | | | 14.2% | |
| |
| AllianzGI International Growth | | | 12.9% | |
| |
| AllianzGI Best Styles Global Managed Volatility | | | 12.3% | |
| |
| AllianzGI Best Styles Global Equity | | | 11.8% | |
| |
| AllianzGI Focused Growth | | | 4.6% | |
| |
| AllianzGIMid-Cap | | | 4.6% | |
| |
| AllianzGIMid-Cap Value | | | 3.8% | |
| |
| Other | | | 7.3% | |
| |
| Cash & Equivalents — Net | | | 9.5% | |
| | | | | | |
| | Semiannual Report | | | March 31, 2020 | | 19 |
Unaudited
AllianzGI Retirement 2055 Fund (cont’d)
| | | | | | | | | | |
| |
| Shareholder Expense Example | | Actual Performance |
| | | Class A | | Class R | | Class P | | Class R6 | | Administrative
Class |
| | | | | |
| Beginning Account Value (10/1/19) | | $1,000.00 | | $1,000.00 | | $1,000.00 | | $1,000.00 | | $1,000.00 |
| | | | | |
| Ending Account Value (3/31/20) | | $862.70 | | $861.20 | | $865.60 | | $864.50 | | $863.10 |
| | | | | |
| Expenses Paid During Period | | $1.86 | | $3.49 | | $0.51 | | $0.01 | | $1.63 |
| | | | | | | | | | | |
| |
| | | Hypothetical Performance |
| | | (5% return before expenses) |
| | | Class A | | Class R | | Class P | | Class R6 | | Administrative
Class |
| | | | | |
| Beginning Account Value (10/1/19) | | $1,000.00 | | $1,000.00 | | $1,000.00 | | $1,000.00 | | $1,000.00 |
| | | | | |
| Ending Account Value (3/31/20) | | $1,023.00 | | $1,021.25 | | $1,024.45 | | $1,024.99 | | $1,023.25 |
| | | | | |
| Expenses Paid During Period | | $2.02 | | $3.79 | | $0.56 | | $0.01 | | $1.77 |
For each class of the Fund, expenses (net of fee waiver and reimbursement, if any) are equal to the annualized expense ratio for the class (0.40% for Class A, 0.75% for Class R, 0.11% for Class P, less than 0.005% for Class R6 and 0.35% for Administrative Class), multiplied by the average account value over the period, multiplied by 183/366. These expenses do not include the expenses of the investment companies in which the Fund invests, which are indirectly borne by Fund shareholders.
| | | | | | |
| 20 | | March 31, 2020 | | | Semiannual Report | | |
Unaudited
AllianzGI Multi Asset Income Fund
For the period of October 1, 2019 through March 31, 2020, as provided by the Multi-Asset US Group.
Fund Insights
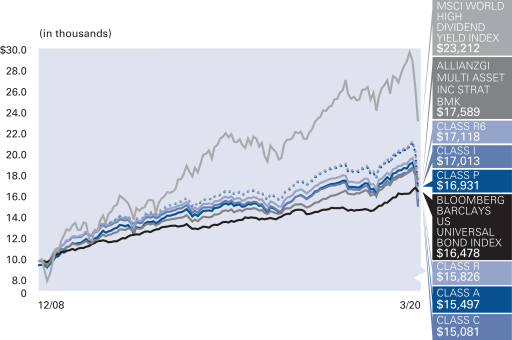
For thesix-month period ended March 31, 2020, Class A shares at net asset value (“NAV”) of the AllianzGI Multi Asset Income Fund (the “Fund”) returned-16.14%, underperforming the Bloomberg Barclays U.S. Universal Bond Index (the “benchmark”), which returned 1.76%.
Market Overview
Global equities ratcheted steadily higher from the beginning of the reporting period untilmid-February 2020, with sentiment lifted by growing optimism over a “phase one” trade deal between the US and China and better-than-expected corporate earnings. However, growing concerns about the impact of the novel coronavirus outbreak(“COVID-19”) led to a steep correction in February 2020, with thesell-off gathering pace in March 2020, as a growing number of countries imposed travel restrictions and lockdown measures. Global equities suffered their worst quarter since the 2008 financial crisis in the first quarter of 2020, with many markets entering an official bear market, defined as a decline of at least 20% from a recent peak.
Global government bond yields trended higher in the fourth quarter of 2019 amid growing optimism over the outlook for global growth, but tumbled in 2020 on growing speculation that theCOVID-19 pandemic would force central banks to slash interest rates and reinstate asset-purchase programs. In the US, the10-year Treasury yield closed the period around 100 basis points lower, while10-year yields in the UK fell just over 10 basis points. However, German Bund yields rose slightly and peripheral euro-zone yields rose even more. Japanese government bonds also increased modestly. Meanwhile, corporate bonds fell sharply as the deteriorating economic outlook led to fears of rising downgrades and defaults.
Hopes that the global economy may be over the worst of the trade-related slowdown were dashed as theCOVID-19 outbreak spread beyond China, forcing countries to impose travel restrictions and draconian quarantine measures. Flash estimates of purchasing managers’ indices for March 2020 revealed the impact thatCOVID-19 was having on the global economy. In the US, the purchasing managers’ composite index fell to an11-year low while the composite survey for the euro zone fell to a record low. Elsewhere, Chinese industrial production plunged 13.5% over the first two months of the year, compared to the same period in 2019, and retail sales plummeted by 20.5% on ayear-on-year basis. In response, central banks lowered interest rates and reinstated asset-purchase programs, but in general these measures failed to reassure financial markets. Instead, governments were forced to shoulder the burden for supporting economies, with many announcing massive fiscal measures.
In the currency markets, the period saw significant swings. The British pound was one of the strongest currencies in the final quarter of 2019, boosted by news that the UK had secured a Withdrawal Agreement with the EU, but lost the majority of these gains during the first quarter of 2020. Elsewhere, the US dollar, euro and Japanese yen all jostled for supremacy throughout thesix-month reporting period, while many emerging market currencies weakened.
Portfolio Review
The Fund maintained its monthly distribution objective over the reporting period, and posted favorable results in the fourth quarter of 2019. Exposure to global equities and income-oriented fixed income such as high yields bonds and emerging market debt benefited from a favorable economic backdrop over the fourth quarter, which was supported by easing trade tensions, a prior contributor to global uncertainty. The Fund started the first quarter of 2020 with a portfolio designed to generate high income in alow-yield environment, with overweight positions in high dividend equities, short-term high yield bonds, emerging market debt and preferred securities. As markets reacted to theCOVID-19 pandemic in late February 2020, and then to plummeting oil prices, credit market liquidity vanished around the globe, spreads widened to levels not seen since 2009 and corporate bonds and emerging market debt suffered significant losses. Asset classes that ordinarily offer some relative downside protection, such as short-term high yield and real estate investment trusts, suffered outsized losses as well. This led the Fund to underperform its benchmark significantly. However, as credit spreads widened and the US Federal Reserve stepped into the bond market to shore up liquidity on March 23rd, the Fund was repositioned to have less equity risk and instead have a greater emphasis on short-term investment grade and high yield bonds. The Fund still targets a stable and relatively high monthly income distribution.
Outlook
TheCOVID-19 pandemic and severe disruptions in the oil market created a simultaneous supply and demand shock for a late-cycle global economy. One consequence is that economies are increasingly vulnerable to exogenous shocks that can exacerbate existing imbalances. As such, we maintain a cautious economic outlook and now expect a global recession in the next few months. We believe that the shape and magnitude of the anticipated recession will depend to an extent on the negative spillover from financial markets in holding back the real economy. The inflection point in financial markets in the context of the current crisis—in contrast to previous financial crises—will depend, in our opinion, on an array of factors, including (1) how theCOVID-19 public health crisis unfolds and ultimately stabilizes; (2) continued credible intervention on the part of governments and public policy; (3) stabilization of corporate and macroeconomic data and (4) adjustment of valuations to recession-like levels.
Against this backdrop, we continue to see elevated risks of additional corrections in risky asset markets in the near term before a sustainable turnaround is achieved. Therefore, unless we see a very strong V-shaped recovery in markets and the economy, we expect to maintain our defensive positioning based on our trend-based and fundamental indicators. We believe that this will position us to be prepared for a persistent downturn in the near term. Of course, if the market rally atquarter-end following the very substantial fiscal package and the series of supports announced by the US Federal Reserve should persist, we will reincorporate risk back into the portfolio accordingly.
| | | | | | |
| | Semiannual Report | | | March 31, 2020 | | 21 |
Unaudited
AllianzGI Multi Asset Income Fund (cont’d)
Average Annual Total Return for the period ended March 31, 2020
| | | | | | | | | | | | | | | | | | | | | | |
| | | | | | |
| | | | | 6 Month* | | | 1 Year | | | 5 Year | | | 10 Year | | | Since Inception† | |
| | | AllianzGI Multi Asset Income Fund Class A | | | –16.14% | | | | –11.59% | | | | 0.36% | | | | 2.81% | | | | 4.49% | |
| | AllianzGI Multi Asset Income Fund Class A (adjusted) | | | –20.75% | | | | –16.45% | | | | –0.77% | | | | 2.23% | | | | 3.97% | |
| | | AllianzGI Multi Asset Income Fund Class C | | | –16.41% | | | | –12.21% | | | | –0.38% | | | | 2.05% | | | | 3.72% | |
| | AllianzGI Multi Asset Income Fund Class C (adjusted) | | | –17.23% | | | | –13.05% | | | | –0.38% | | | | 2.05% | | | | 3.72% | |
| | AllianzGI Multi Asset Income Fund Class R | | | –16.24% | | | | –11.88% | | | | 0.02% | | | | 2.47% | | | | 4.16% | |
| | AllianzGI Multi Asset Income Fund Class P | | | –15.93% | | | | –11.31% | | | | 0.67% | | | | 3.12% | | | | 4.79% | |
| | AllianzGI Multi Asset Income Fund Institutional Class | | | –15.98% | | | | –11.24% | | | | 0.71% | | | | 3.16% | | | | 4.84% | |
| | AllianzGI Multi Asset Income Fund Class R6 | | | –15.94% | | | | –11.18% | | | | 0.77% | | | | 3.22% | | | | 4.89% | |
| | | AllianzGI Multi Asset Income Fund Administrative Class | | | –16.12% | | | | –12.63% | | | | 0.01% | | | | 2.63% | | | | 4.34% | |
| | Bloomberg Barclays U.S. Universal Bond Index | | | 1.76% | | | | 7.15% | | | | 3.35% | | | | 4.05% | | | | 4.54% | |
| | AllianzGI Multi Asset Income Strategic Benchmark | | | –1.40% | | | | 3.66% | | | | 3.56% | | | | 4.26% | | | | 5.15% | |
| | MSCI World High Dividend Yield Index | | | –16.27% | | | | –12.73% | | | | 2.11% | | | | 5.57% | | | | 7.77% | |
| | | Lipper Mixed-Asset Target Today Funds Average | | | –5.80% | | | | –1.97% | | | | 2.04% | | | | 3.90% | | | | 5.23% | |
* Cumulative return
† The Fund began operations on December 29, 2008. Benchmark return comparisons began on the fund inception date. Lipper performance comparisons began on December 31, 2008.
Performance quoted represents past performance and is no guarantee of future results. Current performance may be lower or higher than performance shown. For performance current to the most recent month-end, visit our website at us.allianzgi.com. Investment return and the principal value will fluctuate. Shares may be worth more or less than original cost when redeemed.The adjusted returns take into account the maximum initial sales charge of 5.50% on Class A shares and the contingent deferred sales charge (CDSC) of 1% on Class C shares, which may apply to shares redeemed during the first year of ownership. Returns do not reflect deduction of taxes that a shareholder would pay on fund distributions or redemption of fund shares. See pages 107 and 108 for more information. The Fund’s gross expense ratios, which include the Acquired Fund Fees and Expenses, are 1.13% for Class A shares, 1.88% for Class C shares, 1.38% for Class R shares, 0.73% for Class P shares, 0.68% for Institutional Class, 0.63% for Class R6 shares and 0.98% for Administrative Class shares. These ratios do not include an expense reduction, contractually guaranteed through at least January 31, 2021. The Fund’s expense ratios net of this reduction, which include the Acquired Fund Fees and Expenses, are 0.95% for Class A shares, 1.70% for Class C shares, 1.30% for Class R shares, 0.65% for Class P shares, 0.60% for Institutional Class, 0.55% for Class R6 shares and 0.90% for Administrative Class shares. Expense ratio information is as of the Fund’s current prospectus dated February 1, 2020, as further revised or supplemented from time to time.
Cumulative Returns Through March 31, 2020
Fund Allocation (as of March 31, 2020)
| | | | |
| |
| AllianzGI Short Duration High Income | | | 20.7% | |
| |
| AllianzGI Emerging Markets SRI Debt | | | 12.6% | |
| |
| AllianzGI Short Term Bond | | | 12.2% | |
| |
| AllianzGI Global High Yield | | | 10.2% | |
| |
| AllianzGI Preferred Securities & Income | | | 10.1% | |
| |
| AllianzGI Floating Rate Note | | | 5.7% | |
| |
| PIMCO Preferred and Capital Security | | | 4.6% | |
| |
| Other | | | 18.5% | |
| |
| Cash & Equivalents — Net | | | 5.4% | |
| | | | | | |
| 22 | | March 31, 2020 | | | Semiannual Report | | |
Unaudited
AllianzGI Multi Asset Income Fund (cont’d)
| | | | | | | | | | | | | | |
| |
| Shareholder Expense Example | | Actual Performance |
| | | Class A | | Class C | | Class R | | Class P | | Institutional
Class | | Class R6 | | Administrative
Class |
| | | | | | | |
| Beginning Account Value (10/1/19) | | $1,000.00 | | $1,000.00 | | $1,000.00 | | $1,000.00 | | $1,000.00 | | $1,000.00 | | $1,000.00 |
| | | | | | | |
| Ending Account Value (3/31/20) | | $838.60 | | $835.90 | | $837.60 | | $840.70 | | $840.20 | | $840.60 | | $838.80 |
| | | | | | | |
| Expenses Paid During Period | | $2.48 | | $5.92 | | $4.09 | | $1.10 | | $0.69 | | $0.64 | | $2.25 |
| | | | | | | | | | | | | | | |
| |
| | | Hypothetical Performance |
| | | (5% return before expenses) |
| | | Class A | | Class C | | Class R | | Class P | | Institutional
Class | | Class R6 | | Administrative
Class |
| | | | | | | |
| Beginning Account Value (10/1/19) | | $1,000.00 | | $1,000.00 | | $1,000.00 | | $1,000.00 | | $1,000.00 | | $1,000.00 | | $1,000.00 |
| | | | | | | |
| Ending Account Value (3/31/20) | | $1,022.30 | | $1,018.55 | | $1,020.55 | | $1,023.80 | | $1,024.25 | | $1,024.30 | | $1,022.55 |
| | | | | | | |
| Expenses Paid During Period | | $2.73 | | $6.51 | | $4.50 | | $1.21 | | $0.76 | | $0.71 | | $2.48 |
For each class of the Fund, expenses (net of fee waiver and reimbursement, if any) are equal to the annualized expense ratio for the class (0.54% for Class A, 1.29% for Class C, 0.89% for Class R, 0.24% for Class P, 0.15% for Institutional Class, 0.14% for Class R6 and 0.49% for Administrative Class), multiplied by the average account value over the period, multiplied by 183/366. These expenses do not include the expenses of the investment companies in which the Fund invests, which are indirectly borne by Fund shareholders.
| | | | | | |
| | Semiannual Report | | | March 31, 2020 | | 23 |
Unaudited
AllianzGI Best Styles Global Equity Fund
For the period of October 1, 2019 through March 31, 2020, as provided by Christian McCormick, Senior Product Specialist.
Fund Insights
For thesix-month period ended March 31, 2020, Class A shares at net asset value (“NAV”) of the AllianzGI Best Styles Global Equity Fund (the “Fund”) returned-15.49%, underperforming the MSCI ACWI (the “benchmark”), which returned-14.33%.
Market Overview
Global equities across all regions generated strong absolute performance in the fourth quarter 2019, but after a steady start to 2020, global equities changed direction inmid-February amid growing evidence that the novel coronavirus outbreak (“COVID-19”) was spreading beyond China. The extended factory shutdowns in China also started to impact the global supply chain. Thesell-off gathered pace as the quarter progressed, with a growing number of countries employing travel restrictions and draconian quarantine measures to try to control the spread of the virus and avoid overloading health care systems. As fears increased that the global economy was heading for a severe recession, most markets entered an official bear market, defined as a retreat of at least 20% from a recent peak. The steep decline meant that global equities suffered their worst quarter since the 2008 financial crisis.
Portfolio Review
Over the reporting period, in what was a noisy and mainly beta driven market, style performance was as expected and somewhat balanced. Unfortunately, on the downside, Value and Small caps had a larger magnitude of detraction versus positive performance in other styles during the first quarter of 2020, which was a reversal from the fourth quarter 2019. Value underperformed by 5.2% and the smallest quintile in the benchmark universe by market cap underperformed by 5.7%. On the flip side, Quality and Low Volatility did well, which was to be expected. However, Revisions and Momentum also outperformed. Momentum did well, as it already consisted of many high quality and low risk names that have been outperforming for the past year, and the performance of Revisions seem to reflect confidence that most sell side analysts had a good understanding of how various companies would be affected by COVID-19 and the corresponding economic fallout.
The Best Styles strategy has only moderate leeway for sector and regional allocation with a maximum deviation of 3% vs. the benchmark for active weightings. The overall contribution from active country/sector allocation was relatively benign as would be expected with our tight active collars, but there was a-25 basis points detraction from the country allocation.
The Fund holds a broad number of stocks to implement a well-diversified mix of investment styles and assigns a maximum active weighting of 1% to individual stocks. Therefore, we expect stock selection to be the biggest driver of relative returns and this was the case over the past six months. Stock selection in the financials sector was among the largest detractors, at -76 basis points, and US stock selection within the real estate sector was the largest contributor, at +24 basis points.
Outlook
Certain economic literature posits that higher indebtedness after the crisis should influence growth negatively. 90% debt/gross domestic product has been considered a threshold for growth to be impacted negatively, and we believe that that threshold will likely be surpassed by many countries. It is possible that such threshold could move up under current monetary policy conditions, but those policies may take a toll on growth themselves (“zombification”, empty toolbox, etc.). After the crisis, we will probably be dealing with a low trend growth environment as the base case. In our opinion, the wild card would be fiscal stimulus, but even though there would be stimulus on top of all the debt issued for guarantees, income substitution etc., it will probably not be enough.
Average Annual Total Return for the period ended March 31, 2020
| | | | | | | | | | | | | | | | | | |
| | | | | |
| | | | | 6 Month* | | | 1 Year | | | 5 Year | | | Since Inception† | |
| | | AllianzGI Best Styles Global Equity Fund Class A | | | –15.49% | | | | –13.69% | | | | 0.93% | | | | 2.48% | |
| | AllianzGI Best Styles Global Equity Fund Class A (adjusted) | | | –20.13% | | | | –18.44% | | | | –0.21% | | | | 1.57% | |
| | | AllianzGI Best Styles Global Equity Fund Class C | | | –15.74% | | | | –14.19% | | | | 0.26% | | | | 1.78% | |
| | AllianzGI Best Styles Global Equity Fund Class C (adjusted) | | | –16.46% | | | | –14.92% | | | | 0.26% | | | | 1.78% | |
| | AllianzGI Best Styles Global Equity Fund Class P | | | –15.35% | | | | –13.44% | | | | 1.16% | | | | 2.71% | |
| | AllianzGI Best Styles Global Equity Fund Institutional Class | | | –15.33% | | | | –13.38% | | | | 1.26% | | | | 2.80% | |
| | AllianzGI Best Styles Global Equity Fund Class R6 | | | –15.38% | | | | –13.40% | | | | 1.28% | | | | 2.84% | |
| | MSCI ACWI | | | –14.33% | | | | –11.26% | | | | 2.85% | | | | 3.63% | |
| | | Lipper GlobalMulti-Cap Core Funds Average | | | –15.57% | | | | –13.15% | | | | 1.57% | | | | 2.51% | |
*Cumulative return
† The Fund began operations on December 2, 2013. Benchmark return comparisons began on the fund inception date. Lipper performance comparisons began on November 30, 2013.
Performance quoted represents past performance and is no guarantee of future results. Current performance may be lower or higher than performance shown. For performance current to the most recent month-end, visit our website at us.allianzgi.com. Investment return and the principal value will fluctuate. Shares may be worth more or less than original cost when redeemed.The adjusted returns take into account the maximum initial sales charge of 5.50% on Class A shares and the contingent deferred sales charge (CDSC) of 1% on Class C shares, which may apply to shares redeemed during the first year of ownership. Returns do not reflect deduction of taxes that a shareholder would pay on fund distributions or redemption of fund shares. See pages 107 and 108 for more information. The Fund’s gross expense ratios are 0.77% for Class A shares, 1.47% for Class C shares, 0.53% for Class P shares, 0.52% for Institutional Class shares and 0.40% for Class R6 shares. These ratios do not include an expense reduction, contractually guaranteed through at least January 31, 2021. The Funds expense ratios net of this reduction are 0.70% for Class A shares, 1.40% for Class C shares, 0.50% for Class P shares, 0.40% for Institutional Class shares and 0.40% for Class R6 shares. Expense ratio information is as of the Fund’s current prospectus dated February 1, 2020, as further revised or supplemented from time to time.
| | | | | | |
| 24 | | March 31, 2020 | | | Semiannual Report | | |
Unaudited
AllianzGI Best Styles Global Equity Fund (cont’d)
Cumulative Returns Through March 31, 2020
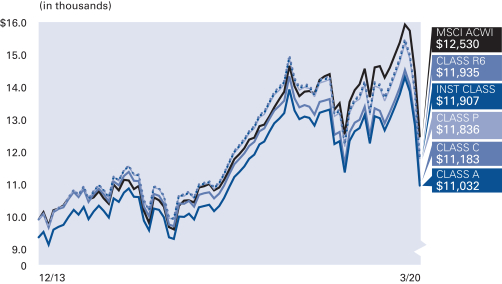
Country/Location Allocation
(as of March 31, 2020)
| | | | |
| |
| United States | | | 54.0% | |
| |
| Japan | | | 7.4% | |
| |
| China | | | 5.4% | |
| |
| France | | | 4.5% | |
| |
| United Kingdom | | | 3.2% | |
| |
| Switzerland | | | 3.0% | |
| |
| Canada | | | 2.9% | |
| |
| Australia | | | 2.0% | |
| |
| Other | | | 16.8% | |
| |
| Cash & Equivalents — Net | | | 0.8% | |
| | | | | | | | | | |
| |
| Shareholder Expense Example | | Actual Performance |
| | | Class A | | Class C | | Class P | | Institutional
Class | | Class R6 |
| | | | | |
| Beginning Account Value (10/1/19) | | $1,000.00 | | $1,000.00 | | $1,000.00 | | $1,000.00 | | $1,000.00 |
| | | | | |
| Ending Account Value (3/31/20) | | $845.10 | | $842.60 | | $846.50 | | $846.70 | | $846.20 |
| | | | | |
| Expenses Paid During Period | | $3.23 | | $6.45 | | $2.31 | | $1.85 | | $1.85 |
| | | | | | | | | | | |
| |
| | | Hypothetical Performance |
| | | (5% return before expenses) |
| | | Class A | | Class C | | Class P | | Institutional
Class | | Class R6 |
| | | | | |
| Beginning Account Value (10/1/19) | | $1,000.00 | | $1,000.00 | | $1,000.00 | | $1,000.00 | | $1,000.00 |
| | | | | |
| Ending Account Value (3/31/20) | | $1,021.50 | | $1,018.00 | | $1,022.50 | | $1,023.00 | | $1,023.00 |
| | | | | |
| Expenses Paid During Period | | $3.54 | | $7.06 | | $2.53 | | $2.02 | | $2.02 |
For each class of the Fund, expenses (net of fee waiver and reimbursement, if any) are equal to the annualized expense ratio for the class (0.70% for Class A, 1.40% for Class C, 0.50% for Class P, 0.40% for Institutional Class and 0.40% for Class R6), multiplied by the average account value over the period, multiplied by 183/366. These expenses do not include the expenses of the investment companies in which the Fund invests, which are indirectly borne by Fund shareholders.
| | | | | | |
| | Semiannual Report | | | March 31, 2020 | | 25 |
Unaudited
AllianzGI Best Styles U.S. Equity Fund*
For the period of October 1, 2019 through March 31, 2020, as provided by Christian McCormick, Senior Product Specialist.
Fund Insights
For thesix-month period ended March 31, 2020, Class A shares at net asset value (“NAV”) of the AllianzGI Best Styles U.S. Equity Fund (the “Fund”) returned-13.84%, underperforming the S&P 500 Index (the “benchmark”), which returned-12.31%.
Market Overview
US equities commenced 2020 on a strong footing, buoyed by better-than-expected corporate earnings and optimism that tax reform would provide a further uplift to profits. However, rising bond yields and signs of apick-up in wage growth led to a sharp correction in February 2020. While stocks subsequently recovered some of these losses, escalating fears of a global trade war following the Trump administration’s decision to impose tariffs on key imports and the effects of the novel coronavirus outbreak (“COVID-19”) caused a furthersell-off in late March 2020. Overall, US equities ended the quarter with slight losses, but finished the six month period with a solid gain.
Portfolio Review
Over thesix-month period, in what was a noisy and mainly beta driven market, style performance was as expected and somewhat balanced. Unfortunately, on the downside Value and Small caps had a larger magnitude of detraction versus positive performance in other styles during the first quarter, which was a reversal from the fourth quarter 2019. Value underperformed by 9.5% and mega caps (largest quintile of stocks in S&P 500) outperformed by 6.8%. On the flip side, Quality and Low Volatility did well, which was to be expected. However, Revisions and Momentum also outperformed. Momentum did well as it already consisted of many high quality and low risk names, which have been outperforming for the past year, and the performance of Revisions seem to reflect confidence that most sell side analysts had a good understanding of how various companies would be affected by the virus and corresponding economic fallout.
The Best Styles strategy has only moderate leeway for sector and regional allocation with a maximum deviation of 3% versus the benchmark for active weightings. The overall contribution from active sector allocation was relatively benign as would be expected with our tight active collars, but there was a-24 basis points detraction overall.
Best Styles holds a broad number of stocks to implement a well-diversified mix of investment styles and assigns a maximum active weighting of 1% to individual stocks. Therefore, we expect stock selection to be the biggest driver of relative returns and this was the case over the past six months. Stock selection in financials was by far the largest detractor as many of these stocks are value names. Stock selection in industrials provided the largest contribution. Although only an average weight of .6% in the benchmark over the period, the Fund’s zero holding in Netflix alone detracted 25 basis points of relative performance.
Outlook
Certain economic literature posits that higher indebtedness after the crisis should influence growth negatively. 90% debt/gross domestic product has been considered a threshold for growth to be impacted negatively, and we believe that that threshold will likely be surpassed by many countries. It is possible that such threshold could move up under current monetary policy conditions, but those policies may take a toll on growth themselves (“zombification”, empty toolbox, etc.). After the crisis, we will probably be dealing with a low trend growth environment as the base case. In our opinion, the wild card would be fiscal stimulus, but even though there would be stimulus on top of all the debt issued for guarantees, income substitution etc., it will probably not be enough
* A plan of liquidation has been adopted in respect of the Fund. Under the terms of the current plan of liquidation, the Fund would liquidate and dissolve, and any outstanding shares redeemed, on or around September 17, 2020. Under the terms of the current plan of liquidation, as of September 10, 2020, shares of the Fund will no longer be available for purchase or exchange. Please see the Fund’s statutory prospectus for more information.
| | | | | | |
| 26 | | March 31, 2020 | | | Semiannual Report | | |
Unaudited
AllianzGI Best Styles U.S. Equity Fund (cont’d)
Average Annual Total Return for the period ended March 31, 2020
| | | | | | | | | | | | | | | | | | |
| | | | | |
| | | | | 6 Month* | | | 1 Year | | | 5 Year | | | Since Inception† | |
| | | AllianzGI Best Styles U.S. Equity Fund Class A | | | –13.84% | | | | –10.13% | | | | 4.84% | | | | 4.83% | |
| | AllianzGI Best Styles U.S. Equity Fund Class A (adjusted) | | | –18.58% | | | | –15.07% | | | | 3.66% | | | | 3.73% | |
| | | AllianzGI Best Styles U.S. Equity Fund Class C | | | –14.15% | | | | –10.79% | | | | 4.08% | | | | 4.07% | |
| | AllianzGI Best Styles U.S. Equity Fund Class C (adjusted) | | | –14.81% | | | | –11.48% | | | | 4.08% | | | | 4.07% | |
| | AllianzGI Best Styles U.S. Equity Fund Class P | | | –13.77% | | | | –9.97% | | | | 5.01% | | | | 5.00% | |
| | AllianzGI Best Styles U.S. Equity Fund Institutional Class | | | –13.69% | | | | –9.89% | | | | 5.08% | | | | 5.08% | |
| | AllianzGI Best Styles U.S. Equity Fund Class R6 | | | –13.64% | | | | –9.81% | | | | 5.17% | | | | 5.16% | |
| | S&P 500 Index | | | –12.31% | | | | –6.98% | | | | 6.73% | | | | 6.57% | |
| | | LipperMulti-Cap Core Funds Average | | | –15.87% | | | | –11.80% | | | | 3.16% | | | | 3.29% | |
* Cumulative return
† The Fund began operations on December 1, 2014. Benchmark return comparisons began on the fund inception date. Lipper performance comparisons began on November 30, 2014.
Performance quoted represents past performance and is no guarantee of future results. Current performance may be lower or higher than performance shown. For performance current to the most recent month-end, visit our website at us.allianzgi.com. Investment return and the principal value will fluctuate. Shares may be worth more or less than original cost when redeemed.The adjusted returns take into account the maximum initial sales charge of 5.50% on Class A shares and the contingent deferred sales charge (CDSC) of 1% on Class C shares, which may apply to shares redeemed during the first year of ownership. Returns do not reflect deduction of taxes that a shareholder would pay on fund distributions or redemption of fund shares. See pages 107 and 108 for more information. The Fund’s gross expense ratios are 0.95% for Class A shares, 1.72% for Class C shares, 0.79% for Class P shares, 0.60% for Institutional Class shares and 0.59% for Class R6 shares. These ratios do not include an expense reduction, contractually guaranteed through at least January 31, 2021. The Fund’s expense ratios net of this reduction are 0.65% for Class A shares, 1.40% for Class C shares, 0.50% for Class P shares, 0.40% for Institutional Class shares and 0.40% for Class R6 shares. Expense ratio information is as of the Fund’s current prospectus dated February 1, 2020, as further revised or supplemented from time to time.
Cumulative Returns Through March 31, 2020
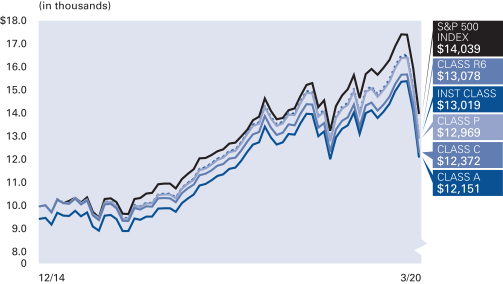
Industry Allocation (as of March 31, 2020 )
| | | | |
| |
| Software | | | 10.3% | |
| |
| Pharmaceuticals | | | 6.1% | |
| |
| Interactive Media & Services | | | 5.5% | |
| |
| IT Services | | | 5.1% | |
| |
| Technology Hardware, Storage & Peripherals | | | 5.0% | |
| |
| Healthcare Equipment & Supplies | | | 4.1% | |
| |
| Healthcare Providers & Services | | | 3.9% | |
| |
| Internet & Direct Marketing Retail | | | 3.8% | |
| |
| Other | | | 55.8% | |
| |
| Cash & Equivalents — Net | | | 0.4% | |
| | | | | | |
| | Semiannual Report | | | March 31, 2020 | | 27 |
Unaudited
AllianzGI Best Styles U.S. Equity Fund (cont’d)
| | | | | | | | | | |
| |
| Shareholder Expense Example | | Actual Performance |
| | | Class A | | Class C | | Class P | | Institutional
Class | | Class R6 |
| | | | | |
| Beginning Account Value (10/1/19) | | $1,000.00 | | $1,000.00 | | $1,000.00 | | $1,000.00 | | $1,000.00 |
| | | | | |
| Ending Account Value (3/31/20) | | $861.60 | | $858.50 | | $862.30 | | $863.10 | | $863.60 |
| | | | | |
| Expenses Paid During Period | | $3.03 | | $6.50 | | $2.33 | | $1.86 | | $1.86 |
| | | | | | | | | | | |
| |
| | | Hypothetical Performance |
| | | (5% return before expenses) |
| | | Class A | | Class C | | Class P | | Institutional
Class | | Class R6 |
| | | | | |
| Beginning Account Value (10/1/19) | | $1,000.00 | | $1,000.00 | | $1,000.00 | | $1,000.00 | | $1,000.00 |
| | | | | |
| Ending Account Value (3/31/20) | | $1,021.75 | | $1,018.00 | | $1,022.50 | | $1,023.00 | | $1,023.00 |
| | | | | |
| Expenses Paid During Period | | $3.29 | | $7.06 | | $2.53 | | $2.02 | | $2.02 |
For each class of the Fund, expenses (net of fee waiver and reimbursement, if any) are equal to the annualized expense ratio for the class (0.65% for Class A, 1.40% for Class C, 0.50% for Class P, 0.40% for Institutional Class and 0.40% for Class R6), multiplied by the average account value over the period, multiplied by 183/366.
| | | | | | |
| 28 | | March 31, 2020 | | | Semiannual Report | | |
Unaudited
AllianzGI Convertible Fund
For the period of October 1, 2019 through March 31, 2020, as provided by Douglas C. Forsyth, CFA, Portfolio Manager.
Fund Insights
For thesix-month period ended March 31, 2020, Class A shares at net asset value (“NAV”) of the AllianzGI Convertible Fund (the “Fund”) returned-4.80%, outperforming the ICE BofA US Convertibles Index (the “benchmark”), which returned-7.24%.
Market Overview
Risk assets rallied over the fourth quarter through January before selling off aggressively in late February as the novel coronavirus outbreak (“COVID-19”) intensified. The short-term trajectory of the global economy and corporate profitability became highly uncertain.
The US Federal Reserve’s (“Fed’s”) response to these events was extraordinary in terms of its swiftness, scope, and willingness to do more. The fiscal response was also immediate with President Trump signing into law three bills including the $2.2 trillion Coronavirus Aid, Relief & Security Act (“CARES Act”) to help support the economy.
Most first-quarter US economic statistics did not reflect real-time developments of theCOVID-19 pandemic and therefore were largely irrelevant. However, data released closer to the end of March began to show a dramatic tick lower in activity. In a matter of weeks the US economy went from record low unemployment to millions in initial jobless claims.
Fourth-quarter financial results and the majority of management outlooks reflected strong fundamentals, healthy balance sheets and ample liquidity exiting 2019. These data points had less utility as the first quarter progressed. The supply-side shock and demand disruption due to travel restrictions, lockdowns and other directives to contain the spread of COVID-19 and avoid overloading the healthcare system significantly altered the near-term path for earnings and sales. By the end of the first quarter, most companies were highly focused on cash management and liquidity, accessing lines of credit, controlling variable costs, deferring capital investment and suspending dividends and share repurchases.
Aggressive rate cuts, the reinstatement of bond-buying programs and “safe haven” demand caused the US Treasury yield curve to compress and steepen sharply over the period.
Non-investment grade issuers outperformed investment grade issuers. Total return (balanced) structures outperformed both equity-sensitive and yield alternative (busted).
Primary market activity increased quarter over quarter despite market volatility. After strong new issuance to start the year activity slowed during the March selloff before picking back up intoquarter-end.
Portfolio Review
The Fund held up much better than stocks and significantly outperformed the benchmark for thesix-month reporting period.
Sector allocations that helped relative performance in the period included technology, financials and energy. Positive credit selection was the primary driver of relative performance in the technology sector. Portfolio underweights in both financials and energy were sources of strength. Sector allocations that detracted from relative performance during the period included healthcare, media and telecommunications. Negative credit selection was the primary driver of relative performance in the healthcare and telecommunications sectors. A portfolio underweight in media was source of weakness.
Outlook
The near-term outlook for the global economy and corporate profitability is uncertain and evolving due to the headwinds associated with theCOVID-19 outbreak. The situation continues to move very rapidly and requires close monitoring, especially in light of the massive confluence of central bank intervention and government stimulus. While the duration and severity of the economic downturn is unknown, the extraordinary monetary and fiscal policy measures instituted by the Fed and the US government aim to not only help stabilize financial markets but also accelerate the recovery.
Upcoming economic reports should reflect materially slower activity resulting from the government-imposed shutdown. Data points are unlikely to rebound in the short term. First-quarter corporate earnings are likely to come in below expectations and most outlooks are expected to be downbeat with reduced visibility.
After the March selloff many convertible bonds have approached their bond floors. Given the vicinity of convertible bonds to their floors, the market’s downside risk should be much more contained going forward. When the underlying equities recover, we believe convertible bonds are well positioned to participate in the upside.
In 2020, we expect significant organic growth in the convertible bond market as scheduled maturities slow and the new issuance calendar reaccelerates. This could provide balanced convertible opportunities and also improve sector diversification.
| | | | | | |
| | Semiannual Report | | | March 31, 2020 | | 29 |
Unaudited
AllianzGI Convertible Fund (cont’d)
Average Annual Total Return for the period ended March 31, 2020
| | | | | | | | | | | | | | | | | | | | | | |
| | | | | | |
| | | | | 6 Month* | | | 1 Year | | | 5 Year | | | 10 Year | | | Since Inception† | |
| | | AllianzGI Convertible Fund Class A | | | –4.80% | | | | 0.07% | | | | 5.64% | | | | 8.62% | | | | 9.62% | |
| | AllianzGI Convertible Fund Class A (adjusted) | | | –10.04% | | | | –5.43% | | | | 4.45% | | | | 8.00% | | | | 9.39% | |
| | | AllianzGI Convertible Fund Class C | | | –5.16% | | | | –0.70% | | | | 4.87% | | | | 7.83% | | | | 8.81% | |
| | AllianzGI Convertible Fund Class C (adjusted) | | | –6.07% | | | | –1.66% | | | | 4.87% | | | | 7.83% | | | | 8.81% | |
| | AllianzGI Convertible Fund Class R | | | –4.93% | | | | –0.18% | | | | 5.33% | | | | 8.28% | | | | 9.32% | |
| | AllianzGI Convertible Fund Class P | | | –4.70% | | | | 0.32% | | | | 5.92% | | | | 8.87% | | | | 9.86% | |
| | AllianzGI Convertible Fund Institutional Class | | | –4.68% | | | | 0.31% | | | | 5.96% | | | | 8.95% | | | | 9.96% | |
| | | AllianzGI Convertible Fund Administrative Class | | | –4.75% | | | | 0.09% | | | | 5.72% | | | | 8.69% | | | | 9.64% | |
| | ICE BofA US Convertibles Index | | | –7.24% | | | | –3.52% | | | | 4.73% | | | | 7.89% | | | | 7.84% | |
| | | Lipper Convertible Securities Funds Average | | | –5.98% | | | | –2.27% | | | | 4.09% | | | | 6.77% | | | | 6.41% | |
* Cumulative return
† The Fund began operations on April 19, 1993. Benchmark return comparisons began on the fund inception date. Lipper performance comparisons began on April 30, 1993.
Performance quoted represents past performance and is no guarantee of future results. Current performance may be lower or higher than performance shown. For performance current to the most recent month-end, visit our website at us.allianzgi.com. Investment return and the principal value will fluctuate. Shares may be worth more or less than original cost when redeemed.The adjusted returns take into account the maximum initial sales charge of 5.50% on Class A shares and the contingent deferred sales charge (CDSC) of 1% on Class C shares, which may apply to shares redeemed during the first year of ownership. Returns do not reflect deduction of taxes that a shareholder would pay on fund distributions or redemption of fund shares. See pages 107 and 108 for more information. The Fund’s gross expense ratios are 1.02% for Class A shares, 1.75% for Class C shares, 1.17% for Class R shares, 0.75% for Class P shares, 0.72% for Institutional Class shares and 0.97% for Administrative Class shares. These ratios do not include an expense reduction, contractually guaranteed through at least January 31, 2021. The Fund’s expense ratios net of this reduction are 0.96% for Class A shares, 1.73% for Class C shares, 1.17% for Class R shares, 0.74% for Class P shares, 0.71% for Institutional Class shares and 0.93% for Administrative Class shares. Expense ratio information is as of the Fund’s current prospectus dated February 1, 2020, as further revised or supplemented from time to time.
Cumulative Returns Through March 31, 2020
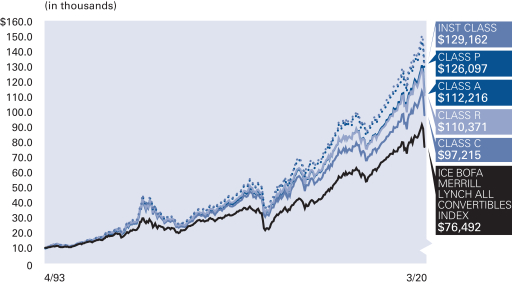
Industry Allocation (as of
March 31, 2020)
| | | | |
| |
| Software | | | 19.2% | |
| |
| Semiconductors | | | 10.0% | |
| |
| Healthcare-Products | | | 7.2% | |
| |
| Internet | | | 6.1% | |
| |
| Biotechnology | | | 5.3% | |
| |
| Banks | | | 5.2% | |
| |
| Pharmaceuticals | | | 4.6% | |
| |
| Media | | | 3.9% | |
| |
| Other | | | 29.0% | |
| |
| Cash & Equivalents — Net | | | 9.5% | |
S&P Ratings* (as of March 31, 2020 )
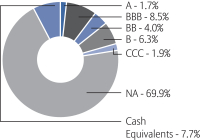
* As a percentage of total investments. Credit ratings refer to the underlying holdings of the Fund and are categorized from highest to lowest credit quality using ratings provided by S&P Global Ratings (“S&P”). S&P’s ratings have been selected for several reasons, including the portfolio managers’ usage of S&P ratings methodology among other credit quality information in managing the Fund, access to background information and other materials provided by S&P, as well as the Funds’ considerations of industry practice. The Fund also displays S&P credit ratings information in materials provided in client presentations. See “Important Information” for more detail on the selection of S&P for the Fund’s ratings presentation. Securities not rated by S&P and bonds that do not currently have a rating available are designated in the chart above as “NR” and “NA”, respectively.
| | | | | | |
| 30 | | March 31, 2020 | | | Semiannual Report | | |
Unaudited
AllianzGI Convertible Fund (cont’d)
| | | | | | | | | | | | |
| |
| Shareholder Expense Example | | Actual Performance |
| | | Class A | | Class C | | Class R | | Class P | | Institutional
Class | | Administrative
Class |
| | | | | | |
| Beginning Account Value (10/1/19) | | $1,000.00 | | $1,000.00 | | $1,000.00 | | $1,000.00 | | $1,000.00 | | $1,000.00 |
| | | | | | |
| Ending Account Value (3/31/20) | | $952.00 | | $948.40 | | $950.70 | | $953.00 | | $953.20 | | $952.50 |
| | | | | | |
| Expenses Paid During Period | | $4.68 | | $8.33 | | $6.00 | | $3.42 | | $3.37 | | $4.44 |
| | | | | | | | | | | | | |
| |
| | | Hypothetical Performance |
| | | (5% return before expenses) |
| | | Class A | | Class C | | Class R | | Class P | | Institutional
Class | | Administrative
Class |
| | | | | | |
| Beginning Account Value (10/1/19) | | $1,000.00 | | $1,000.00 | | $1,000.00 | | $1,000.00 | | $1,000.00 | | $1,000.00 |
| | | | | | |
| Ending Account Value (3/31/20) | | $1,020.20 | | $1,016.45 | | $1,018.85 | | $1,021.50 | | $1,021.55 | | $1,020.45 |
| | | | | | |
| Expenses Paid During Period | | $4.85 | | $8.62 | | $6.21 | | $3.54 | | $3.49 | | $4.60 |
For each class of the Fund, expenses are equal to the annualized expense ratio for the class (0.96% for Class A, 1.71% for Class C, 1.23% for Class R, 0.70% for Class P, 0.69% for Institutional Class and 0.91% for Administrative Class), multiplied by the average account value over the period, multiplied by 183/366.
| | | | | | |
| | Semiannual Report | | | March 31, 2020 | | 31 |
Unaudited
AllianzGI Core Bond Fund
For the period of October 1, 2019 through March 31, 2020, as provided by Carl W. Pappo, Jr., CFA, Portfolio Manager.
Fund Insights
For thesix-month period ended March 31, 2020, Institutional Class shares at net asset value (“NAV”) of the AllianzGI Core Bond Fund (the “Fund”) returned 2.96%, underperforming the Bloomberg Barclays U.S. Aggregate Bond Index (the “benchmark”), which returned 3.33%.
Market Overview
The novel coronavirus outbreak (“COVID-19”) caused considerable dislocation across US fixed income markets at the end of March 2020. As businesses shuttered and the US economy essentially shut down in response to COVID-19, fixed income market liquidity rapidly dried up and forced selling quickly drove valuations on risk assets to levels not seen since the global financial crisis. The US Government’s monetary and fiscal response was substantial, beginning with immediate easing of the Federal Funds rate to0.00%-0.25%, and when that proved futile a ramping up of a fiscal stimulus package including everything from direct payments to consumers to purchases of fixed income securities in the secondary market.
Ultimately more than $2.2 trillion will be pumped out by the US Treasury to help carry the economy over an indeterminate period in which consumers and employees will be locked in their homes. While conditions have improved significantly frommid-March, when liquidity conditions were at their worst, yield spreads on risk assets remain historically wide, reflecting the new economic reality. At this point, we believe that a recession is technically imminent, though the extent of the damage will center on how quickly businesses can return to normal operation.
Portfolio Review
Underperformance was primarily driven by our underweight to Treasuries and exposure to risk assets including investment grade corporates, asset-backed (“ABS”) and mortgage backed securities (“MBS”) as well as collateralized loan obligations (“CLO”) and preferred bonds. The Fund came into March 2020 0.60yrs underweight corporate credit and began adding to the sector in the month as spreads widened over 200 basis points to levels not seen since the 2007-2008 global financial crisis, reaching 3 standard deviations cheap relative to historical measures.
The Fund began the period with significant overweights to high quality ABS including consumer auto loans and credit cards, as well as small business administration loans. Despite high fundamental credit quality—and in the case of small business administration (“SBA”) loans, a full government guarantee—these assets were not sheltered from the extreme liquidity-driven selloff as secondary supply for the period grew 50% year-over-year, most notably in March, and investment managers were forced to sell what they could to fund redemptions while dealer support dissipated. As technical forces began to normalize at the end of March 2020, fundamental considerationsre-emerged and the highest quality asset classes enjoyed an outsized share of the improvement. We have reduced our overall ABS positioning to a smaller targeted exposure in segments of the market where we continue to see outsized relative value. We additionally maintain a small allocation to senior tranches of collateralized loan obligations, which offer attractive spreads for assets with substantial credit enhancement.
The Fund’s portfolio overweight to agency MBS was very supportive as the government announced early on their intention to purchase MBS to lower market volatility and provide liquidity for customer outflows. We reduced exposure to agency MBS following the market disruption as government buying to bolster market liquidity was heavily concentrated in that sector. Exposure to high quality assets including agency MBS, ABS and SBA loans was ultimately reduced to move into higher beta sectors such as corporate credit when spreads widened.
Outlook
Fund exposure to corporate bonds has been increased given the risk/reward profile created by much wider spreads, with most purchases coming after the US Federal Reserve announced corporate bond buying facilities on March 23rd.
Market stress allowed the Fund to buy very high quality credits at very cheap levels as companies seek to shore up liquidity through the primary market. The Fund’s focus has been to buy quality companies with great assets that will see limited impacts fromCOVID-19 shutdowns, including regulated utilities, telecommunications & cable, defense, food & beverage retailers, and diversified media. The Fund continues to avoid companies who are generating significantly less revenue in this environment including auto, travel & leisure, restaurants, andnon-food retailers as the path forward for these companies remains quite uncertain, even if the lockdown ends in short order. The Fund also remains overweight ABS and SBA loans where credit structures provide significant support even in the current uncertain environment. To this end, the Fund continues to focus on a strictbottom-up selection process focused on high quality underlying collateral.
Now that the fear of a liquidity shock seemingly has been calmed, 2020 fundamentals have little importance, as we believe that they will be largely looked-through. We are focusing on what each business is likely to look like in 2021. We believe strongly that bottom up research is more important than ever as the coming 6 to 12 months will impact industries in very diverse ways and owning the right companies will be a big differentiator for total returns.
| | | | | | |
| 32 | | March 31, 2020 | | | Semiannual Report | | |
Unaudited
AllianzGI Core Bond Fund (cont’d)
Average Annual Total Return for the period ended March 31, 2020
| | | | | | | | | | | | | | |
| | | | |
| | | | | 6 Month* | | | 1 Year | | | Since Inception† | |
| | AllianzGI Core Bond Fund Class P | | | 2.84% | | | | 8.35% | | | | 7.36% | |
| | AllianzGI Core Bond Fund Institutional Class | | | 2.96% | | | | 8.43% | | | | 7.44% | |
| | AllianzGI Core Bond Fund Class R6 | | | 2.92% | | | | 8.48% | | | | 7.47% | |
| | Bloomberg Barclays U.S. Aggregate Bond Index | | | 3.33% | | | | 8.93% | | | | 7.37% | |
| | | Lipper Core Bond Funds Average | | | 0.63% | | | | 5.79% | | | | 5.43% | |
* Cumulative return
† The Fund began operations on May 30, 2018. Benchmark return comparisons began on the fund inception date. Lipper performance comparisons began on May 31, 2018.
Performance quoted represents past performance and is no guarantee of future results. Current performance may be lower or higher than performance shown. For performance current to the most recent month-end, visit our website at us.allianzgi.com. Investment return and the principal value will fluctuate. Shares may be worth more or less than original cost when redeemed. Returns do not reflect deduction of taxes that a shareholder would pay on funds distributions or redemption of fund shares. See pages 107 and 108 for more information. The Fund’s gross expense ratios are 1.15% for Class P shares, 7.52% for Institutional Class shares and 1.04% for Class R6 shares. These ratios do not include an expense reduction, contractually guaranteed through at least January 31, 2022. The Fund’s expense ratios net of this reduction are 0.30% for Class P shares, 0.25% for Institutional Class shares and 0.20% for Class R6 shares. Expense ratio information is as of the Fund’s current prospectus dated February 1, 2020, as further revised or supplemented from time to time.
Cumulative Returns Through March 31, 2020
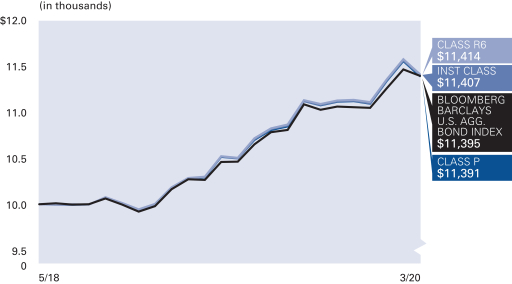
Asset Allocation (as of March 31, 2020)
| | | | |
| |
| U.S. Government Agency Securities | | | 33.9% | |
| |
| Corporate Bonds and Notes | | | 33.2% | |
| |
| Asset-Backed Securities | | | 16.6% | |
| |
| U.S. Treasury Obligations | | | 10.5% | |
| |
| Mortgage-Backed Securities | | | 3.0% | |
| |
| Preferred Stock | | | 1.1% | |
| |
| Cash & Equivalents — Net | | | 1.7% | |
Credit Ratings* (as of March 31, 2020 )
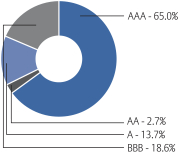
* As a percentage of total investments. Credit ratings apply to the credit worthiness of the issuers of the underlying securities and not to the Fund or its shares. Ratings are subject to change. Ratings are based off of the highest available rating from S&P Global Ratings (“S&P”), Moody’s and Fitch. Bonds not rated by the aforementioned agencies are “unrated”. Ratings are shown based on the S&P rating scale, which ranges from AAA (highest) to D (lowest). Where applicable, securities ratings of an agency other than S&P have been converted to the S&P equivalent. “NR” denotes securities that are not rated. Not rated securities do not necessarily indicate low quality. Ratings are relative, subjective and not absolute standards of quality, and represent the opinions of the independent Nationally Recognized Statistical Rating Organizations (NRSRO). The security’s credit rating does not eliminate risk. The Fund is not rated by an independent rating agency.
| | | | | | |
| | Semiannual Report | | | March 31, 2020 | | 33 |
Unaudited
AllianzGI Core Bond Fund (cont’d)
| | | | | | |
| |
| Shareholder Expense Example | | Actual Performance |
| | | Class P | | Institutional
Class | | Class R6 |
| | | |
| Beginning Account Value (10/1/19) | | $1,000.00 | | $1,000.00 | | $1,000.00 |
| | | |
| Ending Account Value (3/31/20) | | $1,028.40 | | $1,029.60 | | $1,029.20 |
| | | |
| Expenses Paid During Period | | $1.52 | | $1.27 | | $1.01 |
| | | | | | | |
| |
| | | Hypothetical Performance |
| | | (5% return before expenses) |
| | | Class P | | Institutional
Class | | Class R6 |
| | | |
| Beginning Account Value (10/1/19) | | $1,000.00 | | $1,000.00 | | $1,000.00 |
| | | |
| Ending Account Value (3/31/20) | | $1,023.50 | | $1,023.75 | | $1,024.00 |
| | | |
| Expenses Paid During Period | | $1.52 | | $1.26 | | $1.01 |
For each class of the Fund, expenses (net of fee waiver and reimbursement, if any) are equal to the annualized expense ratio for the class (0.30% for Class P, 0.25% for Institutional Class and 0.20% for Class R6), multiplied by the average account value over the period, multiplied by 183/366 for the Actual example and 183/366.
| | | | | | |
| 34 | | March 31, 2020 | | | Semiannual Report | | |
Unaudited
AllianzGI Core Plus Bond Fund
For the period of October 1, 2019 through March 31, 2020, as provided by Carl W. Pappo, Jr., CFA, Portfolio Manager.
Fund Insights
For thesix-month period ended March 31, 2020, Institutional Class shares at net asset value (“NAV”) of the AllianzGI Core Plus Bond Fund (the “Fund”) returned 1.06%, underperforming the Bloomberg Barclays U.S. Aggregate Bond Index (the “benchmark”), which returned 3.33%.
Market Overview
The novel coronavirus outbreak (“COVID-19”) caused considerable dislocation across US fixed income markets at the end of March 2020. As businesses shuttered and the US economy essentially shut down in response to COVID-19, fixed income market liquidity rapidly dried up and forced selling quickly drove valuations on risk assets to levels not seen since the global financial crisis. The US Government’s monetary and fiscal response was substantial, beginning with immediate easing of the Federal Funds rate to0.00%-0.25%, and when that proved futile a ramping up of a fiscal stimulus package including everything from direct payments to consumers to purchases of fixed income securities in the secondary market.
Ultimately more than $2.2 trillion will be pumped out by the US Treasury to help carry the economy over an indeterminate period in which consumers and employees will be locked in their homes. While conditions have improved significantly frommid-March, when liquidity conditions were at their worst, yield spreads on risk assets remain historically wide, reflecting the new economic reality. At this point, we believe that a recession is technically imminent, though the extent of the damage will center on how quickly businesses can return to normal operation.
Portfolio Review
Underperformance was primarily driven by our underweight to Treasuries and exposure to risk assets including investment grade corporates, asset-backed (“ABS”) and mortgage backed securities (“MBS”) as well as collateralized loan obligations (“CLO”) and preferred bonds. The Fund came into March 2020 0.60yrs underweight corporate credit and began adding to the sector in the month as spreads widened over 200 basis points to levels not seen since the 2007-2008 global financial crisis, reaching 3 standard deviations cheap relative to historical measures. The strategy was also 7% underweight high-yield exposure entering the period, where exposure was also increased as spreads widened.
The Fund began the period with significant overweights to high quality ABS including consumer auto loans and credit cards, as well as small business administration loans. Despite high fundamental credit quality—and in the case of small business administration (“SBA”) loans, a full government guarantee—these assets were not sheltered from the extreme liquidity-driven selloff as secondary supply for the period grew 50% year-over-year, most notably in March, and investment managers were forced to sell what they could to fund redemptions while dealer support dissipated. As technical forces began to normalize at the end of March 2020, fundamental considerationsre-emerged and the highest quality asset classes enjoyed an outsized share of the improvement. We have reduced our overall ABS positioning to a smaller targeted exposure in segments of the market where we continue to see outsized relative value. We additionally maintain a small allocation to senior tranches of collateralized loan obligations, which offer attractive spreads for assets with substantial credit enhancement.
The Fund’s portfolio overweight to agency MBS was very supportive as the government announced early on their intention to purchase MBS to lower market volatility and provide liquidity for customer outflows. We reduced exposure to agency MBS following the market disruption as government buying to bolster market liquidity was heavily concentrated in that sector. Exposure to high quality assets including agency MBS, ABS and SBA loans was ultimately reduced to move into higher beta sectors such as corporate credit when spreads widened.
Outlook
Fund exposure to corporate bonds has been increased given the risk/reward profile created by much wider spreads, with most purchases coming after the US Federal Reserve announced corporate bond buying facilities on March 23rd.
Market stress allowed the Fund to buy very high quality credits at very cheap levels as companies seek to shore up liquidity through the primary market. The Fund’s focus has been to buy quality companies with great assets that will see limited impacts fromCOVID-19 shutdowns, including regulated utilities, telecommunications & cable, defense, food & beverage retailers, and diversified media. The Fund continues to avoid companies who are generating significantly less revenue in this environment including auto, travel & leisure, restaurants, andnon-food retailers as the path forward for these companies remains quite uncertain, even if the lockdown ends in short order. The Fund also remains overweight ABS and SBA loans where credit structures provide significant support even in the current uncertain environment. To this end, the Fund continues to focus on a strictbottom-up selection process focused on high quality underlying collateral.
Now that the fear of a liquidity shock seemingly has been calmed, 2020 fundamentals have little importance, as we believe that they will be largely looked-through. We are focusing on what each business is likely to look like in 2021. We believe strongly that bottom up research is more important than ever as the coming 6 to 12 months will impact industries in very diverse ways and owning the right companies will be a big differentiator for total returns.
| | | | | | |
| | Semiannual Report | | | March 31, 2020 | | 35 |
Unaudited
AllianzGI Core Plus Bond Fund (cont’d)
Average Annual Total Return for the period ended March 31, 2020
| | | | | | | | | | | | | | |
| | | | |
| | | | | 6 Month* | | | 1 Year | | | Since Inception† | |
| | AllianzGI Core Plus Bond Fund Class P | | | 1.04% | | | | 6.51% | | | | 6.23% | |
| | AllianzGI Core Plus Bond Fund Institutional Class | | | 1.06% | | | | 6.56% | | | | 6.30% | |
| | AllianzGI Core Plus Bond Fund Class R6 | | | 1.08% | | | | 6.54% | | | | 6.33% | |
| | Bloomberg Barclays U.S. Aggregate Bond Index | | | 3.33% | | | | 8.93% | | | | 7.37% | |
| | | Lipper Core Plus Bond Funds Average | | | –0.32% | | | | 4.80% | | | | 4.97% | |
* Cumulative return
† The Fund began operations on May 30, 2018. Benchmark return comparisons began on the fund inception date. Lipper performance comparisons began on May 31, 2018.
Performance quoted represents past performance and is no guarantee of future results. Current performance may be lower or higher than performance shown. For performance current to the most recent month-end, visit our website at us.allianzgi.com. Investment return and the principal value will fluctuate. Shares may be worth more or less than original cost when redeemed. Returns do not reflect deduction of taxes that a shareholder would pay on funds distributions or redemption of fund shares. See pages 107 and 108 for more information. The Fund’s gross expense ratios are 0.83% for Class P shares, 20.93% for Institutional Class shares and 0.84% for Class R6 shares. These ratios do not include an expense reduction, contractually guaranteed through at least January 31, 2022. The Fund’s expense ratios net of this reduction are 0.35% for Class P shares, 0.30% for Institutional Class shares and 0.25% for Class R6 shares. Expense ratio information is as of the Fund’s current prospectus dated February 1, 2020, as further revised or supplemented from time to time.
Cumulative Returns Through March 31, 2020
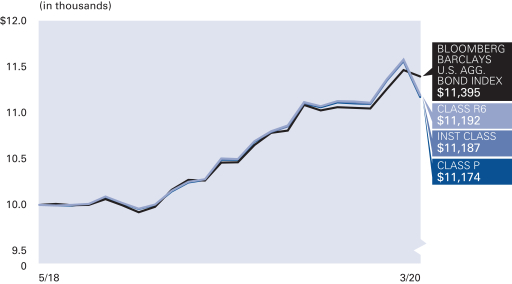
Asset Allocation
(as of March 31, 2020 )
| | | | |
| |
| Corporate Bonds & Notes | | | 38.1% | |
| |
| U.S. Government Agency Securities | | | 31.5% | |
| |
| Asset-Backed Securities | | | 23.6% | |
| |
| U.S. Treasury Obligations | | | 5.1% | |
| |
| Mortgage-Backed Securities | | | 3.1% | |
| |
| Preferred Stock | | | 1.1% | |
| |
| Cash & Equivalents — Net | | | -2.5% | |
Credit Ratings* (as of March 31, 2020)
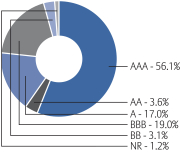
* As a percentage of total investments. Credit ratings apply to the credit worthiness of the issuers of the underlying securities and not to the Fund or its shares. Ratings are subject to change. Ratings are based off of the highest available rating from S&P Global Ratings (“S&P”), Moody’s and Fitch. Bonds not rated by the aforementioned agencies are “unrated”. Ratings are shown based on the S&P rating scale, which ranges from AAA (highest) to D (lowest). Where applicable, securities ratings of an agency other than S&P have been converted to the S&P equivalent. “NR” denotes securities that are not rated. Not rated securities do not necessarily indicate low quality. Ratings are relative, subjective and not absolute standards of quality, and represent the opinions of the independent Nationally Recognized Statistical Rating Organizations (NRSRO). The security’s credit rating does not eliminate risk. The Fund is not rated by an independent rating agency.
| | | | | | |
| 36 | | March 31, 2020 | | | Semiannual Report | | |
Unaudited
AllianzGI Core Plus Bond Fund (cont’d)
| | | | | | |
| |
| Shareholder Expense Example | | Actual Performance |
| | | Class P | | Institutional
Class | | Class R6 |
| | | |
| Beginning Account Value (10/1/19) | | $1,000.00 | | $1,000.00 | | $1,000.00 |
| | | |
| Ending Account Value (3/31/20) | | $1,010.40 | | $1,010.60 | | $1,010.80 |
| | | |
| Expenses Paid During Period | | $1.76 | | $1.51 | | $1.26 |
| | | | | | | |
| |
| | | Hypothetical Performance |
| | | (5% return before expenses) |
| | | Class P | | Institutional
Class | | Class R6 |
| | | |
| Beginning Account Value (10/1/19) | | $1,000.00 | | $1,000.00 | | $1,000.00 |
| | | |
| Ending Account Value (3/31/20) | | $1,023.25 | | $1,023.50 | | $1,023.75 |
| | | |
| Expenses Paid During Period | | $1.77 | | $1.52 | | $1.26 |
For each class of the Fund, expenses (net of fee waiver and reimbursement, if any) are equal to the annualized expense ratio for the class (0.35% for Class P, 0.30% for Institutional Class and 0.25% for Class R6), multiplied by the average account value over the period, multiplied by 183/366.
| | | | | | |
| | Semiannual Report | | | March 31, 2020 | | 37 |
Unaudited
AllianzGI Emerging Markets Consumer Fund
For the period of October 1, 2019 through March 31, 2020, as provided by Lu Yu, CFA, CIPM, Portfolio Manager.
Fund Insights
For thesix-month period ended March 31, 2020, Class A shares at net asset value (“NAV”) of the AllianzGI Emerging Markets Consumer Fund (the “Fund”) returned-13.25%, outperforming the MSCI Emerging Markets Index (the “benchmark”), which returned-14.55%.
Market Overview
During thesix-month period, emerging markets equities were broadly lower due to the significant headwinds related to theCOVID-19 outbreak. The asset class initially advanced in October 2019, with modestly negative performance in November, and a strong rebound in December 2019 as markets focused on expectations of stable global growth projections, the agreement of a “phase one” trade deal between the US and China and better-than-expected corporate earnings. Emerging markets equities declined in January 2020 as investors were nervous about tensions between the United States and Iran, andCOVID-19 news began to capture headlines, mainly in China. The broad-based asset classsell-off intensified toward the end of February 2020 amid growing evidence that theCOVID-19 outbreak was spreading beyond China. Thesell-off accelerated in March 2020 as travel restrictions and social distancing efforts related toCOVID-19 led to fears grew that the global economy would be unable to avoid a recession.
Benchmark sector performance was broadly lower as 10 out of 11 sectors posted declines. Health care notched a 5% gain followed by modest losses in communication services and information technology. Meanwhile, the energy sector declined more than 33% due to the significant headwinds in oil and gas companies. Financials, utilities, industrials and materials were each down by more than 22% as cyclical segments of the market were under pressure.
Country results for the benchmark index were broadly negative as 25 of 26 countries were lower during the reporting period. China gained 3% as the country was the first to be impacted byCOVID-19 and thus was ahead of other countries globally in terms of the subsequent rebound when news improved. Taiwan was down 4% while all other countries posted double-digit losses for the period. Brazil was the hardest hit with a 43% decline followed by losses in Colombia and Chile.
Portfolio Review
The Fund is strategically focused on local emerging markets consumption while avoiding hard-asset and export-oriented stocks which do not directly capture secular growth of the rising middle class. The Fund outperformed the benchmark thanks primarily to sector allocation decisions, which led to the underweight in key cyclical segments of the market which were under pressure due to slowing global growth expectations.
Sector results were led by the exclusion of energy stocks, followed by a relative overweight in health care and positive stock selection in communication services. The avoidance of materials, industrials and utilities sectors also aided to performance results. Conversely, stockpicking in financials, consumer discretionary and information technology trailed the benchmark during the reporting period. From a country standpoint, a relative underweight allocation to South Africa contributed to results as did consumer-related companies traded in Switzerland and the United States. Alternatively, stock selection in Taiwan trailed the benchmark, primarily due to the exclusion of semiconductor stocks, which are not deemed as consumer-related. Selections in South Korea and Mexico also trailed the benchmark during the reporting period.
Outlook
COVID-19 has thrown the market for a painful shock. What was originally thought be fairly short and sharp in terms of the economic impact, given initial stabilization in China and greater transparency from the government, has resulted in an unexpected contagion across the globe. In the short-term, we expect the market to continue experiencing bouts of volatility, which will be heavily data-driven based uponCOVID-19 news and the corresponding response from governments globally. Our belief is there will be an eventual return to normalcy with limited discernable impact onmedium-to-longer-term outlook for most companies. The consumer-related focus, which was advantageous during the semi-annual period, may also help dampen any near-term return volatility from broader emerging markets equities.
We continue to construct the Fund on abottom-up basis with conviction at the stock level. In addition, we apply a dual risk-budget, targeting a tracking error of5-10% and lower forecast risk than the benchmark, which may help protect capital during inevitable down market periods and provide our clients with a greater level of return consistency. We believe investment results will be supported by earnings growth in consumer-related stocks and that our behavioral finance-focused investment process and focus on higher quality securities with attractive company fundamentals will be a driver of returns for the coming periods.
| | | | | | |
| 38 | | March 31, 2020 | | | Semiannual Report | | |
Unaudited
AllianzGI Emerging Markets Consumer Fund (cont’d)
Average Annual Total Return for the period ended March 31, 2020
| | | | | | | | | | | | | | | | | | |
| | | | | |
| | | | | 6 Month* | | | 1 Year | | | 5 Year | | | Since Inception† | |
| | | AllianzGI Emerging Markets Consumer Fund Class A | | | –13.25% | | | | –15.08% | | | | –3.17% | | | | –3.23% | |
| | AllianzGI Emerging Markets Consumer Fund Class A (adjusted) | | | –18.03% | | | | –19.75% | | | | –4.26% | | | | –4.25% | |
| | AllianzGI Emerging Markets Consumer Fund Institutional Class | | | –13.02% | | | | –14.72% | | | | –2.81% | | | | –2.87% | |
| | MSCI Emerging Markets Index | | | –14.55% | | | | –17.69% | | | | –0.37% | | | | –0.44% | |
| | | Lipper Emerging Markets Funds Average | | | –17.15% | | | | –18.53% | | | | –1.24% | | | | –1.87% | |
* Cumulative return
† The Fund began operations on December 1, 2014. Benchmark return comparisons began on the fund inception date. Lipper performance comparisons began on November 30, 2014.
Performance quoted represents past performance and is no guarantee of future results. Current performance may be lower or higher than performance shown. For performance current to the most recent month-end, visit our website at us.allianzgi.com. Investment return and the principal value will fluctuate. Shares may be worth more or less than original cost when redeemed.The adjusted returns take into account the maximum initial sales charge of 5.50% on Class A shares.Returns do not reflect deduction of taxes that a shareholder would pay on fund distributions or redemption of fund shares. See pages 107 and 108 for more information. The Fund’s gross expense ratios are 1.71% for Class A shares and 1.39% for Institutional Class shares. These ratios do not include an expense reduction, contractually guaranteed through at least January 31, 2021. The Fund’s expense ratios net of this reduction are 1.39% for Class A shares and 1.05% for Institutional Class shares. Expense ratio information is as of the Fund’s current prospectus dated February 1, 2020, as further revised or supplemented from time to time.
Cumulative Returns Through March 31, 2020
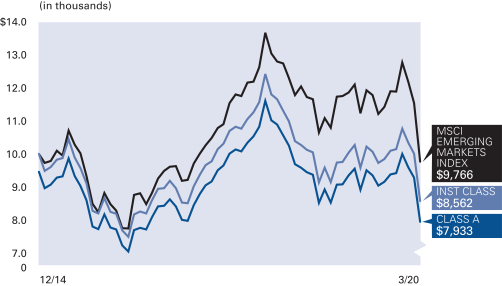
Country/Location Allocation
(as of March 31, 2020)
| | | | |
| |
| China | | | 43.6% | |
| |
| Taiwan | | | 10.7% | |
| |
| Korea (Republic of) | | | 9.4% | |
| |
| United States | | | 8.3% | |
| |
| India | | | 4.3% | |
| |
| Thailand | | | 3.4% | |
| |
| Switzerland | | | 3.0% | |
| |
| Brazil | | | 3.0% | |
| |
| Other | | | 10.7% | |
| |
| Cash & Equivalents — Net | | | 3.6% | |
| | | | | | |
| | Semiannual Report | | | March 31, 2020 | | 39 |
Unaudited
AllianzGI Emerging Markets Consumer Fund (cont’d)
| | | | |
| |
| Shareholder Expense Example | | Actual Performance |
| | | Class A | | Institutional
Class |
| | |
| Beginning Account Value (10/1/19) | | $1,000.00 | | $1,000.00 |
| | |
| Ending Account Value (3/31/20) | | $867.50 | | $869.80 |
| | |
| Expenses Paid During Period | | $6.54 | | $4.91 |
| | | | | |
| |
| | | Hypothetical Performance |
| | | (5% return before expenses) |
| | | Class A | | Institutional
Class |
| | |
| Beginning Account Value (10/1/19) | | $1,000.00 | | $1,000.00 |
| | |
| Ending Account Value (3/31/20) | | $1,018.00 | | $1,019.75 |
| | |
| Expenses Paid During Period | | $7.06 | | $5.30 |
For each class of the Fund, expenses (net of fee waiver and reimbursement, if any) are equal to the annualized expense ratio for the class (1.40% for Class A and 1.05% for Institutional Class), multiplied by the average account value over the period, multiplied by 183/366.
| | | | | | |
| 40 | | March 31, 2020 | | | Semiannual Report | | |
Unaudited
AllianzGI Emerging Markets Small-Cap Fund
For the period of October 1, 2019 through March 31, 2020, as provided by Kunal Ghosh, Portfolio Manager.
Fund Insights
For thesix-month period ended March 31, 2020, Class A shares at net asset value (“NAV”) of the AllianzGI Emerging MarketsSmall-Cap Fund (the “Fund”) returned-22.84%, outperforming the MSCI Emerging MarketsSmall-Cap Index (the “benchmark”), which returned-24.83%.
Market Overview
During the reporting period, emerging markets small cap equities were broadly lower due to the significant headwinds related to theCOVID-19 outbreak The asset class initially advanced in October 2019, with modestly negative performance in November 2019, and a strong rebound in December 2019 as markets focused on expectations of stable global growth projections, the agreement of a “phase one” trade deal between the US and China and better-than-expected corporate earnings. Emerging markets equities declined in January 2020 as investors were nervous about tensions between the United States and Iran, andCOVID-19 news began to capture headlines, mainly in China. The broad-based asset classsell-off intensified toward the end of February amid growing evidence that theCOVID-19 outbreak was spreading beyond China. Thesell-off accelerated in March as travel restrictions and social distancing efforts related toCOVID-19 led to fears grew that the global economy would be unable to avoid a recession.
Benchmark sector performance was lower across the board as all 11 sectors posted declines. Health care was the best performing sector, lower by roughly 1%, followed by double-digit losses in information technology and consumer staples. Meanwhile, the energy sector declined more than 37% due to the significant headwinds in oil and gas companies. Consumer discretionary and financials rounded out the three largest benchmark sector laggards for the period.
Country results for the benchmark index were broadly negative as each of the 26 countries declined due to concerns of slowing global growth. China was the top relative performer with a 7% decline, followed by greater than 12% losses in Pakistan and Saudi Arabia. Meanwhile, Indonesia as the largest laggard with a 58% decline, followed by greater than 45% losses in Chile and Colombia.
Portfolio Review
The Fund seeks to benefit frombottom-up stock selection due to the capture the greater level of inefficiencies in emerging market small cap equities. During the reporting period, the Fund topped the benchmark thanks tobottom-up stock selection on both a sector and country basis.
Sector results were led by strongbottom-up stockpicking in materials, thanks primarily to gains in the construction materials industry. Stock selection in consumer discretionary and a sizable overweight to information technology also contributed to results. Alternatively,bottom-up stockpicking in health care, communication services and financials trailed the benchmark. Country results were led by selections in Brazil, South Africa and India. Conversely, stock selection in South Korea offset performance due primarily to an underweight in health care and biotechnology stocks in the country. Stockpicking in Mexico and Saudi Arabia offset results more modestly.
Outlook
COVID-19 has thrown the market for a painful shock. What was originally thought be fairly short and sharp in terms of the economic impact, given initial stabilization in China and greater transparency from the government, has resulted in an unexpected contagion across the globe. In the short-term, we expect the market to continue experiencing bouts of volatility, which will be heavily data-driven based uponCOVID-19 news and the corresponding response from governments globally. Our belief is there will be an eventual return to normalcy with limited discernable impact onmedium-to-longer-term outlook for most companies. Furthermore, investors may benefit from the profusion ofbottom-up opportunities in emerging markets small cap equities as evident by the historical outperformance of actively managed strategies relative to the benchmark.
We continue to construct the Fund on abottom-up basis with conviction at the stock level. In addition, we apply a dual risk-budget, targeting a tracking error of4-6% and lower forecast risk than the benchmark, which may help protect capital during inevitable down market periods and provide our clients with a greater level of return consistency. We believe investment results will be supported by earnings growth and our behavioral finance-focused investment process and focus on higher quality securities with attractive company fundamentals will be a driver of returns for the coming quarters.
| | | | | | |
| | Semiannual Report | | | March 31, 2020 | | 41 |
Unaudited
AllianzGI Emerging Markets Small-Cap Fund (cont’d)
Average Annual Total Return for the period ended March 31, 2020
| | | | | | | | | | | | | | | | | | |
| | | | | |
| | | | | 6 Month* | | | 1 Year | | | 5 Year | | | Since Inception† | |
| | | AllianzGI Emerging Markets Small-Cap Fund Class A | | | –22.84% | | | | –23.50% | | | | –1.42% | | | | –0.91% | |
| | AllianzGI Emerging Markets Small-Cap Fund Class A (adjusted) | | | –27.08% | | | | –27.71% | | | | –2.53% | | | | –1.95% | |
| | AllianzGI Emerging Markets Small-Cap Fund Institutional Class | | | –22.73% | | | | –23.26% | | | | –1.08% | | | | –0.56% | |
| | MSCI Emerging Markets Small-Cap Index | | | –24.83% | | | | –28.98% | | | | –5.17% | | | | –4.49% | |
| | | Lipper Emerging Markets Funds Average | | | –17.15% | | | | –18.53% | | | | –1.24% | | | | –1.87% | |
* Cumulative return
† The Fund began operations on December 1, 2014. Benchmark return comparisons began on the fund inception date. Lipper performance comparisons began on November 30, 2014.
Performance quoted represents past performance and is no guarantee of future results. Current performance may be lower or higher than performance shown. For performance current to the most recent month-end, visit our website at us.allianzgi.com. Investment return and the principal value will fluctuate. Shares may be worth more or less than original cost when redeemed.The adjusted returns take into account the maximum initial sales charge of 5.50% on Class A shares.Returns do not reflect deduction of taxes that a shareholder would pay on fund distributions or redemption of fund shares. See pages 107 and 108 for more information. The Fund’s gross expense ratios are 3.00% for Class A shares and 2.84% for Institutional Class shares. These ratios do not include an expense reduction, contractually guaranteed through at least January 31, 2021. The Fund’s expense ratios net of this reduction are 1.80% for Class A shares and 1.50% for Institutional Class shares. Expense ratio information is as of the Fund’s current prospectus dated February 1, 2020, as further revised or supplemented from time to time.
Cumulative Returns Through March 31, 2020
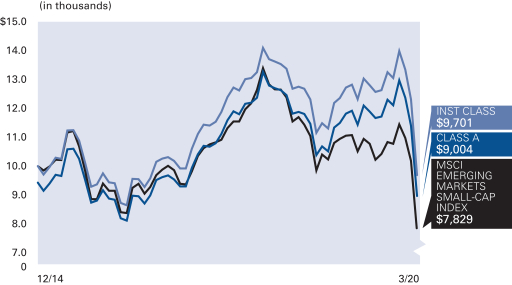
Country/Location Allocation
(as of March 31, 2020 )
| | | | |
| |
| Taiwan | | | 27.6% | |
| |
| China | | | 18.6% | |
| |
| India | | | 13.5% | |
| |
| Korea (Republic of) | | | 12.1% | |
| |
| South Africa | | | 4.4% | |
| |
| Brazil | | | 4.2% | |
| |
| Turkey | | | 3.9% | |
| |
| Russian Federation | | | 3.5% | |
| |
| Other | | | 10.7% | |
| |
| Cash & Equivalents — Net | | | 1.5% | |
| | | | | | |
| 42 | | March 31, 2020 | | | Semiannual Report | | |
Unaudited
AllianzGI Emerging Markets Small-Cap Fund (cont’d)
| | | | |
| |
| Shareholder Expense Example | | Actual Performance |
| | | Class A | | Institutional
Class |
| | |
| Beginning Account Value (10/1/19) | | $1,000.00 | | $1,000.00 |
| | |
| Ending Account Value (3/31/20) | | $771.60 | | $772.70 |
| | |
| Expenses Paid During Period | | $8.11 | | $6.65 |
| | | | | |
| |
| | | Hypothetical Performance |
| | | (5% return before expenses) |
| | | Class A | | Institutional
Class |
| | |
| Beginning Account Value (10/1/19) | | $1,000.00 | | $1,000.00 |
| | |
| Ending Account Value (3/31/20) | | $1,015.85 | | $1,017.50 |
| | |
| Expenses Paid During Period | | $9.22 | | $7.57 |
For each class of the Fund, expenses (net of fee waiver and reimbursement, if any) are equal to the annualized expense ratio for the class (1.83% for Class A and 1.50% for Institutional Class), multiplied by the average account value over the period, multiplied by 183/366.
| | | | | | |
| | Semiannual Report | | | March 31, 2020 | | 43 |
Unaudited
AllianzGI Emerging Markets SRI Debt Fund
For the period of October 1, 2019 through March 31, 2020, as provided by the AllianzGI Emerging Markets Debt Team.
Fund Insights
For the six-month period ended March 31, 2020, Class A shares at net asset value (“NAV”) of the AllianzGI Emerging Markets SRI Debt Fund (the “Fund”) returned -8.64%, outperforming the JPM JESG EMBI Global Diversified USD (the “benchmark”), which returned -9.75%.
Market Overview
After recording positive returns in the fourth quarter of 2019, emerging market bonds fell sharply over the first quarter of 2020 as they suffered heavy outflows with investors favoring lower risk assets amid the deepeningCOVID-19 crisis. Emerging markets hard currency bonds on average fell close to 10%, with sovereign spreads finishing the period nearly 300 basis points wider.
In March the asset class experienced its biggest outflows on record (~$30bn) and amidst the rush for liquidity, high yielding oil exporting sovereigns fared worst given the collapse in oil prices to $20 per barrel, and any higher beta “fragile” credits were punished too.
At the country level, we have started to see several downgrades materializing from the rating agencies; most of the initial focus has been on oil exporting nations. Mexico (and Pemex) and Colombia (and Ecopetrol) have seen ratings and outlooks notched down and Pemex is no longer investment grade, although the others retain their investment grade positions for now. In Africa, some of the weaker oil-related credits have been notched down too (Angola to CCC+, Nigeria to B-).
Towards the end of the period the International Monetary Fund (“IMF”), World Bank (“WB”) and the United Nations (“UN”) called for debt relief for the poorest countries, of the 189 members of the IMF, over 80 countries have now asked the IMF for financial assistance since theCOVID-19 outbreak—this number of requests is unprecedented in the 75 year history of the fund.
Portfolio Review
The Fund structure heading into the new year was relatively conservative, with key exposures amongst the higher quality parts of Central and Eastern Europe (“CEE”) & Asia (eg. Kazakhstan, Russia, S Korea, Indonesia). Frontier exposure in Africa and Latin America was limited to where we had good conviction on fundamentals, and we had a structural underweight to the Middle East.
Generally this structure has been robust, with the Middle East underweight adding value amidst the fall in oil prices. As a result, we have not had to make significant asset allocation changes to the strategy during the March crisis month. We have instead focused onbottom-upre-evaluations of sovereign creditworthiness given the changing growth backdrop—as a result, we did elect to trim exposure to Egypt, Kenya, Hungary and Poland.
With regards to the IMF financing developments, we believe any such aid may be associated with the requirement for bond holders to share some of the burden and accept haircuts and/or payment suspension. So the rating adjustments are likely fair for now, given the increasing bond holder risk. We believe that some Frontier Markets with weaker balance sheets will be most affected, and therefore we are now avoiding risk in Angola, Kenya, Sri Lanka, Pakistan and Tunisia.
We already saw one emerging market default this year prior to the crisis, in Lebanon, which we were able to avoid in the Fund. During March, Zambia also announced a restructuring process for its $11bn external debt pile (of which $3bn is in Eurobonds)—this is a small credit and we have also avoided it. Attention now turns to several credits that may well facecapacity-to-pay issues given the new economic reality. This is already evident in Ecuador, but we think Mongolia and Oman are also at an increased risk of a credit event, in addition to the Frontier economies noted above.
Outlook
All of the problematic countries only represent c.5.5% of the emerging market sovereign universe and it should be noted that bond prices already reflect a significant likelihood of default/restructuring. Away from these names, many emerging market countries have solid balance sheets and particularly those with free-float currencies should be able to navigate a downturn in growth. With spreads now +600 basis points on average (double where they started the year)—we believe that there is scope to capture some interesting value opportunities. Whilst in the near-term focus will be on containing the health crisis, the policy responses we have seen to date are likely to help reduce the depth and longevity of the coming recession.
| | | | | | |
| 44 | | March 31, 2020 | | | Semiannual Report | | |
Unaudited
AllianzGI Emerging Markets SRI Debt Fund (cont’d)
Average Annual Total Return for the period ended March 31, 2020
| | | | | | | | | | | | | | | | | | |
| | | | | |
| | | | | 6 Month* | | | 1 Year | | | 5 Year | | | Since Inception† | |
| | | AllianzGI Emerging Markets SRI Debt Fund Class A | | | –8.64% | | | | –4.85% | | | | 1.92% | | | | 1.44% | |
| | AllianzGI Emerging Markets SRI Debt Fund Class A (adjusted) | | | –12.07% | | | | –8.42% | | | | 1.14% | | | | 0.74% | |
| | | AllianzGI Emerging Markets SRI Debt Fund Class C | | | –9.07% | | | | –5.62% | | | | 1.14% | | | | 0.67% | |
| | AllianzGI Emerging Markets SRI Debt Fund Class C (adjusted) | | | –9.97% | | | | –6.54% | | | | 1.14% | | | | 0.67% | |
| | AllianzGI Emerging Markets SRI Debt Fund Class P | | | –8.59% | | | | –4.73% | | | | 2.08% | | | | 1.60% | |
| | AllianzGI Emerging Markets SRI Debt Fund Institutional Class | | | –8.57% | | | | –4.61% | | | | 2.18% | | | | 1.70% | |
| | JPM JESG EMBI Global Diversified USD | | | –9.75% | | | | –3.84% | | | | 3.24% | | | | 3.12% | |
| | JPM EMBI Global Diversified USD | | | –11.81% | | | | –6.84% | | | | 2.82% | | | | 2.71% | |
| | | Lipper Emerging Market Hard Currency Debt Funds Average | | | –12.57% | | | | –9.17% | | | | 1.32% | | | | 0.73% | |
* Cumulative return
† The Fund began operations on September 15, 2014. Benchmark return comparisons began on the fund inception date. Lipper performance comparisons began on September 30, 2014.
Performance quoted represents past performance and is no guarantee of future results. Current performance may be lower or higher than performance shown. For performance current to the most recent month-end, visit our website at us.allianzgi.com. Investment return and the principal value will fluctuate. Shares may be worth more or less than original cost when redeemed.The adjusted returns take into account the maximum initial sales charge of 3.75% on Class A shares and the contingent deferred sales charge (CDSC) of 1% on Class C shares, which may apply to shares redeemed during the first year of ownership. Returns do not reflect deduction of taxes that a shareholder would pay on fund distributions or redemption of fund shares. See pages 107 and 108 for more information. The Fund’s gross expense ratios are 2.08% for Class A shares, 2.79% for Class C shares, and 1.76% for Class P shares and 1.76% for Institutional Class shares. These ratios do not include an expense reduction, contractually guaranteed through at least January 31, 2021. The Fund’s expense ratios net of this reduction are 1.05% for Class A shares, 1.80% for Class C shares, 0.90% for Class P shares and 0.80% for Institutional Class shares. Expense ratio information is as of the Fund’s current prospectus dated February 1, 2020, as further revised or supplemented from time to time.
Cumulative Returns Through March 31, 2020
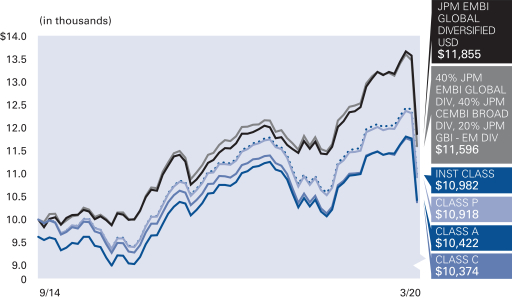
Country/Location Allocation (as of March 31, 2020 )
| | | | |
| |
| Uruguay | | | 7.0% | |
| |
| Kazakhstan | | | 5.8% | |
| |
| Ukraine | | | 5.7% | |
| |
| Indonesia | | | 5.5% | |
| |
| Philippines | | | 5.0% | |
| |
| Panama | | | 4.4% | |
| |
| Colombia | | | 3.9% | |
| |
| Jamaica | | | 3.9% | |
| |
| Other | | | 44.2% | |
| |
| Cash & Equivalents — Net | | | 14.6% | |
| | | | | | |
| | Semiannual Report | | | March 31, 2020 | | 45 |
Unaudited
AllianzGI Emerging Markets SRI Debt Fund (cont’d)
Moody’s Ratings* (as of March 31, 2020)
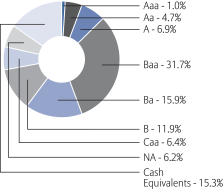
* As a percentage of total investments. Credit ratings refer to the underlying holdings of the Fund and are categorized from highest to lowest credit quality using ratings provided by Moody’s. Moody’s ratings have been selected for several reasons, including the access to information and materials provided by Moody’s, as well as the Fund’s consideration of industry practice. See “Important Information” for more detail on the selection of Moody’s for the Fund’s ratings presentation. Securities not rated by Moody’s and bonds that do not currently have a rating available are designated in the chart above as “NR” and “NA”, respectively.
| | | | | | | | |
| |
| Shareholder Expense Example | | Actual Performance |
| | | Class A | | Class C | | Class P | | Institutional
Class |
| | | | |
| Beginning Account Value (10/1/19) | | $1,000.00 | | $1,000.00 | | $1,000.00 | | $1,000.00 |
| | | | |
| Ending Account Value (3/31/20) | | $913.60 | | $909.30 | | $914.10 | | $914.30 |
| | | | |
| Expenses Paid During Period | | $5.02 | | $8.59 | | $4.31 | | $3.83 |
| | | | | | | | | |
| |
| | | Hypothetical Performance |
| | | (5% return before expenses) |
| | | Class A | | Class C | | Class P | | Institutional
Class |
| | | | |
| Beginning Account Value (10/1/19) | | $1,000.00 | | $1,000.00 | | $1,000.00 | | $1,000.00 |
| | | | |
| Ending Account Value (3/31/20) | | $1,019.75 | | $1,016.00 | | $1,020.50 | | $1,021.00 |
| | | | |
| Expenses Paid During Period | | $5.30 | | $9.07 | | $4.55 | | $4.04 |
For each class of the Fund, expenses (net of fee waiver and reimbursement, if any) are equal to the annualized expense ratio for the class (1.05% for Class A, 1.80% for Class C, 0.90% for Class P and 0.80% for Institutional Class), multiplied by the average account value over the period, multiplied by 183/366.
| | | | | | |
| 46 | | March 31, 2020 | | | Semiannual Report | | |
Unaudited
AllianzGI Emerging Markets Value Fund (formerly AllianzGI NFJ Emerging Markets Value Fund)*
For the period of October 1, 2019 through March 31, 2020, as provided by the Value Equity, US team.
Fund Insights
For the six-month period ended March 31, 2020, Class A shares at net asset value (“NAV”) of the AllianzGI Emerging Markets Value Fund (the “Fund”) returned -12.88%, outperforming the MSCI Emerging Markets Index (the “benchmark”), which returned -14.55%.
Market Overview
It was a volatilesix-month period for emerging market equities. In January 2020, the benchmark touched its highest level since early 2018, boosted by growing optimism over the outlook for the global economy and optimism over a “phase one” trade deal between the US and China. However, emerging markets stocks later plunged, with the benchmark index reaching levels last seen in early 2016, as the rapidly evolvingCOVID-19 pandemic caused risk appetite to tumble and demand for raw materials to significantly drop. Currency weakness also weighed on returns fornon-domestic investors, with the Brazilian real, Mexican peso, Russian rouble, South African rand and Turkish lira all depreciating substantially.
Within the benchmark, all but four sectors experienced double-digit losses over the reporting period. Energy and utility stocks drastically declined, as global oil demand plummeted and a price war between Russia and Saudi Arabia caused oil prices to hit an18-year low. Industrials companies were also hit hard as airlines were forced to ground their fleets and factories shut down, while deteriorating economic fundamentals hurt financial companies. In contrast, health care stocks advanced modestly over the reporting period, with companies rushing to develop tests, treatments and vaccines for the novel coronavirus (“COVID-19”). Technology companies also outperformed the broader market, as did providers of online content as a growing number of people were forced to stay at home.
Portfolio Review
The Fund’s relative outperformance versus the benchmark was driven by positive stock selection by sector and country. Allocations by country also contributed, albeit to a lesser degree. In contrast, sector allocations modestly dampened relative performance during the trailingsix-month period.
In terms of stock selection by sector, Fund holdings in the real estate, consumer staples and communication services sectors were robust contributors to performance. These gains were only partially offset by negative selection effects across the financials, consumer discretionary and health care sectors.
From a sector allocation perspective, underweight exposures in communication services and health care were the most significant detractors. Conversely, underweight exposures in the materials and financials sectors boosted relative results.
Selection by country was overall positive with strong contributions from the Fund’s Taiwan, China and South Africa-based holdings. In contrast, the Fund’s holdings in Russia, Brazil and Saudi Arabia did not keep pace with benchmark shares and detracted from performance during the reporting period.
Country allocation also contributed to results, due to underweight exposures in Brazil and South Africa. These gains were only partially offset by the negative impact from an underweight in China and an overweight in the UK.
Outlook
COVID-19 and the precipitous fall in oil prices have shocked global equity markets, as uncertainty has reigned and volatility has soared. Despite signs of a recovery in the final days of March 2020, fueled by an unprecedented wave of accommodative global central bank measures, the benchmark ended the first quarter of 2020 down 24%. Latin American countries and commodity exporters were some of thehardest-hit, while several countries in Asia, demonstrating cautious signs of recovery toward the end of quarter, held up on a relative basis.
While it is all but impossible to anticipate how markets, governments and individuals will respond moving forward, we have already witnessed policy makers and central banking within emerging markets implement significant, and in some cases, successful, actions to counter the negative economic impacts of this pandemic. In the meantime, emerging market valuations have fallen to 11x forward earnings and there is potential for stocks tore-rate amid supportive policies, firmer economic footing and/orpent-up demand. Our team has a favorable outlook for emerging market equities. While growth rates are slowing in emerging markets, many companies that appear able to weather this crisis have been discounted steeply—and these are the types of stocks we seek to own in our portfolio.
Undoubtedly, there is volatility attached to trading in today’s markets. However, we believe a focus on quality and valuations can uncover buying opportunities. To this end, our team is focused on companies that should be winners in a market rebound and industry leaders with clean balance sheets that are effectively “on sale,” trading at discounts to where we could have bought them before COVID-19. Furthermore, with interest rates likely to remain low for an extended period, dividend payers and companies that can grow their dividends could offer additional strength.
* Effective April 30, 2020, the Fund was renamed from “AllianzGI NFJ Emerging Markets Value Fund” to “AllianzGI Emerging Markets Value Fund”.
| | | | | | |
| | Semiannual Report | | | March 31, 2020 | | 47 |
Unaudited
AllianzGI Emerging Markets Value Fund (formerly AllianzGI NFJ Emerging Markets Value Fund) (cont’d)
Average Annual Total Return for the period ended March 31, 2020
| | | | | | | | | | | | | | | | |
| | | | | |
| | | | | 6 Month* | | 1 Year | | | 5 Year | | | Since Inception† | |
| | | AllianzGI Emerging Markets Value Fund Class A | | –12.88% | | | –14.99% | | | | 1.07% | | | | 1.29% | |
| | AllianzGI Emerging Markets Value Fund Class A (adjusted) | | –17.67% | | | –19.67% | | | | –0.07% | | | | 0.50% | |
| | | AllianzGI Emerging Markets Value Fund Class C | | –13.15% | | | –15.58% | | | | 0.31% | | | | 0.54% | |
| | AllianzGI Emerging Markets Value Fund Class C (adjusted) | | –14.02% | | | –16.41% | | | | 0.31% | | | | 0.54% | |
| | AllianzGI Emerging Markets Value Fund Class P | | –12.79% | | | –14.88% | | | | 1.23% | | | | 1.45% | |
| | AllianzGI Emerging Markets Value Fund Institutional Class | | –12.76% | | | –14.76% | | | | 1.33% | | | | 1.55% | |
| | MSCI Emerging Markets Index | | –14.55% | | | –17.69% | | | | –0.37% | | | | –0.48% | |
| | | Lipper Emerging Markets Funds Average | | –17.15% | | | –18.53% | | | | –1.24% | | | | –0.96% | |
* Cumulative return
† The Fund began operations on December 18, 2012. Benchmark return comparisons began on the fund inception date. Lipper performance comparisons began on December 31, 2012.
Performance quoted represents past performance and is no guarantee of future results. Current performance may be lower or higher than performance shown. For performance current to the most recent month-end, visit our website at us.allianzgi.com. Investment return and the principal value will fluctuate. Shares may be worth more or less than original cost when redeemed.The adjusted returns take into account the maximum initial sales charge of 5.50% on Class A shares and the contingent deferred sales charge (CDSC) of 1% on Class C shares, which may apply to shares redeemed during the first year of ownership. Returns do not reflect deduction of taxes that a shareholder would pay on fund distributions or redemption of fund shares. See pages 107 and 108 for more information. The Fund’s gross expense ratios are 1.65% for Class A shares, 2.40% for Class C shares, 1.32% for Class P shares and 1.37% for Institutional Class shares. These ratios do not include an expense reduction, contractually guaranteed through at least January 31, 2021. The Fund’s expense ratios net of this reduction are 1.14% for Class A shares, 1.89% for Class C shares, 0.98% for Class P shares and 0.89% for Institutional Class shares. Expense ratio information is as of the Fund’s current prospectus dated February 1, 2020, as further revised or supplemented from time to time.
Cumulative Returns Through March 31, 2020

Country/Location Allocation
(as of March 31, 2020 )
| | | | |
| |
| China | | | 38.2% | |
| |
| Taiwan | | | 12.5% | |
| |
| Korea (Republic of) | | | 11.3% | |
| |
| India | | | 7.9% | |
| |
| United States | | | 5.0% | |
| |
| Brazil | | | 3.7% | |
| |
| Hong Kong | | | 3.1% | |
| |
| Russian Federation | | | 2.6% | |
| |
| Other | | | 13.6% | |
| |
| Cash & Equivalents — Net | | | 2.1% | |
| | | | | | |
| 48 | | March 31, 2020 | | | Semiannual Report | | |
Unaudited
AllianzGI Emerging Markets Value Fund (formerly AllianzGI NFJ Emerging Markets Value Fund) (cont’d)
| | | | | | | | |
| |
| Shareholder Expense Example | | Actual Performance |
| | | Class A | | Class C | | Class P | | Institutional
Class |
| | | | |
| Beginning Account Value (10/1/19) | | $1,000.00 | | $1,000.00 | | $1,000.00 | | $1,000.00 |
| | | | |
| Ending Account Value (3/31/20) | | $871.20 | | $868.50 | | $872.10 | | $872.40 |
| | | | |
| Expenses Paid During Period | | $5.33 | | $8.83 | | $4.59 | | $4.17 |
| | | | | | | | | |
| |
| | | Hypothetical Performance |
| | | (5% return before expenses) |
| | | Class A | | Class C | | Class P | | Institutional
Class |
| | | | |
| Beginning Account Value (10/1/19) | | $1,000.00 | | $1,000.00 | | $1,000.00 | | $1,000.00 |
| | | | |
| Ending Account Value (3/31/20) | | $1,019.30 | | $1,015.55 | | $1,020.10 | | $1,020.55 |
| | | | |
| Expenses Paid During Period | | $5.76 | | $9.52 | | $4.95 | | $4.50 |
For each class of the Fund, expenses (net of fee waiver and reimbursement, if any) are equal to the annualized expense ratio for the class (1.14% for Class A, 1.89% for Class C, 0.98% for Class P and 0.89% for Institutional Class), multiplied by the average account value over the period, multiplied by 183/366.
| | | | | | |
| | Semiannual Report | | | March 31, 2020 | | 49 |
Unaudited
AllianzGI Floating Rate Note Fund
For the period of October 1, 2019 through March 31, 2020, as provided by Malie Conway and Jonathan Yip, CFA, Co-Lead Portfolio Managers.
Fund Insights
For thesix-month period ended March 31, 2020, Institutional Class shares at net asset value (“NAV”) of the AllianzGI Floating Rate Note Fund (the “Fund”) returned-6.48%, underperforming the ICE BofA3-Month U.S. Treasury Bill Index (the “benchmark”), which returned 0.91%.
Market Overview
Global government bond yields trended higher in the fourth quarter of 2019 amid growing optimism over the outlook for global growth, but tumbled in 2020 on growing speculation that theCOVID-19 pandemic would force central banks to slash interest rates and reinstate asset-purchase programs. In the US, the10-year Treasury yield closed the period around 100 basis points lower. Meanwhile, corporate bond prices fell sharply as the deteriorating economic outlook led to fears of rising downgrades and defaults. Credit spreads more than doubled even in less risky investment grade issuers—and floating rate note short-dated assets were particularly hard hit as investors rushed to sell higher quality assets to help raise cash for liquidity purposes.
Hopes that the global economy may be over the worst of the trade-related slowdown were dashed as theCOVID-19 outbreak spread beyond China, forcing countries to impose travel restrictions and draconian quarantine measures. Flash estimates of purchasing managers’ indices for March revealed the impact thatCOVID-19 was having on the global economy. In the US, the composite index fell to an11-year low while the composite survey for the euro zone fell to a record low. In response, central banks lowered interest rates and reinstated asset-purchase programs, but in general these measures failed to reassure financial markets. Instead, governments were forced to shoulder the burden for supporting economies, with many announcing massive fiscal measures.
Oil prices tumbled, with Brent crude falling to an18-year low of below $25 a barrel as a price war between Russia and Saudi Arabia compounded concerns over weakening global demand.
Portfolio Overview
Against this backdrop, the Fund returned-6.48% for the period (ClassI-shares including dividends) as portfolio carry was outweighed by strong price declines from spread widening. The main sources of return detractors were the Investment Grade corporate allocations. Within industry, financials were affected by the perception of increased risk from increasing bad loans, as well as decreasing net interest margin given the US Federal Reserve’s (“Fed’s”) interest rate cuts. Within industrials, a decision to avoid the riskiest segments of the energy industry was positive given the fall in oil prices. However, some geographic exposure to emerging market issuers (within industrials and also in sovereign bonds) detracted given the weak backdrop for risk sentiment. The Fund was structured relatively defensively headed in the March market crisis, with a bias to avoid very cyclical and highly leveraged credits—for this reason no significant asset allocation changes were made. Some issuer-specific substitutions were identified, where our convictions changed in light of theCOVID-19 outlook, and where alternative bonds are now showing relatively attractive value.
The overall duration of the Fund remained near 0.2 years.
Outlook
In March 2020 we witnessed one of the most significant dislocations in the market, surpassing in many respects that witnessed in the financial crisis. Rating agencies have been assertive in downgrading issuers across both investment grade and high yield, and these actions have been affecting the market, particularly with several large fallen angels already entering the high yield index. However, there are a number of positive data points for credit markets following on from central bank actions:
Ø Global investment grade spreads are around 50 basis points back from their widest
Ø There has been a record level of corporate bond issuance in March 2020
Ø The breadth of issuance is increasing, including BBB and some high yield rated issuers
Ø Secondary liquidity is improving, credit curves are normalizing (steepening)
Ø Industry fund outflows are decelerating, exchange-traded funds (“ETFs”) are trading in line with their NAVs
There are many opportunities amidst the confusion; we will closely monitor the situation in a continued disciplined manner, looking for opportunities to add risk, poised for any further recovery in asset prices.
| | | | | | |
| 50 | | March 31, 2020 | | | Semiannual Report | | |
Unaudited
AllianzGI Floating Rate Note Fund (cont’d)
Average Annual Total Return for the period ended March 31, 2020
| | | | | | | | | | | | | | |
| | | | |
| | | | | 6 Month* | | | 1 Year | | | Since Inception† | |
| | AllianzGI Floating Rate Note Fund Class P | | | –6.51% | | | | –4.57% | | | | –1.09% | |
| | AllianzGI Floating Rate Note Fund Institutional Class | | | –6.48% | | | | –4.48% | | | | –0.99% | |
| | ICE BofA3-Month U.S. Treasury Bill Index | | | 0.91% | | | | 2.08% | | | | 2.00% | |
| | | Lipper Ultra-Short Obligations Funds Average | | | –1.22% | | | | 0.21% | | | | 1.21% | |
* Cumulative return
† The Fund began operations on December 27, 2017. Benchmark return comparisons began on the fund inception date. Lipper performance comparisons began on December 31, 2017.
Performance quoted represents past performance and is no guarantee of future results. Current performance may be lower or higher than performance shown. For performance current to the most recent month-end, visit our website at us.allianzgi.com. Investment return and the principal value will fluctuate. Shares may be worth more or less than original cost when redeemed. Returns do not reflect deduction of taxes that a shareholder would pay on fund distributions or redemption of fund shares. See pages 107 and 108 for more information. The Fund’s gross expense ratios are 1.52% for Class P shares and 1.54% for Institutional Class shares. These ratios do not include an expense reduction contractually guaranteed through at least January 31, 2021. The Fund’s expense ratios net of this reduction are 0.40% for Class P shares and 0.30% for Institutional Class shares. Expense ratio information is as of the Fund’s current prospectus dated February 1, 2020, as further revised or supplemented from time to time.
Cumulative Returns Through March 31, 2020
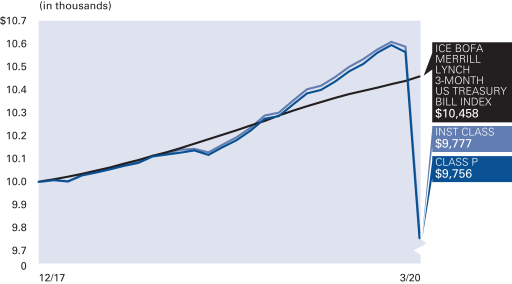
Asset Allocation (as of March 31, 2020)
| | | | |
| |
| Corporate Bonds & Notes | | | 73.4% | |
| |
| Mortgage-Backed Securities | | | 15.8% | |
| |
| Asset-Backed Securities | | | 4.9% | |
| |
| Sovereign Debt Obligations | | | 0.7% | |
| |
| U.S. Government Agency Securities | | | 0.2% | |
| |
| Cash & Equivalents — Net | | | 5.0% | |
Credit Ratings* (as of March 31, 2020)
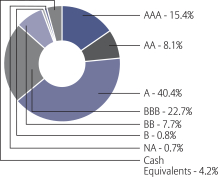
* As a percentage of total investments. Credit ratings apply to the credit worthiness of the issuers of the underlying securities and not to the Fund or its shares. Ratings are subject to change. Ratings are based off of a weighted average credit rating based on the highest rating assigned by S&P Global Ratings (“S&P”), Moody’s, Fitch, Kroll and Morningstar. Bonds not rated by the aforementioned agencies are “unrated”. Ratings are shown based on the S&P rating scale, which ranges from AAA (highest) to D (lowest). Where applicable, securities ratings of an agency other than S&P have been converted to the S&P equivalent. “NR” denotes securities that are not rated. Not rated securities do not necessarily indicate low quality. Ratings are relative, subjective and not absolute represent standards of quality, and the opinions of the independent Nationally Recognized Statistical Rating Organizations (NRSRO). The security’s credit rating does not eliminate risk. The Fund is not rated by an independent rating agency. Previous shareholder reports for the Fund displayed bond ratings derived from a lowest available rating from S&P, Moody’s and Fitch.
| | | | | | |
| | Semiannual Report | | | March 31, 2020 | | 51 |
Unaudited
AllianzGI Floating Rate Note Fund (cont’d)
| | | | |
| |
| Shareholder Expense Example | | Actual Performance |
| | | Class P | | Institutional
Class |
| | |
| Beginning Account Value (10/1/19) | | $1,000.00 | | $1,000.00 |
| | |
| Ending Account Value (3/31/20) | | $ 934.90 | | $ 935.20 |
| | |
| Expenses Paid During Period | | $ 1.93 | | $ 1.45 |
| | | | | |
| |
| | | Hypothetical Performance |
| | | (5% return before expenses) |
| | | Class P | | Institutional
Class |
| | |
| Beginning Account Value (10/1/19) | | $1,000.00 | | $1,000.00 |
| | |
| Ending Account Value (3/31/20) | | $1,023.00 | | $1,023.50 |
| | |
| Expenses Paid During Period | | $ 2.02 | | $ 1.52 |
For each class of the Fund, expenses (net of fee waiver and reimbursement, if any) are equal to the annualized expense ratio for the class (0.40% for Class P and 0.30% for Institutional Class), multiplied by the average account value over the period, multiplied by 183/366.
| | | | | | |
| 52 | | March 31, 2020 | | | Semiannual Report | | |
Unaudited
AllianzGI Global Allocation Fund
For the period of October 1, 2019 through March 31, 2020, as provided by the Multi-Asset US Group.
Fund Insights
For thesix-month period ended March 31, 2020, class A shares at net asset value (“NAV”) of the AllianzGI Global Allocation Fund (the “Fund”) returned-7.92%, underperforming the 60% MSCI ACWI, 40% Bloomberg Barclays U.S. Aggregate Bond Index (the “benchmark”), which returned-7.29%.
Market Overview
Global equities ratcheted steadily higher untilmid-February 2020, with sentiment lifted by growing optimism over a “phase one” trade deal between the US and China and better-than-expected corporate earnings. However, growing concerns about the impact of the novel coronavirus outbreak(“COVID-19”) led to a steep correction in February 2020, with thesell-off gathering pace in March 2020 as a growing number of countries imposed travel restrictions and lockdown measures. Global equities suffered their worst quarter since the 2008 financial crisis in the first quarter of 2020, with many markets entering an official bear market, defined as a decline of at least 20% from a recent peak.
Global government bond yields trended higher in the fourth quarter 2019 amid growing optimism over the outlook for global growth, but tumbled in 2020 on growing speculation that theCOVID-19 pandemic would force central banks to slash interest rates and reinstate asset-purchase programs. In the US, the10-year Treasury yield closed the period around 100 basis points lower, while10-year yields in the UK fell just over 10 basis points. However, German Bund yields rose slightly and peripheral euro-zone yields rose even more. Japanese government bonds also increased modestly. Meanwhile, corporate bonds fell sharply as the deteriorating economic outlook led to fears of rising downgrades and defaults.
Hopes that the global economy may be over the worst of the trade-related slowdown were dashed as theCOVID-19 outbreak spread beyond China, forcing countries to impose travel restrictions and draconian quarantine measures. Flash estimates of purchasing managers’ indices for March 2020 revealed the impact thatCOVID-19 was having on the global economy. In the US, the composite index fell to an11-year low while the composite survey for the euro zone fell to a record low. Elsewhere, Chinese industrial production plunged 13.5% over the first two months of the year, compared to the same period in 2019, and retail sales plummeted by 20.5% on ayear-on-year basis. In response, central banks lowered interest rates and reinstated asset-purchase programs, but in general these measures failed to reassure financial markets. Instead, governments were forced to shoulder the burden for supporting economies, with many announcing massive fiscal measures.
In the currency markets, the period saw significant swings. The British pound was one of the strongest currencies in the final quarter of 2019, boosted by news that the UK had secured a Withdrawal Agreement with the EU, but lost the majority of these gains during the first quarter of 2020. Elsewhere, the US dollar, Euro and Japanese yen all jostled for supremacy throughout thesix-month period, while many emerging market currencies weakened.
Portfolio Review
In terms of relative performance, selection effects contributed to overall performance while allocation detracted. The Fund benefitted from positive selection across equity categories with the most pronounced effect in US equities. In particular, the Fund benefited from the relative outperformance of the AllianzGI Global Sustainability Fund, which was added during the period as part of the broader transition of the Global Allocation Fund to a sustainable focus. In Fixed Income, selection in treasuries and exposure to long term inflation protected bonds also contributed. While allocation effects overall were negative – mainly attributable to the opportunistic portion of the portfolio and to an overweight to corporate bonds, which underperformed treasuries during the market selloff in March 2020 – allocation in equities was positive. During the equity marketsell-off in the first quarter of 2020, a modest underweight to global equities combined with an overweight to US duration and a long exposure to the Japanese yen versus the US dollar helped offset losses due related to corporate credit and emerging market debt exposure.
The Fund ended the period with a modest underweight to equities, through the AllianzGI Managed Futures Fund, which had a net short equity position. The Fund maintained an overweight to US duration throughout the period and ended with an overweight. In the opportunistic portion of the Fund, we have maintained exposure to emerging market debt and equities. In currencies, we have maintained an overweight in the Japanese yen, which increased when volatility spiked, and an underweight to the Euro.
Outlook
TheCOVID-19 pandemic and severe disruptions in the oil market created a simultaneous supply and demand shock for a late-cycle global economy. One consequence is that economies are increasingly vulnerable to exogenous shocks that can exacerbate existing imbalances. As such, we maintain a cautious economic outlook and now expect a global recession in the next few months. The shape and magnitude of the recession will depend to an extent on the negative spillover from financial markets in holding back the real economy. We believe that the inflection point in financial markets in the context of the current crisis—in contrast to previous financial crises—will depend on an array of factors, including (1) how theCOVID-19 public health crisis unfolds and ultimately stabilizes; (2) continued credible intervention on the part of governments and public policy; (3) stabilization of corporate and macroeconomic data and (4) adjustment of valuations to recession-like levels.
Against this backdrop, we continue to see elevated risks of additional corrections in risky asset markets in the near term before a sustainable turnaround is achieved. Therefore, unless we see a very strongV-shaped recovery in markets and the economy, we expect to maintain our defensive positioning based on our trend-based and fundamental indicators. This should position the Fund to be well prepared for a persistent downturn in the near term. Of course, if the market rally atquarter-end following the very substantial fiscal package and the series of supports announced by the US Federal Reserve should persist, we will reincorporate risk back into the portfolio accordingly.
| | | | | | |
| | Semiannual Report | | | March 31, 2020 | | 53 |
Unaudited
AllianzGI Global Allocation Fund (cont’d)
Average Annual Total Return for the period ended March 31, 2020
| | | | | | | | | | | | | | | | | | | | | | |
| | | | | | |
| | | | | 6 Month* | | | 1 Year | | | 5 Year | | | 10 Year | | | Since Inception† | |
| | | AllianzGI Global Allocation Fund Class A | | | –7.92% | | | | –4.44% | | | | 1.71% | | | | 4.36% | | | | 4.96% | |
| | AllianzGI Global Allocation Fund Class A (adjusted) | | | –12.98% | | | | –9.70% | | | | 0.56% | | | | 3.77% | | | | 4.68% | |
| | | AllianzGI Global Allocation Fund Class C | | | –8.34% | | | | –5.17% | | | | 0.94% | | | | 3.58% | | | | 4.18% | |
| | AllianzGI Global Allocation Fund Class C (adjusted) | | | –9.19% | | | | –6.05% | | | | 0.94% | | | | 3.58% | | | | 4.18% | |
| | AllianzGI Global Allocation Fund Class R | | | –8.10% | | | | –4.77% | | | | 1.50% | | | | 4.15% | | | | 4.73% | |
| | AllianzGI Global Allocation Fund Class P | | | –7.88% | | | | –4.22% | | | | 1.99% | | | | 4.60% | | | | 5.20% | |
| | AllianzGI Global Allocation Fund Institutional Class | | | –7.91% | | | | –4.30% | | | | 1.92% | | | | 4.61% | | | | 5.36% | |
| | AllianzGI Global Allocation Fund Class R6 | | | –7.81% | | | | –4.17% | | | | 2.03% | | | | 4.72% | | | | 5.47% | |
| | | AllianzGI Global Allocation Fund Administrative Class | | | –7.93% | | | | –4.35% | | | | 1.78% | | | | 4.40% | | | | 5.01% | |
| | 60% MSCI ACWI, 40% Bloomberg Barclays U.S. Aggregate Bond Index | | | –7.29% | | | | –3.13% | | | | 3.31% | | | | 5.35% | | | | 5.32% | |
| | MSCI ACWI | | | –14.33% | | | | –11.26% | | | | 2.85% | | | | 5.88% | | | | 5.11% | |
| | Bloomberg Barclays U.S. Aggregate Bond Index | | | 3.33% | | | | 8.93% | | | | 3.36% | | | | 3.88% | | | | 4.80% | |
| | | Lipper Alternative Global Macro Funds Average | | | –9.59% | | | | –7.43% | | | | –0.26% | | | | 2.18% | | | | 4.76% | |
* Cumulative return
† The Fund began operations on September 30, 1998. Benchmark return comparisons began on the fund inception date. Lipper performance comparisons began on September 30, 1998.
Performance quoted represents past performance and is no guarantee of future results. Current performance may be lower or higher than performance shown. For performance current to the most recent month-end, visit our website at us.allianzgi.com. Investment return and the principal value will fluctuate. Shares may be worth more or less than original cost when redeemed.The adjusted returns take into account the maximum sales charge of 5.50% on Class A shares and the contingent deferred sales charge (CDSC) of 1% on Class C shares, which may apply to shares redeemed during the first year of ownership. Returns do not reflect deduction of taxes that a shareholder would pay on fund distributions or redemption of fund shares. See pages 107 and 108 for more information. The Fund’s gross expense ratios, which include the Acquired Fund Fees and Expenses, are 1.54% for Class A shares, 2.31% for Class C shares, 1.86% for Class R shares, 1.31% for Class P shares, 1.29% for Institutional Class shares, 1.22% for Class R6 shares and 1.47% for Administrative Class shares. These ratios do not include an expense reduction, contractually guaranteed through at least January 31, 2021. The Fund’s expense ratios net of this reduction, which include the Acquired Fund Fees and Expenses, are 1.01% for Class A shares, 1.76% for Class C shares, 1.21% for Class R shares, 0.81% for Class P shares, 0.74% for Institutional Class shares, 0.71% for Class R6 shares and 0.96% for Administrative Class shares. Expense ratio information is as of the Fund’s current prospectus dated February 1, 2020, as further revised or supplemented from time to time.
Cumulative Returns Through March 31, 2020
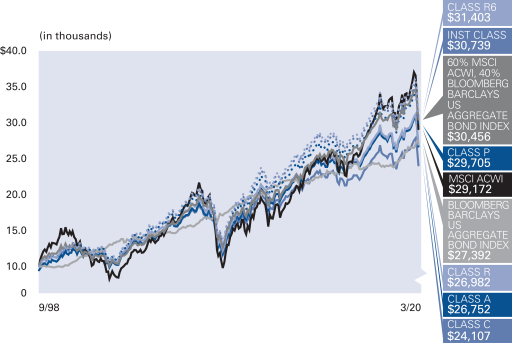
Fund Allocation (as of March 31, 2020)
| | | | |
| |
| AllianzGI Global Sustainability | | | 40.1% | |
| |
| AllianzGI PerformanceFee Managed Futures Strategy | | | 10.7% | |
| |
| AllianzGI Best Styles Global Managed Volatility | | | 9.7% | |
| |
| AllianzGI Green Bond | | | 9.5% | |
| |
| AllianzGI Emerging Markets SRI Debt | | | 5.6% | |
| |
| AllianzGI Emerging MarketsSmall-Cap | | | 1.4% | |
| |
| Other | | | 17.4% | |
| |
| Cash & Equivalents — Net | | | 5.6% | |
| | | | | | |
| 54 | | March 31, 2020 | | | Semiannual Report | | |
Unaudited
AllianzGI Global Allocation Fund (cont’d)
| | | | | | | | | | | | | | |
| |
| Shareholder Expense Example | | Actual Performance |
| | | Class A | | Class C | | Class R | | Class P | | Institutional
Class | | Class R6 | | Administrative
Class |
| | | | | | | |
| Beginning Account Value (10/1/19) | | $1,000.00 | | $1,000.00 | | $1,000.00 | | $1,000.00 | | $1,000.00 | | $1,000.00 | | $1,000.00 |
| | | | | | | |
| Ending Account Value (3/31/20) | | $ 920.80 | | $ 916.60 | | $ 919.00 | | $ 921.20 | | $ 920.90 | | $ 921.90 | | $ 920.70 |
| | | | | | | |
| Expenses Paid During Period | | $ 2.40 | | $ 5.99 | | $ 3.36 | | $ 1.44 | | $ 1.54 | | $ 0.96 | | $ 2.16 |
| | | | | | | | | | | | | | | |
| |
| | | Hypothetical Performance |
| | | (5% return before expenses) |
| | | Class A | | Class C | | Class R | | Class P | | Institutional
Class | | Class R6 | | Administrative
Class |
| | | | | | | |
| Beginning Account Value (10/1/19) | | $1,000.00 | | $1,000.00 | | $1,000.00 | | $1,000.00 | | $1,000.00 | | $1,000.00 | | $1,000.00 |
| | | | | | | |
| Ending Account Value (3/31/20) | | $1,022.50 | | $1,018.75 | | $1,021.50 | | $1,023.50 | | $1,023.40 | | $1,024.00 | | $1,022.75 |
| | | | | | | |
| Expenses Paid During Period | | $ 2.53 | | $ 6.31 | | $ 3.54 | | $ 1.52 | | $ 1.62 | | $ 1.01 | | $ 2.28 |
For each class of the Fund, expenses (net of fee waiver and reimbursement, if any) are equal to the annualized expense ratio for the class (0.50% for Class A, 1.25% for Class C, 0.70% for Class R, 0.30% for Class P, 0.32% for Institutional Class, 0.20% for Class R6 and 0.45% for Administrative Class), multiplied by the average account value over the period, multiplied by 183/366. These expenses do not include the expenses of the investment companies in which the Fund invests, which are indirectly borne by Fund shareholders.
| | | | | | |
| | Semiannual Report | | | March 31, 2020 | | 55 |
Unaudited
AllianzGI Global Dynamic Allocation Fund
For the period of October 1, 2019 through March 31, 2020, as provided by the Multi-Asset US Group.
Fund Insights
For thesix-month period ended March 31, 2020, class A shares at net asset value (“NAV”) of the AllianzGI Global Dynamic Allocation Fund (the “Fund”) returned-9.18%, outperforming the MSCI ACWI (the “benchmark”), which returned-14.33%.
Market Overview
Global equities ratcheted steadily higher untilmid-February 2020, with sentiment lifted by growing optimism over a “phase one” trade deal between the US and China and better-than-expected corporate earnings. However, growing concerns about the impact of the novel coronavirus outbreak (“COVID-19”) led to a steep correction in February 2020, with thesell-off gathering pace in March 2020 as a growing number of countries imposed travel restrictions and lockdown measures. Global equities suffered their worst quarter since the 2008 financial crisis in the first quarter of 2020, with many markets entering an official bear market, defined as a decline of at least 20% from a recent peak.
Global government bond yields trended higher in the fourth quarter 2019 amid growing optimism over the outlook for global growth, but tumbled in 2020 on growing speculation that theCOVID-19 pandemic would force central banks to slash interest rates and reinstate asset-purchase programs. In the US, the10-year Treasury yield closed the period around 100 basis points lower, while10-year yields in the UK fell just over 10 basis points. However, German Bund yields rose slightly and peripheral euro-zone yields rose even more. Japanese government bonds also increased modestly. Meanwhile, corporate bonds fell sharply as the deteriorating economic outlook led to fears of rising downgrades and defaults.
Hopes that the global economy may be over the worst of the trade-related slowdown were dashed as theCOVID-19 outbreak spread beyond China, forcing countries to impose travel restrictions and draconian quarantine measures. Flash estimates of purchasing managers’ indices for March 2020 revealed the impact thatCOVID-19 was having on the global economy. In the US, the composite index fell to an11-year low while the composite survey for the euro zone fell to a record low. Elsewhere, Chinese industrial production plunged 13.5% over the first two months of the year, compared to the same period in 2019, and retail sales plummeted by 20.5% on ayear-on-year basis. In response, central banks lowered interest rates and reinstated asset-purchase programs, but in general these measures failed to reassure financial markets. Instead, governments were forced to shoulder the burden for supporting economies, with many announcing massive fiscal measures.
In the currency markets, the period saw significant swings. The British pound was one of the strongest currencies in the final quarter of 2019, boosted by news that the UK had secured a Withdrawal Agreement with the EU, but lost the majority of these gains during the first quarter of 2020. Elsewhere, the US dollar, Euro and Japanese yen all jostled for supremacy throughout thesix-month period, while many emerging market currencies weakened.
Portfolio Review
At the start of the fourth quarter of 2019, the Fund had an overweight to global equities and US corporate bonds through which it benefitted through the quarter against the backdrop of easing trade tensions which supported risk assets into year’s end. Stock selection effects also contributed positively, through the AllianzGI International Growth Portfolio. Conversely, positions in the Japanese yen and Italian government bonds detracted modestly. At the start of the first quarter of 2020, the Fund was positioned for ongoing global growth and a potential acceleration in the US economy, with 91% of the Fund invested in equities compared to the benchmark weight of 60%. As the financial markets abruptly switched direction in late February 2020 due to theCOVID-19 pandemic, this caused the Fund to start to underperform. In early March 2020, the Fund was still significantly overweight equities, although being reduced in steps; bymid-month, the portfolio was underweight, which limited downside as equities continued to decline through March 23rd. An overweight to fixed income during the month also helped to mitigate losses. At the end of the period, the Fund remained defensively positioned with an underweight to global equities and an overweight to duration.
Outlook
TheCOVID-19 pandemic and severe disruptions in the oil market created a simultaneous supply and demand shock for a late-cycle global economy. One consequence is that economies are increasingly vulnerable to exogenous shocks that can exacerbate existing imbalances. As such, we maintain a cautious economic outlook and now expect a global recession in the next few months. The shape and magnitude of the recession will depend to an extent on the negative spillover from financial markets in holding back the real economy. We believe that the inflection point in financial markets in the context of the current crisis—in contrast to previous financial crises—will depend on an array of factors, including (1) how theCOVID-19 public health crisis unfolds and ultimately stabilizes; (2) continued credible intervention on the part of governments and public policy; (3) stabilization of corporate and macroeconomic data and (4) adjustment of valuations to recession-like levels.
Against this backdrop, we continue to see elevated risks of additional corrections in risky asset markets in the near term before a sustainable turnaround is achieved. Therefore, unless we see a very strongV-shaped recovery in markets and the economy, we expect to maintain our defensive positioning based on our trend-based and fundamental indicators. This should position the Fund to be well prepared for a persistent downturn in the near term. Of course, if the market rally atquarter-end following the very substantial fiscal package and the series of supports announced by the US Federal Reserve should persist, we will reincorporate risk back into the portfolio accordingly.
| | | | | | |
| 56 | | March 31, 2020 | | | Semiannual Report | | |
Unaudited
AllianzGI Global Dynamic Allocation Fund (cont’d)
Average Annual Total Return for the period ended March 31, 2020
| | | | | | | | | | | | | | | | | | | | | | |
| | | | | | |
| | | | | 6 Month* | | | 1 Year | | | 5 Year | | | 10 Year | | | Since Inception† | |
| | | AllianzGI Global Dynamic Allocation Fund Class A | | | –9.18% | | | | –7.10% | | | | 0.57% | | | | 4.06% | | | | 6.97% | |
| | AllianzGI Global Dynamic Allocation Fund Class A (adjusted) | | | –14.18% | | | | –12.21% | | | | –0.57% | | | | 3.47% | | | | 6.42% | |
| | | AllianzGI Global Dynamic Allocation Fund Class C | | | –9.51% | | | | –7.79% | | | | –0.20% | | | | 3.27% | | | | 6.17% | |
| | AllianzGI Global Dynamic Allocation Fund Class C (adjusted) | | | –10.32% | | | | –8.63% | | | | –0.20% | | | | 3.27% | | | | 6.17% | |
| | AllianzGI Global Dynamic Allocation Fund Class R | | | –9.34% | | | | –7.45% | | | | 0.24% | | | | 3.76% | | | | 6.68% | |
| | AllianzGI Global Dynamic Allocation Fund Class P | | | –7.78% | | | | –5.61% | | | | 1.03% | | | | 4.39% | | | | 7.31% | |
| | AllianzGI Global Dynamic Allocation Fund Institutional Class | | | –9.03% | | | | –6.83% | | | | 0.83% | | | | 4.34% | | | | 7.27% | |
| | AllianzGI Global Dynamic Allocation Fund Class R6 | | | –9.06% | | | | –6.87% | | | | 0.87% | | | | 4.41% | | | | 7.35% | |
| | | AllianzGI Global Dynamic Allocation Fund Administrative Class | | | –9.15% | | | | –7.07% | | | | 0.57% | | | | 4.08% | | | | 7.00% | |
| | MSCI ACWI | | | –14.33% | | | | –11.26% | | | | 2.85% | | | | 5.88% | | | | 8.82% | |
| | Bloomberg Barclays U.S. Aggregate Bond Index | | | 3.33% | | | | 8.93% | | | | 3.36% | | | | 3.88% | | | | 4.19% | |
| | 60% MSCI ACWI, 40% Bloomberg Barclays U.S. Aggregate Bond Index | | | –7.29% | | | | –3.13% | | | | 3.31% | | | | 5.35% | | | | 7.23% | |
| | | Lipper Alternative Global Macro Funds Average | | | –9.59% | | | | –7.43% | | | | –0.26% | | | | 2.18% | | | | 3.72% | |
* Cumulative return
† The Fund began operations on April 27, 2009. Benchmark return comparisons began on the fund inception date. Lipper performance comparisons began on April 30, 2009.
Performance quoted represents past performance and is no guarantee of future results. Current performance may be lower or higher than performance shown. For performance current to the most recent month-end, visit our website at us.allianzgi.com. Investment return and the principal value will fluctuate. Shares may be worth more or less than original cost when redeemed.The adjusted returns take into account the maximum initial sales charge of 5.50% on Class A shares and the contingent deferred sales charge (CDSC) of 1% on Class C shares, which may apply to shares redeemed during the first year of ownership. Returns do not reflect deduction of taxes that a shareholder would pay on fund distributions or redemption of fund shares. See pages 107 and 108 for more information. The Fund’s gross expense ratios, which include the Acquired Fund Fees and Expenses, are 1.35% for Class A shares, 2.11% for Class C shares, 1.68% for Class R shares, 1.13% for Class P shares, 1.04% for Institutional Class shares, 1.01% for Class R6 shares and 1.27% for Administrative Class shares. These ratios do not include an expense reduction, contractually guaranteed through at least January 31, 2021. The Fund’s expense ratios net of this reduction, which include the Acquired Fund Fees and Expenses, are 1.01% for Class A shares, 1.78% for Class C shares, 1.38% for Class R shares, 0.84% for Class P shares, 0.74% for Institutional Class shares, 0.74% for Class R6 shares and 0.99% for Administrative Class shares. Expense ratio information is as of the Fund’s current prospectus dated February 1, 2020, as further revised or supplemented from time to time.
Cumulative Returns Through March 31, 2020
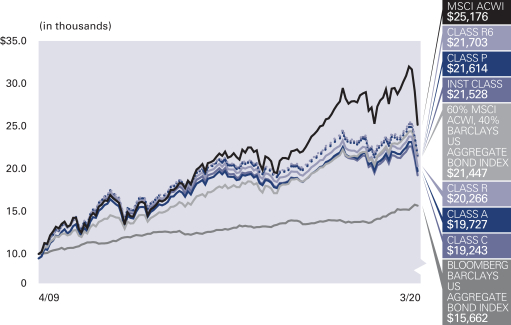
Country/Location Allocation
(as of March 31, 2020)
| | | | |
| |
| United States | | | 74.4% | |
| |
| Japan | | | 2.7% | |
| |
| Australia | | | 1.4% | |
| |
| Switzerland | | | 1.2% | |
| |
| China | | | 1.2% | |
| |
| Taiwan | | | 0.9% | |
| |
| France | | | 0.9% | |
| |
| United Kingdom | | | 0.8% | |
| |
| Other | | | 9.4% | |
| |
| Cash & Equivalents — Net | | | 7.1% | |
| | | | | | |
| | Semiannual Report | | | March 31, 2020 | | 57 |
Unaudited
AllianzGI Global Dynamic Allocation Fund (cont’d)
| | | | | | | | | | | | | | |
| |
| Shareholder Expense Example | | Actual Performance |
| | | Class A | | Class C | | Class R | | Class P | | Institutional
Class | | Class R6 | | Administrative
Class |
| | | | | | | |
| Beginning Account Value (10/1/19) | | $1,000.00 | | $1,000.00 | | $1,000.00 | | $1,000.00 | | $1,000.00 | | $1,000.00 | | $1,000.00 |
| | | | | | | |
| Ending Account Value (3/31/20) | | $ 908.20 | | $ 904.90 | | $ 906.60 | | $ 922.20 | | $ 909.70 | | $ 909.40 | | $ 908.50 |
| | | | | | | |
| Expenses Paid During Period | | $ 3.91 | | $ 7.52 | | $ 5.62 | | $ 3.22 | | $ 2.58 | | $ 2.58 | | $ 3.77 |
| | | | | | | | | | | | | | | |
| |
| | | Hypothetical Performance |
| | | (5% return before expenses) |
| | | Class A | | Class C | | Class R | | Class P | | Institutional
Class | | Class R6 | | Administrative
Class |
| | | | | | | |
| Beginning Account Value (10/1/19) | | $1,000.00 | | $1,000.00 | | $1,000.00 | | $1,000.00 | | $1,000.00 | | $1,000.00 | | $1,000.00 |
| | | | | | | |
| Ending Account Value (3/31/20) | | $1,020.90 | | $1,017.10 | | $1,019.10 | | $1,021.65 | | $1,022.30 | | $1,022.30 | | $1,021.05 |
| | | | | | | |
| Expenses Paid During Period | | $ 4.14 | | $ 7.97 | | $ 5.96 | | $ 3.39 | | $ 2.73 | | $ 2.73 | | $ 3.99 |
For each class of the Fund, expenses (net of fee waiver and reimbursement, if any) are equal to the annualized expense ratio for the class (0.82% for Class A, 1.58% for Class C, 1.18% for Class R, 0.67% for Class P, 0.54% for Institutional Class, 0.54% for Class R6 and 0.79% for Administrative Class), multiplied by the average account value over the period, multiplied by 183/366. These expenses do not include the expenses of the investment companies in which the Fund invests, which are indirectly borne by Fund shareholders.
| | | | | | |
| 58 | | March 31, 2020 | | | Semiannual Report | | |
Unaudited
AllianzGI Global High Yield Fund*
For the period of October 1, 2019 through March 31, 2020, as provided by David Newman, Portfolio Manager.
Fund Insights
For thesix-month period ended March 31, 2020, Institutional Class shares at net asset value (“NAV”) of the AllianzGI Global High Yield Fund (the “Fund”) returned-9.82%, outperforming the ICE BofA Global High Yield Constrained Index USD Hedged (the “benchmark”), which returned-11.03%.
Market Overview
The six month period under review could be divided into two distinct halves. For the final quarter of 2019, financial markets enjoyed positive returns, helped by a US Federal Reserve (“Fed”) policy rate cut in October, strong corporate profits and continued low unemployment. Several equity market indices touchedall-time record highs and, in the high yield bond market, benchmark credit spreads tightened to 352 basis points in late January.
This situation reversed dramatically in February and March 2020, as the novel coronavirus(“COVID-19”) turned from a localized outbreak into a serious global pandemic. Countries around the world were forced to shut down large parts of their economies and implement social restrictions in order to contain the spread of the disease, with the result that the world economy faces its deepest contraction since the Great Depression. Simultaneously, a falling out between members of OPEC and Russia led to a supply glut in the oil market, even as global demand was shrinking from the aforementioned public health emergency measures. The West Texas Intermediate (“WTI”) crude oil price fell from just over $60 a barrel at the beginning of 2020 to just over $20 a barrel at the end of the review period. This compounded the deflationary effects at the macroeconomic level, which are negative for riskier assets, and impacted the high yield market more directly as around 11% of the index is represented by the Energy sector. Few of the oil producing companies in the universe are profitable with oil prices below $30 a barrel and many bonds became distressed. To illustrate, credit spreads on the benchmark index widened to 1094 basis points on March 23, while for high yield energy the spread widened to 2272 basis points. Losses were also a function of credit quality, withCCC-rated issues suffering the most, given their weaker starting financial position.
Central banks and governments were proactive in their attempts to mitigate the economic effects, with policy rates slashed globally and substantial fiscal stimulus measures announced. The market prognosis improved in the final week of the period with credit spreads on the benchmark recovering to 915 basis points.
Portfolio Review
The Fund’s sector and security selection were prime drivers of its relative outperformance vs. the benchmark. An underweight position in oil names (particularly the lowest rated ones) was strongly beneficial as crude prices collapsed in March 2020. Likewise, underweight exposure in airlines, autos and retail was additive to relative performance, given the enforced shutdowns and travel restrictions imposed globally. Even in some more sheltered sectors such as communications, food and defense, our name selection helped us avoid some significant underperformers.
Outlook
In our view, high yield will see a significant increase in defaults but we see this focused on the most levered companies and sectors most challenged by a global slowdown. We find value in BBs and opportunistically in lower ratednon-cyclical credits with good liquidity. The Fed’s intervention to buy investment grade companies downgraded to BB (also known as “fallen angels”) as well as the “Main Street” program to provide liquidity to smaller US businesses, should be supportive for many issuers within the universe, but it has also widened the gap between the strongest and weakest companies.
Emerging markets have been disadvantaged by a strong dollar and recessionary forces; however, not all countries or business are affected equally. Thus, we believe that security selection will be key.
While predicting the end of the pandemic and associated economic disruption is extremely difficult—indeed we could see another leg down—overall the balance of scenarios on a 12+ month horizon seems to offer us an attractive entry point for high yield.
* Effective on or about June 11, 2020, the AllianzGI Global High Yield Fund will be liquidated and dissolved, and any outstanding shares redeemed. As of June 4, 2020, shares of the Fund will no longer be available for purchase or exchange. Please see the Fund’s statutory prospectus for more information.
| | | | | | |
| | Semiannual Report | | | March 31, 2020 | | 59 |
Unaudited
AllianzGI Global High Yield Fund (cont’d)
Average Annual Total Return for the period ended March 31, 2020
| | | | | | | | | | | | | | |
| | | | |
| | | | | 6 Month* | | | 1 Year | | | Since Inception† | |
| | AllianzGI Global High Yield Fund Class P | | | –9.87% | | | | –5.51% | | | | 0.40% | |
| | AllianzGI Global High Yield Fund Institutional Class | | | –9.82% | | | | –5.42% | | | | 0.50% | |
| | ICE BofA Global High Yield Constrained Index USD Hedged | | | –11.03% | | | | –7.33% | | | | 0.21% | |
| | | Lipper Global High Yield Funds Average | | | –12.30% | | | | –9.36% | | | | –1.32% | |
* Cumulative return
† The Fund began operations on May 3, 2017. Benchmark return comparisons began on the fund inception date. Lipper performance comparisons began on April 30, 2017.
Performance quoted represents past performance and is no guarantee of future results. Current performance may be lower or higher than performance shown. For performance current to the most recent month-end, visit our website at us.allianzgi.com. Investment return and the principal value will fluctuate. Shares may be worth more or less than original cost when redeemed. Returns do not reflect deduction of taxes that a shareholder would pay on fund distributions or redemption of fund shares. See pages 107 and 108 for more information. The Fund’s gross expense ratios are 1.13% for Class P shares and 1.12% for Institutional Class shares. These ratios do not include an expense reduction, contractually guaranteed through at least January 31, 2021. The Fund’s expense ratios net of this reduction are 0.80% for Class P shares and 0.70% for Institutional Class shares. Expense ratio information is as of the Fund’s current prospectus dated February 1, 2020, as further revised or supplemented from time to time.
Cumulative Returns Through March 31, 2020
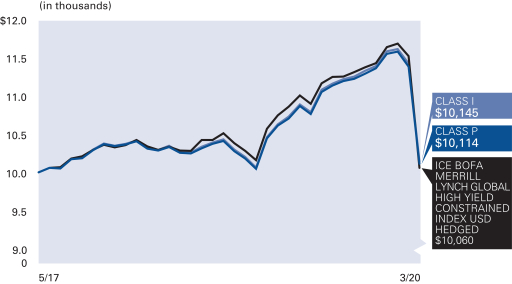
Country/Location Allocation
(as of March 31, 2020)
| | | | |
| |
| United States | | | 52.0% | |
| |
| Netherlands | | | 7.0% | |
| |
| Italy | | | 4.6% | |
| |
| Ireland | | | 4.3% | |
| |
| United Kingdom | | | 4.1% | |
| |
| Canada | | | 3.1% | |
| |
| Luzembourg | | | 2.7% | |
| |
| China | | | 1.9% | |
| |
| Other | | | 11.0% | |
| |
| Cash &Equivalents-Net | | | 9.3% | |
Credit Ratings* (as of March 31, 2020)
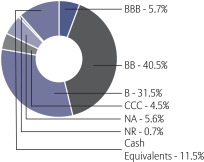
* As a percentage of total investments. Credit ratings apply to the credit worthiness of the issuers of the underlying securities and not to the Fund or its shares. Ratings are subject to change. Ratings are based off of the lowest available rating from S&P Global Ratings (“S&P”), Moody’s and Fitch. Bonds not rated by the aforementioned agencies are “unrated”. Ratings are shown based on the S&P rating scale, which ranges from AAA (highest) to D (lowest). Where applicable, securities ratings of an agency other than S&P have been converted to the S&P equivalent. “NR” denotes securities that are not rated. Not rated securities do not necessarily indicate low quality. Ratings are relative, subjective and not absolute standards of quality, and represent the opinions of the independent Nationally Recognized Statistical Rating Organizations (NRSRO). The security’s credit rating does not eliminate risk. The Fund is not rated by an independent rating agency. Previous shareholder reports for the Fund displayed bond ratings provided by S&P.
| | | | | | |
| 60 | | March 31, 2020 | | | Semiannual Report | | |
Unaudited
AllianzGI Global High Yield Fund (cont’d)
| | | | |
| |
| Shareholder Expense Example | | Actual Performance |
| | | Class P | | Institutional
Class |
| | |
| Beginning Account Value (10/1/19) | | $1,000.00 | | $1,000.00 |
| | |
| Ending Account Value (3/31/20) | | $ 901.30 | | $ 901.80 |
| | |
| Expenses Paid During Period | | $ 3.80 | | $ 3.33 |
| | | | | |
| |
| | | Hypothetical Performance |
| | | (5% return before expenses) |
| | | Class P | | Institutional
Class |
| | |
| Beginning Account Value (10/1/19) | | $1,000.00 | | $1,000.00 |
| | |
| Ending Account Value (3/31/20) | | $1,021.00 | | $1,021.50 |
| | |
| Expenses Paid During Period | | $ 4.04 | | $ 3.54 |
For each class of the Fund, expenses (net of fee waiver and reimbursement, if any) are equal to the annualized expense ratio for the class (0.80% for Class P and 0.70% for Institutional Class), multiplied by the average account value over the period, multiplied 183/366.
| | | | | | |
| | Semiannual Report | | | March 31, 2020 | | 61 |
Unaudited
AllianzGI Global Sustainability Fund
For the period of October 1, 2019 through March 31, 2020, as provided by the Global Equity Team.
Fund Insights
For thesix-month period ended March 31, 2020, Class A shares at net asset value (“NAV”) of the AllianzGI Global Sustainability Fund (the “Fund”) returned-9.78%, outperforming the MSCI ACWI (the “benchmark”), which returned-14.33%.
Market Overview
Global equities ratcheted steadily higher untilmid-February 2020, with sentiment lifted by growing optimism over a “phase one” trade deal between the US and China, as well as better-than-expected corporate earnings. However, growing concerns aboutCOVID-19 led to sharp pullbacks and an official bear market, with the benchmark recording its worst quarter since 2008. The World Health Organization (“WHO”) declaredCOVID-19 a global pandemic, and governments restricted travel, public assembly and business operations in a bid to avoid overloading health systems. The resulting reduction in economic activity means a global recession is now most investors’ base case scenario.
Hopes the global economy could recover from any trade-related slowdowns were dashed asCOVID-19 spread beyond China. The end of March saw weekly US jobless claims surge from under 400,000 to a record 6.65 million, with further increases expected. In the euro-zone, the composite Purchasing Manager Index (“PMI”) fell to a record low, reaching 31.4, while in the UK the same figure reached 37.1. In China, industrial production declined 13.5% over the first two months of the year, compared to the same period in 2019, whileyear-on-year retail sales fell 20.5%.
This has translated to double-digit share price declines across all sectors. Energy stocks performed worst, as on top of reduced demand, a price war between Saudi Arabia and Russia caused oil prices to hit an18-year low. Financial stocks also underperformed, along with Industrials companies and companies with meaningful travel exposure. Providers of online content ande-retailers fared relatively well, as did the consumer staples and health care sectors.
Central banks and governments have been quick to provide support. The US Federal Reserve (“Fed”) reintroduced asset-purchase programs, and announced two emergency rate cuts, bringing the federal funds rate to a range of 0.00% to 0.25%. Monetary policy is similarly accommodative across Europe and Asia. However, unprecedented fiscal measures are providing the bulk of economic support, with governments paying furloughed workers, relaxing credit terms and urging companies to cancel dividends.
Portfolio Review
The Fund outperformed its benchmark over the six month period, demonstrating its resilience in an extremely volatile quarter. Our portfolio of quality companies, exposed to structural growth trends and on reasonable valuations has shown itself to be more defensive than global equity markets and has delivered greater upside in the recent period of relative stabilization. Stock selection continues to be a positive driver of returns, with picks in the industrials, financials and health care sectors all contributing positively. While sector allocation is largely driven by our ability to find quality growth names at reasonable valuations, our overweight allocation to information technology names has also been positive. The major negative impact on returns was weaker stock selection in the consumer discretionary sector.
Adobe has made the largest positive contribution to returns. While the provider of creative software is exposed to cyclical trends in business spending, the company has also successfully transformed its revenue base into one based on digital subscriptions. The shares have thus proved resilient in the recent volatility, boosted further by first quarter results in March 2020. Adobe reported revenue and earnings per share growth of 19% and 33%, respectively. Looking forward, Adobe has provided cautious guidance around its enterprise exposure, where management expects weaker marketing spend and lower consultancy demand. However, Adobe’s over $4 billion in cash provides balance sheet resilience and its current valuation continues to discount the steady revenue base. It thus remains a key holding.
Microsoft has also boosted performance. The global computing giant is not immune to the effects ofCOVID-19, having announced at the end of February that it no longer expected to meet its third quarter revenue guidance as a result of supply chain issues in its ‘More Personal Computing’ division. However, as the disease and national lockdowns spread further, the resilience of Microsoft’s corporate cloud revenues have provided a defensive element to the shares. Indeed, recent analysis suggests that the shift to working from home may actually accelerate investment in digital infrastructure, a trend likely assisted by the release of additional functionality for Microsoft Teams, the company’s online meeting software. With only 3% of workloads currently on cloud services, Microsoft’s established relationships with enterprise customers make it well-positioned to continue capturing this growing market and our long-term investment case remains intact.
Shell had the largest negative impact on returns. Shares in the energy giant have weakened in response to the sharp decline in oil prices. With a breakeven oil price of $65, Shell has announced impairments of between$400-800 million as of the first quarter of 2020. However, first quarter demand has been better than feared and the company has access to $40 billion of liquidity. Moreover, since the previous oil price collapse of 2015, Shell has dramatically improved its efficiency and responsiveness. As a result, the firm has already announced substantial spending cuts in exploration and production, as well as marketing, generating nearly $10 billion of saving. This combination means that, despite short-term volatility, we expect that Shell continues to be a long-term structural winner in an industry that will see weaker players struggle.
EOG Resources has also weakened performance. Like Shell, shares in the shale exploration and production company weakened in response to the sharp fall in oil prices. The breakdown of relations between Saudi Arabia and Russia has caused a supply glut. Similarly, the International Energy Agency’s worst case scenario now estimatesCOVID-19 could suppress global oil demand by 730,000 barrels per day in 20201. Nonetheless, EOG remains well-capitalized with net positive cash flows as of March 31, 2020. The firm has also continued to reduce its leverage, while hedging its oil exposure and having access to a two billion USD credit facility. Overall, we believe EOG is one of the best-positioned companies within its sector and is ideally positioned to weather macro
| | | | | | |
| 62 | | March 31, 2020 | | | Semiannual Report | | |
Unaudited
AllianzGI Global Sustainability Fund (cont’d)
volatility. In addition, we met with EOG’s management in February to discuss the company’s readiness and role in transitioning to a low carbon economy. This is the second year of dialogue on the subject, and the firm continues to have one of the most advanced approaches to ESG amongst oil exploration and production firms, with clear policies on disclosure and resource use. Yet the quality of EOG’s business appears consistently under-appreciated by the market. As a result, we are exiting our position and will look to take advantage of any strength in the share price to do so.
Outlook
The current environment is one of profound uncertainty. Major economies face extended lockdowns with no clear end point. We believe company revenues will be sharply reduced, while workers are paid lower salaries or furloughed. At the same time, mounting social costs are pushing governments and regulators to make unprecedented fiscal and corporate interventions. The market backdrop is therefore one of heightened volatility.
Nonetheless, we expect the sharp drop in supply and demand for the global economy to be a pause, rather than a complete derailment. In China, whereCOVID-19 first emerged, factory workers are already resuming their duties. Around the world, central bank and fiscal support has provided equity markets some respite from daily double digit-declines. If further turbulence does lie ahead, we are using the present period to ensure portfolios are well-positioned both to weather it and benefit from any recovery.
Across all global equity funds, we arere-examining each holding’s level of debt. Our bias towards quality growth stocks means we typically invest in companies with more robust balance sheets than peers. Many such businesses are already using their strong financial position to raise debt in order to sustain operations. More stretched companies may put off doing so now, only to face greater issues later on. Identifying points of potential weakness at this stage should increase portfolio resilience in the event of renewed volatility.
Despite a lack of immediate economic certainty, the current situation may expedite longer-term structural trends to which we already have exposure. Social distancing is visibly accelerating the digitalization of consumer products and professional services. For example, Microsoft’s cloud computing and home office solutions are direct beneficiaries, as is Alphabet’s YouTube platform. Similarly, as customer interaction moves almost exclusively online, we believe more companies are likely to require the type of digital consultancy provided by Accenture.
In addition, an extended period of elevated valuations has given way to a sharp compression of earnings multiples. Global equity markets have repeatedly demonstrated their ability to deliver long-term growth despite sharp pullbacks. Against a background of monetary and fiscal support, valuations in some well-managed, consistently high-returning businesses with solid balance sheets are thus becoming attractive. As a team, we maintain a watch-list of stocks with these characteristics and have taken the opportunity to add to disproportionately punished positions.
In these circumstances, we feel investors and clients are best served by maintaining a long term investment horizon. While performance year to date has been resilient and our longer-term track record remains intact, our team seeks to outperform global equity markets through a market cycle. More than ever, we believe maintaining focus on our investment philosophy and process will be key to delivering meaningful returns over thelonger-term.
Average Annual Total Return for the period ended March 31, 2020
| | | | | | | | | | | | | | | | | | |
| | | | | |
| | | | | 6 Month* | | | 1 Year | | | 5 Year | | | Since Inception† | |
| | | AllianzGI Global Sustainability Fund Class A | | | –9.78% | | | | –5.05% | | | | 4.88% | | | | 4.64% | |
| | AllianzGI Global Sustainability Fund Class A (adjusted) | | | –14.75% | | | | –10.28% | | | | 3.70% | | | | 3.53% | |
| | AllianzGI Global Sustainability Fund Class P | | | –9.73% | | | | –4.97% | | | | 5.04% | | | | 4.80% | |
| | AllianzGI Global Sustainability Fund Institutional Class | | | –9.69% | | | | –4.87% | | | | 5.12% | | | | 4.89% | |
| | MSCI ACWI | | | –14.33% | | | | –11.26% | | | | 2.85% | | | | 3.00% | |
| | Dow Jones Sustainability World Total Return Composite Net Index | | | –10.21% | | | | –5.89% | | | | 4.11% | | | | 3.81% | |
| | | Lipper GlobalLarge-Cap Growth Funds Average | | | –9.13% | | | | –5.45% | | | | 5.27% | | | | 5.17% | |
* Cumulative return
† The Fund began operations on December 9, 2014. Benchmark return comparisons began on the fund inception date. Lipper performance comparisons began on November 30, 2014.
Performance quoted represents past performance and is no guarantee of future results. Current performance may be lower or higher than performance shown. For performance current to the most recent month-end, visit our website at us.allianzgi.com. Investment return and the principal value will fluctuate. Shares may be worth more or less than original cost when redeemed.The adjusted returns take into account the maximum initial sales charge of 5.50% on Class A shares. Returns do not reflect deduction of taxes that a shareholder would pay on fund distributions or redemption of fund shares. See pages 107 and 108 for more information. The Fund’s gross expense ratios are 1.84% for Class A shares, 1.65% for Class P shares and 1.66% for Institutional Class shares. These ratios do not include an expense reduction, contractually guaranteed through at least January 31, 2021. The Fund’s expense ratios net of this reduction are 0.94% for Class A shares, 0.79% for Class P shares and 0.69% for Institutional Class shares. Expense ratio information is as of the Fund’s current prospectus dated February 1, 2020, as further revised or supplemented from time to time.
| | | | | | |
| | Semiannual Report | | | March 31, 2020 | | 63 |
Unaudited
AllianzGI Global Sustainability Fund (cont’d)
Cumulative Returns Through March 31, 2020
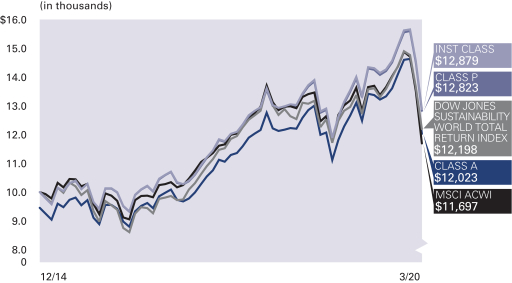
Country/Location Allocation (as of March 31, 2020)
| | | | |
| |
| United States | | | 55.1% | |
| |
| United Kingdom | | | 10.0% | |
| |
| Germany | | | 6.5% | |
| |
| Japan | | | 4.5% | |
| |
| Switzerland | | | 4.1% | |
| |
| Sweden | | | 3.7% | |
| |
| France | | | 3.1% | |
| |
| Denmark | | | 1.8% | |
| |
| Other | | | 6.9% | |
| |
| Cash & Equivalents — Net | | | 4.3% | |
| | | | | | |
| |
| Shareholder Expense Example | | Actual Performance |
| | | Class A | | Class P | | Institutional
Class |
| | | |
| Beginning Account Value (10/1/19) | | $1,000.00 | | $1,000.00 | | $1,000.00 |
| | | |
| Ending Account Value (3/31/20) | | $ 902.20 | | $ 902.70 | | $ 903.10 |
| | | |
| Expenses Paid During Period | | $ 4.95 | | $ 4.23 | | $ 3.76 |
| | | | | | | |
| |
| | | Hypothetical Performance |
| | | (5% return before expenses) |
| | | Class A | | Class P | | Institutional
Class |
| | | |
| Beginning Account Value (10/1/19) | | $1,000.00 | | $1,000.00 | | $1,000.00 |
| | | |
| Ending Account Value (3/31/20) | | $1,019.80 | | $1,020.55 | | $1,021.05 |
| | | |
| Expenses Paid During Period | | $ 5.25 | | $ 4.50 | | $ 3.99 |
For each class of the Fund, expenses (net of fee waiver and reimbursement, if any) are equal to the annualized expense ratio for the class (1.04% for Class A, 0.89% for Class P and 0.79% for Institutional Class), multiplied by the average account value over the period, multiplied by 183/366.
| | | | | | |
| 64 | | March 31, 2020 | | | Semiannual Report | | |
Unaudited
AllianzGI Green Bond Fund
For the period of October 1, 2019 through March 31, 2020, as provided by Julien Bras, CFA, Portfolio Manager.
Fund Insights
For thesix-month period ended March 31, 2020, Class A shares at net asset value (“NAV”) of the AllianzGI Green Bond Fund (the “Fund”) returned-5.24%, underperforming the ICE BofA Green Bond Index (the “benchmark”), which returned-2.21 %.
Market Overview
Global government bond yields trended higher in the fourth quarter amid growing optimism over the outlook for global growth, but tumbled in 2020 on growing speculation that the novel coronavirus outbreak (“COVID-19”) would force central banks to slash interest rates and reinstate asset-purchase programs. In the US, the10-year Treasury yield closed the period around 100 basis points lower, while10-year yields in the UK fell just over 10 basis points. However, German Bund yields rose slightly and peripheral euro-zone yields rose even more. Japanese government bonds also increased modestly. Meanwhile, corporate bonds fell sharply as the deteriorating economic outlook led to fears of rising downgrades and defaults.
Hopes that the global economy may be over the worst of the trade-related slowdown were dashed as COVID-19 spread beyond China, forcing countries to impose travel restrictions and draconian quarantine measures. Flash estimates of purchasing managers’ indices for March revealed the impact thatCOVID-19 was having on the global economy. In the US, the composite index fell to an11-year low while the composite survey for the euro zone fell to a record low. Elsewhere, Chinese industrial production plunged 13.5% over the first two months of the year, compared to the same period in 2019, and retail sales plummeted by 20.5% on ayear-on-year basis . In response, central banks lowered interest rates and reinstated asset-purchase programs, but these measures failed to reassure financial markets. Instead, governments were forced to shoulder the burden for supporting economies, with many announcing massive fiscal measures.
In this difficult context, primary activity slowed dramatically in March 2020 with only $3 billion of new issues according to the Climate Bonds Initiative database. After themonth-end rebalancing, the benchmark is composed of 523 securities from 233 issuers for a market value of $399 billion equivalent.
Portfolio Review
The Fund underperformed its benchmark over the reporting period. Most of this underperformance was due to March 2020 extreme conditions in which the Fund was penalized by its structural overweight on corporate issuers in a context of massive spreads widening. Over this month, spreads on the benchmark nearly doubled from 75 basis points to 143 basis points, impacting negatively performance.
On single issuer basis, Chile, Renew Power Limited and Paprec were the largest detractors from the Fund’s relative performance. On the other hand, the absence of exposure to the French Green OAT was the largest positive contributor in relative terms.
Outlook
It is now a given that the world is plunging into a global recession, with a very sharp downturn followed by a slow recovery. Economists estimate 2020 European Union (“EU”) gross domestic product (“GDP”) to contract between 3.5% and 5.5% with risks on the downside if quarantine measures are not lifted by the early summer. We note the current exceptional dispersion in economic forecasts: while economists have had a very tight consensus on growth in recent years, there is an incredibly wide distribution of views on what the economic impact ofCOVID-19 will be. Markets will need some certainty that large economies finally have the spread of the virus under control before risk assets could be globally on a sustained rally path. Current spread levels point to a severe recession but do not take into account the full spectrum of very powerful technical factors.
On the green bond regulation side the EU Technical Expert Group (“TEG”) on Sustainable Finance published the update of the EU Taxonomy on green bonds setting out the TEG’s final recommendations to the European Commission. The proposed taxonomy of green activities now includes criteria for climate adaptation activities from the forestry, agriculture and manufacturing sectors. Interesting to mention as well that nuclear energy has not been included in the list of sustainable activities.
| | | | | | |
| | Semiannual Report | | | March 31, 2020 | | 65 |
Unaudited
AllianzGI Green Bond Fund (cont’d)
Average Annual Total Return for the period ended March 31, 2020
| | | | | | | | | | | | | | |
| | | | |
| | | | | 6 Month* | | | 1 Year | | | Since Inception† | |
| | | AllianzGI Green Bond Fund Class A | | | –5.24% | | | | 0.59% | | | | 4.09% | |
| | AllianzGI Green Bond Fund Class A (adjusted) | | | –8.79% | | | | –3.18% | | | | 1.21% | |
| | AllianzGI Green Bond Fund Class P | | | –5.11% | | | | 0.82% | | | | 4.30% | |
| | AllianzGI Green Bond Fund Institutional Class | | | –5.13% | | | | 0.83% | | | | 4.33% | |
| | ICE BofA Green Bond Index | | | –2.21% | | | | 4.69 % | | | | 7.53% | |
| | | Lipper Core Bond Funds Average | | | 0.63% | | | | 5.79% | | | | 7.92% | |
* Cumulative return
† The Fund began operations on November 19, 2018. Benchmark return comparisons began on the fund inception date. Lipper performance comparisons began on November 30, 2018.
Performance quoted represents past performance and is no guarantee of future results. Current performance may be lower or higher than performance shown. For performance current to the most recent month-end, visit our website at us.allianzgi.com. Investment return and the principal value will fluctuate. Shares may be worth more or less than original cost when redeemed. The adjusted returns take into account the maximum initial sales charge of 3.75% on Class A Shares. Returns do not reflect deduction of taxes that a shareholder would pay on funds distributions or redemption of fund shares. See pages 107 and 108 for more information. The Fund’s gross expense ratios are 4.16% for Class A shares, 4.24% for Class P shares and 3.54% for Institutional Class shares. These ratios do not include an expense reduction, contractually guaranteed through at least January 31, 2022. The Fund’s expense ratios net of this reduction are 0.75% for Class A shares, 0.55% for Class P shares and 0.50% for Institutional Class shares. Expense ratio information is as of the Fund’s current prospectus dated February 1, 2020, as further revised or supplemented from time to time.
Cumulative Returns Through March 31, 2020
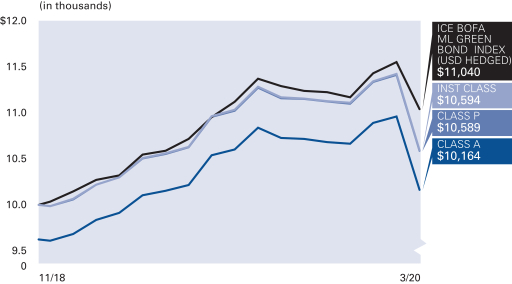
Country/Location Allocation (as of March 31, 2020)
| | | | |
| |
| United States | | | 19.6% | |
| |
| France | | | 9.2% | |
| |
| Spain | | | 6.5% | |
| |
| Sweden | | | 6.0% | |
| |
| Hong Kong | | | 5.4% | |
| |
| United Kingdom | | | 4.9% | |
| |
| Korea (Republic of) | | | 4.8% | |
| |
| Supranational | | | 4.6% | |
| |
| Other | | | 36.2% | |
| |
| Cash & Equivalents — Net | | | 2.8% | |
Credit Ratings* (as of March 31, 2020)
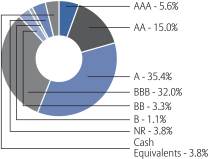
* As a percentage of total investments. Credit ratings apply to the credit worthiness of the issuers of the underlying securities and not to the Fund or its shares. Ratings are subject to change. Ratings are based off of the highest available rating from S&P Global Ratings (“S&P”), Moody’s and Fitch. Bonds not rated by the aforementioned agencies are “unrated”. Ratings are shown based on the S&P rating scale, which ranges from AAA (highest) to D (lowest). Where applicable, securities ratings of an agency other than S&P have been converted to the S&P equivalent. “NR” denotes securities that are not rated. Not rated securities do not necessarily indicate low quality. Ratings are relative, subjective and not absolute standards of quality, and represent the opinions of the independent Nationally Recognized Statistical Rating Organizations (NRSRO). The security’s credit rating does not eliminate risk. The Fund is not rated by an independent rating agency.
| | | | | | |
| 66 | | March 31, 2020 | | | Semiannual Report | | |
Unaudited
AllianzGI Green Bond Fund (cont’d)
| | | | | | |
| |
| Shareholder Expense Example | | Actual Performance |
| | | Class A | | Class P | | Institutional
Class |
| | | |
| Beginning Account Value (10/1/19) | | $1,000.00 | | $1,000.00 | | $1,000.00 |
| | | |
| Ending Account Value (3/31/20) | | $947.60 | | $948.90 | | $948.70 |
| | | |
| Expenses Paid During Period | | $ 3.70 | | $ 2.73 | | $ 2.48 |
| | | | | | | |
| |
| | | Hypothetical Performance |
| | | (5% return before expenses) |
| | | Class A | | Class P | | Institutional
Class |
| | | |
| Beginning Account Value (10/1/19) | | $1,000.00 | | $1,000.00 | | $1,000.00 |
| | | |
| Ending Account Value (3/31/20) | | $1,021.20 | | $1,022.20 | | $1,022.45 |
| | | |
| Expenses Paid During Period | | $ 3.84 | | $ 2.83 | | $ 2.58 |
For each class of the Fund, expenses (net of fee waiver and reimbursement, if any) are equal to the annualized expense ratio for the class (0.76% for Class A, 0.56% for Class P and 0.51% for Institutional Class), multiplied by the average account value over the period, multiplied by 183/366.
| | | | | | |
| | Semiannual Report | | | March 31, 2020 | | 67 |
Unaudited
AllianzGI High Yield Bond Fund
For the period of October 1, 2019 through March 31, 2020, as provided by Doug Forsyth, Portfolio Manager.
Fund Insights
For thesix-month period ended March 31, 2020, Class A shares at net asset value (“NAV”) of the AllianzGI High Yield Bond Fund (the “Fund”) returned-9.62%, outperforming the ICE BofA High Yield Master II Index (the “benchmark”), which returned-10.86%.
Market Overview
Risk assets gained over the fourth quarter through January before selling off aggressively in late February 2020 as the novel coronavirus outbreak(“COVID-19”) intensified. The short-term trajectory of the global economy and corporate profitability became highly uncertain.
The US Federal Reserve’s (“Fed’s”) response to these events was extraordinary in terms of its swiftness, scope, and willingness to do more. The fiscal response was also immediate with President Trump signing into law three bills including the $2.2 trillion Coronavirus Aid, Relief & Security Act to help support the economy.
Most first-quarter 2020 US economic statistics did not reflect real-time developments of COVID-19. However, data released closer to the end of March began to show a dramatic decrease in activity. In a matter of weeks the US economy went from record low unemployment to millions in initial jobless claims.
Fourth-quarter 2019 financial results and the majority of management outlooks reflected strong fundamentals, healthy balance sheets and ample liquidity exiting 2019. These data points had less utility as the first quarter progressed. The supply-side shock and demand disruption due to travel restrictions, lockdowns and other directives to contain the spread of the virus and avoid overloading the healthcare system significantly altered the near-term path for earnings and sales. By the end of the first quarter, most companies were highly focused on cash management and liquidity, accessing lines of credit, controlling variable costs, deferring capital investment and suspending dividends and share repurchases.
Aggressive rate cuts, the reinstatement of bond-buying programs and safe haven demand caused the US Treasury yield curve to compress and steepen sharply over the period.
Performance dispersion among credit ratings widened in the period after the lowest-rated issues dropped significantly in March. The highest-quality credits benefited from aflight-to-quality rotation and falling interest rates during the selloff.
Despite a dormant March, high-yield new issuance was elevated in the first quarter. The trailing12-month default rates on an issuer-weighted basis and a dollar-weighted basis were 2.82% and 3.35%, respectively, atperiod-end.
Portfolio Review
The Fund performed better than equities and significantly outperformed the benchmark for thesix-month period.
Most industries and issues in the Fund finished lower, however active management and defensive positioning provided resiliency during the selloff. The Fund’s underweight allocation to CCC rated bonds enhanced relative performance. Furthermore, the Fund did not own airline operators and had reduced exposure to energy, hotels, gaming and recreation & travel prior to the March 2020 decline. Throughout the first quarter the investment team remained focused on issuers with operating visibility, low leverage and balance sheet strength.
Industry allocations that helped relative performance during the period included energy, telecommunications and technology & electronics. A relative underweight in energy, specifically the higher beta exploration & production (“E&P”) subindustry was beneficial. Security selection was positive in telecommunications and the Fund’s overweight in technology was a source of strength.
Industry allocations that hurt relative performance during the period included theaters & entertainment, media and retail.Shelter-in-place and social distancing measures pressured exposure in theaters & entertainment. Issue selection weighed on relative performance in media and retail.
Outlook
The near-term outlook for the global economy and corporate profitability is uncertain and evolving due to the headwinds associated withCOVID-19. The situation continues to move very rapidly and requires close monitoring, especially in light of the massive confluence of central bank intervention and government stimulus.
While the duration and severity of the economic downturn are unknown, the extraordinary monetary and fiscal policy measures instituted by the Fed and the US government aim to not only help stabilize financial markets but also accelerate the recovery.
Upcoming economic reports should reflect materially slower activity resulting from the government-imposed shutdown. Data points are unlikely to rebound in the short term. First-quarter corporate earnings are likely to come in below expectations and most outlooks are expected to be downbeat with reduced visibility.
TheCOVID-19 pandemic is expected to impact all high-yield issuers and cause defaults to increase. However, we believe the asset class remains well diversified across many industries. In our view, health care energy, telecommunications, cable & satellite TV and technology are among the top industries in the universe. Few industries have greater than 10% market exposure and none exceed 12% (atquarter-end). Energy industry issuers are likely to face a higher rate of default, but risk should be concentrated in the most distressed credits within the E&P and oil field equipment & services subindustries.
| | | | | | |
| 68 | | March 31, 2020 | | | Semiannual Report | | |
Unaudited
AllianzGI High Yield Bond Fund (cont’d)
While the near-term outlook for the high-yield asset class is less certain, the intermediate- and long-term outlooks are constructive. The high yield market, as represented by the ICE BofA US High Yield Index, displayed a spread of 877 basis points and a yield greater than 9% atquarter-end it is difficult to identify a better risk/reward option in fixed income. US high-yield bonds are attractive on an absolute return basis, can provide better downside protection than equities and offer a very compelling yield opportunity compared to negative and depressed yields globally.
Average Annual Total Return for the period ended March 31, 2020
| | | | | | | | | | | | | | | | | | | | | | |
| | | | | | |
| | | | | 6 Month* | | | 1 Year | | | 5 Year | | | 10 Year | | | Since Inception† | |
| | | AllianzGI High Yield Bond Fund Class A | | | –9.62% | | | | –5.96% | | | | 1.18% | | | | 4.38% | | | | 6.31% | |
| | AllianzGI High Yield Bond Fund Class A (adjusted) | | | –13.01% | | | | –9.49% | | | | 0.41% | | | | 3.98% | | | | 6.14% | |
| | | AllianzGI High Yield Bond Fund Class C | | | –9.88% | | | | –6.56% | | | | 0.51% | | | | 3.67% | | | | 5.55% | |
| | AllianzGI High Yield Bond Fund Class C (adjusted) | | | –10.76% | | | | –7.45% | | | | 0.51% | | | | 3.67% | | | | 5.55% | |
| | AllianzGI High Yield Bond Fund Class R | | | –9.74% | | | | –6.35% | | | | 0.76% | | | | 4.01% | | | | 6.00% | |
| | AllianzGI High Yield Bond Fund Class P | | | –9.41% | | | | –5.61% | | | | 1.58% | | | | 4.70% | | | | 6.54% | |
| | AllianzGI High Yield Bond Fund Institutional Class | | | –9.51% | | | | –5.66% | | | | 1.53% | | | | 4.75% | | | | 6.76% | |
| | | AllianzGI High Yield Bond Fund Administrative Class | | | –9.47% | | | | –5.59% | | | | 1.24% | | | | 4.42% | | | | 6.33% | |
| | ICE BofA High Yield Master II Index | | | –10.86% | | | | –7.45% | | | | 2.67% | | | | 5.50% | | | | 6.38% | |
| | | Lipper High Yield Funds Average | | | –10.73% | | | | –7.48% | | | | 1.76% | | | | 4.58% | | | | 5.25% | |
* Cumulative return
† The Fund began operations on July 31, 1996. Benchmark return comparisons began on the fund inception date. Lipper performance comparisons began on July 31, 1996.
Performance quoted represents past performance and is no guarantee of future results. Current performance may be lower or higher than performance shown. For performance current to the most recent month-end, visit our website at us.allianzgi.com. Investment return and the principal value will fluctuate. Shares may be worth more or less than original cost when redeemed.The adjusted returns take into account themaximum initial sales charge of 3.75% on Class A shares and the contingent deferred sales charge (CDSC) of 1% on Class C shares, which may apply to shares redeemed during the first year of ownership. Returns do not reflect deduction of taxes that a shareholder would pay on fund distributions or redemption of fund shares. See pages 107 and 108 for more information. The Fund’s expense ratios are 1.07% for Class A shares, 1.76% for Class C shares, 1.48% for Class R shares, 0.73% for Class P shares, 0.79% for Institutional Class shares and 0.94% for Administrative Class shares. Expense ratio information is as of the Fund’s current prospectus dated February 1, 2020, as further revised or supplemented from time to time.
Cumulative Returns Through March 31, 2020
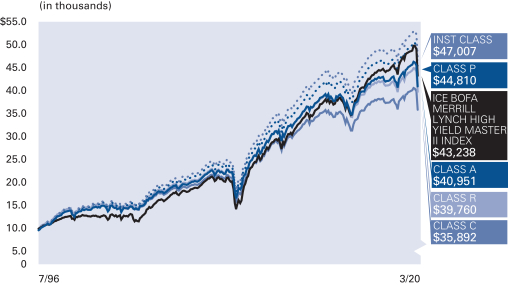
Industry Allocation (as of March 31, 2020)
| | | | |
| |
| Media | | | 15.5% | |
| |
| Telecommunications | | | 10.0% | |
| |
| Diversified Financial Services | | | 6.3% | |
| |
| Healthcare-Services | | | 5.9% | |
| |
| Commercial Services | | | 4.0% | |
| |
| Internet | | | 3.8% | |
| |
| Aerospace & Defense | | | 3.1% | |
| |
| Food & Beverage | | | 3.0% | |
| |
| Other | | | 41.6% | |
| |
| Cash & Equivalents — Net | | | 6.8% | |
| | | | | | |
| | Semiannual Report | | | March 31, 2020 | | 69 |
Unaudited
AllianzGI High Yield Bond Fund (cont’d)
Credit Ratings* (as of March 31, 2020)
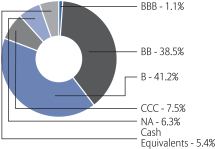
* As a percentage of total investments. Securities ratings refer to the underlying holdings of the Fund and are categorized from highest to lowest credit quality using ratings provided by S&P Global Ratings (“S&P”). S&P’s ratings have been selected for several reasons, including the portfolio managers’ usage of S&P ratings methodology among other credit quality information in managing the Fund, access to background information and other materials provided by S&P, as well as the Funds’ considerations of industry practice. The Fund also displays S&P credit ratings information in materials provided in client presentations. Previous shareholder reports for the Fund displayed bond ratings provided by Moody’s. See “Important Information” for more detail on the selection of S&P for the Fund’s ratings presentation. Securities not rated by S&P and bonds that do not currently have a rating available are designated in the chart above as “NR” and “NA”, respectively.
| | | | | | | | | | | | |
| |
| Shareholder Expense Example | | Actual Performance |
| | | Class A | | Class C | | Class R | | Class P | | Institutional
Class | | Administrative
Class |
| | | | | | |
| Beginning Account Value (10/1/19) | | $1,000.00 | | $1,000.00 | | $1,000.00 | | $1,000.00 | | $1,000.00 | | $1,000.00 |
| | | | | | |
| Ending Account Value (3/31/20) | | $903.80 | | $901.20 | | $902.60 | | $905.90 | | $904.90 | | $905.30 |
| | | | | | |
| Expenses Paid During Period | | $ 5.52 | | $ 8.75 | | $ 7.23 | | $ 3.91 | | $ 4.10 | | $ 4.76 |
| | | | | | | | | | | | | |
| |
| | | Hypothetical Performance |
| | | (5% return before expenses) |
| | | Class A | | Class C | | Class R | | Class P | | Institutional
Class | | Administrative
Class |
| | | | | | |
| Beginning Account Value (10/1/19) | | $1,000.00 | | $1,000.00 | | $1,000.00 | | $1,000.00 | | $1,000.00 | | $1,000.00 |
| | | | | | |
| Ending Account Value (3/31/20) | | $1,019.20 | | $1,015.80 | | $1,017.40 | | $1,020.90 | | $1,020.70 | | $1,020.00 |
| | | | | | |
| Expenses Paid During Period | | $ 5.86 | | $ 9.27 | | $ 7.67 | | $ 4.14 | | $ 4.34 | | $ 5.05 |
For each class of the Fund, expenses are equal to the annualized expense ratio for the class (1.16% for Class A, 1.84% for Class C, 1.52% for Class R, 0.82% for Class P, 0.86% for Institutional Class and 1.00% for Administrative Class), multiplied by the average account value over the period, multiplied by 183/366.
| | | | | | |
| 70 | | March 31, 2020 | | | Semiannual Report | | |
Unaudited
AllianzGI International Small-Cap Fund
For the period of October 1, 2019 through March 31, 2020, as provided by Andrew Neville, Portfolio Manager
Fund Insights
For the six-month period ended March 31, 2020, Class A shares at net asset value (“NAV”) of the AllianzGI International Small-Cap Fund (the “Fund”) returned -17.30%, outperforming the MSCI World ex USA Small Cap Index (the “benchmark”), which returned -20.23%.
Market Overview
In the last six months, international small caps ratcheted steadily higher until mid-February 2020, with sentiment lifted by growing optimism over a “phase one” trade deal between the US and China and better-than-expected corporate earnings. However, growing concerns about the impact of the novel coronavirus outbreak (“COVID-19”) led to a steep correction in February 2020, with the sell-off gathering pace in March 2020 as a growing number of countries imposed travel restrictions and lockdown measures. International small caps suffered their worst quarter since the 2008 financial crisis in the first quarter of 2020, with many markets entering an official bear market, defined as a decline of at least 20% from a recent peak.
Portfolio Review
The Fund represents the highest conviction names from three underlying regional small cap strategies: Europe, Japan, and Asia ex-Japan. Stock selection is the key driver of relative returns as the regional allocation of the Fund is neutral to the benchmark and there are risk controls to ensure sector deviations do not become too large.
In absolute terms, all three small cap markets showed losses. Asia ex Japan small caps registered the strongest losses followed by small caps from Europe and Japan. In relative terms, the European and the Japanese sleeve portfolios were able to outperform their local markets, and the Asia ex Japan sleeve portfolio closed in-line with its index.
Despite negative absolute returns, our portfolio of quality companies, exposed to structural growth trends has been more defensive than broader equity markets. During the period, the Fund saw a positive contribution from stock selection as well as sector allocation. The underweight in utilities, real estate and consumer staples weighed on the Fund’s relative performance. Nevertheless, the overweight in health care and information technology (“IT”) and the underweight in energy companies were favorable. Stock selection was most successful within IT, health care and consumer staples. Stock selection detracted within consumer discretionary, materials and energy.
The Fund’s largest contributors to performance came from the IT industry. ASM International (Netherlands) and Ingenico Group (France) particularly positively impacted performance. ASM is a leading supplier of semiconductor process equipment for wafer processing. This outperformance is driven by ASM’s strong position in atomic layer deposition (“ALD”). Ingenico offers payment solutions and increased strongly in February after Europe’s largest payment services provider Worldline bid for the company.
The largest detractors to performance were Tullow Oil, a leading UK-listed exploration company. At the end of last year, the company reported that production from flagship projects had disappointed. The departures of both the CEO and the Exploration Director also detracted from performance. We sold the holding in the fourth quarter of 2019. Another detractor was Dalata Hotel Group. The UK-based hotel operator has clearly been affected by travel restrictions.
Portfolio companies have weathered the turbulences of February and March 2020 better than many other companies in the International small cap universe. In cases where portfolio companies were directly affected, we sold them immediately. We used the current market weakness to pick up or increase investment in long-term winners, even though their near-term earnings outlook might be depressed. We are willing to support those companies where they seek to raise additional equity capital to give them more comfort.
Outlook
As we have seen, sectors that have been hit hardest are those most exposed to cyclical demand such as energy, travel/leisure and consumer discretionary. Companies that have weak balance sheets or face structural headwinds or those that will emerge from the disruption materially weakened have been noticeably weak. Names with meaningful online revenues or the potential for increased demand as a result of COVID-19 have proved resilient like IT service companies, IT hardware and software suppliers, cloud services provider and telecommunications (videoconferencing becoming the norm). In addition, medical researchers world-wide are urgently trying to develop a vaccine and effective drugs against COVID-19, so medical spending has increased. This should remain positive for biotechnology, health care at home, life sciences and diagnostics companies. Health care is set to be one of the least impacted sectors.
The COVID-19 related disruption to demand, global supply chains and the ever tighter restrictions on public life have already had a significant impact on recent economic data and asset prices. Against this background, the probability of a recession has risen considerably. Over the coming weeks and months, the changed outlook will be increasingly reflected in corporate results and the equity markets will be looking to 2021 as a guide to what normality will now look like. Moreover, many companies are likely to delay investments and cut dividends. Much will depend on how companies and consumers recover with the help of massive government / central bank stimulus.
| | | | | | |
| | Semiannual Report | | | March 31, 2020 | | 71 |
Unaudited
AllianzGI International Small-Cap Fund (cont’d)
Average Annual Total Return for the period ended March 31, 2020
| | | | | | | | | | | | | | | | | | | | | | |
| | | | | | |
| | | | | 6 Month* | | | 1 Year | | | 5 Year | | | 10 Year | | | Since Inception† | |
| | | AllianzGI InternationalSmall-Cap Fund Class A | | | –17.30% | | | | –15.94% | | | | –0.75% | | | | 4.93% | | | | 9.38% | |
| | AllianzGI InternationalSmall-Cap Fund Class A (adjusted) | | | –21.85% | | | | –20.57% | | | | –1.87% | | | | 4.33% | | | | 9.10% | |
| | | AllianzGI InternationalSmall-Cap Fund Class C | | | –17.63% | | | | –16.60% | | | | –1.53% | | | | 4.12% | | | | 8.56% | |
| | AllianzGI InternationalSmall-Cap Fund Class C (adjusted) | | | –18.46% | | | | –17.43% | | | | –1.53% | | | | 4.12% | | | | 8.56% | |
| | AllianzGI InternationalSmall-Cap Fund Class R | | | –17.42% | | | | –16.23% | | | | –1.05% | | | | 4.64% | | | | 9.10% | |
| | AllianzGI InternationalSmall-Cap Fund Class P | | | –17.25% | | | | –15.83% | | | | –0.60% | | | | 5.11% | | | | 9.67% | |
| | AllianzGI InternationalSmall-Cap Fund Institutional Class | | | –17.22% | | | | –15.77% | | | | –0.54% | | | | 5.19% | | | | 9.76% | |
| | AllianzGI InternationalSmall-Cap Fund Class R6 | | | –17.22% | | | | –15.74% | | | | –0.48% | | | | 5.28% | | | | 9.86% | |
| | MSCI World ex USA Small Cap Index | | | –20.23% | | | | –19.04% | | | | 0.39% | | | | 3.95% | | | | 6.01% | |
| | MSCI EAFE Small Cap Index | | | –19.17% | | | | –18.15% | | | | 0.97% | | | | 4.81% | | | | 6.20% | |
| | | Lipper InternationalSmall/Mid-Cap Growth Funds Average | | | –18.06% | | | | –16.81% | | | | 0.39% | | | | 4.75% | | | | 7.74% | |
* Cumulative return
† The Fund began operations on December 31, 1997. Benchmark return and Lipper performance comparisons began on the fund inception date.
Performance quoted represents past performance and is no guarantee of future results. Current performance may be lower or higher than performance shown. For performance current to the most recent month-end, visit our website at us.allianzgi.com. Investment return and the principal value will fluctuate. Shares may be worth more or less than original cost when redeemed.The adjusted returns take into account the maximum initial sales charge of 5.50% on Class A shares and the contingent deferred sales charge (CDSC) of 1% on Class C shares, which may apply to shares redeemed during the first year of ownership. Returns do not reflect deduction of taxes that a shareholder would pay on fund distributions or redemption of fund shares. See pages 107 and 108 for more information. The Fund’s gross expense ratios are 1.94% for Class A shares, 2.59% for Class C shares, 2.30% for Class R shares, 1.58% for Class P shares, 1.61% for Institutional Class shares and 1.49% for Class R6 shares. These ratios do not include expense reductions, contractually guaranteed through at least January 31, 2021. The Fund’s expense ratios net of this reduction are 1.25% for Class A shares, 2.00% for Class C shares, 1.59% for Class R shares, 1.10% for Class P shares, 1.04% for Institutional Class shares and 1.00% for Class R6 shares. Expense ratio information is as of the Fund’s current prospectus dated February 1, 2020, as further revised or supplemented from time to time.
Cumulative Returns Through March 31, 2020
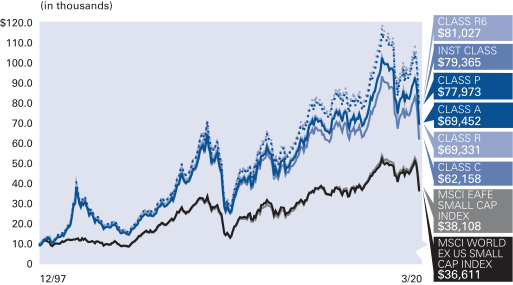
Country/Location Allocation (as of March 31, 2020)
| | | | |
| |
| Japan | | | 31.6% | |
| |
| United Kingdom | | | 14.2% | |
| |
| Germany | | | 9.4% | |
| |
| Switzerland | | | 5.9% | |
| |
| Australia | | | 5.0% | |
| |
| France | | | 3.5% | |
| |
| Denmark | | | 3.5% | |
| |
| Sweden | | | 3.0% | |
| |
| Other | | | 17.1% | |
| |
| Cash & Equivalents — Net | | | 6.8% | |
| | | | | | |
| 72 | | March 31, 2020 | | | Semiannual Report | | |
Unaudited
AllianzGI International Small-Cap Fund (cont’d)
| | | | | | | | | | | | |
| |
| Shareholder Expense Example | | Actual Performance |
| | | Class A | | Class C | | Class R | | Class P | | Institutional
Class | | Class R6 |
| | | | | | |
| Beginning Account Value (10/1/19) | | $1,000.00 | | $1,000.00 | | $1,000.00 | | $1,000.00 | | $1,000.00 | | $1,000.00 |
| | | | | | |
| Ending Account Value (3/31/20) | | $ 827.00 | | $ 823.70 | | $ 825.80 | | $ 827.50 | | $ 827.80 | | $ 827.80 |
| | | | | | |
| Expenses Paid During Period | | $ 5.71 | | $ 9.12 | | $ 7.26 | | $ 5.03 | | $ 4.75 | | $ 4.57 |
| | | | | | | | | | | | | |
| |
| | | Hypothetical Performance |
| | | (5% return before expenses) |
| | | Class A | | Class C | | Class R | | Class P | | Institutional
Class | | Class R6 |
| | | | | | |
| Beginning Account Value (10/1/19) | | $1,000.00 | | $1,000.00 | | $1,000.00 | | $1,000.00 | | $1,000.00 | | $1,000.00 |
| | | | | | |
| Ending Account Value (3/31/20) | | $1,018.75 | | $1,015.00 | | $1,017.05 | | $1,019.50 | | $1,019.80 | | $1,020.00 |
| | | | | | |
| Expenses Paid During Period | | $ 6.31 | | $ 10.08 | | $ 8.02 | | $ 5.55 | | $ 5.25 | | $ 5.05 |
For each class of the Fund, expenses (net of fee waiver and reimbursement, if any) are equal to the annualized expense ratio for the class (1.25% for Class A, 2.00% for Class C, 1.59% for Class R, 1.10% for Class P, 1.04% for Institutional Class and 1.00% for Class R6), multiplied by the average account value over the period, multiplied by 183/366.
| | | | | | |
| | Semiannual Report | | | March 31, 2020 | | 73 |
Unaudited
AllianzGI Micro Cap Fund*
For the period of October 1, 2019 through March 31, 2020, as provided by Steve Klopukh, Portfolio Manager.
Fund Insights
For thesix-month period ended March 31, 2020, Class A shares at net asset value (“NAV”) of the AllianzGI Micro Cap Fund (the “Fund”) returned-17.87%, underperforming the Russell Microcap Growth Index (the “benchmark”), which returned-13.61%.
Market Overview
It was a volatile period for US equities. In the fourth quarter of 2019, US equities surged, as risk appetite was boosted by the agreement of a “phase one” trade deal between the US and China and better-than-expected corporate earnings. In the first quarter of 2020, US stocks sold off sharply alongside the escalating novel coronavirus outbreak(“COVID-19”). As the US and rest of the world experienced an accelerating spread of the outbreak, governments in response issued lockdowns and travel restrictions to control the spread of the virus. Against this market backdrop, the Russell Microcap Index returned-22.84% and outperformed the Russell 2000 Index by 0.88%. Within themicro-cap universe, growth stocks outperformed value.
Portfolio Review
The Fund outperformed its benchmark over thesix-month period. From an attribution perspective, security selection was the primary driver for the underperformance while asset weightings had a slightly positive effect. Stock picking contributed from the communication services, information technology and consumer staples sectors. Conversely, negative security selection in the health care, industrials and materials sectors was offsetting.
A top contributor, NeoGenomics Inc. is a cancer diagnostics and testing company. The stock benefitted from delivering strong quarterly earnings results and guidance, helped by accelerating testing volumes. The largest absolute detractor was Century Casinos Inc., which is a casino and gaming operator. The stock was challenged as the company announced temporary casino closures amidCOVID-19.
Outlook
The advent ofCOVID-19 significantly changed the growth trajectory of the US economy, from slow growth to contractionary conditions. The draconian social distancing measures resulted in significant business disruptions and revenue drop-offs for many industries. The equity marketsell-off reflected the unknown duration and correction in company earnings.
In late March 2020, equity market valuations reached levels close to past market troughs. Moreover, equity valuation spreads (cheapest valuation quintile vs long term averages) gapped out to 4.5 standard deviation levels, signifying an aggressive move to “safe haven” equities. It is important to highlight that valuation spreads in 2008 took 5 months to move from a standard deviation of 3.5 to 4.5. In this market environment, it took only a few weeks to traverse the same distance, representing extreme investor risk aversion.
Lastly, looking back at previous periods of extreme volatility, equities have historically outperformed in the following period. Since 1990, there have been 8 times when the CBOE Volatility Index (“VIX Index”) spiked above 40, including the recentCOVID-19 sell off. For both 1 year returns that followed these periods, equities have on average generated positive returns, including small caps. Further, small caps valuations continue to trade at a discount relative to large cap stocks that has not been seen since the early 2000s, which was the start of a multi-year outperformance cycle of small-caps above large-caps.
*Effective on or about June 26, 2020, the AllianzGI Micro Cap Fund will be liquidated and dissolved, and any outstanding shares redeemed. As of June 19, 2020, shares of the Fund will no longer be available for purchase or exchange. Please see the Fund’s statutory prospectus for more information.
| | | | | | |
| 74 | | March 31, 2020 | | | Semiannual Report | | |
Unaudited
AllianzGI Micro Cap Fund (cont’d)
Average Annual Total Return for the period ended March 31, 2020
| | | | | | | | | | | | | | | | | | | | | | |
| | | | | | |
| | | | | 6 Month* | | | 1 Year | | | 5 Year | | | 10 Year | | | Since Inception† | |
| | | AllianzGI Micro Cap Fund Class A | | | –17.87% | | | | –23.15% | | | | –2.39% | | | | 6.58% | | | | 8.87% | |
| | AllianzGI Micro Cap Fund Class A (adjusted) | | | –22.39% | | | | –27.38% | | | | –3.49% | | | | 5.98% | | | | 8.62% | |
| | AllianzGI Micro Cap Fund Class P | | | –17.89% | | | | –23.12% | | | | –2.33% | | | | 6.70% | | | | 9.07% | |
| | AllianzGI Micro Cap Fund Institutional Class | | | –17.85% | | | | –23.04% | | | | –2.31% | | | | 6.76% | | | | 9.16% | |
| | Russell Microcap Growth Index | | | –13.61% | | | | –21.96% | | | | –2.49% | | | | 6.65% | | | | 5.19% | |
| | | LipperSmall-Cap Growth Funds Average | | | –16.71% | | | | –16.89% | | | | 3.05% | | | | 9.06% | | | | 7.79% | |
* Cumulative return
† The Fund began operations on July 12, 1995. Benchmark return comparisons began on the fund inception date. Lipper performance comparisons began on June 30, 1995.
Performance quoted represents past performance and is no guarantee of future results. Current performance may be lower or higher than performance shown. For performance current to the most recent month-end, visit our website at us.allianzgi.com. Investment return and the principal value will fluctuate. Shares may be worth more or less than original cost when redeemed.The adjusted returns take into account the maximum initial sales charge of 5.50% on Class A shares.Returns do not reflect deduction of taxes that a shareholder would pay on fund distributions or redemption of fund shares. See pages 107 and 108 for more information. The Fund’s gross expense ratios are 2.51% for Class A shares, 2.15% for Class P shares and 2.18% for Institutional Class shares. This ratio does not include an expense reduction, contractually guaranteed through at least January 31, 2021. The Fund’s expense ratios net of this reduction are 1.42% for Class A shares, 1.34% for Class P shares and 1.34% for Institutional Class shares. Expense ratio information is as of the Fund’s current prospectus dated February 1, 2020, as further revised or supplemented from time to time.
Cumulative Returns Through March 31, 2020
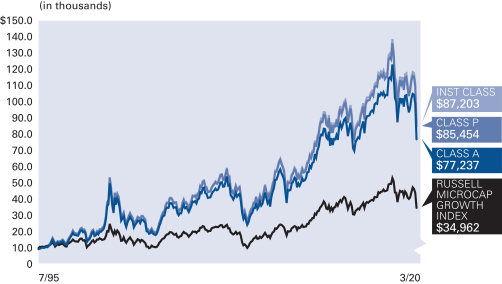
Industry Allocation (as of March 31, 2020)
| | | | |
| |
| Biotechnology | | | 19.2% | |
| |
| Healthcare Equipment & Supplies | | | 12.4% | |
| |
| Software | | | 9.4% | |
| |
| Healthcare Providers & Services | | | 7.1% | |
| |
| Semiconductors & Semiconductor Equipment | | | 5.9% | |
| |
| Pharmaceuticals | | | 5.2% | |
| |
| Machinery | | | 4.4% | |
| |
| Life Sciences Tools & Services | | | 4.2% | |
| |
| Other | | | 30.4% | |
| |
| Cash & Equivalents — Net | | | 1.8% | |
| | | | | | |
| | Semiannual Report | | | March 31, 2020 | | 75 |
Unaudited
AllianzGI Micro Cap Fund (cont’d)
| | | | | | |
| |
| Shareholder Expense Example | | Actual Performance |
| | | Class A | | Class P | | Institutional
Class |
| | | |
| Beginning Account Value (10/1/19) | | $1,000.00 | | $1,000.00 | | $1,000.00 |
| | | |
| Ending Account Value (3/31/20) | | $821.30 | | $821.10 | | $821.50 |
| | | |
| Expenses Paid During Period | | $6.47 | | $6.10 | | $6.10 |
| | | | | | | |
| |
| | | Hypothetical Performance |
| | | (5% return before expenses) |
| | | Class A | | Class P | | Institutional
Class |
| | | |
| Beginning Account Value (10/1/19) | | $1,000.00 | | $1,000.00 | | $1,000.00 |
| | | |
| Ending Account Value (3/31/20) | | $1,017.90 | | $1,018.30 | | $1,018.30 |
| | | |
| Expenses Paid During Period | | $7.16 | | $6.76 | | $6.76 |
For each class of the Fund, expenses (net of fee waiver and reimbursement, if any) are equal to the annualized expense ratio for the class (1.42% for Class A, 1.34% for Class P and 1.34% for Institutional Class), multiplied by the average account value over the period, multiplied by 183/366.
| | | | | | |
| 76 | | March 31, 2020 | | | Semiannual Report | | |
Unaudited
AllianzGI PerformanceFee Managed Futures Strategy Fund
For the period of October 1, 2019 through March 31, 2020, as provided by the Multi-Asset US Group.
Fund Insights
For thesix-month period ended March 31, 2020, Institutional Class shares at net asset value (“NAV”) of the AllianzGI PerformanceFee Managed Futures Strategy Fund (the “Fund”) returned-9.93%, underperforming the ICE BofA3-Month U.S. Treasury Bill Index (the “benchmark”), which returned 1.04%.
Market Overview
Global equities ratcheted steadily higher untilmid-February 2020, with sentiment lifted by growing optimism over a “phase one” trade deal between the US and China and better-than-expected corporate earnings. However, growing concerns about the impact of the novel coronavirus outbreak(“COVID-19”) led to a steep correction in February 2020, with thesell-off gathering pace in March 2020 as a growing number of countries imposed travel restrictions and lockdown measures. Global equities suffered their worst quarter since the 2008 financial crisis in the first quarter of 2020, with many markets entering an official bear market, defined as a decline of at least 20% from a recent peak.
Global government bond yields trended higher in the fourth quarter 2019 amid growing optimism over the outlook for global growth, but tumbled in 2020 on growing speculation that theCOVID-19 pandemic would force central banks to slash interest rates and reinstate asset-purchase programs. In the US, the10-year Treasury yield closed the period around 100 basis points lower, while10-year yields in the UK fell just over 10 basis points. However, German Bund yields rose slightly and peripheral euro-zone yields rose even more. Japanese government bonds also increased modestly. Meanwhile, corporate bonds fell sharply as the deteriorating economic outlook led to fears of rising downgrades and defaults.
Hopes that the global economy may be over the worst of the trade-related slowdown were dashed as theCOVID-19 outbreak spread beyond China, forcing countries to impose travel restrictions and draconian quarantine measures. Flash estimates of purchasing managers’ indices for March 2020 revealed the impact thatCOVID-19 was having on the global economy. In the US, the composite index fell to an11-year low while the composite survey for the euro zone fell to a record low. Elsewhere, Chinese industrial production plunged 13.5% over the first two months of the year, compared to the same period in 2019, and retail sales plummeted by 20.5% on ayear-on-year basis. In response, central banks lowered interest rates and reinstated asset-purchase programs, but in general these measures failed to reassure financial markets. Instead, governments were forced to shoulder the burden for supporting economies, with many announcing massive fiscal measures.
In the currency markets, the period saw significant swings. The British pound was one of the strongest currencies in the final quarter of 2019, boosted by news that the UK had secured a Withdrawal Agreement with the EU, but lost the majority of these gains during the first quarter of 2020. Elsewhere, the US dollar, euro and Japanese yen all jostled for supremacy throughout thesix-month period, while many emerging market currencies weakened.
Portfolio Review
The primary positive contributors to the Fund over thesix-month period were short commodity exposures, long US Government bonds, long volatility and short commodity related currencies such as the Australian dollar. Conversely, long equity positions and credit exposure going into the period endsell-off, along with currency positions, particularly in the Japanese yen were the most notable detractors.
The Fund entered the period with roughly 40% exposure to global equities, 165% to fixed income (including roughly 30% to credits) and roughly-56% to currencies vs. the US dollar, and mixed but ultimately short exposure to commodities(-24%). In the equity portion of the Fund, exposures were increased toward the end of 2019 to over 80%, reflecting the favorable economic backdrop supported by easing trade tensions globally. The exposure was reduced into the period end selloff, to ultimately end with short exposure of roughly-12%. In the fixed income portion of the Fund, net exposure to hard duration was also reduced over the period reflecting rising fixed income volatility, along with long credit exposures which were turned to short exposures over the month of March. Commodity exposures fluctuated as political factors steered market trends in 2019 whileCOVID-19 driven risks dominated the first quarter of 2020. Currency positions were also notably changed over the period, as the Fund was generally long the US dollar, a position which remained against the commodity related currencies such as the Australian dollar, but was reverted to a short US dollar position against the Euro and Japanese yen to end the period.
Outlook
TheCOVID-19 pandemic and severe disruptions in the oil market created a simultaneous supply and demand shock for a late-cycle global economy. One consequence is that economies are increasingly vulnerable to exogenous shocks that can exacerbate existing imbalances. As such, we maintain a cautious economic outlook and now expect a global recession in the next few months. In our view, the shape and magnitude of the recession will depend to an extent on the negative spillover from financial markets in holding back the real economy. We believe the inflection point in financial markets in the context of the current crisis—in contrast to previous financial crises – will depend on an array of factors, including (1) how theCOVID-19 public health crisis unfolds and ultimately stabilizes; (2) continued credible intervention on the part of governments and public policy; (3) stabilization of corporate and macroeconomic data and (4) adjustment of valuations to recession-like levels.
Against this backdrop, we continue to see elevated risks of additional corrections in risky asset markets in the near term before a sustainable turnaround is achieved. Therefore, unless we see a very strongV-shaped recovery in markets and the economy, we expect to maintain our defensive positioning based on our trend-based and fundamental indicators. We believe this will position us to be prepared for a persistent downturn in the near term. Of course, if the market rally atquarter-end following the very substantial fiscal package and the series of supports announced by the US Federal Reserve should persist, we will reincorporate risk back into the portfolio accordingly.
| | | | | | |
| | Semiannual Report | | | March 31, 2020 | | 77 |
Unaudited
AllianzGI PerformanceFee Managed Futures Strategy Fund (cont’d)
Average Annual Total Return for the period ended March 31, 2020
| | | | | | | | | | | | | | |
| | | | |
| | | | | 6 Month* | | | 1 Year | | | Since Inception† | |
| | AllianzGI PerformanceFee Managed Futures Strategy Fund Class P | | | –10.03% | | | | –5.92% | | | | –4.89% | |
| | AllianzGI PerformanceFee Managed Futures Strategy Fund Institutional Class | | | –9.93% | | | | –5.91% | | | | –4.86% | |
| | AllianzGI PerformanceFee Managed Futures Strategy Fund Class R6 | | | –9.93% | | | | –5.81% | | | | –4.78% | |
| | ICE BofA3-Month U.S. Treasury Bill Index | | | 1.04% | | | | 2.25% | | | | 2.10% | |
| | | Lipper Alternative Managed Futures Funds Average | | | –3.78% | | | | 2.01% | | | | –1.71% | |
* Cumulative return
† The Fund began operations on December 18, 2017. Benchmark return comparisons began on the fund inception date. Lipper performance comparisons began on December 31, 2017.
Performance quoted represents past performance and is no guarantee of future results. Current performance may be lower or higher than performance shown. For performance current to the most recent month-end, visit our website at us.allianzgi.com. Investment return and the principal value will fluctuate. Shares may be worth more or less than original cost when redeemed. Returns do not reflect deduction of taxes that a shareholder would pay on funds distributions or redemption of fund shares. See pages 107 and 108 for more information. The Fund’s gross expense ratios, which include the Acquired Fund Fees and Expenses, are 1.17% for Class P shares, 1.30% for Institutional Class shares and 1.15% for Class R6 shares. These ratios do not include an expense reduction, contractually guaranteed through at least January 31, 2021. The Fund’s expense ratios net of this reduction, which include the Acquired Fund Fees and Expenses, are 0.26% for Institutional Class shares, 0.31% for Class P shares and 0.21% for Class R6 shares. Expense ratio information is as of the Fund’s current prospectus dated February 1, 2020, as further revised or supplemented from time to time.
Cumulative Returns Through March 31, 2020
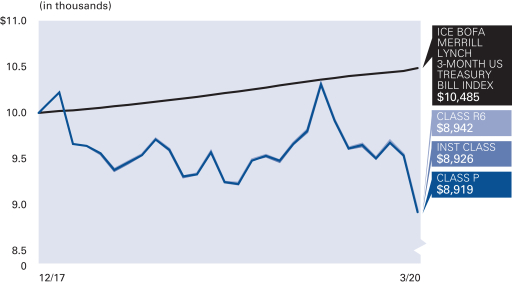
Asset Allocation (as of March 31, 2020)
| | | | |
| |
| U.S. Treasury Obligations | | | 69.4% | |
| |
| Mutual Funds | | | 4.4% | |
| |
| Cash & Equivalents — Net | | | 26.2% | |
| | | | | | |
| 78 | | March 31, 2020 | | | Semiannual Report | | |
Unaudited
AllianzGI PerformanceFee Managed Futures Strategy Fund (cont’d)
| | | | | | |
| |
| Shareholder Expense Example | | Actual Performance |
| | | Class P | | Institutional
Class | | Class R6 |
| | | |
| Beginning Account Value (10/1/19) | | $1,000.00 | | $1,000.00 | | $1,000.00 |
| | | |
| Ending Account Value (3/31/20) | | $ 899.70 | | $ 900.70 | | $ 900.70 |
| | | |
| Expenses Paid During Period | | $ 1.57 | | $ 1.38 | | $ 1.09 |
| | | | | | | |
| |
| | | Hypothetical Performance |
| | | (5% return before expenses) |
| | | Class P | | Institutional
Class | | Class R6 |
| | | |
| Beginning Account Value (10/1/19) | | $1,000.00 | | $1,000.00 | | $1,000.00 |
| | | |
| Ending Account Value (3/31/20) | | $1,023.35 | | $1,023.55 | | $1,023.85 |
| | | |
| Expenses Paid During Period | | $ 1.67 | | $ 1.47 | | $ 1.16 |
For each class of the Fund, expenses (net of fee waiver and reimbursement, if any) are equal to the annualized expense ratio for the class (0.33% for Class P, 0.29% for Institutional Class and 0.23% for Class R6), multiplied by the average account value over the period, multiplied by 183/366. These expenses do not include the expenses of the investment companies in which the Fund invests, which are indirectly borne by Fund shareholders.
| | | | | | |
| | Semiannual Report | | | March 31, 2020 | | 79 |
Unaudited
AllianzGI PerformanceFee Structured US Equity Fund
For the period of October 1, 2019 through March 31, 2020, as provided by Greg Tournant and Stephen Bond-Nelson, Co-Portfolio Managers.
Fund Insights
For thesix-month period ended March 31, 2020, Institutional Class shares at net asset value (“NAV”) of the AllianzGI PerformanceFee Structured US Equity Fund (the “Fund”) returned-33.85%, underperforming the S&P 500 Index (the “benchmark”) which returned-12.31%.
Market Overview
The Fund underperformed for thesix-month period ended March 31, 2020 as a result of extremely challenging market conditions. The equity declines and implied volatility increases during this period were more extreme than many historical precedents, which had a significant impact on the performance of the strategy’s option portfolio.
Portfolio Review
This year’s 30% drop in the benchmark happened in just 22 trading days, instead of the many months a similar decline took during the global financial crisis that began in 2008. This combination of extremely high market volatility coupled with significant drops in market valuations had a particularly large impact on the option positions held by the Fund. During this market turmoil, we sought tode-risk the option portfolio, primarily through closing out many short put positions.
Heading into the market decline, the Fund’s option portfolio had in place a ladder of hedging positions that was very much in line with what was in place during prior periods. A key feature of the Fund’s option portfolio is that it is a net buyer of long puts. That is consistent with our historical approach and was true as well for this period. The Fund’s option portfolio held approximately 1.8 times more long puts than short puts. We also had structured a layer of long puts slightly out of the money that were paired with short puts as part of the strategy’s low volatility configuration spreads.
The market decline was a multi-week move which, as compared with aone-day shock scenario, has real implications on the price appreciation that thedeep-out-of-the-money long puts typically held by the Fund are able to provide. The Fund’s option portfolio is designed to navigate a multi-week move via its restructuring process, under which, in more typical circumstances, we address the existing short option positions while often relying on cost offsets from the existing long puts. Unfortunately, under the recent circumstances, a historic level of steepness of the inversion in the volatility term structure prevented many of the strategy’s existing long puts from providing as much benefit as reasonably expected. This steepness reduced the price appreciation of the existing layer of long puts, reducing the ability to harvest gains on the long puts that we could in turn use to cover short put exposure.
In addition, in late February we shifted certain out-of-the-money puts deeper out of the money in order to widen some of the short puts, a strategy that should have been effective based on the contours of prior market deteriorations. However, in this instance the market unpredictably continued to decline beyond the shifted positioning.
In light of these largely unprecedented market dynamics, we began restructuring the various put positions, in advance of the index reaching the strike prices for those puts, and restructured the various put positions with wider extensions than in past market dislocations. Soon after, we began de-risking, i.e., covering short puts without relayering any new positions. But the daily market moves, many of which ranged between -7% and -12%, made it extremely difficult to implement all of these trades and to mitigate realized costs. Unlike in prior dislocations, in this particular case the speed of the market moves was too severe.
Outlook
While markets may remain challenging, we believe that a high-volatility environment is a favorable one for the Fund’s option portfolio when constructing new positions. Since the underperformance of the first quarter has been realized, themark-to-market snapback we have frequently delivered in the past is not applicable in this case. That said, any continued future high volatility could potentially position the Fund not only to better navigate large index swings in either direction, but also to pursue an accelerated performance recovery.
| | | | | | |
| 80 | | March 31, 2020 | | | Semiannual Report | | |
Unaudited
AllianzGI PerformanceFee Structured US Equity Fund (cont’d)
Average Annual Total Return for the period ended March 31, 2020
| | | | | | | | | | | | | | |
| | | | |
| | | | | 6 Month* | | | 1 Year | | | Since Inception† | |
| | AllianzGI PerformanceFee Structured US Equity Fund Class P | | | –33.90% | | | | –29.12% | | | | –10.90% | |
| | AllianzGI PerformanceFee Structured US Equity Fund Institutional Class | | | –33.85% | | | | –29.21% | | | | –10.89% | |
| | AllianzGI PerformanceFee Structured US Equity Fund Class R6 | | | –33.79% | | | | –28.95% | | | | –10.76% | |
| | S&P 500 Index | | | –12.31% | | | | –6.98% | | | | 0.22% | |
| | | LipperLarge-Cap Core Funds Average | | | –13.03% | | | | –8.13% | | | | –1.07% | |
* Cumulative return
† The Fund began operations on December 18, 2017. Benchmark return comparisons began on the fund inception date. Lipper performance comparisons began on December 31, 2017.
Performance quoted represents past performance and is no guarantee of future results. Current performance may be lower or higher than performance shown. For performance current to the most recent month-end, visit our website at us.allianzgi.com. Investment return and the principal value will fluctuate. Shares may be worth more or less than original cost when redeemed. Returns do not reflect deduction of taxes that a shareholder would pay on fund distributions or redemption of fund shares. See pages 107 and 108 for more information. The Fund’s gross expense ratios, which include the Acquired Fund Fees and Expenses, are 0.84% for Class P shares, 0.89% for Institutional Class shares and 0.80% for Class R6 shares. These ratios do not include an expense reduction, contractually guaranteed through at least January 31, 2021. The Fund’s expense ratios net of this reduction, which include the Acquired Fund Fees and Expenses, are 0.37% for Institutional Class shares, 0.37% for Class P shares and 0.37% for Class R6 shares. Expense ratio information is as of the Fund’s current prospectus dated February 1, 2020, as further revised or supplemented from time to time.
Cumulative Returns Through March 31, 2020
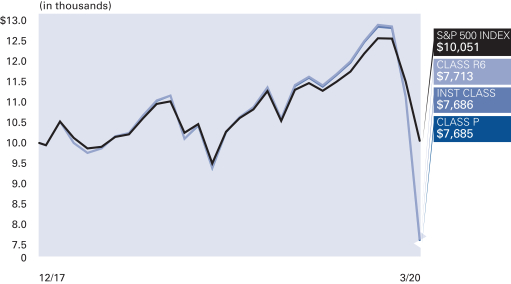
Asset Allocation (as of March 31, 2020)
| | | | |
| |
| Exchange-Traded Funds | | | 101.0% | |
| |
| Cash & Equivalents — Net | | | –1.0% | |
| | | | | | |
| | Semiannual Report | | | March 31, 2020 | | 81 |
Unaudited
AllianzGI PerformanceFee Structured US Equity Fund (cont’d)
| | | | | | |
| |
| Shareholder Expense Example | | Actual Performance |
| | | Class P | | Institutional
Class | | Class R6 |
| | | |
| Beginning Account Value (10/1/19) | | $1,000.00 | | $1,000.00 | | $1,000.00 |
| | | |
| Ending Account Value (3/31/20) | | $661.00 | | $661.50 | | $662.10 |
| | | |
| Expenses Paid During Period | | $ 3.03 | | $ 2.87 | | $ 3.86 |
| | | | | | | |
| |
| | | Hypothetical Performance |
| | | (5% return before expenses) |
| | | Class P | | Institutional
Class | | Class R6 |
| | | |
| Beginning Account Value (10/1/19) | | $1,000.00 | | $1,000.00 | | $1,000.00 |
| | | |
| Ending Account Value (3/31/20) | | $1,021.35 | | $1,021.55 | | $1,020.35 |
| | | |
| Expenses Paid During Period | | $ 3.69 | | $ 3.49 | | $ 4.70 |
For each class of the Fund, expenses (net of fee waiver and reimbursement, if any) are equal to the annualized expense ratio for the class (0.73% for Class P ,0.69% for Institutional Class and less than 0.93% for Class R6), multiplied by the average account value over the period, multiplied by 183/366. These expenses do not include the expenses of the investment companies in which the Fund invests, which are indirectly borne by Fund shareholders.
| | | | | | |
| 82 | | March 31, 2020 | | | Semiannual Report | | |
Unaudited
AllianzGI PerformanceFee Structured US Fixed Income Fund*
For the period of October 1, 2019 through March 31, 2020, as provided by Greg Tournant and Stephen Bond-Nelson, Co-Portfolio Managers.
Fund Insights
For thesix-month period ended March 31, 2020, Institutional Class shares at net asset value (“NAV”) of the AllianzGI PerformanceFee Structured US Fixed Income Fund (the “Fund”) returned-6.87%, underperforming the Bloomberg Barclays U.S. Aggregate Bond Index (the “benchmark”), which returned 3.33%.
Overview
The Fund underperformed for thesix-month period ended March 31, 2020 as a result of extremely challenging market conditions. The equity declines and implied volatility increases during this period were more extreme than many historical precedents, which had a significant impact on the performance of the strategy’s option portfolio.
Portfolio Review
This year’s 30% drop in the S&P 500 Index happened in just 22 trading days, instead of the many months a similar decline took during the global financial crisis that began in 2008. This combination of extremely high market volatility coupled with significant drops in market valuations had a particularly large impact on the option positions held by the Fund. During the market turmoil, we sought tode-risk the option portfolio, primarily through closing out many short put positions.
Heading into the market decline, the Fund’s option portfolio had in place a ladder of hedging positions that was very much in line with what was in place during prior periods. A key feature of the Fund’s option portfolio is that it is a net buyer of long puts. That is consistent with our historical approach and was true as well for this period. The Fund’s option portfolio held approximately 1.8 times more long puts than short puts. We also had structured a layer of long puts slightly out of the money that were paired with an equal number of short puts as part of the strategy’slow-volatility configuration spreads.
The market decline was a multi-week move which, as compared with aone-day shock scenario, has real implications on the price appreciation that thedeep-out-of-the-money long puts typically held by the Fund are able to provide. The Fund’s option portfolio is designed to navigate a multi-week move via its restructuring process, under which, in more typical circumstances, we address the existing short option positions while often relying on cost offsets from the existing long puts. Unfortunately, under the recent circumstances, a historic level of steepness of the inversion in the volatility term structure prevented many of the strategy’s existing long puts from providing as much benefit as reasonably expected. This steepness reduced the price appreciation of the existing layer of long puts, reducing the ability to harvest gains on the long puts that we could in turn use to cover short put exposure.
In addition, in late February we shifted certain out-of-the-money puts deeper out of the money in order to widen some of the short puts, a strategy that should have been effective based on the contours of prior market deteriorations. However, in this instance the market unpredictably continued to decline beyond the shifted positioning.
In light of these largely unprecedented market dynamics, we began restructuring the various put positions in advance of the index reaching the strike prices for those puts, and restructured the various put positions with wider extensions than in past market dislocations. Soon after, we began de-risking, i.e., covering short puts without relayering any new positions. But the daily market moves, many of which ranged between -7% and -12%, made it extremely difficult to implement all of these trades and to mitigate realized costs. Unlike in prior dislocations, in this particular case the speed of the market moves was too severe.
Outlook
While markets may remain challenging, we believe that a high-volatility environment is a favorable one for the Fund’s option portfolio when constructing new positions. Since the underperformance of the first quarter has been realized, themark-to-market snapback we have frequently delivered in the past is not applicable in this case. That said, any continued future high volatility could potentially position the Fund not only to better navigate large index swings in either direction, but also to pursue an accelerated performance recovery.
* Effective on or about June 24, 2020, the AllianzGI PerformanceFee Structured US Fixed Income Fund will be liquidated and dissolved, and any outstanding shares redeemed. As of June 17, 2020, shares of the Fund will no longer be available for purchase or exchange. Please see the Fund’s statutory prospectus for more information.
| | | | | | |
| | Semiannual Report | | | March 31, 2020 | | 83 |
Unaudited
AllianzGI PerformanceFee Structured US Fixed Income Fund (cont’d)
Average Annual Total Return for the period ended March 31, 2020
| | | | | | | | | | | | | | |
| | | | |
| | | | | 6 Month* | | | 1 Year | | | Since Inception† | |
| | AllianzGI PerformanceFee Structured US Fixed Income Fund Class P | | | –6.93% | | | | –1.54% | | | | 1.00% | |
| | AllianzGI PerformanceFee Structured US Fixed Income Fund Institutional Class | | | –6.87% | | | | –1.54% | | | | 1.02% | |
| | AllianzGI PerformanceFee Structured US Fixed Income Fund Class R6 | | | –6.99% | | | | –1.52% | | | | 1.00% | |
| | Bloomberg Barclays U.S. Aggregate Bond Index | | | 3.33% | | | | 8.93% | | | | 5.18% | |
| | | Lipper General Bond Funds Average | | | –3.01% | | | | 1.87% | | | | 1.82% | |
* Cumulative return
† The Fund began operations on December 18, 2017. Benchmark return comparisons began on the fund inception date. Lipper performance comparisons began on December 31, 2017.
Performance quoted represents past performance and is no guarantee of future results. Current performance may be lower or higher than performance shown. For performance current to the most recent month-end, visit our website at us.allianzgi.com. Investment return and the principal value will fluctuate. Shares may be worth more or less than original cost when redeemed. Returns do not reflect deduction of taxes that a shareholder would pay on fund distributions or redemption of fund shares. See pages 107 and 108 for more information. The Fund’s gross expense ratios, which include the Acquired Fund Fees and Expenses, are 0.89% for Class P shares, 0.82% for Institutional Class shares and 1.19% for Class R6 shares. These ratios do not include an expense reduction, contractually guaranteed through at least January 31, 2021. The Fund’s expense ratios net of this reduction, which include the Acquired Fund Fees and Expenses, are 0.37% for Class P shares, 0.37% for Institutional Class shares and 0.37% for Class R6 shares. Expense ratio information is as of the Fund’s current prospectus dated February 1, 2020, as further revised or supplemented from time to time.
Cumulative Returns Through March 31, 2020

Asset Allocation (as of March 31, 2020)
| | | | |
| |
| Exchange-Traded Funds | | | 98.9% | |
| |
| Cash & Equivalents — Net | | | 1.1% | |
| | | | | | |
| 84 | | March 31, 2020 | | | Semiannual Report | | |
Unaudited
AllianzGI PerformanceFee Structured US Fixed Income Fund (cont’d)
| | | | | | |
| |
| Shareholder Expense Example | | Actual Performance |
| | | Class P | | Institutional
Class | | Class R6 |
| | | |
| Beginning Account Value (10/1/19) | | $1,000.00 | | $1,000.00 | | $1,000.00 |
| | | |
| Ending Account Value (3/31/20) | | $ 930.70 | | $ 931.30 | | $ 930.10 |
| | | |
| Expenses Paid During Period | | $ 0.24 | | $ 0.87 | | $ 1.98 |
| | | |
| |
| | | Hypothetical Performance |
| | | (5% return before expenses) |
| | | Class P | | Institutional
Class | | Class R6 |
| | | |
| Beginning Account Value (10/1/19) | | $1,000.00 | | $1,000.00 | | $1,000.00 |
| | | |
| Ending Account Value (3/31/20) | | $1,024.75 | | $1,024.10 | | $1,022.95 |
| | | |
| Expenses Paid During Period | | $ 0.25 | | $ 0.91 | | $ 2.07 |
For each class of the Fund, expenses (net of fee waiver and reimbursement, if any) are equal to the annualized expense ratio for the class (0.05% for Class P ,0.18% for Institutional Class and 0.41% for Class R6), multiplied by the average account value over the period, multiplied by 183/366. These expenses do not include the expenses of the investment companies in which the Fund invest, which are indirectly borne by Fund shareholders.
| | | | | | |
| | Semiannual Report | | | March 31, 2020 | | 85 |
Unaudited
AllianzGI Preferred Securities and Income Fund
For the period of October 1, 2019 through March 31, 2020, as provided by Carl W. Pappo Jr., CFA, Portfolio Manager.
Fund Insights
For thesix-month period ended March 31, 2020, Institutional Class shares at net asset value (“NAV”) of the AllianzGI Preferred Securities and Income Fund (the “Fund”) returned-13.64% , underperforming the ICE BofA Fixed Rate Preferred Securities Index USD Hedged (the “benchmark”), which returned-7.00%.
Market Overview
TheCOVID-19 outbreak caused considerable dislocation across US fixed income markets at the end of March 2020. As businesses shuttered and the US economy essentially shut down in response to the virus, fixed income market liquidity rapidly dried up and forced selling quickly drove valuations on risk assets to levels not seen since the global financial crisis. The US Government’s monetary and fiscal response was substantial, beginning with immediate easing of the Federal Funds rate to0.00%-0.25%, and continued with a ramping up of a fiscal stimulus package including everything from direct payments to consumers to purchases of fixed income securities in the secondary market.
Ultimately, we believe that more than $2.2 trillion will be pumped out by the US Treasury to help carry the economy over the still-indeterminate period in which consumers and employees will need to shelter-in-place. While we believe that conditions have improved significantly frommid-March, when liquidity conditions were at their worst, yield spreads on risk assets remain historically wide, which in our view reflects the new economic reality. At this point a recession is technically imminent, though we believe the extent of the damage will center on how quickly businesses can return to normal operation.
Portfolio Review
The dislocation in risk assets pervaded the preferred market in March 2020, driving returns for thesix-month period significantly negative. The path was similar to other markets, with the lowest point reached inmid-March before monetary and fiscal responses were set in place. The market, as measured by the benchmark, returned-7.0% between September 30, 2019 and March 31, 2020, with itsquarter-to-date low point being reached on March 18, 2020 at-21.2%, exacerbated by a record in4- week rolling redemptions from ETFs of -$1.4bn peaking at the same time, and straining market liquidity. With risk appetite greatly reduced in the market, preferreds underperformed the-3.0%six-month return of Investment Grade bonds, as measured by the Ice BofA US Corporate Index, but outperformed the-19.3% return of High Yield bonds, as measured by Ice BofA US High Yield Index and the-12.3% return of the equity markets, as measured by the S&P500 Index.
Within the preferred market, investment grade sectors outperformed high yield sectors, with the $25 and $1000 Investment Grade market, represented by the Ice BofA US Investment Grade Preferred & Hybrid Securities Index and the Ice BofA US Investment Grade Institutional Capital Securities Index returning –8.0% and-7.1%, respectively and the High Yield preferred market, represented by the Ice BofA US High Yield Institutional Capital Securities Index, returning-15.5%.
Overall in the preferred market, thefixed-for-life security structures that are prevalent in the retail $25 market outperformed. Many of those securities had higher legacy coupons, and were expected to be refinanced at their upcoming call dates. However, in our view with the market dislocation, those expectations were curtailed, and higher legacy coupons benefited from the decline in base rates and could therefore accommodate much of the spread widening.
A significant underweight allocation tofixed-for-life structures (20% vs 60% for the benchmark) hurt relative returns, as they generally outperformed the broader market by 200 basis points. Prior to the disruption many of these securities traded at a premium despite approaching call dates. Additionally returns were hurt by overweight allocations to the underperforming insurance and pipeline sectors. Spread widening for insurance reflected concerns about the long-term revenue impact of low rates, while pipelines were hurt by their proximity to the energy business. Declines in oil and gas prices raised counterparty concerns, as the pipelines themselves are paid on volume, and not commodity price.
Outlook
We believe that distressed prices in the preferred market may present a rare opportunity to for long term investors. Inmid-March 2020, yields and spreads approached levels not seen since 2012. While they came in modestly post the fiscal and monetary stimulus, we are continuing to addfixed-for-life securities of high quality companies with yields approaching 6%. While the risks to the economy are novel, and the success of the virus containment strategy has not fully played out, the government stimulus measures should help build a bridge for consumers and businesses to the other side. In our view, banks, which represent 60% of the universe, are well-positioned headed into this downturn, with significant capital and liquidity buffers.
| | | | | | |
| 86 | | March 31, 2020 | | | Semiannual Report | | |
Unaudited
AllianzGI Preferred Securities and Income Fund (cont’d)
Average Annual Total Return for the period ended March 31, 2020
| | | | | | | | | | | | | | |
| | | | |
| | | | | 6 Month* | | | 1 Year | | | Since Inception† | |
| | AllianzGI Preferred Securities and Income Fund Class P | | | –13.78% | | | | –8.02% | | | | –2.34% | |
| | AllianzGI Preferred Securities and Income Fund Institutional Class | | | –13.64% | | | | –7.89% | | | | –2.25% | |
| | AllianzGI Preferred Securities and Income Fund Class R6 | | | –13.68% | | | | –7.93% | | | | –2.24% | |
| | ICE BofA Fixed Rate Preferred Securities Index USD Hedged | | | –7.00% | | | | –1.27% | | | | 1.96% | |
| | S&P 500 Financials Index Total Return in USD | | | –24.80% | | | | –17.15% | | | | –11.85% | |
| | | Lipper Flexible Income Funds Average | | | –10.07% | | | | –5.49% | | | | –1.73% | |
* Cumulative return
† The Fund began operations on May 30, 2018. Benchmark return comparisons began on the fund inception date. Lipper performance comparisons began on May 31, 2018.
Performance quoted represents past performance and is no guarantee of future results. Current performance may be lower or higher than performance shown. For performance current to the most recent month-end, visit our website at us.allianzgi.com. Investment return and the principal value will fluctuate. Shares may be worth more or less than original cost when redeemed. Returns do not reflect deduction of taxes that a shareholder would pay on funds distributions or redemption of fund shares. See pages 107 and 108 for more information. The Fund’s gross expense ratios are 1.69% for Class P shares, 1.91% for Institutional Class shares and 1.70% for Class R6 shares. These ratios do not include an expense reduction, contractually guaranteed through at least January 31, 2022. The Fund’s expense ratios net of this reduction are 0.60% for Class P shares, 0.55% for Institutional Class shares and 0.50% for Class R6 shares. Expense ratio information is as of the Fund’s current prospectus dated February 1, 2020, as further revised or supplemented from time to time.
Cumulative Returns Through March 31, 2020

Industry Allocation (as of March 31, 2020)
| | | | |
| |
| Banks | | | 47.6% | |
| |
| Insurance | | | 20.5% | |
| |
| Pipelines | | | 7.4% | |
| |
| Diversified Financial Services | | | 3.2% | |
| |
| Electric Utilities | | | 2.8% | |
| |
| Consumer Finance | | | 2.7% | |
| |
| Miscellaneous Manufacturing | | | 2.7% | |
| |
| Telecommunications | | | 2.2% | |
| |
| Other | | | 4.8% | |
| |
| Cash &Equivalents-Net | | | 6.1% | |
Credit Ratings* (as of March 31, 2020)
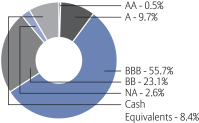
* As a percentage of total investments. Credit ratings apply to the credit worthiness of the issuers of the underlying securities and not to the Fund or its shares. Ratings are subject to change. Ratings are based off of the highest available rating from S&P Global Ratings (“S&P”), Moody’s and Fitch. Bonds not rated by the aforementioned agencies are “unrated”. Ratings are shown based on the S&P rating scale, which ranges from AAA (highest) to D (lowest). Where applicable, securities ratings of an agency other than S&P have been converted to the S&P equivalent. “NR” denotes securities that are not rated. Not rated securities do not necessarily indicate low quality. Ratings are relative, subjective and not absolute standards of quality, and represent the opinions of the independent Nationally Recognized Statistical Rating Organizations (NRSRO). The security’s credit rating does not eliminate risk. The Fund is not rated by an independent rating agency.
| | | | | | |
| | Semiannual Report | | | March 31, 2020 | | 87 |
Unaudited
AllianzGI Preferred Securities and Income Fund (cont’d)
| | | | | | |
| |
| Shareholder Expense Example | | Actual Performance |
| | | Class P | | Institutional
Class | | Class R6 |
| | | |
| Beginning Account Value (10/1/19) | | $1,000.00 | | $1,000.00 | | $1,000.00 |
| | | |
| Ending Account Value (3/31/20) | | $ 862.20 | | $ 863.60 | | $ 863.20 |
| | | |
| Expenses Paid During Period | | $ 2.79 | | $ 2.56 | | $ 2.33 |
| | | | | | | |
| |
| | | Hypothetical Performance |
| | | (5% return before expenses) |
| | | Class P | | Institutional
Class | | Class R6 |
| | | |
| Beginning Account Value (10/1/19) | | $1,000.00 | | $1,000.00 | | $1,000.00 |
| | | |
| Ending Account Value (3/31/20) | | $1,022.00 | | $1,022.25 | | $1,022.50 |
| | | |
| Expenses Paid During Period | | $ 3.03 | | $ 2.78 | | $ 2.53 |
For each class of the Fund, expenses (net of fee waiver and reimbursement, if any) are equal to the annualized expense ratio for the class (0.60% for Class P, 0.55% for Institutional Class and 0.50% for Class R6), multiplied by the average account value over the period, multiplied by 183/366.
| | | | | | |
| 88 | | March 31, 2020 | | | Semiannual Report | | |
Unaudited
AllianzGI Short Duration High Income Fund
For the period of October 1, 2019 through March 31, 2020, as provided by Doug Forsyth, Portfolio Manager.
Fund Insights
For thesix-month period ended March 31, 2020, Class A shares at net asset value (“NAV”) of the AllianzGI Short Duration High Income Fund (the “Fund”) returned-10.90% underperforming the ICE BofA1-3 Year BB U.S. Cash Pay High Yield Index (the “benchmark”), which returned-6.43%.
Market Overview
Risk assets gained over the fourth quarter through January before selling off aggressively in late February 2020 as theCOVID-19 global outbreak intensified. The short-term trajectory of the global economy and corporate profitability became highly uncertain.
The US Federal Reserve’s (the “Fed’s”) response to these events was extraordinary in terms of its swiftness, scope, and willingness to do more. The fiscal response was also immediate with President Trump signing into law three bills including the $2.2 trillion Coronavirus Aid, Relief & Security Act to help support the economy.
Most first-quarter 2020 US economic statistics did not reflect real-time developments of theCOVID-19 pandemic and therefore were largely irrelevant. However, data released closer to the end of March began to show a dramatic tick lower in activity. In a matter of weeks the US economy went from record low unemployment to millions in initial jobless claims.
Fourth-quarter 2019 financial results and the majority of management outlooks reflected strong fundamentals, healthy balance sheets and ample liquidity exiting 2019. These data points had less utility as the first quarter progressed. The supply-side shock and demand disruption due to travel restrictions, lockdowns and other directives to contain the spread of the virus and avoid overloading the healthcare system significantly altered the near-term path for earnings and sales. By the end of the first quarter, most companies were highly focused on cash management and liquidity, accessing lines of credit, controlling variable costs, deferring capital investment and suspending dividends and share repurchases.
We believe that aggressive rate cuts, the reinstatement of bond-buying programs and “safe haven” demand caused the US Treasury yield curve to compress and steepen sharply over the period.
Performance dispersion among credit ratings widened in the period after the lowest-rated issues dropped significantly in March 2020. The highest-quality credits benefited from aflight-to-quality rotation and falling interest rates during the selloff.
Despite a dormant March 2020, high-yield new issuance was elevated in the first quarter. The trailing12-month default rates on an issuer-weighted basis and a dollar-weighted basis were 2.82% and 3.35%, respectively, atperiod-end.
Portfolio Review
The Fund was lower alongside the broad high-yield market and trailed the benchmark return over thesix-month period.
The Fund was not immune to the indiscriminate selling on the back of forced market redemptions during the month of March. Historically, the Fund withstood episodes of heavy broad-market selling pressure due to its higher-quality bias and liquidity focus. However, in March 2020 these defensive characteristics were specifically sought out by broad high-yield fund managers targeting higher-quality issues for liquidity.
Nearly all industries were negatively impacted—directly or indirectly—byCOVID-19. Industry exposure that benefited performance in the period was limited to metals/mining excluding steel, support-services and telecommunications-wireless. Conversely, industry exposure that detracted from performance in the period included retail, energy and financial services.
Outlook
We believe the near-term outlook for the global economy and corporate profitability is highly uncertain and evolving due to the headwinds associated with theCOVID-19 outbreak. The situation continues to move very rapidly and requires close monitoring, especially in light of the massive confluence of central bank intervention and government stimulus.
While the duration and severity of the economic downturn are unknown, the extraordinary monetary and fiscal policy measures instituted by the Fed and the US government aim to not only help stabilize financial markets but also accelerate the recovery and set the stage for the Great Restart.
In our view, upcoming economic reports should reflect materially slower activity resulting from the government-imposed shutdown. Data points are unlikely to rebound in the short term. First-quarter corporate earnings are likely to come in below expectations and most outlooks are expected to be downbeat with reduced visibility.
TheCOVID-19 pandemic is expected to impact all high-yield issuers and cause defaults to increase. However, the asset class remains well diversified across many industries. Healthcare, energy, telecommunications, cable & satellite TV and technology are among the top industries in the universe. Few industries have greater than 10% market exposure and none exceed 12% (atquarter-end). Energy industry issuers are likely to face a higher rate of default, but risk should be concentrated in the most distressed credits within the exploration & production (“E&P”) and oil field equipment & services subindustries.
While the near-term outlook for the high-yield asset class is less certain, we believe the intermediate- and long-term outlooks are constructive. In our view, the Fed and fiscal response to support the orderly flow and stabilization of credit continues to work with further evidence of healing in the investment grade and high-yield markets. It appears that opportunities may exist for those with capital to invest currently at discounts to par in high yield. With a spread of 877 basis points and a yield greater than 9% atperiod-end it is difficult to identify a better risk/reward option in fixed income. We believe that US high-yield bonds are attractive on an absolute return basis, can provide better downside protection than equities and offer a very compelling yield opportunity compared to negative and depressed yields globally.
| | | | | | |
| | Semiannual Report | | | March 31, 2020 | | 89 |
Unaudited
AllianzGI Short Duration High Income Fund (cont’d)
Average Annual Total Return for the period ended March 31, 2020
| | | | | | | | | | | | | | | | | | |
| | | | | |
| | | | | 6 Month* | | | 1 Year | | | 5 Year | | | Since Inception† | |
| | | AllianzGI Short Duration High Income Fund Class A | | | –10.90% | | | | –8.16% | | | | 0.92% | | | | 2.91% | |
| | AllianzGI Short Duration High Income Fund Class A (adjusted) | | | –12.90% | | | | –10.23% | | | | 0.47% | | | | 2.63% | |
| | | AllianzGI Short Duration High Income Fund Class C | | | –11.01% | | | | –8.42% | | | | 0.66% | | | | 2.60% | |
| | AllianzGI Short Duration High Income Fund Class C (adjusted) | | | –11.88% | | | | –9.29% | | | | 0.66% | | | | 2.60% | |
| | AllianzGI Short Duration High Income Fund Class P | | | –10.70% | | | | –7.92% | | | | 1.17% | | | | 3.12% | |
| | AllianzGI Short Duration High Income Fund Institutional Class | | | –10.72% | | | | –7.90% | | | | 1.21% | | | | 3.19% | |
| | AllianzGI Short Duration High Income Fund Class R6 | | | –10.69% | | | | –7.86% | | | | 1.26% | | | | 3.23% | |
| | ICE BofA 1-3 Year BB U.S. Cash Pay High Yield Index | | | –6.43% | | | | –3.40% | | | | 2.63% | | | | 4.26% | |
| | | Lipper Short High Yield Funds Average | | | –9.05% | | | | –6.71% | | | | 1.09% | | | | 2.85% | |
* Cumulative return
† The Fund began operations on October 3, 2011. Benchmark return comparisons began on the fund inception date. Lipper performance comparisons began on September 30, 2011.
Performance quoted represents past performance and is no guarantee of future results. Current performance may be lower or higher than performance shown. For performance current to the most recent month-end, visit our website at us.allianzgi.com. Investment return and the principal value will fluctuate. Shares may be worth more or less than original cost when redeemed.The adjusted returns take into account the maximum initial sales charge of 2.25% on Class A shares and the contingent deferred sales charge (CDSC) of 1% on Class C shares, which may apply to shares redeemed during the first year of ownership.Returns do not reflect deduction of taxes that a shareholder would pay on fund distributions or redemption of fund shares. See pages 107 and 108 for more information. The Fund’s gross expense ratios are 0.88% for Class A shares, 1.14% for Class C shares, 0.65% for Class P shares, 0.63% for Institutional Class shares and 0.57% for Class R6 shares. These ratios do not include an expense reduction, contractually guaranteed through at least January 31, 2021. The Fund’s expense ratios net of this reduction are 0.86% for Class A shares, 1.11% for Class C shares, 0.65% for Class P shares, 0.60% for Institutional Class shares and 0.55% for Class R6 shares. Expense ratio information is as of the Fund’s current prospectus dated February 1, 2020, as further revised or supplemented from time to time.
Cumulative Returns Through March 31, 2020
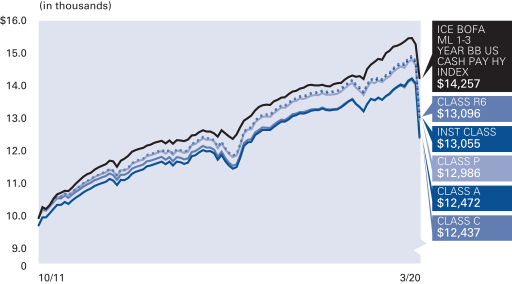
Industry Allocation (as of March 31, 2020)
| | | | |
| |
| Oil, Gas & Consumable Fuels | | | 10.0% | |
| |
| Pipelines | | | 8.6% | |
| |
| Retail | | | 7.8% | |
| |
| Commercial Services & Supplies | | | 7.7% | |
| |
| Diversified Financial Services | | | 7.3% | |
| |
| Real Estate | | | 7.0% | |
| |
| Media | | | 6.4% | |
| |
| Distribution/Wholesale | | | 5.6% | |
| |
| Other | | | 35.8% | |
| |
| Cash & Equivalents — Net | | | 3.8% | |
| | | | | | |
| 90 | | March 31, 2020 | | | Semiannual Report | | |
Unaudited
AllianzGI Short Duration High Income Fund (cont’d)
S&P Ratings* (as of March 31, 2020)
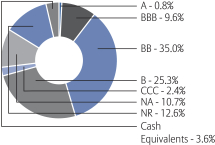
* As a percentage of total investments. Bond ratings refer to the underlying holdings of the Fund and are categorized from highest to lowest credit quality using ratings provided by S&P Global Ratings (“S&P”). S&P’s ratings have been selected for several reasons, including the portfolio managers’ usage of S&P ratings methodology among other credit quality information in managing the Fund, access to background information and other materials provided by S&P, as well as the Funds’ considerations of industry practice. The Fund also displays S&P credit ratings information in materials provided in client presentations. Previous shareholder reports for the Fund displayed bond ratings provided by Moody’s. See “Important Information” for more detail on the selection of S&P for the Fund’s ratings presentation. Bonds not rated by S&P and bonds that do not currently have a rating available are designated in the chart above as “NR” and “NA”, respectively.
| | | | | | | | | | |
| |
| Shareholder Expense Example | | Actual Performance |
| | | Class A | | Class C | | Class P | | Institutional
Class | | Class R6 |
| | | | | |
| Beginning Account Value (10/1/19) | | $1,000.00 | | $1,000.00 | | $1,000.00 | | $1,000.00 | | $1,000.00 |
| | | | | |
| Ending Account Value (3/31/20) | | $ 891.00 | | $ 889.90 | | $ 893.00 | | $ 892.80 | | $ 893.10 |
| | | | | |
| Expenses Paid During Period | | $ 4.07 | | $ 5.29 | | $ 2.93 | | $ 2.89 | | $ 2.60 |
| | | |
| |
| | | Hypothetical Performance |
| | | (5% return before expenses) |
| | | Class A | | Class C | | Class P | | Institutional
Class | | Class R6 |
| | | | | |
| Beginning Account Value (10/1/19) | | $1,000.00 | | $1,000.00 | | $1,000.00 | | $1,000.00 | | $1,000.00 |
| | | | | |
| Ending Account Value (3/31/20) | | $1,020.70 | | $1,019.40 | | $1,021.90 | | $1,021.95 | | $1,022.25 |
| | | | | |
| Expenses Paid During Period | | $ 4.34 | | $ 5.65 | | $ 3.13 | | $ 3.08 | | $ 2.78 |
For each class of the Fund, expenses (net of fee waiver and reimbursement, if any) are equal to the annualized expense ratio for the class (0.86% for Class A, 1.12% for Class C, 0.62% for Class P, 0.61% for Institutional Class and 0.55% for Class R6), multiplied by the average account value over the period, multiplied by 183/366.
| | | | | | |
| | Semiannual Report | | | March 31, 2020 | | 91 |
Unaudited
AllianzGI Short Term Bond Fund
For the period of October 1, 2019 through March 31, 2020, as provided by Doug Forsyth, Portfolio Manager.
Fund Insights
For thesix-month period ended March 31, 2020, Class A shares at net asset value (“NAV”) of the AllianzGI Short Term Bond Fund (the “Fund”) returned-2.24%, underperforming the Bloomberg Barclays U.S. Government/Credit1-3 Year Index (the “benchmark”), which returned 2.29%.
Market Overview
Short-maturity US Treasuries produced a positive return in the reporting period, while sort-maturity investment grade corporates finished lower but held up much better than longer dated credit.
Corporate credit was firm before selling off aggressively in late February 2020 as theCOVID-19 global outbreak intensified. The short-term trajectory of the global economy and corporate profitability became highly uncertain. This uncertainty led to indiscriminate selling pressure across most US asset classes and created dislocations in credit markets.
The US Federal Reserve’s (the “Fed’s”) response to these events was extraordinary in terms of its swiftness, scope, and willingness to do more. The impact of these initiatives was immediate with US investment grade corporate new issuance setting a monthly record in March. The fiscal response was also swift with President Trump signing into law three bills including the $2.2 trillion Coronavirus Aid, Relief & Security Act to help support the economy.
Most first-quarter 2020 US economic statistics did not reflect real-time developments of theCOVID-19 pandemic and therefore were largely irrelevant. However, data released closer to the end of March began to show a dramatic tick lower in activity. In a matter of weeks the US economy went from record low unemployment to millions in initial jobless claims.
Fourth-quarter 2019 financial results and the majority of management outlooks reflected strong fundamentals, healthy balance sheets and ample liquidity exiting 2019. These data points had less utility as the first quarter progressed. The supply-side shock and demand disruption due to travel restrictions, lockdowns and other directives to contain the spread of the virus and avoid overloading the healthcare system significantly altered the near-term path for earnings and sales. By the end of the first quarter 2020, most companies were highly focused on cash management and liquidity, accessing lines of credit, controlling variable costs, deferring capital investment and suspending dividends and share repurchases.
We believe that aggressive rate cuts, the reinstatement of bond-buying programs and “safe haven” demand caused the US Treasury yield curve to compress and steepen sharply over the period.
Portfolio Review
The Fund held up better than the broad investment grade corporate bond market but underperformed its benchmark.
The strongest-performing sectors within the Fund were treasuries and government-sponsored enterprise holdings followed by select corporate bond issues. Conversely, high-yield credit exposure detracted the most from performance.
Within corporate credit, industries that contributed the most to portfolio performance were basic industry & real estate, gaming and healthcare. Conversely, the industries that detracted the most from performance in the period were financial services, support-services and hotels.
Outlook
We believe the near-term outlook for the global economy and corporate profitability is highly uncertain and evolving due to the headwinds associated withCOVID-19 outbreak. The situation continues to move very rapidly and requires close monitoring, especially in light of the massive confluence of central bank intervention and government stimulus.
While the duration and severity of the economic downturn are unknown, the extraordinary monetary and fiscal policy measures instituted by the Fed and the US government aim to not only help stabilize financial markets but also accelerate the recovery and set the stage for the “Great Restart”.
In our view, upcoming economic reports should reflect materially slower activity resulting from the government-imposed shutdown. We believe that data points are unlikely to rebound in the short term. First-quarter 2020 corporate earnings are likely to come in below expectations and most outlooks are expected to be downbeat with reduced visibility.
We believe the Fed and fiscal response to support the orderly flow and stabilization of credit continues to work with further evidence of healing in the investment grade andnon-investment grade corporate bond markets.
| | | | | | |
| 92 | | March 31, 2020 | | | Semiannual Report | | |
Unaudited
AllianzGI Short Term Bond Fund (cont’d)
Average Annual Total Return for the period ended March 31, 2020
| | | | | | | | | | | | | | |
| | | | |
| | | | | 6 Month* | | | 1 Year | | | Since Inception† | |
| | | AllianzGI Short Term Bond Fund Class A | | | –2.24% | | | | 0.45% | | | | 2.08% | |
| | AllianzGI Short Term Bond Fund Class A (adjusted) | | | –4.44% | | | | –1.81% | | | | 0.64% | |
| | AllianzGI Short Term Bond Fund Class P | | | –2.14% | | | | 0.61% | | | | 2.26% | |
| | AllianzGI Short Term Bond Fund Institutional Class | | | –2.04% | | | | 0.77% | | | | 2.39% | |
| | Bloomberg Barclays U.S. Government/Credit1-3 Year Index | | | 2.29% | | | | 4.53% | | | | 4.30% | |
| | | Lipper Short Investment Grade Debt Funds Average | | | –2.03% | | | | 0.12% | | | | 1.37% | |
* Cumulative return
† The Fund began operations on August 23, 2018. Benchmark return comparisons began on the fund inception date. Lipper performance comparisons began on August 31, 2018.
Performance quoted represents past performance and is no guarantee of future results. Current performance may be lower or higher than performance shown. For performance current to the most recent month-end, visit our website at us.allianzgi.com. Investment return and the principal value will fluctuate. Shares may be worth more or less than original cost when redeemed.The adjusted returns take into account the maximum sales charge of 2.25% on Class A shares. Returns do not reflect deduction of taxes that a shareholder would pay on funds distributions or redemption of fund shares. See pages 107 and 108 for more information. The Fund’s gross expense ratios are 2.81% for Class A shares, 22.10% for Class P shares and 2.38% for Institutional Class shares. These ratios do not include an expense reduction, contractually guaranteed through at least January 31, 2022. The Fund’s expense ratios net of this reduction are 0.64% for Class A shares, 0.49% for Class P shares, 0.39% for Institutional Class shares. Expense ratio information is as of the Fund’s current prospectus dated February 1, 2020, as further revised or supplemented from time to time.
Cumulative Returns Through March 31, 2020
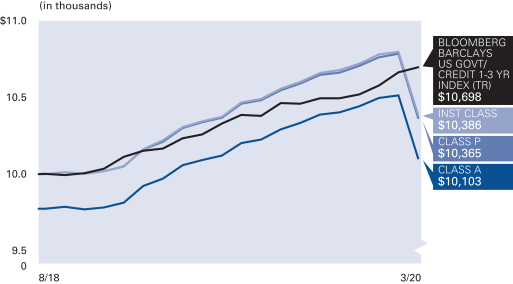
Asset Allocation (as of March 31, 2020)
| | | | |
| |
| Corporate Bonds & Notes | | | 74.5% | |
| |
| U.S. Treasury Obligations | | | 4.8% | |
| |
| U.S. Government Agency Securities | | | 2.7% | |
| |
| Cash & Equivalents — Net | | | 18.0% | |
Credit Ratings* (as of March 31, 2020)
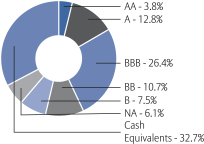
* As a percentage of total investments. Bond ratings refer to the underlying holdings of the Fund and are categorized from highest to lowest credit quality using ratings provided by S&P Global Ratings (“S&P”). S&P’s ratings have been selected for several reasons, including the portfolio managers’ usage of S&P ratings methodology among other credit quality information in managing the Fund, access to background information and other materials provided by S&P, as well as the Funds’ considerations of industry practice. The Fund also displays S&P credit ratings information in materials provided in client presentations. Previous shareholder reports for the Fund displayed bond ratings provided by Moody’s. See “Important Information” for more detail on the selection of S&P for the Fund’s ratings presentation. Bonds not rated by S&P and bonds that do not currently have a rating available are designated in the chart above as “NR” and “NA”, respectively.
| | | | | | |
| | Semiannual Report | | | March 31, 2020 | | 93 |
Unaudited
AllianzGI Short Term Bond Fund (cont’d)
| | | | | | |
| |
| Shareholder Expense Example | | Actual Performance |
| | | Class A | | Class P | | Institutional
Class |
| | | |
| Beginning Account Value (10/1/19) | | $1,000.00 | | $1,000.00 | | $1,000.00 |
| | | |
| Ending Account Value (3/31/20) | | $977.60 | | $978.60 | | $979.60 |
| | | |
| Expenses Paid During Period | | $ 3.16 | | $ 2.42 | | $ 1.93 |
| | | |
| |
| | | Hypothetical Performance |
| | | (5% return before expenses) |
| | | Class A | | Class P | | Institutional
Class |
| | | |
| Beginning Account Value (10/1/19) | | $1,000.00 | | $1,000.00 | | $1,000.00 |
| | | |
| Ending Account Value (3/31/20) | | $1,021.80 | | $1,022.55 | | $1,023.05 |
| | | |
| Expenses Paid During Period | | $ 3.23 | | $ 2.48 | | $ 1.97 |
For each class of the Fund, expenses (net of fee waiver and reimbursement, if any) are equal to the annualized expense ratio for the class (0.64% for Class A , 0.49% for Class P and 0.39% for Institutional Class), multiplied by the average account value over the period, multiplied by 183/366.
| | | | | | |
| 94 | | March 31, 2020 | | | Semiannual Report | | |
Unaudited
AllianzGI Structured Return Fund
For the period of October 1, 2019 through March 31, 2020, as provided by Greg Tournant and Stephen Bond-Nelson, Co-Portfolio Managers.
Fund Insights
For thesix-month period ended March 31, 2020, the Class A shares at net asset value (“NAV”) of the AllianzGI Structured Return Fund returned-32.96%, underperforming the ICE BofA3-Month U.S. Treasury Bill Index (the “benchmark”), which returned 1.04%
Market Overview
The Fund underperformed for thesix-month period ended March 31, 2020 as a result of extremely challenging market conditions due, in part, to the novel coronavirus outbreak (“COVID-19”). The equity declines and implied volatility increases during this period were more extreme than many historical precedents, which had a significant impact on the performance of the Fund’s option portfolio.
Portfolio Review
This year’s 30% drop in the S&P 500 Index happened in just 22 trading days, instead of the many months a similar decline took during the global financial crisis that began in 2008. This combination of extremely high market volatility coupled with significant drops in market valuations had a particularly large impact on the option positions held by the Fund. During this market turmoil, we sought tode-risk the portfolio, primarily through closing out many short put positions.
Heading into the market decline, the Fund had in-place a ladder of hedging positions that was very much in line with what was in place during prior market events, including 2015 and 2018. A key feature of the Fund is that it is a net buyer of long puts. That is consistent with our historical approach and was true as well for this period. The Fund held approximately 1.8 times more long puts than short puts. We also had structured a layer of long puts slightly out of the money that were paired with an equal number of short puts as part of the strategy’s low volatility configuration spreads.
The market decline was a multi-week move which, as compared with aone-day shock scenario, has real implications on the price appreciation that thedeep-out-of-the-money long puts typically held by the Fund are able to provide. The Fund is designed to navigate a multi-week move via its restructuring process, under which, in more typical circumstances, we address the existing short option positions while often relying on cost offsets from the existing long puts. Unfortunately, under the recent circumstances, a historic level of steepness of the inversion in the volatility term structure prevented many of the Fund’s existing long puts from providing as much benefit as reasonably expected. This steepness reduced the price appreciation of the existing layer of long puts, reducing our ability to harvest gains on the long puts that we could in turn use to cover short put exposure, as the strategy often has done in severe market corrections.
In addition, in late February we shifted certain out-of-the-money puts deeper out of the money in order to widen some of the short puts, a strategy that had worked well in prior market deteriorations. However, in this instance the market unpredictably continued to decline beyond the shifted positioning.
In light of these largely unprecedented market dynamics, we began restructuring the various put positions in advance of the index reaching the strike prices for those puts, and restructured the various put positions with wider extensions than in past market dislocations. Soon after, we began de-risking, i.e., covering short puts without relayering any new positions. But the daily market moves, many of which ranged between -7% and -12%, made it extremely difficult to implement all of these trades and to mitigate realized costs. Unlike in prior dislocations, in this particular case the speed of the market moves was too severe.
Outlook
While markets may remain challenging, we believe that a high-volatility environment is a favorable one for the Fund’s option portfolio when constructing new positions. Since the underperformance of the first quarter has been realized, themark-to-market snapback we have frequently delivered in the past is not applicable in this case. That said, any continued future high volatility could potentially position the Fund not only to better navigate large index swings in either direction, but also to pursue an accelerated performance recovery.
| | | | | | |
| | Semiannual Report | | | March 31, 2020 | | 95 |
Unaudited
AllianzGI Structured Return Fund (cont’d)
Average Annual Total Return for the period ended March 31, 2020
| | | | | | | | | | | | | | | | | | |
| | | | | |
| | | | | 6 Month* | | | 1 Year | | | 5 Year | | | Since Inception† | |
| | | AllianzGI Structured Return Fund Class A | | | –32.96% | | | | –31.27% | | | | –4.80% | | | | –1.74% | |
| | AllianzGI Structured Return Fund Class A (adjusted) | | | –36.65% | | | | –35.05% | | | | –5.87% | | | | –2.50% | |
| | | AllianzGI Structured Return Fund Class C | | | –33.22% | | | | –31.77% | | | | –5.52% | | | | –2.49% | |
| | AllianzGI Structured Return Fund Class C (adjusted) | | | –33.87% | | | | –32.43% | | | | –5.52% | | | | –2.49% | |
| | AllianzGI Structured Return Fund Class P | | | –32.91% | | | | –31.13% | | | | –4.62% | | | | –1.56% | |
| | AllianzGI Structured Return Fund Institutional Class | | | –32.84% | | | | –31.02% | | | | –4.53% | | | | –1.48% | |
| | AllianzGI Structured Return Fund Class R6 | | | –32.91% | | | | –31.08% | | | | –4.50% | | | | –1.42% | |
| | ICE BofA3-Month U.S. Treasury Bill Index | | | 1.04% | | | | 2.25% | | | | 1.19% | | | | 0.83% | |
| | | Lipper Absolute Return Funds Average | | | –5.75% | | | | –3.90% | | | | 0.13% | | | | 1.82% | |
* Cumulative return
† The Fund began operations on December 3, 2012. Benchmark return comparisons began on the fund inception date. Lipper performance comparisons began on November 30, 2012.
Performance quoted represents past performance and is no guarantee of future results. Current performance may be lower or higher than performance shown. For performance current to the most recent month-end, visit our website at us.allianzgi.com. Investment return and the principal value will fluctuate. Shares may be worth more or less than original cost when redeemed.The adjusted returns take into account the maximum initial sales charge of 5.50% on Class A shares and the contingent deferred sales charge (CDSC) of 1% on Class C shares, which may apply to shares redeemed during the first year of ownership. Returns do not reflect deduction of taxes that a shareholder would pay on fund distributions or redemption of fund shares. See pages 107 and 108 for more information. The Fund’s gross expense ratios, which include the Acquired Fund Fees and Expenses, are 1.10% for Class A shares, 1.88% for Class C shares, 0.88% for Class P shares, 0.82% for Institutional Class shares and 0.75% for Class R6 shares. These ratios do not include an expense reduction, contractually guaranteed through at least January 31, 2021. The Fund’s expense ratios net of this reduction, which include the Acquired Fund Fees and Expenses, are 1.05% for Class A shares, 1.81% for Class C shares, 0.82% for Class P shares, 0.77% for Institutional Class shares and 0.74% for Class R6 shares. Expense ratio information is as of the Fund’s current prospectus dated February 1, 2020, as further revised or supplemented from time to time.
Cumulative Returns Through March 31, 2020
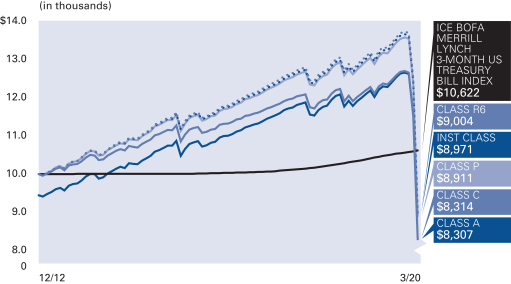
Asset Allocation (as of March 31, 2020)
| | | | |
| |
| Exchange-Traded Funds | | | 86.0% | |
| |
| Cash & Equivalents — Net | | | 14.0% | |
| | | | | | |
| 96 | | March 31, 2020 | | | Semiannual Report | | |
Unaudited
AllianzGI Structured Return Fund (cont’d)
| | | | | | | | | | |
| |
| Shareholder Expense Example | | Actual Performance |
| | | Class A | | Class C | | Class P | | Institutional
Class | | Class R6 |
| | | | | |
| Beginning Account Value (10/1/19) | | $1,000.00 | | $1,000.00 | | $1,000.00 | | $1,000.00 | | $1,000.00 |
| | | | | |
| Ending Account Value (3/31/20) | | $670.40 | | $667.80 | | $670.90 | | $671.60 | | $670.90 |
| | | | | |
| Expenses Paid During Period | | $ 4.30 | | $ 7.42 | | $ 3.34 | | $ 3.09 | | $ 2.97 |
| | | |
| |
| | | Hypothetical Performance |
| | | (5% return before expenses) |
| | | Class A | | Class C | | Class P | | Institutional
Class | | Class R6 |
| | | | | |
| Beginning Account Value (10/1/19) | | $1,000.00 | | $1,000.00 | | $1,000.00 | | $1,000.00 | | $1,000.00 |
| | | | | |
| Ending Account Value (3/31/20) | | $1,019.85 | | $1,016.10 | | $1,021.00 | | $1,021.30 | | $1,021.45 |
| | | | | |
| Expenses Paid During Period | | $ 5.20 | | $ 8.97 | | $ 4.04 | | $ 3.74 | | $ 3.59 |
For each class of the Fund, expenses (net of fee waiver and reimbursement, if any) are equal to the annualized expense ratio for the class (1.03% for Class A, 1.78% for Class C, 0.80% for Class P, 0.74% for Institutional Class and 0.71% for Class R6), multiplied by the average account value over the period, multiplied by 183/366. These expenses do not include the expenses of the investment companies in which the Fund invests, which are indirectly borne by Fund shareholders.
| | | | | | |
| | Semiannual Report | | | March 31, 2020 | | 97 |
Unaudited
AllianzGI U.S. Equity Hedged Fund*
For the period of October 1, 2019 through March 31, 2020, as provided by Greg Tournant and Stephen Bond-Nelson, Co-Portfolio Managers.
Fund Insights
For thesix-month period ended March 31, 2020, Class A shares at net asset value (“NAV”) of the AllianzGI U.S. Equity Hedged Fund (the “Fund”) returned-9.44%, outperforming the S&P 500 Index (the “benchmark”), which returned-12.31%.
Portfolio Review
The equity declines and implied volatility increases experienced during the first quarter were more extreme than many historical precedents. The 30% drop in the benchmark at the start of this year happened in just 22 trading days, instead of the many months a similar decline took in 2008. The Fund’s long put positions, laddered into the portfolio with aone-year duration at position inception, helped cushion the severe equity market declines. Additionally, the Fund’s short call positions, designed to help offset the costs associated with the portfolio’s hedging positions, were successfully held to expiration.
The benchmark declined 8.23% and 12.35% in February and March 2020, respectively, as fears surrounding the impact of the coronavirus pandemic escalated. The Fund was able to mitigate some of these losses, returning-6.71% and-8.17% for the two months, respectively. For the quarter, the benchmark finished down 19.60%, while the Fund returned-14.65%, helping to smooth downside equity market volatility.
Outlook
Looking ahead, we believe the Fund is well positioned to help smooth potential future equity market volatility, while continually mitigating downside risk. Regardless of the future market environment, we believe the fund has been positioned to buffer against severe equity market declines, and smooth equity market volatility over time.
* Effective on or about June 11, 2020, the AllianzGI U.S. Equity Hedged Fund will be liquidated and dissolved, and any outstanding shares redeemed. As of June 4, 2020, shares of the Fund will no longer be available for purchase or exchange. Please see the Fund’s statutory prospectus for more information.
| | | | | | |
| 98 | | March 31, 2020 | | | Semiannual Report | | |
Unaudited
AllianzGI U.S. Equity Hedged Fund (cont’d)
Average Annual Total Return for the period ended March 31, 2020
| | | | | | | | | | | | | | | | | | |
| | | | | |
| | | | | 6 Month* | | | 1 Year | | | 5 Year | | | Since Inception† | |
| | | AllianzGI U.S. Equity Hedged Fund Class A | | | –9.44% | | | | –5.19% | | | | 1.77% | | | | 4.34% | |
| | AllianzGI U.S. Equity Hedged Fund Class A (adjusted) | | | –14.42% | | | | –10.41% | | | | 0.62% | | | | 3.54% | |
| | | AllianzGI U.S. Equity Hedged Fund Class C | | | –9.80% | | | | –5.88% | | | | 1.01% | | | | 3.57% | |
| | AllianzGI U.S. Equity Hedged Fund Class C (adjusted) | | | –10.70% | | | | –6.82% | | | | 1.01% | | | | 3.57% | |
| | AllianzGI U.S. Equity Hedged Fund Class P | | | –9.40% | | | | –5.05% | | | | 1.90% | | | | 4.49% | |
| | AllianzGI U.S. Equity Hedged Fund Institutional Class | | | –9.36% | | | | –4.92% | | | | 2.02% | | | | 4.60% | |
| | S&P 500 Index | | | –12.31% | | | | –6.98% | | | | 6.73% | | | | 10.90% | |
| | | Lipper Alternative Long/Short Equity Funds Average | | | –10.94% | | | | –9.19% | | | | 0.48% | | | | 2.95% | |
* Cumulative return
† The Fund began operations on December 3, 2012. Benchmark return comparisons began on the fund inception date. Lipper performance comparisons began on November 30, 2012.
Performance quoted represents past performance and is no guarantee of future results. Current performance may be lower or higher than performance shown. For performance current to the most recent month-end, visit our website at us.allianzgi.com. Investment return and the principal value will fluctuate. Shares may be worth more or less than original cost when redeemed.The adjusted returns take into account the maximum initial sales charge of 5.50% on Class A shares and the contingent deferred sales charge (CDSC) of 1% on Class C shares, which may apply to shares redeemed during the first year of ownership. Returns do not reflect deduction of taxes that a shareholder would pay on fund distributions or redemption of fund shares. See pages 107 and 108 for more information. The Fund’s gross expense ratios, which include the Acquired Fund Fees and Expenses, are 10.12% for Class A shares, 10.91% for Class C shares, 9.88% for Class P shares and 9.80% for Institutional Class shares. These ratios do not include an expense reduction, contractually guaranteed through at least January 31, 2021. The Fund’s expense ratios net of this reduction, which include the Acquired Fund Fees and Expenses, are 1.34% for Class A shares, 2.09% for Class C shares, 1.19% for Class P shares and 1.09% for Institutional Class shares. Expense ratio information is as of the Fund’s current prospectus dated February 1, 2020, as further revised or supplemented from time to time.
Cumulative Returns Through March 31, 2020
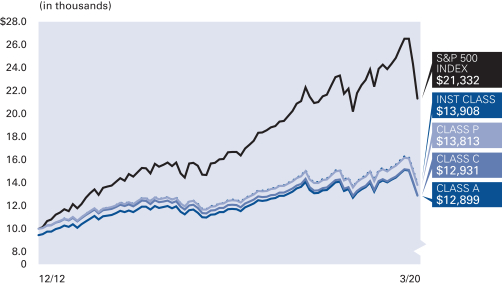
Asset Allocation (as of March 31, 2020)
| | | | |
| |
| Exchange-Traded Funds | | | 91.4% | |
| |
| Cash & Equivalents — Net | | | 8.6% | |
| | | | | | |
| | Semiannual Report | | | March 31, 2020 | | 99 |
Unaudited
AllianzGI U.S. Equity Hedged Fund (cont’d)
| | | | | | | | |
| |
| Shareholder Expense Example | | Actual Performance |
| | | Class A | | Class C | | Class P | | Institutional
Class |
| | | | |
| Beginning Account Value (10/1/19) | | $1,000.00 | | $1,000.00 | | $1,000.00 | | $1,000.00 |
| | | | |
| Ending Account Value (3/31/20) | | $ 905.60 | | $ 902.00 | | $ 906.00 | | $ 906.40 |
| | | | |
| Expenses Paid During Period | | $ 5.96 | | $ 9.51 | | $ 5.24 | | $ 4.77 |
| | | |
| |
| | | Hypothetical Performance |
| | | (5% return before expenses) |
| | | Class A | | Class C | | Class P | | Institutional
Class |
| | | | |
| Beginning Account Value (10/1/19) | | $1,000.00 | | $1,000.00 | | $1,000.00 | | $1,000.00 |
| | | | |
| Ending Account Value (3/31/20) | | $1,018.75 | | $1,015.00 | | $1,019.50 | | $1,020.00 |
| | | | |
| Expenses Paid During Period | | $ 6.31 | | $ 10.08 | | $ 5.55 | | $ 5.05 |
For each class of the Fund, expenses (net of fee waiver and reimbursement, if any) are equal to the annualized expense ratio for the class (1.25% for Class A, 2.00% for Class C, 1.10% for Class P and 1.00% for Institutional Class), multiplied by the average account value over the period, multiplied by 183/366. These expenses do not include the expenses of the investment companies in which the Fund invests, which are indirectly borne by Fund shareholders.
| | | | | | |
| 100 | | March 31, 2020 | | | Semiannual Report | | |
Unaudited
AllianzGI Ultra Micro Cap Fund*
For the period of October 1, 2019 through March 31, 2020, as provided by Steve Klopukh, Portfolio Manager.
Fund Insights
For thesix-month period ended March 31, 2020, Class A shares at net asset value (“NAV”) of the AllianzGI Ultra Micro Cap Fund (the “Fund”) returned-17.85%, underperforming the Russell Microcap Growth Index (the “benchmark”), which returned-13.61%.
Market Overview
It was a volatile period for US equities. In the fourth quarter of 2019, US equities surged, as risk appetite was boosted by the agreement of a “phase one” trade deal between the US and China and better-than-expected corporate earnings. In the first quarter of 2020, US stocks sold off sharply alongside the escalating novel coronavirus outbreak(“COVID-19”). As the US and rest of the world experienced an accelerating spread of the outbreak, governments in response issued lockdowns and travel restrictions to control the spread of the virus. Against this market backdrop, the Russell Microcap Index returned-22.84% and outperformed the Russell 2000 Index by 0.88%. Within themicro-cap universe, growth stocks outperformed value.
Portfolio Review
The Fund underperformed its benchmark over the reporting period. From an attribution perspective, security selection was the primary driver for the underperformance while asset weightings had a slightly positive effect. Stock picking contributed from the communication services, consumer staples and information technology sectors. Conversely, negative security selection in the health care, industrials and financials sectors was offsetting.
A top contributor, ACM Research, Inc. is a semiconductor equipment manufacturer with a focus on water cleaning applications. The stock benefitted from delivering solid quarterly results with multi-quarter visibility amid a challenging environment. The largest absolute detractor was Century Casinos, Inc., a casino and gaming operator. The stock was challenged as the company announced temporary casino closures amid theCOVID-19 situation.
Outlook
We believe that the advent ofCOVID-19 significantly changed the growth trajectory of the US economy, from slow growth to contractionary conditions. The draconian social distancing measures resulted in significant business disruptions and revenue drop-offs for many industries. The equity marketsell-off reflected the unknown duration and correction in company earnings.
In late March 2020, equity market valuations reached levels close to past market troughs. Moreover, equity valuation spreads (cheapest valuation quintile vs long term averages) gapped out to 4.5 standard deviation levels, signifying an aggressive move to safe haven equities. It is important to highlight that valuation spreads in 2008 took 5 months to move from a standard deviation of 3.5 to 4.5. In this market environment, it took only a few weeks to traverse the same distance, representing extreme investor risk aversion.
Lastly, looking back at previous periods of extreme volatility, equities have historically outperformed in the following period. Since 1990, there have been 8 times when the CBOE Volatility Index (“VIX Index”) spiked above 40, including the recentCOVID-19 sell off. For both 1 year returns that followed these periods, equities have on average generated positive returns, including small caps. Further, small caps valuations continues to trade at a discount relative to large cap stocks that has not been seen since the early 2000s, which was the start of a multi-year outperformance cycle of small caps above large caps.
* Effective on or about June 26, 2020, the AllianzGI Ultra Micro Cap Fund will be liquidated and dissolved, and any outstanding shares redeemed. As of June 19, 2020, shares of the Fund will no longer be available for purchase or exchange. Please see the Fund’s statutory prospectus for more information.
| | | | | | |
| | Semiannual Report | | | March 31, 2020 | | 101 |
Unaudited
AllianzGI Ultra Micro Cap Fund (cont’d)
Average Annual Total Return for the period ended March 31, 2020
| | | | | | | | | | | | | | | | | | | | | | |
| | | | | | |
| | | | | 6 Month* | | | 1 Year | | | 5 Year | | | 10 Year | | | Since Inception† | |
| | | AllianzGI Ultra Micro Cap Fund Class A | | | –17.85% | | | | –23.48% | | | | –4.81% | | | | 7.34% | | | | 6.56% | |
| | AllianzGI Ultra Micro Cap Fund Class A (adjusted) | | | –22.37% | | | | –27.69% | | | | –5.88% | | | | 6.74% | | | | 6.07% | |
| | AllianzGI Ultra Micro Cap Fund Class P | | | –17.85% | | | | –23.43% | | | | –4.56% | | | | 7.60% | | | | 6.83% | |
| | AllianzGI Ultra Micro Cap Fund Institutional Class | | | –17.85% | | | | –23.35% | | | | –4.56% | | | | 7.63% | | | | 6.87% | |
| | Russell Microcap Growth Index | | | –13.61% | | | | –21.96% | | | | –2.49% | | | | 6.65% | | | | 4.74% | |
| | | LipperSmall-Cap Growth Funds Average | | | –16.71% | | | | –16.89% | | | | 3.05% | | | | 9.06% | | | | 7.10% | |
* Cumulative return
† The Fund began operations on January 28, 2008. Benchmark return comparisons began on the fund inception date. Lipper performance comparisons began on January 31, 2008.
Performance quoted represents past performance and is no guarantee of future results. Current performance may be lower or higher than performance shown. For performance current to the most recent month-end, visit our website at us.allianzgi.com. Investment return and the principal value will fluctuate. Shares may be worth more or less than original cost when redeemed.The adjusted returns take into account the maximum initial sales charge of 5.50% on Class A shares. Returns do not reflect deduction of taxes that a shareholder would pay on fund distributions or redemption of fund shares. See pages 107 and 108 for more information. The Fund’s gross expense ratios are 2.36% for Class A shares, 2.06% for Class P shares and 2.05% for Institutional Class shares. These ratios do not include an expense reduction contractually guaranteed through at least January 31, 2021. The Fund’s expense ratios net of this reduction are 1.56% for Class A share, 1.52% for Class P shares and 1.49% for Institutional Class shares. Expense ratio information is as of the Fund’s current prospectus dated February 1, 2020, as further revised or supplemented from time to time.
Cumulative Returns Through March 31, 2020
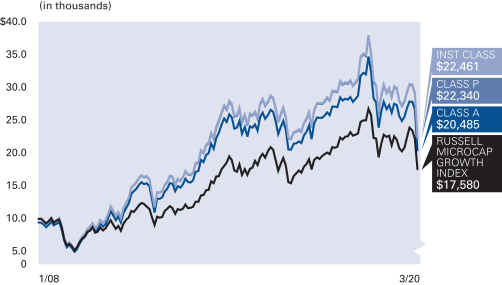
Industry Allocation (as of March 31, 2020)
| | | | |
| |
| Biotechnology | | | 16.3% | |
| |
| Healthcare Equipment & Supplies | | | 15.6% | |
| |
| Software | | | 8.7% | |
| |
| Healthcare Providers & Services | | | 7.6% | |
| |
| Semiconductors & Semiconductor Equipment | | | 5.1% | |
| |
| Healthcare Technology | | | 4.7% | |
| |
| Banks | | | 4.7% | |
| |
| Life Sciences Tools & Services | | | 4.1% | |
| |
| Other | | | 31.5% | |
| |
| Cash & Equivalents — Net | | | 1.7% | |
| | | | | | |
| 102 | | March 31, 2020 | | | Semiannual Report | | |
Unaudited
AllianzGI Ultra Micro Cap Fund (cont’d)
| | | | | | |
| |
| Shareholder Expense Example | | Actual Performance |
| | | Class A | | Class P | | Institutional
Class |
| | | |
| Beginning Account Value (10/1/19) | | $1,000.00 | | $1,000.00 | | $1,000.00 |
| | | |
| Ending Account Value (3/31/20) | | $ 821.50 | | $ 821.50 | | $ 821.50 |
| | | |
| Expenses Paid During Period | | $ 7.10 | | $ 6.92 | | $ 6.79 |
| | | |
| |
| | | Hypothetical Performance |
| | | (5% return before expenses) |
| | | Class A | | Class P | | Institutional
Class |
| | | |
| Beginning Account Value (10/1/19) | | $1,000.00 | | $1,000.00 | | $1,000.00 |
| | | |
| Ending Account Value (3/31/20) | | $1,017.20 | | $1,017.40 | | $1,017.55 |
| | | |
| Expenses Paid During Period | | $ 7.87 | | $ 7.67 | | $ 7.52 |
For each class of the Fund, expenses (net of fee waiver and reimbursement, if any) are equal to the annualized expense ratio for the class (1.56% for Class A, 1.52% for Class P and 1.49% for Institutional Class), multiplied by the average account value over the period, multiplied by 183/366.
| | | | | | |
| | Semiannual Report | | | March 31, 2020 | | 103 |
Unaudited
AllianzGI Water Fund (formerly AllianzGI Global Water Fund)*
For the period of October 1, 2019 through March 31, 2020, as provided by Andreas Fruschki, CFA, Portfolio Manager.
Fund Insights
For thesix-month period ended March 31, 2020, Class A shares at net asset value (“NAV”) of the AllianzGI Water Fund (the “Fund”) returned-10.89%, outperforming the S&P Global Water Index (the “benchmark”), which returned-11.29%.
Market Overview
In the fourth quarter of 2019, global equities surged, with many markets closing the year at or near fresh/multi-month highs. The rally meant many equity markets recorded their strongest annual gains in several years. Sentiment was lifted by the agreement of a “phase one” trade deal between the US and China, better-than-expected third-quarter corporate earnings, further central bank easing and signs that the worst of the slowdown in the global economy may be over. Apick-up in corporate activity also lifted stocks. In addition, the Conservative Party’s decisive victory in the UK general election provided some clarity on Brexit. The “risk on” environment favored emerging markets over developed ones. At a sector level, health care and technology stocks led the advance, while the consumer staples, real estate and utilities sectors underperformed amid a rotation out of higher yielding, defensive assets.
After a steady start to 2020, global equities changed direction inmid-February amid growing evidence that theCOVID-19 outbreak was spreading beyond China. The extended factory shutdowns in China also started to impact the global supply chain. Thesell-off gathered pace as the quarter progressed, with a growing number of countries employing travel restrictions and draconian quarantine measures to try to control the spread of the virus and avoid overloading health care systems. As fears increased that the global economy was heading for a severe recession, most markets entered an official bear market, defined as a retreat of at least 20% from a recent peak. The steep decline meant that global equities suffered their worst quarter since the 2008 financial crisis.
All sectors registered steep declines, with companies suspending dividends and share buyback programs in response to the financial tensions amid the quarantines. Meanwhile, energy stocks almost halved in value as a price war between Russia and Saudi Arabia caused oil prices to hit an18-year low. Industrial companies also performed poorly as airlines were forced to ground their fleets and factories shut, while falling bond yields hit banks’ profit margins. In contrast, health care and consumer staples stocks held up the best, while utility companies were supported by their defensive characteristics. Additionally, technology companies, providers of online content ande-retailers fared relatively well as a growing number of people were forced to stay at home.
Portfolio Review
Over the past 6 months, water related investments delivered strong returns despite market turmoil. Water utilities have once again demonstrated the resilience of the water theme, outperforming their sector peers even during theCOVID-19 market pull back.
The concentration of opportunities within the utility sector was particularly supportive as investors sought safety in more defensively oriented sectors. In addition, the market recognized the secular support for the theme and the long-term drivers, which remain in place despite short to medium demand shifts resulting fromCOVID-19.
The Fund outperformed its benchmark during thesix-month period, which was largely driven by sector allocation, particularly the Fund’s overweight in healthcare and underweight in the industrial sector. The Fund’s stock selection was negative, with picks in information technology and utilities hurting the most.
Due to the current market pullback, the Fund’s focus is on pure play companies with significant revenue exposure to water investments. The Fund not holding Aalberts NV, a technology company that helps to enhance building and project efficiencies, and Conway Co, a company with little exposure to the water space were its largest active contributors. The Fund holding Thermo Fisher Scientific, and being overweight in Pennon Group and American Water Works Co. also contributed to active returns. Thermo Fisher Scientific is a healthcare company that manufactures scientific instruments, consumables and chemicals. They also develop environmental control measurement technology that is used for water, soil and air. In this market pullback, Thermo Fisher is rather insulated as pharma has held up well during the pandemic. In response to theCOVID-19 outbreak, Thermo Fisher has mobilized support through its products that help analyze, diagnose and protect people from the virus. Pennon Group, a UK based water utility, and American Water Works, a US based water utility both benefited from risk off sentiment and the stable nature of their regulated water businesses. More specifically, Pennon Group rallied after it announced the sale of its waste business at an attractive valuation, supporting the overall valuation of the stock. The company is now increasingly attractive given the stable nature of its water business. American Water Works continues to have structural support as seen by the recent $2 trillion infrastructure bill currently being discussed by congress.
In contrast, the Fund holding Itron and SABESP and not holding Algonquin Power Utilities Corp were the largest absolute detractors from results. Itron Inc provides solutions that measure, manage and analyze energy and water usage. Whileyear-to-date, the security is down, we believe that it continues to be a solid long-term investment. Recently it announced a partnership with Panasonic to deliver smart metering solutions in Japan. Like many other countries, Japan has mandated the adoption of smart meters over the next 10 years to help manage utility supply and demand, and Itron is well positioned to capitalize on this trend. SABESB supplies water to the state of Parana in Brazil. This Brazilian utility was challenged due to declining commodity prices affecting the prospects for the Brazilian economy, as well as fears that the government would delay the regulation encouraging the privatization of water assets. We see this as a short-term setback with valuations becoming increasingly attractive as the long-term drivers remain unchanged. The index also holds Algonquin Power Utilities which operates outside the water utility business. As we choose to invest in utilities that mainly focus on water, we have not included Algonquin Power in the Fund. Other detractors to the Fund’s results were underweights in United Utilities Group and Severn Trent. Both are water-based utility companies that operate in the United Kingdom. In a bear market, utilities tend to do better due to their stable business nature. With that being said, the Fund maintains its underweight positions for both due to the uncertainty around what it means to have a nationalized utility.
* Effective February 1, 2020, the Fund changed its name from “AllianzGI Global Water Fund” to “AllianzGI Water Fund”.
| | | | | | |
| 104 | | March 31, 2020 | | | Semiannual Report | | |
Unaudited
AllianzGI Water Fund (formerly AllianzGI Global Water Fund) (cont’d)
Outlook
The current social and economic crisis creates a challenging environment for investing, as the implications on human lives, as well global economies, are difficult to assess. This is further exacerbated by the daily variability of news, assumptions and signals that we are all closely monitoring.
In these conditions, however, we remain committed to the water theme and its long-term solutions, as the basic need for water access, safety of water resources and efficient use of this precious resource remain strong drivers for the businesses we invest in.
The global water strategy has historically been an attractive asset and we believe continues to be an attractive asset in spite of the uncertainty due to the global economic impacts ofCOVID-19 and recent oil price moves. The markets continue to be volatile. During this time, the water theme remains unchanged as the investment needs continue to be supported by significant secular drivers, supporting the outlook for sustainable growth. We have seen the strategy hold up during this time of uncertainty, and we believe the outlook continues to be equally attractive. In our view, the defensive nature of some of the investments offers a downside cushion during this time of uncertainty, while the portfolio also remains positioned to capture growth opportunities stemming from increasing spending and innovation needs in the water space. We will continue to monitor the effect of the human and economic activity in months to come, assessing the economic impact and the market moves. We remain convinced that the water theme offers an attractive diversification opportunity during this transient volatile time.
Adequate water infrastructure in developing countries continues to be an issue with population growth, industrial evolution and climate change further increasing the need for investments, with this current crisis only further emphasizing the need for clean water. We have begun to see developed nations like the United States make the very necessary investments. In developing regions, the attractive investment opportunity is anchored in the lack of adequate water infrastructure combined with rising living standards and growing income levels. In order for these nations to continue to progress, significant infrastructure investments are required. Given economic slowdown and low to negative interests rates globally, the prospects for infrastructure stimulus are increasingly attractive, with the US already proposing a $2 trillion in spending bill. Water quality is also under growing scrutiny, with emerging contaminants on the rise. The negative health consequences and moral and legal responsibility to deliver water of sufficient quality is driving up the demand for enhanced water monitoring and treatment solutions. The global pandemic emphasizes this need given the need for clean water to combat the spread of the virus.
In order to capitalize on these opportunities, we invest in companies that offer solutions to growing water scarcity issues. We believe these companies stand to benefit from the required investments in water infrastructure and resource management solutions. We seek to invest, under normal circumstances, at least 80% of the Fund’s net assets in equities that are substantially engaged in water-related activities. We target investments with the most attractive combination of alignment to the United National Sustainable Development Goals (SDGs) related to water resource management and clean water access, and high-quality companies with significant exposure to the water end markets. We believe this combination offers investors the most attractive and effective long-term exposure to the water theme.
Average Annual Total Return for the period ended March 31, 2020
| | | | | | | | | | | | | | | | | | | | | | |
| | | | | | |
| | | | | 6 Month* | | | 1 Year | | | 5 Year | | | 10 Year | | | Since Inception† | |
| | | AllianzGI Water Fund Class A | | | –10.89% | | | | –3.23% | | | | 4.37% | | | | 7.00% | | | | 4.28% | |
| | AllianzGI Water Fund Class A (adjusted) | | | –15.79% | | | | –8.55% | | | | 3.19% | | | | 6.40% | | | | 3.79% | |
| | | AllianzGI Water Fund Class C | | | –11.18% | | | | –3.87% | | | | 3.59% | | | | 6.18% | | | | 3.49% | |
| | AllianzGI Water Fund Class C (adjusted) | | | –12.05% | | | | –4.81% | | | | 3.59% | | | | 6.18% | | | | 3.49% | |
| | AllianzGI Water Fund Class P | | | –10.76% | | | | –2.91% | | | | 4.65% | | | | 7.25% | | | | 4.53% | |
| | AllianzGI Water Fund Institutional Class | | | –10.73% | | | | –2.91% | | | | 4.66% | | | | 7.31% | | | | 4.60% | |
| | S&P Global Water Index | | | –11.29% | | | | –3.84% | | | | 6.01% | | | | 8.84% | | | | 6.27% | |
| | MSCI ACWI | | | –14.33% | | | | –11.26% | | | | 2.85% | | | | 5.88% | | | | 3.81% | |
| | | Lipper Global Natural Resources Funds Average | | | –29.25% | | | | –32.23% | | | | –8.97% | | | | –5.15% | | | | –7.16% | |
* Cumulative return
† The Fund began operations on March 31, 2008. Benchmark return comparisons began on the fund inception date. Lipper performance comparisons began on March 31, 2008.
Performance quoted represents past performance and is no guarantee of future results. Current performance may be lower or higher than performance shown. For performance current to the most recent month-end, visit our website at us.allianzgi.com. Investment return and the principal value will fluctuate. Shares may be worth more or less than original cost when redeemed.The adjusted returns take into account the maximum initial sales charge of 5.50% on Class A shares and the contingent deferred sales charge (CDSC) of 1% on Class C shares, which may apply to shares redeemed during the first year of ownership. Returns do not reflect deduction of taxes that a shareholder would pay on fund distributions or redemption of fund shares. See pages 107 and 108 for more information. The Fund’s gross expense ratios are 1.40% for Class A shares, 2.15% for Class C shares, 1.17% for Class P shares and 1.18% for Institutional Class shares. These ratios do not include an expense reduction contractually guaranteed through at least January 31, 2021. The Fund’s expense ratios net of this reduction are 1.22% for Class A shares, 1.97% for Class C shares, 0.94% for Class P shares and 0.93% for Institutional Class shares. Expense ratio information is as of the Fund’s current prospectus dated February 1, 2020, as further revised or supplemented from time to time.
| | | | | | |
| | Semiannual Report | | | March 31, 2020 | | 105 |
Unaudited
AllianzGI Water Fund (formerly AllianzGI Global Water Fund) (cont’d)
Cumulative Returns Through March 31, 2020
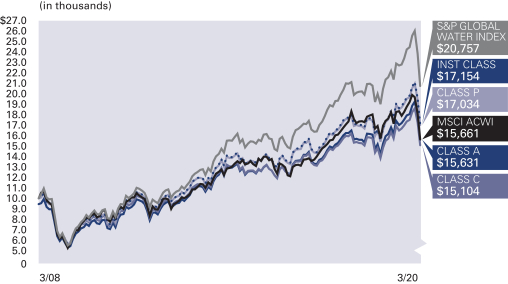
Country /Location Allocation (as of March 31, 2020)
| | | | |
| |
| United States | | | 57.1% | |
| |
| United Kingdom | | | 14.1% | |
| |
| France | | | 7.6% | |
| |
| Switzerland | | | 5.9% | |
| |
| Sweden | | | 3.5% | |
| |
| China | | | 3.2% | |
| |
| Brazil | | | 2.3% | |
| |
| Netherlands | | | 1.5% | |
| |
| Other | | | 2.6% | |
| |
| Cash & Equivalents — Net | | | 2.2% | |
| | | | | | | | |
| |
| Shareholder Expense Example | | Actual Performance |
| | | Class A | | Class C | | Class P | | Institutional
Class |
| | | | |
| Beginning Account Value (10/1/19) | | $1,000.00 | | $1,000.00 | | $1,000.00 | | $1,000.00 |
| | | | |
| Ending Account Value (3/31/20) | | $891.10 | | $888.20 | | $892.40 | | $892.70 |
| | | | |
| Expenses Paid During Period | | $ 5.77 | | $ 9.30 | | $ 4.45 | | $ 4.40 |
| | | |
| |
| | | Hypothetical Performance |
| | | (5% return before expenses) |
| | | Class A | | Class C | | Class P | | Institutional
Class |
| | | | |
| Beginning Account Value (10/1/19) | | $1,000.00 | | $1,000.00 | | $1,000.00 | | $1,000.00 |
| | | | |
| Ending Account Value (3/31/20) | | $1,018.90 | | $1,015.15 | | $1,020.30 | | $1,020.35 |
| | | | |
| Expenses Paid During Period | | $ 6.16 | | $ 9.92 | | $ 4.75 | | $ 4.70 |
For each class of the Fund, expenses (net of fee waiver and reimbursement, if any) are equal to the annualized expense ratio for the class (1.22% for Class A, 1.97% for Class C, 0.94% for Class P and 0.93% for Institutional Class), multiplied by the average account value over the period, multiplied by 183/366.
| | | | | | |
| 106 | | March 31, 2020 | | | Semiannual Report | | |
Unaudited
Important Information
The inception date on each Fund Summary page is the inception date of the Fund’s oldest share class or classes. The AllianzGI Global Allocation Fund reorganized on May 4, 2009 when its predecessor merged into the Trust. The Global Allocation Fund’s shares were first offered in 9/98. On April 12, 2010, the following funds reorganized when their predecessors merged into series of the Trust (including fund’s inception date): AllianzGI Convertible Fund (4/93), AllianzGI High Yield Bond Fund (7/96), AllianzGI International Small-Cap Fund (12/97), AllianzGI Micro Cap Fund (7/95), AllianzGI Ultra Micro Cap Fund (1/08). For each of the reorganized funds, Institutional Class is the oldest share class, except that for AllianzGI International Small-Cap Fund, the oldest share class of the predecessor fund merged into Class P.
The Target-Date Funds are designed to offer individual investors comprehensive asset allocation strategies tailored to the approximate date when they expect to begin withdrawing assets. The target date included in the Fund’s name does not necessarily represent the specific year an investor will begin withdrawing assets. It is intended only as a general guide. Each Fund follows a target asset allocation schedule that changes over time to help reduce portfolio risk, increasing its exposure to conservative investments as the target date approaches. The principal value of a Fund is not guaranteed at any time, including the target date. A Fund’s shareholders may experiences losses, including losses near, at or after the target year indicated in the Fund’s name.
Returns measure performance from the inception of the oldest share class to the present, so some returns predate the inception of the actual share class. Those returns are calculated by adjusting the returns of the oldest share class to reflect the indicated share class’s different operating expenses. Total return performance assumes that all dividend and capital gain distributions were reinvested on the payable date.
Class A shares are subject to an initial sales charge. Class C shares are subject to a 1% contingent deferred sales charge (“CDSC”) for shares redeemed in the first year. Class R shares are generally available only to 401(k) plans, 457 plans, employer sponsored 403(b) plans, profit sharing and money purchase pension plans, defined benefit plans, non-qualified deferred compensation plans and healthcare benefit funding plans. Class P shares are offered primarily through certain asset allocation, wrap fee and other similar programs offered by broker-dealers and other intermediaries. Class P shares may also be offered for direct investment by other investors such as pension and profit sharing plans, employee benefit trusts and plan alliances, endowments, foundations and corporations. Institutional Class shares are offered primarily for direct investment by investors such as pension and profit sharing plans, employee benefit trusts, endowments, foundations, corporations and high net worth individuals. Administrative Class shares are offered primarily through employee benefit plan alliances, broker-dealers and other intermediaries. Class R6 shares are offered primarily for 401(k) plans, 457 plans, employer sponsored 403(b) plans, profit sharing and money purchase pension plans, defined benefit plans, non-qualified deferred compensation plans, healthcare benefit funding plans and other specified benefit plans and accounts whereby the plan or the plan’s broker, dealer or other financial Intermediary has an agreement with the Distributor or the Investment Manager to utilize Class R6 shares In certain Investment products or programs.
Class D and Class B shares were converted into Class A shares on November 13, 2015 and December 4, 2015, respectively.
The Lipper Averages are calculated by Lipper, Inc. They are based on the total return performance, with distributions reinvested and operating expenses deducted, of funds included by Lipper in the stated category. Lipper does not take into account sales charges.
The Cumulative Returns charts for each Fund assume the initial investment was made on the first day of the Fund’s initial fiscal year. The charts reflect any sales load that would have applied at the time of purchase or any CDSC that would have applied if a full redemption occurred on the last business day of the most recent fiscal year. Results assume that all dividends and capital gain distributions were reinvested. They do not take into account the effect of taxes. The benchmark cumulative return began on the last day of the month of the respective Fund’s inception date.
“Cash & Equivalents—Net” in the Allocation Summaries may be comprised of cash, repurchase agreements, U.S. Treasury Bills, options purchased, options written and other assets net of other liabilities including net unrealized appreciation (depreciation) on futures contracts, forward foreign currency contracts and swap agreements, as applicable.
Proxy Voting
The Funds’ Investment Manager has adopted written proxy voting policies and procedures (the “Proxy Policy”) as required by Rule 206(4)-6 under the Investment Advisers Act of 1940. The Proxy Policy has been adopted by Allianz Funds Multi-Strategy Trust (the “Trust”) as the policies and procedures that the Investment Manager will use when voting proxies on behalf of the Funds. Copies of the written Proxy Policy and the factors that the Investment Manager may consider in determining how to vote proxies for each Fund, and information about how each Fund voted proxies relating to portfolio securities held during the most recent twelve-month period ended June 30, are available without charge, upon request, by calling1-800-988-8380 (retail classes: A, C & R) or1-800-498-5413 (Class P, R6, Institutional & Administrative classes), on the Allianz Global Investors Distributors LLC’s website at us.allianzgi.com, and on the Securities and Exchange Commission’s (“SEC”) website at http://www.sec.gov.
Form N-PORT
The Trust files complete schedules of each Fund’s portfolio holdings with the SEC on Form N-PORT for the first and third quarters of the fiscal year; such filings are available on the SEC’s website at http://www.sec.gov. A copy of the Trust’s Form N-PORT, when available, will be provided without charge, upon request, by calling1-800-988-8380 (Class A, Class C and Class R) or 1-800-498-5413 (Class P, Class R6, Institutional and Administrative classes). A description of the Trust’s policies and procedures with respect to the disclosure of each Fund’s portfolio holdings is available in the Trust’s Statement of Additional Information. The Investment Manager will post each Fund’s holdings information on the Fund’s website at us.allianzgi.com. Each Fund’s website will contain a complete schedule of portfolio holdings as of the relevant month end. The information will be posted on the website approximately thirty (30) calendar days after the relevant month’s end. Portfolio holdings information for each Fund will remain accessible on its website until the Trust files its Form N-CSR, or Form N-PORT (for the last month of the Fund’s first or third fiscal quarters), with the SEC for the period that
| | | | | | |
| | Semiannual Report | | | March 31, 2020 | | 107 |
Unaudited
Important Information (cont’d)
includes the date as of which the website information is current. The Trust’s policies with respect to the disclosure of the portfolio holdings are subject to change without notice.
The following disclosure provides important information regarding each Fund’s Shareholder Expense Example, which appears on each Fund Summary page in this Semiannual Report. Please refer to this information when reviewing the Shareholder Expense Example for a Fund.
Shareholder Expense Example
Shareholders of a Fund incur two types of costs: (1) transaction costs; and (2) ongoing costs, including investment management fees; distribution and/or service (12b-1) fees and other Fund expenses. The Shareholder Expense Example is intended to help shareholders understand ongoing costs (in dollars) of investing in a Fund and to compare these costs with the ongoing costs of investing in other mutual funds. The Shareholder Expense Example is based on an investment of $1,000.00 invested at the beginning of the period, as indicated, and held for the entire period through March 31, 2020.
Actual Expenses
The information in the table under the heading “Actual Performance” provides information about actual account values and actual expenses. You may use the information in these columns, together with the amount you invested, to estimate the expenses that you paid over the period. Simply divide your account value by $1,000.00 (for example, an $8,600.00 account value divided by $1,000.00 = 8.6), then multiply the result by the number in the appropriate column for your share class, in the row entitled “Expenses Paid During Period”, to estimate the expenses you paid on your account during this period.
Hypothetical Example for Comparison Purposes
The information in the table under the heading “Hypothetical Performance (5% return before expenses)” provides information about hypothetical account values and hypothetical expenses based on a Fund’s actual expense ratio and an assumed rate of return of 5% per year before expenses, which is not a Fund’s actual return. The hypothetical account values and expenses may not be used to estimate the actual ending account balance or expenses you paid for the period. You may use this information to compare the ongoing costs of investing in a Fund and other funds. To do so, compare this 5% hypothetical example with the 5% hypothetical examples that appear in the shareholder reports of other funds.
Please note that the expenses shown in the table are meant to highlight your ongoing costs only and do not reflect any transactional costs. Therefore, the information under the heading “Hypothetical Performance (5% return before expenses)” is useful in comparing ongoing costs only, and will not help you determine the relative total costs of owning different funds. In addition, if these transactional costs were included, your costs would have been higher.
Shareholders may be subject to an annual fee of $15 for any accounts, including fiduciary accounts, with balances that fall below $1,000. This fee is not included in the shareholder expense example. If you are subject to the fee, keep it in mind when you are estimating the ongoing expenses of investing in the Funds and when comparing the expenses of these Funds with other funds.
Credit Ratings
Credit ratings apply to the underlying holdings of a Fund and not the Fund itself and are divided into categories ranging from highest to lowest credit quality.
With respect to AllianzGI Core Bond Fund, AllianzGI Core Plus Bond Fund, AllianzGI Green Bond Fund, AllianzGI Floating Rate Note Fund and AllianzGI Preferred Securities and Income Fund, the presentation of credit ratings information in this report use the highest available rating provided by S&P, Moody’s or Fitch to ensure the quality of the portfolios.
With respect to AllianzGI Emerging Markets SRI Debt Fund, presentations of credit ratings information in this report use ratings provided by Moody’s because of, among other reasons, the access to background information and other materials provided by Moody’s, as well as the Funds’ considerations of industry practice. With respect to AllianzGI Convertible Fund, AllianzGI High Yield Bond Fund, AllianzGI Short Duration High Income Fund and AllianzGI Short Term Bond Fund, presentations of credit ratings information in this report use ratings provided by S&P because of, among other reasons, the applicable portfolio managers’ usage of S&P ratings methodology among other credit quality information in managing the respective portfolios, access to background information and other materials provided by S&P, as well as the Funds’ considerations of industry practice. The Funds also display S&P credit ratings information in materials provided in client presentations.
With respect to AllianzGI Global High Yield Fund, the presentation of credit ratings information in this report uses the lowest available rating provided by S&P, Moody’s or Fitch to ensure the most conservative presentation of the quality of the portfolio.
Except for the methodologies described above for AllianzGI Floating Rate Note Fund, AllianzGI Global High Yield Fund and AllianzGI Green Bond Fund, securities not rated by Moody’s or S&P, or securities that do not have a rating available from Moody’s or S&P are designated as “NR” and “NA”, respectively. Credit quality ratings assigned by a rating agency are subjective opinions, not statements of fact, and are subject to change periodically, even as frequently as daily. Ratings assigned by Moody’s, S&P or another rating agency are not absolute standards of credit quality and do not evaluate market risk. Rating agencies may fail to make timely changes in credit ratings, and an issuer’s current financial condition may be better or worse than a rating indicates. In formulating investment decisions for the applicable Funds, Allianz Global Investors U.S. LLC develops its own analysis of the credit quality and risks associated with individual debt instruments, rather than relying exclusively on rating agencies or third-party research.
All the information on the Fund Summary pages, including Fund Insights, Average Annual Total Return tables and Cumulative Returns charts, Shareholder Expense Examples and Allocation/Credit Rating Summaries is unaudited.
Allianz Global Investors Distributors LLC, 1633 Broadway, New York, NY, 10019, us.allianzgi.com, 1-800-988-8380 (retail classes: A, C & R) or 1-800-498-5413 (Class P, R6, Institutional & Administrative classes).
| | | | | | |
| 108 | | March 31, 2020 | | | Semiannual Report | | |
Unaudited
Benchmark Descriptions
Unless otherwise noted, index returns reflect the reinvestment of income dividends and capital gains, if any, but do not reflect fees, brokerage commissions or other expenses of investing. It is not possible to invest directly in an index.
Prior to November 1, 2006, performance data for the MSCI Indices was calculated gross of dividend tax withholding. Performance data presently shown for the Indices is net of dividend tax withholding. This recalculation results in lower performance for the Indices.
| | |
| Index | | Description |
| AllianzGI 2020 Strategic Benchmark, AllianzGI 2025 Strategic Benchmark, AllianzGI 2030 Strategic Benchmark, AllianzGI 2035 Strategic Benchmark, AllianzGI 2040 Strategic Benchmark, AllianzGI 2045 Strategic Benchmark, AllianzGI 2050 Strategic Benchmark and AllianzGI 2055 Strategic Benchmark | | The AllianzGI 2020 Strategic Benchmark, AllianzGI 2025 Strategic Benchmark, AllianzGI 2030 Strategic Benchmark, AllianzGI 2035 Strategic Benchmark, AllianzGI 2040 Strategic Benchmark, AllianzGI 2045 Strategic Benchmark, AllianzGI 2050 Strategic Benchmark and AllianzGI 2055 Strategic Benchmark each represents the performance of a custom blended index developed by AllianzGI U.S., it is comprised of three underlying indices: MSCI USA Index, MSCI ACWI ex USA Index and Bloomberg Barclays U.S. Aggregate Bond Index. The strategic weights to these indices reflect the glidepath which starts with a 93% weight to the Equity Indices, becoming more conservative to end 5 years past the target retirement date with 30% weight to the equity indices. |
| |
| AllianzGI Multi Asset Income Strategic Benchmark | | The AllianzGI Multi Asset Income StrategicBenchmark represents the performance of a custom blended index developed by the Manager, it is comprised of three underlying indices: 20% MSCI USA Index, 10% MSCI ACWI ex USA Index and 70% Bloomberg Barclays US Aggregate Bond Index. |
| |
| Bloomberg Barclays Global High Yield Index | | The Bloomberg Barclays Global High Yield Index is a multi-currency flagship measure of the global high yield debt market. The index represents the union of the U.S. High Yield, the Pan-European High Yield, and Emerging Markets (EM) Hard Currency High Yield Indices. |
| |
| Bloomberg Barclays U.S. Aggregate Bond Index | | The Bloomberg Barclays U.S. Aggregate Bond Index represents securities that are SEC-registered, taxable, and U.S. dollar denominated. The index covers the U.S. investment grade fixed rate bond market, with index components for government and corporate securities, mortgage pass-through securities, and asset-backed securities. |
| |
| Bloomberg Barclays U.S. Credit Index | | The Bloomberg Barclays U.S. Credit Index is the credit component of the U.S. Government/Credit Index. It includes publicly issued U.S. corporate and specified foreign debentures and secured notes that meet the specified maturity, liquidity and quality requirements. To qualify, bonds must be SEC-registered. |
| |
| Bloomberg Barclays U.S. Government Bond Index | | The Bloomberg Barclays U.S. Bond Index is a market capitalization-weighted index, meaning the securities in the index are weighted according to the market size of each bond type. Most U.S. traded investment grade bonds are represented. |
| |
| Bloomberg Barclays U.S. Government/Credit 1-3 Year Index | | The Bloomberg Barclays U.S. Government/Credit 1-3 Year Index is the 1-3 Year component of the U.S. Government/Credit Index. The Government Index includes treasuries and agencies. The Credit Index includes publicly issued U.S. corporate and foreign debentures and secured notes that meet specified maturity, liquidity, and quality requirements. |
| |
| Bloomberg Barclays US Treasury US TIPS Index | | The Bloomberg Barclays U.S. Treasury U.S. TIPS Index consists of Inflation-Protection securities issued by the U.S. Treasury. |
| |
| Bloomberg Barclays U.S. Universal Bond Index | | The Bloomberg Barclays U.S. Universal Bond Index represents the union of the U.S. Aggregate Index, the U.S. High-Yield Corporate Index, the 144A Index, the Eurodollar Index, the Emerging Markets Index, and the non-ERISA portion of the CMBS Index. Municipal debt, private placements, and non-dollar-denominated issues are excluded from the Universal Index. The only constituent of the index that includes floating-rate debt is the Emerging Markets Index. |
| |
| Dow Jones Sustainability World Total Return Composite Net Index | | The Dow Jones Sustainability World Total Return Index tracks the performance of the top 10% of the 2500 largest companies in the S&P Global Broad Market Index that are the world’s sustainability leaders based on economic, environmental and social criteria. |
| |
| ICE BofA 0-3 Month US Treasury Bill Index | | The ICE BofA 0-3 Month US Treasury Bill Index is a subset of ICE BofA US Treasury Bill Index including all securities with a remaining term to final maturity less than 3 months. |
| | | | | | |
| | Semiannual Report | | | March 31, 2020 | | 109 |
Unaudited
Benchmark Descriptions (cont’d)
| | |
| Index | | Description |
| ICE BofA 1-3 Year BB U.S. Cash Pay High Yield Index | | The ICE BofA 1-3 Year BB U.S. Cash Pay High Yield Index is a subset of the ICE BofA U.S. Cash Pay High Yield Index, including all securities with a remaining term to final maturity less than 3 years and rated BB1 through BB3, inclusive. The ICE BofA US Cash Pay High Yield Index tracks the performance of U.S. dollar-denominated below investment grade corporate debt, currently in a coupon paying period, that is publicly issued in the U.S. domestic market. |
| |
| ICE BofA 3-Month U.S. Treasury Bill Index | | The ICE BofA 3-Month U.S. Treasury Bill Index tracks the performance of the3-month U.S. Treasury markets. |
| |
| ICE BofA US Convertibles Index | | The ICE BofA US Convertible Index is a widely used, unmanaged index that measures the performance of U.S. dollar-denominated convertible securities not currently in bankruptcy with a total market value greater than $50 million at issuance. |
| |
| ICE BofA Fixed Rate Preferred Securities Index | | The ICE BofA Fixed Rate Preferred Securities Index tracks the performance of fixed rate US dollar denominated preferred securities issued in the US domestic market. |
| |
| ICE BofA Global High Yield Constrained Index | | The ICE BofA Global High Yield Constrained Index contains all securities in the ICE BofA Global High Yield Index USD but caps issuer exposure at 2%. The ICE BofA Global High Yield Index tracks the performance of below investment grade corporate debt publicly issued in the major domestic or eurobond markets. |
| |
| ICE BofA Green Bond Index | | The ICE BofA Green Bond Index tracks the performance of securities issued for qualified “green” purposes. Qualifying bonds must have a clearly designated use of proceeds that is solely applied toward projects or activities that promote climate change mitigation or adaptation or other environmental sustainability purposes. |
| |
| ICE BofA High Yield Master II Index | | The ICE BofA High Yield Master II Index is an unmanaged index consisting of US dollar-denominated bonds that are issued in countries having a BBB3 or higher debt rating with at least one year remaining until maturity. All bonds must have a credit rating below investment grade but not in default. |
| |
| ICE BofA US Treasury Bill Index | | The ICE BofA US Treasury Bill Index tracks the performance of US dollar denominated US Treasury Bills publicly issued in the US domestic market. |
| |
| JP Morgan Emerging Markets Bond Index Global Diversified (EMBI Global Diversified) | | The JP Morgan Emerging Markets Bond Index Global Diversified (EMBI Global Diversified) is a uniquely-weighted version of the EMBI Global. It limits the weights of those index countries with larger debt stocks by only including specified portions of these countries’ eligible current face amounts of debt outstanding. The countries covered in the EMBI Global Diversified are identical to those covered by the EMBI Global. |
| |
| JP Morgan JESG Emerging Markets Bond Global Diversified Index JPM (JESG EMBI Global Diversified) | | The JP Morgan JESG Emerging Markets Bond Global Diversified Index JPM (JESG EMBI Global Diversified) integrates environmental, social, and governance (ESG) factors to the baseline index (EMBI Global Diversified). |
| |
Morningstar Lifetime Moderate 2020, Morningstar Lifetime Moderate 2025, Morningstar Lifetime Moderate 2030, Morningstar Lifetime Moderate 2035, Morningstar Lifetime Moderate 2040, Morningstar Lifetime Moderate 2045, Morningstar Lifetime Moderate 2050 and Morningstar Lifetime Moderate 2055 | | The Morningstar Lifetime Moderate 2020, Morningstar Lifetime Moderate 2025, Morningstar Lifetime Moderate 2030, Morningstar Lifetime Moderate 2035, Morningstar Lifetime Moderate 2040, Morningstar Lifetime Moderate 2045, Morningstar Lifetime Moderate 2050 and Morningstar Lifetime Moderate 2055 Indices each represents a portfolio of global equities, bonds and traditional inflation hedges such as commodities and TIPS. The portfolio is held in proportions appropriate for a U.S. investor’s investment horizon until retirement. The moderate risk profile is for investors who are comfortable with average exposure to equity market volatility. |
| MSCI ACWI ex USA Growth Index | | The MSCI ACWI ex USA Growth Index captures large and mid-cap securities exhibiting overall growth style characteristics across developed and emerging markets, excluding the United States. |
| |
| MSCI ACWI ex USA Index | | The MSCI ACWI ex USA Index captures large and mid cap representation across Developed Markets countries (excluding the U.S.) and Emerging Markets countries. The index covers approximately 85% of the global equity opportunity set outside the US. |
| | | | | | |
| 110 | | March 31, 2020 | | | Semiannual Report | | |
Unaudited
Benchmark Descriptions (cont’d)
| | |
| Index | | Description |
MSCI All Country World Index
(Also known as: MSCI AC World Index and MSCI ACWI) | | The MSCI All Country World Index (ACWI) captures large and mid-cap representation across the Developed Markets and Emerging Markets countries. The index covers approximately 85% of the global investable equity opportunity set. |
| |
| MSCI EAFE Index | | The MSCI EAFE Index is an equity index which captures large and mid-cap representation across Developed Markets countries around the world, excluding the US and Canada. |
| |
| MSCI EAFE Small Cap Index | | The MSCI EAFE Small Cap Index is an equity index which captures small cap representation across Developed Markets countries around the world, excluding the US and Canada. |
| |
| MSCI Emerging Markets Index | | The MSCI Emerging Markets Index captures large and mid-cap representation across Emerging Markets countries. The index covers approximately 85% of the free float-adjusted market capitalization in each country. |
| |
| MSCI Emerging Markets Small-Cap Index | | The MSCI Emerging Markets Small-Cap Index includes small cap representation across Emerging Markets countries. The index covers approximately 14% of the free float-adjusted market capitalization in each country. The small cap segment tends to capture more local economic and sector characteristics relative to larger Emerging Markets capitalization segments. |
| |
| MSCI World ex USA Small Cap Index | | The MSCI World ex USA Small Cap Index captures small cap representation across Developed Markets countries (excluding the United States). The index covers approximately 14% of the free float-adjusted market capitalization in each country. |
| |
| MSCI World High Dividend Yield Index | | The MSCI World High Dividend Yield Index is based on the MSCI World Index, its parent index, and includes large and mid cap stocks across Developed Markets countries. The index is designed to reflect the performance of equities in the parent index (excluding REITs) with higher dividend income and quality characteristics than average dividend yields that are both sustainable and persistent. The index also applies quality screens and reviews 12-month past performance to omit stocks with potentially deteriorating fundamentals that could force them to cut or reduce dividends. |
| |
| MSCI World Index | | The MSCI World Index captures large and mid cap representation across Developed Markets countries. The index covers approximately 85% of the free float-adjusted market capitalization in each country. |
| |
| Russell 2000 Index | | The Russell 2000 Index measures the performance of the small cap segment of the U.S. equity universe. The Russell 2000 Index is a subset of the Russell 3000 Index representing approximately 10% of total market capitalization of that index. It includes approximately 2000 of the smallest securities based on a combination of their market cap and current index membership. |
| |
| Russell Microcap Growth Index | | The Russell Microcap Growth Index measures the performance of the microcap growth segment of the US equity market. It includes those Russell Microcap Index companies with higherprice-to-book ratios and higher forecasted growth values. |
| |
| Russell Microcap Index | | The Russell Microcap Index measures the performance of the microcap segment of the U.S. equity market. It makes up less than 3% of the U.S. equity market. |
| |
| S&P 500 Financials Index | | The S&P 500 Financials Index comprises those companies included in the S&P 500 that are classified as members of the GICS® financials sector. |
| |
| S&P 500 Index | | The S&P 500 Index is an unmanaged index of large capitalization common stocks. |
| |
| S&P Global Water Index | | The S&P Global Water Index is comprised of 50 of the largest publicly traded companies in water-related businesses that meet specific investability requirements. This index is designed to provide liquid exposure to the leading publicly-listed companies in the global water industry, from both developed markets and emerging markets. |
| |
| USD Overnight LIBOR | | USD Overnight LIBOR (London Inter-Bank Offered Rate) Index is the average interest rate at which leading banks in London borrow U.S. dollar funds from one another with a maturity of one day (overnight). |
| | | | | | |
| | Semiannual Report | | | March 31, 2020 | | 111 |
Schedule of Investments
March 31, 2020 (unaudited)
AllianzGI Retirement 2020 Fund
| | | | | | | | |
| | | Shares | | | Value | |
|
| Mutual Funds(a)—100.2% | |
AllianzGI Core Bond (c) | | | 214,893 | | | | $3,317,950 | |
AllianzGI Emerging MarketsSmall-Cap (b) | | | 5,877 | | | | 69,530 | |
AllianzGI Global Dynamic Allocation (c) | | | 508,247 | | | | 7,984,568 | |
| | | | | | | | |
Total Mutual Funds
(cost—$12,494,066) | | | | | | | 11,372,048 | |
| | | | | | | | |
| | | | | | | | |
| | | Principal
Amount
(000s) | | | Value | |
|
| Repurchase Agreements—1.9% | |
State Street Bank and Trust Co., dated 3/31/20, 0.00%, due 4/1/20, proceeds $219,000; collateralized by U.S. Treasury Notes, 2.75%, due 4/30/23, valued at $228,288 including accrued interest | |
(cost—$219,000) | | | $219 | | | $ | 219,000 | |
| | | | | | | | |
| |
Total Investments
(cost—$12,713,066)—102.1% | | | | 11,591,048 | |
| | | | | | | | |
| | |
| Liabilities in excess of other assets (d)—(2.1)% | | | | | | | (239,919 | ) |
| | | | | | | | |
| | |
| Net Assets—100.0% | | | | | | | $11,351,129 | |
| | | | | | | | |
Notes to Schedule of Investments:
(a) Affiliated fund.
(b) Institutional Class share.
(c) Class R6 share.
(d) Includes net unrealized appreciation (depreciation) of other financial instruments as follows:
| | | | | | | | | | | | | | | | | | | | | | |
|
| Futures contracts outstanding at March 31, 2020: | |
| Type | | | | Contracts | | | Expiration
Date | | | Notional
Amount
(000s) | | | Market
Value
(000s) | | | Unrealized
Appreciation
(Depreciation) | |
Long position contracts: | | | | | | | | | | | | | | | | | | | | |
| | E-mini Russell 2000 Index | | | 2 | | | | 6/19/20 | | | $ | — | (f) | | $ | 115 | | | $ | (4,569 | ) |
| | E-mini S&P 500 Index | | | 2 | | | | 6/19/20 | | | | — | (f) | | | 257 | | | | 7,245 | |
| | | | | | | | | | | | | | | | | | | | | | |
| | | | | | | | | | | | | | | | | | | | $ | 2,676 | |
| | | | | | | | | | | | | | | | | | | | | | |
| | | | | |
Short position contracts: | | | | | | | | | | | | | | | | | | | | |
| | Mini MSCI Emerging Markets Index | | | (3 | ) | | | 6/19/20 | | | $ | (— | )(f) | | $ | (126 | ) | | $ | (4,245 | ) |
| | MSCI EAFE Index | | | (4 | ) | | | 6/19/20 | | | | (— | )(f) | | | (312 | ) | | | (30,649 | ) |
| | | | | | | | | | | | | | | | | | | | | | |
| | | | | | | | | | | | | | | | | | | | $ | (34,894 | ) |
| | | | | | | | | | | | | | | | | | | | | | |
| | | | | | | | | | | | | | | | | | | | $ | (32,218 | ) |
| | | | | | | | | | | | | | | | | | | | | | |
(e) At March 31, 2020, the Fund pledged $360,897 in cash as collateral for futures contracts.
(f) Notional amount rounds to less than 500.
Glossary:
EAFE — Europe, Australasia and Far East
MSCI — Morgan Stanley Capital International
| | | | | | |
| 112 | | Semiannual Report | | | March 31, 2020 | | | See accompanying Notes to Financial Statements |
Schedule of Investments
March 31, 2020 (unaudited)
AllianzGI Retirement 2025 Fund
| | | | | | | | |
| | | Shares | | | Value | |
|
| Mutual Funds(a)—94.9% | |
AllianzGI Core Bond (c) | | | 42,941 | | | | $663,003 | |
AllianzGI Emerging MarketsSmall-Cap (b) | | | 8,315 | | | | 98,371 | |
AllianzGI Global Dynamic Allocation (c) | | | 946,020 | | | | 14,861,966 | |
| | | | | | | | |
| |
Total Investments
(cost—$17,991,221)—94.9% | | | | 15,623,340 | |
| | | | | | | | |
| | |
| Other assets less liabilities (d)—5.1% | | | | | | | 836,867 | |
| | | | | | | | |
| | |
| Net Assets—100.0% | | | | | | | $16,460,207 | |
| | | | | | | | |
Notes to Schedule of Investments:
(a) Affiliated fund.
(b) Institutional Class share.
(c) Class R6 share.
(d) Includes net unrealized appreciation (depreciation) of other financial instruments as follows:
| | | | | | | | | | | | | | | | | | | | | | |
|
| Futures contracts outstanding at March 31, 2020: | |
| Type | | Contracts | | | Expiration
Date | | | Notional
Amount
(000s) | | | Market
Value
(000s) | | | Unrealized
Appreciation
(Depreciation) | |
Long position contracts: | | | | | | | | | | | | | | | | | | | | |
| | E-mini Russell 2000 Index | | | 2 | | | | 6/19/20 | | | $ | — | (f) | | $ | 115 | | | $ | (4,569 | ) |
| | E-mini S&P 500 Index | | | 5 | | | | 6/19/20 | | | | — | (f) | | | 642 | | | | 27,736 | |
| | | | | | | | | | | | | | | | | | | | | | |
| | | | | | | | | | | | | | | | | | | | $ | 23,167 | |
| | | | | | | | | | | | | | | | | | | | | | |
| | | | | |
Short position contracts: | | | | | | | | | | | | | | | | | | | | |
| | Mini MSCI Emerging Markets Index | | | (7 | ) | | | 6/19/20 | | | $ | (— | )(f) | | $ | (295 | ) | | $ | (9,905 | ) |
| | MSCI EAFE Index | | | (9 | ) | | | 6/19/20 | | | | (— | )(f) | | | (702 | ) | | | (68,961 | ) |
| | | | | | | | | | | | | | | | | | | | | | |
| | | | | | | | | | | | | | | | | | | | $ | (78,866 | ) |
| | | | | | | | | | | | | | | | | | | | | | |
| | | | | | | | | | | | | | | | | | | | $ | (55,699 | ) |
| | | | | | | | | | | | | | | | | | | | | | |
(e) At March 31, 2020, the Fund pledged $984,296 in cash as collateral for futures contracts.
(f) Notional amount rounds to less than 500.
Glossary:
EAFE — Europe, Australasia and Far East
MSCI — Morgan Stanley Capital International
| | | | | | | | |
| See accompanying Notes to Financial Statements | | | March 31, 2020 | | | Semiannual Report | | | 113 | |
Schedule of Investments
March 31, 2020 (unaudited)
AllianzGI Retirement 2030 Fund
| | | | | | | | |
| | | Shares | | | Value | |
|
| Mutual Funds(a)—96.7% | |
AllianzGI Best Styles Global Managed Volatility | | | 27,422 | | | | $367,183 | |
AllianzGI Best Styles U.S. Equity (c) | | | 63,701 | | | | 687,967 | |
AllianzGI Global Dynamic Allocation (c) | | | 1,277,690 | | | | 20,072,511 | |
AllianzGI GlobalSmall-Cap Opportunities | | | 7,570 | | | | 88,340 | |
AllianzGI International Growth | | | 35,111 | | | | 485,235 | |
AllianzGIMid-Cap (b) | | | 33,604 | | | | 128,704 | |
| | | | | | | | |
Total Mutual Funds
(cost—$25,332,904) | | | | | | | 21,829,940 | |
| | | | | | | | |
| | | | | | | | |
| | | Principal
Amount
(000s) | | | Value | |
|
| Repurchase Agreements—0.5% | |
State Street Bank and Trust Co., dated 3/31/20, 0.00%, due 4/1/20, proceeds $110,000; collateralized by U.S. Treasury Notes, 2.75%, due 4/30/23, valued at $114,144 including accrued interest | |
(cost—$110,000) | | | $110 | | | $ | 110,000 | |
| | | | | | | | |
| |
Total Investments
(cost—$25,442,904)—97.2% | | | | 21,939,940 | |
| | | | | | | | |
| | |
| Other assets less liabilities (d)—2.8% | | | | | | | 624,452 | |
| | | | | | | | |
| | |
| Net Assets—100.0% | | | | | | | $22,564,392 | |
| | | | | | | | |
Notes to Schedule of Investments:
(a) Affiliated fund.
(b) Institutional Class share.
(c) Class R6 share.
(d) Includes net unrealized appreciation (depreciation) of other financial instruments as follows:
| | | | | | | | | | | | | | | | | | | | | | |
|
| Futures contracts outstanding at March 31, 2020: | |
| Type | | | | Contracts | | | Expiration
Date | | | Notional
Amount
(000s) | | | Market
Value
(000s) | | | Unrealized
Appreciation
(Depreciation) | |
Long position contracts: | | | | | | | | | | | | | | | | | | | | |
| | E-mini Russell 2000 Index | | | 3 | | | | 6/19/20 | | | $ | — | (f) | | $ | 172 | | | $ | (6,853 | ) |
| | E-mini S&P 500 Index | | | 15 | | | | 6/19/20 | | | | 1 | | | | 1,927 | | | | 18,236 | |
| | | | | | | | | | | | | | | | | | | | | | |
| | | | | | | | | | | | | | | | | | | | $ | 11,383 | |
| | | | | | | | | | | | | | | | | | | | | | |
| | | | | |
Short position contracts: | | | | | | | | | | | | | | | | | | | | |
| | Mini MSCI Emerging Markets Index | | | (5 | ) | | | 6/19/20 | | | $ | (— | )(f) | | $ | (211 | ) | | $ | (7,075 | ) |
| | MSCI EAFE Index | | | (12 | ) | | | 6/19/20 | | | | (1 | ) | | | (935 | ) | | | (91,947 | ) |
| | | | | | | | | | | | | | | | | | | | | | |
| | | | | | | | | | | | | | | | | | | | $ | (99,022 | ) |
| | | | | | | | | | | | | | | | | | | | | | |
| | | | | | | | | | | | | | | | | | | | $ | (87,639 | ) |
| | | | | | | | | | | | | | | | | | | | | | |
(e) At March 31, 2020, the Fund pledged $922,004 in cash as collateral for futures contracts.
(f) Notional amount rounds to less than 500.
Glossary:
EAFE — Europe, Australasia and Far East
MSCI — Morgan Stanley Capital International
| | | | | | |
| 114 | | Semiannual Report | | | March 31, 2020 | | | See accompanying Notes to Financial Statements |
Schedule of Investments
March 31, 2020 (unaudited)
AllianzGI Retirement 2035 Fund
| | | | | | | | |
| | | Shares | | | Value | |
|
| Mutual Funds(a)—93.7% | |
AllianzGI Best Styles Global Managed Volatility | | | 70,384 | | | | $942,446 | |
AllianzGI Best Styles U.S. Equity (c) | | | 176,640 | | | | 1,907,716 | |
AllianzGI Emerging MarketsSmall-Cap (b) | | | 14,271 | | | | 168,830 | |
AllianzGI Focused Growth (c) | | | 10,578 | | | | 429,770 | |
AllianzGI Global Dynamic Allocation (c) | | | 751,466 | | | | 11,805,537 | |
AllianzGI GlobalSmall-Cap Opportunities | | | 20,459 | | | | 238,761 | |
AllianzGI International Growth | | | 79,817 | | | | 1,103,070 | |
AllianzGIMid-Cap (b) | | | 106,116 | | | | 406,424 | |
AllianzGIMid-Cap Value (c) | | | 10,384 | | | | 246,526 | |
AllianzGISmall-Cap (c) | | | 17,153 | | | | 256,606 | |
| | | | | | | | |
Total Mutual Funds
(cost—$20,672,667) | | | | 17,505,686 | |
| | | | | | | | |
| | | | | | | | |
| | | Principal
Amount
(000s) | | | Value | |
|
| Repurchase Agreements—2.2% | |
State Street Bank and Trust Co., dated 3/31/20, 0.00%, due 4/1/20, proceeds $404,000; collateralized by U.S. Treasury Inflation Indexed Notes, 0.625%, due 4/15/23, valued at $415,534 including accrued interest | |
(cost—$404,000) | | | $404 | | | | $404,000 | |
| | | | | | | | |
| |
Total Investments
(cost—$21,076,667)—95.9% | | | | 17,909,686 | |
| | | | | | | | |
| | |
Other assets less
liabilities (d)—4.1% | | | | | | | 759,927 | |
| | | | | | | | |
| | |
| Net Assets—100.0% | | | | | | | $18,669,613 | |
| | | | | | | | |
Notes to Schedule of Investments:
(a) Affiliated fund.
(b) Institutional Class share.
(c) Class R6 share.
(d) Includes net unrealized appreciation (depreciation) of other financial instruments as follows:
| | | | | | | | | | | | | | | | | | | | | | |
| |
| Futures contracts outstanding at March 31, 2020: | | | | |
| Type | | Contracts | | | Expiration
Date | | | Notional
Amount
(000s) | | | Market
Value
(000s) | | | Unrealized
Appreciation
(Depreciation) | |
Long position contracts: | | | | | | | | | | | | | | | | | | | | |
| | E-mini Russell 2000 Index | | | 3 | | | | 6/19/20 | | | $ | — | (f) | | $ | 172 | | | $ | (6,853 | ) |
| | E-mini S&P 500 Index | | | 13 | | | | 6/19/20 | | | | 1 | | | | 1,670 | | | | 48,138 | |
| | | | | | | | | | | | | | | | | | | | | | |
| | | | | | | | | | | | | | | | | | | | $ | 41,285 | |
| | | | | | | | | | | | | | | | | | | | | | |
| | | | | |
Short position contracts: | | | | | | | | | | | | | | | | | | | | |
| | Mini MSCI Emerging Markets Index | | | (3 | ) | | | 6/19/20 | | | $ | (— | )(f) | | $ | (126 | ) | | $ | (4,245 | ) |
| | MSCI EAFE Index | | | (6 | ) | | | 6/19/20 | | | | (— | )(f) | | | (468 | ) | | | (45,973 | ) |
| | | | | | | | | | | | | | | | | | | | | | |
| | | | | | | | | | | | | $ | (50,218 | ) |
| | | | | | | | | | | | | | | | | | | | | | |
| | | | | | | | | | | | | $ | (8,933 | ) |
| | | | | | | | | | | | | | | | | | | | | | |
(e) At March 31, 2020, the Fund pledged $904,218 in cash as collateral for futures contracts.
(f) Notional amount rounds to less than 500.
Glossary:
EAFE—Europe, Australasia and Far East
MSCI—Morgan Stanley Capital International
| | | | | | | | |
| See accompanying Notes to Financial Statements | | | March 31, 2020 | | | Semiannual Report | | | 115 | |
Schedule of Investments
March 31, 2020 (unaudited)
AllianzGI Retirement 2040 Fund
| | | | | | | | |
| | | Shares | | | Value | |
| |
| Mutual Funds(a)—96.5% | | | | | |
AllianzGI Best Styles Global Equity (c) | | | 138,197 | | | | $1,424,808 | |
AllianzGI Best Styles Global Managed Volatility | | | 136,788 | | | | 1,831,596 | |
AllianzGI Best Styles U.S. Equity (c) | | | 238,919 | | | | 2,580,322 | |
AllianzGI Emerging MarketsSmall-Cap (b) | | | 17,363 | | | | 205,405 | |
AllianzGI Focused Growth (c) | | | 14,935 | | | | 606,814 | |
AllianzGI Global Dynamic Allocation (c) | | | 489,977 | | | | 7,697,540 | |
AllianzGI GlobalSmall-Cap Opportunities | | | 39,221 | | | | 457,708 | |
AllianzGI International Growth | | | 145,274 | | | | 2,007,684 | |
AllianzGIMid-Cap (b) | | | 158,348 | | | | 606,475 | |
AllianzGIMid-Cap Value (c) | | | 19,524 | | | | 463,495 | |
AllianzGISmall-Cap (c) | | | 25,894 | | | | 387,380 | |
| | | | | | | | |
Total Mutual Funds
(cost—$21,806,250) | | | | 18,269,227 | |
| | | | | | | | |
| | | | | | | | |
| | | Principal
Amount
(000s) | | | Value | |
|
| Repurchase Agreements—2.9% | |
State Street Bank and Trust Co., dated 3/31/20, 0.00%, due 4/1/20, proceeds $549,000; collateralized by U.S. Treasury Notes, 2.75%, due 4/30/23, valued at $565,285 including accrued interest | |
(cost—$549,000) | | | $549 | | | $ | 549,000 | |
| | | | | | | | |
| |
Total Investments
(cost—$22,355,250)—99.4% | | | | 18,818,227 | |
| | | | | | | | |
| |
Other assets less
liabilities (d)—0.6% | | | | 109,052 | |
| | | | | | | | |
| |
| Net Assets—100.0% | | | | $18,927,279 | |
| | | | | | | | |
Notes to Schedule of Investments:
(a) Affiliated fund.
(b) Institutional Class share.
(c) Class R6 share.
(d) Includes net unrealized appreciation (depreciation) of other financial instruments as follows:
| | | | | | | | | | | | | | | | | | | | | | |
|
| Futures contracts outstanding at March 31, 2020: | |
| Type | | Contracts | | | Expiration
Date | | | Notional
Amount
(000s) | | | Market
Value
(000s) | | | Unrealized
Appreciation
(Depreciation) | |
Long position contracts: | | | | | | | | | | | | | | | | | | | | |
| | E-mini Russell 2000 Index | | | 4 | | | | 6/19/20 | | | $ | — | (f) | | $ | 229 | | | $ | (9,138 | ) |
| | E-mini S&P 500 Index | | | 16 | | | | 6/19/20 | | | | 1 | | | | 2,056 | | | | 22,171 | |
| | | | | | | | | | | | | | | | | | | | | | |
| | | | | | | | | | | | | | | | | | | | $ | 13,033 | |
| | | | | | | | | | | | | | | | | | | | | | |
| | | | | |
Short position contracts: | | | | | | | | | | | | | | | | | | | | |
| | MSCI EAFE Index | | | (5 | ) | | | 6/19/20 | | | $ | (— | )(f) | | $ | (390 | ) | | $ | (38,312 | ) |
| | | | | | | | | | | | | | | | | | | | | | |
| | | | | | | | | | | | | | | | | | | | $ | (38,312 | ) |
| | | | | | | | | | | | | | | | | | | | | | |
| | | | | | | | | | | | | | | | | | | | $ | (25,279 | ) |
| | | | | | | | | | | | | | | | | | | | | | |
(e) At March 31, 2020, the Fund pledged $1,044,286 in cash as collateral for futures contracts.
(f) Notional amount rounds to less than 500.
Glossary:
EAFE—Europe, Australasia and Far East
MSCI—Morgan Stanley Capital International
| | | | | | |
| 116 | | Semiannual Report | | | March 31, 2020 | | | See accompanying Notes to Financial Statements |
Schedule of Investments
March 31, 2020 (unaudited)
AllianzGI Retirement 2045 Fund
| | | | | | | | |
| | | Shares | | | Value | |
| |
| Mutual Funds(a)—92.5% | | | | | |
AllianzGI Best Styles Global Equity (c) | | | 115,818 | | | | $1,194,078 | |
AllianzGI Best Styles Global Managed Volatility | | | 108,535 | | | | 1,453,282 | |
AllianzGI Best Styles U.S. Equity (c) | | | 137,593 | | | | 1,486,005 | |
AllianzGI Emerging MarketsSmall-Cap (b) | | | 9,643 | | | | 114,076 | |
AllianzGI Focused Growth (c) | | | 11,172 | | | | 453,899 | |
AllianzGI Global Dynamic Allocation (c) | | | 186,258 | | | | 2,926,108 | |
AllianzGI GlobalSmall-Cap Opportunities | | | 27,995 | | | | 326,705 | |
AllianzGI International Growth | | | 101,618 | | | | 1,404,359 | |
AllianzGIMid-Cap (b) | | | 118,447 | | | | 453,650 | |
AllianzGIMid-Cap Value (c) | | | 12,380 | | | | 293,894 | |
AllianzGISmall-Cap (c) | | | 21,153 | | | | 316,444 | |
| | | | | | | | |
Total Mutual Funds
(cost—$12,476,193) | | | | 10,422,500 | |
| | | | | | | | |
| | | | | | | | |
| | | Principal
Amount
(000s) | | | Value | |
|
| Repurchase Agreements—1.3% | |
State Street Bank and Trust Co., dated 3/31/20, 0.00%, due 4/1/20, proceeds $147,000; collateralized by U.S. Treasury Inflation Indexed Notes, 0.625%, due 4/15/23, valued at $152,538 including accrued interest | |
(cost—$147,000) | | | $147 | | | $ | 147,000 | |
| | | | | | | | |
| |
Total Investments
(cost—$12,623,193)—93.8% | | | | 10,569,500 | |
| | | | | | | | |
| | |
| Other assets less liabilities (d)—6.2% | | | | | | | 703,165 | |
| | | | | | | | |
| | |
| Net Assets—100.0% | | | | | | | $11,272,665 | |
| | | | | | | | |
Notes to Schedule of Investments:
(a) Affiliated fund.
(b) Institutional Class share.
(c) Class R6 share.
(d) Includes net unrealized appreciation (depreciation) of other financial instruments as follows:
| | | | | | | | | | | | | | | | | | | | | | |
| | | | | |
| Futures contracts outstanding at March 31, 2020: | | | | | | | | | | | | | | | |
| Type | | Contracts | | | Expiration
Date | | | Notional
Amount
(000s) | | | Market
Value
(000s) | | | Unrealized
Appreciation
(Depreciation) | |
| | | | | |
| Long position contracts: | | | | | | | | | | | | | | | | | | | | |
| | E-mini Russell 2000 Index | | | 2 | | | | 6/19/20 | | | $ | — | (f) | | $ | 115 | | | $ | (4,569 | ) |
| | E-mini S&P 500 Index | | | 8 | | | | 6/19/20 | | | | — | (f) | | | 1,028 | | | | (35,873 | ) |
| | MSCI Emerging Markets Index | | | 3 | | | | 6/19/20 | | | | — | (f) | | | 126 | | | | 4,380 | |
| | | | | | | | | | | | | | | | | | | | | | |
| | | | | | | | | | | | | $ | (36,062 | ) |
| | | | | | | | | | | | | | | | | | | | | | |
Short position contracts: | | | | | | | | | | | | | | | | | | | | |
| | MSCI EAFE Index | | | (3 | ) | | | 6/19/20 | | | $ | (— | )(f) | | $ | (234 | ) | | $ | (22,987 | ) |
| | | | | | | | | | | | | | | | | | | | | | |
| | | | | | | | | | | | | $ | (59,049 | ) |
| | | | | | | | | | | | | | | | | | | | | | |
(e) At March 31, 2020, the Fund pledged $756,758 in cash as collateral for futures contracts.
(f) Notional amount rounds to less than 500.
Glossary:
EAFE—Europe, Australasia and Far East
MSCI—Morgan Stanley Capital International
| | | | | | | | |
| See accompanying Notes to Financial Statements | | | March 31, 2020 | | | Semiannual Report | | | 117 | |
Schedule of Investments
March 31, 2020 (unaudited)
AllianzGI Retirement 2050 Fund
| | | | | | | | |
| | | Shares | | | Value | |
| |
| Mutual Funds(a)—93.0% | | | | | |
AllianzGI Best Styles Global Equity (d) | | | 197,112 | | | | $2,032,224 | |
AllianzGI Best Styles Global Managed Volatility | | | 145,270 | | | | 1,945,163 | |
AllianzGI Best Styles U.S. Equity (d) | | | 259,450 | | | | 2,802,064 | |
AllianzGI Emerging MarketsSmall-Cap (b) | | | 14,202 | | | | 168,004 | |
AllianzGI Focused Growth (d) | | | 20,437 | | | | 830,356 | |
AllianzGI Global Dynamic Allocation (d) | | | 197,273 | | | | 3,099,153 | |
AllianzGI GlobalSmall-Cap Opportunities | | | 39,687 | | | | 463,144 | |
AllianzGI International Growth (e) | | | 146,242 | | | | 2,021,068 | |
AllianzGIMid-Cap (b) | | | 207,620 | | | | 795,185 | |
AllianzGIMid-Cap Value (d) | | | 28,568 | | | | 678,201 | |
AllianzGISmall-Cap (d) | | | 34,372 | | | | 514,199 | |
| | | | | | | | |
Total Mutual Funds
(cost—$18,566,290) | | | | 15,348,761 | |
| | | | | | | | |
| | | | | | | | |
| | | Principal
Amount
(000s) | | | Value | |
|
| Short-Term Investments—4.0% | |
|
| U.S. Treasury Obligations(c)—3.0% | |
U.S. Treasury Bills,
1.506%-1.522%, 12/3/20 (cost—$494,962) | | | $500 | | | $ | 499,678 | |
| | | | | | | | |
|
| Repurchase Agreements—1.0% | |
State Street Bank and Trust Co., dated 3/31/20, 0.00%, due 4/1/20, proceeds $166,000; collateralized by U.S. Treasury Notes, 2.75%, due 4/30/23, valued at $173,934 including accrued interest | |
(cost—$166,000) | | | 166 | | | | 166,000 | |
| | | | | | | | |
| Total Short-Term Investments (cost—$660,962) | | | | 665,678 | |
| | | | | | | | |
| |
Total Investments
(cost—$19,227,252)—97.0% | | | | 16,014,439 | |
| | | | | | | | |
| | |
| Other assets less liabilities (f)—3.0% | | | | | | | 500,798 | |
| | | | | | | | |
| | |
| Net Assets—100.0% | | | | | | | $16,515,237 | |
| | | | | | | | |
Notes to Schedule of Investments:
(a) Affiliated fund.
(b) Institutional Class share.
(c) Rates reflect the effective yields at purchase date.
(d) Class R6 share.
(e)Non-income producing.
(f) Includes net unrealized appreciation (depreciation) of other financial instruments as follows:
| | | | | | | | | | | | | | | | | | | | | | |
| | | | | |
| Futures contracts outstanding at March 31, 2020: | | | | | | | | | | | | | | | |
| Type | | Contracts | | | Expiration
Date | | | Notional
Amount
(000s) | | | Market
Value
(000s) | | | Unrealized
Appreciation
(Depreciation) | |
Long position contracts: | | | | | | | | | | | | | | | | | | | | |
| | E-mini Russell 2000 Index | | | 3 | | | | 6/19/20 | | | $ | — | (h) | | $ | 172 | | | $ | (6,853 | ) |
| | E-mini S&P 500 Index | | | 14 | | | | 6/19/20 | | | | 1 | | | | 1,799 | | | | (59,820 | ) |
| | Mini MSCI Emerging Markets Index | | | 5 | | | | 6/19/20 | | | | — | (h) | | | 211 | | | | 7,300 | |
| | | | | | | | | | | | | | | | | | | | | | |
| | | | | | | | | | | | | $ | (59,373 | ) |
| | | | | | | | | | | | | | | | | | | | | | |
Short position contracts: | | | | | | | | | | | | | | | | | | | | |
| | MSCI EAFE Index | | | (4 | ) | | | 6/19/20 | | | $ | (— | )(h) | | $ | (312 | ) | | $ | (30,649 | ) |
| | | | | | | | | | | | | | | | | | | | | | |
| | | | | | | | | | | | | $ | (30,649 | ) |
| | | | | | | | | | | | | | | | | | | | | | |
| | | | | | | | | | | | | $ | (90,022 | ) |
| | | | | | | | | | | | | | | | | | | | | | |
(g) At March 31, 2020, the Fund pledged $1,015,098 in cash as collateral for futures contracts.
(h) Notional amount rounds to less than 500.
Glossary:
EAFE—Europe, Australasia and Far East
MSCI—Morgan Stanley Capital International
| | | | | | |
| 118 | | Semiannual Report | | | March 31, 2020 | | | See accompanying Notes to Financial Statements |
Schedule of Investments
March 31, 2020 (unaudited)
AllianzGI Retirement 2055 Fund
| | | | | | | | |
| | | Shares | | | Value | |
| |
| Mutual Funds(a)—90.5% | | | | | |
AllianzGI Best Styles Global Equity (c) | | | 90,280 | | | | $930,791 | |
AllianzGI Best Styles Global Managed Volatility | | | 72,801 | | | | 974,807 | |
AllianzGI Best Styles U.S. Equity (c) | | | 103,656 | | | | 1,119,482 | |
AllianzGI Emerging MarketsSmall-Cap (b) | | | 7,016 | | | | 83,005 | |
AllianzGI Focused Growth (c) | | | 8,943 | | | | 363,347 | |
AllianzGI Global Dynamic Allocation (c) | | | 95,759 | | | | 1,504,378 | |
AllianzGI GlobalSmall-Cap Opportunities | | | 20,290 | | | | 236,779 | |
AllianzGI International Growth | | | 73,949 | | | | 1,021,970 | |
AllianzGIMid-Cap (b) | | | 94,741 | | | | 362,860 | |
AllianzGIMid-Cap Value (c) | | | 12,445 | | | | 295,434 | |
AllianzGISmall-Cap (c) | | | 16,858 | | | | 252,191 | |
| | | | | | | | |
Total Mutual Funds
(cost—$8,606,382) | | | | 7,145,044 | |
| | | | | | | | |
| | | | | | | | |
| | | Principal
Amount
(000s) | | | Value | |
|
| Repurchase Agreements—3.3% | |
State Street Bank and Trust Co., dated 3/31/20, 0.00%, due 4/1/20, proceeds $264,000; collateralized by U.S. Treasury Inflation Indexed Notes, 0.625%, due 4/15/23, valued at $273,516 including accrued interest | |
(cost—$264,000) | | | $264 | | | | $264,000 | |
| | | | | | | | |
| |
Total Investments
(cost—$8,870,382)—93.8% | | | | 7,409,044 | |
| | | | | | | | |
| | |
Other assets less
liabilities (d)—6.2% | | | | | | | 493,498 | |
| | | | | | | | |
| | |
| Net Assets—100.0% | | | | | | | $7,902,542 | |
| | | | | | | | |
Notes to Schedule of Investments:
(a) Affiliated fund.
(b) Institutional Class share.
(c) Class R6 share.
(d) Includes net unrealized appreciation (depreciation) of other financial instruments as follows:
| | | | | | | | | | | | | | | | | | | | | | |
| | | | | |
| Futures contracts outstanding at March 31, 2020: | | | | | | | | | | | | | | | |
Type | | Contracts | | | Expiration
Date | | | Notional
Amount
(000s) | | | Market
Value
(000s) | | | Unrealized
Appreciation
(Depreciation) | |
Long position contracts: | | | | | | | | | | | | | | | | | | | | |
| | E-mini Russell 2000 Index | | | 2 | | | | 6/19/20 | | | $ | — | (f) | | $ | 115 | | | $ | (4,569 | ) |
| | E-mini S&P 500 Index | | | 6 | | | | 6/19/20 | | | | — | (f) | | | 771 | | | | (24,159 | ) |
| | MSCI EAFE Index | | | 2 | | | | 6/19/20 | | | | — | (f) | | | 84 | | | | 2,920 | |
| | | | | | | | | | | | | | | | | | | | | | |
| | | | | | | | | | | | | $ | (25,808 | ) |
| | | | | | | | | | | | | | | | | | | | | | |
Short position contracts: | | | | | | | | | | | | | | | | | | | | |
| | MSCI EAFE Index | | | (2 | ) | | | 6/19/20 | | | $ | (— | )(f) | | $ | (156 | ) | | $ | (15,324 | ) |
| | | | | | | | | | | | | | | | | | | | | | |
| | | | | | | | | | | | | $ | (41,132 | ) |
| | | | | | | | | | | | | | | | | | | | | | |
(e) At March 31, 2020, the Fund pledged $571,157 in cash as collateral for futures contracts.
(f) Notional amount rounds to less than 500.
Glossary:
EAFE—Europe, Australasia and Far East
MSCI—Morgan Stanley Capital International
| | | | | | | | |
| See accompanying Notes to Financial Statements | | | March 31, 2020 | | | Semiannual Report | | | 119 | |
Schedule of Investments
March 31, 2020 (unaudited)
AllianzGI Multi Asset Income Fund
| | | | | | | | |
| | | Shares | | | Value | |
| |
| Mutual Funds(b)—79.7% | | | | | |
AllianzGI Emerging Markets SRI Debt (c) | | | 502,007 | | | | $6,275,087 | |
AllianzGI Floating Rate Note (c) | | | 205,509 | | | | 2,827,809 | |
AllianzGI Global High Yield (c) | | | 382,618 | | | | 5,088,825 | |
AllianzGI Preferred Securities & Income (d) | | | 388,234 | | | | 4,992,695 | |
AllianzGI Short Duration High Income (d) | | | 813,286 | | | | 10,279,939 | |
AllianzGI Short Term Bond (c) | | | 412,791 | | | | 6,047,394 | |
PIMCO Preferred and Capital Security (c) | | | 245,097 | | | | 2,262,248 | |
PIMCO Senior Floating Rate (c) | | | 209,918 | | | | 1,811,591 | |
| | | | | | | | |
Total Mutual Funds
(cost-$43,236,122) | | | | 39,585,588 | |
| | | | | | | | |
| | | | | | | | |
| |
| Common Stock—14.9% | | | | | |
|
| Equity Real Estate Investment Trusts (REITs)—5.9% | |
American Tower Corp. | | | 765 | | | | 166,579 | |
Apple Hospitality REIT, Inc. | | | 20,000 | | | | 183,400 | |
AvalonBay Communities, Inc. | | | 1,388 | | | | 204,272 | |
Crown Castle International Corp. | | | 1,200 | | | | 173,280 | |
Digital Realty Trust, Inc. | | | 1,860 | | | | 258,373 | |
Gaming and Leisure Properties, Inc. | | | 12,000 | | | | 332,520 | |
Iron Mountain, Inc. | | | 5,520 | | | | 131,376 | |
Macerich Co. | | | 12,700 | | | | 71,501 | |
Medical Properties Trust, Inc. | | | 9,000 | | | | 155,610 | |
Park Hotels & Resorts, Inc. | | | 10,000 | | | | 79,100 | |
Public Storage | | | 1,200 | | | | 238,332 | |
Sabra Health Care REIT, Inc. | | | 17,000 | | | | 185,640 | |
Service Properties Trust | | | 24,273 | | | | 131,074 | |
STAG Industrial, Inc. | | | 5,900 | | | | 132,868 | |
VEREIT, Inc. | | | 18,932 | | | | 92,577 | |
Welltower, Inc. | | | 4,369 | | | | 200,013 | |
WP Carey, Inc. | | | 3,525 | | | | 204,732 | |
| | | | | | | | |
| | | | | | | 2,941,247 | |
| | | | | | | | |
|
| Mortgage Real Estate Investment Trusts (REITs)—4.1% | |
AGNC Investment Corp. | | | 33,000 | | | | 349,140 | |
Annaly Capital Management, Inc. | | | 80,000 | | | | 405,600 | |
Chimera Investment Corp. | | | 33,750 | | | | 307,125 | |
New Residential Investment Corp. | | | 76,000 | | | | 380,760 | |
PennyMac Mortgage Investment Trust | | | 30,000 | | | | 318,600 | |
Starwood Property Trust, Inc. | | | 24,000 | | | | 246,000 | |
| | | | | | | | |
| | | | | | | 2,007,225 | |
| | | | | | | | |
|
| Oil, Gas & Consumable Fuels—3.0% | |
Chevron Corp. | | | 2,100 | | | | 152,166 | |
Enbridge, Inc. | | | 5,805 | | | | 168,867 | |
Exxon Mobil Corp. | | | 3,800 | | | | 144,286 | |
Inter Pipeline Ltd. | | | 26,960 | | | | 161,304 | |
Kinder Morgan, Inc. | | | 15,080 | | | | 209,914 | |
Marathon Petroleum Corp. | | | 3,800 | | | | 89,756 | |
Targa Resources Corp. | | | 7,500 | | | | 51,825 | |
Valero Energy Corp. | | | 2,900 | | | | 131,544 | |
Williams Cos., Inc. | | | 24,815 | | | | 351,132 | |
| | | | | | | | |
| | | | | | | 1,460,794 | |
| | | | | | | | |
| |
| Tobacco—1.9% | | | | | |
Altria Group, Inc. | | | 10,940 | | | | 423,050 | |
British American Tobacco PLC | | | 7,475 | | | | 254,638 | |
Japan Tobacco, Inc. | | | 15,300 | | | | 282,999 | |
| | | | | | | | |
| | | | | | | 960,687 | |
| | | | | | | | |
Total Common Stock
(cost—$9,544,819) | | | | 7,369,953 | |
| | | | | | | | |
| | | | | | | | |
| | | Principal
Amount
(000s) | | | Value | |
|
| Repurchase Agreements—0.7% | |
State Street Bank and Trust Co., dated 3/31/20, 0.00%, due 4/1/20, proceeds $363,000; collateralized by U.S. Treasury Notes, 2.75%, due 4/30/23, valued at $375,045 including accrued interest | |
(cost-$363,000) | | | $363 | | | $ | 363,000 | |
| | | | | | | | |
| |
Total Investments
(cost-$53,143,941) (a)—95.3% | | | | 47,318,541 | |
| | | | | | | | |
| |
| Other assets less liabilities (e)—4.7% | | | | 2,329,760 | |
| | | | | | | | |
| |
| Net Assets—100.0% | | | | $49,648,301 | |
| | | | | | | | |
Notes to Schedule of Investments:
(a) Securities with an aggregate value of $537,637, representing 1.1% of net assets, were valued utilizing modeling tools provided by a third-party vendor. See Note 1(a) and Note 1(b) in the Notes to Financial Statements.
(b) Affiliated fund.
(c) Institutional Class share.
(d) Class R6 share.
| | | | | | |
| 120 | | Semiannual Report | | | March 31, 2020 | | | See accompanying Notes to Financial Statements |
Schedule of Investments
March 31, 2020 (unaudited)
(e) Includes net unrealized appreciation (depreciation) of other financial instruments as follows:
| | | | | | | | | | | | | | | | | | | | | | |
|
| Futures contracts outstanding at March 31, 2020: | |
| Type | | Contracts | | | Expiration
Date | | | Notional Amount
(000s) | | | Market
Value
(000s) | | | Unrealized
Appreciation
(Depreciation) | |
Long position contracts: | | | | | | | | | | | | | | | | | | | | |
| | E-mini Russell 100 Index | | | 36 | | | | 6/19/20 | | | $ | 2 | | | $ | 2,717 | | | $ | 242,550 | |
| | Euro-Bund10-Year Bond | | | 40 | | | | 6/8/20 | | | EUR | 4,000 | | | | 6,239 | | | | (67,093 | ) |
| | Euro STOXX 50 Index | | | 70 | | | | 6/19/20 | | | | 1 | | | | 2,121 | | | | 53,424 | |
| | Mini MSCI Emerging Markets Index | | | 23 | | | | 6/19/20 | | | $ | 1 | | | | 969 | | | | (19,235 | ) |
| | MSCI EAFE Index | | | 17 | | | | 6/19/20 | | | | 1 | | | | 1,559 | | | | (4,074 | ) |
| | United Kingdom Government10-Year Gilt | | | 35 | | | | 6/26/20 | | | | 3,500 | | | | 5,921 | | | | 161,145 | |
| | | | | | | | | | | | | | | | | | | | | | |
| | | | | | | | | | | | | $ | 366,717 | |
| | | | | | | | | | | | | | | | | | | | | | |
Short position contracts: | | | | | | | | | | | | | | | | | | | | |
| | Dow Jones U.S. Real Estate Index | | | (28 | ) | | | 6/19/20 | | | $ | (3 | ) | | $ | (769 | ) | | $ | 114,491 | |
| | | | | | | | | | | | | | | | | | | | | | |
| | | | | | | | | | | | | $ | 481,208 | |
| | | | | | | | | | | | | | | | | | | | | | |
(f) At March 31, 2020, the Fund pledged $2,668,306 in cash as collateral for futures contracts.
Glossary:
EAFE—Europe, Australasia and Far East
MSCI—Morgan Stanley Capital International
REIT—Real Estate Investment Trust
TIPS—Treasury Inflation Protected Securities
| | | | | | | | |
| See accompanying Notes to Financial Statements | | | March 31, 2020 | | | Semiannual Report | | | 121 | |
Schedule of Investments
March 31, 2020 (unaudited)
AllianzGI Best Styles Global Equity Fund
| | | | | | | | |
| | | Shares | | | Value | |
| |
| Common Stock—96.9% | | | | | |
| |
| Argentina—0.2% | | | | | |
MercadoLibre, Inc. (e) | | | 453 | | | | $221,327 | |
| | | | | | | | |
| |
| Australia—2.0% | | | | | |
Atlassian Corp. PLC, Class A (e) | | | 1,480 | | | | 203,145 | |
Aurizon Holdings Ltd. | | | 49,561 | | | | 128,441 | |
Austal Ltd. | | | 76,795 | | | | 138,695 | |
BHP Group Ltd. | | | 16,226 | | | | 294,361 | |
Coca-Cola Amatil Ltd. | | | 24,982 | | | | 134,835 | |
CSL Ltd. | | | 2,321 | | | | 420,731 | |
Flight Centre Travel Group Ltd. (c)(d) | | | 7,755 | | | | 48,960 | |
Fortescue Metals Group Ltd. | | | 22,423 | | | | 137,413 | |
Goodman Group REIT | | | 28,717 | | | | 210,486 | |
IDP Education Ltd. (c)(d) | | | 9,203 | | | | 71,759 | |
Jupiter Mines Ltd. | | | 529,073 | | | | 72,432 | |
National Australia Bank Ltd. | | | 26,057 | | | | 267,289 | |
Rio Tinto Ltd. | | | 3,228 | | | | 166,305 | |
Select Harvests Ltd. | | | 32,424 | | | | 138,747 | |
Sonic Healthcare Ltd. | | | 11,436 | | | | 171,881 | |
| | | | | | | | |
| | | | | | | 2,605,480 | |
| | | | | | | | |
| |
| Austria—0.3% | | | | | |
BAWAG Group AG (a) | | | 2,513 | | | | 70,101 | |
Erste Group Bank AG | | | 5,707 | | | | 104,482 | |
OMV AG | | | 3,468 | | | | 94,908 | |
Raiffeisen Bank International AG | | | 8,987 | | | | 129,271 | |
| | | | | | | | |
| | | | | | | 398,762 | |
| | | | | | | | |
| |
| Belgium—0.1% | | | | | |
Aedifica S.A. REIT | | | 1,483 | | | | 153,937 | |
| | | | | | | | |
| |
| Brazil—0.6% | | | | | |
Banco do Brasil S.A. | | | 17,000 | | | | 91,247 | |
BB Seguridade Participacoes S.A. | | | 12,900 | | | | 61,693 | |
BR Malls Participacoes S.A. | | | 37,900 | | | | 72,793 | |
Cia Brasileira de Distribuicao | | | 4,800 | | | | 61,283 | |
JBS S.A. | | | 34,100 | | | | 133,484 | |
Vale S.A. (e) | | | 23,000 | | | | 191,309 | |
WEG S.A. | | | 22,900 | | | | 147,948 | |
| | | | | | | | |
| | | | | | | 759,757 | |
| | | | | | | | |
| |
| Canada—2.9% | | | | | |
B2Gold Corp. | | | 39,461 | | | | 119,451 | |
Canadian Natural Resources Ltd. | | | 32,744 | | | | 447,895 | |
Cascades, Inc. | | | 9,141 | | | | 81,647 | |
Centerra Gold, Inc. | | | 15,456 | | | | 91,925 | |
Cogeco Communications, Inc. | | | 2,776 | | | | 188,321 | |
Exchange Income Corp. | | | 5,352 | | | | 67,504 | |
Franco-Nevada Corp. | | | 1,755 | | | | 175,350 | |
Genworth MI Canada, Inc. | | | 2,204 | | | | 48,973 | |
George Weston Ltd. | | | 3,930 | | | | 281,017 | |
IA Financial Corp., Inc. | | | 3,432 | | | | 107,889 | |
Lundin Mining Corp. | | | 73,635 | | | | 276,792 | |
Manulife Financial Corp. | | | 26,904 | | | | 337,806 | |
Open Text Corp. | | | 4,553 | | | | 159,208 | |
Power Corp. of Canada | | | 18,353 | | | | 295,255 | |
Sun Life Financial, Inc. | | | 6,472 | | | | 208,191 | |
Suncor Energy, Inc. | | | 26,831 | | | | 428,213 | |
Toronto-Dominion Bank | | | 10,506 | | | | 446,652 | |
| | | | | | | | |
| | | | | | | 3,762,089 | |
| | | | | | | | |
| |
| Chile—0.1% | | | | | |
Empresa Nacional de Telecomunicaciones S.A. (e) | | | 16,150 | | | | 68,253 | |
| | | | | | | | |
| | | Shares | | | Value | |
Engie Energia Chile S.A. | | | 59,381 | | | $ | 65,493 | |
| | | | | | | | |
| | | | | | | 133,746 | |
| | | | | | | | |
| |
| China—5.4% | | | | | |
Alibaba Group Holding Ltd. ADR (e) | | | 5,532 | | | | 1,075,863 | |
Autohome, Inc. ADR (e) | | | 2,917 | | | | 207,165 | |
Baidu, Inc. ADR (e) | | | 2,111 | | | | 212,768 | |
Bank of China Ltd., Class H | | | 693,000 | | | | 263,800 | |
China Conch Venture Holdings Ltd. | | | 33,500 | | | | 148,572 | |
China Construction Bank Corp., Class H | | | 619,188 | | | | 503,305 | |
China Lumena New Materials Corp. (c)(d)(e) | | | 1,505 | | | | — | † |
China Minsheng Banking Corp., Ltd., Class H | | | 140,000 | | | | 103,550 | |
China Mobile Ltd. | | | 59,500 | | | | 445,910 | |
China Telecom Corp., Ltd., Class H | | | 300,000 | | | | 90,895 | |
CITIC Ltd. | | | 75,000 | | | | 77,729 | |
Country Garden Holdings Co., Ltd. | | | 89,000 | | | | 106,401 | |
Country Garden Services Holdings Co., Ltd. | | | 39,597 | | | | 159,330 | |
CSPC Pharmaceutical Group Ltd. | | | 86,000 | | | | 169,170 | |
Industrial & Commercial Bank of China Ltd., Class H | | | 496,000 | | | | 338,361 | |
JD.com, Inc. ADR (e) | | | 5,382 | | | | 217,971 | |
Meituan Dianping, Class B (e) | | | 16,500 | | | | 196,701 | |
Momo, Inc. ADR | | | 6,935 | | | | 150,420 | |
NetEase, Inc. ADR | | | 638 | | | | 204,772 | |
Ping An Insurance Group Co. of China Ltd., Class H | | | 45,000 | | | | 439,482 | |
Postal Savings Bank of China Co., Ltd., Class H (a) | | | 121,000 | | | | 73,670 | |
Shenzhen International Holdings Ltd. | | | 47,000 | | | | 85,239 | |
Sinotruk Hong Kong Ltd. | | | 41,500 | | | | 68,169 | |
SSY Group Ltd. | | | 210,000 | | | | 162,713 | |
TAL Education Group ADR (e) | | | 3,640 | | | | 193,866 | |
Tencent Holdings Ltd. | | | 25,319 | | | | 1,251,457 | |
Yuexiu Transport Infrastructure Ltd. | | | 116,000 | | | | 70,202 | |
| | | | | | | | |
| | | | | | | 7,017,481 | |
| | | | | | | | |
| |
| Colombia—0.1% | | | | | |
Corp. Financiera Colombiana S.A. (e) | | | 14,883 | | | | 94,457 | |
| | | | | | | | |
| |
| Denmark—0.2% | | | | | |
Carlsberg A/S, Class B | | | 2,778 | | | | 312,746 | |
| | | | | | | | |
| |
| France—4.5% | | | | | |
Amundi S.A. (a) | | | 2,197 | | | | 127,117 | |
Atos SE | | | 4,987 | | | | 332,260 | |
AXA S.A. | | | 14,722 | | | | 249,272 | |
BNP Paribas S.A. | | | 7,750 | | | | 226,263 | |
Cie Generale des Etablissements Michelin SCA | | | 2,516 | | | | 220,363 | |
CNP Assurances | | | 26,067 | | | | 252,396 | |
Credit Agricole S.A. | | | 10,249 | | | | 72,521 | |
Engie S.A. | | | 59,615 | | | | 610,484 | |
Faurecia SE | | | 2,202 | | | | 64,478 | |
Kering S.A. | | | 530 | | | | 276,349 | |
Klepierre S.A. REIT | | | 7,192 | | | | 137,091 | |
L’Oreal S.A. | | | 1,069 | | | | 276,668 | |
LVMH Moet Hennessy Louis Vuitton SE | | | 1,697 | | | | 622,376 | |
Orange S.A. | | | 19,407 | | | | 234,969 | |
Peugeot S.A. | | | 11,010 | | | | 143,342 | |
| | | | | | | | |
| | | Shares | | | Value | |
Publicis Groupe S.A. | | | 4,316 | | | $ | 123,347 | |
Renault S.A. | | | 7,810 | | | | 148,427 | |
Schneider Electric SE | | | 5,136 | | | | 434,109 | |
Societe Generale S.A. | | | 14,541 | | | | 238,213 | |
Teleperformance | | | 825 | | | | 170,871 | |
Total S.A. | | | 14,021 | | | | 528,294 | |
Vinci S.A. | | | 3,849 | | | | 314,499 | |
| | | | | | | | |
| | | | | | | 5,803,709 | |
| | | | | | | | |
| |
| Georgia—0.0% | | | | | |
TBC Bank Group PLC | | | 3,994 | | | | 35,615 | |
| | | | | | | | |
| |
| Germany—1.3% | | | | | |
Bayerische Motoren Werke AG | | | 3,700 | | | | 188,882 | |
Cewe Stiftung & Co. KGAA | | | 695 | | | | 61,148 | |
Daimler AG | | | 7,197 | | | | 214,932 | |
Deutsche Boerse AG | | | 1,792 | | | | 246,192 | |
Deutsche Lufthansa AG | | | 16,156 | | | | 151,109 | |
DWS Group GmbH & Co. KGaA (a) | | | 4,347 | | | | 105,539 | |
Hannover Rueck SE | | | 1,176 | | | | 166,058 | |
HeidelbergCement AG | | | 3,197 | | | | 136,586 | |
Muenchener Rueckversicherungs-Gesellschaft AG in Muenchen | | | 1,166 | | | | 234,448 | |
Puma SE | | | 2,961 | | | | 173,974 | |
Varta AG (e) | | | 663 | | | | 46,650 | |
| | | | | | | | |
| | | | | | | 1,725,518 | |
| | | | | | | | |
| |
| Greece—0.1% | | | | | |
Hellenic Telecommunications Organization S.A. | | | 10,756 | | | | 130,024 | |
| | | | | | | | |
| |
| Hong Kong—0.2% | | | | | |
CK Hutchison Holdings Ltd. | | | 28,500 | | | | 189,957 | |
Kerry Properties Ltd. | | | 18,257 | | | | 47,742 | |
| | | | | | | | |
| | | | | | | 237,699 | |
| | | | | | | | |
| |
| Hungary—0.2% | | | | | |
Magyar Telekom Telecommunications PLC | | | 45,560 | | | | 50,737 | |
OTP Bank Nyrt | | | 5,583 | | | | 160,144 | |
| | | | | | | | |
| | | | | | | 210,881 | |
| | | | | | | | |
| |
| Indonesia—0.1% | | | | | |
Indofood CBP Sukses Makmur Tbk PT | | | 114,600 | | | | 71,479 | |
Media Nusantara Citra Tbk PT | | | 1,061,100 | | | | 58,627 | |
Wijaya Karya Persero Tbk PT | | | 1,055,200 | | | | 53,451 | |
| | | | | | | | |
| | | | | | | 183,557 | |
| | | | | | | | |
| |
| Ireland—0.7% | | | | | |
Kingspan Group PLC | | | 3,372 | | | | 179,957 | |
Medtronic PLC | | | 8,752 | | | | 789,256 | |
| | | | | | | | |
| | | | | | | 969,213 | |
| | | | | | | | |
| |
| Israel—0.2% | | | | | |
First International Bank of Israel Ltd. | | | 2,713 | | | | 65,547 | |
Formula Systems 1985 Ltd. | | | 1,235 | | | | 68,189 | |
Mellanox Technologies Ltd. (e) | | | 1,109 | | | | 134,544 | |
| | | | | | | | |
| | | | | | | 268,280 | |
| | | | | | | | |
| |
| Italy—1.1% | | | | | |
Assicurazioni Generali SpA | | | 21,185 | | | | 286,946 | |
Enel SpA | | | 82,994 | | | | 572,479 | |
Intesa Sanpaolo SpA | | | 241,704 | | | | 391,091 | |
| | | | | | |
| 122 | | Semiannual Report | | | March 31, 2020 | | | See accompanying Notes to Financial Statements |
Schedule of Investments
March 31, 2020 (unaudited)
| | | | | | | | |
| | | Shares | | | Value | |
Mediobanca Banca di Credito Finanziario SpA | | | 9,620 | | | $ | 52,460 | |
Poste Italiane SpA (a) | | | 11,839 | | | | 99,647 | |
Unipol Gruppo SpA | | | 15,401 | | | | 52,522 | |
| | | | | | | | |
| | | | | | | 1,455,145 | |
| | | | | | | | |
| |
| Japan—7.4% | | | | | |
Astellas Pharma, Inc. | | | 38,400 | | | | 591,643 | |
Chubu Electric Power Co., Inc. | | | 10,000 | | | | 141,132 | |
Daiichi Sankyo Co., Ltd. | | | 3,800 | | | | 260,971 | |
Electric Power Development Co., Ltd. | | | 7,100 | | | | 142,296 | |
Hitachi Ltd. | | | 6,800 | | | | 195,340 | |
Honda Motor Co., Ltd. | | | 17,000 | | | | 380,399 | |
Hoya Corp. | | | 3,000 | | | | 255,095 | |
Hulic Co., Ltd. | | | 14,200 | | | | 143,705 | |
ITOCHU Corp. | | | 15,523 | | | | 321,242 | |
Japan Airlines Co., Ltd. | | | 5,900 | | | | 108,427 | |
Japan Post Holdings Co., Ltd. | | | 23,600 | | | | 184,614 | |
Japan Post Insurance Co., Ltd. | | | 10,300 | | | | 127,257 | |
JFE Holdings, Inc. | | | 4,800 | | | | 31,104 | |
Kajima Corp. | | | 9,600 | | | | 98,127 | |
KDDI Corp. | | | 10,300 | | | | 304,247 | |
Konica Minolta, Inc. | | | 51,500 | | | | 207,486 | |
Kurita Water Industries Ltd. | | | 9,500 | | | | 217,952 | |
Mitsubishi Corp. | | | 15,000 | | | | 317,284 | |
Mitsubishi UFJ Financial Group, Inc. | | | 72,000 | | | | 269,392 | |
Mitsubishi UFJ Lease & Finance Co., Ltd. | | | 21,700 | | | | 106,217 | |
Mitsui & Co., Ltd. | | | 25,500 | | | | 354,034 | |
Mitsui Fudosan Co., Ltd. | | | 7,800 | | | | 135,055 | |
NEC Corp. | | | 4,500 | | | | 163,859 | |
Nippon Telegraph & Telephone Corp. | | | 10,496 | | | | 251,029 | |
Nissan Motor Co., Ltd. | | | 45,641 | | | | 152,702 | |
NTT DOCOMO, Inc. | | | 7,700 | | | | 240,803 | |
Obayashi Corp. | | | 19,300 | | | | 163,771 | |
Olympus Corp. | | | 15,400 | | | | 221,995 | |
SMC Corp. | | | 400 | | | | 167,698 | |
Softbank Corp. | | | 15,300 | | | | 194,902 | |
SoftBank Group Corp. | | | 14,000 | | | | 495,633 | |
Sojitz Corp. | | | 19,616 | | | | 45,993 | |
Sony Corp. | | | 6,300 | | | | 373,171 | |
Sony Financial Holdings, Inc. | | | 9,000 | | | | 151,125 | |
Sumitomo Chemical Co., Ltd. | | | 75,500 | | | | 223,061 | |
Sumitomo Corp. | | | 21,400 | | | | 244,051 | |
Sumitomo Mitsui Financial Group, Inc. | | | 11,600 | | | | 281,803 | |
Sumitomo Rubber Industries Ltd. | | | 11,600 | | | | 108,956 | |
TIS, Inc. | | | 4,800 | | | | 79,603 | |
Tokyo Electron Ltd. | | | 1,400 | | | | 260,923 | |
Tosoh Corp. | | | 12,900 | | | | 145,784 | |
Toyota Motor Corp. | | | 10,749 | | | | 647,787 | |
Tsuruha Holdings, Inc. | | | 1,100 | | | | 145,032 | |
| | | | | | | | |
| | | | | | | 9,652,700 | |
| | | | | | | | |
| |
| Korea (Republic of)—1.7% | | | | | |
Daelim Industrial Co., Ltd. | | | 2,331 | | | | 139,769 | |
GS Holdings Corp. | | | 4,207 | | | | 126,827 | |
Hana Financial Group, Inc. | | | 3,368 | | | | 63,364 | |
KB Financial Group, Inc. | | | 4,223 | | | | 118,768 | |
Kia Motors Corp. | | | 3,942 | | | | 82,975 | |
Lotte Shopping Co., Ltd. | | | 1,698 | | | | 103,834 | |
NCSoft Corp. | | | 344 | | | | 183,594 | |
Samsung Electronics Co., Ltd. | | | 18,111 | | | | 704,182 | |
Shinhan Financial Group Co., Ltd. | | | 6,218 | | | | 145,465 | |
SK Hynix, Inc. | | | 4,119 | | | | 278,461 | |
SK Telecom Co., Ltd. | | | 713 | | | | 103,703 | |
Woori Financial Group, Inc. (e) | | | 20,829 | | | | 129,589 | |
| | | | | | | | |
| | | | | | | 2,180,531 | |
| | | | | | | | |
| | | | | | | | |
| | | Shares | | | Value | |
| |
| Malaysia—0.0% | | | | | |
TIME dotCom Bhd. | | | 29,100 | | | $ | 61,950 | |
| | | | | | | | |
| |
| Mexico—0.2% | | | | | |
Alfa S.A.B de C.V., Class A | | | 286,300 | | | | 77,240 | |
Grupo Aeroportuario del Centro Norte S.A.B de C.V. | | | 19,300 | | | | 65,224 | |
Grupo Financiero Banorte S.A.B de C.V., Class O | | | 33,700 | | | | 92,338 | |
| | | | | | | | |
| | | | | | | 234,802 | |
| | | | | | | | |
| |
| Netherlands—1.9% | | | | | |
AerCap Holdings NV (e) | | | 2,301 | | | | 52,440 | |
Airbus SE | | | 5,602 | | | | 361,227 | |
ASM International NV | | | 1,582 | | | | 160,955 | |
ASR Nederland NV | | | 3,055 | | | | 76,813 | |
Coca-Cola European Partners PLC | | | 8,656 | | | | 324,860 | |
ING Groep NV | | | 29,927 | | | | 153,349 | |
Just Eat Takeaway (a)(e) | | | 1,924 | | | | 145,498 | |
Koninklijke Ahold Delhaize NV | | | 15,414 | | | | 359,093 | |
Signify NV (a) | | | 3,084 | | | | 59,769 | |
Unilever NV | | | 10,489 | | | | 515,547 | |
Wolters Kluwer NV | | | 4,414 | | | | 312,441 | |
| | | | | | | | |
| | | | | | | 2,521,992 | |
| | | | | | | | |
| |
| New Zealand—0.3% | | | | | |
a2 Milk Co., Ltd. (e) | | | 15,653 | | | | 159,905 | |
Air New Zealand Ltd. | | | 75,360 | | | | 37,767 | |
Fisher & Paykel Healthcare Corp. Ltd. | | | 9,135 | | | | 166,060 | |
| | | | | | | | |
| | | | | | | 363,732 | |
| | | | | | | | |
| |
| Norway—0.3% | | | | | |
Frontline Ltd. | | | 17,656 | | | | 174,873 | |
Orkla ASA | | | 17,410 | | | | 149,164 | |
| | | | | | | | |
| | | | | | | 324,037 | |
| | | | | | | | |
| |
| Philippines—0.2% | | | | | |
BDO Unibank, Inc. | | | 44,680 | | | | 90,320 | |
Megaworld Corp. | | | 1,413,000 | | | | 69,241 | |
Robinsons Land Corp. | | | 261,100 | | | | 75,962 | |
SM Prime Holdings, Inc. | | | 149,700 | | | | 83,135 | |
| | | | | | | | |
| | | | | | | 318,658 | |
| | | | | | | | |
| |
| Poland—0.1% | | | | | |
PlayWay S.A. | | | 911 | | | | 66,256 | |
TEN Square Games S.A. | | | 1,018 | | | | 68,287 | |
| | | | | | | | |
| | | | | | | 134,543 | |
| | | | | | | | |
| |
| Portugal—0.1% | | | | | |
Jeronimo Martins SGPS S.A. | | | 8,100 | | | | 146,198 | |
| | | | | | | | |
| |
| Singapore—0.2% | | | | | |
Singapore Technologies Engineering Ltd. | | | 118,000 | | | | 258,164 | |
Yangzijiang Shipbuilding Holdings Ltd. | | | 109,400 | | | | 63,478 | |
| | | | | | | | |
| | | | | | | 321,642 | |
| | | | | | | | |
| |
| South Africa—0.1% | | | | | |
Astral Foods Ltd. | | | 15,031 | | | | 161,332 | |
| | | | | | | | |
| |
| Spain—1.4% | | | | | |
Banco Santander S.A. | | | 146,786 | | | | 349,178 | |
Iberdrola S.A. | | | 57,301 | | | | 560,461 | |
Industria de Diseno Textil S.A. | | | 8,864 | | | | 229,698 | |
Mapfre S.A. | | | 103,324 | | | | 175,279 | |
Repsol S.A. | | | 15,086 | | | | 134,586 | |
Telefonica S.A. | | | 70,595 | | | | 321,284 | |
| | | | | | | | |
| | | | | | | 1,770,486 | |
| | | | | | | | |
| | | | | | | | |
| | | Shares | | | Value | |
| |
| Sweden—0.5% | | | | | |
Alfa Laval AB | | | 8,184 | | | $ | 140,118 | |
Arjo AB, Class B | | | 10,188 | | | | 50,349 | |
Dios Fastigheter AB | | | 13,971 | | | | 93,379 | |
Essity AB, Class B | | | 5,927 | | | | 181,565 | |
Skanska AB, Class B (e) | | | 9,109 | | | | 137,083 | |
SSAB AB, Class A | | | 27,594 | | | | 62,571 | |
| | | | | | | | |
| | | | | | | 665,065 | |
| | | | | | | | |
| |
| Switzerland—3.0% | | | | | |
Nestle S.A. | | | 7,983 | | | | 817,202 | |
Novartis AG | | | 9,335 | | | | 770,126 | |
Roche Holding AG | | | 4,330 | | | | 1,393,142 | |
Sonova Holding AG | | | 1,662 | | | | 296,359 | |
Swiss Life Holding AG | | | 789 | | | | 264,825 | |
UBS Group AG (e) | | | 36,272 | | | | 332,473 | |
| | | | | | | | |
| | | | | | | 3,874,127 | |
| | | | | | | | |
| |
| Taiwan—1.7% | | | | | |
Accton Technology Corp. | | | 25,000 | | | | 133,765 | |
Asia Cement Corp. | | | 97,000 | | | | 125,940 | |
Hon Hai Precision Industry Co., Ltd. | | | 159,001 | | | | 366,062 | |
Pou Chen Corp. | | | 136,000 | | | | 114,950 | |
Powertech Technology, Inc. | | | 44,000 | | | | 124,608 | |
Realtek Semiconductor Corp. | | | 35,000 | | | | 251,261 | |
Taiwan Semiconductor Manufacturing Co., Ltd. ADR | | | 9,949 | | | | 475,463 | |
Tripod Technology Corp. | | | 36,000 | | | | 111,987 | |
United Microelectronics Corp. ADR | | | 62,180 | | | | 134,931 | |
Yuanta Financial Holding Co., Ltd. | | | 509,000 | | | | 259,872 | |
Zhen Ding Technology Holding Ltd. | | | 50,000 | | | | 152,804 | |
| | | | | | | | |
| | | | | | | 2,251,643 | |
| | | | | | | | |
| |
| Thailand—0.1% | | | | | |
Gulf Energy Development PCL (c)(d) | | | 15,400 | | | | 70,140 | |
Thanachart Capital PCL (c)(d) | | | 61,400 | | | | 61,758 | |
| | | | | | | | |
| | | | | | | 131,898 | |
| | | | | | | | |
| |
| Turkey—0.2% | | | | | |
Turkcell Iletisim Hizmetleri AS | | | 93,839 | | | | 174,296 | |
Turkiye Garanti Bankasi AS (e) | | | 59,989 | | | | 73,572 | |
| | | | | | | | |
| | | | | | | 247,868 | |
| | | | | | | | |
| |
| United Kingdom—3.2% | | | | | |
Airtel Africa PLC (a) | | | 144,811 | | | | 72,877 | |
Anglo American PLC | | | 19,452 | | | | 340,869 | |
Aviva PLC | | | 40,405 | | | | 132,842 | |
BP PLC | | | 129,939 | | | | 532,873 | |
BT Group PLC | | | 157,426 | | | | 228,986 | |
Cranswick PLC | | | 3,504 | | | | 160,408 | |
Firstgroup PLC (e) | | | 255,870 | | | | 157,529 | |
Frontier Developments PLC (e) | | | 4,338 | | | | 66,042 | |
JD Sports Fashion PLC | | | 34,651 | | | | 194,071 | |
Keller Group PLC | | | 13,500 | | | | 88,592 | |
Lloyds Banking Group PLC | | | 514,389 | | | | 201,101 | |
Micro Focus International PLC | | | 33,974 | | | | 167,648 | |
Morgan Sindall Group PLC | | | 4,370 | | | | 64,403 | |
National Express Group PLC | | | 112,303 | | | | 284,355 | |
Rio Tinto PLC | | | 8,417 | | | | 385,854 | |
Royal Dutch Shell PLC, Class A | | | 8,494 | | | | 147,294 | |
Royal Dutch Shell PLC, Class B | | | 24,495 | | | | 410,881 | |
STERIS PLC | | | 1,264 | | | | 176,922 | |
Vodafone Group PLC | | | 219,095 | | | | 303,106 | |
| | | | | | | | |
| | | | | | | 4,116,653 | |
| | | | | | | | |
| | | | | | | | |
| See accompanying Notes to Financial Statements | | | March 31, 2020 | | | Semiannual Report | | | 123 | |
Schedule of Investments
March 31, 2020 (unaudited)
| | | | | | | | |
| | | Shares | | | Value | |
| |
| United States—54.0% | | | | | |
Abbott Laboratories | | | 10,059 | | | $ | 793,756 | |
AbbVie, Inc. | | | 12,861 | | | | 979,880 | |
ACCO Brands Corp. | | | 21,195 | | | | 107,035 | |
Adobe, Inc. (e) | | | 2,100 | | | | 668,304 | |
Affiliated Managers Group, Inc. | | | 2,142 | | | | 126,678 | |
Aflac, Inc. | | | 8,475 | | | | 290,184 | |
AGNC Investment Corp. REIT | | | 33,923 | | | | 358,905 | |
Air Products & Chemicals, Inc. | | | 1,837 | | | | 366,684 | |
Akamai Technologies, Inc. (e) | | | 3,041 | | | | 278,221 | |
Allstate Corp. | | | 5,580 | | | | 511,853 | |
Ally Financial, Inc. | | | 15,041 | | | | 217,042 | |
Alphabet, Inc., Class A (e) | | | 1,217 | | | | 1,414,093 | |
Alphabet, Inc., Class C (e) | | | 1,264 | | | | 1,469,792 | |
Amazon.com, Inc. (e) | | | 1,409 | | | | 2,747,156 | |
American Equity Investment Life Holding Co. | | | 4,733 | | | | 88,980 | |
American Express Co. | | | 6,091 | | | | 521,451 | |
American Financial Group, Inc. | | | 2,718 | | | | 190,477 | |
Amgen, Inc. | | | 2,354 | | | | 477,226 | |
Anthem, Inc. | | | 2,721 | | | | 617,776 | |
Apple, Inc. | | | 13,225 | | | | 3,362,985 | |
Applied Materials, Inc. | | | 5,965 | | | | 273,316 | |
AT&T, Inc. | | | 41,786 | | | | 1,218,062 | |
Bank of America Corp. | | | 35,102 | | | | 745,215 | |
Best Buy Co., Inc. | | | 5,102 | | | | 290,814 | |
Booking Holdings, Inc. (e) | | | 334 | | | | 449,337 | |
BorgWarner, Inc. | | | 1,917 | | | | 46,717 | |
Boston Scientific Corp. (e) | | | 13,061 | | | | 426,180 | |
Bright Horizons Family Solutions, Inc. (e) | | | 1,641 | | | | 167,382 | |
Cadence Design Systems, Inc. (e) | | | 5,024 | | | | 331,785 | |
Cardinal Health, Inc. | | | 8,765 | | | | 420,194 | |
CBRE Group, Inc., Class A (e) | | | 4,138 | | | | 156,044 | |
CDW Corp. | | | 4,225 | | | | 394,066 | |
CenturyLink, Inc. | | | 34,058 | | | | 322,189 | |
Chevron Corp. | | | 7,585 | | | | 549,609 | |
Chipotle Mexican Grill, Inc. (e) | | | 496 | | | | 324,582 | |
Cintas Corp. | | | 1,009 | | | | 174,779 | |
Cisco Systems, Inc. | | | 20,404 | | | | 802,081 | |
Citigroup, Inc. | | | 10,994 | | | | 463,067 | |
Citizens Financial Group, Inc. | | | 5,724 | | | | 107,668 | |
CNA Financial Corp. | | | 4,495 | | | | 139,525 | |
Coca-Cola Co. | | | 18,463 | | | | 816,988 | |
Comcast Corp., Class A | | | 20,381 | | | | 700,699 | |
Costco Wholesale Corp. | | | 2,354 | | | | 671,196 | |
CVS Health Corp. | | | 14,136 | | | | 838,689 | |
Danaher Corp. | | | 5,206 | | | | 720,562 | |
Delta Air Lines, Inc. | | | 12,124 | | | | 345,898 | |
DexCom, Inc. (e) | | | 1,750 | | | | 471,223 | |
Discover Financial Services | | | 10,894 | | | | 388,589 | |
Dollar General Corp. | | | 1,519 | | | | 229,384 | |
DR Horton, Inc. | | | 5,378 | | | | 182,852 | |
DXC Technology Co. | | | 14,717 | | | | 192,057 | |
Edwards Lifesciences Corp. (e) | | | 2,760 | | | | 520,591 | |
Electronic Arts, Inc. (e) | | | 2,207 | | | | 221,075 | |
Eli Lilly & Co. | | | 4,821 | | | | 668,769 | |
Equinix, Inc. REIT | | | 682 | | | | 425,957 | |
Equitable Holdings, Inc. | | | 9,375 | | | | 135,469 | |
Exxon Mobil Corp. | | | 10,175 | | | | 386,345 | |
Facebook, Inc., Class A (e) | | | 4,887 | | | | 815,152 | |
Fidelity National Information Services, Inc. | | | 4,389 | | | | 533,878 | |
Fortinet, Inc. (e) | | | 2,080 | | | | 210,434 | |
Fortune Brands Home & Security, Inc. | | | 7,111 | | | | 307,551 | |
FTI Consulting, Inc. (e) | | | 981 | | | | 117,494 | |
Garmin Ltd. | | | 2,024 | | | | 151,719 | |
General Mills, Inc. | | | 8,000 | | | | 422,160 | |
General Motors Co. | | | 20,887 | | | | 434,032 | |
Global Payments, Inc. | | | 2,174 | | | | 313,556 | |
Hartford Financial Services Group, Inc. | | | 17,840 | | | | 628,682 | |
| | | | | | | | |
| | | Shares | | | Value | |
HCA Healthcare, Inc. | | | 4,794 | | | $ | 430,741 | |
HEICO Corp., Class A | | | 2,859 | | | | 182,690 | |
Herc Holdings, Inc. (e) | | | 2,064 | | | | 42,229 | |
Hershey Co. | | | 1,444 | | | | 191,330 | |
Hewlett Packard Enterprise Co. | | | 17,129 | | | | 166,323 | |
Honeywell International, Inc. | | | 5,465 | | | | 731,162 | |
HP, Inc. | | | 22,629 | | | | 392,839 | |
Humana, Inc. | | | 1,035 | | | | 325,011 | |
Intel Corp. | | | 22,590 | | | | 1,222,571 | |
Intuit, Inc. | | | 1,603 | | | | 368,690 | |
Johnson & Johnson | | | 9,462 | | | | 1,240,752 | |
Johnson Controls International PLC | | | 25,168 | | | | 678,529 | |
JPMorgan Chase & Co. | | | 11,802 | | | | 1,062,534 | |
Kelly Services, Inc., Class A | | | 6,820 | | | | 86,546 | |
KeyCorp | | | 27,738 | | | | 287,643 | |
Kimberly-Clark Corp. | | | 2,853 | | | | 364,813 | |
Kroger Co. | | | 19,170 | | | | 577,400 | |
L3Harris Technologies, Inc. | | | 3,910 | | | | 704,269 | |
Lam Research Corp. | | | 1,207 | | | | 289,680 | |
Lear Corp. | | | 1,410 | | | | 114,563 | |
Leidos Holdings, Inc. | | | 5,733 | | | | 525,429 | |
Lululemon Athletica, Inc. (e) | | | 2,435 | | | | 461,554 | |
LyondellBasell Industries NV, Class A | | | 2,312 | | | | 114,745 | |
Marathon Petroleum Corp. | | | 5,504 | | | | 130,004 | |
MarketAxess Holdings, Inc. | | | 497 | | | | 165,287 | |
Mastercard, Inc., Class A | | | 3,808 | | | | 919,860 | |
McGrath RentCorp | | | 4,526 | | | | 237,072 | |
MDC Holdings, Inc. | | | 3,497 | | | | 81,130 | |
Merck & Co., Inc. | | | 13,920 | | | | 1,071,005 | |
Methode Electronics, Inc. | | | 3,259 | | | | 86,135 | |
MetLife, Inc. | | | 13,030 | | | | 398,327 | |
Microsoft Corp. | | | 23,752 | | | | 3,745,928 | |
MSCI, Inc. | | | 1,652 | | | | 477,362 | |
Nasdaq, Inc. | | | 1,674 | | | | 158,946 | |
Newmont Corp. | | | 11,374 | | | | 515,015 | |
NIKE, Inc., Class B | | | 5,886 | | | | 487,008 | |
NVIDIA Corp. | | | 2,895 | | | | 763,122 | |
NVR, Inc. (e) | | | 220 | | | | 565,204 | |
Omnicom Group, Inc. | | | 2,800 | | | | 153,720 | |
Oracle Corp. | | | 13,675 | | | | 660,913 | |
Owens Corning | | | 3,643 | | | | 141,385 | |
Pfizer, Inc. | | | 23,345 | | | | 761,981 | |
Phillips 66 | | | 2,283 | | | | 122,483 | |
Popular, Inc. | | | 4,495 | | | | 157,325 | |
Principal Financial Group, Inc. | | | 10,075 | | | | 315,751 | |
Procter & Gamble Co. | | | 11,778 | | | | 1,295,580 | |
Qorvo, Inc. (e) | | | 3,557 | | | | 286,801 | |
QUALCOMM, Inc. | | | 7,205 | | | | 487,418 | |
Reinsurance Group of America, Inc. | | | 5,836 | | | | 491,041 | |
Ross Stores, Inc. | | | 3,238 | | | | 281,609 | |
Royal Caribbean Cruises Ltd. | | | 3,949 | | | | 127,039 | |
Salesforce.com, Inc. (e) | | | 5,348 | | | | 770,005 | |
Southern Co. | | | 9,998 | | | | 541,292 | |
Steel Dynamics, Inc. | | | 5,675 | | | | 127,915 | |
Stryker Corp. | | | 3,117 | | | | 518,949 | |
Synopsys, Inc. (e) | | | 2,860 | | | | 368,339 | |
Target Corp. | | | 3,961 | | | | 368,254 | |
Taylor Morrison Home Corp. (e) | | | 11,899 | | | | 130,889 | |
Teledyne Technologies, Inc. (e) | | | 1,207 | | | | 358,805 | |
Teradyne, Inc. | | | 3,005 | | | | 162,781 | |
Tetra Tech, Inc. | | | 1,646 | | | | 116,241 | |
Thermo Fisher Scientific, Inc. | | | 2,453 | | | | 695,671 | |
Tyson Foods, Inc., Class A | | | 4,105 | | | | 237,556 | |
UniFirst Corp. | | | 1,562 | | | | 236,003 | |
UnitedHealth Group, Inc. | | | 3,867 | | | | 964,352 | |
Unum Group | | | 6,351 | | | | 95,329 | |
Veeva Systems, Inc., Class A (e) | | | 2,146 | | | | 335,570 | |
Verizon Communications, Inc. | | | 22,797 | | | | 1,224,883 | |
Visa, Inc., Class A | | | 6,904 | | | | 1,112,372 | |
| | | | | | | | |
| | | Shares | | | Value | |
Vulcan Materials Co. | | | 3,156 | | | $ | 341,069 | |
Walgreens Boots Alliance, Inc. | | | 5,484 | | | | 250,893 | |
WestRock Co. | | | 7,377 | | | | 208,474 | |
Xerox Holdings, Corp. (e) | | | 16,872 | | | | 319,556 | |
| | | | | | | | |
| | | | | | | 70,373,783 | |
| | | | | | | | |
Total Common Stock
(cost-$138,696,123) | | | | 126,333,063 | |
| | | | | | | | |
| | | | | | | | |
|
| Exchange-Traded Funds—1.6% | |
iShares Core MSCI EAFE | | | 13,356 | | | | 666,331 | |
iShares Core MSCI Emerging Markets | | | 9,562 | | | | 386,974 | |
iShares Core S&P 500 | | | 3,871 | | | | 1,000,266 | |
| | | | | | | | |
Total Exchange-Traded Funds
(cost—$2,414,771) | | | | 2,053,571 | |
| | | | | | | | |
| | | | | | | | |
| |
| Preferred Stock—0.7% | | | | | |
| |
| Brazil—0.2% | | | | | |
Cia Energetica de Minas Gerais | | | 28,500 | | | | 48,870 | |
Cia Paranaense de Energia | | | 6,400 | | | | 65,896 | |
Petroleo Brasileiro S.A. | | | 35,800 | | | | 96,388 | |
Telefonica Brasil S.A. | | | 9,500 | | | | 90,409 | |
| | | | | | | | |
| | | | | | | 301,563 | |
| | | | | | | | |
| |
| Chile—0.1% | | | | | |
Embotelladora Andina S.A., Class B | | | 32,524 | | | | 72,301 | |
| | | | | | | | |
| |
| Colombia—0.0% | | | | | |
Grupo Aval Acciones y Valores S.A. | | | 271,880 | | | | 60,038 | |
| | | | | | | | |
| |
| Germany—0.2% | | | | | |
Volkswagen AG | | | 1,856 | | | | 213,805 | |
| | | | | | | | |
| |
| Korea (Republic of)—0.2% | | | | | |
Samsung Electronics Co., Ltd. | | | 7,620 | | | | 248,318 | |
| | | | | | | | |
Total Preferred Stock
(cost—$1,186,802) | | | | 896,025 | |
| | | | | | | | |
| | | | | | | | |
| | |
| | | Principal
Amount
(000s) | | | | |
|
| Repurchase Agreements—0.2% | |
State Street Bank and Trust Co.,
dated 3/31/20, 0.00%, due 4/1/20, proceeds $295,000; collateralized by U.S. Treasury Notes, 2.75%, due 4/30/23, valued at $304,384 including accrued interest | |
(cost—$295,000) | | | $295 | | | | 295,000 | |
| | | | | | | | |
| |
Total Investments
(cost—$142,592,696) (b)—99.4% | | | | 129,577,659 | |
| | | | | | | | |
| |
Other assets less
liabilities—0.6% | | | | 763,887 | |
| | | | | | | | |
| |
| Net Assets—100.0% | | | | $130,341,546 | |
| | | | | | | | |
Notes to Schedule of Investments:
† Actual amount rounds to less than $1.
(a) 144A—Exempt from registration under Rule 144A of the Securities Act of 1933. These securities may be resold in transactions exempt from registration, typically only to qualified institutional buyers. Securities with an aggregate value of $754,218, representing 0.6% of net assets.
| | | | | | |
| 124 | | Semiannual Report | | | March 31, 2020 | | | See accompanying Notes to Financial Statements |
Schedule of Investments
March 31, 2020 (unaudited)
(b) Securities with an aggregate value of $46,075,003, representing 35.3% of net assets, were valued utilizing modeling tools provided by a third-party vendor. See Note 1(a) and Note 1(b) in the Notes to Financial Statements.
(c) Fair-Valued—Securities with an aggregate value of $252,617, representing 0.2% of net assets. See Note 1(a) and Note 1(b) in the Notes to Financial Statements.
(d) Level 3 security. See Note 1(a) and Note 1(b) in the Notes to Financial Statements.
(e)Non-income producing.
Glossary:
ADR—American Depositary Receipt
EAFE—Europe, Australasia and Far East
MSCI—Morgan Stanley Capital International
REIT—Real Estate Investment Trust
The industry classification of portfolio holdings and other assets less liabilities shown as a percentage of net assets were as follows:
| | | | |
Banks | | | 6.6% | |
Software | | | 6.0% | |
Pharmaceuticals | | | 5.4% | |
Insurance | | | 5.4% | |
Interactive Media & Services | | | 4.2% | |
Healthcare Equipment & Supplies | | | 4.2% | |
Technology Hardware, Storage & Peripherals | | | 4.2% | |
Semiconductors & Semiconductor Equipment | | | 4.1% | |
Internet & Direct Marketing Retail | | | 3.9% | |
IT Services | | | 3.5% | |
Oil, Gas & Consumable Fuels | | | 3.3% | |
Diversified Telecommunication Services | | | 3.2% | |
Healthcare Providers & Services | | | 2.9% | |
Metals & Mining | | | 2.3% | |
Food Products | | | 2.0% | |
Automobiles | | | 2.0% | |
Food & Staples Retailing | | | 1.9% | |
Wireless Telecommunication Services | | | 1.9% | |
Textiles, Apparel & Luxury Goods | | | 1.6% | |
Exchange-Traded Funds | | | 1.6% | |
Aerospace & Defense | | | 1.5% | |
Electric Utilities | | | 1.5% | |
Biotechnology | | | 1.4% | |
Household Products | | | 1.4% | |
Beverages | | | 1.2% | |
Capital Markets | | | 1.2% | |
Household Durables | | | 1.1% | |
Trading Companies & Distributors | | | 1.1% | |
Building Products | | | 1.0% | |
Electronic Equipment, Instruments & Components | | | 1.0% | |
Media | | | 0.9% | |
Consumer Finance | | | 0.9% | |
Commercial Services & Supplies | | | 0.8% | |
Industrial Conglomerates | | | 0.8% | |
Real Estate Management & Development | | | 0.8% | |
Construction & Engineering | | | 0.8% | |
Specialty Retail | | | 0.8% | |
Machinery | | | 0.7% | |
Communications Equipment | | | 0.7% | |
| | | | |
Chemicals | | | 0.7% | |
Personal Products | | | 0.6% | |
Equity Real Estate Investment Trusts (REITs) | | | 0.6% | |
Diversified Financial Services | | | 0.6% | |
Airlines | | | 0.6% | |
Multi-Line Retail | | | 0.5% | |
Life Sciences Tools & Services | | | 0.5% | |
Professional Services | | | 0.5% | |
Multi-Utilities | | | 0.5% | |
Entertainment | | | 0.5% | |
Construction Materials | | | 0.5% | |
Road & Rail | | | 0.4% | |
Auto Components | | | 0.4% | |
Electrical Equipment | | | 0.4% | |
Hotels, Restaurants & Leisure | | | 0.4% | |
Diversified Consumer Services | | | 0.3% | |
Mortgage Real Estate Investment Trusts (REITs) | | | 0.3% | |
Healthcare Technology | | | 0.3% | |
Containers & Packaging | | | 0.2% | |
Transportation Infrastructure | | | 0.2% | |
Independent Power Producers & Energy Traders | | | 0.2% | |
Real Estate | | | 0.1% | |
Food & Beverage | | | 0.1% | |
Thrifts & Mortgage Finance | | | 0.0% | |
Repurchase Agreements | | | 0.2% | |
Other assets less liabilities | | | 0.6% | |
| | | | |
| | | 100.0% | |
| | | | |
AllianzGI Best Styles U.S. Equity Fund
| | | | | | | | |
| | | Shares | | | Value | |
| |
| Common Stock—99.6% | | | | | |
| |
| Aerospace & Defense—2.3% | | | | | |
General Dynamics Corp. | | | 1,122 | | | | $148,452 | |
Huntington Ingalls Industries, Inc. | | | 311 | | | | 56,667 | |
L3Harris Technologies, Inc. (b) | | | 737 | | | | 132,748 | |
Lockheed Martin Corp. | | | 604 | | | | 204,726 | |
Northrop Grumman Corp. | | | 469 | | | | 141,896 | |
| | | | | | | | |
| | | | | | | 684,489 | |
| | | | | | | | |
| |
| Banks—3.3% | | | | | |
Bank of America Corp. | | | 14,832 | | | | 314,883 | |
Citigroup, Inc. | | | 2,071 | | | | 87,231 | |
Citizens Financial Group, Inc. | | | 2,998 | | | | 56,392 | |
Comerica, Inc. | | | 1,872 | | | | 54,925 | |
JPMorgan Chase & Co. | | | 4,633 | | | | 417,109 | |
Laurentian Bank of Canada | | | 1,025 | | | | 22,258 | |
Regions Financial Corp. | | | 3,872 | | | | 34,732 | |
| | | | | | | | |
| | | | | | | 987,530 | |
| | | | | | | | |
| |
| Beverages—1.0% | | | | | |
Coca-Cola Co. | | | 3,620 | | | | 160,185 | |
Constellation Brands, Inc., Class A | | | 750 | | | | 107,520 | |
PepsiCo, Inc. | | | 216 | | | | 25,942 | |
| | | | | | | | |
| | | | | | | 293,647 | |
| | | | | | | | |
| |
| Biotechnology—2.1% | | | | | |
AbbVie, Inc. | | | 3,537 | | | | 269,484 | |
Amgen, Inc. | | | 1,352 | | | | 274,091 | |
Biogen, Inc. (b) | | | 273 | | | | 86,372 | |
| | | | | | | | |
| | | | | | | 629,947 | |
| | | | | | | | |
| |
| Building Products—0.7% | | | | | |
Allegion PLC | | | 842 | | | | 77,481 | |
Johnson Controls International PLC | | | 4,448 | | | | 119,918 | |
| | | | | | | | |
| | | | | | | 197,399 | |
| | | | | | | | |
| |
| Capital Markets—3.5% | | | | | |
Ameriprise Financial, Inc. | | | 870 | | | | 89,158 | |
Carlyle Group, Inc. | | | 3,721 | | | | 80,560 | |
CME Group, Inc. | | | 1,118 | | | | 193,313 | |
Cohen & Steers, Inc. | | | 279 | | | | 12,680 | |
Legg Mason, Inc. | | | 165 | | | | 8,060 | |
MarketAxess Holdings, Inc. | | | 282 | | | | 93,785 | |
Moody’s Corp. | | | 808 | | | | 170,892 | |
Morgan Stanley | | | 5,251 | | | | 178,534 | |
S&P Global, Inc. | | | 875 | | | | 214,419 | |
| | | | | | | | |
| | | | | | | 1,041,401 | |
| | | | | | | | |
| |
| Chemicals—0.4% | | | | | |
LyondellBasell Industries NV, Class A | | | 1,150 | | | | 57,075 | |
Rayonier Advanced Materials, Inc. | | | 2,240 | | | | 2,374 | |
Sherwin-Williams Co. | | | 157 | | | | 72,145 | |
| | | | | | | | |
| | | | | | | 131,594 | |
| | | | | | | | |
|
| Commercial Services & Supplies—1.0% | |
Boyd Group Services, Inc. | | | 123 | | | | 12,804 | |
Cintas Corp. | | | 630 | | | | 109,129 | |
Copart, Inc. (b) | | | 547 | | | | 37,480 | |
Tetra Tech, Inc. | | | 411 | | | | 29,025 | |
Waste Management, Inc. | | | 1,354 | | | | 125,326 | |
| | | | | | | | |
| | | | | | | 313,764 | |
| | | | | | | | |
| |
| Communications Equipment—1.1% | | | | | |
Cisco Systems, Inc. | | | 6,098 | | | | 239,713 | |
Juniper Networks, Inc. | | | 4,245 | | | | 81,249 | |
| | | | | | | | |
| | | | | | | 320,962 | |
| | | | | | | | |
| |
| Construction & Engineering—0.0% | | | | | |
Aecon Group, Inc. | | | 1,179 | | | | 10,522 | |
| | | | | | | | |
| | | | | | | | |
| See accompanying Notes to Financial Statements | | | March 31, 2020 | | | Semiannual Report | | | 125 | |
Schedule of Investments
March 31, 2020 (unaudited)
| | | | | | | | |
| | | Shares | | | Value | |
| |
| Consumer Finance—0.8% | | | | | |
Capital One Financial Corp. | | | 2,420 | | | $ | 122,016 | |
Santander Consumer USA Holdings, Inc. | | | 1,271 | | | | 17,680 | |
Synchrony Financial | | | 6,129 | | | | 98,616 | |
| | | | | | | | |
| | | | | | | 238,312 | |
| | | | | | | | |
| |
| Containers & Packaging—0.2% | | | | | |
Avery Dennison Corp. | | | 733 | | | | 74,671 | |
| | | | | | | | |
|
| Diversified Financial Services—1.2% | |
Berkshire Hathaway, Inc., Class B (b) | | | 1,714 | | | | 313,371 | |
Onex Corp. | | | 593 | | | | 21,705 | |
Voya Financial, Inc. | | | 804 | | | | 32,602 | |
| | | | | | | | |
| | | | | | | 367,678 | |
| | | | | | | | |
|
| Diversified Telecommunication Services—2.4% | |
AT&T, Inc. | | | 11,842 | | | | 345,194 | |
Verizon Communications, Inc. | | | 6,686 | | | | 359,239 | |
| | | | | | | | |
| | | | | | | 704,433 | |
| | | | | | | | |
| |
| Electric Utilities—2.0% | | | | | |
Duke Energy Corp. | | | 2,450 | | | | 198,156 | |
Entergy Corp. | | | 629 | | | | 59,107 | |
Exelon Corp. | | | 4,099 | | | | 150,884 | |
Fortis, Inc. | | | 553 | | | | 21,325 | |
Hydro One Ltd. (a) | | | 978 | | | | 17,610 | |
NextEra Energy, Inc. | | | 497 | | | | 119,588 | |
PPL Corp. | | | 186 | | | | 4,591 | |
Southern Co. | | | 225 | | | | 12,182 | |
| | | | | | | | |
| | | | | | | 583,443 | |
| | | | | | | | |
| |
| Electrical Equipment—0.5% | | | | | |
Eaton Corp. PLC | | | 2,032 | | | | 157,866 | |
| | | | | | | | |
|
| Electronic Equipment, Instruments & Components—0.6% | |
Anixter International, Inc. (b) | | | 752 | | | | 66,078 | |
CDW Corp. | | | 803 | | | | 74,896 | |
Tech Data Corp. (b) | | | 412 | | | | 53,910 | |
| | | | | | | | |
| | | | | | | 194,884 | |
| | | | | | | | |
|
| Energy Equipment & Services—0.0% | |
Hermitage Offshore Services Ltd. (b) | | | 28 | | | | 18 | |
Mammoth Energy Services, Inc. | | | 2,878 | | | | 2,155 | |
| | | | | | | | |
| | | | | | | 2,173 | |
| | | | | | | | |
| |
| Entertainment—1.8% | | | | | |
Activision Blizzard, Inc. | | | 1,508 | | | | 89,696 | |
Electronic Arts, Inc. (b) | | | 610 | | | | 61,104 | |
Netflix, Inc. (b) | | | 187 | | | | 70,218 | |
Take-Two Interactive Software, Inc. (b) | | | 787 | | | | 93,346 | |
Walt Disney Co. | | | 2,440 | | | | 235,704 | |
| | | | | | | | |
| | | | | | | 550,068 | |
| | | | | | | | |
|
| Equity Real Estate Investment Trusts (REITs)—1.9% | |
American Tower Corp. | | | 1,152 | | | | 250,848 | |
Canadian Apartment Properties REIT | | | 886 | | | | 26,813 | |
Douglas Emmett, Inc. | | | 842 | | | | 25,689 | |
Essex Property Trust, Inc. | | | 432 | | | | 95,144 | |
Extra Space Storage, Inc. | | | 972 | | | | 93,079 | |
Mid-America Apartment Communities, Inc. | | | 603 | | | | 62,127 | |
| | | | | | | | |
| | | | | | | 553,700 | |
| | | | | | | | |
| |
| Food & Staples Retailing—2.2% | | | | | |
Costco Wholesale Corp. | | | 843 | | | | 240,365 | |
Empire Co., Ltd., Class A | | | 1,014 | | | | 19,836 | |
Kroger Co. | | | 2,654 | | | | 79,938 | |
| | | | | | | | |
| | | Shares | | | Value | |
Sysco Corp. | | | 3,336 | | | $ | 152,222 | |
Walmart, Inc. | | | 1,552 | | | | 176,338 | |
| | | | | | | | |
| | | | | | | 668,699 | |
| | | | | | | | |
| |
| Food Products—1.4% | | | | | |
Campbell Soup Co. | | | 1,700 | | | | 78,472 | |
General Mills, Inc. | | | 2,426 | | | | 128,020 | |
Kellogg Co. | | | 1,593 | | | | 95,564 | |
Tyson Foods, Inc., Class A | | | 1,788 | | | | 103,472 | |
| | | | | | | | |
| | | | | | | 405,528 | |
| | | | | | | | |
|
| Healthcare Equipment & Supplies—4.1% | |
Abbott Laboratories | | | 3,903 | | | | 307,986 | |
CONMED Corp. | | | 167 | | | | 9,564 | |
DENTSPLY SIRONA, Inc. | | | 2,381 | | | | 92,454 | |
Edwards Lifesciences Corp. (b) | | | 58 | | | | 10,940 | |
Hologic, Inc. (b) | | | 2,664 | | | | 93,506 | |
Integer Holdings Corp. (b) | | | 182 | | | | 11,441 | |
Intuitive Surgical, Inc. (b) | | | 283 | | | | 140,144 | |
Medtronic PLC | | | 2,909 | | | | 262,334 | |
STERIS PLC | | | 691 | | | | 96,719 | |
Stryker Corp. | | | 1,204 | | | | 200,454 | |
| | | | | | | | |
| | | | | | | 1,225,542 | |
| | | | | | | | |
|
| Healthcare Providers & Services—3.9% | |
Anthem, Inc. | | | 451 | | | | 102,395 | |
Cigna Corp. (b) | | | 1,215 | | | | 215,274 | |
CVS Health Corp. | | | 1,510 | | | | 89,588 | |
HCA Healthcare, Inc. | | | 349 | | | | 31,358 | |
Humana, Inc. | | | 486 | | | | 152,614 | |
Laboratory Corp. of America Holdings (b) | | | 793 | | | | 100,227 | |
UnitedHealth Group, Inc. | | | 1,727 | | | | 430,679 | |
Universal Health Services, Inc., Class B | | | 445 | | | | 44,090 | |
| | | | | | | | |
| | | | | | | 1,166,225 | |
| | | | | | | | |
|
| Hotels, Restaurants & Leisure—1.8% | |
Chipotle Mexican Grill, Inc. (b) | | | 204 | | | | 133,498 | |
Darden Restaurants, Inc. | | | 496 | | | | 27,012 | |
Restaurant Brands International, Inc. | | | 2,246 | | | | 89,907 | |
Starbucks Corp. | | | 3,391 | | | | 222,924 | |
Wingstop, Inc. | | | 183 | | | | 14,585 | |
Yum! Brands, Inc. | | | 862 | | | | 59,073 | |
| | | | | | | | |
| | | | | | | 546,999 | |
| | | | | | | | |
| |
| Household Durables—0.5% | | | | | |
DR Horton, Inc. | | | 1,553 | | | | 52,802 | |
MDC Holdings, Inc. | | | 721 | | | | 16,727 | |
NVR, Inc. (b) | | | 10 | | | | 25,691 | |
PulteGroup, Inc. | | | 2,240 | | | | 49,997 | |
| | | | | | | | |
| | | | | | | 145,217 | |
| | | | | | | | |
| |
| Household Products—2.5% | | | | | |
Church & Dwight Co., Inc. | | | 809 | | | | 51,922 | |
Colgate-Palmolive Co. | | | 2,481 | | | | 164,639 | |
Kimberly-Clark Corp. | | | 1,071 | | | | 136,949 | |
Procter & Gamble Co. | | | 3,446 | | | | 379,060 | |
| | | | | | | | |
| | | | | | | 732,570 | |
| | | | | | | | |
|
| Independent Power Producers & Energy Traders—0.2% | |
AES Corp. | | | 4,530 | | | | 61,608 | |
| | | | | | | | |
| |
| Industrial Conglomerates—0.8% | | | | | |
Honeywell International, Inc. | | | 1,701 | | | | 227,577 | |
| | | | | | | | |
| |
| Insurance—2.4% | | | | | |
Aflac, Inc. | | | 3,437 | | | | 117,683 | |
Allstate Corp. | | | 733 | | | | 67,238 | |
American International Group, Inc. | | | 596 | | | | 14,453 | |
Assurant, Inc. | | | 678 | | | | 70,573 | |
| | | | | | | | |
| | | Shares | | | Value | |
First American Financial Corp. | | | 1,242 | | | $ | 52,673 | |
Genworth Financial, Inc., Class A (b) | | | 3,864 | | | | 12,829 | |
Hartford Financial Services Group, Inc. | | | 2,623 | | | | 92,435 | |
Intact Financial Corp. | | | 220 | | | | 19,014 | |
MetLife, Inc. | | | 3,946 | | | | 120,629 | |
Progressive Corp. | | | 1,567 | | | | 115,707 | |
Prudential Financial, Inc. | | | 428 | | | | 22,316 | |
| | | | | | | | |
| | | | | | | 705,550 | |
| | | | | | | | |
|
| Interactive Media & Services—5.5% | |
Alphabet, Inc., Class A (b) | | | 435 | | | | 505,448 | |
Alphabet, Inc., Class C (b) | | | 423 | | | | 491,869 | |
Facebook, Inc., Class A (b) | | | 3,787 | | | | 631,671 | |
| | | | | | | | |
| | | | | | | 1,628,988 | |
| | | | | | | | |
|
| Internet & Direct Marketing Retail—3.8% | |
Amazon.com, Inc. (b) | | | 525 | | | | 1,023,603 | |
Booking Holdings, Inc. (b) | | | 77 | | | | 103,590 | |
| | | | | | | | |
| | | | | | | 1,127,193 | |
| | | | | | | | |
| |
| IT Services—5.1% | | | | | |
Automatic Data Processing, Inc. | | | 1,580 | | | | 215,955 | |
DXC Technology Co. | | | 1,308 | | | | 17,069 | |
Fidelity National Information Services, Inc. | | | 315 | | | | 38,317 | |
Fiserv, Inc. (b) | | | 1,302 | | | | 123,677 | |
International Business Machines Corp. | | | 1,780 | | | | 197,455 | |
Leidos Holdings, Inc. | | | 916 | | | | 83,951 | |
Mastercard, Inc., Class A | | | 1,192 | | | | 287,940 | |
PayPal Holdings, Inc. (b) | | | 2,527 | | | | 241,935 | |
Visa, Inc., Class A | | | 2,002 | | | | 322,562 | |
| | | | | | | | |
| | | | | | | 1,528,861 | |
| | | | | | | | |
|
| Life Sciences Tools & Services—1.7% | |
Bio-Rad Laboratories, Inc., Class A (b) | | | 244 | | | | 85,537 | |
IQVIA Holdings, Inc. (b) | | | 815 | | | | 87,906 | |
Mettler-Toledo International, Inc. (b) | | | 124 | | | | 85,623 | |
Thermo Fisher Scientific, Inc. | | | 933 | | | | 264,599 | |
| | | | | | | | |
| | | | | | | 523,665 | |
| | | | | | | | |
| |
| Machinery—0.3% | | | | | |
PACCAR, Inc. | | | 1,706 | | | | 104,288 | |
| | | | | | | | |
| |
| Media—0.9% | | | | | |
Cogeco Communications, Inc. | | | 182 | | | | 12,347 | |
Comcast Corp., Class A | | | 3,584 | | | | 123,218 | |
Omnicom Group, Inc. | | | 1,522 | | | | 83,558 | |
ViacomCBS, Inc., Class B | | | 3,363 | | | | 47,115 | |
| | | | | | | | |
| | | | | | | 266,238 | |
| | | | | | | | |
|
| Mortgage Real Estate Investment Trusts (REITs)—0.0% | |
MFA Financial, Inc. | | | 7,406 | | | | 11,479 | |
TPG RE Finance Trust, Inc. | | | 358 | | | | 1,966 | |
Western Asset Mortgage Capital Corp. | | | 441 | | | | 1,010 | |
| | | | | | | | |
| | | | | | | 14,455 | |
| | | | | | | | |
| |
| Multi-Line Retail—0.6% | | | | | |
Dollar General Corp. | | | 1,148 | | | | 173,359 | |
| | | | | | | | |
| |
| Multi-Utilities—1.2% | | | | | |
Algonquin Power & Utilities Corp. | | | 2,343 | | | | 31,550 | |
Ameren Corp. | | | 1,185 | | | | 86,303 | |
Canadian Utilities Ltd., Class A | | | 448 | | | | 10,709 | |
Dominion Energy, Inc. | | | 468 | | | | 33,785 | |
DTE Energy Co. | | | 401 | | | | 38,083 | |
Sempra Energy | | | 1,361 | | | | 153,779 | |
| | | | | | | | |
| | | | | | | 354,209 | |
| | | | | | | | |
| | | | | | |
| 126 | | Semiannual Report | | | March 31, 2020 | | | See accompanying Notes to Financial Statements |
Schedule of Investments
March 31, 2020 (unaudited)
| | | | | | | | |
| | | Shares | | | Value | |
|
| Oil, Gas & Consumable Fuels—3.1% | |
Cenovus Energy, Inc. | | | 17,422 | | | $ | 35,158 | |
Chevron Corp. | | | 1,831 | | | | 132,674 | |
ConocoPhillips | | | 5,647 | | | | 173,928 | |
EOG Resources, Inc. | | | 977 | | | | 35,094 | |
Exxon Mobil Corp. | | | 2,754 | | | | 104,569 | |
Kinder Morgan, Inc. | | | 10,279 | | | | 143,084 | |
ONEOK, Inc. | | | 3,131 | | | | 68,287 | |
Parkland Fuel Corp. | | | 963 | | | | 16,977 | |
Peabody Energy Corp. | | | 622 | | | | 1,804 | |
Pioneer Natural Resources Co. | | | 499 | | | | 35,005 | |
TC Energy Corp. | | | 1,465 | | | | 65,115 | |
Unit Corp. (b) | | | 2,371 | | | | 617 | |
Valero Energy Corp. | | | 2,512 | | | | 113,944 | |
| | | | | | | | |
| | | | | | | 926,256 | |
| | | | | | | | |
| |
| Pharmaceuticals—6.1% | | | | | |
Bristol-Myers Squibb Co. | | | 4,014 | | | | 223,740 | |
Eli Lilly & Co. | | | 925 | | | | 128,316 | |
Johnson & Johnson | | | 3,963 | | | | 519,668 | |
Merck & Co., Inc. | | | 5,253 | | | | 404,166 | |
Pfizer, Inc. | | | 10,551 | | | | 344,385 | |
Zoetis, Inc. | | | 1,746 | | | | 205,487 | |
| | | | | | | | |
| | | | | | | 1,825,762 | |
| | | | | | | | |
| |
| Professional Services—0.4% | | | | | |
Exponent, Inc. | | | 87 | | | | 6,256 | |
Verisk Analytics, Inc. | | | 727 | | | | 101,329 | |
| | | | | | | | |
| | | | | | | 107,585 | |
| | | | | | | | |
| |
| Road & Rail—0.1% | | | | | |
Union Pacific Corp. | | | 145 | | | | 20,451 | |
| | | | | | | | |
|
| Semiconductors & Semiconductor Equipment—3.1% | |
Amkor Technology, Inc. (b) | | | 1,048 | | | | 8,164 | |
Applied Materials, Inc. | | | 2,982 | | | | 136,635 | |
Broadcom, Inc. | | | 546 | | | | 129,457 | |
Intel Corp. | | | 6,565 | | | | 355,298 | |
KLA Corp. | | | 161 | | | | 23,142 | |
Lam Research Corp. | | | 525 | | | | 126,000 | |
Micron Technology, Inc. (b) | | | 758 | | | | 31,882 | |
QUALCOMM, Inc. (b) | | | 1,265 | | | | 85,577 | |
Texas Instruments, Inc. | | | 382 | | | | 38,173 | |
| | | | | | | | |
| | | | | | | 934,328 | |
| | | | | | | | |
| |
| Software—10.3% | | | | | |
Adobe, Inc. (b) | | | 841 | | | | 267,640 | |
Cadence Design Systems, Inc. (b) | | | 609 | | | | 40,218 | |
Citrix Systems, Inc. | | | 817 | | | | 115,646 | |
Intuit, Inc. | | | 893 | | | | 205,390 | |
LogMeIn, Inc. | | | 477 | | | | 39,725 | |
Microsoft Corp. | | | 11,102 | | | | 1,750,896 | |
NortonLifeLock, Inc. | | | 4,950 | | | | 92,615 | |
Oracle Corp. | | | 5,607 | | | | 270,986 | |
Salesforce.com, Inc. (b) | | | 924 | | | | 133,038 | |
ServiceNow, Inc. (b) | | | 503 | | | | 144,150 | |
| | | | | | | | |
| | | | | | | 3,060,304 | |
| | | | | | | | |
| |
| Specialty Retail—3.1% | | | | | |
Best Buy Co., Inc. | | | 1,195 | | | | 68,115 | |
Home Depot, Inc. | | | 1,145 | | | | 213,783 | |
Lowe’s Cos., Inc. | | | 2,355 | | | | 202,648 | |
MarineMax, Inc. (b) | | | 897 | | | | 9,347 | |
O’Reilly Automotive, Inc. (b) | | | 369 | | | | 111,087 | |
Ross Stores, Inc. | | | 1,578 | | | | 137,238 | |
TJX Cos., Inc. | | | 3,854 | | | | 184,260 | |
| | | | | | | | |
| | | | | | | 926,478 | |
| | | | | | | | |
| | | | | | | | |
| | | Shares | | | Value | |
|
| Technology Hardware, Storage & Peripherals—5.0% | |
Apple, Inc. | | | 5,603 | | | $ | 1,424,787 | |
Xerox Holdings, Corp. (b) | | | 3,323 | | | | 62,937 | |
| | | | | | | | |
| | | | | | | 1,487,724 | |
| | | | | | | | |
|
| Textiles, Apparel & Luxury Goods—0.8% | |
NIKE, Inc., Class B | | | 2,764 | | | | 228,693 | |
| | | | | | | | |
|
| Thrifts & Mortgage Finance—0.3% | |
Essent Group Ltd. | | | 2,004 | | | | 52,786 | |
Genworth MI Canada, Inc. | | | 1,120 | | | | 24,886 | |
| | | | | | | | |
| | | | | | | 77,672 | |
| | | | | | | | |
| |
| Tobacco—1.2% | | | | | |
Altria Group, Inc. | | | 1,751 | | | | 67,711 | |
Philip Morris International, Inc. | | | 4,066 | | | | 296,655 | |
| | | | | | | | |
| | | | | | | 364,366 | |
| | | | | | | | |
| |
| Wireless Telecommunication Services—0.4% | | | | | |
T-Mobile U.S., Inc. (b) | | | 1,318 | | | | 110,580 | |
| | | | | | | | |
Total Common Stock
(cost—$29,274,677) | | | | 29,715,453 | |
| | | | | | | | |
| | | | | | | | |
| | |
| | | Principal
Amount
(000s) | | | | |
|
| Repurchase Agreements—0.4% | |
State Street Bank and Trust Co., dated 3/31/20, 0.00%, due 4/1/20, proceeds $105,000; collateralized by U.S. Treasury Notes, 2.75%, due 4/30/23, valued at $108,709 including accrued interest | |
(cost—$105,000) | | | $105 | | | | 105,000 | |
| | | | | | | | |
| |
Total Investments
(cost—$29,379,677)—100.0% | | | | 29,820,453 | |
| | | | | | | | |
| |
Other assets less
liabilities—0.0% | | | | 733 | |
| | | | | |
| |
| Net Assets—100.0% | | | | $29,821,186 | |
| | | | | |
Notes to Schedule of Investments:
(a) 144A—Exempt from registration under Rule 144A of the Securities Act of 1933. These securities may be resold in transactions exempt from registration, typically only to qualified institutional buyers. Security with a value of $17,610, representing 0.1% of net assets.
(b)Non-income producing.
Glossary:
REIT—Real Estate Investment Trust
AllianzGI Convertible Fund
| | | | | | | | |
| | | Principal
Amount
(000s) | | | Value | |
|
| Convertible Bonds & Notes—72.9% | |
| |
| Aerospace & Defense—0.5% | | | | | |
Aerojet Rocketdyne Holdings, Inc., | |
2.25%, 12/15/23 | | | $2,390 | | | | $3,952,681 | |
| | | | | | | | |
|
| Auto Components—0.8% | |
Meritor, Inc., | | | | | | | | |
3.25%, 10/15/37 | | | 7,645 | | | | 6,507,806 | |
| | | | | | | | |
|
| Auto Manufacturers—2.0% | |
Tesla, Inc., | | | | | | | | |
1.25%, 3/1/21 | | | 6,195 | | | | 9,534,093 | |
2.00%, 5/15/24 | | | 4,310 | | | | 7,873,017 | |
| | | | | | | | |
| | | | | | | 17,407,110 | |
| | | | | | | | |
|
| Banks—1.6% | |
Barclays Bank PLC, | |
zero coupon, 2/4/25 | | | 3,065 | | | | 3,246,586 | |
BofA Finance LLC, | |
0.125%, 9/1/22 | | | 2,775 | | | | 2,750,039 | |
JPMorgan Chase Bank N.A. (a)(b), | |
0.125%, 1/1/23 | | | 7,100 | | | | 7,361,812 | |
| | | | | | | | |
| | | | | | | 13,358,437 | |
| | | | | | | | |
|
| Biotechnology—5.3% | |
BioMarin Pharmaceutical, Inc., | |
0.599%, 8/1/24 | | | 7,360 | | | | 7,731,184 | |
Exact Sciences Corp., | |
0.375%, 3/15/27 | | | 12,160 | | | | 10,277,915 | |
Halozyme Therapeutics, Inc. (a)(b), | |
1.25%, 12/1/24 | | | 6,010 | | | | 6,009,954 | |
Illumina, Inc., | |
0.50%, 6/15/21 | | | 1,405 | | | | 1,723,152 | |
Insmed, Inc., | |
1.75%, 1/15/25 | | | 6,165 | | | | 5,178,967 | |
Karyopharm Therapeutics Inc., | |
3.00%, 10/15/25 | | | 3,120 | | | | 4,471,118 | |
PTC Therapeutics, Inc., | | | | | | | | |
1.50%, 9/15/26 (a)(b) | | | 3,725 | | | | 4,010,796 | |
3.00%, 8/15/22 | | | 5,305 | | | | 5,947,369 | |
| | | | | | | | |
| | | | | | | 45,350,455 | |
| | | | | | | | |
|
| Commercial Services—2.9% | |
Chegg, Inc. (a)(b), | | | | | | | | |
0.125%, 3/15/25 | | | 8,455 | | | | 8,015,340 | |
FTI Consulting, Inc., | | | | | | | | |
2.00%, 8/15/23 | | | 3,195 | | | | 4,183,161 | |
Square, Inc. (a)(b), | | | | | | | | |
0.125%, 3/1/25 | | | 4,860 | | | | 4,224,352 | |
Square, Inc.,
| | | | | | | | |
0.50%, 5/15/23 | | | 8,025 | | | | 8,313,954 | |
| | | | | | | | |
| | | | | | | 24,736,807 | |
| | | | | | | | |
|
| Computers—2.5% | |
CyberArk Software Ltd. (a)(b), | |
zero coupon, 11/15/24 | | | 4,305 | | | | 3,751,253 | |
Lumentum Holdings, Inc. (a)(b), | |
0.50%, 12/15/26 | | | 13,385 | | | | 13,652,700 | |
Rapid7, Inc., | |
1.25%, 8/1/23 | | | 2,960 | | | | 3,601,950 | |
| | | | | | | | |
| | | | | | | 21,005,903 | |
| | | | | | | | |
|
| Diversified Financial Services—0.6% | |
GS Finance Corp. (Fidelity National Information Services, Inc.) (d)(e), | |
zero coupon, 6/5/23 | | | 3,925 | | | | 5,357,978 | |
| | | | | | | | |
|
| Electronics—0.9% | |
SMART Global Holdings, Inc. (a)(b), | |
2.25%, 2/15/26 | | | 8,675 | | | | 7,682,020 | |
| | | | | | | | |
|
| Energy-Alternate Sources—0.8% | |
Enphase Energy, Inc. (a)(b), | |
0.25%, 3/1/25 | | | 8,105 | | | | 6,479,810 | |
| | | | | | | | |
| | | | | | | | |
| See accompanying Notes to Financial Statements | | | March 31, 2020 | | | Semiannual Report | | | 127 | |
Schedule of Investments
March 31, 2020 (unaudited)
| | | | | | | | |
| | | Principal
Amount
(000s) | | | Value | |
|
| Engineering & Construction—0.7% | |
KBR, Inc., | |
2.50%, 11/1/23 | | $ | 6,005 | | | $ | 6,237,774 | |
| | | | | | | | |
|
| Entertainment—0.4% | |
Live Nation Entertainment, Inc., | |
2.50%, 3/15/23 | | | 3,720 | | | | 3,545,272 | |
| | | | | | | | |
|
| Equity Real Estate Investment Trusts (REITs)—0.7% | |
Blackstone Mortgage Trust, Inc., | |
4.375%, 5/5/22 | | | 7,130 | | | | 5,668,350 | |
| | | | | | | | |
|
| Healthcare-Products—4.9% | |
CONMED Corp., | | | | | | | | |
2.625%, 2/1/24 | | | 6,240 | | | | 5,807,337 | |
Insulet Corp. (a)(b), | |
0.375%, 9/1/26 | | | 12,845 | | | | 13,042,337 | |
NanoString Technologies, Inc. (a)(b), | |
2.625%, 3/1/25 | | | 5,050 | | | | 4,354,468 | |
Nevro Corp., | |
1.75%, 6/1/21 | | | 3,265 | | | | 3,884,865 | |
NuVasive, Inc., | | | | | | | | |
2.25%, 3/15/21 | | | 4,150 | | | | 4,360,936 | |
Repligen Corp., | |
0.375%, 7/15/24 | | | 10,250 | | | | 10,848,764 | |
| | | | | | | | |
| | | | | | | 42,298,707 | |
| | | | | | | | |
|
| Healthcare-Services—1.9% | |
Anthem, Inc., | | | | | | | | |
2.75%, 10/15/42 | | | 2,320 | | | | 7,338,392 | |
Teladoc Health, Inc., | |
1.375%, 5/15/25 | | | 3,020 | | | | 8,792,235 | |
| | | | | | | | |
| | | | | | | 16,130,627 | |
| | | | | | | | |
|
| Home Builders—0.8% | |
Winnebago Industries, Inc. (a)(b), | |
1.50%, 4/1/25 | | | 8,730 | | | | 6,585,694 | |
| | | | | | | | |
|
| Internet—6.1% | |
Etsy, Inc. (a)(b), | |
0.125%, 10/1/26 | | | 7,070 | | | | 5,854,922 | |
IAC Financeco 2, Inc. (a)(b), | |
0.875%, 6/15/26 | | | 7,520 | | | | 6,956,536 | |
Okta, Inc. (a)(b), | | | | | | | | |
0.125%, 9/1/25 | | | 11,085 | | | | 10,634,672 | |
Proofpoint, Inc. (a)(b), | |
0.25%, 8/15/24 | | | 8,440 | | | | 7,944,150 | |
Snap, Inc. (a)(b), | |
0.75%, 8/1/26 | | | 11,985 | | | | 10,559,108 | |
Zillow Group, Inc. (a)(b), | | | | | | | | |
1.375%, 9/1/26 | | | 9,785 | | | | 10,033,942 | |
| | | | | | | | |
| | | | | | | 51,983,330 | |
| | | | | | | | |
|
| Iron/Steel—0.3% | |
Cleveland-Cliffs, Inc., | |
1.50%, 1/15/25 | | | 3,765 | | | | 2,678,798 | |
| | | | | | | | |
|
| Media—3.9% | |
DISH Network Corp., | |
2.375%, 3/15/24 | | | 5,030 | | | | 4,005,138 | |
3.375%, 8/15/26 | | | 14,260 | | | | 11,612,652 | |
Liberty Media Corp-Liberty Formula One, | |
1.00%, 1/30/23 | | | 3,575 | | | | 3,382,649 | |
Liberty Media Corp., | |
1.375%, 10/15/23 | | | 6,660 | | | | 6,310,350 | |
2.75%, 12/1/49 (a)(b) | | | 9,385 | | | | 8,053,649 | |
| | | | | | | | |
| | | | | | | 33,364,438 | |
| | | | | | | | |
|
| Mining—0.4% | |
SSR Mining, Inc., | |
2.50%, 4/1/39 | | | 3,590 | | | | 3,534,520 | |
| | | | | | | | |
| | | | | | | | |
| | | Principal
Amount
(000s) | | | Value | |
|
| Oil, Gas & Consumable Fuels—0.5% | |
Helix Energy Solutions Group, Inc.,
| |
4.125%, 9/15/23 | | $ | 3,755 | | | $ | 2,479,649 | |
Transocean, Inc., | |
0.50%, 1/30/23 | | | 6,005 | | | | 2,177,211 | |
| | | | | | | | |
| | | | | | | 4,656,860 | |
| | | | | | | | |
|
| Pharmaceuticals—3.5% | |
DexCom, Inc., | | | | | | | | |
0.75%, 12/1/23 | | | 7,535 | | | | 13,191,145 | |
Flexion Therapeutics, Inc., | |
3.375%, 5/1/24 | | | 4,335 | | | | 3,368,380 | |
Horizon Pharma Investment Ltd., | |
2.50%, 3/15/22 | | | 5,385 | | | | 6,219,675 | |
Neurocrine Biosciences, Inc., | |
2.25%, 5/15/24 | | | 2,425 | | | | 3,119,813 | |
Sarepta Therapeutics, Inc., | |
1.50%, 11/15/24 | | | 2,650 | | | | 4,029,043 | |
| | | | | | | | |
| | | | | | | 29,928,056 | |
| | | | | | | | |
|
| Real Estate Management & Development—0.2% | |
Uniti Fiber Holdings, Inc. (a)(b), | |
4.00%, 6/15/24 | | | 2,175 | | | | 1,747,435 | |
| | | | | | | | |
|
| Retail—0.8% | |
Guess?, Inc. (a)(b), | |
2.00%, 4/15/24 | | | 4,880 | | | | 2,892,878 | |
RH, zero coupon, 6/15/23 | | | 2,130 | | | | 1,720,315 | |
zero coupon, | |
9/15/24 (a)(b) | | | 2,885 | | | | 2,112,252 | |
| | | | | | | | |
| | | | | | | 6,725,445 | |
| | | | | | | | |
|
| Semiconductors—8.0% | |
Advanced Micro Devices, Inc., | |
2.125%, 9/1/26 | | | 1,935 | | | | 11,093,509 | |
Inphi Corp., | |
0.75%, 9/1/21 | | | 6,155 | | | | 8,994,140 | |
Microchip Technology, Inc., | |
1.625%, 2/15/27 | | | 21,155 | | | | 21,765,188 | |
Micron Technology, Inc., Ser. D, | |
3.125%, 5/1/32 | | | 2,035 | | | | 8,595,026 | |
Novellus Systems, Inc., | |
2.625%, 5/15/41 | | | 900 | | | | 6,790,558 | |
ON Semiconductor Corp., | |
1.625%, 10/15/23 | | | 6,835 | | | | 6,805,773 | |
Teradyne, Inc., | |
1.25%, 12/15/23 | | | 2,570 | | | | 4,606,725 | |
| | | | | | | | |
| | | | | | | 68,650,919 | |
| | | | | | | | |
| |
| Software—19.2% | | | | | |
Akamai Technologies, Inc., | |
0.125%, 5/1/25 | | | 13,950 | | | | 15,638,327 | |
Alteryx, Inc. (a)(b), | |
0.50%, 8/1/24 | | | 1,170 | | | | 1,053,078 | |
1.00%, 8/1/26 | | | 5,025 | | | | 4,532,220 | |
Atlassian, Inc., | |
0.625%, 5/1/23 | | | 6,245 | | | | 10,889,906 | |
Bandwidth Inc, (a)(b), | |
0.25%, 3/1/26 | | | 5,485 | | | | 5,315,139 | |
Coupa Software, Inc. (a)(b), | |
0.125%, 6/15/25 | | | 6,595 | | | | 7,303,142 | |
DocuSign, Inc., | |
0.50%, 9/15/23 | | | 6,230 | | | | 8,782,256 | |
Envestnet, Inc., | |
1.75%, 6/1/23 | | | 5,585 | | | | 5,736,004 | |
Everbridge, Inc. (a)(b), | |
0.125%, 12/15/24 | | | 7,905 | | | | 8,986,997 | |
Five9, Inc., | |
0.125%, 5/1/23 | | | 2,265 | | | | 4,305,141 | |
i3 Verticals LLC (a)(b), | |
1.00%, 2/15/25 | | | 6,860 | | | | 5,484,181 | |
| | | | | | | | |
| | | Principal
Amount
(000s) | | | Value | |
j2 Global, Inc. (a)(b), | |
1.75%, 11/1/26 | | $ | 8,485 | | | $ | 7,784,987 | |
MongoDB, Inc. (a)(b), | | | | | | | | |
0.25%, 1/15/26 | | | 10,270 | | | | 10,006,831 | |
Nuance Communications, Inc., | |
1.25%, 4/1/25 | | | 4,430 | | | | 4,792,330 | |
Pegasystems, Inc. (a)(b), | |
0.75%, 3/1/25 | | | 7,345 | | | | 6,455,570 | |
RealPage, Inc., | |
1.50%, 11/15/22 | | | 3,300 | | | | 4,521,000 | |
RingCentral, Inc. (a)(b), | |
zero coupon, 3/1/25 | | | 15,910 | | | | 14,818,608 | |
Sea Ltd. (a)(b), | |
1.00%, 12/1/24 | | | 3,840 | | | | 4,272,446 | |
ServiceNow, Inc., | |
zero coupon, 6/1/22 | | | 3,320 | | | | 7,075,355 | |
Splunk, Inc., | |
1.125%, 9/15/25 | | | 11,460 | | | | 12,691,950 | |
Workday, Inc., | | | | | | | | |
0.25%, 10/1/22 | | | 5,435 | | | | 6,046,437 | |
Zynga, Inc. (a)(b), | |
0.25%, 6/1/24 | | | 7,485 | | | | 7,694,809 | |
| | | | | | | | |
| | | | | | | 164,186,714 | |
| | | | | | | | |
| |
| Telecommunications—2.7% | | | | | |
GCI Liberty, Inc. (a)(b), | |
1.75%, 9/30/46 | | | 6,360 | | | | 8,037,564 | |
Infinera Corp.,
| |
2.125%, 9/1/24 | | | 5,990 | | | | 5,049,943 | |
Viavi Solutions, Inc.,
| |
1.00%, 3/1/24 | | | 9,525 | | | | 10,078,043 | |
| | | | | | | | |
| | | | | | | 23,165,550 | |
| | | | | | | | |
| Total Convertible Bonds & Notes (cost—$647,377,478) | | | | 622,927,496 | |
| | | | | | | | |
| | | | | | | | |
| | |
| | | Shares | | | | |
|
| Convertible Preferred StocK—17.6% | |
|
| Banks—3.6% | |
Bank of America Corp., Ser. L (c), | |
7.25% | | | 13,390 | | | | 16,952,008 | |
Wells Fargo & Co., Ser. L (c), | |
7.50% | | | 10,910 | | | | 13,899,558 | |
| | | | | | | | |
| | | | | | | 30,851,566 | |
| | | | | | | | |
| |
| Electric Utilities—3.3% | | | | | |
NextEra Energy, Inc., | |
5.279%, 3/1/23 | | | 346,310 | | | | 15,268,808 | |
Sempra Energy, Ser. A, | |
6.00%, 1/15/21 | | | 77,230 | | | | 7,145,320 | |
Southern Co., Ser. 2019, | |
6.75%, 8/1/22 | | | 135,680 | | | | 6,024,192 | |
| | | | | | | | |
| | | | | | | 28,438,320 | |
| | | | | | | | |
| |
| Electronics—0.6% | | | | | |
Fortive Corp., Ser. A, | | | | | | | | |
5.00%, 7/1/21 | | | 6,980 | | | | 5,023,715 | |
| | | | | | | | |
| |
| Environmental Services—0.5% | | | | | |
GFL Environmental Inc., | |
6.00%, 3/15/23 | | | 101,405 | | | | 4,643,335 | |
| | | | | | | | |
|
| Equity Real Estate Investment Trusts (REITs)—1.7% | |
Crown Castle International Corp., Ser. A, | |
6.875%, 8/1/20 | | | 11,785 | | | | 14,731,250 | |
| | | | | | | | |
| |
| Hand/Machine Tools—1.1% | | | | | |
Colfax Corp., | |
5.75%, 1/15/22 | | | 29,820 | | | | 2,738,669 | |
Stanley Black & Decker, Inc., | |
5.25%, 11/15/22 | | | 89,585 | | | | 6,267,366 | |
| | | | | | | | |
| | | | | | | 9,006,035 | |
| | | | | | | | |
| | | | | | |
| 128 | | Semiannual Report | | | March 31, 2020 | | | See accompanying Notes to Financial Statements |
Schedule of Investments
March 31, 2020 (unaudited)
| | | | | | | | |
| | |
Shares | | | Value | |
| |
| Healthcare Technology—0.4% | | | | | |
Change Healthcare, Inc., | |
6.00%, 6/30/22 | | | 91,510 | | | $ | 3,725,372 | |
| | | | | | | | |
| |
| Healthcare-Products—2.3% | | | | | |
Avantor, Inc., Ser. A, | |
6.25%, 5/15/22 | | | 140,250 | | | | 6,081,240 | |
Danaher Corp., Ser. A, | | | | | | | | |
4.75%, 4/15/22 | | | 12,765 | | | | 13,188,160 | |
| | | | | | | | |
| | | | | | | 19,269,400 | |
| | | | | | | | |
| |
| Insurance—0.9% | | | | | |
Assurant, Inc., Ser. D, | |
6.50%, 3/15/21 | | | 71,040 | | | | 7,564,339 | |
| | | | | | | | |
| |
| Pharmaceuticals—1.2% | | | | | |
Becton Dickinson and Co., Ser. A, | |
6.125%, 5/1/20 | | | 83,510 | | | | 4,365,903 | |
Elanco Animal Health, Inc., | |
5.00%, 2/1/23 | | | 132,860 | | | | 5,465,860 | |
| | | | | | | | |
| | | | | | | 9,831,763 | |
| | | | | | | | |
| |
| Semiconductors—2.0% | | | | | |
Broadcom, Inc., Ser. A, | |
8.00%, 9/30/22 | | | 18,065 | | | | 16,879,214 | |
| | | | | | | | |
Total Convertible Preferred Stock (cost-$160,758,136) | | | | 149,964,309 | |
| | | | | | | | |
| | |
| | | Principal
Amount
(000s) | | | | |
|
| Repurchase Agreements—7.6% | |
State Street Bank and Trust Co.,
dated 3/31/20, 0.00%, due 4/1/20, proceeds $64,769,000; collateralized by U.S. Treasury Inflation Indexed Notes, 0.625%, due 4/15/23, valued at $66,064,658 including accrued interest | |
(cost—$64,769,000) | | | $64,769 | | | | 64,769,000 | |
| | | | | | | | |
| |
Total Investments
(cost-$872,904,614)—98.1% | | | | 837,660,805 | |
| | | | | | | | |
| |
| Other assets less liabilities—1.9% | | | | 16,410,045 | |
| | | | | | | | |
| |
| NetAssets-100.0% | | | | $854,070,850 | |
| | | | | | | | |
Notes to Schedule of Investments:
(a) Private Placement—Restricted as to resale and may not have a readily available market. Securities with an aggregate value of $243,705,652, representing 28.5% of net assets.
(b) 144A—Exempt from registration under Rule 144A of the Securities Act of 1933. These securities may be resold in transactions exempt from registration, typically only to qualified institutional buyers. Securities with an aggregate value of $243,705,652, representing 28.5% of net assets.
(c) Perpetual maturity. The date shown, if any, is the next call date.
(d) Level 3 security. See Note 1(a) and Note 1(b) in the Notes to Financial Statements.
(e) Securities exchangeable or convertible into securities of an entity different than the issuer or structured by the issuer to provide exposure to securities of an entity different than the issuer (synthetic convertible securities). Such entity is identified in the parenthetical.
Glossary:
REIT—Real Estate Investment Trust
AllianzGI Core Bond Fund
| | | | | | | | |
| | | Principal
Amount
(000s) | | | Value | |
|
| U.S. Government Agency Securities—33.9% | |
Fannie Mae, MBS, Pool, | | | | | | | | |
2.50%, 11/1/31, 15 Year | | | $686 | | | | $714,687 | |
3.00%, 10/1/29, 15 Year | | | 600 | | | | 629,929 | |
3.00%, 3/1/50, 30 Year | | | 2,617 | | | | 2,751,067 | |
3.50%, 7/1/49, 30 Year | | | 2,314 | | | | 2,470,137 | |
4.00%, 8/1/49, 30 Year | | | 1,651 | | | | 1,771,703 | |
4.50%, 8/1/48, 30 Year | | | 771 | | | | 841,297 | |
Freddie Mac, MBS, Pool, 30 Year | | | | | |
3.00%, 1/1/46 | | | 1,096 | | | | 1,160,763 | |
3.50%, 10/1/49 | | | 1,156 | | | | 1,222,739 | |
4.00%, 4/1/49 | | | 359 | | | | 382,981 | |
Ginnie Mae, MBS, Pool, 30 Year | | | | | |
3.00%, 2/20/50 | | | 400 | | | | 424,556 | |
3.50%, 7/20/49 | | | 1,264 | | | | 1,345,643 | |
4.00%, 3/20/48 | | | 384 | | | | 413,318 | |
United States Small Business Administration, ABS, | |
1.49%, 3/1/40
Series2020-20, Class C1 | | | 358 | | | | 351,070 | |
2.15%, 8/1/39
Series2019-20, Class H1 | | | 147 | | | | 148,343 | |
2.60%, 6/1/39
Series2019-20, Class F1 | | | 104 | | | | 106,667 | |
2.88%, 5/1/39
Series2019-20, Class E1 | | | 159 | | | | 164,934 | |
2.92%, 1/1/38
Series2018-20, Class A1 | | | 284 | | | | 295,613 | |
3.20%, 3/1/39
Series2019-20, Class C1 | | | 86 | | | | 91,544 | |
3.37%, 1/1/39
Series2019-20, Class A1 | | | 202 | | | | 214,714 | |
3.50%, 5/1/38
Series2018-20, Class E1 | | | 227 | | | | 243,945 | |
3.53%, 9/1/38
Series2018-20, Class I1 | | | 248 | | | | 264,951 | |
3.54%, 7/1/38
Series2018-20, Class G1 | | | 181 | | | | 195,620 | |
3.58%, 8/1/38
Series2018-20, Class H1 | | | 269 | | | | 290,273 | |
| | | | | | | | |
Total U.S. Government Agency Securities | |
| (cost—$16,036,955) | | | | 16,496,494 | |
| | | | | | | | |
| | | | | | | | |
|
| Corporate Bonds & Notes—33.2% | |
| |
| Aerospace & Defense—2.9% | | | | | |
Boeing Co.,
| | | | | | | | |
2.80%, 3/1/27 | | | 240 | | | | 212,279 | |
General Dynamics Corp.,
| | | | | | | | |
3.25%, 4/1/25 | | | 405 | | | | 418,925 | |
L3Harris Technologies, Inc.,
| | | | | | | | |
4.40%, 6/15/28 | | | 345 | | | | 373,176 | |
Northrop Grumman Systems Corp.,
| |
7.875%, 3/1/26 | | | 290 | | | | 311,858 | |
United Technologies Corp.,
| | | | | | | | |
6.125%, 7/15/38 | | | 75 | | | | 99,858 | |
| | | | | | | | |
| | | | | | | 1,416,096 | |
| | | | | | | | |
| |
| Banks—5.9% | | | | | |
Australia & New Zealand Banking Group Ltd., (converts to FRN on 7/22/25) (a)(b)(d), | |
2.95%, 7/22/30 | | | 213 | | | | 203,954 | |
Bank of America Corp. (c)(d), | | | | | | | | |
4.30%, 1/28/25 (converts to FRN on 1/28/25) | | | 300 | | | | 258,750 | |
5.875%, 3/15/28 (converts to FRN on 3/15/28) | | | 230 | | | | 233,643 | |
Fifth Third Bancorp, (converts to FRN on 6/30/23) (c)(d), | |
5.10%, 6/30/23 | | | 295 | | | | 239,155 | |
First Maryland Capital II, 3 mo. LIBOR + 0.850% (d), | |
2.613%, 2/1/27 | | | 275 | | | | 265,719 | |
| | | | | | | | |
| | | Principal
Amount
(000s) | | | Value | |
JPMorgan Chase & Co. (d), 3 mo. LIBOR + 0.950%, | |
2.713%, 2/2/37 | | $ | 464 | | | $ | 321,320 | |
4.493%, 3/24/31 (converts to
FRN on 3/24/30) | | | 290 | | | | 333,930 | |
KeyCorp, | | | | | | | | |
2.55%, 10/1/29 | | | 415 | | | | 371,394 | |
Lloyds Banking Group PLC, (converts to FRN on
9/27/25) (c)(d), | |
7.50%, 9/27/25 | | | 265 | | | | 238,366 | |
State Street Corp., (converts to FRN on
3/30/30) (a)(b)(d), | |
3.152%, 3/30/31 | | | 69 | | | | 70,787 | |
Truist Financial Corp., Ser. M, (converts to FRN on
12/15/27) (c)(d), | |
5.125%, 12/15/27 | | | 45 | | | | 38,287 | |
Westpac Banking Corp., (converts to FRN on
2/4/25) (d), | |
2.894%, 2/4/30 | | | 295 | | | | 283,090 | |
| | | | | | | | |
| | | | | | | 2,858,395 | |
| | | | | | | | |
| |
| Beverages—0.2% | | | | | |
Anheuser-Busch Cos. LLC, | | | | | | | | |
4.90%, 2/1/46 | | | 90 | | | | 98,677 | |
| | | | | | | | |
|
| Diversified Financial Services—1.0% | |
Mastercard Inc., | | | | | | | | |
3.85%, 3/26/50 | | | 119 | | | | 147,090 | |
Visa, Inc., | | | | | | | | |
1.90%, 4/15/27 | | | 355 | | | | 355,426 | |
| | | | | | | | |
| | | | | | | 502,516 | |
| | | | | | | | |
| |
| Electric Utilities—6.2% | | | | | |
Berkshire Hathaway Energy Co., | | | | | | | | |
3.50%, 2/1/25 | | | 232 | | | | 243,196 | |
4.05%, 4/15/25 (a)(b) | | | 120 | | | | 129,871 | |
4.25%, 10/15/50 (a)(b) | | | 162 | | | | 184,802 | |
Commonwealth Edison Co., | | | | | | | | |
5.90%, 3/15/36 | | | 100 | | | | 128,126 | |
Consolidated Edison Co. of New York, Inc., Ser. 06-E, | |
5.70%, 12/1/36 | | | 40 | | | | 52,099 | |
DTE Electric Co., Ser. A, | | | | | | | | |
6.625%, 6/1/36 | | | 25 | | | | 33,700 | |
DTE Energy Co., | | | | | | | | |
2.95%, 3/1/30 | | | 145 | | | | 139,321 | |
Duke Energy Indiana LLC, | | | | | | | | |
3.25%, 10/1/49 | | | 120 | | | | 122,646 | |
3.75%, 5/15/46 | | | 45 | | | | 47,966 | |
Edison International,
| | | | | | | | |
4.95%, 4/15/25 | | | 213 | | | | 216,791 | |
Florida Power & Light Co.,
| | | | | | | | |
2.85%, 4/1/25 | | | 162 | | | | 165,789 | |
Georgia Power Co., Ser. B,
| | | | | | | | |
3.70%, 1/30/50 | | | 151 | | | | 155,524 | |
Jersey Central Power & Light Co., | |
4.30%, 1/15/26 (a)(b) | | | 160 | | | | 171,505 | |
6.15%, 6/1/37 | | | 70 | | | | 86,116 | |
Oncor Electric Delivery Co LLC, | | | | | | | | |
2.95%, 4/1/25 | | | 208 | | | | 215,707 | |
PacifiCorp,
| | | | | | | | |
4.15%, 2/15/50 | | | 120 | | | | 137,238 | |
Pennsylvania Electric Co. (a)(b),
| | | | | | | | |
3.25%, 3/15/28 | | | 55 | | | | 56,971 | |
San Diego Gas & Electric Co., Ser. NNN,
| |
3.60%, 9/1/23 | | | 145 | | | | 150,719 | |
Sempra Energy,
| | | | | | | | |
3.55%, 6/15/24 | | | 290 | | | | 289,471 | |
Southern California Edison Co., | | | | | | | | |
1.845%, 2/1/22 | | | 14 | | | | 14,174 | |
3.70%, 8/1/25, Ser. E | | | 215 | | | | 222,512 | |
3.90%, 12/1/41 | | | 57 | | | | 54,151 | |
| | | | | | | | |
| | | | | | | 3,018,395 | |
| | | | | | | | |
| | | | | | | | |
| See accompanying Notes to Financial Statements | | | March 31, 2020 | | | Semiannual Report | | | 129 | |
Schedule of Investments
March 31, 2020 (unaudited)
| | | | | | | | |
| | | Principal
Amount
(000s) | | | Value | |
|
Equity Real Estate Investment Trusts
(REITs)—1.0% | |
American Tower Corp., | | | | | | | | |
3.375%, 5/15/24 | | $ | 273 | | | $ | 270,059 | |
4.00%, 6/1/25 | | | 235 | | | | 245,537 | |
| | | | | | | | |
| | | | | | | 515,596 | |
| | | | | | | | |
| |
| Healthcare-Services—0.4% | | | | | |
UnitedHealth Group, Inc.,
| | | | | | | | |
3.50%, 8/15/39 | | | 173 | | | | 186,743 | |
| | | | | | | | |
| |
| Insurance—1.1% | | | | | |
American International Group, Inc., | |
4.375%, 1/15/55 | | | 135 | | | | 128,560 | |
Lincoln National Corp., 3 mo. LIBOR + 2.358% (d),
| | | | | | | | |
4.049%, 5/17/66 | | | 385 | | | | 231,482 | |
New York Life Insurance Co. (a)(b), | |
4.45%, 5/15/69 | | | 165 | | | | 171,448 | |
| | | | | | | | |
| | | | | | | 531,490 | |
| | | | | | | | |
| |
| Machinery-Diversified—0.3% | | | | | |
Deere & Co.,
| | | | | | | | |
3.75%, 4/15/50 | | | 121 | | | | 136,262 | |
| | | | | | | | |
| |
| Media—2.9% | | | | | |
Charter Communications Operating LLC, | |
4.908%, 7/23/25 | | | 280 | | | | 301,718 | |
5.375%, 5/1/47 | | | 95 | | | | 103,783 | |
Comcast Corp., | | | | | | | | |
3.10%, 4/1/25 | | | 81 | | | | 86,257 | |
3.75%, 4/1/40 | | | 162 | | | | 178,721 | |
Fox Corp., | | | | | | | | |
3.05%, 4/7/25 | | | 72 | | | | 72,756 | |
Time Warner Cable LLC, | | | | | | | | |
4.50%, 9/15/42 | | | 55 | | | | 52,308 | |
6.55%, 5/1/37 | | | 55 | | | | 63,260 | |
ViacomCBS, Inc., | | | | | | | | |
4.75%, 5/15/25 | | | 140 | | | | 140,517 | |
6.25%, 2/28/57 (converts to FRN on 2/28/27) (d) | | | 235 | | | | 203,351 | |
Walt Disney Co., | | | | | | | | |
4.70%, 3/23/50 | | | 95 | | | | 123,865 | |
7.30%, 4/30/28 | | | 55 | | | | 72,461 | |
| | | | | | | | |
| | | | | | | 1,398,997 | |
| | | | | | | | |
|
| Miscellaneous Manufacturing—0.9% | |
3M Co., | | | | | | | | |
3.70%, 4/15/50 | | | 81 | | | | 90,891 | |
General Electric Co., | | | | | | | | |
5.55%, 1/5/26 | | | 200 | | | | 215,633 | |
6.75%, 3/15/32 | | | 100 | | | | 120,514 | |
| | | | | | | | |
| | | | | | | 427,038 | |
| | | | | | | | |
|
| Oil, Gas & Consumable Fuels—0.9% | |
Boston Gas Co. (a)(b), | | | | | | | | |
3.15%, 8/1/27 | | | 208 | | | | 205,360 | |
Hess Corp., | | | | | | | | |
7.125%, 3/15/33 | | | 103 | | | | 78,981 | |
NiSource, Inc., | | | | | | | | |
6.25%, 12/15/40 | | | 110 | | | | 155,698 | |
| | | | | | | | |
| | | | | | | 440,039 | |
| | | | | | | | |
| |
| Pharmaceuticals—1.5% | | | | | |
AbbVie, Inc. (a)(b), | | | | | | | | |
2.60%, 11/21/24 | | | 352 | | | | 356,627 | |
Allergan Funding SCS, | | | | | | | | |
3.85%, 6/15/24 | | | 215 | | | | 223,562 | |
Cigna Corp., | | | | | | | | |
4.80%, 8/15/38 | | | 120 | | | | 135,467 | |
CVS Health Corp., | | | | | | | | |
4.875%, 7/20/35 | | | 25 | | | | 28,294 | |
| | | | | | | | |
| | | | | | | 743,950 | |
| | | | | | | | |
| | | | | | | | |
| | | Principal
Amount
(000s) | | | Value | |
| |
| Pipelines—3.0% | | | | | |
Columbia Pipeline Group, Inc., | | | | | | | | |
4.50%, 6/1/25 | | $ | 151 | | | $ | 149,701 | |
El Paso Natural Gas Co. LLC, | | | | | | | | |
8.375%, 6/15/32 | | | 73 | | | | 85,719 | |
Energy Transfer Operating L.P., | |
2.90%, 5/15/25 | | | 357 | | | | 302,567 | |
4.05%, 3/15/25 | | | 139 | | | | 123,461 | |
4.75%, 1/15/26 | | | 180 | | | | 158,325 | |
5.50%, 6/1/27 | | | 150 | | | | 131,648 | |
6.50%, 2/1/42 | | | 90 | | | | 82,104 | |
Kinder Morgan Energy Partners L.P., | |
7.50%, 11/15/40 | | | 20 | | | | 22,095 | |
Plains All American Pipeline L.P., | |
4.65%, 10/15/25 | | | 520 | | | | 418,475 | |
| | | | | | | | |
| | | | | | | 1,474,095 | |
| | | | | | | | |
|
| Real Estate Management & Development—1.5% | |
American Tower Corp., | | | | | | | | |
5.00%, 2/15/24 | | | 352 | | | | 371,255 | |
Target Corp., | | | | | | | | |
2.25%, 4/15/25 | | | 355 | | | | 359,338 | |
| | | | | | | | |
| | | | | | | 730,593 | |
| | | | | | | | |
| |
| Semiconductors—1.2% | | | | | |
Broadcom, Inc. (a)(b), | | | | | | | | |
4.25%, 4/15/26 | | | 560 | | | | 569,443 | |
| | | | | | | | |
| |
| Shipbuilding—0.3% | | | | | |
Huntington Ingalls Industries Inc. (a)(b), | |
3.844%, 5/1/25 | | | 142 | | | | 144,950 | |
| | | | | | | | |
| |
| Software—0.4% | | | | | |
Oracle Corp., | | | | | | | | |
2.50%, 4/1/25 | | | 201 | | | | 205,432 | |
| | | | | | | | |
| |
| Telecommunications—1.1% | | | | | |
AT&T, Inc., | | | | | | | | |
3.90%, 3/11/24 | | | 300 | | | | 315,399 | |
4.30%, 2/15/30 | | | 205 | | | | 221,300 | |
| | | | | | | | |
| | | | | | | 536,699 | |
| | | | | | | | |
| |
| Transportation—0.5% | | | | | |
Kansas City Southern, | | | | | | | | |
4.20%, 11/15/69 | | | 55 | | | | 52,808 | |
United Parcel Service, Inc., | | | | | | | | |
3.40%, 9/1/49 | | | 169 | | | | 170,907 | |
| | | | | | | | |
| | | | | | | 223,715 | |
| | | | | | | | |
| Total Corporate Bonds & Notes (cost—$16,963,144) | | | | 16,159,121 | |
| | | | | | | | |
| | | | | | | | |
|
| Asset-Backed Securities—16.6% | |
Ally Auto Receivables Trust, Series2019-1, Class A3, | |
2.91%, 9/15/23 | | | 190 | | | | 193,715 | |
American Express Credit Account Master Trust, 1 mo. LIBOR + 0.380%, Series2017-5, Class A (d), | |
1.085%, 2/18/25 | | | 547 | | | | 529,775 | |
BA Credit Card Trust, Series2018-A3, Class A3, | |
3.10%, 12/15/23 | | | 285 | | | | 291,277 | |
BMW Vehicle Owner Trust, Series2018-A, Class A4, | |
2.51%, 6/25/24 | | | 123 | | | | 123,414 | |
CarMax Auto Owner Trust, Series2020-1, Class A4, | |
2.03%, 6/16/25 | | | 230 | | | | 231,752 | |
Citibank Credit Card Issuance Trust, 1 mo. LIBOR + 0.620%, Series2017-A5, Class A5 (d), | |
1.544%, 4/22/26 | | | 580 | | | | 555,255 | |
CNH Equipment Trust, Series2019-B, Class A3, | |
2.52%, 8/15/24 | | | 210 | | | | 214,507 | |
Dryden 68 CLO Ltd., 3 mo.USD-LIBOR + 1.310%, Series2019-68A, Class A (a)(b)(d), | |
3.141%, 7/15/32 | | | 385 | | | | 363,608 | |
| | | | | | | | |
| | | Principal
Amount
(000s) | | | Value | |
Ford Credit Auto Owner Trust, | | | | | | | | |
1.93%, 4/15/25
Series2019-C, Class A4 | | | $775 | | | | $778,941 | |
2.04%, 8/15/31
Series2020-1, Class A (a)(b) | | | 143 | | | | 133,679 | |
GM Financial Consumer Automobile Receivables Trust, Series2019-3, Class A3,
| |
2.18%, 4/16/24 | | | 520 | | | | 523,975 | |
Honda Auto Receivables Owner Trust, | |
1.63%, 10/21/26
Series2020-1, Class A4 | | | 205 | | | | 204,126 | |
1.68%, 8/16/21
Series2017-2, Class A3 | | | 9 | | | | 9,205 | |
2.83%, 3/20/23
Series2019-1, Class A3 | | | 325 | | | | 331,069 | |
HPEFS Equipment Trust, Series2019-1A, Class A3 (a)(b), | |
2.21%, 9/20/29 | | | 283 | | | | 279,000 | |
Hyundai Auto Receivables Trust, | |
1.94%, 2/15/24
Series2019-B, Class A3 | | | 321 | | | | 315,944 | |
1.96%, 2/15/23
Series2017-B, Class A4 | | | 275 | | | | 276,852 | |
2.66%, 6/15/23
Series2019-A, Class A3 | | | 260 | | | | 261,690 | |
John Deere Owner Trust, Series2019-B, Class A2, | |
2.28%, 5/16/22 | | | 268 | | | | 269,066 | |
Nissan Auto Receivables Owner Trust, Series2019-A, Class A3, | |
2.90%, 10/16/23 | | | 320 | | | | 327,365 | |
Octagon Investment Partners 30 Ltd., 3 mo.USD-LIBOR-BBA + 1.320%, Series2017-1A, Class A1 (a)(b)(d), | |
3.139%, 3/17/30 | | | 260 | | | | 249,802 | |
Toyota Auto Receivables Owner Trust, Series2020-A, Class A4, | |
1.68%, 5/15/25 | | | 450 | | | | 450,982 | |
Verizon Owner Trust, Series2019-C, Class A1A, | |
1.94%, 4/22/24 | | | 640 | | | | 612,694 | |
Volvo Financial Equipment Master Owner Trust, 1 mo. LIBOR + 0.520%, Series2018-A, Class A (a)(b)(d), | |
1.225%, 7/17/23 | | | 532 | | | | 526,524 | |
| | | | | | | | |
Total Asset-Backed Securities
(cost—$8,169,596) | | | | 8,054,217 | |
| | | | | | | | |
| | | | | | | | |
|
| U.S. Treasury Obligations—10.5% | |
U.S. Treasury Bonds, | |
2.375%, 11/15/49 | | | 503 | | | | 628,986 | |
4.50%, 5/15/38 | | | 131 | | | | 207,502 | |
U.S. Treasury Coupon Strips, | |
zero coupon, 5/15/38 | | | 1,770 | | | | 1,420,389 | |
U.S. Treasury Notes, | |
0.375%, 3/31/22 | | | 225 | | | | 225,703 | |
0.50%, 3/15/23 | | | 490 | | | | 493,062 | |
0.50%, 3/31/25 | | | 159 | | | | 160,056 | |
0.625%, 3/31/27 | | | 258 | | | | 259,108 | |
1.125%, 4/30/20 | | | 750 | | | | 750,703 | |
1.50%, 2/15/30 | | | 867 | | | | 933,380 | |
| | | | | | | | |
Total U.S. Treasury Obligations
(cost—$4,907,593) | | | | 5,078,889 | |
| | | | | | | | |
| | | | | | | | |
|
| Mortgage-Backed Securities—3.0% | |
Bank 2019, 2.92%, | |
12/15/52 Series BNK23, Class A3 | | | 385 | | | | 407,786 | |
3.183%, 8/15/61 Series BNK19, Class A3 | | | 380 | | | | 410,604 | |
Bank 2020, Series BN26, Class A4, | |
2.403%, 3/15/63 | | | 540 | | | | 545,536 | |
| | | | | | |
| 130 | | Semiannual Report | | | March 31, 2020 | | | See accompanying Notes to Financial Statements |
Schedule of Investments
March 31, 2020 (unaudited)
| | | | | | | | |
| | | Principal
Amount
(000s) | | | Value | |
Benchmark Mortgage Trust, | |
Series2020-B17, Class A5,
2.289%, 3/15/53 | | | $100 | | | | $100,458 | |
| | | | | | | | |
| Total Mortgage-Backed Securities (cost—$1,465,935) | | | | 1,464,384 | |
| | | | | | | | |
| | |
| | | Shares | | | | |
| |
| Preferred Stock—1.1% | | | | | |
| |
| Banks—1.1% | | | | | |
Citigroup Capital XIII (d), | |
8.14%, 10/30/40 | | | 11,055 | | | | 283,008 | |
JPMorgan Chase & Co. (c) | | | 822 | | | | 20,751 | |
Wells Fargo & Co. (c), | |
4.75%, 3/15/25 | | | 11,900 | | | | 249,900 | |
| | | | | | | | |
Total Preferred Stock
(cost—$624,049) | | | | 553,659 | |
| | | | | | | | |
| |
Total Investments
(cost—$48,167,272)—98.3% | | | | 47,806,764 | |
| | | | | | | | |
| |
Other assets less
liabilities (e)—1.7% | | | | 837,455 | |
| | | | | | | | |
| |
| Net Assets—100.0% | | | | $48,644,219 | |
| | | | | | | | |
Notes to Schedule of Investments:
(a) Private Placement—Restricted as to resale and may not have a readily available market. Securities with an aggregate value of $3,818,331, representing 7.8% of net assets.
(b) 144A—Exempt from registration under Rule 144A of the Securities Act of 1933. These securities may be resold in transactions exempt from registration, typically only to qualified institutional buyers. Securities with an aggregate value of $3,818,331, representing 7.8% of net assets.
(c) Perpetual maturity. The date shown, if any, is the next call date.
(d) Variable or Floating Rate Security—Securities with an interest rate that changes periodically. The interest rate disclosed reflects the rate in effect on March 31, 2020.
(e) Includes net unrealized appreciation (depreciation) of other financial instruments as follows:
| | | | | | | | | | | | | | | | | | | | | | |
|
| Futures contracts outstanding at March 31, 2020: | |
| Type | | Contracts | | | Expiration
Date | | | Notional
Amount
(000s) | | | Market
Value
(000s) | | | Unrealized
Appreciation
(Depreciation) | |
Long position contracts: | | | | | | | | | | | | | | | | | | | | |
| | 2-Year U.S. Treasury Note | | | 28 | | | | 6/30/20 | | | $ | 5,600 | | | $ | 6,171 | | | $ | 4,261 | |
| | 5-Year U.S. Treasury Note | | | 58 | | | | 6/30/20 | | | | 5,800 | | | | 7,271 | | | | 31,048 | |
| | 10-Year Ultra U.S. Treasury Bond | | | 15 | | | | 6/19/20 | | | | 1,500 | | | | 2,340 | | | | 12,248 | |
| | U.S. Long Bond | | | 10 | | | | 6/19/20 | | | | 1,000 | | | | 2,219 | | | | 54,504 | |
| | | | | | | | | | | | | | | | | | | | | | |
| | | | | | | | | | | | | | | | | | | | $ | 102,061 | |
| | | | | | | | | | | | | | | | | | | | | | |
| | | | | |
Short position contracts: | | | | | | | | | | | | | | | | | | | | |
| | 10-Year U.S. Treasury Note | | | (8 | ) | | | 6/19/20 | | | $ | (800 | ) | | $ | (1,109 | ) | | $ | 3,329 | |
| | U.S. Long Bond | | | (10 | ) | | | 6/19/20 | | | | (1,000 | ) | | | (1,791 | ) | | | (17,828 | ) |
| | | | | | | | | | | | | | | | | | | | | | |
| | | | | | | | | | | | | | | | | | | | $ | (14,499 | ) |
| | | | | | | | | | | | | | | | | | | | | | |
| | | | | | | | | | | | | | | | | | | | $ | 87,562 | |
| | | | | | | | | | | | | | | | | | | | | | |
| | | | | | | | | | | | | | | | | | | | | | | | | | | | | | | | |
|
| Credit default swaps agreements outstanding at March 31, 2020: | |
Centrally cleared buy protection swap agreements: | |
Broker (Exchange)/
Reference Debt Issuer | | Notional
Amount
(000s)(1) | | | Implied
Credit
Spread | | | Termination
Date | | | Fixed Deal
Pay Rate | | | Payment
Frequency | | | Value(2) | | | Upfront
Premiums
Paid (Received) | | | Unrealized
Appreciation
(Depreciation) | |
Goldman Sachs (ICE): | | | | | | | | | | | | | | | | | | | | | | | | | | | | | | | | |
American Express Co. | | $ | 520 | | | | 5.828 | % | | | 12/20/24 | | | | (1.00 | )% | | | Quarterly | | | $ | (11,125 | ) | | $ | (9,050 | ) | | $ | (2,075 | ) |
AT&T, Inc. | | | 430 | | | | 2.377 | % | | | 12/20/24 | | | | (1.00 | )% | | | Quarterly | | | | 20,204 | | | | (3,269 | ) | | | 23,473 | |
Berkshire Hathaway Inc. | | | 695 | | | | 0.287 | % | | | 12/20/24 | | | | (1.00 | )% | | | Quarterly | | | | (24,373 | ) | | | (21,277 | ) | | | (3,096 | ) |
Citigroup Inc. | | | 565 | | | | 0.838 | % | | | 12/20/24 | | | | (1.00 | )% | | | Quarterly | | | | 2,463 | | | | 17,903 | | | | (15,440 | ) |
CSX Corp. | | | 420 | | | | 3.289 | % | | | 12/20/24 | | | | (1.00 | )% | | | Quarterly | | | | (14,348 | ) | | | (14,351 | ) | | | 3 | |
Energy Transfer Operating, L.P. | | | 1,340 | | | | 3.583 | % | | | 12/20/24 | | | | (1.00 | )% | | | Quarterly | | | | 128,648 | | | | 68,352 | | | | 60,296 | |
International Business Machines Corp. | | | 520 | | | | 0.496 | % | | | 12/20/24 | | | | (1.00 | )% | | | Quarterly | | | | (14,347 | ) | | | (14,586 | ) | | | 239 | |
Kinder Morgan, Inc. | | | 630 | | | | 2.047 | % | | | 12/20/24 | | | | (1.00 | )% | | | Quarterly | | | | 16,637 | | | | 35,642 | | | | (19,005 | ) |
| | | | | | | | |
| See accompanying Notes to Financial Statements | | | March 31, 2020 | | | Semiannual Report | | | 131 | |
Schedule of Investments
March 31, 2020 (unaudited)
| | | | | | | | | | | | | | | | | | | | | | | | | | | | | | | | |
|
| Credit default swaps agreements outstanding at March 31, 2020 (continued): | |
Centrally cleared buy protection swap agreements (continued): | |
Broker (Exchange)/
Reference Debt Issuer | | Notional
Amount
(000s)(1) | | | Implied
Credit
Spread | | | Termination
Date | | | Fixed Deal
Pay Rate | | | Payment
Frequency | | | Value(2) | | | Upfront
Premiums
Paid (Received) | | | Unrealized
Appreciation
(Depreciation) | |
Marriott International, Inc. | | $ | 249 | | | | 1.336 | % | | | 12/20/20 | | | | (1.00 | )% | | | Quarterly | | | $ | (1,058 | ) | | $ | (1,517 | ) | | $ | 459 | |
McKesson Corp. | | | 845 | | | | 0.396 | % | | | 12/20/24 | | | | (1.00 | )% | | | Quarterly | | | | (23,385 | ) | | | (10,040 | ) | | | (13,345 | ) |
Morgan Stanley | | | 785 | | | | 1.341 | % | | | 6/20/25 | | | | (1.00 | )% | | | Quarterly | | | | 9,126 | | | | 17,340 | | | | (8,214 | ) |
Prudential Financial, Inc. | | | 430 | | | | 0.679 | % | | | 12/20/24 | | | | (1.00 | )% | | | Quarterly | | | | (3,899 | ) | | | (10,599 | ) | | | 6,700 | |
Simon Property Group, L.P. | | | 555 | | | | 2.947 | % | | | 6/20/25 | | | | (1.00 | )% | | | Quarterly | | | | 40,284 | | | | 48,156 | | | | (7,872 | ) |
Southwest Airlines Co. | | | 249 | | | | 0.728 | % | | | 12/20/20 | | | | (1.00 | )% | | | Quarterly | | | | (141 | ) | | | (1,537 | ) | | | 1,396 | |
Union Pacific Corp. | | | 420 | | | | 0.262 | % | | | 12/20/24 | | | | (1.00 | )% | | | Quarterly | | | | (15,615 | ) | | | (14,769 | ) | | | (846 | ) |
| | | | | | | | | | | | | | | | | | | | | | | | |
| | | | | | | | | | | | | | | | | | | | | | $ | 109,071 | | | $ | 86,398 | | | $ | 22,673 | |
| | | | | | | | | | | | | | | | | | | | | | | | |
| | | | | | | | | | | | | | | | | | | | | | | | | | | | | | | | |
Centrally cleared sell protection swap agreements: | |
Broker (Exchange)/
Referenced Debt Issuer | | Notional
Amount
(000s)(1) | | | Implied
Credit
Spread | | | Termination
Date | | | Fixed Deal
Received Rate | | | Payment
Frequency | | | Value(2) | | | Upfront
Premiums
Paid | | | Unrealized
Depreciation | |
Goldman Sachs (ICE): | | | | | | | | | | | | | | | | | | | | | | | | | | | | | | | | |
CDX.NA.IG.34 | | $ | 5,420 | | | | 1.168 | % | | | 6/20/25 | | | | 1.00 | % | | | Quarterly | | | $ | (34,269 | ) | | $ | 13,590 | | | $ | (47,859 | ) |
Verizon Communications Inc. | | | 530 | | | | 0.522 | % | | | 12/20/24 | | | | 1.00 | % | | | Quarterly | | | | (2,469 | ) | | | 10,332 | | | | (12,801 | ) |
| | | | | | | | | | | | | | | | | | | | | | | | |
| | | | | | | | | | | | | | | | | | | | | | $ | (36,738 | ) | | $ | 23,922 | | | $ | (60,660 | ) |
| | | | | | | | | | | | | | | | | | | | | | | | |
(1) This represents the maximum potential amount the Fund could be required to make available as a seller of credit protection or receive as a buyer of credit protection if a credit event occurs as defined under the terms of that particular swap agreement.
(2) The quoted market prices and resulting values for credit default swap agreements serve as an indicator of the status at March 31, 2020 of the payment/performance risk and represent the likelihood of an expected liability (or profit) for the credit derivative should the notional amount of the swap agreement have been closed/sold as of the period end. Increasing market values, in absolute terms when compared to the notional amount of the swap, represent a deterioration of the referenced entity’s credit soundness and a greater likelihood or risk of default or other credit event occurring as defined under the terms of the agreement.
(f) At March 31, 2020, the Fund pledged $824,657 in cash as collateral for futures contracts and held $64,400 in cash as collateral for swap contracts. The Fund also held U.S. Treasury Obligations valued at $622,397 as collateral for swap contracts. Securities held as collateral will not be pledged and are not reflected in the Schedule of Investments.
Glossary:
ABS—Asset-Backed Securities
BBA—British Bankers’ Association
CDX—Credit Derivatives Index
CLO—Collateralized Loan Obligation
FRN—Floating Rate Note
ICE—Intercontinental Exchange
LIBOR—London Inter-Bank Offered Rate
MBS—Mortgage-Backed Securities
REIT – Real Estate Investment Trust
| | | | | | |
| 132 | | Semiannual Report | | | March 31, 2020 | | | See accompanying Notes to Financial Statements |
Schedule of Investments
March 31, 2020 (unaudited)
AllianzGI Core Plus Bond Fund
| | | | | | | | |
| | | Principal
Amount
(000s) | | | Value | |
|
| Corporate Bonds & Notes—38.1% | |
| |
| Aerospace & Defense—2.5% | | | | | |
Boeing Co., | |
2.80%, 3/1/27 | | | $270 | | | | $238,814 | |
General Dynamics Corp., | |
3.25%, 4/1/25 | | | 460 | | | | 475,816 | |
L3Harris Technologies, Inc., | | | | | | | | |
4.40%, 6/15/28 | | | 280 | | | | 302,867 | |
Northrop Grumman Systems Corp., | |
7.875%, 3/1/26 | | | 240 | | | | 258,089 | |
United Technologies Corp., | |
6.125%, 7/15/38 | | | 85 | | | | 113,173 | |
| | | | | | | | |
| | | | | | | 1,388,759 | |
| | | | | | | | |
| |
| Banks—9.2% | | | | | |
Australia & New Zealand Banking Group Ltd., (converts to FRN on 7/22/25) (a)(b)(d), | |
2.95%, 7/22/30 | | | 352 | | | | 337,051 | |
Bank of America Corp. (c)(d), | |
4.30%, 1/28/25 (converts to FRN on 1/28/25) | | | 350 | | | | 301,875 | |
5.875%, 3/15/28 (converts to FRN on 3/15/28) | | | 305 | | | | 309,831 | |
Citigroup, Inc., (converts to FRN on 1/30/25) (c)(d), | |
4.70%, 1/30/25 | | | 177 | | | | 153,990 | |
Citizens Financial Group, Inc., Ser. B, (converts to FRN on 7/6/23) (c)(d), | |
6.00%, 7/6/23 | | | 75 | | | | 63,802 | |
Credit Suisse Group AG, (converts to FRN on 8/1/26) (a)(b)(c)(d), | |
6.375%, 8/21/26 | | | 185 | | | | 162,529 | |
Fifth Third Bancorp, (converts to FRN on 6/30/23) (c)(d), | |
5.10%, 6/30/23 | | | 675 | | | | 547,219 | |
First Maryland Capital II, 3 mo. LIBOR + 0.850% (d), | |
2.613%, 2/1/27 | | | 443 | | | | 428,049 | |
Huntington Bancshares, Inc., Ser. E, (converts to FRN on 4/15/23) (c)(d), | |
5.70%, 4/15/23 | | | 105 | | | | 84,051 | |
Huntington Capital Trust I, 3 mo. LIBOR + 0.700% (d), | |
2.477%, 2/1/27 | | | 107 | | | | 101,650 | |
JPMorgan Chase & Co. (d), 3 mo. LIBOR + 0.950%, | |
2.713%, 2/2/37 | | | 602 | | | | 416,885 | |
4.493%, 3/24/31 (converts to FRN on 3/24/30) | | | 335 | | | | 385,747 | |
KeyCorp, | |
2.55%, 10/1/29 | | | 345 | | | | 308,749 | |
Lloyds Banking Group PLC, (converts to FRN on 9/27/25) (c)(d), | |
7.50%, 9/27/25 | | | 430 | | | | 386,783 | |
Popular, Inc., | |
6.125%, 9/14/23 | | | 275 | | | | 256,780 | |
State Street Corp. (d), 3 mo. LIBOR + 1.000%, | |
1.741%, 6/15/47 | | | 365 | | | | 283,787 | |
3.152%, 3/30/31 (converts to FRN on 3/30/30) (a)(b) | | | 80 | | | | 82,072 | |
Truist Financial Corp., Ser. M, (converts to FRN on 12/15/27) (c)(d), | |
5.125%, 12/15/27 | | | 100 | | | | 85,082 | |
Wells Fargo & Co., | |
5.95%, 12/1/86 | | | 85 | | | | 106,894 | |
Westpac Banking Corp., (converts to FRN on 2/4/25) (d), | |
2.894%, 2/4/30 | | | 350 | | | | 335,870 | |
| | | | | | | | |
| | | | | | | 5,138,696 | |
| | | | | | | | |
| |
| Beverages—0.2% | | | | | |
Anheuser-Busch Cos. LLC, | |
4.90%, 2/1/46 | | | 85 | | | | 93,195 | |
| | | | | | | | |
| | | | | | | | |
| | | Principal
Amount
(000s) | | | Value | |
|
| Diversified Financial Services—1.2% | |
Discover Financial Services, Ser. C, (converts to FRN on 10/30/27) (c)(d), | |
5.50%, 10/30/27 | | $ | 135 | | | $ | 108,110 | |
Mastercard Inc., | |
3.85%, 3/26/50 | | | 137 | | | | 169,339 | |
Visa, Inc., | |
1.90%, 4/15/27 | | | 410 | | | | 410,492 | |
| | | | | | | | |
| | | | | | | 687,941 | |
| | | | | | | | |
| |
| Electric Utilities—6.3% | | | | | |
Berkshire Hathaway Energy Co., | |
3.50%, 2/1/25 | | | 267 | | | | 279,885 | |
4.05%, 4/15/25 (a)(b) | | | 138 | | | | 149,352 | |
4.25%, 10/15/50 (a)(b) | | | 186 | | | | 212,180 | |
Commonwealth Edison Co., | |
5.90%, 3/15/36 | | | 135 | | | | 172,970 | |
Consolidated Edison Co. of New York, Inc., Ser. 06-E, | |
5.70%, 12/1/36 | | | 45 | | | | 58,612 | |
DTE Electric Co., Ser. A, | |
6.625%, 6/1/36 | | | 45 | | | | 60,660 | |
DTE Energy Co., | |
2.95%, 3/1/30 | | | 125 | | | | 120,104 | |
Duke Energy Indiana LLC, | |
3.25%, 10/1/49 | | | 140 | | | | 143,087 | |
3.75%, 5/15/46 | | | 55 | | | | 58,625 | |
Edison International, | |
4.95%, 4/15/25 | | | 246 | | | | 250,379 | |
Florida Power & Light Co., | |
2.85%, 4/1/25 | | | 186 | | | | 190,350 | |
Georgia Power Co., Ser. B, | |
3.70%, 1/30/50 | | | 147 | | | | 151,404 | |
Jersey Central Power & Light Co., | |
4.30%, 1/15/26 (a)(b) | | | 170 | | | | 182,224 | |
6.15%, 6/1/37 | | | 165 | | | | 202,988 | |
Oncor Electric Delivery Co LLC, | |
2.95%, 4/1/25 | | | 239 | | | | 247,855 | |
PacifiCorp, | |
4.15%, 2/15/50 | | | 140 | | | | 160,111 | |
Pennsylvania Electric Co. (a)(b), | |
3.25%, 3/15/28 | | | 60 | | | | 62,150 | |
San Diego Gas & Electric Co., Ser. NNN, | |
3.60%, 9/1/23 | | | 190 | | | | 197,493 | |
Sempra Energy, | |
3.55%, 6/15/24 | | | 285 | | | | 284,481 | |
Southern California Edison Co., | |
1.845%, 2/1/22 | | | 20 | | | | 19,844 | |
3.70%, 8/1/25, Ser. E | | | 250 | | | | 258,735 | |
3.90%, 12/1/41 | | | 56 | | | | 53,201 | |
| | | | | | | | |
| | | | | | | 3,516,690 | |
| | | | | | | | |
|
| Equity Real Estate Investment Trusts (REITs)—0.5% | |
American Tower Corp., | |
4.00%, 6/1/25 | | | 280 | | | | 292,555 | |
| | | | | | | | |
| |
| Healthcare-Services—0.3% | | | | | |
UnitedHealth Group, Inc., | |
3.50%, 8/15/39 | | | 160 | | | | 172,710 | |
| | | | | | | | |
| |
| Insurance—1.1% | | | | | |
American International Group, Inc., | |
4.375%, 1/15/55 | | | 135 | | | | 128,560 | |
Lincoln National Corp., 3 mo. LIBOR + 2.358% (d), | |
4.049%, 5/17/66 | | | 540 | | | | 324,675 | |
MetLife, Inc. (a)(b), | |
9.25%, 4/8/38 | | | 55 | | | | 67,925 | |
New York Life Insurance Co. (a)(b), | |
4.45%, 5/15/69 | | | 105 | | | | 109,104 | |
| | | | | | | | |
| | | | | | | 630,264 | |
| | | | | | | | |
| |
| Machinery-Diversified—0.3% | | | | | |
Deere & Co., | |
3.75%, 4/15/50 | | | 139 | | | | 156,532 | |
| | | | | | | | |
| | | | | | | | |
| | | Principal
Amount
(000s) | | | Value | |
| |
| Media—2.5% | | | | | |
Charter Communications Operating LLC, | |
4.908%, 7/23/25 | | $ | 50 | | | $ | 53,878 | |
5.375%, 5/1/47 | | | 90 | | | | 98,321 | |
Comcast Corp., | | | | | | | | |
3.10%, 4/1/25 | | | 93 | | | | 99,035 | |
3.75%, 4/1/40 | | | 186 | | | | 205,198 | |
Fox Corp., | | | | | | | | |
3.05%, 4/7/25 | | | 83 | | | | 83,872 | |
Time Warner Cable LLC, | | | | | | | | |
4.50%, 9/15/42 | | | 115 | | | | 109,371 | |
6.55%, 5/1/37 | | | 45 | | | | 51,759 | |
ViacomCBS, Inc., | | | | | | | | |
4.75%, 5/15/25 | | | 162 | | | | 162,598 | |
6.25%, 2/28/57 (converts to FRN on 2/28/27) (d) | | | 312 | | | | 269,981 | |
Walt Disney Co., | | | | | | | | |
4.70%, 3/23/50 | | | 110 | | | | 143,423 | |
7.30%, 4/30/28 | | | 100 | | | | 131,747 | |
| | | | | | | | |
| | | | | | | 1,409,183 | |
| | | | | | | | |
|
| Miscellaneous Manufacturing—1.0% | |
3M Co., | | | | | | | | |
3.125%, 9/19/46 | | | 77 | | | | 76,792 | |
3.70%, 4/15/50 | | | 93 | | | | 104,357 | |
General Electric Co., | | | | | | | | |
5.55%, 1/5/26 | | | 240 | | | | 258,759 | |
6.75%, 3/15/32 | | | 100 | | | | 120,514 | |
| | | | | | | | |
| | | | | | | 560,422 | |
| | | | | | | | |
|
| Oil, Gas & Consumable Fuels—1.0% | |
Boston Gas Co. (a)(b), | | | | | | | | |
3.15%, 8/1/27 | | | 204 | | | | 201,410 | |
Hess Corp., | | | | | | | | |
7.125%, 3/15/33 | | | 87 | | | | 66,712 | |
NiSource, Inc., | | | | | | | | |
6.25%, 12/15/40 | | | 220 | | | | 311,396 | |
| | | | | | | | |
| | | | | | | 579,518 | |
| | | | | | | | |
| |
| Pharmaceuticals—2.0% | | | | | |
AbbVie, Inc. (a)(b), | |
2.60%, 11/21/24 | | | 292 | | | | 295,839 | |
Allergan Funding SCS, | |
3.85%, 6/15/24 | | | 375 | | | | 389,933 | |
Cigna Corp., | |
4.80%, 8/15/38 | | | 115 | | | | 129,823 | |
Shire Acquisitions Investments Ireland DAC, | |
3.20%, 9/23/26 | | | 280 | | | | 288,086 | |
| | | | | | | | |
| | | | | | | 1,103,681 | |
| | | | | | | | |
| |
| Pipelines—5.0% | | | | | |
Columbia Pipeline Group, Inc., | |
4.50%, 6/1/25 | | | 143 | | | | 141,770 | |
El Paso Natural Gas Co. LLC, | |
8.375%, 6/15/32 | | | 75 | | | | 88,068 | |
Energy Transfer Operating L.P., | |
2.90%, 5/15/25 | | | 592 | | | | 501,736 | |
4.05%, 3/15/25 | | | 230 | | | | 204,289 | |
4.75%, 1/15/26 | | | 295 | | | | 259,477 | |
6.50%, 2/1/42 | | | 110 | | | | 100,349 | |
7.125%, 5/15/30 (converts to FRN on 5/15/30) (c)(d) | | | 1,161 | | | | 712,622 | |
Kinder Morgan Energy Partners L.P., | |
7.50%, 11/15/40 | | | 30 | | | | 33,142 | |
Plains All American Pipeline L.P., | |
4.65%, 10/15/25 | | | 490 | | | | 394,332 | |
6.125%, 11/15/22, Ser. B (converts to FRN on 11/15/22) (c)(d) | | | 667 | | | | 334,664 | |
| | | | | | | | |
| | | | | | | 2,770,449 | |
| | | | | | | | |
|
| Real Estate Management & Development—2.1% | |
American Tower Corp., | |
5.00%, 2/15/24 | | | 715 | | | | 754,112 | |
| | | | | | | | |
| See accompanying Notes to Financial Statements | | | March 31, 2020 | | | Semiannual Report | | | 133 | |
Schedule of Investments
March 31, 2020 (unaudited)
| | | | | | | | |
| | | Principal
Amount
(000s) | | | Value | |
Target Corp., | |
2.25%, 4/15/25 | | $ | 405 | | | $ | 409,949 | |
| | | | | | | | |
| | | | | | | 1,164,061 | |
| | | | | | | | |
| |
| Semiconductors—0.8% | | | | | |
Broadcom, Inc. (a)(b), | |
4.25%, 4/15/26 | | | 430 | | | | 437,251 | |
| | | | | | | | |
| |
| Shipbuilding—0.3% | | | | | |
Huntington Ingalls Industries Inc. (a)(b), | |
3.844%, 5/1/25 | | | 162 | | | | 165,366 | |
| | | | | | | | |
| |
| Software—0.4% | | | | | |
Oracle Corp., | |
2.50%, 4/1/25 | | | 231 | | | | 236,093 | |
| | | | | | | | |
| |
| Telecommunications—1.0% | | | | | |
AT&T, Inc., | | | | | | | | |
3.90%, 3/11/24 | | | 345 | | | | 362,709 | |
4.30%, 2/15/30 | | | 200 | | | | 215,903 | |
| | | | | | | | |
| | | | | | | 578,612 | |
| | | | | | | | |
| |
| Transportation—0.4% | | | | | |
Kansas City Southern, | | | | | | | | |
4.20%, 11/15/69 | | | 50 | | | | 48,007 | |
United Parcel Service, Inc., | | | | | | | | |
3.40%, 9/1/49 | | | 154 | | | | 155,738 | |
| | | | | | | | |
| | | | | | | 203,745 | |
| | | | | | | | |
| Total Corporate Bonds & Notes (cost—$23,028,098) | | | | | | | 21,285,723 | |
| | | | | | | | |
| | | | | | | | |
|
| U.S. Government Agency Securities—31.5% | |
Fannie Mae, MBS, | | | | | | | | |
2.50%, 11/1/31 Pool, 15 Year | | | 375 | | | | 390,895 | |
3.00%, 10/1/29 Pool, 15 Year | | | 1,018 | | | | 1,067,637 | |
3.00%, 3/1/50 Pool, 30 Year | | | 2,748 | | | | 2,887,632 | |
3.50%, 4/1/48 Pool, 30 Year | | | 3,101 | | | | 3,319,243 | |
4.00%, 3/1/49 Pool, 30 Year | | | 2,908 | | | | 3,117,803 | |
4.50%, 2/1/48 Pool, 30 Year | | | 1,178 | | | | 1,279,773 | |
Freddie Mac, MBS, Pool, 30 Year, | |
3.00%, 1/1/46 | | | 1,236 | | | | 1,309,233 | |
Ginnie Mae, MBS, | |
3.50%, 2/20/48 Pool, 30 Year | | | 923 | | | | 988,408 | |
4.00%, 3/20/48 Pool, 30 Year | | | 512 | | | | 551,090 | |
United States Small Business Administration, ABS, | |
2.60%, 6/1/39 Series2019-20, Class F1 | | | 135 | | | | 138,869 | |
2.88%, 5/1/39 Series2019-20, Class E1 | | | 211 | | | | 218,563 | |
2.92%, 1/1/38 Series2018-20, Class A1 | | | 377 | | | | 392,611 | |
3.20%, 3/1/39 Series2019-20, Class C1 | | | 115 | | | | 122,059 | |
3.26%, 2/1/39 Series2019-20, Class B1 | | | 105 | | | | 111,458 | |
3.37%, 1/1/39 Series2019-20, Class A1 | | | 275 | | | | 292,792 | |
3.50%, 5/1/38 Series2018-20, Class E1 | | | 281 | | | | 302,492 | |
3.53%, 9/1/38 Series2018-20, Class I1 | | | 341 | | | | 364,557 | |
3.54%, 7/1/38 Series2018-20, Class G1 | | | 252 | | | | 271,960 | |
3.58%, 8/1/38 Series2018-20, Class H1 | | | 480 | | | | 517,654 | |
| | | | | | | | |
| Total U.S. Government Agency Securities (cost—$17,096,351) | | | | 17,644,729 | |
| | | | | | | | |
| | | | | | | | |
| |
| Asset-Backed Securities—23.6% | | | | | |
American Express Credit Account, 1 mo. LIBOR + 0.320%, Series2018-3, Class A (d), | |
1.025%, 10/15/25 | | | 100 | | | | 97,904 | |
| | | | | | | | |
| | | Principal
Amount
(000s) | | | Value | |
American Express Credit Account Master Trust, 1 mo. LIBOR + 0.380%, Series2017-5, Class A (d), | |
1.085%, 2/18/25 | | $ | 903 | | | $ | 874,564 | |
BA Credit Card Trust, Series2018-A3, Class A3, | |
3.10%, 12/15/23 | | | 510 | | | | 521,232 | |
BMW Vehicle Owner Trust, Series2018-A, Class A4, | |
2.51%, 6/25/24 | | | 260 | | | | 260,876 | |
CarMax Auto Owner Trust, Series2020-1, Class A4, | |
2.03%, 6/16/25 | | | 585 | | | | 589,457 | |
Carmax Auto Owner Trust, Series2019-3, Class C, | |
2.60%, 6/16/25 | | | 400 | | | | 398,385 | |
Chesapeake Funding II LLC, Series2019-2A, Class C (a)(b), | |
2.27%, 9/15/31 | | | 400 | | | | 390,289 | |
Citibank Credit Card Issuance Trust, 1 mo. LIBOR + 0.620%, Series2017-A5, Class A5 (d), | |
1.544%, 4/22/26 | | | 695 | | | | 665,349 | |
CNH Equipment Trust, Series2019-B, Class A3, | |
2.52%, 8/15/24 | | | 515 | | | | 526,052 | |
Dryden 68 CLO Ltd., 3 mo.USD-LIBOR + 1.310%, Series2019-68A, Class A (a)(b)(d), | |
3.141%, 7/15/32 | | | 515 | | | | 486,385 | |
Ford Credit Auto Owner Trust, | |
1.93%, 4/15/25 Series2019-C, Class A4 | | | 575 | | | | 577,924 | |
2.04%, 8/15/31 Series2020-1, Class A (a)(b) | | | 232 | | | | 216,877 | |
GM Financial Automobile Leasing Trust,Series 2019-3, Class C, | |
2.35%, 7/20/23 | | | 400 | | | | 374,754 | |
Honda Auto Receivables Owner Trust, | |
1.63%, 10/21/26 Series2020-1, Class A4 | | | 290 | | | | 288,763 | |
1.68%, 8/16/21 Series2017-2, Class A3 | | | 11 | | | | 10,600 | |
2.83%, 3/20/23 Series2019-1, Class A3 | | | 210 | | | | 213,922 | |
HPEFS Equipment Trust (a)(b), | |
2.21%, 9/20/29Series 2019-1A, Class A3 | | | 507 | | | | 499,834 | |
2.49%, 9/20/29Series 2019-1A, Class C | | | 400 | | | | 392,418 | |
Hyundai Auto Receivables Trust, Series2019-B, | |
Class C, 2.40%, 6/15/26 | | | 600 | | | | 594,421 | |
John Deere Owner Trust, Series2019-B, Class A2,
| |
2.28%, 5/16/22 | | | 358 | | | | 358,754 | |
MVW LLC, Series2019-2A, Class A (a)(b), | |
2.22%, 10/20/38 | | | 540 | | | | 489,473 | |
Nissan Auto Receivables Owner Trust, Series2019-A, Class A3, | |
2.90%, 10/16/23 | | | 435 | | | | 445,012 | |
Octagon Investment Partners 30 Ltd., 3 mo.USD-LIBOR-BBA + 1.320%, Series2017-1A, Class A1 (a)(b)(d), | |
3.139%, 3/17/30 | | | 566 | | | | 543,524 | |
Sofi Consumer Loan Program LLC, Series2016-3, Class B (a)(b)(d), | |
4.49%, 12/26/25 | | | 600 | | | | 578,215 | |
Toyota Auto Receivables Owner Trust, Series2020-A, Class A4, | |
1.68%, 5/15/25 | | | 800 | | | | 801,745 | |
Verizon Owner Trust, 1.94%, | | | | | | | | |
4/22/24 Series2019-C, Class A1A | | | 755 | | | | 722,788 | |
2.16%, 4/22/24 Series2019-C, Class C | | | 600 | | | | 578,718 | |
Volvo Financial Equipment Master Owner Trust, 1 mo. LIBOR + 0.520%, Series2018-A, Class A (a)(b)(d), | |
1.225%, 7/17/23 | | | 728 | | | | 720,507 | |
| | | | | | | | |
Total Asset-Backed Securities
(cost—$13,532,690) | | | | | | | 13,218,742 | |
| | | | | | | | |
| | | | | | | | |
| | | Principal
Amount
(000s) | | | Value | |
|
| U.S. Treasury Obligations—5.1% | |
U.S. Treasury Bonds, | | | | | | | | |
2.375%, 11/15/49 | | $ | 574 | | | $ | 717,769 | |
U.S. Treasury Notes, | | | | | | | | |
0.50%, 3/31/25 | | | 181 | | | | 182,202 | |
0.625%, 3/31/27 | | | 599 | | | | 601,574 | |
1.125%, 4/30/20 | | | 900 | | | | 900,844 | |
1.375%, 10/31/20 | | | 260 | | | | 261,889 | |
1.50%, 2/15/30 | | | 187 | | | | 201,317 | |
| | | | | | | | |
Total U.S. Treasury Obligations
(cost—$2,862,307) | | | | 2,865,595 | |
| | | | | | | | |
| | | | | | | | |
|
| Mortgage-Backed Securities—3.1% | |
Bank 2019, 2.92%, | | | | | | | | |
12/15/52 Series BNK23, Class A3 | | | 660 | | | | 699,063 | |
3.183%, 8/15/61 Series BNK19, Class A3 | | | 660 | | | | 713,153 | |
Bank 2020, Series BN26, Class A4, | |
2.403%, 3/15/63 | | | 315 | | | | 318,229 | |
| | | | | | | | |
| Total Mortgage-Backed Securities (cost—$1,705,825) | | | | 1,730,445 | |
| | | | | | | | |
| | |
| | | Shares | | | | |
| |
| Preferred Stock—1.1% | | | | | |
| |
| Banks—1.1% | | | | | |
Citigroup Capital XIII (d), | |
8.14%, 10/30/40 | | | 11,980 | | | | 306,688 | |
JPMorgan Chase & Co. (c) | | | 947 | | | | 23,907 | |
Wells Fargo & Co. (c), | | | | | | | | |
4.75%, 3/15/25 | | | 13,805 | | | | 289,905 | |
| | | | | | | | |
| Total Preferred Stock (cost—$700,015) | | | | | | | 620,500 | |
| | | | | | | | |
| |
Total Investments
(cost—$58,925,286)—102.5% | | | | 57,365,734 | |
| | | | | | | | |
| |
Liabilities in excess of
other assets (e)—(2.5)% | | | | (1,389,686 | ) |
| | | | | | | | |
| |
| Net Assets—100.0% | | | | $55,976,048 | |
| | | | | | | | |
Notes to Schedule of Investments:
(a) Private Placement—Restricted as to resale and may not have a readily available market. Securities with an aggregate value of $6,781,975, representing 12.1% of net assets.
(b) 144A—Exempt from registration under Rule 144A of the Securities Act of 1933. These securities may be resold in transactions exempt from registration, typically only to qualified institutional buyers. Securities with an aggregate value of $6,781,975, representing 12.1% of net assets.
(c) Perpetual maturity. The date shown, if any, is the next call date.
(d) Variable or Floating Rate Security—Securities with an interest rate that changes periodically. The interest rate disclosed reflects the rate in effect on March 31, 2020.
| | | | | | |
| 134 | | Semiannual Report | | | March 31, 2020 | | | See accompanying Notes to Financial Statements |
Schedule of Investments
March 31, 2020 (unaudited)
(e) Includes net unrealized appreciation (depreciation) of other financial instruments as follows:
| | | | | | | | | | | | | | | | | | | | | | |
|
| Futures contracts outstanding at March 31, 2020: | |
| Type | | Contracts | | | Expiration
Date | | | Notional
Amount
(000s) | | | Market
Value
(000s) | | | Unrealized
Appreciation
(Depreciation) | |
Long position contracts: | | | | | | | | | | | | | | | | | | | | |
| | 2-Year U.S. Treasury Note | | | 42 | | | | 6/30/20 | | | $ | 8,400 | | | $ | 9,256 | | | $ | 5,635 | |
| | 5-Year U.S. Treasury Note | | | 55 | | | | 6/30/20 | | | | 5,500 | | | | 6,895 | | | | 26,464 | |
| | 10-Year U.S. Treasury Note | | | 2 | | | | 6/19/20 | | | | 200 | | | | 277 | | | | 996 | |
| | 10-Year Ultra U.S. Treasury Bond | | | 5 | | | | 6/19/20 | | | | 500 | | | | 780 | | | | (634 | ) |
| | U.S. Long Bond | | | 24 | | | | 6/19/20 | | | | 2,400 | | | | 4,769 | | | | 51,436 | |
| | | | | | | | | | | | | | | | | | | | | | |
| | | | | | | | | | | | | | | | | | | | $ | 83,897 | |
| | | | | | | | | | | | | | | | | | | | | | |
| | | | | | | | | | | | | | | | | | | | | | | | | | | | | | | | |
|
| Credit default swaps agreements outstanding at March 31, 2020: | |
Centrally cleared buy protection swap agreements: | |
Broker (Exchange)/
Reference Debt Issuer | | Notional
Amount
(000s)(1) | | | Implied
Credit
Spread | | | Termination
Date | | | Fixed Deal
Pay Rate | | | Payment
Frequency | | | Value(2) | | | Upfront
Premiums
Paid (Received) | | | Unrealized
Appreciation
(Depreciation) | |
Goldman Sachs (ICE): | |
American Express Co. | | $ | 595 | | | | 5.828 | % | | | 12/20/24 | | | | (1.00 | )% | | | Quarterly | | | $ | (12,729 | ) | | $ | (10,356 | ) | | $ | (2,373 | ) |
AT&T, Inc. | | | 1,165 | | | | 2.377 | % | | | 12/20/24 | | | | (1.00 | )% | | | Quarterly | | | | 54,742 | | | | (8,855 | ) | | | 63,597 | |
Berkshire Hathaway Inc. | | | 1,205 | | | | 0.287 | % | | | 12/20/24 | | | | (1.00 | )% | | | Quarterly | | | | (42,257 | ) | | | (36,891 | ) | | | (5,366 | ) |
Citigroup Inc. | | | 650 | | | | 0.838 | % | | | 12/20/24 | | | | (1.00 | )% | | | Quarterly | | | | 2,834 | | | | 20,584 | | | | (17,750 | ) |
CSX Corp. | | | 560 | | | | 0.329 | % | | | 12/20/24 | | | | (1.00 | )% | | | Quarterly | | | | (19,133 | ) | | | (19,662 | ) | | | 529 | |
Energy Transfer Operating, L.P. | | | 2,640 | | | | 3.583 | % | | | 12/20/24 | | | | (1.00 | )% | | | Quarterly | | | | 253,458 | | | | 160,005 | | | | 93,453 | |
International Business Machines Corp. | | | 605 | | | | 0.496 | % | | | 12/20/24 | | | | (1.00 | )% | | | Quarterly | | | | (16,693 | ) | | | (16,970 | ) | | | 277 | |
Kinder Morgan, Inc. | | | 720 | | | | 2.047 | % | | | 12/20/24 | | | | (1.00 | )% | | | Quarterly | | | | 19,013 | | | | 40,733 | | | | (21,720 | ) |
Marathon Petroleum Corp. | | | 410 | | | | 1.662 | % | | | 12/20/24 | | | | (5.00 | )% | | | Quarterly | | | | (42,224 | ) | | | (25,455 | ) | | | (16,769 | ) |
McKesson Corp. | | | 1,205 | | | | 0.473 | % | | | 12/20/24 | | | | (1.00 | )% | | | Quarterly | | | | (33,348 | ) | | | (11,697 | ) | | | (21,651 | ) |
Morgan Stanley | | | 1,030 | | | | 1.341 | % | | | 6/20/25 | | | | (1.00 | )% | | | Quarterly | | | | 11,974 | | | | 22,751 | | | | (10,777 | ) |
Prudential Financial, Inc. | | | 605 | | | | 0.679 | % | | | 12/20/24 | | | | (1.00 | )% | | | Quarterly | | | | (5,487 | ) | | | (14,913 | ) | | | 9,426 | |
Simon Property Group, L.P. | | | 640 | | | | 2.947 | % | | | 6/20/25 | | | | (1.00 | )% | | | Quarterly | | | | 46,453 | | | | 55,532 | | | | (9,079 | ) |
The Williams Companies, Inc. | | | 410 | | | | 1.749 | % | | | 12/20/24 | | | | (1.00 | )% | | | Quarterly | | | | 28,679 | | | | 46,979 | | | | (18,300 | ) |
Union Pacific Corp. | | | 560 | | | | 0.262 | % | | | 12/20/24 | | | | (1.00 | )% | | | Quarterly | | | | (20,821 | ) | | | (20,259 | ) | | | (562 | ) |
| | | | | | | | | | | | | | | | | | | | | | | | |
| | | | | | | | | | | | | | | | | | | | | | $ | 224,461 | | | $ | 181,526 | | | $ | 42,935 | |
| | | | | | | | | | | | | | | | | | | | | | | | |
| | | | | | | | | | | | | | | | | | | | | | | | | | | | | | | | |
Centrally cleared sell protection swap agreements: | |
Broker (Exchange)/
Referenced Debt Issuer | | Notional
Amount
(000s)(1) | | | Implied
Credit
Spread | | | Termination
Date | | | Fixed Deal
Received
Rate | | | Payment
Frequency | | | Value(2) | | | Upfront
Premiums
Paid (Received) | | | Unrealized
Appreciation
(Depreciation) | |
Goldman Sachs (ICE): | |
CDX.NA.HY.33 Index | | $ | 4,485 | | | | 5.762 | % | | | 12/20/24 | | | | 5.00 | % | | | Quarterly | | | $ | (281,508 | ) | | $ | (348,936 | ) | | $ | 67,428 | |
CDX.NA.IG.34 | | | 6,440 | | | | 1.168 | % | | | 6/20/25 | | | | 1.00 | % | | | Quarterly | | | | (40,718 | ) | | | 16,148 | | | | (56,866 | ) |
Verizon Communications Inc. | | | 615 | | | | 0.522 | % | | | 12/20/24 | | | | 1.00 | % | | | Quarterly | | | | (2,866 | ) | | | 11,989 | | | | (14,855 | ) |
| | | | | | | | | | | | | | | | | | | | | | | | |
| | | | | | | | | | | | | | | | | | | | | | $ | (325,092 | ) | | $ | (320,799 | ) | | $ | (4,293 | ) |
| | | | | | | | | | | | | | | | | | | | | | | | |
(1) This represents the maximum potential amount the Fund could be required to make available as a seller of credit protection or receive as a buyer of credit protection if a credit event occurs as defined under the terms of that particular swap agreement.
(2) The quoted market prices and resulting values for credit default swap agreements serve as an indicator of the status at March 31, 2020 of the payment/performance risk and represent the likelihood of an expected liability (or profit) for the credit derivative should the notional amount of the swap agreement have been closed/sold as of the period end. Increasing market values, in absolute terms when compared to the notional amount of the swap, represent a deterioration of the referenced entity’s credit soundness and a greater likelihood or risk of default or other credit event occurring as defined under the terms of the agreement.
| | | | | | | | |
| See accompanying Notes to Financial Statements | | | March 31, 2020 | | | Semiannual Report | | | 135 | |
Schedule of Investments
March 31, 2020 (unaudited)
(f) At March 31, 2020, the Fund pledged $1,490,159 in cash as collateral for futures contracts and $367,797 in cash as collateral for swap contracts. The Fund also held U.S. Treasury Obligations valued at $849,621 as collateral for swap contracts. Securities held as collateral will not be pledged and are not reflected in the Schedule of Investments.
Glossary:
ABS—Asset-Backed Securities
BBA—British Bankers’ Association
CDX—Credit Derivatives Index
CLO—Collateralized Loan Obligation
FRN—Floating Rate Note
ICE—Intercontinental Exchange
LIBOR—London Inter-Bank Offered Rate
MBS—Mortgage-Backed Securities
REIT – Real Estate Investment Trust
| | | | | | |
| 136 | | Semiannual Report | | | March 31, 2020 | | | See accompanying Notes to Financial Statements |
Schedule of Investments
March 31, 2020 (unaudited)
AllianzGI Emerging Markets Consumer Fund
| | | | | | | | |
| | | Shares | | | Value | |
| |
| Common Stock—95.7% | | | | | |
| |
| Brazil—2.3% | | | | | |
Ambev S.A. | | | 60,400 | | | | $138,559 | |
Cyrela Brazil Realty S.A. Empreendimentos e Participacoes | | | 29,300 | | | | 79,677 | |
Porto Seguro S.A. | | | 19,100 | | | | 165,118 | |
Qualicorp Consultoria e Corretora de Seguros S.A. | | | 52,800 | | | | 239,811 | |
Tim Participacoes S.A. | | | 46,700 | | | | 111,805 | |
| | | | | | | | |
| | | | | | | 734,970 | |
| | | | | | | | |
| |
| Canada—1.5% | | | | | |
Manulife Financial Corp. | | | 39,217 | | | | 492,407 | |
| | | | | | | | |
| |
| China—43.6% | | | | | |
Alibaba Group Holding Ltd. ADR (e) | | | 11,485 | | | | 2,233,603 | |
Autobio Diagnostics Co., Ltd., Class A | | | 20,694 | | | | 337,322 | |
BYD Electronic International Co., Ltd. | | | 91,000 | | | | 149,631 | |
Changchun High & New Technology Industry Group, Inc., Class A | | | 2,800 | | | | 214,192 | |
China Medical System Holdings Ltd. | | | 66,000 | | | | 70,604 | |
China Merchants Bank Co., Ltd., Class H | | | 217,000 | | | | 970,808 | |
China Vanke Co., Ltd., Class H | | | 169,200 | | | | 551,060 | |
China Yuhua Education Corp., Ltd. (a) | | | 148,000 | | | | 108,572 | |
Geely Automobile Holdings Ltd. | | | 100,000 | | | | 145,122 | |
Greenland Holdings Corp., Ltd., Class A | | | 498,885 | | | | 377,672 | |
Guangzhou Baiyunshan Pharmaceutical Holdings Co., Ltd., Class H | | | 60,000 | | | | 159,734 | |
Guangzhou R&F Properties Co., Ltd., Class H | | | 154,800 | | | | 199,107 | |
Hisense Home Appliances Group Co., Ltd., Class H | | | 144,000 | | | | 131,485 | |
JD.com, Inc. ADR (e) | | | 20,700 | | | | 838,350 | |
Lenovo Group Ltd. | | | 268,000 | | | | 141,971 | |
Longfor Group Holdings Ltd. (a) | | | 56,000 | | | | 269,522 | |
Luye Pharma Group Ltd. (a) | | | 229,000 | | | | 110,344 | |
Meituan Dianping, Class B (e) | | | 20,000 | | | | 238,425 | |
NetEase, Inc. ADR | | | 3,400 | | | | 1,091,264 | |
New Oriental Education & Technology Group, Inc. ADR | | | 4,900 | | | | 530,376 | |
Ping An Insurance Group Co. of China Ltd., Class H | | | 124,000 | | | | 1,211,016 | |
Shenzhen MindrayBio-Medical Electronics Co., Ltd., Class A | | | 22,900 | | | | 833,135 | |
Shimao Property Holdings Ltd. | | | 113,500 | | | | 393,348 | |
Tencent Holdings Ltd. | | | 51,200 | | | | 2,530,693 | |
Wuliangye Yibin Co., Ltd., Class A | | | 11,601 | | | | 186,613 | |
Zhongsheng Group Holdings Ltd. | | | 34,500 | | | | 119,721 | |
| | | | | | | | |
| | | | | | | 14,143,690 | |
| | | | | | | | |
| |
| Hong Kong—1.3% | | | | | |
Brilliance China Automotive Holdings Ltd. | | | 222,000 | | | | 180,778 | |
Vinda International Holdings Ltd. | | | 93,000 | | | | 223,944 | |
| | | | | | | | |
| | | | | | | 404,722 | |
| | | | | | | | |
| | | | | | | | |
| | | Shares | | | Value | |
| |
| India—4.3% | | | | | |
Bajaj Finance Ltd. | | | 4,238 | | | $ | 123,864 | |
HDFC Bank Ltd. ADR | | | 22,820 | | | | 877,657 | |
Hindustan Unilever Ltd. | | | 12,466 | | | | 378,057 | |
| | | | | | | | |
| | | | | | | 1,379,578 | |
| | | | | | | | |
| |
| Indonesia—0.8% | | | | | |
Indofood Sukses Makmur Tbk PT | | | 441,300 | | | | 170,722 | |
Media Nusantara Citra Tbk PT | | | 1,533,700 | | | | 84,738 | |
| | | | | | | | |
| | | | | | | 255,460 | |
| | | | | | | | |
| |
| Japan—0.8% | | | | | |
Astellas Pharma, Inc. | | | 7,100 | | | | 109,392 | |
Hoya Corp. | | | 1,800 | | | | 153,057 | |
| | | | | | | | |
| | | | | | | 262,449 | |
| | | | | | | | |
| |
| Korea (Republic of)—9.4% | | | | | |
Hyundai Mobis Co., Ltd. | | | 3,439 | | | | 475,709 | |
Kia Motors Corp. | | | 9,259 | | | | 194,892 | |
LG Electronics, Inc. | | | 3,754 | | | | 147,600 | |
Samsung Electronics Co., Ltd. | | | 57,586 | | | | 2,239,029 | |
| | | | | | | | |
| | | | | | | 3,057,230 | |
| | | | | | | | |
| |
| Malaysia—0.4% | | | | | |
Top Glove Corp. Bhd. | | | 91,000 | | | | 135,505 | |
| | | | | | | | |
| |
| Mexico—1.1% | | | | | |
Banco Santander Mexico S.A. Institucion de Banca Multiple Grupo Financiero Santand ADR | | | 11,665 | | | | 37,794 | |
Grupo Financiero Banorte S.A.B de C.V., Class O | | | 115,400 | | | | 316,198 | |
| | | | | | | | |
| | | | | | | 353,992 | |
| | | | | | | | |
| |
| Philippines—0.9% | | | | | |
Altus San Nicolas Corp. (c)(d)(e) | | | 5,738 | | | | 1,139 | |
Ayala Land, Inc. | | | 153,450 | | | | 90,552 | |
Globe Telecom, Inc. | | | 3,005 | | | | 113,883 | |
Robinsons Land Corp. | | | 304,900 | | | | 88,705 | |
| | | | | | | | |
| | | | | | | 294,279 | |
| | | | | | | | |
| |
| Poland—0.3% | | | | | |
Dino Polska S.A. (a)(e) | | | 2,654 | | | | 103,238 | |
| | | | | | | | |
| |
| Russian Federation—1.7% | | | | | |
Mobile TeleSystems PJSC ADR | | | 71,150 | | | | 540,740 | |
| | | | | | | | |
| |
| Singapore—0.5% | | | | | |
CapitaLand Ltd. | | | 88,300 | | | | 176,947 | |
| | | | | | | | |
| |
| South Africa—0.8% | | | | | |
Mr Price Group Ltd. | | | 17,700 | | | | 112,320 | |
Naspers Ltd., Class N | | | 1,142 | | | | 162,295 | |
| | | | | | | | |
| | | | | | | 274,615 | |
| | | | | | | | |
| |
| Switzerland—3.0% | | | | | |
Roche Holding AG | | | 3,018 | | | | 971,017 | |
| | | | | | | | |
| |
| Taiwan—10.7% | | | | | |
Asustek Computer, Inc. | | | 31,000 | | | | 209,898 | |
Chicony Electronics Co., Ltd. | | | 34,000 | | | | 84,889 | |
Chlitina Holding Ltd. | | | 27,000 | | | | 153,327 | |
Chong Hong Construction Co., Ltd. | | | 62,000 | | | | 153,259 | |
CTBC Financial Holding Co., Ltd. | | | 875,000 | | | | 515,234 | |
Eclat Textile Co., Ltd. | | | 7,000 | | | | 55,415 | |
First Financial Holding Co., Ltd. | | | 1,017,447 | | | | 657,475 | |
Grape King Bio Ltd. | | | 19,000 | | | | 123,534 | |
Lite-On Technology Corp. | | | 280,000 | | | | 380,911 | |
Pou Chen Corp. | | | 71,000 | | | | 60,010 | |
Primax Electronics Ltd. | | | 273,000 | | | | 345,805 | |
| | | | | | | | |
| | | Shares | | | Value | |
Shin Kong Financial Holding Co., Ltd. (e) | | | 407,724 | | | $ | 102,260 | |
Taiwan Paiho Ltd. | | | 48,000 | | | | 82,247 | |
Wistron Corp. | | | 691,000 | | | | 558,626 | |
| | | | | | | | |
| | | | | | | 3,482,890 | |
| | | | | | | | |
| |
| Thailand—3.4% | | | | | |
Advanced Info Service PCL (c)(d) | | | 77,300 | | | | 468,679 | |
Bangkok Dusit Medical Services PCL (c)(d) | | | 500,800 | | | | 286,756 | |
Charoen Pokphand Foods PCL (c)(d) | | | 173,300 | | | | 127,634 | |
Thanachart Capital PCL (c)(d) | | | 220,000 | | | | 221,282 | |
| | | | | | | | |
| | | | | | | 1,104,351 | |
| | | | | | | | |
| |
| Turkey—0.6% | | | | | |
Turkcell Iletisim Hizmetleri AS | | | 79,660 | | | | 147,960 | |
Ulker Biskuvi Sanayi AS (e) | | | 17,302 | | | | 51,409 | |
| | | | | | | | |
| | | | | | | 199,369 | |
| | | | | | | | |
| |
| United States—8.3% | | | | | |
Apple, Inc. | | | 2,100 | | | | 534,009 | |
Garmin Ltd. | | | 2,900 | | | | 217,384 | |
Mastercard, Inc., Class A | | | 3,710 | | | | 896,188 | |
Microsoft Corp. | | | 1,300 | | | | 205,023 | |
Procter & Gamble Co. | | | 4,900 | | | | 539,000 | |
Thermo Fisher Scientific, Inc. | | | 1,020 | | | | 289,272 | |
| | | | | | | | |
| | | | | | | 2,680,876 | |
| | | | | | | | |
| Total Common Stock (cost—$30,710,626) | | | | 31,048,325 | |
| | | | | | | | |
| | | | | | | | |
| |
| Preferred Stock—0.7% | | | | | |
| |
| Brazil—0.7% | | | | | |
Banco do Estado do Rio Grande do Sul S.A., Class B | | | 41,600 | | | | 95,512 | |
Itau Unibanco Holding S.A. | | | 30,850 | | | | 137,089 | |
| | | | | | | | |
| Total Preferred Stock (cost—$501,512) | | | | 232,601 | |
| | | | | | | | |
| | | | | | | | |
| | |
| | | Principal
Amount
(000s) | | | | |
|
| Repurchase Agreements—3.5% | |
State Street Bank and Trust Co., dated 3/31/20, 0.00%, due 4/1/20, proceeds $1,130,000; collateralized by U.S. Treasury Notes, 2.75%, due 4/30/23, valued at $1,157,747 including accrued interest | |
(cost—$1,130,000) | | | $1,130 | | | | 1,130,000 | |
| | | | | | | | |
| |
Total Investments
(cost—$32,342,138) (b)—99.9% | | | | 32,410,926 | |
| | | | | | | | |
| |
Other assets less
liabilities—0.1% | | | | 42,247 | |
| | | | | | | | |
| |
| Net Assets—100.0% | | | | $32,453,173 | |
| | | | | | | | |
Notes to Schedule of Investments:
(a) 144A—Exempt from registration under Rule 144A of the Securities Act of 1933. These securities may be resold in transactions exempt from registration, typically only to qualified institutional buyers. Securities with an aggregate value of $591,676, representing 1.8% of net assets.
| | | | | | | | |
| See accompanying Notes to Financial Statements | | | March 31, 2020 | | | Semiannual Report | | | 137 | |
Schedule of Investments
March 31, 2020 (unaudited)
(b) Securities with an aggregate value of $19,517,191, representing 60.1% of net assets, were valued utilizing modeling tools provided by a third-party vendor. See Note 1(a) and Note 1(b) in the Notes to Financial Statements.
(c) Fair-Valued—Securities with an aggregate value of $1,105,490, representing 3.4% of net assets. See Note 1(a) and Note 1(b) in the Notes to Financial Statements.
(d) Level 3 security. See Note 1(a) and Note 1(b) in the Notes to Financial Statements.
(e)Non-income producing.
Glossary:
ADR—American Depositary Receipt
The industry classification of portfolio holdings and other assets less liabilities shown as a percentage of net assets were as follows:
| | | | |
Technology Hardware, Storage & Peripherals | | | 13.8% | |
Banks | | | 11.8% | |
Internet & Direct Marketing Retail | | | 10.7% | |
Interactive Media & Services | | | 7.8% | |
Real Estate Management & Development | | | 7.1% | |
Insurance | | | 6.1% | |
Pharmaceuticals | | | 5.0% | |
Healthcare Equipment & Supplies | | | 4.5% | |
Wireless Telecommunication Services | | | 4.3% | |
Household Products | | | 3.5% | |
Entertainment | | | 3.4% | |
IT Services | | | 2.8% | |
Diversified Consumer Services | | | 2.0% | |
Household Durables | | | 1.8% | |
Healthcare Providers & Services | | | 1.6% | |
Automobiles | | | 1.6% | |
Auto Components | | | 1.5% | |
Food Products | | | 1.1% | |
Beverages | | | 1.0% | |
Life Sciences Tools & Services | | | 0.9% | |
Personal Products | | | 0.8% | |
Specialty Retail | | | 0.7% | |
Software | | | 0.6% | |
Textiles, Apparel & Luxury Goods | | | 0.6% | |
Communications Equipment | | | 0.4% | |
Consumer Finance | | | 0.4% | |
Food & Staples Retailing | | | 0.3% | |
Media | | | 0.3% | |
Hotels, Restaurants & Leisure | | | 0.0% | |
Repurchase Agreements | | | 3.5% | |
Other assets less liabilities | | | 0.1% | |
| | | | |
| | | 100.0% | |
| | | | |
AllianzGI Emerging Markets
Small-Cap Fund
| | | | | | | | |
| | | Shares | | | Value | |
| |
| Common Stock—95.9% | | | | | |
| |
| Brazil—2.2% | | | | | |
Camil Alimentos S.A. | | | 17,600 | | | | $26,386 | |
Qualicorp Consultoria e Corretora de Seguros S.A. | | | 20,900 | | | | 94,925 | |
| | | | | | | | |
| | | | | | | 121,311 | |
| | | | | | | | |
| |
| China—18.6% | | | | | |
China Lesso Group Holdings Ltd. | | | 88,000 | | | | 113,925 | |
China National Building Material Co., Ltd., Class H | | | 182,000 | | | | 195,524 | |
China Power International Development Ltd. | | | 68,000 | | | | 12,583 | |
China Yuhua Education Corp., Ltd. (a) | | | 100,000 | | | | 73,359 | |
Guangzhou Baiyunshan Pharmaceutical Holdings Co., Ltd., Class H | | | 16,000 | | | | 42,596 | |
Hisense Home Appliances Group Co., Ltd., Class H | | | 59,000 | | | | 53,872 | |
Jiangsu Expressway Co., Ltd., Class H | | | 48,000 | | | | 53,350 | |
NetDragon Websoft Holdings Ltd. | | | 30,500 | | | | 72,877 | |
West China Cement Ltd. | | | 948,000 | | | | 145,768 | |
YiChang HEC ChangJiang Pharmaceutical Co., Ltd., Class H (a) | | | 31,400 | | | | 146,922 | |
Zoomlion Heavy Industry Science and Technology Co., Ltd., Class H | | | 154,600 | | | | 111,210 | |
| | | | | | | | |
| | | | | | | 1,021,986 | |
| | | | | | | | |
| |
| Czech Republic—0.6% | | | | | |
Philip Morris CR AS | | | 60 | | | | 32,196 | |
| | | | | | | | |
| |
| Greece—0.2% | | | | | |
Motor Oil Hellas Corinth Refineries S.A. | | | 860 | | | | 10,497 | |
| | | | | | | | |
| |
| Hong Kong—0.8% | | | | | |
K Wah International Holdings Ltd. | | | 101,197 | | | | 43,481 | |
| | | | | | | | |
| |
| India—13.5% | | | | | |
Amara Raja Batteries Ltd. | | | 7,964 | | | | 50,371 | |
Bata India Ltd. | | | 4,683 | | | | 75,882 | |
DCM Shriram Ltd. | | | 8,983 | | | | 25,484 | |
Godfrey Phillips India Ltd. | | | 1,729 | | | | 21,288 | |
Granules India Ltd. (e) | | | 21,789 | | | | 40,559 | |
Indraprastha Gas Ltd. | | | 16,146 | | | | 83,094 | |
Ipca Laboratories Ltd. | | | 6,882 | | | | 124,749 | |
Mindtree Ltd. | | | 6,735 | | | | 73,777 | |
Mphasis Ltd. | | | 5,447 | | | | 47,615 | |
NIIT Technologies Ltd. (e) | | | 2,630 | | | | 39,808 | |
REC Ltd. | | | 22,801 | | | | 26,691 | |
SRF Ltd. | | | 1,429 | | | | 52,426 | |
Strides Pharma Science Ltd. | | | 19,711 | | | | 83,624 | |
| | | | | | | | |
| | | | | | | 745,368 | |
| | | | | | | | |
| |
| Indonesia—1.2% | | | | | |
Bukit Asam Tbk PT | | | 75,500 | | | | 9,979 | |
Media Nusantara Citra Tbk PT | | | 643,200 | | | | 35,537 | |
Wijaya Karya Persero Tbk PT | | | 396,600 | | | | 20,090 | |
| | | | | | | | |
| | | | | | | 65,606 | |
| | | | | | | | |
| |
| Korea (Republic of)—12.1% | | | | | |
CJ CheilJedang Corp. | | | 477 | | | | 84,253 | |
Daelim Industrial Co., Ltd. | | | 553 | | | | 33,159 | |
DB HiTek Co., Ltd. | | | 2,419 | | | | 42,257 | |
F&F Co., Ltd. | | | 1,121 | | | | 84,198 | |
Hite Jinro Co., Ltd. | | | 1,779 | | | | 38,827 | |
| | | | | | | | |
| | | Shares | | | Value | |
Hyosung Corp. | | | 1,974 | | | $ | 98,379 | |
LG Innotek Co., Ltd. | | | 1,450 | | | | 133,437 | |
Macquarie Korea Infrastructure Fund | | | 9,254 | | | | 82,182 | |
Partron Co., Ltd. | | | 3,544 | | | | 21,873 | |
SK Networks Co., Ltd. | | | 7,724 | | | | 28,636 | |
Unid Co., Ltd. | | | 690 | | | | 19,271 | |
| | | | | | | | |
| | | | | | | 666,472 | |
| | | | | | | | |
| |
| Malaysia—1.1% | | | | | |
Kossan Rubber Industries | | | 49,900 | | | | 59,000 | |
| | | | | | | | |
| |
| Mexico—2.7% | | | | | |
Fibra Uno Administracion S.A. de C.V. REIT | | | 124,000 | | | | 97,172 | |
Grupo Aeroportuario del Centro Norte S.A.B de C.V. | | | 5,100 | | | | 17,235 | |
Qualitas Controladora S.A.B. de C.V. | | | 14,300 | | | | 36,729 | |
| | | | | | | | |
| | | | | | | 151,136 | |
| | | | | | | | |
| |
| Poland—1.4% | | | | | |
Dino Polska S.A. (a)(e) | | | 1,283 | | | | 49,908 | |
Energa S.A. (e) | | | 15,313 | | | | 25,436 | |
| | | | | | | | |
| | | | | | | 75,344 | |
| | | | | | | | |
| |
| Russian Federation—2.9% | | | | | |
Federal Grid Co. Unified Energy System PJSC (c)(d) | | | 40,890,000 | | | | 84,234 | |
Magnitogorsk Iron & Steel Works PJSC GDR | | | 8,057 | | | | 50,517 | |
PIK Group PJSC (c)(d) | | | 5,407 | | | | 28,377 | |
| | | | | | | | |
| | | | | | | 163,128 | |
| | | | | | | | |
| |
| South Africa—4.4% | | | | | |
Gold Fields Ltd. ADR | | | 26,855 | | | | 127,561 | |
Netcare Ltd. | | | 136,315 | | | | 114,323 | |
| | | | | | | | |
| | | | | | | 241,884 | |
| | | | | | | | |
| |
| Taiwan—27.6% | | | | | |
Accton Technology Corp. | | | 12,000 | | | | 64,207 | |
Aten International Co., Ltd. | | | 13,000 | | | | 33,544 | |
BenQ Materials Corp. | | | 53,000 | | | | 23,518 | |
Bioteque Corp. | | | 29,000 | | | | 89,773 | |
Chipbond Technology Corp. | | | 66,000 | | | | 106,878 | |
ChipMOS Technologies, Inc. | | | 97,000 | | | | 84,851 | |
Darfon Electronics Corp. | | | 13,000 | | | | 12,755 | |
Farglory Land Development Co., Ltd. | | | 14,000 | | | | 17,505 | |
Formosa Advanced Technologies Co., Ltd. | | | 14,000 | | | | 14,921 | |
Greatek Electronics, Inc. | | | 12,000 | | | | 16,668 | |
Huaku Development Co., Ltd. | | | 22,000 | | | | 59,962 | |
ITE Technology, Inc. | | | 32,000 | | | | 41,298 | |
Lite-On Technology Corp. | | | 128,000 | | | | 174,131 | |
Novatek Microelectronics Corp. | | | 12,000 | | | | 67,658 | |
Pixart Imaging, Inc. | | | 17,000 | | | | 78,186 | |
Radiant Opto-Electronics Corp. | | | 43,000 | | | | 111,272 | |
Sercomm Corp. | | | 64,000 | | | | 132,722 | |
Shinkong Synthetic Fibers Corp. | | | 56,000 | | | | 18,470 | |
Syncmold Enterprise Corp. | | | 35,250 | | | | 75,063 | |
TaiDoc Technology Corp. | | | 9,000 | | | | 49,651 | |
Taiwan Surface Mounting Technology Corp. | | | 12,000 | | | | 27,107 | |
Tripod Technology Corp. | | | 48,000 | | | | 149,316 | |
TXC Corp. | | | 48,000 | | | | 69,314 | |
| | | | | | | | |
| | | | | | | 1,518,770 | |
| | | | | | | | |
| | | | | | |
| 138 | | Semiannual Report | | | March 31, 2020 | | | See accompanying Notes to Financial Statements |
Schedule of Investments
March 31, 2020 (unaudited)
| | | | | | | | |
| | | Shares | | | Value | |
| |
| Thailand—2.7% | | | | | |
Carabao Group PCL (c)(d) | | | 39,000 | | | $ | 74,460 | |
KGI Securities Thailand PCL (c)(d) | | | 100,800 | | | | 11,253 | |
Thanachart Capital PCL (c)(d) | | | 61,000 | | | | 61,355 | |
| | | | | | | | |
| | | | | | | 147,068 | |
| | | | | | | | |
| |
| Turkey—3.9% | | | | | |
Anadolu Cam Sanayii AS | | | 39,920 | | | | 18,758 | |
Enerjisa Enerji AS (a) | | | 51,105 | | | | 52,394 | |
Soda Sanayii AS | | | 37,186 | | | | 28,677 | |
Torunlar Gayrimenkul Yatirim Ortakligi AS REIT (e) | | | 102,493 | | | | 28,827 | |
Trakya Cam Sanayii AS | | | 91,701 | | | | 39,796 | |
Vestel Elektronik Sanayi ve Ticaret AS (e) | | | 28,912 | | | | 46,005 | |
| | | | | | | | |
| | | | | | | 214,457 | |
| | | | | | | | |
| Total Common Stock (cost—$6,140,913) | | | | 5,277,704 | |
| | | | | | | | |
| | | | | | | | |
|
| Preferred Stock—2.6% | |
| |
| Brazil—2.0% | | | | | |
Cia de Transmissao de Energia Eletrica Paulista | | | 14,400 | | | | 52,572 | |
Cia Paranaense de Energia | | | 5,500 | | | | 56,629 | |
| | | | | | | | |
| | | | | | | 109,201 | |
| | | | | | | | |
| |
| Russian Federation—0.6% | | | | | |
Surgutneftegas PJSC (c)(d) | | | 69,697 | | | | 33,454 | |
| | | | | | | | |
Total Preferred Stock
(cost—$144,639) | | | | 142,655 | |
| | | | | | | | |
| |
Total Investments
(cost—$6,285,552) (b)—98.5% | | | | 5,420,359 | |
| | | | | | | | |
| |
Other assets less
liabilities—1.5% | | | | 81,133 | |
| | | | | | | | |
| |
| Net Assets—100.0% | | | | $5,501,492 | |
| | | | | | | | |
Notes to Schedule of Investments:
(a) 144A—Exempt from registration under Rule 144A of the Securities Act of 1933. These securities may be resold in transactions exempt from registration, typically only to qualified institutional buyers. Securities with an aggregate value of $322,583, representing 5.9% of net assets.
(b) Securities with an aggregate value of $4,210,435, representing 76.5% of net assets, were valued utilizing modeling tools provided by a third-party vendor. See Note 1(a) and Note 1(b) in the Notes to Financial Statements.
(c) Fair-Valued—Securities with an aggregate value of $293,133, representing 5.3% of net assets. See Note 1(a) and Note 1(b) in the Notes to Financial Statements.
(d) Level 3 security. See Note 1(a) and Note 1(b) in the Notes to Financial Statements.
(e)Non-income producing.
Glossary:
ADR—American Depositary Receipt
GDR—Global Depositary Receipt
REIT—Real Estate Investment Trust
The industry classification of portfolio holdings and other assets less liabilities shown as a percentage of net assets were as follows:
| | | | |
Semiconductors & Semiconductor Equipment | | | 10.8% | |
Electronic Equipment, Instruments & Components | | | 8.6% | |
Pharmaceuticals | | | 8.0% | |
Construction Materials | | | 6.2% | |
Electric Utilities | | | 4.9% | |
Technology Hardware, Storage & Peripherals | | | 4.0% | |
Healthcare Providers & Services | | | 3.8% | |
Healthcare Equipment & Supplies | | | 3.6% | |
Communications Equipment | | | 3.6% | |
Metals & Mining | | | 3.2% | |
IT Services | | | 2.9% | |
Textiles, Apparel & Luxury Goods | | | 2.9% | |
Building Products | | | 2.8% | |
Chemicals | | | 2.6% | |
Household Durables | | | 2.3% | |
Equity Real Estate Investment Trusts (REITs) | | | 2.3% | |
Real Estate Management & Development | | | 2.2% | |
Beverages | | | 2.1% | |
Machinery | | | 2.0% | |
Food Products | | | 2.0% | |
Industrial Conglomerates | | | 1.8% | |
Capital Markets | | | 1.7% | |
Gas Utilities | | | 1.5% | |
Diversified Consumer Services | | | 1.3% | |
Entertainment | | | 1.3% | |
Transportation Infrastructure | | | 1.3% | |
Banks | | | 1.1% | |
Oil, Gas & Consumable Fuels | | | 1.0% | |
Tobacco | | | 1.0% | |
Construction & Engineering | | | 1.0% | |
Electrical Equipment | | | 0.9% | |
Food & Staples Retailing | | | 0.9% | |
Insurance | | | 0.7% | |
Media | | | 0.7% | |
Trading Companies & Distributors | | | 0.5% | |
Diversified Financial Services | | | 0.5% | |
Containers & Packaging | | | 0.3% | |
Independent Power Producers & Energy Traders | | | 0.2% | |
Other assets less liabilities | | | 1.5% | |
| | | | |
| | | 100.0% | |
| | | | |
AllianzGI Emerging Markets SRI Debt Fund
| | | | | | | | |
| | | Principal
Amount
(000s) | | | Value | |
|
| Sovereign Debt Obligations—83.0% | |
| |
| Argentina—1.2% | | | | | |
Argentine Republic Government International Bond, | |
3.75%, 12/31/38 | | | $500 | | | | $141,250 | |
6.875%, 1/11/48 | | | 500 | | | | 128,156 | |
| | | | | | | | |
| | | | | | | 269,406 | |
| | | | | | | | |
| |
| Azerbaijan—1.8% | | | | | |
Republic of Azerbaijan International Bond, | |
3.50%, 9/1/32 | | | 500 | | | | 419,500 | |
| | | | | | | | |
| |
| Belarus—2.4% | | | | | |
Republic of Belarus International Bond, | |
6.20%, 2/28/30 | | | 200 | | | | 182,149 | |
6.20%, 2/28/30 (a)(b) | | | 400 | | | | 365,289 | |
| | | | | | | | |
| | | | | | | 547,438 | |
| | | | | | | | |
| |
| Brazil—2.7% | | | | | |
Brazilian Government International Bond, | |
5.625%, 2/21/47 | | | 600 | | | | 618,398 | |
| | | | | | | | |
| |
| Chile—0.9% | | | | | |
Chile Government International Bond, | |
2.55%, 1/27/32 | | | 200 | | | | 200,820 | |
| | | | | | | | |
| |
| Colombia—3.2% | | | | | |
Colombia Government International Bond, | |
3.00%, 1/30/30 | | | 550 | | | | 501,967 | |
3.875%, 4/25/27 | | | 235 | | | | 231,616 | |
| | | | | | | | |
| | | | | | | 733,583 | |
| | | | | | | | |
| |
| Costa Rica—1.5% | | | | | |
Costa Rica Government International Bond, | |
4.25%, 1/26/23 | | | 200 | | | | 179,200 | |
6.125%, 2/19/31 (a)(b) | | | 200 | | | | 169,068 | |
| | | | | | | | |
| | | | | | | 348,268 | |
| | | | | | | | |
| |
| Dominican Republic—3.3% | | | | | |
Dominican Republic International Bond, | |
5.95%, 1/25/27 | | | 600 | | | | 563,633 | |
6.50%, 2/15/48 | | | 200 | | | | 176,689 | |
| | | | | | | | |
| | | | | | | 740,322 | |
| | | | | | | | |
| |
| Ecuador—1.1% | | | | | |
Ecuador Government International Bond, | |
9.50%, 3/27/30 | | | 550 | | | | 165,236 | |
9.50%, 3/27/30 (a)(b) | | | 250 | | | | 75,107 | |
| | | | | | | | |
| | | | | | | 240,343 | |
| | | | | | | | |
| |
| Egypt—1.5% | | | | | |
Egypt Government International Bond, | |
4.55%, 11/20/23 (a)(b) | | | 200 | | | | 178,142 | |
8.50%, 1/31/47 | | | 200 | | | | 164,795 | |
| | | | | | | | |
| | | | | | | 342,937 | |
| | | | | | | | |
| |
| El Salvador—2.7% | | | | | |
El Salvador Government International Bond, | |
6.375%, 1/18/27 | | | 575 | | | | 506,383 | |
7.125%, 1/20/50 | | | 150 | | | | 117,701 | |
| | | | | | | | |
| | | | | | | 624,084 | |
| | | | | | | | |
| |
| Indonesia—5.5% | | | | | |
Indonesia Government International Bond, | |
3.50%, 1/11/28 | | | 200 | | | | 197,531 | |
Indonesia Government International Bond, | |
2.85%, 2/14/30 | | | 800 | | | | 778,132 | |
5.25%, 1/8/47 | | | 250 | | | | 277,629 | |
| | | | | | | | |
| | | | | | | 1,253,292 | |
| | | | | | | | |
| | | | | | | | |
| See accompanying Notes to Financial Statements | | | March 31, 2020 | | | Semiannual Report | | | 139 | |
Schedule of Investments
March 31, 2020 (unaudited)
| | | | | | | | |
| | | Principal
Amount
(000s) | | | Value | |
| |
| Israel—2.2% | | | | | |
State of Israel, | |
3.375%, 1/15/50 | | $ | 300 | | | $ | 291,202 | |
3.875%, 7/3/50 | | | 200 | | | | 200,000 | |
| | | | | | | | |
| | | | | | | 491,202 | |
| | | | | | | | |
| |
| Jamaica—3.9% | | | | | |
Jamaica Government International Bond, | |
6.75%, 4/28/28 | | | 425 | | | | 448,545 | |
7.875%, 7/28/45 | | | 400 | | | | 435,600 | |
| | | | | | | | |
| | | | | | | 884,145 | |
| | | | | | | | |
| |
| Kazakhstan—5.8% | | | | | |
Kazakhstan Government International Bond, | |
4.875%, 10/14/44 | | | 500 | | | | 571,125 | |
5.125%, 7/21/25 | | | 700 | | | | 757,453 | |
| | | | | | | | |
| | | | | | | 1,328,578 | |
| | | | | | | | |
| |
| Korea (Republic of)—1.0% | | | | | |
Korea International Bond, | |
2.50%, 6/19/29 | | | 200 | | | | 215,820 | |
| | | | | | | | |
| |
| Malaysia—1.2% | | | | | |
Malaysia Sukuk Global Bhd, | |
3.179%, 4/27/26 | | | 250 | | | | 263,916 | |
| | | | | | | | |
| |
| Mexico—3.6% | | | | | |
Mexico Government International Bond, | |
4.50%, 4/22/29 | | | 750 | | | | 767,829 | |
5.75%, 10/12/10 | | | 50 | | | | 52,136 | |
| | | | | | | | |
| | | | | | | 819,965 | |
| | | | | | | | |
| |
| Morocco—2.6% | | | | | |
Morocco Government International Bond, | |
1.50%, 11/27/31 | | € | 100 | | | | 96,984 | |
1.50%, 11/27/31 (a)(b) | | | 300 | | | | 290,951 | |
5.50%, 12/11/42 | | | $200 | | | | 213,850 | |
| | | | | | | | |
| | | | | | | 601,785 | |
| | | | | | | | |
| |
| Panama—4.4% | | | | | |
Panama Government International Bond, | |
3.16%, 1/23/30 | | | 800 | | | | 801,400 | |
3.87%, 7/23/60 | | | 200 | | | | 199,913 | |
| | | | | | | | |
| | | | | | | 1,001,313 | |
| | | | | | | | |
| |
| Paraguay—1.8% | | | | | |
Paraguay Government International Bond, | |
5.40%, 3/30/50 | | | 400 | | | | 400,600 | |
| | | | | | | | |
| | | | | | | | |
| | | Principal
Amount
(000s) | | | Value | |
| |
| Philippines—5.0% | | | | | |
Philippine Government International Bond, | |
3.95%, 1/20/40 | | $ | 725 | | | $ | 799,914 | |
Philippine Government International Bond, | |
3.70%, 2/2/42 | | | 300 | | | | 333,597 | |
| | | | | | | | |
| | | | | | | 1,133,511 | |
| | | | | | | | |
| |
| Romania—0.3% | | | | | |
Romanian Government International Bond, | |
6.125%, 1/22/44 | | | 50 | | | | 57,592 | |
| | | | | | | | |
| |
| Russian Federation—3.0% | | | | | |
Russian Federal Bond, | |
4.375%, 3/21/29 | | | 400 | | | | 429,192 | |
5.25%, 6/23/47 | | | 200 | | | | 243,350 | |
| | | | | | | | |
| | | | | | | 672,542 | |
| | | | | | | | |
| |
| South Africa—2.9% | | | | | |
Republic of South Africa Government International Bond, | |
4.30%, 10/12/28 | | | 450 | | | | 369,126 | |
5.75%, 9/30/49 | | | 400 | | | | 288,300 | |
| | | | | | | | |
| | | | | | | 657,426 | |
| | | | | | | | |
| |
| Ukraine—5.7% | | | | | |
Ukraine Government International Bond, | |
4.375%, 1/27/30 (a)(b) | | € | 100 | | | | 88,457 | |
7.75%, 9/1/23 (a)(b) | | | $200 | | | | 187,924 | |
7.75%, 9/1/27 | | | 1,100 | | | | 1,011,516 | |
| | | | | | | | |
| | | | | | | 1,287,897 | |
| | | | | | | | |
| |
| United Arab Emirates—3.7% | | | | | |
Abu Dhabi Government International Bond, | |
2.50%, 9/30/29 | | | 200 | | | | 194,481 | |
3.125%, 9/30/49 (a)(b) | | | 700 | | | | 654,476 | |
| | | | | | | | |
| | | | | | | 848,957 | |
| | | | | | | | |
| |
| Uruguay—7.0% | | | | | |
Uruguay Government International Bond, | |
4.375%, 10/27/27 | | | 1,000 | | | | 1,081,205 | |
5.10%, 6/18/50 | | | 450 | | | | 515,610 | |
| | | | | | | | |
| | | | | | | 1,596,815 | |
| | | | | | | | |
| |
| Vietnam—1.1% | | | | | |
Vietnam Government International Bond, | |
4.80%, 11/19/24 | | | 250 | | | | 246,860 | |
| | | | | | | | |
Total Sovereign Debt Obligations (cost—$20,721,262) | | | | 18,847,315 | |
| | | | | | | | |
| | | | | | | | |
| | | Principal
Amount
(000s) | | | Value | |
|
| Corporate Bonds & Notes—1.5% | |
| |
| Colombia—0.7% | | | | | |
Promigas S.A. ESP (a)(b), | |
3.75%, 10/16/29 | | $ | 200 | | | $ | 164,061 | |
| | | | | | | | |
| |
| Paraguay—0.8% | | | | | |
Telefonica Celular del Paraguay S.A. (a)(b), | |
5.875%, 4/15/27 | | | 200 | | | | 182,091 | |
| | | | | | | | |
Total Corporate Bonds & Notes (cost—$410,752) | | | | 346,152 | |
| | | | | | | | |
| | | | | | | | |
|
| U.S. Treasury Obligation—0.9% | |
U.S. Treasury Notes, | | | | | | | | |
2.00%, 2/15/25 (cost—$202,286) | | | 200 | | | | 215,594 | |
| | | | | | | | |
|
| Repurchase Agreements—15.5% | |
State Street Bank and Trust Co., dated 3/31/20, 0.00%, due 4/1/20, proceeds $3,517,000; collateralized by U.S. Treasury Inflation Indexed Notes, 0.625%, due 4/15/23, valued at $3,592,529 including accrued interest | |
(cost—$3,517,000) | | | 3,517 | | | | 3,517,000 | |
| | | | | | | | |
| |
Total Investments
(cost-$24,851,300)—100.9% | | | | 22,926,061 | |
| | | | | | | | |
| |
| Liabilities in excess of other assets (c)—(0.9)% | | | | (214,430 | ) |
| | | | | | | | |
| |
| Net Assets—100.0% | | | | $22,711,631 | |
| | | | | | | | |
Notes to Schedule of Investments:
(a) Private Placement—Restricted as to resale and may not have a readily available market. Securities with an aggregate value of $2,355,566, representing 10.4% of net assets.
(b) 144A—Exempt from registration under Rule 144A of the Securities Act of 1933. These securities may be resold in transactions exempt from registration, typically only to qualified institutional buyers. Securities with an aggregate value of $2,355,566, representing 10.4% of net assets.
(c) Includes net unrealized appreciation (depreciation) of other financial instruments as follows:
| | | | | | | | | | | | | | | | | | | | | | |
|
| Futures contracts outstanding at March 31, 2020: | |
Type | | Contracts | | | Expiration
Date | | | Notional
Amount
(000s) | | | Market
Value
(000s) | | | Unrealized
Appreciation
(Depreciation) | |
Long position contracts: | |
| | 5-Year U.S. Treasury Note | | | 3 | | | | 6/30/20 | | | $ | 300 | | | $ | 376 | | | $ | 12,351 | |
| | | | | | | | | | | | | | | | | | | | | | |
Short position contracts: | |
| | 10-Year U.S. Treasury Note | | | (2 | ) | | | 6/19/20 | | | $ | (200 | ) | | $ | (277 | ) | | $ | (5,031 | ) |
| | | | | | | | | | | | | | | | | | | | | | |
| | | | | | | | | | | | | $ | 7,320 | |
| | | | | | | | | | | | | | | | | | | | | | |
| | | | | | |
| 140 | | Semiannual Report | | | March 31, 2020 | | | See accompanying Notes to Financial Statements |
Schedule of Investments
March 31, 2020 (unaudited)
| | | | | | | | | | | | | | | | | | |
|
| Forward foreign currency contracts outstanding at March 31, 2020: | |
| Description | | Counterparty | | U.S.$ Value on
Origination Date | | | U.S.$ Value
March 31, 2020 | | | Unrealized
Appreciation | | | Unrealized
Depreciation | |
Purchased: | |
29,900,000 Russian Ruble settling 4/15/20 | | JPMorgan Chase | | $ | 379,593 | | | $ | 379,925 | | | $ | 332 | | | $ | — | |
23,019,454 Russian Ruble settling 4/15/20 | | State Street Bank and Trust Co. | | | 361,515 | | | | 292,497 | | | | — | | | | (69,018 | ) |
656,000 Singapore Dollar settling 4/15/20 | | State Street Bank and Trust Co. | | | 479,794 | | | | 461,624 | | | | — | | | | (18,170 | ) |
|
Sold: | |
406,701 Euro Currency settling 6/17/20 | | JPMorgan Chase | | | 461,523 | | | | 449,854 | | | | 11,669 | | | | — | |
97,201 Euro Currency settling 6/17/20 | | State Street Bank and Trust Co. | | | 108,822 | | | | 107,514 | | | | 1,308 | | | | — | |
31,105,066 Russian Ruble settling 4/15/20 | | JPMorgan Chase | | | 494,789 | | | | 395,237 | | | | 99,552 | | | | — | |
25,226,000 Russian Ruble settling 4/15/20 | | State Street Bank and Trust Co. | | | 381,475 | | | | 320,534 | | | | 60,941 | | | | — | |
654,500 Singapore Dollar settling 4/15/20 | | State Street Bank and Trust Co. | | | 482,544 | | | | 460,568 | | | | 21,976 | | | | — | |
| | | | | | | | | | | | | | |
| | | $ | 195,778 | | | $ | (87,188 | ) |
| | | | | | | | | | | | | | |
(d) At March 31, 2020, the Fund pledged $1,837 in cash as collateral for futures contracts.
Glossary:
€—Euro
The industry classification of portfolio holdings and liabilities in excess of other assets shown as a percentage of net assets were as follows:
| | | | |
Sovereign Debt Obligations | | | 83.0% | |
U.S. Treasury Obligations | | | 0.9% | |
Telecommunications | | | 0.8% | |
Oil, Gas & Consumable Fuels | | | 0.7% | |
Repurchase Agreements | | | 15.5% | |
Liabilities in excess of other assets | | | (0.9)% | |
| | | | |
| | | 100.0% | |
| | | | |
| | | | | | | | |
| See accompanying Notes to Financial Statements | | | March 31, 2020 | | | Semiannual Report | | | 141 | |
Schedule of Investments
March 31, 2020 (unaudited)
AllianzGI Emerging Markets Value Fund
| | | | | | | | |
| | | Shares | | | Value | |
| |
| Common Stock—95.1% | | | | | |
| |
| Brazil—2.8% | | | | | |
B3 S.A.—Brasil Bolsa Balcao | | | 87,000 | | | | $601,086 | |
Cia de Locacao das Americas | | | 106,700 | | | | 215,408 | |
GRUPO SBF S.A. (c) | | | 80,200 | | | | 371,358 | |
IRB Brasil Resseguros S.A. | | | 69,500 | | | | 129,474 | |
Notre Dame Intermedica Participacoes S.A. | | | 39,400 | | | | 340,914 | |
StoneCo Ltd., Class A (c) | | | 17,500 | | | | 380,975 | |
Vale S.A. ADR (c) | | | 71,800 | | | | 595,222 | |
| | | | | | | | |
| | | | | | | 2,634,437 | |
| | | | | | | | |
| |
| China—38.2% | | | | | |
Aier Eye Hospital Group Co., Ltd., Class A | | | 96,800 | | | | 531,180 | |
Alibaba Group Holding Ltd. (c) | | | 47,800 | | | | 1,158,242 | |
Alibaba Group Holding Ltd. ADR (c) | | | 34,394 | | | | 6,688,945 | |
Anhui Conch Cement Co., Ltd., Class H | | | 131,000 | | | | 899,919 | |
Anhui Kouzi Distillery Co., Ltd., Class A | | | 88,800 | | | | 512,782 | |
ANTA Sports Products Ltd. | | | 79,000 | | | | 573,279 | |
Bank of China Ltd., Class H | | | 1,557,000 | | | | 592,693 | |
China Communications Services Corp., Ltd., Class H | | | 880,000 | | | | 632,767 | |
China Construction Bank Corp. Class H, Class H | | | 1,391,000 | | | | 1,130,669 | |
China Gas Holdings Ltd. | | | 186,800 | | | | 645,941 | |
China Merchants Bank Co., Ltd., Class A | | | 241,144 | | | | 1,088,279 | |
China Merchants Bank Co., Ltd., Class H | | | 167,100 | | | | 747,567 | |
China Overseas Land & Investment Ltd. | | | 146,000 | | | | 447,626 | |
CIFI Holdings Group Co., Ltd. | | | 460,000 | | | | 326,113 | |
CSPC Pharmaceutical Group Ltd. | | | 252,000 | | | | 495,706 | |
ENN Energy Holdings Ltd. | | | 62,900 | | | | 609,327 | |
Foshan Haitian Flavouring & Food Co., Ltd., Class A | | | 35,001 | | | | 614,503 | |
Guangdong Investment Ltd. | | | 322,000 | | | | 617,934 | |
Kweichow Moutai Co., Ltd., Class A | | | 1,700 | | | | 264,193 | |
Logan Property Holdings Co., Ltd. | | | 334,000 | | | | 508,076 | |
Longfor Group Holdings Ltd. (a) | | | 127,000 | | | | 611,237 | |
Luxshare Precision Industry Co., Ltd., Class A | | | 109,080 | | | | 578,414 | |
Luzhou Laojiao Co., Ltd., Class A | | | 58,537 | | | | 602,086 | |
Midea Group Co., Ltd., Class A | | | 69,200 | | | | 468,280 | |
NetEase, Inc. ADR | | | 1,600 | | | | 513,536 | |
New Oriental Education & Technology Group, Inc. ADR (c) | | | 5,300 | | | | 573,672 | |
Ping An Insurance Group Co of China Ltd., Class A | | | 89,900 | | | | 870,034 | |
Ping An Insurance Group Co. of China Ltd., Class H | | | 148,000 | | | | 1,445,406 | |
Shenzhou International Group Holdings Ltd. | | | 38,200 | | | | 400,720 | |
Tencent Holdings Ltd. | | | 129,400 | | | | 6,395,931 | |
Tencent Holdings Ltd. ADR | | | 14,900 | | | | 731,441 | |
Times China Holdings Ltd. | | | 308,000 | | | | 507,540 | |
Wuliangye Yibin Co., Ltd., Class A | | | 37,055 | | | | 596,066 | |
Yihai International Holding Ltd. (c) | | | 72,000 | | | | 542,340 | |
| | | | | | | | |
| | | Shares | | | Value | |
Yonghui Superstores Co., Ltd., Class A | | | 424,000 | | | $ | 608,128 | |
Zhangzhou Pientzehuang Pharmaceutical Co., Ltd., Class A | | | 40,673 | | | | 706,698 | |
Zhejiang Expressway Co., Ltd., Class H | | | 678,000 | | | | 468,574 | |
| | | | | | | | |
| | | | | | | 35,705,844 | |
| | | | | | | | |
| |
| France—1.2% | | | | | |
Kering S.A. ADR | | | 11,600 | | | | 601,692 | |
LVMH Moet Hennessy Louis Vuitton SE | | | 1,365 | | | | 500,615 | |
| | | | | | | | |
| | | | | | | 1,102,307 | |
| | | | | | | | |
| |
| Hong Kong—3.1% | | | | | |
AIA Group Ltd. | | | 110,600 | | | | 990,383 | |
Hong Kong Exchanges & Clearing Ltd. | | | 19,600 | | | | 587,202 | |
SITC International Holdings Co., Ltd. | | | 603,000 | | | | 561,281 | |
Techtronic Industries Co., Ltd. | | | 105,000 | | | | 666,740 | |
Times Neighborhood Holdings Ltd. (c) | | | 122,307 | | | | 96,543 | |
| | | | | | | | |
| | | | | | | 2,902,149 | |
| | | | | | | | |
| |
| Hungary—0.5% | | | | | |
OTP Bank Nyrt | | | 18,082 | | | | 518,670 | |
| | | | | | | | |
| |
| India—7.9% | | | | | |
Aarti Industries Ltd. | | | 62,244 | | | | 630,500 | |
Atul Ltd. | | | 11,528 | | | | 604,036 | |
Bajaj Finserv Ltd. | | | 4,669 | | | | 282,334 | |
HDFC Bank Ltd. | | | 68,712 | | | | 783,051 | |
Hindustan Unilever Ltd. | | | 34,556 | | | | 1,047,980 | |
Indraprastha Gas Ltd. | | | 95,967 | | | | 493,884 | |
Infosys Ltd. | | | 121,295 | | | | 1,004,926 | |
KEI Industries Ltd. (c) | | | 137,722 | | | | 486,817 | |
Muthoot Finance Ltd. (c) | | | 45,561 | | | | 368,810 | |
Reliance Industries Ltd. | | | 101,312 | | | | 1,477,355 | |
Sonata Software Ltd. | | | 100,111 | | | | 218,253 | |
| | | | | | | | |
| | | | | | | 7,397,946 | |
| | | | | | | | |
| |
| Indonesia—1.8% | | | | | |
Ace Hardware Indonesia Tbk PT | | | 4,921,500 | | | | 391,553 | |
Bank Central Asia Tbk PT | | | 527,000 | | | | 887,952 | |
Bank Rakyat Indonesia Persero Tbk PT | | | 2,253,800 | | | | 413,358 | |
| | | | | | | | |
| | | | | | | 1,692,863 | |
| | | | | | | | |
| |
| Korea (Republic of)—9.4% | | | | | |
Douzone Bizon Co., Ltd. | | | 10,105 | | | | 666,847 | |
Hansol Chemical Co., Ltd. | | | 7,753 | | | | 501,109 | |
Macquarie Korea Infrastructure Fund | | | 79,840 | | | | 709,037 | |
NCSoft Corp. | | | 1,909 | | | | 1,018,841 | |
Samsung Electronics Co., Ltd. | | | 127,809 | | | | 4,969,404 | |
SK Hynix, Inc. | | | 13,202 | | | | 892,508 | |
| | | | | | | | |
| | | | | | | 8,757,746 | |
| | | | | | | | |
| |
| Malaysia—0.9% | | | | | |
Serba Dinamik Holdings Bhd. | | | 971,580 | | | | 336,497 | |
TIME dotCom Bhd. | | | 244,800 | | | | 521,143 | |
| | | | | | | | |
| | | | | | | 857,640 | |
| | | | | | | | |
| |
| Mexico—1.8% | | | | | |
Grupo Aeroportuario del Centro Norte S.A.B de C.V. | | | 85,800 | | | | 289,961 | |
Grupo Financiero Banorte S.A.B de C.V., Class O | | | 130,235 | | | | 356,846 | |
Prologis Property Mexico S.A. de C.V. REIT | | | 307,246 | | | | 463,022 | |
| | | | | | | | |
| | | Shares | | | Value | |
Wal-Mart de Mexico S.A.B de C.V. | | | 226,000 | | | $ | 531,120 | |
| | | | | | | | |
| | | | | | | 1,640,949 | |
| | | | | | | | |
| |
| Netherlands—0.6% | | | | | |
Prosus NV (c) | | | 7,814 | | | | 544,230 | |
| | | | | | | | |
| |
| Philippines—0.7% | | | | | |
SM Investments Corp. | | | 40,300 | | | | 644,684 | |
| | | | | | | | |
| |
| Poland—0.6% | | | | | |
Dino Polska S.A. (a)(c) | | | 15,649 | | | | 608,732 | |
| | | | | | | | |
| |
| Russian Federation—2.6% | | | | | |
Gazprom Neft PJSC ADR | | | 22,889 | | | | 457,551 | |
Lukoil PJSC | | | 8,747 | | | | 515,476 | |
Novatek PJSC GDR | | | 3,685 | | | | 424,880 | |
Sberbank of Russia PJSC ADR | | | 53,040 | | | | 498,576 | |
Tatneft PJSC ADR | | | 12,176 | | | | 508,037 | |
| | | | | | | | |
| | | | | | | 2,404,520 | |
| | | | | | | | |
| |
| Saudi Arabia—1.0% | | | | | |
Riyad Bank | | | 111,925 | | | | 444,735 | |
Saudi Arabian Oil Co. (a) | | | 58,901 | | | | 472,681 | |
| | | | | | | | |
| | | | | | | 917,416 | |
| | | | | | | | |
| |
| Singapore—1.3% | | | | | |
Keppel DC REIT | | | 341,000 | | | | 547,274 | |
Mapletree Industrial Trust REIT | | | 269,700 | | | | 457,995 | |
Singapore Technologies Engineering Ltd. | | | 76,700 | | | | 167,806 | |
| | | | | | | | |
| | | | | | | 1,173,075 | |
| | | | | | | | |
| |
| South Africa—2.5% | | | | | |
AngloGold Ashanti Ltd. | | | 28,961 | | | | 490,656 | |
Capitec Bank Holdings Ltd. | | | 7,775 | | | | 382,453 | |
Clicks Group Ltd. | | | 38,539 | | | | 555,482 | |
Naspers Ltd., Class N | | | 5,043 | | | | 716,683 | |
Standard Bank Group Ltd. | | | 41,789 | | | | 239,163 | |
| | | | | | | | |
| | | | | | | 2,384,437 | |
| | | | | | | | |
| |
| Taiwan—12.5% | | | | | |
Accton Technology Corp. | | | 146,000 | | | | 781,186 | |
Chailease Holding Co., Ltd. | | | 114,000 | | | | 343,360 | |
E.Sun Financial Holding Co., Ltd. | | | 947,000 | | | | 755,948 | |
First Financial Holding Co., Ltd. | | | 439,000 | | | | 283,682 | |
Getac Technology Corp. | | | 316,000 | | | | 440,386 | |
Lotes Co., Ltd. | | | 33,000 | | | | 297,222 | |
Micro-Star International Co., Ltd. | | | 176,000 | | | | 514,412 | |
Parade Technologies Ltd. | | | 29,000 | | | | 612,936 | |
Poya International Co., Ltd. | | | 44,000 | | | | 623,050 | |
Realtek Semiconductor Corp. | | | 91,000 | | | | 653,279 | |
Sinbon Electronics Co., Ltd. | | | 176,000 | | | | 724,515 | |
Taiwan Semiconductor Manufacturing Co., Ltd. | | | 204,178 | | | | 1,838,074 | |
Taiwan Semiconductor Manufacturing Co., Ltd. ADR | | | 20,869 | | | | 997,329 | |
Taiwan Union Technology Corp. | | | 109,000 | | | | 433,879 | |
Tripod Technology Corp. | | | 136,000 | | | | 423,061 | |
Uni-President Enterprises Corp. | | | 287,000 | | | | 621,188 | |
Unimicron Technology Corp. | | | 318,000 | | | | 333,755 | |
Wiwynn Corp. | | | 27,133 | | | | 623,877 | |
Yuanta Financial Holding Co., Ltd. | | | 722,000 | | | | 368,620 | |
| | | | | | | | |
| | | | | | | 11,669,759 | |
| | | | | | | | |
| | | | | | |
| 142 | | Semiannual Report | | | March 31, 2020 | | | See accompanying Notes to Financial Statements |
Schedule of Investments
March 31, 2020 (unaudited)
| | | | | | | | |
| | | Shares | | | Value | |
| |
| Thailand—0.7% | | | | | |
Home Product Center PCL | | | 1,270,600 | | | $ | 425,379 | |
Thanachart Capital PCL NVDR | | | 257,300 | | | | 258,799 | |
| | | | | | | | |
| | | | | | | 684,178 | |
| | | | | | | | |
| |
| United States—5.0% | | | | | |
Broadcom, Inc. | | | 4,679 | | | | 1,109,391 | |
Citigroup, Inc. | | | 18,400 | | | | 775,008 | |
Equinix, Inc. REIT | | | 900 | | | | 562,113 | |
Lam Research Corp. | | | 2,000 | | | | 480,000 | |
Roper Technologies, Inc. | | | 2,700 | | | | 841,887 | |
Royal Gold, Inc. | | | 5,357 | | | | 469,862 | |
Universal Display Corp. | | | 3,229 | | | | 425,518 | |
| | | | | | | | |
| | | | | | | 4,663,779 | |
| | | | | | | | |
Total Common Stock (cost-$94,391,579) | | | | 88,905,361 | |
| | | | | | | | |
| | | | | | | | |
| |
| Preferred Stock—2.8% | | | | | |
| |
| Brazil—0.9% | | | | | |
Banco Bradesco S.A. | | | 111,700 | | | | 446,490 | |
Petroleo Brasileiro S.A. | | | 151,000 | | | | 406,553 | |
| | | | | | | | |
| | | | | | | 853,043 | |
| | | | | | | | |
| |
| Korea (Republic of)—1.9% | | | | | |
LG Household & Health Care Ltd. | | | 492 | | | | 256,500 | |
Samsung Electronics Co., Ltd. | | | 45,049 | | | | 1,468,039 | |
| | | | | | | | |
| | | | | | | 1,724,539 | |
| | | | | | | | |
Total Preferred Stock (cost-$3,354,408) | | | | 2,577,582 | |
| | | | | | | | |
| | | | | | | | |
| | |
| | | Principal
Amount
(000s) | | | | |
|
| Repurchase Agreements—1.2% | |
State Street Bank and Trust Co., dated 3/31/20, 0.00%, due 4/1/20, proceeds $1,127,000; collateralized by U.S. Treasury Inflation Indexed Notes, 0.625%, due 4/15/23, valued at $1,151,924 including accrued interest | |
(cost—$1,127,000) | | | $1,127 | | | | 1,127,000 | |
| | | | | | | | |
| |
Total Investments
(cost-$98,872,987) (b)—99.1% | | | | 92,609,943 | |
| | | | | | | | |
| |
Other assets less
liabilities—0.9% | | | | 840,407 | |
| | | | | | | | |
| |
| Net Assets—100.0% | | | | $93,450,350 | |
| | | | | | | | |
Notes to Schedule of Investments:
(a) 144A—Exempt from registration under Rule 144A of the Securities Act of 1933. These securities may be resold in transactions exempt from registration, typically only to qualified institutional buyers. Securities with an aggregate value of $1,692,650, representing 1.8% of net assets.
(b) Securities with an aggregate value of $69,186,202, representing 74.0% of net assets, were valued utilizing modeling tools provided by a third-party vendor. See Note 1(a) and Note 1(b) in the Notes to Financial Statements.
(c)Non-income producing.
Glossary:
ADR—American Depositary Receipt
GDR—Global Depositary Receipt
NVDR—Non-Voting Depository Receipt
REIT—Real Estate Investment Trust
The industry classification of portfolio holdings and other assets less liabilities shown as a percentage of net assets were as follows:
| | | | |
Banks | | | 11.3% | |
Internet & Direct Marketing Retail | | | 9.7% | |
Technology Hardware, Storage & Peripherals | | | 8.6% | |
Interactive Media & Services | | | 7.6% | |
Semiconductors & Semiconductor Equipment | | | 7.5% | |
Oil, Gas & Consumable Fuels | | | 4.6% | |
Insurance | | | 4.0% | |
Electronic Equipment, Instruments & Components | | | 3.0% | |
Real Estate Management & Development | | | 2.6% | |
Food & Staples Retailing | | | 2.5% | |
Textiles, Apparel & Luxury Goods | | | 2.2% | |
Equity Real Estate Investment Trusts (REITs) | | | 2.2% | |
Beverages | | | 2.1% | |
Capital Markets | | | 2.0% | |
Food Products | | | 1.9% | |
Gas Utilities | | | 1.9% | |
Chemicals | | | 1.8% | |
IT Services | | | 1.7% | |
Metals & Mining | | | 1.7% | |
Entertainment | | | 1.6% | |
Industrial Conglomerates | | | 1.6% | |
Pharmaceuticals | | | 1.3% | |
Specialty Retail | | | 1.3% | |
Household Products | | | 1.1% | |
Construction Materials | | | 1.0% | |
Healthcare Providers & Services | | | 0.9% | |
Communications Equipment | | | 0.8% | |
Transportation Infrastructure | | | 0.8% | |
Diversified Financial Services | | | 0.8% | |
Software | | | 0.7% | |
Machinery | | | 0.7% | |
Construction & Engineering | | | 0.7% | |
Multi-Line Retail | | | 0.7% | |
Water Utilities | | | 0.7% | |
Diversified Consumer Services | | | 0.6% | |
Marine | | | 0.6% | |
Diversified Telecommunication Services | | | 0.5% | |
Electrical Equipment | | | 0.5% | |
Household Durables | | | 0.5% | |
Consumer Finance | | | 0.4% | |
Energy Equipment & Services | | | 0.4% | |
Personal Products | | | 0.3% | |
Road & Rail | | | 0.2% | |
Aerospace & Defense | | | 0.2% | |
Commercial Services & Supplies | | | 0.1% | |
Repurchase Agreements | | | 1.2% | |
Other assets less liabilities | | | 0.9% | |
| | | | |
| | | 100.0% | |
| | | | |
AllianzGI Floating Rate Note Fund
| | | | | | | | |
| | | Principal
Amount
(000s) | | | Value | |
| |
| Corporate Bonds & Notes—73.4% | | | | | |
| |
| Aerospace & Defense—0.7% | | | | | |
L3Harris Technologies, Inc., 3 mo. LIBOR + 0.750% (c), | |
1.523%, 3/10/23 | | | $100 | | | | $97,808 | |
| | | | | | | | |
| |
| Apparel & Textiles—0.4% | | | | | |
Hanesbrands, Inc. (a)(b), | | | | | | | | |
4.625%, 5/15/24 | | | 50 | | | | 49,813 | |
| | | | | | | | |
| |
| Auto Manufacturers—3.1% | | | | | |
| Daimler Finance North America LLC, 3 mo. LIBOR + 0.840% (a)(b)(c), | |
2.591%, 5/4/23 | | | 250 | | | | 221,353 | |
General Motors Financial Co., Inc., 3 mo. LIBOR + 1.310% (c), | | | | | | | | |
2.685%, 6/30/22 | | | 100 | | | | 84,455 | |
Volkswagen International Finance NV, 3 mo. LIBOR + 1.550% (c), | |
1.139%, 11/16/24 | | € | 100 | | | | 104,694 | |
| | | | | | | | |
| | | | | | | 410,502 | |
| | | | | | | | |
| |
| Banks—34.2% | | | | | |
Banco Santander S.A, 3 mo. EURIBOR + 1.000% (c), | |
0.621%, 1/5/23 | | | 200 | | | | 213,418 | |
Bank of America Corp. (c), 3 mo. LIBOR + 0.760%, | |
1.501%, 9/15/26 | | | $200 | | | | 152,992 | |
3 mo. LIBOR + 0.960%, 2.766%, 7/23/24 | | | 40 | | | | 37,867 | |
Barclays PLC, 3 mo. LIBOR + 1.625% (c), | |
3.459%, 1/10/23 | | | 200 | | | | 183,100 | |
BPCE S.A., 3 mo. LIBOR + 1.240% (c), | |
2.024%, 9/12/23 | | | 250 | | | | 250,057 | |
Canadian Imperial Bank of Commerce, SOFR + 0.800% (c), | |
0.818%, 3/17/23 | | | 150 | | | | 143,052 | |
CIT Group, Inc., | | | | | | | | |
5.00%, 8/1/23 | | | 50 | | | | 48,418 | |
Citigroup, Inc., 3 mo. LIBOR + 1.520% (c), | |
3.159%, 7/1/26 | | | 250 | | | | 220,324 | |
Cooperatieve Rabobank UA, 3 mo. LIBOR + 0.860% (a)(b)(c), | |
2.092%, 9/26/23 | | | 250 | | | | 232,648 | |
Credit Suisse Group AG (c), | | | | | | | | |
2.024%, 6/12/24 | | | 250 | | | | 223,970 | |
Goldman Sachs Group, Inc., 3 mo. LIBOR + 1.170% (c), | |
2.862%, 5/15/26 | | | 200 | | | | 179,427 | |
HSBC Holdings PLC, 3 mo. LIBOR + 1.380% (c), | |
2.164%, 9/12/26 | | | 250 | | | | 211,041 | |
Industrial & Commercial Bank of China Ltd., 3 mo. LIBOR + 0.850% (c), | |
2.693%, 4/16/23 | | | 250 | | | | 251,048 | |
ING Groep NV, 3 mo. LIBOR + 1.000% (c), | |
2.451%, 10/2/23 | | | 250 | | | | 217,633 | |
Intesa Sanpaolo SpA, | | | | | | | | |
6.625%, 9/13/23 | | € | 100 | | | | 117,161 | |
JPMorgan Chase & Co. (c), 3 mo. LIBOR + 0.890%, | |
2.696%, 7/23/24 | | | $ 40 | | | | 37,730 | |
3 mo. LIBOR + 1.230%, 3.031%, 10/24/23 | | | 200 | | | | 198,765 | |
Mizuho Financial Group, Inc., 3 mo. LIBOR + 0.630% (c), | |
2.309%, 5/25/24 | | | 200 | | | | 182,039 | |
Morgan Stanley, 3 mo. LIBOR + 1.400% (c), | |
3.201%, 10/24/23 | | | 200 | | | | 186,317 | |
Nordea Bank Abp, 3 mo. LIBOR + 0.940% (a)(b)(c), | |
2.553%, 8/30/23 | | | 200 | | | | 186,639 | |
QNB Finance Ltd., 3 mo. LIBOR + 1.300% (c), | |
2.084%, 3/12/24 | | | 200 | | | | 199,494 | |
Royal Bank of Scotland Group PLC, 3 mo. LIBOR + 1.470% (c), | |
3.162%, 5/15/23 | | | 200 | | | | 177,272 | |
| | | | | | | | |
| See accompanying Notes to Financial Statements | | | March 31, 2020 | | | Semiannual Report | | | 143 | |
Schedule of Investments
March 31, 2020 (unaudited)
| | | | | | | | |
| | | Principal
Amount
(000s) | | | Value | |
Santander UK Group Holdings PLC, 3 mo. EURIBOR + 0.850% (c), | |
0.481%, 3/27/24 | | € | 100 | | | $ | 103,032 | |
Standard Chartered PLC, 3 mo. LIBOR + 1.200% (a)(b)(c), | |
2.096%, 9/10/22 | | | $200 | | | | 188,212 | |
Truist Bank, SOFR + 0.730% (c), | |
0.883%, 3/9/23 | | | 250 | | | | 227,820 | |
Wells Fargo & Co., 3 mo. LIBOR + 1.230% (c), | |
3.007%, 10/31/23 | | | 200 | | | | 194,371 | |
| | | | | | | | |
| | | | | | | 4,563,847 | |
| | | | | | | | |
| |
| Chemicals—2.2% | | | | | |
CNAC HK Finbridge Co., Ltd., | |
4.875%, 3/14/25 | | | 200 | | | | 210,138 | |
DuPont de Nemours, Inc., 3 mo. LIBOR + 1.110% (c), | |
2.802%, 11/15/23 | | | 100 | | | | 87,133 | |
| | | | | | | | |
| | | | | | | 297,271 | |
| | | | | | | | |
| |
| Commercial Services—0.8% | | | | | |
IHS Markit Ltd. (a)(b), | |
5.00%, 11/1/22 | | | 100 | | | | 105,247 | |
| | | | | | | | |
| |
| Computers—0.6% | | | | | |
Seagate HDD Cayman, | |
4.875%, 3/1/24 | | | 82 | | | | 81,875 | |
| | | | | | | | |
| |
| Containers & Packaging—2.0% | | | | | |
Ball Corp., | |
4.00%, 11/15/23 | | | 50 | | | | 50,748 | |
Crown European Holdings S.A, | | | | | | | | |
4.00%, 7/15/22 | | € | 100 | | | | 112,470 | |
Reynolds Group Issuer, Inc. (a)(b), | |
5.125%, 7/15/23 | | | $50 | | | | 49,937 | |
3 mo. LIBOR + 3.500%, 5.331%, 7/15/21 (c) | | | 50 | | | | 49,088 | |
| | | | | | | | |
| | | | | | | 262,243 | |
| | | | | | | | |
|
| Diversified Financial Services—4.8% | |
AerCap Ireland Capital DAC, | |
4.45%, 10/1/25 | | | 150 | | | | 129,971 | |
Avolon Holdings Funding Ltd. (a)(b), | |
5.125%, 10/1/23 | | | 100 | | | | 84,782 | |
Capital One Financial Corp., 3 mo. LIBOR + 0.720% (c), | |
2.49%, 1/30/23 | | | 100 | | | | 93,244 | |
ICBCIL Finance Co., Ltd., 3 mo. LIBOR + 1.050% (c), | |
2.745%, 11/20/24 | | | 200 | | | | 193,872 | |
Navient Corp., | | | | | | | | |
5.50%, 1/25/23 | | | 50 | | | | 47,375 | |
Synchrony Financial, | | | | | | | | |
2.85%, 7/25/22 | | | 100 | | | | 95,308 | |
| | | | | | | | |
| | | | | | | 644,552 | |
| | | | | | | | |
| |
| Electric Utilities—0.4% | | | | | |
NextEra Energy Operating Partners L.P. (a)(b), | |
4.25%, 9/15/24 | | | 50 | | | | 49,063 | |
| | | | | | | | |
| |
| Energy-Alternate Sources—0.4% | | | | | |
TerraForm Power Operating LLC (a)(b), | |
4.25%, 1/31/23 | | | 50 | | | | 49,999 | |
| | | | | | | | |
| |
| Equity Real Estate Investment Trusts (REITs)—2.4% | | | | | |
CyrusOne L.P., | |
2.90%, 11/15/24 | | | 100 | | | | 98,070 | |
Digital Stout Holding LLC, | | | | | | | | |
4.75%, 10/13/23 | | £ | 100 | | | | 133,456 | |
Equinix, Inc., | | | | | | | | |
2.625%, 11/18/24 | | | $100 | | | | 94,380 | |
| | | | | | | | |
| | | | | | | 325,906 | |
| | | | | | | | |
| |
| Food & Beverage—0.9% | | | | | |
Albertsons Cos., Inc., | |
6.625%, 6/15/24 | | | 50 | | | | 51,124 | |
| | | | | | | | |
| | | Principal
Amount
(000s) | | | Value | |
Tesco PLC, | | | | | | | | |
6.125%, 2/24/22 | | | £ 50 | | | $ | 65,988 | |
| | | | | | | | |
| | | | | | | 117,112 | |
| | | | | | | | |
| |
| Healthcare-Products—0.8% | | | | | |
DH Europe Finance Sarl, 3 mo. EURIBOR + 0.300% (c), | |
zero coupon, 6/30/22 | | € | 100 | | | | 108,364 | |
| | | | | | | | |
| |
| Healthcare-Services—0.8% | | | | | |
Centene Corp., | |
4.75%, 5/15/22 | | | $50 | | | | 50,562 | |
Universal Health Services, Inc. (a)(b), | |
4.75%, 8/1/22 | | | 50 | | | | 49,625 | |
| | | | | | | | |
| | | | | | | 100,187 | |
| | | | | | | | |
| |
| Home Builders—1.0% | | | | | |
Lennar Corp., | |
4.50%, 4/30/24 | | | 100 | | | | 98,429 | |
Meritage Homes Corp., | | | | | | | | |
6.00%, 6/1/25 | | | 40 | | | | 37,250 | |
| | | | | | | | |
| | | | | | | 135,679 | |
| | | | | | | | |
| |
| Insurance—1.9% | | | | | |
Phoenix Group Holdings PLC,, | |
6.625%, 12/18/25 | | £ | 100 | | | | 126,411 | |
Society of Lloyd’s, | | | | | | | | |
4.75%, 10/30/24 | | | 100 | | | | 126,838 | |
| | | | | | | | |
| | | | | | | 253,249 | |
| | | | | | | | |
| |
| Investment Companies—1.5% | | | | | |
Huarong Finance 2017 Co., Ltd., 3 mo. LIBOR + 1.325% (c), | |
3.233%, 7/3/23 | | | $200 | | | | 197,165 | |
| | | | | | | | |
| |
| Machinery-Diversified—0.7% | | | | | |
Otis Worldwide Corp., 3 mo. LIBOR + 1.450% (a)(b)(c), | |
2.088%, 4/5/23 | | | 100 | | | | 100,096 | |
| | | | | | | | |
| |
| Media—0.8% | | | | | |
Charter Communications Operating LLC, 3 mo. LIBOR + 1.650% (c), | |
3.413%, 2/1/24 | | | 100 | | | | 100,905 | |
| | | | | | | | |
| |
| Miscellaneous Manufacturing—0.6% | | | | | |
General Electric Co, 3 mo. LIBOR + 0.380% (c), | |
2.121%, 5/5/26 | | | 100 | | | | 80,257 | |
| | | | | | | | |
| |
| Oil, Gas & Consumable Fuels—0.7% | | | | | |
Petrobras Global Finance BV, | |
6.25%, 3/17/24 | | | 50 | | | | 49,638 | |
Sunoco L.P., | | | | | | | | |
4.875%, 1/15/23 | | | 50 | | | | 48,721 | |
| | | | | | | | |
| | | | | | | 98,359 | |
| | | | | | | | |
| |
| Pharmaceuticals—2.8% | | | | | |
Bayer U.S. Finance II LLC, 3 mo.LIBOR + 1.010% (a)(b)(c), | |
1.751%, 12/15/23 | | | 200 | | | | 184,892 | |
Becton Dickinson and Co., 3 mo. LIBOR + 1.030% (c), | |
2.031%, 6/6/22 | | | 100 | | | | 95,360 | |
Cigna Corp., 3 mo. LIBOR + 0.890% (c), | |
2.721%, 7/15/23 | | | 100 | | | | 91,602 | |
| | | | | | | | |
| | | | | | | 371,854 | |
| | | | | | | | |
| |
| Pipelines—2.4% | | | | | |
Energy Transfer Operating L.P., | |
4.25%, 3/15/23 | | | 100 | | | | 90,944 | |
Kinder Morgan, Inc., 3 mo. LIBOR + 1.280% (c), | |
3.111%, 1/15/23 | | | 100 | | | | 91,940 | |
MPLX LP, | |
4.875%, 12/1/24 | | | 100 | | | | 86,126 | |
| | | | | | | | |
| | | Principal
Amount
(000s) | | | Value | |
NGPL PipeCo LLC (a)(b), | |
4.375%, 8/15/22 | | | £ 50 | | | $ | 48,376 | |
| | | | | | | | |
| | | | | | | 317,386 | |
| | | | | | | | |
| |
| Retail—1.1% | | | | | |
1011778 BC ULC (a)(b), | |
4.25%, 5/15/24 | | | 50 | | | | 50,187 | |
Dollar Tree, Inc., | | | | | | | | |
3.70%, 5/15/23 | | | 100 | | | | 101,735 | |
| | | | | | | | |
| | | | | | | 151,922 | |
| | | | | | | | |
| |
| Semiconductors—0.4% | | | | | |
Broadcom Corp.,
| |
3.625%, 1/15/24 | | | 50 | | | | 49,485 | |
| | | | | | | | |
| |
| Telecommunications—3.6% | | | | | |
AT&T, Inc. (c), 3 mo. EURIBOR + 0.850%, | |
0.416%, 9/5/23 | | € | 100 | | | | 109,547 | |
3 mo. LIBOR + 1.180%, 1.964%, 6/12/24 | | | $100 | | | | 93,551 | |
Verizon Communications, Inc., 3 mo. LIBOR + 1.100% (c), | |
2.792%, 5/15/25 | | | 200 | | | | 182,512 | |
Vodafone Group PLC, 3 mo. LIBOR + 0.990% (c), | |
2.833%, 1/16/24 | | | 100 | | | | 94,627 | |
| | | | | | | | |
| | | | | | | 480,237 | |
| | | | | | | | |
| |
| Transportation—1.4% | | | | | |
Aviation Capital Group LLC, 3 mo. LIBOR + 0.670% (a)(b)(c), | |
2.44%, 7/30/21 | | | 200 | | | | 192,217 | |
| | | | | | | | |
Total Corporate Bonds & Notes
(cost-$10,610,526) | | | | 9,792,600 | |
| | | | | | | | |
| | | | | | | | |
|
| Mortgage-Backed Securities(c)—15.8% | |
280 Park Avenue Mortgage Trust, 1 mo. LIBOR + 0.880%, Series 2017-280P, Class A (b), | |
1.585%, 9/15/34 | | | 200 | | | | 191,159 | |
BHMS, 1 mo. LIBOR + 1.250%, Series 2018-ATLS, Class A (a)(b),
| |
1.955%, 7/15/35 | | | 100 | | | | 86,159 | |
BX Commercial Mortgage Trust (a)(b), 1 mo. LIBOR + 0.671%, | |
1.376%, 3/15/37, Series 2018-BIOA, Class A | | | 150 | | | | 141,439 | |
1 mo. LIBOR + 0.750%, 1.455%, 11/15/35, Series2018-IND, Class A | | | 113 | | | | 108,336 | |
1 mo. LIBOR + 0.900%, 1.605%, 11/15/35, Series2018-IND, Class B | | | 70 | | | | 66,083 | |
BX Commercial Mortgage Trust2019-XL, 1 mo. LIBOR + 0.920% (a)(b), | |
1.625%, 10/15/36 | | | 239 | | | | 230,629 | |
BX Trust, 1 mo. LIBOR + 0.800%, Series 2018-BILT, Class A (a)(b), | |
1.505%, 5/15/30 | | | 100 | | | | 93,179 | |
CGDBB Commercial Mortgage Trust, 1 mo. LIBOR + 0.790%, Series 2017-BIOC, Class A (b), | |
1.495%, 7/15/32 | | | 91 | | | | 83,802 | |
CHT 2017-COSMO Mortgage Trust, 1 mo. LIBOR+ 3.000% (b), | |
3.705%, 11/15/36 | | | 100 | | | | 79,579 | |
Credit Suisse Mortgage Capital Certificates 2019-ICE4, 1 mo. LIBOR+ 0.980% (a)(b), | |
1.685%, 5/15/36 | | | 250 | | | | 238,973 | |
CWSF, 1 mo. LIBOR + 1.000%, Series2018-TOP, Class A (a)(b), | |
1.705%, 8/15/35 | | | 88 | | | | 79,221 | |
| | | | | | |
| 144 | | Semiannual Report | | | March 31, 2020 | | | See accompanying Notes to Financial Statements |
Schedule of Investments
March 31, 2020 (unaudited)
| | | | | | | | |
| | | Principal
Amount
(000s) | | | Value | |
DBCG Mortgage Trust, 1 mo. LIBOR + 0.700%,Series 2017-BBG, Class A (a)(b), | |
1.405%, 6/15/34 | | £ | 200 | | | $ | 184,493 | |
DBGS 2018-BIOD Mortgage Trust, 1 mo. LIBOR+ 0.803% (a)(b), | |
1.508%, 5/15/35 | | | 186 | | | | 171,761 | |
Dutch Property Finance BV, 3 mo. EURIBOR + 0.680%, Series2017-1, Class A, | |
0.294%, 1/28/48 | | € | 126 | | | | 138,857 | |
Morgan Stanley Capital I Trust2017-CLS, 1 mo. LIBOR+ 0.700% (b), | |
1.405%, 11/15/34 | | | $150 | | | | 143,736 | |
Motel 6 Trust, 1 mo. LIBOR + 0.920%, Series 2017-MTL6, Class A (b), | |
1.625%, 8/15/34 | | | 71 | | | | 66,530 | |
| | | | | | | | |
Total Mortgage-Backed Securities
(cost-$2,257,561) | | | | 2,103,936 | |
| | | | | | | | |
| | | | | | | | |
|
| Asset-Backed Securities(b)—4.9% | |
DB Master Finance LLC, Series2019-1A Class A2I (a), | |
3.787%, 5/20/49 | | | 99 | | | | 97,491 | |
Domino’s Pizza Master Issuer LLC, 3 mo. LIBOR + 1.250%, Series2017-1A Class A2I (a)(c), | |
3.044%, 7/25/47 | | | 98 | | | | 92,756 | |
Invitation Homes Trust (a)(c), 1 mo. LIBOR + 0.900%, 1.605%, 6/17/37, Series 2018-SFR2, Class A | | | 89 | | | | 83,919 | |
1 mo. LIBOR + 0.850%, 1.65%, 12/17/36, Series 2017-SFR2, Class A | | | 92 | | | | 85,447 | |
Taco Bell Funding LLC, Series2018-1A Class A2I (a), | |
4.318%, 11/25/48 | | | 99 | | | | 96,406 | |
| | | | | | | | |
| | | Principal
Amount
(000s) | | | Value | |
Vantage Data Centers Issuer LLC, Series2018-1A, Class A2, | |
4.072%, 2/16/43 | | | $196 | | | $ | 195,342 | |
| | | | | | | | |
Total Asset-Backed Securities (cost-$676,828) | | | | 651,361 | |
| | | | | | | | |
| | | | | | | | |
|
| Sovereign Debt Obligations—0.7% | |
| |
| Dominican Republic—0.7% | | | | | |
Dominican Republic International Bond, | |
5.50%, 1/27/25 (cost-$107,463) | | | 100 | | | | 95,444 | |
| | | | | | | | |
| | | | | | | | |
|
| U.S. Government Agency Securities—0.2% | |
Fannie Mae, MBS, 1 mo.USD-LIBOR-BBA + 3.000%, Series2014-C03, Class 1M2, CMO (c), 3.947%, 7/25/24 | |
(cost-$38,578) | | | 36 | | | | 33,616 | |
| | | | | | | | |
|
| Repurchase Agreements—4.2% | |
State Street Bank and Trust Co.,
dated 3/31/20, 0.00%, due 4/1/20, proceeds $556,000; collateralized by U.S. Treasury Inflation Indexed Notes, 0.625%, due 4/15/23, valued at $568,072 including accrued interest | |
(cost-$556,000) | | | 556 | | | | 556,000 | |
| | | | | | | | |
| |
Total Investments
(cost-$14,246,956)—99.2% | | | | 13,232,957 | |
| | | | | | | | |
| |
Other assets less
liabilities (d)—0.8% | | | | 109,383 | |
| | | | | | | | |
| |
| Net Assets—100.0% | | | | $13,342,340 | |
| | | | | | | | |
Notes to Schedule of Investments:
(a) Private Placement—Restricted as to resale and may not have a readily available market. Securities with an aggregate value of $3,748,466, representing 28.1% of net assets.
(b) 144A—Exempt from registration under Rule 144A of the Securities Act of 1933. These securities may be resold in transactions exempt from registration, typically only to qualified institutional buyers. Securities with an aggregate value of $4,508,614, representing 33.8% of net assets.
(c) Variable or Floating Rate Security—Securities with an interest rate that changes periodically. The interest rate disclosed reflects the rate in effect on March 31, 2020.
(d) Includes net unrealized appreciation (depreciation) of other financial instruments as follows:
| | | | | | | | | | | | | | | | | | | | | | |
|
| Futures contracts outstanding at March 31, 2020: | |
| Type | | Contracts | | | Expiration
Date | | | Notional
Amount
(000s) | | | Market
Value
(000s) | | | Unrealized
Appreciation
(Depreciation) | |
Long position contracts: | | | | | | | | | | | | | | | | | �� | | | |
| | 2-Year U.S. Treasury Note | | | 4 | | | | 6/30/20 | | | | $ 800 | | | $ | 882 | | | $ | 13,656 | |
| | | | | | | | | | | | | | | | | | | | | | |
| | | | | |
| Short position contracts: | | | | | | | | | | | | | | | | | | | | |
| | 5-Year U.S. Treasury Note | | | (19 | ) | | | 6/30/20 | | | | $(1,900 | ) | | $ | (2,382 | ) | | $ | (78,375 | ) |
| | | | | | | | | | | | | | | | | | | | | | |
| | | | | | | | | $ | (64,719 | ) |
| | | | | | | | | | | | | | | | | | | | | | |
| | | | | | | | | | | | | | | | |
|
| Forward foreign currency contracts outstanding at March 31, 2020: | |
| Description | | Counterparty | | | U.S.$ Value on
Origination Date | | | U.S.$ Value
March 31, 2020 | | | Unrealized
Appreciation | |
Sold: | | | | | | | | | | | | | | | | |
394,859 British Pound settling 6/17/20 | | | Citibank N.A. | | | $ | 511,006 | | | $ | 491,107 | | | $ | 19,899 | |
936,983 Euro settling 6/17/20 | | | Citibank N.A. | | | | 1,064,648 | | | | 1,036,401 | | | | 28,247 | |
| | | | | | | | | | | | | | | | |
| | | | | | | | | | | | | | $ | 48,146 | |
| | | | | | | | | | | | | | | | |
| | | | | | | | |
| See accompanying Notes to Financial Statements | | | March 31, 2020 | | | Semiannual Report | | | 145 | |
Schedule of Investments
March 31, 2020 (unaudited)
(e) At March 31, 2020, the Fund pledged $21,203 in cash as collateral for futures contracts.
Glossary:
BBA—British Bankers’ Association
£—British Pound
CMO—Collateralized Mortgage Obligation
EURIBOR—Euro Inter-Bank Offered Rate
€—Euro
LIBOR—London Inter-Bank Offered Rate
MBS—Mortgage-Backed Securities
REIT—Real Estate Investment Trust
SOFR—Secured Overnight Financing Rate
| | | | | | |
| 146 | | Semiannual Report | | | March 31, 2020 | | | See accompanying Notes to Financial Statements |
Schedule of Investments
March 31, 2020 (unaudited)
AllianzGI Global Allocation Fund
| | | | | | | | |
| | | Shares | | | Value | |
| |
| Mutual Funds(d)—77.0% | | | | | |
AllianzGI Best Styles Global Managed Volatility | | | 1,892,561 | | | | $25,341,395 | |
AllianzGI Emerging MarketsSmall-Cap (e) | | | 301,347 | | | | 3,564,940 | |
AllianzGI Emerging Markets SRI Debt (e) | | | 1,170,835 | | | | 14,635,435 | |
AllianzGI Global Sustainability (e) | | | 6,293,816 | | | | 104,603,229 | |
AllianzGI Green Bond (e) | | | 1,606,093 | | | | 24,798,080 | |
AllianzGI PerformanceFee Managed Futures Strategy (g) | | | 3,362,454 | | | | 27,740,246 | |
| | | | | | | | |
| Total Mutual Funds(cost-$226,003,418) | | | | 200,683,325 | |
| | | | | | | | |
| | | | | | | | |
| | |
| | | Principal
Amount
(000s) | | | | |
|
| Corporate Bonds & Notes—17.3% | |
| |
| Aerospace & Defense—1.4% | | | | | |
Boeing Co., | | | | | | | | |
2.80%, 3/1/27 | | | $930 | | | | 822,581 | |
General Dynamics Corp., | | | | | | | | |
3.25%, 4/1/25 | | | 370 | | | | 382,722 | |
L3Harris Technologies, Inc., | | | | | | | | |
3.95%, 5/28/24 (a)(b) | | | 335 | | | | 351,850 | |
4.40%, 6/15/28 | | | 425 | | | | 459,710 | |
4.40%, 6/15/28 (a)(b) | | | 180 | | | | 194,700 | |
Northrop Grumman Corp., | | | | | | | | |
3.20%, 2/1/27 | | | 600 | | | | 620,747 | |
3.25%, 1/15/28 | | | 325 | | | | 341,978 | |
Northrop Grumman Systems Corp., | |
7.875%, 3/1/26 | | | 210 | | | | 225,828 | |
United Technologies Corp., | | | | | | | | |
6.125%, 7/15/38 | | | 270 | | | | 359,490 | |
| | | | | | | | |
| | | | | | | 3,759,606 | |
| | | | | | | | |
| |
| Banks—2.8% | | | | | |
Australia & New Zealand Banking Group Ltd., (converts to FRN on 7/22/25) (a)(b)(f), | |
2.95%, 7/22/30 | | | 493 | | | | 472,062 | |
Bank of America Corp. (f), | | | | | | | | |
3 mo. LIBOR + 1.180%, 2.999%, 10/21/22 | | | 500 | | | | 489,495 | |
4.30%, 1/28/25 (converts to FRN on 1/28/25) (c) | | | 150 | | | | 129,375 | |
Citigroup, Inc. (f), | | | | | | | | |
2.976%, 11/5/30 (converts to FRN on 11/5/29) | | | 435 | | | | 429,912 | |
3.887%, 1/10/28 (converts to FRN on 1/10/27) | | | 705 | | | | 734,232 | |
4.70%, 1/30/25 (converts to FRN on 1/30/25) (c) | | | 152 | | | | 132,240 | |
Comerica, Inc., | | | | | | | | |
3.70%, 7/31/23 | | | 655 | | | | 673,233 | |
Credit Suisse Group AG, (converts to FRN on 8/1/26) (a)(b)(c)(f), | |
6.375%, 8/21/26 | | | 235 | | | | 206,456 | |
Fifth Third Bancorp, (converts to FRN on 6/30/23) (c)(f), | |
5.10%, 6/30/23 | | | 670 | | | | 543,166 | |
Huntington Capital Trust I, 3 mo. LIBOR + 0.700% (f), | |
2.477%, 2/1/27 | | | 255 | | | | 242,250 | |
JPMorgan Chase & Co., (converts to FRN on 3/24/30) (f), | |
4.493%, 3/24/31 | | | 270 | | | | 310,901 | |
Lloyds Banking Group PLC, (converts to FRN on 9/27/25) (c)(f), | |
7.50%, 9/27/25 | | | 130 | | | | 116,934 | |
| | | | | | | | |
| | | Principal
Amount
(000s) | | | Value | |
Popular, Inc., | | | | | | | | |
6.125%, 9/14/23 | | $ | 645 | | | $ | 602,266 | |
State Street Corp. (f), | | | | | | | | |
3 mo. LIBOR + 1.000%, 1.741%, 6/15/47 | | | 375 | | | | 291,562 | |
2.354%, 11/1/25 (converts to FRN on 11/1/24) | | | 1,000 | | | | 973,288 | |
3.152%, 3/30/31 (converts to FRN on 3/30/30) (a)(b) | | | 65 | | | | 66,683 | |
Truist Financial Corp. (c)(f), | |
4.80%, 9/1/24, Ser. N (converts to FRN on 9/1/24) | | | 20 | | | | 17,214 | |
5.125%, 12/15/27, Ser. M (converts to FRN on 12/15/27) | | | 95 | | | | 80,827 | |
Wells Fargo & Co., | | | | | | | | |
5.95%, 12/1/86 | | | 170 | | | | 213,789 | |
Westpac Banking Corp., (converts to FRN on 2/4/25) (f), | |
2.894%, 2/4/30 | | | 620 | | | | 594,970 | |
| | | | | | | | |
| | | | | | | 7,320,855 | |
| | | | | | | | |
| |
| Beverages—0.0% | | | | | |
Anheuser-Busch Cos. LLC, | | | | | | | | |
4.90%, 2/1/46 | | | 115 | | | | 126,087 | |
| | | | | | | | |
| |
| Commercial Services—0.2% | | | | | |
Massachusetts Institute of Technology, | |
5.60%, 7/1/11 | | | 120 | | | | 201,526 | |
President & Fellows of Harvard College, | |
4.875%, 10/15/40 | | | 255 | | | | 338,630 | |
| | | | | | | | |
| | | | | | | 540,156 | |
| | | | | | | | |
| |
| Diversified Financial Services—1.2% | | | | | |
American Express Co., | | | | | | | | |
2.20%, 10/30/20 | | | 600 | | | | 599,771 | |
2.50%, 7/30/24 | | | 530 | | | | 535,217 | |
8.15%, 3/19/38 | | | 105 | | | | 155,991 | |
Discover Financial Services, | | | | | | | | |
4.10%, 2/9/27 | | | 355 | | | | 340,192 | |
5.50%, 10/30/27, Ser. C (converts to FRN on 10/30/27) (c)(f) | | | 270 | | | | 216,220 | |
GE Capital International Funding Co. Unlimited Co., | |
2.342%, 11/15/20 | | | 80 | | | | 79,183 | |
Mastercard Inc., | | | | | | | | |
3.85%, 3/26/50 | | | 108 | | | | 133,494 | |
Nuveen Finance LLC (a)(b), | | | | | | | | |
4.125%, 11/1/24 | | | 490 | | | | 481,353 | |
Synchrony Financial, | | | | | | | | |
3.70%, 8/4/26 | | | 160 | | | | 144,552 | |
Visa, Inc., | | | | | | | | |
1.90%, 4/15/27 | | | 335 | | | | 335,402 | |
| | | | | | | | |
| | | | | | | 3,021,375 | |
| | | | | | | | |
| |
| Electric Utilities—3.3% | | | | | |
Alabama Power Co., | | | | | | | | |
4.10%, 1/15/42 | | | 455 | | | | 469,079 | |
Arizona Public service Co., | | | | | | | | |
5.50%, 9/1/35 | | | 90 | | | | 125,467 | |
Berkshire Hathaway Energy Co., | |
3.50%, 2/1/25 | | | 214 | | | | 224,327 | |
4.05%, 4/15/25 (a)(b) | | | 112 | | | | 121,213 | |
4.25%, 10/15/50 (a)(b) | | | 150 | | | | 171,112 | |
Commonwealth Edison Co., | | | | | | | | |
5.90%, 3/15/36 | | | 155 | | | | 198,595 | |
Consolidated Edison Co. of New York, Inc., Ser.06-E, | |
5.70%, 12/1/36 | | | 40 | | | | 52,099 | |
Consumers Energy Co., | | | | | | | | |
2.85%, 5/15/22 | | | 610 | | | | 615,939 | |
DTE Electric Co., | | | | | | | | |
5.70%, 10/1/37 | | | 240 | | | | 300,122 | |
6.625%, 6/1/36, Ser. A | | | 40 | | | | 53,920 | |
| | | | | | | | |
| | | Principal
Amount
(000s) | | | Value | |
DTE Energy Co., | | | | | | | | |
2.95%, 3/1/30 | | $ | 275 | | | $ | 264,230 | |
Duke Energy Florida LLC, | | | | | | | | |
2.50%, 12/1/29 | | | 273 | | | | 270,825 | |
Duke Energy Indiana LLC, | | | | | | | | |
3.25%, 10/1/49 | | | 120 | | | | 122,646 | |
3.75%, 5/15/46 | | | 45 | | | | 47,966 | |
Edison International, | | | | | | | | |
2.95%, 3/15/23 | | | 315 | | | | 304,127 | |
4.95%, 4/15/25 | | | 201 | | | | 204,578 | |
Eversource Energy, Ser. K, | | | | | | | | |
2.75%, 3/15/22 | | | 465 | | | | 464,853 | |
Florida Power & Light Co., | | | | | | | | |
2.85%, 4/1/25 | | | 148 | | | | 151,461 | |
Georgia Power Co., Ser. B, | | | | | | | | |
3.70%, 1/30/50 | | | 180 | | | | 185,393 | |
Jersey Central Power & Light Co., | |
6.15%, 6/1/37 | | | 95 | | | | 116,872 | |
NextEra Energy Capital Holdings, Inc., | |
2.403%, 9/1/21 | | | 200 | | | | 199,780 | |
Oncor Electric Delivery Co LLC, | | | | | | | | |
2.95%, 4/1/25 | | | 192 | | | | 199,114 | |
PacifiCorp, | | | | | | | | |
4.15%, 2/15/50 | | | 115 | | | | 131,520 | |
PPL Electric Utilities Corp., | | | | | | | | |
5.20%, 7/15/41 | | | 360 | | | | 443,355 | |
Public Service Co of Colorado, | | | | | | | | |
2.25%, 9/15/22 | | | 610 | | | | 608,589 | |
4.75%, 8/15/41 | | | 319 | | | | 370,354 | |
San Diego Gas & Electric Co., Ser. NNN, | |
3.60%, 9/1/23 | | | 560 | | | | 582,086 | |
Sempra Energy, | | | | | | | | |
3.55%, 6/15/24 | | | 560 | | | | 558,979 | |
Southern California Edison Co., | | | | | | | | |
3.70%, 8/1/25, Ser. E | | | 200 | | | | 206,988 | |
3.90%, 12/1/41 | | | 95 | | | | 90,251 | |
Virginia Electric & Power Co., | | | | | | | | |
2.75%, 3/15/23, Ser. C | | | 460 | | | | 467,524 | |
3.80%, 4/1/28, Ser. A | | | 195 | | | | 210,939 | |
| | | | | | | | |
| | | | | | | 8,534,303 | |
| | | | | | | | |
|
| Equity Real Estate Investment Trusts (REITs)—0.5% | |
American Tower Corp., | | | | | | | | |
2.25%, 1/15/22 | | | 1,000 | | | | 986,273 | |
3.375%, 5/15/24 | | | 277 | | | | 274,016 | |
| | | | | | | | |
| | | | | | | 1,260,289 | |
| | | | | | | | |
| |
| Food & Beverage—0.3% | | | | | |
Anheuser-Busch InBev Finance, Inc., | |
3.65%, 2/1/26 | | | 650 | | | | 678,594 | |
| | | | | | | | |
| |
| Healthcare-Services—0.2% | | | | | |
UnitedHealth Group, Inc., | | | | | | | | |
3.50%, 8/15/39 | | | 470 | | | | 507,337 | |
| | | | | | | | |
| |
| Insurance—0.5% | | | | | |
American International Group, Inc., | |
4.375%, 1/15/55 | | | 155 | | | | 147,606 | |
Berkshire Hathaway Finance Corp., | |
4.25%, 1/15/49 | | | 140 | | | | 175,021 | |
Harborwalk Funding Trust, (converts to FRN on 2/15/49) (a)(b)(f), | |
5.077%, 2/15/69 | | | 235 | | | | 248,647 | |
Lincoln National Corp., 3 mo. LIBOR + 2.358% (f), | |
4.049%, 5/17/66 | | | 405 | | | | 243,506 | |
MetLife, Inc. (a)(b), | | | | | | | | |
9.25%, 4/8/38 | | | 145 | | | | 179,075 | |
New York Life Insurance Co. (a)(b), | |
4.45%, 5/15/69 | | | 300 | | | | 311,724 | |
| | | | | | | | |
| | | | | | | 1,305,579 | |
| | | | | | | | |
| | | | | | | | |
| See accompanying Notes to Financial Statements | | | March 31, 2020 | | | Semiannual Report | | | 147 | |
Schedule of Investments
March 31, 2020 (unaudited)
| | | | | | | | |
| | | Principal
Amount
(000s) | | | Value | |
| |
| Machinery-Diversified—0.1% | | | | | |
Deere & Co., | | | | | | | | |
3.75%, 4/15/50 | | $ | 112 | | | $ | 126,127 | |
| | | | | | | | |
| |
| Media—1.8% | | | | | |
Charter Communications Operating LLC, | |
4.908%, 7/23/25 | | | 670 | | | | 721,967 | |
5.375%, 5/1/47 | | | 75 | | | | 81,934 | |
Comcast Corp., | | | | | | | | |
3.10%, 4/1/25 | | | 74 | | | | 78,802 | |
3.375%, 2/15/25 | | | 960 | | | | 1,022,510 | |
3.75%, 4/1/40 | | | 148 | | | | 163,276 | |
Discovery Communications LLC, | |
3.95%, 3/20/28 | | | 320 | | | | 311,144 | |
Fox Corp., | | | | | | | | |
3.05%, 4/7/25 | | | 70 | | | | 70,735 | |
Time Warner Cable LLC, | | | | | | | | |
4.50%, 9/15/42 | | | 85 | | | | 80,839 | |
6.55%, 5/1/37 | | | 90 | | | | 103,517 | |
ViacomCBS, Inc., | | | | | | | | |
3.45%, 10/4/26 | | | 200 | | | | 212,647 | |
4.75%, 5/15/25 | | | 130 | | | | 130,480 | |
5.25%, 4/1/44 | | | 225 | | | | 214,862 | |
6.25%, 2/28/57 (converts to FRN on 2/28/27) (f) | | | 303 | | | | 262,193 | |
Walt Disney Co., | | | | | | | | |
3.00%, 9/15/22 | | | 1,000 | | | | 1,032,693 | |
4.70%, 3/23/50 | | | 180 | | | | 234,692 | |
| | | | | | | | |
| | | | | | | 4,722,291 | |
| | | | | | | | |
|
| Miscellaneous Manufacturing—0.4% | |
3M Co., | | | | | | | | |
3.125%, 9/19/46 | | | 195 | | | | 194,473 | |
3.70%, 4/15/50 | | | 75 | | | | 84,159 | |
General Electric Co., | | | | | | | | |
3 mo. LIBOR + 1.000%, 2.831%, 4/15/23 (f) | | | 561 | | | | 523,540 | |
5.55%, 1/5/26 | | | 125 | | | | 134,770 | |
6.75%, 3/15/32 | | | 110 | | | | 132,565 | |
| | | | | | | | |
| | | | | | | 1,069,507 | |
| | | | | | | | |
| |
| Oil, Gas & Consumable Fuels—0.7% | | | | | |
Boston Gas Co. (a)(b), | | | | | | | | |
3.15%, 8/1/27 | | | 820 | | | | 809,592 | |
Cenovus Energy, Inc., | | | | | | | | |
6.75%, 11/15/39 | | | 100 | | | | 48,052 | |
Hess Corp., | | | | | | | | |
4.30%, 4/1/27 | | | 330 | | | | 241,776 | |
7.125%, 3/15/33 | | | 125 | | | | 95,850 | |
Marathon Petroleum Corp., | | | | | | | | |
5.85%, 12/15/45 | | | 140 | | | | 106,365 | |
NiSource, Inc., | | | | | | | | |
6.25%, 12/15/40 | | | 350 | | | | 495,403 | |
| | | | | | | | |
| | | | | | | 1,797,038 | |
| | | | | | | | |
| |
| Pharmaceuticals—0.8% | | | | | |
AbbVie, Inc. (a)(b), | | | | | | | | |
2.60%, 11/21/24 | | | 292 | | | | 295,839 | |
2.95%, 11/21/26 | | | 245 | | | | 251,423 | |
4.05%, 11/21/39 | | | 265 | | | | 280,179 | |
Allergan Funding SCS, | | | | | | | | |
3.85%, 6/15/24 | | | 295 | | | | 306,747 | |
Cigna Corp., | | | | | | | | |
4.125%, 11/15/25 | | | 230 | | | | 247,174 | |
4.80%, 8/15/38 | | | 130 | | | | 146,756 | |
CVS Health Corp., | | | | | | | | |
4.10%, 3/25/25 | | | 230 | | | | 242,865 | |
4.875%, 7/20/35 | | | 145 | | | | 164,105 | |
Shire Acquisitions Investments Ireland DAC, | |
3.20%, 9/23/26 | | | 240 | | | | 246,931 | |
| | | | | | | | |
| | | | | | | 2,182,019 | |
| | | | | | | | |
| | | | | | | | |
| | | Principal
Amount
(000s) | | | Value | |
| |
| Pipelines—1.0% | | | | | |
Columbia Pipeline Group, Inc., | | | | | | | | |
4.50%, 6/1/25 | | $ | 555 | | | $ | 550,226 | |
5.80%, 6/1/45 | | | 110 | | | | 117,160 | |
El Paso Natural Gas Co. LLC, | | | | | | | | |
8.375%, 6/15/32 | | | 100 | | | | 117,423 | |
Energy Transfer Operating L.P., | | | | | | | | |
6.50%, 2/1/42 | | | 330 | | | | 301,048 | |
7.125%, 5/15/30 (converts to FRN on 5/15/30) (c)(f) | | | 505 | | | | 309,969 | |
Kinder Morgan Energy Partners L.P., | |
7.50%, 11/15/40 | | | 75 | | | | 82,855 | |
Kinder Morgan, Inc., | | | | | | | | |
4.30%, 6/1/25 | | | 460 | | | | 471,256 | |
Plains All American Pipeline L.P., | |
4.65%, 10/15/25 | | | 440 | | | | 354,094 | |
6.125%, 11/15/22, Ser. B (converts to FRN on 11/15/22) (c)(f) | | | 285 | | | | 142,997 | |
6.65%, 1/15/37 | | | 115 | | | | 91,579 | |
| | | | | | | | |
| | | | | | | 2,538,607 | |
| | | | | | | | |
|
| Real Estate Management & Development—0.3% | |
American Tower Corp., | | | | | | | | |
5.00%, 2/15/24 | | | 348 | | | | 367,037 | |
Target Corp., | | | | | | | | |
2.25%, 4/15/25 | | | 330 | | | | 334,032 | |
| | | | | | | | |
| | | | | | | 701,069 | |
| | | | | | | | |
| |
| Retail—0.0% | | | | | |
Lowe’s Cos., Inc., | | | | | | | | |
4.65%, 4/15/42 | | | 90 | | | | 98,336 | |
| | | | | | | | |
| |
| Semiconductors—0.3% | | | | | |
Broadcom, Inc. (a)(b), | | | | | | | | |
4.25%, 4/15/26 | | | 460 | | | | 467,756 | |
Intel Corp., | | | | | | | | |
3.10%, 2/15/60 | | | 265 | | | | 281,388 | |
| | | | | | | | |
| | | | | | | 749,144 | |
| | | | | | | | |
| |
| Software—0.4% | | | | | |
Fiserv, Inc., | | | | | | | | |
4.40%, 7/1/49 | | | 195 | | | | 209,859 | |
Microsoft Corp., | | | | | | | | |
3.50%, 11/15/42 | | | 360 | | | | 419,572 | |
Oracle Corp., | | | | | | | | |
2.50%, 4/1/25 | | | 402 | | | | 410,863 | |
| | | | | | | | |
| | | | | | | 1,040,294 | |
| | | | | | | | |
| |
| Telecommunications—0.8% | | | | | |
AT&T, Inc., | | | | | | | | |
3.80%, 3/15/22 | | | 800 | | | | 826,375 | |
3.90%, 3/11/24 | | | 280 | | | | 294,372 | |
4.85%, 3/1/39 | | | 400 | | | | 456,012 | |
5.25%, 3/1/37 | | | 180 | | | | 211,006 | |
Verizon Communications, Inc., | | | | | | | | |
5.25%, 3/16/37 | | | 315 | | | | 405,919 | |
| | | | | | | | |
| | | | | | | 2,193,684 | |
| | | | | | | | |
| |
| Transportation—0.3% | | | | | |
CSX Corp., | | | | | | | | |
4.75%, 5/30/42 | | | 145 | | | | 167,604 | |
Kansas City Southern, | | | | | | | | |
4.20%, 11/15/69 | | | 175 | | | | 168,025 | |
Union Pacific Corp., | | | | | | | | |
3.75%, 2/5/70 | | | 102 | | | | 104,874 | |
United Parcel Service, Inc., | | | | | | | | |
3.40%, 9/1/49 | | | 325 | | | | 328,667 | |
| | | | | | | | |
| | | | | | | 769,170 | |
| | | | | | | | |
| Total Corporate Bonds & Notes(cost-$47,397,979) | | | | 45,041,467 | |
| | | | | | | | |
| | | | | | | | |
| | | Principal
Amount
(000s) | | | Value | |
|
| U.S. Treasury Obligations—0.1% | |
U.S. Treasury Bonds, | | | | | | | | |
2.375%, 11/15/49 | | $ | 82 | | | $ | 102,539 | |
U.S. Treasury Notes, | | | | | | | | |
0.50%, 3/31/25 | | | 152 | | | | 153,009 | |
1.50%, 2/15/30 | | | 121 | | | | 130,264 | |
| | | | | | | | |
Total U.S. Treasury Obligations (cost-$383,073) | | | | 385,812 | |
| | | | | | | | |
| | | | | | | | |
| | |
| | | Shares | | | | |
| |
| Preferred Stock—0.0% | | | | | |
| |
| Banks—0.0% | | | | | |
Wells Fargo & Co. (c) | | | | | | | | |
(cost-$148,341) | | | 5,910 | | | | 124,110 | |
| | | | | | | | |
| | | | | | | | |
| | |
| | | Principal
Amount
(000s) | | | | |
|
| Repurchase Agreements—2.1% | |
State Street Bank and Trust Co.,
dated 3/31/20, 0.00%, due 4/1/20, proceeds $5,460,000; collateralized by U.S. Treasury Notes, 2.75%, due 4/30/23, valued at $5,571,316 including accrued interest | |
(cost-$5,460,000) | | | $5,460 | | | | 5,460,000 | |
| | | | | | | | |
| |
Total Investments
(cost-$279,392,811)—96.5% | | | | 251,694,714 | |
| | | | | | | | |
| | |
Other assets less
liabilities (h)—3.5% | | | | | | | 9,057,176 | |
| | | | | | | | |
| |
| NetAssets-100.0% | | | | $260,751,890 | |
| | | | | | | | |
Notes to Schedule of Investments:
(a) Private Placement—Restricted as to resale and may not have a readily available market. Securities with an aggregate value of $4,909,664, representing 1.9% of net assets.
(b) 144A—Exempt from registration under Rule 144A of the Securities Act of 1933. These securities may be resold in transactions exempt from registration, typically only to qualified institutional buyers. Securities with an aggregate value of $4,909,664, representing 1.9% of net assets.
(c) Perpetual maturity. The date shown, if any, is the next call date.
(d) Affiliated fund.
(e) Institutional Class share.
(f) Variable or Floating Rate Security—Securities with an interest rate that changes periodically. The interest rate disclosed reflects the rate in effect on March 31, 2020.
(g) Class R6 share.
| | | | | | |
| 148 | | Semiannual Report | | | March 31, 2020 | | | See accompanying Notes to Financial Statements |
Schedule of Investments
March 31, 2020 (unaudited)
(h) Includes net unrealized appreciation (depreciation) of other financial instruments as follows:
| | | | | | | | | | | | | | | | | | | | | | |
|
| Futures contracts outstanding at March 31, 2020: | |
Type | | Contracts | | | Expiration
Date | | | Notional
Amount
(000s) | | | Market
Value
(000s) | | | Unrealized
Appreciation
(Depreciation) | |
Long position contracts: | | | | | | | | | | | | | | | | | | | | |
| | 2-Year U.S. Treasury Note | | | 75 | | | | 6/30/20 | | | $ | 15,000 | | | | $ 16,529 | | | $ | 240,017 | |
| | 10-Year Ultra U.S. Treasury Bond | | | 13 | | | | 6/19/20 | | | | 1,300 | | | | 2,028 | | | | 55,563 | |
| | 10-Year U.S. Treasury Note | | | 295 | | | | 6/19/20 | | | | 29,500 | | | | 40,913 | | | | 1,655,067 | |
| | E-mini S&P 500 Index | | | 103 | | | | 6/19/20 | | | | 5 | | | | 13,234 | | | | (580,860 | ) |
| | Japanese Yen | | | 28 | | | | 6/15/20 | | | | 35 | | | | 3,262 | | | | (70,950 | ) |
| | Mini MSCI Emerging Markets Index | | | 59 | | | | 6/19/20 | | | | 3 | | | | 2,486 | | | | 86,140 | |
| | MSCI EAFE Index | | | 60 | | | | 6/19/20 | | | | 3 | | | | 4,678 | | | | 503,637 | |
| | U.S. Long Bond | | | 7 | | | | 6/19/20 | | | | 700 | | | | 1,553 | | | | 41,613 | |
| | | | | | | | | | | | | | | | | | | | | | |
| | | | | | | | | | | | | | | | | | | | $ | 1,930,227 | |
| | | | | | | | | | | | | | | | | | | | | | |
| | | | | |
Short position contracts: | | | | | | | | | | | | | | | | | | | | |
| | 5-Year U.S. Treasury Note | | | (39 | ) | | | 6/30/20 | | | | $(3,900 | ) | | | $(4,889) | | | $ | (37,998 | ) |
| | Euro Currency | | | (25 | ) | | | 6/15/20 | | | | (3,125 | ) | | | (3,453 | ) | | | 20,058 | |
| | U.S. Long Bond | | | (2 | ) | | | 6/19/20 | | | | (200 | ) | | | (358 | ) | | | (2,450 | ) |
| | | | | | | | | | | | | | | | | | | | | | |
| | | | | | | | | | | | | | | | | | | | $ | (20,390 | ) |
| | | | | | | | | | | | | | | | | | | | | | |
| | | | | | | | | | | | | | | | | | | | $ | 1,909,837 | |
| | | | | | | | | | | | | | | | | | | | | | |
(i) At March 31, 2020, the Fund pledged $9,185,619 in cash as collateral for futures contracts.
Glossary:
EAFE—Europe, Australasia and Far East
FRN—Floating Rate Note
LIBOR—London Inter-Bank Offered Rate
MSCI—Morgan Stanley Capital International
REIT—Real Estate Investment Trust
| | | | | | | | |
| See accompanying Notes to Financial Statements | | | March 31, 2020 | | | Semiannual Report | | | 149 | |
Schedule of Investments
March 31, 2020 (unaudited)
AllianzGI Global Dynamic Allocation Fund
| | | | | | | | |
| | | Principal
Amount
(000s) | | | Value | |
|
| Corporate Bonds & Notes—31.4% | |
| |
| Australia—0.9% | | | | | |
Australia & New Zealand Banking Group Ltd., (converts to FRN on 7/22/25) (a)(b)(i), | |
2.95%, 7/22/30 | | | $600 | | | | $574,518 | |
Westpac Banking Corp., (converts to FRN on 2/4/25) (i), | |
2.894%, 2/4/30 | | | 425 | | | | 407,842 | |
| | | | | | | | |
| | | | | | | 982,360 | |
| | | | | | | | |
| |
| Belgium—0.2% | | | | | |
Anheuser-Busch Cos. LLC, | |
4.90%, 2/1/46 | | | 55 | | | | 60,302 | |
Anheuser-Busch InBev Finance, Inc., | |
3.65%, 2/1/26 | | | 155 | | | | 161,819 | |
| | | | | | | | |
| | | | | | | 222,121 | |
| | | | | | | | |
| |
| Canada—0.1% | | | | | |
Cenovus Energy, Inc., | | | | | | | | |
6.75%, 11/15/39 | | | 125 | | | | 60,065 | |
| | | | | | | | |
| |
| Ireland—0.1% | | | | | |
Shire Acquisitions Investments Ireland DAC, | |
3.20%, 9/23/26 | | | 120 | | | | 123,466 | |
| | | | | | | | |
| |
| Luxembourg—0.1% | | | | | |
Allergan Funding SCS, | | | | | | | | |
3.85%, 6/15/24 | | | 155 | | | | 161,172 | |
| | | | | | | | |
| |
| Puerto Rico—0.3% | | | | | |
Popular, Inc., | | | | | | | | |
6.125%, 9/14/23 | | | 405 | | | | 378,167 | |
| | | | | | | | |
| |
| Switzerland—0.2% | | | | | |
Credit Suisse Group AG, (converts to FRN on 8/1/26) (a)(b)(e)(i), | |
6.375%, 8/21/26 | | | 200 | | | | 175,707 | |
| | | | | | | | |
| |
| United Kingdom—0.1% | | | | | |
Lloyds Banking Group PLC, (converts to FRN on 9/27/25) (e)(i), | |
7.50%, 9/27/25 | | | 100 | | | | 89,949 | |
| | | | | | | | |
| |
| United States—29.4% | | | | | |
3M Co., | | | | | | | | |
3.125%, 9/19/46 | | | 155 | | | | 154,581 | |
3.70%, 4/15/50 | | | 59 | | | | 66,205 | |
AbbVie, Inc. (a)(b), | | | | | | | | |
2.60%, 11/21/24 | | | 152 | | | | 153,998 | |
2.95%, 11/21/26 | | | 400 | | | | 410,486 | |
4.05%, 11/21/39 | | | 260 | | | | 274,893 | |
Alabama Power Co., | | | | | | | | |
2.80%, 4/1/25 | | | 445 | | | | 443,675 | |
4.10%, 1/15/42 | | | 120 | | | | 123,713 | |
Allergan Finance LLC, | | | | | | | | |
3.25%, 10/1/22 | | | 86 | | | | 86,389 | |
Allergan Sales LLC (a)(b), | | | | | | | | |
5.00%, 12/15/21 | | | 145 | | | | 148,577 | |
American Express Co., | | | | | | | | |
2.50%, 7/30/24 | | | 240 | | | | 242,362 | |
8.15%, 3/19/38 | | | 120 | | | | 178,275 | |
American International Group, Inc., | |
3.75%, 7/10/25 | | | 420 | | | | 428,580 | |
4.375%, 1/15/55 | | | 95 | | | | 90,468 | |
American Tower Corp., | | | | | | | | |
3.375%, 5/15/24 | | | 140 | | | | 138,492 | |
4.00%, 6/1/25 | | | 300 | | | | 313,452 | |
5.00%, 2/15/24 | | | 180 | | | | 189,847 | |
Anheuser- Busch InBev Finance, Inc., | |
4.00%, 1/17/43 | | | 210 | | | | 207,851 | |
Apple, Inc., | | | | | | | | |
3.45%, 2/9/45 | | | 115 | | | | 131,154 | |
Arizona Public Service Co., | | | | | | | | |
5.50%, 9/1/35 | | | 95 | | | | 132,437 | |
| | | | | | | | |
| | | Principal
Amount
(000s) | | | Value | |
AT&T, Inc., | | | | | | | | |
3.80%, 3/15/22 | | $ | 495 | | | $ | 511,319 | |
3.90%, 3/11/24 | | | 150 | | | | 157,700 | |
4.85%, 3/1/39 | | | 300 | | | | 342,009 | |
5.25%, 3/1/37 | | | 95 | | | | 111,364 | |
Bank of America Corp. (i), | | | | | | | | |
2.881%, 4/24/23 (converts to FRN on 4/24/22) | | | 695 | | | | 703,144 | |
3 mo. USD-LIBOR + 1.180%, 2.999%, 10/21/22 | | | 210 | | | | 205,588 | |
4.30%, 1/28/25 (converts to FRN on 1/28/25) (e) | | | 115 | | | | 99,187 | |
4.33%, 3/15/50 (converts to FRN on 3/15/49) | | | 175 | | | | 207,924 | |
Berkshire Hathaway Energy Co., | | | | | | | | |
3.50%, 2/1/25 | | | 115 | | | | 120,550 | |
4.05%, 4/15/25 (a)(b) | | | 60 | | | | 64,936 | |
4.25%, 10/15/50 (a)(b) | | | 118 | | | | 134,608 | |
Berkshire Hathaway Finance Corp., | |
4.25%, 1/15/49 | | | 170 | | | | 212,525 | |
Boeing Co., | | | | | | | | |
2.80%, 3/1/27 | | | 180 | | | | 159,209 | |
2.95%, 2/1/30 | | | 96 | | | | 89,380 | |
Boston Gas Co. (a)(b), | | | | | | | | |
3.15%, 8/1/27 | | | 420 | | | | 414,669 | |
Bristol-Myers Squibb Co. (a)b), | | | | | | | | |
3.625%, 5/15/24 | | | 250 | | | | 264,660 | |
4.125%, 6/15/39 | | | 90 | | | | 109,449 | |
Broadcom, Inc. (a)(b), | | | | | | | | |
4.25%, 4/15/26 | | | 570 | | | | 579,611 | |
4.75%, 4/15/29 | | | 115 | | | | 117,504 | |
Charter Communications Operating LLC, | |
4.908%, 7/23/25 | | | 265 | | | | 285,554 | |
5.375%, 5/1/47 | | | 20 | | | | 21,849 | |
Cigna Corp., | | | | | | | | |
4.125%, 11/15/25 | | | 215 | | | | 231,054 | |
4.80%, 8/15/38 | | | 105 | | | | 118,534 | |
Citibank N.A., (converts to FRN on 2/19/21) (i), | |
3.165%, 2/19/22 | | | 740 | | | | 744,745 | |
Citigroup, Inc., | | | | | | | | |
2.976%, 11/5/30 (converts to FRN on 11/5/29) (i) | | | 85 | | | | 84,006 | |
4.65%, 7/30/45 | | | 90 | | | | 107,678 | |
4.70%, 1/30/25 (converts to FRN on 1/30/25) (e)(i) | | | 119 | | | | 103,530 | |
Columbia Pipeline Group, Inc., | | | | | | | | |
4.50%, 6/1/25 | | | 425 | | | | 421,345 | |
5.80%, 6/1/45 | | | 85 | | | | 90,533 | |
Comcast Corp., | | | | | | | | |
3.10%, 4/1/25 | | | 57 | | | | 60,699 | |
3.20%, 7/15/36 | | | 280 | | | | 294,489 | |
3.375%, 2/15/25 | | | 570 | | | | 607,115 | |
3.75%, 4/1/40 | | | 36 | | | | 39,716 | |
Comerica, Inc., | | | | | | | | |
3.70%, 7/31/23 | | | 180 | | | | 185,011 | |
Commonwealth Edison Co., | | | | | | | | |
5.90%, 3/15/36 | | | 90 | | | | 115,313 | |
Consolidated Edison Co. of New York, Inc., Ser. 06-E, | |
5.70%, 12/1/36 | | | 10 | | | | 13,025 | |
Consumers Energy Co., | | | | | | | | |
2.85%, 5/15/22 | | | 245 | | | | 247,385 | |
CSX Corp., | | | | | | | | |
4.75%, 5/30/42 | | | 90 | | | | 104,030 | |
CVS Health Corp., | | | | | | | | |
4.10%, 3/25/25 | | | 220 | | | | 232,306 | |
4.875%, 7/20/35 | | | 120 | | | | 135,811 | |
Deere & Co., | | | | | | | | |
3.75%, 4/15/50 | | | 57 | | | | 64,190 | |
| | | | | | | | |
| | | Principal
Amount
(000s) | | | Value | |
Discover Financial Services, Ser. C, (converts to FRN on 10/30/27) (e)(i), | |
5.50%, 10/30/27 | | $ | 185 | | | $ | 148,151 | |
DTE Electric Co., | | | | | | | | |
5.70%, 10/1/37 | | | 60 | | | | 75,030 | |
6.625%, 6/1/36, Ser. A | | | 10 | | | | 13,480 | |
DTE Energy Co., | | | | | | | | |
2.95%, 3/1/30 | | | 100 | | | | 96,083 | |
Duke Energy Carolinas LLC, | | | | | | | | |
4.25%, 12/15/41 | | | 35 | | | | 39,930 | |
Duke Energy Indiana LLC, | | | | | | | | |
3.25%, 10/1/49 | | | 35 | | | | 35,772 | |
3.75%, 5/15/46 | | | 10 | | | | 10,659 | |
Duke Energy Ohio, Inc., | | | | | | | | |
4.30%, 2/1/49 | | | 130 | | | | 152,077 | |
Duke Energy Progress LLC, | | | | | | | | |
6.125%, 9/15/33 | | | 25 | | | | 35,635 | |
Edison International, | | | | | | | | |
2.95%, 3/15/23 | | | 160 | | | | 154,477 | |
4.95%, 4/15/25 | | | 156 | | | | 158,777 | |
El Paso Natural Gas Co. LLC, | | | | | | | | |
8.375%, 6/15/32 | | | 142 | | | | 166,741 | |
Energy Transfer Operating L.P., | | | | | | | | |
2.90%, 5/15/25 | | | 392 | | | | 332,231 | |
4.05%, 3/15/25 | | | 152 | | | | 135,008 | |
4.75%, 1/15/26 | | | 195 | | | | 171,519 | |
6.50%, 2/1/42 | | | 195 | | | | 177,892 | |
7.125%, 2/15/30 (converts to FRN on 5/15/30) (e)(i) | | | 440 | | | | 270,072 | |
Eversource Energy, Ser. K, | | | | | | | | |
2.75%, 3/15/22 | | | 355 | | | | 354,888 | |
Express Scripts Holding Co., | | | | | | | | |
4.75%, 11/15/21 | | | 270 | | | | 274,214 | |
Fifth Third Bancorp, (converts to FRN on 6/30/23) (e)(i), | |
5.10%, 6/30/23 | | | 490 | | | | 397,241 | |
First Maryland Capital II, 3 mo. LIBOR + 0.850% (i), | |
2.613%, 2/1/27 | | | 40 | | | | 38,650 | |
Fiserv, Inc., | | | | | | | | |
4.40%, 7/1/49 | | | 60 | | | | 64,572 | |
Florida Power & Light Co., | | | | | | | | |
2.85%, 4/1/25 | | | 114 | | | | 116,666 | |
Fox Corp., 3.05%, 4/7/25 | | | 35 | | | | 35,368 | |
GE Capital International Funding Co. Unlimited Co., | |
2.342%, 11/15/20 | | | 50 | | | | 49,490 | |
General Dynamics Corp., | | | | | | | | |
3.25%, 4/1/25 | | | 290 | | | | 299,971 | |
General Electric Co., | | | | | | | | |
3 mo. LIBOR + 1.000%, 2.831%, 4/15/23 (i) | | | 289 | | | | 269,702 | |
5.55%, 1/5/26 | | | 105 | | | | 113,207 | |
6.75%, 3/15/32 | | | 205 | | | | 247,054 | |
General Motors Financial Co., Inc., | |
3.55%, 7/8/22 | | | 325 | | | | 300,685 | |
Georgia Power Co., Ser. B, | | | | | | | | |
3.70%, 1/30/50 | | | 45 | | | | 46,348 | |
Global Payments, Inc., | | | | | | | | |
2.65%, 2/15/25 | | | 295 | | | | 292,901 | |
Harborwalk Funding Trust, (converts to FRN on 2/15/49) (a)(b)(i), | |
5.077%, 2/15/69 | | | 150 | | | | 158,711 | |
Hess Corp., | | | | | | | | |
4.30%, 4/1/27 | | | 200 | | | | 146,531 | |
7.125%, 3/15/33 | | | 160 | | | | 122,688 | |
Huntington Bancshares, Inc., Ser. E, (converts to FRN on 4/15/23) (e)(i), | |
5.70%, 4/15/23 | | | 185 | | | | 148,091 | |
Huntington Capital Trust I, 3 mo. LIBOR + 0.700% (i), | |
2.477%, 2/1/27 | | | 245 | | | | 232,750 | |
Huntington Ingalls Industries Inc. (a)(b), | |
3.844%, 5/1/25 | | | 70 | | | | 71,454 | |
Intel Corp., | | | | | | | | |
3.10%, 2/15/60 | | | 65 | | | | 69,020 | |
| | | | | | |
| 150 | | Semiannual Report | | | March 31, 2020 | | | See accompanying Notes to Financial Statements |
Schedule of Investments
March 31, 2020 (unaudited)
| | | | | | | | |
| | | Principal
Amount
(000s) | | | Value | |
Jersey Central Power & Light Co., | |
6.15%, 6/1/37 | | $ | 170 | | | $ | 209,139 | |
JPMorgan Chase & Co. (i), | | | | | | | | |
3 mo. LIBOR + 0.950%, 2.713%, 2/2/37 | | | 445 | | | | 308,162 | |
4.493%, 3/24/31 (converts to FRN on 3/24/30) | | | 210 | | | | 241,812 | |
Kansas City Southern, | | | | | | | | |
4.20%, 11/15/69 | | | 105 | | | | 100,815 | |
Kinder Morgan Energy Partners L.P., | |
7.50%, 11/15/40 | | | 50 | | | | 55,237 | |
Kinder Morgan, Inc., | | | | | | | | |
4.30%, 6/1/25 | | | 455 | | | | 466,133 | |
L3Harris Technologies, Inc., | | | | | | | | |
3.95%, 5/28/24 (a)(b) | | | 150 | | | | 157,545 | |
4.40%, 6/15/28 (a)(b) | | | 220 | | | | 237,967 | |
4.40%, 6/15/28 | | | 145 | | | | 156,842 | |
Lincoln National Corp., 3 mo. LIBOR + 2.358% (i), | |
4.049%, 5/17/66 | | | 270 | | | | 162,337 | |
Lowe’s Cos., Inc., | | | | | | | | |
4.65%, 4/15/42 | | | 70 | | | | 76,484 | |
Manufacturers & Traders Trust Co., | |
2.625%, 1/25/21 | | | 300 | | | | 300,421 | |
Marathon Petroleum Corp., | | | | | | | | |
5.85%, 12/15/45 | | | 110 | | | | 83,573 | |
Massachusetts Institute of Technology, | |
5.60%, 7/1/11 | | | 45 | | | | 75,572 | |
Mastercard Inc., | | | | | | | | |
3.85%, 3/26/50 | | | 84 | | | | 103,828 | |
MetLife, Inc. (a)(b), | | | | | | | | |
9.25%, 4/8/38 | | | 95 | | | | 117,325 | |
Microsoft Corp., | | | | | | | | |
4.875%, 12/15/43 | | | 225 | | | | 309,608 | |
New York Life Insurance Co. (a)(b), | |
4.45%, 5/15/69 | | | 135 | | | | 140,276 | |
NiSource, Inc., | | | | | | | | |
3.49%, 5/15/27 | | | 435 | | | | 439,752 | |
6.25%, 12/15/40 | | | 140 | | | | 198,161 | |
Northrop Grumman Corp., | | | | | | | | |
3.20%, 2/1/27 | | | 435 | | | | 450,042 | |
4.03%, 10/15/47 | | | 40 | | | | 45,638 | |
Northrop Grumman Systems Corp., | |
7.875%, 3/1/26 | | | 160 | | | | 172,059 | |
Nuveen Finance LLC (a)(b), | | | | | | | | |
4.125%, 11/1/24 | | | 690 | | | | 677,824 | |
Oncor Electric Delivery Co LLC, | | | | | | | | |
2.95%, 4/1/25 | | | 103 | | | | 106,816 | |
Oracle Corp., | | | | | | | | |
2.50%, 4/1/25 | | | 105 | | | | 107,315 | |
3.60%, 4/1/50 | | | 100 | | | | 99,070 | |
PacifiCorp, | | | | | | | | |
4.15%, 2/15/50 | | | 135 | | | | 154,393 | |
PepsiCo, Inc., | | | | | | | | |
4.45%, 4/14/46 | | | 115 | | | | 150,420 | |
Plains All American Pipeline L.P., | | | | | | | | |
4.65%, 10/15/25 | | | 415 | | | | 333,975 | |
6.125%, 11/15/22, Ser. B (converts to FRN on 11/15/22) (e)(i) | | | 225 | | | | 112,893 | |
6.65%, 1/15/37 | | | 170 | | | | 135,377 | |
PPL Electric Utilities Corp., | | | | | | | | |
5.20%, 7/15/41 | | | 140 | | | | 172,416 | |
President & Fellows of Harvard College, | |
4.875%, 10/15/40 | | | 65 | | | | 86,318 | |
Public Service Co of Colorado, | | | | | | | | |
2.25%, 9/15/22 | | | 245 | | | | 244,433 | |
4.75%, 8/15/41 | | | 77 | | | | 89,396 | |
| | | | | | | | |
| | | Principal
Amount
(000s) | | | Value | |
San Diego Gas & Electric Co., Ser. NNN, | |
3.60%, 9/1/23 | | $ | 610 | | | $ | 634,058 | |
Sempra Energy, | | | | | | | | |
3.55%, 6/15/24 | | | 275 | | | | 274,499 | |
3.80%, 2/1/38 | | | 95 | | | | 91,832 | |
Southern California Edison Co., | | | | | | | | |
3.70%, 8/1/25, Ser. E | | | 105 | | | | 108,669 | |
3.90%, 12/1/41 | | | 275 | | | | 261,254 | |
State Street Corp. (i), | | | | | | | | |
3 mo. LIBOR + 1.000%, 1.741%, 6/15/47 | | | 300 | | | | 233,250 | |
3.152%, 3/30/31 (converts to FRN on 3/30/30) (a)(b) | | | 50 | | | | 51,295 | |
Synchrony Bank, | | | | | | | | |
3.65%, 5/24/21 | | | 95 | | | | 93,723 | |
Target Corp., | | | | | | | | |
2.25%, 4/15/25 | | | 175 | | | | 177,138 | |
3.90%, 11/15/47 | | | 20 | | | | 23,525 | |
Time Warner Cable LLC, | | | | | | | | |
4.50%, 9/15/42 | | | 105 | | | | 99,860 | |
6.55%, 5/1/37 | | | 225 | | | | 258,793 | |
Truist Financial Corp., | | | | | | | | |
2.70%, 1/27/22 | | | 885 | | | | 892,368 | |
5.125%, 12/15/27, Ser. M (converts to FRN on 12/15/27) (e)(i) | | | 55 | | | | 46,795 | |
Union Pacific Corp., | | | | | | | | |
3.75%, 2/5/70 | | | 48 | | | | 49,352 | |
United Parcel Service, Inc., | | | | | | | | |
3.40%, 9/1/49 | | | 150 | | | | 151,693 | |
United Technologies Corp., | | | | | | | | |
4.15%, 5/15/45 | | | 165 | | | | 183,687 | |
6.125%, 7/15/38 | | | 20 | | | | 26,629 | |
UnitedHealth Group, Inc., | | | | | | | | |
3.50%, 8/15/39 | | | 285 | | | | 307,640 | |
Verizon Communications, Inc., | | | | | | | | |
5.25%, 3/16/37 | | | 165 | | | | 212,624 | |
ViacomCBS, Inc., | | | | | | | | |
3.125%, 6/15/22 | | | 490 | | | | 498,067 | |
4.75%, 5/15/25 | | | 102 | | | | 102,377 | |
5.25%, 4/1/44 | | | 45 | | | | 42,972 | |
6.25%, 2/28/57 (converts to FRN on 2/28/27) (i) | | | 69 | | | | 59,707 | |
Virginia Electric & Power Co., | | | | | | | | |
2.75%, 3/15/23, Ser. C | | | 220 | | | | 223,598 | |
3.80%, 4/1/28, Ser. A | | | 100 | | | | 108,174 | |
3.80%, 9/15/47, Ser. B | | | 150 | | | | 162,066 | |
Visa, Inc., | | | | | | | | |
1.90%, 4/15/27 | | | 260 | | | | 260,312 | |
Walt Disney Co., | | | | | | | | |
4.70%, 3/23/50 | | | 45 | | | | 58,673 | |
Wells Fargo & Co., | | | | | | | | |
5.95%, 12/1/86 | | | 110 | | | | 138,334 | |
| | | | | | | | |
| |
| | | | 31,764,763 | |
| | | | | | | | |
Total Corporate Bonds & Notes (cost—$36,074,535) | | | | | | | 33,957,770 | |
| | | | | | | | |
| | | | | | | | |
| | |
| | | Shares | | | | |
| |
| Common Stock—28.8% | | | | | |
| |
| Argentina—0.0% | | | | | |
MercadoLibre, Inc. (k) | | | 66 | | | | 32,246 | |
| | | | | | | | |
| |
| Australia—0.5% | | | | | |
Atlassian Corp. PLC, Class A (k) | | | 242 | | | | 33,217 | |
Aurizon Holdings Ltd. | | | 7,214 | | | | 18,696 | |
Austal Ltd. | | | 11,178 | | | | 20,188 | |
BHP Group Ltd. | | | 2,163 | | | | 39,240 | |
Brickworks Ltd. | | | 1,877 | | | | 15,355 | |
| | | | | | | | |
| | |
Shares | | | Value | |
Coca-Cola Amatil Ltd. | | | 3,636 | | | $ | 19,624 | |
CSL Ltd. | | | 323 | | | | 58,551 | |
Flight Centre Travel Group Ltd. (d)(f) | | | 801 | | | | 5,057 | |
Fortescue Metals Group Ltd. | | | 3,264 | | | | 20,002 | |
Goodman Group REIT | | | 4,180 | | | | 30,638 | |
IDP Education Ltd. (d)(f) | | | 1,339 | | | | 10,441 | |
Jupiter Mines Ltd. | | | 77,016 | | | | 10,544 | |
National Australia Bank Ltd. | | | 3,793 | | | | 38,908 | |
Newcrest Mining Ltd. | | | 2,060 | | | | 28,289 | |
Regis Resources Ltd. | | | 7,776 | | | | 17,281 | |
Rio Tinto Ltd. | | | 410 | | | | 21,123 | |
Saracen Mineral Holdings Ltd. (k) | | | 10,262 | | | | 23,076 | |
Select Harvests Ltd. | | | 4,720 | | | | 20,197 | |
Silver Lake Resources Ltd. (k) | | | 10,754 | | | | 9,158 | |
Sonic Healthcare Ltd. | | | 1,563 | | | | 23,492 | |
St. Barbara Ltd. | | | 6,297 | | | | 8,314 | |
Stockland REIT | | | 800 | | | | 1,230 | |
Telstra Corp. Ltd. | | | 17,437 | | | | 32,732 | |
Vicinity Centres REIT | | | 1,738 | | | | 1,087 | |
| | | | | | | | |
| | | | | | | 506,440 | |
| | | | | | | | |
| |
| Austria—0.1% | | | | | |
BAWAG Group AG (b) | | | 365 | | | | 10,182 | |
Erste Group Bank AG | | | 870 | | | | 15,928 | |
Flughafen Wien AG | | | 322 | | | | 8,414 | |
OMV AG | | | 453 | | | | 12,397 | |
Raiffeisen Bank International AG | | | 734 | | | | 10,558 | |
Telekom Austria AG | | | 987 | | | | 6,890 | |
| | | | | | | | |
| | | | | | | 64,369 | |
| | | | | | | | |
| |
| Belgium—0.1% | | | | | |
Aedifica S.A. REIT | | | 215 | | | | 22,317 | |
Ageas | | | 512 | | | | 21,336 | |
Elia Group S.A | | | 281 | | | | 27,371 | |
Proximus SADP | | | 1,263 | | | | 29,004 | |
| | | | | | | | |
| | | | | | | 100,028 | |
| | | | | | | | |
| |
| Bermuda—0.0% | | | | | |
Arch Capital Group Ltd. (k) | | | 876 | | | | 24,931 | |
| | | | | | | | |
| |
| Brazil—0.1% | | | | | |
Banco do Brasil S.A. | | | 4,400 | | | | 23,617 | |
BB Seguridade Participacoes S.A. | | | 1,900 | | | | 9,087 | |
BR Malls Participacoes S.A. | | | 5,400 | | | | 10,372 | |
Cia Brasileira de Distribuicao | | | 700 | | | | 8,937 | |
JBS S.A. | | | 4,300 | | | | 16,832 | |
Vale S.A. (k) | | | 3,345 | | | | 27,823 | |
WEG S.A. | | | 3,300 | | | | 21,320 | |
| | | | | | | | |
| | | | | | | 117,988 | |
| | | | | | | | |
| |
| Canada—0.6% | | | | | |
B2Gold Corp. | | | 5,679 | | | | 17,191 | |
Baytex Energy Corp. (k) | | | 1,346 | | | | 320 | |
Bonavista Energy Corp. | | | 3,032 | | | | 269 | |
Canadian Natural Resources Ltd. | | | 4,779 | | | | 65,370 | |
Cascades, Inc. | | | 1,630 | | | | 14,559 | |
Centerra Gold, Inc. | | | 1,967 | | | | 11,699 | |
Cogeco Communications, Inc. | | | 695 | | | | 47,148 | |
Crescent Point Energy Corp. | | | 346 | | | | 266 | |
Emera, Inc. | | | 695 | | | | 27,409 | |
Empire Co., Ltd., Class A | | | 793 | | | | 15,513 | |
Exchange Income Corp. | | | 529 | | | | 6,672 | |
Fairfax Financial Holdings Ltd. | | | 82 | | | | 25,138 | |
Franco-Nevada Corp. | | | 246 | | | | 24,579 | |
Genworth MI Canada, Inc. | | | 326 | | | | 7,244 | |
George Weston Ltd. | | | 545 | | | | 38,971 | |
Husky Energy, Inc. | | | 1,004 | | | | 2,526 | |
IA Financial Corp., Inc. | | | 428 | | | | 13,455 | |
InterRent Real Estate Investment Trust REIT | | | 1,332 | | | | 12,598 | |
Killam Apartment Real Estate Investment Trust REIT | | | 1,091 | | | | 12,233 | |
| | | | | | | | |
| See accompanying Notes to Financial Statements | | | March 31, 2020 | | | Semiannual Report | | | 151 | |
Schedule of Investments
March 31, 2020 (unaudited)
| | | | | | | | |
| | |
Shares | | | Value | |
Lundin Mining Corp. | | | 10,708 | | | $ | 40,251 | |
Magellan Aerospace Corp. | | | 541 | | | | 2,503 | |
Manulife Financial Corp. | | | 3,960 | | | | 49,722 | |
Open Text Corp. | | | 698 | | | | 24,407 | |
Power Corp. of Canada | | | 2,816 | | | | 45,302 | |
Restaurant Brands International, Inc. | | | 599 | | | | 24,138 | |
Sun Life Financial, Inc. | | | 945 | | | | 30,399 | |
Suncor Energy, Inc. | | | 3,958 | | | | 63,168 | |
Toronto-Dominion Bank | | | 1,612 | | | | 68,533 | |
| | | | | | | | |
| | | | | | | 691,583 | |
| | | | | | | | |
| |
| Chile—0.0% | | | | | |
Empresa Nacional de Telecomunicaciones S.A. (k) | | | 2,402 | | | | 10,152 | |
Engie Energia Chile S.A. | | | 8,600 | | | | 9,485 | |
| | | | | | | | |
| | | | | | | 19,637 | |
| | | | | | | | |
| |
| China—1.2% | | | | | |
Alibaba Group Holding Ltd. ADR (k) | | | 799 | | | | 155,390 | |
Autohome, Inc. ADR (k) | | | 297 | | | | 21,093 | |
Baidu, Inc. ADR (k) | | | 203 | | | | 20,460 | |
Bank of China Ltd., Class H | | | 100,000 | | | | 38,066 | |
BOC Aviation Ltd. (b) | | | 3,400 | | | | 21,480 | |
China Conch Venture Holdings Ltd. | | | 4,500 | | | | 19,958 | |
China Construction Bank Corp., Class H | | | 146,064 | | | | 118,728 | |
China Dongxiang Group Co., Ltd. | | | 43,117 | | | | 3,709 | |
China Everbright Greentech Ltd. (b) | | | 32,000 | | | | 13,365 | |
China Lumena New Materials Corp. (d)(f)(k) | | | 44 | | | | — | † |
China Minsheng Banking Corp., Ltd., Class H | | | 20,000 | | | | 14,793 | |
China Mobile Ltd. | | | 17,000 | | | | 127,403 | |
China SCE Group Holdings Ltd. | | | 63,000 | | | | 27,804 | |
China Telecom Corp., Ltd., Class H | | | 64,000 | | | | 19,391 | |
China Water Affairs Group Ltd. | | | 10,000 | | | | 7,468 | |
Chongqing Rural Commercial Bank Co., Ltd., Class H | | | 6,488 | | | | 2,643 | |
CITIC Ltd. | | | 13,000 | | | | 13,473 | |
Country Garden Holdings Co., Ltd. | | | 16,000 | | | | 19,128 | |
Country Garden Services Holdings Co., Ltd. | | | 5,172 | | | | 20,811 | |
EVA Precision Industrial Holdings Ltd. | | | 20,236 | | | | 1,279 | |
Golden Eagle Retail Group Ltd. | | | 6,000 | | | | 5,882 | |
Industrial & Commercial Bank of China Ltd., Class H | | | 72,000 | | | | 49,117 | |
JD.com, Inc. ADR (k) | | | 789 | | | | 31,955 | |
Jiangsu Expressway Co., Ltd., Class H | | | 5,189 | | | | 5,767 | |
Ju Teng International Holdings Ltd. | | | 4,744 | | | | 871 | |
Lenovo Group Ltd. | | | 60,000 | | | | 31,785 | |
Meituan Dianping, Class B (k) | | | 2,400 | | | | 28,611 | |
NetEase, Inc. ADR | | | 91 | | | | 29,207 | |
Ping An Insurance Group Co. of China Ltd., Class H | | | 6,500 | | | | 63,481 | |
Postal Savings Bank of China Co., Ltd., Class H (b) | | | 22,000 | | | | 13,394 | |
Shenzhen Expressway Co., Ltd., Class H | | | 25,700 | | | | 25,983 | |
Shenzhen International Holdings Ltd. | | | 6,500 | | | | 11,788 | |
| | | | | | | | |
| | |
Shares | | | Value | |
Shenzhen Investment Holdings Bay Area Development Co., Ltd. | | | 30,000 | | | $ | 10,442 | |
Sinotruk Hong Kong Ltd. | | | 6,500 | | | | 10,677 | |
TAL Education Group ADR (k) | | | 540 | | | | 28,760 | |
Tencent Holdings Ltd. | | | 3,981 | | | | 196,771 | |
Tong Ren Tang Technologies Co., Ltd., Class H | | | 2,726 | | | | 2,159 | |
Yuexiu Real Estate Investment Trust REIT | | | 13,000 | | | | 6,360 | |
Yuexiu Transport Infrastructure Ltd. | | | 16,000 | | | | 9,683 | |
Yuzhou Properties Co., Ltd. | | | 44,796 | | | | 18,871 | |
| | | | | | | | |
| | | | | | | 1,248,006 | |
| | | | | | | | |
| |
| Colombia—0.0% | | | | | |
Corp. Financiera Colombiana S.A. (k) | | | 2,511 | | | | 15,936 | |
| | | | | | | | |
| |
| Czech Republic—0.1% | | | | | |
CEZ AS | | | 1,225 | | | | 19,984 | |
Moneta Money Bank AS (b) | | | 6,630 | | | | 13,655 | |
O2 Czech Republic AS | | | 2,387 | | | | 21,717 | |
| | | | | | | | |
| | | | | | | 55,356 | |
| | | | | | | | |
| |
| Denmark—0.1% | | | | | |
Carlsberg A/S, Class B | | | 403 | | | | 45,370 | |
Solar A/S, Class B | | | 111 | | | | 3,250 | |
Spar Nord Bank A/S | | | 377 | | | | 2,276 | |
Topdanmark A/S | | | 384 | | | | 15,409 | |
Tryg A/S | | | 1,482 | | | | 36,071 | |
| | | | | | | | |
| | | | | | | 102,376 | |
| | | | | | | | |
| |
| Finland—0.1% | | | | | |
Elisa Oyj | | | 611 | | | | 37,713 | |
Metsa Board Oyj | | | 429 | | | | 2,321 | |
Neste Oyj | | | 1,601 | | | | 53,229 | |
Oriola Oyj, Class B | | | 700 | | | | 1,264 | |
| | | | | | | | |
| | | | | | | 94,527 | |
| | | | | | | | |
| |
| France—0.9% | | | | | |
Amundi S.A. (b) | | | 319 | | | | 18,457 | |
APERAM S.A. | | | 51 | | | | 1,079 | |
Atos SE | | | 724 | | | | 48,237 | |
AXA S.A. | | | 2,138 | | | | 36,200 | |
BNP Paribas S.A. | | | 1,125 | | | | 32,845 | |
Boiron S.A. | | | 31 | | | | 961 | |
Cegereal S.A. REIT | | | 421 | | | | 16,606 | |
Cie Generale des Etablissements Michelin SCA | | | 404 | | | | 35,384 | |
CNP Assurances | | | 3,786 | | | | 36,658 | |
Credit Agricole S.A. | | | 1,293 | | | | 9,149 | |
Eiffage S.A. | | | 334 | | | | 23,708 | |
Engie S.A. | | | 8,659 | | | | 88,672 | |
Faurecia SE | | | 378 | | | | 11,068 | |
Hermes International | | | 85 | | | | 57,835 | |
Kering S.A. | | | 77 | | | | 40,149 | |
Klepierre S.A. REIT | | | 1,044 | | | | 19,900 | |
L’Oreal S.A. | | | 164 | �� | | | 42,445 | |
LVMH Moet Hennessy Louis Vuitton SE | | | 247 | | | | 90,588 | |
Orange S.A. | | | 2,801 | | | | 33,913 | |
Peugeot S.A. | | | 1,273 | | | | 16,574 | |
Publicis Groupe S.A. | | | 544 | | | | 15,547 | |
Renault S.A. | | | 629 | | | | 11,954 | |
Schneider Electric SE | | | 746 | | | | 63,054 | |
SEB S.A. | | | 19 | | | | 2,353 | |
Societe Generale S.A. | | | 2,112 | | | | 34,599 | |
Sodexo S.A. | | | 194 | | | | 13,028 | |
Teleperformance | | | 119 | | | | 24,647 | |
Total S.A. | | | 2,036 | | | | 76,714 | |
Vinci S.A. | | | 1,145 | | | | 93,557 | |
| | | | | | | | |
| | | | | | | 995,881 | |
| | | | | | | | |
| | | | | | | | |
| | |
Shares | | | Value | |
| |
| Georgia—0.0% | | | | | |
TBC Bank Group PLC | | | 579 | | | $ | 5,163 | |
| | | | | | | | |
| |
| Germany—0.4% | | | | | |
Bayerische Motoren Werke AG | | | 393 | | | | 20,062 | |
Cewe Stiftung & Co. KGAA | | | 101 | | | | 8,886 | |
Daimler AG | | | 1,045 | | | | 31,208 | |
Deutsche Boerse AG | | | 260 | | | | 35,720 | |
Deutsche Lufthansa AG | | | 2,491 | | | | 23,299 | |
Deutsche Telekom AG | | | 3,723 | | | | 48,084 | |
DWS Group GmbH & Co. KGaA (b) | | | 573 | | | | 13,911 | |
Hannover Rueck SE | | | 170 | | | | 24,005 | |
HeidelbergCement AG | | | 509 | | | | 21,746 | |
Muenchener Rueckversicherungs-Gesellschaft AG in Muenchen | | | 454 | | | | 91,286 | |
Puma SE | | | 377 | | | | 22,151 | |
Sixt SE | | | 37 | | | | 1,958 | |
TAG Immobilien AG | | | 1,546 | | | | 30,404 | |
Talanx AG (k) | | | 791 | | | | 26,614 | |
TLG Immobilien AG | | | 794 | | | | 12,592 | |
Varta AG (k) | | | 149 | | | | 10,484 | |
WCM Beteiligungs & Grundbesitz AG | | | 2,676 | | | | 8,159 | |
| | | | | | | | |
| | | | | | | 430,569 | |
| | | | | | | | |
| |
| Greece—0.0% | | | | | |
Hellenic Telecommunications Organization S.A. | | | 1,562 | | | | 18,882 | |
| | | | | | | | |
| |
| Hong Kong—0.2% | | | | | |
Cathay Pacific Airways Ltd. | | | 1,543 | | | | 1,644 | |
CITIC Telecom International Holdings Ltd. | | | 37,000 | | | | 12,209 | |
CK Hutchison Holdings Ltd. | | | 6,797 | | | | 45,303 | |
CLP Holdings Ltd. | | | 10,281 | | | | 94,174 | |
Dah Sing Banking Group Ltd. | | | 1,623 | | | | 1,405 | |
Fairwood Holdings Ltd. | | | 5,000 | | | | 9,470 | |
Global Brands Group Holding Ltd. (k) | | | 61,400 | | | | 1,616 | |
Hang Seng Bank Ltd. | | | 1,100 | | | | 18,741 | |
Hui Xian Real Estate Investment Trust REIT | | | 15,000 | | | | 4,720 | |
Kerry Properties Ltd. | | | 2,743 | | | | 7,173 | |
NWS Holdings Ltd. | | | 6,000 | | | | 6,114 | |
Shanghai Industrial Urban Development Group Ltd. | | | 17,000 | | | | 1,605 | |
Swire Pacific Ltd., Class A | | | 3,656 | | | | 23,273 | |
Yue Yuen Industrial Holdings Ltd. | | | 698 | | | | 1,067 | |
| | | | | | | | |
| | | | | | | 228,514 | |
| | | | | | | | |
| |
| Hungary—0.1% | | | | | |
Magyar Telekom Telecommunications PLC | | | 30,802 | | | | 34,302 | |
MOL Hungarian Oil & Gas PLC | | | 2,686 | | | | 15,761 | |
OTP Bank Nyrt | | | 1,271 | | | | 36,458 | |
| | | | | | | | |
| | | | | | | 86,521 | |
| | | | | | | | |
| |
| Indonesia—0.0% | | | | | |
Indofood CBP Sukses Makmur Tbk PT | | | 16,600 | | | | 10,354 | |
Media Nusantara Citra Tbk PT | | | 154,400 | | | | 8,531 | |
Wijaya Karya Persero Tbk PT | | | 153,500 | | | | 7,775 | |
| | | | | | | | |
| | | | | | | 26,660 | |
| | | | | | | | |
| |
| Ireland—0.1% | | | | | |
Irish Residential Properties REIT PLC | | | 1,116 | | | | 1,511 | |
Kingspan Group PLC | | | 489 | | | | 26,097 | |
Medtronic PLC | | | 1,293 | | | | 116,603 | |
Origin Enterprises PLC | | | 320 | | | | 721 | |
| | | | | | | | |
| | | | | | | 144,932 | |
| | | | | | | | |
| | | | | | |
| 152 | | Semiannual Report | | | March 31, 2020 | | | See accompanying Notes to Financial Statements |
Schedule of Investments
March 31, 2020 (unaudited)
| | | | | | | | |
| | |
Shares | | | Value | |
| |
| Israel—0.1% | | | | | |
B Communications Ltd. (k) | | | 1,705 | | | $ | 1,511 | |
Bank Leumi Le-Israel BM | | | 5,359 | | | | 29,549 | |
Equital Ltd. (k) | | | — | †† | | | 3 | |
First International Bank of Israel Ltd. | | | 396 | | | | 9,568 | |
Formula Systems 1985 Ltd. | | | 180 | | | | 9,938 | |
Israel Discount Bank Ltd., Class A | | | 6,144 | | | | 17,915 | |
Mellanox Technologies Ltd. (k) | | | 160 | | | | 19,411 | |
Mizrahi Tefahot Bank Ltd. | | | 1,385 | | | | 25,492 | |
Shufersal Ltd. | | | 769 | | | | 4,352 | |
| | | | | | | | |
| | | | | | | 117,739 | |
| | | | | | | | |
| |
| Italy—0.3% | | | | | |
Assicurazioni Generali SpA | | | 3,077 | | | | 41,677 | |
Enav SpA (b) | | | 3,145 | | | | 13,867 | |
Enel SpA | | | 18,941 | | | | 130,652 | |
Eni SpA | | | 1,498 | | | | 14,886 | |
Intesa Sanpaolo SpA | | | 35,109 | | | | 56,808 | |
Mediobanca Banca di Credito Finanziario SpA | | | 1,860 | | | | 10,143 | |
Poste Italiane SpA (b) | | | 1,506 | | | | 12,676 | |
Snam SpA | | | 15,927 | | | | 72,791 | |
Unipol Gruppo SpA | | | 2,831 | | | | 9,655 | |
| | | | | | | | |
| | | | | | | 363,155 | |
| | | | | | | | |
| |
| Japan—2.7% | | | | | |
ADEKA Corp. | | | 26 | | | | 324 | |
Aida Engineering Ltd. | | | 142 | | | | 898 | |
ANA Holdings, Inc. | | | 1,545 | | | | 37,642 | |
Aoyama Trading Co., Ltd. | | | 111 | | | | 950 | |
Asahi Group Holdings Ltd. | | | 1,100 | | | | 35,688 | |
Astellas Pharma, Inc. | | | 5,092 | | | | 78,454 | |
Bookoff Group Holdings Ltd. | | | 400 | | | | 2,968 | |
Canon, Inc. | | | 1,210 | | | | 26,294 | |
Chubu Electric Power Co., Inc. | | | 1,500 | | | | 21,170 | |
Daiichi Sankyo Co., Ltd. | | | 500 | | | | 34,338 | |
Daito Pharmaceutical Co., Ltd. | | | 152 | | | | 4,160 | |
Daiwa Office Investment Corp. REIT | | | 2 | | | | 11,099 | |
DCM Holdings Co., Ltd. | | | 2,725 | | | | 25,205 | |
Doutor Nichires Holdings Co., Ltd. | | | 1,551 | | | | 23,532 | |
DTS Corp. | | | 1,098 | | | | 19,064 | |
DyDo Group Holdings, Inc. | | | 426 | | | | 14,379 | |
Electric Power Development Co., Ltd. | | | 1,000 | | | | 20,042 | |
FamilyMart Co., Ltd. | | | 1,200 | | | | 21,547 | |
FUJIFILM Holdings Corp. | | | 1,521 | | | | 74,954 | |
Fukuyama Transporting Co., Ltd. | | | 345 | | | | 12,277 | |
Geo Holdings Corp. | | | 536 | | | | 6,489 | |
Hitachi Ltd. | | | 1,100 | | | | 31,599 | |
Honda Motor Co., Ltd. | | | 2,600 | | | | 58,179 | |
Honeys Holdings Co., Ltd. | | | 39 | | | | 391 | |
Hoya Corp. | | | 500 | | | | 42,516 | |
Hulic Co., Ltd. | | | 2,000 | | | | 20,240 | |
ITOCHU Corp. | | | 4,377 | | | | 90,580 | |
Japan Airlines Co., Ltd. | | | 2,320 | | | | 42,636 | |
Japan Post Holdings Co., Ltd. | | | 3,100 | | | | 24,250 | |
Japan Post Insurance Co., Ltd. | | | 1,300 | | | | 16,062 | |
Japan Wool Textile Co., Ltd. | | | 2,200 | | | | 19,032 | |
JFE Holdings, Inc. | | | 700 | | | | 4,536 | |
Kajima Corp. | | | 4,100 | | | | 41,908 | |
Kamigumi Co., Ltd. | | | 1,100 | | | | 18,568 | |
Kandenko Co., Ltd. | | | 900 | | | | 7,153 | |
KDDI Corp. | | | 3,100 | | | | 91,570 | |
Kintetsu Group Holdings Co., Ltd. | | | 700 | | | | 32,398 | |
Konica Minolta, Inc. | | | 6,600 | | | | 26,590 | |
Kurita Water Industries Ltd. | | | 1,400 | | | | 32,119 | |
LaSalle Logiport REIT | | | 19 | | | | 25,755 | |
| | | | | | | | |
| | |
Shares | | | Value | |
McDonald’s Holdings Co. Japan Ltd. | | | 600 | | | $ | 27,061 | |
Mirait Holdings Corp. | | | 1,700 | | | | 21,106 | |
Mitsubishi Corp. | | | 3,500 | | | | 74,033 | |
Mitsubishi UFJ Financial Group, Inc. | | | 10,500 | | | | 39,286 | |
Mitsubishi UFJ Lease & Finance Co., Ltd. | | | 3,600 | | | | 17,621 | |
Mitsuboshi Belting Ltd. | | | 71 | | | | 793 | |
Mitsui & Co., Ltd. | | | 3,600 | | | | 49,981 | |
Mitsui Fudosan Co., Ltd. | | | 1,200 | | | | 20,778 | |
Morinaga Milk Industry Co., Ltd. | | | 600 | | | | 23,143 | |
NEC Corp. | | | 2,200 | | | | 80,109 | |
NET One Systems Co., Ltd. | | | 1,200 | | | | 24,969 | |
Nichias Corp. | | | 498 | | | | 9,241 | |
Nihon Unisys Ltd. | | | 821 | | | | 21,899 | |
Nippon REIT Investment Corp. REIT | | | 6 | | | | 17,768 | |
Nippon Telegraph & Telephone Corp. | | | 7,216 | | | | 172,582 | |
Nishimatsu Construction Co., Ltd. | | | 800 | | | | 15,274 | |
Nissan Motor Co., Ltd. | | | 4,859 | | | | 16,257 | |
Nisshin Seifun Group, Inc. | | | 1,700 | | | | 28,360 | |
NTT DOCOMO, Inc. | | | 7,843 | | | | 245,275 | |
Obayashi Corp. | | | 5,127 | | | | 43,505 | |
Okumura Corp. | | | 1,000 | | | | 20,676 | |
Olympus Corp. | | | 1,900 | | | | 27,389 | |
Pacific Industrial Co., Ltd. | | | 224 | | | | 1,938 | |
Raito Kogyo Co., Ltd. | | | 2,063 | | | | 23,326 | |
Rengo Co., Ltd. | | | 1,100 | | | | 8,550 | |
S Foods, Inc. | | | 172 | | | | 3,553 | |
Sankyo Co., Ltd. | | | 1,000 | | | | 29,001 | |
Sanyo Special Steel Co., Ltd. | | | 182 | | | | 1,626 | |
Sawai Pharmaceutical Co., Ltd. | | | 525 | | | | 28,130 | |
Sekisui House Ltd. | | | 1,800 | | | | 29,686 | |
Senko Group Holdings Co., Ltd. | | | 2,496 | | | | 19,309 | |
Shibaura Electronics Co., Ltd. | | | 200 | | | | 3,760 | |
Softbank Corp. | | | 2,400 | | | | 30,573 | |
SoftBank Group Corp. | | | 2,000 | | | | 70,805 | |
Sojitz Corp. | | | 2,584 | | | | 6,059 | |
Sony Corp. | | | 900 | | | | 53,310 | |
Sony Financial Holdings, Inc. | | | 1,300 | | | | 21,829 | |
Sumitomo Chemical Co., Ltd. | | | 9,900 | | | | 29,249 | |
Sumitomo Corp. | | | 6,100 | | | | 69,566 | |
Sumitomo Densetsu Co., Ltd. | | | 300 | | | | 6,139 | |
Sumitomo Mitsui Financial Group, Inc. | | | 1,500 | | | | 36,440 | |
Sumitomo Rubber Industries Ltd. | | | 1,500 | | | | 14,089 | |
Sushiro Global Holdings Ltd. | | | 1,600 | | | | 23,456 | |
Suzuken Co., Ltd. | | | 600 | | | | 21,799 | |
Takasago Thermal Engineering Co., Ltd. | | | 1,397 | | | | 21,362 | |
TIS, Inc. | | | 600 | | | | 9,950 | |
Toho Co., Ltd. | | | 600 | | | | 18,346 | |
Tokyo Electron Ltd. | | | 200 | | | | 37,275 | |
Tokyo Gas Co., Ltd. | | | 1,200 | | | | 28,276 | |
Tokyu Construction Co., Ltd. | | | 700 | | | | 3,676 | |
Tosoh Corp. | | | 1,800 | | | | 20,342 | |
Towa Pharmaceutical Co., Ltd. | | | 414 | | | | 8,654 | |
Toyo Seikan Group Holdings Ltd. | | | 1,700 | | | | 19,392 | |
Toyo Suisan Kaisha Ltd. | | | 700 | | | | 33,833 | |
Toyota Motor Corp. | | | 1,651 | | | | 99,497 | |
Tsuruha Holdings, Inc. | | | 100 | | | | 13,185 | |
Tv Tokyo Holdings Corp. | | | 266 | | | | 5,926 | |
Yorozu Corp. | | | 259 | | | | 2,520 | |
Yurtec Corp. | | | 132 | | | | 748 | |
| | | | | | | | |
| | | | | | | 2,949,837 | |
| | | | | | | | |
| |
| Korea (Republic of)—0.4% | | | | | |
Daeduck Electronics Co. | | | 2,244 | | | | 13,266 | |
Daekyo Co., Ltd. | | | 777 | | | | 3,769 | |
| | | | | | | | |
| | |
Shares | | | Value | |
Daelim Industrial Co., Ltd. | | | 283 | | | $ | 16,969 | |
Easy Bio, Inc. | | | 559 | | | | 1,632 | |
GS Holdings Corp. | | | 510 | | | | 15,375 | |
Hana Financial Group, Inc. | | | 408 | | | | 7,676 | |
Hansol Paper Co., Ltd. | | | 477 | | | | 4,076 | |
HDC Hyundai Development Co-Engineering & Construction | | | 1 | | | | 13 | |
HDC Hyundai Engineering Plastics Co., Ltd. | �� | | 864 | | | | 1,954 | |
KB Financial Group, Inc. | | | 660 | | | | 18,562 | |
KC Co., Ltd. | | | 70 | | | | 721 | |
KC Tech Co., Ltd. | | | 103 | | | | 1,379 | |
Kia Motors Corp. | | | 646 | | | | 13,598 | |
KT Corp. | | | 221 | | | | 3,577 | |
KT&G Corp. | | | 498 | | | | 30,491 | |
Kukdo Chemical Co., Ltd. | | | 130 | | | | 4,117 | |
LG HelloVision Co., Ltd. | | | 889 | | | | 2,222 | |
Lotte Shopping Co., Ltd. | | | 206 | | | | 12,597 | |
Macquarie Korea Infrastructure Fund | | | 2,320 | | | | 20,603 | |
NCSoft Corp. | | | 50 | | | | 26,685 | |
Partron Co., Ltd. | | | 2,165 | | | | 13,362 | |
Samsung Electronics Co., Ltd. | | | 917 | | | | 35,654 | |
Samsung Electronics Co., Ltd. GDR | | | 69 | | | | 68,517 | |
Samsung Fire & Marine Insurance Co., Ltd. | | | 177 | | | | 22,386 | |
Shinhan Financial Group Co., Ltd. | | | 1,175 | | | | 27,488 | |
SK Hynix, Inc. | | | 599 | | | | 40,495 | |
SK Telecom Co., Ltd. | | | 172 | | | | 25,017 | |
Ubiquoss Holdings, Inc. | | | 633 | | | | 10,622 | |
Ubiquoss, Inc. | | | 140 | | | | 2,416 | |
Woori Financial Group, Inc. | | | 2,528 | | | | 15,728 | |
| | | | | | | | |
| | | | | | | 460,967 | |
| | | | | | | | |
| |
| Malaysia—0.1% | | | | | |
Axis Real Estate Investment Trust REIT | | | 11,200 | | | | 4,744 | |
Bermaz Auto Bhd. | | | 9,500 | | | | 2,474 | |
Hong Leong Bank Bhd. | | | 6,000 | | | | 18,561 | |
KNM Group Bhd. (k) | | | 31,700 | | | | 832 | |
Malayan Banking Bhd. | | | 25,300 | | | | 43,650 | |
Maxis Bhd. | | | 3,200 | | | | 3,972 | |
MISC Bhd. | | | 7,300 | | | | 12,524 | |
Syarikat Takaful Malaysia Keluarga Bhd. | | | 4,000 | | | | 3,015 | |
Tenaga Nasional Bhd. | | | 7,300 | | | | 20,317 | |
TIME dotCom Bhd. | | | 4,200 | | | | 8,941 | |
VS Industry Bhd. | | | 13,575 | | | | 2,389 | |
| | | | | | | | |
| | | | | | | 121,419 | |
| | | | | | | | |
| |
| Mexico—0.1% | | | | | |
Alfa S.A.B de C.V., Class A | | | 22,800 | | | | 6,151 | |
Banco del Bajio S.A. (b) | | | 8,700 | | | | 7,511 | |
Grupo Aeroportuario del Centro Norte S.A.B de C.V. | | | 2,800 | | | | 9,462 | |
Grupo Financiero Banorte S.A.B de C.V., Class O | | | 4,600 | | | | 12,604 | |
Grupo Lala S.A.B de C.V. | | | 4,496 | | | | 2,032 | |
Qualitas Controladora S.A.B. de C.V. | | | 5,100 | | | | 13,099 | |
| | | | | | | | |
| | | | | | | 50,859 | |
| | | | | | | | |
| |
| Morocco—0.0% | | | | | |
Douja Promotion Groupe Addoha S.A. (k) | | | 3,431 | | | | 2,231 | |
| | | | | | | | |
| |
| Netherlands—0.4% | | | | | |
AerCap Holdings NV (k) | | | 365 | | | | 8,318 | |
Airbus SE | | | 813 | | | | 52,424 | |
ASM International NV | | | 229 | | | | 23,299 | |
ASR Nederland NV | | | 1,070 | | | | 26,903 | |
| | | | | | | | |
| See accompanying Notes to Financial Statements | | | March 31, 2020 | | | Semiannual Report | | | 153 | |
Schedule of Investments
March 31, 2020 (unaudited)
| | | | | | | | |
| | |
Shares | | | Value | |
Coca-Cola European Partners PLC | | | 1,616 | | | $ | 60,649 | |
ING Groep NV | | | 4,347 | | | | 22,274 | |
Just Eat Takeaway (b)(k) | | | 279 | | | | 21,099 | |
Koninklijke Ahold Delhaize NV | | | 3,925 | | | | 91,439 | |
Signify NV (b) | | | 314 | | | | 6,085 | |
Unilever NV | | | 1,686 | | | | 82,869 | |
Vastned Retail NV REIT | | | 232 | | | | 3,893 | |
Wolters Kluwer NV | | | 641 | | | | 45,373 | |
| | | | | | | | |
| | | | | | | 444,625 | |
| | | | | | | | |
| |
| New Zealand—0.1% | | | | | |
a2 Milk Co., Ltd. (k) | | | 2,284 | | | | 23,332 | |
Air New Zealand Ltd. | | | 26,556 | | | | 13,308 | |
Arvida Group Ltd. | | | 9,216 | | | | 6,857 | |
Fisher & Paykel Healthcare Corp. Ltd. | | | 1,333 | | | | 24,232 | |
Kiwi Property Group Ltd. REIT | | | 1,590 | | | | 887 | |
Summerset Group Holdings Ltd. | | | 5,883 | | | | 18,996 | |
Tourism Holdings Ltd. | | | 4,537 | | | | 2,928 | |
| | | | | | | | |
| | | | | | | 90,540 | |
| | | | | | | | |
| |
| Norway—0.1% | | | | | |
Avance Gas Holding Ltd. (b) | | | 97 | | | | 199 | |
Elkem ASA (b) | | | 2,558 | | | | 3,224 | |
Frontline Ltd. | | | 2,578 | | | | 25,533 | |
Mowi ASA | | | 1,011 | | | | 15,286 | |
Orkla ASA | | | 2,541 | | | | 21,770 | |
| | | | | | | | |
| | | | | | | 66,012 | |
| | | | | | | | |
| |
| Peru—0.0% | | | | | |
Ferreycorp SAA | | | 19,594 | | | | 7,194 | |
| | | | | | | | |
| |
| Philippines—0.1% | | | | | |
Globe Telecom, Inc. | | | 185 | | | | 7,011 | |
Megaworld Corp. | | | 205,000 | | | | 10,046 | |
PLDT, Inc. | | | 345 | | | | 7,631 | |
Robinsons Land Corp. | | | 37,900 | | | | 11,027 | |
SM Prime Holdings, Inc. | | | 21,700 | | | | 12,051 | |
Vista Land & Lifescapes, Inc. | | | 145,700 | | | | 11,665 | |
| | | | | | | | |
| | | | | | | 59,431 | |
| | | | | | | | |
| |
| Poland—0.1% | | | | | |
Asseco Poland S.A. | | | 1,513 | | | | 21,136 | |
Ciech S.A. (k) | | | 570 | | | | 3,679 | |
PlayWay S.A. | | | 132 | | | | 9,600 | |
TEN Square Games S.A. | | | 148 | | | | 9,928 | |
| | | | | | | | |
| | | | | | | 44,343 | |
| | | | | | | | |
| |
| Portugal—0.0% | | | | | |
Jeronimo Martins SGPS S.A. | | | 1,176 | | | | 21,226 | |
| | | | | | | | |
| |
| Russian Federation—0.0% | | | | | |
Surgutneftegas PJSC ADR | | | 669 | | | | 2,772 | |
| | | | | | | | |
| |
| Singapore—0.3% | | | | | |
Accordia Golf Trust UNIT | | | 12,500 | | | | 4,227 | |
CapitaLand Mall Trust REIT | | | 25,200 | | | | 31,598 | |
ComfortDelGro Corp. Ltd. | | | 11,400 | | | | 12,139 | |
Fortune Real Estate Investment Trust REIT | | | 22,000 | | | | 20,225 | |
Frasers Logistics & Industrial Trust REIT | | | 29,500 | | | | 18,237 | |
Keppel DC REIT | | | 16,500 | | | | 26,481 | |
Mapletree Commercial Trust REIT | | | 15,101 | | | | 19,368 | |
Oversea-Chinese Banking Corp., Ltd. | | | 4,400 | | | | 26,659 | |
Sheng Siong Group Ltd. | | | 5,100 | | | | 4,261 | |
Singapore Airlines Ltd. | | | 5,400 | | | | 21,919 | |
Singapore Technologies Engineering Ltd. | | | 17,100 | | | | 37,412 | |
Sino Grandness Food Industry Group Ltd. (k) | | | 25,900 | | | | 214 | |
Wilmar International Ltd. | | | 14,100 | | | | 31,886 | |
| | | | | | | | |
| | |
Shares | | | Value | |
Yangzijiang Shipbuilding Holdings Ltd. | | | 15,900 | | | $ | 9,226 | |
| | | | | | | | |
| | | | | | | 263,852 | |
| | | | | | | | |
| |
| South Africa—0.1% | | | | | |
Anglo American Platinum Ltd. | | | 702 | | | | 29,324 | |
Impala Platinum Holdings Ltd. | | | 4,058 | | | | 16,908 | |
Telkom S.A. SOC Ltd. | | | 8,548 | | | | 9,730 | |
| | | | | | | | |
| | | | | | | 55,962 | |
| | | | | | | | |
| |
| Spain—0.3% | | | | | |
Banco Santander S.A. | | | 21,322 | | | | 50,721 | |
Ebro Foods S.A. | | | 719 | | | | 14,757 | |
Iberdrola S.A. | | | 13,493 | | | | 131,975 | |
Industria de Diseno Textil S.A. | | | 1,287 | | | | 33,351 | |
Inmobiliaria Colonial Socimi S.A. REIT | | | 410 | | | | 3,865 | |
Lar Espana Real Estate Socimi S.A. REIT | | | 137 | | | | 608 | |
Mapfre S.A. | | | 15,856 | | | | 26,898 | |
Repsol S.A. | | | 1,910 | | | | 17,040 | |
Telefonica S.A. | | | 9,641 | | | | 43,877 | |
| | | | | | | | |
| | | | | | | 323,092 | |
| | | | | | | | |
| |
| Sweden—0.1% | | | | | |
Alfa Laval AB | | | 1,190 | | | | 20,374 | |
Arjo AB, Class B | | | 2,123 | | | | 10,492 | |
BillerudKorsnas AB | | | 199 | | | | 2,170 | |
Castellum AB | | | 1,113 | | | | 18,766 | |
Dios Fastigheter AB | | | 1,811 | | | | 12,104 | |
Essity AB, Class B | | | 862 | | | | 26,406 | |
Peab AB | | | 211 | | | | 1,511 | |
Skanska AB, Class B (k) | | | 1,325 | | | | 19,940 | |
SSAB AB, Class A | | | 3,513 | | | | 7,966 | |
SSAB AB, Class B | | | 4,208 | | | | 9,183 | |
Stillfront Group AB (k) | | | 236 | | | | 10,317 | |
| | | | | | | | |
| | | | | | | 139,229 | |
| | | | | | | | |
| |
| Switzerland—1.0% | | | | | |
Amcor PLC (k) | | | 51 | | | | 414 | |
Baloise Holding AG | | | 201 | | | | 26,205 | |
Banque Cantonale Vaudoise | | | 10 | | | | 8,186 | |
Barry Callebaut AG | | | 18 | | | | 36,028 | |
Cembra Money Bank AG | | | 275 | | | | 25,075 | |
Intershop Holding AG | | | 24 | | | | 12,599 | |
Nestle S.A. | | | 2,262 | | | | 231,556 | |
Novartis AG | | | 1,371 | | | | 113,106 | |
PSP Swiss Property AG | | | 214 | | | | 26,761 | |
Roche Holding AG | | | 934 | | | | 300,507 | |
Sonova Holding AG | | | 241 | | | | 42,974 | |
Swiss Life Holding AG | | | 223 | | | | 74,849 | |
Swiss Re AG | | | 467 | | | | 35,958 | |
UBS Group AG | | | 5,751 | | | | 52,714 | |
Zurich Insurance Group AG | | | 272 | | | | 95,555 | |
| | | | | | | | |
| | | | | | | 1,082,487 | |
| | | | | | | | |
| |
| Taiwan—0.9% | | | | | |
Accton Technology Corp. | | | 3,000 | | | | 16,052 | |
Asia Cement Corp. | | | 29,000 | | | | 37,652 | |
Cheng Loong Corp. | | | 15,000 | | | | 10,161 | |
China Airlines Ltd. | | | 12,000 | | | | 2,614 | |
China Metal Products | | | 8,000 | | | | 5,947 | |
China Motor Corp. | | | 4,000 | | | | 3,282 | |
China Petrochemical Development Corp. | | | 36,000 | | | | 8,645 | |
Chunghwa Telecom Co., Ltd. | | | 15,000 | | | | 53,179 | |
CTBC Financial Holding Co., Ltd. | | | 62,000 | | | | 36,508 | |
E.Sun Financial Holding Co., Ltd. | | | 45,000 | | | | 35,921 | |
First Financial Holding Co., Ltd. | | | 141,322 | | | | 91,322 | |
Formosa Petrochemical Corp. | | | 16,000 | | | | 42,718 | |
Formosa Plastics Corp. | | | 6,000 | | | | 14,842 | |
| | | | | | | | |
| | |
Shares | | | Value | |
Fulgent Sun International Holding Co., Ltd. | | | 2,000 | | | $ | 5,521 | |
Getac Technology Corp. | | | 13,000 | | | | 18,117 | |
Global Mixed Mode Technology, Inc. | | | 4,000 | | | | 13,378 | |
Great Wall Enterprise Co., Ltd. | | | 9,450 | | | | 11,536 | |
HannStar Display Corp. | | | 124,000 | | | | 21,166 | |
Hon Hai Precision Industry Co., Ltd. | | | 23,200 | | | | 53,413 | |
Hua Nan Financial Holdings Co., Ltd. | | | 27,417 | | | | 16,310 | |
International CSRC Investment Holdings Co. | | | 14,690 | | | | 9,353 | |
King Yuan Electronics Co., Ltd. | | | 14,000 | | | | 13,900 | |
Lien Hwa Industrial Holdings Corp. | | | 15,750 | | | | 19,364 | |
Mega Financial Holding Co., Ltd. | | | 30,000 | | | | 28,170 | |
Nanya Technology Corp. | | | 11,000 | | | | 19,360 | |
Pou Chen Corp. | | | 18,000 | | | | 15,214 | |
Powertech Technology, Inc. | | | 17,000 | | | | 48,144 | |
Realtek Semiconductor Corp. | | | 5,000 | | | | 35,894 | |
Sinbon Electronics Co., Ltd. | | | 8,000 | | | | 32,932 | |
Sitronix Technology Corp. | | | 3,000 | | | | 11,611 | |
Taichung Commercial Bank Co., Ltd. | | | 27,352 | | | | 9,324 | |
Taiwan Fertilizer Co., Ltd. | | | 5,000 | | | | 6,869 | |
Taiwan Hon Chuan Enterprise Co., Ltd. | | | 5,000 | | | | 8,136 | |
Taiwan PCB Techvest Co., Ltd. | | | 5,000 | | | | 4,738 | |
Taiwan Semiconductor Manufacturing Co., Ltd. ADR | | | 1,579 | | | | 75,460 | |
Tripod Technology Corp. | | | 11,000 | | | | 34,218 | |
TXC Corp. | | | 15,000 | | | | 21,660 | |
United Microelectronics Corp. ADR | | | 11,269 | | | | 24,454 | |
United Renewable Energy Co., Ltd. (k) | | | 8,340 | | | | 1,293 | |
WT Microelectronics Co., Ltd. | | | 6,707 | | | | 7,560 | |
Yuanta Financial Holding Co., Ltd. | | | 106,000 | | | | 54,119 | |
Zhen Ding Technology Holding Ltd. | | | 7,000 | | | | 21,393 | |
| | | | | | | | |
| | | | | | | 1,001,450 | |
| | | | | | | | |
| |
| Thailand—0.2% | | | | | |
Bangchak Corp. PCL (d)(f) | | | 23,900 | | | | 10,829 | |
Bangkok Bank PCL (d)(f) | | | 5,700 | | | | 17,403 | |
Electricity Generating PCL (d)(f) | | | 2,500 | | | | 17,514 | |
Intouch Holdings PCL (d)(f) | | | 16,000 | | | | 24,229 | |
PTT PCL (d)(f) | | | 18,700 | | | | 17,288 | |
Siam Cement PCL (d)(f) | | | 2,800 | | | | 27,473 | |
Sri Trang Agro-Industry PCL (d)(f) | | | 8,200 | | | | 2,731 | |
Thai Oil PCL (d)(f) | | | 3,600 | | | | 3,329 | |
Thanachart Capital PCL (d)(f) | | | 17,200 | | | | 17,300 | |
Tisco Financial Group PCL (d)(f) | | | 16,000 | | | | 34,097 | |
| | | | | | | | |
| | | | | | | 172,193 | |
| | | | | | | | |
| |
| Turkey—0.0% | | | | | |
Dogus Otomotiv Servis ve Ticaret AS | | | 909 | | | | 947 | |
Tupras Turkiye Petrol Rafinerileri AS (k) | | | 58 | | | | 660 | |
Turkcell Iletisim Hizmetleri AS | | | 11,947 | | | | 22,190 | |
Turkiye Garanti Bankasi AS (k) | | | 7,638 | | | | 9,368 | |
| | | | | | | | |
| | | | | | | 33,165 | |
| | | | | | | | |
| |
| United Kingdom—0.7% | | | | | |
Airtel Africa PLC (b) | | | 21,017 | | | | 10,577 | |
Anglo American PLC | | | 2,823 | | | | 49,469 | |
| | | | | | |
| 154 | | Semiannual Report | | | March 31, 2020 | | | See accompanying Notes to Financial Statements |
Schedule of Investments
March 31, 2020 (unaudited)
| | | | | | | | |
| | |
Shares | | | Value | |
Aviva PLC | | | 5,094 | | | $ | 16,748 | |
Berkeley Group Holdings PLC | | | 374 | | | | 16,693 | |
BP PLC | | | 23,134 | | | | 94,871 | |
BT Group PLC | | | 22,848 | | | | 33,234 | |
Cranswick PLC | | | 508 | | | | 23,255 | |
Diageo PLC | | | 507 | | | | 16,077 | |
Firstgroup PLC (k) | | | 37,135 | | | | 22,863 | |
Frontier Developments PLC (k) | | | 629 | | | | 9,576 | |
Gamma Communications PLC | | | 1,603 | | | | 19,608 | |
Highland Gold Mining Ltd. | | | 5,782 | | | | 13,954 | |
JD Sports Fashion PLC | | | 5,029 | | | | 28,166 | |
Johnson Service Group PLC | | | 8,414 | | | | 10,701 | |
Keller Group PLC | | | 2,052 | | | | 13,466 | |
Lloyds Banking Group PLC | | | 64,542 | | | | 25,233 | |
Marston’s PLC | | | 8,232 | | | | 4,164 | |
Micro Focus International PLC | | | 4,930 | | | | 24,328 | |
Morgan Sindall Group PLC | | | 557 | | | | 8,209 | |
National Express Group PLC | | | 16,299 | | | | 41,270 | |
Primary Health Properties PLC REIT | | | 4,727 | | | | 9,386 | |
Regional REIT Ltd. REIT (b) | | | 5,398 | | | | 5,517 | |
Rio Tinto PLC | | | 1,292 | | | | 59,228 | |
Royal Dutch Shell PLC, Class A | | | 4,402 | | | | 76,422 | |
Royal Dutch Shell PLC, Class B | | | 2,377 | | | | 39,872 | |
STERIS PLC | | | 188 | | | | 26,314 | |
Tate & Lyle PLC | | | 1,634 | | | | 13,294 | |
Unilever PLC | | | 831 | | | | 41,907 | |
Valaris PLC (k) | | | 195 | | | | 88 | |
Virgin Money UK PLC (k) | | | 1,098 | | | | 837 | |
Vodafone Group PLC | | | 30,543 | | | | 42,254 | |
| | | | | | | | |
| | | | | | | 797,581 | |
| | | | | | | | |
| |
| United States—16.1% | | | | | |
Abbott Laboratories | | | 1,519 | | | | 119,864 | |
AbbVie, Inc. | | | 1,891 | | | | 144,075 | |
Accenture PLC, Class A | | | 173 | | | | 28,244 | |
ACCO Brands Corp. | | | 3,510 | | | | 17,726 | |
Adobe, Inc. (k) | | | 402 | | | | 127,932 | |
Affiliated Managers Group, Inc. | | | 318 | | | | 18,807 | |
Aflac, Inc. | | | 2,395 | | | | 82,005 | |
AG Mortgage Investment Trust, Inc. REIT | | | 1,242 | | | | 3,403 | |
AGNC Investment Corp. REIT | | | 7,869 | | | | 83,254 | |
Air Products & Chemicals, Inc. | | | 269 | | | | 53,695 | |
Akamai Technologies, Inc. (k) | | | 340 | | | | 31,107 | |
Alleghany Corp. | | | 73 | | | | 40,322 | |
Allstate Corp. | | | 1,905 | | | | 174,746 | |
Ally Financial, Inc. | | | 1,750 | | | | 25,252 | |
Alphabet, Inc., Class A (k) | | | 179 | | | | 207,989 | |
Alphabet, Inc., Class C (k) | | | 185 | | | | 215,120 | |
Altria Group, Inc. | | | 1,119 | | | | 43,272 | |
Amazon.com, Inc. (k) | | | 260 | | | | 506,927 | |
Amdocs Ltd. | | | 297 | | | | 16,326 | |
Ameren Corp. | | | 710 | | | | 51,709 | |
American Electric Power Co., Inc. | | | 896 | | | | 71,662 | |
American Equity Investment Life Holding Co. | | | 585 | | | | 10,998 | |
American Express Co. | | | 907 | | | | 77,648 | |
American Financial Group, Inc. | | | 705 | | | | 49,406 | |
American Tower Corp. REIT | | | 92 | | | | 20,033 | |
Amgen, Inc. | | | 612 | | | | 124,071 | |
Annaly Capital Management, Inc. REIT | | | 5,123 | | | | 25,974 | |
Anthem, Inc. | | | 610 | | | | 138,494 | |
Anworth Mortgage Asset Corp. REIT | | | 837 | | | | 946 | |
Apollo Commercial Real Estate Finance, Inc. REIT | | | 1,173 | | | | 8,704 | |
Apple, Inc. | | | 2,725 | | | | 692,940 | |
Applied Materials, Inc. | | | 861 | | | | 39,451 | |
Ares Commercial Real Estate Corp. REIT | | | 1,266 | | | | 8,849 | |
| | | | | | | | |
| | |
Shares | | | Value | |
AT&T, Inc. | | | 10,353 | | | $ | 301,790 | |
Atmos Energy Corp. | | | 59 | | | | 5,855 | |
Automatic Data Processing, Inc. | | | 447 | | | | 61,096 | |
AutoZone, Inc. (k) | | | 94 | | | | 79,524 | |
AvalonBay Communities, Inc. REIT | | | 199 | | | | 29,287 | |
Bank of America Corp. | | | 5,226 | | | | 110,948 | |
Berkshire Hathaway, Inc., Class B (k) | | | 135 | | | | 24,682 | |
Best Buy Co., Inc. | | | 798 | | | | 45,486 | |
Booking Holdings, Inc. (k) | | | 49 | | | | 65,921 | |
BorgWarner, Inc. | | | 384 | | | | 9,358 | |
Boston Scientific Corp. (k) | | | 1,890 | | | | 61,671 | |
Bright Horizons Family Solutions, Inc. (k) | | | 466 | | | | 47,532 | |
Bristol-Myers Squibb Co. | | | 1,242 | | | | 69,229 | |
Cadence Design Systems, Inc. (k) | | | 739 | | | | 48,804 | |
Cardinal Health, Inc. | | | 1,284 | | | | 61,555 | |
Carnival Corp. | | | 1,391 | | | | 18,319 | |
Casey’s General Stores, Inc. | | | 120 | | | | 15,899 | |
CBRE Group, Inc., Class A (k) | | | 604 | | | | 22,777 | |
CBTX, Inc. | | | 653 | | | | 11,604 | |
CDW Corp. | | | 629 | | | | 58,667 | |
Centene Corp. (k) | | | 409 | | | | 24,299 | |
CenturyLink, Inc. | | | 5,014 | | | | 47,432 | |
Chemed Corp. | | | 65 | | | | 28,158 | |
Chevron Corp. | | | 1,139 | | | | 82,532 | |
Chimera Investment Corp. REIT | | | 975 | | | | 8,873 | |
Chipotle Mexican Grill, Inc. (k) | | | 74 | | | | 48,426 | |
Church & Dwight Co., Inc. | | | 605 | | | | 38,829 | |
Cincinnati Financial Corp. | | | 313 | | | | 23,616 | |
Cintas Corp. | | | 146 | | | | 25,290 | |
Cisco Systems, Inc. | | | 5,324 | | | | 209,286 | |
Citigroup, Inc. | | | 1,638 | | | | 68,993 | |
Citizens Financial Group, Inc. | | | 882 | | | | 16,590 | |
CMS Energy Corp. | | | 642 | | | | 37,717 | |
CNA Financial Corp. | | | 555 | | | | 17,227 | |
Coca-Cola Co. | | | 3,369 | | | | 149,078 | |
Comcast Corp., Class A | | | 3,056 | | | | 105,065 | |
Consolidated Edison, Inc. | | | 1,842 | | | | 143,676 | |
Costco Wholesale Corp. | | | 650 | | | | 185,334 | |
CVS Health Corp. | | | 2,082 | | | | 123,525 | |
Danaher Corp. | | | 745 | | | | 103,115 | |
Darden Restaurants, Inc. | | | 259 | | | | 14,105 | |
Delta Air Lines, Inc. | | | 1,755 | | | | 50,070 | |
DexCom, Inc. (k) | | | 265 | | | | 71,357 | |
Discover Financial Services | | | 1,548 | | | | 55,217 | |
Dollar General Corp. | | | 223 | | | | 33,675 | |
DR Horton, Inc. | | | 767 | | | | 26,078 | |
DTE Energy Co. | | | 479 | | | | 45,491 | |
Duke Energy Corp. | | | 1,622 | | | | 131,187 | |
DXC Technology Co. | | | 2,093 | | | | 27,314 | |
Edwards Lifesciences Corp. (k) | | | 411 | | | | 77,523 | |
Electronic Arts, Inc. (k) | | | 323 | | | | 32,355 | |
Eli Lilly & Co. | | | 1,567 | | | | 217,374 | |
Ellington Financial, Inc. REIT | | | 890 | | | | 5,082 | |
Encompass Health Corp. | | | 467 | | | | 29,902 | |
Ennis, Inc. | | | 415 | | | | 7,794 | |
Entergy Corp. | | | 534 | | | | 50,180 | |
Equinix, Inc. REIT | | | 101 | | | | 63,082 | |
Equitable Holdings, Inc. | | | 1,582 | | | | 22,860 | |
Equity LifeStyle Properties, Inc. REIT | | | 544 | | | | 31,269 | |
Equity Residential REIT | | | 961 | | | | 59,303 | |
Essex Property Trust, Inc. REIT | | | 182 | | | | 40,084 | |
Exelon Corp. | | | 762 | | | | 28,049 | |
Exxon Mobil Corp. | | | 1,756 | | | | 66,675 | |
Facebook, Inc., Class A (k) | | | 1,033 | | | | 172,304 | |
Fidelity National Information Services, Inc. | | | 653 | | | | 79,431 | |
First NBC Bank Holding Co. (k) | | | 1,041 | | | | 21 | |
Fiserv, Inc. (k) | | | 1,333 | | | | 126,622 | |
| | | | | | | | |
| | |
Shares | | | Value | |
Fortinet, Inc. (k) | | | 311 | | | $ | 31,464 | |
Fortune Brands Home & Security, Inc. | | | 1,029 | | | | 44,504 | |
frontdoor, Inc. (k) | | | 542 | | | | 18,851 | |
FTI Consulting, Inc. (k) | | | 372 | | | | 44,554 | |
Garmin Ltd. | | | 297 | | | | 22,263 | |
General Mills, Inc. | | | 2,347 | | | | 123,851 | |
General Motors Co. | | | 3,140 | | | | 65,249 | |
German American Bancorp, Inc. | | | 67 | | | | 1,839 | |
Global Payments, Inc. | | | 323 | | | | 46,586 | |
Granite Point Mortgage Trust, Inc. REIT | | | 160 | | | | 811 | |
Hartford Financial Services Group, Inc. | | | 3,048 | | | | 107,412 | |
HCA Healthcare, Inc. | | | 740 | | | | 66,489 | |
HEICO Corp., Class A | | | 381 | | | | 24,346 | |
Herc Holdings, Inc. (k) | | | 255 | | | | 5,217 | |
Hershey Co. | | | 659 | | | | 87,317 | |
Hewlett Packard Enterprise Co. | | | 2,462 | | | | 23,906 | |
Honeywell International, Inc. | | | 810 | | | | 108,370 | |
HP, Inc. | | | 4,624 | | | | 80,273 | |
Humana, Inc. | | | 327 | | | | 102,685 | |
Insight Enterprises, Inc. (k) | | | 12 | | | | 506 | |
Intel Corp. | | | 4,662 | | | | 252,307 | |
Intuit, Inc. | | | 346 | | | | 79,580 | |
Intuitive Surgical, Inc. (k) | | | 216 | | | | 106,965 | |
Invesco Mortgage Capital, Inc. REIT | | | 1,475 | | | | 5,030 | |
Johnson & Johnson | | | 2,890 | | | | 378,966 | |
Johnson Controls International PLC | | | 3,647 | | | | 98,323 | |
JPMorgan Chase & Co. | | | 2,055 | | | | 185,012 | |
Kellogg Co. | | | 248 | | | | 14,878 | |
Kelly Services, Inc., Class A | | | 1,158 | | | | 14,695 | |
KeyCorp | | | 4,133 | | | | 42,859 | |
Kimberly-Clark Corp. | | | 1,174 | | | | 150,119 | |
Kroger Co. | | | 2,776 | | | | 83,613 | |
L3Harris Technologies, Inc. | | | 591 | | | | 106,451 | |
Laboratory Corp. of America Holdings (k) | | | 250 | | | | 31,597 | |
Lam Research Corp. | | | 171 | | | | 41,040 | |
Lear Corp. | | | 208 | | | | 16,900 | |
Leidos Holdings, Inc. | | | 1,372 | | | | 125,744 | |
Lockheed Martin Corp. | | | 420 | | | | 142,359 | |
Lululemon Athletica, Inc. (k) | | | 359 | | | | 68,048 | |
LyondellBasell Industries NV, Class A | | | 265 | | | | 13,152 | |
ManTech International Corp., Class A | | | 405 | | | | 29,431 | |
Marathon Petroleum Corp. | | | 830 | | | | 19,605 | |
MarketAxess Holdings, Inc. | | | 73 | | | | 24,278 | |
Marsh & McLennan Cos., Inc. | | | 211 | | | | 18,243 | |
Mastercard, Inc., Class A | | | 1,321 | | | | 319,101 | |
McDonald’s Corp. | | | 985 | | | | 162,870 | |
McGrath RentCorp | | | 865 | | | | 45,309 | |
MDC Holdings, Inc. | | | 432 | | | | 10,022 | |
Merck & Co., Inc. | | | 4,189 | | | | 322,302 | |
Methode Electronics, Inc. | | | 402 | | | | 10,625 | |
MetLife, Inc. | | | 1,941 | | | | 59,336 | |
MFA Financial, Inc. REIT | | | 3,113 | | | | 4,825 | |
Microsoft Corp. | | | 4,374 | | | | 689,824 | |
Motorola Solutions, Inc. | | | 495 | | | | 65,795 | |
MSCI, Inc. | | | 246 | | | | 71,084 | |
Nasdaq, Inc. | | | 246 | | | | 23,358 | |
Newmont Corp. | | | 1,577 | | | | 71,407 | |
NextEra Energy, Inc. | | | 205 | | | | 49,327 | |
NIKE, Inc., Class B | | | 898 | | | | 74,301 | |
Northrop Grumman Corp. | | | 194 | | | | 58,695 | |
NVIDIA Corp. | | | 426 | | | | 112,294 | |
NVR, Inc. (k) | | | 42 | | | | 107,903 | |
O’Reilly Automotive, Inc. (k) | | | 107 | | | | 32,212 | |
Occidental Petroleum Corp. | | | 938 | | | | 10,862 | |
| | | | | | | | |
| See accompanying Notes to Financial Statements | | | March 31, 2020 | | | Semiannual Report | | | 155 | |
Schedule of Investments
March 31, 2020 (unaudited)
| | | | | | | | |
| | |
Shares | | | Value | |
Old Republic International Corp. | | | 1,514 | | | $ | 23,089 | |
Omega Healthcare Investors, Inc. REIT | | | 615 | | | | 16,322 | |
Omnicom Group, Inc. | | | 413 | | | | 22,674 | |
Oracle Corp. | | | 2,006 | | | | 96,950 | |
Owens Corning | | | 542 | | | | 21,035 | |
Paychex, Inc. | | | 480 | | | | 30,202 | |
PepsiCo, Inc. | | | 983 | | | | 118,058 | |
Pfizer, Inc. | | | 7,410 | | | | 241,862 | |
Phillips 66 | | | 334 | | | | 17,919 | |
Pinnacle West Capital Corp. | | | 431 | | | | 32,665 | |
Popular, Inc. | | | 661 | | | | 23,135 | |
Portland General Electric Co. | | | 487 | | | | 23,347 | |
Principal Financial Group, Inc. | | | 1,501 | | | | 47,041 | |
Procter & Gamble Co. | | | 3,338 | | | | 367,180 | |
Progressive Corp. | | | 1,303 | | | | 96,214 | |
Prospect Capital Corp. | | | 3,921 | | | | 16,664 | |
PS Business Parks, Inc. REIT | | | 157 | | | | 21,277 | |
Public Storage REIT | | | 135 | | | | 26,812 | |
QCR Holdings, Inc. | | | 90 | | | | 2,436 | |
Qorvo, Inc. (k) | | | 516 | | | | 41,605 | |
QUALCOMM, Inc. | | | 1,050 | | | | 71,032 | |
Quest Diagnostics, Inc. | | | 323 | | | | 25,937 | |
Raytheon Co. | | | 166 | | | | 21,771 | |
Realty Income Corp. REIT | | | 541 | | | | 26,974 | |
Reinsurance Group of America, Inc. | | | 847 | | | | 71,267 | |
RenaissanceRe Holdings Ltd. | | | 400 | | | | 59,728 | |
Republic Services, Inc. | | | 828 | | | | 62,150 | |
Retail Properties of America, Inc., Class A REIT | | | 2,152 | | | | 11,126 | |
Ross Stores, Inc. | | | 726 | | | | 63,140 | |
Royal Caribbean Cruises Ltd. | | | 715 | | | | 23,002 | |
S&P Global, Inc. | | | 121 | | | | 29,651 | |
Salesforce.com, Inc. (k) | | | 789 | | | | 113,600 | |
Shockwave Medical, Inc. (k) | | | 511 | | | | 16,955 | |
Southern Co. | | | 2,348 | | | | 127,121 | |
SP Plus Corp. (k) | | | 603 | | | | 12,512 | |
Starbucks Corp. | | | 1,516 | | | | 99,662 | |
Steel Dynamics, Inc. | | | 880 | | | | 19,835 | |
STORE Capital Corp. REIT | | | 175 | | | | 3,171 | |
Stryker Corp. | | | 660 | | | | 109,883 | |
Synopsys, Inc. (k) | | | 426 | | | | 54,865 | |
Sysco Corp. | | | 825 | | | | 37,645 | |
T-Mobile U.S., Inc. (k) | | | 726 | | | | 60,911 | |
Target Corp. | | | 1,074 | | | | 99,850 | |
Taylor Morrison Home Corp. (k) | | | 1,703 | | | | 18,733 | |
TCG BDC, Inc. | | | 821 | | | | 4,286 | |
Teledyne Technologies, Inc. (k) | | | 174 | | | | 51,725 | |
Teradyne, Inc. | | | 435 | | | | 23,564 | |
Tetra Tech, Inc. | | | 243 | | | | 17,161 | |
Thermo Fisher Scientific, Inc. | | | 361 | | | | 102,380 | |
TJX Cos., Inc. | | | 1,165 | | | | 55,699 | |
TPG RE Finance Trust, Inc. REIT | | | 321 | | | | 1,762 | |
Tyson Foods, Inc., Class A | | | 1,200 | | | | 69,444 | |
UniFirst Corp. | | | 232 | | | | 35,053 | |
United Therapeutics Corp. (k) | | | 255 | | | | 24,180 | |
UnitedHealth Group, Inc. | | | 1,163 | | | | 290,029 | |
Unum Group | | | 828 | | | | 12,428 | |
Valley National Bancorp | | | 201 | | | | 1,469 | |
Veeva Systems, Inc., Class A (k) | | | 315 | | | | 49,257 | |
Verizon Communications, Inc. | | | 6,536 | | | | 351,179 | |
Visa, Inc., Class A | | | 1,237 | | | | 199,305 | |
VMware, Inc., Class A (k) | | | 203 | | | | 24,583 | |
Vulcan Materials Co. | | | 415 | | | | 44,849 | |
Walgreens Boots Alliance, Inc. | | | 740 | | | | 33,855 | |
Walmart, Inc. | | | 728 | | | | 82,715 | |
Walt Disney Co. | | | 157 | | | | 15,166 | |
Waste Management, Inc. | | | 1,804 | | | | 166,978 | |
Waterstone Financial, Inc. | | | 1,032 | | | | 15,005 | |
WEC Energy Group, Inc. | | | 1,599 | | | | 140,920 | |
| | | | | | | | |
| | |
Shares | | | Value | |
Western Asset Mortgage Capital Corp. REIT | | | 1,738 | | | $ | 3,980 | |
WestRock Co. | | | 1,088 | | | | 30,747 | |
Windstream Holdings, Inc. (k) | | | 294 | | | | 15 | |
Xcel Energy, Inc. | | | 2,371 | | | | 142,971 | |
Xerox Holdings, Corp. (k) | | | 2,442 | | | | 46,251 | |
Zoetis, Inc. | | | 470 | | | | 55,314 | |
| | | | | | | | |
| |
| | | | 17,438,838 | |
| | | | | | | | |
Total Common Stock
(cost—$31,922,811) | | | | | | | 31,120,744 | |
| | | | | | | | |
| | | | | | | | |
| |
| Mutual Funds(g)—27.8% | | | | | |
AllianzGI Focused Growth (j) | | | 96,984 | | | | 3,940,469 | |
AllianzGI Global Small-Cap Opportunities | | | 178,508 | | | | 2,083,190 | |
AllianzGI International Growth | | | 678,114 | | | | 9,371,532 | |
AllianzGI Mid-Cap (h) | | | 1,000,900 | | | | 3,833,448 | |
AllianzGI Mid-Cap Value (j) | | | 135,569 | | | | 3,218,415 | |
AllianzGI Short Duration High Income (j) | | | 428,508 | | | | 5,416,337 | |
AllianzGI Small-Cap (j) | | | 145,199 | | | | 2,172,177 | |
| | | | | | | | |
Total Mutual Funds
(cost—$35,011,341) | | | | | | | 30,035,568 | |
| | | | | | | | |
| |
| Exchange-Traded Funds—3.7% | | | | | |
iShares JPMorgan USD Emerging Markets Bond | | | 22,000 | | | | 2,126,960 | |
iShares Mortgage Real Estate | | | 100,000 | | | | 1,870,000 | |
| | | | | | | | |
Total Exchange-Traded Funds
(cost—$4,255,398) | | | | | | | 3,996,960 | |
| | | | | | | | |
| | | | | | | | |
| | |
| | | Principal
Amount
(000s) | | | | |
|
| U.S. Treasury Obligations—1.0% | |
U.S. Treasury Bonds, | | | | | | | | |
2.375%, 11/15/49 | | | $80 | | | | 100,037 | |
U.S. Treasury Notes, | | | | | | | | |
0.50%, 3/31/25 | | | 143 | | | | 143,950 | |
1.125%, 2/28/25 | | | 206 | | | | 213,789 | |
1.50%, 2/15/30 | | | 592 | | | | 637,325 | |
| | | | | | | | |
Total U.S. Treasury Obligations
(cost—$1,037,564) | | | | 1,095,101 | |
| | | | | | | | |
| | | | | | | | |
| | |
| | | Shares | | | | |
| |
| Preferred Stock—0.2% | | | | | |
| |
| Brazil—0.1% | | | | | |
Cia Energetica de Minas Gerais | | | 4,100 | | | | 7,031 | |
Cia Paranaense de Energia (k) | | | 900 | | | | 9,267 | |
Petroleo Brasileiro S.A. | | | 3,300 | | | | 8,885 | |
Telefonica Brasil S.A. | | | 4,500 | | | | 42,825 | |
| | | | | | | | |
| | | | | | | 68,008 | |
| | | | | | | | |
| |
| Chile—0.0% | | | | | |
Embotelladora Andina S.A., Class B | | | 4,830 | | | | 10,737 | |
| | | | | | | | |
| |
| Colombia—0.0% | | | | | |
Grupo Aval Acciones y Valores S.A. | | | 48,305 | | | | 10,667 | |
| | | | | | | | |
| |
| Germany—0.0% | | | | | |
Volkswagen AG | | | 296 | | | | 34,098 | |
| | | | | | | | |
| | | | | | | | |
| | |
Shares | | | Value | |
| |
| Korea (Republic of)—0.0% | | | | | |
Samsung Electronics Co., Ltd. | | | 1,569 | | | $ | 51,130 | |
| | | | | | | | |
| |
| United States—0.1% | | | | | |
Wells Fargo & Co. (e) | | | 4,580 | | | | 96,180 | |
Total Preferred Stock (cost—$325,780) | | | | | | | 270,820 | |
| | | | | | | | |
| | | | | | | | |
| | |
| | | Principal
Amount
(000s) | | | | |
|
| Repurchase Agreements—0.6% | |
State Street Bank and Trust Co., dated 3/31/20, 0.00%, due 4/1/20, proceeds $627,000; collateralized by U.S. Treasury Notes, 2.75%, due 4/30/23, valued at $641,381 including accrued interest | |
(cost—$627,000) | | | $627 | | | | 627,000 | |
| | | | | | | | |
| |
| Total Investments(cost-$109,254,429) (c)—93.5% | | | | 101,103,963 | |
| | | | | | | | |
| | |
| Other assets less liabilities (l)—6.5% | | | | | | | 7,003,983 | |
| | | | | | | | |
| |
| Net Assets—100.0% | | | | $108,107,946 | |
| | | | | | | | |
Notes to Schedule of Investments:
† Actual amount rounds to less than $1.
†† Actual amount rounds to less than 1 share.
(a) Private Placement—Restricted as to resale and may not have a readily available market. Securities with an aggregate value of $5,036,013, representing 4.7% of net assets.
(b) 144A—Exempt from registration under Rule 144A of the Securities Act of 1933. These securities may be resold in transactions exempt from registration, typically only to qualified institutional buyers. Securities with an aggregate value of $5,221,212, representing 4.8% of net assets.
(c) Securities with an aggregate value of $11,845,097, representing 11.0% of net assets, were valued utilizing modeling tools provided by a third-party vendor. See Note 1(a) and Note 1(b) in the Notes to Financial Statements.
(d) Fair-Valued—Securities with an aggregate value of $187,691, representing 0.2% of net assets. See Note 1(a) and Note 1(b) in the Notes to Financial Statements.
(e) Perpetual maturity. The date shown, if any, is the next call date.
(f) Level 3 security. See Note 1(a) and Note 1(b) in the Notes to Financial Statements.
(g) Affiliated fund.
(h) Institutional Class share.
(i) Variable or Floating Rate Security—Securities with an interest rate that changes periodically. The interest rate disclosed reflects the rate in effect on March 31, 2020.
(j) Class R6 share.
(k) Non-income producing.
| | | | | | |
| 156 | | Semiannual Report | | | March 31, 2020 | | | See accompanying Notes to Financial Statements |
Schedule of Investments
March 31, 2020 (unaudited)
(l) Includes net unrealized appreciation (depreciation) of other financial instruments as follows:
| | | | | | | | | | | | | | | | | | | | | | |
|
| Futures contracts outstanding at March 31, 2020: | |
| Type | | Contracts | | | Expiration
Date | | | Notional
Amount
(000s) | | | Market
Value
(000s) | | | Unrealized
Appreciation
(Depreciation) | |
Long position contracts: | | | | | | | | | | | | | | | | | | | | |
| | 10-Year U.S. Treasury Note | | | 3 | | | | 6/19/20 | | | $ | 300 | | | $ | 416 | | | $ | 4,136 | |
| | 10-Year Ultra U.S. Treasury Bond | | | 13 | | | | 6/19/20 | | | | 1,300 | | | | 2,029 | | | | 37,091 | |
| | Euro STOXX 50 Index | | | 180 | | | | 6/19/20 | | | EUR | 2 | | | | 5,453 | | | | 137,376 | |
| | Euro-Bund10-Year Bond | | | 34 | | | | 6/8/20 | | | | 3,400 | | | | 5,303 | | | | (90,765 | ) |
| | U.S. Long Bond | | | 6 | | | | 6/19/20 | | | $ | 600 | | | | 1,331 | | | | 7,488 | |
| | United Kingdom Government10-Year Gilt | | | 55 | | | | 6/26/20 | | | GBP | 5,500 | | | | 9,304 | | | | 226,027 | |
| | | | | | | | | | | | | | | | | | | | | | |
| | | | | | | | | | | | | | | | | | | | $ | 321,353 | |
| | | | | | | | | | | | | | | | | | | | | | |
| | | | | |
Short position contracts: | | | | | | | | | | | | | | | | | | | | |
| | 5-Year U.S. Treasury Note | | | (21 | ) | | | 6/30/20 | | | $ | (2,100 | ) | | $ | (2,633 | ) | | $ | (10,207 | ) |
| | E-mini S&P 500 Index | | | (122 | ) | | | 6/19/20 | | | | (6 | ) | | | (15,675 | ) | | | (653,888 | ) |
| | MSCI EAFE Index | | | (56 | ) | | | 6/19/20 | | | | (3 | ) | | | (4,366 | ) | | | (456,847 | ) |
| | U.S. Long Bond | | | (4 | ) | | | 6/19/20 | | | | (400 | ) | | | (716 | ) | | | 3,744 | |
| | | | | | | | | | | | | | | | | | | | | | |
| | | | | | | | | | | | | | | | | | | | $ | (1,117,198 | ) |
| | | | | | | | | | | | | | | | | | | | | | |
| | | | | | | | | | | | | | | | | | | | $ | (795,845 | ) |
| | | | | | | | | | | | | | | | | | | | | | |
| | | | | | | | | | | | | | | | | | | | | | | | | | | | | | | | |
| | | | |
| Credit default swaps agreements outstanding at March 31, 2020: | | | | | | | | | | | | | |
Centrally cleared buy protection swap agreements: | | | | | | | | | | | | | | | | | | | | | | | | | |
Broker (Exchange)/
Reference Debt Issuer | | Notional
Amount
(000s)(1) | | | Implied
Credit
Spread | | | Termination
Date | | | Fixed Deal
Pay Rate | | | Payment
Frequency | | | Value(2) | | | Upfront
Premiums
Paid
(Received) | | | Unrealized
Appreciation
(Depreciation) | |
Goldman Sachs (ICE): | |
American Express Co. | | $ | 193 | | | | 0.583 | %% | | | 12/20/24 | | | | (1.00 | )% | | | Quarterly | | | $ | (4,129 | ) | | $ | (3,591 | ) | | $ | (538 | ) |
Berkshire Hathaway Inc. | | | 740 | | | | 0.287 | %% | | | 12/20/24 | | | | (1.00 | )% | | | Quarterly | | | | (25,950 | ) | | | (22,655 | ) | | | (3,295 | ) |
CDX.NA.HY.33 | | | 6,500 | | | | 5.762 | %% | | | 12/20/24 | | | | (5.00 | )% | | | Quarterly | | | | 401,059 | | | | (614,024 | ) | | | 1,015,083 | |
CDX.NA.IG.33 | | | 15,000 | | | | 0.820 | %% | | | 12/20/24 | | | | (1.00 | )% | | | Quarterly | | | | 47,095 | | | | (392,216 | ) | | | 439,311 | |
Citigroup Inc. | | | 420 | | | | 0.838 | %% | | | 12/20/24 | | | | (1.00 | )% | | | Quarterly | | | | 1,831 | | | | 13,309 | | | | (11,478 | ) |
Energy Transfer Operating, L.P. | | | 1,230 | | | | 3.583 | %% | | | 12/20/24 | | | | (1.00 | )% | | | Quarterly | | | | 118,090 | | | | 48,259 | | | | 69,831 | |
Kinder Morgan, Inc. | | | 465 | | | | 2.047 | %% | | | 12/20/24 | | | | (1.00 | )% | | | Quarterly | | | | 12,282 | | | | 26,308 | | | | (14,026 | ) |
Marathon Petroleum Corp. | | | 180 | | | | 1.662 | %% | | | 12/20/24 | | | | (5.00 | )% | | | Quarterly | | | | (18,536 | ) | | | (11,176 | ) | | | (7,360 | ) |
McKesson Corp. | | | 405 | | | | 0.396 | %% | | | 12/20/24 | | | | (1.00 | )% | | | Quarterly | | | | (11,208 | ) | | | (7,896 | ) | | | (3,312 | ) |
Prudential Financial, Inc. | | | 405 | | | | 0.679 | %% | | | 12/20/24 | | | | (1.00 | )% | | | Quarterly | | | | (3,672 | ) | | | (9,983 | ) | | | 6,311 | |
Simon Property Group, L.P. | | | 405 | | | | 2.947 | %% | | | 6/20/25 | | | | (1.00 | )% | | | Quarterly | | | | 29,397 | | | | 35,142 | | | | (5,745 | ) |
The Williams Companies, Inc. | | | 180 | | | | 1.749 | %% | | | 12/20/24 | | | | (1.00 | )% | | | Quarterly | | | | 12,592 | | | | 20,625 | | | | (8,033 | ) |
| | | | | | | | | | | | | | | | | | | | | | | | |
| | | | | | | | | | | | | | | | | | | | | | $ | 558,851 | | | $ | (917,898 | ) | | $ | 1,476,749 | |
| | | | | | | | | | | | | | | | | | | | | | | | |
(1) This represents the maximum potential amount the Fund could be required to make available as a seller of credit protection or receive as a buyer of credit protection if a credit event occurs as defined under the terms of that particular swap agreement.
(2) The quoted market prices and resulting values for credit default swap agreements serve as an indicator of the status at March 31, 2020 of the payment/performance risk and represent the likelihood of an expected liability (or profit) for the credit derivative should the notional amount of the swap agreement have been closed/sold as of the period end. Increasing market values, in absolute terms when compared to the notional amount of the swap, represent a deterioration of the referenced entity’s credit soundness and a greater likelihood or risk of default or other credit event occurring as defined under the terms of the agreement.
| | | | | | | | |
| See accompanying Notes to Financial Statements | | | March 31, 2020 | | | Semiannual Report | | | 157 | |
Schedule of Investments
March 31, 2020 (unaudited)
| | | | | | | | | | | | | | | | | | | | | | | | | | | | | | | | |
| | | | |
| Volatility swap agreements outstanding at March 31, 2020: | | | | | | | | | | | | | |
Over-the-counter total return swap agreements: | | | | | | | | | | | | | | | | | | | | | | | | | |
| Counterparty | | Pay/Receive
Volatility | | | Reference
Entity | | | Volatility
Strike | | | Payment
Frequency | | | Maturity
Date | | | Notional
Amount
(000s) | | | Premiums
Paid
(Received) | | | Unrealized
Appreciation | |
UBS AG | | | Receive | | | | S&P Index | (3) | | | 5.329 | % | | | Maturity | | | | 6/19/20 | | | $ | 20 | | | $ | — | | | $ | 348,815 | |
(3) Variance swap.
(m) At March 31, 2020, the Fund pledged $4,619,282 in cash as collateral for futures contracts and $1,514,519 in cash as collateral for swap contracts. The Fund also held U.S. Treasury Obligations valued at $114,028 as collateral for swap contracts. Securities held as collateral will not be pledged and are not reflected in the Schedule of Investments.
Glossary:
ADR—American Depositary Receipt
CDX—Credit Derivatives Index
EAFE—Europe, Australasia and Far East
EUR—Euro
FRN—Floating Rate Note
GDR—Global Depositary Receipt
ICE—Intercontinental Exchange
LIBOR—London Inter-Bank Offered Rate
MSCI—Morgan Stanley Capital International
REIT—Real Estate Investment Trust
UNIT—More than one class of securities traded together
The industry classification of portfolio holdings and other assets less liabilities shown as a percentage of net assets were as follows:
| | | | |
Mutual Funds | | | 27.8% | |
Banks | | | 8.4% | |
Electric Utilities | | | 6.2% | |
Pharmaceuticals | | | 4.2% | |
Exchange-Traded Funds | | | 3.7% | |
Insurance | | | 3.0% | |
Pipelines | | | 2.7% | |
Media | | | 2.5% | |
Aerospace & Defense | | | 2.3% | |
Oil, Gas & Consumable Fuels | | | 2.1% | |
Software | | | 1.8% | |
Diversified Financial Services | | | 1.7% | |
Diversified Telecommunication Services | | | 1.3% | |
Telecommunications | | | 1.2% | |
IT Services | | | 1.2% | |
Technology Hardware, Storage & Peripherals | | | 1.1% | |
Equity Real Estate Investment Trusts (REITs) | | | 1.0% | |
U.S. Treasury Obligations | | | 1.0% | |
Healthcare Providers & Services | | | 0.9% | |
Healthcare Equipment & Supplies | | | 0.9% | |
Semiconductors & Semiconductor Equipment | | | 0.9% | |
Food Products | | | 0.8% | |
Beverages | | | 0.8% | |
Miscellaneous Manufacturing | | | 0.8% | |
Internet & Direct Marketing Retail | | | 0.8% | |
Interactive Media & Services | | | 0.8% | |
Wireless Telecommunication Services | | | 0.7% | |
Semiconductors | | | 0.7% | |
Real Estate Management & Development | | | 0.7% | |
Food & Staples Retailing | | | 0.6% | |
Metals & Mining | | | 0.5% | |
Household Products | | | 0.5% | |
Multi-Utilities | | | 0.5% | |
Hotels, Restaurants & Leisure | | | 0.5% | |
Commercial Services | | | 0.4% | |
Commercial Services & Supplies | | | 0.4% | |
Transportation | | | 0.4% | |
Textiles, Apparel & Luxury Goods | | | 0.4% | |
Specialty Retail | | | 0.3% | |
Automobiles | | | 0.3% | |
Construction & Engineering | | | 0.3% | |
Biotechnology | | | 0.3% | |
Trading Companies & Distributors | | | 0.3% | |
Electronic Equipment, Instruments & Components | | | 0.3% | |
Capital Markets | | | 0.3% | |
Healthcare-Services | | | 0.3% | |
Auto Manufacturers | | | 0.3% | |
Communications Equipment | | | 0.3% | |
| | | | |
Household Durables | | | 0.3% | |
Building Products | | | 0.2% | |
Airlines | | | 0.2% | |
Consumer Finance | | | 0.2% | |
Industrial Conglomerates | | | 0.2% | |
Food & Beverage | | | 0.2% | |
Chemicals | | | 0.2% | |
Personal Products | | | 0.2% | |
Road & Rail | | | 0.2% | |
Mortgage Real Estate Investment Trusts (REITs) | | | 0.1% | |
Multi-Line Retail | | | 0.1% | |
Construction Materials | | | 0.1% | |
Entertainment | | | 0.1% | |
Computers | | | 0.1% | |
Professional Services | | | 0.1% | |
Machinery | | | 0.1% | |
Transportation Infrastructure | | | 0.1% | |
Diversified Consumer Services | | | 0.1% | |
Gas Utilities | | | 0.1% | |
Life Sciences Tools & Services | | | 0.1% | |
Auto Components | | | 0.1% | |
Containers & Packaging | | | 0.1% | |
Electrical Equipment | | | 0.1% | |
Retail | | | 0.1% | |
Tobacco | | | 0.1% | |
Shipbuilding | | | 0.1% | |
Machinery-Diversified | | | 0.1% | |
Independent Power Producers & Energy Traders | | | 0.0% | |
Healthcare Technology | | | 0.0% | |
Leisure Equipment & Products | | | 0.0% | |
Thrifts & Mortgage Finance | | | 0.0% | |
Marine | | | 0.0% | |
Real Estate | | | 0.0% | |
Water Utilities | | | 0.0% | |
Paper & Forest Products | | | 0.0% | |
Energy Equipment & Services | | | 0.0% | |
Repurchase Agreements | | | 0.6% | |
Other assets less liabilities | | | 6.5% | |
| | | | |
| | | 100.0% | |
| | | | |
| | | | | | |
| 158 | | Semiannual Report | | | March 31, 2020 | | | See accompanying Notes to Financial Statements |
Schedule of Investments
March 31, 2020 (unaudited)
AllianzGI Global High Yield Fund
| | | | | | | | | | | | |
| | | Principal
Amount
(000s) | | | Value | |
|
| Corporate Bonds & Notes—90.7% | |
| |
| Australia—0.4% | | | | | |
FMG Resources August 206 Pty Ltd. (a)(b), | |
5.125%, 5/15/24 | | | $ | | | | 100 | | | | $99,126 | |
| | | | | | | | | | | | |
| |
| Brazil—1.9% | | | | | |
BRF GmbH, | |
4.35%, 9/29/26 | | | | | | | 200 | | | | 171,890 | |
Petrobras Global Finance BV (a)(b), | |
5.093%, 1/15/30 | | | | | | | 339 | | | | 310,609 | |
| | | | | | | | | | | | |
| | | | | | | | | | | 482,499 | |
| | | | | | | | | | | | |
| |
| Canada—3.1% | | | | | |
1011778 BC ULC (a)(b), | |
5.00%, 10/15/25 | | | | | | | 200 | | | | 192,249 | |
Cenovus Energy, Inc., | |
6.75%, 11/15/39 | | | | | | | 100 | | | | 48,050 | |
Cott Holdings, Inc. (a)(b), | |
5.50%, 4/1/25 | | | | | | | 150 | | | | 146,438 | |
Kronos Acquisition Holdings, Inc. (a)(b), | |
9.00%, 8/15/23 | | | | | | | 150 | | | | 124,312 | |
Rockpoint Gas Storage Canada Ltd. (a)(b), | |
7.00%, 3/31/23 | | | | | | | 65 | | | | 47,856 | |
Superior Plus L.P. (a)(b), | |
7.00%, 7/15/26 | | | | | | | 250 | | | | 245,886 | �� |
| | | | | | | | | | | | |
| | | | | | | | | | | 804,791 | |
| | | | | | | | | | | | |
| |
| China—1.9% | | | | | |
China Evergrande Group, | |
9.50%, 4/11/22 | | | | | | | 200 | | | | 163,633 | |
Kaisa Group Holdings Ltd., | |
9.375%, 6/30/24 | | | | | | | 200 | | | | 154,905 | |
Yuzhou Properties Co., Ltd., | |
6.00%, 10/25/23 | | | | | | | 200 | | | | 166,504 | |
| | | | | | | | | | | | |
| | | | | | | | | | | 485,042 | |
| | | | | | | | | | | | |
| |
| Colombia—0.7% | | | | | |
Millicom International Cellular S.A. (a)(b), | |
6.25%, 3/25/29 | | | | | | | 200 | | | | 180,110 | |
| | | | | | | | | | | | |
| |
| France—1.6% | | | | | |
Altice France S.A. (a)(b), | |
7.375%, 5/1/26 | | | | | | | 200 | | | | 203,110 | |
Credit Agricole S.A., USD 5 Year Swap Rate + 6.185% (c)(d), | |
8.125%, 12/23/25 | | | | | | | 200 | | | | 207,170 | |
| | | | | | | | | | | | |
| | | | | | | | | | | 410,280 | |
| | | | | | | | | | | | |
| |
| Germany—1.3% | | | | | |
Consus Real Estate AG (a)(b), | |
9.625%, 5/15/24 | | € | | | | | 150 | | | | 137,311 | |
Techem Verwaltungsgesellschaft 674 mbH (a)(b), | |
6.00%, 7/30/26 | | | | | | | 100 | | | | 102,517 | |
WEPA Hygieneprodukte GmbH (a)(b), | |
2.875%, 12/15/27 | | | | | | | 100 | | | | 100,937 | |
| | | | | | | | | | | | |
| | | | | | | | | | | 340,765 | |
| | | | | | | | | | | | |
| |
| Greece—0.8% | | | | | |
Crystal Almond Sarl (a)(b), | |
4.25%, 10/15/24 | | | | | | | 200 | | | | 192,576 | |
| | | | | | | | | | | | |
| |
| Guatemala—0.7% | | | | | |
Central American Bottling Corp., | |
5.75%, 1/31/27 | | | | | | | $200 | | | | 173,709 | |
| | | | | | | | | | | | |
| |
| Indonesia—0.7% | | | | | |
Listrindo Capital BV, | |
4.95%, 9/14/26 | | | | | | | 200 | | | | 175,749 | |
| | | | | | | | | | | | |
| |
| Ireland—4.3% | | | | | |
C&W Senior Financing DAC, | |
6.875%, 9/15/27 | | | | | | | 200 | | | | 173,893 | |
Eircom Finance DAC, | |
3.50%, 5/15/26 | | € | | | | | 300 | | | | 316,505 | |
| | | | | | | | | | | | |
| | | Principal
Amount
(000s) | | | Value | |
LCPR Senior Secured Financing DAC, | |
6.75%, 10/15/27 | | | $ | | | | 200 | | | $ | 198,110 | |
Smurfit Kappa Treasury Funding, | |
7.50%, 11/20/25 | | | | | | | 150 | | | | 180,000 | |
Virgin Media Receivables Financing Notes II DAC, | |
5.75%, 4/15/23 | | £ | | | | | 200 | | | | 241,003 | |
| | | | | | | | | | | | |
| | | | | | | | | | | 1,109,511 | |
| | | | | | | | | | | | |
| |
| Israel—0.1% | | | | | |
Teva Pharmaceutical Finance Netherlands III BV, | |
2.20%, 7/21/21 | | | $ | | | | 26 | | | | 24,977 | |
| | | | | | | | | | | | |
| |
| Italy—4.6% | | | | | |
Assicurazioni Generali SpA, (converts to FRN on 6/8/28) (d), | |
5.00%, 6/8/48 | | € | | | | | 100 | | | | 117,899 | |
Banco BPM SpA, | |
2.50%, 6/21/24 | | | | | | | 200 | | | | 206,529 | |
Enel SpA, USD 5 Year Swap Rate + 5.880% (a)(b)(d), | |
8.75%, 9/24/73 | | | $ | | | | 200 | | | | 213,043 | |
F-Brasile SpA, Ser. XR (a)(b), | |
7.375%, 8/15/26 | | | | | | | 200 | | | | 200,000 | |
Intesa Sanpaolo SpA, | |
6.625%, 9/13/23 | | € | | | | | 150 | | | | 175,742 | |
Societa Cattolica di Assicurazioni SC, (converts to FRN on 12/14/27) (d), | |
4.25%, 12/14/47 | | | | | | | 100 | | | | 95,988 | |
Telecom Italia Finance S.A., | |
7.75%, 1/24/33 | | | | | | | 50 | | | | 72,902 | |
Telecom Italia SpA, | |
2.75%, 4/15/25 | | | | | | | 100 | | | | 104,253 | |
| | | | | | | | | | | | |
| | | | | | | | | | | 1,186,356 | |
| | | | | | | | | | | | |
| |
| Luxembourg—2.7% | | | | | |
Altice Financing S.A. (a)(b), | |
7.50%, 5/15/26 | | | $ | | | | 200 | | | | 195,610 | |
ARD Finance S.A., PIK 7.25% (a)(b), | |
6.50%, 6/30/27 | | | | | | | 200 | | | | 172,890 | |
Arena Luxembourg Finance Sarl (a)(b), | |
1.875%, 2/1/28 | | € | | | | | 200 | | | | 189,589 | |
Codere Finance 2 Luxembourg S.A. (a)(b), | |
7.625%, 11/1/21 | | | $ | | | | 200 | | | | 70,358 | |
Summer BC Holdco A Sarl, | |
9.25%, 10/31/27 | | € | | | | | 90 | | | | 77,058 | |
| | | | | | | | | | | | |
| | | | | | | | | | | 705,505 | |
| | | | | | | | | | | | |
| |
| Mexico—0.3% | | | | | |
Petroleos Mexicanos (a)(b), | |
6.49%, 1/23/27 | | | $ | | | | 100 | | | | 74,000 | |
| | | | | | | | | | | | |
| |
| Netherlands—7.0% | | | | | |
Atradius Finance BV, (converts to FRN on 9/23/24) (d), | |
5.25%, 9/23/44 | | € | | | | | 100 | | | | 112,651 | |
Energizer Gamma Acquisition BV, | |
4.625%, 7/15/26 | | | | | | | 100 | | | | 100,187 | |
Intertrust Group BV (a)(b), | |
3.375%, 11/15/25 | | | | | | | 150 | | | | 159,577 | |
Koninklijke KPN NV, USD 10 Year Swap Rate + 5.210% (d), | |
7.00%, 3/28/73 | | | $ | | | | 200 | | | | 200,349 | |
LeasePlan Corp. NV, (converts to FRN on 5/29/24) (c)(d), | |
7.375%, 5/29/24 | | € | | | | | 200 | | | | 180,839 | |
Q-Park Holding I BV (a)(b), | |
2.00%, 3/1/27 | | | | | | | 100 | | | | 94,679 | |
Sunshine Mid BV (a)(b), | |
6.50%, 5/15/26 | | | | | | | 100 | | | | 103,788 | |
Teva Pharmaceutical Finance Netherlands II BV, | |
6.00%, 1/31/25 | | | | | | | 200 | | | | 215,176 | |
Trivium Packaging Finance BV (a)(b), | |
8.50%, 8/15/27 | | | $ | | | | 200 | | | | 202,110 | |
United Group BV (a)(b), | |
3.125%, 2/15/26 | | € | | | | | 200 | | | | 186,877 | |
| | | | | | | | | | | | |
| | | Principal
Amount
(000s) | | | Value | |
Ziggo BV (a)(b), | |
4.875%, 1/15/30 | | | $ | | | | 250 | | | $ | 245,225 | |
| | | | | | | | | | | | |
| | | | | | | | | | | 1,801,458 | |
| | | | | | | | | | | | |
| |
| Portugal—1.3% | | | | | |
Caixa Geral de Depositos S.A., (converts to FRN on 3/30/22) (c)(d), | |
10.75%, 3/30/22 | | € | | | | | 200 | | | | 219,322 | |
EDP—Energias de Portugal S.A., (converts to FRN on 4/30/2024) (d), | |
4.496%, 4/30/79 | | | | | | | 100 | | | | 114,123 | |
| | | | | | | | | | | | |
| | | | | | | | | | | 333,445 | |
| | | | | | | | | | | | |
| |
| Spain—0.8% | | | | | |
Cirsa Finance International Sarl (a)(b), | |
4.75%, 5/22/25 | | | | | | | 150 | | | | 103,253 | |
Grifols S.A. (a)(b), | |
2.25%, 11/15/27 | | | | | | | 100 | | | | 106,615 | |
| | | | | | | | | | | | |
| | | | | | | | | | | 209,868 | |
| | | | | | | | | | | | |
| |
| Switzerland—0.2% | | | | | |
Selecta Group BV, | |
5.875%, 2/1/24 | | | | | | | 100 | | | | 59,023 | |
| | | | | | | | | | | | |
| |
| United Arab Emirates—0.2% | | | | | |
Shelf Drilling Holdings Ltd. (a)(b), | |
8.25%, 2/15/25 | | | $ | | | | $100 | | | | 50,300 | |
| | | | | | | | | | | | |
| |
| United Kingdom—4.1% | | | | | |
AA Bond Co., Ltd., | |
5.50%, 7/31/22 | | £ | | | | | 100 | | | | 81,707 | |
Beazley Insurance DAC, | |
5.50%, 9/10/29 | | | $ | | | | 200 | | | | 208,792 | |
CPUK Finance Ltd. (a)(b), | |
4.875%, 8/28/25 | | £ | | | | | 100 | | | | 100,302 | |
Galaxy Bidco Ltd. (a)(b), | |
6.50%, 7/31/26 | | | | | | | 100 | | | | 112,652 | |
Miller Homes Group Holdings PLC, | |
5.50%, 10/15/24 | | | | | | | 100 | | | | 110,838 | |
Phoenix Group Holdings PLC, | |
4.125%, 7/20/22 | | | | | | | 100 | | | | 125,396 | |
Pinewood Finance Co., Ltd., | |
3.25%, 9/30/25 | | | | | | | 150 | | | | 174,733 | |
Virgin Money UK PLC, (converts to FRN on 12/14/23) (d), | |
7.875%, 12/14/28 | | | | | | | 100 | | | | 126,135 | |
| | | | | | | | | | | | |
| | | | | | | | | | | 1,040,555 | |
| | | | | | | | | | | | |
| |
| United States—52.0% | | | | | |
Albertsons Cos., Inc. (a)(b), | |
4.625%, 1/15/27 | | | $ | | | | 200 | | | | 200,110 | |
5.875%, 2/15/28 | | | | | | | 50 | | | | 51,168 | |
Allied Universal Holdco LLC (a)(b), | |
9.75%, 7/15/27 | | | | | | | 150 | | | | 142,405 | |
American Axle & Manufacturing, Inc., | |
6.50%, 4/1/27 | | | | | | | 50 | | | | 38,941 | |
AmeriGas Partners L.P., | |
5.875%, 8/20/26 | | | | | | | 50 | | | | 48,168 | |
ASGN, Inc. (a)(b), | |
4.625%, 5/15/28 | | | | | | | 100 | | | | 94,305 | |
Ball Corp., | |
5.00%, 3/15/22 | | | | | | | 325 | | | | 336,264 | |
Beazer Homes USA, Inc., | |
7.25%, 10/15/29 | | | | | | | 150 | | | | 115,136 | |
Brink’s Co. (a)(b), | |
4.625%, 10/15/27 | | | | | | | 200 | | | | 185,893 | |
Broadcom, Inc. (a)(b), | |
4.75%, 4/15/29 | | | | | | | 150 | | | | 153,266 | |
BWX Technologies, Inc. (a)(b), | |
5.375%, 7/15/26 | | | | | | | 100 | | | | 96,854 | |
Capitol Investment Merger Sub 2 LLC (a)(b), | |
10.00%, 8/1/24 | | | | | | | 150 | | | | 136,312 | |
Catalent Pharma Solutions ,Inc. (a)(b), | |
2.375%, 3/1/28 | | € | | | | | 100 | | | | 102,522 | |
| | | | | | | | |
| See accompanying Notes to Financial Statements | | | March 31, 2020 | | | Semiannual Report | | | 159 | |
Schedule of Investments
March 31, 2020 (unaudited)
| | | | | | | | | | | | |
| | | Principal
Amount
(000s) | | | Value | |
Catalent Pharma Solutions, Inc. (a)(b), | |
5.00%, 7/15/27 | | | $ | | | | 150 | | | $ | 146,332 | |
CCO Holdings LLC (a)(b), | |
4.50%, 8/15/30 | | | | | | | 50 | | | | 49,281 | |
5.00%, 2/1/28 | | | | | | | 100 | | | | 100,956 | |
5.375%, 6/1/29 | | | | | | | 100 | | | | 103,315 | |
Centene Corp. (a)(b), | |
3.375%, 2/15/30 | | | | | | | 100 | | | | 93,250 | |
5.375%, 8/15/26 | | | | | | | 200 | | | | 205,000 | |
Cheniere Corpus Christi Holdings LLC, | |
5.875%, 3/31/25 | | | | | | | 200 | | | | 167,592 | |
CIT Group, Inc., | |
6.125%, 3/9/28 | | | | | | | 200 | | | | 189,708 | |
Clearway Energy Operating LLC, | |
4.75%, 3/15/28 (a)(b) | | | | | | | 200 | | | | 186,250 | |
5.75%, 10/15/25 | | | | | | | 100 | | | | 99,626 | |
Cleveland-Cliffs, Inc. (a)(b), | |
5.875%, 6/1/27 | | | | | | | 150 | | | | 90,668 | |
Covanta Holding Corp., | |
5.875%, 7/1/25 | | | | | | | 250 | | | | 232,186 | |
Crestwood Midstream Partners L.P., | |
5.75%, 4/1/25 | | | | | | | 125 | | | | 72,504 | |
CSC Holdings LLC (a)(b), | |
5.75%, 1/15/30 | | | | | | | 200 | | | | 202,442 | |
DCP Midstream Operating L.P. (a)(b), | |
6.75%, 9/15/37 | | | | | | | 50 | | | | 27,515 | |
Diamond Sports Group LLC (a)(b), | |
5.375%, 8/15/26 | | | | | | | 100 | | | | 81,814 | |
DISH DBS Corp., | |
5.875%, 11/15/24 | | | | | | | 100 | | | | 98,009 | |
7.75%, 7/1/26 | | | | | | | 50 | | | | 51,653 | |
Dole Food Co., Inc. (a)(b), | |
7.25%, 6/15/25 | | | | | | | 150 | | | | 119,812 | |
Dun & Bradstreet Corp. (a)(b), | |
10.25%, 2/15/27 | | | | | | | 85 | | | | 90,572 | |
Encompass Health Corp., | |
4.50%, 2/1/28 | | | | | | | 250 | | | | 246,575 | |
EQT Corp., | |
6.125%, 2/1/25 | | | | | | | 150 | | | | 116,640 | |
Five Point Operating Co. L.P. (a)(b), | |
7.875%, 11/15/25 | | | | | | | 50 | | | | 43,374 | |
Ford Motor Credit Co. LLC, | |
2.33%, 11/25/25 | | € | | | | | 100 | | | | 84,584 | |
Freeport-McMoRan, Inc., | |
5.25%, 9/1/29 | | | $ | | | | 100 | | | | 94,785 | |
General Electric Co., Ser. D, (converts to FRN on 1/21/21) (c)(d), | |
5.00%, 1/21/21 | | | | | | | 100 | | | | 83,102 | |
Granite Merger Sub 2, Inc. (a)(b), | |
11.00%, 7/15/27 | | | | | | | 100 | | | | 99,354 | |
Gray Television, Inc. (a)(b), | |
7.00%, 5/15/27 | | | | | | | 200 | | | | 200,110 | |
Harsco Corp. (a)(b), | |
5.75%, 7/31/27 | | | | | | | 150 | | | | 139,937 | |
HCA, Inc., | |
5.625%, 9/1/28 | | | | | | | 175 | | | | 184,144 | |
5.875%, 2/1/29 | | | | | | | 100 | | | | 106,125 | |
Hill-Rom Holdings, Inc. (a)(b), | |
4.375%, 9/15/27 | | | | | | | 250 | | | | 248,386 | |
Horizon Therapeutics USA, Inc. (a)(b), | |
5.50%, 8/1/27 | | | | | | | 200 | | | | 201,890 | |
iHeartCommunications, Inc., | |
8.375%, 5/1/27 | | | | | | | 150 | | | | 128,542 | |
Installed Building Products, Inc. (a)(b), | |
5.75%, 2/1/28 | | | | | | | 100 | | | | 96,104 | |
Itron, Inc. (a)(b), | |
5.00%, 1/15/26 | | | | | | | 240 | | | | 230,050 | |
KB Home, | |
4.80%, 11/15/29 | | | | | | | 115 | | | | 97,463 | |
Kraft Heinz Foods Co., | |
6.875%, 1/26/39 | | | | | | | 50 | | | | 57,543 | |
LifePoint Health, Inc. (a)(b), | |
4.375%, 2/15/27 | | | | | | | 150 | | | | 142,425 | |
| | | | | | | | | | | | |
| | | Principal
Amount
(000s) | | | Value | |
Moog, Inc. (a)(b), | |
4.25%, 12/15/27 | | | $ | | | | 300 | | | $ | 273,000 | |
Moss Creek Resources Holdings, Inc. (a)(b), | |
7.50%, 1/15/26 | | | | | | | 125 | | | | 37,318 | |
MSCI, Inc. (a)(b), | |
5.375%, 5/15/27 | | | | | | | 100 | | | | 102,197 | |
MTS Systems Corp. (a)(b), | |
5.75%, 8/15/27 | | | | | | | 100 | | | | 93,604 | |
Navient Corp., | |
5.625%, 8/1/33 | | | | | | | 150 | | | | 111,625 | |
Netflix, Inc., | |
5.375%, 2/1/21 | | | | | | | 300 | | | | 304,275 | |
6.375%, 5/15/29 | | | | | | | 150 | | | | 164,332 | |
NGPL PipeCo LLC (a)(b), | |
7.768%, 12/15/37 | | | | | | | 100 | | | | 100,771 | |
Outfront Media Capital LLC (a)(b), | |
4.625%, 3/15/30 | | | | | | | 100 | | | | 89,555 | |
Panther BF Aggregator 2 L.P. (a)(b), | |
8.50%, 5/15/27 | | | | | | | 250 | | | | 219,487 | |
Parsley Energy LLC (a)(b), | |
5.25%, 8/15/25 | | | | | | | 50 | | | | 38,437 | |
PDC Energy, Inc., | |
5.75%, 5/15/26 | | | | | | | 50 | | | | 28,336 | |
Performance Food Group, Inc. (a)(b), | |
5.50%, 10/15/27 | | | | | | | 75 | | | | 70,131 | |
Qualitytech L.P. (a)(b), | |
4.75%, 11/15/25 | | | | | | | 100 | | | | 97,375 | |
Rackspace Hosting, Inc. (a)(b), | |
8.625%, 11/15/24 | | | | | | | 150 | | | | 134,580 | |
Radiology Partners, Inc. (a)(b), | |
9.25%, 2/1/28 | | | | | | | 150 | | | | 130,987 | |
Range Resources Corp., | |
5.00%, 3/15/23 | | | | | | | 250 | | | | 186,940 | |
Refinitiv U.S. Holdings, Inc., | |
6.875%, 11/15/26 | | € | | | | | 100 | | | | 112,647 | |
SBA Communications Corp. (a)(b), | |
3.875%, 2/15/27 | | | $ | | | | 50 | | | | 50,500 | |
Scientific Games International, Inc., | |
5.50%, 2/15/26 | | € | | | | | 100 | | | | 75,902 | |
Scripps Escrow, Inc. (a)(b), | |
5.875%, 7/15/27 | | | $ | | | | 150 | | | | 132,832 | |
Seagate HDD Cayman, | |
4.75%, 1/1/25 | | | | | | | 198 | | | | 197,293 | |
Sealed Air Corp. (a)(b), | |
5.50%, 9/15/25 | | | | | | | 300 | | | | 306,390 | |
Select Medical Corp., | |
6.25%, 8/15/26 (a)(b) | | | | | | | 100 | | | | 100,551 | |
6.25%, 8/15/26 | | | | | | | 50 | | | | 50,275 | |
Service Corp. International, | |
4.625%, 12/15/27 | | | | | | | 200 | | | | 201,393 | |
Shea Homes L P (a)(b), | |
4.75%, 2/15/28 | | | | | | | 200 | | | | 171,875 | |
Silgan Holdings, Inc. (a)(b), | |
4.125%, 2/1/28 | | | | | | | 350 | | | | 325,500 | |
Smithfield Foods, Inc. (a)(b), | |
4.25%, 2/1/27 | | | | | | | 50 | | | | 47,169 | |
Southwestern Energy Co., | |
6.20%, 1/23/25 | | | | | | | 50 | | | | 34,421 | |
Sprint Communications, Inc., | |
11.50%, 11/15/21 | | | | | | | 320 | | | | 354,547 | |
Sprint Corp., | |
7.625%, 3/1/26 | | | | | | | 200 | | | | 227,470 | |
Sunoco L.P., | |
5.875%, 3/15/28 | | | | | | | 250 | | | | 209,636 | |
Talen Energy Supply LLC (a)(b), | |
6.625%, 1/15/28 | | | | | | | 150 | | | | 126,969 | |
7.25%, 5/15/27 | | | | | | | 50 | | | | 45,463 | |
TEGNA ,Inc. (a)(b), | |
4.625%, 3/15/28 | | | | | | | 100 | | | | 88,438 | |
Tenet Healthcare Corp. (a)(b), | |
4.875%, 1/1/26 | | | | | | | 200 | | | | 191,250 | |
6.25%, 2/1/27 | | | | | | | 50 | | | | 48,938 | |
TerraForm Power Operating LLC (a)(b), | |
4.75%, 1/15/30 | | | | | | | 150 | | | | 146,332 | |
| | | | | | | | | | | | |
| | | Principal
Amount
(000s) | | | Value | |
Terrier Media Buyer, Inc. (a)(b), | |
8.875%, 12/15/27 | | | $ | | | | 150 | | | $ | 127,125 | |
TransDigm, Inc. (a)(b), | |
5.50%, 11/15/27 | | | | | | | 150 | | | | 135,457 | |
Transocean, Inc. (a)(b), | |
8.00%, 2/1/27 | | | | | | | 50 | | | | 23,938 | |
US Renal Care, Inc. (a)(b), | |
10.625%, 7/15/27 | | | | | | | 125 | | | | 106,068 | |
VICI Properties L.P. (a)(b), | |
4.25%, 12/1/26 | | | | | | | 75 | | | | 69,225 | |
4.625%, 12/1/29 | | | | | | | 50 | | | | 45,778 | |
Vistra Operations Co. LLC (a)(b), | |
5.00%, 7/31/27 | | | | | | | 100 | | | | 102,055 | |
5.625%, 2/15/27 | | | | | | | 150 | | | | 155,520 | |
Voya Financial, Inc., (converts to FRN on 1/23/28) (d), | |
4.70%, 1/23/48 | | | | | | | 130 | | | | 107,250 | |
WPX Energy, Inc., | |
4.50%, 1/15/30 | | | | | | | 50 | | | | 27,338 | |
5.75%, 6/1/26 | | | | | | | 50 | | | | 28,848 | |
Wyndham Destinations, Inc., | |
6.35%, 10/1/25 | | | | | | | 150 | | | | 127,312 | |
Yum! Brands, Inc. (a)(b), | |
4.75%, 1/15/30 | | | | | | | 150 | | | | 140,542 | |
| | | | | | | | | | | | |
| | | | | | | | | | | 13,336,159 | |
| | | | | | | | | | | | |
| Total Corporate Bonds & Notes (cost—$26,077,687) | | | | 23,275,804 | |
| | | | | | | | | | | | |
| | | | | | | | | | | | |
|
| Short-Term Investments—11.8% | |
|
| Repurchase Agreements—9.3% | |
State Street Bank and Trust Co., dated 3/31/20, 0.00%, due 4/1/20, proceeds $2,376,000; collateralized by U.S. Treasury Inflation Indexed Notes, 0.625%, due 4/15/23, valued at $2,424,825 including accrued interest | |
(cost—$2,376,000) | | | | | | | 2,376 | | | | 2,376,000 | |
| | | | | | | | | | | | |
|
| U.S. Treasury Obligation(e)— 2.5% | |
U.S. Treasury Bill,
1.40%-1.53%, 6/25/20 (cost—$647,895) | | | | | | | 650 | | | | 649,871 | |
| | | | | | | | | | | | |
| Total Short-Term Investments (cost—$3,023,895) | | | | 3,025,871 | |
| | | | | | | | | | | | |
| |
Total Investments
(cost—$29,101,582)—102.5% | | | | 26,301,675 | |
| | | | | | | | | | | | |
| | |
| Liabilities in excess of other assets (f)—(2.5)% | | | | | | | | (644,036 | ) |
| | | | | | | | | | | | |
| |
| Net Assets—100.0% | | | | $25,657,639 | |
| | | | | | | | | | | | |
Notes to Schedule of Investments:
(a) Private Placement—Restricted as to resale and may not have a readily available market. Securities with an aggregate value of $12,800,934, representing 49.9% of net assets.
(b) 144A—Exempt from registration under Rule 144A of the Securities Act of 1933. These securities may be resold in transactions exempt from registration, typically only to qualified institutional buyers. Securities with an aggregate value of $12,800,934, representing 49.9% of net assets.
(c) Perpetual maturity. The date shown, if any, is the next call date.
(d) Variable or Floating Rate Security—Securities with an interest rate that changes periodically. The interest rate disclosed reflects the rate in effect on March 31, 2020.
(e) Rates reflect the effective yields at purchase date.
| | | | | | |
| 160 | | Semiannual Report | | | March 31, 2020 | | | See accompanying Notes to Financial Statements |
Schedule of Investments
March 31, 2020 (unaudited)
(f) Includes net unrealized appreciation (depreciation) of other financial instruments as follows:
| | | | | | | | | | | | | | | | | | | | | | |
|
| Futures contracts outstanding at March 31, 2020: | |
| Type | | Contracts | | | Expiration
Date | | | Notional
Amount
(000s) | | | Market
Value
(000s) | | | Unrealized
Depreciation | |
Short position contracts: | | | | | | | | | | | | | | | | | | | | |
| | 5-Year U.S. Treasury Note | | | (13 | ) | | | 6/30/20 | | | $ | (1,300 | ) | | $ | (1,630 | ) | | $ | (53,625 | ) |
| | E-mini S&P 500 Index | | | (6 | ) | | | 6/19/20 | | | | (— | )(h) | | | (771 | ) | | | (2,151 | ) |
| | | | | | | | | | | | | | | | | | | | | | |
| | | | | | | | | | | | | | | | | | | | $ | (55,776 | ) |
| | | | | | | | | | | | | | | | | | | | | | |
| | | | | | | | | | | | | | | | | | | | |
|
| Forward foreign currency contracts outstanding at March 31, 2020: | |
| Description | | Counterparty | | | U.S.$ Value on
Origination Date | | | U.S.$ Value
March 31, 2020 | | | Unrealized
Appreciation | | | Unrealized
Depreciation | |
Purchased: | | | | | | | | | | | | | | | | | | | | |
883,785 Euro Currency settling 6/17/20 | | | JPMorgan Chase | | | $ | 968,745 | | | $ | 977,560 | | | $ | 8,815 | | | $ | — | |
| | | | | | | | | | | | | | | | | | | | |
| | | | | |
| Sold: | | | | | | | | | | | | | | | | | | | | |
4,565,070 Euro Currency settling 6/17/20 | | | Goldman Sachs | | | | 5,198,245 | | | | 5,049,442 | | | | 148,803 | | | | — | |
739,046 Pound Sterling settling 6/17/20 | | | Goldman Sachs | | | | 964,958 | | | | 919,193 | | | | 45,765 | | | | — | |
196,104 Pound Sterling settling 6/17/20 | | | JPMorgan Chase | | | | 226,458 | | | | 243,906 | | | | — | | | | (17,448 | ) |
| | | | | | | | | | | | | | | | | | | | |
| | | | | | | | | | | | | | $ | 203,383 | | | $ | (17,448 | ) |
| | | | | | | | | | | | | | | | | | | | |
(g) At March 31, 2020, the Fund pledged $44,263 in cash as collateral for futures contracts and received $400,000 in cash as collateral for swap contracts. There were no open swap contracts outstanding as of March 31, 2020, however the Fund had recevied collateral for any transactions in the future.
(h) Notional amount rounds to less than 500.
Glossary:
£ — British Pound
€ — Euro
FRN — Floating Rate Note
MSCI — Morgan Stanley Capital International
PIK —Payment-in-Kind
The industry classification of portfolio holdings and liabilities in excess of other assets shown as a percentage of net assets were as follows:
| | | | |
Telecommunications | | | 8.3% | |
Media | | | 8.3% | |
Healthcare-Services | | | 7.2% | |
Commercial Services | | | 5.8% | |
Containers & Packaging | | | 5.2% | |
Oil, Gas & Consumable Fuels | | | 5.1% | |
Electric Utilities | | | 4.7% | |
Banks | | | 4.4% | |
Insurance | | | 3.4% | |
Food & Beverage | | | 2.7% | |
Real Estate | | | 2.6% | |
Internet | | | 2.6% | |
U.S. Treasury Obligations | | | 2.5% | |
Aerospace & Defense | | | 2.4% | |
Home Builders | | | 2.3% | |
Retail | | | 2.3% | |
Pharmaceuticals | | | 2.1% | |
Entertainment | | | 2.0% | |
Diversified Financial Services | | | 1.7% | |
Software | | | 1.7% | |
Beverages | | | 1.5% | |
Pipelines | | | 1.4% | |
Advertising | | | 1.1% | |
Computers | | | 1.1% | |
Paper & Forest Products | | | 1.1% | |
Auto Components | | | 1.0% | |
Healthcare-Products | | | 1.0% | |
Environmental Services | | | 0.9% | |
Electronics | | | 0.9% | |
Mining | | | 0.8% | |
Equity Real Estate Investment Trusts (REITs) | | | 0.6% | |
Semiconductors | | | 0.6% | |
Energy-Alternate Sources | | | 0.6% | |
| | | | |
Lodging | | | 0.5% | |
Household Products/Wares | | | 0.5% | |
Electronic Equipment, Instruments & Components | | | 0.4% | |
Machinery-Construction & Mining | | | 0.4% | |
Iron/Steel | | | 0.4% | |
Auto Manufacturers | | | 0.3% | |
Miscellaneous Manufacturing | | | 0.3% | |
Distribution/Wholesale | | | 0.3% | |
Machinery-Diversified | | | 0.2% | |
Repurchase Agreements | | | 9.3% | |
Liabilities in excess of other assets | | | (2.5)% | |
| | | | |
| | | 100.0% | |
| | | | |
| | | | | | | | |
| See accompanying Notes to Financial Statements | | | March 31, 2020 | | | Semiannual Report | | | 161 | |
Schedule of Investments
March 31, 2020 (unaudited)
AllianzGI Global Sustainability Fund
| | | | | | | | |
| | | Shares | | | Value | |
|
| Common Stock—95.7% | |
| |
| Australia—1.7% | | | | | |
CSL Ltd. | | | 13,245 | | | | $2,400,942 | |
| | | | | | | | |
| |
| Canada—0.8% | | | | | |
Gibson Energy, Inc. | | | 98,805 | | | | 1,140,895 | |
| | | | | | | | |
| |
| Denmark—1.8% | | | | | |
Novo Nordisk A/S, Class B | | | 41,127 | | | | 2,455,942 | |
| | | | | | | | |
| |
| France—3.1% | | | | | |
Bureau Veritas S.A. | | | 72,719 | | | | 1,370,672 | |
Credit Agricole S.A. | | | 142,790 | | | | 1,010,366 | |
Kering S.A. | | | 3,542 | | | | 1,846,843 | |
| | | | | | | | |
| | | | | | | 4,227,881 | |
| | | | | | | | |
| |
| Germany—6.5% | | | | | |
Adidas AG | | | 14,461 | | | | 3,210,736 | |
Muenchener Rueckversicherungs-Gesellschaft AG in Muenchen | | | 14,415 | | | | 2,898,427 | |
SAP SE | | | 25,173 | | | | 2,810,513 | |
| | | | | | | | |
| | | | | | | 8,919,676 | |
| | | | | | | | |
| |
| Hong Kong—1.4% | | | | | |
AIA Group Ltd. | | | 215,800 | | | | 1,932,410 | |
| | | | | | | | |
| |
| Japan—4.5% | | | | | |
Daikin Industries Ltd. | | | 25,500 | | | | 3,078,207 | |
Keyence Corp. | | | 9,500 | | | | 3,054,368 | |
| | | | | | | | |
| | | | | | | 6,132,575 | |
| | | | | | | | |
| |
| Korea (Republic of)—1.6% | | | | | |
Samsung Electronics Co., Ltd. GDR | | | 2,185 | | | | 2,161,284 | |
| | | | | | | | |
| |
| Spain—1.4% | | | | | |
Industria de Diseno Textil S.A. | | | 73,610 | | | | 1,907,501 | |
| | | | | | | | |
| |
| Sweden—3.7% | | | | | |
Assa Abloy AB, Class B | | | 111,511 | | | | 2,081,765 | |
Atlas Copco AB, Class A | | | 91,302 | | | | 3,036,179 | |
| | | | | | | | |
| | | | | | | 5,117,944 | |
| | | | | | | | |
| |
| Switzerland—4.1% | | | | | |
Roche Holding AG | | | 12,165 | | | | 3,913,990 | |
UBS Group AG (b) | | | 178,939 | | | | 1,640,175 | |
| | | | | | | | |
| | | | | | | 5,554,165 | |
| | | | | | | | |
| |
| United Kingdom—10.0% | | | | | |
AstraZeneca PLC | | | 35,226 | | | | 3,138,598 | |
Prudential PLC | | | 163,071 | | | | 2,043,253 | |
Reckitt Benckiser Group PLC | | | 37,179 | | | | 2,832,132 | |
Royal Dutch Shell PLC, Class B | | | 119,757 | | | | 2,008,811 | |
Unilever PLC | | | 53,369 | | | | 2,691,409 | |
Vodafone Group PLC | | | 689,241 | | | | 953,526 | |
| | | | | | | | |
| | | | | | | 13,667,729 | |
| | | | | | | | |
| |
| United States—55.1% | | | | | |
AbbVie, Inc. | | | 25,734 | | | | 1,960,673 | |
Accenture PLC, Class A | | | 18,272 | | | | 2,983,087 | |
Adobe, Inc. (b) | | | 13,817 | | | | 4,397,122 | |
Agilent Technologies, Inc. | | | 53,181 | | | | 3,808,823 | |
Alphabet, Inc., Class A (b) | | | 2,657 | | | | 3,087,301 | |
American Express Co. | | | 33,409 | | | | 2,860,145 | |
Apple, Inc. | | | 20,000 | | | | 5,085,800 | |
Bright Horizons Family Solutions, Inc. (b) | | | 17,167 | | | | 1,751,034 | |
Citigroup, Inc. | | | 34,530 | | | | 1,454,404 | |
Colgate-Palmolive Co. | | | 30,006 | | | | 1,991,198 | |
Eaton Corp. PLC | | | 25,545 | | | | 1,984,591 | |
Ecolab, Inc. | | | 16,900 | | | | 2,633,527 | |
| | | | | | | | |
| | | Shares | | | Value | |
EOG Resources, Inc. | | | 26,327 | | | $ | 945,666 | |
Estee Lauder Cos., Inc., Class A | | | 14,303 | | | | 2,279,040 | |
International Flavors & Fragrances, Inc. | | | 24,428 | | | | 2,493,610 | |
Intuit, Inc. | | | 17,038 | | | | 3,918,740 | |
Johnson & Johnson | | | 19,699 | | | | 2,583,130 | |
Microsoft Corp. | | | 47,435 | | | | 7,480,974 | |
Mondelez International, Inc., Class A | | | 45,865 | | | | 2,296,919 | |
S&P Global, Inc. | | | 18,999 | | | | 4,655,705 | |
Starbucks Corp. | | | 49,654 | | | | 3,264,254 | |
UnitedHealth Group, Inc. | | | 14,303 | | | | 3,566,882 | |
Visa, Inc., Class A | | | 36,286 | | | | 5,846,400 | |
Xylem, Inc. | | | 31,801 | | | | 2,071,199 | |
| | | | | | | | |
| | | | | | | 75,400,224 | |
| | | | | | | | |
Total Common Stock
(cost—$142,520,081) | | | | 131,019,168 | |
| | | | | | | | |
| | | | | | | | |
| | |
| | | Principal
Amount
(000s) | | | | |
|
| Repurchase Agreements—3.8% | |
State Street Bank and Trust Co.,
dated 3/31/20, 0.00%, due 4/1/20, proceeds $5,210,000; collateralized by U.S. Treasury Inflation Indexed Notes, 0.625%, due 4/15/23, valued at $5,317,784 including accrued interest | |
(cost—$5,210,000) | | | $5,210 | | | | 5,210,000 | |
| | | | | | | | |
| |
Total Investments
(cost—$147,730,081) (a)—99.5% | | | | 136,229,168 | |
| | | | | | | | |
| | |
Other assets
less liabilities—0.5% | | | | | | | 646,865 | |
| | | | | | | | |
| |
| Net Assets—100.0% | | | | $136,876,033 | |
| | | | | | | | |
Notes to Schedule of Investments:
(a) Securities with an aggregate value of $54,473,084, representing 39.8% of net assets, were valued utilizing modeling tools provided by a third-party vendor. See Note 1(a) and Note 1(b) in the Notes to Financial Statements.
(b)Non-income producing.
Glossary:
GDR—Global Depositary Receipt
The industry classification of portfolio holdings and other assets less liabilities shown as a percentage of net assets were as follows:
| | | | |
Software | | | 13.6% | |
Pharmaceuticals | | | 8.8% | |
IT Services | | | 6.5% | |
Technology Hardware, Storage & Peripherals | | | 5.3% | |
Insurance | | | 5.0% | |
Capital Markets | | | 4.6% | |
Building Products | | | 3.8% | |
Chemicals | | | 3.7% | |
Machinery | | | 3.7% | |
Textiles, Apparel & Luxury Goods | | | 3.7% | |
Personal Products | | | 3.6% | |
Household Products | | | 3.5% | |
Biotechnology | | | 3.2% | |
Oil, Gas & Consumable Fuels | | | 3.0% | |
Life Sciences Tools & Services | | | 2.8% | |
Healthcare Providers & Services | | | 2.6% | |
Hotels, Restaurants & Leisure | | | 2.4% | |
Interactive Media & Services | | | 2.3% | |
Electronic Equipment, Instruments & Components | | | 2.2% | |
Consumer Finance | | | 2.1% | |
Banks | | | 1.8% | |
Food Products | | | 1.7% | |
Electrical Equipment | | | 1.4% | |
Specialty Retail | | | 1.4% | |
Diversified Consumer Services | | | 1.3% | |
Professional Services | | | 1.0% | |
Wireless Telecommunication Services | | | 0.7% | |
Repurchase Agreements | | | 3.8% | |
Other assets less liabilities | | | 0.5% | |
| | | | |
| | | 100.0% | |
| | | | |
| | | | | | |
| 162 | | Semiannual Report | | | March 31, 2020 | | | See accompanying Notes to Financial Statements |
Schedule of Investments
March 31, 2020 (unaudited)
AllianzGI Green Bond Fund
| | | | | | | | | | | | |
| | | | | | Principal
Amount
(000s) | | | Value | |
| |
| Corporate Bonds & Notes—79.0% | |
| |
| Brazil—0.3% | | | | | |
Fibria Overseas Finance Ltd., | | | | | |
5.50%, 1/17/27 | | | $ | | | | 100 | | | | $96,220 | |
| | | | | | | | | | | | |
| |
| Canada—1.9% | | | | | |
Bank of Nova Scotia, | | | | | |
2.375%, 1/18/23 | | | | | | | 500 | | | | 502,951 | |
| | | | | | | | | | | | |
| |
| China—1.5% | | | | | |
Industrial & Commercial Bank of China Ltd. (d), | |
3 mo. LIBOR + 0.720%, 2.515%, 4/25/22 | | | | | | | 200 | | | | 200,737 | |
3 mo. LIBOR + 0.830%, 2.625%, 4/25/24 | | | | | | | 200 | | | | 200,386 | |
| | | | | | | | | | | | |
| | | | | | | | | | | 401,123 | |
| | | | | | | | | | | | |
| |
| Czech Republic—2.6% | | | | | |
CPI Property Group SA, | | | | | |
1.625%, 4/23/27 | | € | | | | | 700 | | | | 702,383 | |
| | | | | | | | | | | | |
| |
| Denmark—3.5% | | | | | |
Orsted A/S, | | | | | |
1.75%, 12/9/3019 (converts to FRN on 12/9/27) (d)(e) | | | | | | | 100 | | | | 98,164 | |
2.25%, 11/24/3017 (converts to FRN on 11/24/24) (d)(e) | | | | | | | 700 | | | | 721,445 | |
2.50%, 5/16/33 | | £ | | | | | 100 | | | | 125,929 | |
| | | | | | | | | | | | |
| | | | | | | | | | | 945,538 | |
| | | | | | | | | | | | |
| |
| France—9.2% | | | | | |
CNP Assurances, (converts to FRN on 7/27/30) (d), | |
2.00%, 7/27/50 | | € | | | | | 500 | | | | 482,965 | |
Covivio, | | | | | |
1.125%, 9/17/31 | | | | | | | 100 | | | | 101,756 | |
Electricite de France S.A., | | | | | |
3.625%, 10/13/25 | | | $ | | | | 100 | | | | 104,368 | |
Engie S.A., | | | | | |
1.375%, 6/21/39 | | € | | | | | 100 | | | | 100,296 | |
Engie SA, | | | | | |
0.50%, 10/24/30 (converts to FRN on 1/16/23) (d) | | | | | | | 500 | | | | 499,658 | |
1.375%, 1/16/23 (converts to FRN on 4/16/23) (c)(d) | | | | | | | 500 | | | | 524,278 | |
1.75%, 3/27/28 | | | | | | | 200 | | | | 227,743 | |
2.125%, 3/30/32 | | | | | | | 100 | | | | 117,738 | |
Paprec Holding S.A., | | | | | |
4.00%, 3/31/25 | | | | | | | 400 | | | | 308,808 | |
| | | | | | | | | | | | |
| | | | | | | | | | | 2,467,610 | |
| | | | | | | | | | | | |
| |
| Germany—2.5% | | | | | |
E.ON SE, | | | | | |
0.35%, 2/28/30 | | | | | | | 450 | | | | 445,752 | |
Landesbank Baden-Wuerttemberg, | | | | | |
1.50%, 2/3/25 | | £ | | | | | 200 | | | | 232,206 | |
| | | | | | | | | | | | |
| | | | | | | | | | | 677,958 | |
| | | | | | | | | | | | |
| |
| Hong Kong—5.4% | | | | | |
CGNPC International Ltd., | | | | | |
2.75%, 7/2/24 | | | $ | | | | 300 | | | | 305,083 | |
MTR Corp CI Ltd, | | | | | |
2.50%, 11/2/26 | | | | | | | 600 | | | | 618,151 | |
Swire Properties MTN Financing Ltd, | | | | | |
3.50%, 1/10/28 | | | | | | | 500 | | | | 533,062 | |
| | | | | | | | | | | | |
| | | | | | | | | | | 1,456,296 | |
| | | | | | | | | | | | |
| |
| India—2.9% | | | | | |
ReNew Power Pvt Ltd., | | | | | |
5.875%, 3/5/27 | | | | | | | 400 | | | | 285,998 | |
| | | | | | | | | | | | |
| | | |
| | | | | | Principal
Amount
(000s) | | | Value | |
State Bank of India/London, | | | | | |
4.50%, 9/28/23 | | | $ | | | | 500 | | | $ | 503,050 | |
| | | | | | | | | | | | |
| | | | | | | | | | | 789,048 | |
| | | | | | | | | | | | |
| |
| Italy—3.6% | | | | | |
A2A SpA, | | | | | |
1.00%, 7/16/29 | | € | | | | | 150 | | | | 157,525 | |
Assicurazioni Generali SpA, | | | | | |
2.124%, 10/1/30 | | | | | | | 500 | | | | 502,194 | |
Intesa Sanpaolo SpA, | | | | | |
0.75%, 12/4/24 | | | | | | | 100 | | | | 101,721 | |
Iren SpA, | | | | | |
0.875%, 10/14/29 | | | | | | | 200 | | | | 207,775 | |
| | | | | | | | | | | | |
| | | | | | | | | | | 969,215 | |
| | | | | | | | | | | | |
| |
| Japan—1.9% | | | | | |
Mitsubishi UFJ Financial Group, Inc., | | | | | |
2.527%, 9/13/23 | | | $ | | | | 500 | | | | 506,379 | |
| | | | | | | | | | | | |
| |
| Korea (Republic of)—2.6% | | | | | |
LG Chem Ltd. (a)(b), | | | | | |
3.25%, 10/15/24 | | | | | | | 500 | | | | 511,615 | |
3.625%, 4/15/29 | | | | | | | 200 | | | | 203,064 | |
| | | | | | | | | | | | |
| | | | | | | | | | | 714,679 | |
| | | | | | | | | | | | |
| |
| Lithuania—0.4% | | | | | |
Ignitis Grupe UAB, | | | | | |
2.00%, 7/14/27 | | € | | | | | 100 | | | | 113,945 | |
| | | | | | | | | | | | |
| |
| Netherlands—3.4% | | | | | |
Digital Dutch Finco BV, | | | | | |
1.50%, 3/15/30 | | | | | | | 100 | | | | 96,380 | |
EDP Finance BV, | | | | | |
0.375%, 9/16/26 | | | | | | | 300 | | | | 309,844 | |
OI European Group BV, | | | | | |
2.875%, 2/15/25 | | | | | | | 200 | | | | 205,168 | |
Telefonica Europe BV, (converts to FRN on 5/5/27) (c)(d), | |
2.502%, 2/5/27 | | | | | | | 200 | | | | 190,255 | |
TenneT Holding BV, (converts to FRN on 6/1/24) (c)(d), | |
2.995%, 3/1/24 | | | | | | | 100 | | | | 106,985 | |
| | | | | | | | | | | | |
| | | | | | | | | | | 908,632 | |
| | | | | | | | | | | | |
| |
| Norway—1.1% | | | | | |
Mowi ASA (d), | | | | | |
1.60%, 1/31/25 | | | | | | | 300 | | | | 303,573 | |
| | | | | | | | | | | | |
| |
| Portugal—0.8% | | | | | |
EDP—Energias de Portugal S.A. (d), | | | | | |
1.70%, 7/20/80 (converts to FRN on 7/20/25) | | | | | | | 100 | | | | 98,548 | |
4.496%, 4/30/79 (converts to FRN on 4/30/24) | | | | | | | 100 | | | | 114,123 | |
| | | | | | | | | | | | |
| | | | | | | | | | | 212,671 | |
| | | | | | | | | | | | |
| |
| Russian Federation—0.8% | | | | | |
Russian Railways Via RZD Capital PLC, | | | | | |
2.20%, 5/23/27 | | | | | | | 200 | | | | 215,847 | |
| | | | | | | | | | | | |
| |
| Spain—6.5% | | | | | |
Banco Bilbao Vizcaya Argentaria S.A., | |
1.00%, 6/21/26 | | | | | | | 400 | | | | 407,769 | |
Banco Santander SA, | |
0.30%, 10/4/26 | | | | | | | 400 | | | | 407,187 | |
Bankinter S.A., | | | | | |
0.625%, 10/6/27 | | | | | | | 200 | | | | 193,188 | |
Iberdrola International BV (c)(d), | |
1.875%, 2/22/23 (converts to FRN on 5/22/23) | | | | | | | 600 | | | | 640,564 | |
5mo. EURIBOR + 2.973%, 3.25%, 11/12/24 (converts to FRN on 5/11/26) | | | | | | | 100 | | | | 111,561 | |
| | | | | | | | | | | | |
| | | | | | | | | | | 1,760,269 | |
| | | | | | | | | | | | |
| | | | | | | | | | | | |
| | | |
| | | | | | Principal
Amount
(000s) | | | Value | |
| |
| Supranational—0.6% | | | | | |
Stedin Holding NV, | |
0.50%, 11/14/29 | | € | | | | | 150 | | | $ | 158,926 | |
| | | | | | | | | | | | |
| |
| Sweden—3.0% | | | | | |
SKF AB, | |
0.875%, 11/15/29 | | | | | | | 200 | | | | 208,186 | |
Telia Co AB, (converts to FRN on 5/11/26) (d), | |
1.375%, 5/11/81 | | | | | | | 400 | | | | 386,427 | |
Vattenfall AB, | |
0.05%, 10/15/25 | | | | | | | 200 | | | | 210,124 | |
| | | | | | | | | | | | |
| | | | | | | | | | | 804,737 | |
| | | | | | | | | | | | |
| |
| United Kingdom—4.9% | | | | | |
Anglian Water Services Financing PLC, | |
1.625%, 8/10/25 | | £ | | | | | 400 | | | | 491,527 | |
Bazalgette Finance PLC, | |
2.375%, 11/29/27 | | | | | | | 100 | | | | 129,770 | |
Cadent Finance PLC, | |
0.75%, 3/11/32 | | € | | | | | 100 | | | | 101,113 | |
Scottish Hydro Electric Transmission PLC, | |
2.25%, 9/27/35 | | £ | | | | | 500 | | | | 590,777 | |
| | | | | | | | | | | | |
| | | | | | | | | | | 1,313,187 | |
| | | | | | | | | | | | |
| |
| United States—19.6% | | | | | |
Apple, Inc., | |
3.00%, 6/20/27 | | | $ | | | | 500 | | | | 538,284 | |
Avangrid, Inc., | |
3.80%, 6/1/29 | | | | | | | 300 | | | | 306,388 | |
Bank of America Corp. (d), | |
2.456%, 10/22/25 (converts to FRN on 10/22/24) | | | | | | | 600 | | | | 605,228 | |
3.499%, 5/17/22 (converts to FRN on 5/17/21) | | | | | | | 400 | | | | 405,131 | |
Boston Properties L.P., | |
3.40%, 6/21/29 | | | | | | | 300 | | | | 293,932 | |
DTE Electric Co., | |
3.95%, 3/1/49 | | | | | | | 200 | | | | 228,587 | |
Duke Energy Carolinas LLC, | |
3.95%, 11/15/28 | | | | | | | 100 | | | | 110,899 | |
Duke Realty L.P., | |
2.875%, 11/15/29 | | | | | | | 400 | | | | 383,003 | |
Hanwha Energy USA Holdings Corp., | |
2.375%, 7/30/22 | | | | | | | 400 | | | | 403,951 | |
Interstate Power & Light Co., | |
4.10%, 9/26/28 | | | | | | | 100 | | | | 107,823 | |
NextEra Energy Capital Holdings, Inc., | |
2.20%, 12/2/26 | | | AUD | | | | 300 | | | | 181,161 | |
Prologis Euro Finance LLC, | |
0.375%, 2/6/28 | | € | | | | | 100 | | | | 100,043 | |
Public Service Co. of Colorado, Ser. 34, | |
3.20%, 3/1/50 | | | $ | | | | 700 | | | | 705,483 | |
Verizon Communications, Inc., | |
3.875%, 2/8/29 | | | | | | | 100 | | | | 112,287 | |
VF Corp., | |
0.25%, 2/25/28 | | € | | | | | 400 | | | | 411,946 | |
Welltower, Inc., | |
2.70%, 2/15/27 | | | $ | | | | 400 | | | | 378,093 | |
| | | | | | | | | | | | |
| | | | | | | | | | | 5,272,239 | |
| | | | | | | | | | | | |
Total Corporate Bonds & Notes
(cost—$22,476,262) | | | | 21,293,426 | |
| | | | | | | | | | | | |
| | | | | | | | | | | | |
| |
| Sovereign Debt Obligations—18.2% | |
| |
| Australia—0.4% | | | | | |
New South Wales Treasury Corp., | |
3.00%, 11/15/28 | | | AUD | | | | 150 | | | | $105,609 | |
| | | | | | | | | | | | |
| | | | | | | | |
| See accompanying Notes to Financial Statements | | | March 31, 2020 | | | Semiannual Report | | | 163 | |
Schedule of Investments
March 31, 2020 (unaudited)
| | | | | | | | | | | | |
| | | |
| | | | | | Principal
Amount
(000s) | | | Value | |
| |
| Belgium—1.9% | | | | | |
Kingdom of Belgium Government Bond, | |
1.25%, 4/22/33 | | € | | | | | 400 | | | $ | 499,803 | |
| | | | | | | | | | | | |
| |
| Canada—2.2% | | | | | |
CPPIB Capital, Inc., | |
0.25%, 4/6/27 | | | | | | | 450 | | | | 493,046 | |
Province of Quebec Canada, | |
2.60%, 7/6/25 | | | CAD | | | | 150 | | | | 112,715 | |
| | | | | | | | | | | | |
| | | | | | | | | | | 605,761 | |
| | | | | | | | | | | | |
| |
| Chile—3.6% | | | | | |
Chile Government International Bond, | |
0.83%, 7/2/31 | | € | | | | | 500 | | | | 496,190 | |
1.25%, 1/29/40 | | | | | | | 500 | | | | 477,303 | |
| | | | | | | | | | | | |
| | | | | | | | | | | 973,493 | |
| | | | | | | | | | | | |
| |
| Korea (Republic of)—2.2% | | | | | |
Export-Import Bank of Korea, 3 mo. LIBOR +0.740% (d), | |
1.935%, 3/22/23 | | | $ | | | | 400 | | | | 402,239 | |
Korea South-East Power Co., Ltd., | |
2.125%, 2/3/25 | | | | | | | 200 | | | | 201,819 | |
| | | | | | | | | | | | |
| | | | | | | | | | | 604,058 | |
| | | | | | | | | | | | |
| |
| Netherlands—0.9% | | | | | |
Netherlands Government Bond (b), | |
0.50%, 1/15/40 | | € | | | | | 200 | | | | 239,684 | |
| | | | | | | | | | | | |
| |
| Supranational—4.0% | | | | | |
African Development Bank, SOFR + 0.320% (d), | |
0.33%, 11/18/20 | | | $ | | | | 100 | | | | 99,768 | |
| | | | | | | | | | | | |
| | | |
| | | | | | Principal
Amount
(000s) | | | Value | |
Central American Bank for Economic Integration, 3 mo. LIBOR + 0.850% (d), | |
2.542%, 11/15/24 | | | $ | | | | 750 | | | $ | 749,692 | |
Corp Andina de Fomento, | |
0.625%, 11/20/26 | | € | | | | | 200 | | | | 221,250 | |
| | | | | | | | | | | | |
| | | | | | | | | | | 1,070,710 | |
| | | | | | | | | | | | |
| |
| Sweden—3.0% | | | | | |
City of Gothenburg Sweden, | |
0.455%, 11/27/25 | | | SEK | | | | 2,000 | | | | 200,422 | |
Kommuninvest I Sverige AB, | |
1.625%, 4/24/23 | | | $ | | | | 600 | | | | 617,593 | |
| | | | | | | | | | | | |
| | | | | | | | | | | 818,015 | |
| | | | | | | | | | | | |
Total Sovereign Debt Obligations (cost—$5,063,238) | | | | 4,917,133 | |
| | | | | | | | | | | | |
|
| Repurchase Agreements—3.9% | |
State Street Bank and Trust Co.,
dated 3/31/20, 0.00%, due 4/1/20, proceeds $1,038,000; collateralized by U.S. Treasury Inflation Indexed Notes, 0.625%, due 4/15/23, valued at $1,062,505 including accrued interest | |
(cost—$1,038,000) | | | | 1,038 | | | | 1,038,000 | |
| | | | | | | | | | | | |
| |
Total Investments
(cost—$28,577,500)—101.1% | | | | 27,248,559 | |
| | | | | | | | | | | | |
| |
| Liabilities in excess of other assets (f)—(1.1)% | | | | (309,230 | ) |
| | | | | | | | | | | | |
| | |
| Net Assets—100.0% | | | | | | | | $26,939,329 | |
| | | | | | | | | | | | |
Notes to Schedule of Investments:
(a) Private Placement—Restricted as to resale and may not have a readily available market. Securities with an aggregate value of $714,679, representing 2.7% of net assets.
(b) 144A—Exempt from registration under Rule 144A of the Securities Act of 1933. These securities may be resold in transactions exempt from registration, typically only to qualified institutional buyers. Securities with an aggregate value of $954,363, representing 3.5% of net assets.
(c) Perpetual maturity. The date shown, if any, is the next call date.
(d) Variable or Floating Rate Security—Securities with an interest rate that changes periodically. The interest rate disclosed reflects the rate in effect on March 31, 2020.
(e) Hybrid bond.
(f) Includes net unrealized appreciation (depreciation) of other financial instruments as follows:
| | | | | | | | | | | | | | | | | | | | | | |
|
| Futures contracts outstanding at March 31, 2020: | |
| Type | | | | Contracts | | | Expiration
Date | | | Notional
Amount
(000s) | | | Market
Value
(000s) | | | Unrealized
Depreciation | |
Long position contracts: | | | | | | | | | | | | | | | | | | | | |
| | Euro-Bund10-Year Bond | | | 39 | | | | 6/8/20 | | | EUR | 3,900 | | | $ | 7,420 | | | $ | (41,802 | ) |
| | | | | | | | | | | | | | | | | | | | | | |
Short position contracts: | | | | | | | | | | | | | | | | | | | | |
| | 10-Year U.S. Treasury Note | | | (27 | ) | | | 6/19/20 | | | $ | (2,700 | ) | | $ | (3,745 | ) | | $ | (111,994 | ) |
| | | | | | | | | | | | | | | | | | | | | | |
| | | | | | | | | | | | | | | | | | | | $ | (153,796 | ) |
| | | | | | | | | | | | | | | | | | | | | | |
| | | | | | | | | | | | | | | | |
|
| Forward foreign currency contracts outstanding at March 31, 2020: | |
| Description | | Counterparty | | | U.S.$ Value on
Origination Date | | | U.S.$ Value
March 31, 2020 | | | Unrealized
Depreciation | |
475,080 Australian Dollar settling 6/26/20 | | | State Street Bank London | | | $ | 283,982 | | | $ | 292,283 | | | $ | (8,301 | ) |
158,550 Canadian Dollar settling 6/26/20 | | | State Street Bank London | | | | 110,341 | | | | 112,754 | | | | (2,413 | ) |
10,991,790 Euro Currency settling 6/26/20 | | | State Street Bank London | | | | 11,921,135 | | | | 12,162,055 | | | | (240,920 | ) |
1,244,970 Pound Sterling settling 6/26/20 | | | State Street Bank London | | | | 1,465,412 | | | | 1,548,606 | | | | (83,194 | ) |
1,967,215 Swedish Krona settling 6/26/20 | | | State Street Bank London | | | | 194,179 | | | | 199,232 | | | | (5,053 | ) |
| | | | | | | | | | | | | | | | |
| | | | | | | | | | | | | | $ | (339,881 | ) |
| | | | | | | | | | | | | | | | |
| | | | | | |
| 164 | | Semiannual Report | | | March 31, 2020 | | | See accompanying Notes to Financial Statements |
Schedule of Investments
March 31, 2020 (unaudited)
(g) At March 31, 2020, the Fund pledged $191,002 in cash as collateral for futures contracts.
Glossary:
AUD—Australian Dollar
£—British Pound
CAD—Canadian Dollar
EURIBOR—Euro Inter-Bank Offered Rate
€/EUR—Euro
FRN—Floating Rate Note
LIBOR—London Inter-Bank Offered Rate
SEK—Swedish Krona
SOFR—Secured Overnight Financing Rate
The industry classification of portfolio holdings and liabilities in excess of other assets shown as a percentage of net assets were as follows:
| | | | |
Electric Utilities | | | 29.0% | |
Sovereign Debt Obligations | | | 18.2% | |
Banks | | | 15.8% | |
Equity Real Estate Investment Trusts (REITs) | | | 5.0% | |
Real Estate | | | 4.6% | |
Insurance | | | 3.7% | |
Transportation | | | 3.1% | |
Chemicals | | | 2.6% | |
Energy-Alternate Sources | | | 2.6% | |
Telecommunications | | | 2.6% | |
Water Utilities | | | 2.3% | |
Computers | | | 2.0% | |
Apparel & Textiles | | | 1.5% | |
Environmental Services | | | 1.1% | |
Food & Beverage | | | 1.1% | |
Metal Fabricate/Hardware | | | 0.8% | |
Containers & Packaging | | | 0.8% | |
Paper & Forest Products | | | 0.4% | |
Repurchase Agreements | | | 3.9% | |
Liabilities in excess of other assets | | | (1.1)% | |
| | | | |
| | | 100.0% | |
| | | | |
| | | | | | | | |
| See accompanying Notes to Financial Statements | | | March 31, 2020 | | | Semiannual Report | | | 165 | |
Schedule of Investments
March 31, 2020 (unaudited)
AllianzGI High Yield Bond Fund
| | | | | | | | |
| | | Principal
Amount
(000s) | | | Value | |
|
| Corporate Bonds & Notes—88.0% | |
| |
| Advertising—0.4% | | | | | |
National CineMedia LLC (a)(b), | |
5.875%, 4/15/28 | | | $545 | | | | $380,706 | |
| | | | | | | | |
| |
| Aerospace & Defense—3.1% | | | | | |
Kratos Defense & Security Solutions, Inc. (a)(b), | |
6.50%, 11/30/25 | | | 770 | | | | 711,284 | |
TransDigm, Inc., | |
5.50%, 11/15/27 (a)(b) | | | 1,145 | | | | 1,033,992 | |
6.50%, 5/15/25 | | | 650 | | | | 621,566 | |
Triumph Group, Inc. (a)(b), | |
6.25%, 9/15/24 | | | 800 | | | | 718,052 | |
| | | | | | | | |
| | | | | | | 3,084,894 | |
| | | | | | | | |
| |
| Auto Components—1.9% | | | | | |
Adient U.S. LLC (a)(b), | |
7.00%, 5/15/26 | | | 505 | | | | 469,964 | |
Goodyear Tire & Rubber Co., | |
5.00%, 5/31/26 | | | 600 | | | | 556,830 | |
Panther BF Aggregator 2 L.P. (a)(b), | |
8.50%, 5/15/27 | | | 930 | | | | 816,494 | |
| | | | | | | | |
| | | | | | | 1,843,288 | |
| | | | | | | | |
| |
| Auto Manufacturers—1.4% | | | | | |
Navistar International Corp. (a)(b), | |
6.625%, 11/1/25 | | | 815 | | | | 683,585 | |
Tesla, Inc. (a)(b), | | | | | | | | |
5.30%, 8/15/25 | | | 750 | | | | 709,688 | |
| | | | | | | | |
| | | | | | | 1,393,273 | |
| | | | | | | | |
| |
| Building Materials—0.7% | | | | | |
Builders FirstSource, Inc. (a)(b), | |
5.00%, 3/1/30 | | | 795 | | | | 719,972 | |
| | | | | | | | |
| |
| Chemicals—0.6% | | | | | |
Tronox, Inc. (a)(b), | |
6.50%, 4/15/26 | | | 620 | | | | 562,697 | |
| | | | | | | | |
| |
| Commercial Services—4.0% | | | | | |
Cenveo Corp. (cost—$2,715,419; purchased3/22/12-3/11/16) (a)(b)(c)(d)(e)(g), | |
6.00%, 5/15/24 | | | 2,299 | | | | 42,141 | |
Herc Holdings, Inc. (a)(b), | |
5.50%, 7/15/27 | | | 850 | | | | 796,939 | |
Hertz Corp. (a)(b), | |
6.00%, 1/15/28 | | | 600 | | | | 318,330 | |
Laureate Education, Inc. (a)(b), | |
8.25%, 5/1/25 | | | 1,015 | | | | 1,017,507 | |
RR Donnelley & Sons Co., | |
7.00%, 2/15/22 | | | 693 | | | | 684,986 | |
United Rentals North America, Inc., | |
5.25%, 1/15/30 | | | 535 | | | | 537,809 | |
5.50%, 7/15/25 | | | 550 | | | | 542,440 | |
| | | | | | | | |
| | | | | | | 3,940,152 | |
| | | | | | | | |
| |
| Computers—0.8% | | | | | |
Dell International LLC (a)(b), | | | | | | | | |
7.125%, 6/15/24 | | | 810 | | | | 839,362 | |
| | | | | | | | |
| |
| Containers & Packaging—1.6% | | | | | |
Berry Global, Inc. (a)(b), | | | | | | | | |
5.625%, 7/15/27 | | | 1,050 | | | | 1,092,729 | |
Trivium Packaging Finance BV (a)(b), | |
8.50%, 8/15/27 | | | 525 | | | | 530,539 | |
| | | | | | | | |
| | | | | | | 1,623,268 | |
| | | | | | | | |
| |
| Distribution/Wholesale—1.9% | | | | | |
H&E Equipment Services, Inc., | |
5.625%, 9/1/25 | | | 930 | | | | 868,392 | |
Performance Food Group, Inc. (a)(b), | |
5.50%, 10/15/27 | | | 1,030 | | | | 963,127 | |
| | | | | | | | |
| | | | | | | 1,831,519 | |
| | | | | | | | |
| | | | | | | | |
| | | Principal
Amount
(000s) | | | Value | |
|
| Diversified Financial Services—6.3% | |
CCF Holdings LLC, PIK 10.75% (a)(b)(d)(e), | |
10.75%, 12/15/23 | | $ | 3,101 | | | $ | 1,111,538 | |
Community Choice Financial Issuer LLC
(cost—$2,000,000; purchased 9/6/18) (a)(b)(g), | |
9.00%, 6/15/23 | | | 2,000 | | | | 2,007,500 | |
Navient Corp., | |
5.00%, 3/15/27 | | | 835 | | | | 719,937 | |
6.75%, 6/15/26 | | | 880 | | | | 814,484 | |
Springleaf Finance Corp., | | | | | | | | |
6.625%, 1/15/28 | | | 845 | | | | 795,948 | |
8.25%, 10/1/23 | | | 795 | | | | 799,885 | |
| | | | | | | | |
| | | | | | | 6,249,292 | |
| | | | | | | | |
| |
| Electric Utilities—0.9% | | | | | |
NRG Energy, Inc., | | | | | | | | |
5.75%, 1/15/28 | | | 880 | | | | 902,484 | |
| | | | | | | | |
|
| Electronic Equipment, Instruments & Components—1.1% | |
Energizer Holdings, Inc. (a)(b), | | | | | | | | |
7.75%, 1/15/27 | | | 1,030 | | | | 1,070,427 | |
| | | | | | | | |
|
| Engineering & Construction—0.8% | |
AECOM, | | | | | | | | |
5.875%, 10/15/24 | | | 500 | | | | 491,877 | |
Tutor Perini Corp. (a)(b), | | | | | | | | |
6.875%, 5/1/25 | | | 410 | | | | 343,375 | |
| | | | | | | | |
| | | | | | | 835,252 | |
| | | | | | | | |
| |
| Entertainment—2.7% | | | | | |
AMC Entertainment Holdings, Inc., | |
6.125%, 5/15/27 | | | 1,010 | | | | 426,801 | |
International Game Technology PLC (a)(b), | |
6.25%, 1/15/27 | | | 385 | | | | 337,087 | |
Lions Gate Capital Holdings LLC (a)(b), | |
6.375%, 2/1/24 | | | 970 | | | | 860,846 | |
Scientific Games International, Inc. (a)(b), | |
5.00%, 10/15/25 | | | 665 | | | | 583,537 | |
Stars Group Holdings BV (a)(b), | |
7.00%, 7/15/26 | | | 510 | | | | 482,332 | |
| | | | | | | | |
| | | | | | | 2,690,603 | |
| | | | | | | | |
| |
| Food & Beverage—3.0% | | | | | |
Albertsons Cos., Inc. (a)(b), | |
4.875%, 2/15/30 | | | 770 | | | | 766,843 | |
7.50%, 3/15/26 | | | 370 | | | | 400,866 | |
Kraft Heinz Foods Co., | |
6.50%, 2/9/40 | | | 595 | | | | 653,358 | |
Post Holdings, Inc. (a)(b), | |
5.75%, 3/1/27 | | | 1,080 | | | | 1,114,212 | |
| | | | | | | | |
| | | | | | | 2,935,279 | |
| | | | | | | | |
| |
| Food Service—0.7% | | | | | |
Aramark Services, Inc. (a)(b), | |
5.00%, 2/1/28 | | | 750 | | | | 702,127 | |
| | | | | | | | |
| |
| Hand/Machine Tools—0.7% | | | | | |
Colfax Corp. (a)(b), | |
6.375%, 2/15/26 | | | 680 | | | | 672,350 | |
| | | | | | | | |
| |
| Healthcare-Products—1.3% | | | | | |
Avantor, Inc. (a)(b), | |
9.00%, 10/1/25 | | | 1,210 | | | | 1,281,336 | |
| | | | | | | | |
| |
| Healthcare-Services—5.9% | | | | | |
Centene Corp. (a)(b), | |
4.625%, 12/15/29 | | | 465 | | | | 468,488 | |
5.375%, 6/1/26 | | | 600 | | | | 616,746 | |
Charles River Laboratories International, Inc. (a)(b), | |
5.50%, 4/1/26 | | | 400 | | | | 410,787 | |
Encompass Health Corp., | |
4.75%, 2/1/30 | | | 410 | | | | 406,126 | |
| | | | | | | | |
| | |
Principal
Amount
(000s) | | | Value | |
HCA, Inc., | |
5.375%, 9/1/26 | | $ | 495 | | | $ | 513,600 | |
5.625%, 9/1/28 | | | 490 | | | | 515,602 | |
IQVIA, Inc. (a)(b), | |
5.00%, 5/15/27 | | | 540 | | | | 555,912 | |
Select Medical Corp. (a)(b), | |
6.25%, 8/15/26 | | | 840 | | | | 844,624 | |
Tenet Healthcare Corp., | |
6.25%, 2/1/27 (a)(b) | | | 1,110 | | | | 1,086,412 | |
8.125%, 4/1/22 | | | 415 | | | | 394,391 | |
| | | | | | | | |
| | | | | | | 5,812,688 | |
| | | | | | | | |
| |
| Home Builders—1.0% | | | | | |
KB Home, | |
4.80%, 11/15/29 | | | 315 | | | | 266,962 | |
Taylor Morrison Communities, Inc. (a)(b), | |
5.75%, 1/15/28 | | | 815 | | | | 734,688 | |
| | | | | | | | |
| | | | | | | 1,001,650 | |
| | | | | | | | |
| |
| Household Products/Wares—0.7% | | | | | |
Prestige Brands, Inc. (a)(b), | |
5.125%, 1/15/28 | | | 645 | | | | 643,581 | |
| | | | | | | | |
| |
| Internet—3.8% | | | | | |
Go Daddy Operating Co. LLC (a)(b), | |
5.25%, 12/1/27 | | | 780 | | | | 791,505 | |
Match Group, Inc. (a)(b), | |
5.00%, 12/15/27 | | | 820 | | | | 790,105 | |
Netflix, Inc. (a)(b), | |
5.375%, 11/15/29 | | | 1,055 | | | | 1,108,330 | |
NortonLifeLock, Inc. (a)(b), | |
5.00%, 4/15/25 | | | 1,000 | | | | 1,010,552 | |
| | | | | | | | |
| | | | | | | 3,700,492 | |
| | | | | | | | |
| |
| Lodging—1.3% | | | | | |
MGM Resorts International, | |
5.50%, 4/15/27 | | | 389 | | | | 356,149 | |
Wyndham Hotels & Resorts, Inc. (a)(b), | |
5.375%, 4/15/26 | | | 540 | | | | 473,562 | |
Wynn Las Vegas LLC (a)(b), | |
5.50%, 3/1/25 | | | 530 | | | | 496,859 | |
| | | | | | | | |
| | | | | | | 1,326,570 | |
| | | | | | | | |
|
| Machinery-Construction & Mining—0.5% | |
Terex Corp. (a)(b), | |
5.625%, 2/1/25 | | | 560 | | | | 528,556 | |
| | | | | | | | |
| |
| Media—10.3% | | | | | |
CCO Holdings LLC (a)(b), | |
5.125%, 5/1/27 | | | 1,055 | | | | 1,067,681 | |
5.375%, 6/1/29 | | | 775 | | | | 800,691 | |
5.50%, 5/1/26 | | | 275 | | | | 280,381 | |
Clear Channel Worldwide Holdings, Inc. (a)(b), | |
9.25%, 2/15/24 | | | 842 | | | | 729,387 | |
CSC Holdings LLC (a)(b), | |
7.50%, 4/1/28 | | | 860 | | | | 922,253 | |
7.75%, 7/15/25 | | | 580 | | | | 607,533 | |
10.875%, 10/15/25 | | | 370 | | | | 400,756 | |
Diamond Sports Group LLC (a)(b), | |
6.625%, 8/15/27 | | | 630 | | | | 424,809 | |
DISH DBS Corp., | |
5.875%, 7/15/22 | | | 280 | | | | 274,165 | |
5.875%, 11/15/24 | | | 770 | | | | 754,665 | |
Gray Television, Inc. (a)(b), | |
5.875%, 7/15/26 | | | 820 | | | | 794,047 | |
LiveStyle, Inc. (cost—$2,761,000; purchased1/31/14-2/3/14) (a)(b)(c)(d)(e)(g)(i), | |
9.625%, 2/1/19 | | | 2,761 | | | | 3 | |
Meredith Corp., | |
6.875%, 2/1/26 | | | 750 | | | | 650,226 | |
Nexstar Broadcasting, Inc. (a)(b), | |
5.625%, 7/15/27 | | | 1,025 | | | | 1,007,626 | |
Sirius XM Radio, Inc. (a)(b), | |
5.00%, 8/1/27 | | | 750 | | | | 765,338 | |
| | | | | | |
| 166 | | Semiannual Report | | | March 31, 2020 | | | See accompanying Notes to Financial Statements |
Schedule of Investments
March 31, 2020 (unaudited)
| | | | | | | | |
| | | Principal
Amount
(000s) | | | Value | |
Virgin Media Secured Finance PLC (a)(b), | |
5.50%, 5/15/29 | | $ | 700 | | | $ | 703,885 | |
| | | | | | | | |
| | | | | | | 10,183,446 | |
| | | | | | | | |
| |
| Metal Fabricate/Hardware—0.8% | | | | | |
Park-Ohio Industries, Inc., | |
6.625%, 4/15/27 | | | 1,005 | | | | 802,952 | |
| | | | | | | | |
| |
| Mining—3.0% | | | | | |
Alcoa Nederland Holding BV (a)(b), | |
6.75%, 9/30/24 | | | 715 | | | | 698,677 | |
Constellium SE (a)(b), | |
6.625%, 3/1/25 | | | 720 | | | | 653,379 | |
Freeport-McMoRan, Inc., | |
5.25%, 9/1/29 | | | 785 | | | | 744,062 | |
Joseph T. Ryerson & Son, Inc. (a)(b), | |
11.00%, 5/15/22 | | | 890 | | | | 834,356 | |
| | | | | | | | |
| | | | | | | 2,930,474 | |
| | | | | | | | |
|
| Miscellaneous Manufacturing—0.5% | |
Koppers, Inc. (a)(b), | |
6.00%, 2/15/25 | | | 605 | | | | 488,519 | |
| | | | | | | | |
|
| Oil, Gas & Consumable Fuels—1.9% | |
Callon Petroleum Co., | |
6.125%, 10/1/24 | | | 840 | | | | 155,400 | |
PBF Holding Co. LLC (a)(b), | |
6.00%, 2/15/28 | | | 705 | | | | 479,400 | |
Sunoco L.P., | |
5.50%, 2/15/26 | | | 330 | | | | 288,362 | |
5.875%, 3/15/28 | | | 205 | | | | 171,901 | |
Transocean, Inc. (a)(b), | |
7.50%, 1/15/26 | | | 925 | | | | 441,195 | |
USA Compression Partners L.P., | |
6.875%, 9/1/27 | | | 495 | | | | 316,800 | |
| | | | | | | | |
| | | | | | | 1,853,058 | |
| | | | | | | | |
| |
| Paper & Forest Products—0.5% | | | | | |
Mercer International, Inc., | |
7.375%, 1/15/25 | | | 550 | | | | 479,875 | |
| | | | | | | | |
| |
| Pharmaceuticals—2.8% | | | | | |
Bausch Health Americas, Inc. (a)(b), | |
8.50%, 1/31/27 | | | 815 | | | | 856,198 | |
Bausch Health Cos., Inc. (a)(b), | |
5.25%, 1/30/30 | | | 275 | | | | 259,188 | |
7.25%, 5/30/29 | | | 755 | | | | 787,729 | |
Horizon Therapeutics USA, Inc. (a)(b), | |
5.50%, 8/1/27 | | | 825 | | | | 832,796 | |
| | | | | | | | |
| | | | | | | 2,735,911 | |
| | | | | | | | |
| |
| Pipelines—2.2% | | | | | |
Cheniere Energy Partners L.P., | |
5.625%, 10/1/26 | | | 785 | | | | 734,463 | |
Crestwood Midstream Partners L.P., | |
5.75%, 4/1/25 | | | 610 | | | | 353,818 | |
DCP Midstream Operating L.P., | |
5.125%, 5/15/29 | | | 590 | | | | 374,945 | |
Targa Resources Partners L.P., | |
6.50%, 7/15/27 | | | 585 | | | | 503,100 | |
6.875%, 1/15/29 | | | 195 | | | | 158,438 | |
| | | | | | | | |
| | | | | | | 2,124,764 | |
| | | | | | | | |
| |
| Real Estate—1.7% | | | | | |
Iron Mountain, Inc. (a)(b), | |
4.875%, 9/15/27 | | | 955 | | | | 933,004 | |
Kennedy-Wilson, Inc., | |
5.875%, 4/1/24 | | | 835 | | | | 753,312 | |
| | | | | | | | |
| | | | | | | 1,686,316 | |
| | | | | | | | |
| |
| Retail—2.7% | | | | | |
1011778 BC ULC (a)(b), | |
5.00%, 10/15/25 | | | 700 | | | | 672,872 | |
Asbury Automotive Group, Inc. (a)(b), | |
4.75%, 3/1/30 | | | 440 | | | | 377,300 | |
| | | | | | | | |
| | | Principal
Amount
(000s) | | | Value | |
Conn’s, Inc., | |
7.25%, 7/15/22 | | $ | 1,095 | | | $ | 633,387 | |
Yum! Brands, Inc. (a)(b), | |
4.75%, 1/15/30 | | | 1,025 | | | | 960,374 | |
| | | | | | | | |
| | | | | | | 2,643,933 | |
| | | | | | | | |
| |
| Semiconductors—1.0% | | | | | |
Amkor Technology, Inc. (a)(b), | |
6.625%, 9/15/27 | | | 995 | | | | 940,822 | |
| | | | | | | | |
| |
| Software—2.4% | | | | | |
j2 Cloud Services LLC (a)(b), | |
6.00%, 7/15/25 | | | 700 | | | | 699,122 | |
Rackspace Hosting, Inc. (a)(b), | |
8.625%, 11/15/24 | | | 855 | | | | 767,106 | |
SS&C Technologies, Inc. (a)(b), | |
5.50%, 9/30/27 | | | 860 | | | | 891,712 | |
| | | | | | | | |
| | | | | | | 2,357,940 | |
| | | | | | | | |
| |
| Telecommunications—10.0% | | | | | |
CenturyLink, Inc., | |
5.125%, 12/15/26 (a)(b) | | | 1,135 | | | | 1,137,838 | |
7.50%, 4/1/24, Ser. Y | | | 705 | | | | 776,385 | |
Cincinnati Bell, Inc. (a)(b), | |
7.00%, 7/15/24 | | | 960 | | | | 973,171 | |
CommScope Technologies LLC (a)(b), | |
6.00%, 6/15/25 | | | 970 | | | | 895,019 | |
Consolidated Communications, Inc., | |
6.50%, 10/1/22 | | | 950 | | | | 838,375 | |
Hughes Satellite Systems Corp., | |
6.625%, 8/1/26 | | | 965 | | | | 985,706 | |
Intelsat Jackson Holdings S.A., | |
5.50%, 8/1/23 | | | 1,295 | | | | 804,525 | |
Level 3 Financing, Inc., | |
5.375%, 5/1/25 | | | 270 | | | | 270,339 | |
Sprint Communications, Inc., | |
11.50%, 11/15/21 | | | 915 | | | | 1,013,783 | |
Sprint Corp., | |
7.625%, 3/1/26 | | | 930 | | | | 1,057,736 | |
T-Mobile USA, Inc., | |
6.50%, 1/15/26 | | | 1,045 | | | | 1,103,050 | |
| | | | | | | | |
| | | | | | | 9,855,927 | |
| | | | | | | | |
| |
| Toys/Games/Hobbies—0.2% | | | | | |
Mattel, Inc. (a)(b), | |
5.875%, 12/15/27 | | | 150 | | | | 153,833 | |
| | | | | | | | |
| |
| Transportation—0.9% | | | | | |
XPO Logistics, Inc. (a)(b), | |
6.125%, 9/1/23 | | | 375 | | | | 369,377 | |
6.50%, 6/15/22 | | | 525 | | | | 529,116 | |
| | | | | | | | |
| | | | | | | 898,493 | |
| | | | | | | | |
Total Corporate Bonds & Notes
(cost—$101,342,405) | | | | 86,708,081 | |
| | | | | | | | |
| | | | | | | | |
| | |
| | | Shares | | | | |
|
| Preferred Stock(a)(d)(e)(h)(i)—5.2% | |
|
| Media—5.2% | |
LiveStyle, Inc., Ser. A | | | 2,672 | | | | 399,464 | |
LiveStyle, Inc., Ser. B (f) | | | 57,581 | | | | 4,714,732 | |
| | | | | | | | |
Total Preferred Stock
(cost—$5,907,093) | | | | 5,114,196 | |
| | | | | | | | |
| | | | | | | | |
|
| Common Stock(d)(e)(h)—0.0% | |
|
| Aerospace & Defense—0.0% | |
Erickson, Inc. (a) | | | 2,675 | | | | 28,997 | |
| | | | | | | | |
| |
| Banks—0.0% | | | | | |
CCF Holdings LLC Class A (cost—$0; purchased 12/18/18) (g) | | | 8,562 | | | | 1 | |
| | | | | | | | |
| | |
Shares | | | Value | |
CCF Holdings LLC Class B (cost—$0; purchased 12/12/18) (f)(g) | | | 7,143 | | | $ | — | † |
| | | | | | | | |
| | | | | | | 1 | |
| | | | | | | | |
| |
| Media—0.0% | | | | | |
LiveStyle, Inc. (a)(i) | | | 67,983 | | | | 7 | |
| | | | | | | | |
Total Common Stock
(cost—$1,491,068) | | | | 29,005 | |
| | | | | | | | |
| | | | | | | | |
| | |
| | | Units | | | | |
|
| Warrants(d)(e)(h)—0.0% | |
|
| Advertising—0.0% | |
Affinion Group Holdings, Inc., exercise price $67.12, expires 4/1/24,
(cost—$769,740; purchased 4/10/19) (g) | | | 3,898 | | | | 39 | |
| | | | | | | | |
| |
| Media—0.0% | | | | | |
LiveStyle, Inc.,
Ser. C, expires 11/30/21, (a)(i) | | | 14,500 | | | | 2 | |
| | | | | | | | |
Total Warrants
(cost—$769,740) | | | | 41 | |
| | | | | | | | |
| | | | | | | | |
| | |
| | | Principal
Amount
(000s) | | | | |
|
| Repurchase Agreements—5.3% | |
State Street Bank and Trust Co., dated 3/31/20, 0.00%, due 4/1/20, proceeds $5,255,000; collateralized by U.S. Treasury Inflation Indexed Notes, 0.625%, due 4/15/23, valued at $5,365,124 including accrued interest | |
(cost—$5,255,000) | | | $5,255 | | | | 5,255,000 | |
| | | | | | | | |
| |
Total Investments
(cost—$114,765,306)—98.5% | | | | 97,106,323 | |
| | | | | | | | |
| |
Other assets less
liabilities—1.5% | | | | 1,456,999 | |
| | | | | | | | |
| |
| NetAssets-100.0% | | | | $98,563,322 | |
| | | | | | | | |
Notes to Schedule of Investments:
† Actual amount rounds to less than $1.
(a) Private Placement—Restricted as to resale and may not have a readily available market. Securities with an aggregate value of $64,981,886, representing 65.9% of net assets.
(b) 144A—Exempt from registration under Rule 144A of the Securities Act of 1933. These securities may be resold in transactions exempt from registration, typically only to qualified institutional buyers. Securities with an aggregate value of $59,838,684, representing 60.7% of net assets.
(c) In default.
(d) Fair-Valued—Securities with an aggregate value of $6,296,924, representing 6.4% of net assets. See Note 1(a) and Note 1(b) in the Notes to Financial Statements.
(e) Level 3 security. See Note 1(a) and Note 1(b) in the Notes to Financial Statements.
(f) Affiliated security.
(g) Restricted. The aggregate cost of such securities is $8,246,159. The aggregate value is $2,049,684, representing 2.1% of net assets.
| | | | | | | | |
| See accompanying Notes to Financial Statements | | | March 31, 2020 | | | Semiannual Report | | | 167 | |
Schedule of Investments
March 31, 2020 (unaudited)
(h)Non-income producing.
(i) A member of the Fund’s portfolio management team is a member of the board of directors of LiveStyle, Inc. The Fund’s aggregate value of investments in LiveStyle, Inc. represents 5.2% of net assets.
Glossary:
PIK—Payment-in-Kind
AllianzGI InternationalSmall-Cap Fund
| | | | | | | | |
| | | Shares | | | Value | |
|
| Common Stock—92.3% | |
| | |
| Australia—5.0% | | | | | | | | |
Austal Ltd. | | | 269,663 | | | | $487,025 | |
Charter Hall Retail REIT | | | 198,826 | | | | 379,725 | |
Cleanaway Waste Management Ltd. | | | 376,920 | | | | 397,546 | |
Growthpoint Properties Australia Ltd. REIT | | | 68,000 | | | | 105,183 | |
GUD Holdings Ltd. | | | 73,673 | | | | 427,015 | |
NEXTDC Ltd. (c) | | | 83,211 | | | | 452,304 | |
Northern Star Resources Ltd. | | | 66,100 | | | | 428,195 | |
Pro Medicus Ltd. | | | 18,100 | | | | 213,931 | |
Seven Group Holdings Ltd. | | | 41,200 | | | | 283,489 | |
Starpharma Holdings Ltd. (c) | | | 181,359 | | | | 86,818 | |
Worley Ltd. | | | 43,857 | | | | 162,747 | |
| | | | | | | | |
| | | | | | | 3,423,978 | |
| | | | | | | | |
| |
| Austria—2.7% | | | | | |
UNIQA Insurance Group AG | | | 139,719 | | | | 1,074,569 | |
Wienerberger AG | | | 49,042 | | | | 766,169 | |
| | | | | | | | |
| | | | | | | 1,840,738 | |
| | | | | | | | |
| |
| China—0.5% | | | | | |
Ping An Healthcare and Technology Co., Ltd. (a)(c) | | | 36,600 | | | | 337,007 | |
| | | | | | | | |
| |
| Denmark—3.5% | | | | | |
Ambu A/S, Class B | | | 56,052 | | | | 1,349,822 | |
SimCorp A/S | | | 12,447 | | | | 1,037,807 | |
| | | | | | | | |
| | | | | | | 2,387,629 | |
| | | | | | | | |
| |
| Finland—0.9% | | | | | |
Huhtamaki Oyj | | | 19,306 | | | | 618,129 | |
| | | | | | | | |
| |
| France—3.5% | | | | | |
Ingenico Group S.A. | | | 6,650 | | | | 695,120 | |
Korian S.A. | | | 30,269 | | | | 933,841 | |
Nexity S.A. | | | 26,014 | | | | 800,717 | |
| | | | | | | | |
| | | | | | | 2,429,678 | |
| | | | | | | | |
| |
| Germany—8.5% | | | | | |
Alstria officeREIT-AG | | | 60,386 | | | | 866,596 | |
Bechtle AG | | | 8,215 | | | | 1,034,372 | |
CANCOM SE | | | 24,707 | | | | 1,038,601 | |
Hella GmbH & Co. KGaA | | | 24,869 | | | | 713,249 | |
Scout24 AG (a) | | | 20,814 | | | | 1,244,237 | |
Siltronic AG | | | 13,474 | | | | 974,756 | |
| | | | | | | | |
| | | | | | | 5,871,811 | |
| | | | | | | | |
| |
| Hong Kong—1.2% | | | | | |
Alphamab Oncology (a)(c) | | | 59,000 | | | | 116,830 | |
Hutchison China MediTech Ltd. ADR (c) | | | 15,300 | | | | 273,105 | |
Techtronic Industries Co., Ltd. | | | 64,500 | | | | 409,569 | |
| | | | | | | | |
| | | | | | | 799,504 | |
| | | | | | | | |
| |
| Indonesia—0.2% | | | | | |
Jasa Marga Persero Tbk PT | | | 1,026,900 | | | | 159,143 | |
| | | | | | | | |
| |
| Ireland—0.9% | | | | | |
Dalata Hotel Group PLC | | | 224,790 | | | | 613,953 | |
| | | | | | | | |
| |
| Italy—2.2% | | | | | |
Buzzi Unicem SpA | | | 54,233 | | | | 990,475 | |
ERG SpA | | | 31,159 | | | | 555,443 | |
| | | | | | | | |
| | | | | | | 1,545,918 | |
| | | | | | | | |
| |
| Japan—31.6% | | | | | |
Advance Residence Investment Corp. REIT | | | 152 | | | | 441,740 | |
Azbil Corp. | | | 62,100 | | | | 1,604,812 | |
CKD Corp. | | | 92,300 | | | | 1,244,111 | |
COMSYS Holdings Corp. | | | 49,200 | | | | 1,259,999 | |
Fuji Electric Co., Ltd. | | | 58,900 | | | | 1,320,675 | |
| | | | | | | | |
| | | Shares | | | Value | |
Fuji Oil Holdings, Inc. | | | 25,300 | | | $ | 608,872 | |
Glory Ltd. | | | 17,800 | | | | 408,983 | |
GLPJ-Reit | | | 271 | | | | 307,299 | |
Heiwa Real Estate Co., Ltd. | | | 30,200 | | | | 780,197 | |
Heiwa Real Estate REIT, Inc. | | | 206 | | | | 191,895 | |
Hisamitsu Pharmaceutical Co., Inc. | | | 21,000 | | | | 974,487 | |
Ichigo, Inc. | | | 104,200 | | | | 240,741 | |
Itochu Techno-Solutions Corp. | | | 60,700 | | | | 1,728,757 | |
Jeol Ltd. | | | 52,100 | | | | 1,259,525 | |
Marui Group Co., Ltd. | | | 28,000 | | | | 468,405 | |
Maruwa Co., Ltd. | | | 10,200 | | | | 617,405 | |
Mitsubishi UFJ Lease & Finance Co., Ltd. | | | 263,300 | | | | 1,288,800 | |
Nihon Unisys Ltd. | | | 50,900 | | | | 1,357,669 | |
PALTAC Corp. | | | 10,900 | | | | 539,837 | |
Penta-Ocean Construction Co., Ltd. | | | 264,800 | | | | 1,386,457 | |
Ship Healthcare Holdings, Inc. | | | 28,800 | | | | 1,175,519 | |
Sojitz Corp. | | | 93,500 | | | | 219,224 | |
T&D Holdings, Inc. | | | 45,800 | | | | 371,284 | |
TechnoPro Holdings, Inc. | | | 7,700 | | | | 359,364 | |
Tokyu Fudosan Holdings Corp. | | | 140,400 | | | | 674,354 | |
Yaoko Co., Ltd. | | | 14,900 | | | | 920,814 | |
| | | | | | | | |
| | | | | | | 21,751,225 | |
| | | | | | | | |
| |
| Korea (Republic of)—0.5% | | | | | |
Koh Young Technology, Inc. | | | 5,540 | | | | 350,957 | |
| | | | | | | | |
| |
| Netherlands—2.7% | | | | | |
ASM International NV | | | 10,445 | | | | 1,062,693 | |
ASR Nederland NV | | | 33,272 | | | | 836,569 | |
| | | | | | | | |
| | | | | | | 1,899,262 | |
| | | | | | | | |
| |
| Norway—1.8% | | | | | |
Elkem ASA (a) | | | 379,882 | | | | 478,751 | |
Storebrand ASA | | | 187,158 | | | | 746,305 | |
| | | | | | | | |
| | | | | | | 1,225,056 | |
| | | | | | | | |
| |
| Singapore—2.3% | | | | | |
Frasers Centrepoint Trust | | | 316,000 | | | | 494,415 | |
Mapletree Commercial Trust REIT | | | 341,571 | | | | 438,091 | |
Mapletree Industrial Trust REIT | | | 372,400 | | | | 632,396 | |
| | | | | | | | |
| | | | | | | 1,564,902 | |
| | | | | | | | |
| |
| Sweden—3.0% | | | | | |
AAK AB | | | 74,666 | | | | 1,207,280 | |
Elekta AB, Class B | | | 102,610 | | | | 836,514 | |
| | | | | | | | |
| | | | | | | 2,043,794 | |
| | | | | | | | |
| |
| Switzerland—5.9% | | | | | |
Galenica AG (a) | | | 18,339 | | | | 1,251,318 | |
Georg Fischer AG | | | 1,226 | | | | 836,544 | |
Interroll Holding AG | | | 672 | | | | 1,111,739 | |
OC Oerlikon Corp. AG | | | 105,717 | | | | 837,043 | |
| | | | | | | | |
| | | | | | | 4,036,644 | |
| | | | | | | | |
| |
| Taiwan—1.2% | | | | | |
Taiwan Surface Mounting Technology Corp. | | | 118,000 | | | | 266,556 | |
Win Semiconductors Corp. | | | 36,000 | | | | 308,961 | |
Yageo Corp. | | | 28,000 | | | | 251,450 | |
| | | | | | | | |
| | | | | | | 826,967 | |
| | | | | | | | |
| |
| United Kingdom—14.2% | | | | | |
ASOS PLC (c) | | | 24,128 | | | | 355,025 | |
Auto Trader Group PLC (a) | | | 182,427 | | | | 985,797 | |
Crest Nicholson Holdings PLC | | | 224,986 | | | | 485,779 | |
Derwent London PLC REIT | | | 25,865 | | | | 1,044,827 | |
Genus PLC | | | 28,596 | | | | 1,155,540 | |
HomeServe PLC | | | 80,438 | | | | 1,047,751 | |
Howden Joinery Group PLC | | | 149,903 | | | | 942,993 | |
Intermediate Capital Group PLC | | | 62,209 | | | | 686,610 | |
| | | | | | |
| 168 | | Semiannual Report | | | March 31, 2020 | | | See accompanying Notes to Financial Statements |
Schedule of Investments
March 31, 2020 (unaudited)
| | | | | | | | |
| | | Shares | | | Value | |
Moneysupermarket.com Group PLC | | | 282,494 | | | $ | 1,049,767 | |
Rotork PLC | | | 307,783 | | | | 814,332 | |
Spectris PLC | | | 27,894 | | | | 840,416 | |
Wizz Air Holdings PLC (a)(c) | | | 13,775 | | | | 387,717 | |
| | | | | | | | |
| | | | | | | 9,796,554 | |
| | | | | | | | |
Total Common Stock
(cost—$68,287,265) | | | | 63,522,849 | |
| | | | | | | | |
| | | | | | | | |
|
| Preferred Stock—0.9% | |
| |
| Germany—0.9% | | | | | |
Jungheinrich AG
(cost—$1,263,927) | | | 41,062 | | | | 624,864 | |
| | | | | | | | |
| | | | | | | | |
| | |
| | | Principal
Amount
(000s) | | | | |
|
| Repurchase Agreements—5.3% | |
State Street Bank and Trust Co., dated 3/31/20, 0.00%, due 4/1/20, proceeds $3,615,000; collateralized by U.S. Treasury Inflation Indexed Notes, 0.625%, due 4/15/23, valued at $3,692,467 including accrued interest | |
(cost—$3,615,000) | | | $3,615 | | | | 3,615,000 | |
| | | | | | | | |
| |
Total Investments
(cost—$73,166,192) (b)—98.5% | | | | 67,762,713 | |
| | | | | | | | |
| | |
| Other assets lessliabilities-1.5% | | | | | | | 1,034,823 | |
| | | | | | | | |
| |
| Net Assets—100.0% | | | | $68,797,536 | |
| | | | | | | | |
Notes to Schedule of Investments:
(a) 144A—Exempt from registration under Rule 144A of the Securities Act of 1933. These securities may be resold in transactions exempt from registration, typically only to qualified institutional buyers. Securities with an aggregate value of $4,801,657, representing 7.0% of net assets.
(b) Securities with an aggregate value of $63,874,608, representing 92.8% of net assets, were valued utilizing modeling tools provided by a third-party vendor. See Note 1(a) and Note 1(b) in the Notes to Financial Statements.
(c)Non-income producing.
Glossary:
ADR—American Depositary Receipt
REIT—Real Estate Investment Trust
The industry classification of portfolio holdings and other assets less liabilities shown as a percentage of net assets were as follows:
| | | | |
Machinery | | | 9.1% | |
IT Services | | | 8.2% | |
Equity Real Estate Investment Trusts (REITs) | | | 6.7% | |
Electronic Equipment, Instruments & Components | | | 5.8% | |
Healthcare Equipment & Supplies | | | 5.0% | |
Healthcare Providers & Services | | | 4.9% | |
Insurance | | | 4.4% | |
Semiconductors & Semiconductor Equipment | | | 4.3% | |
Construction & Engineering | | | 3.9% | |
Interactive Media & Services | | | 3.2% | |
Real Estate Management & Development | | | 2.9% | |
Food Products | | | 2.6% | |
Construction Materials | | | 2.6% | |
Trading Companies & Distributors | | | 2.1% | |
Commercial Services & Supplies | | | 2.1% | |
Internet & Direct Marketing Retail | | | 2.1% | |
Pharmaceuticals | | | 1.9% | |
Electrical Equipment | | | 1.9% | |
Diversified Financial Services | | | 1.9% | |
Biotechnology | | | 1.9% | |
Auto Components | | | 1.7% | |
Software | | | 1.5% | |
Food & Staples Retailing | | | 1.3% | |
Real Estate | | | 1.1% | |
Capital Markets | | | 1.0% | |
Containers & Packaging | | | 0.9% | |
Hotels, Restaurants & Leisure | | | 0.9% | |
Independent Power Producers & Energy Traders | | | 0.8% | |
Healthcare Technology | | | 0.8% | |
Distributors | | | 0.8% | |
Aerospace & Defense | | | 0.7% | |
Household Durables | | | 0.7% | |
Chemicals | | | 0.7% | |
Multi-Line Retail | | | 0.7% | |
Metals & Mining | | | 0.6% | |
Airlines | | | 0.6% | |
Professional Services | | | 0.5% | |
Energy Equipment & Services | | | 0.2% | |
Transportation Infrastructure | | | 0.2% | |
Repurchase Agreements | | | 5.3% | |
Other assets less liabilities | | | 1.5% | |
| | | | |
| | | 100.0% | |
| | | | |
AllianzGI Micro Cap Fund
| | | | | | | | |
| | | Shares | | | Value | |
|
| Common Stock—98.2% | |
| |
| Banks—2.0% | | | | | |
First Foundation, Inc. | | | 10,492 | | | | $107,229 | |
Preferred Bank | | | 2,866 | | | | 96,928 | |
Tristate Capital Holdings, Inc. (a) | | | 5,869 | | | | 56,753 | |
| | | | | | | | |
| | | | | | | 260,910 | |
| | | | | | | | |
| |
| Beverages—0.2% | | | | | |
MGP Ingredients, Inc. | | | 837 | | | | 22,507 | |
| | | | | | | | |
| |
| Biotechnology—19.2% | | | | | |
Adverum Biotechnologies, Inc. (a) | | | 7,080 | | | | 69,172 | |
Avrobio, Inc. (a) | | | 3,041 | | | | 47,318 | |
BioSpecifics Technologies Corp. (a) | | | 2,173 | | | | 122,927 | |
Castle Biosciences, Inc. (a) | | | 2,649 | | | | 78,967 | |
ChemoCentryx, Inc. (a) | | | 1,089 | | | | 43,756 | |
Dicerna Pharmaceuticals, Inc. (a) | | | 6,565 | | | | 120,599 | |
Dynavax Technologies Corp. (a) | | | 10,023 | | | | 35,381 | |
Fate Therapeutics, Inc. (a) | | | 3,877 | | | | 86,108 | |
Homology Medicines, Inc. (a) | | | 3,827 | | | | 59,472 | |
Intellia Therapeutics, Inc. (a) | | | 7,395 | | | | 90,441 | |
Invitae Corp. (a) | | | 7,919 | | | | 108,253 | |
Kadmon Holdings, Inc. (a) | | | 21,834 | | | | 91,484 | |
Karyopharm Therapeutics, Inc. (a) | | | 7,082 | | | | 136,045 | |
Kindred Biosciences, Inc. (a) | | | 11,413 | | | | 45,652 | |
Krystal Biotech, Inc. (a) | | | 1,508 | | | | 65,206 | |
Kura Oncology, Inc. (a) | | | 5,773 | | | | 57,441 | |
MeiraGTx Holdings PLC (a) | | | 2,819 | | | | 37,887 | |
Natera, Inc. (a) | | | 6,464 | | | | 193,015 | |
Precision BioSciences, Inc. (a) | | | 4,655 | | | | 28,070 | |
Principia Biopharma, Inc. (a) | | | 799 | | | | 47,445 | |
Progenics Pharmaceuticals, Inc. (a) | | | 10,594 | | | | 40,257 | |
Rocket Pharmaceuticals, Inc. (a) | | | 3,729 | | | | 52,020 | |
Stemline Therapeutics, Inc. (a) | | | 5,672 | | | | 27,452 | |
TG Therapeutics, Inc. (a) | | | 9,430 | | | | 92,791 | |
Twist Bioscience Corp. (a) | | | 3,471 | | | | 106,143 | |
Vanda Pharmaceuticals, Inc. (a) | | | 5,906 | | | | 61,186 | |
Veracyte, Inc. (a) | | | 12,021 | | | | 292,231 | |
Vericel Corp. (a) | | | 8,673 | | | | 79,531 | |
Viking Therapeutics, Inc. (a) | | | 9,724 | | | | 45,508 | |
Voyager Therapeutics, Inc. (a) | | | 4,317 | | | | 39,501 | |
ZIOPHARM Oncology, Inc. (a) | | | 22,031 | | | | 53,976 | |
| | | | | | | | |
| | | | | | | 2,455,235 | |
| | | | | | | | |
| |
| Building Products—0.5% | | | | | |
PGT Innovations, Inc. (a) | | | 7,495 | | | | 62,883 | |
| | | | | | | | |
| |
| Construction & Engineering—3.4% | | | | | |
Construction Partners, Inc., Class A (a) | | | 8,221 | | | | 138,853 | |
NV5 Global, Inc. (a) | | | 4,132 | | | | 170,610 | |
Sterling Construction Co., Inc. (a) | | | 12,976 | | | | 123,272 | |
| | | | | | | | |
| | | | | | | 432,735 | |
| | | | | | | | |
| |
| Construction Materials—0.4% | | | | | |
U.S. Concrete, Inc. (a) | | | 3,082 | | | | 55,908 | |
| | | | | | | | |
| |
| Diversified Consumer Services—1.5% | | | | | |
Aspen Group, Inc. (a) | | | 13,484 | | | | 107,737 | |
Carriage Services, Inc. | | | 4,935 | | | | 79,700 | |
| | | | | | | | |
| | | | | | | 187,437 | |
| | | | | | | | |
| |
| Electrical Equipment—0.6% | | | | | |
Allied Motion Technologies, Inc. | | | 3,002 | | | | 71,147 | |
| | | | | | | | |
| |
| Electronic Equipment, Instruments & Components—0.9% | | | | | |
Napco Security Technologies, Inc. (a) | | | 7,748 | | | | 117,537 | |
| | | | | | | | |
| |
| Energy Equipment & Services—0.3% | | | | | |
DMC Global, Inc. | | | 1,905 | | | | 43,834 | |
| | | | | | | | |
| | | | | | | | |
| See accompanying Notes to Financial Statements | | | March 31, 2020 | | | Semiannual Report | | | 169 | |
Schedule of Investments
March 31, 2020 (unaudited)
| | | | | | | | |
| | | Shares | | | Value | |
| |
| Food Products—1.5% | | | | | |
John B Sanfilippo & Son, Inc. | | | 2,188 | | | $ | 195,607 | |
| | | | | | | | |
|
| Healthcare Equipment & Supplies—12.4% | |
Antares Pharma, Inc. (a) | | | 42,191 | | | | 99,571 | |
Axogen, Inc. (a) | | | 7,413 | | | | 77,095 | |
Axonics Modulation Technologies, Inc. (a) | | | 5,964 | | | | 151,545 | |
BioLife Solutions, Inc. (a) | | | 9,984 | | | | 94,848 | |
Cerus Corp. (a) | | | 27,327 | | | | 127,071 | |
CryoLife, Inc. (a) | | | 4,253 | | | | 71,961 | |
CryoPort, Inc. (a) | | | 16,979 | | | | 289,831 | |
Mesa Laboratories, Inc. | | | 774 | | | | 174,994 | |
OrthoPediatrics Corp. (a) | | | 5,470 | | | | 216,831 | |
Surmodics, Inc. (a) | | | 3,431 | | | | 114,321 | |
Tactile Systems Technology, Inc. (a) | | | 4,339 | | | | 174,254 | |
| | | | | | | | |
| | | | | | | 1,592,322 | |
| | | | | | | | |
|
| Healthcare Providers & Services—7.1% | |
Addus HomeCare Corp. (a) | | | 2,746 | | | | 185,629 | |
BioTelemetry, Inc. (a) | | | 4,149 | | | | 159,778 | |
Catasys, Inc. (a) | | | 9,515 | | | | 144,913 | |
Joint Corp. (a) | | | 11,249 | | | | 122,052 | |
R1 RCM, Inc. (a) | | | 19,122 | | | | 173,819 | |
RadNet, Inc. (a) | | | 11,429 | | | | 120,119 | |
| | | | | | | | |
| | | | | | | 906,310 | |
| | | | | | | | |
|
| Healthcare Technology—2.8% | |
Tabula Rasa HealthCare, Inc. (a) | | | 4,725 | | | | 247,070 | |
Vocera Communications, Inc. (a) | | | 5,096 | | | | 108,239 | |
| | | | | | | | |
| | | | | | | 355,309 | |
| | | | | | | | |
|
| Hotels, Restaurants & Leisure—0.7% | |
Kura Sushi USA, Inc., Class A (a) | | | 7,201 | | | | 86,124 | |
| | | | | | | | |
| |
| Household Durables—0.9% | | | | | |
LGI Homes, Inc. (a) | | | 2,473 | | | | 111,656 | |
| | | | | | | | |
| |
| Insurance—1.7% | | | | | |
Palomar Holdings, Inc. (a) | | | 3,856 | | | | 224,265 | |
| | | | | | | | |
|
| Interactive Media & Services—1.5% | |
EverQuote, Inc., Class A (a) | | | 3,402 | | | | 89,302 | |
QuinStreet, Inc. (a) | | | 12,075 | | | | 97,204 | |
| | | | | | | | |
| | | | | | | 186,506 | |
| | | | | | | | |
|
| Internet & Direct Marketing Retail—1.0% | |
Rubicon Project, Inc. (a) | | | 22,798 | | | | 126,529 | |
| | | | | | | | |
| |
| IT Services—3.2% | | | | | |
Brightcove, Inc. (a) | | | 18,230 | | | | 127,063 | |
Hackett Group, Inc. | | | 8,999 | | | | 114,467 | |
Paysign, Inc. (a) | | | 11,169 | | | | 57,632 | |
Perficient, Inc. (a) | | | 4,172 | | | | 113,020 | |
| | | | | | | | |
| | | | | | | 412,182 | |
| | | | | | | | |
|
| Life Sciences Tools & Services—4.2% | |
Codexis, Inc. (a) | | | 7,653 | | | | 85,407 | |
NanoString Technologies, Inc. (a) | | | 5,902 | | | | 141,943 | |
NeoGenomics, Inc. (a) | | | 5,774 | | | | 159,420 | |
Quanterix Corp. (a) | | | 8,537 | | | | 156,825 | |
| | | | | | | | |
| | | | | | | 543,595 | |
| | | | | | | | |
| |
| Machinery—4.4% | | | | | |
Columbus McKinnon Corp. | | | 3,937 | | | | 98,425 | |
Kadant, Inc. | | | 1,893 | | | | 141,312 | |
Kornit Digital Ltd. (a) | | | 8,393 | | | | 208,902 | |
Spartan Motors, Inc. | | | 8,411 | | | | 108,586 | |
| | | | | | | | |
| | | | | | | 557,225 | |
| | | | | | | | |
| |
| Media—2.6% | | | | | |
Cardlytics, Inc. (a) | | | 4,446 | | | | 155,432 | |
TechTarget, Inc. (a) | | | 8,684 | | | | 178,977 | |
| | | | | | | | |
| | | | | | | 334,409 | |
| | | | | | | | |
| | | | | | | | |
| | | Shares | | | Value | |
| |
| Pharmaceuticals—5.2% | | | | | |
Amphastar Pharmaceuticals, Inc. (a) | | | 6,635 | | | $ | 98,463 | |
ANI Pharmaceuticals, Inc. (a) | | | 2,493 | | | | 101,565 | |
Axsome Therapeutics, Inc. (a) | | | 3,141 | | | | 184,785 | |
Cara Therapeutics, Inc. (a) | | | 4,489 | | | | 59,300 | |
Collegium Pharmaceutical, Inc. (a) | | | 7,237 | | | | 118,180 | |
Omeros Corp. (a) | | | 4,280 | | | | 57,224 | |
Provention Bio, Inc. (a) | | | 5,032 | | | | 46,294 | |
| | | | | | | | |
| | | | | | | 665,811 | |
| | | | | | | | |
| |
| Professional Services—2.2% | | | | | |
CRA International, Inc. | | | 3,261 | | | | 108,950 | |
Franklin Covey Co. (a) | | | 3,722 | | | | 57,840 | |
Kforce, Inc. | | | 4,318 | | | | 110,411 | |
| | | | | | | | |
| | | | | | | 277,201 | |
| | | | | | | | |
|
Semiconductors & Semiconductor
Equipment—5.9% | |
ACM Research, Inc., Class A (a) | | | 1,892 | | | | 56,022 | |
Adesto Technologies Corp. (a) | | | 22,860 | | | | 255,804 | |
Axcelis Technologies, Inc. (a) | | | 6,721 | | | | 123,062 | |
FormFactor, Inc. (a) | | | 10,101 | | | | 202,929 | |
Ichor Holdings Ltd. (a) | | | 6,140 | | | | 117,642 | |
| | | | | | | | |
| | | | | | | 755,459 | |
| | | | | | | | |
| |
| Software—9.4% | | | | | |
Agilysys, Inc. (a) | | | 7,412 | | | | 123,780 | |
Cerence, Inc. (a) | | | 5,625 | | | | 86,625 | |
Digital Turbine, Inc. (a) | | | 34,626 | | | | 149,238 | |
LivePerson, Inc. (a) | | | 5,390 | | | | 122,623 | |
Model N, Inc. (a) | | | 10,558 | | | | 234,493 | |
PROS Holdings, Inc. (a) | | | 1,820 | | | | 56,475 | |
Sapiens International Corp. NV | | | 7,814 | | | | 148,622 | |
Upland Software, Inc. (a) | | | 6,488 | | | | 174,008 | |
Zix Corp. (a) | | | 24,128 | | | | 103,992 | |
| | | | | | | | |
| | | | | | | 1,199,856 | |
| | | | | | | | |
|
| Thrifts & Mortgage Finance—1.5% | |
First Defiance Financial Corp. | | | 6,140 | | | | 90,504 | |
Meridian Bancorp, Inc. | | | 9,309 | | | | 104,447 | |
| | | | | | | | |
| | | | | | | 194,951 | |
| | | | | | | | |
|
| Wireless Telecommunication Services—1.0% | |
Boingo Wireless, Inc. (a) | | | 11,934 | | | | 126,620 | |
| | | | | | | | |
Total Common Stock
(cost—$12,334,958) | | | | 12,562,070 | |
| | | | | | | | |
| | | | | | | | |
| | |
| | | Principal
Amount
(000s) | | | | |
|
| Repurchase Agreements—1.8% | |
State Street Bank and Trust Co., dated 3/31/20, 0.00%, due 4/1/20, proceeds $226,000; collateralized by U.S. Treasury Inflation Indexed Notes, 0.00%, due 4/15/23, valued at $231,437 | |
(cost—$226,000) | | | $226 | | | | 226,000 | |
| | | | | | | | |
| |
Total Investments
(cost—$12,560,958)—100.0% | | | | 12,788,070 | |
| | | | | | | | |
| |
Liabilities in excess of
other assets—(0.0)% | | | | (2,784 | ) |
| | | | | | | | |
| |
| Net Assets—100.0% | | | | $12,785,286 | |
| | | | | | | | |
Notes to Schedule of Investments:
(a)Non-income producing.
AllianzGI PerformanceFee Managed Futures Strategy Fund
| | | | | | | | |
| | | Principal
Amount
(000s) | | | Value | |
|
| U.S. Treasury Obligations—69.4% | |
| U.S. Treasury Notes, 1.375%, 5/31/20 | | | $3,300 | | | | $3,307,219 | |
| 1.375%, 8/31/20 | | | 3,300 | | | | 3,317,531 | |
| 1.375%, 9/30/20 | | | 3,300 | | | | 3,320,883 | |
| 1.375%, 10/31/20 | | | 3,300 | | | | 3,323,976 | |
| 1.625%, 6/30/20 | | | 3,300 | | | | 3,313,664 | |
| 1.625%, 7/31/20 | | | 3,300 | | | | 3,317,015 | |
| | | | | | | | |
Total U.S. Treasury Obligations
(cost—$19,792,717) | | | | 19,900,288 | |
| | | | | | | | |
| | | | | | | | |
| | |
| | | Shares | | | | |
| |
| Mutual Fund—4.4% | | | | | |
AllianzGI Short Duration High Income (a)(b)
(cost—$1,438,888) | | | 99,792 | | | | 1,261,374 | |
| | | | | | | | |
| | |
| | | Principal
Amount
(000s) | | | | |
|
| Repurchase Agreements—3.0% | |
State Street Bank and Trust Co., dated 3/31/20, 0.00%, due 4/1/20, proceeds $854,000; collateralized by U.S. Treasury Inflation Indexed Notes, 0.625%, due 4/15/23, valued at $873,148 including accrued interest | |
(cost—$854,000) | | | $854 | | | | 854,000 | |
| | | | | | | | |
| |
Total Investments
(cost—$22,085,605)—76.8% | | | | 22,015,662 | |
| | | | | | | | |
| |
Other assets less
liabilities (c)—23.2% | | | | 6,666,630 | |
| | | | | | | | |
| |
| Net Assets—100.0% | | | | $28,682,292 | |
| | | | | | | | |
Notes to Schedule of Investments:
(a) Affiliated fund.
(b) Class R6 share.
| | | | | | |
| 170 | | Semiannual Report | | | March 31, 2020 | | | See accompanying Notes to Financial Statements |
Schedule of Investments
March 31, 2020 (unaudited)
(c) Includes net unrealized appreciation (depreciation) of other financial instruments as follows:
| | | | | | | | | | | | | | | | | | | | | | |
|
| Futures contracts outstanding at March 31, 2020: | |
Type | | Contracts | | | Expiration
Date | | | Notional
Amount
(000s) | | | Market
Value
(000s) | | | Unrealized
Appreciation
(Depreciation) | |
Long position contracts: | | | | | | | | | | | | | | | | | | | | |
| | 10-Year U.S. Treasury Note | | | 55 | | | | 6/19/20 | | | $ | 5,500 | | | $ | 7,628 | | | $ | 312,283 | |
| | Aluminum† | | | 46 | | | | 4/9/20 | | | | 1 | | | | 1,727 | | | | (261,573 | ) |
| | Aluminum† | | | 57 | | | | 5/18/20 | | | | 1 | | | | 2,158 | | | | (230,014 | ) |
| | Aluminum† | | | 5 | | | | 6/17/20 | | | | — | (e) | | | 190 | | | | (7,974 | ) |
| | Australia Government10-Year Bond | | | 27 | | | | 6/15/20 | | | AUD | 2,700 | | | | 2,501 | | | | 447 | |
| | Canada Government10-Year Bond | | | 44 | | | | 6/19/20 | | | CAD | 4,400 | | | | 4,600 | | | | 165,251 | |
| | Coffee† | | | 2 | | | | 12/18/20 | | | $ | 75 | | | | 92 | | | | (4,766 | ) |
| | Euro FX Currency | | | 13 | | | | 6/15/20 | | | | 1,625 | | | | 1,796 | | | | 20,228 | |
| | Euro-BTP | | | 1 | | | | 6/8/20 | | | EUR | 100 | | | | 156 | | | | (7,225 | ) |
| | Euro-Bund | | | 4 | | | | 6/8/20 | | | | 400 | | | | 761 | | | | (11,398 | ) |
| | Euro-OAT | | | 2 | | | | 6/8/20 | | | | 200 | | | | 369 | | | | (10,094 | ) |
| | Gold 100 Oz† | | | 3 | | | | 8/27/20 | | | $ | — | (e) | | | 479 | | | | (8,938 | ) |
| | Japan Government10-Year Bond | | | 2 | | | | 6/15/20 | | | JPY | 200,000 | | | | 2,838 | | | | (33,671 | ) |
| | Japanese Yen | | | 9 | | | | 6/15/20 | | | $ | 11 | | | | 1,048 | | | | 214 | |
| | KC HRW Wheat† | | | 7 | | | | 9/14/20 | | | | 35 | | | | 177 | | | | (2,282 | ) |
| | Nickel† | | | 6 | | | | 4/9/20 | | | | — | (e) | | | 412 | | | | (51,753 | ) |
| | Nickel† | | | 10 | | | | 5/18/20 | | | | — | (e) | | | 688 | | | | (29,794 | ) |
| | United Kingdom Government10-Year Gilt | | | 10 | | | | 6/26/20 | | | GBP | 1,000 | | | | 1,692 | | | | 13,026 | |
| | | | | | | | | | | | | | | | | | | | | | |
| | | | | | | | | | | | | | | | | | | | $ | (148,033 | ) |
| | | | | | | | | | | | | | | | | | | | | | |
| | | | | |
Short position contracts: | | | | | | | | | | | | | | | | | | | | |
| | Aluminum† | | | (46 | ) | | | 4/9/20 | | | | (1 | ) | | $ | (1,727 | ) | | $ | 271,788 | |
| | Aluminum† | | | (57 | ) | | | 5/18/20 | | | | (1 | ) | | | (2,158 | ) | | | 261,966 | |
| | Aluminum† | | | (45 | ) | | | 6/17/20 | | | | (1 | ) | | | (1,713 | ) | | | 162,384 | |
| | Australian Dollar | | | (5 | ) | | | 6/15/20 | | | $ | (500 | ) | | | (307 | ) | | | (5,448 | ) |
| | BIST 30 | | | (105 | ) | | | 4/30/20 | | | TRY | (11 | ) | | | (170 | ) | | | (3,893 | ) |
| | Bovespa Index | | | (5 | ) | | | 4/15/20 | | | BRL | (— | )(e) | | | (70 | ) | | | (6,556 | ) |
| | Brent Crude† | | | (3 | ) | | | 5/29/20 | | | $ | (3 | ) | | | (89 | ) | | | 70,792 | |
| | British Pound | | | (17 | ) | | | 6/15/20 | | | | (688 | ) | | | (1,323 | ) | | | (70,548 | ) |
| | Canadian Dollar | | | (10 | ) | | | 6/16/20 | | | | (1,000 | ) | | | (710 | ) | | | (1,937 | ) |
| | Cattle Feeder† | | | (3 | ) | | | 9/24/20 | | | | (150 | ) | | | (194 | ) | | | 7,413 | |
| | Cocoa† | | | (11 | ) | | | 12/15/20 | | | | (— | )(e) | | | (248 | ) | | | (3,410 | ) |
| | Copper† | | | (17 | ) | | | 9/28/20 | | | | (425 | ) | | | (951 | ) | | | 121,506 | |
| | Corn† | | | (40 | ) | | | 9/14/20 | | | | (200 | ) | | | (699 | ) | | | 48,546 | |
| | Cotton† | | | (19 | ) | | | 12/8/20 | | | | (950 | ) | | | (507 | ) | | | 113,960 | |
| | DAX Mini Index | | | (7 | ) | | | 6/19/20 | | | EUR | (— | )(e) | | | (382 | ) | | | (48,289 | ) |
| | E-mini S&P 500 Index | | | (4 | ) | | | 6/19/20 | | | $ | (— | )(e) | | | (514 | ) | | | (17,907 | ) |
| | FTSE 100 Index | | | (8 | ) | | | 6/19/20 | | | GBP | (— | )(e) | | | (560 | ) | | | (59,068 | ) |
| | FTSE China | | | (4 | ) | | | 4/29/20 | | | $ | (— | )(e) | | | (50 | ) | | | 262 | |
| | FTSE/JSE Top 40 Index | | | (8 | ) | | | 6/18/20 | | | ZAR | (— | )(e) | | | (184 | ) | | | (19,542 | ) |
| | Gas Oil† | | | (11 | ) | | | 6/11/20 | | | $ | (1 | ) | | | (332 | ) | | | 83,421 | |
| | IBEX 35 Index | | | (1 | ) | | | 4/17/20 | | | EUR | (— | )(e) | | | (75 | ) | | | (8,342 | ) |
| | Lean Hogs† | | | (19 | ) | | | 7/15/20 | | | $ | (760 | ) | | | (492 | ) | | | 132,181 | |
| | Live Cattle† | | | (7 | ) | | | 10/30/20 | | | | (280 | ) | | | (271 | ) | | | 12,153 | |
| | Natural Gas† | | | (50 | ) | | | 6/26/20 | | | | (500 | ) | | | (956 | ) | | | 25,331 | |
| | New Zealand Dollar | | | (7 | ) | | | 6/15/20 | | | | (700 | ) | | | (416 | ) | | | (2,122 | ) |
| | Nickel† | | | (6 | ) | | | 4/9/20 | | | | (— | )(e) | | | (412 | ) | | | 53,979 | |
| | Nickel† | | | (10 | ) | | | 5/18/20 | | | | (— | )(e) | | | (688 | ) | | | 68,378 | |
| | Nickel† | | | (10 | ) | | | 6/15/20 | | | | (— | )(e) | | | (689 | ) | | | 15,224 | |
| | Platinum† | | | (8 | ) | | | 7/29/20 | | | | (— | )(e) | | | (292 | ) | | | (48,453 | ) |
| | S&P Index 60 | | | (1 | ) | | | 6/18/20 | | | | (— | )(e) | | | (116 | ) | | | (15,692 | ) |
| | Silver† | | | (3 | ) | | | 9/28/20 | | | | (15 | ) | | | (213 | ) | | | (33,313 | ) |
| | Soybean† | | | (13 | ) | | | 8/14/20 | | | | (65 | ) | | | (578 | ) | | | (3,214 | ) |
| | SPI 200 | | | (2 | ) | | | 6/18/20 | | | | (— | )(e) | | | (157 | ) | | | (2,756 | ) |
| | Sugar No. 11† | | | (36 | ) | | | 2/26/21 | | | | (4,032 | ) | | | (460 | ) | | | 34,899 | |
| | | | | | | | |
| See accompanying Notes to Financial Statements | | | March 31, 2020 | | | Semiannual Report | | | 171 | |
Schedule of Investments
March 31, 2020 (unaudited)
| | | | | | | | | | | | | | | | | | | | | | |
|
| Futures contracts outstanding at March 31, 2020 (continued): | |
Type | | Contracts | | | Expiration
Date | | | Notional
Amount
(000s) | | | Market
Value
(000s) | | | Unrealized
Appreciation
(Depreciation) | |
Short position contracts (continued): | | | | | | | | | | | | | | | | | | | | |
| | Topix Index | | | (8 | ) | | | 6/11/20 | | | $ | (80 | ) | | $ | (1,044 | ) | | $ | (101,126 | ) |
| | WTI Crude† | | | (4 | ) | | | 6/22/20 | | | | (4 | ) | | | (111 | ) | | | 15,587 | |
| | | | | | | | | | | | | | | | | | | | | | |
| | | | | | | | | | | | | | | | | | | | $ | 1,048,154 | |
| | | | | | | | | | | | | | | | | | | | | | |
| | | | | | | | | | | | | | | | | | | | $ | 900,121 | |
| | | | | | | | | | | | | | | | | | | | | | |
† All or a portion of this security is owned by AllianzGI PerformanceFee Managed Futures Strategy Offshore Fund Ltd., which is a wholly-owned subsidiary of the Fund.
| | | | | | | | | | | | | | | | | | | | | | | | | | | | | | | | |
| | | | |
| Credit default swaps agreements outstanding at March 31, 2020: | | | | | | | | | | | | | |
Centrally cleared buy protection swap agreements: | | | | | | | | | | | | | | | | | | | | | |
Broker (Exchange)/
Reference Debt Issuer | | Notional
Amount
(000s)(1) | | | Implied
Credit
Spread | | | Termination
Date | | | Fixed Deal
Pay Rate | | | Payment
Frequency | | | Value(2) | | | Upfront
Premiums
Paid | | | Unrealized
Depreciation | |
Goldman Sachs (ICE): | |
CDX.EM.32 | | $ | 1,650 | | | | 3.37 | % | | | 12/20/24 | | | | (1.00 | )% | | | Quarterly | | | $ | 193,010 | | | $ | 219,900 | | | $ | (26,890 | ) |
CDX.NA.HY.33 | | | 800 | | | | 5.76 | % | | | 12/20/24 | | | | (5.00 | )% | | | Quarterly | | | | 49,361 | | | | 62,573 | | | | (13,212 | ) |
| | | | | | | | | | | | | | | | | | | | | | | | |
| | | | | | | | | | | | | | | | | | | | | | $ | 242,371 | | | $ | 282,473 | | | $ | (40,102 | ) |
| | | | | | | | | | | | | | | | | | | | | | | | |
(1) This represents the maximum potential amount the Fund could be required to make available as a seller of credit protection or receive as a buyer of credit protection if a credit event occurs as defined under the terms of that particular swap agreement.
(2) The quoted market prices and resulting values for credit default swap agreements serve as an indicator of the status at March 31, 2020 of the payment/performance risk and represent the likelihood of an expected liability (or profit) for the credit derivative should the notional amount of the swap agreement have been closed/sold as of the period end. Increasing market values, in absolute terms when compared to the notional amount of the swap, represent a deterioration of the referenced entity’s credit soundness and a greater likelihood or risk of default or
other credit event occurring as defined under the terms of the agreement.
(d) At March 31, 2020, the Fund pledged $6,070,734 in cash as collateral for futures contracts and received $137,383 in cash as collateral for swap contracts.
(e) Notional amount rounds to less than 500.
Glossary:
AUD – Australian Dollar
BIST—Borsa Istanbul
BRL – Brazilian Real
CAD – Canadian Dollar
CDX—Credit Derivatives Index
EUR – Euro
FTSE—Financial Times Stock Exchange
GBP – British Pound
ICE—Intercontinental Exchange
JPY – Japanese Yen
JSE—Johannesburg Stock Exchange Limited
OAT—Obligations Assimilables du Trésor
TOPIX—Tokyo Stock Price Index
TRY – Turkish Lira
WTI—West Texas Intermediate
ZAR—South African Rand
| | | | | | |
| 172 | | Semiannual Report | | | March 31, 2020 | | | See accompanying Notes to Financial Statements |
Schedule of Investments
March 31, 2020 (unaudited)
AllianzGI PerformanceFee Structured US Equity Fund
| | | | | | | | |
| | | Shares | | | Value | |
|
| Exchange-Traded Funds—101.0% | |
iShares Core S&P 500 (a) (cost—$75,414,896) | | | 248,881 | | | | $64,310,850 | |
| | | | | | | | |
| | | | | | | | |
| | |
| | | Principal
Amount
(000s) | | | | |
|
| Repurchase Agreements—3.0% | |
State Street Bank and Trust Co., dated 3/31/20, 0.00%, due 4/1/20, proceeds $1,888,000; collateralized by U.S. Treasury Inflation Indexed Notes, 0.625%, due 4/15/23, valued at $1,930,392 including accrued interest | |
(cost—$1,888,000) | | | $1,888 | | | | 1,888,000 | |
| | | | | | | | |
Total Options Purchased—2.9%
(cost—$2,568,485) (b)(c)(d) | | | | 1,860,581 | |
| | | | | | | | |
| | | | | | |
| | | | | Value | |
Total Investments, before options written
(cost—$79,871,381)—106.9% | | $ | 68,059,431 | |
| | | | | | |
Total Options Written—(2.5)%
(premiums received—$2,190,558) (b)(c)(d) | | | (1,585,111 | ) |
| | | | | | |
| |
| Total Investments, net of options written(cost—$77,680,823)—104.4% | | | 66,474,320 | |
| | | | | | |
| |
| Other liabilities in excess of other assets—(4.4)% | | | (2,807,059 | ) |
| | | | | | |
| |
| Net Assets—100.0% | | | $63,667,261 | |
| | | | | | |
Notes to Schedule of Investments:
(a) All or partial amount segregated for the benefit of the counterparty as collateral for options written.
(b)Non-income producing.
(c) Exchange traded-Chicago Board Options Exchange.
(d) Exchange traded option contracts outstanding at March 31, 2020:
| | | | | | | | | | | | | | | | | | | | | | | | | | | | |
| | | |
| Options purchased contracts outstanding at March 31, 2020: | | | | | | | | | | |
| Description | | Exercise
Price | | | Expiration
Date | | | Number of
Contracts | | | Notional
Amount | | | Market
Value | | | Cost | | | Unrealized
Appreciation
(Depreciation) | |
Call options: | | | | | | | | | | | | | | | | | | | | | | | | | | | | |
CBOE Volatility Index | | | 42.50 USD | | | | 4/15/20 | | | | 68 | | | $ | 6,800 | | | $ | 60,860 | | | $ | 73,559 | | | $ | (12,699 | ) |
CBOE Volatility Index | | | 47.50 USD | | | | 4/15/20 | | | | 98 | | | | 9,800 | | | | 68,110 | | | | 110,006 | | | | (41,896 | ) |
CBOE Volatility Index | | | 90.00 USD | | | | 4/15/20 | | | | 332 | | | | 33,200 | | | | 30,710 | | | | 62,982 | | | | (32,272 | ) |
CBOE Volatility Index | | | 40.00 USD | | | | 4/22/20 | | | | 34 | | | | 3,400 | | | | 35,190 | | | | 37,990 | | | | (2,800 | ) |
CBOE Volatility Index | | | 95.00 USD | | | | 4/22/20 | | | | 68 | | | | 6,800 | | | | 32,504 | | | | 33,118 | | | | (614 | ) |
Nasdaq 100 Stock Index | | | 9,250.00 USD | | | | 4/3/20 | | | | 12 | | | | 1,200 | | | | 416 | | | | 3,206 | | | | (2,790 | ) |
Nasdaq 100 Stock Index | | | 9,300.00 USD | | | | 4/9/20 | | | | 12 | | | | 1,200 | | | | 746 | | | | 3,985 | | | | (3,239 | ) |
Nasdaq 100 Stock Index | | | 9,300.00 USD | | | | 4/17/20 | | | | 12 | | | | 1,200 | | | | 2,310 | | | | 4,105 | | | | (1,795 | ) |
Nasdaq 100 Stock Index | | | 11,500.00 USD | | | | 4/17/20 | | | | 7 | | | | 700 | | | | 1 | | | | 162 | | | | (161 | ) |
Nasdaq 100 Stock Index | | | 11,800.00 USD | | | | 4/17/20 | | | | 2 | | | | 200 | | | | — | | | | 82 | | | | (82 | ) |
Nasdaq 100 Stock Index | | | 8,200.00 USD | | | | 5/15/20 | | | | 3 | | | | 300 | | | | 74,880 | | | | 94,812 | | | | (19,932 | ) |
Nasdaq 100 Stock Index | | | 11,900.00 USD | | | | 5/15/20 | | | | 4 | | | | 400 | | | | 338 | | | | 44 | | | | 294 | |
Nasdaq 100 Stock Index | | | 8,200.00 USD | | | | 6/19/20 | | | | 3 | | | | 300 | | | | 103,395 | | | | 113,032 | | | | (9,637 | ) |
Russell 2000 Index | | | 1,800.00 USD | | | | 4/3/20 | | | | 19 | | | | 1,900 | | | | 665 | | | | 334 | | | | 331 | |
Russell 2000 Index | | | 1,800.00 USD | | | | 4/17/20 | | | | 62 | | | | 6,200 | | | | 155 | | | | 1,686 | | | | (1,531 | ) |
Russell 2000 Index | | | 2,550.00 USD | | | | 4/17/20 | | | | 10 | | | | 1,000 | | | | 325 | | | | 111 | | | | 214 | |
Russell 2000 Index | | | 1,900.00 USD | | | | 4/30/20 | | | | 13 | | | | 1,300 | | | | 4 | | | | 145 | | | | (141 | ) |
Russell 2000 Index | | | 1,900.00 USD | | | | 5/29/20 | | | | 10 | | | | 1,000 | | | | 404 | | | | 308 | | | | 96 | |
S&P 500 Index | | | 2,900.00 USD | | | | 4/3/20 | | | | 14 | | | | 1,400 | | | | 210 | | | | 15,750 | | | | (15,540 | ) |
S&P 500 Index | | | 3,500.00 USD | | | | 4/3/20 | | | | 156 | | | | 15,600 | | | | 1,560 | | | | 8,808 | | | | (7,248 | ) |
S&P 500 Index | | | 2,475.00 USD | | | | 4/8/20 | | | | 2 | | | | 200 | | | | 28,890 | | | | 34,197 | | | | (5,307 | ) |
S&P 500 Index | | | 2,700.00 USD | | | | 4/8/20 | | | | 1 | | | | 100 | | | | 1,975 | | | | 10,402 | | | | (8,427 | ) |
S&P 500 Index | | | 2,950.00 USD | | | | 4/8/20 | | | | 4 | | | | 400 | | | | 250 | | | | 411 | | | | (161 | ) |
S&P 500 Index | | | 3,100.00 USD | | | | 4/8/20 | | | | 9 | | | | 900 | | | | 180 | | | | 189 | | | | (9 | ) |
S&P 500 Index | | | 2,475.00 USD | | | | 4/9/20 | | | | 2 | | | | 200 | | | | 29,830 | | | | 34,654 | | | | (4,824 | ) |
S&P 500 Index | | | 2,900.00 USD | | | | 4/9/20 | | | | 7 | | | | 700 | | | | 892 | | | | 14,486 | | | | (13,594 | ) |
S&P 500 Index | | | 2,950.00 USD | | | | 4/9/20 | | | | 4 | | | | 400 | | | | 320 | | | | 576 | | | | (256 | ) |
S&P 500 Index | | | 3,900.00 USD | | | | 4/9/20 | | | | 6 | | | | 600 | | | | 75 | | | | 97 | | | | (22 | ) |
S&P 500 Index | | | 2,475.00 USD | | | | 4/13/20 | | | | 2 | | | | 200 | | | | 31,060 | | | | 37,060 | | | | (6,000 | ) |
S&P 500 Index | | | 2,950.00 USD | | | | 4/13/20 | | | | 4 | | | | 400 | | | | 480 | | | | 786 | | | | (306 | ) |
S&P 500 Index | | | 2,475.00 USD | | | | 4/15/20 | | | | 2 | | | | 200 | | | | 32,530 | | | | 37,990 | | | | (5,460 | ) |
S&P 500 Index | | | 2,900.00 USD | | | | 4/15/20 | | | | 1 | | | | 100 | | | | 242 | | | | 2,731 | | | | (2,489 | ) |
S&P 500 Index | | | 2,950.00 USD | | | | 4/15/20 | | | | 4 | | | | 400 | | | | 640 | | | | 1,068 | | | | (428 | ) |
S&P 500 Index | | | 2,800.00 USD | | | | 4/17/20 | | | | 2 | | | | 200 | | | | 2,300 | | | | 14,055 | | | | (11,755 | ) |
S&P 500 Index | | | 3,220.00 USD | | | | 4/17/20 | | | | 1 | | | | 100 | | | | 38 | | | | 3,493 | | | | (3,455 | ) |
S&P 500 Index | | | 3,260.00 USD | | | | 4/17/20 | | | | 1 | | | | 100 | | | | 28 | | | | 3,192 | | | | (3,164 | ) |
| | | | | | | | |
| See accompanying Notes to Financial Statements | | | March 31, 2020 | | | Semiannual Report | | | 173 | |
Schedule of Investments
March 31, 2020 (unaudited)
| | | | | | | | | | | | | | | | | | | | | | | | | | | | |
| | | |
| Options purchased contracts outstanding at March 31, 2020 (continued): | | | | | | | | | | |
| Description | | Exercise
Price | | | Expiration
Date | | | Number of
Contracts | | | Notional
Amount | | | Market
Value | | | Cost | | | Unrealized
Appreciation
(Depreciation) | |
Call options (continued): | | | | | | | | | | | | | | | | | | | | | | | | | | | | |
S&P 500 Index | | | 3,270.00 USD | | | | 4/17/20 | | | | 1 | | | $ | 100 | | | $ | 28 | | | $ | 2,518 | | | $ | (2,490 | ) |
S&P 500 Index | | | 3,675.00 USD | | | | 4/17/20 | | | | 3 | | | | 300 | | | | 30 | | | | 137 | | | | (107 | ) |
S&P 500 Index | | | 4,400.00 USD | | | | 4/17/20 | | | | 9 | | | | 900 | | | | 45 | | | | 100 | | | | (55 | ) |
S&P 500 Index | | | 4,000.00 USD | | | | 5/15/20 | | | | 13 | | | | 1,300 | | | | 130 | | | | 266 | | | | (136 | ) |
S&P 500 Index | | | 2,800.00 USD | | | | 6/19/20 | | | | 11 | | | | 1,100 | | | | 76,615 | | | | 138,238 | | | | (61,623 | ) |
S&P 500 Mini Index | | | 328.00 USD | | | | 4/1/20 | | | | 3 | | | | 300 | | | | 14 | | | | 1,357 | | | | (1,343 | ) |
S&P 500 Mini Index | | | 336.00 USD | | | | 4/1/20 | | | | 9 | | | | 900 | | | | 41 | | | | 2,269 | | | | (2,228 | ) |
S&P 500 Mini Index | | | 345.00 USD | | | | 4/1/20 | | | | 15 | | | | 1,500 | | | | 67 | | | | 2,521 | | | | (2,454 | ) |
S&P 500 Mini Index | | | 385.00 USD | | | | 4/1/20 | | | | 16 | | | | 1,600 | | | | — | | | | 49 | | | | (49 | ) |
S&P 500 Mini Index | | | 390.00 USD | | | | 4/1/20 | | | | 45 | | | | 4,500 | | | | — | | | | 94 | | | | (94 | ) |
S&P 500 Mini Index | | | 305.00 USD | | | | 4/3/20 | | | | 8 | | | | 800 | | | | 56 | | | | 6,925 | | | | (6,869 | ) |
S&P 500 Mini Index | | | 327.00 USD | | | | 4/3/20 | | | | 3 | | | | 300 | | | | 21 | | | | 2,104 | | | | (2,083 | ) |
S&P 500 Mini Index | | | 344.00 USD | | | | 4/3/20 | | | | 16 | | | | 1,600 | | | | 112 | | | | 3,809 | | | | (3,697 | ) |
S&P 500 Mini Index | | | 345.00 USD | | | | 4/3/20 | | | | 347 | | | | 34,700 | | | | 2,429 | | | | 2,115 | | | | 314 | |
S&P 500 Mini Index | | | 355.00 USD | | | | 4/3/20 | | | | 15 | | | | 1,500 | | | | 105 | | | | 67 | | | | 38 | |
S&P 500 Mini Index | | | 385.00 USD | | | | 4/3/20 | | | | 16 | | | | 1,600 | | | | 112 | | | | 32 | | | | 80 | |
S&P 500 Mini Index | | | 390.00 USD | | | | 4/3/20 | | | | 45 | | | | 4,500 | | | | 315 | | | | 94 | | | | 221 | |
S&P 500 Mini Index | | | 303.00 USD | | | | 4/6/20 | | | | 8 | | | | 800 | | | | 40 | | | | 8,584 | | | | (8,544 | ) |
S&P 500 Mini Index | | | 308.00 USD | | | | 4/6/20 | | | | 3 | | | | 300 | | | | 14 | | | | 2,379 | | | | (2,365 | ) |
S&P 500 Mini Index | | | 325.00 USD | | | | 4/6/20 | | | | 5 | | | | 500 | | | | 23 | | | | 3,716 | | | | (3,693 | ) |
S&P 500 Mini Index | | | 334.00 USD | | | | 4/6/20 | | | | 3 | | | | 300 | | | | 14 | | | | 1,795 | | | | (1,781 | ) |
S&P 500 Mini Index | | | 341.00 USD | | | | 4/6/20 | | | | 4 | | | | 400 | | | | 18 | | | | 1,452 | | | | (1,434 | ) |
S&P 500 Mini Index | | | 343.00 USD | | | | 4/6/20 | | | | 8 | | | | 800 | | | | 36 | | | | 1,577 | | | | (1,541 | ) |
S&P 500 Mini Index | | | 355.00 USD | | | | 4/6/20 | | | | 3 | | | | 300 | | | | 14 | | | | 25 | | | | (11 | ) |
S&P 500 Mini Index | | | 385.00 USD | | | | 4/6/20 | | | | 61 | | | | 6,100 | | | | 274 | | | | 188 | | | | 86 | |
S&P 500 Mini Index | | | 390.00 USD | | | | 4/6/20 | | | | 79 | | | | 7,900 | | | | — | | | | 235 | | | | (235 | ) |
S&P 500 Mini Index | | | 316.00 USD | | | | 4/8/20 | | | | 5 | | | | 500 | | | | 25 | | | | 3,555 | | | | (3,530 | ) |
S&P 500 Mini Index | | | 339.00 USD | | | | 4/8/20 | | | | 8 | | | | 800 | | | | — | | | | 1,849 | | | | (1,849 | ) |
S&P 500 Mini Index | | | 344.00 USD | | | | 4/8/20 | | | | 9 | | | | 900 | | | | — | | | | 1,648 | | | | (1,648 | ) |
S&P 500 Mini Index | | | 347.00 USD | | | | 4/8/20 | | | | 34 | | | | 3,400 | | | | — | | | | 7,551 | | | | (7,551 | ) |
S&P 500 Mini Index | | | 380.00 USD | | | | 4/8/20 | | | | 79 | | | | 7,900 | | | | — | | | | 206 | | | | (206 | ) |
S&P 500 Mini Index | | | 386.00 USD | | | | 4/8/20 | | | | 16 | | | | 1,600 | | | | — | | | | 72 | | | | (72 | ) |
S&P 500 Mini Index | | | 390.00 USD | | | | 4/8/20 | | | | 45 | | | | 4,500 | | | | — | | | | 94 | | | | (94 | ) |
S&P 500 Mini Index | | | 335.00 USD | | | | 4/9/20 | | | | 3 | | | | 300 | | | | 14 | | | | 1,814 | | | | (1,800 | ) |
S&P 500 Mini Index | | | 338.00 USD | | | | 4/9/20 | | | | 6 | | | | 600 | | | | 27 | | | | 2,788 | | | | (2,761 | ) |
S&P 500 Mini Index | | | 341.00 USD | | | | 4/9/20 | | | | 8 | | | | 800 | | | | 36 | | | | 1,529 | | | | (1,493 | ) |
S&P 500 Mini Index | | | 344.00 USD | | | | 4/9/20 | | | | 9 | | | | 900 | | | | 41 | | | | 1,720 | | | | (1,679 | ) |
S&P 500 Mini Index | | | 385.00 USD | | | | 4/9/20 | | | | 35 | | | | 3,500 | | | | 157 | | | | 108 | | | | 49 | |
S&P 500 Mini Index | | | 386.00 USD | | | | 4/9/20 | | | | 16 | | | | 1,600 | | | | — | | | | 33 | | | | (33 | ) |
S&P 500 Mini Index | | | 390.00 USD | | | | 4/9/20 | | | | 45 | | | | 4,500 | | | | 202 | | | | 94 | | | | 108 | |
S&P 500 Mini Index | | | 324.00 USD | | | | 4/13/20 | | | | 4 | | | | 400 | | | | 22 | | | | 3,368 | | | | (3,346 | ) |
S&P 500 Mini Index | | | 338.00 USD | | | | 4/13/20 | | | | 3 | | | | 300 | | | | — | | | | 1,779 | | | | (1,779 | ) |
S&P 500 Mini Index | | | 341.00 USD | | | | 4/13/20 | | | | 8 | | | | 800 | | | | — | | | | 1,440 | | | | (1,440 | ) |
S&P 500 Mini Index | | | 345.00 USD | | | | 4/13/20 | | | | 12 | | | | 1,200 | | | | 54 | | | | 2,665 | | | | (2,611 | ) |
S&P 500 Mini Index | | | 347.00 USD | | | | 4/13/20 | | | | 9 | | | | 900 | | | | — | | | | 1,729 | | | | (1,729 | ) |
S&P 500 Mini Index | | | 385.00 USD | | | | 4/13/20 | | | | 52 | | | | 5,200 | | | | — | | | | 159 | | | | (159 | ) |
S&P 500 Mini Index | | | 390.00 USD | | | | 4/13/20 | | | | 45 | | | | 4,500 | | | | — | | | | 94 | | | | (94 | ) |
S&P 500 Mini Index | | | 316.00 USD | | | | 4/15/20 | | | | 4 | | | | 400 | | | | 1 | | | | 3,168 | | | | (3,167 | ) |
S&P 500 Mini Index | | | 339.00 USD | | | | 4/15/20 | | | | 3 | | | | 300 | | | | — | | | | 1,656 | | | | (1,656 | ) |
S&P 500 Mini Index | | | 342.00 USD | | | | 4/15/20 | | | | 8 | | | | 800 | | | | — | | | | 1,624 | | | | (1,624 | ) |
S&P 500 Mini Index | | | 348.00 USD | | | | 4/15/20 | | | | 9 | | | | 900 | | | | — | | | | 1,495 | | | | (1,495 | ) |
S&P 500 Mini Index | | | 385.00 USD | | | | 4/15/20 | | | | 36 | | | | 3,600 | | | | — | | | | 108 | | | | (108 | ) |
S&P 500 Mini Index | | | 386.00 USD | | | | 4/15/20 | | | | 16 | | | | 1,600 | | | | — | | | | 32 | | | | (32 | ) |
S&P 500 Mini Index | | | 390.00 USD | | | | 4/15/20 | | | | 45 | | | | 4,500 | | | | — | | | | 139 | | | | (139 | ) |
S&P 500 Mini Index | | | 342.00 USD | | | | 4/17/20 | | | | 3 | | | | 300 | | | | 17 | | | | 1,180 | | | | (1,163 | ) |
S&P 500 Mini Index | | | 346.00 USD | | | | 4/17/20 | | | | 8 | | | | 800 | | | | 44 | | | | 1,497 | | | | (1,453 | ) |
S&P 500 Mini Index | | | 347.00 USD | | | | 4/17/20 | | | | 9 | | | | 900 | | | | 49 | | | | 1,827 | | | | (1,778 | ) |
S&P 500 Mini Index | | | 388.00 USD | | | | 4/17/20 | | | | 16 | | | | 1,600 | | | | 72 | | | | 32 | | | | 40 | |
| | | | | | |
| 174 | | Semiannual Report | | | March 31, 2020 | | | See accompanying Notes to Financial Statements |
Schedule of Investments
March 31, 2020 (unaudited)
| | | | | | | | | | | | | | | | | | | | | | | | | | | | |
| | | |
| Options purchased contracts outstanding at March 31, 2020 (continued): | | | | | | | | | | |
| Description | | Exercise
Price | | | Expiration
Date | | | Number of
Contracts | | | Notional
Amount | | | Market
Value | | | Cost | | | Unrealized
Appreciation
(Depreciation) | |
Call options (continued): | | | | | | | | | | | | | | | | | | | | | | | | | | | | |
S&P 500 Mini Index | | | 395.00 USD | | | | 4/17/20 | | | | 45 | | | $ | 4,500 | | | $ | 202 | | | $ | 94 | | | $ | 108 | |
S&P 500 Mini Index | | | 2,500.00 USD | | | | 4/17/20 | | | | 6 | | | | 600 | | | | 89,790 | | | | 100,362 | | | | (10,572 | ) |
S&P 500 Mini Index | | | 2,900.00 USD | | | | 4/17/20 | | | | 14 | | | | 1,400 | | | | 4,270 | | | | 42,036 | | | | (37,766 | ) |
S&P 500 Mini Index | | | 3,050.00 USD | | | | 4/17/20 | | | | 6 | | | | 600 | | | | 585 | | | | 3,064 | | | | (2,479 | ) |
S&P 500 Mini Index | | | 343.00 USD | | | | 4/20/20 | | | | 3 | | | | 300 | | | | — | | | | 1,296 | | | | (1,296 | ) |
S&P 500 Mini Index | | | 347.00 USD | | | | 4/20/20 | | | | 8 | | | | 800 | | | | — | | | | 1,376 | | | | (1,376 | ) |
S&P 500 Mini Index | | | 350.00 USD | | | | 4/20/20 | | | | 9 | | | | 900 | | | | 50 | | | | 1,558 | | | | (1,508 | ) |
S&P 500 Mini Index | | | 390.00 USD | | | | 4/20/20 | | | | 61 | | | | 6,100 | | | | — | | | | 173 | | | | (173 | ) |
S&P 500 Mini Index | | | 337.00 USD | | | | 4/22/20 | | | | 3 | | | | 300 | | | | 1 | | | | 1,806 | | | | (1,805 | ) |
S&P 500 Mini Index | | | 345.00 USD | | | | 4/22/20 | | | | 9 | | | | 900 | | | | 2 | | | | 2,368 | | | | (2,366 | ) |
S&P 500 Mini Index | | | 347.00 USD | | | | 4/22/20 | | | | 8 | | | | 800 | | | | 2 | | | | 1,457 | | | | (1,455 | ) |
S&P 500 Mini Index | | | 385.00 USD | | | | 4/22/20 | | | | 61 | | | | 6,100 | | | | — | | | | 172 | | | | (172 | ) |
S&P 500 Mini Index | | | 325.00 USD | | | | 4/24/20 | | | | 3 | | | | 300 | | | | 23 | | | | 2,611 | | | | (2,588 | ) |
S&P 500 Mini Index | | | 385.00 USD | | | | 4/24/20 | | | | 16 | | | | 1,600 | | | | — | | | | 65 | | | | (65 | ) |
S&P 500 Mini Index | | | 390.00 USD | | | | 4/24/20 | | | | 27 | | | | 2,700 | | | | — | | | | 83 | | | | (83 | ) |
S&P 500 Mini Index | | | 317.00 USD | | | | 4/27/20 | | | | 3 | | | | 300 | | | | 21 | | | | 2,556 | | | | (2,535 | ) |
S&P 500 Mini Index | | | 342.00 USD | | | | 4/27/20 | | | | 9 | | | | 900 | | | | 8 | | | | 4,249 | | | | (4,241 | ) |
S&P 500 Mini Index | | | 385.00 USD | | | | 4/27/20 | | | | 45 | | | | 4,500 | | | | 1 | | | | 136 | | | | (135 | ) |
S&P 500 Mini Index | | | 340.00 USD | | | | 4/29/20 | | | | 8 | | | | 800 | | | | 6 | | | | 2,497 | | | | (2,491 | ) |
S&P 500 Mini Index | | | 348.00 USD | | | | 4/29/20 | | | | 16 | | | | 1,600 | | | | 5 | | | | 3,567 | | | | (3,562 | ) |
S&P 500 Mini Index | | | 385.00 USD | | | | 4/29/20 | | | | 16 | | | | 1,600 | | | | — | | | | 49 | | | | (49 | ) |
S&P 500 Mini Index | | | 390.00 USD | | | | 4/29/20 | | | | 16 | | | | 1,600 | | | | — | | | | 33 | | | | (33 | ) |
S&P 500 Mini Index | | | 340.00 USD | | | | 5/1/20 | | | | 9 | | | | 900 | | | | 58 | | | | 1,638 | | | | (1,580 | ) |
S&P 500 Mini Index | | | 390.00 USD | | | | 5/1/20 | | | | 18 | | | | 1,800 | | | | 1 | | | | 56 | | | | (55 | ) |
S&P 500 Mini Index | | | 340.00 USD | | | | 5/4/20 | | | | 9 | | | | 900 | | | | 4 | | | | 2,368 | | | | (2,364 | ) |
S&P 500 Mini Index | | | 348.00 USD | | | | 5/4/20 | | | | 18 | | | | 1,800 | | | | 4 | | | | 3,187 | | | | (3,183 | ) |
S&P 500 Mini Index | | | 390.00 USD | | | | 5/4/20 | | | | 18 | | | | 1,800 | | | | — | | | | 37 | | | | (37 | ) |
S&P 500 Mini Index | | | 348.00 USD | | | | 5/6/20 | | | | 8 | | | | 800 | | | | 3 | | | | 1,473 | | | | (1,470 | ) |
S&P 500 Mini Index | | | 390.00 USD | | | | 5/6/20 | | | | 16 | | | | 1,600 | | | | 16 | | | | 34 | | | | (18 | ) |
S&P 500 Mini Index | | | 347.00 USD | | | | 5/8/20 | | | | 9 | | | | 900 | | | | 5 | | | | 1,918 | | | | (1,913 | ) |
S&P 500 Mini Index | | | 390.00 USD | | | | 5/8/20 | | | | 18 | | | | 1,800 | | | | — | | | | 38 | | | | (38 | ) |
S&P 500 Mini Index | | | 347.00 USD | | | | 5/11/20 | | | | 9 | | | | 900 | | | | 2 | | | | 1,999 | | | | (1,997 | ) |
S&P 500 Mini Index | | | 390.00 USD | | | | 5/11/20 | | | | 18 | | | | 1,800 | | | | — | | | | 38 | | | | (38 | ) |
S&P 500 Mini Index | | | 351.00 USD | | | | 5/13/20 | | | | 9 | | | | 900 | | | | 7 | | | | 1,846 | | | | (1,839 | ) |
S&P 500 Mini Index | | | 390.00 USD | | | | 5/13/20 | | | | 18 | | | | 1,800 | | | | 1 | | | | 56 | | | | (55 | ) |
S&P 500 Mini Index | | | 351.00 USD | | | | 5/15/20 | | | | 9 | | | | 900 | | | | 63 | | | | 1,990 | | | | (1,927 | ) |
S&P 500 Mini Index | | | 390.00 USD | | | | 5/15/20 | | | | 18 | | | | 1,800 | | | | 99 | | | | 92 | | | | 7 | |
S&P 500 Mini Index | | | 2,650.00 USD | | | | 5/15/20 | | | | 6 | | | | 600 | | | | 67,080 | | | | 116,380 | | | | (49,300 | ) |
S&P 500 Mini Index | | | 2,675.00 USD | | | | 5/15/20 | | | | 3 | | | | 300 | | | | 29,250 | | | | 46,201 | | | | (16,951 | ) |
S&P 500 Mini Index | | | 2,700.00 USD | | | | 5/15/20 | | | | 2 | | | | 200 | | | | 17,330 | | | | 29,107 | | | | (11,777 | ) |
S&P 500 Mini Index | | | 351.00 USD | | | | 5/18/20 | | | | 9 | | | | 900 | | | | 21 | | | | 1,990 | | | | (1,969 | ) |
S&P 500 Mini Index | | | 395.00 USD | | | | 5/18/20 | | | | 18 | | | | 1,800 | | | | 3 | | | | 38 | | | | (35 | ) |
S&P 500 Mini Index | | | 353.00 USD | | | | 5/20/20 | | | | 9 | | | | 900 | | | | 18 | | | | 1,593 | | | | (1,575 | ) |
S&P 500 Mini Index | | | 390.00 USD | | | | 5/20/20 | | | | 18 | | | | 1,800 | | | | 4 | | | | 56 | | | | (52 | ) |
S&P 500 Mini Index | | | 349.00 USD | | | | 5/22/20 | | | | 9 | | | | 900 | | | | 3 | | | | 2,098 | | | | (2,095 | ) |
S&P 500 Mini Index | | | 390.00 USD | | | | 5/22/20 | | | | 18 | | | | 1,800 | | | | — | | | | 74 | | | | (74 | ) |
S&P 500 Mini Index | | | 2,650.00 USD | | | | 6/19/20 | | | | 7 | | | | 700 | | | | 98,490 | | | | 193,284 | | | | (94,794 | ) |
S&P 500 Mini Index | | | 2,700.00 USD | | | | 6/19/20 | | | | 15 | | | | 1,500 | | | | 172,200 | | | | 266,770 | | | | (94,570 | ) |
| | | | | | | | | | | | | | | | | | | | |
| Total call options | | | | | | | | | | | $ | 1,103,455 | | | $ | 1,835,280 | | | $ | (731,825 | ) |
| | | | | | | | | | | | | | | | | | | | |
| | | | | | | |
Put options: | | | | | | | | | | | | | | | | | | | | | | | | | | | | |
CBOE Volatility Index | | | 42.50 USD | | | | 4/15/20 | | | | 64 | | | $ | 6,400 | | | $ | 30,080 | | | $ | 51,270 | | | $ | (21,190 | ) |
CBOE Volatility Index | | | 60.00 USD | | | | 4/15/20 | | | | 98 | | | | 9,800 | | | | 165,130 | | | | 149,349 | | | | 15,781 | |
CBOE Volatility Index | | | 65.00 USD | | | | 4/15/20 | | | | 34 | | | | 3,400 | | | | 71,400 | | | | 64,158 | | | | 7,242 | |
CBOE Volatility Index | | | 70.00 USD | | | | 4/15/20 | | | | 34 | | | | 3,400 | | | | 86,360 | | | | 84,731 | | | | 1,629 | |
CBOE Volatility Index | | | 30.00 USD | | | | 4/22/20 | | | | 68 | | | | 6,800 | | | | 4,012 | | | | 6,287 | | | | (2,275 | ) |
CBOE Volatility Index | | | 70.00 USD | | | | 4/22/20 | | | | 34 | | | | 3,400 | | | | 91,494 | | | | 98,042 | | | | (6,548 | ) |
CBOE Volatility Index | | | 32.50 USD | | | | 5/20/20 | | | | 166 | | | | 16,600 | | | | 59,760 | | | | 106,588 | | | | (46,828 | ) |
| | | | | | | | |
| See accompanying Notes to Financial Statements | | | March 31, 2020 | | | Semiannual Report | | | 175 | |
Schedule of Investments
March 31, 2020 (unaudited)
| | | | | | | | | | | | | | | | | | | | | | | | | | | | |
| | | |
| Options purchased contracts outstanding at March 31, 2020 (continued): | | | | | | | | | | |
| Description | | Exercise
Price | | | Expiration
Date | | | Number of
Contracts | | | Notional
Amount | | | Market
Value | | | Cost | | | Unrealized
Appreciation
(Depreciation) | |
Put options (continued): | | | | | | | | | | | | | | | | | | | | | | | | | | | | |
Nasdaq 100 Stock Index | | | 4,000.00 USD | | | | 4/17/20 | | | | 28 | | | $ | 2,800 | | | $ | 1,120 | | | $ | 11,299 | | | $ | (10,179 | ) |
S&P 500 Index | | | 2,200.00 USD | | | | 4/8/20 | | | | 4 | | | | 400 | | | | 4,680 | | | | 5,938 | | | | (1,258 | ) |
S&P 500 Index | | | 2,675.00 USD | | | | 4/8/20 | | | | 2 | | | | 200 | | | | 26,510 | | | | 24,289 | | | | 2,221 | |
S&P 500 Index | | | 2,200.00 USD | | | | 4/9/20 | | | | 4 | | | | 400 | | | | 6,752 | | | | 6,752 | | | | — | |
S&P 500 Index | | | 2,675.00 USD | | | | 4/9/20 | | | | 2 | | | | 200 | | | | 27,340 | | | | 24,891 | | | | 2,449 | |
S&P 500 Index | | | 2,200.00 USD | | | | 4/13/20 | | | | 4 | | | | 400 | | | | 7,000 | | | | 7,834 | | | | (834 | ) |
S&P 500 Index | | | 2,675.00 USD | | | | 4/13/20 | | | | 2 | | | | 200 | | | | 28,430 | | | | 25,827 | | | | 2,603 | |
S&P 500 Index | | | 2,200.00 USD | | | | 4/15/20 | | | | 4 | | | | 400 | | | | 8,940 | | | | 9,694 | | | | (754 | ) |
S&P 500 Index | | | 2,675.00 USD | | | | 4/15/20 | | | | 2 | | | | 200 | | | | 29,960 | | | | 27,828 | | | | 2,132 | |
S&P 500 Index | | | 2,910.00 USD | | | | 4/17/20 | | | | 1 | | | | 100 | | | | 34,390 | | | | 10,742 | | | | 23,648 | |
S&P 500 Index | | | 2,920.00 USD | | | | 4/17/20 | | | | 1 | | | | 100 | | | | 35,355 | | | | 5,942 | | | | 29,413 | |
S&P 500 Index | | | 2,950.00 USD | | | | 4/17/20 | | | | 1 | | | | 100 | | | | 38,290 | | | | 8,540 | | | | 29,750 | |
S&P 500 Mini Index | | | 1,000.00 USD | | | | 4/3/20 | | | | 7 | | | | 700 | | | | 18 | | | | 218 | | | | (200 | ) |
S&P 500 Mini Index | | | 1,100.00 USD | | | | 4/3/20 | | | | 42 | | | | 4,200 | | | | 105 | | | | 2,986 | | | | (2,881 | ) |
| | | | | | | | | | | | | | | | | | | | |
| Total put options | | | | | | | | | | | $ | 757,126 | | | $ | 733,205 | | | $ | 23,921 | |
| | | | | | | | | | | | | | | | | | | | |
| Total options purchased contracts | | | | | | | | | | | $ | 1,860,581 | | | $ | 2,568,485 | | | $ | (707,904 | ) |
| | | | | | | | | | | | | | | | | | | | |
| | | | | | | | | | | | | | | | | | | | | | | | | | | | |
| | | |
| Options written contracts outstanding at March 31, 2020: | | | | | | | | | | |
| Description | | Exercise
Price | | | Expiration
Date | | | Number of
Contracts | | | Notional
Amount | | | Market
Value | | | Premiums
Received | | | Unrealized
Appreciation
(Depreciation) | |
Call options: | | | | | | | | | | | | | | | | | | | | | | | | | | | | |
CBOE Volatility Index | | | 67.50 USD | | | | 4/15/20 | | | | (498 | ) | | | $(49,800 | ) | | | $(123,255 | ) | | | $(215,384 | ) | | | $92,129 | |
CBOE Volatility Index | | | 67.50 USD | | | | 4/22/20 | | | | (102 | ) | | | (10,200 | ) | | | (43,758 | ) | | | (53,458 | ) | | | 9,700 | |
E-mini S&P 500 Index | | | 350.00 USD | | | | 4/3/20 | | | | (138 | ) | | | (13,800 | ) | | | (966 | ) | | | (11,303 | ) | | | 10,337 | |
E-mini S&P 500 Index | | | 342.00 USD | | | | 4/6/20 | | | | (50 | ) | | | (5,000 | ) | | | (225 | ) | | | (3,395 | ) | | | 3,170 | |
E-mini S&P 500 Index | | | 350.00 USD | | | | 4/6/20 | | | | (24 | ) | | | (2,400 | ) | | | (108 | ) | | | (1,510 | ) | | | 1,402 | |
E-mini S&P 500 Index | | | 351.00 USD | | | | 4/9/20 | | | | (81 | ) | | | (8,100 | ) | | | (365 | ) | | | (3,557 | ) | | | 3,192 | |
E-mini S&P 500 Index | | | 354.00 USD | | | | 4/9/20 | | | | (41 | ) | | | (4,100 | ) | | | (184 | ) | | | (1,185 | ) | | | 1,001 | |
E-mini S&P 500 Index | | | 352.00 USD | | | | 4/17/20 | | | | (24 | ) | | | (2,400 | ) | | | (120 | ) | | | (1,870 | ) | | | 1,750 | |
E-mini S&P 500 Index | | | 356.00 USD | | | | 4/17/20 | | | | (27 | ) | | | (2,700 | ) | | | (135 | ) | | | (1,293 | ) | | | 1,158 | |
E-mini S&P 500 Index | | | 358.00 USD | | | | 4/17/20 | | | | (30 | ) | | | (3,000 | ) | | | (150 | ) | | | (987 | ) | | | 837 | |
E-mini S&P 500 Index | | | 346.00 USD | | | | 4/24/20 | | | | (22 | ) | | | (2,200 | ) | | | (132 | ) | | | (1,560 | ) | | | 1,428 | |
E-mini S&P 500 Index | | | 353.00 USD | | | | 4/24/20 | | | | (24 | ) | | | (2,400 | ) | | | (132 | ) | | | (1,414 | ) | | | 1,282 | |
E-mini S&P 500 Index | | | 358.00 USD | | | | 5/15/20 | | | | (27 | ) | | | (2,700 | ) | | | (175 | ) | | | (2,454 | ) | | | 2,279 | |
Nasdaq 100 Stock Index | | | 8,800.00 USD | | | | 5/15/20 | | | | (4 | ) | | | (400 | ) | | | (25,700 | ) | | | (42,042 | ) | | | 16,342 | |
Nasdaq 100 Stock Index | | | 8,850.00 USD | | | | 5/15/20 | | | | (2 | ) | | | (200 | ) | | | (11,270 | ) | | | (23,470 | ) | | | 12,200 | |
Nasdaq 100 Stock Index | | | 9,350.00 USD | | | | 5/15/20 | | | | (3 | ) | | | (300 | ) | | | (4,260 | ) | | | (22,306 | ) | | | 18,046 | |
Nasdaq 100 Stock Index | | | 10,050.00 USD | | | | 5/15/20 | | | | (2 | ) | | | (200 | ) | | | (1,219 | ) | | | (4,135 | ) | | | 2,916 | |
Nasdaq 100 Stock Index | | | 8,875.00 USD | | | | 6/19/20 | | | | (6 | ) | | | (600 | ) | | | (60,300 | ) | | | (94,069 | ) | | | 33,769 | |
Russell 2000 Index | | | 1,630.00 USD | | | | 4/3/20 | | | | (6 | ) | | | (600 | ) | | | (210 | ) | | | (2,567 | ) | | | 2,357 | |
Russell 2000 Index | | | 1,790.00 USD | | | | 4/3/20 | | | | (13 | ) | | | (1,300 | ) | | | (455 | ) | | | (2,703 | ) | | | 2,248 | |
Russell 2000 Index | | | 1,500.00 USD | | | | 4/17/20 | | | | (17 | ) | | | (1,700 | ) | | | (118 | ) | | | (11,027 | ) | | | 10,909 | |
Russell 2000 Index | | | 1,660.00 USD | | | | 5/29/20 | | | | (19 | ) | | | (1,900 | ) | | | (2,258 | ) | | | (10,708 | ) | | | 8,450 | |
Russell 2000 Index | | | 1,730.00 USD | | | | 6/19/20 | | | | (12 | ) | | | (1,200 | ) | | | (1,034 | ) | | | (5,375 | ) | | | 4,341 | |
Russell 2000 Index | | | 1,580.00 USD | | | | 6/30/20 | | | | (15 | ) | | | (1,500 | ) | | | (2,325 | ) | | | (6,584 | ) | | | 4,259 | |
Russell 2000 Index | | | 1,770.00 USD | | | | 9/18/20 | | | | (4 | ) | | | (400 | ) | | | (470 | ) | | | (1,914 | ) | | | 1,444 | |
S&P 500 Index | | | 2,725.00 USD | | | | 4/8/20 | | | | (6 | ) | | | (600 | ) | | | (8,070 | ) | | | (14,406 | ) | | | 6,336 | |
S&P 500 Index | | | 2,780.00 USD | | | | 4/8/20 | | | | (9 | ) | | | (900 | ) | | | (4,500 | ) | | | (5,211 | ) | | | 711 | |
S&P 500 Index | | | 2,725.00 USD | | | | 4/9/20 | | | | (6 | ) | | | (600 | ) | | | (9,660 | ) | | | (16,065 | ) | | | 6,405 | |
S&P 500 Index | | | 2,725.00 USD | | | | 4/13/20 | | | | (6 | ) | | | (600 | ) | | | (12,000 | ) | | | (20,099 | ) | | | 8,099 | |
S&P 500 Index | | | 2,725.00 USD | | | | 4/15/20 | | | | (6 | ) | | | (600 | ) | | | (15,300 | ) | | | (23,276 | ) | | | 7,976 | |
S&P 500 Index | | | 3,060.00 USD | | | | 4/17/20 | | | | (1 | ) | | | (100 | ) | | | (92 | ) | | | (10,787 | ) | | | 10,695 | |
S&P 500 Index | | | 3,090.00 USD | | | | 4/17/20 | | | | (1 | ) | | | (100 | ) | | | (75 | ) | | | (11,718 | ) | | | 11,643 | |
S&P 500 Index | | | 3,100.00 USD | | | | 4/17/20 | | | | (1 | ) | | | (100 | ) | | | (60 | ) | | | (9,952 | ) | | | 9,892 | |
S&P 500 Mini Index | | | 343.00 USD | | | | 4/1/20 | | | | (27 | ) | | | (2,700 | ) | | | — | | | | (2,130 | ) | | | 2,130 | |
| | | | | | |
| 176 | | Semiannual Report | | | March 31, 2020 | | | See accompanying Notes to Financial Statements |
Schedule of Investments
March 31, 2020 (unaudited)
| | | | | | | | | | | | | | | | | | | | | | | | | | | | |
| | | |
| Options written contracts outstanding at March 31, 2020 (continued): | | | | | | | | | | |
| Description | | Exercise
Price | | | Expiration
Date | | | Number of
Contracts | | | Notional
Amount | | | Market
Value | | | Premiums
Received | | | Unrealized
Appreciation
(Depreciation) | |
Call options (continued): | | | | | | | | | | | | | | | | | | | | | | | | | | | | |
S&P 500 Mini Index | | | 354.00 USD | | | | 4/1/20 | | | | (135 | ) | | $ | (13,500 | ) | | $ | — | | | $ | (2,552 | ) | | $ | 2,552 | |
S&P 500 Mini Index | | | 318.00 USD | | | | 4/3/20 | | | | (23 | ) | | | (2,300 | ) | | | (161 | ) | | | (5,996 | ) | | | 5,835 | |
S&P 500 Mini Index | | | 2,800.00 USD | | | | 4/3/20 | | | | (21 | ) | | | (2,100 | ) | | | (1,733 | ) | | | (80,880 | ) | | | 79,147 | |
S&P 500 Mini Index | | | 2,825.00 USD | | | | 4/3/20 | | | | (15 | ) | | | (1,500 | ) | | | (788 | ) | | | (44,634 | ) | | | 43,846 | |
S&P 500 Mini Index | | | 315.00 USD | | | | 4/6/20 | | | | (24 | ) | | | (2,400 | ) | | | (108 | ) | | | (10,560 | ) | | | 10,452 | |
S&P 500 Mini Index | | | 326.00 USD | | | | 4/6/20 | | | | (30 | ) | | | (3,000 | ) | | | (135 | ) | | | (3,450 | ) | | | 3,315 | |
S&P 500 Mini Index | | | 351.00 USD | | | | 4/6/20 | | | | (30 | ) | | | (3,000 | ) | | | — | | | | (1,617 | ) | | | 1,617 | |
S&P 500 Mini Index | | | 336.00 USD | | | | 4/8/20 | | | | (47 | ) | | | (4,700 | ) | | | — | | | | (2,726 | ) | | | 2,726 | |
S&P 500 Mini Index | | | 348.00 USD | | | | 4/8/20 | | | | (24 | ) | | | (2,400 | ) | | | — | | | | (1,534 | ) | | | 1,534 | |
S&P 500 Mini Index | | | 351.00 USD | | | | 4/8/20 | | | | (57 | ) | | | (5,700 | ) | | | — | | | | (3,358 | ) | | | 3,358 | |
S&P 500 Mini Index | | | 355.00 USD | | | | 4/8/20 | | | | (68 | ) | | | (6,800 | ) | | | — | | | | (3,734 | ) | | | 3,734 | |
S&P 500 Mini Index | | | 344.00 USD | | | | 4/13/20 | | | | (40 | ) | | | (4,000 | ) | | | (1 | ) | | | (2,436 | ) | | | 2,435 | |
S&P 500 Mini Index | | | 350.00 USD | | | | 4/13/20 | | | | (24 | ) | | | (2,400 | ) | | | (108 | ) | | | (912 | ) | | | 804 | |
S&P 500 Mini Index | | | 353.00 USD | | | | 4/13/20 | | | | (12 | ) | | | (1,200 | ) | | | — | | | | (587 | ) | | | 587 | |
S&P 500 Mini Index | | | 354.00 USD | | | | 4/13/20 | | | | (57 | ) | | | (5,700 | ) | | | (1 | ) | | | (3,472 | ) | | | 3,471 | |
S&P 500 Mini Index | | | 338.00 USD | | | | 4/15/20 | | | | (40 | ) | | | (4,000 | ) | | | (1 | ) | | | (2,760 | ) | | | 2,759 | |
S&P 500 Mini Index | | | 354.00 USD | | | | 4/15/20 | | | | (27 | ) | | | (2,700 | ) | | | — | | | | (1,617 | ) | | | 1,617 | |
S&P 500 Mini Index | | | 355.00 USD | | | | 4/15/20 | | | | (40 | ) | | | (4,000 | ) | | | — | | | | (1,756 | ) | | | 1,756 | |
S&P 500 Mini Index | | | 356.00 USD | | | | 4/15/20 | | | | (30 | ) | | | (3,000 | ) | | | — | | | | (1,467 | ) | | | 1,467 | |
S&P 500 Mini Index | | | 2,660.00 USD | | | | 4/17/20 | | | | (14 | ) | | | (1,400 | ) | | | (77,560 | ) | | | (91,991 | ) | | | 14,431 | |
S&P 500 Mini Index | | | 357.00 USD | | | | 4/20/20 | | | | (24 | ) | | | (2,400 | ) | | | (1 | ) | | | (1,009 | ) | | | 1,008 | |
S&P 500 Mini Index | | | 360.00 USD | | | | 4/20/20 | | | | (57 | ) | | | (5,700 | ) | | | (1 | ) | | | (1,933 | ) | | | 1,932 | |
S&P 500 Mini Index | | | 353.00 USD | | | | 4/22/20 | | | | (24 | ) | | | (2,400 | ) | | | (3 | ) | | | (1,774 | ) | | | 1,771 | |
S&P 500 Mini Index | | | 354.00 USD | | | | 4/22/20 | | | | (27 | ) | | | (2,700 | ) | | | (3 | ) | | | (1,591 | ) | | | 1,588 | |
S&P 500 Mini Index | | | 356.00 USD | | | | 4/22/20 | | | | (30 | ) | | | (3,000 | ) | | | (3 | ) | | | (1,018 | ) | | | 1,015 | |
S&P 500 Mini Index | | | 340.00 USD | | | | 4/27/20 | | | | (30 | ) | | | (3,000 | ) | | | (32 | ) | | | (2,370 | ) | | | 2,338 | |
S&P 500 Mini Index | | | 354.00 USD | | | | 4/27/20 | | | | (27 | ) | | | (2,700 | ) | | | (9 | ) | | | (2,373 | ) | | | 2,364 | |
S&P 500 Mini Index | | | 347.00 USD | | | | 4/29/20 | | | | (24 | ) | | | (2,400 | ) | | | (9 | ) | | | (2,878 | ) | | | 2,869 | |
S&P 500 Mini Index | | | 358.00 USD | | | | 4/29/20 | | | | (32 | ) | | | (3,200 | ) | | | (4 | ) | | | (1,565 | ) | | | 1,561 | |
S&P 500 Mini Index | | | 346.00 USD | | | | 5/1/20 | | | | (9 | ) | | | (900 | ) | | | (9 | ) | | | (530 | ) | | | 521 | |
S&P 500 Mini Index | | | 353.00 USD | | | | 5/1/20 | | | | (27 | ) | | | (2,700 | ) | | | (17 | ) | | | (2,160 | ) | | | 2,143 | |
S&P 500 Mini Index | | | 346.00 USD | | | | 5/4/20 | | | | (27 | ) | | | (2,700 | ) | | | (7 | ) | | | (3,186 | ) | | | 3,179 | |
S&P 500 Mini Index | | | 357.00 USD | | | | 5/4/20 | | | | (54 | ) | | | (5,400 | ) | | | (6 | ) | | | (2,641 | ) | | | 2,635 | |
S&P 500 Mini Index | | | 353.00 USD | | | | 5/6/20 | | | | (24 | ) | | | (2,400 | ) | | | (5 | ) | | | (2,254 | ) | | | 2,249 | |
S&P 500 Mini Index | | | 354.00 USD | | | | 5/8/20 | | | | (27 | ) | | | (2,700 | ) | | | (7 | ) | | | (2,266 | ) | | | 2,259 | |
S&P 500 Mini Index | | | 354.00 USD | | | | 5/11/20 | | | | (27 | ) | | | (2,700 | ) | | | (3 | ) | | | (1,996 | ) | | | 1,993 | |
S&P 500 Mini Index | | | 358.00 USD | | | | 5/13/20 | | | | (27 | ) | | | (2,700 | ) | | | (12 | ) | | | (2,130 | ) | | | 2,118 | |
S&P 500 Mini Index | | | 2,650.00 USD | | | | 5/15/20 | | | | (6 | ) | | | (600 | ) | | | (66,240 | ) | | | (67,577 | ) | | | 1,337 | |
S&P 500 Mini Index | | | 2,770.00 USD | | | | 5/15/20 | | | | (6 | ) | | | (600 | ) | | | (33,210 | ) | | | (41,762 | ) | | | 8,552 | |
S&P 500 Mini Index | | | 2,800.00 USD | | | | 5/15/20 | | | | (4 | ) | | | (400 | ) | | | (18,200 | ) | | | (25,088 | ) | | | 6,888 | |
S&P 500 Mini Index | | | 3,000.00 USD | | | | 5/15/20 | | | | (11 | ) | | | (1,100 | ) | | | (7,315 | ) | | | (48,112 | ) | | | 40,797 | |
S&P 500 Mini Index | | | 3,050.00 USD | | | | 5/15/20 | | | | (8 | ) | | | (800 | ) | | | (3,320 | ) | | | (24,284 | ) | | | 20,964 | |
S&P 500 Mini Index | | | 360.00 USD | | | | 5/18/20 | | | | (27 | ) | | | (2,700 | ) | | | (36 | ) | | | (1,833 | ) | | | 1,797 | |
S&P 500 Mini Index | | | 363.00 USD | | | | 5/20/20 | | | | (27 | ) | | | (2,700 | ) | | | (30 | ) | | | (1,051 | ) | | | 1,021 | |
S&P 500 Mini Index | | | 358.00 USD | | | | 5/22/20 | | | | (27 | ) | | | (2,700 | ) | | | (3 | ) | | | (2,049 | ) | | | 2,046 | |
S&P 500 Mini Index | | | 2,825.00 USD | | | | 6/19/20 | | | | (10 | ) | | | (1,000 | ) | | | (60,000 | ) | | | (66,725 | ) | | | 6,725 | |
S&P 500 Mini Index | | | 2,830.00 USD | | | | 6/19/20 | | | | (8 | ) | | | (800 | ) | | | (47,080 | ) | | | (63,595 | ) | | | 16,515 | |
S&P 500 Mini Index | | | 2,890.00 USD | | | | 6/19/20 | | | | (22 | ) | | | (2,200 | ) | | | (85,470 | ) | | | (119,767 | ) | | | 34,297 | |
S&P 500 Mini Index | | | 2,900.00 USD | | | | 6/19/20 | | | | (21 | ) | | | (2,100 | ) | | | (75,705 | ) | | | (86,571 | ) | | | 10,866 | |
S&P 500 Mini Index | | | 2,950.00 USD | | | | 6/19/20 | | | | (18 | ) | | | (1,800 | ) | | | (43,560 | ) | | | (57,896 | ) | | | 14,336 | |
| | | | | | | | | | | | | | | | | | | | |
| Total call options | | | | | | | | | | | | $(849,977 | ) | | | $(1,547,937 | ) | | | $697,960 | |
| | | | | | | | | | | | | | | | | | | | |
Put options: | | | | | | | | | | | | | | | | | | | | | | | | | | | | |
CBOE Volatility Index | | | 19.00 USD | | | | 4/3/20 | | | | (14 | ) | | | $(1,400 | ) | | | $(7 | ) | | | $(923 | ) | | | $916 | |
CBOE Volatility Index | | | 30.00 USD | | | | 4/3/20 | | | | (132 | ) | | | (13,200 | ) | | | (198 | ) | | | (18,130 | ) | | | 17,932 | |
CBOE Volatility Index | | | 19.50 USD | | | | 4/9/20 | | | | (109 | ) | | | (10,900 | ) | | | (163 | ) | | | (4,349 | ) | | | 4,186 | |
CBOE Volatility Index | | | 19.00 USD | | | | 4/17/20 | | | | (85 | ) | | | (8,500 | ) | | | (212 | ) | | | (3,731 | ) | | | 3,519 | |
CBOE Volatility Index | | | 28.00 USD | | | | 4/17/20 | | | | (132 | ) | | | (13,200 | ) | | | (2,706 | ) | | | (16,650 | ) | | | 13,944 | |
CBOE Volatility Index | | | 37.50 USD | | | | 4/15/20 | | | | (354 | ) | | | (35,400 | ) | | | (86,730 | ) | | | (80,851 | ) | | | (5,879 | ) |
| | | | | | | | |
| See accompanying Notes to Financial Statements | | | March 31, 2020 | | | Semiannual Report | | | 177 | |
Schedule of Investments
March 31, 2020 (unaudited)
| | | | | | | | | | | | | | | | | | | | | | | | | | | | |
| | | |
| Options written contracts outstanding at March 31, 2020 (continued): | | | | | | | | | | |
| Description | | Exercise
Price | | | Expiration
Date | | | Number of
Contracts | | | Notional
Amount | | | Market
Value | | | Premiums
Received | | | Unrealized
Appreciation
(Depreciation) | |
Put options (continued): | | | | | | | | | | | | | | | | | | | | | | | | | | | | |
CBOE Volatility Index | | | 40.00 USD | | | | 4/15/20 | | | | (144 | ) | | $ | (14,400 | ) | | $ | (49,680 | ) | | $ | (47,272 | ) | | $ | (2,408 | ) |
CBOE Volatility Index | | | 45.00 USD | | | | 4/15/20 | | | | (396 | ) | | | (39,600 | ) | | | (237,600 | ) | | | (219,473 | ) | | | (18,127 | ) |
CBOE Volatility Index | | | 42.50 USD | | | | 4/22/20 | | | | (102 | ) | | | (10,200 | ) | | | (49,215 | ) | | | (57,859 | ) | | | 8,644 | |
CBOE Volatility Index | | | 29.00 USD | | | | 5/20/20 | | | | (249 | ) | | | (24,900 | ) | | | (54,780 | ) | | | (35,284 | ) | | | (19,496 | ) |
iPath S&P 500 VIX Short-Term | | | 20.00 USD | | | | 4/17/20 | | | | (141 | ) | | | (14,100 | ) | | | (353 | ) | | | (21,281 | ) | | | 20,928 | |
S&P 500 Index | | | 2,400.00 USD | | | | 4/8/20 | | | | (6 | ) | | | (600 | ) | | | (19,890 | ) | | | (20,128 | ) | | | 238 | |
S&P 500 Index | | | 2,400.00 USD | | | | 4/9/20 | | | | (6 | ) | | | (600 | ) | | | (22,620 | ) | | | (22,302 | ) | | | (318 | ) |
S&P 500 Index | | | 2,400.00 USD | | | | 4/13/20 | | | | (6 | ) | | | (600 | ) | | | (25,950 | ) | | | (25,212 | ) | | | (738 | ) |
S&P 500 Index | | | 2,400.00 USD | | | | 4/15/20 | | | | (6 | ) | | | (600 | ) | | | (30,510 | ) | | | (29,747 | ) | | | (763 | ) |
S&P 500 Index | | | 3,060.00 USD | | | | 4/17/20 | | | | (1 | ) | | | (100 | ) | | | (49,190 | ) | | | (15,818 | ) | | | (33,372 | ) |
S&P 500 Index | | | 3,090.00 USD | | | | 4/17/20 | | | | (1 | ) | | | (100 | ) | | | (52,170 | ) | | | (10,248 | ) | | | (41,922 | ) |
S&P 500 Index | | | 3,100.00 USD | | | | 4/17/20 | | | | (1 | ) | | | (100 | ) | | | (53,160 | ) | | | (13,363 | ) | | | (39,797 | ) |
| | | | | | | | | | | | | | | | | | | | |
| Total put options | | | | | | | | | | | | $(735,134 | ) | | | $(642,621 | ) | | | $(92,513 | ) |
| | | | | | | | | | | | | | | | | | | | |
| Total options written contracts | | | | | | | | | | | | $(1,585,111 | ) | | | $(2,190,558 | ) | | | $605,447 | |
| | | | | | | | | | | | | | | | | | | | |
(e) At March 31, 2020, the Fund pledged $933,735 in cash as collateral for options written.
Glossary:
CBOE—Chicago Board Options Exchange
VIX—Volatility Index
| | | | | | |
| 178 | | Semiannual Report | | | March 31, 2020 | | | See accompanying Notes to Financial Statements |
Schedule of Investments
March 31, 2020 (unaudited)
AllianzGI PerformanceFee Structured US Fixed Income Fund
| | | | | | | | |
| | | Shares | | | Value | |
| |
| Exchange-Traded Funds—98.9% | | | | | |
iShares Core U.S. Aggregate Bond (a)
(cost—$8,175,025) | | | 74,906 | | | | $8,641,905 | |
| | | | | | | | |
| |
Total Options Purchased —0.0%
(cost—$734) (b)(c)(d) | | | | 195 | |
| | | | | | | | |
| |
Total Investments, before options written
(cost—$8,175,759)—98.9% | | | | 8,642,100 | |
| | | | | | | | |
| | | | | | |
| | | | | Value | |
Total Options Written —(0.1)%
(premiums received—$52,593) (b)(c)(d) | | $ | (6,082 | ) |
| | | | | | |
| |
Total Investments, net of options written
(cost—$8,123,166)—98.8% | | | 8,636,018 | |
| | | | | | |
| |
Other assets less other
liabilities—1.2% | | | 103,256 | |
| | | | | | |
| |
| Net Assets—100.0% | | | $8,739,274 | |
| | | | | | |
Notes to Schedule of Investments:
(a) All or partial amount segregated for the benefit of the counterparty as collateral for options written.
(b)Non-income producing.
(c) Exchange traded-Chicago Board Options Exchange.
(d) Exchange traded option contracts outstanding at March 31, 2020:
| | | | | | | | | | | | | | | | | | | | | | | | | | | | |
|
| Options purchased contracts outstanding at March 31, 2020: | |
| Description | | Exercise
Price | | | Expiration
Date | | | Number of
Contracts | | | Notional
Amount | | | Market
Value | | | Cost | | | Unrealized
(Depreciation) | |
| | | | | | | |
Call options: | | | | | | | | | | | | | | | | | | | | | | | | | | | | |
S&P 500 Index | | | 3,700.00 USD | | | | 4/3/20 | | | | 6 | | | $ | 600 | | | $ | 60 | | | $ | 160 | | | $ | (100 | ) |
S&P 500 Index | | | 3,700.00 USD | | | | 4/9/20 | | | | 6 | | | | 600 | | | | 75 | | | | 194 | | | | (119 | ) |
S&P 500 Mini Index | | | 3,700.00 USD | | | | 4/17/20 | | | | 5 | | | | 500 | | | | 50 | | | | 229 | | | | (179 | ) |
| | | | | | | | | | | | | | | | | | | | |
| Total call options | | | | | | | | | | | $ | 185 | | | $ | 583 | | | $ | (398 | ) |
| | | | | | | | | | | | | | | | | | | | |
Put options: | | | | | | | | | | | | | | | | | | | | | | | | | | | | |
S&P 500 Index | | | 1,600.00 USD | | | | 4/3/20 | | | | 2 | | | $ | 200 | | | $ | 10 | | | $ | 151 | | | $ | (141 | ) |
| | | | | | | | | | | | | | | | | | | | |
| Total options purchased contracts | | | | | | | | | | | $ | 195 | | | $ | 734 | | | $ | (539 | ) |
| | | | | | | | | | | | | | | | | | | | |
| | | | | | | | | | | | | | | | | | | | | | | | | | | | |
|
| Options written contracts outstanding at March 31, 2020: | |
| Description | | Exercise
Price | | | Expiration
Date | | | Number of
Contracts | | | Notional
Amount | | | Market
Value | | | Premiums
Received | | | Unrealized
Appreciation | |
| | | | | | | |
Call options: | | | | | | | | | | | | | | | | | | | | | | | | | | | | |
S&P 500 Mini Index | | | 3,290.00 USD | | | | 4/3/20 | | | | (1 | ) | | $ | (100 | ) | | $ | (12 | ) | | $ | (949 | ) | | $ | 937 | |
S&P 500 Mini Index | | | 3,310.00 USD | | | | 4/9/20 | | | | (1 | ) | | | (100 | ) | | | (15 | ) | | | (1,009 | ) | | | 994 | |
S&P 500 Mini Index | | | 3,300.00 USD | | | | 4/17/20 | | | | (5 | ) | | | (500 | ) | | | (112 | ) | | | (5,118 | ) | | | 5,006 | |
S&P 500 Mini Index | | | 3,335.00 USD | | | | 4/17/20 | | | | (1 | ) | | | (100 | ) | | | (20 | ) | | | (1,059 | ) | | | 1,039 | |
S&P 500 Mini Index | | | 3,150.00 USD | | | | 5/29/20 | | | | (1 | ) | | | (100 | ) | | | (290 | ) | | | (3,474 | ) | | | 3,184 | |
S&P 500 Mini Index | | | 3,200.00 USD | | | | 6/30/20 | | | | (1 | ) | | | (100 | ) | | | (363 | ) | | | (3,475 | ) | | | 3,112 | |
| | | | | | | | | | | | | | | | | | | | |
| Total call options | | | | | | | | | | | $ | (812 | ) | | $ | (15,084 | ) | | $ | 14,272 | |
| | | | | | | | | | | | | | | | | | | | |
| | | | | | | |
Put options: | | | | | | | | | | | | | | | | | | | | | | | | | | | | |
CBOE Volatility Index | | | 19.00 USD | | | | 4/15/20 | | | | (120 | ) | | $ | (12,000 | ) | | $ | (300 | ) | | $ | (13,111 | ) | | $ | 12,811 | |
CBOE Volatility Index | | | 20.00 USD | | | | 4/15/20 | | | | (70 | ) | | | (7,000 | ) | | | (175 | ) | | | (10,454 | ) | | | 10,279 | |
CBOE Volatility Index | | | 21.00 USD | | | | 4/15/20 | | | | (20 | ) | | | (2,000 | ) | | | (100 | ) | | | (1,698 | ) | | | 1,598 | |
CBOE Volatility Index | | | 26.00 USD | | | | 4/15/20 | | | | (15 | ) | | | (1,500 | ) | | | (262 | ) | | | (1,513 | ) | | | 1,251 | |
CBOE Volatility Index | | | 27.00 USD | | | | 4/15/20 | | | | (15 | ) | | | (1,500 | ) | | | (337 | ) | | | (1,890 | ) | | | 1,553 | |
CBOE Volatility Index | | | 28.00 USD | | | | 4/15/20 | | | | (12 | ) | | | (1,200 | ) | | | (330 | ) | | | (1,655 | ) | | | 1,325 | |
CBOE Volatility Index | | | 24.00 USD | | | | 5/20/20 | | | | (27 | ) | | | (2,700 | ) | | | (2,228 | ) | | | (4,129 | ) | | | 1,901 | |
CBOE Volatility Index | | | 25.00 USD | | | | 5/20/20 | | | | (15 | ) | | | (1,500 | ) | | | (1,538 | ) | | | (3,059 | ) | | | 1,521 | |
| | | | | | | | | | | | | | | | | | | | |
| Total put options | | | | | | | | | | | $ | (5,270 | ) | | $ | (37,509 | ) | | $ | 32,239 | |
| | | | | | | | | | | | | | | | | | | | |
| Total options written contracts | | | | | | | | | | | $ | (6,082 | ) | | $ | (52,593 | ) | | $ | 46,511 | |
| | | | | | | | | | | | | | | | | | | | |
(e) At March 31, 2020, the Fund received $929,565 in cash as collateral for options written.
Glossary:
CBOE—Chicago Board Options Exchange
| | | | | | | | |
| See accompanying Notes to Financial Statements | | | March 31, 2020 | | | Semiannual Report | | | 179 | |
Schedule of Investments
March 31, 2020 (unaudited)
AllianzGI Preferred Securities and Income Fund
| | | | | | | | |
| | | Principal
Amount
(000s) | | | Value | |
|
| Corporate Bonds & Notes—72.7% | |
| |
| Banks—35.6% | | | | | |
Bank of America Corp., (converts to FRN on 10/22/29) (d),
2.884%, 10/22/30 | | | $210 | | | | $210,342 | |
BNP Paribas S.A., USD 5 Year Swap Rate + 6.314% (a)(b)(c)(d),
7.625%, 3/30/21 | | | 200 | | | | 196,000 | |
Citigroup, Inc., (converts to FRN on 1/30/25) (c)(d),
4.70%, 1/30/25 | | | 410 | | | | 356,700 | |
Citizens Financial Group, Inc., Ser. B, (converts to FRN on 7/6/23) (c)(d),
6.00%, 7/6/23 | | | 610 | | | | 518,924 | |
Credit Suisse Group AG (a)(b)(d),
4.194%, 4/1/31 (converts to FRN on 4/1/30) | | | 350 | | | | 356,850 | |
| 6.375%, 8/21/26 (converts to FRN on 8/1/26) (c) | | | 620 | | | | 544,692 | |
Fifth Third Bancorp, (converts to FRN on 6/30/23) (c)(d),
5.10%, 6/30/23 | | | 340 | | | | 275,636 | |
First Maryland Capital II, 3 mo. LIBOR + 0.850% (d),
2.613%, 2/1/27 | | | 828 | | | | 800,055 | |
Huntington Bancshares, Inc., Ser. E, (converts to FRN on 4/15/23) (c)(d),
5.70%, 4/15/23 | | | 560 | | | | 448,274 | |
JPMorgan Chase & Co. (d),
3 mo. LIBOR + 0.950%, 2.713%, 2/2/37 | | | 797 | | | | 551,923 | |
| 4.493%, 3/24/31 (converts to FRN on 3/24/30) | | | 85 | | | | 97,876 | |
KeyCorp,
2.55%, 10/1/29 | | | 745 | | | | 666,719 | |
Lloyds Banking Group PLC, (converts to FRN on 9/27/25) (c)(d),
7.50%, 9/27/25 | | | 425 | | | | 382,285 | |
NTC Capital II, 3 mo. LIBOR + 0.590%, Ser. B (d),
2.421%, 4/15/27 | | | 230 | | | | 186,990 | |
State Street Corp., 3 mo. LIBOR + 1.000% (d),
1.741%, 6/15/47 | | | 270 | | | | 209,925 | |
| Truist Financial Corp. (c)(d), 4.80%, 9/1/24, Ser. N (converts to FRN on 9/1/24) | | | 535 | | | | 460,472 | |
| 5.125%, 12/15/27, Ser. M (converts to FRN on 12/15/27) | | | 335 | | | | 285,023 | |
| | | | | | | | |
| | | | | | | 6,548,686 | |
| | | | | | | | |
|
| Diversified Financial Services—3.2% | |
Discover Financial Services, Ser. C, (converts to FRN on 10/30/27) (c)(d),
5.50%, 10/30/27 | | | 730 | | | | 584,595 | |
| | | | | | | | |
| |
| Electric Utilities—2.8% | | | | | |
Emera, Inc., Ser.16-A, (converts to FRN on 6/15/26) (d),
6.75%, 6/15/76 | | | 550 | | | | 510,125 | |
| | | | | | | | |
| | | | | | | | |
| | | Principal
Amount
(000s) | | | Value | |
| |
| Insurance—17.8% | | | | | |
Allstate Corp., (converts to FRN on 5/15/37) (d),
6.50%, 5/15/57 | | $ | 330 | | | $ | 362,093 | |
| American International Group, Inc. (d), 5.75%, 4/1/48, Ser.A-9 (converts to FRN on 4/1/28) | | | 360 | | | | 315,972 | |
| 8.175%, 5/15/58 (converts to FRN on 5/15/38) | | | 340 | | | | 354,882 | |
Hartford Financial Services Group, Inc., 3 mo. LIBOR + 2.125% (a)(b)(d),
3.817%, 2/12/47 | | | 800 | | | | 582,400 | |
Lincoln National Corp., 3 mo. LIBOR + 2.358% (d),
4.049%, 5/17/66 | | | 1,470 | | | | 883,837 | |
MetLife, Inc.,
9.25%, 4/8/38 (a)(b) | | | 215 | | | | 265,525 | |
| 10.75%, 8/1/39 | | | 375 | | | | 514,406 | |
| | | | | | | | |
| | | | | | | 3,279,115 | |
| | | | | | | | |
| |
| Media—2.1% | | | | | |
ViacomCBS, Inc., (converts to FRN on 2/28/27) (d),
6.25%, 2/28/57 | | | 440 | | | | 380,743 | |
| | | | | | | | |
|
| Miscellaneous Manufacturing—2.7% | |
General Electric Co., Ser. D, (converts to FRN on 1/21/21) (c)(d),
5.00%, 1/21/21 | | | 600 | | | | 498,611 | |
| | | | | | | | |
| |
| Pipelines—7.4% | | | | | |
Energy Transfer Operating L.P., (converts to FRN on 5/15/30) (c)(d),
7.125%, 5/15/30 | | | 1,501 | | | | 921,314 | |
Enterprise Products Operating LLC, Ser. E, (converts to FRN on 8/16/27) (d),
5.25%, 8/16/77 | | | 80 | | | | 55,827 | |
Plains All American Pipeline L.P., Ser. B, (converts to FRN on 11/15/22) (c)(d),
6.125%, 11/15/22 | | | 431 | | | | 216,252 | |
Transcanada Trust, (converts to FRN on 9/15/29) (d),
5.50%, 9/15/79 | | | 231 | | | | 180,402 | |
| | | | | | | | |
| | | | | | | 1,373,795 | |
| | | | | | | | |
| |
| Transportation—1.1% | | | | | |
BNSF Funding Trust I, (converts to FRN on 1/15/26) (d),
6.613%, 12/15/55 | | | 220 | | | | 206,360 | |
| | | | | | | | |
| Total Corporate Bonds & Notes (cost—$16,051,353) | | | | 13,382,030 | |
| | | | | | | | |
| | | | | | | | |
| | |
| | | Shares | | | | |
| |
| Preferred Stock—21.2% | | | | | |
| |
| Banks—12.0% | | | | | |
Bank of America Corp. (c),
6.20%, 1/29/21 | | | 415 | | | | 10,437 | |
Citigroup Capital XIII (d),
8.14%, 10/30/40 | | | 22,495 | | | | 575,872 | |
| JPMorgan Chase & Co. (c), | | | | | | | | |
6.10%, 9/1/20 | | | 3,900 | | | | 97,734 | |
6.15%, 9/1/20 | | | 600 | | | | 15,174 | |
PNC Financial Services Group, Inc. (c),
5.375%, 6/1/20 | | | 5,000 | | | | 121,500 | |
| | | | | | | | |
| | |
Shares | | | Value | |
Regions Financial Corp., Ser. C (c)(d),
5.70%, 5/15/29 | | | 17,918 | | | $ | 421,073 | |
| Wells Fargo & Co., | | | | | | | | |
4.75%, 3/15/25 (c) | | | 26,960 | | | | 566,160 | |
5.85%, 9/15/23, Ser. Q (d) | | | 16,350 | | | | 398,123 | |
| | | | | | | | |
| | | | | | | 2,206,073 | |
| | | | | | | | |
| |
| Capital Markets—1.6% | | | | | |
Northern Trust Corp., Ser. E (c),
4.70%, 1/1/25 | | | 11,900 | | | | 284,648 | |
| | | | | | | | |
| |
| Consumer Finance—2.7% | | | | | |
Capital One Financial Corp., Ser. I (c),
5.00%, 12/1/24 | | | 10,810 | | | | 216,741 | |
Synchrony Financial, Ser. A (c),
5.625%, 11/15/24 | | | 16,700 | | | | 284,902 | |
| | | | | | | | |
| | | | | | | 501,643 | |
| | | | | | | | |
| |
| Insurance—2.7% | | | | | |
Athene Holding Ltd., Ser. A (c)(d),
6.35%, 6/30/29 | | | 21,888 | | | | 497,295 | |
| | | | | | | | |
| |
| Telecommunications—2.2% | | | | | |
AT&T, Inc., Ser. C (c),
4.75%, 2/18/25 | | | 19,100 | | | | 404,920 | |
| | | | | | | | |
Total Preferred Stock
(cost—$4,457,436) | | | | 3,894,579 | |
| | | | | | | | |
| | |
| | | Principal
Amount
(000s) | | | | |
|
| Repurchase Agreements—8.6% | |
State Street Bank and Trust Co., dated 3/31/20, 0.00%, due 4/1/20, proceeds $1,590,000; collateralized by U.S. Treasury Inflation Indexed Notes, 0.625%, due 4/15/23, valued at $1,625,317 including accrued interest | |
(cost—$1,590,000) | | | $1,590 | | | | 1,590,000 | |
| | | | | | | | |
| |
Total Investments
(cost—$22,098,789)—102.5% | | | | 18,866,609 | |
| | | | | | | | |
| |
Liabilities in excess of
other assets (e)—(2.5)% | | | | (467,837 | ) |
| | | | | | | | |
| |
| Net Assets—100.0% | | | | $18,398,772 | |
| | | | | | | | |
| | | | | | |
| 180 | | Semiannual Report | | | March 31, 2020 | | | See accompanying Notes to Financial Statements |
Schedule of Investments
March 31, 2020 (unaudited)
Notes to Schedule of Investments:
(a) Private Placement—Restricted as to resale and may not have a readily available market. Securities with an aggregate value of $1,945,467, representing 10.6% of net assets.
(b) 144A—Exempt from registration under Rule 144A of the Securities Act of 1933. These securities may be resold in transactions exempt from registration, typically only to qualified institutional buyers. Securities with an aggregate value of $1,945,467, representing 10.6% of net assets.
(c) Perpetual maturity. The date shown, if any, is the next call date.
(d) Variable or Floating Rate Security—Securities with an interest rate that changes periodically. The interest rate disclosed reflects the rate in effect on March 31, 2020.
(e) Includes net unrealized appreciation (depreciation) of other financial instruments as follows:
| | | | | | | | | | | | | | | | | | | | | | |
|
| Futures contracts outstanding at March 31, 2020: | |
Type | | Contracts | | | Expiration
Date | | | Notional
Amount
(000s) | | | Market
Value
(000s) | | | Unrealized
Appreciation | |
Long position contracts: | |
| | 5-Year U.S. Treasury Note | | | 3 | | | | 6/30/20 | | | $ | 300 | | | $ | 376 | | | $ | 12,114 | |
| | | | | | | | | | | | | | | | | | | | | | |
| | | | | | | | | | | | | | | | | | | | | | | | | | | | | | | | |
|
Credit default swaps agreements outstanding at March 31, 2020: | |
Centrally cleared buy protection swap agreements: | | | | | | | | | | | | | | | | | | | | | |
Broker (Exchange)/
Reference Debt Issuer | | Notional
Amount
(000s)(1) | | | Implied
Credit
Spread | | | Termination
Date | | | Fixed Deal
Pay Rate | | | Payment
Frequency | | | Value(2) | | | Upfront
Premiums
Paid (Received) | | | Unrealized
Depreciation | |
Energy Transfer Operating, L.P. | | $ | 1,900 | | | | 3.583 | % | | | 12/20/24 | | | | (1.00 | )% | | | Quarterly | | | $ | 182,406 | | | $ | 211,560 | | | $ | (29,154 | ) |
Marathon Petroleum Corp. | | | 260 | | | | 1.662 | % | | | 12/20/24 | | | | (5.00 | )% | | | Quarterly | | | | (26,776 | ) | | | (16,142 | ) | | | (10,634 | ) |
Simon Property Group, L.P. | | | 210 | | | | 2.947 | % | | | 6/20/25 | | | | (1.00 | )% | | | Quarterly | | | | 15,242 | | | | 18,220 | | | | (2,978 | ) |
The Williams Companies, Inc. | | | 260 | | | | 1.749 | % | | | 12/20/24 | | | | (1.00 | )% | | | Quarterly | | | | 18,186 | | | | 29,791 | | | | (11,605 | ) |
| | | | | | | | | | | | | | | | | | | | | | | | |
| | | | | | | | | | | | | | | | | | | | | | $ | 189,058 | | | $ | 243,429 | | | $ | (54,371 | ) |
| | | | | | | | | | | | | | | | | | | | | | | | |
(1) This represents the maximum potential amount the Fund could be required to make available as a seller of credit protection or receive as a buyer of credit protection if a credit event occurs as defined under the terms of that particular swap agreement.
(2) The quoted market prices and resulting values for credit default swap agreements serve as an indicator of the status at March 31, 2020 of the payment/performance risk and represent the likelihood of an expected liability (or profit) for the credit derivative
should the notional amount of the swap agreement have been closed/sold as of the period end. Increasing market values, in absolute terms when compared to the notional amount of the swap, represent a deterioration of the referenced entity’s credit soundness and a greater likelihood or risk of default or other credit event occurring as defined under the terms of the agreement.
(f) At March 31, 2020, the Fund pledged $29,378 in cash as collateral for futures contracts and received $93,963 in cash as collateral for swap contracts.
Glossary:
FRN—Floating Rate Note
LIBOR—London Inter-Bank Offered Rate
| | | | | | | | |
| See accompanying Notes to Financial Statements | | | March 31, 2020 | | | Semiannual Report | | | 181 | |
Schedule of Investments
March 31, 2020 (unaudited)
AllianzGI Short Duration High Income Fund
| | | | | | | | |
| | | Principal
Amount
(000s) | | | Value | |
|
| Corporate Bonds & Notes—83.2% | |
| |
| Advertising—0.1% | | | | | |
Outfront Media Capital LLC, | |
5.625%, 2/15/24 | | | $825 | | | | $821,910 | |
| | | | | | | | |
| |
| Aerospace & Defense—0.2% | | | | | |
Triumph Group, Inc. (a)(c), | |
6.25%, 9/15/24 | | | 1,550 | | | | 1,391,226 | |
| | | | | | | | |
| |
| Auto Manufacturers—0.8% | | | | | |
Allison Transmission, Inc. (a)(c), | |
5.00%, 10/1/24 | | | 2,656 | | | | 2,596,160 | |
General Motors Financial Co., Inc., 3 mo. LIBOR + 0.930% (g), | |
2.778%, 4/13/20 | | | 4,000 | | | | 3,999,153 | |
| | | | | | | | |
| | | | | | | 6,595,313 | |
| | | | | | | | |
| |
| Banks—1.3% | | | | | |
CIT Group, Inc., | |
5.00%, 8/15/22 | | | 2,522 | | | | 2,477,918 | |
Fifth Third Bancorp, | |
4.30%, 1/16/24 | | | 8,291 | | | | 8,736,419 | |
| | | | | | | | |
| | | | | | | 11,214,337 | |
| | | | | | | | |
| |
| Building Materials—0.6% | | | | | |
Louisiana-Pacific Corp., | |
4.875%, 9/15/24 | | | 6,186 | | | | 5,389,522 | |
| | | | | | | | |
| |
| Chemicals—0.9% | | | | | |
OCI NV (a)(c), | |
5.25%, 11/1/24 | | | 4,446 | | | | 3,890,250 | |
6.625%, 4/15/23 | | | 4,285 | | | | 3,942,200 | |
| | | | | | | | |
| | | | | | | 7,832,450 | |
| | | | | | | | |
| |
| Coal—0.7% | | | | | |
Cloud Peak Energy Resources LLC, | |
12.00%, 11/21/21 (e)(f) | | | 40,020 | | | | 4 | |
12.00%, 5/1/25 | | | 9,151 | | | | 5,719,409 | |
| | | | | | | | |
| | | | | | | 5,719,413 | |
| | | | | | | | |
| |
| Commercial Services—2.7% | | | | | |
APX Group, Inc., | |
6.75%, 2/15/27 (a)(c) | | | 3,000 | | | | 2,506,875 | |
7.875%, 12/1/22 | | | 4,607 | | | | 4,411,113 | |
8.50%, 11/1/24 (a)(c) | | | 15,400 | | | | 14,187,327 | |
Nielsen Co. Luxembourg Sarl (a)(c), | |
5.50%, 10/1/21 | | | 2,848 | | | | 2,810,264 | |
| | | | | | | | |
| | | | | | | 23,915,579 | |
| | | | | | | | |
| |
| Computers—1.3% | | | | | |
NCR Corp., | |
5.00%, 7/15/22 | | | 6,990 | | | | 6,596,812 | |
6.375%, 12/15/23 | | | 5,150 | | | | 5,117,787 | |
| | | | | | | | |
| | | | | | | 11,714,599 | |
| | | | | | | | |
| |
| Containers & Packaging—0.3% | | | | | |
Reynolds Group Issuer, Inc., 3 mo. LIBOR + 3.500% (a)(c)(g), | |
5.331%, 7/15/21 | | | 3,000 | | | | 2,945,250 | |
| | | | | | | | |
| |
| Distribution/Wholesale—5.6% | | | | | |
KAR Auction Services, Inc. (a)(c), | |
5.125%, 6/1/25 | | | 11,412 | | | | 10,969,842 | |
Wolverine Escrow LLC (a)(c), | |
8.50%, 11/15/24 | | | 24,400 | | | | 19,611,378 | |
9.00%, 11/15/26 | | | 22,250 | | | | 18,200,611 | |
| | | | | | | | |
| | | | | | | 48,781,831 | |
| | | | | | | | |
|
| Diversified Financial Services—7.3% | |
Alliance Data Systems Corp. (a)(c), | |
4.75%, 12/15/24 | | | 34,000 | | | | 25,850,390 | |
| | | | | | | | |
| | | Principal
Amount
(000s) | | | Value | |
Credit Acceptance Corp. (a)(c), | |
5.125%, 12/31/24 | | $ | 3,200 | | | $ | 2,936,000 | |
Global Aircraft Leasing Co., Ltd., PIK 7.25% (a)(c), | |
6.50%, 9/15/24 | | | 41,100 | | | | 26,776,650 | |
LPL Holdings, Inc. (a)(c), | |
5.75%, 9/15/25 | | | 3,357 | | | | 3,247,797 | |
Park Aerospace Holdings Ltd. (a)(c), | |
5.25%, 8/15/22 | | | 6,000 | | | | 5,460,240 | |
| | | | | | | | |
| | | | | | | 64,271,077 | |
| | | | | | | | |
| |
| Electric Utilities—0.6% | | | | | |
AES Corp., | | | | | | | | |
4.00%, 3/15/21 | | | 1,000 | | | | 988,250 | |
4.875%, 5/15/23 | | | 4,825 | | | | 4,674,195 | |
| | | | | | | | |
| | | | | | | 5,662,445 | |
| | | | | | | | |
| |
| Entertainment—3.1% | | | | | |
Banijay Entertainment S.A.S. U. (a)(c), | |
5.375%, 3/1/25 | | | 15,850 | | | | 14,756,350 | |
International Game Technology PLC (a)(c), | |
6.25%, 2/15/22 | | | 13,803 | | | | 12,765,705 | |
| | | | | | | | |
| | | | | | | 27,522,055 | |
| | | | | | | | |
|
| Equity Real Estate Investment Trusts (REITs)—1.1% | |
ESH Hospitality, Inc. (a)(c), | |
5.25%, 5/1/25 | | | 9,300 | | | | 7,870,171 | |
Starwood Property Trust, Inc., | |
3.625%, 2/1/21 | | | 2,000 | | | | 1,887,600 | |
| | | | | | | | |
| | | | | | | 9,757,771 | |
| | | | | | | | |
| |
| Food & Staples Retailing—0.1% | | | | | |
U.S. Foods, Inc. (a)(c), | |
5.875%, 6/15/24 | | | 1,000 | | | | 908,745 | |
| | | | | | | | |
| |
| Food Service—0.5% | | | | | |
Aramark Services, Inc. (a)(c), | |
5.00%, 4/1/25 | | | 4,586 | | | | 4,375,365 | |
| | | | | | | | |
| |
| Hand/Machine Tools—0.7% | | | | | |
Colfax Corp. (a)(c), | |
6.00%, 2/15/24 | | | 6,000 | | | | 6,007,530 | |
| | | | | | | | |
| |
| Healthcare-Products—0.9% | | | | | |
Fresenius U.S. Finance II, Inc. (a)(c), | |
4.25%, 2/1/21 | | | 7,795 | | | | 7,925,525 | |
| | | | | | | | |
| |
| Home Builders—0.6% | | | | | |
CalAtlantic Group, Inc., | |
6.625%, 5/1/20 | | | 3,000 | | | | 3,003,750 | |
TRI Pointe Group, Inc., | |
4.875%, 7/1/21 | | | 2,599 | | | | 2,436,692 | |
| | | | | | | | |
| | | | | | | 5,440,442 | |
| | | | | | | | |
|
| Household Products/Wares—0.1% | |
Central Garden & Pet Co., | |
6.125%, 11/15/23 | | | 925 | | | | 889,059 | |
| | | | | | | | |
| |
| Lodging—3.9% | | | | | |
Hilton Worldwide Finance LLC, | |
4.625%, 4/1/25 | | | 2,000 | | | | 1,877,490 | |
Las Vegas Sands Corp., | |
3.20%, 8/8/24 | | | 27,930 | | | | 25,206,289 | |
Wynn Las Vegas LLC (a)(c), | |
5.50%, 3/1/25 | | | 8,000 | | | | 7,499,760 | |
| | | | | | | | |
| | | | | | | 34,583,539 | |
| | | | | | | | |
| |
| Machinery-Diversified—1.1% | | | | | |
CNH Industrial Capital LLC, | |
4.375%, 4/5/22 | | | 2,675 | | | | 2,616,743 | |
John Deere Capital Corp. (g), | |
3 mo. LIBOR + 0.240%, 1.024%, 3/12/21 | | | 2,000 | | | | 1,966,637 | |
3 mo. LIBOR + 0.480%, 1.479%, 9/8/22 | | | 5,000 | | | | 4,775,842 | |
| | | | | | | | |
| | | | | | | 9,359,222 | |
| | | | | | | | |
| | | | | | | | |
| | | Principal
Amount
(000s) | | | Value | |
| |
| Media—6.4% | | | | | |
AMC Networks, Inc., | |
4.75%, 12/15/22 | | $ | 1,758 | | | $ | 1,714,120 | |
5.00%, 4/1/24 | | | 33,350 | | | | 32,182,750 | |
CCO Holdings LLC (a)(c), | |
5.125%, 5/1/23 | | | 2,300 | | | | 2,337,387 | |
Clear Channel Worldwide Holdings, Inc. (a)(c), | |
9.25%, 2/15/24 | | | 8,243 | | | | 7,140,540 | |
Quebecor Media, Inc., | |
5.75%, 1/15/23 | | | 1,038 | | | | 1,059,949 | |
Sinclair Television Group, Inc. (a)(c), | |
5.625%, 8/1/24 | | | 1,650 | | | | 1,530,383 | |
Univision Communications, Inc. (a)(c), | |
6.75%, 9/15/22 | | | 10,434 | | | | 10,104,661 | |
| | | | | | | | |
| | | | | | | 56,069,790 | |
| | | | | | | | |
|
| Miscellaneous Manufacturing—3.3% | |
General Electric Co., | |
4.625%, 1/7/21 | | | 4,343 | | | | 4,352,403 | |
4.65%, 10/17/21 | | | 12,000 | | | | 12,297,838 | |
LSB Industries, Inc. (a)(c), | |
9.625%, 5/1/23 | | | 15,100 | | | | 12,665,049 | |
| | | | | | | | |
| | | | | | | 29,315,290 | |
| | | | | | | | |
|
| Oil, Gas & Consumable Fuels—10.0% | |
AmeriGas Partners L.P., | |
5.50%, 5/20/25 | | | 25,692 | | | | 23,828,559 | |
5.625%, 5/20/24 | | | 5,760 | | | | 5,407,027 | |
CVR Energy, Inc. (a)(c), | |
5.25%, 2/15/25 | | | 38,449 | | | | 30,182,465 | |
PBF Holding Co. LLC, | |
7.25%, 6/15/25 | | | 32,000 | | | | 21,649,760 | |
Sunoco L.P., | |
4.875%, 1/15/23 | | | 6,500 | | | | 6,333,698 | |
| | | | | | | | |
| | | | | | | 87,401,509 | |
| | | | | | | | |
| |
| Pipelines—8.2% | | | | | |
Cheniere Energy Partners LP, | |
5.25%, 10/1/25 | | | 13,200 | | | | 12,374,604 | |
Kinder Morgan Energy Partners L.P., | |
6.50%, 4/1/20 | | | 2,825 | | | | 2,825,000 | |
Kinder Morgan, Inc. (a)(c), | |
5.00%, 2/15/21 | | | 5,000 | | | | 5,065,356 | |
MPLX L.P. (a)(c), | |
6.25%, 10/15/22 | | | 745 | | | | 681,601 | |
PBF Logistics L.P., | |
6.875%, 5/15/23 | | | 11,912 | | | | 7,427,608 | |
Tallgrass Energy Partners L.P. (a)(c), | |
4.75%, 10/1/23 | | | 6,000 | | | | 3,750,180 | |
Targa Resources Partners L.P., | |
5.25%, 5/1/23 | | | 31,720 | | | | 27,794,809 | |
6.75%, 3/15/24 | | | 13,801 | | | | 12,247,973 | |
| | | | | | | | |
| | | | | | | 72,167,131 | |
| | | | | | | | |
| |
| Real Estate—7.0% | | | | | |
Iron Mountain, Inc., | |
6.00%, 8/15/23 | | | 5,968 | | | | 6,035,170 | |
Newmark Group, Inc., | |
6.125%, 11/15/23 | | | 17,522 | | | | 17,853,284 | |
Realogy Group LLC (a)(c), | |
4.875%, 6/1/23 | | | 11,550 | | | | 9,788,625 | |
5.25%, 12/1/21 | | | 29,635 | | | | 27,760,586 | |
| | | | | | | | |
| | | | | | | 61,437,665 | |
| | | | | | | | |
| |
| Retail—7.5% | | | | | |
Beacon Roofing Supply, Inc. (a)(c), | |
4.50%, 11/15/26 | | | 8,606 | | | | 7,973,889 | |
Dollar Tree, Inc., | | | | | | | | |
3.70%, 5/15/23 | | | 5,000 | | | | 5,086,723 | |
eG Global Finance PLC (a)(c), | |
6.75%, 2/7/25 | | | 8,250 | | | | 6,816,604 | |
8.50%, 10/30/25 | | | 22,000 | | | | 19,717,610 | |
| | | | | | |
| 182 | | Semiannual Report | | | March 31, 2020 | | | See accompanying Notes to Financial Statements |
Schedule of Investments
March 31, 2020 (unaudited)
| | | | | | | | |
| | | Principal
Amount
(000s) | | | Value | |
GameStop Corp. (a)(c), | |
6.75%, 3/15/21 | | $ | 9,075 | | | $ | 6,511,312 | |
KGA Escrow LLC (a)(c), | |
7.50%, 8/15/23 | | | 12,428 | | | | 11,418,163 | |
Party City Holdings, Inc. (a)(c), | |
6.125%, 8/15/23 | | | 35,159 | | | | 8,438,160 | |
| | | | | | | | |
| | | | | | | 65,962,461 | |
| | | | | | | | |
|
| Telecommunications—4.1% | |
Connect Finco SARL (a)(c), | |
6.75%, 10/1/26 | | | 35,550 | | | | 29,506,500 | |
Hughes Satellite Systems Corp., | |
7.625%, 6/15/21 | | | 5,830 | | | | 5,978,432 | |
Level 3 Financing, Inc., | |
5.375%, 1/15/24 | | | 425 | | | | 428,716 | |
| | | | | | | | |
| | | | | | | 35,913,648 | |
| | | | | | | | |
| |
| Transportation—2.2% | | | | | |
Fly Leasing Ltd., | |
5.25%, 10/15/24 | | | 3,000 | | | | 2,546,235 | |
6.375%, 10/15/21 | | | 10,125 | | | | 9,726,328 | |
XPO Logistics, Inc. (a)(c), | |
6.75%, 8/15/24 | | | 6,900 | | | | 6,789,980 | |
| | | | | | | | |
| | | | | | | 19,062,543 | |
| | | | | | | | |
Total Corporate Bonds & Notes
(cost—$882,841,139) | | | | 730,354,242 | |
| | | | | | | | |
| | | | | | | | |
| |
| Senior Loans(a)(b)— 12.6% | | | | | |
|
| Commercial Services & Supplies—7.7% | |
APX Group, Inc., 2 mo. LIBOR + 5.000%, 2020 Term Loan, | |
6.704%, 12/31/25 | | | 31,585 | | | | 26,289,742 | |
Asurion LLC, 3.989%, 8/4/22, 1 mo. LIBOR + 3.000, 2017 Term Loan B4 | | | 12,670 | | | | 12,141,874 | |
7.489%, 8/4/25, 2017 2nd Lien Term Loan (d) | | | 31,000 | | | | 28,733,125 | |
| | | | | | | | |
| | | | | | | 67,164,741 | |
| | | | | | | | |
| |
| Electric Utilities—0.3% | | | | | |
Calpine Corp., 1 mo. LIBOR + 2.250%, Term Loan B5, | |
3.24%, 1/15/24 | | | 2,969 | | | | 2,869,376 | |
| | | | | | | | |
| |
| Entertainment—0.3% | | | | | |
Banijay Entertainment S.A.S, USD Term Loan (d), | |
3.75%, 3/4/25 | | | 2,950 | | | | 2,655,000 | |
| | | | | | | | |
| |
| Pipelines—0.4% | | | | | |
Prairie ECI Acquiror LP, 3 mo. LIBOR + 4.750%, Term Loan B, | |
6.20%, 3/11/26 | | | 7,200 | | | | 3,832,304 | |
| | | | | | | | |
| |
| Retail—0.3% | | | | | |
Whatabrands LLC, 1 mo. LIBOR + 2.750%, 2020 Term Loan B, | |
3.766%, 8/2/26 | | | 2,985 | | | | 2,502,132 | |
| | | | | | | | |
| |
| Specialty Retail—3.6% | | | | | |
PetSmart, Inc., 6 mo. LIBOR + 4.000%, Consenting Term Loan, | |
5.00%, 3/11/22 | | | 32,882 | | | | 31,620,299 | |
| | | | | | | | |
Total Senior Loans
(cost—$123,427,532) | | | | 110,643,852 | |
| | | | | | | | |
| | | | | | | | |
|
| Asset-Backed Security—0.4% | |
Navajo Transitional Energy Co. LLC, 9.00%, 10/24/24 | |
(cost—$12,899,477) | | | 5,796 | | | | 3,752,694 | |
| | | | | | | | |
|
| Repurchase Agreements—3.6% | |
State Street Bank and Trust Co., dated 3/31/20, 0.00%, due 4/1/20, proceeds $31,938,000; collateralized by U.S. Treasury Inflation Indexed Notes, 0.625%, due 4/15/23, valued at $32,579,975 including accrued interest | |
(cost—$31,938,000) | | | 31,938 | | | | 31,938,000 | |
| | | | | | | | |
| | | | | | |
| | | | |
Value | |
| |
Total Investments
(cost—$1,051,106,148)—99.8% | | $ | 876,688,788 | |
| | | | | | |
| |
Other assets less
liabilities—0.2% | | | 1,371,735 | |
| | | | | | |
| |
| Net Assets—100.0% | | | $878,060,523 | |
| | | | | | |
Notes to Schedule of Investments:
(a) Private Placement—Restricted as to resale and may not have a readily available market. Securities with an aggregate value of $528,254,514, representing 60.2% of net assets.
(b) These securities generally pay interest at rates which are periodicallypre-determined by reference to a base lending rate plus a premium. These base lending rates are generally either the lending rate offered by one or more major European banks, such as the “LIBOR” or the prime rate offered by one or more major United States banks, or the certificate of deposit rate. These securities are generally considered to be restricted as the Fund is ordinarily contractually obligated to receive approval from the Agent bank and/or borrower prior to disposition. Remaining maturities of senior loans may be less than the stated maturities shown as a result of contractual or optional payments by the borrower. Such prepayments cannot be predicted with certainty. The interest rate disclosed reflects the rate in effect on March 31, 2020.
(c) 144A—Exempt from registration under Rule 144A of the Securities Act of 1933. These securities may be resold in transactions exempt from registration, typically only to qualified institutional buyers. Securities with an aggregate value of $417,610,662, representing 47.6% of net assets.
(d) When-issued or delayed-delivery. To be settled/delivered after March 31, 2020.
(e) Fair-Valued—Security with a value of $4, representing less than 0.05% of net assets. See Note 1(a) and Note 1(b) in the Notes to Financial Statements.
(f) Level 3 security. See Note 1(a) and Note 1(b) in the Notes to Financial Statements.
(g) Variable or Floating Rate Security—Securities with an interest rate that changes periodically. The interest rate disclosed reflects the rate in effect on March 31, 2020.
Glossary:
LIBOR — London Inter-Bank Offered Rate
PIK—Payment-in-Kind
REIT—Real Estate Investment Trust
AllianzGI Short Term Bond Fund
| | | | | | | | |
| | | Principal
Amount
(000s) | | | Value | |
|
| Corporate Bonds & Notes—74.5% | |
| |
| Aerospace & Defense—0.5% | | | | | |
Raytheon Co., | | | | | | | | |
3.125%, 10/15/20 | | | $100 | | | | $101,038 | |
| | | | | | | | |
| |
| Banks—13.5% | | | | | |
Bank of America Corp., | | | | | | | | |
5.70%, 1/24/22 | | | 447 | | | | 473,138 | |
Barclays Bank PLC, 3 mo. LIBOR + 0.460% (c), | |
2.308%, 1/11/21 | | | 100 | | | | 97,161 | |
Citigroup, Inc., | |
| 3.142%, 1/24/23 (converts to FRN on 1/24/2020) (c) | | | 432 | | | | 437,417 | |
4.50%, 1/14/22 | | | 200 | | | | 208,264 | |
Fifth Third Bancorp, | | | | | | | | |
3.50%, 3/15/22 | | | 500 | | | | 505,218 | |
4.30%, 1/16/24 | | | 100 | | | | 105,372 | |
Goldman Sachs Group, Inc., | | | | | | | | |
5.25%, 7/27/21 | | | 300 | | | | 310,957 | |
JPMorgan Chase & Co., | | | | | | | | |
4.625%, 5/10/21 | | | 300 | | | | 308,361 | |
Morgan Stanley, | | | | | | | | |
5.50%, 7/28/21 | | | 300 | | | | 312,196 | |
PNC Financial Services Group, Inc., | |
3.50%, 1/23/24 | | | 200 | | | | 208,007 | |
| | | | | | | | |
| | | | | | | 2,966,091 | |
| | | | | | | | |
| |
| Chemicals—0.8% | | | | | |
CVR Partners L.P. (a)(b), | | | | | | | | |
9.25%, 6/15/23 | | | 100 | | | | 80,795 | |
Dow Chemical Co., | | | | | | | | |
3.15%, 5/15/24 | | | 100 | | | | 101,116 | |
| | | | | | | | |
| | | | | | | 181,911 | |
| | | | | | | | |
| |
| Commercial Services—3.2% | | | | | |
APX Group, Inc., | | | | | | | | |
6.75%, 2/15/27 (a)(b) | | | 200 | | | | 167,125 | |
7.875%, 12/1/22 | | | 75 | | | | 71,811 | |
8.50%, 11/1/24 (a)(b) | | | 500 | | | | 460,628 | |
| | | | | | | | |
| | | | | | | 699,564 | |
| | | | | | | | |
| |
| Computers—2.8% | | | | | |
Apple, Inc., 3 mo. LIBOR + 0.500% (c), | |
2.234%, 2/9/22 | | | 200 | | | | 197,054 | |
Dell International LLC (a)(b),
| | | | | | | | |
7.125%, 6/15/24 | | | 300 | | | | 310,875 | |
NCR Corp.,
| | | | | | | | |
6.375%, 12/15/23 | | | 100 | | | | 99,375 | |
| | | | | | | | |
| | | | | | | 607,304 | |
| | | | | | | | |
| |
| Containers & Packaging—0.8% | | | | | |
Crown Americas LLC,
| | | | | | | | |
4.50%, 1/15/23 | | | 75 | | | | 77,361 | |
Reynolds Group Issuer, Inc., 3 mo. LIBOR + 3.500% (a)(b)(c),
| |
5.331%, 7/15/21 | | | 100 | | | | 98,175 | |
| | | | | | | | |
| | | | | | | 175,536 | |
| | | | | | | | |
| |
| Distribution/Wholesale—1.1% | | | | | |
Wolverine Escrow LLC (a)(b),
| |
8.50%, 11/15/24 | | | 300 | | | | 241,123 | |
| | | | | | | | |
|
| Diversified Financial Services—7.5% | |
AerCap Ireland Capital DAC, | |
4.50%, 5/15/21 | | | 245 | | | | 224,427 | |
4.625%, 7/1/22 | | | 150 | | | | 130,345 | |
Alliance Data Systems Corp. (a)(b), | |
4.75%, 12/15/24 | | | 500 | | | | 380,153 | |
| | | | | | | | |
| See accompanying Notes to Financial Statements | | | March 31, 2020 | | | Semiannual Report | | | 183 | |
Schedule of Investments
March 31, 2020 (unaudited)
| | | | | | | | |
| | | Principal
Amount
(000s) | | | Value | |
American Express Co.,
| | | | | | | | |
3.70%, 11/5/21 | | $ | 200 | | | $ | 205,055 | |
Capital One Financial Corp.,
| | | | | | | | |
4.75%, 7/15/21 | | | 130 | | | | 133,629 | |
Charles Schwab Corp.,
| | | | | | | | |
3.25%, 5/21/21 | | | 200 | | | | 201,528 | |
Global Aircraft Leasing Co., Ltd., PIK 7.25% (a)(b), | |
6.50%, 9/15/24 | | | 200 | | | | 130,300 | |
LPL Holdings, Inc. (a)(b),
5.75%, 9/15/25 | | | 250 | | | | 241,868 | |
| | | | | | | | |
| | | | | | | 1,647,305 | |
| | | | | | | | |
| |
| Entertainment—0.8% | | | | | |
Banijay Entertainment S.A.S. U. (a)(b), | |
5.375%, 3/1/25 | | | 200 | | | | 186,200 | |
| | | | | | | | |
| |
| Environmental Services—0.9% | | | | | |
Waste Management, Inc.,
4.75%, 6/30/20 | | | 200 | | | | 200,853 | |
| | | | | | | | |
|
| Equity Real Estate Investment Trusts (REITs)—2.8% | |
American Tower Corp.,
3.375%, 5/15/24 | | | 100 | | | | 98,922 | |
CC Holdings GS V LLC,
3.849%, 4/15/23 | | | 100 | | | | 100,770 | |
ERP Operating L.P.,
4.625%, 12/15/21 | | | 200 | | | | 204,392 | |
ESH Hospitality, Inc. (a)(b),
5.25%, 5/1/25 | | | 250 | | | | 211,564 | |
| | | | | | | | |
| | | | | | | 615,648 | |
| | | | | | | | |
| |
| Food & Beverage—2.0% | | | | | |
General Mills, Inc.,
3.15%, 12/15/21 | | | 300 | | | | 303,900 | |
Hershey Co.,
4.125%, 12/1/20 | | | 125 | | | | 125,750 | |
| | | | | | | | |
| | | | | | | 429,650 | |
| | | | | | | | |
| |
| Food & Staples Retailing—1.2% | | | | | |
U.S. Foods, Inc. (a)(b),
5.875%, 6/15/24 | | | 300 | | | | 272,623 | |
| | | | | | | | |
| |
| Healthcare-Products—0.9% | | | | | |
Fresenius U.S. Finance II, Inc. (a)(b), | |
4.50%, 1/15/23 | | | 150 | | | | 145,802 | |
Medtronic, Inc.,
3.15%, 3/15/22 | | | 50 | | | | 51,992 | |
| | | | | | | | |
| | | | | | | 197,794 | |
| | | | | | | | |
| |
| Insurance—6.5% | | | | | |
American International Group, Inc.,
| |
3.30%, 3/1/21 | | | 500 | | | | 500,785 | |
Aon PLC,
4.00%, 11/27/23 | | | 500 | | | | 515,641 | |
Marsh & McLennan Cos., Inc.,
4.05%, 10/15/23 | | | 200 | | | | 207,584 | |
Prudential Financial, Inc.,
4.50%, 11/16/21 | | | 200 | | | | 207,422 | |
| | | | | | | | |
| | | | | | | 1,431,432 | |
| | | | | | | | |
| |
| Iron/Steel—2.1% | | | | | |
ArcelorMittal S.A.,
3.60%, 7/16/24 | | | 500 | | | | 455,906 | |
| | | | | | | | |
| |
| Lodging—2.0% | | | | | |
Choice Hotels International, Inc., | |
5.75%, 7/1/22 | | | 361 | | | | 334,636 | |
| | | | | | | | |
| | | Principal
Amount
(000s) | | | Value | |
Marriott International, Inc.,
3.60%, 4/15/24 | | $ | 100 | | | $ | 95,100 | |
| | | | | | | | |
| | | | | | | 429,736 | |
| | | | | | | | |
|
| Machinery-Construction & Mining—0.9% | |
| Caterpillar Financial Services Corp., 3 mo. LIBOR + 0.350 (c), | |
1.349%, 12/7/20 | | | 200 | | | | 197,138 | |
| | | | | | | | |
| |
| Media—4.8% | | | | | |
CCO Holdings LLC (a)(b),
5.125%, 5/1/23 | | | 100 | | | | 101,626 | |
Clear Channel Worldwide Holdings, Inc. (a)(b), | |
9.25%, 2/15/24 | | | 150 | | | | 129,938 | |
Cox Communications, Inc. (a)(b), | |
3.25%, 12/15/22 | | | 200 | | | | 203,121 | |
Fox Corp.,
3.05%, 4/7/25 | | | 600 | | | | 606,300 | |
| | | | | | | | |
| | | | | | | 1,040,985 | |
| | | | | | | | |
|
| Miscellaneous Manufacturing—1.2% | |
General Electric Co., | | | | | | | | |
4.625%, 1/7/21 | | | 68 | | | | 68,147 | |
4.65%, 10/17/21 | | | 200 | | | | 204,964 | |
| | | | | | | | |
| | | | | | | 273,111 | |
| | | | | | | | |
|
| Oil, Gas & Consumable Fuels—4.3% | |
CVR Energy, Inc. (a)(b),
5.25%, 2/15/25 | | | 500 | | | | 392,500 | |
Occidental Petroleum Corp.,
4.10%, 2/1/21 | | | 200 | | | | 172,500 | |
PBF Holding Co. LLC,
7.25%, 6/15/25 | | | 550 | | | | 372,105 | |
| | | | | | | | |
| | | | | | | 937,105 | |
| | | | | | | | |
| |
| Pharmaceuticals—2.8% | | | | | |
Bausch Health Cos., Inc. (a)(b), | |
7.00%, 3/15/24 | | | 100 | | | | 103,126 | |
Pfizer, Inc.,
3.00%, 9/15/21 | | | 200 | | | | 205,053 | |
Zoetis, Inc.,
3.25%, 8/20/21 | | | 300 | | | | 302,308 | |
| | | | | | | | |
| | | | | | | 610,487 | |
| | | | | | | | |
| |
| Pipelines—4.1% | | | | | |
Kinder Morgan Energy Partners L.P., | |
6.50%, 4/1/20 | | | 300 | | | | 300,000 | |
PBF Logistics L.P.,
6.875%, 5/15/23 | | | 476 | | | | 296,805 | |
Sabine Pass Liquefaction LLC,
5.625%, 2/1/21 | | | 300 | | | | 296,643 | |
| | | | | | | | |
| | | | | | | 893,448 | |
| | | | | | | | |
|
| Real Estate Management & Development—2.7% | |
Crown Castle International Corp., | |
5.25%, 1/15/23 | | | 550 | | | | 588,885 | |
| | | | | | | | |
| |
| Retail—2.9% | | | | | |
Dollar Tree, Inc.,
3.70%, 5/15/23 | | | 150 | | | | 152,602 | |
eG Global Finance PLC (a)(b),
8.50%, 10/30/25 | | | 200 | | | | 179,251 | |
KGA Escrow LLC (a)(b),
7.50%, 8/15/23 | | | 100 | | | | 91,874 | |
Yum! Brands, Inc. (a)(b),
7.75%, 4/1/25 | | | 200 | | | | 210,500 | |
| | | | | | | | |
| | | | | | | 634,227 | |
| | | | | | | | |
| | | | | | | | |
| | | Principal
Amount
(000s) | | | Value | |
| |
| Telecommunications—0.5% | | | | | |
T-Mobile USA, Inc.,
6.00%, 3/1/23 | | $ | 100 | | | $ | 101,177 | |
| | | | | | | | |
| |
| Transportation—0.9% | | | | | |
Burlington Northern Santa Fe LLC, | |
4.10%, 6/1/21 | | | 200 | | | | 203,410 | |
| | | | | | | | |
Total Corporate Bonds & Notes
(cost—$16,531,048) | | | | 16,319,687 | |
| | | | | | | | |
| | | | | | | | |
|
| U.S. Treasury Obligations—4.8% | |
U.S. Treasury Notes, | | | | | | | | |
2.50%, 5/31/20 | | | 200 | | | | 200,891 | |
2.50%, 6/30/20 | | | 200 | | | | 201,188 | |
2.625%, 7/31/20 | | | 200 | | | | 201,687 | |
2.625%, 8/15/20 | | | 200 | | | | 201,922 | |
3.125%, 5/15/21 | | | 100 | | | | 103,367 | |
3.50%, 5/15/20 | | | 150 | | | | 150,703 | |
| | | | | | | | |
Total U.S. Treasury Obligations
(cost—$1,051,858) | | | | 1,059,758 | |
| | | | | | | | |
| | | | | | | | |
|
| U.S. Government Agency Securities—2.7% | |
Federal Home Loan Banks, | |
2.875%, 9/11/20 | | | 100 | | | | 101,212 | |
3.00%, 9/10/21 | | | 100 | | | | 103,814 | |
3.125%, 9/9/22 | | | 100 | | | | 106,444 | |
5.00%, 12/10/21 | | | 250 | | | | 269,443 | |
| | | | | | | | |
Total U.S. Government Agency Securities
(cost—$564,959) | | | | 580,913 | |
| | | | | | | | |
|
| Repurchase Agreements—38.5% | |
State Street Bank and Trust Co., dated 3/31/20, 0.00%, due 4/1/20, proceeds $8,421,000; collateralized by U.S. Treasury Inflation Indexed Notes, 0.625%, due 4/15/23, valued at $8,589,458 including accrued interest | |
(cost—$8,421,000) | | | 8,421 | | | | 8,421,000 | |
| | | | | | | | |
| |
Total Investments
(cost—$26,568,865)—120.5% | | | | 26,381,358 | |
| | | | | | | | |
| |
| Liabilities in excess of other assets—(20.5)% | | | | (4,481,236 | ) |
| | | | | | | | |
| |
| Net Assets—100.0% | | | | $21,900,122 | |
| | | | | | | | |
| | | | | | |
| 184 | | Semiannual Report | | | March 31, 2020 | | | See accompanying Notes to Financial Statements |
Schedule of Investments
March 31, 2020 (unaudited)
Notes to Schedule of Investments:
(a) Private Placement—Restricted as to resale and may not have a readily available market. Securities with an aggregate value of $4,339,167, representing 19.8% of net assets.
(b) 144A—Exempt from registration under Rule 144A of the Securities Act of 1933. These securities may be resold in transactions exempt from registration, typically only to qualified institutional buyers. Securities with an aggregate value of $4,339,167, representing 19.8% of net assets.
(c) Variable or Floating Rate Security—Securities with an interest rate that changes periodically. The interest rate disclosed reflects the rate in effect on March 31, 2020.
Glossary:
FRN—Floating Rate Note
LIBOR—London Inter-Bank Offered Rate
PIK—Payment-in-Kind
REIT—Real Estate Investment Trust
AllianzGI Structured Return Fund
| | | | | | | | |
| | | Shares | | | Value | |
|
| Exchange-Traded Funds—86.0% | |
iShares Core S&P 500 (a)
(cost—$228,780,456) | | | 835,000 | | | | $215,764,000 | |
| | | | | | | | |
| | | | | | | | |
| | |
| | | Principal
Amount
(000s) | | | | |
|
| Repurchase Agreements—3.2% | |
State Street Bank and Trust Co., dated 3/31/20, 0.00%, due 4/1/20, proceeds $7,950,000; collateralized by U.S. Treasury Inflation Indexed Notes, 0.625%, due 4/15/23, valued at $8,110,804 including accrued interest | |
(cost—$7,950,000) | | | $7,950 | | | | 7,950,000 | |
| | | | | | | | |
| Total Options Purchased —19.7% (cost—$22,448,949) (b)(c)(d) | | | | 49,378,554 | |
| | | | | | | | |
| |
Total Investments, before options written
(cost—$259,179,405)—108.9% | | | | 273,092,554 | |
| | | | | | | | |
Total Options Written—(6.2)%
(premiums received—$45,557,873) (b)(c)(d) | | | | (15,448,581 | ) |
| | | | | | | | |
| |
Total Investments, net of options written
(cost—$213,621,532)—102.7% | | | | 257,643,973 | |
| | | | | | | | |
| |
| Other liabilities in excess of other assets—(2.7)% | | | | (6,691,648 | ) |
| | | | | | | | |
| |
| Net Assets—100.0% | | | | $250,952,325 | |
| | | | | | | | |
Notes to Schedule of Investments:
(a) All or partial amount segregated for the benefit of the counterparty as collateral for options written.
(b)Non-income producing.
(c) Exchange traded-Chicago Board Options Exchange.
(d) Exchange traded option contracts outstanding at March 31, 2020:
| | | | | | | | | | | | | | | | | | | | | | | | | | | | |
| | | |
| Options purchased contracts outstanding at March 31, 2020: | | | | | | | | | | |
| Description | | Exercise
Price | | | Expiration
Date | | | Number of
Contracts | | | Notional
Amount | | | Market
Value | | | Cost | | | Unrealized
Appreciation
(Depreciation) | |
| | | | | | | |
Call options: | | | | | | | | | | | | | | | | | | | | | | | | | | | | |
CBOE Volatility Index | | | 42.50 USD | | | | 4/15/20 | | | | 574 | | | $ | 57,400 | | | $ | 513,730 | | | $ | 620,894 | | | $ | (107,164 | ) |
CBOE Volatility Index | | | 47.50 USD | | | | 4/15/20 | | | | 909 | | | | 90,900 | | | | 631,755 | | | | 1,021,939 | | | | (390,184 | ) |
CBOE Volatility Index | | | 90.00 USD | | | | 4/15/20 | | | | 2,966 | | | | 296,600 | | | | 274,355 | | | | 571,694 | | | | (297,339 | ) |
CBOE Volatility Index | | | 40.00 USD | | | | 4/22/20 | | | | 287 | | | | 28,700 | | | | 296,901 | | | | 320,651 | | | | (23,750 | ) |
CBOE Volatility Index | | | 95.00 USD | | | | 4/22/20 | | | | 574 | | | | 57,400 | | | | 274,085 | | | | 279,500 | | | | (5,415 | ) |
S&P 500 Index | | | 2,900.00 USD | | | | 4/3/20 | | | | 8 | | | | 800 | | | | 120 | | | | 12,141 | | | | (12,021 | ) |
S&P 500 Index | | | 3,500.00 USD | | | | 4/3/20 | | | | 571 | | | | 57,100 | | | | 5,710 | | | | 19,614 | | | | (13,904 | ) |
S&P 500 Index | | | 3,700.00 USD | | | | 4/3/20 | | | | 215 | | | | 21,500 | | | | 2,150 | | | | 3,815 | | | | (1,665 | ) |
S&P 500 Index | | | 2,475.00 USD | | | | 4/8/20 | | | | 20 | | | | 2,000 | | | | 288,900 | | | | 341,973 | | | | (53,073 | ) |
S&P 500 Index | | | 2,700.00 USD | | | | 4/8/20 | | | | 8 | | | | 800 | | | | 15,800 | | | | 83,217 | | | | (67,417 | ) |
S&P 500 Index | | | 2,950.00 USD | | | | 4/8/20 | | | | 40 | | | | 4,000 | | | | 2,500 | | | | 4,108 | | | | (1,608 | ) |
S&P 500 Index | | | 3,100.00 USD | | | | 4/8/20 | | | | 92 | | | | 9,200 | | | | 1,840 | | | | 1,932 | | | | (92 | ) |
S&P 500 Index | | | 2,475.00 USD | | | | 4/9/20 | | | | 20 | | | | 2,000 | | | | 298,300 | | | | 346,534 | | | | (48,234 | ) |
S&P 500 Index | | | 2,900.00 USD | | | | 4/9/20 | | | | 8 | | | | 800 | | | | 1,020 | | | | 19,139 | | | | (18,119 | ) |
S&P 500 Index | | | 2,950.00 USD | | | | 4/9/20 | | | | 40 | | | | 4,000 | | | | 3,200 | | | | 5,760 | | | | (2,560 | ) |
S&P 500 Index | | | 3,700.00 USD | | | | 4/9/20 | | | | 210 | | | | 21,000 | | | | 2,625 | | | | 6,876 | | | | (4,251 | ) |
S&P 500 Index | | | 3,900.00 USD | | | | 4/9/20 | | | | 90 | | | | 9,000 | | | | 1,125 | | | | 1,448 | | | | (323 | ) |
S&P 500 Index | | | 2,475.00 USD | | | | 4/13/20 | | | | 20 | | | | 2,000 | | | | 310,600 | | | | 370,594 | | | | (59,994 | ) |
S&P 500 Index | | | 2,950.00 USD | | | | 4/13/20 | | | | 40 | | | | 4,000 | | | | 4,800 | | | | 7,853 | | | | (3,053 | ) |
S&P 500 Index | | | 2,475.00 USD | | | | 4/15/20 | | | | 20 | | | | 2,000 | | | | 325,300 | | | | 379,896 | | | | (54,596 | ) |
S&P 500 Index | | | 2,900.00 USD | | | | 4/15/20 | | | | 12 | | | | 1,200 | | | | 2,910 | | | | 32,783 | | | | (29,873 | ) |
S&P 500 Index | | | 2,950.00 USD | | | | 4/15/20 | | | | 40 | | | | 4,000 | | | | 6,400 | | | | 10,680 | | | | (4,280 | ) |
S&P 500 Index | | | 2,800.00 USD | | | | 4/17/20 | | | | 6 | | | | 600 | | | | 6,900 | | | | 44,413 | | | | (37,513 | ) |
S&P 500 Index | | | 3,220.00 USD | | | | 4/17/20 | | | | 6 | | | | 600 | | | | 225 | | | | 20,953 | | | | (20,728 | ) |
| | | | | | | | |
| See accompanying Notes to Financial Statements | | | March 31, 2020 | | | Semiannual Report | | | 185 | |
Schedule of Investments
March 31, 2020 (unaudited)
| | | | | | | | | | | | | | | | | | | | | | | | | | | | |
| | | |
| Options purchased contracts outstanding at March 31, 2020 (continued): | | | | | | | | | | |
| Description | | Exercise
Price | | | Expiration
Date | | | Number of
Contracts | | | Notional
Amount | | | Market
Value | | | Cost | | | Unrealized
Appreciation
(Depreciation) | |
Call options (continued): | | | | | | | | | | | | | | | | | | | | | | | | | | | | |
S&P 500 Index | | | 3,260.00 USD | | | | 4/17/20 | | | | 10 | | | $ | 1,000 | | | $ | 275 | | | $ | 31,920 | | | $ | (31,645 | ) |
S&P 500 Index | | | 3,270.00 USD | | | | 4/17/20 | | | | 7 | | | | 700 | | | | 193 | | | | 17,620 | | | | (17,427 | ) |
S&P 500 Index | | | 3,675.00 USD | | | | 4/17/20 | | | | 34 | | | | 3,400 | | | | 340 | | | | 1,555 | | | | (1,215 | ) |
S&P 500 Index | | | 3,800.00 USD | | | | 4/17/20 | | | | 210 | | | | 21,000 | | | | 2,625 | | | | 4,756 | | | | (2,131 | ) |
S&P 500 Index | | | 3,800.00 USD | | | | 4/17/20 | | | | 124 | | | | 12,400 | | | | 620 | | | | 2,054 | | | | (1,434 | ) |
S&P 500 Index | | | 4,400.00 USD | | | | 4/17/20 | | | | 124 | | | | 12,400 | | | | 620 | | | | 1,376 | | | | (756 | ) |
S&P 500 Index | | | 3,750.00 USD | | | | 4/24/20 | | | | 200 | | | | 20,000 | | | | 4,000 | | | | 6,200 | | | | (2,200 | ) |
S&P 500 Index | | | 3,800.00 USD | | | | 5/15/20 | | | | 144 | | | | 14,400 | | | | 2,880 | | | | 5,184 | | | | (2,304 | ) |
S&P 500 Index | | | 2,800.00 USD | | | | 6/19/20 | | | | 6 | | | | 600 | | | | 41,790 | | | | 75,403 | | | | (33,613 | ) |
S&P 500 Mini Index | | | 328.00 USD | | | | 4/1/20 | | | | 39 | | | | 3,900 | | | | 176 | | | | 17,632 | | | | (17,456 | ) |
S&P 500 Mini Index | | | 336.00 USD | | | | 4/1/20 | | | | 108 | | | | 10,800 | | | | 486 | | | | 27,226 | | | | (26,740 | ) |
S&P 500 Mini Index | | | 345.00 USD | | | | 4/1/20 | | | | 177 | | | | 17,700 | | | | 797 | | | | 29,753 | | | | (28,956 | ) |
S&P 500 Mini Index | | | 360.00 USD | | | | 4/1/20 | | | | 1,173 | | | | 117,300 | | | | 5,278 | | | | 2,345 | | | | 2,933 | |
S&P 500 Mini Index | | | 385.00 USD | | | | 4/1/20 | | | | 206 | | | | 20,600 | | | | — | | | | 618 | | | | (618 | ) |
S&P 500 Mini Index | | | 390.00 USD | | | | 4/1/20 | | | | 567 | | | | 56,700 | | | | — | | | | 1,187 | | | | (1,187 | ) |
S&P 500 Mini Index | | | 305.00 USD | | | | 4/3/20 | | | | 98 | | | | 9,800 | | | | 686 | | | | 84,834 | | | | (84,148 | ) |
S&P 500 Mini Index | | | 327.00 USD | | | | 4/3/20 | | | | 39 | | | | 3,900 | | | | 273 | | | | 27,347 | | | | (27,074 | ) |
S&P 500 Mini Index | | | 344.00 USD | | | | 4/3/20 | | | | 205 | | | | 20,500 | | | | 1,435 | | | | 48,809 | | | | (47,374 | ) |
S&P 500 Mini Index | | | 345.00 USD | | | | 4/3/20 | | | | 1,054 | | | | 105,400 | | | | 7,378 | | | | 6,420 | | | | 958 | |
S&P 500 Mini Index | | | 355.00 USD | | | | 4/3/20 | | | | 195 | | | | 19,500 | | | | 1,365 | | | | 874 | | | | 491 | |
S&P 500 Mini Index | | | 385.00 USD | | | | 4/3/20 | | | | 206 | | | | 20,600 | | | | 1,442 | | | | 412 | | | | 1,030 | |
S&P 500 Mini Index | | | 390.00 USD | | | | 4/3/20 | | | | 571 | | | | 57,100 | | | | 3,997 | | | | 1,142 | | | | 2,855 | |
S&P 500 Mini Index | | | 303.00 USD | | | | 4/6/20 | | | | 108 | | | | 10,800 | | | | 540 | | | | 115,884 | | | | (115,344 | ) |
S&P 500 Mini Index | | | 308.00 USD | | | | 4/6/20 | | | | 39 | | | | 3,900 | | | | 176 | | | | 30,927 | | | | (30,751 | ) |
S&P 500 Mini Index | | | 325.00 USD | | | | 4/6/20 | | | | 58 | | | | 5,800 | | | | 261 | | | | 43,099 | | | | (42,838 | ) |
S&P 500 Mini Index | | | 334.00 USD | | | | 4/6/20 | | | | 39 | | | | 3,900 | | | | 176 | | | | 23,322 | | | | (23,146 | ) |
S&P 500 Mini Index | | | 341.00 USD | | | | 4/6/20 | | | | 48 | | | | 4,800 | | | | 216 | | | | 17,424 | | | | (17,208 | ) |
S&P 500 Mini Index | | | 343.00 USD | | | | 4/6/20 | | | | 108 | | | | 10,800 | | | | 486 | | | | 21,276 | | | | (20,790 | ) |
S&P 500 Mini Index | | | 355.00 USD | | | | 4/6/20 | | | | 87 | | | | 8,700 | | | | 392 | | | | 705 | | | | (313 | ) |
S&P 500 Mini Index | | | 385.00 USD | | | | 4/6/20 | | | | 726 | | | | 72,600 | | | | 3,267 | | | | 2,227 | | | | 1,040 | |
S&P 500 Mini Index | | | 390.00 USD | | | | 4/6/20 | | | | 999 | | | | 99,900 | | | | — | | | | 2,828 | | | | (2,828 | ) |
S&P 500 Mini Index | | | 316.00 USD | | | | 4/8/20 | | | | 60 | | | | 6,000 | | | | 300 | | | | 42,660 | | | | (42,360 | ) |
S&P 500 Mini Index | | | 339.00 USD | | | | 4/8/20 | | | | 102 | | | | 10,200 | | | | — | | | | 23,562 | | | | (23,562 | ) |
S&P 500 Mini Index | | | 344.00 USD | | | | 4/8/20 | | | | 108 | | | | 10,800 | | | | — | | | | 19,764 | | | | (19,764 | ) |
S&P 500 Mini Index | | | 347.00 USD | | | | 4/8/20 | | | | 403 | | | | 40,300 | | | | — | | | | 89,504 | | | | (89,504 | ) |
S&P 500 Mini Index | | | 380.00 USD | | | | 4/8/20 | | | | 943 | | | | 94,300 | | | | — | | | | 2,464 | | | | (2,464 | ) |
S&P 500 Mini Index | | | 386.00 USD | | | | 4/8/20 | | | | 204 | | | | 20,400 | | | | — | | | | 895 | | | | (895 | ) |
S&P 500 Mini Index | | | 390.00 USD | | | | 4/8/20 | | | | 558 | | | | 55,800 | | | | — | | | | 1,116 | | | | (1,116 | ) |
S&P 500 Mini Index | | | 335.00 USD | | | | 4/9/20 | | | | 39 | | | | 3,900 | | | | 176 | | | | 23,575 | | | | (23,399 | ) |
S&P 500 Mini Index | | | 338.00 USD | | | | 4/9/20 | | | | 72 | | | | 7,200 | | | | 324 | | | | 33,452 | | | | (33,128 | ) |
S&P 500 Mini Index | | | 341.00 USD | | | | 4/9/20 | | | | 102 | | | | 10,200 | | | | 459 | | | | 19,482 | | | | (19,023 | ) |
S&P 500 Mini Index | | | 344.00 USD | | | | 4/9/20 | | | | 108 | | | | 10,800 | | | | 486 | | | | 20,638 | | | | (20,152 | ) |
S&P 500 Mini Index | | | 385.00 USD | | | | 4/9/20 | | | | 408 | | | | 40,800 | | | | 1,836 | | | | 1,262 | | | | 574 | |
S&P 500 Mini Index | | | 386.00 USD | | | | 4/9/20 | | | | 204 | | | | 20,400 | | | | — | | | | 408 | | | | (408 | ) |
S&P 500 Mini Index | | | 390.00 USD | | | | 4/9/20 | | | | 567 | | | | 56,700 | | | | 2,552 | | | | 1,188 | | | | 1,364 | |
S&P 500 Mini Index | | | 324.00 USD | | | | 4/13/20 | | | | 50 | | | | 5,000 | | | | 275 | | | | 42,105 | | | | (41,830 | ) |
S&P 500 Mini Index | | | 338.00 USD | | | | 4/13/20 | | | | 38 | | | | 3,800 | | | | 3 | | | | 22,538 | | | | (22,535 | ) |
S&P 500 Mini Index | | | 341.00 USD | | | | 4/13/20 | | | | 107 | | | | 10,700 | | | | 5 | | | | 19,260 | | | | (19,255 | ) |
S&P 500 Mini Index | | | 345.00 USD | | | | 4/13/20 | | | | 157 | | | | 15,700 | | | | 707 | | | | 34,869 | | | | (34,162 | ) |
S&P 500 Mini Index | | | 347.00 USD | | | | 4/13/20 | | | | 107 | | | | 10,700 | | | | 3 | | | | 20,554 | | | | (20,551 | ) |
S&P 500 Mini Index | | | 385.00 USD | | | | 4/13/20 | | | | 664 | | | | 66,400 | | | | — | | | | 2,034 | | | | (2,034 | ) |
S&P 500 Mini Index | | | 390.00 USD | | | | 4/13/20 | | | | 556 | | | | 55,600 | | | | — | | | | 1,164 | | | | (1,164 | ) |
S&P 500 Mini Index | | | 316.00 USD | | | | 4/15/20 | | | | 51 | | | | 5,100 | | | | 16 | | | | 40,392 | | | | (40,376 | ) |
S&P 500 Mini Index | | | 339.00 USD | | | | 4/15/20 | | | | 38 | | | | 3,800 | | | | 1 | | | | 20,980 | | | | (20,979 | ) |
S&P 500 Mini Index | | | 342.00 USD | | | | 4/15/20 | | | | 106 | | | | 10,600 | | | | 1 | | | | 21,518 | | | | (21,517 | ) |
S&P 500 Mini Index | | | 348.00 USD | | | | 4/15/20 | | | | 107 | | | | 10,700 | | | | 1 | | | | 17,772 | | | | (17,771 | ) |
S&P 500 Mini Index | | | 385.00 USD | | | | 4/15/20 | | | | 459 | | | | 45,900 | | | | — | | | | 1,377 | | | | (1,377 | ) |
S&P 500 Mini Index | | | 386.00 USD | | | | 4/15/20 | | | | 212 | | | | 21,200 | | | | — | | | | 424 | | | | (424 | ) |
S&P 500 Mini Index | | | 390.00 USD | | | | 4/15/20 | | | | 556 | | | | 55,600 | | | | — | | | | 1,720 | | | | (1,720 | ) |
| | | | | | |
| 186 | | Semiannual Report | | | March 31, 2020 | | | See accompanying Notes to Financial Statements |
Schedule of Investments
March 31, 2020 (unaudited)
| | | | | | | | | | | | | | | | | | | | | | | | | | | | |
| | | |
| Options purchased contracts outstanding at March 31, 2020 (continued): | | | | | | | | | | |
| Description | | Exercise
Price | | | Expiration
Date | | | Number of
Contracts | | | Notional
Amount | | | Market
Value | | | Cost | | | Unrealized
Appreciation
(Depreciation) | |
Call options (continued): | | | | | | | | | | | | | | | | | | | | | | | | | | | | |
S&P 500 Mini Index | | | 342.00 USD | | | | 4/17/20 | | | | 38 | | | $ | 3,800 | | | $ | 209 | | | $ | 14,934 | | | $ | (14,725 | ) |
S&P 500 Mini Index | | | 346.00 USD | | | | 4/17/20 | | | | 105 | | | | 10,500 | | | | 578 | | | | 19,645 | | | | (19,067 | ) |
S&P 500 Mini Index | | | 347.00 USD | | | | 4/17/20 | | | | 108 | | | | 10,800 | | | | 594 | | | | 21,924 | | | | (21,330 | ) |
S&P 500 Mini Index | | | 388.00 USD | | | | 4/17/20 | | | | 210 | | | | 21,000 | | | | 945 | | | | 420 | | | | 525 | |
S&P 500 Mini Index | | | 395.00 USD | | | | 4/17/20 | | | | 558 | | | | 55,800 | | | | 2,511 | | | | 1,116 | | | | 1,395 | |
S&P 500 Mini Index | | | 343.00 USD | | | | 4/20/20 | | | | 38 | | | | 3,800 | | | | 3 | | | | 16,420 | | | | (16,417 | ) |
S&P 500 Mini Index | | | 347.00 USD | | | | 4/20/20 | | | | 105 | | | | 10,500 | | | | 5 | | | | 18,070 | | | | (18,065 | ) |
S&P 500 Mini Index | | | 350.00 USD | | | | 4/20/20 | | | | 107 | | | | 10,700 | | | | 589 | | | | 18,522 | | | | (17,933 | ) |
S&P 500 Mini Index | | | 390.00 USD | | | | 4/20/20 | | | | 766 | | | | 76,600 | | | | 1 | | | | 2,159 | | | | (2,158 | ) |
S&P 500 Mini Index | | | 337.00 USD | | | | 4/22/20 | | | | 39 | | | | 3,900 | | | | 18 | | | | 23,481 | | | | (23,463 | ) |
S&P 500 Mini Index | | | 345.00 USD | | | | 4/22/20 | | | | 109 | | | | 10,900 | | | | 25 | | | | 28,677 | | | | (28,652 | ) |
S&P 500 Mini Index | | | 347.00 USD | | | | 4/22/20 | | | | 102 | | | | 10,200 | | | | 19 | | | | 18,573 | | | | (18,554 | ) |
S&P 500 Mini Index | | | 385.00 USD | | | | 4/22/20 | | | | 773 | | | | 77,300 | | | | 6 | | | | 2,188 | | | | (2,182 | ) |
S&P 500 Mini Index | | | 325.00 USD | | | | 4/24/20 | | | | 40 | | | | 4,000 | | | | 300 | | | | 34,804 | | | | (34,504 | ) |
S&P 500 Mini Index | | | 385.00 USD | | | | 4/24/20 | | | | 210 | | | | 21,000 | | | | 4 | | | | 859 | | | | (855 | ) |
S&P 500 Mini Index | | | 390.00 USD | | | | 4/24/20 | | | | 360 | | | | 36,000 | | | | 5 | | | | 1,114 | | | | (1,109 | ) |
S&P 500 Mini Index | | | 317.00 USD | | | | 4/27/20 | | | | 41 | | | | 4,100 | | | | 281 | | | | 34,932 | | | | (34,651 | ) |
S&P 500 Mini Index | | | 342.00 USD | | | | 4/27/20 | | | | 107 | | | | 10,700 | | | | 96 | | | | 50,514 | | | | (50,418 | ) |
S&P 500 Mini Index | | | 385.00 USD | | | | 4/27/20 | | | | 583 | | | | 58,300 | | | | 19 | | | | 1,769 | | | | (1,750 | ) |
S&P 500 Mini Index | | | 340.00 USD | | | | 4/29/20 | | | | 106 | | | | 10,600 | | | | 81 | | | | 33,082 | | | | (33,001 | ) |
S&P 500 Mini Index | | | 348.00 USD | | | | 4/29/20 | | | | 212 | | | | 21,200 | | | | 73 | | | | 47,268 | | | | (47,195 | ) |
S&P 500 Mini Index | | | 385.00 USD | | | | 4/29/20 | | | | 212 | | | | 21,200 | | | | 2 | | | | 656 | | | | (654 | ) |
S&P 500 Mini Index | | | 390.00 USD | | | | 4/29/20 | | | | 212 | | | | 21,200 | | | | 1 | | | | 444 | | | | (443 | ) |
S&P 500 Mini Index | | | 340.00 USD | | | | 5/1/20 | | | | 108 | | | | 10,800 | | | | 702 | | | | 19,666 | | | | (18,964 | ) |
S&P 500 Mini Index | | | 390.00 USD | | | | 5/1/20 | | | | 216 | | | | 21,600 | | | | 11 | | | | 668 | | | | (657 | ) |
S&P 500 Mini Index | | | 340.00 USD | | | | 5/4/20 | | | | 110 | | | | 11,000 | | | | 51 | | | | 28,930 | | | | (28,879 | ) |
S&P 500 Mini Index | | | 348.00 USD | | | | 5/4/20 | | | | 220 | | | | 22,000 | | | | 51 | | | | 38,961 | | | | (38,910 | ) |
S&P 500 Mini Index | | | 390.00 USD | | | | 5/4/20 | | | | 220 | | | | 22,000 | | | | 2 | | | | 440 | | | | (438 | ) |
S&P 500 Mini Index | | | 348.00 USD | | | | 5/6/20 | | | | 108 | | | | 10,800 | | | | 37 | | | | 19,872 | | | | (19,835 | ) |
S&P 500 Mini Index | | | 390.00 USD | | | | 5/6/20 | | | | 216 | | | | 21,600 | | | | 210 | | | | 432 | | | | (222 | ) |
S&P 500 Mini Index | | | 347.00 USD | | | | 5/8/20 | | | | 108 | | | | 10,800 | | | | 58 | | | | 23,003 | | | | (22,945 | ) |
S&P 500 Mini Index | | | 390.00 USD | | | | 5/8/20 | | | | 216 | | | | 21,600 | | | | 1 | | | | 432 | | | | (431 | ) |
S&P 500 Mini Index | | | 347.00 USD | | | | 5/11/20 | | | | 108 | | | | 10,800 | | | | 20 | | | | 23,986 | | | | (23,966 | ) |
S&P 500 Mini Index | | | 390.00 USD | | | | 5/11/20 | | | | 216 | | | | 21,600 | | | | 1 | | | | 432 | | | | (431 | ) |
S&P 500 Mini Index | | | 351.00 USD | | | | 5/13/20 | | | | 107 | | | | 10,700 | | | | 79 | | | | 21,945 | | | | (21,866 | ) |
S&P 500 Mini Index | | | 390.00 USD | | | | 5/13/20 | | | | 214 | | | | 21,400 | | | | 10 | | | | 662 | | | | (652 | ) |
S&P 500 Mini Index | | | 351.00 USD | | | | 5/15/20 | | | | 107 | | | | 10,700 | | | | 749 | | | | 23,657 | | | | (22,908 | ) |
S&P 500 Mini Index | | | 390.00 USD | | | | 5/15/20 | | | | 214 | | | | 21,400 | | | | 1,177 | | | | 1,090 | | | | 87 | |
S&P 500 Mini Index | | | 2,800.00 USD | | | | 5/15/20 | | | | 6 | | | | 600 | | | | 26,790 | | | | 63,613 | | | | (36,823 | ) |
S&P 500 Mini Index | | | 351.00 USD | | | | 5/18/20 | | | | 108 | | | | 10,800 | | | | 254 | | | | 23,868 | | | | (23,614 | ) |
S&P 500 Mini Index | | | 395.00 USD | | | | 5/18/20 | | | | 216 | | | | 21,600 | | | | 35 | | | | 432 | | | | (397 | ) |
S&P 500 Mini Index | | | 353.00 USD | | | | 5/20/20 | | | | 107 | | | | 10,700 | | | | 220 | | | | 18,949 | | | | (18,729 | ) |
S&P 500 Mini Index | | | 390.00 USD | | | | 5/20/20 | | | | 214 | | | | 21,400 | | | | 46 | | | | 662 | | | | (616 | ) |
S&P 500 Mini Index | | | 349.00 USD | | | | 5/22/20 | | | | 109 | | | | 10,900 | | | | 31 | | | | 25,407 | | | | (25,376 | ) |
S&P 500 Mini Index | | | 390.00 USD | | | | 5/22/20 | | | | 218 | | | | 21,800 | | | | 2 | | | | 892 | | | | (890 | ) |
| | | | | | | | | | | | | | | | | | | | |
| Total call options | | | | | | | | | | | $ | 3,397,468 | | | $ | 6,437,013 | | | $ | (3,039,545 | ) |
| | | | | | | | | | | | | | | | | | | | |
| | | | | | | |
Put options: | | | | | | | | | | | | | | | | | | | | | | | | | | | | |
CBOE Volatility Index | | | 42.50 USD | | | | 4/15/20 | | | | 1,252 | | | $ | 125,200 | | | $ | 588,440 | | | $ | 1,002,922 | | | $ | (414,482 | ) |
CBOE Volatility Index | | | 60.00 USD | | | | 4/15/20 | | | | 909 | | | | 90,900 | | | | 1,531,665 | | | | 1,388,993 | | | | 142,672 | |
CBOE Volatility Index | | | 65.00 USD | | | | 4/15/20 | | | | 287 | | | | 28,700 | | | | 602,700 | | | | 541,569 | | | | 61,131 | |
CBOE Volatility Index | | | 70.00 USD | | | | 4/15/20 | | | | 287 | | | | 28,700 | | | | 728,980 | | | | 715,204 | | | | 13,776 | |
CBOE Volatility Index | | | 30.00 USD | | | | 4/22/20 | | | | 574 | | | | 57,400 | | | | 33,579 | | | | 53,020 | | | | (19,441 | ) |
CBOE Volatility Index | | | 70.00 USD | | | | 4/22/20 | | | | 287 | | | | 28,700 | | | | 772,317 | | | | 827,562 | | | | (55,245 | ) |
CBOE Volatility Index | | | 32.50 USD | | | | 5/20/20 | | | | 2,113 | | | | 211,300 | | | | 760,680 | | | | 1,356,665 | | | | (595,985 | ) |
S&P 500 Index | | | 2,200.00 USD | | | | 4/8/20 | | | | 40 | | | | 4,000 | | | | 46,800 | | | | 59,372 | | | | (12,572 | ) |
S&P 500 Index | | | 2,675.00 USD | | | | 4/8/20 | | | | 20 | | | | 2,000 | | | | 265,100 | | | | 242,893 | | | | 22,207 | |
S&P 500 Index | | | 2,200.00 USD | | | | 4/9/20 | | | | 40 | | | | 4,000 | | | | 67,520 | | | | 67,520 | | | | — | |
S&P 500 Index | | | 2,675.00 USD | | | | 4/9/20 | | | | 20 | | | | 2,000 | | | | 273,400 | | | | 248,904 | | | | 24,496 | |
| | | | | | | | |
| See accompanying Notes to Financial Statements | | | March 31, 2020 | | | Semiannual Report | | | 187 | |
Schedule of Investments
March 31, 2020 (unaudited)
| | | | | | | | | | | | | | | | | | | | | | | | | | | | |
| | | |
| Options purchased contracts outstanding at March 31, 2020 (continued): | | | | | | | | | | |
| Description | | Exercise
Price | | | Expiration
Date | | | Number of
Contracts | | | Notional
Amount | | | Market
Value | | | Cost | | | Unrealized
Appreciation
(Depreciation) | |
Put options (continued): | | | | | | | | | | | | | | | | | | | | | | | | | | | | |
S&P 500 Index | | | 2,990.00 USD | | | | 4/9/20 | | | | 210 | | | $ | 21,000 | | | $ | 8,821,050 | | | $ | 1,233,256 | | | $ | 7,587,794 | |
S&P 500 Index | | | 2,200.00 USD | | | | 4/13/20 | | | | 40 | | | | 4,000 | | | | 70,000 | | | | 78,340 | | | | (8,340 | ) |
S&P 500 Index | | | 2,675.00 USD | | | | 4/13/20 | | | | 20 | | | | 2,000 | | | | 284,300 | | | | 258,267 | | | | 26,033 | |
S&P 500 Index | | | 2,200.00 USD | | | | 4/15/20 | | | | 40 | | | | 4,000 | | | | 89,400 | | | | 96,938 | | | | (7,538 | ) |
S&P 500 Index | | | 2,675.00 USD | | | | 4/15/20 | | | | 20 | | | | 2,000 | | | | 299,600 | | | | 278,275 | | | | 21,325 | |
S&P 500 Index | | | 2,050.00 USD | | | | 4/17/20 | | | | 210 | | | | 21,000 | | | | 308,700 | | | | 8,536 | | | | 300,164 | |
S&P 500 Index | | | 2,910.00 USD | | | | 4/17/20 | | | | 6 | | | | 600 | | | | 206,340 | | | | 64,453 | | | | 141,887 | |
S&P 500 Index | | | 2,920.00 USD | | | | 4/17/20 | | | | 10 | | | | 1,000 | | | | 353,550 | | | | 59,420 | | | | 294,130 | |
S&P 500 Index | | | 2,950.00 USD | | | | 4/17/20 | | | | 7 | | | | 700 | | | | 268,030 | | | | 59,781 | | | | 208,249 | |
S&P 500 Index | | | 3,040.00 USD | | | | 4/17/20 | | | | 210 | | | | 21,000 | | | | 9,914,100 | | | | 1,916,711 | | | | 7,997,389 | |
S&P 500 Index | | | 2,970.00 USD | | | | 4/24/20 | | | | 200 | | | | 20,000 | | | | 8,046,000 | | | | 1,842,149 | | | | 6,203,851 | |
S&P 500 Mini Index | | | 2,850.00 USD | | | | 4/3/20 | | | | 215 | | | | 21,500 | | | | 5,995,275 | | | | 1,687,030 | | | | 4,308,245 | |
S&P 500 Mini Index | | | 2,800.00 USD | | | | 4/17/20 | | | | 215 | | | | 21,500 | | | | 5,210,525 | | | | 1,051,800 | | | | 4,158,725 | |
S&P 500 Mini Index | | | 2,150.00 USD | | | | 6/19/20 | | | | 8 | | | | 800 | | | | 64,120 | | | | 149,605 | | | | (85,485 | ) |
S&P 500 Mini Index | | | 2,100.00 USD | | | | 8/21/20 | | | | 7 | | | | 700 | | | | 70,665 | | | | 137,485 | | | | (66,820 | ) |
S&P 500 Mini Index | | | 2,200.00 USD | | | | 8/21/20 | | | | 25 | | | | 2,500 | | | | 308,250 | | | | 585,266 | | | | (277,016 | ) |
| | | | | | | | | | | | | | | | | | | | |
| Total put options | | | | | | | | | | | $ | 45,981,086 | | | $ | 16,011,936 | | | $ | 29,969,150 | |
| | | | | | | | | | | | | | | | | | | | |
| Total options purchased contracts | | | | | | | | | | | $ | 49,378,554 | | | $ | 22,448,949 | | | $ | 26,929,605 | |
| | | | | | | | | | | | | | | | | | | | |
| | | | | | | | | | | | | | | | | | | | | | | | | | | | |
| | | |
| Options written contracts outstanding at March 31, 2020: | | | | | | | | | | |
| Description | | Exercise
Price | | | Expiration
Date | | | Number of
Contracts | | | Notional
Amount | | | Market
Value | | | Premiums
Received | | | Unrealized
Appreciation
(Depreciation) | |
Call options: | | | | | | | | | | | | | | | | | | | | | | | | | | | | |
CBOE Volatility Index | | | 67.50 USD | | | | 4/15/20 | | | | (4,449 | ) | | $ | (444,900 | ) | | $ | (1,101,128 | ) | | $ | (1,948,609 | ) | | $ | 847,481 | |
CBOE Volatility Index | | | 67.50 USD | | | | 4/22/20 | | | | (861 | ) | | | (86,100 | ) | | | (369,369 | ) | | | (451,328 | ) | | | 81,959 | |
E-mini S&P 500 Index | | | 350.00 USD | | | | 4/3/20 | | | | (1,785 | ) | | | (178,500 | ) | | | (12,495 | ) | | | (146,246 | ) | | | 133,751 | |
E-mini S&P 500 Index | | | 342.00 USD | | | | 4/6/20 | | | | (580 | ) | | | (58,000 | ) | | | (2,610 | ) | | | (39,386 | ) | | | 36,776 | |
E-mini S&P 500 Index | | | 350.00 USD | | | | 4/6/20 | | | | (324 | ) | | | (32,400 | ) | | | (1,458 | ) | | | (20,412 | ) | | | 18,954 | |
E-mini S&P 500 Index | | | 351.00 USD | | | | 4/9/20 | | | | (1,020 | ) | | | (102,000 | ) | | | (4,590 | ) | | | (44,784 | ) | | | 40,194 | |
E-mini S&P 500 Index | | | 354.00 USD | | | | 4/9/20 | | | | (480 | ) | | | (48,000 | ) | | | (2,160 | ) | | | (13,875 | ) | | | 11,715 | |
E-mini S&P 500 Index | | | 352.00 USD | | | | 4/17/20 | | | | (315 | ) | | | (31,500 | ) | | | (1,575 | ) | | | (24,540 | ) | | | 22,965 | |
E-mini S&P 500 Index | | | 356.00 USD | | | | 4/17/20 | | | | (324 | ) | | | (32,400 | ) | | | (1,620 | ) | | | (15,552 | ) | | | 13,932 | |
E-mini S&P 500 Index | | | 358.00 USD | | | | 4/17/20 | | | | (380 | ) | | | (38,000 | ) | | | (1,900 | ) | | | (12,540 | ) | | | 10,640 | |
E-mini S&P 500 Index | | | 346.00 USD | | | | 4/24/20 | | | | (295 | ) | | | (29,500 | ) | | | (1,770 | ) | | | (20,917 | ) | | | 19,147 | |
E-mini S&P 500 Index | | | 353.00 USD | | | | 4/24/20 | | | | (315 | ) | | | (31,500 | ) | | | (1,732 | ) | | | (18,555 | ) | | | 16,823 | |
E-mini S&P 500 Index | | | 358.00 USD | | | | 5/15/20 | | | | (321 | ) | | | (32,100 | ) | | | (2,086 | ) | | | (29,180 | ) | | | 27,094 | |
S&P 500 Index | | | 2,850.00 USD | | | | 4/3/20 | | | | (215 | ) | | | (21,500 | ) | | | (8,600 | ) | | | (8,366,995 | ) | | | 8,358,395 | |
S&P 500 Index | | | 2,725.00 USD | | | | 4/8/20 | | | | (60 | ) | | | (6,000 | ) | | | (80,700 | ) | | | (144,060 | ) | | | 63,360 | |
S&P 500 Index | | | 2,780.00 USD | | | | 4/8/20 | | | | (92 | ) | | | (9,200 | ) | | | (46,000 | ) | | | (53,271 | ) | | | 7,271 | |
S&P 500 Index | | | 2,725.00 USD | | | | 4/9/20 | | | | (60 | ) | | | (6,000 | ) | | | (96,600 | ) | | | (160,654 | ) | | | 64,054 | |
S&P 500 Index | | | 2,990.00 USD | | | | 4/9/20 | | | | (210 | ) | | | (21,000 | ) | | | (12,075 | ) | | | (7,346,064 | ) | | | 7,333,989 | |
S&P 500 Index | | | 2,725.00 USD | | | | 4/13/20 | | | | (60 | ) | | | (6,000 | ) | | | (120,000 | ) | | | (200,993 | ) | | | 80,993 | |
S&P 500 Index | | | 2,725.00 USD | | | | 4/15/20 | | | | (60 | ) | | | (6,000 | ) | | | (153,000 | ) | | | (232,769 | ) | | | 79,769 | |
S&P 500 Index | | | 3,040.00 USD | | | | 4/17/20 | | | | (210 | ) | | | (21,000 | ) | | | (24,675 | ) | | | (7,383,883 | ) | | | 7,359,208 | |
S&P 500 Index | | | 3,060.00 USD | | | | 4/17/20 | | | | (6 | ) | | | (600 | ) | | | (555 | ) | | | (64,727 | ) | | | 64,172 | |
S&P 500 Index | | | 3,090.00 USD | | | | 4/17/20 | | | | (10 | ) | | | (1,000 | ) | | | (750 | ) | | | (117,180 | ) | | | 116,430 | |
S&P 500 Index | | | 3,100.00 USD | | | | 4/17/20 | | | | (7 | ) | | | (700 | ) | | | (420 | ) | | | (69,663 | ) | | | 69,243 | |
S&P 500 Index | | | 2,970.00 USD | | | | 4/24/20 | | | | (200 | ) | | | (20,000 | ) | | | (56,500 | ) | | | (7,663,165 | ) | | | 7,606,665 | |
S&P 500 Mini Index | | | 343.00 USD | | | | 4/1/20 | | | | (324 | ) | | | (32,400 | ) | | | — | | | | (25,566 | ) | | | 25,566 | |
S&P 500 Mini Index | | | 354.00 USD | | | | 4/1/20 | | | | (1,701 | ) | | | (170,100 | ) | | | — | | | | (32,198 | ) | | | 32,198 | |
S&P 500 Mini Index | | | 318.00 USD | | | | 4/3/20 | | | | (293 | ) | | | (29,300 | ) | | | (2,051 | ) | | | (76,382 | ) | | | 74,331 | |
S&P 500 Mini Index | | | 315.00 USD | | | | 4/6/20 | | | | (324 | ) | | | (32,400 | ) | | | (1,458 | ) | | | (142,560 | ) | | | 141,102 | |
S&P 500 Mini Index | | | 326.00 USD | | | | 4/6/20 | | | | (390 | ) | | | (39,000 | ) | | | (1,755 | ) | | | (44,850 | ) | | | 43,095 | |
S&P 500 Mini Index | | | 351.00 USD | | | | 4/6/20 | | | | (390 | ) | | | (39,000 | ) | | | — | | | | (21,060 | ) | | | 21,060 | |
S&P 500 Mini Index | | | 336.00 USD | | | | 4/8/20 | | | | (562 | ) | | | (56,200 | ) | | | (2 | ) | | | (32,596 | ) | | | 32,594 | |
S&P 500 Mini Index | | | 348.00 USD | | | | 4/8/20 | | | | (306 | ) | | | (30,600 | ) | | | — | | | | (19,584 | ) | | | 19,584 | |
S&P 500 Mini Index | | | 351.00 USD | | | | 4/8/20 | | | | (704 | ) | | | (70,400 | ) | | | — | | | | (41,536 | ) | | | 41,536 | |
S&P 500 Mini Index | | | 355.00 USD | | | | 4/8/20 | | | | (806 | ) | | | (80,600 | ) | | | — | | | | (44,254 | ) | | | 44,254 | |
| | | | | | |
| 188 | | Semiannual Report | | | March 31, 2020 | | | See accompanying Notes to Financial Statements |
Schedule of Investments
March 31, 2020 (unaudited)
| | | | | | | | | | | | | | | | | | | | | | | | | | | | |
| | | |
| Options written contracts outstanding at March 31, 2020 (continued): | | | | | | | | | | |
| Description | | Exercise
Price | | | Expiration
Date | | | Number of
Contracts | | | Notional
Amount | | | Market
Value | | | Premiums
Received | | | Unrealized
Appreciation
(Depreciation) | |
Call options (continued): | | | | | | | | | | | | | | | | | | | | | | | | | | | | |
S&P 500 Mini Index | | | 344.00 USD | | | | 4/13/20 | | | | (500 | ) | | $ | (50,000 | ) | | $ | (17 | ) | | $ | (30,453 | ) | | $ | 30,436 | |
S&P 500 Mini Index | | | 350.00 USD | | | | 4/13/20 | | | | (321 | ) | | | (32,100 | ) | | | (1,444 | ) | | | (12,198 | ) | | | 10,754 | |
S&P 500 Mini Index | | | 353.00 USD | | | | 4/13/20 | | | | (157 | ) | | | (15,700 | ) | | | (2 | ) | | | (7,678 | ) | | | 7,676 | |
S&P 500 Mini Index | | | 354.00 USD | | | | 4/13/20 | | | | (701 | ) | | | (70,100 | ) | | | (7 | ) | | | (42,695 | ) | | | 42,688 | |
S&P 500 Mini Index | | | 338.00 USD | | | | 4/15/20 | | | | (510 | ) | | | (51,000 | ) | | | (9 | ) | | | (35,190 | ) | | | 35,181 | |
S&P 500 Mini Index | | | 354.00 USD | | | | 4/15/20 | | | | (321 | ) | | | (32,100 | ) | | | (1 | ) | | | (19,230 | ) | | | 19,229 | |
S&P 500 Mini Index | | | 355.00 USD | | | | 4/15/20 | | | | (530 | ) | | | (53,000 | ) | | | (2 | ) | | | (23,271 | ) | | | 23,269 | |
S&P 500 Mini Index | | | 356.00 USD | | | | 4/15/20 | | | | (380 | ) | | | (38,000 | ) | | | (1 | ) | | | (18,584 | ) | | | 18,583 | |
S&P 500 Mini Index | | | 357.00 USD | | | | 4/20/20 | | | | (315 | ) | | | (31,500 | ) | | | (7 | ) | | | (13,230 | ) | | | 13,223 | |
S&P 500 Mini Index | | | 360.00 USD | | | | 4/20/20 | | | | (701 | ) | | | (70,100 | ) | | | (12 | ) | | | (23,769 | ) | | | 23,757 | |
S&P 500 Mini Index | | | 353.00 USD | | | | 4/22/20 | | | | (306 | ) | | | (30,600 | ) | | | (34 | ) | | | (22,615 | ) | | | 22,581 | |
S&P 500 Mini Index | | | 354.00 USD | | | | 4/22/20 | | | | (327 | ) | | | (32,700 | ) | | | (34 | ) | | | (19,263 | ) | | | 19,229 | |
S&P 500 Mini Index | | | 356.00 USD | | | | 4/22/20 | | | | (390 | ) | | | (39,000 | ) | | | (34 | ) | | | (13,224 | ) | | | 13,190 | |
S&P 500 Mini Index | | | 340.00 USD | | | | 4/27/20 | | | | (410 | ) | | | (41,000 | ) | | | (433 | ) | | | (32,390 | ) | | | 31,957 | |
S&P 500 Mini Index | | | 354.00 USD | | | | 4/27/20 | | | | (321 | ) | | | (32,100 | ) | | | (112 | ) | | | (28,218 | ) | | | 28,106 | |
S&P 500 Mini Index | | | 347.00 USD | | | | 4/29/20 | | | | (318 | ) | | | (31,800 | ) | | | (121 | ) | | | (38,130 | ) | | | 38,009 | |
S&P 500 Mini Index | | | 358.00 USD | | | | 4/29/20 | | | | (424 | ) | | | (42,400 | ) | | | (53 | ) | | | (20,736 | ) | | | 20,683 | |
S&P 500 Mini Index | | | 2,950.00 USD | | | | 4/30/20 | | | | (201 | ) | | | (20,100 | ) | | | (101,505 | ) | | | (791,529 | ) | | | 690,024 | |
S&P 500 Mini Index | | | 346.00 USD | | | | 5/1/20 | | | | (108 | ) | | | (10,800 | ) | | | (111 | ) | | | (6,362 | ) | | | 6,251 | |
S&P 500 Mini Index | | | 353.00 USD | | | | 5/1/20 | | | | (324 | ) | | | (32,400 | ) | | | (203 | ) | | | (25,920 | ) | | | 25,717 | |
S&P 500 Mini Index | | | 346.00 USD | | | | 5/4/20 | | | | (330 | ) | | | (33,000 | ) | | | (91 | ) | | | (38,940 | ) | | | 38,849 | |
S&P 500 Mini Index | | | 357.00 USD | | | | 5/4/20 | | | | (660 | ) | | | (66,000 | ) | | | (74 | ) | | | (32,340 | ) | | | 32,266 | |
S&P 500 Mini Index | | | 353.00 USD | | | | 5/6/20 | | | | (324 | ) | | | (32,400 | ) | | | (67 | ) | | | (30,456 | ) | | | 30,389 | |
S&P 500 Mini Index | | | 354.00 USD | | | | 5/8/20 | | | | (324 | ) | | | (32,400 | ) | | | (79 | ) | | | (27,216 | ) | | | 27,137 | |
S&P 500 Mini Index | | | 354.00 USD | | | | 5/11/20 | | | | (324 | ) | | | (32,400 | ) | | | (32 | ) | | | (23,946 | ) | | | 23,914 | |
S&P 500 Mini Index | | | 358.00 USD | | | | 5/13/20 | | | | (321 | ) | | | (32,100 | ) | | | (143 | ) | | | (25,329 | ) | | | 25,186 | |
S&P 500 Mini Index | | | 2,950.00 USD | | | | 5/15/20 | | | | (68 | ) | | | (6,800 | ) | | | (76,160 | ) | | | (159,992 | ) | | | 83,832 | |
S&P 500 Mini Index | | | 360.00 USD | | | | 5/18/20 | | | | (324 | ) | | | (32,400 | ) | | | (434 | ) | | | (22,032 | ) | | | 21,598 | |
S&P 500 Mini Index | | | 363.00 USD | | | | 5/20/20 | | | | (321 | ) | | | (32,100 | ) | | | (353 | ) | | | (12,489 | ) | | | 12,136 | |
S&P 500 Mini Index | | | 358.00 USD | | | | 5/22/20 | | | | (327 | ) | | | (32,700 | ) | | | (39 | ) | | | (24,822 | ) | | | 24,783 | |
| | | | | | | | | | | | | | | | | | | | |
| Total call options | | | | | | | | | | | $ | (2,291,248 | ) | | $ | (36,692,181 | ) | | $ | 34,400,933 | |
| | | | | | | | | | | | | | | | | | | | |
| | | | | | | |
Put options: | | | | | | | | | | | | | | | | | | | | | | | | | | | | |
CBOE Volatility Index | | | 37.50 USD | | | | 4/15/20 | | | | (4,512 | ) | | $ | (451,200 | ) | | $ | (1,105,440 | ) | | $ | (1,030,218 | ) | | $ | (75,222 | ) |
CBOE Volatility Index | | | 40.00 USD | | | | 4/15/20 | | | | (1,827 | ) | | | (182,700 | ) | | | (630,315 | ) | | | (599,766 | ) | | | (30,549 | ) |
CBOE Volatility Index | | | 45.00 USD | | | | 4/15/20 | | | | (3,588 | ) | | | (358,800 | ) | | | (2,152,800 | ) | | | (2,001,886 | ) | | | (150,914 | ) |
CBOE Volatility Index | | | 42.50 USD | | | | 4/22/20 | | | | (861 | ) | | | (86,100 | ) | | | (415,433 | ) | | | (488,480 | ) | | | 73,047 | |
CBOE Volatility Index | | | 29.00 USD | | | | 5/20/20 | | | | (3,170 | ) | | | (317,000 | ) | | | (697,400 | ) | | | (449,197 | ) | | | (248,203 | ) |
S&P 500 Index | | | 2,400.00 USD | | | | 4/8/20 | | | | (60 | ) | | | (6,000 | ) | | | (198,900 | ) | | | (201,280 | ) | | | 2,380 | |
S&P 500 Index | | | 2,400.00 USD | | | | 4/9/20 | | | | (60 | ) | | | (6,000 | ) | | | (226,200 | ) | | | (223,025 | ) | | | (3,175 | ) |
S&P 500 Index | | | 2,400.00 USD | | | | 4/13/20 | | | | (60 | ) | | | (6,000 | ) | | | (259,500 | ) | | | (252,122 | ) | | | (7,378 | ) |
S&P 500 Index | | | 2,400.00 USD | | | | 4/15/20 | | | | (60 | ) | | | (6,000 | ) | | | (305,100 | ) | | | (297,478 | ) | | | (7,622 | ) |
S&P 500 Index | | | 2,800.00 USD | | | | 4/17/20 | | | | (215 | ) | | | (21,500 | ) | | | (5,246,000 | ) | | | (1,228,331 | ) | | | (4,017,669 | ) |
S&P 500 Index | | | 3,060.00 USD | | | | 4/17/20 | | | | (6 | ) | | | (600 | ) | | | (295,140 | ) | | | (94,907 | ) | | | (200,233 | ) |
S&P 500 Index | | | 3,090.00 USD | | | | 4/17/20 | | | | (10 | ) | | | (1,000 | ) | | | (521,700 | ) | | | (102,480 | ) | | | (419,220 | ) |
S&P 500 Index | | | 3,100.00 USD | | | | 4/17/20 | | | | (7 | ) | | | (700 | ) | | | (372,120 | ) | | | (93,540 | ) | | | (278,580 | ) |
S&P 500 Mini Index | | | 2,050.00 USD | | | | 4/17/20 | | | | (210 | ) | | | (21,000 | ) | | | (290,850 | ) | | | (1,480,080 | ) | | | 1,189,230 | |
S&P 500 Mini Index | | | 2,150.00 USD | | | | 6/19/20 | | | | (8 | ) | | | (800 | ) | | | (63,440 | ) | | | (138,112 | ) | | | 74,672 | |
S&P 500 Mini Index | | | 2,100.00 USD | | | | 8/21/20 | | | | (7 | ) | | | (700 | ) | | | (70,245 | ) | | | (42,342 | ) | | | (27,903 | ) |
S&P 500 Mini Index | | | 2,200.00 USD | | | | 8/21/20 | | | | (25 | ) | | | (2,500 | ) | | | (306,750 | ) | | | (142,448 | ) | | | (164,302 | ) |
| | | | | | | | | | | | | | | | | | | | |
| Total put options | | | | | | | | | | | $ | (13,157,333 | ) | | $ | (8,865,692 | ) | | $ | (4,291,641 | ) |
| | | | | | | | | | | | | | | | | | | | |
| Total options written contracts | | | | | | | | | | | $ | (15,448,581 | ) | | $ | (45,557,873 | ) | | $ | 30,109,292 | |
| | | | | | | | | | | | | | | | | | | | |
(e) At March 31, 2020, the Fund received $36,003 in cash as collateral for options written.
Glossary:
CBOE—Chicago Board Options Exchange
| | | | | | | | |
| See accompanying Notes to Financial Statements | | | March 31, 2020 | | | Semiannual Report | | | 189 | |
Schedule of Investments
March 31, 2020 (unaudited)
AllianzGI U.S. Equity Hedged Fund
| | | | | | | | |
| | | Shares | | | Value | |
|
| Exchange-Traded Funds—91.4% | |
SPDR S&P 500 (a)
(cost—$1,741,224) | | | 7,095 | | | | $1,828,737 | |
| | | | | | | | |
| Total Options Purchased—7.0% (cost—$65,812) (b)(c)(d) | | | | | | | 140,450 | |
| | | | | | | | |
| |
Total Investments, before
options written
(cost—$1,807,036)—98.4% | | | | 1,969,187 | |
| | | | | | | | |
Total Options Written —0.0%
(premiums received—$4,303) (b)(c)(d) | | | | (668 | ) |
| | | | | | | | |
| |
Total Investments, net of
options written
(cost—$1,802,733)—98.4% | | | | 1,968,519 | |
| | | | | | | | |
| |
Other assets less
other liabilities—1.6% | | | | 33,358 | |
| | | | | | | | |
| |
| Net Assets—100.0% | | | | $2,001,877 | |
| | | | | | | | |
Notes to Schedule of Investments:
(a) All or partial amount segregated for the benefit of the counterparty as collateral for options written.
(b)Non-income producing.
(c) Exchange traded-Chicago Board Options Exchange.
(d) Exchange traded option contracts outstanding at March 31, 2020:
| | | | | | | | | | | | | | | | | | | | | | | | | | | | |
| | | |
| Options purchased contracts outstanding at March 31, 2020: | | | | | | | | | | |
| Description | | Exercise
Price | | | Expiration
Date | | | Number of
Contracts | | | Notional
Amount | | | Market
Value | | | Cost | | | Unrealized
Appreciation
(Depreciation) | |
| | | | | | | |
Call options: | | | | | | | | | | | | | | | | | | | | | | | | | | | | |
S&P 500 Mini Index | | | 3,650.00 USD | | | | 4/24/20 | | | | 3 | | | $ | 300 | | | $ | 60 | | | $ | 107 | | | $ | (47 | ) |
| | | | | | | | | | | | | | | | | | | | |
Put options: | | | | | | | | | | | | | | | | | | | | | | | | | | | | |
S&P 500 Index | | | 2,550.00 USD | | | | 4/17/20 | | | | 1 | | | $ | 100 | | | $ | 9,735 | | | $ | 6,869 | | | $ | 2,866 | |
S&P 500 Index | | | 2,500.00 USD | | | | 5/15/20 | | | | 1 | | | | 100 | | | | 13,735 | | | | 7,412 | | | | 6,323 | |
S&P 500 Index | | | 2,575.00 USD | | | | 6/19/20 | | | | 2 | | | | 200 | | | | 39,630 | | | | 14,679 | | | | 24,951 | |
S&P 500 Index | | | 2,625.00 USD | | | | 7/17/20 | | | | 1 | | | | 100 | | | | 23,965 | | | | 7,437 | | | | 16,528 | |
S&P 500 Index | | | 2,450.00 USD | | | | 8/21/20 | | | | 1 | | | | 100 | | | | 19,370 | | | | 7,803 | | | | 11,567 | |
S&P 500 Index | | | 2,575.00 USD | | | | 9/18/20 | | | | 1 | | | | 100 | | | | 25,245 | | | | 7,804 | | | | 17,441 | |
S&P 500 Mini Index | | | 1,800.00 USD | | | | 3/19/21 | | | | 1 | | | | 100 | | | | 8,710 | | | | 13,701 | | | | (4,991 | ) |
| | | | | | | | | | | | | | | | | | | | |
| Total put options | | | | | | | | | | | $ | 140,390 | | | $ | 65,705 | | | $ | 74,685 | |
| | | | | | | | | | | | | | | | | | | | |
| Total options purchased contracts | | | | | | | | | | | $ | 140,450 | | | $ | 65,812 | | | $ | 74,638 | |
| | | | | | | | | | | | | | | | | | | | |
| | | | | | | | | | | | | | | | | | | | | | | | | | | | |
| | | |
| Options written contracts outstanding at March 31, 2020: | | | | | | | | | | |
| Description | | Exercise
Price | | | Expiration
Date | | | Number of
Contracts | | | Notional
Amount | | | Market
Value | | | Premiums
Received | | | Unrealized
Appreciation | |
| | | | | | | |
Call options: | | | | | | | | | | | | | | | | | | | | | | | | | | | | |
S&P 500 Mini Index | | | 3,000.00 USD | | | | 4/24/20 | | | | (3 | ) | | $ | (300 | ) | | $ | (668 | ) | | $ | (4,303 | ) | | $ | 3,635 | |
| | | | | | | | | | | | | | | | | | | | |
(e) At March 31, 2020, the Fund pledged $7,613 in cash as collateral for options written.
| | | | | | |
| 190 | | Semiannual Report | | | March 31, 2020 | | | See accompanying Notes to Financial Statements |
Schedule of Investments
March 31, 2020 (unaudited)
AllianzGI Ultra Micro Cap Fund
| | | | | | | | |
| | | Shares | | | Value | |
| |
| Common Stock—98.3% | | | | | |
|
| Aerospace & Defense—0.8% | |
| | |
| Ducommun, Inc. (a) | | | 3,049 | | | | $75,768 | |
| | | | | | | | |
|
| Banks—4.7% | |
Atlantic Capital Bancshares, Inc. (a) | | | 6,934 | | | | 82,307 | |
First Foundation, Inc. | | | 6,726 | | | | 68,740 | |
Heritage Commerce Corp. | | | 10,353 | | | | 79,407 | |
People’s Utah Bancorp | | | 3,922 | | | | 75,969 | |
Preferred Bank | | | 2,736 | | | | 92,532 | |
Tristate Capital Holdings, Inc. (a) | | | 4,569 | | | | 44,182 | |
| | | | | | | | |
| | | | | | | 443,137 | |
| | | | | | | | |
| |
| Biotechnology—16.3% | | | | | |
Adverum Biotechnologies, Inc. (a) | | | 5,499 | | | | 53,725 | |
Avrobio, Inc. (a) | | | 2,219 | | | | 34,528 | |
BioSpecifics Technologies Corp. (a) | | | 1,946 | | | | 110,085 | |
Castle Biosciences, Inc. (a) | | | 3,650 | | | | 108,806 | |
Dicerna Pharmaceuticals, Inc. (a) | | | 4,845 | | | | 89,003 | |
Dynavax Technologies Corp. (a) | | | 7,696 | | | | 27,167 | |
Eiger BioPharmaceuticals, Inc. (a) | | | 2,150 | | | | 14,620 | |
Fortress Biotech, Inc. (a) | | | 16,242 | | | | 30,697 | |
Homology Medicines, Inc. (a) | | | 2,788 | | | | 43,326 | |
Intellia Therapeutics, Inc. (a) | | | 5,676 | | | | 69,417 | |
Kadmon Holdings, Inc. (a) | | | 16,822 | | | | 70,484 | |
Karyopharm Therapeutics, Inc. (a) | | | 2,578 | | | | 49,523 | |
Kindred Biosciences, Inc. (a) | | | 8,451 | | | | 33,804 | |
Krystal Biotech, Inc. (a) | | | 1,121 | | | | 48,472 | |
Kura Oncology, Inc. (a) | | | 4,664 | | | | 46,407 | |
MeiraGTx Holdings PLC (a) | | | 2,199 | | | | 29,555 | |
Precision BioSciences, Inc. (a) | | | 3,525 | | | | 21,256 | |
Progenics Pharmaceuticals, Inc. (a) | | | 8,400 | | | | 31,920 | |
Rocket Pharmaceuticals, Inc. (a) | | | 2,587 | | | | 36,089 | |
Stemline Therapeutics, Inc. (a) | | | 4,531 | | | | 21,930 | |
TG Therapeutics, Inc. (a) | | | 6,982 | | | | 68,703 | |
Twist Bioscience Corp. (a) | | | 2,323 | | | | 71,037 | |
Vanda Pharmaceuticals, Inc. (a) | | | 4,312 | | | | 44,672 | |
Veracyte, Inc. (a) | | | 9,519 | | | | 231,407 | |
Vericel Corp. (a) | | | 5,843 | | | | 53,580 | |
Viking Therapeutics, Inc. (a) | | | 8,181 | | | | 38,287 | |
Voyager Therapeutics, Inc. (a) | | | 3,471 | | | | 31,760 | |
ZIOPHARM Oncology, Inc. (a) | | | 17,177 | | | | 42,084 | |
| | | | | | | | |
| | | | | | | 1,552,344 | |
| | | | | | | | |
| |
| Construction & Engineering—2.8% | | | | | |
NV5 Global, Inc. (a) | | | 3,930 | | | | 162,270 | |
Sterling Construction Co., Inc. (a) | | | 10,548 | | | | 100,206 | |
| | | | | | | | |
| | | | | | | 262,476 | |
| | | | | | | | |
| |
| Construction Materials—0.5% | | | | | |
U.S. Concrete, Inc. (a) | | | 2,347 | | | | 42,575 | |
| | | | | | | | |
|
| Diversified Consumer Services—1.6% | |
Aspen Group, Inc. (a) | | | 12,110 | | | | 96,759 | |
Carriage Services, Inc. | | | 3,607 | | | | 58,253 | |
| | | | | | | | |
| | | | | | | 155,012 | |
| | | | | | | | |
| |
| Electrical Equipment—0.8% | | | | | |
Allied Motion Technologies, Inc. | | | 3,024 | | | | 71,669 | |
| | | | | | | | |
| |
| Electronic Equipment, Instruments & Components—1.6% | | | | | |
Iteris, Inc. (a) | | | 19,394 | | | | 62,061 | |
Napco Security Technologies, Inc. (a) | | | 5,790 | | | | 87,834 | |
| | | | | | | | |
| | | | | | | 149,895 | |
| | | | | | | | |
| | | | | | | | |
| | | Shares | | | Value | |
| |
| Energy Equipment & Services—0.4% | | | | | |
DMC Global, Inc. | | | 1,418 | | | $ | 32,628 | |
| | | | | | | | |
| |
| Food Products—1.7% | | | | | |
John B Sanfilippo & Son, Inc. | | | 1,820 | | | | 162,708 | |
| | | | | | | | |
|
| Healthcare Equipment & Supplies—15.6% | |
Alphatec Holdings, Inc. (a) | | | 20,651 | | | | 71,246 | |
Antares Pharma, Inc. (a) | | | 35,821 | | | | 84,538 | |
Axogen, Inc. (a) | | | 6,109 | | | | 63,534 | |
Axonics Modulation Technologies, Inc. (a) | | | 4,410 | | | | 112,058 | |
BioLife Solutions, Inc. (a) | | | 8,076 | | | | 76,722 | |
CryoLife, Inc. (a) | | | 3,120 | | | | 52,790 | |
CryoPort, Inc. (a) | | | 12,558 | | | | 214,365 | |
Mesa Laboratories, Inc. | | | 664 | | | | 150,124 | |
OrthoPediatrics Corp. (a) | | | 5,141 | | | | 203,789 | |
Quotient Ltd. (a) | | | 15,094 | | | | 59,621 | |
Surmodics, Inc. (a) | | | 2,637 | | | | 87,865 | |
Tactile Systems Technology, Inc. (a) | | | 3,240 | | | | 130,118 | |
Zynex, Inc. (a) | | | 16,236 | | | | 179,733 | |
| | | | | | | | |
| | | | | | | 1,486,503 | |
| | | | | | | | |
|
| Healthcare Providers & Services—7.6% | |
Addus HomeCare Corp. (a) | | | 2,241 | | | | 151,491 | |
BioTelemetry, Inc. (a) | | | 2,839 | | | | 109,330 | |
Catasys, Inc. (a) | | | 9,155 | | | | 139,431 | |
Fulgent Genetics, Inc. (a) | | | 11,769 | | | | 126,634 | |
Joint Corp. (a) | | | 9,059 | | | | 98,290 | |
RadNet, Inc. (a) | | | 9,519 | | | | 100,045 | |
| | | | | | | | |
| | | | | | | 725,221 | |
| | | | | | | | |
| |
| Healthcare Technology—4.7% | | | | | |
Icad, Inc. (a) | | | 15,338 | | | | 112,581 | |
OptimizeRx Corp. (a) | | | 6,770 | | | | 61,336 | |
Tabula Rasa HealthCare, Inc. (a) | | | 3,726 | | | | 194,833 | |
Vocera Communications, Inc. (a) | | | 3,860 | | | | 81,986 | |
| | | | | | | | |
| | | | | | | 450,736 | |
| | | | | | | | |
| |
| Hotels, Restaurants & Leisure—0.7% | | | | | |
Kura Sushi USA, Inc., Class A (a) | | | 5,321 | | | | 63,639 | |
| | | | | | | | |
| |
| Household Durables—1.8% | | | | | |
Green Brick Partners, Inc. (a) | | | 10,746 | | | | 86,505 | |
LGI Homes, Inc. (a) | | | 1,766 | | | | 79,735 | |
| | | | | | | | |
| | | | | | | 166,240 | |
| | | | | | | | |
|
| Interactive Media & Services—2.7% | |
EverQuote, Inc., Class A (a) | | | 6,949 | | | | 182,411 | |
QuinStreet, Inc. (a) | | | 9,714 | | | | 78,198 | |
| | | | | | | | |
| | | | | | | 260,609 | |
| | | | | | | | |
|
| Internet & Direct Marketing Retail—1.8% | |
Rubicon Project, Inc. (a) | | | 16,871 | | | | 93,634 | |
U.S. Auto Parts Network, Inc. (a) | | | 41,680 | | | | 72,940 | |
| | | | | | | | |
| | | | | | | 166,574 | |
| | | | | | | | |
| |
| IT Services—3.3% | | | | | |
Brightcove, Inc. (a) | | | 14,309 | | | | 99,734 | |
Hackett Group, Inc. | | | 6,907 | | | | 87,857 | |
Paysign, Inc. (a) | | | 8,199 | | | | 42,307 | |
Perficient, Inc. (a) | | | 3,218 | | | | 87,175 | |
| | | | | | | | |
| | | | | | | 317,073 | |
| | | | | | | | |
| |
| Life Sciences Tools & Services—4.1% | | | | | |
Codexis, Inc. (a) | | | 5,418 | | | | 60,465 | |
NanoString Technologies, Inc. (a) | | | 3,559 | | | | 85,594 | |
NeoGenomics, Inc. (a) | | | 4,176 | | | | 115,299 | |
Quanterix Corp. (a) | | | 7,138 | | | | 131,125 | |
| | | | | | | | |
| | | | | | | 392,483 | |
| | | | | | | | |
| | | | | | | | |
| | | Shares | | | Value | |
| |
| Machinery—1.9% | | | | | |
LiqTech International, Inc. (a) | | | 20,633 | | | $ | 88,516 | |
Spartan Motors, Inc. | | | 7,206 | | | | 93,029 | |
| | | | | | | | |
| | | | | | | 181,545 | |
| | | | | | | | |
| |
| Media—2.5% | | | | | |
Cardlytics, Inc. (a) | | | 3,111 | | | | 108,760 | |
TechTarget, Inc. (a) | | | 6,449 | | | | 132,914 | |
| | | | | | | | |
| | | | | | | 241,674 | |
| | | | | | | | |
| |
| Pharmaceuticals—4.0% | | | | | |
ANI Pharmaceuticals, Inc. (a) | | | 1,858 | | | | 75,695 | |
Axsome Therapeutics, Inc. (a) | | | 2,337 | | | | 137,486 | |
Cara Therapeutics, Inc. (a) | | | 3,512 | | | | 46,394 | |
Collegium Pharmaceutical, Inc. (a) | | | 5,256 | | | | 85,830 | |
Provention Bio, Inc. (a) | | | 3,740 | | | | 34,408 | |
| | | | | | | | |
| | | | | | | 379,813 | |
| | | | | | | | |
| |
| Professional Services—0.9% | | | | | |
CRA International, Inc. | | | 2,529 | | | | 84,494 | |
| | | | | | | | |
|
| Semiconductors & Semiconductor Equipment—5.1% | |
ACM Research, Inc., Class A (a) | | | 1,436 | | | | 42,520 | |
Adesto Technologies Corp. (a) | | | 17,395 | | | | 194,650 | |
FormFactor, Inc. (a) | | | 7,740 | | | | 155,497 | |
Ichor Holdings Ltd. (a) | | | 4,728 | | | | 90,588 | |
| | | | | | | | |
| | | | | | | 483,255 | |
| | | | | | | | |
| |
| Software—8.7% | | | | | |
Agilysys, Inc. (a) | | | 6,837 | | | | 114,178 | |
Cerence, Inc. (a) | | | 4,343 | | | | 66,882 | |
Digital Turbine, Inc. (a) | | | 30,537 | | | | 131,615 | |
Model N, Inc. (a) | | | 8,102 | | | | 179,945 | |
QAD, Inc., Class A | | | 2,839 | | | | 113,361 | |
Upland Software, Inc. (a) | | | 5,301 | | | | 142,173 | |
Zix Corp. (a) | | | 18,966 | | | | 81,744 | |
| | | | | | | | |
| | | | | | | 829,898 | |
| | | | | | | | |
|
| Trading Companies & Distributors—0.7% | |
Lawson Products, Inc. (a) | | | 2,576 | | | | 68,831 | |
| | | | | | | | |
| |
| Wireless Telecommunication Services—1.0% | | | | | |
Boingo Wireless, Inc. (a) | | | 9,045 | | | | 95,967 | |
| | | | | | | | |
Total Common Stock
(cost—$9,001,861) | | | | 9,342,767 | |
| | | | | | | | |
| | | | | | | | |
| | |
| | | Principal
Amount
(000s) | | | | |
|
| Repurchase Agreements—1.5% | |
State Street Bank and Trust Co., dated 3/31/20, 0.00%, due 4/1/20, proceeds $144,000; collateralized by U.S. Treasury Inflation Indexed Notes, 0.625%, due 4/15/23, valued at $147,278 including accrued interest | |
(cost—$144,000) | | | $144 | | | | 144,000 | |
| | | | | | | | |
| |
Total Investments
(cost—$9,145,861)—99.8% | | | | 9,486,767 | |
| | | | | | | | |
| |
Other assets less
liabilities—0.2% | | | | 22,969 | |
| | | | | | | | |
| |
| Net Assets—100.0% | | | | $9,509,736 | |
| | | | | | | | |
Notes to Schedule of Investments:
(a)Non-income producing.
| | | | | | | | |
| See accompanying Notes to Financial Statements | | | March 31, 2020 | | | Semiannual Report | | | 191 | |
Schedule of Investments
March 31, 2020 (unaudited)
AllianzGI Water Fund
| | | | | | | | |
| | | Shares | | | Value | |
| |
| Common Stock—97.8% | | | | | |
|
| Austria—0.8% | |
ANDRITZ AG | | | 148,127 | | | | $4,640,778 | |
| | | | | | | | |
| |
| Brazil—2.3% | | | | | |
Cia de Saneamento Basico do Estado de Sao Paulo | | | 1,033,900 | | | | 7,781,957 | |
Cia de Saneamento do Parana UNIT | | | 1,099,800 | | | | 5,048,061 | |
| | | | | | | | |
| | | | | | | 12,830,018 | |
| | | | | | | | |
| |
| China—3.2% | | | | | |
China Water Affairs Group Ltd. | | | 8,212,000 | | | | 6,132,961 | |
Guangdong Investment Ltd. | | | 6,036,000 | | | | 11,583,381 | |
| | | | | | | | |
| | | | | | | 17,716,342 | |
| | | | | | | | |
| |
| Finland—0.3% | | | | | |
Uponor Oyj | | | 151,493 | | | | 1,364,165 | |
| | | | | | | | |
| |
| France—7.6% | | | | | |
Suez | | | 1,284,389 | | | | 13,048,599 | |
Veolia Environnement S.A. | | | 1,365,235 | | | | 28,834,948 | |
| | | | | | | | |
| | | | | | | 41,883,547 | |
| | | | | | | | |
| |
| Italy—1.5% | | | | | |
Hera SpA | | | 2,286,513 | | | | 8,272,339 | |
| | | | | | | | |
| |
| Netherlands—1.5% | | | | | |
Arcadis NV | | | 528,577 | | | | 8,505,282 | |
| | | | | | | | |
| |
| Sweden—3.5% | | | | | |
Alfa Laval AB | | | 1,116,551 | | | | 19,116,447 | |
| | | | | | | | |
| |
| Switzerland—5.9% | | | | | |
Geberit AG | | | 44,280 | | | | 19,402,584 | |
Georg Fischer AG | | | 8,783 | | | | 5,992,959 | |
Landis+Gyr Group AG (b) | | | 99,104 | | | | 6,780,911 | |
| | | | | | | | |
| | | | | | | 32,176,454 | |
| | | | | | | | |
| |
| United Kingdom—14.1% | | | | | |
Halma PLC | | | 1,331,376 | | | | 31,268,776 | |
Pennon Group PLC | | | 1,368,399 | | | | 18,297,095 | |
Severn Trent PLC | | | 468,578 | | | | 13,264,011 | |
United Utilities Group PLC | | | 1,325,295 | | | | 14,835,234 | |
| | | | | | | | |
| | | | | | | 77,665,116 | |
| | | | | | | | |
| |
| United States—57.1% | | | | | |
Agilent Technologies, Inc. | | | 113,743 | | | | 8,146,274 | |
American States Water Co. | | | 136,450 | | | | 11,153,423 | |
American Water Works Co., Inc. | | | 493,111 | | | | 58,956,351 | |
AO Smith Corp. | | | 130,308 | | | | 4,926,946 | |
California Water Service Group | | | 262,495 | | | | 13,208,748 | |
Danaher Corp. | | | 277,138 | | | | 38,358,671 | |
Ecolab, Inc. | | | 67,985 | | | | 10,594,103 | |
Essential Utilities, Inc. | | | 559,050 | | | | 22,753,335 | |
IDEX Corp. | | | 237,377 | | | | 32,784,137 | |
Itron, Inc. (b) | | | 227,221 | | | | 12,685,748 | |
Mueller Water Products, Inc., Class A | | | 928,724 | | | | 7,439,079 | |
PerkinElmer, Inc. | | | 143,250 | | | | 10,783,860 | |
Tetra Tech, Inc. | | | 303,267 | | | | 21,416,716 | |
Thermo Fisher Scientific, Inc. | | | 76,509 | | | | 21,697,952 | |
Waste Management, Inc. | | | 137,755 | | | | 12,750,603 | |
Xylem, Inc. | | | 410,308 | | | | 26,723,360 | |
| | | | | | | | |
| | | | | | | 314,379,306 | |
| | | | | | | | |
Total Common Stock
(cost—$473,235,521) | | | | 538,549,794 | |
| | | | | | | | |
| | | | | | | | |
| | | Principal
Amount
(000s) | | | Value | |
|
| Repurchase Agreements—2.0% | |
State Street Bank and Trust Co., dated 3/31/20, 0.00%, due 4/1/20, proceeds $10,758,000; collateralized by U.S. Treasury Notes, 2.75%, due 4/30/23, valued at $10,974,133 including accrued interest | |
(cost—$10,758,000) | | | $10,758 | | | $ | 10,758,000 | |
| | | | | | | | |
| |
Total Investments
(cost—$483,993,521) (a)—99.8% | | | | 549,307,794 | |
| | | | | | | | |
| |
Other assets less
liabilities—0.2% | | | | 978,269 | |
| | | | | | | | |
| |
| Net Assets—100.0% | | | | $550,286,063 | |
| | | | | | | | |
Notes to Schedule of Investments:
(a) Securities with an aggregate value of $211,340,470, representing 38.4% of net assets, were valued utilizing modeling tools provided by a third-party vendor. See Note 1(a) and Note 1(b) in the Notes to Financial Statements.
(b)Non-income producing.
Glossary:
UNIT—More than one class of securities traded together
The industry classification of portfolio holdings and other assets less liabilities shown as a percentage of net assets were as follows:
| | | | |
Water Utilities | | | 33.2% | |
Machinery | | | 17.6% | |
Electronic Equipment, Instruments & Components | | | 9.2% | |
Multi-Utilities | | | 9.1% | |
Life Sciences Tools & Services | | | 7.4% | |
Healthcare Equipment & Supplies | | | 7.0% | |
Commercial Services & Supplies | | | 6.2% | |
Building Products | | | 4.7% | |
Chemicals | | | 1.9% | |
Construction & Engineering | | | 1.5% | |
Repurchase Agreements | | | 2.0% | |
Other assets less liabilities | | | 0.2% | |
| | | | |
| | | 100.0% | |
| | | | |
| | | | | | |
| 192 | | Semiannual Report | | | March 31, 2020 | | | See accompanying Notes to Financial Statements |
(THIS PAGE INTENTIONALLY LEFT BLANK)
| | | | | | | | |
| See accompanying Notes to Financial Statements | | | March 31, 2020 | | | Semiannual Report | | | 193 | |
Statements of Assets and Liabilities
March 31, 2020 (unaudited)
| | | | | | | | | | | | | | | | | | | | | | | | |
| | |
AllianzGI
Retirement
2020 | | | AllianzGI
Retirement
2025 | | | AllianzGI
Retirement
2030 | | | AllianzGI
Retirement
2035 | | | AllianzGI
Retirement
2040 | | | | |
| Assets: | | Assets: | | | | |
| Investments, at value | | $ | — | | | $ | — | | | $ | — | | | $ | — | | | $ | — | | | | | |
| Investments in Affiliates, at value | | | 11,372,048 | | | | 15,623,340 | | | | 21,829,940 | | | | 17,505,686 | | | | 18,269,227 | | | | | |
| Repurchase agreements, at value | | | 219,000 | | | | — | | | | 110,000 | | | | 404,000 | | | | 549,000 | | | | | |
| Cash | | | 339 | | | | — | | | | 554 | | | | 976 | | | | 725 | | | | | |
| Foreign currency, at value | | | — | | | | — | | | | — | | | | — | | | | — | | | | | |
| Deposits with brokers for derivatives collateral | | | 360,897 | | | | 984,296 | | | | 922,004 | | | | 904,218 | | | | 1,044,286 | | | | | |
| Investments in Affiliated Funds — Trustees Deferred Compensation Plan (see Note 5) | | | 6,871 | | | | 8,267 | | | | 9,247 | | | | 7,364 | | | | 6,673 | | | | | |
| Receivable for investments sold | | | — | | | | — | | | | — | | | | — | | | | — | | | | | |
| Receivable for Fund shares sold | | | — | | | | 441 | | | | 9,820 | | | | 50 | | | | 82 | | | | | |
| Dividends and interest receivable (net of foreign withholding taxes) | | | — | | | | — | | | | — | | | | — | | | | — | | | | | |
| Dividends receivable from Affiliates | | | — | | | | — | | | | — | | | | — | | | | — | | | | | |
| Tax reclaims receivable | | | — | | | | — | | | | — | | | | — | | | | — | | | | | |
| Receivable from Investment Manager | | | — | | | | 525 | | | | 1,330 | | | | 627 | | | | 1,518 | | | | | |
| Prepaid expenses and other assets | | | 154 | | | | 186 | | | | 237 | | | | 203 | | | | 224 | | | | | |
Total Assets | | | 11,959,309 | | | | 16,617,055 | | | | 22,883,132 | | | | 18,823,124 | | | | 19,871,735 | | | | | |
| Liabilities: | | | | | | | | | | | | | | | | | | |
| Payable for Fund shares redeemed | | | 596,439 | | | | 115,469 | | | | 280,691 | | | | 119,268 | | | | 905,317 | | | | | |
| Trustees Deferred Compensation Plan payable (see Note 5) | | | 6,871 | | | | 8,267 | | | | 9,247 | | | | 7,364 | | | | 6,673 | | | | | |
| Payable for variation margin on futures contracts | | | 3,615 | | | | 8,415 | | | | 27,000 | | | | 25,610 | | | | 31,635 | | | | | |
| Servicing fees payable | | | 558 | | | | 1,022 | | | | 1,105 | | | | 931 | | | | 431 | | | | | |
| Distribution fees payable | | | 521 | | | | 287 | | | | 697 | | | | 338 | | | | 400 | | | | | |
| Administration fees payable | | | 176 | | | | — | | | | — | | | | — | | | | — | | | | | |
| Payable to custodian for cash overdraft | | | — | | | | 23,388 | | | | — | | | | — | | | | — | | | | | |
| Payable for investments purchased | | | — | | | | — | | | | — | | | | — | | | | — | | | | | |
| Payable for investments in Affiliates purchased | | | — | | | | — | | | | — | | | | — | | | | — | | | | | |
| Investment management fees payable | | | — | | | | — | | | | — | | | | — | | | | — | | | | | |
| Accrued expenses and other liabilities | | | — | | | | — | | | | — | | | | — | | | | — | | | | | |
Total Liabilities | | | 608,180 | | | | 156,848 | | | | 318,740 | | | | 153,511 | | | | 944,456 | | | | | |
| Net Assets | | $ | 11,351,129 | | | $ | 16,460,207 | | | $ | 22,564,392 | | | $ | 18,669,613 | | | $ | 18,927,279 | | | | | |
| Net Assets Consist of: | | | | | | | | | | | | | | | | | | |
| Paid-in-capital | | $ | 11,562,824 | | | $ | 17,311,116 | | | $ | 24,277,888 | | | $ | 20,168,925 | | | $ | 21,087,148 | | | | | |
| Total distributable earnings (loss) | | | (211,695 | ) | | | (850,909 | ) | | | (1,713,496 | ) | | | (1,499,312 | ) | | | (2,159,869 | ) | | | | |
| Net Assets | | $ | 11,351,129 | | | $ | 16,460,207 | | | $ | 22,564,392 | | | $ | 18,669,613 | | | $ | 18,927,279 | | | | | |
| Cost of Investments | | $ | — | | | $ | — | | | $ | — | | | $ | — | | | $ | — | | | | | |
| Cost of Investments in Affiliates | | $ | 12,494,066 | | | $ | 17,991,221 | | | $ | 25,332,904 | | | $ | 20,672,667 | | | $ | 21,806,250 | | | | | |
| Cost of Repurchase Agreements | | $ | 219,000 | | | $ | — | | | $ | 110,000 | | | $ | 404,000 | | | $ | 549,000 | | | | | |
| Cost of Foreign Currency | | $ | — | | | $ | — | | | $ | — | | | $ | — | | | $ | — | | | | | |
| | | | | | |
| 194 | | Semiannual Report | | | March 31, 2020 | | | See accompanying Notes to Financial Statements |
| | | | | | | | | | | | | | | | | | | | | | | | | | | | | | |
| | | | AllianzGI
Retirement
2045 | | | AllianzGI
Retirement
2050 | | | AllianzGI
Retirement
2055 | | |
AllianzGI
Multi Asset
Income | | | AllianzGI Best Styles
Global Equity | | | AllianzGI
Best Styles
U.S. Equity | | | AllianzGI
Convertible | |
| | | | | | | | | | | | | | | | | | | | | | | |
| | | | | $ | — | | | $ | 499,678 | | | $ | — | | | $ | 7,369,953 | | | $ | 129,282,659 | | | $ | 29,715,453 | | | $ | 772,891,805 | |
| | | | | | 10,422,500 | | | | 15,348,761 | | | | 7,145,044 | | | | 39,585,588 | | | | — | | | | — | | | | — | |
| | | | | | 147,000 | | | | 166,000 | | | | 264,000 | | | | 363,000 | | | | 295,000 | | | | 105,000 | | | | 64,769,000 | |
| | | | | | 346 | | | | 768 | | | | 822 | | | | 299,600 | | | | 627 | | | | 1,933 | | | | 925,845 | |
| | | | | | — | | | | — | | | | — | | | | 11,588 | | | | 131,493 | | | | 369 | | | | — | |
| | | | | | 756,758 | | | | 1,015,098 | | | | 571,157 | | | | 2,668,306 | | | | — | | | | — | | | | — | |
| | | | | | | | |
| | | | | | 4,162 | | | | 4,016 | | | | 1,837 | | | | 1,786 | | | | 76,320 | | | | 14,738 | | | | 125,755 | |
| | | | | | — | | | | — | | | | — | | | | — | | | | — | | | | 217,692 | | | | 5,973,682 | |
| | | | | | 7 | | | | 665 | | | | 1,268 | | | | 366 | | | | 28,277 | | | | 975 | | | | 18,210,227 | |
| | | | | | | | |
| | | | | | — | | | | — | | | | — | | | | 117,678 | | | | 362,878 | | | | 35,473 | | | | 2,203,235 | |
| | | | | | — | | | | — | | | | — | | | | 8,843 | | | | — | | | | — | | | | — | |
| | | | | | — | | | | — | | | | — | | | | 1,454 | | | | 351,300 | | | | — | | | | — | |
| | | | | | 626 | | | | — | | | | — | | | | — | | | | 9,084 | | | | 12,535 | | | | — | |
| | | | | | 157 | | | | 203 | | | | 129 | | | | 672 | | | | 45,540 | | | | 46,761 | | | | 99,036 | |
| | | | | 11,331,556 | | | | 17,035,189 | | | | 7,984,257 | | | | 50,428,834 | | | | 130,583,178 | | | | 30,150,929 | | | | 865,198,585 | |
| | | | | | | | | | | | | | | | | | | | | | | |
| | | | | | 39,745 | | | | 488,565 | | | | 67,992 | | | | 436,864 | | | | 29,366 | | | | 867 | | | | 3,270,821 | |
| | | | |
|
4,162 |
| | | 4,016 | | | | 1,837 | | | | 1,786 | | | | 76,320 | | | | 14,738 | | | | 125,755 | |
| | | | | | 14,400 | | | | 25,855 | | | | 11,210 | | | | 49,775 | | | | — | | | | — | | | | — | |
| | | | | | 367 | | | | 543 | | | | 298 | | | | 2,620 | | | | 163 | | | | 212 | | | | 33,592 | |
| | | | | | 217 | | | | 828 | | | | 334 | | | | 1,093 | | | | 10 | | | | 25 | | | | 42,443 | |
| | | | | | — | | | | 145 | | | | 44 | | | | 4,873 | | | | — | | | | — | | | | — | |
| | | | | | — | | | | — | | | | — | | | | — | | | | — | | | | — | | | | — | |
| | | | | | — | | | | — | | | | — | | | | 269,604 | | | | — | | | | 256,515 | | | | 6,991,821 | |
| | | | | | — | | | | — | | | | — | | | | 9,009 | | | | — | | | | — | | | | — | |
| | | | | | — | | | | — | | | | — | | | | 4,909 | | | | — | | | | — | | | | 398,031 | |
| | | | | | — | | | | — | | | | — | | | | — | | | | 135,773 | | | | 57,386 | | | | 265,272 | |
| | | | | | 58,891 | | | | 519,952 | | | | 81,715 | | | | 780,533 | | | | 241,632 | | | | 329,743 | | | | 11,127,735 | |
| | | | $ | 11,272,665 | | | $ | 16,515,237 | | | $ | 7,902,542 | | | $ | 49,648,301 | | | $ | 130,341,546 | | | $ | 29,821,186 | | | $ | 854,070,850 | |
| | | | | | | | | | | | | | | | | | | | | | | |
| | | | | $ | 12,740,856 | | | $ | 19,139,807 | | | $ | 9,278,263 | | | $ | 62,230,048 | | | $ | 144,367,233 | | | $ | 28,510,691 | | | $ | 865,590,210 | |
| | | | | | (1,468,191 | ) | | | (2,624,570 | ) | | | (1,375,721 | ) | | | (12,581,747 | ) | | | (14,025,687 | ) | | | 1,310,495 | | | | (11,519,360 | ) |
| | | | | $ | 11,272,665 | | | $ | 16,515,237 | | | $ | 7,902,542 | | | $ | 49,648,301 | | | $ | 130,341,546 | | | $ | 29,821,186 | | | $ | 854,070,850 | |
| | | | | $ | — | | | $ | 494,962 | | | $ | — | | | $ | 9,544,819 | | | $ | 142,297,696 | | | $ | 29,274,677 | | | $ | 808,135,614 | |
| | | | | $ | 12,476,193 | | | $ | 18,566,290 | | | $ | 8,606,382 | | | $ | 43,236,122 | | | $ | — | | | $ | — | | | $ | — | |
| | | | | $ | 147,000 | | | $ | 166,000 | | | $ | 264,000 | | | $ | 363,000 | | | $ | 295,000 | | | $ | 105,000 | | | $ | 64,769,000 | |
| | | | | $ | — | | | $ | — | | | $ | — | | | $ | 11,506 | | | $ | 131,430 | | | $ | 369 | | | $ | — | |
| | | | | | | | |
| See accompanying Notes to Financial Statements | | | March 31, 2020 | | | Semiannual Report | | | 195 | |
Statements of Assets and Liabilities (cont’d)
March 31, 2020 (unaudited)
| | | | | | | | | | | | | | | | | | | | | | | | |
| | | AllianzGI
Retirement
2020 | | | AllianzGI
Retirement
2025 | | | AllianzGI
Retirement
2030 | | | AllianzGI
Retirement
2035 | | | AllianzGI
Retirement
2040 | | | | |
| Net Assets: | | | | | | | | | | | | | | | | | | |
| Class A | | $ | 2,330,119 | | | $ | 4,567,854 | | | $ | 4,652,320 | | | $ | 4,212,017 | | | $ | 1,792,371 | | | | | |
| Class C | | | 296,950 | | | | — | | | | 517,416 | | | | — | | | | 149,709 | | | | | |
| Class R | | | 9,779 | | | | 182,384 | | | | 78,265 | | | | 246,178 | | | | 86,230 | | | | | |
| Class P | | | 1,164,296 | | | | 1,368,649 | | | | 1,741,858 | | | | 1,096,832 | | | | 434,192 | | | | | |
| Institutional Class | | | — | | | | — | | | | — | | | | — | | | | — | | | | | |
| Class R6 | | | 7,516,148 | | | | 10,196,339 | | | | 15,423,301 | | | | 12,987,408 | | | | 16,420,624 | | | | | |
| Administrative Class | | | 33,837 | | | | 144,981 | | | | 151,232 | | | | 127,178 | | | | 44,153 | | | | | |
| Shares Issued and Outstanding: | | | | |
| Class A | | | 144,050 | | | | 334,415 | | | | 288,677 | | | | 298,300 | | | | 108,920 | | | | | |
| Class C | | | 18,394 | | | | — | | | | 32,441 | | | | — | | | | 9,141 | | | | | |
| Class R | | | 619 | | | | 13,456 | | | | 4,827 | | | | 17,524 | | | | 5,295 | | | | | |
| Class P | | | 71,262 | | | | 99,882 | | | | 106,461 | | | | 76,249 | | | | 25,936 | | | | | |
| Institutional Class | | | — | | | | — | | | | — | | | | — | | | | — | | | | | |
| Class R6 | | | 461,031 | | | | 745,938 | | | | 940,403 | | | | 915,275 | | | | 994,144 | | | | | |
| Administrative Class | | | 2,062 | | | | 10,562 | | | | 9,233 | | | | 8,927 | | | | 2,677 | | | | | |
| Net Asset Value and Redemption Price Per Share:* | | | | |
| Class A | | $ | 16.18 | | | $ | 13.66 | | | $ | 16.12 | | | $ | 14.12 | | | $ | 16.46 | | | | | |
| Class C | | | 16.14 | | | | — | | | | 15.95 | | | | — | | | | 16.38 | | | | | |
| Class R | | | 15.80 | | | | 13.55 | | | | 16.21 | | | | 14.05 | | | | 16.29 | | | | | |
| Class P | | | 16.34 | | | | 13.70 | | | | 16.36 | | | | 14.38 | | | | 16.74 | | | | | |
| Institutional Class | | | — | | | | — | | | | — | | | | — | | | | — | | | | | |
| Class R6 | | | 16.30 | | | | 13.67 | | | | 16.40 | | | | 14.19 | | | | 16.52 | | | | | |
| Administrative Class | | | 16.41 | | | | 13.73 | | | | 16.38 | | | | 14.25 | | | | 16.49 | | | | | |
| * | Net asset value and redemption price per share may not recalculate exactly due to rounding. |
| | | | | | |
| 196 | | Semiannual Report | | | March 31, 2020 | | | See accompanying Notes to Financial Statements |
| | | | | | | | | | | | | | | | | | | | | | | | | | | | | | |
| | | | AllianzGI
Retirement
2045 | | | AllianzGI
Retirement
2050 | | | AllianzGI
Retirement
2055 | | | AllianzGI
Multi Asset
Income | | | AllianzGI
Best Styles
Global Equity | | | AllianzGI
Best Styles
U.S. Equity | | | AllianzGI
Convertible | |
| | | | | | | | | | | | | | | | | | | | | | | |
| | | | | $ | 1,648,100 | | | $ | 2,113,556 | | | $ | 1,382,128 | | | $ | 10,776,745 | | | $ | 725,496 | | | $ | 962,994 | | | $ | 102,222,254 | |
| | | | | | — | | | | 197,375 | | | | — | | | | 1,216,025 | | | | 15,123 | | | | 39,060 | | | | 64,758,768 | |
| | | | | | 103,131 | | | | 252,117 | | | | 33,009 | | | | 86,876 | | | | — | | | | — | | | | 174,717 | |
| | | | | | 600,792 | | | | 512,178 | | | | 150,682 | | | | 556,770 | | | | 441,437 | | | | 164,991 | | | | 210,358,406 | |
| | | | | | — | | | | — | | | | — | | | | 276,980 | | | | 381,658 | | | | 18,693 | | | | 475,816,557 | |
| | | | | | 8,633,531 | | | | 12,928,945 | | | | 6,201,555 | | | | 36,726,019 | | | | 128,777,832 | | | | 28,635,448 | | | | — | |
| | | | | 287,111 | | | | 511,066 | | | | 135,168 | | | | 8,886 | | | | — | | | | — | | | | 740,148 | |
| | | | | | | | | | | | | | | | | | | | | | | |
| | | | | | 115,494 | | | | 129,230 | | | | 95,643 | | | | 751,875 | | | | 70,250 | | | | 89,884 | | | | 3,822,721 | |
| | | | | | — | | | | 12,442 | | | | — | | | | 84,219 | | | | 1,466 | | | | 3,771 | | | | 2,381,374 | |
| | | | | | 7,313 | | | | 15,500 | | | | 2,287 | | | | 5,754 | | | | — | | | | — | | | | 6,266 | |
| | | | | | 41,054 | | | | 30,649 | | | | 10,127 | | | | 38,252 | | | | 42,713 | | | | 15,580 | | | | 8,117,474 | |
| | | | | | — | | | | — | | | | — | | | | 19,719 | | | | 37,563 | | | | 1,759 | | | | 18,138,259 | |
| | | | | | 604,791 | | | | 780,828 | | | | 423,849 | | | | 2,612,831 | | | | 12,489,254 | | | | 2,652,507 | | | | — | |
| | | | | 20,307 | | | | 31,178 | | | | 9,333 | | | | 607 | | | | — | | | | — | | | | 27,943 | |
| | | | | | | | | | | | | | | | | | | | | | | |
| | | | | $ | 14.27 | | | $ | 16.36 | | | $ | 14.45 | | | $ | 14.33 | | | $ | 10.33 | | | $ | 10.71 | | | $ | 26.74 | |
| | | | | | — | | | | 15.86 | | | | — | | | | 14.44 | | | | 10.32 | | | | 10.36 | | | | 27.19 | |
| | | | | | 14.10 | | | | 16.27 | | | | 14.43 | | | | 15.10 | | | | — | | | | — | | | | 27.88 | |
| | | | | | 14.63 | | | | 16.71 | | | | 14.88 | | | | 14.56 | | | | 10.33 | | | | 10.59 | | | | 25.91 | |
| | | | | | — | | | | — | | | | — | | | | 14.05 | | | | 10.16 | | | | 10.62 | | | | 26.23 | |
| | | | | | 14.28 | | | | 16.56 | | | | 14.63 | | | | 14.06 | | | | 10.31 | | | | 10.80 | | | | — | |
| | | | | | 14.14 | | | | 16.39 | | | | 14.48 | | | | 14.64 | | | | — | | | | — | | | | 26.49 | |
| | | | | | | | |
| See accompanying Notes to Financial Statements | | | March 31, 2020 | | | Semiannual Report | | | 197 | |
Statements of Assets and Liabilities (cont’d)
March 31, 2020 (unaudited)
| | | | | | | | | | | | | | | | | | | | | | | | |
| | | AllianzGI
Core Bond | | | AllianzGI
Core Plus
Bond | | | AllianzGI
Emerging
Markets
Consumer | | | AllianzGI
Emerging
Markets
Small-Cap | | | AllianzGI
Emerging
Markets SRI
Debt | | | | |
| Assets: | | | | |
| Investments, at value | | $ | 47,806,764 | | | $ | 57,365,734 | | | $ | 31,280,926 | | | $ | 5,420,359 | | | $ | 19,409,061 | | | | | |
| Investments in Affiliates, at value | | | — | | | | — | | | | — | | | | — | | | | — | | | | | |
| Repurchase agreements, at value | | | — | | | | — | | | | 1,130,000 | | | | — | | | | 3,517,000 | | | | | |
| Cash | | | — | | | | — | | | | 1,936 | | | | 43,704 | | | | 31,534 | | | | | |
| Foreign currency, at value | | | — | | | | — | | | | 12,968 | | | | 51,211 | | | | 31,444 | | | | | |
| Unrealized appreciation of forward foreign currency contracts | | | — | | | | — | | | | — | | | | — | | | | 195,778 | | | | | |
| Dividends and interest receivable (net of foreign withholding taxes) | | | 202,357 | | | | 272,249 | | | | 71,121 | | | | 19,348 | | | | 210,510 | | | | | |
| Receivable for investments sold | | | 4,318,013 | | | | 3,809,347 | | | | 128,109 | | | | 163,935 | | | | 314,916 | | | | | |
| Receivable for TBA investments sold | | | 4,562,640 | | | | 3,472,825 | | | | — | | | | — | | | | — | | | | | |
| Swap premiums paid | | | 110,320 | | | | — | | | | — | | | | — | | | | — | | | | | |
| Unrealized appreciation of OTC swaps | | | — | | | | — | | | | — | | | | — | | | | — | | | | | |
| Deposits with brokers for derivatives collateral | | | 760,257 | | | | 1,857,956 | | | | — | | | | — | | | | 1,837 | | | | | |
| Receivable for terminated swaps | | | 255 | | | | 16,353 | | | | — | | | | — | | | | — | | | | | |
| Receivable for Fund shares sold | | | — | | | | — | | | | — | | | | — | | | | — | | | | | |
| Receivable from Investment Manager | | | 7,104 | | | | 11,472 | | | | — | | | | 8,593 | | | | 9,880 | | | | | |
| Tax reclaims receivable | | | — | | | | — | | | | 9,625 | | | | — | | | | — | | | | | |
| Investments in Affiliated Funds — Trustees Deferred Compensation Plan (see Note 5) | | | 629 | | | | 884 | | | | 5,675 | | | | 1,384 | | | | 4,286 | | | | | |
| Receivable for variation margin on centrally cleared swaps | | | — | | | | — | | | | — | | | | — | | | | — | | | | | |
| Receivable for variation margin on futures contracts | | | — | | | | — | | | | — | | | | — | | | | 141 | | | | | |
| Prepaid expenses and other assets | | | 14,634 | | | | 14,711 | | | | 21,183 | | | | 20,294 | | | | 28,719 | | | | | |
Total Assets | | | 57,782,973 | | | | 66,821,531 | | | | 32,661,543 | | | | 5,728,828 | | | | 23,755,106 | | | | | |
| Liabilities: | | | | |
| Payable for investments purchased | | | 4,328,691 | | | | 5,014,977 | | | | 131,491 | | | | 162,524 | | | | 921,663 | | | | | |
| Payable for Fund shares redeemed | | | — | | | | — | | | | — | | | | — | | | | — | | | | | |
| Payable for TBA investments purchased | | | 4,524,713 | | | | 3,431,294 | | | | — | | | | — | | | | — | | | | | |
| Payable to custodian for cash overdraft | | | 123,763 | | | | 1,842,655 | | | | — | | | | — | | | | — | | | | | |
| Payable to custodian for foreign currency overdraft | | | — | | | | — | | | | — | | | | — | | | | — | | | | | |
| Payable for variation margin on centrally cleared swaps | | | 24,127 | | | | 261,199 | | | | — | | | | — | | | | — | | | | | |
| Deposits received from brokers for derivatives collateral | | | — | | | | — | | | | — | | | | — | | | | — | | | | | |
| Payable for terminated swaps | | | — | | | | — | | | | — | | | | — | | | | — | | | | | |
| Payable for variation margin on futures contracts | | | 55,385 | | | | 106,303 | | | | — | | | | — | | | | — | | | | | |
| Investment management fees payable | | | — | | | | — | | | | 10,131 | | | | — | | | | — | | | | | |
| Distribution fees payable | | | — | | | | — | | | | — | | | | — | | | | 8 | | | | | |
| Servicing fees payable | | | — | | | | — | | | | 12 | | | | 34 | | | | 33 | | | | | |
| Swap premiums received | | | — | | | | 139,273 | | | | — | | | | — | | | | — | | | | | |
| Unrealized depreciation of forward foreign currency contracts | | | — | | | | — | | | | — | | | | — | | | | 87,188 | | | | | |
| Trustees Deferred Compensation Plan payable (see Note 5) | | | 629 | | | | 884 | | | | 5,675 | | | | 1,384 | | | | 4,286 | | | | | |
| Accrued expenses and other liabilities | | | 81,446 | | | | 48,898 | | | | 61,061 | | | | 63,394 | | | | 30,297 | | | | | |
Total Liabilities | | | 9,138,754 | | | | 10,845,483 | | | | 208,370 | | | | 227,336 | | | | 1,043,475 | | | | | |
| Net Assets | | $ | 48,644,219 | | | $ | 55,976,048 | | | $ | 32,453,173 | | | $ | 5,501,492 | | | $ | 22,711,631 | | | | | |
| | | | | | |
| 198 | | Semiannual Report | | | March 31, 2020 | | | See accompanying Notes to Financial Statements |
| | | | | | | | | | | | | | | | | | | | | | | | | | | | | | |
| | | | AllianzGI
Emerging
Markets
Value | | | AllianzGI
Floating
Rate Note | | | AllianzGI
Global
Allocation | | | AllianzGI
Global
Dynamic
Allocation | | | AllianzGI
Global High
Yield | | | AllianzGI
Global
Sustainability | | | AllianzGI
Green Bond | |
| | | | | | | | | | | | | | | | | | | | | | | |
| | | | | $ | 91,482,943 | | | $ | 12,676,957 | | | $ | 45,551,389 | | | $ | 70,441,395 | | | $ | 23,925,675 | | | $ | 131,019,168 | | | $ | 26,210,559 | |
| | | | | | — | | | | — | | | | 200,683,325 | | | | 30,035,568 | | | | — | | | | — | | | | — | |
| | | | | | 1,127,000 | | | | 556,000 | | | | 5,460,000 | | | | 627,000 | | | | 2,376,000 | | | | 5,210,000 | | | | 1,038,000 | |
| | | | | | 34,142 | | | | 29 | | | | 71,893 | | | | — | | | | 737 | | | | 921 | | | | — | |
| | | | | | 263,927 | | | | 13,208 | | | | — | | | | 537,557 | | | | 11,385 | | | | 176,379 | | | | — | |
| | | | | | — | | |
|
48,146 |
| | | — | | | | — | | | | 203,383 | | | | — | | | | — | |
| | | | |
|
244,825 |
| | | 66,805 | | | | 361,449 | | | | 401,633 | | | | 387,215 | | | | 147,573 | | | | 178,111 | |
| | | | | | — | | | | — | | | | 3,798,954 | | | | 2,513,995 | | | | 326,640 | | | | — | | | | 603,595 | |
| | | | | | — | | | | — | | | | — | | | | — | | | | — | | | | — | | | | — | |
| | | | | | — | | | | — | | | | — | | | | — | | | | — | | | | — | | | | — | |
| | | | | | — | | | | — | | | | — | | | | 348,815 | | | | — | | | | — | | | | — | |
| | | | | | — | | | | 21,203 | | | | 9,185,619 | | | | 6,133,801 | | | | — | | | | — | | | | 191,002 | |
| | | | | | — | | | | — | | | | — | | | | — | | | | — | | | | — | | | | — | |
| | | | | | 456,953 | | | | — | | | | 26,495 | | | | — | | | | — | | | | 450,462 | | | | — | |
| | | | | | — | | | | 9,484 | | | | 12,305 | | | | 16,955 | | | | — | | | | — | | | | 5,594 | |
| | | | | | 5,185 | | | | — | | | | — | | | | 82,130 | | | | 1,158 | | | | 58,312 | | | | 1,234 | |
| | | | |
|
12,034 |
| | | 755 | | | | 49,900 | | | | 27,779 | | | | 2,082 | | | | 3,307 | | | | 35 | |
| | | | | | — | | | | — | | | | — | | |
|
136,704 |
| | | — | | | | — | | | | — | |
| | | | | | — | | | | 766 | | | | — | | | | 267,229 | | | | 10,182 | | | | — | | | | — | |
| | | | | | 36,324 | | | | 18,144 | | | | 61,153 | | | | 69,625 | | | | 25,509 | | | | 28,417 | | | | 27,495 | |
| | | | | 93,663,333 | | | | 13,411,497 | | | | 265,262,482 | | | | 111,640,186 | | | | 27,269,966 | | | | 137,094,539 | | | | 28,255,625 | |
| | | | | | | | | | | | | | | | | | | | | | | |
| | | | | | — | | | | — | | | | 3,765,474 | | | | 2,369,191 | | | | 1,192,044 | | | | 92,549 | | | | 494,210 | |
| | | | | | 23,947 | | | | — | | | | 272,498 | | | | — | | | | — | | | | 17,728 | | | | — | |
| | | | | | — | | | | — | | | | — | | | | — | | | | — | | | | — | | | | — | |
| | | | | | — | | | | — | | | | — | | | | 144,644 | | | | — | | | | — | | | | 398,123 | |
| | | | | | — | | | | — | | | | — | | | | — | | | | — | | | | — | | | | 189 | |
| | | | |
|
— |
| | | — | | | | — | | | | — | | | | — | | | | — | | | | — | |
| | | | | | — | | | | — | | | | — | | | | — | | |
|
355,737 |
| | | — | | | | — | |
| | | | | | — | | | | — | | | | — | | | | 46 | | | | — | | | | — | | | | — | |
| | | | | | — | | | | — | | | | 303,637 | | | | — | | | | — | | | | — | | | | 36,269 | |
| | | | | | 19,021 | | | | — | | | | — | | | | — | | | | 1,810 | | | | 47,976 | | | | — | |
| | | | | | 530 | | | | — | | | | 3,373 | | | | 875 | | | | — | | | | — | | | | — | |
| | | | | | 2,824 | | | | — | | | | 9,628 | | | | 406 | | | | — | | | | 316 | | | | 33 | |
| | | | | | — | | | | — | | | | — | | | | 917,898 | | | | — | | | | — | | | | — | |
| | | | | | — | | | | — | | | | — | | | | — | | |
|
17,448 |
| | | — | | | | 339,881 | |
| | | | |
|
12,034 |
| | | 755 | | | | 49,900 | | | | 27,779 | | | | 2,082 | | | | 3,307 | | | | 35 | |
| | | | | | 154,627 | | | | 68,402 | | | | 106,082 | | | | 71,401 | | | | 43,206 | | | | 56,630 | | | | 47,556 | |
| | | | | | 212,983 | | | | 69,157 | | | | 4,510,592 | | | | 3,532,240 | | | | 1,612,327 | | | | 218,506 | | | | 1,316,296 | |
| | | | | $ | 93,450,350 | | | $ | 13,342,340 | | | $ | 260,751,890 | | | $ | 108,107,946 | | | $ | 25,657,639 | | | $ | 136,876,033 | | | $ | 26,939,329 | |
| | | | | | | | |
| See accompanying Notes to Financial Statements | | | March 31, 2020 | | | Semiannual Report | | | 199 | |
Statements of Assets and Liabilities (cont’d)
March 31, 2020 (unaudited)
| | | | | | | | | | | | | | | | | | | | | | | | |
| | | AllianzGI
Core Bond | | | AllianzGI
Core Plus
Bond | | | AllianzGI
Emerging
Markets
Consumer | | | AllianzGI
Emerging
Markets
Small-Cap | | | AllianzGI
Emerging
Markets SRI
Debt | | | | |
| Net Assets Consist of: | | | | |
| Paid-in-capital | | $ | 47,800,018 | | | $ | 55,632,251 | | | $ | 36,774,402 | | | $ | 6,648,503 | | | $ | 25,335,357 | | | | | |
| Total distributable earnings (loss) | | | 844,201 | | | | 343,797 | | | | (4,321,229 | ) | | | (1,147,011 | ) | | | (2,623,726 | ) | | | | |
| Net Assets | | $ | 48,644,219 | | | $ | 55,976,048 | | | $ | 32,453,173 | | | $ | 5,501,492 | | | $ | 22,711,631 | | | | | |
| Cost of Investments | | $ | 48,167,272 | | | $ | 58,925,286 | | | $ | 31,212,138 | | | $ | 6,285,552 | | | $ | 21,334,300 | | | | | |
| Cost of Investments in Affiliates | | $ | — | | | $ | — | | | $ | — | | | $ | — | | | $ | — | | | | | |
| Cost of Repurchase Agreements | | $ | — | | | $ | — | | | $ | 1,130,000 | | | $ | — | | | $ | 3,517,000 | | | | | |
| Cost of Foreign Currency | | $ | — | | | $ | — | | | $ | 13,032 | | | $ | 51,368 | | | $ | 35,951 | | | | | |
| Net Assets: | | | | |
| Class A | | $ | — | | | $ | — | | | $ | 53,812 | | | $ | 166,302 | | | $ | 144,019 | | | | | |
| Class C | | | — | | | | — | | | | — | | | | — | | | | 12,493 | | | | | |
| Class R | | | — | | | | — | | | | — | | | | — | | | | — | | | | | |
| Class P | | | 11,394 | | | | 11,142 | | | | — | | | | — | | | | 10,915 | | | | | |
| Institutional Class | | | 61,166 | | | | 11,152 | | | | 32,399,361 | | | | 5,335,190 | | | | 22,544,204 | | | | | |
| Class R6 | | | 48,571,659 | | | | 55,953,754 | | | | — | | | | — | | | | — | | | | | |
| Administrative Class | | | — | | | | — | | | | — | | | | — | | | | — | | | | | |
| Shares Issued and Outstanding: | | | | |
| Class A | | | — | | | | — | | | | 4,622 | | | | 13,918 | | | | 11,343 | | | | | |
| Class C | | | — | | | | — | | | | — | | | | — | | | | 977 | | | | | |
| Class R | | | — | | | | — | | | | — | | | | — | | | | — | | | | | |
| Class P | | | 737 | | | | 727 | | | | — | | | | — | | | | 876 | | | | | |
| Institutional Class | | | 3,959 | | | | 728 | | | | 2,786,998 | | | | 450,999 | | | | 1,803,967 | | | | | |
| Class R6 | | | 3,144,464 | | | | 3,652,656 | | | | — | | | | — | | | | — | | | | | |
| Administrative Class | | | — | | | | — | | | | — | | | | — | | | | — | | | | | |
| Net Asset Value and Redemption Price Per Share:* | | | | |
| Class A | | $ | — | | | $ | — | | | $ | 11.64 | | | $ | 11.95 | | | $ | 12.70 | | | | | |
| Class C | | | — | | | | — | | | | — | | | | — | | | | 12.78 | | | | | |
| Class R | | | — | | | | — | | | | — | | | | — | | | | — | | | | | |
| Class P | | | 15.45 | | | | 15.33 | | | | — | | | | — | | | | 12.46 | | | | | |
| Institutional Class | | | 15.45 | | | | 15.32 | | | | 11.63 | | | | 11.83 | | | | 12.50 | | | | | |
| Class R6 | | | 15.45 | | | | 15.32 | | | | — | | | | — | | | | — | | | | | |
| Administrative Class | | | — | | | | — | | | | — | | | | — | | | | — | | | | | |
| * | Net asset value and redemption price per share may not recalculate exactly due to rounding. |
| | | | | | |
| 200 | | Semiannual Report | | | March 31, 2020 | | | See accompanying Notes to Financial Statements |
| | | | | | | | | | | | | | | | | | | | | | | | | | | | | | |
| | | | AllianzGI
Emerging
Markets
Value | | | AllianzGI
Floating
Rate Note | | | AllianzGI
Global
Allocation | | | AllianzGI
Global
Dynamic
Allocation | | | AllianzGI
Global High
Yield | | | AllianzGI
Global
Sustainability | | | AllianzGI
Green Bond | |
| | | | | | | | | | | | | | | | | | | | | | | |
| | | | | $ | 128,442,861 | | | $ | 14,557,835 | | | $ | 284,811,875 | | | $ | 115,498,942 | | | $ | 28,776,441 | | | $ | 148,236,275 | | | $ | 27,979,015 | |
| | | | | | (34,992,511 | ) | | | (1,215,495 | ) | | | (24,059,985 | ) | | | (7,390,996 | ) | | | (3,118,802 | ) | | | (11,360,242 | ) | | | (1,039,686 | ) |
| | | | | $ | 93,450,350 | | | $ | 13,342,340 | | | $ | 260,751,890 | | | $ | 108,107,946 | | | $ | 25,657,639 | | | $ | 136,876,033 | | | $ | 26,939,329 | |
| | | | | $ | 97,745,987 | | | $ | 13,690,956 | | | $ | 47,929,393 | | | $ | 73,616,088 | | | $ | 26,725,582 | | | $ | 142,520,081 | | | $ | 27,539,500 | |
| | | | | $ | — | | | $ | — | | | $ | 226,003,418 | | | $ | 35,011,341 | | | $ | — | | | $ | — | | | $ | — | |
| | | | | $ | 1,127,000 | | | $ | 556,000 | | | $ | 5,460,000 | | | $ | 627,000 | | | $ | 2,376,000 | | | $ | 5,210,000 | | | $ | 1,038,000 | |
| | | | $ | 263,531 | | | $ | 12,805 | | | $ | — | | | $ | 533,673 | | | $ | 11,325 | | | $ | 175,953 | | | $ | — | |
| | | | | | | | | | | | | | | | | | | | | | | |
| | | | | $ | 11,663,454 | | | $ | — | | | $ | 40,667,595 | | | $ | 1,214,683 | | | $ | — | | | $ | 1,590,505 | | | $ | 162,076 | |
| | | | | | 821,649 | | | | — | | | | 4,315,419 | | | | 539,083 | | | | — | | | | — | | | | — | |
| | | | | | — | | | | — | | | | 18,935 | | | | 96,987 | | | | — | | | | — | | | | — | |
| | | | | | 1,378,493 | | | | 9,754 | | | | 3,540,008 | | | | 63,792 | | | | 10,114 | | | | 24,403,537 | | | | 1,088,188 | |
| | | | | | 79,586,754 | | | | 13,332,586 | | | | 5,345,145 | | | | 8,968,792 | | | | 25,647,525 | | | | 110,881,991 | | | | 25,689,065 | |
| | | | | | — | | | | — | | | | 206,842,793 | | | | 97,203,580 | | | | — | | | | — | | | | — | |
| | | | | — | | | | — | | | | 21,995 | | | | 21,029 | | | | — | | | | — | | | | — | |
| | | | | | | | | | | | | | | | | | | | | | | |
| | | | | | 865,973 | | | | — | | | | 4,379,000 | | | | 76,945 | | | | — | | | | 98,248 | | | | 10,505 | |
| | | | | | 61,041 | | | | — | | | | 448,677 | | | | 34,792 | | | | — | | | | — | | | | — | |
| | | | | | — | | | | — | | | | 2,061 | | | | 6,170 | | | | — | | | | — | | | | — | |
| | | | | | 102,405 | | | | 708 | | | | 386,617 | | | | 3,857 | | | | 759 | | | | 1,497,101 | | | | 70,567 | |
| | | | | | 5,935,426 | | | | 969,190 | | | | 579,241 | | | | 559,559 | | | | 1,928,666 | | | | 6,673,072 | | | | 1,664,330 | |
| | | | | | — | | | | — | | | | 22,957,803 | | | | 6,162,617 | | | | — | | | | — | | | | — | |
| | | | | — | | | | — | | | | 2,297 | | | | 1,337 | | | | — | | | | — | | | | — | |
| | | | | | | | | | | | | | | | | | | | | | | |
| | | | | $ | 13.47 | | | $ | — | | | $ | 9.29 | | | $ | 15.79 | | | $ | — | | | $ | 16.19 | | | $ | 15.43 | |
| | | | | | 13.46 | | | | — | | | | 9.62 | | | | 15.49 | | | | — | | | | — | | | | — | |
| | | | | | — | | | | — | | | | 9.19 | | | | 15.72 | | | | — | | | | — | | | | — | |
| | | | | | 13.46 | | | | 13.78 | | | | 9.16 | | | | 16.54 | | | | 13.32 | | | | 16.30 | | | | 15.42 | |
| | | | | | 13.41 | | | | 13.76 | | | | 9.23 | | | | 16.03 | | | | 13.30 | | | | 16.62 | | | | 15.44 | |
| | | | | | — | | | | — | | | | 9.01 | | | | 15.77 | | | | — | | | | — | | | | — | |
| | | | | | — | | | | — | | | | 9.58 | | | | 15.73 | | | | — | | | | — | | | | — | |
| | | | | | | | |
| See accompanying Notes to Financial Statements | | | March 31, 2020 | | | Semiannual Report | | | 201 | |
Statements of Assets and Liabilities† (cont’d)
March 31, 2020 (unaudited)
| | | | | | | | | | | | | | | | | | | | | | | | |
| | | AllianzGI
High Yield
Bond | | | AllianzGI
International
Small-Cap | | | AllianzGI
Micro Cap | | | AllianzGI
PerformanceFee
Managed
Futures
Strategy† | | | AllianzGI
PerformanceFee
Structured US
Equity | | | | |
| Assets: | | | | |
| Investments, at value | | $ | 87,136,591 | | | $ | 64,147,713 | | | $ | 12,562,070 | | | $ | 19,900,288 | | | $ | 66,171,431 | | | | | |
| Investments in Affiliates, at value | | | 4,714,732 | | | | — | | | | — | | | | 1,261,374 | | | | — | | | | | |
| Repurchase agreements, at value | | | 5,255,000 | | | | 3,615,000 | | | | 226,000 | | | | 854,000 | | | | 1,888,000 | | | | | |
| Cash | | | 725,919 | | | | 94 | | | | 855 | | | | 458,475 | | | | — | | | | | |
| Foreign currency, at value | | | — | | | | 709,655 | | | | — | | | | — | | | | — | | | | | |
| Dividends and interest receivable (net of foreign withholding taxes) | | | 1,632,143 | | | | 277,605 | | | | 1,100 | | | | 60,931 | | | | — | | | | | |
| Receivable for investments sold | | | 448,266 | | | | 492,629 | | | | 46,441 | | | | — | | | | 440,276 | | | | | |
| Swap premiums paid | | | — | | | | — | | | | — | | | | 282,473 | | | | — | | | | | |
| Deposits with brokers for derivatives collateral | | | — | | | | — | | | | — | | | | 5,933,351 | | | | 933,735 | | | | | |
| Receivable for terminated swaps | | | — | | | | — | | | | — | | | | — | | | | — | | | | | |
| Receivable due from custodian | | | — | | | | — | | | | — | | | | — | | | | — | | | | | |
| Receivable for Fund shares sold | | | 17,476 | | | | 40,508 | | | | — | | | | — | | | | 18,276 | | | | | |
| Receivable from Investment Manager | | | — | | | | — | | | | — | | | | 23,994 | | | | 41,768 | | | | | |
| Tax reclaims receivable | | | — | | | | 329,924 | | | | — | | | | — | | | | — | | | | | |
| Investments in Affiliated Funds — Trustees Deferred Compensation Plan (see Note 5) | | | 35,434 | | | | 20,469 | | | | 4,419 | | | | 1,720 | | | | 1,729 | | | | | |
| Receivable for variation margin on centrally cleared swaps | | | — | | | | — | | | | — | | | | 12,221 | | | | — | | | | | |
| Receivable for principal paydowns | | | — | | | | — | | | | — | | | | — | | | | — | | | | | |
| Prepaid expenses and other assets | | | 61,111 | | | | 62,204 | | | | 32,471 | | | | 27,984 | | | | 28,830 | | | | | |
Total Assets | | | 100,026,672 | | | | 69,695,801 | | | | 12,873,356 | | | | 28,816,811 | | | | 69,524,045 | | | | | |
| Liabilities: | | | | |
| Payable for investments purchased | | | 1,112,859 | | | | 692,268 | | | | 9,874 | | | | — | | | | 2,171,104 | | | | | |
| Payable for Fund shares redeemed | | | 116,633 | | | | 17,267 | | | | 13,421 | | | | — | | | | 1,838,699 | | | | | |
| Payable to custodian for cash overdraft | | | — | | | | — | | | | — | | | | — | | | | 53,437 | | | | | |
| Payable to custodian for foreign currency overdraft | | | — | | | | — | | | | — | | | | 2,306 | | | | — | | | | | |
| Deposits received from brokers for derivatives collateral | | | — | | | | — | | | | — | | | | — | | | | — | | | | | |
| Payable for variation margin on futures contracts | | | — | | | | — | | | | — | | | | 75,014 | | | | — | | | | | |
| Options written, at value | | | — | | | | — | | | | — | | | | — | | | | 1,585,111 | | | | | |
| Investment management fees payable | | | 38,001 | | | | 21,376 | | | | 77 | | | | — | | | | — | | | | | |
| Distribution fees payable | | | 2,274 | | | | 596 | | | | — | | | | — | | | | — | | | | | |
| Servicing fees payable | | | 5,045 | | | | 1,056 | | | | 217 | | | | — | | | | — | | | | | |
| Trustees Deferred Compensation Plan payable (see Note 5) | | | 35,434 | | | | 20,469 | | | | 4,419 | | | | 1,720 | | | | 1,729 | | | | | |
| Accrued expenses and other liabilities | | | 153,104 | | | | 145,233 | | | | 60,062 | | | | 55,479 | | | | 206,704 | | | | | |
Total Liabilities | | | 1,463,350 | | | | 898,265 | | | | 88,070 | | |
| 134,519
|
| | | 5,856,784 | | | | | |
| Net Assets | | $ | 98,563,322 | | | $ | 68,797,536 | | | $ | 12,785,286 | | | $ | 28,682,292 | | | $ | 63,667,261 | | | | | |
| † | Consolidated Statement of Assets and Liabilities for the AllianzGI PerformanceFee Managed Futures Strategy Fund. These financial statements are consolidated to include the accounts of AllianzGI PerformanceFee Managed Futures Strategy Offshore Fund Ltd., a wholly-owned subsidiary of the AllianzGI PerformanceFee Managed Futures Strategy Fund. See Note 14. |
| | | | | | |
| 202 | | Semiannual Report | | | March 31, 2020 | | | See accompanying Notes to Financial Statements |
| | | | | | | | | | | | | | | | | | | | | | | | | | |
| | | |
AllianzGI
PerformanceFee
Structured US
Fixed Income | | | AllianzGI
Preferred
Securities
and Income | | | AllianzGI
Short
Duration
High Income | | | AllianzGI
Short Term
Bond | | | AllianzGI
Structured
Return | | | AllianzGI
U.S. Equity
Hedged | |
| | | | | | | | | | | | | | | | | | | | |
| | | | | $ | 8,642,100 | | | $ | 17,276,609 | | | $ | 844,750,788 | | | $ | 17,960,358 | | | $ | 265,142,554 | | | $ | 1,969,187 | |
| | | | | | — | | | | — | | | | — | | | | — | | | | — | | | | — | |
| | | | | | — | | | | 1,590,000 | | | | 31,938,000 | | | | 8,421,000 | | | | 7,950,000 | | | | — | |
| | | | | | 191,732 | | | | — | | | | — | | | | 238,938 | | | | 592 | | | | 31,256 | |
| | | | | | — | | | | — | | | | — | | | | — | | | | — | | | | — | |
| | | | |
| —
|
| | | 193,053 | | | | 15,948,833 | | | | 230,365 | | | | — | | | | 9,881 | |
| | | | | | 850,101 | | | | 544,917 | | | | 4,870,635 | | | | — | | | | 3,981,242 | | | | — | |
| | | | | | — | | | | 243,429 | | | | — | | | | — | | | | — | | | | — | |
| | | | | | — | | | | — | | | | — | | | | — | | | | — | | | | 7,613 | |
| | | | | | — | | | | 154 | | | | — | | | | — | | | | — | | | | — | |
| | | | | | — | | | | — | | | | — | | | | — | | | | 398,975 | | | | — | |
| | | | | | — | | | | 9,950 | | | | 859,395 | | | | 260,000 | | | | 292,077 | | | | — | |
| | | | | | 18,094 | | | | 6,468 | | | | — | | | | 8,464 | | | | — | | | | 11,006 | |
| | | | | | — | | | | — | | | | — | | | | — | | | | — | | | | — | |
| | | | |
|
2,925 |
| | | 248 | | | | 161,026 | | | | 82 | | | | 62,464 | | | | 632 | |
| | | | | | — | | |
|
454 |
| | | — | | | | — | | | | — | | | | — | |
| | | | | | — | | | | — | | | | 48,181 | | | | — | | | | — | | | | — | |
| | | | | | 27,955 | | | | 16,092 | | | | 80,586 | | | | 20,933 | | | | 60,511 | | | | 34,541 | |
| | | | | 9,732,907 | | | | 19,881,374 | | | | 898,657,444 | | | | 27,140,140 | | | | 277,888,415 | | | | 2,064,116 | |
| | | | | | | | | | | | | | | | | | | | |
| | | | | | — | | | | 923,677 | | | | 9,199,255 | | | | 5,189,589 | | | | 5,555,579 | | | | 16,620 | |
| | | | | | — | | | | 256,594 | | | | 4,063,368 | | | | — | | | | 4,173,735 | | | | — | |
| | | | | | — | | | | 192,563 | | | | 6,076,648 | | | | — | | | | — | | | | — | |
| | | | | | — | | | | — | | | | — | | | | — | | | | — | | | | — | |
| | | | |
|
929,565 |
| | | 64,585 | | | | — | | | | — | | | | 36,003 | | | | — | |
| | | | | | — | | | | 141 | | | | — | | | | — | | | | — | | | | — | |
| | | | | | 6,082 | | | | — | | | | — | | | | — | | | | 15,448,581 | | | | 668 | |
| | | | | | — | | | | — | | | | 434,684 | | | | — | | | | 189,760 | | | | — | |
| | | | | | — | | | | — | | | | 20,664 | | | | — | | | | 4,722 | | | | 103 | |
| | | | | | — | | | | — | | | | 48,162 | | | | 321 | | | | 5,201 | | | | 127 | |
| | | | |
|
2,925 |
| | | 248 | | | | 161,026 | | | | 82 | | | | 62,464 | | | | 632 | |
| | | | | | 55,061 | | | | 44,794 | | | | 593,114 | | | | 50,026 | | | | 1,460,045 | | | | 44,089 | |
| | | | | | 993,633 | | | | 1,482,602 | | | | 20,596,921 | | | | 5,240,018 | | | | 26,936,090 | | | | 62,239 | |
| | | | | $ | 8,739,274 | | | $ | 18,398,772 | | | $ | 878,060,523 | | | $ | 21,900,122 | | | $ | 250,952,325 | | | $ | 2,001,877 | |
| | | | | | | | |
| See accompanying Notes to Financial Statements | | | March 31, 2020 | | | Semiannual Report | | | 203 | |
Statements of Assets and Liabilities† (cont’d)
March 31, 2020 (unaudited)
| | | | | | | | | | | | | | | | | | | | | | | | |
| | | AllianzGI
High Yield
Bond | | | AllianzGI
International
Small-Cap | | | AllianzGI
Micro Cap | | | AllianzGI
PerformanceFee
Managed
Futures
Strategy† | | | AllianzGI
PerformanceFee
Structured US
Equity | | | | |
| Net Assets Consist of: | | | | |
| Paid-in-capital | | $ | 149,746,137 | | | $ | 76,727,858 | | | $ | 13,461,885 | | | $ | 32,268,079 | | | $ | 107,074,186 | | | | | |
| Total distributable earnings (loss) | | | (51,182,815 | ) | | | (7,930,322 | ) | | | (676,599 | ) | | | (3,585,787 | ) | | | (43,406,925 | ) | | | | |
| Net Assets | | $ | 98,563,322 | | | $ | 68,797,536 | | | $ | 12,785,286 | | | $ | 28,682,292 | | | $ | 63,667,261 | | | | | |
| Cost of Investments | | $ | 103,865,158 | | | $ | 69,551,192 | | | $ | 12,334,958 | | | $ | 19,792,717 | | | $ | 77,983,381 | | | | | |
| Cost of Investments in Affiliates | | $ | 5,645,148 | | | $ | — | | | $ | — | | | $ | 1,438,888 | | | $ | — | | | | | |
| Cost of Repurchase Agreements | | $ | 5,255,000 | | | $ | 3,615,000 | | | $ | 226,000 | | | $ | 854,000 | | | $ | 1,888,000 | | | | | |
| Cost of Foreign Currency | | $ | — | | | $ | 708,884 | | | $ | — | | | $ | — | | | $ | — | | | | | |
| Premiums Received for Options Written | | $ | — | | | $ | — | | | $ | — | | | $ | — | | | $ | 2,190,558 | | | | | |
| Net Assets: | | | | |
| Class A | | $ | 19,600,142 | | | $ | 3,466,719 | | | $ | 994,371 | | | $ | — | | | $ | — | | | | | |
| Class C | | | 3,598,165 | | | | 657,481 | | | | — | | | | — | | | | — | | | | | |
| Class R | | | 528,386 | | | | 841,702 | | | | — | | | | — | | | | — | | | | | |
| Class P | | | 9,238,302 | | | | 12,554,311 | | | | 204,346 | | | | 8,908 | | | | 15,185,070 | | | | | |
| Institutional Class | | | 65,574,590 | | | | 26,356,670 | | | | 11,586,569 | | | | 363,834 | | | | 46,950,137 | | | | | |
| Class R6 | | | — | | | | 24,920,653 | | | | — | | | | 28,309,550 | | | | 1,532,054 | | | | | |
| Administrative Class | | | 23,737 | | | | — | | | | — | | | | — | | | | — | | | | | |
| Shares Issued and Outstanding: | | | | |
| Class A | | | 2,496,046 | | | | 132,216 | | | | 121,863 | | | | — | | | | — | | | | | |
| Class C | | | 458,789 | | | | 26,013 | | | | — | | | | — | | | | — | | | | | |
| Class R | | | 70,579 | | | | 34,346 | | | | — | | | | — | | | | — | | | | | |
| Class P | | | 1,230,664 | | | | 481,503 | | | | 24,784 | | | | 1,081 | | | | 2,238,551 | | | | | |
| Institutional Class | | | 8,706,307 | | | | 974,361 | | | | 1,394,980 | | | | 44,201 | | | | 6,914,086 | | | | | |
| Class R6 | | | — | | | | 929,782 | | | | — | | | | 3,437,872 | | | | 222,827 | | | | | |
| Administrative Class | | | 3,158 | | | | — | | | | — | | | | — | | | | — | | | | | |
| Net Asset Value and Redemption Price Per Share:* | | | | |
| Class A | | $ | 7.85 | | | $ | 26.22 | | | $ | 8.16 | | | $ | — | | | $ | — | | | | | |
| Class C | | | 7.84 | | | | 25.27 | | | | — | | | | — | | | | — | | | | | |
| Class R | | | 7.49 | | | | 24.51 | | | | — | | | | — | | | | — | | | | | |
| Class P | | | 7.51 | | | | 26.07 | | | | 8.25 | | | | 8.24 | | | | 6.78 | | | | | |
| Institutional Class | | | 7.53 | | | | 27.05 | | | | 8.31 | | | | 8.23 | | | | 6.79 | | | | | |
| Class R6 | | | — | | | | 26.80 | | | | — | | | | 8.23 | | | | 6.88 | | | | | |
| Administrative Class | | | 7.52 | | | | — | | | | — | | | | — | | | | — | | | | | |
| † | Consolidated Statement of Assets and Liabilities for the AllianzGI PerformanceFee Managed Futures Strategy Fund. These financial statements are consolidated to include the accounts of AllianzGI PerformanceFee Managed Futures Strategy Offshore Fund Ltd., a wholly-owned subsidiary of the AllianzGI PerformanceFee Managed Futures Strategy Fund. See Note 14. |
| * | Net asset value and redemption price per share may not recalculate exactly due to rounding. |
| | | | | | |
| 204 | | Semiannual Report | | | March 31, 2020 | | | See accompanying Notes to Financial Statements |
| | | | | | | | | | | | | | | | | | | | | | | | | | |
| | | |
AllianzGI
PerformanceFee
Structured US
Fixed Income | | | AllianzGI
Preferred
Securities
and Income | | | AllianzGI Short
Duration
High Income | | | AllianzGI
Short Term
Bond | | | AllianzGI
Structured
Return | | | AllianzGI
U.S. Equity
Hedged | |
| | | | | | | | | | | | | | | | | | | | |
| | | | | $ | 8,583,557 | | | $ | 21,554,221 | | | $ | 1,152,408,831 | | | $ | 22,109,491 | | | $ | 475,271,850 | | | $ | 2,446,317 | |
| | | | | | 155,717 | | | | (3,155,449 | ) | | | (274,348,308 | ) | | | (209,369 | ) | | | (224,319,525 | ) | | | (444,440 | ) |
| | | | | $ | 8,739,274 | | | $ | 18,398,772 | | | $ | 878,060,523 | | | $ | 21,900,122 | | | $ | 250,952,325 | | | $ | 2,001,877 | |
| | | | | $ | 8,175,759 | | | $ | 20,508,789 | | | $ | 1,019,168,148 | | | $ | 18,147,865 | | | $ | 251,229,405 | | | $ | 1,807,036 | |
| | | | | $ | — | | | $ | — | | | $ | — | | | $ | — | | | $ | — | | | $ | — | |
| | | | | $ | — | | | $ | 1,590,000 | | | $ | 31,938,000 | | | $ | 8,421,000 | | | $ | 7,950,000 | | | $ | — | |
| | | | | $ | — | | | $ | — | | | $ | — | | | $ | — | | | $ | — | | | $ | — | |
| | | | $ | 52,593 | | | $ | — | | | $ | — | | | $ | — | | | $ | 45,557,873 | | | $ | 4,303 | |
| | | | | | | | | | | | | | | | | | | | |
| | | | | $ | — | | | $ | — | | | $ | 121,805,946 | | | $ | 3,430,685 | | | $ | 12,431,758 | | | $ | 435,797 | |
| | | | | | — | | | | — | | | | 93,255,343 | | | | — | | | | 5,728,566 | | | | 177,881 | |
| | | | | | — | | | | — | | | | — | | | | — | | | | — | | | | — | |
| | | | | | 152,285 | | | | 9,571 | | | | 289,847,254 | | | | 10,380 | | | | 47,096,427 | | | | 64,334 | |
| | | | | | 1,186,514 | | | | 2,702,534 | | | | 321,528,766 | | | | 18,459,057 | | | | 160,870,788 | | | | 1,323,865 | |
| | | | | | 7,400,475 | | | | 15,686,667 | | | | 51,623,214 | | | | — | | | | 24,824,786 | | | | — | |
| | | | | — | | | | — | | | | — | | | | — | | | | — | | | | — | |
| | | | | | | | | | | | | | | | | | | | |
| | | | | | — | | | | — | | | | 9,572,900 | | | | 234,157 | | | | 1,185,806 | | | | 27,097 | |
| | | | | | — | | | | — | | | | 7,335,624 | | | | — | | | | 573,844 | | | | 11,571 | |
| | | | | | — | | | | — | | | | — | | | | — | | | | — | | | | — | |
| | | | | | 16,860 | | | | 744 | | | | 22,934,738 | | | | 707 | | | | 4,547,746 | | | | 4,106 | |
| | | | | | 130,996 | | | | 210,188 | | | | 25,446,969 | | | | 1,258,549 | | | | 15,396,000 | | | | 80,961 | |
| | | | | | 812,991 | | | | 1,220,235 | | | | 4,085,655 | | | | — | | | | 2,393,092 | | | | — | |
| | | | | — | | | | — | | | | — | | | | — | | | | — | | | | — | |
| | | | | | | | | | | | | | | | | | | | |
| | | | | $ | — | | | $ | — | | | $ | 12.72 | | | $ | 14.65 | | | $ | 10.48 | | | $ | 16.08 | |
| | | | | | — | | | | — | | | | 12.71 | | | | — | | | | 9.98 | | | | 15.37 | |
| | | | | | — | | | | — | | | | — | | | | — | | | | — | | | | — | |
| | | | | | 9.03 | | | | 12.86 | | | | 12.64 | | | | 14.67 | | | | 10.36 | | | | 15.67 | |
| | | | | | 9.06 | | | | 12.86 | | | | 12.64 | | | | 14.67 | | | | 10.45 | | | | 16.35 | |
| | | | | | 9.10 | | | | 12.86 | | | | 12.64 | | | | — | | | | 10.37 | | | | — | |
| | | | | | — | | | | — | | | | — | | | | — | | | | — | | | | — | |
| | | | | | | | |
| See accompanying Notes to Financial Statements | | | March 31, 2020 | | | Semiannual Report | | | 205 | |
Statements of Assets and Liabilities (cont’d)
March 31, 2020 (unaudited)
| | | | | | | | |
| | | AllianzGI
Ultra Micro
Cap | | | AllianzGI
Water | |
| Assets: | |
| Investments, at value | | $ | 9,342,767 | | | $ | 538,549,794 | |
| Repurchase agreements, at value | | | 144,000 | | | | 10,758,000 | |
| Cash | | | 173 | | | | 371 | |
| Foreign currency, at value | | | — | | | | 6 | |
| Dividends and interest receivable (net of foreign withholding taxes) | | | 291 | | | | 456,269 | |
| Receivable for investments sold | | | 49,791 | | | | — | |
| Receivable for Fund shares sold | | | 177 | | | | 1,503,344 | |
| Receivable from Investment Manager | | | 4,953 | | | | — | |
| Tax reclaims receivable | | | — | | | | 1,068,066 | |
| Investments in Affiliated Funds — Trustees Deferred Compensation Plan (see Note 5) | | | 5,891 | | | | 77,289 | |
| Prepaid expenses and other assets | | | 33,062 | | | | 59,839 | |
Total Assets | | | 9,581,105 | | | | 552,472,978 | |
| Liabilities: | |
| Payable for Fund shares redeemed | | | 3,448 | | | | 1,236,588 | |
| Investment management fees payable | | | — | | | | 356,644 | |
| Distribution fees payable | | | — | | | | 38,468 | |
| Servicing fees payable | | | 548 | | | | 47,049 | |
| Trustees Deferred Compensation Plan payable (see Note 5) | | | 5,891 | | | | 77,289 | |
| Accrued expenses and other liabilities | | | 61,482 | | | | 430,877 | |
Total Liabilities | | | 71,369 | | | | 2,186,915 | |
| Net Assets | | $ | 9,509,736 | | | $ | 550,286,063 | |
| Net Assets Consist of: | |
| Paid-in-capital | | $ | 9,546,406 | | | $ | 490,410,675 | |
| Total distributable earnings (loss) | | | (36,670 | ) | | | 59,875,388 | |
| Net Assets | | $ | 9,509,736 | | | $ | 550,286,063 | |
| Cost of Investments | | $ | 9,001,861 | | | $ | 473,235,521 | |
| Cost of Repurchase Agreements | | $ | 144,000 | | | $ | 10,758,000 | |
| Cost of Foreign Currency | | $ | — | | | $ | 6 | |
| Net Assets: | |
| Class A | | $ | 2,264,557 | | | $ | 158,002,533 | |
| Class C | | | — | | | | 58,650,572 | |
| Class P | | | 1,011,934 | | | | 187,802,709 | |
| Institutional Class | | | 6,233,245 | | | | 145,830,249 | |
| Shares Issued and Outstanding: | |
| Class A | | | 308,184 | | | | 11,195,480 | |
| Class C | | | — | | | | 4,362,032 | |
| Class P | | | 121,189 | | | | 13,289,067 | |
| Institutional Class | | | 718,068 | | | | 10,526,765 | |
| Net Asset Value and Redemption Price Per Share:* | |
| Class A | | $ | 8.03 | | | $ | 14.11 | |
| Class C | | | — | | | | 13.45 | |
| Class P | | | 8.35 | | | | 14.13 | |
| Institutional Class | | | 8.39 | | | | 13.85 | |
| * | Net asset value and redemption price per share may not recalculate exactly due to rounding. |
| | | | | | |
| 206 | | Semiannual Report | | | March 31, 2020 | | | See accompanying Notes to Financial Statements |
(THIS PAGE INTENTIONALLY LEFT BLANK)
| | | | | | | | |
| See accompanying Notes to Financial Statements | | | March 31, 2020 | | | Semiannual Report | | | 207 | |
Statements of Operations
Six Months ended March 31, 2020 (unaudited)
| | | | | | | | | | | | | | | | | | | | | | | | |
| | |
AllianzGI
Retirement
2020 | | | AllianzGI
Retirement
2025 | | | AllianzGI
Retirement
2030 | | | AllianzGI
Retirement
2035 | | | AllianzGI
Retirement
2040 | | | | |
| Investment Income: | | | | |
| Dividends from investments in Affiliates | | $ | 482,146 | | | $ | 677,548 | | | $ | 973,423 | | | $ | 648,800 | | | $ | 666,413 | | | | | |
| Dividends, net of foreign withholding taxes* | | | 10,477 | | | | 6,381 | | | | 5,525 | | | | 5,112 | | | | 5,054 | | | | | |
| Contribution from Investment Manager (see Note 6) | | | 1,394 | | | | 5,671 | | | | 10,468 | | | | 6,321 | | | | 4,366 | | | | | |
| Interest | | | 1,811 | | | | 3,104 | | | | 4,593 | | | | 3,878 | | | | 5,696 | | | | | |
| Miscellaneous | | | — | | | | — | | | | — | | | | — | | | | — | | | | | |
Total Investment Income | | | 495,828 | | | | 692,704 | | | | 994,009 | | | | 664,111 | | | | 681,529 | | | | | |
| Expenses: | | | | |
| Investment management | | | 3,721 | | | | 5,197 | | | | 7,361 | | | | 5,917 | | | | 6,758 | | | | | |
| Administration | | | 9,213 | | | | 13,508 | | | | 17,228 | | | | 13,762 | | | | 11,188 | | | | | |
| Distribution — Class C | | | 1,748 | | | | — | | | | 2,276 | | | | — | | | | 631 | | | | | |
| Distribution — Class R | | | 13 | | | | 285 | | | | 104 | | | | 349 | | | | 219 | | | | | |
| Servicing — Class A | | | 3,937 | | | | 6,766 | | | | 6,930 | | | | 6,203 | | | | 2,698 | | | | | |
| Servicing — Class C | | | 583 | | | | — | | | | 759 | | | | — | | | | 210 | | | | | |
| Servicing — Class R | | | 13 | | | | 285 | | | | 104 | | | | 349 | | | | 219 | | | | | |
| Administrative servicing — Class P | | | — | | | | — | | | | — | | | | — | | | | — | | | | | |
| Distribution and/or servicing—Administrative Class | | | 42 | | | | 194 | | | | 209 | | | | 199 | | | | 65 | | | | | |
| Sub-transfer agent — Class A | | | — | | | | — | | | | — | | | | — | | | | — | | | | | |
| Sub-transfer agent — Class C | | | — | | | | — | | | | — | | | | — | | | | — | | | | | |
| Sub-transfer agent — Class R | | | — | | | | — | | | | — | | | | — | | | | — | | | | | |
| Sub-transfer agent — Institutional Class | | | — | | | | — | | | | — | | | | — | | | | — | | | | | |
| Sub-transfer agent — Administrative Class | | | — | | | | — | | | | — | | | | — | | | | — | | | | | |
| Line of credit commitment | | | 122 | | | | 169 | | | | 237 | | | | 184 | | | | 202 | | | | | |
| Legal | | | 10 | | | | 13 | | | | 18 | | | | 15 | | | | 16 | | | | | |
| Trustees | | | — | | | | — | | | | — | | | | — | | | | — | | | | | |
| Custodian and accounting agent | | | — | | | | — | | | | — | | | | — | | | | — | | | | | |
| Shareholder communications | | | — | | | | — | | | | — | | | | — | | | | — | | | | | |
| Transfer agent | | | — | | | | — | | | | — | | | | — | | | | — | | | | | |
| Insurance | | | — | | | | — | | | | — | | | | — | | | | — | | | | | |
| Audit and tax services | | | — | | | | — | | | | — | | | | — | | | | — | | | | | |
| Registration | | | — | | | | — | | | | — | | | | — | | | | — | | | | | |
| Recoupment | | | — | | | | — | | | | — | | | | — | | | | — | | | | | |
| Miscellaneous | | | — | | | | — | | | | — | | | | — | | | | — | | | | | |
Total Expenses | | | 19,402 | | | | 26,417 | | | | 35,226 | | | | 26,978 | | | | 22,206 | | | | | |
Less: Fee Waiver/Reimbursement from Investment Manager | | | (10,087 | ) | | | (16,784 | ) | | | (23,526 | ) | | | (17,463 | ) | | | (15,721 | ) | | | | |
Net Expenses | | | 9,315 | | | | 9,633 | | | | 11,700 | | | | 9,515 | | | | 6,485 | | | | | |
| Net Investment Income | | | 486,513 | | | | 683,071 | | | | 982,309 | | | | 654,596 | | | | 675,044 | | | | | |
| | | | | | |
| 208 | | Semiannual Report | | | March 31, 2020 | | | See accompanying Notes to Financial Statements |
| | | | | | | | | | | | | | | | | | | | | | | | | | | | | | |
| | | |
AllianzGI
Retirement
2045 | | | AllianzGI
Retirement
2050 | | | AllianzGI
Retirement
2055 | | | AllianzGI
Multi
Asset
Income | | | AllianzGI
Best Styles
Global Equity | | | AllianzGI
Best Styles
U.S. Equity | | | AllianzGI
Convertible | |
| | | | | | | | | | | | | | | | | | | | | | | |
| | | | | $ | 367,198 | | | $ | 514,079 | | | $ | 252,836 | | | $ | 346,374 | | | $ | — | | | $ | — | | | $ | — | |
| | | | | | 3,042 | | | | 4,973 | | | | 2,497 | | | | 588,302 | | | | 2,120,082 | | | | 442,255 | | | | 3,683,253 | |
| | | | | | 1,264 | | | | — | | | | — | | | | — | | | | — | | | | — | | | | — | |
| | | | | | 3,809 | | | | 6,436 | | | | 2,906 | | | | 5,045 | | | | 3,205 | | | | 766 | | | | 3,905,646 | |
| | | | | | — | | | | — | | | | — | | | | — | | | | — | | | | — | | | | 78,941 | |
| | | | | 375,313 | | | | 525,488 | | | | 258,239 | | | | 939,721 | | | | 2,123,287 | | | | 443,021 | | | | 7,667,840 | |
| | | | | | | | | | | | | | | | | | | | | | | |
| | | | | | 4,106 | | | | 5,863 | | | | 2,939 | | | | 7,093 | | | | 320,707 | | | | 65,475 | | | | 2,339,433 | |
| | | | | | 7,407 | | | | 11,035 | | | | 5,582 | | | | 25,313 | | | | — | | | | — | | | | — | |
| | | | | | — | | | | 905 | | | | — | | | | 5,631 | | | | 69 | | | | 204 | | | | 259,279 | |
| | | | | | 141 | | | | 267 | | | | 50 | | | | 129 | | | | — | | | | — | | | | 228 | |
| | | | | | 2,317 | | | | 3,268 | | | | 2,148 | | | | 15,509 | | | | 1,285 | | | | 1,465 | | | | 108,026 | |
| | | | | | — | | | | 302 | | | | — | | | | 1,877 | | | | 23 | | | | 68 | | | | 86,426 | |
| | | | | | 141 | | | | 267 | | | | 50 | | | | 129 | | | | — | | | | — | | | | 228 | |
| | | | | | — | | | | — | | | | — | | | | — | | | | 294 | | | | 134 | | | | 48,617 | |
| | | | | | 430 | | | | 784 | | | | 225 | | | | 13 | | | | — | | | | — | | | | 852 | |
| | | | | | — | | | | — | | | | — | | | | — | | | | 585 | | | | 640 | | | | 27,878 | |
| | | | | | — | | | | — | | | | — | | | | — | | | | 9 | | | | 35 | | | | 21,879 | |
| | | | | | — | | | | — | | | | — | | | | — | | | | — | | | | — | | | | 79 | |
| | | | | | — | | | | — | | | | — | | | | — | | | | 214 | | | | 10 | | | | 95,541 | |
| | | | | | — | | | | — | | | | — | | | | — | | | | — | | | | — | | | | 46 | |
| | | | | | 129 | | | | 164 | | | | 84 | | | | 155 | | | | 3,802 | | | | 744 | | | | 7,778 | |
| | | | | | 11 | | | | 14 | | | | 9 | | | | 13 | | | | 26,621 | | | | 8,274 | | | | 34,295 | |
| | | | | | — | | | | — | | | | — | | | | — | | | | 24,463 | | | | 5,317 | | | | 44,511 | |
| | | | | | — | | | | — | | | | — | | | | — | | | | 155,918 | | | | 49,164 | | | | 70,367 | |
| | | | | | — | | | | — | | | | — | | | | — | | | | 11,171 | | | | 5,102 | | | | 30,578 | |
| | | | | | — | | | | — | | | | — | | | | — | | | | 9,908 | | | | 4,032 | | | | 18,261 | |
| | | | | | — | | | | — | | | | — | | | | — | | | | 9,228 | | | | 3,562 | | | | 10,230 | |
| | | | | | — | | | | — | | | | — | | | | — | | | | 22,956 | | | | 20,427 | | | | 36,503 | |
| | | | | | — | | | | — | | | | — | | | | — | | | | 35,904 | | | | 34,829 | | | | 59,384 | |
| | | | | | — | | | | — | | | | 336 | | | | 2,872 | | | | — | | | | — | | | | — | |
| | | | | | — | | | | — | | | | — | | | | — | | | | 10,054 | | | | 2,664 | | | | 7,644 | |
| | | | | | 14,682 | | | | 22,869 | | | | 11,423 | | | | 58,734 | | | | 633,211 | | | | 202,146 | | | | 3,308,063 | |
| | | | |
|
(9,516 |
) | | | (13,153 | ) | | | (7,077 | ) | | | (4,173 | ) | | | (199,562 | ) | | | (112,233 | ) | | | — | |
| | | | | | 5,166 | | | | 9,716 | | | | 4,346 | | | | 54,561 | | | | 433,649 | | | | 89,913 | | | | 3,308,063 | |
| | | | | | 370,147 | | | | 515,772 | | | | 253,893 | | | | 885,160 | | | | 1,689,638 | | | | 353,108 | | | | 4,359,777 | |
| | | | | | | | |
| See accompanying Notes to Financial Statements | | | March 31, 2020 | | | Semiannual Report | | | 209 | |
Statements of Operations (cont’d)
Six Months ended March 31, 2020 (unaudited)
| | | | | | | | | | | | | | | | | | | | | | | | |
| | |
AllianzGI
Retirement
2020 | | | AllianzGI
Retirement
2025 | | | AllianzGI
Retirement
2030 | | | AllianzGI
Retirement
2035 | | | AllianzGI
Retirement
2040 | | | | |
| Realized and Change in Unrealized Gain (Loss): | | | | |
| Net realized gain (loss) on: | | | | | | | | | | | | | | | | | | | | | | | | |
Investments | | $ | (452,279 | ) | | $ | (951,922 | ) | | $ | (405,957 | ) | | $ | 616,823 | | | $ | 1,304,322 | | | | | |
Investments in Affiliates | | | 853,015 | | | | 1,339,723 | | | | 893,761 | | | | (77,895 | ) | | | (1,284,470 | ) | | | | |
Futures contracts | | | 91,314 | | | | 325,531 | | | | 151,975 | | | | (53,683 | ) | | | (318,347 | ) | | | | |
Forward foreign currency contracts | | | — | | | | — | | | | — | | | | — | | | | — | | | | | |
Foreign currency transactions | | | — | | | | — | | | | (631 | ) | | | — | | | | — | | | | | |
| Net capital gain distributions received from underlying Affiliated funds | | | 696,959 | | | | 1,133,354 | | | | 1,870,178 | | | | 1,585,290 | | | | 1,832,027 | | | | | |
| Net change in unrealized appreciation/depreciation of: | | | | | | | | | | | | | | | | | | | | | | | | |
Investments | | | (92,437 | ) | | | (8,616 | ) | | | (512 | ) | | | (399 | ) | | | (452 | ) | | | | |
Investments in Affiliates | | | (1,897,302 | ) | | | (3,524,536 | ) | | | (5,336,959 | ) | | | (4,621,925 | ) | | | (4,958,514 | ) | | | | |
Futures contracts | | | (32,776 | ) | | | (50,105 | ) | | | (72,147 | ) | | | 15,065 | | | | 15,494 | | | | | |
Foreign currency transactions | | | (10 | ) | | | (3,427 | ) | | | (6,645 | ) | | | (9,801 | ) | | | (9,815 | ) | | | | |
| Net realized and change in unrealized loss | | | (833,516 | ) | | | (1,739,998 | ) | | | (2,906,937 | ) | | | (2,546,525 | ) | | | (3,419,755 | ) | | | | |
| Net Decrease in Net Assets Resulting from Investment Operations | | $ | (347,003 | ) | | $ | (1,056,927 | ) | | $ | (1,924,628 | ) | | $ | (1,891,929 | ) | | $ | (2,744,711 | ) | | | | |
| *Foreign withholding taxes | | $ | — | | | $ | — | | | $ | — | | | $ | — | | | $ | — | | | | | |
| | | | | | |
| 210 | | Semiannual Report | | | March 31, 2020 | | | See accompanying Notes to Financial Statements |
| | | | | | | | | | | | | | | | | | | | | | | | | | | | | | |
| | | |
AllianzGI
Retirement
2045 | | | AllianzGI
Retirement
2050 | | | AllianzGI
Retirement
2055 | | | AllianzGI
Multi Asset
Income | | | AllianzGI
Best Styles
Global Equity | | | AllianzGI
Best Styles
U.S. Equity | | | AllianzGI
Convertible | |
| | | | | | | | | | | | | | | | | | | | | | | |
| | | | | | | | | | | | | | | | | | | | | | | | | | | | | | |
| | | | | $ | 1,286,893 | | | $ | 1,669,837 | | | $ | 1,067,909 | | | $ | (4,311,614 | ) | | $ | 10,887,059 | | | $ | 1,368,877 | | | $ | 25,645,613 | |
| | | | | | (1,340,990 | ) | | | (2,041,402 | ) | | | (1,302,792 | ) | | | (877,708 | ) | | | — | | | | — | | | | — | |
| | | | | | (274,012 | ) | | | (452,172 | ) | | | (244,209 | ) | | | (709,356 | ) | | | — | | | | — | | | | — | |
| | | | | | — | | | | — | | | | — | | | | — | | | | (1,353 | ) | | | — | | | | — | |
| | | | | | — | | | | — | | | | — | | | | (5,826 | ) | | | (28,672 | ) | | | 9,608 | | | | — | |
| | | | |
|
1,092,832 |
| | | 1,603,394 | | | | 791,634 | | | | 63,481 | | | | — | | | | — | | | | — | |
| | | | | | | | | | | | | | | | | | | | | | | | | | | | | | |
| | | | | | (282 | ) | | | 4,340 | | | | (188 | ) | | | (2,568,278 | ) | | | (30,970,937 | ) | | | (5,912,742 | ) | | | (89,386,844 | ) |
| | | | | | (3,009,195 | ) | | | (3,995,156 | ) | | | (1,940,549 | ) | | | (3,825,906 | ) | | | — | | | | — | | | | — | |
| | | | | | (26,826 | ) | | | (53,123 | ) | | | (23,056 | ) | | | 680,846 | | | | — | | | | — | | | | — | |
| | | | | | (6,153 | ) | | | (7,249 | ) | | | (7,244 | ) | | | (1,668 | ) | | | 4,618 | | | | 7 | | | | — | |
| | | | | | (2,277,733 | ) | | | (3,271,531 | ) | | | (1,658,495 | ) | | | (11,556,029 | ) | | | (20,109,285 | ) | | | (4,534,250 | ) | | | (63,741,231 | ) |
| | | | |
$ |
(1,907,586 |
) | | $ | (2,755,759 | ) | | $ | (1,404,602 | ) | | $ | (10,670,869 | ) | | $ | (18,419,647 | ) | | $ | (4,181,142 | ) | | $ | (59,381,454 | ) |
| | | | | $ | — | | | $ | — | | | $ | — | | | $ | 6,155 | | | $ | 128,522 | | | $ | 4,548 | | | $ | — | |
| | | | | | | | |
| See accompanying Notes to Financial Statements | | | March 31, 2020 | | | Semiannual Report | | | 211 | |
Statements of Operations (cont’d)
Six Months ended March 31, 2020 (unaudited)
| | | | | | | | | | | | | | | | | | | | | | | | |
| | | AllianzGI
Core Bond | | | AllianzGI
Core Plus
Bond | | | AllianzGI
Emerging
Markets
Consumer | | | AllianzGI
Emerging
Markets
Small-Cap | | | AllianzGI
Emerging
Markets SRI
Debt | | | | |
| Investment Income: | | | | |
| Interest, net of foreign withholding taxes* | | $ | 475,716 | | | $ | 818,005 | | | $ | 448 | | | $ | 14 | | | $ | 440,712 | | | | | |
| Dividends from investments in Affiliates | | | — | | | | — | | | | — | | | | — | | | | — | | | | | |
| Dividends, net of foreign withholding taxes* | | | 7,766 | | | | 29,495 | | | | 301,696 | | | | 94,914 | | | | — | | | | | |
| Miscellaneous | | | 3 | | | | 5 | | | | — | | | | 3 | | | | — | | | | | |
Total Investment Income | | | 483,485 | | | | 847,505 | | | | 302,144 | | | | 94,931 | | | | 440,712 | | | | | |
| Expenses: | | | | |
| Investment management | | | 46,359 | | | | 86,759 | | | | 171,466 | | | | 46,369 | | | | 60,584 | | | | | |
| Distribution — Class C | | | — | | | | — | | | | — | | | | — | | | | 51 | | | | | |
| Distribution — Class R | | | — | | | | — | | | | — | | | | — | | | | — | | | | | |
| Servicing — Class A | | | — | | | | — | | | | 80 | | | | 219 | | | | 157 | | | | | |
| Servicing — Class C | | | — | | | | — | | | | — | | | | — | | | | 17 | | | | | |
| Servicing — Class R | | | — | | | | — | | | | — | | | | — | | | | — | | | | | |
| Administrative servicing — Class P | | | — | | | | — | | | | — | | | | — | | | | — | | | | | |
| Distribution and/or servicing — Administrative Class | | | — | | | | — | | | | — | | | | — | | | | — | | | | | |
| Sub-transfer agent — Class A | | | — | | | | — | | | | 31 | | | | 39 | | | | 37 | | | | | |
| Sub-transfer agent — Class C | | | — | | | | — | | | | — | | | | — | | | | 2 | | | | | |
| Sub-transfer agent — Class R | | | — | | | | — | | | | — | | | | — | | | | — | | | | | |
| Sub-transfer agent — Institutional Class | | | 17 | | | | — | | | | 4,785 | | | | 421 | | | | 937 | | | | | |
| Custodian and accounting agent | | | 51,462 | | | | 48,221 | | | | 56,669 | | | | 48,214 | | | | 39,389 | | | | | |
| Audit and tax services | | | 26,440 | | | | 26,412 | | | | 20,852 | | | | 21,530 | | | | 26,420 | | | | | |
| Shareholder communications | | | 5,256 | | | | 3,087 | | | | 3,185 | | | | 3,354 | | | | 4,710 | | | | | |
| Legal | | | 11,396 | | | | 14,804 | | | | 6,719 | | | | 5,746 | | | | 21,941 | | | | | |
| Transfer agent | | | 1,802 | | | | 2,051 | | | | 1,695 | | | | 1,265 | | | | 2,297 | | | | | |
| Trustees | | | 2,309 | | | | 3,452 | | | | 2,813 | | | | 623 | | | | 1,405 | | | | | |
| Registration | | | 22,507 | | | | 22,501 | | | | 17,122 | | | | 16,550 | | | | 30,009 | | | | | |
| Offering | | | — | | | | — | | | | — | | | | — | | | | — | | | | | |
| Recoupment | | | — | | | | — | | | | — | | | | — | | | | — | | | | | |
| Insurance | | | 2,672 | | | | 2,834 | | | | 2,784 | | | | 2,334 | | | | 2,501 | | | | | |
| Line of credit commitment | | | 354 | | | | 586 | | | | 459 | | | | 94 | | | | 230 | | | | | |
| Miscellaneous | | | 1,355 | | | | 1,977 | | | | 2,133 | | | | 1,691 | | | | 3,165 | | | | | |
Total Expenses | | | 171,929 | | | | 212,684 | | | | 290,793 | | | | 148,449 | | | | 193,852 | | | | | |
Less: Fee Waiver/Reimbursement from Investment Manager | | | (134,461 | ) | | | (139,768 | ) | | | (78,392 | ) | | | (90,097 | ) | | | (112,409 | ) | | | | |
Net Expenses | | | 37,468 | | | | 72,916 | | | | 212,401 | | | | 58,352 | | | | 81,443 | | | | | |
| Net Investment Income | | | 446,017 | | | | 774,589 | | | | 89,743 | | | | 36,579 | | | | 359,269 | | | | | |
| Realized and Change in Unrealized Gain (Loss): | | | | |
| Net realized gain (loss) on: | | | | | | | | | | | | | | | | | | | | | | | | |
Investments | | | 1,126,678 | | | | 1,402,858 | | | | (137,808 | ) | | | 142,438 | | | | 88,750 | | | | | |
Investments in Affiliates | | | — | | | | — | | | | — | | | | — | | | | — | | | | | |
Futures contracts | | | 31,220 | | | | 332,358 | | | | — | | | | — | | | | (36,523 | ) | | | | |
Swaps | | | 181,663 | | | | 242,123 | | | | — | | | | — | | | | — | | | | | |
Forward foreign currency contracts | | | — | | | | — | | | | — | | | | — | | | | (59,183 | ) | | | | |
Foreign currency transactions | | | — | | | | — | | | | (16,915 | ) | | | (1,997 | ) | | | 3,157 | | | | | |
| Net capital gain distributions received from underlying Affiliated funds | | | — | | | | — | | | | — | | | | — | | | | — | | | | | |
| Payments from Affiliates (See Note 7) | | | 313 | | | | — | | | | — | | | | — | | | | — | | | | | |
| Net change in unrealized appreciation/depreciation of: | | | | | | | | | | | | | | | | | | | | | | | | |
Investments | | | (906,817 | ) | | | (2,450,490 | ) | | | (4,955,460 | ) | | | (1,814,732 | ) | | | (2,401,236 | ) | | | | |
Investments in Affiliates | | | — | | | | — | | | | — | | | | — | | | | — | | | | | |
Futures contracts | | | 123,875 | | | | 116,317 | | | | — | | | | — | | | | 14,961 | | | | | |
Swaps | | | (40,153 | ) | | | 40,841 | | | | — | | | | — | | | | — | | | | | |
Forward foreign currency contracts | | | — | | | | — | | | | — | | | | — | | | | 107,750 | | | | | |
Foreign currency transactions | | | — | | | | — | | | | (6,102 | ) | | | (2,179 | ) | | | (2,988 | ) | | | | |
| Net realized and change in unrealized gain (loss) | | | 516,779 | | | | (315,993 | ) | | | (5,116,285 | ) | | | (1,676,470 | ) | | | (2,285,312 | ) | | | | |
| Net Increase (Decrease) in Net Assets Resulting from Investment Operations | | $ | 962,796 | | | $ | 458,596 | | | $ | (5,026,542 | ) | | $ | (1,639,891 | ) | | $ | (1,926,043 | ) | | | | |
| *Foreign withholding taxes | | $ | — | | | $ | — | | | $ | 41,984 | | | $ | 10,748 | | | $ | 37 | | | | | |
| | | | | | |
| 212 | | Semiannual Report | | | March 31, 2020 | | | See accompanying Notes to Financial Statements |
| | | | | | | | | | | | | | | | | | | | | | | | | | | | | | |
| | | | AllianzGI
Emerging
Markets
Value | | | AllianzGI
Floating
Rate Note | | | AllianzGI
Global
Allocation | | | AllianzGI
Global
Dynamic
Allocation | | | AllianzGI
Global High
Yield | | | AllianzGI
Global
Sustainability | | | AllianzGI
Green Bond | |
| | | | | | | | | | | | | | | | | | | | | | | |
| | | | | $ | 1,357 | | | $ | 180,452 | | | $ | 742,733 | | | $ | 573,280 | | | $ | 662,932 | | | $ | 6,466 | | | $ | 246,262 | |
| | | | | | — | | | | — | | | | 3,539,951 | | | | 172,302 | | | | — | | | | — | | | | — | |
| | | | | | 931,020 | | | | — | | | | 29,960 | | | | 702,816 | | | | — | | | | 1,108,303 | | | | — | |
| | | | | | — | | | | — | | | | 501 | | | | 19 | | | | 250 | | | | — | | | | — | |
| | | | | 932,377 | | | | 180,452 | | | | 4,313,145 | | | | 1,448,417 | | | | 663,182 | | | | 1,114,769 | | | | 246,262 | |
| | | | | | | | | | | | | | | | | | | | | | | |
| | | | | | 470,435 | | | | 13,565 | | | | 1,102,080 | | | | 467,346 | | | | 74,049 | | | | 563,156 | | | | 58,400 | |
| | | | | | 3,789 | | | | — | | | | 21,400 | | | | 2,387 | | | | — | | | | — | | | | — | |
| | | | | | — | | | | — | | | | 26 | | | | 137 | | | | — | | | | — | | | | — | |
| | | | | | 18,698 | | | | — | | | | 59,815 | | | | 2,111 | | | | — | | | | 1,944 | | | | 162 | |
| | | | | | 1,263 | | | | — | | | | 7,133 | | | | 796 | | | | — | | | | — | | | | — | |
| | | | | | — | | | | — | | | | 26 | | | | 137 | | | | — | | | | — | | | | — | |
| | | | | | — | | | | — | | | | 2,606 | | | | 947 | | | | — | | | | 6,945 | | | | 319 | |
| | | | | | — | | | | — | | | | 30 | | | | 29 | | | | — | | | | — | | | | — | |
| | | | | | 9,017 | | | | — | | | | 15,140 | | | | 627 | | | | — | | | | 492 | | | | 21 | |
| | | | | | 488 | | | | — | | | | 2,013 | | | | 234 | | | | — | | | | — | | | | — | |
| | | | | | — | | | | — | | | | 3 | | | | 94 | | | | — | | | | — | | | | — | |
| | | | | | 48,229 | | | | 141 | | | | 1,577 | | | | 4,179 | | | | 59 | | | | 4,758 | | | | 39 | |
| | | | | | 135,545 | | | | 26,199 | | | | 27,713 | | | | 211,287 | | | | 27,468 | | | | 63,340 | | | | 26,747 | |
| | | | | | 30,151 | | | | 26,440 | | | | 16,826 | | | | 25,980 | | | | 25,620 | | | | 19,513 | | | | 26,440 | |
| | | | | | 10,467 | | | | 3,060 | | | | 9,554 | | | | 9,510 | | | | 3,454 | | | | 4,789 | | | | 5,058 | |
| | | | | | 6,500 | | | | 11,062 | | | | 20,077 | | | | 20,995 | | | | 5,549 | | | | 7,718 | | | | 14,145 | |
| | | | | | 5,052 | | | | 554 | | | | 30,236 | | | | 7,077 | | | | 1,203 | | | | 2,307 | | | | 1,503 | |
| | | | | | 8,102 | | | | 1,008 | | | | 22,407 | | | | 12,379 | | | | 1,670 | | | | 5,299 | | | | 1,152 | |
| | | | | | 31,963 | | | | 17,364 | | | | 48,932 | | | | 46,959 | | | | 16,366 | | | | 23,352 | | | | 19,476 | |
| | | | | | — | | | | — | | | | — | | | | — | | | | — | | | | — | | | | 18,006 | |
| | | | | | — | | | | — | | | | 2,531 | | | | — | | | | — | | | | — | | | | — | |
| | | | | | 3,921 | | | | 2,413 | | | | 6,873 | | | | 5,018 | | | | 2,545 | | | | 2,507 | | | | 2,290 | |
| | | | | | 1,270 | | | | 158 | | | | 3,443 | | | | 1,696 | | | | 271 | | | | 1,057 | | | | 238 | |
| | | | | | 2,932 | | | | 567 | | | | 3,343 | | | | 5,916 | | | | 2,297 | | | | 3,232 | | | | 3,983 | |
| | | | | | 787,822 | | | | 102,531 | | | | 1,403,784 | | | | 825,841 | | | | 160,551 | | | | 710,409 | | | | 177,979 | |
| | | | | | (269,152 | ) | | | (81,986 | ) | | | (976,713 | ) | | | (458,772 | ) | | | (73,645 | ) | | | (139,646 | ) | | | (103,253 | ) |
| | | | | | 518,670 | | | | 20,545 | | | | 427,071 | | | | 367,069 | | | | 86,906 | | | | 570,763 | | | | 74,726 | |
| | | | | 413,707 | | | | 159,907 | | | | 3,886,074 | | | | 1,081,348 | | | | 576,276 | | | | 544,006 | | | | 171,536 | |
| | | | | | | | | | | | | | | | | | | | | | | |
| | | | | | | | | | | | | | | | | | | | | | | | | | | | | | |
| | | | | | (3,584,558 | ) | | | 25,182 | | | | 671,236 | | | | 411,404 | | | | (65,254 | ) | | | (179,342 | ) | | | 79,420 | |
| | | | | | — | | | | — | | | | 8,193,567 | | | | (128,074 | ) | | | — | | | | — | | | | — | |
| | | | | | — | | | | (22,631 | ) | | | (2,599,160 | ) | | | (581,777 | ) | | | 31,204 | | | | — | | | | (150,738 | ) |
| | | | | | — | | | | — | | | | — | | | | 61,203 | | | | — | | | | — | | | | — | |
| | | | | | — | | | | (10,293 | ) | | | — | | | | — | | | | (156,706 | ) | | | — | | | | 444,554 | |
| | | | | | (91,808 | ) | | | (1,875 | ) | | | — | | | | (28,396 | ) | | | (7,466 | ) | | | (3,778 | ) | | | 337,853 | |
| | | | | | — | | | | — | | | | 3,682,631 | | | | 1,052,860 | | | | — | | | | — | | | | — | |
| | | | | | — | | | | — | | | | — | | | | — | | | | — | | | | — | | | | — | |
| | | | | | | | | | | | | | | | | | | | | | | | | | | | | | |
| | | | | | (10,233,365 | ) | | | (1,035,052 | ) | | | (2,897,262 | ) | | | (7,896,214 | ) | | | (3,208,191 | ) | | | (14,984,324 | ) | | | (1,602,548 | ) |
| | | | | | — | | | | — | | | | (34,420,051 | ) | | | (4,666,568 | ) | | | — | | | | — | | | | — | |
| | | | | | — | | | | (72,245 | ) | | | 2,384,971 | | | | (655,598 | ) | | | (63,815 | ) | | | — | | | | (153,796 | ) |
| | | | | | — | | | | — | | | | — | | | | 1,825,564 | | | | — | | | | — | | | | — | |
| | | | | | — | | | | 17,792 | | | | — | | | | — | | | | 131,137 | | | | — | | | | (346,944 | ) |
| | | | | | (9,152 | ) | | | 98 | | | | 1,035 | | | | 8,219 | | | | 1,568 | | | | 2,049 | | | | (730 | ) |
| | | | | | (13,918,883 | ) | | | (1,099,024 | ) | | | (24,983,033 | ) | | | (10,597,377 | ) | | | (3,337,523 | ) | | | (15,165,395 | ) | | | (1,392,929 | ) |
| | | | |
$ |
(13,505,176 |
) | | $ | (939,117 | ) | | $ | (21,096,959 | ) | | $ | (9,516,029 | ) | | $ | (2,761,247 | ) | | $ | (14,621,389 | ) | | $ | (1,221,393 | ) |
| | | | | $ | 120,199 | | | $ | — | | | $ | — | | | $ | 22,630 | | | $ | 1,079 | | | $ | 44,268 | | | $ | — | |
| | | | | | | | |
| See accompanying Notes to Financial Statements | | | March 31, 2020 | | | Semiannual Report | | | 213 | |
Statements of Operations† (cont’d)
Six Months ended March 31, 2020 (unaudited)
| | | | | | | | | | | | | | | | | | | | | | | | |
| | | AllianzGI
High Yield
Bond | | | AllianzGI
International
Small-Cap | | | AllianzGI
Micro Cap | | | AllianzGI
PerformanceFee
Managed
Futures Strategy † | | | AllianzGI
PerformanceFee
Structured US
Equity | | | | |
| Investment Income: | | | | |
| Interest | | $ | 3,235,428 | | | $ | 1,469 | | | $ | 326 | | | $ | 231,967 | | | $ | 661 | | | | | |
| Dividends from investments in Affiliates | | | — | | | | — | | | | — | | | | 35,341 | | | | — | | | | | |
| Dividends, net of foreign withholding taxes* | | | — | | | | 487,835 | | | | 21,426 | | | | — | | | | 1,152,795 | | | | | |
| Miscellaneous | | | 45 | | | | — | | | | 15 | | | | — | | | | — | | | | | |
Total Investment Income | | | 3,235,473 | | | | 489,304 | | | | 21,767 | | | | 267,308 | | | | 1,153,456 | | | | | |
| Expenses: | | | | |
| Investment management | | | 276,265 | | | | 459,854 | | | | 90,840 | | | | 122,115 | | | | 331,167 | | | | | |
| Performance fee adjustment | | | — | | | | — | | | | — | | | | (98,411 | ) | | | 89,802 | | | | | |
| Distribution — Class C | | | 16,397 | | | | 3,285 | | | | — | | | | — | | | | — | | | | | |
| Distribution — Class R | | | 871 | | | | 1,365 | | | | — | | | | — | | | | — | | | | | |
| Servicing — Class A | | | 30,260 | | | | 5,814 | | | | 1,658 | | | | — | | | | — | | | | | |
| Servicing — Class C | | | 5,465 | | | | 1,095 | | | | — | | | | — | | | | — | | | | | |
| Servicing — Class R | | | 871 | | | | 1,365 | | | | — | | | | — | | | | — | | | | | |
| Administrative servicing — Class P | | | 3,421 | | | | 4,801 | | | | 176 | | | | — | | | | 1,395 | | | | | |
| Distribution and/or servicing — Administrative Class | | | 32 | | | | — | | | | — | | | | — | | | | — | | | | | |
| Sub-transfer agent — Class A | | | 18,435 | | | | 2,168 | | | | 926 | | | | — | | | | — | | | | | |
| Sub-transfer agent — Class C | | | 1,755 | | | | 454 | | | | — | | | | — | | | | — | | | | | |
| Sub-transfer agent — Class R | | | 897 | | | | 1,265 | | | | — | | | | — | | | | — | | | | | |
| Sub-transfer agent — Institutional Class | | | 36,456 | | | | 19,238 | | | | 7,659 | | | | 437 | | | | 14,879 | | | | | |
| Custodian and accounting agent | | | 35,733 | | | | 107,677 | | | | 36,836 | | | | 56,888 | | | | 97,983 | | | | | |
| Audit and tax services | | | 30,001 | | | | 20,510 | | | | 18,334 | | | | 25,690 | | | | 24,690 | | | | | |
| Shareholder communications | | | 8,814 | | | | 8,024 | | | | 3,795 | | | | 2,595 | | | | 7,782 | | | | | |
| Legal | | | 12,605 | | | | 12,120 | | | | 6,075 | | | | 12,199 | | | | 9,776 | | | | | |
| Transfer agent | | | 9,410 | | | | 7,079 | | | | 2,564 | | | | 1,785 | | | | 2,690 | | | | | |
| Trustees | | | 8,891 | | | | 7,112 | | | | 1,272 | | | | 7,325 | | | | 6,960 | | | | | |
| Registration | | | 43,491 | | | | 43,416 | | | | 23,172 | | | | 22,356 | | | | 23,137 | | | | | |
| Insurance | | | 4,078 | | | | 3,690 | | | | 2,463 | | | | 2,664 | | | | 3,496 | | | | | |
| Line of credit commitment | | | 1,379 | | | | 1,107 | | | | 203 | | | | 369 | | | | 1,194 | | | | | |
| Miscellaneous | | | 5,545 | | | | 3,509 | | | | 2,107 | | | | 13,328 | | | | 9,830 | | | | | |
Total Expenses | | | 551,072 | | | | 714,948 | | | | 198,080 | | | | 169,340 | | | | 624,781 | | | | | |
Less: Fee Waiver/Reimbursement from Investment Manager | | | — | | | | (224,209 | ) | | | (81,418 | ) | | | (131,228 | ) | | | (206,724 | ) | | | | |
Net Expenses | | | 551,072 | | | | 490,739 | | | | 116,662 | | | | 38,112 | | | | 418,057 | | | | | |
| Net Investment Income (Loss) | | | 2,684,401 | | | | (1,435 | ) | | | (94,895 | ) | | | 229,196 | | | | 735,399 | | | | | |
| Realized and Change in Unrealized Gain (Loss): | | | | |
| Net realized gain (loss) on: | | | | | | | | | | | | | | | | | | | | | | | | |
| Net realized loss on investments | | | (714,730 | ) | | | 496,561 | | | | 296,694 | | | | 12,793 | | | | 2,129,728 | | | | | |
Futures contracts | | | — | | | | — | | | | — | | | | (3,372,322 | ) | | | — | | | | | |
Options written | | | — | | | | — | | | | — | | | | — | | | | (29,474,922 | ) | | | | |
Swaps | | | — | | | | — | | | | — | | | | (762,084 | ) | | | — | | | | | |
Forward foreign currency contracts | | | — | | | | 10,106 | | | | — | | | | — | | | | — | | | | | |
Foreign currency transactions | | | — | | | | 10,433 | | | | — | | | | (19,708 | ) | | | — | | | | | |
| Net change in unrealized appreciation/depreciation of: | | | | | | | | | | | | | | | | | | | | | | | | |
Investments | | | (11,510,026 | ) | | | (14,250,934 | ) | | | (3,069,856 | ) | | | 92,242 | | | | (17,576,967 | ) | | | | |
Investments in Affiliates | | | (1,043,368 | ) | | | — | | | | — | | | | (186,296 | ) | | | — | | | | | |
Futures contracts | | | — | | | | — | | | | — | | | | 784,084 | | | | — | | | | | |
Options written | | | — | | | | — | | | | — | | | | — | | | | (117,115 | ) | | | | |
Swaps | | | — | | | | — | | | | — | | | | 4,717 | | | | — | | | | | |
Foreign currency transactions | | | — | | | | 8,327 | | | | — | | | | 6,802 | | | | — | | | | | |
| Net realized and change in unrealized loss | | | (13,268,124 | ) | | | (13,725,507 | ) | | | (2,773,162 | ) | | | (3,439,772 | ) | | | (45,039,276 | ) | | | | |
| Net Decrease in Net Assets Resulting from Investment Operations | | $ | (10,583,723 | ) | | $ | (13,726,942 | ) | | $ | (2,868,057 | ) | | $ | (3,210,576 | ) | | $ | (44,303,877 | ) | | | | |
| | | | | | | |
| *Foreign withholding taxes | | $ | — | | | $ | 32,931 | | | $ | — | | | $ | — | | | $ | — | | | | | |
| † | Consolidated Statement of Operations for the AllianzGI PerformanceFee Managed Futures Strategy Fund. These financial statements are consolidated to include the accounts of AllianzGI PerformanceFee Managed Futures Strategy Offshore Fund Ltd., which is a wholly-owned subsidiary of the AllianzGI PerformanceFee Managed Futures Strategy Fund. See Note 14. |
| | | | | | |
| 214 | | Semiannual Report | | | March 31, 2020 | | | See accompanying Notes to Financial Statements |
| | | | | | | | | | | | | | | | | | | | | | | | | | |
| | | | AllianzGI
PerformanceFee
Structured US
Fixed Income | | | AllianzGI
Preferred
Securities
and
Income | | | AllianzGI
Short
Duration High
Income | | | AllianzGI
Short
Term
Bond | | | AllianzGI
Structured
Return | | |
AllianzGI
U.S. Equity
Hedged | |
| | | | | | | | | | | | | | | | | | | | |
| | | | | $ | 25 | | | $ | 335,017 | | | $ | 31,386,106 | | | $ | 201,548 | | | $ | 324,496 | | | $ | — | |
| | | | | | — | | | | — | | | | — | | | | — | | | | — | | | | — | |
| | | | | | 251,171 | | | | 73,233 | | | | — | | | | — | | | | 5,214,124 | | | | 21,578 | |
| | | | | | 227 | | | | — | | | | 196,175 | | | | — | | | | — | | | | 11 | |
| | | | | | 251,423 | | | | 408,250 | | | | 31,582,281 | | | | 201,548 | | | | 5,538,620 | | | | 21,589 | |
| | | | | | | | | | | | | | | | | | | | |
| | | | | | 27,103 | | | | 40,455 | | | | 3,412,970 | | | | 19,282 | | | | 1,868,073 | | | | 8,123 | |
| | | | | | 13,980 | | | | — | | | | — | | | | — | | | | — | | | | — | |
| | | | | | — | | | | — | | | | 141,332 | | | | — | | | | 41,207 | | | | 702 | |
| | | | | | — | | | | — | | | | — | | | | — | | | | — | | | | — | |
| | | | | | — | | | | — | | | | 176,767 | | | | 1,187 | | | | 35,839 | | | | 656 | |
| | | | | | — | | | | — | | | | 141,332 | | | | — | | | | 13,736 | | | | 234 | |
| | | | | | — | | | | — | | | | — | | | | — | | | | — | | | | — | |
| | | | | | — | | | | — | | | | 253,446 | | | | — | | | | 56,066 | | | | 23 | |
| | | | | | — | | | | — | | | | — | | | | — | | | | — | | | | — | |
| | | | | | — | | | | — | | | | 48,473 | | | | 61 | | | | 14,626 | | | | 188 | |
| | | | | | — | | | | — | | | | 43,052 | | | | — | | | | 4,899 | | | | 109 | |
| | | | | | — | | | | — | | | | — | | | | — | | | | — | | | | — | |
| | | | | | — | | | | 1,232 | | | | 144,126 | | | | 870 | | | | 150,992 | | | | 918 | |
| | | | | | 29,914 | | | | 27,551 | | | | 110,863 | | | | 24,050 | | | | 119,146 | | | | 31,032 | |
| | | | | | 24,576 | | | | 26,423 | | | | 21,900 | | | | 24,599 | | | | 21,689 | | | | 16,940 | |
| | | | | | 3,765 | | | | 3,007 | | | | 59,403 | | | | 3,006 | | | | 34,525 | | | | 2,933 | |
| | | | | | 5,540 | | | | 5,560 | | | | 54,950 | | | | 5,784 | | | | 23,041 | | | | 4,415 | |
| | | | | | 1,740 | | | | 1,559 | | | | 47,349 | | | | 1,617 | | | | 23,277 | | | | 1,736 | |
| | | | | | 1,977 | | | | 1,171 | | | | 91,274 | | | | 703 | | | | 46,532 | | | | 151 | |
| | | | | | 22,367 | | | | 22,695 | | | | 58,314 | | | | 22,103 | | | | 45,098 | | | | 28,285 | |
| | | | | | 2,604 | | | | 2,453 | | | | 19,524 | | | | 2,313 | | | | 11,984 | | | | 2,230 | |
| | | | | | 278 | | | | 193 | | | | 15,362 | | | | 116 | | | | 7,354 | | | | 26 | |
| | | | | | 7,099 | | | | 2,173 | | | | 12,675 | | | | 1,779 | | | | 65,536 | | | | 2,053 | |
| | | | | | 140,943 | | | | 134,472 | | | | 4,853,112 | | | | 107,470 | | | | 2,583,620 | | | | 100,754 | |
| | | | |
|
(105,243 |
) | | | (88,627 | ) | | | (28,763 | ) | | | (81,095 | ) | | | (150,843 | ) | | | (87,484 | ) |
| | | | | | 35,700 | | | | 45,845 | | | | 4,824,349 | | | | 26,375 | | | | 2,432,777 | | | | 13,270 | |
| | | | | 215,723 | | | | 362,405 | | | | 26,757,932 | | | | 175,173 | | | | 3,105,843 | | | | 8,319 | |
| | | | | | | | | | | | | | | | | | | | |
| | | | | | | | | | | | | | | | | | | | | | | | | | |
| | | | | | 819,282 | | | | 399,667 | | | | (14,383,151 | ) | | | 80,247 | | | | 83,845,259 | | | | 108,788 | |
| | | | | | — | | | | 3,673 | | | | — | | | | — | | | | — | | | | — | |
| | | | | | (956,034 | ) | | | — | | | | — | | | | — | | | | (293,416,284 | ) | | | (18,882 | ) |
| | | | | | — | | | | (508 | ) | | | — | | | | — | | | | — | | | | — | |
| | | | | | — | | | | — | | | | — | | | | — | | | | — | | | | — | |
| | | | | | — | | | | — | | | | — | | | | — | | | | — | | | | — | |
| | | | | | | | | | | | | | | | | | | | | | | | | | |
| | | | | | (572,959 | ) | | | (3,823,135 | ) | | | (156,736,341 | ) | | | (334,638 | ) | | | (38,341,181 | ) | | | (294,807 | ) |
| | | | | | — | | | | — | | | | — | | | | — | | | | — | | | | — | |
| | | | | | — | | | | 12,486 | | | | — | | | | — | | | | — | | | | — | |
| | | | | | (76,243 | ) | | | — | | | | — | | | | — | | | | 30,596,099 | | | | (1,759 | ) |
| | | | | | — | | | | (54,371 | ) | | | — | | | | — | | | | — | | | | — | |
| | | | | | — | | | | — | | | | — | | | | — | | | | — | | | | — | |
| | | | | | (785,954 | ) | | | (3,462,188 | ) | | | (171,119,492 | ) | | | (254,391 | ) | | | (217,316,107 | ) | | | (206,660 | ) |
| | | | |
$ |
(570,231 |
) | | $ | (3,099,783 | ) | | $ | (144,361,560 | ) | | $ | (79,218 | ) | | $ | (214,210,264 | ) | | $ | (198,341 | ) |
| | | | | | | |
| | | | | $ | — | | | $ | — | | | $ | — | | | $ | — | | | $ | — | | | $ | — | |
| | | | | | | | |
| See accompanying Notes to Financial Statements | | | March 31, 2020 | | | Semiannual Report | | | 215 | |
Statements of Operations (cont’d)
Six Months ended March 31, 2020 (unaudited)
| | | | | | | | | | | | |
| | | AllianzGI
Ultra Micro
Cap | | | AllianzGI
Water | | | | |
| Investment Income: | | | | |
| Interest | | $ | 268 | | | $ | 14,296 | | | | | |
| Dividends, net of foreign withholding taxes* | | | 17,185 | | | | 3,127,093 | | | | | |
Non-cash income | | | — | | |
| 241,835
|
| | | | |
| Miscellaneous | | | 4 | | | | — | | | | | |
Total Investment Income | | | 17,457 | | | | 3,383,224 | | | | | |
| Expenses: | | | | |
| Investment management | | | 79,776 | | | | 3,021,603 | | | | | |
| Distribution — Class C | | | — | | | | 266,175 | | | | | |
| Servicing — Class A | | | 4,575 | | | | 230,801 | | | | | |
| Servicing — Class C | | | — | | | | 88,725 | | | | | |
| Administrative servicing — Class P | | | 805 | | | | 86,708 | | | | | |
| Sub-transfer agent — Class A | | | 3,457 | | | | 71,210 | | | | | |
| Sub-transfer agent — Class C | | | — | | | | 32,277 | | | | | |
| Sub-transfer agent — Institutional Class | | | 5,269 | | | | 58,666 | | | | | |
| Custodian and accounting agent | | | 40,786 | | | | 140,749 | | | | | |
| Audit and tax services | | | 18,414 | | | | 28,194 | | | | | |
| Shareholder communications | | | 4,639 | | | | 50,663 | | | | | |
| Legal | | | 4,878 | | | | 26,100 | | | | | |
| Transfer agent | | | 2,748 | | | | 27,509 | | | | | |
| Trustees | | | 1,377 | | | | 41,086 | | | | | |
| Registration | | | 23,130 | | | | 34,202 | | | | | |
| Insurance | | | 2,513 | | | | 10,777 | | | | | |
| Line of credit commitment | | | 200 | | | | 6,962 | | | | | |
| Miscellaneous | | | 2,032 | | | | 4,557 | | | | | |
Total Expenses | | | 194,599 | | | | 4,226,964 | | | | | |
Less: Fee Waiver/Reimbursement from Investment Manager | | | (84,816 | ) | | | (614,348 | ) | | | | |
Net Expenses | | | 109,783 | | | | 3,612,616 | | | | | |
| Net Investment Loss | | | (92,326 | ) | | | (229,392 | ) | | | | |
| Realized and Change in Unrealized Gain (Loss): | | | | |
| Net realized gain (loss) on: | | | | | | | | | | | | |
| Net realized gain on investments | | | 1,471,360 | | | | (2,350,176 | ) | | | | |
Forward foreign currency contracts | | | — | | | | (10,726 | ) | | | | |
Foreign currency transactions | | | — | | | | (46,129 | ) | | | | |
| Net change in unrealized appreciation/depreciation of: | | | | | | | | | | | | |
Investments | | | (3,183,784 | ) | | | (66,178,541 | ) | | | | |
Foreign currency transactions | | | — | | | | (9,002 | ) | | | | |
| Net realized and change in unrealized loss | | | (1,712,424 | ) | | | (68,594,574 | ) | | | | |
| Net Decrease in Net Assets Resulting from Investment Operations | | $ | (1,804,750 | ) | | $ | (68,823,966 | ) | | | | |
| *Foreign withholding taxes | | $ | — | | | $ | 19,167 | | | | | |
| | | | | | |
| 216 | | Semiannual Report | | | March 31, 2020 | | | See accompanying Notes to Financial Statements |
(THIS PAGE INTENTIONALLY LEFT BLANK)
| | | | | | | | |
| See accompanying Notes to Financial Statements | | | March 31, 2020 | | | Semiannual Report | | | 217 | |
Statements of Changes in Net Assets
| | | | | | | | | | | | | | | | | | | | |
| | | AllianzGI Retirement 2020 | | | AllianzGI Retirement 2025 | | | | |
| | | | | | |
| | | Six Months ended
March 31, 2020
(unaudited) | | | Year ended
September 30,
2019 | | | Six Months ended
March 31, 2020
(unaudited) | | | Year ended
September 30,
2019 | | | | |
| Decrease in Net Assets from: | | | | | | | | | | | | | | | |
| | | | | | |
Investment Operations: | | | | | | | | | | | | | | | | | | | | |
| Net investment income | | $ | 486,513 | | | $ | 706,797 | | | $ | 683,071 | | | $ | 982,215 | | | | | |
| Net realized gain | | | 1,189,009 | | | | 1,640,041 | | | | 1,846,686 | | | | 2,669,700 | | | | | |
| Net change in unrealized appreciation/depreciation | | | (2,022,525 | ) | | | (1,307,914 | ) | | | (3,586,684 | ) | | | (2,932,935 | ) | | | | |
| | | | | | |
Net increase (decrease) in net assets resulting from investment operations | | | (347,003 | ) | | | 1,038,924 | | | | (1,056,927 | ) | | | 718,980 | | | | | |
| Distributions to Shareholders from: | | | | | | | | | | | | | | | |
| | | | | | |
| Distributable earnings: | | | | | | | | | | | | | | | | | | | | |
Class A | | | (527,372 | ) | | | (252,877 | ) | | | (927,969 | ) | | | (398,059 | ) | | | | |
Class C | | | (71,918 | ) | | | (9,967 | ) | | | — | | | | — | | | | | |
Class R | | | (1,448 | ) | | | (5,237 | ) | | | (37,375 | ) | | | (14,713 | ) | | | | |
Class P | | | (240,321 | ) | | | (817,411 | ) | | | (241,379 | ) | | | (1,540,332 | ) | | | | |
Class R6 | | | (1,345,669 | ) | | | (1,122,479 | ) | | | (2,145,039 | ) | | | (1,426,045 | ) | | | | |
Administrative Class | | | (4,387 | ) | | | (31,996 | ) | | | (25,453 | ) | | | (12,898 | ) | | | | |
| Total distributions to shareholders | | | (2,191,115 | ) | | | (2,239,967 | ) | | | (3,377,215 | ) | | | (3,392,047 | ) | | | | |
| Fund Share Transactions: | | | | | | | | | | | | | | | |
| Net proceeds from the sale of shares | | | 1,466,631 | | | | 8,364,701 | | | | 2,634,066 | | | | 8,677,928 | | | | | |
| Issued in reinvestment of distributions | | | 2,190,771 | | | | 2,225,737 | | | | 3,232,590 | | | | 3,318,998 | | | | | |
| Cost of shares redeemed | | | (7,651,366 | ) | | | (26,266,095 | ) | | | (9,934,816 | ) | | | (35,220,754 | ) | | | | |
| Net decrease from Fund share transactions | | | (3,993,964 | ) | | | (15,675,657 | ) | | | (4,068,160 | ) | | | (23,223,828 | ) | | | | |
| Total decrease in net assets | | | (6,532,082 | ) | | | (16,876,700 | ) | | | (8,502,302 | ) | | | (25,896,895 | ) | | | | |
| Net Assets: | | | | | | | | | | | | | | | |
| Beginning of period | | | 17,883,211 | | | | 34,759,911 | | | | 24,962,509 | | | | 50,859,404 | | | | | |
| End of period | | $ | 11,351,129 | | | $ | 17,883,211 | | | $ | 16,460,207 | | | $ | 24,962,509 | | | | | |
| – | May reflect actual amounts rounding to less than $1. |
| | | | | | |
| 218 | | Semiannual Report | | | March 31, 2020 | | | See accompanying Notes to Financial Statements |
| | | | | | | | | | | | | | | | | | | | | | | | | | |
| | | | AllianzGI Retirement 2030 | | | AllianzGI Retirement 2035 | | | AllianzGI Retirement 2040 | |
| | | | | | | |
| | | | Six Months ended
March 31, 2020
(unaudited) | | | Year ended
September 30,
2019 | | | Six Months ended
March 31, 2020
(unaudited) | | | Year ended
September 30,
2019 | | | Six Months ended
March 31, 2020
(unaudited) | | | Year ended
September 30,
2019 | |
| | | | | | | | | | | | | | | | | | | | |
| | | | | | | |
| | | | | | | | | | | | | | | | | | | | |
| | | | | $ | 982,309 | | | $ | 1,191,797 | | | $ | 654,596 | | | $ | 915,139 | | | $ | 675,044 | | | $ | 982,246 | |
| | | | | | 2,509,326 | | | | 3,297,396 | | | | 2,070,535 | | | | 2,448,408 | | | | 1,533,532 | | | | 2,720,818 | |
| | | | | | (5,416,263 | ) | | | (4,278,804 | ) | | | (4,617,060 | ) | | | (3,460,814 | ) | | | (4,953,287 | ) | | | (4,100,731 | ) |
| | | | | | | |
| | | | | (1,924,628 | ) | | | 210,389 | | | | (1,891,929 | ) | | | (97,267 | ) | | | (2,744,711 | ) | | | (397,667 | ) |
| | | | | | | | | | | | | | | | | | | | |
| | | | | | | |
| | | | | | | | | | | | | | | | | | | | | | | | | | |
| | | | | | (969,397 | ) | | | (459,971 | ) | | | (703,838 | ) | | | (559,351 | ) | | | (265,059 | ) | | | (286,794 | ) |
| | | | | | (97,719 | ) | | | (37,009 | ) | | | — | | | | — | | | | (19,529 | ) | | | (3,800 | ) |
| | | | | | (12,855 | ) | | | (17,850 | ) | | | (37,420 | ) | | | (53,770 | ) | | | (21,610 | ) | | | (16,100 | ) |
| | | | | | (437,102 | ) | | | (1,813,033 | ) | | | (152,643 | ) | | | (1,872,017 | ) | | | (143,771 | ) | | | (1,432,745 | ) |
| | | | | | (3,114,746 | ) | | | (1,689,460 | ) | | | (2,228,625 | ) | | | (1,619,599 | ) | | | (2,676,679 | ) | | | (1,976,521 | ) |
| | | | | | (26,973 | ) | | | (32,781 | ) | | | (22,659 | ) | | | (33,357 | ) | | | (5,898 | ) | | | (40,518 | ) |
| | | | | (4,658,792 | ) | | | (4,050,104 | ) | | | (3,145,185 | ) | | | (4,138,094 | ) | | | (3,132,546 | ) | | | (3,756,478 | ) |
| | | | | | | | | | | | | | | | | | | | |
| | | | | | 4,211,401 | | | | 11,155,281 | | | | 4,170,205 | | | | 10,378,077 | | | | 4,714,270 | | | | 10,386,928 | |
| | | | | | 4,604,075 | | | | 4,007,395 | | | | 3,087,107 | | | | 4,063,470 | | | | 3,111,897 | | | | 3,645,076 | |
| | | | | | (15,042,623 | ) | | | (36,290,474 | ) | | | (11,106,759 | ) | | | (27,103,964 | ) | | | (14,273,676 | ) | | | (25,485,111 | ) |
| | | | | | (6,227,147 | ) | | | (21,127,798 | ) | | | (3,849,447 | ) | | | (12,662,417 | ) | | | (6,447,509 | ) | | | (11,453,107 | ) |
| | | | | (12,810,567 | ) | | | (24,967,513 | ) | | | (8,886,561 | ) | | | (16,897,778 | ) | | | (12,324,766 | ) | | | (15,607,252 | ) |
| | | | | | | | | | | | | | | | | | | | |
| | | | | | 35,374,959 | | | | 60,342,472 | | | | 27,556,174 | | | | 44,453,952 | | | | 31,252,045 | | | | 46,859,297 | |
| | | | | $ | 22,564,392 | | | $ | 35,374,959 | | | $ | 18,669,613 | | | $ | 27,556,174 | | | $ | 18,927,279 | | | $ | 31,252,045 | |
| | | | | | | | |
| See accompanying Notes to Financial Statements | | | March 31, 2020 | | | Semiannual Report | | | 219 | |
Statements of Changes in Net Assets (cont’d)
| | | | | | | | | | | | | | | | | | | | |
| | | AllianzGI Retirement 2045 | | | AllianzGI Retirement 2050 | | | | |
| | | | | | |
| | | Six Months ended
March 31, 2020
(unaudited) | | | Year ended
September 30,
2019 | | | Six Months ended
March 31, 2020
(unaudited) | | | Year ended
September 30,
2019 | | | | |
| Increase (Decrease) in Net Assets from: | | | | | | | | | | | | | | | |
| | | | | | |
Investment Operations: | | | | | | | | | | | | | | | | | | | | |
| Net investment income | | $ | 370,147 | | | $ | 655,995 | | | $ | 515,772 | | | $ | 701,530 | | | | | |
| Net realized gain (loss) | | | 764,723 | | | | 1,671,412 | | | | 779,657 | | | | 1,641,310 | | | | | |
| Net change in unrealized appreciation/depreciation | | | (3,042,456 | ) | | | (2,646,928 | ) | | | (4,051,188 | ) | | | (2,797,029 | ) | | | | |
| | | | | | |
Net increase (decrease) in net assets resulting from investment operations | | | (1,907,586 | ) | | | (319,521 | ) | | | (2,755,759 | ) | | | (454,189 | ) | | | | |
| Distributions to Shareholders from: | | | | | | | | | | | | | | | |
| | | | | | |
| Distributable earnings: | | | | | | | | | | | | | | | | | | | | |
Class A | | | (218,979 | ) | | | (159,914 | ) | | | (214,373 | ) | | | (200,608 | ) | | | | |
Class C | | | — | | | | — | | | | (21,499 | ) | | | (13,008 | ) | | | | |
Class R | | | (12,410 | ) | | | (11,916 | ) | | | (23,415 | ) | | | (9,569 | ) | | | | |
Class P | | | (25,949 | ) | | | (1,099,610 | ) | | | (76,758 | ) | | | (831,742 | ) | | | | |
Institutional Class | | | — | | | | — | | | | — | | | | — | | | | | |
Class R6 | | | (1,543,002 | ) | | | (1,145,865 | ) | | | (1,465,864 | ) | | | (1,328,104 | ) | | | | |
Class R6 | | | — | | | | — | | | | — | | | | — | | | | | |
Administrative Class | | | (40,864 | ) | | | (47,868 | ) | | | (50,709 | ) | | | (64,296 | ) | | | | |
| Total distributions to shareholders | | | (1,841,204 | ) | | | (2,465,173 | ) | | | (1,852,618 | ) | | | (2,447,327 | ) | | | | |
| Fund Share Transactions: | | | | | | | | | | | | | | | |
| Net proceeds from the sale of shares | | | 3,560,423 | | | | 8,165,521 | | | | 3,365,031 | | | | 8,259,946 | | | | | |
| Issued in reinvestment of distributions | | | 1,832,894 | | | | 2,442,952 | | | | 1,832,058 | | | | 2,438,284 | | | | | |
| Cost of shares redeemed | | | (9,891,267 | ) | | | (19,404,795 | ) | | | (10,130,139 | ) | | | (14,722,675 | ) | | | | |
| Net increase (decrease) from Fund share transactions | | | (4,497,950 | ) | | | (8,796,322 | ) | | | (4,933,050 | ) | | | (4,024,445 | ) | | | | |
| Total increase (decrease) in net assets | | | (8,246,740 | ) | | | (11,581,016 | ) | | | (9,541,427 | ) | | | (6,925,961 | ) | | | | |
| Net Assets: | | | | | | | | | | | | | | | |
| Beginning of period | | | 19,519,405 | | | | 31,100,421 | | | | 26,056,664 | | | | 32,982,625 | | | | | |
| End of period | | $ | 11,272,665 | | | $ | 19,519,405 | | | $ | 16,515,237 | | | $ | 26,056,664 | | | | | |
| – | May reflect actual amounts rounding to less than $1. |
| | | | | | |
| 220 | | Semiannual Report | | | March 31, 2020 | | | See accompanying Notes to Financial Statements |
| | | | | | | | | | | | | | | | | | | | | | | | | | |
| | | | AllianzGI Retirement 2055 | | | AllianzGI Multi Asset Income | | | AllianzGI Best Styles Global Equity | |
| | | | | | | |
| | | | Six Months ended
March 31, 2020
(unaudited) | | | Year ended
September 30,
2019 | | | Six Months ended
March 31, 2020
(unaudited) | | | Year ended
September 30,
2019 | | | Six Months ended
March 31, 2020
(unaudited) | | | Year ended
September 30,
2019 | |
| | | | | | | | | | | | | | | | | | | | |
| | | | | | | |
| | | | | | | | | | | | | | | | | | | | |
| | | | | $ | 253,893 | | | $ | 346,742 | | | $ | 885,160 | | | $ | 1,908,396 | | | $ | 1,689,638 | | | $ | 10,861,253 | |
| | | | | | 312,542 | | | | 596,870 | | | | (5,841,023 | ) | | | 139,095 | | | | 10,857,034 | | | | 14,108,203 | |
| | | | | | (1,971,037 | ) | | | (1,052,972 | ) | | | (5,715,006 | ) | | | 263,587 | | | | (30,966,319 | ) | | | (37,439,039 | ) |
| | | | | | | |
| | | | | (1,404,602 | ) | | | (109,360 | ) | | | (10,670,869 | ) | | | 2,311,078 | | | | (18,419,647 | ) | | | (12,469,583 | ) |
| | | | | | | | | | | | | | | | | | | | |
| | | | | | | |
| | | | | | | | | | | | | | | | | | | | | | | | | | |
| | | | | | (111,003 | ) | | | (113,406 | ) | | | (377,013 | ) | | | (628,310 | ) | | | (171,121 | ) | | | (133,530 | ) |
| | | | | | — | | | | — | | | | (28,949 | ) | | | (68,590 | ) | | | (2,911 | ) | | | (1,808 | ) |
| | | | | | (2,222 | ) | | | (6,898 | ) | | | (2,464 | ) | | | (4,813 | ) | | | — | | | | — | |
| | | | | | (6,455 | ) | | | (431,803 | ) | | | (33,615 | ) | | | (442,685 | ) | | | (129,756 | ) | | | (162,066 | ) |
| | | | | | — | | | | — | | | | (8,237 | ) | | | (4,881 | ) | | | (82,209 | ) | | | (276,295 | ) |
| | | | | | (580,489 | ) | | | (592,429 | ) | | | (415,775 | ) | | | (653,978 | ) | | | — | | | | — | |
| | | | | | — | | | | — | | | | — | | | | — | | | | (33,639,966 | ) | | | (66,179,468 | ) |
| | | | | | (11,265 | ) | | | (27,083 | ) | | | (232 | ) | | | (12,480 | ) | | | — | | | | — | |
| | | | | (711,434 | ) | | | (1,171,619 | ) | | | (866,285 | ) | | | (1,815,737 | ) | | | (34,025,963 | ) | | | (66,753,167 | ) |
| | | | | | | | | | | | | | | | | | | | |
| | | | | | 2,600,681 | | | | 7,021,147 | | | | 43,379,312 | | | | 8,462,252 | | | | 10,822,750 | | | | 41,216,340 | |
| | | | | | 709,191 | | | | 1,163,653 | | | | 862,934 | | | | 1,798,604 | | | | 34,003,323 | | | | 66,731,633 | |
| | | | | | (6,423,767 | ) | | | (9,863,413 | ) | | | (7,588,934 | ) | | | (22,353,244 | ) | | | (223,645,421 | ) | | | (191,927,497 | ) |
| | | | | | (3,113,895 | ) | | | (1,678,613 | ) | | | 36,653,312 | | | | (12,092,388 | ) | | | (178,819,348 | ) | | | (83,979,524 | ) |
| | | | | (5,229,931 | ) | | | (2,959,592 | ) | | | 25,116,158 | | | | (11,597,047 | ) | | | (231,264,958 | ) | | | (163,202,274 | ) |
| | | | | | | | | | | | | | | | | | | | |
| | | | | | 13,132,473 | | | | 16,092,065 | | | | 24,532,143 | | | | 36,129,190 | | | | 361,606,504 | | | | 524,808,778 | |
| | | | | $ | 7,902,542 | | | $ | 13,132,473 | | | $ | 49,648,301 | | | $ | 24,532,143 | | | $ | 130,341,546 | | | $ | 361,606,504 | |
| | | | | | | | |
| See accompanying Notes to Financial Statements | | | March 31, 2020 | | | Semiannual Report | | | 221 | |
Statements of Changes in Net Assets (cont’d)
| | | | | | | | | | | | | | | | | | | | |
| | | AllianzGI Best Styles U.S. Equity | | | AllianzGI Convertible | | | | |
| | | | | | |
| | | Six Months ended
March 31, 2020
(unaudited) | | | Year ended
September 30,
2019 | | | Six Months ended
March 31, 2020
(unaudited) | | | Year ended
September 30,
2019 | | | | |
| Increase (Decrease) in Net Assets from: | | | | | | | | | | | | | | | |
| | | | | | |
Investment Operations: | | | | | | | | | | | | | | | | | | | | |
| Net investment income | | $ | 353,108 | | | $ | 1,682,940 | | | $ | 4,359,777 | | | $ | 6,304,664 | | | | | |
| Net realized gain (loss) | | | 1,378,485 | | | | 9,332,558 | | | | 25,645,613 | | | | 29,128,468 | | | | | |
| Net change in unrealized appreciation/depreciation | | | (5,912,735 | ) | | | (10,400,300 | ) | | | (89,386,844 | ) | | | (10,656,584 | ) | | | | |
| | | | | | |
Net increase (decrease) in net assets resulting from investment operations | | | (4,181,142 | ) | | | 615,198 | | | | (59,381,454 | ) | | | 24,776,548 | | | | | |
| Distributions to Shareholders from: | | | | | | | | | | | | | | | |
| | | | | | |
| Distributable earnings: | | | | | | | | | | | | | | | | | | | | |
Class A | | | (347,801 | ) | | | (82,774 | ) | | | (3,314,315 | ) | | | (8,353,498 | ) | | | | |
Class C | | | (13,304 | ) | | | (11,259 | ) | | | (2,225,302 | ) | | | (6,532,887 | ) | | | | |
Class R | | | — | | | | — | | | | (6,456 | ) | | | (13,215 | ) | | | | |
Class P | | | (117,495 | ) | | | (109,529 | ) | | | (9,146,440 | ) | | | (15,008,660 | ) | | | | |
Institutional Class | | | (51,888 | ) | | | (25,032 | ) | | | (19,620,510 | ) | | | (47,761,194 | ) | | | | |
Class R6 | | | (10,480,298 | ) | | | (18,027,043 | ) | | | — | | | | — | | | | | |
Administrative Class | | | — | | | | — | | | | (24,743 | ) | | | (116,747 | ) | | | | |
| Total distributions to shareholders | | | (11,010,786 | ) | | | (18,255,637 | ) | | | (34,337,766 | ) | | | (77,786,201 | ) | | | | |
| Fund Share Transactions: | | | | | | | | | | | | | | | |
| Net proceeds from the sale of shares | | | 4,081,376 | | | | 12,130,113 | | | | 424,947,895 | | | | 279,386,457 | | | | | |
| Issued in reinvestment of distributions | | | 11,010,786 | | | | 18,255,434 | | | | 33,000,188 | | | | 74,563,876 | | | | | |
| Cost of shares redeemed | | | (21,222,244 | ) | | | (61,548,625 | ) | | | (166,630,717 | ) | | | (195,695,315 | ) | | | | |
| Net increase (decrease) from Fund share transactions | | | (6,130,082 | ) | | | (31,163,078 | ) | | | 291,317,366 | | | | 158,255,018 | | | | | |
| Total increase (decrease) in net assets | | | (21,322,010 | ) | | | (48,803,517 | ) | | | 197,598,146 | | | | 105,245,365 | | | | | |
| Net Assets: | | | | | | | | | | | | | | | |
| Beginning of period | | | 51,143,196 | | | | 99,946,713 | | | | 656,472,704 | | | | 551,227,339 | | | | | |
| End of period | | $ | 29,821,186 | | | $ | 51,143,196 | | | $ | 854,070,850 | | | $ | 656,472,704 | | | | | |
| – | May reflect actual amounts rounding to less than $1. |
| | | | | | |
| 222 | | Semiannual Report | | | March 31, 2020 | | | See accompanying Notes to Financial Statements |
| | | | | | | | | | | | | | | | | | | | | | | | | | |
| | | | AllianzGI Core Bond | | | AllianzGI Core Plus Bond | | | AllianzGI Emerging Markets Consumer | |
| | | | | | | |
| | | | Six Months ended
March 31, 2020
(unaudited) | | | Year ended
September 30,
2019 | | | Six Months ended
March 31, 2020
(unaudited) | | | Year ended
September 30,
2019 | | | Six Months ended
March 31, 2020
(unaudited) | | | Year ended
September 30,
2019 | |
| | | | | | | | | | | | | | | | | | | | |
| | | | | | | |
| | | | | | | | | | | | | | | | | | | | |
| | | | | $ | 446,017 | | | $ | 952,052 | | | $ | 774,589 | | | $ | 1,325,823 | | | $ | 89,743 | | | $ | 516,779 | |
| | | | | | 1,339,874 | | | | 1,630,170 | | | | 1,977,339 | | | | 1,971,692 | | | | (154,723 | ) | | | (3,410,403 | ) |
| | | | | | (823,095 | ) | | | 652,594 | | | | (2,293,332 | ) | | | 1,027,232 | | | | (4,961,562 | ) | | | 1,901,550 | |
| | | | | | | |
| | | | | 962,796 | | | | 3,234,816 | | | | 458,596 | | | | 4,324,747 | | | | (5,026,542 | ) | | | (992,074 | ) |
| | | | | | | | | | | | | | | | | | | | |
| | | | | | | |
| | | | | | | | | | | | | | | | | | | | | | | | | | |
| | | | | | — | | | | — | | | | — | | | | — | | | | (457 | ) | | | (207 | ) |
| | | | | | — | | | | — | | | | — | | | | — | | | | — | | | | — | |
| | | | | | — | | | | — | | | | — | | | | — | | | | — | | | | — | |
| | | | | | (1,571 | ) | | | (381 | ) | | | (550 | ) | | | (302 | ) | | | — | | | | — | |
| | | | | | (3,715 | ) | | | (875 | ) | | | (554 | ) | | | (310 | ) | | | (437,367 | ) | | | (608,756 | ) |
| | | | | | (2,198,072 | ) | | | (977,793 | ) | | | (2,946,330 | ) | | | (1,286,062 | ) | | | — | | | | — | |
| | | | | | — | | | | — | | | | — | | | | — | | | | — | | | | — | |
| | | | | | (2,203,358 | ) | | | (979,049 | ) | | | (2,947,434 | ) | | | (1,286,674 | ) | | | (437,824 | ) | | | (608,963 | ) |
| | | | | | | | | | | | | | | | | | | | |
| | | | | | 16,502,635 | | | | 1,641,578 | | | | 524,333 | | | | 15,168,884 | | | | 302,568 | | | | 21,253,333 | |
| | | | | | 2,203,358 | | | | 979,049 | | | | 2,947,434 | | | | 1,286,674 | | | | 388,159 | | | | 442,815 | |
| | | | | | (2,685,764 | ) | | | (388,329 | ) | | | (4,448,137 | ) | | | (147,681 | ) | | | (2,020,835 | ) | | | (24,249,417 | ) |
| | | | | | 16,020,229 | | | | 2,232,298 | | | | (976,370 | ) | | | 16,307,877 | | | | (1,330,108 | ) | | | (2,553,269 | ) |
| | | | | | 14,779,667 | | | | 4,488,065 | | | | (3,465,208 | ) | | | 19,345,950 | | | | (6,794,474 | ) | | | (4,154,306 | ) |
| | | | | | | | | | | | | | | | | | | | |
| | | | | | 33,864,552 | | | | 29,376,487 | | | | 59,441,256 | | | | 40,095,306 | | | | 39,247,647 | | | | 43,401,953 | |
| | | | | $ | 48,644,219 | | | $ | 33,864,552 | | | $ | 55,976,048 | | | $ | 59,441,256 | | | $ | 32,453,173 | | | $ | 39,247,647 | |
| | | | | | | | |
| See accompanying Notes to Financial Statements | | | March 31, 2020 | | | Semiannual Report | | | 223 | |
Statements of Changes in Net Assets (cont’d)
| | | | | | | | | | | | | | | | | | | | |
| | | AllianzGI Emerging Markets
Small-Cap | | | AllianzGI Emerging Markets
SRI Debt | | | | |
| | | | | | |
| | | Six Months ended
March 31, 2020
(unaudited) | | | Year ended
September 30,
2019 | | | Six Months ended
March 31, 2020
(unaudited) | | | Year ended
September 30,
2019 | | | | |
| Increase (Decrease) in Net Assets from: | | | | | | | | | | | | | | | |
| | | | | | |
Investment Operations: | | | | | | | | | | | | | | | | | | | | |
| Net investment income | | $ | 36,579 | | | $ | 200,702 | | | $ | 359,269 | | | $ | 809,912 | | | | | |
| Net realized gain (loss) | | | 140,441 | | | | 123,303 | | | | (3,799 | ) | | | 382,697 | | | | | |
| Net change in unrealized appreciation/depreciation | | | (1,816,911 | ) | | | (119,008 | ) | | | (2,281,513 | ) | | | 638,542 | | | | | |
| | | | | | |
Net increase (decrease) in net assets resulting from investment operations | | | (1,639,891 | ) | | | 204,997 | | | | (1,926,043 | ) | | | 1,831,151 | | | | | |
| Distributions to Shareholders from: | | | | | | | | | | | | | | | |
| | | | | | |
| Distributable earnings: | | | | | | | | | | | | | | | | | | | | |
Class A | | | (8,030 | ) | | | (5,633 | ) | | | (1,549 | ) | | | (99 | ) | | | | |
Class C | | | — | | | | — | | | | (127 | ) | | | (14 | ) | | | | |
Class R | | | — | | | | — | | | | — | | | | — | | | | | |
Class P | | | — | | | | — | | | | (165 | ) | | | (120 | ) | | | | |
Institutional Class | | | (282,337 | ) | | | (528,395 | ) | | | (298,128 | ) | | | (138,538 | ) | | | | |
Class R6 | | | — | | | | — | | | | — | | | | — | | | | | |
Administrative Class | | | — | | | | — | | | | — | | | | — | | | | | |
| | | | | | |
| Return of Capital: | | | | | | | | | | | | | | | | | | | | |
Class A | | | — | | | | — | | | | — | | | | (4,479 | ) | | | | |
Class C | | | — | | | | — | | | | — | | | | (390 | ) | | | | |
Class P | | | — | | | | — | | | | — | | | | (425 | ) | | | | |
Institutional Class | | | — | | | | — | | | | — | | | | (746,475 | ) | | | | |
| Total distributions to shareholders | | | (290,367 | ) | | | (534,028 | ) | | | (299,969 | ) | | | (890,540 | ) | | | | |
| Fund Share Transactions: | | | | | | | | | | | | | | | |
| Net proceeds from the sale of shares | | | 267,280 | | | | 466,679 | | | | 6,208,607 | | | | 1,554,735 | | | | | |
| Issued in reinvestment of distributions | | | 290,367 | | | | 534,028 | | | | 299,785 | | | | 890,026 | | | | | |
| Cost of shares redeemed | | | (1,056,082 | ) | | | (2,906,507 | ) | | | (1,845,057 | ) | | | (1,623,619 | ) | | | | |
| Net increase (decrease) from Fund share transactions | | | (498,435 | ) | | | (1,905,800 | ) | | | 4,663,335 | | | | 821,142 | | | | | |
| Total increase (decrease) in net assets | | | (2,428,693 | ) | | | (2,234,831 | ) | | | 2,437,323 | | | | 1,761,753 | | | | | |
| Net Assets: | | | | | | | | | | | | | | | |
| Beginning of period | | | 7,930,185 | | | | 10,165,016 | | | | 20,274,308 | | | | 18,512,555 | | | | | |
| End of period | | $ | 5,501,492 | | | $ | 7,930,185 | | | $ | 22,711,631 | | | $ | 20,274,308 | | | | | |
| – | May reflect actual amounts rounding to less than $1. |
| | | | | | |
| 224 | | Semiannual Report | | | March 31, 2020 | | | See accompanying Notes to Financial Statements |
| | | | | | | | | | | | | | | | | | | | | | | | | | |
| | | | AllianzGI Emerging Markets Value | | | AllianzGI Floating Rate Note | | | AllianzGI Global Allocation | |
| | | | | | | |
| | | | Six Months ended
March 31, 2020
(unaudited) | | | Year ended
September 30,
2019 | | | Six Months ended
March 31, 2020
(unaudited) | | | Year ended
September 30,
2019 | | | Six Months ended
March 31, 2020
(unaudited) | | | Year ended
September 30,
2019 | |
| | | | | | | | | | | | | | | | | | | | |
| | | | | | | |
| | | | | | | | | | | | | | | | | | | | |
| | | | | $ | 413,707 | | | $ | 3,602,184 | | | $ | 159,907 | | | $ | 366,387 | | | $ | 3,886,074 | | | $ | 6,742,411 | |
| | | | | | (3,676,366 | ) | | | (16,198,997 | ) | | | (9,617 | ) | | | (117,805 | ) | | | 9,948,274 | | | | 18,854,482 | |
| | | | | | (10,242,517 | ) | | | 8,838,136 | | | | (1,089,407 | ) | | | 220,115 | | | | (34,931,307 | ) | | | (15,592,813 | ) |
| | | | | | | |
| | | | | (13,505,176 | ) | | | (3,758,677 | ) | | | (939,117 | ) | | | 468,697 | | | | (21,096,959 | ) | | | 10,004,080 | |
| | | | | | | | | | | | | | | | | | | | |
| | | | | | | |
| | | | | | | | | | | | | | | | | | | | | | | | | | |
| | | | | | (86,764 | ) | | | (356,129 | ) | | | — | | | | — | | | | (4,250,613 | ) | | | (3,251,123 | ) |
| | | | | | (3,508 | ) | | | (20,510 | ) | | | — | | | | — | | | | (444,086 | ) | | | (368,972 | ) |
| | | | | | — | | | | — | | | | — | | | | — | | | | (1,855 | ) | | | (1,966 | ) |
| | | | | | (13,053 | ) | | | (52,446 | ) | | | (85 | ) | | | (376 | ) | | | (666,303 | ) | | | (292,653 | ) |
| | | | | | (647,730 | ) | | | (3,312,431 | ) | | | (114,739 | ) | | | (590,756 | ) | | | (577,139 | ) | | | (418,147 | ) |
| | | | | | — | | | | — | | | | — | | | | — | | | | (23,880,158 | ) | | | (16,591,827 | ) |
| | | | | | — | | | | — | | | | — | | | | — | | | | (2,101 | ) | | | (1,312 | ) |
| | | | | | | |
| | | | | | | | | | | | | | | | | | | | | | | | | | |
| | | | | | — | | | | — | | | | — | | | | — | | | | — | | | | — | |
| | | | | | — | | | | — | | | | — | | | | — | | | | — | | | | — | |
| | | | | | — | | | | — | | | | — | | | | — | | | | — | | | | — | |
| | | | | | — | | | | — | | | | — | | | | — | | | | — | | | | — | |
| | | | | (751,055 | ) | | | (3,741,516 | ) | | | (114,824 | ) | | | (591,132 | ) | | | (29,822,255 | ) | | | (20,926,000 | ) |
| | | | | | | | | | | | | | | | | | | | |
| | | | | | 19,030,816 | | | | 38,354,932 | | | | 1,722,726 | | | | 849,209 | | | | 29,721,092 | | | | 63,845,365 | |
| | | | | | 749,853 | | | | 3,737,331 | | | | 114,824 | | | | 591,132 | | | | 28,633,930 | | | | 20,228,963 | |
| | | | | | (20,207,653 | ) | | | (64,717,857 | ) | | | (1,113,666 | ) | | | (2,892,682 | ) | | | (63,847,505 | ) | | | (86,496,879 | ) |
| | | | | | (426,984 | ) | | | (22,625,594 | ) | | | 723,884 | | | | (1,452,341 | ) | | | (5,492,483 | ) | | | (2,422,551 | ) |
| | | | | (14,683,215 | ) | | | (30,125,787 | ) | | | (330,057 | ) | | | (1,574,776 | ) | | | (56,411,697 | ) | | | (13,344,471 | ) |
| | | | | | | | | | | | | | | | | | | | |
| | | | | | 108,133,565 | | | | 138,259,352 | | | | 13,672,397 | | | | 15,247,173 | | | | 317,163,587 | | | | 330,508,058 | |
| | | | | $ | 93,450,350 | | | $ | 108,133,565 | | | $ | 13,342,340 | | | $ | 13,672,397 | | | $ | 260,751,890 | | | $ | 317,163,587 | |
| | | | | | | | |
| See accompanying Notes to Financial Statements | | | March 31, 2020 | | | Semiannual Report | | | 225 | |
Statements of Changes in Net Assets (cont’d)
| | | | | | | | | | | | | | | | | | | | |
| | | AllianzGI Global Dynamic Allocation | | | AllianzGI Global High Yield | | | | |
| | | | | | |
| | | Six Months ended
March 31, 2020
(unaudited) | | | Year ended
September 30,
2019 | | | Six Months ended
March 31, 2020
(unaudited) | | | Year ended
September 30,
2019 | | | | |
| Increase (Decrease) in Net Assets from: | | | | | | | | | | | | | | | |
| | | | | | |
Investment Operations: | | | | | | | | | | | | | | | | | | | | |
| Net investment income | | $ | 1,081,348 | | | $ | 4,015,735 | | | $ | 576,276 | | | $ | 1,104,928 | | | | | |
| Net realized gain (loss) | | | 787,220 | | | | 7,644,189 | | | | (198,222 | ) | | | (42,733 | ) | | | | |
| Net change in unrealized appreciation/depreciation | | | (11,384,597 | ) | | | (11,768,448 | ) | | | (3,139,301 | ) | | | 720,423 | | | | | |
| | | | | | |
Net increase (decrease) in net assets resulting from investment operations | | | (9,516,029 | ) | | | (108,524 | ) | | | (2,761,247 | ) | | | 1,782,618 | | | | | |
| Distributions to Shareholders from: | | | | | | | | | | | | | | | |
| | | | | | |
| Distributable earnings: | | | | | | | | | | | | | | | | | | | | |
Class A | | | (178,698 | ) | | | (93,517 | ) | | | — | | | | — | | | | | |
Class C | | | (63,940 | ) | | | (17,748 | ) | | | — | | | | — | | | | | |
Class R | | | (10,836 | ) | | | (3,802 | ) | | | — | | | | — | | | | | |
Class P | | | (4,691 | ) | | | (573,450 | ) | | | (134 | ) | | | (689 | ) | | | | |
Institutional Class | | | (1,011,446 | ) | | | (356,643 | ) | | | (323,031 | ) | | | (1,534,320 | ) | | | | |
Class R6 | | | (11,995,496 | ) | | | (8,485,926 | ) | | | — | | | | — | | | | | |
Administrative Class | | | (2,455 | ) | | | (975 | ) | | | — | | | | — | | | | | |
| Total distributions to shareholders | | | (13,267,562 | ) | | | (9,532,061 | ) | | | (323,165 | ) | | | (1,535,009 | ) | | | | |
| Fund Share Transactions: | | | | | | | | | | | | | | | |
| Net proceeds from the sale of shares | | | 11,325,079 | | | | 24,174,501 | | | | 4,538,776 | | | | 534,849 | | | | | |
| Issued in reinvestment of distributions | | | 13,265,491 | | | | 9,531,384 | | | | 323,165 | | | | 1,535,009 | | | | | |
| Cost of shares redeemed | | | (44,313,800 | ) | | | (95,879,882 | ) | | | (187,848 | ) | | | (428,150 | ) | | | | |
| Net increase (decrease) from Fund share transactions | | | (19,723,230 | ) | | | (62,173,997 | ) | | | 4,674,093 | | | | 1,641,708 | | | | | |
| Total increase (decrease) in net assets | | | (42,506,821 | ) | | | (71,814,582 | ) | | | 1,589,681 | | | | 1,889,317 | | | | | |
| Net Assets: | | | | | | | | | | | | | | | |
| Beginning of period | | | 150,614,767 | | | | 222,429,349 | | | | 24,067,958 | | | | 22,178,641 | | | | | |
| End of period | | $ | 108,107,946 | | | $ | 150,614,767 | | | $ | 25,657,639 | | | $ | 24,067,958 | | | | | |
| – | May reflect actual amounts rounding to less than $1. |
| * | Commencement of operations. |
| | | | | | |
| 226 | | Semiannual Report | | | March 31, 2020 | | | See accompanying Notes to Financial Statements |
| | | | | | | | | | | | | | | | | | | | | | | | | | |
| | | | AllianzGI Global Sustainability | | | AllianzGI Green Bond | | | AllianzGI High Yield Bond | |
| | | | | | | |
| | | | Six Months ended
March 31, 2020
(unaudited) | | | Year ended
September 30,
2019 | | | Six Months ended
March 31, 2020
(unaudited) | | | Period from
November 19,
2018* through
September 30, 2019 | | | Six Months ended
March 31, 2020
(unaudited) | | | Year ended
September 30,
2019 | |
| | | | | | | | | | | | | | | | | | | | |
| | | | | | | |
| | | | | | | | | | | | | | | | | | | | |
| | | | | $ | 544,006 | | | $ | 292,314 | | | $ | 171,536 | | | $ | 104,455 | | | $ | 2,684,401 | | | $ | 7,365,238 | |
| | | | | | (183,120 | ) | | | 2,621,055 | | | | 711,089 | | | | 257,000 | | | | (714,730 | ) | | | (3,199,435 | ) |
| | | | | | (14,982,275 | ) | | | (2,796,738 | ) | | | (2,104,018 | ) | | | 281,141 | | | | (12,553,394 | ) | | | 1,720,441 | |
| | | | | | | |
| | | | | (14,621,389 | ) | | | 116,631 | | | | (1,221,393 | ) | | | 642,596 | | | | (10,583,723 | ) | | | 5,886,244 | |
| | | | | | | | | | | | | | | | | | | | |
| | | | | | | |
| | | | | | | | | | | | | | | | | | | | | | | | | | |
| | | | | | (26,611 | ) | | | (44,718 | ) | | | (1,398 | ) | | | (1,313 | ) | | | (604,564 | ) | | | (1,536,708 | ) |
| | | | | | — | | | | — | | | | — | | | | — | | | | (91,990 | ) | | | (253,579 | ) |
| | | | | | — | | | | — | | | | — | | | | — | | | | (17,266 | ) | | | (39,565 | ) |
| | | | | | (490,968 | ) | | | (876,192 | ) | | | (13,637 | ) | | | (8,287 | ) | | | (316,283 | ) | | | (793,003 | ) |
| | | | | | (2,565,366 | ) | | | (822,141 | ) | | | (343,831 | ) | | | (92,825 | ) | | | (2,065,325 | ) | | | (5,082,491 | ) |
| | | | | | — | | | | — | | | | — | | | | — | | | | — | | | | — | |
| | | | | | — | | | | — | | | | — | | | | — | | | | (681 | ) | | | (1,258 | ) |
| | | | | (3,082,945 | ) | | | (1,743,051 | ) | | | (358,866 | ) | | | (102,425 | ) | | | (3,096,109 | ) | | | (7,706,604 | ) |
| | | | 145,316,786 | | | 17,557,245 | | | 34,041,221 | | | 1,449,854 | | | 20,399,948 | | | 28,252,863 | |
| | | | | | 145,316,786 | | | | 17,557,245 | | | | 34,041,221 | | | | 1,449,854 | | | | 20,399,948 | | | | 28,252,863 | |
| | | | | | 3,082,945 | | | | 1,743,051 | | | | 358,849 | | | | 102,301 | | | | 3,009,039 | | | | 7,411,305 | |
| | | | | | (18,916,921 | ) | | | (32,789,644 | ) | | | (12,863,944 | ) | | | (108,864 | ) | | | (33,154,163 | ) | | | (94,678,330 | ) |
| | | | | | 129,482,810 | | | | (13,489,348 | ) | | | 21,536,126 | | | | 1,443,291 | | | | (9,745,176 | ) | | | (59,014,162 | ) |
| | | | | 111,778,476 | | | | (15,115,768 | ) | | | 19,955,867 | | | | 1,983,462 | | | | (23,425,008 | ) | | | (60,834,522 | ) |
| | | | 25,097,557 | | | 40,213,325 | | | 6,983,462 | | | 5,000,000 | | | 121,988,330 | | | 182,822,852 | |
| | | | | | 25,097,557 | | | | 40,213,325 | | | | 6,983,462 | | | | 5,000,000 | | | | 121,988,330 | | | | 182,822,852 | |
| | | | | $ | 136,876,033 | | | $ | 25,097,557 | | | $ | 26,939,329 | | | $ | 6,983,462 | | | $ | 98,563,322 | | | $ | 121,988,330 | |
| | | | | | | | |
| See accompanying Notes to Financial Statements | | | March 31, 2020 | | | Semiannual Report | | | 227 | |
Statements of Changes in Net Assets† (cont’d)
| | | | | | | | | | | | | | | | | | | | |
| | | AllianzGI International Small-Cap | | | AllianzGI Micro Cap | | | | |
| | | | | | |
| | | Six Months ended
March 31, 2020
(unaudited) | | | Year ended
September 30,
2019 | | | Six Months ended
March 31, 2020
(unaudited) | | | Year ended
September 30,
2019 | | | | |
| Increase (Decrease) in Net Assets from: | | | | | | | | | | | | | | | |
| | | | | | |
Investment Operations: | | | | | | | | | | | | | | | | | | | | |
| Net investment income (loss) | | $ | (1,435 | ) | | $ | 1,369,256 | | | $ | (94,895 | ) | | $ | (214,111 | ) | | | | |
| Net realized gain (loss) | | | 517,100 | | | | (397,025 | ) | | | 296,694 | | | | (529,216 | ) | | | | |
| Net change in unrealized appreciation/depreciation | | | (14,242,607 | ) | | | (19,390,703 | ) | | | (3,069,856 | ) | | | (4,667,859 | ) | | | | |
| | | | | | |
Net increase (decrease) in net assets resulting from investment operations | | | (13,726,942 | ) | | | (18,418,472 | ) | | | (2,868,057 | ) | | | (5,411,186 | ) | | | | |
| Distributions to Shareholders from: | | | | | | | | | | | | | | | |
| | | | | | |
| Distributable earnings: | | | | | | | | | | | | | | | | | | | | |
Class A | | | (67,732 | ) | | | (825,408 | ) | | | (14,595 | ) | | | (411,226 | ) | | | | |
Class C | | | (1,250 | ) | | | (220,455 | ) | | | — | | | | — | | | | | |
Class R | | | (19,727 | ) | | | (167,366 | ) | | | — | | | | — | | | | | |
Class P | | | (223,775 | ) | | | (4,463,787 | ) | | | (3,423 | ) | | | (271,612 | ) | | | | |
Institutional Class | | | (628,894 | ) | | | (6,651,510 | ) | | | (170,441 | ) | | | (3,889,195 | ) | | | | |
Class R6 | | | (690,384 | ) | | | (4,068,417 | ) | | | — | | | | — | | | | | |
| Total distributions to shareholders | | | (1,631,762 | ) | | | (16,396,943 | ) | | | (188,459 | ) | | | (4,572,033 | ) | | | | |
| Fund Share Transactions: | | | | | | | | | | | | | | | |
| Net proceeds from the sale of shares | | | 12,861,957 | | | | 23,342,926 | | | | 1,168,861 | | | | 3,775,725 | | | | | |
| Issued in reinvestment of distributions | | | 1,567,745 | | | | 15,849,165 | | | | 184,174 | | | | 4,557,294 | | | | | |
| Cost of shares redeemed | | | (25,953,932 | ) | | | (53,408,177 | ) | | | (2,645,512 | ) | | | (9,926,429 | ) | | | | |
| Net increase (decrease) from Fund share transactions | | | (11,524,230 | ) | | | (14,216,086 | ) | | | (1,292,477 | ) | | | (1,593,410 | ) | | | | |
| Total increase (decrease) in net assets | | | (26,882,934 | ) | | | (49,031,501 | ) | | | (4,348,993 | ) | | | (11,576,629 | ) | | | | |
| Net Assets: | | | | | | | | | | | | | | | |
| Beginning of period | | | 95,680,470 | | | | 144,711,971 | | | | 17,134,279 | | | | 28,710,908 | | | | | |
| End of period | | $ | 68,797,536 | | | $ | 95,680,470 | | | $ | 12,785,286 | | | $ | 17,134,279 | | | | | |
| – | May reflect actual amounts rounding to less than $1. |
| † | Consolidated Statement of Changes in Net Assets for the AllianzGI PerformanceFee Managed Futures Strategy Fund. These financial statements are consolidated to include the accounts of AllianzGI PerformanceFee Managed Futures Strategy Offshore Fund Ltd., a wholly-owned subsidiary of the AllianzGI PerformanceFee Managed Futures Strategy Fund.See Note 14. |
| | | | | | |
| 228 | | Semiannual Report | | | March 31, 2020 | | | See accompanying Notes to Financial Statements |
| | | | | | | | | | | | | | | | | | | | | | | | | | |
| | | | AllianzGI PerformanceFee Managed
Futures Strategy† | | | AllianzGI PerformanceFee Structured
US Equity | | | AllianzGI PerformanceFee Structured
US Fixed Income | |
| | | | | | | |
| | | | Six Months ended
March 31, 2020
(unaudited) | | | Year ended
September 30,
2019 | | | Six Months ended
March 31, 2020
(unaudited) | | | Year ended
September 30,
2019 | | | Six Months ended
March 31, 2020
(unaudited) | | | Year ended
September 30,
2019 | |
| | | | | | | | | | | | | | | | | | | | |
| | | | | | | |
| | | | | | | | | | | | | | | | | | | | |
| | | | | $ | 229,196 | | | $ | 640,725 | | | $ | 735,399 | | | $ | 1,898,984 | | | $ | 215,723 | | | $ | 726,103 | |
| | | | | | (4,141,321 | ) | | | 1,134,370 | | | | (27,345,194 | ) | | | 531,378 | | | | (136,752 | ) | | | 67,983 | |
| | | | | | 701,549 | | | | (86,597 | ) | | | (17,694,082 | ) | | | 2,179,668 | | | | (649,202 | ) | | | 2,003,781 | |
| | | | | | | |
| | | | | (3,210,576 | ) | | | 1,688,498 | | | | (44,303,877 | ) | | | 4,610,030 | | | | (570,231 | ) | | | 2,797,867 | |
| | | | | | | | | | | | | | | | | | | | |
| | | | | | | |
| | | | | | | | | | | | | | | | | | | | | | | | | | |
| | | | | | — | | | | — | | | | — | | | | — | | | | — | | | | — | |
| | | | | | — | | | | — | | | | — | | | | — | | | | — | | | | — | |
| | | | | | — | | | | — | | | | — | | | | — | | | | — | | | | — | |
| | | | | | (647 | ) | | | (81 | ) | | | (931,615 | ) | | | (5,757 | ) | | | (5,634 | ) | | | (786 | ) |
| | | | | | (33,299 | ) | | | (4,473 | ) | | | (2,329,516 | ) | | | (2,775,165 | ) | | | (79,007 | ) | | | (8,218 | ) |
| | | | | | (2,258,487 | ) | | | (305,782 | ) | | | (449,085 | ) | | | (2,828,770 | ) | | | (643,282 | ) | | | (1,142,377 | ) |
| | | | | (2,292,433 | ) | | | (310,336 | ) | | | (3,710,216 | ) | | | (5,609,692 | ) | | | (727,923 | ) | | | (1,151,381 | ) |
| | | | | | | | | | | | | | | | | | | | |
| | | | | | 1,826,831 | | | | 17,009,552 | | | | 55,104,002 | | | | 33,444,291 | | | | 781,563 | | | | 2,393,890 | |
| | | | | | 2,292,433 | | | | 310,336 | | | | 3,693,261 | | | | 5,609,691 | | | | 727,923 | | | | 1,151,380 | |
| | | | | | (2,965,041 | ) | | | (1,446,013 | ) | | | (61,727,443 | ) | | | (6,517,994 | ) | | | (20,900,224 | ) | | | (741,983 | ) |
| | | | | | 1,154,223 | | | | 15,873,875 | | | | (2,930,180 | ) | | | 32,535,988 | | | | (19,390,738 | ) | | | 2,803,287 | |
| | | | | (4,348,786 | ) | | | 17,252,037 | | | | (50,944,273 | ) | | | 31,536,326 | | | | (20,688,892 | ) | | | 4,449,773 | |
| | | | | | | | | | | | | | | | | | | | |
| | | | | | 33,031,078 | | | | 15,779,041 | | | | 114,611,534 | | | | 83,075,208 | | | | 29,428,166 | | | | 24,978,393 | |
| | | | | $ | 28,682,292 | | | $ | 33,031,078 | | | $ | 63,667,261 | | | $ | 114,611,534 | | | $ | 8,739,274 | | | $ | 29,428,166 | |
| | | | | | | | |
| See accompanying Notes to Financial Statements | | | March 31, 2020 | | | Semiannual Report | | | 229 | |
Statements of Changes in Net Assets (cont’d)
| | | | | | | | | | | | | | | | | | | | |
| | | AllianzGI Preferred Securities
and Income | | | AllianzGI Short Duration High
Income | | | | |
| | | | | | |
| | | Six Months ended
March 31, 2020
(unaudited) | | | Year ended
September 30,
2019 | | | Six Months ended
March 31, 2020
(unaudited) | | | Year ended
September 30,
2019 | | | | |
| Increase (Decrease) in Net Assets from: | | | | | | | | | | | | | | | |
| | | | | | |
Investment Operations: | | | | | | | | | | | | | | | | | | | | |
| Net investment income | | $ | 362,405 | | | $ | 690,870 | | | $ | 26,757,932 | | | $ | 42,380,614 | | | | | |
| Net realized gain (loss) | | | 402,832 | | | | 195,391 | | | | (14,383,151 | ) | | | 1,804,081 | | | | | |
| Net change in unrealized appreciation/depreciation | | | (3,865,020 | ) | | | 593,715 | | | | (156,736,341 | ) | | | (9,183,277 | ) | | | | |
| | | | | | |
Net increase (decrease) in net assets resulting from investment operations | | | (3,099,783 | ) | | | 1,479,976 | | | | (144,361,560 | ) | | | 35,001,418 | | | | | |
| Distributions to Shareholders from: | | | | | | | | | | | | | | | |
| | | | | | |
| Distributable earnings: | | | | | | | | | | | | | | | | | | | | |
Class A | | | — | | | | — | | | | (3,307,947 | ) | | | (7,162,693 | ) | | | | |
Class C | | | — | | | | — | | | | (2,502,583 | ) | | | (5,575,310 | ) | | | | |
Class P | | | (534 | ) | | | (506 | ) | | | (17,471,275 | ) | | | (25,427,233 | ) | | | | |
Institutional Class | | | (115,012 | ) | | | (98,925 | ) | | | (9,963,476 | ) | | | (20,662,259 | ) | | | | |
Class R6 | | | (717,553 | ) | | | (637,469 | ) | | | (996,160 | ) | | | (2,447,475 | ) | | | | |
| Total distributions to shareholders | | | (833,099 | ) | | | (736,900 | ) | | | (34,241,441 | ) | | | (61,274,970 | ) | | | | |
| Fund Share Transactions: | | | | | | | | | | | | | | | |
| Net proceeds from the sale of shares | | | 9,336,106 | | | | 5,757,775 | | | | 1,140,580,780 | | | | 794,898,546 | | | | | |
| Issued in reinvestment of distributions | | | 832,967 | | | | 736,900 | | | | 31,482,740 | | | | 54,086,373 | | | | | |
| Cost of shares redeemed | | | (5,529,038 | ) | | | (1,261,168 | ) | | | (1,297,588,224 | ) | | | (779,637,383 | ) | | | | |
| Net increase (decrease) from Fund share transactions | | | 4,640,035 | | | | 5,233,507 | | | | (125,524,704 | ) | | | 69,347,536 | | | | | |
| Total increase (decrease) in net assets | | | 707,153 | | | | 5,976,583 | | | | (304,127,705 | ) | | | 43,073,984 | | | | | |
| Net Assets: | | | | | | | | | | | | | | | |
| Beginning of period | | | 17,691,619 | | | | 11,715,036 | | | | 1,182,188,228 | | | | 1,139,114,244 | | | | | |
| End of period | | $ | 18,398,772 | | | $ | 17,691,619 | | | $ | 878,060,523 | | | $ | 1,182,188,228 | | | | | |
| – | May reflect actual amounts rounding to less than $1. |
| | | | | | |
| 230 | | Semiannual Report | | | March 31, 2020 | | | See accompanying Notes to Financial Statements |
| | | | | | | | | | | | | | | | | | | | | | | | | | |
| | | | AllianzGI Short Term Bond | | | AllianzGI Structured Return | | | AllianzGI U.S. Equity Hedged | |
| | | | | | | |
| | | | Six Months ended
March 31, 2020
(unaudited) | | | Year ended
September 30,
2019 | | | Six Months ended
March 31, 2020
(unaudited) | | | Year ended
September 30,
2019 | | | Six Months
ended
March 31,
2020
(unaudited) | | | Year ended
September 30,
2019 | |
| | | | | | | | | | | | | | | | | | | | |
| | | | | | | |
| | | | | | | | | | | | | | | | | | | | |
| | | | | $ | 175,173 | | | $ | 223,256 | | | $ | 3,105,843 | | | $ | 8,847,282 | | | $ | 8,319 | | | $ | 16,753 | |
| | | | | | 80,247 | | | | 35,302 | | | | (209,571,025 | ) | | | (38,209,015 | ) | | | 89,906 | | | | 155,868 | |
| | | | | | (334,638 | ) | | | 152,784 | | | | (7,745,082 | ) | | | 47,285,750 | | | | (296,566 | ) | | | (193,069 | ) |
| | | | | | | |
| | | | | (79,218 | ) | | | 411,342 | | | | (214,210,264 | ) | | | 17,924,017 | | | | (198,341 | ) | | | (20,448 | ) |
| | | | | | | | | | | | | | | | | | | | |
| | | | | | | |
| | | | | | | | | | | | | | | | | | | | | | | | | | |
| | | | | | (17,860 | ) | | | (22,615 | ) | | | (921,602 | ) | | | (2,148,071 | ) | | | (2,802 | ) | | | (35,189 | ) |
| | | | | | — | | | | — | | | | (418,026 | ) | | | (365,836 | ) | | | (2 | ) | | | (11,667 | ) |
| | | | | | (224 | ) | | | (392 | ) | | | (6,796,245 | ) | | | (3,115,188 | ) | | | (626 | ) | | | (4,848 | ) |
| | | | | | (262,707 | ) | | | (246,170 | ) | | | (16,745,080 | ) | | | (10,621,296 | ) | | | (13,422 | ) | | | (89,856 | ) |
| | | | | | — | | | | — | | | | (3,075,528 | ) | | | (1,407,534 | ) | | | — | | | | — | |
| | | | | (280,791 | ) | | | (269,177 | ) | | | (27,956,481 | ) | | | (17,657,925 | ) | | | (16,852 | ) | | | (141,560 | ) |
| | | | | | | | | | | | | | | | | | | | |
| | | | | | 12,226,048 | | | | 9,047,192 | | | | 176,046,625 | | | | 319,452,174 | | | | 199,537 | | | | 333,608 | |
| | | | | | 280,791 | | | | 269,177 | | | | 27,391,104 | | | | 17,258,570 | | | | 16,852 | | | | 141,560 | |
| | | | | | (3,736,833 | ) | | | (1,152,862 | ) | | | (356,557,196 | ) | | | (364,822,631 | ) | | | (253,556 | ) | | | (987,071 | ) |
| | | | | | 8,770,006 | | | | 8,163,507 | | | | (153,119,467 | ) | | | (28,111,887 | ) | | | (37,167 | ) | | | (511,903 | ) |
| | | | | 8,409,997 | | | | 8,305,672 | | | | (395,286,212 | ) | | | (27,845,795 | ) | | | (252,360 | ) | | | (673,911 | ) |
| | | | | | | | | | | | | | | | | | | | |
| | | | | | 13,490,125 | | | | 5,184,453 | | | | 646,238,537 | | | | 674,084,332 | | | | 2,254,237 | | | | 2,928,148 | |
| | | | | $ | 21,900,122 | | | $ | 13,490,125 | | | $ | 250,952,325 | | | $ | 646,238,537 | | | $ | 2,001,877 | | | $ | 2,254,237 | |
| | | | | | | | |
| See accompanying Notes to Financial Statements | | | March 31, 2020 | | | Semiannual Report | | | 231 | |
Statements of Changes in Net Assets (cont’d)
| | | | | | | | | | | | | | | | | | | | |
| | | AllianzGI Ultra Micro Cap | | | AllianzGI Water | | | | |
| | | | | | |
| | | Six Months ended
March 31, 2020
(unaudited) | | | Year ended
September 30,
2019 | | | Six Months ended
March 31, 2020
(unaudited) | | | Year ended
September 30,
2019 | | | | |
| Decrease in Net Assets from: | | | | | | | | | | | | | | | |
| | | | | | |
Investment Operations: | | | | | | | | | | | | | | | | | | | | |
| Net investment income (loss) | | $ | (92,326 | ) | | $ | (317,320 | ) | | $ | (229,392 | ) | | $ | 4,818,285 | | | | | |
| Net realized gain (loss) | | | 1,471,360 | | | | 901,771 | | | | (2,407,031 | ) | | | 19,046,207 | | | | | |
| Net change in unrealized appreciation/depreciation | | | (3,183,784 | ) | | | (7,708,809 | ) | | | (66,187,543 | ) | | | 18,580,055 | | | | | |
| | | | | | |
Net increase (decrease) in net assets resulting from investment operations | | | (1,804,750 | ) | | | (7,124,358 | ) | | | (68,823,966 | ) | | | 42,444,547 | | | | | |
| Distributions to Shareholders from: | | | | | | | | | | | | | | | |
| | | | | | |
| Distributable earnings: | | | | | | | | | | | | | | | | | | | | |
Class A | | | (532,780 | ) | | | (1,694,585 | ) | | | (5,630,824 | ) | | | (5,249,498 | ) | | | | |
Class C | | | — | | | | — | | | | (1,775,781 | ) | | | (1,910,913 | ) | | | | |
Class P | | | (217,195 | ) | | | (1,123,484 | ) | | | (6,754,853 | ) | | | (7,916,135 | ) | | | | |
Institutional Class | | | (1,254,238 | ) | | | (3,566,635 | ) | | | (5,443,459 | ) | | | (4,962,595 | ) | | | | |
| Total distributions to shareholders | | | (2,004,213 | ) | | | (6,384,704 | ) | | | (19,604,917 | ) | | | (20,039,141 | ) | | | | |
| Fund Share Transactions: | | | | | | | | | | | | | | | |
| Net proceeds from the sale of shares | | | 704,727 | | | | 2,558,153 | | | | 108,539,491 | | | | 131,364,152 | | | | | |
| Issued in reinvestment of distributions | | | 2,001,219 | | | | 6,379,652 | | | | 15,915,920 | | | | 15,949,272 | | | | | |
| Cost of shares redeemed | | | (5,836,338 | ) | | | (12,781,712 | ) | | | (96,299,518 | ) | | | (222,350,140 | ) | | | | |
| Net increase (decrease) from Fund share transactions | | | (3,130,392 | ) | | | (3,843,907 | ) | | | 28,155,893 | | | | (75,036,716 | ) | | | | |
| Total decrease in net assets | | | (6,939,355 | ) | | | (17,352,969 | ) | | | (60,272,990 | ) | | | (52,631,310 | ) | | | | |
| Net Assets: | | | | | | | | | | | | | | | |
| Beginning of period | | | 16,449,091 | | | | 33,802,060 | | | | 610,559,053 | | | | 663,190,363 | | | | | |
| End of period | | $ | 9,509,736 | | | $ | 16,449,091 | | | $ | 550,286,063 | | | $ | 610,559,053 | | | | | |
| — | May reflect actual amounts rounding to less than $1. |
| | | | | | |
| 232 | | Semiannual Report | | | March 31, 2020 | | | See accompanying Notes to Financial Statements |
(THIS PAGE INTENTIONALLY LEFT BLANK)
| | | | | | | | |
| See accompanying Notes to Financial Statements | | | March 31, 2020 | | | Semiannual Report | | | 233 | |
Financial Highlights
For a Share Outstanding for the Period ended:^
| | | | | | | | | | | | | | | | | | | | | | | | | | | | |
| | | Net Asset
Value,
Beginning
of Period | | | Net
Investment
Income (a) | | |
Net Realized
and Change
in Unrealized
Gain (Loss) | | | Total from
Investment
Operations | | | Dividends
from Net
Investment
Income | | | Distributions
from Net
Realized Capital
Gains | | | | |
| AllianzGI Retirement 2020: | | | | | | | | | | | | | | | | | | | | | |
| Class A | | | | | | | | | | | | | | | | | | | | | | | | | | | | |
3/31/2020† | | $ | 19.61 | | | $ | 0.68 | | | $ | (1.28 | ) | | $ | (0.60 | ) | | $ | (0.87 | ) | | $ | (1.96 | ) | | | | |
9/30/2019 | | | 20.30 | | | | 0.37 | | | | 0.15 | | | | 0.52 | | | | (0.47 | ) | | | (0.74 | ) | | | | |
9/30/2018 | | | 20.42 | | | | 0.38 | | | | 0.15 | | | | 0.53 | | | | (0.65 | ) | | | — | | | | | |
9/30/2017 | | | 19.20 | | | | 0.20 | | | | 1.48 | | | | 1.68 | | | | (0.46 | ) | | | — | | | | | |
9/30/2016 | | | 18.09 | | | | 0.46 | | | | 1.23 | | | | 1.69 | | | | (0.58 | ) | | | — | | | | | |
12/1/2014 - 9/30/2015# | | | 19.72 | | | | 0.46 | | | | (1.45 | ) | | | (0.99 | ) | | | (0.56 | ) | | | (0.08 | ) | | | | |
11/30/2014 | | | 19.32 | | | | 0.41 | | | | 0.37 | | | | 0.78 | | | | (0.38 | ) | | | — | | | | | |
| Class C | | | | | | | | | | | | | | | | | | | | | | | | | | | | |
3/31/2020† | | $ | 19.58 | | | $ | 0.56 | | | $ | (1.23 | ) | | $ | (0.67 | ) | | $ | (0.81 | ) | | $ | (1.96 | ) | | | | |
9/30/2019 | | | 20.16 | | | | 0.19 | | | | 0.19 | | | | 0.38 | | | | (0.22 | ) | | | (0.74 | ) | | | | |
9/30/2018 | | | 20.27 | | | | 0.16 | | | | 0.21 | | | | 0.37 | | | | (0.48 | ) | | | — | | | | | |
9/30/2017 | | | 19.10 | | | | 0.05 | | | | 1.50 | | | | 1.55 | | | | (0.38 | ) | | | — | | | | | |
9/30/2016 | | | 18.02 | | | | 0.31 | | | | 1.22 | | | | 1.53 | | | | (0.45 | ) | | | — | | | | | |
12/1/2014 - 9/30/2015# | | | 19.60 | | | | 0.36 | | | | (1.47 | ) | | | (1.11 | ) | | | (0.39 | ) | | | (0.08 | ) | | | | |
11/30/2014 | | | 19.16 | | | | 0.27 | | | | 0.35 | | | | 0.62 | | | | (0.18 | ) | | | — | | | | | |
| Class R | | | | | | | | | | | | | | | | | | | | | | | | | | | | |
3/31/2020† | | $ | 19.12 | | | $ | 0.52 | | | $ | (1.13 | ) | | $ | (0.61 | ) | | $ | (0.75 | ) | | $ | (1.96 | ) | | | | |
9/30/2019 | | | 19.97 | | | | 0.72 | | | | (0.36 | ) | | | 0.36 | | | | (0.47 | ) | | | (0.74 | ) | | | | |
9/30/2018 | | | 20.09 | | | | 0.26 | | | | 0.19 | | | | 0.45 | | | | (0.57 | ) | | | — | | | | | |
9/30/2017 | | | 19.21 | | | | 0.32 | | | | 0.94 | | | | 1.26 | | | | (0.38 | ) | | | — | | | | | |
9/30/2016 | | | 18.10 | | | | 0.40 | | | | 1.22 | | | | 1.62 | | | | (0.51 | ) | | | — | | | | | |
12/1/2014 - 9/30/2015# | | | 19.70 | | | | 0.39 | | | | (1.43 | ) | | | (1.04 | ) | | | (0.48 | ) | | | (0.08 | ) | | | | |
11/30/2014 | | | 19.27 | | | | 0.35 | | | | 0.36 | | | | 0.71 | | | | (0.28 | ) | | | — | | | | | |
| Class P | | | | | | | | | | | | | | | | | | | | | | | | | | | | |
3/31/2020† | | $ | 19.73 | | | $ | 0.55 | | | $ | (1.13 | ) | | $ | (0.58 | ) | | $ | (0.85 | ) | | $ | (1.96 | ) | | | | |
9/30/2019 | | | 20.51 | | | | 0.45 | | | | 0.10 | | | | 0.55 | | | | (0.59 | ) | | | (0.74 | ) | | | | |
9/30/2018 | | | 20.62 | | | | 0.39 | | | | 0.20 | | | | 0.59 | | | | (0.70 | ) | | | — | | | | | |
9/30/2017 | | | 19.41 | | | | 0.28 | | | | 1.48 | | | | 1.76 | | | | (0.55 | ) | | | — | | | | | |
9/30/2016 | | | 18.34 | | | | 0.52 | | | | 1.24 | | | | 1.76 | | | | (0.69 | ) | | | — | | | | | |
12/1/2014 - 9/30/2015# | | | 19.98 | | | | 0.46 | | | | (1.42 | ) | | | (0.96 | ) | | | (0.60 | ) | | | (0.08 | ) | | | | |
11/30/2014 | | | 19.53 | | | | 0.47 | | | | 0.38 | | | | 0.85 | | | | (0.40 | ) | | | — | | | | | |
| Class R6 | | | | | | | | | | | | | | | | | | | | | | | | | | | | |
3/31/2020† | | $ | 19.78 | | | $ | 0.61 | | | $ | (1.17 | ) | | $ | (0.56 | ) | | $ | (0.96 | ) | | $ | (1.96 | ) | | | | |
9/30/2019 | | | 20.55 | | | | 0.48 | | | | 0.10 | | | | 0.58 | | | | (0.61 | ) | | | (0.74 | ) | | | | |
9/30/2018 | | | 20.66 | | | | 0.41 | | | | 0.20 | | | | 0.61 | | | | (0.72 | ) | | | — | | | | | |
9/30/2017 | | | 19.43 | | | | 0.26 | | | | 1.53 | | | | 1.79 | | | | (0.56 | ) | | | — | | | | | |
9/30/2016 | | | 18.37 | | | | 0.54 | | | | 1.23 | | | | 1.77 | | | | (0.71 | ) | | | — | | | | | |
12/1/2014 - 9/30/2015# | | | 20.01 | | | | 0.51 | | | | (1.45 | ) | | | (0.94 | ) | | | (0.62 | ) | | | (0.08 | ) | | | | |
11/30/2014 | | | 19.57 | | | | 0.51 | | | | 0.35 | | | | 0.86 | | | | (0.42 | ) | | | — | | | | | |
| Administrative Class | | | | | | | | | | | | | | | | | | | | | | | | | | | | |
3/31/2020† | | $ | 19.67 | | | $ | 0.57 | | | $ | (1.18 | ) | | $ | (0.61 | ) | | $ | (0.69 | ) | | $ | (1.96 | ) | | | | |
9/30/2019 | | | 20.44 | | | | 0.68 | | | | (0.18 | ) | | | 0.50 | | | | (0.53 | ) | | | (0.74 | ) | | | | |
9/30/2018 | | | 20.56 | | | | 0.33 | | | | 0.21 | | | | 0.54 | | | | (0.66 | ) | | | — | | | | | |
9/30/2017 | | | 19.28 | | | | 0.24 | | | | 1.47 | | | | 1.71 | | | | (0.43 | ) | | | — | | | | | |
9/30/2016 | | | 18.22 | | | | 0.51 | | | | 1.18 | | | | 1.69 | | | | (0.63 | ) | | | — | | | | | |
12/1/2014 - 9/30/2015# | | | 19.84 | | | | 0.87 | | | | (1.86 | ) | | | (0.99 | ) | | | (0.55 | ) | | | (0.08 | ) | | | | |
11/30/2014 | | | 19.42 | | | | 0.43 | | | | 0.36 | | | | 0.79 | | | | (0.37 | ) | | | — | | | | | |
| ^ | A “—” may reflect actual amounts rounding to less than $0.01 or 0.01%. |
| # | Fiscal year end changed from November 30th to September 30th. |
| (a) | Calculated on average shares outstanding during the period. |
| | | | | | |
| 234 | | Semiannual Report | | | March 31, 2020 | | | See accompanying Notes to Financial Statements |
| | | | | | | | | | | | | | | | | | | | | | | | | | | | | | | | | | |
| | | | Total
Dividends and
Distributions | | | Net Asset
Value, End
of Period | | | Total Return (b) | | | Net Assets,
End of Period
(000s) | | | Ratio of
Expenses to
Average Net
Assets with
Fee Waiver/
Reimbursement (c) | | | Ratio of
Expenses to
Average Net
Assets without
Fee Waiver/
Reimbursement (c) | | | Ratio of Net
Investment
Income to
Average
Net Assets (c) | | | Portfolio
Turnover Rate | |
| | | | | | | | | | | | | | | | | | | | | | | | | | |
| | | | | | | | | | | | | | | | | | | | | | | | | | | | | | | | | | |
| | | | | $ | (2.83 | ) | | $ | 16.18 | | | | (4.22 | )% | | $ | 2,330 | | | | 0.37 | %(d) | | | 0.60 | %(d) | | | 7.19 | %(d) | | | 40 | % |
| | | | | | (1.21 | ) | | | 19.61 | | | | 3.19 | | | | 3,687 | | | | 0.39 | | | | 0.60 | | | | 1.94 | | | | 28 | |
| | | | | | (0.65 | ) | | | 20.30 | | | | 2.56 | | | | 4,002 | | | | 0.36 | | | | 0.60 | | | | 1.84 | | | | 24 | |
| | | | | | (0.46 | ) | | | 20.42 | | | | 9.02 | | | | 13,645 | | | | 0.36 | | | | 0.60 | | | | 1.04 | | | | 143 | |
| | | | | | (0.58 | ) | | | 19.20 | | | | 9.57 | | | | 12,715 | | | | 0.48 | | | | 0.60 | | | | 2.51 | | | | 106 | |
| | | | | | (0.64 | ) | | | 18.09 | | | | (5.13 | ) | | | 30,401 | | | | 0.47 | (d)(e) | | | 0.62 | (d)(e) | | | 2.93 | (d)(e) | | | 144 | |
| | | | | | (0.38 | ) | | | 19.72 | | | | 4.11 | | | | 34,624 | | | | 0.42 | | | | 0.60 | | | | 2.08 | | | | 89 | |
| | | | | | | | | | | | | | | | | | | | | | | | | | | | | | | | | | |
| | | | | $ | (2.77 | ) | | $ | 16.14 | | | | (4.59 | )% | | $ | 297 | | | | 1.12 | %(d) | | | 1.35 | %(d) | | | 6.00 | %(d) | | | 40 | % |
| | | | | | (0.96 | ) | | | 19.58 | | | | 2.37 | | | | 547 | | | | 1.14 | | | | 1.35 | | | | 0.98 | | | | 28 | |
| | | | | | (0.48 | ) | | | 20.16 | | | | 1.79 | | | | 423 | | | | 1.11 | | | | 1.35 | | | | 0.79 | | | | 24 | |
| | | | | | (0.38 | ) | | | 20.27 | | | | 8.31 | | | | 454 | | | | 1.11 | | | | 1.35 | | | | 0.28 | | | | 143 | |
| | | | | | (0.45 | ) | | | 19.10 | | | | 8.68 | | | | 408 | | | | 1.23 | | | | 1.35 | | | | 1.71 | | | | 106 | |
| | | | | | (0.47 | ) | | | 18.02 | | | | (5.72 | ) | | | 327 | | | | 1.22 | (d)(e) | | | 1.37 | (d)(e) | | | 2.28 | (d)(e) | | | 144 | |
| | | | | | (0.18 | ) | | | 19.60 | | | | 3.29 | | | | 468 | | | | 1.17 | | | | 1.35 | | | | 1.39 | | | | 89 | |
| | | | | | | | | | | | | | | | | | | | | | | | | | | | | | | | | | |
| | | | | $ | (2.71 | ) | | $ | 15.80 | | | | (4.37 | )% | | $ | 10 | | | | 0.72 | %(d) | | | 0.84 | %(d) | | | 5.76 | %(d) | | | 40 | % |
| | | | | | (1.21 | ) | | | 19.12 | | | | 2.42 | | | | 10 | | | | 0.74 | | | | 0.85 | | | | 3.84 | | | | 28 | |
| | | | | | (0.57 | ) | | | 19.97 | | | | 2.21 | | | | 86 | | | | 0.71 | | | | 0.85 | | | | 1.29 | | | | 24 | |
| | | | | | (0.38 | ) | | | 20.09 | | | | 6.70 | | | | 43 | | | | 0.71 | | | | 0.86 | | | | 1.71 | | | | 143 | |
| | | | | | (0.51 | ) | | | 19.21 | | | | 9.12 | | | | 649 | | | | 0.83 | | | | 0.85 | | | | 2.18 | | | | 106 | |
| | | | | | (0.56 | ) | | | 18.10 | | | | (5.39 | ) | | | 1,043 | | | | 0.82 | (d)(e) | | | 0.87 | (d)(e) | | | 2.49 | (d)(e) | | | 144 | |
| | | | | | (0.28 | ) | | | 19.70 | | | | 3.72 | | | | 1,008 | | | | 0.77 | | | | 0.85 | | | | 1.81 | | | | 89 | |
| | | | | | | | | | | | | | | | | | | | | | | | | | | | | | | | | | |
| | | | | $ | (2.81 | ) | | $ | 16.34 | | | | (4.07 | )% | | $ | 1,164 | | | | 0.07 | %(d) | | | 0.20 | %(d) | | | 5.85 | %(d) | | | 40 | % |
| | | | | | (1.33 | ) | | | 19.73 | | | | 3.41 | | | | 2,394 | | | | 0.09 | | | | 0.20 | | | | 2.33 | | | | 28 | |
| | | | | | (0.70 | ) | | | 20.51 | | | | 2.87 | | | | 12,932 | | | | 0.06 | | | | 0.20 | | | | 1.92 | | | | 24 | |
| | | | | | (0.55 | ) | | | 20.62 | | | | 9.37 | | | | 20,137 | | | | 0.06 | | | | 0.20 | | | | 1.42 | | | | 143 | |
| | | | | | (0.69 | ) | | | 19.41 | | | | 9.88 | | | | 25,879 | | | | 0.18 | | | | 0.20 | | | | 2.82 | | | | 106 | |
| | | | | | (0.68 | ) | | | 18.34 | | | | (4.89 | ) | | | 21,193 | | | | 0.17 | (d)(e) | | | 0.22 | (d)(e) | | | 2.91 | (d)(e) | | | 144 | |
| | | | | | (0.40 | ) | | | 19.98 | | | | 4.43 | | | | 12,665 | | | | 0.12 | | | | 0.20 | | | | 2.38 | | | | 89 | |
| | | | | | | | | | | | | | | | | | | | | | | | | | | | | | | | | | |
| | | | | $ | (2.92 | ) | | $ | 16.30 | | | | (4.05 | )% | | $ | 7,516 | | | | — | %(d)(f) | | | 0.10 | %(d) | | | 6.49 | %(d) | | | 40 | % |
| | | | | | (1.35 | ) | | | 19.78 | | | | 3.55 | | | | 11,215 | | | | — | (f) | | | 0.10 | | | | 2.48 | | | | 28 | |
| | | | | | (0.72 | ) | | | 20.55 | | | | 2.95 | | | | 16,796 | | | | — | (f) | | | 0.10 | | | | 2.00 | | | | 24 | |
| | | | | | (0.56 | ) | | | 20.66 | | | | 9.54 | | | | 17,943 | | | | — | (f) | | | 0.10 | | | | 1.31 | | | | 143 | |
| | | | | | (0.71 | ) | | | 19.43 | | | | 9.94 | | | | 13,274 | | | | 0.08 | | | | 0.10 | | | | 2.93 | | | | 106 | |
| | | | | | (0.70 | ) | | | 18.37 | | | | (4.82 | ) | | | 11,847 | | | | 0.07 | (d)(e) | | | 0.12 | (d)(e) | | | 3.22 | (d)(e) | | | 144 | |
| | | | | | (0.42 | ) | | | 20.01 | | | | 4.48 | | | | 5,574 | | | | 0.02 | | | | 0.10 | | | | 2.59 | | | | 89 | |
| | | | | | | | | | | | | | | | | | | | | | | | | | | | | | | | | | |
| | | | | $ | (2.65 | ) | | $ | 16.41 | | | | (4.17 | )% | | $ | 34 | | | | 0.32 | %(d) | | | 0.45 | %(d) | | | 6.12 | %(d) | | | 40 | % |
| | | | | | (1.27 | ) | | | 19.67 | | | | 3.13 | | | | 30 | | | | 0.34 | | | | 0.45 | | | | 3.51 | | | | 28 | |
| | | | | | (0.66 | ) | | | 20.44 | | | | 2.61 | | | | 521 | | | | 0.31 | | | | 0.45 | | | | 1.61 | | | | 24 | |
| | | | | | (0.43 | ) | | | 20.56 | | | | 9.10 | | | | 665 | | | | 0.31 | | | | 0.45 | | | | 1.22 | | | | 143 | |
| | | | | | (0.63 | ) | | | 19.28 | | | | 9.55 | | | | 377 | | | | 0.43 | | | | 0.45 | | | | 2.76 | | | | 106 | |
| | | | | | (0.63 | ) | | | 18.22 | | | | (5.09 | ) | | | 1,747 | | | | 0.41 | (d)(e) | | | 0.46 | (d)(e) | | | 5.41 | (d)(e) | | | 144 | |
| | | | | | (0.37 | ) | | | 19.84 | | | | 4.15 | | | | 7,974 | | | | 0.37 | | | | 0.45 | | | | 2.19 | | | | 89 | |
| | (b) | Total return is calculated assuming a purchase of a share on the first day of the period and a sale of a share on the last day of each period reported. Dividends and distributions, if any, are assumed, for purposes of this calculation, to be reinvested. Total return does not reflect sales charges and includes the effect of fee waivers and reimbursements. Total return may reflect adjustments to conform to U.S. GAAP. Total return for a period of less than one year is not annualized. |
| | (c) | Does not include expenses of the investment companies in which the Fund invests. |
| | (d) | Annualized, unless otherwise noted. |
| | (e) | Certain expenses incurred by the Fund were not annualized. |
| | (f) | See Note 6 in the Notes to Financial Statements. |
| | | | | | | | |
| See accompanying Notes to Financial Statements | | | March 31, 2020 | | | Semiannual Report | | | 235 | |
Financial Highlights (cont’d)
For a Share Outstanding for the Period ended:^
| | | | | | | | | | | | | | | | | | | | | | | | | | | | |
| | | Net Asset
Value,
Beginning
of Period | | | Net
Investment
Income (a) | | |
Net Realized
and Change
in Unrealized
Gain (Loss) | | | Total from
Investment
Operations | | | Dividends
from Net
Investment
Income | | | Distributions
from Net
Realized Capital
Gains | | | | |
| AllianzGI Retirement 2025: | | | | | | | | | | | | | | | | | | | | | |
| Class A | | | | | | | | | | | | | | | | | | | | | | | | | | | | |
3/31/2020† | | $ | 17.40 | | | $ | 0.55 | | | $ | (1.34 | ) | | $ | (0.79 | ) | | $ | (0.81 | ) | | $ | (2.14 | ) | | | | |
9/30/2019 | | | 18.50 | | | | 0.31 | | | | (0.23 | ) | | | 0.08 | | | | (0.41 | ) | | | (0.77 | ) | | | | |
9/30/2018 | | | 18.54 | | | | 0.27 | | | | 0.52 | | | | 0.79 | | | | (0.61 | ) | | | (0.22 | ) | | | | |
9/30/2017 | | | 16.95 | | | | 0.10 | | | | 1.81 | | | | 1.91 | | | | (0.31 | ) | | | (0.01 | ) | | | | |
9/30/2016 | | | 15.89 | | | | 0.40 | | | | 1.16 | | | | 1.56 | | | | (0.50 | ) | | | — | | | | | |
12/1/2014 - 9/30/2015# | | | 17.30 | | | | 0.41 | | | | (1.31 | ) | | | (0.90 | ) | | | (0.50 | ) | | | (0.01 | ) | | | | |
11/30/2014 | | | 16.92 | | | | 0.37 | | | | 0.33 | | | | 0.70 | | | | (0.32 | ) | | | — | | | | | |
| Class R | | | | | | | | | | | | | | | | | | | | | | | | | | | | |
3/31/2020† | | $ | 17.26 | | | $ | 0.50 | | | $ | (1.32 | ) | | $ | (0.82 | ) | | $ | (0.75 | ) | | $ | (2.14 | ) | | | | |
9/30/2019 | | | 18.36 | | | | 0.25 | | | | (0.22 | ) | | | 0.03 | | | | (0.36 | ) | | | (0.77 | ) | | | | |
9/30/2018 | | | 18.35 | | | | 0.18 | | | | 0.54 | | | | 0.72 | | | | (0.49 | ) | | | (0.22 | ) | | | | |
9/30/2017 | | | 16.89 | | | | 0.14 | | | | 1.69 | | | | 1.83 | | | | (0.36 | ) | | | (0.01 | ) | | | | |
9/30/2016 | | | 15.83 | | | | 0.34 | | | | 1.16 | | | | 1.50 | | | | (0.44 | ) | | | — | | | | | |
12/1/2014 - 9/30/2015# | | | 17.21 | | | | 0.34 | | | | (1.29 | ) | | | (0.95 | ) | | | (0.42 | ) | | | (0.01 | ) | | | | |
11/30/2014 | | | 16.84 | | | | 0.32 | | | | 0.32 | | | | 0.64 | | | | (0.27 | ) | | | — | | | | | |
| Class P | | | | | | | | | | | | | | | | | | | | | | | | | | | | |
3/31/2020† | | $ | 17.38 | | | $ | 0.36 | | | $ | (1.14 | ) | | $ | (0.78 | ) | | $ | (0.76 | ) | | $ | (2.14 | ) | | | | |
9/30/2019 | | | 18.51 | | | | 0.39 | | | | (0.27 | ) | | | 0.12 | | | | (0.48 | ) | | | (0.77 | ) | | | | |
9/30/2018 | | | 18.54 | | | | 0.34 | | | | 0.52 | | | | 0.86 | | | | (0.67 | ) | | | (0.22 | ) | | | | |
9/30/2017 | | | 17.05 | | | | 0.16 | | | | 1.80 | | | | 1.96 | | | | (0.46 | ) | | | (0.01 | ) | | | | |
9/30/2016 | | | 16.01 | | | | 0.44 | | | | 1.19 | | | | 1.63 | | | | (0.59 | ) | | | — | | | | | |
12/1/2014 - 9/30/2015# | | | 17.43 | | | | 0.38 | | | | (1.24 | ) | | | (0.86 | ) | | | (0.55 | ) | | | (0.01 | ) | | | | |
11/30/2014 | | | 17.02 | | | | 0.40 | | | | 0.35 | | | | 0.75 | | | | (0.34 | ) | | | — | | | | | |
| Class R6 | | | | | | | | | | | | | | | | | | | | | | | | | | | | |
3/31/2020† | | $ | 17.44 | | | $ | 0.57 | | | $ | (1.33 | ) | | $ | (0.76 | ) | | $ | (0.87 | ) | | $ | (2.14 | ) | | | | |
9/30/2019 | | | 18.55 | | | | 0.41 | | | | (0.27 | ) | | | 0.14 | | | | (0.48 | ) | | | (0.77 | ) | | | | |
9/30/2018 | | | 18.57 | | | | 0.35 | | | | 0.52 | | | | 0.87 | | | | (0.67 | ) | | | (0.22 | ) | | | | |
9/30/2017 | | | 17.07 | | | | 0.15 | | | | 1.83 | | | | 1.98 | | | | (0.47 | ) | | | (0.01 | ) | | | | |
9/30/2016 | | | 16.03 | | | | 0.45 | | | | 1.19 | | | | 1.64 | | | | (0.60 | ) | | | — | | | | | |
12/1/2014 - 9/30/2015# | | | 17.45 | | | | 0.45 | | | | (1.30 | ) | | | (0.85 | ) | | | (0.56 | ) | | | (0.01 | ) | | | | |
11/30/2014 | | | 17.04 | | | | 0.44 | | | | 0.33 | | | | 0.77 | | | | (0.36 | ) | | | — | | | | | |
| Administrative Class | | | | | | | | | | | | | | | | | | | | | | | | | | | | |
3/31/2020† | | $ | 17.46 | | | $ | 0.53 | | | $ | (1.32 | ) | | $ | (0.79 | ) | | $ | (0.80 | ) | | $ | (2.14 | ) | | | | |
9/30/2019 | | | 18.57 | | | | 0.36 | | | | (0.27 | ) | | | 0.09 | | | | (0.43 | ) | | | (0.77 | ) | | | | |
9/30/2018 | | | 18.55 | | | | 0.28 | | | | 0.52 | | | | 0.80 | | | | (0.56 | ) | | | (0.22 | ) | | | | |
9/30/2017 | | | 17.00 | | | | 0.11 | | | | 1.81 | | | | 1.92 | | | | (0.36 | ) | | | (0.01 | ) | | | | |
9/30/2016 | | | 15.96 | | | | 0.41 | | | | 1.17 | | | | 1.58 | | | | (0.54 | ) | | | — | | | | | |
12/1/2014 - 9/30/2015# | | | 17.37 | | | | 1.16 | | | | (2.06 | ) | | | (0.90 | ) | | | (0.50 | ) | | | (0.01 | ) | | | | |
11/30/2014 | | | 16.98 | | | | 0.38 | | | | 0.33 | | | | 0.71 | | | | (0.32 | ) | | | — | | | | | |
| ^ | A “—” may reflect actual amounts rounding to less than $0.01 or 0.01%. |
| # | Fiscal year end changed from November 30th to September 30th. |
| (a) | Calculated on average shares outstanding during the period. |
| | | | | | |
| 236 | | Semiannual Report | | | March 31, 2020 | | | See accompanying Notes to Financial Statements |
| | | | | | | | | | | | | | | | | | | | | | | | | | | | | | | | | | |
| | | | Total
Dividends and
Distributions | | | Net Asset
Value, End
of Period | | | Total Return (b) | | | Net Assets,
End of Period
(000s) | | | Ratio of
Expenses to
Average Net
Assets with
Fee Waiver/
Reimbursement (c) | | | Ratio of
Expenses to
Average Net
Assets without Fee
Waiver/
Reimbursement (c) | | | Ratio of Net
Investment
Income to
Average
Net Assets (c) | | | Portfolio
Turnover Rate | |
| | | | | | | | | | | | | | | | | | | | | | | | | | |
| | | | | | | | | | | | | | | | | | | | | | | | | | | | | | | | | | |
| | | | | $ | (2.95 | ) | | $ | 13.66 | | | | (6.51 | )% | | $ | 4,568 | | | | 0.31 | %(d) | | | 0.60 | %(d) | | | 6.73 | %(d) | | | 16 | % |
| | | | | | (1.18 | ) | | | 17.40 | | | | 1.13 | | | | 5,738 | | | | 0.35 | | | | 0.60 | | | | 1.78 | | | | 24 | |
| | | | | | (0.83 | ) | | | 18.50 | | | | 4.30 | | | | 6,444 | | | | 0.32 | | | | 0.60 | | | | 1.48 | | | | 19 | |
| | | | | | (0.32 | ) | | | 18.54 | | | | 11.55 | | | | 7,843 | | | | 0.32 | | | | 0.60 | | | | 0.56 | | | | 129 | |
| | | | | | (0.50 | ) | | | 16.95 | | | | 10.02 | | | | 6,663 | | | | 0.48 | | | | 0.60 | | | | 2.48 | | | | 115 | |
| | | | | | (0.51 | ) | | | 15.89 | | | | (5.28 | ) | | | 26,916 | | | | 0.45 | (d)(e) | | | 0.62 | (d)(e) | | | 2.98 | (d)(e) | | | 147 | |
| | | | | | (0.32 | ) | | | 17.30 | | | | 4.22 | | | | 31,358 | | | | 0.41 | | | | 0.60 | | | | 2.16 | | | | 93 | |
| | | | | | | | | | | | | | | | | | | | | | | | | | | | | | | | | | |
| | | | | $ | (2.89 | ) | | $ | 13.55 | | | | (6.71 | )% | | $ | 182 | | | | 0.66 | %(d) | | | 0.85 | %(d) | | | 6.16 | %(d) | | | 16 | % |
| | | | | | (1.13 | ) | | | 17.26 | | | | 0.80 | | | | 222 | | | | 0.70 | | | | 0.85 | | | | 1.45 | | | | 24 | |
| | | | | | (0.71 | ) | | | 18.36 | | | | 3.94 | | | | 237 | | | | 0.67 | | | | 0.85 | | | | 1.01 | | | | 19 | |
| | | | | | (0.37 | ) | | | 18.35 | | | | 11.11 | | | | 219 | | | | 0.67 | | | | 0.86 | | | | 0.79 | | | | 129 | |
| | | | | | (0.44 | ) | | | 16.89 | | | | 9.67 | | | | 835 | | | | 0.83 | | | | 0.85 | | | | 2.08 | | | | 115 | |
| | | | | | (0.43 | ) | | | 15.83 | | | | (5.59 | ) | | | 1,066 | | | | 0.80 | (d)(e) | | | 0.87 | (d)(e) | | | 2.43 | (d)(e) | | | 147 | |
| | | | | | (0.27 | ) | | | 17.21 | | | | 3.83 | | | | 1,004 | | | | 0.76 | | | | 0.85 | | | | 1.89 | | | | 93 | |
| | | | | | | | | | | | | | | | | | | | | | | | | | | | | | | | | | |
| | | | | $ | (2.90 | ) | | $ | 13.70 | | | | (6.41 | )% | | $ | 1,369 | | | | 0.01 | %(d) | | | 0.20 | %(d) | | | 4.28 | %(d) | | | 16 | % |
| | | | | | (1.25 | ) | | | 17.38 | | | | 1.37 | | | | 5,113 | | | | 0.05 | | | | 0.20 | | | | 2.26 | | | | 24 | |
| | | | | | (0.89 | ) | | | 18.51 | | | | 4.65 | | | | 22,387 | | | | 0.02 | | | | 0.20 | | | | 1.85 | | | | 19 | |
| | | | | | (0.47 | ) | | | 18.54 | | | | 11.85 | | | | 36,000 | | | | 0.02 | | | | 0.20 | | | | 0.92 | | | | 129 | |
| | | | | | (0.59 | ) | | | 17.05 | | | | 10.43 | | | | 34,729 | | | | 0.18 | | | | 0.20 | | | | 2.70 | | | | 115 | |
| | | | | | (0.56 | ) | | | 16.01 | | | | (5.04 | ) | | | 29,233 | | | | 0.15 | (d)(e) | | | 0.22 | (d)(e) | | | 2.71 | (d)(e) | | | 147 | |
| | | | | | (0.34 | ) | | | 17.43 | | | | 4.49 | | | | 13,866 | | | | 0.11 | | | | 0.20 | | | | 2.32 | | | | 93 | |
| | | | | | | | | | | | | | | | | | | | | | | | | | | | | | | | | | |
| | | | | $ | (3.01 | ) | | $ | 13.67 | | | | (6.32 | )% | | $ | 10,196 | | | | — | %(d)(f) | | | 0.10 | %(d) | | | 6.94 | %(d) | | | 16 | % |
| | | | | | (1.25 | ) | | | 17.44 | | | | 1.52 | | | | 13,742 | | | | — | (f) | | | 0.10 | | | | 2.41 | | | | 24 | |
| | | | | | (0.89 | ) | | | 18.55 | | | | 4.73 | | | | 21,599 | | | | — | (f) | | | 0.10 | | | | 1.89 | | | | 19 | |
| | | | | | (0.48 | ) | | | 18.57 | | | | 11.97 | | | | 20,971 | | | | — | (f) | | | 0.10 | | | | 0.87 | | | | 129 | |
| | | | | | (0.60 | ) | | | 17.07 | | | | 10.55 | | | | 12,439 | | | | 0.08 | | | | 0.10 | | | | 2.78 | | | | 115 | |
| | | | | | (0.57 | ) | | | 16.03 | | | | (4.97 | ) | | | 10,047 | | | | 0.05 | (d)(e) | | | 0.12 | (d)(e) | | | 3.25 | (d)(e) | | | 147 | |
| | | | | | (0.36 | ) | | | 17.45 | | | | 4.60 | | | | 6,745 | | | | 0.01 | | | | 0.10 | | | | 2.54 | | | | 93 | |
| | | | | | | | | | | | | | | | | | | | | | | | | | | | | | | | | | |
| | | | | $ | (2.94 | ) | | $ | 13.73 | | | | (6.45 | )% | | $ | 145 | | | | 0.26 | %(d) | | | 0.45 | %(d) | | | 6.51 | %(d) | | | 16 | % |
| | | | | | (1.20 | ) | | | 17.46 | | | | 1.16 | | | | 148 | | | | 0.30 | | | | 0.45 | | | | 2.12 | | | | 24 | |
| | | | | | (0.78 | ) | | | 18.57 | | | | 4.34 | | | | 192 | | | | 0.27 | | | | 0.45 | | | | 1.48 | | | | 19 | |
| | | | | | (0.37 | ) | | | 18.55 | | | | 11.57 | | | | 740 | | | | 0.27 | | | | 0.45 | | | | 0.61 | | | | 129 | |
| | | | | | (0.54 | ) | | | 17.00 | | | | 10.12 | | | | 585 | | | | 0.43 | | | | 0.45 | | | | 2.56 | | | | 115 | |
| | | | | | (0.51 | ) | | | 15.96 | | | | (5.26 | ) | | | 1,165 | | | | 0.39 | (d)(e) | | | 0.46 | (d)(e) | | | 8.16 | (d)(e) | | | 147 | |
| | | | | | (0.32 | ) | | | 17.37 | | | | 4.26 | | | | 12,135 | | | | 0.36 | | | | 0.45 | | | | 2.23 | | | | 93 | |
| | (b) | Total return is calculated assuming a purchase of a share on the first day of the period and a sale of a share on the last day of each period reported. Dividends and distributions, if any, are assumed, for purposes of this calculation, to be reinvested. Total return does not reflect sales charges and includes the effect of fee waivers and reimbursements. Total return may reflect adjustments to conform to U.S. GAAP. Total return for a period of less than one year is not annualized. |
| | (c) | Does not include expenses of the investment companies in which the Fund invests. |
| | (d) | Annualized, unless otherwise noted. |
| | (e) | Certain expenses incurred by the Fund were not annualized. |
| | (f) | See Note 6 in the Notes to Financial Statements. |
| | | | | | | | |
| See accompanying Notes to Financial Statements | | | March 31, 2020 | | | Semiannual Report | | | 237 | |
Financial Highlights (cont’d)
For a Share Outstanding for the Period ended:^
| | | | | | | | | | | | | | | | | | | | | | | | | | | | |
| | | Net Asset
Value,
Beginning of
Period | | | Net
Investment
Income
(Loss) (a) | | |
Net Realized
and Change
in Unrealized
Gain (Loss) | | | Total from
Investment
Operations | | | Dividends
from Net
Investment
Income | | | Distributions
from Net
Realized Capital
Gains | | | | |
| AllianzGI Retirement 2030: | | | | | | | | | | | | | | | | | | | | | |
| Class A | | | | | | | | | | | | | | | | | | | | | | | | | | | | |
3/31/2020† | | $ | 20.82 | | | $ | 0.69 | | | $ | (1.88 | ) | | $ | (1.19 | ) | | $ | (1.05 | ) | | $ | (2.46 | ) | | | | |
9/30/2019 | | | 22.47 | | | | 0.39 | | | | (0.60 | ) | | | (0.21 | ) | | | (0.47 | ) | | | (0.97 | ) | | | | |
9/30/2018 | | | 22.48 | | | | 0.35 | | | | 0.85 | | | | 1.20 | | | | (0.89 | ) | | | (0.32 | ) | | | | |
9/30/2017 | | | 20.14 | | | | 0.07 | | | | 2.70 | | | | 2.77 | | | | (0.35 | ) | | | (0.08 | ) | | | | |
9/30/2016 | | | 18.84 | | | | 0.44 | | | | 1.39 | | | | 1.83 | | | | (0.53 | ) | | | — | | | | | |
12/1/2014 - 9/30/2015# | | | 21.05 | | | | 0.50 | | | | (1.75 | ) | | | (1.25 | ) | | | (0.69 | ) | | | (0.27 | ) | | | | |
11/30/2014 | | | 20.66 | | | | 0.48 | | | | 0.38 | | | | 0.86 | | | | (0.47 | ) | | | — | | | | | |
| Class C | | | | | | | | | | | | | | | | | | | | | | | | | | | | |
3/31/2020† | | $ | 20.56 | | | $ | 0.58 | | | $ | (1.84 | ) | | $ | (1.26 | ) | | $ | (0.89 | ) | | $ | (2.46 | ) | | | | |
9/30/2019 | | | 22.15 | | | | 0.21 | | | | (0.56 | ) | | | (0.35 | ) | | | (0.27 | ) | | | (0.97 | ) | | | | |
9/30/2018 | | | 22.17 | | | | 0.15 | | | | 0.87 | | | | 1.02 | | | | (0.72 | ) | | | (0.32 | ) | | | | |
9/30/2017 | | | 19.96 | | | | (0.09 | ) | | | 2.66 | | | | 2.57 | | | | (0.28 | ) | | | (0.08 | ) | | | | |
9/30/2016 | | | 18.70 | | | | 0.27 | | | | 1.41 | | | | 1.68 | | | | (0.42 | ) | | | — | | | | | |
12/1/2014 - 9/30/2015# | | | 20.83 | | | | 0.36 | | | | (1.72 | ) | | | (1.36 | ) | | | (0.50 | ) | | | (0.27 | ) | | | | |
11/30/2014 | | | 20.42 | | | | 0.33 | | | | 0.36 | | | | 0.69 | | | | (0.28 | ) | | | — | | | | | |
| Class R | | | | | | | | | | | | | | | | | | | | | | | | | | | | |
3/31/2020† | | $ | 20.80 | | | $ | 0.60 | | | $ | (1.84 | ) | | $ | (1.24 | ) | | $ | (0.89 | ) | | $ | (2.46 | ) | | | | |
9/30/2019 | | | 22.41 | | | | 0.54 | | | | (0.82 | ) | | | (0.28 | ) | | | (0.36 | ) | | | (0.97 | ) | | | | |
9/30/2018 | | | 22.35 | | | | 0.30 | | | | 0.81 | | | | 1.11 | | | | (0.73 | ) | | | (0.32 | ) | | | | |
9/30/2017 | | | 20.11 | | | | 0.15 | | | | 2.54 | | | | 2.69 | | | | (0.37 | ) | | | (0.08 | ) | | | | |
9/30/2016 | | | 18.89 | | | | 0.36 | | | | 1.40 | | | | 1.76 | | | | (0.54 | ) | | | — | | | | | |
12/1/2014 - 9/30/2015# | | | 21.07 | | | | 0.42 | | | | (1.72 | ) | | | (1.30 | ) | | | (0.61 | ) | | | (0.27 | ) | | | | |
11/30/2014 | | | 20.65 | | | | 0.41 | | | | 0.37 | | | | 0.78 | | | | (0.36 | ) | | | — | | | | | |
| Class P | | | | | | | | | | | | | | | | | | | | | | | | | | | | |
3/31/2020† | | $ | 21.05 | | | $ | 0.48 | | | $ | (1.66 | ) | | $ | (1.18 | ) | | $ | (1.05 | ) | | $ | (2.46 | ) | | | | |
9/30/2019 | | | 22.73 | | | | 0.46 | | | | (0.62 | ) | | | (0.16 | ) | | | (0.55 | ) | | | (0.97 | ) | | | | |
9/30/2018 | | | 22.72 | | | | 0.43 | | | | 0.85 | | | | 1.28 | | | | (0.95 | ) | | | (0.32 | ) | | | | |
9/30/2017 | | | 20.43 | | | | 0.15 | | | | 2.71 | | | | 2.86 | | | | (0.49 | ) | | | (0.08 | ) | | | | |
9/30/2016 | | | 19.14 | | | | 0.48 | | | | 1.44 | | | | 1.92 | | | | (0.63 | ) | | | — | | | | | |
12/1/2014 - 9/30/2015# | | | 21.37 | | | | 0.47 | | | | (1.69 | ) | | | (1.22 | ) | | | (0.74 | ) | | | (0.27 | ) | | | | |
11/30/2014 | | | 20.93 | | | | 0.51 | | | | 0.43 | | | | 0.94 | | | | (0.50 | ) | | | — | | | | | |
| Class R6 | | | | | | | | | | | | | | | | | | | | | | | | | | | | |
3/31/2020† | | $ | 21.15 | | | $ | 0.69 | | | $ | (1.85 | ) | | $ | (1.16 | ) | | $ | (1.13 | ) | | $ | (2.46 | ) | | | | |
9/30/2019 | | | 22.81 | | | | 0.48 | | | | (0.62 | ) | | | (0.14 | ) | | | (0.55 | ) | | | (0.97 | ) | | | | |
9/30/2018 | | | 22.78 | | | | 0.44 | | | | 0.87 | | | | 1.31 | | | | (0.96 | ) | | | (0.32 | ) | | | | |
9/30/2017 | | | 20.48 | | | | 0.15 | | | | 2.73 | | | | 2.88 | | | | (0.50 | ) | | | (0.08 | ) | | | | |
9/30/2016 | | | 19.19 | | | | 0.50 | | | | 1.44 | | | | 1.94 | | | | (0.65 | ) | | | — | | | | | |
12/1/2014 - 9/30/2015# | | | 21.42 | | | | 0.54 | | | | (1.74 | ) | | | (1.20 | ) | | | (0.76 | ) | | | (0.27 | ) | | | | |
11/30/2014 | | | 20.98 | | | | 0.59 | | | | 0.36 | | | | 0.95 | | | | (0.51 | ) | | | — | | | | | |
| Administrative Class | | | | | | | | | | | | | | | | | | | | | | | | | | | | |
3/31/2020† | | $ | 21.08 | | | $ | 0.66 | | | $ | (1.86 | ) | | $ | (1.20 | ) | | $ | (1.04 | ) | | $ | (2.46 | ) | | | | |
9/30/2019 | | | 22.76 | | | | 0.64 | | | | (0.85 | ) | | | (0.21 | ) | | | (0.50 | ) | | | (0.97 | ) | | | | |
9/30/2018 | | | 22.66 | | | | 0.33 | | | | 0.90 | | | | 1.23 | | | | (0.81 | ) | | | (0.32 | ) | | | | |
9/30/2017 | | | 20.34 | | | | 0.09 | | | | 2.72 | | | | 2.81 | | | | (0.41 | ) | | | (0.08 | ) | | | | |
9/30/2016 | | | 19.06 | | | | 0.45 | | | | 1.41 | | | | 1.86 | | | | (0.58 | ) | | | — | | | | | |
12/1/2014 - 9/30/2015# | | | 21.28 | | | | 1.21 | | | | (2.47 | ) | | | (1.26 | ) | | | (0.69 | ) | | | (0.27 | ) | | | | |
11/30/2014 | | | 20.87 | | | | 0.50 | | | | 0.38 | | | | 0.88 | | | | (0.47 | ) | | | — | | | | | |
| ^ | A “—” may reflect actual amounts rounding to less than $0.01 or 0.01%. |
| # | Fiscal year end changed from November 30th to September 30th. |
| (a) | Calculated on average shares outstanding during the period. |
| | | | | | |
| 238 | | Semiannual Report | | | March 31, 2020 | | | See accompanying Notes to Financial Statements |
| | | | | | | | | | | | | | | | | | | | | | | | | | | | | | | | | | |
| | | | Total
Dividends and
Distributions | | | Net Asset
Value, End
of Period | | | Total Return (b) | | | Net Assets,
End of Period
(000s) | | | Ratio of
Expenses to
Average Net
Assets with
Fee Waiver/
Reimbursement (c) | | | Ratio of
Expenses to
Average Net
Assets without
Fee Waiver/
Reimbursement (c) | | | Ratio of Net
Investment
Income (Loss)
to Average
Net Assets (c) | | | Portfolio
Turnover Rate | |
| | | | | | | | | | | | | | | | | | | | | | | | | | |
| | | | | | | | | | | | | | | | | | | | | | | | | | | | | | | | | | |
| | | | | $ | (3.51 | ) | | $ | 16.12 | | | | (8.04 | )% | | $ | 4,652 | | | | 0.29 | %(d) | | | 0.60 | %(d) | | | 7.10 | %(d) | | | 24 | % |
| | | | | | (1.44 | ) | | | 20.82 | | | | (0.19 | ) | | | 5,706 | | | | 0.34 | | | | 0.60 | | | | 1.90 | | | | 21 | |
| | | | | | (1.21 | ) | | | 22.47 | | | | 5.40 | | | | 6,521 | | | | 0.32 | | | | 0.60 | | | | 1.58 | | | | 16 | |
| | | | | | (0.43 | ) | | | 22.48 | | | | 14.04 | | | | 9,633 | | | | 0.33 | | | | 0.60 | | | | 0.32 | | | | 125 | |
| | | | | | (0.53 | ) | | | 20.14 | | | | 9.91 | | | | 7,473 | | | | 0.47 | | | | 0.60 | | | | 2.26 | | | | 105 | |
| | | | | | (0.96 | ) | | | 18.84 | | | | (6.16 | ) | | | 22,695 | | | | 0.42 | (d)(e) | | | 0.62 | (d)(e) | | | 3.01 | (d)(e) | | | 147 | |
| | | | | | (0.47 | ) | | | 21.05 | | | | 4.26 | | | | 25,487 | | | | 0.39 | | | | 0.60 | | | | 2.28 | | | | 93 | |
| | | | | | | | | | | | | | | | | | | | | | | | | | | | | | | | | | |
| | | | | $ | (3.35 | ) | | $ | 15.95 | | | | (8.37 | )% | | $ | 518 | | | | 1.04 | %(d) | | | 1.35 | %(d) | | | 5.97 | %(d) | | | 24 | % |
| | | | | | (1.24 | ) | | | 20.56 | | | | (0.95 | ) | | | 602 | | | | 1.09 | | | | 1.35 | | | | 1.04 | | | | 21 | |
| | | | | | (1.04 | ) | | | 22.15 | | | | 4.64 | | | | 865 | | | | 1.07 | | | | 1.35 | | | | 0.69 | | | | 16 | |
| | | | | | (0.36 | ) | | | 22.17 | | | | 13.11 | | | | 790 | | | | 1.08 | | | | 1.35 | | | | (0.42 | ) | | | 125 | |
| | | | | | (0.42 | ) | | | 19.96 | | | | 9.11 | | | | 696 | | | | 1.22 | | | | 1.35 | | | | 1.44 | | | | 105 | |
| | | | | | (0.77 | ) | | | 18.70 | | | | (6.72 | ) | | | 608 | | | | 1.17 | (d)(e) | | | 1.37 | (d)(e) | | | 2.19 | (d)(e) | | | 147 | |
| | | | | | (0.28 | ) | | | 20.83 | | | | 3.43 | | | | 680 | | | | 1.14 | | | | 1.35 | | | | 1.59 | | | | 93 | |
| | | | | | | | | | | | | | | | | | | | | | | | | | | | | | | | | | |
| | | | | $ | (3.35 | ) | | $ | 16.21 | | | | (8.17 | )% | | $ | 78 | | | | 0.64 | %(d) | | | 0.85 | %(d) | | | 6.18 | %(d) | | | 24 | % |
| | | | | | (1.33 | ) | | | 20.80 | | | | (0.60 | ) | | | 78 | | | | 0.69 | | | | 0.85 | | | | 2.62 | | | | 21 | |
| | | | | | (1.05 | ) | | | 22.41 | | | | 5.03 | | | | 295 | | | | 0.67 | | | | 0.85 | | | | 1.36 | | | | 16 | |
| | | | | | (0.45 | ) | | | 22.35 | | | | 13.64 | | | | 500 | | | | 0.68 | | | | 0.86 | | | | 0.73 | | | | 125 | |
| | | | | | (0.54 | ) | | | 20.11 | | | | 9.48 | | | | 2,295 | | | | 0.82 | | | | 0.85 | | | | 1.87 | | | | 105 | |
| | | | | | (0.88 | ) | | | 18.89 | | | | (6.38 | ) | | | 1,445 | | | | 0.77 | (d)(e) | | | 0.87 | (d)(e) | | | 2.49 | (d)(e) | | | 147 | |
| | | | | | (0.36 | ) | | | 21.07 | | | | 3.85 | | | | 1,420 | | | | 0.74 | | | | 0.85 | | | | 1.94 | | | | 93 | |
| | | | | | | | | | | | | | | | | | | | | | | | | | | | | | | | | | |
| | | | | $ | (3.51 | ) | | $ | 16.36 | | | | (7.88 | )% | | $ | 1,742 | | | | — | %(d)(f) | | | 0.20 | %(d) | | | 4.72 | %(d) | | | 24 | % |
| | | | | | (1.52 | ) | | | 21.05 | | | | 0.09 | | | | 8,489 | | | | 0.04 | | | | 0.20 | | | | 2.22 | | | | 21 | |
| | | | | | (1.27 | ) | | | 22.73 | | | | 5.72 | | | | 27,035 | | | | 0.02 | | | | 0.20 | | | | 1.88 | | | | 16 | |
| | | | | | (0.57 | ) | | | 22.72 | | | | 14.34 | | | | 36,184 | | | | 0.03 | | | | 0.20 | | | | 0.70 | | | | 125 | |
| | | | | | (0.63 | ) | | | 20.43 | | | | 10.25 | | | | 33,628 | | | | 0.17 | | | | 0.20 | | | | 2.49 | | | | 105 | |
| | | | | | (1.01 | ) | | | 19.14 | | | | (5.91 | ) | | | 28,597 | | | | 0.12 | (d)(e) | | | 0.22 | (d)(e) | | | 2.80 | (d)(e) | | | 147 | |
| | | | | | (0.50 | ) | | | 21.37 | | | | 4.58 | | | | 17,741 | | | | 0.09 | | | | 0.20 | | | | 2.42 | | | | 93 | |
| | | | | | | | | | | | | | | | | | | | | | | | | | | | | | | | | | |
| | | | | $ | (3.59 | ) | | $ | 16.40 | | | | (7.82 | )% | | $ | 15,423 | | | | — | %(d)(f) | | | 0.10 | %(d) | | | 6.98 | %(d) | | | 24 | % |
| | | | | | (1.52 | ) | | | 21.15 | | | | 0.20 | | | | 20,340 | | | | — | (f) | | | 0.10 | | | | 2.28 | | | | 21 | |
| | | | | | (1.28 | ) | | | 22.81 | | | | 5.83 | | | | 25,140 | | | | — | (f) | | | 0.10 | | | | 1.92 | | | | 16 | |
| | | | | | (0.58 | ) | | | 22.78 | | | | 14.44 | | | | 24,904 | | | | — | (f) | | | 0.10 | | | | 0.69 | | | | 125 | |
| | | | | | (0.65 | ) | | | 20.48 | | | | 10.34 | | | | 16,758 | | | | 0.07 | | | | 0.10 | | | | 2.54 | | | | 105 | |
| | | | | | (1.03 | ) | | | 19.19 | | | | (5.81 | ) | | | 12,883 | | | | 0.02 | (d)(e) | | | 0.12 | (d)(e) | | | 3.19 | (d)(e) | | | 147 | |
| | | | | | (0.51 | ) | | | 21.42 | | | | 4.63 | | | | 8,752 | | | | — | (f) | | | 0.10 | | | | 2.79 | | | | 93 | |
| | | | | | | | | | | | | | | | | | | | | | | | | | | | | | | | | | |
| | | | | $ | (3.50 | ) | | $ | 16.38 | | | | (7.97 | )% | | $ | 151 | | | | 0.24 | %(d) | | | 0.45 | %(d) | | | 6.70 | %(d) | | | 24 | % |
| | | | | | (1.47 | ) | | | 21.08 | | | | (0.18 | ) | | | 160 | | | | 0.29 | | | | 0.45 | | | | 3.04 | | | | 21 | |
| | | | | | (1.13 | ) | | | 22.76 | | | | 5.48 | | | | 486 | | | | 0.27 | | | | 0.45 | | | | 1.44 | | | | 16 | |
| | | | | | (0.49 | ) | | | 22.66 | | | | 14.09 | | | | 1,392 | | | | 0.28 | | | | 0.45 | | | | 0.44 | | | | 125 | |
| | | | | | (0.58 | ) | | | 20.34 | | | | 9.96 | | | | 1,250 | | | | 0.42 | | | | 0.45 | | | | 2.33 | | | | 105 | |
| | | | | | (0.96 | ) | | | 19.06 | | | | (6.11 | ) | | | 1,817 | | | | 0.36 | (d)(e) | | | 0.46 | (d)(e) | | | 7.07 | (d)(e) | | | 147 | |
| | | | | | (0.47 | ) | | | 21.28 | | | | 4.29 | | | | 9,586 | | | | 0.34 | | | | 0.45 | | | | 2.37 | | | | 93 | |
| | (b) | Total return is calculated assuming a purchase of a share on the first day of the period and a sale of a share on the last day of each period reported. Dividends and distributions, if any, are assumed, for purposes of this calculation, to be reinvested. Total return does not reflect sales charges and includes the effect of fee waivers and reimbursements. Total return may reflect adjustments to conform to U.S. GAAP. Total return for a period of less than one year is not annualized. |
| | (c) | Does not include expenses of the investment companies in which the Fund invests. |
| | (d) | Annualized, unless otherwise noted. |
| | (e) | Certain expenses incurred by the Fund were not annualized. |
| | (f) | See Note 6 in the Notes to Financial Statements. |
| | | | | | | | |
| See accompanying Notes to Financial Statements | | | March 31, 2020 | | | Semiannual Report | | | 239 | |
Financial Highlights (cont’d)
For a Share Outstanding for the Period ended:^
| | | | | | | | | | | | | | | | | | | | | | | | | | | | |
| | | Net Asset
Value,
Beginning of
Period | | | Net
Investment
Income (a) | | |
Net Realized
and Change
in Unrealized
Gain (Loss) | | | Total from
Investment
Operations | | | Dividends
from Net
Investment
Income | | | Distributions
from Net
Realized Capital
Gains | | | | |
| AllianzGI Retirement 2035: | | | | | | | | | | | | | | | | | | | | | |
| Class A | | | | | | | | | | | | | | | | | | | | | | | | | | | | |
3/31/2020† | | $ | 17.90 | | | $ | 0.49 | | | $ | (1.74 | ) | | $ | (1.25 | ) | | $ | (0.69 | ) | | $ | (1.84 | ) | | | | |
9/30/2019 | | | 20.10 | | | | 0.35 | | | | (0.78 | ) | | | (0.43 | ) | | | (0.48 | ) | | | (1.29 | ) | | | | |
9/30/2018 | | | 20.05 | | | | 0.36 | | | | 0.88 | | | | 1.24 | | | | (0.94 | ) | | | (0.25 | ) | | | | |
9/30/2017 | | | 17.69 | | | | 0.12 | | | | 2.67 | | | | 2.79 | | | | (0.34 | ) | | | (0.09 | ) | | | | |
9/30/2016 | | | 16.52 | | | | 0.28 | | | | 1.32 | | | | 1.60 | | | | (0.43 | ) | | | — | | | | | |
12/1/2014 - 9/30/2015# | | | 18.49 | | | | 0.43 | | | | (1.58 | ) | | | (1.15 | ) | | | (0.61 | ) | | | (0.21 | ) | | | | |
11/30/2014 | | | 18.09 | | | | 0.41 | | | | 0.39 | | | | 0.80 | | | | (0.40 | ) | | | — | | | | | |
| Class R | | | | | | | | | | | | | | | | | | | | | | | | | | | | |
3/31/2020† | | $ | 17.79 | | | $ | 0.43 | | | $ | (1.70 | ) | | $ | (1.27 | ) | | $ | (0.63 | ) | | $ | (1.84 | ) | | | | |
9/30/2019 | | | 19.99 | | | | 0.51 | | | | (1.00 | ) | | | (0.49 | ) | | | (0.42 | ) | | | (1.29 | ) | | | | |
9/30/2018 | | | 19.92 | | | | 0.28 | | | | 0.88 | | | | 1.16 | | | | (0.84 | ) | | | (0.25 | ) | | | | |
9/30/2017 | | | 17.62 | | | | 0.17 | | | | 2.55 | | | | 2.72 | | | | (0.33 | ) | | | (0.09 | ) | | | | |
9/30/2016 | | | 16.48 | | | | 0.22 | | | | 1.31 | | | | 1.53 | | | | (0.39 | ) | | | — | | | | | |
12/1/2014 - 9/30/2015# | | | 18.43 | | | | 0.30 | | | | (1.50 | ) | | | (1.20 | ) | | | (0.54 | ) | | | (0.21 | ) | | | | |
11/30/2014 | | | 18.00 | | | | 0.35 | | | | 0.38 | | | | 0.73 | | | | (0.30 | ) | | | — | | | | | |
| Class P | | | | | | | | | | | | | | | | | | | | | | | | | | | | |
3/31/2020† | | $ | 17.99 | | | $ | 0.26 | | | $ | (1.51 | ) | | $ | (1.25 | ) | | $ | (0.52 | ) | | $ | (1.84 | ) | | | | |
9/30/2019 | | | 20.22 | | | | 0.41 | | | | (0.79 | ) | | | (0.38 | ) | | | (0.56 | ) | | | (1.29 | ) | | | | |
9/30/2018 | | | 20.16 | | | | 0.45 | | | | 0.86 | | | | 1.31 | | | | (1.00 | ) | | | (0.25 | ) | | | | |
9/30/2017 | | | 17.82 | | | | 0.17 | | | | 2.70 | | | | 2.87 | | | | (0.44 | ) | | | (0.09 | ) | | | | |
9/30/2016 | | | 16.67 | | | | 0.33 | | | | 1.33 | | | | 1.66 | | | | (0.51 | ) | | | — | | | | | |
12/1/2014 - 9/30/2015# | | | 18.65 | | | | 0.38 | | | | (1.50 | ) | | | (1.12 | ) | | | (0.65 | ) | | | (0.21 | ) | | | | |
11/30/2014 | | | 18.20 | | | | 0.43 | | | | 0.43 | | | | 0.86 | | | | (0.41 | ) | | | — | | | | | |
| Class R6 | | | | | | | | | | | | | | | | | | | | | | | | | | | | |
3/31/2020† | | $ | 18.02 | | | $ | 0.51 | | | $ | (1.73 | ) | | $ | (1.22 | ) | | $ | (0.77 | ) | | $ | (1.84 | ) | | | | |
9/30/2019 | | | 20.26 | | | | 0.40 | | | | (0.77 | ) | | | (0.37 | ) | | | (0.58 | ) | | | (1.29 | ) | | | | |
9/30/2018 | | | 20.20 | | | | 0.44 | | | | 0.89 | | | | 1.33 | | | | (1.02 | ) | | | (0.25 | ) | | | | |
9/30/2017 | | | 17.86 | | | | 0.16 | | | | 2.73 | | | | 2.89 | | | | (0.46 | ) | | | (0.09 | ) | | | | |
9/30/2016 | | | 16.70 | | | | 0.33 | | | | 1.35 | | | | 1.68 | | | | (0.52 | ) | | | — | | | | | |
12/1/2014 - 9/30/2015# | | | 18.68 | | | | 0.48 | | | | (1.58 | ) | | | (1.10 | ) | | | (0.67 | ) | | | (0.21 | ) | | | | |
11/30/2014 | | | 18.23 | | | | 0.49 | | | | 0.38 | | | | 0.87 | | | | (0.42 | ) | | | — | | | | | |
| Administrative Class | | | | | | | | | | | | | | | | | | | | | | | | | | | | |
3/31/2020† | | $ | 18.04 | | | $ | 0.50 | | | $ | (1.75 | ) | | $ | (1.25 | ) | | $ | (0.70 | ) | | $ | (1.84 | ) | | | | |
9/30/2019 | | | 20.27 | | | | 0.52 | | | | (0.94 | ) | | | (0.42 | ) | | | (0.52 | ) | | | (1.29 | ) | | | | |
9/30/2018 | | | 20.11 | | | | 0.26 | | | | 0.98 | | | | 1.24 | | | | (0.83 | ) | | | (0.25 | ) | | | | |
9/30/2017 | | | 17.77 | | | | 0.11 | | | | 2.70 | | | | 2.81 | | | | (0.38 | ) | | | (0.09 | ) | | | | |
9/30/2016 | | | 16.60 | | | | 0.29 | | | | 1.33 | | | | 1.62 | | | | (0.45 | ) | | | — | | | | | |
12/1/2014 - 9/30/2015# | | | 18.58 | | | | 1.63 | | | | (2.79 | ) | | | (1.16 | ) | | | (0.61 | ) | | | (0.21 | ) | | | | |
11/30/2014 | | | 18.15 | | | | 0.43 | | | | 0.39 | | | | 0.82 | | | | (0.39 | ) | | | — | | | | | |
| ^ | A “—” may reflect actual amounts rounding to less than $0.01 or 0.01%. |
| # | Fiscal year end changed from November 30th to September 30th. |
| (a) | Calculated on average shares outstanding during the period. |
| | | | | | |
| 240 | | Semiannual Report | | | March 31, 2020 | | | See accompanying Notes to Financial Statements |
| | | | | | | | | | | | | | | | | | | | | | | | | | | | | | | | | | |
| | | | Total
Dividends and
Distributions | | | Net Asset
Value, End
of Period | | | Total Return (b) | | | Net Assets,
End of Period
(000s) | | | Ratio of
Expenses to
Average Net
Assets with
Fee Waiver/
Reimbursement (c) | | | Ratio of
Expenses to
Average Net
Assets without
Fee Waiver/
Reimbursement (c) | | | Ratio of Net
Investment
Income to
Average
Net Assets (c) | | | Portfolio
Turnover Rate | |
| | | | | | | | | | | | | | | | | | | | | | | | | | |
| | | | | | | | | | | | | | | | | | | | | | | | | | | | | | | | | | |
| | | | | $ | (2.53 | ) | | $ | 14.12 | | | | (9.16 | )% | | $ | 4,212 | | | | 0.32 | %(d) | | | 0.60 | %(d) | | | 5.68 | %(d) | | | 33 | % |
| | | | | | (1.77 | ) | | | 17.90 | | | | (1.06 | ) | | | 5,083 | | | | 0.41 | | | | 0.60 | | | | 1.95 | | | | 36 | |
| | | | | | (1.19 | ) | | | 20.10 | | | | 6.27 | | | | 6,258 | | | | 0.39 | | | | 0.60 | | | | 1.81 | | | | 19 | |
| | | | | | (0.43 | ) | | | 20.05 | | | | 16.14 | | | | 8,683 | | | | 0.40 | | | | 0.60 | | | | 0.66 | | | | 122 | |
| | | | | | (0.43 | ) | | | 17.69 | | | | 9.83 | | | | 9,173 | | | | 0.50 | | | | 0.60 | | | | 1.66 | | | | 97 | |
| | | | | | (0.82 | ) | | | 16.52 | | | | (6.46 | ) | | | 19,205 | | | | 0.41 | (d)(e) | | | 0.61 | (d)(e) | | | 2.93 | (d)(e) | | | 138 | |
| | | | | | (0.40 | ) | | | 18.49 | | | | 4.49 | | | | 20,351 | | | | 0.39 | | | | 0.60 | | | | 2.27 | | | | 90 | |
| | | | | | | | | | | | | | | | | | | | | | | | | | | | | | | | | | |
| | | | | $ | (2.47 | ) | | $ | 14.05 | | | | (9.30 | )% | | $ | 247 | | | | 0.67 | %(d) | | | 0.85 | %(d) | | | 5.11 | %(d) | | | 33 | % |
| | | | | | (1.71 | ) | | | 17.79 | | | | (1.41 | ) | | | 266 | | | | 0.76 | | | | 0.85 | | | | 2.83 | | | | 36 | |
| | | | | | (1.09 | ) | | | 19.99 | | | | 5.92 | | | | 614 | | | | 0.74 | | | | 0.85 | | | | 1.44 | | | | 19 | |
| | | | | | (0.42 | ) | | | 19.92 | | | | 15.74 | | | | 672 | | | | 0.75 | | | | 0.86 | | | | 0.92 | | | | 122 | |
| | | | | | (0.39 | ) | | | 17.62 | | | | 9.45 | | | | 1,575 | | | | 0.85 | | | | 0.85 | | | | 1.30 | | | | 97 | |
| | | | | | (0.75 | ) | | | 16.48 | | | | (6.76 | ) | | | 1,600 | | | | 0.76 | (d)(e) | | | 0.87 | (d)(e) | | | 2.07 | (d)(e) | | | 138 | |
| | | | | | (0.30 | ) | | | 18.43 | | | | 4.14 | | | | 1,089 | | | | 0.74 | | | | 0.85 | | | | 1.93 | | | | 90 | |
| | | | | | | | | | | | | | | | | | | | | | | | | | | | | | | | | | |
| | | | | $ | (2.36 | ) | | $ | 14.38 | | | | (9.00 | )% | | $ | 1,097 | | | | 0.02 | %(d) | | | 0.20 | %(d) | | | 2.88 | %(d) | | | 33 | % |
| | | | | | (1.85 | ) | | | 17.99 | | | | (0.74 | ) | | | 6,103 | | | | 0.11 | | | | 0.20 | | | | 2.31 | | | | 36 | |
| | | | | | (1.25 | ) | | | 20.22 | | | | 6.59 | | | | 20,108 | | | | 0.09 | | | | 0.20 | | | | 2.24 | | | | 19 | |
| | | | | | (0.53 | ) | | | 20.16 | | | | 16.52 | | | | 32,371 | | | | 0.10 | | | | 0.20 | | | | 0.93 | | | | 122 | |
| | | | | | (0.51 | ) | | | 17.82 | | | | 10.13 | | | | 29,994 | | | | 0.20 | | | | 0.20 | | | | 1.96 | | | | 97 | |
| | | | | | (0.86 | ) | | | 16.67 | | | | (6.23 | ) | | | 26,729 | | | | 0.11 | (d)(e) | | | 0.21 | (d)(e) | | | 2.58 | (d)(e) | | | 138 | |
| | | | | | (0.41 | ) | | | 18.65 | | | | 4.84 | | | | 14,105 | | | | 0.09 | | | | 0.20 | | | | 2.32 | | | | 90 | |
| | | | | | | | | | | | | | | | | | | | | | | | | | | | | | | | | | |
| | | | | $ | (2.61 | ) | | $ | 14.19 | | | | (8.99 | )% | | $ | 12,987 | | | | — | %(d)(f) | | | 0.10 | %(d) | | | 5.89 | %(d) | | | 33 | % |
| | | | | | (1.87 | ) | | | 18.02 | | | | (0.65 | ) | | | 15,938 | | | | 0.01 | | | | 0.10 | | | | 2.21 | | | | 36 | |
| | | | | | (1.27 | ) | | | 20.26 | | | | 6.68 | | | | 17,113 | | | | — | (f) | | | 0.10 | | | | 2.21 | | | | 19 | |
| | | | | | (0.55 | ) | | | 20.20 | | | | 16.61 | | | | 15,879 | | | | — | (f) | | | 0.10 | | | | 0.86 | | | | 122 | |
| | | | | | (0.52 | ) | | | 17.86 | | | | 10.29 | | | | 9,265 | | | | 0.10 | | | | 0.10 | | | | 1.94 | | | | 97 | |
| | | | | | (0.88 | ) | | | 16.70 | | | | (6.15 | ) | | | 6,172 | | | | — | (d)(e) | | | 0.12 | (d)(e) | | | 3.22 | (d)(e) | | | 138 | |
| | | | | | (0.42 | ) | | | 18.68 | | | | 4.89 | | | | 6,587 | | | | — | (f) | | | 0.10 | | | | 2.66 | | | | 90 | |
| | | | | | | | | | | | | | | | | | | | | | | | | | | | | | | | | | |
| | | | | $ | (2.54 | ) | | $ | 14.25 | | | | (9.14 | )% | | $ | 127 | | | | 0.27 | %(d) | | | 0.45 | %(d) | | | 5.79 | %(d) | | | 33 | % |
| | | | | | (1.81 | ) | | | 18.04 | | | | (0.97 | ) | | | 166 | | | | 0.36 | | | | 0.45 | | | | 2.86 | | | | 36 | |
| | | | | | (1.08 | ) | | | 20.27 | | | | 6.28 | | | | 361 | | | | 0.34 | | | | 0.45 | | | | 1.31 | | | | 19 | |
| | | | | | (0.47 | ) | | | 20.11 | | | | 16.22 | | | | 884 | | | | 0.35 | | | | 0.45 | | | | 0.57 | | | | 122 | |
| | | | | | (0.45 | ) | | | 17.77 | | | | 9.93 | | | | 639 | | | | 0.45 | | | | 0.45 | | | | 1.74 | | | | 97 | |
| | | | | | (0.82 | ) | | | 16.60 | | | | (6.50 | ) | | | 719 | | | | 0.35 | (d)(e) | | | 0.46 | (d)(e) | | | 10.75 | (d)(e) | | | 138 | |
| | | | | | (0.39 | ) | | | 18.58 | | | | 4.60 | | | | 11,550 | | | | 0.34 | | | | 0.45 | | | | 2.33 | | | | 90 | |
| | (b) | Total return is calculated assuming a purchase of a share on the first day of the period and a sale of a share on the last day of each period reported. Dividends and distributions, if any, are assumed, for purposes of this calculation, to be reinvested. Total return does not reflect sales charges and includes the effect of fee waivers and reimbursements. Total return may reflect adjustments to conform to U.S. GAAP. Total return for a period of less than one year is not annualized. |
| | (c) | Does not include expenses of the investment companies in which the Fund invests. |
| | (d) | Annualized, unless otherwise noted. |
| | (e) | Certain expenses incurred by the Fund were not annualized. |
| | (f) | See Note 6 in the Notes to Financial Statements. |
| | | | | | | | |
| See accompanying Notes to Financial Statements | | | March 31, 2020 | | | Semiannual Report | | | 241 | |
Financial Highlights (cont’d)
For a Share Outstanding for the Period ended:^
| | | | | | | | | | | | | | | | | | | | | | | | | | | | |
| | | Net Asset
Value,
Beginning of
Period | | | Net
Investment
Income (a) | | |
Net Realized
and Change
in Unrealized
Gain (Loss) | | | Total from
Investment
Operations | | | Dividends
from Net
Investment
Income | | | Distributions
from Net
Realized Capital
Gains | | | | |
| AllianzGI Retirement 2040: | | | | | | | | | | | | | | | | | | | | | |
| Class A | | | | | | | | | | | | | | | | | | | | | | | | | | | | |
3/31/2020† | | $ | 20.98 | | | $ | 0.52 | | | $ | (2.47 | ) | | $ | (1.95 | ) | | $ | (0.59 | ) | | $ | (1.98 | ) | | | | |
9/30/2019 | | | 23.35 | | | | 0.45 | | | | (1.07 | ) | | | (0.62 | ) | | | (0.55 | ) | | | (1.20 | ) | | | | |
9/30/2018 | | | 23.24 | | | | 0.49 | | | | 1.06 | | | | 1.55 | | | | (1.23 | ) | | | (0.21 | ) | | | | |
9/30/2017 | | | 20.51 | | | | 0.12 | | | | 3.35 | | | | 3.47 | | | | (0.37 | ) | | | (0.37 | ) | | | | |
9/30/2016 | | | 19.04 | | | | 0.27 | | | | 1.61 | | | | 1.88 | | | | (0.38 | ) | | | (0.03 | ) | | | | |
12/1/2014 - 9/30/2015# | | | 21.91 | | | | 0.49 | | | | (1.94 | ) | | | (1.45 | ) | | | (0.83 | ) | | | (0.59 | ) | | | | |
11/30/2014 | | | 21.45 | | | | 0.48 | | | | 0.50 | | | | 0.98 | | | | (0.51 | ) | | | (0.01 | ) | | | | |
| Class C | | | | | | | | | | | | | | | | | | | | | | | | | | | | |
3/31/2020† | | $ | 20.93 | | | $ | 0.41 | | | $ | (2.43 | ) | | $ | (2.02 | ) | | $ | (0.55 | ) | | $ | (1.98 | ) | | | | |
9/30/2019 | | | 23.06 | | | | 0.11 | | | | (0.84 | ) | | | (0.73 | ) | | | (0.20 | ) | | | (1.20 | ) | | | | |
9/30/2018 | | | 22.97 | | | | 0.33 | | | | 1.03 | | | | 1.36 | | | | (1.06 | ) | | | (0.21 | ) | | | | |
9/30/2017 | | | 20.36 | | | | 0.01 | | | | 3.26 | | | | 3.27 | | | | (0.29 | ) | | | (0.37 | ) | | | | |
9/30/2016 | | | 18.94 | | | | 0.19 | | | | 1.54 | | | | 1.73 | | | | (0.28 | ) | | | (0.03 | ) | | | | |
12/1/2014 - 9/30/2015# | | | 21.68 | | | | 0.38 | | | | (1.94 | ) | | | (1.56 | ) | | | (0.59 | ) | | | (0.59 | ) | | | | |
11/30/2014 | | | 21.21 | | | | 0.33 | | | | 0.48 | | | | 0.81 | | | | (0.33 | ) | | | (0.01 | ) | | | | |
| Class R | | | | | | | | | | | | | | | | | | | | | | | | | | | | |
3/31/2020† | | $ | 20.79 | | | $ | 0.49 | | | $ | (2.46 | ) | | $ | (1.97 | ) | | $ | (0.55 | ) | | $ | (1.98 | ) | | | | |
9/30/2019 | | | 23.14 | | | | 0.37 | | | | (1.06 | ) | | | (0.69 | ) | | | (0.46 | ) | | | (1.20 | ) | | | | |
9/30/2018 | | | 22.94 | | | | 0.50 | | | | 0.95 | | | | 1.45 | | | | (1.04 | ) | | | (0.21 | ) | | | | |
9/30/2017 | | | 20.37 | | | | 0.33 | | | | 3.01 | | | | 3.34 | | | | (0.40 | ) | | | (0.37 | ) | | | | |
9/30/2016 | | | 18.97 | | | | 0.18 | | | | 1.63 | | | | 1.81 | | | | (0.38 | ) | | | (0.03 | ) | | | | |
12/1/2014 - 9/30/2015# | | | 21.80 | | | | 0.42 | | | | (1.91 | ) | | | (1.49 | ) | | | (0.75 | ) | | | (0.59 | ) | | | | |
11/30/2014 | | | 21.31 | | | | 0.41 | | | | 0.49 | | | | 0.90 | | | | (0.40 | ) | | | (0.01 | ) | | | | |
| Class P | | | | | | | | | | | | | | | | | | | | | | | | | | | | |
3/31/2020† | | $ | 21.06 | | | $ | 0.28 | | | $ | (2.24 | ) | | $ | (1.96 | ) | | $ | (0.38 | ) | | $ | (1.98 | ) | | | | |
9/30/2019 | | | 23.49 | | | | 0.50 | | | | (1.08 | ) | | | (0.58 | ) | | | (0.65 | ) | | | (1.20 | ) | | | | |
9/30/2018 | | | 23.36 | | | | 0.58 | | | | 1.05 | | | | 1.63 | | | | (1.29 | ) | | | (0.21 | ) | | | | |
9/30/2017 | | | 20.70 | | | | 0.23 | | | | 3.32 | | | | 3.55 | | | | (0.52 | ) | | | (0.37 | ) | | | | |
9/30/2016 | | | 19.26 | | | | 0.32 | | | | 1.65 | | | | 1.97 | | | | (0.50 | ) | | | (0.03 | ) | | | | |
12/1/2014 - 9/30/2015# | | | 22.15 | | | | 0.46 | | | | (1.87 | ) | | | (1.41 | ) | | | (0.89 | ) | | | (0.59 | ) | | | | |
11/30/2014 | | | 21.63 | | | | 0.50 | | | | 0.56 | | | | 1.06 | | | | (0.53 | ) | | | (0.01 | ) | | | | |
| Class R6 | | | | | | | | | | | | | | | | | | | | | | | | | | | | |
3/31/2020† | | $ | 21.11 | | | $ | 0.54 | | | $ | (2.45 | ) | | $ | (1.91 | ) | | $ | (0.70 | ) | | $ | (1.98 | ) | | | | |
9/30/2019 | | | 23.55 | | | | 0.47 | | | | (1.03 | ) | | | (0.56 | ) | | | (0.68 | ) | | | (1.20 | ) | | | | |
9/30/2018 | | | 23.42 | | | | 0.55 | | | | 1.10 | | | | 1.65 | | | | (1.31 | ) | | | (0.21 | ) | | | | |
9/30/2017 | | | 20.75 | | | | 0.21 | | | | 3.37 | | | | 3.58 | | | | (0.54 | ) | | | (0.37 | ) | | | | |
9/30/2016 | | | 19.30 | | | | 0.33 | | | | 1.66 | | | | 1.99 | | | | (0.51 | ) | | | (0.03 | ) | | | | |
12/1/2014 - 9/30/2015# | | | 22.19 | | | | 0.53 | | | | (1.92 | ) | | | (1.39 | ) | | | (0.91 | ) | | | (0.59 | ) | | | | |
11/30/2014 | | | 21.66 | | | | 0.61 | | | | 0.47 | | | | 1.08 | | | | (0.54 | ) | | | (0.01 | ) | | | | |
| Administrative Class | | | | | | | | | | | | | | | | | | | | | | | | | | | | |
3/31/2020† | | $ | 20.92 | | | $ | 0.50 | | | $ | (2.47 | ) | | $ | (1.97 | ) | | $ | (0.48 | ) | | $ | (1.98 | ) | | | | |
9/30/2019 | | | 23.35 | | | | 0.90 | | | | (1.53 | ) | | | (0.63 | ) | | | (0.60 | ) | | | (1.20 | ) | | | | |
9/30/2018 | | | 23.24 | | | | 0.42 | | | | 1.14 | | | | 1.56 | | | | (1.24 | ) | | | (0.21 | ) | | | | |
9/30/2017 | | | 20.57 | | | | 0.16 | | | | 3.32 | | | | 3.48 | | | | (0.44 | ) | | | (0.37 | ) | | | | |
9/30/2016 | | | 19.14 | | | | 0.31 | | | | 1.60 | | | | 1.91 | | | | (0.45 | ) | | | (0.03 | ) | | | | |
12/1/2014 - 9/30/2015# | | | 22.02 | | | | 1.71 | | | | (3.16 | ) | | | (1.45 | ) | | | (0.84 | ) | | | (0.59 | ) | | | | |
11/30/2014 | | | 21.53 | | | | 0.50 | | | | 0.49 | | | | 0.99 | | | | (0.49 | ) | | | (0.01 | ) | | | | |
| ^ | A “—” may reflect actual amounts rounding to less than $0.01 or 0.01%. |
| # | Fiscal year end changed from November 30th to September 30th. |
| (a) | Calculated on average shares outstanding during the period. |
| | | | | | |
| 242 | | Semiannual Report | | | March 31, 2020 | | | See accompanying Notes to Financial Statements |
| | | | | | | | | | | | | | | | | | | | | | | | | | | | | | | | | | |
| | | | Total
Dividends and
Distributions | | | Net Asset
Value, End
of Period | | | Total Return (b) | | | Net Assets,
End of Period
(000s) | | | Ratio of
Expenses to
Average Net
Assets with
Fee Waiver/
Reimbursement (c) | | | Ratio of
Expenses to
Average Net
Assets without
Fee Waiver/
Reimbursement (c) | | | Ratio of Net
Investment
Income to
Average
Net Assets (c) | | | Portfolio
Turnover Rate | |
| | | | | | | | | | | | | | | | | | | | | | | | | | |
| | | | | | | | | | | | | | | | | | | | | | | | | | | | | | | | | | |
| | | | | $ | (2.57 | ) | | $ | 16.46 | | | | (11.54 | )% | | $ | 1,792 | | | | 0.36 | %(d) | | | 0.60 | %(d) | | | 5.09 | %(d) | | | 36 | % |
| | | | | | (1.75 | ) | | | 20.98 | | | | (1.66 | ) | | | 2,171 | | | | 0.46 | | | | 0.60 | | | | 2.16 | | | | 40 | |
| | | | | | (1.44 | ) | | | 23.35 | | | | 6.78 | | | | 3,797 | | | | 0.44 | | | | 0.60 | | | | 2.10 | | | | 18 | |
| | | | | | (0.74 | ) | | | 23.24 | | | | 17.46 | | | | 6,480 | | | | 0.46 | | | | 0.60 | | | | 0.57 | | | | 103 | |
| | | | | | (0.41 | ) | | | 20.51 | | | | 9.99 | | | | 4,106 | | | | 0.51 | | | | 0.60 | | | | 1.36 | | | | 101 | |
| | | | | | (1.42 | ) | | | 19.04 | | | | (6.99 | ) | | | 13,551 | | | | 0.37 | (d)(e) | | | 0.60 | (d)(e) | | | 2.87 | (d)(e) | | | 143 | |
| | | | | | (0.52 | ) | | | 21.91 | | | | 4.65 | | | | 16,631 | | | | 0.38 | | | | 0.60 | | | | 2.22 | | | | 84 | |
| | | | | | | | | | | | | | | | | | | | | | | | | | | | | | | | | | |
| | | | | $ | (2.53 | ) | | $ | 16.38 | | | | (11.88 | )% | | $ | 150 | | | | 1.11 | %(d) | | | 1.35 | %(d) | | | 4.11 | %(d) | | | 36 | % |
| | | | | | (1.40 | ) | | | 20.93 | | | | (2.41 | ) | | | 163 | | | | 1.21 | | | | 1.35 | | | | 0.54 | | | | 40 | |
| | | | | | (1.27 | ) | | | 23.06 | | | | 6.00 | | | | 110 | | | | 1.19 | | | | 1.35 | | | | 1.42 | | | | 18 | |
| | | | | | (0.66 | ) | | | 22.97 | | | | 16.53 | | | | 139 | | | | 1.21 | | | | 1.36 | | | | 0.03 | | | | 103 | |
| | | | | | (0.31 | ) | | | 20.36 | | | | 9.20 | | | | 126 | | | | 1.26 | | | | 1.35 | | | | 0.99 | | | | 101 | |
| | | | | | (1.18 | ) | | | 18.94 | | | | (7.54 | ) | | | 202 | | | | 1.12 | (d)(e) | | | 1.35 | (d)(e) | | | 2.22 | (d)(e) | | | 143 | |
| | | | | | (0.34 | ) | | | 21.68 | | | | 3.90 | | | | 269 | | | | 1.13 | | | | 1.35 | | | | 1.51 | | | | 84 | |
| | | | | | | | | | | | | | | | | | | | | | | | | | | | | | | | | | |
| | | | | $ | (2.53 | ) | | $ | 16.29 | | | | (11.72 | )% | | $ | 86 | | | | 0.71 | %(d) | | | 0.85 | %(d) | | | 4.80 | %(d) | | | 36 | % |
| | | | | | (1.66 | ) | | | 20.79 | | | | (2.02 | ) | | | 167 | | | | 0.81 | | | | 0.85 | | | | 1.80 | | | | 40 | |
| | | | | | (1.25 | ) | | | 23.14 | | | | 6.42 | | | | 237 | | | | 0.79 | | | | 0.85 | | | | 2.16 | | | | 18 | |
| | | | | | (0.77 | ) | | | 22.94 | | | | 16.98 | | | | 416 | | | | 0.81 | | | | 0.86 | | | | 1.55 | | | | 103 | |
| | | | | | (0.41 | ) | | | 20.37 | | | | 9.64 | | | | 1,648 | | | | 0.86 | | | | 0.86 | | | | 0.94 | | | | 101 | |
| | | | | | (1.34 | ) | | | 18.97 | | | | (7.22 | ) | | | 1,272 | | | | 0.72 | (d)(e) | | | 0.85 | (d)(e) | | | 2.48 | (d)(e) | | | 143 | |
| | | | | | (0.41 | ) | | | 21.80 | | | | 4.31 | | | | 1,343 | | | | 0.73 | | | | 0.85 | | | | 1.88 | | | | 84 | |
| | | | | | | | | | | | | | | | | | | | | | | | | | | | | | | | | | |
| | | | | $ | (2.36 | ) | | $ | 16.74 | | | | (11.37 | )% | | $ | 434 | | | | 0.06 | %(d) | | | 0.20 | %(d) | | | 2.70 | %(d) | | | 36 | % |
| | | | | | (1.85 | ) | | | 21.06 | | | | (1.39 | ) | | | 6,115 | | | | 0.16 | | | | 0.20 | | | | 2.38 | | | | 40 | |
| | | | | | (1.50 | ) | | | 23.49 | | | | 7.11 | | | | 17,742 | | | | 0.14 | | | | 0.20 | | | | 2.47 | | | | 18 | |
| | | | | | (0.89 | ) | | | 23.36 | | | | 17.83 | | | | 24,077 | | | | 0.16 | | | | 0.21 | | | | 1.06 | | | | 103 | |
| | | | | | (0.53 | ) | | | 20.70 | | | | 10.36 | | | | 20,628 | | | | 0.21 | | | | 0.21 | | | | 1.61 | | | | 101 | |
| | | | | | (1.48 | ) | | | 19.26 | | | | (6.76 | ) | | | 16,997 | | | | 0.07 | (d)(e) | | | 0.20 | (d)(e) | | | 2.67 | (d)(e) | | | 143 | |
| | | | | | (0.54 | ) | | | 22.15 | | | | 4.99 | | | | 11,734 | | | | 0.08 | | | | 0.20 | | | | 2.27 | | | | 84 | |
| | | | | | | | | | | | | | | | | | | | | | | | | | | | | | | | | | |
| | | | | $ | (2.68 | ) | | $ | 16.52 | | | | (11.36 | )% | | $ | 16,421 | | | | — | %(d)(f) | | | 0.10 | %(d) | | | 5.28 | %(d) | | | 36 | % |
| | | | | | (1.88 | ) | | | 21.11 | | | | (1.29 | ) | | | 22,586 | | | | 0.06 | | | | 0.10 | | | | 2.24 | | | | 40 | |
| | | | | | (1.52 | ) | | | 23.55 | | | | 7.20 | | | | 24,458 | | | | 0.04 | | | | 0.10 | | | | 2.37 | | | | 18 | |
| | | | | | (0.91 | ) | | | 23.42 | | | | 17.95 | | | | 23,705 | | | | 0.06 | | | | 0.10 | | | | 0.98 | | | | 103 | |
| | | | | | (0.54 | ) | | | 20.75 | | | | 10.47 | | | | 15,812 | | | | 0.11 | | | | 0.11 | | | | 1.65 | | | | 101 | |
| | | | | | (1.50 | ) | | | 19.30 | | | | (6.67 | ) | | | 12,053 | | | | — | (d)(e)(f) | | | 0.10 | (d)(e) | | | 3.09 | (d)(e) | | | 143 | |
| | | | | | (0.55 | ) | | | 22.19 | | | | 5.09 | | | | 8,071 | | | | — | (f) | | | 0.10 | | | | 2.78 | | | | 84 | |
| | | | | | | | | | | | | | | | | | | | | | | | | | | | | | | | | | |
| | | | | $ | (2.46 | ) | | $ | 16.49 | | | | (11.56 | )% | | $ | 44 | | | | 0.31 | %(d) | | | 0.45 | %(d) | | | 4.94 | %(d) | | | 36 | % |
| | | | | | (1.80 | ) | | | 20.92 | | | | (1.65 | ) | | | 50 | | | | 0.41 | | | | 0.45 | | | | 4.28 | | | | 40 | |
| | | | | | (1.45 | ) | | | 23.35 | | | | 6.82 | | | | 515 | | | | 0.39 | | | | 0.45 | | | | 1.84 | | | | 18 | |
| | | | | | (0.81 | ) | | | 23.24 | | | | 17.52 | | | | 425 | | | | 0.41 | | | | 0.45 | | | | 0.73 | | | | 103 | |
| | | | | | (0.48 | ) | | | 20.57 | | | | 10.09 | | | | 374 | | | | 0.46 | | | | 0.46 | | | | 1.58 | | | | 101 | |
| | | | | | (1.43 | ) | | | 19.14 | | | | (7.00 | ) | | | 488 | | | | 0.32 | (d)(e) | | | 0.45 | (d)(e) | | | 9.63 | (d)(e) | | | 143 | |
| | | | | | (0.50 | ) | | | 22.02 | | | | 4.72 | | | | 5,278 | | | | 0.33 | | | | 0.45 | | | | 2.31 | | | | 84 | |
| | (b) | Total return is calculated assuming a purchase of a share on the first day of the period and a sale of a share on the last day of each period reported. Dividends and distributions, if any, are assumed, for purposes of this calculation, to be reinvested. Total return does not reflect sales charges and includes the effect of fee waivers and reimbursements. Total return may reflect adjustments to conform to U.S. GAAP. Total return for a period of less than one year is not annualized. |
| | (c) | Does not include expenses of the investment companies in which the Fund invests. |
| | (d) | Annualized, unless otherwise noted. |
| | (e) | Certain expenses incurred by the Fund were not annualized. |
| | (f) | See Note 6 in the Notes to Financial Statements. |
| | | | | | | | |
| See accompanying Notes to Financial Statements | | | March 31, 2020 | | | Semiannual Report | | | 243 | |
Financial Highlights (cont’d)
For a Share Outstanding for the Period ended:^
| | | | | | | | | | | | | | | | | | | | | | | | | | | | |
| | | Net Asset
Value,
Beginning of
Period | | | Net
Investment
Income (a) | | |
Net Realized
and Change
in Unrealized
Gain (Loss) | | | Total from
Investment
Operations | | | Dividends
from Net
Investment
Income | | | Distributions
from Net
Realized Capital
Gains | | | | |
| AllianzGI Retirement 2045: | | | | | | | | | | | | | | | | | | | | | |
| Class A | | | | | | | | | | | | | | | | | | | | | | | | | | | | |
3/31/2020† | | $ | 18.39 | | | $ | 0.40 | | | $ | (2.30 | ) | | $ | (1.90 | ) | | $ | (0.45 | ) | | $ | (1.77 | ) | | | | |
9/30/2019 | | | 20.48 | | | | 0.38 | | | | (1.00 | ) | | | (0.62 | ) | | | (0.46 | ) | | | (1.01 | ) | | | | |
9/30/2018 | | | 20.36 | | | | 0.44 | | | | 0.95 | | | | 1.39 | | | | (1.12 | ) | | | (0.15 | ) | | | | |
9/30/2017 | | | 18.07 | | | | 0.13 | | | | 3.04 | | | | 3.17 | | | | (0.34 | ) | | | (0.54 | ) | | | | |
9/30/2016 | | | 16.71 | | | | 0.20 | | | | 1.54 | | | | 1.74 | | | | (0.34 | ) | | | (0.04 | ) | | | | |
12/1/2014 - 9/30/2015# | | | 19.09 | | | | 0.41 | | | | (1.75 | ) | | | (1.34 | ) | | | (0.70 | ) | | | (0.34 | ) | | | | |
11/30/2014 | | | 18.67 | | | | 0.41 | | | | 0.49 | | | | 0.90 | | | | (0.45 | ) | | | (0.03 | ) | | | | |
| Class R | | | | | | | | | | | | | | | | | | | | | | | | | | | | |
3/31/2020† | | $ | 18.14 | | | $ | 0.36 | | | $ | (2.27 | ) | | $ | (1.91 | ) | | $ | (0.36 | ) | | $ | (1.77 | ) | | | | |
9/30/2019 | | | 20.28 | | | | 0.31 | | | | (1.00 | ) | | | (0.69 | ) | | | (0.44 | ) | | | (1.01 | ) | | | | |
9/30/2018 | | | 20.14 | | | | 0.40 | | | | 0.91 | | | | 1.31 | | | | (1.02 | ) | | | (0.15 | ) | | | | |
9/30/2017 | | | 17.97 | | | | 0.30 | | | | 2.78 | | | | 3.08 | | | | (0.37 | ) | | | (0.54 | ) | | | | |
9/30/2016 | | | 16.65 | | | | 0.13 | | | | 1.55 | | | | 1.68 | | | | (0.32 | ) | | | (0.04 | ) | | | | |
12/1/2014 - 9/30/2015# | | | 19.01 | | | | 0.36 | | | | (1.74 | ) | | | (1.38 | ) | | | (0.64 | ) | | | (0.34 | ) | | | | |
11/30/2014 | | | 18.57 | | | | 0.34 | | | | 0.49 | | | | 0.83 | | | | (0.36 | ) | | | (0.03 | ) | | | | |
| Class P | | | | | | | | | | | | | | | | | | | | | | | | | | | | |
3/31/2020† | | $ | 18.36 | | | $ | 0.09 | | | $ | (2.05 | ) | | $ | (1.96 | ) | | $ | — | | | $ | (1.77 | ) | | | | |
9/30/2019 | | | 20.55 | | | | 0.44 | | | | (1.03 | ) | | | (0.59 | ) | | | (0.59 | ) | | | (1.01 | ) | | | | |
9/30/2018 | | | 20.42 | | | | 0.51 | | | | 0.95 | | | | 1.46 | | | | (1.18 | ) | | | (0.15 | ) | | | | |
9/30/2017 | | | 18.19 | | | | 0.21 | | | | 3.03 | | | | 3.24 | | | | (0.47 | ) | | | (0.54 | ) | | | | |
9/30/2016 | | | 16.84 | | | | 0.26 | | | | 1.56 | | | | 1.82 | | | | (0.43 | ) | | | (0.04 | ) | | | | |
12/1/2014 - 9/30/2015# | | | 19.24 | | | | 0.43 | | | | (1.74 | ) | | | (1.31 | ) | | | (0.75 | ) | | | (0.34 | ) | | | | |
11/30/2014 | | | 18.77 | | | | 0.40 | | | | 0.57 | | | | 0.97 | | | | (0.47 | ) | | | (0.03 | ) | | | | |
| Class R6 | | | | | | | | | | | | | | | | | | | | | | | | | | | | |
3/31/2020† | | $ | 18.43 | | | $ | 0.44 | | | $ | (2.30 | ) | | $ | (1.86 | ) | | $ | (0.52 | ) | | $ | (1.77 | ) | | | | |
9/30/2019 | | | 20.62 | | | | 0.40 | | | | (0.97 | ) | | | (0.57 | ) | | | (0.61 | ) | | | (1.01 | ) | | | | |
9/30/2018 | | | 20.48 | | | | 0.50 | | | | 0.99 | | | | 1.49 | | | | (1.20 | ) | | | (0.15 | ) | | | | |
9/30/2017 | | | 18.25 | | | | 0.19 | | | | 3.07 | | | | 3.26 | | | | (0.49 | ) | | | (0.54 | ) | | | | |
9/30/2016 | | | 16.89 | | | | 0.22 | | | | 1.62 | | | | 1.84 | | | | (0.44 | ) | | | (0.04 | ) | | | | |
12/1/2014 - 9/30/2015# | | | 19.28 | | | | 0.65 | | | | (1.94 | ) | | | (1.29 | ) | | | (0.76 | ) | | | (0.34 | ) | | | | |
11/30/2014 | | | 18.80 | | | | 0.49 | | | | 0.49 | | | | 0.98 | | | | (0.47 | ) | | | (0.03 | ) | | | | |
| Administrative Class | | | | | | | | | | | | | | | | | | | | | | | | | | | | |
3/31/2020† | | $ | 18.24 | | | $ | 0.40 | | | $ | (2.28 | ) | | $ | (1.88 | ) | | $ | (0.45 | ) | | $ | (1.77 | ) | | | | |
9/30/2019 | | | 20.41 | | | | 0.49 | | | | (1.11 | ) | | | (0.62 | ) | | | (0.54 | ) | | | (1.01 | ) | | | | |
9/30/2018 | | | 20.28 | | | | 0.42 | | | | 0.98 | | | | 1.40 | | | | (1.12 | ) | | | (0.15 | ) | | | | |
9/30/2017 | | | 18.10 | | | | 0.16 | | | | 3.01 | | | | 3.17 | | | | (0.45 | ) | | | (0.54 | ) | | | | |
9/30/2016 | | | 16.76 | | | | 0.22 | | | | 1.55 | | | | 1.77 | | | | (0.39 | ) | | | (0.04 | ) | | | | |
12/1/2014 - 9/30/2015# | | | 19.15 | | | | 1.22 | | | | (2.56 | ) | | | (1.34 | ) | | | (0.71 | ) | | | (0.34 | ) | | | | |
11/30/2014 | | | 18.71 | | | | 0.42 | | | | 0.49 | | | | 0.91 | | | | (0.44 | ) | | | (0.03 | ) | | | | |
| ^ | A “—” may reflect actual amounts rounding to less than $0.01 or 0.01%. |
| # | Fiscal year end changed from November 30th to September 30th. |
| (a) | Calculated on average shares outstanding during the period. |
| | | | | | |
| 244 | | Semiannual Report | | | March 31, 2020 | | | See accompanying Notes to Financial Statements |
| | | | | | | | | | | | | | | | | | | | | | | | | | | | | | | | | | |
| | | | Total
Dividends and
Distributions | | | Net Asset
Value, End
of Period | | | Total Return (b) | | | Net Assets,
End of Period
(000s) | | | Ratio of
Expenses to
Average Net
Assets with
Fee Waiver/
Reimbursement (c) | | | Ratio of
Expenses to
Average Net
Assets without
Fee Waiver/
Reimbursement (c) | | | Ratio of Net
Investment
Income to
Average
Net Assets (c) | | | Portfolio
Turnover Rate | |
| | | | | | | | | | | | | | | | | | | | | | | | | | |
| | | | | | | | | | | | | | | | | | | | | | | | | | | | | | | | | | |
| | | | | $ | (2.22 | ) | | $ | 14.27 | | | | (12.71 | )% | | $ | 1,648 | | | | 0.38 | %(d) | | | 0.60 | %(d) | | | 4.51 | %(d) | | | 44 | % |
| | | | | | (1.47 | ) | | | 18.39 | | | | (2.07 | ) | | | 1,750 | | | | 0.49 | | | | 0.60 | | | | 2.07 | | | | 41 | |
| | | | | | (1.27 | ) | | | 20.48 | | | | 6.96 | | | | 2,387 | | | | 0.47 | | | | 0.60 | | | | 2.16 | | | | 22 | |
| | | | | | (0.88 | ) | | | 20.36 | | | | 18.35 | | | | 4,630 | | | | 0.49 | | | | 0.60 | | | | 0.70 | | | | 97 | |
| | | | | | (0.38 | ) | | | 18.07 | | | | 10.55 | | | | 3,753 | | | | 0.51 | | | | 0.60 | | | | 1.17 | | | | 103 | |
| | | | | | (1.04 | ) | | | 16.71 | | | | (7.35 | ) | | | 10,022 | | | | 0.37 | (d)(e) | | | 0.61 | (d)(e) | | | 2.74 | (d)(e) | | | 149 | |
| | | | | | (0.48 | ) | | | 19.09 | | | | 4.89 | | | | 10,080 | | | | 0.37 | | | | 0.60 | | | | 2.17 | | | | 69 | |
| | | | | | | | | | | | | | | | | | | | | | | | | | | | | | | | | | |
| | | | | $ | (2.13 | ) | | $ | 14.10 | | | | (12.89 | )% | | $ | 103 | | | | 0.73 | %(d) | | | 0.85 | %(d) | | | 4.10 | %(d) | | | 44 | % |
| | | | | | (1.45 | ) | | | 18.14 | | | | (2.43 | ) | | | 108 | | | | 0.84 | | | | 0.85 | | | | 1.75 | | | | 41 | |
| | | | | | (1.17 | ) | | | 20.28 | | | | 6.61 | | | | 151 | | | | 0.82 | | | | 0.85 | | | | 1.98 | | | | 22 | |
| | | | | | (0.91 | ) | | | 20.14 | | | | 17.94 | | | | 193 | | | | 0.84 | | | | 0.86 | | | | 1.64 | | | | 97 | |
| | | | | | (0.36 | ) | | | 17.97 | | | | 10.20 | | | | 625 | | | | 0.86 | | | | 0.86 | | | | 0.78 | | | | 103 | |
| | | | | | (0.98 | ) | | | 16.65 | | | | (7.59 | ) | | | 464 | | | | 0.72 | (d)(e) | | | 0.86 | (d)(e) | | | 2.38 | (d)(e) | | | 149 | |
| | | | | | (0.39 | ) | | | 19.01 | | | | 4.52 | | | | 449 | | | | 0.72 | | | | 0.85 | | | | 1.82 | | | | 69 | |
| | | | | | | | | | | | | | | | | | | | | | | | | | | | | | | | | | |
| | | | | $ | (1.77 | ) | | $ | 14.63 | | | | (12.57 | )% | | $ | 601 | | | | 0.08 | %(d) | | | 0.20 | %(d) | | | 0.97 | %(d) | | | 44 | % |
| | | | | | (1.60 | ) | | | 18.36 | | | | (1.80 | ) | | | 4,195 | | | | 0.19 | | | | 0.20 | | | | 2.41 | | | | 41 | |
| | | | | | (1.33 | ) | | | 20.55 | | | | 7.29 | | | | 13,742 | | | | 0.17 | | | | 0.20 | | | | 2.49 | | | | 22 | |
| | | | | | (1.01 | ) | | | 20.42 | | | | 18.74 | | | | 15,458 | | | | 0.19 | | | | 0.21 | | | | 1.10 | | | | 97 | |
| | | | | | (0.47 | ) | | | 18.19 | | | | 10.95 | | | | 12,764 | | | | 0.21 | | | | 0.21 | | | | 1.49 | | | | 103 | |
| | | | | | (1.09 | ) | | | 16.84 | | | | (7.15 | ) | | | 10,650 | | | | 0.07 | (d)(e) | | | 0.21 | (d)(e) | | | 2.88 | (d)(e) | | | 149 | |
| | | | | | (0.50 | ) | | | 19.24 | | | | 5.26 | | | | 8,793 | | | | 0.07 | | | | 0.20 | | | | 2.10 | | | | 69 | |
| | | | | | | | | | | | | | | | | | | | | | | | | | | | | | | | | | |
| | | | | $ | (2.29 | ) | | $ | 14.28 | | | | (12.52 | )% | | $ | 8,634 | | | | — | %(d)(f) | | | 0.10 | %(d) | | | 4.88 | %(d) | | | 44 | % |
| | | | | | (1.62 | ) | | | 18.43 | | | | (1.66 | ) | | | 13,130 | | | | 0.09 | | | | 0.10 | | | | 2.21 | | | | 41 | |
| | | | | | (1.35 | ) | | | 20.62 | | | | 7.42 | | | | 14,205 | | | | 0.07 | | | | 0.10 | | | | 2.44 | | | | 22 | |
| | | | | | (1.03 | ) | | | 20.48 | | | | 18.82 | | | | 12,770 | | | | 0.09 | | | | 0.10 | | | | 1.01 | | | | 97 | |
| | | | | | (0.48 | ) | | | 18.25 | | | | 11.06 | | | | 7,919 | | | | 0.11 | | | | 0.11 | | | | 1.25 | | | | 103 | |
| | | | | | (1.10 | ) | | | 16.89 | | | | (7.02 | ) | | | 3,563 | | | | — | (d)(e)(f) | | | 0.10 | (d)(e) | | | 4.23 | (d)(e) | | | 149 | |
| | | | | | (0.50 | ) | | | 19.28 | | | | 5.33 | | | | 5,477 | | | | — | (f) | | | 0.10 | | | | 2.55 | | | | 69 | |
| | | | | | | | | | | | | | | | | | | | | | | | | | | | | | | | | | |
| | | | | $ | (2.22 | ) | | $ | 14.14 | | | | (12.71 | )% | | $ | 287 | | | | 0.33 | %(d) | | | 0.45 | %(d) | | | 4.55 | %(d) | | | 44 | % |
| | | | | | (1.55 | ) | | | 18.24 | | | | (1.97 | ) | | | 336 | | | | 0.44 | | | | 0.45 | | | | 2.71 | | | | 41 | |
| | | | | | (1.27 | ) | | | 20.41 | | | | 7.02 | | | | 615 | | | | 0.42 | | | | 0.45 | | | | 2.05 | | | | 22 | |
| | | | | | (0.99 | ) | | | 20.28 | | | | 18.40 | | | | 666 | | | | 0.44 | | | | 0.45 | | | | 0.85 | | | | 97 | |
| | | | | | (0.43 | ) | | | 18.10 | | | | 10.67 | | | | 359 | | | | 0.46 | | | | 0.46 | | | | 1.27 | | | | 103 | |
| | | | | | (1.05 | ) | | | 16.76 | | | | (7.37 | ) | | | 346 | | | | 0.32 | (d)(e) | | | 0.46 | (d)(e) | | | 7.95 | (d)(e) | | | 149 | |
| | | | | | (0.47 | ) | | | 19.15 | | | | 4.95 | | | | 1,763 | | | | 0.32 | | | | 0.45 | | | | 2.24 | | | | 69 | |
| | (b) | Total return is calculated assuming a purchase of a share on the first day of the period and a sale of a share on the last day of each period reported. Dividends and distributions, if any, are assumed, for purposes of this calculation, to be reinvested. Total return does not reflect sales charges and includes the effect of fee waivers and reimbursements. Total return may reflect adjustments to conform to U.S. GAAP. Total return for a period of less than one year is not annualized. |
| | (c) | Does not include expenses of the investment companies in which the Fund invests. |
| | (d) | Annualized, unless otherwise noted. |
| | (e) | Certain expenses incurred by the Fund were not annualized. |
| | (f) | See Note 6 in the Notes to Financial Statements. |
| | | | | | | | |
| See accompanying Notes to Financial Statements | | | March 31, 2020 | | | Semiannual Report | | | 245 | |
Financial Highlights (cont’d)
For a Share Outstanding for the Period ended:^
| | | | | | | | | | | | | | | | | | | | | | | | | | | | |
| | | Net Asset
Value,
Beginning of
Period | | | Net
Investment
Income (a) | | | Net Realized
and Change
in Unrealized
Gain (Loss) | | | Total from
Investment
Operations | | |
Dividends
from Net
Investment
Income | | | Distributions
from Net
Realized Capital
Gains | | | | |
| AllianzGI Retirement 2050: | | | | | | | | | | | | | | | | | | | | | |
| Class A | | | | | | | | | | | | | | | | | | | | | | | | | | | | |
3/31/2020† | | $ | 20.42 | | | $ | 0.44 | | | $ | (2.80 | ) | | $ | (2.36 | ) | | $ | (0.30 | ) | | $ | (1.40 | ) | | | | |
9/30/2019 | | | 22.75 | | | | 0.41 | | | | (1.12 | ) | | | (0.71 | ) | | | (0.60 | ) | | | (1.02 | ) | | | | |
9/30/2018 | | | 22.66 | | | | 0.45 | | | | 1.12 | | | | 1.57 | | | | (1.28 | ) | | | (0.20 | ) | | | | |
9/30/2017 | | | 20.10 | | | | 0.09 | | | | 3.46 | | | | 3.55 | | | | (0.44 | ) | | | (0.55 | ) | | | | |
9/30/2016 | | | 18.72 | | | | 0.20 | | | | 1.78 | | | | 1.98 | | | | (0.23 | ) | | | (0.37 | ) | | | | |
12/1/2014 - 9/30/2015# | | | 21.87 | | | | 0.44 | | | | (2.04 | ) | | | (1.60 | ) | | | (0.87 | ) | | | (0.68 | ) | | | | |
11/30/2014 | | | 21.55 | | | | 0.44 | | | | 0.58 | | | | 1.02 | | | | (0.57 | ) | | | (0.13 | ) | | | | |
| Class C | | | | | | | | | | | | | | | | | | | | | | | | | | | | |
3/31/2020† | | $ | 19.97 | | | $ | 0.37 | | | $ | (2.73 | ) | | $ | (2.36 | ) | | $ | (0.35 | ) | | $ | (1.40 | ) | | | | |
9/30/2019 | | | 22.30 | | | | 0.20 | | | | (1.04 | ) | | | (0.84 | ) | | | (0.47 | ) | | | (1.02 | ) | | | | |
9/30/2018 | | | 22.25 | | | | 0.30 | | | | 1.08 | | | | 1.38 | | | | (1.13 | ) | | | (0.20 | ) | | | | |
9/30/2017 | | | 19.80 | | | | 0.01 | | | | 3.33 | | | | 3.34 | | | | (0.34 | ) | | | (0.55 | ) | | | | |
9/30/2016 | | | 18.52 | | | | 0.11 | | | | 1.71 | | | | 1.82 | | | | (0.17 | ) | | | (0.37 | ) | | | | |
12/1/2014 - 9/30/2015# | | | 21.62 | | | | 0.31 | | | | (2.03 | ) | | | (1.72 | ) | | | (0.70 | ) | | | (0.68 | ) | | | | |
11/30/2014 | | | 21.34 | | | | 0.30 | | | | 0.55 | | | | 0.85 | | | | (0.44 | ) | | | (0.13 | ) | | | | |
| Class R | | | | | | | | | | | | | | | | | | | | | | | | | | | | |
3/31/2020† | | $ | 20.37 | | | $ | 0.54 | | | $ | (2.92 | ) | | $ | (2.38 | ) | | $ | (0.32 | ) | | $ | (1.40 | ) | | | | |
9/30/2019 | | | 22.72 | | | | 0.31 | | | | (1.09 | ) | | | (0.78 | ) | | | (0.55 | ) | | | (1.02 | ) | | | | |
9/30/2018 | | | 22.46 | | | | 0.31 | | | | 1.17 | | | | 1.48 | | | | (1.02 | ) | | | (0.20 | ) | | | | |
9/30/2017 | | | 19.99 | | | | 0.44 | | | | 3.00 | | | | 3.44 | | | | (0.42 | ) | | | (0.55 | ) | | | | |
9/30/2016 | | | 18.68 | | | | 0.15 | | | | 1.76 | | | | 1.91 | | | | (0.23 | ) | | | (0.37 | ) | | | | |
12/1/2014 - 9/30/2015# | | | 21.80 | | | | 0.37 | | | | (2.03 | ) | | | (1.66 | ) | | | (0.78 | ) | | | (0.68 | ) | | | | |
11/30/2014 | | | 21.46 | | | | 0.39 | | | | 0.53 | | | | 0.92 | | | | (0.45 | ) | | | (0.13 | ) | | | | |
| Class P | | | | | | | | | | | | | | | | | | | | | | | | | | | | |
3/31/2020† | | $ | 20.59 | | | $ | 0.25 | | | $ | (2.65 | ) | | $ | (2.40 | ) | | $ | (0.08 | ) | | $ | (1.40 | ) | | | | |
9/30/2019 | | | 22.96 | | | | 0.48 | | | | (1.15 | ) | | | (0.67 | ) | | | (0.68 | ) | | | (1.02 | ) | | | | |
9/30/2018 | | | 22.86 | | | | 0.57 | | | | 1.09 | | | | 1.66 | | | | (1.36 | ) | | | (0.20 | ) | | | | |
9/30/2017 | | | 20.31 | | | | 0.25 | | | | 3.39 | | | | 3.64 | | | | (0.54 | ) | | | (0.55 | ) | | | | |
9/30/2016 | | | 18.97 | | | | 0.27 | | | | 1.80 | | | | 2.07 | | | | (0.36 | ) | | | (0.37 | ) | | | | |
12/1/2014 - 9/30/2015# | | | 22.14 | | | | 0.47 | | | | (2.04 | ) | | | (1.57 | ) | | | (0.92 | ) | | | (0.68 | ) | | | | |
11/30/2014 | | | 21.77 | | | | 0.45 | | | | 0.64 | | | | 1.09 | | | | (0.59 | ) | | | (0.13 | ) | | | | |
| Class R6 | | | | | | | | | | | | | | | | | | | | | | | | | | | | |
3/31/2020† | | $ | 20.68 | | | $ | 0.48 | | | $ | (2.82 | ) | | $ | (2.34 | ) | | $ | (0.38 | ) | | $ | (1.40 | ) | | | | |
9/30/2019 | | | 23.06 | | | | 0.46 | | | | (1.11 | ) | | | (0.65 | ) | | | (0.71 | ) | | | (1.02 | ) | | | | |
9/30/2018 | | | 22.96 | | | | 0.57 | | | | 1.11 | | | | 1.68 | | | | (1.38 | ) | | | (0.20 | ) | | | | |
9/30/2017 | | | 20.39 | | | | 0.23 | | | | 3.45 | | | | 3.68 | | | | (0.56 | ) | | | (0.55 | ) | | | | |
9/30/2016 | | | 19.03 | | | | 0.30 | | | | 1.79 | | | | 2.09 | | | | (0.36 | ) | | | (0.37 | ) | | | | |
12/1/2014 - 9/30/2015# | | | 22.20 | | | | 0.57 | | | | (2.13 | ) | | | (1.56 | ) | | | (0.93 | ) | | | (0.68 | ) | | | | |
11/30/2014 | | | 21.80 | | | | 0.57 | | | | 0.55 | | | | 1.12 | | | | (0.59 | ) | | | (0.13 | ) | | | | |
| Administrative Class | | | | | | | | | | | | | | | | | | | | | | | | | | | | |
3/31/2020† | | $ | 20.46 | | | $ | 0.44 | | | $ | (2.81 | ) | | $ | (2.37 | ) | | $ | (0.30 | ) | | $ | (1.40 | ) | | | | |
9/30/2019 | | | 22.82 | | | | 0.51 | | | | (1.22 | ) | | | (0.71 | ) | | | (0.63 | ) | | | (1.02 | ) | | | | |
9/30/2018 | | | 22.74 | | | | 0.49 | | | | 1.09 | | | | 1.58 | | | | (1.30 | ) | | | (0.20 | ) | | | | |
9/30/2017 | | | 20.20 | | | | 0.18 | | | | 3.40 | | | | 3.58 | | | | (0.49 | ) | | | (0.55 | ) | | | | |
9/30/2016 | | | 18.87 | | | | 0.24 | | | | 1.77 | | | | 2.01 | | | | (0.31 | ) | | | (0.37 | ) | | | | |
12/1/2014 - 9/30/2015# | | | 22.03 | | | | 0.80 | | | | (2.42 | ) | | | (1.62 | ) | | | (0.86 | ) | | | (0.68 | ) | | | | |
11/30/2014 | | | 21.69 | | | | 0.49 | | | | 0.54 | | | | 1.03 | | | | (0.56 | ) | | | (0.13 | ) | | | | |
| ^ | A “—” may reflect actual amounts rounding to less than $0.01 or 0.01%. |
| # | Fiscal year end changed from November 30th to September 30th. |
| (a) | Calculated on average shares outstanding during the period. |
| | | | | | |
| 246 | | Semiannual Report | | | March 31, 2020 | | | See accompanying Notes to Financial Statements |
| | | | | | | | | | | | | | | | | | | | | | | | | | | | | | | | | | |
| | | | Total
Dividends and
Distributions | | | Net Asset
Value, End
of Period | | | Total Return (b) | | | Net Assets,
End of Period
(000s) | | | Ratio of
Expenses to
Average Net
Assets with
Fee Waiver/
Reimbursement (c) | | | Ratio of
Expenses to
Average Net
Assets without
Fee Waiver/
Reimbursement (c) | | | Ratio of Net
Investment
Income to
Average
Net Assets (c) | | | Portfolio
Turnover Rate | |
| | | | | | | | | | | | | | | | | | | | | | | | | | |
| | | | | | | | | | | | | | | | | | | | | | | | | | | | | | | | | | |
| | | | | $ | (1.70 | ) | | $ | 16.36 | | | | (13.27 | )% | | $ | 2,114 | | | | 0.40 | %(d) | | | 0.60 | %(d) | | �� | 4.34 | %(d) | | | 44 | % |
| | | | | | (1.62 | ) | | | 20.42 | | | | (2.09 | ) | | | 2,534 | | | | 0.50 | | | | 0.60 | | | | 2.05 | | | | 42 | |
| | | | | | (1.48 | ) | | | 22.75 | | | | 7.07 | | | | 2,717 | | | | 0.49 | | | | 0.60 | | | | 1.98 | | | | 21 | |
| | | | | | (0.99 | ) | | | 22.66 | | | | 18.45 | | | | 3,713 | | | | 0.50 | | | | 0.60 | | | | 0.41 | | | | 94 | |
| | | | | | (0.60 | ) | | | 20.10 | | | | 10.74 | | | | 1,633 | | | | 0.50 | | | | 0.60 | | | | 1.03 | | | | 89 | |
| | | | | | (1.55 | ) | | | 18.72 | | | | (7.79 | ) | | | 4,863 | | | | 0.34 | (d)(e) | | | 0.61 | (d)(e) | | | 2.62 | (d)(e) | | | 147 | |
| | | | | | (0.70 | ) | | | 21.87 | | | | 4.85 | | | | 4,772 | | | | 0.35 | | | | 0.60 | | | | 2.02 | | | | 78 | |
| | | | | | | | | | | | | | | | | | | | | | | | | | | | | | | | | | |
| | | | | $ | (1.75 | ) | | $ | 15.86 | | | | (13.62 | )% | | $ | 197 | | | | 1.15 | %(d) | | | 1.35 | %(d) | | | 3.72 | %(d) | | | 44 | % |
| | | | | | (1.49 | ) | | | 19.97 | | | | (2.87 | ) | | | 238 | | | | 1.25 | | | | 1.35 | | | | 0.99 | | | | 42 | |
| | | | | | (1.33 | ) | | | 22.30 | | | | 6.29 | | | | 199 | | | | 1.24 | | | | 1.35 | | | | 1.36 | | | | 21 | |
| | | | | | (0.89 | ) | | | 22.25 | | | | 17.58 | | | | 175 | | | | 1.25 | | | | 1.35 | | | | 0.04 | | | | 94 | |
| | | | | | (0.54 | ) | | | 19.80 | | | | 9.96 | | | | 145 | | | | 1.25 | | | | 1.35 | | | | 0.56 | | | | 89 | |
| | | | | | (1.38 | ) | | | 18.52 | | | | (8.40 | ) | | | 148 | | | | 1.09 | (d)(e) | | | 1.36 | (d)(e) | | | 1.83 | (d)(e) | | | 147 | |
| | | | | | (0.57 | ) | | | 21.62 | | | | 4.08 | | | | 138 | | | | 1.10 | | | | 1.35 | | | | 1.38 | | | | 78 | |
| | | | | | | | | | | | | | | | | | | | | | | | | | | | | | | | | | |
| | | | | $ | (1.72 | ) | | $ | 16.27 | | | | (13.42 | )% | | $ | 252 | | | | 0.75 | %(d) | | | 0.85 | %(d) | | | 5.48 | %(d) | | | 44 | % |
| | | | | | (1.57 | ) | | | 20.37 | | | | (2.46 | ) | | | 105 | | | | 0.85 | | | | 0.85 | | | | 1.52 | | | | 42 | |
| | | | | | (1.22 | ) | | | 22.72 | | | | 6.70 | | | | 128 | | | | 0.84 | | | | 0.85 | | | | 1.40 | | | | 21 | |
| | | | | | (0.97 | ) | | | 22.46 | | | | 17.99 | | | | 95 | | | | 0.85 | | | | 0.85 | | | | 2.13 | | | | 94 | |
| | | | | | (0.60 | ) | | | 19.99 | | | | 10.41 | | | | 740 | | | | 0.85 | | | | 0.85 | | | | 0.80 | | | | 89 | |
| | | | | | (1.46 | ) | | | 18.68 | | | | (8.07 | ) | | | 608 | | | | 0.69 | (d)(e) | | | 0.86 | (d)(e) | | | 2.20 | (d)(e) | | | 147 | |
| | | | | | (0.58 | ) | | | 21.80 | | | | 4.41 | | | | 584 | | | | 0.70 | | | | 0.85 | | | | 1.79 | | | | 78 | |
| | | | | | | | | | | | | | | | | | | | | | | | | | | | | | | | | | |
| | | | | $ | (1.48 | ) | | $ | 16.71 | | | | (13.13 | )% | | $ | 512 | | | | 0.10 | %(d) | | | 0.20 | %(d) | | | 2.44 | %(d) | | | 44 | % |
| | | | | | (1.70 | ) | | | 20.59 | | | | (1.84 | ) | | | 4,876 | | | | 0.20 | | | | 0.20 | | | | 2.37 | | | | 42 | |
| | | | | | (1.56 | ) | | | 22.96 | | | | 7.40 | | | | 11,185 | | | | 0.19 | | | | 0.20 | | | | 2.51 | | | | 21 | |
| | | | | | (1.09 | ) | | | 22.86 | | | | 18.81 | | | | 11,758 | | | | 0.20 | | | | 0.20 | | | | 1.18 | | | | 94 | |
| | | | | | (0.73 | ) | | | 20.31 | | | | 11.12 | | | | 10,021 | | | | 0.20 | | | | 0.20 | | | | 1.42 | | | | 89 | |
| | | | | | (1.60 | ) | | | 18.97 | | | | (7.55 | ) | | | 7,750 | | | | 0.04 | (d)(e) | | | 0.21 | (d)(e) | | | 2.74 | (d)(e) | | | 147 | |
| | | | | | (0.72 | ) | | | 22.14 | | | | 5.13 | | | | 5,234 | | | | 0.05 | | | | 0.20 | | | | 2.06 | | | | 78 | |
| | | | | | | | | | | | | | | | | | | | | | | | | | | | | | | | | | |
| | | | | $ | (1.78 | ) | | $ | 16.56 | | | | (13.08 | )% | | $ | 12,929 | | | | — | %(d)(f) | | | 0.10 | %(d) | | | 4.63 | %(d) | | | 44 | % |
| | | | | | (1.73 | ) | | | 20.68 | | | | (1.74 | ) | | | 17,703 | | | | 0.10 | | | | 0.10 | | | | 2.25 | | | | 42 | |
| | | | | | (1.58 | ) | | | 23.06 | | | | 7.47 | | | | 17,875 | | | | 0.09 | | | | 0.10 | | | | 2.49 | | | | 21 | |
| | | | | | (1.11 | ) | | | 22.96 | | | | 18.96 | | | | 16,063 | | | | 0.10 | | | | 0.10 | | | | 1.07 | | | | 94 | |
| | | | | | (0.73 | ) | | | 20.39 | | | | 11.23 | | | | 10,525 | | | | 0.10 | | | | 0.10 | | | | 1.54 | | | | 89 | |
| | | | | | (1.61 | ) | | | 19.03 | | | | (7.49 | ) | | | 8,110 | | | | — | (d)(e)(f) | | | 0.10 | (d)(e) | | | 3.31 | (d)(e) | | | 147 | |
| | | | | | (0.72 | ) | | | 22.20 | | | | 5.27 | | | | 9,227 | | | | — | (f) | | | 0.10 | | | | 2.58 | | | | 78 | |
| | | | | | | | | | | | | | | | | | | | | | | | | | | | | | | | | | |
| | | | | $ | (1.70 | ) | | $ | 16.39 | | | | (13.27 | )% | | $ | 511 | | | | 0.35 | %(d) | | | 0.45 | %(d) | | | 4.31 | %(d) | | | 44 | % |
| | | | | | (1.65 | ) | | | 20.46 | | | | (2.08 | ) | | | 601 | | | | 0.45 | | | | 0.45 | | | | 2.50 | | | | 42 | |
| | | | | | (1.50 | ) | | | 22.82 | | | | 7.11 | | | | 879 | | | | 0.44 | | | | 0.45 | | | | 2.16 | | | | 21 | |
| | | | | | (1.04 | ) | | | 22.74 | | | | 18.54 | | | | 813 | | | | 0.45 | | | | 0.45 | | | | 0.86 | | | | 94 | |
| | | | | | (0.68 | ) | | | 20.20 | | | | 10.87 | | | | 646 | | | | 0.45 | | | | 0.45 | | | | 1.23 | | | | 89 | |
| | | | | | (1.54 | ) | | | 18.87 | | | | (7.80 | ) | | | 605 | | | | 0.29 | (d)(e) | | | 0.46 | (d)(e) | | | 4.66 | (d)(e) | | | 147 | |
| | | | | | (0.69 | ) | | | 22.03 | | | | 4.87 | | | | 1,245 | | | | 0.30 | | | | 0.45 | | | | 2.25 | | | | 78 | |
| | (b) | Total return is calculated assuming a purchase of a share on the first day of the period and a sale of a share on the last day of each period reported. Dividends and distributions, if any, are assumed, for purposes of this calculation, to be reinvested. Total return does not reflect sales charges and includes the effect of fee waivers and reimbursements. Total return may reflect adjustments to conform to U.S. GAAP. Total return for a period of less than one year is not annualized. |
| | (c) | Does not include expenses of the investment companies in which the Fund invests. |
| | (d) | Annualized, unless otherwise noted. |
| | (e) | Certain expenses incurred by the Fund were not annualized. |
| | (f) | See Note 6 in the Notes to Financial Statements. |
| | | | | | | | |
| See accompanying Notes to Financial Statements | | | March 31, 2020 | | | Semiannual Report | | | 247 | |
Financial Highlights (cont’d)
For a Share Outstanding for the Period ended:^
| | | | | | | | | | | | | | | | | | | | | | | | | | | | |
| | | Net Asset
Value,
Beginning
of Period | | | Net
Investment
Income (a) | | | Net Realized
and Change
in Unrealized
Gain (Loss) | | | Total from
Investment
Operations | | |
Dividends
from Net
Investment
Income | | | Distributions
from Net
Realized Capital
Gains | | | | |
| AllianzGI Retirement 2055: | | | | | | | | | | | | | | | | | | | | | |
| Class A | | | | | | | | | | | | | | | | | | | | | | | | | | | | |
3/31/2020† | | $ | 17.79 | | | $ | 0.39 | | | $ | (2.60 | ) | | $ | (2.21 | ) | | $ | (0.32 | ) | | $ | (0.81 | ) | | | | |
9/30/2019 | | | 19.68 | | | | 0.34 | | | | (0.94 | ) | | | (0.60 | ) | | | (0.49 | ) | | | (0.80 | ) | | | | |
9/30/2018 | | | 19.52 | | | | 0.39 | | | | 0.99 | | | | 1.38 | | | | (1.11 | ) | | | (0.11 | ) | | | | |
9/30/2017 | | | 17.17 | | | | 0.09 | | | | 2.95 | | | | 3.04 | | | | (0.33 | ) | | | (0.36 | ) | | | | |
9/30/2016 | | | 16.02 | | | | 0.17 | | | | 1.49 | | | | 1.66 | | | | (0.28 | ) | | | (0.23 | ) | | | | |
12/1/2014 - 9/30/2015# | | | 18.70 | | | | 0.33 | | | | (1.69 | ) | | | (1.36 | ) | | | (0.76 | ) | | | (0.56 | ) | | | | |
11/30/2014 | | | 18.51 | | | | 0.39 | | | | 0.50 | | | | 0.89 | | | | (0.49 | ) | | | (0.21 | ) | | | | |
| Class R | | | | | | | | | | | | | | | | | | | | | | | | | | | | |
3/31/2020† | | $ | 17.70 | | | $ | 0.34 | | | $ | (2.58 | ) | | $ | (2.24 | ) | | $ | (0.22 | ) | | $ | (0.81 | ) | | | | |
9/30/2019 | | | 19.60 | | | | 0.51 | | | | (1.17 | ) | | | (0.66 | ) | | | (0.44 | ) | | | (0.80 | ) | | | | |
9/30/2018 | | | 19.37 | | | | 0.31 | | | | 1.00 | | | | 1.31 | | | | (0.97 | ) | | | (0.11 | ) | | | | |
9/30/2017 | | | 17.07 | | | | 0.29 | | | | 2.67 | | | | 2.96 | | | | (0.30 | ) | | | (0.36 | ) | | | | |
9/30/2016 | | | 15.97 | | | | 0.10 | | | | 1.48 | | | | 1.58 | | | | (0.25 | ) | | | (0.23 | ) | | | | |
12/1/2014 - 9/30/2015# | | | 18.63 | | | | 0.26 | | | | (1.66 | ) | | | (1.40 | ) | | | (0.70 | ) | | | (0.56 | ) | | | | |
11/30/2014 | | | 18.42 | | | | 0.30 | | | | 0.53 | | | | 0.83 | | | | (0.41 | ) | | | (0.21 | ) | | | | |
| Class P | | | | | | | | | | | | | | | | | | | | | | | | | | | | |
3/31/2020† | | $ | 17.93 | | | $ | 0.08 | | | $ | (2.32 | ) | | $ | (2.24 | ) | | $ | — | | | $ | (0.81 | ) | | | | |
9/30/2019 | | | 19.87 | | | | 0.39 | | | | (0.96 | ) | | | (0.57 | ) | | | (0.57 | ) | | | (0.80 | ) | | | | |
9/30/2018 | | | 19.68 | | | | 0.48 | | | | 0.98 | | | | 1.46 | | | | (1.16 | ) | | | (0.11 | ) | | | | |
9/30/2017 | | | 17.32 | | | | 0.17 | | | | 2.94 | | | | 3.11 | | | | (0.39 | ) | | | (0.36 | ) | | | | |
9/30/2016 | | | 16.17 | | | | 0.20 | | | | 1.52 | | | | 1.72 | | | | (0.34 | ) | | | (0.23 | ) | | | | |
12/1/2014 - 9/30/2015# | | | 18.85 | | | | 0.35 | | | | (1.68 | ) | | | (1.33 | ) | | | (0.79 | ) | | | (0.56 | ) | | | | |
11/30/2014 | | | 18.61 | | | | 0.38 | | | | 0.57 | | | | 0.95 | | | | (0.50 | ) | | | (0.21 | ) | | | | |
| Class R6 | | | | | | | | | | | | | | | | | | | | | | | | | | | | |
3/31/2020† | | $ | 18.02 | | | $ | 0.41 | | | $ | (2.60 | ) | | $ | (2.19 | ) | | $ | (0.39 | ) | | $ | (0.81 | ) | | | | |
9/30/2019 | | | 19.96 | | | | 0.38 | | | | (0.92 | ) | | | (0.54 | ) | | | (0.60 | ) | | | (0.80 | ) | | | | |
9/30/2018 | | | 19.77 | | | | 0.46 | | | | 1.01 | | | | 1.47 | | | | (1.17 | ) | | | (0.11 | ) | | | | |
9/30/2017 | | | 17.38 | | | | 0.17 | | | | 2.98 | | | | 3.15 | | | | (0.40 | ) | | | (0.36 | ) | | | | |
9/30/2016 | | | 16.22 | | | | 0.26 | | | | 1.48 | | | | 1.74 | | | | (0.35 | ) | | | (0.23 | ) | | | | |
12/1/2014 - 9/30/2015# | | | 18.90 | | | | 0.46 | | | | (1.78 | ) | | | (1.32 | ) | | | (0.80 | ) | | | (0.56 | ) | | | | |
11/30/2014 | | | 18.64 | | | | 0.47 | | | | 0.50 | | | | 0.97 | | | | (0.50 | ) | | | (0.21 | ) | | | | |
| Administrative Class | | | | | | | | | | | | | | | | | | | | | | | | | | | | |
3/31/2020† | | $ | 17.80 | | | $ | 0.40 | | | $ | (2.60 | ) | | $ | (2.20 | ) | | $ | (0.31 | ) | | $ | (0.81 | ) | | | | |
9/30/2019 | | | 19.74 | | | | 0.52 | | | | (1.12 | ) | | | (0.60 | ) | | | (0.54 | ) | | | (0.80 | ) | | | | |
9/30/2018 | | | 19.56 | | | | 0.47 | | | | 0.92 | | | | 1.39 | | | | (1.10 | ) | | | (0.11 | ) | | | | |
9/30/2017 | | | 17.21 | | | | 0.14 | | | | 2.92 | | | | 3.06 | | | | (0.35 | ) | | | (0.36 | ) | | | | |
9/30/2016 | | | 16.08 | | | | 0.18 | | | | 1.49 | | | | 1.67 | | | | (0.31 | ) | | | (0.23 | ) | | | | |
12/1/2014 - 9/30/2015# | | | 18.76 | | | | 0.62 | | | | (1.98 | ) | | | (1.36 | ) | | | (0.76 | ) | | | (0.56 | ) | | | | |
11/30/2014 | | | 18.55 | | | | 0.38 | | | | 0.52 | | | | 0.90 | | | | (0.48 | ) | | | (0.21 | ) | | | | |
| ^ | A “—” may reflect actual amounts rounding to less than $0.01 or 0.01%. |
| # | Fiscal year end changed from November 30th to September 30th. |
| (a) | Calculated on average shares outstanding during the period. |
| | | | | | |
| 248 | | Semiannual Report | | | March 31, 2020 | | | See accompanying Notes to Financial Statements |
| | | | | | | | | | | | | | | | | | | | | | | | | | | | | | | | | | |
| | | | Total
Dividends and
Distributions | | | Net Asset
Value, End
of Period | | | Total
Return (b) | | | Net Assets,
End of Period
(000s) | | | Ratio of
Expenses to
Average Net
Assets with
Fee Waiver/
Reimbursement (c) | | | Ratio of
Expenses to
Average Net
Assets without
Fee Waiver/
Reimbursement (c) | | | Ratio of Net
Investment
Income
to Average
Net Assets (c) | | | Portfolio
Turnover Rate | |
| | | | | | | | | | | | | | | | | | | | | | | | | | |
| | | | | | | | | | | | | | | | | | | | | | | | | | | | | | | | | | |
| | | | | $ | (1.13 | ) | | $ | 14.45 | | | | (13.73 | )% | | $ | 1,382 | | | | 0.40 | %(d) | | | 0.60 | %(d) | | | 4.40 | %(d) | | | 48 | % |
| | | | | | (1.29 | ) | | | 17.79 | | | | (2.10 | ) | | | 1,631 | | | | 0.51 | | | | 0.60 | | | | 1.96 | | | | 51 | |
| | | | | | (1.22 | ) | | | 19.68 | | | | 7.19 | | | | 1,697 | | | | 0.49 | | | | 0.60 | | | | 2.01 | | | | 31 | |
| | | | | | (0.69 | ) | | | 19.52 | | | | 18.34 | | | | 2,063 | | | | 0.50 | | | | 0.60 | | | | 0.48 | | | | 76 | |
| | | | | | (0.51 | ) | | | 17.17 | | | | 10.52 | | | | 1,036 | | | | 0.51 | | | | 0.60 | | | | 1.02 | | | | 92 | |
| | | | | | (1.32 | ) | | | 16.02 | | | | (7.75 | ) | | | 1,399 | | | | 0.34 | (d)(e) | | | 0.60 | (d)(e) | | | 2.26 | (d)(e) | | | 153 | |
| | | | | | (0.70 | ) | | | 18.70 | | | | 4.96 | | | | 1,089 | | | | 0.35 | | | | 0.60 | | | | 2.11 | | | | 74 | |
| | | | | | | | | | | | | | | | | | | | | | | | | | | | | | | | | | |
| | | | | $ | (1.03 | ) | | $ | 14.43 | | | | (13.88 | )% | | $ | 33 | | | | 0.75 | %(d) | | | 0.85 | %(d) | | | 3.84 | %(d) | | | 48 | % |
| | | | | | (1.24 | ) | | | 17.70 | | | | (2.47 | ) | | | 38 | | | | 0.86 | | | | 0.86 | | | | 2.91 | | | | 51 | |
| | | | | | (1.08 | ) | | | 19.60 | | | | 6.86 | | | | 112 | | | | 0.84 | | | | 0.85 | | | | 1.58 | | | | 31 | |
| | | | | | (0.66 | ) | | | 19.37 | | | | 17.93 | | | | 91 | | | | 0.85 | | | | 0.85 | | | | 1.64 | | | | 76 | |
| | | | | | (0.48 | ) | | | 17.07 | | | | 10.06 | | | | 350 | | | | 0.86 | | | | 0.86 | | | | 0.64 | | | | 92 | |
| | | | | | (1.26 | ) | | | 15.97 | | | | (7.98 | ) | | | 217 | | | | 0.69 | (d)(e) | | | 0.85 | (d)(e) | | | 1.78 | (d)(e) | | | 153 | |
| | | | | | (0.62 | ) | | | 18.63 | | | | 4.61 | | | | 144 | | | | 0.70 | | | | 0.85 | | | | 1.61 | | | | 74 | |
| | | | | | | | | | | | | | | | | | | | | | | | | | | | | | | | | | |
| | | | | $ | (0.81 | ) | | $ | 14.88 | | | | (13.44 | )% | | $ | 151 | | | | 0.11 | %(d) | | | 0.21 | %(d) | | | 0.91 | %(d) | | | 48 | % |
| | | | | | (1.37 | ) | | | 17.93 | | | | (1.86 | ) | | | 2,383 | | | | 0.21 | | | | 0.21 | | | | 2.23 | | | | 51 | |
| | | | | | (1.27 | ) | | | 19.87 | | | | 7.57 | | | | 5,865 | | | | 0.19 | | | | 0.20 | | | | 2.45 | | | | 31 | |
| | | | | | (0.75 | ) | | | 19.68 | | | | 18.69 | | | | 5,934 | | | | 0.20 | | | | 0.20 | | | | 0.95 | | | | 76 | |
| | | | | | (0.57 | ) | | | 17.32 | | | | 10.84 | | | | 3,457 | | | | 0.21 | | | | 0.21 | | | | 1.21 | | | | 92 | |
| | | | | | (1.35 | ) | | | 16.17 | | | | (7.51 | ) | | | 1,762 | | | | 0.04 | (d)(e) | | | 0.20 | (d)(e) | | | 2.42 | (d)(e) | | | 153 | |
| | | | | | (0.71 | ) | | | 18.85 | | | | 5.27 | | | | 1,362 | | | | 0.05 | | | | 0.20 | | | | 2.04 | | | | 74 | |
| | | | | | | | | | | | | | | | | | | | | | | | | | | | | | | | | | |
| | | | | $ | (1.20 | ) | | $ | 14.63 | | | | (13.55 | )% | | $ | 6,202 | | | | — | %(d)(f) | | | 0.11 | %(d) | | | 4.57 | %(d) | | | 48 | % |
| | | | | | (1.40 | ) | | | 18.02 | | | | (1.72 | ) | | | 8,889 | | | | 0.11 | | | | 0.11 | | | | 2.15 | | | | 51 | |
| | | | | | (1.28 | ) | | | 19.96 | | | | 7.62 | | | | 8,055 | | | | 0.09 | | | | 0.10 | | | | 2.35 | | | | 31 | |
| | | | | | (0.76 | ) | | | 19.77 | | | | 18.87 | | | | 6,215 | | | | 0.10 | | | | 0.10 | | | | 0.92 | | | | 76 | |
| | | | | | (0.58 | ) | | | 17.38 | | | | 10.91 | | | | 2,982 | | | | 0.11 | | | | 0.11 | | | | 1.60 | | | | 92 | |
| | | | | | (1.36 | ) | | | 16.22 | | | | (7.45 | ) | | | 2,591 | | | | — | (d)(e)(f) | | | 0.10 | (d)(e) | | | 3.09 | (d)(e) | | | 153 | |
| | | | | | (0.71 | ) | | | 18.90 | | | | 5.37 | | | | 4,934 | | | | — | (f) | | | 0.10 | | | | 2.52 | | | | 74 | |
| | | | | | | | | | | | | | | | | | | | | | | | | | | | | | | | | | |
| | | | | $ | (1.12 | ) | | $ | 14.48 | | | | (13.69 | )% | | $ | 135 | | | | 0.35 | %(d) | | | 0.46 | %(d) | | | 4.40 | %(d) | | | 48 | % |
| | | | | | (1.34 | ) | | | 17.80 | | | | (2.10 | ) | | | 191 | | | | 0.46 | | | | 0.46 | | | | 2.93 | | | | 51 | |
| | | | | | (1.21 | ) | | | 19.74 | | | | 7.25 | | | | 363 | | | | 0.44 | | | | 0.45 | | | | 2.39 | | | | 31 | |
| | | | | | (0.71 | ) | | | 19.56 | | | | 18.44 | | | | 404 | | | | 0.45 | | | | 0.45 | | | | 0.78 | | | | 76 | |
| | | | | | (0.54 | ) | | | 17.21 | | | | 10.54 | | | | 298 | | | | 0.46 | | | | 0.46 | | | | 1.10 | | | | 92 | |
| | | | | | (1.32 | ) | | | 16.08 | | | | (7.75 | ) | | | 216 | | | | 0.29 | (d)(e) | | | 0.45 | (d)(e) | | | 4.23 | (d)(e) | | | 153 | |
| | | | | | (0.69 | ) | | | 18.76 | | | | 5.00 | | | | 357 | | | | 0.30 | | | | 0.45 | | | | 2.06 | | | | 74 | |
| | (b) | Total return is calculated assuming a purchase of a share on the first day of the period and a sale of a share on the last day of each period reported. Dividends and distributions, if any, are assumed, for purposes of this calculation, to be reinvested. Total return does not reflect sales charges and includes the effect of fee waivers and reimbursements. Total return may reflect adjustments to conform to U.S. GAAP. Total return for a period of less than one year is not annualized. |
| | (c) | Does not include expenses of the investment companies in which the Fund invests. |
| | (d) | Annualized, unless otherwise noted. |
| | (e) | Certain expenses incurred by the Fund were not annualized. |
| | (f) | See Note 6 in the Notes to Financial Statements. |
| | | | | | | | |
| See accompanying Notes to Financial Statements | | | March 31, 2020 | | | Semiannual Report | | | 249 | |
Financial Highlights (cont’d)
For a Share Outstanding for the Period ended:^
| | | | | | | | | | | | | | | | | | | | | | | | | | | | | | | | |
| | | Net Asset
Value,
Beginning
of Period | | | Net
Investment
Income (a) | | | Net Realized
and Change
in Unrealized
Gain (Loss) | | | Total from
Investment
Operations | | | Dividends
from Net
Investment
Income | | |
Distributions
from Net
Realized Capital
Gains | | | Distributions
from Return
of Capital | | | | |
| AllianzGI Multi Asset Income: | | | | | | | | | | | | | | | | | | | | | | |
| Class A | | | | | | | | | | | | | | | | | | | | | | | | | | | | | | | | |
3/31/2020† | | $ | 17.64 | | | $ | 0.49 | | | $ | (3.27 | ) | | $ | (2.78 | ) | | $ | (0.53 | ) | | $ | — | | | $ | — | | | | | |
9/30/2019 | | | 17.35 | | | | 0.99 | | | | 0.25 | | | | 1.24 | | | | (0.95 | ) | | | — | | | | — | | | | | |
9/30/2018 | | | 18.53 | | | | 0.73 | | | | (0.71 | ) | | | 0.02 | | | | (0.85 | ) | | | (0.23 | ) | | | (0.12 | ) | | | | |
9/30/2017 | | | 18.31 | | | | 0.94 | | | | 0.22 | | | | 1.16 | | | | (0.85 | ) | | | (0.09 | ) | | | — | | | | | |
9/30/2016 | | | 17.34 | | | | 0.75 | | | | 1.09 | | | | 1.84 | | | | (0.80 | ) | | | (0.07 | ) | | | — | | | | | |
12/1/2014 - 9/30/2015# | | | 19.35 | | | | 0.48 | | | | (1.32 | ) | | | (0.84 | ) | | | (0.67 | ) | | | (0.50 | ) | | | — | | | | | |
11/30/2014 | | | 18.96 | | | | 0.42 | | | | 0.31 | | | | 0.73 | | | | (0.34 | ) | | | — | | | | — | | | | | |
| Class C | | | | | | | | | | | | | | | | | | | | | | | | | | | | | | | | |
3/31/2020† | | $ | 17.64 | | | $ | 0.42 | | | $ | (3.28 | ) | | $ | (2.86 | ) | | $ | (0.34 | ) | | $ | — | | | $ | — | | | | | |
9/30/2019 | | | 17.36 | | | | 0.84 | | | | 0.26 | | | | 1.10 | | | | (0.82 | ) | | | — | | | | — | | | | | |
9/30/2018 | | | 18.53 | | | | 0.62 | | | | (0.72 | ) | | | (0.10 | ) | | | (0.74 | ) | | | (0.23 | ) | | | (0.10 | ) | | | | |
9/30/2017 | | | 18.21 | | | | 0.80 | | | | 0.22 | | | | 1.02 | | | | (0.61 | ) | | | (0.09 | ) | | | — | | | | | |
9/30/2016 | | | 17.16 | | | | 0.66 | | | | 1.04 | | | | 1.70 | | | | (0.58 | ) | | | (0.07 | ) | | | — | | | | | |
12/1/2014 - 9/30/2015# | | | 19.14 | | | | 0.38 | | | | (1.33 | ) | | | (0.95 | ) | | | (0.53 | ) | | | (0.50 | ) | | | — | | | | | |
11/30/2014 | | | 18.76 | | | | 0.27 | | | | 0.31 | | | | 0.58 | | | | (0.20 | ) | | | — | | | | — | | | | | |
| Class R | | | | | | | | | | | | | | | | | | | | | | | | | | | | | | | | |
3/31/2020† | | $ | 18.49 | | | $ | 0.48 | | | $ | (3.43 | ) | | $ | (2.95 | ) | | $ | (0.44 | ) | | $ | — | | | $ | — | | | | | |
9/30/2019 | | | 18.14 | | | | 0.97 | | | | 0.26 | | | | 1.23 | | | | (0.88 | ) | | | — | | | | — | | | | | |
9/30/2018 | | | 19.31 | | | | 0.71 | | | | (0.74 | ) | | | (0.03 | ) | | | (0.80 | ) | | | (0.23 | ) | | | (0.11 | ) | | | | |
9/30/2017 | | | 18.97 | | | | 0.84 | | | | 0.30 | | | | 1.14 | | | | (0.71 | ) | | | (0.09 | ) | | | — | | | | | |
9/30/2016 | | | 17.92 | | | | 0.73 | | | | 1.11 | | | | 1.84 | | | | (0.72 | ) | | | (0.07 | ) | | | — | | | | | |
12/1/2014 - 9/30/2015# | | | 19.95 | | | | 0.44 | | | | (1.36 | ) | | | (0.92 | ) | | | (0.61 | ) | | | (0.50 | ) | | | — | | | | | |
11/30/2014 | | | 19.53 | | | | 0.36 | | | | 0.33 | | | | 0.69 | | | | (0.27 | ) | | | — | | | | — | | | | | |
| Class P | | | | | | | | | | | | | | | | | | | | | | | | | | | | | | | | |
3/31/2020† | | $ | 17.83 | | | $ | 0.48 | | | $ | (3.26 | ) | | $ | (2.78 | ) | | $ | (0.49 | ) | | $ | — | | | $ | — | | | | | |
9/30/2019 | | | 17.54 | | | | 1.08 | | | | 0.21 | | | | 1.29 | | | | (1.00 | ) | | | — | | | | — | | | | | |
9/30/2018 | | | 18.71 | | | | 0.82 | | | | (0.73 | ) | | | 0.09 | | | | (0.90 | ) | | | (0.23 | ) | | | (0.13 | ) | | | | |
9/30/2017 | | | 18.51 | | | | 0.99 | | | | 0.23 | | | | 1.22 | | | | (0.93 | ) | | | (0.09 | ) | | | — | | | | | |
9/30/2016 | | | 17.58 | | | | 0.83 | | | | 1.09 | | | | 1.92 | | | | (0.92 | ) | | | (0.07 | ) | | | — | | | | | |
12/1/2014 - 9/30/2015# | | | 19.61 | | | | 0.51 | | | | (1.31 | ) | | | (0.80 | ) | | | (0.73 | ) | | | (0.50 | ) | | | — | | | | | |
11/30/2014 | | | 19.20 | | | | 0.47 | | | | 0.34 | | | | 0.81 | | | | (0.40 | ) | | | — | | | | — | | | | | |
| Institutional Class | | | | | | | | | | | | | | | | | | | | | | | | | | | | | | | | |
3/31/2020† | | $ | 17.35 | | | $ | 0.53 | | | $ | (3.21 | ) | | $ | (2.68 | ) | | $ | (0.62 | ) | | $ | — | | | $ | — | | | | | |
9/30/2019 | | | 17.08 | | | | 1.00 | | | | 0.28 | | | | 1.28 | | | | (1.01 | ) | | | — | | | | — | | | | | |
2/1/2018* - 9/30/2018 | | | 17.87 | | | | 0.42 | | | | (0.64 | ) | | | (0.22 | ) | | | (0.44 | ) | | | — | | | | (0.13 | ) | | | | |
| Class R6 | | | | | | | | | | | | | | | | | | | | | | | | | | | | | | | | |
3/31/2020† | | $ | 17.36 | | | $ | 0.56 | | | $ | (3.24 | ) | | $ | (2.68 | ) | | $ | (0.62 | ) | | $ | — | | | $ | — | | | | | |
9/30/2019 | | | 17.09 | | | | 1.03 | | | | 0.25 | | | | 1.28 | | | | (1.01 | ) | | | — | | | | — | | | | | |
9/30/2018 | | | 18.26 | | | | 0.81 | | | | (0.71 | ) | | | 0.10 | | | | (0.91 | ) | | | (0.23 | ) | | | (0.13 | ) | | | | |
9/30/2017 | | | 18.08 | | | | 1.00 | | | | 0.21 | | | | 1.21 | | | | (0.94 | ) | | | (0.09 | ) | | | — | | | | | |
9/30/2016 | | | 17.21 | | | | 0.82 | | | | 1.07 | | | | 1.89 | | | | (0.95 | ) | | | (0.07 | ) | | | — | | | | | |
12/1/2014 - 9/30/2015# | | | 19.23 | | | | 0.56 | | | | (1.33 | ) | | | (0.77 | ) | | | (0.75 | ) | | | (0.50 | ) | | | — | | | | | |
11/30/2014 | | | 18.83 | | | | 0.49 | | | | 0.33 | | | | 0.82 | | | | (0.42 | ) | | | — | | | | — | | | | | |
| Administrative Class | | | | | | | | | | | | | | | | | | | | | | | | | | | | | | | | |
3/31/2020† | | $ | 17.87 | | | $ | 0.50 | | | $ | (3.34 | ) | | $ | (2.84 | ) | | $ | (0.39 | ) | | $ | — | | | $ | — | | | | | |
9/30/2019 | | | 17.66 | | | | 0.93 | | | | 0.12 | | | | 1.05 | | | | (0.84 | ) | | | — | | | | — | | | | | |
9/30/2018 | | | 18.82 | | | | 0.80 | | | | (0.75 | ) | | | 0.05 | | | | (0.86 | ) | | | (0.23 | ) | | | (0.12 | ) | | | | |
9/30/2017 | | | 18.61 | | | | 1.00 | | | | 0.19 | | | | 1.19 | | | | (0.89 | ) | | | (0.09 | ) | | | — | | | | | |
9/30/2016 | | | 17.60 | | | | 0.75 | | | | 0.94 | | | | 1.69 | | | | (0.61 | ) | | | (0.07 | ) | | | — | | | | | |
12/1/2014 - 9/30/2015# | | | 19.56 | | | | 1.70 | | | | (2.55 | ) | | | (0.85 | ) | | | (0.61 | ) | | | (0.50 | ) | | | — | | | | | |
11/30/2014 | | | 19.15 | | | | 0.43 | | | | 0.33 | | | | 0.76 | | | | (0.35 | ) | | | — | | | | — | | | | | |
| ^ | A “—” may reflect actual amounts rounding to less than $0.01 or 0.01%. |
| # | Fiscal year end changed from November 30th to September 30th. |
| * | Commencement of operations. |
| (a) | Calculated on average shares outstanding during the period. |
| | | | | | |
| 250 | | Semiannual Report | | | March 31, 2020 | | | See accompanying Notes to Financial Statements |
| | | | | | | | | | | | | | | | | | | | | | | | | | | | | | | | | | |
| | | | Total
Dividends and
Distributions | | | Net Asset
Value, End
of Period | | | Total Return (b) | | | Net Assets,
End of Period
(000s) | | | Ratio of
Expenses to
Average Net
Assets with
Fee Waiver/
Reimbursement (c) | | | Ratio of
Expenses to
Average Net
Assets without
Fee Waiver/
Reimbursement (c) | | | Ratio of Net
Investment
Income
to Average
Net Assets (c) | | | Portfolio
Turnover Rate | |
| | | | | | | | | | | | | | | | | | | | | | | | | | |
| | | | | | | | | | | | | | | | | | | | | | | | | | | | | | | | | | |
| | | | | $ | (0.53 | ) | | $ | 14.33 | | | | (16.20 | )% | | $ | 10,776 | | | | 0.54 | %(d) | | | 0.60 | %(d) | | | 5.60 | %(d) | | | 165 | % |
| | | | | | (0.95 | ) | | | 17.64 | | | | 7.47 | | | | 12,460 | | | | 0.41 | | | | 0.60 | | | | 5.79 | | | | 277 | |
| | | | | | (1.20 | ) | | | 17.35 | | | | 0.12 | | | | 8,826 | | | | 0.36 | | | | 0.61 | | | | 4.12 | | | | 172 | |
| | | | | | (0.94 | ) | | | 18.53 | | | | 6.55 | | | | 10,145 | | | | 0.35 | | | | 0.61 | | | | 5.12 | | | | 151 | |
| | | | | | (0.87 | ) | | | 18.31 | | | | 10.97 | | | | 10,140 | | | | 0.40 | | | | 0.60 | | | | 4.25 | | | | 116 | |
| | | | | | (1.17 | ) | | | 17.34 | | | | (4.53 | ) | | | 6,006 | | | | 0.44 | (d)(e) | | | 0.62 | (d)(e) | | | 3.15 | (d)(e) | | | 179 | |
| | | | | | (0.34 | ) | | | 19.35 | | | | 3.88 | | | | 6,324 | | | | 0.40 | | | | 0.60 | | | | 2.18 | | | | 101 | |
| | | | | | | | | | | | | | | | | | | | | | | | | | | | | | | | | | |
| | | | | $ | (0.34 | ) | | $ | 14.44 | | | | (16.47 | )% | | $ | 1,216 | | | | 1.29 | %(d) | | | 1.35 | %(d) | | | 4.78 | %(d) | | | 165 | % |
| | | | | | (0.82 | ) | | | 17.64 | | | | 6.58 | | | | 1,520 | | | | 1.16 | | | | 1.35 | | | | 4.90 | | | | 277 | |
| | | | | | (1.07 | ) | | | 17.36 | | | | (0.58 | ) | | | 2,210 | | | | 1.11 | | | | 1.36 | | | | 3.51 | | | | 172 | |
| | | | | | (0.70 | ) | | | 18.53 | | | | 5.78 | | | | 3,435 | | | | 1.10 | | | | 1.36 | | | | 4.37 | | | | 151 | |
| | | | | | (0.65 | ) | | | 18.21 | | | | 10.16 | | | | 3,361 | | | | 1.15 | | | | 1.35 | | | | 3.75 | | | | 116 | |
| | | | | | (1.03 | ) | | | 17.16 | | | | (5.16 | ) | | | 2,988 | | | | 1.19 | (d)(e) | | | 1.37 | (d)(e) | | | 2.49 | (d)(e) | | | 179 | |
| | | | | | (0.20 | ) | | | 19.14 | | | | 3.12 | | | | 3,984 | | | | 1.15 | | | | 1.35 | | | | 1.42 | | | | 101 | |
| | | | | | | | | | | | | | | | | | | | | | | | | | | | | | | | | | |
| | | | | $ | (0.44 | ) | | $ | 15.10 | | | | (16.30 | )% | | $ | 87 | | | | 0.89 | %(d) | | | 0.85 | %(d) | | | 5.25 | %(d) | | | 165 | % |
| | | | | | (0.88 | ) | | | 18.49 | | | | 7.08 | | | | 103 | | | | 0.76 | | | | 0.85 | | | | 5.39 | | | | 277 | |
| | | | | | (1.14 | ) | | | 18.14 | | | | (0.20 | ) | | | 100 | | | | 0.71 | | | | 0.86 | | | | 3.82 | | | | 172 | |
| | | | | | (0.80 | ) | | | 19.31 | | | | 6.17 | | | | 128 | | | | 0.70 | | | | 0.86 | | | | 4.38 | | | | 151 | |
| | | | | | (0.79 | ) | | | 18.97 | | | | 10.59 | | | | 519 | | | | 0.75 | | | | 0.85 | | | | 4.00 | | | | 116 | |
| | | | | | (1.11 | ) | | | 17.92 | | | | (4.83 | ) | | | 238 | | | | 0.79 | (d)(e) | | | 0.87 | (d)(e) | | | 2.78 | (d)(e) | | | 179 | |
| | | | | | (0.27 | ) | | | 19.95 | | | | 3.55 | | | | 215 | | | | 0.75 | | | | 0.85 | | | | 1.80 | | | | 101 | |
| | | | | | | | | | | | | | | | | | | | | | | | | | | | | | | | | | |
| | | | | $ | (0.49 | ) | | $ | 14.56 | | | | (15.99 | )% | | $ | 557 | | | | 0.24 | %(d) | | | 0.24 | %(d) | | | 5.39 | %(d) | | | 165 | % |
| | | | | | (1.00 | ) | | | 17.83 | | | | 7.68 | | | | 2,119 | | | | 0.11 | | | | 0.20 | | | | 6.21 | | | | 277 | |
| | | | | | (1.26 | ) | | | 17.54 | | | | 0.46 | | | | 9,526 | | | | 0.06 | | | | 0.21 | | | | 4.56 | | | | 172 | |
| | | | | | (1.02 | ) | | | 18.71 | | | | 6.86 | | | | 14,507 | | | | 0.05 | | | | 0.21 | | | | 5.37 | | | | 151 | |
| | | | | | (0.99 | ) | | | 18.51 | | | | 11.32 | | | | 17,120 | | | | 0.10 | | | | 0.20 | | | | 4.63 | | | | 116 | |
| | | | | | (1.23 | ) | | | 17.58 | | | | (4.31 | ) | | | 5,450 | | | | 0.14 | (d)(e) | | | 0.22 | (d)(e) | | | 3.31 | (d)(e) | | | 179 | |
| | | | | | (0.40 | ) | | | 19.61 | | | | 4.23 | | | | 6,349 | | | | 0.11 | | | | 0.21 | | | | 2.39 | | | | 101 | |
| | | | | | | | | | | | | | | | | | | | | | | | | | | | | | | | | | |
| | | | | $ | (0.62 | ) | | $ | 14.05 | | | | (15.98 | )% | | $ | 277 | | | | 0.15 | %(d) | | | 0.15 | %(d) | | | 6.32 | %(d) | | | 165 | % |
| | | | | | (1.01 | ) | | | 17.35 | | | | 7.84 | | | | 199 | | | | 0.06 | | | | 0.15 | | | | 6.00 | | | | 277 | |
| | | | | | (0.57 | ) | | | 17.08 | | | | (1.16 | ) | | | 49 | | | | 0.01 | (d) | | | 0.15 | (d) | | | 3.72 | (d) | | | 172 | |
| | | | | | | | | | | | | | | | | | | | | | | | | | | | | | | | | | |
| | | | | $ | (0.62 | ) | | $ | 14.06 | | | | (15.94 | )% | | $ | 36,726 | | | | 0.14 | %(d) | | | 0.14 | %(d) | | | 7.12 | %(d) | | | 165 | % |
| | | | | | (1.01 | ) | | | 17.36 | | | | 7.88 | | | | 8,121 | | | | 0.01 | | | | 0.10 | | | | 6.12 | | | | 277 | |
| | | | | | (1.27 | ) | | | 17.09 | | | | 0.56 | | | | 14,894 | | | | — | (f) | | | 0.11 | | | | 4.60 | | | | 172 | |
| | | | | | (1.03 | ) | | | 18.26 | | | | 6.99 | | | | 20,448 | | | | — | (f) | | | 0.11 | | | | 5.54 | | | | 151 | |
| | | | | | (1.02 | ) | | | 18.08 | | | | 11.40 | | | | 19,128 | | | | — | | | | 0.10 | | | | 4.70 | | | | 116 | |
| | | | | | (1.25 | ) | | | 17.21 | | | | (4.23 | ) | | | 8,058 | | | | 0.04 | (d)(e) | | | 0.12 | (d)(e) | | | 3.69 | (d)(e) | | | 179 | |
| | | | | | (0.42 | ) | | | 19.23 | | | | 4.36 | | | | 9,496 | | | | — | (f) | | | 0.10 | | | | 2.56 | | | | 101 | |
| | | | | | | | | | | | | | | | | | | | | | | | | | | | | | | | | | |
| | | | | $ | (0.39 | ) | | $ | 14.64 | | | | (16.18 | )% | | $ | 9 | | | | 0.49 | %(d) | | | 0.49 | %(d) | | | 5.64 | %(d) | | | 165 | % |
| | | | | | (0.84 | ) | | | 17.87 | | | | 6.17 | | | | 10 | | | | 0.36 | | | | 0.45 | | | | 5.46 | | | | 277 | |
| | | | | | (1.21 | ) | | | 17.66 | | | | 0.25 | | | | 524 | | | | 0.31 | | | | 0.46 | | | | 4.36 | | | | 172 | |
| | | | | | (0.98 | ) | | | 18.82 | | | | 6.62 | | | | 1,550 | | | | 0.30 | | | | 0.46 | | | | 5.38 | | | | 151 | |
| | | | | | (0.68 | ) | | | 18.61 | | | | 9.87 | | | | 822 | | | | 0.35 | | | | 0.45 | | | | 4.13 | | | | 116 | |
| | | | | | (1.11 | ) | | | 17.60 | | | | (4.53 | ) | | | 24 | | | | 0.37 | (d)(e) | | | 0.45 | (d)(e) | | | 10.47 | (d)(e) | | | 179 | |
| | | | | | (0.35 | ) | | | 19.56 | | | | 3.97 | | | | 2,001 | | | | 0.35 | | | | 0.45 | | | | 2.20 | | | | 101 | |
| | (b) | Total return is calculated assuming a purchase of a share on the first day of the period and a sale of a share on the last day of each period reported. Dividends and distributions, if any, are assumed, for purposes of this calculation, to be reinvested. Total return does not reflect sales charges and includes the effect of fee waivers and reimbursements. Total return may reflect adjustments to conform to U.S. GAAP. Total return for a period of less than one year is not annualized. |
| | (c) | Does not include expenses of the investment companies in which the Fund invests. |
| | (d) | Annualized, unless otherwise noted. |
| | (e) | Certain expenses incurred by the Fund were not annualized. |
| | (f) | See Note 6 in the Notes to Financial Statements. |
| | | | | | | | |
| See accompanying Notes to Financial Statements | | | March 31, 2020 | | | Semiannual Report | | | 251 | |
Financial Highlights (cont’d)
For a Share Outstanding for the Period ended:^
| | | | | | | | | | | | | | | | | | | | | | | | | | | | |
| | | Net Asset
Value,
Beginning
of Period | | | Net
Investment
Income (a) | | | Net Realized
and Change
in Unrealized
Gain (Loss) | | | Total from
Investment
Operations | | |
Dividends
from Net
Investment
Income | | | Distributions
from Net
Realized Capital
Gains | | | | |
| AllianzGI Best Styles Global Equity: | | | | | | | | | | | | | | | | | | | | | |
| Class A | | | | | | | | | | | | | | | | | | | | | | | | | | | | |
3/31/2020† | | $ | 14.44 | | | $ | 0.09 | | | $ | (1.78 | ) | | $ | (1.69 | ) | | $ | (0.73 | ) | | $ | (1.69 | ) | | | | |
9/30/2019 | | | 17.30 | | | | 0.29 | | | | (1.02 | ) | | | (0.73 | ) | | | (0.38 | ) | | | (1.75 | ) | | | | |
9/30/2018 | | | 18.83 | | | | 0.30 | | | | 0.68 | | | | 0.98 | | | | (0.62 | ) | | | (1.89 | ) | | | | |
9/30/2017 | | | 15.62 | | | | 0.19 | | | | 3.12 | | | | 3.31 | | | | — | | | | (0.10 | ) | | | | |
9/30/2016 | | | 14.60 | | | | 0.28 | | | | 0.89 | | | | 1.17 | | | | (0.15 | ) | | | — | | | | | |
12/1/2014 - 9/30/2015# | | | 16.57 | | | | 0.52 | | | | (1.65 | ) | | | (1.13 | ) | | | (0.43 | ) | | | (0.41 | ) | | | | |
9/2/2014* - 11/30/2014 | | | 16.51 | | | | 0.05 | | | | 0.01 | | | | 0.06 | | | | — | | | | — | | | | | |
| Class C | | | | | | | | | | | | | | | | | | | | | | | | | | | | |
3/31/2020† | | $ | 14.39 | | | $ | 0.05 | | | $ | (1.79 | ) | | $ | (1.74 | ) | | $ | (0.64 | ) | | $ | (1.69 | ) | | | | |
9/30/2019 | | | 16.90 | | | | 0.18 | | | | (0.94 | ) | | | (0.76 | ) | | �� | — | | | | (1.75 | ) | | | | |
9/30/2018 | | | 18.51 | | | | 0.16 | | | | 0.68 | | | | 0.84 | | | | (0.56 | ) | | | (1.89 | ) | | | | |
9/30/2017 | | | 15.61 | | | | 0.27 | | | | 2.91 | | | | 3.18 | | | | (0.18 | ) | | | (0.10 | ) | | | | |
4/26/2016* - 9/30/2016 | | | 15.29 | | | | 0.11 | | | | 0.21 | | | | 0.32 | | | | — | | | | — | | | | | |
| Class P | | | | | | | | | | | | | | | | | | | | | | | | | | | | |
3/31/2020† | | $ | 14.47 | | | $ | 0.11 | | | $ | (1.79 | ) | | $ | (1.68 | ) | | $ | (0.77 | ) | | $ | (1.69 | ) | | | | |
9/30/2019 | | | 17.31 | | | | 0.31 | | | | (1.00 | ) | | | (0.69 | ) | | | (0.40 | ) | | | (1.75 | ) | | | | |
9/30/2018 | | | 18.82 | | | | 0.32 | | | | 0.69 | | | | 1.01 | | | | (0.63 | ) | | | (1.89 | ) | | | | |
9/30/2017 | | | 15.79 | | | | 0.36 | | | | 3.01 | | | | 3.37 | | | | (0.24 | ) | | | (0.10 | ) | | | | |
9/30/2016 | | | 14.68 | | | | 0.32 | | | | 0.89 | | | | 1.21 | | | | (0.10 | ) | | | — | | | | | |
12/22/2014* - 9/30/2015# | | | 15.68 | | | | 0.27 | | | | (1.27 | ) | | | (1.00 | ) | | | — | | | | — | | | | | |
| Institutional Class | | | | | | | | | | | | | | | | | | | | | | | | | | | | |
3/31/2020† | | $ | 14.26 | | | $ | 0.11 | | | $ | (1.74 | ) | | $ | (1.63 | ) | | $ | (0.78 | ) | | $ | (1.69 | ) | | | | |
9/30/2019 | | | 17.15 | | | | 0.30 | | | | (0.98 | ) | | | (0.68 | ) | | | (0.46 | ) | | | (1.75 | ) | | | | |
9/30/2018 | | | 18.68 | | | | 0.35 | | | | 0.67 | | | | 1.02 | | | | (0.66 | ) | | | (1.89 | ) | | | | |
9/30/2017 | | | 15.68 | | | | 0.36 | | | | 3.01 | | | | 3.37 | | | | (0.27 | ) | | | (0.10 | ) | | | | |
9/30/2016 | | | 14.63 | | | | 0.37 | | | | 0.84 | | | | 1.21 | | | | (0.16 | ) | | | — | | | | | |
12/1/2014 - 9/30/2015# | | | 16.58 | | | | 0.28 | | | | (1.38 | ) | | | (1.10 | ) | | | (0.44 | ) | | | (0.41 | ) | | | | |
9/2/2014* - 11/30/2014 | | | 16.51 | | | | 0.06 | | | | 0.01 | | | | 0.07 | | | | — | | | | — | | | | | |
| Class R6 | | | | | | | | | | | | | | | | | | | | | | | | | | | | |
3/31/2020† | | $ | 14.39 | | | $ | 0.11 | | | $ | (1.78 | ) | | $ | (1.67 | ) | | $ | (0.72 | ) | | $ | (1.69 | ) | | | | |
9/30/2019 | | | 17.28 | | | | 0.33 | | | | (1.01 | ) | | | (0.68 | ) | | | (0.46 | ) | | | (1.75 | ) | | | | |
9/30/2018 | | | 18.79 | | | | 0.35 | | | | 0.67 | | | | 1.02 | | | | (0.64 | ) | | | (1.89 | ) | | | | |
9/30/2017 | | | 15.78 | | | | 0.37 | | | | 3.02 | | | | 3.39 | | | | (0.28 | ) | | | (0.10 | ) | | | | |
9/30/2016 | | | 14.70 | | | | 0.37 | | | | 0.86 | | | | 1.23 | | | | (0.15 | ) | | | — | | | | | |
12/1/2014 - 9/30/2015# | | | 16.58 | | | | 0.31 | | | | (1.40 | ) | | | (1.09 | ) | | | (0.38 | ) | | | (0.41 | ) | | | | |
12/2/2013* - 11/30/2014 | | | 15.00 | | | | 0.38 | | | | 1.20 | | | | 1.58 | | | | — | | | | — | | | | | |
| ^ | A “—” may reflect actual amounts rounding to less than $0.01 or 0.01%. |
| # | Fiscal year end changed from November 30th to September 30th. |
| * | Commencement of operations. |
| (a) | Calculated on average shares outstanding during the period. |
| | | | | | |
| 252 | | Semiannual Report | | | March 31, 2020 | | | See accompanying Notes to Financial Statements |
| | | | | | | | | | | | | | | | | | | | | | | | | | | | | | | | | | |
| | | | Total
Dividends and
Distributions | | | Net Asset
Value, End
of Period | | | Total Return (b) | | | Net Assets,
End of Period
(000s) | | | Ratio of
Expenses to
Average Net
Assets with
Fee Waiver/
Reimbursement | | | Ratio of
Expenses to
Average Net
Assets without
Fee Waiver/
Reimbursement | | | Ratio of Net
Investment
Income
to Average
Net Assets | | | Portfolio
Turnover Rate | |
| | | | | | | | | | | | | | | | | | | | | | | | | | |
| | | | | | | | | | | | | | | | | | | | | | | | | | | | | | | | | | |
| | | | | $ | (2.42 | ) | | $ | 10.33 | | | | (15.49 | )% | | $ | 726 | | | | 0.70 | %(c)(d) | | | 0.97 | %(c)(d) | | | 1.37 | %(c)(d) | | | 56 | % |
| | | | | | (2.13 | ) | | | 14.44 | | | | (2.23 | ) | | | 1,067 | | | | 0.70 | (c) | | | 0.77 | (c) | | | 2.00 | (c) | | | 33 | |
| | | | | | (2.51 | ) | | | 17.30 | | | | 5.33 | | | | 1,255 | | | | 0.70 | (c) | | | 0.75 | (c) | | | 1.71 | (c) | | | 87 | |
| | | | | | (0.10 | ) | | | 18.83 | | | | 21.29 | | | | 1,317 | | | | 0.74 | (c) | | | 1.07 | (c) | | | 1.15 | (c) | | | 81 | (e) |
| | | | | | (0.15 | ) | | | 15.62 | | | | 8.09 | | | | 36,257 | | | | 0.75 | | | | 0.79 | | | | 1.88 | | | | 70 | |
| | | | | | (0.84 | ) | | | 14.60 | | | | (7.13 | ) | | | 32,383 | | | | 0.75 | (d)(f) | | | 1.22 | (d)(f) | | | 4.64 | (d)(f) | | | 35 | |
| | | | | | — | | | | 16.57 | | | | 0.36 | | | | 10 | | | | 0.75 | (d) | | | 2.53 | (d) | | | 1.31 | (d) | | | 76 | |
| | | | | | | | | | | | | | | | | | | | | | | | | | | | | | | | | | |
| | | | | $ | (2.33 | ) | | $ | 10.32 | | | | (15.74 | )% | | $ | 15 | | | | 1.40 | %(c)(d) | | | 1.70 | %(c)(d) | | | 0.72 | %(c)(d) | | | 56 | % |
| | | | | | (1.75 | ) | | | 14.39 | | | | (2.87 | ) | | | 18 | | | | 1.40 | (c) | | | 1.47 | (c) | | | 1.22 | (c) | | | 33 | |
| | | | | | (2.45 | ) | | | 16.90 | | | | 4.57 | | | | 41 | | | | 1.40 | (c) | | | 1.49 | (c) | | | 0.89 | (c) | | | 87 | |
| | | | | | (0.28 | ) | | | 18.51 | | | | 20.68 | | | | 102 | | | | 1.40 | (c) | | | 1.44 | (c) | | | 1.62 | (c) | | | 81 | (e) |
| | | | | | — | | | | 15.61 | | | | 2.09 | | | | 10 | | | | 1.49 | (d) | | | 1.49 | (d) | | | 1.68 | (d) | | | 70 | |
| | | | | | | | | | | | | | | | | | | | | | | | | | | | | | | | | | |
| | | | | $ | (2.46 | ) | | $ | 10.33 | | | | (15.44 | )% | | $ | 441 | | | | 0.50 | %(c)(d) | | | 0.69 | %(c)(d) | | | 1.58 | %(c)(d) | | | 56 | % |
| | | | | | (2.15 | ) | | | 14.47 | | | | (2.00 | ) | | | 691 | | | | 0.50 | (c) | | | 0.53 | (c) | | | 2.07 | (c) | | | 33 | |
| | | | | | (2.52 | ) | | | 17.31 | | | | 5.52 | | | | 1,868 | | | | 0.50 | (c) | | | 0.52 | (c) | | | 1.83 | (c) | | | 87 | |
| | | | | | (0.34 | ) | | | 18.82 | | | | 21.72 | | | | 2,835 | | | | 0.53 | (c) | | | 0.56 | (c) | | | 2.09 | (c) | | | 81 | (e) |
| | | | | | (0.10 | ) | | | 15.79 | | | | 8.28 | | | | 2,851 | | | | 0.60 | | | | 0.62 | | | | 2.13 | | | | 70 | |
| | | | | | — | | | | 14.68 | | | | (6.35 | ) | | | 4,069 | | | | 0.61 | (d)(f) | | | 0.69 | (d)(f) | | | 2.20 | (d)(f) | | | 35 | |
| | | | | | | | | | | | | | | | | | | | | | | | | | | | | | | | | | |
| | | | | $ | (2.47 | ) | | $ | 10.16 | | | | (15.33 | )% | | $ | 382 | | | | 0.40 | %(c)(d) | | | 0.69 | %(c)(d) | | | 1.67 | %(c)(d) | | | 56 | % |
| | | | | | (2.21 | ) | | | 14.26 | | | | (1.88 | ) | | | 575 | | | | 0.40 | (c) | | | 0.52 | (c) | | | 2.01 | (c) | | | 33 | |
| | | | | | (2.55 | ) | | | 17.15 | | | | 5.63 | | | | 2,386 | | | | 0.40 | (c) | | | 0.49 | (c) | | | 2.01 | (c) | | | 87 | |
| | | | | | (0.37 | ) | | | 18.68 | | | | 21.88 | | | | 2,323 | | | | 0.42 | (c) | | | 0.54 | (c) | | | 2.15 | (c) | | | 81 | (e) |
| | | | | | (0.16 | ) | | | 15.68 | | | | 8.31 | | | | 2,390 | | | | 0.50 | | | | 0.51 | | | | 2.44 | | | | 70 | |
| | | | | | (0.85 | ) | | | 14.63 | | | | (6.92 | ) | | | 366 | | | | 0.51 | (d)(f) | | | 0.68 | (d)(f) | | | 2.17 | (d)(f) | | | 35 | |
| | | | | | — | | | | 16.58 | | | | 0.42 | | | | 10 | | | | 0.50 | (d) | | | 2.27 | (d) | | | 1.56 | (d) | | | 76 | |
| | | | | | | | | | | | | | | | | | | | | | | | | | | | | | | | | | |
| | | | | $ | (2.41 | ) | | $ | 10.31 | | | | (15.38 | )% | | $ | 128,778 | | | | 0.40 | %(c)(d) | | | 0.59 | %(c)(d) | | | 1.58 | %(c)(d) | | | 56 | % |
| | | | | | (2.21 | ) | | | 14.39 | | | | (1.88 | ) | | | 359,256 | | | | 0.40 | (c) | | | 0.40 | (c) | | | 2.30 | (c) | | | 33 | |
| | | | | | (2.53 | ) | | | 17.28 | | | | 5.61 | | | | 519,259 | | | | 0.40 | (c) | | | 0.42 | (c) | | | 2.02 | (c) | | | 87 | |
| | | | | | (0.38 | ) | | | 18.79 | | | | 21.92 | | | | 594,634 | | | | 0.40 | (c) | | | 0.43 | (c) | | | 2.20 | (c) | | | 81 | (e) |
| | | | | | (0.15 | ) | | | 15.78 | | | | 8.41 | | | | 560,066 | | | | 0.40 | | | | 0.49 | | | | 2.42 | | | | 70 | |
| | | | | | (0.79 | ) | | | 14.70 | | | | (6.83 | ) | | | 250,203 | | | | 0.40 | (d)(f) | | | 0.70 | (d)(f) | | | 2.39 | (d)(f) | | | 35 | |
| | | | | | — | | | | 16.58 | | | | 10.53 | | | | 33,422 | | | | 0.40 | (d) | | | 1.80 | (d) | | | 2.40 | (d) | | | 76 | |
| | (b) | Total return is calculated assuming a purchase of a share on the first day of the period and a sale of a share on the last day of each period reported. Dividends and distributions, if any, are assumed, for purposes of this calculation, to be reinvested. Total return does not reflect sales charges and includes the effect of fee waivers and reimbursements. Total return may reflect adjustments to conform to U.S. GAAP. Total return for a period of less than one year is not annualized. |
| | (c) | Does not include expenses of the investment companies in which the Fund invests. |
| | (d) | Annualized, unless otherwise noted. |
| | (e) | Portfolio turnover rate excludes securities received or delivered from in-kind fund share transactions. |
| | (f) | Certain expenses incurred by the Fund were not annualized. |
| | | | | | | | |
| See accompanying Notes to Financial Statements | | | March 31, 2020 | | | Semiannual Report | | | 253 | |
Financial Highlights (cont’d)
For a Share Outstanding for the Period ended:^
| | | | | | | | | | | | | | | | | | | | | | | | | | | | |
| | | Net Asset
Value,
Beginning
of Period | | | Net
Investment
Income (a) | | | Net Realized
and Change
in Unrealized
Gain (Loss) | | | Total from
Investment
Operations | | |
Dividends
from Net
Investment
Income | | | Distributions
from Net
Realized Capital
Gains | | | | |
| AllianzGI Best Styles U.S. Equity: | | | | | | | | | | | | | | | | | | | | | |
| Class A | | | | | | | | | | | | | | | | | | | | | | | | | | | | |
3/31/2020† | | $ | 16.21 | | | $ | 0.10 | | | $ | (1.50 | ) | | $ | (1.40 | ) | | $ | (0.60 | ) | | $ | (3.50 | ) | | | | |
9/30/2019 | | | 20.49 | | | | 0.25 | | | | (0.81 | ) | | | (0.56 | ) | | | (0.39 | ) | | | (3.33 | ) | | | | |
9/30/2018 | | | 18.42 | | | | 0.23 | | | | 2.81 | | | | 3.04 | | | | (0.13 | ) | | | (0.84 | ) | | | | |
9/30/2017 | | | 15.47 | | | | 0.25 | | | | 2.93 | | | | 3.18 | | | | (0.23 | ) | | | — | | | | | |
4/26/2016* - 9/30/2016 | | | 14.91 | | | | 0.11 | | | | 0.45 | | | | 0.56 | | | | — | | | | — | | | | | |
| Class C | | | | | | | | | | | | | | | | | | | | | | | | | | | | |
3/31/2020† | | $ | 15.66 | | | $ | 0.04 | | | $ | (1.45 | ) | | $ | (1.41 | ) | | $ | (0.39 | ) | | $ | (3.50 | ) | | | | |
9/30/2019 | | | 19.98 | | | | 0.13 | | | | (0.80 | ) | | | (0.67 | ) | | | (0.32 | ) | | | (3.33 | ) | | | | |
9/30/2018 | | | 18.24 | | | | 0.11 | | | | 2.74 | | | | 2.85 | | | | (0.27 | ) | | | (0.84 | ) | | | | |
9/30/2017 | | | 15.42 | | | | 0.12 | | | | 2.92 | | | | 3.04 | | | | (0.22 | ) | | | — | | | | | |
4/26/2016* - 9/30/2016 | | | 14.91 | | | | 0.06 | | | | 0.45 | | | | 0.51 | | | | — | | | | — | | | | | |
| Class P | | | | | | | | | | | | | | | | | | | | | | | | | | | | |
3/31/2020† | | $ | 16.08 | | | $ | 0.11 | | | $ | (1.48 | ) | | $ | (1.37 | ) | | $ | (0.62 | ) | | $ | (3.50 | ) | | | | |
9/30/2019 | | | 20.29 | | | | 0.29 | | | | (0.81 | ) | | | (0.52 | ) | | | (0.36 | ) | | | (3.33 | ) | | | | |
9/30/2018 | | | 18.45 | | | | 0.28 | | | | 2.77 | | | | 3.05 | | | | (0.37 | ) | | | (0.84 | ) | | | | |
9/30/2017 | | | 15.46 | | | | 0.28 | | | | 2.94 | | | | 3.22 | | | | (0.23 | ) | | | — | | | | | |
9/30/2016 | | | 14.19 | | | | 0.24 | | | | 1.30 | | | | 1.54 | | | | (0.22 | ) | | | (0.05 | ) | | | | |
12/1/2014* - 9/30/2015# | | | 15.00 | | | | 0.18 | | | | (0.97 | ) | | | (0.79 | ) | | | (0.02 | ) | | | — | | | | | |
| Institutional Class | | | | | | | | | | | | | | | | | | | | | | | | | | | | |
3/31/2020† | | $ | 16.14 | | | $ | 0.12 | | | $ | (1.49 | ) | | $ | (1.37 | ) | | $ | (0.65 | ) | | $ | (3.50 | ) | | | | |
9/30/2019 | | | 20.36 | | | | 0.30 | | | | (0.82 | ) | | | (0.52 | ) | | | (0.37 | ) | | | (3.33 | ) | | | | |
9/30/2018 | | | 18.48 | | | | 0.28 | | | | 2.78 | | | | 3.06 | | | | (0.34 | ) | | | (0.84 | ) | | | | |
9/30/2017 | | | 15.49 | | | | 0.28 | | | | 2.94 | | | | 3.22 | | | | (0.23 | ) | | | — | | | | | |
9/30/2016 | | | 14.20 | | | | 0.25 | | | | 1.32 | | | | 1.57 | | | | (0.23 | ) | | | (0.05 | ) | | | | |
12/1/2014* - 9/30/2015# | | | 15.00 | | | | 0.18 | | | | (0.96 | ) | | | (0.78 | ) | | | (0.02 | ) | | | — | | | | | |
| Class R6 | | | | | | | | | | | | | | | | | | | | | | | | | | | | |
3/31/2020† | | $ | 16.25 | | | $ | 0.12 | | | $ | (1.52 | ) | | $ | (1.40 | ) | | $ | (0.55 | ) | | $ | (3.50 | ) | | | | |
9/30/2019 | | | 20.46 | | | | 0.30 | | | | (0.81 | ) | | | (0.51 | ) | | | (0.37 | ) | | | (3.33 | ) | | | | |
9/30/2018 | | | 18.56 | | | | 0.31 | | | | 2.78 | | | | 3.09 | | | | (0.35 | ) | | | (0.84 | ) | | | | |
9/30/2017 | | | 15.53 | | | | 0.30 | | | | 2.97 | | | | 3.27 | | | | (0.24 | ) | | | — | | | | | |
9/30/2016 | | | 14.21 | | | | 0.27 | | | | 1.31 | | | | 1.58 | | | | (0.21 | ) | | | (0.05 | ) | | | | |
12/1/2014* - 9/30/2015# | | | 15.00 | | | | 0.20 | | | | (0.97 | ) | | | (0.77 | ) | | | (0.02 | ) | | | — | | | | | |
| ^ | A “—” may reflect actual amounts rounding to less than $0.01 or 0.01%. |
| * | Commencement of operations. |
| # | Fiscal year end changed from November 30th to September 30th. |
| (a) | Calculated on average shares outstanding during the period. |
| (b) | Total return is calculated assuming a purchase of a share on the first day of the period and a sale of a share on the last day of each period reported. Dividends and distributions, if any, are assumed, for purposes of this calculation, to be reinvested. Total return does not reflect sales charges and includes the effect of fee waivers and reimbursements. Total return may reflect adjustments to conform to U.S. GAAP. Total return for a period of less than one year is not annualized. |
| (c) | Annualized, unless otherwise noted. |
| (d) | Portfolio turnover rate excludes securities received or delivered from in-kind fund share transactions. |
| (e) | Certain expenses incurred by the Fund were not annualized. |
| | | | | | |
| 254 | | Semiannual Report | | | March 31, 2020 | | | See accompanying Notes to Financial Statements |
| | | | | | | | | | | | | | | | | | | | | | | | | | | | | | | | | | |
| | | | Total
Dividends and
Distributions | | | Net Asset
Value, End
of Period | | | Total Return (b) | | | Net Assets,
End of Period
(000s) | | | Ratio of
Expenses to
Average Net
Assets with
Fee Waiver/
Reimbursement | | | Ratio of
Expenses to
Average Net
Assets without
Fee Waiver/
Reimbursement | | | Ratio of Net
Investment
Income
to Average
Net Assets | | | Portfolio
Turnover Rate | |
| | | | | | | | | | | | | | | | | | | | | | | | | | |
| | | | | | | | | | | | | | | | | | | | | | | | | | | | | | | | | | |
| | | | | $ | (4.10 | ) | | $ | 10.71 | | | | (13.84 | )% | | $ | 963 | | | | 0.65 | %(c) | | | 1.29 | %(c) | | | 1.39 | %(c) | | | 46 | % |
| | | | | | (3.72 | ) | | | 16.21 | | | | 0.70 | | | | 1,105 | | | | 0.65 | | | | 0.95 | | | | 1.54 | | | | 33 | |
| | | | | | (0.97 | ) | | | 20.49 | | | | 16.96 | | | | 353 | | | | 0.65 | | | | 0.76 | | | | 1.17 | | | | 80 | |
| | | | | | (0.23 | ) | | | 18.42 | | | | 20.80 | | | | 46 | | | | 0.68 | | | | 1.02 | | | | 1.49 | | | | 55 | (d) |
| | | | | | — | | | | 15.47 | | | | 3.76 | | | | 47 | | | | 0.75 | (c) | | | 0.93 | (c) | | | 1.75 | (c) | | | 64 | |
| | | | | | | | | | | | | | | | | | | | | | | | | | | | | | | | | | |
| | | | | $ | (3.89 | ) | | $ | 10.36 | | | | (14.15 | )% | | $ | 39 | | | | 1.40 | %(c) | | | 2.04 | %(c) | | | 0.62 | %(c) | | | 46 | % |
| | | | | | (3.65 | ) | | | 15.66 | | | | (0.01 | ) | | | 74 | | | | 1.40 | | | | 1.72 | | | | 0.85 | | | | 33 | |
| | | | | | (1.11 | ) | | | 19.98 | | | | 16.14 | | | | 26 | | | | 1.40 | | | | 1.53 | | | | 0.58 | | | | 80 | |
| | | | | | (0.22 | ) | | | 18.24 | | | | 19.92 | | | | 20 | | | | 1.42 | | | | 1.56 | | | | 0.74 | | | | 55 | (d) |
| | | | | | — | | | | 15.42 | | | | 3.42 | | | | 10 | | | | 1.50 | (c) | | | 1.61 | (c) | | | 0.88 | (c) | | | 64 | |
| | | | | | | | | | | | | | | | | | | | | | | | | | | | | | | | | | |
| | | | | $ | (4.12 | ) | | $ | 10.59 | | | | (13.77 | )% | | $ | 165 | | | | 0.50 | %(c) | | | 1.01 | %(c) | | | 1.53 | %(c) | | | 46 | % |
| | | | | | (3.69 | ) | | | 16.08 | | | | 0.91 | | | | 274 | | | | 0.50 | | | | 0.79 | | | | 1.74 | | | | 33 | |
| | | | | | (1.21 | ) | | | 20.29 | | | | 17.12 | | | | 672 | | | | 0.50 | | | | 0.56 | | | | 1.43 | | | | 80 | |
| | | | | | (0.23 | ) | | | 18.45 | | | | 21.07 | | | | 476 | | | | 0.51 | | | | 0.57 | | | | 1.62 | | | | 55 | (d) |
| | | | | | (0.27 | ) | | | 15.46 | | | | 10.95 | | | | 54 | | | | 0.60 | | | | 0.71 | | | | 1.63 | | | | 64 | |
| | | | | | (0.02 | ) | | | 14.19 | | | | (5.27 | ) | | | 25 | | | | 0.60 | (c)(e) | | | 1.32 | (c)(e) | | | 1.40 | (c)(e) | | | 51 | |
| | | | | | | | | | | | | | | | | | | | | | | | | | | | | | | | | | |
| | | | | $ | (4.15 | ) | | $ | 10.62 | | | | (13.74 | )% | | $ | 19 | | | | 0.40 | %(c) | | | 0.92 | %(c) | | | 1.62 | %(c) | | | 46 | % |
| | | | | | (3.70 | ) | | | 16.14 | | | | 0.96 | | | | 72 | | | | 0.45 | | | | 0.60 | | | | 1.79 | | | | 33 | |
| | | | | | (1.18 | ) | | | 20.36 | | | | 17.17 | | | | 138 | | | | 0.50 | | | | 0.51 | | | | 1.45 | | | | 80 | |
| | | | | | (0.23 | ) | | | 18.48 | | | | 21.04 | | | | 121 | | | | 0.50 | | | | 0.66 | | | | 1.64 | | | | 55 | (d) |
| | | | | | (0.28 | ) | | | 15.49 | | | | 11.20 | | | | 86 | | | | 0.50 | | | | 0.75 | | | | 1.72 | | | | 64 | |
| | | | | | (0.02 | ) | | | 14.20 | | | | (5.20 | ) | | | 1,771 | | | | 0.50 | (c)(e) | | | 1.45 | (c)(e) | | | 1.51 | (c)(e) | | | 51 | |
| | | | | | | | | | | | | | | | | | | | | | | | | | | | | | | | | | |
| | | | | $ | (4.05 | ) | | $ | 10.80 | | | | (13.70 | )% | | $ | 28,635 | | | | 0.40 | %(c) | | | 0.91 | %(c) | | | 1.63 | %(c) | | | 46 | % |
| | | | | | (3.70 | ) | | | 16.25 | | | | 0.99 | | | | 49,618 | | | | 0.40 | | | | 0.59 | | | | 1.86 | | | | 33 | |
| | | | | | (1.19 | ) | | | 20.46 | | | | 17.25 | | | | 98,758 | | | | 0.40 | | | | 0.50 | | | | 1.59 | | | | 80 | |
| | | | | | (0.24 | ) | | | 18.56 | | | | 21.26 | | | | 113,074 | | | | 0.40 | | | | 0.56 | | | | 1.78 | | | | 55 | (d) |
| | | | | | (0.26 | ) | | | 15.53 | | | | 11.23 | | | | 100,878 | | | | 0.40 | | | | 0.62 | | | | 1.80 | | | | 64 | |
| | | | | | (0.02 | ) | | | 14.21 | | | | (5.12 | ) | | | 86,456 | | | | 0.40 | (c)(e) | | | 0.74 | (c)(e) | | | 1.63 | (c)(e) | | | 51 | |
| | | | | | | | |
| See accompanying Notes to Financial Statements | | | March 31, 2020 | | | Semiannual Report | | | 255 | |
Financial Highlights (cont’d)
For a Share Outstanding for the Period ended:^
| | | | | | | | | | | | | | | | | | | | | | | | | | | | |
| | | Net Asset
Value,
Beginning
of Period | | | Net
Investment
Income (a) | | | Net Realized
and Change
in Unrealized
Gain (Loss) | | | Total from
Investment
Operations | | |
Dividends
from Net
Investment
Income | | | Distributions
from Net
Realized Capital
Gains | | | | |
| AllianzGI Convertible: | | | | | | | | | | | | | | | | | | | | | |
| Class A | | | | | | | | | | | | | | | | | | | | | | | | | | | | |
3/31/2020† | | $ | 29.25 | | | $ | 0.14 | | | $ | (1.41 | ) | | $ | (1.27 | ) | | $ | (0.33 | ) | | $ | (0.91 | ) | | | | |
9/30/2019 | | | 32.78 | | | | 0.29 | | | | 0.63 | | | | 0.92 | | | | (0.90 | ) | | | (3.55 | ) | | | | |
9/30/2018 | | | 34.27 | | | | 0.32 | | | | 4.58 | | | | 4.90 | | | | (1.30 | ) | | | (5.09 | ) | | | | |
9/30/2017 | | | 31.02 | | | | 0.38 | | | | 3.64 | | | | 4.02 | | | | (0.77 | ) | | | — | | | | | |
9/30/2016 | | | 32.13 | | | | 0.64 | | | | 1.29 | | | | 1.93 | | | | (0.53 | ) | | | (2.51 | ) | | | | |
12/1/2014 - 9/30/2015# | | | 36.54 | | | | 0.31 | | | | (1.88 | ) | | | (1.57 | ) | | | (0.55 | ) | | | (2.29 | ) | | | | |
11/30/2014 | | | 34.91 | | | | 0.39 | | | | 2.81 | | | | 3.20 | | | | (0.73 | ) | | | (0.84 | ) | | | | |
| Class C | | | | | | | | | | | | | | | | | | | | | | | | | | | | |
3/31/2020† | | $ | 29.61 | | | $ | 0.02 | | | $ | (1.43 | ) | | $ | (1.41 | ) | | $ | (0.10 | ) | | $ | (0.91 | ) | | | | |
9/30/2019 | | | 32.95 | | | | 0.08 | | | | 0.67 | | | | 0.75 | | | | (0.54 | ) | | | (3.55 | ) | | | | |
9/30/2018 | | | 34.36 | | | | 0.08 | | | | 4.59 | | | | 4.67 | | | | (0.99 | ) | | | (5.09 | ) | | | | |
9/30/2017 | | | 31.19 | | | | 0.17 | | | | 3.65 | | | | 3.82 | | | | (0.65 | ) | | | — | | | | | |
9/30/2016 | | | 32.20 | | | | 0.42 | | | | 1.30 | | | | 1.72 | | | | (0.22 | ) | | | (2.51 | ) | | | | |
12/1/2014 - 9/30/2015# | | | 36.55 | | | | 0.10 | | | | (1.88 | ) | | | (1.78 | ) | | | (0.28 | ) | | | (2.29 | ) | | | | |
11/30/2014 | | | 34.93 | | | | 0.13 | | | | 2.80 | | | | 2.93 | | | | (0.47 | ) | | | (0.84 | ) | | | | |
| Class R | | | | | | | | | | | | | | | | | | | | | | | | | | | | |
3/31/2020† | | $ | 30.43 | | | $ | 0.10 | | | $ | (1.47 | ) | | $ | (1.37 | ) | | $ | (0.27 | ) | | $ | (0.91 | ) | | | | |
9/30/2019 | | | 33.92 | | | | 0.26 | | | | 0.66 | | | | 0.92 | | | | (0.86 | ) | | | (3.55 | ) | | | | |
9/30/2018 | | | 34.19 | | | | 0.27 | | | | 4.70 | | | | 4.97 | | | | (0.15 | ) | | | (5.09 | ) | | | | |
9/30/2017 | | | 30.97 | | | | 0.26 | | | | 3.64 | | | | 3.90 | | | | (0.68 | ) | | | — | | | | | |
9/30/2016 | | | 32.08 | | | | 0.52 | | | | 1.27 | | | | 1.79 | | | | (0.39 | ) | | | (2.51 | ) | | | | |
12/1/2014 - 9/30/2015# | | | 36.45 | | | | 0.20 | | | | (1.87 | ) | | | (1.67 | ) | | | (0.41 | ) | | | (2.29 | ) | | | | |
11/30/2014 | | | 34.87 | | | | 0.26 | | | | 2.81 | | | | 3.07 | | | | (0.65 | ) | | | (0.84 | ) | | | | |
| Class P | | | | | | | | | | | | | | | | | | | | | | | | | | | | |
3/31/2020† | | $ | 28.45 | | | $ | 0.17 | | | $ | (1.37 | ) | | $ | (1.20 | ) | | $ | (0.43 | ) | | $ | (0.91 | ) | | | | |
9/30/2019 | | | 32.12 | | | | 0.35 | | | | 0.60 | | | | 0.95 | | | | (1.07 | ) | | | (3.55 | ) | | | | |
9/30/2018 | | | 33.95 | | | | 0.38 | | | | 4.50 | | | | 4.88 | | | | (1.62 | ) | | | (5.09 | ) | | | | |
9/30/2017 | | | 30.84 | | | | 0.48 | | | | 3.61 | | | | 4.09 | | | | (0.98 | ) | | | — | | | | | |
9/30/2016 | | | 32.07 | | | | 0.72 | | | | 1.27 | | | | 1.99 | | | | (0.71 | ) | | | (2.51 | ) | | | | |
12/1/2014 - 9/30/2015# | | | 36.47 | | | | 0.39 | | | | (1.87 | ) | | | (1.48 | ) | | | (0.63 | ) | | | (2.29 | ) | | | | |
11/30/2014 | | | 34.84 | | | | 0.47 | | | | 2.80 | | | | 3.27 | | | | (0.80 | ) | | | (0.84 | ) | | | | |
| Institutional Class | | | | | | | | | | | | | | | | | | | | | | | | | | | | |
3/31/2020† | | $ | 28.76 | | | $ | 0.17 | | | $ | (1.38 | ) | | $ | (1.21 | ) | | $ | (0.41 | ) | | $ | (0.91 | ) | | | | |
9/30/2019 | | | 32.41 | | | | 0.37 | | | | 0.61 | | | | 0.98 | | | | (1.08 | ) | | | (3.55 | ) | | | | |
9/30/2018 | | | 33.89 | | | | 0.40 | | | | 4.52 | | | | 4.92 | | | | (1.31 | ) | | | (5.09 | ) | | | | |
9/30/2017 | | | 30.76 | | | | 0.49 | | | | 3.61 | | | | 4.10 | | | | (0.97 | ) | | | — | | | | | |
9/30/2016 | | | 32.02 | | | | 0.74 | | | | 1.26 | | | | 2.00 | | | | (0.75 | ) | | | (2.51 | ) | | | | |
12/1/2014 - 9/30/2015# | | | 36.42 | | | | 0.40 | | | | (1.86 | ) | | | (1.46 | ) | | | (0.65 | ) | | | (2.29 | ) | | | | |
11/30/2014 | | | 34.80 | | | | 0.50 | | | | 2.79 | | | | 3.29 | | | | (0.83 | ) | | | (0.84 | ) | | | | |
| Administrative Class | | | | | | | | | | | | | | | | | | | | | | | | | | | | |
3/31/2020† | | $ | 28.95 | | | $ | 0.14 | | | $ | (1.39 | ) | | $ | (1.25 | ) | | $ | (0.30 | ) | | $ | (0.91 | ) | | | | |
9/30/2019 | | | 32.46 | | | | 0.30 | | | | 0.61 | | | | 0.91 | | | | (0.87 | ) | | | (3.55 | ) | | | | |
9/30/2018 | | | 34.08 | | | | 0.33 | | | | 4.54 | | | | 4.87 | | | | (1.40 | ) | | | (5.09 | ) | | | | |
9/30/2017 | | | 30.96 | | | | 0.42 | | | | 3.62 | | | | 4.04 | | | | (0.92 | ) | | | — | | | | | |
9/30/2016 | | | 32.14 | | | | 0.66 | | | | 1.29 | | | | 1.95 | | | | (0.62 | ) | | | (2.51 | ) | | | | |
12/1/2014 - 9/30/2015# | | | 36.54 | | | | 0.33 | | | | (1.88 | ) | | | (1.55 | ) | | | (0.56 | ) | | | (2.29 | ) | | | | |
11/30/2014 | | | 34.84 | | | | 0.43 | | | | 2.79 | | | | 3.22 | | | | (0.68 | ) | | | (0.84 | ) | | | | |
| ^ | A “—” may reflect actual amounts rounding to less than $0.01 or 0.01%. |
| # | Fiscal year end changed from November 30th to September 30th. |
| (a) | Calculated on average shares outstanding during the period. |
| | | | | | |
| 256 | | Semiannual Report | | | March 31, 2020 | | | See accompanying Notes to Financial Statements |
| | | | | | | | | | | | | | | | | | | | | | | | | | | | | | | | | | |
| | | | Total
Dividends and
Distributions | | | Net Asset
Value, End
of Period | | | Total Return (b) | | | Net Assets,
End of Period
(000s) | | | Ratio of
Expenses to
Average Net
Assets with
Fee Waiver/
Reimbursement | | | Ratio of
Expenses to
Average Net
Assets without
Fee Waiver/
Reimbursement | | | Ratio of Net
Investment
Income
to Average
Net Assets | | | Portfolio
Turnover Rate | |
| | | | | | | | | | | | | | | | | | | | | | | | | | |
| | | | | | | | | | | | | | | | | | | | | | | | | | | | | | | | | | |
| | | | | $ | (1.24 | ) | | $ | 26.74 | | | | (4.80 | )% | | $ | 102,222 | | | | 0.96 | %(c) | | | 0.96 | %(c) | | | 0.92 | %(c) | | | 70 | % |
| | | | | | (4.45 | ) | | | 29.25 | | | | 5.29 | | | | 69,611 | | | | 1.02 | | | | 1.02 | | | | 0.99 | | | | 143 | |
| | | | | | (6.39 | ) | | | 32.78 | | | | 16.83 | | | | 61,385 | | | | — | | | | 0.96 | | | | 1.02 | | | | 133 | |
| | | | | | (0.77 | ) | | | 34.27 | | | | 13.14 | | | | 76,586 | | | | — | | | | 1.02 | | | | 1.19 | | | | 124 | (d) |
| | | | | | (3.04 | ) | | | 31.02 | | | | 6.42 | | | | 259,711 | | | | — | | | | 0.99 | | | | 2.12 | | | | 101 | |
| | | | | | (2.84 | ) | | | 32.13 | | | | (4.56 | ) | | | 465,080 | | | | — | (c)(e) | | | 0.98 | (c)(e) | | | 1.08 | (c)(e) | | | 73 | |
| | | | | | (1.57 | ) | | | 36.54 | (f) | | | 9.47 | (f) | | | 483,863 | | | | — | | | | 0.97 | | | | 1.09 | | | | 94 | |
| | | | | | | | | | | | | | | | | | | | | | | | | | | | | | | | | | |
| | | | | $ | (1.01 | ) | | $ | 27.19 | | | | (5.16 | )% | | $ | 64,759 | | | | 1.71 | %(c) | | | 1.71 | %(c) | | | 0.15 | %(c) | | | 70 | % |
| | | | | | (4.09 | ) | | | 29.61 | | | | 4.53 | | | | 60,434 | | | | 1.75 | | | | 1.75 | | | | 0.26 | | | | 143 | |
| | | | | | (6.08 | ) | | | 32.95 | | | | 15.90 | | | | 53,461 | | | | — | | | | 1.73 | | | | 0.24 | | | | 133 | |
| | | | | | (0.65 | ) | | | 34.36 | | | | 12.41 | | | | 48,905 | | | | — | | | | 1.69 | | | | 0.51 | | | | 124 | (d) |
| | | | | | (2.73 | ) | | | 31.19 | | | | 5.65 | | | | 67,423 | | | | — | | | | 1.71 | | | | 1.40 | | | | 101 | |
| | | | | | (2.57 | ) | | | 32.20 | | | | (5.11 | ) | | | 101,326 | | | | — | (c)(e) | | | 1.71 | (c)(e) | | | 0.34 | (c)(e) | | | 73 | |
| | | | | | (1.31 | ) | | | 36.55 | (f) | | | 8.66 | (f) | | | 127,201 | | | | — | | | | 1.70 | | | | 0.36 | | | | 94 | |
| | | | | | | | | | | | | | | | | | | | | | | | | | | | | | | | | | |
| | | | | $ | (1.18 | ) | | $ | 27.88 | | | | (4.93 | )% | | $ | 175 | | | | 1.23 | %(c) | | | 1.23 | %(c) | | | 0.62 | %(c) | | | 70 | % |
| | | | | | (4.41 | ) | | | 30.43 | | | | 5.12 | | | | 166 | | | | 1.17 | | | | 1.17 | | | | 0.87 | | | | 143 | |
| | | | | | (5.24 | ) | | | 33.92 | | | | 16.59 | | | | 98 | | | | — | | | | 1.17 | | | | 0.81 | | | | 133 | |
| | | | | | (0.68 | ) | | | 34.19 | | | | 12.79 | | | | 114 | | | | — | | | | 1.42 | | | | 0.82 | | | | 124(d | ) |
| | | | | | (2.90 | ) | | | 30.97 | | | | 5.95 | | | | 1,145 | | | | — | | | | 1.43 | | | | 1.73 | | | | 101 | |
| | | | | | (2.70 | ) | | | 32.08 | | | | (4.82 | ) | | | 1,592 | | | | — | (c)(e) | | | 1.36 | (c)(e) | | | 0.70 | (c)(e) | | | 73 | |
| | | | | | (1.49 | ) | | | 36.45 | (f) | | | 9.10 | (f) | | | 1,440 | | | | — | | | | 1.30 | | | | 0.74 | | | | 94 | |
| | | | | | | | | | | | | | | | | | | | | | | | | | | | | | | | | | |
| | | | | $ | (1.34 | ) | | $ | 25.91 | | | | (4.68 | )% | | $ | 210,358 | | | | 0.70 | %(c) | | | 0.70 | %(c) | | | 1.17 | %(c) | | | 70 | % |
| | | | | | (4.62 | ) | | | 28.45 | | | | 5.59 | | | | 155,601 | | | | 0.75 | | | | 0.75 | | | | 1.26 | | | | 143 | |
| | | | | | (6.71 | ) | | | 32.12 | | | | 17.08 | | | | 102,412 | | | | — | | | | 0.74 | | | | 1.24 | | | | 133 | |
| | | | | | (0.98 | ) | | | 33.95 | | | | 13.52 | | | | 80,392 | | | | — | | | | 0.72 | | | | 1.49 | | | | 124 | (d) |
| | | | | | (3.22 | ) | | | 30.84 | | | | 6.67 | | | | 88,900 | | | | — | | | | 0.73 | | | | 2.38 | | | | 101 | |
| | | | | | (2.92 | ) | | | 32.07 | | | | (4.32 | ) | | | 160,998 | | | | — | (c)(e) | | | 0.69 | (c)(e) | | | 1.36 | (c)(e) | | | 73 | |
| | | | | | (1.64 | ) | | | 36.47 | (f) | | | 9.71 | (f) | | | 224,860 | | | | — | | | | 0.74 | | | | 1.32 | | | | 94 | |
| | | | | | | | | | | | | | | | | | | | | | | | | | | | | | | | | | |
| | | | | $ | (1.32 | ) | | $ | 26.23 | | | | (4.70 | )% | | $ | 475,817 | | | | 0.69 | %(c) | | | 0.69 | %(c) | | | 1.18 | %(c) | | | 70 | % |
| | | | | | (4.63 | ) | | | 28.76 | | | | 5.62 | | | | 370,111 | | | | 0.72 | | | | 0.72 | | | | 1.29 | | | | 143 | |
| | | | | | (6.40 | ) | | | 32.41 | | | | 17.10 | | | | 332,874 | | | | — | | | | 0.71 | | | | 1.27 | | | | 133 | |
| | | | | | (0.97 | ) | | | 33.89 | | | | 13.58 | | | | 322,732 | | | | — | | | | 0.68 | | | | 1.54 | | | | 124 | (d) |
| | | | | | (3.26 | ) | | | 30.76 | | | | 6.73 | | | | 1,089,974 | | | | — | | | | 0.67 | | | | 2.47 | | | | 101 | |
| | | | | | (2.94 | ) | | | 32.02 | | | | (4.27 | ) | | | 1,428,098 | | | | — | (c)(e) | | | 0.66 | (c)(e) | | | 1.40 | (c)(e) | | | 73 | |
| | | | | | (1.67 | ) | | | 36.42 | (f) | | | 9.79 | (f) | | | 1,781,193 | | | | — | | | | 0.65 | | | | 1.41 | | | | 94 | |
| | | | | | | | | | | | | | | | | | | | | | | | | | | | | | | | | | |
| | | | | $ | (1.21 | ) | | $ | 26.49 | | | | (4.75 | )% | | $ | 740 | | | | 0.91 | %(c) | | | 0.91 | %(c) | | | 0.96 | %(c) | | | 70 | % |
| | | | | | (4.42 | ) | | | 28.95 | | | | 5.29 | | | | 550 | | | | 0.97 | | | | 0.97 | | | | 1.03 | | | | 143 | |
| | | | | | (6.49 | ) | | | 32.46 | | | | 16.88 | | | | 997 | | | | — | | | | 0.93 | | | | 1.05 | | | | 133 | |
| | | | | | (0.92 | ) | | | 34.08 | | | | 13.30 | | | | 1,240 | | | | — | | | | 0.89 | | | | 1.32 | | | | 124 | (d) |
| | | | | | (3.13 | ) | | | 30.96 | | | | 6.52 | | | | 1,428 | | | | — | | | | 0.90 | | | | 2.20 | | | | 101 | |
| | | | | | (2.85 | ) | | | 32.14 | | | | (4.49 | ) | | | 1,998 | | | | — | (c)(e) | | | 0.89 | (c)(e) | | | 1.15 | (c)(e) | | | 73 | |
| | | | | | (1.52 | ) | | | 36.54 | (f) | | | 9.57 | (f) | | | 3,783 | | | | — | | | | 0.89 | | | | 1.22 | | | | 94 | |
| | (b) | Total return is calculated assuming a purchase of a share on the first day of the period and a sale of a share on the last day of each period reported. Dividends and distributions, if any, are assumed, for purposes of this calculation, to be reinvested. Total return does not reflect sales charges and includes the effect of fee waivers and reimbursements. Total return may reflect adjustments to conform to U.S. GAAP. Total return for a period of less than one year is not annualized. |
| | (c) | Annualized, unless otherwise noted. |
| | (d) | Portfolio turnover rate excludes securities received or delivered from in-kind fund share transactions. |
| | (e) | Certain expenses incurred by the Fund were not annualized. |
| | (f) | Payments from Affiliates increased the end of period net asset value and total return by less than $0.01 and 0.01%, respectively. |
| | | | | | | | |
| See accompanying Notes to Financial Statements | | | March 31, 2020 | | | Semiannual Report | | | 257 | |
Financial Highlights (cont’d)
For a Share Outstanding for the Period ended:^
| | | | | | | | | | | | | | | | | | | | | | | | | | | | |
| | | Net Asset
Value,
Beginning
of Period | | | Net
Investment
Income (a) | | | Net Realized
and Change
in Unrealized
Gain (Loss) | | | Total from
Investment
Operations | | |
Dividends
from Net
Investment
Income | | | Distributions
from Net
Realized Capital
Gains | | | | |
| AllianzGI Core Bond: | | | | | | | | | | | | | | | | | | | | | |
| Class P | | | | | | | | | | | | | | | | | | | | | | | | | | | | |
3/31/2020† | | $ | 16.01 | | | $ | 0.18 | | | $ | 0.25 | | | $ | 0.43 | | | $ | (0.23 | ) | | $ | (0.76 | ) | | | | |
9/30/2019 | | | 14.91 | | | | 0.45 | | | | 1.11 | | | | 1.56 | | | | (0.46 | ) | | | — | | | | | |
5/30/2018* - 9/30/2018 | | | 15.00 | | | | 0.14 | | | | (0.12 | ) | | | 0.02 | | | | (0.11 | ) | | | — | | | | | |
| Institutional Class | | | | | | | | | | | | | | | | | | | | | | | | | | | | |
3/31/2020† | | $ | 16.00 | | | $ | 0.18 | | | $ | 0.27 | | | $ | 0.45 | | | $ | (0.24 | ) | | $ | (0.76 | ) | | | | |
9/30/2019 | | | 14.91 | | | | 0.46 | | | | 1.10 | | | | 1.56 | | | | (0.47 | ) | | | — | | | | | |
5/30/2018* - 9/30/2018 | | | 15.00 | | | | 0.14 | | | | (0.12 | ) | | | 0.02 | | | | (0.11 | ) | | | — | | | | | |
| Class R6 | | | | | | | | | | | | | | | | | | | | | | | | | | | | |
3/31/2020† | | $ | 16.00 | | | $ | 0.19 | | | $ | 0.26 | | | $ | 0.45 | | | $ | (0.24 | ) | | $ | (0.76 | ) | | | | |
9/30/2019 | | | 14.91 | | | | 0.47 | | | | 1.10 | | | | 1.57 | | | | (0.48 | ) | | | — | | | | | |
5/30/2018* - 9/30/2018 | | | 15.00 | | | | 0.14 | | | | (0.12 | ) | | | 0.02 | | | | (0.11 | ) | | | — | | | | | |
| AllianzGI Core Plus Bond: | | | | | | | | | | | | | | | | | | | | | |
| Class P | | | | | | | | | | | | | | | | | | | | | | | | | | | | |
3/31/2020† | | $ | 16.00 | | | $ | 0.20 | | | $ | (0.08 | ) | | $ | 0.12 | | | $ | (0.22 | ) | | $ | (0.57 | ) | | | | |
9/30/2019 | | | 14.92 | | | | 0.46 | | | | 1.06 | | | | 1.52 | | | | (0.44 | ) | | | — | | | | | |
5/30/2018* - 9/30/2018 | | | 15.00 | | | | 0.14 | | | | (0.11 | ) | | | 0.03 | | | | (0.11 | ) | | | — | | | | | |
| Institutional Class | | | | | | | | | | | | | | | | | | | | | | | | | | | | |
3/31/2020† | | $ | 16.00 | | | $ | 0.21 | | | $ | (0.10 | ) | | $ | 0.11 | | | $ | (0.22 | ) | | $ | (0.57 | ) | | | | |
9/30/2019 | | | 14.92 | | | | 0.47 | | | | 1.06 | | | | 1.53 | | | | (0.45 | ) | | | — | | | | | |
5/30/2018* - 9/30/2018 | | | 15.00 | | | | 0.14 | | | | (0.11 | ) | | | 0.03 | | | | (0.11 | ) | | | — | | | | | |
| Class R6 | | | | | | | | | | | | | | | | | | | | | | | | | | | | |
3/31/2020† | | $ | 16.00 | | | $ | 0.21 | | | $ | (0.09 | ) | | $ | 0.12 | | | $ | (0.23 | ) | | $ | (0.57 | ) | | | | |
9/30/2019 | | | 14.92 | | | | 0.48 | | | | 1.07 | | | | 1.55 | | | | (0.47 | ) | | | — | | | | | |
5/30/2018* - 9/30/2018 | | | 15.00 | | | | 0.15 | | | | (0.12 | ) | | | 0.03 | | | | (0.11 | ) | | | — | | | | | |
| ^ | A “—” may reflect actual amounts rounding to less than $0.01 or 0.01%. |
| * | Commencement of operations. |
| (a) | Calculated on average shares outstanding during the period. |
| (b) | Total return is calculated assuming a purchase of a share on the first day of the period and a sale of a share on the last day of each period reported. Dividends and distributions, if any, are assumed, for purposes of this calculation, to be reinvested. Total return does not reflect sales charges and includes the effect of fee waivers and reimbursements. Total return may reflect adjustments to conform to U.S. GAAP. Total return for a period of less than one year is not annualized. |
| (c) | Annualized, unless otherwise noted. |
| (d) | Certain expenses incurred by the Fund were not annualized. |
| (e) | Payments from Affiliates increased the end of period net asset value and total return by less than $0.01 and 0.01%, respectively. |
| | | | | | |
| 258 | | Semiannual Report | | | March 31, 2020 | | | See accompanying Notes to Financial Statements |
| | | | | | | | | | | | | | | | | | | | | | | | | | | | | | | | | | |
| | | | Total
Dividends and
Distributions | | | Net Asset
Value, End
of Period | | | Total Return (b) | | | Net Assets,
End of Period
(000s) | | | Ratio of
Expenses to
Average Net
Assets with
Fee Waiver/
Reimbursement | | | Ratio of
Expenses to
Average Net
Assets without
Fee Waiver/
Reimbursement | | | Ratio of Net
Investment
Income
to Average
Net Assets | | | Portfolio
Turnover Rate | |
| | | | | | | | | | | | | | | | | | | | | | | | | | |
| | | | | | | | | | | | | | | | | | | | | | | | | | | | | | | | | | |
| | | | | $ | (0.99 | ) | | $ | 15.45(e | ) | | | 2.84 | %(e) | | $ | 11 | | | | 0.30 | %(c) | | | 0.98 | %(c) | | | 2.32 | %(c) | | | 382 | % |
| | | | | | (0.46 | ) | | | 16.01 | | | | 10.64 | | | | 26 | | | | 0.30 | | | | 1.13 | | | | 2.90 | | | | 902 | |
| | | | | | (0.11 | ) | | | 14.91 | | | | 0.11 | | | | 10 | | | | 0.30 | (c)(d) | | | 1.45 | (c)(d) | | | 2.71 | (c)(d) | | | 305 | |
| | | | | | | | | | | | | | | | | | | | | | | | | | | | | | | | | | |
| | | | | $ | (1.00 | ) | | $ | 15.45 | (e) | | | 2.96 | %(e) | | $ | 61 | | | | 0.25 | %(c) | | | 1.00 | %(c) | | | 2.35 | %(c) | | | 382 | % |
| | | | | | (0.47 | ) | | | 16.00 | | | | 10.65 | | | | 51 | | | | 0.25 | | | | 7.46 | | | | 2.98 | | | | 902 | |
| | | | | | (0.11 | ) | | | 14.91 | | | | 0.13 | | | | 10 | | | | 0.25 | (c)(d) | | | 1.45 | (c)(d) | | | 2.76 | (c)(d) | | | 305 | |
| | | | | | | | | | | | | | | | | | | | | | | | | | | | | | | | | | |
| | | | | $ | (1.00 | ) | | $ | 15.45 | (e) | | | 2.99 | %(e) | | $ | 48,572 | | | | 0.20 | %(c) | | | 0.93 | %(c) | | | 2.41 | %(c) | | | 382 | % |
| | | | | | (0.48 | ) | | | 16.00 | | | | 10.73 | | | | 33,788 | | | | 0.20 | | | | 1.17 | | | | 3.03 | | | | 902 | |
| | | | | | (0.11 | ) | | | 14.91 | | | | 0.15 | | | | 29,356 | | | | 0.20 | (c)(d) | | | 1.47 | (c)(d) | | | 2.83 | (c)(d) | | | 305 | |
| | | | | | | | | | | | | | | | | | | | | | | | | | |
| | | | | | | | | | | | | | | | | | | | | | | | | | | | | | | | | | |
| | | | | $ | (0.79 | ) | | $ | 15.33 | | | | 0.77 | % | | $ | 11 | | | | 0.35 | %(c) | | | 0.70 | %(c) | | | 2.58 | %(c) | | | 296 | % |
| | | | | | (0.44 | ) | | | 16.00 | | | | 10.39 | | | | 11 | | | | 0.35 | | | | 0.93 | | | | 3.01 | | | | 864 | |
| | | | | | (0.11 | ) | | | 14.92 | | | | 0.18 | | | | 10 | | | | 0.35 | (c)(d) | | | 1.19 | (c)(d) | | | 2.81 | (c)(d) | | | 302 | |
| | | | | | | | | | | | | | | | | | | | | | | | | | | | | | | | | | |
| | | | | $ | (0.79 | ) | | $ | 15.32 | | | | 0.74 | % | | $ | 11 | | | | 0.30 | %(c) | | | 0.70 | %(c) | | | 2.63 | %(c) | | | 296 | % |
| | | | | | (0.45 | ) | | | 16.00 | | | | 10.47 | | | | 11 | | | | 0.30 | | | | 21.03 | | | | 3.06 | | | | 864 | |
| | | | | | (0.11 | ) | | | 14.92 | | | | 0.20 | | | | 10 | | | | 0.30 | (c)(d) | | | 1.19 | (c)(d) | | | 2.86 | (c)(d) | | | 302 | |
| | | | | | | | | | | | | | | | | | | | | | | | | | | | | | | | | | |
| | | | | $ | (0.80 | ) | | $ | 15.32 | | | | 0.76 | % | | $ | 55,954 | | | | 0.25 | %(c) | | | 0.74 | %(c) | | | 2.68 | %(c) | | | 296 | % |
| | | | | | (0.47 | ) | | | 16.00 | | | | 10.56 | | | | 59,419 | | | | 0.25 | | | | 0.94 | | | | 3.11 | | | | 864 | |
| | | | | | (0.11 | ) | | | 14.92 | | | | 0.22 | | | | 40,075 | | | | 0.25 | (c)(d) | | | 1.19 | (c)(d) | | | 2.91 | (c)(d) | | | 302 | |
| | | | | | | | |
| See accompanying Notes to Financial Statements | | | March 31, 2020 | | | Semiannual Report | | | 259 | |
Financial Highlights (cont’d)
For a Share Outstanding for the Period ended:^
| | | | | | | | | | | | | | | | | | | | | | | | | | | | |
| | | Net Asset
Value,
Beginning
of Period | | | Net
Investment
Income (a) | | |
Net Realized
and Change
in Unrealized
Gain (Loss) | | | Total from
Investment
Operations | | | Dividends
from Net
Investment
Income | | | Distributions
from Net
Realized Capital
Gains | | | | |
| AllianzGI Emerging Markets Consumer: | | | | | | | | | | | | | | | | | | | | | |
| Class A | | | | | | | | | | | | | | | | | | | | | | | | | | | | |
3/31/2020† | | $ | 13.51 | | | $ | 0.01 | | | $ | (1.78 | ) | | $ | (1.77 | ) | | $ | (0.10 | ) | | $ | — | | | | | |
9/30/2019 | | | 13.88 | | | | 0.12 | | | | (0.45 | ) | | | (0.33 | ) | | | (0.04 | ) | | | — | | | | | |
9/30/2018 | | | 15.76 | | | | 0.11 | | | | (1.11 | ) | | | (1.00 | ) | | | (0.26 | ) | | | (0.62 | ) | | | | |
9/30/2017 | | | 13.60 | | | | 0.21 | | | | 2.07 | | | | 2.28 | | | | (0.12 | ) | | | — | | | | | |
9/30/2016 | | | 12.24 | | | | 0.11 | | | | 1.31 | | | | 1.42 | | | | (0.06 | ) | | | — | | | | | |
12/1/2014* - 9/30/2015# | | | 15.00 | | | | 0.13 | | | | (2.89 | ) | | | (2.76 | ) | | | — | | | | — | | | | | |
| Institutional Class | | | | | | | | | | | | | | | | | | | | | | | | | | | | |
3/31/2020† | | $ | 13.51 | | | $ | 0.03 | | | $ | (1.76 | ) | | $ | (1.73 | ) | | $ | (0.15 | ) | | $ | — | | | | | |
9/30/2019 | | | 14.05 | | | | 0.17 | | | | (0.48 | ) | | | (0.31 | ) | | | (0.23 | ) | | | — | | | | | |
9/30/2018 | | | 15.86 | | | | 0.21 | | | | (1.17 | ) | | | (0.96 | ) | | | (0.23 | ) | | | (0.62 | ) | | | | |
9/30/2017 | | | 13.68 | | | | 0.22 | | | | 2.11 | | | | 2.33 | | | | (0.15 | ) | | | — | | | | | |
9/30/2016 | | | 12.28 | | | | 0.19 | | | | 1.28 | | | | 1.47 | | | | (0.07 | ) | | | — | | | | | |
12/1/2014* - 9/30/2015# | | | 15.00 | | | | 0.13 | | | | (2.85 | ) | | | (2.72 | ) | | | — | | | | — | | | | | |
| AllianzGI Emerging MarketsSmall-Cap: | | | | | | | | | | | | | | | | | | | | | |
| Class A | | | | | | | | | | | | | | | | | | | | | | | | | | | | |
3/31/2020† | | $ | 16.15 | | | $ | 0.05 | | | $ | (3.53 | ) | | $ | (3.48 | ) | | $ | (0.72 | ) | | $ | — | | | | | |
9/30/2019 | | | 16.61 | | | | 0.24 | | | | 0.03 | | | | 0.27 | | | | (0.10 | ) | | | (0.63 | ) | | | | |
9/30/2018 | | | 18.36 | | | | 0.16 | | | | (0.59 | ) | | | (0.43 | ) | | | (0.85 | ) | | | (0.47 | ) | | | | |
9/30/2017 | | | 15.15 | | | | 0.23 | | | | 2.98 | | | | 3.21 | | | | — | | | | — | | | | | |
9/30/2016 | | | 14.04 | | | | 0.16 | | | | 1.16 | | | | 1.32 | | | | (0.21 | ) | | | — | | | | | |
12/1/2014* - 9/30/2015# | | | 15.00 | | | | 0.26 | | | | (1.22 | ) | | | (0.96 | ) | | | — | | | | — | | | | | |
| Institutional Class | | | | | | | | | | | | | | | | | | | | | | | | | | | | |
3/31/2020† | | $ | 15.87 | | | $ | 0.08 | | | $ | (3.51 | ) | | $ | (3.43 | ) | | $ | (0.61 | ) | | $ | — | | | | | |
9/30/2019 | | | 16.45 | | | | 0.34 | | | | (0.03 | ) | | | 0.31 | | | | (0.26 | ) | | | (0.63 | ) | | | | |
9/30/2018 | | | 18.04 | | | | 0.26 | | | | (0.62 | ) | | | (0.36 | ) | | | (0.76 | ) | | | (0.47 | ) | | | | |
9/30/2017 | | | 15.30 | | | | 0.24 | | | | 2.95 | | | | 3.19 | | | | (0.45 | ) | | | — | | | | | |
9/30/2016 | | | 14.08 | | | | 0.30 | | | | 1.06 | | | | 1.36 | | | | (0.14 | ) | | | — | | | | | |
12/1/2014* - 9/30/2015# | | | 15.00 | | | | 0.22 | | | | (1.14 | ) | | | (0.92 | ) | | | — | | | | — | | | | | |
| ^ | A “—” may reflect actual amounts rounding to less than $0.01 or 0.01%. |
| # | Fiscal year end changed from November 30th to September 30th. |
| * | Commencement of operations. |
| (a) | Calculated on average shares outstanding during the period. |
| (b) | Total return is calculated assuming a purchase of a share on the first day of the period and a sale of a share on the last day of each period reported. Dividends and distributions, if any, are assumed, for purposes of this calculation, to be reinvested. Total return does not reflect sales charges and includes the effect of fee waivers and reimbursements. Total return may reflect adjustments to conform to U.S. GAAP. Total return for a period of less than one year is not annualized. |
| (c) | Annualized, unless otherwise noted. |
| (d) | Certain expenses incurred by the Fund were not annualized. |
| (e) | Payments from Affiliates increased the end of period net asset value (“NAV”) and total return by $0.01 and 0.06%, respectively, for Class A and $0.01 and 0.05%, respectively, for Institutional Class. If the Affiliates had not made these payments, the end of year NAV and total return would have been $16.60 and (2.78)%, respectively, for Class A and $16.44 and (2.43)%, respectively, for Institutional Class. |
| (f) | Due to a change in accounting estimate resulting from a revised agreement with the Fund’s custodian and accounting agent, in order to lower costs and seek economies of scale for all Funds in the Trust, the custodian and accounting agent expense was reduced for the period. The effect on the Ratio of Expenses to Average Net Assets without Fee Waiver/Reimbursement was a decrease in the ratio of 0.90%. |
| | | | | | |
| 260 | | Semiannual Report | | | March 31, 2020 | | | See accompanying Notes to Financial Statements |
| | | | | | | | | | | | | | | | | | | | | | | | | | | | | | | | | | |
| | | | Total
Dividends and
Distributions | | | Net Asset
Value, End
of Period | | | Total Return (b) | | | Net Assets,
End of Period
(000s) | | | Ratio of
Expenses to
Average Net
Assets with
Fee Waiver/
Reimbursement | | | Ratio of
Expenses to
Average Net
Assets without
Fee Waiver/
Reimbursement | | | Ratio of Net
Investment
Income to
Average
Net Assets | | | Portfolio
Turnover Rate | |
| | | | | | | | | | | | | | | | | | | | | | | | | | |
| | | | | | | | | | | | | | | | | | | | | | | | | | | | | | | | | | |
| | | | | $ | (0.10 | ) | | $ | 11.64 | | | | (13.25 | )% | | $ | 54 | | �� | | 1.40 | %(c) | | | 1.76 | %(c) | | | 0.10 | %(c) | | | 29 | % |
| | | | | | (0.04 | ) | | | 13.51 | | | | (2.34 | ) | | | 62 | | | | 1.52 | | | | 1.75 | | | | 0.90 | | | | 82 | |
| | | | | | (0.88 | ) | | | 13.88 | | | | (7.04 | ) | | | 69 | | | | 1.55 | | | | 1.78 | | | | 0.68 | | | | 115 | |
| | | | | | (0.12 | ) | | | 15.76 | | | | 16.97 | | | | 155 | | | | 1.55 | | | | 16.84 | | | | 1.47 | | | | 122 | |
| | | | | | (0.06 | ) | | | 13.60 | | | | 11.67 | | | | 48 | | | | 1.58 | | | | 38.88 | | | | 0.90 | | | | 91 | |
| | | | | | — | | | | 12.24 | | | | (18.40 | ) | | | 37 | | | | 1.65 | (c)(d) | | | 9.30 | (c)(d) | | | 1.15 | (c)(d) | | | 77 | |
| | | | | | | | | | | | | | | | | | | | | | | | | | | | | | | | | | |
| | | | | $ | (0.15 | ) | | $ | 11.63 | | | | (13.02 | )% | | $ | 32,399 | | | | 1.05 | %(c) | | | 1.44 | %(c) | | | 0.45 | %(c) | | | 29 | % |
| | | | | | (0.23 | ) | | | 13.51 | | | | (2.05 | ) | | | 39,186 | | | | 1.16 | | | | 1.43 | | | | 1.30 | | | | 82 | |
| | | | | | (0.85 | ) | | | 14.05 | | | | (6.69 | ) | | | 43,333 | | | | 1.20 | | | | 1.37 | | | | 1.36 | | | | 115 | |
| | | | | | (0.15 | ) | | | 15.86 | | | | 17.37 | | | | 43,487 | | | | 1.20 | | | | 1.64 | | | | 1.55 | | | | 122 | |
| | | | | | (0.07 | ) | | | 13.68 | | | | 12.06 | | | | 44,630 | | | | 1.22 | | | | 2.04 | | | | 1.49 | | | | 91 | |
| | | | | | — | | | | 12.28 | | | | (18.13 | ) | | | 15,591 | | | | 1.30 | (c)(d) | | | 3.55 | (c)(d) | | | 1.14 | (c)(d) | | | 77 | |
| | | | | | | | | | | | | | | | | | | | | | | | | | |
| | | | | | | | | | | | | | | | | | | | | | | | | | | | | | | | | | |
| | | | | $ | (0.72 | ) | | $ | 11.95 | | | | (22.84 | )% | | $ | 166 | | | | 1.83 | %(c) | | | 4.15 | %(c) | | | 0.61 | %(c) | | | 32 | % |
| | | | | | (0.73 | ) | | | 16.15 | | | | 2.14 | | | | 116 | | | | 1.85 | | | | 3.00 | (f) | | | 1.55 | | | | 73 | |
| | | | | | (1.32 | ) | | | 16.61(e | ) | | | (2.72 | )(e) | | | 135 | | | | 1.85 | | | | 3.71 | | | | 0.90 | | | | 119 | |
| | | | | | — | | | | 18.36 | | | | 21.19 | | | | 204 | | | | 1.85 | | | | 15.72 | | | | 1.39 | | | | 121 | |
| | | | | | (0.21 | ) | | | 15.15 | | �� | | 9.54 | | | | 67 | | | | 1.85 | | | | 6.84 | | | | 1.14 | | | | 147 | |
| | | | | | — | | | | 14.04 | | | | (6.39 | ) | | | 621 | | | | 1.85 | (c)(d) | | | 9.40 | (c)(d) | | | 2.12 | (c)(d) | | | 103 | |
| | | | | | | | | | | | | | | | | | | | | | | | | | | | | | | | | | |
| | | | | $ | (0.61 | ) | | $ | 11.83 | | | | (22.73 | )% | | $ | 5,335 | | | | 1.50 | %(c) | | | 3.83 | %(c) | | | 0.95 | %(c) | | | 32 | % |
| | | | | | (0.89 | ) | | | 15.87 | | | | 2.52 | | | | 7,814 | | | | 1.50 | | | | 2.84 | (f) | | | 2.19 | | | | 73 | |
| | | | | | (1.23 | ) | | | 16.45 | (e) | | | (2.38 | )(e) | | | 10,030 | | | | 1.50 | | | | 3.05 | | | | 1.46 | | | | 119 | |
| | | | | | (0.45 | ) | | | 18.04 | | | | 21.69 | | | | 11,251 | | | | 1.50 | | | | 3.38 | | | | 1.47 | | | | 121 | |
| | | | | | (0.14 | ) | | | 15.30 | | | | 9.80 | | | | 13,367 | | | | 1.50 | | | | 4.72 | | | | 2.08 | | | | 147 | |
| | | | | | — | | | | 14.08 | | | | (6.11 | ) | | | 7,921 | | | | 1.50 | (c)(d) | | | 7.77 | (c)(d) | | | 1.78 | (c)(d) | | | 103 | |
| | | | | | | | |
| See accompanying Notes to Financial Statements | | | March 31, 2020 | | | Semiannual Report | | | 261 | |
Financial Highlights (cont’d)
For a Share Outstanding for the Period ended:^
| | | | | | | | | | | | | | | | | | | | | | | | | | | | |
| | | Net Asset
Value,
Beginning
of Period | | | Net
Investment
Income (a) | | |
Net Realized
and Change
in Unrealized
Gain (Loss) | | | Total from
Investment
Operations | | | Dividends
from Net
Investment
Income | | | Distributions
from Net
Realized Capital
Gains | | | | |
| AllianzGI Emerging Markets SRI Debt: | | | | | | | | | | | | | | | | | | | | | |
| Class A | | | | | | | | | | | | | | | | | | | | | | | | | | | | |
3/31/2020† | | $ | 14.09 | | | $ | 0.23 | | | $ | (1.44 | ) | | $ | (1.21 | ) | | $ | (0.18 | ) | | $ | — | | | | | |
9/30/2019 | | | 13.35 | | | | 0.54 | | | | 0.70 | | | | 1.24 | | | | (0.01 | ) | | | — | | | | | |
9/30/2018 | | | 14.87 | | | | 0.71 | | | | (1.52 | ) | | | (0.81 | ) | | | (0.60 | ) | | | (0.11 | ) | | | | |
9/30/2017 | | | 14.89 | | | | 0.75 | | | | 0.16 | | | | 0.91 | | | | (0.91 | ) | | | (0.02 | ) | | | | |
9/30/2016 | | | 13.51 | | | | 0.71 | | | | 1.32 | | | | 2.03 | | | | (0.65 | ) | | | — | | | | | |
12/1/2014 - 9/30/2015# | | | 14.92 | | | | 0.47 | | | | (1.35 | ) | | | (0.88 | ) | | | (0.53 | ) | | | — | | | | | |
9/15/2014* - 11/30/2014 | | | 15.00 | | | | 0.11 | | | | (0.19 | ) | | | (0.08 | ) | | | — | | | | — | | | | | |
| Class C | | | | | | | | | | | | | | | | | | | | | | | | | | | | |
3/31/2020† | | $ | 14.19 | | | $ | 0.18 | | | $ | (1.46 | ) | | $ | (1.28 | ) | | $ | (0.13 | ) | | $ | — | | | | | |
9/30/2019 | | | 13.48 | | | | 0.44 | | | | 0.70 | | | | 1.14 | | | | (0.02 | ) | | | — | | | | | |
9/30/2018 | | | 14.95 | | | | 0.64 | | | | (1.56 | ) | | | (0.92 | ) | | | (0.44 | ) | | | (0.11 | ) | | | | |
9/30/2017 | | | 14.96 | | | | 0.64 | | | | 0.17 | | | | 0.81 | | | | (0.80 | ) | | | (0.02 | ) | | | | |
9/30/2016 | | | 13.51 | | | | 0.61 | | | | 1.32 | | | | 1.93 | | | | (0.48 | ) | | | — | | | | | |
12/1/2014 - 9/30/2015# | | | 14.90 | | | | 0.39 | | | | (1.36 | ) | | | (0.97 | ) | | | (0.42 | ) | | | — | | | | | |
9/15/2014* - 11/30/2014 | | | 15.00 | | | | 0.09 | | | | (0.19 | ) | | | (0.10 | ) | | | — | | | | — | | | | | |
| Class P | | | | | | | | | | | | | | | | | | | | | | | | | | | | |
3/31/2020† | | $ | 13.83 | | | $ | 0.24 | | | $ | (1.42 | ) | | $ | (1.18 | ) | | $ | (0.19 | ) | | $ | — | | | | | |
9/30/2019 | | | 13.24 | | | | 0.55 | | | | 0.69 | | | | 1.24 | | | | (0.15 | ) | | | — | | | | | |
9/30/2018 | | | 14.84 | | | | 0.75 | | | | (1.53 | ) | | | (0.78 | ) | | | (0.71 | ) | | | (0.11 | ) | | | | |
9/30/2017 | | | 14.90 | | | | 0.77 | | | | 0.16 | | | | 0.93 | | | | (0.97 | ) | | | (0.02 | ) | | | | |
9/30/2016 | | | 13.51 | | | | 0.70 | | | | 1.35 | | | | 2.05 | | | | (0.66 | ) | | | — | | | | | |
12/1/2014 - 9/30/2015# | | | 14.92 | | | | 0.49 | | | | (1.34 | ) | | | (0.85 | ) | | | (0.56 | ) | | | — | | | | | |
9/15/2014* - 11/30/2014 | | | 15.00 | | | | 0.12 | | | | (0.20 | ) | | | (0.08 | ) | | | — | | | | — | | | | | |
| Institutional Class | | | | | | | | | | | | | | | | | | | | | | | | | | | | |
3/31/2020† | | $ | 13.88 | | | $ | 0.25 | | | $ | (1.43 | ) | | $ | (1.18 | ) | | $ | (0.20 | ) | | $ | — | | | | | |
9/30/2019 | | | 13.23 | | | | 0.56 | | | | 0.70 | | | | 1.26 | | | | (0.10 | ) | | | — | | | | | |
9/30/2018 | | | 14.83 | | | | 0.77 | | | | (1.55 | ) | | | (0.78 | ) | | | (0.71 | ) | | | (0.11 | ) | | | | |
9/30/2017 | | | 14.88 | | | | 0.79 | | | | 0.16 | | | | 0.95 | | | | (0.98 | ) | | | (0.02 | ) | | | | |
9/30/2016 | | | 13.51 | | | | 0.72 | | | | 1.34 | | | | 2.06 | | | | (0.69 | ) | | | — | | | | | |
12/1/2014 - 9/30/2015# | | | 14.93 | | | | 0.50 | | | | (1.35 | ) | | | (0.85 | ) | | | (0.57 | ) | | | — | | | | | |
9/15/2014* - 11/30/2014 | | | 15.00 | | | | 0.12 | | | | (0.19 | ) | | | (0.07 | ) | | | — | | | | — | | | | | |
| ^ | A “—” may reflect actual amounts rounding to less than $0.01 or 0.01%. |
| # | Fiscal year end changed from November 30th to September 30th. |
| * | Commencement of operations. |
| (a) | Calculated on average shares outstanding during the period. |
| (b) | Total return is calculated assuming a purchase of a share on the first day of the period and a sale of a share on the last day of each period reported. Dividends and distributions, if any, are assumed, for purposes of this calculation, to be reinvested. Total return does not reflect sales charges and includes the effect of fee waivers and reimbursements. Total return may reflect adjustments to conform to U.S. GAAP. Total return for a period of less than one year is not annualized. |
| (c) | Annualized, unless otherwise noted. |
| (d) | Certain expenses incurred by the Fund were not annualized. |
| | | | | | |
| 262 | | Semiannual Report | | | March 31, 2020 | | | See accompanying Notes to Financial Statements |
| | | | | | | | | | | | | | | | | | | | | | | | | | | | | | | | | | | | | | |
| | | | Distributions
from Return
of Capital | | | Total
Dividends and
Distributions | | | Net Asset
Value, End
of Period | | | Total Return (b) | | | Net Assets,
End of Period
(000s) | | | Ratio of
Expenses to
Average Net
Assets with
Fee Waiver/
Reimbursement | | | Ratio of
Expenses to
Average Net
Assets without
Fee Waiver/
Reimbursement | | | Ratio of Net
Investment
Income to
Average
Net Assets | | | Portfolio
Turnover Rate | |
| | | | | | | | | | | | | | | | | | | | | | | | | | | | | |
| | | | | | | | | | | | | | | | | | | | | | | | | | | | | | | | | | | | | | |
| | | | | $ | — | | | $ | (0.18 | ) | | $ | 12.70 | | | | (8.64 | )% | | $ | 144 | | | | 1.05 | %(c) | | | 2.23 | %(c) | | | 3.34 | %(c) | | | 86 | % |
| | | | | | (0.49 | ) | | | (0.50 | ) | | | 14.09 | | | | 9.38 | | | | 134 | | | | 1.06 | | | | 2.08 | | | | 3.91 | | | | 176 | |
| | | | | | — | | | | (0.71 | ) | | | 13.35 | | | | (5.62 | ) | | | 135 | | | | 1.20 | | | | 1.89 | | | | 4.89 | | | | 127 | |
| | | | | | — | | | | (0.93 | ) | | | 14.87 | | | | 6.41 | | | | 140 | | | | 1.20 | | | | 1.66 | | | | 5.05 | | | | 118 | |
| | | | | | — | | | | (0.65 | ) | | | 14.89 | | | | 15.39 | | | | 175 | | | | 1.20 | | | | 1.68 | | | | 5.01 | | | | 123 | |
| | | | | | — | | | | (0.53 | ) | | | 13.51 | | | | (6.00 | ) | | | 9 | | | | 1.23 | (c)(d) | | | 2.32 | (c)(d) | | | 3.97 | (c)(d) | | | 125 | |
| | | | | | — | | | | — | | | | 14.92 | | | | (0.53 | ) | | | 10 | | | | 1.20 | (c) | | | 2.51 | (c) | | | 3.65 | (c) | | | 27 | |
| | | | | | | | | | | | | | | | | | | | | | | | | | | | | | | | | | | | | | |
| | | | | $ | — | | | $ | (0.13 | ) | | $ | 12.78 | | | | (9.07 | )% | | $ | 12 | | | | 1.80 | %(c) | | | 2.93 | %(c) | | | 2.55 | %(c) | | | 86 | % |
| | | | | | (0.41 | ) | | | (0.43 | ) | | | 14.19 | | | | 8.49 | | | | 13 | | | | 1.80 | | | | 2.79 | | | | 3.15 | | | | 176 | |
| | | | | | — | | | | (0.55 | ) | | | 13.48 | | | | (6.30 | ) | | | 46 | | | | 1.95 | | | | 2.68 | | | | 4.41 | | | | 127 | |
| | | | | | — | | | | (0.82 | ) | | | 14.95 | | | | 5.64 | | | | 113 | | | | 1.95 | | | | 2.41 | | | | 4.33 | | | | 118 | |
| | | | | | — | | | | (0.48 | ) | | | 14.96 | | | | 14.56 | | | | 109 | | | | 1.95 | | | | 2.34 | | | | 4.28 | | | | 123 | |
| | | | | | — | | | | (0.42 | ) | | | 13.51 | | | | (6.61 | ) | | | 9 | | | | 1.98 | (c)(d) | | | 3.06 | (c)(d) | | | 3.23 | (c)(d) | | | 125 | |
| | | | | | — | | | | — | | | | 14.90 | | | | (0.67 | ) | | | 10 | | | | 1.95 | (c) | | | 3.25 | (c) | | | 2.90 | (c) | | | 27 | |
| | | | | | | | | | | | | | | | | | | | | | | | | | | | | | | | | | | | | | |
| | | | | $ | — | | | $ | (0.19 | ) | | $ | 12.46 | | | | (8.59 | )% | | $ | 11 | | | | 0.90 | %(c) | | | 1.91 | %(c) | | | 3.45 | %(c) | | | 86 | % |
| | | | | | (0.50 | ) | | | (0.65 | ) | | | 13.83 | | | | 9.56 | | | | 12 | | | | 0.90 | | | | 1.76 | | | | 4.07 | | | | 176 | |
| | | | | | — | | | | (0.82 | ) | | | 13.24 | | | | (5.44 | ) | | | 11 | | | | 1.04 | | | | 1.68 | | | | 5.27 | | | | 127 | |
| | | | | | — | | | | (0.99 | ) | | | 14.84 | | | | 6.55 | | | | 12 | | | | 1.05 | | | | 1.34 | | | | 5.26 | | | | 118 | |
| | | | | | — | | | | (0.66 | ) | | | 14.90 | | | | 15.57 | | | | 11 | | | | 1.05 | | | | 1.40 | | | | 5.02 | | | | 123 | |
| | | | | | — | | | | (0.56 | ) | | | 13.51 | | | | (5.86 | ) | | | 10 | | | | 1.08 | (c)(d) | | | 2.06 | (c)(d) | | | 4.12 | (c)(d) | | | 125 | |
| | | | | | — | | | | — | | | | 14.92 | | | | (0.53 | ) | | | 10 | | | | 1.05 | (c) | | | 2.25 | (c) | | | 3.80 | (c) | | | 27 | |
| | | | | | | | | | | | | | | | | | | | | | | | | | | | | | | | | | | | | | |
| | | | | $ | — | | | $ | (0.20 | ) | | $ | 12.50 | | | | (8.57 | )% | | $ | 22,544 | | | | 0.80 | %(c) | | | 1.92 | %(c) | | | 3.56 | %(c) | | | 86 | % |
| | | | | | (0.51 | ) | | | (0.61 | ) | | | 13.88 | | | | 9.70 | | | | 20,115 | | | | 0.81 | | | | 1.76 | | | | 4.17 | | | | 176 | |
| | | | | | — | | | | (0.82 | ) | | | 13.23 | | | | (5.40 | ) | | | 18,321 | | | | 0.95 | | | | 1.61 | | | | 5.34 | | | | 127 | |
| | | | | | — | | | | (1.00 | ) | | | 14.83 | | | | 6.73 | | | | 36,313 | | | | 0.95 | | | | 1.35 | | | | 5.35 | | | | 118 | |
| | | | | | — | | | | (0.69 | ) | | | 14.88 | | | | 15.67 | | | | 43,318 | | | | 0.95 | | | | 1.40 | | | | 5.15 | | | | 123 | |
| | | | | | — | | | | (0.57 | ) | | | 13.51 | | | | (5.82 | ) | | | 28,557 | | | | 0.97 | (c)(d) | | | 2.07 | (c)(d) | | | 4.22 | (c)(d) | | | 125 | |
| | | | | | — | | | | — | | | | 14.93 | | | | (0.47 | ) | | | 29,856 | | | | 0.95 | (c) | | | 2.28 | (c) | | | 3.91 | (c) | | | 27 | |
| | | | | | | | |
| See accompanying Notes to Financial Statements | | | March 31, 2020 | | | Semiannual Report | | | 263 | |
Financial Highlights (cont’d)
For a Share Outstanding for the Period ended:^
| | | | | | | | | | | | | | | | | | | | | | | | | | | | |
| | | Net Asset
Value,
Beginning
of Period | | | Net Investment
Income (Loss) (a) | | | Net Realized
and Change
in Unrealized
Gain (Loss) | | | Total from
Investment
Operations | | |
Dividends
from Net
Investment
Income | | | Distributions
from Net
Realized Capital
Gains | | | | |
| AllianzGI Emerging Markets Value: | | | | | | | | | | | | | | | | | | | | | |
| Class A | | | | | | | | | | | | | | | | | | | | | | | | | | | | |
3/31/2020† | | $ | 15.55 | | | $ | 0.04 | | | $ | (2.03 | ) | | $ | (1.99 | ) | | $ | (0.09 | ) | | $ | — | | | | | |
9/30/2019 | | | 16.18 | | | | 0.42 | | | | (0.68 | ) | | | (0.26 | ) | | | (0.37 | ) | | | — | | | | | |
9/30/2018 | | | 17.24 | | | | 0.41 | | | | (1.14 | ) | | | (0.73 | ) | | | (0.26 | ) | | | (0.07 | ) | | | | |
9/30/2017 | | | 14.31 | | | | 0.40 | | | | 2.85 | | | | 3.25 | | | | (0.32 | ) | | | — | | | | | |
9/30/2016 | | | 12.34 | | | | 0.47 | | | | 1.90 | | | | 2.37 | | | | (0.40 | ) | | | — | | | | | |
12/1/2014 - 9/30/2015# | | | 15.45 | | | | 0.49 | | | | (2.74 | ) | | | (2.25 | ) | | | (0.62 | ) | | | (0.24 | ) | | | | |
11/30/2014 | | | 15.42 | | | | 0.37 | | | | 0.08 | | | | 0.45 | | | | (0.42 | ) | | | — | | | | | |
| Class C | | | | | | | | | | | | | | | | | | | | | | | | | | | | |
3/31/2020† | | $ | 15.56 | | | $ | (0.02 | ) | | $ | (2.02 | ) | | $ | (2.04 | ) | | $ | (0.06 | ) | | $ | — | | | | | |
9/30/2019 | | | 16.23 | | | | 0.35 | | | | (0.73 | ) | | | (0.38 | ) | | | (0.29 | ) | | | — | | | | | |
9/30/2018 | | | 17.33 | | | | 0.24 | | | | (1.11 | ) | | | (0.87 | ) | | | (0.16 | ) | | | (0.07 | ) | | | | |
9/30/2017 | | | 14.29 | | | | 0.34 | | | | 2.81 | | | | 3.15 | | | | (0.11 | ) | | | — | | | | | |
9/30/2016 | | | 12.31 | | | | 0.32 | | | | 1.96 | | | | 2.28 | | | | (0.30 | ) | | | — | | | | | |
12/1/2014 - 9/30/2015# | | | 15.40 | | | | 0.36 | | | | (2.68 | ) | | | (2.32 | ) | | | (0.53 | ) | | | (0.24 | ) | | | | |
11/30/2014 | | | 15.35 | | | | 0.28 | | | | 0.05 | | | | 0.33 | | | | (0.28 | ) | | | — | | | | | |
| Class P | | | | | | | | | | | | | | | | | | | | | | | | | | | | |
3/31/2020† | | $ | 15.53 | | | $ | 0.05 | | | $ | (2.02 | ) | | $ | (1.97 | ) | | $ | (0.10 | ) | | $ | — | | | | | |
9/30/2019 | | | 16.16 | | | | 0.45 | | | | (0.69 | ) | | | (0.24 | ) | | | (0.39 | ) | | | — | | | | | |
9/30/2018 | | | 17.13 | | | | 0.36 | | | | (1.08 | ) | | | (0.72 | ) | | | (0.18 | ) | | | (0.07 | ) | | | | |
9/30/2017 | | | 14.31 | | | | 0.46 | | | | 2.78 | | | | 3.24 | | | | (0.42 | ) | | | — | | | | | |
9/30/2016 | | | 12.46 | | | | 0.62 | | | | 1.80 | | | | 2.42 | | | | (0.57 | ) | | | — | | | | | |
12/1/2014 - 9/30/2015# | | | 15.56 | | | | 0.49 | | | | (2.74 | ) | | | (2.25 | ) | | | (0.61 | ) | | | (0.24 | ) | | | | |
11/30/2014 | | | 15.45 | | | | 0.43 | | | | 0.05 | | | | 0.48 | | | | (0.37 | ) | | | — | | | | | |
| Institutional Class | | | | | | | | | | | | | | | | | | | | | | | | | | | | |
3/31/2020† | | $ | 15.48 | | | $ | 0.06 | | | $ | (2.02 | ) | | $ | (1.96 | ) | | $ | (0.11 | ) | | $ | — | | | | | |
9/30/2019 | | | 16.29 | | | | 0.49 | | | | (0.73 | ) | | | (0.24 | ) | | | (0.57 | ) | | | — | | | | | |
9/30/2018 | | | 17.49 | | | | 0.42 | | | | (1.11 | ) | | | (0.69 | ) | | | (0.44 | ) | | | (0.07 | ) | | | | |
9/30/2017 | | | 14.46 | | | | 0.44 | | | | 2.91 | | | | 3.35 | | | | (0.32 | ) | | | — | | | | | |
9/30/2016 | | | 12.47 | | | | 0.43 | | | | 2.01 | | | | 2.44 | | | | (0.45 | ) | | | — | | | | | |
12/1/2014 - 9/30/2015# | | | 15.57 | | | | 0.51 | | | | (2.74 | ) | | | (2.23 | ) | | | (0.63 | ) | | | (0.24 | ) | | | | |
11/30/2014 | | | 15.46 | | | | 0.46 | | | | 0.03 | | | | 0.49 | | | | (0.38 | ) | | | — | | | | | |
| ^ | A “—” may reflect actual amounts rounding to less than $0.01 or 0.01%. |
| # | Fiscal year end changed from November 30th to September 30th. |
| (a) | Calculated on average shares outstanding during the period. |
| (b) | Total return is calculated assuming a purchase of a share on the first day of the period and a sale of a share on the last day of each period reported. Dividends and distributions, if any, are assumed, for purposes of this calculation, to be reinvested. Total return does not reflect sales charges and includes the effect of fee waivers and reimbursements. Total return may reflect adjustments to conform to U.S. GAAP. Total return for a period of less than one year is not annualized. |
| (c) | Annualized, unless otherwise noted. |
| (d) | Payments from Affiliates increased the end of year net asset value (“NAV”) and total return by $0.02 and 0.15%, respectively, for Class A, $0.02 and 0.14%, respectively, for Class C, $0.02 and 0.14%, respectively, for Class P and $0.01 and 0.07%, respectively for Institutional Class. If the Affiliates had not made these payments, the end of year NAV and total return would have been $17.22 and 22.92%, respectively, for Class A, $17.31 and 21.92%, respectively, for Class C, $17.11 and 23.08%, respectively, for Class P and $17.48 and 23.26%, respectively for Institutional Class. |
| | | | | | |
| 264 | | Semiannual Report | | | March 31, 2020 | | | See accompanying Notes to Financial Statements |
| | | | | | | | | | | | | | | | | | | | | | | | | | | | | | | | |
| | | Total
Dividends and
Distributions | | | Net Asset
Value, End
of Period | | | Total Return (b) | | | Net Assets,
End of Period
(000s) | | | Ratio of
Expenses to
Average Net
Assets with
Fee Waiver/
Reimbursement | | | Ratio of
Expenses to
Average Net
Assets without
Fee Waiver/
Reimbursement | | | Ratio of Net
Investment
Income (Loss)
to Average
Net Assets | | | Portfolio
Turnover Rate | |
| | | | | | | | | | | | | | | | | | | | | | | | | |
| | | | | | | | | | | | | | | | | | | | | | | | | | | | | | | | | |
| | | $ | (0.09 | ) | | $ | 13.47 | | | | (12.88 | )% | | $ | 11,663 | | | | 1.14 | %(c) | | | 1.64 | %(c) | | | 0.54 | %(c) | | | 53 | % |
| | | | (0.37 | ) | | | 15.55 | | | | (1.68 | ) | | | 14,395 | | | | 1.15 | | | | 1.65 | | | | 2.69 | | | | 101 | |
| | | | (0.33 | ) | | | 16.18 | | | | (4.36 | ) | | | 22,590 | | | | 1.14 | | | | 1.65 | | | | 2.31 | | | | 116 | |
| | | | (0.32 | ) | | | 17.24 | (d) | | | 23.07 | (d) | | | 11,026 | | | | 1.22 | (e) | | | 3.32 | (e) | | | 2.58 | (e) | | | 120 | |
| | | | (0.40 | ) | | | 14.31 | (f) | | | 19.57 | (f) | | | 2,141 | | | | 1.39 | | | | 7.84 | | | | 3.62 | | | | 104 | |
| | | | (0.86 | ) | | | 12.34 | | | | (15.12 | ) | | | 207 | | | | 1.55 | (c)(g) | | | 6.55 | (c)(g) | | | 4.13 | (c)(g) | | | 93 | |
| | | | (0.42 | ) | | | 15.45 | | | | 2.94 | | | | 110 | | | | 1.55 | | | | 4.86 | | | | 2.33 | | | | 85 | |
| | | | | | | | | | | | | | | | | | | | | | | | | | | | | | | | | |
| | | $ | (0.06 | ) | | $ | 13.46 | | | | (13.21 | )% | | $ | 822 | | | | 1.89 | %(c) | | | 2.37 | %(c) | | | (0.21 | )%(c) | | | 53 | % |
| | | | (0.29 | ) | | | 15.56 | | | | (2.38 | ) | | | 1,006 | | | | 1.90 | | | | 2.40 | | | | 2.24 | | | | 101 | |
| | | | (0.23 | ) | | | 16.23 | | | | (5.08 | ) | | | 1,196 | | | | 1.90 | | | | 2.38 | | | | 1.35 | | | | 116 | |
| | | | (0.11 | ) | | | 17.33 | (d) | | | 22.06 | (d) | | | 527 | | | | 1.95 | (e) | | | 4.00 | (e) | | | 2.16 | (e) | | | 120 | |
| | | | (0.30 | ) | | | 14.29 | (f) | | | 18.80 | (f) | | | 113 | | | | 2.16 | | | | 8.01 | | | | 2.49 | | | | 104 | |
| | | | (0.77 | ) | | | 12.31 | | | | (15.62 | ) | | | 104 | | | | 2.30 | (c)(g) | | | 7.39 | (c)(g) | | | 3.12 | (c)(g) | | | 93 | |
| | | | (0.28 | ) | | | 15.40 | | | | 2.19 | | | | 73 | | | | 2.30 | | | | 5.60 | | | | 1.82 | | | | 85 | |
| | | | | | | | | | | | | | | | | | | | | | | | | | | | | | | | | |
| | | $ | (0.10 | ) | | $ | 13.46 | | | | (12.79 | )% | | $ | 1,378 | | | | 0.98 | %(c) | | | 1.27 | %(c) | | | 0.67 | %(c) | | | 53 | % |
| | | | (0.39 | ) | | | 15.53 | | | | (1.53 | ) | | | 2,022 | | | | 0.99 | | | | 1.32 | | | | 2.90 | | | | 101 | |
| | | | (0.25 | ) | | | 16.16 | | | | (4.30 | ) | | | 3,312 | | | | 0.98 | | | | 1.48 | | | | 2.03 | | | | 116 | |
| | | | (0.42 | ) | | | 17.13 | (d) | | | 23.22 | (d) | | | 19,899 | | | | 1.05 | (e) | | | 3.00 | (e) | | | 2.99 | (e) | | | 120 | |
| | | | (0.57 | ) | | | 14.31 | (f) | | | 19.95 | (f) | | | 139 | | | | 1.20 | | | | 7.47 | | | | 4.67 | | | | 104 | |
| | | | (0.85 | ) | | | 12.46 | | | | (15.03 | ) | | | 9 | | | | 1.39 | (c)(g) | | | 5.87 | (c)(g) | | | 4.12 | (c)(g) | | | 93 | |
| | | | (0.37 | ) | | | 15.56 | | | | 3.13 | | | | 11 | | | | 1.39 | | | | 4.64 | | | | 2.77 | | | | 85 | |
| | | | | | | | | | | | | | | | | | | | | | | | | | | | | | | | | |
| | | $ | (0.11 | ) | | $ | 13.41 | | | | (12.76 | )% | | $ | 79,587 | | | | 0.89 | %(c) | | | 1.38 | %(c) | | | 0.79 | %(c) | | | 53 | % |
| | | | (0.57 | ) | | | 15.48 | | | | (1.45 | ) | | | 90,711 | | | | 0.90 | | | | 1.37 | | | | 3.13 | | | | 101 | |
| | | | (0.51 | ) | | | 16.29 | | | | (4.12 | ) | | | 111,161 | | | | 0.90 | | | | 1.39 | | | | 2.41 | | | | 116 | |
| | | | (0.32 | ) | | | 17.49 | (d) | | | 23.33 | (d) | | | 34,444 | | | | 0.95 | (e) | | | 2.87 | (e) | | | 2.71 | (e) | | | 120 | |
| | | | (0.45 | ) | | | 14.46 | (f) | | | 19.95 | (f) | | | 6,370 | | | | 1.17 | | | | 6.98 | | | | 3.35 | | | | 104 | |
| | | | (0.87 | ) | | | 12.47 | | | | (14.91 | ) | | | 6,688 | | | | 1.30 | (c)(g) | | | 5.93 | (c)(g) | | | 4.25 | (c)(g) | | | 93 | |
| | | | (0.38 | ) | | | 15.57 | | | | 3.18 | | | | 7,889 | | | | 1.30 | | | | 4.63 | | | | 2.96 | | | | 85 | |
| | (e) | Does not include expenses of the investment companies in which the Fund invests. |
| | (f) | Payments from Affiliates increased the end of period net asset value and total return by less than $0.01 and 0.01%, respectively. |
| | (g) | Certain expenses incurred by the Fund were not annualized. |
| | | | | | | | |
| See accompanying Notes to Financial Statements | | | March 31, 2020 | | | Semiannual Report | | | 265 | |
Financial Highlights (cont’d)
For a Share Outstanding for the Period ended:^
| | | | | | | | | | | | | | | | | | | | | | | | | | | | |
| | | Net Asset
Value,
Beginning
of Period | | | Net
Investment
Income (a) | | | Net Realized
and Change
in Unrealized
Gain (Loss) | | | Total from
Investment
Operations | | |
Dividends
from Net
Investment
Income | | | Distributions
from Net
Realized Capital
Gains | | | | |
| AllianzGI Floating Rate Note: | | | | | | | | | | | | | | | | | | | | | |
| Class P | | | | | | | | | | | | | | | | | | | | | | | | | | | | |
3/31/2020† | | $ | 14.86 | | | $ | 0.17 | | | $ | (1.13 | ) | | $ | (0.96 | ) | | $ | (0.11 | ) | | $ | (0.01 | ) | | | | |
9/30/2019 | | | 14.95 | | | | 0.35 | | | | 0.11 | | | | 0.46 | | | | (0.39 | ) | | | (0.16 | ) | | | | |
12/27/2017* - 9/30/2018 | | | 15.00 | | | | 0.20 | | | | (0.02 | ) | | | 0.18 | | | | (0.23 | ) | | | — | | | | | |
| Institutional Class | | | | | | | | | | | | | | | | | | | | | | | | | | | | |
3/31/2020† | | $ | 14.84 | | | $ | 0.17 | | | $ | (1.12 | ) | | $ | (0.95 | ) | | $ | (0.12 | ) | | $ | (0.01 | ) | | | | |
9/30/2019 | | | 14.95 | | | | 0.37 | | | | 0.11 | | | | 0.48 | | | | (0.43 | ) | | | (0.16 | ) | | | | |
12/27/2017* - 9/30/2018 | | | 15.00 | | | | 0.21 | | | | (0.02 | ) | | | 0.19 | | | | (0.24 | ) | | | — | | | | | |
| ^ | A “—” may reflect actual amounts rounding to less than $0.01 or 0.01%. |
| * | Commencement of operations. |
| (a) | Calculated on average shares outstanding during the period. |
| (b) | Total return is calculated assuming a purchase of a share on the first day of the period and a sale of a share on the last day of each period reported. Dividends and distributions, if any, are assumed, for purposes of this calculation, to be reinvested. Total return does not reflect sales charges and includes the effect of fee waivers and reimbursements. Total return may reflect adjustments to conform to U.S. GAAP. Total return for a period of less than one year is not annualized. |
| (c) | Annualized, unless otherwise noted. |
| (d) | Certain expenses incurred by the Fund were not annualized. |
| | | | | | |
| 266 | | Semiannual Report | | | March 31, 2020 | | | See accompanying Notes to Financial Statements |
| | | | | | | | | | | | | | | | | | | | | | | | | | | | | | | | | | |
| | | | Total
Dividends and
Distributions | | | Net Asset
Value, End
of Period | | | Total Return (b) | | | Net Assets,
End of Period
(000s) | | | Ratio of
Expenses to
Average Net
Assets with
Fee Waiver/
Reimbursement | | | Ratio of
Expenses to
Average Net
Assets without
Fee Waiver/
Reimbursement | | | Ratio of Net
Investment
Income
to Average
Net Assets | | | Portfolio
Turnover Rate | |
| | | | | | | | | | | | | | | | | | | | | | | | | | |
| | | | | | | | | | | | | | | | | | | | | | | | | | | | | | | | | | |
| | | | | $ | (0.12 | ) | | $ | 13.78 | | | | (6.51 | )% | | $ | 10 | | | | 0.40 | %(c) | | | 1.51 | %(c) | | | 2.26 | %(c) | | | 50 | % |
| | | | | | (0.55 | ) | | | 14.86 | | | | 3.14 | | | | 10 | | | | 0.50 | | | | 1.67 | | | | 2.38 | | | | 161 | |
| | | | | | (0.23 | ) | | | 14.95 | | | | 1.18 | | | | 10 | | | | 0.68 | (c)(d) | | | 3.39 | (c)(d) | | | 1.75 | (c)(d) | | | 39 | |
| | | | | | | | | | | | | | | | | | | | | | | | | | | | | | | | | | |
| | | | | $ | (0.13 | ) | | $ | 13.76 | | | | (6.48 | )% | | $ | 13,332 | | | | 0.30 | %(c) | | | 1.51 | %(c) | | | 2.36 | %(c) | | | 50 | % |
| | | | | | (0.59 | ) | | | 14.84 | | | | 3.27 | | | | 13,662 | | | | 0.40 | | | | 1.70 | | | | 2.48 | | | | 161 | |
| | | | | | (0.24 | ) | | | 14.95 | | | | 1.25 | | | | 15,237 | | | | 0.58 | (c)(d) | | | 3.26 | (c)(d) | | | 1.88 | (c)(d) | | | 39 | |
| | | | | | | | |
| See accompanying Notes to Financial Statements | | | March 31, 2020 | | | Semiannual Report | | | 267 | |
Financial Highlights (cont’d)
For a Share Outstanding for the Period ended:^
| | | | | | | | | | | | | | | | | | | | | | | | | | | | |
| | | Net Asset
Value,
Beginning
of Period | | | Net
Investment
Income
(Loss) (a) | | | Net Realized
and Change
in Unrealized
Gain (Loss) | | | Total from
Investment
Operations | | |
Dividends
from Net
Investment
Income | | | Distributions
from Net
Realized Capital
Gains | | | | |
| AllianzGI Global Allocation: | | | | | | | | | | | | | | | | | | | | | |
| Class A | | | | | | | | | | | | | | | | | | | | | | | | | | | | |
3/31/2020† | | $ | 11.05 | | | $ | 0.12 | | | $ | (0.88 | ) | | $ | (0.76 | ) | | $ | (0.12 | ) | | $ | (0.88 | ) | | | | |
9/30/2019 | | | 11.47 | | | | 0.21 | | | | 0.06 | | | | 0.27 | | | | (0.25 | ) | | | (0.44 | ) | | | | |
9/30/2018 | | | 12.34 | | | | 0.26 | | | | 0.07 | | | | 0.33 | | | | (0.55 | ) | | | (0.65 | ) | | | | |
9/30/2017 | | | 11.23 | | | | 0.20 | | | | 1.11 | | | | 1.31 | | | | (0.20 | ) | | | — | | | | | |
9/30/2016 | | | 10.98 | | | | 0.07 | | | | 0.63 | | | | 0.70 | | | | (0.05 | ) | | | (0.40 | ) | | | | |
12/1/2014 - 9/30/2015# | | | 12.18 | | | | 0.25 | | | | (0.89 | ) | | | (0.64 | ) | | | (0.42 | ) | | | (0.14 | ) | | | | |
11/30/2014 | | | 11.90 | | | | 0.30 | | | | 0.25 | | | | 0.55 | | | | (0.27 | ) | | | — | | | | | |
| Class C | | | | | | | | | | | | | | | | | | | | | | | | | | | | |
3/31/2020† | | $ | 11.37 | | | $ | 0.08 | | | $ | (0.92 | ) | | $ | (0.84 | ) | | $ | (0.03 | ) | | $ | (0.88 | ) | | | | |
9/30/2019 | | | 11.67 | | | | 0.13 | | | | 0.08 | | | | 0.21 | | | | (0.07 | ) | | | (0.44 | ) | | | | |
9/30/2018 | | | 12.47 | | | | 0.19 | | | | 0.06 | | | | 0.25 | | | | (0.40 | ) | | | (0.65 | ) | | | | |
9/30/2017 | | | 11.32 | | | | 0.13 | | | | 1.12 | | | | 1.25 | | | | (0.10 | ) | | | — | | | | | |
9/30/2016 | | | 11.13 | | | | (0.01 | ) | | | 0.63 | | | | 0.62 | | | | (0.03 | ) | | | (0.40 | ) | | | | |
12/1/2014 - 9/30/2015# | | | 12.33 | | | | 0.18 | | | | (0.91 | ) | | | (0.73 | ) | | | (0.33 | ) | | | (0.14 | ) | | | | |
11/30/2014 | | | 12.04 | | | | 0.22 | | | | 0.24 | | | | 0.46 | | | | (0.17 | ) | | | — | | | | | |
| Class R | | | | | | | | | | | | | | | | | | | | | | | | | | | | |
3/31/2020† | | $ | 10.93 | | | $ | 0.11 | | | $ | (0.87 | ) | | $ | (0.76 | ) | | $ | (0.10 | ) | | $ | (0.88 | ) | | | | |
9/30/2019 | | | 11.34 | | | | 0.26 | | | | (0.01 | ) | | | 0.25 | | | | (0.22 | ) | | | (0.44 | ) | | | | |
9/30/2018 | | | 12.22 | | | | 0.21 | | | | 0.10 | | | | 0.31 | | | | (0.54 | ) | | | (0.65 | ) | | | | |
9/30/2017 | | | 11.15 | | | | 0.18 | | | | 1.11 | | | | 1.29 | | | | (0.22 | ) | | | — | | | | | |
9/30/2016 | | | 10.93 | | | | 0.05 | | | | 0.62 | | | | 0.67 | | | | (0.05 | ) | | | (0.40 | ) | | | | |
12/1/2014 - 9/30/2015# | | | 12.13 | | | | 0.22 | | | | (0.88 | ) | | | (0.66 | ) | | | (0.40 | ) | | | (0.14 | ) | | | | |
11/30/2014 | | | 11.84 | | | | 0.28 | | | | 0.26 | | | | 0.54 | | | | (0.25 | ) | | | — | | | | | |
| Class P | | | | | | | | | | | | | | | | | | | | | | | | | | | | |
3/31/2020† | | $ | 10.94 | | | $ | 0.14 | | | $ | (0.88 | ) | | $ | (0.74 | ) | | $ | (0.16 | ) | | $ | (0.88 | ) | | | | |
9/30/2019 | | | 11.38 | | | | 0.18 | | | | 0.12 | | | | 0.30 | | | | (0.30 | ) | | | (0.44 | ) | | | | |
9/30/2018 | | | 12.28 | | | | 0.27 | | | | 0.09 | | | | 0.36 | | | | (0.61 | ) | | | (0.65 | ) | | | | |
9/30/2017 | | | 11.24 | | | | 0.24 | | | | 1.11 | | | | 1.35 | | | | (0.31 | ) | | | — | | | | | |
9/30/2016 | | | 10.98 | | | | 0.12 | | | | 0.61 | | | | 0.73 | | | | (0.07 | ) | | | (0.40 | ) | | | | |
12/1/2014 - 9/30/2015# | | | 12.19 | | | | 0.25 | | | | (0.87 | ) | | | (0.62 | ) | | | (0.45 | ) | | | (0.14 | ) | | | | |
11/30/2014 | | | 11.90 | | | | 0.32 | | | | 0.26 | | | | 0.58 | | | | (0.29 | ) | | | — | | | | | |
| Institutional Class | | | | | | | | | | | | | | | | | | | | | | | | | | | | |
3/31/2020† | | $ | 11.02 | | | $ | 0.13 | | | $ | (0.88 | ) | | $ | (0.75 | ) | | $ | (0.16 | ) | | $ | (0.88 | ) | | | | |
9/30/2019 | | | 11.45 | | | | 0.24 | | | | 0.06 | | | | 0.30 | | | | (0.29 | ) | | | (0.44 | ) | | | | |
9/30/2018 | | | 12.15 | | | | 0.28 | | | | 0.08 | | | | 0.36 | | | | (0.41 | ) | | | (0.65 | ) | | | | |
9/30/2017 | | | 11.11 | | | | 0.26 | | | | 1.05 | | | | 1.31 | | | | (0.27 | ) | | | — | | | | | |
9/30/2016 | | | 10.86 | | | | 0.10 | | | | 0.61 | | | | 0.71 | | | | (0.06 | ) | | | (0.40 | ) | | | | |
12/1/2014 - 9/30/2015# | | | 12.07 | | | | 0.25 | | | | (0.87 | ) | | | (0.62 | ) | | | (0.45 | ) | | | (0.14 | ) | | | | |
11/30/2014 | | | 11.78 | | | | 0.32 | | | | 0.27 | | | | 0.59 | | | | (0.30 | ) | | | — | | | | | |
| Class R6 | | | | | | | | | | | | | | | | | | | | | | | | | | | | |
3/31/2020† | | $ | 10.78 | | | $ | 0.13 | | | $ | (0.85 | ) | | $ | (0.72 | ) | | $ | (0.17 | ) | | $ | (0.88 | ) | | | | |
9/30/2019 | | | 11.23 | | | | 0.23 | | | | 0.06 | | | | 0.29 | | | | (0.30 | ) | | | (0.44 | ) | | | | |
9/30/2018 | | | 12.13 | | | | 0.29 | | | | 0.07 | | | | 0.36 | | | | (0.61 | ) | | | (0.65 | ) | | | | |
9/30/2017 | | | 11.10 | | | | 0.23 | | | | 1.11 | | | | 1.34 | | | | (0.31 | ) | | | — | | | | | |
9/30/2016 | | | 10.85 | | | | 0.05 | | | | 0.67 | | | | 0.72 | | | | (0.07 | ) | | | (0.40 | ) | | | | |
9/8/2015* - 9/30/2015# | | | 11.01 | | | | 0.01 | | | | (0.13 | ) | | | (0.12 | ) | | | (0.04 | ) | | | — | | | | | |
| Administrative Class | | | | | | | | | | | | | | | | | | | | | | | | | | | | |
3/31/2020† | | $ | 11.38 | | | $ | 0.13 | | | $ | (0.91 | ) | | $ | (0.78 | ) | | $ | (0.14 | ) | | $ | (0.88 | ) | | | | |
9/30/2019 | | | 11.77 | | | | 0.22 | | | | 0.08 | | | | 0.30 | | | | (0.25 | ) | | | (0.44 | ) | | | | |
9/30/2018 | | | 12.64 | | | | 0.28 | | | | 0.07 | | | | 0.35 | | | | (0.57 | ) | | | (0.65 | ) | | | | |
9/30/2017 | | | 11.52 | | | | 0.22 | | | | 1.15 | | | | 1.37 | | | | (0.25 | ) | | | — | | | | | |
9/30/2016 | | | 11.25 | | | | 0.08 | | | | 0.64 | | | | 0.72 | | | | (0.05 | ) | | | (0.40 | ) | | | | |
12/1/2014 - 9/30/2015# | | | 12.47 | | | | 0.23 | | | | (0.89 | ) | | | (0.66 | ) | | | (0.42 | ) | | | (0.14 | ) | | | | |
11/30/2014 | | | 12.17 | | | | 0.30 | | | | 0.27 | | | | 0.57 | | | | (0.27 | ) | | | — | | | | | |
| ^ | A “—” may reflect actual amounts rounding to less than $0.01 or 0.01%. |
| # | Fiscal year end changed from November 30th to September 30th. |
| * | Commencement of operations. |
| (a) | Calculated on average shares outstanding during the period. |
| | | | | | |
| 268 | | Semiannual Report | | | March 31, 2020 | | | See accompanying Notes to Financial Statements |
| | | | | | | | | | | | | | | | | | | | | | | | | | | | | | | | | | |
| | | | Total
Dividends and
Distributions | | | Net Asset
Value, End
of Period | | | Total Return (b) | | | Net Assets,
End of Period
(000s) | | | Ratio of Expenses
to Average Net
Assets with
Fee Waiver/
Reimbursement (c) | | | Ratio of Expenses
to Average Net
Assets without
Fee Waiver/
Reimbursement (c) | | | Ratio of Net
Investment
Income
(Loss)
to Average
Net Assets (c) | | | Portfolio
Turnover Rate | |
| | | | | | | | | | | | | | | | | | | | | | | | | | |
| | | | | | | | | | | | | | | | | | | | | | | | | | | | | | | | | | |
| | | | | $ | (1.00 | ) | | $ | 9.29 | | | | (7.92 | )% | | $ | 40,668 | | | | 0.50 | %(d) | | | 1.13 | %(d) | | | 2.21 | %(d) | | | 103 | % |
| | | | | | (0.69 | ) | | | 11.05 | (e) | | | 3.05 | (e) | | | 49,259 | | | | 0.61 | | | | 1.14 | | | | 1.95 | | | | 29 | |
| | | | | | (1.20 | ) | | | 11.47 | | | | 2.62 | | | | 40,974 | | | | 0.59 | | | | 1.12 | | | | 2.24 | | | | 17 | |
| | | | | | (0.20 | ) | | | 12.34 | | | | 11.88 | | | | 47,170 | | | | 0.60 | | | | 1.12 | | | | 1.73 | | | | 15 | |
| | | | | | (0.45 | ) | | | 11.23 | | | | 6.55 | | | | 84,852 | | | | 0.60 | | | | 1.13 | | | | 0.68 | | | | 57 | |
| | | | | | (0.56 | ) | | | 10.98 | | | | (5.45 | ) | | | 88,132 | | | | 0.55 | (d)(f) | | | 1.30 | (d)(f) | | | 2.52 | (d)(f) | | | 113 | |
| | | | | | (0.27 | ) | | | 12.18 | | | | 4.62 | | | | 65,499 | | | | 0.40 | | | | 1.34 | | | | 2.48 | | | | 48 | |
| | | | | | | | | | | | | | | | | | | | | | | | | | | | | | | | | | |
| | | | | $ | (0.91 | ) | | $ | 9.62 | | | | (8.34 | )% | | $ | 4,315 | | | | 1.25 | %(d) | | | 1.89 | %(d) | | | 1.43 | %(d) | | | 103 | % |
| | | | | | (0.51 | ) | | | 11.37 | (e) | | | 2.29 | (e) | | | 6,393 | | | | 1.34 | | | | 1.91 | | | | 1.14 | | | | 29 | |
| | | | | | (1.05 | ) | | | 11.67 | | | | 1.90 | | | | 26,220 | | | | 1.33 | | | | 1.86 | | | | 1.56 | | | | 17 | |
| | | | | | (0.10 | ) | | | 12.47 | | | | 11.09 | | | | 34,670 | | | | 1.35 | | | | 1.87 | | | | 1.12 | | | | 15 | |
| | | | | | (0.43 | ) | | | 11.32 | | | | 5.72 | | | | 46,387 | | | | 1.38 | | | | 1.90 | | | | (0.06 | ) | | | 57 | |
| | | | | | (0.47 | ) | | | 11.13 | | | | (6.07 | ) | | | 51,322 | | | | 1.29 | (d)(f) | | | 2.04 | (d)(f) | | | 1.78 | (d)(f) | | | 113 | |
| | | | | | (0.17 | ) | | | 12.33 | | | | 3.88 | | | | 62,275 | | | | 1.13 | | | | 2.08 | | | | 1.78 | | | | 48 | |
| | | | | | | | | | | | | | | | | | | | | | | | | | | | | | | | | | |
| | | | | $ | (0.98 | ) | | $ | 9.19 | | | | (8.00 | )% | | $ | 19 | | | | 0.70 | %(d) | | | 1.34 | %(d) | | | 2.02 | %(d) | | | 103 | % |
| | | | | | (0.66 | ) | | | 10.93 | (e) | | | 2.80 | (e) | | | 21 | | | | 0.81 | | | | 1.46 | | | | 2.43 | | | | 29 | |
| | | | | | (1.19 | ) | | | 11.34 | | | | 2.43 | | | | 35 | | | | 0.80 | | | | 1.32 | | | | 1.85 | | | | 17 | |
| | | | | | (0.22 | ) | | | 12.22 | | | | 11.78 | | | | 24 | | | | 0.78 | | | | 1.31 | | | | 1.55 | | | | 15 | |
| | | | | | (0.45 | ) | | | 11.15 | | | | 6.25 | | | | 17 | | | | 0.81 | | | | 1.33 | | | | 0.45 | | | | 57 | |
| | | | | | (0.54 | ) | | | 10.93 | | | | (5.61 | ) | | | 16 | | | | 0.72 | (d)(f) | | | 1.50 | (d)(f) | | | 2.23 | (d)(f) | | | 113 | |
| | | | | | (0.25 | ) | | | 12.13 | | | | 4.57 | | | | 17 | | | | 0.56 | | | | 1.53 | | | | 2.32 | | | | 48 | |
| | | | | | | | | | | | | | | | | | | | | | | | | | | | | | | | | | |
| | | | | $ | (1.04 | ) | | $ | 9.16 | | | | (7.88 | )% | | $ | 3,540 | | | | 0.30 | %(d) | | | 0.90 | %(d) | | | 2.66 | %(d) | | | 103 | % |
| | | | | | (0.74 | ) | | | 10.94 | (e) | | | 3.30 | (e) | | | 6,173 | | | | 0.37 | | | | 0.91 | | | | 1.68 | | | | 29 | |
| | | | | | (1.26 | ) | | | 11.38 | | | | 2.92 | | | | 4,292 | | | | 0.35 | | | | 0.88 | | | | 2.30 | | | | 17 | |
| | | | | | (0.31 | ) | | | 12.28 | | | | 12.31 | | | | 3,563 | | | | 0.32 | | | | 0.85 | | | | 2.05 | | | | 15 | |
| | | | | | (0.47 | ) | | | 11.24 | | | | 6.78 | | | | 1,901 | | | | 0.30 | | | | 0.83 | | | | 1.10 | | | | 57 | |
| | | | | | (0.59 | ) | | | 10.98 | | | | (5.30 | ) | | | 2,069 | | | | 0.33 | (d)(f) | | | 1.06 | (d)(f) | | | 2.52 | (d)(f) | | | 113 | |
| | | | | | (0.29 | ) | | | 12.19 | | | | 4.96 | | | | 2,139 | | | | 0.16 | | | | 1.12 | | | | 2.68 | | | | 48 | |
| | | | | | | | | | | | | | | | | | | | | | | | | | | | | | | | | | |
| | | | | $ | (1.04 | ) | | $ | 9.23 | | | | (7.91 | )% | | $ | 5,345 | | | | 0.32 | %(d) | | | 0.95 | %(d) | | | 2.39 | %(d) | | | 103 | % |
| | | | | | (0.73 | ) | | | 11.02 | (e) | | | 3.34 | (e) | | | 6,026 | | | | 0.36 | | | | 0.89 | | | | 2.25 | | | | 29 | |
| | | | | | (1.06 | ) | | | 11.45 | | | | 2.92 | | | | 6,652 | | | | 0.33 | | | | 0.86 | | | | 2.43 | | | | 17 | |
| | | | | | (0.27 | ) | | | 12.15 | | | | 12.08 | | | | 6,871 | | | | 0.40 | | | | 0.95 | | | | 2.35 | | | | 15 | |
| | | | | | (0.46 | ) | | | 11.11 | | | | 6.72 | | | | 68,709 | | | | 0.40 | | | | 0.92 | | | | 0.89 | | | | 57 | |
| | | | | | (0.59 | ) | | | 10.86 | | | | (5.34 | ) | | | 74,024 | | | | 0.32 | (d)(f) | | | 1.07 | (d)(f) | | | 2.58 | (d)(f) | | | 113 | |
| | | | | | (0.30 | ) | | | 12.07 | | | | 5.01 | | | | 74,957 | | | | 0.16 | | | | 1.11 | | | | 2.69 | | | | 48 | |
| | | | | | | | | | | | | | | | | | | | | | | | | | | | | | | | | | |
| | | | | $ | (1.05 | ) | | $ | 9.01 | | | | (7.81 | )% | | $ | 206,843 | | | | 0.20 | %(d) | | | 0.82 | %(d) | | | 2.54 | %(d) | | | 103 | % |
| | | | | | (0.74 | ) | | | 10.78 | (e) | | | 3.34 | (e) | | | 249,269 | | | | 0.28 | | | | 0.82 | | | | 2.23 | | | | 29 | |
| | | | | | (1.26 | ) | | | 11.23 | | | | 2.95 | | | | 252,313 | | | | 0.28 | | | | 0.81 | | | | 2.48 | | | | 17 | |
| | | | | | (0.31 | ) | | | 12.13 | | | | 12.40 | | | | 264,255 | | | | 0.28 | | | | 0.80 | | | | 1.99 | | | | 15 | |
| | | | | | (0.47 | ) | | | 11.10 | | | | 6.81 | | | | 291,767 | | | | 0.30 | | | | 0.83 | | | | 0.48 | | | | 57 | |
| | | | | | (0.04 | ) | | | 10.85 | | | | (1.14 | ) | | | 91,912 | | | | 0.30 | (d)(f) | | | 1.31 | (d)(f) | | | 2.07 | (d)(f) | | | 113 | |
| | | | | | | | | | | | | | | | | | | | | | | | | | | | | | | | | | |
| | | | | $ | (1.02 | ) | | $ | 9.58 | | | | (7.93 | )% | | $ | 22 | | | | 0.45 | %(d) | | | 1.07 | %(d) | | | 2.26 | %(d) | | | 103 | % |
| | | | | | (0.69 | ) | | | 11.38 | (e) | | | 3.17 | (e) | | | 23 | | | | 0.53 | | | | 1.07 | | | | 1.97 | | | | 29 | |
| | | | | | (1.22 | ) | | | 11.77 | | | | 2.68 | | | | 22 | | | | 0.53 | | | | 1.06 | | | | 2.28 | | | | 17 | |
| | | | | | (0.25 | ) | | | 12.64 | | | | 12.07 | | | | 26 | | | | 0.53 | | | | 1.06 | | | | 1.86 | | | | 15 | |
| | | | | | (0.45 | ) | | | 11.52 | | | | 6.58 | | | | 32 | | | | 0.56 | | | | 1.08 | | | | 0.67 | | | | 57 | |
| | | | | | (0.56 | ) | | | 11.25 | | | | (5.50 | ) | | | 27 | | | | 0.57 | (d)(f) | | | 1.23 | (d)(f) | | | 2.35 | (d)(f) | | | 113 | |
| | | | | | (0.27 | ) | | | 12.47 | | | | 4.68 | | | | 33 | | | | 0.41 | | | | 1.27 | | | | 2.45 | | | | 48 | |
| | (b) | Total return is calculated assuming a purchase of a share on the first day of the period and a sale of a share on the last day of each period reported. Dividends and distributions, if any, are assumed, for purposes of this calculation, to be reinvested. Total return does not reflect sales charges and includes the effect of fee waivers and reimbursements. Total return may reflect adjustments to conform to U.S. GAAP. Total return for a period of less than one year is not annualized. |
| | (c) | Does not include expenses of the investment companies in which the Fund invests. |
| | (d) | Annualized, unless otherwise noted. |
| | (e) | Payments from Affiliates increased the end of period net asset value and total return by less than $0.01 and 0.01%, respectively. |
| | (f) | Certain expenses incurred by the Fund were not annualized. |
| | | | | | | | |
| See accompanying Notes to Financial Statements | | | March 31, 2020 | | | Semiannual Report | | | 269 | |
Financial Highlights (cont’d)
For a Share Outstanding for the Period ended:^
| | | | | | | | | | | | | | | | | | | | | | | | | | | | |
| | | Net Asset
Value,
Beginning
of Period | | | Net
Investment
Income (a) | | | Net Realized
and Change
in Unrealized
Gain (Loss) | | | Total from
Investment
Operations | | |
Dividends
from Net
Investment
Income | | | Distributions
from Net
Realized Capital
Gains | | | | |
| AllianzGI Global Dynamic Allocation: | | | | | | | | | | | | | | | | | | | | | |
| Class A | | | | | | | | | | | | | | | | | | | | | | | | | | | | |
3/31/2020† | | $ | 19.21 | | | $ | 0.13 | | | $ | (1.53 | ) | | $ | (1.40 | ) | | $ | (0.72 | ) | | $ | (1.30 | ) | | | | |
9/30/2019 | | | 20.19 | | | | 0.34 | | | | (0.48 | ) | | | (0.14 | ) | | | (0.36 | ) | | | (0.48 | ) | | | | |
9/30/2018 | | | 20.52 | | | | 0.28 | | | | 0.32 | | | | 0.60 | | | | (0.21 | ) | | | (0.72 | ) | | | | |
9/30/2017 | | | 18.32 | | | | 0.20 | | | | 2.00 | | | | 2.20 | | | | — | | | | — | | | | | |
9/30/2016 | | | 17.99 | | | | 0.17 | | | | 0.66 | | | | 0.83 | | | | (0.22 | ) | | | (0.28 | ) | | | | |
12/1/2014 - 9/30/2015# | | | 21.93 | | | | 0.39 | | | | (1.43 | ) | | | (1.04 | ) | | | (0.81 | ) | | | (2.09 | ) | | | | |
11/30/2014 | | | 24.70 | | | | 0.44 | | | | 0.31 | | | | 0.75 | | | | (0.66 | ) | | | (2.86 | ) | | | | |
| Class C | | | | | | | | | | | | | | | | | | | | | | | | | | | | |
3/31/2020† | | $ | 18.84 | | | $ | 0.06 | | | $ | (1.52 | ) | | $ | (1.46 | ) | | $ | (0.59 | ) | | $ | (1.30 | ) | | | | |
9/30/2019 | | | 19.56 | | | | 0.19 | | | | (0.43 | ) | | | (0.24 | ) | | | — | | | | (0.48 | ) | | | | |
9/30/2018 | | | 20.05 | | | | 0.12 | | | | 0.31 | | | | 0.43 | | | | (0.20 | ) | | | (0.72 | ) | | | | |
9/30/2017 | | | 18.05 | | | | 0.08 | | | | 1.92 | | | | 2.00 | | | | — | | | | — | | | | | |
9/30/2016 | | | 17.63 | | | | 0.08 | | | | 0.62 | | | | 0.70 | | | | — | | | | (0.28 | ) | | | | |
12/1/2014 - 9/30/2015# | | | 21.52 | | | | 0.30 | | | | (1.45 | ) | | | (1.15 | ) | | | (0.65 | ) | | | (2.09 | ) | | | | |
11/30/2014 | | | 24.28 | | | | 0.25 | | | | 0.32 | | | | 0.57 | | | | (0.47 | ) | | | (2.86 | ) | | | | |
| Class R | | | | | | | | | | | | | | | | | | | | | | | | | | | | |
3/31/2020† | | $ | 19.10 | | | $ | 0.10 | | | $ | (1.53 | ) | | $ | (1.43 | ) | | $ | (0.65 | ) | | $ | (1.30 | ) | | | | |
9/30/2019 | | | 19.97 | | | | 0.26 | | | | (0.45 | ) | | | (0.19 | ) | | | (0.20 | ) | | | (0.48 | ) | | | | |
9/30/2018 | | | 20.35 | | | | 0.21 | | | | 0.30 | | | | 0.51 | | | | (0.17 | ) | | | (0.72 | ) | | | | |
9/30/2017 | | | 18.23 | | | | 0.16 | | | | 1.96 | | | | 2.12 | | | | — | | | | — | | | | | |
9/30/2016 | | | 17.84 | | | | 0.16 | | | | 0.63 | | | | 0.79 | | | | (0.12 | ) | | | (0.28 | ) | | | | |
12/1/2014 - 9/30/2015# | | | 21.79 | | | | 0.36 | | | | (1.45 | ) | | | (1.09 | ) | | | (0.77 | ) | | | (2.09 | ) | | | | |
11/30/2014 | | | 24.62 | | | | 0.40 | | | | 0.30 | | | | 0.70 | | | | (0.67 | ) | | | (2.86 | ) | | | | |
| Class P | | | | | | | | | | | | | | | | | | | | | | | | | | | | |
3/31/2020† | | $ | 19.09 | | | $ | 0.10 | | | $ | (1.35 | ) | | $ | (1.25 | ) | | $ | — | | | $ | (1.30 | ) | | | | |
9/30/2019 | | | 20.07 | | | | 0.36 | | | | (0.46 | ) | | | (0.10 | ) | | | (0.40 | ) | | | (0.48 | ) | | | | |
9/30/2018 | | | 20.48 | | | | 0.32 | | | | 0.31 | | | | 0.63 | | | | (0.32 | ) | | | (0.72 | ) | | | | |
9/30/2017 | | | 18.36 | | | | 0.28 | | | | 1.94 | | | | 2.22 | | | | (0.10 | ) | | | — | | | | | |
9/30/2016 | | | 17.97 | | | | 0.16 | | | | 0.71 | | | | 0.87 | | | | (0.20 | ) | | | (0.28 | ) | | | | |
12/1/2014 - 9/30/2015# | | | 21.94 | | | | 0.40 | | | | (1.42 | ) | | | (1.02 | ) | | | (0.86 | ) | | | (2.09 | ) | | | | |
11/30/2014 | | | 24.71 | | | | 0.46 | | | | 0.33 | | | | 0.79 | | | | (0.70 | ) | | | (2.86 | ) | | | | |
| Institutional Class | | | | | | | | | | | | | | | | | | | | | | | | | | | | |
3/31/2020† | | $ | 19.50 | | | $ | 0.16 | | | $ | (1.55 | ) | | $ | (1.39 | ) | | $ | (0.78 | ) | | $ | (1.30 | ) | | | | |
9/30/2019 | | | 20.22 | | | | 0.39 | | | | (0.45 | ) | | | (0.06 | ) | | | (0.18 | ) | | | (0.48 | ) | | | | |
9/30/2018 | | | 20.61 | | | | 0.34 | | | | 0.32 | | | | 0.66 | | | | (0.33 | ) | | | (0.72 | ) | | | | |
9/30/2017 | | | 18.37 | | | | 0.27 | | | | 1.98 | | | | 2.25 | | | | (0.01 | ) | | | — | | | | | |
9/30/2016 | | | 18.02 | | | | 0.23 | | | | 0.65 | | | | 0.88 | | | | (0.25 | ) | | | (0.28 | ) | | | | |
12/1/2014 - 9/30/2015# | | | 22.00 | | | | 0.36 | | | | (1.37 | ) | | | (1.01 | ) | | | (0.88 | ) | | | (2.09 | ) | | | | |
11/30/2014 | | | 24.74 | | | | 0.48 | | | | 0.34 | | | | 0.82 | | | | (0.70 | ) | | | (2.86 | ) | | | | |
| Class R6 | | | | | | | | | | | | | | | | | | | | | | | | | | | | |
3/31/2020† | | $ | 19.18 | | | $ | 0.15 | | | $ | (1.53 | ) | | $ | (1.38 | ) | | $ | (0.73 | ) | | $ | (1.30 | ) | | | | |
9/30/2019 | | | 20.15 | | | | 0.39 | | | | (0.48 | ) | | | (0.09 | ) | | | (0.40 | ) | | | (0.48 | ) | | | | |
9/30/2018 | | | 20.56 | | | | 0.34 | | | | 0.32 | | | | 0.66 | | | | (0.35 | ) | | | (0.72 | ) | | | | |
9/30/2017 | | | 18.38 | | | | 0.28 | | | | 1.99 | | | | 2.27 | | | | (0.09 | ) | | | — | | | | | |
2/1/2016* - 9/30/2016 | | | 17.30 | | | | 0.09 | | | | 0.99 | | | | 1.08 | | | | — | | | | — | | | | | |
| Administrative Class | | | | | | | | | | | | | | | | | | | | | | | | | | | | |
3/31/2020† | | $ | 19.16 | | | $ | 0.13 | | | $ | (1.52 | ) | | $ | (1.39 | ) | | $ | (0.74 | ) | | $ | (1.30 | ) | | | | |
9/30/2019 | | | 20.15 | | | | 0.34 | | | | (0.48 | ) | | | (0.14 | ) | | | (0.37 | ) | | | (0.48 | ) | | | | |
9/30/2018 | | | 20.55 | | | | 0.29 | | | | 0.32 | | | | 0.61 | | | | (0.29 | ) | | | (0.72 | ) | | | | |
9/30/2017 | | | 18.35 | | | | 0.23 | | | | 1.97 | | | | 2.20 | | | | — | | | | — | | | | | |
9/30/2016 | | | 17.93 | | | | 0.21 | | | | 0.63 | | | | 0.84 | | | | (0.14 | ) | | | (0.28 | ) | | | | |
12/1/2014 - 9/30/2015# | | | 21.90 | | | | 0.42 | | | | (1.46 | ) | | | (1.04 | ) | | | (0.84 | ) | | | (2.09 | ) | | | | |
11/30/2014 | | | 24.67 | | | | 0.42 | | | | 0.33 | | | | 0.75 | | | | (0.66 | ) | | | (2.86 | ) | | | | |
| ^ | A “—” may reflect actual amounts rounding to less than $0.01 or 0.01%. |
| # | Fiscal year end changed from November 30th to September 30th. |
| * | Commencement of operations. |
| (a) | Calculated on average shares outstanding during the period. |
| | | | | | |
| 270 | | Semiannual Report | | | March 31, 2020 | | | See accompanying Notes to Financial Statements |
| | | | | | | | | | | | | | | | | | | | | | | | | | | | | | | | | | |
| | | | Total Dividends and
Distributions | | | Net Asset
Value, End
of Period | | | Total Return (b) | | | Net Assets,
End of Period
(000s) | | | Ratio of Expenses
to Average Net
Assets with
Fee Waiver/
Reimbursement (c) | | |
Ratio of Expenses
to Average Net
Assets without
Fee Waiver/
Reimbursement (c) | | | Ratio of Net
Investment
Income
to Average
Net Assets (c) | | | Portfolio
Turnover Rate | |
| | | | | | | | | | | | | | | | | | | | | | | | | | |
| | | | | | | | | | | | | | | | | | | | | | | | | | | | | | | | | | |
| | | | | $ | (2.02 | ) | | $ | 15.79 | | | | (8.83 | )% | | $ | 1,215 | | | | 0.82 | %(d) | | | 1.54 | %(d) | | | 1.36 | %(d) | | | 114 | % |
| | | | | | (0.84 | ) | | | 19.21 | | | | (0.25 | ) | | | 1,812 | | | | 0.97 | | | | 1.32 | | | | 1.78 | | | | 222 | |
| | | | | | (0.93 | ) | | | 20.19 | | | | 2.93 | | | | 2,015 | | | | 0.97 | | | | 1.25 | | | | 1.37 | | | | 152 | |
| | | | | | — | | | | 20.52 | | | | 12.01 | | | | 2,421 | | | | 1.02 | | | | 1.35 | | | | 1.05 | | | | 192 | |
| | | | | | (0.50 | ) | | | 18.32 | | | | 4.69 | | | | 5,198 | | | | 0.76 | | | | 1.73 | | | | 0.96 | | | | 79 | |
| | | | | | (2.90 | ) | | | 17.99 | | | | (5.30 | ) | | | 1,324 | | | | 0.63 | (d)(e) | | | 4.38 | (d)(e) | | | 2.46 | (d)(e) | | | 121 | |
| | | | | | (3.52 | ) | | | 21.93 | | | | 3.40 | | | | 1,042 | | | | 0.40 | | | | 4.53 | | | | 2.00 | | | | 62 | |
| | | | | | | | | | | | | | | | | | | | | | | | | | | | | | | | | | |
| | | | | $ | (1.89 | ) | | $ | 15.49 | | | | (9.21 | )% | | $ | 539 | | | | 1.58 | %(d) | | | 2.30 | %(d) | | | 0.62 | %(d) | | | 114 | % |
| | | | | | (0.48 | ) | | | 18.84 | | | | (1.00 | ) | | | 588 | | | | 1.74 | | | | 2.08 | | | | 1.00 | | | | 222 | |
| | | | | | (0.92 | ) | | | 19.56 | | | | 2.09 | | | | 1,195 | | | | 1.74 | | | | 2.01 | | | | 0.61 | | | | 152 | |
| | | | | | — | | | | 20.05 | | | | 11.08 | | | | 1,325 | | | | 1.77 | | | | 2.08 | | | | 0.42 | | | | 192 | |
| | | | | | (0.28 | ) | | | 18.05 | | | | 4.02 | | | | 1,029 | | | | 1.49 | | | | 2.69 | | | | 0.45 | | | | 79 | |
| | | | | | (2.74 | ) | | | 17.63 | | | | (5.95 | ) | | | 1,194 | | | | 1.37 | (d)(e) | | | 5.05 | (d)(e) | | | 1.90 | (d)(e) | | | 121 | |
| | | | | | (3.33 | ) | | | 21.52 | | | | 2.57 | | | | 1,346 | | | | 1.18 | | | | 5.31 | | | | 1.16 | | | | 62 | |
| | | | | | | | | | | | | | | | | | | | | | | | | | | | | | | | | | |
| | | | | $ | (1.95 | ) | | $ | 15.72 | | | | (8.99 | )% | | $ | 97 | | | | 1.18 | %(d) | | | 1.90 | %(d) | | | 1.03 | %(d) | | | 114 | % |
| | | | | | (0.68 | ) | | | 19.10 | | | | (0.60 | ) | | | 121 | | | | 1.34 | | | | 1.67 | | | | 1.38 | | | | 222 | |
| | | | | | (0.89 | ) | | | 19.97 | | | | 2.49 | | | | 160 | | | | 1.34 | | | | 1.58 | | | | 1.05 | | | | 152 | |
| | | | | | — | | | | 20.35 | | | | 11.63 | | | | 137 | | | | 1.35 | | | | 1.70 | | | | 0.84 | | | | 192 | |
| | | | | | (0.40 | ) | | | 18.23 | | | | 4.50 | | | | 159 | | | | 1.01 | | | | 2.25 | | | | 0.90 | | | | 79 | |
| | | | | | (2.86 | ) | | | 17.84 | | | | (5.55 | ) | | | 152 | | | | 0.87 | (d)(e) | | | 4.80 | (d)(e) | | | 2.27 | (d)(e) | | | 121 | |
| | | | | | (3.53 | ) | | | 21.79 | | | | 3.17 | | | | 145 | | | | 0.63 | | | | 4.99 | | | | 1.79 | | | | 62 | |
| | | | | | | | | | | | | | | | | | | | | | | | | | | | | | | | | | |
| | | | | $ | (1.30 | ) | | $ | 16.54 | | | | (7.45 | )% | | $ | 64 | | | | 0.67 | %(d) | | | 1.16 | %(d) | | | 1.06 | %(d) | | | 114 | % |
| | | | | | (0.88 | ) | | | 19.09 | | | | (0.05 | ) | | | 11,456 | | | | 0.80 | | | | 1.12 | | | | 1.95 | | | | 222 | |
| | | | | | (1.04 | ) | | | 20.07 | | | | 3.08 | | | | 13,436 | | | | 0.80 | | | | 1.03 | | | | 1.58 | | | | 152 | |
| | | | | | (0.10 | ) | | | 20.48 | | | | 12.18 | | | | 12,730 | | | | 0.82 | | | | 1.11 | | | | 1.44 | | | | 192 | |
| | | | | | (0.48 | ) | | | 18.36 | | | | 4.89 | | | | 186 | | | | 0.61 | | | | 1.47 | | | | 0.90 | | | | 79 | |
| | | | | | (2.95 | ) | | | 17.97 | | | | (5.19 | ) | | | 53 | | | | 0.47 | (d)(e) | | | 4.07 | (d)(e) | | | 2.53 | (d)(e) | | | 121 | |
| | | | | | (3.56 | ) | | | 21.94 | | | | 3.57 | | | | 43 | | | | 0.23 | | | | 4.40 | | | | 2.06 | | | | 62 | |
| | | | | | | | | | | | | | | | | | | | | | | | | | | | | | | | | | |
| | | | | $ | (2.08 | ) | | $ | 16.03 | | | | (8.69 | )% | | $ | 8,969 | | | | 0.54 | %(d) | | | 1.32 | %(d) | | | 1.67 | %(d) | | | 114 | % |
| | | | | | (0.66 | ) | | | 19.50 | | | | 0.03 | | | | 9,330 | | | | 0.70 | | | | 1.12 | | | | 2.05 | | | | 222 | |
| | | | | | (1.05 | ) | | | 20.22 | | | | 3.18 | | | | 13,225 | | | | 0.70 | | | | 0.94 | | | | 1.65 | | | | 152 | |
| | | | | | (0.01 | ) | | | 20.61 | | | | 12.27 | | | | 31,783 | | | | 0.75 | | | | 1.03 | | | | 1.42 | | | | 192 | |
| | | | | | (0.53 | ) | | | 18.37 | | | | 4.98 | | | | 37,722 | | | | 0.51 | | | | 1.45 | | | | 1.27 | | | | 79 | |
| | | | | | (2.97 | ) | | | 18.02 | | | | (5.12 | ) | | | 4,714 | | | | 0.39 | (d)(e) | | | 4.10 | (d)(e) | | | 2.27 | (d)(e) | | | 121 | |
| | | | | | (3.56 | ) | | | 22.00 | | | | 3.69 | | | | 3,401 | | | | 0.13 | | | | 4.30 | | | | 2.16 | | | | 62 | |
| | | | | | | | | | | | | | | | | | | | | | | | | | | | | | | | | | |
| | | | | $ | (2.03 | ) | | $ | 15.77 | | | | (8.71 | ) | | $ | 97,204 | | | | 0.54 | %(d) | | | 1.22 | %(d) | | | 1.64 | %(d) | | | 114 | % |
| | | | | | (0.88 | ) | | | 19.18 | | | | (0.01 | ) | | | 127,285 | | | | 0.70 | | | | 1.01 | | | | 2.08 | | | | 222 | |
| | | | | | (1.07 | ) | | �� | 20.15 | | | | 3.19 | | | | 192,375 | | | | 0.70 | | | | 0.91 | | | | 1.67 | | | | 152 | |
| | | | | | (0.09 | ) | | | 20.56 | | | | 12.39 | | | | 231,584 | | | | 0.70 | | | | 0.99 | | | | 1.49 | | | | 192 | |
| | | | | | — | | | | 18.38 | | | | 6.24 | | | | 9,029 | | | | 0.36 | (d) | | | 1.36 | (d) | | | 0.77 | (d) | | | 79 | |
| | | | | | | | | | | | | | | | | | | | | | | | | | | | | | | | | | |
| | | | | $ | (2.04 | ) | | $ | 15.73 | | | | (8.81 | )% | | $ | 20 | | | | 0.79 | %(d) | | | 1.47 | %(d) | | | 1.42 | %(d) | | | 114 | % |
| | | | | | (0.85 | ) | | | 19.16 | | | | (0.26 | ) | | | 23 | | | | 0.95 | | | | 1.27 | | | | 1.80 | | | | 222 | |
| | | | | | (1.01 | ) | | | 20.15 | | | | 2.93 | | | | 23 | | | | 0.96 | | | | 1.17 | | | | 1.42 | | | | 152 | |
| | | | | | — | | | | 20.55 | | | | 11.99 | | | | 23 | | | | 1.00 | | | | 1.25 | | | | 1.18 | | | | 192 | |
| | | | | | (0.42 | ) | | | 18.35 | | | | 4.73 | | | | 20 | | | | 0.76 | | | | 1.89 | | | | 1.15 | | | | 79 | |
| | | | | | (2.93 | ) | | | 17.93 | | | | (5.29 | ) | | | 19 | | | | 0.61 | (d)(e) | | | 4.29 | (d)(e) | | | 2.64 | (d)(e) | | | 121 | |
| | | | | | (3.52 | ) | | | 21.90 | | | | 3.38 | | | | 26 | | | | 0.38 | | | | 4.55 | | | | 1.90 | | | | 62 | |
| | (b) | Total return is calculated assuming a purchase of a share on the first day of the period and a sale of a share on the last day of each period reported. Dividends and distributions, if any, are assumed, for purposes of this calculation, to be reinvested. Total return does not reflect sales charges and includes the effect of fee waivers and reimbursements. Total return may reflect adjustments to conform to U.S. GAAP. Total return for a period of less than one year is not annualized. |
| | (c) | Does not include expenses of the investment companies in which the Fund invests. |
| | (d) | Annualized, unless otherwise noted. |
| | (e) | Certain expenses incurred by the Fund were not annualized. |
| | | | | | | | |
| See accompanying Notes to Financial Statements | | | March 31, 2020 | | | Semiannual Report | | | 271 | |
Financial Highlights (cont’d)
For a Share Outstanding for the Period ended:^
| | | | | | | | | | | | | | | | | | | | | | | | | | | | |
| | | Net Asset
Value,
Beginning
of Period | | | Net
Investment
Income (a) | | | Net Realized
and Change
in Unrealized
Gain (Loss) | | | Total from
Investment
Operations | | |
Dividends
from Net
Investment
Income | | | Distributions
from Net
Realized Capital
Gains | | | | |
| AllianzGI Global High Yield: | | | | | | | | | | | | | | | | | | | | | |
| Class P | | | | | | | | | | | | | | | | | | | | | | | | | | | | |
3/31/2020† | | $ | 14.97 | | | $ | 0.37 | | | $ | (1.84 | ) | | $ | (1.47 | ) | | $ | (0.18 | ) | | $ | — | | | | | |
9/30/2019 | | | 14.84 | | | | 0.69 | | | | 0.40 | | | | 1.09 | | | | (0.96 | ) | | | — | | | | | |
9/30/2018 | | | 15.36 | | | | 0.67 | | | | (0.48 | ) | | | 0.19 | | | | (0.71 | ) | | | — | | | | | |
5/3/2017* - 9/30/2017 | | | 15.00 | | | | 0.26 | | | | 0.18 | | | | 0.44 | | | | (0.08 | ) | | | — | | | | | |
| Institutional Class | | | | | | | | | | | | | | | | | | | | | | | | | | | | |
3/31/2020† | | $ | 14.95 | | | $ | 0.38 | | | $ | (1.84 | ) | | $ | (1.46 | ) | | $ | (0.19 | ) | | $ | — | | | | | |
9/30/2019 | | | 14.83 | | | | 0.70 | | | | 0.40 | | | | 1.10 | | | | (0.98 | ) | | | — | | | | | |
9/30/2018 | | | 15.36 | | | | 0.68 | | | | (0.48 | ) | | | 0.20 | | | | (0.73 | ) | | | — | | | | | |
5/3/2017* - 9/30/2017 | | | 15.00 | | | | 0.27 | | | | 0.17 | | | | 0.44 | | | | (0.08 | ) | | | — | | | | | |
| AllianzGI Global Sustainability: | | | | | | | | | | | | | | | | | | | | | |
| Class A | | | | | | | | | | | | | | | | | | | | | | | | | | | | |
3/31/2020† | | $ | 18.27 | | | $ | 0.05 | | | $ | (1.78 | ) | | $ | (1.73 | ) | | $ | (0.02 | ) | | $ | (0.33 | ) | | | | |
9/30/2019 | | | 19.46 | | | | 0.14 | | | | 0.04 | | | | 0.18 | | | | (0.30 | ) | | | (1.07 | ) | | | | |
9/30/2018 | | | 17.96 | | | | 0.17 | | | | 1.98 | | | | 2.15 | | | | (0.21 | ) | | | (0.44 | ) | | | | |
9/30/2017 | | | 15.80 | | | | 0.13 | | | | 2.20 | | | | 2.33 | | | | (0.14 | ) | | | (0.03 | ) | | | | |
9/30/2016 | | | 14.10 | | | | 0.14 | | | | 1.76 | | | | 1.90 | | | | (0.20 | ) | | | — | | | | | |
12/9/2014* - 9/30/2015# | | | 15.00 | | | | 0.11 | | | | (1.01 | ) | | | (0.90 | ) | | | — | | | | — | | | | | |
| Class P | | | | | | | | | | | | | | | | | | | | | | | | | | | | |
3/31/2020† | | $ | 18.39 | | | $ | 0.06 | | | $ | (1.79 | ) | | $ | (1.73 | ) | | $ | (0.03 | ) | | $ | (0.33 | ) | | | | |
9/30/2019 | | | 19.68 | | | | 0.21 | | | | (0.02 | ) | | | 0.19 | | | | (0.41 | ) | | | (1.07 | ) | | | | |
9/30/2018 | | | 18.13 | | | | 0.16 | | | | 2.05 | | | | 2.21 | | | | (0.22 | ) | | | (0.44 | ) | | | | |
9/30/2017 | | | 15.91 | | | | 0.15 | | | | 2.23 | | | | 2.38 | | | | (0.13 | ) | | | (0.03 | ) | | | | |
9/30/2016 | | | 14.12 | | | | 0.17 | | | | 1.75 | | | | 1.92 | | | | (0.13 | ) | | | — | | | | | |
12/9/2014* - 9/30/2015# | | | 15.00 | | | | 0.15 | | | | (1.03 | ) | | | (0.88 | ) | | | — | | | | — | | | | | |
| Institutional Class | | | | | | | | | | | | | | | | | | | | | | | | | | | | |
3/31/2020† | | $ | 18.75 | | | $ | 0.08 | | | $ | (1.83 | ) | | $ | (1.75 | ) | | $ | (0.05 | ) | | $ | (0.33 | ) | | | | |
9/30/2019 | | | 19.72 | | | | 0.19 | | | | 0.06 | | | | 0.25 | | | | (0.15 | ) | | | (1.07 | ) | | | | |
9/30/2018 | | | 18.13 | | | | 0.22 | | | | 2.00 | | | | 2.22 | | | | (0.19 | ) | | | (0.44 | ) | | | | |
9/30/2017 | | | 15.92 | | | | 0.19 | | | | 2.20 | | | | 2.39 | | | | (0.15 | ) | | | (0.03 | ) | | | | |
9/30/2016 | | | 14.13 | | | | 0.22 | | | | 1.71 | | | | 1.93 | | | | (0.14 | ) | | | — | | | | | |
12/9/2014* - 9/30/2015# | | | 15.00 | | | | 0.16 | | | | (1.03 | ) | | | (0.87 | ) | | | — | | | | — | | | | | |
| ^ | A “—” may reflect actual amounts rounding to less than $0.01 or 0.01%. |
| * | Commencement of operations. |
| # | Fiscal year end changed from November 30th to September 30th. |
| (a) | Calculated on average shares outstanding during the period. |
| (b) | Total return is calculated assuming a purchase of a share on the first day of the period and a sale of a share on the last day of each period reported. Dividends and distributions, if any, are assumed, for purposes of this calculation, to be reinvested. Total return does not reflect sales charges and includes the effect of fee waivers and reimbursements. Total return may reflect adjustments to conform to U.S. GAAP. Total return for a period of less than one year is not annualized. |
| (c) | Annualized, unless otherwise noted. |
| (d) | Certain expenses incurred by the Fund were not annualized. |
| (e) | Due to a change in accounting estimate resulting from a revised agreement with the Fund’s custodian and accounting agent, in order to lower costs and seek economies of scale for all Funds in the Trust, the custodian and accounting agent expense was reduced for the period. The effect on the Ratio of Expenses to Average Net Assets without Fee Waiver/ Reimbursement was a decrease in the ratio of 0.25%. |
| | | | | | |
| 272 | | Semiannual Report | | | March 31, 2020 | | | See accompanying Notes to Financial Statements |
| | | | | | | | | | | | | | | | | | | | | | | | | | | | | | | | | | |
| | | | Total
Dividends and
Distributions | | | Net Asset
Value, End
of Period | | | Total Return (b) | | | Net Assets,
End of Period
(000s) | | | Ratio of
Expenses to
Average Net
Assets with
Fee Waiver/
Reimbursement | | | Ratio of
Expenses to
Average Net
Assets without
Fee Waiver/
Reimbursement | | | Ratio of Net
Investment
Income to
Average
Net Assets | | | Portfolio
Turnover Rate | |
| | | | | | | | | | | | | | | | | | | | | | | | | | |
| | | | | | | | | | | | | | | | | | | | | | | | | | | | | | | | | | |
| | | | | $ | (0.18 | ) | | $ | 13.32 | | | | (9.87 | )% | | $ | 10 | | | | 0.80 | %(c) | | | 1.30 | %(c) | | | 4.93 | %(c) | | | 62 | % |
| | | | | | (0.96 | ) | | | 14.97 | | | | 7.70 | | | | 11 | | | | 0.81 | | | | 1.13 | (e)(f) | | | 4.67 | | | | 112 | |
| | | | | | (0.71 | ) | | | 14.84 | | | | 1.26 | | | | 11 | | | | 0.81 | | | | 1.79 | | | | 4.41 | | | | 101 | |
| | | | | | (0.08 | ) | | | 15.36 | | | | 2.91 | | | | 10 | | | | 0.80 | (c)(d) | | | 2.76 | (c)(d) | | | 4.22 | (c)(d) | | | 107 | |
| | | | | | | | | | | | | | | | | | | | | | | | | | | | | | | | | | |
| | | | | $ | (0.19 | ) | | $ | 13.30 | | | | (9.82 | )% | | $ | 25,648 | | | | 0.70 | %(c) | | | 1.30 | %(c) | | | 5.04 | %(c) | | | 62 | % |
| | | | | | (0.98 | ) | | | 14.95 | | | | 7.84 | | | | 24,057 | | | | 0.71 | | | | 1.12 | (e) | | | 4.77 | | | | 112 | |
| | | | | | (0.73 | ) | | | 14.83 | | | | 1.32 | | | | 22,168 | | | | 0.71 | | | | 1.78 | | | | 4.52 | | | | 101 | |
| | | | | | (0.08 | ) | | | 15.36 | | | | 2.96 | | | | 21,625 | | | | 0.70 | (c)(d) | | | 2.79 | (c)(d) | | | 4.32 | (c)(d) | | | 107 | |
| | | | | | | | | | | | | | | | | | | | | | | | | | |
| | | | | | | | | | | | | | | | | | | | | | | | | | | | | | | | | | |
| | | | | $ | (0.35 | ) | | $ | 16.19 | | | | (9.78 | )% | | $ | 1,591 | | | | 1.04 | %(c) | | | 1.37 | %(c) | | | 0.53 | %(c) | | | 13 | % |
| | | | | | (1.37 | ) | | | 18.27 | | | | 2.43 | | | | 1,444 | | | | 1.09 | | | | 1.84 | | | | 0.77 | | | | 49 | |
| | | | | | (0.65 | ) | | | 19.46 | | | | 12.23 | | | | 614 | | | | 1.09 | | | | 1.70 | | | | 0.92 | | | | 20 | |
| | | | | | (0.17 | ) | | | 17.96 | | | | 14.94 | | | | 402 | | | | 1.12 | | | | 7.55 | | | | 0.79 | | | | 27 | |
| | | | | | (0.20 | ) | | | 15.80 | | | | 13.54 | | | | 125 | | | | 1.20 | | | | 21.93 | | | | 0.94 | | | | 20 | |
| | | | | | — | | | | 14.10 | | | | (6.00 | ) | | | 62 | | | | 1.20 | (c)(d) | | | 15.36 | (c)(d) | | | 0.89 | (c)(d) | | | 25 | |
| | | | | | | | | | | | | | | | | | | | | | | | | | | | | | | | | | |
| | | | | $ | (0.36 | ) | | $ | 16.30 | | | | (9.73 | )% | | $ | 24,404 | | | | 0.89 | %(c) | | | 1.10 | %(c) | | | 0.65 | %(c) | | | 13 | % |
| | | | | | (1.48 | ) | | | 18.39 | | | | 2.56 | | | | 21,582 | | | | 0.94 | | | | 1.65 | | | | 1.17 | | | | 49 | |
| | | | | | (0.66 | ) | | | 19.68 | | | | 12.44 | | | | 11,362 | | | | 0.94 | | | | 1.25 | | | | 0.84 | | | | 20 | |
| | | | | | (0.16 | ) | | | 18.13 | | | | 15.13 | | | | 64 | | | | 0.96 | | | | 1.62 | | | | 0.88 | | | | 27 | |
| | | | | | (0.13 | ) | | | 15.91 | | | | 13.67 | | | | 11 | | | | 1.05 | | | | 3.44 | | | | 1.15 | | | | 20 | |
| | | | | | — | | | | 14.12 | | | | (5.87 | ) | | | 9 | | | | 1.05 | (c)(d) | | | 8.70 | (c)(d) | | | 1.22 | (c)(d) | | | 25 | |
| | | | | | | | | | | | | | | | | | | | | | | | | | | | | | | | | | |
| | | | | $ | (0.38 | ) | | $ | 16.62 | | | | (9.69 | )% | | $ | 110,881 | | | | 0.79 | %(c) | | | 0.98 | %(c) | | | 0.80 | %(c) | | | 13 | % |
| | | | | | (1.22 | ) | | | 18.75 | | | | 2.63 | | | | 2,072 | | | | 0.84 | | | | 1.66 | | | | 1.05 | | | | 49 | |
| | | | | | (0.63 | ) | | | 19.72 | | | | 12.52 | | | | 28,237 | | | | 0.84 | | | | 1.43 | | | | 1.18 | | | | 20 | |
| | | | | | (0.18 | ) | | | 18.13 | | | | 15.25 | | | | 26,615 | | | | 0.89 | | | | 1.63 | | | | 1.16 | | | | 27 | |
| | | | | | (0.14 | ) | | | 15.92 | | | | 13.77 | | | | 20,610 | | | | 0.95 | | | | 2.04 | | | | 1.47 | | | | 20 | |
| | | | | | — | | | | 14.13 | | | | (5.80 | ) | | | 2,826 | | | | 0.95 | (c)(d) | | | 8.70 | (c)(d) | | | 1.32 | (c)(d) | | | 25 | |
| | | | | | | | |
| See accompanying Notes to Financial Statements | | | March 31, 2020 | | | Semiannual Report | | | 273 | |
Financial Highlights (cont’d)
For a Share Outstanding for the Period ended:^
| | | | | | | | | | | | | | | | | | | | | | | | | | | | |
| | | Net Asset
Value,
Beginning
of Period | | | Net
Investment
Income (a) | | | Net Realized
and Change
in Unrealized
Gain (Loss) | | | Total from
Investment
Operations | | |
Dividends
from Net
Investment
Income | | | Distributions
from Net
Realized Capital
Gains | | | | |
| AllianzGI Green Bond: | | | | | | | | | | | | | | | | | | | | | |
| Class A | | | | | | | | | | | | | | | | | | | | | | | | | | | | |
3/31/2020† | | $ | 16.46 | | | $ | 0.08 | | | $ | (0.93 | ) | | $ | (0.85 | ) | | $ | (0.11 | ) | | $ | (0.07 | ) | | | | |
11/19/2018* - 9/30/2019 | | | 15.00 | | | | 0.26 | | | | 1.45 | | | | 1.71 | | | | (0.25 | ) | | | — | | | | | |
| Class P | | | | | | | | | | | | | | | | | | | | | | | | | | | | |
3/31/2020† | | $ | 16.45 | | | $ | 0.10 | | | $ | (0.94 | ) | | $ | (0.84 | ) | | $ | (0.12 | ) | | $ | (0.07 | ) | | | | |
11/19/2018* -9/30/2019 | | | 15.00 | | | | 0.29 | | | | 1.44 | | | | 1.73 | | | | (0.28 | ) | | | — | | | | | |
| Institutional Class | | | | | | | | | | | | | | | | | | | | | | | | | | | | |
3/31/2020† | | $ | 16.47 | | | $ | 0.10 | | | $ | (0.94 | ) | | $ | (0.84 | ) | | $ | (0.12 | ) | | $ | (0.07 | ) | | | | |
11/19/2018* - 9/30/2019 | | | 15.00 | | | | 0.28 | | | | 1.46 | | | | 1.74 | | | | (0.27 | ) | | | — | | | | | |
| ^ | A “—” may reflect actual amounts rounding to less than $0.01 or 0.01%. |
| * | Commencement of operations. |
| (a) | Calculated on average shares outstanding during the period. |
| (b) | Total return is calculated assuming a purchase of a share on the first day of the period and a sale of a share on the last day of each period reported. Dividends and distributions, if any, are assumed, for purposes of this calculation, to be reinvested. Total return does not reflect sales charges and includes the effect of fee waivers and reimbursements. Total return may reflect adjustments to conform to U.S. GAAP. Total return for a period of less than one year is not annualized. |
| (c) | Annualized, unless otherwise noted. |
| (d) | Certain expenses incurred by the Fund were not annualized. |
| | | | | | |
| 274 | | Semiannual Report | | | March 31, 2020 | | | See accompanying Notes to Financial Statements |
| | | | | | | | | | | | | | | | | | | | | | | | | | | | | | | | | | |
| | | | Total
Dividends and
Distributions | | | Net Asset
Value, End
of Period | | | Total Return (b) | | | Net Assets,
End of Period
(000s) | | | Ratio of
Expenses to
Average Net
Assets with
Fee Waiver/
Reimbursement | | | Ratio of
Expenses to
Average Net
Assets without
Fee Waiver/
Reimbursement | | | Ratio of Net
Investment
Income
to Average
Net Assets | | | Portfolio
Turnover Rate | |
| | | | | | | | | | | | | | | | | | | | | | | | | | |
| | | | | | | | | | | | | | | | | | | | | | | | | | | | | | | | | | |
| | | | | $ | (0.18 | ) | | $ | 15.43 | | | | (5.24 | )% | | $ | 162 | | | | 0.76 | %(c)(d) | | | 1.74 | %(c)(d) | | | 0.99 | %(c)(d) | | | 51 | % |
| | | | | | (0.25 | ) | | | 16.46 | | | | 11.45 | | | | 95 | | | | 0.77 | (c)(d) | | | 5.73 | (c)(d) | | | 1.89 | (c)(d) | | | 121 | |
| | | | | | | | | | | | | | | | | | | | | | | | | | | | | | | | | | |
| | | | | $ | (0.19 | ) | | $ | 15.42 | | | | (5.17 | )% | | $ | 1,088 | | | | 0.56 | %(c)(d) | | | 1.44 | %(c)(d) | | | 1.17 | %(c)(d) | | | 51 | % |
| | | | | | (0.28 | ) | | | 16.45 | | | | 11.60 | | | | 1,093 | | | | 0.56 | (c)(d) | | | 5.51 | (c)(d) | | | 2.11 | (c)(d) | | | 121 | |
| | | | | | | | | | | | | | | | | | | | | | | | | | | | | | | | | | |
| | | | | $ | (0.19 | ) | | $ | 15.44 | | | | (5.13 | )% | | $ | 25,689 | | | | 0.51 | %(c)(d) | | | 1.14 | %(c)(d) | | | 1.18 | %(c)(d) | | | 51 | % |
| | | | | | (0.27 | ) | | | 16.47 | | | | 11.68 | | | | 5,795 | | | | 0.52 | (c)(d) | | | 6.33 | (c)(d) | | | 2.06 | (c)(d) | | | 121 | |
| | | | | | | | |
| See accompanying Notes to Financial Statements | | | March 31, 2020 | | | Semiannual Report | | | 275 | |
Financial Highlights (cont’d)
For a Share Outstanding for the Period ended:^
| | | | | | | | | | | | | | | | | | | | | | | | | | | | |
| | | Net Asset
Value,
Beginning
of Period | | | Net
Investment
Income (a) | | | Net Realized
and Change
in Unrealized
Gain (Loss) | | | Total from
Investment
Operations | | |
Dividends
from Net
Investment
Income | | | Distributions
from Net
Realized Capital
Gains | | | | |
| AllianzGI High Yield Bond: | | | | | | | | | | | | | | | | | | | | | |
| Class A | | | | | | | | | | | | | | | | | | | | | | | | | | | | |
3/31/2020† | | $ | 8.91 | | | $ | 0.20 | | | $ | (1.04 | ) | | $ | (0.84 | ) | | $ | (0.22 | ) | | $ | — | | | | | |
9/30/2019 | | | 8.91 | | | | 0.43 | | | | 0.01 | | | | 0.44 | | | | (0.44 | ) | | | — | | | | | |
9/30/2018 | | | 9.31 | | | | 0.45 | | | | (0.39 | ) | | | 0.06 | | | | (0.46 | ) | | | — | | | | | |
9/30/2017 | | | 9.14 | | | | 0.48 | | | | 0.18 | | | | 0.66 | | | | (0.49 | ) | | | — | | | | | |
9/30/2016 | | | 8.92 | | | | 0.53 | | | | 0.24 | | | | 0.77 | | | | (0.55 | ) | | | — | | | | | |
12/1/2014 - 9/30/2015# | | | 9.85 | | | | 0.47 | | | | (0.91 | ) | | | (0.44 | ) | | | (0.49 | ) | | | — | | | | | |
11/30/2014 | | | 10.36 | | | | 0.61 | | | | (0.36 | ) | | | 0.25 | | | | (0.67 | ) | | | (0.09 | ) | | | | |
| Class C | | | | | | | | | | | | | | | | | | | | | | | | | | | | |
3/31/2020† | | $ | 8.89 | | | $ | 0.17 | | | $ | (1.03 | ) | | $ | (0.86 | ) | | $ | (0.19 | ) | | $ | — | | | | | |
9/30/2019 | | | 8.90 | | | | 0.37 | | | | — | | | | 0.37 | | | | (0.38 | ) | | | — | | | | | |
9/30/2018 | | | 9.30 | | | | 0.39 | | | | (0.39 | ) | | | — | | | | (0.40 | ) | | | — | | | | | |
9/30/2017 | | | 9.12 | | | | 0.42 | | | | 0.20 | | | | 0.62 | | | | (0.44 | ) | | | — | | | | | |
9/30/2016 | | | 8.90 | | | | 0.46 | | | | 0.24 | | | | 0.70 | | | | (0.48 | ) | | | — | | | | | |
12/1/2014 - 9/30/2015# | | | 9.83 | | | | 0.42 | | | | (0.91 | ) | | | (0.49 | ) | | | (0.44 | ) | | | — | | | | | |
11/30/2014 | | | 10.35 | | | | 0.54 | | | | (0.37 | ) | | | 0.17 | | | | (0.60 | ) | | | (0.09 | ) | | | | |
| Class R | | | | | | | | | | | | | | | | | | | | | | | | | | | | |
3/31/2020† | | $ | 8.51 | | | $ | 0.17 | | | $ | (0.98 | ) | | $ | (0.81 | ) | | $ | (0.21 | ) | | $ | — | | | | | |
9/30/2019 | | | 8.54 | | | | 0.38 | | | | — | | | | 0.38 | | | | (0.41 | ) | | | — | | | | | |
9/30/2018 | | | 8.94 | | | | 0.39 | | | | (0.37 | ) | | | 0.02 | | | | (0.42 | ) | | | — | | | | | |
9/30/2017 | | | 8.79 | | | | 0.43 | | | | 0.18 | | | | 0.61 | | | | (0.46 | ) | | | — | | | | | |
9/30/2016 | | | 8.61 | | | | 0.48 | | | | 0.22 | | | | 0.70 | | | | (0.52 | ) | | | — | | | | | |
12/1/2014 - 9/30/2015# | | | 9.53 | | | | 0.43 | | | | (0.90 | ) | | | (0.47 | ) | | | (0.45 | ) | | | — | | | | | |
11/30/2014 | | | 10.05 | | | | 0.54 | | | | (0.34 | ) | | | 0.20 | | | | (0.63 | ) | | | (0.09 | ) | | | | |
| Class P | | | | | | | | | | | | | | | | | | | | | | | | | | | | |
3/31/2020† | | $ | 8.53 | | | $ | 0.20 | | | $ | (0.98 | ) | | $ | (0.78 | ) | | $ | (0.24 | ) | | $ | — | | | | | |
9/30/2019 | | | 8.55 | | | | 0.44 | | | | 0.01 | | | | 0.45 | | | | (0.47 | ) | | | — | | | | | |
9/30/2018 | | | 8.96 | | | | 0.46 | | | | (0.38 | ) | | | 0.08 | | | | (0.49 | ) | | | — | | | | | |
9/30/2017 | | | 8.80 | | | | 0.50 | | | | 0.19 | | | | 0.69 | | | | (0.53 | ) | | | — | | | | | |
9/30/2016 | | | 8.62 | | | | 0.53 | | | | 0.23 | | | | 0.76 | | | | (0.58 | ) | | | — | | | | | |
12/1/2014 - 9/30/2015# | | | 9.53 | | | | 0.49 | | | | (0.88 | ) | | | (0.39 | ) | | | (0.52 | ) | | | — | | | | | |
11/30/2014 | | | 10.05 | | | | 0.62 | | | | (0.35 | ) | | | 0.27 | | | | (0.70 | ) | | | (0.09 | ) | | | | |
| Institutional Class | | | | | | | | | | | | | | | | | | | | | | | | | | | | |
3/31/2020† | | $ | 8.56 | | | $ | 0.20 | | | $ | (1.00 | ) | | $ | (0.80 | ) | | $ | (0.23 | ) | | $ | — | | | | | |
9/30/2019 | | | 8.58 | | | | 0.44 | | | | 0.01 | | | | 0.45 | | | | (0.47 | ) | | | — | | | | | |
9/30/2018 | | | 8.98 | | | | 0.46 | | | | (0.37 | ) | | | 0.09 | | | | (0.49 | ) | | | — | | | | | |
9/30/2017 | | | 8.83 | | | | 0.50 | | | | 0.18 | | | | 0.68 | | | | (0.53 | ) | | | — | | | | | |
9/30/2016 | | | 8.64 | | | | 0.53 | | | | 0.24 | | | | 0.77 | | | | (0.58 | ) | | | — | | | | | |
12/1/2014 - 9/30/2015# | | | 9.55 | | | | 0.49 | | | | (0.88 | ) | | | (0.39 | ) | | | (0.52 | ) | | | — | | | | | |
11/30/2014 | | | 10.08 | | | | 0.62 | | | | (0.35 | ) | | | 0.27 | | | | (0.71 | ) | | | (0.09 | ) | | | | |
| Administrative Class | | | | | | | | | | | | | | | | | | | | | | | | | | | | |
3/31/2020† | | $ | 8.54 | | | $ | 0.19 | | | $ | (0.98 | ) | | $ | (0.79 | ) | | $ | (0.23 | ) | | $ | — | | | | | |
9/30/2019 | | | 8.44 | | | | 0.43 | | | | 0.03 | | | | 0.46 | | | | (0.36 | ) | | | — | | | | | |
9/30/2018 | | | 8.84 | | | | 0.44 | | | | (0.37 | ) | | | 0.07 | | | | (0.47 | ) | | | — | | | | | |
9/30/2017 | | | 8.70 | | | | 0.48 | | | | 0.17 | | | | 0.65 | | | | (0.51 | ) | | | — | | | | | |
9/30/2016 | | | 8.52 | | | | 0.50 | | | | 0.22 | | | | 0.72 | | | | (0.54 | ) | | | — | | | | | |
12/1/2014 - 9/30/2015# | | | 9.51 | | | | 0.46 | | | | (0.94 | ) | | | (0.48 | ) | | | (0.51 | ) | | | — | | | | | |
11/30/2014 | | | 10.04 | | | | 0.59 | | | | (0.36 | ) | | | 0.23 | | | | (0.67 | ) | | | (0.09 | ) | | | | |
| ^ | A “—” may reflect actual amounts rounding to less than $0.01 or 0.01%. |
| # | Fiscal year end changed from November 30th to September 30th. |
| (a) | Calculated on average shares outstanding during the period. |
| | | | | | |
| 276 | | Semiannual Report | | | March 31, 2020 | | | See accompanying Notes to Financial Statements |
| | | | | | | | | | | | | | | | | | | | | | | | | | | | | | | | | | |
| | | | Total
Dividends and
Distributions | | | Net Asset
Value, End
of Period | | | Total Return (b) | | | Net Assets,
End of Period
(000s) | | | Ratio of
Expenses to
Average Net
Assets with
Fee Waiver/
Reimbursement | | | Ratio of
Expenses to
Average Net
Assets without
Fee Waiver/
Reimbursement | | | Ratio of Net
Investment
Income to
Average
Net Assets | | | Portfolio
Turnover Rate | |
| | | | | | | | | | | | | | | | | | | | | | | | | | |
| | | | | | | | | | | | | | | | | | | | | | | | | | | | | | | | | | |
| | | | | $ | (0.22 | ) | | $ | 7.85 | | | | (9.62 | )% | | $ | 19,600 | | | | 1.16 | %(c) | | | 1.16 | %(c) | | | 4.46 | %(c) | | | 39 | % |
| | | | | | (0.44 | ) | | | 8.91 | | | | 5.18 | | | | 26,937 | | | | 1.07 | | | | 1.07 | | | | 4.98 | | | | 70 | |
| | | | | | (0.46 | ) | | | 8.91 | | | | 0.67 | | | | 33,768 | | | | 1.05 | | | | 1.05 | | | | 4.93 | | | | 40 | |
| | | | | | (0.49 | ) | | | 9.31 | | | | 7.42 | | | | 58,525 | | | | 1.09 | | | | 1.09 | | | | 5.19 | | | | 37 | |
| | | | | | (0.55 | ) | | | 9.14 | | | | 9.08 | | | | 58,004 | | | | 0.98 | | | | 0.98 | | | | 6.02 | | | | 59 | |
| | | | | | (0.49 | ) | | | 8.92 | | | | (4.72 | ) | | | 34,151 | | | | 1.03 | (c)(d) | | | 1.03 | (c)(d) | | | 5.88 | (c)(d) | | | 47 | |
| | | | | | (0.76 | ) | | | 9.85 | (e) | | | 2.39 | (e) | | | 76,274 | | | | 0.94 | | | | 0.94 | | | | 5.93 | | | | 66 | |
| | | | | | | | | | | | | | | | | | | | | | | | | | | | | | | | | | |
| | | | | $ | (0.19 | ) | | $ | 7.84 | | | | (9.88 | )% | | $ | 3,598 | | | | 1.84 | %(c) | | | 1.84 | %(c) | | | 3.78 | %(c) | | | 39 | % |
| | | | | | (0.38 | ) | | | 8.89 | | | | 4.33 | | | | 4,880 | | | | 1.76 | | | | 1.76 | | | | 4.28 | | | | 70 | |
| | | | | | (0.40 | ) | | | 8.90 | | | | 0.02 | | | | 8,544 | | | | 1.71 | | | | 1.71 | | | | 4.27 | | | | 40 | |
| | | | | | (0.44 | ) | | | 9.30 | | | | 6.90 | | | | 11,723 | | | | 1.70 | | | | 1.70 | | | | 4.59 | | | | 37 | |
| | | | | | (0.48 | ) | | | 9.12 | | | | 8.32 | | | | 14,815 | | | | 1.71 | | | | 1.71 | | | | 5.28 | | | | 59 | |
| | | | | | (0.44 | ) | | | 8.90 | | | | (5.24 | ) | | | 17,866 | | | | 1.68 | (c)(d) | | | 1.68 | (c)(d) | | | 5.24 | (c)(d) | | | 47 | |
| | | | | | (0.69 | ) | | | 9.83 | (e) | | | 1.57 | (e) | | | 23,249 | | | | 1.68 | | | | 1.68 | | | | 5.23 | | | | 66 | |
| | | | | | | | | | | | | | | | | | | | | | | | | | | | | | | | | | |
| | | | | $ | (0.21 | ) | | $ | 7.49 | | | | (9.74 | )% | | $ | 528 | | | | 1.52 | %(c) | | | 1.52 | %(c) | | | 4.09 | %(c) | | | 39 | % |
| | | | | | (0.41 | ) | | | 8.51 | | | | 4.68 | | | | 654 | | | | 1.48 | | | | 1.48 | | | | 4.56 | | | | 70 | |
| | | | | | (0.42 | ) | | | 8.54 | | | | 0.33 | | | | 878 | | | | 1.44 | | | | 1.44 | | | | 4.55 | | | | 40 | |
| | | | | | (0.46 | ) | | | 8.94 | | | | 7.12 | | | | 1,048 | | | | 1.44 | | | | 1.44 | | | | 4.84 | | | | 37 | |
| | | | | | (0.52 | ) | | | 8.79 | | | | 8.62 | | | | 1,310 | | | | 1.34 | | | | 1.34 | | | | 5.65 | | | | 59 | |
| | | | | | (0.45 | ) | | | 8.61 | | | | (5.20 | ) | | | 1,126 | | | | 1.46 | (c)(d) | | | 1.46 | (c)(d) | | | 5.47 | (c)(d) | | | 47 | |
| | | | | | (0.72 | ) | | | 9.53 | (e) | | | 1.91 | (e) | | | 2,823 | | | | 1.43 | | | | 1.45 | | | | 5.48 | | | | 66 | |
| | | | | | | | | | | | | | | | | | | | | | | | | | | | | | | | | | |
| | | | | $ | (0.24 | ) | | $ | 7.51 | | | | (9.41 | )% | | $ | 9,238 | | | | 0.82 | %(c) | | | 0.82 | %(c) | | | 4.80 | %(c) | | | 39 | % |
| | | | | | (0.47 | ) | | | 8.53 | | | | 5.56 | | | | 12,128 | | | | 0.73 | | | | 0.73 | | | | 5.31 | | | | 70 | |
| | | | | | (0.49 | ) | | | 8.55 | | | | 0.94 | | | | 17,535 | | | | 0.70 | | | | 0.70 | | | | 5.26 | | | | 40 | |
| | | | | | (0.53 | ) | | | 8.96 | | | | 8.07 | | | | 35,931 | | | | 0.67 | | | | 0.67 | | | | 5.62 | | | | 37 | |
| | | | | | (0.58 | ) | | | 8.80 | | | | 9.31 | | | | 57,378 | | | | 0.69 | | | | 0.69 | | | | 6.30 | | | | 59 | |
| | | | | | (0.52 | ) | | | 8.62 | | | | (4.36 | ) | | | 63,324 | | | | 0.64 | (c)(d) | | | 0.64 | (c)(d) | | | 6.29 | (c)(d) | | | 47 | |
| | | | | | (0.79 | ) | | | 9.53 | (e) | | | 2.63 | (e) | | | 47,385 | | | | 0.71 | | | | 0.71 | | | | 6.21 | | | | 66 | |
| | | | | | | | | | | | | | | | | | | | | | | | | | | | | | | | | | |
| | | | | $ | (0.23 | ) | | $ | 7.53 | | | | (9.51 | )% | | $ | 65,575 | | | | 0.86 | %(c) | | | 0.86 | %(c) | | | 4.77 | %(c) | | | 39 | % |
| | | | | | (0.47 | ) | | | 8.56 | | | | 5.48 | | | | 77,365 | | | | 0.79 | | | | 0.79 | | | | 5.25 | | | | 70 | |
| | | | | | (0.49 | ) | | | 8.58 | | | | 1.03 | | | | 122,078 | | | | 0.73 | | | | 0.73 | | | | 5.26 | | | | 40 | |
| | | | | | (0.53 | ) | | | 8.98 | | | | 7.91 | | | | 155,022 | | | | 0.69 | | | | 0.69 | | | | 5.61 | | | | 37 | |
| | | | | | (0.58 | ) | | | 8.83 | | | | 9.41 | | | | 227,149 | | | | 0.66 | | | | 0.66 | | | | 6.31 | | | | 59 | |
| | | | | | (0.52 | ) | | | 8.64 | | | | (4.32 | ) | | | 173,030 | | | | 0.63 | (c)(d) | | | 0.63 | (c)(d) | | | 6.29 | (c)(d) | | | 47 | |
| | | | | | (0.80 | ) | | | 9.55 | (e) | | | 2.59 | (e) | | | 163,567 | | | | 0.64 | | | | 0.64 | | | | 6.27 | | | | 66 | |
| | | | | | | | | | | | | | | | | | | | | | | | | | | | | | | | | | |
| | | | | $ | (0.23 | ) | | $ | 7.52 | | | | (9.47 | )% | | $ | 24 | | | | 1.00 | %(c) | | | 1.00 | %(c) | | | 4.64 | %(c) | | | 39 | % |
| | | | | | (0.36 | ) | | | 8.54 | | | | 5.60 | | | | 24 | | | | 0.94 | | | | 0.94 | | | | 5.10 | | | | 70 | |
| | | | | | (0.47 | ) | | | 8.44 | | | | 0.83 | | | | 20 | | | | 0.88 | | | | 0.88 | | | | 4.93 | | | | 40 | |
| | | | | | (0.51 | ) | | | 8.84 | | | | 7.75 | | | | 1,490 | | �� | | 0.86 | | | | 0.86 | | | | 5.45 | | | | 37 | |
| | | | | | (0.54 | ) | | | 8.70 | | | | 8.97 | | | | 2,086 | | | | 1.07 | | | | 1.07 | | | | 5.94 | | | | 59 | |
| | | | | | (0.51 | ) | | | 8.52 | | | | (5.30 | ) | | | 2,073 | | | | 0.98 | (c)(d) | | | 0.98 | (c)(d) | | | 5.90 | (c)(d) | | | 47 | |
| | | | | | (0.76 | ) | | | 9.51 | (e) | | | 2.27 | (e) | | | 34,714 | | | | 0.97 | | | | 0.97 | | | | 5.93 | | | | 66 | |
| | (b) | Total return is calculated assuming a purchase of a share on the first day of the period and a sale of a share on the last day of each period reported. Dividends and distributions, if any, are assumed, for purposes of this calculation, to be reinvested. Total return does not reflect sales charges and includes the effect of fee waivers and reimbursements. Total return may reflect adjustments to conform to U.S. GAAP. Total return for a period of less than one year is not annualized. |
| | (c) | Annualized, unless otherwise noted. |
| | (d) | Certain expenses incurred by the Fund were not annualized. |
| | (e) | Payments from Affiliates increased the end of period net asset value and total return by less than $0.01 and 0.01%, respectively. |
| | | | | | | | |
| See accompanying Notes to Financial Statements | | | March 31, 2020 | | | Semiannual Report | | | 277 | |
Financial Highlights (cont’d)
For a Share Outstanding for the Period ended:^
| | | | | | | | | | | | | | | | | | | | | | | | | | | | |
| | | Net Asset
Value,
Beginning
of Period | | | Net
Investment
Income
(Loss) (a) | | | Net Realized
and Change
in Unrealized
Gain (Loss) | | | Total from
Investment
Operations | | |
Dividends
from Net
Investment
Income | | | Distributions
from Net
Realized Capital
Gains | | | | |
| AllianzGI InternationalSmall-Cap: | | | | | | | | | | | | | | | | | | | | | |
| Class A | | | | | | | | | | | | | | | | | | | | | | | | | | | | |
3/31/2020† | | $ | 32.15 | | | $ | (0.03 | ) | | $ | (5.42 | ) | | $ | (5.45 | ) | | $ | (0.48 | ) | | $ | — | | | | | |
9/30/2019 | | | 43.09 | | | | 0.34 | | | | (6.28 | ) | | | (5.94 | ) | | | (0.10 | ) | | | (4.90 | ) | | | | |
9/30/2018 | | | 41.19 | | | | 0.42 | | | | 2.41 | | | | 2.83 | | | | (0.25 | ) | | | (0.68 | ) | | | | |
9/30/2017 | | | 34.57 | | | | — | | | | 6.93 | | | | 6.93 | | | | (0.31 | ) | | | — | | | | | |
9/30/2016 | | | 34.53 | | | | 0.10 | | | | 1.67 | | | | 1.77 | | | | (0.28 | ) | | | (1.45 | ) | | | | |
12/1/2014 - 9/30/2015# | | | 35.77 | | | | 0.26 | | | | 2.24 | | | | 2.50 | | | | (0.14 | ) | | | (3.60 | ) | | | | |
11/30/2014 | | | 42.30 | | | | 0.09 | | | | (2.41 | ) | | | (2.32 | ) | | | (0.64 | ) | | | (3.57 | ) | | | | |
| Class C | | | | | | | | | | | | | | | | | | | | | | | | | | | | |
3/31/2020† | | $ | 30.72 | | | $ | (0.15 | ) | | $ | (5.26 | ) | | $ | (5.41 | ) | | $ | (0.04 | ) | | $ | — | | | | | |
9/30/2019 | | | 41.63 | | | | 0.05 | | | | (6.06 | ) | | | (6.01 | ) | | | — | | | | (4.90 | ) | | | | |
9/30/2018 | | | 40.01 | | | | (0.15 | ) | | | 2.55 | | | | 2.40 | | | | (0.10 | ) | | | (0.68 | ) | | | | |
9/30/2017 | | | 33.78 | | | | (0.19 | ) | | | 6.67 | | | | 6.48 | | | | (0.25 | ) | | | — | | | | | |
9/30/2016 | | | 33.94 | | | | (0.12 | ) | | | 1.61 | | | | 1.49 | | | | (0.20 | ) | | | (1.45 | ) | | | | |
12/1/2014 - 9/30/2015# | | | 35.33 | | | | 0.06 | | | | 2.18 | | | | 2.24 | | | | (0.03 | ) | | | (3.60 | ) | | | | |
11/30/2014 | | | 41.78 | | | | (0.18 | ) | | | (2.39 | ) | | | (2.57 | ) | | | (0.31 | ) | | | (3.57 | ) | | | | |
| Class R | | | | | | | | | | | | | | | | | | | | | | | | | | | | |
3/31/2020† | | $ | 30.19 | | | $ | (0.08 | ) | | $ | (5.05 | ) | | $ | (5.13 | ) | | $ | (0.55 | ) | | $ | — | | | | | |
9/30/2019 | | | 41.90 | | | | 0.27 | | | | (6.28 | ) | | | (6.01 | ) | | | (0.80 | ) | | | (4.90 | ) | | | | |
9/30/2018 | | | 40.46 | | | | 0.13 | | | | 2.50 | | | | 2.63 | | | | (0.51 | ) | | | (0.68 | ) | | | | |
9/30/2017 | | | 34.07 | | | | 0.01 | | | | 6.70 | | | | 6.71 | | | | (0.32 | ) | | | — | | | | | |
9/30/2016 | | | 34.03 | | | | 0.03 | | | | 1.63 | | | | 1.66 | | | | (0.17 | ) | | | (1.45 | ) | | | | |
12/1/2014 - 9/30/2015# | | | 35.30 | | | | 0.16 | | | | 2.23 | | | | 2.39 | | | | (0.06 | ) | | | (3.60 | ) | | | | |
11/30/2014 | | | 42.23 | | | | 0.07 | | | | (2.47 | ) | | | (2.40 | ) | | | (0.96 | ) | | | (3.57 | ) | | | | |
| Class P | | | | | | | | | | | | | | | | | | | | | | | | | | | | |
3/31/2020† | | $ | 31.91 | | | $ | (0.01 | ) | | $ | (5.39 | ) | | $ | (5.40 | ) | | $ | (0.44 | ) | | $ | — | | | | | |
9/30/2019 | | | 43.06 | | | | 0.33 | | | | (6.25 | ) | | | (5.92 | ) | | | (0.33 | ) | | | (4.90 | ) | | | | |
9/30/2018 | | | 41.33 | | | | 0.22 | | | | 2.68 | | | | 2.90 | | | | (0.49 | ) | | | (0.68 | ) | | | | |
9/30/2017 | | | 34.66 | | | | 0.19 | | | | 6.82 | | | | 7.01 | | | | (0.34 | ) | | | — | | | | | |
9/30/2016 | | | 34.49 | | | | 0.18 | | | | 1.64 | | | | 1.82 | | | | (0.20 | ) | | | (1.45 | ) | | | | |
12/1/2014 - 9/30/2015# | | | 35.65 | | | | 0.28 | | | | 2.25 | | | | 2.53 | | | | (0.09 | ) | | | (3.60 | ) | | | | |
11/30/2014 | | | 41.97 | | | | 0.16 | | | | (2.41 | ) | | | (2.25 | ) | | | (0.50 | ) | | | (3.57 | ) | | | | |
| Institutional Class | | | | | | | | | | | | | | | | | | | | | | | | | | | | |
3/31/2020† | | $ | 33.21 | | | $ | — | | | $ | (5.58 | ) | | $ | (5.58 | ) | | $ | (0.58 | ) | | $ | — | | | | | |
9/30/2019 | | | 44.65 | | | | 0.47 | | | | (6.58 | ) | | | (6.11 | ) | | | (0.43 | ) | | | (4.90 | ) | | | | |
9/30/2018 | | | 42.85 | | | | 0.32 | | | | 2.71 | | | | 3.03 | | | | (0.55 | ) | | | (0.68 | ) | | | | |
9/30/2017 | | | 35.91 | | | | 0.36 | | | | 6.92 | | | | 7.28 | | | | (0.34 | ) | | | — | | | | | |
9/30/2016 | | | 35.65 | | | | 0.10 | | | | 1.81 | | | | 1.91 | | | | (0.20 | ) | | | (1.45 | ) | | | | |
12/1/2014 - 9/30/2015# | | | 36.68 | | | | 0.29 | | | | 2.34 | | | | 2.63 | | | | (0.06 | ) | | | (3.60 | ) | | | | |
11/30/2014 | | | 42.94 | | | | 0.21 | | | | (2.49 | ) | | | (2.28 | ) | | | (0.41 | ) | | | (3.57 | ) | | | | |
| Class R6 | | | | | | | | | | | | | | | | | | | | | | | | | | | | |
3/31/2020† | | $ | 33.03 | | | $ | 0.02 | | | $ | (5.54 | ) | | $ | (5.52 | ) | | $ | (0.71 | ) | | $ | — | | | | | |
9/30/2019 | | | 44.64 | | | | 0.48 | | | | (6.59 | ) | | | (6.11 | ) | | | (0.60 | ) | | | (4.90 | ) | | | | |
9/30/2018 | | | 42.90 | | | | 0.40 | | | | 2.66 | | | | 3.06 | | | | (0.64 | ) | | | (0.68 | ) | | | | |
9/30/2017 | | | 35.94 | | | | 0.22 | | | | 7.09 | | | | 7.31 | | | | (0.35 | ) | | | — | | | | | |
2/1/2016* - 9/30/2016 | | | 33.52 | | | | 0.34 | | | | 2.08 | | | | 2.42 | | | | — | | | | — | | | | | |
| ^ | A “—” may reflect actual amounts rounding to less than $0.01 or 0.01%. |
| # | Fiscal year end changed from November 30th to September 30th. |
| * | Commencement of operations. |
| (a) | Calculated on average shares outstanding during the period. |
| | | | | | |
| 278 | | Semiannual Report | | | March 31, 2020 | | | See accompanying Notes to Financial Statements |
| | | | | | | | | | | | | | | | | | | | | | | | | | | | | | | | | | |
| | | | Total
Dividends and
Distributions | | | Net Asset
Value, End
of Period | | | Total Return (b) | | | Net Assets,
End of Period
(000s) | | | Ratio of
Expenses to
Average Net
Assets with
Fee Waiver/
Reimbursement | | | Ratio of
Expenses to
Average Net
Assets without
Fee Waiver/
Reimbursement | | | Ratio of Net
Investment
Income (Loss)
to Average
Net Assets | | | Portfolio
Turnover Rate | |
| | | | | | | | | | | | | | | | | | | | | | | | | | |
| | | | | | | | | | | | | | | | | | | | | | | | | | | | | | | | | | |
| | | | | $ | (0.48 | ) | | $ | 26.22 | | | | (17.30 | )% | | $ | 3,467 | | | | 1.25 | %(c) | | | 1.81 | %(c) | | | (0.19 | )%(c) | | | 28 | % |
| | | | | | (5.00 | ) | | | 32.15 | | | | (12.05 | ) | | | 4,826 | | | | 1.25 | | | | 1.94 | | | | 1.05 | | | | 55 | |
| | | | | | (0.93 | ) | | | 43.09 | | | | 6.88 | | | | 9,108 | | | | 1.25 | | | | 1.50 | | | | 0.95 | | | | 62 | |
| | | | | | (0.31 | ) | | | 41.19 | (d) | | | 20.34 | (d) | | | 6,068 | | | | 1.36 | | | | 1.93 | | | | 0.01 | | | | 67 | |
| | | | | | (1.73 | ) | | | 34.57 | | | | 5.07 | | | | 13,524 | | | | 1.45 | | | | 1.68 | | | | 0.30 | | | | 76 | |
| | | | | | (3.74 | ) | | | 34.53 | | | | 7.83 | | | | 11,816 | | | | 1.45 | (c)(e) | | | 1.63 | (c)(e) | | | 0.88 | (c)(e) | | | 39 | |
| | | | | | (4.21 | ) | | | 35.77 | | | | (5.84 | ) | | | 5,290 | | | | 1.45 | | | | 1.76 | | | | 0.23 | | | | 77 | |
| | | | | | | | | | | | | | | | | | | | | | | | | | | | | | | | | | |
| | | | | $ | (0.04 | ) | | $ | 25.27 | | | | (17.63 | )% | | $ | 657 | | | | 2.00 | %(c) | | | 2.57 | %(c) | | | (0.93 | )%(c) | | | 28 | % |
| | | | | | (4.90 | ) | | | 30.72 | | | | (12.75 | ) | | | 963 | | | | 2.04 | | | | 2.59 | | | | 0.16 | | | | 55 | |
| | | | | | (0.78 | ) | | | 41.63 | | | | 5.99 | | | | 2,610 | | | | 2.08 | | | | 2.27 | | | | (0.35 | ) | | | 62 | |
| | | | | | (0.25 | ) | | | 40.01 | (d) | | | 19.39 | (d) | | | 2,829 | | | | 2.14 | | | | 2.50 | | | | (0.56 | ) | | | 67 | |
| | | | | | (1.65 | ) | | | 33.78 | | | | 4.30 | | | | 3,232 | | | | 2.19 | | | | 2.54 | | | | (0.35 | ) | | | 76 | |
| | | | | | (3.63 | ) | | | 33.94 | | | | 7.14 | | | | 2,837 | | | | 2.19 | (c)(e) | | | 2.42 | (c)(e) | | | 0.20 | (c)(e) | | | 39 | |
| | | | | | (3.88 | ) | | | 35.33 | | | | (6.52 | ) | | | 1,135 | | | | 2.19 | | | | 2.45 | | | | (0.47 | ) | | | 77 | |
| | | | | | | | | | | | | | | | | | | | | | | | | | | | | | | | | | |
| | | | | $ | (0.55 | ) | | $ | 24.51 | | | | (17.42 | )% | | $ | 842 | | | | 1.59 | %(c) | | | 2.20 | %(c) | | | (0.50 | )%(c) | | | 28 | % |
| | | | | | (5.70 | ) | | | 30.19 | | | | (12.36 | ) | | | 1,044 | | | | 1.59 | | | | 2.30 | | | | 0.89 | | | | 55 | |
| | | | | | (1.19 | ) | | | 41.90 | | | | 6.51 | | | | 845 | | | | 1.59 | | | | 1.86 | | | | 0.30 | | | | 62 | |
| | | | | | (0.32 | ) | | | 40.46 | (d) | | | 19.98 | (d) | | | 264 | | | | 1.64 | | | | 2.11 | | | | 0.02 | | | | 67 | |
| | | | | | (1.62 | ) | | | 34.07 | | | | 4.81 | | | | 130 | | | | 1.70 | | | | 2.17 | | | | 0.09 | | | | 76 | |
| | | | | | (3.66 | ) | | | 34.03 | | | | 7.60 | | | | 100 | | | | 1.70 | (c)(e) | | | 2.09 | (c)(e) | | | 0.57 | (c)(e) | | | 39 | |
| | | | | | (4.53 | ) | | | 35.30 | | | | (6.06 | ) | | | 73 | | | | 1.70 | | | | 2.10 | | | | 0.19 | | | | 77 | |
| | | | | | | | | | | | | | | | | | | | | | | | | | | | | | | | | | |
| | | | | $ | (0.44 | ) | | $ | 26.07 | | | | (17.25 | )% | | $ | 12,554 | | | | 1.10 | %(c) | | | 1.52 | %(c) | | | (0.06 | )%(c) | | | 28 | % |
| | | | | | (5.23 | ) | | | 31.91 | | | | (11.92 | ) | | | 19,740 | | | | 1.10 | | | | 1.58 | | | | 1.01 | | | | 55 | |
| | | | | | (1.17 | ) | | | 43.06 | | | | 7.02 | | | | 48,830 | | | | 1.10 | | | | 1.29 | | | | 0.51 | | | | 62 | |
| | | | | | (0.34 | ) | | | 41.33 | (d) | | | 20.55 | (d) | | | 55,843 | | | | 1.17 | | | | 1.42 | | | | 0.55 | | | | 67 | |
| | | | | | (1.65 | ) | | | 34.66 | | | | 5.25 | | | | 40,183 | | | | 1.28 | | | | 1.44 | | | | 0.54 | | | | 76 | |
| | | | | | (3.69 | ) | | | 34.49 | | | | 7.96 | | | | 36,377 | | | | 1.28 | (c)(e) | | | 1.37 | (c)(e) | | | 0.97 | (c)(e) | | | 39 | |
| | | | | | (4.07 | ) | | | 35.65 | | | | (5.68 | ) | | | 27,882 | | | | 1.29 | | | | 1.54 | | | | 0.41 | | | | 77 | |
| | | | | | | | | | | | | | | | | | | | | | | | | | | | | | | | | | |
| | | | | $ | (0.58 | ) | | $ | 27.05 | | | | (17.22 | )% | | $ | 26,357 | | | | 1.04 | %(c) | | | 1.57 | %(c) | | | — | %(c) | | | 28 | % |
| | | | | | (5.33 | ) | | | 33.21 | | | | (11.88 | ) | | | 40,477 | | | | 1.04 | | | | 1.61 | | | | 1.39 | | | | 55 | |
| | | | | | (1.23 | ) | | | 44.65 | | | | 7.09 | | | | 49,443 | | | | 1.05 | | | | 1.28 | | | | 0.70 | | | | 62 | |
| | | | | | (0.34 | ) | | | 42.85 | (d) | | | 20.58 | (d) | | | 67,921 | | | | 1.11 | | | | 1.43 | | | | 0.94 | | | | 67 | |
| | | | | | (1.65 | ) | | | 35.91 | | | | 5.31 | | | | 29,031 | | | | 1.21 | | | | 1.48 | | | | 0.28 | | | | 76 | |
| | | | | | (3.66 | ) | | | 35.65 | | | | 8.04 | | | | 59,061 | | | | 1.21 | (c)(e) | | | 1.39 | (c)(e) | | | 0.97 | (c)(e) | | | 39 | |
| | | | | | (3.98 | ) | | | 36.68 | | | | (5.61 | ) | | | 55,743 | | | | 1.21 | | | | 1.46 | | | | 0.53 | | | | 77 | |
| | | | | | | | | | | | | | | | | | | | | | | | | | | | | | | | | | |
| | | | | $ | (0.71 | ) | | $ | 26.80 | | | | (17.22 | )% | | $ | 24,921 | | | | 1.00 | %(c) | | | 1.47 | %(c) | | | 0.09 | %(c) | | | 28 | % |
| | | | | | (5.50 | ) | | | 33.03 | | | | (11.82 | ) | | | 28,630 | | | | 1.00 | | | | 1.49 | | | | 1.44 | | | | 55 | |
| | | | | | (1.32 | ) | | | 44.64 | | | | 7.14 | | | | 33,876 | | | | 1.00 | | | | 1.22 | | | | 0.87 | | | | 62 | |
| | | | | | (0.35 | ) | | | 42.90 | (d) | | | 20.66 | (d) | | | 17,804 | | | | 1.05 | | | | 1.42 | | | | 0.60 | | | | 67 | |
| | | | | | — | | | | 35.94 | | | | 7.22 | | | | 15,534 | | | | 1.11 | (c) | | | 1.56 | (c) | | | 1.48 | (c) | | | 76 | |
| | (b) | Total return is calculated assuming a purchase of a share on the first day of the period and a sale of a share on the last day of each period reported. Dividends and distributions, if any, are assumed, for purposes of this calculation, to be reinvested. Total return does not reflect sales charges and includes the effect of fee waivers and reimbursements. Total return may reflect adjustments to conform to U.S. GAAP. Total return for a period of less than one year is not annualized. |
| | (c) | Annualized, unless otherwise noted. |
| | (d) | Payments from Affiliates increased the end of period net asset value and total return by less than $0.01 and 0.01%, respectively. |
| | (e) | Certain expenses incurred by the Fund were not annualized. |
| | | | | | | | |
| See accompanying Notes to Financial Statements | | | March 31, 2020 | | | Semiannual Report | | | 279 | |
Financial Highlights (cont’d)
For a Share Outstanding for the Period ended:^
| | | | | | | | | | | | | | | | | | | | | | | | |
| | | Net Asset
Value,
Beginning
of Period | | | Net
Investment
Loss (a) | | | Net Realized
and Change
in Unrealized
Gain (Loss) | | | Total from
Investment
Operations | | |
Distributions
from Net
Realized Capital
Gains | | | | |
| AllianzGI Micro Cap: | | | | | | | | | | | | | | | | | | |
| Class A | | | | | | | | | | | | | | | | | | | | | | | | |
3/31/2020† | | $ | 10.04 | | | $ | (0.06 | ) | | $ | (1.70 | ) | | $ | (1.76 | ) | | $ | (0.12 | ) | | | | |
9/30/2019 | | | 16.62 | | | | (0.13 | ) | | | (3.43 | ) | | | (3.56 | ) | | | (3.02 | ) | | | | |
9/30/2018 | | | 15.85 | | | | (0.21 | ) | | | 1.87 | | | | 1.66 | | | | (0.89 | ) | | | | |
9/30/2017 | | | 14.73 | | | | (0.18 | ) | | | 2.72 | | | | 2.54 | | | | (1.42 | ) | | | | |
9/30/2016 | | | 13.99 | | | | (0.18 | ) | | | 1.75 | | | | 1.57 | | | | (0.83 | ) | | | | |
12/1/2014 - 9/30/2015# | | | 14.88 | | | | (0.17 | ) | | | 0.54 | | | | 0.37 | | | | (1.26 | ) | | | | |
11/30/2014 | | | 16.06 | | | | (0.21 | ) | | | — | | | | (0.21 | ) | | | (0.97 | ) | | | | |
| Class P | | | | | | | | | | | | | | | | | | | | | | | | |
3/31/2020† | | $ | 10.14 | | | $ | (0.06 | ) | | $ | (1.71 | ) | | $ | (1.77 | ) | | $ | (0.12 | ) | | | | |
9/30/2019 | | | 16.73 | | | | (0.13 | ) | | | (3.44 | ) | | | (3.57 | ) | | | (3.02 | ) | | | | |
9/30/2018 | | | 15.94 | | | | (0.20 | ) | | | 1.88 | | | | 1.68 | | | | (0.89 | ) | | | | |
9/30/2017 | | | 14.80 | | | | (0.17 | ) | | | 2.73 | | | | 2.56 | | | | (1.42 | ) | | | | |
9/30/2016 | | | 14.05 | | | | (0.16 | ) | | | 1.74 | | | | 1.58 | | | | (0.83 | ) | | | | |
12/1/2014 - 9/30/2015# | | | 14.92 | | | | (0.16 | ) | | | 0.55 | | | | 0.39 | | | | (1.26 | ) | | | | |
11/30/2014 | | | 16.08 | | | | (0.19 | ) | | | — | | | | (0.19 | ) | | | (0.97 | ) | | | | |
| Institutional Class | | | | | | | | | | | | | | | | | | | | | | | | |
3/31/2020† | | $ | 10.22 | | | $ | (0.06 | ) | | $ | (1.73 | ) | | $ | (1.79 | ) | | $ | (0.12 | ) | | | | |
9/30/2019 | | | 16.82 | | | | (0.12 | ) | | | (3.46 | ) | | | (3.58 | ) | | | (3.02 | ) | | | | |
9/30/2018 | | | 16.03 | | | | (0.20 | ) | | | 1.88 | | | | 1.68 | | | | (0.89 | ) | | | | |
9/30/2017 | | | 14.87 | | | | (0.17 | ) | | | 2.75 | | | | 2.58 | | | | (1.42 | ) | | | | |
9/30/2016 | | | 14.11 | | | | (0.16 | ) | | | 1.75 | | | | 1.59 | | | | (0.83 | ) | | | | |
12/1/2014 - 9/30/2015# | | | 14.99 | | | | (0.16 | ) | | | 0.54 | | | | 0.38 | | | | (1.26 | ) | | | | |
11/30/2014 | | | 16.15 | | | | (0.19 | ) | | | — | | | | (0.19 | ) | | | (0.97 | ) | | | | |
| ^ | A “—” may reflect actual amounts rounding to less than $0.01 or 0.01%. |
| # | Fiscal year end changed from November 30th to September 30th. |
| (a) | Calculated on average shares outstanding during the period. |
| (b) | Total return is calculated assuming a purchase of a share on the first day of the period and a sale of a share on the last day of each period reported. Dividends and distributions, if any, are assumed, for purposes of this calculation, to be reinvested. Total return does not reflect sales charges and includes the effect of fee waivers and reimbursements. Total return may reflect adjustments to conform to U.S. GAAP. Total return for a period of less than one year is not annualized. |
| (c) | Annualized, unless otherwise noted. |
| (d) | Certain expenses incurred by the Fund were not annualized. |
| | | | | | |
| 280 | | Semiannual Report | | | March 31, 2020 | | | See accompanying Notes to Financial Statements |
| | | | | | | | | | | | | | | | | | | | | | | | | | | | | | |
| | | | Net Asset
Value, End
of Period | | | Total Return (b) | | | Net Assets,
End of Period
(000s) | | | Ratio of
Expenses to
Average Net
Assets with
Fee Waiver/
Reimbursement | | | Ratio of
Expenses to
Average Net
Assets without
Fee Waiver/
Reimbursement | | | Ratio of Net
Investment
Loss
to Average
Net Assets | | | Portfolio
Turnover Rate | |
| | | | | | | | | | | | | | | | | | | | | | | |
| | | | | | | | | | | | | | | | | | | | | | | | | | | | | | |
| | | | | $ | 8.16 | | | | (17.87 | )% | | $ | 994 | | | | 1.42 | %(c) | | | 2.56 | %(c) | | | (1.17 | )%(c) | | | 15 | % |
| | | | | | 10.04 | | | | (19.39 | ) | | | 1,340 | | | | 1.42 | | | | 2.51 | | | | (1.15 | ) | | | 37 | |
| | | | | | 16.62 | | | | 11.03 | | | | 2,570 | | | | 1.57 | | | | 2.13 | | | | (1.34 | ) | | | 47 | |
| | | | | | 15.85 | | | | 18.74 | | | | 3,031 | | | | 1.62 | | | | 2.18 | | | | (1.27 | ) | | | 32 | |
| | | | | | 14.73 | | | | 11.47 | | | | 3,388 | | | | 1.62 | | | | 2.16 | | | | (1.26 | ) | | | 39 | |
| | | | | | 13.99 | | | | 2.77 | | | | 15,305 | | | | 1.62 | (c)(d) | | | 2.07 | (c)(d) | | | (1.35 | )(c)(d) | | | 55 | |
| | | | | | 14.88 | | | | (1.11 | ) | | | 4,684 | | | | 1.66 | | | | 2.10 | | | | (1.40 | ) | | | 48 | |
| | | | | | | | | | | | | | | | | | | | | | | | | | | | | | |
| | | | | $ | 8.25 | | | | (17.79 | )% | | $ | 204 | | | | 1.34 | %(c) | | | 2.28 | %(c) | | | (1.09 | )%(c) | | | 15 | % |
| | | | | | 10.14 | | | | (19.32 | ) | | | 322 | | | | 1.34 | | | | 2.15 | | | | (1.09 | ) | | | 37 | |
| | | | | | 16.73 | | | | 11.10 | | | | 1,722 | | | | 1.49 | | | | 1.91 | | | | (1.26 | ) | | | 47 | |
| | | | | | 15.94 | | | | 18.79 | | | | 1,568 | | | | 1.54 | | | | 1.89 | | | | (1.19 | ) | | | 32 | |
| | | | | | 14.80 | | | | 11.50 | | | | 1,289 | | | | 1.54 | | | | 1.85 | | | | (1.17 | ) | | | 39 | |
| | | | | | 14.05 | | | | 2.91 | | | | 2,264 | | | | 1.51 | (c)(d) | | | 1.80 | (c)(d) | | | (1.24 | )(c)(d) | | | 55 | |
| | | | | | 14.92 | | | | (0.98 | ) | | | 1,550 | | | | 1.52 | | | | 1.81 | | | | (1.21 | ) | | | 48 | |
| | | | | | | | | | | | | | | | | | | | | | | | | | | | | | |
| | | | | $ | 8.31 | | | | (17.85 | )% | | $ | 11,587 | | | | 1.34 | %(c) | | | 2.27 | %(c) | | | (1.09 | )%(c) | | | 15 | % |
| | | | | | 10.22 | | | | (19.25 | ) | | | 15,472 | | | | 1.34 | | | | 2.18 | | | | (1.07 | ) | | | 37 | |
| | | | | | 16.82 | | | | 11.04 | | | | 24,419 | | | | 1.49 | | | | 1.93 | | | | (1.26 | ) | | | 47 | |
| | | | | | 16.03 | | | | 18.84 | | | | 27,984 | | | | 1.54 | | | | 1.93 | | | | (1.20 | ) | | | 32 | |
| | | | | | 14.87 | | | | 11.53 | | | | 30,768 | | | | 1.54 | | | | 1.91 | | | | (1.17 | ) | | | 39 | |
| | | | | | 14.11 | | | | 2.83 | | | | 34,575 | | | | 1.54 | (c)(d) | | | 1.80 | (c)(d) | | | (1.26 | )(c)(d) | | | 55 | |
| | | | | | 14.99 | | | | (0.97 | ) | | | 33,513 | | | | 1.54 | | | | 1.80 | | | | (1.25 | ) | | | 48 | |
| | | | | | | | |
| See accompanying Notes to Financial Statements | | | March 31, 2020 | | | Semiannual Report | | | 281 | |
Financial Highlights (cont’d)
For a Share Outstanding for the Period ended:^††
| | | | | | | | | | | | | | | | | | | | | | | | | | | | |
| | | Net Asset
Value,
Beginning
of Period | | | Net
Investment
Income (a) | | |
Net Realized
and Change
in Unrealized
Gain (Loss) | | | Total from
Investment
Operations | | | Dividends
from Net
Investment
Income | | | Distributions
from Net
Realized Capital
Gains | | | | |
| AllianzGI PerformanceFee Managed Futures Strategy:†† | | | | | | | | | | | | | | | | | | | | | |
| Class P | | | | | | | | | | | | | | | | | | | | | | | | | | | | |
3/31/2020† | | $ | 9.83 | | | $ | 0.06 | | | $ | (1.01 | ) | | $ | (0.95 | ) | | $ | (0.52 | ) | | $ | (0.12 | ) | | | | |
9/30/2019 | | | 9.61 | | | | 0.19 | | | | 0.11 | | | | 0.30 | | | | (0.08 | ) | | | — | | | | | |
12/18/2017* - 9/30/2018 | | | 10.00 | | | | 0.12 | | | | (0.51 | ) | | | (0.39 | ) | | | — | | | | — | | | | | |
| Institutional Class | | | | | | | | | | | | | | | | | | | | | | | | | | | | |
3/31/2020† | | $ | 9.82 | | | $ | 0.06 | | | $ | (1.01 | ) | | $ | (0.95 | ) | | $ | (0.52 | ) | | $ | (0.12 | ) | | | | |
9/30/2019 | | | 9.60 | | | | 0.20 | | | | 0.11 | | | | 0.31 | | | | (0.09 | ) | | | — | | | | | |
12/18/2017* - 9/30/2018 | | | 10.00 | | | | 0.13 | | | | (0.53 | ) | | | (0.40 | ) | | | — | | | | — | | | | | |
| Class R6 | | | | | | | | | | | | | | | | | | | | | | | | | | | | |
3/31/2020† | | $ | 9.83 | | | $ | 0.06 | | | $ | (1.01 | ) | | $ | (0.95 | ) | | $ | (0.53 | ) | | $ | (0.12 | ) | | | | |
9/30/2019 | | | 9.61 | | | | 0.20 | | | | 0.11 | | | | 0.31 | | | | (0.09 | ) | | | — | | | | | |
12/18/2017* - 9/30/2018 | | | 10.00 | | | | 0.13 | | | | (0.52 | ) | | | (0.39 | ) | | | — | | | | — | | | | | |
| AllianzGI PerformanceFee Structured US Equity: | | | | | | | | | | | | | | | | | | | | | |
| Class P | | | | | | | | | | | | | | | | | | | | | | | | | | | | |
3/31/2020† | | $ | 10.67 | | | $ | 0.06 | | | $ | (3.49 | ) | | $ | (3.43 | ) | | $ | (0.30 | ) | | $ | (0.16 | ) | | | | |
9/30/2019 | | | 11.12 | | | | 0.33 | | | | (0.02 | ) | | | 0.31 | | | | (0.09 | ) | | | (0.67 | ) | | | | |
12/18/2017* - 9/30/2018 | | | 10.00 | | | | 0.14 | | | | 0.98 | | | | 1.12 | | | | — | | | | — | | | | | |
| Institutional Class | | | | | | | | | | | | | | | | | | | | | | | | | | | | |
3/31/2020† | | $ | 10.67 | | | $ | 0.07 | | | $ | (3.50 | ) | | $ | (3.43 | ) | | $ | (0.29 | ) | | $ | (0.16 | ) | | | | |
9/30/2019 | | | 11.13 | | | | 0.21 | | | | 0.09 | | | | 0.30 | | | | (0.09 | ) | | | (0.67 | ) | | | | |
12/18/2017* - 9/30/2018 | | | 10.00 | | | | 0.18 | | | | 0.95 | | | | 1.13 | | | | — | | | | — | | | | | |
| Class R6 | | | | | | | | | | | | | | | | | | | | | | | | | | | | |
3/31/2020† | | $ | 10.73 | | | $ | 0.07 | | | $ | (3.53 | ) | | $ | (3.46 | ) | | $ | (0.23 | ) | | $ | (0.16 | ) | | | | |
9/30/2019 | | | 11.13 | | | | 0.23 | | | | 0.10 | | | | 0.33 | | | | (0.06 | ) | | | (0.67 | ) | | | | |
12/18/2017* - 9/30/2018 | | | 10.00 | | | | 0.13 | | | | 1.00 | | | | 1.13 | | | | — | | | | — | | | | | |
| AllianzGI PerformanceFee Structured US Fixed Income: | | | | | | | | | | | | | | | | | | | | | |
| Class P | | | | | | | | | | | | | | | | | | | | | | | | | | | | |
3/31/2020† | | $ | 10.51 | | | $ | 0.11 | | | $ | (0.78 | ) | | $ | (0.67 | ) | | $ | (0.50 | ) | | $ | (0.31 | ) | | | | |
9/30/2019 | | | 9.92 | | | | 0.23 | | | | 0.80 | | | | 1.03 | | | | (0.33 | ) | | | (0.11 | ) | | | | |
12/18/2017* - 9/30/2018 | | | 10.00 | | | | 0.16 | | | | (0.24 | ) | | | (0.08 | ) | | | — | | | | — | | | | | |
| Institutional Class | | | | | | | | | | | | | | | | | | | | | | | | | | | | |
3/31/2020† | | $ | 10.53 | | | $ | 0.12 | | | $ | (0.78 | ) | | $ | (0.66 | ) | | $ | (0.50 | ) | | $ | (0.31 | ) | | | | |
9/30/2019 | | | 9.92 | | | | 0.23 | | | | 0.80 | | | | 1.03 | | | | (0.31 | ) | | | (0.11 | ) | | | | |
12/18/2017* - 9/30/2018 | | | 10.00 | | | | 0.09 | | | | (0.17 | ) | | | (0.08 | ) | | | — | | | | — | | | | | |
| Class R6 | | | | | | | | | | | | | | | | | | | | | | | | | | | | |
3/31/2020† | | $ | 10.52 | | | $ | 0.12 | | | $ | (0.80 | ) | | $ | (0.68 | ) | | $ | (0.43 | ) | | $ | (0.31 | ) | | | | |
9/30/2019 | | | 9.92 | | | | 0.27 | | | | 0.77 | | | | 1.04 | | | | (0.33 | ) | | | (0.11 | ) | | | | |
12/18/2017* - 9/30/2018 | | | 10.00 | | | | 0.16 | | | | (0.24 | ) | | | (0.08 | ) | | | — | | | | — | | | | | |
| AllianzGI Preferred Securities and Income: | | | | | | | | | | | | | | | | | | | | | |
| Class P | | | | | | | | | | | | | | | | | | | | | | | | | | | | |
3/31/2020† | | $ | 15.65 | | | $ | 0.30 | | | $ | (2.35 | ) | | $ | (2.05 | ) | | $ | (0.35 | ) | | $ | (0.39 | ) | | | | |
9/30/2019 | | | 15.06 | | | | 0.68 | | | | 0.64 | | | | 1.32 | | | | (0.71 | ) | | | (0.02 | ) | | | | |
5/30/2018* - 9/30/2018 | | | 15.00 | | | | 0.23 | | | | 0.03 | | | | 0.26 | | | | (0.20 | ) | | | — | | | | | |
| Institutional Class | | | | | | | | | | | | | | | | | | | | | | | | | | | | |
3/31/2020† | | $ | 15.65 | | | $ | 0.31 | | | $ | (2.35 | ) | | $ | (2.04 | ) | | $ | (0.36 | ) | | $ | (0.39 | ) | | | | |
9/30/2019 | | | 15.06 | | | | 0.69 | | | | 0.64 | | | | 1.33 | | | | (0.72 | ) | | | (0.02 | ) | | | | |
5/30/2018* - 9/30/2018 | | | 15.00 | | | | 0.26 | | | | — | | | | 0.26 | | | | (0.20 | ) | | | — | | | | | |
| Class R6 | | | | | | | | | | | | | | | | | | | | | | | | | | | | |
3/31/2020† | | $ | 15.65 | | | $ | 0.31 | | | $ | (2.35 | ) | | $ | (2.04 | ) | | $ | (0.36 | ) | | $ | (0.39 | ) | | | | |
9/30/2019 | | | 15.06 | | | | 0.70 | | | | 0.64 | | | | 1.34 | | | | (0.73 | ) | | | (0.02 | ) | | | | |
5/30/2018* - 9/30/2018 | | | 15.00 | | | | 0.24 | | | | 0.03 | | | | 0.27 | | | | (0.21 | ) | | | — | | | | | |
| ^ | A “—” may reflect actual amounts rounding to less than $0.01 or 0.01%. |
| †† | Consolidated Financial Highligths for the AllianzGI PerformanceFee Managed Futures Strategy Fund. These financial statements are consolidated to include the accounts of AllianzGI PerformanceFee Managed Futures Strategy Offshore Fund Ltd., a wholly-owned subsidiary of the AllianzGI PerformanceFee Managed Futures Strategy Fund. See Note 14. |
| * | Commencement of operations. |
| (a) | Calculated on average shares outstanding during the period. |
| | | | | | |
| 282 | | Semiannual Report | | | March 31, 2020 | | | See accompanying Notes to Financial Statements |
| | | | | | | | | | | | | | | | | | | | | | | | | | | | | | | | | | |
| | | | Total
Dividends and
Distributions | | | Net Asset
Value, End
of Period | | | Total Return (b) | | | Net Assets,
End of Period
(000s) | | | Ratio of
Expenses to
Average Net
Assets with
Fee Waiver/
Reimbursement | | | Ratio of
Expenses to
Average Net
Assets without
Fee Waiver/
Reimbursement | | | Ratio of Net
Investment
Income
to Average
Net Assets | | | Portfolio
Turnover Rate | |
| | | | | | | | | | | | | | | | | | | | | | | | | | |
| | | | | | | | | | | | | | | | | | | | | | | | | | | | | | | | | | |
| | | | | $ | (0.64 | ) | | $ | 8.24 | | | | (10.14 | )% | | $ | 8 | | | | 0.33 | %(c)(d) | | | 1.00 | %(c)(d) | | | 1.31 | %(c)(d) | | | — | % |
| | | | | | (0.08 | ) | | | 9.83 | | | | 3.17 | | | | 10 | | | | 0.28 | (d) | | | 1.28 | (d) | | | 2.02 | (d) | | | 184 | |
| | | | | | — | | | | 9.61 | | | | (3.90 | ) | | | 10 | | | | 0.20 | (c)(e) | | | 4.01 | (c)(e) | | | 1.59 | (c)(e) | | | 121 | |
| | | | | | | | | | | | | | | | | | | | | | | | | | | | | | | | | | |
| | | | | $ | (0.64 | ) | | $ | 8.23 | | | | (10.15 | )% | | $ | 364 | | | | 0.29 | %(c)(d) | | | 1.19 | %(c)(d) | | | 1.36 | %(c)(d) | | | — | % |
| | | | | | (0.09 | ) | | | 9.82 | | | | 3.24 | | | | 605 | | | | 0.22 | (d) | | | 1.39 | (d) | | | 2.11 | (d) | | | 184 | |
| | | | | | — | | | | 9.60 | | | | (4.00 | ) | | | 515 | | | | 0.15 | (c)(e) | | | 5.42 | (c)(e) | | | 1.74 | (c)(e) | | | 121 | |
| | | | | | | | | | | | | | | | | | | | | | | | | | | | | | | | | | |
| | | | | $ | (0.65 | ) | | $ | 8.23 | | | | (10.04 | )% | | $ | 28,310 | | | | 0.23 | %(c)(d) | | | 1.04 | %(c)(d) | | | 1.41 | %(c)(d) | | | — | % |
| | | | | | (0.09 | ) | | | 9.83 | | | | 3.31 | | | | 32,416 | | | | 0.18 | (d) | | | 1.24 | (d) | | | 2.13 | (d) | | | 184 | |
| | | | | | — | | | | 9.61 | | | | (3.90 | ) | | | 15,254 | | | | 0.10 | (c)(e) | | | 4.00 | (c)(e) | | | 1.70 | (c)(e) | | | 121 | |
| | | | | | | | | | | | | | | | | | | | | | | | | | |
| | | | | | | | | | | | | | | | | | | | | | | | | | | | | | | | | | |
| | | | | $ | (0.46 | ) | | $ | 6.78 | | | | (33.90 | )% | | $ | 15,185 | | | | 0.73 | %(c)(d) | | | 1.10 | %(c)(d) | | | 1.20 | %(c)(d) | | | 53 | % |
| | | | | | (0.76 | ) | | | 10.67 | | | | 4.55 | | | | 20,458 | | | | 0.25 | (d) | | | 0.70 | (d) | | | 3.16 | (d) | | | 8 | |
| | | | | | — | | | | 11.12 | | | | 11.20 | | | | 11 | | | | 0.61 | (c)(e) | | | 1.75 | (c)(e) | | | 1.71 | (c)(e) | | | 2 | |
| | | | | | | | | | | | | | | | | | | | | | | | | | | | | | | | | | |
| | | | | $ | (0.45 | ) | | $ | 6.79 | | | | (33.85 | )% | | $ | 46,950 | | | | 0.69 | %(c)(d) | | | 1.10 | %(c)(d) | | | 1.38 | %(c)(d) | | | 53 | % |
| | | | | | (0.76 | ) | | | 10.67 | | | | 4.39 | | | | 51,188 | | | | 0.17 | (d) | | | 0.94 | (d) | | | 2.06 | (d) | | | 8 | |
| | | | | | — | | | | 11.13 | | | | 11.30 | | | | 40,290 | | | | 0.62 | (c)(e) | | | 1.58 | (c)(e) | | | 2.12 | (c)(e) | | | 2 | |
| | | | | | | | | | | | | | | | | | | | | | | | | | | | | | | | | | |
| | | | | $ | (0.39 | ) | | $ | 6.88 | | | | (33.69 | )% | | $ | 1,532 | | | | 0.93 | %(c)(d) | | | 1.25 | %(c)(d) | | | 1.34 | %(c)(d) | | | 53 | % |
| | | | | | (0.73 | ) | | | 10.73 | | | | 4.66 | | | | 42,966 | | | | (0.08 | )(d) | | | 0.86 | (d) | | | 2.27 | (d) | | | 8 | |
| | | | | | — | | | | 11.13 | | | | 11.30 | | | | 42,774 | | | | 0.61 | (c)(e) | | | 1.72 | (c)(e) | | | 1.64 | (c)(e) | | | 2 | |
| | | | | | | | | | | | | | | | | | | | | | | | | | |
| | | | | | | | | | | | | | | | | | | | | | | | | | | | | | | | | | |
| | | | | $ | (0.81 | ) | | $ | 9.03 | | | | (6.93 | )% | | $ | 152 | | | | 0.05 | %(c)(d) | | | 1.81 | %(c)(d) | | | 2.32 | %(c)(d) | | | 5 | % |
| | | | | | (0.44 | ) | | | 10.51 | | | | 10.79 | | | | 66 | | | | 0.18 | (d) | | | 0.83 | (d) | | | 2.27 | (d) | | | 3 | |
| | | | | | — | | | | 9.92 | | | | (0.80 | ) | | | 10 | | | | 0.30 | (c)(e) | | | 1.97 | (c)(e) | | | 2.04 | (c)(e) | | | 1 | |
| | | | | | | | | | | | | | | | | | | | | | | | | | | | | | | | | | |
| | | | | $ | (0.81 | ) | | $ | 9.06 | | | | (6.87 | )% | | $ | 1,187 | | | | 0.18 | %(c)(d) | | | 1.81 | %(c)(d) | | | 2.31 | %(c)(d) | | | 5 | % |
| | | | | | (0.42 | ) | | | 10.53 | | | | 10.77 | | | | 1,005 | | | | 0.26 | (d) | | | 0.72 | (d) | | | 2.25 | (d) | | | 3 | |
| | | | | | — | | | | 9.92 | | | | (0.80 | ) | | | 10 | | | | 0.30 | (c)(e) | | | 34.22 | (c)(e) | | | 1.17 | (c)(e) | | | 1 | |
| | | | | | | | | | | | | | | | | | | | | | | | | | | | | | | | | | |
| | | | | $ | (0.74 | ) | | $ | 9.10 | | | | (6.99 | )% | | $ | 7,400 | | | | 0.41 | %(c)(d) | | | 1.54 | %(c)(d) | | | 2.39 | %(c)(d) | | | 5 | % |
| | | | | | (0.44 | ) | | | 10.52 | | | | 10.88 | | | | 28,357 | | | | 0.11 | (e) | | | 1.22 | | | | 2.72 | | | | 3 | |
| | | | | | — | | | | 9.92 | | | | (0.80 | ) | | | 24,958 | | | | 0.30 | (c)(e) | | | 2.00 | (c)(e) | | | 2.03 | (c)(e) | | | 1 | |
| | | | | | | | | | | | | | | | | | | | | | | | | | |
| | | | | | | | | | | | | | | | | | | | | | | | | | | | | | | | | | |
| | | | | $ | (0.74 | ) | | $ | 12.86 | | | | (13.78 | )% | | $ | 9 | | | | 0.60 | %(c) | | | 1.50 | %(c) | | | 3.92 | %(c) | | | 102 | % |
| | | | | | (0.73 | ) | | | 15.65 | | | | 9.14 | | | | 11 | | | | 0.60 | | | | 2.04 | | | | 4.55 | | | | 98 | |
| | | | | | (0.20 | ) | | | 15.06 | | | | 1.74 | | | | 10 | | | | 0.60 | (c)(e) | | | 3.21 | (c)(e) | | | 4.62 | (c)(e) | | | 39 | |
| | | | | | | | | | | | | | | | | | | | | | | | | | | | | | | | | | |
| | | | | $ | (0.75 | ) | | $ | 12.86 | | | | (13.76 | )% | | $ | 2,703 | | | | 0.55 | %(c) | | | 1.56 | %(c) | | | 4.00 | %(c) | | | 102 | % |
| | | | | | (0.74 | ) | | | 15.65 | | | | 9.21 | | | | 3,035 | | | | 0.55 | | | | 2.09 | | | | 4.62 | | | | 98 | |
| | | | | | (0.20 | ) | | | 15.06 | | | | 1.76 | | | | 1,548 | | | | 0.56 | (c)(e) | | | 4.22 | (c)(e) | | | 5.28 | (c)(e) | | | 39 | |
| | | | | | | | | | | | | | | | | | | | | | | | | | | | | | | | | | |
| | | | | $ | (0.75 | ) | | $ | 12.86 | | | | (13.74 | )% | | $ | 15,687 | | | | 0.50 | %(c) | | | 1.48 | %(c) | | | 4.04 | %(c) | | | 102 | % |
| | | | | | (0.75 | ) | | | 15.65 | | | | 9.26 | | | | 14,646 | | | | 0.50 | | | | 2.00 | | | | 4.66 | | | | 98 | |
| | | | | | (0.21 | ) | | | 15.06 | | | | 1.78 | | | | 10,157 | | | | 0.50 | (c)(e) | | | 3.22 | (c)(e) | | | 4.71 | (c)(e) | | | 39 | |
| | (b) | Total return is calculated assuming a purchase of a share on the first day of the period and a sale of a share on the last day of each period reported. Dividends and distributions, if any, are assumed, for purposes of this calculation, to be reinvested. Total return does not reflect sales charges and includes the effect of fee waivers and reimbursements. Total return may reflect adjustments to conform to U.S. GAAP. Total return for a period of less than one year is not annualized. |
| | (c) | Annualized, unless otherwise noted. |
| | (d) | Does not include expenses of the investment companies in which the Fund invests. |
| | (e) | Certain expenses incurred by the Fund were not annualized. |
| | | | | | | | |
| See accompanying Notes to Financial Statements | | | March 31, 2020 | | | Semiannual Report | | | 283 | |
Financial Highlights (cont’d)
For a Share Outstanding for the Period ended:^
| | | | | | | | | | | | | | | | | | | | | | | | |
| | | Net Asset
Value,
Beginning
of Period | | | Net
Investment
Income (a) | | | Net Realized
and Change
in Unrealized
Gain (Loss) | | | Total from
Investment
Operations | | |
Dividends
from Net
Investment
Income | | | | |
| AllianzGI Short Duration High Income: | | | | | | | | | | | | | | | | | | |
| Class A | | | | | | | | | | | | | | | | | | | | | | | | |
3/31/2020† | | $ | 14.62 | | | $ | 0.26 | | | $ | (1.82 | ) | | $ | (1.56 | ) | | $ | (0.34 | ) | | | | |
9/30/2019 | | | 14.93 | | | | 0.51 | | | | (0.11 | ) | | | 0.40 | | | | (0.71 | ) | | | | |
9/30/2018 | | | 15.18 | | | | 0.59 | | | | (0.16 | ) | | | 0.43 | | | | (0.68 | ) | | | | |
9/30/2017 | | | 15.29 | | | | 0.60 | | | | 0.04 | | | | 0.64 | | | | (0.75 | ) | | | | |
9/30/2016 | | | 15.04 | | | | 0.72 | | | | 0.38 | | | | 1.10 | | | | (0.85 | ) | | | | |
12/1/2014 - 9/30/2015# | | | 15.59 | | | | 0.57 | | | | (0.46 | ) | | | 0.11 | | | | (0.66 | ) | | | | |
11/30/2014 | | | 15.92 | | | | 0.64 | | | | (0.23 | ) | | | 0.41 | | | | (0.74 | ) | | | | |
| Class C | | | | | | | | | | | | | | | | | | | | | | | | |
3/31/2020† | | $ | 14.61 | | | $ | 0.24 | | | $ | (1.82 | ) | | $ | (1.58 | ) | | $ | (0.32 | ) | | | | |
9/30/2019 | | | 14.90 | | | | 0.47 | | | | (0.10 | ) | | | 0.37 | | | | (0.66 | ) | | | | |
9/30/2018 | | | 15.15 | | | | 0.55 | | | | (0.15 | ) | | | 0.40 | | | | (0.65 | ) | | | | |
9/30/2017 | | | 15.27 | | | | 0.56 | | | | 0.03 | | | | 0.59 | | | | (0.71 | ) | | | | |
9/30/2016 | | | 15.00 | | | | 0.68 | | | | 0.38 | | | | 1.06 | | | | (0.79 | ) | | | | |
12/1/2014 - 9/30/2015# | | | 15.56 | | | | 0.53 | | | | (0.46 | ) | | | 0.07 | | | | (0.63 | ) | | | | |
11/30/2014 | | | 15.89 | | | | 0.60 | | | | (0.23 | ) | | | 0.37 | | | | (0.70 | ) | | | | |
| Class P | | | | | | | | | | | | | | | | | | | | | | | | |
3/31/2020† | | $ | 14.51 | | | $ | 0.27 | | | $ | (1.79 | ) | | $ | (1.52 | ) | | $ | (0.35 | ) | | | | |
9/30/2019 | | | 14.88 | | | | 0.53 | | | | (0.10 | ) | | | 0.43 | | | | (0.80 | ) | | | | |
9/30/2018 | | | 15.13 | | | | 0.62 | | | | (0.15 | ) | | | 0.47 | | | | (0.72 | ) | | | | |
9/30/2017 | | | 15.24 | | | | 0.63 | | | | 0.05 | | | | 0.68 | | | | (0.79 | ) | | | | |
9/30/2016 | | | 15.03 | | | | 0.74 | | | | 0.38 | | | | 1.12 | | | | (0.91 | ) | | | | |
12/1/2014 - 9/30/2015# | | | 15.58 | | | | 0.60 | | | | (0.47 | ) | | | 0.13 | | | | (0.68 | ) | | | | |
11/30/2014 | | | 15.92 | | | | 0.66 | | | | (0.23 | ) | | | 0.43 | | | | (0.77 | ) | | | | |
| Institutional Class | | | | | | | | | | | | | | | | | | | | | | | | |
3/31/2020† | | $ | 14.52 | | | $ | 0.28 | | | $ | (1.81 | ) | | $ | (1.53 | ) | | $ | (0.35 | ) | | | | |
9/30/2019 | | | 14.89 | | | | 0.54 | | | | (0.11 | ) | | | 0.43 | | | | (0.80 | ) | | | | |
9/30/2018 | | | 15.14 | | | | 0.63 | | | | (0.15 | ) | | | 0.48 | | | | (0.73 | ) | | | | |
9/30/2017 | | | 15.25 | | | | 0.64 | | | | 0.04 | | | | 0.68 | | | | (0.79 | ) | | | | |
9/30/2016 | | | 15.05 | | | | 0.76 | | | | 0.37 | | | | 1.13 | | | | (0.93 | ) | | | | |
12/1/2014 - 9/30/2015# | | | 15.60 | | | | 0.60 | | | | (0.45 | ) | | | 0.15 | | | | (0.70 | ) | | | | |
11/30/2014 | | | 15.94 | | | | 0.68 | | | | (0.24 | ) | | | 0.44 | | | | (0.78 | ) | | | | |
| Class R6 | | | | | | | | | | | | | | | | | | | | | | | | |
3/31/2020† | | $ | 14.52 | | | $ | 0.28 | | | $ | (1.80 | ) | | $ | (1.52 | ) | | $ | (0.36 | ) | | | | |
9/30/2019 | | | 14.89 | | | | 0.56 | | | | (0.11 | ) | | | 0.45 | | | | (0.82 | ) | | | | |
9/30/2018 | | | 15.14 | | | | 0.64 | | | | (0.16 | ) | | | 0.48 | | | | (0.73 | ) | | | | |
2/1/2017* - 9/30/2017 | | | 15.18 | | | | 0.42 | | | | 0.03 | | | | 0.45 | | | | (0.49 | ) | | | | |
| ^ | A “—” may reflect actual amounts rounding to less than $0.01 or 0.01%. |
| # | Fiscal year end changed from November 30th to September 30th. |
| * | Commencement of operations. |
| (a) | Calculated on average shares outstanding during the period. |
| | | | | | |
| 284 | | Semiannual Report | | | March 31, 2020 | | | See accompanying Notes to Financial Statements |
| | | | | | | | | | | | | | | | | | | | | | | | | | | | | | |
| | | | Net Asset
Value, End
of Period | | | Total Return (b) | | | Net Assets,
End of Period
(000s) | | | Ratio of
Expenses to
Average Net
Assets with Fee
Waiver/
Reimbursement | | | Ratio of
Expenses to
Average Net
Assets without
Fee Waiver/
Reimbursement | | | Ratio of Net
Investment
Income
to Average
Net Assets | | | Portfolio
Turnover Rate | |
| | | | | | | | | | | | | | | | | | | | | | | |
| | | | | | | | | | | | | | | | | | | | | | | | | | | | | | |
| | | | | $ | 12.72 | | | | (10.90 | )% | | $ | 121,806 | | | | 0.86 | %(c) | | | 0.87 | %(c) | | | 3.61 | %(c) | | | 51 | % |
| | | | | | 14.62 | | | | 2.85 | | | | 136,086 | | | | 0.88 | | | | 0.88 | | | | 3.52 | | | | 47 | |
| | | | | | 14.93 | | | | 2.95 | | | | 150,899 | | | | 0.89 | | | | 0.89 | | | | 3.92 | | | | 60 | |
| | | | | | 15.18 | | | | 4.27 | | | | 218,312 | | | | 0.89 | | | | 0.89 | | | | 3.94 | | | | 88 | |
| | | | | | 15.29 | | | | 7.65 | | | | 226,149 | | | | 0.85 | | | | 0.85 | | | | 4.85 | | | | 63 | |
| | | | | | 15.04 | | | | 0.67 | | | | 164,978 | | | | 0.86 | (c)(d) | | | 0.86 | (c)(d) | | | 4.44 | (c)(d) | | | 65 | |
| | | | | | 15.59 | | | | 2.60 | | | | 163,070 | | | | 0.85 | | | | 0.88 | | | | 4.01 | | | | 94 | |
| | | | | | | | | | | | | | | | | | | | | | | | | | | | | | |
| | | | | $ | 12.71 | | | | (11.01 | )% | | $ | 93,256 | | | | 1.12 | %(c) | | | 1.13 | %(c) | | | 3.35 | %(c) | | | 51 | % |
| | | | | | 14.61 | | | | 2.58 | | | | 117,058 | | | | 1.14 | | | | 1.14 | | | | 3.25 | | | | 47 | |
| | | | | | 14.90 | | | | 2.74 | | | | 135,483 | | | | 1.11 | | | | 1.11 | | | | 3.70 | | | | 60 | |
| | | | | | 15.15 | | | | 4.00 | | | | 148,587 | | | | 1.12 | | | | 1.12 | | | | 3.70 | | | | 88 | |
| | | | | | 15.27 | | | | 7.42 | | | | 132,649 | | | | 1.13 | | | | 1.13 | | | | 4.58 | | | | 63 | |
| | | | | | 15.00 | | | | 0.38 | | | | 100,557 | | | | 1.15 | (c)(d) | | | 1.15 | (c)(d) | | | 4.15 | (c)(d) | | | 65 | |
| | | | | | 15.56 | | | | 2.38 | | | | 89,801 | | | | 1.10 | | | | 1.13 | | | | 3.78 | | | | 94 | |
| | | | | | | | | | | | | | | | | | | | | | | | | | | | | | |
| | | | | $ | 12.64 | | | | (10.70 | )% | | $ | 289,847 | | | | 0.62 | %(c) | | | 0.62 | %(c) | | | 3.80 | %(c) | | | 51 | % |
| | | | | | 14.51 | | | | 3.05 | | | | 501,138 | | | | 0.65 | | | | 0.65 | | | | 3.70 | | | | 47 | |
| | | | | | 14.88 | | | | 3.21 | | | | 411,367 | | | | 0.65 | | | | 0.65 | | | | 4.14 | | | | 60 | |
| | | | | | 15.13 | | | | 4.56 | | | | 700,376 | | | | 0.63 | | | | 0.63 | | | | 4.19 | | | | 88 | |
| | | | | | 15.24 | | | | 7.84 | | | | 554,281 | | | | 0.66 | | | | 0.66 | | | | 4.97 | | | | 63 | |
| | | | | | 15.03 | | | | 0.83 | | | | 330,431 | | | | 0.64 | (c)(d) | | | 0.64 | (c)(d) | | | 4.65 | (c)(d) | | | 65 | |
| | | | | | 15.58 | | | | 2.74 | | | | 248,345 | | | | 0.70 | | | | 0.70 | | | | 4.20 | | | | 94 | |
| | | | | | | | | | | | | | | | | | | | | | | | | | | | | | |
| | | | | $ | 12.64 | | | | (10.72 | )% | | $ | 321,529 | | | | 0.61 | %(c) | | | 0.62 | %(c) | | | 3.86 | %(c) | | | 51 | % |
| | | | | | 14.52 | | | | 3.06 | | | | 388,672 | | | | 0.63 | | | | 0.63 | | | | 3.74 | | | | 47 | |
| | | | | | 14.89 | | | | 3.26 | | | | 388,443 | | | | 0.60 | | | | 0.60 | | | | 4.20 | | | | 60 | |
| | | | | | 15.14 | | | | 4.61 | | | | 539,078 | | | | 0.59 | | | | 0.59 | | | | 4.22 | | | | 88 | |
| | | | | | 15.25 | | | | 7.90 | | | | 420,440 | | | | 0.58 | | | | 0.58 | | | | 5.10 | | | | 63 | |
| | | | | | 15.05 | | | | 0.91 | | | | 445,473 | | | | 0.60 | (c)(d) | | | 0.60 | (c)(d) | | | 4.70 | (c)(d) | | | 65 | |
| | | | | | 15.60 | | | | 2.81 | | | | 225,643 | | | | 0.60 | | | | 0.60 | | | | 4.28 | | | | 94 | |
| | | | | | | | | | | | | | | | | | | | | | | | | | | | | | |
| | | | | $ | 12.64 | | | | (10.69 | )% | | $ | 51,623 | | | | 0.55 | %(c) | | | 0.55 | %(c) | | | 3.96 | %(c) | | | 51 | % |
| | | | | | 14.52 | | | | 3.20 | | | | 39,234 | | | | 0.57 | | | | 0.57 | | | | 3.89 | | | | 47 | |
| | | | | | 14.89 | | | | 3.29 | | | | 52,922 | | | | 0.55 | | | | 0.55 | | | | 4.27 | | | | 60 | |
| | | | | | 15.14 | | | | 3.04 | | | | 70,595 | | | | 0.56 | (c) | | | 0.56 | (c) | | | 4.25 | (c) | | | 88 | |
| | (b) | Total return is calculated assuming a purchase of a share on the first day of the period and a sale of a share on the last day of each period reported. Dividends and distributions, if any, are assumed, for purposes of this calculation, to be reinvested. Total return does not reflect sales charges and includes the effect of fee waivers and reimbursements. Total return may reflect adjustments to conform to U.S. GAAP. Total return for a period of less than one year is not annualized. |
| | (c) | Annualized, unless otherwise noted. |
| | (d) | Certain expenses incurred by the Fund were not annualized. |
| | | | | | | | |
| See accompanying Notes to Financial Statements | | | March 31, 2020 | | | Semiannual Report | | | 285 | |
Financial Highlights (cont’d)
For a Share Outstanding for the Period ended:^
| | | | | | | | | | | | | | | | | | | | | | | | | | | | |
| | | Net Asset
Value,
Beginning
of Period | | | Net
Investment
Income (a) | | |
Net Realized
and Change
in Unrealized
Gain (Loss) | | | Total from
Investment
Operations | | | Dividends
from Net
Investment
Income | | | Distributions
from Net
Realized Capital
Gains | | | | |
| AllianzGI Short Term Bond: | | | | |
| Class A | | | | | | | | | | | | | | | | | | | | | | | | | | | | |
3/31/2020† | | $ | 15.28 | | | $ | 0.19 | | | $ | (0.50 | ) | | $ | (0.31 | ) | | $ | (0.29 | ) | | $ | (0.03 | ) | | | | |
9/30/2019 | | | 15.02 | | | | 0.45 | | | | 0.37 | | | | 0.82 | | | | (0.56 | ) | | | — | | | | | |
8/23/2018* - 9/30/2018 | | | 15.00 | | | | 0.04 | | | | (0.02 | ) | | | 0.02 | | | | — | | | | — | | | | | |
| Class P | | | | | | | | | | | | | | | | | | | | | | | | | | | | |
3/31/2020† | | $ | 15.29 | | | $ | 0.20 | | | $ | (0.50 | ) | | $ | (0.30 | ) | | $ | (0.29 | ) | | $ | (0.03 | ) | | | | |
9/30/2019 | | | 15.02 | | | | 0.47 | | | | 0.38 | | | | 0.85 | | | | (0.58 | ) | | | — | | | | | |
8/23/2018* - 9/30/2018 | | | 15.00 | | | | 0.04 | | | | (0.02 | ) | | | 0.02 | | | | — | | | | — | | | | | |
| Institutional Class | | | | | | | | | | | | | | | | | | | | | | | | | | | | |
3/31/2020† | | $ | 15.29 | | | $ | 0.21 | | | $ | (0.49 | ) | | $ | (0.28 | ) | | $ | (0.31 | ) | | $ | (0.03 | ) | | | | |
9/30/2019 | | | 15.02 | | | | 0.48 | | | | 0.38 | | | | 0.86 | | | | (0.59 | ) | | | — | | | | | |
8/23/2018* - 9/30/2018 | | | 15.00 | | | | 0.04 | | | | (0.02 | ) | | | 0.02 | | | | — | | | | — | | | | | |
| ^ | A “—” may reflect actual amounts rounding to less than $0.01 or 0.01%. |
| * | Commencement of operations. |
| (a) | Calculated on average shares outstanding during the period. |
| (b) | Total return is calculated assuming a purchase of a share on the first day of the period and a sale of a share on the last day of each period reported. Dividends and distributions, if any, are assumed, for purposes of this calculation, to be reinvested. Total return does not reflect sales charges and includes the effect of fee waivers and reimbursements. Total return may reflect adjustments to conform to U.S. GAAP. Total return for a period of less than one year is not annualized. |
| (c) | Annualized, unless otherwise noted. |
| (d) | Certain expenses incurred by the Fund were not annualized. |
| | | | | | |
| 286 | | Semiannual Report | | | March 31, 2020 | | | See accompanying Notes to Financial Statements |
| | | | | | | | | | | | | | | | | | | | | | | | | | | | | | | | | | |
| | | | Total
Dividends and
Distributions | | | Net Asset
Value, End
of Period | | | Total
Return (b) | | | Net Assets,
End of Period
(000s) | | | Ratio of
Expenses to
Average Net
Assets with Fee
Waiver/
Reimbursement | | | Ratio of
Expenses to
Average Net
Assets without
Fee Waiver/
Reimbursement | | | Ratio of Net
Investment
Income
to Average
Net Assets | | | Portfolio
Turnover Rate | |
| | | | | | | | | | | | | | | | | | | | | | | | | | |
| | | | | | | | | | | | | | | | | | | | | | | | | | | | | | | | | | |
| | | | | $ | (0.32 | ) | | $ | 14.65 | | | | (2.11 | )% | | $ | 3,431 | | | | 0.64 | %(c) | | | 1.88 | %(c) | | | 2.53 | %(c) | | | 27 | % |
| | | | | | (0.56 | ) | | | 15.28 | | | | 5.58 | | | | 770 | | | | 0.64 | | | | 4.48 | | | | 3.00 | | | | 46 | |
| | | | | | — | | | | 15.02 | | | | 0.13 | | | | 10 | | | | 0.64 | (c)(d) | | | 10.85 | (c)(d) | | | 2.41 | (c)(d) | | | — | |
| | | | | | | | | | | | | | | | | | | | | | | | | | | | | | | | | | |
| | | | | $ | (0.32 | ) | | $ | 14.67 | | | | (2.01 | )% | | $ | 10 | | | | 0.49 | %(c) | | | 1.65 | %(c) | | | 2.64 | %(c) | | | 27 | % |
| | | | | | (0.58 | ) | | | 15.29 | | | | 5.78 | | | | 11 | | | | 0.49 | | | | 23.90 | | | | 3.12 | | | | 46 | |
| | | | | | — | | | | 15.02 | | | | 0.13 | | | | 10 | | | | 0.49 | (c)(d) | | | 10.60 | (c)(d) | | | 2.56 | (c)(d) | | | — | |
| | | | | | | | | | | | | | | | | | | | | | | | | | | | | | | | | | |
| | | | | $ | (0.34 | ) | | $ | 14.67 | | | | (1.91 | )% | | $ | 18,459 | | | | 0.39 | %(c) | | | 1.66 | %(c) | | | 2.74 | %(c) | | | 27 | % |
| | | | | | (0.59 | ) | | | 15.29 | | | | 5.88 | | | | 12,709 | | | | 0.39 | | | | 4.13 | | | | 3.23 | | | | 46 | |
| | | | | | — | | | | 15.02 | | | | 0.13 | | | | 5,164 | | | | 0.39 | (c)(d) | | | 10.62 | (c)(d) | | | 2.68 | (c)(d) | | | — | |
| | | | | | | | |
| See accompanying Notes to Financial Statements | | | March 31, 2020 | | | Semiannual Report | | | 287 | |
Financial Highlights (cont’d)
For a Share Outstanding for the Period ended:^
| | | | | | | | | | | | | | | | | | | | | | | | | | | | |
| | | Net Asset
Value,
Beginning
of Period | | | Net
Investment
Income
(Loss) (a) | | |
Net Realized
and Change
in Unrealized
Gain (Loss) | | | Total from
Investment
Operations | | | Dividends
from Net
Investment
Income | | | Distributions
from Net
Realized Capital
Gains | | | | |
| AllianzGI Structured Return: | | | | |
| Class A | | | | | | | | | | | | | | | | | | | | | | | | | | | | |
3/31/2020† | | $ | 16.20 | | | $ | 0.06 | | | $ | (5.20 | ) | | $ | (5.14 | ) | | $ | (0.14 | ) | | $ | (0.44 | ) | | | | |
9/30/2019 | | | 16.16 | | | | 0.15 | | | | 0.24 | | | | 0.39 | | | | — | | | | (0.35 | ) | | | | |
9/30/2018 | | | 16.26 | | | | 0.10 | | | | 0.41 | | | | 0.51 | | | | (0.10 | ) | | | (0.51 | ) | | | | |
9/30/2017 | | | 15.85 | | | | 0.09 | | | | 0.74 | | | | 0.83 | | | | (0.06 | ) | | | (0.36 | ) | | | | |
9/30/2016 | | | 15.47 | | | | 0.15 | | | | 0.51 | | | | 0.66 | | | | (0.10 | ) | | | (0.18 | ) | | | | |
12/1/2014 - 9/30/2015# | | | 15.64 | | | | 0.16 | | | | 0.28 | | | | 0.44 | | | | — | | | | (0.61 | ) | | | | |
11/30/2014 | | | 15.87 | | | | (0.12 | ) | | | 0.65 | | | | 0.53 | | | | — | | | | (0.76 | ) | | | | |
| Class C | | | | | | | | | | | | | | | | | | | | | | | | | | | | |
3/31/2020† | | $ | 15.50 | | | $ | — | | | $ | (4.95 | ) | | $ | (4.95 | ) | | $ | (0.13 | ) | | $ | (0.44 | ) | | | | |
9/30/2019 | | | 15.58 | | | | 0.05 | | | | 0.22 | | | | 0.27 | | | | — | | | | (0.35 | ) | | | | |
9/30/2018 | | | 15.73 | | | | (0.03 | ) | | | 0.39 | | | | 0.36 | | | | — | | | | (0.51 | ) | | | | |
9/30/2017 | | | 15.39 | | | | (0.04 | ) | | | 0.74 | | | | 0.70 | | | | — | | | | (0.36 | ) | | | | |
9/30/2016 | | | 15.12 | | | | 0.02 | | | | 0.51 | | | | 0.53 | | | | (0.08 | ) | | | (0.18 | ) | | | | |
12/1/2014 - 9/30/2015# | | | 15.39 | | | | 0.09 | | | | 0.25 | | | | 0.34 | | | | — | | | | (0.61 | ) | | | | |
11/30/2014 | | | 15.73 | | | | (0.25 | ) | | | 0.67 | | | | 0.42 | | | | — | | | | (0.76 | ) | | | | |
| Class P | | | | | | | | | | | | | | | | | | | | | | | | | | | | |
3/31/2020† | | $ | 16.17 | | | $ | 0.08 | | | $ | (5.13 | ) | | $ | (5.05 | ) | | $ | (0.32 | ) | | $ | (0.44 | ) | | | | |
9/30/2019 | | | 16.14 | | | | 0.22 | | | | 0.21 | | | | 0.43 | | | | (0.05 | ) | | | (0.35 | ) | | | | |
9/30/2018 | | | 16.26 | | | | 0.13 | | | | 0.41 | | | | 0.54 | | | | (0.15 | ) | | | (0.51 | ) | | | | |
9/30/2017 | | | 15.87 | | | | 0.18 | | | | 0.69 | | | | 0.87 | | | | (0.12 | ) | | | (0.36 | ) | | | | |
9/30/2016 | | | 15.53 | | | | 0.17 | | | | 0.53 | | | | 0.70 | | | | (0.18 | ) | | | (0.18 | ) | | | | |
12/1/2014 - 9/30/2015# | | | 15.69 | | | | 0.21 | | | | 0.24 | | | | 0.45 | | | | — | | | | (0.61 | ) | | | | |
11/30/2014 | | | 15.89 | | | | (0.15 | ) | | | 0.71 | | | | 0.56 | | | | — | | | | (0.76 | ) | | | | |
| Institutional Class | | | | | | | | | | | | | | | | | | | | | | | | | | | | |
3/31/2020† | | $ | 16.29 | | | $ | 0.09 | | | $ | (5.17 | ) | | $ | (5.08 | ) | | $ | (0.32 | ) | | $ | (0.44 | ) | | | | |
9/30/2019 | | | 16.32 | | | | 0.22 | | | | 0.21 | | | | 0.43 | | | | (0.11 | ) | | | (0.35 | ) | | | | |
9/30/2018 | | | 16.42 | | | | 0.16 | | | | 0.40 | | | | 0.56 | | | | (0.15 | ) | | | (0.51 | ) | | | | |
9/30/2017 | | | 15.96 | | | | 0.14 | | | | 0.74 | | | | 0.88 | | | | (0.06 | ) | | | (0.36 | ) | | | | |
9/30/2016 | | | 15.54 | | | | 0.19 | | | | 0.52 | | | | 0.71 | | | | (0.11 | ) | | | (0.18 | ) | | | | |
12/1/2014 - 9/30/2015# | | | 15.72 | | | | 0.22 | | | | 0.24 | | | | 0.46 | | | | (0.03 | ) | | | (0.61 | ) | | | | |
11/30/2014 | | | 15.90 | | | | (0.08 | ) | | | 0.66 | | | | 0.58 | | | | — | | | | (0.76 | ) | | | | |
| Class R6 | | | | | | | | | | | | | | | | | | | | | | | | | | | | |
3/31/2020† | | $ | 16.23 | | | $ | 0.06 | | | $ | (5.13 | ) | | $ | (5.07 | ) | | $ | (0.35 | ) | | $ | (0.44 | ) | | | | |
9/30/2019 | | | 16.24 | | | | 0.23 | | | | 0.22 | | | | 0.45 | | | | (0.11 | ) | | | (0.35 | ) | | | | |
9/30/2018 | | | 16.32 | | | | 0.15 | | | | 0.40 | | | | 0.55 | | | | (0.12 | ) | | | (0.51 | ) | | | | |
12/5/2016* - 9/30/2017 | | | 16.13 | | | | 0.15 | | | | 0.58 | | | | 0.73 | | | | (0.18 | ) | | | (0.36 | ) | | | | |
| ^ | A “—” may reflect actual amounts rounding to less than $0.01 or 0.01%. |
| # | Fiscal year end changed from November 30th to September 30th. |
| * | Commencement of operations. |
| (a) | Calculated on average shares outstanding during the period. |
| | | | | | |
| 288 | | Semiannual Report | | | March 31, 2020 | | | See accompanying Notes to Financial Statements |
| | | | | | | | | | | | | | | | | | | | | | | | | | | | | | | | | | |
| | | | Total
Dividends and
Distributions | | | Net Asset
Value, End
of Period | | | Total
Return (b) | | | Net Assets,
End of Period
(000s) | | | Ratio of
Expenses to
Average Net
Assets with Fee
Waiver/
Reimbursement | | | Ratio of
Expenses to
Average Net
Assets without
Fee Waiver/
Reimbursement | | | Ratio of Net
Investment
Income
(Loss)
to Average
Net Assets | | | Portfolio
Turnover Rate | |
| | | | | | | | | | | | | | | | | | | | | | | | | | |
| | | | | | | | | | | | | | | | | | | | | | | | | | | | | | | | | | |
| | | | | $ | (0.58 | ) | | $ | 10.48 | | | | (32.96 | )% | | $ | 12,432 | | | | 1.03 | %(c)(d) | | | 1.08 | %(c)(d) | | | 0.75 | %(c)(d) | | | 8 | % |
| | | | | | (0.35 | ) | | | 16.20 | | | | 2.55 | | | | 38,397 | | | | 0.99 | (c) | | | 1.06 | (c) | | | 0.97 | (c) | | | 96 | |
| | | | | | (0.61 | ) | | | 16.16 | | | | 3.23 | | | | 110,429 | | | | 0.98 | (c) | | | 1.04 | (c) | | | 0.61 | (c) | | | 586 | |
| | | | | | (0.42 | ) | | | 16.26 | (e) | | | 5.35 | (e) | | | 136,344 | | | | 1.02 | (c) | | | 1.15 | (c) | | | 0.57 | (c) | | | 680 | |
| | | | | | (0.28 | ) | | | 15.85 | | | | 4.32 | | | | 96,870 | | | | 1.15 | (c) | | | 1.17 | (c) | | | 0.95 | (c) | | | 500 | |
| | | | | | (0.61 | ) | | | 15.47 | | | | 2.93 | | | | 8,014 | | | | 1.15 | (c)(d)(f) | | | 1.58 | (c)(d)(f) | | | 1.28 | (c)(d)(f) | | | 34 | |
| | | | | | (0.76 | ) | | | 15.64 | | | | 3.52 | | | | 2,551 | | | | 1.52 | | | | 4.22 | | | | (0.75 | ) | | | 229 | |
| | | | | | | | | | | | | | | | | | | | | | | | | | | | | | | | | | |
| | | | | $ | (0.57 | ) | | $ | 9.98 | | | | (33.22 | )% | | $ | 5,728 | | | | 1.78 | %(c)(d) | | | 1.82 | %(c)(d) | | | 0.04 | %(c)(d) | | | 8 | % |
| | | | | | (0.35 | ) | | | 15.50 | | | | 1.84 | | | | 12,179 | | | | 1.76 | (c) | | | 1.84 | (c) | | | 0.31 | (c) | | | 96 | |
| | | | | | (0.51 | ) | | | 15.58 | | | | 2.34 | | | | 16,862 | | | | 1.78 | (c) | | | 1.78 | (c) | | | (0.18 | )(c) | | | 586 | |
| | | | | | (0.36 | ) | | | 15.73 | (e) | | | 4.61 | (e) | | | 16,535 | | | | 1.80 | (c) | | | 1.87 | (c) | | | (0.24 | )(c) | | | 680 | |
| | | | | | (0.26 | ) | | | 15.39 | | | | 3.52 | | | | 12,605 | | | | 1.90 | (c) | | | 1.97 | (c) | | | 0.10 | (c) | | | 500 | |
| | | | | | (0.61 | ) | | | 15.12 | | | | 2.31 | | | | 3,803 | | | | 1.90 | (c)(d)(f) | | | 2.09 | (c)(d)(f) | | | 0.70 | (c)(d)(f) | | | 34 | |
| | | | | | (0.76 | ) | | | 15.39 | | | | 2.82 | | | | 138 | | | | 2.31 | | | | 4.74 | | | | (1.64 | ) | | | 229 | |
| | | | | | | | | | | | | | | | | | | | | | | | | | | | | | | | | | |
| | | | | $ | (0.76 | ) | | $ | 10.36 | | | | (32.85 | )% | | $ | 47,096 | | | | 0.80 | %(c)(d) | | | 0.80 | %(c)(d) | | | 0.96 | %(c)(d) | | | 8 | % |
| | | | | | (0.40 | ) | | | 16.17 | | | | 2.83 | | | | 153,249 | | | | 0.79 | (c) | | | 0.84 | (c) | | | 1.37 | (c) | | | 96 | |
| | | | | | (0.66 | ) | | | 16.14 | | | | 3.40 | | | | 150,441 | | | | 0.77 | (c) | | | 0.77 | (c) | | | 0.85 | (c) | | | 586 | |
| | | | | | (0.48 | ) | | | 16.26 | (e) | | | 5.59 | (e) | | | 136,127 | | | | 0.79 | (c) | | | 0.83 | (c) | | | 1.12 | (c) | | | 680 | |
| | | | | | (0.36 | ) | | | 15.87 | | | | 4.55 | | | | 20,664 | | | | 0.96 | (c) | | | 0.96 | (c) | | | 1.11 | (c) | | | 500 | |
| | | | | | (0.61 | ) | | | 15.53 | | | | 2.99 | | | | 503 | | | | 1.00 | (c)(d)(f) | | | 1.16 | (c)(d)(f) | | | 1.67 | (c)(d)(f) | | | 34 | |
| | | | | | (0.76 | ) | | | 15.69 | | | | 3.72 | | | | 37 | | | | 1.50 | | | | 3.73 | | | | (1.00 | ) | | | 229 | |
| | | | | | | | | | | | | | | | | | | | | | | | | | | | | | | | | | |
| | | | | $ | (0.76 | ) | | $ | 10.45 | | | | (32.80 | )% | | $ | 160,871 | | | | 0.74 | %(c)(d) | | | 0.81 | %(c)(d) | | | 1.10 | %(c)(d) | | | 8 | % |
| | | | | | (0.46 | ) | | | 16.29 | | | | 2.85 | | | | 385,323 | | | | 0.71 | (c) | | | 0.78 | (c) | | | 1.41 | (c) | | | 96 | |
| | | | | | (0.66 | ) | | | 16.32 | | | | 3.52 | | | | 345,453 | | | | 0.69 | (c) | | | 0.77 | (c) | | | 1.01 | (c) | | | 586 | |
| | | | | | (0.42 | ) | | �� | 16.42 | (e) | | | 5.62 | (e) | | | 205,068 | | | | 0.74 | (c) | | | 0.87 | (c) | | | 0.86 | (c) | | | 680 | |
| | | | | | (0.29 | ) | | | 15.96 | | | | 4.60 | | | | 146,194 | | | | 0.90 | (c) | | | 0.90 | (c) | | | 1.21 | (c) | | | 500 | |
| | | | | | (0.64 | ) | | | 15.54 | | | | 3.08 | | | | 55,028 | | | | 0.90 | (c)(d)(f) | | | 1.22 | (c)(d)(f) | | | 1.71 | (c)(d)(f) | | | 34 | |
| | | | | | (0.76 | ) | | | 15.72 | | | | 3.84 | | | | 15,142 | | | | 1.28 | | | | 3.65 | | | | (0.54 | ) | | | 229 | |
| | | | | | | | | | | | | | | | | | | | | | | | | | | | | | | | | | |
| | | | | $ | (0.79 | ) | | $ | 10.37 | | | | (32.91 | )% | | $ | 24,825 | | | | 0.71 | %(c)(d) | | | 0.72 | %(c)(d) | | | 0.76 | %(c)(d) | | | 8 | % |
| | | | | | (0.46 | ) | | | 16.23 | | | | 2.93 | | | | 57,091 | | | | 0.69 | (c) | | | 0.71 | (c) | | | 1.46 | (c) | | | 96 | |
| | | | | | (0.63 | ) | | | 16.24 | | | | 3.47 | | | | 50,899 | | | | 0.67 | (c) | | | 0.71 | (c) | | | 0.97 | (c) | | | 586 | |
| | | | | | (0.54 | ) | | | 16.32 | (e) | | | 4.64 | (e) | | | 34,047 | | | | 0.68 | (c)(d) | | | 0.76 | (c)(d) | | | 1.17 | (c)(d) | | | 680 | |
| | (b) | Total return is calculated assuming a purchase of a share on the first day of the period and a sale of a share on the last day of each period reported. Dividends and distributions, if any, are assumed, for purposes of this calculation, to be reinvested. Total return does not reflect sales charges and includes the effect of fee waivers and reimbursements. Total return may reflect adjustments to conform to U.S. GAAP. Total return for a period of less than one year is not annualized. |
| | (c) | Does not include expenses of the investment companies in which the Fund invests. |
| | (d) | Annualized, unless otherwise noted. |
| | (e) | Payments from Affiliates increased the end of period net asset value and total return by less than $0.01 and 0.01%, respectively. |
| | (f) | Certain expenses incurred by the Fund were not annualized. |
| | | | | | | | |
| See accompanying Notes to Financial Statements | | | March 31, 2020 | | | Semiannual Report | | | 289 | |
Financial Highlights (cont’d)
For a Share Outstanding for the Period ended:^
| | | | | | | | | | | | | | | | | | | | | | | | | | | | |
| | | Net Asset
Value,
Beginning
of Period | | | Net Investment
Income (Loss) (a) | | |
Net Realized
and Change
in Unrealized
Gain (Loss) | | | Total from
Investment
Operations | | | Dividends
from Net
Investment
Income | | | Distributions
from Net
Realized Capital
Gains | | | | |
| AllianzGI U.S. Equity Hedged: | | | | |
| Class A | | | | | | | | | | | | | | | | | | | | | | | | | | | | |
3/31/2020† | | $ | 17.85 | | | $ | 0.05 | | | $ | (1.72 | ) | | $ | (1.67 | ) | | $ | (0.10 | ) | | $ | — | | | | | |
9/30/2019 | | | 18.94 | | | | 0.11 | | | | (0.06 | ) | | | 0.05 | | | | (0.15 | ) | | | (0.99 | ) | | | | |
9/30/2018 | | | 17.80 | | | | 0.09 | | | | 1.35 | | | | 1.44 | | | | (0.30 | ) | | | — | | | | | |
9/30/2017 | | | 16.20 | | | | 0.13 | | | | 1.71 | | | | 1.84 | | | | (0.24 | ) | | | — | | | | | |
9/30/2016 | | | 15.79 | | | | 0.11 | | | | 0.53 | | | | 0.64 | | | | (0.23 | ) | | | — | | | | | |
12/1/2014 - 9/30/2015# | | | 17.74 | | | | 0.14 | | | | (1.09 | ) | | | (0.95 | ) | | | (0.02 | ) | | | (0.98 | ) | | | | |
11/30/2014 | | | 17.26 | | | | 0.12 | | | | 1.45 | | | | 1.57 | | | | (0.15 | ) | | | (0.94 | ) | | | | |
| Class C | | | | | | | | | | | | | | | | | | | | | | | | | | | | |
3/31/2020† | | $ | 17.04 | | | $ | (0.01 | ) | | $ | (1.66 | ) | | $ | (1.67 | ) | | $ | — | | | $ | — | | | | | |
9/30/2019 | | | 18.09 | | | | (0.01 | ) | | | (0.05 | ) | | | (0.06 | ) | | | — | | | | (0.99 | ) | | | | |
9/30/2018 | | | 17.06 | | | | (0.05 | ) | | | 1.30 | | | | 1.25 | | | | (0.22 | ) | | | — | | | | | |
9/30/2017 | | | 15.59 | | | | — | | | | 1.63 | | | | 1.63 | | | | (0.16 | ) | | | — | | | | | |
9/30/2016 | | | 15.43 | | | | 0.01 | | | | 0.51 | | | | 0.52 | | | | (0.36 | ) | | | — | | | | | |
12/1/2014 - 9/30/2015# | | | 17.45 | | | | 0.05 | | | | (1.09 | ) | | | (1.04 | ) | | | — | | | | (0.98 | ) | | | | |
11/30/2014 | | | 17.14 | | | | (0.01 | ) | | | 1.44 | | | | 1.43 | | | | (0.18 | ) | | | (0.94 | ) | | | | |
| Class P | | | | | | | | | | | | | | | | | | | | | | | | | | | | |
3/31/2020† | | $ | 17.44 | | | $ | 0.07 | | | $ | (1.69 | ) | | $ | (1.62 | ) | | $ | (0.15 | ) | | $ | — | | | | | |
9/30/2019 | | | 18.68 | | | | 0.14 | | | | (0.07 | ) | | | 0.07 | | | | (0.32 | ) | | | (0.99 | ) | | | | |
9/30/2018 | | | 17.61 | | | | 0.12 | | | | 1.33 | | | | 1.45 | | | | (0.38 | ) | | | — | | | | | |
9/30/2017 | | | 16.18 | | | | 0.18 | | | | 1.65 | | | | 1.83 | | | | (0.40 | ) | | | — | | | | | |
9/30/2016 | | | 15.92 | | | | 0.14 | | | | 0.54 | | | | 0.68 | | | | (0.42 | ) | | | — | | | | | |
12/1/2014 - 9/30/2015# | | | 17.90 | | | | 0.15 | | | | (1.10 | ) | | | (0.95 | ) | | | (0.05 | ) | | | (0.98 | ) | | | | |
11/30/2014 | | | 17.29 | | | | 0.15 | | | | 1.47 | | | | 1.62 | | | | (0.07 | ) | | | (0.94 | ) | | | | |
| Institutional Class | | | | | | | | | | | | | | | | | | | | | | | | | | | | |
3/31/2020† | | $ | 18.19 | | | $ | 0.08 | | | $ | (1.76 | ) | | $ | (1.68 | ) | | $ | (0.16 | ) | | $ | — | | | | | |
9/30/2019 | | | 19.21 | | | | 0.16 | | | | (0.04 | ) | | | 0.12 | | | | (0.15 | ) | | | (0.99 | ) | | | | |
9/30/2018 | | | 17.92 | | | | 0.16 | | | | 1.33 | | | | 1.49 | | | | (0.20 | ) | | | — | | | | | |
9/30/2017 | | | 16.24 | | | | 0.14 | | | | 1.74 | | | | 1.88 | | | | (0.20 | ) | | | — | | | | | |
9/30/2016 | | | 15.86 | | | | 0.11 | | | | 0.59 | | | | 0.70 | | | | (0.32 | ) | | | — | | | | | |
12/1/2014 - 9/30/2015# | | | 17.89 | | | | 0.18 | | | | (1.11 | ) | | | (0.93 | ) | | | (0.12 | ) | | | (0.98 | ) | | | | |
11/30/2014 | | | 17.31 | | | | 0.17 | | | | 1.46 | | | | 1.63 | | | | (0.11 | ) | | | (0.94 | ) | | | | |
| ^ | A “—” may reflect actual amounts rounding to less than $0.01 or 0.01%. |
| # | Fiscal year end changed from November 30th to September 30th. |
| (a) | Calculated on average shares outstanding during the period. |
| (b) | Total return is calculated assuming a purchase of a share on the first day of the period and a sale of a share on the last day of each period reported. Dividends and distributions, if any, are assumed, for purposes of this calculation, to be reinvested. Total return does not reflect sales charges and includes the effect of fee waivers and reimbursements. Total return may reflect adjustments to conform to U.S. GAAP. Total return for a period of less than one year is not annualized. |
| (c) | Annualized, unless otherwise noted. |
| (d) | Does not include expenses of the investment companies in which the Fund invests. |
| (e) | Payments from Affiliates increased the end of period net asset value and total return by less than $0.01 and 0.01%, respectively. |
| (f) | Certain expenses incurred by the Fund were not annualized. |
| | | | | | |
| 290 | | Semiannual Report | | | March 31, 2020 | | | See accompanying Notes to Financial Statements |
| | | | | | | | | | | | | | | | | | | | | | | | | | | | | | | | | | |
| | | | Total Dividends and
Distributions | | | Net Asset
Value, End
of Period | | | Total Return (b) | | | Net Assets,
End of Period
(000s) | | | Ratio of
Expenses to
Average Net
Assets with
Fee Waiver/
Reimbursement | | | Ratio of
Expenses to
Average Net
Assets without
Fee Waiver/
Reimbursement | | | Ratio of Net
Investment
Income (Loss)
to Average
Net Assets | | | Portfolio
Turnover Rate | |
| | | | | | | | | | | | | | | | | | | | | | | | | | |
| | | | | | | | | | | | | | | | | | | | | | | | | | | | | | | | | | |
| | | | | $ | (0.10 | ) | | $ | 16.08 | | | | (9.44 | )% | | $ | 436 | | | | 1.25 | %(c)(d) | | | 8.75 | %(c)(d) | | | 0.56 | %(c)(d) | | | 8 | % |
| | | | | | (1.14 | ) | | | 17.85 | | | | 1.02 | | | | 499 | | | | 1.25 | | | | 10.03 | | | | 0.64 | | | | 13 | |
| | | | | | (0.30 | ) | | | 18.94 | | | | 8.13 | | | | 544 | | | | 1.25 | (d) | | | 7.40 | (d) | | | 0.50 | (d) | | | 21 | |
| | | | | | (0.24 | ) | | | 17.80 | | | | 11.44 | | | | 582 | | | | 1.25 | (d) | | | 8.26 | (d) | | | 0.75 | (d) | | | — | |
| | | | | | (0.23 | ) | | | 16.20 | (e) | | | 4.11 | (e) | | | 624 | | | | 1.25 | (d) | | | 3.63 | (d) | | | 0.70 | (d) | | | 6 | |
| | | | | | (1.00 | ) | | | 15.79 | | | | (5.68 | ) | | | 1,067 | | | | 1.26 | (c)(d)(f) | | | 2.31 | (c)(d)(f) | | | 0.98 | (c)(d)(f) | | | 98 | |
| | | | | | (1.09 | ) | | | 17.74 | (e) | | | 9.57 | (e) | | | 1,491 | | | | 1.25 | | | | 3.70 | | | | 0.70 | | | | 5 | |
| | | | | | | | | | | | | | | | | | | | | | | | | | | | | | | | | | |
| | | | | $ | — | | | $ | 15.37 | | | | (9.80 | )% | | $ | 178 | | | | 2.00 | %(c)(d) | | | 9.57 | %(c)(d) | | | (0.12 | )%(c)(d) | | | 8 | % |
| | | | | | (0.99 | ) | | | 17.04 | | | | 0.31 | | | | 187 | | | | 2.00 | | | | 10.82 | | | | (0.08 | ) | | | 13 | |
| | | | | | (0.22 | ) | | | 18.09 | | | | 7.35 | | | | 230 | | | | 2.00 | (d) | | | 8.20 | (d) | | | (0.26 | )(d) | | | 21 | |
| | | | | | (0.16 | ) | | | 17.06 | | | | 10.51 | | | | 278 | | | | 2.00 | (d) | | | 6.58 | (d) | | | (0.01 | )(d) | | | — | |
| | | | | | (0.36 | ) | | | 15.59 | (e) | | | 3.42 | (e) | | | 271 | | | | 2.00 | (d) | | | 4.37 | (d) | | | 0.06 | (d) | | | 6 | |
| | | | | | (0.98 | ) | | | 15.43 | | | | (6.31 | ) | | | 280 | | | | 2.01 | (c)(d)(f) | | | 2.93 | (c)(d)(f) | | | 0.36 | (c)(d)(f) | | | 98 | |
| | | | | | (1.12 | ) | | | 17.45 | (e) | | | 8.78 | (e) | | | 180 | | | | 2.00 | | | | 4.48 | | | | (0.05 | ) | | | 5 | |
| | | | | | | | | | | | | | | | | | | | | | | | | | | | | | | | | | |
| | | | | $ | (0.15 | ) | | $ | 15.67 | | | | (9.40 | )% | | $ | 64 | | | | 1.10 | %(c)(d) | | | 8.50 | %(c)(d) | | | 0.78 | %(c)(d) | | | 8 | % |
| | | | | | (1.31 | ) | | | 17.44 | | | | 1.25 | | | | 71 | | | | 1.10 | | | | 9.79 | | | | 0.80 | | | | 13 | |
| | | | | | (0.38 | ) | | | 18.68 | | | | 8.28 | | | | 69 | | | | 1.10 | (d) | | | 7.20 | (d) | | | 0.65 | (d) | | | 21 | |
| | | | | | (0.40 | ) | | | 17.61 | | | | 11.51 | | | | 19 | | | | 1.10 | (d) | | | 5.59 | (d) | | | 1.05 | (d) | | | — | |
| | | | | | (0.42 | ) | | | 16.18 | (e) | | | 4.31 | (e) | | | 12 | | | | 1.10 | (d) | | | 3.29 | (d) | | | 0.91 | (d) | | | 6 | |
| | | | | | (1.03 | ) | | | 15.92 | | | | (5.62 | ) | | | 12 | | | | 1.11 | (c)(d)(f) | | | 1.91 | (c)(d)(f) | | | 1.06 | (c)(d)(f) | | | 98 | |
| | | | | | (1.01 | ) | | | 17.90 | (e) | | | 9.77 | (e) | | | 13 | | | | 1.10 | | | | 3.38 | | | | 0.85 | | | | 5 | |
| | | | | | | | | | | | | | | | | | | | | | | | | | | | | | | | | | |
| | | | | $ | (0.16 | ) | | $ | 16.35 | | | | (9.36 | )% | | $ | 1,324 | | | | 1.00 | %(c)(d) | | | 8.56 | %(c)(d) | | | 0.87 | %(c)(d) | | | 8 | % |
| | | | | | (1.14 | ) | | | 18.19 | | | | 1.36 | | | | 1,497 | | | | 1.00 | | | | 9.71 | (d) | | | 0.88 | | | | 13 | |
| | | | | | (0.20 | ) | | | 19.21 | | | | 8.36 | | | | 2,085 | | | | 1.00 | (d) | | | 7.10 | (d) | | | 0.86 | (d) | | | 21 | |
| | | | | | (0.20 | ) | | | 17.92 | | | | 11.66 | | | | 1,705 | | | | 1.00 | (d) | | | 5.12 | (d) | | | 0.81 | (d) | | | — | |
| | | | | | (0.32 | ) | | | 16.24 | (e) | | | 4.45 | (e) | | | 4,745 | | | | 1.00 | (d) | | | 3.09 | (d) | | | 0.68 | (d) | | | 6 | |
| | | | | | (1.10 | ) | | | 15.86 | | | | (5.55 | ) | | | 12,973 | | | | 1.01 | (c)(d)(f) | | | 1.98 | (c)(d)(f) | | | 1.27 | (c)(d)(f) | | | 98 | |
| | | | | | (1.05 | ) | | | 17.89 | (e) | | | 9.87 | (e) | | | 12,678 | | | | 1.00 | | | | 3.04 | | | | 1.00 | | | | 5 | |
| | | | | | | | |
| See accompanying Notes to Financial Statements | | | March 31, 2020 | | | Semiannual Report | | | 291 | |
Financial Highlights (cont’d)
For a Share Outstanding for the Period ended:^
| | | | | | | | | | | | | | | | | | | | | | | | | | | | |
| | | Net Asset Value,
Beginning
of Period | | | Net Investment Loss (a) | | | Net Realized and Change in Unrealized Gain (Loss) | | | Total from Investment Operations | | |
Distributions from Net Realized Capital Gains | | | Net Asset Value, End of Period | | | | |
| AllianzGI Ultra Micro Cap: | | | | | | | | | | | | | | | | | | | | | |
| Class A | | | | | | | | | | | | | | | | | | | | | | | | | | | | |
3/31/2020† | | $ | 11.28 | | | $ | (0.07 | ) | | $ | (1.51 | ) | | $ | (1.58 | ) | | $ | (1.67 | ) | | $ | 8.03 | | | | | |
9/30/2019 | | | 20.52 | | | | (0.20 | ) | | | (4.88 | ) | | | (5.08 | ) | | | (4.16 | ) | | | 11.28 | | | | | |
9/30/2018 | | | 23.68 | | | | (0.37 | ) | | | 2.79 | | | | 2.42 | | | | (5.58 | ) | | | 20.52 | | | | | |
9/30/2017 | | | 21.85 | | | | (0.42 | ) | | | 4.04 | | | | 3.62 | | | | (1.79 | ) | | | 23.68 | (d) | | | | |
9/30/2016 | | | 22.58 | | | | (0.38 | ) | | | 1.64 | | | | 1.26 | | | | (1.99 | ) | | | 21.85 | | | | | |
12/1/2014 - 9/30/2015# | | | 23.75 | | | | (0.35 | ) | | | (0.61 | ) | | | (0.96 | ) | | | (0.21 | ) | | | 22.58 | | | | | |
11/30/2014 | | | 24.34 | | | | (0.44 | ) | | | (0.04 | ) | | | (0.48 | ) | | | (0.11 | ) | | | 23.75 | | | | | |
| Class P | | | | | | | | | | | | | | | | | | | | | | | | | | | | |
3/31/2020† | | $ | 11.67 | | | $ | (0.07 | ) | | $ | (1.58 | ) | | $ | (1.65 | ) | | $ | (1.67 | ) | | $ | 8.35 | | | | | |
9/30/2019 | | | 20.99 | | | | (0.18 | ) | | | (4.98 | ) | | | (5.16 | ) | | | (4.16 | ) | | | 11.67 | | | | | |
9/30/2018 | | | 24.03 | | | | (0.31 | ) | | | 2.85 | | | | 2.54 | | | | (5.58 | ) | | | 20.99 | | | | | |
9/30/2017 | | | 22.08 | | | | (0.35 | ) | | | 4.09 | | | | 3.74 | | | | (1.79 | ) | | | 24.03 | (d) | | | | |
9/30/2016 | | | 22.74 | | | | (0.32 | ) | | | 1.65 | | | | 1.33 | | | | (1.99 | ) | | | 22.08 | | | | | |
12/1/2014 - 9/30/2015# | | | 23.86 | | | | (0.30 | ) | | | (0.61 | ) | | | (0.91 | ) | | | (0.21 | ) | | | 22.74 | | | | | |
11/30/2014 | | | 24.40 | | | | (0.39 | ) | | | (0.04 | ) | | | (0.43 | ) | | | (0.11 | ) | | | 23.86 | | | | | |
| Institutional Class | | | | | | | | | | | | | | | | | | | | | | | | | | | | |
3/31/2020† | | $ | 11.72 | | | $ | (0.07 | ) | | $ | (1.59 | ) | | $ | (1.66 | ) | | $ | (1.67 | ) | | $ | 8.39 | | | | | |
9/30/2019 | | | 21.04 | | | | (0.17 | ) | | | (4.99 | ) | | | (5.16 | ) | | | (4.16 | ) | | | 11.72 | | | | | |
9/30/2018 | | | 24.08 | | | | (0.31 | ) | | | 2.85 | | | | 2.54 | | | | (5.58 | ) | | | 21.04 | | | | | |
9/30/2017 | | | 22.13 | | | | (0.36 | ) | | | 4.10 | | | | 3.74 | | | | (1.79 | ) | | | 24.08 | (d) | | | | |
9/30/2016 | | | 22.77 | | | | (0.32 | ) | | | 1.67 | | | | 1.35 | | | | (1.99 | ) | | | 22.13 | | | | | |
12/1/2014 - 9/30/2015# | | | 23.93 | | | | (0.34 | ) | | | (0.61 | ) | | | (0.95 | ) | | | (0.21 | ) | | | 22.77 | | | | | |
11/30/2014 | | | 24.49 | | | | (0.40 | ) | | | (0.05 | ) | | | (0.45 | ) | | | (0.11 | ) | | | 23.93 | | | | | |
| ^ | A “—” may reflect actual amounts rounding to less than $0.01 or 0.01%. |
| # | Fiscal year end changed from November 30th to September 30th. |
| (a) | Calculated on average shares outstanding during the period. |
| (b) | Total return is calculated assuming a purchase of a share on the first day of the period and a sale of a share on the last day of each period reported. Dividends and distributions, if any, are assumed, for purposes of this calculation, to be reinvested. Total return does not reflect sales charges and includes the effect of fee waivers and reimbursements. Total return may reflect adjustments to conform to U.S. GAAP. Total return for a period of less than one year is not annualized. |
| (c) | Annualized, unless otherwise noted. |
| (d) | Payments from Affiliates increased the end of period net asset value and total return by less than $0.01 and 0.01%, respectively. |
| (e) | Certain expenses incurred by the Fund were not annualized. |
| | | | | | |
| 292 | | Semiannual Report | | | March 31, 2020 | | | See accompanying Notes to Financial Statements |
| | | | | | | | | | | | | | | | | | | | | | | | | | |
| | | | Total Return (b) | | | Net Assets, End of Period (000s) | | | Ratio of
Expenses to
Average Net
Assets with Fee Waiver/ Reimbursement | | | Ratio of
Expenses to
Average Net Assets without Fee Waiver/ Reimbursement | | | Ratio of Net Investment
Loss to Average Net Assets | | | Portfolio
Turnover Rate | |
| | | | | | | | | | | | | | | | | | | | |
| | | | | | | | | | | | | | | | | | | | | | | | | | |
| | | | | | (17.85 | )% | | $ | 2,265 | | | | 1.56 | %(c) | | | 2.93 | %(c) | | | (1.32 | )%(c) | | | 16 | % |
| | | | | | (23.13 | ) | | | 4,083 | | | | 1.80 | | | | 2.36 | | | | (1.55 | ) | | | 37 | |
| | | | | | 13.62 | | | | 8,898 | | | | 2.09 | | | | 2.37 | | | | (1.86 | ) | | | 41 | |
| | | | | | 17.69 | (d) | | | 12,331 | | | | 2.35 | | | | 2.40 | | | | (1.93 | ) | | | 33 | |
| | | | | | 5.73 | | | | 19,312 | | | | 2.26 | | | | 2.26 | | | | (1.83 | ) | | | 32 | |
| | | | | | (4.08 | ) | | | 41,119 | | | | 2.08 | (c)(e) | | | 2.08 | (c)(e) | | | (1.70 | )(c)(e) | | | 43 | |
| | | | | | (1.98 | ) | | | 53,192 | | | | 2.16 | | | | 2.16 | | | | (1.81 | ) | | | 66 | |
| | | | | | | | | | | | | | | | | | | | | | | | | | |
| | | | | | (17.85 | )% | | $ | 1,012 | | | | 1.52 | %(c) | | | 2.58 | %(c) | | | (1.28 | )%(c) | | | 16 | % |
| | | | | | (22.95 | ) | | | 1,949 | | | | 1.56 | | | | 2.06 | | | | (1.32 | ) | | | 37 | |
| | | | | | 13.98 | | | | 5,925 | | | | 1.75 | | | | 2.09 | | | | (1.50 | ) | | | 41 | |
| | | | | | 18.07 | (d) | | | 4,478 | | | | 2.02 | | | | 2.07 | | | | (1.62 | ) | | | 33 | |
| | | | | | 6.02 | | | | 5,343 | | | | 1.97 | | | | 1.97 | | | | (1.54 | ) | | | 32 | |
| | | | | | (3.84 | ) | | | 7,710 | | | | 1.81 | (c)(e) | | | 1.81 | (c)(e) | | | (1.42 | )(c)(e) | | | 43 | |
| | | | | | (1.77 | ) | | | 10,561 | | | | 1.94 | | | | 1.94 | | | | (1.67 | ) | | | 66 | |
| | | | | | | | | | | | | | | | | | | | | | | | | | |
| | | | | | (17.85 | )% | | $ | 6,233 | | | | 1.49 | %(c) | | | 2.60 | %(c) | | | (1.25 | )%(c) | | | 16 | % |
| | | | | | (22.88 | ) | | | 10,417 | | | | 1.53 | | | | 2.05 | | | | (1.28 | ) | | | 37 | |
| | | | | | 13.95 | | | | 18,979 | | | | 1.75 | | | | 2.12 | | | | (1.51 | ) | | | 41 | |
| | | | | | 18.04 | (d) | | | 21,208 | | | | 2.06 | | | | 2.12 | | | | (1.65 | ) | | | 33 | |
| | | | | | 6.10 | | | | 23,504 | | | | 1.94 | | | | 1.94 | | | | (1.52 | ) | | | 32 | |
| | | | | | (4.00 | ) | | | 43,621 | | | | 1.97 | (c)(e) | | | 1.97 | (c)(e) | | | (1.60 | )(c)(e) | | | 43 | |
| | | | | | (1.84 | ) | | | 49,525 | | | | 2.00 | | | | 2.00 | | | | (1.65 | ) | | | 66 | |
| | | | | | | | |
| See accompanying Notes to Financial Statements | | | March 31, 2020 | | | Semiannual Report | | | 293 | |
Financial Highlights (cont’d)
For a Share Outstanding for the Period ended:^
| | | | | | | | | | | | | | | | | | | | | | | | | | | | |
| | | Net Asset Value, Beginning of Period | | | Net
Investment Income (Loss) (a) | | | Net Realized and Change in Unrealized Gain (Loss) | | | Total from Investment Operations | | |
Dividends from Net Investment Income | | | Distributions from Net
Realized Capital Gains | | | | |
| AllianzGI Water: | | | | |
| Class A | | | | | | | | | | | | | | | | | | | | | | | | | | | | |
3/31/2020† | | $ | 16.31 | | | $ | (0.01 | ) | | $ | (1.68 | ) | | $ | (1.69 | ) | | $ | (0.11 | ) | | $ | (0.40 | ) | | | | |
9/30/2019 | | | 15.54 | | | | 0.11 | | | | 1.15 | | | | 1.26 | | | | (0.13 | ) | | | (0.36 | ) | | | | |
9/30/2018 | | | 15.49 | | | | 0.13 | | | | 0.34 | | | | 0.47 | | | | (0.04 | ) | | | (0.38 | ) | | | | |
9/30/2017 | | | 14.46 | | | | 0.08 | | | | 1.08 | | | | 1.16 | | | | (0.05 | ) | | | (0.08 | ) | | | | |
9/30/2016 | | | 11.99 | | | | 0.08 | | | | 2.44 | | | | 2.52 | | | | (0.03 | ) | | | (0.02 | ) | | | | |
12/1/2014 - 9/30/2015# | | | 12.70 | | | | 0.06 | | | | (0.74 | ) | | | (0.68 | ) | | | (0.03 | ) | | | — | | | | | |
11/30/2014 | | | 12.41 | | | | 0.07 | | | | 0.25 | | | | 0.32 | | | | (0.03 | ) | | | — | | | | | |
| Class C | | | | | | | | | | | | | | | | | | | | | | | | | | | | |
3/31/2020† | | $ | 15.52 | | | $ | (0.07 | ) | | $ | (1.60 | ) | | $ | (1.67 | ) | | $ | — | | | $ | (0.40 | ) | | | | |
9/30/2019 | | | 14.79 | | | | — | | | | 1.10 | | | | 1.10 | | | | (0.01 | ) | | | (0.36 | ) | | | | |
9/30/2018 | | | 14.82 | | | | 0.01 | | | | 0.34 | | | | 0.35 | | | | — | | | | (0.38 | ) | | | | |
9/30/2017 | | | 13.90 | | | | (0.01 | ) | | | 1.01 | | | | 1.00 | | | | — | | | | (0.08 | ) | | | | |
9/30/2016 | | | 11.59 | | | | (0.02 | ) | | | 2.35 | | | | 2.33 | | | | — | | | | (0.02 | ) | | | | |
12/1/2014 - 9/30/2015# | | | 12.33 | | | | (0.02 | ) | | | (0.72 | ) | | | (0.74 | ) | | | — | | | | — | | | | | |
11/30/2014 | | | 12.11 | | | | (0.03 | ) | | | 0.25 | | | | 0.22 | | | | — | | | | — | | | | | |
| Class P | | | | | | | | | | | | | | | | | | | | | | | | | | | | |
3/31/2020† | | $ | 16.33 | | | $ | 0.01 | | | $ | (1.68 | ) | | $ | (1.67 | ) | | $ | (0.13 | ) | | $ | (0.40 | ) | | | | |
9/30/2019 | | | 15.59 | | | | 0.15 | | | | 1.14 | | | | 1.29 | | | | (0.19 | ) | | | (0.36 | ) | | | | |
9/30/2018 | | | 15.57 | | | | 0.17 | | | | 0.36 | | | | 0.53 | | | | (0.13 | ) | | | (0.38 | ) | | | | |
9/30/2017 | | | 14.54 | | | | 0.15 | | | | 1.04 | | | | 1.19 | | | | (0.08 | ) | | | (0.08 | ) | | | | |
9/30/2016 | | | 12.05 | | | | 0.11 | | | | 2.45 | | | | 2.56 | | | | (0.05 | ) | | | (0.02 | ) | | | | |
12/1/2014 - 9/30/2015# | | | 12.80 | | | | 0.09 | | | | (0.75 | ) | | | (0.66 | ) | | | (0.09 | ) | | | — | | | | | |
11/30/2014 | | | 12.49 | | | | 0.09 | | | | 0.27 | | | | 0.36 | | | | (0.05 | ) | | | — | | | | | |
| Institutional Class | | | | | | | | | | | | | | | | | | | | | | | | | | | | |
3/31/2020† | | $ | 16.03 | | | $ | 0.01 | | | $ | (1.64 | ) | | $ | (1.63 | ) | | $ | (0.15 | ) | | $ | (0.40 | ) | | | | |
9/30/2019 | | | 15.31 | | | | 0.15 | | | | 1.11 | | | | 1.26 | | | | (0.18 | ) | | | (0.36 | ) | | | | |
9/30/2018 | | | 15.32 | | | | 0.17 | | | | 0.34 | | | | 0.51 | | | | (0.14 | ) | | | (0.38 | ) | | | | |
9/30/2017 | | | 14.33 | | | | 0.16 | | | | 1.02 | | | | 1.18 | | | | (0.11 | ) | | | (0.08 | ) | | | | |
9/30/2016 | | | 11.90 | | | | 0.11 | | | | 2.41 | | | | 2.52 | | | | (0.07 | ) | | | (0.02 | ) | | | | |
12/1/2014 - 9/30/2015# | | | 12.61 | | | | 0.09 | | | | (0.73 | ) | | | (0.64 | ) | | | (0.07 | ) | | | — | | | | | |
11/30/2014 | | | 12.37 | | | | 0.11 | | | | 0.24 | | | | 0.35 | | | | (0.11 | ) | | | — | | | | | |
| ^ | A “—” may reflect actual amounts rounding to less than $0.01 or 0.01%. |
| # | Fiscal year end changed from November 30th to September 30th. |
| (a) | Calculated on average shares outstanding during the period. |
| (b) | Total return is calculated assuming a purchase of a share on the first day of the period and a sale of a share on the last day of each period reported. Dividends and distributions, if any, are assumed, for purposes of this calculation, to be reinvested. Total return does not reflect sales charges and includes the effect of fee waivers and reimbursements. Total return may reflect adjustments to conform to U.S. GAAP. Total return for a period of less than one year is not annualized. |
| (c) | Annualized, unless otherwise noted. |
| (d) | Certain expenses incurred by the Fund were not annualized. |
| | | | | | |
| 294 | | Semiannual Report | | | March 31, 2020 | | | See accompanying Notes to Financial Statements |
| | | | | | | | | | | | | | | | | | | | | | | | | | | | | | | | | | |
| | | | Total
Dividends and Distributions | | | Net Asset Value, End
of Period | | | Total Return (b) | | | Net Assets, End of Period (000s) | | | Ratio of
Expenses to
Average Net
Assets with Fee
Waiver/
Reimbursement | | | Ratio of Expenses to Average Net Assets without Fee Waiver/ Reimbursement | | | Ratio of Net Investment
Income (Loss)
to Average Net Assets | | | Portfolio
Turnover Rate | |
| | | | | | | | | | | | | | | | | | | | | | | | | | |
| | | | | | | | | | | | | | | | | | | | | | | | | | | | | | | | | | |
| | | | | $ | (0.51 | ) | | $ | 14.11 | | | | (10.89 | )% | | $ | 158,003 | | | | 1.22 | %(c) | | | 1.39 | %(c) | | | (0.16 | )%(c) | | | 10 | % |
| | | | | | (0.49 | ) | | | 16.31 | | | | 8.88 | | | | 177,463 | | | | 1.23 | | | | 1.40 | | | | 0.76 | | | | 33 | |
| | | | | | (0.42 | ) | | | 15.54 | | | | 3.05 | | | | 172,374 | | | | 1.19 | | | | 1.41 | | | | 0.84 | | | | 34 | |
| | | | | | (0.13 | ) | | | 15.49 | | | | 8.18 | | | | 190,693 | | | | 1.33 | | | | 1.44 | | | | 0.59 | | | | 29 | |
| | | | | | (0.05 | ) | | | 14.46 | | | | 21.06 | | | | 237,785 | | | | 1.49 | | | | 1.49 | | | | 0.62 | | | | 55 | |
| | | | | | (0.03 | ) | | | 11.99 | | | | (5.37 | ) | | | 128,465 | | | | 1.44 | (c)(d) | | | 1.44 | (c)(d) | | | 0.58 | (c)(d) | | | 66 | |
| | | | | | (0.03 | ) | | | 12.70 | | | | 2.57 | | | | 138,219 | | | | 1.46 | | | | 1.46 | | | | 0.55 | | | | 28 | |
| | | | | | | | | | | | | | | | | | | | | | | | | | | | | | | | | | |
| | | | | $ | (0.40 | ) | | $ | 13.45 | | | | (11.18 | )% | | $ | 58,651 | | | | 1.97 | %(c) | | | 2.16 | %(c) | | | (0.91 | )%(c) | | | 10 | % |
| | | | | | (0.37 | ) | | | 15.52 | | | | 8.02 | | | | 70,175 | | | | 1.98 | | | | 2.15 | | | | 0.01 | | | | 33 | |
| | | | | | (0.38 | ) | | | 14.79 | | | | 2.35 | | | | 83,156 | | | | 1.94 | | | | 2.16 | | | | 0.07 | | | | 34 | |
| | | | | | (0.08 | ) | | | 14.82 | | | | 7.32 | | | | 89,250 | | | | 2.07 | | | | 2.19 | | | | (0.07 | ) | | | 29 | |
| | | | | | (0.02 | ) | | | 13.90 | | | | 20.13 | | | | 92,028 | | | | 2.25 | | | | 2.25 | | | | (0.18 | ) | | | 55 | |
| | | | | | — | | | | 11.59 | | | | (6.00 | ) | | | 69,700 | | | | 2.23 | (c)(d) | | | 2.23 | (c)(d) | | | (0.21 | )(c)(d) | | | 66 | |
| | | | | | — | | | | 12.33 | | | | 1.82 | | | | 77,082 | | | | 2.23 | | | | 2.23 | | | | (0.26 | ) | | | 28 | |
| | | | | | | | | | | | | | | | | | | | | | | | | | | | | | | | | | |
| | | | | $ | (0.53 | ) | | $ | 14.13 | | | | (10.76 | )% | | $ | 187,803 | | | | 0.94 | %(c) | | | 1.15 | %(c) | | | 0.12 | %(c) | | | 10 | % |
| | | | | | (0.55 | ) | | | 16.33 | | | | 9.14 | | | | 210,425 | | | | 0.95 | | | | 1.17 | | | | 1.03 | | | | 33 | |
| | | | | | (0.51 | ) | | | 15.59 | | | | 3.40 | | | | 243,338 | | | | 0.93 | | | | 1.15 | | | | 1.12 | | | | 34 | |
| | | | | | (0.16 | ) | | | 15.57 | | | | 8.40 | | | | 210,746 | | | | 1.04 | | | | 1.16 | | | | 1.02 | | | | 29 | |
| | | | | | (0.07 | ) | | | 14.54 | | | | 21.37 | | | | 125,532 | | | | 1.24 | | | | 1.24 | | | | 0.82 | | | | 55 | |
| | | | | | (0.09 | ) | | | 12.05 | | | | (5.17 | ) | | | 82,847 | | | | 1.16 | (c)(d) | | | 1.16 | (c)(d) | | | 0.84 | (c)(d) | | | 66 | |
| | | | | | (0.05 | ) | | | 12.80 | | | | 2.87 | | | | 84,835 | | | | 1.21 | | | | 1.21 | | | | 0.67 | | | | 28 | |
| | | | | | | | | | | | | | | | | | | | | | | | | | | | | | | | | | |
| | | | | $ | (0.55 | ) | | $ | 13.85 | | | | (10.73 | )% | | $ | 145,829 | | | | 0.93 | %(c) | | | 1.14 | %(c) | | | 0.13 | %(c) | | | 10 | % |
| | | | | | (0.54 | ) | | | 16.03 | | | | 9.12 | | | | 152,496 | | | | 0.94 | | | | 1.18 | | | | 1.04 | | | | 33 | |
| | | | | | (0.52 | ) | | | 15.31 | | | | 3.36 | | | | 164,322 | | | | 0.92 | | | | 1.14 | | | | 1.13 | | | | 34 | |
| | | | | | (0.19 | ) | | | 15.32 | | | | 8.49 | | | | 142,353 | | | | 1.01 | | | | 1.15 | | | | 1.13 | | | | 29 | |
| | | | | | (0.09 | ) | | | 14.33 | | | | 21.32 | | | | 68,550 | | | | 1.21 | | | | 1.21 | | | | 0.86 | | | | 55 | |
| | | | | | (0.07 | ) | | | 11.90 | | | | (5.08 | ) | | | 30,004 | | | | 1.17 | (c)(d) | | | 1.17 | (c)(d) | | | 0.87 | (c)(d) | | | 66 | |
| | | | | | (0.11 | ) | | | 12.61 | | | | 2.82 | | | | 23,685 | | | | 1.15 | | | | 1.15 | | | | 0.84 | | | | 28 | |
| | | | | | | | |
| See accompanying Notes to Financial Statements | | | March 31, 2020 | | | Semiannual Report | | | 295 | |
Notes to Financial Statements
March 31, 2020 (unaudited)
| 1. | ORGANIZATION AND SIGNIFICANT ACCOUNTING POLICIES |
Allianz Funds Multi-Strategy Trust (the “Trust”) is registered under the Investment Company Act of 1940, as amended, (the “1940 Act”), as anopen-end registered investment management company organized as a Massachusetts business trust and accordingly, follows the investment company accounting and reporting guidance of the Financial Accounting Standards Board (“FASB”) Accounting Standards Codification Topic 946 Financial Services-Investment Companies. As of March 31, 2020, the Trust consisted of thirty seven separate investment series (each a “Fund” and collectively the “Funds”). Allianz
Global Investors U.S. LLC (“AllianzGI U.S.” or the “Investment Manager”) serves as the Funds’ investment manager. AllianzGI U.S. is an indirect wholly-owned subsidiary of PFP Holdings, Inc. and is a member of Munich-based Allianz Group. Currently, the Trust offers up to seven classes of shares to new and existing investors: A, C, R, P, Institutional, R6 and Administrative. Class C shares of a Fund will automatically convert to Class A shares of the same Fund following theten-year anniversary of purchase. Such conversions are subject to certain limitations.
The investment objective of each Fund is disclosed below. There can be no assurance that the Funds will meet their stated objectives.
| | |
| | | Investment Objective |
| AllianzGI Retirement 2020 | | The Funds seek capital growth and preservation consistent with its asset allocation as the target date in the Fund name approaches, and thereafter current income and, secondarily, capital appreciation. |
| AllianzGI Retirement 2025 |
| AllianzGI Retirement 2030 |
| AllianzGI Retirement 2035 | | |
| AllianzGI Retirement 2040 | | |
| AllianzGI Retirement 2045 | | |
| AllianzGI Retirement 2050 | | |
| AllianzGI Retirement 2055 | | |
| AllianzGI Multi Asset Income | | The Fund seeks current income, and secondarily, capital appreciation. The Fund is intended for investors who have already retired or begun withdrawing portions of their investments, or are seeking a conservative allocation fund. |
| AllianzGI Best Styles Global Equity | | The Funds seek long-term capital appreciation. |
| AllianzGI Best Styles U.S. Equity | | |
| AllianzGI Emerging Markets Consumer | | |
| AllianzGI Emerging MarketsSmall-Cap | | |
| AllianzGI Emerging Markets Value | | |
| AllianzGI Global Dynamic Allocation | | |
| AllianzGI Global Sustainability | | |
| AllianzGI PerformanceFee Managed Futures Strategy | | |
| AllianzGI Structured Return | | |
| AllianzGI Water | | |
| AllianzGI Convertible | | The Fund seeks maximum total return, consisting of capital appreciation and current income. |
| AllianzGI Core Bond | | The Fund seeks current income, consistent with minimal fluctuations of principal. |
| AllianzGI Core Plus Bond | | The Fund seeks total return, consisting of current income and capital appreciation. |
| AllianzGI Emerging Markets SRI Debt | | The Fund seeks long-term capital appreciation and current income. |
| AllianzGI Floating Rate Note | | The Fund seeks to maximize current income. |
| AllianzGI Global Allocation | | The Fund seeks after-inflation capital appreciation and current income. |
| AllianzGI Global High Yield | | The Fund seeks total return with a controlled level of portfolio risk. |
| AllianzGI Green Bond | | The Fund seeks to provide total return, through a combination of capital appreciation and current income by investing in Green Bonds. |
| AllianzGI High Yield Bond | | The Fund seeks a high level of current income and capital growth. |
| AllianzGI InternationalSmall-Cap | | The Funds seek maximum long-term capital appreciation. |
| AllianzGI Micro Cap |
| AllianzGI Ultra Micro Cap | | |
| AllianzGI PerformanceFee Structured US Equity | | The Fund seeks to earn total return that exceeds the return of the S&P 500 Index. |
| AllianzGI PerformanceFee Structured US Fixed Income | | The Fund seeks to earn total return that exceeds the return of the Bloomberg Barclays U.S. Aggregate Bond Index. |
| | | | | | |
| 296 | | March 31, 2020 | | | Semiannual Report | | |
| | |
| | | Investment Objective |
| AllianzGI Preferred Securities and Income | | The Fund seeks total return consisting of high current income and capital appreciation. |
| AllianzGI Short Duration High Income | | The Fund seeks a high level of current income with lower volatility than the broader high yield market. |
| AllianzGI Short Term Bond | | The Fund seeks capital preservation, followed by liquidity and positive total return. |
| AllianzGI U.S. Equity Hedged | | The Fund seeks capital appreciation, with added emphasis on the protection of capital during unfavorable market conditions. |
The preparation of the Funds’ financial statements in accordance with accounting principles generally accepted in the United States of America (“U.S. GAAP”) requires the Funds’ management to make estimates and assumptions that affect the reported amounts and disclosures in each Fund’s financial statements. Actual results could differ from those estimates.
In the normal course of business, the Funds enter into contracts that contain a variety of representations that provide general indemnification. The Funds’ maximum exposures under these arrangements are unknown as this would involve future claims that may be made against the Funds that have not yet occurred. However, based on experience, the risk of loss is expected to be remote.
Like many other companies, the Funds’ organizational documents provide that its officers (“Officers”) and the Board of Trustees (the “Board” or the “Trustees”) are indemnified against certain liabilities arising out of the performance of their duties to the Funds. In addition, both in some of their principal service contracts and in the normal course of its business, the Funds enter into contracts that provide indemnifications to other parties for certain types of losses or liabilities. The Funds’ maximum exposure under these arrangements is unknown as this could involve future claims against the Funds.
The following is a summary of significant accounting policies consistently followed by the Funds:
(a) Valuation of Investments. Portfolio securities and other financial instruments for which market quotations are readily available are valued at market value. Market values for various types of securities and other instruments are determined on the basis of closing prices or last sales prices on an exchange or other market, based on quotes or other market information obtained from quotation reporting systems, established market makers or independent pricing services. Investments in mutual funds are valued at the net asset value (“NAV”) as reported on each business day, and, under normal circumstances. Exchange-traded funds (“ETFs”) are valued at their current market trading price. The Funds’ investments are valued daily using prices supplied by an independent pricing service or broker/dealer quotations, or by using the last sale or settlement price on the exchange that is the primary market for such securities, or the mean between the last bid and ask quotations. The market value for NASDAQ Global Market and NASDAQ Capital Market securities may also be calculated using the NASDAQ Official Closing Price instead of the last reported sales price. Independent pricing services use information provided by market makers or estimates of market values obtained from yield data relating to investments or securities with
similar characteristics. Exchange traded futures are valued at the price determined by the relevant exchange. Securities purchased on a when-issued or delayed-delivery basis are marked to market daily until settlement at the forward settlement date.
The Board has adopted procedures for valuing portfolio securities and other financial instruments in circumstances where market quotes are not readily available (including in cases where available market quotes are deemed to be unreliable), and has delegated primary responsibility for applying the valuation methods to the Investment Manager. The Trust’s Valuation Committee was established by the Board to oversee the implementation of the Funds’ valuation methods and to make fair value determinations on behalf of the Board, as instructed. The Investment Manager monitors the continued appropriateness of methods applied and identifies circumstances and events that may require fair valuation. The Investment Manager determines if adjustments should be made in light of market changes, events affecting the issuer or other factors. If the Investment Manager determines that a valuation method may no longer be appropriate, another valuation method previously approved by the Trust’s Valuation Committee may be selected or the Trust’s Valuation Committee will be convened to consider the matter and take any appropriate action in accordance with procedures set forth by the Board. The Board shall review and ratify the appropriateness of the valuation methods and these methods may be amended or supplemented from time to time by the Valuation Committee.
Short-term debt investments having a remaining maturity of 60 days or less are valued at amortized cost unless the Board or its Valuation Committee determines that particular circumstances dictate otherwise.
Investments initially valued in currencies other than the U.S. dollar are converted to the U.S. dollar using exchange rates obtained from pricing services. As a result, the NAV of each share class of a Fund may be affected by changes in the value of currencies in relation to the U.S. dollar. The value of securities traded in markets outside the United States or denominated in currencies other than the U.S. dollar may be affected significantly on a day that the New York Stock Exchange (“NYSE”) is closed and the NAV of a Fund’s shares may change on days when an investor is not able to purchase or redeem or exchange shares.
The prices used by the Funds to value investments may differ from the value that would be realized if the investments were sold, and these differences could be material to the Funds’ financial statements. The NAV of each share class of a Fund is normally determined as of the
| | | | | | |
| | Semiannual Report | | | March 31, 2020 | | 297 |
Notes to Financial Statements (cont’d)
March 31, 2020 (unaudited)
close of regular trading (normally, 4:00 p.m., Eastern Time) on the NYSE on each day the NYSE is open for business. In unusual circumstances, the Board or the Valuation Committee may in good faith determine the NAV as of 4:00 p.m., Eastern Time, notwithstanding an earlier, unscheduled close or halt of trading on the NYSE.
The prices of certain portfolio securities or financial instruments may be determined at a time prior to the close of regular trading on the NYSE. In considering whether fair value pricing is required and in determining fair values, the Funds may, among other things, consider significant events (which may be considered to include changes in the value of U.S. securities or securities indices) that occur after the close of the relevant market and before the time the NAV of each share class of a Fund is calculated. With respect to certain foreign securities, the Funds may fair value securities using modeling tools provided by third-party vendors, where appropriate. The Funds have retained a statistical research service to assist in determining the fair value of foreign securities. This service utilizes statistics and programs based on historical performance of markets and other economic data to assist in making fair value estimates. Fair value estimates used by the Funds for foreign securities may differ from the value realized from the sale of those securities and the difference could be material to the financial statements. Fair value pricing may require subjective determinations about the value of a security or other assets, and fair values used to determine the NAV of each share class of a Fund may differ from quoted or published prices, or from prices that are used by others, for the same investments. In addition, the use of fair value pricing may not always result in adjustments to the prices of securities or other assets held by a Fund.
(b) Fair Value Measurements. Fair value is defined as the price that would be received to sell an asset or paid to transfer a liability (i.e., the “exit price”) in an orderly transaction between market participants. The three levels of the fair value hierarchy are described below:
| ∎ | | Level 1—quoted prices in active markets for identical investments that the Funds have the ability to access |
| ∎ | | Level 2—valuations based on other significant observable inputs, which may include, but are not limited to, quoted prices for similar assets or liabilities, interest rates, yield curves, volatilities, prepayment speeds, loss severities, credit risks and default rates or other market corroborated inputs |
| ∎ | | Level 3—valuations based on significant unobservable inputs (including the Investment Manager’s or the Trust’s Valuation Committee’s own assumptions and securities whose price was determined by using a single broker’s quote) |
The valuation techniques used by the Funds to measure fair value during the six months ended March 31, 2020 were intended to maximize the use of observable inputs and to minimize the use of unobservable inputs.
An investment asset’s or liability’s level within the fair value hierarchy is based on the lowest level input, individually or in aggregate, that is significant to the fair value measurement. The objective of fair value
measurement remains the same even when there is a significant decrease in the volume and level of activity for an asset or liability and regardless of the valuation techniques used.
The inputs or methodology used for valuing securities are not necessarily an indication of the risk associated with investing in those securities. The following are certain inputs and techniques that the Funds generally use to evaluate how to classify each major category of assets and liabilities within Level 2 and Level 3, in accordance with U.S. GAAP.
An asset or liability for which market values cannot be measured using the methodologies described above is valued by methods deemed reasonable in good faith by the Valuation Committee, following the procedures established by the Board, to represent fair value. Under these procedures, the Funds generally use a market-based approach which may use related or comparable assets or liabilities, recent transactions, market multiples, book values and other relevant information. Fair value determinations involve the consideration of a number of subjective factors, an analysis of applicable facts and circumstances and the exercise of judgment. As a result, it is possible that the fair value for a security determined in good faith in accordance with the Funds’ valuation procedures may differ from valuations for the same security determined by other funds using their own valuation procedures. Although the Funds’ valuation procedures are designed to value a security at the price the Funds may reasonably expect to receive upon the security’s sale in an orderly transaction, there can be no assurance that any fair value determination thereunder would, in fact, approximate the amount that the Funds would actually realize upon the sale of the security or the price at which the security would trade if a reliable market price were readily available.
Equity Securities (Common and Preferred Stock and Warrants)— Equity securities traded in inactive markets and certain foreign equity securities are valued using inputs which include broker-dealer quotes, recently executed transactions adjusted for changes in the benchmark index, or evaluated price quotes received from independent pricing services that take into account the integrity of the market sector and issuer, the individual characteristics of the security, and information received from broker-dealers and other market sources pertaining to the issuer or security. To the extent that these inputs are observable, the values of equity securities are categorized as Level 2. To the extent that these inputs are unobservable, the values are categorized as Level 3.
U.S. Treasury Obligations—U.S. Treasury obligations are valued by independent pricing services based on pricing models that evaluate the mean between the most recently quoted bid and ask price. The models also take into consideration data received from active market makers and broker-dealers, yield curves, and the spread over comparable U.S. Treasury issues. The spreads change daily in response to market conditions and are generally obtained from the new issue market and broker-dealer sources. To the extent that these inputs are observable, the values of U.S. Treasury obligations are categorized as Level 2. To the extent that these inputs are unobservable, the values are categorized as Level 3.
| | | | | | |
| 298 | | March 31, 2020 | | | Semiannual Report | | |
Government Sponsored Enterprise and Mortgage-Backed Securities—Government sponsored enterprise and mortgage-backed securities are valued by independent pricing services using pricing models based on inputs that include issuer type, coupon, cash flows, mortgage prepayment projection tables and Adjustable Rate Mortgage evaluations that incorporate index data, periodic life caps and the next coupon reset date. To the extent that these inputs are observable, the values of government sponsored enterprise and mortgage-backed securities are categorized as Level 2. To the extent that these inputs are unobservable, the values are categorized as Level 3.
Sovereign Debt Obligations—Sovereign debt obligations are valued by independent pricing services based on discounted cash flow models that incorporate option adjusted spreads along with benchmark curves and credit spreads. In addition, international bond markets are monitored regularly for information pertaining to the issuer and/or the specific issue. To the extent that these inputs are observable, the values of sovereign debt obligations are categorized as Level 2. To the extent that these inputs are unobservable, the values are categorized as Level 3.
Corporate Bonds & Notes—Corporate bonds & notes are generally comprised of two main categories: investment grade bonds and high yield bonds. Investment grade bonds are valued by independent pricing services using various inputs and techniques, which include broker-dealer quotations, live trading levels, recently executed transactions in securities of the issuer or comparable issuers, and option adjusted spread models that include base curve and spread curve inputs. Adjustments to individual bonds can be applied to recognize trading differences compared to other bonds issued by the same issuer. High yield bonds are valued by independent pricing services based primarily on broker-dealer quotations from relevant market makers and recently executed transactions in securities of the issuer or comparable issuers. The broker-dealer quotations received are supported by credit analysis of the issuer that takes into consideration credit quality assessments, daily trading activity, and the activity of the underlying equities, listed bonds and sector-specific trends. To the extent that these inputs are observable, the values of corporate bonds & notes are categorized as Level 2. To the extent that these inputs are unobservable, the values are categorized as Level 3.
Convertible Bonds & Notes—Convertible bonds & notes are valued by independent pricing services based on various inputs and techniques, which include broker-dealer quotations from relevant market makers and recently executed transactions in securities of the issuer or comparable issuers. The broker-dealer quotations received are supported by credit analysis of the issuer that takes into consideration credit quality assessments, daily trading activity, and the activity of the underlying equities, listed bonds and sector-specific trends. To the extent that these inputs are observable, the values of convertible bonds & notes are categorized as Level 2. To the extent that these inputs are unobservable, the values are categorized as Level 3.
Option Contracts—Option contracts tradedover-the-counter (“OTC”) and FLexible EXchange (“FLEX”) options are valued by independent pricing services based on pricing models that incorporate various inputs such as interest rates, credit spreads, currency exchange rates and volatility measurements forin-the-money,at-the-money, andout-of-the-money contracts based on a given strike price. To the extent that these inputs are observable, the values of OTC and FLEX option contracts are categorized as Level 2. To the extent that these inputs are unobservable, the values are categorized as Level 3.
Forward Foreign Currency Contracts—Forward foreign currency contracts are valued by independent pricing services using various inputs and techniques, which include broker-dealer quotations, actual trading information and foreign currency exchange rates gathered from leading market makers and foreign currency exchange trading centers throughout the world. To the extent that these inputs are observable, the values of forward foreign currency contracts are categorized as Level 2. To the extent that these inputs are unobservable, the values are categorized as Level 3.
Credit Default Swaps—OTC credit default swaps are valued by independent pricing services using pricing models that take into account, among other factors, information received from market makers and broker/dealers, default probabilities from index specific credit spread curves, recovery rates, and cash flows. To the extent that these inputs are observable, the values of credit default swaps are categorized as Level 2. To the extent that these inputs are unobservable, the values are categorized as Level 3.
Total Return Swaps—OTC total return swaps are valued by independent pricing services using pricing models that take into account among other factors, index spread curves, nominal values, modified duration values and cash flows. To the extent that these inputs are observable, the values of OTC total return swaps are categorized as Level 2. To the extent that these inputs are unobservable, the values are categorized as Level 3.
Senior Loans—Senior Loans generally are valued by independent pricing services based on the average of quoted prices received from multiple dealers or valued relative to other benchmark securities when broker-dealer quotes are unavailable. These quoted prices are based on interest rates, yield curves, option adjusted spreads, credit spreads and/or other criteria. To the extent that these inputs are observable, the values of Senior Loans are categorized as Level 2. To the extent that these inputs are unobservable, the values are categorized as Level 3.
| | | | | | |
| | Semiannual Report | | | March 31, 2020 | | 299 |
Notes to Financial Statements (cont’d)
March 31, 2020 (unaudited)
A summary of the inputs used at March 31, 2020 in valuing each Fund’s assets and liabilities is listed below (refer to the Schedules of Investments and Notes to the Schedules of Investments for more detailed information on Investments in Securities and Other Financial Instruments):
| | | | | | | | | | | | | | | | |
| | | | |
| AllianzGI Retirement 2020: | | | | | | | | | | | | |
| Investments in Securities – Assets | | Level 1–
Quoted Prices | | | Level 2–
Other Significant
Observable Inputs | | | Level 3–
Significant
Unobservable Inputs | | | Value at
3/31/20 | |
Mutual Funds | | $ | 11,372,048 | | | | — | | | | — | | | $ | 11,372,048 | |
Repurchase Agreements | | | — | | | $ | 219,000 | | | | — | | | | 219,000 | |
| | | | 11,372,048 | | | | 219,000 | | | | — | | | | 11,591,048 | |
Other Financial Instruments* – Assets | | | | | | | | | | | | | | | | |
Market Price | | | 7,245 | | | | — | | | | — | | | | 7,245 | |
Other Financial Instruments* – Liabilities | | | | | | | | | | | | | | | | |
Market Price | | | (39,463 | ) | | | — | | | | — | | | | (39,463 | ) |
Totals | | $ | 11,339,830 | | | $ | 219,000 | | | | — | | | $ | 11,558,830 | |
| | | | | | | | | | | | | | | | |
| | | | |
| AllianzGI Retirement 2025: | | | | | | | | | | | | |
| Investments in Securities – Assets | | Level 1–
Quoted Prices | | | Level 2–
Other Significant
Observable Inputs | | | Level 3–
Significant
Unobservable Inputs | | | Value at
3/31/20 | |
Mutual Funds | | $ | 15,623,340 | | | | — | | | | — | | | $ | 15,623,340 | |
Other Financial Instruments* – Assets | | | | | | | | | | | | | | | | |
Market Price | | | 27,736 | | | | — | | | | — | | | | 27,736 | |
Other Financial Instruments* – Liabilities | | | | | | | | | | | | | | | | |
Market Price | | | (83,435 | ) | | | — | | | | — | | | | (83,435 | ) |
Totals | | $ | 15,567,641 | | | | — | | | | — | | | $ | 15,567,641 | |
| | | | | | | | | | | | | | | | |
| | | | |
| AllianzGI Retirement 2030: | | | | | | | | | | | | |
| Investments in Securities – Assets | | Level 1–
Quoted Prices | | | Level 2–
Other Significant
Observable Inputs | | | Level 3–
Significant
Unobservable Inputs | | | Value at
3/31/20 | |
Mutual Funds | | $ | 21,829,940 | | | | — | | | | — | | | $ | 21,829,940 | |
Repurchase Agreements | | | — | | | $ | 110,000 | | | | — | | | | 110,000 | |
| | | | 21,829,940 | | | | 110,000 | | | | — | | | | 21,939,940 | |
Other Financial Instruments* – Assets | | | | | | | | | | | | | | | | |
Market Price | | | 18,236 | | | | — | | | | — | | | | 18,236 | |
Other Financial Instruments* – Liabilities | | | | | | | | | | | | | | | | |
Market Price | | | (105,875 | ) | | | — | | | | — | | | | (105,875 | ) |
Totals | | $ | 21,742,301 | | | $ | 110,000 | | | | — | | | $ | 21,852,301 | |
| | | | | | | | | | | | | | | | |
| | | | |
| AllianzGI Retirement 2035: | | | | | | | | | | | | |
| Investments in Securities – Assets | | Level 1–
Quoted Prices | | | Level 2– Other Significant
Observable Inputs | | | Level 3– Significant
Unobservable Inputs | | | Value at
3/31/20 | |
Mutual Funds | | $ | 17,505,686 | | | | — | | | | — | | | $ | 17,505,686 | |
Repurchase Agreements | | | — | | | $ | 404,000 | | | | — | | | | 404,000 | |
| | | | 17,505,686 | | | | 404,000 | | | | — | | | | 17,909,686 | |
Other Financial Instruments* – Assets | | | | | | | | | | | | | | | | |
Market Price | | | 48,138 | | | | — | | | | — | | | | 48,138 | |
Other Financial Instruments* – Liabilities | | | | | | | | | | | | | | | | |
Market Price | | | (57,071 | ) | | | — | | | | — | | | | (57,071 | ) |
Totals | | $ | 17,496,753 | | | $ | 404,000 | | | | — | | | $ | 17,900,753 | |
| | | | | | |
| 300 | | March 31, 2020 | | | Semiannual Report | | |
| | | | | | | | | | | | | | | | |
| | | | |
| AllianzGI Retirement 2040: | | | | | | | | | | | | |
| Investments in Securities – Assets | | Level 1–
Quoted Prices | | | Level 2–
Other Significant
Observable Inputs | | | Level 3–
Significant
Unobservable Inputs | | | Value at
3/31/20 | |
Mutual Funds | | $ | 18,269,227 | | | | — | | | | — | | | $ | 18,269,227 | |
Repurchase Agreements | | | — | | | $ | 549,000 | | | | — | | | | 549,000 | |
| | | | 18,269,227 | | | | 549,000 | | | | — | | | | 18,818,227 | |
Other Financial Instruments* – Assets | | | | | | | | | | | | | | | | |
Market Price | | | 22,171 | | | | — | | | | — | | | | 22,171 | |
Other Financial Instruments* – Liabilities | | | | | | | | | | | | | | | | |
Market Price | | | (47,450 | ) | | | — | | | | — | | | | (47,450 | ) |
Totals | | $ | 18,243,948 | | | $ | 549,000 | | | | — | | | $ | 18,792,948 | |
| | | | | | | | | | | | | | | | |
| | | | |
| AllianzGI Retirement 2045: | | | | | | | | | | | | |
| Investments in Securities – Assets | | Level 1–
Quoted Prices | | | Level 2–
Other Significant
Observable Inputs | | | Level 3–
Significant
Unobservable Inputs | | | Value at
3/31/20 | |
Mutual Funds | | $ | 10,422,500 | | | | — | | | | — | | | $ | 10,422,500 | |
Repurchase Agreements | | | — | | | $ | 147,000 | | | | — | | | | 147,000 | |
| | | | 10,422,500 | | | | 147,000 | | | | — | | | | 10,569,500 | |
Other Financial Instruments* – Assets | | | | | | | | | | | | | | | | |
Market Price | | | 4,380 | | | | — | | | | — | | | | 4,380 | |
Other Financial Instruments* – Liabilities | | | | | | | | | | | | | | | | |
Market Price | | | (63,429 | ) | | | — | | | | — | | | | (63,429 | ) |
Totals | | $ | 10,363,451 | | | $ | 147,000 | | | | — | | | $ | 10,510,451 | |
| | | | | | | | | | | | | | | | |
| | | | |
| AllianzGI Retirement 2050: | | | | | | | | | | | | |
| Investments in Securities – Assets | | Level 1–
Quoted Prices | | | Level 2–
Other Significant
Observable Inputs | | | Level 3–
Significant
Unobservable Inputs | | | Value at
3/31/20 | |
Mutual Funds | | $ | 15,348,761 | | | | — | | | | — | | | $ | 15,348,761 | |
U.S. Treasury Obligations | | | — | | | $ | 499,678 | | | | — | | | | 499,678 | |
Repurchase Agreements | | | — | | | | 166,000 | | | | — | | | | 166,000 | |
| | | | 15,348,761 | | | | 665,678 | | | | — | | | | 16,014,439 | |
Other Financial Instruments* – Assets | | | | | | | | | | | | | | | | |
Market Price | | | 7,300 | | | | — | | | | — | | | | 7,300 | |
Other Financial Instruments* – Liabilities | | | | | | | | | | | | | | | | |
Market Price | | | (97,322 | ) | | | — | | | | — | | | | (97,322 | ) |
Totals | | $ | 15,258,739 | | | $ | 665,678 | | | | — | | | $ | 15,924,417 | |
| | | | | | | | | | | | | | | | |
| | | | |
| AllianzGI Retirement 2055: | | | | | | | | | | | | |
| Investments in Securities – Assets | | Level 1–
Quoted Prices | | | Level 2–
Other Significant
Observable Inputs | | | Level 3–
Significant
Unobservable Inputs | | | Value at
3/31/20 | |
Mutual Funds | | $ | 7,145,044 | | | | — | | | | — | | | $ | 7,145,044 | |
Repurchase Agreements | | | — | | | $ | 264,000 | | | | — | | | | 264,000 | |
| | | | 7,145,044 | | | | 264,000 | | | | — | | | | 7,409,044 | |
Other Financial Instruments* – Assets | | | | | | | | | | | | | | | | |
Market Price | | | 2,920 | | | | — | | | | — | | | | 2,920 | |
Other Financial Instruments* – Liabilities | | | | | | | | | | | | | | | | |
Market Price | | | (44,052 | ) | | | — | | | | — | | | | (44,052 | ) |
Totals | | $ | 7,103,912 | | | $ | 264,000 | | | | — | | | $ | 7,367,912 | |
| | | | | | |
| | Semiannual Report | | | March 31, 2020 | | 301 |
Notes to Financial Statements (cont’d)
March 31, 2020 (unaudited)
| | | | | | | | | | | | | | | | |
| | | | |
| AllianzGI Multi Asset Income: | | | | | | | | | | | | |
| Investments in Securities – Assets | | Level 1–
Quoted Prices | | | Level 2–
Other Significant
Observable Inputs | | | Level 3–
Significant
Unobservable Inputs | | | Value at
3/31/20 | |
Mutual Funds | | $ | 39,585,588 | | | | — | | | | — | | | $ | 39,585,588 | |
Common Stock: | |
Tobacco | | | 423,050 | | | $ | 537,637 | | | | — | | | | 960,687 | |
All Other | | | 6,409,266 | | | | — | | | | — | | | | 6,409,266 | |
Repurchase Agreements | | | — | | | | 363,000 | | | | — | | | | 363,000 | |
| | | | 46,417,904 | | | | 900,637 | | | | — | | | | 47,318,541 | |
Other Financial Instruments* – Assets | | | | | | | | | | | | | | | | |
Interest Rate Contracts | | | 161,145 | | | | — | | | | — | | | | 161,145 | |
Market Price | | | 410,465 | | | | — | | | | — | | | | 410,465 | |
| | | | 571,610 | | | | — | | | | — | | | | 571,610 | |
Other Financial Instruments* – Liabilities | | | | | | | | | | | | | | | | |
Interest Rate Contracts | | | (67,093 | ) | | | — | | | | — | | | | (67,093 | ) |
Market Price | | | (23,309 | ) | | | — | | | | — | | | | (23,309 | ) |
| | | | (90,402 | ) | | | — | | | | — | | | | (90,402 | ) |
Totals | | $ | 46,899,112 | | | $ | 900,637 | | | | — | | | $ | 47,799,749 | |
| | | | | | | | | | | | | | | | |
| | | | |
| AllianzGI Best Styles Global Equity: | | | | | | | | | | | | |
| Investments in Securities – Assets | | Level 1–
Quoted Prices | | | Level 2–
Other Significant
Observable Inputs | | | Level 3–
Significant
Unobservable Inputs | | | Value at
3/31/20 | |
Common Stock: | |
Australia | | $ | 203,145 | | | $ | 2,281,616 | | | $ | 120,719 | | | $ | 2,605,480 | |
Austria | | | — | | | | 398,762 | | | | — | | | | 398,762 | |
Belgium | | | — | | | | 153,937 | | | | — | | | | 153,937 | |
Chile | | | 65,493 | | | | 68,253 | | | | — | | | | 133,746 | |
China | | | 2,262,825 | | | | 4,754,656 | | | | — | †† | | | 7,017,481 | |
Denmark | | | — | | | | 312,746 | | | | — | | | | 312,746 | |
France | | | — | | | | 5,803,709 | | | | — | | | | 5,803,709 | |
Georgia | | | — | | | | 35,615 | | | | — | | | | 35,615 | |
Germany | | | — | | | | 1,725,518 | | | | — | | | | 1,725,518 | |
Greece | | | — | | | | 130,024 | | | | — | | | | 130,024 | |
Hong Kong | | | — | | | | 237,699 | | | | — | | | | 237,699 | |
Hungary | | | — | | | | 210,881 | | | | — | | | | 210,881 | |
Indonesia | | | — | | | | 183,557 | | | | — | | | | 183,557 | |
Ireland | | | 789,256 | | | | 179,957 | | | | — | | | | 969,213 | |
Israel | | | 134,544 | | | | 133,736 | | | | — | | | | 268,280 | |
Italy | | | — | | | | 1,455,145 | | | | — | | | | 1,455,145 | |
Japan | | | — | | | | 9,652,700 | | | | — | | | | 9,652,700 | |
Korea (Republic of) | | | — | | | | 2,180,531 | | | | — | | | | 2,180,531 | |
Malaysia | | | — | | | | 61,950 | | | | — | | | | 61,950 | |
Netherlands | | | 689,741 | | | | 1,832,251 | | | | — | | | | 2,521,992 | |
New Zealand | | | — | | | | 363,732 | | | | — | | | | 363,732 | |
Norway | | | — | | | | 324,037 | | | | — | | | | 324,037 | |
Philippines | | | — | | | | 318,658 | | | | — | | | | 318,658 | |
Poland | | | — | | | | 134,543 | | | | — | | | | 134,543 | |
Portugal | | | — | | | | 146,198 | | | | — | | | | 146,198 | |
Singapore | | | — | | | | 321,642 | | | | — | | | | 321,642 | |
Spain | | | — | | | | 1,770,486 | | | | — | | | | 1,770,486 | |
Sweden | | | — | | | | 665,065 | | | | — | | | | 665,065 | |
| | | | | | |
| 302 | | March 31, 2020 | | | Semiannual Report | | |
| | | | | | | | | | | | | | | | |
| | | | |
| AllianzGI Best Styles Global Equity (cont’d) | | | | | | | | | | | | |
| Investments in Securities – Assets | | Level 1–
Quoted Prices | | | Level 2–
Other Significant
Observable Inputs | | | Level 3–
Significant
Unobservable Inputs | | | Value at
3/31/20 | |
Switzerland | | | — | | | $ | 3,874,127 | | | | — | | | $ | 3,874,127 | |
Taiwan | | $ | 610,394 | | | | 1,641,249 | | | | — | | | | 2,251,643 | |
Thailand | | | — | | | | — | | | $ | 131,898 | | | | 131,898 | |
Turkey | | | — | | | | 247,868 | | | | — | | | | 247,868 | |
United Kingdom | | | 176,922 | | | | 3,939,731 | | | | — | | | | 4,116,653 | |
All Other | | | 75,607,547 | | | | — | | | | — | | | | 75,607,547 | |
Exchange-Traded Funds | | | 2,053,571 | | | | — | | | | — | | | | 2,053,571 | |
Preferred Stock: | |
Brazil | | | 301,563 | | | | — | | | | — | | | | 301,563 | |
Colombia | | | 60,038 | | | | — | | | | — | | | | 60,038 | |
All Other | | | — | | | | 534,424 | | | | — | | | | 534,424 | |
Repurchase Agreements | | | — | | | | 295,000 | | | | — | | | | 295,000 | |
Totals | | $ | 82,955,039 | | | $ | 46,370,003 | | | $ | 252,617 | | | $ | 129,577,659 | |
| | | | | | | | | | | | | | | | |
| | | | |
| AllianzGI Best Styles U.S. Equity: | | | | | | | | | | | | |
| Investments in Securities – Assets | | Level 1–
Quoted Prices | | | Level 2–
Other Significant
Observable Inputs | | | Level 3–
Significant
Unobservable Inputs | | | Value at
3/31/20 | |
Common Stock | | $ | 29,715,453 | | | | — | | | | — | | | $ | 29,715,453 | |
Repurchase Agreements | | | — | | | $ | 105,000 | | | | — | | | | 105,000 | |
Totals | | $ | 29,715,453 | | | $ | 105,000 | | | | — | | | $ | 29,820,453 | |
| | | | | | | | | | | | | | | | |
| | | | |
| AllianzGI Convertible: | | | | | | | | | | | | |
| Investments in Securities – Assets | | Level 1–
Quoted Prices | | | Level 2–
Other Significant
Observable Inputs | | | Level 3–
Significant
Unobservable Inputs | | | Value at
3/31/20 | |
Convertible Bonds & Notes: | | | | | | | | | | | | | | | | |
Diversified Financial Services | | | — | | | | — | | | $ | 5,357,978 | | | $ | 5,357,978 | |
All Other | | | — | | | $ | 617,569,518 | | | | — | | | | 617,569,518 | |
Convertible Preferred Stock | | $ | 149,964,309 | | | | — | | | | — | | | | 149,964,309 | |
Repurchase Agreements | | | — | | | | 64,769,000 | | | | — | | | | 64,769,000 | |
Totals | | $ | 149,964,309 | | | $ | 682,338,518 | | | $ | 5,357,978 | | | $ | 837,660,805 | |
| | | | | | | | | | | | | | | | |
| | | | |
| AllianzGI Core Bond: | | | | | | | | | | | | |
| Investments in Securities – Assets | | Level 1–
Quoted Prices | | | Level 2–
Other Significant
Observable Inputs | | | Level 3–
Significant
Unobservable Inputs | | | Value at
3/31/20 | |
U.S. Government Agency Securities | | | — | | | $ | 16,496,494 | | | | — | | | $ | 16,496,494 | |
Corporate Bonds & Notes | | | — | | | | 16,159,121 | | | | — | | | | 16,159,121 | |
Asset-Backed Securities | | | — | | | | 8,054,217 | | | | — | | | | 8,054,217 | |
U.S. Treasury Obligations | | | — | | | | 5,078,889 | | | | — | | | | 5,078,889 | |
Mortgage-Backed Securities | | | — | | | | 1,464,384 | | | | — | | | | 1,464,384 | |
Preferred Stock | | $ | 553,659 | | | | — | | | | — | | | | 553,659 | |
| | | | 553,659 | | | | 47,253,105 | | | | — | | | | 47,806,764 | |
Other Financial Instruments* – Assets | | | | | | | | | | | | | | | | |
Credit Contracts | | | — | | | | 92,566 | | | | — | | | | 92,566 | |
Interest Rate Contracts | | | 105,390 | | | | — | | | | — | | | | 105,390 | |
| | | | 105,390 | | | | 92,566 | | | | — | | | | 197,956 | |
| | | | | | |
| | Semiannual Report | | | March 31, 2020 | | 303 |
Notes to Financial Statements (cont’d)
March 31, 2020 (unaudited)
| | | | | | | | | | | | | | | | |
| | | | |
| AllianzGI Core Bond (cont’d) | | | | | | | | | | | | |
| Other Financial Instruments* – Liabilities | | Level 1–
Quoted Prices | | | Level 2–
Other Significant
Observable Inputs | | | Level 3–
Significant
Unobservable Inputs | | | Value at
3/31/20 | |
Credit Contracts | | | — | | | $ | (130,553 | ) | | | — | | | | (130,553 | ) |
Interest Rate Contracts | | $ | (17,828 | ) | | | — | | | | — | | | | (17,828 | ) |
| | | (17,828 | ) | | | (130,553 | ) | | | — | | | | (148,381 | ) |
Totals | | $ | 641,221 | | | $ | 47,215,118 | | | | — | | | $ | 47,856,339 | |
| | | | | | | | | | | | | | | | |
| | | | |
| AllianzGI Core Plus Bond: | | | | | | | | | | | | |
| Investments in Securities – Assets | | Level 1–
Quoted Prices | | | Level 2–
Other Significant
Observable Inputs | | | Level 3–
Significant
Unobservable Inputs | | | Value at
3/31/20 | |
Corporate Bonds & Notes | | | — | | | $ | 21,285,723 | | | | — | | | $ | 21,285,723 | |
U.S. Government Agency Securities | | | — | | | | 17,644,729 | | | | — | | | | 17,644,729 | |
Asset-Backed Securities | | | — | | | | 13,218,742 | | | | — | | | | 13,218,742 | |
U.S. Treasury Obligations | | | — | | | | 2,865,595 | | | | — | | | | 2,865,595 | |
Mortgage-Backed Securities | | | — | | | | 1,730,445 | | | | — | | | | 1,730,445 | |
Preferred Stock | | $ | 620,500 | | | | — | | | | — | | | | 620,500 | |
| | | | 620,500 | | | | 56,745,234 | | | | — | | | | 57,365,734 | |
Other Financial Instruments* – Assets | | | | | | | | | | | | | | | | |
Credit Contracts | | | — | | | | 234,710 | | | | — | | | | 234,710 | |
Interest Rate Contracts | | | 84,531 | | | | — | | | | — | | | | 84,531 | |
| | | | 84,531 | | | | 234,710 | | | | — | | | | 319,241 | |
Other Financial Instruments* – Liabilities | | | | | | | | | | | | | | | | |
Credit Contracts | | | — | | | | (196,068 | ) | | | — | | | | (196,068 | ) |
Interest Rate Contracts | | | (634 | ) | | | — | | | | — | | | | (634 | ) |
| | | (634 | ) | | | (196,068 | ) | | | — | | | | (196,702 | ) |
Totals | | $ | 704,397 | | | $ | 56,783,876 | | | | — | | | $ | 57,488,273 | |
| | | | | | | | | | | | | | | | |
| | | | |
| AllianzGI Emerging Markets Consumer: | | | | | | | | | | | | |
| Investments in Securities – Assets | | Level 1–
Quoted Prices | | | Level 2–
Other Significant
Observable Inputs | | | Level 3–
Significant
Unobservable Inputs | | | Value at
3/31/20 | |
Common Stock: | | | | | | | | | | | | | | | | |
Brazil | | $ | 734,970 | | | | — | | | | — | | | $ | 734,970 | |
Canada | | | 492,407 | | | | — | | | | — | | | | 492,407 | |
China | | | 4,693,593 | | | $ | 9,450,097 | | | | — | | | | 14,143,690 | |
India | | | 877,657 | | | | 501,921 | | | | — | | | | 1,379,578 | |
Mexico | | | 353,992 | | | | — | | | | — | | | | 353,992 | |
Philippines | | | — | | | | 293,140 | | | $ | 1,139 | | | | 294,279 | |
Russian Federation | | | 540,740 | | | | — | | | | — | | | | 540,740 | |
Thailand | | | — | | | | — | | | | 1,104,351 | | | | 1,104,351 | |
Turkey | | | 51,409 | | | | 147,960 | | | | — | | | | 199,369 | |
United States | | | 2,680,876 | | | | — | | | | — | | | | 2,680,876 | |
All Other | | | — | | | | 9,124,073 | | | | — | | | | 9,124,073 | |
Preferred Stock | | | 232,601 | | | | — | | | | — | | | | 232,601 | |
Repurchase Agreements | | | — | | | | 1,130,000 | | | | — | | | | 1,130,000 | |
Totals | | $ | 10,658,245 | | | $ | 20,647,191 | | | $ | 1,105,490 | | | $ | 32,410,926 | |
| | | | | | | | | | | | | | | | |
| | | | | | |
| 304 | | March 31, 2020 | | | Semiannual Report | | |
| | | | | | | | | | | | | | | | |
| | | | |
| AllianzGI Emerging MarketsSmall-Cap: | | | | | | | | | | | | |
| Investments in Securities – Assets | | Level 1–
Quoted Prices | | | Level 2–
Other Significant
Observable Inputs | | | Level 3–
Significant
Unobservable Inputs | | | Value at
3/31/20 | |
Common Stock: | | | | | | | | | | | | | | | | |
Brazil | | $ | 121,311 | | | | — | | | | — | | | $ | 121,311 | |
India | | | 73,777 | | | $ | 671,591 | | | | — | | | | 745,368 | |
Korea (Republic of) | | | 19,271 | | | | 647,201 | | | | — | | | | 666,472 | |
Mexico | | | 151,136 | | | | — | | | | — | | | | 151,136 | |
Russian Federation | | | 50,517 | | | | — | | | $ | 112,611 | | | | 163,128 | |
South Africa | | | 241,884 | | | | — | | | | — | | | | 241,884 | |
Thailand | | | — | | | | — | | | | 147,068 | | | | 147,068 | |
Turkey | | | 149,694 | | | | 64,763 | | | | — | | | | 214,457 | |
All Other | | | — | | | | 2,826,880 | | | | — | | | | 2,826,880 | |
Preferred Stock: | | | | | | | | | | | | | | | | |
Brazil | | | 109,201 | | | | — | | | | — | | | | 109,201 | |
Russian Federation | | | — | | | | — | | | | 33,454 | | | | 33,454 | |
Totals | | $ | 916,791 | | | $ | 4,210,435 | | | $ | 293,133 | | | $ | 5,420,359 | |
| | | | | | | | | | | | | | | | |
| | | | |
| AllianzGI Emerging Markets SRI Debt: | | | | | | | | | | | | |
| Investments in Securities – Assets | | Level 1–
Quoted Prices | | | Level 2–
Other Significant
Observable Inputs | | | Level 3–
Significant
Unobservable Inputs | | | Value at
3/31/20 | |
Sovereign Debt Obligations | | | — | | | $ | 18,847,315 | | | | — | | | $ | 18,847,315 | |
Corporate Bonds & Notes | | | — | | | | 346,152 | | | | — | | | | 346,152 | |
U.S. Treasury Obligations | | | — | | | | 215,594 | | | | — | | | | 215,594 | |
Repurchase Agreements | | | — | | | | 3,517,000 | | | | — | | | | 3,517,000 | |
| | | | — | | | | 22,926,061 | | | | — | | | | 22,926,061 | |
Other Financial Instruments* – Assets | | | | | | | | | | | | | | | | |
Foreign Exchange Contracts | | | — | | | | 195,778 | | | | — | | | | 195,778 | |
Interest Rate Contracts | | $ | 12,351 | | | | — | | | | — | | | | 12,351 | |
| | | | 12,351 | | | | 195,778 | | | | — | | | | 208,129 | |
Other Financial Instruments* – Liabilities | | | | | | | | | | | | | | | | |
Foreign Exchange Contracts | | | — | | | | (87,188 | ) | | | — | | | | (87,188 | ) |
Interest Rate Contracts | | | (5,031 | ) | | | — | | | | — | | | | (5,031 | ) |
| | | (5,031 | ) | | | (87,188 | ) | | | — | | | | (92,219 | ) |
Totals | | $ | 7,320 | | | $ | 23,034,651 | | | | — | | | $ | 23,041,971 | |
| | | | | | | | | | | | | | | | |
| | | | |
| AllianzGI Emerging Markets Value: | | | | | | | | | | | | |
| Investments in Securities – Assets | | Level 1–
Quoted Prices | | | Level 2–
Other Significant
Observable Inputs | | | Level 3–
Significant
Unobservable Inputs | | | Value at
3/31/20 | |
Common Stock: | | | | | | | | | | | | | | | | |
Brazil | | $ | 2,634,437 | | | | — | | | | — | | | $ | 2,634,437 | |
China | | | 8,507,594 | | | $ | 27,198,250 | | | | — | | | | 35,705,844 | |
France | | | 601,692 | | | | 500,615 | | | | — | | | | 1,102,307 | |
Mexico | | | 1,640,949 | | | | — | | | | — | | | | 1,640,949 | |
Netherlands | | | 544,230 | | | | — | | | | — | | | | 544,230 | |
Russian Federation | | | 1,381,007 | | | | 1,023,513 | | | | — | | | | 2,404,520 | |
Saudi Arabia | | | 472,681 | | | | 444,735 | | | | — | | | | 917,416 | |
Taiwan | | | 997,329 | | | | 10,672,430 | | | | — | | | | 11,669,759 | |
United States | | | 4,663,779 | | | | — | | | | — | | | | 4,663,779 | |
All Other | | | — | | | | 27,622,120 | | | | — | | | | 27,622,120 | |
| | | | | | |
| | Semiannual Report | | | March 31, 2020 | | 305 |
Notes to Financial Statements (cont’d)
March 31, 2020 (unaudited)
| | | | | | | | | | | | | | | | |
| | | | |
| AllianzGI Emerging Markets Value (cont’d) | | | | | | | | | | | | |
| Investments in Securities – Assets | | Level 1–
Quoted Prices | | | Level 2–
Other Significant
Observable Inputs | | | Level 3–
Significant
Unobservable Inputs | | | Value at
3/31/20 | |
Preferred Stock: | |
Brazil | | $ | 853,043 | | | | — | | | | — | | | $ | 853,043 | |
Korea (Republic of) | | | — | | | $ | 1,724,539 | | | | — | | | | 1,724,539 | |
Repurchase Agreements | | | — | | | | 1,127,000 | | | | — | | | | 1,127,000 | |
Totals | | $ | 22,296,741 | | | $ | 70,313,202 | | | | — | | | $ | 92,609,943 | |
| | | | | | | | | | | | | | | | |
| | | | |
| AllianzGI Floating Rate Note: | | | | | | | | | | | | |
| Investments in Securities – Assets | | Level 1–
Quoted Prices | | | Level 2–
Other Significant
Observable Inputs | | | Level 3–
Significant
Unobservable Inputs | | | Value at
3/31/20 | |
Corporate Bonds & Notes | | | — | | | $ | 9,792,600 | | | | — | | | $ | 9,792,600 | |
Mortgage-Backed Securities | | | — | | | | 2,103,936 | | | | — | | | | 2,103,936 | |
Asset-Backed Securities | | | — | | | | 651,361 | | | | — | | | | 651,361 | |
Sovereign Debt Obligations | | | — | | | | 95,444 | | | | — | | | | 95,444 | |
U.S. Government Agency Securities | | | — | | | | 33,616 | | | | — | | | | 33,616 | |
Repurchase Agreements | | | — | | | | 556,000 | | | | — | | | | 556,000 | |
| | | | — | | | | 13,232,957 | | | | — | | | | 13,232,957 | |
Other Financial Instruments* – Assets | | | | | | | | | | | | | | | | |
Foreign Exchange Contracts | | | — | | | | 48,146 | | | | — | | | | 48,146 | |
Interest Rate Contracts | | $ | 13,656 | | | | — | | | | — | | | | 13,656 | |
| | | | 13,656 | | | | 48,146 | | | | — | | | | 61,802 | |
Other Financial Instruments* – Liabilities | | | | | | | | | | | | | | | | |
Interest Rate Contracts | | | (78,375 | ) | | | — | | | | — | | | | (78,375 | ) |
Totals | | $ | (64,719 | ) | | $ | 13,281,103 | | | | — | | | $ | 13,216,384 | |
| | | | | | | | | | | | | | | | |
| | | | |
| AllianzGI Global Allocation: | | | | | | | | | | | | |
| Investments in Securities – Assets | | Level 1–
Quoted Prices | | | Level 2–
Other Significant
Observable Inputs | | | Level 3–
Significant
Unobservable Inputs | | | Value at
3/31/20 | |
Mutual Funds | | $ | 200,683,325 | | | | — | | | | — | | | $ | 200,683,325 | |
Corporate Bonds & Notes | | | — | | | $ | 45,041,467 | | | | — | | | | 45,041,467 | |
U.S. Treasury Obligations | | | — | | | | 385,812 | | | | — | | | | 385,812 | |
Preferred Stock | | | 124,110 | | | | — | | | | — | | | | 124,110 | |
Repurchase Agreements | | | — | | | | 5,460,000 | | | | — | | | | 5,460,000 | |
| | | | 200,807,435 | | | | 50,887,279 | | | | — | | | | 251,694,714 | |
Other Financial Instruments* – Assets | | | | | | | | | | | | | | | | |
Foreign Exchange Contracts | | | 20,058 | | | | — | | | | — | | | | 20,058 | |
Interest Rate Contracts | | | 1,992,260 | | | | — | | | | — | | | | 1,992,260 | |
Market Price | | | 589,777 | | | | — | | | | — | | | | 589,777 | |
| | | | 2,602,095 | | | | — | | | | — | | | | 2,602,095 | |
Other Financial Instruments* – Liabilities | | | | | | | | | | | | | | | | |
Foreign Exchange Contracts | | | (70,950 | ) | | | — | | | | — | | | | (70,950 | ) |
Interest Rate Contracts | | | (40,448 | ) | | | — | | | | — | | | | (40,448 | ) |
Market Price | | | (580,860 | ) | | | — | | | | — | | | | (580,860 | ) |
| | | (692,258 | ) | | | — | | | | — | | | | (692,258 | ) |
Totals | | $ | 202,717,272 | | | $ | 50,887,279 | | | | — | | | $ | 253,604,551 | |
| | | | | | | | | | | | | | | | |
| | | | | | |
| 306 | | March 31, 2020 | | | Semiannual Report | | |
| | | | | | | | | | | | | | | | |
| | | | |
| AllianzGI Global Dynamic Allocation: | | | | | | | | | | | | |
| Investments in Securities – Assets | | Level 1–
Quoted Prices | | | Level 2–
Other Significant
Observable Inputs | | | Level 3–
Significant
Unobservable Inputs | | | Value at
3/31/20 | |
Corporate Bonds & Notes | | | — | | | $ | 33,957,770 | | | | — | | | $ | 33,957,770 | |
Common Stock: | |
Australia | | $ | 33,217 | | | | 457,725 | | | $ | 15,498 | | | | 506,440 | |
Austria | | | — | | | | 64,369 | | | | — | | | | 64,369 | |
Belgium | | | — | | | | 100,028 | | | | — | | | | 100,028 | |
Chile | | | 9,485 | | | | 10,152 | | | | — | | | | 19,637 | |
China | | | 294,026 | | | | 953,980 | | | | — | †† | | | 1,248,006 | |
Czech Republic | | | — | | | | 55,356 | | | | — | | | | 55,356 | |
Denmark | | | — | | | | 102,376 | | | | — | | | | 102,376 | |
Finland | | | — | | | | 94,527 | | | | — | | | | 94,527 | |
France | | | 961 | | | | 994,920 | | | | — | | | | 995,881 | |
Georgia | | | — | | | | 5,163 | | | | — | | | | 5,163 | |
Germany | | | — | | | | 430,569 | | | | — | | | | 430,569 | |
Greece | | | — | | | | 18,882 | | | | — | | | | 18,882 | |
Hong Kong | | | — | | | | 228,514 | | | | — | | | | 228,514 | |
Hungary | | | — | | | | 86,521 | | | | — | | | | 86,521 | |
Indonesia | | | — | | | | 26,660 | | | | — | | | | 26,660 | |
Ireland | | | 116,603 | | | | 28,329 | | | | — | | | | 144,932 | |
Israel | | | 19,411 | | | | 98,328 | | | | — | | | | 117,739 | |
Italy | | | — | | | | 363,155 | | | | — | | | | 363,155 | |
Japan | | | — | | | | 2,949,837 | | | | — | | | | 2,949,837 | |
Korea (Republic of) | | | 68,517 | | | | 392,450 | | | | — | | | | 460,967 | |
Malaysia | | | 4,744 | | | | 116,675 | | | | — | | | | 121,419 | |
Morocco | | | — | | | | 2,231 | | | | — | | | | 2,231 | |
Netherlands | | | 114,340 | | | | 330,285 | | | | — | | | | 444,625 | |
New Zealand | | | — | | | | 90,540 | | | | — | | | | 90,540 | |
Norway | | | — | | | | 66,012 | | | | — | | | | 66,012 | |
Philippines | | | — | | | | 59,431 | | | | — | | | | 59,431 | |
Poland | | | — | | | | 44,343 | | | | — | | | | 44,343 | |
Portugal | | | — | | | | 21,226 | | | | — | | | | 21,226 | |
Russian Federation | | | — | | | | 2,772 | | | | — | | | | 2,772 | |
Singapore | | | — | | | | 263,852 | | | | — | | | | 263,852 | |
South Africa | | | — | | | | 55,962 | | | | — | | | | 55,962 | |
Spain | | | 15,365 | | | | 307,727 | | | | — | | | | 323,092 | |
Sweden | | | — | | | | 139,229 | | | | — | | | | 139,229 | |
Switzerland | | | 414 | | | | 1,082,073 | | | | — | | | | 1,082,487 | |
Taiwan | | | 99,914 | | | | 901,536 | | | | — | | | | 1,001,450 | |
Thailand | | | — | | | | — | | | | 172,193 | | | | 172,193 | |
Turkey | | | 947 | | | | 32,218 | | | | — | | | | 33,165 | |
United Kingdom | | | 26,402 | | | | 771,179 | | | | — | | | | 797,581 | |
All Other | | | 18,379,575 | | | | — | | | | — | | | | 18,379,575 | |
Mutual Funds | | | 30,035,568 | | | | — | | | | — | | | | 30,035,568 | |
Exchange-Traded Funds | | | 3,996,960 | | | | — | | | | — | | | | 3,996,960 | |
U.S. Treasury Obligations | | | — | | | | 1,095,101 | | | | — | | | | 1,095,101 | |
Preferred Stock: | |
Chile | | | — | | | | 10,737 | | | | — | | | | 10,737 | |
Germany | | | — | | | | 34,098 | | | | — | | | | 34,098 | |
Korea (Republic of) | | | — | | | | 51,130 | | | | — | | | | 51,130 | |
All Other | | | 174,855 | | | | — | | | | — | | | | 174,855 | |
Repurchase Agreements | | | — | | | | 627,000 | | | | — | | | | 627,000 | |
| | | | 53,391,304 | | | | 47,524,968 | | | | 187,691 | | | | 101,103,963 | |
| | | | | | |
| | Semiannual Report | | | March 31, 2020 | | 307 |
Notes to Financial Statements (cont’d)
March 31, 2020 (unaudited)
| | | | | | | | | | | | | | | | |
| | | | |
| AllianzGI Global Dynamic Allocation (cont’d) | | | | | | | | | | | | |
| Other Financial Instruments* – Assets | | Level 1–
Quoted Prices | | | Level 2–
Other Significant
Observable Inputs | | | Level 3–
Significant
Unobservable Inputs | | | Value at
3/31/20 | |
Credit Contracts | | | — | | | $ | 1,530,536 | | | | — | | | $ | 1,530,536 | |
Interest Rate Contracts | | $ | 278,486 | | | | — | | | | — | | | | 278,486 | |
Market Price | | | 137,376 | | | | 348,815 | | | | — | | | | 486,191 | |
| | | | 415,862 | | | | 1,879,351 | | | | — | | | | 2,295,213 | |
Other Financial Instruments* – Liabilities | | | | | | | | | | | | | | | | |
Credit Contracts | | | — | | | | (53,787 | ) | | | — | | | | (53,787 | ) |
Interest Rate Contracts | | | (100,972 | ) | | | — | | | | — | | | | (100,972 | ) |
Market Price | | | (1,110,735 | ) | | | — | | | | — | | | | (1,110,735 | ) |
| | | (1,211,707 | ) | | | (53,787 | ) | | | — | | | | (1,265,494 | ) |
Totals | | $ | 52,595,459 | | | $ | 49,350,532 | | | $ | 187,691 | | | $ | 102,133,682 | |
| | | | | | | | | | | | | | | | |
| | | | |
| AllianzGI Global High Yield: | | | | | | | | | | | | |
| Investments in Securities – Assets | | Level 1–
Quoted Prices | | | Level 2–
Other Significant
Observable Inputs | | | Level 3–
Significant
Unobservable Inputs | | | Value at
3/31/20 | |
Corporate Bonds & Notes | | | — | | | $ | 23,275,804 | | | | — | | | $ | 23,275,804 | |
Repurchase Agreements | | | — | | | | 2,376,000 | | | | — | | | | 2,376,000 | |
U.S. Treasury Obligations | | | — | | | | 649,871 | | | | — | | | | 649,871 | |
| | | | — | | | | 26,301,675 | | | | — | | | | 26,301,675 | |
Other Financial Instruments* – Assets | | | | | | | | | | | | | | | | |
Foreign Exchange Contracts | | | — | | | | 203,383 | | | | — | | | | 203,383 | |
Other Financial Instruments* – Liabilities | | | | | | | | | | | | | | | | |
Foreign Exchange Contracts | | | — | | | | (17,448 | ) | | | — | | | | (17,448 | ) |
Interest Rate Contracts | | $ | (53,625 | ) | | | — | | | | — | | | | (53,625 | ) |
Market Price | | | (2,151 | ) | | | — | | | | — | | | | (2,151 | ) |
| | | (55,776 | ) | | | (17,448 | ) | | | — | | | | (73,224 | ) |
Totals | | $ | (55,776 | ) | | $ | 26,487,610 | | | | — | | | $ | 26,431,834 | |
| | | | | | | | | | | | | | | | |
| | | | |
| AllianzGI Global Sustainability: | | | | | | | | | | | | |
| Investments in Securities – Assets | | Level 1 –
Quoted Prices | | | Level 2 –
Other Significant
Observable Inputs | | | Level 3 –
Significant
Unobservable Inputs | | | Value at
3/31/20 | |
Common Stock: | |
Australia | | | — | | | $ | 2,400,942 | | | | — | | | $ | 2,400,942 | |
Denmark | | | — | | | | 2,455,942 | | | | — | | | | 2,455,942 | |
France | | | — | | | | 4,227,881 | | | | — | | | | 4,227,881 | |
Germany | | | — | | | | 8,919,676 | | | | — | | | | 8,919,676 | |
Hong Kong | | | — | | | | 1,932,410 | | | | — | | | | 1,932,410 | |
Japan | | | — | | | | 6,132,575 | | | | — | | | | 6,132,575 | |
Korea (Republic of) | | $ | 4,965 | | | | 2,156,319 | | | | — | | | | 2,161,284 | |
Spain | | | — | | | | 1,907,501 | | | | — | | | | 1,907,501 | |
Sweden | | | — | | | | 5,117,944 | | | | — | | | | 5,117,944 | |
Switzerland | | | — | | | | 5,554,165 | | | | — | | | | 5,554,165 | |
United Kingdom | | | — | | | | 13,667,729 | | | | — | | | | 13,667,729 | |
All Other | | | 76,541,119 | | | | — | | | | — | | | | 76,541,119 | |
Repurchase Agreements | | | — | | | | 5,210,000 | | | | — | | | | 5,210,000 | |
Totals | | $ | 76,546,084 | | | $ | 59,683,084 | | | | — | | | $ | 136,229,168 | |
| | | | | | |
| 308 | | March 31, 2020 | | | Semiannual Report | | |
| | | | | | | | | | | | | | | | |
| | | | |
| AllianzGI Green Bond: | | | | | | | | | | | | |
| Investments in Securities – Assets | | Level 1–
Quoted Prices | | | Level 2–
Other Significant
Observable Inputs | | | Level 3–
Significant
Unobservable Inputs | | | Value at
3/31/20 | |
Corporate Bonds & Notes | | | — | | | $ | 21,293,426 | | | | — | | | $ | 21,293,426 | |
Sovereign Debt Obligations | | | — | | | | 4,917,133 | | | | — | | | | 4,917,133 | |
Repurchase Agreements | | | — | | | | 1,038,000 | | | | — | | | | 1,038,000 | |
| | | | — | | | | 27,248,559 | | | | — | | | | 27,248,559 | |
Other Financial Instruments* – Liabilities | | | | | | | | | | | | | | | | |
Foreign Exchange Contracts | | | — | | | | (339,881 | ) | | | — | | | | (339,881 | ) |
Interest Rate Contracts | | $ | (153,796 | ) | | | — | | | | — | | | | (153,796 | ) |
| | | (153,796 | ) | | | (339,881 | ) | | | — | | | | (493,677 | ) |
Totals | | $ | (153,796 | ) | | $ | 26,908,678 | | | | — | | | $ | 26,754,882 | |
| | | | | | | | | | | | | | | | |
| | | | |
| AllianzGI High Yield Bond: | | | | | | | | | | | | |
| Investments in Securities – Assets | | Level 1–
Quoted Prices | | | Level 2–
Other Significant
Observable Inputs | | | Level 3–
Significant
Unobservable Inputs | | | Value at
3/31/20 | |
Corporate Bonds & Notes: | |
Commercial Services | | | — | | | $ | 3,898,011 | | | $ | 42,141 | | | $ | 3,940,152 | |
Diversified Financial Services | | | — | | | | 5,137,754 | | | | 1,111,538 | | | | 6,249,292 | |
Media | | | — | | | | 10,183,443 | | | | 3 | | | | 10,183,446 | |
All Other | | | — | | | | 66,335,191 | | | | — | | | | 66,335,191 | |
Preferred Stock | | | — | | | | — | | | | 5,114,196 | | | | 5,114,196 | |
Common Stock | | | — | | | | — | | | | 29,005 | | | | 29,005 | |
Warrants | | | — | | | | — | | | | 41 | | | | 41 | |
Repurchase Agreements | | | — | | | | 5,255,000 | | | | — | | | | 5,255,000 | |
Totals | | | — | | | $ | 90,809,399 | | | $ | 6,296,924 | | | $ | 97,106,323 | |
| | | | | | | | | | | | | | | | |
| | | | |
| AllianzGI InternationalSmall-Cap: | | | | | | | | | | | | |
| Investments in Securities – Assets | | Level 1–
Quoted Prices | | | Level 2–
Other Significant
Observable Inputs | | | Level 3–
Significant
Unobservable Inputs | | | Value at
3/31/20 | |
Common Stock: | |
Hong Kong | | $ | 273,105 | | | $ | 526,399 | | | | — | | | $ | 799,504 | |
All Other | | | — | | | | 62,723,345 | | | | — | | | | 62,723,345 | |
Preferred Stock | | | — | | | | 624,864 | | | | — | | | | 624,864 | |
Repurchase Agreements | | | — | | | | 3,615,000 | | | | — | | | | 3,615,000 | |
Totals | | $ | 273,105 | | | $ | 67,489,608 | | | | — | | | $ | 67,762,713 | |
| | | | | | | | | | | | | | | | |
| | | | |
| AllianzGI Micro Cap: | | | | | | | | | | | | |
| Investments in Securities – Assets | | Level 1–
Quoted Prices | | | Level 2–
Other Significant
Observable Inputs | | | Level 3–
Significant
Unobservable Inputs | | | Value at
3/31/20 | |
Common Stock | | $ | 12,562,070 | | | | — | | | | — | | | $ | 12,562,070 | |
Repurchase Agreements | | | — | | | $ | 226,000 | | | | — | | | | 226,000 | |
Totals | | $ | 12,562,070 | | | $ | 226,000 | | | | — | | | $ | 12,788,070 | |
| | | | | | | | | | | | | | | | |
| | | | | | |
| | Semiannual Report | | | March 31, 2020 | | 309 |
Notes to Financial Statements (cont’d)
March 31, 2020 (unaudited)
| | | | | | | | | | | | | | | | |
| | | | |
| AllianzGI PerformanceFee Managed Futures Strategy: | | | | | | | | | | | | |
| Investments in Securities – Assets | | Level 1–
Quoted Prices | | | Level 2–
Other Significant
Observable Inputs | | | Level 3–
Significant
Unobservable Inputs | | | Value at
3/31/20 | |
U.S. Treasury Obligations | | | — | | | $ | 19,900,288 | | | | — | | | $ | 19,900,288 | |
Mutual Funds | | $ | 1,261,374 | | | | — | | | | — | | | | 1,261,374 | |
Repurchase Agreements | | | — | | | | 854,000 | | | | — | | | | 854,000 | |
| | | | 1,261,374 | | | | 20,754,288 | | | | — | | | | 22,015,662 | |
Other Financial Instruments* – Assets | |
Commodity Contracts | | | 1,499,508 | | | | — | | | | — | | | | 1,499,508 | |
Foreign Exchange Contracts | | | 20,442 | | | | — | | | | — | | | | 20,442 | |
Interest Rate Contracts | | | 491,007 | | | | — | | | | — | | | | 491,007 | |
Market Price | | | 262 | | | | — | | | | — | | | | 262 | |
| | | | 2,011,219 | | | | — | | | | — | | | | 2,011,219 | |
Other Financial Instruments* – Liabilities | |
Commodity Contracts | | | (685,484 | ) | | | — | | | | — | | | | (685,484 | ) |
Credit Contracts | | | — | | | | (40,102 | ) | | | — | | | | (40,102 | ) |
Foreign Exchange Contracts | | | (80,055 | ) | | | — | | | | — | | | | (80,055 | ) |
Interest Rate Contracts | | | (62,388 | ) | | | — | | | | — | | | | (62,388 | ) |
Market Price | | | (283,171 | ) | | | — | | | | — | | | | (283,171 | ) |
| | | (1,111,098 | ) | | | (40,102 | ) | | | — | | | | (1,151,200 | ) |
Totals | | $ | 2,161,495 | | | $ | 20,714,186 | | | | — | | | $ | 22,875,681 | |
| | | | | | | | | | | | | | | | |
| | | | |
| AllianzGI PerformanceFee Structured US Equity: | | | | | | | | | | | | |
| Investments in Securities – Assets | | Level 1–
Quoted Prices | | | Level 2–
Other Significant
Observable Inputs | | | Level 3–
Significant
Unobservable Inputs | | | Value at
3/31/20 | |
Exchange-Traded Funds | | $ | 64,310,850 | | | | — | | | | — | | | $ | 64,310,850 | |
Repurchase Agreements | | | — | | | $ | 1,888,000 | | | | — | | | | 1,888,000 | |
Options Purchased: | |
Market Price | | | 1,860,442 | | | | 139 | | | | — | | | | 1,860,581 | |
| | | | 66,171,292 | | | | 1,888,139 | | | | — | | | | 68,059,431 | |
Investments in Securities – Liabilities | |
Options Written: | |
Market Price | | | (1,584,908 | ) | | | (203 | ) | | | — | | | | (1,585,111 | ) |
Totals | | $ | 64,586,384 | | | $ | 1,887,936 | | | | — | | | $ | 66,474,320 | |
| | | | | | | | | | | | | | | | |
| | | | |
| AllianzGI PerformanceFee Structured US Fixed Income: | | | | | | | | | | | | |
| Investments in Securities – Assets | | Level 1–
Quoted Prices | | | Level 2–
Other Significant
Observable Inputs | | | Level 3–
Significant
Unobservable Inputs | | | Value at
3/31/20 | |
Exchange-Traded Funds | | $ | 8,641,905 | | | | — | | | | — | | | $ | 8,641,905 | |
Options Purchased: | |
Market Price | | | 195 | | | | — | | | | — | | | | 195 | |
| | | | 8,642,100 | | | | — | | | | — | | | | 8,642,100 | |
Investments in Securities – Liabilities | |
Options Written: | |
Market Price | | | (6,082 | ) | | | — | | | | — | | | | (6,082 | ) |
Totals | | $ | 8,636,018 | | | | — | | | | — | | | $ | 8,636,018 | |
| | | | | | | | | | | | | | | | |
| | | | | | |
| 310 | | March 31, 2020 | | | Semiannual Report | | |
| | | | | | | | | | | | | | | | |
| | | | |
| AllianzGI Preferred Securities and Income: | | | | | | | | | | | | |
| Investments in Securities – Assets | | Level 1–
Quoted Prices | | | Level 2–
Other Significant
Observable Inputs | | | Level 3–
Significant
Unobservable Inputs | | | Value at
3/31/20 | |
Corporate Bonds & Notes | | | — | | | $ | 13,382,030 | | | | — | | | $ | 13,382,030 | |
Preferred Stock | | $ | 3,894,579 | | | | — | | | | — | | | | 3,894,579 | |
Repurchase Agreements | | | — | | | | 1,590,000 | | | | — | | | | 1,590,000 | |
| | | | 3,894,579 | | | | 14,972,030 | | | | — | | | | 18,866,609 | |
Other Financial Instruments* – Assets | |
Interest Rate Contracts | | | 12,114 | | | | — | | | | — | | | | 12,114 | |
Other Financial Instruments* – Liabilities | |
Credit Contracts | | | — | | | | (54,371 | ) | | | — | | | | (54,371 | ) |
Totals | | $ | 3,906,693 | | | $ | 14,917,659 | | | | — | | | $ | 18,824,352 | |
| | | | | | | | | | | | | | | | |
| | | | |
| AllianzGI Short Duration High Income: | | | | | | | | | | | | |
| Investments in Securities – Assets | | Level 1–
Quoted Prices | | | Level 2–
Other Significant
Observable Inputs | | | Level 3–
Significant
Unobservable Inputs | | | Value at
3/31/20 | |
Corporate Bonds & Notes: | | | | | | | | | | | | | | | | |
Coal | | | — | | | $ | 5,719,409 | | | $ | 4 | | | $ | 5,719,413 | |
All Other | | | — | | | | 724,634,829 | | | | — | | | | 724,634,829 | |
Senior Loans | | | — | | | | 110,643,852 | | | | — | | | | 110,643,852 | |
Asset-Backed Securities | | | — | | | | 3,752,694 | | | | — | | | | 3,752,694 | |
Repurchase Agreements | | | — | | | | 31,938,000 | | | | — | | | | 31,938,000 | |
Totals | | | — | | | $ | 876,688,784 | | | $ | 4 | | | $ | 876,688,788 | |
| | | | | | | | | | | | | | | | |
| | | | |
| AllianzGI Short Term Bond: | | | | | | | | | | | | |
| Investments in Securities – Assets | | Level 1–
Quoted Prices | | | Level 2–
Other Significant
Observable Inputs | | | Level 3–
Significant
Unobservable Inputs | | | Value at
3/31/20 | |
Corporate Bonds & Notes | | | — | | | $ | 16,319,687 | | | | — | | | $ | 16,319,687 | |
U.S. Treasury Obligations | | | — | | | | 1,059,758 | | | | — | | | | 1,059,758 | |
U.S. Government Agency Securities | | | — | | | | 580,913 | | | | — | | | | 580,913 | |
Repurchase Agreements | | | — | | | | 8,421,000 | | | | — | | | | 8,421,000 | |
Totals | | | — | | | $ | 26,381,358 | | | | — | | | $ | 26,381,358 | |
| | | | | | | | | | | | | | | | |
| | | | |
| AllianzGI Structured Return: | | | | | | | | | | | | |
| Investments in Securities – Assets | | Level 1–
Quoted Prices | | | Level 2–
Other Significant
Observable Inputs | | | Level 3–
Significant
Unobservable Inputs | | | Value at
3/31/20 | |
Exchange-Traded Funds | | $ | 215,764,000 | | | | — | | | | — | | | $ | 215,764,000 | |
Repurchase Agreements | | | — | | | $ | 7,950,000 | | | | — | | | | 7,950,000 | |
Options Purchased: | |
Market Price | | | 49,376,766 | | | | 1,788 | | | | — | | | | 49,378,554 | |
| | | | 265,140,766 | | | | 7,951,788 | | | | — | | | | 273,092,554 | |
Investments in Securities – Liabilities | |
Options Written: | |
Market Price | | | (15,446,074 | ) | | | (2,507 | ) | | | — | | | | (15,448,581 | ) |
Totals | | $ | 249,694,692 | | | $ | 7,949,281 | | | | — | | | $ | 257,643,973 | |
| | | | | | | | | | | | | | | | |
| | | | | | |
| | Semiannual Report | | | March 31, 2020 | | 311 |
Notes to Financial Statements (cont’d)
March 31, 2020 (unaudited)
| | | | | | | | | | | | | | | | |
| | | | |
| AllianzGI U.S. Equity Hedged: | | | | | | | | | | | | |
| Investments in Securities – Assets | | Level 1–
Quoted Prices | | | Level 2–
Other Significant
Observable Inputs | | | Level 3–
Significant
Unobservable Inputs | | | Value at
3/31/20 | |
Exchange-Traded Funds | | $ | 1,828,737 | | | | — | | | | — | | | $ | 1,828,737 | |
Options Purchased: | |
Market Price | | | 140,450 | | | | — | | | | — | | | | 140,450 | |
| | | | 1,969,187 | | | | — | | | | — | | | | 1,969,187 | |
Investments in Securities – Liabilities | |
Options Written: | |
Market Price | | | (668 | ) | | | — | | | | — | | | | (668 | ) |
Totals | | $ | 1,968,519 | | | | — | | | | — | | | $ | 1,968,519 | |
| | | | | | | | | | | | | | | | |
| | | | |
| AllianzGI Ultra Micro Cap: | | | | | | | | | | | | |
| Investments in Securities – Assets | | Level 1–
Quoted Prices | | | Level 2–
Other Significant
Observable Inputs | | | Level 3–
Significant
Unobservable Inputs | | | Value at
3/31/20 | |
Common Stock | | $ | 9,342,767 | | | | — | | | | — | | | $ | 9,342,767 | |
Repurchase Agreements | | | — | | | $ | 144,000 | | | | — | | | | 144,000 | |
Totals | | $ | 9,342,767 | | | $ | 144,000 | | | | — | | | $ | 9,486,767 | |
| | | | | | | | | | | | | | | | |
| | | | |
| AllianzGI Water: | | | | | | | | | | | | |
| Investments in Securities – Assets | | Level 1–
Quoted Prices | | | Level 2–
Other Significant
Observable Inputs | | | Level 3–
Significant
Unobservable Inputs | | | Value at
3/31/20 | |
Common Stock: | |
Austria | | | — | | | $ | 4,640,778 | | | | — | | | $ | 4,640,778 | |
China | | | — | | | | 17,716,342 | | | | — | | | | 17,716,342 | |
Finland | | | — | | | | 1,364,165 | | | | — | | | | 1,364,165 | |
France | | | — | | | | 41,883,547 | | | | — | | | | 41,883,547 | |
Italy | | | — | | | | 8,272,339 | | | | — | | | | 8,272,339 | |
Netherlands | | | — | | | | 8,505,282 | | | | — | | | | 8,505,282 | |
Sweden | | | — | | | | 19,116,447 | | | | — | | | | 19,116,447 | |
Switzerland | | | — | | | | 32,176,454 | | | | — | | | | 32,176,454 | |
United Kingdom | | | — | | | | 77,665,116 | | | | — | | | | 77,665,116 | |
All Other | | $ | 327,209,324 | | | | — | | | | — | | | | 327,209,324 | |
Repurchase Agreements | | | — | | | | 10,758,000 | | | | — | | | | 10,758,000 | |
Totals | | $ | 327,209,324 | | | $ | 222,098,470 | | | | — | | | $ | 549,307,794 | |
A roll forward of fair value measurements using significant unobservable inputs (Level 3) for the six months ended March 31, 2020, was as follows:
| | | | | | | | | | | | | | | | | | | | | | | | | | | | | | | | | | | | |
| | | | |
| AllianzGI Best Styles Global Equity: | | | | | | | | | | | | | |
| Investments in Securities – Assets | | Beginning
Balance
9/30/19 | | | Purchases | | | Sales | | | Accrued
Discount
(Premiums) | | | Net
Realized
Gain (Loss) | | | Net Change
in Unrealized
Appreciation/
Depreciation | | | Transfers into
Level 3** | | | Transfers out
of Level 3 | | | Ending
Balance
3/31/20 | |
Common Stock: | |
Australia | | $ | — | | | $ | 65,132 | | | $ | — | | | $ | — | | | $ | — | | | $ | 6,627 | | | $ | 48,960 | | | $ | — | | | $ | 120,719 | |
China | | | 1,153 | | | | — | | | | — | ††, @ | | | — | | | | (6 | ) | | | (1,147 | ) | | | — | | | | — | | | | — | †† |
Greece | | | — | †† | | | — | | | | (1,069 | ) | | | — | | | | (386,601 | ) | | | 387,670 | | | | — | | | | — | | | | — | |
Thailand | | | 1,829,586 | | | | 128,481 | | | | (1,756,772 | ) | | | — | | | | (85,711 | ) | | | 16,314 | | | | — | | | | — | | | | 131,898 | |
Totals | | $ | 1,830,739 | | | $ | 193,613 | | | $ | (1,757,841 | ) | | $ | — | | | $ | (472,318 | ) | | $ | 409,464 | | | $ | 48,960 | | | $ | — | | | $ | 252,617 | |
| | | | | | | | | | | | | | | | | | | | | | | | | | | | | | | | | | | | |
| | | | | | |
| 312 | | March 31, 2020 | | | Semiannual Report | | |
| | | | | | | | | | | | | | | | | | | | | | | | | | | | | | | | | | | | |
| | | | |
| AllianzGI Convertible: | | | | | | | | | | | | | |
Investments in Securities –
Assets | | Beginning
Balance
9/30/19 | | | Purchases | | | Sales | | | Accrued
Discount
(Premiums) | | | Net
Realized
Gain (Loss) | | | Net Change
in Unrealized
Appreciation/
Depreciation | | | Transfers into
Level 3 | | | Transfers out
of Level 3 | | | Ending
Balance
3/31/20 | |
Convertible Bonds & Notes: | |
Diversified Financial Services | | $ | 3,857,048 | | | $ | 1,964,241 | | | $ | — | | | $ | 350 | | | $ | — | | | $ | (463,661 | ) | | $ | — | | | $ | — | | | $ | 5,357,978 | |
| | | | | | | | | | | | | | | | | | | | | | | | | | | | | | | | | | | | |
| | | | |
| AllianzGI Emerging Markets Consumer: | | | | | | | | | | | | | |
Investments in Securities –
Assets | | Beginning
Balance
9/30/19 | | | Purchases | | | Sales | | | Accrued
Discount
(Premiums) | | | Net
Realized
Gain (Loss) | | | Net Change
in Unrealized
Appreciation/
Depreciation | | | Transfers into
Level 3 | | | Transfers out
of Level 3 | | | Ending
Balance
3/31/20 | |
Common Stock: | |
Philippines | | $ | 575 | | | $ | — | | | $ | — | | | $ | — | | | $ | — | | | $ | 564 | | | $ | — | | | $ | — | | | $ | 1,139 | |
Thailand | | | 2,327,954 | | | | — | | | | (784,696 | ) | | | — | | | | 31,283 | | | | (470,190 | ) | | | — | | | | — | | | | 1,104,351 | |
Totals | | $ | 2,328,529 | | | $ | — | | | $ | (784,696 | ) | | $ | — | | | $ | 31,283 | | | $ | (469,626 | ) | | $ | — | | | $ | — | | | $ | 1,105,490 | |
| | | | | | | | | | | | | | | | | | | | | | | | | | | | | | | | | | | | |
| | | | |
| AllianzGI Emerging MarketsSmall-Cap: | | | | | | | | | | | | | |
Investments in Securities –
Assets | | Beginning
Balance
9/30/19 | | | Purchases | | | Sales | | | Accrued
Discount
(Premiums) | | | Net
Realized
Gain (Loss) | | | Net Change
in Unrealized
Appreciation/
Depreciation | | | Transfers into
Level 3 | | | Transfers out
of Level 3 | | | Ending
Balance
3/31/20 | |
Common Stock: | |
Russian Federation | | $ | 36,894 | | | $ | 151,369 | | | $ | (3,376 | ) | | $ | — | | | $ | 341 | | | $ | (72,617 | ) | | $ | — | | | $ | — | | | $ | 112,611 | |
Thailand | | | 496,692 | | | | — | | | | (250,024 | ) | | | — | | | | 9,445 | | | | (109,045 | ) | | | — | | | | — | | | | 147,068 | |
Preferred Stock: | |
Russian Federation | | | 221,365 | | | | — | | | | (174,666 | ) | | | — | | | | 10,676 | | | | (23,921 | ) | | | — | | | | — | | | | 33,454 | |
Totals | | $ | 754,951 | | | $ | 151,369 | | | $ | (428,066 | ) | | $ | — | | | $ | 20,462 | | | $ | (205,583 | ) | | $ | — | | | $ | — | | | $ | 293,133 | |
| | | | | | | | | | | | | | | | | | | | | | | | | | | | | | | | | | | | |
|
| AllianzGI Emerging Markets Value: | |
Investments in Securities –
Assets | | Beginning
Balance
9/30/19 | | | Purchases | | | Sales | | | Accrued
Discount
(Premiums) | | | Net
Realized
Gain (Loss) | | | Net Change
in Unrealized
Appreciation/
Depreciation | | | Transfers into
Level 3 | | | Transfers out
of Level 3 | | | Ending
Balance
3/31/20 | |
Common Stock: | |
Russian Federation | | $ | 1,612,979 | | | $ | 175,198 | | | $ | (2,002,959 | ) | | $ | — | | | $ | 511,492 | | | $ | (296,710 | ) | | $ | — | | | $ | — | | | $ | — | |
Rights: | |
Singapore | | | 3,590 | | | | — | | | | — | | | | — | | | | — | | | | (3,590 | ) | | | — | | | | — | | | | — | |
Totals | | $ | 1,616,569 | | | $ | 175,198 | | | $ | (2,002,959 | ) | | $ | — | | | $ | 511,492 | | | $ | (300,300 | ) | | $ | — | | | $ | — | | | $ | — | |
| | | | | | | | | | | | | | | | | | | | | | | | | | | | | | | | | | | | |
|
| AllianzGI Global Dynamic Allocation: | |
Investments in Securities –
Assets | | Beginning
Balance
9/30/19 | | | Purchases | | | Sales | | | Accrued
Discount
(Premiums) | | | Net
Realized
Gain (Loss) | | | Net Change
in Unrealized
Appreciation/
Depreciation | | | Transfers into
Level 3** | | | Transfers out
of Level 3*** | | | Ending
Balance
3/31/20 | |
Common Stock: | |
Australia | | $ | — | | | $ | 9,477 | | | $ | — | | | $ | — | | | $ | — | | | $ | 964 | | | $ | 5,057 | | | $ | — | | | $ | 15,498 | |
China | | | 34 | | | | — | | | | — | | | | — | | | | — | | | | (34 | ) | | | — | | | | — | | | | — | †† |
Greece | | | — | †† | | | — | | | | (273 | ) | | | — | | | | (98,895 | ) | | | 99,168 | | | | — | | | | — | | | | — | |
Taiwan | | | 7,958 | | | | — | | | | — | | | | — | | | | — | | | | (4,676 | ) | | | — | | | | (3,282 | ) | | | — | |
Thailand | | | 410,024 | | | | 8,719 | | | | (168,138 | ) | | | — | | | | 20,507 | | | | (116,322 | ) | | | 17,403 | | | | — | | | | 172,193 | |
Rights: | |
Singapore | | | 207 | | | | — | | | | — | | | | — | | | | — | | | | (207 | ) | | | — | | | | — | | | | — | |
Totals | | $ | 418,223 | | | $ | 18,196 | | | $ | (168,411 | ) | | $ | — | | | $ | (78,388 | ) | | $ | (21,107 | ) | | $ | 22,460 | | | $ | (3,282 | ) | | $ | 187,691 | |
| | | | | | |
| | Semiannual Report | | | March 31, 2020 | | 313 |
Notes to Financial Statements (cont’d)
March 31, 2020 (unaudited)
| | | | | | | | | | | | | | | | | | | | | | | | | | | | | | | | | | | | |
|
| AllianzGI High Yield Bond: | |
| Investments in Securities –Assets | | Beginning
Balance
9/30/19 | | | Purchases | | | Sales | | | Accrued
Discount
(Premiums) | | | Net
Realized
Gain (Loss) | | | Net Change
in Unrealized
Appreciation/
Depreciation | | | Transfers into
Level 3 | | | Transfers out
of Level 3 | | | Ending
Balance
3/31/20 | |
Corporate Bonds & Notes: | |
Commercial Services | | $ | 126,445 | | | $ | — | | | $ | (27,988 | )@ | | $ | — | | | $ | — | | | $ | (56,316 | ) | | $ | — | | | $ | — | | | $ | 42,141 | |
Diversified Financial Services | | | 1,447,756 | | | | 158,197 | † | | | — | | | | 13,121 | | | | — | | | | (507,536 | ) | | | — | | | | — | | | | 1,111,538 | |
Media | | | 3 | | | | — | | | | — | | | | — | | | | — | | | | — | | | | — | | | | — | | | | 3 | |
Preferred Stock | | | 6,148,346 | | | | — | | | | — | | | | — | | | | — | | | | (1,034,150 | ) | | | — | | | | — | | | | 5,114,196 | |
Common Stock: | |
Aerospace & Defense | | | 68,454 | | | | — | | | | — | | | | — | | | | — | | | | (39,457 | ) | | | — | | | | — | | | | 28,997 | |
Banks | | | 1 | | | | — | | | | — | | | | — | | | | — | | | | — | | | | — | | | | — | | | | 1 | |
Media | | | 7 | | | | — | | | | — | | | | — | | | | — | | | | — | | | | — | | | | — | | | | 7 | |
Warrants: | |
Advertising | | | 38,238 | | | | — | | | | — | | | | — | | | | — | | | | (38,199 | ) | | | — | | | | — | | | | 39 | |
Media | | | 1 | | | | — | | | | — | | | | — | | | | — | | | | 1 | | | | — | | | | — | | | | 2 | |
Totals | | $ | 7,829,251 | | | $ | 158,197 | | | $ | (27,988 | ) | | $ | 13,121 | | | $ | — | | | $ | (1,675,657 | ) | | $ | — | | | $ | — | | | $ | 6,296,924 | |
| | | | | | | | | | | | | | | | | | | | | | | | | | | | | | | | | | | | |
|
| AllianzGI InternationalSmall-Cap: | |
| Investments in Securities –Assets | | Beginning
Balance
9/30/19 | | | Purchases | | | Sales | | | Accrued
Discount
(Premiums) | | | Net
Realized
Gain (Loss) | | | Net Change
in Unrealized
Appreciation/
Depreciation | | | Transfers into
Level 3 | | | Transfers out
of Level 3 | | | Ending
Balance
3/31/20 | |
Common Stock: | |
Thailand | | $ | 494,789 | | | $ | — | | | $ | (279,088 | ) | | $ | — | | | $ | (159,143 | ) | | $ | (56,558 | ) | | $ | — | | | $ | — | | | $ | — | |
The tables above may include Level 3 investments that are valued by brokers or independent pricing services. The inputs for these investments are not readily available or cannot be reasonably estimated and are generally those inputs described in Note 1(b).
The following table presents additional information about valuation techniques and inputs used for investments that are measured at fair value and categorized within Level 3 at March 31, 2020:
| | | | | | | | | | | | |
|
| AllianzGI High Yield Bond: | |
| Investments in Securities – Assets | | Ending
Balance
at 3/31/20 | | | Valuation
Technique Used | | Unobservable
Inputs | | Input Values
(Ranges) | |
Corporate Bonds & Notes: | | | | | | | | | | | | |
Diversified Financial Services | | $ | 2,007,500 | | | Market and Company Comparables | | EV Multiples | | | 1.06x (0.70x –1.81x) | |
| | | | | | | | | | | 3.18x (1.06x –4.91x) | |
| | | | | | | | | | | 0.63x (0.38x –0.76x) | |
| | | | | | | | | Illiquidity Discount | | | 20 | % |
Preferred Stock | | | | | | | | | | | | |
Media | | $ | 399,464 | | | Market and Company Comparables | | EV Multiples | | | 0.56x (0.11x –0.97x) | |
| | | | | | | | Illiquidity Discount | | | 1% –30 | % |
| | $ | 4,714,732 | | | Market and Company Comparables | | EV Multiples | | | 0.56x (0.11x –0.97x) | |
| | | | | | | | | Illiquidity Discount | | | 30 | % |
Common Stock | | $ | 28,997 | | | Market and Company Comparables | | EV Multiples | | | 0.39x (0.39x –0.41x) | |
| | | | | | | | | | | 3.49x (2.62x –4.79x) | |
| | | | | | | | | | | 0.32x (0.21x –0.39x) | |
| | | | | | | | M&A Transaction Multiples | | | 0.80x (0.38x –2.12x) | |
| | | | | | | | | Illiquidity Discount | | | 40 | % |
The table above does not include Level 3 investments that are valued by brokers or independent pricing services.
| | | | | | |
| 314 | | March 31, 2020 | | | Semiannual Report | | |
| * | Other financial instruments are derivatives, such as futures contracts, swap agreements and forward foreign currency contracts, which are valued at the unrealized appreciation (depreciation) of the instrument. |
| ** | Transferred out of Level 2 and into Level 3 due to an exchange traded closing price being unavailable or unreliable at March 31, 2020. |
| *** | Transferred out of Level 3 and into Level 2 as a result of securities trading outside of the U.S. whose values were adjusted by the application of a modeling tool at March 31, 2020. |
| †† | Actual amount rounds to less than $1. |
| @ | Issued or removed via corporate action. |
The net change in unrealized appreciation/depreciation of Level 3 investments which the following Funds held at March 31, 2020 was:
| | | | |
AllianzGI Best Styles Global Equity | | $ | (244,407 | ) |
AllianzGI Convertible | | | (463,661 | ) |
AllianzGI Emerging Markets Consumer | | | (406,725 | ) |
AllianzGI Emerging MarketsSmall-Cap | | | (164,658 | ) |
AllianzGI Global Dynamic Allocation | | | (127,498 | ) |
AllianzGI High Yield Bond | | | (1,703,644 | ) |
The net realized gain (loss) and net change in unrealized appreciation/depreciation are reflected on the Statements of Operations.
(c) Investment Transactions and Investment Income. Investment transactions are accounted for on the trade date. Securities purchased and sold on a when-issued or delayed-delivery basis may be settled beyond a standard settlement period for the security after the trade date. Realized gains and losses on investments are determined on an identified cost basis. Estimated tax liabilities on certain foreign securities are recorded on an accrual basis and are reflected as a component of net change in unrealized appreciation (depreciation) of investments on the Statements of Operations. Tax liabilities realized as a result of such security sales are reflected as a component of net realized gain (loss) on investments on the Statements of Operations. Interest income adjusted for the accretion of discounts and amortization of premiums is recorded on an accrual basis. Discounts or premiums on debt securities purchased are accreted or amortized, respectively, to interest income. Conversion premium is not amortized. Dividend income is recorded on theex-dividend date, except for certain dividends from foreign securities where theex-dividend date may have passed, and then are recorded as soon after theex-dividend date as the Funds, using reasonable diligence, become aware of such dividends. Payments received on synthetic convertible securities are generally included in dividends. Dividend and interest income on the Statements of Operations are shown net of any foreign taxes withheld on income from foreign securities. Payments received from certain investments may be comprised of dividends, realized gains and return of capital. These payments may initially be recorded as dividend income and may subsequently be reclassified as realized gains and/or return of capital upon receipt of information from the issuer. Payments considered return of capital reduce the cost basis of the respective security. Distributions, if any, in excess of the cost basis of a security are recognized as capital gains. Dividends from underlying funds are recorded as dividend income, while capital gain distributions are recorded as net capital gain distributions received from underlying funds on the Statements of Operations. Facility fees and other fees (such as origination fees) received on settlement date are amortized as income over the
expected term of the senior loan. Facility fees and other fees received after settlement date relating to senior loans, commitment fees received relating to unfunded purchase or lending commitments and consent fees relating to corporate actions are recorded as miscellaneous income upon receipt. Paydown gains and losses are netted and recorded as interest income on the Statements of Operations. Expenses are recorded on an accrual basis and such expenses exclude those of the underlying funds. Expenses of the underlying funds are reflected in the NAV of those funds.
(d) Federal Income Taxes. The Funds intend to distribute all of their taxable income and to comply with the other requirements of Subchapter M of the U.S. Internal Revenue Code of 1986, as amended, applicable to regulated investment companies. Accordingly, no provision for U.S. federal income taxes is required. The Funds may be subject to excise tax based on distributions to shareholders.
Accounting for uncertainty in income taxes establishes for all entities, including pass-through entities such as the Funds, a minimum threshold for financial statement recognition of the benefit of positions taken in filing tax returns (including whether an entity is taxable in a particular jurisdiction), and requires certain expanded tax disclosures. In accordance with provisions set forth under U.S. GAAP, the Investment Manager has reviewed the Funds’ tax positions for all open tax years. As of March 31, 2020, the Funds have recorded no liability for net unrecognized tax benefits relating to uncertain income tax positions they have taken. The Funds’ U.S. federal income tax returns for the prior three years, as applicable, remain subject to examination by the Internal Revenue Service.
(e) Dividends and Distributions to Shareholders. The Funds (except AllianzGI Multi Asset Income, AllianzGI Convertible, AllianzGI Core Bond, AllianzGI Core Plus Bond, AllianzGI Emerging Markets SRI Debt, AllianzGI Floating Rate Note, AllianzGI Global Allocation, AllianzGI Global High Yield, AllianzGI Green Bond, AllianzGI High Yield Bond, AllianzGI Emerging Markets Value, AllianzGI PerformanceFee Structured US Fixed Income, AllianzGI Preferred Securities and Income, AllianzGI Short Duration High Income and AllianzGI Short Term Bond) declare dividends and distributions from net investment income and net realized capital gains, if any, annually. AllianzGI Convertible, AllianzGI Emerging Markets SRI Debt, AllianzGI Emerging Markets Value, AllianzGI Global Allocation and AllianzGI Global High Yield declare dividends from net investment income quarterly and distributions from net realized capital gains, if any, annually. AllianzGI Core Bond, AllianzGI Core Plus Bond, AllianzGI Floating Rate Note, AllianzGI Green Bond, AllianzGI High Yield Bond, AllianzGI PerformanceFee Structured US Fixed Income, AllianzGI Preferred Securities and Income, AllianzGI Short Duration High Income and AllianzGI Short Term Bond declare dividends from net investment income monthly and distributions from net realized capital gains, if
| | | | | | |
| | Semiannual Report | | | March 31, 2020 | | 315 |
Notes to Financial Statements (cont’d)
March 31, 2020 (unaudited)
any, annually. AllianzGI Multi Asset Income declares dividends from net investment income and/or distributions from short-term capital gains monthly. Net realized capital gains, if any, will continue to be distributed annually by each Fund. The Funds record dividends and distributions to their respective shareholders on theex-dividend date. The amount of dividends from net investment income and distributions from net realized capital gains is determined in accordance with U.S. federal income tax regulations, which may differ from U.S. GAAP. These“book-tax” differences are considered either temporary or permanent in nature. To the extent these differences are permanent in nature, such amounts are reclassified within the capital accounts based on their U.S. federal income tax treatment. Temporary differences do not require reclassification. To the extent dividends and/or distributions exceed current and accumulated earnings and profits for U.S. federal income tax purposes, they are reported as dividends and/or distributions to shareholders from return of capital.
(f) Multi-Class Operations. Each class offered by the Trust has equal rights as to assets and voting privileges (except that shareholders of a class have exclusive voting rights regarding any matter relating solely to that class of shares). Income,non-class specific expenses, and realized and unrealized capital gains and losses of each Fund are allocated daily to each class of shares based on the relative net assets of each class. Class specific expenses, where applicable, include administration, administrative servicing, distribution, recoupment, servicing andsub-transfer agent fees.
(g) Foreign Currency Translation. The Funds’ accounting records are maintained in U.S. dollars as follows: (1) the foreign currency market values of investments and other assets and liabilities denominated in foreign currencies are translated at the prevailing exchange rate at the end of the period; and (2) purchases and sales, income and expenses are translated at the prevailing exchange rate on the respective dates of such transactions. The resulting net foreign currency gain (loss) is included in the Funds’ Statements of Operations.
The Funds do not generally isolate that portion of the results of operations arising as a result of changes in foreign currency exchange rates from the fluctuations arising from changes in the market prices of securities. Accordingly, such foreign currency gain (loss) is included in net realized and unrealized gain (loss) on investments. However, the Funds do isolate the effect of fluctuations in foreign currency exchange rates when determining the gain (loss) upon the sale or maturity of foreign currency denominated debt obligations pursuant to U.S. federal income tax regulations; such amount is categorized as foreign currency gain (loss) for both financial reporting and income tax reporting purposes.
(h) Repurchase Agreements. The Funds are parties to Master Repurchase Agreements (“Master Repo Agreements”) with select counterparties. The Master Repo Agreements include provisions for initiation of repurchase transactions, income payments, events of default, and maintenance of collateral.
The Funds enter into transactions, under the Master Repo Agreements, with their custodian bank or securities brokerage firms whereby they purchase securities under agreements (i.e., repurchase agreements) to resell such securities at an agreed upon price and date. The Funds, through their custodian, take possession of securities collateralizing the repurchase agreement. Such agreements are carried at the contract amount in the financial statements, which is considered to represent fair value. The collateral that is pledged (i.e. the securities received by the Funds), which consists primarily of U.S. government obligations and asset-backed securities, is held by the custodian bank for the benefit of the Funds until maturity of the repurchase agreement. Provisions of the repurchase agreements and the procedures adopted by the Funds require that the market value of the collateral, including accrued interest thereon, be sufficient in the event of default by the counterparty. If the counterparty defaults under the Master Repo Agreements and the value of the collateral declines or if the counterparty enters an insolvency proceeding, realization of the collateral by the Funds may be delayed or limited. The gross values are included in the Funds’ Schedules of Investments. As of March 31, 2020, the value of the related collateral exceeded the value of the repurchase agreements for each Fund.
(i) Warrants. The Funds may receive warrants. Warrants are securities that are usually issued together with a debt security or preferred stock and that give the holder the right to buy a proportionate amount of common stock at a specified price. Warrants may be freely transferable and are often traded on major exchanges. Warrants normally have a life that is measured in years and entitle the holder to buy common stock of a company at a price that is usually higher than the market price at the time the warrant is issued. Warrants may entail greater risks than certain other types of investments. Generally, warrants do not carry the right to receive dividends or exercise voting rights with respect to the underlying securities, and they do not represent any rights in the assets of the issuer. In addition, their value does not necessarily change with the value of the underlying securities, and they cease to have value if they are not exercised on or before their expiration date. If the market price of the underlying stock does not exceed the exercise price during the life of the warrant, the warrant will expire worthless. Warrants may increase the potential profit or loss to be realized from the investment as compared with investing the same amount in the underlying securities. Similarly, the percentage increase or decrease in the value of an equity security warrant may be greater than the percentage increase or decrease in the value of the underlying common stock. Warrants may relate to the purchase of equity or debt securities. Debt obligations with warrants attached to purchase equity securities have many characteristics of convertible securities and their prices may, to some degree, reflect the performance of the underlying stock. Debt obligations also may be issued with warrants attached to purchase additional debt securities at the same coupon rate. A decline in interest rates would permit a Fund to sell such warrants at a profit. If interest rates rise, these warrants would generally expire with no value.
| | | | | | |
| 316 | | March 31, 2020 | | | Semiannual Report | | |
(j) Rights. The Funds may receive rights. A right is a privilege granted to existing shareholders of a corporation to subscribe for shares of a new issue of common stock before it is issued. Rights normally have a short life, usually two to four weeks, are freely transferable and entitle the holder to buy the new common stock at a lower price than the public offering price. Rights may entail greater risks than certain other types of investments. Generally, rights do not carry the right to receive dividends or exercise voting rights with respect to the underlying securities, and they do not represent any rights in the assets of the issuer. In addition, their value does not necessarily change with the value of the underlying securities, and they cease to have value if they are not exercised on or before their expiration date. If the market price of the underlying stock does not exceed the exercise price during the life of the right, the right will expire worthless. Rights may increase the potential profit or loss to be realized from the investment as compared with investing the same amount in the underlying securities.
(k) Senior Loans. The Funds may purchase assignments of, and participations in, Senior Loans originated, negotiated and structured by a U.S. or foreign commercial bank, insurance company, finance company or other financial institution for a lending syndicate of financial institutions (the “Lender”). When purchasing an assignment, the Funds succeed to all the rights and obligations under the loan agreement with the same rights and obligations as the assigning Lender. Assignments may, however, be arranged through private negotiations between potential assignees and potential assignors, and the rights and obligations acquired by the purchaser of an assignment may differ from, and be more limited than, those held by the assigning Lender. The Funds may also enter into lending arrangements involving unfunded loan commitments, which are contractual obligations for future funding. Unfunded loan commitments may include revolving credit facilities, which may obligate the Funds to supply additional cash to the borrower on demand. Unfunded loan commitments represent a future obligation in full, even though a percentage of the principal amounts may never be utilized by the borrower.
Certain Funds may purchase the securities of distressed companies (including assignments or direct investments), including companies engaged in restructurings or bankruptcy proceedings. Investments in distressed companies may include senior obligations of an issuer issued in connection with a restructuring under Chapter 11 of the U.S. Bankruptcy Code (commonly known as“debtor-in-possession” or “DIP” financings).Debtor-in-possession financings generally allow the issuer to continue its operations while reorganizing. Such financings constitute senior liens on unencumbered collateral (i.e., collateral not subject to other creditors’ claims). There is risk that the issuer under adebtor-in-possession financing will not emerge from Chapter 11 and be forced to liquidate its assets under Chapter 7 of the U.S. Bankruptcy Code. In the event of liquidation, the Funds’ only recourse would be against the collateral securing thedebtor-in-possession financing.
(l) PaymentIn-Kind Securities. The Funds may invest in paymentin-kind securities, which are debt or preferred stock securities that require or permit payment of interest in the form of additional securities. Paymentin-kind securities allow the issuer to avoid or delay
the need to generate cash to meet current interest payments and, as a result, may involve greater risk than securities that pay interest currently or in cash.
(m) U.S. Government Agencies or Government-Sponsored Enterprises. Securities issued by U.S. Government agencies or government-sponsored enterprises may not be guaranteed by the U.S. Treasury. The Government National Mortgage Association (“GNMA” or “Ginnie Mae”), a wholly-owned U.S. Government corporation, is authorized to guarantee, with the full faith and credit of the U.S. Government, the timely payment of principal and interest on securities issued by institutions approved by GNMA and backed by pools of mortgages insured by the Federal Housing Administration or guaranteed by the Department of Veterans Affairs. Government-related guarantors not backed by the full faith and credit of the U.S. Government include the Federal National Mortgage Association (“FNMA” or “Fannie Mae”) and the Federal Home Loan Mortgage Corporation (“FHLMC” or “Freddie Mac”). Pass-through securities issued by FNMA are guaranteed as to timely payment of principal and interest by FNMA, but are not backed by the full faith and credit of the U.S. Government. FHLMC guarantees the timely payment of interest and ultimate collection of principal, but its participation certificates are not backed by the full faith and credit of the U.S. Government.
(n) Exchange-Traded Funds. Certain Funds may invest in ETFs, which typically are index-based investment companies that hold substantially all of their assets in securities representing their specific index, but may also be actively-managed investment companies. Shares of ETFs trade throughout the day on an exchange and represent an investment in a portfolio of securities and other assets. As a shareholder of another investment company, the Funds would bear their pro rata portion of the other investment company’s expenses, including advisory fees, in addition to the expenses the Funds bear directly in connection with their own operations.
(o) Inflation-Indexed Bonds. Certain Funds may invest in inflation-indexed bonds. Inflation-indexed bonds are fixed income securities whose principal value is periodically adjusted to the rate of inflation. The interest rate on these bonds is generally fixed at issuance at a rate lower than typical bonds. Over the life of an inflation-indexed bond, however, interest will be paid based on a principal value which is adjusted for inflation.
(p) Convertible Securities. Certain Funds may invest a portion of their assets in convertible securities. Although convertible securities derive part of their value from that of the securities into which they are convertible, they are not considered derivative financial instruments. However, certain of the Funds’ investments in convertible securities include features which render them sensitive to price changes in their underlying securities. The value of structured/synthetic convertible securities can be affected by interest rate changes and credit risks of the issuer. Such securities may be structured in ways that limit their potential for capital appreciation and the entire value of the security may be at risk of loss depending on the performance of the underlying
| | | | | | |
| | Semiannual Report | | | March 31, 2020 | | 317 |
Notes to Financial Statements (cont’d)
March 31, 2020 (unaudited)
equity security. Consequently, the Funds are exposed to greater downside risk than traditional convertible securities, but typically still less than that of the underlying stock.
(q) When-Issued/Delayed-Delivery Transactions. When-issued or delayed-delivery transactions involve a commitment to purchase or sell securities for a predetermined price or yield, with payment and delivery taking place beyond the customary settlement period. When delayed-delivery purchases are outstanding, the Funds will set aside and maintain until the settlement date in a designated account, liquid assets in an amount sufficient to meet the purchase price. Upon entering into these when-issued or delayed-delivery transactions, the Funds and the counterparties are required to pledge to the other party an amount of cash or securities collateral when either party has a net exposure that exceeds the minimum transfer amount of the other party. When purchasing a security on a delayed-delivery basis, the Funds assume the rights and risks of ownership of the security, including the risk of price and yield fluctuations; consequently, such fluctuations are taken into account when determining the NAV. The Funds may dispose of or renegotiate a delayed-delivery transaction after it is entered into, and may sell when-issued securities before they are delivered, which may result in a realized gain or loss. When a security is sold on a delayed-delivery basis, the Funds do not participate in future gains and losses with respect to the security.
(r) Securities Traded onTo-Be-Announced Basis. The Funds may from time to time purchase securities on ato-be-announced (“TBA”) basis. In a TBA transaction, the Fund commits to purchasing or selling securities for which all specific information is not yet known at the time of the trade, particularly the face amount and maturity date of the underlying security transactions. Securities purchased on a TBA basis are not settled until they are delivered to the Fund, normally 15 to 45 days later. Beginning on the date the Fund enters into a TBA transaction, cash, U.S. government securities or other liquid securities are segregated in an amount equal in value to the purchase price of the TBA security. These transactions are subject to market fluctuations, and their current value is determined in the same manner as for other securities.
(s) Contingent Value Rights. A Fund may invest in contingent value rights (“CVRs”). A CVR gives the holder the right to receive an amount (which may be a fixed amount or determined by a formula) in the event that a specified corporate action, business milestone, or other trigger occurs (or does not occur) which is often subject to an expiration date. CVRs often are awarded to shareholders in the context of a corporate acquisition or major restructuring. For example, shareholders of an acquired company may receive a CVR that enables them to receive additional shares of the acquiring company in the event that the acquiring company’s share price falls below a certain level by a specified date. Risks associated with the use of CVRs are generally similar to risks associated with the use of options, such as the risk that the required trigger does not (or does) occur prior to a CVR’s expiration, causing the CVR to expire with no value. CVRs also present illiquidity risk, as they may not be registered securities or may otherwise benon-transferable or difficult to transfer, as well as
counterparty risk and credit risk. Further, because CVRs are valued based on the likelihood of the occurrence of a trigger, valuation often requires modeling and judgment, which increases the risk of mispricing or improper valuation.
(t) Restricted Securities. The Funds are permitted to invest in securities that are subject to legal or contractual restrictions on resale. These securities generally may be resold in transactions exempt from registration or to the public if the securities are registered. Disposal of these securities may involve time-consuming negotiations and expenses, and prompt sale at an acceptable price may be difficult.
(u) Organizational and Offering Costs. Organizational costs are expensed at the inception of the Fund. Offering costs are amortized over a twelve-month period from the inception of the Fund.
(v) Loan Interest Expense. Loan interest expense relates to the amounts borrowed under the credit facility (See Note 12). Loan interest expense is recorded as it is incurred.
(w) New Accounting Pronouncements. In March 2020, the FASB issued Accounting Standards Update (“ASU”) 2020-04, which provides optional expedients and exceptions for contracts, hedging relationships and other transactions affected by reference rate reform if certain criteria are met. The adoption of the ASU is elective. At this time, management is evaluating the implications of these changes on the financial statements.
In the normal course of business, the Funds trade financial instruments and enter into financial transactions where risk of potential loss exists due to, among other things, changes in the market (market risk) or failure of the other party to a transaction to perform (counterparty risk). The Funds are also exposed to other risks such as, but not limited to, interest rate, foreign currency, credit and leverage risks.
Interest rate risk is the risk that fixed income securities’ valuations will change because of changes in interest rates. During periods of rising nominal interest rates, the values of fixed income instruments are generally expected to decline. Conversely, during periods of declining nominal interest rates, the values of fixed income instruments are generally expected to rise. To the extent that a Fund effectively has short positions with respect to fixed income instruments, the values of such short positions would generally be expected to rise when nominal interest rates rise and to decline when nominal interest rates decline. A nominal interest rate can be described as the sum of a real interest rate and an expected inflation rate. Fixed income securities with longer durations tend to be more sensitive to changes in interest rates, usually making them more volatile than securities with shorter durations. Duration is used primarily as a measure of the sensitivity of a fixed income security’s market price to interest rate (i.e., yield) movements. Interest rate changes can be sudden and unpredictable, and the Funds may lose money as a result of movements in interest rates. High-yield or junk bonds are subject to greater levels of credit and liquidity risk, may be speculative and may decline in value due to increase in interest rates or an issuer’s deterioration and/or default.
| | | | | | |
| 318 | | March 31, 2020 | | | Semiannual Report | | |
The Funds may not be able to hedge against changes in interest rates or may choose not to do so for cost or other reasons. In addition, any hedges may not work as intended. The values of equity and othernon-fixed income securities may also decline due to fluctuations in interest rates.
Variable and floating rate securities generally are less sensitive to interest rate changes but may decline in value if their interest rates do not rise as much, or as quickly, as interest rates in general. Conversely, floating rate securities will not generally increase in value if interest rates decline. Inverse floating rate securities may decrease in value if interest rates increase. Inverse floating rate securities may also exhibit greater price volatility than a fixed rate obligation with similar credit quality. When the Funds hold variable or floating rate securities, a decrease (or, in the case of inverse floating rate securities, an increase) in market interest rates will adversely affect the income received from such securities and the NAV of the Funds’ shares.
The Funds are exposed to credit risk, which is the risk of losing money if the issuer or guarantor of a fixed income security is unable or unwilling, or is perceived (whether by market participants, rating agencies, pricing services or otherwise) as unable or unwilling, to make timely principal and/or interest payments, or to otherwise honor its obligations. Securities are subject to varying degrees of credit risk, which are often reflected in credit ratings.
To the extent the Funds directly invest in foreign currencies or in securities that trade in, and receive revenues in, foreign currencies, or in derivatives that provide exposure to foreign currencies, they will be subject to the risk that those currencies will decline in value relative to the U.S. dollar, or, in the case of hedging positions, that the U.S. dollar will decline in value relative to the currency being hedged. Currency rates in foreign countries may fluctuate significantly over short periods of time for a number of reasons, including economic growth, inflation, changes in interest rates, intervention (or the failure to intervene) by U.S. or foreign governments, central banks or supranational entities such as the International Monetary Fund, or the imposition of currency controls or other political developments in the United States or abroad. As a result, the Funds’ investments in foreign currency-denominated securities may reduce the returns of the Funds. The local emerging market currencies in which the Funds may be invested may experience substantially greater volatility against the U.S. dollar than the major convertible currencies in developed countries.
The Funds are subject to elements of risk not typically associated with investments in the U.S., due to concentrated investments in foreign issuers located in a specific country or region. Such concentrations will subject the Funds to additional risks resulting from future political or economic conditions in such country or region and the possible imposition of adverse governmental laws or currency exchange restrictions affecting such country or region, which could cause the securities and their markets to be less liquid and prices more volatile than those of comparable U.S. companies.
Funds may be subject to increased risk to the extent they allocate assets among investment styles and certain styles underperform relative to other investment styles.
The market values of securities may decline due to general market conditions (market risk) which are not specifically related to a particular company, such as real or perceived adverse economic conditions, changes in the general outlook for corporate earnings, changes in interest or currency rates, adverse changes to credit markets or adverse investor sentiment. They may also decline due to factors that affect a particular industry or industries, such as labor shortages or increased production costs and competitive conditions within an industry. Equity securities and equity-related investments generally have greater market price volatility than fixed income securities, although under certain market conditions fixed income securities may have comparable or greater price volatility. Credit ratings downgrades may also negatively affect securities held by the Funds. Even when markets perform well, there is no assurance that the investments held by the Funds will increase in value along with the broader market. In addition, market risk includes the risk that local, regional or global events, including geopolitical and other events, may disrupt the economy on a national or global level. For example, events such as war, acts of terrorism, the spread of infectious illness or other public health issues, recessions, or other events could have a significant impact on the economy or the markets for financial instruments and, as a result, could have a significant impact on a Fund and its investments. As a further example, an outbreak of respiratory disease caused by a novel coronavirus designated asCOVID-19 was first detected in China in December 2019 and subsequently spread globally, being designated as a pandemic in early 2020. Associated disruptions could impair the Funds’ ability to maintain operational standards, disrupt the operations of the Funds’ service providers, adversely affect the value and liquidity of the Funds’ investments, and negatively impact the Funds’ performance and your investment in a Fund.
Certain of the Funds invest in ETFs. Shareholders will indirectly bear fees and expenses associated with the ETFs in which a Fund invests, in addition to a Fund’s direct fees and expenses. The cost of investing in a Fund, therefore, may be higher than the cost of investing in a mutual fund that invests directly in individual stocks and bonds. In addition, a Fund’s NAV will be subject to fluctuations in the market values of the ETFs in which it invests. A Fund is also subject to the risks associated with the securities or other investments in which the ETFs invest, and the ability of a Fund to meet its investment objective will directly depend on the ability of the ETFs to meet their investment objectives. An index based ETF’s performance may not match that of the index it seeks to track.
The Funds are exposed to counterparty risk, or the risk that an institution or other entity with which the Funds have unsettled or open transactions will default. The potential loss to the Funds could exceed the value of the financial assets recorded in the Funds’ financial statements. Financial assets, which potentially expose the Funds to counterparty risk, consist principally of cash due from counterparties and investments. The Investment Manager seeks to minimize the Funds’ counterparty risk by performing reviews of each counterparty and by minimizing concentration of counterparty risk by undertaking
| | | | | | |
| | Semiannual Report | | | March 31, 2020 | | 319 |
Notes to Financial Statements (cont’d)
March 31, 2020 (unaudited)
transactions with multiple customers and counterparties on recognized and reputable exchanges. Delivery of securities sold is only made once the Funds have received payment. Payment is made on a purchase once the securities have been delivered by the counterparty. The trade will fail if either party fails to meet its obligation.
The Funds are exposed to risks associated with leverage. Leverage may cause the value of the Funds’ shares to be more volatile than if the Funds did not use leverage. This is because leverage tends to exaggerate the effect of any increase or decrease in the value of the Funds’ portfolio securities. The Funds may engage in transactions or purchase instruments that give rise to forms of leverage. In addition, to the extent the Funds employ leverage, dividend and interest costs on such leverage may not be recovered by any appreciation of the securities purchased with the leverage proceeds and could exceed the Funds’ investment returns, resulting in greater losses. As discussed further in Note 12, the Funds have entered into a credit agreement. In connection with their use of leverage as well as their investment activities, the Funds may have exposure to the London Interbank Offered Rate (“LIBOR”). LIBOR is an average interest rate, determined by the ICE Benchmark Administration, that banks charge one another for the use of short-term money. The United Kingdom’s Financial Conduct Authority, which regulates LIBOR, has announced plans to phase out the use of LIBOR by the end of 2021. There remains uncertainty regarding the future utilization of LIBOR and the nature of any replacement rate, and any potential effects of the transition away from LIBOR on a Fund or on certain instruments in which a Fund invests are not known.
The Funds may hold defaulted securities that may involve special considerations including bankruptcy proceedings, other regulatory and legal restrictions affecting the Funds’ ability to trade, and the availability of prices from independent pricing services or dealer quotations. Defaulted securities are often illiquid and may not be actively traded. Sale of securities in bankrupt companies at an acceptable price may be difficult and differences compared to the value of the securities used by the Funds could be material. A Fund may incur additional expenses to the extent it is required to seek recovery upon a portfolio security’s default in the payment of principal or interest. In any bankruptcy proceeding relating to a defaulted investment, a Fund may lose its entire investment or may be required to accept cash or securities with a value substantially less than its original investment.
Short sales may be used by certain Funds. When a Fund engages in a short sale on a security, it must borrow the security sold short and deliver it to the counterparty. The Fund will ordinarily have to pay a fee or premium to borrow particular securities and be obligated to repay the lender of the security any dividends or interest that accrue on the security during the period of the loan. The amount of any gain from a short sale will be decreased, and the amount of any loss increased, by the amount of the premium, dividends, interest or expenses a Fund pays in connection with the short sale. Short sales expose a Fund to the risk that it will be required to cover its short position at a time when the securities have appreciated in value, thus resulting in a loss to the Fund. Investments in senior loans and repurchase agreements
also involve special risks. Although typically secured, senior loans may not be backed by sufficient collateral to satisfy their issuers’ obligations in the event of bankruptcy or similar scenarios. Senior loans may also be illiquid. Similarly, repurchase agreements may result in losses if the collateral associated with such positions is insufficient in the event of a counterparty default or similar scenario. Repurchase agreement positions may also be illiquid.
AllianzGI PerformanceFee Managed Futures Strategy may gain exposure to commodity markets by investing in a subsidiary of the Trust, the AllianzGI PerformanceFee Managed Futures Strategy Offshore Fund Ltd (the “Cayman Subsidiary”). By investing in the Cayman Subsidiary, the Fund is indirectly exposed to the risks associated with the Cayman Subsidiary’s investments. AllianzGI PerformanceFee Managed Futures Strategy may invest no more than 25% of its assets in the Cayman Subsidiary.
The Funds are party to International Swaps and Derivatives Association, Inc. Master Agreements (“ISDA Master Agreements”) with select counterparties that govern transactions,over-the-counter derivatives and foreign exchange contracts entered into by the Funds and those counterparties. The ISDA Master Agreements contain provisions for general obligations, representations, agreements, collateral and events of default or termination. Events of termination include conditions that may entitle counterparties to elect to terminate early and cause settlement of all outstanding transactions under the applicable ISDA Master Agreement. Any election to terminate early could be material to the financial statements of the Funds.
The considerations and factors surrounding the settlement of certain purchases and sales made on a delayed-delivery basis are governed by Master Securities Forward Transaction Agreements (“Master Forward Agreements”) between the Funds and select counterparties. The Master Forward Agreements maintain provisions for, among other things, initiation and confirmation, payment and transfer, events of default, termination, and maintenance of collateral.
The counterparty risk associated with certain contracts may be reduced by master netting arrangements to the extent that if an event of default occurs, all amounts with the counterparty are terminated and settled on a net basis. The Funds’ overall exposure to counterparty risk with respect to transactions subject to master netting arrangements can change substantially within a short period, as it is affected by each transaction subject to the arrangement.
AllianzGI Retirement 2020, AllianzGI Retirement 2025, AllianzGI Retirement 2030, AllianzGI Retirement 2035, AllianzGI Retirement 2040, AllianzGI Retirement 2045, AllianzGI Retirement 2050, AllianzGI Retirement 2055, AllianzGI Multi Asset Income (collectively the “Target Funds”) and Global Allocation, intend to invest their assets significantly or primarily in series of the Trust, Allianz Funds, AllianzGI Institutional Multi-Series Trust, PIMCO Funds and PIMCO ETF Trust (together, “Affiliated Underlying Funds”). The Target Funds and Global Allocation may also invest a portion of their assets in ETFs and mutual
| | | | | | |
| 320 | | March 31, 2020 | | | Semiannual Report | | |
funds and pooled vehicles other than Affiliated Underlying Funds (collectively, with the Affiliated Underlying Funds, the “Underlying Funds”). PerformanceFee Structured US Equity, PerformanceFee Structured US Fixed Income, Structured Return and U.S. Equity Hedged may have substantial exposure to Underlying Funds. Accordingly, the investment performance of the Funds depends upon a favorable allocation among the Underlying Funds as well as the ability of the Underlying Funds to achieve their objectives. There can be no assurance that the investment objective of any Underlying Fund will be achieved. The risks associated with investing in each Fund are closely related to the risks associated with the securities and other investments held by the Underlying Funds.
Investing in the Underlying Funds involves certain additional expenses and tax results that would not be present in a direct investment in the securities and other investments held by the Underlying Funds. Each Fund’s NAV will fluctuate in response to changes in the NAVs of the Underlying Funds in which it invests. The extent to which the investment performance and risks associated with each Fund correlate to those of a particular Underlying Fund will depend upon the extent to which each Fund’s assets are allocated from time to time for investments in the Underlying Fund, which will vary. To the extent that a Fund invests a significant portion of its assets in an Underlying Fund it will be particularly sensitive to the risks associated with that Underlying Fund.
| 4. | FINANCIAL DERIVATIVE INSTRUMENTS |
Disclosure about derivatives and hedging activities requires qualitative disclosure regarding objectives and strategies for using derivatives, quantitative disclosure about fair value amounts of gains and losses on derivatives, and disclosure about credit-risk-related contingent features in derivative agreements. The disclosure requirements distinguish between derivatives which are accounted for as “hedges”, and those that do not qualify for such accounting. Although the Funds at times use derivatives for hedging purposes, the Funds reflect derivatives at fair value and recognize changes in fair value through the Funds’ Statements of Operations, and such derivatives do not qualify for hedge accounting treatment.
The U.S. Commodity Futures Trading Commission (the “CFTC”) has adopted regulations that subject registered investment companies and their investment advisers to regulation by the CFTC if the registered investment company invests more than a prescribed level of its liquidation value in commodity futures, options on commodities or commodity futures, swaps, or other financial instruments regulated under the Commodity Exchange Act, or if the fund markets itself as providing investment exposure to such instruments. The Investment Manager is registered as a commodity pool operator with respect to AllianzGI PerformanceFee Managed Futures Strategy and the Cayman Subsidiary.
Option Transactions. The Funds purchase put and call options on securities and indices for hedging purposes, risk management purposes or otherwise as part of their investment strategies. The risks associated with purchasing an option include the risk that the Funds pay a premium whether or not the option is exercised. Additionally, the Funds bear the risk of loss of premiums and changes in market
value should the counterparty not perform under the contract. Put and call options purchased are accounted for in the same manner as portfolio securities. The cost of securities acquired through the exercise of call options is increased by the premiums paid. The proceeds from securities sold through the exercise of put options are decreased by the premiums paid.
The Funds may write (sell) put and call options on securities and indices to earn premiums, for hedging purposes, risk management purposes or otherwise as part of their investment strategies. When an option is written, the premium received is recorded as an asset with an equal liability that is subsequently marked to market to reflect the market value of the option written. These liabilities, if any, are reflected as options written in the Funds’ Statements of Assets and Liabilities. Premiums received from writing options which expire unexercised are recorded on the expiration date as a realized gain. The difference between the premium received and the amount paid on effecting a closing purchase transaction, including brokerage commissions, is also treated as a realized gain, or if the premium is less than the amount paid for the closing purchase transaction, as a realized loss. If a call option written is exercised, the premium is added to the proceeds from the sale of the underlying security in determining whether there has been a realized gain or loss. If a put option written is exercised, the premium reduces the cost basis of the security. In writing an option, the Funds bear the market risk of an unfavorable change in the price of the security underlying the written option. Exercise of a written option could result in the Funds purchasing a security at a price different from its current market value.
There are several risks associated with option transactions on securities. For example, there are significant differences between the securities and options markets that could result in an imperfect correlation between these markets, causing a given transaction not to achieve its objective. The Funds’ ability to use options successfully will depend on the Investment Manager’s ability to predict pertinent market movements, which cannot be assured. As the writer of a covered call option, a Fund foregoes, during the option’s life, the opportunity to profit from increases in the market value of the security covering the call option above the sum of the premium and the strike price of the call, but has retained the risk of loss should the price of the underlying security decline.
Futures Contracts. The Funds use futures contracts to manage their exposure to the securities markets or the movements in interest rates and currency values. A futures contract is an agreement between two parties to buy and sell a financial instrument at a set price on a future date. Upon entering into such a contract, the Funds are required to pledge to the broker an amount of cash or securities equal to the minimum “initial margin” requirements of the exchange. Pursuant to the contracts, the Funds agree to receive from or pay to the broker an amount of cash or securities equal to the daily fluctuation in the value of the contracts. Such receipts or payments are known as “variation margin” and are recorded by the Funds as unrealized appreciation or depreciation. When the contracts are closed, the Funds record a realized gain or loss equal to the difference between the value of the contracts at the time they were opened and the value at the time they
| | | | | | |
| | Semiannual Report | | | March 31, 2020 | | 321 |
Notes to Financial Statements (cont’d)
March 31, 2020 (unaudited)
were closed. Any unrealized appreciation or depreciation recorded is simultaneously reversed. The use of futures transactions involves various risks, including the risk of an imperfect correlation in the movements in the price of futures contracts, interest rates and underlying hedging assets, and possible inability or unwillingness of counterparties to meet the terms of their contracts.
Swap Agreements. Swap agreements are bilaterally negotiated agreements between the Funds and a counterparty to exchange or swap investment cash flows, assets, foreign currencies or market or event-linked returns at specified, future intervals. Swap agreements may be privately negotiated in theover-the-counter market (“OTC swaps”) or may be executed in a multilateral or other trade facility platform, such as a registered commodities exchange (“centrally cleared swaps”). The Funds may enter into credit default, cross-currency, interest rate, total return, variance and other forms of swap agreements in order, among other things, manage their exposure to credit, currency and interest rate risk. In connection with these agreements, securities or cash may be identified as collateral or margin in accordance with the terms of the respective swap agreements to provide assets of value and recourse in the event of default or bankruptcy/insolvency.
OTC swap payments received or made at the beginning of the measurement period, if any, are reflected as such on the Funds’ Statements of Assets and Liabilities and represent payments made or received upon entering into the swap agreement to compensate for differences between the stated terms of the swap agreement and prevailing market conditions (credit spreads, currency exchange rates, interest rates, and other relevant factors). These upfront payments are recorded as realized gains or losses on the Funds’ Statements of Operations upon termination or maturity of the swap. A liquidation payment received or made at the termination of the swap is recorded as realized gain or loss on the Funds’ Statements of Operations. Net periodic payments received or paid by the Funds are included as part of realized gains or losses on the Funds’ Statements of Operations. Changes in market value, if any, are reflected as a component of net changes in unrealized appreciation/depreciation on the Funds’ Statements of Operations. Daily changes in valuation of centrally cleared swaps, if any, are recorded as receivable or payable, as applicable, for variation margin on centrally cleared swaps on the Funds’ Statements of Assets and Liabilities.
Entering into these agreements involves, to varying degrees, elements of credit, legal, market and documentation risk in excess of the amounts recognized on the Funds’ Statements of Assets and Liabilities. Such risks include the possibility that there will be no liquid market for these agreements, that the counterparties to the agreements may default on their obligation to perform or disagree as to the meaning of contractual terms in the agreements and that there may be unfavorable changes in interest rates.
Credit Default Swap Agreements. Credit default swap agreements involve one party (referred to as the buyer of protection) making a stream of payments to another party (the seller of protection) in
exchange for the right to receive a specified return in the event of a default or other credit event for the referenced entity, obligation or index. As the sellers of protection on credit default swap agreements, the Funds will generally receive from the buyer of protection a fixed rate of income throughout the term of the swap provided that there is no credit event. As the sellers, the Funds would effectively add leverage to their investment portfolios because, in addition to their total net assets, the Funds would be subject to investment exposure on the notional amount of the swap.
If the Funds are sellers of protection and a credit event occurs, as defined under the terms of that particular swap agreement, a Fund will either (i) pay to the buyer of protection an amount equal to the notional amount of the swap and take delivery of the referenced obligation, other deliverable obligations or underlying securities comprising the referenced index or (ii) pay a net settlement amount in the form of cash or securities equal to the notional amount of the swap less the recovery value of the referenced obligation or underlying securities comprising the referenced index. If the Funds are buyers of protection and a credit event occurs, as defined under the terms of that particular swap agreement, a Fund will either (i) receive from the seller of protection an amount equal to the notional amount of the swap and deliver the referenced obligation, other deliverable obligations or underlying securities comprising the referenced index or (ii) receive a net settlement amount in the form of cash or securities equal to the notional amount of the swap less the recovery value of the referenced obligation or underlying securities comprising the referenced index. Recovery values are assumed by market makers considering either industry standard recovery rates or entity specific factors and considerations until a credit event occurs. If a credit event has occurred, the recovery value is determined by a facilitated auction whereby a minimum number of allowable broker bids, together with a specified valuation method, are used to calculate the settlement value.
Credit default swap agreements on credit indices involve one party making a stream of payments to another party in exchange for the right to receive a specified return in the event of a write-down, principal shortfall, interest shortfall or default of all or part of the referenced entities comprising the credit index. A credit index is a basket of credit instruments or exposures designed to be representative of some part of the credit market as a whole. These indices are made up of reference credits that are judged by a poll of dealers to be the most liquid entities in the credit default swap market based on the sector of the index. Components of the indices may include, but are not limited to, investment grade securities, high yield securities, asset backed securities, emerging markets, and/or various credit ratings within each sector. Credit indices are traded using credit default swaps with standardized terms including a fixed spread and standard maturity dates. An index credit default swap references all the names in the index, and if there is a default, the credit event is settled based on that name’s weight in the index, or in the case of a tranched index credit default swap, the credit event is settled based on the name’s weight in the index that falls within the tranche for which
| | | | | | |
| 322 | | March 31, 2020 | | | Semiannual Report | | |
the Funds bear exposure. The composition of the indices changes periodically, usually every six months, and for most indices, each name has an equal weight in the index. The Funds use credit default swaps on credit indices to hedge a portfolio of credit default swaps or bonds, which is less expensive than it would be to buy many credit default swaps to achieve a similar effect. Credit default swaps on indices are benchmarks for protecting investors owning bonds against default, and traders use them to speculate on changes in credit quality.
Implied credit spreads, represented in absolute terms, utilized in determining the market value of credit default swap agreements on corporate or sovereign issues serve as an indicator of the current status of the payment/performance risk, and represent the likelihood or risk of default for the credit derivative. The implied credit spread of a particular referenced entity reflects the cost of buying/selling protection and may include upfront payments required to be made to enter into the agreement. For credit default swap agreements on asset-backed securities and credit indices, the quoted market prices and resulting values serve as the indicator of the current status of the payment/performance risk. Wider credit spreads and increasing market values, in absolute terms when compared to the notional amount of the swap, represent a deterioration of the referenced entity’s credit soundness and a greater likelihood or risk of default or other credit event occurring as defined under the terms of the agreement.
The maximum potential amount of future payments (undiscounted) that the Funds as sellers of protection could be required to make under a credit default swap agreement would be an amount equal to the notional amount of the agreement. These potential amounts would be partially offset by any recovery values of the respective referenced obligations, upfront payments received upon entering into the agreement, or net amounts received from the settlement of buy protection credit default swap agreements entered into by the Funds for the same referenced entity or entities.
Total Return Swap Agreements. Total return swap agreements are entered into gain or mitigate exposure to the underlying reference asset. Total return swap agreements involve commitments where single or multiple cash flows are exchanged based on the price of an underlying reference asset and on a fixed or variable interest rate. One counterparty pays out the total return of a specific underlying reference asset, and in return receives a fixed or variable rate. At maturity date, a net cash flow is exchanged where the total return is equivalent to the return of the underlying reference asset less a financing rate, if any. As a receiver, a Fund would receive payments based on any net positive total return and would owe payments in the event of a net negative total return. As a payer, a Fund would owe payments on any net positive total return and would receive payments in the event of a net negative return.
Volatility Swap Agreements. Volatility swap agreements are agreements in which the counterparties agree to make payments in connection with changes in the volatility of an underlying referenced instrument, such as a currency, rate, index, security or other financial
instrument. Volatility swap agreements permit the parties to attempt to hedge volatility risk and/or take positions on the projected future volatility of an underlying referenced instrument. At the maturity date, a net cash flow is exchanged, where the payoff amount is equivalent to the difference between the realized price volatility of the referenced instrument and the strike multiplied by the notional amount. As a receiver of the realized price volatility, a Fund would receive the payoff amount when the realized price volatility of the referenced instrument is greater than the strike and would owe the payoff amount when the volatility is less than the strike. As a payer of the realized price volatility, a Fund would owe the payoff amount when the realized price volatility of the referenced instrument is greater than the strike and would receive the payoff amount when the volatility is less than the strike. Payments on a volatility swap will be greater if they are based upon the mathematical square of volatility (i.e., the measured volatility multiplied by itself, which is referred to as “variance”). This type of volatility swap is frequently referred to as a variance swap.
Forward Foreign Currency Contracts. A forward foreign currency contract is an agreement between two parties to buy and sell a currency at a set exchange rate on a future date. The Funds enter into forward foreign currency contracts for the purpose of hedging against foreign currency risk arising from the investment or anticipated investment in securities denominated in foreign currencies. The Funds also enter into these contracts for purposes of increasing exposure to a foreign currency or shifting exposure to foreign currency fluctuations from one country to another. The market value of a forward foreign currency contract fluctuates with changes in foreign currency exchange rates. All commitments are marked to market daily at the applicable exchange rates and any resulting unrealized appreciation or depreciation is recorded. Realized gains or losses are recorded at the time the forward contract matures or by delivery of the currency. Risks may arise upon entering into these contracts from the potential inability of counterparties to meet the terms of their contracts and from unanticipated movements in the value of a foreign currency relative to the U.S. dollar. In addition, these contracts may involve market risk in excess of the unrealized appreciation (depreciation) reflected in the Funds’ Statements of Assets and Liabilities.
The following is a summary of the Funds’ derivatives categorized by risk exposure.
The effect of derivatives on the Statements of Assets and Liabilities at March 31, 2020:
| | | | |
|
| AllianzGI Retirement 2020: | |
| Location | | Market
Price | |
Asset derivatives: | | | | |
Unrealized appreciation on futures contracts* | | $ | 7,245 | |
Liability derivatives: | | | | |
Unrealized depreciation on futures contracts* | | $ | (39,463 | ) |
| * | Included in net unrealized depreciation of $32,218 on futures contracts as reported in the Fund’s Notes to Schedule of Investments. Only variation margin is reported within the Statements of Assets and Liabilities. |
| | | | | | |
| | Semiannual Report | | | March 31, 2020 | | 323 |
Notes to Financial Statements (cont’d)
March 31, 2020 (unaudited)
| | | | |
|
| AllianzGI Retirement 2025: | |
| Location | | Market
Price | |
Asset derivatives: | | | | |
Unrealized appreciation on futures contracts* | | $ | 27,736 | |
Liability derivatives: | | | | |
Unrealized depreciation on futures contracts* | | $ | (83,435 | ) |
| * | Included in net unrealized depreciation of $55,699 on futures contracts as reported in the Fund’s Notes to Schedule of Investments. Only variation margin is reported within the Statements of Assets and Liabilities. |
| | | | |
|
| AllianzGI Retirement 2030: | |
| Location | | Market
Price | |
Asset derivatives: | | | | |
Unrealized appreciation on futures contracts* | | $ | 18,236 | |
Liability derivatives: | | | | |
Unrealized depreciation on futures contracts* | | $ | (105,875 | ) |
| * | Included in net unrealized depreciation of $87,639 on futures contracts as reported in the Fund’s Notes to Schedule of Investments. Only variation margin is reported within the Statements of Assets and Liabilities. |
| | | | |
|
| AllianzGI Retirement 2035: | |
| Location | | Market
Price | |
Asset derivatives: | | | | |
Unrealized appreciation on futures contracts* | | $ | 48,138 | |
Liability derivatives: | | | | |
Unrealized depreciation on futures contracts* | | $ | (57,071 | ) |
| * | Included in net unrealized depreciation of $8,933 on futures contracts as reported in the Fund’s Notes to Schedule of Investments. Only variation margin is reported within the Statements of Assets and Liabilities. |
| | | | |
|
| AllianzGI Retirement 2040: | |
| Location | | Market
Price | |
Asset derivatives: | | | | |
Unrealized appreciation on futures contracts* | | $ | 22,171 | |
Liability derivatives: | | | | |
Unrealized depreciation on futures contracts* | | $ | (47,450 | ) |
| * | Included in net unrealized depreciation of $25,279 on futures contracts as reported in the Fund’s Notes to Schedule of Investments. Only variation margin is reported within the Statements of Assets and Liabilities. |
| | | | |
|
| AllianzGI Retirement 2045: | |
| Location | | Market
Price | |
Asset derivatives: | | | | |
Unrealized appreciation on futures contracts* | | $ | 4,380 | |
Liability derivatives: | | | | |
Unrealized depreciation on futures contracts* | | $ | (63,429 | ) |
| * | Included in net unrealized depreciation of $59,049 on futures contracts as reported in the Fund’s Notes to Schedule of Investments. Only variation margin is reported within the Statements of Assets and Liabilities. |
| | | | |
|
| AllianzGI Retirement 2050: | |
| Location | | Market
Price | |
Asset derivatives: | | | | |
Unrealized appreciation on futures contracts* | | $ | 7,300 | |
Liability derivatives: | | | | |
Unrealized depreciation on futures contracts* | | $ | (97,322 | ) |
| * | Included in net unrealized depreciation of $90,022 on futures contracts as reported in the Fund’s Notes to Schedule of Investments. Only variation margin is reported within the Statements of Assets and Liabilities. |
| | | | |
|
| AllianzGI Retirement 2055: | |
| Location | | Market
Price | |
Asset derivatives: | | | | |
Unrealized appreciation on futures contracts* | | $ | 2,920 | |
Liability derivatives: | | | | |
Unrealized depreciation on futures contracts* | | $ | (44,052 | ) |
| * | Included in net unrealized depreciation of $41,132 on futures contracts as reported in the Fund’s Notes to Schedule of Investments. Only variation margin is reported within the Statements of Assets and Liabilities. |
| | | | | | | | | | | | |
|
| AllianzGI Multi Asset Income: | |
| Location | | Market
Price | | | Interest
Rate
Contracts | | | Total | |
Asset derivatives: | | | | | | | | | | | | |
Unrealized appreciation on futures contracts* | | $ | 410,465 | | | $ | 161,145 | | | $ | 571,610 | |
Liability derivatives: | | | | | | | | | | | | |
Unrealized depreciation on futures contracts* | | $ | (23,309 | ) | | $ | (67,093 | ) | | $ | (90,402 | ) |
| * | Included in net unrealized appreciation of $481,208 on futures contracts as reported in the Fund’s Notes to Schedule of Investments. Only variation margin is reported within the Statements of Assets and Liabilities. |
| | | | | | |
| 324 | | March 31, 2020 | | | Semiannual Report | | |
| | | | | | | | | | | | |
|
| AllianzGI Core Bond: | |
| Location | | Interest
Rate
Contracts | | | Credit
Contracts | | | Total | |
Asset derivatives: | | | | | | | | | | | | |
Unrealized appreciation of swaps** | | $ | — | | | $ | 92,566 | | | $ | 92,566 | |
Unrealized appreciation on futures contracts* | | | 105,390 | | | | — | | | | 105,390 | |
Total asset derivatives | | $ | 105,390 | | | $ | 92,566 | | | $ | 197,956 | |
Liability derivatives: | | | | | | | | | | | | |
Unrealized depreciation of swaps** | | $ | — | | | $ | (130,553 | ) | | $ | (130,553 | ) |
Unrealized depreciation on futures contracts* | | | (17,828 | ) | | | — | | | | (17,828 | ) |
Total liability derivatives | | $ | (17,828 | ) | | $ | (130,553 | ) | | $ | (148,381 | ) |
| * | Included in net unrealized appreciation of $87,562 on futures contracts as reported in the Fund’s Notes to Schedule of Investments. Only variation margin is reported within the Statements of Assets and Liabilities. |
| ** | Included in net unrealized depreciation of $37,987 on swaps as reported in the Fund’s Notes to Schedule of Investments. Only variation margin is reported within the Statements of Assets and Liabilities. |
| | | | | | | | | | | | |
|
| AllianzGI Core Plus Bond: | |
| Location | | Interest
Rate
Contracts | | | Credit
Contracts | | | Total | |
Asset derivatives: | | | | | | | | | | | | |
Unrealized appreciation of swaps** | | $ | — | | | $ | 234,710 | | | $ | 234,710 | |
Unrealized appreciation on futures contracts* | | | 84,531 | | | | — | | | | 84,531 | |
Total asset derivatives | | $ | 84,531 | | | $ | 234,710 | | | $ | 319,241 | |
Liability derivatives: | | | | | | | | | | | | |
Unrealized depreciation of swaps** | | $ | — | | | $ | (196,068 | ) | | $ | (196,068 | ) |
Unrealized depreciation on futures contracts* | | | (634 | ) | | | — | | | | (634 | ) |
Total liability derivatives | | $ | (634 | ) | | $ | (196,068 | ) | | $ | (196,702 | ) |
| * | Included in net unrealized appreciation of $83,897 on futures contracts as reported in the Fund’s Notes to Schedule of Investments. Only variation margin is reported within the Statements of Assets and Liabilities. |
| ** | Included in net unrealized appreciation of $38,642 on swaps as reported in the Fund’s Notes to Schedule of Investments. Only variation margin is reported within the Statements of Assets and Liabilities. |
| | | | | | | | | | | | |
|
| AllianzGI Emerging Markets SRI Debt: | |
| Location | | Interest
Rate
Contracts | | | Foreign
Exchange
Contracts | | | Total | |
Asset derivatives: | | | | | | | | | | | | |
Unrealized appreciation on futures contracts* | | $ | 12,351 | | | $ | — | | | $ | 12,351 | |
Unrealized appreciation of forward foreign currency contracts | | | — | | | | 195,778 | | | | 195,778 | |
Total asset derivatives | | $ | 12,351 | | | $ | 195,778 | | | $ | 208,129 | |
Liability derivatives: | | | | | | | | | | | | |
Unrealized depreciation on futures contracts* | | $ | (5,031 | ) | | $ | — | | | $ | (5,031 | ) |
Unrealized depreciation of forward foreign currency contracts | | | — | | | | (87,188 | ) | | | (87,188 | ) |
Total liability derivatives | | $ | (5,031 | ) | | $ | (87,188 | ) | | $ | (92,219 | ) |
| * | Included in net unrealized appreciation of $7,320 on futures contracts as reported in the Fund’s Notes to Schedule of Investments. Only variation margin is reported within the Statements of Assets and Liabilities. |
| | | | | | |
| | Semiannual Report | | | March 31, 2020 | | 325 |
Notes to Financial Statements (cont’d)
March 31, 2020 (unaudited)
| | | | | | | | | | | | |
|
| AllianzGI Floating Rate Note: | |
| Location | | Interest
Rate
Contracts | | | Foreign
Exchange
Contracts | | | Total | |
Asset derivatives: | | | | | | | | | | | | |
Unrealized appreciation on futures contracts* | | $ | 13,656 | | | $ | — | | | $ | 13,656 | |
Unrealized appreciation of forward foreign currency contracts | | | — | | | | 48,146 | | | | 48,146 | |
Total asset derivatives | | $ | 13,656 | | | $ | 48,146 | | | $ | 61,802 | |
Liability derivatives: | | | | | | | | | | | | |
Unrealized depreciation on futures contracts* | | $ | (78,375 | ) | | $ | — | | | $ | (78,375 | ) |
| * | Included in net unrealized depreciation of $64,719 on futures contracts as reported in the Fund’s Notes to Schedule of Investments. Only variation margin is reported within the Statements of Assets and Liabilities. |
| | | | | | | | | | | | | | | | |
|
| AllianzGI Global Allocation: | |
| Location | | Market
Price | | | Interest
Rate
Contracts | | | Foreign
Exchange
Contracts | | | Total | |
Asset derivatives: | | | | | | | | | | | | | | | | |
Unrealized appreciation on futures contracts* | | $ | 589,777 | | | $ | 1,992,260 | | | $ | 20,058 | | | $ | 2,602,095 | |
Liability derivatives: | | | | | | | | | | | | | | | | |
Unrealized depreciation on futures contracts* | | $ | (580,860 | ) | | $ | (40,448 | ) | | $ | (70,950 | ) | | $ | (692,258 | ) |
| * | Included in net unrealized appreciation of $1,909,837 on futures contracts as reported in the Fund’s Notes to Schedule of Investments. Only variation margin is reported within the Statements of Assets and Liabilities. |
| | | | | | | | | | | | | | | | | | | | |
|
| AllianzGI Global Dynamic Allocation: | |
| Location | | Market
Price | | | Interest
Rate
Contracts | | | Credit
Contracts | | | Foreign
Exchange
Contracts | | | Total | |
Asset derivatives: | | | | | | | | | | | | | | | | | | | | |
Unrealized appreciation of swaps** | | $ | 348,815 | | | $ | — | | | $ | 1,530,536 | | | $ | — | | | $ | 1,879,351 | |
Unrealized appreciation on futures contracts* | | | 137,376 | | | | 278,486 | | | | — | | | | — | | | | 415,862 | |
Total asset derivatives | | $ | 486,191 | | | $ | 278,486 | | | $ | 1,530,536 | | | $ | — | | | $ | 2,295,213 | |
Liability derivatives: | | | | | | | | | | | | | | | | | | | | |
Unrealized depreciation of swaps** | | $ | — | | | $ | — | | | $ | (53,787 | ) | | $ | — | | | $ | (53,787 | ) |
Unrealized depreciation on futures contracts* | | | (1,110,735 | ) | | | (100,972 | ) | | | — | | | | — | | | | (1,211,707 | ) |
Total liability derivatives | | $ | (1,110,735 | ) | | $ | (100,972 | ) | | $ | (53,787 | ) | | $ | — | | | $ | (1,265,494 | ) |
| * | Included in net unrealized depreciation of $795,845 on futures contracts as reported in the Fund’s Notes to Schedule of Investments. Only variation margin is reported within the Statements of Assets and Liabilities. |
| ** | Included in net unrealized appreciation of $1,825,564 on swaps as reported in the Fund’s Notes to Schedule of Investments. Only variation margin is reported within the Statements of Assets and Liabilities. |
| | | | | | | | | | | | | | | | |
| |
| AllianzGI Global High Yield: | | | | |
| Location | | Market
Price | | | Interest
Rate
Contracts | | | Foreign
Exchange
Contracts | | | Total | |
Asset derivatives: | | | | | | | | | | | | | | | | |
Unrealized appreciation of forward foreign currency contracts | | $ | — | | | | — | | | $ | 203,383 | | | $ | 203,383 | |
Liability derivatives: | | | | | | | | | | | | | | | | |
Unrealized depreciation on futures contracts* | | $ | (2,151 | ) | | $ | (53,625 | )�� | | $ | — | | | $ | (55,776 | ) |
Unrealized depreciation of forward foreign currency contracts | | | — | | | | — | | | | (17,448 | ) | | | (17,448 | ) |
Total liability derivatives | | $ | (2,151 | ) | | $ | (53,625 | ) | | $ | (17,448 | ) | | $ | (73,224 | ) |
| * | Included in net unrealized depreciation of $55,776 on futures contracts as reported in the Fund’s Notes to Schedule of Investments. Only variation margin is reported within the Statements of Assets and Liabilities. |
| | | | | | |
| 326 | | March 31, 2020 | | | Semiannual Report | | |
| | | | | | | | | | | | |
|
| AllianzGI Green Bond: | |
| Location | | Interest
Rate
Contracts | | | Foreign
Exchange
Contracts | | | Total | |
Liability derivatives: | | | | | | | | | | | | |
Unrealized depreciation on futures contracts* | | $ | (153,796 | ) | | $ | — | | | $ | (153,796 | ) |
Unrealized depreciation of forward foreign currency contracts | | | — | | | | (339,881 | ) | | | (339,881 | ) |
Total liability derivatives | | $ | (153,796 | ) | | $ | (339,881 | ) | | $ | (493,677 | ) |
| * | Included in net unrealized depreciation of $153,796 on futures contracts as reported in the Fund’s Notes to Schedule of Investments. Only variation margin is reported within the Statements of Assets and Liabilities. |
| | | | | | | | | | | | | | | | | | | | | | | | |
|
| AllianzGI PerformanceFee Managed Futures Strategy: | |
| Location | | Market
Price | | | Interest
Rate
Contracts | | | Credit
Contracts | | | Commodity
Contracts | | | Foreign
Exchange
Contracts | | | Total | |
Asset derivatives: | | | | | | | | | | | | | | | | | | | | | | | | |
Unrealized appreciation on futures contracts* | | $ | 262 | | | $ | 491,007 | | | $ | — | | | $ | 1,499,508 | | | $ | 20,442 | | | $ | 2,011,219 | |
Liability derivatives: | | | | | | | | | | | | | | | | | | | | | | | | |
Unrealized depreciation of swaps** | | $ | — | | | $ | — | | | $ | (40,102 | ) | | $ | — | | | $ | — | | | $ | (40,102 | ) |
Unrealized depreciation on futures contracts* | | | (283,171 | ) | | | (62,388 | ) | | | — | | | | (685,484 | ) | | | (80,055 | ) | | | (1,111,098 | ) |
Total liability derivatives | | $ | (283,171 | ) | | $ | (62,388 | ) | | $ | (40,102 | ) | | $ | (685,484 | ) | | $ | (80,055 | ) | | $ | (1,151,200 | ) |
| * | Included in net unrealized appreciation of $900,121 on futures contracts as reported in the Fund’s Notes to Schedule of Investments. Only variation margin is reported within the Statements of Assets and Liabilities. |
| ** | Included in net unrealized depreciation of $40,102 on swaps as reported in the Fund’s Notes to Schedule of Investments. Only variation margin is reported within the Statements of Assets and Liabilities. |
| | | | |
|
| AllianzGI PerformanceFee Structured US Equity: | |
| Location | | Market
Price | |
Asset derivatives: | | | | |
Investments, at value (options purchased) | | $ | 1,860,581 | |
Liability derivatives: | | | | |
Options written, at value | | $ | (1,585,111 | ) |
| | | | |
|
| AllianzGI PerformanceFee Structured US Fixed Income: | |
| Location | | Market
Price | |
Asset derivatives: | | | | |
Investments, at value (options purchased) | | $ | 195 | |
Liability derivatives: | | | | |
Options written, at value | | $ | (6,082 | ) |
| | | | | | | | | | | | |
|
| AllianzGI Preferred Securities and Income: | |
| Location | | Interest
Rate
Contracts | | | Credit
Contracts | | | Total | |
Asset derivatives: | | | | | | | | | | | | |
Unrealized appreciation on futures contracts* | | $ | 12,114 | | | $ | — | | | $ | 12,114 | |
Liability derivatives: | | | | | | | | | | | | |
Unrealized depreciation of swaps** | | $ | — | | | $ | (54,371 | ) | | $ | (54,371 | ) |
| * | Included in net unrealized appreciation of $12,114 on futures contracts as reported in the Fund’s Notes to Schedule of Investments. Only variation margin is reported within the Statements of Assets and Liabilities. |
| ** | Included in net unrealized depreciation of $54,371 on swaps as reported in the Fund’s Notes to Schedule of Investments. Only variation margin is reported within the Statements of Assets and Liabilities. |
| | | | |
|
| AllianzGI Structured Return: | |
| Location | | Market
Price | |
Asset derivatives: | | | | |
Investments, at value (options purchased) | | $ | 49,378,554 | |
Liability derivatives: | | | | |
Options written, at value | | $ | (15,448,581 | ) |
| | | | |
|
| AllianzGI U.S. Equity Hedged: | |
| Location | | Market
Price | |
Asset derivatives: | | | | |
Investments, at value (options purchased) | | $ | 140,450 | |
Liability derivatives: | | | | |
Options written, at value | | $ | (668 | ) |
| | | | | | |
| | Semiannual Report | | | March 31, 2020 | | 327 |
Notes to Financial Statements (cont’d)
March 31, 2020 (unaudited)
The effect of derivatives on the Statements of Operations for the six months ended March 31, 2020:
| | | | | | | | | | | | | | | | |
|
| AllianzGI Retirement 2020: | |
| Location | | Market
Price | | | Interest
Rate
Contracts | | | Foreign
Exchange
Contracts | | | Total | |
Net realized gain(loss) on: | | | | | | | | | | | | | | | | |
Futures contracts | | $ | 87,398 | | | $ | 16,148 | | | $ | (12,232 | ) | | $ | 91,314 | |
Net change in unrealized appreciation/depreciation of: | | | | | | | | | | | | | | | | |
Futures contracts | | $ | (31,839 | ) | | $ | (3,186 | ) | | $ | 2,249 | | | $ | (32,776 | ) |
| | | | | | | | | | | | | | | | |
|
| AllianzGI Retirement 2025: | |
| Location | | Market
Price | | | Interest
Rate
Contracts | | | Foreign
Exchange
Contracts | | | Total | |
Net realized gain(loss) on: | | | | | | | | | | | | | | | | |
Futures contracts | | $ | 318,586 | | | $ | 25,787 | | | $ | (18,842 | ) | | $ | 325,531 | |
Net change in unrealized appreciation/depreciation of: | | | | | | | | | | | | | | | | |
Futures contracts | | $ | (45,433 | ) | | $ | (8,036 | ) | | $ | 3,364 | | | $ | (50,105 | ) |
| | | | | | | | | | | | | | | | |
|
| AllianzGI Retirement 2030: | |
| Location | | Market
Price | | | Interest
Rate
Contracts | | | Foreign
Exchange
Contracts | | | Total | |
Net realized gain(loss) on: | | | | | | | | | | | | | | | | |
Futures contracts | | $ | 158,913 | | | $ | 19,131 | | | $ | (26,069 | ) | | $ | 151,975 | |
Net change in unrealized appreciation/depreciation of: | | | | | | | | | | | | | | | | |
Futures contracts | | $ | (66,142 | ) | | $ | (11,600 | ) | | $ | 5,595 | | | $ | (72,147 | ) |
| | | | | | | | | | | | | | | | |
|
| AllianzGI Retirement 2035: | |
| Location | | Market
Price | | | Interest
Rate
Contracts | | | Foreign
Exchange
Contracts | | | Total | |
Net realized gain(loss) on: | | | | | | | | | | | | | | | | |
Futures contracts | | $ | (55,996 | ) | | $ | 24,323 | | | $ | (22,010 | ) | | $ | (53,683 | ) |
Net change in unrealized appreciation/depreciation of: | | | | | | | | | | | | | | | | |
Futures contracts | | $ | 18,737 | | | $ | (9,267 | ) | | $ | 5,595 | | | $ | 15,065 | |
| | | | | | | | | | | | | | | | |
|
| AllianzGI Retirement 2040: | |
| Location | | Market
Price | | | Interest
Rate
Contracts | | | Foreign
Exchange
Contracts | | | Total | |
Net realized gain(loss) on: | | | | | | | | | | | | | | | | |
Futures contracts | | $ | (315,296 | ) | | $ | 19,884 | | | $ | (22,935 | ) | | $ | (318,347 | ) |
Net change in unrealized appreciation/depreciation of: | | | | | | | | | | | | | | | | |
Futures contracts | | $ | 17,966 | | | $ | (8,073 | ) | | $ | 5,601 | | | $ | 15,494 | |
| | | | | | | | | | | | | | | | |
| | | | | | |
| 328 | | March 31, 2020 | | | Semiannual Report | | |
| | | | | | | | | | | | | | | | |
|
| AllianzGI Retirement 2045: | |
| Location | | Market
Price | | | Interest
Rate
Contracts | | | Foreign
Exchange
Contracts | | | Total | |
Net realized gain(loss) on: | | | | | | | | | | | | | | | | |
Futures contracts | | $ | (271,764 | ) | | $ | 12,522 | | | $ | (14,770 | ) | | $ | (274,012 | ) |
Net change in unrealized appreciation/depreciation of: | | | | | | | | | | | | | | | | |
Futures contracts | | $ | (25,135 | ) | | $ | (5,055 | ) | | $ | 3,364 | | | $ | (26,826 | ) |
| | | | | | | | | | | | | | | | |
|
| AllianzGI Retirement 2050: | |
| Location | | Market
Price | | | Interest
Rate
Contracts | | | Foreign
Exchange
Contracts | | | Total | |
Net realized gain(loss) on: | | | | | | | | | | | | | | | | |
Futures contracts | | $ | (436,276 | ) | | $ | 6,121 | | | $ | (22,017 | ) | | $ | (452,172 | ) |
Net change in unrealized appreciation/depreciation of: | | | | | | | | | | | | | | | | |
Futures contracts | | $ | (52,046 | ) | | $ | (6,678 | ) | | $ | 5,601 | | | $ | (53,123 | ) |
| | | | | | | | | | | | | | | | |
|
| AllianzGI Retirement 2055: | |
| Location | | Market
Price | | | Interest
Rate
Contracts | | | Foreign
Exchange
Contracts | | | Total | |
Net realized gain(loss) on: | | | | | | | | | | | | | | | | |
Futures contracts | | $ | (235,312 | ) | | $ | 3,046 | | | $ | (11,943 | ) | | $ | (244,209 | ) |
Net change in unrealized appreciation/depreciation of: | | | | | | | | | | | | | | | | |
Futures contracts | | $ | (23,415 | ) | | $ | (3,018 | ) | | $ | 3,377 | | | $ | (23,056 | ) |
| | | | | | | | | | | | | | | | |
| | | | | | | | | | | | | | | | |
|
| AllianzGI Multi Asset Income: | |
| Location | | Market
Price | | | Interest
Rate
Contracts | | | Foreign
Exchange
Contracts | | | Total | |
Net realized gain(loss) on: | | | | | | | | | | | | | | | | |
Futures contracts | | $ | (647,300 | ) | | $ | 76,127 | | | $ | (138,183 | ) | | $ | (709,356 | ) |
Net change in unrealized appreciation/depreciation of: | | | | | | | | | | | | | | | | |
Futures contracts | | $ | 483,071 | | | $ | 185,906 | | | $ | 11,869 | | | $ | 680,846 | |
| | | | | | | | | | | | | | | | |
| | | | |
|
| AllianzGI Best Styles Global Equity: | |
| Location | | Foreign
Exchange
Contracts | |
Net realized loss on: | | | | |
Forward foreign currency contracts | | $ | (1,353 | ) |
| | | | | | | | | | | | |
|
| AllianzGI Core Bond: | |
| Location | | Interest
Rate
Contracts | | | Credit
Contracts | | | Total | |
Net realized gain on: | | | | | | | | | | | | |
Futures contracts | | $ | 31,220 | | | $ | — | | | $ | 31,220 | |
Swaps | | | — | | | | 181,663 | | | | 181,663 | |
Total net realized gain | | $ | 31,220 | | | $ | 181,663 | | | $ | 212,883 | |
Net change in unrealized appreciation/depreciation of: | | | | | | | | | | | | |
Futures contracts | | $ | 123,875 | | | $ | — | | | $ | 123,875 | |
Swaps | | | — | | | | (40,153 | ) | | | (40,153 | ) |
Total net change in unrealized appreciation/depreciation | | $ | 123,875 | | | $ | (40,153 | ) | | $ | 83,722 | |
| | | | | | |
| | Semiannual Report | | | March 31, 2020 | | 329 |
Notes to Financial Statements (cont’d)
March 31, 2020 (unaudited)
| | | | | | | | | | | | |
|
| AllianzGI Core Plus Bond: | |
| Location | | Interest
Rate
Contracts | | | Credit
Contracts | | | Total | |
Net realized gain on: | | | | | | | | | | | | |
Futures contracts | | $ | 332,358 | | | $ | — | | | $ | 332,358 | |
Swaps | | | — | | | | 242,123 | | | | 242,123 | |
Total net realized gain | | $ | 332,358 | | | $ | 242,123 | | | $ | 574,481 | |
Net change in unrealized appreciation/depreciation of: | | | | | | | | | | | | |
Futures contracts | | $ | 116,317 | | | $ | — | | | $ | 116,317 | |
Swaps | | | — | | | | 40,841 | | | | 40,841 | |
Total net change in unrealized appreciation/depreciation | | $ | 116,317 | | | $ | 40,841 | | | $ | 157,158 | |
| | | | | | | | | | | | |
|
| AllianzGI Emerging Markets SRI Debt: | |
| Location | | Interest
Rate
Contracts | | | Foreign
Exchange
Contracts | | | Total | |
Net realized loss on: | | | | | | | | | | | | |
Futures contracts | | $ | (36,523 | ) | | $ | — | | | $ | (36,523 | ) |
Forward foreign currency contracts | | | — | | | | (59,183 | ) | | | (59,183 | ) |
Total net realized loss | | $ | (36,523 | ) | | $ | (59,183 | ) | | $ | (95,706 | ) |
Net change in unrealized appreciation/depreciation of: | | | | | | | | | | | | |
Futures contracts | | $ | 14,961 | | | $ | — | | | $ | 14,961 | |
Forward foreign currency contracts | | | — | | | | 107,750 | | | | 107,750 | |
Total net change in unrealized appreciation/depreciation | | $ | 14,961 | | | $ | 107,750 | | | $ | 122,711 | |
| | | | | | | | | | | | |
|
| AllianzGI Floating Rate Note: | |
| Location | | Interest
Rate
Contracts | | | Foreign
Exchange
Contracts | | | Total | |
Net realized loss on: | | | | | | | | | | | | |
Futures contracts | | $ | (22,631 | ) | | $ | — | | | $ | (22,631 | ) |
Forward foreign currency contracts | | | — | | | | (10,293 | ) | | | (10,293 | ) |
Total net realized loss | | $ | (22,631 | ) | | $ | (10,293 | ) | | $ | (32,924 | ) |
Net change in unrealized appreciation/depreciation of: | | | | | | | | | | | | |
Futures contracts | | $ | (72,245 | ) | | $ | — | | | $ | (72,245 | ) |
Forward foreign currency contracts | | | — | | | | 17,792 | | | | 17,792 | |
Total net change in unrealized appreciation/depreciation | | $ | (72,245 | ) | | $ | 17,792 | | | $ | (54,453 | ) |
| | | | | | | | | | | | | | | | |
|
| AllianzGI Global Allocation: | |
| Location | | Market
Price | | | Interest
Rate
Contracts | | | Foreign
Exchange
Contracts | | | Total | |
Net realized gain(loss) on: | | | | | | | | | | | | | | | | |
Futures contracts | | $ | (2,733,553 | ) | | $ | 160,734 | | | $ | (26,341 | ) | | $ | (2,599,160 | ) |
Net change in unrealized appreciation/depreciation of: | | | | | | | | | | | | | | | | |
Futures contracts | | $ | 83,712 | | | $ | 2,322,197 | | | $ | (20,938 | ) | | | 2,384,971 | |
| | | | | | |
| 330 | | March 31, 2020 | | | Semiannual Report | | |
| | | | | | | | | | | | | | | | | | | | |
|
| AllianzGI Global Dynamic Allocation: | |
| Location | | Market
Price | | | Interest
Rate
Contracts | | | Credit
Contracts | | | Foreign
Exchange
Contracts | | | Total | |
Net realized gain(loss) on: | | | | | | | | | | | | | | | | | | | | |
Futures contracts | | $ | (637,130 | ) | | $ | 638,067 | | | $ | — | | | $ | (582,714 | ) | | $ | (581,777 | ) |
Swaps | | | — | | | | — | | | | 61,203 | | | | — | | | | 61,203 | |
Total net realized gain(loss) | | $ | (637,130 | ) | | $ | 638,067 | | | $ | 61,203 | | | $ | (582,714 | ) | | $ | (520,574 | ) |
Net change in unrealized appreciation/depreciation of: | | | | | | | | | | | | | | | | | | | | |
Futures contracts | | $ | (845,818 | ) | | $ | 155,179 | | | $ | — | | | $ | 35,041 | | | $ | (655,598 | ) |
Swaps | | | 348,815 | | | | — | | | | 1,476,749 | | | | — | | | | 1,825,564 | |
Total net change in unrealized appreciation/depreciation | | $ | (497,003 | ) | | $ | 155,179 | | | $ | 1,476,749 | | | $ | 35,041 | | | $ | 1,169,966 | |
| | | | | | | | | | | | | | | | |
|
| AllianzGI Global High Yield: | |
| Location | | Market
Price | | | Interest
Rate
Contracts | | | Foreign
Exchange
Contracts | | | Total | |
Net realized gain(loss) on: | | | | | | | | | | | | | | | | |
Futures contracts | | $ | 44,295 | | | $ | (13,091 | ) | | $ | — | | | $ | 31,204 | |
Forward foreign currency contracts | | | — | | | | — | | | | (156,706 | ) | | | (156,706 | ) |
Total net realized gain(loss) | | $ | 44,295 | | | $ | (13,091 | ) | | $ | (156,706 | ) | | $ | (125,502 | ) |
Net change in unrealized appreciation/depreciation of: | | | | | | | | | | | | | | | | |
Futures contracts | | $ | (5,151 | ) | | $ | (58,664 | ) | | $ | — | | | $ | (63,815 | ) |
Forward foreign currency contracts | | | — | | | | — | | | | 131,137 | | | | 131,137 | |
Total net change in unrealized appreciation/depreciation | | $ | (5,151 | ) | | $ | (58,664 | ) | | $ | 131,137 | | | $ | 67,322 | |
| | | | | | | | | | | | |
|
| AllianzGI Green Bond: | |
| Location | | Interest
Rate
Contracts | | | Foreign
Exchange
Contracts | | | Total | |
Net realized gain(loss) on: | | | | | | | | | | | | |
Futures contracts | | $ | (150,738 | ) | | $ | — | | | $ | (150,738 | ) |
Forward foreign currency contracts | | | — | | | | 444,554 | | | | 444,554 | |
Total net realized gain(loss) | | $ | (150,738 | ) | | $ | 444,554 | | | $ | 293,816 | |
Net change in unrealized appreciation/depreciation of: | | | | | | | | | | | | |
Futures contracts | | $ | (153,796 | ) | | $ | — | | | $ | (153,796 | ) |
Forward foreign currency contracts | | | — | | | | (346,944 | ) | | | (346,944 | ) |
Total net change in unrealized appreciation/depreciation | | $ | (153,796 | ) | | $ | (346,944 | ) | | $ | (500,740 | ) |
| | | | |
|
| AllianzGI InternationalSmall-Cap: | |
| Location | | Foreign
Exchange
Contracts | |
Net realized gain on: | | | | |
Forward foreign currency contracts | | $ | 10,106 | |
| | | | | | |
| | Semiannual Report | | | March 31, 2020 | | 331 |
Notes to Financial Statements (cont’d)
March 31, 2020 (unaudited)
| | | | | | | | | | | | | | | | | | | | | | | | |
|
| AllianzGI PerformanceFee Managed Futures Strategy: | |
| Location | | Market
Price | | | Interest
Rate
Contracts | | | Credit
Contracts | | | Commodity
Contracts | | | Foreign
Exchange
Contracts | | | Total | |
Net realized loss on: | | | | | | | | | | | | | | | | | | | | | | | | |
Futures contracts | | $ | (2,544,459 | ) | | $ | (131,278 | ) | | $ | — | | | $ | (324,203 | ) | | $ | (372,382 | ) | | $ | (3,372,322 | ) |
Swaps | | | — | | | | — | | | | (762,084 | ) | | | — | | | | — | | | | (762,084 | ) |
Total net realized loss | | $ | (2,544,459 | ) | | $ | (131,278 | ) | | $ | (762,084 | ) | | $ | (324,203 | ) | | $ | (372,382 | ) | | $ | (4,134,406 | ) |
Net change in unrealized appreciation/depreciation of: | | | | | | | | | | | | | | | | | | | | | | | | |
Futures contracts | | $ | (238,275 | ) | | $ | 497,801 | | | $ | — | | | $ | 838,642 | | | $ | (314,084 | ) | | $ | 784,084 | |
Swaps | | | — | | | | — | | | | 4,717 | | | | — | | | | — | | | | 4,717 | |
Total net change in unrealized appreciation/depreciation | | $ | (238,275 | ) | | $ | 497,801 | | | $ | 4,717 | | | $ | 838,642 | | | $ | (314,084 | ) | | $ | 788,801 | |
| | | | |
| |
| AllianzGI PerformanceFee Structured US Equity: | | | |
| Location | | Market
Price | |
Net realized gain(loss) on: | | | | |
Investments (options purchased) | | $ | 5,812,978 | |
Options written | | | (29,474,922 | ) |
Total net realized loss | | $ | (23,661,944 | ) |
Net change in unrealized appreciation/depreciation of: | | | | |
Investments (options purchased) | | $ | (455,226 | ) |
Options written | | | (117,115 | ) |
Total net change in unrealized appreciation/depreciation | | $ | (572,341 | ) |
| | | | |
| |
| AllianzGI PerformanceFee Structured US Fixed Income: | | | |
| Location | | Market
Price | |
Net realized gain(loss) on: | | | | |
Investments (options purchased) | | $ | 220,579 | |
Options written | | | (956,034 | ) |
Total net realized loss | | $ | (734,455 | ) |
Net change in unrealized appreciation/depreciation of: | | | | |
Investments (options purchased) | | $ | (580 | ) |
Options written | | | (76,243 | ) |
Total net change in unrealized appreciation/depreciation | | $ | (76,823 | ) |
| | | | | | | | | | | | |
|
| AllianzGI Preferred Securities and Income: | |
| Location | | Interest
Rate
Contracts | | | Credit
Contracts | | | Total | |
Net realized gain(loss) on: | | | | | | | | | | | | |
Futures contracts | | $ | 3,673 | | | $ | — | | | $ | 3,673 | |
Swaps | | | — | | | | (508 | ) | | | (508 | ) |
Total net realized gain(loss) | | $ | 3,673 | | | $ | (508 | ) | | $ | 3,165 | |
Net change in unrealized appreciation/depreciation of: | | | | | | | | | | | | |
Futures contracts | | $ | 12,486 | | | $ | — | | | $ | 12,486 | |
Swaps | | | — | | | | (54,371 | ) | | | (54,371 | ) |
Total net change in unrealized appreciation/depreciation | | $ | 12,486 | | | $ | (54,371 | ) | | $ | (41,885 | ) |
| | | | |
| |
| AllianzGI Structured Return: | | | |
| Location | | Market
Price | |
Net realized gain(loss) on: | | | | |
Investments (options purchased) | | $ | 77,707,157 | |
Options written | | | (293,416,284 | ) |
Total net realized loss | | $ | (215,709,127 | ) |
Net change in unrealized appreciation/depreciation of: | | | | |
Investments (options purchased) | | $ | 29,634,564 | |
Options written | | | 30,596,099 | |
Total net change in unrealized appreciation/depreciation | | $ | 60,230,663 | |
| | | | |
| |
| AllianzGI U.S. Equity Hedged: | | | |
| Location | | Market
Price | |
Net realized loss on: | | | | |
Investments (options purchased) | | $ | (5,761 | ) |
Options written | | | (18,882 | ) |
Total net realized loss | | $ | (24,643 | ) |
Net change in unrealized appreciation/depreciation of: | | | | |
Investments (options purchased) | | $ | 84,927 | |
Options written | | | (1,759 | ) |
Total net change in unrealized appreciation/depreciation | | $ | 83,168 | |
| | | | |
|
| AllianzGI Water: | |
| Location | | Foreign
Exchange
Contracts | |
Net realized loss on: | | | | |
Forward foreign currency contracts | | $ | (10,726 | ) |
| | | | | | |
| 332 | | March 31, 2020 | | | Semiannual Report | | |
The average volume (based on the open positions at eachmonth-end) of derivative activity for the six months ended March 31, 2020:
| | | | | | | | | | | | | | | | | | | | | | | | | | | | | | | | | | | | |
| | | | | | |
| | | Options
Purchased
Contracts(1) | | | Options
Written
Contracts(1) | | | Forward Foreign
Currency
Contracts(2) | | | Futures
Contracts(1) | | | Credit Default
Swap
Agreements(3) | | | Total Return
Swap Agreements (3) | |
| | | Purchased | | | Sold | | | Long | | | Short | | | Buy | | | Sell | |
AllianzGI Retirement 2020 | | | — | | | | — | | | | — | | | | — | | | | 18 | | | | 22 | | | | — | | | | — | | | | — | |
AllianzGI Retirement 2025 | | | — | | | | — | | | | — | | | | — | | | | 23 | | | | 35 | | | | — | | | | — | | | | — | |
AllianzGI Retirement 2030 | | | — | | | | — | | | | — | | | | — | | | | 40 | | | | 43 | | | | — | | | | — | | | | — | |
AllianzGI Retirement 2035 | | | — | | | | — | | | | — | | | | — | | | | 38 | | | | 29 | | | | — | | | | — | | | | — | |
AllianzGI Retirement 2040 | | | — | | | | — | | | | — | | | | — | | | | 48 | | | | 26 | | | | — | | | | — | | | | — | |
AllianzGI Retirement 2045 | | | — | | | | — | | | | — | | | | — | | | | 33 | | | | 16 | | | | — | | | | — | | | | — | |
AllianzGI Retirement 2050 | | | — | | | | — | | | | — | | | | — | | | | 46 | | | | 22 | | | | — | | | | — | | | | — | |
AllianzGI Retirement 2055 | | | — | | | | — | | | | — | | | | — | | | | 23 | | | | 9 | | | | — | | | | — | | | | — | |
AllianzGI Multi Asset Income | | | — | | | | — | | | | — | | | | — | | | | 142 | | | | 38 | | | | — | | | | — | | | | — | |
AllianzGI Best Styles Global Equity | | | — | | | | — | | | | — | † | | | — | | | | — | | | | — | | | | — | | | | — | | | | — | |
AllianzGI Core Bond | | | — | | | | — | | | | — | | | | — | | | | 43 | | | | 16 | | | $ | 8,875 | | | $ | 8,948 | | | | — | |
AllianzGI Core Plus Bond | | | — | | | | — | | | | — | | | | — | | | | 61 | | | | 17 | | | | 19,542 | | | | 19,868 | | | | — | |
AllianzGI Emerging Markets SRI Debt | | | — | | | | — | | | $ | 815,716 | | | $ | 1,677,959 | | | | 5 | | | | 6 | | | | — | | | | — | | | | — | |
AllianzGI Floating Rate Note | | | — | | | | — | | | | 368,416 | | | | 2,475,415 | | | | 3 | | | | 23 | | | | — | | | | — | | | | — | |
AllianzGI Global Allocation | | | — | | | | — | | | | — | | | | — | | | | 673 | | | | 44 | | | | — | | | | — | | | | — | |
AllianzGI Global Dynamic Allocation | | | — | | | | — | | | | — | | | | 37 | | | | 757 | | | | 38 | | | | 13,948 | | | | 13,915 | | | $ | 3 | |
AllianzGI Global High Yield | | | — | | | | — | | | | 552,773 | | | | 5,578,962 | | | | — | | | | 17 | | | | — | | | | — | | | | — | |
AllianzGI Green Bond | | | — | | | | — | | | | 893,388 | | | | 15,366,273 | | | | 45 | | | | 18 | | | | — | | | | — | | | | — | |
AllianzGI InternationalSmall-Cap | | | — | | | | — | | | | — | | | | 58,095 | | | | — | | | | — | | | | — | | | | — | | | | — | |
AllianzGI PerformanceFee Managed Futures Strategy | | | — | | | | — | | | | — | | | | — | | | | 799 | | | | 685 | | | | 9,846 | | | | 9,614 | | | | — | |
AllianzGI PerformanceFee Structured US Equity | | | 6,384 | | | | (8,245 | ) | | | — | | | | — | | | | — | | | | — | | | | — | | | | — | | | | — | |
AllianzGI PerformanceFee Structured US Fixed Income | | | 175 | | | | (228 | ) | | | — | | | | — | | | | — | | | | — | | | | — | | | | — | | | | — | |
AllianzGI Preferred Securities and Income | | | — | | | | — | | | | — | | | | — | | | | 3 | | | | — | | | | 501 | | | | 474 | | | | — | |
AllianzGI Structured Return | | | 69,370 | | | | (78,785 | ) | | | — | | | | — | | | | — | | | | — | | | | — | | | | — | | | | — | |
AllianzGI U.S. Equity Hedged | | | 14 | | | | (6 | ) | | | — | | | | — | | | | — | | | | — | | | | — | | | | — | | | | — | |
| † | Fund had derivative activity during the period but it did not have open positions at anymonth-end in the period. |
| (2) | U.S. $ value on origination date |
| (3) | Notional amount (in thousands) |
The following tables present by counterparty, the Funds’ derivative assets and liabilities net of related collateral held by the Funds at March 31, 2020 which has not been offset in the Statements of Assets and Liabilities, but would be available for offset to the extent of a default by the counterparty to the transaction.
Financial Assets and Derivative Assets, and Collateral Received (Pledged) at March 31, 2020:
| | | | | | | | | | | | | | | | |
| | | | |
| AllianzGI Emerging Markets SRI Debt: | | | | | | | | | | | | |
| Gross Amounts Not Offset in the Statement of Assets and Liabilities | |
| Counterparty | | Gross Asset Derivatives
Presented in Statement of
Assets and Liabilities | | | Financial
Instrument/
Derivative
Offset | | | Cash
Collateral
Received | | | Net Amount | |
Foreign Currency Exchange Contracts | | | | | | | | | | | | | | | | |
JPMorgan Chase | | $ | 111,553 | | | $ | — | | | $ | — | | | $ | 111,553 | |
State Street Bank and Trust Co. | | | 84,225 | | | | (84,225 | ) | | | — | | | | — | |
Totals | | $ | 195,778 | | | $ | (84,225 | ) | | $ | — | | | $ | 111,553 | |
| | | | | | |
| | Semiannual Report | | | March 31, 2020 | | 333 |
Notes to Financial Statements (cont’d)
March 31, 2020 (unaudited)
| | | | | | | | | | | | | | | | |
| | | | |
| AllianzGI Floating Rate Note: | | | | | | | | | | | | |
| Gross Amounts Not Offset in the Statement of Assets and Liabilities | |
| Counterparty | | Gross Asset Derivatives
Presented in Statement of
Assets and Liabilities | | | Financial
Instrument/
Derivative
Offset | | | Cash
Collateral
Received | | | Net Amount | |
Foreign Currency Exchange Contracts | | | | | | | | | | | | | | | | |
Citibank N.A. | | $ | 48,146 | | | $ | — | | | $ | — | | | $ | 48,146 | |
| | | | | | | | | | | | | | | | |
| | | | |
| AllianzGI Global Dynamic Allocation: | | | | | | | | | | | | |
| Gross Amounts Not Offset in the Statement of Assets and Liabilities | |
| Counterparty | | Gross Asset Derivatives
Presented in Statement of
Assets and Liabilities | | | Financial
Instrument/
Derivative
Offset | | | Cash
Collateral
Received | | | Net Amount | |
Volatility Swaps | | | | | | | | | | | | | | | | |
UBS AG | | $ | 348,815 | | | $ | — | | | $ | — | | | $ | 348,815 | |
| | | | | | | | | | | | | | | | |
| | | | |
| AllianzGI Global High Yield: | | | | | | | | | | | | |
| Gross Amounts Not Offset in the Statement of Assets and Liabilities | |
| Counterparty | | Gross Asset Derivatives
Presented in Statement of
Assets and Liabilities | | | Financial
Instrument/
Derivative
Offset | | | Cash
Collateral
Received | | | Net Amount | |
Foreign Currency Exchange Contracts | | | | | | | | | | | | | | | | |
Goldman Sachs | | $ | 194,568 | | | $ | — | | | $ | — | | | $ | 194,568 | |
JPMorgan Chase | | | 8,815 | | | | (8,815 | ) | | | — | | | | — | |
Totals | | $ | 203,383 | | | $ | (8,815 | ) | | $ | — | | | $ | 194,568 | |
Financial Liabilities and Derivative Liabilities, and Collateral Received (Pledged) at March 31, 2020:
| | | | | | | | | | | | | | | | |
| | | | |
| AllianzGI Emerging Markets SRI Debt: | | | | | | | | | | | | |
| Gross Amounts Not Offset in the Statement of Assets and Liabilities | |
| Counterparty | | Gross Liability Derivatives
Presented in Statement of
Assets and Liabilities | | | Financial
Instrument/
Derivative
Offset | | | Cash
Collateral
Received
(Pledged) | | | Net Amount | |
Foreign Currency Exchange Contracts | | | | | | | | | | | | | | | | |
State Street Bank and Trust Co. | | $ | 87,188 | | | $ | (84,225 | ) | | $ | — | | | $ | 2,963 | |
| | | | | | | | | | | | | | | | |
| | | | |
| AllianzGI Global High Yield: | | | | | | | | | | | | |
| Gross Amounts Not Offset in the Statement of Assets and Liabilities | |
| Counterparty | | Gross Liability Derivatives
Presented in Statement of
Assets and Liabilities | | | Financial
Instrument/
Derivative
Offset | | | Cash
Collateral
Received
(Pledged) | | | Net Amount | |
Foreign Currency Exchange Contracts | | | | | | | | | | | | | | | | |
JPMorgan Chase | | $ | 17,448 | | | $ | (8,815 | ) | | $ | — | | | $ | 8,633 | |
| | | | | | | | | | | | | | | | |
| | | | |
| AllianzGI Green Bond: | | | | | | | | | | | | |
| Gross Amounts Not Offset in the Statement of Assets and Liabilities | |
| Counterparty | | Gross Liability Derivatives
Presented in Statement of
Assets and Liabilities | | | Financial
Instrument/
Derivative
Offset | | | Cash
Collateral
Received
(Pledged) | | | Net Amount | |
Foreign Currency Exchange Contracts | | | | | | | | | | | | | | | | |
State Street Bank London | | $ | 339,881 | | | $ | — | | | $ | — | | | $ | 339,881 | |
| | | | | | |
| 334 | | March 31, 2020 | | | Semiannual Report | | |
| 5. | INVESTMENT MANAGER/ADMINISTRATOR/DISTRIBUTOR FEES/DEFERRED COMPENSATION |
Investment Management Fee and Performance Fee.Each Fund has an Investment Management Agreement (for the purpose of this section, the “Agreement”) with the Investment Manager. Subject to the supervision of the Trust’s Board, the Investment Manager is responsible for managing, either directly or through others selected by it, each Fund’s investment activities, business affairs and administrative matters. Pursuant to the Agreement, the Investment Manager receives an annual fee, payable monthly (net of any fee waivers, reimbursements and recoupment), at an annual rate of each Fund’s average daily net assets (the “Investment Management Fee”). With respect to AllianzGI PerformanceFee Managed Futures Strategy, the Investment Manager also serves as investment manager to the Cayman Subsidiary pursuant to an investment management agreement. The Investment Manager does not receive a fee for its services to the Cayman Subsidiary.
Each of AllianzGI PerformanceFee Structured US Equity Fund, AllianzGI PerformanceFee Structured US Fixed Income Fund and AllianzGI PerformanceFee Managed Futures Strategy Fund, (together the “AllianzGI PerformanceFee Funds”) pays a monthly management fee (a “Management Fee”) to the Investment Manager in return for managing the investment activities of the Fund and the Fund’s business affairs and other administrative matters. For each AllianzGI PerformanceFee Fund, the Management Fee consists of two components: (i) a base fee (the “Base Fee”) calculated by applying a fixed advisory fee rate to the Fund’s average daily net assets during the previous month, and (ii) a positive or negative performance adjustment (the “Performance Adjustment”) calculated by applying a variable rate to the Fund’s average daily net assets during the applicable performance measurement period (the “Performance Period”). The Performance Period generally consists of the trailing twelve months. The Performance Adjustment is calculated monthly in arrears and is added to or subtracted from the Base Fee to determine the Management Fee. Because the Base Fee and Performance Adjustment are calculated with respect to the PerformanceFee Funds’ average daily net assets over two different time periods (the previous month for the Base Fee and the Performance Period for the Performance Adjustment), the effective Management Fee may be less than 0.0% or greater than the Base Fee plus the Maximum Performance Adjustment described below for certain periods (subject to any fee limitations and waivers described below).
With respect to AllianzGI PerformanceFee Managed Futures Strategy Fund, the Investment Manager’s Base Fee is calculated at an annualized rate of 0.75% of the Fund’s average daily net assets. The Management Fee is determined as the Base Fee plus or minus a Performance Adjustment that is based on whether, and to what extent, the investment performance of the Fund exceeds, or is exceeded by, the performance of the ICE BofA3-Month UST-Bill Index (the “Index “) plus 5.00% (the “Index Hurdle”) over the Performance Period. The Performance Adjustment is calculated using the performance of the Class P share class of the Fund (the “Measurement
Class”). The Performance Adjustment is calculated according to a schedule that adds or subtracts 0.0015% of the Fund’s average daily net assets for each 0.01% by which the performance of the Measurement Class exceeds or lags the performance of the Index Hurdle for the Performance Period. The maximum Performance Adjustment (positive or negative) will not exceed an annualized rate of +/- 0.75% (the “Maximum Performance Adjustment”) of the Fund’s average daily net assets over the full Performance Period, which would occur when the performance of the Measurement Class exceeds, or is exceeded by, the Index Hurdle by 5.00% for the Performance Period.
With respect to AllianzGI PerformanceFee Structured US Equity Fund, the Investment Manager’s Base Fee is calculated at an annualized rate of 0.60% of the Fund’s average daily net assets. The Management Fee is determined as the Base Fee plus or minus a Performance Adjustment that is based on whether, and to what extent, the investment performance of the Fund exceeds, or is exceeded by, the performance of the S&P 500 Index (the “Index”) plus 1.25% (the “Index Hurdle”) over the Performance Period. The Performance Adjustment is calculated using the performance of the Class P share class of the Fund (the “Measurement Class”). The Performance Adjustment is calculated according to a schedule that adds or subtracts 0.0048% of the Fund’s average daily net assets for each 0.01% by which the performance of the Measurement Class exceeds or lags the performance of the Index Hurdle during the Performance Period. The maximum Performance Adjustment (positive or negative) will not exceed an annualized rate of +/- 0.60% (the “Maximum Performance Adjustment”) of the Fund’s average daily net assets over the full Performance Period, which would occur when the performance of the Measurement Class exceeds, or is exceeded by, the Index Hurdle by 1.25% for the Performance Period.
With respect to AllianzGI PerformanceFee Structured US Fixed Income Fund, the Investment Manager’s Base Fee is calculated at an annualized rate of 0.30% of the Fund’s average daily net assets. The Management Fee is determined as the Base Fee plus or minus a Performance Adjustment that is based on whether, and to what extent, the investment performance of the Fund exceeds, or is exceeded by, the performance of the Bloomberg Barclays U.S. Aggregate Bond Index (the “Index”) plus 0.625% (the “Index Hurdle”) over the Performance Period. The Performance Adjustment is calculated using the performance of the Class P share class of the Fund (the “Measurement Class”). The Performance Adjustment is calculated according to a schedule that adds or subtracts 0.0048% of the Fund’s average daily net assets for each 0.01% by which the performance of the Measurement Class exceeds or lags the performance of the Index Hurdle during the Performance Period. The maximum Performance Adjustment (positive or negative) will not exceed an annualized rate of +/- 0.30% (the “Maximum Performance Adjustment”) of the Fund’s average daily net assets over the full Performance Period, which would occur when the performance of the Measurement Class exceeds, or is exceeded by, the Index Hurdle by 0.625% for the Performance Period.
| | | | | | |
| | Semiannual Report | | | March 31, 2020 | | 335 |
Notes to Financial Statements (cont’d)
March 31, 2020 (unaudited)
Administration Fee.The Investment Manager provides administrative services to the Target Funds and also bears the cost of most third-party administrative services required by the Target Funds,
and in return it receives from each share class of each Target Fund a monthly administration fee based on each share class’ average daily net assets (the “Administration Fee”).
The Investment Management Fee and Administration Fee for all outstanding share classes are charged at an annual rate as indicated in the following table:
| | | | | | | | | | | | | | | | | | | | | | | | |
| | | | | |
| | | | | | Class A,C
and R | | | Class P and
Administrative | | | Class R6 | | | Institutional
Class | |
| | | |
| | | Management
Fee | | | Effective
Management
Fee | | | Administration Fee | |
AllianzGI Retirement 2020 | | | 0.05 | % | | | 0.05 | % | | | 0.30 | % | | | 0.15 | % | | | 0.05 | % | | | N/A | |
AllianzGI Retirement 2025 | | | 0.05 | | | | 0.05 | | | | 0.30 | | | | 0.15 | | | | 0.05 | | | | N/A | |
AllianzGI Retirement 2030 | | | 0.05 | | | | 0.05 | | | | 0.30 | | | | 0.15 | | | | 0.05 | | | | N/A | |
AllianzGI Retirement 2035 | | | 0.05 | | | | 0.05 | | | | 0.30 | | | | 0.15 | | | | 0.05 | | | | N/A | |
AllianzGI Retirement 2040 | | | 0.05 | | | | 0.05 | | | | 0.30 | | | | 0.15 | | | | 0.05 | | | | N/A | |
AllianzGI Retirement 2045 | | | 0.05 | | | | 0.05 | | | | 0.30 | | | | 0.15 | | | | 0.05 | | | | N/A | |
AllianzGI Retirement 2050 | | | 0.05 | | | | 0.05 | | | | 0.30 | | | | 0.15 | | | | 0.05 | | | | N/A | |
AllianzGI Retirement 2055 | | | 0.05 | | | | 0.05 | | | | 0.30 | | | | 0.15 | | | | 0.05 | | | | N/A | |
AllianzGI Multi Asset Income | | | 0.05 | | | | 0.05 | | | | 0.30 | | | | 0.15 | | | | 0.05 | | | | 0.10 | % |
AllianzGI Best Styles Global Equity | | | 0.30 | | | | 0.30 | | | | N/A | | | | N/A | | | | N/A | | | | N/A | |
AllianzGI Best Styles U.S. Equity | | | 0.30 | | | | 0.30 | | | | N/A | | | | N/A | | | | N/A | | | | N/A | |
AllianzGI Convertible | | | 0.57 | | | | 0.57 | | | | N/A | | | | N/A | | | | N/A | | | | N/A | |
AllianzGI Core Bond | | | 0.25 | | | | 0.25 | | | | N/A | | | | N/A | | | | N/A | | | | N/A | |
AllianzGI Core Plus Bond | | | 0.30 | | | | 0.30 | | | | N/A | | | | N/A | | | | N/A | | | | N/A | |
AllianzGI Emerging Markets Consumer | | | 0.85 | | | | 0.85 | | | | N/A | | | | N/A | | | | N/A | | | | N/A | |
AllianzGI Emerging MarketsSmall-Cap | | | 1.20 | | | | 1.20 | | | | N/A | | | | N/A | | | | N/A | | | | N/A | |
AllianzGI Emerging Markets SRI Debt | | | 0.60 | | | | 0.60 | | | | N/A | | | | N/A | | | | N/A | | | | N/A | |
AllianzGI Emerging Markets Value | | | 0.85 | | | | 0.85 | | | | N/A | | | | N/A | | | | N/A | | | | N/A | |
AllianzGI Floating Rate Note | | | 0.20 | | | | 0.20 | | | | N/A | | | | N/A | | | | N/A | | | | N/A | |
AllianzGI Global Allocation | | | 0.70 | * | | | 0.25 | | | | N/A | | | | N/A | | | | N/A | | | | N/A | |
AllianzGI Global Dynamic Allocation | | | 0.70 | * | | | 0.57 | | | | N/A | | | | N/A | | | | N/A | | | | N/A | |
AllianzGI Global High Yield | | | 0.60 | | | | 0.60 | | | | N/A | | | | N/A | | | | N/A | | | | N/A | |
AllianzGI Global Sustainability | | | 0.80 | | | | 0.80 | | | | N/A | | | | N/A | | | | N/A | | | | N/A | |
AllianzGI Green Bond | | | 0.40 | | | | 0.40 | | | | N/A | | | | N/A | | | | N/A | | | | N/A | |
AllianzGI High Yield Bond | | | 0.48 | | | | 0.48 | | | | N/A | | | | N/A | | | | N/A | | | | N/A | |
AllianzGI InternationalSmall-Cap | | | 1.00 | | | | 1.00 | | | | N/A | | | | N/A | | | | N/A | | | | N/A | |
AllianzGI Micro Cap | | | 1.05 | | | | 1.05 | | | | N/A | | | | N/A | | | | N/A | | | | N/A | |
AllianzGI PerformanceFee Managed Futures Strategy | | | 0.75 | *# | | | 0.15 | | | | N/A | | | | N/A | | | | N/A | | | | N/A | |
AllianzGI PerformanceFee Structured US Equity | | | 0.60 | *@ | | | 0.75 | | | | N/A | | | | N/A | | | | N/A | | | | N/A | |
AllianzGI PerformanceFee Structured US Fixed Income | | | 0.30 | *^ | | | 0.39 | | | | N/A | | | | N/A | | | | N/A | | | | N/A | |
AllianzGI Preferred Securities and Income | | | 0.45 | | | | 0.45 | | | | N/A | | | | N/A | | | | N/A | | | | N/A | |
AllianzGI Short Duration High Income | | | 0.48 | | | | 0.48 | | | | N/A | | | | N/A | | | | N/A | | | | N/A | |
AllianzGI Short Term Bond | | | 0.30 | | | | 0.30 | | | | N/A | | | | N/A | | | | N/A | | | | N/A | |
AllianzGI Structured Return | | | 0.60 | | | | 0.60 | | | | N/A | | | | N/A | | | | N/A | | | | N/A | |
AllianzGI U.S. Equity Hedged | | | 0.70 | | | | 0.70 | | | | N/A | | | | N/A | | | | N/A | | | | N/A | |
AllianzGI Ultra Micro Cap | | | 1.10 | | | | 1.10 | | | | N/A | | | | N/A | | | | N/A | | | | N/A | |
AllianzGI Water | | | 0.95 | | | | 0.95 | | | | N/A | | | | N/A | | | | N/A | | | | N/A | |
| * | See Note 6 for management fee waivers. |
| # | The management fee consists of a base fee at an annualized rate of 0.75% of the Fund’s average daily net assets, subject to a positive or negative performance adjustment of up to 0.75% based on the Fund’s performance relative to the ICE BofA3-Month UST-Bill Index plus 5.00% (annualized). |
| @ | The management fee consists of a base fee at an annualized rate of 0.60% of the Fund’s average daily net assets, subject to a positive or negative performance adjustment of up to 0.60% based on the Fund’s performance relative to the S&P 500 Index plus 1.25% (annualized). |
| ^ | The management fee consists of a base fee at an annualized rate of 0.30% of the Fund’s average daily net assets, subject to a positive or negative performance adjustment of up to 0.30% based on the Fund’s performance relative to the Bloomberg Barclays U.S. Aggregate Bond Index plus 0.625% (annualized). |
| | | | | | |
| 336 | | March 31, 2020 | | | Semiannual Report | | |
Distribution and Servicing Fees.Allianz Global Investors Distributors LLC (the “Distributor”), an affiliate of the of the Investment Manager serves as the distributor of the Funds’ shares pursuant to separate Distribution Servicing Plans for Class A, C and R. The Distributor, for each of the Funds, receives (i) servicing fees of 0.25% of the average daily net assets of each of Class A, C and R in connection with services rendered to shareholders of each class and the maintenance of shareholder accounts, and (ii) distribution fees of 0.75% of the average daily net assets of Class C (with the exception for AllianzGI Short Duration High Income which is 0.25%) and 0.25% of average daily net assets of Class R in connection with the distribution of Class C and R shares.
Pursuant to the Distribution and Servicing Plans adopted by the A, C and R classes, the Funds compensate the Distributor for services provided and expenses incurred in connection with assistance rendered in the sale of shares and services rendered to shareholders and for maintenance of shareholder accounts.
Pursuant to the Distribution Plan for the Administrative Class shares, the Funds are permitted to reimburse the Distributor out of the Administrative Class’ assets of each Fund offering Administrative Class shares, in an amount up to 0.25% on an annual basis of the average net assets of the Administrative Class, for payments made to financial intermediaries that provide services in connection with the distribution of shares or administration plans or programs that use fund shares as their funding medium. Unreimbursed costs may be carried forward for reimbursement for up to twelve months beyond the date in which they are incurred, subject always to the limit that no more than 0.25% of the average daily net assets attributable to the Administrative Class may be expensed.
The Distributor also receives the proceeds of the initial sales charges paid by the shareholders upon the purchase of Class A shares and contingent deferred sales charges (“CDSC”) paid by the shareholders upon certain redemptions of Class A and C shares. For the six months ended March 31, 2020, the Distributor received $198,057, representing commissions (sales charges) and CDSC from the Funds.
Deferred Compensation.The Trustees do not currently receive any pension or retirement benefits from the Trust. In calendar year 2018 and certain prior periods, the Trust maintained a deferred compensation plan pursuant to which each Independent Trustee had the opportunity to elect not to receive all or a portion of his or her fees from the Trust on a current basis, but instead to receive in a subsequent period chosen by the Trustee an amount equal to the value of such compensation if such compensation had been invested in one or more series of Allianz Funds or the Trust selected by the Trustees from and after the normal payment dates for such compensation. The deferred compensation program was closed to new deferrals effective January 1, 2019, and all Trustee fees earned with respect to service in calendar year 2019 and beyond have been or will be paid in cash, on a current basis, unless the Board of Trustees of the Allianz-Sponsored Funds reopens the program to new deferrals. Allianz Funds and the Trust still have obligations with respect to Trustee fees deferred in 2018 and in prior periods, and will continue to have such obligations until all deferred Trustee fees are paid out pursuant to the terms of the deferred compensation plan.
| 6. | EXPENSE LIMITATION/MANAGEMENT FEE WAIVER AND RECOUPMENT |
The Trust and the Investment Manager have entered into Expense Limitation and Management Fee Waiver Agreements as indicated below:
| | | | | | | | | | | | | | | | | | | | | | | | | | | | | | | | |
| | |
| | | | | | Expense Limitation | |
| | | | | | | | |
| | | Management
Fee Waiver | | | Class A | | | Class C | | | Class R | | | Class P | | | Institutional
Class | | | Class R6 | | | Administrative
Class | |
AllianzGI Retirement 2020(3) | | | N/A | | | | 0.95 | % | | | 1.70 | % | | | 1.30 | % | | | 0.65 | % | | | N/A | | | | 0.55 | %* | | | 0.90 | % |
AllianzGI Retirement 2025(3) | | | N/A | | | | 0.95 | | | | N/A | | | | 1.30 | | | | 0.65 | | | | N/A | | | | 0.55 | * | | | 0.90 | |
AllianzGI Retirement 2030(3) | | | N/A | | | | 0.95 | | | | 1.70 | | | | 1.30 | | | | 0.65 | * | | | N/A | | | | 0.55 | * | | | 0.90 | |
AllianzGI Retirement 2035(3) | | | N/A | | | | 0.95 | | | | N/A | | | | 1.30 | | | | 0.65 | | | | N/A | | | | 0.55 | * | | | 0.90 | |
AllianzGI Retirement 2040(3) | | | N/A | | | | 0.95 | | | | 1.70 | | | | 1.30 | | | | 0.65 | | | | N/A | | | | 0.55 | * | | | 0.90 | |
AllianzGI Retirement 2045(3) | | | N/A | | | | 0.95 | | | | N/A | | | | 1.30 | | | | 0.65 | | | | N/A | | | | 0.55 | * | | | 0.90 | |
AllianzGI Retirement 2050(3) | | | N/A | | | | 0.95 | | | | 1.70 | | | | 1.30 | | | | 0.65 | | | | N/A | | | | 0.55 | | | | 0.90 | |
AllianzGI Retirement 2055(3) | | | N/A | | | | 0.95 | | | | N/A | | | | 1.30 | | | | 0.65 | | | | N/A | | | | 0.55 | | | | 0.90 | |
AllianzGI Multi Asset Income(3) | | | N/A | | | | 0.95 | | | | 1.70 | | | | 1.30 | | | | 0.65 | | | | 0.60 | % | | | 0.55 | | | | 0.90 | |
AllianzGI Best Styles Global Equity(5) | | | N/A | | | | 0.70 | | | | 1.40 | | | | N/A | | | | 0.50 | | | | 0.40 | | | | 0.40 | | | | N/A | |
AllianzGI Best Styles U.S. Equity(5) | | | N/A | | | | 0.65 | | | | 1.40 | | | | N/A | | | | 0.50 | | | | 0.40 | | | | 0.40 | | | | N/A | |
AllianzGI Convertible(5) | | | N/A | | | | 0.96 | | | | 1.73 | | | | 1.17 | | | | 0.74 | | | | 0.71 | | | | N/A | | | | 0.93 | |
AllianzGI Core Bond(6) | | | N/A | | | | N/A | | | | N/A | | | | N/A | | | | 0.30 | | | | 0.25 | | | | 0.20 | | | | N/A | |
AllianzGI Core Plus Bond(6) | | | N/A | | | | N/A | | | | N/A | | | | N/A | | | | 0.35 | | | | 0.30 | | | | 0.25 | | | | N/A | |
AllianzGI Emerging Markets Consumer(5) | | | N/A | | | | 1.39 | | | | N/A | | | | N/A | | | | N/A | | | | 1.05 | | | | N/A | | | | N/A | |
AllianzGI Emerging MarketsSmall-Cap(5) | | | N/A | | | | 1.80 | | | | N/A | | | | N/A | | | | N/A | | | | 1.50 | | | | N/A | | | | N/A | |
| | | | | | |
| | Semiannual Report | | | March 31, 2020 | | 337 |
Notes to Financial Statements (cont’d)
March 31, 2020 (unaudited)
| | | | | | | | | | | | | | | | | | | | | | | | | | | | | | | | |
| | |
| | | | | | Expense Limitation | |
| | | | | | | | |
| | | Management
Fee Waiver | | | Class A | | | Class C | | | Class R | | | Class P | | | Institutional
Class | | | Class R6 | | | Administrative
Class | |
AllianzGI Emerging Markets SRI Debt(5) | | | N/A | | | | 1.05 | % | | | 1.80 | % | | | N/A | | | | 0.90 | % | | | 0.80 | % | | | N/A | | | | N/A | |
AllianzGI Emerging Markets Value(5) | | | N/A | | | | 1.14 | | | | 1.89 | | | | N/A | | | | 0.98 | | | | 0.89 | | | | N/A | | | | N/A | |
AllianzGI Floating Rate Note(5) | | | N/A | | | | N/A | | | | N/A | | | | N/A | | | | 0.40 | | | | 0.30 | | | | N/A | | | | N/A | |
AllianzGI Global Allocation(4) | | | 0.55 | %(1) | | | 1.01 | | | | 1.76 | | | | 1.21 | % | | | 0.81 | | | | 0.74 | | | | 0.71 | % | | | 0.96 | % |
AllianzGI Global Dynamic Allocation(4) | | | 0.55 | (1) | | | 1.01 | | | | 1.78 | | | | 1.38 | | | | 0.84 | | | | 0.74 | | | | 0.74 | | | | 0.99 | |
AllianzGI Global High Yield(5) | | | N/A | | | | N/A | | | | N/A | | | | N/A | | | | 0.80 | | | | 0.70 | | | | N/A | | | | N/A | |
AllianzGI Global Sustainability(5) | | | N/A | | | | 0.94 | | | | N/A | | | | N/A | | | | 0.79 | | | | 0.69 | | | | N/A | | | | N/A | |
AllianzGI Green Bond(6) | | | N/A | | | | 0.75 | | | | N/A | | | | N/A | | | | 0.55 | | | | 0.50 | | | | N/A | | | | N/A | |
AllianzGI High Yield Bond | | | N/A | | | | N/A | | | | N/A | | | | N/A | | | | N/A | | | | N/A | | | | N/A | | | | N/A | |
AllianzGI InternationalSmall-Cap(5) | | | N/A | | | | 1.25 | | | | 2.00 | | | | 1.59 | | | | 1.10 | | | | 1.04 | | | | 1.00 | | | | N/A | |
AllianzGI Micro Cap(5) | | | N/A | | | | 1.42 | | | | N/A | | | | N/A | | | | 1.34 | | | | 1.34 | | | | N/A | | | | N/A | |
AllianzGI PerformanceFee Managed Futures Strategy(7) | | | (2 | ) | | | N/A | | | | N/A | | | | N/A | | | | 0.19 | | | | 0.14 | | | | 0.09 | | | | N/A | |
AllianzGI PerformanceFee Structured US Equity(7) | | | (2 | ) | | | N/A | | | | N/A | | | | N/A | | | | 0.00 | | | | 0.00 | | | | 0.00 | | | | N/A | |
AllianzGI PerformanceFee Structured US Fixed Income(7) | | | (2 | ) | | | N/A | | | | N/A | | | | N/A | | | | 0.00 | | | | 0.00 | | | | 0.00 | | | | N/A | |
AllianzGI Preferred Securities and Income(6) | | | N/A | | | | N/A | | | | N/A | | | | N/A | | | | 0.60 | | | | 0.55 | | | | 0.50 | | | | N/A | |
AllianzGI Short Duration High Income(5) | | | N/A | | | | 0.86 | | | | 1.11 | | | | N/A | | | | 0.65 | | | | 0.60 | | | | 0.55 | | | | N/A | |
AllianzGI Short Term Bond(6) | | | N/A | | | | 0.64 | | | | N/A | | | | N/A | | | | 0.49 | | | | 0.39 | | | | N/A | | | | N/A | |
AllianzGI Structured Return(8) | | | N/A | | | | 1.01 | | | | 1.77 | | | | N/A | | | | 0.78 | | | | 0.73 | | | | 0.70 | | | | N/A | |
AllianzGI U.S. Equity Hedged(8) | | | N/A | | | | 1.25 | | | | 2.00 | | | | N/A | | | | 1.10 | | | | 1.00 | | | | N/A | | | | N/A | |
AllianzGI Ultra Micro Cap(5) | | | N/A | | | | 1.56 | | | | N/A | | | | N/A | | | | 1.52 | | | | 1.49 | | | | N/A | | | | N/A | |
AllianzGI Water(5) | | | N/A | | | | 1.22 | | | | 1.97 | | | | N/A | | | | 0.94 | | | | 0.93 | | | | N/A | | | | N/A | |
| (1) | The Investment Manager has contractually agreed to irrevocably waive a portion of its management fee equal to 0.55% of the average daily net assets of each applicable Fund that are attributable to investments in Underlying Funds. This waiver with respect to investments in Underlying Funds for which the Investment Manager or an affiliated person thereof serves as investment adviser, is terminable only by the Board of Trustees of the Trust, and the waiver with respect to investments in unaffiliated Underlying Funds will continue through at least January 31, 2021. |
| (2) | The Investment Manager has agreed to waivers with respect to each AllianzGI PerformanceFee Fund such that (i) its monthly Management Fee (including Base Fee plus Performance Adjustment) will not exceed the product of the maximum percentage fee rate (equal to the Base Fee plus the maximum upward Performance Adjustment) and the Fund’s average daily net assets over the preceding month, and (ii) the Investment Manager will not collect a Management Fee with respect to any month in which the Measurement Class has failed to outperform the Index. |
| (3) | The Investment Manager has contractually agreed, until January 31, 2021, to irrevocably waive its management and administrative fees and reimburse any additional Other Expenses or Acquired Fund Fees and Expenses, to the extent that Total Annual Fund Operating Expenses after Expense Reductions, excluding, interest, taxes, and extraordinary expenses, exceed the rates noted in the table above based on the Fund’s average net assets attributable to each share class. Under the Expense Limitation Agreement, the Investment Manager may recoup waived or reimbursed amounts for three years, provided total expenses, including such recoupment, do not exceed the annual expense limit in effect at the time of such waiver or reimbursement. The Expense Limitation Agreement is terminable by the Trust or by mutual agreement of the parties. |
| (4) | The Investment Manager has contractually agreed, until January 31, 2021, to irrevocably waive its management fee, or reimburse the Fund, to the extent that, after the application of the fee waiver described in footnote (1) above, Total Annual Fund Operating Expenses, including Acquired Fund Fees and Expenses, but excluding interest, tax, and extraordinary expenses, and certain credits and other expenses, exceed the rates noted in the table above based on the Fund’s average net assets attributable to each share class. Under the Expense Limitation Agreement, the Investment Manager may recoup waived or reimbursed amounts for three years, provided total expenses, including such recoupment, do not exceed the annual expense limit in effect at the time of such waiver/reimbursement or recoupment. The Expense Limitation Agreement is terminable by the Trust or by mutual agreement of the parties. |
| (5) | The Investment Manager has contractually agreed to irrevocably waive its management fee and/or reimburse the Fund through January 31, 2021, to the extent that Total Annual Fund Operating Expenses, excluding interest, tax, and extraordinary expenses, and certain credits and other expenses, exceed the rates noted in the table above based on the Fund’s average net assets attributable to each share class. Under the Expense Limitation Agreement, the Investment Manager may recoup waived or reimbursed amounts for three years, provided total expenses, including such recoupment, do not exceed the annual expense limit in effect at the time of such waiver/reimbursement or recoupment. The Expense Limitation Agreement is terminable by the Trust by mutual agreement of the parties. |
| (6) | The Investment Manager has contractually agreed to irrevocably waive its management fee and/or reimburse the Fund through January 31, 2022 to the extent that Total Annual Fund Operating Expenses excluding interest, tax, and extraordinary expenses, and certain credits and other expenses, exceed the rates noted in the table above based upon the Fund’s average net assets attributable to each share class. Under the Expense Limitation Agreement, the Investment Manager may recoup waived or reimbursed amounts for three years, provided total expenses, including such recoupment, do not exceed the annual expense limit in effect at the time of such waiver/reimbursement or recoupment. The Expense Limitation Agreement is terminable by the Trust or by mutual agreement of the parties. |
| (7) | Effective February 1, 2020, the Investment Manager has contractually agreed to irrevocably waive its management fee and/or reimburse the Fund through January 31, 2021 to the extent that Other Expenses, excluding interest, tax, and extraordinary expenses, Acquired Fund Fees and Expenses, and certain credits and other expenses, exceed the rates noted in the table above based on the Fund’s average net assets attributable to each share class. The Expense Limitation Agreement is terminable by the Trust or by mutual agreement of the parties. |
| (8) | The Investment Manager has contractually agreed to irrevocably waive its management fee and/or reimburse the Fund through January 31, 2021 to the extent that Total Annual Fund Operating Expenses excluding interest, tax, and extraordinary expenses, Acquired Fund Fees and Expenses, and certain credits and other expenses exceed the rates noted in the table above based upon the Fund’s average net assets attributable to each share class. Under the Expense Limitation Agreement, the Investment Manager may recoup waived or reimbursed amounts for three years, provided total expenses, including such recoupment, do not exceed the annual expense limit in effect at the time of such waiver/reimbursement or recoupment. The Expense Limitation Agreement is terminable by the Trust or by mutual agreement of the parties. |
| * | As a result of reimbursing expenses inclusive of acquired fund fees and expenses, the Investment Manager reimbursed amounts in excess of the respective share class’ operating expenses. The aggregate excess reimbursement of each share class is accounted for as “Contribution from Investment Manager” on the Statements of Operations. |
| | | | | | |
| 338 | | March 31, 2020 | | | Semiannual Report | | |
The following Funds revised their expense limitation rates during the six months ended March 31, 2020. The expense limitation rates in effect during the period (except as noted in the tables below) and at March 31, 2020 for all the Funds are disclosed in the table above. In January, the Board approved (i) new expense limitation arrangements for AllianzGI Convertible Fund and AllianzGI Short Duration High Income Fund and (ii) revised expense limits for AllianzGI Emerging Markets Consumer Fund, AllianzGI Emerging Markets Small-Cap Fund, AllianzGI Global Allocation Fund, AllianzGI Global Dynamic Allocation Fund, AllianzGI Global Sustainability Fund and AllianzGI Structured Return Fund.
| | | | | | | | | | | | | | | | | | | | | | | | | | | | |
| |
| | | Expense Limitation (10/1/19 - 1/31/20) | |
| | | | | | | |
| | | Class A | | | Class C | | | Class R | | | Class P | | | Institutional Class | | | Class R6 | | | Administrative Class | |
AllianzGI Convertible | | | N/A | | | | N/A | | | | N/A | | | | N/A | | | | N/A | | | | N/A | | | | N/A | |
AllianzGI Emerging Markets Consumer | | | 1.40 | % | | | N/A | | | | N/A | | | | N/A | | | | 1.05 | % | | | N/A | | | | N/A | |
AllianzGI Emerging MarketsSmall-Cap | | | 1.85 | | | | N/A | | | | N/A | | | | N/A | | | | 1.50 | | | | N/A | | | | N/A | |
AllianzGI Global Allocation | | | 1.01 | | | | 1.76 | % | | | 1.21 | % | | | 0.81 | % | | | 0.76 | | | | 0.71 | % | | | 0.96 | % |
AllianzGI Global Dynamic Allocation | | | 0.97 | | | | 1.74 | | | | 1.34 | | | | 0.80 | | | | 0.70 | | | | 0.70 | | | | 0.95 | |
AllianzGI Global Sustainability | | | 1.09 | | | | N/A | | | | N/A | | | | 0.94 | | | | 0.84 | | | | N/A | | | | N/A | |
AllianzGI Short Duration High Income | | | N/A | | | | N/A | | | | N/A | | | | N/A | | | | N/A | | | | N/A | | | | N/A | |
AllianzGI Structured Return | | | 1.00 | | | | 1.75 | | | | N/A | | | | 0.79 | | | | 0.71 | | | | 0.69 | | | | N/A | |
The Investment Manager, per the expense limitation agreements, may recoup waived/reimbursed amounts for a period of up to three years, provided total expenses, including such recoupment, do not exceed the annual expense limit in effect at the time of such waiver/reimbursement. During the period or six months ended March 31, 2020, the Investment Manager recouped a total of $5,739 from the Funds as disclosed on the Statements of Operations. The following represents the amounts that still can be recouped by the Investment Manager as of March 31, 2020.
| | | | | | | | | | | | | | | | |
| |
| | | Unrecouped Expenses Waived/Reimbursed through | |
| |
| | | Fiscal Period or Year ended | |
| | | | |
| | | 9/30/2017 | | | 9/30/2018 | | | 9/30/2019 | | | Totals | |
AllianzGI Retirement 2020 | | $ | 88,906 | | | $ | 80,682 | | | $ | 37,741 | | | $ | 207,329 | |
AllianzGI Retirement 2025 | | | 116,776 | | | | 122,969 | | | | 72,001 | | | | 311,746 | |
AllianzGI Retirement 2030 | | | 123,768 | | | | 142,601 | | | | 94,383 | | | | 360,752 | |
AllianzGI Retirement 2035 | | | 63,406 | | | | 73,903 | | | | 43,247 | | | | 180,556 | |
AllianzGI Retirement 2040 | | | 25,645 | | | | 39,583 | | | | 20,978 | | | | 86,206 | |
AllianzGI Retirement 2045 | | | 7,838 | | | | 15,532 | | | | 5,257 | | | | 28,627 | |
AllianzGI Retirement 2050 | | | 3,702 | | | | 7,609 | | | | 3,289 | | | | 14,600 | |
AllianzGI Retirement 2055 | | | 1,560 | | | | 2,851 | | | | 1,438 | | | | 5,849 | |
AllianzGI Multi Asset Income | | | 89,948 | | | | 79,551 | | | | 42,135 | | | | 211,634 | |
AllianzGI Best Styles Global Equity | | | 222,208 | | | | 129,151 | | | | 4,556 | | | | 355,915 | |
AllianzGI Best Styles U.S. Equity | | | 174,158 | | | | 119,713 | | | | 168,885 | | | | 462,756 | |
AllianzGI Core Bond | | | — | | | | 175,017 | | | | 305,308 | | | | 480,325 | |
AllianzGI Core Plus Bond | | | — | | | | 180,862 | | | | 292,997 | | | | 473,859 | |
AllianzGI Emerging Markets Consumer | | | 185,526 | | | | 82,270 | | | | 104,650 | | | | 372,446 | |
AllianzGI Emerging MarketsSmall-Cap | | | 251,209 | | | | 172,437 | | | | 122,389 | | | | 546,035 | |
AllianzGI Emerging Markets SRI Debt | | | 162,523 | | | | 187,669 | | | | 186,500 | | | | 536,692 | |
AllianzGI Emerging Markets Value | | | 548,032 | | | | 377,554 | | | | 488,650 | | | | 1,414,236 | |
AllianzGI Floating Rate Note | | | — | | | | 278,716 | | | | 192,419 | | | | 471,135 | |
AllianzGI Global Allocation | | | 8,935 | | | | — | | | | 4,732 | | | | 13,667 | |
AllianzGI Global Dynamic Allocation | | | 650,337 | | | | 457,777 | | | | 535,503 | | | | 1,643,617 | |
AllianzGI Global High Yield | | | 236,455 | | | | 236,908 | | | | 96,205 | | | | 569,568 | |
AllianzGI Global Sustainability | | | 175,647 | | | | 139,780 | | | | 186,454 | | | | 501,881 | |
AllianzGI Green Bond | | | — | | | | — | | | | 301,543 | | | | 301,543 | |
AllianzGI InternationalSmall-Cap | | | 279,258 | | | | 190,541 | | | | 530,473 | | | | 1,000,272 | |
AllianzGI Micro Cap | | | 137,352 | | | | 133,846 | | | | 170,230 | | | | 441,428 | |
| | | | | | |
| | Semiannual Report | | | March 31, 2020 | | 339 |
Notes to Financial Statements (cont’d)
March 31, 2020 (unaudited)
| | | | | | | | | | | | | | | | |
| |
| | | Unrecouped Expenses Waived/Reimbursed through | |
| |
| | | Fiscal Period or Year ended | |
| | | | |
| | | 9/30/2017 | | | 9/30/2018 | | | 9/30/2019 | | | Totals | |
AllianzGI Preferred Securities and Income | | $ | — | | | $ | 151,931 | | | $ | 223,469 | | | $ | 375,400 | |
AllianzGI Short Term Bond | | | — | | | | 128,601 | | | | 262,202 | | | | 390,803 | |
AllianzGI Structured Return | | | 409,881 | | | | 296,728 | | | | 413,146 | | | | 1,119,755 | |
AllianzGI U.S. Equity Hedged | | | 193,599 | | | | 160,089 | | | | 197,160 | | | | 550,848 | |
AllianzGI Ultra Micro Cap | | | — | | | | 89,364 | | | | 122,669 | | | | 212,033 | |
AllianzGI Water | | | — | | | | — | | | | 767,632 | | | | 767,632 | |
| 7. | RELATED PARTY TRANSACTIONS |
The Investment Manager and the Distributor are related parties. Fees payable to these parties are disclosed in Note 5 and Note 6 and the accrued related party fee and receivable amounts are disclosed on the Statements of Assets and Liabilities.
(a) Payments from Affiliates
During the six months ended March 31, 2020, AllianzGI U.S. reimbursed AllianzGI Core Bond Fund $313 for realized losses resulting from trading errors.
During the year ended September 30, 2019, AllianzGI U.S. reimbursed AllianzGI Global Allocation Fund $36,174 for realized losses resulting from trading errors.
(b) Affiliated Transactions
The following tables show the transactions in and earnings from affiliates for the six months ended March 31, 2020:
| | | | | | | | | | | | | | | | | | | | | | | | | | | | | | | | | | | | |
|
| AllianzGI Retirement 2020: | |
| | | Market
Value
9/30/2019 | | | Purchases
at Cost | | | Proceeds
from Sales | | | Change in
Unrealized
Appreciation
(Depreciation) | | | Market
Value
3/31/2020 | | | Dividend
Income | | | Shares
as of
3/31/2020 | | | Net
Realized
Gain (Loss) | | | Net Capital
Gain
Distributions
Received | |
AllianzGI Advanced Core Bond | | $ | 3,309,016 | | | $ | 1,035,758 | | | $ | 4,303,713 | | | $ | (137,575 | ) | | | — | | | $ | 65,358 | | | | — | | | $ | 96,514 | | | | — | |
AllianzGI Best Styles U.S. Equity | | | 287,860 | | | | 373,461 | | | | 761,638 | | | | (46,441 | ) | | | — | | | | — | | | | — | | | | 146,758 | | | | — | |
AllianzGI Core Bond Fund | | | — | | | | 3,733,760 | | | | 410,239 | | | | 12,235 | | | $ | 3,317,950 | | | | 15,789 | | | | 214,893 | | | | (17,806 | ) | | | — | |
AllianzGI Emerging MarketsSmall-Cap | | | 89,979 | | | | 20,377 | | | | 21,649 | | | | (23,907 | ) | | | 69,530 | | | | 3,458 | | | | 5,877 | | | | 4,730 | | | | — | |
AllianzGI Emerging Markets SRI Debt | | | 155,057 | | | | 153,723 | | | | 312,607 | | | | (2,876 | ) | | | — | | | | 1,542 | | | | — | | | | 6,703 | | | | — | |
AllianzGI Global Dynamic Allocation | | | 11,605,860 | | | | 5,387,938 | | | | 7,921,316 | | | | (1,694,912 | ) | | | 7,984,568 | | | | 395,999 | | | | 508,247 | | | | 606,998 | | | $ | 696,959 | |
AllianzGI Short Duration High Income | | | 246,357 | | | | 46,212 | | | | 297,861 | | | | (3,826 | ) | | | — | | | | — | | | | — | | | | 9,118 | | | | — | |
Totals | | $ | 15,694,129 | | | $ | 10,751,229 | | | $ | 14,029,023 | | | $ | (1,897,302 | ) | | $ | 11,372,048 | | | $ | 482,146 | | | | 729,017 | | | $ | 853,015 | | | $ | 696,959 | |
| | | | | | |
| 340 | | March 31, 2020 | | | Semiannual Report | | |
| | | | | | | | | | | | | | | | | | | | | | | | | | | | | | | | | | | | |
|
| AllianzGI Retirement 2025: | |
| | | Market
Value
9/30/2019 | | | Purchases
at Cost | | | Proceeds
from Sales | | | Change in
Unrealized
Appreciation
(Depreciation) | | | Market
Value
3/31/2020 | | | Dividend
Income | | | Shares
as of
3/31/2020 | | | Net
Realized
Gain (Loss) | | | Net Capital
Gain
Distributions
Received | |
AllianzGI Advanced Core Bond | | $ | 1,755,627 | | | $ | 311,061 | | | $ | 2,069,634 | | | $ | (100,228 | ) | | | — | | | $ | 25,191 | | | | — | | | $ | 103,174 | | | | — | |
AllianzGI Best Styles U.S. Equity | | | 1,268,041 | | | | 745,981 | | | | 2,236,017 | | | | (138,140 | ) | | | — | | | | — | | | | — | | | | 360,135 | | | | — | |
AllianzGI Core Bond Fund | | | — | | | | 894,625 | | | | 224,254 | | | | 1,791 | | | $ | 663,003 | | | | 3,515 | | | | 42,941 | | | | (9,159 | ) | | | — | |
AllianzGI Emerging MarketsSmall-Cap | | | 127,301 | | | | 23,058 | | | | 22,296 | | | | (33,823 | ) | | | 98,371 | | | | 4,892 | | | | 8,315 | | | | 4,131 | | | | — | |
AllianzGI Emerging Markets SRI Debt | | | 104,294 | | | | 102,243 | | | | 206,837 | | | | (2,051 | ) | | | — | | | | — | | | | — | | | | 2,351 | | | | — | |
AllianzGI Global Dynamic Allocation | | | 19,901,976 | | | | 8,020,785 | | | | 10,692,185 | | | | (3,252,085 | ) | | | 14,861,966 | | | | 643,950 | | | | 946,020 | | | | 883,475 | | | $ | 1,133,354 | |
AllianzGI Short Duration High Income | | | — | | | | 148,201 | | | | 143,817 | | | | — | | | | — | | | | — | | | | — | | | | (4,384 | ) | | | — | |
Totals | | $ | 23,157,239 | | | $ | 10,245,954 | | | $ | 15,595,040 | | | $ | (3,524,536 | ) | | $ | 15,623,340 | | | $ | 677,548 | | | | 997,276 | | | $ | 1,339,723 | | | $ | 1,133,354 | |
| | | | | | | | | | | | | | | | | | | | | | | | | | | | | | | | | | | | |
|
| AllianzGI Retirement 2030: | |
| | | Market
Value
9/30/2019 | | | Purchases
at Cost | | | Proceeds
from Sales | | | Change in
Unrealized
Appreciation
(Depreciation) | | | Market
Value
3/31/2020 | | | Dividend
Income | | | Shares
as of
3/31/2020 | | | Net
Realized
Gain (Loss) | | | Net Capital
Gain
Distributions
Received | |
AllianzGI Advanced Core Bond | | $ | 891,741 | | | $ | 667,852 | | | $ | 1,601,851 | | | $ | (56,960 | ) | | | — | | | | — | | | | — | | | $ | 99,218 | | | | — | |
AllianzGI Best Styles Global Equity | | | — | | | | 811,016 | | | | 354,700 | | | | — | | | | — | | | | — | | | | — | | | | (456,316 | ) | | | — | |
AllianzGI Best Styles Global Managed Volatility | | | — | | | | 540,076 | | | | 89,932 | | | | (83,666 | ) | | $ | 367,183 | | | $ | 9,927 | | | | 27,422 | | | | 705 | | | $ | 11,222 | |
AllianzGI Best Styles U.S. Equity | | | 3,262,679 | | | | 1,882,142 | | | | 4,261,509 | | | | (681,523 | ) | | | 687,967 | | | | 37,519 | | | | 63,701 | | | | 486,178 | | | | 237,323 | |
AllianzGI Emerging MarketsSmall-Cap | | | 360,141 | | | | 46,428 | | | | 409,430 | | | | (17,060 | ) | | | — | | | | 5,224 | | | | — | | | | 19,921 | | | | — | |
AllianzGI Global Dynamic Allocation | | | 28,315,735 | | | | 12,185,309 | | | | 16,825,286 | | | | (4,336,976 | ) | | | 20,072,511 | | | | 918,046 | | | | 1,277,690 | | | | 733,729 | | | | 1,615,764 | |
AllianzGI GlobalSmall-Cap Opportunities | | | — | | | | 175,637 | | | | 48,441 | | | | (39,666 | ) | | | 88,340 | | | | 2,707 | | | | 7,570 | | | | 810 | | | | — | |
AllianzGI International Growth | | | — | | | | 591,270 | | | | — | | | | (106,035 | ) | | | 485,235 | | | | — | | | | 35,111 | | | | — | | | | — | |
AllianzGIMid-Cap | | | — | | | | 359,446 | | | | 225,185 | | | | (15,073 | ) | | | 128,704 | | | | — | | | | 33,604 | | | | 9,516 | | | | 5,869 | |
Totals | | $ | 32,830,296 | | | $ | 17,259,176 | | | $ | 23,816,334 | | | $ | (5,336,959 | ) | | $ | 21,829,940 | | | $ | 973,423 | | | | 1,445,098 | | | $ | 893,761 | | | $ | 1,870,178 | |
| | | | | | |
| | Semiannual Report | | | March 31, 2020 | | 341 |
Notes to Financial Statements (cont’d)
March 31, 2020 (unaudited)
| | | | | | | | | | | | | | | | | | | | | | | | | | | | | | | | | | | | |
|
| AllianzGI Retirement 2035: | |
| | | Market
Value
9/30/2019 | | | Purchases
at Cost | | | Proceeds
from Sales | | | Change in
Unrealized
Appreciation
(Depreciation) | | | Market
Value
3/31/2020 | | | Dividend
Income | | | Shares
as of
3/31/2020 | | | Net
Realized
Gain (Loss) | | | Net Capital
Gain
Distributions
Received | |
AllianzGI Advanced Core Bond | | $ | 554,587 | | | $ | 267,640 | | | $ | 838,236 | | | $ | (31,845 | ) | | | — | | | | — | | | | — | | | $ | 47,854 | | | | — | |
AllianzGI Best Styles Global Equity | | | 2,213,145 | | | | 2,950,856 | | | | 4,104,433 | | | | (292,361 | ) | | | — | | | | — | | | | — | | | | (767,207 | ) | | | — | |
AllianzGI Best Styles Global Managed Volatility | | | — | | | | 1,724,052 | | | | 538,876 | | | | (216,424 | ) | | $ | 942,446 | | | $ | 30,970 | | | | 70,384 | | | | (26,306 | ) | | $ | 35,009 | |
AllianzGI Best Styles U.S. Equity | | | 3,129,700 | | | | 2,350,174 | | | | 2,885,183 | | | | (979,941 | ) | | | 1,907,716 | | | | 86,029 | | | | 176,640 | | | | 292,966 | | | | 544,161 | |
AllianzGI Emerging MarketsSmall-Cap | | | 280,494 | | | | 42,259 | | | | 93,417 | | | | (59,288 | ) | | | 168,830 | | | | 8,397 | | | | 14,271 | | | | (1,218 | ) | | | — | |
AllianzGI Focused Growth | | | 273,007 | | | | 621,068 | | | | 395,139 | | | | (73,554 | ) | | | 429,770 | | | | — | | | | 10,578 | | | | 4,388 | | | | 64,713 | |
AllianzGI Global Dynamic Allocation | | | 15,411,476 | | | | 9,608,738 | | | | 11,003,712 | | | | (2,563,820 | ) | | | 11,805,537 | | | | 511,778 | | | | 751,466 | | | | 352,855 | | | | 900,732 | |
AllianzGI GlobalSmall-Cap Opportunities | | | — | | | | 421,485 | | | | 77,786 | | | | (105,261 | ) | | | 238,761 | | | | 5,332 | | | | 20,459 | | | | 323 | | | | — | |
AllianzGI International Growth | | | 1,375,564 | | | | 1,488,984 | | | | 1,700,250 | | | | (74,989 | ) | | | 1,103,070 | | | | 396 | | | | 79,817 | | | | 13,761 | | | | 954 | |
AllianzGIMid-Cap | | | 164,485 | | | | 572,239 | | | | 284,936 | | | | (46,803 | ) | | | 406,424 | | | | — | | | | 106,116 | | | | 1,439 | | | | 18,534 | |
AllianzGIMid-Cap Value | | | 276,706 | | | | 422,516 | | | | 353,500 | | | | (100,407 | ) | | | 246,526 | | | | 4,509 | | | | 10,384 | | | | 1,211 | | | | 21,187 | |
AllianzGISmall-Cap | | | 410,932 | | | | 415,271 | | | | 494,404 | | | | (77,232 | ) | | | 256,606 | | | | 1,389 | | | | 17,153 | | | | 2,039 | | | | — | |
Totals | | $ | 24,090,096 | | | $ | 20,885,282 | | | $ | 22,769,872 | | | $ | (4,621,925 | ) | | $ | 17,505,686 | | | $ | 648,800 | | | | 1,257,268 | | | $ | (77,895 | ) | | $ | 1,585,290 | |
| | | | | | | | | | | | | | | | | | | | | | | | | | | | | | | | | | | | |
|
| AllianzGI Retirement 2040: | |
| | | Market
Value
9/30/2019 | | | Purchases
at Cost | | | Proceeds
from Sales | | | Change in
Unrealized
Appreciation
(Depreciation) | | | Market
Value
3/31/2020 | | | Dividend
Income | | | Shares
as of
3/31/2020 | | | Net
Realized
Gain (Loss) | | | Net Capital
Gain
Distributions
Received | |
AllianzGI Advanced Core Bond | | $ | — | | | $ | 698,892 | | | $ | 745,797 | | | | — | | | | — | | | | — | | | | — | | | $ | 46,905 | | | | — | |
AllianzGI Best Styles Global Equity | | | 6,247,862 | | | | 5,283,634 | | | | 7,822,017 | | | $ | (670,032 | ) | | $ | 1,424,808 | | | $ | 92,165 | | | | 138,197 | | | | (1,614,639 | ) | | $ | 216,474 | |
AllianzGI Best Styles Global Managed Volatility | | | 1,567,206 | | | | 3,584,728 | | | | 2,790,577 | | | | (403,914 | ) | | | 1,831,596 | | | | 65,348 | | | | 136,788 | | | | (125,847 | ) | | | 73,871 | |
AllianzGI Best Styles U.S. Equity | | | 4,125,385 | | | | 2,717,526 | | | | 3,341,366 | | | | (1,309,958 | ) | | | 2,580,322 | | | | 112,898 | | | | 238,919 | | | | 388,735 | | | | 714,118 | |
AllianzGI Emerging MarketsSmall-Cap | | | 313,771 | | | | 38,979 | | | | 74,848 | | | | (70,232 | ) | | | 205,405 | | | | 10,216 | | | | 17,363 | | | | (2,265 | ) | | | — | |
AllianzGI Focused Growth | | | 619,017 | | | | 1,053,512 | | | | 954,664 | | | | (100,798 | ) | | | 606,814 | | | | — | | | | 14,935 | | | | (10,253 | ) | | | 106,479 | |
AllianzGI Global Dynamic Allocation | | | 10,896,722 | | | | 5,459,177 | | | | 7,003,434 | | | | (1,708,018 | ) | | | 7,697,540 | | | | 362,045 | | | | 489,977 | | | | 53,093 | | | | 637,199 | |
AllianzGI GlobalSmall-Cap Opportunities | | | — | | | | 785,794 | | | | 126,825 | | | | (201,787 | ) | | | 457,708 | | | | 10,222 | | | | 39,221 | | | | 526 | | | | — | |
AllianzGI International Growth | | | 2,487,961 | | | | 2,816,949 | | | | 3,183,685 | | | | (136,888 | ) | | | 2,007,684 | | | | 720 | | | | 145,274 | | | | 23,347 | | | | 1,737 | |
AllianzGIMid-Cap | | | 310,795 | | | | 972,027 | | | | 597,704 | | | | (66,932 | ) | | | 606,475 | | | | — | | | | 158,348 | | | | (11,711 | ) | | | 31,865 | |
AllianzGIMid-Cap Value | | | 623,971 | | | | 1,000,208 | | | | 940,640 | | | | (180,771 | ) | | | 463,495 | | | | 10,702 | | | | 19,524 | | | | (39,273 | ) | | | 50,284 | |
AllianzGISmall-Cap | | | — | | | | 626,008 | | | | 136,356 | | | | (109,184 | ) | | | 387,380 | | | | 2,097 | | | | 25,894 | | | | 6,912 | | | | — | |
Totals | | $ | 27,192,690 | | | $ | 25,037,434 | | | $ | 27,717,913 | | | $ | (4,958,514 | ) | | $ | 18,269,227 | | | $ | 666,413 | | | | 1,424,440 | | | $ | (1,284,470 | ) | | $ | 1,832,027 | |
| | | | | | |
| 342 | | March 31, 2020 | | | Semiannual Report | | |
| | | | | | | | | | | | | | | | | | | | | | | | | | | | | | | | | | | | |
|
| AllianzGI Retirement 2045: | |
| | | Market
Value
9/30/2019 | | | Purchases
at Cost | | | Proceeds
from Sales | | | Change in
Unrealized
Appreciation
(Depreciation) | | | Market
Value
3/31/2020 | | | Dividend
Income | | | Shares
as of
3/31/2020 | | | Net
Realized
Gain (Loss) | | | Net Capital
Gain
Distributions
Received | |
AllianzGI Best Styles Global Equity | | $ | 4,681,059 | | | $ | 4,212,735 | | | $ | 5,715,551 | | | $ | (581,679 | ) | | $ | 1,194,078 | | | $ | 80,047 | | | | 115,818 | | | $ | (1,402,486 | ) | | $ | 188,013 | |
AllianzGI Best Styles Global Managed Volatility | | | 1,084,782 | | | | 2,889,120 | | | | 2,112,599 | | | | (321,942 | ) | | | 1,453,282 | | | | 47,845 | | | | 108,535 | | | | (86,079 | ) | | | 54,087 | |
AllianzGI Best Styles U.S. Equity | | | 2,805,046 | | | | 2,237,865 | | | | 2,990,151 | | | | (810,375 | ) | | | 1,486,005 | | | | 73,192 | | | | 137,593 | | | | 243,620 | | | | 462,963 | |
AllianzGI Emerging MarketsSmall-Cap | | | 202,724 | | | | 22,649 | | | | 72,099 | | | | (40,193 | ) | | | 114,076 | | | | 5,674 | | | | 9,643 | | | | 995 | | | | — | |
AllianzGI Focused Growth | | | 391,026 | | | | 788,574 | | | | 641,195 | | | | (75,419 | ) | | | 453,899 | | | | — | | | | 11,172 | | | | (9,087 | ) | | | 76,639 | |
AllianzGI Global Dynamic Allocation | | | 4,518,488 | | | | 2,415,383 | | | | 3,315,006 | | | | (688,734 | ) | | | 2,926,108 | | | | 143,617 | | | | 186,258 | | | | (4,023 | ) | | | 252,767 | |
AllianzGI GlobalSmall-Cap Opportunities | | | — | | | | 588,617 | | | | 118,371 | | | | (144,032 | ) | | | 326,705 | | | | 7,297 | | | | 27,995 | | | | 491 | | | | — | |
AllianzGI International Growth | | | 1,954,761 | | | | 2,158,412 | | | | 2,615,553 | | | | (90,111 | ) | | | 1,404,359 | | | | 533 | | | | 101,618 | | | | (3,150 | ) | | | 1,284 | |
AllianzGIMid-Cap | | | 196,326 | | | | 750,757 | | | | 430,776 | | | | (49,994 | ) | | | 453,650 | | | | — | | | | 118,447 | | | | (12,663 | ) | | | 22,174 | |
AllianzGIMid-Cap Value | | | 550,802 | | | | 772,255 | | | | 866,212 | | | | (115,275 | ) | | | 293,894 | | | | 7,428 | | | | 12,380 | | | | (47,676 | ) | | | 34,905 | |
AllianzGISmall-Cap | | | 58,659 | | | | 624,296 | | | | 254,138 | | | | (91,441 | ) | | | 316,444 | | | | 1,565 | | | | 21,153 | | | | (20,932 | ) | | | — | |
Totals | | $ | 16,443,673 | | | $ | 17,460,663 | | | $ | 19,131,651 | | | $ | (3,009,195 | ) | | $ | 10,422,500 | | | $ | 367,198 | | | | 850,612 | | | $ | (1,340,990 | ) | | $ | 1,092,832 | |
| | | | | | | | | | | | | | | | | | | | | | | | | | | | | | | | | | | | |
|
| AllianzGI Retirement 2050: | |
| | | Market
Value
9/30/2019 | | | Purchases
at Cost | | | Proceeds
from Sales | | | Change in
Unrealized
Appreciation
(Depreciation) | | | Market
Value
3/31/2020 | | | Dividend
Income | | | Shares
as of
3/31/2020 | | | Net
Realized
Gain (Loss) | | | Net Capital
Gain
Distributions
Received | |
AllianzGI Best Styles Global Equity | | $ | 8,058,154 | | | $ | 4,842,952 | | | $ | 8,453,284 | | | $ | (501,987 | ) | | $ | 2,032,224 | | | $ | 140,176 | | | | 197,112 | | | $ | (1,913,611 | ) | | $ | 329,243 | |
AllianzGI Best Styles Global Managed Volatility | | | 1,565,187 | | | | 4,421,108 | | | | 3,382,405 | | | | (429,499 | ) | | | 1,945,163 | | | | 78,279 | | | | 145,270 | | | | (229,228 | ) | | | 88,489 | |
AllianzGI Best Styles U.S. Equity | | | 3,715,289 | | | | 2,359,664 | | | | 2,113,566 | | | | (1,298,033 | ) | | | 2,802,064 | | | | 110,588 | | | | 259,450 | | | | 138,710 | | | | 699,505 | |
AllianzGI Emerging MarketsSmall-Cap | | | 262,548 | | | | 24,672 | | | | 61,420 | | | | (57,396 | ) | | | 168,004 | | | | 8,356 | | | | 14,202 | | | | (400 | ) | | | — | |
AllianzGI Focused Growth | | | 515,472 | | | | 1,175,004 | | | | 723,623 | | | | (142,668 | ) | | | 830,356 | | | | — | | | | 20,437 | | | | 6,171 | | | | 125,032 | |
AllianzGI Global Dynamic Allocation | | | 4,514,020 | | | | 1,165,387 | | | | 1,824,942 | | | | (717,283 | ) | | | 3,099,153 | | | | 150,299 | | | | 197,273 | | | | (38,029 | ) | | | 264,525 | |
AllianzGI GlobalSmall-Cap Opportunities | | | — | | | | 802,046 | | | | 135,280 | | | | (204,183 | ) | | | 463,144 | | | | 10,344 | | | | 39,687 | | | | 561 | | | | — | |
AllianzGI International Growth | | | 2,585,584 | | | | 3,358,253 | | | | 3,776,715 | | | | (135,516 | ) | | | 2,021,068 | | | | 850 | | | | 146,242 | | | | (10,538 | ) | | | 2,051 | |
AllianzGIMid-Cap | | | 258,807 | | | | 1,080,515 | | | | 454,221 | | | | (91,688 | ) | | | 795,185 | | | | — | | | | 207,620 | | | | 1,772 | | | | 36,263 | |
AllianzGIMid-Cap Value | | | 896,227 | | | | 1,154,187 | | | | 1,100,259 | | | | (274,124 | ) | | | 678,201 | | | | 12,404 | | | | 28,568 | | | | 2,170 | | | | 58,286 | |
AllianzGISmall-Cap | | | 128,878 | | | | 785,603 | | | | 258,523 | | | | (142,779 | ) | | | 514,199 | | | | 2,783 | | | | 34,372 | | | | 1,020 | | | | — | |
Totals | | $ | 22,500,166 | | | $ | 21,169,391 | | | $ | 22,284,238 | | | $ | (3,995,156 | ) | | $ | 15,348,761 | | | $ | 514,079 | | | | 1,290,233 | | | $ | (2,041,402 | ) | | $ | 1,603,394 | |
| | | | | | |
| | Semiannual Report | | | March 31, 2020 | | 343 |
Notes to Financial Statements (cont’d)
March 31, 2020 (unaudited)
| | | | | | | | | | | | | | | | | | | | | | | | | | | | | | | | | | | | |
|
| AllianzGI Retirement 2055: | |
| | | Market
Value
9/30/2019 | | | Purchases
at Cost | | | Proceeds
from Sales | | | Change in
Unrealized
Appreciation
(Depreciation) | | | Market
Value
3/31/2020 | | | Dividend
Income | | | Shares
as of
3/31/2020 | | | Net
Realized
Gain (Loss) | | | Net Capital
Gain
Distributions
Received | |
AllianzGI Best Styles Global Equity | | $ | 4,046,842 | | | $ | 3,321,700 | | | $ | 5,066,523 | | | $ | (349,206 | ) | | $ | 930,791 | | | $ | 68,678 | | | | 90,280 | | | $ | (1,022,022 | ) | | $ | 161,307 | |
AllianzGI Best Styles Global Managed Volatility | | | 790,410 | | | | 2,215,469 | | | | 1,697,535 | | | | (215,211 | ) | | | 974,807 | | | | 38,109 | | | | 72,801 | | | | (118,326 | ) | | | 43,079 | |
AllianzGI Best Styles U.S. Equity | | | 1,703,250 | | | | 1,660,515 | | | | 1,640,640 | | | | (537,732 | ) | | | 1,119,482 | | | | 54,770 | | | | 103,656 | | | | (65,911 | ) | | | 346,438 | |
AllianzGI Emerging MarketsSmall-Cap | | | 130,081 | | | | 12,685 | | | | 28,010 | | | | (25,755 | ) | | | 83,005 | | | | 4,128 | | | | 7,016 | | | | (5,996 | ) | | | — | |
AllianzGI Focused Growth | | | 260,326 | | | | 591,574 | | | | 422,171 | | | | (60,449 | ) | | | 363,347 | | | | — | | | | 8,943 | | | | (5,933 | ) | | | 62,327 | |
AllianzGI Global Dynamic Allocation | | | 2,247,318 | | | | 956,183 | | | | 1,292,789 | | | | (349,130 | ) | | | 1,504,378 | | | | 73,898 | | | | 95,759 | | | | (57,204 | ) | | | 130,059 | |
AllianzGI GlobalSmall-Cap Opportunities | | | — | | | | 410,395 | | | | 69,517 | | | | (104,387 | ) | | | 236,779 | | | | 5,288 | | | | 20,290 | | | | 288 | | | | — | |
AllianzGI International Growth | | | 1,297,314 | | | | 1,661,777 | | | | 1,858,891 | | | | (68,785 | ) | | | 1,021,970 | | | | 417 | | | | 73,949 | | | | (9,445 | ) | | | 1,008 | |
AllianzGIMid-Cap | | | 182,985 | | | | 545,447 | | | | 319,494 | | | | (41,074 | ) | | | 362,860 | | | | — | | | | 94,741 | | | | (5,004 | ) | | | 18,363 | |
AllianzGIMid-Cap Value | | | 449,820 | | | | 562,209 | | | | 584,671 | | | | (118,027 | ) | | | 295,434 | | | | 6,183 | | | | 12,445 | | | | (13,897 | ) | | | 29,053 | |
AllianzGISmall-Cap | | | 130,173 | | | | 397,118 | | | | 204,965 | | | | (70,793 | ) | | | 252,191 | | | | 1,365 | | | | 16,858 | | | | 658 | | | | — | |
Totals | | $ | 11,238,519 | | | $ | 12,335,072 | | | $ | 13,185,206 | | | $ | (1,940,549 | ) | | $ | 7,145,044 | | | $ | 252,836 | | | | 596,738 | | | $ | (1,302,792 | ) | | $ | 791,634 | |
| | | | | | | | | | | | | | | | | | | | | | | | | | | | | | | | | | | | |
|
| AllianzGI Multi Asset Income: | |
| | | Market
Value
9/30/2019 | | | Purchases
at Cost | | | Proceeds
from Sales | | | Change in
Unrealized
Appreciation
(Depreciation) | | | Market
Value
3/31/2020 | | | Dividend
Income | | | Shares
as of
3/31/2020 | | | Net
Realized
Gain (Loss) | | | Net Capital
Gain
Distributions
Received | |
AllianzGI Emerging Markets SRI Debt | | $ | 2,415,623 | | | $ | 6,314,240 | | | $ | 1,912,209 | | | $ | (407,147 | ) | | $ | 6,275,087 | | | $ | 43,758 | | | | 502,007 | | | $ | (135,420 | ) | | | — | |
AllianzGI Floating Rate | | | 2,451,582 | | | | 1,601,125 | | | | 982,595 | | | | (224,549 | ) | | | 2,827,809 | | | | 16,687 | | | | 205,509 | | | | (17,754 | ) | | $ | 1,237 | |
AllianzGI Global High Yield | | | 1,467,350 | | | | 4,887,556 | | | | 704,155 | | | | (556,649 | ) | | | 5,088,825 | | | | 38,648 | | | | 382,618 | | | | (5,277 | ) | | | — | |
AllianzGI High Yield Bond | | | — | | | | — | | | | 46,823 | | | | — | | | | — | | | | — | | | | — | | | | 46,823 | | | | — | |
AllianzGI Preferred Securities & Income | | | 2,464,147 | | | | 6,831,722 | | | | 3,191,699 | | | | (1,125,664 | ) | | | 4,992,695 | | | | 69,769 | | | | 388,234 | | | | 14,189 | | | | 62,244 | |
AllianzGI Short Duration High Income | | | 3,195,801 | | | | 23,425,414 | | | | 14,929,555 | | | | (936,844 | ) | | | 10,279,939 | | | | 110,931 | | | | 813,286 | | | | (474,877 | ) | | | — | |
AllianzGI Short Term Bond | | | 1,226,783 | | | | 7,231,071 | | | | 2,461,943 | | | | 48,733 | | | | 6,047,394 | | | | 7,232 | | | | 412,791 | | | | 2,750 | | | | — | |
PIMCO Preferred and Capital Security | | | — | | | | 6,149,172 | | | | 3,444,501 | | | | (384,028 | ) | | | 2,262,248 | | | | 25,364 | | | | 245,097 | | | | (58,395 | ) | | | — | |
PIMCO Senior Floating Rate | | | 1,230,042 | | | | 6,001,140 | | | | 4,930,086 | | | | (239,758 | ) | | | 1,811,591 | | | | 33,985 | | | | 209,918 | | | | (249,747 | ) | | | — | |
Totals | | $ | 14,451,328 | | | $ | 62,441,440 | | | $ | 32,603,566 | | | $ | (3,825,906 | ) | | $ | 39,585,588 | | | $ | 346,374 | | | | 3,159,460 | | | $ | (877,708 | ) | | $ | 63,481 | |
| | | | | | |
| 344 | | March 31, 2020 | | | Semiannual Report | | |
| | | | | | | | | | | | | | | | | | | | | | | | | | | | | | | | | | | | |
|
| AllianzGI Global Allocation: | |
| | | Market
Value
9/30/2019 | | | Purchases
at Cost | | | Proceeds
from Sales | | | Change in
Unrealized
Appreciation
(Depreciation) | | | Market
Value
3/31/2020 | | | Dividend
Income | | | Shares
as of
3/31/2020 | | | Net
Realized
Gain (Loss) | | | Net Capital
Gain
Distributions
Received | |
AllianzGI Advanced Core Bond | | $ | 61,014,797 | | | | — | | | $ | 60,814,354 | | | $ | (1,388,186 | ) | | | — | | | | — | | | | — | | | $ | 1,187,743 | | | | — | |
AllianzGI Best Styles Global Equity | | | 123,606,164 | | | | — | | | | 125,539,589 | | | | (3,106,358 | ) | | | — | | | | — | | | | — | | | | 5,039,783 | | | | — | |
AllianzGI Best Styles Global Managed Volatility | | | 38,652,884 | | | | 1,696,127 | | | | 9,425,531 | | | | (6,070,300 | ) | | $ | 25,341,395 | | | $ | 796,142 | | | | 1,892,561 | | | | 488,215 | | | $ | 899,985 | |
AllianzGI Emerging MarketsSmall-Cap | | | 4,613,387 | | | | 177,303 | | | | — | | | | (1,225,750 | ) | | | 3,564,940 | | | | 177,303 | | | | 301,347 | | | | — | | | | — | |
AllianzGI Emerging Markets SRI Debt | | | 16,006,721 | | | | 230,722 | | | | — | | | | (1,602,008 | ) | | | 14,635,435 | | | | 230,722 | | | | 1,170,835 | | | | — | | | | — | |
AllianzGI Global Sustainability | | | — | | | | 133,459,237 | | | | 15,062,193 | | | | (14,378,695 | ) | | | 104,603,229 | | | | 305,860 | | | | 6,293,816 | | | | 584,880 | | | | 2,215,175 | |
AllianzGI Green Bond | | | — | | | | 33,056,344 | | | | 6,864,410 | | | | (1,528,691 | ) | | | 24,798,080 | | | | 189,735 | | | | 1,606,093 | | | | 134,837 | | | | 146,075 | |
AllianzGI International Growth | | | 18,480,225 | | | | — | | | | 19,166,063 | | | | 49,879 | | | | — | | | | — | | | | — | | | | 635,959 | | | | — | |
AllianzGIMid-Cap Value | | | — | | | | — | | | | — | | | | — | | | | — | | | | — | | | | — | | | | — | | | | — | |
AllianzGI PerformanceFee Managed Futures Strategy | | | 31,666,254 | | | | 3,818,936 | | | | 2,495,220 | | | | (4,993,874 | ) | | | 27,740,246 | | | | 1,790,313 | | | | 3,362,454 | | | | (255,850 | ) | | | 421,396 | |
PIMCO 15 Year U.S. TIPS Index | | | 3,180,908 | | | | 1,626,508 | | | | 5,009,348 | | | | (176,068 | ) | | | — | | | | 49,876 | | | | — | | | | 378,000 | | | | — | |
Totals | | $ | 297,221,340 | | | $ | 174,065,177 | | | $ | 244,376,708 | | | $ | (34,420,051 | ) | | $ | 200,683,325 | | | $ | 3,539,951 | | | | 14,627,106 | | | $ | 8,193,567 | | | $ | 3,682,631 | |
| | | | | | | | | | | | | | | | | | | | | | | | | | | | | | | | | | | | |
|
| AllianzGI Global Dynamic Allocation: | |
| | | Market
Value
9/30/2019 | | | Purchases
at Cost | | | Proceeds
from Sales | | | Change in
Unrealized
Appreciation
(Depreciation) | | | Market
Value
3/31/2020 | | | Dividend
Income | | | Shares
as of
3/31/2020 | | | Net
Realized
Gain (Loss) | | | Net Capital
Gain
Distributions
Received | |
AllianzGI Focused Growth | | $ | 4,246,825 | | | $ | 905,966 | | | $ | 524,786 | | | $ | (705,643 | ) | | $ | 3,940,469 | | | $ | — | | | | 96,984 | | | $ | 18,107 | | | $ | 593,340 | |
AllianzGI GlobalSmall-Cap Opportunities | | | 2,828,496 | | | | 46,525 | | | | — | | | | (791,831 | ) | | | 2,083,190 | | | | 46,525 | | | | 178,508 | | | | — | | | | — | |
AllianzGI International Growth | | | 11,148,486 | | | | 11,664,464 | | | | 12,851,674 | | | | (646,403 | ) | | | 9,371,532 | | | | 3,360 | | | | 678,114 | | | | 56,659 | | | | 8,109 | |
AllianzGIMid-Cap | | | 4,244,775 | | | | 4,837,657 | | | | 4,745,384 | | | | (506,568 | ) | | | 3,833,448 | | | | — | | | | 1,000,900 | | | | 2,968 | | | | 174,818 | |
AllianzGIMid-Cap Value | | | 4,272,200 | | | | 5,004,232 | | | | 4,763,682 | | | | (1,301,367 | ) | | | 3,218,415 | | | | 58,865 | | | | 135,569 | | | | 7,032 | | | | 276,593 | |
AllianzGI Short Duration High Income | | | — | | | | 5,300,640 | | | | — | | | | 115,697 | | | | 5,416,337 | | | | — | | | | 428,508 | | | | — | | | | — | |
AllianzGISmall-Cap | | | 2,819,302 | | | | 3,135,065 | | | | 3,134,561 | | | | (651,083 | ) | | | 2,172,177 | | | | 11,757 | | | | 145,199 | | | | 3,454 | | | | — | |
PIMCO 15 Year U.S. TIPS Index | | | 6,727,995 | | | | 26,034,950 | | | | 32,623,429 | | | | (179,370 | ) | | | — | | | | 51,795 | | | | — | | | | 39,854 | | | | — | |
Totals | | $ | 36,288,079 | | | $ | 56,929,499 | | | $ | 58,643,516 | | | $ | (4,666,568 | ) | | $ | 30,035,568 | | | $ | 172,302 | | | | 2,663,782 | | | $ | 128,074 | | | $ | 1,052,860 | |
| | | | | | | | | | | | | | | | | | | | | | | | | | | | | | | | |
|
| AllianzGI High Yield Bond: | |
| | | Market
Value
9/30/2019 | | | Purchases
at Cost | | | Proceeds
from
Sales | | | Change in
Unrealized
Appreciation
(Depreciation) | | | Market
Value
3/31/2020 | | | Dividend
Income | | | Shares as
of
3/31/2020 | | | Net
Realized
Gain
(Loss) | |
CCF Holdings LLC Class B | | | — | * | | | — | | | | — | | | | — | | | | — | * | | | — | | | | 7,143 | | | | — | |
LiveStyle, Inc., Ser. B | | $ | 5,758,100 | | | | — | | | | — | | | $ | (1,043,368 | ) | | $ | 4,714,732 | | | | — | | | | 57,581 | | | | — | |
Totals | | $ | 5,758,100 | | | | — | | | | — | | | $ | (1,043,368 | ) | | $ | 4,714,732 | | | | — | | | | 64,724 | | | | — | |
| | | | | | | | | | | | | | | | | | | | | | | | | | | | | | | | |
|
| AllianzGI PerformanceFee Managed Futures Strategy: | |
| | | Market
Value
9/30/2019 | | | Purchases
at Cost | | | Proceeds
from
Sales | | | Change in
Unrealized
Appreciation
(Depreciation) | | | Market
Value
3/31/2020 | | | Dividend
Income | | | Shares as
of
3/31/2020 | | | Net
Realized
Gain
(Loss) | |
AllianzGI Short Duration High Income | | $ | 1,412,329 | | | $ | 35,341 | | | $ | — | | | $ | (186,296 | ) | | $ | 1,261,374 | | | $ | 35,341 | | | $ | 99,792 | | | $ | — | |
| * | Actual amount rounds to less than $1. |
| | | | | | |
| | Semiannual Report | | | March 31, 2020 | | 345 |
Notes to Financial Statements (cont’d)
March 31, 2020 (unaudited)
Certain Funds are permitted to purchase or sell securities from or to certain related affiliated funds under specified conditions outlined in procedures adopted by the Board. The procedures have been designed to ensure that any purchase or sale of securities by the Funds from or to another fund or portfolio that are, or could be, considered an affiliate by virtue of having a common investment adviser (or affiliated investment advisers), common Trustees and/or common officers comply with Rule17a-7 of the 1940 Act. Further, as defined under the procedures, each transaction is effected at the current market price.
During the six months ended March 31, 2020, the following Fund engaged in sales of securities pursuant to Rule17a-7 of the 1940 Act:
| | | | | | | | |
| | |
| | | Purchases | | | Sales | |
AllianzGI Short Duration High Income | | | — | | | $ | 122,264,528 | |
| 8. | SIGNIFICANT ACCOUNT HOLDERS |
From time to time, a Fund may have a concentration of shareholders, which may include the Investment Manager or affiliates of the Investment Manager, holding a significant percentage of shares outstanding. Investment activities of these shareholders could have a material impact to a Fund.
At March 31, 2020, the significant account-holders, owners of 5% or greater of each respective Fund’s outstanding shares were as follows:
| | | | | | | | | | | | | | | | | | | | |
| | | Unaffiliated | | | Affiliated | |
| | | Number of
Account
Holders | | | Approximate
Ownership | | | Number of
Account
Holders | | | Approximate
Ownership* | | | AFI/Allianz of
America** | |
AllianzGI Retirement 2020 | | | 5 | | | | 80 | % | | | — | | | | — | | | | — | |
AllianzGI Retirement 2025 | | | 5 | | | | 85 | % | | | — | | | | — | | | | — | |
AllianzGI Retirement 2030 | | | 5 | | | | 80 | % | | | — | | | | — | | | | — | |
AllianzGI Retirement 2035 | | | 6 | | | | 93 | % | | | — | | | | — | | | | — | |
AllianzGI Retirement 2040 | | | 3 | | | | 83 | % | | | — | | | | — | | | | — | |
AllianzGI Retirement 2045 | | | 5 | | | | 89 | % | | | — | | | | — | | | | — | |
AllianzGI Retirement 2050 | | | 3 | | | | 77 | % | | | — | | | | — | | | | — | |
AllianzGI Retirement 2055 | | | 5 | | | | 92 | % | | | — | | | | — | | | | — | |
AllianzGI Multi Asset Income | | | 1 | | | | 12 | % | | | 1 | | | | 64 | % | | | — | |
AllianzGI Best Styles Global Equity | | | — | | | | — | | | | 3 | | | | 90 | % | | | — | |
AllianzGI Best Styles U.S. Equity | | | 1 | | | | 23 | % | | | 5 | | | | 62 | % | | | — | |
AllianzGI Core Bond | | | — | | | | — | | | | 2 | | | | 36 | % | | | 59 | % |
AllianzGI Core Plus Bond | | | — | | | | — | | | | 1 | | | | 19 | % | | | 80 | % |
AllianzGI Convertible | | | 8 | | | | 73 | % | | | — | | | | — | | | | — | |
AllianzGI Emerging Markets Consumer | | | 6 | | | | 97 | % | | | — | | | | — | | | | — | |
AllianzGI Emerging Markets Small-Cap | | | 1 | | | | 14 | % | | | 1 | | | | 65 | % | | | — | |
AllianzGI Emerging Markets SRI Debt | | | 1 | | | | 7 | % | | | 2 | | | | 92 | % | | | — | |
AllianzGI Emerging Markets Value | | | 2 | | | | 89 | % | | | — | | | | — | | | | — | |
AllianzGI Floating Rate Note | | | — | | | | — | | | | 1 | | | | 21 | % | | | 73 | % |
AllianzGI Global Allocation | | | 1 | | | | 29 | % | | | 2 | | | | 52 | % | | | — | |
AllianzGI Global Dynamic Allocation | | | 1 | | | | 29 | % | | | 5 | | | | 58 | % | | | — | |
AllianzGI Global High Yield | | | — | | | | — | | | | 1 | | | | 20 | % | | | 79 | % |
AllianzGI Global Sustainability | | | 2 | | | | 22 | % | | | 1 | | | | 76 | % | | | — | |
AllianzGI Green Bond | | | 1 | | | | 5 | % | | | 1 | | | | 92 | % | | | — | |
AllianzGI High Yield Bond | | | 3 | | | | 72 | % | | | 1 | | | | 9 | % | | | — | |
AllianzGI International Small-Cap | | | 2 | | | | 74 | % | | | — | | | | — | | | | — | |
AllianzGI Micro Cap | | | 1 | | | | 81 | % | | | — | | | | — | | | | — | |
AllianzGI PerformanceFee Managed Futures Strategy | | | — | | | | — | | | | 1 | | | | 97 | % | | | — | |
AllianzGI PerformanceFee Structured US Equity | | | 3 | | | | 90 | % | | | — | | | | — | | | | — | |
AllianzGI PerformanceFee Structured US Fixed Income | | | 2 | | | | 22 | % | | | — | | | | — | | | | 74 | % |
AllianzGI Preferred Securities and Income | | | 2 | | | | 19 | % | | | 1 | | | | 27 | % | | | 52 | % |
AllianzGI Short Duration High Income | | | 8 | | | | 76 | % | | | — | | | | — | | | | — | |
AllianzGI Short Term Bond | | | 1 | | | | 7 | % | | | 2 | | | | 53 | % | | | 24 | % |
AllianzGI Structured Return | | | 5 | | | | 76 | % | | | — | | | | — | | | | — | |
AllianzGI U.S. Equity Hedged | | | 4 | | | | 88 | % | | | — | | | | — | | | | — | |
AllianzGI Ultra Micro Cap | | | 4 | | | | 80 | % | | | — | | | | — | | | | — | |
AllianzGI Water | | | 8 | | | | 82 | % | | | — | | | | — | | | | — | |
| * | This represents the aggregate percentage of affiliated entities that own 5% or more of the Fund’s outstanding shares. These affiliated entities include funds/portfolios of the Trust, CollegeAccess 529 Plan, OklahomaDream 529 Plan and Allianz Multi-Series Collective Investment Trust. |
| ** | Allianz Funds Investments, Inc. (“AFI”) and Allianz of America, Inc. (“Allianz of America”) are indirect, wholly-owned subsidiaries of Allianz SE. |
| | | | | | |
| 346 | | March 31, 2020 | | | Semiannual Report | | |
(THIS PAGE INTENTIONALLY LEFT BLANK)
| | | | | | |
| | Semiannual Report | | | March 31, 2020 | | 347 |
Notes to Financial Statements (cont’d)
March 31, 2020 (unaudited)
9. SHARES OF BENEFICIAL INTEREST
The Trust may issue an unlimited number of shares of beneficial interest with $0.0001 par value. Changes in shares of beneficial interest were as follows:
| | | | | | | | | | | | | | | | | | | | | | | | | | | | | | | | | | | | |
| | | AllianzGI Retirement 2020 | | | AllianzGI Retirement 2025 | | | | |
| | | | | |
| | | Six Months ended
March 31, 2020
(unaudited) | | | Year ended
September 30, 2019 | | | Six Months ended
March 31, 2020
(unaudited) | | | Year ended
September 30, 2019 | | | | |
| | | Shares | | | Amount | | | Shares | | | Amount | | | Shares | | | Amount | | | Shares | | | Amount | | | | |
Shares sold: | | | | | | | | | | | | | | | | | | | | | | | | | | | | | | | | | | | | |
Class A | | | 7,205 | | | $ | 128,198 | | | | 52,251 | | | $ | 1,002,018 | | | | 31,322 | | | $ | 489,753 | | | | 58,783 | | | $ | 989,272 | | | | | |
Class C | | | 3,076 | | | | 53,398 | | | | 19,937 | | | | 388,866 | | | | — | | | | — | | | | — | | | | — | | | | | |
Class R | | | — | | | | — | | | | 897 | | | | 16,346 | | | | 2,587 | | | | 39,801 | | | | 1,377 | | | | 22,209 | | | | | |
Class P | | | 6,653 | | | | 120,335 | | | | 78,499 | | | | 1,510,382 | | | | 6,535 | | | | 110,586 | | | | 191,904 | | | | 3,295,249 | | | | | |
Class R6 | | | 62,556 | | | | 1,158,832 | | | | 282,870 | | | | 5,415,943 | | | | 121,941 | | | | 1,984,569 | | | | 252,935 | | | | 4,344,566 | | | | | |
Administrative Class | | | 314 | | | | 5,868 | | | | 1,620 | | | | 31,146 | | | | 570 | | | | 9,357 | | | | 1,554 | | | | 26,632 | | | | | |
| | | | | | | | | |
Issued in reinvestment of dividends and distributions: | | | | | | | | | | | | | | | | | | | | | | | | | | | | | | | | | | | | |
Class A | | | 29,928 | | | | 527,028 | | | | 13,754 | | | | 243,713 | | | | 53,102 | | | | 819,360 | | | | 21,567 | | | | 338,607 | | | | | |
Class C | | | 4,084 | | | | 71,918 | | | | 560 | | | | 9,967 | | | | — | | | | — | | | | — | | | | — | | | | | |
Class R | | | 84 | | | | 1,448 | | | | 10 | | | | 171 | | | | 89 | | | | 1,359 | | | | 71 | | | | 1,116 | | | | | |
Class P | | | 13,524 | | | | 240,321 | | | | 45,922 | | | | 817,411 | | | | 15,603 | | | | 241,379 | | | | 98,361 | | | | 1,540,332 | | | | | |
Class R6 | | | 75,898 | | | | 1,345,669 | | | | 62,990 | | | | 1,122,479 | | | | 139,017 | | | | 2,145,039 | | | | 90,889 | | | | 1,426,045 | | | | | |
Administrative Class | | | 246 | | | | 4,387 | | | | 1,799 | | | | 31,996 | | | | 1,641 | | | | 25,453 | | | | 819 | | | | 12,898 | | | | | |
| | | | | | | | | |
Cost of shares redeemed: | | | | | | | | | | | | | | | | | | | | | | | | | | | | | | | | | | | | |
Class A | | | (81,108 | ) | | | (1,441,853 | ) | | | (75,107 | ) | | | (1,438,544 | ) | | | (79,863 | ) | | | (1,249,975 | ) | | | (98,838 | ) | | | (1,711,595 | ) | | | | |
Class C | | | (16,724 | ) | | | (289,518 | ) | | | (13,523 | ) | | | (267,802 | ) | | | — | | | | — | | | | — | | | | — | | | | | |
Class R | | | — | | | | — | | | | (4,679 | ) | | | (83,878 | ) | | | (2,093 | ) | | | (27,161 | ) | | | (1,488 | ) | | | (25,639 | ) | | | | |
Class P | | | (70,212 | ) | | | (1,288,709 | ) | | | (633,658 | ) | | | (12,454,458 | ) | | | (216,543 | ) | | | (3,827,757 | ) | | | (1,205,422 | ) | | | (21,018,023 | ) | | | | |
Class R6 | | | (244,385 | ) | | | (4,630,967 | ) | | | (596,235 | ) | | | (11,510,811 | ) | | | (303,052 | ) | | | (4,827,726 | ) | | | (720,193 | ) | | | (12,395,330 | ) | | | | |
Administrative Class | | | (18 | ) | | | (319 | ) | | | (27,361 | ) | | | (510,602 | ) | | | (129 | ) | | | (2,197 | ) | | | (4,220 | ) | | | (70,167 | ) | | | | |
Net decrease resulting from Fund share transactions | | | (208,879 | ) | | $ | (3,993,964 | ) | | | (789,454 | ) | | $ | (15,675,657 | ) | | | (229,273 | ) | | $ | (4,068,160 | ) | | | (1,311,901 | ) | | $ | (23,223,828 | ) | | | | |
| — | May reflect actual amounts rounding to less than $1 or less than 1 share. |
| | | | | | |
| 348 | | March 31, 2020 | | | Semiannual Report | | |
| | | | | | | | | | | | | | | | | | | | | | | | | | | | | | | | | | | | | | | | | | | | | | | | | | |
| | | | AllianzGI Retirement 2030 | | | AllianzGI Retirement 2035 | | | AllianzGI Retirement 2040 | |
| | | | | | |
| | | | Six Months ended
March 31, 2020
(unaudited) | | | Year ended
September 30, 2019 | | | Six Months ended
March 31, 2020
(unaudited) | | | Year ended
September 30, 2019 | | | Six Months ended
March 31, 2020
(unaudited) | | | Year ended
September 30, 2019 | |
| | | | Shares | | | Amount | | | Shares | | | Amount | | | Shares | | | Amount | | | Shares | | | Amount | | | Shares | | | Amount | | | Shares | | | Amount | |
| | | | | | | | | | | | | | | | | | | | | | | | | | | | | | | | | | | | | | | | | | | | | | | | | | |
| | | | | | 60,098 | | | $ | 1,136,594 | | | | 120,958 | | | $ | 2,514,425 | | | | 21,908 | | | $ | 369,414 | | | | 39,750 | | | $ | 714,467 | | | | 9,876 | | | $ | 198,497 | | | | 37,380 | | | $ | 771,666 | |
| | | | | | 2,279 | | | | 40,964 | | | | 8,689 | | | | 175,636 | | | | — | | | | — | | | | — | | | | — | | | | 886 | | | | 17,376 | | | | 5,834 | | | | 123,648 | |
| | | | | | 907 | | | | 17,439 | | | | 1,612 | | | | 32,584 | | | | 2,798 | | | | 46,848 | | | | 6,145 | | | | 102,595 | | | | 2,111 | | | | 42,880 | | | | 3,266 | | | | 65,228 | |
| | | | | | 11,718 | | | | 227,487 | | | | 138,741 | | | | 2,878,973 | | | | 8,191 | | | | 145,976 | | | | 117,368 | | | | 2,092,186 | | | | 39,296 | | | | 790,521 | | | | 115,899 | | | | 2,399,155 | |
| | | | | | 145,996 | | | | 2,783,942 | | | | 264,958 | | | | 5,509,733 | | | | 212,799 | | | | 3,599,780 | | | | 415,065 | | | | 7,433,119 | | | | 180,876 | | | | 3,663,710 | | | | 336,855 | | | | 7,005,421 | |
| | | | | | 248 | | | | 4,975 | | | | 2,124 | | | | 43,930 | | | | 473 | | | | 8,187 | | | | 2,001 | | | | 35,710 | | | | 59 | | | | 1,286 | | | | 1,053 | | | | 21,810 | |
| | | | | | | | | | | | |
|
|
| | | | | | | | | | | | | | | | | | | | | | | | | | | | | | | | | | | | | | | | | | | | | | | | |
| | | | | | 49,379 | | | | 922,896 | | | | 22,579 | | | | 421,095 | | | | 40,832 | | | | 682,715 | | | | 33,525 | | | | 534,052 | | | | 13,140 | | | | 264,911 | | | | 10,158 | | | | 187,924 | |
| | | | | | 5,276 | | | | 97,719 | | | | 1,998 | | | | 37,009 | | | | — | | | | — | | | | — | | | | — | | | | 971 | | | | 19,529 | | | | 205 | | | | 3,800 | |
| | | | | | 247 | | | | 4,639 | | | | 750 | | | | 14,017 | | | | 28 | | | | 465 | | | | 280 | | | | 4,445 | | | | 55 | | | | 1,109 | | | | 194 | | | | 3,568 | |
| | | | | | 23,078 | | | | 437,102 | | | | 96,335 | | | | 1,813,033 | | | | 8,968 | | | | 152,643 | | | | 117,294 | | | | 1,872,017 | | | | 7,020 | | | | 143,771 | | | | 77,320 | | | | 1,432,745 | |
| | | | | | 164,020 | | | | 3,114,746 | | | | 89,389 | | | | 1,689,460 | | | | 132,735 | | | | 2,228,625 | | | | 101,352 | | | | 1,619,599 | | | | 132,378 | | | | 2,676,679 | | | | 106,494 | | | | 1,976,521 | |
| | | | | | 1,421 | | | | 26,973 | | | | 1,735 | | | | 32,781 | | | | 1,343 | | | | 22,659 | | | | 2,080 | | | | 33,357 | | | | 292 | | | | 5,898 | | | | 2,197 | | | | 40,518 | |
| | | | | | | | | | | | |
| | | | | | | | | | | | | | | | | | | | | | | | | | | | | | | | | | | | | | | | | | | | | | | | | | |
| | | | | | (94,893 | ) | | | (1,769,347 | ) | | | (159,637 | ) | | | (3,283,349 | ) | | | (48,401 | ) | | | (832,832 | ) | | | (100,566 | ) | | | (1,806,712 | ) | | | (17,568 | ) | | | (361,154 | ) | | | (106,700 | ) | | | (2,243,401 | ) |
| | | | | | (4,380 | ) | | | (75,153 | ) | | | (20,490 | ) | | | (429,568 | ) | | | — | | | | — | | | | — | | | | — | | | | (496 | ) | | | (9,518 | ) | | | (3,033 | ) | | | (67,387 | ) |
| | | | | | (65 | ) | | | (1,367 | ) | | | (11,804 | ) | | | (242,375 | ) | | | (260 | ) | | | (3,947 | ) | | | (22,205 | ) | | | (371,249 | ) | | | (4,908 | ) | | | (86,485 | ) | | | (5,680 | ) | | | (117,152 | ) |
| | | | | | (331,569 | ) | | | (6,965,909 | ) | | | (1,021,013 | ) | | | (21,640,161 | ) | | | (280,120 | ) | | | (5,195,598 | ) | | | (889,941 | ) | | | (16,098,234 | ) | | | (310,736 | ) | | | (6,511,674 | ) | | | (658,305 | ) | | | (13,903,621 | ) |
| | | | | | (331,251 | ) | | | (6,230,332 | ) | | | (494,644 | ) | | | (10,340,243 | ) | | | (314,826 | ) | | | (5,038,319 | ) | | | (476,478 | ) | | | (8,609,208 | ) | | | (388,939 | ) | | | (7,303,147 | ) | | | (412,060 | ) | | | (8,696,184 | ) |
| | | | | | (27 | ) | | | (515 | ) | | | (17,630 | ) | | | (354,778 | ) | | | (2,110 | ) | | | (36,063 | ) | | | (12,688 | ) | | | (218,561 | ) | | | (79 | ) | | | (1,698 | ) | | | (22,884 | ) | | | (457,366 | ) |
|
|
| | | (297,518 | ) | | $ | (6,227,147 | ) | | | (975,350 | ) | | $ | (21,127,798 | ) | | | (215,642 | ) | | $ | (3,849,447 | ) | | | (667,018 | ) | | $ | (12,662,417 | ) | | | (335,766 | ) | | $ | (6,447,509 | ) | | | (511,807 | ) | | $ | (11,453,107 | ) |
| | | | | | |
| | Semiannual Report | | | March 31, 2020 | | 349 |
Notes to Financial Statements (cont’d)
March 31, 2020 (unaudited)
| | | | | | | | | | | | | | | | | | | | | | | | | | | | | | | | | | | | |
| | | AllianzGI Retirement 2045 | | | AllianzGI Retirement 2050 | | | | |
| | | | | |
| | | Six Months ended
March 31, 2020
(unaudited) | | | Year ended
September 30, 2019 | | | Six Months ended
March 31, 2020
(unaudited) | | | Year ended
September 30, 2019 | | | | |
| | | Shares | | | Amount | | | Shares | | | Amount | | | Shares | | | Amount | | | Shares | | | Amount | | | | |
Shares sold: | | | | | | | | | | | | | | | | | | | | | | | | | | | | | | | | | | | | |
Class A | | | 20,312 | | | $ | 356,599 | | | | 32,067 | | | $ | 584,763 | | | | 8,920 | | | $ | 179,509 | | | | 28,118 | | | $ | 569,742 | | | | | |
Class C | | | — | | | | — | | | | — | | | | — | | | | 815 | | | | 15,675 | | | | 2,898 | | | | 56,712 | | | | | |
Class R | | | 1,859 | | | | 31,838 | | | | 3,743 | | | | 66,194 | | | | 10,221 | | | | 220,637 | | | | 2,043 | | | | 40,002 | | | | | |
Class P | | | 30,557 | | | | 569,355 | | | | 126,256 | | | | 2,295,406 | | | | 10,251 | | | | 203,097 | | | | 99,017 | | | | 2,003,872 | | | | | |
Institutional Class | | | — | | | | — | | | | — | | | | — | | | | — | | | | — | | | | — | | | | — | | | | | |
Class R6 | | | 147,804 | | | | 2,584,884 | | | | 283,991 | | | | 5,151,105 | | | | 135,255 | | | | 2,732,963 | | | | 273,553 | | | | 5,535,073 | | | | | |
Administrative Class | | | 993 | | | | 17,747 | | | | 3,758 | | | | 68,053 | | | | 636 | | | | 13,150 | | | | 2,690 | | | | 54,545 | | | | | |
| | | | | | | | | |
Issued in reinvestment of dividends and distributions: | | | | | | | | | | | | | | | | | | | | | | | | | | | | | | | | | | | | |
Class A | | | 12,308 | | | | 218,968 | | | | 9,009 | | | | 145,674 | | | | 10,427 | | | | 214,373 | | | | 11,121 | | | | 198,732 | | | | | |
Class C | | | — | | | | — | | | | — | | | | — | | | | 1,076 | | | | 21,499 | | | | 740 | | | | 13,008 | | | | | |
Class R | | | 234 | | | | 4,111 | | | | 246 | | | | 3,935 | | | | 139 | | | | 2,855 | | | | 134 | | | | 2,402 | | | | | |
Class P | | | 1,424 | | | | 25,949 | | | | 68,256 | | | | 1,099,610 | | | | 3,659 | | | | 76,758 | | | | 46,234 | | | | 831,742 | | | | | |
Institutional Class | | | — | | | | — | | | | — | | | | — | | | | — | | | | — | | | | — | | | | — | | | | | |
Class R6 | | | 86,783 | | | | 1,543,002 | | | | 70,951 | | | | 1,145,865 | | | | 70,508 | | | | 1,465,864 | | | | 73,579 | | | | 1,328,104 | | | | | |
Administrative Class | | | 2,318 | | | | 40,864 | | | | 2,988 | | | | 47,868 | | | | 2,462 | | | | 50,709 | | | | 3,590 | | | �� | 64,296 | | | | | |
| | | | | | | |
Cost of shares redeemed: | | | | | | | | | | | | | | | | | | | | | | | | | | | | | |
Class A | | | (12,268 | ) | | | (216,487 | ) | | | (62,492 | ) | | | (1,155,016 | ) | | | (14,204 | ) | | | (289,419 | ) | | | (34,542 | ) | | | (701,150 | ) | | | | |
Class C | | | — | | | | — | | | | — | | | | — | | | | (1,344 | ) | | | (26,887 | ) | | | (659 | ) | | | (13,344 | ) | | | | |
Class R | | | (710 | ) | | | (13,099 | ) | | | (5,524 | ) | | | (99,847 | ) | | | (3 | ) | | | (66 | ) | | | (2,641 | ) | | | (51,530 | ) | | | | |
Class P | | | (219,364 | ) | | | (4,191,869 | ) | | | (634,787 | ) | | | (11,721,901 | ) | | | (220,057 | ) | | | (4,576,482 | ) | | | (395,618 | ) | | | (8,181,991 | ) | | | | |
Institutional Class | | | — | | | | — | | | | — | | | | — | | | | — | | | | — | | | | — | | | | — | | | | | |
Class R6 | | | (342,273 | ) | | | (5,443,954 | ) | | | (331,395 | ) | | | (6,105,767 | ) | | | (280,824 | ) | | | (5,213,740 | ) | | | (266,356 | ) | | | (5,472,793 | ) | | | | |
Administrative Class | | | (1,447 | ) | | | (25,858 | ) | | | (18,410 | ) | | | (322,264 | ) | | | (1,308 | ) | | | (23,545 | ) | | | (15,424 | ) | | | (301,867 | ) | | | | |
Net increase (decrease) resulting from Fund share transactions | | | (271,470 | ) | | $ | (4,497,950 | ) | | | (451,343 | ) | | $ | (8,796,322 | ) | | | (263,371 | ) | | $ | (4,933,050 | ) | | | (171,523 | ) | | $ | (4,024,445 | ) | | | | |
| — | May reflect actual amounts rounding to less than $1 or less than 1 share. |
| | | | | | |
| 350 | | March 31, 2020 | | | Semiannual Report | | |
| | | | | | | | | | | | | | | | | | | | | | | | | | | | | | | | | | | | | | | | | | | | | | | | | | |
| | | | AllianzGI Retirement 2055 | | | AllianzGI Multi Asset Income | | | AllianzGI Best Styles Global Equity | |
| | | | | | |
| | | | Six Months ended
March 31, 2020
(unaudited) | | | Year ended
September 30, 2019 | | | Six Months ended
March 31, 2020
(unaudited) | | | Year ended
September 30, 2019 | | | Six Months ended
March 31, 2020
(unaudited) | | | Year ended
September 30, 2019 | |
| | | | Shares | | | Amount | | | Shares | | | Amount | | | Shares | | | Amount | | | Shares | | | Amount | | | Shares | | | Amount | | | Shares | | | Amount | |
| | | | | | | | | | | | | | | | | | | | | | | | | | | | | | | | | | | | | | | | | | | | | | | | | | |
| | | | | | 16,888 | | | $ | 304,412 | | | | 31,899 | | | $ | 560,670 | | | | 148,741 | | | $ | 2,638,714 | | | | 312,863 | | | $ | 5,281,026 | | | | 1,306 | | | $ | 17,024 | | | | 18,318 | | | $ | 254,679 | |
| | | �� | | | — | | | | 1 | | | | — | | | | — | | | | 15,578 | | | | 279,065 | | | | 30,338 | | | | 509,546 | | | | — | | | | — | | | | 73 | | | | 1,000 | |
| | | | | | 10 | | | | 178 | | | | 643 | | | | 10,854 | | | | 172 | | | | 3,109 | | | | 482 | | | | 8,636 | | | | — | | | | — | | | | — | | | | — | |
| | | | | | 8,171 | | | | 149,437 | | | | 132,724 | | | | 2,346,978 | | | | 20,926 | | | | 364,376 | | | | 85,102 | | | | 1,472,847 | | | | 17,035 | | | | 242,869 | | | | 31,398 | | | | 433,985 | |
| | | | | | — | | | | — | | | | — | | | | — | | | | 8,546 | | | | 149,723 | | | | 10,350 | | | | 176,024 | | | | 4,081 | | | | 45,588 | | | | 17,279 | | | | 240,568 | |
| | | | | | 119,140 | | | | 2,132,463 | | | | 227,263 | | | | 4,023,703 | | | | 2,319,101 | | | | 39,944,325 | | | | 59,036 | | | | 993,049 | | | | 815,993 | | | | 10,517,269 | | | | 2,781,064 | | | | 40,286,108 | |
| | | | | | 798 | | | | 14,190 | | | | 4,479 | | | | 78,942 | | | | — | | | | — | | | | 1,228 | | | | 21,124 | | | | — | | | | — | | | | — | | | | — | |
| | | | | | | | | | | | |
|
|
| | | | | | | | | | | | | | | | | | | | | | | | | | | | | | | | | | | | | | | | | | | | | | | | |
| | | | | | 5,962 | | | | 108,801 | | | | 6,941 | | | | 108,202 | | | | 22,220 | | | | 375,426 | | | | 35,907 | | | | 614,376 | | | | 11,139 | | | | 148,481 | | | | 8,996 | | | | 111,996 | |
| | | | | | — | | | | — | | | | — | | | | — | | | | 1,721 | | | | 28,860 | | | | 4,015 | | | | 68,590 | | | | 218 | | | | 2,911 | | | | 145 | | | | 1,808 | |
| | | | | | 119 | | | | 2,181 | | | | 266 | | | | 4,136 | | | | 49 | | | | 863 | | | | 91 | | | | 1,615 | | | | — | | | | — | | | | — | | | | — | |
| | | | | | 344 | | | | 6,455 | | | | 27,538 | | | | 431,803 | | | | 1,969 | | | | 33,615 | | | | 25,743 | | | | 442,685 | | | | 9,734 | | | | 129,756 | | | | 13,017 | | | | 162,066 | |
| | | | | | — | | | | — | | | | — | | | | — | | | | 504 | | | | 8,237 | | | | 289 | | | | 4,881 | | | | 6,276 | | | | 82,209 | | | | 22,536 | | | | 276,295 | |
| | | | | | 31,446 | | | | 580,489 | | | | 37,615 | | | | 592,429 | | | | 28,147 | | | | 415,701 | | | | 39,088 | | | | 653,978 | | | | 2,529,321 | | | | 33,639,966 | | | | 5,349,997 | | | | 66,179,468 | |
| | | | | | 616 | | | | 11,265 | | | | 1,736 | | | | 27,083 | | | | 14 | | | | 232 | | | | 737 | | | | 12,479 | | | | — | | | | — | | | | — | | | | — | |
| | | | | | | | | | | | |
| | | | | | | | | | | | | | | | | | | | | | | | | | | | | | | | | | | | | | | | | | | | | | | | | | |
| | | | | | (18,894 | ) | | | (350,666 | ) | | | (33,373 | ) | | | (588,957 | ) | | | (125,575 | ) | | | (2,210,392 | ) | | | (150,949 | ) | | | (2,569,046 | ) | | | (16,046 | ) | | | (201,206 | ) | | | (26,033 | ) | | | (383,931 | ) |
| | | | | | — | | | | — | | | | — | | | | — | | | | (19,269 | ) | | | (309,386 | ) | | | (75,511 | ) | | | (1,293,717 | ) | | | — | | | | — | | | | (1,386 | ) | | | (22,108 | ) |
| | | | | | — | | | | (3 | ) | | | (4,486 | ) | | | (76,687 | ) | | | (28 | ) | | | (497 | ) | | | (533 | ) | | | (9,369 | ) | | | — | | | | — | | | | — | | | | — | |
| | | | | | (131,247 | ) | | | (2,454,167 | ) | | | (322,619 | ) | | | (5,812,059 | ) | | | (103,434 | ) | | | (1,745,700 | ) | | | (535,136 | ) | | | (9,471,935 | ) | | | (31,776 | ) | | | (363,051 | ) | | | (104,629 | ) | | | (1,459,278 | ) |
| | | | | | — | | | | — | | | | — | | | | — | | | | (797 | ) | | | (13,519 | ) | | | (2,027 | ) | | | (32,947 | ) | | | (13,093 | ) | | | (180,551 | ) | | | (138,631 | ) | | | (1,772,912 | ) |
| | | | | | (220,062 | ) | | | (3,567,380 | ) | | | (175,044 | ) | | | (3,150,281 | ) | | | (202,309 | ) | | | (3,309,440 | ) | | | (501,706 | ) | | | (8,442,035 | ) | | | (15,827,796 | ) | | | (222,900,613 | ) | | | (13,210,270 | ) | | | (188,289,268 | ) |
| | | | | | (2,832 | ) | | | (51,551 | ) | | | (13,838 | ) | | | (235,429 | ) | | | — | | | | — | | | | (31,039 | ) | | | (534,195 | ) | | | — | | | | — | | | | — | | | | — | |
|
|
| | | (189,541 | ) | | $ | (3,113,895 | ) | | | (78,256 | ) | | $ | (1,678,613 | ) | | | 2,116,276 | | | $ | 36,653,312 | | | | (691,632 | ) | | $ | (12,092,388 | ) | | | (12,493,608 | ) | | $ | (178,819,348 | ) | | | (5,238,126 | ) | | $ | (83,979,524 | ) |
| | | | | | |
| | Semiannual Report | | | March 31, 2020 | | 351 |
Notes to Financial Statements (cont’d)
March 31, 2020 (unaudited)
| | | | | | | | | | | | | | | | | | | | | | | | | | | | | | | | | | | | |
| | | AllianzGI Best Styles U.S. Equity | | | AllianzGI Convertible | | | | |
| | | | | |
| | | Six Months ended
March 31, 2020
(unaudited) | | | Year ended
September 30, 2019 | | | Six Months ended
March 31, 2020
(unaudited) | | | Year ended
September 30, 2019 | | | | |
| | | Shares | | | Amount | | | Shares | | | Amount | | | Shares | | | Amount | | | Shares | | | Amount | | | | |
Shares sold: | | | | | | | | | | | | | | | | | | | | | | | | | | | | | | | | | | | | |
Class A | | | 23,349 | | | $ | 381,118 | | | | 48,815 | | | $ | 761,156 | | | | 1,855,536 | | | $ | 54,637,740 | | | | 927,069 | | | $ | 27,007,767 | | | | | |
Class C | | | — | | | | — | | | | 6,836 | | | | 104,042 | | | | 582,823 | | | | 17,841,743 | | | | 835,945 | | | | 24,294,977 | | | | | |
Class R | | | — | | | | — | | | | — | | | | — | | | | 663 | | | | 21,336 | | | | 2,421 | | | | 74,232 | | | | | |
Class P | | | 12,378 | | | | 215,000 | | | | 31,547 | | | | 576,275 | | | | 4,267,779 | | | | 123,994,626 | | | | 3,280,675 | | | | 92,499,330 | | | | | |
Institutional Class | | | 9,084 | | | | 158,138 | | | | 3,574 | | | | 55,100 | | | | 7,840,344 | | | | 228,074,279 | | | | 4,715,339 | | | | 135,402,514 | | | | | |
Class R6 | | | 234,015 | | | | 3,327,120 | | | | 645,776 | | | | 10,633,540 | | | | — | | | | — | | | | — | | | | — | | | | | |
Administrative Class | | | — | | | | — | | | | — | | | | — | | | | 12,320 | | | | 378,171 | | | | 3,695 | | | | 107,637 | | | | | |
| | | | | | | | | |
Issued in reinvestment of dividends and distributions: | | | | | | | | | | | | | | | | | | | | | | | | | | | | | | | | | | | | |
Class A | | | 25,782 | | | | 347,801 | | | | 6,062 | | | | 82,571 | | | | 107,142 | | | | 3,204,189 | | | | 323,724 | | | | 8,061,431 | | | | | |
Class C | | | 1,018 | | | | 13,304 | | | | 851 | | | | 11,259 | | | | 63,483 | | | | 1,943,210 | | | | 227,221 | | | | 5,693,349 | | | | | |
Class R | | | — | | | | — | | | | — | | | | — | | | | 206 | | | | 6,453 | | | | 492 | | | | 12,717 | | | | | |
Class P | | | 8,814 | | | | 117,495 | | | | 8,119 | | | | 109,529 | | | | 287,442 | | | | 8,319,452 | | | | 537,881 | | | | 13,089,974 | | | | | |
Institutional Class | | | 3,884 | | | | 51,888 | | | | 1,850 | | | | 25,032 | | | | 665,912 | | | | 19,502,141 | | | | 1,940,013 | | | | 47,589,658 | | | | | |
Class R6 | | | 771,745 | | | | 10,480,298 | | | | 1,323,571 | | | | 18,027,043 | | | | — | | | | — | | | | — | | | | — | | | | | |
Administrative Class | | | — | | | | — | | | | — | | | | — | | | | 837 | | | | 24,743 | | | | 4,758 | | | | 116,747 | | | | | |
| | | | | | | | | |
Cost of shares redeemed: | | | | | | | | | | | | | | | | | | | | | | | | | | | | | | | | | | | | |
Class A | | | (27,390 | ) | | | (370,890 | ) | | | (3,905 | ) | | | (69,296 | ) | | | (519,839 | ) | | | (15,115,600 | ) | | | (743,559 | ) | | | (21,015,895 | ) | | | | |
Class C | | | (1,954 | ) | | | (29,221 | ) | | | (4,294 | ) | | | (62,681 | ) | | | (305,719 | ) | | | (9,113,318 | ) | | | (644,782 | ) | | | (18,689,403 | ) | | | | |
Class R | | | — | | | | — | | | | — | | | | — | | | | (49 | ) | | | (1,576 | ) | | | (362 | ) | | | (11,089 | ) | | | | |
Class P | | | (22,640 | ) | | | (303,105 | ) | | | (55,752 | ) | | | (937,034 | ) | | | (1,907,945 | ) | | | (52,318,258 | ) | | | (1,536,819 | ) | | | (42,210,655 | ) | | | | |
Institutional Class | | | (15,715 | ) | | | (217,461 | ) | | | (7,713 | ) | | | (109,953 | ) | | | (3,237,951 | ) | | | (89,961,129 | ) | | | (4,054,854 | ) | | | (113,207,612 | ) | | | | |
Class R6 | | | (1,407,115 | ) | | | (20,301,567 | ) | | | (3,743,463 | ) | | | (60,369,661 | ) | | | — | | | | — | | | | — | | | | — | | | | | |
Administrative Class | | | — | | | | — | | | | — | | | | — | | | | (4,203 | ) | | | (120,836 | ) | | | (20,190 | ) | | | (560,661 | ) | | | | |
Net increase (decrease) resulting from Fund share transactions | | | (384,745 | ) | | $ | (6,130,082 | ) | | | (1,738,126 | ) | | $ | (31,163,078 | ) | | | 9,708,781 | | | $ | 291,317,366 | | | | 5,798,667 | | | $ | 158,255,018 | | | | | |
| — | May reflect actual amounts rounding to less than $1 or less than 1 share. |
| | | | | | |
| 352 | | March 31, 2020 | | | Semiannual Report | | |
| | | | | | | | | | | | | | | | | | | | | | | | | | | | | | | | | | | | | | | | | | | | | | | | | | |
| | | | AllianzGI Core Bond | | | AllianzGI Core Plus Bond | | | AllianzGI Emerging Markets Consumer | |
| | | | | | |
| | | | Six Months ended
March 31, 2020
(unaudited) | | | Year ended
September 30, 2019 | | | Six Months ended
March 31, 2020
(unaudited) | | | Year ended
September 30, 2019 | | | Six Months ended
March 31, 2020
(unaudited) | | | Year ended
September 30, 2019 | |
| | | | Shares | | | Amount | | | Shares | | | Amount | | | Shares | | | Amount | | | Shares | | | Amount | | | Shares | | | Amount | | | Shares | | | Amount | |
| | | | | | | | | | | | | | | | | | | | | | | | | | | | | | | | | | | | | | | | | | | | | | | | | | |
| | | | | | — | | | $ | — | | | | — | | | $ | — | | | | — | | | $ | — | | | | — | | | $ | — | | | | 19 | | | $ | 272 | | | | 80 | | | $ | 1,025 | |
| | | | | | — | | | | — | | | | — | | | | — | | | | — | | | | — | | | | — | | | | — | | | | — | | | | — | | | | — | | | | — | |
| | | | | | — | | | | — | | | | — | | | | — | | | | — | | | | — | | | | — | | | | — | | | | — | | | | — | | | | — | | | | — | |
| | | | | | — | | | | — | | | | 936 | | | | 15,000 | | | | — | | | | — | | | | — | | | | — | | | | — | | | | — | | | | — | | | | — | |
| | | | | | 563 | | | | 9,001 | | | | 2,424 | | | | 36,913 | | | | — | | | | — | | | | — | | | | — | | | | 21,256 | | | | 302,296 | | | | 1,608,568 | | | | 21,252,308 | |
| | | | | | 1,063,032 | | | | 16,493,634 | | | | 103,977 | | | | 1,589,665 | | | | 33,478 | | | | 524,333 | | | | 954,928 | | | | 15,168,884 | | | | — | | | | — | | | | — | | | | — | |
| | | | | | — | | | | — | | | | — | | | | — | | | | — | | | | — | | | | — | | | | — | | | | — | | | | — | | | | — | | | | — | |
| | | | | | | | | | | | |
| | | |
|
|
| | | | | | | | | | | | | | | | | | | | | | | | | | | | | | | | | | | | | | | | | | | | |
| | | | | | — | | | | — | | | | — | | | | — | | | | — | | | | — | | | | — | | | | — | | | | 32 | | | | 457 | | | | 17 | | | | 207 | |
| | | | | | — | | | | — | | | | — | | | | — | | | | — | | | | — | | | | — | | | | — | | | | — | | | | — | | | | — | | | | — | |
| | | | | | — | | | | — | | | | — | | | | — | | | | — | | | | — | | | | — | | | | — | | | | — | | | | — | | | | — | | | | — | |
| | | | | | 103 | | | | 1,571 | | | | 25 | | | | 381 | | | | 36 | | | | 550 | | | | 20 | | | | 302 | | | | — | | | | — | | | | — | | | | — | |
| | | | | | 244 | | | | 3,715 | | | | 56 | | | | 875 | | | | 36 | | | | 554 | | | | 20 | | | | 310 | | | | 26,628 | | | | 387,702 | | | | 35,465 | | | | 442,608 | |
| | | | | | 144,871 | | | | 2,198,072 | | | | 63,955 | | | | 977,793 | | | | 191,618 | | | | 2,946,330 | | | | 84,166 | | | | 1,286,062 | | | | — | | | | — | | | | — | | | | — | |
| | | | | | — | | | | — | | | | — | | | | — | | | | — | | | | — | | | | — | | | | — | | | | — | | | | — | | | | — | | | | — | |
| | | | | | | | | | | | |
| | | | | | | | | | | | | | | | | | | | | | | | | | | | | | | | | | | | | | | | | | | | | | | | | | |
| | | | | | — | | | | — | | | | — | | | | — | | | | — | | | | — | | | | — | | | | — | | | | (18 | ) | | | (257 | ) | | | (507 | ) | | | (7,035 | ) |
| | | | | | — | | | | — | | | | — | | | | — | | | | — | | | | — | | | | — | | | | — | | | | — | | | | — | | | | — | | | | — | |
| | | | | | — | | | | — | | | | — | | | | — | | | | — | | | | — | | | | — | | | | — | | | | — | | | | — | | | | — | | | | — | |
| | | | | | (998 | ) | | | (15,420 | ) | | | — | | | | — | | | | — | | | | — | | | | — | | | | — | | | | — | | | | — | | | | — | | | | — | |
| | | | | | — | | | | — | | | | — | | | | — | | | | — | | | | — | | | | — | | | | — | | | | (161,569 | ) | | | (2,020,578 | ) | | | (1,828,055 | ) | | | (24,242,382 | ) |
| | | | | | (175,475 | ) | | | (2,670,344 | ) | | | (25,224 | ) | | | (388,329 | ) | | | (287,146 | ) | | | (4,448,137 | ) | | | (9,784 | ) | | | (147,681 | ) | | | — | | | | — | | | | — | | | | — | |
| | | | | | — | | | | — | | | | — | | | | — | | | | — | | | | — | | | | — | | | | — | | | | — | | | | — | | | | — | | | | — | |
|
|
| | | 1,032,340 | | | $ | 16,020,229 | | | | 146,149 | | | $ | 2,232,298 | | | | (61,978 | ) | | $ | (976,370 | ) | | | 1,029,350 | | | $ | 16,307,877 | | | | (113,652 | ) | | $ | (1,330,108 | ) | | | (184,432 | ) | | $ | (2,553,269 | ) |
| | | | | | |
| | Semiannual Report | | | March 31, 2020 | | 353 |
Notes to Financial Statements (cont’d)
March 31, 2020 (unaudited)
| | | | | | | | | | | | | | | | | | | | | | | | | | | | | | | | | | | | |
| | | AllianzGI Emerging MarketsSmall-Cap | | | AllianzGI Emerging Markets SRI Debt | | | | |
| | | | | |
| | | Six Months ended
March 31, 2020
(unaudited) | | | Year ended
September 30, 2019 | | | Six Months ended
March 31, 2020
(unaudited) | | | Year ended
September 30, 2019 | | | | |
| | | Shares | | | Amount | | | Shares | | | Amount | | | Shares | | | Amount | | | Shares | | | Amount | | | | |
Shares sold: | | | | | | | | | | | | | | | | | | | | | | | | | | | | | | | | | | | | |
Class A | | | 10,225 | | | $ | 163,298 | | | | 4,660 | | | $ | 76,707 | | | | 3,950 | | | $ | 57,096 | | | | 3,899 | | | $ | 52,207 | | | | | |
Class C | | | — | | | | — | | | | — | | | | — | | | | — | | | | — | | | | — | | | | — | | | | | |
Class R | | | — | | | | — | | | | — | | | | — | | | | — | | | | — | | | | — | | | | — | | | | | |
Class P | | | — | | | | — | | | | — | | | | — | | | | — | | | | — | | | | — | | | | — | | | | | |
Institutional Class | | | 7,470 | | | | 103,982 | | | | 24,943 | | | | 389,972 | | | | 461,972 | | | | 6,151,511 | | | | 112,026 | | | | 1,502,528 | | | | | |
Class R6 | | | — | | | | — | | | | — | | | | — | | | | — | | | | — | | | | — | | | | — | | | | | |
Administrative Class | | | — | | | | — | | | | — | | | | — | | | | — | | | | — | | | | — | | | | — | | | | | |
| | | | | | | | | |
Issued in reinvestment of dividends and distributions: | | | | | | | | | | | | | | | | | | | | | | | | | | | | | | | | | | | | |
Class A | | | 477 | | | | 8,030 | | | | 389 | | | | 5,633 | | | | 105 | | | | 1,365 | | | | 290 | | | | 4,064 | | | | | |
Class C | | | — | | | | — | | | | — | | | | — | | | | 9 | | | | 127 | | | | 29 | | | | 404 | | | | | |
Class R | | | — | | | | — | | | | — | | | | — | | | | — | | | | — | | | | — | | | | — | | | | | |
Class P | | | — | | | | — | | | | — | | | | — | | | | 12 | | | | 165 | | | | 40 | | | | 545 | | | | | |
Institutional Class | | | 16,957 | | | | 282,337 | | | | 37,237 | | | | 528,395 | | | | 22,862 | | | | 298,128 | | | | 64,791 | | | | 885,013 | | | | | |
Class R6 | | | — | | | | — | | | | — | | | | — | | | | — | | | | — | | | | — | | | | — | | | | | |
Administrative Class | | | — | | | | — | | | | — | | | | — | | | | — | | | | — | | | | — | | | | — | | | | | |
| | | | | | | | | |
Cost of shares redeemed: | | | | | | | | | | | | | | | | | | | | | | | | | | | | | | | | | | | | |
Class A | | | (3,968 | ) | | | (62,955 | ) | | | (6,001 | ) | | | (95,663 | ) | | | (2,199 | ) | | | (30,856 | ) | | | (4,800 | ) | | | (62,966 | ) | | | | |
Class C | | | — | | | | — | | | | — | | | | — | | | | — | | | | — | | | | (2,438 | ) | | | (32,418 | ) | | | | |
Class R | | | — | | | | — | | | | — | | | | — | | | | — | | | | — | | | | — | | | | — | | | | | |
Class P | | | — | | | | — | | | | — | | | | — | | | | — | | | | — | | | | — | | | | — | | | | | |
Institutional Class | | | (65,849 | ) | | | (993,127 | ) | | | (179,420 | ) | | | (2,810,844 | ) | | | (130,232 | ) | | | (1,814,201 | ) | | | (111,962 | ) | | | (1,528,235 | ) | | | | |
Class R6 | | | — | | | | — | | | | — | | | | — | | | | — | | | | — | | | | — | | | | — | | | | | |
Net increase (decrease) resulting from Fund share transactions | | | (34,688 | ) | | $ | (498,435 | ) | | | (118,192 | ) | | $ | (1,905,800 | ) | | | 356,479 | | | $ | 4,663,335 | | | | 61,875 | | | $ | 821,142 | | | | | |
| — | May reflect actual amounts rounding to less than $1 or less than 1 share. |
| | | | | | |
| 354 | | March 31, 2020 | | | Semiannual Report | | |
| | | | | | | | | | | | | | | | | | | | | | | | | | | | | | | | | | | | | | | | | | | | | | | | | | |
| | | | AllianzGI Emerging Markets Value | | | AllianzGI Floating Rate Note | | | AllianzGI Global Allocation | |
| | | | | | |
| | | | Six Months ended
March 31, 2020
(unaudited) | | | Year ended
September 30, 2019 | | | Six Months ended
March 31, 2020
(unaudited) | | | Year ended
September 30, 2019 | | | Six Months ended
March 31, 2020
(unaudited) | | | Year ended
September 30, 2019 | |
| | | | Shares | | | Amount | | | Shares | | | Amount | | | Shares | | | Amount | | | Shares | | | Amount | | | Shares | | | Amount | | | Shares | | | Amount | |
| | | | | | | | | | | | | | | | | | | | | | | | | | | | | | | | | | | | | | | | | | | | | | | | | | |
| | | | | | 210,250 | | | $ | 3,383,373 | | | | 219,385 | | | $ | 3,367,289 | | | | — | | | $ | — | | | | — | | | $ | — | | | | 193,689 | | | $ | 2,088,540 | | | | 1,759,689 | | | $ | 19,613,414 | |
| | | | | | 1,716 | | | | 28,674 | | | | 32,404 | | | | 509,060 | | | | — | | | | — | | | | — | | | | — | | | | 82,557 | | | | 923,042 | | | | 119,762 | | | | 1,250,907 | |
| | | | | | — | | | | — | | | | — | | | | — | | | | — | | | | — | | | | — | | | | — | | | | — | | | | — | | | | 160 | | | | 1,735 | |
| | | | | | 12,538 | | | | 204,320 | | | | 42,135 | | | | 658,306 | | | | — | | | | — | | | | — | | | | — | | | | 161,085 | | | | 1,747,442 | | | | 333,520 | | | | 3,328,407 | |
| | | | | | 992,707 | | | | 15,414,449 | | | | 2,197,656 | | | | 33,820,277 | | | | 115,421 | | | | 1,722,726 | | | | 57,149 | | | | 849,209 | | | | 91,628 | | | | 1,003,340 | | | | 94,795 | | | | 1,030,055 | |
| | | | | | — | | | | — | | | | — | | | | — | | | | — | | | | — | | | | — | | | | — | | | | 2,340,331 | | | | 23,957,909 | | | | 3,703,382 | | | | 38,620,649 | |
| | | | | | — | | | | — | | | | — | | | | — | | | | — | | | | — | | | | — | | | | — | | | | 75 | | | | 819 | | | | 17 | | | | 198 | |
| | | | | | | | | | | | |
| | | | | | | | | | | | | | | | | | | | | | | | | | | | | | | | | | | | | | | | | | | | | | | | | | |
| | | | | | 5,183 | | | | 85,562 | | | | 21,910 | | | | 351,944 | | | | — | | | | — | | | | — | | | | — | | | | 339,775 | | | | 3,591,403 | | | | 278,260 | | | | 2,798,425 | |
| | | | | | 207 | | | | 3,508 | | | | 1,283 | | | | 20,510 | | | | — | | | | — | | | | — | | | | — | | | | 33,633 | | | | 369,764 | | | | 28,248 | | | | 290,703 | |
| | | | | | — | | | | — | | | | — | | | | — | | | | — | | | | — | | | | — | | | | — | | | | 177 | | | | 1,855 | | | | 199 | | | | 1,965 | |
| | | | | | 788 | | | | 13,053 | | | | 3,267 | | | | 52,446 | | | | 6 | | | | 85 | | | | 25 | | | | 376 | | | | 24,872 | | | | 259,272 | | | | 12,825 | | | | 127,708 | |
| | | | | | 40,581 | | | | 647,730 | | | | 213,903 | | | | 3,312,431 | | | | 7,751 | | | | 114,739 | | | | 40,108 | | | | 590,756 | | | | 50,459 | | | | 529,377 | | | | 41,540 | | | | 417,023 | |
| | | | | | — | | | | — | | | | — | | | | — | | | | — | | | | — | | | | — | | | | — | | | | 2,330,267 | | | | 23,880,158 | | | | 1,685,062 | | | | 16,591,827 | |
| | | | | | — | | | | — | | | | — | | | | — | | | | — | | | | — | | | | — | | | | — | | | | 193 | | | | 2,101 | | | | 127 | | | | 1,312 | |
| | | | | | | | | | | | |
| | | | | | | | | | | | | | | | | | | | | | | | | | | | | | | | | | | | | | | | | | | | | | | | | | |
| | | | | | (275,193 | ) | | | (4,182,487 | ) | | | (711,983 | ) | | | (10,974,346 | ) | | | — | | | | — | | | | — | | | | — | | | | (610,283 | ) | | | (6,529,443 | ) | | | (1,153,312 | ) | | | (12,396,960 | ) |
| | | | | | (5,572 | ) | | | (91,423 | ) | | | (42,723 | ) | | | (658,495 | ) | | | — | | | | — | | | | — | | | | — | | | | (229,950 | ) | | | (2,526,629 | ) | | | (1,832,217 | ) | | | (20,828,729 | ) |
| | | | | | — | | | | — | | | | — | | | | — | | | | — | | | | — | | | | — | | | | — | | | | — | | | | — | | | | (1,534 | ) | | | (15,480 | ) |
| | | | | | (41,112 | ) | | | (649,636 | ) | | | (120,149 | ) | | | (1,843,801 | ) | | | — | | | | — | | | | — | | | | — | | | | (363,587 | ) | | | (3,816,599 | ) | | | (159,246 | ) | | | (1,673,173 | ) |
| | | | | | (957,021 | ) | | | (15,284,107 | ) | | | (3,377,357 | ) | | | (51,241,215 | ) | | | (74,585 | ) | | | (1,113,666 | ) | | | (195,593 | ) | | | (2,892,682 | ) | | | (109,839 | ) | | | (1,098,370 | ) | | | (170,380 | ) | | | (1,806,024 | ) |
| | | | | | — | | | | — | | | | — | | | | — | | | | — | | | | — | | | | — | | | | — | | | | (4,826,772 | ) | | | (49,876,464 | ) | | | (4,746,544 | ) | | | (49,776,513 | ) |
|
|
| | | (14,928 | ) | | $ | (426,984 | ) | | | (1,520,269 | ) | | $ | (22,625,594 | ) | | | 48,593 | | | $ | 723,884 | | | | (98,311 | ) | | $ | (1,452,341 | ) | | | (491,690 | ) | | $ | (5,492,483 | ) | | | (5,647 | ) | | $ | (2,422,551 | ) |
| | | | | | |
| | Semiannual Report | | | March 31, 2020 | | 355 |
Notes to Financial Statements (cont’d)
March 31, 2020 (unaudited)
| | | | | | | | | | | | | | | | | | | | | | | | | | | | | | | | | | | | |
| | | AllianzGI Global Dynamic Allocation | | | AllianzGI Global High Yield | | | | |
| | | | | |
| | |
Six Months ended
March 31, 2020
(unaudited) | | | Year ended
September 30, 2019 | | | Six Months ended
March 31, 2020
(unaudited) | | | Year ended
September 30, 2019 | | | | |
| | | Shares | | | Amount | | | Shares | | | Amount | | | Shares | | | Amount | | | Shares | | | Amount | | | | |
Shares sold: | | | | | | | | | | | | | | | | | | | | | | | | | | | | | | | | | | | | |
Class A | | | 2,416 | | | $ | 46,312 | | | | 47,994 | | | $ | 919,957 | | | | — | | | $ | — | | | | — | | | $ | — | | | | | |
Class C | | | 5,991 | | | | 111,535 | | | | 4,461 | | | | 82,898 | | | | — | | | | — | | | | — | | | | — | | | | | |
Class R | | | 382 | | | | 7,115 | | | | 795 | | | | 14,907 | | | | — | | | | — | | | | — | | | | — | | | | | |
Class P | | | 5 | | | | 100 | | | | 14,883 | | | | 272,835 | | | | — | | | | — | | | | — | | | | — | | | | | |
Institutional Class | | | 62,863 | | | | 1,129,323 | | | | 21,516 | | | | 404,272 | | | | 308,395 | | | | 4,538,776 | | | | 36,279 | | | | 534,849 | | | | | |
Class R6 | | | 543,926 | | | | 10,030,694 | | | | 1,181,860 | | | | 22,479,632 | | | | — | | | | — | | | | — | | | | — | | | | | |
Administrative Class | | | — | | | | — | | | | — | | | | — | | | | — | | | | — | | | | — | | | | — | | | | | |
| | | | | | | | | |
Issued in reinvestment of dividends and distributions: | | | | | | | | | | | | | | | | | | | | | | | | | | | | | | | | | | | | |
Class A | | | 9,553 | | | | 176,628 | | | | 5,336 | | | | 92,840 | | | | — | | | | — | | | | — | | | | — | | | | | |
Class C | | | 3,516 | | | | 63,940 | | | | 1,034 | | | | 17,748 | | | | — | | | | — | | | | — | | | | — | | | | | |
Class R | | | 587 | | | | 10,836 | | | | 219 | | | | 3,802 | | | | — | | | | — | | | | — | | | | — | | | | | |
Class P | | | 247 | | | | 4,691 | | | | 33,205 | | | | 573,450 | | | | 9 | | | | 134 | | | | 48 | | | | 689 | | | | | |
Institutional Class | | | 53,944 | | | | 1,011,445 | | | | 20,229 | | | | 356,643 | | | | 23,701 | | | | 323,031 | | | | 106,069 | | | | 1,534,320 | | | | | |
Class R6 | | | 650,162 | | | | 11,995,496 | | | | 489,384 | | | | 8,485,926 | | | | — | | | | — | | | | — | | | | — | | | | | |
Administrative Class | | | 133 | | | | 2,455 | | | | 57 | | | | 975 | | | | — | | | | — | | | | — | | | | — | | | | | |
| | | | | | | | | |
Cost of shares redeemed: | | | | | | | | | | | | | | | | | | | | | | | | | | | | | | | | | | | | |
Class A | | | (29,361 | ) | | | (517,036 | ) | | | (58,861 | ) | | | (1,092,588 | ) | | | — | | | | — | | | | — | | | | — | | | | | |
Class C | | | (5,906 | ) | | | (109,230 | ) | | | (35,403 | ) | | | (669,078 | ) | | | — | | | | — | | | | — | | | | — | | | | | |
Class R | | | (1,161 | ) | | | (21,396 | ) | | | (2,663 | ) | | | (50,381 | ) | | | — | | | | — | | | | — | | | | — | | | | | |
Class P | | | (596,611 | ) | | | (11,721,906 | ) | | | (117,170 | ) | | | (2,142,526 | ) | | | — | | | | — | | | | — | | | | — | | | | | |
Institutional Class | | | (35,666 | ) | | | (655,770 | ) | | | (217,234 | ) | | | (4,167,618 | ) | | | (12,318 | ) | | | (187,848 | ) | | | (28,404 | ) | | | (428,150 | ) | | | | |
Class R6 | | | (1,666,902 | ) | | | (31,288,462 | ) | | | (4,583,267 | ) | | | (87,757,691 | ) | | | — | | | | — | | | | — | | | | — | | | | | |
Administrative Class | | | — | | | | — | | | | — | | | | — | | | | — | | | | — | | | | — | | | | — | | | | | |
Net increase (decrease) resulting from Fund share transactions | | | (1,001,882 | ) | | $ | (19,723,230 | ) | | | (3,193,625 | ) | | $ | (62,173,997 | ) | | | 319,787 | | | $ | 4,674,093 | | | | 113,992 | | | $ | 1,641,708 | | | | | |
| — | May reflect actual amounts rounding to less than $1 or less than 1 share. |
| * | Commencement of operations. |
| | | | | | |
| 356 | | March 31, 2020 | | | Semiannual Report | | |
| | | | | | | | | | | | | | | | | | | | | | | | | | | | | | | | | | | | | | | | | | | | | | | | | | |
| | | | AllianzGI Global Sustainability | | | AllianzGI Green Bond | | | AllianzGI High Yield Bond | |
| | | | | | |
| | | | Six Months ended
March 31, 2020
(unaudited) | | | Year ended
September 30, 2019 | | | Six Months ended
March 31, 2020
(unaudited) | | | Year ended
November 19, 2018*
through
September 30, 2019 | | | Six Months ended
March 31, 2020
(unaudited) | | | Year ended
September 30, 2019 | |
| | | | Shares | | | Amount | | | Shares | | | Amount | | | Shares | | | Amount | | | Shares | | | Amount | | | Shares | | | Amount | | | Shares | | | Amount | |
| | | | | | | | | | | | | | | | | | | | | | | | | | | | | | | | | | | | | | | | | | | | | | | | | | |
| | | | | | 27,699 | | | $ | 513,434 | | | | 115,395 | | | $ | 2,114,648 | | | | 5,273 | | | $ | 86,265 | | | | 5,017 | | | $ | 76,142 | | | | 228,533 | | | $ | 2,040,288 | | | | 744,048 | | | $ | 6,483,990 | |
| | | | | | — | | | | — | | | | — | | | | — | | | | — | | | | — | | | | — | | | | — | | | | 17,493 | | | | 155,139 | | | | 94,473 | | | | 805,389 | |
| | | | | | — | | | | — | | | | — | | | | — | | | | — | | | | — | | | | — | | | | — | | | | 46,173 | | | | 389,516 | | | | 87,935 | | | | 729,106 | |
| | | | | | 452,222 | | | | 8,462,415 | | | | 839,758 | | | | 14,425,605 | | | | 13,208 | | | | 215,800 | | | | 65,759 | | | | 1,050,700 | | | | 86,568 | | | | 734,115 | | | | 760,572 | | | | 6,286,286 | |
| | | | | | 7,225,303 | | | | 136,340,937 | | | | 55,785 | | | | 1,016,992 | | | | 2,057,856 | | | | 33,739,156 | | | | 20,174 | | | | 323,012 | | | | 2,020,394 | | | | 17,077,853 | | | | 1,661,437 | | | | 13,894,508 | |
| | | | | | — | | | | — | | | | — | | | | — | | | | — | | | | — | | | | — | | | | — | | | | — | | | | — | | | | — | | | | — | |
| | | | | | — | | | | — | | | | — | | | | — | | | | — | | | | — | | | | — | | | | — | | | | 360 | | | | 3,037 | | | | 6,348 | | | | 53,584 | |
| | | | | | | | | | | | |
|
|
| | | | | | | | | | | | | | | | | | | | | | | | | | | | | | | | | | | | | | | | | | | | | | | | |
| | | | | | 1,364 | | | | 26,611 | | | | 2,973 | | | | 44,718 | | | | 86 | | | | 1,398 | | | | 83 | | | | 1,313 | | | | 65,784 | | | | 567,556 | | | | 164,994 | | | | 1,438,431 | |
| | | | | | — | | | | — | | | | — | | | | — | | | | — | | | | — | | | | — | | | | — | | | | 9,949 | | | | 85,626 | | | | 26,644 | | | | 231,665 | |
| | | | | | — | | | | — | | | | — | | | | — | | | | — | | | | — | | | | — | | | | — | | | | 1,617 | | | | 13,328 | | | | 3,136 | | | | 26,160 | |
| | | | | | 24,998 | | | | 490,968 | | | | 57,911 | | | | 876,192 | | | | 841 | | | | 13,620 | | | | 504 | | | | 8,163 | | | | 37,676 | | | | 311,239 | | | | 93,832 | | | | 783,115 | |
| | | | | | 128,204 | | | | 2,565,366 | | | | 53,317 | | | | 822,141 | | | | 21,215 | | | | 343,831 | | | | 5,846 | | | | 92,825 | | | | 245,851 | | | | 2,030,609 | | | | 588,936 | | | | 4,930,676 | |
| | | | | | — | | | | — | | | | — | | | | — | | | | — | | | | — | | | | — | | | | — | | | | — | | | | — | | | | — | | | | — | |
| | | | | | — | | | | — | | | | — | | | | — | | | | — | | | | — | | | | — | | | | — | | | | 83 | | | | 681 | | | | 150 | | | | 1,258 | |
| | | | | | | | | | | | |
| | | | | | | | | | | | | | | | | | | | | | | | | | | | | | | | | | | | | | | | | | | | | | | | | | |
| | | | | | (9,866 | ) | | | (190,278 | ) | | | (70,883 | ) | | | (1,286,395 | ) | | | (621 | ) | | | (10,128 | ) | | | — | | | | — | | | | (821,659 | ) | | | (7,235,119 | ) | | | (1,673,896 | ) | | | (14,642,983 | ) |
| | | | | | — | | | | — | | | | — | | | | — | | | | — | | | | — | | | | — | | | | — | | | | (117,318 | ) | | | (1,043,533 | ) | | | (532,830 | ) | | | (4,651,423 | ) |
| | | | | | — | | | | — | | | | — | | | | — | | | | — | | | | — | | | | — | | | | — | | | | (54,037 | ) | | | (459,816 | ) | | | (117,093 | ) | | | (974,669 | ) |
| | | | | | (153,740 | ) | | | (2,928,733 | ) | | | (301,248 | ) | | | (5,343,279 | ) | | | (9,923 | ) | | | (163,663 | ) | | | (489 | ) | | | (7,930 | ) | | | (315,710 | ) | | | (2,611,271 | ) | | | (1,482,333 | ) | | | (12,310,235 | ) |
| | | | | | (790,922 | ) | | | (15,797,910 | ) | | | (1,430,354 | ) | | | (26,159,970 | ) | | | (766,630 | ) | | | (12,690,153 | ) | | | (6,131 | ) | | | (100,934 | ) | | | (2,601,607 | ) | | | (21,803,298 | ) | | | (7,435,928 | ) | | | (62,047,291 | ) |
| | | | | | — | | | | — | | | | — | | | | — | | | | — | | | | — | | | | — | | | | — | | | | — | | | | — | | | | — | | | | — | |
| | | | | | — | | | | — | | | | — | | | | — | | | | — | | | | — | | | | — | | | | — | | | | (134 | ) | | | (1,126 | ) | | | (6,061 | ) | | | (51,729 | ) |
|
|
| | | 6,905,262 | | | $ | 129,482,810 | | | | (677,346 | ) | | $ | (13,489,348 | ) | | | 1,321,305 | | | $ | 21,536,126 | | | | 90,763 | | | $ | 1,443,291 | | | | (1,149,984 | ) | | $ | (9,745,176 | ) | | | (7,015,636 | ) | | $ | (59,014,162 | ) |
| | | | | | |
| | Semiannual Report | | | March 31, 2020 | | 357 |
Notes to Financial Statements (cont’d)
March 31, 2020 (unaudited)
| | | | | | | | | | | | | | | | | | | | | | | | | | | | | | | | | | | | |
| | |
AllianzGI InternationalSmall-Cap | | | AllianzGI Micro Cap | | | | |
| | | | | |
| | | Six Months ended
March 31, 2020
(unaudited) | | | Year ended
September 30, 2019 | | | Six Months ended
March 31, 2020
(unaudited) | | | Year ended
September 30, 2019 | | | | |
| | | Shares | | | Amount | | | Shares | | | Amount | | | Shares | | | Amount | | | Shares | | | Amount | | | | |
Shares sold: | | | | | | | | | | | | | | | | | | | | | | | | | | | | | | | | | | | | |
Class A | | | 11,963 | | | $ | 387,036 | | | | 45,024 | | | $ | 1,513,968 | | | | 3,980 | | | $ | 43,499 | | | | 14,982 | | | $ | 162,669 | | | | | |
Class C | | | 126 | | | | 4,116 | | | | 1,796 | | | | 55,502 | | | | — | | | | — | | | | — | | | | — | | | | | |
Class R | | | 3,254 | | | | 95,017 | | | | 14,224 | | | | 496,464 | | | | — | | | | — | | | | — | | | | — | | | | | |
Class P | | | 13,433 | | | | 407,057 | | | | 101,230 | | | | 3,421,259 | | | | 4,978 | | | | 51,819 | | | | 53,913 | | | | 575,596 | | | | | |
Institutional Class | | | 55,138 | | | | 1,750,887 | | | | 365,319 | | | | 12,608,298 | | | | 106,233 | | | | 1,073,543 | | | | 271,376 | | | | 3,037,460 | | | | | |
Class R6 | | | 309,254 | | | | 10,217,844 | | | | 166,939 | | | | 5,247,432 | | | | — | | | | — | | | | — | | | | — | | | | | |
| | | | | | | | | |
Issued in reinvestment of dividends and distributions: | | | | | | | | | | | | | | | | | | | | | | | | | | | | | | | | | | | | |
Class A | | | 1,918 | | | | 66,312 | | | | 28,989 | | | | 810,249 | | | | 1,309 | | | | 14,555 | | | | 44,402 | | | | 400,953 | | | | | |
Class C | | | 36 | | | | 1,196 | | | | 8,012 | | | | 215,286 | | | | — | | | | — | | | | — | | | | — | | | | | |
Class R | | | 610 | | | | 19,727 | | | | 6,359 | | | | 167,366 | | | | — | | | | — | | | | — | | | | — | | | | | |
Class P | | | 6,420 | | | | 220,655 | | | | 159,754 | | | | 4,426,791 | | | | 305 | | | | 3,423 | | | | 29,782 | | | | 271,612 | | | | | |
Institutional Class | | | 15,974 | | | | 569,471 | | | | 213,703 | | | | 6,161,056 | | | | 14,695 | | | | 166,196 | | | | 423,173 | | | | 3,884,729 | | | | | |
Class R6 | | | 19,547 | | | | 690,384 | | | | 141,955 | | | | 4,068,417 | | | | — | | | | — | | | | — | | | | — | | | | | |
| | | | | | | | | |
Cost of shares redeemed: | | | | | | | | | | | | | | | | | | | | | | | | | | | | | | | | | | | | |
Class A | | | (31,754 | ) | | | (1,027,568 | ) | | | (135,306 | ) | | | (4,608,453 | ) | | | (16,806 | ) | | | (170,710 | ) | | | (80,650 | ) | | | (913,338 | ) | | | | |
Class C | | | (5,504 | ) | | | (179,674 | ) | | | (41,167 | ) | | | (1,381,885 | ) | | | — | | | | — | | | | — | | | | — | | | | | |
Class R | | | (4,079 | ) | | | (100,924 | ) | | | (6,194 | ) | | | (189,894 | ) | | | — | | | | — | | | | — | | | | — | | | | | |
Class P | | | (156,951 | ) | | | (5,099,850 | ) | | | (776,355 | ) | | | (25,582,703 | ) | | | (12,260 | ) | | | (117,645 | ) | | | (154,831 | ) | | | (1,684,464 | ) | | | | |
Institutional Class | | | (315,608 | ) | | | (10,869,938 | ) | | | (467,635 | ) | | | (15,005,607 | ) | | | (240,164 | ) | | | (2,357,157 | ) | | | (631,977 | ) | | | (7,328,627 | ) | | | | |
Class R6 | | | (265,904 | ) | | | (8,675,978 | ) | | | (200,875 | ) | | | (6,639,632 | ) | | | — | | | | — | | | | — | | | | — | | | | | |
Net increase (decrease) resulting from Fund share transactions | | | (342,127 | ) | | $ | (11,524,230 | ) | | | (374,228 | ) | | $ | (14,216,086 | ) | | | (137,730 | ) | | $ | (1,292,477 | ) | | | (29,830 | ) | | $ | (1,593,410 | ) | | | | |
| — | May reflect actual amounts rounding to less than $1 or less than 1 share. |
| | | | | | |
| 358 | | March 31, 2020 | | | Semiannual Report | | |
| | | | | | | | | | | | | | | | | | | | | | | | | | | | | | | | | | | | | | | | | | | | | | | | | | |
| | | | AllianzGI PerformanceFee Managed Futures
Strategy | | | AllianzGI PerformanceFee Structured US Equity | | | AllianzGI PerformanceFee Structured US Fixed
Income | |
| | | | | | |
| | | | Six Months ended
March 31, 2020
(unaudited) | | | Year ended
September 30, 2019 | | | Six Months ended
March 31, 2020
(unaudited) | | | Year ended
September 30, 2019 | | | Six Months ended
March 31, 2020
(unaudited) | | | Year ended
September 30, 2019 | |
| | | | Shares | | | Amount | | | Shares | | | Amount | | | Shares | | | Amount | | | Shares | | | Amount | | | Shares | | | Amount | | | Shares | | | Amount | |
| | | | | | | | | | | | | | | | | | | | | | | | | | | | | | | | | | | | | | | | | | | | | | | | | | |
| | | | | | — | | | $ | — | | | | — | | | $ | — | | | | — | | | $ | — | | | | — | | | $ | — | | | | — | | | $ | — | | | | — | | | $ | — | |
| | | | | | — | | | | — | | | | — | | | | — | | | | — | | | | — | | | | — | | | | — | | | | — | | | | — | | | | — | | | | — | |
| | | | | | — | | | | — | | | | — | | | | — | | | | — | | | | — | | | | — | | | | — | | | | — | | | | — | | | | — | | | | — | |
| | | | | | — | | | | — | | | | — | | | | — | | | | 824,057 | | | | 8,933,566 | | | | 1,929,421 | | | | 19,945,782 | | | | 10,101 | | | | 100,000 | | | | 5,162 | | | | 53,138 | |
| | | | | | 22 | | | | 214 | | | | 112,309 | | | | 1,070,810 | | | | 4,405,243 | | | | 45,398,281 | | | | 1,058,546 | | | | 10,946,436 | | | | 30,617 | | | | 304,189 | | | | 114,097 | | | | 1,169,045 | |
| | | | | | 193,236 | | | | 1,826,617 | | | | 1,729,780 | | | | 15,938,742 | | | | 96,389 | | | | 772,155 | | | | 275,101 | | | | 2,552,073 | | | | 38,696 | | | | 377,374 | | | | 117,800 | | | | 1,171,707 | |
| | | | | | | | | | | | |
|
|
| | | | | | | | | | | | | | | | | | | | | | | | | | | | | | | | | | | | | | | | | | | | | | | | |
| | | | | | — | | | | — | | | | — | | | | — | | | | — | | | | — | | | | — | | | | — | | | | — | | | | — | | | | — | | | | — | |
| | | | | | — | | | | — | | | | — | | | | — | | | | — | | | | — | | | | — | | | | — | | | | — | | | | — | | | | — | | | | — | |
| | | | | | — | | | | — | | | | — | | | | — | | | | — | | | | — | | | | — | | | | — | | | | — | | | | — | | | | — | | | | — | |
| | | | | | 72 | | | | 647 | | | | 9 | | | | 81 | | | | 82,298 | | | | 931,615 | | | | 675 | | | | 5,757 | | | | 575 | | | | 5,634 | | | | 78 | | | | 785 | |
| | | | | | 3,737 | | | | 33,299 | | | | 474 | | | | 4,473 | | | | 204,110 | | | | 2,312,561 | | | | 324,961 | | | | 2,775,164 | | | | 8,024 | | | | 79,007 | | | | 796 | | | | 8,218 | |
| | | | | | 253,478 | | | | 2,258,487 | | | | 32,392 | | | | 305,782 | | | | 39,221 | | | | 449,085 | | | | 330,464 | | | | 2,828,770 | | | | 64,485 | | | | 643,282 | | | | 115,794 | | | | 1,142,377 | |
| | | | | | | | | | | | |
| | | | | | | | | | | | | | | | | | | | | | | | | | | | | | | | | | | | | | | | | | | | | | | | | | |
| | | | | | — | | | | — | | | | — | | | | — | | | | — | | | | — | | | | — | | | | — | | | | — | | | | — | | | | — | | | | — | |
| | | | | | — | | | | — | | | | — | | | | — | | | | — | | | | — | | | | — | | | | — | | | | — | | | | — | | | | — | | | | — | |
| | | | | | — | | | | — | | | | — | | | | — | | | | — | | | | — | | | | — | | | | — | | | | — | | | | — | | | | — | | | | — | |
| | | | | | — | | | | — | | | | — | | | | — | | | | (585,481 | ) | | | (4,812,048 | ) | | | (13,419 | ) | | | (141,192 | ) | | | (56 | ) | | | (524 | ) | | | — | | | | — | |
| | | | | | (21,212 | ) | | | (193,922 | ) | | | (104,829 | ) | | | (961,460 | ) | | | (2,491,453 | ) | | | (16,950,620 | ) | | | (207,142 | ) | | | (2,067,716 | ) | | | (3,089 | ) | | | (29,393 | ) | | | (20,459 | ) | | | (212,615 | ) |
| | | | | | (305,414 | ) | | | (2,771,119 | ) | | | (52,264 | ) | | | (484,553 | ) | | | (3,917,915 | ) | | | (39,964,775 | ) | | | (444,647 | ) | | | (4,309,086 | ) | | | (1,986,963 | ) | | | (20,870,307 | ) | | | (52,153 | ) | | | (529,368 | ) |
|
|
| | | 123,919 | | | $ | 1,154,223 | | | | 1,717,871 | | | $ | 15,873,875 | | | | (1,343,531 | ) | | $ | (2,930,180 | ) | | | 3,253,960 | | | $ | 32,535,988 | | | | (1,837,610 | ) | | $ | (19,390,738 | ) | | | 281,115 | | | $ | 2,803,287 | |
| | | | | | |
| | Semiannual Report | | | March 31, 2020 | | 359 |
Notes to Financial Statements (cont’d)
March 31, 2020 (unaudited)
| | | | | | | | | | | | | | | | | | | | | | | | | | | | | | | | | | | | |
| | | AllianzGI Preferred Securities and Income | | | AllianzGI Short Duration High Income | | | | |
| | | | | |
| | | Six Months ended
March 31, 2020
(unaudited) | | | Year ended
September 30, 2019 | | | Six Months ended
March 31, 2020
(unaudited) | | | Year ended
September 30, 2019 | | | | |
| | | Shares | | | Amount | | | Shares | | | Amount | | | Shares | | | Amount | | | Shares | | | Amount | | | | |
Shares sold: | | | | | | | | | | | | | | | | | | | | | | | | | | | | | | | | | | | | |
Class A | | | — | | | $ | — | | | | — | | | $ | — | | | | 3,358,628 | | | $ | 48,659,649 | | | | 5,692,412 | | | $ | 82,896,626 | | | | | |
Class C | | | — | | | | — | | | | — | | | | — | | | | 1,324,292 | | | | 19,077,045 | | | | 2,696,853 | | | | 39,150,889 | | | | | |
Class P | | | — | | | | — | | | | — | | | | — | | | | 62,703,791 | | | | 907,745,330 | | | | 30,969,732 | | | | 446,971,610 | | | | | |
Institutional Class | | | 305,534 | | | | 4,747,823 | | | | 97,673 | | | | 1,491,677 | | | | 9,675,602 | | | | 138,780,116 | | | | 13,461,959 | | | | 195,008,059 | | | | | |
Class R6 | | | 293,075 | | | | 4,588,283 | | | | 288,347 | | | | 4,266,098 | | | | 1,993,584 | | | | 26,318,640 | | | | 2,137,280 | | | | 30,871,362 | | | | | |
| | | | | | | | | |
Issued in reinvestment of dividends and distributions: | | | | | | | | | | | | | | | | | | | | | | | | | | | | | | | | | | | | |
Class A | | | — | | | | — | | | | — | | | | — | | | | 205,392 | | | | 2,898,075 | | | | 441,306 | | | | 6,401,352 | | | | | |
Class C | | | — | | | | — | | | | — | | | | — | | | | 154,688 | | | | 2,183,393 | | | | 336,506 | | | | 4,878,351 | | | | | |
Class P | | | 34 | | | | 534 | | | | 34 | | | | 506 | | | | 1,087,479 | | | | 15,561,616 | | | | 1,425,882 | | | | 20,529,506 | | | | | |
Institutional Class | | | 7,555 | | | | 115,012 | | | | 6,603 | | | | 98,925 | | | | 702,068 | | | | 9,843,496 | | | | 1,376,229 | | | | 19,830,219 | | | | | |
Class R6 | | | 47,215 | | | | 717,421 | | | | 42,699 | | | | 637,469 | | | | 71,470 | | | | 996,160 | | | | 169,926 | | | | 2,446,945 | | | | | |
| | | | | | | | | |
Cost of shares redeemed: | | | | | | | | | | | | | | | | | | | | | | | | | | | | | | | | | | | | |
Class A | | | — | | | | — | | | | — | | | | — | | | | (3,299,774 | ) | | | (46,056,965 | ) | | | (6,932,123 | ) | | | (100,602,728 | ) | | | | |
Class C | | | — | | | | — | | | | — | | | | — | | | | (2,157,240 | ) | | | (30,270,252 | ) | | | (4,112,920 | ) | | | (59,871,987 | ) | | | | |
Class P | | | — | | | | — | | | | — | | | | — | | | | (75,383,942 | ) | | | (1,052,412,483 | ) | | | (25,514,747 | ) | | | (368,867,801 | ) | | | | |
Institutional Class | | | (296,846 | ) | | | (4,643,157 | ) | | | (13,082 | ) | | | (199,741 | ) | | | (11,699,545 | ) | | | (159,577,354 | ) | | | (14,164,781 | ) | | | (204,589,918 | ) | | | | |
Class R6 | | | (56,162 | ) | | | (885,881 | ) | | | (69,385 | ) | | | (1,061,427 | ) | | | (681,530 | ) | | | (9,271,170 | ) | | | (3,158,264 | ) | | | (45,704,949 | ) | | | | |
Net increase (decrease) resulting from Fund share transactions | | | 300,405 | | | $ | 4,640,035 | | | | 352,889 | | | $ | 5,233,507 | | | | (11,945,037 | ) | | $ | (125,524,704 | ) | | | 4,825,250 | | | $ | 69,347,536 | | | | | |
| — | May reflect actual amounts rounding to less than $1 or less than 1 share. |
| | | | | | |
| 360 | | March 31, 2020 | | | Semiannual Report | | |
| | | | | | | | | | | | | | | | | | | | | | | | | | | | | | | | | | | | | | | | | | | | | | | | | | |
| | | | AllianzGI Short Term Bond | | | AllianzGI Structured Return | | | AllianzGI U.S. Equity Hedged | |
| | | | | | |
| | | | Six Months ended
March 31, 2020
(unaudited) | | | Year ended
September 30, 2019 | | | Six Months ended
March 31, 2020
(unaudited) | | | Year ended
September 30, 2019 | | | Six Months ended
March 31, 2020
(unaudited) | | | Year ended
September 30, 2019 | |
| | | | Shares | | | Amount | | | Shares | | | Amount | | | Shares | | | Amount | | | Shares | | | Amount | | | Shares | | | Amount | | | Shares | | | Amount | |
| | | | | | | | | | | | | | | | | | | | | | | | | | | | | | | | | | | | | | | | | | | | | | | | | | |
| | | | | | 202,275 | | | $ | 2,931,194 | | | | 68,247 | | | $ | 1,022,997 | | | | 172,103 | | | $ | 2,721,957 | | | | 1,712,573 | | | $ | 26,894,471 | | | | 6,077 | | | $ | 115,081 | | | | 6,775 | | | $ | 121,553 | |
| | | | | | — | | | | — | | | | — | | | | — | | | | 11,607 | | | | 179,896 | | | | 115,831 | | | | 1,748,836 | | | | 1,096 | | | | 16,812 | | | | 1,449 | | | | 24,377 | |
| | | | | | — | | | | — | | | | — | | | | — | | | | 1,528,444 | | | | 23,062,461 | | | | 6,880,663 | | | | 108,150,719 | | | | — | | | | — | | | | 3,224 | | | | 56,118 | |
| | | | | | 634,815 | | | | 9,294,854 | | | | 527,485 | | | | 8,024,195 | | | | 6,694,794 | | | | 105,421,985 | | | | 10,951,308 | | | | 173,893,497 | | | | 3,665 | | | | 67,644 | | | | 7,382 | | | | 131,560 | |
| | | | | | — | | | | — | | | | — | | | | — | | | | 2,901,189 | | | | 44,660,326 | | | | 548,876 | | | | 8,764,651 | | | | — | | | | — | | | | — | | | | — | |
| | | | | | | | | | | | |
|
|
| | | | | | | | | | | | | | | | | | | | | | | | | | | | | | | | | | | | | | | | | | | | | | | | |
| | | | | | 1,184 | | | | 17,860 | | | | 1,500 | | | | 22,615 | | | | 57,421 | | | | 916,446 | | | | 140,751 | | | | 2,142,234 | | | | 149 | | | | 2,802 | | | | 2,216 | | | | 35,189 | |
| | | | | | — | | | | — | | | | — | | | | — | | | | 27,322 | | | | 416,121 | | | | 24,914 | | | | 364,737 | | | | — | | | | 2 | | | | 766 | | | | 11,667 | |
| | | | | | 14 | | | | 224 | | | | 26 | | | | 392 | | | | 431,097 | | | | 6,794,088 | | | | 205,402 | | | | 3,113,889 | | | | 34 | | | | 626 | | | | 313 | | | | 4,848 | |
| | | | | | 17,344 | | | | 262,707 | | | | 16,342 | | | | 246,170 | | | | 1,018,812 | | | | 16,188,921 | | | | 669,953 | | | | 10,230,176 | | | | 700 | | | | 13,422 | | | | 5,567 | | | | 89,856 | |
| | | | | | — | | | | — | | | | — | | | | — | | | | 194,777 | | | | 3,075,528 | | | | 92,540 | | | | 1,407,534 | | | | — | | | | — | | | | — | | | | — | |
| | | | | | | | | | | | |
| | | | | | | | | | | | | | | | | | | | | | | | | | | | | | | | | | | | | | | | | | | | | | | | | | |
| | | | | | (19,725 | ) | | | (299,580 | ) | | | (19,991 | ) | | | (302,984 | ) | | | (1,414,306 | ) | | | (21,176,560 | ) | | | (6,318,012 | ) | | | (98,981,983 | ) | | | (7,094 | ) | | | (133,244 | ) | | | (9,764 | ) | | | (168,069 | ) |
| | | | | | — | | | | — | | | | — | | | | — | | | | (251,038 | ) | | | (3,241,436 | ) | | | (437,098 | ) | | | (6,633,312 | ) | | | (478 | ) | | | (8,629 | ) | | | (3,966 | ) | | | (67,848 | ) |
| | | | | | — | | | | — | | | | — | | | | — | | | | (6,892,067 | ) | | | (87,698,039 | ) | | | (6,926,461 | ) | | | (109,557,797 | ) | | | (26 | ) | | | (492 | ) | | | (3,145 | ) | | | (54,823 | ) |
| | | | | | (224,839 | ) | | | (3,437,253 | ) | | | (56,329 | ) | | | (849,878 | ) | | | (15,964,833 | ) | | | (199,350,954 | ) | | | (9,144,614 | ) | | | (145,586,918 | ) | | | (5,707 | ) | | | (111,191 | ) | | | (39,153 | ) | | | (696,331 | ) |
| | | | | | — | | | | — | | | | — | | | | — | | | | (4,220,766 | ) | | | (45,090,207 | ) | | | (257,417 | ) | | | (4,062,621 | ) | | | — | | | | — | | | | — | | | | — | |
|
|
| | | 611,068 | | | $ | 8,770,006 | | | | 537,280 | | | $ | 8,163,507 | | | | (15,705,444 | ) | | $ | (153,119,467 | ) | | | (1,740,791 | ) | | $ | (28,111,887 | ) | | | (1,584 | ) | | $ | (37,167 | ) | | | (28,336 | ) | | $ | (511,903 | ) |
| | | | | | |
| | Semiannual Report | | | March 31, 2020 | | 361 |
Notes to Financial Statements (cont’d)
March 31, 2020 (unaudited)
| | | | | | | | | | | | | | | | | | | | | | | | | | | | | | | | | | | | |
| | | AllianzGI Ultra Micro Cap | | | AllianzGI Water | | | | |
| | | | | |
| | | Six Months ended
March 31, 2020
(unaudited) | | | Year ended
September 30, 2019 | | | Six Months ended
March 31, 2020
(unaudited) | | | Year ended
September 30, 2019 | | | | |
| | | Shares | | | Amount | | | Shares | | | Amount | | | Shares | | | Amount | | | Shares | | | Amount | | | | |
Shares sold: | | | | | | | | | | | | | | | | | | | | | | | | | | | | | | | | | | | | |
Class A | | | 2,840 | | | $ | 30,442 | | | | 23,604 | | | $ | 357,864 | | | | 1,730,952 | | | $ | 29,048,591 | | | | 2,286,105 | | | $ | 35,090,817 | | | | | |
Class C | | | — | | | | — | | | | — | | | | — | | | | 293,870 | | | | 4,776,368 | | | | 414,437 | | | | 5,966,725 | | | | | |
Class P | | | 32 | | | | 395 | | | | 23,153 | | | | 302,140 | | | | 2,151,103 | | | | 34,929,005 | | | | 2,823,956 | | | | 41,892,641 | | | | | |
Institutional Class | | | 62,244 | | | | 673,890 | | | | 143,694 | | | | 1,898,149 | | | | 2,485,150 | | | | 39,785,527 | | | | 3,247,348 | | | | 48,413,969 | | | | | |
| | | | | | | | | |
Issued in reinvestment of dividends and distributions: | | | | | | | | | | | | | | | | | | | | | | | | | | | | | | | | | | | | |
Class A | | | 48,873 | | | | 529,786 | | | | 161,678 | | | | 1,689,533 | | | | 277,313 | | | | 4,678,272 | | | | 327,536 | | | | 4,297,269 | | | | | |
Class C | | | — | | | | — | | | | — | | | | — | | | | 89,591 | | | | 1,443,306 | | | | 123,952 | | | | 1,556,835 | | | | | |
Class P | | | 19,272 | | | | 217,195 | | | | 104,123 | | | | 1,123,484 | | | | 258,241 | | | | 4,359,113 | | | | 392,540 | | | | 5,146,199 | | | | | |
Institutional Class | | | 110,798 | | | | 1,254,238 | | | | 329,329 | | | | 3,566,635 | | | | 328,413 | | | | 5,435,229 | | | | 384,535 | | | | 4,948,969 | | | | | |
| | | | | | | | | |
Cost of shares redeemed: | | | | | | | | | | | | | | | | | | | | | | | | | | | | | | | | | | | | |
Class A | | | (105,453 | ) | | | (1,157,080 | ) | | | (257,009 | ) | | | (3,243,158 | ) | | | (1,694,903 | ) | | | (27,592,208 | ) | | | (2,821,095 | ) | | | (41,821,369 | ) | | | | |
Class C | | | — | | | | — | | | | — | | | | — | | | | (544,157 | ) | | | (8,355,804 | ) | | | (1,639,837 | ) | | | (23,408,048 | ) | | | | |
Class P | | | (65,121 | ) | | | (756,609 | ) | | | (242,570 | ) | | | (3,126,355 | ) | | | (2,007,760 | ) | | | (31,942,597 | ) | | | (5,940,274 | ) | | | (86,920,412 | ) | | | | |
Institutional Class | | | (344,091 | ) | | | (3,922,649 | ) | | | (485,914 | ) | | | (6,412,199 | ) | | | (1,797,760 | ) | | | (28,408,909 | ) | | | (4,854,572 | ) | | | (70,200,311 | ) | | | | |
Net increase (decrease) resulting from Fund share transactions | | | (270,606 | ) | | $ | (3,130,392 | ) | | | (199,912 | ) | | $ | (3,843,907 | ) | | | 1,570,053 | | | $ | 28,155,893 | | | | (5,255,369 | ) | | $ | (75,036,716 | ) | | | | |
| – | May reflect actual amounts rounding to less than $1 or less than 1 share. |
| | | | | | |
| 362 | | March 31, 2020 | | | Semiannual Report | | |
| 10. | INVESTMENTS IN SECURITIES |
For the period or six months ended March 31, 2020, purchases and sales of investments, other than short-term securities and U.S. government obligations were:
| | | | | | | | |
| | |
| | | Purchases | | | Sales | |
AllianzGI Retirement 2020 | | $ | 5,779,595 | | | $ | 10,211,133 | |
AllianzGI Retirement 2025 | | | 3,176,504 | | | | 8,316,468 | |
AllianzGI Retirement 2030 | | | 6,803,476 | | | | 13,308,034 | |
AllianzGI Retirement 2035 | | | 7,171,725 | | | | 9,948,654 | |
AllianzGI Retirement 2040 | | | 8,936,713 | | | | 13,233,136 | |
AllianzGI Retirement 2045 | | | 6,491,288 | | | | 9,643,617 | |
AllianzGI Retirement 2050 | | | 9,351,592 | | | | 12,395,497 | |
AllianzGI Retirement 2055 | | | 5,049,098 | | | | 7,097,401 | |
AllianzGI Multi Asset Income | | | 85,220,626 | | | | 50,258,610 | |
AllianzGI Best Styles Global Equity | | | 119,268,588 | | | | 341,176,384 | |
AllianzGI Best Styles U.S. Equity | | | 19,523,039 | | | | 36,111,465 | |
AllianzGI Convertible | | | 737,152,895 | | | | 523,912,797 | |
AllianzGI Core Bond | | | 51,134,077 | | | | 40,010,237 | |
AllianzGI Core Plus Bond | | | 78,119,122 | | | | 73,757,376 | |
AllianzGI Emerging Markets Consumer | | | 11,006,930 | | | | 13,348,418 | |
AllianzGI Emerging MarketsSmall-Cap | | | 2,396,571 | | | | 3,240,519 | |
AllianzGI Emerging Markets SRI Debt | | | 16,718,005 | | | | 14,866,507 | |
AllianzGI Emerging Markets Value | | | 58,561,657 | | | | 55,993,873 | |
AllianzGI Floating Rate Note | | | 6,794,156 | | | | 6,676,597 | |
AllianzGI Global Allocation | | | 274,591,140 | | | | 309,895,180 | |
AllianzGI Global Dynamic Allocation | | | 114,594,782 | | | | 134,352,370 | |
AllianzGI Global High Yield | | | 18,265,155 | | | | 14,590,724 | |
| | | | | | | | |
| | |
| | | Purchases | | | Sales | |
AllianzGI Global Sustainability | | $ | 138,893,828 | | | $ | 16,926,799 | |
AllianzGI Green Bond | | | 33,699,110 | | | | 12,792,913 | |
AllianzGI High Yield Bond | | | 42,536,966 | | | | 54,378,259 | |
AllianzGI InternationalSmall-Cap | | | 25,016,767 | | | | 40,755,037 | |
AllianzGI Micro Cap | | | 2,513,410 | | | | 4,026,526 | |
AllianzGI PerformanceFee Managed Futures Strategy | | | 35,341 | | | | — | |
AllianzGI PerformanceFee Structured US Equity | | | 55,848,767 | | | | 85,090,266 | |
AllianzGI PerformanceFee Structured US Fixed Income | | | 914,727 | | | | 21,715,537 | |
AllianzGI Preferred Securities and Income | | | 21,641,905 | | | | 18,133,354 | |
AllianzGI Short Duration High Income | | | 634,862,341 | | | | 714,365,689 | |
AllianzGI Short Term Bond | | | 10,102,387 | | | | 2,935,860 | |
AllianzGI Structured Return | | | 43,755,075 | | | | 367,759,898 | |
AllianzGI U.S. Equity Hedged | | | 171,208 | | | | 321,990 | |
AllianzGI Ultra Micro Cap | | | 2,231,972 | | | | 7,568,425 | |
AllianzGI Water | | | 64,595,404 | | | | 60,972,969 | |
Purchases and sales in U.S. government obligations were:
| | | | | | | | |
| | |
| | | Purchases | | | Sales | |
AllianzGI Core Bond | | $ | 107,108,662 | | | $ | 106,787,026 | |
AllianzGI Core Plus Bond | | | 99,749,782 | | | | 114,620,017 | |
AllianzGI Emerging Markets SRI Debt | | | 1,906,747 | | | | 1,714,086 | |
AllianzGI Floating Rate Note | | | — | | | | 3,344 | |
AllianzGI Global Allocation | | | 24,915,578 | | | | 24,615,773 | |
AllianzGI Global Dynamic Allocation | | | 20,025,308 | | | | 19,302,394 | |
AllianzGI Short Term Bond | | | — | | | | 150,204 | |
11. INCOME TAX INFORMATION
At March 31, 2020, the aggregate cost basis and the net unrealized appreciation (depreciation) of investments in securities and other financial instruments for federal income tax purposes were:
| | | | | | | | | | | | | | | | |
| | | Federal Tax
Cost Basis(1) | | | Unrealized
Appreciation | | | Unrealized
Depreciation | | | Net Unrealized
Appreciation
(Depreciation) | |
AllianzGI Retirement 2020 | | $ | 12,754,814 | | | $ | 19,480 | | | $ | 1,215,464 | | | $ | (1,195,984 | ) |
AllianzGI Retirement 2025 | | | 18,060,553 | | | | 29,527 | | | | 2,522,439 | | | | (2,492,912 | ) |
AllianzGI Retirement 2030 | | | 25,543,479 | | | | 18,236 | | | | 3,709,414 | | | | (3,691,178 | ) |
AllianzGI Retirement 2035 | | | 21,109,230 | | | | 15,576 | | | | 3,224,053 | | | | (3,208,477 | ) |
AllianzGI Retirement 2040 | | | 22,364,905 | | | | 12,515 | | | | 3,584,472 | | | | (3,571,957 | ) |
AllianzGI Retirement 2045 | | | 12,639,201 | | | | 4,380 | | | | 2,133,130 | | | | (2,128,750 | ) |
AllianzGI Retirement 2050 | | | 19,271,504 | | | | 12,017 | | | | 3,359,104 | | | | (3,347,087 | ) |
AllianzGI Retirement 2055 | | | 8,895,617 | | | | 2,920 | | | | 1,530,625 | | | | (1,527,705 | ) |
AllianzGI Multi Asset Income | | | 54,876,677 | | | | 821,930 | | | | 7,898,858 | | | | (7,076,928 | ) |
AllianzGI Best Styles Global Equity | | | 143,538,536 | | | | 8,261,554 | | | | 22,222,431 | | | | (13,960,877 | ) |
AllianzGI Best Styles U.S. Equity | | | 29,554,094 | | | | 3,598,335 | | | | 3,331,976 | | | | 266,359 | |
AllianzGI Convertible | | | 877,366,969 | | | | 33,101,729 | | | | 72,807,893 | | | | (39,706,164 | ) |
| | | | | | |
| | Semiannual Report | | | March 31, 2020 | | 363 |
Notes to Financial Statements (cont’d)
March 31, 2020 (unaudited)
| | | | | | | | | | | | | | | | |
| | | Federal Tax
Cost Basis(1) | | | Unrealized
Appreciation | | | Unrealized
Depreciation | | | Net Unrealized
Appreciation
(Depreciation) | |
AllianzGI Core Bond | | $ | 48,300,444 | | | $ | 1,074,610 | | | $ | 1,518,715 | | | $ | (444,105 | ) |
AllianzGI Core Plus Bond | | | 59,029,988 | | | | 1,325,759 | | | | 2,867,474 | | | | (1,541,715 | ) |
AllianzGI Emerging Markets Consumer | | | 33,046,994 | | | | 4,358,461 | | | | 4,994,529 | | | | (636,068 | ) |
AllianzGI Emerging Markets Small-Cap | | | 6,323,941 | | | | 201,418 | | | | 1,105,000 | | | | (903,582 | ) |
AllianzGI Emerging Markets SRI Debt | | | 24,898,572 | | | | 289,655 | | | | 2,146,256 | | | | (1,856,601 | ) |
AllianzGI Emerging Markets Value | | | 99,699,469 | | | | 6,051,381 | | | | 13,140,907 | | | | (7,089,526 | ) |
AllianzGI Floating Rate Note | | | 14,273,101 | | | | 64,800 | | | | 1,121,517 | | | | (1,056,717 | ) |
AllianzGI Global Allocation | | | 279,427,236 | | | | 3,045,663 | | | | 28,868,348 | | | | (25,822,685 | ) |
AllianzGI Global Dynamic Allocation | | | 109,646,479 | | | | 6,091,611 | | | | 13,604,408 | | | | (7,512,797 | ) |
AllianzGI Global High Yield | | | 29,162,247 | | | | 257,413 | | | | 2,987,826 | | | | (2,730,413 | ) |
AllianzGI Global Sustainability | | | 147,851,002 | | | | 3,806,426 | | | | 15,428,260 | | | | (11,621,834 | ) |
AllianzGI Green Bond | | | 28,597,624 | | | | 205,295 | | | | 2,048,037 | | | | (1,842,742 | ) |
AllianzGI High Yield Bond | | | 115,431,080 | | | | 835,191 | | | | 19,159,948 | | | | (18,324,757 | ) |
AllianzGI International Small-Cap | | | 73,353,883 | | | | 7,479,370 | | | | 13,070,540 | | | | (5,591,170 | ) |
AllianzGI Micro Cap | | | 12,637,213 | | | | 2,567,869 | | | | 2,417,012 | | | | 150,857 | |
AllianzGI PerformanceFee Managed Futures Strategy | | | 22,085,605 | | | | 2,118,341 | | | | 1,328,265 | | | | 790,076 | |
AllianzGI PerformanceFee Structured US Equity | | | 81,384,752 | | | | 887,122 | | | | 15,797,554 | | | | (14,910,432 | ) |
AllianzGI PerformanceFee Structured US Fixed Income | | | 8,137,594 | | | | 498,962 | | | | 538 | | | | 498,424 | |
AllianzGI Preferred Securities and Income | | | 22,128,466 | | | | 57,529 | | | | 3,361,643 | | | | (3,304,114 | ) |
AllianzGI Short Duration High Income | | | 1,060,170,637 | | | | 117,068 | | | | 183,598,917 | | | | (183,481,849 | ) |
AllianzGI Short Term Bond | | | 26,666,433 | | | | 148,372 | | | | 433,447 | | | | (285,075 | ) |
AllianzGI Structured Return | | | 231,687,661 | | | | 49,199,458 | | | | 23,243,146 | | | | 25,956,312 | |
AllianzGI U.S. Equity Hedged | | | 1,802,733 | | | | 170,824 | | | | 5,038 | | | | 165,786 | |
AllianzGI Ultra Micro Cap | | | 9,235,861 | | | | 2,158,145 | | | | 1,907,239 | | | | 250,906 | |
AllianzGI Water | | | 487,238,658 | | | | 106,627,630 | | | | 44,558,494 | | | | 62,069,136 | |
| (1) | Differences, if any, between book and tax cost basis are primarily attributable to wash sale loss deferrals and differing treatment of bond premium amortization. |
The Trust entered into a credit agreement (the “State Street Agreement”), among the Trust, AllianzGI Institutional Multi-Series Trust and Allianz Funds, as borrowers (collectively, the “AllianzGI Borrowers” and each series thereof, an “AllianzGI Borrower Fund”), and State Street Bank and Trust Company, as agent and lender, for a committed line of credit. The State Street Agreement permits the AllianzGI Borrowers to borrow up to $200 million in aggregate, subject to (i) a requirement that each AllianzGI Borrower Fund’s asset coverage with respect to senior securities representing indebtedness be 300% or higher, and (ii) certain other limitations and conditions. Each AllianzGI Borrower Fund must pay interest on any amounts borrowed under the facility at a rate per annum equal to 1.25% plus the higher of the then-current federal funds overnight rate or theone-month LIBOR rate, subject to upward adjustment when any past due payments are outstanding. As discussed in Note 2 above, the Funds may face certain risks and uncertainties insofar as they are exposed to LIBOR. The State Street Agreement was extended by an additional364-day period by an amendment effective October 24, 2019 with an expiration date of October 2, 2020 (the “Amendment”). The Amendment includes a usage fee on undrawn amounts at an annualized rate of 0.20%, to be allocated pro rata among the AllianzGI Borrower Funds on the basis of net assets. Amounts borrowed may be repaid and reborrowed on a revolving basis during the term of the facility. The Funds did not utilize the line of credit during the six months ended March 31, 2020.
Pursuant to an exemptive order issued by the SEC (the “Order”), the Funds are authorized to enter into a master interfund lending agreement (the “Interfund Program”) with each other and certain funds advised by the Investment Manager (each a “Participating Fund”). The Interfund Program allows each Participating Fund, whose policies permit it to do so, to lend money directly to and borrow money directly from other Funds for temporary purposes. During the six months ended March 31, 2020, the Funds did not participate as a borrower or lender in the Interfund Program.
(a) Name and Investment Strategy Changes
Effective February 1, 2020, AllianzGI Global Water Fund was renamed to AllianzGI Water Fund.
Effective October 11, 2019, AllianzGI Global Allocation Fund changed its investment strategy. The Fund incorporated a new ESG-benchmarked US credit sleeve and transitioned positions in certain affiliated funds to each of AllianzGI Global Sustainability Fund, AllianzGI Emerging Markets SRI Debt Fund and AllianzGI Green Bond Fund. Each of these funds includes either an ESG integrated, sustainable or ESG informed investment strategy.
(b) Fund Liquidations
On March 4, 2020, AllianzGI Best Styles International Equity Fund liquidated as a series of the Trust.
| | | | | | |
| 364 | | March 31, 2020 | | | Semiannual Report | | |
| 14. | BASIS FOR CONSOLIDATION |
The Cayman Subsidiary is a wholly-owned and controlled subsidiary of AllianzGI PerformanceFee Managed Futures Strategy (the “Consolidated Fund”). The Consolidated Fund is the sole shareholder of the Cayman Subsidiary and will continue to control the Cayman Subsidiary. The Consolidated Fund’s investment portfolio has been consolidated and includes the portfolio holdings of the Consolidated Fund and the Cayman Subsidiary. The consolidated financial statements include the accounts of the Consolidated Fund and the Cayman Subsidiary. All inter-company transactions and balances have been eliminated. As of March 31, 2020, consolidated net assets of the Consolidated Fund were $28,682,292, of which $3,271,477 or 11.4%, represented the Consolidated Fund’s ownership of all issued shares and voting rights of the Cayman Subsidiary.
In preparing these financial statements, the Funds’ management has evaluated events and transactions for potential recognition or disclosure through the date the financial statements were issued.
Since the end of the reporting period, global responses toCOVID-19 have significantly impacted broad financial sectors and the global economy. This has caused significant volatility and negative performance in global financial markets generally and in the securities in which the Funds invest specifically. The extent of the impact ofCOVID-19 on the Funds’ operational and financial performance will depend on certain developments including, among others, the duration and spread of the outbreak, and the resulting impact on financial markets, all of which are uncertain and cannot be predicted. Given the inherent uncertainties, it is not practicable at this time to determine what impactCOVID-19 will have on the Funds or to provide a quantitative estimate of any future impact. These effects could have a material negative impact on the Funds’ future results of operations.
On April 16, 2020, the following Funds declaredper-share net investment income dividends to shareholders, payable April 16, 2020 to shareholders of record on April 15, 2020.
| | | | | | | | | | | | | | | | | | | | | | | | | | | | |
| | | Net Investment Income | |
| | | | | | | |
| | | Class A | | | Class C | | | Class R | | | Class P | | | Institutional Class | | | Class R6 | | | Administrative Class | |
AllianzGI Multi Asset Income | | $ | 0.07603 | | | $ | 0.06706 | | | $ | 0.07191 | | | $ | 0.07991 | | | $ | 0.08066 | | | $ | 0.08120 | | | $ | 0.07683 | |
AllianzGI Core Bond | | | N/A | | | | N/A | | | | N/A | | | $ | 0.02622 | | | $ | 0.02686 | | | $ | 0.02750 | | | | N/A | |
AllianzGI Core Plus Bond | | | N/A | | | | N/A | | | | N/A | | | $ | 0.02624 | | | $ | 0.02690 | | | $ | 0.02750 | | | | N/A | |
AllianzGI Floating Rate Note | | | N/A | | | | N/A | | | | N/A | | | $ | 0.00919 | | | $ | 0.01032 | | | | N/A | | | | N/A | |
AllianzGI Green Bond | | $ | 0.00689 | | | | N/A | | | | N/A | | | $ | 0.00937 | | | $ | 0.01000 | | | | N/A | | | | N/A | |
AllianzGI High Yield Bond | | $ | 0.03653 | | | $ | 0.03165 | | | $ | 0.03437 | | | $ | 0.03922 | | | $ | 0.03900 | | | | N/A | | | $ | 0.03795 | |
AllianzGI PerformanceFee Structured US Fixed Income | | | N/A | | | | N/A | | | | N/A | | | $ | 0.01570 | | | $ | 0.01570 | | | $ | 0.01570 | | | | N/A | |
AllianzGI Preferred Securities and Income | | | N/A | | | | N/A | | | | N/A | | | $ | 0.05397 | | | $ | 0.05591 | | | $ | 0.05500 | | | | N/A | |
AllianzGI Short Duration High Income | | $ | 0.05500 | | | $ | 0.05247 | | | | N/A | | | $ | 0.05721 | | | $ | 0.05786 | | | $ | 0.05832 | | | | N/A | |
AllianzGI Short Term Bond | | $ | 0.04505 | | | | N/A | | | | N/A | | | $ | 0.04079 | | | $ | 0.04500 | | | | N/A | | | | N/A | |
On May 21, 2020, the following Funds declaredper-share net investment income dividends to shareholders, payable May 21, 2020 to shareholders of record on May 20, 2020.
| | | | | | | | | | | | | | | | | | | | | | | | | | | | |
| |
| | | Net Investment Income | |
| | | | | | | |
| | | Class A | | | Class C | | | Class R | | | Class P | | | Institutional Class | | | Class R6 | | | Administrative Class | |
AllianzGI Multi Asset Income | | $ | 0.07017 | | | $ | 0.05990 | | | $ | 0.06535 | | | $ | 0.07457 | | | $ | 0.07549 | | | $ | 0.07600 | | | $ | 0.07130 | |
AllianzGI Core Bond | | | N/A | | | | N/A | | | | N/A | | | $ | 0.02624 | | | $ | 0.02693 | | | $ | 0.02750 | | | | N/A | |
AllianzGI Core Plus Bond | | | N/A | | | | N/A | | | | N/A | | | $ | 0.02621 | | | $ | 0.02692 | | | $ | 0.02750 | | | | N/A | |
AllianzGI Floating Rate Note | | | N/A | | | | N/A | | | | N/A | | | $ | 0.00902 | | | $ | 0.01030 | | | | N/A | | | | N/A | |
AllianzGI Green Bond | | $ | 0.00641 | | | | N/A | | | | N/A | | | $ | 0.00928 | | | $ | 0.01000 | | | | N/A | | | | N/A | |
AllianzGI High Yield Bond | | $ | 0.03615 | | | $ | 0.03160 | | | $ | 0.03359 | | | $ | 0.03904 | | | $ | 0.03900 | | | | N/A | | | $ | 0.03768 | |
AllianzGI PerformanceFee Structured US Fixed Income | | | N/A | | | | N/A | | | | N/A | | | $ | 0.01570 | | | $ | 0.01570 | | | $ | 0.01570 | | | | N/A | |
AllianzGI Preferred Securities and Income | | | N/A | | | | N/A | | | | N/A | | | $ | 0.05378 | | | $ | 0.05512 | | | $ | 0.05500 | | | | N/A | |
AllianzGI Short Duration High Income | | $ | 0.05500 | | | $ | 0.05212 | | | | N/A | | | $ | 0.05690 | | | $ | 0.05780 | | | $ | 0.05825 | | | | N/A | |
AllianzGI Short Term Bond | | $ | 0.04528 | | | | N/A | | | | N/A | | | $ | 0.04098 | | | $ | 0.04500 | | | | N/A | | | | N/A | |
Effective April 30, 2020, the AllianzGI NFJ Emerging Markets Value Fund was renamed to AllianzGI Emerging Markets Value Fund.
Effective on or about June 11, 2020, the AllianzGI Global High Yield Fund and the AllianzGI U.S. Equity Hedged Fund will be liquidated and dissolved.
Effective on or about June 24, 2020, the AllianzGI PerformanceFee Structured US Fixed Income Fund will be liquidated and dissolved.
Effective on or about June 26, 2020, the AllianzGI Micro Cap Fund and the AllianzGI Ultra Micro Cap Fund will be liquidated and dissolved.
A plan of liquidation has been adopted in respect of the AllianzGI Best Styles U.S. Equity Fund. Under the terms of the current plan of liquidation, the AllianzGI Best Styles U.S. Equity Fund would liquidate and dissolve on or around September 17, 2020.
There were no other subsequent events identified that require recognition or disclosure.
| | | | | | |
| | Semiannual Report | | | March 31, 2020 | | 365 |
Unaudited
Changes to the Board of Trustees
Effective December 31, 2019, Bradford K. Gallagher retired as an Independent Trustee of the Trust.
| | | | | | |
| 366 | | March 31, 2020 | | | Semiannual Report | | |
Unaudited
Privacy Policy
Please read this Policy carefully. It gives you important information about how Allianz Global Investors U.S. and its U.S. affiliates (“AllianzGI US,” “we” or “us”) handlenon-public personal information (“Personal Information”) that we may receive about you. It applies to all of our past, present and future clients and shareholders of AllianzGI US and the funds and accounts it manages, advises, administers or distributes, and will continue to apply when you are no longer a client or shareholder. As used throughout this Policy, “AllianzGI US” means Allianz Global Investors U.S. LLC, Allianz Global Investors Distributors LLC, and the family of registered and unregistered funds managed by one or more of these firms. AllianzGI US is part of a global investment management group, and the privacy policies of other Allianz Global Investors entities outside of the United States may have provisions in their policies that differ from this Privacy Policy. Please refer to the website of the specificnon-US Allianz Global Investors entity for its policy on privacy.
We Care about Your Privacy
We consider your privacy to be a fundamental aspect of our relationship with you, and we strive to maintain the confidentiality, integrity and security of your Personal Information. To ensure your privacy, we have developed policies that are designed to protect your Personal Information while allowing your needs to be served.
Information We May Collect
In the course of providing you with products and services, we may obtain Personal Information about you, which may come from sources such as account application and other forms, from other written, electronic, or verbal communications, from account transactions, from a brokerage or financial advisory firm, financial advisor or consultant, and/or from information you provide on our website.
You are not required to supply any of the Personal Information that we may request. However, failure to do so may result in us being unable to open and maintain your account, or to provide services to you.
How Your Information Is Shared
We do not disclose your Personal Information to anyone for marketing purposes. We disclose your Personal Information only to those service providers, affiliated andnon-affiliated, who need the information for everyday business purposes, such as to respond to your inquiries, to perform services, and/or to service and maintain your account. This applies to all of the categories of Personal Information we collect about you. The affiliated andnon-affiliated service providers who receive your Personal Information also may use it to process your transactions, provide you with materials (including preparing and mailing prospectuses and shareholder reports and gathering shareholder proxies), and provide you with account statements and other materials relating to your account. These service providers provide services at our direction, and under their agreements with us, are required to keep your Personal Information confidential and to use it only for providing the contractually required services. Our service providers may not use your Personal Information to market products and services to you except in conformance with applicable laws and regulations. We also may provide your Personal Information to your respective brokerage or financial advisory firm, custodian, and/or to your financial advisor or consultant.
In addition, we reserve the right to disclose or report Personal Information tonon-affiliated third parties, in limited circumstances, where we believe in good faith that disclosure is required under law, to cooperate with regulators or law enforcement authorities or pursuant to other legal process, or to protect our rights or property, including to enforce our Privacy Policy or other agreements with you. Personal Information collected by us may also be transferred as part of a corporate sale, restructuring, bankruptcy, or other transfer of assets.
Security of Your Information
We maintain your Personal Information for as long as necessary for legitimate business purposes or otherwise as required by law. In maintaining this information, we have implemented appropriate procedures that are designed to restrict access to your Personal Information only to those who need to know that information in order to provide products and/or services to you. In addition, we have implemented physical, electronic and procedural safeguards to help protect your Personal Information.
Privacy and the Internet
The Personal Information that you provide through our website, as applicable, is handled in the same way as the Personal Information that you provide by any other means, as described above. This section of the Policy gives you additional information about the way in which Personal Information that is obtained online is handled.
| | ∎ | | Online Enrollment, Account Access and Transactions: When you visit our website, you can visit pages that are open to the general public, or, where available, log into protected pages to enroll online, access information about your account, or conduct certain transactions. Access to these secure pages is permitted only after you have created a User ID and Password. The User ID and Password must be supplied each time you want to |
| | | | | | |
| | Semiannual Report | | | March 31, 2020 | | 367 |
Unaudited
Privacy Policy (cont’d)
| | access your account information online. This information serves to verify your identity. When you enter Personal Information into our website to enroll or access your account online, you will log into secure pages. By using our website, you consent to this Privacy Policy and to the use of your Personal Information in accordance with the practices described in this Policy. If you provide Personal Information to effect transactions, a record of the transactions you have performed while on the site is retained by us. For additional terms and conditions governing your use of our website, please refer to the Investor Mutual Fund Access – Disclaimer which is incorporated herein by reference and is available on our website. |
| | ∎ | | Cookies and Similar Technologies:Cookies are small text files stored in your computer’s hard drive when you visit certain web pages. Clear GIFs (also known as Web Beacons) are typically transparent very small graphic images (usually 1 pixel x 1 pixel) that are placed on a website that may be included on our services provided via our website and typically work in conjunction with cookies to identify our users and user behavior. We may use cookies and automatically collected information to: (i) personalize our website and the services provided via our website, such as remembering your information so that you will not have tore-enter it during your use of, or the next time you use, our website and the services provided via our website; (ii) provide customized advertisements, content, and information; (iii) monitor and analyze the effectiveness of our website and the services provided via our website and third-party marketing activities; (iv) monitor aggregate site usage metrics such as total number of visitors and pages viewed; and (v) track your entries, submissions, and status in any promotions or other activities offered through our website and the services provided via our website. Tracking technology also helps us manage and improve the usability of our website, (i) detecting whether there has been any contact between your computer and us in the past and (ii) to identify the most popular sections of our website. Because an industry-standardDo-Not-Track protocol is not yet established, our website will continue to operate as described in this Privacy Policy and will not be affected by anyDo-Not-Track signals from any browser. |
| | ∎ | | Use of Social Media Plugins Our website uses the following Social Media Plugins (“Plugins”): |
| | ∎ | | Facebook Share Button operated by Facebook Inc., 1601 S. California Ave, Palo Alto, CA 94304, USA |
| | ∎ | | Tweet Button operated by Twitter Inc., 795 Folsom St., Suite 600, San Francisco, CA 94107, USA |
| | ∎ | | LinkedIn Share Button operated by LinkedIn Corporation, 2029 Stierlin Court, Mountain View, CA 94043, USA |
All Plugins are marked with the brand of the respective operators Facebook, Twitter and LinkedIn (“Operators”). When you visit our website that contains a social plugin, your browser establishes a direct connection to the servers of the Operator. The Operator directly transfers the plugin content to your browser which embeds the latter into our website, enabling the Operator to receive information about you having accessed the respective page of our website. Thus, AllianzGI US has no influence on the data gathered by the plugin and we inform you according to our state of knowledge: The embedded plugins provide the Operator with the information that you have accessed the corresponding page of our website. If you do not wish to have such data transferred to the Operators, you need to log out of your respective account before visiting our website. Please see the Operators’ data privacy statements in order to get further information about purpose and scope of the data collection and the processing and use:
| | ∎ | | Facebook:https://de-de.facebook.com/about/privacy |
| | ∎ | | Twitter: https://twitter.com/privacy |
| | ∎ | | Linked In: https://www.linkedin.com/legal/privacy-policy |
Changes to Our Privacy Policy
We may modify this Privacy Policy fromtime-to-time to reflect changes in related practices and procedures, or applicable laws and regulations. If we make changes, we will notify you on our website and the revised Policy will become effective immediately upon posting to our website. We also will provide account owners with a copy of our Privacy Policy, annually if required. We encourage you to visit our website periodically to remain up to date on our Privacy Policy. You acknowledge that by using our website after we have posted changes to this Privacy Policy, you are agreeing to the terms of the Privacy Policy as modified.
Obtaining Additional Information
If you have any questions about this Privacy Policy or our privacy related practices in the United States, you may contact us via our dedicated email at PrivacyUS@allianzgi.com.
| | | | | | |
| 368 | | March 31, 2020 | | | Semiannual Report | | |
Allianz Funds Multi-Strategy Trust
Trustees
Alan Rappaport
Chairman of the Board of Trustees
Sarah E. Cogan
Deborah A. DeCotis
F. Ford Drummond
Thomas J. Fuccillo
Erick R. Holt
James A. Jacobson
Hans W. Kertess
James S. MacLeod
William B. Ogden, IV
Davey S. Scoon
Officers
Thomas J. Fuccillo
President and Chief Executive Officer
Scott Whisten
Treasurer, Principal Financial and Accounting Officer
Angela Borreggine
Chief Legal Officer and Secretary
Thomas L. Harter
Chief Compliance Officer
Richard J. Cochran
Assistant Treasurer
Orhan Dzemaili
Assistant Treasurer
Debra Rubano
Assistant Secretary
Craig A. Ruckman
Assistant Secretary
Investment Manager
Allianz Global Investors U.S. LLC
1633 Broadway
New York, NY 10019
Distributor
Allianz Global Investors Distributors LLC
1633 Broadway
New York, NY 10019
Custodian & Accounting Agent
State Street Bank and Trust Co.
801 Pennsylvania Avenue
Kansas City, MO 64105
Shareholder Servicing and Transfer Agents
State Street Bank and Trust Company, which has delegated its obligations
as transfer agent to:
DST Asset Manager Solutions, Inc.
(Class A, Class C and Class R shares)
P.O. Box 219723
Kansas City, MO 64121-9723
(Class P, Institutional Class, Class R6 and Administrative Class shares)
P.O. Box 219968,
Kansas City, MO 64121-9968
Independent Registered Public Accounting Firm
PricewaterhouseCoopers LLP
300 Madison Avenue
New York, NY 10017
Legal Counsel
Ropes & Gray LLP
Prudential Tower
800 Boylston Street
Boston, MA 02199
This report, including the financial information herein, is transmitted to the shareholders of the Funds for their information. It is not a prospectus, circular or representation intended for use in the purchase of shares of each Fund or any securities mentioned in this report.
The financial information included herein is taken from the records of the Funds without examination by an independent registered public accounting firm, who did not express an opinion herein.
For Account Information
Contact your financial adviser, or if you receive account statements directly from Allianz Global Investors Distributors LLC, you can also call (800)988-8380 for Class A, C and R shares or (800)498-5413 for Class P, Institutional, R6 and Administrative shares. Telephone representatives are available Monday-Friday 8:30 am to 6:00 pm Eastern Time. Or visit our website, us.allianzgi.com.
About Allianz Global Investors
Allianz Global Investors is a leading active asset manager with over 750 investment professionals in 25 offices worldwide and managing $560 billion in assets for individuals, families and institutions.*
Active is the most important word in our vocabulary. Active is how we create and share value with clients. We believe in solving, not selling, and in adding value beyond pure economic gain. We invest for the long term, employing our innovative investment expertise and global resources. Our goal is to ensure a superior experience for our clients, wherever they are based and whatever their investment needs.
Active is: Allianz Global Investors
* Data as of March 31, 2020.
For more information about any of our investment solutions or client services, call your financial advisor or visit us.allianzgi.com.
Investors should consider the investment objectives, risks, charges and expenses of the above mentioned Funds carefully before investing. This and other information is contained in each Fund’s prospectus, which may be obtained by contacting your financial advisor, by visiting us.allianzgi.com or by calling 1-800-988-8380 (retail classes: A, C & R) or 1-800-498-5413 (Class P, Class R6, Institutional & Administrative classes). Please read the prospectus carefully before you invest or send money.
Allianz Global Investors U.S. LLC serves as the investment manager for the Allianz Funds and the Allianz Funds Multi-Strategy Trust. Allianz Funds and the Allianz FundsMulti-Strategy Trust are distributed by Allianz Global Investors Distributors LLC.© 2019. For information about any product, contact your financial advisor.
us.allianzgi.com
Receive this report electronically and eliminate paper mailings.
To enroll, go to us.allianzgi.com/edelivery
1136038
(a) Not required in this filing.
| ITEM 3. | AUDIT COMMITTEE FINANCIAL EXPERT |
Not required in this filing.
| ITEM 4. | PRINCIPAL ACCOUNTANT FEES AND SERVICES |
Not required in this filing.
| ITEM 5. | AUDIT COMMITTEE OF LISTED REGISTRANT |
Disclosure not required foropen-end management investment companies.
(a) Schedule of Investments is included as part of the report to shareholders filed under Item 1 of this form.
(b) Not applicable.
| ITEM 7. | DISCLOSURE OF PROXY VOTING POLICIES AND PROCEDURES FORCLOSED-END MANAGEMENT INVESTMENT COMPANIES |
Disclosure not required foropen-end management investment companies.
| ITEM 8. | PORTFOLIO MANAGERS OFCLOSED-END MANAGEMENT INVESTMENT COMPANIES |
Disclosure not required foropen-end management investment companies.
| ITEM 9. | PURCHASES OF EQUITY SECURITIES BYCLOSED-END MANAGEMENT INVESTMENT COMPANY AND AFFILIATED PURCHASERS. |
Disclosure not required foropen-end management investment companies.
| ITEM 10. | SUBMISSION OF MATTERS TO A VOTE OF SECURITY HOLDERS |
There have been no material changes to the procedures by which shareholders may recommend nominees to the Trust’s Board of Trustees since the Trust’s last provided disclosure in response to this item.
| ITEM 11. | CONTROLS AND PROCEDURES |
| (a) | The registrant’s President & Chief Executive Officer and Treasurer, Principal Financial & Accounting Officer have concluded that the registrant’s disclosure controls and procedures (as defined in Rule30a-3(c) under the Investment Company Act of 1940 (the “1940 Act”) (17 CFR270.30a-3(c)) as amended), are effective based on their evaluation of these controls and procedures as of a date within 90 days of the filing date of this document. |
| (b) | There were no significant changes in the registrant’s internal control over financial reporting (as defined in Rule30a-3(d) under the 1940 Act (17 CFR270.30a-3(d))) that occurred during the most recent semi-annual period covered by this report that has materially affected, or is reasonably likely to materially affect, the registrant’s internal control over financial reporting. |
| ITEM 12. | DISCLOSURE OF SECURITIES LENDING ACTIVITIES FORCLOSED-END MANAGEMENT INVESTMENT COMPANIES |
Disclosure not required foropen-end management investment companies
(a) (1) Not required in this filing.
(a) (2) Exhibit 99.302_CERT. –Certification pursuant to Section 302 of the Sarbanes-Oxley Act of 2002
(a) (3) Not applicable.
(a) (4) Not applicable.
(b) Exhibit 99.906_CERT. –Certification pursuant to Section 906 of the Sarbanes-Oxley Act of 2002
Signatures
Pursuant to the requirements of the Securities Exchange Act of 1934 and the Investment Company Act of 1940, the registrant has duly caused this report to be signed on its behalf by the undersigned, thereunto duly authorized.
| | |
| Allianz Funds Multi-Strategy Trust |
| |
| By: | | /s/ Thomas J. Fuccillo |
| | Thomas J. Fuccillo |
| | President & Chief Executive Officer |
|
| Date: June 4, 2020 |
| |
| By: | | /s/ Scott Whisten |
| | Scott Whisten |
| | Treasurer, Principal Financial & Accounting Officer |
|
| Date: June 4, 2020 |
Pursuant to the requirements of the Securities Exchange Act of 1934 and the Investment Company Act of 1940, this report has been signed below by the following persons on behalf of the registrant and in the capacities and on the dates indicated.
| | |
| By: | | /s/ Thomas J. Fuccillo |
| | Thomas J. Fuccillo |
| | President & Chief Executive Officer |
|
| Date: June 4, 2020 |
| |
| By: | | /s/ Scott Whisten |
| | Scott Whisten |
| | Treasurer, Principal Financial & Accounting Officer |
|
| Date: June 4, 2020 |