Table of Contents
UNITED STATES
SECURITIES AND EXCHANGE COMMISSION
Washington, D.C. 20549
FORM N-CSR
CERTIFIED SHAREHOLDER REPORT OF
REGISTERED MANAGEMENT INVESTMENT COMPANIES
Investment Company Act file number: 811-22167
Allianz Funds Multi-Strategy Trust
(Exact name of registrant as specified in charter)
1633 Broadway, New York, NY 10019
(Address of principal executive offices) (Zip code)
Scott Whisten
1633 Broadway, New York, NY 10019
(Name and address of agent for service)
Registrant’s telephone number, including area code: 212-739-3367
Date of fiscal year end: September 30
Date of reporting period: March 31, 2018
Table of Contents
Item 1. Report to Shareholders

Allianz Multi-Strategy Funds
SHARE CLASSES A, C, R, P, INSTITUTIONAL, R6, ADMINISTRATIVE
Semiannual Report
March 31, 2018
AllianzGI Retirement 2020 Fund
AllianzGI Retirement 2025 Fund
AllianzGI Retirement 2030 Fund
AllianzGI Retirement 2035 Fund
AllianzGI Retirement 2040 Fund
AllianzGI Retirement 2045 Fund
AllianzGI Retirement 2050 Fund
AllianzGI Retirement 2055 Fund
AllianzGI Multi Asset Income Fund (formerly AllianzGI Retirement Income Fund)
AllianzGI Global Allocation Fund
AllianzGI Best Styles Emerging Markets Equity Fund
AllianzGI Best Styles Global Equity Fund
AllianzGI Best Styles International Equity Fund
AllianzGI Best Styles U.S. Equity Fund
AllianzGI Convertible Fund
AllianzGI Emerging Markets Consumer Fund
AllianzGI Emerging Markets Debt Fund
AllianzGI Emerging Markets Small-Cap Fund
AllianzGI Europe Equity Dividend Fund
AllianzGI Global Dynamic Allocation Fund
AllianzGI Global Fundamental Strategy Fund
AllianzGI Global High Yield Fund
AllianzGI Global Sustainability Fund
AllianzGI Global Water Fund
AllianzGI High Yield Bond Fund
AllianzGI International Growth Fund
AllianzGI International Small-Cap Fund
AllianzGI Micro Cap Fund
AllianzGI NFJ Emerging Markets Value Fund
AllianzGI NFJ International Small-Cap Value Fund
AllianzGI PerformanceFee Managed Futures Strategy Fund
AllianzGI PerformanceFee Structured US Equity Fund
AllianzGI PerformanceFee Structured US Fixed Income Fund
AllianzGI Real Estate Debt Fund
AllianzGI Short Duration High Income Fund
AllianzGI Structured Return Fund
AllianzGI U.S. Equity Hedged Fund
AllianzGI Ultra Micro Cap Fund
This material is authorized for use only when preceded or accompanied by the current Allianz Multi-Strategy Funds, prospectus. Investors should consider the investment objectives, risks, charges and expenses of each Fund carefully before investing. This and other information is contained in the Funds’ prospectuses and summary prospectuses. Please read the prospectus carefully before you invest.

Receive this report electronically and eliminate paper mailings.
To enroll, go to us.allianzgi.com/edelivery.
Table of Contents
| 2–3 | Letter from the President | |||
| 4–105 | Fund Summaries | |||
| 106–107 | Important Information | |||
| 108–111 | Benchmark Descriptions | |||
| 112–197 | Schedules of Investments | |||
| 198–211 | Statements of Assets and Liabilities | |||
| 212–224 | Statements of Operations | |||
| 226–241 | Statements of Changes in Net Assets | |||
| 242–301 | Financial Highlights | |||
| 302–379 | Notes to Financial Statements | |||
| 380 | Changes to the Board of Trustees and Fund Officers | |||
| 381–385 | Matters Relating to the Trustees’ Consideration of the Investment Management Agreements | |||
| 386–387 | Privacy Policy |
A Word About Risk: A fund may be subject to various risks as described in its prospectus. Some of those risks may include, but are not limited to, the following: derivatives risk, smaller company risk, non-US investment risk, focused investment risk and specific sector investment risks. Use of derivative instruments may involve certain costs and risks such as liquidity risk, interest rate risk, market risk, credit risk, counterparty risk, management risk and the risk that a fund is unable to close out a position when it is most advantageous to do so. Portfolios investing in derivatives could lose more than the principal amount invested in those instruments. Investing in foreign securities may entail risk due to foreign economic and political developments; this risk may be enhanced when investing in emerging markets. Smaller companies may be more volatile than larger companies and may entail more risk. Concentrating investments in individual sectors may add additional risk and additional volatility compared to a diversified equity portfolio. AllianzGI target-date funds seek to manage risk and return by blending two separately-managed portfolios: a return-generating portfolio for growth potential, and a defensive portfolio for principal protection. The balance grows increasingly defensive over time until the target date is reached, after which the Fund’s assets roll into a retirement income strategy. The principal values of the Funds are not guaranteed at any time, including the target date. Please refer to each Fund’s applicable current prospectus for complete details.
Table of Contents

Thomas J. Fuccillo
President & CEO
Dear Shareholder,
The US economy continued to expand during the six-month period ended March 31, 2018. This trend also occurred outside the US, and global inflation remained well-contained. Against this backdrop, US and international equities generated positive results. Elsewhere, the US bond market posted a modest decline during the reporting period.
Six Months in Review
For the six-month period ended March 31, 2018, US stocks, as measured by the Standard & Poor’s 500 Index, gained 5.84%. Two measures of stock performance in developed international and global markets, the MSCI EAFE (Europe, Australasia and Far East) Index (net) and the MSCI World Index (net), returned 2.63% and 4.15%, respectively, in dollar-denominated terms. Elsewhere, the MSCI Emerging Markets Index (net) rose 8.96%. With respect to bonds, the Bloomberg Barclays US Credit Index returned -1.10%, whereas the Bloomberg Barclays Global High Yield Index rose 0.50%. The Bloomberg Barclays US Government Bond Index returned 0.51%, while the broader bond market index, as measured by the Bloomberg Barclays US Aggregate Bond Index, returned -1.08%.
Turning to the US economy, gross domestic product (“GDP”), the value of goods and services produced in the country, the broadest measure of economic activity and the principal indicator of economic performance, expanded at an annual pace of 3.2% and 2.9% during the third and fourth quarters of 2017, respectively. The Commerce Department’s initial estimate for the first quarter of 2018 — released after the reporting period had ended — showed that GDP grew at an annual pace of 2.3%.
The US Federal Reserve (the “Fed”) raised interest rates twice during the reporting period, in December 2017 and March 2018. With the rate hike in March, the federal funds rate moved to a range between 1.50% and 1.75%. This marked the Fed’s sixth rate hike since December 2015 and the first under new Chairman Jerome Powell. Meanwhile, in October 2017, the Fed started to gradually reduce its balance sheet — a process that will likely take several years. The Fed’s actions during the reporting period were well telegraphed and there were minimal market disruptions.
| 2 | March 31, 2018 | | Semiannual Report |
Table of Contents
Outlook
Since the depths of the global financial crisis, central banks have supported financial markets and the economies they serve through expansionary monetary policies, increasing their balance sheets to previously unheard-of sizes. In our opinion, the strong growth in corporate profits and diminishing fears of deflation show that this approach has worked, and central banks will be careful not to stifle current gains.
So, while we anticipate the scale of central bank support will diminish in 2018 — led by the Fed — we expect the overall shift to be slow and the precise actions to vary from one central bank to the next. In our view, interest rates will stay low overall in 2018. Consequently, we believe investors should continue to keep a careful eye on inflation, particularly because official data appear to understate rises in real-world costs. In addition to macroeconomic considerations, we believe several dominant investment themes, including geopolitical risk and business disruption, will persist in 2018.
Against this backdrop, we will continue to use our fundamental research and insights — and our strong global network — to help our clients balance risk and reward. Where appropriate, we will also seek to capitalize on volatility spikes and prepare to trim exposure to risky assets if cyclical data start to lose momentum.
On behalf of Allianz Global Investors U.S. LLC, the Funds’ investment manager, thank you for investing with us. We encourage you to consult with your financial advisor and to visit our website, us.allianzgi.com, for additional information. We remain dedicated to serving your investment needs.
Sincerely,

Thomas J. Fuccillo
President & Chief Executive Officer
Past performance is no guarantee of future results. Unless otherwise noted, index returns reflect the reinvestment of income dividends and capital gains, if any, but do not reflect fees, brokerage commissions or other expenses of investing. It is not possible to invest directly in an index.
Receive this report electronically and eliminate paper mailings.
To enroll, go to us.allianzgi.com/edelivery.
| Semiannual Report | | March 31, 2018 | 3 |
Table of Contents
Unaudited
For the period of October 1, 2017 through March 31, 2018, as provided by the Multi-Asset US Group.
Fund Insights
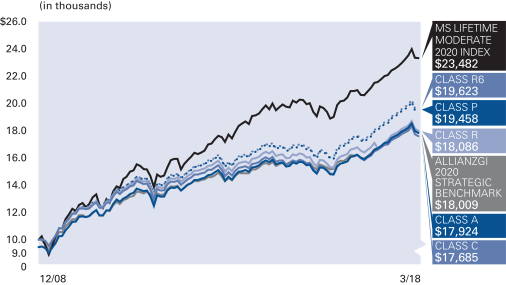
For the six-month period ended March 31, 2018, Class A shares at net asset value (“NAV”) of the AllianzGI Target-Date Funds (the “Funds”) returned between 0.74% and 3.38% with longer dated Funds posting more favorable results. In terms of relative performance, all strategies underperformed their respective benchmarks (Morningstar Lifetime Moderate series) for the six-month period.
Market Overview
The six-month period ending on March 31, 2018 is best characterized as one which began with markets being supported by optimism about global growth and mostly positive political developments. About midway through the period, however, market expectations began to reset.
Global equities appreciated through January buoyed by optimism about the trajectory of global growth. Late in the fourth quarter, the passage of the Tax Cuts and Jobs Act provided an additional boost to sentiment around US equities in light of positive implications for corporate earnings. In terms of economic expansion, we received confirmation that the US economy expanded at a greater than 3.0% rate for two consecutive quarters (on a quarter-over-quarter annualized rate) and that in the US and almost all major economies, the labor market continued to tighten. And yet inflation failed to materialize in spite of such improvements, while official forecasts (from the US Federal Reserve (the “Fed”)) and unofficial ones (from consumer sentiment surveys) suggested that the absence of inflation would continue in the US and in most major economies. Emerging market assets continued to benefit from the “spillover” effects of strong global growth, with its attendant boost to international trade and support for some industrial commodity prices (such as copper) that benefit key commodity exporters. In addition, emerging markets benefited from a weaker US dollar and persistent inflows of foreign capital.
However, signs of rising inflationary pressures and higher bond yields led to a sharp correction in early February. For the remainder of the period macroeconomic and policy uncertainty forced a recalibration of expectations among market participants across asset classes. As of January, markets expected the Fed to increase its benchmark interest rate two times during 2018 and markets seemed to have grown complacent with the low volatility environment of the previous two years. Several new themes arose during the reporting period including (i) a re-emergence of volatility, (ii) renewed vigilance about the possibility of creeping inflation, and (iii) revised forecasts for the pace and magnitude of increases in the Fed’s benchmark interest rate. In this new context, we observed a spike in the Chicago Board Options Exchange Volatility Index (“VIX”) of around 300% during the first week of February, a correction in US equities of more than 6% intraday during the day following a report showing that US wages in January increased more than expected, and an increase in yields on 10-Year Treasuries of roughly 40 basis points by the end of the period.
In March, these factors, combined with the looming threat of a global trade war linked to the White House’s announcement of steep tariffs on steel and aluminum, weighed on markets. Later in March, the technology sector suffered in the wake of several company-specific events, including the launch of a federal investigation into Facebook’s alleged privacy breach.
Overall, the best performing assets for the six-month period were emerging market equities and emerging market bonds followed by global and US equities. Among the worst performing assets were corporate and US government bonds.
Portfolio Review
An overweight to global equities, especially in emerging markets and US equities, provided a tailwind to performance during the reporting period across the board. In addition, selection in equities detracted from performance as the Funds underperformed their respective benchmarks. In addition, selection in bonds also had a negative impact as the AllianzGI Advanced Core Bond Portfolio also underperformed the Bloomberg Barclays US Aggregate Bond Index. Lastly, opportunistic positions in energy and industrial metals commodities also detracted from the Funds’ performance.
At the end of the reporting period, the Funds maintained an underweight position in US government bonds (duration weighted) and an overweight position in global equities including emerging markets, although less so than at the start of the period. The Funds also have an opportunistic position in US bank loans, which are floating rate instruments and which we believe should outperform traditional corporate credit in a rising interest rate environment.
Outlook
Overall, despite the recent volatility in markets, there is still evidence to support a prolonged period of synchronized global growth. As of the end of the quarter, around the world more than two-thirds of countries (developed and emerging) were producing above-average economic data changes. In addition, monetary policy remains accommodative in historical terms as the removal of excess liquidity has been gradual and we believe monetary policy will likely remain accommodative. Although the Fed raised its benchmark interest rate in March and provided more hawkish guidance for the next two years, comments from new Fed Chair Jerome Powell suggest that policy will move at a measured pace. For its part, the European Central Bank signaled that it will not increase the policy rate in 2018. Inflation remains low albeit higher than at the end of last year. Inflation expectations, especially survey-based measures, however, are more elevated.
As of the end of the quarter, our market cycle signals and fundamental analysis recommend a neutral position for global equities favoring emerging markets and US equities and with a small underweight to Europe and the United Kingdom. On the fixed income side, we are neutral to modestly underweight US bonds and long periphery European bonds and emerging market local bonds.
* The “Target-Date Funds” are the AllianzGI Retirement 2020 Fund, the AllianzGI Retirement 2025 Fund, the AllianzGI Retirement 2030 Fund, the AllianzGI Retirement 2035 Fund, the AllianzGI Retirement 2040 Fund, the AllianzGI Retirement 2045 Fund, the AllianzGI Retirement 2050 Fund, and the AllianzGI Retirement 2055 Fund.
| 4 | March 31, 2018 | | Semiannual Report |
Table of Contents
Unaudited
AllianzGI Retirement 2020 Fund
Average Annual Total Return for the period ended March 31, 2018
| 6 Month* | 1 Year | 5 Year | Since Inception† | |||||||||||||||
| AllianzGI Retirement 2020 Fund Class A | 0.74% | 6.87% | 3.64% | 7.17% | ||||||||||||||
| AllianzGI Retirement 2020 Fund Class A (adjusted) | –4.80% | 0.99% | 2.47% | 6.51% | |||||||||||||
| AllianzGI Retirement 2020 Fund Class C | 0.33% | 6.09% | 2.86% | 6.35% | ||||||||||||||
| AllianzGI Retirement 2020 Fund Class C (adjusted) | –0.65% | 5.09% | 2.86% | 6.35% | |||||||||||||
| AllianzGI Retirement 2020 Fund Class R | 0.58% | 7.71% | 2.89% | 6.61% | |||||||||||||
| AllianzGI Retirement 2020 Fund Class P | 0.87% | 7.15% | 3.94% | 7.46% | |||||||||||||
| AllianzGI Retirement 2020 Fund Class R6 | 0.90% | 7.29% | 4.04% | 7.56% | |||||||||||||
| AllianzGI Retirement 2020 Fund Administrative Class | 0.80% | 6.94% | 3.68% | 7.21% | ||||||||||||||
| Morningstar Lifetime Moderate 2020 Index | 2.67% | 8.19% | 6.12% | 9.67% | |||||||||||||
| AllianzGI 2020 Strategic Benchmark | 1.78% | 7.31% | 4.06% | 6.57% | |||||||||||||
| Lipper Mixed-Asset Target 2020 Funds Average | 1.95% | 7.14% | 5.32% | 8.63% | ||||||||||||||
* Cumulative return
† The Fund began operations on December 29, 2008. Benchmark return comparisons began on the fund inception date. Lipper performance comparisons began on December 31, 2008.
Performance quoted represents past performance and is no guarantee of future results. Current performance may be lower or higher than performance shown. For performance current to the most recent month-end, visit our website at us.allianzgi.com. Investment return and the principal value will fluctuate. Shares may be worth more or less than original cost when redeemed. The adjusted returns take into account the maximum initial sales charge of 5.50% on Class A shares and the contingent deferred sales charge (CDSC) of 1% on Class C shares, which may apply to shares redeemed during the first year of ownership. Returns do not reflect deduction of taxes that a shareholder would pay on fund distributions or redemption of fund shares. See pages 106 and 107 for more information. The Fund’s gross expense ratios are 1.19% for Class A shares, 1.94% for Class C shares, 1.44% for Class R shares, 0.79% for Class P shares, 0.69% for Class R6 shares, and 1.04% for Administrative Class shares. These ratios do not include an expense reduction, contractually guaranteed through at least January 31, 2020. The Fund’s expense ratios net of this reduction are 0.95% for Class A shares, 1.70% for Class C shares, 1.30% for Class R shares, 0.65% for Class P shares, 0.55% for Class R6 shares and 0.90% for Administrative Class shares. Expense ratio information is as of the Fund’s current prospectus dated February 1, 2018.
Cumulative Returns Through March 31, 2018
Fund Allocation (as of March 31, 2018)
| AllianzGI Global Dynamic Allocation | 63.3% | |||
| AllianzGI Advanced Core Bond | 17.2% | |||
| AllianzGI Best Styles U.S. Equity | 6.0% | |||
| Vanguard Mortgage-Backed Securities | 2.3% | |||
| AllianzGI Short Duration High Income | 1.2% | |||
| iShares TIPS Bond | 1.1% | |||
| Vanguard Intermediate-Term Corporate Bond | 0.9% | |||
| AllianzGI Emerging Markets Small-Cap | 0.7% | |||
| Other | 0.7% | |||
| Cash & Equivalents — Net | 6.6% |
| Semiannual Report | | March 31, 2018 | 5 |
Table of Contents
Unaudited
AllianzGI Retirement 2020 Fund (cont’d)
| Shareholder Expense Example | Actual Performance | |||||||||||
| Class A | Class C | Class R | Class P | Class R6 | Administrative Class | |||||||
| Beginning Account Value (10/1/17) | $1,000.00 | $1,000.00 | $1,000.00 | $1,000.00 | $1,000.00 | $1,000.00 | ||||||
| Ending Account Value (3/31/18) | $1,007.40 | $1,003.30 | $1,005.80 | $1,008.70 | $1,009.00 | $1,008.00 | ||||||
| Expenses Paid During Period | $1.75 | $5.49 | $3.50 | $0.25 | $0.02 | $1.50 | ||||||
| Hypothetical Performance | ||||||||||||
| (5% return before expenses) | ||||||||||||
| Class A | Class C | Class R | Class P | Class R6 | Administrative Class | |||||||
| Beginning Account Value (10/1/17) | $1,000.00 | $1,000.00 | $1,000.00 | $1,000.00 | $1,000.00 | $1,000.00 | ||||||
| Ending Account Value (3/31/18) | $1,023.19 | $1,019.45 | $1,021.44 | $1,024.68 | $1,024.92 | $1,023.44 | ||||||
| Expenses Paid During Period | $1.77 | $5.54 | $3.53 | $0.25 | $0.02 | $1.51 | ||||||
For each class of the Fund, expenses (net of fee waiver and reimbursement, if any) are equal to the annualized expense ratio for the class (0.35% for Class A, 1.10% for Class C, 0.70% for Class R, 0.05% for Class P, less than 0.005% for Class R6 and 0.30% for Administrative Class), multiplied by the average account value over the period, multiplied by 182/365. These expenses do not include the expenses of the investment companies in which the Fund invests, which are indirectly borne by Fund shareholders.
| 6 | March 31, 2018 | | Semiannual Report |
Table of Contents
Unaudited
AllianzGI Retirement 2025 Fund
Average Annual Total Return for the period ended March 31, 2018
| 6 Month* | 1 Year | 5 Year | Since Inception† | |||||||||||||||
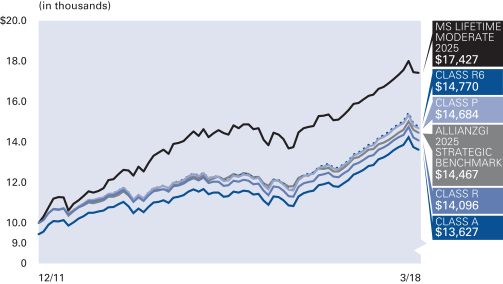
| AllianzGI Retirement 2025 Fund Class A | 1.76% | 8.99% | 4.50% | 6.00% | ||||||||||||||
| AllianzGI Retirement 2025 Fund Class A (adjusted) | –3.84% | 3.00% | 3.32% | 5.05% | |||||||||||||
| AllianzGI Retirement 2025 Fund Class R | 1.57% | 8.61% | 4.12% | 5.61% | |||||||||||||
| AllianzGI Retirement 2025 Fund Class P | 1.88% | 9.31% | 4.81% | 6.31% | |||||||||||||
| AllianzGI Retirement 2025 Fund Class R6 | 1.91% | 9.38% | 4.91% | 6.41% | |||||||||||||
| AllianzGI Retirement 2025 Fund Administrative Class | 1.76% | 9.05% | 4.55% | 6.04% | ||||||||||||||
| Morningstar Lifetime Moderate 2025 Index | 3.08% | 9.31% | 7.00% | 9.25% | |||||||||||||
| AllianzGI 2025 Strategic Benchmark | 2.56% | 8.99% | 4.89% | 6.06% | |||||||||||||
| Lipper Mixed-Asset Target 2025 Funds Average | 2.48% | 8.65% | 6.45% | 8.30% | ||||||||||||||
* Cumulative returns
† The Fund began operations on December 19, 2011. Benchmark return comparisons began on the fund inception date. Lipper performance comparisons began on December 31, 2011.
Performance quoted represents past performance and is no guarantee of future results. Current performance may be lower or higher than performance shown. For performance current to the most recent month-end, visit our website at us.allianzgi.com. Investment return and the principal value will fluctuate. Shares may be worth more or less than original cost when redeemed. The adjusted returns take into account the maximum initial sales charge of 5.50% on Class A shares. Returns do not reflect deduction of taxes that a shareholder would pay on fund distributions or redemption of fund shares. See pages 106 and 107 for more information. The Fund’s gross expense ratios are 1.23% for Class A shares, 1.48% for Class R shares, 0.83% for Class P shares, 0.73% for Class R6 shares and 1.08% for Administrative Class shares. These ratios do not include an expense reduction, contractually guaranteed through at least January 31, 2020. The Fund’s expense ratios net of this reduction are 0.95% for Class A shares, 1.30% for Class R shares, 0.65% for Class P shares, 0.55% for Class R6 shares and 0.90% for Administrative Class shares. Expense ratio information is as of the Fund’s current prospectus dated February 1, 2018.
Cumulative Returns Through March 31, 2018
Fund Allocation (as of March 31, 2018)
| AllianzGI Global Dynamic Allocation | 72.0% | |||
| AllianzGI Advanced Core Bond | 13.6% | |||
| AllianzGI Best Styles U.S. Equity | 9.4% | |||
| AllianzGI Emerging Markets Small-Cap | 0.6% | |||
| AllianzGI Short Duration High Income | 0.5% | |||
| iShares TIPS Bond | 0.5% | |||
| AllianzGI Emerging Markets Debt | 0.3% | |||
| Cash & Equivalents — Net | 3.1% |
| Semiannual Report | | March 31, 2018 | 7 |
Table of Contents
Unaudited
AllianzGI Retirement 2025 Fund (cont’d)
| Shareholder Expense Example | Actual Performance | |||||||||
| Class A | Class R | Class P | Class R6 | Administrative Class | ||||||
| Beginning Account Value (10/1/17) | $1,000.00 | $1,000.00 | $1,000.00 | $1,000.00 | $1,000.00 | |||||
| Ending Account Value (3/31/18) | $1,017.60 | $1,015.70 | $1,018.80 | $1,019.10 | $1,017.60 | |||||
| Expenses Paid During Period | $1.56 | $3.32 | $0.05 | $0.02 | $1.31 | |||||
| Hypothetical Performance | ||||||||||
| (5% return before expenses) | ||||||||||
| Class A | Class R | Class P | Class R6 | Administrative Class | ||||||
| Beginning Account Value (10/1/17) | $1,000.00 | $1,000.00 | $1,000.00 | $1,000.00 | $1,000.00 | |||||
| Ending Account Value (3/31/18) | $1,023.39 | $1,021.64 | $1,024.88 | $1,024.92 | $1,023.64 | |||||
| Expenses Paid During Period | $1.56 | $3.33 | $0.05 | $0.02 | $1.31 | |||||
For each class of the Fund, expenses (net of fee waiver and reimbursement, if any) are equal to the annualized expense ratio for the class (0.31% for Class A, 0.66% for Class R, 0.01% for Class P, less than 0.005% for Class R6 and 0.26% for Administrative Class), multiplied by the average account value over the period, multiplied by 182/365. These expenses do not include the expenses of the investment companies in which the Fund invests, which are indirectly borne by Fund shareholders.
| 8 | March 31, 2018 | | Semiannual Report |
Table of Contents
Unaudited
AllianzGI Retirement 2030 Fund
Average Annual Total Return for the period ended March 31, 2018
| 6 Month* | 1 Year | 5 Year | Since Inception† | |||||||||||||||
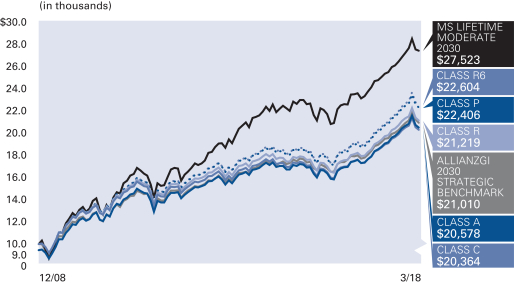
| AllianzGI Retirement 2030 Fund Class A | 2.31% | 10.62% | 5.22% | 8.77% | ||||||||||||||
| AllianzGI Retirement 2030 Fund Class A (adjusted) | –3.32% | 4.54% | 4.04% | 8.11% | |||||||||||||
| AllianzGI Retirement 2030 Fund Class C | 1.95% | 9.77% | 4.43% | 8.00% | ||||||||||||||
| AllianzGI Retirement 2030 Fund Class C (adjusted) | 0.98% | 8.77% | 4.43% | 8.00% | |||||||||||||
| AllianzGI Retirement 2030 Fund Class R | 2.17% | 10.26% | 4.85% | 8.47% | |||||||||||||
| AllianzGI Retirement 2030 Fund Class P | 2.46% | 10.91% | 5.53% | 9.11% | |||||||||||||
| AllianzGI Retirement 2030 Fund Class R6 | 2.54% | 11.02% | 5.64% | 9.21% | |||||||||||||
| AllianzGI Retirement 2030 Fund Administrative Class | 2.38% | 10.68% | 5.27% | 8.87% | ||||||||||||||
| Morningstar Lifetime Moderate 2030 Index | 3.61% | 10.66% | 7.92% | 11.57% | |||||||||||||
| AllianzGI 2030 Strategic Benchmark | 3.24% | 10.47% | 5.70% | 8.36% | |||||||||||||
| Lipper Mixed-Asset Target 2030 Funds Average | 3.15% | 10.12% | 7.17% | 10.23% | ||||||||||||||
* Cumulative return
† The Fund began operations on December 29, 2008. Benchmark return comparisons began on the fund inception date. Lipper performance comparisons began on December 31, 2008.
Performance quoted represents past performance and is no guarantee of future results. Current performance may be lower or higher than performance shown. For performance current to the most recent month-end, visit our website at us.allianzgi.com. Investment return and the principal value will fluctuate. Shares may be worth more or less than original cost when redeemed. The adjusted returns take into account the maximum initial sales charge of 5.50% on Class A shares and the contingent deferred sales charge (CDSC) of 1% on Class C shares, which may apply to shares redeemed during the first year of ownership. Returns do not reflect deduction of taxes that a shareholder would pay on fund distributions or redemption of fund shares. See pages 106 and 107 for more information. The Fund’s gross expense ratios are 1.22% for Class A shares, 1.97% for Class C shares, 1.47% for Class R shares, 0.82% for Class P shares, 0.72% for Class R6 shares and 1.07% for Administrative Class shares. These ratios do not include an expense reduction, contractually guaranteed through at least January 31, 2020. The Fund’s expense ratios net of this reduction are 0.95% for Class A shares, 1.70% for Class C shares, 1.30% for Class R shares, 0.65% for Class P shares, 0.55% for Class R6 shares and 0.90% for Administrative Class shares. Expense ratio information is as of the Fund’s current prospectus dated February 1, 2018.
Cumulative Returns Through March 31, 2018
Fund Allocation (as of March 31, 2018)
| AllianzGI Global Dynamic Allocation | 70.4% | |||
| AllianzGI Best Styles U.S. Equity | 13.0% | |||
| AllianzGI Best Styles Global Equity | 9.0% | |||
| AllianzGI Advanced Core Bond | 3.0% | |||
| AllianzGI Emerging Markets Small-Cap | 1.1% | |||
| Vanguard FTSE All World ex-U.S. Small-Cap | 0.5% | |||
| Cash & Equivalents — Net | 3.0% |
| Semiannual Report | | March 31, 2018 | 9 |
Table of Contents
Unaudited
AllianzGI Retirement 2030 Fund (cont’d)
| Shareholder Expense Example | Actual Performance | |||||||||||
| Class A | Class C | Class R | Class P | Class R6 | Administrative Class | |||||||
| Beginning Account Value (10/1/17) | $1,000.00 | $1,000.00 | $1,000.00 | $1,000.00 | $1,000.00 | $1,000.00 | ||||||
| Ending Account Value (3/31/18) | $1,023.10 | $1,019.50 | $1,021.70 | $1,024.60 | $1,025.40 | $1,023.80 | ||||||
| Expenses Paid During Period | $1.61 | $5.39 | $3.38 | $0.10 | $0.02 | $1.36 | ||||||
| Hypothetical Performance | ||||||||||||
| (5% return before expenses) | ||||||||||||
| Class A | Class C | Class R | Class P | Class R6 | Administrative Class | |||||||
| Beginning Account Value (10/1/17) | $1,000.00 | $1,000.00 | $1,000.00 | $1,000.00 | $1,000.00 | $1,000.00 | ||||||
| Ending Account Value (3/31/18) | $1,023.34 | $1,019.60 | $1,021.59 | $1,024.83 | $1,024.92 | $1,023.59 | ||||||
| Expenses Paid During Period | $1.61 | $5.39 | $3.38 | $0.10 | $0.02 | $1.36 | ||||||
For each class of the Fund, expenses (net of fee waiver and reimbursement, if any) are equal to the annualized expense ratio for the class (0.32% for Class A, 1.07% for Class C, 0.67% for Class R, 0.02% for Class P, less than 0.005% for Class R6 and 0.27% for Administrative Class), multiplied by the average account value over the period, multiplied by 182/365. These expenses do not include the expenses of the investment companies in which the Fund invests, which are indirectly borne by Fund shareholders.
| 10 | March 31, 2018 | | Semiannual Report |
Table of Contents
Unaudited
AllianzGI Retirement 2035 Fund
Average Annual Total Return for the period ended March 31, 2018
| 6 Month* | 1 Year | 5 Year | Since Inception† | |||||||||||||||
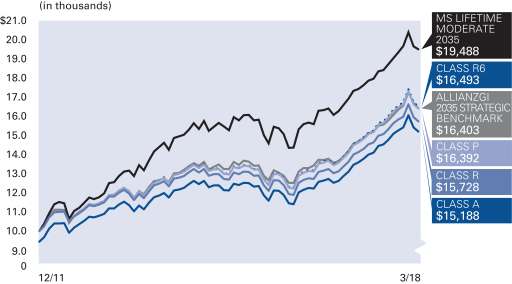
| AllianzGI Retirement 2035 Fund Class A | 2.78% | 11.75% | 5.93% | 7.85% | ||||||||||||||
| AllianzGI Retirement 2035 Fund Class A (adjusted) | –2.88% | 5.60% | 4.74% | 6.88% | |||||||||||||
| AllianzGI Retirement 2035 Fund Class R | 2.63% | 11.41% | 5.57% | 7.48% | |||||||||||||
| AllianzGI Retirement 2035 Fund Class P | 2.96% | 12.07% | 6.26% | 8.19% | |||||||||||||
| AllianzGI Retirement 2035 Fund Class R6 | 3.00% | 12.22% | 6.37% | 8.29% | |||||||||||||
| AllianzGI Retirement 2035 Fund Administrative Class | 2.77% | 11.77% | 5.98% | 7.90% | ||||||||||||||
| Morningstar Lifetime Moderate 2035 Index | 4.14% | 11.95% | 8.65% | 11.21% | |||||||||||||
| AllianzGI 2035 Strategic Benchmark | 3.84% | 11.82% | 6.43% | 8.20% | |||||||||||||
| Lipper Mixed-Asset Target 2035 Funds Average | 3.76% | 11.74% | 8.13% | 9.91% | ||||||||||||||
* Cumulative return
† The Fund began operations on December 19, 2011. Benchmark return comparisons began on the fund inception date. Lipper performance comparisons began on December 31, 2011.
Performance quoted represents past performance and is no guarantee of future results. Current performance may be lower or higher than performance shown. For performance current to the most recent month-end, visit our website at us.allianzgi.com. Investment return and the principal value will fluctuate. Shares may be worth more or less than original cost when redeemed. The adjusted returns take into account the maximum initial sales charge of 5.50% on Class A shares. Returns do not reflect deduction of taxes that a shareholder would pay on fund distributions or redemption of fund shares. See pages 106 and 107 for more information. The Fund’s gross expense ratios are 1.15% for Class A shares, 1.40% for Class R shares, 0.75% for Class P shares, 0.65% for Class R6 shares and 1.00% for Administrative Class shares. These ratios do not include an expense reduction, contractually guaranteed through at least January 31, 2020. The Fund’s expense ratios net of this reduction are 0.95% for Class A shares, 1.30% for Class R shares, 0.65% for Class P shares, 0.55% for Class R6 shares and 0.90% for Administrative Class shares. Expense ratio information is as of the Fund’s current prospectus dated February 1, 2018.
Cumulative Returns Through March 31, 2018
Fund Allocation (as of March 31, 2018)
| AllianzGI Global Dynamic Allocation | 46.7% | |||
| AllianzGI Best Styles Global Equity | 30.6% | |||
| AllianzGI Best Styles U.S. Equity | 15.5% | |||
| AllianzGI Advanced Core Bond | 2.5% | |||
| AllianzGI Emerging Markets Small-Cap | 1.1% | |||
| Vanguard FTSE All World ex-U.S. Small-Cap | 0.9% | |||
| Cash & Equivalents — Net | 2.7% |
| Semiannual Report | | March 31, 2018 | 11 |
Table of Contents
Unaudited
AllianzGI Retirement 2035 Fund (cont’d)
| Shareholder Expense Example | Actual Performance | |||||||||
| Class A | Class R | Class P | Class R6 | Administrative Class | ||||||
| Beginning Account Value (10/1/17) | $1,000.00 | $1,000.00 | $1,000.00 | $1,000.00 | $1,000.00 | |||||
| Ending Account Value (3/31/18) | $1,027.80 | $1,026.30 | $1,029.60 | $1,030.00 | $1,027.70 | |||||
| Expenses Paid During Period | $1.97 | $3.74 | $0.46 | $0.02 | $1.72 | |||||
| Hypothetical Performance | ||||||||||
| (5% return before expenses) | ||||||||||
| Class A | Class R | Class P | Class R6 | Administrative Class | ||||||
| Beginning Account Value (10/1/17) | $1,000.00 | $1,000.00 | $1,000.00 | $1,000.00 | $1,000.00 | |||||
| Ending Account Value (3/31/18) | $1,022.99 | $1,021.24 | $1,024.48 | $1,024.92 | $1,023.24 | |||||
| Expenses Paid During Period | $1.97 | $3.73 | $0.45 | $0.02 | $1.72 | |||||
For each class of the Fund, expenses (net of fee waiver and reimbursement, if any) are equal to the annualized expense ratio for the class (0.39% for Class A, 0.74% for Class R, 0.09% for Class P, 0.005% for Class R6 and 0.34% for Administrative Class), multiplied by the average account value over the period, multiplied by 182/365. These expenses do not include the expenses of the investment companies in which the Fund invests, which are indirectly borne by Fund shareholders.
| 12 | March 31, 2018 | | Semiannual Report |
Table of Contents
Unaudited
AllianzGI Retirement 2040 Fund
Average Annual Total Return for the period ended March 31, 2018
| 6 Month* | 1 Year | 5 Year | Since Inception† | |||||||||||||||
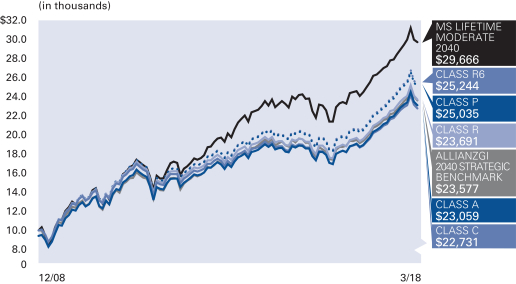
| AllianzGI Retirement 2040 Fund Class A | 3.08% | 12.52% | 6.42% | 10.12% | ||||||||||||||
| AllianzGI Retirement 2040 Fund Class A (adjusted) | –2.59% | 6.33% | 5.22% | 9.45% | |||||||||||||
| AllianzGI Retirement 2040 Fund Class C | 2.69% | 11.63% | 5.63% | 9.28% | ||||||||||||||
| AllianzGI Retirement 2040 Fund Class C (adjusted) | 1.72% | 10.63% | 5.63% | 9.28% | |||||||||||||
| AllianzGI Retirement 2040 Fund Class R | 2.93% | 12.11% | 6.06% | 9.77% | |||||||||||||
| AllianzGI Retirement 2040 Fund Class P | 3.24% | 12.85% | 6.76% | 10.43% | |||||||||||||
| AllianzGI Retirement 2040 Fund Class R6 | 3.28% | 12.98% | 6.86% | 10.53% | |||||||||||||
| AllianzGI Retirement 2040 Fund Administrative Class | 3.07% | 12.56% | 6.48% | 10.16% | ||||||||||||||
| Morningstar Lifetime Moderate 2040 Index | 4.51% | 12.86% | 9.03% | 12.47% | |||||||||||||
| AllianzGI 2040 Strategic Benchmark | 4.31% | 12.85% | 6.97% | 9.72% | |||||||||||||
| Lipper Mixed-Asset Target 2040 Funds Average | 4.03% | 12.25% | 8.25% | 11.12% | ||||||||||||||
* Cumulative return
† The Fund began operations on December 29, 2008. Benchmark return comparisons began on the fund inception date. Lipper performance comparisons began on December 31, 2008.
Performance quoted represents past performance and is no guarantee of future results. Current performance may be lower or higher than performance shown. For performance current to the most recent month-end, visit our website at us.allianzgi.com. Investment return and the principal value will fluctuate. Shares may be worth more or less than original cost when redeemed. The adjusted returns take into account the maximum initial sales charge of 5.50% on Class A shares and the contingent deferred sales charge (CDSC) of 1% on Class C shares, which may apply to shares redeemed during the first year of ownership. Returns do not reflect deduction of taxes that a shareholder would pay on fund distributions or redemption of fund shares. See pages 106 and 107 for more information. The Fund’s gross expense ratios are 1.09% for Class A shares, 1.84% for Class C shares, 1.34% for Class R shares, 0.69% for Class P shares, 0.59% for Class R6 shares and 0.94% for Administrative Class shares. These ratios do not include an expense reduction, contractually guaranteed through at least January 31, 2020. The Fund’s expense ratios net of this reduction are 0.95% for Class A shares, 1.70% for Class C shares, 1.30% for Class R shares, 0.65% for Class P shares, 0.55% for Class R6 shares and 0.90% for Administrative Class shares. Expense ratio information is as of the Fund’s current prospectus dated February 1, 2018.
Cumulative Returns Through March 31, 2018
Fund Allocation (as of March 31, 2018)
| AllianzGI Best Styles Global Equity | 44.7% | |||
| AllianzGI Global Dynamic Allocation | 32.8% | |||
| AllianzGI Best Styles U.S. Equity | 18.1% | |||
| Vanguard FTSE All World ex-U.S. Small-Cap | 1.1% | |||
| AllianzGI Emerging Markets Small-Cap | 1.1% | |||
| Cash & Equivalents — Net | 2.2% |
| Semiannual Report | | March 31, 2018 | 13 |
Table of Contents
Unaudited
AllianzGI Retirement 2040 Fund (cont’d)
| Shareholder Expense Example | Actual Performance | |||||||||||
| Class A | Class C | Class R | Class P | Class R6 | Administrative Class | |||||||
| Beginning Account Value (10/1/17) | $1,000.00 | $1,000.00 | $1,000.00 | $1,000.00 | $1,000.00 | $1,000.00 | ||||||
| Ending Account Value (3/31/18) | $1,030.80 | $1,026.90 | $1,029.30 | $1,032.40 | $1,032.80 | $1,030.70 | ||||||
| Expenses Paid During Period | $2.23 | $6.01 | $4.00 | $0.71 | $0.20 | $1.97 | ||||||
| Hypothetical Performance | ||||||||||||
| (5% return before expenses) | ||||||||||||
| Class A | Class C | Class R | Class P | Class R6 | Administrative Class | |||||||
| Beginning Account Value (10/1/17) | $1,000.00 | $1,000.00 | $1,000.00 | $1,000.00 | $1,000.00 | $1,000.00 | ||||||
| Ending Account Value (3/31/18) | $1,022.74 | $1,019.00 | $1,020.99 | $1,024.23 | $1,024.73 | $1,022.99 | ||||||
| Expenses Paid During Period | $2.22 | $5.99 | $3.98 | $0.71 | $0.20 | $1.97 | ||||||
For each class of the Fund, expenses (net of fee waiver and reimbursement, if any) are equal to the annualized expense ratio for the class (0.44% for Class A, 1.19% for Class C, 0.79% for Class R, 0.14% for Class P, 0.04% for Class R6 and 0.39% for Administrative Class), multiplied by the average account value over the period, multiplied by 182/365. These expenses do not include the expenses of the investment companies in which the Fund invests, which are indirectly borne by Fund shareholders.
| 14 | March 31, 2018 | | Semiannual Report |
Table of Contents
Unaudited
AllianzGI Retirement 2045 Fund
Average Annual Total Return for the period ended March 31, 2018
| 6 Month* | 1 Year | 5 Year | Since Inception† | |||||||||||||||
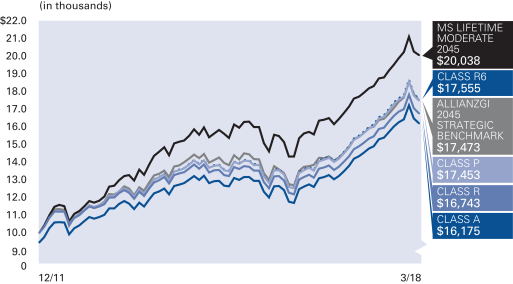
| AllianzGI Retirement 2045 Fund Class A | 3.20% | 13.03% | 6.84% | 8.93% | ||||||||||||||
| AllianzGI Retirement 2045 Fund Class A (adjusted) | –2.48% | 6.81% | 5.64% | 7.95% | |||||||||||||
| AllianzGI Retirement 2045 Fund Class R | 2.98% | 12.60% | 6.47% | 8.55% | |||||||||||||
| AllianzGI Retirement 2045 Fund Class P | 3.32% | 13.31% | 7.18% | 9.27% | |||||||||||||
| AllianzGI Retirement 2045 Fund Class R6 | 3.41% | 13.44% | 7.30% | 9.37% | |||||||||||||
| AllianzGI Retirement 2045 Fund Administrative Class | 3.24% | 13.11% | 6.90% | 8.97% | ||||||||||||||
| Morningstar Lifetime Moderate 2045 Index | 4.68% | 13.31% | 9.11% | 11.70% | |||||||||||||
| AllianzGI 2045 Strategic Benchmark | 4.56% | 13.40% | 7.22% | 9.29% | |||||||||||||
| Lipper Mixed-Asset Target 2045 Funds Average | 4.31% | 13.10% | 8.84% | 10.76% | ||||||||||||||
* Cumulative return
† The Fund began operations on December 19, 2011. Benchmark return comparisons began on the fund inception date. Lipper performance comparisons began on December 31, 2011.
Performance quoted represents past performance and is no guarantee of future results. Current performance may be lower or higher than performance shown. For performance current to the most recent month-end, visit our website at us.allianzgi.com. Investment return and the principal value will fluctuate. Shares may be worth more or less than original cost when redeemed. The adjusted returns take into account the maximum initial sales charge of 5.50% on Class A shares. Returns do not reflect deduction of taxes that a shareholder would pay on fund distributions or redemption of fund shares. See pages 106 and 107 for more information. The Fund’s gross expense ratios are 1.06% for Class A shares, 1.31% for Class R shares, 0.66% for Class P shares, 0.56% for Class R6 shares and 0.91% for Administrative Class shares. These ratios do not include an expense reduction, contractually guaranteed through at least January 31, 2020. The Fund’s expense ratios net of this reduction are 0.95% for Class A shares, 1.30% for Class R shares, 0.65% for Class P shares, 0.55% for Class R6 shares and 0.90% for Administrative Class shares. Expense ratio information is as of the Fund’s current prospectus dated February 1, 2018.
Cumulative Returns Through March 31, 2018
Fund Allocation (as of March 31, 2018)
| AllianzGI Best Styles Global Equity | 53.9% | |||
| AllianzGI Global Dynamic Allocation | 22.0% | |||
| AllianzGI Best Styles U.S. Equity | 18.9% | |||
| Vanguard FTSE All World ex-U.S. Small-Cap | 1.3% | |||
| AllianzGI Emerging Markets Small-Cap | 1.0% | |||
| Cash & Equivalents — Net | 2.9% |
| Semiannual Report | | March 31, 2018 | 15 |
Table of Contents
Unaudited
AllianzGI Retirement 2045 Fund (cont’d)
| Shareholder Expense Example | Actual Performance | |||||||||
| Class A | Class R | Class P | Class R6 | Administrative Class | ||||||
| Beginning Account Value (10/1/17) | $1,000.00 | $1,000.00 | $1,000.00 | $1,000.00 | $1,000.00 | |||||
| Ending Account Value (3/31/18) | $1,032.00 | $1,029.80 | $1,033.20 | $1,034.10 | $1,032.40 | |||||
| Expenses Paid During Period | $2.43 | $4.20 | $0.91 | $0.41 | $2.18 | |||||
| Hypothetical Performance | ||||||||||
| (5% return before expenses) | ||||||||||
| Class A | Class R | Class P | Class R6 | Administrative Class | ||||||
| Beginning Account Value (10/1/17) | $1,000.00 | $1,000.00 | $1,000.00 | $1,000.00 | $1,000.00 | |||||
| Ending Account Value (3/31/18) | $1,022.54 | $1,020.79 | $1,024.03 | $1,024.53 | $1,022.79 | |||||
| Expenses Paid During Period | $2.42 | $4.18 | $0.91 | $0.40 | $2.17 | |||||
For each class of the Fund, expenses (net of fee waiver and reimbursement, if any) are equal to the annualized expense ratio for the class (0.48% for Class A, 0.83% for Class R, 0.18% for Class P, 0.08% for Class R6 and 0.43% for Administrative Class), multiplied by the average account value over the period, multiplied by 182/365. These expenses do not include the expenses of the investment companies in which the Fund invests, which are indirectly borne by Fund shareholders.
| 16 | March 31, 2018 | | Semiannual Report |
Table of Contents
Unaudited
AllianzGI Retirement 2050 Fund
Average Annual Total Return for the period ended March 31, 2018
| 6 Month* | 1 Year | 5 Year | Since Inception† | |||||||||||||||
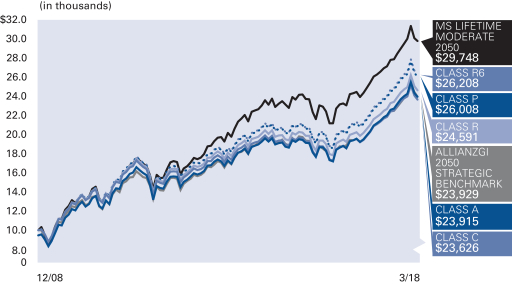
| AllianzGI Retirement 2050 Fund Class A | 3.31% | 13.14% | 6.89% | 10.55% | ||||||||||||||
| AllianzGI Retirement 2050 Fund Class A (adjusted) | –2.37% | 6.92% | 5.68% | 9.88% | |||||||||||||
| AllianzGI Retirement 2050 Fund Class C | 2.91% | 12.30% | 6.08% | 9.74% | ||||||||||||||
| AllianzGI Retirement 2050 Fund Class C (adjusted) | 1.94% | 11.30% | 6.08% | 9.74% | |||||||||||||
| AllianzGI Retirement 2050 Fund Class R | 3.13% | 12.77% | 6.50% | 10.22% | |||||||||||||
| AllianzGI Retirement 2050 Fund Class P | 3.47% | 13.50% | 7.22% | 10.88% | |||||||||||||
| AllianzGI Retirement 2050 Fund Class R6 | 3.47% | 13.56% | 7.32% | 10.98% | |||||||||||||
| AllianzGI Retirement 2050 Fund Administrative Class | 3.31% | 13.16% | 6.94% | 10.62% | ||||||||||||||
| Morningstar Lifetime Moderate 2050 Index | 4.72% | 13.47% | 9.05% | 12.51% | |||||||||||||
| AllianzGI 2050 Strategic Benchmark | 4.66% | 13.61% | 7.28% | 9.90% | |||||||||||||
| Lipper Mixed-Asset Target 2050+ Funds Average | 4.23% | 12.76% | 8.69% | 11.37% | ||||||||||||||
* Cumulative return
† The Fund began operations on December 29, 2008. Benchmark return comparisons began on the fund inception date. Lipper performance comparisons began on December 31, 2008.
Performance quoted represents past performance and is no guarantee of future results. Current performance may be lower or higher than performance shown. For performance current to the most recent month-end, visit our website at us.allianzgi.com. Investment return and the principal value will fluctuate. Shares may be worth more or less than original cost when redeemed. The adjusted returns take into account the maximum initial sales charge of 5.50% on Class A shares and the contingent deferred sales charge (CDSC) of 1% on Class C shares, which may apply to shares redeemed during the first year of ownership. Returns do not reflect deduction of taxes that a shareholder would pay on fund distributions or redemption of fund shares. See pages 106 and 107 for more information. The Fund’s gross expense ratios are 1.05% for Class A shares, 1.80% for Class C shares, 1.30% for Class R shares, 0.65% for Class P shares, 0.55% for Class R6 shares and 0.90% for Administrative Class shares. These ratios do not include an expense reduction, contractually guaranteed through at least January 31, 2020. The Fund’s expense ratios net of this reduction are 0.95% for Class A shares, 1.70% for Class C shares, 1.30% for Class R shares, 0.65% for Class P shares, 0.55% for Class R6 shares and 0.90% for Administrative Class shares. Expense ratio information is as of the Fund’s current prospectus dated February 1, 2018.
Cumulative Returns Through March 31, 2018
Fund Allocation (as of March 31, 2018)
| AllianzGI Best Styles Global Equity | 58.9% | |||
| AllianzGI Best Styles U.S. Equity | 18.4% | |||
| AllianzGI Global Dynamic Allocation | 17.5% | |||
| Vanguard FTSE All World ex-U.S. Small-Cap | 1.4% | |||
| AllianzGI Emerging Markets Small-Cap | 1.0% | |||
| Cash & Equivalents — Net | 2.8% |
| Semiannual Report | | March 31, 2018 | 17 |
Table of Contents
Unaudited
AllianzGI Retirement 2050 Fund (cont’d)
| Shareholder Expense Example | Actual Performance | |||||||||||
| Class A | Class C | Class R | Class P | Class R6 | Administrative Class | |||||||
| Beginning Account Value (10/1/17) | $1,000.00 | $1,000.00 | $1,000.00 | $1,000.00 | $1,000.00 | $1,000.00 | ||||||
| Ending Account Value (3/31/18) | $1,033.10 | $1,029.10 | $1,031.30 | $1,034.70 | $1,034.70 | $1,033.10 | ||||||
| Expenses Paid During Period | $2.48 | $6.27 | $4.25 | $0.96 | $0.46 | $2.23 | ||||||
| Hypothetical Performance | ||||||||||||
| (5% return before expenses) | ||||||||||||
| Class A | Class C | Class R | Class P | Class R6 | Administrative Class | |||||||
| Beginning Account Value (10/1/17) | $1,000.00 | $1,000.00 | $1,000.00 | $1,000.00 | $1,000.00 | $1,000.00 | ||||||
| Ending Account Value (3/31/18) | $1,022.49 | $1,018.75 | $1,020.74 | $1,023.98 | $1,024.48 | $1,022.74 | ||||||
| Expenses Paid During Period | $2.47 | $6.24 | $4.23 | $0.96 | $0.45 | $2.22 | ||||||
For each class of the Fund, expenses (net of fee waiver and reimbursement, if any) are equal to the annualized expense ratio for the class (0.49% for Class A, 1.24% for Class C, 0.84% for Class R, 0.19% for Class P, 0.09% for Class R6 and 0.44% for Administrative Class), multiplied by the average account value over the period, multiplied by 182/365. These expenses do not include the expenses of the investment companies in which the Fund invests, which are indirectly borne by Fund shareholders.
| 18 | March 31, 2018 | | Semiannual Report |
Table of Contents
Unaudited
AllianzGI Retirement 2055 Fund
Average Annual Total Return for the period ended March 31, 2018
| 6 Month* | 1 Year | 5 Year | Since Inception† | |||||||||||||||
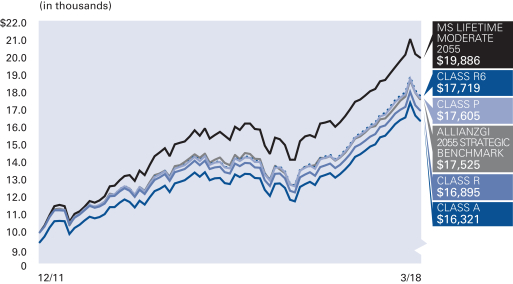
| AllianzGI Retirement 2055 Fund Class A | 3.38% | 13.18% | 6.90% | 9.08% | ||||||||||||||
| AllianzGI Retirement 2055 Fund Class A (adjusted) | –2.31% | 6.95% | 5.69% | 8.11% | |||||||||||||
| AllianzGI Retirement 2055 Fund Class R | 3.20% | 12.81% | 6.52% | 8.71% | |||||||||||||
| AllianzGI Retirement 2055 Fund Class P | 3.51% | 13.48% | 7.21% | 9.42% | |||||||||||||
| AllianzGI Retirement 2055 Fund Class R6 | 3.58% | 13.64% | 7.33% | 9.53% | |||||||||||||
| AllianzGI Retirement 2055 Fund Administrative Class | 3.39% | 13.24% | 6.94% | 9.13% | ||||||||||||||
| Morningstar Lifetime Moderate 2055 Index | 4.73% | 13.57% | 8.96% | 11.57% | |||||||||||||
| AllianzGI 2055 Strategic Benchmark | 4.66% | 13.61% | 7.28% | 9.34% | |||||||||||||
| Lipper Mixed-Asset Target 2055+ Funds Average | 4.51% | 13.57% | 9.19% | 11.11% | ||||||||||||||
* Cumulative return
† The Fund began operations on December 19, 2011. Benchmark return comparisons began on the fund inception date. Lipper performance comparisons began on December 31, 2011.
Performance quoted represents past performance and is no guarantee of future results. Current performance may be lower or higher than performance shown. For performance current to the most recent month-end, visit our website at us.allianzgi.com. Investment return and the principal value will fluctuate. Shares may be worth more or less than original cost when redeemed. The adjusted returns take into account the maximum initial sales charge of 5.50% on Class A shares. Returns do not reflect deduction of taxes that a shareholder would pay on fund distributions or redemption of fund shares. See pages 106 and 107 for more information. The Fund’s gross expense ratios are 1.05% for Class A shares, 1.30% for Class R shares, 0.65% for Class P shares, 0.55% for Class R6 shares and 0.90% for Administrative Class shares. These ratios do not include an expense reduction, contractually guaranteed through at least January 31, 2020. The Fund’s expense ratios net of this reduction are 0.95% for Class A shares, 1.30% for Class R shares, 0.65% for Class P shares, 0.55% for Class R6 shares and 0.90% for Administrative Class shares. Expense ratio information is as of the Fund’s current prospectus dated February 1, 2018.
Cumulative Returns Through March 31, 2018
Fund Allocation (as of March 31, 2018)
| AllianzGI Best Styles Global Equity | 58.8% | |||
| AllianzGI Best Styles U.S. Equity | 18.3% | |||
| AllianzGI Global Dynamic Allocation | 17.5% | |||
| Vanguard FTSE All World ex-U.S. Small-Cap | 1.4% | |||
| AllianzGI Emerging Markets Small-Cap | 1.0% | |||
| Cash & Equivalents — Net | 3.0% |
| Semiannual Report | | March 31, 2018 | 19 |
Table of Contents
Unaudited
AllianzGI Retirement 2055 Fund (cont’d)
| Shareholder Expense Example | Actual Performance | |||||||||
| Class A | Class R | Class P | Class R6 | Administrative Class | ||||||
| Beginning Account Value (10/1/17) | $1,000.00 | $1,000.00 | $1,000.00 | $1,000.00 | $1,000.00 | |||||
| Ending Account Value (3/31/18) | $1,033.80 | $1,032.00 | $1,035.10 | $1,035.80 | $1,033.90 | |||||
| Expenses Paid During Period | $2.48 | $4.26 | $0.96 | $0.46 | $2.23 | |||||
| Hypothetical Performance | ||||||||||
| (5% return before expenses) | ||||||||||
| Class A | Class R | Class P | Class R6 | Administrative Class | ||||||
| Beginning Account Value (10/1/17) | $1,000.00 | $1,000.00 | $1,000.00 | $1,000.00 | $1,000.00 | |||||
| Ending Account Value (3/31/18) | $1,022.49 | $1,020.74 | $1,023.98 | $1,024.48 | $1,022.74 | |||||
| Expenses Paid During Period | $2.47 | $4.23 | $0.96 | $0.45 | $2.22 | |||||
For each class of the Fund, expenses (net of fee waiver and reimbursement, if any) are equal to the annualized expense ratio for the class (0.49% for Class A, 0.84% for Class R, 0.19% for Class P, 0.09% for Class R6 and 0.44% for Administrative Class), multiplied by the average account value over the period, multiplied by 182/365. These expenses do not include the expenses of the investment companies in which the Fund invests, which are indirectly borne by Fund shareholders.
| 20 | March 31, 2018 | | Semiannual Report |
Table of Contents
Unaudited
AllianzGI Multi Asset Income Fund (formerly AllianzGI Retirement Income Fund)
For the period of October 1, 2017 through March 31, 2018, as provided by the Multi-Asset US Group.
Fund Insights
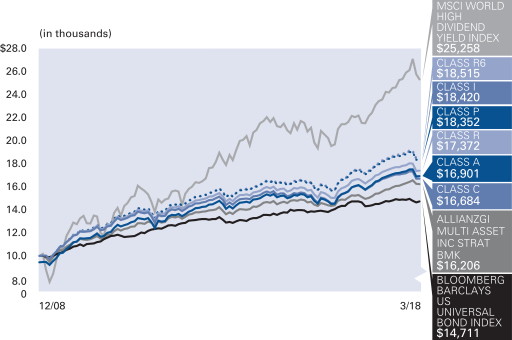
For the six-month period ended March 31, 2018, Class A shares at net asset value (“NAV”) of the AllianzGI Multi Asset Income Fund (the “Fund”) returned -1.59%, underperforming the Bloomberg Barclays US Universal Bond Index (the “benchmark”), which returned -1.00%.
Market Overview
The six-month period ending on March 31, 2018 is best characterized as one which began with markets being supported by optimism about global growth and mostly positive political developments. About midway through the period, however, market expectations began to reset.
Global equities appreciated through January buoyed by optimism about the trajectory of global growth. Late in the fourth quarter, the passage of the Tax Cuts and Jobs Act provided an additional boost to sentiment around US equities in light of positive implications for corporate earnings. In terms of economic expansion, we received confirmation that the US economy expanded at a greater than 3.0% rate for two consecutive quarters (on a quarter-over-quarter annualized rate) and that in the US and almost all major economies, the labor market continued to tighten. And yet inflation failed to materialize in spite of such improvements, while official forecasts (from the US Federal Reserve (the “Fed”)) and unofficial ones (from consumer sentiment surveys) suggested that the absence of inflation would continue in the US and in most major economies. Emerging market assets continued to benefit from the “spillover” effects of strong global growth, with its attendant boost to international trade and support for some industrial commodity prices (such as copper) that benefit key commodity exporters. In addition, emerging markets benefited from a weaker US dollar and persistent inflows of foreign capital.
However, signs of rising inflationary pressures and higher bond yields led to a sharp correction in early February. For the remainder of the period macroeconomic and policy uncertainty forced a recalibration of expectations among market participants across asset classes. As of January, markets expected the Fed to increase its benchmark interest rate two times during 2018 and markets seemed to have grown complacent with the low volatility environment of the previous two years. Several new themes arose including (i) a re-emergence of volatility, (ii) renewed vigilance about the possibility of creeping inflation, and (iii) revised forecasts for the pace and magnitude of increases in the Fed’s benchmark interest rate. In this new context, we observed a spike in the Chicago Board Options Exchange Volatility Index (“VIX”) of around 300% during the first week of February, a correction in US equities of more than 6% intraday during the day following a report showing that US wages in January increased more than expected, and an increase in yields on 10-Year Treasuries of roughly 40 basis points by the end of the period.
In March, these factors, combined with the looming threat of a global trade war linked to the White House’s announcement of steep tariffs on steel and aluminum, weighed on markets. Later in March, the technology sector suffered in the wake of several company-specific events including the launch of a federal investigation into Facebook’s alleged privacy breach.
Overall, the best performing assets for the six-month period were emerging market equities and emerging market bonds followed by global and US equities. Among the worst performing assets were corporate and US government bonds.
Portfolio Review
Given the Fund’s focus on generating a relatively high level of income via dividends and interest, the Fund was overweight with respect to REITs and held an opportunistic position in MLPs during the reporting period; these two positions were responsible for most of the Fund’s underperformance. The Fund benefited from the use of high dividend paying equities and from a positive allocation effect in developed Asian and emerging market equities. The use of flexible income-oriented core strategies and the AllianzGI Short Duration High Income Fund offset the negative contribution from the Fund’s treasury positions.
The Fund is currently overweight with respect to equities, including preferred stocks and convertible securities, bank loans and emerging market debt, and underweight with respect to traditional high yield bonds, investment grade bonds and overall duration.
Overall, the Fund seeks to maintain a highly diversified mix of income sources throughout all market environments to mitigate portfolio risks.
Outlook
Overall, despite the recent volatility in markets, there is still evidence to support a prolonged period of synchronized global growth. As of the end of the quarter, around the world more than two-thirds of countries (developed and emerging) were producing above-average economic data changes. In addition, monetary policy remains accommodative in historical terms as the removal of excess liquidity has been gradual and we believe monetary policy will likely remain accommodative. Although the Fed raised its benchmark interest rate in March and provided more hawkish guidance for the next two years, comments from new Fed Chair Jerome Powell suggest that policy will move at a measured pace. For its part, the European Central Bank signaled that it will not increase the policy rate in 2018. Inflation remains low albeit higher than at the end of last year. Inflation expectations, especially survey-based measures, however, are more elevated.
As of the end of the quarter, our market cycle signals and fundamental analysis recommend a neutral position for global equities favoring emerging markets and US equities and with a small underweight to Europe and the United Kingdom. On the fixed income side, we are neutral to modestly underweight US bonds and long periphery European bonds and emerging market local bonds.
| Semiannual Report | | March 31, 2018 | 21 |
Table of Contents
Unaudited
AllianzGI Multi Asset Income Fund (formerly AllianzGI Retirement Income Fund) (cont’d)
Average Annual Total Return for the period ended March 31, 2018
| 6 Month* | 1 Year | 5 Year | Since Inception† | |||||||||||||||
| AllianzGI Multi Asset Income Fund Class A | –1.59% | 2.28% | 2.95% | 6.48% | ||||||||||||||
| AllianzGI Multi Asset Income Fund Class A (adjusted) | –7.00% | –3.34% | 1.79% | 5.83% | |||||||||||||
| AllianzGI Multi Asset Income Fund Class C | –2.01% | 1.47% | 2.16% | 5.69% | ||||||||||||||
| AllianzGI Multi Asset Income Fund Class C (adjusted) | –2.95% | 0.51% | 2.16% | 5.69% | |||||||||||||
| AllianzGI Multi Asset Income Fund Class R | –1.76% | 1.87% | 2.59% | 6.14% | |||||||||||||
| AllianzGI Multi Asset Income Fund Class P | –1.43% | 2.56% | 3.26% | 6.78% | |||||||||||||
| AllianzGI Multi Asset Income Fund Class R6 | –1.37% | 2.68% | 3.37% | 6.88% | |||||||||||||
| AllianzGI Multi Asset Income Fund Administrative Class | –1.57% | 2.32% | 2.79% | 6.42% | ||||||||||||||
| AllianzGI Multi Asset Income Fund Institutional Class | –1.45% | 2.57% | 3.30% | 6.82% | |||||||||||||
| Bloomberg Barclays US Universal Bond Index | –1.00% | 1.52% | 2.19% | 4.26% | |||||||||||||
| AllianzGI Multi Asset Income Strategic Benchmark | 0.81% | 5.15% | 2.93% | 5.36% | |||||||||||||
| MSCI World High Dividend Yield Index | 0.24% | 8.04% | 6.87% | 10.53% | |||||||||||||
| Lipper Mixed-Asset Target Today Funds Average | 1.11% | 5.04% | 3.62% | 6.37% | ||||||||||||||
* Cumulative return
† The Fund began operations on December 29, 2008. Benchmark return comparisons began on the fund inception date. Lipper performance comparisons began on December 31, 2008.
Performance quoted represents past performance and is no guarantee of future results. Current performance may be lower or higher than performance shown. For performance current to the most recent month-end, visit our website at us.allianzgi.com. Investment return and the principal value will fluctuate. Shares may be worth more or less than original cost when redeemed. The adjusted returns take into account the maximum initial sales charge of 5.50% on Class A shares and the contingent deferred sales charge (CDSC) of 1% on Class C shares, which may apply to shares redeemed during the first year of ownership. Returns do not reflect deduction of taxes that a shareholder would pay on fund distributions or redemption of fund shares. See pages 106 and 107 for more information. The Fund’s gross expense ratios are 1.20% for Class A shares, 1.95% for Class C shares, 1.45% for Class R shares, 0.80% for Class P shares, 0.75% for Institutional Class, 0.70% for Class R6 shares and 1.05% for Administrative Class shares. These ratios do not include an expense reduction, contractually guaranteed through at least January 31, 2020. The Fund’s expense ratios net of this reduction are 0.95% for Class A shares, 1.70% for Class C shares, 1.30% for Class R shares, 0.65% for Class P shares, 0.60% for Institutional Class, 0.55% for Class R6 shares and 0.90% for Administrative Class shares. Expense ratio information is as of the Fund’s current prospectus dated February 1, 2018.
| 22 | March 31, 2018 | | Semiannual Report |
Table of Contents
Unaudited
AllianzGI Multi Asset Income Fund (formerly AllianzGI Retirement Income Fund) (cont’d)
Cumulative Returns Through March 31, 2018
Fund Allocation (as of March 31, 2018)
| PIMCO Income | 12.8% | |||
| AllianzGI Short Duration High Income | 10.2% | |||
| PIMCO Investment Grade Corporate Bond | 7.6% | |||
| AllianzGI Emerging Markets Debt | 7.4% | |||
| AllianzGI Europe Equity Dividend | 6.8% | |||
| PIMCO Preferred and Capital Securites | 6.0% | |||
| PIMCO Mortgage Opportunities | 5.0% | |||
| AllianzGI High Yield Bond | 5.0% | |||
| Other | 26.8% | |||
| Cash & Equivalents — Net | 12.4% |
| Shareholder Expense Example | Actual Performance | |||||||||||||
| Class A | Class C | Class R | Class P | Institutional Class* | Class R6 | Administrative Class | ||||||||
| Beginning Account Value (10/1/17) | $1,000.00 | $1,000.00 | $1,000.00 | $1,000.00 | $1,000.00 | $1,000.00 | $1,000.00 | |||||||
| Ending Account Value (3/31/18) | $984.10 | $979.90 | $982.40 | $985.70 | $969.60 | $986.30 | $984.30 | |||||||
| Expenses Paid During Period | $1.93 | $5.63 | $3.66 | $0.45 | $0.06 | $0.01 | $1.68 | |||||||
| Hypothetical Performance | ||||||||||||||
| (5% return before expenses) | ||||||||||||||
| Class A | Class C | Class R | Class P | Institutional Class* | Class R6 | Administrative Class | ||||||||
| Beginning Account Value (10/1/17) | $1,000.00 | $1,000.00 | $1,000.00 | $1,000.00 | $1,000.00 | $1,000.00 | $1,000.00 | |||||||
| Ending Account Value (3/31/18) | $1,022.99 | $1,019.25 | $1,021.24 | $1,024.48 | $1,024.73 | $1,024.92 | $1,023.24 | |||||||
| Expenses Paid During Period | $1.97 | $5.74 | $3.73 | $0.45 | $0.20 | $0.02 | $1.72 | |||||||
* Institutional Class commenced operations on February 1, 2018. The Actual expense example for Institutional Class is based on the period since inception; the Actual expense example for Class A, Class C, Class R, Class P, Class R6, and Administrative Class and the Hypothetical expense example for all classes are based on the period beginning October 1, 2017. If the Hypothetical expense example for Institutional Class had been based on the period since inception, the Ending Account Value and Expenses Paid During Period would have been: $1,007.88 and $0.06, respectively.
For each class of the Fund, expenses (net of fee waiver and reimbursement, if any) are equal to the annualized expense ratio for the class (0.39% for Class A, 1.14% for Class C, 0.74% for Class R, 0.09% for Class P, 0.04% for Institutional Class, less than 0.005% for Class R6 and 0.34% for Administrative Class), multiplied by the average account value over the period, multiplied by 182 (58 for Institutional Class)/365 for the Actual expense example and 182/365 for the Hypothetical expense example. These expenses do not include the expenses of the investment companies in which the Fund invests, which are indirectly borne by Fund shareholders.
| Semiannual Report | | March 31, 2018 | 23 |
Table of Contents
Unaudited
AllianzGI Global Allocation Fund
For the period of October 1, 2017 through March 31, 2018, as provided by the Multi-Asset US Group.
Fund Insights
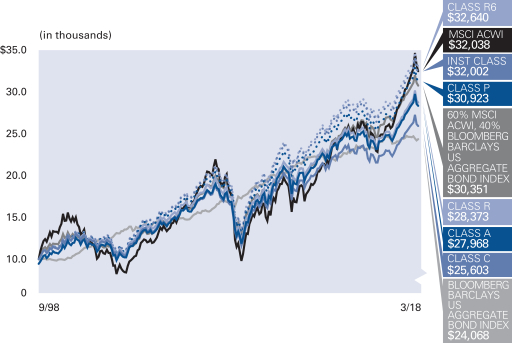
For the six-month period ended March 31, 2018, Class A shares at net asset value (“NAV”) of the AllianzGI Global Allocation Fund (the “Fund”) returned 1.80%, underperforming the 60% MSCI ACWI, 40% Bloomberg Barclays US Aggregate Bond Index (the “benchmark”), which returned 2.45%.
Market Overview
The six-month period ending on March 31, 2018 is best characterized as one which began with markets being supported by optimism about global growth and mostly positive political developments. About midway through the period, however, market expectations began to reset.
Global equities appreciated through January buoyed by optimism about the trajectory of global growth. Late in the fourth quarter, the passage of the Tax Cuts and Jobs Act provided an additional boost to sentiment around US equities in light of positive implications for corporate earnings. In terms of economic expansion, we received confirmation that the US economy expanded at a greater than 3.0% rate for two consecutive quarters (on a quarter-over-quarter annualized rate) and that in the US and almost all major economies, the labor market continued to tighten. And yet inflation failed to materialize in spite of such improvements, while official forecasts (from the US Federal Reserve (the “Fed”)) and unofficial ones (from consumer sentiment surveys) suggested that the absence of inflation would continue in the US and in most major economies. Emerging market assets continued to benefit from the “spillover” effects of strong global growth, with its attendant boost to international trade and support for some industrial commodity prices (such as copper) that benefit key commodity exporters. In addition, emerging markets benefited from a weaker US dollar and persistent inflows of foreign capital.
However, signs of rising inflationary pressures and higher bond yields led to a sharp correction in early February. For the remainder of the reporting period macroeconomic and policy uncertainty forced a recalibration of expectations among market participants across asset classes. As of January, markets expected the Fed to increase its benchmark interest rate two times during 2018 and seemed to have grown complacent with the low volatility environment of the previous two years. Several new themes arose during the reporting period including (i) a re-emergence of volatility, (ii) renewed vigilance about the possibility of creeping inflation, and (iii) revised forecasts for the pace and magnitude of increases in the Fed’s benchmark interest rate. In this new context, we observed a spike in the Chicago Board Options Exchange Volatility Index (“VIX”) of around 300% during the first week of February, a correction in US equities of more than 6% intraday during the day following a report showing that US wages in January increased more than expected, and an increase in yields on 10-Year Treasuries of roughly 40 basis points by the end of the period.
In March, these factors, combined with the looming threat of a global trade war linked to the White House’s announcement of steep tariffs on steel and aluminum, weighed on markets. Later in March, the technology sector suffered in the wake of several company-specific events, including the launch of a federal investigation into Facebook’s alleged privacy breach.
Overall, the best performing assets for the six-month period were emerging market equities and emerging market bonds followed by global and US equities. Among the worst performing assets were corporate and US government bonds.
Portfolio Review
An overweight to global equities, especially in emerging markets and US equities, provided a tailwind to performance during the reporting period across the board. In addition, selection in equities detracted from performance as the Fund underperformed its benchmark. In the opportunistic portion of the portfolio, performance benefitted from exposure to small-cap stocks in both emerging markets and the US. Other opportunistic holdings such as high yield bonds and UK government bonds detracted from the Fund’s performance. In addition, exposure to commodities and selected currencies through a managed futures strategy detracted from the Fund’s performance. The Fund’s exposure to US Treasuries ultimately detracted, although positioning helped intermittently, including as exposure was decreased when yields went up in February.
At the end of the reporting period, the Fund maintained an underweight position in US government bonds (duration weighted) and an overweight position with respect to global equities including emerging markets, although less so than at the start of the reporting period.
Outlook
Overall, despite the recent volatility in markets, there is still evidence to support a prolonged period of synchronized global growth. As of the end of the quarter, around the world more than two-thirds of countries (developed and emerging) were producing above-average economic data changes. In addition, monetary policy remains accommodative in historical terms as the removal of excess liquidity has been gradual and we believe monetary policy will likely remain accommodative. Although the Fed raised its benchmark interest rate in March and provided more hawkish guidance for the next two years, comments from new Fed Chair Jerome Powell suggest that policy will move at a measured pace. For its part, the European Central Bank signaled that it will not increase the policy rate in 2018. Inflation remains low albeit higher than at the end of last year. Inflation expectations, especially survey-based measures, however, are more elevated.
As of the end of the quarter, our market cycle signals and fundamental analysis recommend a neutral position for global equities favoring emerging markets and US equities and with a small underweight to Europe and the United Kingdom. On the fixed income side, we are neutral to modestly underweight US bonds and long periphery European bonds and Emerging Market local bonds.
| 24 | March 31, 2018 | | Semiannual Report |
Table of Contents
Unaudited
AllianzGI Global Allocation Fund (cont’d)
Average Annual Total Return for the period ended March 31, 2018
| 6 Month* | 1 Year | 5 Year | 10 Year | Since Inception† | ||||||||||||||||||
| AllianzGI Global Allocation Fund Class A | 1.80% | 9.64% | 4.84% | 5.09% | 5.72% | |||||||||||||||||
| AllianzGI Global Allocation Fund Class A (adjusted) | –3.80% | 3.61% | 3.66% | 4.50% | 5.42% | ||||||||||||||||
| AllianzGI Global Allocation Fund Class C | 1.47% | 8.85% | 4.06% | 4.32% | 4.94% | |||||||||||||||||
| AllianzGI Global Allocation Fund Class C (adjusted) | 0.54% | 7.85% | 4.06% | 4.32% | 4.94% | ||||||||||||||||
| AllianzGI Global Allocation Fund Class R | 1.77% | 9.52% | 4.68% | 4.89% | 5.49% | ||||||||||||||||
| AllianzGI Global Allocation Fund Class P | 1.96% | 9.97% | 5.12% | 5.34% | 5.96% | ||||||||||||||||
| AllianzGI Global Allocation Fund Institutional Class | 1.97% | 9.79% | 5.07% | 5.40% | 6.14% | ||||||||||||||||
| AllianzGI Global Allocation Fund Administrative Class | 1.85% | 9.80% | 4.86% | 5.13% | 5.78% | ||||||||||||||||
| AllianzGI Global Allocation Fund R6 | 1.95% | 10.08% | 5.18% | 5.51% | 6.25% | ||||||||||||||||
| MSCI ACWI | 4.71% | 14.85% | 9.20% | 5.57% | 6.15% | ||||||||||||||||
| 60% MSCI ACWI, 40% Bloomberg Barclays US Aggregate Bond Index | 2.45% | 9.29% | 6.33% | 5.15% | 5.86% | ||||||||||||||||
| Bloomberg Barclays US Aggregate Bond Index | –1.08% | 1.20% | 1.82% | 3.63% | 4.61% | ||||||||||||||||
| Lipper Alternative Global Macro Funds Average | 0.64% | 4.89% | 2.17% | 3.17% | 5.12% | |||||||||||||||||
* Cumulative return
† The Fund began operations on September 30,1998. Benchmark return comparisons began on the fund inception date. Lipper performance comparisons began on September 30, 1998.
Performance quoted represents past performance and is no guarantee of future results. Current performance may be lower or higher than performance shown. For performance current to the most recent month-end, visit our website at us.allianzgi.com. Investment return and the principal value will fluctuate. Shares may be worth more or less than original cost when redeemed. The adjusted returns take into account the maximum sales charge of 5.50% on Class A shares and the contingent deferred sales charge (CDSC) of 1% on Class C shares, which may apply to shares redeemed during the first year of ownership. Returns do not reflect deduction of taxes that a shareholder would pay on fund distributions or redemption of fund shares. See pages 106 and 107 for more information. The Fund’s gross expense ratios are 1.53% for Class A shares, 2.28% for Class C shares, 1.72% for Class R shares, 1.26% for Class P shares, 1.36% for Institutional Class shares, 1.21% for Class R6 shares and 1.47% for Administrative Class shares. These ratios do not include an expense reduction, contractually guaranteed through at least January 31, 2019. The Fund’s expense ratios net of this reduction are 1.01% for Class A shares, 1.78% for Class C shares, 1.21% for Class R shares, 0.81% for Class P shares, 0.81% for Institutional Class shares, 0.71% for Class R6 shares and 0.96% for Administrative Class shares. Expense ratio information is as of the Fund’s current prospectus dated February 1, 2018.
Cumulative Returns Through March 31, 2018
Fund Allocation (as of March 31, 2018)
| AllianzGI Best Styles Global Equity | 39.7% | |||
| AllianzGI Advanced Core Bond | 25.6% | |||
| AllianzGI Best Styles Global Managed Volatility | 10.4% | |||
| AllianzGI International Growth | 5.3% | |||
| AllianzGI Emerging Markets Debt | 4.3% | |||
| AllianzGI PerformanceFee Managed Futures Strategy | 4.1% | |||
| iShares iBoxx $ Investment Grade Corporate Bond | 2.9% | |||
| iShares MBS | 1.9% | |||
| Other | 2.8% | |||
| Cash & Equivalents — Net | 3.0% |
| Semiannual Report | | March 31, 2018 | 25 |
Table of Contents
Unaudited
AllianzGI Global Allocation Fund (cont’d)
| Shareholder Expense Example | Actual Performance | |||||||||||||
| Class A | Class C | Class R | Class P | Institutional Class | Class R6 | Administrative Class | ||||||||
| Beginning Account Value (10/1/17) | $1,000.00 | $1,000.00 | $1,000.00 | $1,000.00 | $1,000.00 | $1,000.00 | $1,000.00 | |||||||
| Ending Account Value (3/31/18) | $1,018.00 | $1,014.70 | $1,017.70 | $1,019.60 | $1,019.70 | $1,019.50 | $1,018.50 | |||||||
| Expenses Paid During Period | $3.02 | $6.83 | $4.02 | $1.86 | $2.01 | $1.52 | $2.77 | |||||||
| Hypothetical Performance | ||||||||||||||
| (5% return before expenses) | ||||||||||||||
| Class A | Class C | Class R | Class P | Institutional Class | Class R6 | Administrative Class | ||||||||
| Beginning Account Value (10/1/17) | $1,000.00 | $1,000.00 | $1,000.00 | $1,000.00 | $1,000.00 | $1,000.00 | $1,000.00 | |||||||
| Ending Account Value (3/31/18) | $1,021.94 | $1,018.15 | $1,020.94 | $1,023.09 | $1,022.94 | $1,023.44 | $1,022.19 | |||||||
| Expenses Paid During Period | $3.02 | $6.84 | $4.03 | $1.87 | $2.02 | $1.51 | $2.77 | |||||||
For each class of the Fund, expenses (net of fee waiver and reimbursement, if any) are equal to the annualized expense ratio for the class (0.60% for Class A, 1.36% for Class C, 0.80% for Class R, 0.37% for Class P, 0.40% for Institutional Class, 0.30% for Class R6 and 0.55% for Administrative Class), multiplied by the average account value over the period, multiplied by 182/365. These expenses do not include the expenses of the investment companies in which the Fund invests, which are indirectly borne by Fund shareholders.
| 26 | March 31, 2018 | | Semiannual Report |
Table of Contents
Unaudited
AllianzGI Best Styles Emerging Markets Equity Fund
For the period of October 1, 2017 through March 31, 2018, as provided by Christian McCormick, Senior Product Specialist.
Fund Insights
For the six-month period ended March 31, 2018, Class A shares at net asset value (“NAV”) of the AllianzGI Best Styles Emerging Markets Equity Fund (the “Fund”) returned 9.07%, outperforming the MSCI Emerging Markets Index (the “benchmark”), which returned 8.96%.
Market Overview
Emerging market equities outperformed developed market ones, ending a volatile quarter with slight gains. Optimism over the strength of the global economy helped emerging markets to lead the global equity rally in January, with US dollar weakness also boosting sentiment. However, in February emerging markets joined the global equities sell-off and fears that more protectionist policies would spark a global trade war further weighed on returns in March. All regions rose, with Latin America faring the best, followed by Eastern Europe and Asia. Chinese equities defied the broader equity sell-off to end a volatile quarter modestly higher as robust gains in January were followed by steep declines in February. Economic data was affected by the timing of the Lunar New Year holiday, but appeared to indicate steady growth. President Xi consolidated his power, with China removing its two-term limit on its presidency, and the country said it was planning retaliatory tariffs to President Trump’s proposed 25% tariffs on a wide range of Chinese imports
Portfolio Review
The Fund implements a blend of five investment styles that are well-diversified and successful over the long term. This blend of investment styles includes: Value, Price Momentum, Earnings Change, Growth and Quality. Over the trailing six months, the style value underperformed the benchmark, but the trend following styles of Price Momentum and Earnings Change, which tend to have a low correlation with Value, outperformed the benchmark. Towards the end of the six-month period, low volatility stocks started to meaningfully outperform as the equity markets turned negative.
The Fund has only moderate leeway for sector and regional allocation with a maximum deviation of 3% vs. the benchmark for active sector weightings. The overall contribution from active sector and country allocation was positive, especially from a country perspective. However, the consumer discretionary sector was the only significant contributor to excess returns at 36 basis points. All other sectors and country attributions were within +/- 20 basis points.
The Fund holds a broad number of stocks to implement a well-diversified mix of investment styles and assigns a maximum active weighting of 1% to individual stocks. Stock selection in the REIT and energy sectors was positive, along with China from a country perspective. Stock selection within healthcare and South Korea was the largest detractors from excess returns.
Outlook
The Fund’s strategy is a diversified mix of hundreds of securities that seeks to harvest the long term risk premiums associated with Value, Price Momentum, Earning Change Growth and Quality. Around these premiums we use a quantitative process, that we believe helps to minimize risk and create a stable excess return stream independent of market and economic environments. Therefore we do not provide a market or economic outlook.
Average Annual Total Return for the period ended March 31, 2018
| 6 Month* | 1 Year | Since Inception† | ||||||||||||
| AllianzGI Best Styles Emerging Markets Equity Fund Class A | 9.07% | 23.84% | 8.55% | |||||||||||
| AllianzGI Best Styles Emerging Markets Equity Fund Class A (adjusted) | 3.07% | 17.03% | 6.71% | ||||||||||
| AllianzGI Best Styles Emerging Markets Equity Fund Class C | 8.62% | 22.93% | 7.73% | |||||||||||
| AllianzGI Best Styles Emerging Markets Equity Fund Class C (adjusted) | 7.62% | 21.93% | 7.73% | ||||||||||
| AllianzGI Best Styles Emerging Markets Equity Fund Class P | 9.11% | 24.00% | 8.70% | ||||||||||
| AllianzGI Best Styles Emerging Markets Equity Fund Institutional Class | 9.20% | 24.10% | 8.82% | ||||||||||
| AllianzGI Best Styles Emerging Markets Equity Fund R6 | 9.20% | 24.15% | 8.90% | ||||||||||
| MSCI Emerging Markets Index | 8.96% | 24.93% | 8.44% | ||||||||||
| Lipper Emerging Markets Funds Average | 8.34% | 23.20% | 6.08% | |||||||||||
* Cumulative return
† The Fund began operations on December 9, 2014. Benchmark return comparisons began on the fund inception date. Lipper performance comparisons began on November 30, 2014.
Performance quoted represents past performance and is no guarantee of future results. Current performance may be lower or higher than performance shown. For performance current to the most recent month-end, visit our website at us.allianzgi.com. Investment return and the principal value will fluctuate. Shares may be worth more or less than original cost when redeemed. The adjusted returns take into account the maximum initial sales charge of 5.50% on Class A shares and the contingent deferred sales charge (CDSC) of 1% on Class C shares, which may apply to shares redeemed during the first year of ownership. Returns do not reflect deduction of taxes that a shareholder would pay on fund distributions or redemption of fund shares. See pages 106 and 107 for more information. The Fund’s gross expense ratios are 4.96% for Class A shares, 6.05% for Class C shares, 5.09% for Class P shares, 6.68% for Institutional Class shares and 5.62% for Class R6 shares. These ratios do not include an expense reduction, contractually guaranteed through at least January 31, 2019. The Fund’s expense ratios net of this reduction are 0.85% for Class A shares, 1.60% for Class C shares, 0.70% for Class P shares, 0.60% for Institutional Class shares and 0.60% for Class R6 shares. Expense ratio information is as of the Fund’s current prospectus dated February 1, 2018.
| Semiannual Report | | March 31, 2018 | 27 |
Table of Contents
Unaudited
AllianzGI Best Styles Emerging Markets Equity Fund (cont’d)
Cumulative Returns Through March 31, 2018
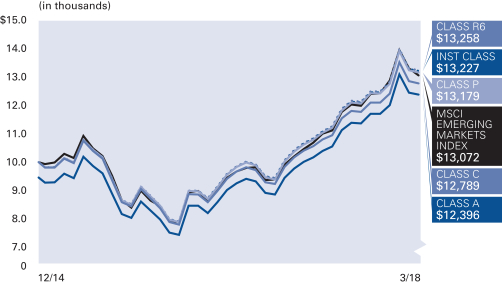
Country Allocation (as of March 31, 2018)
| China | 31.3% | |||
| Korea (Republic of) | 15.2% | |||
| Taiwan | 8.7% | |||
| Brazil | 7.4% | |||
| Thailand | 3.9% | |||
| South Africa | 3.7% | |||
| Mexico | 2.7% | |||
| Turkey | 2.5% | |||
| Other | 8.7% | |||
| Cash & Equivalents — Net | 15.9% |
| Shareholder Expense Example | Actual Performance | |||||||||
| Class A | Class C | Class P | Institutional Class | Class R6 | ||||||
Beginning Account Value (10/1/17) | $1,000.00 | $1,000.00 | $1,000.00 | $1,000.00 | $1,000.00 | |||||
Ending Account Value (3/31/18) | $1,090.70 | $1,086.20 | $1,091.10 | $1,092.00 | $1,092.00 | |||||
Expenses Paid During Period | $4.43 | $8.32 | $3.65 | $3.13 | $3.13 | |||||
| Hypothetical Performance | ||||||||||
| (5% return before expenses) | ||||||||||
| Class A | Class C | Class P | Institutional Class | Class R6 | ||||||
Beginning Account Value (10/1/17) | $1,000.00 | $1,000.00 | $1,000.00 | $1,000.00 | $1,000.00 | |||||
Ending Account Value (3/31/18) | $1,020.69 | $1,016.95 | $1,021.44 | $1,021.94 | $1,021.94 | |||||
Expenses Paid During Period | $4.28 | $8.05 | $3.53 | $3.02 | $3.02 | |||||
For each class of the Fund, expenses (net of fee waiver and reimbursement, if any) are equal to the annualized expense ratio for the class (0.85% for Class A, 1.60% for Class C, 0.70% for Class P, 0.60% for Institutional Class and 0.60% for Class R6), multiplied by the average account value over the period, multiplied by 182/365.
| 28 | March 31, 2018 | | Semiannual Report |
Table of Contents
Unaudited
AllianzGI Best Styles Global Equity Fund
For the period of October 1, 2017 through March 31, 2018, as provided by Christian McCormick, Senior Product Specialist.
Fund Insights
For the six-month period ended March 31, 2018, Class A shares at net asset value (“NAV”) of the AllianzGI Best Styles Global Equity Fund (the “Fund”) returned 3.02%, underperforming the MSCI ACWI (the “benchmark”), which returned 4.71%.
Market Overview
It was a volatile quarter for global equities, which started the year strongly before suffering sell-offs in February and March. Initially stocks rallied, boosted by ongoing optimism over the health of the global economy and by expectations that tax reforms would help to lift US company profits. However, signs of rising inflationary pressures and higher bond yields led to a sharp correction in February. While stocks later recovered some of these losses, the Trump administration’s decision to impose tariffs on a raft of imports led to escalating fears of a global trade war, causing stocks to retreat once more. Despite record levels of global M&A activity, most equity markets ended the quarter with losses.
Portfolio Review
The Fund implements a blend of five investment styles that are well-diversified and successful over the long term. This blend of investment styles includes: Value, Price Momentum, Earnings Change, Growth and Quality. Over the trailing six months, the style Value underperformed globally, and across most regions except for emerging markets. The trend following styles of Price Momentum and Earnings Change outperformed while Growth was the worst relative performer of our five target investment styles.
The Fund has only moderate leeway for sector and regional allocation with a maximum deviation of 3% vs. the benchmark for active weightings. The overall contribution from active country/sector allocation was neutral with no sector or individual country contributing more than +\- 10 bps.
The Fund holds a broad number of stocks to implement a well-diversified mix of investment styles and assigns a maximum active weighting of 1% to individual stocks. Therefore, we expect stock selection to be the biggest driver of relative returns and this was the case over the past six months. Stock selection in the consumer discretionary and information technology sectors were the largest detractors along with the US from a country context. Individually, technology stocks such as Microsoft and tech oriented consumer discretionary stocks such s Netflix and Amazon were big detractors.
Outlook
The Fund is a diversified mix of hundreds of securities that seeks to harvest the long-term risk premiums associated with Value, Price Momentum, Earnings Change, Growth, and Quality. Around these premiums we use a quantitative process, that we believe helps to minimize risk and create a stable excess return stream independent of market and economic environments. Therefore, we do not provide a market or economic outlook.
| March 31, 2018 | | Semiannual Report | 29 |
Table of Contents
Unaudited
AllianzGI Best Styles Global Equity Fund (cont’d)
Average Annual Total Return for the period ended March 31, 2018
| 6 Month* | 1 Year | Since Inception† | ||||||||||||
| AllianzGI Best Styles Global Equity Fund Class A | 3.02% | 14.11% | 7.76% | |||||||||||
| AllianzGI Best Styles Global Equity Fund Class A (adjusted) | –2.65% | 7.83% | 6.36% | ||||||||||
| AllianzGI Best Styles Global Equity Fund Class C | 2.65% | 13.30% | 7.03% | |||||||||||
| AllianzGI Best Styles Global Equity Fund Class C (adjusted) | 1.75% | 12.31% | 7.03% | ||||||||||
| AllianzGI Best Styles Global Equity Fund Class P | 3.09% | 14.32% | 7.99% | ||||||||||
| AllianzGI Best Styles Global Equity Fund Institutional Class | 3.16% | 14.50% | 8.09% | ||||||||||
| AllianzGI Best Styles Global Equity Fund R6 | 3.17% | 14.50% | 8.17% | ||||||||||
| MSCI ACWI | 4.71% | 14.85% | 7.66% | ||||||||||
| Lipper Global Multi-Cap Value Average | 2.30% | 10.45% | 5.39% | |||||||||||
* Cumulative return
† The Fund began operations on December 2, 2013. Benchmark return comparisons began on the fund inception date. Lipper performance comparisons began on November 30, 2013.
Performance quoted represents past performance and is no guarantee of future results. Current performance may be lower or higher than performance shown. For performance current to the most recent month-end, visit our website at us.allianzgi.com. Investment return and the principal value will fluctuate. Shares may be worth more or less than original cost when redeemed. The adjusted returns take into account the maximum initial sales charge of 5.50% on Class A shares and the contingent deferred sales charge (CDSC) of 1% on Class C shares, which may apply to shares redeemed during the first year of ownership. Returns do not reflect deduction of taxes that a shareholder would pay on fund distributions or redemption of fund shares. See pages 106 and 107 for more information. The Fund’s gross expense ratios are 1.07% for Class A shares, 1.44% for Class C shares, 0.56% for Class P shares, 0.54% for Institutional Class shares and 0.43% for Class R6 shares. These ratios do not include an expense reduction, contractually guaranteed through at least January 31, 2019. The Funds expense ratios net of this reduction are 0.70% for Class A shares, 1.40% for Class C shares, 0.50% for Class P shares, 0.40% for Institutional Class shares and 0.40% for Class R6 shares. Expense ratio information is as of the Fund’s current prospectus dated February 1, 2018.
Cumulative Returns Through March 31, 2018
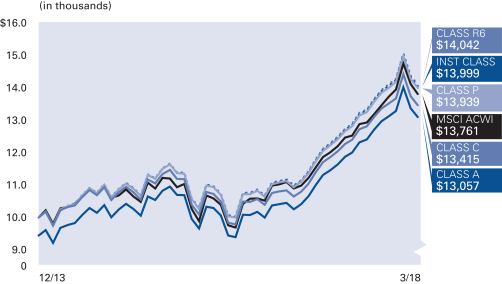
Country Allocation (as of March 31, 2018)
| United States | 51.0% | |||
| Japan | 7.9% | |||
| United Kingdom | 4.9% | |||
| China | 4.9% | |||
| France | 4.4% | |||
| Canada | 4.2% | |||
| Korea (Republic of) | 2.9% | |||
| Netherlands | 1.7% | |||
| Other | 17.3% | |||
| Cash & Equivalents — Net | 0.8% |
| 30 | March 31, 2018 | | Semiannual Report |
Table of Contents
Unaudited
AllianzGI Best Styles Global Equity Fund (cont’d)
| Shareholder Expense Example | Actual Performance | |||||||||
| Class A | Class C | Class P | Institutional Class | Class R6 | ||||||
| Beginning Account Value (10/1/17) | $1,000.00 | $1,000.00 | $1,000.00 | $1,000.00 | $1,000.00 | |||||
| Ending Account Value (3/31/18) | $1,030.20 | $1,026.50 | $1,030.90 | $1,031.60 | $1,031.70 | |||||
| Expenses Paid During Period | $3.54 | $7.07 | $2.53 | $2.03 | $2.03 | |||||
| Hypothetical Performance | ||||||||||
| (5% return before expenses) | ||||||||||
| Class A | Class C | Class P | Institutional Class | Class R6 | ||||||
| Beginning Account Value (10/1/17) | $1,000.00 | $1,000.00 | $1,000.00 | $1,000.00 | $1,000.00 | |||||
| Ending Account Value (3/31/18) | $1,021.44 | $1,017.95 | $1,022.44 | $1,022.94 | $1,022.94 | |||||
| Expenses Paid During Period | $3.53 | $7.04 | $2.52 | $2.02 | $2.02 | |||||
For each class of the Fund, expenses (net of fee waiver and reimbursement, if any) are equal to the annualized expense ratio for the class (0.70% for Class A, 1.40% for Class C, 0.50% for Class P, 0.40% for Institutional Class and 0.40% for Class R6), multiplied by the average account value over the period, multiplied by 182/365. These expenses do not include the expenses of the investent companies in which the Fund invests, which are indirectly borne by Fund shareholders.
| March 31, 2018 | | Semiannual Report | 31 |
Table of Contents
Unaudited
AllianzGI Best Styles International Equity Fund
For the period of October 1, 2017 through March 31, 2018, as provided by Christian McCormick, Senior Product Specialist.
Fund Insights
For the six-month period ended March 31, 2018, Class A shares at net asset value (“NAV”) of the AllianzGI Best Styles International Equity Fund (the “Fund”) returned 3.05%, outperforming the MSCI EAFE Index (the “benchmark”), which returned 2.63%.
Market Overview
Euro-zone equities ended the quarter with negative returns (in EUR terms). Company earnings remained supportive, but the strength of the euro tempered investors’ sentiment and politics remained a concern as Italy’s elections resulted in no outright winner, with populist parties gathering the largest votes. After modest gains in January, euro-zone equities joined the global sell-off in February and March amid growing fears of a global trade war following the Trump administration’s decision to implement tariffs on key imports. Almost all sectors lost ground, with the exception of the energy and information technology sectors which experience slight gains. The largest declines were seen in health care and telecoms stocks. Japanese equities sold off over the quarter, lagging most other regions as the strength of the Japanese yen weighed on returns. Japan’s fourth-quarter Gross Domestic Product (“GDP”) growth was revised up to 1.6% on an annualized basis, from an initial estimate of 0.5%. This is the eighth consecutive quarter of growth and the longest unbroken period of expansion in almost three decades.
Portfolio Review
The Fund implements a blend of five investment styles that are well-diversified and successful over the long term. This blend of investment styles includes: Value, Price Momentum, Earnings Change, Growth and Quality. Over the trailing six months, the style Value underperformed the benchmark, primarily driven by significant underperformance in Japan. Value was flat in Europe. The trend following styles of Price Momentum and Earnings Change, which tend to have a low correlation with Value, outperformed the benchmark. Towards the end of the six month period, low volatility stocks started to meaningfully outperform as the equity markets turned negative.
The Fund has only moderate leeway for sector and regional allocation with a maximum deviation of 3% vs. the benchmark for active sector weightings. The overall contribution from active sector and country allocation was positive, but no single one contributed more than +/- 20 basis points to the relative performance.
The Fund holds a broad number of stocks to implement a well-diversified mix of investment styles and assigns a maximum active weighting of 1% to individual stocks. Stock selection in Japan and France were detractors to performance, in addition to the healthcare sector. Stock selection in the UK was positive, and for from a sector context, selection in Materials and Finance were the strongest.
Outlook
The Fund is a diversified mix of hundreds of securities that seeks to harvest the long term risk premiums associated with Value, Price Momentum, Earnings Change, Growth, and Quality. Around these premiums we use a quantitative process, that we believe helps to minimize risk and create a stable excess return stream independent of market and economic environments. Therefore we do not provide a market or economic outlook.
| 32 | March 31, 2018 | | Semiannual Report |
Table of Contents
Unaudited
AllianzGI Best Styles International Equity Fund (cont’d)
Average Annual Total Return for the period ended March 31, 2018
| 6 Month* | 1 Year | Since Inception† | ||||||||||||
| AllianzGI Best Styles International Equity Fund Class A | 3.05% | 16.13% | 5.89% | |||||||||||
| AllianzGI Best Styles International Equity Fund Class A (adjusted) | –2.62% | 9.74% | 4.09% | ||||||||||
| AllianzGI Best Styles International Equity Fund Class C | 2.64% | 15.29% | 5.11% | |||||||||||
| AllianzGI Best Styles International Equity Fund Class C (adjusted) | 1.66% | 14.29% | 5.11% | ||||||||||
| AllianzGI Best Styles International Equity Fund Class P | 3.12% | 16.36% | 6.07% | ||||||||||
| AllianzGI Best Styles International Equity Fund Institutional Class | 3.18% | 16.48% | 6.16% | ||||||||||
| AllianzGI Best Styles International Equity Fund R6 | 3.15% | 16.47% | 6.21% | ||||||||||
| MSCI EAFE Index | 2.63% | 14.80% | 5.91% | ||||||||||
| Lipper Int’l. Multi-Cap Value Funds Average | 1.96% | 12.89% | 4.68% | |||||||||||
* Cumulative return
† The Fund began operations on December 9, 2014. Benchmark return comparisons began on the fund inception date. Lipper performance comparisons began on November 30, 2014.
Performance quoted represents past performance and is no guarantee of future results. Current performance may be lower or higher than performance shown. For performance current to the most recent month-end, visit our website at us.allianzgi.com. Investment return and the principal value will fluctuate. Shares may be worth more or less than original cost when redeemed. The adjusted returns take into account the maximum initial sales charge of 5.50% on Class A shares and the contingent deferred sales charge (CDSC) of 1% on Class C shares, which may apply to shares redeemed during the first year of ownership. Returns do not reflect deduction of taxes that a shareholder would pay on fund distributions or redemption of fund shares. See pages 106 and 107 for more information. The Fund’s gross expense ratios are 1.99% for Class A shares, 2.69% for Class C shares, 1.73% for Class P shares, 1.66% for Institutional Class shares and 1.50% for Class R6 shares. These ratios do not include an expense reduction, contractually guaranteed through at least January 31, 2019. The Fund’s expense ratios net of this reduction are 0.70% for Class A shares, 1.45% for Class C shares, 0.55% for Class P shares, 0.45% for Institutional Class shares and 0.45% for Class R6 shares. Expense ratio information is as of the Fund’s current prospectus dated February 1, 2018.
Cumulative Returns Through March 31, 2018
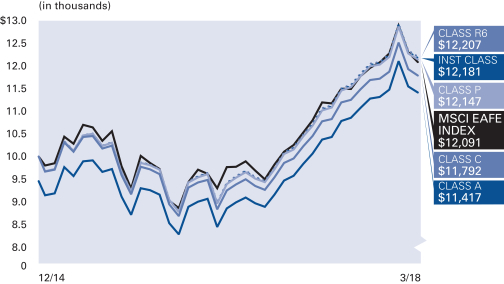
Country Allocation (as of March 31, 2018)
| Japan | 25.7% | |||
| United Kingdom | 15.9% | |||
| France | 10.6% | |||
| Switzerland | 7.4% | |||
| Germany | 5.1% | |||
| Italy | 4.1% | |||
| Hong Kong | 3.3% | |||
| Netherlands | 3.3% | |||
| Other | 23.7% | |||
| Cash & Equivalents — Net | 0.9% |
| Semiannual Report | | March 31, 2018 | 33 |
Table of Contents
Unaudited
AllianzGI Best Styles International Equity Fund (cont’d)
| Shareholder Expense Example | Actual Performance | |||||||||
| Class A | Class C | Class P | Institutional Class | Class R6 | ||||||
| Beginning Account Value (10/1/17) | $1,000.00 | $1,000.00 | $1,000.00 | $1,000.00 | $1,000.00 | |||||
| Ending Account Value (3/31/18) | $1,030.50 | $1,026.40 | $1,031.20 | $1,031.80 | $1,031.50 | |||||
| Expenses Paid During Period | $3.54 | $7.33 | $2.79 | $2.28 | $2.28 | |||||
| Hypothetical Performance | ||||||||||
| (5% return before expenses) | ||||||||||
| Class A | Class C | Class P | Institutional Class | Class R6 | ||||||
| Beginning Account Value (10/1/17) | $1,000.00 | $1,000.00 | $1,000.00 | $1,000.00 | $1,000.00 | |||||
| Ending Account Value (3/31/18) | $1,021.44 | $1,017.70 | $1,022.19 | $1,022.69 | $1,022.69 | |||||
| Expenses Paid During Period | $3.53 | $7.29 | $2.77 | $2.27 | $2.27 | |||||
For each class of the Fund, expenses (net of fee waiver and reimbursement, if any) are equal to the annualized expense ratio for the class (0.70% for Class A, 1.45% for Class C, 0.55% for Class P, 0.45% for Institutional Class and 0.45% for Class R6), multiplied by the average account value over the period, multiplied by 182/365. These expenses do not include the expenses of the investment companies in which the Fund invests, which are indirectly borne by Fund shareholders.
| 34 | March 31, 2018 | | Semiannual Report |
Table of Contents
Unaudited
AllianzGI Best Styles U.S. Equity Fund
For the period of October 1, 2017 through March 31, 2018, as provided by Christian McCormick, Senior Product Specialist.
Fund Insights
For the six-month period ended March 31, 2018, Class A shares at net asset value (“NAV”) of the AllianzGI Best Styles U.S. Equity Fund (the “Fund”) returned 5.95%, outperforming the S&P 500 Index (the “benchmark”), which returned 5.84%.
Market Overview
US equities commenced the New Year on a strong footing, buoyed by better-than-expected corporate earnings and optimism that tax reform would provide a further uplift to profits. However, rising bond yields and signs of a pick-up in wage growth led to a sharp correction in February. While stocks subsequently recovered some of these losses, escalating fears of a global trade war following the Trump administration’s decision to impose tariffs on key imports caused a further sell-off in late March. Overall, US equities ended the quarter with slight losses, but finished the six month period with a solid gain.
Portfolio Review
The Fund implements a blend of five investment styles that are well-diversified and successful over the long term. This blend of investment styles includes: Value, Price Momentum, Earnings Change, Growth and Quality. Over the trailing six months, the style Value significantly underperformed the benchmark, despite what was overall a more conducive macro-economic environment for cyclical stocks. Price Momentum outperformed and Earnings Change was slightly ahead.
The Fund has only moderate leeway for sector allocation with a maximum deviation of 3% vs. the benchmark for active sector weightings. The overall contribution from active sector allocation was positive, but rather benign. Information technology was the largest relative contributor at only +16 basis points, but healthcare was the largest detractor at -11 basis points. Overall, no sector contributed more than +/- 20 basis points of relative performance.
The Fund holds a broad number of stocks to implement a well-diversified mix of investment styles and assigns a maximum active weighting of 1% to individual stocks. Stock selection in industrials was a positive, but was negative in consumer discretionary. In terms of individual holdings, interestingly the two largest relative winners and losers were all underweights. General Electric and Celgene had significant underperformance and therefore the underweight helped, but the Fund did not hold Mastercard or Adobe Systems, which had strong absolute performance and therefore were large detractors.
Outlook
The Fund is a diversified mix of hundreds of securities that seeks to harvest the long term risk premiums associated with Value, Price Momentum, Earnings Change, Growth, and Quality. Around these premiums we use a quantitative process, that we believe helps to minimize risk and create a stable excess return stream independent of market and economic environments. Therefore we do not provide a market or economic outlook.
Average Annual Total Return for the period ended March 31, 2018
| 6 Month* | 1 Year | Since Inception† | ||||||||||||
| AllianzGI Best Styles U.S. Equity Fund Class A | 5.95% | 15.68% | 9.26% | |||||||||||
| AllianzGI Best Styles U.S. Equity Fund Class A (adjusted) | 0.12% | 9.31% | 7.42% | ||||||||||
| AllianzGI Best Styles U.S. Equity Fund Class C | 5.56% | 14.81% | 8.45% | |||||||||||
| AllianzGI Best Styles U.S. Equity Fund Class C (adjusted) | 4.56% | 13.81% | 8.45% | ||||||||||
| AllianzGI Best Styles U.S. Equity Fund Class P | 6.04% | 15.90% | 9.42% | ||||||||||
| AllianzGI Best Styles U.S. Equity Fund Institutional Class | 6.00% | 15.85% | 9.50% | ||||||||||
| AllianzGI Best Styles U.S. Equity Fund R6 | 6.07% | 16.02% | 9.62% | ||||||||||
| S&P 500 Index | 5.84% | 13.99% | 10.12% | ||||||||||
| Lipper Multi-Cap Core Funds Average | 5.06% | 12.48% | 7.66% | |||||||||||
* Cumulative return
† The Fund began operations on December 1, 2014. Benchmark return comparisons began on the fund inception date. Lipper performance comparisons began on November 30, 2014.
Performance quoted represents past performance and is no guarantee of future results. Current performance may be lower or higher than performance shown. For performance current to the most recent month-end, visit our website at us.allianzgi.com. Investment return and the principal value will fluctuate. Shares may be worth more or less than original cost when redeemed. The adjusted returns take into account the maximum initial sales charge of 5.50% on Class A shares and the contingent deferred sales charge (CDSC) of 1% on Class C shares, which may apply to shares redeemed during the first year of ownership. Returns do not reflect deduction of taxes that a shareholder would pay on fund distributions or redemption of fund shares. See pages 106 and 107 for more information. The Fund’s gross expense ratios are 1.02% for Class A shares, 1.56% for Class C shares, 0.57% for Class P shares, 0.66% for Institutional Class shares and 0.56% for Class R6 shares. These ratios do not include an expense reduction, contractually guaranteed through at least January 31, 2019. The Fund’s expense ratios net of this reduction are 0.65% for Class A shares, 1.40% for Class C shares, 0.50% for Class P shares, 0.50% for Institutional Class shares and 0.40% for Class R6 shares. Expense ratio information is as of the Fund’s current prospectus dated February 1, 2018.
| Semiannual Report | | March 31, 2018 | 35 |
Table of Contents
Unaudited
AllianzGI Best Styles U.S. Equity Fund (cont’d)
Cumulative Returns Through March 31, 2018
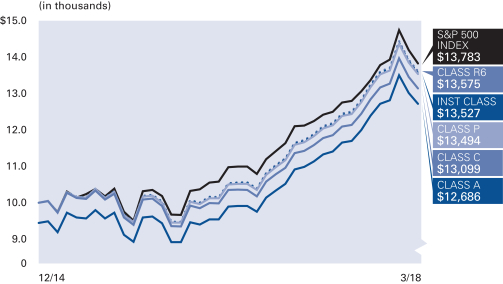
Industry Allocation (as of March 31, 2018)
| Semiconductors & Semiconductor Equipment | 6.4% | |||
| Banks | 6.3% | |||
| Software | 5.2% | |||
| Technology Hardware, Storage & Peripherals | 5.2% | |||
| Oil, Gas & Consumable Fuels | 4.7% | |||
| Health Care Providers & Services | 4.5% | |||
| Internet Software & Services | 4.3% | |||
| Pharmaceuticals | 3.6% | |||
| Other | 58.0% | |||
| Cash & Equivalents — Net | 1.8% |
| Shareholder Expense Example | Actual Performance | |||||||||
| Class A | Class C | Class P | Institutional Class | Class R6 | ||||||
| Beginning Account Value (10/1/17) | $1,000.00 | $1,000.00 | $1,000.00 | $1,000.00 | $1,000.00 | |||||
| Ending Account Value (3/31/18) | $1,059.50 | $1,055.60 | $1,060.40 | $1,060.00 | $1,060.70 | |||||
| Expenses Paid During Period | $3.34 | $7.17 | $2.57 | $2.57 | $2.06 | |||||
| Hypothetical Performance | ||||||||||
| (5% return before expenses) | ||||||||||
| Class A | Class C | Class P | Institutional Class | Class R6 | ||||||
| Beginning Account Value (10/1/17) | $1,000.00 | $1,000.00 | $1,000.00 | $1,000.00 | $1,000.00 | |||||
| Ending Account Value (3/31/18) | $1,021.69 | $1,017.95 | $1,022.44 | $1,022.44 | $1,022.94 | |||||
| Expenses Paid During Period | $3.28 | $7.04 | $2.52 | $2.52 | $2.02 | |||||
For each class of the Fund, expenses (net of fee waiver and reimbursement, if any) are equal to the annualized expense ratio for the class (0.65% for Class A, 1.40% for Class C, 0.50% for Class P, 0.50% for Institutional Class and 0.40% for Class R6), multiplied by the average account value over the period, multiplied by 182/365.
| 36 | March 31, 2018 | | Semiannual Report |
Table of Contents
Unaudited
AllianzGI Convertible Fund
For the period of October 1, 2017, through March 31, 2018, as provided by Doug Forsyth, CFA, Portfolio Manager.
Fund Insights
For the six-month period ended March 31, 2018, Class A shares at net asset value (“NAV”) of the AllianzGI Convertible Fund (the “Fund”) returned 6.14%, outperforming the ICE BofA Merrill Lynch All Convertibles Index (the “benchmark”), which returned 4.00%.
Market Overview
The convertible bond market advanced over the trailing six months. The asset class was a beneficiary of higher stock prices earlier in the period and into the new year and effectively weathered the surge in equity market volatility and interest rate volatility over the remainder of the reporting period.
Corporate fundamentals continued to improve with most issuers reporting better-than-expected financial results and positive outlooks, citing increasing demand, a more favorable regulatory environment and recent tax-reform benefits.
Major US economic reports were predominately healthy and supported a positive operating environment for convertible issuers. Manufacturing and service surveys signaled continued expansionary activity, consumer confidence hit a 14-year high, payrolls surged and fourth-quarter Gross Domestic Product (“GDP”) was revised higher to 2.9%.
The 10-year US Treasury yield climbed from 2.33% to 2.94%, before closing the period at 2.74%. The rise in interest rates helped drive a surge in convertible new issuance during the first quarter of 2018 as companies acted to lock-in lower coupon rates.
The US Federal Reserve (the “Fed”) increased its benchmark interest rate by 25 basis points twice over the last six months, once in December and once in March, to settle at a range of 1.50% to 1.75%. The Fed’s decision and commentary minimally influenced convertible bonds.
Finally, fear of a global trade war potentially disrupting global growth and higher inflation weighed on investor sentiment in the second half of the reporting period, but had little impact on convertible bonds.
Against this backdrop, equity-like convertibles outperformed total-return convertibles, which outperformed bond-like, or busted, convertibles.
Portfolio Review
The Fund gained along with the market for the six-month period and outperformed the benchmark return.
The attribution for the period included several positive single-name performers from a variety of industries. The majority of the portfolio’s issuers exceeded earnings expectations, which contributed to absolute performance during the reporting period.
Sector allocations that helped relative performance in the period included technology, financials, and energy. In technology, credit selection and a portfolio overweight contributed to relative performance. In financials, a portfolio underweight and issue selection helped. In energy, the portfolio benefited from security selection and a slight relative underweight.
Sector allocations that hurt relative performance during the period included consumer staples, transportation and industrials. In consumer staples, issue selection and a portfolio underweight detracted. In transportation, a portfolio overweight and credit selection were sources of weakness. In industrials, the portfolio underperformed the peer group return.
Outlook
Despite the increased equity market volatility in 2018, we believe positive market fundamentals remain. Solid corporate earnings growth and an improving global economic outlook, in our opinion, continue to be supportive of investments in risk assets.
New convertible issuance accelerated in the first quarter of the new year and, in our opinion, will likely continue remain strong throughout 2018, given rising interest rates and attractive market dynamics for new convertible issuers. Further, we expect redemptions and maturities to decline over the next couple of years, which if new issuance improves, could cause the convertible market to grow significantly. In our opinion, this would provide more balanced convertible opportunities and could also improve sector diversification.
| Semiannual Report | | March 31, 2018 | 37 |
Table of Contents
Unaudited
AllianzGI Convertible Fund (cont’d)
Average Annual Total Return for the period ended March 31, 2018
| 6 Month* | 1 Year | 5 Year | 10 Year | Since Inception† | ||||||||||||||||||
| AllianzGI Convertible Fund Class A | 6.14% | 13.52% | 8.66% | 8.46% | 9.99% | |||||||||||||||||
| AllianzGI Convertible Fund Class A (adjusted) | 0.30% | 7.28% | 7.44% | 7.85% | 9.74% | ||||||||||||||||
| AllianzGI Convertible Fund Class C | 5.73% | 12.70% | 7.89% | 7.67% | 9.18% | |||||||||||||||||
| AllianzGI Convertible Fund Class C (adjusted) | 4.86% | 11.77% | 7.89% | 7.67% | 9.18% | ||||||||||||||||
| AllianzGI Convertible Fund Class R | 5.92% | 13.17% | 8.23% | 8.10% | 9.68% | ||||||||||||||||
| AllianzGI Convertible Fund Class P | 6.27% | 13.84% | 8.95% | 8.71% | 10.24% | ||||||||||||||||
| AllianzGI Convertible Fund Institutional Class | 6.27% | 13.84% | 9.01% | 8.80% | 10.34% | ||||||||||||||||
| AllianzGI Convertible Fund Administrative Class | 6.17% | 13.62% | 8.76% | 8.52% | 10.02% | |||||||||||||||||
| ICE BofA Merrill Lynch All Convertibles Index | 4.00% | 10.57% | 9.65% | 8.22% | 8.33% | ||||||||||||||||
| Lipper Conv. Securities Funds Average | 4.07% | 10.29% | 7.85% | 6.67% | 7.01% | |||||||||||||||||
* Cumulative return
† The Fund began operations on April 19,1993. Benchmark return comparisons began on the fund inception date. Lipper performance comparisons began on April 30,1993.
Performance quoted represents past performance and is no guarantee of future results. Current performance may be lower or higher than performance shown. For performance current to the most recent month-end, visit our website at us.allianzgi.com. Investment return and the principal value will fluctuate. Shares may be worth more or less than original cost when redeemed. The adjusted returns take into account the maximum initial sales charge of 5.50% on Class A shares and the contingent deferred sales charge (CDSC) of 1% on Class C shares, which may apply to shares redeemed during the first year of ownership. Returns do not reflect deduction of taxes that a shareholder would pay on fund distributions or redemption of fund shares. See pages 106 and 107 for more information. The Fund’s expense ratios are 1.02% for Class A shares, 1.69% for Class C shares, 1.42% for Class R shares, 0.72% for Class P shares, 0.68% for Institutional Class shares and 0.89% for Administrative Class shares. Expense ratio information is as of the Fund’s current prospectus dated February 1, 2018.
Cumulative Returns Through March 31, 2018
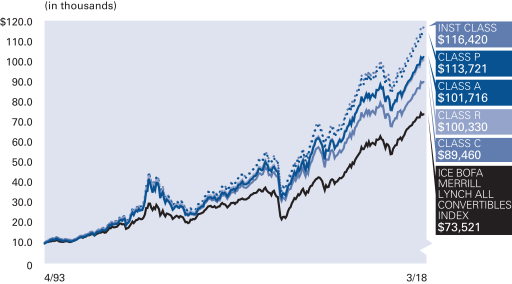
Industry Allocation (as of
March 31, 2018)
| Internet | 12.7% | |||
| Software | 12.1% | |||
| Semiconductors | 11.1% | |||
| Pharmaceuticals | 5.1% | |||
| Biotechnology | 4.1% | |||
| Oil, Gas & Consumable Fuels | 3.9% | |||
| Healthcare-Products | 3.9% | |||
| Transportation | 3.9% | |||
| Other | 39.8% | |||
| Cash & Equivalents — Net | 3.4% |
S&P Ratings* (as of March 31, 2018)
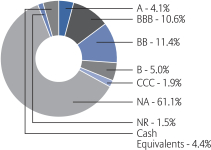
* As a percentage of total investments. Credit ratings refer to the underlying holdings of the Fund and are categorized from highest to lowest credit quality using ratings provided by S&P Global Ratings (“S&P”). S&P’s ratings have been selected for several reasons, including the portfolio managers’ usage of S&P ratings methodology among other credit quality information in managing the Fund, access to background information and other materials provided by S&P, as well as the Funds’ considerations of industry practice. The Fund also displays S&P credit ratings information in materials provided in client presentations. See “Important Information” for more detail on the selection of S&P for the Fund’s ratings presentation. Securities not rated by S&P and bonds that do not currently have a rating available are designated in the chart above as “NR” and “NA”, respectively.
| 38 | March 31, 2018 | | Semiannual Report |
Table of Contents
Unaudited
AllianzGI Convertible Fund (cont’d)
| Shareholder Expense Example | Actual Performance | |||||||||||
| Class A | Class C | Class R | Class P | Institutional Class | Administrative Class | |||||||
| Beginning Account Value (10/1/17) | $1,000.00 | $1,000.00 | $1,000.00 | $1,000.00 | $1,000.00 | $1,000.00 | ||||||
| Ending Account Value (3/31/18) | $1,061.40 | $1,057.30 | $1,059.20 | $1,062.70 | $1,062.70 | $1,061.70 | ||||||
| Expenses Paid During Period | $5.24 | $9.03 | $7.19 | $3.75 | $3.70 | $4.83 | ||||||
| Hypothetical Performance | ||||||||||||
| (5% return before expenses) | ||||||||||||
| Class A | Class C | Class R | Class P | Institutional Class | Administrative Class | |||||||
| Beginning Account Value (10/1/17) | $1,000.00 | $1,000.00 | $1,000.00 | $1,000.00 | $1,000.00 | $1,000.00 | ||||||
| Ending Account Value (3/31/18) | $1,019.85 | $1,016.16 | $1,017.95 | $1,021.29 | $1,021.34 | $1,020.24 | ||||||
| Expenses Paid During Period | $5.14 | $8.85 | $7.04 | $3.68 | $3.63 | $4.73 | ||||||
For each class of the Fund, expenses are equal to the annualized expense ratio for the class (1.02% for Class A, 1.76% for Class C, 1.40% for Class R, 0.73% for Class P, 0.72% for Institutional Class and 0.94% for Administrative Class), multiplied by the average account value over the period, multiplied by 182/365.
| Semiannual Report | | March 31, 2018 | 39 |
Table of Contents
Unaudited
AllianzGI Emerging Markets Consumer Fund
For the period of October 1, 2017 through March 31, 2018, as provided by Lu Yu, CFA, CIPM, Portfolio Manager.
Fund Insights
For the six-month period ended March 31, 2018, Class A shares at net asset value (“NAV”) of the AllianzGI Emerging Markets Consumer Fund (the “Fund”) returned 8.17%, underperforming the MSCI Emerging Markets Index (the “benchmark”), which returned 8.96%.
Market Overview
Emerging market equities advanced thanks to positive sentiment and a more favorable growth and valuation mix relative to developed market equities. The benchmark rose in the initial four months during the reporting period, as investors were optimistic over the economic health and global demand expectations. Performance moderated in the last two months of the reporting period as volatility increased amid apprehension over a global trade war as well as concerns that rising inflation expectations could lead the US Federal Reserve (the “Fed”) to accelerate rate hikes.
Benchmark sector performance was broad-based, with 10 out of 11 sectors positing positive results. Health care was the top performer, followed by gains in cyclically-oriented sectors of energy, financials and materials which benefitted from higher demand and rising inflation expectations. Meanwhile, telecommunication services posted a modest decline during the reporting period.
Country results were predominantly higher, with 19 out of 24 countries posting gains. Thailand, Peru and Malaysia were the top three performers thanks to rebounds in growth expectations. Conversely, Mexico led the decliners due to uncertainty over The North American Free Trade Agreement (“NAFTA”) and concerns of rising inflation, followed by the Philippines and the United Arab Emirates.
Portfolio Review
The Fund is strategically focused on local emerging markets consumption while avoiding hard-asset and export-oriented stocks which do not capture secular growth of the rising middle class. The Fund modestly trailed the benchmark due primarily to asset allocation decisions, given the exclusion of energy, non-consumer financials and materials, which were among the top benchmark performers during the reporting period.
Industrials was the top performing sector, outpacing the benchmark on a relative basis thanks to selections in the airlines industry. Bottom-up stock selection in real estate, information technology and telecommunication services also topped the benchmark. Conversely, more conservative stock selection in health care offset results, as did the exclusion of cyclically-oriented segments of the benchmark which do not directly capture growth of the local emerging markets consumer. Country results were led by stockpicking in Turkey, as well as a relative underweight and positive selections in Mexico, and an overweight allocation to Thailand. Meanwhile, South Korea was the primary source of underperformance, followed by emerging market consumer-related securities in Japan.
Outlook
While uncertainty regarding the trade and political climate may cloud short-term visibility, our viewpoint for emerging markets equities remains constructive. In our view, emerging markets are more stable than the past and are increasingly driven by favorable demographics and growth within emerging countries; as such, the direct impact from a trade war and geopolitical impacts may be limited. However, results may be impacted by ebbs and flows of sentiment, which could increase volatility for the coming periods.
Emerging market calendar year earnings expectations have increased from the onset of the calendar year to the end of the reporting period, a signal in the confidence of the asset class. Many investors are gradually increasing their exposure to the asset class, after emerging markets have outperformed developed markets in the last two calendar years. This is consistent with past market cycles as sentiment oscillates from fear to optimism, suggesting the potential for future upside should allocations meaningfully increase. In addition, we continue to have a bullish medium and long-term viewpoint on the local emerging markets consumer, which we believe stands to benefit from rising wages, the backdrop of favorable demographics and expanding middle class consumption.
| 40 | March 31, 2018 | | Semiannual Report |
Table of Contents
Unaudited
AllianzGI Emerging Markets Consumer Fund (cont’d)
Average Annual Total Return for the period ended March 31, 2018
| 6 Month* | 1 Year | Since Inception† | ||||||||||||
| AllianzGI Emerging Markets Consumer Fund Class A | 8.17% | 20.47% | 4.37% | |||||||||||
| AllianzGI Emerging Markets Consumer Fund Class A (adjusted) | 2.21% | 13.85% | 2.61% | ||||||||||
| AllianzGI Emerging Markets Consumer Fund Institutional Class | 8.32% | 20.82% | 4.73% | ||||||||||
| MSCI Emerging Markets Index | 8.96% | 24.93% | 7.73% | ||||||||||
| Lipper Emerging Markets Funds Average | 8.34% | 23.20% | 6.08% | |||||||||||
* Cumulative return
† The Fund began operations on December 1, 2014. Benchmark return comparisons began on the fund inception date. Lipper performance comparisons began on November 30, 2014.
Performance quoted represents past performance and is no guarantee of future results. Current performance may be lower or higher than performance shown. For performance current to the most recent month-end, visit our website at us.allianzgi.com. Investment return and the principal value will fluctuate. Shares may be worth more or less than original cost when redeemed. The adjusted returns take into account the maximum initial sales charge of 5.50% on Class A shares. Returns do not reflect deduction of taxes that a shareholder would pay on fund distributions or redemption of fund shares. See pages 106 and 107 for more information. The Fund’s gross expense ratios are 16.84% for Class A shares and 1.64% for Institutional Class shares. These ratios do not include an expense reduction, contractually guaranteed through at least January 31, 2019. The Fund’s expense ratios net of this reduction are 1.55% for Class A shares and 1.20% for Institutional Class shares. Expense ratio information is as of the Fund’s current prospectus dated February 1, 2018.
Cumulative Returns Through March 31, 2018
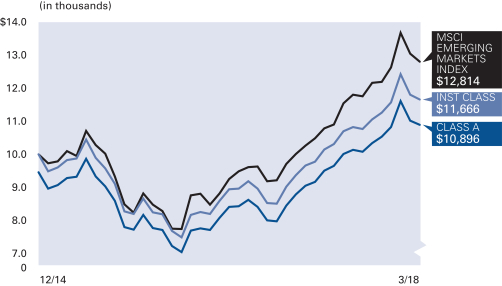
Country Allocation (as of March 31, 2018 )
| China | 28.1% | |||
| United States | 9.6% | |||
| Korea (Republic of) | 9.6% | |||
| Taiwan | 8.7% | |||
| South Africa | 6.8% | |||
| Brazil | 6.4% | |||
| Thailand | 5.8% | |||
| India | 4.0% | |||
| Other | 17.0% | |||
| Cash & Equivalents — Net | 4.0% |
| Semiannual Report | | March 31, 2018 | 41 |
Table of Contents
Unaudited
AllianzGI Emerging Markets Consumer Fund (cont’d)
| Shareholder Expense Example | Actual Performance | |||
| Class A | Institutional Class | |||
Beginning Account Value (10/1/17) | $1,000.00 | $1,000.00 | ||
Ending Account Value (3/31/18) | $1,081.70 | $1,083.20 | ||
Expenses Paid During Period | $8.04 | $6.23 | ||
| Hypothetical Performance | ||||
| (5% return before expenses) | ||||
| Class A | Institutional Class | |||
Beginning Account Value (10/1/17) | $1,000.00 | $1,000.00 | ||
Ending Account Value (3/31/18) | $1,017.20 | $1,018.95 | ||
Expenses Paid During Period | $7.80 | $6.04 | ||
For each class of the Fund, expenses (net of fee waiver and reimbursement, if any) are equal to the annualized expense ratio for the class (1.55% for Class A and 1.20% forInstitutional Class), multiplied by the average account value over the period, multiplied by 182/365.
| 42 | March 31, 2018 | | Semiannual Report |
Table of Contents
Unaudited
AllianzGI Emerging Markets Debt Fund
For the period of October 1, 2017 through March 31, 2018, as provided by the AllianzGI Emerging Markets Debt Team.
Fund Insights
For the six-month period ended March 31, 2018, Class A shares at net asset value (“NAV”) of the AllianzGI Emerging Markets Debt Fund (the “Fund”) returned -0.05%, underperforming the 40% JPM EMBI Global Diversified, 40% JPM CEMBI Broad Diversified, 20% JPM GBI-EM Index (the “benchmark”), which returned 0.64%.
Portfolio Review
Over the reporting period, the emerging markets hard currency sovereign debt universe posted a negative -0.63% return and hard currency corporate debt posted a negative -0.46% return. Relative to the US dollar, emerging markets local currencies saw a positive performance of +5.81% for the period. US dollar weakness helped to bolster emerging markets local currency returns during the reporting period. Our weighting in local currency markets throughout the reporting period averaged 11.4%. While a positive contributor to returns, our lower allocation to Local Currencies and Foreign Exchange (“LCFX”) dragged on relative performance versus the reference benchmark, given the substantial outperformance of local currency versus hard currency assets during the reporting period.
As the reporting period moved forward, rising rates and US Treasuries (“UST”) led to increased volatility and weakness in risk markets. The front end of the curve steepened by +78 basis points in the UST 2yr. The 5yr and 10yr treasuries widened by +63 basis points and +41 basis points, respectively. The 30yr part of the curve performed best, widening by +11 basis points through March end. Against this backdrop, the spread of the Emerging Markets Bond Index Global Diversified (“EMBIG-D”) widened by +17 basis points, and the Corporate Emerging Markets Bond Index Broad Diversified (“CEMBI-BD”) widened by +10 basis points.
The LCFX markets saw inflows during each month of the reporting period, whereas the hard currency asset class saw some outflows during February of this year. During the first quarter of 2018, inflows to hard currency and local currency markets were approximately equal, at $10.5bn each. Asset allocators were actively moving money into the local currency space, taking advantage of the high current carry, investment grade ratings and opportunity to reflect views on the weakening US dollar. On a regional basis, Africa was the best performer, with gains largely stemming from South Africa, which returned +26.4%, during the reporting period as Ramaphosa took office in February and installed a market friendly, reform minded finance minister, Nhlanhla Nene.
As noted, emerging markets asset prices were supported by the significant inflows during the six-months ended March 31, 2018. Improving economic fundamentals in many emerging market economies, upward revisions to Chinese and other developing markets GDP growth expectations, and a continued widening of the differential between emerging markets economic growth and the growth of advanced economies continues to drive investors to the asset class. Inflation has generally remained subdued, across emerging market economies.
Commodities were largely supportive to the asset class during the reporting period. Oil continued its upward trajectory during the reporting period, with Brent Crude gaining more than 22%, ending March at $70.27/bbl. Copper and zinc returned a positive +2.4% and +3.0%, respectively, and iron declined by -2.6% in volatile trading.
Corporate bonds were slightly more resilient than sovereigns during the reporting period with the CEMBI-BD widening a mere +10 basis points. Corporates continue to be supported by dedicated and cross-over buyers, owing in part to the shorter duration and investment grade nature of the asset class. New issuance came in at record levels in Q1, but this was easily absorbed, with new issues outperforming the secondary market, even given underlying volatility in global markets. Issuance remains largely Asia/China skewed and net issuance, ex-Asia, is anticipated to be flat, this year. Given that investors diversify across all geographies, one should expect the technical bid for Central Eastern Europe Middle East and Africa (“CEEMEA”) and Latin America (LATAM) assets to remain supportive through year end.
Within hard currency sovereigns, the more treasury sensitive investment grade component of the EMBIG-D returned a negative -1.46% during the six month period ended March 29, 2018, whereas the high yield component returned +0.18%. On a regional basis, commodity-rich Africa saw the largest gains (+2.36), followed by the Middle East (+0.12%), Europe (-0.43%), Latin America (-1.19%), and Asia (-1.54%).
Unsurprisingly, within the EMBIG-D index, oil exporting regions tended to fare well. Africa benefited not only from its commodity exposure, but from demand emanating from China, where growth in this transitioning economy is still targeted at 6.5%. Actual growth in 2017 actually exceeded government targets, reaching 6.9%. Within the CEEMEA region, Angola, Ghana, and Gabon led returns. Mongolia was the top performer in Asia, and El Salvador, Ecuador and Trinidad were the top performers in LATAM. Venezuela was the worst performer, returning -20.2%, during the reporting period, as defaulted securities see little prospect for improvement until the current administration is removed from office, something which is not, at the moment, imminent.
Within our Fund, positive contributions were derived from our Arbitrage, Sovereign, Corporate, and Local Currency sub-strategies over the reporting period. We held no positions in the Income strategy, and the Momentum strategy was a negative contributor to returns. Local Currency holdings, with an average weight of 11.4%, generated the most alpha within the Fund, led by S. Africa, Poland and Russia. Local currency markets in the 1Q 2018 have proven the star performer, with the JP Morgan Government Bond Index-Emerging Markets (GBI-EM) index returning +4.42%, whereas hard currency sovereigns (EMBIG-D index) returned negative -1.74%, and hard currency corporates (CEMBI-BD index) negative -1.12%.
Within our Sovereign Strategy, CEEMEA provided the greatest source of Alpha with Nigeria, Ukraine and Egypt topping returns. The LATAM region yielded flat returns, with gains in quasi-sovereigns being effectively offset by losses in sovereigns. Argentina was the biggest drag on returns, as the pace of reforms slowed and investors in a crowded trade cut positions.
| Semiannual Report | | March 31, 2018 | 43 |
Table of Contents
Unaudited
AllianzGI Emerging Markets Debt Fund (cont’d)
Within Corporates, high yield holdings outperformed investment grade holdings in all regions during the reporting period. Within our regional baskets (CEEMEA, LATAM, and Asia) Latin America was the largest contributor to returns. Brazilian holdings made up the largest average weighting in LATAM corporates and were the greatest contributors to return. Holdings there were reasonably well diversified across industry sectors. Jamaican holdings in the telco sector (Digicel) proved to be the sole negative country returns within LATAM corporates. Within CEEMEA, Nigerian corporates led performance whereas holdings in Qatar dragged on returns. Within Asian credit, China led and Malaysia detracted from returns. Perpetual securities underperformed in the rising rate environment. Across the credit space, energy names were the best performers, as oil prices rose, followed by financials and utilities. Diversified holdings and communications positions were negative contributors to returns.
Momentum positions detracted slightly from performance as LATAM holdings in Mexico and Argentina yielded negative returns. Arbitrage positions contributed modestly over the six month period, adding to the fund’s overall performance.
The ratings of our fund remained in the BB range throughout the reporting period, reflecting our weightings in hard currency sovereigns and high yield credit.
Average Annual Total Return for the period ended March 31, 2018
| 6 Month* | 1 Year | Since Inception† | ||||||||||||
| AllianzGI Emerging Markets Debt Fund Class A | –0.05% | 4.44% | 3.96% | |||||||||||
| AllianzGI Emerging Markets Debt Fund Class A (adjusted) | –3.80% | 0.53% | 2.84% | ||||||||||
| AllianzGI Emerging Markets Debt Fund Class C | –0.48% | 3.63% | 3.18% | |||||||||||
| AllianzGI Emerging Markets Debt Fund Class C (adjusted) | –1.46% | 2.64% | 3.18% | ||||||||||
| AllianzGI Emerging Markets Debt Fund Class P | –0.01% | 4.57% | 4.10% | ||||||||||
| AllianzGI Emerging Markets Debt Fund Institutional Class | 0.02% | 4.61% | 4.20% | ||||||||||
| 40% JPM EMBI Global Diversified, 40% JPM CEMBI Broad Diversified, 20% JPM GBI-EM Index | 0.64% | 5.76% | 4.10% | ||||||||||
| Lipper Emerging Market Hard Currency Debt Funds Average | 0.34% | 5.64% | 3.93% | |||||||||||
* Cumulative return
† The Fund began operations on September 15, 2014. Benchmark return comparisons began on the fund inception date. Lipper performance comparisons began on September 30, 2014.
Performance quoted represents past performance and is no guarantee of future results. Current performance may be lower or higher than performance shown. For performance current to the most recent month-end, visit our website at us.allianzgi.com. Investment return and the principal value will fluctuate. Shares may be worth more or less than original cost when redeemed. The adjusted returns take into account the maximum initial sales charge of 3.75% on Class A shares and the contingent deferred sales charge (CDSC) of 1% on Class C shares, which may apply to shares redeemed during the first year of ownership. Returns do not reflect deduction of taxes that a shareholder would pay on fund distributions or redemption of fund shares. See pages 106 and 107 for more information. The Fund’s gross expense ratios are 1.66% for Class A shares, 2.41% for Class C shares, and 1.34% for Class P shares and 1.35% shares for Institutional Class shares. These ratios do not include an expense reduction, contractually guaranteed through at least January 31, 2019. The Fund’s expense ratios net of this reduction are 1.20% for Class A shares, 1.95% for Class C shares, 1.05% for Class P shares and 0.95% for Institutional Class shares. Expense ratio information is as of the Fund’s current prospectus dated February 1, 2018.
Cumulative Returns Through March 31, 2018
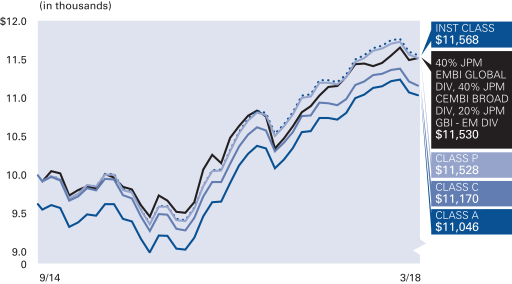
Country Allocation (as of March 31, 2018)
| Argentina | 11.5% | |||
| Russian Federation | 7.2% | |||
| China | 6.5% | |||
| Turkey | 6.3% | |||
| Brazil | 4.9% | |||
| South Africa | 4.4% | |||
| Indonesia | 3.8% | |||
| Nigeria | 3.3% | |||
| Other | 43.2% | |||
| Cash & Equivalents — Net | 8.9% |
| 44 | March 31, 2018 | | Semiannual Report |
Table of Contents
Unaudited
AllianzGI Emerging Markets Debt Fund (cont’d)
Moody’s Ratings* (as of March 31, 2018)
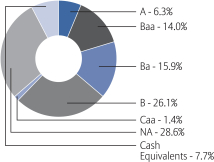
* As a percentage of total investments. Credit ratings refer to the underlying holdings of the Fund and are categorized from highest to lowest credit quality using ratings provided by Moody’s. Moody’s ratings have been selected for several reasons, including the access to information and materials provided by Moody’s, as well as the Fund’s consideration of industry practice. See “Important Information” for more detail on the selection of Moody’s for the Fund’s ratings presentation. Securities not rated by Moody’s and bonds that do not currently have a rating available are designated in the chart above as “NR” and “NA”, respectively.
| Shareholder Expense Example | Actual Performance | |||||||
| Class A | Class C | Class P | Institutional Class | |||||
| Beginning Account Value (10/1/17) | $1,000.00 | $1,000.00 | $1,000.00 | $1,000.00 | ||||
| Ending Account Value (3/31/18) | $999.50 | $995.20 | $999.90 | $1,000.20 | ||||
| Expenses Paid During Period | $6.08 | $9.80 | $5.34 | $4.84 | ||||
| Hypothetical Performance | ||||||||
| (5% return before expenses) | ||||||||
| Class A | Class C | Class P | Institutional Class | |||||
| Beginning Account Value (10/1/17) | $1,000.00 | $1,000.00 | $1,000.00 | $1,000.00 | ||||
| Ending Account Value (3/31/18) | $1,018.85 | $1,015.11 | $1,019.60 | $1,020.09 | ||||
| Expenses Paid During Period | $6.14 | $9.90 | $5.39 | $4.89 | ||||
For each class of the Fund, expenses (net of fee waiver and reimbursement, if any) are equal to the annualized expense ratio for the class (1.22% for Class A, 1.97% for Class C, 1.07% for Class P and 0.97% for Institutional Class), multiplied by the average account value over the period, multiplied by 182/365.
| Semiannual Report | | March 31, 2018 | 45 |
Table of Contents
Unaudited
AllianzGI Emerging Markets Small-Cap Fund
For the period of October 1, 2017 through March 31, 2018, as provided by Jie Wei, CFA, Portfolio Manager.
Fund Insights
For the six-month period ended March 31, 2018, Class A shares at net asset value (“NAV”) of the AllianzGI Emerging Markets Small-Cap Fund (the “Fund”) returned 7.53%, underperforming the MSCI Emerging Markets Small Cap Index (the “benchmark”), which returned 9.41%.
Market Overview
Emerging market small-cap equities advanced thanks to positive sentiment and a more favorable growth and valuation mix relative to developed market small-cap equities. The benchmark rose in the initial four months during the reporting period, as investors were optimistic over the economic health and global demand expectations. Performance moderated in the last two months of the reporting period as volatility increased amid apprehension over a global trade war as well as concerns that rising inflation expectations could lead the US Federal Reserve to accelerate rate hikes.
Benchmark sector performance was broad-based, with 10 out of 11 sectors positing positive results. Health care was by far the top performer, followed by double-digit gains in consumer staples and information technology. Meanwhile, utilities posted a modest decline during the reporting period.
Country results were mostly higher, with 16 out of 24 countries posting gains. Egypt, South Korea and South Africa were the three top performers thanks to improving growth expectations in local small-cap shares. Conversely, Poland, Peru and the Philippines led results to the downside.
Portfolio Review
The Fund seeks to benefit from bottom-up stock selection to capture greater levels of inefficiencies in emerging market small-cap equities. During the reporting period, the Fund trailed the benchmark due to more conservative stock selection and an underweight in growth-related segments of the market.
Consumer discretionary was the top performing sector, outpacing the benchmark thanks to bottom-up stock selection. Stockpicking in materials and financials also contributed positively to results during the reporting period. Conversely, health care was the primary source of underperformance given the combination of a relative underweight allocation and bottom-up selections which trailed the benchmark. Stock selection in utilities and energy offset results more modestly. From a country standpoint, bottom-up stockpicking in South Africa, India and Brazil topped the benchmark. Meanwhile, an underweight to higher growth-oriented securities in South Korea and China detracted from results as did a modest overweight allocation to Poland, which was the worst benchmark performer during the reporting period.
Outlook
While uncertainty regarding the trade and political climate may cloud short-term visibility, our viewpoint for emerging markets small-cap equities remains optimistic. We believe emerging markets are more stable than the past and are increasingly driven by favorable demographics and growth within emerging countries; as such, in our view, the direct impact from a trade war and geopolitical impacts may be limited. However, results may be impacted by ebbs and flows of sentiment, which could increase volatility for the coming periods.
In our view, emerging market small-cap equities are attractive in light of superior earnings growth expectations and higher idiosyncratic opportunities than emerging market large-cap equities. In addition, the fact that emerging market small-cap equities have underperformed their large-cap counterparts in each of the last two calendar years, in our opinion, suggests the potential for outperformance, as small had outperformed large in six of the seven prior calendar year periods as investors have historically been rewarded for the size premium in emerging markets over time.
Average Annual Total Return for the period ended March 31, 2018
| 6 Month* | 1 Year | Since Inception† | ||||||||||||
| AllianzGI Emerging Markets Small-Cap Fund Class A | 7.53% | 18.15% | 9.10% | |||||||||||
| AllianzGI Emerging Markets Small-Cap Fund Class A (adjusted) | 1.62% | 11.65% | 7.26% | ||||||||||
| AllianzGI Emerging Markets Small-Cap Fund Institutional Class | 7.77% | 18.62% | 9.48% | ||||||||||
| MSCI Emerging Markets Small Cap Index | 9.41% | 18.62% | 7.16% | ||||||||||
| Lipper Emerging Markets Funds Average | 8.34% | 23.20% | 6.08% | |||||||||||
* Cumulative return
† The Fund began operations on December 1, 2014. Benchmark return comparisons began on the fund inception date. Lipper performance comparisons began on November 30, 2014.
Performance quoted represents past performance and is no guarantee of future results. Current performance may be lower or higher than performance shown. For performance current to the most recent month-end, visit our website at us.allianzgi.com. Investment return and the principal value will fluctuate. Shares may be worth more or less than original cost when redeemed. The adjusted returns take into account the maximum initial sales charge of 5.50% on Class A shares. Returns do not reflect deduction of taxes that a shareholder would pay on fund distributions or redemption of fund shares. See pages 106 and 107 for more information. The Fund’s gross expense ratios are 15.72% for Class A shares and 3.38% for Institutional Class shares. These ratios do not include an expense reduction, contractually guaranteed through at least January 31, 2019. The Fund’s expense ratios net of this reduction are 1.85% for Class A shares and 1.50% for Institutional Class shares. Expense ratio information is as of the Fund’s current prospectus dated February 1, 2018.
| 46 | March 31, 2018 | | Semiannual Report |
Table of Contents
Unaudited
AllianzGI Emerging Markets Small-Cap Fund (cont’d)
Cumulative Returns Through March 31, 2018
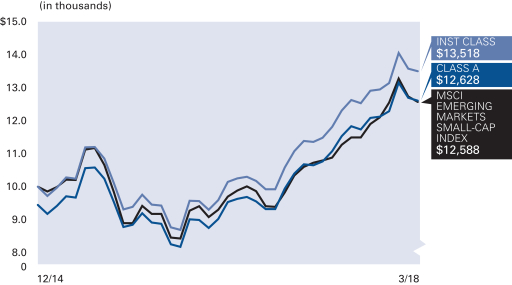
Country Allocation (as of March 31, 2018)
| Korea (Republic of) | 17.3% | |||
| Taiwan | 15.5% | |||
| India | 11.0% | |||
| China | 10.5% | |||
| Thailand | 6.6% | |||
| Hong Kong | 6.5% | |||
| Malaysia | 5.9% | |||
| South Africa | 4.6% | |||
| Other | 20.6% | |||
| Cash & Equivalents — Net | 1.5% |
| Shareholder Expense Example | Actual Performance | |||
| Class A | Institutional Class | |||
| Beginning Account Value (10/1/17) | $1,000.00 | $1,000.00 | ||
| Ending Account Value (3/31/18) | $1,075.30 | $1,077.70 | ||
| Expenses Paid During Period | $9.57 | $7.77 | ||
| Hypothetical Performance | ||||
| (5% return before expenses) | ||||
| Class A | Institutional Class | |||
| Beginning Account Value (10/1/17) | $1,000.00 | $1,000.00 | ||
| Ending Account Value (3/31/18) | $1,015.71 | $1,017.45 | ||
| Expenses Paid During Period | $9.30 | $7.54 | ||
For each class of the Fund, expenses (net of fee waiver and reimbursement, if any) are equal to the annualized expense ratio for the class (1.85% for Class A and 1.50% for Institutional Class), multiplied by the average account value over the period, multiplied by 182/365.
| Semiannual Report | | March 31, 2018 | 47 |
Table of Contents
Unaudited
AllianzGI Europe Equity Dividend Fund
For the period of October 1, 2017 through March 31, 2018, as provided by Christian McCormick, Senior European Inter-Regional Product Specialist.
Fund Insights
For the six-month period ended March 31, 2018, Class A shares at net asset value (“NAV”) of the AllianzGI Europe Equity Dividend Fund (the “Fund”) returned -1.50%, underperforming the MSCI Europe Index (Net) (the “benchmark”), which returned 0.18%.
Market Overview
In USD terms, European companies closed the reporting period unchanged. Markets trended positively until January, but subsequently experienced a setback driven by interest rate concerns and growing fears of a global trade war. The strategy lagged the market impacted by a taper tantrum-like market environment in February and March putting temporary pressure on higher yielding stocks in general.
European equities ended the fourth quarter 2017 slightly higher despite political risks weighing on investor sentiment. In October, Catalonia voted for independence from Spain and snap elections in December failed to resolve the situation. In Germany, attempts to establish a coalition government failed. However, economic news continued to paint a very positive picture. The Eurozone economy showed a year-on-year growth rate of 2.6%, and the unemployment rate slipped below 9% for the first time since the start of 2009. After more gains in January, European equities joined the global sell-off in February and March driven by interest rate concerns and later on growing fears of a global trade war following the Trump administration’s decision to implement tariffs on key imports. Company earnings remained supportive, but the Euro strength tempered investor sentiment and politics remained a concern as Italy’s elections resulted in no outright winner. Eurozone economic activity lost some momentum in early 2018 but leading indicators remained solidly in expansionary activity. The ECB dropped its commitment to increase its bond-buying program should growth weaken, but reiterated that rates would not rise until “well past” the programme’s end. The UK and EU reached broad agreement on a 21-month transition period following Brexit.
In the tug-of-war between a buoyant economic environment and concerns with regard to the liquidity withdrawal by Central Banks, the Fund underperformed the broader European equity market in a falling market. This rather unusual behavior has to be seen against the background of the taper tantrum-like market environment. Dividend stocks generally performed weaker as May 2013 market participants played a stronger and faster than the previously expected surge in interest rates—a situation with a certain resemblance to relative performance of the Fund also came under pressure. However, as expectations did not further materialize, the discount that applied to the dividend stocks quickly got priced out again. Similarly, the relative performance of the Fund started to recover towards the end of the period (into the second quarter). Stock selection was the main driver of underperformance with contributions broadly distributed. Selection particularly hurt within consumer staples, industrials and telecommunication services. Selection was most successful within financials and health care.
Portfolio Review
During the reporting period, the Fund’s largest overweights relative to the benchmark were in telecommunication services and energy whilst the largest underweights were in health care followed by consumer staples. With regard to country exposure, the largest overweights were in the UK and Spain whilst the largest underweights were in Switzerland and Sweden.
The largest detractors on single stock basis were the positions in SES (France), Imperial Brands (UK) and KPN (Netherlands). The most significant positive contributors were the positions in TUI (Germany), a tourism service provider, and IG Group (UK), a provider of online trading services for CFDs and other products, which both continued to present good results. Shares of Munich Re (Germany), the global leader in the reinsurance sector, also performed strongly after it became clear that it had weathered the difficulties of 2017 with generally high claims due to hurricane activity better than competitors.
| 48 | March 31, 2018 | | Semiannual Report |
Table of Contents
Unaudited
AllianzGI Europe Equity Dividend Fund (cont’d)
Average Annual Total Return for the period ended March 31, 2018
| 6 Month* | 1 Year | Since Inception† | ||||||||||||
| AllianzGI Europe Equity Dividend Fund Class A | –1.50% | 12.31% | 4.35% | |||||||||||
| AllianzGI Europe Equity Dividend Fund Class A (adjusted) | –6.92% | 6.13% | 2.50% | ||||||||||
| AllianzGI Europe Equity Dividend Fund Class C | –1.85% | 11.49% | 3.57% | |||||||||||
| AllianzGI Europe Equity Dividend Fund Class C (adjusted) | –2.81% | 10.49% | 3.57% | ||||||||||
| AllianzGI Europe Equity Dividend Fund Class P | –1.39% | 12.50% | 4.50% | ||||||||||
| AllianzGI Europe Equity Dividend Fund Institutional Class | –1.33% | 12.60% | 4.63% | ||||||||||
| MSCI Europe Index (Net) | 0.18% | 14.49% | 5.46% | ||||||||||
| Lipper International Equity Income Funds Average | 2.21% | 12.82% | 5.21% | |||||||||||
* Cumulative return
† The Fund began operations on February 2, 2015. Benchmark return comparisons began on the fund inception date. Lipper performance comparisons began on January 31, 2015.
Performance quoted represents past performance and is no guarantee of future results. Current performance may be lower or higher than performance shown. For performance current to the most recent month-end, visit our website at us.allianzgi.com. Investment return and the principal value will fluctuate. Shares may be worth more or less than original cost when redeemed. The adjusted returns take into account the maximum initial sales charge of 5.50% on Class A shares and the contingent deferred sales charge (CDSC) of 1% on Class C shares, which may apply to shares redeemed during the first year of ownership. Returns do not reflect deduction of taxes that a shareholder would pay on fund distributions or redemption of fund shares. See pages 106 and 107 for more information. The Fund’s gross expense ratios are 5.63% for Class A shares, 6.66% for Class C shares, 5.31% for Class P shares and 5.69% for Institutional Class shares. These ratios do not include an expense reduction, contractually guaranteed through at least January 31, 2019. The Fund’s expense ratios net of this reduction are 1.20% for Class A shares, 1.95% for Class C shares, 1.05% for Class P shares and 0.95% for Institutional Class shares. Expense ratio information is as of the Fund’s current prospectus dated February 1, 2018.
Cumulative Returns Through March 31, 2018
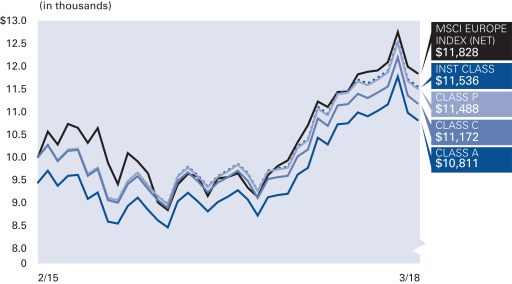
Country Allocation (as of March 31, 2018)
| United Kingdom | 32.3% | |||
| France | 17.1% | |||
| Spain | 10.2% | |||
| Germany | 10.2% | |||
| Netherlands | 9.9% | |||
| Norway | 6.1% | |||
| Italy | 6.1% | |||
| Switzerland | 2.3% | |||
| Other | 2.0% | |||
| Cash & Equivalents — Net | 3.8% |
| Semiannual Report | | March 31, 2018 | 49 |
Table of Contents
Unaudited
AllianzGI Europe Equity Dividend Fund (cont’d)
| Shareholder Expense Example | Actual Performance | |||||||
| Class A | Class C | Class P | Institutional Class | |||||
| Beginning Account Value (10/1/17) | $1,000.00 | $1,000.00 | $1,000.00 | $1,000.00 | ||||
| Ending Account Value (3/31/18) | $985.00 | $981.50 | $986.10 | $986.70 | ||||
| Expenses Paid During Period | $5.94 | $9.63 | $5.20 | $4.70 | ||||
| Hypothetical Performance | ||||||||
| (5% return before expenses) | ||||||||
| Class A | Class C | Class P | Institutional Class | |||||
| Beginning Account Value (10/1/17) | $1,000.00 | $1,000.00 | $1,000.00 | $1,000.00 | ||||
| Ending Account Value (3/31/18) | $1,018.95 | $1,015.21 | $1,019.70 | $1,020.19 | ||||
| Expenses Paid During Period | $6.04 | $9.80 | $5.29 | $4.78 | ||||
For each class of the Fund, expenses (net of fee waiver and reimbursement, if any) are equal to the annualized expense ratio for the class (1.20% for Class A, 1.95% for Class C, 1.05% for Class P and 0.95% for Institutional Class), multiplied by the average account value over the period, multiplied by 182/365.
| 50 | March 31, 2018 | | Semiannual Report |
Table of Contents
Unaudited
AllianzGI Global Dynamic Allocation Fund
For the period of October 1, 2017 through March 31, 2018, as provided by the Multi-Asset US Group.
Fund Insights
For the six-month period ended March 31, 2018, Class A shares at net asset value (“NAV”) of the AllianzGI Global Dynamic Allocation Fund (the “Fund”) returned 1.40%, underperforming the 60% MSCI ACWI, 40% Bloomberg Barclays US Aggregate Bond Index (the “benchmark”), which returned 2.45%.
Market Overview
The six-month period ending on March 31, 2018 is best characterized as one which began with markets being supported by optimism about global growth and mostly positive political developments. About midway through the period, however, market expectations began to reset.
Global equities appreciated through January buoyed by optimism about the trajectory of global growth. Late in the fourth quarter, the passage of the Tax Cuts and Jobs Act provided an additional boost to sentiment around US equities in light of positive implications for corporate earnings. In terms of economic expansion, we received confirmation that the US economy expanded at a greater than 3.0% rate for two consecutive quarters (on a quarter-over-quarter annualized rate) and that in the US and almost all major economies, the labor market continued to tighten. And yet inflation failed to materialize in spite of such improvements, while official forecasts (from the US Federal Reserve (the “Fed”)) and unofficial ones (from consumer sentiment surveys) suggested that the absence of inflation would continue in the US and in most major economies. Emerging market assets continued to benefit from the “spillover” effects of strong global growth, with its attendant boost to international trade and support for some industrial commodity prices (such as copper) that benefit key commodity exporters. In addition, emerging markets benefited from a weaker US dollar and persistent inflows of foreign capital.
However, signs of rising inflationary pressures and higher bond yields led to a sharp correction in early February. For the remainder of the reporting period macroeconomic and policy uncertainty forced a recalibration of expectations among market participants across asset classes. As of January, markets expected the Fed to increase its benchmark interest rate two times during 2018 and markets seemed to have grown complacent with the low volatility environment of the previous two years. Several new themes arose during the reporting period including (i) a re-emergence of volatility, (ii) renewed vigilance about the possibility of creeping inflation, and (iii) revised forecasts for the pace and magnitude of increases in the Fed’s benchmark interest rate. In this new context, we observed a spike in the Chicago Board Options Exchange Volatility Index (“VIX”) of around 300% during the first week of February, a correction in US equities of more than 6% intraday during the day following a report showing that US wages in January increased more than expected, and an increase in yields on 10-Year Treasuries of roughly 40 basis points by the end of the period.
In March, these factors, combined with the looming threat of a global trade war linked to the White House’s announcement of steep tariffs on steel and aluminum, weighed on markets. Later in March, the technology sector suffered in the wake of several company-specific events, including the launch of a federal investigation into Facebook’s alleged privacy breach.
Overall, the best performing assets for the six-month period were emerging market equities and emerging market bonds followed by global and US equities. Among the worst performing assets were corporate and US government bonds.
Portfolio Review
Selection in equities was the single largest detractor from performance as the Fund underperformed its benchmark. Allocation within equities had a positive effect, as overweight positions in emerging markets and Asian developed contributed to Fund performance. Detractors from performance were an overweight in corporate bonds and opportunistic positions in energy and industrial metal commodities. The Fund modestly benefitted from opportunistic positions in US small-cap stocks and Italian bond futures. Lastly, the Fund’s positions in the Australian and Canadian dollars detracted from overall performance.
At the end of the period, the Fund maintained a slight underweight position in US government bonds (duration weighted) and an overweight to global equities including emerging markets, against a backdrop of favorable trends and fundamental views across risk assets. The Fund also has an opportunistic position in U.S. bank loans, which are floating rate instruments and which we believe should outperform traditional corporate credit in a rising rate environment.
Outlook
Overall, despite the recent volatility in markets, there is still evidence to support a prolonged period of synchronized global growth. As of the end of the quarter, around the world more than two-thirds of countries (developed and emerging) were producing above-average economic data changes. In addition, monetary policy remains accommodative in historical terms as the removal of excess liquidity has been gradual and we believe monetary policy will likely remain accommodative. Although the Fed raised its benchmark interest rate in March and provided more hawkish guidance for the next two years, comments from new Fed Chair Jerome Powell suggest that policy will move at a measured pace. For its part, the European Central Bank signaled that it will not increase the policy rate in 2018. Inflation remains low albeit higher than at the end of last year. Inflation expectations, especially survey-based measures, however, are more elevated.
As of the end of the quarter, our market cycle signals and fundamental analysis recommend a neutral position for global equities favoring emerging markets and US equities and with a small underweight to Europe and the United Kingdom. On the fixed income side, we are neutral to modestly underweight US bonds and long periphery European bonds and Emerging Market local bonds.
| Semiannual Report | | March 31, 2018 | 51 |
Table of Contents
Unaudited
AllianzGI Global Dynamic Allocation Fund (cont’d)
Average Annual Total Return for the period ended March 31, 2018
| 6 Month* | 1 Year | 5 Year | Since Inception† | |||||||||||||||
AllianzGI Global Dynamic Allocation Fund Class A | 1.40% | 9.34% | 4.61% | 9.63% | ||||||||||||||
| AllianzGI Global Dynamic Allocation Fund Class A (adjusted) | –4.18% | 3.33% | 3.44% | 8.93% | |||||||||||||
AllianzGI Global Dynamic Allocation Fund Class C | 0.95% | 8.47% | 3.80% | 8.80% | ||||||||||||||
| AllianzGI Global Dynamic Allocation Fund Class C (adjusted) | –0.02% | 7.47% | 3.80% | 8.80% | |||||||||||||
| AllianzGI Global Dynamic Allocation Fund Class R | 1.16% | 8.92% | 4.32% | 9.34% | |||||||||||||
| AllianzGI Global Dynamic Allocation Fund Class P | 1.49% | 9.56% | 4.78% | 9.83% | |||||||||||||
| AllianzGI Global Dynamic Allocation Fund Institutional Class | 1.49% | 9.58% | 4.87% | 9.93% | |||||||||||||
| AllianzGI Global Dynamic Allocation Fund Class R6 | 1.50% | 9.60% | 4.97% | 10.03% | |||||||||||||
AllianzGI Global Dynamic Allocation Fund Administrative Class | 1.35% | 9.33% | 4.61% | 9.65% | ||||||||||||||
| 60% MSCI ACWI, 40% Bloomberg Barclays US Aggregate Bond Index | 2.45% | 9.29% | 6.33% | 8.88% | |||||||||||||
| MSCI ACWI | 4.71% | 14.85% | 9.20% | 12.07% | |||||||||||||
| Bloomberg Barclays US Aggregate Bond Index | –1.08% | 1.20% | 1.82% | 3.64% | |||||||||||||
Lipper Alternative Global Macro Funds Average | 0.64% | 4.89% | 2.17% | 6.27% | ||||||||||||||
* Cumulative return
† The Fund began operations on April 27, 2009. Benchmark return comparisons began on the fund inception date. Lipper performance comparisons began on April 30, 2009.
Performance quoted represents past performance and is no guarantee of future results. Current performance may be lower or higher than performance shown. For performance current to the most recent month-end, visit our website at us.allianzgi.com. Investment return and the principal value will fluctuate. Shares may be worth more or less than original cost when redeemed. The adjusted returns take into account the maximum initial sales charge of 5.50% on Class A shares and the contingent deferred sales charge (CDSC) of 1% on Class C shares, which may apply to shares redeemed during the first year of ownership. Returns do not reflect deduction of taxes that a shareholder would pay on fund distributions or redemption of fund shares. See pages 106 and 107 for more information. The Fund’s gross expense ratios are 1.38% for Class A shares, 2.11% for Class C shares, 1.73% for Class R shares, 1.14% for Class P shares, 1.06% for Institutional Class shares, 1.02% for Class R6 shares and 1.28% for Administrative Class shares. These ratios do not include an expense reduction, contractually guaranteed through at least January 31, 2019. The Fund’s expense ratios net of this reduction are 1.00% for Class A shares, 1.77% for Class C shares, 1.37% for Class R shares, 0.83% for Class P shares, 0.73% for Institutional Class shares, 0.73% for Class R6 shares and 0.98% for Administrative Class shares. Expense ratio information is as of the Fund’s current prospectus dated February 1, 2018.
Cumulative Returns Through March 31, 2018
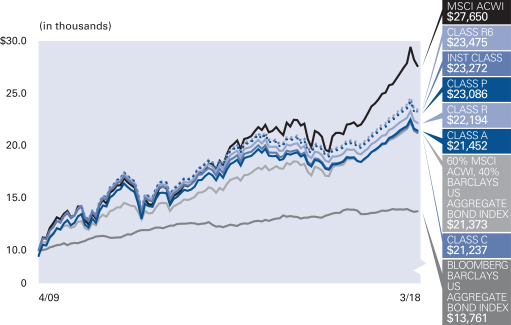
Country Allocation (as of March 31, 2018 )
| United States | 56.0% | |||
| Japan | 5.5% | |||
| Canada | 4.2% | |||
| United Kingdom | 3.3% | |||
| China | 2.8% | |||
| France | 2.6% | |||
| Korea (Republic of) | 1.9% | |||
| Germany | 1.7% | |||
| Other | 26.4% | |||
| Cash & Equivalents — Net | –4.4% |
| 52 | March 31, 2018 | | Semiannual Report |
Table of Contents
Unaudited
AllianzGI Global Dynamic Allocation Fund (cont’d)
| Shareholder Expense Example | Actual Performance | |||||||||||||
| Class A | Class C | Class R | Class P | Institutional Class | Class R6 | Administrative Class | ||||||||
| Beginning Account Value (10/1/17) | $1,000.00 | $1,000.00 | $1,000.00 | $1,000.00 | $1,000.00 | $1,000.00 | $1,000.00 | |||||||
| Ending Account Value (3/31/18) | $1,014.00 | $1,009.50 | $1,011.60 | $1,014.90 | $1,014.90 | $1,015.00 | $1,013.50 | |||||||
| Expenses Paid During Period | $4.87 | $8.72 | $6.72 | $4.02 | $3.52 | $3.52 | $4.87 | |||||||
| Hypothetical Performance | ||||||||||||||
| (5% return before expenses) | ||||||||||||||
| Class A | Class C | Class R | Class P | Institutional Class | Class R6 | Administrative Class | ||||||||
| Beginning Account Value (10/1/17) | $1,000.00 | $1,000.00 | $1,000.00 | $1,000.00 | $1,000.00 | $1,000.00 | $1,000.00 | |||||||
| Ending Account Value (3/31/18) | $1,020.09 | $1,016.26 | $1,018.25 | $1,020.94 | $1,021.44 | $1,021.44 | $1,020.09 | |||||||
| Expenses Paid During Period | $4.89 | $8.75 | $6.74 | $4.03 | $3.53 | $3.53 | $4.89 | |||||||
For each class of the Fund, expenses (net of fee waiver and reimbursement, if any) are equal to the annualized expense ratio for the class (0.97% for Class A, 1.74% for Class C, 1.34% for Class R, 0.80% for Class P, 0.70% for Institutional Class, 0.70% for Class R6 and 0.97% for Administrative Class), multiplied by the average account value over the period, multiplied by 182/365. These expenses do not include the expenses of the investment companies in which the Fund invests, which are indirectly borne by Fund shareholders.
| Semiannual Report | | March 31, 2018 | 53 |
Table of Contents
Unaudited
AllianzGI Global Fundamental Strategy Fund
For the period of October 1, 2017 through March 31, 2018, as provided by Neil Dwane, Portfolio Manager.
Fund Insights
For the six-month period ended March 31, 2018, Class A shares at net asset value (“NAV”) of the AllianzGI Global Fundamental Strategy Fund (the “Fund”) returned -2.43% underperforming the USD Overnight LIBOR (the “benchmark”), which returned 0.68%.
Market Overview
Global bond markets yielded mixed performance during the last six months. The yield on 10-year US Treasuries reached a four year high of just under 3% in February and remained elevated, while the yield on 10-year German Bunds jumped to an intraday peak of 0.8% in February only to fall back to around 0.5% at the end of March. Peripheral euro area bonds outperformed German Bunds. UK and Japanese bonds also posted moderate gains over the six-month period. Emerging market US dollar-denominated fell broadly, following the sell-off in US bond markets, while local currency bonds overall gained. Against the backdrop of positive economic data, the US Federal Reserve raised rates in December and in March, signaling a more tightening policy stance ahead as did the European Central Bank and the Bank of England.
Global equities advanced further over the four months to January, supported by positive sentiment on global growth, US tax cuts and corporate earnings, but pulled back sharply in February as bond yields jumped higher. While stocks later recouped some of their losses, the Trump administration’s decision to impose import tariffs led major equity indices to fall again in March. Emerging market equities outperformed developed markets over the six-month period. Oil prices rallied and the US dollar weakened against other major currencies, with the British pound rising back above USD 1.40 as the EU and UK reached a broad agreement on a 21-month transition period following Brexit.
Portfolio Review
During the last six months we continued to review and evolve our investment themes. Following our annual Investment Forum in Hong Kong in January, we decided to have Infrastructure & Security and Oil & Energy subsumed under Hunt for Income, Real Assets, Winners from Disruption and Structural Growth. We have since recast and split out Structural Growth into two new themes: Rise of Asia and Global Capex (Capital Expenditure) Revival. Asia merits its own stand-alone investment theme since in our view it represents the biggest economic story of the 21st century so far – in large part due to China’s ongoing transformation from an export-led economy to one fueled by domestic consumption. Meanwhile corporate capex spending outside of Asia has remained too low for too long to meet future demand, relative to the cyclical upturn and to the declining economic value and life of corporate assets. A select group of companies are bucking the trend of continuing record share buybacks and (re)investing more in their hard assets as well as in research and digitalization. We believe these are the companies that will help us express some of our best investment ideas in the future as they develop the right capacity and supply chains needed to grow productivity and earnings.
Outlook
Looking ahead we expect recurring bouts of downside volatility in equity, bond and currency markets throughout this year. Therefore, alongside rotating and adding prudently to long exposures to our core investment themes, we are maintaining tactical tail-risk protection and cash-equivalent positions. At the same time we are aiming to minimize the cost, to shorter term performance, from hedging and the mark-to-market value of derivatives. Currency pair gyrations in the short term remain particularly challenging as they are driven by a mix of interacting factors, including differences in bond yields, fiscal and trade deficits/surpluses, (geo)political risks and perceived safe haven merits, and of course differences in the cost of hedging. At the end of March the Fund’s realized monthly volatility over a one year period was approximately 3.5%.
| 54 | March 31, 2018 | | Semiannual Report |
Table of Contents
Unaudited
AllianzGI Global Fundamental Strategy Fund (cont’d)
Average Annual Total Return for the period ended March 31, 2018
| 6 Month* | 1 Year | Since Inception† | ||||||||||||
| AllianzGI Global Fundamental Strategy Fund Class A | –2.43% | 3.00% | 3.34% | |||||||||||
| AllianzGI Global Fundamental Strategy Fund Class A (adjusted) | –7.80% | –2.67% | 2.11% | ||||||||||
| AllianzGI Global Fundamental Strategy Fund Class C | –2.76% | 2.25% | 2.56% | |||||||||||
| AllianzGI Global Fundamental Strategy Fund Class C (adjusted) | –3.71% | 1.25% | 2.56% | ||||||||||
| AllianzGI Global Fundamental Strategy Fund Class P | –2.39% | 3.13% | 3.47% | ||||||||||
| AllianzGI Global Fundamental Strategy Fund Institutional Class | –2.36% | 3.21% | 3.59% | ||||||||||
| USD Overnight LIBOR | 0.68% | 1.23% | 0.45% | ||||||||||
| 70% MSCI ACWI, 30% Bloomberg Barclays Global Aggregate Bond Index | 4.08% | 12.49% | 7.46% | ||||||||||
| USD Overnight LIBOR + 4% | 2.74% | 5.41% | 4.60% | ||||||||||
| Lipper Absolute Return Funds Average | 0.79% | 2.94% | 2.62% | |||||||||||
* Cumulative return
† The Fund began operations on July 1, 2013. Benchmark return comparisons began on the fund inception date. Lipper performance comparisons began on June 30, 2013.
Performance quoted represents past performance and is no guarantee of future results. Current performance may be lower or higher than performance shown. For performance current to the most recent month-end, visit our website at us.allianzgi.com. Investment return and the principal value will fluctuate. Shares may be worth more or less than original cost when redeemed. The adjusted returns take into account the maximum initial sales charge of 5.50% on Class A shares and the contingent deferred sales charge (CDSC) of 1% on Class C shares, which may apply to shares redeemed during the first year of ownership. Returns do not reflect deduction of taxes that a shareholder would pay on fund distributions or redemption of fund shares. See pages 106 and 107 for more information. The Fund’s gross expense ratios are 2.40% for Class A shares, 3.21% for Class C shares, 2.14% for Class P shares and 2.15% for Institutional Class shares. These ratios do not include an expense reduction, contractually guaranteed through at least January 31, 2019. The Fund’s expense ratios net of this reduction are 1.14% for Class A shares, 1.89% for Class C shares, 0.99% for Class P shares and 0.89% for Institutional Class shares. Expense ratio information is as of the Fund’s current prospectus dated February 1, 2018.
Cumulative Returns Through March 31, 2018

Country Allocation (as of March 31, 2018)
| United States | 16.5% | |||
| United Kingdom | 13.9% | |||
| Japan | 10.2% | |||
| Canada | 9.4% | |||
| Germany | 5.4% | |||
| Russian Federation | 4.6% | |||
| Argentina | 4.6% | |||
| Supranational | 3.7% | |||
| Other | 25.4% | |||
| Cash & Equivalents — Net | 6.3% |
| Semiannual Report | | March 31, 2018 | 55 |
Table of Contents
Unaudited
AllianzGI Global Fundamental Strategy Fund (cont’d)
Moody’s Ratings* (as of March 31, 2018)
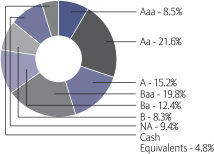
* As a percentage of fixed-income investments. Credit ratings refer to the underlying holdings of the Fund and are categorized from highest to lowest credit quality using ratings provided by Moody’s. Moody’s ratings have been selected for several reasons, including the access to information and materials provided by Moody’s, as well as the Fund’s consideration of industry practice. See “Important Information” for more detail on the selection of Moody’s for the Fund’s ratings presentation. Securities not rated by Moody’s and bonds that do not currently have a rating available are designated in the chart above as “NR” and “NA”, respectively.
| Shareholder Expense Example | Actual Performance | |||||||
| Class A | Class C | Class P | Institutional Class | |||||
| Beginning Account Value (10/1/17) | $1,000.00 | $1,000.00 | $1,000.00 | $1,000.00 | ||||
| Ending Account Value (3/31/18) | $975.70 | $972.40 | $976.10 | $976.40 | ||||
| Expenses Paid During Period | $5.66 | $9.34 | $4.93 | $4.43 | ||||
| Hypothetical Performance | ||||||||
| (5% return before expenses) | ||||||||
| Class A | Class C | Class P | Institutional Class | |||||
| Beginning Account Value (10/1/17) | $1,000.00 | $1,000.00 | $1,000.00 | $1,000.00 | ||||
| Ending Account Value (3/31/18) | $1,019.20 | $1,015.46 | $1,019.95 | $1,020.44 | ||||
| Expenses Paid During Period | $5.79 | $9.55 | $5.04 | $4.53 | ||||
For each class of the Fund, expenses (net of fee waiver and reimbursement, if any) are equal to the annualized expense ratio for the class (1.15% for Class A, 1.90% for Class C, 1.00% for Class P and 0.90% for Institutional Class), multiplied by the average account value over the period, multiplied by 182/365. These expenses do not include the expenses of the investment companies in which the Fund invests, which are indirectly borne by Fund shareholders.
| 56 | March 31, 2018 | | Semiannual Report |
Table of Contents
Unaudited
AllianzGI Global High Yield Fund
For the period of October 1, 2017 through March 31, 2018, as provided by David Newman, Portfolio Manager.
Fund Insights
For the six-month period ended March 31, 2018, Institutional Class shares at net asset value (“NAV”) of the AllianzGI Global High Yield Fund (the “Fund”) returned -0.04%, performing in line with the ICE BofA Merrill Lynch Global High Yield Constrained Index USD Hedged (the “benchmark”), which returned -0.02%.
Market Overview
The reporting period was marked with bouts of volatility primarily due to geopolitics and the theme of flattening global yield curves. The eventual passage of the tax bill in late December fuelled a rally into early 1st quarter of 2018. However, the optimism came to an abrupt halt in February when higher than expected wage and inflation data led to fears of a more aggressive interest rate hiking policy by the US Federal Reserve (the “Fed”). Market volatility surged again in the latter half of March as the equity market priced in the potential impact of a trade war resulting from President Donald Trump’s rhetoric on the imposition of tariffs.
The small negative return of -0.02% of the global high market was primarily due to a sell-off in government bonds rather than any deterioration in credit fundamentals as the 10-year US Treasury yield rose by 41 basis points. In fact, the fundamentals of the global high yield market remain strong as companies continue to report solid earnings growth. By region, GBP-denominated credit returned 1.54% (hedged to the US dollar (“USD”)) and Euro (“EUR”)-denominated credit returned 1.46% (hedged to the USD), outperforming the USD credit return of -0.51% as yields rose in the US due to expectations the Fed would continue to raise interest rates, albeit slowly, whereas the European Central Bank (“ECB”) and the Bank of England (“BOE”) remained on hold.
The longer duration profile of BB issuers resulted in a modest negative return of -0.19% (hedged to US dollars) when compared to a return of 0.27% for B-rated issues and 0.15% for CCC and lower issues which have a lower duration.
Portfolio Review
In terms of the geographic selection within the Fund, we have maintained a preference for EUR and GBP-denominated holdings versus USD holdings which helped performance as financial conditions remain favorable in Europe due to ECB maintaining an accommodative monetary policy while the Fed has been tightening policy. Specifically, European B-rated issues in particular appear cheap compared to USD issues while GBP issuers trade cheap to EUR due to Brexit risks. Although, emerging market fundamentals are continuing to improve, we have an underweight exposure due to tight valuations which detracted performance modestly.
Within credit ratings category, an overweight position in B-rated issues versus BB’s helped performance. We continue to maintain this exposure, as we view B’s to be sweet spot on the credit curve as it would benefit from a continuing global growth environment while providing a higher spread cushion in the event of rising interest rates when compared to BB which has a higher duration profile. The high yield market is efficiently identifying and pricing high risk issuers, as such, we are neutral among CCC issues and underweight below CCC. In terms of sector allocations, our main overweights have been in leisure, capital goods and insurance, while our primary underweights have been in telecommunications, retail and media where underlying credit trends remain structurally challenged. Sector allocation was a small positive contribution as overweights in consumer cyclicals and energy added value as oil prices recovered along with companies cutting costs to a much lower breakeven whereas our underweight in utilities detracted from performance.
Security selection among industries such as energy and retail contributed positively to performance whereas issuer selection within cable/satellite, telecommunications and consumer products detracted performance. It is important to note that during a flat to rising interest rate environment, the higher carry sectors periodically outperform sectors with strong credit fundamentals, for example, our underweight in select wirelines issuers which is a flawed business model performed well during the reporting period, as such, our underweight detracted from performance.
Outlook
While recent market volatility has risen from the historically low levels of 2017, this should not distract long-term investors from the fact that the fundamentals of the high yield market remain positive. We expect default rates to remain below long term averages, while earnings momentum is strong and is supported by a growing global economy. We believe this constructive backdrop is supportive for investors that seek to harvest returns from credit risk premium. While there is a possibility that spreads widen, we expect the global high yield asset class to provide positive returns, which is still attractive against other fixed-income alternatives for long-term investors.
| Semiannual Report | | March 31, 2018 | 57 |
Table of Contents
Unaudited
AllianzGI Global High Yield Fund (cont’d)
Cumulative Total Return for the period ended March 31, 2018
| 6 Month | Since Inception† | |||||||||
| AllianzGI Global High Yield Fund Institutional Class | –0.04% | 2.92% | |||||||
| AllianzGI Global High Yield Fund Class P | –0.05% | 2.85% | |||||||
| ICE BofA Merrill Lynch Global High Yield Constrained Index USD Hedged | –0.02% | 2.92% | |||||||
| Lipper High Yield Fund Average | –0.41% | 2.20% | ||||||||
† The Fund began operations on May 3, 2017. Benchmark return comparisons began on the fund inception date. Lipper performance comparisons began on April 30, 2017.
Performance quoted represents past performance and is no guarantee of future results. Current performance may be lower or higher than performance shown. For performance current to the most recent month-end, visit our website at us.allianzgi.com. Investment return and the principal value will fluctuate. Shares may be worth more or less than original cost when redeemed. Returns do not reflect deduction of taxes that a shareholder would pay on fund distributions or redemption of fund shares. See pages 106 and 107 for more information. The Fund’s gross expense ratios are 2.00% for Class P shares and 2.02% for Institutional Class shares. These ratios do not include an expense reduction, contractually guaranteed through at least January 31, 2019. The Fund’s expense ratios net of this reduction are 0.80% for Class P shares and 0.70% for Institutional Class shares. Expense ratio information is as of the Fund’s current prospectus dated February 1, 2018.
Cumulative Returns Through March 31, 2018
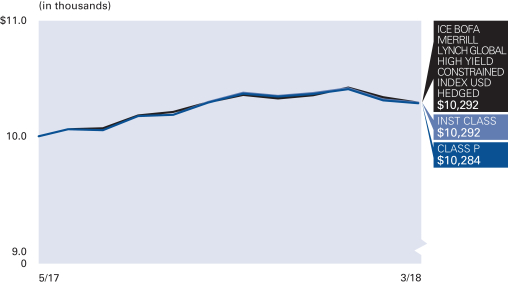
Country Allocation (as of March 31, 2018)
| United States | 47.8% | |||
| United Kingdom | 9.9% | |||
| Canada | 6.1% | |||
| Netherlands | 3.2% | |||
| Luxembourg | 2.8% | |||
| France | 2.7% | |||
| Spain | 2.0% | |||
| Italy | 2.0% | |||
| Other | 19.1% | |||
| Cash & Equivalents — Net | 4.4% |
Credit Ratings* (as of March 31, 2018)
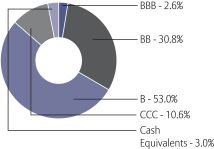
* Credit ratings apply to the credit worthiness of the issuers of the underlying securities and not to the Fund or its shares. Ratings are subject to change. Ratings are based off of the lowest available rating from S&P Global Ratings (“S&P”), Moody’s and Fitch. Bonds not rated by the aforementioned agencies are “unrated”. Ratings are shown based on the S&P rating scale, which ranges from AAA (highest) to D (lowest). Where applicable, securities ratings of an agency other than S&P have been converted to the S&P equivalent. “NR” denotes securities that are not rated. Not rated securities do not necessarily indicate low quality. Ratings are relative, subjective and not absolute standards of quality, and represent the opinions of the independent Nationally Recognized Statistical Rating Organizations (NRSRO). The security’s credit rating does not eliminate risk. The Fund is not rated by an independent rating agency. Previous shareholder reports for the Fund displayed bond ratings provided by S&P.
| 58 | March 31, 2018 | | Semiannual Report |
Table of Contents
Unaudited
AllianzGI Global High Yield Fund (cont’d)
| Shareholder Expense Example | Actual Performance | |||
| Class P | Institutional Class | |||
| Beginning Account Value (10/1/17) | $1,000.00 | $1,000.00 | ||
| Ending Account Value (3/31/18) | $ 999.50 | $ 999.60 | ||
| Expenses Paid During Period | $ 4.04 | $ 3.54 | ||
| Hypothetical Performance | ||||
| (5% return before expenses) | ||||
| Class P | Institutional Class | |||
| Beginning Account Value (10/1/17) | $1,000.00 | $1,000.00 | ||
| Ending Account Value (3/31/18) | $1,020.89 | $1,021.39 | ||
| Expenses Paid During Period | $4.08 | $3.58 | ||
For each class of the Fund, expenses (net of fee waiver and reimbursement, if any) are equal to the annualized expense ratio for the class (0.81% for Class P and 0.71% for Institutional Class), multiplied by the average account value over the period, multiplied 182/365.
| Semiannual Report | | March 31, 2018 | 59 |
Table of Contents
Unaudited
AllianzGI Global Sustainability Fund
For the period of October 1, 2017 through March 31, 2018, as provided by the Global Equity Team.
Fund Insights
For the six-month period ended March 31, 2018, Class A shares at net asset value (“NAV”) of the AllianzGI Global Sustainability Fund (the “Fund”) returned 4.56%, underperforming the MSCI ACWI (the “benchmark”), which returned 4.71%.
Market Overview
Global equities rose steadily over the four months to January boosted by optimism over the health of the global economy and by expectations that tax reforms would help lift US company profits. However, signs of rising inflationary pressures and higher bond yields led to a sharp correction in February. While stocks later recovered some of these losses, the Trump administration’s decision to impose tariffs on a raft of imports led to escalating fears of a global trade war, causing stocks to retreat once more in March. In general, emerging market equities recorded strong gains over the six-month period. Despite record levels of global mergers and acquisitions activity, developed equity delivered mixed returns, with US stocks rallying while European stocks fell.
With data indicating the US economy was in robust health, the US Federal Reserve (the “Fed”) raised rates twice (in December and again in March) and provided more hawkish forecasts for rate rises in 2019 and 2020. The Bank of England also raised rates in November, and hinted that it would do so again in May. The European Central Bank dropped its reference to committing to buy more bonds should growth disappoint but signaled that, when rates did rise, the pace of increases would be “measured”. The Bank of Japan maintained its policy measures, but its governor suggested that it could start to move away from its ultra-loose monetary policy as early as next year.
Oil prices rallied, with Brent crude rising to a two-year high back above $70 a barrel. Gold also rose modestly as it benefitted from investors’ rising risk aversion in early 2018.
Portfolio Review
Estee Lauder made the top contribution to performance, rallying strongly after the release of its first quarter 2018 results and continuing its upward trajectory. Estee Lauder continues to do well on the back of rising Chinese demand, as well as its e-commerce initiative, which grew 33%. At over thirty times price to earnings, Estee Lauder is richly valued and we have taken some profit.
S&P Global has also contributed positively to returns following strong fourth quarter results. The provider of financial services and data delivered total revenues that were up 13.6% year on year, significantly beating the consensus 8%. This was largely driven by better than expected performance from the ratings business, where revenues were up 40%. Looking ahead, the company has guided for mid-single digit organic revenue growth, thanks to a lower tax rate and expenses which should improve earnings and free cash flow.
Inditex has detracted from performance. The multinational clothing company saw its shares decline after difficult Christmas trading and slowing like for like sales. However, the company remains a best-in-class retailer and is one of few retailers well-positioned to deal with the shifting channel mix. In combination with its short lead times and fast feedback model, this makes Zara much more capable of competing with pure-play online fashion retailers. While fourth quarter may prove a tough one, the long-term investment thesis remains intact.
Skandinaviska Enskilda Banken (“SEB”) has also detracted from returns. The Swedish bank posted third quarter results with net profit 3% ahead of consensus at 4.2 billion SEK. However, despite this positive headline number, a failure to deliver on its core corporate banking business has been punished by the market. Despite this, the bank remains one of the highest quality financial institutions in Europe, with almost unrivalled environmental, social, and corporate governance (“ESG”) scores. As a result, SEB continues to be a high conviction holding for the fund.
Outlook
The recent jitters in global equity markets are a stark change from the relative tranquility of 2017.
After years of low and, in some cases, negative rates, monetary policy is steadily marching towards normalization. The arrival at ‘Peak Liquidity’ is important for all asset markets, not just equities. At the same time, macroeconomic indicators like Purchasing Manager Indices and employment data are starting to top out. Figures for key industrial regions such as the US, the euro area and Japan have noticeably weakened. The data continues to be positive but, in our opinion, does suggest slowing economic momentum will bring us to ‘Peak Growth’.
Companies also face the prospect of lower profit growth in 2019, as the main benefit of the Tax Cuts and Jobs Act is captured this year. Thanks to the low interest rate environment, valuations are already high. With this passing, it seems that ‘Peak Valuation’ too has been reached. Combined with increasing geopolitical noise, we believe these factors have brought volatility back to more normal levels.
Overall, our investment philosophy of looking for businesses capable of growing independently from market trends remains the same. In the current market, we have been taking profits where valuations appear stretched and continue to search further a field for quality companies on more reasonable multiples.
| 60 | March 31, 2018 | | Semiannual Report |
Table of Contents
Unaudited
AllianzGI Global Sustainability Fund (cont’d)
Average Annual Total Return for the period ended March 31, 2018
| 6 Month* | 1 Year | Since Inception† | ||||||||||||
| AllianzGI Global Sustainability Fund Class A | 4.56% | 15.00% | 7.82% | |||||||||||
| AllianzGI Global Sustainability Fund Class A (adjusted) | –1.19% | 8.67% | 5.99% | ||||||||||
| AllianzGI Global Sustainability Fund Class P | 4.67% | 15.22% | 7.99% | ||||||||||
| AllianzGI Global Sustainability Fund Institutional Class | 4.64% | 15.26% | 8.07% | ||||||||||
| MSCI ACWI | 4.71% | 14.85% | 7.87% | ||||||||||
| Dow Jones Sustainability World Total Return Index | 3.47% | 16.31% | 7.44% | ||||||||||
| Lipper Global Large-Cap Growth Funds Average | 6.76% | 19.13% | 8.41% | |||||||||||
* Cumulative return
† The Fund began operations on December 9, 2014. Benchmark return comparisons began on the fund inception date. Lipper performance comparisons began on November 30, 2014.
Performance quoted represents past performance and is no guarantee of future results. Current performance may be lower or higher than performance shown. For performance current to the most recent month-end, visit our website at us.allianzgi.com. Investment return and the principal value will fluctuate. Shares may be worth more or less than original cost when redeemed. The adjusted returns take into account the maximum initial sales charge of 5.50% on Class A shares. Returns do not reflect deduction of taxes that a shareholder would pay on fund distributions or redemption of fund shares. See pages 106 and 107 for more information. The Fund’s gross expense ratios are 7.55% for Class A shares, 1.62% for Class P shares and 1.63% for Institutional Class shares. These ratios do not include an expense reduction, contractually guaranteed through at least January 31, 2019. The Fund’s expense ratios net of this reduction are 1.09% for Class A shares, 0.94% for Class P shares and 0.84% for Institutional Class shares. Expense ratio information is as of the Fund’s current prospectus dated February 1, 2018.
Cumulative Returns Through March 31, 2018
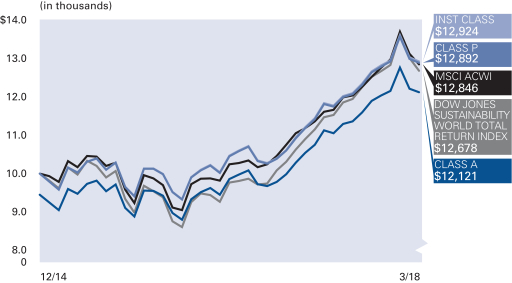
Country Allocation (as of March 31, 2018 )
| United States | 48.4% | |||
| United Kingdom | 13.4% | |||
| Germany | 9.1% | |||
| Sweden | 5.0% | |||
| Japan | 4.8% | |||
| Spain | 4.3% | |||
| Switzerland | 3.1% | |||
| Korea (Republic of) | 1.7% | |||
| Other | 5.1% | |||
| Cash & Equivalents — Net | 5.1% |
| Semiannual Report | | March 31, 2018 | 61 |
Table of Contents
Unaudited
AllianzGI Global Sustainability Fund (cont’d)
| Shareholder Expense Example | Actual Performance | |||||
| Class A | Class P | Institutional Class | ||||
| Beginning Account Value (10/1/17) | $1,000.00 | $1,000.00 | $1,000.00 | |||
| Ending Account Value (3/31/18) | $1,045.60 | $1,046.70 | $1,046.40 | |||
| Expenses Paid During Period | $5.56 | $4.80 | $4.29 | |||
| Hypothetical Performance | ||||||
| (5% return before expenses) | ||||||
| Class A | Class P | Institutional Class | ||||
| Beginning Account Value (10/1/17) | $1,000.00 | $1,000.00 | $1,000.00 | |||
| Ending Account Value (3/31/18) | $1,019.50 | $1,020.24 | $1,020.74 | |||
| Expenses Paid During Period | $5.49 | $4.73 | $4.23 | |||
For each class of the Fund, expenses (net of fee waiver and reimbursement, if any) are equal to the annualized expense ratio for the class (1.09% for Class A, 0.94% for Class P and 0.84% for Institutional Class), multiplied by the average account value over the period, multiplied by 182/365.
| 62 | March 31, 2018 | | Semiannual Report |
Table of Contents
Unaudited
AllianzGI Global Water Fund
For the period of October 1, 2017 through March 31, 2018, as provided by Andreas Fruschki, CFA, Portfolio Manager.
Fund Insights
For the six-month period ended March 31, 2018, Class A shares at net asset value (“NAV”) of the AllianzGI Global Water Fund (the “Fund”) returned 0.53%, underperforming the S&P Global Water Index (the “benchmark”), which returned 0.99%.
Market Overview
Global equities rose steadily through January boosted by optimism over the health of the global economy and by expectations of positive implication of the Tax Cuts and Jobs Act in the US. However, signs of rising inflationary pressures and higher bond yields led to a sharp correction in February. While stocks later recovered some of these losses, the Trump administration’s decision to impose tariffs on a raft of imports led to escalating fears of a global trade war, causing stocks to retreat once more in March. In general, emerging market equities recorded strong gains over the six-month period but, despite record levels of global mergers and acquisitions activity, developed equity delivered mixed returns, with US stocks doing relatively better, while European stocks receded.
With respect to the Water thematic, the end of the 2017 calendar year and the start of the reporting period began with strength in the market with both water utilities and water industrials delivering strong performance. European utilities appreciated given solid end market dynamics, while US utilities recovered after fears of rising interest rates lessened. Water industrials also showed strength, given economic growth, industrial recovery, and released spending on the environmentally focused solutions. However, volatility returned to the market in 2018 and water utilities began to lag the broader market. The utilities sector once again retreated, especially in the US, as investors moved from bond proxies into fixed income. European utilities have faced further strains from the political environment, caused by elections in Spain and discussions across the UK political parties. Water industrials also pulled back in the selloff, with more cyclical stocks under pressure following concerns over sustainability of the economic momentum.
In this environment, we continue to believe fundamentals for water thematic investments remain intact backed by strong secular drivers. We continue to see a focus on water resource management and accommodative regulatory conditions for municipal spending both of which are positive for water companies.
Portfolio Review
The Fund underperformed the broad market as measured by the MSCI ACWI, and slightly lagged its benchmark during the reporting period. Broad market underperformance was due to an overweight in utilities, which pulled back on rising interest rates. It is not uncommon for water utilities to move with sector sentiment in the short-term, however in the long term, water utilities return to normal trading based on strong fundamentals de-correlated to the macro environment.
In contrast, industrial water companies helped performance during the period. Xylem and Idex, two US industrial companies offering water quality monitoring and water-efficiency solutions, were the largest contributors. Both companies benefitted from recovery in their key end markets, and the increased focus on water resource management across their customer base. Xylem has continued to significantly expand its range of solutions, tapping deeper into digital technologies and smart water solutions. Danaher was also was additive, supported by improving water municipal spending in North America, an increased spending on water efficiency across the industrial end markets, and product introductions enhancing the competitive position of the company’s brand.
Among the largest absolute detractors during the period was French utility company Suez. The company retracted after disappointing announcements related to operating results due to political events in some European countries, consequently inflicting a sentiment shift against the name. Beijing Enterprises also detracted from returns given the increase in regulatory standards for Public-Private Partnerships in China, and thus reduced prospects for new project additions. Swiss industrial company Geberit, a leading producer of sanitary equipment, has also hurt performance due to a slowdown in its key end markets, and rising raw material costs.
Outlook
We continue to believe the global water imbalance is increasing. In order to capitalize on this opportunity, we invest in companies that offer solutions to the scarcity crisis across water efficiency and quality solutions, and those that stand to benefit from investments in water infrastructure.
The water-infrastructure theme remains intact and continues to gain attention and attract investments. In the US, we believe the Tax Cuts and Jobs Act provides water utilities with a leeway to increase their capital spending with neutral impact on the customer tariffs, leading to higher growth prospects. The emerging markets are also becoming more proactive in tackling the infrastructure issues, as is clear from China’s recent determination to combat the non-revenue water. These developments are also increasingly including technological innovations like real-time monitoring and quality sensors for the water networks, boosting demand for industrial water players. In addition to the municipalities, the industrial users are also taking higher responsibility for the environmental footprint, directing more effort and investment in, among other, water-efficient processes and equipment. The combination of these, and many other factors, gives us confidence in the strong positive outlook for the water space.
| Semiannual Report | | March 31, 2018 | 63 |
Table of Contents
Unaudited
AllianzGI Global Water Fund (cont’d)
Average Annual Total Return for the period ended March 31, 2018
| 6 Month* | 1 Year | 5 Year | 10 Year | Since Inception† | ||||||||||||||||||
| AllianzGI Global Water Fund Class A | 0.53% | 10.91% | 7.11% | 5.21% | 5.21% | |||||||||||||||||
| AllianzGI Global Water Fund Class A (adjusted) | –5.00% | 4.81% | 5.90% | 4.62% | 4.62% | ||||||||||||||||
| AllianzGI Global Water Fund Class C | 0.21% | 10.09% | 6.28% | 4.42% | 4.42% | |||||||||||||||||
| AllianzGI Global Water Fund Class C (adjusted) | –0.77% | 9.09% | 6.28% | 4.42% | 4.42% | ||||||||||||||||
| AllianzGI Global Water Fund Class P | 0.68% | 11.18% | 7.37% | 5.46% | 5.46% | ||||||||||||||||
| AllianzGI Global Water Fund Institutional Class | 0.66% | 11.18% | 7.43% | 5.54% | 5.54% | ||||||||||||||||
| S&P Global Water Index | 0.99% | 12.41% | 9.92% | 7.24% | 7.24% | ||||||||||||||||
| MSCI ACWI | 4.71% | 14.85% | 9.20% | 5.57% | 5.57% | ||||||||||||||||
| Lipper Global Natural Resources Funds Average | 2.20% | 4.72% | –1.31% | –3.62% | –3.62% | |||||||||||||||||
* Cumulative return
† The Fund began operations on March 31, 2008. Benchmark return comparisons began on the fund inception date. Lipper performance comparisons began on March 31, 2008.
Performance quoted represents past performance and is no guarantee of future results. Current performance may be lower or higher than performance shown. For performance current to the most recent month-end, visit our website at us.allianzgi.com. Investment return and the principal value will fluctuate. Shares may be worth more or less than original cost when redeemed. The adjusted returns take into account the maximum initial sales charge of 5.50% on Class A shares and the contingent deferred sales charge (CDSC) of 1% on Class C shares, which may apply to shares redeemed during the first year of ownership. Returns do not reflect deduction of taxes that a shareholder would pay on fund distributions or redemption of fund shares. See pages 106 and 107 for more information. The Fund’s gross expense ratios are 1.44% for Class A shares, 2.19% for Class C shares 1.16% for Class P shares and 1.15% for Institutional Class shares. These ratios do not include an expense reduction contractually guaranteed through at least January 31, 2019. The Fund’s expense ratios net of this reduction are 1.22% for Class A shares, 1.97% for Class C shares, 0.94% for Class P shares, and 0.93% for Institutional Class shares. Expense ratio information is as of the Fund’s current prospectus dated February 1, 2018.
Cumulative Returns Through March 31, 2018
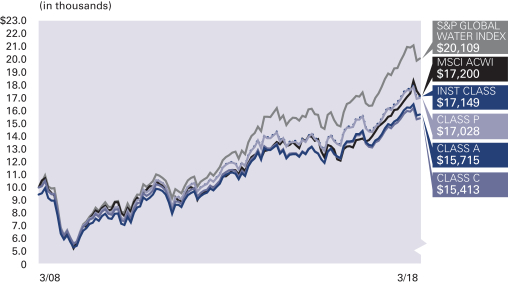
Country Allocation (as of March 31, 2018)
| United States | 48.1% | |||
| France | 10.2% | |||
| United Kingdom | 9.2% | |||
| Switzerland | 6.2% | |||
| Japan | 4.1% | |||
| Netherlands | 4.0% | |||
| Finland | 3.9% | |||
| Austria | 3.8% | |||
| Other | 8.4% | |||
| Cash & Equivalents — Net | 2.1% |
| 64 | March 31, 2018 | | Semiannual Report |
Table of Contents
Unaudited
AllianzGI Global Water Fund (cont’d)
| Shareholder Expense Example | Actual Performance | |||||||
| Class A | Class C | Class P | Institutional Class | |||||
| Beginning Account Value (10/1/17) | $1,000.00 | $1,000.00 | $1,000.00 | $1,000.00 | ||||
| Ending Account Value (3/31/18) | $1,005.30 | $1,002.10 | $1,006.80 | $1,006.60 | ||||
| Expenses Paid During Period | $5.90 | $9.68 | $4.60 | $4.50 | ||||
| Hypothetical Performance | ||||||||
| (5% return before expenses) | ||||||||
| Class A | Class C | Class P | Institutional Class | |||||
| Beginning Account Value (10/1/17) | $1,000.00 | $1,000.00 | $1,000.00 | $1,000.00 | ||||
| Ending Account Value (3/31/18) | $1,019.05 | $1,015.26 | $1,020.34 | $1,020.44 | ||||
| Expenses Paid During Period | $5.94 | $9.75 | $4.63 | $4.53 | ||||
For each class of the Fund, expenses (net of fee waiver and reimbursement, if any) are equal to the annualized expense ratio for the class (1.18% for Class A, 1.94% for Class C, 0.92% for Class P and 0.90% for Institutional Class), multiplied by the average account value over the period, multiplied by 182/365.
| Semiannual Report | | March 31, 2018 | 65 |
Table of Contents
Unaudited
AllianzGI High Yield Bond Fund
For the period of October 1, 2017 through March 31, 2018, as provided by Doug Forsyth, Portfolio Manager.
Fund Insights
For the six-month period ended March 31, 2018, Class A shares at net asset value (“NAV”), of the AllianzGI High Yield Bond Fund (the “Fund”) returned -1.88%, underperforming the ICE BofA Merrill Lynch High Yield Master II Index (the “benchmark”), which returned -0.51%.
Market Overview
The high-yield bond market advanced alongside stocks in the first half of the reporting period. Over the remainder of the period, the asset class contended with a surge in equity market volatility and interest rate volatility.
High-yield bonds weathered the equity volatility better than stocks, providing greater downside protection during the stock market correction.
The 10-year US Treasury yield climbed from 2.33% to 2.94%, before closing the period at 2.74%. Long-duration fixed income was adversely impacted whereas high-yield spreads provided some cushion to absorb the move. The high-yield market’s reduced interest-rate sensitivity provided portfolio diversification benefits as treasuries and investment-grade bonds underperformed on a relative basis.
Credit trends continued to improve with most high-yield issuers reporting better-than-expected financial results and positive outlooks. Managements cited strengthening fundamentals, increasing demand, a more favorable regulatory environment and tax reform benefits. This promising fundamental backdrop helped to buoy the market.
On balance, major US economic reports were healthy and supported the operating environment for high-yield bond issuers.
The US Federal Reserve (the “Fed”) increased its benchmark interest rate by 25 basis points twice over the last six months, once in December and once in March, to settle at a range of 1.50% to 1.75%. The Fed’s decision and commentary minimally influenced convertible bonds.
Finally, fear of a global trade war potentially disrupting global growth and higher inflation weighed on investor sentiment in the second half of the reporting period, but had little impact on the high-yield bond market.
Against this backdrop, CCC-rated bonds returned 1.10%, significantly outperforming the -0.09% and -1.31% returns for B-rated and BB-rated bonds, respectively. CCC-rated bonds rallied with stocks, but did not surrender gains in the subsequent equity market sell-off. Strength in the riskiest, most distressed credits was partially attributable to continued demand by yield-motivated investors. BB-rated issues, which have lower yields and tighter spreads, were influenced by the move higher in Treasury yields.
Portfolio Review
The Fund finished lower and lagged the benchmark return.
Performance dispersion among credit-quality subcategories weighed on relative performance. The Fund’s credit allocation, specifically an underweight in CCC-rated bonds was a headwind as the lowest quality, highest risk issues outperformed higher-quality bonds.
Industry allocations that helped relative performance during the period included cable & satellite television, healthcare and retail. In cable & satellite television, a Fund underweight was a source of strength. Avoiding weaker-performing issues in this industry contributed to issue selection. In healthcare and retail, credit selection was also positive.
Industry allocations that negatively impacted relative performance during the reporting period included printing & publishing, energy and support-services. In printing & publishing, a relative overweight was beneficial, but portfolio underperformance was offsetting. In Energy, a portfolio underweight and issue selection detracted. In support-services, credit selection weighed on relative performance.
Outlook
Volatility returned after being absent for more than a year. However, the US economy is healthy, consumer and business confidence levels are elevated, and corporate profits are estimated to grow significantly in 2018.
Despite a more volatile backdrop, we believe high-yield bond performance expectations should not deviate from their historical return profile of delivering a compelling total return with less volatility than stocks and providing fixed-income diversification benefits in rising interest rate environments compared to US Treasuries and investment-grade corporate bonds.
| 66 | March 31, 2018 | | Semiannual Report |
Table of Contents
Unaudited
AllianzGI High Yield Bond Fund (cont’d)
Average Annual Total Return for the period ended March 31, 2018
| 6 Month* | 1 Year | 5 Year | 10 Year | Since Inception† | ||||||||||||||||||
| AllianzGI High Yield Bond Fund Class A | –1.88% | 1.31% | 3.11% | 6.70% | 7.04% | |||||||||||||||||
| AllianzGI High Yield Bond Fund Class A (adjusted) | –5.56% | –2.49% | 2.33% | 6.29% | 6.85% | ||||||||||||||||
| AllianzGI High Yield Bond Fund Class C | –2.18% | 0.86% | 2.42% | 5.96% | 6.27% | |||||||||||||||||
| AllianzGI High Yield Bond Fund Class C (adjusted) | –3.14% | –0.11% | 2.42% | 5.96% | 6.27% | ||||||||||||||||
| AllianzGI High Yield Bond Fund Class R | –2.09% | 0.95% | 2.68% | 6.35% | 6.73% | ||||||||||||||||
| AllianzGI High Yield Bond Fund Class P | –1.75% | 1.86% | 3.47% | 6.98% | 7.26% | ||||||||||||||||
| AllianzGI High Yield Bond Fund Institutional Class | –1.62% | 1.82% | 3.50% | 7.12% | 7.51% | ||||||||||||||||
| AllianzGI High Yield Bond Fund Administrative Class | –1.84% | 1.60% | 3.03% | 6.67% | 7.03% | |||||||||||||||||
| ICE BofA Merrill Lynch High Yield Master II Index | –0.51% | 3.69% | 5.01% | 8.12% | 7.09% | ||||||||||||||||
| Lipper High Yield Funds Average | –0.41% | 3.25% | 3.86% | 6.67% | 5.94% | |||||||||||||||||
* Cumulative return
† The Fund began operations on July 31, 1996. Benchmark return comparisons began on the fund inception date. Lipper performance comparisons began on July 31, 1996.
Performance quoted represents past performance and is no guarantee of future results. Current performance may be lower or higher than performance shown. For performance current to the most recent month-end, visit our website at us.allianzgi.com. Investment return and the principal value will fluctuate. Shares may be worth more or less than original cost when redeemed. The adjusted returns take into account the maximum initial sales charge of 3.75% on Class A shares and the contingent deferred sales charge (CDSC) of 1% on Class C shares, which may apply to shares redeemed during the first year of ownership. Returns do not reflect deduction of taxes that a shareholder would pay on fund distributions or redemption of fund shares. See pages 106 and 107 for more information. The Fund’s expense ratios are 1.09% for Class A shares, 1.70% for Class C shares, 1.44% for Class R shares, 0.67% for Class P shares, 0.69% for Institutional Class shares and 0.86% for Administrative Class shares. Expense ratio information is as of the Fund’s current prospectus dated February 1, 2018.
Cumulative Returns Through March 31, 2018
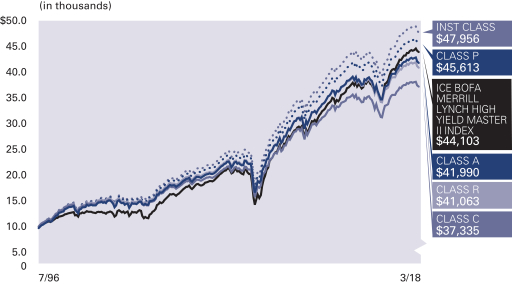
Industry Allocation (as of March 31, 2018 )
| Media | 10.2% | |||
| Oil, Gas & Consumable Fuels | 8.9% | |||
| Telecommunications | 8.7% | |||
| Diversified Financial Services | 5.2% | |||
| Chemicals | 5.0% | |||
| Healthcare-Services | 4.6% | |||
| Commercial Services | 4.1% | |||
| Retail | 3.7% | |||
| Other | 46.6% | |||
| Cash & Equivalents — Net | 3.0% |
| Semiannual Report | | March 31, 2018 | 67 |
Table of Contents
Unaudited
AllianzGI High Yield Bond Fund (cont’d)
S&P Ratings* (as of March 31, 2018)
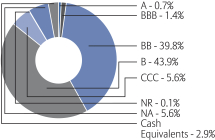
* As a percentage of total investments. Securities ratings refer to the underlying holdings of the Fund and are categorized from highest to lowest credit quality using ratings provided by S&P Global Ratings (“S&P”). S&P’s ratings have been selected for several reasons, including the portfolio managers’ usage of S&P ratings methodology among other credit quality information in managing the Fund, access to background information and other materials provided by S&P, as well as the Funds’ considerations of industry practice. The Fund also displays S&P credit ratings information in materials provided in client presentations. Previous shareholder reports for the Fund displayed bond ratings provided by Moody’s. See “Important Information” for more detail on the selection of S&P for the Fund’s ratings presentation. Securities not rated by S&P and bonds that do not currently have a rating available are designated in the chart above as “NR” and “NA”, respectively.
| Shareholder Expense Example | Actual Performance | |||||||||||
| Class A | Class C | Class R | Class P | Institutional Class | Administrative Class | |||||||
| Beginning Account Value (10/1/17) | $1,000.00 | $1,000.00 | $1,000.00 | $1,000.00 | $1,000.00 | $1,000.00 | ||||||
| Ending Account Value (3/31/18) | $981.20 | $978.20 | $979.10 | $982.50 | $983.80 | $981.60 | ||||||
| Expenses Paid During Period | $5.33 | $8.53 | $7.89 | $3.36 | $3.56 | $4.35 | ||||||
| Hypothetical Performance | ||||||||||||
| (5% return before expenses) | ||||||||||||
| Class A | Class C | Class R | Class P | Institutional Class | Administrative Class | |||||||
| Beginning Account Value (10/1/17) | $1,000.00 | $1,000.00 | $1,000.00 | $1,000.00 | $1,000.00 | $1,000.00 | ||||||
| Ending Account Value (3/31/18) | $1,019.55 | $1,016.31 | $1,016.95 | $1,021.54 | $1,021.34 | $1,020.54 | ||||||
| Expenses Paid During Period | $5.44 | $8.70 | $8.05 | $3.43 | $3.63 | $4.43 | ||||||
For each class of the Fund, expenses are equal to the annualized expense ratio for the class (1.08% for Class A, 1.73% for Class C, 1.60% for Class R, 0.68% for Class P, 0.72% for Institutional Class and 0.88% for Administrative Class), multiplied by the average account value over the period, multiplied by 182/365.
| 68 | March 31, 2018 | | Semiannual Report |
Table of Contents
Unaudited
AllianzGI International Growth Fund
For the period of October 1, 2017 through March 31, 2018 as provided by Laura Villani, Product Specialist Associate, Equities.
Fund Insights
For the six-month period ended March 31, 2018, Class A shares at net asset value (“NAV”) of the AllianzGI International Growth Fund (the “Fund”) returned 5.71%, outperforming the MSCI ACWI ex USA Index (the “benchmark”), which returned 3.76%.
Market Overview
Global equities rose steadily from September 2017 to January 2018, boosted by optimism over the health of the global economy and by expectations that tax reforms would help to lift US company profits. However, signs of rising inflationary pressures and higher bond yields led to a sharp correction in February 2018. While stocks later recovered some of these losses, President Donald Trump’s administration’s decision to impose tariffs on a raft of imports led to escalating fears of a global trade war, causing stocks to retreat once more in March 2018.
European equities lagged many other regions, ending the period with negative returns (in EUR terms) as they joined in the global equity sell-off during February and March amid fears of higher interest rates and a global trade war. UK equities also fell (in GBP terms) but outperformed those in the euro zone by a modest margin. Investors cheered progress in the Brexit negotiations, with the UK and EU reaching broad agreement on a 21-month transition period.
Equity markets in the Pacific ex Japan advanced over the quarter. Markets rallied strongly to the end of January, boosted by growing optimism over the health of the global economy and signs of a pick-up in Asian trade. In Japan, equities closed the six-month period with moderate gains. Shares were boosted by Prime Minister Shinzo Abe’s decisive victory in October’s snap election in which he won over two-thirds of available seats. The victory was seen to reinforce his mandate to continue with “Abenomics”.
Portfolio Review
The Fund takes a bottom-up approach to identifying structural growth, rather than chasing growth momentum. We believe that our focus on high quality businesses, displaying long term structural growth independent of the wider market, should shelter us to some extent from uncertainty in the markets.
During the period, the Fund saw a positive contribution to performance from both stock selection and sector allocation. In terms of sector allocation, the overweight of the Information Technology sector was a key driver of outperformance, along with the underweights of telecommunication services and utilities. From a country perspective, stock selection in Denmark contributed most positively, also supported by Germany, Sweden and France. Stock picking in Brazil and the UK slightly detracted from performance. Both sector and country attributions are a result of the stock selection.
Danish life-saving equipment maker Ambu was the top contributor, with an active contribution of 83 basis points, followed by LG Household & Healthcare, Tencent Holdings, Constellation Software, and Weibo (between 32 and 52 basis points each). Ambu delivered a small fiscal year upgrade given strong gross margin development, with the business comfortably achieving an organic growth rate of 13%. Ambu is focusing again on sales growth in its Visualization division, which contains single-use endoscopes such as aScope, VivaSight, and Isiris (marketed by Coloplast). An increase in US sales reps should be supportive of growth.
Meanwhile Restaurant Brands International was the lead detractor, subtracting 39 basis points from relative performance, with a class action lawsuit from Tim Hortons’ franchisees dragging down performance. European names SAP and Reckitt Benckiser also detracted.
Outlook
Volatility across the market has picked up, creating opportunities for us, as bottom-up stock pickers, to reposition portfolios based on our long-term beliefs. The recent price correction in markets may be seen as healthy after a period of complacency. However, our expectation is for volatility to remain higher, as we approach peak liquidity, and monetary policy gradually begins to tighten.
Although macro data remains strong, several indicators have softened, most locally being the Eurozone Purchasing Managers Index (“PMI”) which now stands at 55.8 from a high of around 58 in January. The topping out of cyclical momentum is a strong indication that the current business cycle has entered its next stage. In this late-cycle reflation phase, we expect growth to stay above potential and inflation to incrementally pick up against a backdrop of ever tighter labor markets and rising economy-wide capacity utilization. Importantly, and particularly in Europe, we have not seen any significant downward trend reflected in the continued recovery of corporate earnings, which we believe is vital to drive the next leg of the European corporate recovery.
Regarding valuations, we consider Europe to be fair-valued, while many larger emerging markets look attractive. Two mid-term headwinds for valuation include fading central bank liquidity provision, and a worsening mix of growth (flattening) and inflation (rising).
Regarding the potential trade war between the US and China, so far the numbers of products involved are not large enough to have a significant impact on growth or inflation figures, and it is potentially a case of politics catching more attention in more uncertain times.
In any case, we see the importance of looking beyond volatility, whilst maintaining our valuation discipline and being selective, to outperform once again in 2018.
| Semiannual Report | | March 31, 2018 | 69 |
Table of Contents
Unaudited
AllianzGI International Growth Fund (cont’d)
Average Annual Total Return for the period ended March 31, 2018
| 6 Month* | 1 Year | Since Inception† | ||||||||||||
| AllianzGI International Growth Fund Class A | 5.71% | 26.26% | 11.35% | |||||||||||
| AllianzGI International Growth Fund Class A (adjusted) | –0.10% | 19.31% | 9.37% | ||||||||||
| AllianzGI International Growth Fund Institutional Class | 5.85% | 26.66% | 11.64% | ||||||||||
| MSCI ACWI ex USA Index | 3.76% | 16.53% | 6.89% | ||||||||||
| MSCI ACWI ex USA Growth Index | 4.84% | 19.92% | 8.14% | ||||||||||
| Lipper Int’l. Multi-Cap Growth Funds Average | 4.44% | 19.44% | 7.92% | |||||||||||
* Cumulative return
† The Fund began operations on February 2, 2015. Benchmark return comparisons began on the fund inception date. Lipper performance comparisons began on January 31, 2015.
Performance quoted represents past performance and is no guarantee of future results. Current performance may be lower or higher than performance shown. For performance current to the most recent month-end, visit our website at us.allianzgi.com. Investment return and the principal value will fluctuate. Shares may be worth more or less than original cost when redeemed. The adjusted returns take into account the maximum initial sales charge of 5.50% on Class A Shares. Returns do not reflect deduction of taxes that a shareholder would pay on fund distributions or redemption of fund shares. See pages 106 and 107 for more information. The Fund’s gross expense ratios are 1.82% for Class A shares and 1.49% for Institutional Class shares. These ratios do not include an expense reduction, contractually guaranteed through at least January 31, 2019. The Fund’s expense ratios net of this reduction are 1.05% for Class A shares and 0.80% for Institutional Class shares. Expense ratio information is as of the Fund’s current prospectus dated February 1, 2018.
Cumulative Returns Through March 31, 2018
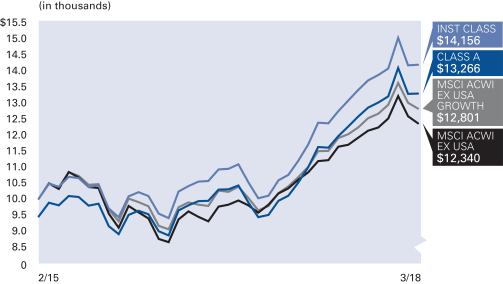
Country Allocation (as of March 31, 2018 )
| Germany | 12.5% | |||
| China | 11.8% | |||
| Denmark | 9.4% | |||
| United Kingdom | 9.2% | |||
| Canada | 8.8% | |||
| Sweden | 7.0% | |||
| Japan | 6.7% | |||
| France | 4.4% | |||
| Other | 28.6% | |||
| Cash & Equivalents — Net | 1.6% |
| 70 | March 31, 2018 | | Semiannual Report |
Table of Contents
Unaudited
AllianzGI International Growth Fund (cont’d)
| Shareholder Expense Example | Actual Performance | |||
| Class A | Institutional Class | |||
| Beginning Account Value (10/1/17) | $1,000.00 | $1,000.00 | ||
| Ending Account Value (3/31/18) | $1,057.10 | $1,058.50 | ||
| Expenses Paid During Period | $5.40 | $4.12 | ||
| Hypothetical Performance | ||||
| (5% return before expenses) | ||||
| Class A | Institutional Class | |||
| Beginning Account Value (10/1/17) | $1,000.00 | $1,000.00 | ||
| Ending Account Value (3/31/18) | $1,019.68 | $1,020.93 | ||
| Expenses Paid During Period | $5.30 | $4.04 | ||
For each class of the Fund, expenses (net of fee waiver and reimbursement, if any) are equal to the annualized expense ratio for the class (1.05% for Class A and 0.80% for Institutional Class), multiplied by the average account value over the period, multiplied by 182/365.
| Semiannual Report | | March 31, 2018 | 71 |
Table of Contents
Unaudited
AllianzGI International Small-Cap Fund
For the period of October 1, 2017 through March 31, 2018, as provided by Alexandra Russo, Product Specialist.
Fund Insights
For the six-month period ended March 31, 2018, Class A shares at net asset value (“NAV”) of the AllianzGI International Small-Cap Fund (the “Fund”) returned 10.70%, outperforming the MSCI World ex USA Small Cap Index (the “benchmark”), which returned 5.29%.
Market Overview
Global equities rose steadily over the four months to January boosted by optimism over the health of the global economy and by expectations that tax reforms would help to lift US company profits. However, signs of rising inflationary pressures and higher bond yields led to a sharp correction in February. While stocks later recovered some of these losses, President Donald Trump’s administration’s decision to impose tariffs on a raft of imports led to escalating fears of a global trade war, causing stocks to retreat once more in March. In general, emerging market equities recorded strong gains over the six-month period but, despite record levels of global mergers and acquisitions activity, developed equity delivered mixed returns, with US stocks rallying while European stocks fell.
European equities lagged many other regions, ending the period with negative returns (in EUR terms) as they joined in the global equity sell-off during February and March amid fears of higher interest rates and a global trade war. Politics also weighed on sentiment. The flash estimate of the Eurozone Purchasing Managers Index (“PMI”) slumped to 55.8 in March, its lowest level since early 2017. However, inflation remained subdued. Germany was among the weakest markets in the Eurozone. Economic data indicated that growth in the Eurozone’s largest market was moderating in 2018, with both the German Ifo Business Climate Index and the ZEW Indicator of Economic Sentiment for Germany easing as the quarter progressed. UK equities also fell (in GBP terms) but outperformed those in the Eurozone by a modest margin.
Equity markets in the Pacific ex Japan advanced over the quarter. In general, markets rallied strongly to the end of January, boosted by growing optimism over the health of the global economy and signs of a pickup in Asian trade. However, stocks lost some of these gains during February and March amid escalating fears of a global trade war. In terms of individual markets, Chinese equities were among those with the strongest returns over the six-month period, although performance was volatile. On balance data pointed to steady growth, underpinned by solid domestic growth and healthy global demand. Australian equities gained, but underperformed the broader region, touching their lowest levels in five months. Having held interest rates at 1.5% since August 2016, the Reserve Bank of Australia indicated that there was no need for a near-term rate rise as inflation was expected to increase only gradually to its target range of 2% to 3%. Returns for Association of Southeast Asian Nations markets were mixed. Thailand, Singapore, Malaysia and Indonesia rose while the Philippines fell sharply. The Philippines has twin deficits (current account and budget), leaving its economy more exposed to US rate increases.
Japanese equities surged for the first fourth months of the review period. Shares were boosted by Prime Minister Shinzo Abe’s decisive victory in October’s snap election in which he won over two-thirds of available seats. The victory was seen to reinforce his mandate to continue with “Abenomics”. However, along with other equity markets, Japanese stocks sold-off sharply in February and March amid escalating fears of a global trade war. In addition, the strength of the yen, which benefitted from its safe-haven status, weighed on returns. Overall, Japanese equities closed the six-month period with moderate gains. In economic news, Japan’s fourth-quarter GDP growth was revised up to 1.6% on an annualized basis, from an initial estimate of 0.5%. This is the eighth consecutive quarter of growth and the longest unbroken period of expansion in almost three decades.
Portfolio Review
International small-cap stocks had a strong six months through the end of March 2018, outperforming their large-cap counterparts.
All three small-cap markets, European, Asia ex Japan and Japanese, showed absolute gains. In USD, Japanese small-caps posted the strongest gains followed by small-caps from Asia ex Japan and the European region.
The Fund performed ahead of its benchmark for the reporting period. The European, Japanese and Asian ex Japan sleeve portfolios all closed well ahead of their respective local markets.
The Fund’s sector positioning resulted in a small positive contribution to relative performance mostly driven by the overweight in information technology and energy.
Country positioning also had a positive impact on relative performance mostly driven by the overweight in China and Taiwan and the underweight in Canada.
Stock selection was the main driver of active performance. Selection was most successful within the industrials, health care and financials sectors. In fact, selection was positive across the portfolio with only slight detraction from selection within consumer discretionary.
On a single stock basis, the positions in Rengo (Japan), Ambu (Denmark) and AMS (Switzerland) were the most significant positive contributors to performance. On the other hand, the positions in NetEnt (Sweden), RPC Group (UK) and Mitsui Mining & Smelting (Japan) were the largest detractors.
Outlook
Even though the global economic data have improved slightly, the figures for key industrial regions such as the US, the Eurozone and Japan recently weakened. The global economy appears to be moving towards the next stage of the current cycle. During this late-cycle reflation phase, the global economy will probably continue to grow, but momentum will not accelerate further. US growth and inflation forecasts for 2018 have been raised again but with expectations already ambitious, any future upward surprises to GDP growth have become considerably less likely. The planned tax cut might give corporate earnings a boost and push them up by a middle single-digit percentage. Wages are slowly, but steadily putting pressure on the margins. Low double-digit earnings growth seems achievable. The economic environment in the Eurozone is robust, but whilst growth rates are still healthy, the cycle might have passed its peak already. In China, indicators such as money supply growth point to a slowdown. Nevertheless, we believe emerging markets equities should continue to rise as long as Chinese growth is sufficiently strong, global trade picks up, the dollar is weak and commodity prices rise.
| 72 | March 31, 2018 | | Semiannual Report |
Table of Contents
Unaudited
AllianzGI International Small-Cap Fund (cont’d)
Average Annual Total Return for the period ended March 31, 2018
| 6 Month* | 1 Year | 5 Year | 10 Year | Since Inception† | ||||||||||||||||||
AllianzGI International Small-Cap Fund Class A | 10.70% | 32.28% | 10.85% | 6.77% | 12.30% | |||||||||||||||||
| AllianzGI International Small-Cap Fund Class A (adjusted) | 4.60% | 25.00% | 9.60% | 6.17% | 11.98% | ||||||||||||||||
AllianzGI International Small-Cap Fund Class C | 10.25% | 31.20% | 10.01% | 5.96% | 11.46% | |||||||||||||||||
| AllianzGI International Small-Cap Fund Class C (adjusted) | 9.25% | 30.20% | 10.01% | 5.96% | 11.46% | ||||||||||||||||
| AllianzGI International Small-Cap Fund Class R | 10.53% | 31.84% | 10.55% | 6.49% | 12.01% | ||||||||||||||||
| AllianzGI International Small-Cap Fund Class P | 10.77% | 32.47% | 11.02% | 6.98% | 12.61% | ||||||||||||||||
| AllianzGI International Small-Cap Fund Institutional Class | 10.81% | 32.52% | 11.10% | 7.09% | 12.70% | ||||||||||||||||
| AllianzGI International Small-Cap Fund Class R6 | 10.84% | 32.60% | 11.20% | 7.19% | 12.81% | ||||||||||||||||
| MSCI World ex USA Small Cap Index | 5.29% | 21.16% | 9.71% | 5.81% | 8.22% | ||||||||||||||||
| MSCI EAFE Small Cap Index | 6.31% | 23.49% | 11.10% | 6.48% | 8.42% | ||||||||||||||||
Lipper International Small/Mid-Cap Growth Funds Average | 6.87% | 24.58% | 9.85% | 6.20% | 9.27% | |||||||||||||||||
* Cumulative return
† The Fund began operations on December 31, 1997. Benchmark return and Lipper performance comparisons began on the fund inception date.
Performance quoted represents past performance and is no guarantee of future results. Current performance may be lower or higher than performance shown. For performance current to the most recent month-end, visit our website at us.allianzgi.com. Investment return and the principal value will fluctuate. Shares may be worth more or less than original cost when redeemed. The adjusted returns take into account the maximum initial sales charge of 5.50% on Class A shares and the contingent deferred sales charge (CDSC) of 1% on Class C shares, which may apply to shares redeemed during the first year of ownership. Returns do not reflect deduction of taxes that a shareholder would pay on fund distributions or redemption of fund shares. See pages 106 and 107 for more information. The Fund’s gross expense ratios are 1.93% for Class A shares, 2.50% for Class C shares, 2.11% for Class R shares, 1.42% for Class P shares, 1.43% for Institutional Class shares and 1.42% for Class R6 shares. These ratios do not include an expense reduction, contractually guaranteed through at least January 31, 2019. The Fund’s expense ratios net of this reduction are 1.25% for Class A shares, 2.08% for Class C shares, 1.59% for Class R shares, 1.10% for Class P shares, 1.04% for Institutional Class shares and 1.00% for Class R6 shares. Expense ratio information is as of the Fund’s current prospectus dated February 1, 2018.
Cumulative Returns Through March 31, 2018
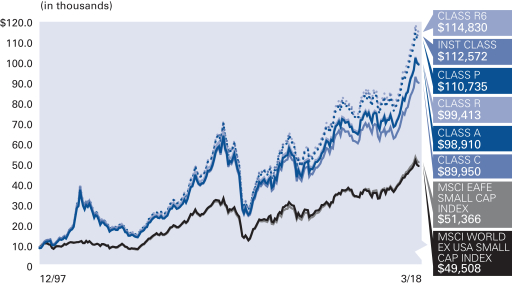
Country Allocation (as of March 31, 2018)
Japan | 30.7% | |||
United Kingdom | 12.1% | |||
Germany | 10.0% | |||
Switzerland | 6.2% | |||
Sweden | 4.6% | |||
France | 4.4% | |||
Austria | 4.2% | |||
Australia | 3.3% | |||
Other | 23.1% | |||
| Cash & Equivalents — Net | 1.4% |
| Semiannual Report | | March 31, 2018 | 73 |
Table of Contents
Unaudited
AllianzGI International Small-Cap Fund (cont’d)
| Shareholder Expense Example | Actual Performance | |||||||||||
Class A | Class C | Class R | Class P | Institutional | Class R6 | |||||||
Beginning Account Value (10/1/17) | $1,000.00 | $1,000.00 | $1,000.00 | $1,000.00 | $1,000.00 | $1,000.00 | ||||||
Ending Account Value (3/31/18) | $1,107.00 | $1,102.50 | $1,105.30 | $1,107.70 | $1,108.10 | $1,108.40 | ||||||
Expenses Paid During Period | $6.57 | $10.90 | $8.35 | $5.78 | $5.57 | $5.26 | ||||||
Hypothetical Performance | ||||||||||||
(5% return before expenses) | ||||||||||||
Class A | Class C | Class R | Class P | Institutional | Class R6 | |||||||
Beginning Account Value (10/1/17) | $1,000.00 | $1,000.00 | $1,000.00 | $1,000.00 | $1,000.00 | $1,000.00 | ||||||
Ending Account Value (3/31/18) | $1,018.70 | $1,014.56 | $1,017.00 | $1,019.45 | $1,019.65 | $1,019.95 | ||||||
Expenses Paid During Period | $6.29 | $10.45 | $8.00 | $5.54 | $5.34 | $5.04 | ||||||
For each class of the Fund, expenses (net of fee waiver and reimbursement, if any) are equal to the annualized expense ratio for the class (1.25% for Class A, 2.08% for Class C, 1.59% for Class R, 1.10% for Class P, 1.06% for Institutional Class and 1.00% for Class R6), multiplied by the average account value over the period, multiplied by 182/365.
| 74 | March 31, 2018 | | Semiannual Report |
Table of Contents
Unaudited
AllianzGI Micro Cap Fund
For the period of October 1, 2017 through March 31, 2018, as provided by Robert Marren, Portfolio Manager.
Fund Insights
For the six-month period ended March 31, 2018, Class A shares at net asset value (“NAV”) of the AllianzGI Micro Cap Fund (the “Fund”) returned -0.19%, underperforming the Russell Microcap Growth Index (the “benchmark”), which returned 1.93%.
Market Overview
US equities rallied strongly through the first four months of the period as sentiment was buoyed by better-than-expected corporate earnings and optimism that $1.5 trillion of tax cuts would further lift profits. However, rising bond yields and signs of a pick-up in wage growth led to a sharp correction in February. While stocks subsequently recovered some of these losses, escalating fears of a global trade war following the Trump administration’s decision to impose tariffs on Chinese imports caused a further sell-off in late March.
Against this backdrop, the Russell Microcap Index returned 2.49% and underperformed the Russell 2000 Index, which returned 3.25%. Within the microcap universe, growth-oriented stocks trailed value-oriented stocks. Specific to the benchmark, sector performance was mostly positive. Consumer staples, financials, and materials were the strongest performing sectors. In contrast, the real estate sector had the weakest performance, followed by utilities and energy.
Portfolio Review
The Fund underperformed its benchmark over the reporting period. From an attribution perspective, security selection drove relative underperformance whereas asset weighting effects had a negligible impact. Stock picking detracted from the healthcare, materials and industrials sectors. Conversely, security selection in the information technology, consumer staples and telecommunications sectors was beneficial and partially offsetting. Separately, an underweight in consumer discretionary helped returns but was balanced by an underweight in healthcare that tempered performance.
A top contributor, Axogen Inc. provides solutions that measures nerve function and repairs damaged peripheral nerves. Shares rallied on better-than-expected revenue growth and management guidance. The largest absolute detractor was Nutrisystems Inc., which provides low-calorie nutritionally-balanced weight management products. The stock was lower on disappointing 2018 guidance due to overspending on television ads with weak viewership.
Outlook
Although 2018 kicked off with elevated levels of volatility, we still expect the economy to expand at a moderate pace. The overall fundamentals still point toward future growth. However, the Trump administration’s aggressive focus on protectionist policies can weaken long-term productivity and negatively impact specific industries. We will continue to closely monitor the situation.
The US Federal Reserve’s March meeting confirmed that the central bank will continue on a path towards monetary policy normalization, with a steady projected 2 to 3 additional rate hikes for 2018. This is supported by the Fed’s outlook for continued positive economic growth and inflation gliding towards the 2% target. Overall, we welcome the return to a more normalized rate environment, which should encourage price discovery based on company fundamentals and can be favorable for active management.
While small-cap equity absolute valuations currently trade at the higher end of historical ranges, relative valuations remain attractive against larger-cap equities. In addition, small-cap equities continue to exhibit stronger growth potential. These factors should support small-cap returns going forward.
| Semiannual Report | | March 31, 2018 | 75 |
Table of Contents
Unaudited
AllianzGI Micro Cap Fund (cont’d)
Average Annual Total Return for the period ended March 31, 2018
| 6 Month* | 1 Year | 5 Year | 10 Year | Since Inception† | ||||||||||||||||||
| AllianzGI Micro Cap Fund Class A | –0.19% | 11.25% | 11.47% | 10.11% | 11.17% | |||||||||||||||||
| AllianzGI Micro Cap Fund Class A (adjusted) | –5.68% | 5.13% | 10.21% | 9.48% | 10.90% | ||||||||||||||||
| AllianzGI Micro Cap Fund Class P | –0.12% | 11.41% | 11.60% | 10.27% | 11.39% | ||||||||||||||||
| AllianzGI Micro Cap Fund Institutional Class | –0.18% | 11.35% | 11.60% | 10.33% | 11.48% | ||||||||||||||||
| Russell Microcap Growth Index | 1.93% | 14.79% | 10.91% | 9.35% | 6.89% | ||||||||||||||||
| Lipper Small-Cap Growth Funds Average | 8.60% | 19.98% | 12.00% | 10.33% | 8.77% | |||||||||||||||||
* Cumulative return
† The Fund began operations on July 12, 1995. Benchmark return comparisons began on the fund inception date. Lipper performance comparisons began on June 30, 1995.
Performance quoted represents past performance and is no guarantee of future results. Current performance may be lower or higher than performance shown. For performance current to the most recent month-end, visit our website at us.allianzgi.com. Investment return and the principal value will fluctuate. Shares may be worth more or less than original cost when redeemed. The adjusted returns take into account the maximum initial sales charge of 5.50% on Class A shares. Returns do not reflect deduction of taxes that a shareholder would pay on fund distributions or redemption of fund shares. See pages 106 and 107 for more information. The Fund’s gross expense ratios are 2.18% for Class A shares, 1.89% for Class P shares and 1.93% for Institutional Class shares. This ratio does not include an expense reduction, contractually guaranteed through at least January 31, 2019. The Fund’s expense ratios net of this reduction are 1.62% for Class A shares, 1.54% for Class P shares and 1.54% for Institutional Class shares. Expense ratio information is as of the Fund’s current prospectus dated February 1, 2018.
Cumulative Returns Through March 31, 2018
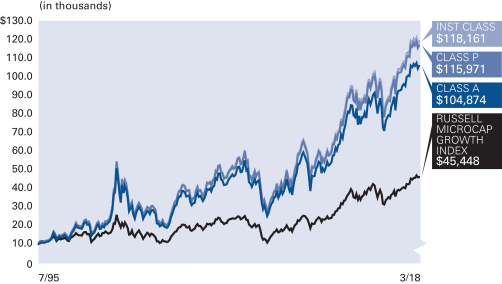
Industry Allocation (as of March 31, 2018)
| Biotechnology | 13.7% | |||
| Healthcare Equipment & Supplies | 9.7% | |||
| Internet Software & Services | 7.9% | |||
| Banks | 6.8% | |||
| Machinery | 5.7% | |||
| Software | 5.3% | |||
| Pharmaceuticals | 4.8% | |||
| Semiconductors & Semiconductor Equipment | 4.5% | |||
| Other | 41.1% | |||
| Cash & Equivalents — Net | 0.5% |
| 76 | March 31, 2018 | | Semiannual Report |
Table of Contents
Unaudited
AllianzGI Micro Cap Fund (cont’d)
| Shareholder Expense Example | Actual Performance | |||||
| Class A | Class P | Institutional Class | ||||
| Beginning Account Value (10/1/17) | $1,000.00 | $1,000.00 | $1,000.00 | |||
| Ending Account Value (3/31/18) | $998.10 | $998.80 | $998.20 | |||
| Expenses Paid During Period | $8.07 | $7.67 | $7.67 | |||
| Hypothetical Performance | ||||||
| (5% return before expenses) | ||||||
| Class A | Class P | Institutional Class | ||||
| Beginning Account Value (10/1/17) | $1,000.00 | $1,000.00 | $1,000.00 | |||
| Ending Account Value (3/31/18) | $1,016.85 | $1,017.25 | $1,017.25 | |||
| Expenses Paid During Period | $8.15 | $7.75 | $7.75 | |||
For each class of the Fund, expenses (net of fee waiver and reimbursement, if any) are equal to the annualized expense ratio for the class (1.62% for Class A, 1.54% for Class P and 1.54% for Institutional Class), multiplied by the average account value over the period, multiplied by 182/365.
| Semiannual Report | | March 31, 2018 | 77 |
Table of Contents
Unaudited
AllianzGI NFJ Emerging Markets Value Fund
For the period of October 1, 2017, through March 31, 2018, as provided by the Value Equity, US team.
Fund Insights
For the six-month period ended March 31, 2018, the Class A shares at net asset value (“NAV”) of the AllianzGI NFJ Emerging Markets Value Fund (the “Fund”) returned 9.41%, outperforming the MSCI Emerging Markets Index (the “benchmark”), which returned 8.96%.
Market Overview
Emerging market equities outperformed developed markets over the six-month period, ending the quarter with strong returns. Initially, emerging market stocks rallied sharply, buoyed by optimism over the global economy and the prospects for global trade. A weak tone to the US dollar also boosted sentiment. However, emerging markets joined in the global stock market correction in February, with fears that more protectionist policies would spark a global trade war further weighing on returns in March. Over the reporting period, Asian equities generally rallied, with Thailand and China among the strongest performers. South Africa rose as well, boosted by hopes of reform when Jacob Zuma was replaced by Cyril Ramaphosa as leader of the ANC, and later as the nation’s President. Russia led the advance in Eastern Europe, delivering double-digit gains, helped by news that Standard & Poor’s had raised the country’s credit rating to investment grade. However, the market weakened in March following universal criticism of Russia’s alleged involvement in the poisoning of a former spy on UK soil.
In terms of sectors, health care, energy and financial stocks in the benchmark climbed into the double digits, followed by robust gains in materials and information technology. In contrast, telecom services stumbled, posting negative total returns, followed by decreases in the real estate, consumer discretionary and industrials sectors over the reporting period.
Portfolio Review
The Fund’s relative outperformance versus its benchmark was driven by robust stock selection, though country and sector allocations also positively impacted relative performance, albeit to a lesser degree, during the six-month period.
In terms of stock selection, Fund holdings in the information technology, consumer discretionary, and consumer staples sectors were robust contributors to performance. These gains were only modestly offset by negative selection effects across the materials, financials and industrials sectors over the reporting period.
From a sector allocation perspective, an underweight in the telecom services sector and overweight in the health care sector boosted relative performance results. Conversely, an overweight in industrials and underweight in information technology detracted from relative performance.
Selection by country was positive due to strength from the Fund’s South Africa-, Taiwan- and Indonesia-based holdings. In contrast, selection in South Korea, Poland and Mexico somewhat muted Fund performance during the reporting period.
Country allocation contributed to positive performance results, largely due to overweight exposures across Singapore and Cyprus. This was somewhat offset by underweight positions in Russia and Brazil.
Outlook
Calendar year 2017 saw emerging market equities realize double-digit gains with all geographic regions across the developed and developing world now achieving sustained positive earnings growth for the first time since September 2011. However, investor optimism stalled in the first quarter of 2018. The emerging markets exhibited strength in January before sinking into negative territory in February and March. This rise in volatility is potentially a healthy sign that market participants are taking into account the risks inherent to equity investing. The possible causes of this volatility are myriad and invariably linked to changing global monetary policy, rising inflation expectations and continued political instability.
As investors navigate the increasingly choppy waters of international equity markets, we believe a dividend-focused approach can help to moderate volatility and realize attractive long term performance. Historical studies indicate dividend-paying equities outperform their non-yielding counterparts, and do so with lower volatility, or variability of return. Furthermore, a rising rate environment has historically benefitted value investing. Our investment process seeks to capture the value premium by identifying higher-quality companies trading at low absolute and relative valuation multiples, and we expect our strategy is well-positioned going forward. Finally, consistently investing at that intersection between dividends and value has been crucial to the strength of our long-term performance results, and we believe this disciplined process will help us continue that trend as we invest in 2018 and beyond.
| 78 | March 31, 2018 | | Semiannual Report |
Table of Contents
Unaudited
AllianzGI NFJ Emerging Markets Value Fund (cont’d)
Average Annual Total Return for the period ended March 31, 2018
| 6 Month* | 1 Year | 5 Year | Since Inception† | |||||||||||||||
| AllianzGI NFJ Emerging Markets Value Fund Class A | 9.41% | 24.82% | 6.79% | 7.51% | ||||||||||||||
| AllianzGI NFJ Emerging Markets Value Fund Class A (adjusted) | 3.39% | 17.96% | 5.59% | 6.37% | |||||||||||||
| AllianzGI NFJ Emerging Markets Value Fund Class C | 9.01% | 23.96% | 6.00% | 6.71% | ||||||||||||||
| AllianzGI NFJ Emerging Markets Value Fund Class C (adjusted) | 8.01% | 22.96% | 6.00% | 6.71% | |||||||||||||
| AllianzGI NFJ Emerging Markets Value Fund Class P | 9.46% | 25.03% | 6.97% | 7.69% | |||||||||||||
| AllianzGI NFJ Emerging Markets Value Fund Institutional Class | 9.53% | 25.20% | 7.06% | 7.78% | |||||||||||||
| MSCI Emerging Markets Index | 8.96% | 24.93% | 4.99% | 4.57% | |||||||||||||
| Lipper Emerging Markets Funds Average | 8.34% | 23.20% | 4.65% | 4.43% | ||||||||||||||
* Cumulative return
† The Fund began operations on December 18, 2012. Benchmark return comparisons began on the fund inception date. Lipper performance comparisons began on December 31, 2012.
Performance quoted represents past performance and is no guarantee of future results. Current performance may be lower or higher than performance shown. For performance current to the most recent month-end, visit our website at us.allianzgi.com. Investment return and the principal value will fluctuate. Shares may be worth more or less than original cost when redeemed. The adjusted returns take into account the maximum initial sales charge of 5.50% on Class A shares and the contingent deferred sales charge (CDSC) of 1% on Class C shares, which may apply to shares redeemed during the first year of ownership. Returns do not reflect deduction of taxes that a shareholder would pay on fund distributions or redemption of fund shares. See pages 106 and 107 for more information. The Fund’s gross expense ratios are 3.33% for Class A shares, 4.01% for Class C shares, 3.01% for Class P shares and 2.88% for Institutional Class shares. These ratios do not include an expense reduction, contractually guaranteed through at least January 31, 2019. The Fund’s expense ratios net of this reduction are 1.15% for Class A shares, 1.90% for Class C shares, 0.99% for Class P shares and 0.90% for Institutional Class shares. Expense ratio information is as of the Fund’s current prospectus dated February 1, 2018.
Cumulative Returns Through March 31, 2018
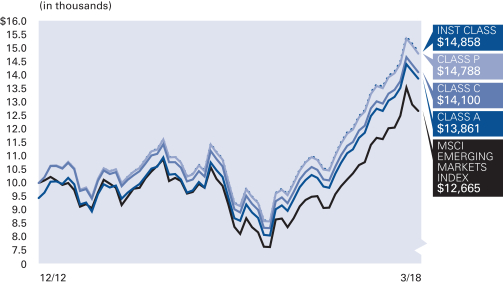
Country Allocation (as of March 31, 2018)
| China | 27.2% | |||
| Korea (Republic of) | 14.7% | |||
| Taiwan | 12.1% | |||
| India | 9.0% | |||
| Brazil | 7.3% | |||
| South Africa | 6.1% | |||
| Russian Federation | 3.5% | |||
| Malaysia | 2.8% | |||
| Other | 12.9% | |||
| Cash & Equivalents — Net | 4.4% |
| Semiannual Report | | March 31, 2018 | 79 |
Table of Contents
Unaudited
AllianzGI NFJ Emerging Markets Value Fund (cont’d)
| Shareholder Expense Example | Actual Performance | |||||||
| Class A | Class C | Class P | Institutional Class | |||||
| Beginning Account Value (10/1/17) | $1,000.00 | $1,000.00 | $1,000.00 | $1,000.00 | ||||
| Ending Account Value (3/31/18) | $1,094.10 | $1,090.10 | $1,094.60 | $1,095.30 | ||||
| Expenses Paid During Period | $5.95 | $9.85 | $5.12 | $4.65 | ||||
| Hypothetical Performance | ||||||||
| (5% return before expenses) | ||||||||
| Class A | Class C | Class P | Institutional Class | |||||
| Beginning Account Value (10/1/17) | $1,000.00 | $1,000.00 | $1,000.00 | $1,000.00 | ||||
| Ending Account Value (3/31/18) | $1,019.25 | $1,015.51 | $1,020.04 | $1,020.49 | ||||
| Expenses Paid During Period | $5.74 | $9.50 | $4.94 | $4.48 | ||||
For each class of the Fund, expenses (net of fee waiver and reimbursement, if any) are equal to the annualized expense ratio for the class (1.14% for Class A, 1.89% for Class C, 0.98% for Class P and 0.89% for Institutional Class), multiplied by the average account value over the period, multiplied by 182/365. These expenses do not include the expenses of the investment companies in which the Fund invests, which are indirectly borne by Fund shareholders.
| 80 | March 31, 2018 | | Semiannual Report |
Table of Contents
Unaudited
AllianzGI NFJ International Small-Cap Value Fund
For the period of October 1, 2017, through March 31, 2018, as provided by the Value Equity, US team.
Fund Insights
For the six-month period ended March 31, 2018, Class A shares at net asset value (“NAV”) of the AllianzGI NFJ International Small-Cap Value Fund (the “Fund”) returned 2.02%, underperforming the MSCI World ex USA Small Cap Index (the “benchmark”), which returned 5.29%.
Market Overview
International equities rose steadily over the four months to January boosted by optimism over the health of the global economy and by expectations that tax reforms would help to lift US company profits. However, signs of rising inflationary pressures and higher bond yields led to a sharp correction in February. While stocks later recovered some of these losses, the Trump administration’s decision to impose tariffs on a raft of imports led to escalating fears of a global trade war, causing stocks to retreat once more in March. Japanese equities surged for the first fourth months of the review period. Shares were boosted by Prime Minister Shinzo Abe’s decisive victory in October’s snap election in which he won over two-thirds of available seats. However, along with other equity markets, Japanese stocks sold-off sharply in February and March amid escalating fears of a global trade war. In addition, the strength of the yen, which benefitted from its safe-haven status, weighed on returns. Overall, Japanese equities closed the six-month period with moderate gains. Eurozone equities joined in the global equity sell-off during February and March amid fears of higher interest rates and a global trade war. In general, company earnings were supportive, though politics weighed on sentiment, with Catalonia voting for independence from Spain and Angela Merkel struggling to establish a coalition government in Germany. Investors cheered progress in the Brexit negotiations, with the UK and EU reaching broad agreement on a 21-month transition period. While the news helped alleviate some of the uncertainty surrounding Brexit, the resulting rally in sterling weighed on share prices as did fears of a global trade war.
In terms of sectors, information technology and financials stocks in the benchmark climbed 9%. Other growth-oriented sectors also performed well, including industrials and materials companies, in addition to utilities names. In contrast, many of the traditionally defensive sectors, such as real estate, consumer staples, health care and telecoms, underperformed.
Portfolio Review
The Fund’s relative underperformance versus the benchmark was largely due to negative stock selection, though country and sector allocations were also negative over the reporting period.
In terms of stock selection, utilities, energy and the materials sectors were the largest contributors to performance. However, these gains were overwhelmed by negative selection across the industrials, financials and information technology sectors.
From a sector allocation perspective, underweight positions in information technology and health care detracted from performance. No sector biases had a meaningful positive impact on relative returns over the reporting period.
Selection by country was negative, led by holdings based in the UK, Japan and Norway, which failed to keep pace with benchmark shares. The Fund realized gains from positive selection in Australia, Canada and Spain-based holdings.
Country allocation was negative, as the Fund’s overweight positions in China and the Philippines, as well as an underweight in Japan weighed on relative performance results. In contrast, an overweight in Argentina and underweight exposures across Italy and France aided relative performance over the reporting period.
Outlook
Calendar year 2017 saw international markets realize double-digit gains with all geographic regions now achieving sustained positive earnings growth for the first time since September 2011. However, investor optimism stalled in the first quarter of 2018. International equities largely sunk into negative territory after strength in January failed to offset declines in February and March. This rise in volatility was perhaps overdue and potentially a healthy sign that market participants are taking into account the risks inherent to equity investing. The possible causes of this volatility are myriad and invariably linked to changing global monetary policy, rising inflation expectations and continued political instability.
As investors navigate the increasingly choppy waters of international equity markets, we believe a dividend-focused approach can help to moderate volatility and realize attractive long term performance. Historical studies indicate dividend-paying equities outperform their non-yielding counterparts, and do so with lower volatility, or variability of return. Furthermore, a rising rate environment has historically benefitted value investing. Our investment process seeks to capture the value premium by identifying higher-quality companies trading at low absolute and relative valuation multiples, and we expect our strategy is well-positioned going forward. Finally, consistently investing at that intersection between dividends and value has been crucial to the strength of our long-term performance results, and we believe this disciplined process will help us continue that trend as we invest in 2018 and beyond.
| Semiannual Report | | March 31, 2018 | 81 |
Table of Contents
Unaudited
AllianzGI NFJ International Small-Cap Value Fund (cont’d)
Average Annual Total Return for the period ended March 31, 2018
| 6 Month* | 1 Year | 5 Year | Since Inception† | |||||||||||||||
| AllianzGI NFJ International Small-Cap Value Class A | 2.02% | 19.10% | 7.51% | 11.04% | ||||||||||||||
| AllianzGI NFJ International Small-Cap Value Class A (adjusted) | –3.59% | 12.55% | 6.30% | 9.97% | |||||||||||||
| AllianzGI NFJ International Small-Cap Value Class C | 1.67% | 18.24% | 6.73% | 10.24% | ||||||||||||||
| AllianzGI NFJ International Small-Cap Value Class C (adjusted) | 0.67% | 17.24% | 6.73% | 10.24% | |||||||||||||
| AllianzGI NFJ International Small-Cap Value Class P | 2.15% | 19.35% | 7.69% | 11.23% | |||||||||||||
| AllianzGI NFJ International Small-Cap Value Institutional Class | 2.18% | 19.46% | 7.81% | 11.34% | |||||||||||||
| AllianzGI NFJ International Small-Cap Value R6 | 2.20% | 19.50% | 7.90% | 11.44% | |||||||||||||
| MSCI World ex USA Small Cap Index | 5.29% | 21.16% | 9.71% | 13.08% | |||||||||||||
| Lipper International Small/Mid-Cap Core Funds Average | 4.63% | 20.08% | 8.18% | 11.33% | ||||||||||||||
* Cumulative return
† The Fund began operations on June 1, 2012. Benchmark return comparisons began on the fund inception date. Lipper performance comparisons began on May 31, 2012.
Performance quoted represents past performance and is no guarantee of future results. Current performance may be lower or higher than performance shown. For performance current to the most recent month-end, visit our website at us.allianzgi.com. Investment return and the principal value will fluctuate. Shares may be worth more or less than original cost when redeemed. The adjusted returns take into account the maximum initial sales charge of 5.50% on Class A shares and the contingent deferred sales charge (CDSC) of 1% on Class C shares, which may apply to shares redeemed during the first year of ownership. Returns do not reflect deduction of taxes that a shareholder would pay on fund distributions or redemption of fund shares. See pages 106 and 107 for more information. The Fund’s gross expense ratios are 7.02% for Class A shares, 7.31% for Class C shares, 6.63% for Class P shares, 6.32% for Institutional Class shares and 6.18% for Class R6 shares. These ratios do not include an expense reduction, contractually guaranteed through at least January 31, 2019. The Fund’s expense ratios net of this reduction are 1.30% for Class A shares, 2.05% for Class C shares, 1.05% for Class P shares, 0.99% for Institutional Class shares and 0.95% for Class R6 shares. Expense ratio information is as of the Fund’s current prospectus dated February 1, 2018.
Cumulative Returns Through March 31, 2018
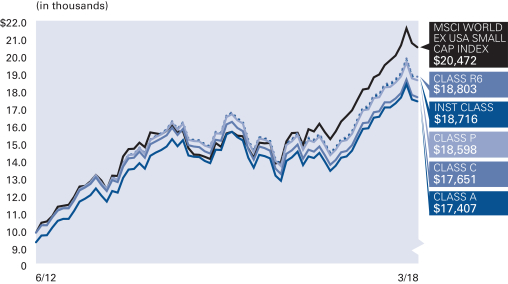
Country Allocation (as of March 31, 2018)
| United Kingdom | 23.4% | |||
| Japan | 18.3% | |||
| Canada | 7.2% | |||
| Australia | 5.9% | |||
| Hong Kong | 5.6% | |||
| Spain | 4.3% | |||
| Norway | 3.9% | |||
| Singapore | 3.6% | |||
| Other | 27.6% | |||
| Cash & Equivalents — Net | 0.2% |
| 82 | March 31, 2018 | | Semiannual Report |
Table of Contents
Unaudited
AllianzGI NFJ International Small-Cap Value Fund (cont’d)
| Shareholder Expense Example | Actual Performance | |||||||||
| Class A | Class C | Class P | Institutional Class | Class R6 | ||||||
| Beginning Account Value (10/1/17) | $1,000.00 | $1,000.00 | $1,000.00 | $1,000.00 | $1,000.00 | |||||
| Ending Account Value (3/31/18) | $1,020.20 | $1,016.70 | $1,021.50 | $1,021.80 | $1,022.00 | |||||
| Expenses Paid During Period | $6.55 | $10.31 | $5.29 | $5.09 | $4.79 | |||||
| Hypothetical Performance | ||||||||||
| (5% return before expenses) | ||||||||||
| Class A | Class C | Class P | Institutional Class | Class R6 | ||||||
| Beginning Account Value (10/1/17) | $1,000.00 | $1,000.00 | $1,000.00 | $1,000.00 | $1,000.00 | |||||
| Ending Account Value (3/31/18) | $1,018.45 | $1,014.71 | $1,019.70 | $1,019.90 | $1,020.19 | |||||
| Expenses Paid During Period | $6.54 | $10.30 | $5.29 | $5.09 | $4.78 | |||||
For each class of the Fund, expenses (net of fee waiver and reimbursement, if any) are equal to the annualized expense ratio for the class (1.30% for Class A, 2.05% for Class C, 1.05% for Class P, 1.01% for Institutional Class and 0.95% for Class R6), multiplied by the average account value over the period, multiplied by 182/365.
| Semiannual Report | | March 31, 2018 | 83 |
Table of Contents
Unaudited
AllianzGI PerformanceFee Managed Futures Strategy Fund
From inception on December 18, 2017 through March 31, 2018, as provided by the Multi-Asset US Group.
Fund Insights
For the period from inception on December 18, 2017 through March 31, 2018, Institutional Class shares at net asset value (“NAV”) of the AllianzGI PerformanceFee Managed Futures Strategy Fund (the “Fund”) returned -3.60%, underperforming the ICE BofA Merrill Lynch 3-Month US Treasury Bill Index (the “benchmark”), which returned 0.41%.
Market Overview
The six-month period ending on March 31, 2018 is best characterized as one which began with markets being supported by optimism about global growth and mostly positive political developments. About midway through the period, however, market expectations began to reset.
Global equities appreciated through January buoyed by optimism about the trajectory of global growth. Late in the fourth quarter, the passage of the Tax Cuts and Jobs Act provided an additional boost to sentiment around US equities in light of positive implications for corporate earnings. In terms of economic expansion, we received confirmation that the US economy expanded at a greater than 3.0% rate for two consecutive quarters (on a quarter-over-quarter annualized rate) and that in the US and almost all major economies, the labor market continued to tighten. And yet inflation failed to materialize in spite of such improvements, while official forecasts (from the US Federal Reserve (the “Fed”)) and unofficial ones (from consumer sentiment surveys) suggested that the absence of inflation would continue in the US and in most major economies. Emerging market assets continued to benefit from the “spillover” effects of strong global growth, with its attendant boost to international trade and support for some industrial commodity prices (such as copper) that benefit key commodity exporters. In addition, emerging markets benefited from a weaker US dollar and persistent inflows of foreign capital.
However, signs of rising inflationary pressures and higher bond yields led to a sharp correction in early February. For the remainder of the reporting period macroeconomic and policy uncertainty forced a recalibration of expectations among market participants across asset classes. As of January, markets expected the Fed to increase its benchmark interest rate two times during 2018 and markets seemed to have grown complacent with the low volatility environment of the previous two years. Several new themes arose during the reporting period including (i) a re-emergence of volatility, (ii) renewed vigilance about the possibility of creeping inflation, and (iii) revised forecasts for the pace and magnitude of increases in the Fed’s benchmark interest rate. In this new context, we observed a spike in the Chicago Board Options Exchange Volatility Index (“VIX”) of around 300% during the first week of February, a correction in US equities of more than 6% intraday during the day following a report showing that US wages in January increased more than expected, and an increase in yields on 10-Year Treasuries of roughly 40 basis points by the end of the period.
In March, these factors, combined with the looming threat of a global trade war linked to the White House’s announcement of steep tariffs on steel and aluminum, weighed on markets. Later in March, the technology sector suffered in the wake of several company-specific events, including the launch of a federal investigation into Facebook’s alleged privacy breach.
Overall, the best performing assets for the six-month period were emerging market equities and emerging market bonds followed by global and US equities. Among the worst performing assets were corporate and US government bonds.
Portfolio Review
After inception on December 18, 2017, the Fund went into 2018 with very strong positive trends in global equities and weak to flat ones in bonds. A trend in US dollar depreciation led to large short dollar positions as well as long positions in more cyclical commodities. This was rewarded in January and by the end of the month equity trends began to show anti-cyclical readings in US equities, causing us to trim our position. In February most positions suffered major losses as equity markets experienced sharp corrections, volatility spiked and the US dollar appreciated due to rising inflation expectations. However, commodities did not move higher despite rising inflation expectations—oil, gold and copper all suffered losses with dollar appreciation possibly being a stronger factor.
As of the beginning of March we were still positioned long global equities though allocations had been reduced slightly after the turmoil in February. Additionally, we were short US bonds as well as UK Gilts. Our currency positioning continued to be short the US dollar vs. all major currencies. In commodities we were long energy and metals (except natural gas) and also some agricultural commodities such as cocoa and live cattle. In March, the dollar continued to depreciate against major currencies, while equity markets recovered somewhat in the first week. Subsequently, global equities resumed correction, currencies flattened and interest rates declined. Therefore, during the remaining part of the month the pro-cyclical positioning in equities and short US fixed income were detractors while we didn’t gain any further from our short US dollar positions. Among commodities we had a strong positive from our long positions in cocoa futures due to constrained supply issues in West Africa.
As of now, the Fund maintains moderate long positions in equities, cyclical commodities and foreign currencies vs. the US dollar. The Fund has a large short position in US and Canadian treasuries while being long Japanese government bonds. On the credit side, emerging market bond positions have been eliminated and US high yield was trimmed significantly.
Outlook
Overall, despite the recent volatility in markets, there is still evidence to support a prolonged period of synchronized global growth. As of the end of the quarter, around the world more than two-thirds of countries (developed and emerging) were producing above-average economic data changes. In addition, monetary policy remains accommodative in historical terms as the removal of excess liquidity has been gradual and we believe monetary policy will likely remain accommodative. Although the Fed raised its benchmark interest rate in March and provided more hawkish guidance for the next two years, comments from new Fed Chairman Jerome Powell suggest that policy will move at a measured pace. For its part, the European Central Bank signaled that it will not increase the policy rate in 2018. Inflation remains low albeit higher than at the end of last year. Inflation expectations, especially survey-based measures, however, are more elevated.
As of the end of the quarter, our market cycle signals and fundamental analysis recommend a neutral position for global equities favoring emerging markets and US equities and with a small underweight to Europe and the United Kingdom. On the fixed income side, we are neutral to modestly underweight US bonds and long periphery European bonds and emerging market local bonds.
| 84 | March 31, 2018 | | Semiannual Report |
Table of Contents
Unaudited
AllianzGI PerformanceFee Managed Futures Strategy Fund (cont’d)
Cumulative Total Return for the period ended March 31, 2018
| Since Inception† | ||||||
| AllianzGI PerformanceFee Managed Futures Strategy Fund Institutional Class | –3.60% | ||||
| AllianzGI PerformanceFee Managed Futures Strategy Fund Class P | –3.60% | ||||
| AllianzGI PerformanceFee Managed Futures Strategy Fund R6 | –3.60% | ||||
| ICE BofA Merrill Lynch 3-Month US Treasury Bill Index | 0.41% | ||||
| Lipper Alt Managed Futures | –2.99% | |||||
† The Fund began operations on December 18, 2017. Benchmark return comparisons began on the fund inception date. Lipper performance comparisons began on December 31, 2017.
Performance quoted represents past performance and is no guarantee of future results. Current performance may be lower or higher than performance shown. For performance current to the most recent month-end, visit our website at us.allianzgi.com. Investment return and the principal value will fluctuate. Shares may be worth more or less than original cost when redeemed. Returns do not reflect deduction of taxes that a shareholder would pay on funds distributions or redemption of fund shares. See pages 106 and 107 for more information. The Fund’s gross expense ratios are 5.49% for Institutional Class shares, 5.54% for Class P shares and 5.44% for Class R6 shares. These ratios do not include an expense reduction, contractually guaranteed through at least January 31, 2019. The Fund’s expense ratios net of this reduction are 0.94% for Institutional Class shares, 0.99% for Class P shares and 0.89% for Class R6 shares. Expense ratio information is as of the Fund’s current prospectus dated February 1, 2018.
Cumulative Returns Through March 31, 2018
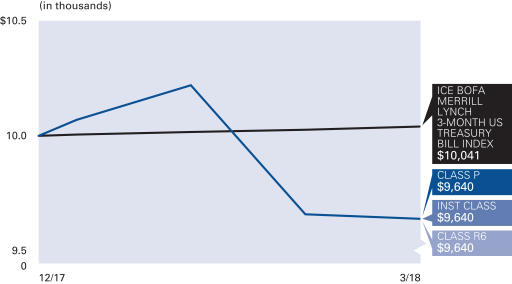
Asset Allocation (as of March 31, 2018 )
| U.S. Treasury Obligations | 83.7% | |||
| Exchange-Traded Funds | 1.0% | |||
| Cash & Equivalents — Net | 15.3% |
| Semiannual Report | | March 31, 2018 | 85 |
Table of Contents
Unaudited
AllianzGI PerformanceFee Managed Futures Strategy Fund (cont’d)
| Shareholder Expense Example | Actual Performance | |||||
| Class P | Institutional Class | Class R6 | ||||
| Beginning Account Value (12/18/17)* | $1,000.00 | $1,000.00 | $1,000.00 | |||
| Ending Account Value (3/31/18) | $964.00 | $964.00 | $964.00 | |||
| Expenses Paid During Period | $0.53 | $0.44 | $0.25 | |||
| Hypothetical Performance | ||||||
| (5% return before expenses) | ||||||
| Class P | Institutional Class | Class R6 | ||||
| Beginning Account Value (10/1/17) | $1,000.00 | $1,000.00 | $1,000.00 | |||
| Ending Account Value (3/31/18) | $1,023.98 | $1,024.18 | $1,024.48 | |||
| Expenses Paid During Period | $0.96 | $0.76 | $0.45 | |||
* The Fund commenced operations on December 18, 2017. The Actual expense example is based on the period since inception; the Hypothetical expense example is based on the period beginning October 1, 2017. If the Hypothetical expense example had been based on the period since inception, the Ending Account Value and Expenses Paid During Period would have been: $1,013.57 and $0.54, respectively, for Class P; $1,013.69 and $0.43, respectively, for Institutional Class; $1,013.86 and $0.26, respectively, for Class R6.
For each class of the Fund, expenses (net of fee waiver and reimbursement, if any) are equal to the annualized expense ratio for the class (0.19% for Class P, 0.15% for Institutional Class and 0.09% for Class R6), multiplied by the average account value over the period, multiplied by 103/365 for the Actual expense example and 182/365 for the Hypothetical expense example. These expenses do not include the expenses of the investment companies in which the Fund invests, which are indirectly borne by Fund shareholders.
| 86 | March 31, 2018 | | Semiannual Report |
Table of Contents
Unaudited
AllianzGI PerformanceFee Structured US Equity Fund
From inception on December 18, 2017 through March 31, 2018, as provided by Greg Tournant and Stephen Bond-Nelson, Co-Portfolio Managers.
Fund Insights
For the period from inception on December 18, 2017 through March 31, 2018, Institutional Class shares at net asset value (“NAV”) of the AllianzGI PerformanceFee Structured US Equity Fund (the “Fund”) returned -2.40%, underperforming the S&P 500 Index (the “benchmark”), which returned -1.32%.
Market Review
The Fund underperformed in the first quarter, as equity markets underwent an abrupt shift from a smooth to a sharply whipsawing environment. It was a challenging quarter for the strategy’s option portfolio, as the severity and speed of equity index moves, combined with a very low starting level of implied volatility and a relatively muted volatility increase, brought about a performance lag.
The benchmark had been coming off 15 consecutive months of gains, including a 5.7% rally in January. At the equity market’s peak on January 26th, the Chicago Board Options Exchange Volatility Index (“VIX”), a fear gauge that measures the implied volatility of at-the-money benchmark options, stood at 11, far below its historical average. This is the volatility environment in which the Fund’s option positions had been built.
Then came the week of February 5th; on this day alone, the benchmark fell 4.1%, while the VIX rose from 17 to 38. This 115% increase was easily the largest one-day percentage move in more than 30 years, and headlines emerged about short-volatility strategies that had collapsed outright. Over the course of the week, from the high of February 2nd to the low of February 9th, the benchmark dropped 10.2%.
Portfolio Review
In response to the market correction, we implemented our restructuring methodology per our risk controls. We restructured all of the option portfolio’s range-bound spreads, lowering the break-evens of our statistical zones by 12%-14% from their original levels. At the same time, the surge in volatility enabled us to harvest gains from our hedging positions—long benchmark puts and long VIX calls—as well as from many of our directional spreads. These gains were not enough to fully offset the restructuring costs, but our first order of business, moving all our strikes out of the way of the market’s descent, was accomplished.
The VIX’s record-setting surge on February 5th belied the implied volatility environment that followed. One week later, the VIX had declined below 20, and three weeks later it stood at 15—remarkably low levels given how violently the equity market had been fluctuating.
For the Fund’s option portfolio, this type of subdued volatility response (a) increases restructuring costs, in that the lower the VIX at time of restructuring, the higher the realized expense; (b) decreases statistical safety, in that strike distances on new range-bound spreads are tighter and less equipped to accommodate incremental equity-index declines; and (c) slows the performance recovery, in that the lower the VIX when new range-bound spreads are built, the less premium collected on short options, thereby extending the time it would take for underperformance to be recouped.
But as always, we must work with the market conditions we have, regardless of how the VIX may have behaved in the past. While the VIX may not be as high as it was in prior corrections, it is still quite an improvement over the exceptionally low levels of 2017.
Outlook
Looking ahead, we are quite mindful of the speed of the equity market. The magnitude of February’s correction was reasonably typical, but lately the market’s rate of descent, especially in the final hours of a trading day, has been noteworthy.
The timing and extent of the Fund’s relative performance recovery depends on several factors. The first is whether additional option restructuring will be necessary. While the market moves have continued to be large, the incremental spreads we have been building are certainly wider and more resilient than what we had been able to construct prior to February. Even if not as high as in the past, a VIX at 20 is better than a VIX at 11.
The second factor is how high the VIX can remain, and for how long. In addition to statistical safety, a higher VIX enables premium collection well above the option portfolio’s typical run rate, which can be a powerful accelerator for a rebound in excess returns. We would like the VIX as high as possible, but again, even a VIX at 20 is better than a VIX at 11. This is especially the case if it can remain elevated for a multi-month period.
Finally, the increase in market volatility afforded us the opportunity to add a number of compelling directional spread positions that could boost outperformance depending on the market’s path from here. If large equity-index moves continue, we could realize incremental excess profitability from directional put spreads, directional call spreads, or perhaps both.
While we never want to underperform, we are pleased that the Fund’s option portfolio was able to limit the damage from this most recent market storm. We are acutely focused on a performance recovery in the second quarter, but in the meantime, we believe the first quarter was a clear demonstration of the Fund’s rigorous risk management tools, its essential combination of short and long volatility, and the strength of the option strategy overall.
| Semiannual Report | | March 31, 2018 | 87 |
Table of Contents
Unaudited
AllianzGI PerformanceFee Structured US Equity Fund (cont’d)
Cumulative Total Return for the period ended March 31, 2018
| Since Inception† | ||||||
| AllianzGI PerformanceFee Structured US Equity Fund Institutional Class | –2.40% | ||||
| AllianzGI PerformanceFee Structured US Equity Fund Class P | –2.40% | ||||
| AllianzGI PerformanceFee Structured US Equity Fund R6 | –2.40% | ||||
| S&P 500 Index | –1.32% | ||||
| Lipper Large-Cap Core Funds | –1.01% | |||||
† The Fund began operations on December 18, 2017. Benchmark return comparisons began on the fund inception date. Lipper performance comparisons began on December 31, 2017.
Performance quoted represents past performance and is no guarantee of future results. Current performance may be lower or higher than performance shown. For performance current to the most recent month-end, visit our website at us.allianzgi.com. Investment return and the principal value will fluctuate. Shares may be worth more or less than original cost when redeemed. Returns do not reflect deduction of taxes that a shareholder would pay on fund distributions or redemption of fund shares. See pages 106 and 107 for more information. The Fund’s gross expense ratios are 4.07% for Institutional Class shares, 4.12% for Class P shares and 4.02% for Class R6 shares. These ratios do not include an expense reduction, contractually guaranteed through at least January 31, 2019. The Fund’s expense ratios net of this reduction are 0.65% for Institutional Class shares, 0.65% for Class P shares and 0.65% for Class R6 shares. Expense ratio information is as of the Fund’s current prospectus dated February 1, 2018.
Cumulative Returns Through March 31, 2018
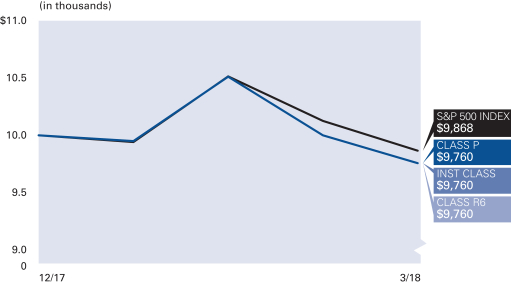
Asset Allocation (as of March 31, 2018)
| Exchange-Traded Funds | 99.3% | |||
| Cash & Equivalents — Net | 0.7% |
| 88 | March 31, 2018 | | Semiannual Report |
Table of Contents
Unaudited
AllianzGI PerformanceFee Structured US Equity Fund (cont’d)
| Shareholder Expense Example | Actual Performance | |||||
| Class P | Institutional Class | Class R6 | ||||
| Beginning Account Value (12/18/17)* | $1,000.00 | $1,000.00 | $1,000.00 | |||
| Ending Account Value (3/31/18) | $976.00 | $976.00 | $976.00 | |||
| Expenses Paid During Period | $0.06 | $0.20 | $0.06 | |||
| Hypothetical Performance | ||||||
| (5% return before expenses) | ||||||
| Class P | Institutional Class | Class R6 | ||||
| Beginning Account Value (10/1/17) | $1,000.00 | $1,000.00 | $1,000.00 | |||
| Ending Account Value (3/31/18) | $1,024.83 | $1,024.58 | $1,024.83 | |||
| Expenses Paid During Period | $0.10 | $0.35 | $0.10 | |||
* The Fund commenced operations on December 18, 2017. The Actual expense example is based on the period since inception; the Hypothetical expense example is based on the period beginning October 1, 2017. If the Hypothetical expense example had been based on the period since inception, the Ending Account Value and Expenses Paid During Period would have been: $1,014.05 and $0.06, respectively, for Class P; $1,013.91 and $0.20, respectively, for Institutional Class; $1,014.05 and $0.06, respectively, for Class R6.
For each class of the Fund, expenses (net of fee waiver and reimbursement, if any) are equal to the annualized expense ratio for the class (0.02% for Class P ,0.07% for Institutional Class and 0.02% for Class R6), multiplied by the average account value over the period, multiplied by 103/365 for the Actual expense example and 182/365 for the Hypothetical expense example. These expenses do not include the expenses of the investment companies in which the Fund invests, which are indirectly borne by Fund shareholders.
| Semiannual Report | | March 31, 2018 | 89 |
Table of Contents
Unaudited
AllianzGI PerformanceFee Structured US Fixed Income Fund
From inception on December 18, 2017 through March 31, 2018, as provided by Greg Tournant and Stephen Bond-Nelson, Co-Portfolio Managers.
Fund Insights
For the period from inception on December 18, 2017 through March 31, 2018, Institutional Class shares at net asset value (“NAV”) of the AllianzGI PerformanceFee Structured US Fixed Income Fund (the “Fund”) returned -1.80%, underperforming the Bloomberg Barclays US Aggregate Bond Index (the “benchmark”), which returned -1.39%.
Market Overview
The Fund underperformed in the first quarter, as equity markets underwent an abrupt shift from a smooth to a sharply whipsawing environment. It was a challenging quarter for the strategy’s option portfolio, as the severity and speed of equity index moves, combined with a very low starting level of implied volatility and a relatively muted volatility increase, brought about a performance lag.
The S&P 500 had been coming off 15 consecutive months of gains, including a 5.7% rally in January. At the equity market’s peak on January 26th, the Chicago Board Options Exchange Volatility Index (“VIX”), a fear gauge that measures the implied volatility of at-the-money S&P 500 options, stood at 11, far below its historical average. This is the volatility environment in which the Fund’s option positions had been built.
Then came the week of February 5th; on this day alone, the S&P 500 fell 4.1%, while the VIX rose from 17 to 38. This 115% increase was easily the largest one-day percentage move in more than 30 years, and headlines emerged about short-volatility strategies that had collapsed outright. Over the course of the week, from the high of February 2nd to the low of February 9th, the S&P 500 dropped 10.2%.
Portfolio Review
In response to the market correction, we implemented our restructuring methodology per our risk controls. We restructured all of the option portfolio’s range-bound spreads, lowering the break-evens of our statistical zones by 12%-14% from their original levels. At the same time, the surge in volatility enabled us to harvest gains from our hedging positions—long S&P 500 puts and long VIX calls—as well as from many of our directional spreads. These gains were not enough to fully offset the restructuring costs, but our first order of business, moving all our strikes out of the way of the market’s descent, was accomplished.
The VIX’s record-setting surge on February 5th belied the implied volatility environment that followed. One week later, the VIX had declined below 20, and three weeks later it stood at 15—remarkably low levels given how violently the equity market had been fluctuating.
For the Fund’s option portfolio, this type of subdued volatility response (a) increases restructuring costs, in that the lower the VIX at time of restructuring, the higher the realized expense; (b) decreases statistical safety, in that strike distances on new range-bound spreads are tighter and less equipped to accommodate incremental equity-index declines; and (c) slows the performance recovery, in that the lower the VIX when new range-bound spreads are built, the less premium collected on short options, thereby extending the time it would take for underperformance to be recouped.
But as always, we must work with the market conditions we have, regardless of how the VIX may have behaved in the past. While the VIX may not be as high as it was in prior corrections, it is still quite an improvement over the exceptionally low levels of 2017.
Outlook
Looking ahead, we are quite mindful of the speed of the equity market. The magnitude of February’s correction was reasonably typical, but lately the market’s rate of descent, especially in the final hours of a trading day, has been noteworthy.
The timing and extent of the Fund’s relative performance recovery depends on several factors. The first is whether additional option restructuring will be necessary. While the market moves have continued to be large, the incremental spreads we have been building are certainly wider and more resilient than what we had been able to construct prior to February. Even if not as high as in the past, a VIX at 20 is better than a VIX at 11.
The second factor is how high the VIX can remain, and for how long. In addition to statistical safety, a higher VIX enables premium collection well above the option portfolio’s typical run rate, which can be a powerful accelerator for a rebound in excess returns. We would like the VIX as high as possible, but again, even a VIX at 20 is better than a VIX at 11. This is especially the case if it can remain elevated for a multi-month period.
Finally, the increase in market volatility afforded us the opportunity to add a number of compelling directional spread positions that could boost outperformance depending on the market’s path from here. If large equity-index moves continue, we could realize incremental excess profitability from directional put spreads, directional call spreads, or perhaps both.
While we never want to underperform, we are pleased that the Fund’s option portfolio was able to limit the damage from this most recent market storm. We are acutely focused on a performance recovery in the second quarter, but in the meantime, we believe the first quarter was a clear demonstration of the Fund’s rigorous risk management tools, its essential combination of short and long volatility, and the strength of the option strategy overall.
| 90 | March 31, 2018 | | Semiannual Report |
Table of Contents
Unaudited
AllianzGI PerformanceFee Structured US Fixed Income Fund (cont’d)
Cumulative Total Return for the period ended March 31, 2018
| Since Inception† | ||||||
| AllianzGI PerformanceFee Structured US Fixed Income Fund Institutional Class | –1.80% | ||||
| AllianzGI PerformanceFee Structured US Fixed Income Fund Class P | –1.80% | ||||
| AllianzGI PerformanceFee Structured US Fixed Income Fund R6 | –1.80% | ||||
| Bloomberg Barclays US Aggregate Bond Index | –1.39% | ||||
| Lipper General Bond Fund Average | –1.09% | |||||
† The Fund began operations on December 18, 2017. Benchmark return comparisons began on the fund inception date. Lipper performance comparisons began on December 31, 2017.
Performance quoted represents past performance and is no guarantee of future results. Current performance may be lower or higher than performance shown. For performance current to the most recent month-end, visit our website at us.allianzgi.com. Investment return and the principal value will fluctuate. Shares may be worth more or less than original cost when redeemed. Returns do not reflect deduction of taxes that a shareholder would pay on fund distributions or redemption of fund shares. See pages 106 and 107 for more information. The Fund’s gross expense ratios are 3.77% for Institutional Class shares, 3.82% for Class P shares and 3.72% for Class R6 shares. These ratios do not include an expense reduction, contractually guaranteed through at least January 31, 2019. The Fund’s expense ratios net of this reduction are 0.35% for Institutional Class shares, 0.35% for Class P shares and 0.35% for Class R6 shares. Expense ratio information is as of the Fund’s current prospectus dated February 1, 2018.
Cumulative Returns Through March 31, 2018
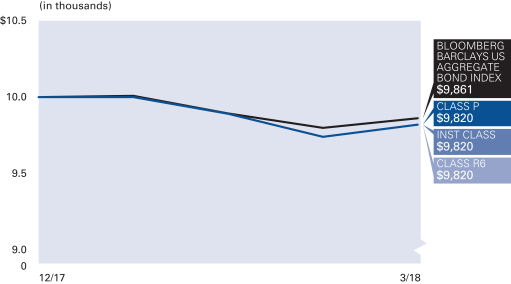
Asset Allocation (as of March 31, 2018)
| Exchange-Traded Funds | 99.8% | |||
| Cash & Equivalents — Net | 0.2% |
| Semiannual Report | | March 31, 2018 | 91 |
Table of Contents
Unaudited
AllianzGI PerformanceFee Structured US Fixed Income Fund (cont’d)
| Shareholder Expense Example | Actual Performance | |||||
| Class P | Institutional Class | Class R6 | ||||
| Beginning Account Value (12/18/17)* | $1,000.00 | $1,000.00 | $1,000.00 | |||
| Ending Account Value (3/31/18) | $982.00 | $982.00 | $982.00 | |||
| Expenses Paid During Period | $0.01 | $0.01 | $0.01 | |||
| Hypothetical Performance | ||||||
| (5% return before expenses) | ||||||
| Class P | Institutional Class | Class R6 | ||||
| Beginning Account Value (10/1/17) | $1,000.00 | $1,000.00 | $1,000.00 | |||
| Ending Account Value (3/31/18) | $1,024.92 | $1,024.92 | $1,024.92 | |||
| Expenses Paid During Period | $0.02 | $0.02 | $0.02 | |||
* The Fund commenced operations on December 18, 2017. The Actual expense example is based on the period since inception; the Hypothetical expense example is based on the period beginning October 1, 2017. If the Hypothetical expense example had been based on the period since inception, the Ending Account Value and Expenses Paid During Period would have been: $1,014.10 and $0.01, respectively, for Class P; $1,014.10 and $0.01, respectively, for Institutional Class; $1,014.10 and $0.01, respectively, for Class R6.
For each class of the Fund, expenses (net of fee waiver and reimbursement, if any) are equal to the annualized expense ratio for the class (less than 0.005% for Class P, less than 0.005% for Institutional Class and less than 0.005% for Class R6), multiplied by the average account value over the period, multiplied by 103/365 for the Actual expense example and 182/365 for the Hypothetical expense example. These expenses do not include the expenses of the investment companies in which the Fund invest, which are indirectly borne by Fund shareholders.
| 92 | March 31, 2018 | | Semiannual Report |
Table of Contents
Unaudited
AllianzGI Real Estate Debt Fund
From inception on December 27, 2017 through March 31, 2018, as provided by Malie Conway and Jonathan Yip, CFA, Co-Lead Portfolio Managers.
Fund Insights
For the period from inception on December 27, 2017 through March 31, 2018, Institutional Class shares at net asset value (“NAV”) of the AllianzGI Real Estate Debt Fund (the “Fund”) returned 0.31%, underperforming the ICE BofA Merrill Lynch 3-Month US Treasury Bill Index (the “benchmark”), which returned 0.35%.
Market Overview
The reporting period was marked with bouts of volatility primarily due to geopolitics and the theme of flattening global yield curves. The eventual passage of the Tax Cuts and Jobs Act in late December fuelled a rally into the early 1st quarter of 2018. However, the optimism came to an abrupt halt in February when higher than expected wage and inflation data led to fears of a more aggressive interest rate hiking policy by the US Federal Reserve. Market volatility surged again in the latter half of March as the equity market priced in the potential impact of a trade war resulting from President Donald Trump’s rhetoric on the imposition of tariffs.
The fundamentals of the US residential market remain strong as home prices continue to rise, inventories remain low and homebuilder confidence remains near its highest levels in the last 30 years. While housing starts have moved higher recently, they remain very low versus historical levels. Similarly, commercial real estate continues to show solid and fairly stable trends with institutional investor demand for real estate expected to remain strong in 2018. While commercial real estate mortgage delinquencies are gradually trending higher with loan seasoning, the overall rate remains low.
In Europe, macroeconomic trends are also supportive of the commercial and residential mortgage markets. During the period, S&P upgraded Spain’s sovereign rating to A-, which should result in a higher rating ceiling for Spanish residential mortgage backed securities up to AAA. This should continue to be a positive story for the sector. Meanwhile, the European commercial mortgage-backed securities market may start to see more momentum in issuance as primary market issuance economics now appear more compelling.
Within the investment grade credit markets, securitized products outperformed corporates, and are attractively positioned going forward.
Portfolio Review
Despite the rise in yields, the Fund performed in line with expectations by strategically having a majority of its investments in floating rate notes whose coupons reset periodically and are tied to LIBOR. During the quarter, 3-month LIBOR increased from 1.69% at the end of December 31, 2017 to 2.31% at the end of the quarter. Fixed rate notes represented an additional 32.3% with the residual in cash and cash equivalents.
Geographic exposure continues to be more weighted toward USD denominated holdings versus EUR and GBP due to more compelling valuations as well as a more robust deal flow in the US commercial and residential real estate holdings in the United States continue to exhibit solid fundamentals. In Europe, we are more focused on residential mortgage-backed securities which offer compelling risk-adjusted returns for short dated floating rate notes while supply in commercial real estate mortgage backed securities remain fairly limited and concentrated in certain jurisdictions such as Italy, which are less preferable.
While we continue to have exposure across the capital structure, we have generally preferred being more weighted in higher rated securities due to the flatter credit curve, which made valuations for subordinated lower-rated tranches less attractive. In terms of sector allocation, we continue to favor office and industrial sectors while we are more selective in the hotel space. We remain cautious on retail property investments particularly in the United States where the sector continues to face challenges from growing e-commerce sector.
Outlook
From a fundamental perspective, the macroeconomic environment continues to be supportive of real estate-related securitized products. Commercial real estate fundamentals appear healthy with stable occupancies, rent growth and steady capital investment flow while overall construction has remained relatively limited. Capitalization rates have also been steady and we believe will remain fairly stable despite expectations for higher rates given the significant cushion between capitalization rates and treasury rates. That said, we are extremely cautious on the retail sector where delinquencies are higher due to the secular shift towards online shopping.
Meanwhile, the US housing market is also seeing positive trends supported by solid and growing demand for housing while inventory levels remain at historic tights putting continued upward pressure on home prices. In addition to a supportive supply/demand balance, we also believe credit standards remain conservative and as a result, the credit environment for housing is healthy.
Despite the increase in interest rate volatility in the first quarter of 2018, we believe that the Fund should continue to provide stable carry and low volatility given its high exposure to floating rate securities and low duration profile. Furthermore, valuations along with the risk-reward profile of the securitized asset class continue to look attractive against other short-duration investment-grade fixed income products.
| Semiannual Report | | March 31, 2018 | 93 |
Table of Contents
Unaudited
AllianzGI Real Estate Debt Fund (cont’d)
Cumulative Total Return for the period ended March 31, 2018
| Since Inception† | ||||||
| AllianzGI Real Estate Debt Fund Class P | 0.28% | ||||
| AllianzGI Real Estate Debt Fund Institutional Class | 0.31% | ||||
| ICE BofA Merrill Lynch 3-Month US Treasury Bill Index | 0.35% | ||||
| Lipper Global Real Estate Fund Average | –3.58% | |||||
† The Fund began operations on December 27, 2017. Benchmark return comparisons began on the fund inception date. Lipper performance comparisons began on December 31, 2017.
Performance quoted represents past performance and is no guarantee of future results. Current performance may be lower or higher than performance shown. For performance current to the most recent month-end, visit our website at us.allianzgi.com. Investment return and the principal value will fluctuate. Shares may be worth more or less than original cost when redeemed. Returns do not reflect deduction of taxes that a shareholder would pay on fund distributions or redemption of fund shares. See pages 106 and 107 for more information. The Fund’s gross expense ratios are 3.55 % for Class P shares and 3.45% for Institutional Class shares. These ratios do not include an expense reduction contractually guaranteed through at least January 31, 2019. The Fund’s expense ratios net of this reduction are 0.68% for Class P shares and 0.58% for Institutional Class shares. Expense ratio information is as of the Fund’s current prospectus dated February 1, 2018.
Cumulative Returns Through March 31, 2018
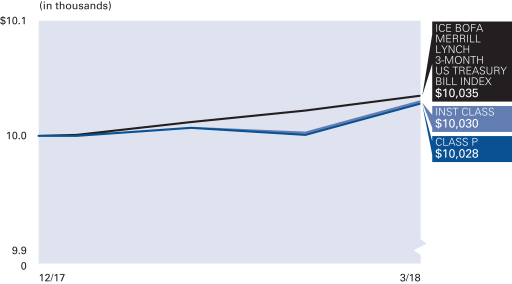
Asset Allocation (as of March 31, 2018)
| Mortgage-Backed Securities | 77.0% | |||
| Corporate Bonds & Notes | 10.0% | |||
| U.S. Government Agency Securities | 2.9% | |||
| Asset-Backed Securities | 2.0% | |||
| Cash & Equivalents — Net | 8.1% |
Credit Ratings* (as of March 31, 2018)
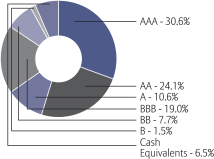
* Credit ratings apply to the credit worthiness of the issuers of the underlying securities and not to the Fund or its shares. Ratings are subject to change. Ratings are derived from a weighted average credit rating based on ratings assigned by Fitch, Moody’s, Kroll, Morningstar, DBRS or S&P. Ratings are shown based on the S&P rating scale, which ranges from AAA (highest) to D (lowest). Where applicable, securities ratings of an agency other than S&P have been converted to the S&P equivalent. “NR” denotes securities that are not rated. Not rated securities do not necessarily indicate low quality. Ratings are relative, subjective and not absolute standards of quality, and represent the opinions of the independent Nationally Recognized Statistical Rating Organizations (NRSRO). The security’s credit rating does not eliminate risk. The Fund is not rated by an independent rating agency.
| 94 | March 31, 2018 | | Semiannual Report |
Table of Contents
Unaudited
AllianzGI Real Estate Debt Fund (cont’d)
| Shareholder Expense Example | Actual Performance | |||
| Class P | Institutional Class | |||
| Beginning Account Value (12/27/17)* | $1,000.00 | $1,000.00 | ||
| Ending Account Value (3/31/18) | $1,002.80 | $1,003.10 | ||
| Expenses Paid During Period | $1.75 | $1.50 | ||
| Hypothetical Performance | ||||
| (5% return before expenses) | ||||
| Class P | Institutional Class | |||
| Beginning Account Value (10/1/17) | $1,000.00 | $1,000.00 | ||
| Ending Account Value (3/31/18) | $1,021.54 | $1,022.04 | ||
| Expenses Paid During Period | $3.43 | $2.92 | ||
* The Fund commenced operations on December 27, 2017. The Actual expense example is based on the period since inception; the Hypothetical expense example is based on the period beginning October 31, 2017. If the Hypothetical expense example had been based on the period since inception, the Ending Account Value and Expenses Paid During Period would have been: $1,011.13 and $1.76, respectively, for Class P and $1,011.38 and $1.50, respectively, for Institutional Class.
For each class of the Fund, expenses (net of fee waiver and reimbursement, if any) are equal to the annualized expense ratio for the class (0.68% for Class P and 0.58% for Institutional Class), multiplied by the average account value over the period, multiplied by 94/365 for the Actual expense example and 182/365 for the Hypothetical expense example.
| Semiannual Report | | March 31, 2018 | 95 |
Table of Contents
Unaudited
AllianzGI Short Duration High Income Fund
For the period of October 1, 2017, through March 31, 2018, as provided by Doug Forsyth, Portfolio Manager.
Fund Insights
For the six-month period ended March 31, 2018, Class A shares at net asset value (“NAV”) of the AllianzGI Short Duration High Income Fund (the “Fund”) returned 0.43%, outperforming the ICE BofA Merrill Lynch 1-3 Year BB US Cash Pay High Yield Index (the “benchmark”), which returned -0.21%.
Market Overview
The broad high-yield bond market advanced alongside stocks in the first half of the reporting period. Over the remainder of the period, the asset class contended with a surge in equity market volatility and interest rate volatility.
High-yield bonds weathered the equity volatility better than stocks, providing greater downside protection during the stock market correction.
The 10-year US Treasury yield climbed from 2.33% to 2.94%, before closing the period at 2.74%. Long-duration fixed income was adversely impacted whereas high-yield spreads provided some cushion to absorb the move. The high-yield market’s reduced interest-rate sensitivity provided portfolio diversification benefits as Treasuries and investment-grade bonds underperformed on a relative basis.
Credit trends continued to improve with most high-yield issuers reporting better-than-expected financial results and positive outlooks. Managements cited strengthening fundamentals, increasing demand, a more favorable regulatory environment and tax reform benefits. This promising fundamental backdrop helped to buoy the market.
On balance, major US economic reports were healthy and supported the operating environment for high-yield bond issuers.
The US Federal Reserve (the “Fed”) increased its benchmark interest rate by 25 basis points twice over the last six months, once in December and once in March, to settle at a range of 1.50% to 1.75%. The Fed’s decision and commentary minimally influenced convertible bonds.
Finally, fear of a global trade war potentially disrupting global growth and higher inflation weighed on investor sentiment in the second half of the reporting period, but had less impact on the high-yield bond market.
Against this backdrop and with respect to the broader high-yield market, CCC-rated bonds returned 1.10%, significantly outperforming the -0.09% and -1.31% returns for B-rated and BB-rated bonds, respectively. CCC-rated bonds rallied with stocks, but did not surrender gains in the subsequent equity market sell-off. Strength in the riskiest, most distressed credits was partially attributable to continued demand by yield-motivated investors. BB-rated issues, which have lower yields and tighter spreads, were influenced by the move higher in Treasury yields.
Portfolio Review
The Fund delivered outperformance and displayed much less volatility relative to fixed income alternatives. While some risk assets and liquid fixed income asset classes finished with losses for the reporting period, the Fund ended with a gain.
Industries that contributed meaningfully to performance in the period included issues in chemicals, healthcare, metals/mining excluding steel followed by retail and insurance. Conversely, capital goods, telecommunications, basic industry & real estate and trucking & delivery detracted from the Fund’s performance.
The majority of positions added to the portfolio over the period were well-seasoned bonds sourced in the secondary market. Several issues were called, tendered or received a make-whole premium over the period.
Outlook
Volatility returned after being absent for more than a year. However, we believe the US economy is healthy, consumer and business confidence levels are elevated, and corporate profits are estimated to grow significantly in 2018.
Despite a more volatile backdrop, high-yield bond performance expectations should not deviate from their historical return profile of delivering a compelling total return with less volatility than stocks and providing fixed-income diversification benefits in rising interest rate environments compared to US Treasuries and investment-grade corporate bonds.
| 96 | March 31, 2018 | | Semiannual Report |
Table of Contents
Unaudited
AllianzGI Short Duration High Income Fund (cont’d)
Average Annual Total Return for the period ended March 31, 2018
| 6 Month* | 1 Year | 5 Year | Since Inception† | |||||||||||||||
| AllianzGI Short Duration High Income Fund Class A | 0.43% | 2.66% | 3.63% | 4.82% | ||||||||||||||
| AllianzGI Short Duration High Income Fund Class A (adjusted) | –1.83% | 0.35% | 3.16% | 4.46% | |||||||||||||
| AllianzGI Short Duration High Income Fund Class C | 0.31% | 2.44% | 3.36% | 4.49% | ||||||||||||||
| AllianzGI Short Duration High Income Fund Class C (adjusted) | –0.67% | 1.46% | 3.36% | 4.49% | |||||||||||||
| AllianzGI Short Duration High Income Fund Class P | 0.53% | 2.93% | 3.84% | 5.02% | |||||||||||||
| AllianzGI Short Duration High Income Fund Institutional Class | 0.57% | 2.99% | 3.91% | 5.11% | |||||||||||||
| AllianzGI Short Duration High Income Fund R6 | 0.63% | 3.06% | 3.94% | 5.13% | |||||||||||||
| ICE BofA Merrill Lynch 1-3 Year BB US Cash Pay High Yield Index | –0.21% | 2.37% | 3.76% | 5.32% | |||||||||||||
| Lipper High Yield Funds Average | –0.41% | 3.25% | 3.86% | 6.49% | ||||||||||||||
* Cumulative return
† The Fund began operations on October 3, 2011. Benchmark return comparisons began on the fund inception date. Lipper performance comparisons began on September 30, 2011.
Performance quoted represents past performance and is no guarantee of future results. Current performance may be lower or higher than performance shown. For performance current to the most recent month-end, visit our website at us.allianzgi.com. Investment return and the principal value will fluctuate. Shares may be worth more or less than original cost when redeemed. The adjusted returns take into account the maximum initial sales charge of 2.25% on Class A shares and the contingent deferred sales charge (CDSC) of 1% on Class C shares, which may apply to shares redeemed during the first year of ownership. Returns do not reflect deduction of taxes that a shareholder would pay on fund distributions or redemption of fund shares. See pages 106 and 107 for more information. The Fund’s gross expense ratios are 0.89% for Class A shares, 1.12% for Class C shares, 0.63% for Class P shares, 0.59% for Institutional Class shares and 0.56% for Class R6 shares. Expense ratio information is as of the Fund’s current prospectus dated February 1, 2018.
Cumulative Returns Through March 31, 2018
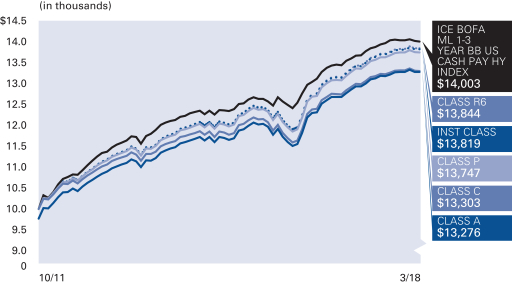
Industry Allocation (as of March 31, 2018)
| Retail | 9.8% | |||
| Telecommunications | 8.9% | |||
| Home Builders | 8.6% | |||
| Commercial Services | 5.6% | |||
| Media | 5.6% | |||
| Healthcare-Services | 5.3% | |||
| Miscellaneous Manufacturing | 5.2% | |||
| Special Retail | 5.1% | |||
| Other | 41.1% | |||
| Cash & Equivalents — Net | 4.8% |
| Semiannual Report | | March 31, 2018 | 97 |
S&P Ratings* (as of March 31, 2018)
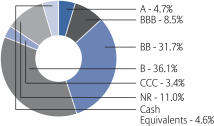
* As a percentage of total investments. Bond ratings refer to the underlying holdings of the Fund and are categorized from highest to lowest credit quality using ratings provided by S&P Global Ratings (“S&P”). S&P’s ratings have been selected for several reasons, including the portfolio managers’ usage of S&P ratings methodology among other credit quality information in managing the Fund, access to background information and other materials provided by S&P, as well as the Funds’ considerations of industry practice. The Fund also displays S&P credit ratings information in materials provided in client presentations. Previous shareholder reports for the Fund displayed bond ratings provided by Moody’s. See “Important Information” for more detail on the selection of S&P for the Fund’s ratings presentation. Bonds not rated by S&P and bonds that do not currently have a rating available are designated in the chart above as “NR” and “NA”, respectively.
Table of Contents
Unaudited
AllianzGI Short Duration High Income Fund (cont’d)
| Shareholder Expense Example | Actual Performance | |||||||||
| Class A | Class C | Class P | Institutional Class | Class R6 | ||||||
| Beginning Account Value (10/1/17) | $1,000.00 | $1,000.00 | $1,000.00 | $1,000.00 | $1,000.00 | |||||
| Ending Account Value (3/31/18) | $1,004.30 | $1,003.10 | $1,005.30 | $1,005.70 | $1,006.30 | |||||
| Expenses Paid During Period | $4.35 | $5.59 | $3.25 | $2.95 | $2.80 | |||||
| Hypothetical Performance | ||||||||||
| (5% return before expenses) | ||||||||||
| Class A | Class C | Class P | Institutional Class | Class R6 | ||||||
| Beginning Account Value (10/1/17) | $1,000.00 | $1,000.00 | $1,000.00 | $1,000.00 | $1,000.00 | |||||
| Ending Account Value (3/31/18) | $1,020.59 | $1,019.35 | $1,021.69 | $1,021.99 | $1,022.14 | |||||
| Expenses Paid During Period | $4.38 | $5.64 | $3.28 | $2.97 | $2.82 | |||||
For each class of the Fund, expenses (net of fee waiver and reimbursement, if any) are equal to the annualized expense ratio for the class (0.87% for Class A, 1.12% for Class C, 0.65% for Class P, 0.59% for Institutional Class and 0.56% for Class R6), multiplied by the average account value over the period, multiplied by 182/365.
| 98 | March 31, 2018 | | Semiannual Report |
Table of Contents
Unaudited
AllianzGI Structured Return Fund
For the period of October 1, 2017 through March 31, 2018, as provided by Greg Tournant and Stephen Bond-Nelson, Co-Portfolio Managers.
Fund Insights
For the six-month period ended March 31, 2018, Class A shares at net asset value (“NAV”) of the AllianzGI Structured Return Fund (the “Fund”) returned -1.56%, underperforming the ICE BofA Merrill Lynch 3-Month US Treasury Bill Index (the “benchmark”), which returned 0.64%.
Market Overview
The Fund declined in the period from October 1, 2017 through March 31, 2018, as markets underwent an abrupt shift from a smooth to a sharply whipsawing environment.
The S&P 500 index surged 6.64% in the fourth quarter of 2017, finishing the year with a 21.83% return. Still, 2017’s most relevant market driver from the Fund’s perspective was not equity appreciation, but rather low volatility. Consistent equity growth over a given year has happened before, for example in 1995, but the volatility environment we experienced in 2017 was unprecedented.
Thus, heading into the first quarter of 2018, the S&P 500 had been coming off 15 consecutive months of gains, including a 5.7% rally in January. At the equity market’s peak on January 26th, the Chicago Board Options Exchange Volatility Index (“VIX”), a fear gauge that measures the implied volatility of at-the-money S&P 500 options, stood at 11, far below its historical average.
Then, from January 26th through February 9th the S&P 500 Index declined more than 11%, triggering a comprehensive restructuring of our range-bound spreads, per our risk controls. The severity and speed of equity index moves, combined with a very low starting level of implied volatility and a relatively muted volatility increase, brought about negative excess returns in the first quarter.
Portfolio Review
In the fourth quarter of 2017, the persistently benign market conditions hurt our ability to collect higher premiums from our range-bound spreads, and also hindered our ability to profit much from directional spreads. However, on the positive side, we were able to hit all our range-bound profit zones.
The environment in 2018 was markedly different. In response to February’s market correction, we implemented our restructuring methodology per the Fund’s risk controls. We restructured all of the Fund’s range-bound spreads, lowering the break-evens of our statistical zones from their original levels. At the same time, the surge in volatility enabled us to harvest gains from our hedging positions — long S&P 500 puts and 8%-12% long VIX calls — as well as from many of our directional spreads. These gains were not enough to fully offset the restructuring costs, but our first order of business, moving all our strikes out of the way of the market’s descent, was accomplished.
The VIX’s record-setting surge on February 5th belied the implied volatility environment that followed. One week later, the VIX had declined below 20, and three weeks later it stood at 15 — remarkably low levels given how violently the market had been fluctuating.
But as always, we must work with the market conditions we have, regardless of how the VIX may have behaved in the past. While the VIX may not be as high as it was in prior corrections, it is still quite an improvement over the exceptionally low levels of 2017.
Outlook
Looking ahead, we are quite mindful of the speed of the market. The magnitude of February’s correction was reasonably typical, but lately the market’s rate of descent, especially in the final hours of a trading day, has been noteworthy.
The timing and extent of the Fund’s performance recovery depends on several factors. The first is whether additional restructuring will be necessary. While the market moves have continued to be large, the incremental spreads we have been building are certainly wider and more resilient than what we had been able to construct prior to February. Even if not as high as in the past, a VIX at 20 is better than a VIX at 11.
The second factor is how high the VIX can remain, and for how long. In addition to statistical safety, a higher VIX enables premium collection well above the portfolio’s typical run rate, which can be a powerful accelerator of a performance rebound. We would like the VIX as high as possible, but again, even a VIX at 20 is better than a VIX at 11. This is especially the case if it can remain elevated for a multi-month period.
Finally, the increase in market volatility afforded us the opportunity to add a number of compelling directional spread positions that could boost performance depending on the market’s path from here. If large S&P 500 Index moves continue, we could realize incremental profitability from directional put spreads, directional call spreads, or perhaps both.
While we never want to deliver negative performance to investors, we are pleased that the Fund was able to limit the damage from this most recent market storm. We are acutely focused on a performance recovery, but in the meantime, we believe this period was a clear demonstration of the Fund’s rigorous risk management tools, its essential combination of short and long volatility, and the strength of the strategy overall.
| Semiannual Report | | March 31, 2018 | 99 |
Table of Contents
Unaudited
AllianzGI Structured Return Fund (cont’d)
Average Annual Total Return for the period ended March 31, 2018
| 6 Month* | 1 Year | 5 Year | Since Inception† | |||||||||||||||
AllianzGI Structured Return Fund Class A | –1.56% | 1.30% | 3.72% | 3.81% | ||||||||||||||
| AllianzGI Structured Return Fund Class A (adjusted) | –6.98% | –4.27% | 2.55% | 2.71% | |||||||||||||
AllianzGI Structured Return Fund Class C | –1.93% | 0.50% | 2.93% | 3.02% | ||||||||||||||
| AllianzGI Structured Return Fund Class C (adjusted) | –2.88% | –0.48% | 2.93% | 3.02% | |||||||||||||
| AllianzGI Structured Return Fund Class P | –1.40% | 1.53% | 3.90% | 3.99% | |||||||||||||
| AllianzGI Structured Return Fund Institutional Class | –1.43% | 1.60% | 3.98% | 4.07% | |||||||||||||
| AllianzGI Structured Return Fund R6 | –1.37% | 1.62% | 4.08% | 4.17% | |||||||||||||
| ICE BofA Merrill Lynch 3-Month US Treasury Bill Index | 0.64% | 1.11% | 0.34% | 0.32% | |||||||||||||
Lipper Absolute Return Funds Average | 0.79% | 2.94% | 2.31% | 2.63% | ||||||||||||||
* Cumulative return
† The Fund began operations on December 3, 2012. Benchmark return comparisons began on the fund inception date. Lipper performance comparisons began on November 30, 2012.
Performance quoted represents past performance and is no guarantee of future results. Current performance may be lower or higher than performance shown. For performance current to the most recent month-end, visit our website at us.allianzgi.com. Investment return and the principal value will fluctuate. Shares may be worth more or less than original cost when redeemed. The adjusted returns take into account the maximum initial sales charge of 5.50% on Class A shares and the contingent deferred sales charge (CDSC) of 1% on Class C shares, which may apply to shares redeemed during the first year of ownership. Returns do not reflect deduction of taxes that a shareholder would pay on fund distributions or redemption of fund shares. See pages 106 and 107 for more information. The Fund’s gross expense ratios are 1.24% for Class A shares, 1.96% for Class C shares, 0.92% for Class P shares, 0.96% for Institutional Class shares and 0.85% for Class R6 shares. These ratios do not include an expense reduction, contractually guaranteed through at least January 31, 2019. The Fund’s expense ratios net of this reduction are 1.07% for Class A shares, 1.86% for Class C shares, 0.86% for Class P shares, 0.78% for Institutional Class shares and 0.76% for Class R6 shares. Expense ratio information is as of the Fund’s current prospectus dated February 1, 2018.
Cumulative Returns Through March 31, 2018
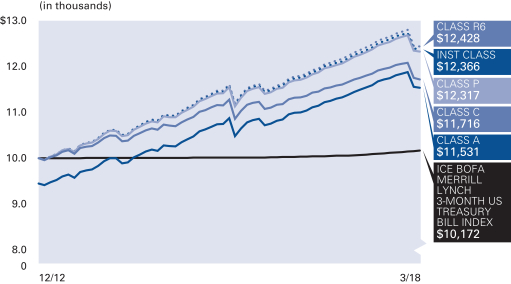
Asset Allocation (as of March 31, 2018 )
| Exchange-Traded Funds | 89.7% | |||
| Cash & Equivalents — Net | 10.3% |
| 100 | March 31, 2018 | | Semiannual Report |
Table of Contents
Unaudited
AllianzGI Structured Return Fund (cont’d)
| Shareholder Expense Example | Actual Performance | |||||||||
Class A | Class C | Class P | Institutional | Class R6 | ||||||
Beginning Account Value (10/1/17) | $1,000.00 | $1,000.00 | $1,000.00 | $1,000.00 | $1,000.00 | |||||
Ending Account Value (3/31/18) | $984.40 | $980.70 | $986.00 | $985.70 | $986.30 | |||||
Expenses Paid During Period | $4.85 | $8.79 | $3.81 | $3.42 | $3.32 | |||||
Hypothetical Performance | ||||||||||
(5% return before expenses) | ||||||||||
Class A | Class C | Class P | Institutional | Class R6 | ||||||
Beginning Account Value (10/1/17) | $1,000.00 | $1,000.00 | $1,000.00 | $1,000.00 | $1,000.00 | |||||
Ending Account Value (3/31/18) | $1,020.04 | $1,016.06 | $1,021.09 | $1,021.49 | $1,021.59 | |||||
Expenses Paid During Period | $4.94 | $8.95 | $3.88 | $3.48 | $3.38 | |||||
For each class of the Fund, expenses (net of fee waiver and reimbursement, if any) are equal to the annualized expense ratio for the class (0.98% for Class A, 1.78% for Class C, 0.77% for Class P, 0.69% for Institutional Class and 0.67% for Class R6), multiplied by the average account value over the period, multiplied by 182/365. These expenses do not include the expenses of the investment companies in which the Fund invests, which are indirectly borne by Fund shareholders.
| Semiannual Report | | March 31, 2018 | 101 |
Table of Contents
Unaudited
AllianzGI U.S. Equity Hedged Fund
For the period of October 1, 2017 through March 31, 2018, as provided by Greg Tournant and Stephen Bond-Nelson, Co-Portfolio Managers.
Fund Insights
For the six-month period ended March 31, 2018, Class A shares of the AllianzGI U.S. Equity Hedged Fund (the “Fund”) returned 0.37%, underperforming the S&P 500 Index (the “benchmark”), which returned 5.84%.
Market Overview
The Fund lagged the benchmark from October 1, 2017 through March 31, 2018, as markets underwent an abrupt shift from a smooth to a sharply whipsawing environment.
The benchmark surged 6.64% in the fourth quarter of 2017, finishing the year with a 21.83% return. The Fund was largely able to keep pace with the rising equity market throughout 2017.
Then, from January 26th through February 9th, the benchmark declined more than 11%. A few weeks later, on February 26th, the benchmark climbed nearly 8% from its lows. In March, the benchmark remained volatile, and once again retested its February lows. The severity and speed of the equity index moves throughout the quarter, combined with a very low starting level of implied volatility and a relatively muted volatility increase, were challenging for the Fund in the first quarter.
Portfolio Review
In the fourth quarter of 2017, the Fund was able to preserve much of the upside potential of the underlying passive equity portfolio in the rising equity market environment. The Chicago Board Options Exchange Volatility Index (“VIX”) averaged just 10.3 for the quarter and 11.1 for the year. When the VIX is low, our call strikes are written closer to the money, with less statistical safety to accommodate rapidly rising equity markets. The quarterly and annual VIX averages were the lowest levels observed over their respective periods since the index’s inception. Nevertheless, our dynamic approach of using a duration mismatch between our short calls and long puts enabled the Fund to largely keep pace with the rising equity market in the fourth quarter.
The environment in 2018 was markedly different. In the first week of February, the benchmark declined over 10%, marking the first equity market correction in two years. The Fund’s long put positions, laddered into the portfolio with a one-year duration at position inception, helped cushion the portfolio against the equity market decline. If the benchmark continued to fall over subsequent days and weeks, these long put positions would have been able to further benefit the portfolio.
A few weeks later, the benchmark rebounded, causing us to incur some losses on some of our short calls. These shorter-duration positions, designed to help offset the cost of our hedging, were written in a low VIX environment, and were therefore unable to accommodate the rapid equity market ascent. For the month of February, Class A Shares of the Fund returned -4.87%, while the benchmark returned -3.69%.
March was a similarly challenging month, as the benchmark continued to vacillate, reaching some of the strikes of our short calls, while the VIX remained relatively muted. The VIX remained in the high-teens throughout most of the month, despite intra-day benchmark movements of up to 3.5%.
Outlook
Looking ahead, the Fund is well positioned to help smooth potential future equity market volatility, while continually mitigating downside risk. Additionally, as demonstrated throughout 2017, the Fund is able to meaningfully participate in the upside in a steadily rising equity market environment.
Until the markets undergo a longer-lasting, more significant period of decline, the Fund will not have an opportunity to demonstrate the full scope of its benefit. Regardless of the future market environment, the Fund has shown it can provide capital appreciation and a reassuring risk profile.
Average Annual Total Return for the period ended March 31, 2018
| 6 Month* | 1 Year | 5 Year | Since Inception† | |||||||||||||||
AllianzGI U.S. Equity Hedged Fund Class A | 0.37% | 5.28% | 5.61% | 6.31% | ||||||||||||||
| AllianzGI U.S. Equity Hedged Fund Class A (adjusted) | –5.15% | –0.51% | 4.42% | 5.18% | |||||||||||||
AllianzGI U.S. Equity Hedged Fund Class C | –0.01% | 4.46% | 4.84% | 5.53% | ||||||||||||||
| AllianzGI U.S. Equity Hedged Fund Class C (adjusted) | –0.99% | 3.46% | 4.84% | 5.53% | |||||||||||||
| AllianzGI U.S. Equity Hedged Fund Class P | 0.46% | 5.42% | 5.77% | 6.47% | |||||||||||||
| AllianzGI U.S. Equity Hedged Fund Institutional Class | 0.52% | 5.52% | 5.89% | 6.58% | |||||||||||||
| S&P 500 Index | 5.84% | 13.99% | 13.31% | 14.90% | |||||||||||||
Lipper Alternative Long/Short Equity Fund Average | 1.92% | 5.92% | 5.20% | 6.28% | ||||||||||||||
* Cumulative return
† The Fund began operations on December 3, 2012. Benchmark return comparisons began on the fund inception date. Lipper performance comparisons began on November 30, 2012.
Performance quoted represents past performance and is no guarantee of future results. Current performance may be lower or higher than performance shown. For performance current to the most recent month-end, visit our website at us.allianzgi.com. Investment return and the principal value will fluctuate. Shares may be worth more or less than original cost when redeemed. The adjusted returns take into account the maximum initial sales charge of 5.50% on Class A shares and the contingent deferred sales charge (CDSC) of 1% on Class C shares, which may apply to shares redeemed during the first year of ownership. Returns do not reflect deduction of taxes that a shareholder would pay on fund distributions or redemption of fund shares. See pages 106 and 107 for more information. The Fund’s gross expense ratios are 8.34% for Class A shares, 6.66% for Class C shares, 5.67% for Class P shares and 5.20% for Institutional Class shares. These ratios do not include an expense reduction, contractually guaranteed through at least January 31, 2019. The Fund’s expense ratios net of this reduction are 1.34% for Class A shares, 2.08% for Class C shares, 1.18% for Class P shares and 1.08% for Institutional Class shares. Expense ratio information is as of the Fund’s current prospectus dated February 1, 2018.
| 102 | March 31, 2018 | | Semiannual Report |
Table of Contents
Unaudited
AllianzGI U.S. Equity Hedged Fund (cont’d)
Cumulative Returns Through March 31, 2018
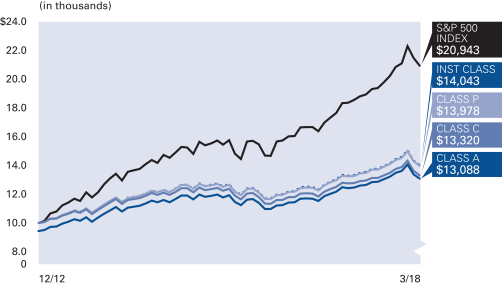
Asset Allocation (as of March 31, 2018 )
Exchange-Traded Funds | 96.4% | |||
Cash & Equivalents — Net | 3.6% |
| Shareholder Expense Example | Actual Performance | |||||||
| Class A | Class C | Class P | Institutional Class | |||||
| Beginning Account Value (10/1/17) | $1,000.00 | $1,000.00 | $1,000.00 | $1,000.00 | ||||
| Ending Account Value (3/31/18) | $1,003.70 | $999.90 | $1,004.60 | $1,005.20 | ||||
| Expenses Paid During Period | $6.24 | $9.97 | $5.50 | $5.00 | ||||
| Hypothetical Performance | ||||||||
| (5% return before expenses) | ||||||||
| Class A | Class C | Class P | Institutional Class | |||||
| Beginning Account Value (10/1/17) | $1,000.00 | $1,000.00 | $1,000.00 | $1,000.00 | ||||
| Ending Account Value (3/31/18) | $1,018.70 | $1,014.96 | $1,019.45 | $1,019.95 | ||||
| Expenses Paid During Period | $6.29 | $10.05 | $5.54 | $5.04 | ||||
For each class of the Fund, expenses (net of fee waiver and reimbursement, if any) are equal to the annualized expense ratio for the class (1.25% for Class A, 2.00% for Class C, 1.10% for Class P and 1.00% for Institutional Class), multiplied by the average account value over the period, multiplied by 182/365. These expenses do not include the expenses of the investment companies in which the Fund invests, which are indirectly borne by Fund shareholders.
| Semiannual Report | | March 31, 2018 | 103 |
Table of Contents
Unaudited
AllianzGI Ultra Micro Cap Fund
For the period of October 1, 2017 through March 31, 2018, as provided by Robert Marren, Portfolio Manager.
Fund Insights
For the six-month period ended March 31, 2018, Class A Shares at net asset value (“NAV”) of the AllianzGI Ultra Micro Cap Fund (the “Fund”) returned -0.89%, underperforming the Russell Microcap Growth Index (the “benchmark”), which returned 1.93%.
Market Overview
US equities rallied strongly through the first four months of the period as sentiment was buoyed by better-than-expected corporate earnings and optimism that $1.5 trillion of tax cuts would further lift profits. However, rising bond yields and signs of a pick-up in wage growth led to a sharp correction in February. While stocks subsequently recovered some of these losses, escalating fears of a global trade war following the Trump administration’s decision to impose tariffs on Chinese imports caused a further sell-off in late March.
Against this backdrop, the Russell Microcap Index returned 2.49% and underperformed the Russell 2000 Index, which returned 3.25%. Within the microcap universe, growth-oriented stocks trailed value-oriented stocks. Specific to the Russell Microcap Growth Index, sector performance was mostly positive. Consumer staples, financials, and materials were the strongest performing sectors. In contrast, the real estate sector had the weakest performance, followed by utilities and energy.
Portfolio Review
The Fund underperformed its benchmark over the reporting period. From an attribution perspective, security selection drove relative underperformance whereas asset weighting effects had a slightly negative impact. Stock picking detracted from the healthcare, materials and consumer staples sectors. Conversely, security selection in the information technology, consumer discretionary and telecommunications sectors was beneficial and partially offsetting. Separately, an underweight in real estate helped returns but was balanced by an overweight in industrials that tempered performance.
A top contributor, Axogen Inc. provides solutions that measures nerve function and repairs damaged peripheral nerves. Shares rallied on better-than-expected revenue growth and management guidance. The largest absolute detractor was Impinj Inc., which supplies radio frequency identification systems to enhance inventory management. The stock fell after the company posted earnings forecasts below consensus due to pricing pressure from competition.
Outlook
Although 2018 kicked off with elevated levels of volatility, we still expect the economy to expand at a moderate pace. The overall fundamentals still point toward future growth. However, the Trump administration’s aggressive focus on protectionist policies can weaken long-term productivity and negatively impact specific industries. We will continue to closely monitor the situation.
The US Federal Reserve meeting in March 2018 confirmed that the central bank will continue on a path towards monetary policy normalization, with a steady projected 2 to 3 additional rate hikes for 2018. This is supported by the Fed’s outlook for continued positive economic growth and inflation gliding towards the 2% target. Overall, we welcome the return to a more normalized rate environment, which should encourage price discovery based on company fundamentals and can be favorable for active management.
While small-cap equity absolute valuations currently trade at the higher end of historical ranges, relative valuations remain attractive against larger-cap equities. In addition, small-cap equities continue to exhibit stronger growth potential. These factors should support small-cap returns going forward.
Average Annual Total Return for the period ended March 31, 2018
| 6 Month* | 1 Year | 5 Year | 10 Year | Since Inception† | ||||||||||||||||||
| AllianzGI Ultra Micro Cap FundClass A | –0.89% | 9.83% | 8.25% | 12.44% | 11.39% | |||||||||||||||||
| AllianzGI Ultra Micro Cap Fund Class A (adjusted) | –6.34% | 3.78% | 7.03% | 11.80% | 10.77% | ||||||||||||||||
| AllianzGI Ultra Micro Cap Fund Class P | –0.68% | 10.23% | 8.55% | 12.73% | 11.68% | ||||||||||||||||
| AllianzGI Ultra Micro Cap Fund Institutional Class | –0.72% | 10.17% | 8.50% | 12.78% | 11.72% | ||||||||||||||||
| Russell Microcap Growth Index | 1.93% | 14.79% | 10.91% | 9.35% | 8.46% | ||||||||||||||||
| Lipper Small-Cap Growth Funds Average | 8.60% | 19.98% | 12.00% | 10.33% | 9.61% | |||||||||||||||||
* Cumulative return
† The Fund began operations on January 28, 2008. Benchmark return comparisons began on the fund inception date. Lipper performance comparisons began on January 31, 2008.
Performance quoted represents past performance and is no guarantee of future results. Current performance may be lower or higher than performance shown. For performance current to the most recent month-end, visit our website at us.allianzgi.com. Investment return and the principal value will fluctuate. Shares may be worth more or less than original cost when redeemed. The adjusted returns take into account the maximum initial sales charge of 5.50% on Class A shares. Returns do not reflect deduction of taxes that a shareholder would pay on fund distributions or redemption of fund shares. See pages 106 and 107 for more information. The Fund’s gross expense ratios are 2.40% for Class A shares, 2.07% for Class P shares and 2.12% for Institutional Class shares. These ratios do not include an expense reduction contractually guaranteed through at least January 31, 2019. The Fund’s expense ratios net of this reduction are 2.01% for Class A share, 1.72% for Class P shares, and 1.69% for Institutional Class shares. Expense ratio information is as of the Fund’s current prospectus dated February 1, 2018.
| 104 | March 31, 2018 | | Semiannual Report |
Table of Contents
Unaudited
AllianzGI Ultra Micro Cap Fund (cont’d)
Cumulative Returns Through March 31, 2018
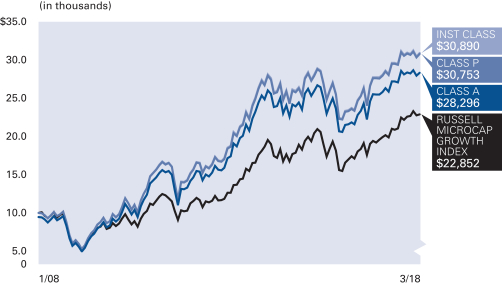
Industry Allocation (as of March 31, 2018 )
| Biotechnology | 13.0% | |||
| Healthcare Equipment & Supplies | 10.9% | |||
| Banks | 9.1% | |||
| Internet Software & Services | 6.0% | |||
| Machinery | 5.8% | |||
| Semiconductors & Semiconductor Equipment | 4.7% | |||
| Software | 4.6% | |||
| Pharmaceuticals | 4.0% | |||
| Other | 41.3% | |||
| Cash & Equivalents — Net | 0.6% |
| Shareholder Expense Example | Actual Performance | |||||
| Class A | Class P | Institutional Class | ||||
| Beginning Account Value (10/1/17) | $1,000.00 | $1,000.00 | $1,000.00 | |||
| Ending Account Value (3/31/18) | $991.10 | $993.20 | $992.80 | |||
| Expenses Paid During Period | $11.02 | $9.34 | $9.34 | |||
| Hypothetical Performance | ||||||
| (5% return before expenses) | ||||||
| Class A | Class P | Institutional Class | ||||
| Beginning Account Value (10/1/17) | $1,000.00 | $1,000.00 | $1,000.00 | |||
| Ending Account Value (3/31/18) | $1,013.86 | $1,015.56 | $1,015.56 | |||
| Expenses Paid During Period | $11.15 | $9.45 | $9.45 | |||
For each class of the Fund, expenses (net of fee waiver and reimbursement, if any) are equal to the annualized expense ratio for the class (2.22% for Class A, 1.88% for Class P and 1.88% for Institutional Class), multiplied by the average account value over the period, multiplied by 182/365.
| Semiannual Report | | March 31, 2018 | 105 |
Table of Contents
Unaudited
The inception date on each Fund Summary page is the inception date of the Fund’s oldest share class or classes. The AllianzGI Global Allocation Fund reorganized on May 4, 2009 when its predecessor merged into the Trust. The Global Allocation Fund’s shares were first offered in 9/98. On April 12, 2010, the following funds reorganized when their predecessors merged into series of the Trust (including fund’s inception date): AllianzGI Convertible Fund (4/93), AllianzGI High Yield Bond Fund (7/96), AllianzGI International Small-Cap Fund (12/97), AllianzGI Micro Cap Fund (7/95), AllianzGI Ultra Micro Cap Fund (1/08). For each of the reorganized funds, Institutional Class is the oldest share class, except that for AllianzGI International Small-Cap Fund, the oldest share class of the predecessor fund merged into Class P.
The Target-Date Funds are designed to offer individual investors comprehensive asset allocation strategies tailored to the approximate date when they expect to begin withdrawing assets. The target date included in the Fund’s name does not necessarily represent the specific year an investor will begin withdrawing assets. It is intended only as a general guide. Each Fund follows a target asset allocation schedule that changes over time to help reduce portfolio risk, increasing its exposure to conservative investments as the target date approaches. The principal value of a Fund is not guaranteed at any time, including the target date. A Fund’s shareholders may experiences losses, including losses near, at or after the target year indicated in the Fund’s name.
Returns measure performance from the inception of the oldest share class to the present, so some returns predate the inception of the actual share class. Those returns are calculated by adjusting the returns of the oldest share class to reflect the indicated share class’s different operating expenses. Total return performance assumes that all dividend and capital gain distributions were reinvested on the payable date.
Class A shares are subject to an initial sales charge. Class C shares are subject to a 1% contingent deferred sales charge (“CDSC”) for shares redeemed in the first year. Class R shares are generally available only to 401(k) plans, 457 plans, employer sponsored 403(b) plans, profit sharing and money purchase pension plans, defined benefit plans, non-qualified deferred compensation plans and healthcare benefit funding plans. Class P shares are offered primarily through certain asset allocation, wrap fee and other similar programs offered by broker-dealers and other intermediaries. Institutional Class shares are offered primarily for direct investment by investors such as pension and profit sharing plans, employee benefit trusts, endowments, foundations, corporations and high net worth individuals. Administrative Class shares are offered primarily through employee benefit plan alliances, broker-dealers and other intermediaries. Class R6 shares are offered primarily for 401(k) plans, 457 plans, employer sponsored 403(b) plans, profit sharing and money purchase pension plans, defined benefit plans, non-qualified deferred compensation plans, healthcare benefit funding plans and other specified benefit plans and accounts whereby the plan or the plan’s broker, dealer or other financial Intermediary has an agreement with the Distributor or the Investment Manager to utilize Class R6 shares In certain Investment products or programs.
Class D and Class B shares were converted into Class A shares on November 13, 2015 and December 4, 2015, respectively.
The Lipper Averages are calculated by Lipper, Inc. They are based on the total return performance, with distributions reinvested and
operating expenses deducted, of funds included by Lipper in the stated category. Lipper does not take into account sales charges.
The Cumulative Returns charts for each Fund assume the initial investment was made on the first day of the Fund’s initial fiscal year. The charts reflect any sales load that would have applied at the time of purchase or any CDSC that would have applied if a full redemption occurred on the last business day of the most recent fiscal year. Results assume that all dividends and capital gain distributions were reinvested. They do not take into account the effect of taxes. The benchmark cumulative return began on the last day of the month of the respective Fund’s inception date.
“Cash & Equivalents—Net” in the Allocation Summaries may be comprised of cash, repurchase agreements, U.S. Treasury Bills, options purchased, options written and other assets net of other liabilities including net unrealized appreciation (depreciation) on futures contracts, forward foreign currency contracts and swap agreements, as applicable.
Proxy Voting
The Funds’ Investment Manager has adopted written proxy voting policies and procedures (the “Proxy Policy”) as required by Rule 206(4)-6 under the Investment Advisers Act of 1940. The Proxy Policy has been adopted by Allianz Funds Multi-Strategy Trust (the “Trust”) as the policies and procedures that the Investment Manager will use when voting proxies on behalf of the Funds. Copies of the written Proxy Policy and the factors that the Investment Manager may consider in determining how to vote proxies for each Fund, and information about how each Fund voted proxies relating to portfolio securities held during the most recent twelve-month period ended June 30, are available without charge, upon request, by calling 1-800-988-8380 (retail classes: A, C & R) or 1-800-498-5413 (Class P, R6, Institutional & Administrative classes), on the Allianz Global Investors Distributors LLC’s website at us.allianzgi.com, and on the Securities and Exchange Commission’s (“SEC”) website at http://www.sec.gov.
Form N-Q
The Trust files complete schedules of each Fund’s portfolio holdings with the SEC on Form N-Q for the first and third quarters of each fiscal year, which are available on the SEC’s website at http://www.sec.gov. A copy of the Trust’s Form N-Q is available without charge, upon request, by calling 1-800-988-8380 (retail classes: A, C & R) or 1-800-498-5413 (Class P, R6, Institutional & Administrative classes). In addition, the Trust’s Form N-Q may be reviewed and copied at the SEC’s Public Reference Room in Washington, DC. Information on the operation of the Public Reference Room may be obtained by calling 1-800-SEC-0330.
The following disclosure provides important information regarding each Fund’s Shareholder Expense Example, which appears on each Fund Summary page in this Semiannual Report. Please refer to this information when reviewing the Shareholder Expense Example for a Fund.
Shareholder Expense Example
Shareholders of a Fund incur two types of costs: (1) transaction costs; and (2) ongoing costs, including investment management fees; distribution and/or service (12b-1) fees and other Fund expenses. The
| 106 | March 31, 2018 | | Semiannual Report |
Table of Contents
Shareholder Expense Example is intended to help shareholders understand ongoing costs (in dollars) of investing in a Fund and to compare these costs with the ongoing costs of investing in other mutual funds. The Shareholder Expense Example is based on an investment of $1,000.00 invested at the beginning of the period, as indicated, and held for the entire period through March 31, 2018.
Actual Expenses
The information in the table under the heading “Actual Performance” provides information about actual account values and actual expenses. You may use the information in these columns, together with the amount you invested, to estimate the expenses that you paid over the period. Simply divide your account value by $1,000.00 (for example, an $8,600.00 account value divided by $1,000.00 = 8.6), then multiply the result by the number in the appropriate column for your share class, in the row entitled “Expenses Paid During Period”, to estimate the expenses you paid on your account during this period.
Hypothetical Example for Comparison Purposes
The information in the table under the heading “Hypothetical Performance (5% return before expenses)” provides information about hypothetical account values and hypothetical expenses based on a Fund’s actual expense ratio and an assumed rate of return of 5% per year before expenses, which is not the Fund’s actual return. The hypothetical account values and expenses may not be used to estimate the actual ending account balance or expenses you paid for the period. You may use this information to compare the ongoing costs of investing in a Fund and other funds. To do so, compare this 5% hypothetical example with the 5% hypothetical examples that appear in the shareholder reports of other funds.
Please note that the expenses shown in the table are meant to highlight your ongoing costs only and do not reflect any transactional costs. Therefore, the information under the heading “Hypothetical Performance (5% return before expenses)” is useful in comparing ongoing costs only, and will not help you determine the relative total costs of owning different funds. In addition, if these transactional costs were included, your costs would have been higher.
Shareholders may be subject to an annual fee of $15 for any accounts, including fiduciary accounts, with balances that fall below $1,000. This fee is not included in the shareholder expense example. If you are subject to the fee, keep it in mind when you are estimating the ongoing expenses of investing in the Funds and when comparing the expenses of these Funds with other funds.
Credit Ratings
Credit ratings apply to the underlying holdings of a Fund and not the Fund itself and are divided into categories ranging from highest to lowest credit quality, determined for purposes of presentations in this report by using ratings provided by S&P Global Ratings (“S&P”), except for AllianzGI Emerging Markets Debt Fund, AllianzGI Global Fundamental Strategy Fund, AllianzGI Global High Yield Fund and AllianzGI Real Estate Debt Fund. AllianzGI Emerging Markets Debt Fund and AllianzGI Global Fundamental Strategy Fund present ratings breakdowns based on Moody’s Investors Service, Inc. (“Moody’s”) ratings. AllianzGI Global High Yield Fund presents ratings breakdowns based on the lowest available rating from S&P, Moody’s or Fitch, Inc. (“Fitch”). Ratings from Moody’s are translated to the S&P equivalent.
AllianzGI Real Estate Debt Fund presents ratings breakdowns based on a weighted average credit rating calculated using ratings assigned by Fitch, Moody’s, Kroll Bond Rating Agency (“Kroll”), Morningstar, DBRS and S&P, as applicable. The weighted average credit rating is translated to the S&P equivalent using a methodology that assigns equal values to equivalent ratings across agencies.
With respect to AllianzGI Emerging Markets Debt Fund and AllianzGI Global Fundamental Strategy Fund, presentations of credit ratings information in this report use ratings provided by Moody’s because of, among other reasons, the access to background information and other materials provided by Moody’s, as well as the Funds’ considerations of industry practice. With respect to AllianzGI Convertible Fund, AllianzGI High Yield Bond Fund and AllianzGI Short Duration High Income Fund, presentations of credit ratings information in this report use ratings provided by S&P because of, among other reasons, the applicable portfolio managers’ usage of S&P ratings methodology among other credit quality information in managing the respective portfolios, access to background information and other materials provided by S&P, as well as the Funds’ considerations of industry practice. The Funds also display S&P credit ratings information in materials provided in client presentations.
With respect to AllianzGI Global High Yield Fund, the presentation of credit ratings information in this report uses the lowest available rating provided by S&P, Moody’s or Fitch to ensure the most conservative presentation of the quality of the portfolio. With respect to AllianzGI Real Estate Debt Fund, the presentation of credit ratings information in this report uses ratings provided by Fitch, Moody’s, Kroll, Morningstar, DBRS and S&P to ensure that each security in the portfolio has at least one rating from a major credit rating agency. This methodology is intended to narrow the universe of securities that are designated “unrated” and to capture variations in ratings among rating agencies.
Except for the methodologies described above for AllianzGI Global High Yield Fund and AllianzGI Real Estate Debt Fund, securities not rated by Moody’s or S&P, or securities that do not have a rating available from Moody’s or S&P are designated as “NR” and “NA”, respectively. Credit quality ratings assigned by a rating agency are subjective opinions, not statements of fact, and are subject to change periodically, even as frequently as daily. Ratings assigned by Moody’s, S&P or another rating agency are not absolute standards of credit quality and do not evaluate market risk. Rating agencies may fail to make timely changes in credit ratings, and an issuer’s current financial condition may be better or worse than a rating indicates. In formulating investment decisions for the applicable Funds, Allianz Global Investors U.S. LLC develops its own analysis of the credit quality and risks associated with individual debt instruments, rather than relying exclusively on rating agencies or third-party research.
All the information on the Fund Summary pages, including Fund Insights, Average Annual Total Return Tables, Cumulative Return Charts, Shareholder Expense Examples and Allocation/Credit Rating Summaries is unaudited.
Allianz Global Investors Distributors LLC, 1633 Broadway, New York, NY, 10019, us.allianzgi.com, 1-800-988-8380 (retail classes: A, C & R) or 1-800-498-5413 (Class P, R6, Institutional & Administrative classes).
| Semiannual Report | | March 31, 2018 | 107 |
Table of Contents
Unaudited
Unless otherwise noted, index returns reflect the reinvestment of income dividends and capital gains, if any, but do not reflect fees, brokerage commissions or other expenses of investing. It is not possible to invest directly in an index.
Prior to November 1, 2006, performance data for the MSCI Indices was calculated gross of dividend tax withholding. Performance data presently shown for the Indices is net of dividend tax withholding. This recalculation results in lower performance for the Indices.
| Index | Description | |
| AllianzGI 2020 Strategic Benchmark, AllianzGI 2025 Strategic Benchmark, AllianzGI 2030 Strategic Benchmark, AllianzGI 2035 Strategic Benchmark, AllianzGI 2040 Strategic Benchmark, AllianzGI 2045 Strategic Benchmark, AllianzGI 2050 Strategic Benchmark and AllianzGI 2055 Strategic Benchmark | The AllianzGI 2020 Strategic Benchmark, AllianzGI 2025 Strategic Benchmark, AllianzGI 2030 Strategic Benchmark, AllianzGI 2035 Strategic Benchmark, AllianzGI 2040 Strategic Benchmark, AllianzGI 2045 Strategic Benchmark, AllianzGI 2050 Strategic Benchmark and AllianzGI 2055 Strategic Benchmark each represents the performance of a custom blended index developed by AllianzGI U.S., it is comprised of three underlying indices: MSCI USA Index, MSCI ACWI ex USA Index and Bloomberg Barclays US Aggregate Bond Index. The strategic weights to these indices reflect the glidepath which starts with a 93% weight to the Equity Indices, becoming more conservative to end 5 years past the target retirement date with 30% weight to the equity indices. | |
| AllianzGI Multi Asset Income Strategic Benchmark | The AllianzGI Multi Asset Income Strategic Benchmark represents the performance of a custom blended index developed by the Adviser it is comprised of three underlying indices: 20% MSCI USA Index, 10% MSCI ACWI ex USA Index and 70% Bloomberg Barclays US Aggregate Bond Index. | |
| Bloomberg Barclays Global Aggregate Bond Index | The Bloomberg Barclays Global Aggregate Bond Index is a broad-based measure of the investment grade fixed-rate debt markets. | |
| Bloomberg Barclays Global High Yield Index | The Bloomberg Barclays Global High Yield Index is a multi-currency flagship measure of the global high yield debt market. The index represents the union of the US High Yield, the Pan-European High Yield, and Emerging Markets (EM) Hard Currency High Yield Indices. | |
| Bloomberg Barclays US Aggregate Bond Index | The Bloomberg Barclays US Aggregate Bond Index represents securities that are SEC-registered, taxable, and US dollar denominated. The index covers the US investment grade fixed rate bond market, with index components for government and corporate securities, mortgage pass-through securities, and asset-backed securities. | |
| Bloomberg Barclays US Credit Index | The Bloomberg Barclays US Credit Index is the credit component of the US Government/Credit Index. It includes publicly issued US corporate and specified foreign debentures and secured notes that meet the specified maturity, liquidity and quality requirements. To qualify, bonds must be SEC-registered. | |
| Bloomberg Barclays US Government Bond Index | The Bloomberg Barclays US Bond Index is a market capitalization-weighted index, meaning the securities in the index are weighted according to the market size of each bond type. Most U.S. traded investment grade bonds are represented. | |
| Bloomberg Barclays US TIPS Index | The Bloomberg Barclays US Treasury US TIPS Index consists of Inflation-Protection securities issued by the US Treasury. | |
| Bloomberg Barclays US Treasury Bills 1-3 Month Index | The Bloomberg Barclays US Treasury Bills 1-3 Month Index includes US Treasury bills with a remaining maturity from 1 up to (but not including) 3 months. | |
| Bloomberg Barclays US Universal Bond Index | The Bloomberg Barclays US Universal Bond Index represents the union of the US Aggregate Index, the US High-Yield Corporate Index, the 144A Index, the Eurodollar Index, the Emerging Markets Index, and the non-ERISA portion of the CMBS Index. Municipal debt, private placements, and non-dollar-denominated issues are excluded from the Universal Index. The only constituent of the index that includes floating-rate debt is the Emerging Markets Index. | |
| Bloomberg Commodity Index | The Bloomberg Commodity Index is a broadly diversified commodity price index distributed by Bloomberg Indexes. | |
| 108 | March 31, 2018 | | Semiannual Report |
Table of Contents
| Index | Description | |
| Dow Jones Sustainability World Total Return Index | The Dow Jones Sustainability World Total Return Index tracks the performance of the top 10% of the 2500 largest companies in the S&P Global Broad Market Index that are the world’s sustainability leaders based on economic, environmental and social criteria. | |
| Dow Jones US Select REIT Index | The Dow Jones US Select REIT Index intends to measure the performance of publicly traded REITs and REIT-like securities. | |
| ICE BofA Merrill Lynch 1-3 Year BB US Cash Pay High Yield Index | The ICE BofA Merrill Lynch 1-3 Year BB US Cash Pay High Yield Index is a subset of the ICE BofA Merrill Lynch US Cash Pay High Yield Index, including all securities with a remaining term to final maturity less than 3 years and rated BB1 through BB3, inclusive. The ICE BofA Merrill Lynch US Cash Pay High Yield Index tracks the performance of US dollar-denominated below investment grade corporate debt, currently in a coupon paying period, that is publicly issued in the US domestic market. | |
| ICE BofA Merrill Lynch 3-Month US Treasury Bill Index | The ICE BofA Merrill Lynch 3-Month US Treasury Bill Index tracks the performance of the 3-month US Treasury markets. | |
| ICE BofA Merrill Lynch All Convertibles Index | The ICE BofA Merrill Lynch All Convertibles Index is a widely used, unmanaged index that measures the performance of US dollar-denominated convertible securities not currently in bankruptcy with a total market value greater than $50 million at issuance. | |
| ICE BofA Merrill Lynch High Yield Master II Index | The ICE BofA Merrill Lynch High Yield Master II Index is an unmanaged index consisting of US dollar-denominated bonds that are issued in countries having a BBB3 or higher debt rating with at least one year remaining until maturity. All bonds must have a credit rating below investment grade but not in default. | |
| ICE BofA Merrill Lynch Global High Yield Constrained Index | The ICE BofA Merrill Lynch Global High Yield Constrained Index contains all securities in the ICE BofA Merrill Lynch Global High Yield Index USD but caps issuer exposure at 2%. The ICE BofA Merrill Lynch Global High Yield Index tracks the performance of below investment grade corporate debt publicly issued in the major domestic or eurobond markets. | |
| JP Morgan Corporate Emerging Markets Broad Diversified Index (CEMBI-BD) | The JP Morgan Corporate Emerging Markets Broad Diversified Index (CEMBI-BD) tracks total returns of US dollar-denominated debt instruments issued by corporate entities in emerging market countries. Two variations are available: CEMBI Broad and CEMBI. The CEMBI Broad is the most comprehensive corporate benchmark followed by the CEMBI, which consists of an investable universe of corporate bonds. Both indices are also available in Diversified versions. | |
| JP Morgan Emerging Markets Bond Index Global Diversified (EMBI Global Diversified) | The JP Morgan Emerging Markets Bond Index Global Diversified (EMBI Global Diversified) is a uniquely-weighted version of the EMBI Global. It limits the weights of those index countries with larger debt stocks by only including specified portions of these countries’ eligible current face amounts of debt outstanding. The countries covered in the EMBI Global Diversified are identical to those covered by the EMBI Global. | |
| JP Morgan Government Bond Index-Emerging Markets (GBI-EM) | The JP Morgan Government Bond Index-Emerging Markets (GBI-EM) is the first comprehensive, global local emerging markets index, and consists of regularly traded, liquid fixed-rate, domestic currency government bonds to which international investors can gain exposure. Variations of the index are available to allow investors to select the most appropriate benchmark for their objectives. | |
Morningstar Lifetime Moderate 2020, Morningstar Lifetime Moderate 2025, Morningstar Lifetime Moderate 2030, Morningstar Lifetime Moderate 2035, Morningstar Lifetime Moderate 2040, Morningstar Lifetime Moderate 2045, Morningstar Lifetime Moderate 2050 and Morningstar Lifetime Moderate 2055 | The Morningstar Lifetime Moderate 2020, Morningstar Lifetime Moderate 2025, Morningstar Lifetime Moderate 2030, Morningstar Lifetime Moderate 2035, Morningstar Lifetime Moderate 2040, Morningstar Lifetime Moderate 2045, Morningstar Lifetime Moderate 2050 and Morningstar Lifetime Moderate 2055 Indices each represents a portfolio of global equities, bonds and traditional inflation hedges such as commodities and TIPS. The portfolio is held in proportions appropriate for a U.S. investor’s investment horizon until retirement. The moderate risk profile is for investors who are comfortable with average exposure to equity market volatility. | |
| Semiannual Report | | March 31, 2018 | 109 |
Table of Contents
Unaudited
Benchmark Descriptions (cont’d)
| Index | Description | |
| MSCI ACWI ex USA Growth Index | The MSCI ACWI ex USA Growth Index captures large and mid-cap securities exhibiting overall growth style characteristics across developed and emerging markets, excluding the United States. | |
| MSCI ACWI ex USA Index | The MSCI ACWI ex USA Index captures large and mid cap representation across Developed Markets countries (excluding the US) and Emerging Markets countries. The index covers approximately 85% of the global equity opportunity set outside the US. | |
| MSCI All Country World Index (Also known as: MSCI AC World Index and MSCI ACWI) | The MSCI All Country World Index (ACWI) captures large and mid cap representation across the Developed Markets and Emerging Markets countries. The index covers approximately 85% of the global investable equity opportunity set. | |
MSCI EAFE Index | The MSCI EAFE Index is an equity index which captures large and mid cap representation across Developed Markets countries around the world, excluding the US and Canada. | |
| MSCI EAFE Small Cap Index | The MSCI EAFE Small Cap Index is an equity index which captures small cap representation across Developed Markets countries around the world, excluding the US and Canada. | |
| MSCI Emerging Markets Index | The MSCI Emerging Markets Index captures large and mid cap representation across Emerging Markets countries. The index covers approximately 85% of the free float-adjusted market capitalization in each country. | |
| MSCI Emerging Markets Small Cap Index | The MSCI Emerging Markets Small Cap Index includes small cap representation across 23 Emerging Markets countries. The index covers approximately 14% of the free float-adjusted market capitalization in each country. The Small cap segment tends to capture more local economic and sector characteristics relative to larger Emerging Markets capitalization segments. | |
| MSCI Europe Index (Net) | The MSCI Europe Index (Net) captures large and mid cap representation across Developed Markets countries in Europe. The index covers approximately 85% of the free float-adjusted market capitalization across the European Developed Markets equity universe. | |
MSCI USA Index | The MSCI USA Index is designed to measure the performance of the large and mid cap segments of the US market. The index covers approximately 85% of the free float-adjusted market capitalization in the US. | |
| MSCI World ex USA Small Cap Index | The MSCI World ex USA Small Cap Index captures small cap representation across 23 of 24 Developed Markets countries (excluding the United States). | |
MSCI World High Dividend Yield Index | The MSCI World High Dividend Yield Index is based on the MSCI World Index, its parent index, and includes large and mid cap stocks across 23 Developed Markets countries. The index is designed to reflect the performance of equities in the parent index (excluding REITs) with higher dividend income and quality characteristics than average dividend yields that are both sustainable and persistent. The index also applies quality screens and reviews 12-month past performance to omit stocks with potentially deteriorating fundamentals that could force them to cut or reduce dividends. Performance data shown for the index is net of dividend tax withholding. | |
| MSCI World Index | The MSCI World Index captures large and mid cap representation across Developed Markets countries. The index covers approximately 85% of the free float-adjusted market capitalization in each country. | |
| Russell 2000 Index | The Russell 2000 Index measures the performance of the small cap segment of the US equity universe. The Russell 2000 Index is a subset of the Russell 3000 Index representing approximately 10% of total market capitalization of that index. It includes approximately 2000 of the smallest securities based on a combination of their market cap and current index membership. | |
| Russell Microcap Growth Index | The Russell Microcap Growth Index measures the performance of the microcap growth segment of the US equity market. It includes those Russell Microcap Index companies with higher price-to-book ratios and higher forecasted growth values. | |
| Russell Microcap Index | The Russell Microcap Index measures the performance of the microcap segment of the US equity market. It makes up less than 3% of the US equity market. | |
| 110 | March 31, 2018 | | Semiannual Report |
Table of Contents
| Index | Description | |
| S&P 500 Index | The Standard & Poor’s 500 Index is an unmanaged index of large capitalization common stocks. | |
| S&P Global Water Index | The Standard & Poor’s Global Water Index is comprised of 50 of the largest publicly traded companies in water-related businesses that meet specific investability requirements. This index is designed to provide liquid exposure to the leading publicly-listed companies in the global water industry, from both developed markets and emerging markets. | |
| USD Overnight LIBOR | USD Overnight LIBOR (London Interbank Offered Rate) Index is the average interest rate at which leading banks in London borrow US dollar funds from one another with a maturity of one day (overnight). | |
| Semiannual Report | | March 31, 2018 | 111 |
Table of Contents
March 31, 2018 (Unaudited)
AllianzGI Retirement 2020 Fund
| Shares | Value | |||||||
| Mutual Funds (a)—88.8% | ||||||||
AllianzGI Advanced Core Bond | 584,061 | $8,451,358 | ||||||
AllianzGI Best Styles U.S. Equity (c) | 160,013 | 2,961,843 | ||||||
AllianzGI Emerging Markets Debt (b) | 14,088 | 201,885 | ||||||
AllianzGI Emerging Markets Small-Cap (b) | 19,019 | 345,391 | ||||||
AllianzGI Global Dynamic Allocation (c) | 1,569,619 | 31,109,851 | ||||||
AllianzGI Short Duration High Income (c) | 39,212 | 582,696 | ||||||
|
| |||||||
| Total Mutual Funds (cost—$41,186,019) | 43,653,024 | |||||||
|
| |||||||
| Exchange-Traded Funds—4.6% | ||||||||
iShares TIPS Bond | 4,604 | 520,482 | ||||||
iShares U.S. Preferred Stock | 4,215 | 158,316 | ||||||
Vanguard Intermediate-Term Corporate Bond | 5,298 | 449,482 | ||||||
Vanguard Mortgage-Backed Securities | 22,171 | 1,144,024 | ||||||
|
| |||||||
| Total Exchange-Traded Funds (cost—$2,292,684) | 2,272,304 | |||||||
|
| |||||||
| Principal Amount (000s) | Value | |||||||
| Repurchase Agreements—5.9% | ||||||||
State Street Bank and Trust Co.,dated 3/29/18, 0.28%, due 4/2/18, proceeds $2,905,090; collateralized by U.S. Treasury Notes, 2.00%, due 8/15/25, valued at $2,964,324 including accrued interest |
| |||||||
(cost—$2,905,000) | $2,905 | $ | 2,905,000 | |||||
|
| |||||||
| Total Investments (cost—$46,383,703)—99.3% | 48,830,328 | |||||||
|
| |||||||
| Other assets less liabilities (d)—0.7% | 348,823 | |||||||
|
| |||||||
| Net Assets—100.0% | $49,179,151 | |||||||
|
| |||||||
Notes to Schedule of Investments:
(a) Affiliated fund.
(b) Institutional Class share.
(c) Class R6 share.
(d) Includes net unrealized appreciation (depreciation) of other financial instruments as follows:
| Futures contracts outstanding at March 31, 2018: | ||||||||||||||||||||||
| Type | Contracts | Expiration Date | Notional Amount (000s) | Market Value (000s) | Unrealized Appreciation (Depreciation) | |||||||||||||||||
Long position contracts: | ||||||||||||||||||||||
10-Year Ultra U.S. Treasury Bond | 15 | 6/20/18 | $ | 1,500 | $ | 1,948 | $ | 32,832 | ||||||||||||||
British Pound | 3 | 6/18/18 | 188 | 264 | 1,042 | |||||||||||||||||
E-mini S&P 500 Index | 12 | 6/15/18 | 1 | 1,586 | (87,327 | ) | ||||||||||||||||
Euro Currency | 1 | 6/18/18 | 125 | 154 | (834 | ) | ||||||||||||||||
Japanese Yen | 2 | 6/18/18 | 3 | 236 | (855 | ) | ||||||||||||||||
|
| |||||||||||||||||||||
| $ | (55,142 | ) | ||||||||||||||||||||
|
| |||||||||||||||||||||
Short position contracts: | ||||||||||||||||||||||
Euro STOXX 50 Index | (4 | ) | 6/15/18 | EUR | (— | )(f) | $ | (162 | ) | $ | 485 | |||||||||||
Euro-Bund 10-Year Bond | (2 | ) | 6/7/18 | (200 | ) | (393 | ) | (5,392 | ) | |||||||||||||
FTSE 100 Index | (1 | ) | 6/15/18 | GBP | (— | )(f) | (98 | ) | 349 | |||||||||||||
Mini MSCI Emerging Markets Index | (6 | ) | 6/15/18 | $ | (— | )(f) | (356 | ) | 9,196 | |||||||||||||
MSCI EAFE Index | (9 | ) | 6/15/18 | (— | )(f) | (900 | ) | 9,025 | ||||||||||||||
|
| |||||||||||||||||||||
| $ | 13,663 | |||||||||||||||||||||
|
| |||||||||||||||||||||
| $ | (41,479 | ) | ||||||||||||||||||||
|
| |||||||||||||||||||||
(e) At March 31, 2018, the Fund pledged $294,432 in cash as collateral for futures contracts.
(f) Notional amount rounds to less than $500.
Glossary:
EAFE—Europe, Australasia and Far East
EUR—Euro
FTSE—Financial Times Stock Exchange
GBP—British Pound
MSCI—Morgan Stanley Capital International
TIPS—Treasury Inflation Protected Securities
| 112 | Semiannual Report | | March 31, 2018 | | See accompanying Notes to Financial Statements |
Table of Contents
Schedule of Investments
March 31, 2018 (Unaudited)
AllianzGI Retirement 2025 Fund
| Shares | Value | |||||||
| Mutual Funds (a)—96.4% | ||||||||
AllianzGI Advanced Core Bond | 598,739 | $8,663,760 | ||||||
AllianzGI Best Styles U.S. Equity (c) | 324,821 | 6,012,434 | ||||||
AllianzGI Emerging Markets Debt (b) | 13,566 | 194,401 | ||||||
AllianzGI Emerging Markets Small-Cap (b) | 20,421 | 370,846 | ||||||
AllianzGI Global Dynamic Allocation (c) | 2,314,065 | 45,864,777 | ||||||
AllianzGI Short Duration High Income (c) | 22,236 | 330,432 | ||||||
|
| |||||||
| Total Mutual Funds (cost—$57,638,484) | 61,436,650 | |||||||
|
| |||||||
| Exchange-Traded Funds—0.5% | ||||||||
iShares TIPS Bond (cost—$324,287) | 2,872 | 324,679 | ||||||
|
| |||||||
| Principal Amount (000s) | Value | |||||||
| Repurchase Agreements—2.0% | ||||||||
State Street Bank and Trust Co., dated 3/29/18, 0.28%, due 4/2/18, proceeds $1,288,040; collateralized by U.S. Treasury Notes, 2.00%, due 8/15/25, valued at $1,315,359 including accrued interest |
| |||||||
(cost—$1,288,000) | $1,288 | $ | 1,288,000 | |||||
|
| |||||||
| Total Investments (cost—$59,250,771)—98.9% | 63,049,329 | |||||||
|
| |||||||
| Other assets less liabilities (d)—1.1% | 683,533 | |||||||
|
| |||||||
| Net Assets—100.0% | $63,732,862 | |||||||
|
| |||||||
Notes to Schedule of Investments:
(a) Affiliated fund.
(b) Institutional Class share.
(c) Class R6 share.
(d) Includes net unrealized appreciation (depreciation) of other financial instruments as follows:
| Futures contracts outstanding at March 31, 2018: | ||||||||||||||||||||||
| Type | Contracts | Expiration Date | Notional Amount (000s) | Market Value (000s) | Unrealized Appreciation (Depreciation) | |||||||||||||||||
Long position contracts: | ||||||||||||||||||||||
British Pound | 4 | 6/18/18 | $ | 250 | $ | 351 | $ | 1,389 | ||||||||||||||
E-mini Russell 2000 Index | 2 | 6/15/18 | — | (f) | 153 | (7,428 | ) | |||||||||||||||
E-mini S&P 500 Index | 25 | 6/15/18 | 1 | 3,304 | (181,931 | ) | ||||||||||||||||
Euro Currency | 1 | 6/18/18 | 125 | 155 | (834 | ) | ||||||||||||||||
Japanese Yen | 3 | 6/18/18 | 4 | 354 | (1,283 | ) | ||||||||||||||||
Mini MSCI Emerging Markets Index | 2 | 6/15/18 | — | (f) | 119 | (3,075 | ) | |||||||||||||||
|
| |||||||||||||||||||||
| $ | (193,162 | ) | ||||||||||||||||||||
|
| |||||||||||||||||||||
Short position contracts: | ||||||||||||||||||||||
10-Year Ultra U.S. Treasury Bond | (4 | ) | 6/20/18 | $ | (400 | ) | $ | (520 | ) | $ | (9,601 | ) | ||||||||||
Euro STOXX 50 Index | (11 | ) | 6/15/18 | EUR | (— | )(f) | (444 | ) | 1,335 | |||||||||||||
Euro-Bund 10-Year Bond | (1 | ) | 6/7/18 | (100 | ) | (196 | ) | (2,696 | ) | |||||||||||||
FTSE 100 Index | (3 | ) | 6/15/18 | GBP | (— | )(f) | (294 | ) | 1,047 | |||||||||||||
SPI 200 Index | (1 | ) | 6/21/18 | AUD | (— | )(f) | (110 | ) | 3,415 | |||||||||||||
|
| |||||||||||||||||||||
| $ | (6,500 | ) | ||||||||||||||||||||
|
| |||||||||||||||||||||
| $ | (199,662 | ) | ||||||||||||||||||||
|
| |||||||||||||||||||||
(e) At March 31, 2018, the Fund pledged $687,879 in cash as collateral for futures contracts.
(f) Notional amount rounds to less than $500.
Glossary:
AUD—Australian Dollar
EUR—Euro
FTSE—Financial Times Stock Exchange
GBP—British Pound
MSCI—Morgan Stanley Capital International
TIPS—Treasury Inflation Protected Securities
| See accompanying Notes to Financial Statements | | March 31, 2018 | | Semiannual Report | 113 |
Table of Contents
Schedule of Investments
March 31, 2018 (Unaudited)
AllianzGI Retirement 2030 Fund
| Shares | Value | |||||||
| Mutual Funds (a)—96.5% | ||||||||
AllianzGI Advanced Core Bond | 152,053 | $2,200,210 | ||||||
AllianzGI Best Styles Global Equity (c) | 395,825 | 6,681,525 | ||||||
AllianzGI Best Styles U.S. Equity (c) | 518,850 | 9,603,905 | ||||||
AllianzGI Emerging Markets Small-Cap (b) | 46,319 | 841,146 | ||||||
AllianzGI Global Dynamic Allocation (c) | 2,626,094 | 52,049,188 | ||||||
|
| |||||||
| Total Mutual Funds (cost—$66,022,711) | 71,375,974 | |||||||
|
| |||||||
| Exchange-Traded Funds—0.5% | ||||||||
Vanguard FTSE All World ex-U.S. Small-Cap (cost—$377,648) | 3,143 | 374,771 | ||||||
|
| |||||||
| Principal Amount (000s) | Value | |||||||
| Repurchase Agreements—1.9% | ||||||||
State Street Bank and Trust Co.,dated 3/29/18, 0.28%, due 4/2/18, proceeds $1,377,043; collateralized by U.S. Treasury Notes, 2.00%, due 8/15/25, valued at $1,405,910 including accrued interest |
| |||||||
(cost—$1,377,000) | $1,377 | $ | 1,377,000 | |||||
|
| |||||||
| Total Investments (cost—$67,777,359)—98.9% | 73,127,745 | |||||||
|
| |||||||
Other assets less liabilities (d)—1.1% | 792,202 | |||||||
|
| |||||||
| Net Assets—100.0% | $73,919,947 | |||||||
|
| |||||||
Notes to Schedule of Investments:
(a) Affiliated fund.
(b) Institutional Class share.
(c) Class R6 share.
(d) Includes net unrealized appreciation (depreciation) of other financial instruments as follows:
| Futures contracts outstanding at March 31, 2018: | ||||||||||||||||||||||
| Type | Contracts | Expiration Date | Notional Amount (000s) | Market Value (000s) | Unrealized Appreciation (Depreciation) | |||||||||||||||||
Long position contracts: | ||||||||||||||||||||||
British Pound | 5 | 6/18/18 | $ | 313 | $ | 439 | $ | 1,737 | ||||||||||||||
E-mini Russell 2000 Index | 4 | 6/15/18 | — | (f) | 306 | (14,857 | ) | |||||||||||||||
E-mini S&P 500 Index | 30 | 6/15/18 | 2 | 3,965 | (218,318 | ) | ||||||||||||||||
Euro Currency | 1 | 6/18/18 | 125 | 155 | (834 | ) | ||||||||||||||||
Japanese Yen | 4 | 6/18/18 | 5 | 472 | (1,723 | ) | ||||||||||||||||
|
| |||||||||||||||||||||
| $ | (233,995 | ) | ||||||||||||||||||||
|
| |||||||||||||||||||||
Short position contracts: | ||||||||||||||||||||||
10-Year Ultra U.S. Treasury Bond | (1 | ) | 6/20/18 | $ | (100 | ) | $ | (130 | ) | $ | (2,400 | ) | ||||||||||
Euro STOXX 50 Index | (24 | ) | 6/15/18 | EUR | (— | )(f) | (969 | ) | 2,913 | |||||||||||||
FTSE 100 Index | (6 | ) | 6/15/18 | GBP | (— | )(f) | (589 | ) | 2,094 | |||||||||||||
SPI 200 Index | (1 | ) | 6/21/18 | AUD | (— | )(f) | (110 | ) | 3,415 | |||||||||||||
TOPIX Index | (1 | ) | 6/7/18 | JPY | (10 | ) | (161 | ) | (615 | ) | ||||||||||||
|
| |||||||||||||||||||||
| $ | 5,407 | |||||||||||||||||||||
|
| |||||||||||||||||||||
| $ | (228,588 | ) | ||||||||||||||||||||
|
| |||||||||||||||||||||
(e) At March 31, 2018, the Fund pledged $727,472 in cash as collateral for futures contracts.
(f) Notional amount rounds to less than $500.
Glossary:
AUD—Australian Dollar
EUR—Euro
FTSE—Financial Times Stock Exchange
GBP—British Pound
JPY—Japanese Yen
TOPIX—Tokyo Stock Price Index
| 114 | Semiannual Report | | March 31, 2018 | | See accompanying Notes to Financial Statements |
Table of Contents
Schedule of Investments
March 31, 2018 (Unaudited)
AllianzGI Retirement 2035 Fund
| Shares | Value | |||||||
| Mutual Funds (a)—96.4% | ||||||||
AllianzGI Advanced Core Bond | 102,465 | $1,482,667 | ||||||
AllianzGI Best Styles Global Equity (c) | 1,089,983 | 18,398,905 | ||||||
AllianzGI Best Styles U.S. Equity (c) | 502,674 | 9,304,493 | ||||||
AllianzGI Emerging Markets Small-Cap (b) | 38,066 | 691,274 | ||||||
AllianzGI Global Dynamic Allocation (c) | 1,417,484 | 28,094,530 | ||||||
|
| |||||||
| Total Mutual Funds (cost—$53,481,783) | 57,971,869 | |||||||
|
| |||||||
| Exchange-Traded Funds—0.9% | ||||||||
Vanguard FTSE All World ex-U.S. Small-Cap (cost—$553,395) | 4,596 | 548,027 | ||||||
|
| |||||||
| Principal Amount (000s) | Value | |||||||
| Repurchase Agreements—1.1% | ||||||||
State Street Bank and Trust Co., dated 3/29/18, 0.28%, due 4/2/18, proceeds $631,020; collateralized by U.S. Treasury Notes, 2.00%, due 8/15/25, valued at $648,148 including accrued interest |
| |||||||
(cost—$631,000) | $631 | $ | 631,000 | |||||
|
| |||||||
| Total Investments (cost—$54,666,178)—98.4% | 59,150,896 | |||||||
|
| |||||||
| Other assets less liabilities (d)—1.6% | 934,382 | |||||||
|
| |||||||
| Net Assets—100.0% | $60,085,278 | |||||||
|
| |||||||
Notes to Schedule of Investments:
(a) Affiliated fund.
(b) Institutional Class share.
(c) Class R6 share.
(d) Includes net unrealized appreciation (depreciation) of other financial instruments as follows:
| Futures contracts outstanding at March 31, 2018: | ||||||||||||||||||||||
| Type | Contracts | Expiration Date | Notional Amount (000s) | Market Value (000s) | Unrealized Appreciation (Depreciation) | |||||||||||||||||
Long position contracts: | ||||||||||||||||||||||
British Pound | 4 | 6/18/18 | $ | 250 | $ | 352 | $ | 1,389 | ||||||||||||||
E-mini Russell 2000 Index | 6 | 6/15/18 | — | (f) | 459 | (22,285 | ) | |||||||||||||||
E-mini S&P 500 Index | 26 | 6/15/18 | 1 | 3,436 | (189,208 | ) | ||||||||||||||||
Euro Currency | 1 | 6/18/18 | 125 | 155 | (834 | ) | ||||||||||||||||
Japanese Yen | 3 | 6/18/18 | 4 | 354 | (1,296 | ) | ||||||||||||||||
Mini MSCI Emerging Markets Index | 11 | 6/15/18 | 1 | 653 | (16,905 | ) | ||||||||||||||||
|
| |||||||||||||||||||||
| $ | (229,139 | ) | ||||||||||||||||||||
|
| |||||||||||||||||||||
Short position contracts: | ||||||||||||||||||||||
Euro STOXX 50 Index | (38 | ) | 6/15/18 | EUR | (— | )(f) | $ | (1,534 | ) | $ | 4,613 | |||||||||||
FTSE 100 Index | (9 | ) | 6/15/18 | GBP | (— | )(f) | (883 | ) | 3,141 | |||||||||||||
SPI 200 Index | (2 | ) | 6/21/18 | AUD | (— | )(f) | (220 | ) | 6,830 | |||||||||||||
TOPIX Index | (2 | ) | 6/7/18 | JPY | (20 | ) | (323 | ) | (7,574 | ) | ||||||||||||
|
| |||||||||||||||||||||
| $ | 7,010 | |||||||||||||||||||||
|
| |||||||||||||||||||||
| $ | (222,129 | ) | ||||||||||||||||||||
|
| |||||||||||||||||||||
(e) At March 31, 2018, the Fund pledged $944,538 in cash as collateral for futures contracts.
(f) Notional amount rounds to less than $500.
Glossary:
AUD—Australian Dollar
EUR—Euro
FTSE—Financial Times Stock Exchange
GBP—British Pound
JPY—Japanese Yen
MSCI—Morgan Stanley Capital International
TOPIX—Tokyo Stock Price Index
| See accompanying Notes to Financial Statements | | March 31, 2018 | | Semiannual Report | 115 |
Table of Contents
Schedule of Investments
March 31, 2018 (Unaudited)
AllianzGI Retirement 2040 Fund
| Shares | Value | |||||||
| Mutual Funds (a)—96.7% | ||||||||
AllianzGI Best Styles Global Equity (c) | 1,432,461 | $24,179,939 | ||||||
AllianzGI Best Styles U.S. Equity (c) | 527,322 | 9,760,730 | ||||||
AllianzGI Emerging Markets Small-Cap (b) | 32,334 | 587,187 | ||||||
AllianzGI Global Dynamic Allocation (c) | 894,063 | 17,720,335 | ||||||
|
| |||||||
| Total Mutual Funds (cost—$48,002,220) | 52,248,191 | |||||||
|
| |||||||
| Shares | Value | |||||||
| Exchange-Traded Funds—1.1% | ||||||||
Vanguard FTSE All World ex-U.S. Small-Cap | 5,071 | $ | 604,666 | |||||
|
| |||||||
| Total Investments (cost—$48,613,456)—97.8% | 52,852,857 | |||||||
|
| |||||||
| Other assets less liabilities (d)—2.2% | 1,171,337 | |||||||
|
| |||||||
| Net Assets—100.0% | $54,024,194 | |||||||
|
| |||||||
Notes to Schedule of Investments:
(a) Affiliated fund.
(b) Institutional Class share.
(c) Class R6 share.
(d) Includes net unrealized appreciation (depreciation) of other financial instruments as follows:
| Futures contracts outstanding at March 31, 2018: | ||||||||||||||||||||||
| Type | Contracts | Expiration Date | Notional Amount (000s) | Market Value (000s) | Unrealized Appreciation (Depreciation) | |||||||||||||||||
Long position contracts: | ||||||||||||||||||||||
British Pound | 4 | 6/18/18 | $ | 250 | $ | 351 | $ | 1,389 | ||||||||||||||
E-mini Russell 2000 Index | 7 | 6/15/18 | — | (f) | 536 | (26,000 | ) | |||||||||||||||
E-mini S&P 500 Index | 24 | 6/15/18 | 1 | 3,172 | (174,654 | ) | ||||||||||||||||
Euro Currency | 1 | 6/18/18 | 125 | 155 | (834 | ) | ||||||||||||||||
Japanese Yen | 3 | 6/18/18 | 4 | 354 | (1,283 | ) | ||||||||||||||||
Mini MSCI Emerging Markets Index | 16 | 6/15/18 | 1 | 950 | (24,591 | ) | ||||||||||||||||
|
| |||||||||||||||||||||
| $ | (225,973 | ) | ||||||||||||||||||||
|
| |||||||||||||||||||||
Short position contracts: | ||||||||||||||||||||||
Euro STOXX 50 Index | (44 | ) | 6/15/18 | EUR | (— | )(f) | $ | (1,777 | ) | $ | 5,341 | |||||||||||
FTSE 100 Index | (11 | ) | 6/15/18 | GBP | (— | )(f) | (1,079 | ) | 3,839 | |||||||||||||
SPI 200 Index | (2 | ) | 6/21/18 | AUD | (— | )(f) | (220 | ) | 6,830 | |||||||||||||
TOPIX Index | (2 | ) | 6/7/18 | JPY | (20 | ) | (323 | ) | (7,574 | ) | ||||||||||||
|
| |||||||||||||||||||||
| $ | 8,436 | |||||||||||||||||||||
|
| |||||||||||||||||||||
| $ | (217,537 | ) | ||||||||||||||||||||
|
| |||||||||||||||||||||
(e) At March 31, 2018, the Fund pledged $1,057,661 in cash as collateral for futures contracts.
(f) Notional amount rounds to less than $500.
Glossary:
AUD—Australian Dollar
EUR—Euro
FTSE—Financial Times Stock Exchange
GBP—British Pound
JPY—Japanese Yen
MSCI—Morgan Stanley Capital International
TOPIX—Tokyo Stock Price Index
| 116 | Semiannual Report | | March 31, 2018 | | See accompanying Notes to Financial Statements |
Table of Contents
Schedule of Investments
March 31, 2018 (Unaudited)
AllianzGI Retirement 2045 Fund
| Shares | Value | |||||||
| Mutual Funds (a)—95.8% | ||||||||
AllianzGI Best Styles Global Equity (c) | 1,110,858 | $18,751,288 | ||||||
AllianzGI Best Styles U.S. Equity (c) | 354,695 | 6,565,411 | ||||||
AllianzGI Emerging Markets Small-Cap (b) | 19,083 | 346,541 | ||||||
AllianzGI Global Dynamic Allocation (c) | 386,065 | 7,651,817 | ||||||
|
| |||||||
| Total Mutual Funds (cost—$30,671,790) | 33,315,057 | |||||||
|
| |||||||
| Exchange-Traded Funds—1.3% | ||||||||
Vanguard FTSE All World ex-U.S. Small-Cap (cost—$460,821) | 3,823 | 455,855 | ||||||
|
| |||||||
| Principal Amount (000s) | Value | |||||||
| Repurchase Agreements—0.7% | ||||||||
State Street Bank and Trust Co., dated 3/29/18, 0.28%, due 4/2/18, proceeds $227,007; collateralized by U.S. Treasury Notes, 2.00%, due 8/15/25, valued at $233,524 including accrued interest |
| |||||||
(cost—$227,000) | $227 | $ | 227,000 | |||||
|
| |||||||
| Total Investments (cost—$31,359,611)—97.8% | 33,997,912 | |||||||
|
| |||||||
| Other assets less liabilities (d)—2.2% | 777,653 | |||||||
|
| |||||||
| Net Assets—100.0% | $34,775,565 | |||||||
|
| |||||||
Notes to Schedule of Investments:
(a) Affiliated fund.
(b) Institutional Class share.
(c) Class R6 share.
(d) Includes net unrealized appreciation (depreciation) of other financial instruments as follows:
| Futures contracts outstanding at March 31, 2018: | ||||||||||||||||||||||
| Type | Contracts | Expiration Date | Notional Amount (000s) | Market Value (000s) | Unrealized Appreciation (Depreciation) | |||||||||||||||||
Long position contracts: | ||||||||||||||||||||||
British Pound | 3 | 6/18/18 | $ | 188 | $ | 264 | $ | 1,042 | ||||||||||||||
E-mini Russell 2000 Index | 5 | 6/15/18 | — | (f) | 383 | (18,571 | ) | |||||||||||||||
E-mini S&P 500 Index | 16 | 6/15/18 | 1 | 2,114 | (116,436 | ) | ||||||||||||||||
Euro Currency | 1 | 6/18/18 | 125 | 155 | (834 | ) | ||||||||||||||||
Japanese Yen | 2 | 6/18/18 | 3 | 236 | (855 | ) | ||||||||||||||||
Mini MSCI Emerging Markets Index | 14 | 6/15/18 | 1 | 831 | (21,522 | ) | ||||||||||||||||
|
| |||||||||||||||||||||
| $ | (157,176 | ) | ||||||||||||||||||||
|
| |||||||||||||||||||||
Short position contracts: | ||||||||||||||||||||||
Euro STOXX 50 Index | (32 | ) | 6/15/18 | EUR | (— | )(f) | $ | (1,292 | ) | $ | 3,884 | |||||||||||
FTSE 100 Index | (8 | ) | 6/15/18 | GBP | (— | )(f) | (785 | ) | 2,792 | |||||||||||||
SPI 200 Index | (2 | ) | 6/21/18 | AUD | (— | )(f) | (220 | ) | 6,830 | |||||||||||||
TOPIX Index | (1 | ) | 6/7/18 | JPY | (10 | ) | (161 | ) | (615 | ) | ||||||||||||
|
| |||||||||||||||||||||
| $ | 12,891 | |||||||||||||||||||||
|
| |||||||||||||||||||||
| $ | (144,285 | ) | ||||||||||||||||||||
|
| |||||||||||||||||||||
(e) At March 31, 2018, the Fund pledged $710,181 in cash as collateral for futures contracts.
(f) Notional amount rounds to less than $500.
Glossary:
AUD—Australian Dollar
EUR—Euro
FTSE—Financial Times Stock Exchange
GBP—British Pound
JPY—Japanese Yen
MSCI—Morgan Stanley Capital International
TOPIX—Tokyo Stock Price Index
| See accompanying Notes to Financial Statements | | March 31, 2018 | | Semiannual Report | 117 |
Table of Contents
Schedule of Investments
March 31, 2018 (Unaudited)
AllianzGI Retirement 2050 Fund
| Shares | Value | |||||||
| Mutual Funds (a)—95.8% | ||||||||
AllianzGI Best Styles Global Equity (c) | 1,198,439 | $20,229,646 | ||||||
AllianzGI Best Styles U.S. Equity (c) | 340,999 | 6,311,887 | ||||||
AllianzGI Emerging Markets Small-Cap (b) | 18,341 | 333,078 | ||||||
AllianzGI Global Dynamic Allocation (c) | 303,224 | 6,009,902 | ||||||
|
| |||||||
| Total Mutual Funds (cost—$30,470,072) | 32,884,513 | |||||||
|
| |||||||
| Exchange-Traded Funds—1.4% | ||||||||
Vanguard FTSE All World ex-U.S. Small-Cap | 4,065 | 484,710 | ||||||
|
| |||||||
| Principal Amount (000s) | Value | |||||||
| Repurchase Agreements—0.5% | ||||||||
State Street Bank and Trust Co., dated 3/29/18, 0.28%, due 4/2/18, proceeds $170,005; collateralized by U.S. Treasury Notes, 2.00%, due 8/15/25, valued at $176,334 including accrued interest |
| |||||||
(cost—$170,000) | $170 | $ | 170,000 | |||||
|
| |||||||
| Total Investments (cost—$31,129,223)—97.7% | 33,539,223 | |||||||
|
| |||||||
| Other assets less liabilities (d)—2.3% | 780,640 | |||||||
|
| |||||||
| Net Assets—100.0% | $34,319,863 | |||||||
|
| |||||||
Notes to Schedule of Investments:
(a) Affiliated fund.
(b) Institutional Class share.
(c) Class R6 share.
(d) Includes net unrealized appreciation (depreciation) of other financial instruments as follows:
| Futures contracts outstanding at March 31, 2018: | ||||||||||||||||||||||
| Type | Contracts | Expiration Date | Notional Amount (000s) | Market Value (000s) | Unrealized Appreciation (Depreciation) | |||||||||||||||||
Long position contracts: | ||||||||||||||||||||||
British Pound | 4 | 6/18/18 | $ | 250 | $ | 352 | $ | 1,389 | ||||||||||||||
E-mini Russell 2000 Index | 6 | 6/15/18 | — | (f) | 459 | (22,285 | ) | |||||||||||||||
E-mini S&P 500 Index | 16 | 6/15/18 | 1 | 2,114 | (116,436 | ) | ||||||||||||||||
Euro Currency | 1 | 6/18/18 | 125 | 155 | (834 | ) | ||||||||||||||||
Japanese Yen | 2 | 6/18/18 | 3 | 236 | (855 | ) | ||||||||||||||||
Mini MSCI Emerging Markets Index | 15 | 6/15/18 | 1 | 891 | (23,059 | ) | ||||||||||||||||
|
| |||||||||||||||||||||
| $ | (162,080 | ) | ||||||||||||||||||||
|
| |||||||||||||||||||||
Short position contracts: | ||||||||||||||||||||||
Euro STOXX 50 Index | (35 | ) | 6/15/18 | EUR | (— | )(f) | $ | (1,413 | ) | $ | 4,248 | |||||||||||
FTSE 100 Index | (9 | ) | 6/15/18 | GBP | (— | )(f) | (883 | ) | 545 | |||||||||||||
SPI 200 Index | (2 | ) | 6/21/18 | AUD | (— | )(f) | (220 | ) | 6,830 | |||||||||||||
TOPIX Index | (1 | ) | 6/7/18 | JPY | (10 | ) | (162 | ) | (615 | ) | ||||||||||||
|
| |||||||||||||||||||||
| $ | 11,008 | |||||||||||||||||||||
|
| |||||||||||||||||||||
| $ | (151,072 | ) | ||||||||||||||||||||
|
| |||||||||||||||||||||
(e) At March 31, 2018, the Fund pledged $730,070 in cash as collateral for futures contracts.
(f) Notional amount rounds to less than $500.
Glossary:
AUD—Australian Dollar
EUR—Euro
FTSE—Financial Times Stock Exchange
GBP—British Pound
JPY—Japanese Yen
MSCI—Morgan Stanley Capital International
TOPIX—Tokyo Stock Price Index
| 118 | Semiannual Report | | March 31, 2018 | | See accompanying Notes to Financial Statements |
Table of Contents
Schedule of Investments
March 31, 2018 (Unaudited)
AllianzGI Retirement 2055 Fund
| Shares | Value | |||||||
| Mutual Funds (a)—95.6% | ||||||||
AllianzGI Best Styles Global Equity (c) | 612,301 | $10,335,635 | ||||||
AllianzGI Best Styles U.S. Equity (c) | 174,286 | 3,226,038 | ||||||
AllianzGI Emerging Markets Small-Cap (b) | 9,619 | 174,679 | ||||||
AllianzGI Global Dynamic Allocation (c) | 154,908 | 3,070,278 | ||||||
|
| |||||||
| Total Mutual Funds (cost—$15,939,488) | 16,806,630 | |||||||
|
| |||||||
| Exchange-Traded Funds—1.4% | ||||||||
Vanguard FTSE All World ex-U.S. Small-Cap | 2,076 | 247,542 | ||||||
|
| |||||||
| Principal Amount (000s) | Value | |||||||
| Repurchase Agreements—0.6% | ||||||||
State Street Bank and Trust Co., dated 3/29/18, 0.28%, due 4/2/18, proceeds $110,003; collateralized by U.S. Treasury Notes, 2.00%, due 8/15/25, valued at $114,379 including accrued interest |
| |||||||
(cost—$110,000) | $110 | $ | 110,000 | |||||
|
| |||||||
| Total Investments (cost—$16,299,211)—97.6% | 17,164,172 | |||||||
|
| |||||||
| Other assets less liabilities (d)—2.4% | 424,149 | |||||||
|
| |||||||
| Net Assets—100.0% | $17,588,321 | |||||||
|
| |||||||
Notes to Schedule of Investments:
(a) Affiliated fund.
(b) Institutional Class share.
(c) Class R6 share.
(d) Includes net unrealized appreciation (depreciation) of other financial instruments as follows:
| Futures contracts outstanding at March 31, 2018: | ||||||||||||||||||||||
| Type | Contracts | Expiration Date | Notional Amount (000s) | Market Value (000s) | Unrealized Appreciation (Depreciation) | |||||||||||||||||
Long position contracts: | ||||||||||||||||||||||
British Pound | 2 | 6/18/18 | $ | 125 | $ | 176 | $ | 695 | ||||||||||||||
E-mini Russell 2000 Index | 3 | 6/15/18 | — | (f) | 230 | (11,143 | ) | |||||||||||||||
E-mini S&P 500 Index | 8 | 6/15/18 | — | (f) | 1,057 | (58,218 | ) | |||||||||||||||
Euro Currency | 1 | 6/18/18 | 125 | 154 | (834 | ) | ||||||||||||||||
Japanese Yen | 1 | 6/18/18 | 1 | 118 | (428 | ) | ||||||||||||||||
Mini MSCI Emerging Markets Index | 8 | 6/15/18 | — | (f) | 475 | (12,293 | ) | |||||||||||||||
|
| |||||||||||||||||||||
| $ | (82,221 | ) | ||||||||||||||||||||
|
| |||||||||||||||||||||
Short position contracts: | ||||||||||||||||||||||
Euro STOXX 50 Index | (18 | ) | 6/15/18 | EUR | (— | )(f) | $ | (727 | ) | $ | 2,185 | |||||||||||
FTSE 100 Index | (4 | ) | 6/15/18 | GBP | (— | )(f) | (393 | ) | 1,396 | |||||||||||||
SPI 200 Index | (1 | ) | 6/21/18 | AUD | (— | )(f) | (110 | ) | 3,415 | |||||||||||||
TOPIX Index | (1 | ) | 6/7/18 | JPY | (10 | ) | (161 | ) | (6,959 | ) | ||||||||||||
|
| |||||||||||||||||||||
| $ | 37 | |||||||||||||||||||||
|
| |||||||||||||||||||||
| $ | (82,184 | ) | ||||||||||||||||||||
|
| |||||||||||||||||||||
(e) At March 31, 2018, the Fund pledged $366,634 in cash as collateral for futures contracts.
(f) Notional amount rounds to less than $500.
Glossary:
AUD—Australian Dollar
EUR—Euro
FTSE—Financial Times Stock Exchange
GBP—British Pound
JPY—Japanese Yen
MSCI—Morgan Stanley Capital International
TOPIX—Tokyo Stock Price Index
| See accompanying Notes to Financial Statements | | March 31, 2018 | | Semiannual Report | 119 |
Table of Contents
Schedule of Investments
March 31, 2018 (Unaudited)
AllianzGI Multi Asset Income Fund
| Shares | Value | |||||||
| Mutual Funds—59.2% | ||||||||
AllianzGI Emerging Markets Debt (d)(e) | 245,032 | $3,511,309 | ||||||
AllianzGI Europe Equity Dividend (d)(e) | 204,810 | 3,229,855 | ||||||
AllianzGI Global High Yield (d)(e) | 106,201 | 1,597,263 | ||||||
AllianzGI High Yield Bond (d)(e) | 275,520 | 2,366,721 | ||||||
AllianzGI Short Duration High Income (d)(f) | 323,774 | 4,811,287 | ||||||
Harvest Asian Bond | 126,204 | 1,240,586 | ||||||
PIMCO Income (d)(e) | 493,503 | 6,025,668 | ||||||
PIMCO Mortgage Opportunities (d)(e) | 215,242 | 2,371,962 | ||||||
PIMCO Preferred and Capital Securities (d)(e) | 275,377 | 2,839,137 | ||||||
|
| |||||||
| Total Mutual Funds (cost—$27,798,076) | 27,993,788 | |||||||
|
| |||||||
| Exchange-Traded Funds—17.1% | ||||||||
Alerian | 177,648 | 1,664,562 | ||||||
PIMCO Investment Grade Corporate Bond Index (d) | 34,801 | 3,559,098 | ||||||
PowerShares Senior Loan Portfolio | 61,411 | 1,420,436 | ||||||
Vanguard Utilities | 12,739 | 1,424,348 | ||||||
|
| |||||||
| Total Exchange-Traded Funds (cost—$8,331,181) | 8,068,444 | |||||||
|
| |||||||
| Common Stock—11.3% | ||||||||
| Equity Real Estate Investment Trusts (REITs)—9.1% | ||||||||
American Tower Corp. | 1,810 | 263,065 | ||||||
Apple Hospitality REIT, Inc. | 8,820 | 154,967 | ||||||
AvalonBay Communities, Inc. | 1,280 | 210,509 | ||||||
Crown Castle International Corp. | 2,110 | 231,277 | ||||||
Digital Realty Trust, Inc. | 1,400 | 147,532 | ||||||
EPR Properties | 2,530 | 140,162 | ||||||
Equinix, Inc. | 360 | 150,530 | ||||||
| Shares | Value | |||||||
Gaming and Leisure Properties, Inc. | 2,797 | $ | 93,615 | |||||
Government Properties Income Trust | 10,910 | 149,031 | ||||||
H&R Real Estate Investment Trust | 10,800 | 176,291 | ||||||
Hospitality Properties Trust | 7,820 | 198,159 | ||||||
Iron Mountain, Inc. | 4,390 | 144,255 | ||||||
Lexington Realty Trust | 17,530 | 137,961 | ||||||
Mapletree Industrial Trust | 164,000 | 254,504 | ||||||
Medical Properties Trust, Inc. | 11,050 | 143,650 | ||||||
Omega Healthcare Investors, Inc. | 5,141 | 139,013 | ||||||
Public Storage | 409 | 81,959 | ||||||
QTS Realty Trust, Inc., Class A | 4,250 | 153,935 | ||||||
Sabra Health Care REIT, Inc. | 7,870 | 138,905 | ||||||
Select Income REIT | 8,000 | 155,840 | ||||||
Senior Housing Properties Trust | 12,210 | 191,209 | ||||||
Simon Property Group, Inc. | 1,216 | 187,690 | ||||||
STAG Industrial, Inc. | 8,080 | 193,274 | ||||||
Uniti Group, Inc. | 9,251 | 150,329 | ||||||
Welltower, Inc. | 3,030 | 164,923 | ||||||
WP Carey, Inc. | 2,340 | 145,057 | ||||||
|
| |||||||
| 4,297,642 | ||||||||
|
| |||||||
| Mortgage Real Estate Investment Trusts (REITs)—1.6% | ||||||||
AGNC Investment Corp. | 38,672 | 731,675 | ||||||
|
| |||||||
| Real Estate Management & Development—0.6% | ||||||||
DAMAC Properties Dubai Co. PJSC | 172,000 | 140,014 | ||||||
Shenzhen Investment Ltd. | 364,000 | 155,451 | ||||||
|
| |||||||
| 295,465 | ||||||||
�� |
| |||||||
| Total Common Stock (cost—$5,517,223) | 5,324,782 | |||||||
|
| |||||||
| Rights (b)(c)(g)—0.0% | ||||||||
| Food & Staples Retailing—0.0% | ||||||||
Safeway CVR—PDC, expires 1/30/17 (cost—$17) | 541 | 9 | ||||||
|
| |||||||
| Principal Amount (000s) | Value | |||||||
| Repurchase Agreements—5.9% | ||||||||
State Street Bank and Trust Co., dated 3/29/18, 0.28%, due 4/2/18, proceeds $2,779,086; collateralized by U.S. Treasury Notes, 2.00%, due 8/15/25, valued at $2,835,648 including accrued interest |
| |||||||
(cost—$2,779,000) | $2,779 | $ | 2,779,000 | |||||
|
| |||||||
| Total Investments (cost—$44,425,497) (a)—93.5% | 44,166,023 | |||||||
|
| |||||||
| Other assets less liabilities (h)—6.5% | 3,064,951 | |||||||
|
| |||||||
| Net Assets—100.0% | $47,230,974 | |||||||
|
| |||||||
Notes to Schedule of Investments:
(a) Securities with an aggregate value of $409,955, representing 0.9% of net assets, were valued utilizing modeling tools provided by a third-party vendor. See Note 1(a) and Note 1(b) in the Notes to Financial Statements.
(b) Fair-Valued—Security with a value of $9, representing less than 0.05% of net assets. See Note 1(a) and Note 1(b) in the Notes to Financial Statements.
(c) Level 3 security. See Note 1(a) and Note 1(b) in the Notes to Financial Statements.
(d) Affiliated fund.
(e) Institutional Class share.
(f) Class R6 share.
(g) Non-income producing.
(h) Includes net unrealized appreciation (depreciation) of other financial instruments as follows:
| Futures contracts outstanding at March 31, 2018: | ||||||||||||||||||||||
| Type | Contracts | Expiration Date | Notional Amount (000s) | Market Value (000s) | Unrealized Appreciation (Depreciation) | |||||||||||||||||
Long position contracts: | ||||||||||||||||||||||
10-Year U.S. Treasury Note | 70 | 6/20/18 | $ | 7,000 | $ | 8,480 | $ | 67,740 | ||||||||||||||
Canada Government 10-Year Bond | 10 | 6/20/18 | CAD | 1,000 | 1,034 | 12,315 | ||||||||||||||||
10-Year Ultra U.S. Treasury Bond | 75 | 6/20/18 | $ | 7,500 | 9,739 | 179,332 | ||||||||||||||||
E-mini S&P 500 Index | 20 | 6/15/18 | 1 | 2,643 | (145,545 | ) | ||||||||||||||||
Euro-Bund 10-Year Bond | 8 | 6/7/18 | EUR | 800 | 1,569 | (306 | ) | |||||||||||||||
Hang Seng Index | 6 | 6/28/18 | HKD | — | (j) | 1,137 | (50,601 | ) | ||||||||||||||
Mini MSCI Emerging Markets Index | 40 | 6/15/18 | $ | 2 | 2,376 | (44,681 | ) | |||||||||||||||
Australia Government 10-Year Bond | 9 | 6/15/18 | AUD | 900 | 896 | 12,758 | ||||||||||||||||
E-mini Russell 2000 Index | 19 | 6/15/18 | $ | 1 | 1,455 | (70,523 | ) | |||||||||||||||
|
| |||||||||||||||||||||
| $ | (39,511 | ) | ||||||||||||||||||||
|
| |||||||||||||||||||||
Short position contracts: | ||||||||||||||||||||||
U.S. Ultra Treasury Bond | (20 | ) | 6/20/18 | $ | (2,000 | ) | $ | (3,209 | ) | $ | (106,445 | ) | ||||||||||
2-Year U.S. Treasury Note | (30 | ) | 6/29/18 | (6,000 | ) | (6,378 | ) | (1,925 | ) | |||||||||||||
FTSE 100 Index | (5 | ) | 6/15/18 | GBP | (— | )(j) | (491 | ) | (1,033 | ) | ||||||||||||
Dow Jones U.S. Real Estate Index | (50 | ) | 6/15/18 | $ | (5 | ) | (1,496 | ) | (3,581 | ) | ||||||||||||
|
| |||||||||||||||||||||
| $ | (112,984 | ) | ||||||||||||||||||||
|
| |||||||||||||||||||||
| $ | (152,495 | ) | ||||||||||||||||||||
|
| |||||||||||||||||||||
| 120 | Semiannual Report | | March 31, 2018 | | See accompanying Notes to Financial Statements |
Table of Contents
Schedule of Investments
March 31, 2018 (Unaudited)
(i) At March 31, 2018, the Fund pledged $1,092,688 in cash as collateral for futures contracts.
(j) Notional amount rounds to less than $500.
Glossary:
AUD—Australian Dollar
CAD—Canadian Dollar
EUR—Euro
FTSE—Financial Times Stock Exchange
GBP—British Pound
HKD—Hong Kong Dollar
MSCI—Morgan Stanley Capital International
REIT—Real Estate Investment Trust
AllianzGI Global Allocation Fund
| Shares | Value | |||||||
| Mutual Funds (a)—90.8% | ||||||||
AllianzGI Advanced Core Bond | 6,311,919 | $91,333,469 | ||||||
AllianzGI Best Styles Global Equity (c) | 8,393,464 | 141,681,670 | ||||||
AllianzGI Best Styles Global Managed Volatility | 2,125,266 | 36,894,622 | ||||||
AllianzGI Emerging Markets Debt (b) | 1,075,831 | 15,416,656 | ||||||
AllianzGI Emerging Markets Small-Cap (b) | 273,550 | 4,967,665 | ||||||
AllianzGI International Growth (b) | 1,021,708 | 18,952,678 | ||||||
AllianzGI PerformanceFee Managed Futures Strategy (c) | 1,500,000 | 14,460,000 | ||||||
|
| |||||||
| Total Mutual Funds (cost—$300,320,354) | 323,706,760 | |||||||
|
| |||||||
| Exchange-Traded Funds—4.8% | ||||||||
iShares iBoxx $ Investment Grade Corporate Bond | 87,950 | 10,324,450 | ||||||
iShares MBS | 65,470 | 6,850,781 | ||||||
|
| |||||||
| Total Exchange-Traded Funds (cost—$17,565,566) | 17,175,231 | |||||||
|
| |||||||
| Principal Amount (000s) | Value | |||||||
| U.S. Treasury Obligations—1.4% | ||||||||
U.S. Treasury Notes, | $5,000 | $ | 5,026,953 | |||||
|
| |||||||
| Repurchase Agreements—2.7% | ||||||||
State Street Bank and Trust Co.,dated 3/29/18, 0.28%, due 4/2/18, proceeds $9,665,301; collateralized by U.S. Treasury Notes, 2.50%, due 5/15/24, valued at $9,863,091 including accrued interest |
| |||||||
(cost—$9,665,000) | 9,665 | 9,665,000 | ||||||
|
| |||||||
| Total Investments (cost—$332,614,481)—99.7% | 355,573,944 | |||||||
|
| |||||||
| Other assets less liabilities (d)—0.3% | 1,022,975 | |||||||
|
| |||||||
| Net Assets—100.0% | $356,596,919 | |||||||
|
| |||||||
Notes to Schedule of Investments:
(a) Affiliated fund.
(b) Institutional Class share.
(c) Class R6 share.
(d) Includes net unrealized appreciation (depreciation) of other financial instruments as follows:
| Futures contracts outstanding at March 31, 2018: | ||||||||||||||||||||||
| Type | Contracts | Expiration Date | Notional Amount (000s) | Market Value (000s) | Unrealized Appreciation (Depreciation) | |||||||||||||||||
Long position contracts: | ||||||||||||||||||||||
2-Year U.S. Treasury Note | 48 | 6/29/18 | $ | 9,600 | $ | 10,205 | $ | 1,795 | ||||||||||||||
5-Year U.S. Treasury Note | 39 | 6/29/18 | 3,900 | 4,464 | 13,948 | |||||||||||||||||
British Pound | 159 | 6/18/18 | 9,938 | 13,970 | 62,182 | |||||||||||||||||
E-mini Russell 2000 Index | 82 | 6/15/18 | 4 | 6,278 | (233,557 | ) | ||||||||||||||||
E-mini S&P 500 Index | 178 | 6/15/18 | 9 | 23,523 | (922,632 | ) | ||||||||||||||||
Euro Currency | 88 | 6/18/18 | 11,000 | 13,594 | (21,135 | ) | ||||||||||||||||
Euro-Bund 10-Year Bond | 22 | 6/7/18 | EUR | 2,200 | 3,757 | 114,206 | ||||||||||||||||
Japanese Yen | 101 | 6/18/18 | $ | 126 | 11,923 | (63,357 | ) | |||||||||||||||
Mini MSCI Emerging Markets Index | 83 | 6/15/18 | 4 | 4,929 | (144,608 | ) | ||||||||||||||||
MSCI EAFE Index | 64 | 6/15/18 | 3 | 6,402 | (98,705 | ) | ||||||||||||||||
|
| |||||||||||||||||||||
| $ | (1,291,863 | ) | ||||||||||||||||||||
|
| |||||||||||||||||||||
Short position contracts: |
| |||||||||||||||||||||
10-Year U.S. Treasury Note | (36 | ) | 6/20/18 | $ | (3,600 | ) | $ | (4,361 | ) | $ | (34,940 | ) | ||||||||||
Canadian Dollar | (48 | ) | 6/19/18 | (4,800 | ) | (3,726 | ) | (49,038 | ) | |||||||||||||
U.S. Treasury Ultra Bond | (48 | ) | 6/20/18 | (4,800 | ) | (7,703 | ) | (255,186 | ) | |||||||||||||
|
| |||||||||||||||||||||
| $ | (339,164 | ) | ||||||||||||||||||||
|
| |||||||||||||||||||||
| $ | (1,631,027 | ) | ||||||||||||||||||||
|
| |||||||||||||||||||||
(e) At March 31, 2018, the Fund pledged $750,912 in cash as collateral for futures contracts.
Glossary:
EAFE—Europe, Australasia and Far East
EUR—Euro
MBS—Mortgage-Backed Securities
MSCI—Morgan Stanley Capital International
| See accompanying Notes to Financial Statements | | March 31, 2018 | | Semiannual Report | 121 |
Table of Contents
Schedule of Investments
March 31, 2018 (Unaudited)
AllianzGI Best Styles Emerging Markets Equity Fund
| Shares | Value | |||||||
| Common Stock—81.1% | ||||||||
| Brazil—5.4% | ||||||||
B3 S.A.—Brasil Bolsa Balcao | 656 | $5,303 | ||||||
Banco Bradesco S.A. | 3,740 | 43,580 | ||||||
Banco do Brasil S.A. | 8,100 | 100,666 | ||||||
Banco Santander Brasil S.A. UNIT | 1,700 | 20,550 | ||||||
Braskem S.A. ADR | 1,417 | 41,079 | ||||||
Cia de Saneamento de Minas Gerais—COPASA | 1,200 | 17,476 | ||||||
Cosan Ltd., Class A | 5,471 | 56,844 | ||||||
Fibria Celulose S.A. | 3,200 | 63,032 | ||||||
JBS S.A. | 4,600 | 13,027 | ||||||
Sao Martinho S.A. | 1,200 | 6,372 | ||||||
|
| |||||||
| 367,929 | ||||||||
|
| |||||||
| China—31.3% | ||||||||
Agricultural Bank of China Ltd., Class H | 94,000 | 53,979 | ||||||
Alibaba Group Holding Ltd. ADR (e) | 1,284 | 235,665 | ||||||
BAIC Motor Corp., Ltd., Class H (a) | 7,000 | 8,660 | ||||||
Baidu, Inc. ADR (e) | 160 | 35,710 | ||||||
Bank of China Ltd., Class H | 158,000 | 86,309 | ||||||
Bank of Communications Co., Ltd., Class H | 84,000 | 66,410 | ||||||
BYD Electronic International Co., Ltd. | �� | 8,500 | 16,123 | |||||
China Communications Services Corp., Ltd., Class H | 18,000 | 10,831 | ||||||
China Construction Bank Corp., Class H | 100,000 | 104,450 | ||||||
China Everbright Bank Co., Ltd., Class H | 47,000 | 22,771 | ||||||
China High Speed Transmission Equipment Group Co., Ltd. | 6,000 | 9,463 | ||||||
China Huarong Asset Management Co., Ltd., Class H (a) | 107,000 | 45,356 | ||||||
China Merchants Bank Co., Ltd., Class H | 24,000 | 99,621 | ||||||
China Mobile Ltd. | 1,500 | 13,748 | ||||||
China Petroleum & Chemical Corp., Class H | 44,000 | 39,032 | ||||||
China Power International Development Ltd. | 97,333 | 25,165 | ||||||
China Southern Airlines Co., Ltd., Class H | 10,000 | 10,451 | ||||||
China Telecom Corp., Ltd., Class H | 112,000 | 49,676 | ||||||
Chinasoft International Ltd. | 18,000 | 16,282 | ||||||
Chongqing Rural Commercial Bank Co., Ltd., Class H | 69,000 | 53,338 | ||||||
CIFI Holdings Group Co., Ltd. | 20,000 | 17,669 | ||||||
Geely Automobile Holdings Ltd. | 14,000 | 41,023 | ||||||
Hollysys Automation Technologies Ltd. | 563 | 13,917 | ||||||
Hua Hong Semiconductor Ltd. (a) | 7,000 | 14,019 | ||||||
Huaneng Renewables Corp., Ltd., Class H | 16,000 | 6,025 | ||||||
Industrial & Commercial Bank of China Ltd., Class H | 213,000 | 185,626 | ||||||
Kingboard Laminates Holdings Ltd. | 14,000 | 20,541 | ||||||
Nexteer Automotive Group Ltd. | 19,000 | 29,043 | ||||||
| Shares | Value | |||||||
Ping An Insurance Group Co. of China Ltd., Class H | 8,500 | $ | 87,641 | |||||
Pou Sheng International Holdings Ltd. | 18,000 | 4,564 | ||||||
Shenzhen Expressway Co., Ltd., Class H | 26,000 | 26,555 | ||||||
Shenzhen Investment Ltd. | 22,000 | 9,395 | ||||||
Sichuan Expressway Co., Ltd., Class H | 14,000 | 4,963 | ||||||
Springland International Holdings Ltd. | 37,000 | 8,906 | ||||||
Tencent Holdings Ltd. | 9,650 | 518,008 | ||||||
Tianneng Power International Ltd. | 28,700 | 34,192 | ||||||
Tongda Group Holdings Ltd. | 80,000 | 15,411 | ||||||
Xinjiang Goldwind Science & Technology Co., Ltd., Class H | 12,740 | 20,562 | ||||||
XTEP International Holdings Ltd. | 16,500 | 9,200 | ||||||
Yuzhou Properties Co., Ltd. | 33,000 | 22,666 | ||||||
Zhejiang Expressway Co., Ltd., Class H | 20,000 | 20,512 | ||||||
Zhongsheng Group Holdings Ltd. | 12,500 | 34,341 | ||||||
|
| |||||||
| 2,147,819 | ||||||||
|
| |||||||
| Colombia—1.1% | ||||||||
Almacenes Exito S.A. | 1,161 | 6,848 | ||||||
Corp. Financiera Colombiana S.A. | 564 | 4,804 | ||||||
Ecopetrol S.A. | 59,953 | 56,111 | ||||||
Grupo Aval Acciones y Valores S.A. ADR | 717 | 5,958 | ||||||
|
| |||||||
| 73,721 | ||||||||
|
| |||||||
| Czech Republic—0.3% | ||||||||
Moneta Money Bank AS (a) | 4,984 | 20,645 | ||||||
|
| |||||||
| Egypt—0.2% | ||||||||
Commercial International Bank Egypt SAE GDR | 2,199 | 11,171 | ||||||
|
| |||||||
| Hong Kong—0.0% | ||||||||
Tongda Hong Tai Holdings Ltd. (e) | 2,000 | 397 | ||||||
|
| |||||||
| Hungary—0.8% | ||||||||
Magyar Telekom Telecommunications PLC | 8,154 | 14,551 | ||||||
MOL Hungarian Oil & Gas PLC | 2,024 | 22,084 | ||||||
OTP Bank PLC | 437 | 19,635 | ||||||
|
| |||||||
| 56,270 | ||||||||
|
| |||||||
| India—0.5% | ||||||||
Tata Motors Ltd. ADR (e) | 718 | 18,453 | ||||||
Wipro Ltd. ADR | 2,734 | 14,107 | ||||||
|
| |||||||
| 32,560 | ||||||||
|
| |||||||
| Indonesia—0.6% | ||||||||
Adaro Energy Tbk PT | 54,300 | 8,460 | ||||||
Gudang Garam Tbk PT | 1,100 | 5,809 | ||||||
Telekomunikasi Indonesia Persero Tbk PT ADR | 999 | 26,394 | ||||||
|
| |||||||
| 40,663 | ||||||||
|
| |||||||
| Korea (Republic of)—14.7% | ||||||||
Daelim Industrial Co., Ltd. | 424 | 29,447 | ||||||
Doosan Heavy Industries & Construction Co., Ltd. (e) | 249 | 3,736 | ||||||
GS Holdings Corp. | 544 | 31,633 | ||||||
Hana Financial Group, Inc. | 2,066 | 89,039 | ||||||
Hanil Cement Co., Ltd. | 83 | 8,410 | ||||||
Hanwha General Insurance Co., Ltd. | 767 | 6,072 | ||||||
| Shares | Value | |||||||
KB Financial Group, Inc. | 716 | $ | 41,526 | |||||
Korea Electric Power Corp. ADR (e) | 3,038 | 46,755 | ||||||
Korea Petrochemical Ind Co., Ltd. | 115 | 31,823 | ||||||
LG Chem Ltd. | 83 | 30,297 | ||||||
LG Corp. | 1,000 | 82,086 | ||||||
Lotte Chemical Corp. | 33 | 13,520 | ||||||
LS Corp. | 237 | 16,488 | ||||||
S&T Motiv Co., Ltd. | 144 | 5,327 | ||||||
S-Oil Corp. | 134 | 15,173 | ||||||
Samsung Electronics Co., Ltd. | 181 | 422,902 | ||||||
Samsung Electronics Co., Ltd. GDR | 35 | 40,486 | ||||||
SK Hynix, Inc. | 815 | 62,439 | ||||||
Woori Bank | 2,243 | 30,498 | ||||||
|
| |||||||
| 1,007,657 | ||||||||
|
| |||||||
| Malaysia—1.7% | ||||||||
Bermaz Auto Bhd. | 15,140 | 8,885 | ||||||
CIMB Group Holdings Bhd. | 10,800 | 20,097 | ||||||
Hong Leong Financial Group Bhd. | 4,900 | 24,383 | ||||||
MISC Bhd. | 3,700 | 6,767 | ||||||
Sunway Bhd. | 17,675 | 7,241 | ||||||
Top Glove Corp. Bhd. | 19,300 | 48,754 | ||||||
|
| |||||||
| 116,127 | ||||||||
|
| |||||||
| Mexico—2.7% | ||||||||
Alpek S.A.B de C.V. | 9,000 | 12,525 | ||||||
Grupo Aeroportuario del Pacifico S.A.B de C.V., Class B | 2,600 | 25,690 | ||||||
Grupo Lala S.A.B de C.V. | 3,300 | 4,498 | ||||||
Industrias Bachoco S.A.B de C.V. ADR | 806 | 49,932 | ||||||
Industrias Bachoco S.A.B de C.V., Ser. B | 1,500 | 7,828 | ||||||
Ternium S.A. ADR | 2,095 | 68,066 | ||||||
Vitro S.A.B de C.V., Ser. A | 5,600 | 18,503 | ||||||
|
| |||||||
| 187,042 | ||||||||
|
| |||||||
| Norway—0.3% | ||||||||
Bakkafrost P/F | 351 | 19,232 | ||||||
|
| |||||||
| Philippines—0.1% | ||||||||
DMCI Holdings, Inc. | 23,600 | 5,524 | ||||||
San Miguel Corp. | 1,350 | 3,480 | ||||||
|
| |||||||
| 9,004 | ||||||||
|
| |||||||
| Russian Federation—1.5% | ||||||||
LUKOIL PJSC ADR | 344 | 23,812 | ||||||
Magnitogorsk Iron & Steel Works PJSC GDR | 444 | 4,421 | ||||||
MegaFon PJSC GDR | 700 | 6,923 | ||||||
MMC Norilsk Nickel PJSC ADR | 403 | 7,536 | ||||||
RusHydro PJSC ADR | 5,912 | 7,424 | ||||||
Severstal PJSC GDR | 348 | 5,261 | ||||||
United Co. RUSAL PLC | 16,000 | 9,735 | ||||||
X5 Retail Group NV GDR (e) | 1,158 | 38,835 | ||||||
|
| |||||||
| 103,947 | ||||||||
|
| |||||||
| Singapore—0.2% | ||||||||
Accordia Golf Trust UNIT | 4,600 | 2,263 | ||||||
Wing Tai Holdings Ltd. | 6,500 | 10,306 | ||||||
|
| |||||||
| 12,569 | ||||||||
|
| |||||||
| South Africa—3.7% | ||||||||
AVI Ltd. | 3,606 | 33,755 | ||||||
Clicks Group Ltd. | 2,581 | 39,874 | ||||||
Fortress REIT Ltd., Class A REIT | 5,234 | 7,097 | ||||||
Investec Ltd. | 1,341 | 10,453 | ||||||
| 122 | Semiannual Report | | March 31, 2018 | | See accompanying Notes to Financial Statements |
Table of Contents
Schedule of Investments
March 31, 2018 (Unaudited)
| Shares | Value | |||||||
Liberty Holdings Ltd. | 4,895 | $ | 51,911 | |||||
Naspers Ltd., Class N | 127 | 31,079 | ||||||
Raubex Group Ltd. | 3,582 | 6,142 | ||||||
Redefine Properties Ltd. REIT | 6,604 | 6,465 | ||||||
SPAR Group Ltd. | 1,306 | 22,346 | ||||||
Super Group Ltd. (e) | 3,534 | 10,782 | ||||||
Tiger Brands Ltd. | 875 | 27,386 | ||||||
Tsogo Sun Holdings Ltd. | 3,201 | 6,290 | ||||||
|
| |||||||
| 253,580 | ||||||||
|
| |||||||
| Taiwan—8.7% | ||||||||
Accton Technology Corp. | 7,000 | 23,125 | ||||||
AmTRAN Technology Co., Ltd. | 9,000 | 4,406 | ||||||
Chicony Power Technology Co., Ltd. | 5,025 | 10,280 | ||||||
China Motor Corp. | 11,000 | 10,411 | ||||||
Compeq Manufacturing Co., Ltd. | 46,000 | 47,906 | ||||||
First Financial Holding Co., Ltd. | 42,840 | 29,879 | ||||||
Formosa Chemicals & Fibre Corp. | 12,000 | 45,309 | ||||||
Grape King Bio Ltd. | 2,000 | 17,649 | ||||||
Hon Hai Precision Industry Co., Ltd. GDR | 2,780 | 17,292 | ||||||
Inventec Corp. | 8,000 | 6,397 | ||||||
King Yuan Electronics Co., Ltd. | 15,000 | 15,745 | ||||||
Lite-On Technology Corp. | 26,439 | 37,190 | ||||||
Mitac Holdings Corp. | 22,437 | 26,013 | ||||||
Powertech Technology, Inc. | 6,800 | 21,437 | ||||||
Sinbon Electronics Co., Ltd. | 5,479 | 14,474 | ||||||
Taiwan Cooperative Financial Holding Co., Ltd. | 28,840 | 17,050 | ||||||
Taiwan Semiconductor Manufacturing Co., Ltd. | 21,000 | 177,874 | ||||||
Taiwan Semiconductor Manufacturing Co., Ltd. ADR | 173 | 7,570 | ||||||
Tong Yang Industry Co., Ltd. | 3,000 | 5,424 | ||||||
Tripod Technology Corp. | 3,000 | 10,175 | ||||||
United Microelectronics Corp. | 36,000 | 18,972 | ||||||
Wistron Corp. | 40,650 | 35,166 | ||||||
|
| |||||||
| 599,744 | ||||||||
|
| |||||||
| Thailand—3.9% | ||||||||
Airports of Thailand PCL (c)(d) | 35,000 | 74,091 | ||||||
GFPT PCL (c)(d) | 5,400 | 2,321 | ||||||
PTT Global Chemical PCL (c)(d) | 9,300 | 28,269 | ||||||
PTT PCL (c)(d) | 6,200 | 109,195 | ||||||
Siam Cement PCL | 1,250 | 19,759 | ||||||
Thai Union Group | 2,600 | 1,556 | ||||||
| Shares | Value | |||||||
Thanachart Capital PCL (c)(d) | 11,500 | $ | 19,179 | |||||
Tisco Financial Group PCL (c)(d) | 6,100 | 17,200 | ||||||
|
| |||||||
| 271,570 | ||||||||
|
| |||||||
| Turkey—2.5% | ||||||||
Akbank Turk AS | 13,323 | 32,395 | ||||||
Arcelik AS | 2,506 | 11,394 | ||||||
BIM Birlesik Magazalar AS | 1,140 | 20,672 | ||||||
Petkim Petrokimya Holding AS | 6,745 | 13,897 | ||||||
Soda Sanayii AS | 44,556 | 61,950 | ||||||
Tofas Turk Otomobil Fabrikasi AS | 3,122 | 21,042 | ||||||
Trakya Cam Sanayii AS | 9,462 | 12,283 | ||||||
|
| |||||||
| 173,633 | ||||||||
|
| |||||||
| United States—0.9% | ||||||||
China Biologic Products Holdings, Inc. (e) | 364 | 29,484 | ||||||
First BanCorp (e) | 5,027 | 30,262 | ||||||
|
| |||||||
| 59,746 | ||||||||
|
| |||||||
| Total Common Stock (cost—$4,062,054) | 5,565,026 | |||||||
|
| |||||||
| Preferred Stock—3.0% | ||||||||
| Brazil—2.0% | ||||||||
Banco do Estado do Rio Grande do Sul S.A., Class B | 3,100 | 19,033 | ||||||
Braskem S.A., Class A | 600 | 8,724 | ||||||
Cia de Gas de Sao Paulo—COMGAS, Class A | 500 | 8,872 | ||||||
Cia de Transmissao de Energia Eletrica Paulista | 1,400 | 28,200 | ||||||
Metalurgica Gerdau S.A. | 3,100 | 6,704 | ||||||
Petroleo Brasileiro S.A. (e) | 10,400 | 67,444 | ||||||
|
| |||||||
| 138,977 | ||||||||
|
| |||||||
| Colombia—0.5% | ||||||||
Banco Davivienda S.A. | 2,951 | 31,812 | ||||||
|
| |||||||
| Korea (Republic of)—0.5% | ||||||||
Samsung Electronics Co., Ltd. | 18 | 34,612 | ||||||
|
| |||||||
| Total Preferred Stock (cost—$136,589) | 205,401 | |||||||
|
| |||||||
| Units | Value | |||||||
| Warrants—0.0% | ||||||||
| Malaysia—0.0% | ||||||||
Sunway Bhd., expires 10/03/24 (e) | 2,272 | $ | 241 | |||||
|
| |||||||
| Principal Amount (000s) | ||||||||
| Repurchase Agreements—5.8% | ||||||||
State Street Bank and Trust Co., dated 3/29/18, 0.28%, due 4/2/18, proceeds $397,012; collateralized by U.S. Treasury Notes, 2.00%, due 8/15/25, valued at $405,093 including accrued interest |
| |||||||
(cost—$397,000) | $397 | 397,000 | ||||||
|
| |||||||
| Total Investments (cost—$4,595,643) (b)—89.9% | 6,167,668 | |||||||
|
| |||||||
| Other assets less liabilities (f)—10.1% | 689,440 | |||||||
|
| |||||||
| Net Assets—100.0% | $6,857,108 | |||||||
|
| |||||||
Notes to Schedule of Investments:
(a) 144A—Exempt from registration under Rule 144A of the Securities Act of 1933. These securities may be resold in transactions exempt from registration, typically only to qualified institutional buyers. Securities with an aggregate value of $88,680, representing 1.3% of net assets.
(b) Securities with an aggregate value of $4,027,711, representing 58.7% of net assets, were valued utilizing modeling tools provided by a third-party vendor. See Note 1(a) and Note 1(b) in the Notes to Financial Statements.
(c) Fair-Valued—Securities with an aggregate value of $251,811, representing 3.7% of net assets. See Note 1(a) and Note 1(b) in the Notes to Financial Statements.
(d) Level 3 security. See Note 1(a) and
Note 1(b) in the Notes to Financial Statements.
(e) Non-income producing.
(f) Includes net unrealized appreciation (depreciation) of other financial instruments as follows:
| Futures contracts outstanding at March 31, 2018: | ||||||||||||||||||||||
| Type | Contracts | Expiration Date | Notional Amount (000s) | Market Value (000s) | Unrealized Appreciation (Depreciation) | |||||||||||||||||
Long position contracts: |
| |||||||||||||||||||||
Mini MSCI Emerging Markets Index | 2 | 6/15/18 | $ | — | (h) | $ | 119 | $ | (3,005 | ) | ||||||||||||
S&P CNX Nifty Index | 31 | 4/26/18 | — | (h) | 635 | 1,761 | ||||||||||||||||
|
| |||||||||||||||||||||
| $ | (1,244 | ) | ||||||||||||||||||||
|
| |||||||||||||||||||||
(g) At March 31, 2018, the Fund pledged $106,932 in cash as collateral for futures contracts.
(h) Notional amount rounds to less than $500.
| See accompanying Notes to Financial Statements | | March 31, 2018 | | Semiannual Report | 123 |
Table of Contents
Schedule of Investments
March 31, 2018 (Unaudited)
Glossary:
ADR—American Depositary Receipt
CNX—National Stock Exchange of India
GDR—Global Depositary Receipt
MSCI—Morgan Stanley Capital International
REIT—Real Estate Investment Trust
UNIT—More than one class of securities traded together.
The industry classification of portfolio holdings and other assets less liabilities shown as a percentage of net assets were as follows:
Banks | 18.9% | |||
Internet Software & Services | 11.5% | |||
Technology Hardware, Storage & Peripherals | 8.8% | |||
Oil, Gas & Consumable Fuels | 6.3% | |||
Semiconductors & Semiconductor Equipment | 4.6% | |||
Chemicals | 4.2% | |||
Food Products | 2.4% | |||
Transportation Infrastructure | 2.2% | |||
Insurance | 2.1% | |||
Electronic Equipment, Instruments & Components | 2.0% | |||
Food & Staples Retailing | 1.9% | |||
Metals & Mining | 1.5% | |||
Diversified Telecommunication Services | 1.5% | |||
Automobiles | 1.4% | |||
Industrial Conglomerates | 1.3% | |||
Electric Utilities | 1.2% | |||
Auto Components | 1.1% | |||
Real Estate Management & Development | 1.0% | |||
Paper & Forest Products | 0.9% | |||
Capital Markets | 0.9% | |||
Electrical Equipment | 0.9% | |||
Specialty Retail | 0.9% | |||
Healthcare Equipment & Supplies | 0.7% | |||
Communications Equipment | 0.6% | |||
Construction & Engineering | 0.5% | |||
Independent Power Producers & Energy Traders | 0.5% | |||
Media | 0.5% | |||
IT Services | 0.4% | |||
Biotechnology | 0.4% | |||
Construction Materials | 0.4% | |||
Wireless Telecommunication Services | 0.3% | |||
Containers & Packaging | 0.3% | |||
Personal Products | 0.3% | |||
Water Utilities | 0.3% | |||
Household Durables | 0.2% | |||
Equity Real Estate Investment Trusts (REITs) | 0.2% | |||
Building Products | 0.2% | |||
Airlines | 0.1% | |||
Textiles, Apparel & Luxury Goods | 0.1% | |||
Multi-Line Retail | 0.1% | |||
Gas Utilities | 0.1% | |||
Hotels, Restaurants & Leisure | 0.1% | |||
Marine | 0.1% | |||
Tobacco | 0.1% | |||
Diversified Financial Services | 0.1% | |||
Repurchase Agreements | 5.8% | |||
Other assets less liabilities | 10.1% | |||
|
| |||
| 100.0% | ||||
|
|
AllianzGI Best Styles Global Equity Fund
| Shares | Value | |||||||
| Common Stock—97.6% | ||||||||
| Australia—0.5% | ||||||||
Abacus Property Group REIT | 116,921 | $313,200 | ||||||
BlueScope Steel Ltd. | 42,948 | 505,291 | ||||||
Elders Ltd. | 37,471 | 215,489 | ||||||
Metcash Ltd. | 235,325 | 569,459 | ||||||
Qantas Airways Ltd. | 136,980 | 617,992 | ||||||
Rio Tinto Ltd. | 10,838 | 613,997 | ||||||
|
| |||||||
| 2,835,428 | ||||||||
|
| |||||||
| Austria—0.6% | ||||||||
Austria Technologie & Systemtechnik AG | 6,383 | 173,318 | ||||||
Erste Group Bank AG | 31,151 | 1,566,063 | ||||||
EVN AG | 15,600 | 304,433 | ||||||
OMV AG | 10,655 | 621,474 | ||||||
POLYTEC Holding AG | 9,614 | 185,209 | ||||||
Raiffeisen Bank International AG (e) | 10,445 | 406,828 | ||||||
S IMMO AG | 9,961 | 197,330 | ||||||
|
| |||||||
| 3,454,655 | ||||||||
|
| |||||||
| Belgium—0.0% | ||||||||
Recticel S.A. | 15,205 | 191,055 | ||||||
|
| |||||||
| Brazil—0.6% | ||||||||
Cia de Saneamento Basico do Estado de Sao Paulo | 31,400 | 332,884 | ||||||
Fibria Celulose S.A. | 35,900 | 707,137 | ||||||
MRV Engenharia e Participacoes S.A. | 54,000 | 265,792 | ||||||
Qualicorp S.A. | 49,000 | 330,679 | ||||||
Smiles Fidelidade S.A. | 5,900 | 124,203 | ||||||
Suzano Papel e Celulose S.A. | 71,400 | 721,472 | ||||||
Vale S.A. | 97,719 | 1,249,366 | ||||||
|
| |||||||
| 3,731,533 | ||||||||
|
| |||||||
| Canada—4.2% | ||||||||
AGF Management Ltd., Class B | 36,529 | 185,998 | ||||||
BRP, Inc. | 17,557 | 674,289 | ||||||
Canadian Apartment Properties REIT | 11,302 | 325,897 | ||||||
Canadian Imperial Bank of Commerce | 18,174 | 1,604,182 | ||||||
Canadian Natural Resources Ltd. | 54,598 | 1,716,319 | ||||||
Canadian Tire Corp., Ltd., Class A | 3,284 | 431,800 | ||||||
Chorus Aviation, Inc. | 33,260 | 214,273 | ||||||
Cogeco Communications, Inc. | 12,039 | 659,162 | ||||||
Colliers International Group, Inc. | 4,626 | 321,147 | ||||||
Corus Entertainment, Inc., Class B | 65,529 | 307,719 | ||||||
Dream Global Real Estate Investment Trust REIT | 33,193 | 354,254 | ||||||
Dream Industrial Real Estate Investment Trust REIT | 26,259 | 194,239 | ||||||
Enerflex Ltd. | 25,828 | 307,927 | ||||||
Exchange Income Corp. | 14,334 | 343,344 | ||||||
Fairfax Financial Holdings Ltd. | 1,674 | 848,558 | ||||||
Fortis, Inc. | 18,091 | 610,686 | ||||||
Genworth MI Canada, Inc. | 8,627 | 274,543 | ||||||
George Weston Ltd. | 14,946 | 1,203,244 | ||||||
Husky Energy, Inc. (e) | 27,627 | 395,422 | ||||||
Industrial Alliance Insurance & Financial Services, Inc. | 12,737 | 523,973 | ||||||
Laurentian Bank of Canada | 13,559 | 498,431 | ||||||
| Shares | Value | |||||||
Linamar Corp. | 10,238 | $ | 559,282 | |||||
Loblaw Cos., Ltd. | 25,139 | 1,270,072 | ||||||
Magna International, Inc. | 10,894 | 613,636 | ||||||
Manulife Financial Corp. | 66,578 | 1,236,113 | ||||||
Martinrea International, Inc. | 22,134 | 261,653 | ||||||
Methanex Corp. | 6,471 | 392,022 | ||||||
National Bank of Canada | 17,723 | 834,185 | ||||||
NorthWest Healthcare Properties Real Estate Investment Trust REIT | 36,080 | 315,614 | ||||||
Power Corp. of Canada | 18,629 | 425,112 | ||||||
Pure Industrial Real Estate Trust REIT | 48,991 | 305,730 | ||||||
Royal Bank of Canada | 25,657 | 1,981,903 | ||||||
Teck Resources Ltd., Class B | 20,387 | 525,044 | ||||||
TMX Group Ltd. | 22,139 | 1,284,504 | ||||||
Toronto-Dominion Bank | 29,972 | 1,700,821 | ||||||
TransCanada Corp. | 24,205 | 1,001,003 | ||||||
Transcontinental, Inc., Class A | 62,628 | 1,237,150 | ||||||
West Fraser Timber Co., Ltd. | 5,431 | 360,886 | ||||||
|
| |||||||
| 26,300,137 | ||||||||
|
| |||||||
| Chile—0.2% | ||||||||
Colbun S.A. | 1,463,444 | 351,260 | ||||||
Enel Chile S.A. | 5,279,619 | 684,366 | ||||||
|
| |||||||
| 1,035,626 | ||||||||
|
| |||||||
| China—4.9% | ||||||||
AAC Technologies Holdings, Inc. | 15,600 | 285,863 | ||||||
Agile Group Holdings Ltd. | 156,909 | 327,221 | ||||||
Agricultural Bank of China Ltd., Class H | 850,000 | 488,107 | ||||||
Alibaba Group Holding Ltd. ADR (e) | 18,771 | 3,445,229 | ||||||
Anhui Conch Cement Co., Ltd., Class H | 73,500 | 404,468 | ||||||
Bank of China Ltd., Class H | 2,839,000 | 1,550,829 | ||||||
Bank of Communications Co., Ltd., Class H | 545,961 | 431,632 | ||||||
Beijing Enterprises Holdings Ltd. | 109,000 | 574,003 | ||||||
BYD Electronic International Co., Ltd. | 142,682 | 270,636 | ||||||
China CITIC Bank Corp., Ltd., Class H | 1,081,000 | 745,866 | ||||||
China Construction Bank Corp., Class H | 2,069,188 | 2,161,275 | ||||||
China Huarong Asset Management Co., Ltd., Class H (a) | 2,639,000 | 1,118,646 | ||||||
China Lumena New Materials | 60,228 | 1,151 | ||||||
China Mobile Ltd. | 55,000 | 504,096 | ||||||
China Petroleum & Chemical Corp., Class H | 930,200 | 825,164 | ||||||
China Southern Airlines Co., Ltd., Class H | 260,846 | 272,601 | ||||||
China Water Affairs Group Ltd. | 396,000 | 405,209 | ||||||
China Yuchai International Ltd. | 18,373 | 388,956 | ||||||
China Zhongwang Holdings Ltd. | 390,000 | 232,866 | ||||||
CITIC Ltd. | 301,000 | 423,856 | ||||||
Country Garden Holdings Co., Ltd. | 214,000 | 446,791 | ||||||
| 124 | Semiannual Report | | March 31, 2018 | | See accompanying Notes to Financial Statements |
Table of Contents
Schedule of Investments
March 31, 2018 (Unaudited)
| Shares | Value | |||||||
CSPC Pharmaceutical Group Ltd. | 158,000 | $ | 425,891 | |||||
Fosun International Ltd. | 141,000 | 309,363 | ||||||
Guangzhou Automobile Group Co., Ltd., Class H | 338,565 | 628,833 | ||||||
Haier Electronics Group Co., Ltd. | 204,000 | 731,373 | ||||||
Hua Hong Semiconductor Ltd. (a) | 237,000 | 474,640 | ||||||
Industrial & Commercial Bank of China Ltd., Class H | 2,110,000 | 1,838,835 | ||||||
Jiangsu Expressway Co., Ltd., Class H | 234,000 | 332,227 | ||||||
Kingboard Chemical Holdings Ltd. | 65,500 | 302,819 | ||||||
Lee & Man Paper Manufacturing Ltd. | 147,483 | 157,479 | ||||||
Nexteer Automotive Group Ltd. | 150,000 | 229,290 | ||||||
Ping An Insurance Group Co. of China Ltd., Class H | 127,000 | 1,309,455 | ||||||
Shanghai Industrial Holdings Ltd. | 206,000 | 540,588 | ||||||
Shenzhen Expressway Co., Ltd., Class H | 291,426 | 297,651 | ||||||
Sihuan Pharmaceutical Holdings Group Ltd. | 867,000 | 259,261 | ||||||
Sinopec Shanghai Petrochemical Co., Ltd., Class H | 420,620 | 257,019 | ||||||
Sinopharm Group Co., Ltd., Class H | 95,679 | 479,117 | ||||||
Sinotrans Ltd., Class H | 214,000 | 118,335 | ||||||
Sinotruk Hong Kong Ltd. | 159,000 | 189,874 | ||||||
Tencent Holdings Ltd. | 89,319 | 4,794,603 | ||||||
Tianneng Power International Ltd. | 230,000 | 274,016 | ||||||
Want Want China Holdings Ltd. | 457,000 | 367,663 | ||||||
Weichai Power Co., Ltd., Class H | 315,000 | 356,248 | ||||||
Yuzhou Properties Co., Ltd. | 472,708 | 324,684 | ||||||
YY, Inc. ADR (e) | 3,084 | 324,437 | ||||||
|
| |||||||
| 30,628,166 | ||||||||
|
| |||||||
| Colombia—0.1% | ||||||||
Bancolombia S.A. | 59,689 | 645,584 | ||||||
|
| |||||||
| Czech Republic—0.1% | ||||||||
Philip Morris CR AS | 404 | 335,817 | ||||||
|
| |||||||
| Finland—0.3% | ||||||||
Cramo Oyj | 13,987 | 291,790 | ||||||
Finnair Oyj | 13,151 | 183,154 | ||||||
Stora Enso Oyj, Class R | 33,675 | 619,161 | ||||||
UPM-Kymmene Oyj | 25,418 | 942,342 | ||||||
|
| |||||||
| 2,036,447 | ||||||||
|
| |||||||
| France—4.4% | ||||||||
Air France-KLM (e) | 22,509 | 251,174 | ||||||
ArcelorMittal (e) | 29,253 | 929,141 | ||||||
Assystem | 3,185 | 109,144 | ||||||
Atos SE | 6,068 | 831,372 | ||||||
AXA S.A. | 77,257 | 2,053,723 | ||||||
Beneteau S.A. | 8,394 | 182,863 | ||||||
Bouygues S.A. | 31,760 | 1,592,389 | ||||||
Capgemini SE | 4,718 | 588,686 | ||||||
Cie Generale des Etablissements Michelin SCA | 11,000 | 1,628,470 | ||||||
CNP Assurances | 30,749 | 776,234 | ||||||
Coface S.A. | 15,991 | 182,812 | ||||||
Derichebourg S.A. | 21,233 | 187,004 | ||||||
| Shares | Value | |||||||
Eiffage S.A. | 15,149 | $ | 1,725,338 | |||||
Engie S.A. | 88,949 | 1,485,313 | ||||||
Faurecia S.A. | 8,403 | 679,937 | ||||||
Interparfums S.A. | 4,258 | 196,046 | ||||||
Klepierre S.A. REIT | 18,400 | 741,652 | ||||||
L’Oreal S.A. | 4,794 | 1,082,766 | ||||||
LVMH Moet Hennessy Louis Vuitton S.A. | 4,738 | 1,460,124 | ||||||
Metropole Television S.A. | 24,611 | 634,072 | ||||||
MGI Coutier | 7,292 | 274,843 | ||||||
Orange S.A. | 85,026 | 1,445,259 | ||||||
Peugeot S.A. | 35,387 | 852,097 | ||||||
Renault S.A. | 7,152 | 867,879 | ||||||
Sanofi | 25,720 | 2,063,773 | ||||||
STMicroelectronics NV | 20,325 | 452,307 | ||||||
Total S.A. | 35,401 | 2,029,172 | ||||||
Vinci S.A. | 22,858 | 2,251,399 | ||||||
|
| |||||||
| 27,554,989 | ||||||||
|
| |||||||
| Germany—1.3% | ||||||||
Bayer AG | 6,311 | 711,462 | ||||||
Bayerische Motoren Werke AG | 5,789 | 629,668 | ||||||
Covestro AG (a) | 10,841 | 1,067,481 | ||||||
Deutsche Lufthansa AG | 33,823 | 1,081,237 | ||||||
Deutsche Post AG | 38,278 | 1,676,549 | ||||||
Fraport AG Frankfurt Airport Services Worldwide | 6,874 | 678,409 | ||||||
Hella GmbH & Co. KGaA | 2,832 | 186,434 | ||||||
Rheinmetall AG | 2,425 | 344,215 | ||||||
Siemens AG | 6,967 | 888,970 | ||||||
Stroeer SE & Co. KGaA | 2,715 | 189,732 | ||||||
Talanx AG (e) | 14,373 | 624,947 | ||||||
Wuestenrot & Wuerttembergische AG | 7,301 | 172,502 | ||||||
|
| |||||||
| 8,251,606 | ||||||||
|
| |||||||
| Greece—0.3% | ||||||||
FF Group (e) | 19,365 | 377,430 | ||||||
Hellenic Petroleum S.A. | 19,594 | 189,569 | ||||||
JUMBO S.A. | 27,934 | 499,755 | ||||||
Motor Oil Hellas Corinth Refineries S.A. | 12,967 | 292,848 | ||||||
Mytilineos Holdings S.A. (e) | 16,057 | 172,147 | ||||||
|
| |||||||
| 1,531,749 | ||||||||
|
| |||||||
| Hong Kong—0.7% | ||||||||
AIA Group Ltd. | 211,800 | 1,810,610 | ||||||
Global Brands Group Holding Ltd. (e) | 2,430,000 | 137,491 | ||||||
IT Ltd. | 438,000 | 203,776 | ||||||
Johnson Electric Holdings Ltd. | 136,000 | 511,772 | ||||||
Kerry Properties Ltd. | 73,257 | 331,267 | ||||||
Minth Group Ltd. | 50,685 | 232,547 | ||||||
Regal Hotels International Holdings Ltd. | 184,000 | 130,885 | ||||||
VSTECS Holdings Ltd. | 220,000 | 116,626 | ||||||
WH Group Ltd. (a) | 260,000 | 278,586 | ||||||
Xinyi Glass Holdings Ltd. | 201,708 | 307,031 | ||||||
|
| |||||||
| 4,060,591 | ||||||||
|
| |||||||
| Hungary—0.2% | ||||||||
Magyar Telekom Telecommunications PLC | 361,141 | 644,475 | ||||||
OTP Bank PLC | 18,992 | 853,346 | ||||||
|
| |||||||
| 1,497,821 | ||||||||
|
| |||||||
| Indonesia—0.5% | ||||||||
Bank Negara Indonesia Persero Tbk PT | 1,053,445 | 667,138 | ||||||
| Shares | Value | |||||||
Bank Tabungan Negara Persero Tbk PT | 1,423,900 | $ | 394,281 | |||||
Gudang Garam Tbk PT | 65,500 | 345,884 | ||||||
Indo Tambangraya Megah Tbk PT | 156,400 | 324,592 | ||||||
Indofood Sukses Makmur Tbk PT | 428,121 | 224,445 | ||||||
Telekomunikasi Indonesia Persero Tbk PT | 3,375,894 | 887,708 | ||||||
Unilever Indonesia Tbk PT | 109,900 | 396,432 | ||||||
|
| |||||||
| 3,240,480 | ||||||||
|
| |||||||
| Israel—0.3% | ||||||||
Bank Leumi Le-Israel BM | 76,300 | 460,886 | ||||||
First International Bank of Israel Ltd. | 13,998 | 295,468 | ||||||
Harel Insurance Investments & Financial Services Ltd. | 24,265 | 192,278 | ||||||
Hilan Ltd. | 12,520 | 279,596 | ||||||
Ituran Location and Control Ltd. | 6,422 | 199,724 | ||||||
Jerusalem Oil Exploration (e) | 4,113 | 228,898 | ||||||
|
| |||||||
| 1,656,850 | ||||||||
|
| |||||||
| Italy—1.3% | ||||||||
ACEA SpA | 14,957 | 253,848 | ||||||
Amplifon SpA | 17,442 | 310,088 | ||||||
ASTM SpA | 7,442 | 187,655 | ||||||
Cementir Holding SpA | 21,925 | 190,147 | ||||||
Enel SpA | 360,877 | 2,208,282 | ||||||
Intesa Sanpaolo SpA | 294,651 | 1,072,825 | ||||||
Iren SpA | 87,670 | 275,258 | ||||||
La Doria SpA | 11,816 | 178,955 | ||||||
Maire Tecnimont SpA | 36,032 | 185,542 | ||||||
Mediobanca Banca di Credito Finanziario SpA | 33,911 | 398,671 | ||||||
Prima Industrie SpA | 3,889 | 175,179 | ||||||
Recordati SpA | 16,318 | 602,058 | ||||||
Societa Iniziative Autostradali e Servizi SpA | 16,774 | 312,610 | ||||||
Telecom Italia SpA (e) | 1,261,661 | 1,197,938 | ||||||
Unipol Gruppo SpA | 52,207 | 255,459 | ||||||
|
| |||||||
| 7,804,515 | ||||||||
|
| |||||||
| Japan—7.9% | ||||||||
Aisin Seiki Co., Ltd. | 16,000 | 873,167 | ||||||
Asahi Glass Co., Ltd. | 10,600 | 444,217 | ||||||
Brother Industries Ltd. | 25,600 | 593,598 | ||||||
Canon, Inc. | 52,000 | 1,886,471 | ||||||
Chubu Electric Power Co., Inc. | 53,700 | 770,688 | ||||||
Concordia Financial Group Ltd. | 74,900 | 422,920 | ||||||
Daiwa House Industry Co., Ltd. | 14,646 | 564,212 | ||||||
Denso Corp. | 12,500 | 687,556 | ||||||
Eizo Corp. | 6,800 | 313,610 | ||||||
Electric Power Development Co., Ltd. | 43,000 | 1,108,365 | ||||||
Exedy Corp. | 5,926 | 187,502 | ||||||
FANUC Corp. | 4,100 | 1,055,148 | ||||||
Fukuoka Financial Group, Inc. | 70,000 | 383,472 | ||||||
Furukawa Electric Co., Ltd. | 5,600 | 301,227 | ||||||
Gecoss Corp. | 24,200 | 249,037 | ||||||
Goldcrest Co., Ltd. | 15,100 | 322,228 | ||||||
Hitachi Ltd. | 143,000 | 1,041,555 | ||||||
Honda Motor Co., Ltd. | 83,200 | 2,880,100 | ||||||
Iida Group Holdings Co., Ltd. | 56,600 | 1,058,004 | ||||||
ITOCHU Corp. | 109,723 | 2,142,579 | ||||||
Japan Airlines Co., Ltd. | 14,783 | 601,907 | ||||||
| See accompanying Notes to Financial Statements | | March 31, 2018 | | Semiannual Report | 125 |
Table of Contents
Schedule of Investments
March 31, 2018 (Unaudited)
| Shares | Value | |||||||
JFE Holdings, Inc. | 18,400 | $ | 371,153 | |||||
JXTG Holdings, Inc. | 96,500 | 588,320 | ||||||
Kamei Corp. | 14,100 | 194,622 | ||||||
Keyence Corp. | 1,800 | 1,124,384 | ||||||
Komatsu Ltd. | 23,800 | 797,275 | ||||||
Konica Minolta, Inc. | 43,000 | 365,541 | ||||||
Kyokuto Kaihatsu Kogyo Co., Ltd. | 12,800 | 189,270 | ||||||
Marubeni Corp. | 118,400 | 864,620 | ||||||
Mazda Motor Corp. | 72,200 | 965,590 | ||||||
Mitsubishi Chemical Holdings Corp. | 53,594 | 521,816 | ||||||
Mitsubishi Corp. | 74,300 | 2,000,086 | ||||||
Mitsubishi UFJ Financial Group, Inc. | 228,815 | 1,520,617 | ||||||
Mitsui & Co., Ltd. | 114,100 | 1,963,416 | ||||||
Mitsui Sugar Co., Ltd. | 16,100 | 619,128 | ||||||
Nidec Corp. | 5,200 | 800,325 | ||||||
Nintendo Co., Ltd. | 2,100 | 932,973 | ||||||
Nippon Road Co., Ltd. | 3,700 | 182,698 | ||||||
Nippon Telegraph & Telephone Corp. | 40,148 | 1,873,027 | ||||||
Nissan Motor Co., Ltd. | 152,641 | 1,575,582 | ||||||
Nomura Real Estate Holdings, Inc. | 18,943 | 444,806 | ||||||
NS United Kaiun Kaisha Ltd. | 9,300 | 187,176 | ||||||
ORIX Corp. | 49,599 | 888,862 | ||||||
Prima Meat Packers Ltd. | 55,000 | 309,527 | ||||||
Rohm Co., Ltd. | 7,600 | 721,398 | ||||||
Shin-Etsu Chemical Co., Ltd. | 15,500 | 1,616,792 | ||||||
SoftBank Group Corp. | 26,600 | 1,984,128 | ||||||
Sojitz Corp. | 88,016 | 280,740 | ||||||
Sony Corp. | 30,800 | 1,515,370 | ||||||
Sumitomo Electric Industries Ltd. | 82,000 | 1,253,247 | ||||||
Teijin Ltd. | 19,100 | 362,946 | ||||||
Toyota Motor Corp. | 52,349 | 3,399,107 | ||||||
Toyota Tsusho Corp. | 12,200 | 412,293 | ||||||
Yamaha Motor Co., Ltd. | 13,500 | 401,651 | ||||||
Yomiuri Land Co., Ltd. | 4,400 | 189,255 | ||||||
|
| |||||||
| 49,305,304 | ||||||||
|
| |||||||
| Korea (Republic of)—2.5% | ||||||||
DGB Financial Group, Inc. | 58,126 | 639,925 | ||||||
GS Holdings Corp. | 5,690 | 330,871 | ||||||
Hana Financial Group, Inc. | 11,387 | 490,747 | ||||||
Hanwha Chemical Corp. | 23,169 | 648,320 | ||||||
Hyundai Department Store Co., Ltd. | 3,721 | 317,616 | ||||||
Hyundai Development Co-Engineering & Construction | 8,509 | 304,472 | ||||||
Hyundai Steel Co. | 11,653 | 566,086 | ||||||
Industrial Bank of Korea | 24,383 | 359,147 | ||||||
KB Financial Group, Inc. | 13,482 | 781,918 | ||||||
KT Corp. ADR (e) | 13,138 | 179,991 | ||||||
LG Corp. | 3,888 | 319,150 | ||||||
LG Electronics, Inc. | 9,110 | 939,938 | ||||||
LG Uplus Corp. | 26,413 | 306,780 | ||||||
Lotte Chemical Corp. | 780 | 319,554 | ||||||
LS Corp. | 4,557 | 317,035 | ||||||
OCI Co., Ltd. | 2,593 | 388,052 | ||||||
POSCO | 5,298 | 1,691,125 | ||||||
S-Oil Corp. | 5,078 | 574,999 | ||||||
Samsung Electronics Co., Ltd. GDR | 2,687 | 3,079,302 | ||||||
Shinhan Financial Group Co., Ltd. | 19,646 | 838,084 | ||||||
SK Innovation Co., Ltd. | 4,004 | 795,830 | ||||||
SK Telecom Co., Ltd. | 2,513 | 544,910 | ||||||
Woori Bank | 33,833 | 460,033 | ||||||
|
| |||||||
| 15,193,885 | ||||||||
|
| |||||||
| Shares | Value | |||||||
| Malaysia—0.3% | ||||||||
AirAsia Group Bhd. | 305,900 | $ | 314,447 | |||||
CIMB Group Holdings Bhd. | 484,000 | 900,639 | ||||||
Genting Malaysia Bhd. | 305,600 | 384,070 | ||||||
Hong Leong Financial Group Bhd. | 67,900 | 337,879 | ||||||
|
| |||||||
| 1,937,035 | ||||||||
|
| |||||||
| Mexico—0.5% | ||||||||
Alfa S.A.B de C.V., Class A | 294,600 | 377,568 | ||||||
Banco del Bajio S.A. (a)(e) | 59,200 | 126,964 | ||||||
El Puerto de Liverpool S.A.B de C.V. | 46,200 | 342,434 | ||||||
Grupo Financiero Banorte S.A.B de C.V., Class O | 85,600 | 519,156 | ||||||
Industrias Bachoco S.A.B de C.V. ADR | 7,678 | 475,652 | ||||||
Macquarie Mexico Real Estate Management S.A. de C.V. REIT (e) | 294,000 | 329,901 | ||||||
Wal-Mart de Mexico SAB De C.V. | 316,200 | 800,066 | ||||||
|
| |||||||
| 2,971,741 | ||||||||
|
| |||||||
| Netherlands—1.7% | ||||||||
ABN AMRO Group NV (a) | 28,706 | 865,581 | ||||||
Aegon NV | 69,015 | 465,631 | ||||||
AerCap Holdings NV (e) | 10,830 | 549,298 | ||||||
AMG Advanced Metallurgical Group NV | 4,116 | 184,079 | ||||||
ASML Holding NV | 6,210 | 1,231,402 | ||||||
ASR Nederland NV | 18,073 | 772,768 | ||||||
BE Semiconductor Industries NV | 3,612 | 370,520 | ||||||
ING Groep NV | 92,707 | 1,564,449 | ||||||
Koninklijke Ahold Delhaize NV | 75,145 | 1,780,630 | ||||||
Koninklijke DSM NV | 5,726 | 569,147 | ||||||
Koninklijke Volkerwessels NV | 12,555 | 344,548 | ||||||
NN Group NV | 22,724 | 1,009,626 | ||||||
Philips Lighting NV (a) | 8,006 | 301,002 | ||||||
Wereldhave NV REIT | 13,537 | 517,656 | ||||||
|
| |||||||
| 10,526,337 | ||||||||
|
| |||||||
| New Zealand—0.2% | ||||||||
Air New Zealand Ltd. | 251,572 | 589,485 | ||||||
Metlifecare Ltd. | 146,583 | 620,712 | ||||||
Summerset Group Holdings Ltd. | 61,600 | 309,793 | ||||||
|
| |||||||
| 1,519,990 | ||||||||
|
| |||||||
| Norway—0.6% | ||||||||
Austevoll Seafood ASA | 22,600 | 227,434 | ||||||
B2Holding ASA | 72,607 | 181,669 | ||||||
Evry AS (a)(e) | 49,339 | 190,714 | ||||||
Leroy Seafood Group ASA | 21,272 | 132,085 | ||||||
Norsk Hydro ASA | 126,148 | 748,270 | ||||||
Norwegian Finans Holding ASA (e) | 26,484 | 299,127 | ||||||
Salmar ASA | 14,701 | 605,322 | ||||||
Sparebank 1 Nord Norge | 31,643 | 251,463 | ||||||
SpareBank 1 SMN | 34,730 | 359,984 | ||||||
Telenor ASA | 38,450 | 874,396 | ||||||
|
| |||||||
| 3,870,464 | ||||||||
|
| |||||||
| Peru—0.0% | ||||||||
Ferreycorp SAA | 164,086 | 129,192 | ||||||
|
| |||||||
| Philippines—0.2% | ||||||||
Cebu Air, Inc. | 171,390 | 310,737 | ||||||
DMCI Holdings, Inc. | 2,048,000 | 479,402 | ||||||
Globe Telecom, Inc. | 9,740 | 302,780 | ||||||
San Miguel Corp. | 48,130 | 124,049 | ||||||
| Shares | Value | |||||||
Vista Land & Lifescapes, Inc. | 2,079,900 | $ | 259,313 | |||||
|
| |||||||
| 1,476,281 | ||||||||
|
| |||||||
| Qatar—0.1% | ||||||||
Doha Bank QPSC | 41,759 | 309,666 | ||||||
Ooredoo QPSC (e) | 13,029 | 296,813 | ||||||
|
| |||||||
| 606,479 | ||||||||
|
| |||||||
| Russian Federation—0.1% | ||||||||
Magnitogorsk Iron & Steel Works PJSC GDR | 28,096 | 279,274 | ||||||
United Co. RUSAL PLC | 701,000 | 426,501 | ||||||
|
| |||||||
| 705,775 | ||||||||
|
| |||||||
| Singapore—0.7% | ||||||||
Asian Pay Television Trust UNIT | 724,900 | 293,887 | ||||||
BOC Aviation Ltd. (a) | 112,300 | 669,776 | ||||||
Bumitama Agri Ltd. | 503,100 | 272,433 | ||||||
DBS Group Holdings Ltd. | 60,500 | 1,277,902 | ||||||
Genting Singapore PLC | 405,200 | 336,082 | ||||||
Oversea-Chinese Banking Corp., Ltd. | 65,700 | 647,211 | ||||||
QAF Ltd. | 163,800 | 126,340 | ||||||
United Overseas Bank Ltd. | 32,100 | 675,455 | ||||||
Yanlord Land Group Ltd. | 177,700 | 230,070 | ||||||
|
| |||||||
| 4,529,156 | ||||||||
|
| |||||||
| South Africa—0.3% | ||||||||
Fortress REIT Ltd., Class A REIT | 232,243 | 314,903 | ||||||
Naspers Ltd., Class N | 6,882 | 1,684,114 | ||||||
|
| |||||||
| 1,999,017 | ||||||||
|
| |||||||
| Spain—1.3% | ||||||||
ACS Actividades de Construccion y Servicios S.A. | 13,892 | 542,003 | ||||||
Amadeus IT Group S.A. | 15,940 | 1,179,610 | ||||||
Banco Santander S.A. | 278,908 | 1,825,558 | ||||||
CaixaBank S.A. | 131,192 | 625,478 | ||||||
Ercros S.A. | 42,826 | 224,736 | ||||||
International Consolidated Airlines Group S.A. | 79,540 | 686,537 | ||||||
Papeles y Cartones de Europa S.A. | 17,768 | 310,304 | ||||||
Repsol S.A. | 90,669 | 1,611,699 | ||||||
Telefonica S.A. | 99,877 | 989,466 | ||||||
|
| |||||||
| 7,995,391 | ||||||||
|
| |||||||
| Sweden—1.0% | ||||||||
Ahlsell AB (a) | 50,220 | 316,735 | ||||||
Bravida Holding AB (a) | 44,450 | 318,290 | ||||||
Dios Fastigheter AB | 46,468 | 314,351 | ||||||
Hemfosa Fastigheter AB | 25,155 | 305,581 | ||||||
Holmen AB, Class B | 7,464 | 405,991 | ||||||
Humana AB | 11,233 | 63,938 | ||||||
Klovern AB, Class B | 183,704 | 228,279 | ||||||
Pandox AB | 10,341 | 186,078 | ||||||
Sandvik AB | 49,639 | 909,447 | ||||||
Scandic Hotels Group AB (a) | 26,102 | 250,374 | ||||||
Swedbank AB, Class A | 40,979 | 920,812 | ||||||
Volvo AB, Class B | 95,172 | 1,742,064 | ||||||
|
| |||||||
| 5,961,940 | ||||||||
|
| |||||||
| Switzerland—0.9% | ||||||||
Bobst Group S.A. | 4,694 | 520,644 | ||||||
Landis+Gyr Group AG (e) | 4,028 | 312,229 | ||||||
Novartis AG | 43,510 | 3,519,127 | ||||||
Straumann Holding AG | 660 | 416,422 | ||||||
Swiss Life Holding AG (e) | 2,658 | 947,225 | ||||||
|
| |||||||
| 5,715,647 | ||||||||
|
| |||||||
| 126 | Semiannual Report | | March 31, 2018 | | See accompanying Notes to Financial Statements |
Table of Contents
Schedule of Investments
March 31, 2018 (Unaudited)
| Shares | Value | |||||||
| Taiwan—1.5% | ||||||||
AU Optronics Corp. | 668,000 | $ | 309,713 | |||||
Chailease Holding Co., Ltd. | 49,000 | 170,175 | ||||||
E Ink Holdings, Inc. | 157,000 | 262,880 | ||||||
General Interface Solution Holding Ltd. | 53,000 | 327,530 | ||||||
Grand Pacific Petrochemical | 296,000 | 312,780 | ||||||
Great Wall Enterprise Co., Ltd. | 103,000 | 123,010 | ||||||
Hon Hai Precision Industry Co., Ltd. | 489,000 | 1,525,176 | ||||||
Huaku Development Co., Ltd. | 90,000 | 223,245 | ||||||
King’s Town Bank Co., Ltd. | 216,000 | 274,927 | ||||||
LCY Chemical Corp. | 131,000 | 200,618 | ||||||
Long Chen Paper Co., Ltd. | 109,000 | 123,788 | ||||||
Nanya Technology Corp. | 105,000 | 336,430 | ||||||
Pou Chen Corp. | 421,000 | 562,181 | ||||||
Powertech Technology, Inc. | 52,000 | 163,928 | ||||||
Qisda Corp. | 436,000 | 326,463 | ||||||
Syncmold Enterprise Corp. | 81,000 | 190,065 | ||||||
Synnex Technology International Corp. | 236,000 | 355,169 | ||||||
Taiwan Business Bank | 659,000 | 197,337 | ||||||
Taiwan Cooperative Financial Holding Co., Ltd. | 336,000 | 198,644 | ||||||
Taiwan Semiconductor Manufacturing Co., Ltd. ADR | 42,878 | 1,876,341 | ||||||
United Integrated Services Co., Ltd. | 97,000 | 218,960 | ||||||
Wistron Corp. | 171,000 | 147,929 | ||||||
Yuanta Financial Holding Co., Ltd. | 1,468,000 | 677,410 | ||||||
|
| |||||||
| 9,104,699 | ||||||||
|
| |||||||
| Thailand—0.8% | ||||||||
Bangchak Corp. PCL (c)(d) | 265,500 | 330,586 | ||||||
Banpu PCL (c)(d) | 378,600 | 253,253 | ||||||
Electricity Generating PCL (c)(d) | 83,900 | 615,083 | ||||||
Kiatnakin Bank PCL (c)(d) | 339,100 | 829,787 | ||||||
PTT Global Chemical PCL (c)(d) | 276,900 | 841,701 | ||||||
PTT PCL (c)(d) | 30,000 | 528,362 | ||||||
Siam Cement PCL | 31,450 | 497,132 | ||||||
Thai Oil PCL (c)(d) | 130,000 | 378,925 | ||||||
Thanachart Capital PCL (c)(d) | 159,700 | 277,712 | ||||||
Tisco Financial Group PCL (c)(d) | 96,700 | 281,897 | ||||||
|
| |||||||
| 4,834,438 | ||||||||
|
| |||||||
| Turkey—0.6% | ||||||||
Akbank Turk AS | 217,763 | 529,498 | ||||||
Emlak Konut Gayrimenkul Yatirim Ortakligi AS REIT (e) | 460,046 | 295,973 | ||||||
Eregli Demir ve Celik Fabrikalari TAS | 121,203 | 320,435 | ||||||
Soda Sanayii AS | 446,358 | 620,607 | ||||||
TAV Havalimanlari Holding AS | 50,295 | 302,986 | ||||||
Tekfen Holding AS | 77,656 | 335,348 | ||||||
Tofas Turk Otomobil Fabrikasi AS | 74,094 | 499,385 | ||||||
Turkiye Halk Bankasi AS | 197,491 | 455,271 | ||||||
Turkiye Vakiflar Bankasi Tao | 141,375 | 234,105 | ||||||
Yatas Yatak ve Yorgan Sanayi ve Ticaret AS (e) | 13,949 | 121,483 | ||||||
|
| |||||||
| 3,715,091 | ||||||||
|
| |||||||
| Shares | Value | |||||||
| United Kingdom—4.9% | ||||||||
3i Group PLC | 35,897 | $ | 433,272 | |||||
Anglo American PLC | 63,791 | 1,485,990 | ||||||
Aviva PLC | 142,577 | 995,058 | ||||||
Bellway PLC | 9,488 | 406,039 | ||||||
Berkeley Group Holdings PLC | 4,823 | 256,388 | ||||||
Biffa PLC (a) | 103,983 | 291,776 | ||||||
BP PLC | 368,068 | 2,482,656 | ||||||
British American Tobacco PLC | 49,869 | 2,882,770 | ||||||
British American Tobacco PLC ADR | 22,199 | 1,280,660 | ||||||
BT Group PLC | 219,319 | 700,025 | ||||||
Carnival PLC | 19,145 | 1,232,238 | ||||||
Central Asia Metals PLC | 41,341 | 186,194 | ||||||
Costain Group PLC | 28,430 | 185,277 | ||||||
easyJet PLC | 15,561 | 350,774 | ||||||
EI Group PLC (e) | 230,502 | 372,373 | ||||||
Equiniti Group PLC (a) | 43,259 | 181,485 | ||||||
Ferrexpo PLC | 44,793 | 153,928 | ||||||
Firstgroup PLC (e) | 338,534 | 390,001 | ||||||
HSBC Holdings PLC | 149,394 | 1,402,916 | ||||||
J Sainsbury PLC | 123,540 | 414,413 | ||||||
Jackpotjoy PLC (e) | 31,957 | 364,066 | ||||||
Keller Group PLC | 45,309 | 553,879 | ||||||
Laird PLC | 67,457 | 189,474 | ||||||
Legal & General Group PLC | 247,124 | 895,392 | ||||||
Lloyds Banking Group PLC | 1,699,943 | 1,546,312 | ||||||
Morgan Sindall Group PLC | 17,267 | 283,440 | ||||||
National Express Group PLC | 152,711 | 827,921 | ||||||
Nomad Foods Ltd. (e) | 11,710 | 184,315 | ||||||
Plus500 Ltd. | 12,753 | 204,348 | ||||||
Renewables Infrastructure Group Ltd. | 127,774 | 190,622 | ||||||
Rio Tinto PLC | 37,582 | 1,907,064 | ||||||
Robert Walters PLC | 13,371 | 127,565 | ||||||
Royal Dutch Shell PLC, Class A | 18,868 | 601,081 | ||||||
Royal Dutch Shell PLC, Class B | 110,298 | 3,549,218 | ||||||
Safestore Holdings PLC REIT | 26,351 | 181,711 | ||||||
Schroders PLC | 5,644 | 180,903 | ||||||
SIG PLC | 97,960 | 186,405 | ||||||
Softcat PLC | 19,909 | 191,258 | ||||||
Stock Spirits Group PLC | 53,433 | 186,292 | ||||||
Tate & Lyle PLC | 115,856 | 884,866 | ||||||
Taylor Wimpey PLC | 157,918 | 409,118 | ||||||
TUI AG | 34,486 | 739,504 | ||||||
Watkin Jones PLC | 73,630 | 185,119 | ||||||
|
| |||||||
| 30,654,106 | ||||||||
|
| |||||||
| United States—51.0% | ||||||||
Aaron’s, Inc. | 6,667 | 310,682 | ||||||
Abbott Laboratories | 42,802 | 2,564,696 | ||||||
AbbVie, Inc. | 37,623 | 3,561,017 | ||||||
ACCO Brands Corp. | 21,042 | 264,077 | ||||||
Adobe Systems, Inc. (e) | 7,256 | 1,567,876 | ||||||
Advanced Energy Industries, Inc. (e) | 4,998 | 319,372 | ||||||
Aflac, Inc. | 38,514 | 1,685,373 | ||||||
AG Mortgage Investment Trust, Inc. REIT | 30,118 | 523,150 | ||||||
Agilent Technologies, Inc. | 25,659 | 1,716,587 | ||||||
AGNC Investment Corp. REIT | 21,063 | 398,512 | ||||||
Air Lease Corp. | 9,163 | 390,527 | ||||||
Alcoa Corp. (e) | 15,618 | 702,185 | ||||||
Align Technology, Inc. (e) | 6,512 | 1,635,359 | ||||||
Allison Transmission Holdings, Inc. | 27,828 | 1,086,962 | ||||||
| Shares | Value | |||||||
Allstate Corp. | 17,770 | $ | 1,684,596 | |||||
Ally Financial, Inc. | 14,636 | 397,367 | ||||||
Alphabet, Inc., Class A (e) | 2,097 | 2,174,883 | ||||||
Alphabet, Inc., Class C (e) | 2,309 | 2,382,403 | ||||||
Altria Group, Inc. | 38,472 | 2,397,575 | ||||||
Amazon.com, Inc. (e) | 3,664 | 5,303,054 | ||||||
Amdocs Ltd. | 9,112 | 607,953 | ||||||
American Equity Investment Life Holding Co. | 16,908 | 496,419 | ||||||
Ameriprise Financial, Inc. | 6,091 | 901,103 | ||||||
AmerisourceBergen Corp. | 14,454 | 1,246,079 | ||||||
Andeavor | 8,675 | 872,358 | ||||||
Annaly Capital Management, Inc. REIT | 125,307 | 1,306,952 | ||||||
Anthem, Inc. | 9,364 | 2,057,271 | ||||||
Apple, Inc. | 51,259 | 8,600,235 | ||||||
Applied Materials, Inc. | 31,912 | 1,774,626 | ||||||
Arrow Electronics, Inc. (e) | 6,250 | 481,375 | ||||||
AT&T, Inc. | 168,468 | 6,005,884 | ||||||
Athene Holding Ltd., Class A (e) | 27,585 | 1,318,839 | ||||||
Automatic Data Processing, Inc. | 5,485 | 622,438 | ||||||
Bank of America Corp. | 177,422 | 5,320,886 | ||||||
Bank of New York Mellon Corp. | 25,909 | 1,335,091 | ||||||
Baxter International, Inc. | 21,314 | 1,386,263 | ||||||
Becton Dickinson and Co. | 7,829 | 1,696,544 | ||||||
Berry Global Group, Inc. (e) | 5,765 | 315,980 | ||||||
Best Buy Co., Inc. | 15,778 | 1,104,302 | ||||||
BGC Partners, Inc., Class A | 46,572 | 626,393 | ||||||
Bio-Techne Corp. | 4,263 | 643,884 | ||||||
BlackRock, Inc. | 2,160 | 1,170,115 | ||||||
Blucora, Inc. (e) | 30,627 | 753,424 | ||||||
Boeing Co. | 10,905 | 3,575,531 | ||||||
BorgWarner, Inc. | 9,367 | 470,504 | ||||||
Broadcom Ltd. | 6,964 | 1,641,067 | ||||||
Broadridge Financial Solutions, Inc. | 4,656 | 510,717 | ||||||
CA, Inc. | 22,206 | 752,783 | ||||||
Camping World Holdings, Inc., Class A | 9,361 | 301,892 | ||||||
Caterpillar, Inc. | 10,170 | 1,498,855 | ||||||
Celanese Corp., Ser. A | 4,999 | 500,950 | ||||||
Centene Corp. (e) | 5,914 | 632,029 | ||||||
CenterPoint Energy, Inc. | 42,621 | 1,167,815 | ||||||
Central Garden & Pet Co., Class A (e) | 10,451 | 413,964 | ||||||
Charles River Laboratories International, Inc. (e) | 3,707 | 395,685 | ||||||
Chatham Lodging Trust REIT | 14,916 | 285,641 | ||||||
Chemours Co. | 10,340 | 503,661 | ||||||
Chevron Corp. | 33,487 | 3,818,857 | ||||||
Children’s Place, Inc. | 6,545 | 885,211 | ||||||
Chimera Investment Corp. REIT | 13,671 | 238,012 | ||||||
Cigna Corp. | 5,478 | 918,880 | ||||||
Cisco Systems, Inc. | 88,394 | 3,791,219 | ||||||
Citigroup, Inc. | 50,406 | 3,402,405 | ||||||
Citizens Financial Group, Inc. | 24,904 | 1,045,470 | ||||||
CNA Financial Corp. | 3,646 | 179,930 | ||||||
Coca-Cola Co. | 25,900 | 1,124,837 | ||||||
Cognizant Technology Solutions Corp., Class A | 30,774 | 2,477,307 | ||||||
Comcast Corp., Class A | 90,966 | 3,108,308 | ||||||
CONSOL Energy, Inc. (e) | 6,354 | 184,075 | ||||||
Cooper Cos., Inc. | 1,653 | 378,223 | ||||||
Cooper-Standard Holdings, Inc. (e) | 2,294 | 281,726 | ||||||
Copa Holdings S.A., Class A | 1,119 | 143,937 | ||||||
Crawford & Co., Class A | 18,181 | 145,812 | ||||||
| See accompanying Notes to Financial Statements | | March 31, 2018 | | Semiannual Report | 127 |
Table of Contents
Schedule of Investments
March 31, 2018 (Unaudited)
| Shares | Value | |||||||
Cummins, Inc. | 6,142 | $ | 995,557 | |||||
CVS Health Corp. | 71,129 | 4,424,935 | ||||||
Danaher Corp. | 17,701 | 1,733,105 | ||||||
Darden Restaurants, Inc. | 5,073 | 432,473 | ||||||
Deere & Co. | 10,157 | 1,577,585 | ||||||
Dell Technologies, Inc., Class V (e) | 16,014 | 1,172,385 | ||||||
Delta Air Lines, Inc. | 7,880 | 431,903 | ||||||
Dollar Tree, Inc. (e) | 7,011 | 665,344 | ||||||
Donegal Group, Inc., Class A | 8,497 | 134,253 | ||||||
DowDuPont, Inc. | 28,470 | 1,813,824 | ||||||
Dynex Capital, Inc. REIT | 87,729 | 581,643 | ||||||
E*TRADE Financial Corp. (e) | 11,089 | 614,441 | ||||||
Eastman Chemical Co. | 14,372 | 1,517,396 | ||||||
eBay, Inc. (e) | 31,507 | 1,267,842 | ||||||
Edison International | 12,091 | 769,713 | ||||||
Entergy Corp. | 18,432 | 1,452,073 | ||||||
Essent Group Ltd. (e) | 14,713 | 626,185 | ||||||
Estee Lauder Cos., Inc., Class A | 7,186 | 1,075,888 | ||||||
Exelon Corp. | 42,552 | 1,659,954 | ||||||
Exxon Mobil Corp. | 51,549 | 3,846,071 | ||||||
Facebook, Inc., Class A (e) | 38,705 | 6,184,672 | ||||||
FedEx Corp. | 9,293 | 2,231,342 | ||||||
Fidelity National Information Services, Inc. | 11,365 | 1,094,449 | ||||||
First American Financial Corp. | 5,227 | 306,720 | ||||||
Ford Motor Co. | 122,583 | 1,358,220 | ||||||
Gap, Inc. | 13,141 | 409,999 | ||||||
General Motors Co. | 82,178 | 2,986,349 | ||||||
Global Brass & Copper Holdings, Inc. | 9,672 | 323,528 | ||||||
Goldman Sachs Group, Inc. | 6,338 | 1,596,289 | ||||||
Hamilton Beach Brands Holding Co., Class A | 13,775 | 292,305 | ||||||
Hawkins, Inc. | 10,312 | 362,467 | ||||||
HCA Healthcare, Inc. | 5,752 | 557,944 | ||||||
Hersha Hospitality Trust REIT | 12,459 | 223,016 | ||||||
Hewlett Packard Enterprise Co. | 69,224 | 1,214,189 | ||||||
Hill-Rom Holdings, Inc. | 3,366 | 292,842 | ||||||
Home Depot, Inc. | 33,968 | 6,054,456 | ||||||
Hooker Furniture Corp. | 4,978 | 182,693 | ||||||
Hospitality Properties Trust REIT | 10,512 | 266,374 | ||||||
HP, Inc. | 108,928 | 2,387,702 | ||||||
Humana, Inc. | 4,253 | 1,143,334 | ||||||
Illumina, Inc. (e) | 4,315 | 1,020,152 | ||||||
Ingredion, Inc. | 16,090 | 2,074,323 | ||||||
Intel Corp. | 97,776 | 5,092,174 | ||||||
Intuitive Surgical, Inc. (e) | 4,347 | 1,794,572 | ||||||
Invesco Mortgage Capital, Inc. REIT | 14,836 | 243,014 | ||||||
IQVIA Holdings, Inc. (e) | 5,978 | 586,502 | ||||||
Jacobs Engineering Group, Inc. | 6,958 | 411,566 | ||||||
Janus Henderson Group PLC | 18,300 | 605,547 | ||||||
JetBlue Airways Corp. (e) | 11,679 | 237,317 | ||||||
Johnson & Johnson | 48,643 | 6,233,600 | ||||||
Jones Lang LaSalle, Inc. | 2,503 | 437,124 | ||||||
JPMorgan Chase & Co. | 61,101 | 6,719,277 | ||||||
Kansas City Southern | 7,198 | 790,700 | ||||||
Kohl’s Corp. | 7,311 | 478,944 | ||||||
Korn/Ferry International | 3,757 | 193,824 | ||||||
Laboratory Corp. of America Holdings (e) | 9,169 | 1,483,086 | ||||||
Lam Research Corp. | 11,027 | 2,240,245 | ||||||
Lamb Weston Holdings, Inc. | 11,383 | 662,718 | ||||||
Las Vegas Sands Corp. | 13,834 | 994,665 | ||||||
Lear Corp. | 4,499 | 837,219 | ||||||
Legg Mason, Inc. | 15,936 | 647,798 | ||||||
Leidos Holdings, Inc. | 11,262 | 736,535 | ||||||
| Shares | Value | |||||||
Lennar Corp., Class A | 9,368 | $ | 552,150 | |||||
Leucadia National Corp. | 18,315 | 416,300 | ||||||
LHC Group, Inc. (e) | 5,153 | 317,219 | ||||||
Lincoln National Corp. | 12,420 | 907,405 | ||||||
ManpowerGroup, Inc. | 6,243 | 718,569 | ||||||
Marathon Petroleum Corp. | 15,858 | 1,159,378 | ||||||
Masimo Corp. (e) | 4,390 | 386,100 | ||||||
Mastercard, Inc., Class A | 15,804 | 2,768,229 | ||||||
Maxim Integrated Products, Inc. | 8,937 | 538,186 | ||||||
MCBC Holdings, Inc. (e) | 12,300 | 309,960 | ||||||
McDonald’s Corp. | 18,536 | 2,898,660 | ||||||
McKesson Corp. | 11,856 | 1,670,155 | ||||||
MDC Holdings, Inc. | 11,141 | 311,057 | ||||||
Mercer International, Inc. | 28,751 | 357,950 | ||||||
Merck & Co., Inc. | 58,001 | 3,159,314 | ||||||
Merit Medical Systems, Inc. (e) | 7,179 | 325,568 | ||||||
Mettler-Toledo International, Inc. (e) | 2,834 | 1,629,635 | ||||||
Micron Technology, Inc. (e) | 30,536 | 1,592,147 | ||||||
Microsoft Corp. | 81,951 | 7,479,668 | ||||||
MKS Instruments, Inc. | 3,604 | 416,803 | ||||||
Mohawk Industries, Inc. (e) | 1,348 | 313,033 | ||||||
Molson Coors Brewing Co., Class B | 15,699 | 1,182,606 | ||||||
Mondelez International, Inc., Class A | 39,583 | 1,651,799 | ||||||
Morgan Stanley | 30,789 | 1,661,374 | ||||||
Motorola Solutions, Inc. | 5,041 | 530,817 | ||||||
New Residential Investment Corp. REIT | 20,697 | 340,466 | ||||||
Nexeo Solutions, Inc. (e) | 66,895 | 715,776 | ||||||
Northrop Grumman Corp. | 4,328 | 1,510,991 | ||||||
NVIDIA Corp. | 9,339 | 2,162,819 | ||||||
ON Semiconductor Corp. (e) | 27,249 | 666,511 | ||||||
Oracle Corp. | 66,454 | 3,040,270 | ||||||
Orthofix International NV (e) | 4,483 | 263,511 | ||||||
Oshkosh Corp. | 2,390 | 184,675 | ||||||
Owens Corning | 7,416 | 596,246 | ||||||
PACCAR, Inc. | 14,536 | 961,847 | ||||||
Park Hotels & Resorts, Inc. REIT | 8,616 | 232,804 | ||||||
Parker-Hannifin Corp. | 3,584 | 612,972 | ||||||
PBF Energy, Inc., Class A | 5,756 | 195,128 | ||||||
Penn Virginia Corp. (e) | 15,502 | 543,190 | ||||||
PepsiCo, Inc. | 43,814 | 4,782,298 | ||||||
PerkinElmer, Inc. | 2,530 | 191,572 | ||||||
Pfizer, Inc. | 113,788 | 4,038,336 | ||||||
PG&E Corp. | 12,088 | 531,026 | ||||||
Phibro Animal Health Corp., Class A | 4,889 | 194,093 | ||||||
Phillips 66 | 9,065 | 869,515 | ||||||
Pinnacle Foods, Inc. | 13,270 | 717,907 | ||||||
PNC Financial Services Group, Inc. | 18,662 | 2,822,441 | ||||||
Principal Financial Group, Inc. | 12,722 | 774,897 | ||||||
Procter & Gamble Co. | 45,055 | 3,571,960 | ||||||
Progressive Corp. | 17,392 | 1,059,695 | ||||||
Prudential Financial, Inc. | 12,118 | 1,254,819 | ||||||
PVH Corp. | 5,464 | 827,414 | ||||||
Quest Diagnostics, Inc. | 7,222 | 724,367 | ||||||
Raymond James Financial, Inc. | 8,281 | 740,404 | ||||||
Regeneron Pharmaceuticals, Inc. (e) | 2,759 | 950,089 | ||||||
Reinsurance Group of America, Inc. | 9,138 | 1,407,252 | ||||||
Reliance Steel & Aluminum Co. | 2,302 | 197,373 | ||||||
Royal Caribbean Cruises Ltd. | 6,168 | 726,220 | ||||||
| Shares | Value | |||||||
Rudolph Technologies, Inc. (e) | 8,644 | $ | 239,439 | |||||
Sanderson Farms, Inc. | 5,159 | 614,024 | ||||||
Schweitzer-Mauduit International, Inc. | 7,172 | 280,784 | ||||||
Seaboard Corp. | 65 | 277,225 | ||||||
SMART Global Holdings, Inc. (e) | 4,798 | 239,132 | ||||||
Southwest Airlines Co. | 8,359 | 478,804 | ||||||
Speedway Motorsports, Inc. | 12,724 | 226,742 | ||||||
Spirit AeroSystems Holdings, Inc., Class A | 9,061 | 758,406 | ||||||
Stanley Black & Decker, Inc. | 12,860 | 1,970,152 | ||||||
State Street Corp. | 10,909 | 1,087,955 | ||||||
Stoneridge, Inc. (e) | 13,107 | 361,753 | ||||||
Stryker Corp. | 7,644 | 1,230,072 | ||||||
Summit Hotel Properties, Inc. REIT | 20,815 | 283,292 | ||||||
Superior Industries International, Inc. | 21,372 | 284,248 | ||||||
Sutherland Asset Management Corp. REIT | 12,764 | 193,375 | ||||||
Sykes Enterprises, Inc. (e) | 4,989 | 144,382 | ||||||
SYNNEX Corp. | 1,563 | 185,059 | ||||||
Sysco Corp. | 17,204 | 1,031,552 | ||||||
Target Corp. | 29,075 | 2,018,677 | ||||||
Teleflex, Inc. | 2,628 | 670,087 | ||||||
Tenneco, Inc. | 6,397 | 351,003 | ||||||
Teradyne, Inc. | 3,882 | 177,446 | ||||||
Texas Instruments, Inc. | 42,802 | 4,446,700 | ||||||
Thermo Fisher Scientific, Inc. | 10,792 | 2,228,116 | ||||||
Thor Industries, Inc. | 4,022 | 463,214 | ||||||
Time Warner, Inc. | 18,303 | 1,731,098 | ||||||
Toll Brothers, Inc. | 9,489 | 410,399 | ||||||
Total System Services, Inc. | 9,234 | 796,525 | ||||||
Tower International, Inc. | 9,675 | 268,481 | ||||||
TransUnion (e) | 12,751 | 724,002 | ||||||
Triton International Ltd. | 6,012 | 183,967 | ||||||
Tyson Foods, Inc., Class A | 23,668 | 1,732,261 | ||||||
United Rentals, Inc. (e) | 2,439 | 421,288 | ||||||
UnitedHealth Group, Inc. | 19,947 | 4,268,658 | ||||||
Unum Group | 28,912 | 1,376,500 | ||||||
Valero Energy Corp. | 15,850 | 1,470,404 | ||||||
Venator Materials PLC (e) | 10,438 | 188,823 | ||||||
Verizon Communications, Inc. | 53,487 | 2,557,748 | ||||||
Versum Materials, Inc. | 4,870 | 183,258 | ||||||
Vishay Intertechnology, Inc. | 14,755 | 274,443 | ||||||
Walmart, Inc. | 38,173 | 3,396,252 | ||||||
Waste Management, Inc. | 20,575 | 1,730,769 | ||||||
Weight Watchers International, Inc. (e) | 4,669 | 297,509 | ||||||
Weis Markets, Inc. | 5,910 | 242,192 | ||||||
WellCare Health Plans, Inc. (e) | 1,309 | 253,462 | ||||||
Wells Fargo & Co. | 40,473 | 2,121,190 | ||||||
Werner Enterprises, Inc. | 8,096 | 295,504 | ||||||
Western Asset Mortgage Capital Corp. REIT | 19,647 | 190,379 | ||||||
Western Digital Corp. | 5,293 | 488,385 | ||||||
Xcerra Corp. (e) | 26,884 | 313,199 | ||||||
Xenia Hotels & Resorts, Inc. REIT | 9,499 | 187,320 | ||||||
Xerox Corp. | 13,164 | 378,860 | ||||||
Zebra Technologies Corp., Class A (e) | 2,226 | 309,837 | ||||||
Zoetis, Inc. | 13,703 | 1,144,338 | ||||||
|
| |||||||
| 317,109,988 | ||||||||
|
| |||||||
| Total Common Stock (cost—$534,702,615) | 606,655,005 | |||||||
|
| |||||||
| 128 | Semiannual Report | | March 31, 2018 | | See accompanying Notes to Financial Statements |
Table of Contents
Schedule of Investments
March 31, 2018 (Unaudited)
| Shares | Value | |||||||
| Exchange-Traded Funds—0.9% | ||||||||
iShares Core MSCI EAFE | 25,600 | $ | 1,686,528 | |||||
iShares Core MSCI Emerging Markets | 21,189 | 1,237,438 | ||||||
iShares Core S&P 500 | 8,832 | 2,343,748 | ||||||
|
| |||||||
| Total Exchange-Traded Funds (cost—$5,223,058) | 5,267,714 | |||||||
|
| |||||||
| Preferred Stock—0.7% | ||||||||
| Brazil—0.0% | ||||||||
Cia Paranaense de Energia | 14,600 | 115,333 | ||||||
|
| |||||||
| Chile—0.1% | ||||||||
Embotelladora Andina S.A., Class B | 69,010 | 338,822 | ||||||
|
| |||||||
| Colombia—0.1% | ||||||||
Avianca Holdings S.A. | 164,483 | 176,018 | ||||||
Banco Davivienda S.A. | 29,616 | 319,261 | ||||||
|
| |||||||
| 495,279 | ||||||||
|
| |||||||
| Germany—0.1% | ||||||||
Henkel AG & Co. KGaA | 4,943 | 649,772 | ||||||
|
| |||||||
| Shares | Value | |||||||
| Korea (Republic of)—0.4% | ||||||||
Samsung Electronics Co., Ltd. | 1,393 | $ | 2,678,646 | |||||
|
| |||||||
| Total Preferred Stock (cost—$3,099,169) | 4,277,852 | |||||||
|
| |||||||
| Principal Amount (000s) | ||||||||
| Repurchase Agreements—0.4% | ||||||||
State Street Bank and Trust Co., dated 3/29/18, 0.28%, due 4/2/18, proceeds $2,648,082; collateralized by U.S. Treasury Notes, 2.50%, due 5/15/24, valued at $2,703,107 including accrued interest |
| |||||||
(cost—$2,648,000) | $2,648 | 2,648,000 | ||||||
|
| |||||||
| Total Investments (cost—$545,672,842) (b)—99.6% | 618,848,571 | |||||||
|
| |||||||
| Other assets less liabilities (f)—0.4% | 2,509,960 | |||||||
|
| |||||||
| Net Assets—100.0% | $621,358,531 | |||||||
|
| |||||||
Notes to Schedule of Investments:
(a) 144A—Exempt from registration under Rule 144A of the Securities Act of 1933. These securities may be resold in transactions exempt from registration, typically only to qualified institutional buyers. Securities with an aggregate value of $6,452,050, representing 1.0% of net assets.
(b) Securities with an aggregate value of $236,809,545, representing 38.1% of net assets, were valued utilizing modeling tools provided by a third-party vendor. See Note 1(a) and Note 1(b) in the Notes to Financial Statements.
(c) Fair-Valued—Securities with an aggregate value of $4,338,457, representing 0.7% of net assets. See Note 1(a) and Note 1(b) in the Notes to Financial Statements.
(d) Level 3 security. See Note 1(a) and
Note 1(b) in the Notes to Financial Statements.
(e) Non-income producing.
(f) Includes net unrealized appreciation (depreciation) of other financial instruments as follows:
| Futures contracts outstanding at March 31, 2018: | ||||||||||||||||||||||
| Type | Contracts | Expiration Date | Notional Amount (000s) | Market Value (000s) | Unrealized Depreciation | |||||||||||||||||
Long position contracts: | ||||||||||||||||||||||
E-mini S&P 500 Index | 5 | 6/15/18 | $ | — | (h) | $ | 661 | $ | (32,447 | ) | ||||||||||||
Mini MSCI Emerging Markets Index | 7 | 6/15/18 | — | (h) | 416 | (11,706 | ) | |||||||||||||||
MSCI EAFE Index | 7 | 6/15/18 | — | (h) | 700 | (10,516 | ) | |||||||||||||||
|
| |||||||||||||||||||||
| $ | (54,669 | ) | ||||||||||||||||||||
|
| |||||||||||||||||||||
| Forward foreign currency contracts outstanding at March 31, 2018: | ||||||||||||||||||
| Description | Counterparty | U.S.$ Value on Origination Date | U.S.$ Value March 31, 2018 | Unrealized Appreciation | Unrealized Depreciation | |||||||||||||
Purchased: |
| |||||||||||||||||
11,131,270 Philippine Piso settling 4/2/18 | State Street Bank and Trust Co. | $ | 213,146 | $ | 213,334 | $ | 188 | $ | — | |||||||||
Sold: |
| |||||||||||||||||
11,186 Australian Dollar settling 4/3/18 | Income Repatriation Boston IBS | 8,526 | 8,591 | — | (65 | ) | ||||||||||||
26,121 British Pound settling 4/3/18 | Income Repatriation Boston IBS | 36,629 | 36,647 | — | (18 | ) | ||||||||||||
4,049 New Zealand Dollar settling 4/3/18 | Income Repatriation Boston IBS | 2,903 | 2,927 | — | (24 | ) | ||||||||||||
106,743 Singapore Dollar settling 4/2/18 | Northern Trust Company | 81,548 | 81,412 | 136 | — | |||||||||||||
395,778 Swedish Krona settling 4/3/18 | Income Repatriation Boston IBS | 47,252 | 47,400 | — | (148 | ) | ||||||||||||
|
| |||||||||||||||||
| $ | 324 | $ | (255 | ) | ||||||||||||||
|
| |||||||||||||||||
(g) At March 31, 2018, the Fund pledged $347,315 in cash as collateral for futures contracts.
(h) Notional amount rounds to less than $500.
Glossary:
ADR—American Depositary Receipt
EAFE—Europe, Australasia and Far East
GDR—Global Depositary Receipt
MSCI—Morgan Stanley Capital International
REIT—Real Estate Investment Trust
UNIT—More than one class of securities traded together.
The industry classification of portfolio holdings and other assets less liabilities shown as a percentage of net assets were as follows:
Banks | 10.5% | |||
Oil, Gas & Consumable Fuels | 5.2% | |||
Insurance | 4.5% | |||
Semiconductors & Semiconductor Equipment | 4.5% | |||
Technology Hardware, Storage & Peripherals | 3.6% | |||
Pharmaceuticals | 3.6% | |||
Internet Software & Services | 3.4% | |||
Diversified Telecommunication Services | 2.9% | |||
Automobiles | 2.8% |
Healthcare Providers & Services | 2.8% | |||
Machinery | 2.5% | |||
Software | 2.5% | |||
Food & Staples Retailing | 2.4% | |||
Healthcare Equipment & Supplies | 2.4% | |||
Capital Markets | 2.2% | |||
Chemicals | 2.2% | |||
Metals & Mining | 2.1% | |||
Food Products | 2.1% | |||
IT Services | 2.1% | |||
Trading Companies & Distributors | 1.9% | |||
Auto Components | 1.8% | |||
Specialty Retail | 1.6% | |||
Hotels, Restaurants & Leisure | 1.5% | |||
Construction & Engineering | 1.5% |
| See accompanying Notes to Financial Statements | | March 31, 2018 | | Semiannual Report | 129 |
Table of Contents
Schedule of Investments
March 31, 2018 (Unaudited)
Electric Utilities | 1.5% | |||
Media | 1.4% | |||
Life Sciences Tools & Services | 1.4% | |||
Household Durables | 1.3% | |||
Electronic Equipment, Instruments & Components | 1.2% | |||
Airlines | 1.2% | |||
Beverages | 1.2% | |||
Tobacco | 1.2% | |||
Aerospace & Defense | 0.9% | |||
Equity Real Estate Investment Trusts (REITs) | 0.9% | |||
Real Estate Management & Development | 0.9% | |||
Internet & Catalog Retail | 0.9% | |||
Exchange-Traded Funds | 0.9% | |||
Household Products | 0.8% | |||
Communications Equipment | 0.8% | |||
Paper & Forest Products | 0.8% | |||
Industrial Conglomerates | 0.7% | |||
Biotechnology | 0.7% | |||
Multi-Line Retail | 0.7% | |||
Commercial Services & Supplies | 0.6% | |||
Air Freight & Logistics | 0.6% | |||
Mortgage Real Estate Investment Trusts (REITs) | 0.6% | |||
Wireless Telecommunication Services | 0.5% | |||
Multi-Utilities | 0.5% | |||
Textiles, Apparel & Luxury Goods | 0.5% | |||
Diversified Financial Services | 0.5% | |||
Personal Products | 0.4% | |||
Road & Rail | 0.4% | |||
Independent Power Producers & Energy Traders | 0.4% | |||
Electrical Equipment | 0.4% | |||
Transportation Infrastructure | 0.3% | |||
Professional Services | 0.3% | |||
Leisure Equipment & Products | 0.2% | |||
Construction Materials | 0.2% | |||
Building Products | 0.2% | |||
Thrifts & Mortgage Finance | 0.1% | |||
Water Utilities | 0.1% | |||
Containers & Packaging | 0.1% | |||
Consumer Finance | 0.1% | |||
Food & Beverage | 0.1% | |||
Energy Equipment & Services | 0.1% | |||
Diversified Consumer Services | 0.0% | |||
Marine | 0.0% | |||
Advertising | 0.0% | |||
Repurchase Agreements | 0.4% | |||
Other assets less liabilities | 0.4% | |||
|
| |||
| 100.0% | ||||
|
|
AllianzGI Best Styles International Equity Fund
| Shares | Value | |||||||
| Common Stock—95.8% | ||||||||
| Australia—2.8% | ||||||||
Aristocrat Leisure Ltd. | 3,501 | $65,366 | ||||||
Australian Pharmaceutical Industries Ltd. | 36,421 | 42,214 | ||||||
Commonwealth Bank of Australia | 536 | 29,974 | ||||||
CSR Ltd. | 10,135 | 40,650 | ||||||
Japara Healthcare Ltd. | 33,604 | 52,029 | ||||||
Macquarie Group Ltd. | 1,173 | 93,532 | ||||||
Metcash Ltd. | 11,047 | 26,733 | ||||||
Orora Ltd. | 13,340 | 34,081 | ||||||
OZ Minerals Ltd. | 5,301 | 37,075 | ||||||
Qantas Airways Ltd. | 23,718 | 107,005 | ||||||
Sigma Healthcare Ltd. | 46,195 | 27,822 | ||||||
Sims Metal Management Ltd. | 2,304 | 25,881 | ||||||
South32 Ltd. | 15,607 | 39,223 | ||||||
Spotless Group Holdings Ltd. | 23,859 | 20,157 | ||||||
Treasury Wine Estates Ltd. | 2,486 | 32,480 | ||||||
Westpac Banking Corp. | 2,782 | 61,620 | ||||||
|
| |||||||
| 735,842 | ||||||||
|
| |||||||
| Austria—1.3% | ||||||||
Erste Group Bank AG | 1,646 | 82,750 | ||||||
Lenzing AG | 190 | 23,496 | ||||||
Mayr Melnhof Karton AG | 307 | 46,601 | ||||||
OMV AG | 1,448 | 84,457 | ||||||
Porr AG | 1,523 | 52,431 | ||||||
Telekom Austria AG (e) | 282 | 2,690 | ||||||
Voestalpine AG | 1,245 | 65,309 | ||||||
|
| |||||||
| 357,734 | ||||||||
|
| |||||||
| Belgium—0.9% | ||||||||
Euronav NV | 5,879 | 48,817 | ||||||
KBC Group NV | 810 | 70,534 | ||||||
UCB S.A. | 1,591 | 129,568 | ||||||
|
| |||||||
| 248,919 | ||||||||
|
| |||||||
| Brazil—0.6% | ||||||||
Banco Santander Brasil S.A. ADR | 5,673 | 68,190 | ||||||
Estacio Participacoes S.A. | 6,200 | 65,672 | ||||||
Vale S.A. | 2,597 | 33,203 | ||||||
|
| |||||||
| 167,065 | ||||||||
|
| |||||||
| Canada—0.8% | ||||||||
Canadian Imperial Bank of Commerce | 776 | 68,496 | ||||||
Empire Co., Ltd. | 935 | 18,768 | ||||||
Manulife Financial Corp. | 2,892 | 53,694 | ||||||
Toronto-Dominion Bank | 1,411 | 80,215 | ||||||
|
| |||||||
| 221,173 | ||||||||
|
| |||||||
| China—0.8% | ||||||||
AAC Technologies Holdings, Inc. | 2,000 | 36,649 | ||||||
Agricultural Bank of China Ltd., Class H | 192,000 | 110,255 | ||||||
China Petroleum & Chemical Corp. ADR | 363 | 32,118 | ||||||
Kingboard Chemical Holdings Ltd. | 6,000 | 27,739 | ||||||
|
| |||||||
| 206,761 | ||||||||
|
| |||||||
| Denmark—1.2% | ||||||||
Alm Brand A/S | 7,131 | 72,883 | ||||||
Danske Bank A/S | 3,605 | 135,073 | ||||||
Schouw & Co. AB | 405 | 40,120 | ||||||
Vestas Wind Systems A/S | 1,120 | 80,138 | ||||||
|
| |||||||
| 328,214 | ||||||||
|
| |||||||
| Shares | Value | |||||||
| Finland—0.6% | ||||||||
UPM-Kymmene Oyj | 4,531 | $ | 167,981 | |||||
|
| |||||||
| France—10.6% | ||||||||
Alten S.A. | 635 | 61,217 | ||||||
Amundi S.A. (a) | 475 | 38,146 | ||||||
ArcelorMittal (e) | 2,152 | 68,352 | ||||||
Arkema S.A. | 122 | 15,927 | ||||||
Atos SE | 618 | 84,672 | ||||||
AXA S.A. | 4,204 | 111,755 | ||||||
BNP Paribas S.A. | 3,729 | 276,545 | ||||||
Bouygues S.A. | 2,423 | 121,485 | ||||||
Capgemini SE | 1,026 | 128,019 | ||||||
Casino Guichard Perrachon S.A. | 1,545 | 75,672 | ||||||
Christian Dior SE | 95 | 37,553 | ||||||
Cie de Saint-Gobain | 1,633 | 86,231 | ||||||
Engie S.A. | 8,397 | 140,217 | ||||||
ICADE REIT | 406 | 39,416 | ||||||
Ipsen S.A. | 192 | 29,844 | ||||||
Kaufman & Broad S.A. | 340 | 17,892 | ||||||
LVMH Moet Hennessy Louis Vuitton S.A. | 383 | 118,030 | ||||||
Natixis S.A. | 5,209 | 42,741 | ||||||
Orange S.A. | 4,073 | 69,232 | ||||||
Peugeot S.A. | 4,058 | 97,714 | ||||||
Rallye S.A. | 2,238 | 33,628 | ||||||
Rubis SCA | 309 | 22,319 | ||||||
Safran S.A. | 1,004 | 106,554 | ||||||
Sanofi | 3,569 | 286,377 | ||||||
SCOR SE | 1,340 | 54,706 | ||||||
Societe Generale S.A. | 4,330 | 235,164 | ||||||
STMicroelectronics NV | 5,238 | 116,565 | ||||||
Total S.A. | 2,114 | 121,174 | ||||||
Valeo S.A. | 723 | 47,826 | ||||||
Vinci S.A. | 1,312 | 129,225 | ||||||
|
| |||||||
| 2,814,198 | ||||||||
|
| |||||||
| Germany—4.7% | ||||||||
Adidas AG | 819 | 199,261 | ||||||
Bayer AG | 2,379 | 268,193 | ||||||
Bayerische Motoren Werke AG | 698 | 75,921 | ||||||
Covestro AG (a) | 897 | 88,325 | ||||||
Daimler AG | 2,113 | 180,028 | ||||||
Deutsche EuroShop AG | 493 | 18,086 | ||||||
Deutsche Lufthansa AG | 2,983 | 95,359 | ||||||
Deutsche Post AG | 3,821 | 167,357 | ||||||
SAP SE | 151 | 15,852 | ||||||
Siltronic AG (e) | 381 | 65,346 | ||||||
Uniper SE | 939 | 28,616 | ||||||
Wuestenrot & Wuerttembergische AG | 2,358 | 55,713 | ||||||
|
| |||||||
| 1,258,057 | ||||||||
|
| |||||||
| Greece—0.6% | ||||||||
Hellenic Petroleum S.A. | 8,372 | 80,998 | ||||||
Mytilineos Holdings S.A. (e) | 5,418 | 58,086 | ||||||
Tsakos Energy Navigation Ltd. | 7,558 | 24,942 | ||||||
|
| |||||||
| 164,026 | ||||||||
|
| |||||||
| Hong Kong—3.3% | ||||||||
BOC Hong Kong Holdings Ltd. | 37,000 | 181,514 | ||||||
CK Asset Holdings Ltd. | 18,000 | 151,903 | ||||||
CK Hutchison Holdings Ltd. | 12,420 | 149,230 | ||||||
CLP Holdings Ltd. | 1,500 | 15,294 | ||||||
Henderson Land Development Co., Ltd. | 6,000 | 39,342 | ||||||
Hongkong Land Holdings Ltd. | 4,000 | 27,636 | ||||||
I-CABLE Communications Ltd. (e) | 2,808 | 72 | ||||||
| 130 | Semiannual Report | | March 31, 2018 | | See accompanying Notes to Financial Statements |
Table of Contents
Schedule of Investments
March 31, 2018 (Unaudited)
| Shares | Value | |||||||
Man Wah Holdings Ltd. | 84,400 | $ | 67,317 | |||||
Minth Group Ltd. | 6,000 | 27,529 | ||||||
Shun Tak Holdings Ltd. | 112,000 | 46,535 | ||||||
WH Group Ltd. (a) | 109,500 | 117,328 | ||||||
Wheelock & Co., Ltd. | 4,000 | 29,340 | ||||||
Xinyi Glass Holdings Ltd. | 8,000 | 12,177 | ||||||
Yue Yuen Industrial Holdings Ltd. | 3,000 | 12,019 | ||||||
|
| |||||||
| 877,236 | ||||||||
|
| |||||||
| Ireland—0.4% | ||||||||
CRH PLC | 2,085 | 70,481 | ||||||
Kingspan Group PLC | 671 | 28,401 | ||||||
Smurfit Kappa Group PLC | 337 | 13,638 | ||||||
|
| |||||||
| 112,520 | ||||||||
|
| |||||||
| Israel—0.1% | ||||||||
Israel Discount Bank Ltd., Class A (e) | 10,049 | 28,929 | ||||||
|
| |||||||
| Italy—4.1% | ||||||||
Assicurazioni Generali SpA | 3,692 | 70,968 | ||||||
DiaSorin SpA | 256 | 23,060 | ||||||
Enel SpA | 38,732 | 237,009 | ||||||
Eni SpA | 7,880 | 138,808 | ||||||
EXOR NV | 1,229 | 87,485 | ||||||
Fiat Chrysler Automobiles NV (e) | 8,674 | 176,917 | ||||||
Fincantieri SpA (e) | 23,774 | 34,867 | ||||||
Hera SpA | 7,857 | 28,789 | ||||||
Intesa Sanpaolo SpA | 26,648 | 97,025 | ||||||
Recordati SpA | 2,488 | 91,796 | ||||||
Societa Cattolica di Assicurazioni SC | 6,744 | 71,811 | ||||||
UniCredit SpA (e) | 2,299 | 48,052 | ||||||
|
| |||||||
| 1,106,587 | ||||||||
|
| |||||||
| Japan—25.7% | ||||||||
Aisin Seiki Co., Ltd. | 1,500 | 81,859 | ||||||
Alfresa Holdings Corp. | 1,800 | 40,645 | ||||||
ANA Holdings, Inc. | 3,200 | 124,000 | ||||||
AOI Electronics Co., Ltd. | 1,400 | 49,531 | ||||||
Asahi Glass Co., Ltd. | 2,600 | 108,959 | ||||||
Asahi Group Holdings Ltd. | 3,300 | 177,469 | ||||||
Asahi Kasei Corp. | 11,800 | 157,717 | ||||||
Astellas Pharma, Inc. | 8,100 | 123,897 | ||||||
Bandai Namco Holdings, Inc. | 1,900 | 61,491 | ||||||
Brother Industries Ltd. | 2,100 | 48,694 | ||||||
Canon Marketing Japan, Inc. | 700 | 18,938 | ||||||
Dai-ichi Life Holdings, Inc. | 5,500 | 101,538 | ||||||
Daikin Industries Ltd. | 700 | 77,765 | ||||||
Denso Corp. | 700 | 38,503 | ||||||
Disco Corp. | 400 | 85,497 | ||||||
FUJIFILM Holdings Corp. | 2,200 | 87,854 | ||||||
Fujitsu Ltd. | 10,000 | 60,769 | ||||||
Heiwado Co., Ltd. | 1,700 | 41,252 | ||||||
Hitachi Chemical Co., Ltd. | 1,400 | 31,276 | ||||||
Hitachi High-Technologies Corp. | 1,200 | 57,046 | ||||||
Hitachi Ltd. | 11,000 | 80,120 | ||||||
Hokuhoku Financial Group, Inc. | 2,900 | 39,806 | ||||||
Hosiden Corp. | 4,800 | 60,388 | ||||||
Idemitsu Kosan Co., Ltd. | 1,800 | 68,869 | ||||||
Japan Airlines Co., Ltd. | 2,200 | 89,575 | ||||||
Kajima Corp. | 7,000 | 65,810 | ||||||
KDDI Corp. | 1,500 | 38,632 | ||||||
Keyence Corp. | 100 | 62,466 | ||||||
Kinden Corp. | 3,500 | 58,547 | ||||||
Kirin Holdings Co., Ltd. | 3,600 | 95,839 | ||||||
KYORIN Holdings, Inc. | 1,300 | 24,561 | ||||||
Lasertec Corp. | 600 | 21,871 | ||||||
Marubeni Corp. | 19,300 | 140,939 | ||||||
Marudai Food Co., Ltd. | 12,000 | 57,343 | ||||||
| Shares | Value | |||||||
Megmilk Snow Brand Co., Ltd. | 900 | $ | 24,445 | |||||
Mitsubishi Chemical Holdings Corp. | 13,500 | 131,442 | ||||||
Mitsubishi Corp. | 7,500 | 201,893 | ||||||
Mitsubishi Gas Chemical Co., Inc. | 3,500 | 84,465 | ||||||
Mitsubishi Heavy Industries Ltd. | 500 | 19,279 | ||||||
Mitsubishi Tanabe Pharma Corp. | 1,600 | 32,325 | ||||||
Mitsui & Co., Ltd. | 7,600 | 130,780 | ||||||
Mizuho Financial Group, Inc. | 97,300 | 177,317 | ||||||
Morinaga Milk Industry Co., Ltd. | 1,200 | 48,834 | ||||||
NH Foods Ltd. | 1,500 | 61,591 | ||||||
Nippon Electric Glass Co., Ltd. | 2,400 | 69,572 | ||||||
Nippon Flour Mills Co., Ltd. | 4,900 | 76,577 | ||||||
Nippon Telegraph & Telephone Corp. | 4,100 | 191,278 | ||||||
Nippon Television Holdings, Inc. | 2,700 | 47,441 | ||||||
Nishimatsu Construction Co., Ltd. | 200 | 4,977 | ||||||
Nissan Motor Co., Ltd. | 19,300 | 199,217 | ||||||
Nisshin Oillio Group Ltd. | 2,000 | 55,794 | ||||||
Nomura Holdings, Inc. | 19,000 | 110,795 | ||||||
NTT DOCOMO, Inc. | 3,200 | 81,579 | ||||||
Obayashi Corp. | 4,300 | 47,368 | ||||||
Okinawa Cellular Telephone Co. | 1,800 | 65,857 | ||||||
Okumura Corp. | 400 | 15,637 | ||||||
ORIX Corp. | 5,900 | 105,734 | ||||||
Prima Meat Packers Ltd. | 7,000 | 39,394 | ||||||
Rohm Co., Ltd. | 900 | 85,429 | ||||||
Seino Holdings Co., Ltd. | 2,300 | 42,499 | ||||||
Sekisui Chemical Co., Ltd. | 5,600 | 98,207 | ||||||
Shin-Etsu Chemical Co., Ltd. | 1,100 | 114,740 | ||||||
Shindengen Electric Manufacturing Co., Ltd. | 500 | 32,755 | ||||||
Shionogi & Co., Ltd. | 2,600 | 135,391 | ||||||
Showa Corp. | 1,300 | 22,272 | ||||||
SoftBank Group Corp. | 2,100 | 156,642 | ||||||
Sojitz Corp. | 21,400 | 68,259 | ||||||
Sompo Holdings, Inc. | 3,800 | 153,113 | ||||||
Sumitomo Corp. | 10,200 | 170,876 | ||||||
Sumitomo Electric Industries Ltd. | 3,100 | 47,379 | ||||||
Sumitomo Forestry Co., Ltd. | 1,200 | 19,298 | ||||||
Sumitomo Mitsui Financial Group, Inc. | 2,200 | 93,333 | ||||||
Taisei Corp. | 2,000 | 102,579 | ||||||
Takeda Pharmaceutical Co., Ltd. | 3,700 | 180,417 | ||||||
Tohoku Electric Power Co., Inc. | 1,400 | 19,045 | ||||||
Tokyo Electron Ltd. | 1,000 | 184,991 | ||||||
Toridoll Holdings Corp. | 700 | 25,871 | ||||||
Toyoda Gosei Co., Ltd. | 800 | 18,528 | ||||||
Toyota Motor Corp. | 4,800 | 311,672 | ||||||
Tsubaki Nakashima Co., Ltd. | 1,500 | 38,735 | ||||||
Tsumura & Co. | 400 | 13,902 | ||||||
Ulvac, Inc. | 700 | 39,602 | ||||||
USS Co., Ltd. | 1,700 | 34,795 | ||||||
Valor Holdings Co., Ltd. | 1,700 | 46,424 | ||||||
Warabeya Nichiyo Holdings Co., Ltd. | 2,200 | 54,786 | ||||||
Zeon Corp. | 2,000 | 29,057 | ||||||
|
| |||||||
| 6,843,654 | ||||||||
|
| |||||||
| Korea (Republic of)—0.6% | ||||||||
POSCO | 138 | 44,050 | ||||||
Samsung Electronics Co., Ltd. GDR | 70 | 80,972 | ||||||
SK Innovation Co., Ltd. | 222 | 44,124 | ||||||
|
| |||||||
| 169,146 | ||||||||
|
| |||||||
| Shares | Value | |||||||
| Mexico—0.1% | ||||||||
Banco Santander Mexico S.A. Institucion de Banca Multiple Grupo Financiero Santand, Class B | 10,100 | $ | 14,528 | |||||
|
| |||||||
| Netherlands—3.3% | ||||||||
Accell Group | 1,300 | 28,321 | ||||||
Aegon NV | 18,296 | 123,440 | ||||||
AerCap Holdings NV (e) | 957 | 48,539 | ||||||
BE Semiconductor Industries NV | 521 | 53,444 | ||||||
Corbion NV | 278 | 8,434 | ||||||
Heineken NV | 369 | 39,687 | ||||||
ING Groep NV | 9,287 | 156,720 | ||||||
Koninklijke DSM NV | 1,420 | 141,144 | ||||||
Koninklijke KPN NV | 21,056 | 63,315 | ||||||
Koninklijke Philips NV | 733 | 28,068 | ||||||
Unilever NV | 3,019 | 170,409 | ||||||
Wereldhave NV REIT | 342 | 13,078 | ||||||
|
| |||||||
| 874,599 | ||||||||
|
| |||||||
| New Zealand—0.7% | ||||||||
Air New Zealand Ltd. | 24,662 | 57,788 | ||||||
Fonterra Co-operative Group Ltd. UNIT | 17,136 | 73,297 | ||||||
New Zealand Refining Co., Ltd. | 29,024 | 48,062 | ||||||
|
| |||||||
| 179,147 | ||||||||
|
| |||||||
| Norway—0.8% | ||||||||
Austevoll Seafood ASA | 2,179 | 21,928 | ||||||
Grieg Seafood ASA | 1,300 | 12,049 | ||||||
Leroy Seafood Group ASA | 3,300 | 20,491 | ||||||
Norsk Hydro ASA | 9,068 | 53,789 | ||||||
Orkla ASA | 3,848 | 41,470 | ||||||
SpareBank 1 SR Bank ASA | 5,431 | 59,696 | ||||||
|
| |||||||
| 209,423 | ||||||||
|
| |||||||
| Portugal—0.1% | ||||||||
Galp Energia SGPS S.A. | 1,215 | 22,913 | ||||||
|
| |||||||
| Russian Federation—0.5% | ||||||||
Novolipetsk Steel PJSC GDR | 2,884 | 72,091 | ||||||
Rosneft Oil Co. PJSC GDR | 2,700 | 14,831 | ||||||
X5 Retail Group NV GDR (e) | 1,425 | 47,789 | ||||||
|
| |||||||
| 134,711 | ||||||||
|
| |||||||
| Singapore—1.4% | ||||||||
DBS Group Holdings Ltd. | 9,200 | 194,325 | ||||||
Oversea-Chinese Banking Corp., Ltd. | 10,600 | 104,421 | ||||||
QAF Ltd. | 64,800 | 49,981 | ||||||
Venture Corp., Ltd. | 1,300 | 28,115 | ||||||
|
| |||||||
| 376,842 | ||||||||
|
| |||||||
| Spain—3.1% | ||||||||
Aena SME S.A. (a) | 159 | 32,061 | ||||||
Amadeus IT Group S.A. | 1,004 | 74,299 | ||||||
Banco Santander S.A. | 14,735 | 96,446 | ||||||
Banco Santander S.A. | 3,591 | 23,429 | ||||||
Bankinter S.A. | 1,113 | 11,459 | ||||||
CaixaBank S.A. | 13,767 | 65,636 | ||||||
Cia de Distribucion Integral Logista Holdings S.A. | 839 | 17,786 | ||||||
CIE Automotive S.A. | 1,369 | 48,914 | ||||||
Endesa S.A. | 1,333 | 29,366 | ||||||
International Consolidated Airlines Group S.A. | 11,899 | 102,705 | ||||||
Mapfre S.A. | 12,497 | 41,577 | ||||||
Melia Hotels International S.A. | 3,837 | 54,316 | ||||||
Repsol S.A. | 9,516 | 169,153 | ||||||
Siemens Gamesa Renewable Energy S.A. | 3,299 | 53,025 | ||||||
|
| |||||||
| 820,172 | ||||||||
|
| |||||||
| See accompanying Notes to Financial Statements | | March 31, 2018 | | Semiannual Report | 131 |
Table of Contents
Schedule of Investments
March 31, 2018 (Unaudited)
| Shares | Value | |||||||
| Sweden—1.8% | ||||||||
Boliden AB | 2,424 | $ | 85,297 | |||||
Loomis AB, Class B | 1,112 | 40,144 | ||||||
Nobina AB (a) | 11,074 | 71,617 | ||||||
SAS AB (e) | 5,875 | 13,959 | ||||||
Svenska Cellulosa AB SCA, Class B | 6,598 | 70,510 | ||||||
Volvo AB, Class B | 10,622 | 194,429 | ||||||
|
| |||||||
| 475,956 | ||||||||
|
| |||||||
| Switzerland—7.4% | ||||||||
Adecco Group AG | 1,351 | 96,232 | ||||||
Baloise Holding AG | 715 | 109,383 | ||||||
Bobst Group S.A. | 483 | 53,573 | ||||||
Flughafen Zurich AG | 103 | 22,749 | ||||||
Lonza Group AG (e) | 573 | 135,136 | ||||||
Nestle S.A. | 4,582 | 362,168 | ||||||
Novartis AG | 3,310 | 267,716 | ||||||
OC Oerlikon Corp. AG (e) | 2,339 | 41,343 | ||||||
Partners Group Holding AG | 201 | 149,569 | ||||||
Roche Holding AG | 832 | 190,858 | ||||||
Sika AG | 6 | 47,065 | ||||||
Swiss Life Holding AG (e) | 238 | 84,815 | ||||||
Swiss Re AG | 1,810 | 184,741 | ||||||
Zurich Insurance Group AG | 724 | 238,820 | ||||||
|
| |||||||
| 1,984,168 | ||||||||
|
| |||||||
| Taiwan—1.2% | ||||||||
Compeq Manufacturing Co., Ltd. | 38,000 | 39,575 | ||||||
Formosa Chemicals & Fibre Corp. | 22,000 | 83,067 | ||||||
Formosa Plastics Corp. | 17,000 | 60,547 | ||||||
HannStar Display Corp. | 140,000 | 48,896 | ||||||
Longwell Co. | 9,000 | 15,243 | ||||||
Mitac Holdings Corp. | 17,000 | 19,709 | ||||||
Nan Ya Plastics Corp. | 8,000 | 22,653 | ||||||
Sunplus Technology Co., Ltd. | 33,000 | 18,174 | ||||||
|
| |||||||
| 307,864 | ||||||||
|
| |||||||
| Thailand—0.3% | ||||||||
Kiatnakin Bank | 10,900 | 25,150 | ||||||
PTT PCL (c)(d) | 3,000 | 52,836 | ||||||
|
| |||||||
| 77,986 | ||||||||
|
| |||||||
| Turkey—0.1% | ||||||||
Soda Sanayii AS | 11,896 | 16,540 | ||||||
|
| |||||||
| United Kingdom—15.9% | ||||||||
3i Group PLC | 6,874 | 82,968 | ||||||
Anglo American PLC | 6,225 | 145,009 | ||||||
| Shares | Value | |||||||
AstraZeneca PLC | 1,287 | $ | 88,470 | |||||
BAE Systems PLC | 10,915 | 89,303 | ||||||
Barratt Developments PLC | 5,353 | 39,833 | ||||||
Bellway PLC | 1,534 | 65,648 | ||||||
Berkeley Group Holdings PLC | 1,836 | 97,601 | ||||||
BP PLC | 36,403 | 245,542 | ||||||
British American Tobacco PLC | 1,239 | 71,623 | ||||||
British Land Co. PLC REIT | 4,183 | 37,707 | ||||||
Britvic PLC | 1,654 | 15,845 | ||||||
Carnival PLC | 1,627 | 104,719 | ||||||
Centamin PLC | 11,048 | 23,954 | ||||||
Centrica PLC | 26,952 | 53,771 | ||||||
Coca-Cola HBC AG (e) | 3,259 | 120,605 | ||||||
Compass Group PLC | 7,606 | 155,307 | ||||||
Dart Group PLC | 4,276 | 49,970 | ||||||
Direct Line Insurance Group PLC | 5,393 | 28,877 | ||||||
Electrocomponents PLC | 7,884 | 66,407 | ||||||
Firstgroup PLC (e) | 26,238 | 30,227 | ||||||
Galliford Try PLC | 2,304 | 27,075 | ||||||
GKN PLC | 9,749 | 63,192 | ||||||
Glencore PLC (e) | 40,487 | 201,189 | ||||||
Greggs PLC | 583 | 10,062 | ||||||
Hansteen Holdings PLC REIT | 12,829 | 22,986 | ||||||
Highland Gold Mining Ltd. | 8,623 | 18,611 | ||||||
HSBC Holdings PLC | 36,361 | 341,456 | ||||||
IQE PLC (e) | 22,214 | 40,305 | ||||||
J Sainsbury PLC | 15,911 | 53,373 | ||||||
Legal & General Group PLC | 30,085 | 109,005 | ||||||
Lloyds Banking Group PLC | 92,902 | 84,506 | ||||||
Lookers PLC | 33,459 | 41,194 | ||||||
National Express Group PLC | 16,032 | 86,917 | ||||||
Northgate PLC | 5,274 | 24,964 | ||||||
OneSavings Bank PLC | 10,539 | 55,278 | ||||||
Persimmon PLC | 3,205 | 113,753 | ||||||
Rio Tinto PLC | 4,854 | 246,312 | ||||||
Royal Dutch Shell PLC, Class A | 13,966 | 441,864 | ||||||
Royal Dutch Shell PLC, Class A | 3,015 | 96,049 | ||||||
Royal Dutch Shell PLC, Class B | 1,391 | 44,760 | ||||||
Shire PLC | 554 | 27,572 | ||||||
Smith & Nephew PLC | 4,942 | 92,450 | ||||||
SSE PLC | 3,128 | 56,114 | ||||||
Taylor Wimpey PLC | 33,958 | 87,975 | ||||||
TUI AG | 6,978 | 149,626 | ||||||
WPP PLC | 4,802 | 76,312 | ||||||
|
| |||||||
| 4,226,286 | ||||||||
|
| |||||||
| Total Common Stock (cost—$22,318,570) | 25,529,177 | |||||||
|
| |||||||
| Shares | Value | |||||||
| Exchange-Traded Funds—2.8% | ||||||||
iShares Core MSCI EAFE | 11,272 | $ | 742,599 | |||||
|
| |||||||
| Preferred Stock—0.5% | ||||||||
| Brazil—0.1% | ||||||||
Petroleo Brasileiro S.A. (e) | 3,800 | 24,643 | ||||||
|
| |||||||
| Germany—0.4% | ||||||||
Volkswagen AG | 555 | 110,619 | ||||||
|
| |||||||
| Total Preferred Stock (cost—$94,044) | 135,262 | |||||||
|
| |||||||
| Rights (e)— 0.0% | ||||||||
| United Kingdom—0.0% | ||||||||
Galliford Try PLC, strike price GBP 5.68, expires 4/13/18 (cost—$0) | 768 | 3,017 | ||||||
|
| |||||||
| Total Investments (cost—$23,165,003) (b)—99.1% | 26,410,055 | |||||||
|
| |||||||
Other assets less liabilities (f)—0.9% | 228,715 | |||||||
|
| |||||||
| Net Assets—100.0% | $26,638,770 | |||||||
|
| |||||||
Notes to Schedule of Investments:
(a) 144A—Exempt from registration under Rule 144A of the Securities Act of 1933. These securities may be resold in transactions exempt from registration, typically only to qualified institutional buyers. Securities with an aggregate value of $347,477, representing 1.3% of net assets.
(b) Securities with an aggregate value of $24,951,116, representing 93.7% of net assets, were valued utilizing modeling tools provided by a third-party vendor. See Note 1(a) and Note 1(b) in the Notes to Financial Statements.
(c) Fair-Valued—Securities with an aggregate value of $77,986, representing 0.3% of net assets. See Note 1(a) and Note 1(b) in the Notes to Financial Statements.
(d) Level 3 security. See Note 1(a) and Note 1(b) in the Notes to Financial Statements.
(e) Non-income producing.
(f) Includes net unrealized appreciation (depreciation) of other financial instruments as follows:
| Forward foreign currency contracts outstanding at March 31, 2018: | ||||||||||||||||||||
| Description | Counterparty | U.S.$ Value on Origination Date | U.S.$ Value March 31, 2018 | Unrealized Appreciation | Unrealized Depreciation | |||||||||||||||
Sold: | ||||||||||||||||||||
1,072 Australian Dollar settling 4/3/18 | | Income Repatriation Boston IBS | | $ | 817 | $ | 823 | $ | — | $ | (6 | ) | ||||||||
6,369 British Pound settling 4/3/18 | | Income Repatriation Boston IBS | | 8,931 | 8,936 | — | (5 | ) | ||||||||||||
85 Euro settling 4/3/18 | | Income Repatriation Boston IBS | | 104 | 104 | — | (0 | ) | ||||||||||||
|
| |||||||||||||||||||
| $ | — | $ | (11 | ) | ||||||||||||||||
|
| |||||||||||||||||||
(g) At March 31, 2018, the Fund pledged $9 in cash as collateral for futures contracts. There were no open futures contracts at March 31, 2018, however the Fund had cash pledged as collateral for any transactions in the future.
Glossary:
ADR—American Depositary Receipt
EAFE—Europe, Australasia and Far East
GBP—British Pound
GDR—Global Depositary Receipt
MSCI—Morgan Stanley Capital International
REIT—Real Estate Investment Trust
UNIT—More than one class of securities traded together.
| 132 | Semiannual Report | | March 31, 2018 | | See accompanying Notes to Financial Statements |
Table of Contents
Schedule of Investments
March 31, 2018 (Unaudited)
The industry classification of portfolio holdings and other assets less liabilities shown as a percentage of net assets were as follows:
Banks | 11.7% | |||
Pharmaceuticals | 7.0% | |||
Oil, Gas & Consumable Fuels | 6.8% | |||
Insurance | 6.3% | |||
Metals & Mining | 4.3% | |||
Food Products | 4.3% | |||
Automobiles | 4.3% | |||
Chemicals | 4.0% | |||
Semiconductors & Semiconductor Equipment | 3.0% | |||
Trading Companies & Distributors | 2.9% | |||
Exchange-Traded Funds | 2.8% | |||
Airlines | 2.4% | |||
Construction & Engineering | 2.4% | |||
Household Durables | 2.3% | |||
Electronic Equipment, Instruments & Components | 2.2% | |||
Hotels, Restaurants & Leisure | 2.1% | |||
Beverages | 1.8% | |||
Capital Markets | 1.8% | |||
IT Services | 1.5% | |||
Auto Components | 1.5% | |||
Machinery | 1.4% | |||
Textiles, Apparel & Luxury Goods | 1.4% | |||
Electric Utilities | 1.3% | |||
Food & Staples Retailing | 1.3% | |||
Wireless Telecommunication Services | 1.3% | |||
Diversified Telecommunication Services | 1.2% | |||
Building Products | 1.1% | |||
Real Estate Management & Development | 1.0% | |||
Road & Rail | 1.0% | |||
Industrial Conglomerates | 0.9% | |||
Technology Hardware, Storage & Peripherals | 0.9% | |||
Multi-Utilities | 0.8% | |||
Aerospace & Defense | 0.7% | |||
Diversified Financial Services | 0.7% | |||
Air Freight & Logistics | 0.7% | |||
Personal Products | 0.6% | |||
Paper & Forest Products | 0.6% | |||
Healthcare Providers & Services | 0.6% | |||
Electrical Equipment | 0.6% | |||
Healthcare Equipment & Supplies | 0.5% | |||
Life Sciences Tools & Services | 0.5% | |||
Media | 0.5% | |||
Equity Real Estate Investment Trusts (REITs) | 0.4% | |||
Construction Materials | 0.4% | |||
Professional Services | 0.4% | |||
Containers & Packaging | 0.4% | |||
Leisure Equipment & Products | 0.3% | |||
Specialty Retail | 0.3% | |||
Tobacco | 0.3% | |||
Household Products | 0.3% | |||
Diversified Consumer Services | 0.2% | |||
Commercial Services & Supplies | 0.2% | |||
Thrifts & Mortgage Finance | 0.2% | |||
Transportation Infrastructure | 0.2% | |||
Independent Power Producers & Energy Traders | 0.1% | |||
Biotechnology | 0.1% | |||
Gas Utilities | 0.1% | |||
Distributors | 0.1% | |||
Software | 0.1% | |||
Other assets less liabilities | 0.9% | |||
|
| |||
| 100.0% | ||||
|
|
AllianzGI Best Styles U.S. Equity Fund
| Shares | Value | |||||||
| Common Stock—97.3% | ||||||||
| Aerospace & Defense—2.5% | ||||||||
Aerovironment, Inc. (d) | 1,883 | $85,695 | ||||||
Boeing Co. | 4,663 | 1,528,905 | ||||||
Huntington Ingalls Industries, Inc. | 1,996 | 514,489 | ||||||
Northrop Grumman Corp. | 3,037 | 1,060,277 | ||||||
|
| |||||||
| 3,189,366 | ||||||||
|
| |||||||
| Air Freight & Logistics—0.4% | ||||||||
FedEx Corp. | 913 | 219,220 | ||||||
United Parcel Service, Inc., Class B | 2,434 | 254,743 | ||||||
|
| |||||||
| 473,963 | ||||||||
|
| |||||||
| Airlines—0.6% | ||||||||
Delta Air Lines, Inc. | 8,114 | 444,728 | ||||||
SkyWest, Inc. | 3,361 | 182,839 | ||||||
Southwest Airlines Co. | 1,875 | 107,400 | ||||||
WestJet Airlines Ltd. | 2,291 | 42,144 | ||||||
|
| |||||||
| 777,111 | ||||||||
|
| |||||||
| Auto Components—0.7% | ||||||||
Dana, Inc. | 5,733 | 147,682 | ||||||
Lear Corp. | 2,046 | 380,740 | ||||||
Magna International, Inc. | 6,817 | 383,987 | ||||||
Superior Industries International, Inc. | 679 | 9,031 | ||||||
|
| |||||||
| 921,440 | ||||||||
|
| |||||||
| Automobiles—0.4% | ||||||||
General Motors Co. | 12,304 | 447,127 | ||||||
Thor Industries, Inc. | 920 | 105,957 | ||||||
|
| |||||||
| 553,084 | ||||||||
|
| |||||||
| Banks—6.3% | ||||||||
Bank of America Corp. | 45,833 | 1,374,531 | ||||||
Canadian Imperial Bank of Commerce | 8,124 | 717,089 | ||||||
CenterState Bank Corp. | 470 | 12,469 | ||||||
Citigroup, Inc. | 17,002 | 1,147,635 | ||||||
Citizens Financial Group, Inc. | 20,464 | 859,079 | ||||||
Heritage Financial Corp. | 973 | 29,774 | ||||||
JPMorgan Chase & Co. | 16,271 | 1,789,322 | ||||||
People’s United Financial, Inc. | 12,275 | 229,051 | ||||||
Regions Financial Corp. | 49,529 | 920,249 | ||||||
SunTrust Banks, Inc. | 4,217 | 286,925 | ||||||
Wells Fargo & Co. | 10,064 | 527,454 | ||||||
|
| |||||||
| 7,893,578 | ||||||||
|
| |||||||
| Beverages—1.1% | ||||||||
Coca-Cola Co. | 3,017 | 131,028 | ||||||
Constellation Brands, Inc., Class A | 1,693 | 385,869 | ||||||
MGP Ingredients, Inc. | 571 | 51,156 | ||||||
PepsiCo, Inc. | 7,902 | 862,503 | ||||||
|
| |||||||
| 1,430,556 | ||||||||
|
| |||||||
| Biotechnology—3.6% | ||||||||
AbbVie, Inc. | 11,690 | 1,106,458 | ||||||
Amgen, Inc. | 7,100 | 1,210,408 | ||||||
Biogen, Inc. (d) | 3,058 | 837,342 | ||||||
Gilead Sciences, Inc. | 15,929 | 1,200,887 | ||||||
Myriad Genetics, Inc. (d) | 6,436 | 190,184 | ||||||
|
| |||||||
| 4,545,279 | ||||||||
|
| |||||||
| Building Products—0.6% | ||||||||
Griffon Corp. | 747 | 13,633 | ||||||
Owens Corning | 8,383 | 673,993 | ||||||
Universal Forest Products, Inc. | 1,527 | 49,551 | ||||||
|
| |||||||
| 737,177 | ||||||||
|
| |||||||
| Shares | Value | |||||||
| Capital Markets—2.4% | ||||||||
Ameriprise Financial, Inc. | 2,330 | $ | 344,700 | |||||
Apollo Investment Corp. | 4,533 | 23,662 | ||||||
Bank of New York Mellon Corp. | 8,487 | 437,335 | ||||||
Charles Schwab Corp. | 5,468 | 285,539 | ||||||
E*TRADE Financial Corp. (d) | 6,286 | 348,308 | ||||||
Morgan Stanley | 22,295 | 1,203,038 | ||||||
S&P Global, Inc. | 2,282 | 435,999 | ||||||
|
| |||||||
| 3,078,581 | ||||||||
|
| |||||||
| Chemicals—2.6% | ||||||||
Air Products & Chemicals, Inc. | 3,294 | 523,845 | ||||||
Ashland Global Holdings, Inc. | 2,768 | 193,179 | ||||||
Cabot Corp. | 464 | 25,854 | ||||||
Chemours Co. | 4,720 | 229,911 | ||||||
DowDuPont, Inc. | 17,479 | 1,113,587 | ||||||
KMG Chemicals, Inc. | 471 | 28,237 | ||||||
LyondellBasell Industries NV, Class A | 3,441 | 363,645 | ||||||
Praxair, Inc. | 2,416 | 348,629 | ||||||
Sherwin-Williams Co. | 1,012 | 396,825 | ||||||
Trinseo S.A. | 986 | 73,013 | ||||||
|
| |||||||
| 3,296,725 | ||||||||
|
| |||||||
| Commercial Services & Supplies—1.1% | ||||||||
Brady Corp., Class A | 666 | 24,742 | ||||||
Herman Miller, Inc. | 1,379 | 44,059 | ||||||
KAR Auction Services, Inc. | 1,895 | 102,709 | ||||||
Republic Services, Inc. | 3,554 | 235,381 | ||||||
Transcontinental, Inc., Class A | 728 | 14,381 | ||||||
Waste Management, Inc. | 10,803 | 908,748 | ||||||
|
| |||||||
| 1,330,020 | ||||||||
|
| |||||||
| Communications Equipment—1.2% | ||||||||
Arista Networks, Inc. (d) | 1,621 | 413,841 | ||||||
Cisco Systems, Inc. | 21,332 | 914,930 | ||||||
Juniper Networks, Inc. | 5,160 | 125,543 | ||||||
Lumentum Holdings, Inc. (d) | 689 | 43,958 | ||||||
|
| |||||||
| 1,498,272 | ||||||||
|
| |||||||
| Construction & Engineering—0.0% | ||||||||
WSP Global, Inc. | 1,065 | 49,053 | ||||||
|
| |||||||
| Consumer Finance—0.1% | ||||||||
Credit Acceptance Corp. (d) | 255 | 84,254 | ||||||
World Acceptance Corp. (d) | 559 | 58,863 | ||||||
|
| |||||||
| 143,117 | ||||||||
|
| |||||||
| Containers & Packaging—1.0% | ||||||||
Avery Dennison Corp. | 4,133 | 439,131 | ||||||
CCL Industries, Inc., Class B | 5,391 | 272,155 | ||||||
Packaging Corp. of America | 4,295 | 484,046 | ||||||
|
| |||||||
| 1,195,332 | ||||||||
|
| |||||||
| Diversified Consumer Services—0.3% | ||||||||
Career Education Corp. (d) | 1,419 | 18,646 | ||||||
H&R Block, Inc. | 12,192 | 309,799 | ||||||
Regis Corp. (d) | 618 | 9,350 | ||||||
|
| |||||||
| 337,795 | ||||||||
|
| |||||||
| Diversified Financial Services—1.0% | ||||||||
Berkshire Hathaway, Inc., Class B (d) | 6,443 | 1,285,250 | ||||||
|
| |||||||
| Diversified Telecommunication Services—1.4% | ||||||||
AT&T, Inc. | 30,652 | 1,092,744 | ||||||
Verizon Communications, Inc. | 15,041 | 719,260 | ||||||
|
| |||||||
| 1,812,004 | ||||||||
|
| |||||||
| Electric Utilities—1.8% | ||||||||
American Electric Power Co., Inc. | 6,389 | 438,221 | ||||||
Duke Energy Corp. | 1,617 | 125,269 | ||||||
| See accompanying Notes to Financial Statements | | March 31, 2018 | | Semiannual Report | 133 |
Table of Contents
Schedule of Investments
March 31, 2018 (Unaudited)
| Shares | Value | |||||||
Edison International | 2,963 | $ | 188,625 | |||||
Hydro One Ltd. (a) | 2,207 | 35,837 | ||||||
NextEra Energy, Inc. | 5,387 | 879,859 | ||||||
PG&E Corp. | 5,243 | 230,325 | ||||||
PPL Corp. | 13,495 | 381,773 | ||||||
|
| |||||||
| 2,279,909 | ||||||||
|
| |||||||
| Electrical Equipment—0.4% | ||||||||
AMETEK, Inc. | 4,452 | 338,218 | ||||||
Hubbell, Inc. | 1,120 | 136,394 | ||||||
|
| |||||||
| 474,612 | ||||||||
|
| |||||||
| Electronic Equipment, Instruments & Components—1.4% | ||||||||
Arrow Electronics, Inc. (d) | 2,763 | 212,806 | ||||||
Benchmark Electronics, Inc. (d) | 372 | 11,104 | ||||||
Control4 Corp. (d) | 4,014 | 86,221 | ||||||
Corning, Inc. | 24,363 | 679,241 | ||||||
ePlus, Inc. (d) | 611 | 47,475 | ||||||
IPG Photonics Corp. (d) | 1,122 | 261,852 | ||||||
TE Connectivity Ltd. | 4,210 | 420,579 | ||||||
|
| |||||||
| 1,719,278 | ||||||||
|
| |||||||
| Energy Equipment & Services—0.0% | ||||||||
Nordic American Offshore Ltd. | 282 | 310 | ||||||
|
| |||||||
| Equity Real Estate Investment Trusts (REITs)—1.3% | ||||||||
Brixmor Property Group, Inc. | 15,185 | 231,571 | ||||||
CoreCivic, Inc. | 2,087 | 40,738 | ||||||
Equity LifeStyle Properties, Inc. | 1,053 | 92,422 | ||||||
Gaming and Leisure Properties, Inc. | 3,312 | 110,853 | ||||||
H&R Real Estate Investment Trust | 1,458 | 23,799 | ||||||
Hospitality Properties Trust | 729 | 18,473 | ||||||
Lamar Advertising Co., Class A | 2,101 | 133,750 | ||||||
Monmouth Real Estate Investment Corp. | 948 | 14,258 | ||||||
New Senior Investment Group, Inc. | 1,702 | 13,922 | ||||||
Omega Healthcare Investors, Inc. | 16,012 | 432,964 | ||||||
Pure Industrial Real Estate Trust | 5,085 | 31,733 | ||||||
Ramco-Gershenson Properties Trust | 2,742 | 33,891 | ||||||
Retail Properties of America, Inc., Class A | 9,245 | 107,797 | ||||||
RLJ Lodging Trust | 7,900 | 153,576 | ||||||
SmartCentres Real Estate Investment Trust | 1,074 | 24,267 | ||||||
Summit Hotel Properties, Inc. | 2,365 | 32,188 | ||||||
WP Carey, Inc. | 1,463 | 90,691 | ||||||
|
| |||||||
| 1,586,893 | ||||||||
|
| |||||||
| Food & Staples Retailing—1.3% | ||||||||
CVS Health Corp. | 4,105 | 255,372 | ||||||
Empire Co., Ltd. | 6,672 | 133,921 | ||||||
SpartanNash Co. | 6,166 | 106,117 | ||||||
Sysco Corp. | 8,824 | 529,087 | ||||||
Walmart, Inc. | 6,911 | 614,872 | ||||||
|
| |||||||
| 1,639,369 | ||||||||
|
| |||||||
| Food Products—1.7% | ||||||||
Bunge Ltd. | 4,774 | 352,990 | ||||||
Cal-Maine Foods, Inc. (d) | 1,328 | 58,034 | ||||||
Fresh Del Monte Produce, Inc. | 2,158 | 97,628 | ||||||
Ingredion, Inc. | 2,470 | 318,432 | ||||||
Kraft Heinz Co. | 4,195 | 261,306 | ||||||
Lamb Weston Holdings, Inc. | 2,873 | 167,266 | ||||||
| Shares | Value | |||||||
Pinnacle Foods, Inc. | 6,164 | $ | 333,472 | |||||
Sanderson Farms, Inc. | 533 | 63,438 | ||||||
Tyson Foods, Inc., Class A | 6,393 | 467,904 | ||||||
|
| |||||||
| 2,120,470 | ||||||||
|
| |||||||
| Gas Utilities—0.0% | ||||||||
Southwest Gas Holdings, Inc. | 436 | 29,487 | ||||||
|
| |||||||
| Healthcare Equipment & Supplies—3.3% | ||||||||
Abbott Laboratories | 18,630 | 1,116,310 | ||||||
Align Technology, Inc. (d) | 1,888 | 474,133 | ||||||
Baxter International, Inc. | 1,953 | 127,023 | ||||||
Cooper Cos., Inc. | 1,976 | 452,129 | ||||||
Danaher Corp. | 5,309 | 519,804 | ||||||
Hill-Rom Holdings, Inc. | 2,043 | 177,741 | ||||||
Integer Holdings Corp. (d) | 937 | 52,987 | ||||||
Intuitive Surgical, Inc. (d) | 709 | 292,696 | ||||||
Medtronic PLC | 9,126 | 732,088 | ||||||
Merit Medical Systems, Inc. (d) | 2,843 | 128,930 | ||||||
Teleflex, Inc. | 464 | 118,311 | ||||||
|
| |||||||
| 4,192,152 | ||||||||
|
| |||||||
| Healthcare Providers & Services—4.5% | ||||||||
Aetna, Inc. | 2,761 | 466,609 | ||||||
Anthem, Inc. | 4,416 | 970,195 | ||||||
BioTelemetry, Inc. (d) | 3,441 | 106,843 | ||||||
Centene Corp. (d) | 9,539 | 1,019,433 | ||||||
Express Scripts Holding Co. (d) | 6,257 | 432,234 | ||||||
LHC Group, Inc. (d) | 908 | 55,897 | ||||||
McKesson Corp. | 1,090 | 153,548 | ||||||
Quest Diagnostics, Inc. | 7,078 | 709,923 | ||||||
UnitedHealth Group, Inc. | 8,263 | 1,768,282 | ||||||
|
| |||||||
| 5,682,964 | ||||||||
|
| |||||||
| Healthcare Technology—0.1% | ||||||||
Allscripts Healthcare Solutions, Inc. (d) | 10,453 | 129,095 | ||||||
Vocera Communications, Inc. (d) | 998 | 23,373 | ||||||
|
| |||||||
| 152,468 | ||||||||
|
| |||||||
| Hotels, Restaurants & Leisure—3.4% | ||||||||
Carnival Corp. | 8,941 | 586,351 | ||||||
Churchill Downs, Inc. | 399 | 97,376 | ||||||
Darden Restaurants, Inc. | 5,059 | 431,280 | ||||||
Las Vegas Sands Corp. | 2,834 | 203,765 | ||||||
Marriott International, Inc., Class A | 2,585 | 351,508 | ||||||
Marriott Vacations Worldwide Corp. | 716 | 95,371 | ||||||
McDonald’s Corp. | 9,643 | 1,507,972 | ||||||
Restaurant Brands International, Inc. | 3,175 | 180,721 | ||||||
Royal Caribbean Cruises Ltd. | 7,481 | 880,813 | ||||||
|
| |||||||
| 4,335,157 | ||||||||
|
| |||||||
| Household Durables—0.1% | ||||||||
Newell Brands, Inc. | 5,299 | 135,018 | ||||||
|
| |||||||
| Household Products—1.0% | ||||||||
Procter & Gamble Co. | 16,418 | 1,301,619 | ||||||
Spectrum Brands Holdings, Inc. | 191 | 19,807 | ||||||
|
| |||||||
| 1,321,426 | ||||||||
|
| |||||||
| Independent Power Producers & Energy Traders—0.0% | ||||||||
Capital Power Corp. | 1,368 | 25,739 | ||||||
|
| |||||||
| Industrial Conglomerates—0.3% | ||||||||
3M Co. | 411 | 90,223 | ||||||
General Electric Co. | 15,148 | 204,195 | ||||||
Honeywell International, Inc. | 896 | 129,481 | ||||||
|
| |||||||
| 423,899 | ||||||||
|
| |||||||
| Shares | Value | |||||||
| Insurance—2.7% | ||||||||
AmTrust Financial Services, Inc. | 6,460 | $ | 79,523 | |||||
Argo Group International Holdings Ltd. | 269 | 15,441 | ||||||
Aspen Insurance Holdings Ltd. | 1,293 | 57,991 | ||||||
Everest Re Group Ltd. | 1,929 | 495,406 | ||||||
Hartford Financial Services Group, Inc. | 203 | 10,459 | ||||||
Lincoln National Corp. | 6,155 | 449,684 | ||||||
Power Corp. of Canada | 2,759 | 62,960 | ||||||
Principal Financial Group, Inc. | 2,274 | 138,509 | ||||||
Progressive Corp. | 14,841 | 904,262 | ||||||
Prudential Financial, Inc. | 8,099 | 838,651 | ||||||
United Fire Group, Inc. | 226 | 10,816 | ||||||
Universal Insurance Holdings, Inc. | 11,210 | 357,599 | ||||||
|
| |||||||
| 3,421,301 | ||||||||
|
| |||||||
| Internet & Catalog Retail—3.1% | ||||||||
Amazon.com, Inc. (d) | 2,302 | 3,331,777 | ||||||
Netflix, Inc. (d) | 1,639 | 484,079 | ||||||
PetMed Express, Inc. | 2,722 | 113,643 | ||||||
|
| |||||||
| 3,929,499 | ||||||||
|
| |||||||
| Internet Software & Services—4.3% | ||||||||
Alphabet, Inc., Class A (d) | 1,172 | 1,215,528 | ||||||
Alphabet, Inc., Class C (d) | 1,190 | 1,227,830 | ||||||
Blucora, Inc. (d) | 608 | 14,957 | ||||||
CoStar Group, Inc. (d) | 901 | 326,775 | ||||||
Facebook, Inc., Class A (d) | 16,068 | 2,567,506 | ||||||
Five9, Inc. (d) | 2,264 | 67,444 | ||||||
|
| |||||||
| 5,420,040 | ||||||||
|
| |||||||
| IT Services—2.2% | ||||||||
Accenture PLC, Class A | 1,661 | 254,964 | ||||||
Amdocs Ltd. | 4,584 | 305,844 | ||||||
Automatic Data Processing, Inc. | 1,817 | 206,193 | ||||||
Broadridge Financial Solutions, Inc. | 2,798 | 306,913 | ||||||
Convergys Corp. | 321 | 7,261 | ||||||
DXC Technology Co. | 4,962 | 498,830 | ||||||
International Business Machines Corp. | 2,817 | 432,212 | ||||||
Visa, Inc., Class A | 6,589 | 788,176 | ||||||
|
| |||||||
| 2,800,393 | ||||||||
|
| |||||||
| Life Sciences Tools & Services—0.2% | ||||||||
Agilent Technologies, Inc. | 3,451 | 230,872 | ||||||
|
| |||||||
| Machinery—1.5% | ||||||||
Allison Transmission Holdings, Inc. | 1,163 | 45,427 | ||||||
American Railcar Industries, Inc. | 1,455 | 54,432 | ||||||
Briggs & Stratton Corp. | 1,041 | 22,288 | ||||||
Cummins, Inc. | 2,228 | 361,136 | ||||||
ESCO Technologies, Inc. | 496 | 29,041 | ||||||
Greenbrier Cos., Inc. | 2,627 | 132,007 | ||||||
Ingersoll-Rand PLC | 1,391 | 118,944 | ||||||
New Flyer Industries, Inc. | 850 | 38,635 | ||||||
RBC Bearings, Inc. (d) | 422 | 52,412 | ||||||
Snap-on, Inc. | 424 | 62,557 | ||||||
Stanley Black & Decker, Inc. | 5,144 | 788,061 | ||||||
WABCO Holdings, Inc. (d) | 333 | 44,579 | ||||||
Xylem, Inc. | 2,063 | 158,686 | ||||||
|
| |||||||
| 1,908,205 | ||||||||
|
| |||||||
| Media—1.8% | ||||||||
Cogeco Communications, Inc. | 593 | 32,468 | ||||||
Comcast Corp., Class A | 13,941 | 476,364 | ||||||
Interpublic Group of Cos., Inc. | 5,742 | 132,238 | ||||||
| 134 | Semiannual Report | | March 31, 2018 | | See accompanying Notes to Financial Statements |
Table of Contents
Schedule of Investments
March 31, 2018 (Unaudited)
| Shares | Value | |||||||
Shaw Communications, Inc., Class B | 1,579 | $ | 30,420 | |||||
TEGNA, Inc. | 12,231 | 139,311 | ||||||
Time Warner, Inc. | 12,009 | 1,135,811 | ||||||
Walt Disney Co. | 2,846 | 285,852 | ||||||
|
| |||||||
| 2,232,464 | ||||||||
|
| |||||||
| Metals & Mining—0.3% | ||||||||
Kaiser Aluminum Corp. | 686 | 69,218 | ||||||
Nucor Corp. | 2,782 | 169,952 | ||||||
OceanaGold Corp. | 9,229 | 24,857 | ||||||
Reliance Steel & Aluminum Co. | 855 | 73,308 | ||||||
Teck Resources Ltd., Class B | 2,055 | 52,924 | ||||||
|
| |||||||
| 390,259 | ||||||||
|
| |||||||
| Mortgage Real Estate Investment Trusts (REITs)—2.2% | ||||||||
AGNC Investment Corp. | 34,619 | 654,991 | ||||||
Annaly Capital Management, Inc. | 44,210 | 461,110 | ||||||
Apollo Commercial Real Estate Finance, Inc. | 678 | 12,190 | ||||||
ARMOUR Residential REIT, Inc. | 8,739 | 203,444 | ||||||
Blackstone Mortgage Trust, Inc., Class A | 2,628 | 82,572 | ||||||
Chimera Investment Corp. | 17,741 | 308,871 | ||||||
CYS Investments, Inc. | 9,895 | 66,494 | ||||||
Granite Point Mortgage Trust, Inc. | 1,153 | 19,071 | ||||||
Invesco Mortgage Capital, Inc. | 4,360 | 71,417 | ||||||
MFA Financial, Inc. | 21,403 | 161,165 | ||||||
MTGE Investment Corp. | 2,153 | 38,539 | ||||||
New Residential Investment Corp. | 10,098 | 166,112 | ||||||
New York Mortgage Trust, Inc. | 2,737 | 16,230 | ||||||
PennyMac Mortgage Investment Trust | 3,388 | 61,086 | ||||||
Starwood Property Trust, Inc. | 8,710 | 182,474 | ||||||
Two Harbors Investment Corp. | 14,623 | 224,756 | ||||||
|
| |||||||
| 2,730,522 | ||||||||
|
| |||||||
| Multi-Line Retail—0.1% | ||||||||
Canadian Tire Corp., Ltd., Class A | 131 | 17,225 | ||||||
Target Corp. | 2,047 | 142,123 | ||||||
|
| |||||||
| 159,348 | ||||||||
|
| |||||||
| Multi-Utilities—0.9% | ||||||||
Ameren Corp. | 3,799 | 215,137 | ||||||
CenterPoint Energy, Inc. | 7,301 | 200,048 | ||||||
SCANA Corp. | 5,465 | 205,211 | ||||||
WEC Energy Group, Inc. | 7,826 | 490,690 | ||||||
|
| |||||||
| 1,111,086 | ||||||||
|
| |||||||
| Oil, Gas & Consumable Fuels—4.7% | ||||||||
Andeavor | 6,678 | 671,540 | ||||||
Bonavista Energy Corp. | 3,551 | 3,252 | ||||||
Chevron Corp. | 5,907 | 673,634 | ||||||
CVR Energy, Inc. | 2,373 | 71,712 | ||||||
Exxon Mobil Corp. | 13,672 | 1,020,068 | ||||||
Gibson Energy, Inc. | 1,945 | 25,076 | ||||||
Keyera Corp. | 2,115 | 55,011 | ||||||
Marathon Petroleum Corp. | 13,143 | 960,885 | ||||||
Occidental Petroleum Corp. | 12,676 | 823,433 | ||||||
Pioneer Natural Resources Co. | 2,429 | 417,254 | ||||||
Scorpio Tankers, Inc. | 32,470 | 63,641 | ||||||
Valero Energy Corp. | 12,213 | 1,133,000 | ||||||
|
| |||||||
| 5,918,506 | ||||||||
|
| |||||||
| Shares | Value | |||||||
| Paper & Forest Products—0.3% | ||||||||
Domtar Corp. | 6,541 | $ | 278,254 | |||||
Norbord, Inc. | 905 | 32,812 | ||||||
Schweitzer-Mauduit International, Inc. | 922 | 36,096 | ||||||
|
| |||||||
| 347,162 | ||||||||
|
| |||||||
| Personal Products—0.3% | ||||||||
Estee Lauder Cos., Inc., Class A | 2,780 | 416,222 | ||||||
|
| |||||||
| Pharmaceuticals—3.6% | ||||||||
Allergan PLC | 5,164 | 869,049 | ||||||
Johnson & Johnson | 18,824 | 2,412,296 | ||||||
Merck & Co., Inc. | 8,376 | 456,241 | ||||||
Pfizer, Inc. | 22,231 | 788,978 | ||||||
Prestige Brands Holdings, Inc. (d) | 1,470 | 49,568 | ||||||
|
| |||||||
| 4,576,132 | ||||||||
|
| |||||||
| Professional Services—0.0% | ||||||||
Kelly Services, Inc., Class A | 494 | 14,346 | ||||||
|
| |||||||
| Road & Rail—1.2% | ||||||||
Kansas City Southern | 3,875 | 425,669 | ||||||
Norfolk Southern Corp. | 636 | 86,356 | ||||||
TFI International, Inc. | 1,299 | 33,383 | ||||||
Union Pacific Corp. | 6,865 | 922,862 | ||||||
|
| |||||||
| 1,468,270 | ||||||||
|
| |||||||
| Semiconductors & Semiconductor Equipment—6.4% | ||||||||
Applied Materials, Inc. | 15,938 | 886,312 | ||||||
Broadcom Ltd. | 2,539 | 598,315 | ||||||
Brooks Automation, Inc. | 1,079 | 29,219 | ||||||
Cabot Microelectronics Corp. | 3,748 | 401,448 | ||||||
Cirrus Logic, Inc. (d) | 7,111 | 288,920 | ||||||
Intel Corp. | 20,181 | 1,051,027 | ||||||
KLA-Tencor Corp. | 5,805 | 632,803 | ||||||
Lam Research Corp. | 4,129 | 838,848 | ||||||
Micron Technology, Inc. (d) | 9,969 | 519,784 | ||||||
MKS Instruments, Inc. | 1,149 | 132,882 | ||||||
Nanometrics, Inc. (d) | 1,081 | 29,079 | ||||||
NVIDIA Corp. | 5,977 | 1,384,213 | ||||||
Rudolph Technologies, Inc. (d) | 1,092 | 30,248 | ||||||
Texas Instruments, Inc. | 12,302 | 1,278,055 | ||||||
|
| |||||||
| 8,101,153 | ||||||||
|
| |||||||
| Software—5.2% | ||||||||
Activision Blizzard, Inc. | 8,253 | 556,747 | ||||||
CA, Inc. | 330 | 11,187 | ||||||
Cadence Design Systems, Inc. (d) | 2,984 | 109,722 | ||||||
Electronic Arts, Inc. (d) | 3,725 | 451,619 | ||||||
Intuit, Inc. | 3,089 | 535,478 | ||||||
Microsoft Corp. | 43,846 | 4,001,824 | ||||||
Open Text Corp. | 987 | 34,337 | ||||||
Oracle Corp. | 14,191 | 649,238 | ||||||
RealPage, Inc. (d) | 495 | 25,493 | ||||||
Synopsys, Inc. (d) | 129 | 10,738 | ||||||
Take-Two Interactive Software, Inc. (d) | 1,480 | 144,714 | ||||||
|
| |||||||
| 6,531,097 | ||||||||
|
| |||||||
| Specialty Retail—1.5% | ||||||||
Best Buy Co., Inc. | 6,076 | 425,259 | ||||||
Home Depot, Inc. | 8,134 | 1,449,804 | ||||||
|
| |||||||
| 1,875,063 | ||||||||
|
| |||||||
| Technology Hardware, Storage & Peripherals—5.2% | ||||||||
Apple, Inc. | 31,729 | 5,323,492 | ||||||
HP, Inc. | 28,563 | 626,101 | ||||||
NetApp, Inc. | 9,160 | 565,080 | ||||||
|
| |||||||
| 6,514,673 | ||||||||
|
| |||||||
| Shares | Value | |||||||
| Thrifts & Mortgage Finance—0.1% | ||||||||
Genworth MI Canada, Inc. | 1,543 | $ | 49,104 | |||||
Kearny Financial Corp. | 1,928 | 25,064 | ||||||
Meta Financial Group, Inc. | 207 | 22,604 | ||||||
Oritani Financial Corp. | 673 | 10,331 | ||||||
|
| |||||||
| 107,103 | ||||||||
|
| |||||||
| Tobacco—1.2% | ||||||||
Altria Group, Inc. | 14,215 | 885,879 | ||||||
British American Tobacco PLC ADR | 5,157 | 297,507 | ||||||
Philip Morris International, Inc. | 3,464 | 344,322 | ||||||
|
| |||||||
| 1,527,708 | ||||||||
|
| |||||||
| Trading Companies & Distributors—0.2% | ||||||||
GATX Corp. | 1,876 | 128,487 | ||||||
Textainer Group Holdings Ltd. (d) | 1,134 | 19,221 | ||||||
United Rentals, Inc. (d) | 731 | 126,266 | ||||||
|
| |||||||
| 273,974 | ||||||||
|
| |||||||
| Wireless Telecommunication Services—0.2% | ||||||||
T-Mobile U.S., Inc. (d) | 4,254 | 259,664 | ||||||
|
| |||||||
| Total Common Stock (cost—$104,205,156) | 122,931,916 | |||||||
|
| |||||||
| Exchange-Traded Funds—0.9% | ||||||||
iShares Core S&P 500 | 4,212 | 1,117,739 | ||||||
|
| |||||||
| Rights (b)(c)(d)—0.0% | ||||||||
| Food & Staples Retailing—0.0% | ||||||||
Safeway CVR—PDC, expires 1/30/17 | 5,723 | 97 | ||||||
|
| |||||||
| Principal Amount (000s) | ||||||||
| Repurchase Agreements—1.6% | ||||||||
State Street Bank and Trust Co., dated 3/29/18, 0.28%, due 4/2/18, proceeds $1,982,062; collateralized by U.S. Treasury Notes, 2.50%, due 5/15/24, valued at $2,023,583 including accrued interest |
| |||||||
(cost—$1,982,000) | $1,982 | 1,982,000 | ||||||
|
| |||||||
| Total Investments (cost—$107,357,401)—99.8% | 126,031,752 | |||||||
|
| |||||||
| Other assets less liabilities (e)—0.2% | 249,387 | |||||||
|
| |||||||
| Net Assets—100.0% | $126,281,139 | |||||||
|
| |||||||
Notes to Schedule of Investments:
(a) 144A—Exempt from registration under Rule 144A of the Securities Act of 1933. These securities may be resold in transactions exempt from registration, typically only to qualified institutional buyers. Security with a value of $35,837, representing less than 0.05% of net assets.
(b) Fair-Valued—Security with a value of $97, representing less than 0.05% of net assets. See Note 1(a) and Note 1(b) in the Notes to Financial Statements.
(c) Level 3 security. See Note 1(a) and Note 1(b) in the Notes to Financial Statements.
(d) Non-income producing.
| See accompanying Notes to Financial Statements | | March 31, 2018 | | Semiannual Report | 135 |
Table of Contents
Schedule of Investments
March 31, 2018 (Unaudited)
(e) Includes net unrealized appreciation (depreciation) of other financial instruments as follows:
| Futures contracts outstanding at March 31, 2018: | ||||||||||||||||||||||
| Type | Contracts | Expiration Date | Notional Amount (000s) | Market Value (000s) | Unrealized Appreciation | |||||||||||||||||
Long position contracts: |
| |||||||||||||||||||||
E-mini S&P 500 Index | 5 | 6/15/18 | $ | — | (g) | $ | 661 | $ | 12,051 | |||||||||||||
|
| |||||||||||||||||||||
(f) At March 31, 2018, the Fund pledged $48,201 in cash as collateral for futures contracts.
(g) Notional amount rounds to less than $500.
Glossary:
ADR—American Depositary Receipt
CVR—Contingent Value Rights
REIT—Real Estate Investment Trust
| 136 | Semiannual Report | | March 31, 2018 | | See accompanying Notes to Financial Statements |
Table of Contents
Schedule of Investments
March 31, 2018 (Unaudited)
AllianzGI Convertible Fund
| Principal Amount (000s) | Value | |||||||
| Convertible Bonds & Notes—84.2% | ||||||||
| Aerospace & Defense—0.3% | ||||||||
Aerojet Rocketdyne Holdings, Inc., |
| |||||||
2.25%, 12/15/23 | $1,190 | $1,514,111 | ||||||
|
| |||||||
| Apparel & Textiles—0.5% | ||||||||
Iconix Brand Group, Inc., |
| |||||||
5.75%, 8/15/23 | 2,340 | 2,171,731 | ||||||
|
| |||||||
| Auto Components—0.9% | ||||||||
Meritor, Inc. (a)(b), |
| |||||||
3.25%, 10/15/37 | 4,170 | 4,204,974 | ||||||
|
| |||||||
| Auto Manufacturers—2.4% | ||||||||
Navistar International Corp., |
| |||||||
4.75%, 4/15/19 | 4,060 | 4,186,842 | ||||||
Tesla, Inc., |
| |||||||
0.25%, 3/1/19 | 5,815 | 5,810,476 | ||||||
2.375%, 3/15/22 | 1,175 | 1,226,940 | ||||||
|
| |||||||
| 11,224,258 | ||||||||
|
| |||||||
| Biotechnology—4.1% | ||||||||
BioMarin Pharmaceutical, Inc., |
| |||||||
0.599%, 8/1/24 | 2,410 | 2,268,412 | ||||||
1.50%, 10/15/20 | 600 | 663,750 | ||||||
Exact Sciences Corp., |
| |||||||
1.00%, 1/15/25 | 4,685 | 4,185,523 | ||||||
Illumina, Inc., |
| |||||||
0.50%, 6/15/21 | 4,380 | 5,362,465 | ||||||
Insmed, Inc., |
| |||||||
1.75%, 1/15/25 | 3,765 | 3,329,062 | ||||||
Ionis Pharmaceuticals, Inc., |
| |||||||
1.00%, 11/15/21 | 2,200 | 2,178,957 | ||||||
Ligand Pharmaceuticals, Inc., |
| |||||||
0.75%, 8/15/19 | 565 | 1,239,204 | ||||||
|
| |||||||
| 19,227,373 | ||||||||
|
| |||||||
| Building Materials—0.8% | ||||||||
Patrick Industries, Inc. (a)(b), |
| |||||||
1.00%, 2/1/23 | 3,890 | 3,869,772 | ||||||
|
| |||||||
| Commercial Services—2.4% | ||||||||
Euronet Worldwide, Inc., | ||||||||
1.50%, 10/1/44 | 1,985 | 2,350,564 | ||||||
LendingTree, Inc. (a)(b), |
| |||||||
0.625%, 6/1/22 | 1,540 | 2,591,222 | ||||||
Live Nation Entertainment, Inc. (a)(b), |
| |||||||
2.50%, 3/15/23 | 3,620 | 3,662,285 | ||||||
Square, Inc., |
| |||||||
0.375%, 3/1/22 | 1,325 | 2,904,930 | ||||||
|
| |||||||
| 11,509,001 | ||||||||
|
| |||||||
| Computers—3.5% | ||||||||
Carbonite, Inc. (a)(b), | ||||||||
2.50%, 4/1/22 | 1,930 | 2,519,980 | ||||||
Lumentum Holdings, Inc., |
| |||||||
0.25%, 3/15/24 | 3,275 | 4,158,290 | ||||||
Nutanix, Inc. (a)(b), |
| |||||||
zero coupon, 1/15/23 | 3,990 | 4,811,154 | ||||||
Western Digital Corp. (a)(b), |
| |||||||
1.50%, 2/1/24 | 4,520 | 4,899,978 | ||||||
|
| |||||||
| 16,389,402 | ||||||||
|
| |||||||
| Diversified Financial Services—1.7% | ||||||||
Air Lease Corp., |
| |||||||
3.875%, 12/1/18 | 2,255 | 3,362,807 | ||||||
Encore Capital Group, Inc., |
| |||||||
3.25%, 3/15/22 | 4,225 | 4,930,575 | ||||||
|
| |||||||
| 8,293,382 | ||||||||
|
| |||||||
| Principal Amount (000s) | Value | |||||||
| Electronics—1.0% | ||||||||
II-VI, Inc. (a)(b), |
| |||||||
0.25%, 9/1/22 | $ | 4,085 | $ | 4,522,095 | ||||
|
| |||||||
| Energy-Alternate Sources—1.0% | ||||||||
NextEra Energy Partners L.P. (a)(b), |
| |||||||
1.50%, 9/15/20 | 4,630 | 4,560,536 | ||||||
|
| |||||||
| Engineering & Construction—0.7% | ||||||||
Dycom Industries, Inc., |
| |||||||
0.75%, 9/15/21 | 2,785 | 3,539,005 | ||||||
|
| |||||||
| Equity Real Estate Investment Trusts (REITs)—0.8% | ||||||||
Extra Space Storage L.P. (a)(b), |
| |||||||
3.125%, 10/1/35 | 3,525 | 3,931,817 | ||||||
|
| |||||||
| Healthcare-Products—2.2% | ||||||||
Hologic, Inc. (c)(e), |
| |||||||
zero coupon, 3/1/42 | 680 | 814,892 | ||||||
Insulet Corp. (a)(b), | ||||||||
1.375%, 11/15/24 | 4,690 | 5,379,528 | ||||||
Quidel Corp., | ||||||||
3.25%, 12/15/20 | 2,390 | 4,145,933 | ||||||
|
| |||||||
| 10,340,353 | ||||||||
|
| |||||||
| Healthcare-Services—3.5% | ||||||||
Anthem, Inc., | ||||||||
2.75%, 10/15/42 | 2,285 | 6,893,991 | ||||||
Molina Healthcare, Inc., | ||||||||
1.125%, 1/15/20 | 1,230 | 2,479,428 | ||||||
Teladoc, Inc. (a)(b), | ||||||||
3.00%, 12/15/22 | 3,550 | 4,212,526 | ||||||
Tivity Health, Inc., | ||||||||
1.50%, 7/1/18 | 1,370 | 2,776,442 | ||||||
|
| |||||||
| 16,362,387 | ||||||||
|
| |||||||
| Internet—12.7% | ||||||||
Altaba, Inc., |
| |||||||
zero coupon, 12/1/18 | 5,200 | 7,279,740 | ||||||
Booking Holdings, Inc., |
| |||||||
0.35%, 6/15/20 | 3,910 | 6,287,190 | ||||||
Chegg, Inc. (a)(b), |
| |||||||
0.25%, 5/15/23 | 3,860 | 3,976,966 | ||||||
IAC FinanceCo., Inc. (a)(b), |
| |||||||
0.875%, 10/1/22 | 4,255 | 5,097,060 | ||||||
Okta, Inc. (a)(b), |
| |||||||
0.25%, 2/15/23 | 3,975 | 4,351,433 | ||||||
Palo Alto Networks, Inc., |
| |||||||
zero coupon, 7/1/19 | 3,430 | 5,676,777 | ||||||
Q2 Holdings, Inc. (a)(b), |
| |||||||
0.75%, 2/15/23 | 4,550 | 4,674,183 | ||||||
RingCentral, Inc. (a)(b), |
| |||||||
zero coupon, 3/15/23 | 2,415 | 2,432,871 | ||||||
VeriSign, Inc., |
| |||||||
4.865%, 8/15/37 | 2,450 | 8,454,460 | ||||||
Weibo Corp. (a)(b), |
| |||||||
1.25%, 11/15/22 | 2,605 | 3,036,031 | ||||||
Zendesk, Inc. (a)(b), |
| |||||||
0.25%, 3/15/23 | 5,210 | 5,324,620 | ||||||
Zillow Group, Inc., |
| |||||||
2.00%, 12/1/21 | 2,840 | 3,446,712 | ||||||
|
| |||||||
| 60,038,043 | ||||||||
|
| |||||||
| Iron/Steel—0.6% | ||||||||
Allegheny Technologies, Inc., |
| |||||||
4.75%, 7/1/22 | 1,505 | 2,750,309 | ||||||
|
| |||||||
| IT Services—0.7% | ||||||||
GS Finance Corp. (Fidelity National Information Services, Inc.) (e)(f), |
| |||||||
zero coupon, 6/5/23 | 3,125 | 3,386,844 | ||||||
|
| |||||||
| Principal Amount (000s) | Value | |||||||
| Lodging—1.4% | ||||||||
Caesars Entertainment Corp. (a), |
| |||||||
5.00%, 10/1/24 | $ | 3,820 | $ | 6,677,837 | ||||
|
| |||||||
| Machinery-Diversified—1.3% | ||||||||
Chart Industries, Inc. (a)(b), |
| |||||||
1.00%, 11/15/24 | 5,120 | 6,008,033 | ||||||
|
| |||||||
| Media—3.0% | ||||||||
DISH Network Corp., | ||||||||
2.375%, 3/15/24 | 775 | 689,201 | ||||||
3.375%, 8/15/26 | 4,235 | 4,089,739 | ||||||
Liberty Interactive LLC (a)(b), |
| |||||||
1.75%, 9/30/46 | 3,780 | 4,206,384 | ||||||
Liberty Media Corp. (a)(b), |
| |||||||
2.125%, 3/31/48 | 5,085 | 5,041,269 | ||||||
|
| |||||||
| 14,026,593 | ||||||||
|
| |||||||
| Miscellaneous Manufacturing—0.6% | ||||||||
Trinity Industries, Inc., |
| |||||||
3.875%, 6/1/36 | 2,010 | 2,749,451 | ||||||
|
| |||||||
| Oil, Gas & Consumable Fuels—2.2% | ||||||||
Ensco Jersey Finance Ltd., | ||||||||
3.00%, 1/31/24 | 4,615 | 3,709,306 | ||||||
Oasis Petroleum, Inc., | ||||||||
2.625%, 9/15/23 | 2,310 | 2,391,400 | ||||||
Oil States International, Inc. (a)(b), | ||||||||
1.50%, 2/15/23 | 4,525 | 4,350,353 | ||||||
|
| |||||||
| 10,451,059 | ||||||||
|
| |||||||
| Pharmaceuticals—5.1% | ||||||||
Array BioPharma, Inc. (a)(b), | ||||||||
2.625%, 12/1/24 | 1,125 | 1,500,412 | ||||||
Clovis Oncology, Inc., |
| |||||||
2.50%, 9/15/21 | 1,765 | 2,052,916 | ||||||
DexCom, Inc. (a)(b), | ||||||||
0.75%, 5/15/22 | 2,390 | 2,464,958 | ||||||
Flexion Therapeutics, Inc. (a)(b), |
| |||||||
3.375%, 5/1/24 | 3,280 | 3,742,834 | ||||||
Jazz Investments I Ltd. (a)(b), |
| |||||||
1.50%, 8/15/24 | 1,190 | 1,164,847 | ||||||
Neurocrine Biosciences, Inc. (a)(b), |
| |||||||
2.25%, 5/15/24 | 4,575 | 6,004,166 | ||||||
Sarepta Therapeutics, Inc. (a)(b), |
| |||||||
1.50%, 11/15/24 | 1,840 | 2,297,628 | ||||||
Supernus Pharmaceuticals, Inc. (a)(b), |
| |||||||
0.625%, 4/1/23 | 4,365 | 4,654,592 | ||||||
|
| |||||||
| 23,882,353 | ||||||||
|
| |||||||
| Pipelines—1.1% | ||||||||
Cheniere Energy, Inc., |
| |||||||
4.25%, 3/15/45 | 6,965 | 5,440,675 | ||||||
|
| |||||||
| Retail—0.7% | ||||||||
RH (a)(b), | ||||||||
zero coupon, 6/15/19 | 3,310 | 3,442,887 | ||||||
|
| |||||||
| Semiconductors—11.1% | ||||||||
Advanced Micro Devices, Inc., |
| |||||||
2.125%, 9/1/26 | 785 | 1,150,653 | ||||||
Cypress Semiconductor Corp., |
| |||||||
2.00%, 2/1/23 (a)(b) | 1,800 | 1,948,500 | ||||||
4.50%, 1/15/22 | 895 | 1,250,942 | ||||||
Intel Corp., |
| |||||||
3.25%, 8/1/39 | 5,095 | 12,683,111 | ||||||
Lam Research Corp., |
| |||||||
1.25%, 5/15/18 | 1,030 | 3,479,513 | ||||||
Microchip Technology, Inc., | ||||||||
1.625%, 2/15/27 | 10,460 | 12,418,342 | ||||||
Micron Technology, Inc., Ser. G, | ||||||||
3.00%, 11/15/43 | 5,025 | 9,016,875 | ||||||
| See accompanying Notes to Financial Statements | | March 31, 2018 | | Semiannual Report | 137 |
Table of Contents
Schedule of Investments
March 31, 2018 (Unaudited)
| Principal Amount (000s) | Value | |||||||
Novellus Systems, Inc., | ||||||||
2.625%, 5/15/41 | $ | 370 | $ | 2,241,427 | ||||
ON Semiconductor Corp. (a)(b), | ||||||||
1.625%, 10/15/23 | 3,490 | 4,792,663 | ||||||
Teradyne, Inc., | ||||||||
1.25%, 12/15/23 | 2,225 | 3,398,033 | ||||||
|
| |||||||
| 52,380,059 | ||||||||
|
| |||||||
| Software—12.1% | ||||||||
Citrix Systems, Inc., | ||||||||
0.50%, 4/15/19 | 4,385 | 5,783,377 | ||||||
Coupa Software, Inc. (a)(b), | ||||||||
0.375%, 1/15/23 | 2,885 | 3,495,463 | ||||||
Envestnet, Inc., |
| |||||||
1.75%, 12/15/19 | 3,975 | 4,375,481 | ||||||
Everbridge, Inc., |
| |||||||
1.50%, 11/1/22 | 2,475 | 3,105,887 | ||||||
Guidewire Software, Inc., |
| |||||||
1.25%, 3/15/25 | 3,490 | 3,429,689 | ||||||
Nice Systems, Inc., |
| |||||||
1.25%, 1/15/24 | 4,025 | 5,002,270 | ||||||
Nuance Communications, Inc. (a)(b), |
| |||||||
1.25%, 4/1/25 | 5,230 | 5,194,070 | ||||||
Proofpoint, Inc., | ||||||||
0.75%, 6/15/20 | 2,760 | 4,042,293 | ||||||
PROS Holdings, Inc. (a)(b), |
| |||||||
2.00%, 6/1/47 | 4,975 | 4,794,408 | ||||||
RealPage, Inc. (a)(b), |
| |||||||
1.50%, 11/15/22 | 3,955 | 5,396,103 | ||||||
ServiceNow, Inc. (a)(b), |
| |||||||
zero coupon, 6/1/22 | 4,535 | 6,029,963 | ||||||
Workday, Inc. (a)(b), |
| |||||||
0.25%, 10/1/22 | 6,180 | 6,736,719 | ||||||
|
| |||||||
| 57,385,723 | ||||||||
|
| |||||||
| Telecommunications—1.9% | ||||||||
CalAmp Corp., |
| |||||||
1.625%, 5/15/20 | 3,655 | 3,915,689 | ||||||
Ciena Corp., |
| |||||||
3.75%, 10/15/18 | 2,460 | 3,249,724 | ||||||
InterDigital, Inc., | ||||||||
1.50%, 3/1/20 | 1,675 | 1,946,350 | ||||||
|
| |||||||
| 9,111,763 | ||||||||
|
| |||||||
| Transportation—3.9% | ||||||||
Air Transport Services Group, Inc. (a)(b), |
| |||||||
1.125%, 10/15/24 | 4,930 | 4,967,650 | ||||||
Atlas Air Worldwide Holdings, Inc., |
| |||||||
1.875%, 6/1/24 | 3,470 | 4,147,976 | ||||||
Echo Global Logistics, Inc., |
| |||||||
2.50%, 5/1/20 | 4,065 | 4,145,186 | ||||||
Greenbrier Cos., Inc., |
| |||||||
2.875%, 2/1/24 | 4,440 | 5,094,909 | ||||||
|
| |||||||
| 18,355,721 | ||||||||
|
| |||||||
| Total Convertible Bonds & Notes (cost—$346,815,445) | 397,747,547 | |||||||
|
| |||||||
| Shares | ||||||||
| Convertible Preferred Stock—12.4% | ||||||||
| Banks—2.5% | ||||||||
Bank of America Corp., Ser. L (d), |
| |||||||
7.25% | 5,160 | 6,653,562 | ||||||
Wells Fargo & Co., Ser. L (d), |
| |||||||
7.50% | 4,015 | 5,179,350 | ||||||
|
| |||||||
| 11,832,912 | ||||||||
|
| |||||||
| Diversified Financial Services—1.5% | ||||||||
2017 Mandatory Exchangeable Trust (a)(b), |
| |||||||
5.188%, 12/1/20 | 24,035 | 2,964,717 | ||||||
| Shares | Value | |||||||
AMG Capital Trust II, |
| |||||||
5.15%, 10/15/37 | 63,885 | $ | 3,975,430 | |||||
|
| |||||||
| 6,940,147 | ||||||||
|
| |||||||
| Electric Utilities—1.5% | ||||||||
NextEra Energy, Inc., |
| |||||||
6.123%, 9/1/19 | 126,845 | 7,313,883 | ||||||
|
| |||||||
| Equity Real Estate Investment Trusts (REITs)—1.7% | ||||||||
Crown Castle International Corp., Ser. A, |
| |||||||
6.875%, 8/1/20 | 7,150 | 7,967,003 | ||||||
|
| |||||||
| Hand/Machine Tools—1.0% | ||||||||
Stanley Black & Decker, Inc., |
| |||||||
5.375%, 5/15/20 | 41,045 | 4,727,563 | ||||||
|
| |||||||
| Healthcare-Products—1.7% | ||||||||
Becton Dickinson and Co., Ser. A, |
| |||||||
6.125%, 5/1/20 | 137,535 | 8,016,269 | ||||||
|
| |||||||
| Metal Fabricate/Hardware—0.8% | ||||||||
Rexnord Corp., Ser. A, |
| |||||||
5.75%, 11/15/19 | 57,430 | 3,691,600 | ||||||
|
| |||||||
| Oil, Gas & Consumable Fuels—1.7% | ||||||||
Hess Corp., | ||||||||
8.00%, 2/1/19 | 60,640 | 3,611,719 | ||||||
WPX Energy, Inc., Ser. A, |
| |||||||
6.25%, 7/31/18 | 68,550 | 4,303,569 | ||||||
|
| |||||||
| 7,915,288 | ||||||||
|
| |||||||
| Total Convertible Preferred Stock (cost—$49,769,740) | 58,404,665 | |||||||
|
| |||||||
| Principal Amount (000s) | ||||||||
| Repurchase Agreements—4.4% | ||||||||
State Street Bank and Trust Co., dated 3/29/18, 0.28%, due 4/2/18, proceeds $20,938,651; collateralized by U.S. Treasury Notes, 2.50%, due 5/15/24, valued at $21,360,038 including accrued interest |
| |||||||
(cost—$20,938,000) | $20,938 | 20,938,000 | ||||||
|
| |||||||
| Total Investments (cost—$417,523,185)—101.0% | 477,090,212 | |||||||
|
| |||||||
| Liabilities in excess of other assets—(1.0)% | (4,704,382 | ) | ||||||
|
| |||||||
| Net Assets—100.0% | $472,385,830 | |||||||
|
| |||||||
Notes to Schedule of Investments:
(a) Private Placement—Restricted as to resale and may not have a readily available market. Securities with an aggregate value of $175,935,487, representing 37.2% of net assets.
(b) 144A—Exempt from registration under Rule 144A of the Securities Act of 1933. These securities may be resold in transactions exempt from registration, typically only to qualified institutional buyers. Securities with an aggregate value of $169,257,650, representing 35.8% of net assets.
(c) Fair-Valued—Security with a value of $814,892, representing 0.2% of net assets. See Note 1(a) and Note 1(b) in the Notes to Financial Statements.
(d) Perpetual maturity. The date shown, if any, is the next call date.
(e) Level 3 security. See Note 1(a) and Note 1(b) in the Notes to Financial Statements.
(f) Securities exchangeable or convertible into securities of an entity different than the issuer or structured by the issuer to provide exposure to securities of an entity different than the issuer (synthetic convertible securities). Such entity is identified in the parenthetical.
Glossary:
REIT—Real Estate Investment Trust
| 138 | Semiannual Report | | March 31, 2018 | | See accompanying Notes to Financial Statements |
Table of Contents
Schedule of Investments
March 31, 2018 (Unaudited)
AllianzGI Emerging Markets
Consumer Fund
| Shares | Value | |||||||
| Common Stock—94.9% | ||||||||
| Brazil—5.3% | ||||||||
Ambev S.A. | 48,500 | $353,601 | ||||||
Ambev S.A. ADR | 167,250 | 1,215,907 | ||||||
Banco Santander Brasil S.A. ADR | 12,985 | 156,080 | ||||||
Estacio Participacoes S.A. | 24,100 | 255,275 | ||||||
Porto Seguro S.A. | 19,300 | 283,878 | ||||||
Tim Participacoes S.A. | 38,700 | 168,798 | ||||||
Via Varejo S.A. UNIT | 31,300 | 287,454 | ||||||
|
| |||||||
| 2,720,993 | ||||||||
|
| |||||||
| China—28.1% | ||||||||
Air China Ltd., Class H | 244,000 | 315,109 | ||||||
Alibaba Group Holding Ltd. ADR (e) | 7,425 | 1,362,785 | ||||||
Autohome, Inc. ADR | 5,180 | 445,169 | ||||||
Baidu, Inc. ADR (e) | 1,390 | 310,234 | ||||||
China Huarong Asset Management Co., Ltd., Class H (a) | 1,899,000 | 804,967 | ||||||
China Life Insurance Co., Ltd., Class H | 181,000 | 506,038 | ||||||
China Merchants Bank Co., Ltd., Class H | 363,500 | 1,508,840 | ||||||
China Southern Airlines Co., Ltd., Class H | 138,000 | 144,219 | ||||||
China Vanke Co., Ltd., Class H | 179,900 | 828,373 | ||||||
Geely Automobile Holdings Ltd. | 72,000 | 210,977 | ||||||
Hengan International Group Co., Ltd. | 63,000 | 587,300 | ||||||
New Oriental Education & Technology Group, Inc. ADR | 1,440 | 126,216 | ||||||
Ping An Insurance Group Co. of China Ltd., Class H | 204,000 | 2,103,377 | ||||||
Tencent Holdings Ltd. | 89,900 | 4,825,791 | ||||||
Yum China Holdings, Inc. | 11,200 | 464,800 | ||||||
|
| |||||||
| 14,544,195 | ||||||||
|
| |||||||
| Greece—0.2% | ||||||||
OPAP S.A. | 7,682 | 88,046 | ||||||
|
| |||||||
| Hong Kong—3.5% | ||||||||
Galaxy Entertainment Group Ltd. | 61,000 | 559,900 | ||||||
Melco Resorts & Entertainment Ltd. ADR | 34,105 | 988,363 | ||||||
WH Group Ltd. (a) | 252,000 | 270,014 | ||||||
|
| |||||||
| 1,818,277 | ||||||||
|
| |||||||
| Hungary—0.3% | ||||||||
OTP Bank PLC | 4,066 | 182,693 | ||||||
|
| |||||||
| India—4.0% | ||||||||
HDFC Bank Ltd. ADR | 14,665 | 1,448,462 | ||||||
Housing Development Finance Corp., Ltd. | 16,167 | 454,246 | ||||||
Indiabulls Housing Finance Ltd. | 8,504 | 162,951 | ||||||
|
| |||||||
| 2,065,659 | ||||||||
|
| |||||||
| Japan—3.0% | ||||||||
Suzuki Motor Corp. | 28,400 | 1,541,931 | ||||||
|
| |||||||
| Korea (Republic of)—9.6% | ||||||||
Hana Tour Service, Inc. | 1,528 | 172,808 | ||||||
Hotel Shilla Co., Ltd. | 1,928 | 167,909 | ||||||
KB Financial Group, Inc. | 21,760 | 1,262,019 | ||||||
LG Electronics, Inc. | 4,280 | 441,596 | ||||||
| Shares | Value | |||||||
LOTTE Himart Co., Ltd. | 3,223 | $ | 222,438 | |||||
Samsung Electronics Co., Ltd. | 1,024 | 2,392,552 | ||||||
SK Telecom Co., Ltd. | 1,465 | 317,666 | ||||||
|
| |||||||
| 4,976,988 | ||||||||
|
| |||||||
| Malaysia—3.0% | ||||||||
AirAsia Group Bhd. | 96,400 | 99,094 | ||||||
Malayan Banking Bhd. | 113,400 | 308,907 | ||||||
Public Bank Bhd. | 186,900 | 1,162,072 | ||||||
|
| |||||||
| 1,570,073 | ||||||||
|
| |||||||
| Mexico—0.3% | ||||||||
Fomento Economico Mexicano S.A.B de C.V. UNIT | 17,800 | 162,932 | ||||||
|
| |||||||
| Russian Federation—3.0% | ||||||||
Mail.Ru Group Ltd. GDR (e) | 6,774 | 236,955 | ||||||
Mobile TeleSystems PJSC ADR | 114,875 | 1,308,426 | ||||||
|
| |||||||
| 1,545,381 | ||||||||
|
| |||||||
| South Africa—6.8% | ||||||||
Astral Foods Ltd. | 7,447 | 196,775 | ||||||
Capitec Bank Holdings Ltd. | 1,191 | 87,619 | ||||||
Discovery Ltd. | 10,610 | 153,067 | ||||||
Mr Price Group Ltd. | 38,708 | 930,845 | ||||||
Sanlam Ltd. | 42,102 | 304,154 | ||||||
Standard Bank Group Ltd. | 99,764 | 1,843,483 | ||||||
|
| |||||||
| 3,515,943 | ||||||||
|
| |||||||
| Taiwan—8.7% | ||||||||
Cathay Financial Holding Co., Ltd. | 849,000 | 1,522,395 | ||||||
CTBC Financial Holding Co., Ltd. | 2,198,000 | 1,588,247 | ||||||
First Financial Holding Co., Ltd. | 910,140 | 634,790 | ||||||
Pou Chen Corp. | 131,000 | 174,930 | ||||||
Shin Kong Financial Holding Co., Ltd. | 1,000,000 | 383,253 | ||||||
St Shine Optical Co., Ltd. | 6,000 | 177,448 | ||||||
|
| |||||||
| 4,481,063 | ||||||||
|
| |||||||
| Thailand—5.8% | ||||||||
Advanced Info Service PCL (c)(d) | 169,600 | 1,120,022 | ||||||
CP ALL PCL (c)(d) | 136,200 | 380,720 | ||||||
Home Product Center PCL (c)(d) | 355,700 | 158,504 | ||||||
Thanachart Capital PCL (c)(d) | 646,500 | 1,078,186 | ||||||
Tisco Financial Group PCL (c)(d) | 102,400 | 288,727 | ||||||
|
| |||||||
| 3,026,159 | ||||||||
|
| |||||||
| Turkey—3.4% | ||||||||
Turk Hava Yollari AO (e) | 205,781 | 1,017,658 | ||||||
Turkiye Garanti Bankasi AS | 261,753 | 725,797 | ||||||
|
| |||||||
| 1,743,455 | ||||||||
|
| |||||||
| United Kingdom—0.3% | ||||||||
Coca-Cola HBC AG (e) | 4,497 | 166,419 | ||||||
|
| |||||||
| United States—9.6% | ||||||||
Copa Holdings S.A., Class A | 9,905 | 1,274,080 | ||||||
Lear Corp. | 1,915 | 356,362 | ||||||
Mastercard, Inc., Class A | 6,785 | 1,188,461 | ||||||
McDonald’s Corp. | 5,120 | 800,666 | ||||||
Mettler-Toledo International, Inc. (e) | 300 | 172,509 | ||||||
| Shares | Value | |||||||
Thermo Fisher Scientific, Inc. | 1,970 | $ | 406,726 | |||||
Visa, Inc., Class A | 4,500 | 538,290 | ||||||
Waters Corp. (e) | 1,245 | 247,319 | ||||||
|
| |||||||
| 4,984,413 | ||||||||
|
| |||||||
| Total Common Stock (cost—$40,284,814) | 49,134,620 | |||||||
|
| |||||||
| Preferred Stock—1.1% | ||||||||
| Brazil—1.1% | ||||||||
Itau Unibanco Holding S.A. | 35,200 | 547,066 | ||||||
|
| |||||||
| Principal Amount (000s) | ||||||||
| Repurchase Agreements—2.2% | ||||||||
State Street Bank and Trust Co.,dated 3/29/18, 0.28%, due 4/2/18, proceeds $1,159,036; collateralized by U.S. Treasury Notes, 2.50%, due 5/15/24, valued at $1,184,171 including accrued interest |
| |||||||
(cost—$1,159,000) | $1,159 | 1,159,000 | ||||||
|
| |||||||
| Total Investments (cost—$41,974,319) (b)—98.2% | 50,840,686 | |||||||
|
| |||||||
| Other assets less liabilities—1.8% | 933,852 | |||||||
|
| |||||||
| Net Assets—100.0% | $51,774,538 | |||||||
|
| |||||||
Notes to Schedule of Investments:
(a) 144A—Exempt from registration under Rule 144A of the Securities Act of 1933. These securities may be resold in transactions exempt from registration, typically only to qualified institutional buyers. Securities with an aggregate value of $1,074,981, representing 2.1% of net assets.
(b) Securities with an aggregate value of $31,351,938, representing 60.6% of net assets, were valued utilizing modeling tools provided by a third-party vendor. See Note 1(a) and Note 1(b) in the Notes to Financial Statements.
(c) Fair-Valued—Securities with an aggregate value of $3,026,159, representing 5.8% of net assets. See Note 1(a) and Note 1(b) in the Notes to Financial Statements.
(d) Level 3 security. See Note 1(a) and Note 1(b) in the Notes to Financial Statements.
(e) Non-income producing.
Glossary:
ADR—American Depositary Receipt
GDR—Global Depositary Receipt
UNIT—More than one class of securities traded together.
| See accompanying Notes to Financial Statements | | March 31, 2018 | | Semiannual Report | 139 |
Table of Contents
Schedule of Investments
March 31, 2018 (Unaudited)
_
The industry classification of portfolio holdings and other assets less liabilities shown as a percentage of net assets were as follows:
Banks | 24.8% | |||
Internet Software & Services | 13.9% | |||
Insurance | 10.2% | |||
Hotels, Restaurants & Leisure | 5.9% | |||
Wireless Telecommunication Services | 5.6% | |||
Airlines | 5.5% | |||
Technology Hardware, Storage & Peripherals | 4.6% | |||
Beverages | 3.7% | |||
Specialty Retail | 3.4% | |||
Automobiles | 3.4% | |||
IT Services | 3.3% | |||
Real Estate Management & Development | 1.6% | |||
Life Sciences Tools & Services | 1.6% | |||
Capital Markets | 1.6% | |||
Thrifts & Mortgage Finance | 1.2% | |||
Personal Products | 1.1% | |||
Food Products | 0.9% | |||
Household Durables | 0.9% | |||
Diversified Consumer Services | 0.7% | |||
Food & Staples Retailing | 0.7% | |||
Auto Components | 0.7% | |||
Healthcare Equipment & Supplies | 0.4% | |||
Textiles, Apparel & Luxury Goods | 0.3% | |||
Repurchase Agreements | 2.2% | |||
Other assets less liabilities | 1.8% | |||
|
| |||
| 100.0% | ||||
|
|
AllianzGI Emerging Markets Debt Fund
| Principal Amount (000s) | Value | |||||||||||
| CORPORATE BONDS & NOTES—48.4% | ||||||||||||
| Argentina—1.8% | ||||||||||||
Banco Hipotecario S.A., BADLAR + |
| |||||||||||
26.771%, 11/7/22 | ARS | 2,400 | $119,682 | |||||||||
Banco Macro S.A. (a)(b), |
| |||||||||||
17.50%, 5/8/22 | 5,200 | 242,785 | ||||||||||
Banco Supervielle S.A., BADLAR + |
| |||||||||||
27.271%, 8/9/20 | 4,500 | 223,955 | ||||||||||
|
| |||||||||||
| 586,422 | ||||||||||||
|
| |||||||||||
| Brazil—2.4% | ||||||||||||
Banco do Brasil S.A., (converts to FRN on 4/15/24) (c)(e), |
| |||||||||||
6.25%, 10/29/49 | $ | 300 | 274,125 | |||||||||
Minerva Luxembourg S.A., |
| |||||||||||
5.875%, 1/19/28 | 200 | 183,052 | ||||||||||
Petrobras Global Finance BV, |
| |||||||||||
7.375%, 1/17/27 | 300 | 325,350 | ||||||||||
|
| |||||||||||
| 782,527 | ||||||||||||
|
| |||||||||||
| China—6.5% | ||||||||||||
China Evergrande Group, |
| |||||||||||
8.75%, 6/28/25 | 400 | 400,049 | ||||||||||
China Reinsurance Finance Corp., Ltd., |
| |||||||||||
3.375%, 3/9/22 | 400 | 387,636 | ||||||||||
Modern Land China Co., Ltd., |
| |||||||||||
6.875%, 10/20/19 | 200 | 199,859 | ||||||||||
Overseas Chinese Town Asia Holdings Ltd., (converts to FRN on 10/10/20) (c)(e), |
| |||||||||||
4.30%, 12/31/99 | 200 | 195,208 | ||||||||||
Postal Savings Bank of China Co., Ltd., (converts to FRN on 9/27/22) (c)(e), |
| |||||||||||
4.50%, 12/31/99 | 200 | 188,894 | ||||||||||
Rock International Investment, Inc., |
| |||||||||||
6.625%, 3/27/20 | 200 | 183,464 | ||||||||||
Sinopec Group Overseas Development 2015 Ltd., |
| |||||||||||
3.25%, 4/28/25 | 400 | 382,252 | ||||||||||
State Grid Overseas Investment 2016 |
| |||||||||||
2.875%, 5/18/26 | 200 | 186,597 | ||||||||||
|
| |||||||||||
| 2,123,959 | ||||||||||||
|
| |||||||||||
| Congo, The Democratic Republic—0.6% | ||||||||||||
HTA Group Ltd., |
| |||||||||||
9.125%, 3/8/22 | 200 | 213,000 | ||||||||||
|
| |||||||||||
| Costa Rica—0.9% | ||||||||||||
Banco de Costa Rica, |
| |||||||||||
5.25%, 8/12/18 | 300 | 302,610 | ||||||||||
|
| |||||||||||
| Dominican Republic—1.0% | ||||||||||||
AES Andres BV, |
| |||||||||||
7.95%, 5/11/26 | 300 | 321,798 | ||||||||||
|
| |||||||||||
| El Salvador—1.4% | ||||||||||||
AES El Salvador Trust II, |
| |||||||||||
6.75%, 3/28/23 | 250 | 245,000 | ||||||||||
6.75%, 3/28/23 (a)(b) | 210 | 205,800 | ||||||||||
|
| |||||||||||
| 450,800 | ||||||||||||
|
| |||||||||||
| Ghana—0.6% | ||||||||||||
Tullow Oil PLC (a)(b), |
| |||||||||||
7.00%, 3/1/25 | 200 | 200,250 | ||||||||||
|
| |||||||||||
| Hong Kong—2.7% | ||||||||||||
Chinalco Capital Holdings Ltd., |
| |||||||||||
4.00%, 8/25/21 | 400 | 390,591 | ||||||||||
CK Hutchison Capital Securities 17 Ltd., (converts to FRN on 5/12/22) (a)(b)(c)(e), |
| |||||||||||
4.00%, 5/12/22 | 300 | 293,036 | ||||||||||
PCCW Capital No 4 Ltd., |
| |||||||||||
5.75%, 4/17/22 | 200 | 214,056 | ||||||||||
|
| |||||||||||
| 897,683 | ||||||||||||
|
| |||||||||||
| Principal Amount (000s) | Value | |||||||||||
| India—1.3% | ||||||||||||
Export-Import Bank of India, |
| |||||||||||
4.00%, 1/14/23 | $ | 409 | $ | 410,658 | ||||||||
|
| |||||||||||
| Indonesia—1.8% | ||||||||||||
ABM Investama Tbk PT, |
| |||||||||||
7.125%, 8/1/22 | 200 | 199,011 | ||||||||||
Medco Straits Services Pte Ltd., |
| |||||||||||
8.50%, 8/17/22 | 200 | 212,160 | ||||||||||
Minejesa Capital BV, |
| |||||||||||
4.625%, 8/10/30 | 200 | 193,108 | ||||||||||
|
| |||||||||||
| 604,279 | ||||||||||||
|
| |||||||||||
| Jamaica—0.8% | ||||||||||||
Digicel Group Ltd., |
| |||||||||||
8.25%, 9/30/20 | 300 | 259,500 | ||||||||||
|
| |||||||||||
| Kazakhstan—1.6% | ||||||||||||
KazMunayGas National Co. JSC (a)(b), |
| |||||||||||
5.75%, 4/19/47 | 350 | 345,214 | ||||||||||
Nostrum Oil & Gas Finance BV (a)(b), |
| |||||||||||
7.00%, 2/16/25 | 200 | 194,950 | ||||||||||
|
| |||||||||||
| 540,164 | ||||||||||||
|
| |||||||||||
| Korea (Republic of)—0.6% | ||||||||||||
Kyobo Life Insurance Co., Ltd., (converts to FRN on 7/24/22) (a)(b)(e), |
| |||||||||||
3.95%, 7/24/47 | 200 | 198,000 | ||||||||||
|
| |||||||||||
| Malaysia—1.2% | ||||||||||||
Gohl Capital Ltd., |
| |||||||||||
4.25%, 1/24/27 | 400 | 393,181 | ||||||||||
|
| |||||||||||
| Mauritius—0.6% | ||||||||||||
Liquid Telecommunications Financing |
| |||||||||||
8.50%, 7/13/22 | 200 | 210,611 | ||||||||||
|
| |||||||||||
| Mexico—1.7% | ||||||||||||
Mexico City Airport Trust, |
| |||||||||||
4.25%, 10/31/26 | 200 | 192,775 | ||||||||||
Petroleos Mexicanos, |
| |||||||||||
6.75%, 9/21/47 | 350 | 354,377 | ||||||||||
|
| |||||||||||
| 547,152 | ||||||||||||
|
| |||||||||||
| Netherlands—0.8% | ||||||||||||
VEON Holdings BV (a)(b), |
| |||||||||||
3.95%, 6/16/21 | 250 | 246,875 | ||||||||||
|
| |||||||||||
| Nigeria—2.7% | ||||||||||||
First Bank of Nigeria Ltd. via FBN Finance Co. BV, (converts to FRN on |
| |||||||||||
8.00%, 7/23/21 | 251 | 249,583 | ||||||||||
IHS Netherlands Holdco BV, |
| |||||||||||
9.50%, 10/27/21 | 400 | 420,750 | ||||||||||
Zenith Bank PLC (a)(b), |
| |||||||||||
7.375%, 5/30/22 | 200 | 206,818 | ||||||||||
|
| |||||||||||
| 877,151 | ||||||||||||
|
| |||||||||||
| Qatar—0.8% | ||||||||||||
Ras Laffan Liquefied Natural Gas Co., Ltd. III (a)(b), |
| |||||||||||
6.332%, 9/30/27 | 250 | 279,329 | ||||||||||
|
| |||||||||||
| Russian Federation—5.3% | ||||||||||||
Credit Bank of Moscow via CBOM Finance PLC (a)(b), |
| |||||||||||
5.55%, 2/14/23 | 200 | 196,801 | ||||||||||
Gazprom OAO via Gaz Capital S.A. (a)(b), |
| |||||||||||
4.95%, 3/23/27 | 200 | 198,750 | ||||||||||
Global Ports Finance PLC (a)(b), |
| |||||||||||
6.50%, 9/22/23 | 200 | 208,864 | ||||||||||
Lukoil International Finance BV (a)(b), |
| |||||||||||
4.75%, 11/2/26 | 500 | 507,668 | ||||||||||
Novolipetsk Steel via Steel Funding |
| |||||||||||
4.00%, 9/21/24 | 200 | 195,392 | ||||||||||
| 140 | Semiannual Report | | March 31, 2018 | | See accompanying Notes to Financial Statements |
Table of Contents
Schedule of Investments
March 31, 2018 (Unaudited)
| Principal Amount (000s) | Value | |||||||||||
Sberbank of Russia via SB Capital S.A. (a)(b), |
| |||||||||||
5.25%, 5/23/23 | $ | 424 | $ | 431,980 | ||||||||
|
| |||||||||||
| 1,739,455 | ||||||||||||
|
| |||||||||||
| Singapore—1.2% | ||||||||||||
Parkway Pantai Ltd., |
| |||||||||||
4.25%, 12/31/99 | 400 | 388,572 | ||||||||||
|
| |||||||||||
| South Africa—2.5% | ||||||||||||
Gold Fields Orogen Holdings BVI Ltd. (a)(b), |
| |||||||||||
4.875%, 10/7/20 | 400 | 403,800 | ||||||||||
MTN Mauritius Investment Ltd., |
| |||||||||||
6.50%, 10/13/26 | 200 | 211,646 | ||||||||||
Myriad International Holdings BV (a)(b), |
| |||||||||||
4.85%, 7/6/27 | 200 | 204,146 | ||||||||||
|
| |||||||||||
| 819,592 | ||||||||||||
|
| |||||||||||
| Spain—0.8% | ||||||||||||
Ajecorp BV, |
| |||||||||||
6.50%, 5/14/22 | 300 | 273,000 | ||||||||||
|
| |||||||||||
| Turkey—4.9% | ||||||||||||
Akbank Turk AS, (converts to FRN on 4/27/23) (a)(b)(e), |
| |||||||||||
6.797%, 4/27/28 | 200 | 198,443 | ||||||||||
Finansbank AS (a)(b), |
| |||||||||||
4.875%, 5/19/22 | 200 | 193,116 | ||||||||||
Global Liman Isletmeleri, |
| |||||||||||
8.125%, 11/14/21 | 200 | 204,612 | ||||||||||
KOC Holding AS, |
| |||||||||||
5.25%, 3/15/23 | 200 | 202,301 | ||||||||||
Tupras Turkiye Petrol Rafinerileri AS (a)(b), |
| |||||||||||
4.50%, 10/18/24 | 200 | 191,248 | ||||||||||
Yapi ve Kredi Bankasi AS (a)(b), |
| |||||||||||
5.75%, 2/24/22 | 200 | 199,424 | ||||||||||
Yasar Holding AS (a)(b), |
| |||||||||||
8.875%, 5/6/20 | 400 | 405,496 | ||||||||||
|
| |||||||||||
| 1,594,640 | ||||||||||||
|
| |||||||||||
| Ukraine—1.3% | ||||||||||||
MHP S.A. (a)(b), |
| |||||||||||
6.95%, 4/3/26 | 200 | 199,960 | ||||||||||
MHP SE (a)(b), |
| |||||||||||
7.75%, 5/10/24 | 200 | 211,178 | ||||||||||
|
| |||||||||||
| 411,138 | ||||||||||||
|
| |||||||||||
| United Arab Emirates—0.6% | ||||||||||||
ADCB Finance Cayman Ltd. (a)(b), |
| |||||||||||
4.00%, 3/29/23 | 200 | 200,275 | ||||||||||
|
| |||||||||||
| Total Corporate Bonds & Notes (cost—$16,155,817) | 15,872,621 | |||||||||||
|
| |||||||||||
| Sovereign Debt Obligations—42.7% | ||||||||||||
| Angola—1.7% | ||||||||||||
Angolan Government International Bond, |
| |||||||||||
9.50%, 11/12/25 | 300 | 338,996 | ||||||||||
9.50%, 11/12/25 (a)(b) | 200 | 226,848 | ||||||||||
|
| |||||||||||
| 565,844 | ||||||||||||
|
| |||||||||||
| Argentina—9.7% | ||||||||||||
Argentine Republic Government International Bond, |
| |||||||||||
5.25%, 1/15/28 | € | 100 | 120,252 | |||||||||
5.875%, 1/11/28 | $ | 150 | 141,581 | |||||||||
6.875%, 1/11/48 | 300 | 273,760 | ||||||||||
7.125%, 6/28/17 (a)(b) | 500 | 461,339 | ||||||||||
8.28%, 12/31/33 | 561 | 603,577 | ||||||||||
Provincia de Buenos Aires, |
| |||||||||||
4.00%, 5/15/35 (d) | € | 200 | 209,177 | |||||||||
7.875%, 6/15/27 | $ | 200 | 208,330 | |||||||||
BADLAR + 3.830%, 26.742%, 5/31/22 (e) | ARS | 6,000 | 304,542 | |||||||||
| Principal Amount (000s) | Value | |||||||||||
Provincia de la Rioja (a)(b), |
| |||||||||||
9.75%, 2/24/25 | $ | 150 | $ | 159,365 | ||||||||
Provincia de Mendoza Argentina, | ||||||||||||
27.292%, 6/9/21 | ARS | 2,400 | 121,588 | |||||||||
Provincia de Rio Negro (a)(b), | ||||||||||||
7.75%, 12/7/25 | $ | 300 | 283,875 | |||||||||
Provincia del Chubut Argentina, | ||||||||||||
7.75%, 7/26/26 | 300 | 290,977 | ||||||||||
|
| |||||||||||
| 3,178,363 | ||||||||||||
|
| |||||||||||
| Bahrain—0.6% | ||||||||||||
Bahrain Government International Bond (a)(b), |
| |||||||||||
6.75%, 9/20/29 | 200 | 187,173 | ||||||||||
|
| |||||||||||
| Belarus—0.6% | ||||||||||||
Republic of Belarus International Bond (a)(b), |
| |||||||||||
6.20%, 2/28/30 | 200 | 198,195 | ||||||||||
|
| |||||||||||
| Brazil—2.5% | ||||||||||||
Brazil Notas do Tesouro Nacional, |
| |||||||||||
10.00%, 1/1/19, Ser. F | BRL | 1,000 | 310,885 | |||||||||
10.00%, 1/1/21, Ser. F | 1,000 | 318,386 | ||||||||||
Brazilian Government International Bond, |
| |||||||||||
5.625%, 2/21/47 | $ | 200 | 195,044 | |||||||||
|
| |||||||||||
| 824,315 | ||||||||||||
|
| |||||||||||
| Cameroon—0.7% | ||||||||||||
Republic of Cameroon International Bond (a)(b), | ||||||||||||
9.50%, 11/19/25 | 200 | 229,727 | ||||||||||
|
| |||||||||||
| Ecuador—1.8% | ||||||||||||
Ecuador Government International Bond (a)(b), |
| |||||||||||
7.875%, 1/23/28 | 200 | 192,684 | ||||||||||
8.875%, 10/23/27 | 400 | 407,683 | ||||||||||
|
| |||||||||||
| 600,367 | ||||||||||||
|
| |||||||||||
| Egypt—0.6% | ||||||||||||
Egypt Government International Bond (a)(b), |
| |||||||||||
6.125%, 1/31/22 | 200 | 207,304 | ||||||||||
|
| |||||||||||
| Ethiopia—0.9% | ||||||||||||
Ethiopia International Bond, |
| |||||||||||
6.625%, 12/11/24 | 300 | 308,115 | ||||||||||
|
| |||||||||||
| Guatemala—0.5% | ||||||||||||
Guatemala Government Bond (a)(b), |
| |||||||||||
4.50%, 5/3/26 | 150 | 149,109 | ||||||||||
|
| |||||||||||
| Honduras—0.5% | ||||||||||||
Honduras Government International |
| |||||||||||
6.25%, 1/19/27 | 150 | 159,250 | ||||||||||
|
| |||||||||||
| Hungary—1.0% | ||||||||||||
Hungary Government Bond, |
| |||||||||||
1.75%, 10/26/22 | HUF | 78,000 | 314,169 | |||||||||
|
| |||||||||||
| Indonesia—2.0% | ||||||||||||
Indonesia Government International Bond (a)(b), |
| |||||||||||
4.625%, 4/15/43 | $ | 300 | 294,778 | |||||||||
Indonesia Treasury Bond, |
| |||||||||||
7.875%, 4/15/19 | IDR | 5,000,000 | 372,772 | |||||||||
|
| |||||||||||
| 667,550 | ||||||||||||
|
| |||||||||||
| Jordan—1.2% | ||||||||||||
Jordan Government International Bond, |
| |||||||||||
5.75%, 1/31/27 | $ | 400 | 390,222 | |||||||||
|
| |||||||||||
| Kenya—0.6% | ||||||||||||
Kenya Government International Bond (a)(b), |
| |||||||||||
8.25%, 2/28/48 | 200 | 214,366 | ||||||||||
|
| |||||||||||
| Principal Amount (000s) | Value | |||||||||||
| Lebanon—0.6% | ||||||||||||
Lebanon Government International Bond, |
| |||||||||||
6.20%, 2/26/25 | $ | 190 | $ | 181,752 | ||||||||
|
| |||||||||||
| Mexico—1.1% | ||||||||||||
Mexican Bonos, |
| |||||||||||
10.00%, 12/5/24 | MXN | 5,800 | 365,576 | |||||||||
|
| |||||||||||
| Mongolia—0.6% | ||||||||||||
Mongolia Government International |
| |||||||||||
5.625%, 5/1/23 | $ | 200 | 197,761 | |||||||||
|
| |||||||||||
| Nigeria—0.6% | ||||||||||||
Nigeria Government International |
| |||||||||||
7.625%, 11/28/47 | 200 | 207,364 | ||||||||||
|
| |||||||||||
| Panama—0.8% | ||||||||||||
Panama Government International Bond, |
| |||||||||||
3.75%, 3/16/25 | 250 | 252,527 | ||||||||||
|
| |||||||||||
| Poland—1.9% | ||||||||||||
Republic of Poland Government Bond, |
| |||||||||||
1.75%, 7/25/21 | PLN | 1,500 | 436,630 | |||||||||
2.00%, 4/25/21 | 600 | 176,420 | ||||||||||
|
| |||||||||||
| 613,050 | ||||||||||||
|
| |||||||||||
| Russian Federation—1.9% | ||||||||||||
Russian Federation Bond, | ||||||||||||
4.25%, 6/23/27 (a)(b) | $ | 400 | 398,641 | |||||||||
4.875%, 9/16/23 | 200 | 210,682 | ||||||||||
|
| |||||||||||
| 609,323 | ||||||||||||
|
| |||||||||||
| Senegal—0.6% | ||||||||||||
Senegal Government International |
| |||||||||||
6.25%, 5/23/33 | 200 | 197,243 | ||||||||||
|
| |||||||||||
| South Africa—1.9% | ||||||||||||
Republic of South Africa Government Bond, |
| |||||||||||
6.75%, 3/31/21 | ZAR | 7,500 | 629,002 | |||||||||
|
| |||||||||||
| Sri Lanka—1.5% | ||||||||||||
Sri Lanka Government International Bond, | ||||||||||||
5.875%, 7/25/22 | $ | 300 | 305,280 | |||||||||
6.20%, 5/11/27 (a)(b) | 200 | 197,329 | ||||||||||
|
| |||||||||||
| 502,609 | ||||||||||||
|
| |||||||||||
| Supranational—1.2% | ||||||||||||
African Export-Import Bank, |
| |||||||||||
4.125%, 6/20/24 | 200 | 195,174 | ||||||||||
Eastern and Southern African Trade and Development Bank, |
| |||||||||||
5.375%, 3/14/22 | 200 | 204,669 | ||||||||||
|
| |||||||||||
| 399,843 | ||||||||||||
|
| |||||||||||
| Trinidad And Tobago—0.9% | ||||||||||||
Trinidad & Tobago Government International Bond (a)(b), |
| |||||||||||
4.50%, 8/4/26 | 300 | 306,000 | ||||||||||
|
| |||||||||||
| Tunisia—0.6% | ||||||||||||
Banque Centrale de Tunisie International Bond, |
| |||||||||||
5.75%, 1/30/25 | 200 | 190,884 | ||||||||||
|
| |||||||||||
| Turkey—1.4% | ||||||||||||
Turkey Government Bond, |
| |||||||||||
10.70%, 8/17/22 | TRY | 1,200 | 279,750 | |||||||||
Turkey Government International Bond, |
| |||||||||||
5.125%, 2/17/28 | $ | 200 | 189,121 | |||||||||
|
| |||||||||||
| 468,871 | ||||||||||||
|
| |||||||||||
| See accompanying Notes to Financial Statements | | March 31, 2018 | | Semiannual Report | 141 |
Table of Contents
Schedule of Investments
March 31, 2018 (Unaudited)
| Principal Amount (000s) | Value | |||||||||||
| Ukraine—1.7% | ||||||||||||
Ukraine Government International Bond (a)(b), |
| |||||||||||
7.375%, 9/25/32 | $ | 350 | $ | 338,581 | ||||||||
7.75%, 9/1/23 | 200 | 207,718 | ||||||||||
|
| |||||||||||
| 546,299 | ||||||||||||
|
| |||||||||||
| Uruguay—0.5% | ||||||||||||
Uruguay Government International |
| |||||||||||
8.50%, 3/15/28 | UYU | 5,000 | 162,550 | |||||||||
|
| |||||||||||
| Total Sovereign Debt Obligations (cost—$14,011,455) | 14,024,723 | |||||||||||
|
| |||||||||||
| Principal Amount (000s) | Value | |||||||||||
| Repurchase Agreements—7.6% | ||||||||||||
State Street Bank and Trust Co., |
| |||||||||||
(cost—$2,492,000) | $ | 2,492 | $2,492,000 | |||||||||
|
| |||||||||||
| Total Investments (cost—$32,659,272)—98.7% | 32,389,344 | |||||||||||
|
| |||||||||||
| Other assets less liabilities (f)—1.3% | 415,402 | |||||||||||
|
| |||||||||||
| Net Assets—100.0% | $32,804,746 | |||||||||||
|
| |||||||||||
Notes to Schedule of Investments:
(a) Private Placement—Restricted as to resale and may not have a readily available market. Securities with an aggregate value of $13,134,909, representing 40.0% of net assets.
(b) 144A—Exempt from registration under Rule 144A of the Securities Act of 1933. These securities may be resold in transactions exempt from registration, typically only to qualified institutional buyers. Securities with an aggregate value of $13,134,909, representing 40.0% of net assets.
(c) Perpetual maturity. The date shown, if any, is the next call date.
(d) Step Bond—Coupon is a fixed rate for an initial period then resets at a specific date and rate.
(e) Variable or Floating Rate Security—Securities with an interest rate that changes periodically. The interest rate disclosed reflects the rate in effect on March 31, 2018.
(f) Includes net unrealized appreciation (depreciation) of other financial instruments as follows:
| Forward foreign currency contracts outstanding at March 31, 2018: | ||||||||||||||||
| Description | Counterparty | U.S.$ Value on Origination Date | U.S.$ Value March 31, 2018 | Unrealized Appreciation | ||||||||||||
Sold: | ||||||||||||||||
1,138,836 Turkish Lira settling 4/6/18 | JPMorgan Securities PLC | $ | 295,730 | $ | 288,318 | $ | 7,412 | |||||||||
|
| |||||||||||||||
(g) At March 31, 2018, the Fund pledged $405 in cash as collateral for futures contracts. There were no open futures contracts at March 31, 2018, however the Fund had cash pledged as collateral for any transactions in the future.
Glossary:
ARS—Argentine Peso
BADLAR—Buenos Aires Deposits of Large Amount Rate
BRL—Brazilian Real
€—Euro
FRN—Floating Rate Note
HUF—Hungarian Forint
IDR—Indonesian Rupiah
MXN—Mexican Peso
PLN—Polish Zloty
TRY—Turkish Lira
UYU—Uruguayan Peso
ZAR—South African Rand
The industry classification of portfolio holdings and other assets less liabilities shown as a percentage of net assets were as follows:
Sovereign Debt Obligations | 42.7% | |||
Banks | 11.1% | |||
Oil, Gas & Consumable Fuels | 9.7% | |||
Telecommunications | 5.4% | |||
Electric Utilities | 3.5% | |||
Holding Companies-Diversified | 3.3% | |||
Mining | 2.4% | |||
Insurance | 1.8% | |||
Food & Beverage | 1.4% | |||
Commercial Services | 1.3% | |||
Agriculture | 1.3% | |||
Real Estate Management & Development | 1.2% | |||
Real Estate | 1.2% | |||
Lodging | 1.2% | |||
Healthcare-Services | 1.2% | |||
Media | 0.6% | |||
Iron/Steel | 0.6% | |||
Engineering & Construction | 0.6% | |||
Chemicals | 0.6% | |||
Repurchase Agreements | 7.6% | |||
Other assets less liabilities | 1.3% | |||
|
| |||
| 100.0% | ||||
|
|
| 142 | Semiannual Report | | March 31, 2018 | | See accompanying Notes to Financial Statements |
Table of Contents
Schedule of Investments
March 31, 2018 (Unaudited)
AllianzGI Emerging Markets Small-Cap Fund
| Shares | Value | |||||||
| Common Stock—95.3% | ||||||||
| Brazil—2.8% | ||||||||
Anima Holding S.A. | 4,600 | $35,265 | ||||||
Even Construtora e Incorporadora S.A. (d) | 15,200 | 24,079 | ||||||
Fibria Celulose S.A. | 5,800 | 114,245 | ||||||
Via Varejo S.A. UNIT | 15,600 | 143,268 | ||||||
|
| |||||||
| 316,857 | ||||||||
|
| |||||||
| China—10.5% | ||||||||
Beijing Capital Land Ltd., Class H | 270,000 | 166,350 | ||||||
China Lesso Group Holdings Ltd. | 64,000 | 48,926 | ||||||
China Lilang Ltd. | 27,000 | 33,870 | ||||||
China Meidong Auto Holdings Ltd. | 90,000 | 36,668 | ||||||
Consun Pharmaceutical Group Ltd. | 67,000 | 71,743 | ||||||
Datang International Power Generation Co., Ltd., Class H (d) | 194,000 | 58,568 | ||||||
Fang Holdings Ltd. ADR (d) | 8,700 | 44,718 | ||||||
Jiangsu Expressway Co., Ltd., Class H | 60,000 | 85,186 | ||||||
Lee & Man Paper Manufacturing Ltd. | 156,000 | 166,573 | ||||||
Tianjin Development Holdings Ltd. | 86,000 | 38,329 | ||||||
Tianjin Zhongxin Pharmaceutical Group Corp., Ltd. | 26,400 | 24,381 | ||||||
Towngas China Co., Ltd. (d) | 285,000 | 249,139 | ||||||
Xingda International Holdings Ltd. | 67,000 | 22,850 | ||||||
Yuexiu Property Co., Ltd. | 300,000 | 71,347 | ||||||
Yuexiu Real Estate Investment Trust REIT | 77,000 | 53,504 | ||||||
|
| |||||||
| 1,172,152 | ||||||||
|
| |||||||
| Colombia—0.6% | ||||||||
Avianca Holdings S.A. ADR | 8,100 | 68,607 | ||||||
|
| |||||||
| Czech Republic—0.8% | ||||||||
Philip Morris CR AS | 80 | 66,498 | ||||||
Unipetrol AS | 1,340 | 24,536 | ||||||
|
| |||||||
| 91,034 | ||||||||
|
| |||||||
| Greece—3.3% | ||||||||
Hellenic Petroleum S.A. | 2,580 | 24,961 | ||||||
Intralot SA-Integrated Lottery Systems & Services (d) | 43,694 | 62,046 | ||||||
Motor Oil Hellas Corinth Refineries S.A. | 7,849 | 177,263 | ||||||
Mytilineos Holdings S.A. (d) | 1,970 | 21,120 | ||||||
OPAP S.A. | 7,302 | 83,691 | ||||||
|
| |||||||
| 369,081 | ||||||||
|
| |||||||
| Hong Kong—6.5% | ||||||||
Hopewell Holdings Ltd. | 8,000 | 30,815 | ||||||
Johnson Electric Holdings Ltd. | 57,500 | 216,374 | ||||||
K Wah International Holdings Ltd. | 246,000 | 164,547 | ||||||
Luk Fook Holdings International Ltd. | 45,000 | 164,254 | ||||||
Xinyi Glass Holdings Ltd. | 96,000 | 146,127 | ||||||
|
| |||||||
| 722,117 | ||||||||
|
| |||||||
| India—11.0% | ||||||||
Bajaj Holdings & Investment Ltd. | 781 | 32,032 | ||||||
| Shares | Value | |||||||
HT Media Ltd. (d) | 16,445 | $ | 21,296 | |||||
Jindal Saw Ltd. (d) | 11,265 | 20,695 | ||||||
Jubilant Foodworks Ltd. | 3,373 | 121,172 | ||||||
Kalyani Steels Ltd. | 4,773 | 21,993 | ||||||
Mphasis Ltd. | 17,133 | 219,798 | ||||||
NIIT Technologies Ltd. (d) | 6,952 | 92,776 | ||||||
Phillips Carbon Black Ltd. (d) | 12,167 | 204,585 | ||||||
SJVN Ltd. | 54,703 | 27,900 | ||||||
Tata Sponge Iron Ltd. (d) | 6,589 | 93,516 | ||||||
Transport Corp. of India Ltd. | 5,628 | 23,062 | ||||||
Uflex Ltd. (d) | 11,966 | 63,118 | ||||||
WNS Holdings Ltd. ADR (d) | 6,200 | 281,046 | ||||||
|
| |||||||
| 1,222,989 | ||||||||
|
| |||||||
| Indonesia—1.4% | ||||||||
Adaro Energy Tbk PT | 359,900 | 56,076 | ||||||
Indo Tambangraya Megah Tbk PT | 45,500 | 94,430 | ||||||
|
| |||||||
| 150,506 | ||||||||
|
| |||||||
| Korea (Republic of)—17.3% | ||||||||
Caregen Co., Ltd. | 394 | 33,255 | ||||||
DGB Financial Group, Inc. | 3,268 | 35,978 | ||||||
Dong-A ST Co., Ltd. | 1,042 | 111,825 | ||||||
Dongwon Development Co., Ltd. | 19,503 | 86,009 | ||||||
F&F Co., Ltd. | 3,294 | 125,603 | ||||||
Fila Korea Ltd. | 324 | 32,880 | ||||||
Hana Tour Service, Inc. | 445 | 50,327 | ||||||
Hotel Shilla Co., Ltd. | 290 | 25,256 | ||||||
Huvis Corp. | 7,098 | 72,943 | ||||||
ICD Co., Ltd. | 5,218 | 47,781 | ||||||
Jeju Air Co., Ltd. | 2,489 | 105,040 | ||||||
Korea District Heating Corp. | 344 | 26,887 | ||||||
LF Corp. | 5,485 | 136,778 | ||||||
LOTTE Fine Chemical Co., Ltd. | 3,541 | 237,858 | ||||||
LOTTE Himart Co., Ltd. | 3,856 | 266,125 | ||||||
Macquarie Korea Infrastructure Fund | 12,796 | 105,523 | ||||||
Meritz Fire & Marine Insurance Co., Ltd. | 3,540 | 70,521 | ||||||
OCI Co., Ltd. | 455 | 68,093 | ||||||
Samchully Co., Ltd. | 403 | 42,534 | ||||||
Seah Besteel Corp. | 5,866 | 146,012 | ||||||
Silicon Works Co., Ltd. | 731 | 26,308 | ||||||
Unid Co., Ltd. | 955 | 45,330 | ||||||
WONIK IPS Co., Ltd. | 858 | 26,716 | ||||||
|
| |||||||
| 1,925,582 | ||||||||
|
| |||||||
| Malaysia—5.9% | ||||||||
AirAsia Group Bhd. | 206,900 | 212,681 | ||||||
Hai-O Enterprise Bhd. | 16,200 | 21,304 | ||||||
Hong Leong Financial Group Bhd. | 5,800 | 28,861 | ||||||
Malaysia Airports Holdings Bhd. | 41,000 | 94,012 | ||||||
Padini Holdings Bhd. | 21,600 | 24,292 | ||||||
Supermax Corp. Bhd. | 39,000 | 26,009 | ||||||
Top Glove Corp. Bhd. | 101,400 | 256,151 | ||||||
|
| |||||||
| 663,310 | ||||||||
|
| |||||||
| Mexico—0.5% | ||||||||
Qualitas Controladora SAB De C.V. | 19,900 | 55,278 | ||||||
|
| |||||||
| Peru—0.2% | ||||||||
Alicorp SAA | 7,300 | 25,457 | ||||||
|
| |||||||
| Philippines—0.2% | ||||||||
Cebu Air, Inc. | 12,280 | 22,264 | ||||||
|
| |||||||
| Poland—2.0% | ||||||||
Energa S.A. | 67,646 | 190,735 | ||||||
| Shares | Value | |||||||
Tauron Polska Energia S.A. (d) | 47,051 | $ | 33,426 | |||||
|
| |||||||
| 224,161 | ||||||||
|
| |||||||
| Russian Federation—0.6% | ||||||||
PIK Group PJSC (b)(c) | 7,478 | 41,167 | ||||||
Unipro PJSC (b)(c) | 502,000 | 24,799 | ||||||
|
| |||||||
| 65,966 | ||||||||
|
| |||||||
| Singapore—0.4% | ||||||||
Valuetronics Holdings Ltd. | 50,500 | 41,895 | ||||||
|
| |||||||
| South Africa—4.6% | ||||||||
AECI Ltd. | 9,421 | 91,912 | ||||||
Astral Foods Ltd. | 11,999 | 317,055 | ||||||
Lewis Group Ltd. | 15,513 | 55,297 | ||||||
Omnia Holdings Ltd. | 4,034 | 50,796 | ||||||
|
| |||||||
| 515,060 | ||||||||
|
| |||||||
| Taiwan—15.5% | ||||||||
China Airlines Ltd. (d) | 287,000 | 105,576 | ||||||
Chipbond Technology Corp. | 132,000 | 313,891 | ||||||
Darfon Electronics Corp. | 22,000 | 23,489 | ||||||
Elan Microelectronics Corp. | 33,000 | 50,744 | ||||||
Epistar Corp. (d) | 40,000 | 58,126 | ||||||
Farglory Land Development Co., Ltd. | 18,000 | 20,339 | ||||||
Feng Hsin Iron & Steel Co. | 11,000 | 22,206 | ||||||
Formosa Advanced Technologies Co., Ltd. | 31,000 | 35,353 | ||||||
Gigabyte Technology Co., Ltd. | 35,000 | 82,661 | ||||||
Grand Pacific Petrochemical | 280,000 | 295,873 | ||||||
Greatek Electronics, Inc. | 24,000 | 45,990 | ||||||
Huaku Development Co., Ltd. | 22,000 | 54,571 | ||||||
ITE Technology, Inc. | 41,000 | 54,397 | ||||||
Radiant Opto-Electronics Corp. | 31,000 | 76,891 | ||||||
Sampo Corp. | 50,000 | 24,034 | ||||||
Shinkong Synthetic Fibers Corp. | 74,000 | 24,570 | ||||||
Sinmag Equipment Corp. | 4,000 | 22,430 | ||||||
Syncmold Enterprise Corp. | 59,000 | 138,442 | ||||||
Taishin Financial Holding Co., Ltd. | 257,000 | 126,929 | ||||||
Transcend Information, Inc. | 25,000 | 74,092 | ||||||
Tripod Technology Corp. | 9,000 | 30,526 | ||||||
United Integrated Services Co., Ltd. | 24,000 | 54,176 | ||||||
|
| |||||||
| 1,735,306 | ||||||||
|
| |||||||
| Thailand—6.6% | ||||||||
Bangchak Corp., PCL NVDR | 116,900 | 137,864 | ||||||
Bangkok Ranch PCL (b)(c) | 307,600 | 69,953 | ||||||
Home Product Center PCL (b)(c) | 420,600 | 187,424 | ||||||
KGI Securities Thailand PCL (b)(c) | 281,700 | 42,764 | ||||||
Thai Oil PCL NVDR | 13,700 | 39,933 | ||||||
Thanachart Capital PCL (b)(c) | 139,100 | 231,981 | ||||||
Thoresen Thai Agencies PCL (b)(c) | 82,800 | 21,240 | ||||||
|
| |||||||
| 731,159 | ||||||||
|
| |||||||
| Turkey—4.3% | ||||||||
Aygaz AS | 5,987 | 22,125 | ||||||
Is Gayrimenkul Yatirim Ortakligi AS REIT | 337,940 | 110,669 | ||||||
Trakya Cam Sanayii AS | 204,423 | 265,369 | ||||||
Turk Hava Yollari AO (d) | 16,740 | 82,785 | ||||||
|
| |||||||
| 480,948 | ||||||||
|
| |||||||
| See accompanying Notes to Financial Statements | | March 31, 2018 | | Semiannual Report | 143 |
Table of Contents
Schedule of Investments
March 31, 2018 (Unaudited)
| Shares | Value | |||||||
| United Arab Emirates—0.3% | ||||||||
RAK Properties PJSC | 197,158 | $ | 36,500 | |||||
|
| |||||||
| Total Common Stock (cost—$9,196,933) | 10,636,229 | |||||||
|
| |||||||
| Preferred Stock—3.2% | ||||||||
| Brazil—0.9% | ||||||||
Cia Ferro Ligas da Bahia—FERBASA | 15,600 | 100,221 | ||||||
|
| |||||||
| Russian Federation—2.3% | ||||||||
Surgutneftegas OJSC (b)(c)(d) | 504,659 | 262,423 | ||||||
|
| |||||||
| Total Preferred Stock (cost—$322,158) | 362,644 | |||||||
|
| |||||||
| Total Investments (cost—$9,519,091) (a)—98.5% | 10,998,873 | |||||||
|
| |||||||
| Other assets less liabilities—1.5% | 162,650 | |||||||
|
| |||||||
| Net Assets—100.0% | $11,161,523 | |||||||
|
| |||||||
Notes to Schedule of Investments:
(a) Securities with an aggregate value of $8,361,940, representing 74.9% of net assets, were valued utilizing modeling tools provided by a third-party vendor. See Note 1(a) and Note 1(b) in the Notes to Financial Statements.
(b) Fair-Valued—Securities with an aggregate value of $881,751, representing 7.9% of net assets. See Note 1(a) and Note 1(b) in the Notes to Financial Statements.
(c) Level 3 security. See Note 1(a) and Note 1(b) in the Notes to Financial Statements.
(d) Non-income producing.
Glossary:
ADR—American Depositary Receipt
NVDR—Non-Voting Depository Receipt
REIT—Real Estate Investment Trust
UNIT—More than one class of securities traded together.
The industry classification of portfolio holdings and other assets less liabilities shown as a percentage of net assets were as follows:
|
| |||
Chemicals | 9.4% | |||
Specialty Retail | 8.1% | |||
Semiconductors & Semiconductor Equipment | 7.3% | |||
Oil, Gas & Consumable Fuels | 7.1% | |||
Real Estate Management & Development | 5.4% | |||
Airlines | 5.3% | |||
IT Services | 4.5% | |||
Banks | 3.8% | |||
Food Products | 3.7% | |||
Textiles, Apparel & Luxury Goods | 3.6% | |||
Gas Utilities | 3.1% | |||
Hotels, Restaurants & Leisure | 2.8% | |||
Building Products | 2.8% | |||
Metals & Mining | 2.7% | |||
Healthcare Equipment & Supplies | 2.5% | |||
Paper & Forest Products | 2.5% | |||
Electric Utilities | 2.3% | |||
Pharmaceuticals | 2.2% | |||
Electrical Equipment | 1.9% | |||
Transportation Infrastructure | 1.6% | |||
Auto Components | 1.5% | |||
Equity Real Estate Investment Trusts (REITs) | 1.5% | |||
Machinery | 1.4% | |||
Capital Markets | 1.3% | |||
Insurance | 1.1% | |||
Technology Hardware, Storage & Peripherals | 1.0% | |||
Iron/Steel | 0.9% | |||
Software | 0.8% | |||
Household Durables | 0.8% | |||
Independent Power Producers & Energy Traders | 0.7% | |||
Electronic Equipment, Instruments & Components | 0.6% | |||
Tobacco | 0.6% | |||
Containers & Packaging | 0.6% | |||
Construction & Engineering | 0.5% | |||
Industrial Conglomerates | 0.5% | |||
Internet Software & Services | 0.4% | |||
Multi-Utilities | 0.3% | |||
Diversified Consumer Services | 0.3% | |||
Diversified Financial Services | 0.3% | |||
Air Freight & Logistics | 0.2% | |||
Internet & Catalog Retail | 0.2% | |||
Media | 0.2% | |||
Marine | 0.2% | |||
Other assets less liabilities | 1.5% | |||
|
| |||
| 100.0% | ||||
|
| |||
AllianzGI Europe Equity Dividend Fund
| Shares | Value | |||||||
| Common Stock—96.2% | ||||||||
| Finland—2.0% | ||||||||
Fortum Oyj | 7,870 | $169,071 | ||||||
|
| |||||||
| France—17.1% | ||||||||
AXA S.A. | 6,830 | 181,562 | ||||||
Coface S.A. | 5,720 | 65,392 | ||||||
Credit Agricole S.A. | 7,560 | 123,266 | ||||||
Klepierre S.A. REIT | 3,535 | 142,486 | ||||||
SCOR SE | 7,875 | 321,498 | ||||||
SES S.A. | 10,724 | 145,160 | ||||||
Total S.A. | 4,790 | 274,561 | ||||||
Unibail-Rodamco SE REIT | 742 | 169,490 | ||||||
|
| |||||||
| 1,423,415 | ||||||||
|
| |||||||
| Germany—10.2% | ||||||||
Daimler AG | 2,650 | 225,780 | ||||||
Drillisch AG | 950 | 64,099 | ||||||
Evonik Industries AG | 1,170 | 41,258 | ||||||
Muenchener Rueckversicherungs-Gesellschaft AG in Muenchen | 2,000 | 465,082 | ||||||
ProSiebenSat.1 Media SE | 1,420 | 49,184 | ||||||
|
| |||||||
| 845,403 | ||||||||
|
| |||||||
| Italy—6.1% | ||||||||
Atlantia SpA | 520 | 16,113 | ||||||
Enel SpA | 43,940 | 268,878 | ||||||
Eni SpA | 12,570 | 221,423 | ||||||
|
| |||||||
| 506,414 | ||||||||
|
| |||||||
| Netherlands—9.9% | ||||||||
ABN AMRO Group NV (a) | 5,845 | 176,246 | ||||||
ING Groep NV | 16,010 | 270,172 | ||||||
Koninklijke KPN NV | 98,730 | 296,880 | ||||||
PostNL NV | 22,390 | 83,900 | ||||||
|
| |||||||
| 827,198 | ||||||||
|
| |||||||
| Norway—6.1% | ||||||||
Statoil ASA | 8,210 | 194,314 | ||||||
Telenor ASA | 13,980 | 317,921 | ||||||
|
| |||||||
| 512,235 | ||||||||
|
| |||||||
| Spain—10.2% | ||||||||
Banco Santander S.A. | 20,890 | 136,733 | ||||||
Cia de Distribucion Integral Logista Holdings S.A. | 12,050 | 255,452 | ||||||
Ferrovial S.A. | 11,655 | 243,679 | ||||||
Iberdrola S.A. | 28,572 | 210,101 | ||||||
|
| |||||||
| 845,965 | ||||||||
|
| |||||||
| Switzerland—2.3% | ||||||||
Swiss Re AG | 1,843 | 188,109 | ||||||
|
| |||||||
| United Kingdom—32.3% | ||||||||
Ashmore Group PLC | 22,488 | 120,410 | ||||||
BHP Billiton PLC | 3,550 | 70,159 | ||||||
BP PLC | 51,780 | 349,261 | ||||||
British American Tobacco PLC | 1,480 | 85,554 | ||||||
BT Group PLC | 74,230 | 236,928 | ||||||
GlaxoSmithKline PLC | 11,660 | 226,449 | ||||||
IG Group Holdings PLC | 15,792 | 176,865 | ||||||
Imperial Brands PLC | 6,120 | 208,383 | ||||||
ITV PLC | 28,740 | 58,178 | ||||||
Lloyds Banking Group PLC | 133,870 | 121,772 | ||||||
Next PLC | 2,520 | 168,460 | ||||||
Royal Dutch Shell PLC, Class A | 12,910 | 411,276 | ||||||
Tate & Lyle PLC | 9,050 | 69,121 | ||||||
TUI AG | 10,960 | 234,949 | ||||||
Vodafone Group PLC | 56,010 | 153,245 | ||||||
|
| |||||||
| 2,691,010 | ||||||||
|
| |||||||
| Total Common Stock (cost—$7,523,672) | 8,008,820 | |||||||
|
| |||||||
| 144 | Semiannual Report | | March 31, 2018 | | See accompanying Notes to Financial Statements |
Table of Contents
Schedule of Investments
March 31, 2018 (Unaudited)
| Principal Amount (000s) | Value | |||||||
| Repurchase Agreements—3.9% | ||||||||
State Street Bank and Trust Co., dated 3/29/18, 0.28%, due 4/2/18, proceeds $327,010; collateralized by U.S. Treasury Notes, 2.00%, due 8/15/25, valued at $333,606 including accrued interest |
| |||||||
(cost—$327,000) | $327 | $ | 327,000 | |||||
|
| |||||||
| Total Investments (cost—$7,850,672) (b)—100.1% | 8,335,820 | |||||||
|
| |||||||
| Liabilities in excess of other assets (c)—(0.1)% | (7,332 | ) | ||||||
|
| |||||||
| Net Assets—100.0% | $8,328,488 | |||||||
|
| |||||||
Notes to Schedule of Investments:
(a) 144A—Exempt from registration under Rule 144A of the Securities Act of 1933. These securities may be resold in transactions exempt from registration, typically only to qualified institutional buyers. Security with a value of $176,246, representing 2.1% of net assets.
(b) Securities with an aggregate value of $8,008,820, representing 96.2% of net assets, were valued utilizing modeling tools provided by a third-party vendor. See Note 1(a) and Note 1(b) in the Notes to Financial Statements.
(c) Includes net unrealized appreciation (depreciation) of other financial instruments as follows:
| Forward foreign currency contracts outstanding at March 31, 2018: | ||||||||||||||||
| Description | Counterparty | U.S.$ Value on Origination Date | U.S.$ Value March 31, 2018 | Unrealized Depreciation | ||||||||||||
Sold: | ||||||||||||||||
8,901 British Pound settling 4/3/18 | | Income Repatriation Boston IBS | | $ | 12,483 | $ | 12,489 | $ | (6 | ) | ||||||
|
| |||||||||||||||
Glossary:
REIT—Real Estate Investment Trust
The industry classification of portfolio holdings and liabilities in excess of other assets shown as a percentage of net assets were as follows:
Oil, Gas & Consumable Fuels | 17.4% | |||
Insurance | 14.7% | |||
Diversified Telecommunication Services | 10.2% | |||
Banks | 10.0% | |||
Electric Utilities | 7.8% | |||
Air Freight & Logistics | 4.1% | |||
Equity Real Estate Investment Trusts (REITs) | 3.8% | |||
Capital Markets | 3.6% | |||
Tobacco | 3.5% | |||
Media | 3.0% | |||
Construction & Engineering | 2.9% | |||
Hotels, Restaurants & Leisure | 2.8% | |||
Pharmaceuticals | 2.7% | |||
Automobiles | 2.7% | |||
Wireless Telecommunication Services | 2.6% | |||
Multi-Line Retail | 2.0% | |||
Metals & Mining | 0.9% | |||
Food Products | 0.8% | |||
Chemicals | 0.5% | |||
Transportation Infrastructure | 0.2% | |||
Repurchase Agreements | 3.9% | |||
Liabilities in excess of other assets | (0.1)% | |||
|
| |||
| 100.0% | ||||
|
|
| See accompanying Notes to Financial Statements | | March 31, 2018 | | Semiannual Report | 145 |
Table of Contents
Schedule of Investments
March 31, 2018 (Unaudited)
AllianzGI Global Dynamic Allocation Fund
| Shares | Value | |||||||
| Common Stock—58.0% | ||||||||
| Australia—0.4% | ||||||||
Abacus Property Group REIT | 24,925 | $66,768 | ||||||
BlueScope Steel Ltd. | 11,262 | 132,499 | ||||||
Breville Group Ltd. | 1,323 | 11,921 | ||||||
Brickworks Ltd. | 2,992 | 35,961 | ||||||
Cochlear Ltd. | 621 | 87,218 | ||||||
Elders Ltd. | 7,988 | 45,938 | ||||||
Metcash Ltd. | 47,137 | 114,066 | ||||||
Qantas Airways Ltd. | 29,605 | 133,564 | ||||||
Regis Resources Ltd. | 15,795 | 55,387 | ||||||
Rio Tinto Ltd. | 2,313 | 131,037 | ||||||
St. Barbara Ltd. | 16,786 | 51,775 | ||||||
Stockland REIT | 800 | 2,482 | ||||||
Vicinity Centres REIT | 1,738 | 3,230 | ||||||
Wesfarmers Ltd. | 3,708 | 118,822 | ||||||
|
| |||||||
| 990,668 | ||||||||
|
| |||||||
| Austria—0.3% | ||||||||
Austria Technologie & Systemtechnik AG | 1,363 | 37,010 | ||||||
Erste Group Bank AG | 7,041 | 353,974 | ||||||
EVN AG | 4,031 | 78,665 | ||||||
Flughafen Wien AG | 322 | 13,213 | ||||||
OMV AG | 2,555 | 149,025 | ||||||
POLYTEC Holding AG | 2,054 | 39,569 | ||||||
Raiffeisen Bank International AG (g) | 2,232 | 86,936 | ||||||
S IMMO AG | 2,128 | 42,156 | ||||||
Telekom Austria AG (g) | 3,344 | 31,901 | ||||||
|
| |||||||
| 832,449 | ||||||||
|
| |||||||
| Belgium—0.0% | ||||||||
Elia System Operator S.A. | 629 | 39,325 | ||||||
Recticel S.A. | 3,249 | 40,824 | ||||||
|
| |||||||
| 80,149 | ||||||||
|
| |||||||
| Bermuda—0.0% | ||||||||
Triton International Ltd. | 1,282 | 39,229 | ||||||
|
| |||||||
| Brazil—0.3% | ||||||||
Cia de Saneamento Basico do Estado de Sao Paulo | 6,700 | 71,029 | ||||||
Fibria Celulose S.A. | 7,700 | 151,670 | ||||||
MRV Engenharia e Participacoes S.A. | 15,600 | 76,784 | ||||||
Qualicorp S.A. | 10,500 | 70,860 | ||||||
Smiles Fidelidade S.A. | 1,200 | 25,262 | ||||||
Suzano Papel e Celulose S.A. | 14,900 | 150,559 | ||||||
Vale S.A. | 20,745 | 265,231 | ||||||
|
| |||||||
| 811,395 | ||||||||
|
| |||||||
| Canada—2.4% | ||||||||
Aecon Group, Inc. | 489 | 6,969 | ||||||
AGF Management Ltd., Class B | 7,791 | 39,670 | ||||||
Agnico Eagle Mines Ltd. | 3,654 | 153,721 | ||||||
Artis Real Estate Investment Trust REIT | 523 | 5,517 | ||||||
BCE, Inc. | 4,005 | 172,342 | ||||||
Bonavista Energy Corp. | 3,032 | 2,777 | ||||||
BRP, Inc. | 3,750 | 144,021 | ||||||
Canadian Apartment Properties REIT | 2,410 | 69,493 | ||||||
Canadian Imperial Bank of Commerce | 5,011 | 442,311 | ||||||
Canadian Natural Resources Ltd. | 7,645 | 240,325 | ||||||
Canadian Tire Corp., Ltd., Class A | 1,319 | 173,430 | ||||||
Canfor Pulp Products, Inc. | 534 | 6,876 | ||||||
Cascades, Inc. | 2,172 | 22,473 | ||||||
| Shares | Value | |||||||
Chorus Aviation, Inc. | 4,609 | $ | 29,693 | |||||
Cogeco Communications, Inc. | 3,365 | 184,241 | ||||||
Colliers International Group, Inc. | 986 | 68,450 | ||||||
Constellation Software, Inc. | 72 | 48,852 | ||||||
Corus Entertainment, Inc., Class B | 13,997 | 65,729 | ||||||
Crescent Point Energy Corp. | 346 | 2,353 | ||||||
Dollarama, Inc. | 806 | 97,958 | ||||||
Dream Global Real Estate Investment Trust REIT | 10,906 | 116,395 | ||||||
Dream Industrial Real Estate Investment Trust REIT | 5,600 | 41,424 | ||||||
ECN Capital Corp. | 1,240 | 3,311 | ||||||
Exchange Income Corp. | 3,541 | 84,818 | ||||||
Fairfax Financial Holdings Ltd. | 357 | 180,965 | ||||||
Fortis, Inc. | 3,373 | 113,860 | ||||||
Genworth MI Canada, Inc. | 2,539 | 80,800 | ||||||
George Weston Ltd. | 3,766 | 303,186 | ||||||
Husky Energy, Inc. (g) | 5,892 | 84,332 | ||||||
Industrial Alliance Insurance & Financial Services, Inc. | 3,160 | 129,996 | ||||||
Intact Financial Corp. | 483 | 36,294 | ||||||
Killam Apartment REIT | 7,135 | 76,869 | ||||||
Laurentian Bank of Canada | 3,533 | 129,874 | ||||||
Linamar Corp. | 2,171 | 118,597 | ||||||
Loblaw Cos., Ltd. | 5,064 | 255,843 | ||||||
Magna International, Inc. | 1,835 | 103,362 | ||||||
Manulife Financial Corp. | 12,912 | 239,729 | ||||||
Martinrea International, Inc. | 7,956 | 94,050 | ||||||
Methanex Corp. | 1,380 | 83,602 | ||||||
National Bank of Canada | 3,759 | 176,928 | ||||||
Northview Apartment Real Estate Investment Trust REIT | 3,393 | 67,947 | ||||||
NorthWest Healthcare Properties Real Estate Investment Trust REIT | 9,038 | 79,061 | ||||||
Power Corp. of Canada | 7,169 | 163,596 | ||||||
Pure Industrial Real Estate Trust REIT | 23,451 | 146,347 | ||||||
Raging River Exploration, Inc. (g) | 990 | 4,795 | ||||||
Royal Bank of Canada | 5,493 | 424,313 | ||||||
Saputo, Inc. | 2,237 | 71,797 | ||||||
Teck Resources Ltd., Class B | 4,348 | 111,978 | ||||||
TMX Group Ltd. | 4,724 | 274,086 | ||||||
Toronto-Dominion Bank | 6,382 | 362,159 | ||||||
TransCanada Corp. | 5,006 | 207,024 | ||||||
Transcontinental, Inc., Class A | 13,487 | 266,422 | ||||||
Valener, Inc. | 739 | 11,598 | ||||||
West Fraser Timber Co., Ltd. | 1,158 | 76,948 | ||||||
|
| |||||||
| 6,699,507 | ||||||||
|
| |||||||
| China—2.7% | ||||||||
AAC Technologies Holdings, Inc. | 3,400 | 62,304 | ||||||
Agile Group Holdings Ltd. | 35,091 | 73,179 | ||||||
Agricultural Bank of China Ltd., Class H | 203,000 | 116,571 | ||||||
Alibaba Group Holding Ltd. ADR (g) | 4,077 | 748,293 | ||||||
Anhui Conch Cement Co., Ltd., Class H | 15,500 | 85,296 | ||||||
Bank of China Ltd., Class H | 606,000 | 331,033 | ||||||
Bank of Communications Co., Ltd., Class H | 117,039 | 92,530 | ||||||
| Shares | Value | |||||||
Beijing Enterprises Holdings Ltd. | 23,500 | $ | 123,753 | |||||
BYD Electronic International Co., Ltd. | 41,818 | 79,320 | ||||||
China CITIC Bank Corp., Ltd., Class H | 218,000 | 150,415 | ||||||
China Construction Bank Corp., Class H | 569,064 | 594,390 | ||||||
China Dongxiang Group Co., Ltd. | 43,117 | 7,538 | ||||||
China Everbright Greentech Ltd. (b)(g) | 35,000 | 35,192 | ||||||
China Evergrande Group (g) | 15,483 | 49,489 | ||||||
China Huarong Asset Management Co., Ltd., Class H (b) | 804,000 | 340,808 | ||||||
China Lumena New Materials | 1,772 | 34 | ||||||
China Mobile Ltd. | 27,500 | 252,048 | ||||||
China Petroleum & Chemical Corp., Class H | 223,800 | 198,529 | ||||||
China Southern Airlines Co., Ltd., Class H | 57,154 | 59,730 | ||||||
China Water Affairs Group Ltd. | 64,000 | 65,488 | ||||||
China Yuchai International Ltd. | 3,015 | 63,828 | ||||||
China Zhongwang Holdings Ltd. | 114,800 | 68,546 | ||||||
Chongqing Rural Commercial Bank Co., Ltd., Class H | 6,488 | 5,015 | ||||||
CITIC Ltd. | 64,000 | 90,122 | ||||||
Country Garden Holdings Co., Ltd. | 45,000 | 93,951 | ||||||
CSPC Pharmaceutical Group Ltd. | 32,000 | �� | 86,256 | |||||
EVA Precision Industrial Holdings Ltd. | 20,236 | 3,120 | ||||||
Fosun International Ltd. | 30,000 | 65,822 | ||||||
Guangzhou Automobile Group Co., Ltd., Class H | 63,435 | 117,821 | ||||||
Guangzhou R&F Properties Co., Ltd., Class H | 2,881 | 7,286 | ||||||
Haier Electronics Group Co., Ltd. | 42,000 | 150,577 | ||||||
Hopewell Highway Infrastructure Ltd. | 21,000 | 12,829 | ||||||
Hua Hong Semiconductor Ltd. (b) | 51,000 | 102,138 | ||||||
Industrial & Commercial Bank of China Ltd., Class H | 450,000 | 392,169 | ||||||
Jiangsu Expressway Co., Ltd., Class H | 55,189 | 78,356 | ||||||
Jiayuan International Group Ltd. (g) | 20,000 | 28,899 | ||||||
Ju Teng International Holdings Ltd. | 4,744 | 1,174 | ||||||
Kingboard Chemical Holdings Ltd. | 14,000 | 64,725 | ||||||
Lee & Man Paper Manufacturing Ltd. | 48,517 | 51,805 | ||||||
Longfor Properties Co., Ltd. | 14,845 | 45,772 | ||||||
Nexteer Automotive Group Ltd. | 39,000 | 59,615 | ||||||
Orient Securities Co., Ltd., Class H (b) | 21,600 | 20,224 | ||||||
Ping An Insurance Group Co. of China Ltd., Class H | 27,000 | 278,388 | ||||||
| 146 | Semiannual Report | | March 31, 2018 | | See accompanying Notes to Financial Statements |
Table of Contents
Schedule of Investments
March 31, 2018 (Unaudited)
| Shares | Value | |||||||
Postal Savings Bank of China Co., Ltd., Class H (b) | 100,000 | $ | 63,425 | |||||
Shanghai Industrial Holdings Ltd. | 43,000 | 112,841 | ||||||
Shenzhen Expressway Co., Ltd., Class H | 64,274 | 65,647 | ||||||
Sihuan Pharmaceutical Holdings Group Ltd. | 185,000 | 55,321 | ||||||
Sinopec Shanghai Petrochemical Co., Ltd., Class H | 91,380 | 55,838 | ||||||
Sinopharm Group Co., Ltd., Class H | 15,921 | 79,725 | ||||||
Sinotrans Ltd., Class H | 45,000 | 24,884 | ||||||
Sinotruk Hong Kong Ltd. | 33,500 | 40,005 | ||||||
Tencent Holdings Ltd. | 24,681 | 1,324,865 | ||||||
Tianneng Power International Ltd. | 78,342 | 93,334 | ||||||
Tong Ren Tang Technologies Co., Ltd., Class H | 2,726 | 4,555 | ||||||
Want Want China Holdings Ltd. | 97,000 | 78,038 | ||||||
Weichai Power Co., Ltd., Class H | 67,000 | 75,773 | ||||||
XTEP International Holdings Ltd. | 7,651 | 4,266 | ||||||
Yum China Holdings, Inc. | 2,047 | 84,950 | ||||||
Yuzhou Properties Co., Ltd. | 133,088 | 91,413 | ||||||
YY, Inc. ADR (g) | 657 | 69,116 | ||||||
|
| |||||||
| 7,678,374 | ||||||||
|
| |||||||
| Colombia—0.1% | ||||||||
Bancolombia S.A. | 12,731 | 137,696 | ||||||
Corp. Financiera Colombiana S.A. | 346 | 2,947 | ||||||
|
| |||||||
| 140,643 | ||||||||
|
| |||||||
| Czech Republic—0.0% | ||||||||
CEZ AS | 1,419 | 35,331 | ||||||
O2 Czech Republic AS | 1,665 | 22,986 | ||||||
Philip Morris CR AS | 93 | 77,304 | ||||||
|
| |||||||
| 135,621 | ||||||||
|
| |||||||
| Denmark—0.1% | ||||||||
Solar A/S, Class B | 111 | 7,310 | ||||||
Spar Nord Bank A/S | 377 | 4,496 | ||||||
Topdanmark A/S (g) | 1,203 | 56,803 | ||||||
William Demant Holding A/S (g) | 3,028 | 112,794 | ||||||
|
| |||||||
| 181,403 | ||||||||
|
| |||||||
| Finland—0.2% | ||||||||
Cramo Oyj | 1,938 | 40,430 | ||||||
Elisa Oyj | 2,053 | 92,856 | ||||||
Finnair Oyj | 2,810 | 39,135 | ||||||
Metsa Board Oyj | 429 | 4,307 | ||||||
Neste Oyj | 1,560 | 108,584 | ||||||
Oriola Oyj, Class B | 700 | 2,120 | ||||||
Stora Enso Oyj, Class R | 8,051 | 148,029 | ||||||
UPM-Kymmene Oyj | 5,669 | 210,171 | ||||||
|
| |||||||
| 645,632 | ||||||||
|
| |||||||
| France—2.3% | ||||||||
Air France-KLM (g) | 6,444 | 71,907 | ||||||
APERAM S.A. | 51 | 2,442 | ||||||
ArcelorMittal (g) | 6,246 | 198,387 | ||||||
Assystem | 517 | 17,717 | ||||||
Atos SE | 1,992 | 272,922 | ||||||
AXA S.A. | 16,478 | 438,035 | ||||||
Beneteau S.A. | 1,793 | 39,061 | ||||||
BioMerieux | 944 | 77,748 | ||||||
Boiron S.A. | 31 | 2,612 | ||||||
Bouygues S.A. | 6,399 | 320,834 | ||||||
Capgemini SE | 1,008 | 125,773 | ||||||
| Shares | Value | |||||||
Cegereal S.A. REIT | 793 | $ | 39,030 | |||||
Cie Generale des Etablissements Michelin SCA | 2,269 | 335,909 | ||||||
CNP Assurances | 6,732 | 169,944 | ||||||
Coface S.A. | 3,416 | 39,052 | ||||||
Derichebourg S.A. | 4,537 | 39,958 | ||||||
Eiffage S.A. | 3,231 | 367,983 | ||||||
Engie S.A. | 18,990 | 317,104 | ||||||
Faurecia S.A. | 1,794 | 145,163 | ||||||
Interparfums S.A. | 909 | 41,852 | ||||||
Klepierre S.A. REIT | 3,928 | 158,327 | ||||||
L’Oreal S.A. | 1,022 | 230,827 | ||||||
LVMH Moet Hennessy Louis Vuitton S.A. | 1,012 | 311,871 | ||||||
Metropole Television S.A. | 5,408 | 139,330 | ||||||
MGI Coutier | 1,628 | 61,361 | ||||||
Nexity S.A. | 322 | 20,623 | ||||||
Orange S.A. | 19,591 | 333,005 | ||||||
Orpea | 512 | 65,018 | ||||||
Peugeot S.A. | 7,196 | 173,275 | ||||||
Renault S.A. | 1,527 | 185,298 | ||||||
Rubis SCA | 80 | 5,778 | ||||||
Sanofi | 5,486 | 440,197 | ||||||
SCOR SE | 2,097 | 85,610 | ||||||
SEB S.A. | 19 | 3,634 | ||||||
STMicroelectronics NV | 4,337 | 96,514 | ||||||
Total S.A. | 9,313 | 533,818 | ||||||
Vinci S.A. | 6,662 | 656,174 | ||||||
|
| |||||||
| 6,564,093 | ||||||||
|
| |||||||
| Germany—0.7% | ||||||||
Bayer AG | 1,347 | 151,852 | ||||||
Bayerische Motoren Werke AG | 1,321 | 143,685 | ||||||
Covestro AG (b) | 2,079 | 204,713 | ||||||
Deutsche Lufthansa AG | 7,221 | 230,837 | ||||||
Deutsche Post AG | 8,158 | 357,314 | ||||||
Fraport AG Frankfurt Airport Services Worldwide | 1,468 | 144,880 | ||||||
Fresenius SE & Co. KGaA | 568 | 43,432 | ||||||
Hella GmbH & Co. KGaA | 605 | 39,828 | ||||||
Rheinmetall AG | 518 | 73,527 | ||||||
Rhoen Klinikum AG | 147 | 4,952 | ||||||
Siemens AG | 1,408 | 179,657 | ||||||
Sixt SE | 37 | 4,021 | ||||||
Stroeer SE & Co. KGaA | 580 | 40,532 | ||||||
TAG Immobilien AG | 3,547 | 73,594 | ||||||
Talanx AG (g) | 4,693 | 204,055 | ||||||
WCM Beteiligungs & Grundbesitz AG | 1,866 | 8,984 | ||||||
Wuestenrot & Wuerttembergische AG | 1,560 | 36,858 | ||||||
|
| |||||||
| 1,942,721 | ||||||||
|
| |||||||
| Greece—0.1% | ||||||||
FF Group (g) | 4,956 | 96,594 | ||||||
Hellenic Petroleum S.A. | 4,186 | 40,499 | ||||||
JUMBO S.A. | 6,391 | 114,338 | ||||||
Motor Oil Hellas Corinth Refineries S.A. | 3,327 | 75,137 | ||||||
Mytilineos Holdings S.A. (g) | 3,431 | 36,784 | ||||||
|
| |||||||
| 363,352 | ||||||||
|
| |||||||
| Hong Kong—0.6% | ||||||||
AIA Group Ltd. | 45,000 | 384,690 | ||||||
Cathay Pacific Airways Ltd. (g) | 1,543 | 2,671 | ||||||
CK Hutchison Holdings Ltd. | 1,297 | 15,584 | ||||||
CLP Holdings Ltd. | 32,281 | 329,137 | ||||||
Dah Sing Banking Group Ltd. | 1,623 | 3,552 | ||||||
Fairwood Holdings Ltd. | 3,500 | 13,759 | ||||||
Global Brands Group Holding Ltd. (g) | 614,000 | 34,741 | ||||||
| Shares | Value | |||||||
Hang Seng Bank Ltd. | 1,300 | $ | 30,205 | |||||
IT Ltd. | 114,000 | 53,038 | ||||||
Johnson Electric Holdings Ltd. | 34,000 | 127,943 | ||||||
Kerry Properties Ltd. | 17,243 | 77,973 | ||||||
Link REIT | 20,492 | 175,652 | ||||||
Minth Group Ltd. | 13,315 | 61,091 | ||||||
Regal Hotels International Holdings Ltd. | 38,000 | 27,031 | ||||||
Swire Pacific Ltd., Class A | 6,156 | 62,339 | ||||||
VSTECS Holdings Ltd. | 46,000 | 24,385 | ||||||
WH Group Ltd. (b) | 114,000 | 122,149 | ||||||
Xinyi Glass Holdings Ltd. | 44,292 | 67,419 | ||||||
Yue Yuen Industrial Holdings Ltd. | 698 | 2,797 | ||||||
|
| |||||||
| 1,616,156 | ||||||||
|
| |||||||
| Hungary—0.2% | ||||||||
Magyar Telekom Telecommunications PLC | 87,892 | 156,848 | ||||||
MOL Hungarian Oil & Gas PLC | 7,424 | 81,001 | ||||||
OTP Bank PLC | 4,055 | 182,198 | ||||||
Richter Gedeon Nyrt | 2,101 | 43,906 | ||||||
|
| |||||||
| 463,953 | ||||||||
|
| |||||||
| India—0.0% | ||||||||
Genpact Ltd. | 1,858 | 59,437 | ||||||
|
| |||||||
| Indonesia—0.3% | ||||||||
Bank Negara Indonesia Persero Tbk PT | 257,655 | 163,171 | ||||||
Bank Tabungan Negara Persero Tbk PT | 343,400 | 95,088 | ||||||
Gudang Garam Tbk PT | 13,900 | 73,401 | ||||||
Indo Tambangraya Megah Tbk PT | 33,400 | 69,318 | ||||||
Indofood Sukses Makmur Tbk PT | 115,479 | 60,541 | ||||||
Telekomunikasi Indonesia Persero Tbk PT | 1,306,806 | 343,631 | ||||||
Unilever Indonesia Tbk PT | 23,400 | 84,409 | ||||||
|
| |||||||
| 889,559 | ||||||||
|
| |||||||
| Ireland—0.0% | ||||||||
Irish Residential Properties REIT PLC | 5,191 | 8,889 | ||||||
Origin Enterprises PLC | 2,219 | 14,607 | ||||||
|
| |||||||
| 23,496 | ||||||||
|
| |||||||
| Israel—0.2% | ||||||||
B Communications Ltd. (g) | 1,705 | 22,466 | ||||||
Bank Hapoalim BM | 17,214 | 118,379 | ||||||
Bank Leumi Le-Israel BM | 27,434 | 165,714 | ||||||
First International Bank of Israel Ltd. | 3,430 | 72,400 | ||||||
Harel Insurance Investments & Financial Services Ltd. | 5,173 | 40,991 | ||||||
Hilan Ltd. | 2,669 | 59,604 | ||||||
Ituran Location and Control Ltd. | 2,028 | 63,071 | ||||||
Jerusalem Oil Exploration (g) | 877 | 48,807 | ||||||
Mizrahi Tefahot Bank Ltd. | 3,739 | 71,624 | ||||||
Shufersal Ltd. | 3,759 | 24,031 | ||||||
|
| |||||||
| 687,087 | ||||||||
|
| |||||||
| Italy—0.6% | ||||||||
Amplifon SpA | 4,460 | 79,291 | ||||||
ASTM SpA | 1,590 | 40,093 | ||||||
Cementir Holding SpA | 4,685 | 40,631 | ||||||
Enel SpA | 74,124 | 453,580 | ||||||
Fila SpA | 543 | 11,691 | ||||||
| See accompanying Notes to Financial Statements | | March 31, 2018 | | Semiannual Report | 147 |
Table of Contents
Schedule of Investments
March 31, 2018 (Unaudited)
| Shares | Value | |||||||
Intesa Sanpaolo SpA | 66,054 | $ | 240,503 | |||||
Iren SpA | 18,717 | 58,766 | ||||||
La Doria SpA | 2,524 | 38,226 | ||||||
Maire Tecnimont SpA | 7,699 | 39,645 | ||||||
Mediobanca Banca di Credito Finanziario SpA | 7,246 | 85,187 | ||||||
Prima Industrie SpA | 831 | 37,432 | ||||||
Snam SpA | 20,804 | 95,632 | ||||||
Societa Iniziative Autostradali e Servizi SpA | 3,584 | 66,794 | ||||||
Telecom Italia SpA (g) | 269,183 | 255,587 | ||||||
Unipol Gruppo SpA | 15,252 | 74,631 | ||||||
|
| |||||||
| 1,617,689 | ||||||||
|
| |||||||
| Japan—5.3% | ||||||||
ADEKA Corp. | 26 | 465 | ||||||
Aida Engineering Ltd. | 142 | 1,741 | ||||||
Aisin Seiki Co., Ltd. | 3,200 | 174,633 | ||||||
ANA Holdings, Inc. | 4,145 | 160,619 | ||||||
Aoyama Trading Co., Ltd. | 111 | 4,362 | ||||||
Asahi Glass Co., Ltd. | 2,200 | 92,196 | ||||||
Asahi Group Holdings Ltd. | 2,600 | 139,824 | ||||||
Astellas Pharma, Inc. | 13,292 | 203,314 | ||||||
Bandai Namco Holdings, Inc. | 2,200 | 71,200 | ||||||
BML, Inc. | 518 | 13,506 | ||||||
Brother Industries Ltd. | 5,500 | 127,531 | ||||||
Canon, Inc. | 13,310 | 482,864 | ||||||
Chubu Electric Power Co., Inc. | 11,500 | 165,045 | ||||||
Concordia Financial Group Ltd. | 16,000 | 90,343 | ||||||
Daiichi Sankyo Co., Ltd. | 3,747 | 125,696 | ||||||
Daito Pharmaceutical Co., Ltd. | 152 | 5,491 | ||||||
Daiwa House Industry Co., Ltd. | 3,454 | 133,059 | ||||||
DCM Holdings Co., Ltd. | 5,325 | 54,186 | ||||||
Denso Corp. | 2,600 | 143,012 | ||||||
Doutor Nichires Holdings Co., Ltd. | 1,851 | 43,995 | ||||||
DTS Corp. | 399 | 13,888 | ||||||
DyDo Group Holdings, Inc. | 326 | 20,538 | ||||||
EDION Corp. | 2,473 | 28,591 | ||||||
Eizo Corp. | 1,500 | 69,179 | ||||||
Electric Power Development Co., Ltd. | 9,100 | 234,561 | ||||||
EPS Holdings, Inc. | 700 | 14,371 | ||||||
Exedy Corp. | 2,074 | 65,623 | ||||||
FANUC Corp. | 800 | 205,882 | ||||||
Fuji Oil Holdings, Inc. | 2,216 | 67,372 | ||||||
Fuji Soft, Inc. | 272 | 10,848 | ||||||
FUJIFILM Holdings Corp. | 3,421 | 136,613 | ||||||
Fukuoka Financial Group, Inc. | 14,000 | 76,694 | ||||||
Fukuyama Transporting Co., Ltd. | 345 | 15,069 | ||||||
Furukawa Electric Co., Ltd. | 1,200 | 64,549 | ||||||
Gecoss Corp. | 5,200 | 53,512 | ||||||
Geo Holdings Corp. | 536 | 8,516 | ||||||
Goldcrest Co., Ltd. | 3,200 | 68,287 | ||||||
Hankyu Hanshin Holdings, Inc. | 2,070 | 77,530 | ||||||
Hitachi Ltd. | 32,000 | 233,075 | ||||||
Hogy Medical Co., Ltd. | 278 | 11,229 | ||||||
Honda Motor Co., Ltd. | 17,100 | 591,944 | ||||||
Honeys Holdings Co., Ltd. | 39 | 367 | ||||||
Iida Group Holdings Co., Ltd. | 12,900 | 241,135 | ||||||
ITOCHU Corp. | 24,177 | 472,108 | ||||||
Japan Airlines Co., Ltd. | 7,237 | 294,663 | ||||||
JFE Holdings, Inc. | 4,000 | 80,685 | ||||||
JXTG Holdings, Inc. | 20,500 | 124,980 | ||||||
Kagome Co., Ltd. | 1,800 | 63,209 | ||||||
Kajima Corp. | 13,000 | 122,218 | ||||||
Kamei Corp. | 3,000 | 41,409 | ||||||
| Shares | Value | |||||||
Keyence Corp. | 300 | $ | 187,397 | |||||
Komatsu Ltd. | 5,000 | 167,495 | ||||||
Konica Minolta, Inc. | 9,100 | 77,359 | ||||||
Kyokuto Kaihatsu Kogyo Co., Ltd. | 2,700 | 39,924 | ||||||
Kyowa Exeo Corp. | 2,600 | 69,596 | ||||||
Kyudenko Corp. | 1,300 | 63,861 | ||||||
LaSalle Logiport REIT | 35 | 37,355 | ||||||
Marubeni Corp. | 24,000 | 175,261 | ||||||
Mazda Motor Corp. | 14,800 | 197,932 | ||||||
Mitsubishi Chemical Holdings Corp. | 11,506 | 112,028 | ||||||
Mitsubishi Corp. | 15,800 | 425,321 | ||||||
Mitsubishi Gas Chemical Co., Inc. | 271 | 6,540 | ||||||
Mitsubishi Tanabe Pharma Corp. | 7,386 | 149,222 | ||||||
Mitsubishi UFJ Financial Group, Inc. | 48,685 | 323,542 | ||||||
Mitsuboshi Belting Ltd. | 142 | 1,582 | ||||||
Mitsui & Co., Ltd. | 23,000 | 395,781 | ||||||
Mitsui Sugar Co., Ltd. | 3,500 | 134,593 | ||||||
NEC Networks & System Integration Corp. | 765 | 19,898 | ||||||
NET One Systems Co., Ltd. | 3,200 | 46,992 | ||||||
Nichias Corp. | 2,396 | 30,426 | ||||||
Nidec Corp. | 1,100 | 169,299 | ||||||
Nihon Unisys Ltd. | 3,321 | 72,134 | ||||||
Nintendo Co., Ltd. | 400 | 177,709 | ||||||
Nippon Road Co., Ltd. | 800 | 39,502 | ||||||
Nippon Telegraph & Telephone Corp. | 15,008 | 700,169 | ||||||
Nissan Motor Co., Ltd. | 33,259 | 343,304 | ||||||
Nisshin Oillio Group Ltd. | 692 | 19,305 | ||||||
Nomura Real Estate Holdings, Inc. | 3,157 | 74,130 | ||||||
NS United Kaiun Kaisha Ltd. | 1,900 | 38,240 | ||||||
NTT Data Corp. | 9,215 | 96,829 | ||||||
NTT DOCOMO, Inc. | 14,043 | 358,004 | ||||||
Obayashi Corp. | 5,027 | 55,377 | ||||||
ORIX Corp. | 11,701 | 209,693 | ||||||
Pacific Industrial Co., Ltd. | 224 | 2,987 | ||||||
Prima Meat Packers Ltd. | 14,462 | 81,389 | ||||||
Raito Kogyo Co., Ltd. | 1,663 | 17,593 | ||||||
Recruit Holdings Co., Ltd. | 4,800 | 120,305 | ||||||
Rohm Co., Ltd. | 1,600 | 151,873 | ||||||
Rohto Pharmaceutical Co., Ltd. | 2,100 | 59,097 | ||||||
S Foods, Inc. | 772 | 31,949 | ||||||
Sanyo Special Steel Co., Ltd. | 182 | 4,601 | ||||||
Sawai Pharmaceutical Co., Ltd. | 925 | 40,677 | ||||||
Sekisui House Ltd. | 4,700 | 86,000 | ||||||
Senko Group Holdings Co., Ltd. | 1,796 | 14,054 | ||||||
Shibaura Electronics Co., Ltd. | 200 | 9,711 | ||||||
Shin-Etsu Chemical Co., Ltd. | 3,300 | 344,220 | ||||||
SoftBank Group Corp. | 6,400 | 477,384 | ||||||
Sojitz Corp. | 17,884 | 57,044 | ||||||
Sony Corp. | 6,500 | 319,802 | ||||||
Stella Chemifa Corp. | 1,511 | 45,451 | ||||||
Sumitomo Dainippon Pharma Co., Ltd. | 4,968 | 82,993 | ||||||
Sumitomo Electric Industries Ltd. | 17,500 | 267,461 | ||||||
Takasago Thermal Engineering Co., Ltd. | 397 | 7,366 | ||||||
Takeda Pharmaceutical Co., Ltd. | 4,243 | 206,894 | ||||||
Teijin Ltd. | 4,000 | 76,010 | ||||||
Toho Co., Ltd. | 2,000 | 66,570 | ||||||
Tokyo Electron Ltd. | 500 | 92,496 | ||||||
Toray Industries, Inc. | 4,826 | 45,907 | ||||||
Toshiba Plant Systems & Services Corp. | 2,000 | 43,734 | ||||||
| Shares | Value | |||||||
Towa Pharmaceutical Co., Ltd. | 138 | $ | 8,792 | |||||
Toyota Motor Corp. | 11,251 | 730,546 | ||||||
Toyota Tsusho Corp. | 2,600 | 87,866 | ||||||
Tv Tokyo Holdings Corp. | 266 | 7,150 | ||||||
Unipres Corp. | 317 | 7,199 | ||||||
Wacoal Holdings Corp. | 298 | 8,648 | ||||||
West Japan Railway Co. | 1,401 | 99,326 | ||||||
Yakult Honsha Co., Ltd. | 1,300 | 97,447 | ||||||
Yamaha Motor Co., Ltd. | 2,900 | 86,281 | ||||||
Yomiuri Land Co., Ltd. | 900 | 38,711 | ||||||
Yorozu Corp. | 259 | 4,299 | ||||||
Yoshinoya Holdings Co., Ltd. | 1,475 | 29,690 | ||||||
Yurtec Corp. | 132 | 1,054 | ||||||
|
| |||||||
| 14,718,104 | ||||||||
|
| |||||||
| Korea (Republic of)—1.3% | ||||||||
CJ Hello Co., Ltd. | 889 | 7,088 | ||||||
Daekyo Co., Ltd. | 777 | 5,788 | ||||||
DGB Financial Group, Inc. | 12,331 | 135,755 | ||||||
Easy Bio, Inc. | 559 | 3,663 | ||||||
GS Holdings Corp. | 1,215 | 70,652 | ||||||
Hana Financial Group, Inc. | 2,429 | 104,683 | ||||||
Hansol Paper Co., Ltd. | 477 | 7,190 | ||||||
Hanwha Chemical Corp. | 4,949 | 138,484 | ||||||
Hyundai Department Store Co., Ltd. | 793 | 67,689 | ||||||
Hyundai Development Co-Engineering & Construction | 1,816 | 64,981 | ||||||
Hyundai Engineering Plastics Co., Ltd. | 864 | 5,291 | ||||||
Hyundai Steel Co. | 1,889 | 91,765 | ||||||
Industrial Bank of Korea | 5,202 | 76,622 | ||||||
KB Financial Group, Inc. | 2,880 | 167,032 | ||||||
KC Co., Ltd. | 70 | 1,577 | ||||||
KC Tech Co., Ltd. (g) | 103 | 2,180 | ||||||
KT Corp. | 221 | 5,690 | ||||||
KT&G Corp. | 853 | 80,237 | ||||||
Kukdo Chemical Co., Ltd. | 130 | 7,315 | ||||||
LG Corp. | 831 | 68,213 | ||||||
LG Electronics, Inc. | 1,946 | 200,782 | ||||||
LG Uplus Corp. | 5,641 | 65,519 | ||||||
Lotte Chemical Corp. | 167 | 68,417 | ||||||
LS Corp. | 973 | 67,693 | ||||||
Macquarie Korea Infrastructure Fund | 4,385 | 36,161 | ||||||
OCI Co., Ltd. | 553 | 82,759 | ||||||
POSCO | 1,132 | 361,335 | ||||||
S-Oil Corp. | 1,011 | 114,479 | ||||||
Samjin Pharmaceutical Co., Ltd. | 320 | 13,090 | ||||||
Samsung Electronics Co., Ltd. | 85 | 198,600 | ||||||
Samsung Electronics Co., Ltd. GDR | 631 | 723,126 | ||||||
Shinhan Financial Group Co., Ltd. | 4,196 | 178,998 | ||||||
SK Innovation Co., Ltd. | 855 | 169,939 | ||||||
SK Telecom Co., Ltd. | 604 | 130,969 | ||||||
Ubiquoss Holdings, Inc. | 442 | 2,549 | ||||||
Ubiquoss, Inc. (g) | 140 | 2,935 | ||||||
Woori Bank | 7,482 | 101,734 | ||||||
|
| |||||||
| 3,630,980 | ||||||||
|
| |||||||
| Malaysia—0.3% | ||||||||
AirAsia Group Bhd. | 65,300 | 67,125 | ||||||
Ann Joo Resources Bhd. | 32,300 | 25,369 | ||||||
CIMB Group Holdings Bhd. | 95,200 | 177,150 | ||||||
Genting Bhd. | 36,500 | 82,305 | ||||||
Genting Malaysia Bhd. | 64,400 | 80,936 | ||||||
Hong Leong Financial Group Bhd. | 14,500 | 72,154 | ||||||
KNM Group Bhd. (g) | 31,700 | 1,731 | ||||||
Malayan Banking Bhd. | 41,200 | 112,231 | ||||||
Maxis Bhd. | 3,200 | 4,712 | ||||||
| 148 | Semiannual Report | | March 31, 2018 | | See accompanying Notes to Financial Statements |
Table of Contents
Schedule of Investments
March 31, 2018 (Unaudited)
| Shares | Value | |||||||
MISC Bhd. | 17,300 | $ | 31,641 | |||||
Public Bank Bhd. | 10,300 | 64,041 | ||||||
Supermax Corp. Bhd. | 20,100 | 13,404 | ||||||
Tenaga Nasional Bhd. | 26,500 | 110,892 | ||||||
VS Industry Bhd. | 56,300 | 34,373 | ||||||
|
| |||||||
| 878,064 | ||||||||
|
| |||||||
| Mexico—0.2% | ||||||||
Alfa S.A.B de C.V., Class A | 62,800 | 80,486 | ||||||
Banco del Bajio | 12,600 | 27,023 | ||||||
El Puerto de Liverpool S.A.B de C.V. | 9,800 | 72,638 | ||||||
Grupo Aeroportuario del Pacifico S.A.B de C.V. ADR | 47 | 4,683 | ||||||
Grupo Financiero Banorte S.A.B de C.V., Class O | 18,200 | 110,381 | ||||||
Grupo Lala S.A.B de C.V. | 4,496 | 6,128 | ||||||
Industrias Bachoco S.A.B de C.V. ADR | 1,280 | 79,296 | ||||||
Macquarie Mexico Real Estate Management S.A. de C.V. REIT (g) | 62,700 | 70,357 | ||||||
Wal-Mart de Mexico SAB De C.V. | 67,400 | 170,539 | ||||||
|
| |||||||
| 621,531 | ||||||||
|
| |||||||
| Morocco—0.0% | ||||||||
Douja Promotion Groupe Addoha S.A. | 3,431 | 12,743 | ||||||
|
| |||||||
| Netherlands—0.8% | ||||||||
ABN AMRO Group NV (b) | 5,801 | 174,919 | ||||||
Aegon NV | 14,747 | 99,495 | ||||||
AerCap Holdings NV (g) | 2,762 | 140,089 | ||||||
AMG Advanced Metallurgical Group NV | 879 | 39,311 | ||||||
ASML Holding NV | 1,326 | 262,937 | ||||||
ASR Nederland NV | 5,907 | 252,573 | ||||||
BE Semiconductor Industries NV | 771 | 79,089 | ||||||
ING Groep NV | 19,773 | 333,673 | ||||||
Koninklijke Ahold Delhaize NV | 15,915 | 377,121 | ||||||
Koninklijke DSM NV | 1,223 | 121,562 | ||||||
Koninklijke Volkerwessels NV | 2,060 | 56,533 | ||||||
NN Group NV | 6,911 | 307,055 | ||||||
Philips Lighting NV (b) | 1,865 | 70,119 | ||||||
Vastned Retail NV REIT | 232 | 11,067 | ||||||
|
| |||||||
| 2,325,543 | ||||||||
|
| |||||||
| New Zealand—0.2% | ||||||||
Air New Zealand Ltd. | 80,996 | 189,790 | ||||||
Arvida Group Ltd. | 9,216 | 7,859 | ||||||
Auckland International Airport Ltd. | 14,167 | 62,865 | ||||||
Fonterra Co-operative Group Ltd. UNIT | 2,607 | 11,151 | ||||||
Kiwi Property Group Ltd. REIT | 1,590 | 1,543 | ||||||
Metlifecare Ltd. | 25,550 | 108,193 | ||||||
Oceania Healthcare Ltd. | 38,432 | 27,357 | ||||||
Summerset Group Holdings Ltd. | 16,553 | 83,247 | ||||||
Tourism Holdings Ltd. | 3,164 | 13,978 | ||||||
|
| |||||||
| 505,983 | ||||||||
|
| |||||||
| Norway—0.3% | ||||||||
Austevoll Seafood ASA | 5,188 | 52,209 | ||||||
Avance Gas Holding | 97 | 290 | ||||||
B2Holding ASA | 15,516 | 38,822 | ||||||
Evry AS (b)(g) | 10,544 | 40,757 | ||||||
Leroy Seafood Group ASA | 6,270 | 38,932 | ||||||
Marine Harvest ASA | 705 | 14,251 | ||||||
Norsk Hydro ASA | 26,959 | 159,912 | ||||||
Norwegian Finans Holding ASA (g) | 6,317 | 71,348 | ||||||
| Shares | Value | |||||||
Orkla ASA | 4,764 | $ | 51,342 | |||||
Salmar ASA | 2,412 | 99,316 | ||||||
Sparebank 1 Nord Norge | 7,721 | 61,358 | ||||||
SpareBank 1 SMN | 7,418 | 76,889 | ||||||
Telenor ASA | 8,132 | 184,931 | ||||||
|
| |||||||
| 890,357 | ||||||||
|
| |||||||
| Peru—0.0% | ||||||||
Ferreycorp SAA | 34,967 | 27,531 | ||||||
Volcan Cia Minera SAA, Class B | 76,624 | 28,502 | ||||||
|
| |||||||
| 56,033 | ||||||||
|
| |||||||
| Philippines—0.1% | ||||||||
Bloomberry Resorts Corp. (g) | 101,900 | 28,203 | ||||||
Cebu Air, Inc. | 28,120 | 50,983 | ||||||
DMCI Holdings, Inc. | 437,900 | 102,505 | ||||||
Filinvest Land, Inc. | 828,000 | 26,184 | ||||||
Globe Telecom, Inc. | 2,315 | 71,964 | ||||||
San Miguel Corp. | 10,250 | 26,418 | ||||||
Vista Land & Lifescapes, Inc. | 443,200 | 55,256 | ||||||
|
| |||||||
| 361,513 | ||||||||
|
| |||||||
| Poland—0.0% | ||||||||
Asseco Poland S.A. | 501 | 6,595 | ||||||
Ciech S.A. (g) | 570 | 9,833 | ||||||
Polski Koncern Naftowy Orlen S.A. | 3,189 | 78,491 | ||||||
|
| |||||||
| 94,919 | ||||||||
|
| |||||||
| Russian Federation—0.1% | ||||||||
Magnitogorsk Iron & Steel Works PJSC GDR | 7,225 | 71,816 | ||||||
PhosAgro PJSC GDR | 1,266 | 18,408 | ||||||
Surgutneftegas OJSC ADR | 669 | 3,278 | ||||||
United Co. RUSAL PLC | 150,000 | 91,263 | ||||||
|
| |||||||
| 184,765 | ||||||||
|
| |||||||
| Singapore—0.6% | ||||||||
Accordia Golf Trust UNIT | 12,500 | 6,149 | ||||||
Asian Pay Television Trust UNIT | 118,900 | 48,204 | ||||||
BOC Aviation Ltd. (b) | 32,000 | 190,854 | ||||||
Bumitama Agri Ltd. | 107,400 | 58,158 | ||||||
DBS Group Holdings Ltd. | 12,900 | 272,478 | ||||||
Fortune Real Estate Investment Trust REIT | 11,000 | 13,356 | ||||||
Frasers Logistics & Industrial Trust REIT | 55,700 | 46,331 | ||||||
Genting Singapore PLC | 86,500 | 71,745 | ||||||
Keppel DC REIT | 13,600 | 14,974 | ||||||
Mapletree Industrial Trust REIT | 9,000 | 13,967 | ||||||
Oversea-Chinese Banking Corp., Ltd. | 29,400 | 289,619 | ||||||
QAF Ltd. | 50,100 | 38,642 | ||||||
SATS Ltd. | 14,100 | 55,409 | ||||||
Sheng Siong Group Ltd. | 23,700 | 16,840 | ||||||
Singapore Airlines Ltd. | 18,000 | 149,574 | ||||||
Sino Grandness Food Industry Group Ltd. (g) | 25,900 | 3,872 | ||||||
United Overseas Bank Ltd. | 6,800 | 143,087 | ||||||
Venture Corp., Ltd. | 4,400 | 95,158 | ||||||
Yanlord Land Group Ltd. | 48,500 | 62,793 | ||||||
|
| |||||||
| 1,591,210 | ||||||||
|
| |||||||
| South Africa—0.2% | ||||||||
Fortress REIT Ltd., Class A REIT | 49,467 | 67,073 | ||||||
Harmony Gold Mining Co., Ltd. | 5,863 | 13,934 | ||||||
Naspers Ltd., Class N | 1,465 | 358,504 | ||||||
|
| |||||||
| 439,511 | ||||||||
|
| |||||||
| Shares | Value | |||||||
| Spain—0.6% | ||||||||
ACS Actividades de Construccion y Servicios S.A. | 3,141 | $ | 122,548 | |||||
Amadeus IT Group S.A. | 3,686 | 272,776 | ||||||
Axiare Patrimonio SOCIMI S.A. REIT | 221 | 4,497 | ||||||
Banco Santander S.A. | 59,596 | 390,078 | ||||||
CaixaBank S.A. | 28,033 | 133,652 | ||||||
Ebro Foods S.A. | 2,800 | 71,235 | ||||||
Ercros S.A. | 9,151 | 48,021 | ||||||
International Consolidated Airlines Group S.A. | 16,982 | 146,577 | ||||||
Lar Espana Real Estate Socimi S.A. REIT | 137 | 1,644 | ||||||
Papeles y Cartones de Europa S.A. | 3,787 | 66,137 | ||||||
Repsol S.A. | 17,807 | 316,531 | ||||||
Telefonica S.A. | 19,791 | 196,066 | ||||||
|
| |||||||
| 1,769,762 | ||||||||
|
| |||||||
| Sweden—0.5% | ||||||||
Ahlsell AB (b) | 8,242 | 51,982 | ||||||
BillerudKorsnas AB | 199 | 3,086 | ||||||
Bravida Holding AB (b) | 9,507 | 68,076 | ||||||
Dios Fastigheter AB | 9,921 | 67,115 | ||||||
Hemfosa Fastigheter AB | 5,370 | 65,234 | ||||||
Holmen AB, Class B | 1,594 | 86,703 | ||||||
Humana AB | 1,844 | 10,496 | ||||||
Klovern AB, Class B | 45,445 | 56,472 | ||||||
Pandox AB | 2,211 | 39,785 | ||||||
Peab AB | 211 | 1,905 | ||||||
Sandvik AB | 10,617 | 194,516 | ||||||
Scandic Hotels Group AB (b) | 5,709 | 54,762 | ||||||
Swedbank AB, Class A | 9,375 | 210,660 | ||||||
Volvo AB, Class B | 20,309 | 371,743 | ||||||
|
| |||||||
| 1,282,535 | ||||||||
|
| |||||||
| Switzerland—0.7% | ||||||||
Allreal Holding AG (g) | 229 | 37,688 | ||||||
Baloise Holding AG | 538 | 82,305 | ||||||
Banque Cantonale Vaudoise | 41 | 33,187 | ||||||
Barry Callebaut AG | 40 | 78,230 | ||||||
BKW AG | 145 | 9,645 | ||||||
Bobst Group S.A. | 1,000 | 110,917 | ||||||
Cembra Money Bank AG | 50 | 4,444 | ||||||
Intershop Holding AG | 17 | 8,927 | ||||||
Landis+Gyr Group AG (g) | 860 | 66,663 | ||||||
Nestle S.A. | 1,560 | 123,305 | ||||||
Novartis AG | 9,287 | 751,141 | ||||||
Partners Group Holding AG | 182 | 135,431 | ||||||
Schweiter Technologies AG | 8 | 9,521 | ||||||
Siegfried Holding AG (g) | 47 | 15,832 | ||||||
Straumann Holding AG | 141 | 88,963 | ||||||
Swiss Life Holding AG (g) | 804 | 286,519 | ||||||
Swiss Re AG | 1,260 | 128,604 | ||||||
|
| |||||||
| 1,971,322 | ||||||||
|
| |||||||
| Taiwan—1.0% | ||||||||
Accton Technology Corp. | 19,000 | 62,767 | ||||||
Arcadyan Technology Corp. | 4,000 | 7,415 | ||||||
Asia Vital Components Co., Ltd. | 12,000 | 12,104 | ||||||
AU Optronics Corp. | 143,000 | 66,301 | ||||||
Chailease Holding Co., Ltd. | 11,000 | 38,203 | ||||||
Chin-Poon Industrial Co., Ltd. | 7,000 | 12,630 | ||||||
China Airlines Ltd. (g) | 56,000 | 20,600 | ||||||
China Metal Products | 8,000 | 7,947 | ||||||
China Motor Corp. | 10,000 | 9,464 | ||||||
Chunghwa Telecom Co., Ltd. | 74,000 | 285,149 | ||||||
E Ink Holdings, Inc. | 56,000 | 93,766 | ||||||
Elite Material Co., Ltd. | 11,000 | 36,503 | ||||||
| See accompanying Notes to Financial Statements | | March 31, 2018 | | Semiannual Report | 149 |
Table of Contents
Schedule of Investments
March 31, 2018 (Unaudited)
| Shares | Value | |||||||
Farglory Land Development Co., Ltd. | 18,000 | $ | 20,339 | |||||
First Financial Holding Co., Ltd. | 200,160 | 139,604 | ||||||
Formosa Petrochemical Corp. | 47,000 | 193,040 | ||||||
Formosa Plastics Corp. | 9,000 | 32,054 | ||||||
General Interface Solution Holding Ltd. | 11,000 | 67,978 | ||||||
Getac Technology Corp. | 18,000 | 26,047 | ||||||
Gintech Energy Corp. (g) | 6,000 | 3,285 | ||||||
Grand Pacific Petrochemical | 84,000 | 88,762 | ||||||
Hon Hai Precision Industry Co., Ltd. | 134,000 | 417,942 | ||||||
Huaku Development Co., Ltd. | 16,000 | 39,688 | ||||||
King Yuan Electronics Co., Ltd. | 28,000 | 29,390 | ||||||
King’s Town Bank Co., Ltd. | 40,000 | 50,912 | ||||||
LCY Chemical Corp. | 24,000 | 36,754 | ||||||
Long Chen Paper Co., Ltd. | 43,000 | 48,834 | ||||||
Nanya Technology Corp. | 13,000 | 41,653 | ||||||
Pou Chen Corp. | 99,000 | 132,199 | ||||||
Powertech Technology, Inc. | 34,000 | 107,184 | ||||||
Qisda Corp. | 63,000 | 47,172 | ||||||
Sercomm Corp. | 11,000 | 30,380 | ||||||
Sinbon Electronics Co., Ltd. | 13,000 | 34,342 | ||||||
Sitronix Technology Corp. | 3,000 | 8,985 | ||||||
Syncmold Enterprise Corp. | 14,000 | 32,851 | ||||||
Taiwan Business Bank | 209,370 | 62,696 | ||||||
Taiwan Cooperative Financial Holding Co., Ltd. | 63,000 | 37,246 | ||||||
Taiwan Hon Chuan Enterprise Co., Ltd. | 5,000 | 9,646 | ||||||
TXC Corp. | 15,000 | 20,264 | ||||||
United Integrated Services Co., Ltd. | 20,000 | 45,146 | ||||||
Wistron Corp. | 37,000 | 32,008 | ||||||
Wistron NeWeb Corp. | 5,148 | 13,590 | ||||||
WT Microelectronics Co., Ltd. | 6,707 | 10,892 | ||||||
Yageo Corp. | 2,096 | 38,028 | ||||||
Yuanta Financial Holding Co., Ltd. | 317,000 | 146,280 | ||||||
|
| |||||||
| 2,698,040 | ||||||||
|
| |||||||
| Thailand—0.6% | ||||||||
Bangchak Corp. PCL (e)(f) | 56,500 | 70,351 | ||||||
Bangkok Bank PCL | 12,700 | 87,282 | ||||||
Banpu PCL (e)(f) | 161,400 | 107,964 | ||||||
Electricity Generating PCL (e)(f) | 23,000 | 168,616 | ||||||
Intouch Holdings PCL | 25,300 | 46,971 | ||||||
Kiatnakin Bank PCL (e)(f) | 100,600 | 232,118 | ||||||
PTT Global Chemical PCL (e)(f) | 47,100 | 143,171 | ||||||
PTT PCL (e)(f) | 15,100 | 265,942 | ||||||
Siam Cement PCL | 14,100 | 222,880 | ||||||
Sri Trang Agro-Industry PCL (e)(f) | 8,200 | 2,897 | ||||||
Thai Oil PCL (e)(f) | 3,600 | 10,493 | ||||||
Thanachart Capital PCL (e)(f) | 43,800 | 73,047 | ||||||
Tisco Financial Group PCL (e)(f) | 44,000 | 124,062 | ||||||
|
| |||||||
| 1,555,794 | ||||||||
|
| |||||||
| Turkey—0.3% | ||||||||
Akbank Turk AS | 56,083 | 136,368 | ||||||
Dogus Otomotiv Servis ve Ticaret AS (g) | 909 | 1,881 | ||||||
Emlak Konut Gayrimenkul Yatirim Ortakligi AS REIT (g) | 83,530 | 53,739 | ||||||
| Shares | Value | |||||||
Eregli Demir ve Celik Fabrikalari TAS | 25,934 | $ | 68,564 | |||||
Soda Sanayii AS | 95,505 | 132,788 | ||||||
TAV Havalimanlari Holding AS | 10,694 | 64,423 | ||||||
Tekfen Holding AS | 16,616 | 71,754 | ||||||
Tofas Turk Otomobil Fabrikasi AS | 15,853 | 106,847 | ||||||
Tupras Turkiye Petrol Rafinerileri AS | 58 | 1,620 | ||||||
Turkiye Halk Bankasi AS | 32,412 | 74,719 | ||||||
Turkiye Vakiflar Bankasi Tao | 39,830 | 65,955 | ||||||
Yatas Yatak ve Yorgan Sanayi ve Ticaret AS (g) | 2,973 | 25,892 | ||||||
|
| |||||||
| 804,550 | ||||||||
|
| |||||||
| United Kingdom—2.5% | ||||||||
3i Group PLC | 8,560 | 103,318 | ||||||
Anglo American PLC | 13,620 | 317,273 | ||||||
Aviva PLC | 28,816 | 201,109 | ||||||
Bellway PLC | 2,026 | 86,703 | ||||||
Berkeley Group Holdings PLC | 1,337 | 71,074 | ||||||
Biffa PLC (b) | 16,942 | 47,539 | ||||||
BP PLC | 77,516 | 522,853 | ||||||
British American Tobacco PLC | 10,680 | 617,377 | ||||||
British American Tobacco PLC ADR | 6,178 | 356,409 | ||||||
BT Group PLC | 46,773 | 149,291 | ||||||
Burford Capital Ltd. | 2,224 | 41,946 | ||||||
Carnival PLC | 3,000 | 193,090 | ||||||
Central Asia Metals PLC | 8,818 | 39,715 | ||||||
Compass Group PLC | 8,703 | 177,706 | ||||||
Costain Group PLC | 6,064 | 39,519 | ||||||
easyJet PLC | 3,319 | 74,817 | ||||||
EI Group PLC (g) | 37,830 | 61,114 | ||||||
Equiniti Group PLC (b) | 9,227 | 38,710 | ||||||
Ferrexpo PLC | 9,554 | 32,832 | ||||||
Firstgroup PLC (g) | 69,732 | 80,333 | ||||||
Gamma Communications PLC | 2,555 | 25,093 | ||||||
HSBC Holdings PLC | 38,751 | 363,900 | ||||||
J Sainsbury PLC | 28,329 | 95,029 | ||||||
Jackpotjoy PLC (g) | 7,484 | 85,260 | ||||||
Johnson Service Group PLC | 5,867 | 11,145 | ||||||
Keller Group PLC | 10,963 | 134,017 | ||||||
Laird PLC | 14,389 | 40,416 | ||||||
Legal & General Group PLC | 52,714 | 190,996 | ||||||
Lloyds Banking Group PLC | 371,644 | 338,057 | ||||||
Micro Focus International PLC | 162 | 2,262 | ||||||
Morgan Sindall Group PLC | 3,892 | 63,888 | ||||||
National Express Group PLC | 29,915 | 162,184 | ||||||
Nomad Foods Ltd. (g) | 2,497 | 39,303 | ||||||
Plus500 Ltd. | 2,720 | 43,584 | ||||||
Primary Health Properties PLC REIT | 4,727 | 7,308 | ||||||
Renewables Infrastructure Group Ltd. | 27,255 | 40,661 | ||||||
Rio Tinto PLC | 7,974 | 404,633 | ||||||
Robert Walters PLC | 2,852 | 27,209 | ||||||
Royal Dutch Shell PLC, Class A | 6,083 | 193,787 | ||||||
Royal Dutch Shell PLC, Class B | 22,544 | 725,431 | ||||||
Safestore Holdings PLC REIT | 5,621 | 38,761 | ||||||
Schroders PLC | 1,204 | 38,591 | ||||||
SIG PLC | 20,896 | 39,762 | ||||||
Softcat PLC | 4,246 | 40,790 | ||||||
Stock Spirits Group PLC | 11,397 | 39,735 | ||||||
Tate & Lyle PLC | 23,415 | 178,835 | ||||||
Taylor Wimpey PLC | 38,774 | 100,452 | ||||||
| Shares | Value | |||||||
Trinity Mirror PLC | 3,803 | $ | 4,242 | |||||
TUI AG | 7,356 | 157,739 | ||||||
Virgin Money Holdings UK PLC | 906 | 3,348 | ||||||
Watkin Jones PLC | 15,706 | 39,488 | ||||||
|
| |||||||
| 6,928,634 | ||||||||
|
| |||||||
| United States—30.9% | ||||||||
3M Co. | 945 | 207,446 | ||||||
Aaron’s, Inc. | 1,421 | 66,219 | ||||||
Abbott Laboratories | 9,127 | 546,890 | ||||||
AbbVie, Inc. | 10,295 | 974,422 | ||||||
Accenture PLC, Class A | 1,252 | 192,182 | ||||||
ACCO Brands Corp. | 5,102 | 64,030 | ||||||
Activision Blizzard, Inc. | 2,000 | 134,920 | ||||||
Adobe Systems, Inc. (g) | 1,709 | 369,281 | ||||||
Advanced Energy Industries, Inc. (g) | 1,225 | 78,278 | ||||||
Aetna, Inc. | 600 | 101,400 | ||||||
Aflac, Inc. | 10,880 | 476,109 | ||||||
AG Mortgage Investment Trust, Inc. REIT | 9,076 | 157,650 | ||||||
Agilent Technologies, Inc. | 5,516 | 369,020 | ||||||
AGNC Investment Corp. REIT | 14,536 | 275,021 | ||||||
Air Lease Corp. | 2,180 | 92,912 | ||||||
Alaska Air Group, Inc. | 1,211 | 75,034 | ||||||
Alcoa Corp. (g) | 3,317 | 149,132 | ||||||
Align Technology, Inc. (g) | 1,771 | 444,751 | ||||||
Allison Transmission Holdings, Inc. | 5,941 | 232,055 | ||||||
Allstate Corp. | 3,789 | 359,197 | ||||||
Ally Financial, Inc. | 3,701 | 100,482 | ||||||
Alphabet, Inc., Class A (g) | 456 | 472,936 | ||||||
Alphabet, Inc., Class C (g) | 491 | 506,609 | ||||||
Altria Group, Inc. | 12,299 | 766,474 | ||||||
Amazon.com, Inc. (g) | 781 | 1,130,373 | ||||||
Amdocs Ltd. | 1,946 | 129,837 | ||||||
Ameren Corp. | 2,208 | 125,039 | ||||||
American Electric Power Co., Inc. | 1,807 | 123,942 | ||||||
American Equity Investment Life Holding Co. | 3,598 | 105,637 | ||||||
American Financial Group, Inc. | 742 | 83,267 | ||||||
Ameriprise Financial, Inc. | 1,298 | 192,026 | ||||||
AmerisourceBergen Corp. | 2,761 | 238,026 | ||||||
Amgen, Inc. | 2,956 | 503,939 | ||||||
Andeavor | 1,878 | 188,852 | ||||||
Annaly Capital Management, Inc. REIT | 51,394 | 536,039 | ||||||
Anthem, Inc. | 2,659 | 584,182 | ||||||
Anworth Mortgage Asset Corp. REIT | 10,022 | 48,106 | ||||||
Apollo Commercial Real Estate Finance, Inc. REIT | 2,507 | 45,076 | ||||||
Apollo Investment Corp. | 906 | 4,729 | ||||||
Apple, Inc. | 12,464 | 2,091,210 | ||||||
Applied Materials, Inc. | 6,269 | 348,619 | ||||||
Ares Commercial Real Estate Corp. REIT | 1,967 | 24,292 | ||||||
ARMOUR Residential REIT, Inc. | 1,450 | 33,756 | ||||||
Arrow Electronics, Inc. (g) | 1,380 | 106,288 | ||||||
ASGN, Inc. (g) | 64 | 5,240 | ||||||
AT&T, Inc. | 45,248 | 1,613,091 | ||||||
Athene Holding Ltd., Class A (g) | 5,968 | 285,330 | ||||||
Atmos Energy Corp. | 946 | 79,691 | ||||||
Automatic Data Processing, Inc. | 4,406 | 499,993 | ||||||
AutoZone, Inc. (g) | 268 | 173,849 | ||||||
AvalonBay Communities, Inc. REIT | 564 | 92,755 | ||||||
Avery Dennison Corp. | 727 | 77,244 | ||||||
Bank of America Corp. | 38,215 | 1,146,068 | ||||||
| 150 | Semiannual Report | | March 31, 2018 | | See accompanying Notes to Financial Statements |
Table of Contents
Schedule of Investments
March 31, 2018 (Unaudited)
| Shares | Value | |||||||
Bank of New York Mellon Corp. | 5,506 | $ | 283,724 | |||||
Baxter International, Inc. | 8,566 | 557,133 | ||||||
Becton Dickinson and Co. | 1,852 | 401,328 | ||||||
Bemis Co., Inc. | 10 | 435 | ||||||
Berkshire Hathaway, Inc., Class B (g) | 84 | 16,756 | ||||||
Berry Global Group, Inc. (g) | 1,229 | 67,362 | ||||||
Best Buy Co., Inc. | 3,087 | 216,059 | ||||||
BGC Partners, Inc., Class A | 9,935 | 133,626 | ||||||
Bio-Techne Corp. | 909 | 137,295 | ||||||
BlackRock, Inc. | 460 | 249,191 | ||||||
Blackstone Mortgage Trust, Inc., Class A REIT | 1,958 | 61,520 | ||||||
Blucora, Inc. (g) | 5,678 | 139,679 | ||||||
Boeing Co. | 2,310 | 757,403 | ||||||
BorgWarner, Inc. | 1,997 | 100,309 | ||||||
Bristol-Myers Squibb Co. | 3,458 | 218,719 | ||||||
Brixmor Property Group, Inc. REIT | 256 | 3,904 | ||||||
Broadcom Ltd. | 1,475 | 347,584 | ||||||
Broadridge Financial Solutions, Inc. | 1,241 | 136,125 | ||||||
Burlington Stores, Inc. (g) | 200 | 26,630 | ||||||
CA, Inc. | 6,635 | 224,927 | ||||||
Cambrex Corp. (g) | 115 | 6,015 | ||||||
Camping World Holdings, Inc., Class A | 1,996 | 64,371 | ||||||
Capitol Federal Financial, Inc. | 2,995 | 36,988 | ||||||
Capstead Mortgage Corp. REIT | 3,269 | 28,277 | ||||||
Caterpillar, Inc. | 2,176 | 320,699 | ||||||
Cavium, Inc. (g) | 83 | 6,589 | ||||||
Celanese Corp., Ser. A | 1,066 | 106,824 | ||||||
Centene Corp. (g) | 2,223 | 237,572 | ||||||
CenterPoint Energy, Inc. | 11,256 | 308,414 | ||||||
Central Garden & Pet Co., Class A (g) | 2,214 | 87,697 | ||||||
Charles River Laboratories International, Inc. (g) | 958 | 102,257 | ||||||
Chatham Lodging Trust REIT | 3,180 | 60,897 | ||||||
Chemours Co. | 2,485 | 121,044 | ||||||
Chevron Corp. | 7,056 | 804,666 | ||||||
Children’s Place, Inc. | 1,176 | 159,054 | ||||||
Chimera Investment Corp. REIT | 6,155 | 107,159 | ||||||
Chubb Ltd. | 600 | 82,062 | ||||||
Cigna Corp. | 1,282 | 215,043 | ||||||
Cisco Systems, Inc. | 23,764 | 1,019,238 | ||||||
Citigroup, Inc. | 10,653 | 719,078 | ||||||
Citizens Financial Group, Inc. | 5,033 | 211,285 | ||||||
Clorox Co. | 1,124 | 149,616 | ||||||
CME Group, Inc. | 917 | 148,316 | ||||||
CMS Energy Corp. | 2,036 | 92,210 | ||||||
CNA Financial Corp. | 777 | 38,345 | ||||||
Coca-Cola Co. | 6,591 | 286,247 | ||||||
Cognizant Technology Solutions Corp., Class A | 6,940 | 558,670 | ||||||
Colgate-Palmolive Co. | 1,107 | 79,350 | ||||||
Comcast Corp., Class A | 19,386 | 662,420 | ||||||
CONSOL Energy, Inc. (g) | 1,354 | 39,225 | ||||||
Consolidated Edison, Inc. | 4,648 | 362,265 | ||||||
Constellation Brands, Inc., Class A | 352 | 80,228 | ||||||
Cooper Cos., Inc. | 870 | 199,065 | ||||||
Cooper-Standard Holdings, Inc. (g) | 545 | 66,931 | ||||||
Copa Holdings S.A., Class A | 310 | 39,875 | ||||||
Crawford & Co., Class A | 6,758 | 54,199 | ||||||
Cummins, Inc. | 1,309 | 212,176 | ||||||
CVS Health Corp. | 12,857 | 799,834 | ||||||
CYS Investments, Inc. REIT | 6,392 | 42,954 | ||||||
Danaher Corp. | 3,779 | 370,002 | ||||||
Darden Restaurants, Inc. | 2,069 | 176,382 | ||||||
| Shares | Value | |||||||
Deciphera Pharmaceuticals, Inc. (g) | 1,084 | $ | 21,723 | |||||
Deere & Co. | 1,819 | 282,527 | ||||||
Dell Technologies, Inc., Class V (g) | 824 | 60,325 | ||||||
Delta Air Lines, Inc. | 1,842 | 100,960 | ||||||
Dime Community Bancshares, Inc. | 279 | 5,134 | ||||||
Dollar Tree, Inc. (g) | 1,495 | 141,876 | ||||||
Dominion Energy, Inc. | 60 | 4,046 | ||||||
Donegal Group, Inc., Class A | 1,812 | 28,630 | ||||||
DowDuPont, Inc. | 6,483 | 413,032 | ||||||
DTE Energy Co. | 923 | 96,361 | ||||||
Duke Energy Corp. | 4,707 | 364,651 | ||||||
DXC Technology Co. | 1,701 | 171,002 | ||||||
Dynex Capital, Inc. REIT | 23,450 | 155,474 | ||||||
E*TRADE Financial Corp. (g) | 2,028 | 112,371 | ||||||
Eastman Chemical Co. | 3,259 | 344,085 | ||||||
eBay, Inc. (g) | 6,808 | 273,954 | ||||||
Edison International | 3,772 | 240,126 | ||||||
Eli Lilly & Co. | 708 | 54,778 | ||||||
Ennis, Inc. | 1,258 | 24,783 | ||||||
Ensco PLC, Class A | 782 | 3,433 | ||||||
Entergy Corp. | 3,930 | 309,605 | ||||||
Enviva Partners L.P. | 505 | 13,837 | ||||||
Equinix, Inc. REIT | 7 | 2,927 | ||||||
Equity LifeStyle Properties, Inc. REIT | 982 | 86,190 | ||||||
Essent Group Ltd. (g) | 3,141 | 133,681 | ||||||
Essex Property Trust, Inc. REIT | 512 | 123,228 | ||||||
Estee Lauder Cos., Inc., Class A | 1,532 | 229,371 | ||||||
Everest Re Group Ltd. | 791 | 203,145 | ||||||
Exelon Corp. | 9,284 | 362,169 | ||||||
Express Scripts Holding Co. (g) | 1,493 | 103,136 | ||||||
Exxon Mobil Corp. | 13,913 | 1,038,049 | ||||||
Facebook, Inc., Class A (g) | 8,533 | 1,363,488 | ||||||
Federal Agricultural Mortgage Corp., Class C | 128 | 11,139 | ||||||
FedEx Corp. | 1,956 | 469,655 | ||||||
Fidelity National Information Services, Inc. | 2,426 | 233,624 | ||||||
First American Financial Corp. | 1,114 | 65,370 | ||||||
First NBC Bank Holding Co. (g) | 1,041 | 30 | ||||||
Ford Motor Co. | 31,120 | 344,810 | ||||||
FTI Consulting, Inc. (g) | 1,023 | 49,523 | ||||||
Gaming and Leisure Properties, Inc. | 2,266 | 75,843 | ||||||
Gap, Inc. | 2,802 | 87,422 | ||||||
Garmin Ltd. | 1,405 | 82,797 | ||||||
General Mills, Inc. | 2,300 | 103,638 | ||||||
General Motors Co. | 17,305 | 628,864 | ||||||
German American Bancorp, Inc. | 67 | 2,234 | ||||||
Gilead Sciences, Inc. | 300 | 22,617 | ||||||
Global Brass & Copper Holdings, Inc. | 1,340 | 44,823 | ||||||
Goldman Sachs Group, Inc. | 1,342 | 337,996 | ||||||
Granite Point Mortgage Trust, Inc. REIT | 160 | 2,646 | ||||||
Hamilton Beach Brands Holding Co., Class A | 2,937 | 62,323 | ||||||
Hartford Financial Services Group, Inc. | 1,785 | 91,963 | ||||||
Hawkins, Inc. | 2,038 | 71,636 | ||||||
Healthcare Services Group, Inc. | 825 | 35,871 | ||||||
Hershey Co. | 719 | 71,152 | ||||||
Hewlett Packard Enterprise Co. | 14,109 | 247,472 | ||||||
Hill-Rom Holdings, Inc. | 825 | 71,775 | ||||||
Home Depot, Inc. | 7,522 | 1,340,721 | ||||||
| Shares | Value | |||||||
Hooker Furniture Corp. | 1,061 | $ | 38,939 | |||||
Horizon Pharma PLC (g) | 462 | 6,560 | ||||||
HP, Inc. | 24,492 | 536,865 | ||||||
Humana, Inc. | 900 | 241,947 | ||||||
Huntington Ingalls Industries, Inc. | 78 | 20,105 | ||||||
Illumina, Inc. (g) | 920 | 217,506 | ||||||
Ingredion, Inc. | 3,846 | 495,826 | ||||||
Insight Enterprises, Inc. (g) | 12 | 419 | ||||||
Intel Corp. | 25,673 | 1,337,050 | ||||||
Intuitive Surgical, Inc. (g) | 2,028 | 837,219 | ||||||
Invesco Ltd. | 257 | 8,227 | ||||||
Invesco Mortgage Capital, Inc. REIT | 7,215 | 118,182 | ||||||
IQVIA Holdings, Inc. (g) | 1,462 | 143,437 | ||||||
Jacobs Engineering Group, Inc. | 1,483 | 87,719 | ||||||
Janus Henderson Group PLC | 3,902 | 129,117 | ||||||
JetBlue Airways Corp. (g) | 2,879 | 58,501 | ||||||
John B Sanfilippo & Son, Inc. | 57 | 3,299 | ||||||
Johnson & Johnson | 15,598 | 1,998,884 | ||||||
Jones Lang LaSalle, Inc. | 870 | 151,937 | ||||||
JPMorgan Chase & Co. | 12,894 | 1,417,953 | ||||||
Kansas City Southern | 1,518 | 166,752 | ||||||
Kellogg Co. | 315 | 20,478 | ||||||
Kimberly-Clark Corp. | 1,387 | 152,750 | ||||||
Kohl’s Corp. | 1,559 | 102,130 | ||||||
Korn/Ferry International | 801 | 41,324 | ||||||
Laboratory Corp. of America Holdings (g) | 3,298 | 533,452 | ||||||
Lam Research Corp. | 2,423 | 492,257 | ||||||
Lamb Weston Holdings, Inc. | 2,427 | 141,300 | ||||||
Las Vegas Sands Corp. | 2,950 | 212,105 | ||||||
Lear Corp. | 957 | 178,088 | ||||||
Legg Mason, Inc. | 3,402 | 138,291 | ||||||
Leidos Holdings, Inc. | 2,391 | 156,371 | ||||||
Lennar Corp., Class A | 1,997 | 117,703 | ||||||
Leucadia National Corp. | 3,905 | 88,761 | ||||||
LHC Group, Inc. (g) | 1,919 | 118,134 | ||||||
Lincoln National Corp. | 2,695 | 196,897 | ||||||
Macy’s, Inc. | 5,102 | 151,733 | ||||||
Manhattan Associates, Inc. (g) | 85 | 3,560 | ||||||
ManpowerGroup, Inc. | 1,261 | 145,141 | ||||||
Marathon Petroleum Corp. | 3,265 | 238,704 | ||||||
Marsh & McLennan Cos., Inc. | 647 | 53,436 | ||||||
Masimo Corp. (g) | 867 | 76,253 | ||||||
Mastercard, Inc., Class A | 4,071 | 713,076 | ||||||
Maxim Integrated Products, Inc. | 1,905 | 114,719 | ||||||
MCBC Holdings, Inc. (g) | 2,622 | 66,074 | ||||||
McDonald’s Corp. | 7,550 | 1,180,669 | ||||||
McKesson Corp. | 2,516 | 354,429 | ||||||
MDC Holdings, Inc. | 2,375 | 66,310 | ||||||
MedEquities Realty Trust, Inc. REIT | 2,912 | 30,605 | ||||||
Mercer International, Inc. | 4,271 | 53,174 | ||||||
Merck & Co., Inc. | 11,730 | 638,933 | ||||||
Merit Medical Systems, Inc. (g) | 1,530 | 69,386 | ||||||
Mettler-Toledo International, Inc. (g) | 569 | 327,192 | ||||||
MFA Financial, Inc. REIT | 7,896 | 59,457 | ||||||
Micron Technology, Inc. (g) | 6,541 | 341,048 | ||||||
Microsoft Corp. | 18,717 | 1,708,301 | ||||||
Mid-America Apartment Communities, Inc. REIT | 709 | 64,689 | ||||||
MKS Instruments, Inc. | 679 | 78,526 | ||||||
Mohawk Industries, Inc. (g) | 327 | 75,936 | ||||||
Molson Coors Brewing Co., Class B | 3,062 | 230,660 | ||||||
Mondelez International, Inc., Class A | 8,366 | 349,113 | ||||||
Morgan Stanley | 6,504 | 350,956 | ||||||
Morningstar, Inc. | 74 | 7,068 | ||||||
| See accompanying Notes to Financial Statements | | March 31, 2018 | | Semiannual Report | 151 |
Table of Contents
Schedule of Investments
March 31, 2018 (Unaudited)
| Shares | Value | |||||||
Motorola Solutions, Inc. | 1,075 | $ | 113,198 | |||||
MTGE Investment Corp. REIT | 2,661 | 47,632 | ||||||
New Residential Investment Corp. REIT | 2,868 | 47,179 | ||||||
Nexeo Solutions, Inc. (g) | 14,264 | 152,625 | ||||||
NextEra Energy, Inc. | 1,985 | 324,210 | ||||||
Northfield Bancorp, Inc. | 664 | 10,365 | ||||||
Northrop Grumman Corp. | 1,796 | 627,020 | ||||||
NVIDIA Corp. | 2,259 | 523,162 | ||||||
NVR, Inc. (g) | 12 | 33,600 | ||||||
ON Semiconductor Corp. (g) | 5,798 | 141,819 | ||||||
Oracle Corp. | 17,838 | 816,089 | ||||||
Orchid Island Capital, Inc. REIT | 5,444 | 40,122 | ||||||
Oritani Financial Corp. | 1,427 | 21,904 | ||||||
Orthofix International NV (g) | 956 | 56,194 | ||||||
Oshkosh Corp. | 509 | 39,330 | ||||||
Owens Corning | 1,694 | 136,198 | ||||||
PACCAR, Inc. | 3,099 | 205,061 | ||||||
Park Hotels & Resorts, Inc. REIT | 1,392 | 37,612 | ||||||
Parker-Hannifin Corp. | 764 | 130,667 | ||||||
Paychex, Inc. | 1,539 | 94,787 | ||||||
PBF Energy, Inc., Class A | 1,227 | 41,595 | ||||||
Penn Virginia Corp. (g) | 3,309 | 115,947 | ||||||
PepsiCo, Inc. | 11,939 | 1,303,142 | ||||||
PerkinElmer, Inc. | 539 | 40,813 | ||||||
PetMed Express, Inc. | 1,091 | 45,549 | ||||||
Pfizer, Inc. | 24,157 | 857,332 | ||||||
PG&E Corp. | 5,852 | 257,078 | ||||||
Phibro Animal Health Corp., Class A | 1,042 | 41,367 | ||||||
Phillips 66 | 1,933 | 185,413 | ||||||
Pinnacle Foods, Inc. | 3,540 | 191,514 | ||||||
Pinnacle West Capital Corp. | 923 | 73,655 | ||||||
PNC Financial Services Group, Inc. | 3,903 | 590,290 | ||||||
PPL Corp. | 3,802 | 107,559 | ||||||
Principal Financial Group, Inc. | 2,709 | 165,005 | ||||||
Procter & Gamble Co. | 14,388 | 1,140,681 | ||||||
Progressive Corp. | 6,486 | 395,192 | ||||||
Prudential Financial, Inc. | 2,376 | 246,035 | ||||||
PVH Corp. | 1,167 | 176,719 | ||||||
QCR Holdings, Inc. | 544 | 24,398 | ||||||
Quest Diagnostics, Inc. | 2,463 | 247,039 | ||||||
Raymond James Financial, Inc. | 1,765 | 157,809 | ||||||
Regeneron Pharmaceuticals, Inc. (g) | 589 | 202,828 | ||||||
Reinsurance Group of America, Inc. | 2,065 | 318,010 | ||||||
Reliance Steel & Aluminum Co. | 554 | 47,500 | ||||||
Republic Services, Inc. | 5,066 | 335,521 | ||||||
Royal Caribbean Cruises Ltd. | 2,024 | 238,306 | ||||||
Rudolph Technologies, Inc. (g) | 2,029 | 56,203 | ||||||
S&P Global, Inc. | 636 | 121,514 | ||||||
Sanderson Farms, Inc. | 1,042 | 124,019 | ||||||
Santander Consumer USA Holdings, Inc. | 369 | 6,015 | ||||||
Schweitzer-Mauduit International, Inc. | 1,649 | 64,558 | ||||||
Seaboard Corp. | 15 | 63,975 | ||||||
SMART Global Holdings, Inc. (g) | 1,023 | 50,986 | ||||||
Southern Co. | 4,655 | 207,892 | ||||||
Southwest Airlines Co. | 1,159 | 66,388 | ||||||
SP Plus Corp. (g) | 1,089 | 38,768 | ||||||
Speedway Motorsports, Inc. | 3,832 | 68,286 | ||||||
Spirit AeroSystems Holdings, Inc., Class A | 1,912 | 160,034 | ||||||
| Shares | Value | |||||||
Stanley Black & Decker, Inc. | 3,441 | $ | 527,161 | |||||
State Street Corp. | 2,320 | 231,374 | ||||||
Stoneridge, Inc. (g) | 2,765 | 76,314 | ||||||
Stryker Corp. | 2,626 | 422,576 | ||||||
SunTrust Banks, Inc. | 2,202 | 149,824 | ||||||
Superior Industries International, Inc. | 4,722 | 62,803 | ||||||
Sutherland Asset Management Corp. REIT | 2,721 | 41,223 | ||||||
Sykes Enterprises, Inc. (g) | 1,758 | 50,877 | ||||||
SYNNEX Corp. | 333 | 39,427 | ||||||
Sysco Corp. | 3,668 | 219,933 | ||||||
T-Mobile U.S., Inc. (g) | 899 | 54,875 | ||||||
Target Corp. | 12,663 | 879,192 | ||||||
Teleflex, Inc. | 900 | 229,482 | ||||||
Tenneco, Inc. | 1,049 | 57,559 | ||||||
Teradyne, Inc. | 827 | 37,802 | ||||||
Texas Instruments, Inc. | 9,108 | 946,230 | ||||||
Thermo Fisher Scientific, Inc. | 2,238 | 462,057 | ||||||
Thor Industries, Inc. | 991 | 114,133 | ||||||
Time Warner, Inc. | 3,895 | 368,389 | ||||||
Toll Brothers, Inc. | 2,023 | 87,495 | ||||||
Total System Services, Inc. | 1,969 | 169,846 | ||||||
Tower International, Inc. | 2,305 | 63,964 | ||||||
TransUnion (g) | 2,719 | 154,385 | ||||||
Travelers Cos., Inc. | 1,750 | 243,005 | ||||||
Two Harbors Investment Corp. REIT | 4,120 | 63,324 | ||||||
Tyson Foods, Inc., Class A | 5,297 | 387,687 | ||||||
UnitedHealth Group, Inc. | 6,057 | 1,296,198 | ||||||
Unum Group | 7,687 | 365,978 | ||||||
Vail Resorts, Inc. | 393 | 87,128 | ||||||
Valero Energy Corp. | 4,650 | 431,381 | ||||||
Venator Materials PLC (g) | 2,225 | 40,250 | ||||||
Verizon Communications, Inc. | 19,277 | 921,826 | ||||||
Versum Materials, Inc. | 1,038 | 39,060 | ||||||
Visa, Inc., Class A | 540 | 64,595 | ||||||
Vishay Intertechnology, Inc. | 3,818 | 71,015 | ||||||
Walmart, Inc. | 9,893 | 880,180 | ||||||
Waste Management, Inc. | 9,954 | 837,330 | ||||||
Waterstone Financial, Inc. | 720 | 12,456 | ||||||
WEC Energy Group, Inc. | 4,633 | 290,489 | ||||||
Weight Watchers International, Inc. (g) | 995 | 63,401 | ||||||
Weis Markets, Inc. | 969 | 39,710 | ||||||
WellCare Health Plans, Inc. (g) | 355 | 68,739 | ||||||
Wells Fargo & Co. | 8,559 | 448,577 | ||||||
Werner Enterprises, Inc. | 1,726 | 62,999 | ||||||
Westar Energy, Inc. | 1,711 | 89,982 | ||||||
Western Asset Mortgage Capital Corp. REIT | 4,189 | 40,591 | ||||||
Western Digital Corp. | 1,276 | 117,737 | ||||||
Windstream Holdings, Inc. | 1,474 | 2,078 | ||||||
Wynn Resorts Ltd. | 579 | 105,586 | ||||||
Xcel Energy, Inc. | 6,566 | 298,622 | ||||||
Xcerra Corp. (g) | 5,732 | 66,778 | ||||||
Xenia Hotels & Resorts, Inc. REIT | 2,025 | 39,933 | ||||||
Xerox Corp. | 2,807 | 80,785 | ||||||
Xylem, Inc. | 1,231 | 94,689 | ||||||
Zebra Technologies Corp., Class A (g) | 474 | 65,976 | ||||||
Zoetis, Inc. | 2,922 | 244,016 | ||||||
|
| |||||||
| 86,434,599 | ||||||||
|
| |||||||
| Total Common Stock (cost—$142,792,853) | 162,219,105 | |||||||
|
| |||||||
| Principal Amount (000s) | Value | |||||||
| Corporate Bonds & Notes—13.5% | ||||||||
| Australia—0.1% | ||||||||
Westpac Banking Corp., | ||||||||
2.80%, 1/11/22 | $100 | $ | 98,686 | |||||
3.40%, 1/25/28 | 250 | 243,002 | ||||||
|
| |||||||
| 341,688 | ||||||||
|
| |||||||
| Canada—1.4% | ||||||||
Bank of Montreal, |
| |||||||
1.90%, 8/27/21 | 400 | 384,294 | ||||||
2.10%, 6/15/20 | 350 | 343,369 | ||||||
Bank of Nova Scotia, | ||||||||
1.85%, 4/14/20 | 1,000 | 981,786 | ||||||
1.875%, 4/26/21 | 98 | 95,120 | ||||||
2.15%, 7/14/20 | 350 | 343,769 | ||||||
Potash Corp. of Saskatchewan, Inc., |
| |||||||
4.00%, 12/15/26 | 100 | 100,114 | ||||||
Royal Bank of Canada, | ||||||||
1.875%, 2/5/20 | 39 | 38,465 | ||||||
2.125%, 3/2/20 | 300 | 295,478 | ||||||
2.30%, 3/22/21 | 300 | 295,171 | ||||||
Toronto-Dominion Bank, |
| |||||||
1.80%, 7/13/21 | 400 | 384,021 | ||||||
1.90%, 10/24/19 | 350 | 345,548 | ||||||
2.25%, 3/15/21 (a)(b) | 200 | 196,541 | ||||||
|
| |||||||
| 3,803,676 | ||||||||
|
| |||||||
| China—0.1% | ||||||||
CNOOC Nexen Finance 2014 ULC, |
| |||||||
4.25%, 4/30/24 | 300 | 304,983 | ||||||
|
| |||||||
| France—0.3% | ||||||||
Electricite de France S.A. (a)(b), |
| |||||||
4.875%, 1/22/44 | 100 | 107,371 | ||||||
Orange S.A., | ||||||||
1.625%, 11/3/19 | 350 | 342,926 | ||||||
Total Capital International S.A., |
| |||||||
2.10%, 6/19/19 | 350 | 347,756 | ||||||
|
| |||||||
| 798,053 | ||||||||
|
| |||||||
| Germany—0.7% | ||||||||
Daimler Finance North America LLC (a)(b), |
| |||||||
2.30%, 2/12/21 | 350 | 341,551 | ||||||
Deutsche Bank AG, | ||||||||
2.85%, 5/10/19 | 350 | 348,856 | ||||||
KFW, | ||||||||
1.25%, 9/30/19 | 400 | 393,410 | ||||||
1.50%, 4/20/20 | 550 | 539,130 | ||||||
Landwirtschaftliche Rentenbank, Ser. 37, |
| |||||||
2.50%, 11/15/27 | 200 | 192,965 | ||||||
|
| |||||||
| 1,815,912 | ||||||||
|
| |||||||
| Korea (Republic of)—0.1% | ||||||||
Kia Motors Corp. (a)(b), | ||||||||
3.50%, 10/25/27 | 350 | 333,238 | ||||||
|
| |||||||
| Netherlands—0.1% | ||||||||
Shell International Finance BV, |
| |||||||
2.125%, 5/11/20 | 350 | 344,652 | ||||||
|
| |||||||
| New Zealand—0.1% | ||||||||
BNZ International Funding Ltd. (a)(b), |
| |||||||
3.375%, 3/1/23 | 250 | 248,110 | ||||||
|
| |||||||
| Norway—0.1% | ||||||||
Statoil ASA, | ||||||||
2.65%, 1/15/24 | 200 | 193,081 | ||||||
|
| |||||||
| Spain—0.1% | ||||||||
Banco Bilbao Vizcaya Argentaria S.A., |
| |||||||
3.00%, 10/20/20 | 400 | 397,341 | ||||||
|
| |||||||
| Switzerland—0.4% | ||||||||
Credit Suisse AG, |
| |||||||
2.30%, 5/28/19 | 350 | 348,132 | ||||||
| 152 | Semiannual Report | | March 31, 2018 | | See accompanying Notes to Financial Statements |
Table of Contents
Schedule of Investments
March 31, 2018 (Unaudited)
| Principal Amount (000s) | Value | |||||||
Glencore Funding LLC (a)(b), |
| |||||||
3.00%, 10/27/22 | $ | 350 | $ | 338,144 | ||||
Novartis Capital Corp., |
| |||||||
1.80%, 2/14/20 | 300 | 295,307 | ||||||
Tyco Electronics Group S.A., |
| |||||||
3.45%, 8/1/24 | 200 | 201,146 | ||||||
|
| |||||||
| 1,182,729 | ||||||||
|
| |||||||
| United Kingdom—0.8% | ||||||||
Barclays PLC, |
| |||||||
2.75%, 11/8/19 | 350 | 347,783 | ||||||
4.375%, 1/12/26 | 400 | 402,259 | ||||||
4.95%, 1/10/47 | 200 | 205,317 | ||||||
BP Capital Markets PLC, |
| |||||||
1.768%, 9/19/19 | 350 | 345,204 | ||||||
2.237%, 5/10/19 | 350 | 348,521 | ||||||
2.315%, 2/13/20 | 300 | 296,948 | ||||||
Unilever Capital Corp., |
| |||||||
1.80%, 5/5/20 | 350 | 343,669 | ||||||
|
| |||||||
| 2,289,701 | ||||||||
|
| |||||||
| United States—9.2% | ||||||||
Abbott Laboratories, |
| |||||||
2.35%, 11/22/19 | 221 | 219,391 | ||||||
4.90%, 11/30/46 | 250 | 276,341 | ||||||
Allstate Corp., |
| |||||||
3.28%, 12/15/26 | 400 | 391,873 | ||||||
American Honda Finance Corp., |
| |||||||
1.95%, 7/20/20 | 200 | 196,021 | ||||||
2.00%, 2/14/20 | 300 | 295,588 | ||||||
2.60%, 11/16/22 | 150 | 147,046 | ||||||
Apple, Inc., |
| |||||||
1.90%, 2/7/20 | 350 | 345,828 | ||||||
3.85%, 8/4/46 | 200 | 195,968 | ||||||
AT&T, Inc., |
| |||||||
5.15%, 2/14/50 | 100 | 100,987 | ||||||
Bank of America Corp., |
| |||||||
2.65%, 4/1/19, Ser. L | 350 | 350,012 | ||||||
5.625%, 7/1/20 | 300 | 316,579 | ||||||
Bank of New York Mellon Corp., |
| |||||||
2.60%, 2/7/22 | 300 | 294,485 | ||||||
Booking Holdings, Inc., |
| |||||||
3.55%, 3/15/28 | 200 | 193,831 | ||||||
Bristol-Myers Squibb Co., |
| |||||||
1.60%, 2/27/19 | 350 | 347,114 | ||||||
Cargill, Inc. (a)(b), |
| |||||||
3.25%, 3/1/23 | 50 | 50,038 | ||||||
Caterpillar Financial Services Corp., |
| |||||||
2.10%, 1/10/20 | 350 | 346,011 | ||||||
CBS Corp. (a)(b), |
| |||||||
3.70%, 6/1/28 | 350 | 334,249 | ||||||
Citigroup, Inc., |
| |||||||
2.45%, 1/10/20 | 500 | 495,233 | ||||||
8.125%, 7/15/39 | 400 | 607,586 | ||||||
CNH Industrial Capital LLC, |
| |||||||
4.875%, 4/1/21 | 350 | 360,949 | ||||||
Coca-Cola Co., |
| |||||||
1.375%, 5/30/19 | 350 | 345,761 | ||||||
Colgate-Palmolive Co., |
| |||||||
2.25%, 11/15/22 | 150 | 145,421 | ||||||
3.70%, 8/1/47 | 200 | 191,664 | ||||||
Comcast Corp., |
| |||||||
2.75%, 3/1/23 | 400 | 389,352 | ||||||
Commonwealth Edison Co., |
| |||||||
2.55%, 6/15/26 | 400 | 374,105 | ||||||
CRH America Finance, Inc. (a)(b), |
| |||||||
3.95%, 4/4/28 | 200 | 200,201 | ||||||
CSX Corp., |
| |||||||
2.60%, 11/1/26 | 350 | 320,606 | ||||||
CVS Health Corp., |
| |||||||
4.10%, 3/25/25 | 350 | 352,988 | ||||||
| Principal Amount (000s) | Value | |||||||
Discovery Communications LLC, |
| |||||||
3.80%, 3/13/24 | $ | 200 | $ | 198,424 | ||||
Dow Chemical Co., |
| |||||||
7.375%, 11/1/29 | 400 | 522,928 | ||||||
Dr. Pepper Snapple Group, Inc., |
| |||||||
4.42%, 12/15/46 | 300 | 282,070 | ||||||
Duke Energy Carolinas LLC, |
| |||||||
2.50%, 3/15/23 | 100 | 97,450 | ||||||
Ecolab, Inc., |
| |||||||
2.375%, 8/10/22 | 100 | 96,939 | ||||||
FedEx Corp., |
| |||||||
3.40%, 2/15/28 | 150 | 146,110 | ||||||
4.10%, 4/15/43 | 400 | 385,222 | ||||||
4.55%, 4/1/46 | 300 | 305,027 | ||||||
Fifth Third Bancorp, |
| |||||||
2.60%, 6/15/22 | 350 | 339,718 | ||||||
Florida Power & Light Co., |
| |||||||
3.70%, 12/1/47 | 100 | 97,971 | ||||||
3.95%, 3/1/48 | 150 | 152,916 | ||||||
Ford Motor Co., |
| |||||||
5.291%, 12/8/46 | 200 | 195,723 | ||||||
Ford Motor Credit Co. LLC, |
| |||||||
2.681%, 1/9/20 | 350 | 346,690 | ||||||
General Electric Co., |
| |||||||
5.50%, 1/8/20 | 300 | 311,577 | ||||||
General Mills, Inc., |
| |||||||
2.60%, 10/12/22 | 150 | 144,189 | ||||||
General Motors Co., |
| |||||||
5.15%, 4/1/38 | 150 | 149,629 | ||||||
General Motors Financial Co., Inc., |
| |||||||
2.35%, 10/4/19 | 350 | 346,541 | ||||||
2.65%, 4/13/20 | 350 | 345,764 | ||||||
Georgia Power Co., Ser. C, |
| |||||||
2.00%, 9/8/20 | 200 | 195,867 | ||||||
Gilead Sciences, Inc., |
| |||||||
1.85%, 9/20/19 | 200 | 197,584 | ||||||
Goldman Sachs Group, Inc., |
| |||||||
2.55%, 10/23/19 | 400 | 398,186 | ||||||
6.00%, 6/15/20, Ser. D | 300 | 317,974 | ||||||
Home Depot, Inc., |
| |||||||
2.00%, 4/1/21 | 200 | 195,181 | ||||||
Honeywell International, Inc., |
| |||||||
1.80%, 10/30/19 | 350 | 345,668 | ||||||
International Business Machines Corp., |
| |||||||
1.80%, 5/17/19 | 500 | 496,025 | ||||||
1.90%, 1/27/20 | 350 | 345,114 | ||||||
International Paper Co., |
| |||||||
4.35%, 8/15/48 | 100 | 94,926 | ||||||
John Deere Capital Corp., |
| |||||||
1.95%, 6/22/20 | 250 | 245,119 | ||||||
2.65%, 6/24/24 | 200 | 192,316 | ||||||
3.05%, 1/6/28 | 350 | 336,165 | ||||||
Johnson & Johnson, |
| |||||||
1.95%, 11/10/20 | 100 | 98,333 | ||||||
JPMorgan Chase & Co., |
| |||||||
3.625%, 5/13/24 | 400 | 399,133 | ||||||
4.40%, 7/22/20 | 300 | 309,162 | ||||||
6.30%, 4/23/19 | 200 | 207,535 | ||||||
Kellogg Co., |
| |||||||
3.40%, 11/15/27 | 250 | 238,554 | ||||||
Kinder Morgan, Inc., |
| |||||||
3.15%, 1/15/23 | 350 | 340,177 | ||||||
Kraft Heinz Foods Co., |
| |||||||
5.375%, 2/10/20 | 350 | 364,555 | ||||||
Kroger Co., |
| |||||||
3.70%, 8/1/27 | 100 | 97,155 | ||||||
4.65%, 1/15/48 | 150 | 145,883 | ||||||
Merck & Co., Inc., |
| |||||||
1.85%, 2/10/20 | 350 | 345,450 | ||||||
Morgan Stanley, |
| |||||||
2.50%, 4/21/21 | 400 | 391,495 | ||||||
| Principal Amount (000s) | Value | |||||||
2.80%, 6/16/20 | $ | 350 | $ | 348,052 | ||||
3.625%, 1/20/27 | 200 | 196,062 | ||||||
4.375%, 1/22/47 | 100 | 102,446 | ||||||
Northrop Grumman Corp., |
| |||||||
2.08%, 10/15/20 | 350 | 342,530 | ||||||
Oracle Corp., |
| |||||||
2.625%, 2/15/23 | 350 | 341,934 | ||||||
3.85%, 7/15/36 | 200 | 198,886 | ||||||
PACCAR Financial Corp., |
| |||||||
2.30%, 8/10/22 | 100 | 96,964 | ||||||
Pacific Gas & Electric Co., |
| |||||||
4.00%, 12/1/46 | 300 | 281,406 | ||||||
PepsiCo, Inc., |
| |||||||
1.55%, 5/2/19 | 350 | 346,701 | ||||||
Pfizer, Inc., |
| |||||||
1.70%, 12/15/19 | 350 | 345,357 | ||||||
Philip Morris International, Inc., |
| |||||||
2.00%, 2/21/20 | 300 | 295,657 | ||||||
2.125%, 5/10/23 | 100 | 94,091 | ||||||
2.375%, 8/17/22 | 200 | 192,903 | ||||||
Phillips 66, |
| |||||||
4.875%, 11/15/44 | 150 | 159,513 | ||||||
Procter & Gamble Co., |
| |||||||
1.90%, 10/23/20 | 100 | 98,281 | ||||||
State Street Corp., |
| |||||||
2.55%, 8/18/20 | 350 | 348,219 | ||||||
Target Corp., |
| |||||||
2.30%, 6/26/19 | 350 | 349,322 | ||||||
Thermo Fisher Scientific, Inc., |
| |||||||
4.10%, 8/15/47 | 150 | 146,006 | ||||||
Toyota Motor Credit Corp., |
| |||||||
1.90%, 4/8/21 | 200 | 194,398 | ||||||
1.95%, 4/17/20 | 350 | 344,817 | ||||||
United Parcel Service, Inc., |
| |||||||
2.05%, 4/1/21 | 350 | 342,388 | ||||||
United Technologies Corp., |
| |||||||
1.90%, 5/4/20 | 350 | 343,171 | ||||||
Verizon Communications, Inc., |
| |||||||
4.125%, 8/15/46 | 200 | 181,100 | ||||||
Walt Disney Co., |
| |||||||
2.30%, 2/12/21 | 250 | 246,517 | ||||||
Wells Fargo & Co., |
| |||||||
2.125%, 4/22/19 | 200 | 198,725 | ||||||
3.00%, 2/19/25 | 150 | 143,037 | ||||||
Wells Fargo Bank N.A., |
| |||||||
2.15%, 12/6/19 | 500 | 494,630 | ||||||
|
| |||||||
| 25,720,786 | ||||||||
|
| |||||||
| Total Corporate Bonds & Notes (cost—$38,575,273) | 37,773,950 | |||||||
|
| |||||||
| Shares | ||||||||
| Exchange-Traded Funds—13.2% | ||||||||
iShares JPMorgan USD Emerging Markets Bond | 25,455 | 2,871,833 | ||||||
PowerShares DB Oil (g) | 268,432 | 2,998,385 | ||||||
PowerShares DB Precious Metals (g) | 148,904 | 5,755,140 | ||||||
PowerShares Senior Loan Portfolio | 485,390 | 11,227,071 | ||||||
Vanguard FTSE All World ex-U.S. Small-Cap | 117,847 | 14,052,076 | ||||||
|
| |||||||
| Total Exchange-Traded Funds (cost—$36,904,154) | 36,904,505 | |||||||
|
| |||||||
| See accompanying Notes to Financial Statements | | March 31, 2018 | | Semiannual Report | 153 |
Table of Contents
3
Schedule of Investments
March 31, 2018 (Unaudited)
| Principal Amount (000s) | Value | |||||||
| U.S. Treasury Obligations—9.0% | ||||||||
U.S. Treasury Bonds, | ||||||||
2.25%, 8/15/46 | $530 | $ | 456,173 | |||||
2.75%, 11/15/47 | 290 | 277,086 | ||||||
3.125%, 2/15/43 | 1,386 | 1,428,446 | ||||||
4.375%, 5/15/41 | 1,341 | 1,669,231 | ||||||
4.50%, 2/15/36 | 500 | 618,047 | ||||||
5.25%, 2/15/29 | 240 | 296,063 | ||||||
6.875%, 8/15/25 | 375 | 480,234 | ||||||
U.S. Treasury Notes, | ||||||||
1.00%, 9/15/18 | 5,000 | 4,980,469 | ||||||
1.00%, 6/30/19 | 5,600 | 5,518,187 | ||||||
1.125%, 9/30/21 | 2,000 | 1,910,937 | ||||||
1.375%, 9/30/23 | 2,400 | 2,249,813 | ||||||
1.50%, 8/15/26 | 450 | 408,656 | ||||||
1.75%, 11/30/19 | 800 | 793,625 | ||||||
2.00%, 7/31/22 | 1,900 | 1,860,070 | ||||||
2.125%, 1/31/21 | 1,300 | 1,290,859 | ||||||
2.125%, 9/30/24 | 1,000 | 967,891 | ||||||
2.25%, 11/15/27 | 100 | 95,828 | ||||||
|
| |||||||
| Total U.S. Treasury Obligations (cost—$25,762,129) | 25,301,615 | |||||||
|
| |||||||
| U.S. Government Agency Securities (c)—6.9% | ||||||||
Fannie Mae, MBS, TBA | ||||||||
2.50%, 4/17/33, 15 Year | 560 | 548,452 | ||||||
3.00%, 4/17/33, 15 Year | 870 | 868,569 | ||||||
3.00%, 4/12/48, 30 Year | 1,800 | 1,754,179 | ||||||
3.50%, 4/17/33, 15 Year | 380 | 387,339 | ||||||
3.50%, 4/12/48, 30 Year | 2,250 | 2,253,368 | ||||||
4.00%, 4/12/48, 30 Year | 1,440 | 1,477,168 | ||||||
4.50%, 4/12/48, 30 Year | 590 | 617,658 | ||||||
5.00%, 4/12/48, 30 Year | 490 | 523,341 | ||||||
Freddie Mac, MBS, TBA | ||||||||
2.50%, 4/17/33, 15 Year | 380 | 371,946 | ||||||
3.00%, 4/17/33, 15 Year | 640 | 638,611 | ||||||
3.00%, 4/12/48, 30 Year | 1,240 | 1,208,059 | ||||||
3.50%, 4/17/33, 15 Year | 170 | 173,262 | ||||||
3.50%, 4/12/48, 30 Year | 1,490 | 1,492,643 | ||||||
4.00%, 4/12/48, 30 Year | 810 | 831,159 | ||||||
4.50%, 4/12/48, 30 Year | 370 | 387,316 | ||||||
5.00%, 4/12/48, 30 Year | 330 | 352,253 | ||||||
Ginnie Mae, MBS, TBA, 30 Year, |
| |||||||
3.00%, 4/19/48 | 1,620 | 1,592,732 | ||||||
3.50%, 4/19/48 | 2,200 | 2,220,290 | ||||||
4.00%, 4/19/48 | 980 | 1,007,058 | ||||||
4.50%, 4/19/48 | 690 | 717,239 | ||||||
|
| |||||||
| Total U.S. Government Agency Securities (cost—$19,308,684) | 19,422,642 | |||||||
|
| |||||||
| Sovereign Debt Obligations—3.5% | ||||||||
| Argentina—0.1% | ||||||||
Argentine Republic Government International Bond, | ||||||||
4.625%, 1/11/23 | 150 | 144,741 | ||||||
6.25%, 4/22/19 | 300 | 308,631 | ||||||
|
| |||||||
| 453,372 | ||||||||
|
| |||||||
| Canada—0.4% | ||||||||
Province of Alberta Canada, | ||||||||
1.90%, 12/6/19 | 350 | 346,462 | ||||||
Province of Ontario Canada, |
| |||||||
1.25%, 6/17/19 | 500 | 493,307 | ||||||
Province of Quebec Canada, |
| |||||||
2.875%, 10/16/24 | 200 | 198,507 | ||||||
|
| |||||||
| 1,038,276 | ||||||||
|
| |||||||
| Principal Amount (000s) | Value | |||||||
| Chile—0.1% | ||||||||
Chile Government International Bond, |
| |||||||
3.86%, 6/21/47 | $ | 200 | $ | 197,185 | ||||
|
| |||||||
| Colombia—0.1% | ||||||||
Colombia Government International Bond, |
| |||||||
5.00%, 6/15/45 | 200 | 203,026 | ||||||
|
| |||||||
| Croatia—0.1% | ||||||||
Croatia Government International Bond, |
| |||||||
6.75%, 11/5/19 | 300 | 318,159 | ||||||
|
| |||||||
| Germany—0.2% | ||||||||
FMS Wertmanagement AoeR, |
| |||||||
1.75%, 1/24/20 | 500 | 493,868 | ||||||
|
| |||||||
| Indonesia—0.1% | ||||||||
Indonesia Government International Bond, |
| |||||||
11.625%, 3/4/19 | 300 | 324,714 | ||||||
|
| |||||||
| Japan—0.2% | ||||||||
Japan Bank for International Cooperation, |
| |||||||
1.50%, 7/21/21 | 300 | 286,734 | ||||||
2.125%, 7/21/20 | 200 | 197,276 | ||||||
|
| |||||||
| 484,010 | ||||||||
|
| |||||||
| Korea (Republic of)—0.3% | ||||||||
Export-Import Bank of Korea, |
| |||||||
1.75%, 5/26/19 | 500 | 493,539 | ||||||
2.50%, 11/1/20 | 200 | 196,854 | ||||||
Korea Development Bank, | ||||||||
3.00%, 1/13/26 | 100 | 95,727 | ||||||
|
| |||||||
| 786,120 | ||||||||
|
| |||||||
| Latvia—0.2% | ||||||||
Latvia Government International Bond, |
| |||||||
2.75%, 1/12/20 | 500 | 498,766 | ||||||
|
| |||||||
| Mexico—0.2% | ||||||||
Mexico Government International Bond, |
| |||||||
4.125%, 1/21/26 | 300 | 305,029 | ||||||
4.60%, 2/10/48 | 200 | 190,680 | ||||||
|
| |||||||
| 495,709 | ||||||||
|
| |||||||
| Panama—0.1% | ||||||||
Panama Government International Bond, |
| |||||||
7.125%, 1/29/26 | 150 | 185,125 | ||||||
|
| |||||||
| Poland—0.2% | ||||||||
Poland Government International Bond, |
| |||||||
6.375%, 7/15/19 | 500 | 523,703 | ||||||
|
| |||||||
| Russian Federation—0.1% | ||||||||
Russian Federation Bond, |
| |||||||
4.50%, 4/4/22 | 400 | 413,031 | ||||||
|
| |||||||
| Supranational—1.0% | ||||||||
Corp. Andina de Fomento, |
| |||||||
2.20%, 7/18/20 | 350 | 345,387 | ||||||
Council of Europe Development Bank, |
| |||||||
1.625%, 3/16/21 | 500 | 486,345 | ||||||
European Bank for Reconstruction & Development, |
| |||||||
1.75%, 6/14/19 | 500 | 496,940 | ||||||
European Investment Bank, |
| |||||||
2.875%, 9/15/20 | 500 | 503,903 | ||||||
Inter-American Development Bank, |
| |||||||
3.20%, 8/7/42 | 180 | 180,993 | ||||||
International Finance Corp., |
| |||||||
1.75%, 9/16/19 | 500 | 495,886 | ||||||
Nordic Investment Bank, | ||||||||
1.25%, 8/2/21 | 500 | 477,859 | ||||||
|
| |||||||
| 2,987,313 | ||||||||
|
| |||||||
| Principal Amount (000s) | Value | |||||||
| Sweden—0.1% | ||||||||
Svensk Exportkredit AB, |
| |||||||
1.75%, 5/18/20 | $ | 350 | $ | 344,338 | ||||
|
| |||||||
| Total Sovereign Debt Obligations (cost—$9,927,696) | 9,746,715 | |||||||
|
| |||||||
| Shares | ||||||||
| Preferred Stock—0.3% | ||||||||
| Brazil—0.0% | ||||||||
Cia Paranaense de Energia | 4,300 | 33,968 | ||||||
|
| |||||||
| Colombia—0.0% | ||||||||
Avianca Holdings S.A. | 35,036 | 37,493 | ||||||
Banco Davivienda S.A. | 6,393 | 68,917 | ||||||
Grupo Aval Acciones y Valores S.A. | 9,215 | 3,842 | ||||||
|
| |||||||
| 110,252 | ||||||||
|
| |||||||
| Germany—0.1% | ||||||||
Henkel AG & Co. KGaA | 1,049 | 137,894 | ||||||
|
| |||||||
| Korea (Republic of)—0.2% | ||||||||
Samsung Electronics Co., Ltd. | 264 | 507,654 | ||||||
|
| |||||||
| Total Preferred Stock (cost—$609,198) | 789,768 | |||||||
|
| |||||||
| Rights (e)(f)(g)—0.0% | ||||||||
| United Kingdom—0.0% | ||||||||
Primary Health Properties PLC, expires 4/25/18 | 278 | 9 | ||||||
|
| |||||||
| United States—0.0% | ||||||||
Safeway CVR—PDC, expires 1/30/17 | 4,893 | 83 | ||||||
|
| |||||||
| Total Rights (cost—$156) | 92 | |||||||
|
| |||||||
| Principal Amount (000s) | ||||||||
| Repurchase Agreements—1.8% | ||||||||
State Street Bank and Trust Co., dated 3/29/18, 0.28%, due 4/2/18, proceeds $4,901,152; collateralized by U.S. Treasury Notes, 2.00%, due 8/15/25, valued at $4,999,319 including accrued interest |
| |||||||
(cost—$4,901,000) | $4,901 | 4,901,000 | ||||||
|
| |||||||
| Total Investments (cost—$278,781,143) (d)—106.2% | 297,059,392 | |||||||
|
| |||||||
| Liabilities in excess of other assets (h)—(6.2)% | (17,279,700 | ) | ||||||
|
| |||||||
| Net Assets—100.0% | $279,779,692 | |||||||
|
| |||||||
| 154 | Semiannual Report | | March 31, 2018 | | See accompanying Notes to Financial Statements |
Table of Contents
Schedule of Investments
March 31, 2018 (Unaudited)
Notes to Schedule of Investments:
(a) Private Placement—Restricted as to resale and may not have a readily available market. Securities with an aggregate value of $2,149,443, representing 0.8% of net assets.
(b) 144A—Exempt from registration under Rule 144A of the Securities Act of 1933. These securities may be resold in transactions exempt from registration, typically only to qualified institutional buyers. Securities with an aggregate value of $3,803,123, representing 1.4% of net assets.
(c) When-issued or delayed-delivery. To be settled/delivered after March 31, 2018.
(d) Securities with an aggregate value of $63,078,763, representing 22.5% of net assets, were valued utilizing modeling tools provided by a third-party vendor. See Note 1(a) and Note 1(b) in the Notes to Financial Statements.
(e) Fair-Valued—Securities with an aggregate value of $1,198,787, representing 0.4% of net assets. See Note 1(a) and Note 1(b) in the Notes to Financial Statements.
(f) Level 3 security. See Note 1(a) and Note 1(b) in the Notes to Financial Statements.
(g) Non-income producing.
(h) Includes net unrealized appreciation (depreciation) of other financial instruments as follows:
| Futures contracts outstanding at March 31, 2018: | ||||||||||||||||||||||
| Type | Contracts | Expiration Date | Notional Amount (000s) | Market Value (000s) | Unrealized Appreciation (Depreciation) | |||||||||||||||||
Long position contracts: | ||||||||||||||||||||||
5-Year U.S. Treasury Note | 128 | 6/29/18 | $ | 12,800 | $ | 14,651 | $ | 39,999 | ||||||||||||||
10-Year Ultra U.S. Treasury Bond | 156 | 6/20/18 | 15,600 | 20,258 | 123,388 | |||||||||||||||||
E-mini Russell 2000 Index | 182 | 6/15/18 | 9 | 13,934 | (459,328 | ) | ||||||||||||||||
E-mini S&P 500 Index | 62 | 6/15/18 | 3 | 8,193 | (210,815 | ) | ||||||||||||||||
Euro Currency | 38 | 6/18/18 | 4,750 | 5,870 | 2,736 | |||||||||||||||||
Hang Seng Index | 29 | 6/28/18 | HKD | 1 | 5,495 | (36,122 | ) | |||||||||||||||
Japanese Yen | 28 | 6/18/18 | $ | 35 | 3,305 | (13,900 | ) | |||||||||||||||
Mini MSCI Emerging Markets Index | 190 | 6/15/18 | 10 | 11,284 | (83,181 | ) | ||||||||||||||||
SPI 200 Index | 25 | 6/21/18 | AUD | 1 | 2,754 | (88,878 | ) | |||||||||||||||
TOPIX Index | 30 | 6/7/18 | JPY | 300 | 4,840 | 6,922 | ||||||||||||||||
|
| |||||||||||||||||||||
| $ | (719,179 | ) | ||||||||||||||||||||
|
| |||||||||||||||||||||
Short position contracts: | ||||||||||||||||||||||
2-Year U.S. Treasury Note | (63 | ) | 6/29/18 | $ | (12,600 | ) | $ | (13,394 | ) | $ | (9,949 | ) | ||||||||||
Euro STOXX 50 Index | (140 | ) | 6/15/18 | EUR | (1 | ) | (5,652 | ) | 33,359 | |||||||||||||
FTSE 100 Index | (59 | ) | 6/15/18 | GBP | (1 | ) | (5,789 | ) | 15,231 | |||||||||||||
|
| |||||||||||||||||||||
| $ | 38,641 | |||||||||||||||||||||
|
| |||||||||||||||||||||
| $ | (680,538 | ) | ||||||||||||||||||||
|
| |||||||||||||||||||||
(i) At March 31, 2018, the Fund pledged $1,734,399 in cash as collateral for futures contracts. The Fund also held U.S. Treasury Obligations valued at $109,317 as collateral for TBA securities. Securities held as collateral will not be pledged and are not reflected in the Schedule of Investments.
Glossary:
ADR—American Depositary Receipt
AUD—Australian Dollar
CVR—Contingent Value Rights
EUR—Euro
FTSE—Financial Times Stock Exchange
GBP—British Pound
GDR—Global Depositary Receipt
HKD—Hong Kong Dollar
JPY—Japanese Yen
MBS—Mortgage-Backed Securities
MSCI—Morgan Stanley Capital International
REIT—Real Estate Investment Trust
TBA—To Be Announced
TOPIX—Tokyo Stock Price Index
UNIT—More than one class of securities traded together.
| See accompanying Notes to Financial Statements | | March 31, 2018 | | Semiannual Report | 155 |
Table of Contents
Schedule of Investments
March 31, 2018 (Unaudited)
The industry classification of portfolio holdings and liabilities in excess of other assets shown as a percentage of net assets were as follows:
Exchange-Traded Funds | 13.2% | |||
U.S. Treasury Obligations | 9.0% | |||
Banks | 8.6% | |||
U.S. Government Agency Securities | 6.9% | |||
Oil, Gas & Consumable Fuels | 3.7% | |||
Sovereign Debt Obligations | 3.5% | |||
Insurance | 3.0% | |||
Pharmaceuticals | 3.0% | |||
Semiconductors & Semiconductor Equipment | 2.1% | |||
Diversified Telecommunication Services | 2.0% | |||
Technology Hardware, Storage & Peripherals | 2.0% | |||
Electric Utilities | 1.9% | |||
Banking | 1.9% | |||
Healthcare Providers & Services | 1.8% | |||
Internet Software & Services | 1.8% | |||
IT Services | 1.7% | |||
Healthcare Equipment & Supplies | 1.7% | |||
Software | 1.5% | |||
Food Products | 1.4% | |||
Automobiles | 1.4% | |||
Chemicals | 1.3% | |||
Capital Markets | 1.3% | |||
Machinery | 1.2% | |||
Food & Staples Retailing | 1.2% | |||
Hotels, Restaurants & Leisure | 1.2% | |||
Auto Manufacturers | 1.2% | |||
Metals & Mining | 1.1% | |||
Media | 1.1% | |||
Auto Components | 0.9% | |||
Specialty Retail | 0.9% | |||
Construction & Engineering | 0.9% | |||
Trading Companies & Distributors | 0.9% | |||
Aerospace & Defense | 0.8% | |||
Airlines | 0.8% | |||
Tobacco | 0.8% | |||
Beverages | 0.7% | |||
Equity Real Estate Investment Trusts (REITs) | 0.7% | |||
Mortgage Real Estate Investment Trusts (REITs) | 0.7% | |||
Food & Beverage | 0.7% | |||
Household Durables | 0.7% | |||
Electronic Equipment, Instruments & Components | 0.7% | |||
Biotechnology | 0.7% | |||
Life Sciences Tools & Services | 0.7% | |||
Household Products | 0.7% | |||
Commercial Services & Supplies | 0.6% | |||
Multi-Line Retail | 0.6% | |||
Real Estate Management & Development | 0.6% | |||
Multi-Utilities | 0.6% | |||
Transportation | 0.5% | |||
Wireless Telecommunication Services | 0.5% | |||
Communications Equipment | 0.5% | |||
Industrial Conglomerates | 0.4% | |||
Internet & Catalog Retail | 0.4% | |||
Paper & Forest Products | 0.4% | |||
Machinery-Diversified | 0.4% |
Computers | 0.3% | |||
Air Freight & Logistics | 0.3% | |||
Consumer Products | 0.3% | |||
Road & Rail | 0.3% | |||
Textiles, Apparel & Luxury Goods | 0.2% | |||
Diversified Financial Services | 0.2% | |||
Healthcare-Products | 0.2% | |||
Telecommunications | 0.2% | |||
Transportation Infrastructure | 0.2% | |||
Professional Services | 0.2% | |||
Electronics | 0.2% | |||
Retail | 0.2% | |||
Personal Products | 0.2% | |||
Electrical Equipment | 0.2% | |||
Independent Power Producers & Energy Traders | 0.2% | |||
Agriculture | 0.2% | |||
Construction Materials | 0.1% | |||
Machinery-Construction & Mining | 0.1% | |||
Pipelines | 0.1% | |||
Mining | 0.1% | |||
Leisure Equipment & Products | 0.1% | |||
Thrifts & Mortgage Finance | 0.1% | |||
Miscellaneous Manufacturing | 0.1% | |||
Building Products | 0.1% | |||
Containers & Packaging | 0.1% | |||
Building Materials | 0.1% | |||
Internet | 0.1% | |||
Gas Utilities | 0.1% | |||
Consumer Finance | 0.1% | |||
Water Utilities | 0.0% | |||
Commercial Services | 0.0% | |||
Marine | 0.0% | |||
Diversified Consumer Services | 0.0% | |||
Advertising | 0.0% | |||
Energy Equipment & Services | 0.0% | |||
Distributors | 0.0% | |||
Repurchase Agreements | 1.8% | |||
Liabilities in excess of other assets | (6.2)% | |||
|
| |||
| 100.0% | ||||
|
|
AllianzGI Global Fundamental Strategy Fund
| Shares | Value | |||||||||||
| Common Stock—49.2% | ||||||||||||
| China—1.9% | ||||||||||||
Agricultural Bank of China Ltd., Class H | 300,000 | $172,273 | ||||||||||
Ping An Insurance Group Co. of China Ltd., Class H | 15,000 | 154,660 | ||||||||||
|
| |||||||||||
| 326,933 | ||||||||||||
|
| |||||||||||
| Finland—1.5% | ||||||||||||
Nokia Oyj | 45,000 | 248,495 | ||||||||||
|
| |||||||||||
| Germany—5.4% | ||||||||||||
Adidas AG | 800 | 194,638 | ||||||||||
Deutsche Pfandbriefbank AG (a) | 9,500 | 149,782 | ||||||||||
Muenchener Rueckversicherungs-Gesellschaft AG in Muenchen | 750 | 174,406 | ||||||||||
OSRAM Licht AG | 2,100 | 154,533 | ||||||||||
SAP SE | 2,323 | 243,873 | ||||||||||
|
| |||||||||||
| 917,232 | ||||||||||||
|
| |||||||||||
| Japan—10.2% | ||||||||||||
Daikin Industries Ltd. | 1,500 | 166,640 | ||||||||||
FANUC Corp. | 1,200 | 308,824 | ||||||||||
Keyence Corp. | 300 | 187,397 | ||||||||||
Mitsubishi UFJ Financial Group, Inc. | 25,500 | 169,463 | ||||||||||
Nintendo Co., Ltd. | 300 | 133,282 | ||||||||||
SoftBank Group Corp. | 2,100 | 156,642 | ||||||||||
Sony Corp. | 5,100 | 250,921 | ||||||||||
Suzuki Motor Corp. | 3,500 | 190,027 | ||||||||||
Tokyo Electron Ltd. | 900 | 166,492 | ||||||||||
|
| |||||||||||
| 1,729,688 | ||||||||||||
|
| |||||||||||
| Portugal—0.7% | ||||||||||||
Jeronimo Martins SGPS S.A. | 6,031 | 109,695 | ||||||||||
|
| |||||||||||
| Russian Federation—1.5% | ||||||||||||
Alrosa PJSC | 163,500 | 259,677 | ||||||||||
|
| |||||||||||
| South Africa—1.4% | ||||||||||||
Naspers Ltd., Class N | 950 | 232,477 | ||||||||||
|
| |||||||||||
| Spain—1.0% | ||||||||||||
Industria de Diseno Textil S.A. | 5,500 | 172,912 | ||||||||||
|
| |||||||||||
| United Kingdom—13.9% | ||||||||||||
Admiral Group PLC | 6,000 | 155,295 | ||||||||||
Ashtead Group PLC | 3,000 | 81,800 | ||||||||||
BP PLC | 52,510 | 354,185 | ||||||||||
easyJet PLC | 7,500 | 169,064 | ||||||||||
Imperial Brands PLC | 3,900 | 132,793 | ||||||||||
Inmarsat PLC | 26,000 | 132,200 | ||||||||||
ITM Power PLC (h) | 625,000 | 279,644 | ||||||||||
Prudential PLC | 7,300 | 182,417 | ||||||||||
Randgold Resources Ltd. | 1,284 | 106,670 | ||||||||||
Royal Dutch Shell PLC, Class A | 11,000 | 348,024 | ||||||||||
Sophos Group PLC (a) | 54,990 | 334,967 | ||||||||||
Tyman PLC | 20,500 | 85,709 | ||||||||||
|
| |||||||||||
| 2,362,768 | ||||||||||||
|
| |||||||||||
| United States—11.7% | ||||||||||||
AECOM (d)(h) | 9,550 | 340,267 | ||||||||||
Blackstone Group L.P. | 5,000 | 159,750 | ||||||||||
Illinois Tool Works, Inc. (d) | 1,500 | 234,990 | ||||||||||
Leidos Holdings, Inc. (d) | 6,600 | 431,640 | ||||||||||
Parker-Hannifin Corp. | 900 | 153,927 | ||||||||||
Philip Morris International, Inc. (d) | 2,520 | 250,488 | ||||||||||
| 156 | Semiannual Report | | March 31, 2018 | | See accompanying Notes to Financial Statements |
Table of Contents
Schedule of Investments
March 31, 2018 (Unaudited)
| Shares | Value | |||||||||||
Snap, Inc., Class A (h) | 15,200 | $ | 241,224 | |||||||||
Time Warner, Inc. | 1,800 | 170,244 | ||||||||||
|
| |||||||||||
| 1,982,530 | ||||||||||||
|
| |||||||||||
Total Common Stock (cost—$7,935,941) |
| 8,342,407 | ||||||||||
|
| |||||||||||
| Principal Amount (000s) | ||||||||||||
| Sovereign Debt Obligations—33.8% | ||||||||||||
| Argentina—4.6% | ||||||||||||
Argentine Republic Government International Bond, | ||||||||||||
7.50%, 4/22/26 | $ | 300 | 321,200 | |||||||||
Province of Jujuy Argentina, | ||||||||||||
8.625%, 9/20/22 | 170 | 176,583 | ||||||||||
Provincia de Buenos Aires, BADLAR + 3.830% (g), | ||||||||||||
26.742%, 5/31/22 | ARS | 5,700 | 289,315 | |||||||||
|
| |||||||||||
| 787,098 | ||||||||||||
|
| |||||||||||
| Canada—9.4% | ||||||||||||
Province of Ontario Canada, | ||||||||||||
2.00%, 9/27/18 | $ | 800 | 799,136 | |||||||||
Province of Quebec Canada, | ||||||||||||
4.625%, 5/14/18 | 790 | 792,225 | ||||||||||
|
| |||||||||||
| 1,591,361 | ||||||||||||
|
| |||||||||||
| Indonesia—3.4% | ||||||||||||
Indonesia Treasury Bond, |
| |||||||||||
7.875%, 4/15/19 | IDR | 4,000,000 | 298,218 | |||||||||
8.375%, 9/15/26 | 3,500,000 | 279,501 | ||||||||||
|
| |||||||||||
| 577,719 | ||||||||||||
|
| |||||||||||
| Italy—2.1% | ||||||||||||
Italy Buoni Poliennali Del Tesoro (c), | ||||||||||||
3.10%, 9/15/26 | € | 237 | 361,888 | |||||||||
|
| |||||||||||
| Portugal—2.2% | ||||||||||||
Portugal Obrigacoes do Tesouro OT (a), | ||||||||||||
4.125%, 4/14/27 | 250 | 377,579 | ||||||||||
|
| |||||||||||
| Russian Federation—3.1% | ||||||||||||
Russian Federal Bond—OFZ, |
| |||||||||||
7.00%, 1/25/23 | RUB | 15,000 | 268,576 | |||||||||
8.15%, 2/3/27 | 14,000 | 265,402 | ||||||||||
|
| |||||||||||
| 533,978 | ||||||||||||
|
| |||||||||||
| South Africa—1.8% | ||||||||||||
Republic of South Africa Government Bond, | ||||||||||||
7.00%, 2/28/31 | ZAR | 4,000 | 299,521 | |||||||||
|
| |||||||||||
| Spain—2.1% | ||||||||||||
Spain Government Inflation Linked | ||||||||||||
1.00%, 11/30/30 | € | 253 | 349,717 | |||||||||
|
| |||||||||||
| Supranational—3.7% | ||||||||||||
European Bank for Reconstruction & Development, | ||||||||||||
6.00%, 2/7/23 | INR | 10,000 | 149,918 | |||||||||
International Finance Corp., |
| |||||||||||
6.30%, 11/25/24 | 10,500 | 158,832 | ||||||||||
7.50%, 1/18/28 | MXN | 5,800 | 314,345 | |||||||||
|
| |||||||||||
| 623,095 | ||||||||||||
|
| |||||||||||
| Turkey—1.4% | ||||||||||||
Turkey Government Bond, | ||||||||||||
9.00%, 7/24/24 | TRY | 1,100 | 239,152 | |||||||||
|
| |||||||||||
| Total Sovereign Debt Obligations (cost—$5,641,353) | 5,741,108 | |||||||||||
|
| |||||||||||
| Principal Amount (000s) | Value | |||||||||||
| Corporate Bonds & Notes—7.5% | ||||||||||||
| India—0.9% | ||||||||||||
Indian Renewable Energy Development Agency Ltd., | ||||||||||||
7.125%, 10/10/22 | INR | 10,000 | $ | 153,246 | ||||||||
|
| |||||||||||
| Switzerland—3.1% | ||||||||||||
Credit Suisse AG, | ||||||||||||
5.30%, 8/13/19 | $ | 500 | 516,418 | |||||||||
|
| |||||||||||
| United States—3.5% | ||||||||||||
Oracle Corp., 5.75%, 4/15/18 | 600 | 600,705 | ||||||||||
|
| |||||||||||
| Total Corporate Bonds & Notes (cost—$1,275,246) | 1,270,369 | |||||||||||
|
| |||||||||||
| Shares | ||||||||||||
| Exchange-Traded Funds (d)—1.9% | ||||||||||||
iShares MSCI India (cost—$282,556) | 9,400 | 320,822 | ||||||||||
|
| |||||||||||
| Mutual Funds (e)(f)—1.3% | ||||||||||||
AllianzGI NFJ Emerging Markets Value | 11,414 | 215,834 | ||||||||||
|
| |||||||||||
| Principal Amount (000s) | ||||||||||||
| Repurchase Agreements—2.1% | ||||||||||||
State Street Bank and Trust Co., dated 3/29/18, 0.28%, due 4/2/18, proceeds $357,011; collateralized by U.S. Treasury Notes, 2.50%, due 5/15/24, valued at $364,745 including accrued interest |
| |||||||||||
(cost—$357,000) | $ | 357 | 357,000 | |||||||||
|
| |||||||||||
Total Options Purchased—0.5% (cost—$142,774) (h)(i)(j) |
| 92,131 | ||||||||||
|
| |||||||||||
| Total Investments, before options written (cost—$15,801,055) (b)—96.3% | 16,339,671 | |||||||||||
|
| |||||||||||
| Total Options Written—(0.2)% (premiums received—$30,548) (h)(i)(j) | (30,909 | ) | ||||||||||
|
| |||||||||||
| Total Investments, net of options written (cost—$15,770,507)—96.1% | 16,308,762 | |||||||||||
|
| |||||||||||
| Other assets less other liabilities (k)—3.9% | 666,137 | |||||||||||
|
| |||||||||||
| Net Assets—100.0% | $16,974,899 | |||||||||||
|
| |||||||||||
Notes to Schedule of Investments:
(a) 144A—Exempt from registration under Rule 144A of the Securities Act of 1933. These securities may be resold in transactions exempt from registration, typically only to qualified institutional buyers. Securities with an aggregate value of $1,212,045, representing 7.1% of net assets.
(b) Securities with an aggregate value of $6,274,168, representing 37.0% of net assets, were valued utilizing modeling tools provided by a third-party vendor. See Note 1(a) and Note 1(b) in the Notes to Financial Statements.
(c) Inflationary Bonds—Principal amount of security is adjusted for inflation/deflation.
(d) All or partial amount segregated for the benefit of the counterparty as collateral for options written.
(e) Affiliated fund.
(f) Institutional Class share.
(g) Variable or Floating Rate Security—Security with an interest rate that changes periodically. The interest rate disclosed reflects the rate in effect on March 31, 2018.
(h) Non-income producing.
(i) Exchange traded-Chicago Board Options Exchange.
| See accompanying Notes to Financial Statements | | March 31, 2018 | | Semiannual Report | 157 |
Table of Contents
Schedule of Investments
March 31, 2018 (Unaudited)
(j) Exchange traded option contracts outstanding at March 31, 2018:
| Options purchased contracts outstanding at March 31, 2018: | ||||||||||||||||||||||||||||
| Description | Exercise Price | Expiration Date | Number of Contracts | Notional Amount | Market Value | Cost | Unrealized Appreciation (Depreciation) | |||||||||||||||||||||
Call options: |
| |||||||||||||||||||||||||||
Euro STOXX 50 Index | 3,800.00 EUR | 12/20/19 | 70 | EUR | 700 | $ | 47,071 | $ | 121,094 | $ | (74,023 | ) | ||||||||||||||||
Put options: |
| |||||||||||||||||||||||||||
S&P 500 Index | 2,710.00 USD | 6/15/18 | 4 | $ | 400 | $ | 45,060 | $ | 21,680 | $ | 23,380 | |||||||||||||||||
|
| |||||||||||||||||||||||||||
| Total options purchased contracts | $ | 92,131 | $ | 142,774 | $ | (50,643 | ) | |||||||||||||||||||||
|
| |||||||||||||||||||||||||||
| Options written contracts outstanding at March 31, 2018: | ||||||||||||||||||||||||||||
| Description | Exercise Price | Expiration Date | Number of Contracts | Notional Amount | Market Value | Premiums Received | Unrealized Appreciation (Depreciation) | |||||||||||||||||||||
Put options: |
| |||||||||||||||||||||||||||
Apple, Inc. | 155.00 USD | 4/20/18 | (23 | ) | $ | (2,300 | ) | $ | (2,185 | ) | $ | (8,510 | ) | $ | 6,325 | |||||||||||||
Euro STOXX 50 Index | 127.50 EUR | 4/20/18 | (70 | ) | EUR | (3,500 | ) | (14,104 | ) | (13,638 | ) | (466 | ) | |||||||||||||||
S&P 500 Index | 2,470.00 USD | 6/15/18 | (4 | ) | $ | (400 | ) | (14,620 | ) | (8,400 | ) | (6,220 | ) | |||||||||||||||
|
| |||||||||||||||||||||||||||
| Total options written contracts | $ | (30,909 | ) | $ | (30,548 | ) | $ | (361 | ) | |||||||||||||||||||
|
| |||||||||||||||||||||||||||
(k) Includes net unrealized appreciation (depreciation) of other financial instruments as follows:
| Futures contracts outstanding at March 31, 2018: | ||||||||||||||||||||||
| Type | Contracts | Expiration Date | Notional Amount (000s) | Market Value (000s) | Unrealized Appreciation (Depreciation) | |||||||||||||||||
Short position contracts: |
| |||||||||||||||||||||
E-mini NASDAQ 100 Index | (8 | ) | 6/15/18 | $ | (— | )(m) | $ | (1,055 | ) | $ | 84,841 | |||||||||||
E-mini S&P 500 Index | (10 | ) | 6/15/18 | (1 | ) | (1,321 | ) | 72,932 | ||||||||||||||
Euro-Bund 10-Year Bond | (17 | ) | 6/7/18 | EUR | (1,700 | ) | (3,335 | ) | (49,597 | ) | ||||||||||||
|
| |||||||||||||||||||||
| $ | 108,176 | |||||||||||||||||||||
|
| |||||||||||||||||||||
| Forward foreign currency contracts outstanding at March 31, 2018: | ||||||||||||||||||||
| Description | Counterparty | U.S.$ Value on Origination Date | U.S.$ Value March 31, 2018 | Unrealized Appreciation | Unrealized Depreciation | |||||||||||||||
Sold: | ||||||||||||||||||||
7,806 British Pound settling 4/3/18 | Income Repatriation Boston IBS | $ | 10,947 | $ | 10,952 | $ | — | $ | (5 | ) | ||||||||||
1,500,000 British Pound settling 5/9/18 | State Street Bank and Trust Co. | 2,130,508 | 2,107,582 | 22,926 | — | |||||||||||||||
165,000,000 Japanese Yen settling 5/9/18 | State Street Bank and Trust Co. | 1,503,391 | 1,553,835 | — | (50,444 | ) | ||||||||||||||
|
| |||||||||||||||||||
| $ | 22,926 | $ | (50,449 | ) | ||||||||||||||||
|
| |||||||||||||||||||
(l) At March 31, 2018, the Fund pledged $404,327 in cash as collateral for futures contracts.
(m) Notional amount rounds to less than $500.
Glossary:
ARS—Argentine Peso
BADLAR—Buenos Aires Deposits of Large Amount Rate
€/EUR—Euro
IDR—Indonesian Rupiah
INR—Indian Rupee
MSCI—Morgan Stanley Capital International
MXN—Mexican Peso
RUB—Russian Ruble
TRY—Turkish Lira
ZAR—South African Rand
| 158 | Semiannual Report | | March 31, 2018 | | See accompanying Notes to Financial Statements |
Table of Contents
Schedule of Investments
March 31, 2018 (Unaudited)
The industry classification of portfolio holdings and other assets less other liabilities shown as a percentage of net assets were as follows:
Sovereign Debt Obligations | 33.8% | |||
Software | 9.1% | |||
Banks | 5.1% | |||
Oil, Gas & Consumable Fuels | 4.1% | |||
Machinery | 4.1% | |||
Insurance | 3.9% | |||
Electrical Equipment | 2.6% | |||
IT Services | 2.5% | |||
Media | 2.4% | |||
Tobacco | 2.3% | |||
Metals & Mining | 2.2% | |||
Construction & Engineering | 2.0% | |||
Exchange-Traded Funds | 1.9% | |||
Building Products | 1.5% | |||
Household Durables | 1.5% | |||
Communications Equipment | 1.5% | |||
Mutual Funds | 1.3% | |||
Textiles, Apparel & Luxury Goods | 1.1% | |||
Automobiles | 1.1% | |||
Electronic Equipment, Instruments & Components | 1.1% | |||
Specialty Retail | 1.0% | |||
Airlines | 1.0% | |||
Semiconductors & Semiconductor Equipment | 1.0% | |||
Capital Markets | 1.0% | |||
Wireless Telecommunication Services | 0.9% | |||
Energy-Alternate Sources | 0.9% | |||
Thrifts & Mortgage Finance | 0.9% | |||
Diversified Telecommunication Services | 0.8% | |||
Food & Staples Retailing | 0.6% | |||
Trading Companies & Distributors | 0.5% | |||
Repurchase Agreements | 2.1% | |||
Options Purchased | 0.5% | |||
Options Written | (0.2%) | |||
Other assets less other liabilities | 3.9% | |||
|
| |||
| 100.0% | ||||
|
|
AllianzGI Global High Yield Fund
| Principal Amount (000s) | Value | |||||||
| Corporate Bonds & Notes—95.6% | ||||||||
| Argentina—0.5% | ||||||||
YPF S.A., | ||||||||
8.50%, 7/28/25 | $100 | $110,633 | ||||||
|
| |||||||
| Austria—1.9% | ||||||||
Erste Group Bank AG, (converts to FRN on 10/15/21) (c)(e), |
| |||||||
8.875%, 10/15/21 | € | 200 | 299,267 | |||||
Raiffeisen Bank International AG, (converts to FRN on 2/21/20) (e), |
| |||||||
4.50%, 2/21/25 | 100 | 130,681 | ||||||
|
| |||||||
| 429,948 | ||||||||
|
| |||||||
| Belgium—0.8% | ||||||||
Nyrstar Netherlands Holdings BV, |
| |||||||
6.875%, 3/15/24 | 150 | 189,158 | ||||||
|
| |||||||
| Brazil—1.7% | ||||||||
Petrobras Global Finance BV, |
| |||||||
4.75%, 1/14/25 | 100 | 133,759 | ||||||
5.299%, 1/27/25 (a)(b) | $50 | 49,437 | ||||||
Vale S.A., | ||||||||
3.75%, 1/10/23 | € | 150 | 206,923 | |||||
|
| |||||||
| 390,119 | ||||||||
|
| |||||||
| Canada—6.1% | ||||||||
Cott Holdings, Inc. (a)(b), |
| |||||||
5.50%, 4/1/25 | $250 | 247,500 | ||||||
goeasy Ltd. (a)(b), |
| |||||||
7.875%, 11/1/22 | 150 | 161,205 | ||||||
Ithaca Energy, Inc. (a)(b), |
| |||||||
8.125%, 7/1/19 | 200 | 200,500 | ||||||
MEG Energy Corp. (a)(b), |
| |||||||
7.00%, 3/31/24 | 50 | 41,500 | ||||||
New Gold, Inc. (a)(b), |
| |||||||
6.375%, 5/15/25 | 100 | 102,500 | ||||||
Northwest Acquisitions ULC (a)(b), |
| |||||||
7.125%, 11/1/22 | 150 | 153,375 | ||||||
Precision Drilling Corp., |
| |||||||
7.75%, 12/15/23 | 100 | 104,375 | ||||||
Ritchie Bros Auctioneers, Inc. (a)(b), |
| |||||||
5.375%, 1/15/25 | 150 | 150,375 | ||||||
Rockpoint Gas Storage Canada Ltd. (a)(b), |
| |||||||
7.00%, 3/31/23 | 100 | 100,375 | ||||||
Teck Resources Ltd. (a)(b), |
| |||||||
8.50%, 6/1/24 | 80 | 89,096 | ||||||
|
| |||||||
| 1,350,801 | ||||||||
|
| |||||||
| Chile—1.2% | ||||||||
VTR Finance BV, |
| |||||||
6.875%, 1/15/24 | 250 | 261,002 | ||||||
|
| |||||||
| China—1.8% | ||||||||
China Evergrande Group, |
| |||||||
7.50%, 6/28/23 | 200 | 195,918 | ||||||
Country Garden Holdings Co., Ltd., |
| |||||||
3.875%, 11/20/18 | 200 | 200,167 | ||||||
|
| |||||||
| 396,085 | ||||||||
|
| |||||||
| Colombia—0.9% | ||||||||
Millicom International Cellular S.A., |
| |||||||
6.00%, 3/15/25 | 200 | 207,100 | ||||||
|
| |||||||
| Finland—0.5% | ||||||||
Outokumpu Oyj, |
| |||||||
7.25%, 6/16/21 | € | 81 | 106,735 | |||||
|
| |||||||
| France—2.7% | ||||||||
Altice France S.A., |
| |||||||
5.625%, 5/15/24 | 100 | 125,171 | ||||||
Banijay Group S.A. (a)(b), |
| |||||||
4.00%, 7/1/22 | 100 | 127,454 | ||||||
| Principal Amount (000s) | Value | |||||||
BNP Paribas S.A., (converts to FRN on 3/20/21) (a)(b)(c)(e), | ||||||||
7.625%, 3/30/21 | $200 | $ | 214,973 | |||||
Paprec Holding S.A. (a)(b), | ||||||||
4.00%, 3/31/25 | € | 100 | 124,066 | |||||
|
| |||||||
| 591,664 | ||||||||
|
| |||||||
| Germany—1.1% | ||||||||
KME AG (a)(b), | ||||||||
6.75%, 2/1/23 | 100 | 125,097 | ||||||
Platin 1426 GmbH (a)(b), | ||||||||
5.375%, 6/15/23 | 100 | 121,857 | ||||||
|
| |||||||
| 246,954 | ||||||||
|
| |||||||
| Ghana—0.9% | ||||||||
Tullow Oil PLC (a)(b), | ||||||||
7.00%, 3/1/25 | $200 | 200,250 | ||||||
|
| |||||||
| Greece—1.2% | ||||||||
Crystal Almond SARL, | ||||||||
10.00%, 11/1/21 | € | 100 | 134,184 | |||||
Intralot Capital Luxembourg S.A. (a)(b), |
| |||||||
5.25%, 9/15/24 | 100 | 123,600 | ||||||
|
| |||||||
| 257,784 | ||||||||
|
| |||||||
| Ireland—1.8% | ||||||||
Ardagh Packaging Finance PLC, | ||||||||
4.625%, 5/15/23 | $200 | 201,500 | ||||||
Borets Finance DAC, | ||||||||
6.50%, 4/7/22 | 200 | 209,000 | ||||||
|
| |||||||
| 410,500 | ||||||||
|
| |||||||
| Israel—1.1% | ||||||||
Teva Pharmaceutical Finance Netherlands II BV, |
| |||||||
0.375%, 7/25/20 | € | 100 | 119,826 | |||||
3.25%, 4/15/22 (a)(b) | 100 | 123,670 | ||||||
|
| |||||||
| 243,496 | ||||||||
|
| |||||||
| Italy—2.0% | ||||||||
Assicurazioni Generali SpA, (converts to FRN on 6/8/28) (e), | ||||||||
5.00%, 6/8/48 | 100 | 136,593 | ||||||
Cooperativa Muratori & Cementisti-CMC di Ravenna (a)(b), | ||||||||
6.00%, 2/15/23 | 100 | 117,507 | ||||||
Telecom Italia Finance S.A., | ||||||||
7.75%, 1/24/33 | 100 | 183,755 | ||||||
|
| |||||||
| 437,855 | ||||||||
|
| |||||||
| Jamaica—0.8% | ||||||||
Digicel Group Ltd., | ||||||||
8.25%, 9/30/20 | $200 | 173,000 | ||||||
|
| |||||||
| Luxembourg—2.8% | ||||||||
Arena Luxembourg Finance Sarl, | ||||||||
2.875%, 11/1/24 | € | 100 | 125,880 | |||||
FAGE International S.A. (a)(b), | ||||||||
5.625%, 8/15/26 | $200 | 186,500 | ||||||
LSF10 Wolverine Investments SCA, (converts to FRN on 3/15/19) (a)(b)(e), | ||||||||
4.625%, 3/15/24 | € | 100 | 124,592 | |||||
Unilabs Subholding AB (a)(b), | ||||||||
5.75%, 5/15/25 | 150 | 186,698 | ||||||
|
| |||||||
| 623,670 | ||||||||
|
| |||||||
| Netherlands—3.2% | ||||||||
de Volksbank NV, (converts to FRN on 11/5/20) (e), | ||||||||
3.75%, 11/5/25 | 100 | 132,188 | ||||||
GTH Finance BV, | ||||||||
6.25%, 4/26/20 | $200 | 207,467 | ||||||
IPD 3 BV (a)(b), | ||||||||
4.50%, 7/15/22 | € | 100 | 125,774 | |||||
| See accompanying Notes to Financial Statements | | March 31, 2018 | | Semiannual Report | 159 |
Table of Contents
Schedule of Investments
March 31, 2018 (Unaudited)
| Principal Amount (000s) | Value | |||||||
Selecta Group BV (a)(b), | ||||||||
5.875%, 2/1/24 | € | 100 | $ | 122,047 | ||||
United Group BV (a)(b), | ||||||||
4.875%, 7/1/24 | 100 | 125,157 | ||||||
|
| |||||||
| 712,633 | ||||||||
|
| |||||||
| Norway—0.7% | ||||||||
Aker BP ASA (a)(b), | ||||||||
5.875%, 3/31/25 | $150 | 152,250 | ||||||
|
| |||||||
| Romania—1.2% | ||||||||
Digi Communications NV, | ||||||||
5.00%, 10/15/23 | € | 200 | 259,882 | |||||
|
| |||||||
| Spain—2.0% | ||||||||
Ajecorp BV, | ||||||||
6.50%, 5/14/22 | $150 | 136,500 | ||||||
Grifols S.A. (a)(b), | ||||||||
3.20%, 5/1/25 | € | 150 | 186,428 | |||||
Masaria Investments s.A.u., 3 mo. Euribor + 5.250% (a)(b)(e), | ||||||||
5.25%, 9/15/24 | 100 | 123,914 | ||||||
|
| |||||||
| 446,842 | ||||||||
|
| |||||||
| Sweden—0.6% | ||||||||
Ovako AB, | ||||||||
5.00%, 10/5/22 | 100 | 126,572 | ||||||
|
| |||||||
| United Arab Emirates—0.4% | ||||||||
Shelf Drilling Holdings Ltd. (a)(b), | ||||||||
8.25%, 2/15/25 | $100 | 100,625 | ||||||
|
| |||||||
| United Kingdom—9.9% | ||||||||
Algeco Scotsman Global Finance 2 PLC (a)(b), | ||||||||
10.00%, 8/15/23 | 200 | 200,000 | ||||||
Amigo Luxembourg S.A., | ||||||||
7.625%, 1/15/24 | £ | 100 | 144,314 | |||||
Aston Martin Capital Holdings Ltd., | ||||||||
5.75%, 4/15/22 | 100 | 147,251 | ||||||
Cabot Financial Luxembourg S.A., | ||||||||
7.50%, 10/1/23 | 100 | 147,165 | ||||||
CPUK Finance Ltd. (a)(b), | ||||||||
4.25%, 8/28/22 | 100 | 141,570 | ||||||
EnQuest PLC, PIK 7.00% (b), | ||||||||
7.00%, 4/15/22 | $52 | 46,446 | ||||||
Fiat Chrysler Automobiles NV, | ||||||||
5.25%, 4/15/23 | 250 | 256,875 | ||||||
HBOS Capital Funding L.P., (converts to FRN on 11/30/18) (c)(e), | ||||||||
6.461%, 11/30/18 | £ | 50 | 72,126 | |||||
Hiscox Ltd., (converts to FRN on 11/24/25) (e), | ||||||||
6.125%, 11/24/45 | 100 | 163,403 | ||||||
Iceland Bondco PLC, | ||||||||
6.75%, 7/15/24 | 100 | 145,324 | ||||||
KCA Deutag UK Finance PLC (a)(b), | ||||||||
7.25%, 5/15/21 | $200 | 194,500 | ||||||
Miller Homes Group Holdings PLC, | ||||||||
5.50%, 10/15/24 | £ | 100 | 140,847 | |||||
Pinewood Finco PLC, | ||||||||
3.75%, 12/1/23 | 100 | 142,128 | ||||||
Pinnacle Bidco PLC (a)(b), | ||||||||
6.375%, 2/15/25 | 100 | 141,119 | ||||||
TVL Finance PLC, | ||||||||
8.50%, 5/15/23 | 80 | 120,154 | ||||||
|
| |||||||
| 2,203,222 | ||||||||
|
| |||||||
| United States—47.8% | ||||||||
AES Corp., | ||||||||
4.50%, 3/15/23 | $50 | 50,973 | ||||||
AK Steel Corp., |
| |||||||
6.375%, 10/15/25 | 150 | 142,125 | ||||||
Alcoa Nederland Holding BV (a)(b), | ||||||||
6.75%, 9/30/24 | 200 | 215,000 | ||||||
Alliance One International, Inc., | ||||||||
9.875%, 7/15/21 | 170 | 165,537 | ||||||
| Principal Amount (000s) | Value | |||||||
AMC Entertainment Holdings, Inc., | ||||||||
6.375%, 11/15/24 | £ | 100 | $ | 144,439 | ||||
APX Group, Inc., | ||||||||
7.625%, 9/1/23 | $150 | 156,000 | ||||||
Belden, Inc., | ||||||||
2.875%, 9/15/25 | € | 150 | 180,044 | |||||
Boyne USA, Inc. (a)(b), | ||||||||
7.25%, 5/1/25 | $50 | 51,562 | ||||||
Calumet Specialty Products Partners L.P., | ||||||||
6.50%, 4/15/21 | 100 | 97,500 | ||||||
Camelot Finance S.A. (a)(b), | ||||||||
7.875%, 10/15/24 | 100 | 104,625 | ||||||
Catalent Pharma Solutions, Inc., | ||||||||
4.75%, 12/15/24 | € | 170 | 219,679 | |||||
CBS Radio, Inc. (a)(b), | ||||||||
7.25%, 11/1/24 | $150 | 153,562 | ||||||
CCO Holdings LLC (a)(b), | ||||||||
5.75%, 2/15/26 | 100 | 99,751 | ||||||
Cedar Fair L.P. (a)(b), | ||||||||
5.375%, 4/15/27 | 150 | 148,875 | ||||||
Centene Corp., | ||||||||
6.125%, 2/15/24 | 150 | 156,480 | ||||||
CenturyLink, Inc., |
| |||||||
6.45%, 6/15/21, Ser. S | 50 | 51,250 | ||||||
7.50%, 4/1/24, Ser. Y | 50 | 50,500 | ||||||
Cheniere Corpus Christi Holdings LLC, | ||||||||
5.875%, 3/31/25 | 100 | 105,000 | ||||||
CNX Midstream Partners L.P. (a)(b), | ||||||||
6.50%, 3/15/26 | 100 | 98,875 | ||||||
Commercial Metals Co., | ||||||||
4.875%, 5/15/23 | 100 | 99,983 | ||||||
CommScope Technologies LLC (a)(b), | ||||||||
5.00%, 3/15/27 | 20 | 19,050 | ||||||
Crown European Holdings S.A., | ||||||||
3.375%, 5/15/25 | € | 200 | 254,772 | |||||
CSC Holdings LLC (a)(b), | ||||||||
10.875%, 10/15/25 | $250 | 294,372 | ||||||
CyrusOne L.P., |
| |||||||
5.00%, 3/15/24 | 100 | 100,375 | ||||||
5.375%, 3/15/27 | 100 | 100,000 | ||||||
Denbury Resources, Inc. (a)(b), | ||||||||
9.00%, 5/15/21 | 100 | 103,000 | ||||||
DISH DBS Corp., | ||||||||
7.75%, 7/1/26 | 50 | 47,250 | ||||||
Eldorado Resorts, Inc., | ||||||||
6.00%, 4/1/25 | 100 | 102,000 | ||||||
Encompass Health Corp., | ||||||||
5.125%, 3/15/23 | 150 | 152,625 | ||||||
EP Energy LLC, | ||||||||
6.375%, 6/15/23 | 100 | 51,500 | ||||||
Equinix, Inc., | ||||||||
2.875%, 10/1/25 | € | 100 | 118,831 | |||||
Federal-Mogul LLC, | ||||||||
4.875%, 4/15/22 | 100 | 123,717 | ||||||
First Data Corp. (a)(b), | ||||||||
5.375%, 8/15/23 | $150 | 153,000 | ||||||
First Quality Finance Co., Inc. (a)(b), |
| |||||||
4.625%, 5/15/21 | 200 | 200,000 | ||||||
5.00%, 7/1/25 | 50 | 48,000 | ||||||
Five Point Operating Co. L.P. (a)(b), | ||||||||
7.875%, 11/15/25 | 150 | 151,687 | ||||||
Freeport-McMoRan, Inc., | ||||||||
3.875%, 3/15/23 | 150 | 145,335 | ||||||
FXI Holdings, Inc. (a)(b), | ||||||||
7.875%, 11/1/24 | 100 | 98,187 | ||||||
Genesis Energy L.P., |
| |||||||
6.25%, 5/15/26 | 50 | 47,750 | ||||||
6.50%, 10/1/25 | 150 | 147,750 | ||||||
Golden Nugget, Inc. (a)(b), | ||||||||
8.75%, 10/1/25 | 100 | 104,000 | ||||||
HCA, Inc., |
| |||||||
5.25%, 4/15/25 | 50 | 51,141 | ||||||
5.50%, 6/15/47 | 100 | 96,702 | ||||||
| Principal Amount (000s) | Value | |||||||
Huntsman International LLC, | ||||||||
4.25%, 4/1/25 | € | 100 | $ | 139,851 | ||||
International Game Technology PLC, | ||||||||
4.75%, 2/15/23 | 100 | 135,221 | ||||||
Itron, Inc. (a)(b), | ||||||||
5.00%, 1/15/26 | $150 | 148,170 | ||||||
Jack Ohio Finance LLC (a)(b), | ||||||||
10.25%, 11/15/22 | 100 | 109,250 | ||||||
Jo-Ann Stores Holdings, Inc., PIK 10.50% (a)(b), | ||||||||
9.75%, 10/15/19 | 50 | 50,125 | ||||||
KAR Auction Services, Inc. (a)(b), | ||||||||
5.125%, 6/1/25 | 180 | 179,550 | ||||||
Kennedy-Wilson, Inc. (a)(b), | ||||||||
5.875%, 4/1/24 | 50 | 49,813 | ||||||
Matthews International Corp. (a)(b), | ||||||||
5.25%, 12/1/25 | 100 | 98,750 | ||||||
McDermott International, Inc. (a)(b), | ||||||||
8.00%, 5/1/21 | 50 | 51,313 | ||||||
Men’s Wearhouse, Inc., | ||||||||
7.00%, 7/1/22 | 100 | 103,250 | ||||||
Micron Technology, Inc., | ||||||||
5.50%, 2/1/25 | 200 | 208,500 | ||||||
Monitronics International, Inc., | ||||||||
9.125%, 4/1/20 | 50 | 38,585 | ||||||
Moss Creek Resources Holdings, Inc. (a)(b), | ||||||||
7.50%, 1/15/26 | 50 | 50,610 | ||||||
Navient Corp., | ||||||||
8.00%, 3/25/20 | 150 | 159,750 | ||||||
NGPL PipeCo LLC (a)(b), |
| |||||||
4.375%, 8/15/22 | 50 | 49,875 | ||||||
7.768%, 12/15/37 | 100 | 121,500 | ||||||
NRG Energy, Inc. (a)(b), | ||||||||
5.75%, 1/15/28 | 200 | 196,000 | ||||||
Parsley Energy LLC (a)(b), | ||||||||
5.625%, 10/15/27 | 150 | 150,375 | ||||||
Pilgrim’s Pride Corp. (a)(b), | ||||||||
5.75%, 3/15/25 | 180 | 175,275 | ||||||
Prime Security Services Borrower LLC, | ||||||||
9.25%, 5/15/23 | 109 | 118,401 | ||||||
Reynolds Group Issuer, Inc. (a)(b), | ||||||||
7.00%, 7/15/24 | 100 | 104,875 | ||||||
Sanchez Energy Corp., | ||||||||
7.75%, 6/15/21 | 100 | 92,500 | ||||||
Seagate HDD Cayman (a)(b), | ||||||||
4.875%, 3/1/24 | 100 | 100,035 | ||||||
SESI LLC (a)(b), | ||||||||
7.75%, 9/15/24 | 100 | 103,750 | ||||||
Shea Homes L.P. (a)(b), | ||||||||
5.875%, 4/1/23 | 150 | 152,625 | ||||||
Silgan Holdings, Inc., | ||||||||
3.25%, 3/15/25 | € | 100 | 125,440 | |||||
Simmons Foods, Inc. (a)(b), | ||||||||
5.75%, 11/1/24 | $100 | 90,875 | ||||||
Six Flags Entertainment Corp. (a)(b), | ||||||||
4.875%, 7/31/24 | 50 | 48,813 | ||||||
Sonic Automotive, Inc., | ||||||||
5.00%, 5/15/23 | 150 | 143,250 | ||||||
Springleaf Finance Corp., | ||||||||
5.25%, 12/15/19 | 100 | 102,250 | ||||||
Sprint Communications, Inc., | ||||||||
6.00%, 11/15/22 | 50 | 49,188 | ||||||
Sprint Corp., | ||||||||
7.875%, 9/15/23 | 150 | 153,562 | ||||||
Surgery Center Holdings, Inc. (a)(b), | ||||||||
6.75%, 7/1/25 | 100 | 97,500 | ||||||
Tallgrass Energy Partners L.P. (a)(b), |
| |||||||
5.50%, 9/15/24 | 50 | 51,125 | ||||||
5.50%, 1/15/28 | 50 | 50,500 | ||||||
TerraForm Power Operating LLC (a)(b)(d), | ||||||||
6.625%, 6/15/25 | 100 | 107,875 | ||||||
Transocean, Inc. (a)(b), | ||||||||
9.00%, 7/15/23 | 60 | 64,050 | ||||||
| 160 | Semiannual Report | | March 31, 2018 | | See accompanying Notes to Financial Statements |
Table of Contents
Schedule of Investments
March 31, 2018 (Unaudited)
| Principal Amount (000s) | Value | |||||||
Trident Merger Sub, Inc. (a)(b), | ||||||||
6.625%, 11/1/25 | $150 | $ | 146,625 | |||||
U.S. Concrete, Inc., | ||||||||
6.375%, 6/1/24 | 109 | 113,632 | ||||||
Universal Hospital Services, Inc., | ||||||||
7.625%, 8/15/20 | 100 | 101,250 | ||||||
Vantiv LLC (a)(b), | ||||||||
3.875%, 11/15/25 | £ | 100 | 138,767 | |||||
VICI Properties 1 LLC, | ||||||||
8.00%, 10/15/23 | $98 | 109,220 | ||||||
Viking Cruises Ltd. (a)(b), | ||||||||
5.875%, 9/15/27 | 150 | 142,500 | ||||||
Voya Financial, Inc., (converts to FRN on 1/23/28) (a)(b)(e), | ||||||||
4.70%, 1/23/48 | 170 | 154,841 | ||||||
Warrior Met Coal, Inc. (a)(b), | ||||||||
8.00%, 11/1/24 | 100 | 102,000 | ||||||
Western Digital Corp., | ||||||||
4.75%, 2/15/26 | 50 | 49,984 | ||||||
WildHorse Resource Development Corp., | ||||||||
6.875%, 2/1/25 | 50 | 50,375 | ||||||
WMG Acquisition Corp., | ||||||||
4.125%, 11/1/24 | € | 100 | 129,260 | |||||
WPX Energy, Inc., | ||||||||
6.00%, 1/15/22 | $100 | 103,250 | ||||||
| Principal Amount (000s) | Value | |||||||
Wynn Las Vegas LLC (a)(b), |
| |||||||
5.25%, 5/15/27 | € | 50 | $ | 49,125 | ||||
5.50%, 3/1/25 | 80 | 80,600 | ||||||
|
| |||||||
| 10,646,610 | ||||||||
|
| |||||||
| Total Corporate Bonds & Notes (cost—$21,099,360) | 21,275,390 | |||||||
|
| |||||||
| Short-Term Investments—3.0% | ||||||||
| Repurchase Agreements—2.3% | ||||||||
State Street Bank and Trust Co., dated 3/29/18, 0.28%, due 4/2/18, proceeds $501,016; collateralized by U.S. Treasury Notes, 2.00%, due 8/15/25, valued at $514,706 including accrued interest |
| |||||||
(cost-$501,000) | 501 | 501,000 | ||||||
|
| |||||||
| U.S. Treasury Obligations—0.7% | ||||||||
U.S. Treasury Bills (f), 0.719%, 6/21/18 (cost—$149,502) | $150 | 149,410 | ||||||
|
| |||||||
| Total Short-Term Investments (cost—$650,502) | 650,410 | |||||||
|
| |||||||
| Total Investments (cost—$21,749,862)—98.6% | 21,925,800 | |||||||
|
| |||||||
| Other assets less liabilities (g)—1.4% | 322,211 | |||||||
|
| |||||||
| Net Assets—100.0% | $22,248,011 | |||||||
|
| |||||||
Notes to Schedule of Investments:
(a) Private Placement—Restricted as to resale and may not have a readily available market. Securities with an aggregate value of $9,946,144, representing 44.7% of net assets.
(b) 144A—Exempt from registration under Rule 144A of the Securities Act of 1933. These securities may be resold in transactions exempt from registration, typically only to qualified institutional buyers. Securities with an aggregate value of $9,992,590, representing 44.9% of net assets.
(c) Perpetual maturity. The date shown, if any, is the next call date.
(d) Step Bond—Coupon is a fixed rate for an initial period then resets at a specific date and rate.
(e) Variable or Floating Rate Security—Securities with an interest rate that changes periodically. The interest rate disclosed reflects the rate in effect on March 31, 2018.
(f) Rates reflect the effective yields at purchase date.
(g) Includes net unrealized appreciation (depreciation) of other financial instruments as follows:
| Futures contracts outstanding at March 31, 2018: | ||||||||||||||||||||||
| Type | Contracts | Expiration Date | Notional Amount (000s) | Market Value (000s) | Unrealized Depreciation | |||||||||||||||||
Short position contracts: |
| |||||||||||||||||||||
5-Year U.S. Treasury Note | (4 | ) | 6/29/18 | $ | (400 | ) | $ | (458 | ) | $ | (2,688 | ) | ||||||||||
|
| |||||||||||||||||||||
| Forward foreign currency contracts outstanding at March 31, 2018: | ||||||||||||||||||||
| Description | Counterparty | U.S.$ Value on Origination Date | U.S.$ Value March 31, 2018 | Unrealized Appreciation | Unrealized Depreciation | |||||||||||||||
Sold: |
| |||||||||||||||||||
1,080,164 British Pound settling 5/23/18 | Goldman Sachs | $ | 1,520,288 | $ | 1,518,490 | $ | 1,798 | $ | — | |||||||||||
102,741 British Pound settling 5/23/18 | JPMorgan Chase | 144,360 | 144,433 | — | (73 | ) | ||||||||||||||
4,585,698 Euro settling 5/23/18 | Goldman Sachs | 5,674,848 | 5,662,198 | 12,650 | — | |||||||||||||||
100,000 Euro settling 5/23/18 | JPMorgan Chase | 124,409 | 123,475 | 934 | — | |||||||||||||||
|
|
|
| |||||||||||||||||
| $ | 15,382 | $ | (73 | ) | ||||||||||||||||
|
|
|
| |||||||||||||||||
(h) At March 31, 2018, the Fund pledged $2,242 in cash as collateral for futures contracts.
Glossary:
£—British Pound Sterling
€—Euro
FRN—Floating Rate Note
PIK—Payment-in-Kind
| See accompanying Notes to Financial Statements | | March 31, 2018 | | Semiannual Report | 161 |
Table of Contents
Schedule of Investments
March 31, 2018 (Unaudited)
The industry classification of portfolio holdings and other assets less liabilities shown as a percentage of net assets were as follows:
Oil, Gas & Consumable Fuels | 11.5% | |||
Media | 6.1% | |||
Telecommunications | 5.5% | |||
Entertainment | 5.2% | |||
Mining | 4.6% | |||
Commercial Services | 4.5% | |||
Food & Beverage | 4.4% | |||
Diversified Financial Services | 4.4% | |||
Banks | 3.8% | |||
Healthcare-Services | 3.3% | |||
Containers & Packaging | 3.1% | |||
Iron/Steel | 3.1% | |||
Pipelines | 3.0% | |||
Pharmaceuticals | 2.9% | |||
Real Estate | 2.8% | |||
Retail | 2.4% | |||
Insurance | 2.0% | |||
Auto Manufacturers | 1.8% | |||
Lodging | 1.6% | |||
Home Builders | 1.3% | |||
Leisure | 1.3% | |||
Software | 1.2% | |||
Consumer Products | 1.1% | |||
Electric Utilities | 1.1% | |||
Machinery-Diversified | 1.1% | |||
Semiconductors | 0.9% | |||
Equity Real Estate Investment Trusts (REITs) | 0.9% | |||
Real Estate Management & Development | 0.9% | |||
Storage/Warehousing | 0.9% | |||
Electrical Equipment | 0.8% | |||
Tobacco | 0.7% | |||
Computers | 0.7% | |||
U.S. Treasury Obligations | 0.7% | |||
Electronics | 0.7% | |||
Holding Companies-Diversified | 0.7% | |||
Chemicals | 0.6% | |||
Internet | 0.6% | |||
Environmental Services | 0.6% | |||
Auto Components | 0.6% | |||
Engineering & Construction | 0.5% | |||
Building Materials | 0.5% | |||
Energy-Alternate Sources | 0.5% | |||
Coal | 0.5% | |||
Healthcare-Products | 0.5% | |||
Miscellaneous Manufacturing | 0.4% | |||
Repurchase Agreements | 2.3% | |||
Other assets less liabilities | 1.4% | |||
|
| |||
| 100.0% | ||||
|
|
AllianzGI Global Sustainability Fund
| Shares | Value | |||||||
| Common Stock—94.9% | ||||||||
| Australia—1.5% | ||||||||
Australia & New Zealand Banking Group Ltd. | 20,821 | $433,354 | ||||||
|
| |||||||
| Canada—0.8% | ||||||||
Gibson Energy, Inc. | 18,210 | 234,772 | ||||||
|
| |||||||
| Denmark—1.4% | ||||||||
Novo Nordisk A/S, Class B | 8,017 | 394,323 | ||||||
|
| |||||||
| France—1.4% | ||||||||
Bureau Veritas S.A. | 15,607 | 405,689 | ||||||
|
| |||||||
| Germany—9.1% | ||||||||
Adidas AG | 2,642 | 642,792 | ||||||
Covestro AG (a) | 3,970 | 390,914 | ||||||
Fresenius SE & Co. KGaA | 6,023 | 460,547 | ||||||
Muenchener Rueckversicherungs-Gesellschaft AG in Muenchen | 2,753 | 640,186 | ||||||
SAP SE | 4,831 | 507,167 | ||||||
|
| |||||||
| 2,641,606 | ||||||||
|
| |||||||
| Japan—4.8% | ||||||||
Daikin Industries Ltd. | 5,900 | 655,449 | ||||||
Keyence Corp. | 1,200 | 749,590 | ||||||
|
| |||||||
| 1,405,039 | ||||||||
|
| |||||||
| Korea (Republic of)—1.7% | ||||||||
Samsung Electronics Co., Ltd. GDR | 434 | 502,027 | ||||||
|
| |||||||
| Spain—4.3% | ||||||||
Amadeus IT Group S.A. | 11,914 | 881,673 | ||||||
Industria de Diseno Textil S.A. | 12,019 | 377,861 | ||||||
|
| |||||||
| 1,259,534 | ||||||||
|
| |||||||
| Sweden—5.0% | ||||||||
Assa Abloy AB, Class B | 23,930 | 518,693 | ||||||
Atlas Copco AB, Class A | 14,075 | 611,302 | ||||||
Skandinaviska Enskilda Banken AB, Class A | 31,359 | 329,467 | ||||||
|
| |||||||
| 1,459,462 | ||||||||
|
| |||||||
| Switzerland—3.1% | ||||||||
Roche Holding AG | 2,612 | 599,185 | ||||||
UBS Group AG (c) | 17,531 | 308,877 | ||||||
|
| |||||||
| 908,062 | ||||||||
|
| |||||||
| United Kingdom—13.4% | ||||||||
AstraZeneca PLC | 7,561 | 519,752 | ||||||
Prudential PLC | 34,995 | 874,479 | ||||||
Reckitt Benckiser Group PLC | 5,825 | 491,676 | ||||||
Royal Dutch Shell PLC, Class B | 20,236 | 651,163 | ||||||
Unilever PLC | 11,452 | 635,157 | ||||||
Vodafone Group PLC | 147,912 | 404,692 | ||||||
WPP PLC | 19,136 | 304,102 | ||||||
|
| |||||||
| 3,881,021 | ||||||||
|
| |||||||
| United States—48.4% | ||||||||
Accenture PLC, Class A | 4,886 | 750,001 | ||||||
Agilent Technologies, Inc. | 10,857 | 726,333 | ||||||
Alphabet, Inc., Class A (c) | 927 | 961,429 | ||||||
American Express Co. | 7,169 | 668,724 | ||||||
Apple, Inc. | 4,291 | 719,944 | ||||||
Biogen, Inc. (c) | 948 | 259,581 | ||||||
Booking Holdings, Inc. (c) | 302 | 628,278 | ||||||
Citigroup, Inc. | 10,193 | 688,027 | ||||||
Colgate-Palmolive Co. | 5,941 | 425,851 | ||||||
Eaton Corp. PLC | 5,483 | 438,147 | ||||||
Ecolab, Inc. | 2,886 | 395,584 | ||||||
EOG Resources, Inc. | 4,813 | 506,665 | ||||||
| Shares | Value | |||||||
Estee Lauder Cos., Inc., Class A | 4,014 | $ | 600,976 | |||||
International Flavors & Fragrances, Inc. | 4,004 | 548,188 | ||||||
Intuit, Inc. | 3,656 | 633,768 | ||||||
Johnson & Johnson | 4,330 | 554,889 | ||||||
Microsoft Corp. | 9,759 | 890,704 | ||||||
Mondelez International, Inc., Class A | 9,847 | 410,915 | ||||||
S&P Global, Inc. | 3,779 | 722,016 | ||||||
Schlumberger Ltd. | 5,308 | 343,852 | ||||||
Starbucks Corp. | 10,657 | 616,934 | ||||||
Visa, Inc., Class A | 8,805 | 1,053,254 | ||||||
Xylem, Inc. | 6,822 | 524,748 | ||||||
|
| |||||||
| 14,068,808 | ||||||||
|
| |||||||
| Total Common Stock (cost—$22,548,698) | 27,593,697 | |||||||
|
| |||||||
| Principal Amount (000s) | ||||||||
| Repurchase Agreements—5.0% | ||||||||
State Street Bank and Trust Co., |
| |||||||
(cost—$1,463,000) | $1,463 | 1,463,000 | ||||||
|
| |||||||
| Total Investments (cost-$24,011,698) (b)—99.9% | 29,056,697 | |||||||
|
| |||||||
| Other assets less liabilities—0.1% | 39,363 | |||||||
|
| |||||||
| Net Assets—100.0% | $29,096,060 | |||||||
|
| |||||||
Notes to Schedule of Investments:
(a) 144A—Exempt from registration under Rule 144A of the Securities Act of 1933. These securities may be resold in transactions exempt from registration, typically only to qualified institutional buyers. Security with a value of $390,914, representing 1.3% of net assets.
(b) Securities with an aggregate value of $13,290,117, representing 45.7% of net assets, were valued utilizing modeling tools provided by a third-party vendor. See Note 1(a) and Note 1(b) in the Notes to Financial Statements.
(c) Non-income producing.
Glossary:
GDR—Global Depositary Receipt
| 162 | Semiannual Report | | March 31, 2018 | | See accompanying Notes to Financial Statements |
Table of Contents
Schedule of Investments
March 31, 2018 (Unaudited)
The industry classification of portfolio holdings and other assets less liabilities shown as a percentage of net assets were as follows:
|
| |||
IT Services | 9.2% | |||
Pharmaceuticals | 7.1% | |||
Software | 7.0% | |||
Insurance | 5.2% | |||
Banks | 5.0% | |||
Oil, Gas & Consumable Fuels | 4.8% | |||
Chemicals | 4.6% | |||
Personal Products | 4.3% | |||
Technology Hardware, Storage & Peripherals | 4.2% | |||
Building Products | 4.0% | |||
Machinery | 3.9% | |||
Capital Markets | 3.5% | |||
Internet Software & Services | 3.3% | |||
Household Products | 3.2% | |||
Electronic Equipment, Instruments & Components | 2.6% | |||
Life Sciences Tools & Services | 2.5% | |||
Consumer Finance | 2.3% | |||
Textiles, Apparel & Luxury Goods | 2.2% | |||
Internet & Catalog Retail | 2.2% | |||
Hotels, Restaurants & Leisure | 2.1% | |||
Healthcare Providers & Services | 1.6% | |||
Electrical Equipment | 1.5% | |||
Food Products | 1.4% | |||
Professional Services | 1.4% | |||
Wireless Telecommunication Services | 1.4% | |||
Specialty Retail | 1.3% | |||
Energy Equipment & Services | 1.2% | |||
Media | 1.0% | |||
Biotechnology | 0.9% | |||
Repurchase Agreements | 5.0% | |||
Other assets less liabilities | 0.1% | |||
|
| |||
| 100.0% | ||||
|
| |||
AllianzGI Global Water Fund
| Shares | Value | |||||||
| Common Stock—97.9% | ||||||||
| Austria—3.8% | ||||||||
ANDRITZ AG | 340,000 | $19,012,100 | ||||||
Wienerberger AG | 255,922 | 6,399,378 | ||||||
|
| |||||||
| 25,411,478 | ||||||||
|
| |||||||
| Canada—1.9% | ||||||||
Stantec, Inc. | 497,861 | 12,284,706 | ||||||
|
| |||||||
| China—2.3% | ||||||||
China Everbright International Ltd. | 10,854,000 | 15,325,603 | ||||||
|
| |||||||
| Finland—3.9% | ||||||||
Uponor Oyj (b) | 756,642 | 12,639,995 | ||||||
Wartsila Oyj Abp | 604,914 | 13,365,767 | ||||||
|
| |||||||
| 26,005,762 | ||||||||
|
| |||||||
| France—10.2% | ||||||||
Suez | 1,565,151 | 22,678,941 | ||||||
Veolia Environnement S.A. | 1,907,334 | 45,313,233 | ||||||
|
| |||||||
| 67,992,174 | ||||||||
|
| |||||||
| Germany—0.6% | ||||||||
GEA Group AG | 98,136 | 4,173,400 | ||||||
|
| |||||||
| Japan—4.1% | ||||||||
Kubota Corp. | 725,200 | 12,783,542 | ||||||
Kurita Water Industries Ltd. | 439,600 | 14,191,558 | ||||||
|
| |||||||
| 26,975,100 | ||||||||
|
| |||||||
| Netherlands—4.0% | ||||||||
Aalberts Industries NV | 522,235 | 26,613,309 | ||||||
|
| |||||||
| Sweden—3.6% | ||||||||
Alfa Laval AB | 1,003,351 | 23,777,457 | ||||||
|
| |||||||
| Switzerland—6.2% | ||||||||
Belimo Holding AG | 643 | 2,603,457 | ||||||
Geberit AG | 86,904 | 38,430,888 | ||||||
|
| |||||||
| 41,034,345 | ||||||||
|
| |||||||
| United Kingdom—9.2% | ||||||||
Halma PLC | 1,305,968 | 21,618,022 | ||||||
Pennon Group PLC | 1,764,532 | 15,952,475 | ||||||
Severn Trent PLC | 921,119 | 23,846,448 | ||||||
|
| |||||||
| 61,416,945 | ||||||||
|
| |||||||
Shares | Value | |||||||
| United States—48.1% | ||||||||
American Water Works Co., Inc. | 787,092 | $ | 64,643,866 | |||||
AO Smith Corp. | 101,870 | 6,477,913 | ||||||
Aqua America, Inc. | 819,855 | 27,924,261 | ||||||
Badger Meter, Inc. | 83,487 | 3,936,412 | ||||||
Danaher Corp. | 424,734 | 41,585,706 | ||||||
IDEX Corp. | 286,883 | 40,883,696 | ||||||
Itron, Inc. (b) | 167,280 | 11,968,884 | ||||||
Masco Corp. | 162,625 | 6,576,555 | ||||||
Mueller Water Products, Inc., Class A | 1,020,789 | 11,095,977 | ||||||
PerkinElmer, Inc. | 181,665 | 13,755,674 | ||||||
Tetra Tech, Inc. | 320,000 | 15,664,000 | ||||||
Waste Management, Inc. | 162,078 | 13,634,001 | ||||||
Xylem, Inc. | 799,392 | 61,489,233 | ||||||
|
| |||||||
| 319,636,178 | ||||||||
|
| |||||||
| Total Common Stock (cost—$548,521,082) | 650,646,457 | |||||||
|
| |||||||
| Principal Amount (000s) | ||||||||
| Repurchase Agreements—0.7% | ||||||||
State Street Bank and Trust Co., dated 3/29/18, 0.28%, due 4/2/18, proceeds $4,945,154; collateralized by U.S. Treasury Notes, 2.00%, due 8/15/25, valued at $5,046,977 including accrued interest |
| |||||||
(cost—$4,945,000) | $4,945 | 4,945,000 | ||||||
|
| |||||||
| Total Investments (cost—$553,466,082) (a)—98.6% | 655,591,457 | |||||||
|
| |||||||
| Other assets less liabilities (c)—1.4% | 9,062,163 | |||||||
|
| |||||||
| Net Assets—100.0% | $664,653,620 | |||||||
|
| |||||||
Notes to Schedule of Investments:
(a) Securities with an aggregate value of $318,725,573, representing 48.0% of net assets, were valued utilizing modeling tools provided by a third-party vendor. See Note 1(a) and Note 1(b) in the Notes to Financial Statements.
(b) Non-income producing.
(c) Includes net unrealized appreciation (depreciation) of other financial instruments as follows:
| Forward foreign currency contracts outstanding at March 31, 2018: | ||||||||||||||||||
| Description | Counterparty | U.S.$ Value on Origination Date | U.S.$ Value March 31, 2018 | Unrealized Appreciation | Unrealized Depreciation | |||||||||||||
Sold: |
| |||||||||||||||||
382,075 Euro settling 4/3/18 | Income Repatriation Boston IBS | $ | 469,222 | $ | 470,124 | $ | — | $ | (902 | ) | ||||||||
27,959,911 Hong Kong Dollar settling 4/3/18 | State Street Bank and Trust Co. | 3,562,635 | 3,562,612 | 23 | — | |||||||||||||
28,745,571 Hong Kong Dollar settling 4/4/18 | State Street Bank and Trust Co. | 3,662,462 | 3,662,719 | — | (257 | ) | ||||||||||||
|
| |||||||||||||||||
| $ | 23 | $ | (1,159 | ) | ||||||||||||||
|
| |||||||||||||||||
The industry classification of portfolio holdings and other assets less liabilities shown as a percentage of net assets were as follows:
|
| |||
Machinery | 34.2% | |||
Water Utilities | 19.9% | |||
Multi-Utilities | 10.2% | |||
Building Products | 10.0% | |||
Commercial Services & Supplies | 6.7% | |||
| ||||
Healthcare Equipment & Supplies | 6.3% | |||
Electronic Equipment, Instruments & Components | 5.6% | |||
Life Sciences Tools & Services | 2.1% | |||
Professional Services | 1.9% |
| ||||
Construction Materials | 1.0% | |||
Repurchase Agreements | 0.7% | |||
Other assets less liabilities | 1.4% | |||
|
| |||
| 100.0% | ||||
|
|
| See accompanying Notes to Financial Statements | | March 31, 2018 | | Semiannual Report | 163 |
Table of Contents
Schedule of Investments
March 31, 2018 (Unaudited)
AllianzGI High Yield Bond Fund
| Principal Amount (000s) | Value | |||||||
| Corporate bonds & Notes—93.6% | ||||||||
| Aerospace & Defense—2.0% | ||||||||
Kratos Defense & Security Solutions, |
| |||||||
6.50%, 11/30/25 | $1,230 | $1,274,587 | ||||||
TransDigm, Inc., | ||||||||
6.50%, 5/15/25 | 1,825 | 1,847,812 | ||||||
Triumph Group, Inc., | ||||||||
7.75%, 8/15/25 | 1,005 | 1,032,638 | ||||||
|
| |||||||
| 4,155,037 | ||||||||
|
| |||||||
| Auto Components—1.6% | ||||||||
American Axle & Manufacturing, Inc., |
| |||||||
6.625%, 10/15/22 | 1,690 | 1,751,263 | ||||||
Delphi Technologies PLC (a)(b), |
| |||||||
5.00%, 10/1/25 | 1,100 | 1,057,375 | ||||||
Goodyear Tire & Rubber Co., |
| |||||||
5.125%, 11/15/23 | 575 | 580,031 | ||||||
|
| |||||||
| 3,388,669 | ||||||||
|
| |||||||
| Auto Manufacturers—0.6% | ||||||||
Navistar International Corp. (a)(b), |
| |||||||
6.625%, 11/1/25 | 1,305 | 1,308,263 | ||||||
|
| |||||||
| Banks—1.2% | ||||||||
CIT Group, Inc., | ||||||||
6.125%, 3/9/28 | 1,165 | 1,211,600 | ||||||
Royal Bank of Scotland Group PLC, |
| |||||||
5.125%, 5/28/24 | 1,300 | 1,323,617 | ||||||
|
| |||||||
| 2,535,217 | ||||||||
|
| |||||||
| Building Materials—0.7% | ||||||||
Builders FirstSource, Inc. (a)(b), |
| |||||||
5.625%, 9/1/24 | 1,545 | 1,558,519 | ||||||
|
| |||||||
| Chemicals—5.0% | ||||||||
Chemours Co., | ||||||||
7.00%, 5/15/25 | 1,495 | 1,622,075 | ||||||
Kraton Polymers LLC (a)(b), |
| |||||||
7.00%, 4/15/25 | 1,275 | 1,326,000 | ||||||
Olin Corp., | ||||||||
5.00%, 2/1/30 | 1,130 | 1,083,387 | ||||||
Platform Specialty Products Corp. (a)(b), |
| |||||||
6.50%, 2/1/22 | 1,780 | 1,813,375 | ||||||
PQ Corp. (a)(b), | ||||||||
5.75%, 12/15/25 | 1,450 | 1,439,125 | ||||||
Trinseo Materials Operating SCA (a)(b), |
| |||||||
5.375%, 9/1/25 | 1,660 | 1,635,100 | ||||||
Tronox Finance PLC (a)(b), |
| |||||||
5.75%, 10/1/25 | 1,560 | 1,521,000 | ||||||
|
| |||||||
| 10,440,062 | ||||||||
|
| |||||||
| Commercial Services—4.1% | ||||||||
Cardtronics, Inc., | ||||||||
5.125%, 8/1/22 | 905 | 886,665 | ||||||
Cenveo Corp. (a)(b)(c)(f), |
| |||||||
6.00%, 5/15/24 | ||||||||
(acquisition cost $3,115,333; purchased 3/22/12—3/11/16) | 2,299 | 126,445 | ||||||
Gartner, Inc. (a)(b), | ||||||||
5.125%, 4/1/25 | 1,440 | 1,443,600 | ||||||
KAR Auction Services, Inc. (a)(b), |
| |||||||
5.125%, 6/1/25 | 1,195 | 1,192,013 | ||||||
Live Nation Entertainment, Inc. (a)(b), |
| |||||||
5.625%, 3/15/26 | 720 | 730,800 | ||||||
RR Donnelley & Sons Co., |
| |||||||
7.00%, 2/15/22 | 1,730 | 1,801,362 | ||||||
United Rentals North America, Inc., |
| |||||||
4.625%, 10/15/25 | 630 | 614,250 | ||||||
5.50%, 7/15/25 | 1,750 | 1,798,125 | ||||||
|
| |||||||
| 8,593,260 | ||||||||
|
| |||||||
| Principal Amount (000s) | Value | |||||||
| Computers—1.6% | ||||||||
Dell International LLC (a)(b), |
| |||||||
7.125%, 6/15/24 | $ | 1,180 | $ | 1,260,793 | ||||
Harland Clarke Holdings Corp. (a)(b), |
| |||||||
9.25%, 3/1/21 | 2,000 | 2,067,500 | ||||||
|
| |||||||
| 3,328,293 | ||||||||
|
| |||||||
| Distribution/Wholesale—2.1% | ||||||||
H&E Equipment Services, Inc., |
| |||||||
5.625%, 9/1/25 | 1,480 | 1,496,650 | ||||||
HD Supply, Inc. (a)(b), | ||||||||
5.75%, 4/15/24 | 1,450 | 1,531,128 | ||||||
Univar USA, Inc. (a)(b), | ||||||||
6.75%, 7/15/23 | 1,385 | 1,435,206 | ||||||
|
| |||||||
| 4,462,984 | ||||||||
|
| |||||||
| Diversified Financial Services—5.2% | ||||||||
Ally Financial, Inc., | ||||||||
5.75%, 11/20/25 | 1,420 | 1,468,351 | ||||||
8.00%, 3/15/20 | 405 | 436,388 | ||||||
Community Choice Financial, Inc., |
| |||||||
10.75%, 5/1/19 | 2,615 | 2,445,025 | ||||||
Nationstar Mortgage LLC, |
| |||||||
7.875%, 10/1/20 | 1,250 | 1,278,125 | ||||||
Navient Corp., | ||||||||
6.625%, 7/26/21 | 1,050 | 1,094,625 | ||||||
7.25%, 9/25/23 | 805 | 845,250 | ||||||
Springleaf Finance Corp., |
| |||||||
5.625%, 3/15/23 | 610 | 600,087 | ||||||
8.25%, 10/1/23 | 1,170 | 1,269,450 | ||||||
Travelport Corporate Finance PLC (a)(b), |
| |||||||
6.00%, 3/15/26 | 1,415 | 1,423,844 | ||||||
|
| |||||||
| 10,861,145 | ||||||||
|
| |||||||
| Electric Utilities—0.9% | ||||||||
NRG Energy, Inc. (a)(b), | ||||||||
5.75%, 1/15/28 | 1,855 | 1,817,900 | ||||||
|
| |||||||
| Electronic Equipment, Instruments & Components—0.7% | ||||||||
Energizer Holdings, Inc. (a)(b), |
| |||||||
5.50%, 6/15/25 | 1,350 | 1,363,500 | ||||||
|
| |||||||
| Engineering & Construction—1.7% | ||||||||
AECOM, | ||||||||
5.875%, 10/15/24 | 1,805 | 1,897,506 | ||||||
Tutor Perini Corp. (a)(b), | ||||||||
6.875%, 5/1/25 | 1,695 | 1,750,088 | ||||||
|
| |||||||
| 3,647,594 | ||||||||
|
| |||||||
| Entertainment—2.7% | ||||||||
AMC Entertainment Holdings, Inc., |
| |||||||
6.125%, 5/15/27 | 1,640 | 1,619,500 | ||||||
Cedar Fair L.P., | ||||||||
5.375%, 6/1/24 | 1,395 | 1,421,156 | ||||||
5.375%, 4/15/27 (a)(b) | 405 | 401,963 | ||||||
International Game Technology PLC (a)(b), |
| |||||||
6.25%, 2/15/22 | 1,300 | 1,368,250 | ||||||
Scientific Games International, Inc. (a)(b), |
| |||||||
5.00%, 10/15/25 | 840 | 819,000 | ||||||
|
| |||||||
| 5,629,869 | ||||||||
|
| |||||||
| Equity Real Estate Investment Trusts (REITs)—1.0% | ||||||||
CyrusOne L.P., | ||||||||
5.00%, 3/15/24 | 710 | 712,662 | ||||||
5.375%, 3/15/27 | 840 | 840,000 | ||||||
Equinix, Inc., | ||||||||
5.375%, 5/15/27 | 470 | 478,225 | ||||||
|
| |||||||
| 2,030,887 | ||||||||
|
| |||||||
| Principal Amount (000s) | Value | |||||||
| Food & Beverage—0.6% | ||||||||
Post Holdings, Inc. (a)(b), |
| |||||||
5.75%, 3/1/27 | $ | 1,250 | $ | 1,246,875 | ||||
|
| |||||||
| Food Service—0.7% | ||||||||
Aramark Services, Inc. (a)(b), |
| |||||||
5.00%, 2/1/28 | 1,510 | 1,481,687 | ||||||
|
| |||||||
| Healthcare-Products—1.8% | ||||||||
Hill-Rom Holdings, Inc. (a)(b), |
| |||||||
5.00%, 2/15/25 | 985 | 981,306 | ||||||
Hologic, Inc. (a)(b), | ||||||||
4.625%, 2/1/28 | 1,095 | 1,053,938 | ||||||
Teleflex, Inc., | ||||||||
5.25%, 6/15/24 | 1,705 | 1,751,887 | ||||||
|
| |||||||
| 3,787,131 | ||||||||
|
| |||||||
| Healthcare-Services—4.6% | ||||||||
Centene Corp., | ||||||||
4.75%, 1/15/25 | 520 | 508,300 | ||||||
Charles River Laboratories International, Inc. (a)(b), |
| |||||||
5.50%, 4/1/26 | 855 | 871,031 | ||||||
Community Health Systems, Inc., |
| |||||||
6.25%, 3/31/23 | 400 | 370,500 | ||||||
DaVita, Inc., | ||||||||
5.125%, 7/15/24 | 1,730 | 1,692,156 | ||||||
Encompass Health Corp., |
| |||||||
5.75%, 11/1/24 | 1,025 | 1,045,500 | ||||||
HCA, Inc., | ||||||||
7.50%, 2/15/22 | 1,600 | 1,762,000 | ||||||
Kindred Healthcare, Inc., |
| |||||||
6.375%, 4/15/22 | 1,123 | 1,131,423 | ||||||
8.75%, 1/15/23 | 150 | 159,375 | ||||||
Tenet Healthcare Corp., | ||||||||
5.125%, 5/1/25 (a)(b) | 500 | 482,500 | ||||||
8.125%, 4/1/22 | 1,455 | 1,522,294 | ||||||
|
| |||||||
| 9,545,079 | ||||||||
|
| |||||||
| Home Builders—2.0% | ||||||||
Beazer Homes USA, Inc., |
| |||||||
5.875%, 10/15/27 | 450 | 419,062 | ||||||
8.75%, 3/15/22 | 655 | 707,400 | ||||||
Brookfield Residential Properties, Inc. (a)(b), |
| |||||||
6.50%, 12/15/20 | 575 | 583,625 | ||||||
KB Home, | ||||||||
8.00%, 3/15/20 | 955 | 1,031,400 | ||||||
Lennar Corp. (a)(b), | ||||||||
5.875%, 11/15/24 | 1,300 | 1,352,000 | ||||||
|
| |||||||
| 4,093,487 | ||||||||
|
| |||||||
| Household Products/Wares—0.7% | ||||||||
Spectrum Brands, Inc., | ||||||||
5.75%, 7/15/25 | 1,435 | 1,470,875 | ||||||
|
| |||||||
| Insurance—0.8% | ||||||||
CNO Financial Group, Inc., |
| |||||||
5.25%, 5/30/25 | 1,735 | 1,756,687 | ||||||
|
| |||||||
| Internet—2.8% | ||||||||
Match Group, Inc. (a)(b), |
| |||||||
5.00%, 12/15/27 | 1,575 | 1,555,312 | ||||||
Netflix, Inc., | ||||||||
5.875%, 2/15/25 | 1,260 | 1,323,000 | ||||||
Symantec Corp. (a)(b), | ||||||||
5.00%, 4/15/25 | 1,415 | 1,430,184 | ||||||
Zayo Group LLC (a)(b), | ||||||||
5.75%, 1/15/27 | 1,505 | 1,473,019 | ||||||
|
| |||||||
| 5,781,515 | ||||||||
|
| |||||||
| 164 | Semiannual Report | | March 31, 2018 | | See accompanying Notes to Financial Statements |
Table of Contents
Schedule of Investments
March 31, 2018 (Unaudited)
| Principal Amount (000s) | Value | |||||||
| Iron/Steel—1.4% | ||||||||
AK Steel Corp., | ||||||||
7.00%, 3/15/27 | $ | 655 | $ | 643,538 | ||||
7.50%, 7/15/23 | 515 | 545,900 | ||||||
United States Steel Corp., | ||||||||
6.875%, 8/15/25 | 1,625 | 1,677,812 | ||||||
|
| |||||||
| 2,867,250 | ||||||||
|
| |||||||
| Lodging—1.6% | ||||||||
Hilton Worldwide Finance LLC, |
| |||||||
4.625%, 4/1/25 | 575 | 575,719 | ||||||
MGM Resorts International, | ||||||||
6.625%, 12/15/21 | 1,000 | 1,081,250 | ||||||
Wyndham Hotels & Resorts, Inc. (a)(b), |
| |||||||
5.375%, 4/15/26 | 755 | 764,438 | ||||||
Wynn Las Vegas LLC (a)(b), |
| |||||||
5.50%, 3/1/25 | 905 | 911,787 | ||||||
|
| |||||||
| 3,333,194 | ||||||||
|
| |||||||
| Machinery-Construction & Mining—0.8% | ||||||||
Terex Corp. (a)(b), | ||||||||
5.625%, 2/1/25 | 1,765 | 1,769,412 | ||||||
|
| |||||||
| Machinery-Diversified—0.3% | ||||||||
Tennant Co., | ||||||||
5.625%, 5/1/25 | 580 | 594,500 | ||||||
|
| |||||||
| Media—7.1% | ||||||||
CCO Holdings LLC, | ||||||||
5.125%, 5/1/27 (a)(b) | 310 | 295,089 | ||||||
5.75%, 1/15/24 | 1,745 | 1,775,538 | ||||||
Clear Channel Worldwide Holdings, Inc., Ser. B, |
| |||||||
6.50%, 11/15/22 | 1,345 | 1,375,263 | ||||||
CSC Holdings LLC, | ||||||||
6.75%, 11/15/21 | 1,460 | 1,523,875 | ||||||
DISH DBS Corp., | ||||||||
5.875%, 7/15/22 | 1,515 | 1,452,506 | ||||||
Gray Television, Inc. (a)(b), |
| |||||||
5.875%, 7/15/26 | 1,180 | 1,150,500 | ||||||
LIN Television Corp., | ||||||||
5.875%, 11/15/22 | 1,085 | 1,121,619 | ||||||
LiveStyle, Inc. (a)(b)(c)(f)(h), |
| |||||||
9.625%, 2/1/19 (acquisition cost—$2,787,813; purchased 1/31/14-2/3/14) | 2,761 | 55 | ||||||
McClatchy Co., | ||||||||
9.00%, 12/15/22 | 1,273 | 1,331,876 | ||||||
Meredith Corp. (a)(b), | ||||||||
6.875%, 2/1/26 | 1,415 | 1,455,681 | ||||||
Nexstar Broadcasting, Inc. (a)(b), |
| |||||||
5.625%, 8/1/24 | 1,795 | 1,763,049 | ||||||
Sirius XM Radio, Inc. (a)(b), |
| |||||||
5.00%, 8/1/27 | 1,580 | 1,493,100 | ||||||
|
| |||||||
| 14,738,151 | ||||||||
|
| |||||||
| Metal Fabricate/Hardware—0.7% | ||||||||
Park-Ohio Industries, Inc., | ||||||||
6.625%, 4/15/27 | 1,500 | 1,560,000 | ||||||
|
| |||||||
| Mining—3.4% | ||||||||
Alcoa Nederland Holding BV (a)(b), |
| |||||||
6.75%, 9/30/24 | 1,000 | 1,075,000 | ||||||
Constellium NV (a)(b), | ||||||||
6.625%, 3/1/25 | 1,545 | 1,568,175 | ||||||
Freeport-McMoRan, Inc., | ||||||||
3.55%, 3/1/22 | 1,660 | 1,610,200 | ||||||
Hudbay Minerals, Inc. (a)(b), |
| |||||||
7.25%, 1/15/23 | 235 | 244,988 | ||||||
7.625%, 1/15/25 | 930 | 986,962 | ||||||
Joseph T. Ryerson & Son, Inc. (a)(b), |
| |||||||
11.00%, 5/15/22 | 1,490 | 1,646,450 | ||||||
|
| |||||||
| 7,131,775 | ||||||||
|
| |||||||
| Miscellaneous Manufacturing—0.7% | ||||||||
Koppers, Inc. (a)(b), | ||||||||
6.00%, 2/15/25 | 1,515 | 1,551,663 | ||||||
|
| |||||||
| Principal Amount (000s) | Value | |||||||
| Oil, Gas & Consumable Fuels—8.9% | ||||||||
AmeriGas Partners L.P., | ||||||||
5.875%, 8/20/26 | $ | 1,505 | $ | 1,478,662 | ||||
Callon Petroleum Co., | ||||||||
6.125%, 10/1/24 | 1,520 | 1,562,256 | ||||||
Calumet Specialty Products Partners L.P., | ||||||||
6.50%, 4/15/21 | 1,635 | 1,594,125 | ||||||
Carrizo Oil & Gas, Inc., | ||||||||
6.25%, 4/15/23 | 935 | 939,675 | ||||||
Chesapeake Energy Corp. (a)(b), |
| |||||||
8.00%, 1/15/25 | 660 | 640,200 | ||||||
Continental Resources, Inc., | ||||||||
5.00%, 9/15/22 | 1,515 | 1,540,566 | ||||||
CVR Refining LLC, | ||||||||
6.50%, 11/1/22 | 1,110 | 1,137,750 | ||||||
Ensco PLC, | ||||||||
5.20%, 3/15/25 | 305 | 249,719 | ||||||
7.75%, 2/1/26 | 1,030 | 947,600 | ||||||
EP Energy LLC, | ||||||||
9.375%, 5/1/20 | 695 | 649,825 | ||||||
Noble Holding International Ltd., |
| |||||||
7.75%, 1/15/24 | 635 | 592,138 | ||||||
Oasis Petroleum, Inc., | ||||||||
6.875%, 3/15/22 | 1,575 | 1,601,365 | ||||||
Range Resources Corp., | ||||||||
4.875%, 5/15/25 | 1,645 | 1,533,962 | ||||||
Sanchez Energy Corp., | ||||||||
6.125%, 1/15/23 | 1,830 | 1,343,906 | ||||||
Sunoco L.P. (a)(b), | ||||||||
5.50%, 2/15/26 | 990 | 957,825 | ||||||
5.875%, 3/15/28 | 650 | 629,688 | ||||||
Transocean, Inc. (a)(b), | ||||||||
7.50%, 1/15/26 | 1,115 | 1,101,063 | ||||||
|
| |||||||
| 18,500,325 | ||||||||
|
| |||||||
| Paper & Forest Products—0.5% | ||||||||
Mercer International, Inc. (a)(b), |
| |||||||
5.50%, 1/15/26 | 1,050 | 1,044,750 | ||||||
|
| |||||||
| Pharmaceuticals—2.2% | ||||||||
Endo Finance LLC (a)(b), |
| |||||||
5.375%, 1/15/23 | 1,550 | 1,181,875 | ||||||
Horizon Pharma, Inc., | ||||||||
6.625%, 5/1/23 | 1,490 | 1,490,000 | ||||||
Valeant Pharmaceuticals International, |
| |||||||
6.125%, 4/15/25 | 1,390 | 1,204,782 | ||||||
7.50%, 7/15/21 | 720 | 728,100 | ||||||
|
| |||||||
| 4,604,757 | ||||||||
|
| |||||||
| Pipelines—0.8% | ||||||||
Crestwood Midstream Partners L.P., |
| |||||||
5.75%, 4/1/25 | 1,520 | 1,512,400 | ||||||
Sabine Pass Liquefaction LLC, |
| |||||||
5.75%, 5/15/24 | 119 | 128,354 | ||||||
|
| |||||||
| 1,640,754 | ||||||||
|
| |||||||
| Real Estate—1.8% | ||||||||
Iron Mountain, Inc. (a)(b), |
| |||||||
4.875%, 9/15/27 | 985 | 918,512 | ||||||
Kennedy-Wilson, Inc., | ||||||||
5.875%, 4/1/24 | 1,483 | 1,477,439 | ||||||
Uniti Group L.P., | ||||||||
8.25%, 10/15/23 | 1,500 | 1,425,000 | ||||||
|
| |||||||
| 3,820,951 | ||||||||
|
| |||||||
| Retail—3.7% | ||||||||
1011778 BC ULC (a)(b), |
| |||||||
5.00%, 10/15/25 | 1,610 | 1,541,092 | ||||||
Beacon Roofing Supply, Inc. (a)(b), |
| |||||||
4.875%, 11/1/25 | 1,390 | 1,330,925 | ||||||
Conn’s, Inc., | ||||||||
7.25%, 7/15/22 | 1,595 | 1,591,012 | ||||||
| Principal Amount (000s) | Value | |||||||
Dollar Tree, Inc., | ||||||||
5.75%, 3/1/23 | $ | 1,315 | $ | 1,374,274 | ||||
KFC Holding Co. (a)(b), |
| |||||||
4.75%, 6/1/27 | 1,370 | 1,323,763 | ||||||
L Brands, Inc., | ||||||||
6.875%, 11/1/35 | 370 | 360,750 | ||||||
Men’s Wearhouse, Inc., | ||||||||
7.00%, 7/1/22 | 210 | 216,825 | ||||||
|
| |||||||
| 7,738,641 | ||||||||
|
| |||||||
| Semiconductors—2.3% | ||||||||
Advanced Micro Devices, Inc., | ||||||||
7.50%, 8/15/22 | 983 | 1,076,385 | ||||||
Amkor Technology, Inc., | ||||||||
6.375%, 10/1/22 | 1,000 | 1,030,000 | ||||||
Entegris, Inc. (a)(b), | ||||||||
4.625%, 2/10/26 | 490 | 480,254 | ||||||
Qorvo, Inc., | ||||||||
7.00%, 12/1/25 | 1,375 | 1,499,891 | ||||||
Sensata Technologies BV (a)(b), |
| |||||||
5.625%, 11/1/24 | 750 | 786,563 | ||||||
|
| |||||||
| 4,873,093 | ||||||||
|
| |||||||
| Software—2.5% | ||||||||
Camelot Finance S.A. (a)(b), |
| |||||||
7.875%, 10/15/24 | 1,420 | 1,485,675 | ||||||
First Data Corp. (a)(b), |
| |||||||
7.00%, 12/1/23 | 1,495 | 1,575,356 | ||||||
j2 Cloud Services LLC (a)(b), |
| |||||||
6.00%, 7/15/25 | 1,570 | 1,615,138 | ||||||
Rackspace Hosting, Inc. (a)(b), |
| |||||||
8.625%, 11/15/24 | 615 | 608,850 | ||||||
|
| |||||||
| 5,285,019 | ||||||||
|
| |||||||
| Telecommunications—8.7% | ||||||||
CenturyLink, Inc., Ser. Y, | ||||||||
7.50%, 4/1/24 | 1,560 | 1,575,600 | ||||||
Cincinnati Bell, Inc. (a)(b), |
| |||||||
7.00%, 7/15/24 | 1,630 | 1,467,000 | ||||||
CommScope Technologies LLC (a)(b), |
| |||||||
5.00%, 3/15/27 | 1,060 | 1,009,650 | ||||||
6.00%, 6/15/25 | 1,000 | 1,045,500 | ||||||
Consolidated Communications, Inc., |
| |||||||
6.50%, 10/1/22 | 1,645 | 1,477,704 | ||||||
Frontier Communications Corp., |
| |||||||
10.50%, 9/15/22 | 1,390 | 1,169,449 | ||||||
GTT Communications, Inc. (a)(b), |
| |||||||
7.875%, 12/31/24 | 900 | 906,750 | ||||||
Hughes Satellite Systems Corp., |
| |||||||
6.625%, 8/1/26 | 1,535 | 1,538,837 | ||||||
Level 3 Financing, Inc., | ||||||||
5.375%, 5/1/25 | 2,075 | 2,017,937 | ||||||
Sprint Communications, Inc., |
| |||||||
11.50%, 11/15/21 | 1,750 | 2,038,750 | ||||||
Sprint Corp., | ||||||||
7.625%, 3/1/26 | 1,065 | 1,042,369 | ||||||
T-Mobile USA, Inc., | ||||||||
4.50%, 2/1/26 | 315 | 302,794 | ||||||
4.75%, 2/1/28 | 1,090 | 1,049,125 | ||||||
Windstream Services LLC (a)(b), |
| |||||||
6.375%, 8/1/23 | 2,700 | 1,552,500 | ||||||
|
| |||||||
| 18,193,965 | ||||||||
|
| |||||||
| Transportation—1.1% | ||||||||
XPO Logistics, Inc. (a)(b), |
| |||||||
6.125%, 9/1/23 | 580 | 601,025 | ||||||
6.50%, 6/15/22 | 1,545 | 1,599,075 | ||||||
|
| |||||||
| 2,200,100 | ||||||||
|
| |||||||
| Total Corporate Bonds & Notes (cost—$201,129,673) | 195,732,835 | |||||||
|
| |||||||
| See accompanying Notes to Financial Statements | | March 31, 2018 | | Semiannual Report | 165 |
Table of Contents
Schedule of Investments
March 31, 2018 (Unaudited)
| Shares | Value | |||||||
| Preferred Stock (a)(d)(e)(g)(h)—3.1% | ||||||||
| Media—3.1% | ||||||||
LiveStyle, Inc., Ser. A | 6,269 | $ | 626,900 | |||||
LiveStyle, Inc., Ser. B | 57,581 | 5,758,100 | ||||||
|
| |||||||
| Total Preferred Stock (cost—$6,259,719) | 6,385,000 | |||||||
|
| |||||||
| Common Stock (a)(d)(e)(g)—0.3% | ||||||||
| Advertising—0.3% | ||||||||
Affinion Group Holdings, Inc. Class A (f) (acquisition | 43,401 | 580,705 | ||||||
|
| |||||||
| Aerospace & Defense—0.0% | ||||||||
Erickson, Inc. | 2,675 | 83,781 | ||||||
|
| |||||||
| Media—0.0% | ||||||||
LiveStyle, Inc. (h) | 67,983 | 7 | ||||||
|
| |||||||
| Total Common Stock (cost—$2,260,807) | 664,493 | |||||||
|
| |||||||
| Units | ||||||||
| Warrants (d)(e)(g) —0.0% | ||||||||
| Commercial Services—0.0% | ||||||||
Cenveo, Inc., strike price $12.00, | 243,090 | 16 | ||||||
|
| |||||||
| Media—0.0% | ||||||||
LiveStyle, Inc., expires 11/30/21, Ser. C., (a)(h) | 14,500 | 1 | ||||||
|
| |||||||
| Total Warrants (cost—$67,409) | 17 | |||||||
|
| |||||||
| Principal Amount (000s) | ||||||||
| Repurchase Agreements—2.9% | ||||||||
State Street Bank and Trust Co., |
| |||||||
(cost—$6,051,000) | $6,051 | 6,051,000 | ||||||
|
| |||||||
| Total Investments (cost—$215,768,608)—99.9% | 208,833,345 | |||||||
|
| |||||||
| Other assets less liabilities—0.1% | 263,358 | |||||||
|
| |||||||
| Net Assets—100.0% | $209,096,703 | |||||||
|
| |||||||
Notes to Schedule of Investments:
(a) Private Placement—Restricted as to resale and may not have a readily available market. Securities with an aggregate value of $95,238,606, representing 45.5% of net assets.
(b) 144A—Exempt from registration under Rule 144A of the Securities Act of 1933. These securities may be resold in transactions exempt from registration, typically only to qualified institutional buyers. Securities with an aggregate value of $88,189,126, representing 42.2% of net assets.
(c) In default.
(d) Fair-Valued—Securities with an aggregate value of $7,049,510, representing 3.4% of net assets. See Note 1(a) and Note 1(b) in the Notes to Financial Statements.
(e) Level 3 security. See Note 1(a) and Note 1(b) in the Notes to Financial Statements.
(f) Restricted. The aggregate acquisition cost of such securities is $6,672,886. The aggregate value is $707,205, representing 0.3% of net assets.
(g) Non-income producing.
(h) A member of the Fund’s portfolio management team is a member of the board of directors of LiveStyle, Inc. The Fund’s aggregate value of investments in LiveStyle, Inc. represents 3.1% of net assets.
AllianzGI International Growth Fund
| Shares | Value | |||||||
| Common Stock—98.4% | ||||||||
| Australia—1.0% | ||||||||
CSL Ltd. | 1,679 | $202,283 | ||||||
|
| |||||||
| Brazil—3.7% | ||||||||
Lojas Renner S.A. | 16,749 | 174,265 | ||||||
Odontoprev S.A. | 38,544 | 174,306 | ||||||
Raia Drogasil S.A. | 10,901 | 246,981 | ||||||
WEG S.A. | 22,241 | 152,317 | ||||||
|
| |||||||
| 747,869 | ||||||||
|
| |||||||
| Canada—8.8% | ||||||||
Alimentation Couche-Tard, Inc., Class B | 11,726 | 524,887 | ||||||
Canadian National Railway Co. | 3,992 | 291,758 | ||||||
Constellation Software, Inc. | 687 | 466,132 | ||||||
Restaurant Brands International, Inc. | 8,550 | 486,581 | ||||||
|
| |||||||
| 1,769,358 | ||||||||
|
| |||||||
| China—11.8% | ||||||||
Alibaba Group Holding Ltd. ADR (c) | 3,835 | 703,876 | ||||||
Baidu, Inc. ADR (c) | 1,669 | 372,504 | ||||||
Tencent Holdings Ltd. | 15,921 | 854,632 | ||||||
Weibo Corp. ADR (c) | 3,659 | 437,397 | ||||||
|
| |||||||
| 2,368,409 | ||||||||
|
| |||||||
| Denmark—9.4% | ||||||||
Ambu A/S, Class B | 24,035 | 544,005 | ||||||
Coloplast A/S, Class B | 2,987 | 253,348 | ||||||
DSV A/S | 6,470 | 510,796 | ||||||
Novo Nordisk A/S, Class B | 11,982 | 589,345 | ||||||
|
| |||||||
| 1,897,494 | ||||||||
|
| |||||||
| France—4.4% | ||||||||
Dassault Systemes SE | 1,970 | 267,907 | ||||||
Ingenico Group S.A. | 1,911 | 155,110 | ||||||
Legrand S.A. | 2,328 | 182,657 | ||||||
Sartorius Stedim Biotech | 3,033 | 273,809 | ||||||
|
| |||||||
| 879,483 | ||||||||
|
| |||||||
| Germany—12.5% | ||||||||
Bechtle AG | 3,801 | 308,333 | ||||||
Fresenius SE & Co. KGaA | 4,495 | 343,709 | ||||||
Infineon Technologies AG | 24,370 | 655,388 | ||||||
SAP SE | 6,233 | 654,351 | ||||||
Scout24 AG (a) | 6,532 | 304,567 | ||||||
Zalando SE (a)(c) | 4,515 | 246,377 | ||||||
|
| |||||||
| 2,512,725 | ||||||||
|
| |||||||
| Hong Kong—2.9% | ||||||||
AIA Group Ltd. | 68,344 | 584,251 | ||||||
|
| |||||||
| India—3.2% | ||||||||
HDFC Bank Ltd. | 9,615 | 280,673 | ||||||
HDFC Bank Ltd. ADR | 3,575 | 353,103 | ||||||
|
| |||||||
| 633,776 | ||||||||
|
| |||||||
| Indonesia—1.9% | ||||||||
Ace Hardware Indonesia Tbk PT | 2,036,110 | 196,697 | ||||||
Bank Central Asia Tbk PT | 109,118 | 185,368 | ||||||
|
| |||||||
| 382,065 | ||||||||
|
| |||||||
| Ireland—3.4% | ||||||||
Kingspan Group PLC | 7,369 | 311,911 | ||||||
Ryanair Holdings PLC ADR (c) | 3,045 | 374,078 | ||||||
|
| |||||||
| 685,989 | ||||||||
|
| |||||||
| 166 | Semiannual Report | | March 31, 2018 | | See accompanying Notes to Financial Statements |
Table of Contents
Schedule of Investments
March 31, 2018 (Unaudited)
| Shares | Value | |||||||
| Japan—6.7% | ||||||||
Hoshizaki Corp. | 2,739 | $ | 244,185 | |||||
Keyence Corp. | 779 | 486,608 | ||||||
MonotaRO Co., Ltd. | 9,069 | 320,970 | ||||||
Sundrug Co., Ltd. | 6,090 | 285,048 | ||||||
|
| |||||||
| 1,336,811 | ||||||||
|
| |||||||
| Korea (Republic of)—1.6% | ||||||||
LG Household & Health Care Ltd. | 294 | 329,657 | ||||||
|
| |||||||
| Mexico—1.0% | ||||||||
Fomento Economico Mexicano S.A.B de C.V. UNIT | 21,963 | 201,038 | ||||||
|
| |||||||
| Netherlands—1.9% | ||||||||
ASML Holding NV | 1,941 | 384,888 | ||||||
|
| |||||||
| Philippines—1.4% | ||||||||
Jollibee Foods Corp. | 23,572 | 135,861 | ||||||
Universal Robina Corp. | 48,389 | 141,112 | ||||||
|
| |||||||
| 276,973 | ||||||||
|
| |||||||
| South Africa—1.8% | ||||||||
PSG Group Ltd. | 18,951 | 360,462 | ||||||
|
| |||||||
| Spain—1.6% | ||||||||
Amadeus IT Group S.A. | 4,302 | 318,361 | ||||||
|
| |||||||
| Sweden—7.0% | ||||||||
Assa Abloy AB, Class B | 13,858 | 300,378 | ||||||
Atlas Copco AB, Class A | 7,275 | 315,966 | ||||||
Hexagon AB, Class B | 5,130 | 306,204 | ||||||
Hexpol AB | 29,063 | 270,169 | ||||||
Trelleborg AB, Class B | 8,754 | 220,585 | ||||||
|
| |||||||
| 1,413,302 | ||||||||
|
| |||||||
| Switzerland—3.2% | ||||||||
Cie Financiere Richemont S.A. | 2,616 | 235,079 | ||||||
Partners Group Holding AG | 325 | 241,840 | ||||||
Roche Holding AG | 723 | 165,854 | ||||||
|
| |||||||
| 642,773 | ||||||||
|
| |||||||
| United Kingdom—9.2% | ||||||||
ASOS PLC (c) | 2,666 | 260,805 | ||||||
British American Tobacco PLC | 8,094 | 467,889 | ||||||
DCC PLC | 4,225 | 389,280 | ||||||
Reckitt Benckiser Group PLC | 5,495 | 463,821 | ||||||
Unilever PLC | 4,995 | 277,035 | ||||||
|
| |||||||
| 1,858,830 | ||||||||
|
| |||||||
| Total Common Stock (cost—$15,065,745) | 19,786,797 | |||||||
|
| |||||||
| Principal Amount (000s) | ||||||||
| Repurchase Agreements—1.5% | ||||||||
State Street Bank and Trust Co., dated 3/29/18, 0.28%, due 4/2/18, proceeds $302,009; collateralized by U.S. Treasury Notes, 2.00%, due 8/15/25, valued at $309,777 including accrued interest |
| |||||||
(cost—$302,000) | $302 | 302,000 | ||||||
|
| |||||||
| Total Investments (cost—$15,367,745) (b)—99.9% | 20,088,797 | |||||||
|
| |||||||
| Other assets less liabilities—0.1% | 28,269 | |||||||
|
| |||||||
| Net Assets—100.0% | $20,117,066 | |||||||
|
| |||||||
Notes to Schedule of Investments:
(a) 144A—Exempt from registration under Rule 144A of the Securities Act of 1933. These securities may be resold in transactions exempt from registration, typically only to qualified institutional buyers. Securities with an aggregate value of $550,944, representing 2.7% of net assets.
(b) Securities with an aggregate value of $14,318,966, representing 71.2% of net assets, were valued utilizing modeling tools provided by a third-party vendor. See Note 1(a) and Note 1(b) in the Notes to Financial Statements.
(c) Non-income producing.
Glossary:
ADR—American Depositary Receipt
UNIT—More than one class of securities traded together.
The industry classification of portfolio holdings and other assets less liabilities shown as a percentage of net assets were as follows:
Internet Software & Services | 13.3% | |||
Software | 6.9% | |||
Healthcare Equipment & Supplies | 5.3% | |||
Food & Staples Retailing | 5.3% | |||
Semiconductors & Semiconductor Equipment | 5.2% | |||
Electronic Equipment, Instruments & Components | 4.7% | |||
Machinery | 4.6% | |||
Banks | 4.1% | |||
Road & Rail | 4.0% | |||
Pharmaceuticals | 3.8% | |||
IT Services | 3.1% | |||
Hotels, Restaurants & Leisure | 3.1% | |||
Building Products | 3.0% | |||
Personal Products | 3.0% | |||
Insurance | 2.9% | |||
Healthcare Providers & Services | 2.6% | |||
Internet & Catalog Retail | 2.5% | |||
Tobacco | 2.3% | |||
Household Products | 2.3% | |||
Industrial Conglomerates | 1.9% | |||
Airlines | 1.9% | |||
Diversified Financial Services | 1.8% | |||
Trading Companies & Distributors | 1.6% | |||
Chemicals | 1.3% | |||
Capital Markets | 1.2% | |||
Textiles, Apparel & Luxury Goods | 1.2% | |||
Biotechnology | 1.0% | |||
Beverages | 1.0% | |||
Specialty Retail | 1.0% | |||
Electrical Equipment | 0.9% | |||
Multi-Line Retail | 0.9% | |||
Food Products | 0.7% | |||
Repurchase Agreements | 1.5% | |||
Other assets less liabilities | 0.1% | |||
|
| |||
| 100.0% | ||||
|
|
AllianzGI International Small-Cap Fund
| Shares | Value | |||||||
| Common Stock—97.1% | ||||||||
| Australia—3.3% | ||||||||
ALS Ltd. | 167,500 | $963,912 | ||||||
Boral Ltd. | 238,934 | 1,378,245 | ||||||
Challenger Ltd. | 111,047 | 994,517 | ||||||
Downer EDI Ltd. | 242,019 | 1,202,899 | ||||||
GUD Holdings Ltd. | 68,610 | 633,677 | ||||||
Santos Ltd. (c) | 304,029 | 1,199,095 | ||||||
|
| |||||||
| 6,372,345 | ||||||||
|
| |||||||
| Austria—4.2% | ||||||||
Schoeller-Bleckmann Oilfield Equipment AG (c) | 19,392 | 2,138,732 | ||||||
UNIQA Insurance Group AG | 263,530 | 3,067,838 | ||||||
Wienerberger AG | 111,177 | 2,780,002 | ||||||
|
| |||||||
| 7,986,572 | ||||||||
|
| |||||||
| China—2.3% | ||||||||
Angel Yeast Co., Ltd., Class A | 239,750 | 1,222,307 | ||||||
China Everbright Greentech | 968,235 | 973,543 | ||||||
CIFI Holdings Group Co., Ltd. | 1,092,000 | 964,718 | ||||||
Sunny Optical Technology Group Co., Ltd. | 32,100 | 602,334 | ||||||
Zhejiang Dingli Machinery Co., Ltd., Class A | 50,260 | 537,084 | ||||||
|
| |||||||
| 4,299,986 | ||||||||
|
| |||||||
| Denmark—3.3% | ||||||||
Ambu A/S, Class B | 166,995 | 3,779,744 | ||||||
SimCorp A/S | 34,711 | 2,425,985 | ||||||
|
| |||||||
| 6,205,729 | ||||||||
|
| |||||||
| Finland—2.8% | ||||||||
Huhtamaki Oyj | 53,515 | 2,348,244 | ||||||
Outotec Oyj (c) | 324,590 | 2,900,604 | ||||||
|
| |||||||
| 5,248,848 | ||||||||
|
| |||||||
| France—4.4% | ||||||||
APERAM S.A. | 49,343 | 2,362,809 | ||||||
Korian S.A. | 37,130 | 1,256,483 | ||||||
Nexity S.A. | 28,344 | 1,815,307 | ||||||
Sartorius Stedim Biotech | 33,150 | 2,992,671 | ||||||
|
| |||||||
| 8,427,270 | ||||||||
|
| |||||||
| Germany—8.5% | ||||||||
Aareal Bank AG | 63,224 | 3,016,167 | ||||||
Bechtle AG | 33,486 | 2,716,344 | ||||||
CANCOM SE | 41,415 | 4,273,869 | ||||||
Deutsche Pfandbriefbank AG (a) | 192,285 | 3,031,673 | ||||||
Hella GmbH & Co. KGaA | 46,789 | 3,080,178 | ||||||
|
| |||||||
| 16,118,231 | ||||||||
|
| |||||||
| Hong Kong—2.3% | ||||||||
Johnson Electric Holdings Ltd. | 343,000 | 1,290,719 | ||||||
Man Wah Holdings Ltd. | 874,800 | 697,739 | ||||||
Melco International Development Ltd. | 200,000 | 586,960 | ||||||
Microport Scientific Corp. | 695,000 | 754,076 | ||||||
Techtronic Industries Co., Ltd. | 176,000 | 1,032,959 | ||||||
|
| |||||||
| 4,362,453 | ||||||||
|
| |||||||
| Indonesia—0.5% | ||||||||
Jasa Marga Persero Tbk PT | 2,858,200 | 955,199 | ||||||
|
| |||||||
| See accompanying Notes to Financial Statements | | March 31, 2018 | | Semiannual Report | 167 |
Table of Contents
Schedule of Investments
March 31, 2018 (Unaudited)
| Shares | Value | |||||||
| Italy—3.1% | ||||||||
De’ Longhi SpA | 72,324 | $ | 2,146,887 | |||||
FinecoBank Banca Fineco SpA | 308,542 | 3,713,694 | ||||||
|
| |||||||
| 5,860,581 | ||||||||
|
| |||||||
| Japan—30.7% | ||||||||
Arata Corp. | 37,000 | 2,095,597 | ||||||
COMSYS Holdings Corp. | 99,300 | 2,639,997 | ||||||
Daifuku Co., Ltd. | 30,300 | 1,796,410 | ||||||
Gunma Bank Ltd. | 514,273 | 2,960,668 | ||||||
Ichigo, Inc. | 526,200 | 2,331,816 | ||||||
Kenko Mayonnaise Co., Ltd. | 43,500 | 1,463,443 | ||||||
KH Neochem Co., Ltd. | 95,600 | 2,771,855 | ||||||
Lion Corp. | 125,200 | 2,569,326 | ||||||
MISUMI Group, Inc. | 87,000 | 2,409,520 | ||||||
Mitsubishi UFJ Lease & Finance Co., Ltd. | 412,400 | 2,470,501 | ||||||
Mitsui Mining & Smelting Co., Ltd. | 35,000 | 1,551,905 | ||||||
Morinaga Milk Industry Co., Ltd. | 53,100 | 2,160,888 | ||||||
Nippon Carbon Co., Ltd. | 32,800 | 1,609,385 | ||||||
Nippon Shinyaku Co., Ltd. | 23,300 | 1,577,264 | ||||||
Nissha Co., Ltd. | 45,700 | 1,216,505 | ||||||
Okamura Corp. | 222,900 | 3,070,391 | ||||||
Persol Holdings Co., Ltd. | 140,600 | 4,085,373 | ||||||
Pigeon Corp. | 67,000 | 3,027,181 | ||||||
Rengo Co., Ltd. | 422,600 | 3,653,011 | ||||||
Sanwa Holdings Corp. | 260,600 | 3,360,311 | ||||||
SCREEN Holdings Co., Ltd. | 25,800 | 2,330,486 | ||||||
Siix Corp. | 53,800 | 1,151,867 | ||||||
Start Today Co., Ltd. | 73,700 | 1,918,226 | ||||||
Ube Industries Ltd. | 141,300 | 4,140,441 | ||||||
|
| |||||||
| 58,362,367 | ||||||||
|
| |||||||
| Korea (Republic of)—0.2% | ||||||||
HyVision System, Inc. | 23,615 | 403,973 | ||||||
|
| |||||||
| Netherlands—3.1% | ||||||||
Aalberts Industries NV | 57,117 | 2,910,706 | ||||||
ASR Nederland NV | 69,079 | 2,953,691 | ||||||
|
| |||||||
| 5,864,397 | ||||||||
|
| |||||||
| Shares | Value | |||||||
| Philippines—0.4% | ||||||||
Integrated Micro-Electronics, Inc. | 1,331,100 | $ | 397,971 | |||||
Robinsons Land Corp. | 1,004,861 | 386,411 | ||||||
|
| |||||||
| 784,382 | ||||||||
|
| |||||||
| Spain—2.7% | ||||||||
Melia Hotels International S.A. | 179,337 | 2,538,665 | ||||||
Unicaja Banco S.A. (a)(c) | 1,541,515 | 2,656,721 | ||||||
|
| |||||||
| 5,195,386 | ||||||||
|
| |||||||
| Sweden—4.6% | ||||||||
AAK AB | 34,841 | 3,084,828 | ||||||
Fastighets AB Balder, Class B (c) | 83,130 | 2,092,094 | ||||||
Indutrade AB | 90,866 | 2,351,013 | ||||||
NetEnt AB (c) | 227,492 | 1,148,384 | ||||||
|
| |||||||
| 8,676,319 | ||||||||
|
| |||||||
| Switzerland—6.2% | ||||||||
ams AG | 34,502 | 3,623,062 | ||||||
Georg Fischer AG | 1,885 | 2,523,774 | ||||||
Interroll Holding AG | 1,798 | 2,823,505 | ||||||
OC Oerlikon Corp. AG (c) | 160,152 | 2,830,765 | ||||||
|
| |||||||
| 11,801,106 | ||||||||
|
| |||||||
| Taiwan—2.4% | ||||||||
ASPEED Technology, Inc. | 26,000 | 815,975 | ||||||
Ennoconn Corp. | 45,063 | 747,549 | ||||||
Faraday Technology Corp. | 405,000 | 981,609 | ||||||
Globalwafers Co., Ltd. | 72,000 | 1,160,376 | ||||||
Merry Electronics Co., Ltd. | 71,000 | 414,611 | ||||||
Sunonwealth Electric Machine Industry Co., Ltd. | 244,000 | 382,201 | ||||||
|
| |||||||
| 4,502,321 | ||||||||
|
| |||||||
| United Kingdom—12.1% | ||||||||
ASOS PLC (c) | 32,098 | 3,140,034 | ||||||
Auto Trader Group PLC (a) | 383,246 | 1,883,816 | ||||||
Genus PLC | 83,390 | 2,726,012 | ||||||
| Shares | Value | |||||||
Intermediate Capital Group PLC | 249,440 | $ | 3,445,298 | |||||
RPC Group PLC | 221,860 | 2,412,040 | ||||||
Senior PLC | 801,302 | 3,387,733 | ||||||
Spectris PLC | 56,498 | 2,138,331 | ||||||
Superdry PLC | 55,873 | 1,224,182 | ||||||
Tullow Oil PLC (c) | 928,717 | 2,560,205 | ||||||
|
| |||||||
| 22,917,651 | ||||||||
|
| |||||||
| Total Common Stock (cost—$142,324,382) | 184,345,116 | |||||||
|
| |||||||
| Preferred Stock—1.5% | ||||||||
| Germany—1.5% | ||||||||
Jungheinrich AG | 65,303 | 2,894,279 | ||||||
|
| |||||||
| Total Investments (cost—$144,546,267) (b)—98.6% | 187,239,395 | |||||||
|
| |||||||
| Other assets less liabilities (d)—1.4% | 2,689,549 | |||||||
|
| |||||||
| Net Assets—100.0% | $189,928,944 | |||||||
|
| |||||||
Notes to Schedule of Investments:
(a) 144A—Exempt from registration under Rule 144A of the Securities Act of 1933. These securities may be resold in transactions exempt from registration, typically only to qualified institutional buyers. Securities with an aggregate value of $8,545,753, representing 4.5% of net assets.
(b) Securities with an aggregate value of $184,115,412, representing 96.9% of net assets, were valued utilizing modeling tools provided by a third-party vendor. See Note 1(a) and Note 1(b) in the Notes to Financial Statements.
(c) Non-income producing.
(d) Includes net unrealized appreciation (depreciation) of other financial instruments as follows:
| Forward foreign currency contracts outstanding at March 31, 2018: | ||||||||||||||||||||
| Description | Counterparty | U.S.$ Value on Origination Date | U.S.$ Value March 31, 2018 | Unrealized Appreciation | Unrealized Depreciation | |||||||||||||||
Purchased: | ||||||||||||||||||||
683,790 Philippine Piso settling 4/2/18 | State Street Bank and Trust Co. | $ | 13,114 | $ | 13,105 | $ | — | $ | (9 | ) | ||||||||||
Sold: | ||||||||||||||||||||
164,704 Danish Krone settling 4/3/18 | Income Repatriation Boston IBS | 27,367 | 27,185 | 182 | — | |||||||||||||||
|
| |||||||||||||||||||
| $ | 182 | $ | (9 | ) | ||||||||||||||||
|
| |||||||||||||||||||
| 168 | Semiannual Report | | March 31, 2018 | | See accompanying Notes to Financial Statements |
Table of Contents
Schedule of Investments
March 31, 2018 (Unaudited)
The industry classification of portfolio holdings and other assets less liabilities shown as a percentage of net assets were as follows:
Machinery | 8.8% | |||
Banks | 4.9% | |||
Semiconductors & Semiconductor Equipment | 4.7% | |||
Containers & Packaging | 4.4% | |||
Food Products | 4.2% | |||
Healthcare Equipment & Supplies | 4.0% | |||
IT Services | 3.7% | |||
Chemicals | 3.6% | |||
Metals & Mining | 3.6% | |||
Thrifts & Mortgage Finance | 3.2% | |||
Insurance | 3.2% | |||
Diversified Financial Services | 3.0% | |||
Household Products | 2.9% | |||
Commercial Services & Supplies | 2.9% | |||
Real Estate Management & Development | 2.8% | |||
Electronic Equipment, Instruments & Components | 2.7% | |||
Internet & Catalog Retail | 2.7% | |||
Professional Services | 2.7% | |||
Trading Companies & Distributors | 2.5% | |||
Construction Materials | 2.2% | |||
Household Durables | 2.0% | |||
Oil, Gas & Consumable Fuels | 2.0% | |||
Auto Components | 2.0% | |||
Capital Markets | 1.8% | |||
Aerospace & Defense | 1.8% | |||
Building Products | 1.8% | |||
Hotels, Restaurants & Leisure | 1.6% | |||
Internet Software & Services | 1.6% | |||
Electrical Equipment | 1.5% | |||
Biotechnology | 1.4% | |||
Construction & Engineering | 1.4% | |||
Software | 1.3% | |||
Energy Equipment & Services | 1.1% | |||
Distributors | 1.1% | |||
Pharmaceuticals | 0.8% | |||
Healthcare Providers & Services | 0.7% | |||
Specialty Retail | 0.6% | |||
Independent Power Producers & Energy Traders | 0.5% | |||
Transportation Infrastructure | 0.5% | |||
Technology Hardware, Storage & Peripherals | 0.4% | |||
Other assets less liabilities | 1.4% | |||
|
| |||
| 100.0% | ||||
|
|
AllianzGI Micro Cap Fund
| Shares | Value | |||||||
| Common Stock—99.5% | ||||||||
| Air Freight & Logistics—0.9% | ||||||||
Echo Global Logistics, Inc. (a) | 8,153 | $225,023 | ||||||
|
| |||||||
| Auto Components—1.2% | ||||||||
Modine Manufacturing Co. (a) | 14,655 | 309,953 | ||||||
|
| |||||||
| Banks—6.8% | ||||||||
Carolina Financial Corp. | 4,818 | 189,251 | ||||||
Equity Bancshares, Inc., Class A (a) | 5,689 | 222,781 | ||||||
First Foundation, Inc. (a) | 13,314 | 246,842 | ||||||
First Internet Bancorp | 5,323 | 196,951 | ||||||
Franklin Financial Network, Inc. (a) | 5,641 | 183,897 | ||||||
National Commerce Corp. (a) | 3,430 | 149,376 | ||||||
Preferred Bank | 3,802 | 244,088 | ||||||
Seacoast Banking Corp. of Florida (a) | 11,128 | 294,558 | ||||||
|
| |||||||
| 1,727,744 | ||||||||
|
| |||||||
| Beverages—2.2% | ||||||||
MGP Ingredients, Inc. | 4,357 | 390,344 | ||||||
Primo Water Corp. (a) | 14,374 | 168,319 | ||||||
|
| |||||||
| 558,663 | ||||||||
|
| |||||||
| Biotechnology—13.7% | ||||||||
Abeona Therapeutics, Inc. (a) | 6,213 | 89,157 | ||||||
Achaogen, Inc. (a) | 5,603 | 72,559 | ||||||
Adamas Pharmaceuticals, Inc. (a) | 2,989 | 71,437 | ||||||
Agenus, Inc. (a) | 14,900 | 70,179 | ||||||
Akebia Therapeutics, Inc. (a) | 6,826 | 65,052 | ||||||
Arena Pharmaceuticals, Inc. (a) | 5,909 | 233,405 | ||||||
Audentes Therapeutics, Inc. (a) | 3,382 | 101,629 | ||||||
BioCryst Pharmaceuticals, Inc. (a) | 13,923 | 66,413 | ||||||
BioSpecifics Technologies Corp. (a) | 3,174 | 140,735 | ||||||
Calithera Biosciences, Inc. (a) | 4,846 | 30,530 | ||||||
Cara Therapeutics, Inc. (a) | 6,045 | 74,837 | ||||||
Concert Pharmaceuticals, Inc. (a) | 6,775 | 155,147 | ||||||
Corbus Pharmaceuticals Holdings, Inc. (a) | 8,083 | 49,306 | ||||||
Cytokinetics, Inc. (a) | 6,918 | 49,810 | ||||||
CytomX Therapeutics, Inc. (a) | 4,824 | 137,243 | ||||||
Esperion Therapeutics, Inc. (a) | 1,392 | 100,683 | ||||||
Flexion Therapeutics, Inc. (a) | 7,551 | 169,218 | ||||||
Heron Therapeutics, Inc. (a) | 6,167 | 170,209 | ||||||
ImmunoGen, Inc. (a) | 15,248 | 160,409 | ||||||
Immunomedics, Inc. (a) | 6,278 | 91,722 | ||||||
Inovio Pharmaceuticals, Inc. (a) | 13,117 | 61,781 | ||||||
Iovance Biotherapeutics, Inc. (a) | 11,065 | 186,998 | ||||||
La Jolla Pharmaceutical Co. (a) | 4,903 | 146,011 | ||||||
MacroGenics, Inc. (a) | 4,407 | 110,880 | ||||||
NewLink Genetics Corp. (a) | 3,062 | 22,199 | ||||||
Pieris Pharmaceuticals, Inc. (a) | 9,752 | 66,509 | ||||||
Progenics Pharmaceuticals, Inc. (a) | 14,300 | 106,678 | ||||||
REGENXBIO, Inc. (a) | 2,569 | 76,685 | ||||||
Rigel Pharmaceuticals, Inc. (a) | 28,253 | 100,016 | ||||||
Sangamo Therapeutics, Inc. (a) | 8,855 | 168,245 | ||||||
Selecta Biosciences, Inc. (a) | 3,014 | 30,713 | ||||||
Synergy Pharmaceuticals, Inc. (a) | 33,454 | 61,221 | ||||||
| Shares | Value | |||||||
TG Therapeutics, Inc. (a) | 9,462 | $ | 134,360 | |||||
Vanda Pharmaceuticals, Inc. (a) | 8,423 | 141,928 | ||||||
|
| |||||||
| 3,513,904 | ||||||||
|
| |||||||
| Building Products—2.2% | ||||||||
Patrick Industries, Inc. (a) | 5,538 | 342,525 | ||||||
PGT Innovations, Inc. (a) | 12,315 | 229,675 | ||||||
|
| |||||||
| 572,200 | ||||||||
|
| |||||||
| Chemicals—2.5% | ||||||||
American Vanguard Corp. | 10,654 | 215,211 | ||||||
KMG Chemicals, Inc. | 3,560 | 213,422 | ||||||
Koppers Holdings, Inc. (a) | 5,354 | 220,049 | ||||||
|
| |||||||
| 648,682 | ||||||||
|
| |||||||
| Commercial Services & Supplies—0.4% | ||||||||
Hudson Technologies, Inc. (a) | 21,305 | 105,247 | ||||||
|
| |||||||
| Construction & Engineering—1.9% | ||||||||
NV5 Global, Inc. (a) | 5,718 | 318,779 | ||||||
Sterling Construction Co., Inc. (a) | 14,409 | 165,127 | ||||||
|
| |||||||
| 483,906 | ||||||||
|
| |||||||
| Construction Materials—1.1% | ||||||||
U.S. Concrete, Inc. (a) | 4,501 | 271,860 | ||||||
|
| |||||||
| Diversified Consumer Services—0.9% | ||||||||
Carriage Services, Inc. | 8,307 | 229,772 | ||||||
|
| |||||||
| Diversified Telecommunication Services—0.8% | ||||||||
ORBCOMM, Inc. (a) | 21,255 | 199,159 | ||||||
|
| |||||||
| Electrical Equipment—0.5% | ||||||||
Plug Power, Inc. (a) | 65,110 | 123,058 | ||||||
|
| |||||||
| Electronic Equipment, Instruments & Components—0.7% | ||||||||
Mesa Laboratories, Inc. | 1,304 | 193,566 | ||||||
|
| |||||||
| Energy Equipment & Services—0.7% | ||||||||
Newpark Resources, Inc. (a) | 11,473 | 92,931 | ||||||
Nine Energy Service, Inc. (a) | 3,194 | 77,774 | ||||||
|
| |||||||
| 170,705 | ||||||||
|
| |||||||
| Food Products—0.8% | ||||||||
John B Sanfilippo & Son, Inc. | 3,418 | 197,800 | ||||||
|
| |||||||
| Healthcare Equipment & Supplies—9.7% | ||||||||
Antares Pharma, Inc. (a) | 46,832 | 103,030 | ||||||
AxoGen, Inc. (a) | 14,225 | 519,213 | ||||||
CryoLife, Inc. (a) | 10,792 | 216,380 | ||||||
CryoPort, Inc. (a) | 23,510 | 202,186 | ||||||
Cutera, Inc. (a) | 8,254 | 414,764 | ||||||
Heska Corp. (a) | 1,617 | 127,856 | ||||||
LeMaitre Vascular, Inc. | 11,700 | 423,891 | ||||||
Surmodics, Inc. (a) | 5,747 | 218,673 | ||||||
Tactile Systems Technology, Inc. (a) | 8,130 | 258,534 | ||||||
|
| |||||||
| 2,484,527 | ||||||||
|
| |||||||
| Healthcare Providers & Services—2.4% | ||||||||
BioTelemetry, Inc. (a) | 12,838 | 398,620 | ||||||
RadNet, Inc. (a) | 14,513 | 208,987 | ||||||
|
| |||||||
| 607,607 | ||||||||
|
| |||||||
| Healthcare Technology—2.4% | ||||||||
Tabula Rasa HealthCare, Inc. (a) | 8,418 | 326,618 | ||||||
Vocera Communications, Inc. (a) | 12,112 | 283,663 | ||||||
|
| |||||||
| 610,281 | ||||||||
|
| |||||||
| See accompanying Notes to Financial Statements | | March 31, 2018 | | Semiannual Report | 169 |
Table of Contents
Schedule of Investments
March 31, 2018 (Unaudited)
| Shares | Value | |||||||
| Hotels, Restaurants & Leisure—2.2% | ||||||||
Carrols Restaurant Group, Inc. (a) | 19,542 | $ | 218,870 | |||||
Century Casinos, Inc. (a) | 21,495 | 160,353 | ||||||
Golden Entertainment, Inc. (a) | 7,932 | 184,260 | ||||||
|
| |||||||
| 563,483 | ||||||||
|
| |||||||
| Household Durables—2.4% | ||||||||
LGI Homes, Inc. (a) | 5,507 | 388,629 | ||||||
M/I Homes, Inc. (a) | 6,967 | 221,899 | ||||||
|
| |||||||
| 610,528 | ||||||||
|
| |||||||
| Internet & Catalog Retail—0.7% | ||||||||
Gaia, Inc. (a) | 11,540 | 178,870 | ||||||
|
| |||||||
| Internet Software & Services—7.9% | ||||||||
Amber Road, Inc. (a) | 22,683 | 201,879 | ||||||
Carbonite, Inc. (a) | 10,107 | 291,082 | ||||||
Five9, Inc. (a) | 16,553 | 493,114 | ||||||
GTT Communications, Inc. (a) | 7,295 | 413,626 | ||||||
Instructure, Inc. (a) | 8,197 | 345,503 | ||||||
LivePerson, Inc. (a) | 17,582 | 287,466 | ||||||
|
| |||||||
| 2,032,670 | ||||||||
|
| |||||||
| IT Services—0.7% | ||||||||
Hackett Group, Inc. | 12,029 | 193,186 | ||||||
|
| |||||||
| Life Sciences Tools & Services—1.4% | ||||||||
Enzo Biochem, Inc. (a) | 15,495 | 84,913 | ||||||
NeoGenomics, Inc. (a) | 32,544 | 265,559 | ||||||
|
| |||||||
| 350,472 | ||||||||
|
| |||||||
| Machinery—5.7% | ||||||||
Commercial Vehicle Group, Inc. (a) | 15,878 | 123,054 | ||||||
Energy Recovery, Inc. (a) | 9,616 | 79,044 | ||||||
Global Brass & Copper Holdings, Inc. | 5,048 | 168,856 | ||||||
Kadant, Inc. | 3,518 | 332,451 | ||||||
Kornit Digital Ltd. (a) | 12,689 | 163,688 | ||||||
NN, Inc. | 4,492 | 107,808 | ||||||
Spartan Motors, Inc. | 13,380 | 230,136 | ||||||
Titan International, Inc. | 19,135 | 241,292 | ||||||
|
| |||||||
| 1,446,329 | ||||||||
|
| |||||||
| Oil, Gas & Consumable Fuels—2.3% | ||||||||
Abraxas Petroleum Corp. (a) | 43,538 | 96,654 | ||||||
Evolution Petroleum Corp. | 23,573 | 189,763 | ||||||
Penn Virginia Corp. (a) | 2,322 | 81,363 | ||||||
Ring Energy, Inc. (a) | 15,989 | 229,442 | ||||||
|
| |||||||
| 597,222 | ||||||||
|
| |||||||
| Personal Products—1.0% | ||||||||
Medifast, Inc. | 2,750 | 256,988 | ||||||
|
| |||||||
| Pharmaceuticals—4.8% | ||||||||
Amphastar Pharmaceuticals, Inc. (a) | 7,015 | 131,531 | ||||||
ANI Pharmaceuticals, Inc. (a) | 3,666 | 213,435 | ||||||
Assembly Biosciences, Inc. (a) | 2,692 | 132,285 | ||||||
Cymabay Therapeutics, Inc. (a) | 7,712 | 100,179 | ||||||
Intersect ENT, Inc. (a) | 7,738 | 304,103 | ||||||
Omeros Corp. (a) | 5,649 | 63,099 | ||||||
Paratek Pharmaceuticals, Inc. (a) | 3,906 | 50,778 | ||||||
Revance Therapeutics, Inc. (a) | 4,098 | 126,218 | ||||||
WaVe Life Sciences Ltd. (a) | 2,387 | 95,719 | ||||||
|
| |||||||
| 1,217,347 | ||||||||
|
| |||||||
| Professional Services—2.1% | ||||||||
CRA International, Inc. | 3,840 | 200,794 | ||||||
GP Strategies Corp. (a) | 5,654 | 128,063 | ||||||
Kforce, Inc. | 7,710 | 208,555 | ||||||
|
| |||||||
| 537,412 | ||||||||
|
| |||||||
| Shares | Value | |||||||
| Road & Rail—0.7% | ||||||||
Daseke, Inc. (a) | 17,520 | $ | 171,521 | |||||
|
| |||||||
| Semiconductors & Semiconductor Equipment—4.5% | ||||||||
Axcelis Technologies, Inc. (a) | 7,842 | 192,913 | ||||||
AXT, Inc. (a) | 27,136 | 196,736 | ||||||
CEVA, Inc. (a) | 5,947 | 215,281 | ||||||
FormFactor, Inc. (a) | 15,932 | 217,472 | ||||||
Ichor Holdings Ltd. (a) | 8,310 | 201,185 | ||||||
PDF Solutions, Inc. (a) | 10,810 | 126,045 | ||||||
|
| |||||||
| 1,149,632 | ||||||||
|
| |||||||
| Software—5.3% | ||||||||
Asure Software, Inc. (a) | 15,169 | 185,669 | ||||||
Datawatch Corp. (a) | 14,592 | 126,221 | ||||||
Everbridge, Inc. (a) | 8,157 | 298,546 | ||||||
Model N, Inc. (a) | 14,251 | 257,230 | ||||||
PROS Holdings, Inc. (a) | 6,727 | 222,058 | ||||||
Upland Software, Inc. (a) | 9,158 | 263,659 | ||||||
|
| |||||||
| 1,353,383 | ||||||||
|
| |||||||
| Technology Hardware, Storage & Peripherals—1.3% | ||||||||
USA Technologies, Inc. (a) | 37,097 | 333,873 | ||||||
|
| |||||||
| Thrifts & Mortgage Finance—2.1% | ||||||||
First Defiance Financial Corp. | 4,315 | 247,336 | ||||||
Meridian Bancorp, Inc. | 13,859 | 279,259 | ||||||
|
| |||||||
| 526,595 | ||||||||
|
| |||||||
| Trading Companies & Distributors—0.8% | ||||||||
Titan Machinery, Inc. (a) | 8,750 | 206,150 | ||||||
|
| |||||||
| Wireless Telecommunication Services—1.8% | ||||||||
Boingo Wireless, Inc. (a) | 19,016 | 471,026 | ||||||
|
| |||||||
| Total Investments (cost—$18,328,530)—99.5% | 25,430,344 | |||||||
|
| |||||||
| Other assets less liabilities—0.5% | 115,812 | |||||||
|
| |||||||
| Net Assets—100.0% | $25,546,156 | |||||||
|
| |||||||
Notes to Schedule of Investments:
(a) Non-income producing.
AllianzGI NFJ Emerging Markets Value Fund
| Shares | Value | |||||||
| Common Stock—90.1% | ||||||||
| Argentina—0.7% | ||||||||
Banco Macro S.A. ADR | 9,610 | $1,037,592 | ||||||
|
| |||||||
| Brazil—4.4% | ||||||||
Banco Santander Brasil S.A. UNIT | 93,700 | 1,132,705 | ||||||
Cia de Locacao das Americas | 116,100 | 1,055,343 | ||||||
Energisa S.A. UNIT | 105,000 | 1,103,606 | ||||||
Hypera S.A. | 89,800 | 983,558 | ||||||
IRB Brasil Resseguros S.A. | 84,400 | 1,070,131 | ||||||
Petrobras Distribuidora S.A. (e) | 151,000 | 1,056,078 | ||||||
|
| |||||||
| 6,401,421 | ||||||||
|
| |||||||
| China—27.2% | ||||||||
AAC Technologies Holdings, Inc. | 53,500 | 980,364 | ||||||
Agricultural Bank of China Ltd., Class H | 1,768,000 | 1,015,262 | ||||||
Anhui Jinhe Industrial Co., Ltd., Class A | 241,564 | 953,939 | ||||||
Baidu, Inc. ADR (e) | 4,210 | 939,630 | ||||||
Bank of China Ltd., Class H | 1,714,000 | 936,288 | ||||||
Baoshan Iron & Steel Co., Ltd., Class A | 686,239 | 951,142 | ||||||
BOE Technology Group Co., Ltd., Class B | 1,755,800 | 1,003,060 | ||||||
China Construction Bank Corp., Class H | 958,000 | 1,000,635 | ||||||
China Medical System Holdings Ltd. | 462,000 | 1,058,387 | ||||||
China Merchants Bank Co., Ltd., Class H | 228,100 | 946,813 | ||||||
China Shenhua Energy Co., Ltd., Class H | 370,500 | 929,855 | ||||||
CNOOC Ltd. | 654,000 | 968,370 | ||||||
Consun Pharmaceutical Group Ltd. | 930,000 | 995,841 | ||||||
Geely Automobile Holdings Ltd. | 336,000 | 984,560 | ||||||
Gree Electric Appliances, Inc. of Zhuhai, Class A | 126,000 | 948,048 | ||||||
Guangdong Provincial Expressway Development Co., Ltd., Class B | 1,176,487 | 1,030,161 | ||||||
Guangzhou Automobile Group Co., Ltd., Class H | 436,000 | 809,803 | ||||||
Haitian International Holdings Ltd. | 326,000 | 991,219 | ||||||
Hengtong Optic-electric Co., Ltd., Class A | 175,300 | 1,035,628 | ||||||
Industrial & Commercial Bank of China Ltd., Class H | 1,146,000 | 998,723 | ||||||
Jinyu Bio-Technology Co., Ltd., Class A | 220,620 | 991,143 | ||||||
JNBY Design Ltd. | 528,000 | 1,079,139 | ||||||
Kingboard Laminates Holdings Ltd. | 604,000 | 886,179 | ||||||
Kweichow Moutai Co., Ltd., Class A | 8,300 | 916,310 | ||||||
Lee & Man Paper Manufacturing Ltd. | 901,000 | 962,069 | ||||||
LONGi Green Energy Technology Co., Ltd., Class A | 178,100 | 965,000 | ||||||
Midea Group Co., Ltd., Class A | 113,314 | 1,006,218 | ||||||
| 170 | Semiannual Report | | March 31, 2018 | | See accompanying Notes to Financial Statements |
Table of Contents
Schedule of Investments
March 31, 2018 (Unaudited)
| Shares | Value | |||||||
People’s Insurance Co. Group of China Ltd., Class H | 1,926,000 | $ | 910,897 | |||||
PICC Property & Casualty Co., Ltd., Class H | 497,000 | 878,213 | ||||||
Qingdao Haier Co., Ltd., Class A | 330,100 | 944,357 | ||||||
Qingdao Port International Co., Ltd., Class H (a) | 1,390,000 | 1,032,878 | ||||||
Shengyi Technology Co., Ltd., Class A | 396,800 | 1,089,391 | ||||||
Shenzhen Expressway Co., Ltd., Class H | 986,000 | 1,007,060 | ||||||
Shenzhen International Holdings Ltd. | 490,000 | 1,079,780 | ||||||
Sinopharm Group Co., Ltd., Class H | 209,600 | 1,049,582 | ||||||
Tencent Holdings Ltd. | 17,600 | 944,760 | ||||||
Tencent Holdings Ltd. ADR | 18,600 | 991,194 | ||||||
Travelsky Technology Ltd., Class H | 325,000 | 949,288 | ||||||
Wanhua Chemical Group Co., Ltd., Class A (c)(d) | 101,200 | 610,253 | ||||||
Wuliangye Yibin Co., Ltd., Class A | 86,000 | 931,585 | ||||||
Zhuzhou Kibing Group Co., Ltd., Class A | 987,600 | 927,358 | ||||||
|
| |||||||
| 39,630,382 | ||||||||
|
| |||||||
| Czech Republic—0.7% | ||||||||
Philip Morris CR AS | 1,271 | 1,056,494 | ||||||
|
| |||||||
| Hong Kong—2.0% | ||||||||
Johnson Electric Holdings Ltd. | 248,000 | 933,231 | ||||||
Xin Point Holdings Ltd. | 1,306,000 | 940,128 | ||||||
Xinyi Glass Holdings Ltd. | 680,000 | 1,035,066 | ||||||
|
| |||||||
| 2,908,425 | ||||||||
|
| |||||||
| India—9.0% | ||||||||
Bharat Petroleum Corp., Ltd. | 148,714 | 982,169 | ||||||
Cyient Ltd. | 106,627 | 1,142,680 | ||||||
DCM Shriram Ltd. | 144,894 | 951,384 | ||||||
Dewan Housing Finance Corp., Ltd. | 124,597 | 992,542 | ||||||
HCL Technologies Ltd. | 67,485 | 999,832 | ||||||
Hexaware Technologies Ltd. | 187,744 | 1,099,235 | ||||||
Indiabulls Housing Finance Ltd. | 53,721 | 1,029,383 | ||||||
Larsen & Toubro Infotech Ltd. (a) | 49,453 | 1,021,622 | ||||||
Mphasis Ltd. | 76,367 | 979,707 | ||||||
Power Grid Corp. of India Ltd. | 321,988 | 957,271 | ||||||
PTC India Ltd. | 710,697 | 950,133 | ||||||
Reliance Industries Ltd. | 71,629 | 976,473 | ||||||
Yes Bank Ltd. | 209,380 | 992,651 | ||||||
|
| |||||||
| 13,075,082 | ||||||||
|
| |||||||
| Indonesia—2.1% | ||||||||
Bank Negara Indonesia Persero Tbk PT | 1,497,400 | 948,292 | ||||||
Bank Rakyat Indonesia Persero Tbk PT | 3,725,000 | 977,587 | ||||||
Bank Tabungan Negara Persero Tbk PT | 3,932,500 | 1,088,917 | ||||||
|
| |||||||
| 3,014,796 | ||||||||
|
| |||||||
| Korea (Republic of)—12.1% | ||||||||
DB Insurance Co., Ltd. | 15,800 | 981,569 | ||||||
F&F Co., Ltd. | 27,650 | 1,054,318 | ||||||
| Shares | Value | |||||||
Hana Financial Group, Inc. | 22,470 | $ | 968,392 | |||||
Hyundai Marine & Fire Insurance Co., Ltd. | 27,235 | 1,010,157 | ||||||
Jin Air Co., Ltd. | 35,260 | 1,007,768 | ||||||
KB Financial Group, Inc. | 17,420 | 1,010,312 | ||||||
Korea Asset In Trust Co., Ltd. | 8,017 | 45,247 | ||||||
Korea United Pharm, Inc. | 37,620 | 977,009 | ||||||
LEENO Industrial, Inc. | 18,240 | 1,025,226 | ||||||
LG Electronics, Inc. | 4,620 | 476,676 | ||||||
Lotte Chemical Corp. | 2,585 | 1,059,035 | ||||||
Meritz Fire & Marine Insurance Co., Ltd. | 46,990 | 936,095 | ||||||
PSK, Inc. | 41,300 | 993,043 | ||||||
Samsung Electronics Co., Ltd. | 454 | 1,060,760 | ||||||
Shinhan Financial Group Co., Ltd. | 22,670 | 967,086 | ||||||
SK Holdings Co., Ltd. | 3,430 | 967,397 | ||||||
SK Hynix, Inc. | 13,410 | 1,027,366 | ||||||
Tokai Carbon Korea Co., Ltd. | 13,900 | 1,086,134 | ||||||
WONIK IPS Co., Ltd. | 32,490 | 1,011,649 | ||||||
|
| |||||||
| 17,665,239 | ||||||||
|
| |||||||
| Malaysia—2.8% | ||||||||
Inari Amertron Bhd. | 1,328,600 | 968,483 | ||||||
Serba Dinamik Holdings Bhd. | 1,223,400 | 1,077,939 | ||||||
SKP Resources Bhd. | 2,418,000 | 992,939 | ||||||
Yinson Holdings Bhd. | 1,004,700 | 979,819 | ||||||
|
| |||||||
| 4,019,180 | ||||||||
|
| |||||||
| Mexico—2.6% | ||||||||
Grupo Aeroportuario del Centro Norte S.A.B de C.V. | 182,300 | 890,543 | ||||||
Grupo Financiero Banorte S.A.B de C.V., Class O | 168,700 | 1,023,150 | ||||||
Grupo Financiero Interacciones S.A. de C.V., Class O | 196,000 | 953,047 | ||||||
Mexichem S.A.B de C.V. | 299,700 | 919,047 | ||||||
|
| |||||||
| 3,785,787 | ||||||||
|
| |||||||
| Russian Federation—3.5% | ||||||||
Gazprom Neft PJSC ADR | 43,042 | 1,096,710 | ||||||
Lukoil PJSC (c)(d) | 14,201 | 985,265 | ||||||
Sberbank of Russia PJSC ADR | 53,218 | 992,516 | ||||||
Tatneft PJSC (c)(d) | 100,148 | 1,070,582 | ||||||
TCS Group Holding PLC GDR | 46,380 | 1,018,041 | ||||||
|
| |||||||
| 5,163,114 | ||||||||
|
| |||||||
| Singapore—0.7% | ||||||||
Venture Corp., Ltd. | 50,300 | 1,087,831 | ||||||
|
| |||||||
| South Africa—6.1% | ||||||||
Astral Foods Ltd. | 41,236 | 1,089,595 | ||||||
Distell Group Ltd. | 84,181 | 974,157 | ||||||
Investec Property Fund Ltd. REIT | 673,566 | 995,445 | ||||||
JSE Ltd. | 63,413 | 992,700 | ||||||
Mondi Ltd. | 37,042 | 1,008,218 | ||||||
Naspers Ltd., Class N | 3,841 | 939,942 | ||||||
Naspers Ltd., Class N ADR | 18,900 | 948,402 | ||||||
Rand Merchant Investment Holdings Ltd. | 279,824 | 946,039 | ||||||
Santam Ltd. | 37,154 | 1,023,130 | ||||||
|
| |||||||
| 8,917,628 | ||||||||
|
| |||||||
| Taiwan—12.1% | ||||||||
Ardentec Corp. | 836,000 | 1,092,440 | ||||||
Catcher Technology Co., Ltd. | 89,000 | 1,118,721 | ||||||
| Shares | Value | |||||||
Chroma ATE, Inc. | 178,000 | $ | 1,107,561 | |||||
E Ink Holdings, Inc. | 622,000 | 1,041,475 | ||||||
Getac Technology Corp. | 677,000 | 979,653 | ||||||
Greatek Electronics, Inc. | 539,000 | 1,032,860 | ||||||
ITEQ Corp. | 428,000 | 1,021,800 | ||||||
King’s Town Bank Co., Ltd. | 774,000 | 985,156 | ||||||
KMC Kuei Meng International, Inc. | 235,000 | 1,083,761 | ||||||
On-Bright Electronics, Inc. | 103,000 | 1,133,905 | ||||||
Powertech Technology, Inc. | 331,000 | 1,043,467 | ||||||
Sinbon Electronics Co., Ltd. | 353,000 | 932,505 | ||||||
Taiwan Semiconductor Manufacturing Co., Ltd. | 124,000 | 1,050,305 | ||||||
Taiwan Semiconductor Manufacturing Co., Ltd. ADR | 22,700 | 993,352 | ||||||
Taiwan Union Technology Corp. | 337,000 | 1,073,940 | ||||||
Tripod Technology Corp. | 311,000 | 1,054,838 | ||||||
WT Microelectronics Co., Ltd. | 607,543 | 986,652 | ||||||
|
| |||||||
| 17,732,391 | ||||||||
|
| |||||||
| Thailand—2.1% | ||||||||
PTT Global Chemical PCL NVDR | 326,200 | 991,560 | ||||||
PTT PCL NVDR | 60,700 | 1,069,052 | ||||||
Tisco Financial Group PCL NVDR | 369,100 | 1,040,713 | ||||||
|
| |||||||
| 3,101,325 | ||||||||
|
| |||||||
| Turkey—1.4% | ||||||||
Tofas Turk Otomobil Fabrikasi AS | 131,825 | 888,485 | ||||||
Trakya Cam Sanayii AS | 851,634 | 1,105,535 | ||||||
|
| |||||||
| 1,994,020 | ||||||||
|
| |||||||
| United Arab Emirates—0.6% | ||||||||
Dubai Islamic Bank PJSC | 656,043 | 948,418 | ||||||
|
| |||||||
| Vietnam—0.0% | ||||||||
FPT Corp. | 8 | 21 | ||||||
|
| |||||||
| Total Common Stock (cost—$124,044,397) | 131,539,146 | |||||||
|
| |||||||
| Preferred Stock—5.5% | ||||||||
| Brazil—2.9% | ||||||||
Azul S.A. (e) | 96,200 | 1,113,099 | ||||||
Banco do Estado do Rio Grande do Sul S.A., Class B | 172,800 | 1,060,945 | ||||||
Itausa - Investimentos Itau S.A. | 232,700 | 971,977 | ||||||
Petroleo Brasileiro S.A. (e) | 163,300 | 1,059,005 | ||||||
|
| |||||||
| 4,205,026 | ||||||||
|
| |||||||
| Korea (Republic of)—2.6% | ||||||||
LG Electronics, Inc. | 13,650 | 570,636 | ||||||
LG Household & Health Care Ltd. | 1,626 | 1,070,881 | ||||||
Samsung Electronics Co., Ltd. | 546 | 1,049,921 | ||||||
SK Innovation Co., Ltd. | 8,012 | 1,048,609 | ||||||
|
| |||||||
| 3,740,047 | ||||||||
|
| |||||||
| Total Preferred Stock (cost—$6,866,742) | 7,945,073 | |||||||
|
| |||||||
| Exchange-Traded Funds—0.0% | ||||||||
iShares MSCI Emerging Markets Index | 1,100 | 53,108 | ||||||
|
| |||||||
| See accompanying Notes to Financial Statements | | March 31, 2018 | | Semiannual Report | 171 |
Table of Contents
Schedule of Investments
March 31, 2018 (Unaudited)
| Principal Amount (000s) | Value | |||||||
| Repurchase Agreements—2.8% | ||||||||
State Street Bank and Trust Co., dated 3/29/18, 0.28%, due 4/2/18, proceeds $4,110,128; collateralized by U.S. Treasury Notes, 2.50%, due 5/15/24, valued at $4,197,060 including accrued interest |
| |||||||
(cost—$4,110,000) | $4,110 | $ | 4,110,000 | |||||
|
| |||||||
| Total Investments (cost—$135,074,074) (b)—98.4% | 143,647,327 | |||||||
|
| |||||||
| Other assets less liabilities (f)—1.6% | 2,284,720 | |||||||
|
| |||||||
| Net Assets—100.0% | $145,932,047 | |||||||
|
| |||||||
Notes to Schedule of Investments:
(a) 144A—Exempt from registration under Rule 144A of the Securities Act of 1933. These securities may be resold in transactions exempt from registration, typically only to qualified institutional buyers. Securities with an aggregate value of $2,054,500, representing 1.4% of net assets.
(b) Securities with an aggregate value of $104,195,441, representing 71.4% of net assets, were valued utilizing modeling tools provided by a third-party vendor. See Note 1(a) and Note 1(b) in the Notes to Financial Statements.
(c) Fair-Valued—Securities with an aggregate value of $2,666,100, representing 1.8% of net assets. See Note 1(a) and Note 1(b) in the Notes to Financial Statements.
(d) Level 3 security. See Note 1(a) and Note 1(b) in the Notes to Financial Statements.
(e) Non-income producing.
(f) Includes net unrealized appreciation (depreciation) of other financial instruments as follows:
| Forward foreign currency contracts outstanding at March 31, 2018: | ||||||||||||||||||
| Description | Counterparty | U.S.$ Value on Origination Date | U.S.$ Value March 31, 2018 | Unrealized Appreciation | Unrealized Depreciation | |||||||||||||
Purchased: |
| |||||||||||||||||
566,004 South African Rand settling 4/5/18 | Northern Trust Company | $ | 47,607 | $ | 47,802 | $ | 195 | $ | — | |||||||||
102,177 Turkish Lira settling 4/2/18 | Northern Trust Company | 25,756 | 25,898 | 142 | — | |||||||||||||
Sold: |
| |||||||||||||||||
96,538 South African Rand settling 4/5/18 | Northern Trust Company | 8,120 | 8,153 | — | (33 | ) | ||||||||||||
|
| |||||||||||||||||
| $ | 337 | $ | (33 | ) | ||||||||||||||
|
| |||||||||||||||||
Glossary:
ADR—American Depositary Receipt
GDR—Global Depositary Receipt
MSCI—Morgan Stanley Capital International
NVDR—Non-Voting Depository Receipt
REIT—Real Estate Investment Trust
UNIT—More than one class of securities traded together.
The industry classification of portfolio holdings and other assets less liabilities shown as a percentage of net assets were as follows:
Banks | 15.8% | |||
Semiconductors & Semiconductor Equipment | 8.5% | |||
Electronic Equipment, Instruments & Components | 8.4% | |||
Oil, Gas & Consumable Fuels | 7.0% | |||
Insurance | 5.3% | |||
Chemicals | 3.8% | |||
Technology Hardware, Storage & Peripherals | 3.6% | |||
IT Services | 3.5% | |||
Transportation Infrastructure | 3.5% | |||
Household Durables | 2.3% | |||
Pharmaceuticals | 2.1% | |||
Internet Software & Services | 2.0% | |||
Beverages | 1.9% | |||
Automobiles | 1.8% | |||
Textiles, Apparel & Luxury Goods | 1.5% | |||
Airlines | 1.5% | |||
Electric Utilities | 1.4% | |||
Energy Equipment & Services | 1.4% | |||
Personal Products | 1.4% | |||
Building Products | 1.4% | |||
Thrifts & Mortgage Finance | 1.4% | |||
Machinery | 1.4% | |||
Auto Components | 1.4% | |||
Paper & Forest Products | 1.3% | |||
Media | 1.3% | |||
Electrical Equipment | 1.0% | |||
Software | 0.8% | |||
Food Products | 0.7% | |||
Leisure Equipment & Products | 0.7% |
Tobacco | 0.7% | |||
Specialty Retail | 0.7% | |||
Road & Rail | 0.7% | |||
Healthcare Providers & Services | 0.7% | |||
Equity Real Estate Investment Trusts (REITs) | 0.7% | |||
Communications Equipment | 0.7% | |||
Capital Markets | 0.7% | |||
Biotechnology | 0.7% | |||
Industrial Conglomerates | 0.7% | |||
Metals & Mining | 0.6% | |||
Independent Power Producers & Energy Traders | 0.6% | |||
Exchange-Traded Funds | 0.0% | |||
Repurchase Agreements | 2.8% | |||
Other assets less liabilities | 1.6% | |||
|
| |||
| 100.0% | ||||
|
| |||
| 172 | Semiannual Report | | March 31, 2018 | | See accompanying Notes to Financial Statements |
Table of Contents
Schedule of Investments
March 31, 2018 (Unaudited)
AllianzGI NFJ International Small-Cap Value Fund
| Shares | Value | |||||||
| COMMON STOCK—99.8% | ||||||||
| Australia—5.9% | ||||||||
Abacus Property Group REIT | 10,596 | $28,384 | ||||||
Beach Energy Ltd. | 39,400 | 37,545 | ||||||
BT Investment Management Ltd. | 4,000 | 31,216 | ||||||
CSR Ltd. | 7,380 | 29,600 | ||||||
Northern Star Resources Ltd. | 6,500 | 31,548 | ||||||
Regis Resources Ltd. | 8,500 | 29,806 | ||||||
Sandfire Resources NL | 9,100 | 51,845 | ||||||
|
| |||||||
| 239,944 | ||||||||
|
| |||||||
| Austria—0.9% | ||||||||
Mayr Melnhof Karton AG | 233 | 35,368 | ||||||
|
| |||||||
| Belgium—1.1% | ||||||||
Befimmo S.A. REIT | 697 | 45,058 | ||||||
|
| |||||||
| Canada—7.2% | ||||||||
BRP, Inc. | 870 | 33,413 | ||||||
Canfor Pulp Products, Inc. | 4,175 | 53,761 | ||||||
Cogeco, Inc. | 663 | 35,246 | ||||||
Laurentian Bank of Canada | 875 | 32,165 | ||||||
Linamar Corp. | 689 | 37,639 | ||||||
Magellan Aerospace Corp. | 2,565 | 38,903 | ||||||
Martinrea International, Inc. | 2,505 | 29,612 | ||||||
Transcontinental, Inc., Class A | 1,658 | 32,752 | ||||||
|
| |||||||
| 293,491 | ||||||||
|
| |||||||
| China—3.3% | ||||||||
China Water Affairs Group Ltd. | 42,000 | 42,977 | ||||||
Gemdale Properties & Investment Corp. Ltd. | 296,000 | 35,952 | ||||||
Lee & Man Paper Manufacturing Ltd. | 30,000 | 32,033 | ||||||
Sinopec Kantons Holdings Ltd. | 50,000 | 24,812 | ||||||
|
| |||||||
| 135,774 | ||||||||
|
| |||||||
| Denmark—0.6% | ||||||||
Sydbank A/S | 700 | 25,857 | ||||||
|
| |||||||
| Finland—1.9% | ||||||||
Ahlstrom-Munksjo Oyj | 1,648 | 34,391 | ||||||
Valmet Oyj | 2,200 | 44,105 | ||||||
|
| |||||||
| 78,496 | ||||||||
|
| |||||||
| France—2.1% | ||||||||
Alten S.A. | 320 | 30,850 | ||||||
Euronext NV (a) | 743 | 54,461 | ||||||
|
| |||||||
| 85,311 | ||||||||
|
| |||||||
| Greece—0.7% | ||||||||
Motor Oil Hellas Corinth Refineries S.A. | 1,265 | 28,569 | ||||||
|
| |||||||
| Hong Kong—5.6% | ||||||||
CITIC Telecom International Holdings Ltd. | 123,000 | 35,720 | ||||||
Dah Sing Financial Holdings Ltd. | 4,800 | 30,524 | ||||||
Fairwood Holdings Ltd. | 8,000 | 31,449 | ||||||
Giordano International Ltd. | 84,000 | 49,368 | ||||||
Johnson Electric Holdings Ltd. | 10,500 | 39,512 | ||||||
Xinyi Glass Holdings Ltd. | 28,000 | 42,620 | ||||||
|
| |||||||
| 229,193 | ||||||||
|
| |||||||
| Indonesia—0.8% | ||||||||
Adaro Energy Tbk PT | 221,600 | 34,527 | ||||||
|
| |||||||
| Israel—0.5% | ||||||||
Shikun & Binui Ltd. | 11,500 | 19,018 | ||||||
|
| |||||||
| Italy—1.0% | ||||||||
A2A SpA | 21,021 | 40,210 | ||||||
|
| |||||||
Shares | Value | |||||||
| Japan—18.3% | ||||||||
Dowa Holdings Co., Ltd. | 800 | $ | 28,627 | |||||
Fujitec Co., Ltd. | 3,000 | 40,006 | ||||||
Fukushima Industries Corp. | 1,200 | 52,401 | ||||||
Goldcrest Co., Ltd. | 1,500 | 32,009 | ||||||
Hamakyorex Co., Ltd. | 1,200 | 40,430 | ||||||
Haseko Corp. | 2,700 | 41,556 | ||||||
Iwatani Corp. | 800 | 29,544 | ||||||
JCU Corp. | 1,600 | 38,016 | ||||||
Kyokuto Kaihatsu Kogyo Co., Ltd. | 2,270 | 33,566 | ||||||
Medipal Holdings Corp. | 1,900 | 39,655 | ||||||
Mitsubishi Shokuhin Co., Ltd. | 1,500 | 43,176 | ||||||
Morita Holdings Corp. | 2,440 | 46,435 | ||||||
Nippo Corp. | 2,000 | 45,087 | ||||||
Nitta Corp. | 875 | 32,952 | ||||||
Paramount Bed Holdings Co., Ltd. | 700 | 35,579 | ||||||
Raito Kogyo Co., Ltd. | 2,800 | 29,622 | ||||||
Shibuya Corp. | 900 | 32,138 | ||||||
T-Gaia Corp. | 1,100 | 30,887 | ||||||
Ulvac, Inc. | 700 | 39,602 | ||||||
Unipres Corp. | 1,700 | 38,609 | ||||||
|
| |||||||
| 749,897 | ||||||||
|
| |||||||
| Korea (Republic of)—1.6% | ||||||||
Huchems Fine Chemical Corp. | 1,763 | 40,667 | ||||||
SFA Engineering Corp. | 700 | 23,034 | ||||||
|
| |||||||
| 63,701 | ||||||||
|
| |||||||
| Mexico—1.7% | ||||||||
Grupo Aeroportuario del Centro Norte S.A.B. de C.V. ADR (c) | 800 | 31,528 | ||||||
Ternium S.A. ADR | 1,200 | 38,988 | ||||||
|
| |||||||
| 70,516 | ||||||||
|
| |||||||
| Netherlands—2.3% | ||||||||
Aalberts Industries NV | 894 | 45,559 | ||||||
Philips Lighting NV (a) | 1,300 | 48,876 | ||||||
|
| |||||||
| 94,435 | ||||||||
|
| |||||||
| Norway—3.9% | ||||||||
Atea ASA (c) | 3,200 | 51,946 | ||||||
B2Holding ASA | 13,400 | 33,528 | ||||||
Borregaard ASA | 3,750 | 35,548 | ||||||
Europris ASA (a)(c) | 12,600 | 40,637 | ||||||
|
| |||||||
| 161,659 | ||||||||
|
| |||||||
| Philippines—0.7% | ||||||||
DMCI Holdings, Inc. | 124,500 | 29,143 | ||||||
|
| |||||||
| Portugal—1.0% | ||||||||
Semapa-Sociedade de Investimento e Gestao | 1,800 | 41,053 | ||||||
|
| |||||||
| Singapore—3.6% | ||||||||
BOC Aviation Ltd. (a) | 6,300 | 37,575 | ||||||
HRnetgroup Ltd. (c) | 61,100 | 34,629 | ||||||
Lippo Malls Indonesia Retail Trust REIT | 109,700 | 32,303 | ||||||
Mapletree Industrial Trust REIT | 29,100 | 45,159 | ||||||
|
| |||||||
| 149,666 | ||||||||
|
| |||||||
| South Africa—2.5% | ||||||||
Astral Foods Ltd. | 1,100 | 29,066 | ||||||
JSE Ltd. | 2,000 | 31,309 | ||||||
Reunert Ltd. | 6,600 | 41,572 | ||||||
|
| |||||||
| 101,947 | ||||||||
|
| |||||||
| Spain—4.3% | ||||||||
Cia de Distribucion Integral Logista Holdings S.A. | 1,857 | 39,367 | ||||||
Shares | Value | |||||||
CIE Automotive S.A. | 868 | $ | 31,013 | |||||
Grupo Catalana Occidente S.A. | 707 | 30,808 | ||||||
Lar Espana Real Estate Socimi S.A. REIT | 3,562 | 42,733 | ||||||
Melia Hotels International S.A. | 2,200 | 31,143 | ||||||
|
| |||||||
| 175,064 | ||||||||
|
| |||||||
| Sweden—0.9% | ||||||||
Loomis AB, Class B | 1,024 | 36,967 | ||||||
|
| |||||||
| Switzerland—1.5% | ||||||||
Cembra Money Bank AG | 311 | 27,641 | ||||||
Georg Fischer AG | 25 | 33,472 | ||||||
|
| |||||||
| 61,113 | ||||||||
|
| |||||||
| Taiwan—1.5% | ||||||||
Grand Pacific Petrochemical | 31,000 | 32,757 | ||||||
King’s Town Bank Co., Ltd. | 24,000 | 30,548 | ||||||
|
| |||||||
| 63,305 | ||||||||
|
| |||||||
| United Kingdom—23.4% | ||||||||
Begbies Traynor Group PLC | 35,700 | 32,406 | ||||||
BGEO Group PLC | 741 | 36,979 | ||||||
Brewin Dolphin Holdings PLC | 8,700 | 42,155 | ||||||
Britvic PLC | 4,200 | 40,235 | ||||||
Card Factory PLC | 16,500 | 43,776 | ||||||
Computacenter PLC | 2,525 | 40,785 | ||||||
Consort Medical PLC | 2,310 | 36,435 | ||||||
Equiniti Group PLC (a) | 9,800 | 41,114 | ||||||
Firstgroup PLC (c) | 39,100 | 45,044 | ||||||
Hastings Group Holdings PLC (a) | 9,100 | 33,399 | ||||||
Hays PLC | 13,100 | 34,655 | ||||||
Headlam Group PLC | 6,700 | 41,830 | ||||||
Hill & Smith Holdings PLC | 1,708 | 31,894 | ||||||
Howden Joinery Group PLC | 4,500 | 29,128 | ||||||
Morgan Advanced Materials PLC | 6,100 | 27,250 | ||||||
OneSavings Bank PLC | 5,900 | 30,946 | ||||||
PayPoint PLC | 3,234 | 36,208 | ||||||
Polypipe Group PLC | 9,161 | 44,780 | ||||||
Redrow PLC | 3,700 | 30,917 | ||||||
RPC Group PLC | 3,850 | 41,857 | ||||||
Savills PLC | 2,200 | 30,317 | ||||||
Sirius Real Estate Ltd. | 49,400 | 42,636 | ||||||
Superdry PLC | 1,250 | 27,388 | ||||||
Synthomer PLC | 5,154 | 34,772 | ||||||
Tyman PLC | 9,100 | 38,046 | ||||||
Virgin Money Holdings UK PLC | 12,200 | 45,087 | ||||||
|
| |||||||
| 960,039 | ||||||||
|
| |||||||
| United States—1.0% | ||||||||
Travelport Worldwide Ltd. | 2,500 | 40,850 | ||||||
|
| |||||||
| Total Common Stock (cost—$3,496,986) | 4,090,171 | |||||||
|
| |||||||
| See accompanying Notes to Financial Statements | | March 31, 2018 | | Semiannual Report | 173 |
Table of Contents
Schedule of Investments
March 31, 2018 (Unaudited)
| Principal Amount (000s) | Value | |||||||
| Repurchase Agreements—3.8% | ||||||||
State Street Bank and Trust Co., dated 3/29/18, 0.28%, due 4/2/18, proceeds $154,005; collateralized by U.S. Treasury Notes, 2.00%, due 8/15/25, valued at $157,271 including accrued interest |
| |||||||
(cost—$154,000) | $154 | $ | 154,000 | |||||
|
| |||||||
| Total Investments (cost—$3,650,986) (b)—103.6% | 4,244,171 | |||||||
|
| |||||||
| Liabilities in excess of other assets (d)—(3.6)% | (148,403 | ) | ||||||
|
| |||||||
| Net Assets—100.0% | $4,095,768 | |||||||
|
| |||||||
Notes to Schedule of Investments:
(a) 144A—Exempt from registration under Rule 144A of the Securities Act of 1933. These securities may be resold in transactions exempt from registration, typically only to qualified institutional buyers. Securities with an aggregate value of $256,062, representing 6.3% of net assets.
(b) Securities with an aggregate value of $3,329,291, representing 81.3% of net assets, were valued utilizing modeling tools provided by a third-party vendor. See Note 1(a) and Note 1(b) in the Notes to Financial Statements.
(c) Non-income producing.
(d) Includes net unrealized appreciation (depreciation) of other financial instruments as follows:
| Forward foreign currency contracts outstanding at March 31, 2018: | ||||||||||||||||||||
| Description | Counterparty | U.S.$ Value on Origination Date | U.S.$ Value March 31, 2018 | Unrealized Appreciation | Unrealized Depreciation | |||||||||||||||
Purchased: | ||||||||||||||||||||
6,412,072 Japanese Yen settling 4/2/18 | Northern Trust Company | $ | 60,384 | $ | 60,261 | $ | — | $ | (123 | ) | ||||||||||
712,809 South African Rand settling 4/3/18 | Northern Trust Company | 61,347 | 60,210 | — | (1,137 | ) | ||||||||||||||
Sold: | ||||||||||||||||||||
3,885,304 Japanese Yen settling 4/2/18 | Northern Trust Company | 36,588 | 36,514 | 74 | — | |||||||||||||||
|
|
|
| |||||||||||||||||
| $ | 74 | $ | (1,260) | |||||||||||||||||
|
|
|
| |||||||||||||||||
Glossary:
ADR—American Depositary Receipt
REIT—Real Estate Investment Trust
The industry classification of portfolio holdings and liabilities in excess of other assets shown as a percentage of net assets were as follows:
Machinery | 9.5% | |||
Metals & Mining | 5.2% | |||
IT Services | 5.0% | |||
Banks | 4.9% | |||
Equity Real Estate Investment Trusts (REITs) | 4.7% | |||
Chemicals | 4.4% | |||
Auto Components | 4.4% | |||
Paper & Forest Products | 3.9% | |||
Capital Markets | 3.9% | |||
Specialty Retail | 3.7% | |||
Real Estate Management & Development | 3.4% | |||
Oil, Gas & Consumable Fuels | 3.1% | |||
Commercial Services & Supplies | 2.6% | |||
Professional Services | 2.5% | |||
Trading Companies & Distributors | 2.3% | |||
Construction & Engineering | 2.3% | |||
Electrical Equipment | 2.1% | |||
Road & Rail | 2.1% | |||
Building Products | 2.0% | |||
Containers & Packaging | 1.9% | |||
Household Durables | 1.8% | |||
Healthcare Equipment & Supplies | 1.8% | |||
Industrial Conglomerates | 1.7% | |||
Insurance | 1.6% | |||
Hotels, Restaurants & Leisure | 1.5% | |||
Consumer Finance | 1.5% | |||
Food & Staples Retailing | 1.0% | |||
Water Utilities | 1.0% | |||
Distributors | 1.0% | |||
Multi-Line Retail | 1.0% | |||
Beverages | 1.0% | |||
Multi-Utilities | 1.0% |
Healthcare Providers & Services | 1.0% | |||
Semiconductors & Semiconductor Equipment | 1.0% | |||
Air Freight & Logistics | 1.0% | |||
Aerospace & Defense | 0.9% | |||
Diversified Telecommunication Services | 0.9% | |||
Media | 0.9% | |||
Leisure Equipment & Products | 0.8% | |||
Transportation Infrastructure | 0.8% | |||
Thrifts & Mortgage Finance | 0.7% | |||
Construction Materials | 0.7% | |||
Food Products | 0.7% | |||
Electronic Equipment, Instruments & Components | 0.6% | |||
Repurchase Agreements | 3.8% | |||
Liabilities in excess of other assets | (3.6%) | |||
|
| |||
| 100.0% | ||||
|
| |||
| 174 | Semiannual Report | | March 31, 2018 | | See accompanying Notes to Financial Statements |
Table of Contents
Consolidated Schedule of Investments
March 31, 2018 (Unaudited)
AllianzGI PerformanceFee Managed Futures Strategy Fund
| Principal Amount (000s) | Value | |||||||
| U.S. Treasury Obligations—83.7% | ||||||||
U.S. Treasury Notes, | $2,100 | $2,075,719 | ||||||
1.00%, 11/30/18 | 1,600 | 1,589,375 | ||||||
1.125%, 1/15/19 | 2,100 | 2,084,578 | ||||||
1.125%, 1/31/19 | 2,100 | 2,083,430 | ||||||
1.125%, 2/28/19 | 900 | 892,195 | ||||||
1.25%, 12/15/18 | 2,000 | 1,989,219 | ||||||
1.25%, 12/31/18 | 2,100 | 2,087,695 | ||||||
|
| |||||||
| Total U.S. Treasury Obligations (cost—$12,806,734) | 12,802,211 | |||||||
|
| |||||||
Shares | Value | |||||||
| Exchange-Traded Funds—1.0% | ||||||||
iShares JPMorgan USD Emerging Markets Bond | 680 | $76,718 | ||||||
Vanguard Emerging Markets Government Bond | 910 | 71,389 | ||||||
|
| |||||||
| Total Exchange-Traded Funds (cost—$151,514) | 148,107 | |||||||
|
| |||||||
Principal | Value | |||||||
| Repurchase Agreements—1.3% | ||||||||
State Street Bank and Trust Co., dated 3/29/18, 0.28%, due 4/2/18, proceeds $204,006; collateralized by U.S. Treasury Notes, 2.00%, due 8/15/25, valued at $209,695 including accrued interest |
| |||||||
(cost—$204,000) | $204 | $204,000 | ||||||
|
| |||||||
| Total Investments (cost—$13,162,248)—86.0% | 13,154,318 | |||||||
|
| |||||||
| Other assets less liabilities (a)—14.0% | 2,134,422 | |||||||
|
| |||||||
| Net Assets—100.0% | $15,288,740 | |||||||
|
| |||||||
Notes to Consolidated Schedule of Investments:
(a) Includes net unrealized appreciation (depreciation) of other financial instruments as follows:
| Futures contracts outstanding at March 31, 2018: | ||||||||||||||||||||||
| Type | Contracts | Expiration Date | Notional Amount (000s) | Market Value (000s) | Unrealized Appreciation (Depreciation) | |||||||||||||||||
Long position contracts: | ||||||||||||||||||||||
5-Year U.S. Treasury Note | 12 | 6/29/18 | $ | 1,200 | $ | 1,374 | $ | 7,690 | ||||||||||||||
10-Year Japanese Government Bond | 2 | 6/13/18 | JPY | 200,000 | 2,835 | (2,077 | ) | |||||||||||||||
BIST 30 Index | 42 | 4/30/18 | TRY | 4 | 150 | (703 | ) | |||||||||||||||
Bovespa Index | 10 | 4/18/18 | BRL | —(c | ) | 259 | 7,978 | |||||||||||||||
British Pound | 22 | 6/18/18 | $ | 1,375 | 1,933 | 2,279 | ||||||||||||||||
CBOE Volatility Index | 4 | 4/18/18 | 4 | 79 | 889 | |||||||||||||||||
Cocoa† | 29 | 5/15/18 | —(c | ) | 741 | 98,855 | ||||||||||||||||
Cotton No.2† | 10 | 5/8/18 | 500 | 407 | (610 | ) | ||||||||||||||||
E-mini S&P 500 Index | 8 | 6/15/18 | —(c | ) | 1,057 | (58,355 | ) | |||||||||||||||
Euro Currency | 17 | 6/18/18 | 2,125 | 2,626 | (21,720 | ) | ||||||||||||||||
Euro-Bund 10-Year Bond | 16 | 6/7/18 | EUR | 1,600 | 2,809 | 48,741 | ||||||||||||||||
FTSE China A50 Index | 7 | 4/26/18 | $ | —(c | ) | 89 | (1,450 | ) | ||||||||||||||
FTSE/JSE Top 40 Index | 10 | 6/21/18 | ZAR | —(c | ) | 417 | (31,384 | ) | ||||||||||||||
FTSE/MIB Index | 2 | 6/15/18 | EUR | —(c | ) | 270 | (1,750 | ) | ||||||||||||||
Gold 100 Oz.† | 2 | 6/27/18 | $ | —(c | ) | 265 | (1,225 | ) | ||||||||||||||
Hang Seng Index | 2 | 4/27/18 | HKD | —(c | ) | 383 | (1,188 | ) | ||||||||||||||
Japanese Yen | 23 | 6/18/18 | $ | 29 | 2,715 | 3,670 | ||||||||||||||||
Lean Hogs† | 1 | 4/13/18 | 40 | 23 | (4,671 | ) | ||||||||||||||||
Live Cattle† | 6 | 4/30/18 | 240 | 273 | (33,603 | ) | ||||||||||||||||
Low Sulphur Gasoil† | 6 | 5/10/18 | 1 | 371 | (700 | ) | ||||||||||||||||
MSCI Taiwan Index | 5 | 4/27/18 | 1 | 206 | (417 | ) | ||||||||||||||||
New Zealand Dollar | 3 | 6/18/18 | 300 | 217 | (3,608 | ) | ||||||||||||||||
S&P/TSX 60 Index | 1 | 6/14/18 | CAD | —(c | ) | 141 | 540 | |||||||||||||||
TOPIX Index | 6 | 6/7/18 | JPY | 60 | 960 | 19,775 | ||||||||||||||||
WTI Crude Oil† | 6 | 5/22/18 | $ | 6 | 389 | 33,340 | ||||||||||||||||
|
| |||||||||||||||||||||
| $ | 60,296 | |||||||||||||||||||||
|
| |||||||||||||||||||||
Short position contracts: | ||||||||||||||||||||||
10-Year U.S. Treasury Note | (32 | ) | 6/20/18 | $ | (3,200 | ) | $ | (3,876 | ) | $ | (40,855 | ) | ||||||||||
Australian Dollar | (4 | ) | 6/18/18 | (400 | ) | (307 | ) | 459 | ||||||||||||||
Canadian Dollar | (6 | ) | 6/19/18 | (600 | ) | (466 | ) | 694 | ||||||||||||||
Copper† | (1 | ) | 6/27/18 | (25 | ) | (76 | ) | 148 | ||||||||||||||
Corn† | (9 | ) | 7/13/18 | (45 | ) | (178 | ) | (5,097 | ) | |||||||||||||
FTSE 100 Index | (2 | ) | 6/15/18 | GBP | (— | )(c) | (196 | ) | 628 | |||||||||||||
Mini DAX European Index | (1 | ) | 6/15/18 | EUR | (— | )(c) | (75 | ) | 180 | |||||||||||||
Natural Gas† | (14 | ) | 5/29/18 | $ | (140 | ) | (389 | ) | 1,203 | |||||||||||||
Platinum† | (4 | ) | 7/27/18 | (— | )(c) | (187 | ) | 685 | ||||||||||||||
Silver† | (4 | ) | 7/27/18 | (20 | ) | (327 | ) | 895 | ||||||||||||||
United Kingdom Government 10-Year Gilt | (18 | ) | 6/27/18 | GBP | (1,800 | ) | (3,102 | ) | (46,331 | ) | ||||||||||||
|
| |||||||||||||||||||||
| $ | (87,391 | ) | ||||||||||||||||||||
|
| |||||||||||||||||||||
| $ | (27,095 | ) | ||||||||||||||||||||
|
| |||||||||||||||||||||
† All or a portion of this security is owned by AllianzGI PerformanceFee Managed Futures Strategy Offshore Fund, Ltd., which is a wholly-owned subsidiary of the Fund.
| See accompanying Notes to Financial Statements | | March 31, 2018 | | Semiannual Report | 175 |
Table of Contents
Consolidated Schedule of Investments
March 31, 2018 (Unaudited)
| Credit default swap agreements outstanding at March 31, 2018: | ||||||||||||||||||||||||||||||||
Centrally cleared sell protection swap agreements(1):
|
| |||||||||||||||||||||||||||||||
| Broker (Exchange)/ Referenced Debt Issuer | Notional Amount (000s)(3) | Implied Credit Spread(2) | Termination Date | Fixed Deal Recieved Rate | Payment Frequency | Value(4) | Upfront Premiums Paid | Unrealized Depreciation | ||||||||||||||||||||||||
Goldman Sachs (ICE): | ||||||||||||||||||||||||||||||||
CDX.NA.HY.29 Index | $ | 2,400 | 3.37 | % | 12/20/22 | 5.00 | % | Quaterly | $ | 158,948 | $ | 187,014 | $ | (28,066 | ) | |||||||||||||||||
(1) If the Fund is a seller of protection and a credit event occurs, as defined under the terms of that particular swap agreement, the Fund will either (i) pay to the buyer of protection an amount equal to the notional amount of the swap and take delivery of the referenced obligation, other deliverable obligations or underlying securities comprising the referenced index or (ii) pay a net settlement amount in the form of cash or securities equal to the notional amount of the swap less the recovery value of the referenced obligation or underlying securities comprising the referenced index. Recovery values are assumed by market makers considering either industry standard recovery rates or entity specific factors and considerations until a credit event occurs. If a credit event has occurred, the recovery value is determined by a facilitated auction whereby a minimum number of allowable broker bids, together with a specified valuation method, are used to calculate the settlement value.
(2) Implied credit spreads, represented in absolute terms, utilized in determining the market value of credit default swap agreements as of year/period end serve as an indicator of the current status of the payment/performance risk and represent the likelihood or risk of default for the credit derivative. The implied credit spread of a particular referenced entity reflects the cost of buying/selling protection and may include upfront payments required to be made to enter into the agreement. Wider credit spreads represent a deterioration of the referenced entity’s credit soundness and a greater likelihood or risk of default or other credit event occurring as defined under the terms of the agreement.
(3) This represents the maximum potential amount the Fund could be required to make available as a seller of credit protection or receive as a buyer of credit protection if a credit event occurs as defined under the terms of that particular swap agreement.
(4) The quoted market prices and resulting values for credit default swap agreements serve as an indicator of the status at March 31, 2018 of the payment/performance risk and represent the likelihood of an expected liability (or profit) for the credit derivative should the notional amount of the swap agreement have been closed/sold as of the period end. Increasing market values, in absolute terms when compared to the notional amount of the swap, represent a deterioration of the referenced entity’s credit soundness and a greater likelihood or risk of default or other credit event occurring as defined under the terms of the agreement.
(b) At March 31, 2018, the Fund pledged $1,083,625 and $111,696 in cash as collateral for futures contracts and swap contracts, respectively.
(c) Notional amount rounds to less than $500.
Glossary:
BIST—Borsa Istanbul
BRL—Brazilian Real
CAD—Canadian Dollar
CBOE—Chicago Board Options Exchange
CDX—Credit Derivatives Index
EUR—Euro
FTSE—Financial Times Stock Exchange
GBP—British Pound
HKD—Hong Kong Dollar
ICE—Intercontinental Exchange
JPY—Japanese Yen
JSE—Johannesburg Stock Exchange Limited
MSCI—Morgan Stanley Capital International
TOPIX—Tokyo Stock Price Index
TRY—Turkish Lira
ZAR—South African Rand
| 176 | Semiannual Report | | March 31, 2018 | | See accompanying Notes to Financial Statements |
Table of Contents
Schedule of Investments
March 31, 2018 (Unaudited)
AllianzGI PerformanceFee Structured US Equity Fund
| Shares | Value | |||||||
| Exchange-Traded Funds—99.3% | ||||||||
iShares Core S&P 500 (a) (cost—$25,158,275) | 92,649 | $24,586,265 | ||||||
|
| |||||||
| Principal Amount (000s) | ||||||||
| Repurchase Agreements—0.5% | ||||||||
State Street Bank and Trust Co., dated 3/29/18, 0.28%, due 4/2/18, proceeds $113,004; collateralized by U.S. Treasury Notes, 2.00%, due 8/15/25, valued at $119,145 including accrued interest |
| |||||||
(cost—$113,000) | $113 | 113,000 | ||||||
|
| |||||||
| Total Options Purchased—1.3% (cost—$341,422) (b)(c)(d) | 310,317 | |||||||
|
| |||||||
| Total Investments, before options written (cost—$25,612,697)—101.1% | 25,009,582 | |||||||
|
| |||||||
| Value | ||||||||
| Total Options Written—(1.6)% (premiums received—$487,785) (b)(c)(d) | $ | (398,005 | ) | |||||
|
| |||||||
| Total Investments, net of options written (cost—$25,124,911)—99.5% | 24,611,577 | |||||||
|
| |||||||
| Other assets less other liabilities—0.5% | 111,593 | |||||||
|
| |||||||
| Net Assets—100.0% | $24,723,170 | |||||||
|
| |||||||
Notes to Schedule of Investments:
(a) All or partial amount segregated for the benefit of the counterparty as collateral for options written.
(b) Non-income producing.
(c) Exchange traded-Chicago Board Options Exchange.
(d) Exchange traded option contracts outstanding at March 31, 2018:
| Options purchased contracts outstanding at March 31, 2018: | ||||||||||||||||||||||||||||
| Description | Exercise Price | Expiration Date | Number of Contracts | Notional Amount | Market Value | Cost | Unrealized Appreciation (Depreciation) | |||||||||||||||||||||
Call options: | ||||||||||||||||||||||||||||
CBOE SPX Volatility Index | 20.00 USD | 6/20/18 | 72 | $ | 7,200 | $ | 18,720 | $ | 11,627 | $ | 7,093 | |||||||||||||||||
CBOE SPX Volatility Index | 21.00 USD | 7/18/18 | 12 | 1,200 | 3,090 | 2,251 | 839 | |||||||||||||||||||||
CBOE SPX Volatility Index | 22.00 USD | 7/18/18 | 12 | 1,200 | 2,820 | 2,089 | 731 | |||||||||||||||||||||
Russell 2000 Index | 1,630.00 USD | 6/15/18 | 1 | 100 | 1,220 | 2,321 | (1,101 | ) | ||||||||||||||||||||
Russell 2000 Index | 1,630.00 USD | 6/29/18 | 1 | 100 | 1,565 | 2,776 | (1,211 | ) | ||||||||||||||||||||
Russell 2000 Index | 1,620.00 USD | 7/31/18 | 1 | 100 | 2,615 | 4,102 | (1,487 | ) | ||||||||||||||||||||
Russell 2000 Index | 1,610.00 USD | 8/31/18 | 1 | 100 | 3,785 | 5,490 | (1,705 | ) | ||||||||||||||||||||
Russell 2000 Index | 1,620.00 USD | 9/21/18 | 1 | 100 | 3,855 | 5,470 | (1,615 | ) | ||||||||||||||||||||
S&P 500 Index | 2,750.00 USD | 4/20/18 | 1 | 100 | 760 | 783 | (23 | ) | ||||||||||||||||||||
S&P 500 Index | 2,750.00 USD | 4/23/18 | 1 | 100 | 835 | 883 | (48 | ) | ||||||||||||||||||||
S&P 500 Index | 2,750.00 USD | 4/25/18 | 1 | 100 | 915 | 993 | (78 | ) | ||||||||||||||||||||
S&P 500 Index | 2,750.00 USD | 4/27/18 | 1 | 100 | 1,005 | 1,093 | (88 | ) | ||||||||||||||||||||
S&P 500 Index | 2,750.00 USD | 4/30/18 | 1 | 100 | 1,075 | 1,164 | (89 | ) | ||||||||||||||||||||
S&P 500 Index | 2,725.00 USD | 5/4/18 | 1 | 100 | 1,955 | 5,974 | (4,019 | ) | ||||||||||||||||||||
S&P 500 Index | 2,750.00 USD | 5/4/18 | 1 | 100 | 1,305 | 1,424 | (119 | ) | ||||||||||||||||||||
S&P 500 Index | 2,750.00 USD | 5/11/18 | 1 | 100 | 1,595 | 1,714 | (119 | ) | ||||||||||||||||||||
S&P 500 Index | 2,750.00 USD | 5/18/18 | 1 | 100 | 1,865 | 2,020 | (155 | ) | ||||||||||||||||||||
S&P 500 Index | 2,800.00 USD | 6/29/18 | 1 | 100 | 2,125 | 4,404 | (2,279 | ) | ||||||||||||||||||||
S&P 500 Index | 3,000.00 USD | 6/29/18 | 2 | 200 | 340 | 787 | (447 | ) | ||||||||||||||||||||
S&P 500 Index | 2,800.00 USD | 7/20/18 | 1 | 100 | 2,765 | 5,204 | (2,439 | ) | ||||||||||||||||||||
S&P 500 Index | 2,975.00 USD | 7/20/18 | 2 | 200 | 735 | 1,505 | (770 | ) | ||||||||||||||||||||
S&P 500 Index | 2,825.00 USD | 7/31/18 | 1 | 100 | 2,475 | 4,554 | (2,079 | ) | ||||||||||||||||||||
S&P 500 Index | 3,000.00 USD | 7/31/18 | 2 | 200 | 720 | 1,307 | (587 | ) | ||||||||||||||||||||
S&P 500 Index | 2,800.00 USD | 8/31/18 | 1 | 100 | 4,225 | 7,004 | (2,779 | ) | ||||||||||||||||||||
S&P 500 Index | 3,000.00 USD | 8/31/18 | 2 | 200 | 1,030 | 2,007 | (977 | ) | ||||||||||||||||||||
S&P 500 Index | 2,800.00 USD | 9/21/18 | 1 | 100 | 4,860 | 7,704 | (2,844 | ) | ||||||||||||||||||||
S&P 500 Index | 3,000.00 USD | 9/21/18 | 2 | 200 | 1,360 | 2,707 | (1,347 | ) | ||||||||||||||||||||
S&P 500 Index | 2,800.00 USD | 9/28/18 | 1 | 100 | 5,125 | 8,054 | (2,929 | ) | ||||||||||||||||||||
S&P 500 Index | 3,000.00 USD | 9/28/18 | 2 | 200 | 1,520 | 2,907 | (1,387 | ) | ||||||||||||||||||||
S&P 500 Index | 2,825.00 USD | 4/20/18 | 1 | 100 | 155 | 1,604 | (1,449 | ) | ||||||||||||||||||||
S&P 500 Index | 3,300.00 USD | 4/20/18 | 2 | 200 | 15 | 23 | (8 | ) | ||||||||||||||||||||
S&P 500 Index | 2,850.00 USD | 4/30/18 | 1 | 100 | 170 | 1,324 | (1,154 | ) | ||||||||||||||||||||
S&P 500 Index | 2,775.00 USD | 5/4/18 | 1 | 100 | 860 | 6,007 | (5,147 | ) | ||||||||||||||||||||
| See accompanying Notes to Financial Statements | | March 31, 2018 | | Semiannual Report | 177 |
Table of Contents
Schedule of Investments
March 31, 2018 (Unaudited)
| Options purchased contracts outstanding at March 31, 2018 (continued): | ||||||||||||||||||||||||||||
| Description | Exercise Price | Expiration Date | Number of Contracts | Notional Amount | Market Value | Cost | Unrealized Appreciation (Depreciation) | |||||||||||||||||||||
Call options (continued): | ||||||||||||||||||||||||||||
S&P 500 Index | 2,900.00 USD | 5/18/18 | 1 | $ | 100 | $ | 208 | $ | 874 | $ | (666 | ) | ||||||||||||||||
S&P 500 Index | 2,925.00 USD | 5/18/18 | 2 | 200 | 310 | 1,325 | (1,015 | ) | ||||||||||||||||||||
S&P 500 Index | 3,075.00 USD | 5/18/18 | 4 | 400 | 150 | 434 | (284 | ) | ||||||||||||||||||||
S&P 500 Index | 3,600.00 USD | 5/18/18 | 2 | 200 | 20 | 32 | (12 | ) | ||||||||||||||||||||
S&P 500 Index | 2,900.00 USD | 5/31/18 | 3 | 300 | 892 | 3,611 | (2,719 | ) | ||||||||||||||||||||
S&P 500 Index | 3,075.00 USD | 5/31/18 | 2 | 200 | — | 287 | (287 | ) | ||||||||||||||||||||
S&P 500 Index | 3,100.00 USD | 5/31/18 | 2 | 200 | — | 227 | (227 | ) | ||||||||||||||||||||
S&P 500 Index | 2,900.00 USD | 6/15/18 | 3 | 300 | 1,200 | 4,511 | (3,311 | ) | ||||||||||||||||||||
S&P 500 Index | 2,925.00 USD | 6/15/18 | 2 | 200 | 580 | 2,247 | (1,667 | ) | ||||||||||||||||||||
S&P 500 Index | 3,100.00 USD | 6/15/18 | 2 | 200 | 105 | 327 | (222 | ) | ||||||||||||||||||||
S&P 500 Index | 3,125.00 USD | 6/15/18 | 2 | 200 | 85 | 267 | (182 | ) | ||||||||||||||||||||
|
| |||||||||||||||||||||||||||
| Total call options | $ | 81,010 | $ | 123,418 | $ | (42,408 | ) | |||||||||||||||||||||
|
| |||||||||||||||||||||||||||
Put options: | ||||||||||||||||||||||||||||
iPath S&P 500 VIX Short-Term | 54.00 USD | 4/6/18 | 9 | $ | 900 | $ | 6,570 | $ | 14,567 | $ | (7,997 | ) | ||||||||||||||||
iPath S&P 500 VIX Short-Term | 65.00 USD | 4/6/18 | 2 | 200 | 3,355 | 3,747 | (392 | ) | ||||||||||||||||||||
iPath S&P 500 VIX Short-Term | 55.00 USD | 4/13/18 | 9 | 900 | 7,672 | 15,079 | (7,407 | ) | ||||||||||||||||||||
iPath S&P 500 VIX Short-Term | 65.00 USD | 4/13/18 | 2 | 200 | 3,510 | 3,807 | (297 | ) | ||||||||||||||||||||
iPath S&P 500 VIX Short-Term | 40.00 USD | 4/20/18 | 13 | 1,300 | 514 | 5,767 | (5,253 | ) | ||||||||||||||||||||
iPath S&P 500 VIX Short-Term | 69.00 USD | 4/20/18 | 9 | 900 | 19,912 | 19,100 | 812 | |||||||||||||||||||||
iPath S&P 500 VIX Short-Term | 67.00 USD | 4/27/18 | 9 | 900 | 8,712 | 18,482 | (9,770 | ) | ||||||||||||||||||||
Nasdaq 100 Stock Index | 3,800.00 USD | 5/18/18 | 1 | 100 | 58 | 264 | (206 | ) | ||||||||||||||||||||
Russell 2000 Index | 1,500.00 USD | 4/2/18 | 1 | 100 | 287 | 1,303 | (1,016 | ) | ||||||||||||||||||||
Russell 2000 Index | 1,560.00 USD | 4/2/18 | 1 | 100 | 3,184 | 2,539 | 645 | |||||||||||||||||||||
S&P 500 Index | 2,575.00 USD | 4/2/18 | 2 | 200 | 176 | 1,287 | (1,111 | ) | ||||||||||||||||||||
S&P 500 Index | 2,695.00 USD | 4/2/18 | 1 | 100 | 5,275 | 909 | 4,366 | |||||||||||||||||||||
S&P 500 Index | 2,500.00 USD | 4/4/18 | 1 | 100 | 85 | 299 | (214 | ) | ||||||||||||||||||||
S&P 500 Index | 2,575.00 USD | 4/4/18 | 2 | 200 | 1,160 | 2,707 | (1,547 | ) | ||||||||||||||||||||
S&P 500 Index | 2,645.00 USD | 4/4/18 | 2 | 200 | 4,890 | 3,122 | 1,768 | |||||||||||||||||||||
S&P 500 Index | 2,540.00 USD | 4/6/18 | 1 | 100 | 465 | 431 | 34 | |||||||||||||||||||||
S&P 500 Index | 2,575.00 USD | 4/6/18 | 2 | 200 | 1,740 | 3,807 | (2,067 | ) | ||||||||||||||||||||
S&P 500 Index | 2,640.00 USD | 4/6/18 | 2 | 200 | 5,570 | 3,163 | 2,407 | |||||||||||||||||||||
S&P 500 Index | 2,470.00 USD | 4/9/18 | 1 | 100 | 215 | 894 | (679 | ) | ||||||||||||||||||||
S&P 500 Index | 2,575.00 USD | 4/9/18 | 3 | 300 | 3,375 | 4,672 | (1,297 | ) | ||||||||||||||||||||
S&P 500 Index | 2,610.00 USD | 4/9/18 | 1 | 100 | 1,955 | 3,709 | (1,754 | ) | ||||||||||||||||||||
S&P 500 Index | 2,615.00 USD | 4/9/18 | 1 | 100 | 2,105 | 1,253 | 852 | |||||||||||||||||||||
S&P 500 Index | 2,695.00 USD | 4/9/18 | 1 | 100 | 6,295 | 1,606 | 4,689 | |||||||||||||||||||||
S&P 500 Index | 2,510.00 USD | 4/11/18 | 1 | 100 | 610 | 476 | 134 | |||||||||||||||||||||
S&P 500 Index | 2,600.00 USD | 4/11/18 | 1 | 100 | 2,035 | 2,985 | (950 | ) | ||||||||||||||||||||
S&P 500 Index | 2,615.00 USD | 4/11/18 | 1 | 100 | 2,485 | 1,120 | 1,365 | |||||||||||||||||||||
S&P 500 Index | 2,650.00 USD | 4/11/18 | 1 | 100 | 3,885 | 2,902 | 983 | |||||||||||||||||||||
S&P 500 Index | 2,720.00 USD | 4/11/18 | 1 | 100 | 8,490 | 1,750 | 6,740 | |||||||||||||||||||||
S&P 500 Index | 1,100.00 USD | 4/13/18 | 12 | 1,200 | 120 | 379 | (259 | ) | ||||||||||||||||||||
S&P 500 Index | 1,200.00 USD | 4/13/18 | 13 | 1,300 | 130 | 216 | (86 | ) | ||||||||||||||||||||
S&P 500 Index | 1,300.00 USD | 4/13/18 | 18 | 1,800 | 225 | 370 | (145 | ) | ||||||||||||||||||||
S&P 500 Index | 1,500.00 USD | 4/13/18 | 7 | 700 | 105 | 186 | (81 | ) | ||||||||||||||||||||
S&P 500 Index | 2,510.00 USD | 4/13/18 | 1 | 100 | 800 | 544 | 256 | |||||||||||||||||||||
S&P 500 Index | 2,555.00 USD | 4/13/18 | 1 | 100 | 1,365 | 2,162 | (797 | ) | ||||||||||||||||||||
S&P 500 Index | 2,575.00 USD | 4/13/18 | 1 | 100 | 1,735 | 2,668 | (933 | ) | ||||||||||||||||||||
S&P 500 Index | 2,695.00 USD | 4/13/18 | 1 | 100 | 6,800 | 1,954 | 4,846 | |||||||||||||||||||||
S&P 500 Index | 1,700.00 USD | 4/16/18 | 24 | 2,400 | 480 | 1,350 | (870 | ) | ||||||||||||||||||||
S&P 500 Index | 2,520.00 USD | 4/16/18 | 1 | 100 | 1,015 | 2,250 | (1,235 | ) | ||||||||||||||||||||
S&P 500 Index | 2,575.00 USD | 4/16/18 | 2 | 200 | 3,780 | 4,705 | (925 | ) | ||||||||||||||||||||
S&P 500 Index | 2,690.00 USD | 4/16/18 | 2 | 200 | 13,210 | 3,762 | 9,448 | |||||||||||||||||||||
S&P 500 Index | 2,525.00 USD | 4/18/18 | 1 | 100 | 1,265 | 2,670 | (1,405 | ) | ||||||||||||||||||||
S&P 500 Index | 2,650.00 USD | 4/18/18 | 1 | 100 | 4,645 | 2,175 | 2,470 | |||||||||||||||||||||
S&P 500 Index | 2,725.00 USD | 4/18/18 | 1 | 100 | 9,305 | 2,027 | 7,278 | |||||||||||||||||||||
| 178 | Semiannual Report | | March 31, 2018 | | See accompanying Notes to Financial Statements |
Table of Contents
Schedule of Investments
March 31, 2018 (Unaudited)
| Options purchased contracts outstanding at March 31, 2018 (continued): | ||||||||||||||||||||||||||||
| Description | Exercise Price | Expiration Date | Number of Contracts | Notional Amount | Market Value | Cost | Unrealized Appreciation (Depreciation) | |||||||||||||||||||||
Put options (continued): | ||||||||||||||||||||||||||||
S&P 500 Index | 1,100.00 USD | 4/20/18 | 37 | $ | 3,700 | $ | 370 | $ | 589 | $ | (219 | ) | ||||||||||||||||
S&P 500 Index | 1,200.00 USD | 4/20/18 | 57 | 5,700 | 713 | 898 | (185 | ) | ||||||||||||||||||||
S&P 500 Index | 1,300.00 USD | 4/20/18 | 8 | 800 | 100 | 221 | (121 | ) | ||||||||||||||||||||
S&P 500 Index | 2,310.00 USD | 4/20/18 | 3 | 300 | 653 | 1,511 | (858 | ) | ||||||||||||||||||||
S&P 500 Index | 2,530.00 USD | 4/20/18 | 1 | 100 | 1,410 | 2,073 | (663 | ) | ||||||||||||||||||||
S&P 500 Index | 2,645.00 USD | 4/20/18 | 1 | 100 | 4,570 | 2,212 | 2,358 | |||||||||||||||||||||
S&P 500 Index | 2,585.00 USD | 4/23/18 | 1 | 100 | 2,705 | 3,149 | (444 | ) | ||||||||||||||||||||
S&P 500 Index | 2,690.00 USD | 4/23/18 | 1 | 100 | 7,095 | 2,282 | 4,813 | |||||||||||||||||||||
S&P 500 Index | 2,500.00 USD | 4/25/18 | 2 | 200 | 2,650 | 4,639 | (1,989 | ) | ||||||||||||||||||||
S&P 500 Index | 2,575.00 USD | 4/25/18 | 1 | 100 | 2,615 | 3,206 | (591 | ) | ||||||||||||||||||||
S&P 500 Index | 2,650.00 USD | 4/25/18 | 1 | 100 | 5,125 | 2,700 | 2,425 | |||||||||||||||||||||
S&P 500 Index | 1,100.00 USD | 4/27/18 | 22 | 2,200 | 275 | 361 | (86 | ) | ||||||||||||||||||||
S&P 500 Index | 1,150.00 USD | 4/27/18 | 11 | 1,100 | 143 | 182 | (39 | ) | ||||||||||||||||||||
S&P 500 Index | 1,200.00 USD | 4/27/18 | 12 | 1,200 | 180 | 439 | (259 | ) | ||||||||||||||||||||
S&P 500 Index | 1,250.00 USD | 4/27/18 | 21 | 2,100 | 315 | 348 | (33 | ) | ||||||||||||||||||||
S&P 500 Index | 1,300.00 USD | 4/27/18 | 12 | 1,200 | 210 | 199 | 11 | |||||||||||||||||||||
S&P 500 Index | 2,540.00 USD | 4/27/18 | 1 | 100 | 2,075 | 3,319 | (1,244 | ) | ||||||||||||||||||||
S&P 500 Index | 2,650.00 USD | 4/27/18 | 1 | 100 | 5,295 | 2,662 | 2,633 | |||||||||||||||||||||
S&P 500 Index | 1,200.00 USD | 4/30/18 | 12 | 1,200 | 156 | 259 | (103 | ) | ||||||||||||||||||||
S&P 500 Index | 2,450.00 USD | 4/30/18 | 1 | 100 | 1,060 | 1,871 | (811 | ) | ||||||||||||||||||||
S&P 500 Index | 2,565.00 USD | 4/30/18 | 1 | 100 | 2,690 | 4,004 | (1,314 | ) | ||||||||||||||||||||
S&P 500 Index | 2,600.00 USD | 5/2/18 | 1 | 100 | 3,775 | 3,480 | 295 | |||||||||||||||||||||
S&P 500 Index | 2,225.00 USD | 5/4/18 | 3 | 300 | 975 | 1,971 | (996 | ) | ||||||||||||||||||||
S&P 500 Index | 2,535.00 USD | 5/4/18 | 1 | 100 | 2,440 | 4,247 | (1,807 | ) | ||||||||||||||||||||
S&P 500 Index | 2,580.00 USD | 5/7/18 | 1 | 100 | 3,520 | 3,344 | 176 | |||||||||||||||||||||
S&P 500 Index | 2,580.00 XXX | 4/4/18 | 1 | 100 | 535 | 488 | 47 | |||||||||||||||||||||
S&P 500 Index | 2,500.00 XXX | 4/6/18 | 7 | 700 | 1,522 | 2,082 | (560 | ) | ||||||||||||||||||||
S&P 500 Index | 1,700.00 USD | 4/2/18 | 11 | 1,100 | 110 | 214 | (104 | ) | ||||||||||||||||||||
S&P 500 Index | 2,660.00 USD | 4/2/18 | 1 | 100 | 2,370 | 2,568 | (198 | ) | ||||||||||||||||||||
S&P 500 Index | 2,700.00 USD | 4/4/18 | 1 | 100 | 6,155 | 2,376 | 3,779 | |||||||||||||||||||||
S&P 500 Index | 1,500.00 USD | 4/6/18 | 17 | 1,700 | 170 | 616 | (446 | ) | ||||||||||||||||||||
S&P 500 Index | 2,680.00 USD | 4/6/18 | 1 | 100 | 5,015 | 2,773 | 2,242 | |||||||||||||||||||||
S&P 500 Index | 1,700.00 USD | 4/9/18 | 20 | 2,000 | 250 | 775 | (525 | ) | ||||||||||||||||||||
S&P 500 Index | 1,700.00 USD | 4/11/18 | 10 | 1,000 | 150 | 412 | (262 | ) | ||||||||||||||||||||
S&P 500 Index | 1,400.00 USD | 4/13/18 | 4 | 400 | 50 | 86 | (36 | ) | ||||||||||||||||||||
S&P 500 Index | 1,600.00 USD | 4/13/18 | 12 | 1,200 | 210 | 379 | (169 | ) | ||||||||||||||||||||
S&P 500 Index | 2,350.00 USD | 4/13/18 | 2 | 200 | 320 | 531 | (211 | ) | ||||||||||||||||||||
S&P 500 Index | 2,650.00 USD | 4/13/18 | 1 | 100 | 4,205 | 2,837 | 1,368 | |||||||||||||||||||||
S&P 500 Index | 2,700.00 USD | 4/20/18 | 1 | 100 | 7,565 | 2,536 | 5,029 | |||||||||||||||||||||
|
| |||||||||||||||||||||||||||
| Total put options | $ | 229,307 | $ | 218,004 | $ | 11,303 | ||||||||||||||||||||||
|
| |||||||||||||||||||||||||||
| Total options purchased contracts | $ | 310,317 | $ | 341,422 | $ | (31,105 | ) | |||||||||||||||||||||
|
| |||||||||||||||||||||||||||
| Options written contracts outstanding at March 31, 2018: | ||||||||||||||||||||||||||||
| Description | Exercise Price | Expiration Date | Number of Contracts | Notional Amount | Market Value | Premiums Received | Unrealized Appreciation (Depreciation) | |||||||||||||||||||||
Call options: | ||||||||||||||||||||||||||||
CBOE SPX Volatility Index | 23.00 USD | 4/11/18 | 4 | $ | (400 | ) | $ | (400 | ) | $ | (324 | ) | $ | (76 | ) | |||||||||||||
CBOE SPX Volatility Index | 24.00 USD | 4/18/18 | 5 | (500 | ) | (487 | ) | (372 | ) | (115 | ) | |||||||||||||||||
CBOE SPX Volatility Index | 25.00 USD | 4/18/18 | 9 | (900 | ) | (765 | ) | (1,273 | ) | 508 | ||||||||||||||||||
CBOE SPX Volatility Index | 26.00 USD | 4/18/18 | 13 | (1,300 | ) | (975 | ) | (1,489 | ) | 514 | ||||||||||||||||||
CBOE SPX Volatility Index | 27.00 USD | 4/18/18 | 6 | (600 | ) | (405 | ) | (1,347 | ) | 942 | ||||||||||||||||||
CBOE SPX Volatility Index | 28.00 USD | 4/18/18 | 56 | (5,600 | ) | (3,360 | ) | (5,073 | ) | 1,713 | ||||||||||||||||||
CBOE SPX Volatility Index | 29.00 USD | 4/18/18 | 5 | (500 | ) | (262 | ) | (492 | ) | 230 | ||||||||||||||||||
CBOE SPX Volatility Index | 30.00 USD | 4/25/18 | 6 | (600 | ) | (375 | ) | (489 | ) | 114 | ||||||||||||||||||
CBOE SPX Volatility Index | 26.00 USD | 5/16/18 | 10 | (1,000 | ) | (1,250 | ) | (974 | ) | (276 | ) | |||||||||||||||||
| See accompanying Notes to Financial Statements | | March 31, 2018 | | Semiannual Report | 179 |
Table of Contents
Schedule of Investments
March 31, 2018 (Unaudited)
| Options written contracts outstanding at March 31, 2018 (continued): | ||||||||||||||||||||||||||||
| Description | Exercise Price | Expiration Date | Number of Contracts | Notional Amount | Market Value | Premiums Received | Unrealized Appreciation (Depreciation) | |||||||||||||||||||||
Call options (continued): | ||||||||||||||||||||||||||||
CBOE SPX Volatility Index | 30.00 USD | 5/16/18 | 23 | $ | (2,300 | ) | $ | (2,070 | ) | $ | (2,041 | ) | $ | (29 | ) | |||||||||||||
CBOE SPX Volatility Index | 32.50 USD | 5/16/18 | 21 | (2,100 | ) | (1,575 | ) | (1,873 | ) | 298 | ||||||||||||||||||
CBOE SPX Volatility Index | 35.00 USD | 5/16/18 | 6 | (600 | ) | (390 | ) | (452 | ) | 62 | ||||||||||||||||||
CBOE SPX Volatility Index | 15.00 USD | 6/20/18 | 72 | (7,200 | ) | (33,120 | ) | (17,193 | ) | (15,927 | ) | |||||||||||||||||
CBOE SPX Volatility Index | 29.00 USD | 6/20/18 | 18 | (1,800 | ) | (2,250 | ) | (1,753 | ) | (497 | ) | |||||||||||||||||
CBOE SPX Volatility Index | 37.50 USD | 6/20/18 | 6 | (600 | ) | (450 | ) | (458 | ) | 8 | ||||||||||||||||||
CBOE SPX Volatility Index | 16.00 USD | 7/18/18 | 12 | (1,200 | ) | (5,160 | ) | (3,305 | ) | (1,855 | ) | |||||||||||||||||
CBOE SPX Volatility Index | 17.00 USD | 7/18/18 | 12 | (1,200 | ) | (4,560 | ) | (3,005 | ) | (1,555 | ) | |||||||||||||||||
iPath S&P 500 VIX Short-Term | 53.00 USD | 4/20/18 | 8 | (800 | ) | (2,120 | ) | (812 | ) | (1,308 | ) | |||||||||||||||||
iPath S&P 500 VIX Short-Term | 56.00 USD | 4/20/18 | 13 | (1,300 | ) | (2,620 | ) | (1,711 | ) | (909 | ) | |||||||||||||||||
iPath S&P 500 VIX Short-Term | 90.00 USD | 4/20/18 | 12 | (1,200 | ) | (222 | ) | (1,877 | ) | 1,655 | ||||||||||||||||||
iPath S&P 500 VIX Short-Term | 105.00 USD | 4/20/18 | 20 | (2,000 | ) | (270 | ) | (6,380 | ) | 6,110 | ||||||||||||||||||
iPath S&P 500 VIX Short-Term | 70.00 USD | 5/4/18 | 18 | (1,800 | ) | (2,133 | ) | (2,257 | ) | 124 | ||||||||||||||||||
iPath S&P 500 VIX Short-Term | 70.00 USD | 5/18/18 | 13 | (1,300 | ) | (1,813 | ) | (1,656 | ) | (157 | ) | |||||||||||||||||
iPath S&P 500 VIX Short-Term | 80.00 USD | 6/15/18 | 17 | (1,700 | ) | (3,604 | ) | (4,818 | ) | 1,214 | ||||||||||||||||||
Russell 2000 Index | 1,690.00 USD | 6/15/18 | 3 | (300 | ) | (1,260 | ) | (2,296 | ) | 1,036 | ||||||||||||||||||
Russell 2000 Index | 1,690.00 USD | 6/29/18 | 2 | (200 | ) | (1,120 | ) | (1,995 | ) | 875 | ||||||||||||||||||
Russell 2000 Index | 1,710.00 USD | 7/31/18 | 3 | (300 | ) | (2,190 | ) | (3,475 | ) | 1,285 | ||||||||||||||||||
Russell 2000 Index | 1,700.00 USD | 8/31/18 | 2 | (200 | ) | (2,610 | ) | (3,963 | ) | 1,353 | ||||||||||||||||||
Russell 2000 Index | 1,710.00 USD | 9/21/18 | 3 | (300 | ) | (4,260 | ) | (6,226 | ) | 1,966 | ||||||||||||||||||
S&P 500 Index | 2,900.00 USD | 6/29/18 | 3 | (300 | ) | (1,725 | ) | (3,889 | ) | 2,164 | ||||||||||||||||||
S&P 500 Index | 2,900.00 USD | 7/20/18 | 3 | (300 | ) | (2,505 | ) | (5,452 | ) | 2,947 | ||||||||||||||||||
S&P 500 Index | 2,925.00 USD | 7/31/18 | 3 | (300 | ) | (2,310 | ) | (4,639 | ) | 2,329 | ||||||||||||||||||
S&P 500 Index | 2,925.00 USD | 8/31/18 | 3 | (300 | ) | (3,645 | ) | (6,889 | ) | 3,244 | ||||||||||||||||||
S&P 500 Index | 2,925.00 USD | 9/21/18 | 3 | (300 | ) | (4,605 | ) | (8,389 | ) | 3,784 | ||||||||||||||||||
S&P 500 Index | 2,925.00 USD | 9/28/18 | 3 | (300 | ) | (5,055 | ) | (8,989 | ) | 3,934 | ||||||||||||||||||
S&P 500 Index | 2,925.00 USD | 4/20/18 | 2 | (200 | ) | (55 | ) | (513 | ) | 458 | ||||||||||||||||||
S&P 500 Index | 2,950.00 USD | 4/30/18 | 2 | (200 | ) | (65 | ) | (453 | ) | 388 | ||||||||||||||||||
S&P 500 Index | 3,025.00 USD | 5/18/18 | 8 | (800 | ) | (420 | ) | (1,161 | ) | 741 | ||||||||||||||||||
S&P 500 Index | 3,025.00 USD | 5/31/18 | 8 | (800 | ) | (540 | ) | (1,781 | ) | 1,241 | ||||||||||||||||||
S&P 500 Index | 3,000.00 USD | 6/15/18 | 1 | (100 | ) | (120 | ) | (397 | ) | 277 | ||||||||||||||||||
S&P 500 Index | 3,050.00 USD | 6/15/18 | 7 | (700 | ) | (525 | ) | (1,645 | ) | 1,120 | ||||||||||||||||||
|
| |||||||||||||||||||||||||||
| Total call options | $ | (103,646 | ) | $ | (123,576 | ) | $ | 19,930 | ||||||||||||||||||||
|
| |||||||||||||||||||||||||||
Put options: | ||||||||||||||||||||||||||||
Nasdaq 100 Stock Index | 6,400.00 USD | 4/13/18 | 1 | $ | (100 | ) | $ | (8,205 | ) | $ | (1,996 | ) | $ | (6,209 | ) | |||||||||||||
Nasdaq 100 Stock Index | 5,800.00 USD | 5/18/18 | 1 | (100 | ) | (5,290 | ) | (4,506 | ) | (784 | ) | |||||||||||||||||
Russell 2000 Index | 1,530.00 USD | 4/2/18 | 2 | (200 | ) | (2,281 | ) | (3,593 | ) | 1,312 | ||||||||||||||||||
S&P 500 Index | 2,350.00 USD | 4/2/18 | 6 | (600 | ) | (75 | ) | (4,959 | ) | 4,884 | ||||||||||||||||||
S&P 500 Index | 2,430.00 USD | 4/2/18 | 2 | (200 | ) | (25 | ) | (2,068 | ) | 2,043 | ||||||||||||||||||
S&P 500 Index | 2,470.00 USD | 4/2/18 | 6 | (600 | ) | (90 | ) | (5,787 | ) | 5,697 | ||||||||||||||||||
S&P 500 Index | 2,510.00 USD | 4/2/18 | 4 | (400 | ) | (60 | ) | (446 | ) | 386 | ||||||||||||||||||
S&P 500 Index | 2,625.00 USD | 4/2/18 | 2 | (200 | ) | (1,330 | ) | (883 | ) | (447 | ) | |||||||||||||||||
S&P 500 Index | 2,450.00 USD | 4/4/18 | 5 | (500 | ) | (250 | ) | (4,382 | ) | 4,132 | ||||||||||||||||||
S&P 500 Index | 2,510.00 USD | 4/4/18 | 4 | (400 | ) | (460 | ) | (1,586 | ) | 1,126 | ||||||||||||||||||
S&P 500 Index | 2,570.00 USD | 4/4/18 | 3 | (300 | ) | (1,230 | ) | (2,143 | ) | 913 | ||||||||||||||||||
S&P 500 Index | 2,510.00 USD | 4/6/18 | 5 | (500 | ) | (1,325 | ) | (4,912 | ) | 3,587 | ||||||||||||||||||
S&P 500 Index | 2,575.00 USD | 4/6/18 | 2 | (200 | ) | (1,740 | ) | (723 | ) | (1,017 | ) | |||||||||||||||||
S&P 500 Index | 2,490.00 USD | 4/9/18 | 4 | (400 | ) | (2,040 | ) | (2,706 | ) | 666 | ||||||||||||||||||
S&P 500 Index | 2,520.00 USD | 4/9/18 | 2 | (200 | ) | (910 | ) | (1,251 | ) | 341 | ||||||||||||||||||
S&P 500 Index | 2,530.00 USD | 4/9/18 | 5 | (500 | ) | (2,675 | ) | (4,237 | ) | 1,562 | ||||||||||||||||||
S&P 500 Index | 2,540.00 USD | 4/9/18 | 2 | (200 | ) | (1,270 | ) | (4,893 | ) | 3,623 | ||||||||||||||||||
S&P 500 Index | 2,635.00 USD | 4/9/18 | 2 | (200 | ) | (5,670 | ) | (1,824 | ) | (3,846 | ) | |||||||||||||||||
S&P 500 Index | 2,450.00 USD | 4/11/18 | 2 | (200 | ) | (565 | ) | (2,065 | ) | 1,500 | ||||||||||||||||||
S&P 500 Index | 2,525.00 USD | 4/11/18 | 2 | (200 | ) | (1,480 | ) | (1,118 | ) | (362 | ) | |||||||||||||||||
S&P 500 Index | 2,580.00 USD | 4/11/18 | 2 | (200 | ) | (3,110 | ) | (3,644 | ) | 534 | ||||||||||||||||||
S&P 500 Index | 2,665.00 USD | 4/11/18 | 2 | (200 | ) | (9,340 | ) | (2,086 | ) | (7,254 | ) | |||||||||||||||||
S&P 500 Index | 2,455.00 USD | 4/13/18 | 2 | (200 | ) | (850 | ) | (2,173 | ) | 1,323 | ||||||||||||||||||
| 180 | Semiannual Report | | March 31, 2018 | | See accompanying Notes to Financial Statements |
Table of Contents
Schedule of Investments
March 31, 2018 (Unaudited)
| Options written contracts outstanding at March 31, 2018 (continued): | ||||||||||||||||||||||||||||
| Description | Exercise Price | Expiration Date | Number of Contracts | Notional Amount | Market Value | Premiums Received | Unrealized Appreciation (Depreciation) | |||||||||||||||||||||
Put options (continued): | ||||||||||||||||||||||||||||
S&P 500 Index | 2,560.00 USD | 4/13/18 | 6 | $ | (600 | ) | $ | (8,670 | ) | $ | (4,616 | ) | $ | (4,054 | ) | |||||||||||||
S&P 500 Index | 2,580.00 USD | 4/13/18 | 2 | (200 | ) | (3,690 | ) | (3,589 | ) | (101 | ) | |||||||||||||||||
S&P 500 Index | 2,585.00 USD | 4/13/18 | 1 | (100 | ) | (1,955 | ) | (636 | ) | (1,319 | ) | |||||||||||||||||
S&P 500 Index | 2,630.00 USD | 4/13/18 | 2 | (200 | ) | (6,700 | ) | (2,241 | ) | (4,459 | ) | |||||||||||||||||
S&P 500 Index | 2,430.00 USD | 4/16/18 | 2 | (200 | ) | (790 | ) | (2,265 | ) | 1,475 | ||||||||||||||||||
S&P 500 Index | 2,450.00 USD | 4/16/18 | 4 | (400 | ) | (1,940 | ) | (3,906 | ) | 1,966 | ||||||||||||||||||
S&P 500 Index | 2,560.00 USD | 4/16/18 | 6 | (600 | ) | (9,540 | ) | (4,718 | ) | (4,822 | ) | |||||||||||||||||
S&P 500 Index | 2,625.00 USD | 4/16/18 | 2 | (200 | ) | (6,650 | ) | (2,467 | ) | (4,183 | ) | |||||||||||||||||
S&P 500 Index | 2,630.00 USD | 4/16/18 | 2 | (200 | ) | (7,030 | ) | (1,938 | ) | (5,092 | ) | |||||||||||||||||
S&P 500 Index | 2,440.00 USD | 4/18/18 | 2 | (200 | ) | (1,090 | ) | (2,659 | ) | 1,569 | ||||||||||||||||||
S&P 500 Index | 2,475.00 USD | 4/18/18 | 6 | (600 | ) | (4,530 | ) | (6,578 | ) | 2,048 | ||||||||||||||||||
S&P 500 Index | 2,580.00 USD | 4/18/18 | 2 | (200 | ) | (4,520 | ) | (2,598 | ) | (1,922 | ) | |||||||||||||||||
S&P 500 Index | 2,660.00 USD | 4/18/18 | 2 | (200 | ) | (10,260 | ) | (2,399 | ) | (7,861 | ) | |||||||||||||||||
S&P 500 Index | 2,440.00 USD | 4/20/18 | 2 | (200 | ) | (1,240 | ) | (2,327 | ) | 1,087 | ||||||||||||||||||
S&P 500 Index | 2,490.00 USD | 4/20/18 | 6 | (600 | ) | (5,940 | ) | (15,999 | ) | 10,059 | ||||||||||||||||||
S&P 500 Index | 2,505.00 USD | 4/20/18 | 6 | (600 | ) | (6,810 | ) | (5,378 | ) | (1,432 | ) | |||||||||||||||||
S&P 500 Index | 2,510.00 USD | 4/20/18 | 6 | (600 | ) | (7,170 | ) | (5,996 | ) | (1,174 | ) | |||||||||||||||||
S&P 500 Index | 2,580.00 USD | 4/20/18 | 2 | (200 | ) | (4,830 | ) | (2,751 | ) | (2,079 | ) | |||||||||||||||||
S&P 500 Index | 2,630.00 USD | 4/20/18 | 2 | (200 | ) | (7,910 | ) | (3,008 | ) | (4,902 | ) | |||||||||||||||||
S&P 500 Index | 2,420.00 USD | 4/23/18 | 6 | (600 | ) | (3,495 | ) | (6,890 | ) | 3,395 | ||||||||||||||||||
S&P 500 Index | 2,440.00 USD | 4/23/18 | 4 | (400 | ) | (2,780 | ) | (4,506 | ) | 1,726 | ||||||||||||||||||
S&P 500 Index | 2,480.00 USD | 4/23/18 | 3 | (300 | ) | (2,985 | ) | (8,389 | ) | 5,404 | ||||||||||||||||||
S&P 500 Index | 2,510.00 USD | 4/23/18 | 2 | (200 | ) | (2,630 | ) | (3,803 | ) | 1,173 | ||||||||||||||||||
S&P 500 Index | 2,625.00 USD | 4/23/18 | 2 | (200 | ) | (7,890 | ) | (2,745 | ) | (5,145 | ) | |||||||||||||||||
S&P 500 Index | 2,350.00 USD | 4/25/18 | 4 | (400 | ) | (1,680 | ) | (3,154 | ) | 1,474 | ||||||||||||||||||
S&P 500 Index | 2,360.00 USD | 4/25/18 | 3 | (300 | ) | (1,328 | ) | (3,197 | ) | 1,869 | ||||||||||||||||||
S&P 500 Index | 2,400.00 USD | 4/25/18 | 3 | (300 | ) | (1,725 | ) | (2,899 | ) | 1,174 | ||||||||||||||||||
S&P 500 Index | 2,500.00 USD | 4/25/18 | 2 | (200 | ) | (2,650 | ) | (3,762 | ) | 1,112 | ||||||||||||||||||
S&P 500 Index | 2,580.00 USD | 4/25/18 | 2 | (200 | ) | (5,490 | ) | (3,392 | ) | (2,098 | ) | |||||||||||||||||
S&P 500 Index | 2,320.00 USD | 4/27/18 | 6 | (600 | ) | (2,280 | ) | (4,256 | ) | 1,976 | ||||||||||||||||||
S&P 500 Index | 2,395.00 USD | 4/27/18 | 2 | (200 | ) | (1,280 | ) | (2,411 | ) | 1,131 | ||||||||||||||||||
S&P 500 Index | 2,420.00 USD | 4/27/18 | 6 | (600 | ) | (4,650 | ) | (6,074 | ) | 1,424 | ||||||||||||||||||
S&P 500 Index | 2,580.00 USD | 4/27/18 | 2 | (200 | ) | (5,860 | ) | (3,326 | ) | (2,534 | ) | |||||||||||||||||
S&P 500 Index | 2,290.00 USD | 4/30/18 | 2 | (200 | ) | (690 | ) | (1,363 | ) | 673 | ||||||||||||||||||
S&P 500 Index | 2,400.00 USD | 4/30/18 | 14 | (1,400 | ) | (10,220 | ) | (29,463 | ) | 19,243 | ||||||||||||||||||
S&P 500 Index | 2,410.00 USD | 4/30/18 | 3 | (300 | ) | (2,280 | ) | (1,999 | ) | (281 | ) | |||||||||||||||||
S&P 500 Index | 2,490.00 USD | 4/30/18 | 2 | (200 | ) | (2,900 | ) | (5,243 | ) | 2,343 | ||||||||||||||||||
S&P 500 Index | 2,530.00 USD | 5/2/18 | 2 | (200 | ) | (4,350 | ) | (4,323 | ) | (27 | ) | |||||||||||||||||
S&P 500 Index | 2,480.00 USD | 5/4/18 | 2 | (200 | ) | (3,250 | ) | (5,593 | ) | 2,343 | ||||||||||||||||||
S&P 500 Index | 2,525.00 USD | 5/4/18 | 2 | (200 | ) | (4,520 | ) | (2,171 | ) | (2,349 | ) | |||||||||||||||||
S&P 500 Index | 2,515.00 USD | 5/7/18 | 2 | (200 | ) | (4,280 | ) | (4,121 | ) | (159 | ) | |||||||||||||||||
S&P 500 Index | 2,440.00 USD | 5/11/18 | 1 | (100 | ) | (1,545 | ) | (3,296 | ) | 1,751 | ||||||||||||||||||
S&P 500 Index | 2,455.00 USD | 5/11/18 | 3 | (300 | ) | (5,115 | ) | (9,589 | ) | 4,474 | ||||||||||||||||||
S&P 500 Index | 2,460.00 USD | 5/11/18 | 2 | (200 | ) | (3,530 | ) | (5,949 | ) | 2,419 | ||||||||||||||||||
S&P 500 Index | 2,440.00 USD | 5/18/18 | 1 | (100 | ) | (1,905 | ) | (3,120 | ) | 1,215 | ||||||||||||||||||
S&P 500 Index | 2,260.00 USD | 6/29/18 | 3 | (300 | ) | (5,565 | ) | (5,119 | ) | (446 | ) | |||||||||||||||||
S&P 500 Index | 2,175.00 USD | 7/20/18 | 3 | (300 | ) | (5,055 | ) | (5,729 | ) | 674 | ||||||||||||||||||
S&P 500 Index | 2,590.00 USD | 4/2/18 | 1 | (100 | ) | (122 | ) | (1,560 | ) | 1,438 | ||||||||||||||||||
S&P 500 Index | 2,580.00 USD | 4/4/18 | 1 | (100 | ) | (535 | ) | (1,394 | ) | 859 | ||||||||||||||||||
S&P 500 Index | 2,640.00 USD | 4/4/18 | 2 | (200 | ) | (4,420 | ) | (2,993 | ) | (1,427 | ) | |||||||||||||||||
S&P 500 Index | 2,275.00 USD | 4/6/18 | 6 | (600 | ) | (195 | ) | (19,905 | ) | 19,710 | ||||||||||||||||||
S&P 500 Index | 2,500.00 USD | 4/6/18 | 10 | (1,000 | ) | (2,175 | ) | (8,149 | ) | 5,974 | ||||||||||||||||||
S&P 500 Index | 2,570.00 USD | 4/6/18 | 2 | (200 | ) | (1,650 | ) | (3,061 | ) | 1,411 | ||||||||||||||||||
S&P 500 Index | 2,610.00 USD | 4/6/18 | 2 | (200 | ) | (3,400 | ) | (3,545 | ) | 145 | ||||||||||||||||||
S&P 500 Index | 2,580.00 USD | 4/9/18 | 5 | (500 | ) | (6,075 | ) | (3,442 | ) | (2,633 | ) | |||||||||||||||||
S&P 500 Index | 2,425.00 USD | 4/13/18 | 2 | (200 | ) | (635 | ) | (2,025 | ) | 1,390 | ||||||||||||||||||
S&P 500 Index | 2,225.00 USD | 4/20/18 | 1 | (100 | ) | (135 | ) | (1,596 | ) | 1,461 | ||||||||||||||||||
S&P 500 Index | 2,250.00 USD | 4/20/18 | 1 | (100 | ) | (153 | ) | (1,747 | ) | 1,594 | ||||||||||||||||||
S&P 500 Index | 2,450.00 USD | 4/20/18 | 5 | (500 | ) | (3,350 | ) | (4,523 | ) | 1,173 | ||||||||||||||||||
| See accompanying Notes to Financial Statements | | March 31, 2018 | | Semiannual Report | 181 |
Table of Contents
Schedule of Investments
March 31, 2018 (Unaudited)
| Options written contracts outstanding at March 31, 2018 (continued): | ||||||||||||||||||||||||||||
| Description | Exercise Price | Expiration Date | Number of Contracts | Notional Amount | Market Value | Premiums Received | Unrealized Appreciation (Depreciation) | |||||||||||||||||||||
Put options (continued): | ||||||||||||||||||||||||||||
S&P 500 Index | 2,430.00 USD | 5/4/18 | 2 | $ | (200 | ) | $ | (2,270 | ) | $ | (5,289 | ) | $ | 3,019 | ||||||||||||||
S&P 500 Index | 2,460.00 USD | 5/4/18 | 2 | (200 | ) | (2,810 | ) | (5,318 | ) | 2,508 | ||||||||||||||||||
S&P 500 Index | 2,250.00 USD | 5/18/18 | 1 | (100 | ) | (670 | ) | (2,476 | ) | 1,806 | ||||||||||||||||||
S&P 500 Index | 2,250.00 USD | 6/15/18 | 1 | (100 | ) | (1,375 | ) | (3,096 | ) | 1,721 | ||||||||||||||||||
S&P 500 Index | 2,300.00 USD | 6/29/18 | 5 | (500 | ) | (10,925 | ) | (8,158 | ) | (2,767 | ) | |||||||||||||||||
|
| |||||||||||||||||||||||||||
| Total put options | $ | (294,359 | ) | $ | (364,209 | ) | $ | 69,850 | ||||||||||||||||||||
|
| |||||||||||||||||||||||||||
| Total options written contracts | $ | (398,005 | ) | $ | (487,785 | ) | $ | 89,780 | ||||||||||||||||||||
|
| |||||||||||||||||||||||||||
(e) At March 31, 2018, the Fund pledged $98,348 in cash as collateral for options written.
Glossary:
CBOE—Chicago Board Options Exchange
VIX—Volatility Index
| 182 | Semiannual Report | | March 31, 2018 | | See accompanying Notes to Financial Statements |
Table of Contents
Schedule of Investments
March 31, 2018 (Unaudited)
AllianzGI PerformanceFee Structured
US Fixed Income Fund
| Shares | Value | |||||||
| Exchange-Traded Funds—99.8% | ||||||||
iShares Core U.S. Aggregate Bond (a) | 228,856 | $24,544,806 | ||||||
|
| |||||||
| Total Options Purchased—0.6% (cost—$148,029) (b)(c)(d) | 162,502 | |||||||
|
| |||||||
| Total Investments, before options written (cost-$25,169,789)—100.4% | 24,707,308 | |||||||
|
| |||||||
| Value | ||||||||
| Total Options Written—(0.8)% (premiums received—$240,865) (b)(c)(d) | $ | (202,277 | ) | |||||
|
| |||||||
| Total Investments, net of options written (cost-$24,928,924)—99.6% | 24,505,031 | |||||||
|
| |||||||
| Other assets less other liabilities—0.4% | 88,998 | |||||||
|
| |||||||
| Net Assets—100.0% | $24,594,029 | |||||||
|
| |||||||
Notes to Schedule of Investments:
(a) All or partial amount segregated for the benefit of the counterparty as collateral for options written.
(b) Non-income producing.
(c) Exchange traded-Chicago Board Options Exchange.
(d) Exchange traded option contracts outstanding at March 31, 2018:
| Options purchased contracts outstanding at March 31, 2018: | ||||||||||||||||||||||||||||
| Description | Exercise Price | Expiration Date | Number of Contracts | Notional Amount | Market Value | Cost | Unrealized Appreciation (Depreciation) | |||||||||||||||||||||
Call options: | ||||||||||||||||||||||||||||
CBOE SPX Volatility Index | 20.00 USD | 6/20/18 | 39 | $ | 3,900 | $ | 10,140 | $ | 6,300 | $ | 3,840 | |||||||||||||||||
CBOE SPX Volatility Index | 21.00 USD | 7/18/18 | 6 | 600 | 1,545 | 1,125 | 420 | |||||||||||||||||||||
CBOE SPX Volatility Index | 22.00 USD | 7/18/18 | 6 | 600 | 1,411 | 1,045 | 366 | |||||||||||||||||||||
S&P 500 Index | 2,750.00 USD | 4/20/18 | 1 | 100 | 760 | 783 | (23 | ) | ||||||||||||||||||||
S&P 500 Index | 2,750.00 USD | 4/25/18 | 1 | 100 | 915 | 993 | (78 | ) | ||||||||||||||||||||
S&P 500 Index | 2,750.00 USD | 4/30/18 | 1 | 100 | 1,075 | 1,164 | (89 | ) | ||||||||||||||||||||
S&P 500 Index | 2,725.00 USD | 5/4/18 | 1 | 100 | 1,955 | 5,974 | (4,019 | ) | ||||||||||||||||||||
S&P 500 Index | 2,750.00 USD | 5/11/18 | 1 | 100 | 1,595 | 1,714 | (119 | ) | ||||||||||||||||||||
S&P 500 Index | 2,900.00 USD | 5/18/18 | 1 | 100 | 207 | 873 | (666 | ) | ||||||||||||||||||||
S&P 500 Index | 2,925.00 USD | 5/18/18 | 1 | 100 | 155 | 663 | (508 | ) | ||||||||||||||||||||
S&P 500 Index | 3,075.00 USD | 5/18/18 | 2 | 200 | 75 | 217 | (142 | ) | ||||||||||||||||||||
S&P 500 Index | 2,900.00 USD | 5/31/18 | 1 | 100 | 297 | 1,223 | (926 | ) | ||||||||||||||||||||
S&P 500 Index | 3,075.00 USD | 5/31/18 | 1 | 100 | — | 144 | (144 | ) | ||||||||||||||||||||
S&P 500 Index | 3,100.00 USD | 5/31/18 | 1 | 100 | — | 114 | (114 | ) | ||||||||||||||||||||
S&P 500 Index | 2,900.00 USD | 6/15/18 | 2 | 200 | 800 | 3,007 | (2,207 | ) | ||||||||||||||||||||
S&P 500 Index | 2,925.00 USD | 6/15/18 | 1 | 100 | 289 | 1,123 | (834 | ) | ||||||||||||||||||||
S&P 500 Index | 3,100.00 USD | 6/15/18 | 1 | 100 | 53 | 164 | (111 | ) | ||||||||||||||||||||
S&P 500 Index | 3,125.00 USD | 6/15/18 | 1 | 100 | 43 | 134 | (91 | ) | ||||||||||||||||||||
|
| |||||||||||||||||||||||||||
| Total call options | $ | 21,315 | $ | 26,760 | $ | (5,445 | ) | |||||||||||||||||||||
|
| |||||||||||||||||||||||||||
Put options: | ||||||||||||||||||||||||||||
iPath S&P 500 VIX Short-Term | 54.00 USD | 4/6/18 | 4 | $ | 400 | $ | 2,920 | $ | 6,474 | $ | (3,554 | ) | ||||||||||||||||
iPath S&P 500 VIX Short-Term | 65.00 USD | 4/6/18 | 1 | 100 | 1,677 | 1,873 | (196 | ) | ||||||||||||||||||||
iPath S&P 500 VIX Short-Term | 55.00 USD | 4/13/18 | 4 | 400 | 3,410 | 6,702 | (3,292 | ) | ||||||||||||||||||||
iPath S&P 500 VIX Short-Term | 65.00 USD | 4/13/18 | 1 | 100 | 1,755 | 1,904 | (149 | ) | ||||||||||||||||||||
iPath S&P 500 VIX Short-Term | 40.00 USD | 4/20/18 | 6 | 600 | 237 | 2,662 | (2,425 | ) | ||||||||||||||||||||
iPath S&P 500 VIX Short-Term | 69.00 USD | 4/20/18 | 4 | 400 | 8,850 | 8,489 | 361 | |||||||||||||||||||||
iPath S&P 500 VIX Short-Term | 67.00 USD | 4/27/18 | 4 | 400 | 3,872 | 8,214 | (4,342 | ) | ||||||||||||||||||||
Nasdaq 100 Stock Index | 3,800.00 USD | 5/18/18 | 1 | 100 | 57 | 263 | (206 | ) | ||||||||||||||||||||
S&P 500 Index | 2,575.00 USD | 4/2/18 | 1 | 100 | 88 | 644 | (556 | ) | ||||||||||||||||||||
S&P 500 Index | 2,695.00 USD | 4/2/18 | 1 | 100 | 5,275 | 909 | 4,366 | |||||||||||||||||||||
S&P 500 Index | 2,575.00 USD | 4/4/18 | 1 | 100 | 580 | 1,354 | (774 | ) | ||||||||||||||||||||
S&P 500 Index | 2,645.00 USD | 4/4/18 | 1 | 100 | 2,445 | 842 | 1,603 | |||||||||||||||||||||
S&P 500 Index | 2,540.00 USD | 4/6/18 | 1 | 100 | 465 | 431 | 34 | |||||||||||||||||||||
S&P 500 Index | 2,575.00 USD | 4/6/18 | 1 | 100 | 870 | 1,904 | (1,034 | ) | ||||||||||||||||||||
S&P 500 Index | 2,640.00 USD | 4/6/18 | 1 | 100 | 2,785 | 631 | 2,154 | |||||||||||||||||||||
S&P 500 Index | 2,575.00 USD | 4/9/18 | 2 | 200 | 2,250 | 2,547 | (297 | ) | ||||||||||||||||||||
S&P 500 Index | 2,615.00 USD | 4/9/18 | 1 | 100 | 2,105 | 1,253 | 852 | |||||||||||||||||||||
S&P 500 Index | 2,695.00 USD | 4/9/18 | 1 | 100 | 6,295 | 1,606 | 4,689 | |||||||||||||||||||||
S&P 500 Index | 2,510.00 USD | 4/11/18 | 1 | 100 | 610 | 476 | 134 | |||||||||||||||||||||
S&P 500 Index | 2,615.00 USD | 4/11/18 | 1 | 100 | 2,485 | 1,120 | 1,365 | |||||||||||||||||||||
S&P 500 Index | 2,650.00 USD | 4/11/18 | 1 | 100 | 3,885 | 2,901 | 984 | |||||||||||||||||||||
| See accompanying Notes to Financial Statements | | March 31, 2018 | | Semiannual Report | 183 |
Table of Contents
Schedule of Investments
March 31, 2018 (Unaudited)
| Options purchased contracts outstanding at March 31, 2018 (continued): | ||||||||||||||||||||||||||||
| Description | Exercise Price | Expiration Date | Number of Contracts | Notional Amount | Market Value | Cost | Unrealized Appreciation (Depreciation) | |||||||||||||||||||||
Put options (continued): | ||||||||||||||||||||||||||||
S&P 500 Index | 1,100.00 USD | 4/13/18 | 6 | $ | 600 | $ | 60 | $ | 190 | $ | (130 | ) | ||||||||||||||||
S&P 500 Index | 1,200.00 USD | 4/13/18 | 6 | 600 | 60 | 99 | (39 | ) | ||||||||||||||||||||
S&P 500 Index | 1,300.00 USD | 4/13/18 | 8 | 800 | 100 | 163 | (63 | ) | ||||||||||||||||||||
S&P 500 Index | 1,500.00 USD | 4/13/18 | 3 | 300 | 45 | 80 | (35 | ) | ||||||||||||||||||||
S&P 500 Index | 2,510.00 USD | 4/13/18 | 1 | 100 | 800 | 544 | 256 | |||||||||||||||||||||
S&P 500 Index | 2,555.00 USD | 4/13/18 | 1 | 100 | 1,365 | 2,162 | (797 | ) | ||||||||||||||||||||
S&P 500 Index | 1,700.00 USD | 4/16/18 | 12 | 1,200 | 240 | 675 | (435 | ) | ||||||||||||||||||||
S&P 500 Index | 2,520.00 USD | 4/16/18 | 1 | 100 | 1,015 | 2,250 | (1,235 | ) | ||||||||||||||||||||
S&P 500 Index | 2,575.00 USD | 4/16/18 | 1 | 100 | 1,890 | 2,353 | (463 | ) | ||||||||||||||||||||
S&P 500 Index | 2,690.00 USD | 4/16/18 | 1 | 100 | 6,605 | 2,100 | 4,505 | |||||||||||||||||||||
S&P 500 Index | 2,525.00 USD | 4/18/18 | 1 | 100 | 1,265 | 2,670 | (1,405 | ) | ||||||||||||||||||||
S&P 500 Index | 2,725.00 USD | 4/18/18 | 1 | 100 | 9,305 | 2,027 | 7,278 | |||||||||||||||||||||
S&P 500 Index | 1,100.00 USD | 4/20/18 | 18 | 1,800 | 180 | 286 | (106 | ) | ||||||||||||||||||||
S&P 500 Index | 1,200.00 USD | 4/20/18 | 28 | 2,800 | 350 | 441 | (91 | ) | ||||||||||||||||||||
S&P 500 Index | 1,300.00 USD | 4/20/18 | 8 | 800 | 100 | 179 | (79 | ) | ||||||||||||||||||||
S&P 500 Index | 2,310.00 USD | 4/20/18 | 2 | 200 | 435 | 1,007 | (572 | ) | ||||||||||||||||||||
S&P 500 Index | 2,530.00 USD | 4/20/18 | 1 | 100 | 1,410 | 2,073 | (663 | ) | ||||||||||||||||||||
S&P 500 Index | 2,690.00 USD | 4/23/18 | 1 | 100 | 7,095 | 2,282 | 4,813 | |||||||||||||||||||||
S&P 500 Index | 2,500.00 USD | 4/25/18 | 1 | 100 | 1,325 | 2,320 | (995 | ) | ||||||||||||||||||||
S&P 500 Index | 2,650.00 USD | 4/25/18 | 1 | 100 | 5,125 | 2,700 | 2,425 | |||||||||||||||||||||
S&P 500 Index | 1,100.00 USD | 4/27/18 | 8 | 800 | 100 | 135 | (35 | ) | ||||||||||||||||||||
S&P 500 Index | 1,150.00 USD | 4/27/18 | 10 | 1,000 | 130 | 166 | (36 | ) | ||||||||||||||||||||
S&P 500 Index | 1,200.00 USD | 4/27/18 | 6 | 600 | 90 | 220 | (130 | ) | ||||||||||||||||||||
S&P 500 Index | 1,250.00 USD | 4/27/18 | 10 | 1,000 | 150 | 166 | (16 | ) | ||||||||||||||||||||
S&P 500 Index | 1,300.00 USD | 4/27/18 | 6 | 600 | 105 | 99 | 6 | |||||||||||||||||||||
S&P 500 Index | 2,540.00 USD | 4/27/18 | 1 | 100 | 2,075 | 3,319 | (1,244 | ) | ||||||||||||||||||||
S&P 500 Index | 2,650.00 USD | 4/27/18 | 1 | 100 | 5,295 | 2,662 | 2,633 | |||||||||||||||||||||
S&P 500 Index | 1,200.00 USD | 4/30/18 | 4 | 400 | 52 | 86 | (34 | ) | ||||||||||||||||||||
S&P 500 Index | 2,450.00 USD | 4/30/18 | 1 | 100 | 1,060 | 1,871 | (811 | ) | ||||||||||||||||||||
S&P 500 Index | 2,565.00 USD | 4/30/18 | 1 | 100 | 2,690 | 4,004 | (1,314 | ) | ||||||||||||||||||||
S&P 500 Index | 2,600.00 USD | 5/2/18 | 1 | 100 | 3,775 | 3,480 | 295 | |||||||||||||||||||||
S&P 500 Index | 2,225.00 USD | 5/4/18 | 2 | 200 | 650 | 1,314 | (664 | ) | ||||||||||||||||||||
S&P 500 Index | 2,535.00 USD | 5/4/18 | 1 | 100 | 2,440 | 4,247 | (1,807 | ) | ||||||||||||||||||||
S&P 500 Index | 2,580.00 USD | 5/7/18 | 1 | 100 | 3,520 | 3,344 | 176 | |||||||||||||||||||||
S&P 500 Index | 2,580.00 XXX | 4/4/18 | 1 | 100 | 535 | 488 | 47 | |||||||||||||||||||||
S&P 500 Index | 2,500.00 XXX | 4/6/18 | 4 | 400 | 870 | 1,154 | (284 | ) | ||||||||||||||||||||
S&P 500 Index | 1,700.00 USD | 4/2/18 | 5 | 500 | 50 | 97 | (47 | ) | ||||||||||||||||||||
S&P 500 Index | 2,660.00 USD | 4/2/18 | 1 | 100 | 2,370 | 2,568 | (198 | ) | ||||||||||||||||||||
S&P 500 Index | 2,700.00 USD | 4/4/18 | 1 | 100 | 6,155 | 2,376 | 3,779 | |||||||||||||||||||||
S&P 500 Index | 1,500.00 USD | 4/6/18 | 10 | 1,000 | 100 | 362 | (262 | ) | ||||||||||||||||||||
S&P 500 Index | 2,680.00 USD | 4/6/18 | 1 | 100 | 5,015 | 2,773 | 2,242 | |||||||||||||||||||||
S&P 500 Index | 1,700.00 USD | 4/9/18 | 12 | 1,200 | 150 | 465 | (315 | ) | ||||||||||||||||||||
S&P 500 Index | 1,700.00 USD | 4/11/18 | 6 | 600 | 90 | 247 | (157 | ) | ||||||||||||||||||||
S&P 500 Index | 1,600.00 USD | 4/13/18 | 6 | 600 | 105 | 189 | (84 | ) | ||||||||||||||||||||
S&P 500 Index | 2,350.00 USD | 4/13/18 | 1 | 100 | 160 | 265 | (105 | ) | ||||||||||||||||||||
S&P 500 Index | 2,650.00 USD | 4/13/18 | 1 | 100 | 4,204 | 2,836 | 1,368 | |||||||||||||||||||||
S&P 500 Index | 2,700.00 USD | 4/20/18 | 1 | 100 | 7,565 | 2,536 | 5,029 | |||||||||||||||||||||
|
| |||||||||||||||||||||||||||
| Total put options | $ | 141,187 | $ | 121,269 | $ | 19,918 | ||||||||||||||||||||||
|
| |||||||||||||||||||||||||||
| Total options purchased contracts | $ | 162,502 | $ | 148,029 | $ | 14,473 | ||||||||||||||||||||||
|
| |||||||||||||||||||||||||||
| Options written contracts outstanding at March 31, 2018: | ||||||||||||||||||||||||||||
| Description | Exercise Price | Expiration Date | Number of Contracts | Notional Amount | Market Value | Premiums Received | Unrealized Appreciation (Depreciation) | |||||||||||||||||||||
Call options: |
| |||||||||||||||||||||||||||
CBOE SPX Volatility Index | 25.00 USD | 4/18/18 | 4 | $ | (400 | ) | $ | (340 | ) | $ | (566 | ) | $ | 226 | ||||||||||||||
CBOE SPX Volatility Index | 26.00 USD | 4/18/18 | 6 | (600 | ) | (450 | ) | (687 | ) | 237 | ||||||||||||||||||
| 184 | Semiannual Report | | March 31, 2018 | | See accompanying Notes to Financial Statements |
Table of Contents
Schedule of Investments
March 31, 2018 (Unaudited)
| Options written contracts outstanding at March 31, 2018 (continued): | ||||||||||||||||||||||||||||
| Description | Exercise Price | Expiration Date | Number of Contracts | Notional Amount | Market Value | Premiums Received | Unrealized Appreciation (Depreciation) | |||||||||||||||||||||
Call options (continued): |
| |||||||||||||||||||||||||||
CBOE SPX Volatility Index | 27.00 USD | 4/18/18 | 3 | $ | (300 | ) | $ | (202 | ) | $ | (673 | ) | $ | 471 | ||||||||||||||
CBOE SPX Volatility Index | 28.00 USD | 4/18/18 | 27 | (2,700 | ) | (1,620 | ) | (2,437 | ) | 817 | ||||||||||||||||||
CBOE SPX Volatility Index | 29.00 USD | 4/18/18 | 2 | (200 | ) | (105 | ) | (197 | ) | 92 | ||||||||||||||||||
CBOE SPX Volatility Index | 30.00 USD | 4/25/18 | 3 | (300 | ) | (187 | ) | (244 | ) | 57 | ||||||||||||||||||
CBOE SPX Volatility Index | 30.00 USD | 5/16/18 | 10 | (1,000 | ) | (900 | ) | (884 | ) | (16 | ) | |||||||||||||||||
CBOE SPX Volatility Index | 32.50 USD | 5/16/18 | 10 | (1,000 | ) | (750 | ) | (892 | ) | 142 | ||||||||||||||||||
CBOE SPX Volatility Index | 35.00 USD | 5/16/18 | 3 | (300 | ) | (195 | ) | (226 | ) | 31 | ||||||||||||||||||
CBOE SPX Volatility Index | 15.00 USD | 6/20/18 | 39 | (3,900 | ) | (17,940 | ) | (9,314 | ) | (8,626 | ) | |||||||||||||||||
CBOE SPX Volatility Index | 29.00 USD | 6/20/18 | 8 | (800 | ) | (1,000 | ) | (779 | ) | (221 | ) | |||||||||||||||||
CBOE SPX Volatility Index | 37.50 USD | 6/20/18 | 3 | (300 | ) | (225 | ) | (229 | ) | 4 | ||||||||||||||||||
CBOE SPX Volatility Index | 16.00 USD | 7/18/18 | 6 | (600 | ) | (2,580 | ) | (1,652 | ) | (928 | ) | |||||||||||||||||
CBOE SPX Volatility Index | 17.00 USD | 7/18/18 | 6 | (600 | ) | (2,280 | ) | (1,502 | ) | (778 | ) | |||||||||||||||||
iPath S&P 500 VIX Short-Term | 53.00 USD | 4/20/18 | 3 | (300 | ) | (795 | ) | (305 | ) | (490 | ) | |||||||||||||||||
iPath S&P 500 VIX Short-Term | 56.00 USD | 4/20/18 | 6 | (600 | ) | (1,209 | ) | (789 | ) | (420 | ) | |||||||||||||||||
iPath S&P 500 VIX Short-Term | 90.00 USD | 4/20/18 | 6 | (600 | ) | (111 | ) | (938 | ) | 827 | ||||||||||||||||||
iPath S&P 500 VIX Short-Term | 105.00 USD | 4/20/18 | 10 | (1,000 | ) | (135 | ) | (3,190 | ) | 3,055 | ||||||||||||||||||
iPath S&P 500 VIX Short-Term | 70.00 USD | 5/4/18 | 9 | (900 | ) | (1,067 | ) | (1,129 | ) | 62 | ||||||||||||||||||
iPath S&P 500 VIX Short-Term | 80.00 USD | 6/15/18 | 12 | (1,200 | ) | (2,544 | ) | (3,401 | ) | 857 | ||||||||||||||||||
S&P 500 Index | 3,025.00 USD | 5/18/18 | 5 | (500 | ) | (263 | ) | (723 | ) | 460 | ||||||||||||||||||
S&P 500 Index | 3,025.00 USD | 5/31/18 | 3 | (300 | ) | (202 | ) | (679 | ) | 477 | ||||||||||||||||||
S&P 500 Index | 3,000.00 USD | 6/15/18 | 1 | (100 | ) | (120 | ) | (397 | ) | 277 | ||||||||||||||||||
S&P 500 Index | 3,050.00 USD | 6/15/18 | 4 | (400 | ) | (300 | ) | (936 | ) | 636 | ||||||||||||||||||
|
| |||||||||||||||||||||||||||
| Total call options | $ | (35,520 | ) | $ | (32,769 | ) | $ | (2,751 | ) | |||||||||||||||||||
|
| |||||||||||||||||||||||||||
Put options: |
| |||||||||||||||||||||||||||
Nasdaq 100 Stock Index | 5,800.00 USD | 5/18/18 | 1 | $ | (100 | ) | $ | (5,290 | ) | $ | (4,506 | ) | $ | (784 | ) | |||||||||||||
S&P 500 Index | 2,350.00 USD | 4/2/18 | 3 | (300 | ) | (37 | ) | (2,479 | ) | 2,442 | ||||||||||||||||||
S&P 500 Index | 2,430.00 USD | 4/2/18 | 2 | (200 | ) | (25 | ) | (2,068 | ) | 2,043 | ||||||||||||||||||
S&P 500 Index | 2,470.00 USD | 4/2/18 | 3 | (300 | ) | (45 | ) | (2,893 | ) | 2,848 | ||||||||||||||||||
S&P 500 Index | 2,510.00 USD | 4/2/18 | 2 | (200 | ) | (30 | ) | (223 | ) | 193 | ||||||||||||||||||
S&P 500 Index | 2,625.00 USD | 4/2/18 | 2 | (200 | ) | (1,330 | ) | (883 | ) | (447 | ) | |||||||||||||||||
S&P 500 Index | 2,450.00 USD | 4/4/18 | 3 | (300 | ) | (150 | ) | (2,629 | ) | 2,479 | ||||||||||||||||||
S&P 500 Index | 2,510.00 USD | 4/4/18 | 2 | (200 | ) | (230 | ) | (793 | ) | 563 | ||||||||||||||||||
S&P 500 Index | 2,570.00 USD | 4/4/18 | 2 | (200 | ) | (820 | ) | (848 | ) | 28 | ||||||||||||||||||
S&P 500 Index | 2,510.00 USD | 4/6/18 | 3 | (300 | ) | (795 | ) | (2,947 | ) | 2,152 | ||||||||||||||||||
S&P 500 Index | 2,575.00 USD | 4/6/18 | 2 | (200 | ) | (1,740 | ) | (723 | ) | (1,017 | ) | |||||||||||||||||
S&P 500 Index | 2,490.00 USD | 4/9/18 | 2 | (200 | ) | (1,020 | ) | (1,353 | ) | 333 | ||||||||||||||||||
S&P 500 Index | 2,520.00 USD | 4/9/18 | 2 | (200 | ) | (910 | ) | (1,251 | ) | 341 | ||||||||||||||||||
S&P 500 Index | 2,530.00 USD | 4/9/18 | 3 | (300 | ) | (1,605 | ) | (2,542 | ) | 937 | ||||||||||||||||||
S&P 500 Index | 2,635.00 USD | 4/9/18 | 2 | (200 | ) | (5,670 | ) | (1,824 | ) | (3,846 | ) | |||||||||||||||||
S&P 500 Index | 2,525.00 USD | 4/11/18 | 2 | (200 | ) | (1,480 | ) | (1,118 | ) | (362 | ) | |||||||||||||||||
S&P 500 Index | 2,580.00 USD | 4/11/18 | 2 | (200 | ) | (3,110 | ) | (3,644 | ) | 534 | ||||||||||||||||||
S&P 500 Index | 2,455.00 USD | 4/13/18 | 2 | (200 | ) | (850 | ) | (2,173 | ) | 1,323 | ||||||||||||||||||
S&P 500 Index | 2,560.00 USD | 4/13/18 | 3 | (300 | ) | (4,335 | ) | (2,308 | ) | (2,027 | ) | |||||||||||||||||
S&P 500 Index | 2,580.00 USD | 4/13/18 | 2 | (200 | ) | (3,690 | ) | (3,589 | ) | (101 | ) | |||||||||||||||||
S&P 500 Index | 2,430.00 USD | 4/16/18 | 2 | (200 | ) | (790 | ) | (2,266 | ) | 1,476 | ||||||||||||||||||
S&P 500 Index | 2,450.00 USD | 4/16/18 | 2 | (200 | ) | (970 | ) | (1,953 | ) | 983 | ||||||||||||||||||
S&P 500 Index | 2,560.00 USD | 4/16/18 | 3 | (300 | ) | (4,770 | ) | (2,359 | ) | (2,411 | ) | |||||||||||||||||
S&P 500 Index | 2,625.00 USD | 4/16/18 | 2 | (200 | ) | (6,650 | ) | (2,467 | ) | (4,183 | ) | |||||||||||||||||
S&P 500 Index | 2,440.00 USD | 4/18/18 | 2 | (200 | ) | (1,090 | ) | (2,659 | ) | 1,569 | ||||||||||||||||||
S&P 500 Index | 2,475.00 USD | 4/18/18 | 3 | (300 | ) | (2,265 | ) | (3,289 | ) | 1,024 | ||||||||||||||||||
S&P 500 Index | 2,660.00 USD | 4/18/18 | 2 | (200 | ) | (10,260 | ) | (2,399 | ) | (7,861 | ) | |||||||||||||||||
S&P 500 Index | 2,440.00 USD | 4/20/18 | 1 | (100 | ) | (620 | ) | (1,163 | ) | 543 | ||||||||||||||||||
S&P 500 Index | 2,490.00 USD | 4/20/18 | 3 | (300 | ) | (2,970 | ) | (7,999 | ) | 5,029 | ||||||||||||||||||
S&P 500 Index | 2,505.00 USD | 4/20/18 | 3 | (300 | ) | (3,405 | ) | (2,689 | ) | (716 | ) | |||||||||||||||||
S&P 500 Index | 2,510.00 USD | 4/20/18 | 3 | (300 | ) | (3,585 | ) | (2,998 | ) | (587 | ) | |||||||||||||||||
S&P 500 Index | 2,630.00 USD | 4/20/18 | 2 | (200 | ) | (7,910 | ) | (3,008 | ) | (4,902 | ) | |||||||||||||||||
S&P 500 Index | 2,420.00 USD | 4/23/18 | 3 | (300 | ) | (1,748 | ) | (3,446 | ) | 1,698 | ||||||||||||||||||
S&P 500 Index | 2,440.00 USD | 4/23/18 | 2 | (200 | ) | (1,390 | ) | (2,253 | ) | 863 | ||||||||||||||||||
| See accompanying Notes to Financial Statements | | March 31, 2018 | | Semiannual Report | 185 |
Table of Contents
Schedule of Investments
March 31, 2018 (Unaudited)
| Options written contracts outstanding at March 31, 2018 (continued): | ||||||||||||||||||||||||||||
| Description | Exercise Price | Expiration Date | Number of Contracts | Notional Amount | Market Value | Premiums Received | Unrealized Appreciation (Depreciation) | |||||||||||||||||||||
Put options (continued): |
| |||||||||||||||||||||||||||
S&P 500 Index | 2,480.00 USD | 4/23/18 | 2 | $ | (200 | ) | $ | (1,990 | ) | $ | (5,593 | ) | $ | 3,603 | ||||||||||||||
S&P 500 Index | 2,625.00 USD | 4/23/18 | 2 | (200 | ) | (7,890 | ) | (2,745 | ) | (5,145 | ) | |||||||||||||||||
S&P 500 Index | 2,350.00 USD | 4/25/18 | 2 | (200 | ) | (840 | ) | (1,577 | ) | 737 | ||||||||||||||||||
S&P 500 Index | 2,360.00 USD | 4/25/18 | 1 | (100 | ) | (443 | ) | (1,066 | ) | 623 | ||||||||||||||||||
S&P 500 Index | 2,400.00 USD | 4/25/18 | 1 | (100 | ) | (575 | ) | (966 | ) | 391 | ||||||||||||||||||
S&P 500 Index | 2,580.00 USD | 4/25/18 | 2 | (200 | ) | (5,490 | ) | (3,392 | ) | (2,098 | ) | |||||||||||||||||
S&P 500 Index | 2,320.00 USD | 4/27/18 | 3 | (300 | ) | (1,140 | ) | (2,128 | ) | 988 | ||||||||||||||||||
S&P 500 Index | 2,395.00 USD | 4/27/18 | 2 | (200 | ) | (1,280 | ) | (2,411 | ) | 1,131 | ||||||||||||||||||
S&P 500 Index | 2,420.00 USD | 4/27/18 | 3 | (300 | ) | (2,325 | ) | (3,037 | ) | 712 | ||||||||||||||||||
S&P 500 Index | 2,580.00 USD | 4/27/18 | 2 | (200 | ) | (5,860 | ) | (3,326 | ) | (2,534 | ) | |||||||||||||||||
S&P 500 Index | 2,290.00 USD | 4/30/18 | 2 | (200 | ) | (690 | ) | (1,363 | ) | 673 | ||||||||||||||||||
S&P 500 Index | 2,400.00 USD | 4/30/18 | 7 | (700 | ) | (5,110 | ) | (15,653 | ) | 10,543 | ||||||||||||||||||
S&P 500 Index | 2,410.00 USD | 4/30/18 | 1 | (100 | ) | (760 | ) | (666 | ) | (94 | ) | |||||||||||||||||
S&P 500 Index | 2,490.00 USD | 4/30/18 | 2 | (200 | ) | (2,900 | ) | (5,243 | ) | 2,343 | ||||||||||||||||||
S&P 500 Index | 2,530.00 USD | 5/2/18 | 2 | (200 | ) | (4,350 | ) | (4,323 | ) | (27 | ) | |||||||||||||||||
S&P 500 Index | 2,480.00 USD | 5/4/18 | 1 | (100 | ) | (1,625 | ) | (2,796 | ) | 1,171 | ||||||||||||||||||
S&P 500 Index | 2,515.00 USD | 5/7/18 | 2 | (200 | ) | (4,280 | ) | (4,121 | ) | (159 | ) | |||||||||||||||||
S&P 500 Index | 2,455.00 USD | 5/11/18 | 2 | (200 | ) | (3,410 | ) | (6,393 | ) | 2,983 | ||||||||||||||||||
S&P 500 Index | 2,460.00 USD | 5/11/18 | 1 | (100 | ) | (1,765 | ) | (2,974 | ) | 1,209 | ||||||||||||||||||
S&P 500 Index | 2,440.00 USD | 5/18/18 | 1 | (100 | ) | (1,905 | ) | (3,120 | ) | 1,215 | ||||||||||||||||||
S&P 500 Index | 2,260.00 USD | 6/29/18 | 2 | (200 | ) | (3,710 | ) | (3,413 | ) | (297 | ) | |||||||||||||||||
S&P 500 Index | 2,175.00 USD | 7/20/18 | 2 | (200 | ) | (3,370 | ) | (3,819 | ) | 449 | ||||||||||||||||||
S&P 500 Index | 2,590.00 USD | 4/2/18 | 1 | (100 | ) | (123 | ) | (1,561 | ) | 1,438 | ||||||||||||||||||
S&P 500 Index | 2,640.00 USD | 4/4/18 | 2 | (200 | ) | (4,420 | ) | (2,993 | ) | (1,427 | ) | |||||||||||||||||
S&P 500 Index | 2,275.00 USD | 4/6/18 | 3 | (300 | ) | (98 | ) | (9,953 | ) | 9,855 | ||||||||||||||||||
S&P 500 Index | 2,500.00 USD | 4/6/18 | 6 | (600 | ) | (1,305 | ) | (5,024 | ) | 3,719 | ||||||||||||||||||
S&P 500 Index | 2,610.00 USD | 4/6/18 | 2 | (200 | ) | (3,400 | ) | (3,545 | ) | 145 | ||||||||||||||||||
S&P 500 Index | 2,580.00 USD | 4/9/18 | 3 | (300 | ) | (3,645 | ) | (2,065 | ) | (1,580 | ) | |||||||||||||||||
S&P 500 Index | 2,225.00 USD | 4/20/18 | 1 | (100 | ) | (135 | ) | (1,597 | ) | 1,462 | ||||||||||||||||||
S&P 500 Index | 2,250.00 USD | 4/20/18 | 1 | (100 | ) | (153 | ) | (1,747 | ) | 1,594 | ||||||||||||||||||
S&P 500 Index | 2,450.00 USD | 4/20/18 | 3 | (300 | ) | (2,010 | ) | (2,824 | ) | 814 | ||||||||||||||||||
S&P 500 Index | 2,430.00 USD | 5/4/18 | 1 | (100 | ) | (1,135 | ) | (2,644 | ) | 1,509 | ||||||||||||||||||
S&P 500 Index | 2,460.00 USD | 5/4/18 | 2 | (200 | ) | (2,810 | ) | (5,318 | ) | 2,508 | ||||||||||||||||||
S&P 500 Index | 2,250.00 USD | 5/18/18 | 1 | (100 | ) | (670 | ) | (2,477 | ) | 1,807 | ||||||||||||||||||
S&P 500 Index | 2,250.00 USD | 6/15/18 | 1 | (100 | ) | (1,375 | ) | (3,097 | ) | 1,722 | ||||||||||||||||||
S&P 500 Index | 2,300.00 USD | 6/29/18 | 1 | (100 | ) | (2,185 | ) | (1,384 | ) | (801 | ) | |||||||||||||||||
|
| |||||||||||||||||||||||||||
| Total put options | $ | (166,757 | ) | $ | (208,096 | ) | $ | 41,339 | ||||||||||||||||||||
|
| |||||||||||||||||||||||||||
| Total options written contracts | $ | (202,277 | ) | $ | (240,865 | ) | $ | 38,588 | ||||||||||||||||||||
|
| |||||||||||||||||||||||||||
(e) At March 31, 2018, the Fund pledged $50,797 in cash as collateral for options written.
Glossary:
CBOE—Chicago Board Options Exchange
VIX—Volatility Index
| 186 | Semiannual Report | | March 31, 2018 | | See accompanying Notes to Financial Statements |
Table of Contents
Schedule of Investments
March 31, 2018 (Unaudited)
AllianzGI Real Estate Debt Fund
| Principal Amount (000s) | Value | |||||||||||
| Mortgage-Backed Securities—77.0% | ||||||||||||
280 Park Avenue Mortgage Trust, 1 mo. LIBOR + 0.880%, Series 2017-280P, Class A (b)(e), | ||||||||||||
2.657%, 9/15/34 | $ | 100 | $100,576 | |||||||||
AOA Mortgage Trust, Series 2015-1177, Class B (a)(b), | ||||||||||||
3.01%, 12/13/29 | 100 | 98,115 | ||||||||||
Aventura Mall Trust, Series 2013-AVM, Class B (a)(b), | ||||||||||||
3.743%, 12/5/32 | 100 | 101,384 | ||||||||||
Bancorp Commercial Mortgage Trust, 1 mo. LIBOR + 1.430%, | ||||||||||||
3.207%, 11/15/33 | 71 | 71,527 | ||||||||||
BBCMS Mortgage Trust, 1 mo. LIBOR + 0.722%, |
| |||||||||||
2.499%, 3/15/37 |
| 100 | 99,650 | |||||||||
BX Commercial Mortgage Trust, 1 mo. LIBOR + 0.871%, Series 2018-BIOA, Class B (a)(b)(e), | ||||||||||||
2.521%, 3/15/37 | 100 | 99,546 | ||||||||||
BX Trust (b)(e), | ||||||||||||
1 mo. LIBOR + 0.880%, 2.657%, 7/15/34, | 90 | 90,881 | ||||||||||
1 mo. LIBOR + 1.200%, 2.977%, 7/15/34, | 100 | 100,297 | ||||||||||
Caesars Palace Las Vegas | ||||||||||||
3.835%, 10/15/34, | 150 | 152,105 | ||||||||||
4.354%, 10/15/34, Series 2017-VICI, Class E | 100 | 98,000 | ||||||||||
CGDB Commercial Mortgage Trust, IO (a)(b)(e), | ||||||||||||
1 mo. LIBOR + 0.750%, 2.527%, 5/15/30, | 140 | 140,258 | ||||||||||
1 mo. LIBOR + 1.700%, 3.477%, 5/15/30, | 100 | 100,156 | ||||||||||
CGDBB Commercial Mortgage Trust, IO (b)(e), | ||||||||||||
1 mo. LIBOR + 0.790%, 2.567%, 7/15/32, | 100 | 100,194 | ||||||||||
1 mo. LIBOR + 1.600%, 3.377%, 7/15/32, | 100 | 100,203 | ||||||||||
Principal | Value | |||||||||||
CHT COSMO Mortgage Trust (b)(e), |
| |||||||||||
1 mo. LIBOR + 1.400%, 3.177%, 11/15/36, | $ | 100 | $ | 100,349 | ||||||||
1 mo. LIBOR + 2.250%, 4.027%, 11/15/36, | 150 | 150,808 | ||||||||||
Citigroup Commercial Mortgage Trust, | ||||||||||||
3.039%, 9/15/48 | 100 | 100,356 | ||||||||||
Cold Storage | ||||||||||||
1 mo. LIBOR + 1.250%, 3.027%, 4/15/36, | 140 | 141,178 | ||||||||||
1 mo. LIBOR + 1.350%, 3.127%, 4/15/36, | 100 | 100,550 | ||||||||||
COMM Mortgage Trust, | ||||||||||||
1 mo. LIBOR + 0.800%, 2.518%, 8/13/27, | 100 | 100,034 | ||||||||||
1 mo. LIBOR + 0.850%, 2.568%, 2/13/32, | 100 | 100,136 | ||||||||||
2.928%, 2/10/47, | 119 | 119,304 | ||||||||||
3.012%, 5/10/47, | 100 | 100,328 | ||||||||||
1 mo. LIBOR + 1.600%, 3.318%, 2/13/32, | 100 | 100,175 | ||||||||||
1 mo. LIBOR + 2.250%, 3.968%, 2/13/32, | 100 | 100,508 | ||||||||||
Credit Suisse Mortgage Capital Certificates, | ||||||||||||
3.639%, 11/15/34 | 100 | 102,212 | ||||||||||
DBCG Mortgage Trust (a)(b)(e), | ||||||||||||
1 mo. LIBOR + 0.700%, 2.477%, 6/15/34, | 100 | 100,229 | ||||||||||
1 mo. LIBOR + 0.850%, 2.627%, 6/15/34, | 100 | 100,204 | ||||||||||
Deco Charlemagne S.A., | ||||||||||||
3 mo. Euribor + 4.250%, Series 2015-CHRX, Class D (e), | € | 73 | 89,739 | |||||||||
Deco Tulip DAC (e), | ||||||||||||
3 mo. Euribor + 1.700%, 1.70%, 7/27/24, | 70 | 86,095 | ||||||||||
Principal | Value | |||||||||||
3 mo. Euribor + 2.100%, 2.10%, 7/27/24, | € | 70 | $ | 86,086 | ||||||||
Finsbury Square PLC, 3 mo. GBP LIBOR + 0.900%, | ||||||||||||
1.444%, 8/16/58 | £ | 85 | 120,300 | |||||||||
Fondo de Titulizacion de Activos Santander Hipotecario 2, 3 mo. Euribor + 0.150%, | € | 92 | 112,342 | |||||||||
Gemgarto PLC, 3 mo. GBP LIBOR + 2.350%, | ||||||||||||
2.894%, 2/16/54 | £ | 100 | 143,824 | |||||||||
GRACE Mortgage Trust, Series 2014-GRCE, Class F (a)(b), | ||||||||||||
3.59%, 6/10/28 | $ | 100 | 98,279 | |||||||||
GS Mortgage Securities Corp. Trust (a)(b), | ||||||||||||
1 mo. LIBOR + 1.050%, 2.638%, 2/15/37, | 100 | 100,194 | ||||||||||
1 mo. LIBOR + 1.300%, 3.077%, 7/15/32, | 100 | 100,292 | ||||||||||
3.302%, 5/10/34, | 100 | 98,399 | ||||||||||
3.79%, 1/10/31, | 100 | 100,534 | ||||||||||
Hilton Orlando Trust, 1 mo. LIBOR + 1.050%, | ||||||||||||
2.827%, 12/15/34 | 100 | 100,354 | ||||||||||
Hyatt Hotel Portfolio Trust, 1 mo. LIBOR + 0.957%, | ||||||||||||
2.733%, 8/9/32 | 100 | 100,044 | ||||||||||
IM Pastor 4 Fondo de Titulizacion de Activos, 3 mo. Euribor + 0.140%, Class A, | € | 51 | 57,089 | |||||||||
J.P. Morgan Chase Commercial Mortgage Securities Trust (a)(b)(e), | ||||||||||||
1 mo. LIBOR + 1.100%, 2.877%, 10/15/32, | $ | 60 | 60,168 | |||||||||
1 mo. LIBOR + 1.450%, 3.227%, 10/15/33, | 150 | 150,283 | ||||||||||
| See accompanying Notes to Financial Statements | | March 31, 2018 | | Semiannual Report | 187 |
Table of Contents
Schedule of Investments
March 31, 2018 (Unaudited)
| Principal Amount (000s) | Value | |||||||||||
JPMBB Commercial Mortgage Securities Trust, | ||||||||||||
1.695%, 3/15/49, | $ | 78 | $ | 77,603 | ||||||||
3.157%, 7/15/45, | 100 | 100,397 | ||||||||||
JPMorgan Chase Commercial Mortgage Securities Trust, | ||||||||||||
2.379%, 10/15/45, | 92 | 90,860 | ||||||||||
2.554%, 4/15/46, | 49 | 48,596 | ||||||||||
3.621%, 9/5/32, | 100 | 98,807 | ||||||||||
4.525%, 7/5/32, | 150 | 154,683 | ||||||||||
Lone Star Portfolio Trust, | ||||||||||||
4.377%, 9/15/28 | 85 | 85,488 | ||||||||||
Lusitano Mortgages No 4 PLC, 3 mo. Euribor + 0.220%, Class A (e), | € | 146 | 172,286 | |||||||||
Lusitano Mortgages No 5 PLC, 3 mo. Euribor + 0.260%, Class A (e), | 85 | 100,421 | ||||||||||
MBS Bancaja 4 FTA, | 73 | 88,946 | ||||||||||
Morgan Stanley Bank of America Merrill Lynch Trust, | ||||||||||||
3.194%, 10/15/47 | $ | 100 | 100,666 | |||||||||
Motel 6 Trust, | ||||||||||||
2.697%, 8/15/34 | 99 | 99,222 | ||||||||||
Residential Mortgage Securities 28 PLC (e), | ||||||||||||
3 mo. GBP LIBOR + 1.150%, 1.756%, 6/15/46, Class A | £ | 93 | 131,892 | |||||||||
3 mo. GBP LIBOR + 2.000%, 2.606%, 6/15/46, Class C | 100 | 142,244 | ||||||||||
Residential Mortgage Securities 29 PLC, | ||||||||||||
2.024%, 12/20/46 | 100 | 142,069 | ||||||||||
Residential Mortgage Securities 30 PLC, | ||||||||||||
1.424%, 3/20/50 | 88 | 124,189 | ||||||||||
| Principal Amount (000s) | Value | |||||||||||
Resource Capital Corp., Ltd., 1 mo. LIBOR + 0.800%, Series 2017-CRE5, Class A (a)(b)(e), | ||||||||||||
2.586%, 7/15/34 | $ | 95 | $ | 94,890 | ||||||||
RMAC Securities PLC (e), | ||||||||||||
3 mo. Euribor + 0.250%, zero coupon, 6/12/44, | € | 70 | 82,615 | |||||||||
3 mo. Euribor + 0.470%, 0.143%, 6/12/44, | 80 | 92,197 | ||||||||||
3 mo. GBP LIBOR + 0.240%, 0.842%, 6/12/44, | £ | 97 | 130,222 | |||||||||
3 mo. GBP LIBOR + 0.270%, 0.872%, 6/12/44, | 68 | 90,536 | ||||||||||
Slate PLC (e), | ||||||||||||
3 mo. GBP LIBOR + 1.450%, 1.978%, 1/24/51, Class B | 100 | 141,691 | ||||||||||
3 mo. GBP LIBOR + 1.850%, 2.378%, 1/24/51, Class C | 100 | 141,692 | ||||||||||
VNDO Mortgage Trust, | ||||||||||||
3.337%, 11/15/30 | $ | 100 | 98,986 | |||||||||
Waldorf Astoria Boca Raton | ||||||||||||
1 mo. LIBOR + 1.350%, 3.127%, 6/15/29, | 100 | 100,215 | ||||||||||
1 mo. LIBOR + 2.050%, 3.827%, 6/15/29, | 55 | 55,049 | ||||||||||
Wells Fargo Commercial Mortgage Trust, | ||||||||||||
1.453%, 11/15/59, | 96 | 94,181 | ||||||||||
3.02%, 7/15/58, | 130 | 130,395 | ||||||||||
WFCG Commercial Mortgage Trust, | ||||||||||||
3.248%, 11/15/29 | 80 | 80,377 | ||||||||||
WFRBS Commercial Mortgage Trust, | ||||||||||||
2.838%, 3/15/48 | 100 | 99,841 | ||||||||||
|
| |||||||||||
| Total Mortgage-Backed Securities (cost—$7,855,492) | 7,764,541 | |||||||||||
|
| |||||||||||
| Principal Amount (000s) | Value | |||||||||||
| Corporate Bonds & Notes—10.0% | ||||||||||||
| Home Builders—1.4% | ||||||||||||
Miller Homes Group Holdings PLC, | ||||||||||||
5.772%, 10/15/23 | £ | 100 | $ | 141,519 | ||||||||
|
| |||||||||||
| Real Estate—8.6% | ||||||||||||
DEMIRE Deutsche Mittelstand Real Estate AG, | ||||||||||||
2.875%, 7/15/22 | € | 100 | 125,917 | |||||||||
Digital Stout Holding LLC, | ||||||||||||
4.25%, 1/17/25 | £ | 100 | 153,632 | |||||||||
Inmobiliaria Colonial Socimi S.A., | ||||||||||||
1.45%, 10/28/24 | € | 100 | 122,981 | |||||||||
Kennedy-Wilson, Inc. (a)(b), | ||||||||||||
5.875%, 4/1/24 | $ | 50 | 49,812 | |||||||||
Merlin Properties Socimi S.A., | ||||||||||||
1.75%, 5/26/25 | € | 100 | 123,575 | |||||||||
Summit Germany Ltd. (a)(b), | ||||||||||||
2.00%, 1/31/25 | 100 | 119,746 | ||||||||||
VICI Properties 1 LLC, | ||||||||||||
8.00%, 10/15/23 | $ | 33 | 36,407 | |||||||||
Westfield America Management Ltd., | ||||||||||||
2.125%, 3/30/25 | £ | 100 | 138,744 | |||||||||
|
| |||||||||||
| 870,814 | ||||||||||||
|
| |||||||||||
| Total Corporate Bonds & Notes (cost—$1,000,544) | 1,012,333 | |||||||||||
|
| |||||||||||
| U.S. Government Agency Securities (e)—2.9% | ||||||||||||
Fannie Mae MBS, | ||||||||||||
1 mo. USD-LIBOR-BBA + 4.300%, 6.172%, 2/25/25, | $ | 36 | 40,081 | |||||||||
1 mo. USD-LIBOR-BBA + 4.400%, 6.272%, 1/25/24, | 70 | 79,949 | ||||||||||
1 mo. USD-LIBOR-BBA + 5.000%, 6.872%, 7/25/25, | 41 | 46,597 | ||||||||||
Freddie Mac, MBS, | ||||||||||||
4.472%, 12/25/27 | 122 | 124,345 | ||||||||||
|
| |||||||||||
| Total U.S. Government Agency Securities (cost—$166,982) | 290,972 | |||||||||||
|
| |||||||||||
| Asset-Backed Securities (b)—2.0% | ||||||||||||
Invitation Homes Trust, | ||||||||||||
1 mo. LIBOR + 1.800%, Series 2017-SFR2, Class D (a)(e), | 100 | 100,884 | ||||||||||
| 188 | Semiannual Report | | March 31, 2018 | | See accompanying Notes to Financial Statements |
Table of Contents
Schedule of Investments
March 31, 2018 (Unaudited)
| Principal Amount (000s) | Value | |||||||||||
Vantage Data Centers Issuer LLC, Series 2018-1A, Class A2, | ||||||||||||
4.072%, 2/16/43 | $ | 100 | $ | 100,950 | ||||||||
|
| |||||||||||
Total Asset-Backed Securities |
| 201,834 | ||||||||||
|
| |||||||||||
| U.S. Treasury Obligations—6.4% | ||||||||||||
U.S. Treasury Bills (f), | 650 | 647,445 | ||||||||||
|
| |||||||||||
| Total Investments (cost—$9,871,967)—98.3% | 9,917,125 | |||||||||||
|
| |||||||||||
| Other assets less liabilities (g)—1.7% | 169,641 | |||||||||||
|
| |||||||||||
| Net Assets—100.0% | $10,086,766 | |||||||||||
|
| |||||||||||
Notes to Schedule of Investments:
(a) Private Placement—Restricted as to resale and may not have a readily available market. Securities with an aggregate value of $3,611,666, representing 35.8% of net assets.
(b) 144A—Exempt from registration under Rule 144A of the Securities Act of 1933. These securities may be resold in transactions exempt from registration, typically only to qualified institutional buyers. Securities with an aggregate value of $4,796,931, representing 47.6% of net assets.
(c) Fair-Valued—Security with a value of $99,650, representing 1.0% of net assets. See Note 1(a) and Note 1(b) in the Notes to Financial Statements.
(d) Level 3 security. See Note 1(a) and Note 1(b) in the Notes to Financial Statements.
(e) Variable or Floating Rate Security—Securities with an interest rate that changes periodically. The interest rate disclosed reflects the rate in effect on March 31, 2018.
(f) Rates reflect the effective yields at purchase date.
(g) Includes net unrealized appreciation (depreciation) of other financial instruments as follows:
| Futures contracts outstanding at March 31, 2018: | ||||||||||||||||||||||
| Type | Contracts | Expiration Date | Notional Amount (000s) | Market Value (000s) | Unrealized Depreciation | |||||||||||||||||
Short position contracts: |
| |||||||||||||||||||||
5-Year U.S. Treasury Note | (5 | ) | 6/29/18 | (500 | ) | $ | (572 | ) | $ | (2,734 | ) | |||||||||||
| Forward foreign currency contracts outstanding at March 31, 2018: | ||||||||||||||||||||
| Description | Counterparty | U.S.$ Value on Origination Date | U.S.$ Value March 31, 2018 | Unrealized Appreciation | Unrealized Depreciation | |||||||||||||||
Purchased: | ||||||||||||||||||||
80,000 British Pound settling settling 5/23/18 | Barclays Bank PLC | $ | 113,439 | $ | 112,464 | $ | — | $ | (975 | ) | ||||||||||
24,000 Euro settling settling 5/23/18 | Barclays Bank PLC | 29,670 | 29,634 | — | (36 | ) | ||||||||||||||
Sold: | ||||||||||||||||||||
729,754 British Pound settling settling 5/23/18 | Barclays Bank PLC | 1,027,129 | 1,025,885 | 1,244 | — | |||||||||||||||
648,393 British Pound settling settling 5/23/18 | Citibank N.A. | 912,603 | 911,508 | 1,095 | — | |||||||||||||||
1,200,592 Euro settling settling 5/23/18 | Barclays Bank PLC | 1,485,672 | 1,482,432 | 3,240 | — | |||||||||||||||
6,614 Euro settling settling 5/23/18 | Citibank N.A. | 8,147 | 8,166 | — | (19 | ) | ||||||||||||||
|
|
|
| |||||||||||||||||
| $ | 5,579 | $ | (1,030 | ) | ||||||||||||||||
|
|
|
| |||||||||||||||||
(h) At March 31, 2018, the Fund pledged $2,808 in cash as collateral for futures contracts.
Glossary:
BBA—British Bankers’ Association
£—British Pound Sterling
CMO—Collateralized Mortgage Obligation
€—Euro
GBP—British Pound
LIBOR—London Inter-Bank Offered Rate
MBS—Mortgage-Backed Securities
| See accompanying Notes to Financial Statements | | March 31, 2018 | | Semiannual Report | 189 |
Table of Contents
Schedule of Investments
March 31, 2018 (Unaudited)
AllianzGI Short Duration High Income Fund
| Principal Amount (000s) | Value | |||||||
| Corporate Bonds & Notes—87.5% | ||||||||
| Advertising—1.2% | ||||||||
Lamar Media Corp., |
| |||||||
5.00%, 5/1/23 | $11,303 | $11,455,025 | ||||||
Outfront Media Capital LLC, |
| |||||||
5.25%, 2/15/22 | 2,500 | 2,553,125 | ||||||
|
| |||||||
| 14,008,150 | ||||||||
|
| |||||||
| Auto Components—0.7% | ||||||||
Goodyear Tire & Rubber Co., |
| |||||||
5.125%, 11/15/23 | 9,000 | 9,078,750 | ||||||
|
| |||||||
| Auto Manufacturers—0.9% | ||||||||
Ford Motor Credit Co. LLC, |
| |||||||
2.597%, 11/4/19 | 2,096 | 2,079,984 | ||||||
2.681%, 1/9/20 | 3,000 | 2,971,629 | ||||||
General Motors Financial Co., Inc., |
| |||||||
3 mo. USD-LIBOR- | 4,000 | 4,038,080 | ||||||
3.25%, 5/15/18 | 1,060 | 1,060,859 | ||||||
6.75%, 6/1/18 | 325 | 327,213 | ||||||
|
| |||||||
| 10,477,765 | ||||||||
|
| |||||||
| Biotechnology—0.5% | ||||||||
Amgen, Inc., |
| |||||||
4.10%, 6/15/21 | 6,260 | 6,442,242 | ||||||
|
| |||||||
| Coal—3.3% | ||||||||
Cloud Peak Energy Resources LLC, |
| |||||||
12.00%, 11/1/21 | 37,961 | 39,669,245 | ||||||
|
| |||||||
| Commercial Services—5.6% | ||||||||
APX Group, Inc., |
| |||||||
6.375%, 12/1/19 | 17,770 | 17,903,275 | ||||||
7.875%, 12/1/22 | 42,395 | 44,097,159 | ||||||
Herc Rentals, Inc. (a)(c), |
| |||||||
7.50%, 6/1/22 | 5,000 | 5,362,500 | ||||||
|
| |||||||
| 67,362,934 | ||||||||
|
| |||||||
| Containers & Packaging—2.2% | ||||||||
Berry Global, Inc., |
| |||||||
6.00%, 10/15/22 | 14,510 | 15,035,988 | ||||||
Owens-Brockway Glass Container, Inc. (a)(c), |
| |||||||
5.00%, 1/15/22 | 2,550 | 2,584,298 | ||||||
Reynolds Group Issuer, Inc., |
| |||||||
5.125%, 7/15/23 (a)(c) | 1,500 | 1,516,425 | ||||||
5.75%, 10/15/20 | 969 | 982,433 | ||||||
6.875%, 2/15/21 | 6,324 | 6,419,170 | ||||||
|
| |||||||
| 26,538,314 | ||||||||
|
| |||||||
| Diversified Financial Services—4.2% | ||||||||
Aircastle Ltd., |
| |||||||
6.25%, 12/1/19 | 4,125 | 4,300,312 | ||||||
Ally Financial, Inc., | ||||||||
3.25%, 11/5/18 | 1,075 | 1,077,688 | ||||||
3.75%, 11/18/19 | 3,000 | 3,015,000 | ||||||
4.125%, 3/30/20 | 4,000 | 4,025,000 | ||||||
8.00%, 12/31/18 | 17,679 | 18,275,666 | ||||||
Fly Leasing Ltd., |
| |||||||
6.375%, 10/15/21 | 10,525 | 10,959,156 | ||||||
International Lease Finance Corp., |
| |||||||
6.25%, 5/15/19 | 6,295 | 6,515,294 | ||||||
7.125%, 9/1/18 (a)(c) | 2,000 | 2,034,750 | ||||||
|
| |||||||
| 50,202,866 | ||||||||
|
| |||||||
Principal | Value | |||||||
| Electric Utilities—2.2% | ||||||||
AES Corp., | ||||||||
4.00%, 3/15/21 | $ | 5,000 | $ | 5,031,250 | ||||
4.50%, 3/15/23 | 5,000 | 5,097,250 | ||||||
Calpine Corp. (a)(c), |
| |||||||
6.00%, 1/15/22 | 16,372 | 16,849,244 | ||||||
|
| |||||||
| 26,977,744 | ||||||||
|
| |||||||
| Entertainment—0.8% | ||||||||
International Game Technology PLC (a)(c), |
| |||||||
6.25%, 2/15/22 | 9,050 | 9,525,125 | ||||||
|
| |||||||
| Environmental Services—2.5% | ||||||||
Clean Harbors, Inc., |
| |||||||
5.125%, 6/1/21 | 22,449 | 22,785,735 | ||||||
5.25%, 8/1/20 | 6,898 | 6,932,490 | ||||||
|
| |||||||
| 29,718,225 | ||||||||
|
| |||||||
| Equity Real Estate Investment Trusts (REITs)—0.6% | ||||||||
Equinix, Inc., |
| |||||||
5.375%, 4/1/23 | 5,526 | 5,671,058 | ||||||
Starwood Property Trust, Inc. (a)(c), |
| |||||||
3.625%, 2/1/21 | 2,000 | 1,970,000 | ||||||
|
| |||||||
| 7,641,058 | ||||||||
|
| |||||||
| Food & Beverage—0.8% | ||||||||
Anheuser-Busch InBev Finance, Inc., |
| |||||||
3.30%, 2/1/23 | 8,000 | 7,998,212 | ||||||
Anheuser-Busch InBev Worldwide, Inc., 3 mo. LIBOR + 0.740% (e), |
| |||||||
3.052%, 1/12/24 | 2,000 | 2,013,376 | ||||||
|
| |||||||
| 10,011,588 | ||||||||
|
| |||||||
| Healthcare-Products—1.1% | ||||||||
Fresenius U.S. Finance II, Inc. (a)(c), |
| |||||||
4.25%, 2/1/21 | 7,795 | 7,930,737 | ||||||
4.50%, 1/15/23 | 5,000 | 5,155,475 | ||||||
|
| |||||||
| 13,086,212 | ||||||||
|
| |||||||
| Healthcare-Services—5.3% | ||||||||
DaVita, Inc., |
| |||||||
5.75%, 8/15/22 | 41,836 | 42,965,572 | ||||||
Fresenius Medical Care U.S. Finance, Inc. (a)(c), |
| |||||||
5.75%, 2/15/21 | 4,425 | 4,680,647 | ||||||
HCA, Inc., | ||||||||
6.50%, 2/15/20 | 15,000 | 15,766,714 | ||||||
|
| |||||||
| 63,412,933 | ||||||||
|
| |||||||
| Holding Companies-Diversified—1.7% | ||||||||
Nielsen Co. Luxembourg Sarl (a)(c), |
| |||||||
5.50%, 10/1/21 | 19,848 | 20,170,530 | ||||||
|
| |||||||
| Home Builders—8.6% | ||||||||
Brookfield Residential Properties, Inc. (a)(c), |
| |||||||
6.50%, 12/15/20 | 22,088 | 22,419,320 | ||||||
CalAtlantic Group, Inc., |
| |||||||
6.625%, 5/1/20 | 3,000 | 3,195,000 | ||||||
Lennar Corp., |
| |||||||
4.50%, 6/15/19 | 2,900 | 2,921,750 | ||||||
4.75%, 4/1/21 | 9,733 | 9,939,826 | ||||||
MDC Holdings, Inc., |
| |||||||
5.625%, 2/1/20 | 1,500 | 1,558,125 | ||||||
PulteGroup, Inc., |
| |||||||
4.25%, 3/1/21 | 13,356 | 13,537,642 | ||||||
Taylor Morrison Communities, Inc. (a)(c), |
| |||||||
5.25%, 4/15/21 | 17,806 | 17,982,635 | ||||||
TRI Pointe Group, Inc., |
| |||||||
4.375%, 6/15/19 | 13,010 | 13,107,575 | ||||||
4.875%, 7/1/21 | 18,599 | 18,767,321 | ||||||
|
| |||||||
| 103,429,194 | ||||||||
|
| |||||||
Principal | Value | |||||||
| Machinery-Diversified—2.3% | ||||||||
John Deere Capital Corp., |
| |||||||
2.15%, 9/8/22 | $ | 3,950 | $ | 3,789,003 | ||||
3 mo. LIBOR + 0.240%, 2.329%, 3/12/21 (e) | 3,000 | 3,001,214 | ||||||
3 mo. LIBOR + 0.480%, 2.527%, 9/8/22 (e) | 15,000 | 15,056,454 | ||||||
2.875%, 3/12/21 | 6,000 | 5,985,325 | ||||||
|
| |||||||
| 27,831,996 | ||||||||
|
| |||||||
| Media—5.6% | ||||||||
AMC Networks, Inc., |
| |||||||
4.75%, 12/15/22 | 2,500 | 2,525,000 | ||||||
CCO Holdings LLC, |
| |||||||
5.25%, 9/30/22 | 6,265 | 6,370,785 | ||||||
DISH DBS Corp., |
| |||||||
5.125%, 5/1/20 | 8,250 | 8,271,450 | ||||||
7.875%, 9/1/19 | 8,773 | 9,211,650 | ||||||
Sinclair Television Group, Inc., |
| |||||||
5.375%, 4/1/21 | 16,445 | 16,630,006 | ||||||
6.125%, 10/1/22 | 1,000 | 1,028,750 | ||||||
Univision Communications, Inc. (a)(c), |
| |||||||
5.125%, 5/15/23 | 15,000 | 14,326,500 | ||||||
6.75%, 9/15/22 | 8,634 | 8,925,397 | ||||||
|
| |||||||
| 67,289,538 | ||||||||
|
| |||||||
| Miscellaneous Manufacturing—5.2% | ||||||||
General Electric Co., |
| |||||||
4.625%, 1/7/21 | 4,343 | 4,508,241 | ||||||
4.65%, 10/17/21 | 10,000 | 10,466,776 | ||||||
LSB Industries, Inc. (d), |
| |||||||
8.50%, 8/1/19 | 47,446 | 47,149,462 | ||||||
|
| |||||||
| 62,124,479 | ||||||||
|
| |||||||
| Oil, Gas & Consumable Fuels—2.6% | ||||||||
Laredo Petroleum, Inc., |
| |||||||
5.625%, 1/15/22 | 12,512 | 12,480,720 | ||||||
Murphy Oil USA, Inc., |
| |||||||
6.00%, 8/15/23 | 2,000 | 2,070,000 | ||||||
RSP Permian, Inc., |
| |||||||
6.625%, 10/1/22 | 5,361 | 5,615,648 | ||||||
Sunoco L.P. (a)(c), |
| |||||||
4.875%, 1/15/23 | 11,500 | 11,111,875 | ||||||
|
| |||||||
| 31,278,243 | ||||||||
|
| |||||||
| Pipelines—1.9% | ||||||||
Andeavor Logistics L.P., |
| |||||||
5.50%, 10/15/19 | 4,000 | 4,122,360 | ||||||
6.25%, 10/15/22 | 745 | 777,361 | ||||||
Kinder Morgan Energy Partners L.P., |
| |||||||
6.50%, 4/1/20 | 2,825 | 2,994,841 | ||||||
Kinder Morgan, Inc. (a)(c), |
| |||||||
5.00%, 2/15/21 | 5,000 | 5,189,931 | ||||||
MPLX L.P., |
| |||||||
5.50%, 2/15/23 | 5,000 | 5,134,375 | ||||||
Sabine Pass Liquefaction LLC, |
| |||||||
5.625%, 2/1/21 | 4,622 | 4,865,741 | ||||||
|
| |||||||
| 23,084,609 | ||||||||
|
| |||||||
| Real Estate—5.0% | ||||||||
Iron Mountain, Inc., |
| |||||||
4.375%, 6/1/21 (a)(c) | 2,250 | 2,266,875 | ||||||
6.00%, 8/15/23 | 4,100 | 4,258,301 | ||||||
Realogy Group LLC (a)(c), |
| |||||||
5.25%, 12/1/21 | 34,880 | 35,108,464 | ||||||
SBA Communications Corp., |
| |||||||
4.875%, 7/15/22 | 18,167 | 18,348,670 | ||||||
|
| |||||||
| 59,982,310 | ||||||||
|
| |||||||
| 190 | Semiannual Report | | March 31, 2018 | | See accompanying Notes to Financial Statements |
Table of Contents
Schedule of Investments
March 31, 2018 (Unaudited)
| Principal Amount (000s) | Value | |||||||
| Retail—9.8% | ||||||||
Dollar Tree, Inc., |
| |||||||
5.75%, 3/1/23 | $ | 21,500 | $ | 22,469,112 | ||||
GameStop Corp. (a)(c), |
| |||||||
5.50%, 10/1/19 | 5,690 | 5,746,900 | ||||||
6.75%, 3/15/21 | 23,075 | 23,421,125 | ||||||
Group 1 Automotive, Inc., |
| |||||||
5.00%, 6/1/22 | 1,740 | 1,762,272 | ||||||
Michaels Stores, Inc. (a)(c), |
| |||||||
5.875%, 12/15/20 | 8,580 | 8,697,975 | ||||||
Party City Holdings, Inc. (a)(c), |
| |||||||
6.125%, 8/15/23 | 33,089 | 33,874,864 | ||||||
Penske Automotive Group, Inc., |
| |||||||
5.75%, 10/1/22 | 21,540 | 22,091,963 | ||||||
|
| |||||||
| 118,064,211 | ||||||||
|
| |||||||
| Software—3.5% | ||||||||
ACI Worldwide, Inc. (a)(c), |
| |||||||
6.375%, 8/15/20 | 12,700 | 12,847,193 | ||||||
First Data Corp. (a)(c), |
| |||||||
7.00%, 12/1/23 | 27,979 | 29,482,871 | ||||||
|
| |||||||
| 42,330,064 | ||||||||
|
| |||||||
| Telecommunications—8.9% | ||||||||
Hughes Satellite Systems Corp., |
| |||||||
7.625%, 6/15/21 | 17,255 | 18,582,255 | ||||||
Sprint Communications, Inc. (a)(c), |
| |||||||
7.00%, 3/1/20 | 4,750 | 4,999,375 | ||||||
9.00%, 11/15/18 | 27,811 | 28,714,857 | ||||||
T-Mobile USA, Inc., |
| |||||||
6.00%, 3/1/23 | 3,000 | 3,127,500 | ||||||
6.625%, 4/1/23 | 49,686 | 51,332,097 | ||||||
|
| |||||||
| 106,756,084 | ||||||||
|
| |||||||
| Transportation—0.5% | ||||||||
Penske Truck Leasing Co. L.P. (a)(c), |
| |||||||
2.70%, 3/14/23 | 6,075 | 5,848,065 | ||||||
|
| |||||||
| Total Corporate Bonds & Notes (cost—$1,060,968,645) | 1,052,342,474 | |||||||
|
| |||||||
| Senior Loans (a)(b)— 7.7% | ||||||||
| Commercial Services & Supplies—2.2% | ||||||||
Asurion LLC, |
| |||||||
1 mo. LIBOR + 2.750%, 4.627%, 8/4/22, 2017 Term Loan B4 | 8,823 | 8,886,163 | ||||||
1 mo. LIBOR + 6.000%, 7.877%, 8/4/25, 2017 2nd Lien Term Loan | 17,000 | 17,493,000 | ||||||
|
| |||||||
| 26,379,163 | ||||||||
|
| |||||||
| Pipelines—0.4% | ||||||||
BCP Renaissance Parent LLC, 3 mo. LIBOR + 4.000%, 2017 Term Loan B, |
| |||||||
5.772%, 10/31/24 | 5,000 | 5,031,250 | ||||||
|
| |||||||
| Specialty Retail—5.1% | ||||||||
Michaels Stores, Inc., 1 mo. LIBOR + 2.750%, 2016 Term Loan B1, |
| |||||||
4.589%, 1/30/23 | 9,762 | 9,819,763 | ||||||
PetSmart, Inc., 1 mo. LIBOR + 3.000%, Term Loan B2, | ||||||||
4.68%, 3/11/22 | 63,186 | 50,872,374 | ||||||
|
| |||||||
| 60,692,137 | ||||||||
|
| |||||||
| Total Senior Loans (cost—$101,701,023) | 92,102,550 | |||||||
|
| |||||||
| Principal Amount (000s) | Value | |||||||
| Repurchase Agreements—4.7% | ||||||||
State Street Bank and Trust Co., dated 3/29/18, 0.28%, due 4/2/18, proceeds $56,699,764; collateralized by U.S. Treasury Notes, 2.00%, due 8/15/25, valued at $57,832,922 including accrued interest |
| |||||||
(cost—$56,698,000) | $ | 56,698 | $ | 56,698,000 | ||||
|
| |||||||
| Total Investments (cost—$1,219,367,668)—99.9% | 1,201,143,024 | |||||||
|
| |||||||
| Other assets less liabilities—0.1% | 835,014 | |||||||
|
| |||||||
| Net Assets—100.0% | $1,201,978,038 | |||||||
|
| |||||||
Notes to Schedule of Investments:
(a) Private Placement—Restricted as to resale and may not have a readily available market. Securities with an aggregate value of $440,846,503, representing 36.7% of net assets.
(b) These securities generally pay interest at rates which are periodically pre-determined by reference to a base lending rate plus a premium. These base lending rates are generally either the lending rate offered by one or more major European banks, such as the “LIBOR” or the prime rate offered by one or more major United States banks, or the certificate of deposit rate. These securities are generally considered to be restricted as the Fund is ordinarily contractually obligated to receive approval from the Agent bank and/or borrower prior to disposition. Remaining maturities of senior loans may be less than the stated maturities shown as a result of contractual or optional payments by the borrower. Such prepayments cannot be predicted with certainty. The interest rate disclosed reflects the rate in effect on March 31, 2018.
(c) 144A—Exempt from registration under Rule 144A of the Securities Act of 1933. These securities may be resold in transactions exempt from registration, typically only to qualified institutional buyers. Securities with an aggregate value of $348,743,953, representing 29.0% of net assets.
(d) Step Bond—Coupon is a fixed rate for an initial period then resets at a specific date and rate.
(e) Variable or Floating Rate Security—Securities with an interest rate that changes periodically. The interest rate disclosed reflects the rate in effect on March 31, 2018.
Glossary:
BBA—British Bankers’ Association
LIBOR—London Inter-Bank Offered Rate
AllianzGI Structured Return Fund
| Shares | Value | |||||||
| Exchange-Traded Funds—89.7% | ||||||||
iShares Core S&P 500 (a) (cost—$561,439,813) | 2,046,000 | $542,947,020 | ||||||
|
| |||||||
| Principal Amount (000s) | ||||||||
| Repurchase Agreements—20.0% | ||||||||
State Street Bank and Trust Co., |
| |||||||
(cost—$121,234,000) | $121,234 | 121,234,000 | ||||||
|
| |||||||
| Total Options Purchased—1.0% (cost—$5,457,636) (b)(c)(d) | 5,617,518 | |||||||
|
| |||||||
| Total Investments, before options written (cost—$688,131,449)—110.7% | 669,798,538 | |||||||
|
| |||||||
| Total Options Written—(7.5)% (premiums received—$47,155,666) (b)(c)(d) | (45,348,093 | ) | ||||||
|
| |||||||
| Total Investments, net of options written (cost—$640,975,783)—103.2% | 624,450,445 | |||||||
|
| |||||||
| Other liabilities in excess of other assets—(3.2)% | (19,109,838 | ) | ||||||
|
| |||||||
| Net Assets—100.0% | $605,340,607 | |||||||
|
| |||||||
Notes to Schedule of Investments:
(a) All or partial amount segregated for the benefit of the counterparty as collateral for options written.
(b) Non-income producing.
(c) Exchange traded-Chicago Board Options Exchange.
| See accompanying Notes to Financial Statements | | March 31, 2018 | | Semiannual Report | 191 |
Table of Contents
Schedule of Investments
March 31, 2018 (Unaudited)
(d) Exchange traded option contracts outstanding at March 31, 2018:
| Options purchased contracts outstanding at March 31, 2018: | ||||||||||||||||||||||||||||
| Description | Exercise Price | Expiration Date | Number of Contracts | Notional Amount | Market Value | Cost | Unrealized Appreciation (Depreciation) | |||||||||||||||||||||
Call options: | ||||||||||||||||||||||||||||
S&P 500 Index | 2,700.00 USD | 4/6/18 | 20 | $ | 2,000 | $ | 15,200 | $ | 20,425 | $ | (5,225 | ) | ||||||||||||||||
S&P 500 Index | 2,800.00 USD | 4/6/18 | 25 | 2,500 | 563 | 27,881 | (27,318 | ) | ||||||||||||||||||||
S&P 500 Index | 2,900.00 USD | 4/6/18 | 40 | 4,000 | 500 | 5,630 | (5,130 | ) | ||||||||||||||||||||
S&P 500 Index | 2,925.00 USD | 4/6/18 | 40 | 4,000 | 500 | 250 | 250 | |||||||||||||||||||||
S&P 500 Index | 3,300.00 USD | 4/6/18 | 288 | 28,800 | 2,880 | 3,138 | (258 | ) | ||||||||||||||||||||
S&P 500 Index | 2,700.00 USD | 4/9/18 | 20 | 2,000 | 18,200 | 23,325 | (5,125 | ) | ||||||||||||||||||||
S&P 500 Index | 3,050.00 USD | 4/9/18 | 40 | 4,000 | 400 | 290 | 110 | |||||||||||||||||||||
S&P 500 Index | 2,800.00 USD | 4/13/18 | 25 | 2,500 | 3,125 | 36,906 | (33,781 | ) | ||||||||||||||||||||
S&P 500 Index | 2,900.00 USD | 4/13/18 | 40 | 4,000 | 700 | 8,525 | (7,825 | ) | ||||||||||||||||||||
S&P 500 Index | 3,050.00 USD | 4/13/18 | 250 | 25,000 | 3,125 | 4,060 | (935 | ) | ||||||||||||||||||||
S&P 500 Index | 3,400.00 USD | 4/13/18 | 280 | 28,000 | 2,800 | 3,148 | (348 | ) | ||||||||||||||||||||
S&P 500 Index | 2,725.00 USD | 4/16/18 | 30 | 3,000 | 28,200 | 32,557 | (4,357 | ) | ||||||||||||||||||||
S&P 500 Index | 3,100.00 USD | 4/16/18 | 60 | 6,000 | 600 | 734 | (134 | ) | ||||||||||||||||||||
S&P 500 Index | 2,725.00 USD | 4/20/18 | 20 | 2,000 | 23,600 | 28,465 | (4,865 | ) | ||||||||||||||||||||
S&P 500 Index | 2,825.00 USD | 4/20/18 | 80 | 8,000 | 12,400 | 159,699 | (147,299 | ) | ||||||||||||||||||||
S&P 500 Index | 3,200.00 USD | 4/20/18 | 220 | 22,000 | 2,200 | 3,760 | (1,560 | ) | ||||||||||||||||||||
S&P 500 Index | 3,250.00 USD | 4/20/18 | 40 | 4,000 | 300 | 130 | 170 | |||||||||||||||||||||
S&P 500 Index | 3,300.00 USD | 4/20/18 | 143 | 14,300 | 1,072 | 943 | 129 | |||||||||||||||||||||
S&P 500 Index | 2,850.00 USD | 4/27/18 | 80 | 8,000 | 12,400 | 134,339 | (121,939 | ) | ||||||||||||||||||||
S&P 500 Index | 3,200.00 USD | 4/27/18 | 80 | 8,000 | 800 | 2,499 | (1,699 | ) | ||||||||||||||||||||
S&P 500 Index | 3,300.00 USD | 4/27/18 | 540 | 54,000 | 5,400 | 6,070 | (670 | ) | ||||||||||||||||||||
S&P 500 Index | 2,775.00 USD | 5/4/18 | 20 | 2,000 | 17,200 | 20,105 | (2,905 | ) | ||||||||||||||||||||
S&P 500 Index | 3,300.00 USD | 5/4/18 | 185 | 18,500 | 1,850 | 2,050 | (200 | ) | ||||||||||||||||||||
S&P 500 Index | 2,775.00 USD | 5/11/18 | 20 | 2,000 | 22,000 | 25,425 | (3,425 | ) | ||||||||||||||||||||
S&P 500 Index | 3,300.00 USD | 5/11/18 | 270 | 27,000 | 2,700 | 4,156 | (1,456 | ) | ||||||||||||||||||||
S&P 500 Index | 2,870.00 USD | 5/18/18 | 75 | 7,500 | 24,000 | 95,193 | (71,193 | ) | ||||||||||||||||||||
S&P 500 Index | 2,925.00 USD | 5/18/18 | 75 | 7,500 | 11,625 | 40,968 | (29,343 | ) | ||||||||||||||||||||
S&P 500 Index | 2,990.00 USD | 5/18/18 | 75 | 7,500 | 5,625 | 16,893 | (11,268 | ) | ||||||||||||||||||||
S&P 500 Index | 3,300.00 USD | 5/18/18 | 150 | 15,000 | 1,875 | 3,411 | (1,536 | ) | ||||||||||||||||||||
S&P 500 Index | 2,900.00 USD | 6/29/18 | 100 | 10,000 | 57,500 | 250,359 | (192,859 | ) | ||||||||||||||||||||
S&P 500 Index | 3,010.00 USD | 6/29/18 | 200 | 20,000 | 30,500 | 118,718 | (88,218 | ) | ||||||||||||||||||||
|
| |||||||||||||||||||||||||||
| Total call options | $ | 309,840 | $ | 1,080,052 | $ | (770,212 | ) | |||||||||||||||||||||
|
| |||||||||||||||||||||||||||
Put options: | ||||||||||||||||||||||||||||
S&P 500 Index | 1,700.00 USD | 4/2/18 | 100 | $ | 10,000 | $ | 1,000 | $ | 2,249 | $ | (1,249 | ) | ||||||||||||||||
S&P 500 Index | 1,800.00 USD | 4/2/18 | 75 | 7,500 | 750 | 2,468 | (1,718 | ) | ||||||||||||||||||||
S&P 500 Index | 2,525.00 USD | 4/2/18 | 75 | 7,500 | 1,313 | 68,044 | (66,731 | ) | ||||||||||||||||||||
S&P 500 Index | 2,625.00 USD | 4/2/18 | 50 | 5,000 | 33,250 | 45,812 | (12,562 | ) | ||||||||||||||||||||
S&P 500 Index | 1,700.00 USD | 4/4/18 | 100 | 10,000 | 1,000 | 3,749 | (2,749 | ) | ||||||||||||||||||||
S&P 500 Index | 1,800.00 USD | 4/4/18 | 75 | 7,500 | 750 | 3,268 | (2,518 | ) | ||||||||||||||||||||
S&P 500 Index | 2,550.00 USD | 4/4/18 | 75 | 7,500 | 18,375 | 113,343 | (94,968 | ) | ||||||||||||||||||||
S&P 500 Index | 2,650.00 USD | 4/4/18 | 50 | 5,000 | 135,250 | 75,062 | 60,188 | |||||||||||||||||||||
S&P 500 Index | 1,400.00 USD | 4/6/18 | 915 | 91,500 | 11,437 | 21,181 | (9,744 | ) | ||||||||||||||||||||
S&P 500 Index | 1,500.00 USD | 4/6/18 | 288 | 28,800 | 2,880 | 4,587 | (1,707 | ) | ||||||||||||||||||||
S&P 500 Index | 1,600.00 USD | 4/6/18 | 2,675 | 267,500 | 26,750 | 111,816 | (85,066 | ) | ||||||||||||||||||||
S&P 500 Index | 2,600.00 USD | 4/6/18 | 75 | 7,500 | 106,875 | 132,093 | (25,218 | ) | ||||||||||||||||||||
S&P 500 Index | 2,650.00 USD | 4/6/18 | 50 | 5,000 | 162,750 | 124,740 | 38,010 | |||||||||||||||||||||
S&P 500 Index | 1,600.00 USD | 4/9/18 | 100 | 10,000 | 1,000 | 4,624 | (3,624 | ) | ||||||||||||||||||||
S&P 500 Index | 1,700.00 USD | 4/9/18 | 120 | 12,000 | 1,500 | 5,774 | (4,274 | ) | ||||||||||||||||||||
S&P 500 Index | 2,550.00 USD | 4/9/18 | 75 | 7,500 | 55,875 | 148,111 | (92,236 | ) | ||||||||||||||||||||
S&P 500 Index | 2,650.00 USD | 4/9/18 | 75 | 7,500 | 263,625 | 219,468 | 44,157 | |||||||||||||||||||||
S&P 500 Index | 1,600.00 USD | 4/11/18 | 100 | 10,000 | 1,250 | 6,124 | (4,874 | ) | ||||||||||||||||||||
S&P 500 Index | 1,700.00 USD | 4/11/18 | 120 | 12,000 | 1,800 | 6,578 | (4,778 | ) | ||||||||||||||||||||
S&P 500 Index | 2,525.00 USD | 4/11/18 | 75 | 7,500 | 55,500 | 136,593 | (81,093 | ) | ||||||||||||||||||||
S&P 500 Index | 2,625.00 USD | 4/11/18 | 75 | 7,500 | 212,625 | 205,818 | 6,807 | |||||||||||||||||||||
S&P 500 Index | 1,400.00 USD | 4/13/18 | 1,170 | 117,000 | 14,625 | 25,825 | (11,200 | ) | ||||||||||||||||||||
S&P 500 Index | 1,600.00 USD | 4/13/18 | 350 | 35,000 | 6,125 | 16,171 | (10,046 | ) | ||||||||||||||||||||
| 192 | Semiannual Report | | March 31, 2018 | | See accompanying Notes to Financial Statements |
Table of Contents
Schedule of Investments
March 31, 2018 (Unaudited)
| Options purchased contracts outstanding at March 31, 2018 (continued): | ||||||||||||||||||||||||||||
| Description | Exercise Price | Expiration Date | Number of Contracts | Notional Amount | Market Value | Cost | Unrealized Appreciation (Depreciation) | |||||||||||||||||||||
Put options (continued): | ||||||||||||||||||||||||||||
S&P 500 Index | 1,700.00 USD | 4/13/18 | 2,750 | $ | 275,000 | $ | 61,875 | $ | 100,544 | $ | (38,669 | ) | ||||||||||||||||
S&P 500 Index | 2,350.00 USD | 4/13/18 | 150 | 15,000 | 24,000 | 41,744 | (17,744 | ) | ||||||||||||||||||||
S&P 500 Index | 2,600.00 USD | 4/13/18 | 75 | 7,500 | 175,875 | 167,418 | 8,457 | |||||||||||||||||||||
S&P 500 Index | 2,650.00 USD | 4/13/18 | 50 | 5,000 | 210,250 | 151,512 | 58,738 | |||||||||||||||||||||
S&P 500 Index | 1,600.00 USD | 4/16/18 | 175 | 17,500 | 3,063 | 4,013 | (950 | ) | ||||||||||||||||||||
S&P 500 Index | 2,565.00 USD | 4/16/18 | 125 | 12,500 | 202,500 | 210,385 | (7,885 | ) | ||||||||||||||||||||
S&P 500 Index | 1,600.00 USD | 4/18/18 | 175 | 17,500 | 3,063 | 4,467 | (1,404 | ) | ||||||||||||||||||||
S&P 500 Index | 2,550.00 USD | 4/18/18 | 125 | 12,500 | 200,000 | 206,530 | (6,530 | ) | ||||||||||||||||||||
S&P 500 Index | 1,400.00 USD | 4/20/18 | 876 | 87,600 | 10,950 | 29,447 | (18,497 | ) | ||||||||||||||||||||
S&P 500 Index | 1,500.00 USD | 4/20/18 | 210 | 21,000 | 3,150 | 4,461 | (1,311 | ) | ||||||||||||||||||||
S&P 500 Index | 1,600.00 USD | 4/20/18 | 150 | 15,000 | 2,250 | 13,386 | (11,136 | ) | ||||||||||||||||||||
S&P 500 Index | 1,700.00 USD | 4/20/18 | 200 | 20,000 | 5,000 | 10,849 | (5,849 | ) | ||||||||||||||||||||
S&P 500 Index | 2,570.00 USD | 4/20/18 | 100 | 10,000 | 218,500 | 350,424 | (131,924 | ) | ||||||||||||||||||||
S&P 500 Index | 2,700.00 USD | 4/20/18 | 100 | 10,000 | 756,500 | 236,927 | 519,573 | |||||||||||||||||||||
S&P 500 Index | 1,400.00 USD | 4/27/18 | 710 | 71,000 | 15,975 | 27,482 | (11,507 | ) | ||||||||||||||||||||
S&P 500 Index | 1,600.00 USD | 4/27/18 | 200 | 20,000 | 7,500 | 10,848 | (3,348 | ) | ||||||||||||||||||||
S&P 500 Index | 2,575.00 USD | 4/27/18 | 125 | 12,500 | 350,625 | 365,155 | (14,530 | ) | ||||||||||||||||||||
S&P 500 Index | 2,700.00 USD | 4/27/18 | 100 | 10,000 | 794,500 | 294,324 | 500,176 | |||||||||||||||||||||
S&P 500 Index | 1,400.00 USD | 5/4/18 | 145 | 14,500 | 3,262 | 7,481 | (4,219 | ) | ||||||||||||||||||||
S&P 500 Index | 1,400.00 USD | 5/11/18 | 645 | 64,500 | 21,285 | 22,400 | (1,115 | ) | ||||||||||||||||||||
S&P 500 Index | 2,600.00 USD | 6/29/18 | 150 | 15,000 | 1,121,250 | 634,289 | 486,961 | |||||||||||||||||||||
|
| |||||||||||||||||||||||||||
| Total put options | $ | 5,307,678 | $ | 4,377,584 | $ | 930,094 | ||||||||||||||||||||||
|
| |||||||||||||||||||||||||||
| Total options purchased contracts | $ | 5,617,518 | $ | 5,457,636 | $ | 159,882 | ||||||||||||||||||||||
|
| |||||||||||||||||||||||||||
| Options written contracts outstanding at March 31, 2018: | ||||||||||||||||||||||||||||
| Description | Exercise Price | Expiration Date | Number of Contracts | Notional Amount | Market Value | Premiums Received | Unrealized Appreciation (Depreciation) | |||||||||||||||||||||
Call options: | ||||||||||||||||||||||||||||
S&P 500 Index | 2,750.00 USD | 4/6/18 | (60 | ) | $ | (6,000 | ) | $ | (7,200 | ) | $ | (14,325 | ) | $ | 7,125 | |||||||||||||
S&P 500 Index | 2,850.00 USD | 4/6/18 | (50 | ) | (5,000 | ) | (750 | ) | (19,418 | ) | 18,668 | |||||||||||||||||
S&P 500 Index | 2,750.00 USD | 4/9/18 | (60 | ) | (6,000 | ) | (11,100 | ) | (18,765 | ) | 7,665 | |||||||||||||||||
S&P 500 Index | 2,850.00 USD | 4/13/18 | (50 | ) | (5,000 | ) | (1,875 | ) | (28,188 | ) | 26,313 | |||||||||||||||||
S&P 500 Index | 2,775.00 USD | 4/16/18 | (90 | ) | (9,000 | ) | (45,900 | ) | (32,918 | ) | (12,982 | ) | ||||||||||||||||
S&P 500 Index | 2,440.00 USD | 4/20/18 | (288 | ) | (28,800 | ) | (6,032,160 | ) | (4,967,097 | ) | (1,065,063 | ) | ||||||||||||||||
S&P 500 Index | 2,480.00 USD | 4/20/18 | (143 | ) | (14,300 | ) | (2,463,175 | ) | (2,725,066 | ) | 261,891 | |||||||||||||||||
S&P 500 Index | 2,565.00 USD | 4/20/18 | (80 | ) | (8,000 | ) | (793,200 | ) | (910,776 | ) | 117,576 | |||||||||||||||||
S&P 500 Index | 2,570.00 USD | 4/20/18 | (70 | ) | (7,000 | ) | (666,750 | ) | (1,154,049 | ) | 487,299 | |||||||||||||||||
S&P 500 Index | 2,780.00 USD | 4/20/18 | (60 | ) | (6,000 | ) | (33,000 | ) | (28,845 | ) | (4,155 | ) | ||||||||||||||||
S&P 500 Index | 2,875.00 USD | 4/20/18 | (160 | ) | (16,000 | ) | (9,200 | ) | (125,401 | ) | 116,201 | |||||||||||||||||
S&P 500 Index | 2,470.00 USD | 4/27/18 | (300 | ) | (30,000 | ) | (5,554,500 | ) | (4,708,923 | ) | (845,577 | ) | ||||||||||||||||
S&P 500 Index | 2,480.00 USD | 4/27/18 | (80 | ) | (8,000 | ) | (1,410,000 | ) | (1,193,233 | ) | (216,767 | ) | ||||||||||||||||
S&P 500 Index | 2,490.00 USD | 4/27/18 | (340 | ) | (34,000 | ) | (5,689,900 | ) | (5,036,105 | ) | (653,795 | ) | ||||||||||||||||
S&P 500 Index | 2,500.00 USD | 4/27/18 | (70 | ) | (7,000 | ) | (1,109,850 | ) | (934,529 | ) | (175,321 | ) | ||||||||||||||||
S&P 500 Index | 2,550.00 USD | 4/27/18 | (70 | ) | (7,000 | ) | (815,150 | ) | (885,249 | ) | 70,099 | |||||||||||||||||
S&P 500 Index | 2,570.00 USD | 4/27/18 | (80 | ) | (8,000 | ) | (806,000 | ) | (956,513 | ) | 150,513 | |||||||||||||||||
S&P 500 Index | 2,900.00 USD | 4/27/18 | (160 | ) | (16,000 | ) | (10,400 | ) | (108,441 | ) | 98,041 | |||||||||||||||||
S&P 500 Index | 2,440.00 USD | 5/4/18 | (70 | ) | (7,000 | ) | (1,512,000 | ) | (1,380,149 | ) | (131,851 | ) | ||||||||||||||||
S&P 500 Index | 2,460.00 USD | 5/4/18 | (145 | ) | (14,500 | ) | (2,869,550 | ) | (2,517,320 | ) | (352,230 | ) | ||||||||||||||||
S&P 500 Index | 2,840.00 USD | 5/4/18 | (60 | ) | (6,000 | ) | (30,600 | ) | (20,325 | ) | (10,275 | ) | ||||||||||||||||
S&P 500 Index | 2,450.00 USD | 5/11/18 | (80 | ) | (8,000 | ) | (1,675,600 | ) | (1,463,313 | ) | (212,287 | ) | ||||||||||||||||
S&P 500 Index | 2,460.00 USD | 5/11/18 | (230 | ) | (23,000 | ) | (4,611,500 | ) | (4,556,049 | ) | (55,451 | ) | ||||||||||||||||
S&P 500 Index | 2,850.00 USD | 5/11/18 | (60 | ) | (6,000 | ) | (31,200 | ) | (23,565 | ) | (7,635 | ) | ||||||||||||||||
S&P 500 Index | 2,930.00 USD | 5/18/18 | (150 | ) | (15,000 | ) | (21,750 | ) | (76,464 | ) | 54,714 | |||||||||||||||||
S&P 500 Index | 3,000.00 USD | 5/18/18 | (225 | ) | (22,500 | ) | (15,750 | ) | (43,071 | ) | 27,321 | |||||||||||||||||
S&P 500 Index | 2,975.00 USD | 6/29/18 | (300 | ) | (30,000 | ) | (67,500 | ) | (268,923 | ) | 201,423 | |||||||||||||||||
|
| |||||||||||||||||||||||||||
| Total call options | $ | (36,295,560 | ) | $ | (34,197,020 | ) | $ | (2,098,540 | ) | |||||||||||||||||||
|
| |||||||||||||||||||||||||||
| See accompanying Notes to Financial Statements | | March 31, 2018 | | Semiannual Report | 193 |
Table of Contents
Schedule of Investments
March 31, 2018 (Unaudited)
| Options written contracts outstanding at March 31, 2018 (continued): | ||||||||||||||||||||||||||||
| Description | Exercise Price | Expiration Date | Number of Contracts | Notional Amount | Market Value | Premiums Received | Unrealized Appreciation (Depreciation) | |||||||||||||||||||||
Put options: | ||||||||||||||||||||||||||||
S&P 500 Index | 2,460.00 USD | 4/2/18 | (150 | ) | $ | (15,000 | ) | $ | (2,250 | ) | $ | (70,764 | ) | $ | 68,514 | |||||||||||||
S&P 500 Index | 2,560.00 USD | 4/2/18 | (100 | ) | (10,000 | ) | (3,250 | ) | (50,876 | ) | 47,626 | |||||||||||||||||
S&P 500 Index | 2,475.00 USD | 4/4/18 | (150 | ) | (15,000 | ) | (9,375 | ) | (114,564 | ) | 105,189 | |||||||||||||||||
S&P 500 Index | 2,580.00 USD | 4/4/18 | (100 | ) | (10,000 | ) | (53,500 | ) | (78,676 | ) | 25,176 | |||||||||||||||||
S&P 500 Index | 2,325.00 USD | 4/6/18 | (200 | ) | (20,000 | ) | (8,500 | ) | (826,747 | ) | 818,247 | |||||||||||||||||
S&P 500 Index | 2,330.00 USD | 4/6/18 | (100 | ) | (10,000 | ) | (4,250 | ) | (442,676 | ) | 438,426 | |||||||||||||||||
S&P 500 Index | 2,480.00 USD | 4/6/18 | (90 | ) | (9,000 | ) | (13,950 | ) | (212,558 | ) | 198,608 | |||||||||||||||||
S&P 500 Index | 2,500.00 USD | 4/6/18 | (150 | ) | (15,000 | ) | (32,625 | ) | (142,314 | ) | 109,689 | |||||||||||||||||
S&P 500 Index | 2,555.00 USD | 4/6/18 | (57 | ) | (5,700 | ) | (35,055 | ) | (80,014 | ) | 44,959 | |||||||||||||||||
S&P 500 Index | 2,565.00 USD | 4/6/18 | (79 | ) | (7,900 | ) | (59,250 | ) | (94,427 | ) | 35,177 | |||||||||||||||||
S&P 500 Index | 2,570.00 USD | 4/6/18 | (100 | ) | (10,000 | ) | (82,500 | ) | (142,924 | ) | 60,424 | |||||||||||||||||
S&P 500 Index | 2,465.00 USD | 4/9/18 | (150 | ) | (15,000 | ) | (30,375 | ) | (151,732 | ) | 121,357 | |||||||||||||||||
S&P 500 Index | 2,580.00 USD | 4/9/18 | (150 | ) | (15,000 | ) | (182,250 | ) | (227,814 | ) | 45,564 | |||||||||||||||||
S&P 500 Index | 2,440.00 USD | 4/11/18 | (150 | ) | (15,000 | ) | (38,250 | ) | (149,814 | ) | 111,564 | |||||||||||||||||
S&P 500 Index | 2,550.00 USD | 4/11/18 | (150 | ) | (15,000 | ) | (155,250 | ) | (222,198 | ) | 66,948 | |||||||||||||||||
S&P 500 Index | 2,425.00 USD | 4/13/18 | (125 | ) | (12,500 | ) | (39,688 | ) | (245,801 | ) | 206,113 | |||||||||||||||||
S&P 500 Index | 2,475.00 USD | 4/13/18 | (125 | ) | (12,500 | ) | (66,875 | ) | (127,345 | ) | 60,470 | |||||||||||||||||
S&P 500 Index | 2,500.00 USD | 4/13/18 | (337 | ) | (33,700 | ) | (239,270 | ) | (608,316 | ) | 369,046 | |||||||||||||||||
S&P 500 Index | 2,520.00 USD | 4/13/18 | (137 | ) | (13,700 | ) | (123,300 | ) | (316,074 | ) | 192,774 | |||||||||||||||||
S&P 500 Index | 2,540.00 USD | 4/13/18 | (68 | ) | (6,800 | ) | (77,860 | ) | (173,298 | ) | 95,438 | |||||||||||||||||
S&P 500 Index | 2,570.00 USD | 4/13/18 | (100 | ) | (10,000 | ) | (163,500 | ) | (183,576 | ) | 20,076 | |||||||||||||||||
S&P 500 Index | 2,505.00 USD | 4/16/18 | (250 | ) | (25,000 | ) | (212,500 | ) | (215,505 | ) | 3,005 | |||||||||||||||||
S&P 500 Index | 2,485.00 USD | 4/18/18 | (250 | ) | (25,000 | ) | (162,500 | ) | (209,439 | ) | 46,939 | |||||||||||||||||
S&P 500 Index | 2,400.00 USD | 4/20/18 | (125 | ) | (12,500 | ) | (53,750 | ) | (261,051 | ) | 207,301 | |||||||||||||||||
S&P 500 Index | 2,450.00 USD | 4/20/18 | (125 | ) | (12,500 | ) | (83,750 | ) | (139,330 | ) | 55,580 | |||||||||||||||||
S&P 500 Index | 2,470.00 USD | 4/20/18 | (200 | ) | (20,000 | ) | (164,000 | ) | (373,752 | ) | 209,752 | |||||||||||||||||
S&P 500 Index | 2,560.00 USD | 4/20/18 | (96 | ) | (9,600 | ) | (189,600 | ) | (117,727 | ) | (71,873 | ) | ||||||||||||||||
S&P 500 Index | 2,635.00 USD | 4/20/18 | (200 | ) | (20,000 | ) | (830,000 | ) | (290,150 | ) | (539,850 | ) | ||||||||||||||||
S&P 500 Index | 2,475.00 USD | 4/27/18 | (250 | ) | (25,000 | ) | (298,750 | ) | (356,989 | ) | 58,239 | |||||||||||||||||
S&P 500 Index | 2,500.00 USD | 4/27/18 | (195 | ) | (19,500 | ) | (287,625 | ) | (285,433 | ) | (2,192 | ) | ||||||||||||||||
S&P 500 Index | 2,520.00 USD | 4/27/18 | (232 | ) | (23,200 | ) | (404,840 | ) | (743,682 | ) | 338,842 | |||||||||||||||||
S&P 500 Index | 2,525.00 USD | 4/27/18 | (150 | ) | (15,000 | ) | (273,750 | ) | (229,239 | ) | (44,511 | ) | ||||||||||||||||
S&P 500 Index | 2,550.00 USD | 4/27/18 | (116 | ) | (11,600 | ) | (262,160 | ) | (399,341 | ) | 137,181 | |||||||||||||||||
S&P 500 Index | 2,625.00 USD | 4/27/18 | (200 | ) | (20,000 | ) | (859,000 | ) | (356,552 | ) | (502,448 | ) | ||||||||||||||||
S&P 500 Index | 2,420.00 USD | 5/4/18 | (174 | ) | (17,400 | ) | (184,440 | ) | (302,135 | ) | 117,695 | |||||||||||||||||
S&P 500 Index | 2,430.00 USD | 5/4/18 | (238 | ) | (23,800 | ) | (270,130 | ) | (713,986 | ) | 443,856 | |||||||||||||||||
S&P 500 Index | 2,440.00 USD | 5/4/18 | (137 | ) | (13,700 | ) | (166,455 | ) | (408,784 | ) | 242,329 | |||||||||||||||||
S&P 500 Index | 2,460.00 USD | 5/4/18 | (86 | ) | (8,600 | ) | (120,830 | ) | (191,471 | ) | 70,641 | |||||||||||||||||
S&P 500 Index | 2,400.00 USD | 5/11/18 | (103 | ) | (10,300 | ) | (124,115 | ) | (196,051 | ) | 71,936 | |||||||||||||||||
S&P 500 Index | 2,480.00 USD | 5/11/18 | (200 | ) | (20,000 | ) | (400,000 | ) | (443,842 | ) | 43,842 | |||||||||||||||||
S&P 500 Index | 2,420.00 USD | 5/18/18 | (158 | ) | (15,800 | ) | (267,810 | ) | (463,320 | ) | 195,510 | |||||||||||||||||
S&P 500 Index | 2,400.00 USD | 5/25/18 | (193 | ) | (19,300 | ) | (354,155 | ) | (579,465 | ) | 225,310 | |||||||||||||||||
S&P 500 Index | 2,300.00 USD | 6/29/18 | (150 | ) | (15,000 | ) | (327,750 | ) | (215,972 | ) | (111,778 | ) | ||||||||||||||||
S&P 500 Index | 2,475.00 USD | 6/29/18 | (300 | ) | (30,000 | ) | (1,333,500 | ) | (802,922 | ) | (530,578 | ) | ||||||||||||||||
|
| |||||||||||||||||||||||||||
| Total put options | $ | (9,052,533 | ) | $ | (12,958,646 | ) | $ | 3,906,113 | ||||||||||||||||||||
|
| |||||||||||||||||||||||||||
| Total options written contracts | $ | (45,348,093 | ) | $ | (47,155,666 | ) | $ | 1,807,573 | ||||||||||||||||||||
|
| |||||||||||||||||||||||||||
(e) At March 31, 2018, the Fund pledged $11,555,197 in cash as collateral for options written.
| 194 | Semiannual Report | | March 31, 2018 | | See accompanying Notes to Financial Statements |
Table of Contents
Schedule of Investments
March 31, 2018 (Unaudited)
AllianzGI U.S. Equity Hedged Fund
| Shares | Value | |||||||
| Exchange-Traded Funds—96.4% | ||||||||
| SPDR S&P 500 (a) (cost—$1,800,918) | 8,620 | $2,268,353 | ||||||
|
| |||||||
Total Options Purchased—2.8% (cost—$55,248) (b)(c)(d) |
| 66,680 | ||||||
|
| |||||||
Total Investments, before (cost—$1,856,166)—99.2% |
| 2,335,033 | ||||||
|
| |||||||
| Value | ||||||
| Total Options Written—(0.3)% (premiums received— $8,561) (b)(c)(d) | $ | (7,060 | ) | |||
|
| |||||
Total Investments, net of (cost—$1,847,605)—98.9% | 2,327,973 | |||||
|
| |||||
| Other assets less other liabilities—1.1% | 26,668 | |||||
|
| |||||
| Net Assets—100.0% | $2,354,641 | |||||
|
| |||||
Notes to Schedule of Investments:
(a) All or partial amount segregated for the benefit of the counterparty as collateral for options written.
(b) Non-income producing.
(c) Exchange traded-Chicago Board Options Exchange.
(d) Exchange traded option contracts outstanding at March 31, 2018:
| Options purchased contracts outstanding at March 31, 2018: | ||||||||||||||||||||||||||||
| Description | Exercise Price | Expiration Date | Number of Contracts | Notional Amount | Market Value | Cost | Unrealized Appreciation (Depreciation) | |||||||||||||||||||||
Put options: |
| |||||||||||||||||||||||||||
S&P 500 Index | 2,475.00 USD | 4/6/18 | 2 | $ | 200 | $ | 290 | $ | 1,552 | $ | (1,262 | ) | ||||||||||||||||
S&P 500 Index | 2,625.00 USD | 4/6/18 | 2 | 200 | 4,380 | 3,942 | 438 | |||||||||||||||||||||
S&P 500 Index | 2,550.00 USD | 4/20/18 | 1 | 100 | 1,785 | 1,384 | 401 | |||||||||||||||||||||
S&P 500 Index | 2,525.00 USD | 5/18/18 | 1 | 100 | 3,145 | 1,904 | 1,241 | |||||||||||||||||||||
S&P 500 Index | 2,175.00 USD | 6/15/18 | 1 | 100 | 990 | 6,891 | (5,901 | ) | ||||||||||||||||||||
S&P 500 Index | 2,425.00 USD | 7/20/18 | 1 | 100 | 4,325 | 3,341 | 984 | |||||||||||||||||||||
S&P 500 Index | 2,275.00 USD | 9/28/18 | 1 | 100 | 4,135 | 6,971 | (2,836 | ) | ||||||||||||||||||||
S&P 500 Index | 2,600.00 USD | 9/28/18 | 1 | 100 | 11,125 | 5,891 | 5,234 | |||||||||||||||||||||
S&P 500 Index | 2,575.00 USD | 12/21/18 | 1 | 100 | 12,845 | 7,614 | 5,231 | |||||||||||||||||||||
S&P 500 Index | 2,575.00 USD | 1/18/19 | 1 | 100 | 13,495 | 8,134 | 5,361 | |||||||||||||||||||||
S&P 500 Index | 2,400.00 USD | 3/15/19 | 1 | 100 | 10,165 | 7,624 | 2,541 | |||||||||||||||||||||
|
| |||||||||||||||||||||||||||
| Total options purchased contracts | $ | 66,680 | $ | 55,248 | $ | 11,432 | ||||||||||||||||||||||
|
| |||||||||||||||||||||||||||
| Options written contracts outstanding at March 31, 2018: | ||||||||||||||||||||||||||||
| Description | Exercise Price | Expiration Date | Number of Contracts | Notional Amount | Market Value | Premiums Received | Unrealized Appreciation (Depreciation) | |||||||||||||||||||||
Call options: |
| |||||||||||||||||||||||||||
S&P 500 Index | 2,740.00 USD | 4/27/18 | (4 | ) | $ | (400 | ) | $ | (4,820 | ) | $ | (3,786 | ) | $ | (1,034 | ) | ||||||||||||
|
| |||||||||||||||||||||||||||
Put options: |
| |||||||||||||||||||||||||||
S&P 500 Index | 2,550.00 USD | 4/6/18 | (4 | ) | $ | (400 | ) | $ | (2,240 | ) | $ | (4,775 | ) | $ | 2,535 | |||||||||||||
|
| |||||||||||||||||||||||||||
| Total options written contracts | $ | (7,060 | ) | $ | (8,561 | ) | $ | 1,501 | ||||||||||||||||||||
|
| |||||||||||||||||||||||||||
(e) At March 31, 2018, the Fund pledged $13,772 in cash as collateral for options written.
| See accompanying Notes to Financial Statements | | March 31, 2018 | | Semiannual Report | 195 |
Table of Contents
Schedule of Investments
March 31, 2018 (Unaudited)
AllianzGI Ultra Micro Cap Fund
| Shares | Value | |||||||
| COMMON STOCK—99.4% | ||||||||
| Aerospace & Defense—0.9% | ||||||||
Ducommun, Inc. (a) | 9,450 | $287,091 | ||||||
|
| |||||||
| Banks—9.1% | ||||||||
Atlantic Capital Bancshares, Inc. (a) | 14,502 | 262,486 | ||||||
Evans Bancorp, Inc. | 4,625 | 209,281 | ||||||
First Internet Bancorp | 7,016 | 259,592 | ||||||
Franklin Financial Network, Inc. (a) | 11,717 | 381,974 | ||||||
Heritage Commerce Corp. | 24,299 | 400,448 | ||||||
National Commerce | 4,837 | 210,651 | ||||||
Preferred Bank | 8,288 | 532,090 | ||||||
Triumph Bancorp, Inc. (a) | 10,485 | 431,982 | ||||||
Veritex Holdings, Inc. (a) | 10,674 | 295,350 | ||||||
|
| |||||||
| 2,983,854 | ||||||||
|
| |||||||
| Beverages—0.7% | ||||||||
Primo Water Corp. (a) | 18,461 | 216,178 | ||||||
|
| |||||||
| Biotechnology—13.0% | ||||||||
Abeona Therapeutics, Inc. (a) | 8,001 | 114,814 | ||||||
Achaogen, Inc. (a) | 7,703 | 99,754 | ||||||
Adamas Pharmaceuticals, Inc. (a) | 5,874 | 140,389 | ||||||
Agenus, Inc. (a) | 19,993 | 94,167 | ||||||
Akebia Therapeutics, | 10,130 | 96,539 | ||||||
Arena Pharmaceuticals, Inc. (a) | 7,530 | 297,435 | ||||||
Audentes Therapeutics, Inc. (a) | 4,461 | 134,053 | ||||||
BioCryst Pharmaceuticals, Inc. (a) | 19,406 | 92,567 | ||||||
BioSpecifics Technologies Corp. (a) | 4,424 | 196,160 | ||||||
Calithera Biosciences, | 7,080 | 44,604 | ||||||
Cara Therapeutics, | 8,125 | 100,587 | ||||||
Concert Pharmaceuticals, Inc. (a) | 9,870 | 226,023 | ||||||
Corbus Pharmaceuticals Holdings, Inc. (a) | 12,076 | 73,664 | ||||||
Cytokinetics, Inc. (a) | 9,670 | 69,624 | ||||||
Esperion Therapeutics, Inc. (a) | 1,752 | 126,722 | ||||||
Flexion Therapeutics, | 8,892 | 199,270 | ||||||
ImmunoGen, Inc. (a) | 18,910 | 198,933 | ||||||
Immunomedics, Inc. (a) | 7,859 | 114,820 | ||||||
Inovio Pharmaceuticals, Inc. (a) | 17,732 | 83,518 | ||||||
Iovance Biotherapeutics, Inc. (a) | 13,912 | 235,113 | ||||||
La Jolla Pharmaceutical Co. (a) | 7,265 | 216,352 | ||||||
MacroGenics, Inc. (a) | 4,828 | 121,472 | ||||||
NewLink Genetics | 6,048 | 43,848 | ||||||
Pieris Pharmaceuticals, Inc. (a) | 13,371 | 91,190 | ||||||
Progenics Pharmaceuticals, Inc. (a) | 18,804 | 140,278 | ||||||
REGENXBIO, Inc. (a) | 3,413 | 101,878 | ||||||
Rigel Pharmaceuticals, Inc. (a) | 36,003 | 127,451 | ||||||
Sangamo Therapeutics, Inc. (a) | 9,101 | 172,919 | ||||||
Selecta Biosciences, | 3,794 | 38,661 | ||||||
Synergy Pharmaceuticals, | 42,045 | 76,942 | ||||||
TG Therapeutics, Inc. (a) | 12,837 | 182,285 | ||||||
Vanda Pharmaceuticals, Inc. (a) | 10,546 | 177,700 | ||||||
|
| |||||||
| 4,229,732 | ||||||||
|
| |||||||
| Building Products—1.2% | ||||||||
Patrick Industries, Inc. (a) | 6,596 | 407,963 | ||||||
|
| |||||||
Shares | Value | |||||||
| Chemicals—1.7% | ||||||||
American Vanguard Corp. | 15,664 | $ | 316,413 | |||||
KMG Chemicals, Inc. | 4,180 | 250,591 | ||||||
|
| |||||||
| 567,004 | ||||||||
|
| |||||||
| Commercial Services & Supplies—0.4% | ||||||||
Hudson Technologies, | 26,759 | 132,189 | ||||||
|
| |||||||
| Construction & Engineering—3.4% | ||||||||
Northwest Pipe Co. (a) | 14,660 | 253,618 | ||||||
NV5 Global, Inc. (a) | 11,058 | 616,483 | ||||||
Sterling Construction Co., Inc. (a) | 19,475 | 223,184 | ||||||
|
| |||||||
| 1,093,285 | ||||||||
|
| |||||||
| Construction Materials—1.1% | ||||||||
U.S. Concrete, Inc. (a) | 5,710 | 344,884 | ||||||
|
| |||||||
| Diversified Consumer Services—1.4% | ||||||||
Carriage Services, Inc. | 16,293 | 450,664 | ||||||
|
| |||||||
| Diversified Telecommunication Services—0.8% | ||||||||
Fusion Telecommunications International, Inc. (a) | 81,392 | 262,896 | ||||||
|
| |||||||
| Electrical Equipment—0.5% | ||||||||
Plug Power, Inc. (a) | 83,066 | 156,995 | ||||||
|
| |||||||
| Electronic Equipment, Instruments & Components—2.2% | ||||||||
IntriCon Corp. (a) | 13,176 | 263,520 | ||||||
Iteris, Inc. (a) | 43,476 | 215,641 | ||||||
Mesa Laboratories, Inc. | 1,649 | 244,777 | ||||||
|
| |||||||
| 723,938 | ||||||||
|
| |||||||
| Energy Equipment & Services—0.7% | ||||||||
Independence Contract Drilling, Inc. (a) | 36,416 | 137,653 | ||||||
Nine Energy Service, | 4,015 | 97,765 | ||||||
|
| |||||||
| 235,418 | ||||||||
|
| |||||||
| Food Products—0.9% | ||||||||
John B Sanfilippo & Son, Inc. | 4,896 | 283,332 | ||||||
|
| |||||||
| Healthcare Equipment & Supplies—10.9% | ||||||||
Antares Pharma, Inc. (a) | 61,174 | 134,583 | ||||||
AxoGen, Inc. (a) | 18,071 | 659,591 | ||||||
CryoLife, Inc. (a) | 13,471 | 270,094 | ||||||
CryoPort, Inc. (a) | 29,657 | 255,050 | ||||||
Cutera, Inc. (a) | 10,371 | 521,143 | ||||||
Heska Corp. (a) | 4,178 | 330,354 | ||||||
LeMaitre Vascular, Inc. | 15,023 | 544,283 | ||||||
Sientra, Inc. (a) | 18,388 | 177,628 | ||||||
Surmodics, Inc. (a) | 9,263 | 352,457 | ||||||
Tactile Systems Technology, Inc. (a) | 10,167 | 323,311 | ||||||
|
| |||||||
| 3,568,494 | ||||||||
|
| |||||||
| Healthcare Providers & Services—2.5% | ||||||||
BioTelemetry, Inc. (a) | 16,088 | 499,533 | ||||||
RadNet, Inc. (a) | 21,903 | 315,403 | ||||||
|
| |||||||
| 814,936 | ||||||||
|
| |||||||
| Healthcare Technology—2.4% | ||||||||
Tabula Rasa HealthCare, Inc. (a) | 10,775 | 418,070 | ||||||
Vocera Communications, Inc. (a) | 16,219 | 379,849 | ||||||
|
| |||||||
| 797,919 | ||||||||
|
| |||||||
| Hotels, Restaurants & Leisure—2.5% | ||||||||
Carrols Restaurant Group, Inc. (a) | 29,874 | 334,589 | ||||||
Century Casinos, Inc. (a) | 29,707 | 221,614 | ||||||
Red Lion Hotels Corp. (a) | 27,761 | 270,670 | ||||||
|
| |||||||
| 826,873 | ||||||||
|
| |||||||
Shares | Value | |||||||
| Household Durables—2.7% | ||||||||
Century Communities, Inc. (a) | 12,482 | $ | 373,836 | |||||
LGI Homes, Inc. (a) | 7,139 | 503,799 | ||||||
|
| |||||||
| 877,635 | ||||||||
|
| |||||||
| Internet & Catalog Retail—0.7% | ||||||||
Gaia, Inc. (a) | 14,691 | 227,710 | ||||||
|
| |||||||
| Internet Software & Services—6.0% | ||||||||
Amber Road, Inc. (a) | 32,248 | 287,007 | ||||||
Carbonite, Inc. (a) | 12,638 | 363,974 | ||||||
eGain Corp. (a) | 36,924 | 293,546 | ||||||
Five9, Inc. (a) | 21,281 | 633,961 | ||||||
GTT Communications, Inc. (a) | 6,500 | 368,550 | ||||||
|
| |||||||
| 1,947,038 | ||||||||
|
| |||||||
| IT Services—1.2% | ||||||||
Hackett Group, Inc. | 24,902 | 399,926 | ||||||
|
| |||||||
| Life Sciences Tools & Services—1.4% | ||||||||
Enzo Biochem, Inc. (a) | 19,729 | 108,115 | ||||||
|
| |||||||
NeoGenomics, Inc. (a) | 44,034 | 359,317 | ||||||
|
| |||||||
| 467,432 | ||||||||
|
| |||||||
| Machinery—5.8% | ||||||||
Commercial Vehicle Group, Inc. (a) | 20,668 | 160,177 | ||||||
DMC Global, Inc. | 20,298 | 542,971 | ||||||
Gencor Industries, | 16,452 | 264,877 | ||||||
Manitex International, Inc. (a) | 30,278 | 346,078 | ||||||
NN, Inc. | 5,683 | 136,392 | ||||||
Spartan Motors, Inc. | 17,188 | 295,634 | ||||||
Westport Fuel Systems, Inc. (a) | 65,311 | 143,031 | ||||||
|
| |||||||
| 1,889,160 | ||||||||
|
| |||||||
| Media—0.6% | ||||||||
Reading International, Inc., Class A (a) | 11,707 | 194,922 | ||||||
|
| |||||||
| Metals & Mining—0.9% | ||||||||
Universal Stainless & Alloy Products, Inc. (a) | 10,563 | 290,482 | ||||||
|
| |||||||
| Oil, Gas & Consumable Fuels—2.3% | ||||||||
Evolution Petroleum Corp. | 29,664 | 238,795 | ||||||
Penn Virginia Corp. (a) | 3,336 | 116,893 | ||||||
Ring Energy, Inc. (a) | 26,990 | 387,307 | ||||||
|
| |||||||
| 742,995 | ||||||||
|
| |||||||
| Personal Products—1.1% | ||||||||
Medifast, Inc. | 3,808 | 355,858 | ||||||
|
| |||||||
| Pharmaceuticals—4.0% | ||||||||
ANI Pharmaceuticals, Inc. (a) | 5,257 | 306,063 | ||||||
Assembly Biosciences, Inc. (a) | 3,388 | 166,486 | ||||||
Cymabay Therapeutics, Inc. (a) | 10,492 | 136,291 | ||||||
Intersect ENT, Inc. (a) | 9,018 | 354,407 | ||||||
Paratek Pharmaceuticals, Inc. (a) | 4,932 | 64,116 | ||||||
Revance Therapeutics, Inc. (a) | 5,191 | 159,883 | ||||||
WaVe Life Sciences | 3,111 | 124,751 | ||||||
|
| |||||||
| 1,311,997 | ||||||||
|
| |||||||
| Professional Services—1.5% | ||||||||
CRA International, Inc. | 5,222 | 273,059 | ||||||
GP Strategies Corp. (a) | 9,645 | 218,459 | ||||||
|
| |||||||
| 491,518 | ||||||||
|
| |||||||
| Road & Rail—2.0% | ||||||||
Daseke, Inc. (a) | 22,135 | 216,702 | ||||||
USA Truck, Inc. (a) | 16,500 | 420,585 | ||||||
|
| |||||||
| 637,287 | ||||||||
|
| |||||||
| 196 | Semiannual Report | | March 31, 2018 | | See accompanying Notes to Financial Statements |
Table of Contents
Schedule of Investments
March 31, 2018 (Unaudited)
Shares | Value | |||||||
| Semiconductors & Semiconductor Equipment—4.7% | ||||||||
Adesto Technologies Corp. (a) | 35,913 | $ | 265,756 | |||||
AXT, Inc. (a) | 38,504 | 279,154 | ||||||
CEVA, Inc. (a) | 7,429 | 268,930 | ||||||
FormFactor, Inc. (a) | 20,724 | 282,883 | ||||||
Ichor Holdings Ltd. (a) | 10,491 | 253,987 | ||||||
PDF Solutions, Inc. (a) | 14,784 | 172,381 | ||||||
|
| |||||||
| 1,523,091 | ||||||||
|
| |||||||
| Software—4.6% | ||||||||
Asure Software, Inc. (a) | 21,649 | 264,984 | ||||||
Datawatch Corp. (a) | 28,339 | 245,132 | ||||||
Model N, Inc. (a) | 18,046 | 325,730 | ||||||
QAD, Inc., Class A | 7,819 | 325,662 | ||||||
Upland Software, Inc. (a) | 12,227 | 352,015 | ||||||
|
| |||||||
| 1,513,523 | ||||||||
|
| |||||||
| Technology Hardware, Storage & Peripherals—1.7% | ||||||||
USA Technologies, Inc. (a) | 62,407 | 561,663 | ||||||
|
| |||||||
| Wireless Telecommunication Services—1.9% | ||||||||
Boingo Wireless, Inc. (a) | 24,448 | 605,577 | ||||||
|
| |||||||
| Total Common Stock (cost—$22,237,530) | 32,421,459 | |||||||
|
| |||||||
| Principal Amount (000s) | ||||||||
| Repurchase Agreements—0.9% | ||||||||
State Street Bank and Trust Co., dated 3/29/18, 0.28%, due 4/2/18, proceeds $295,009; collateralized by U.S. Treasury Notes, 2.50%, due 5/15/24, valued at $304,787 including accrued interest |
| |||||||
(cost—$295,000) | $295 | 295,000 | ||||||
|
| |||||||
| Total Investments (cost-$22,532,530)—100.3% | 32,716,459 | |||||||
|
| |||||||
| Liabilities in excess of other assets—(0.3)% | (91,872 | ) | ||||||
|
| |||||||
| Net Assets—100.0% | $32,624,587 | |||||||
|
| |||||||
Notes to Schedule of Investments:
(a) Non-income producing.
| See accompanying Notes to Financial Statements | | March 31, 2018 | | Semiannual Report | 197 |
Table of Contents
Statements of Assets and Liabilities
March 31, 2018 (Unaudited)
| AllianzGI Retirement 2020 | AllianzGI Retirement 2025 | AllianzGI Retirement 2030 | AllianzGI Retirement 2035 | AllianzGI Retirement 2040 | ||||||||||||||||||||
| Assets: | ||||||||||||||||||||||||
| Investments, at value | $ | 5,177,304 | $ | 1,612,679 | $ | 1,751,771 | $ | 1,179,027 | $ | 604,666 | ||||||||||||||
| Investments in Affiliates, at value | 43,653,024 | 61,436,650 | 71,375,974 | 57,971,869 | 52,248,191 | |||||||||||||||||||
| Cash | 797 | 779 | 795 | 423 | 55,386 | |||||||||||||||||||
| Foreign currency, at value | — | — | — | — | — | |||||||||||||||||||
| Deposits with brokers for derivatives collateral | 294,432 | 687,879 | 727,472 | 944,538 | 1,057,661 | |||||||||||||||||||
| Receivable for Fund shares sold | 60,553 | 24,900 | 28,433 | 43,286 | 51,040 | |||||||||||||||||||
| Receivable for variation margin on futures contracts | 7,144 | 38,023 | 36,374 | 33,733 | 32,228 | |||||||||||||||||||
| Investments in Affiliated Funds — Trustees Deferred Compensation Plan (see Note 5) | 5,088 | 5,730 | 6,138 | 4,903 | 4,271 | |||||||||||||||||||
| Receivable from Investment Manager | 3,347 | 3,545 | 3,539 | — | — | |||||||||||||||||||
| Dividends and interest receivable (net of foreign withholding taxes) | 68 | 31 | 32 | 15 | — | |||||||||||||||||||
| Receivable for investments sold | — | — | — | — | — | |||||||||||||||||||
| Receivable for investments in Affiliates sold | — | — | — | — | — | |||||||||||||||||||
| Dividends receivable from Affiliates | — | — | — | — | — | |||||||||||||||||||
| Unrealized appreciation of forward foreign currency contracts | — | — | — | — | — | |||||||||||||||||||
| Tax reclaims receivable | — | — | — | — | — | |||||||||||||||||||
| Prepaid expenses and other assets | — | — | — | — | — | |||||||||||||||||||
Total Assets | 49,201,757 | 63,810,216 | 73,930,528 | 60,177,794 | 54,053,443 | |||||||||||||||||||
| Liabilities: | ||||||||||||||||||||||||
| Payable for Fund shares redeemed | 14,322 | 69,521 | 1,128 | 83,809 | 20,676 | |||||||||||||||||||
| Trustees Deferred Compensation Plan payable (see Note 5) | 5,088 | 5,730 | 6,138 | 4,903 | 4,271 | |||||||||||||||||||
| Servicing fees payable | 2,506 | 1,787 | 2,301 | 2,182 | 1,402 | |||||||||||||||||||
| Distribution fees payable | 690 | 316 | 1,014 | 450 | 523 | |||||||||||||||||||
| Unrealized depreciation of forward foreign currency contracts | — | — | — | — | — | |||||||||||||||||||
| Payable for investments purchased | — | — | — | — | — | |||||||||||||||||||
| Payable for investments in Affiliates purchased | — | — | — | — | — | |||||||||||||||||||
| Investment management fees payable | — | — | — | — | — | |||||||||||||||||||
| Administration fees payable | — | — | — | 1,172 | 2,377 | |||||||||||||||||||
| Accrued expenses and other liabilities | — | — | — | — | — | |||||||||||||||||||
Total Liabilities | 22,606 | 77,354 | 10,581 | 92,516 | 29,249 | |||||||||||||||||||
| Net Assets | $ | 49,179,151 | $ | 63,732,862 | $ | 73,919,947 | $ | 60,085,278 | $ | 54,024,194 | ||||||||||||||
| 198 | Semiannual Report | | March 31, 2018 | | See accompanying Notes to Financial Statements |
Table of Contents
| AllianzGI Retirement 2045 | AllianzGI Retirement 2050 | AllianzGI Retirement 2055 | AllianzGI Multi Asset Income | AllianzGI Global Allocation | AllianzGI Best Styles Emerging Markets Equity | AllianzGI Best Styles Global Equity | ||||||||||||||||||||||||
| $ | 682,855 | $ | 654,710 | $ | 357,542 | $ | 13,853,723 | $ | 31,867,184 | $ | 6,167,668 | $ | 618,848,571 | |||||||||||||||||
| 33,315,057 | 32,884,513 | 16,806,630 | 30,312,300 | 323,706,760 | — | — | ||||||||||||||||||||||||
| 741 | 166 | 951 | 4,354 | 378 | 282 | 198,620 | ||||||||||||||||||||||||
| — | — | — | 819 | — | 554,399 | 1,713,277 | ||||||||||||||||||||||||
| 710,181 | 730,070 | 366,634 | 1,092,688 | 750,912 | 106,932 | 347,315 | ||||||||||||||||||||||||
| 49,724 | 32,143 | 48,526 | 116,440 | 207,123 | 9,452 | 179,158 | ||||||||||||||||||||||||
| | 24,435 | 23,530 | 11,615 | 176,703 | 448,673 | 8,474 | 94,535 | |||||||||||||||||||||||
| | 2,566 | 2,374 | 928 | 3,360 | 37,265 | 702 | 50,678 | |||||||||||||||||||||||
| — | — | — | — | — | 15,020 | — | ||||||||||||||||||||||||
| | 5 | 4 | 3 | 59,323 | 17,318 | 15,080 | 1,652,467 | |||||||||||||||||||||||
| — | — | — | 974,121 | — | — | 820,286 | ||||||||||||||||||||||||
| — | — | — | 3,908,606 | — | — | — | ||||||||||||||||||||||||
| — | — | — | 36,951 | — | — | — | ||||||||||||||||||||||||
| | — | — | — | — | — | — | 324 | |||||||||||||||||||||||
| — | — | — | — | — | — | 195,687 | ||||||||||||||||||||||||
| — | — | — | — | 60,509 | 44,583 | 46,073 | ||||||||||||||||||||||||
| 34,785,564 | 34,327,510 | 17,592,829 | 50,539,388 | 357,096,122 | 6,922,592 | 624,146,991 | ||||||||||||||||||||||||
| 3,130 | 979 | 1,101 | 41,475 | 189,969 | — | 1,868,766 | ||||||||||||||||||||||||
| | 2,566 | 2,374 | 928 | 3,360 | 37,265 | 702 | 50,678 | |||||||||||||||||||||||
| 1,089 | 777 | 550 | 2,922 | 16,383 | 61 | 324 | ||||||||||||||||||||||||
| 291 | 724 | 308 | 2,590 | 20,968 | 34 | 37 | ||||||||||||||||||||||||
| | — | — | — | — | — | — | 255 | |||||||||||||||||||||||
| — | — | — | 1,891,307 | — | — | 453,446 | ||||||||||||||||||||||||
| — | — | — | 1,362,285 | — | — | — | ||||||||||||||||||||||||
| — | — | — | — | 53,656 | — | 149,397 | ||||||||||||||||||||||||
| 2,923 | 2,793 | 1,621 | 4,475 | — | — | — | ||||||||||||||||||||||||
| — | — | — | — | 180,962 | 64,687 | 265,557 | ||||||||||||||||||||||||
| 9,999 | 7,647 | 4,508 | 3,308,414 | 499,203 | 65,484 | 2,788,460 | ||||||||||||||||||||||||
| $ | 34,775,565 | $ | 34,319,863 | $ | 17,588,321 | $ | 47,230,974 | $ | 356,596,919 | $ | 6,857,108 | $ | 621,358,531 | |||||||||||||||||
| See accompanying Notes to Financial Statements | | March 31, 2018 | | Semiannual Report | 199 |
Table of Contents
Statements of Assets and Liabilities (cont’d)
March 31, 2018 (Unaudited)
| AllianzGI Retirement 2020 | AllianzGI Retirement 2025 | AllianzGI Retirement 2030 | AllianzGI Retirement 2035 | AllianzGI Retirement 2040 | ||||||||||||||||||||
| Net Assets Consist of: | ||||||||||||||||||||||||
| Paid-in-capital | $ | 46,452,687 | $ | 58,945,811 | $ | 67,245,585 | $ | 54,022,693 | $ | 47,926,807 | ||||||||||||||
| Undistributed (dividends in excess of) net investment income | (701,829 | ) | (1,192,006 | ) | (1,733,354 | ) | (1,666,434 | ) | (1,750,865 | ) | ||||||||||||||
| Accumulated net realized gain (loss) | 1,022,987 | 2,380,283 | 3,286,227 | 3,463,252 | 3,823,237 | |||||||||||||||||||
| Net unrealized appreciation (depreciation) | 2,405,306 | 3,598,774 | 5,121,489 | 4,265,767 | 4,025,015 | |||||||||||||||||||
| Net Assets | $ | 49,179,151 | $ | 63,732,862 | $ | 73,919,947 | $ | 60,085,278 | $ | 54,024,194 | ||||||||||||||
| Cost of Investments | $ | 5,197,684 | $ | 1,612,287 | $ | 1,754,648 | $ | 1,184,395 | $ | 611,236 | ||||||||||||||
| Cost of Investments in Affiliates | $ | 41,186,019 | $ | 57,638,484 | $ | 66,022,711 | $ | 53,481,783 | $ | 48,002,220 | ||||||||||||||
| Cost of Foreign Currency | $ | — | $ | — | $ | — | $ | — | $ | — | ||||||||||||||
| Net Assets: | ||||||||||||||||||||||||
| Class A | $ | 10,004,555 | $ | 8,049,646 | $ | 9,485,451 | $ | 9,486,647 | $ | 6,012,754 | ||||||||||||||
| Class C | 402,719 | — | 802,988 | — | 141,248 | |||||||||||||||||||
| Class R | 85,573 | 230,078 | 436,945 | 725,317 | 313,469 | |||||||||||||||||||
| Class P | 20,628,818 | 35,522,309 | 37,881,469 | 33,388,834 | 23,214,666 | |||||||||||||||||||
| Institutional Class | — | — | — | — | — | |||||||||||||||||||
| Class R6 | 17,365,261 | 19,675,375 | 24,871,182 | 16,145,073 | 23,863,262 | |||||||||||||||||||
| Administrative Class | 692,225 | 255,454 | 441,912 | 339,407 | 478,795 | |||||||||||||||||||
| Shares Issued and Outstanding: | ||||||||||||||||||||||||
| Class A | 501,679 | 446,070 | 434,968 | 487,944 | 266,755 | |||||||||||||||||||
| Class C | 20,265 | — | 37,216 | — | 6,322 | |||||||||||||||||||
| Class R | 4,356 | 12,824 | 20,047 | 37,454 | 14,009 | |||||||||||||||||||
| Class P | 1,025,612 | 1,970,931 | 1,719,391 | 1,710,032 | 1,025,590 | |||||||||||||||||||
| Institutional Class | — | — | — | — | — | |||||||||||||||||||
| Class R6 | 862,074 | 1,089,770 | 1,125,388 | 825,564 | 1,051,822 | |||||||||||||||||||
| Administrative Class | 34,480 | 14,106 | 20,008 | 17,315 | 21,248 | |||||||||||||||||||
| Net Asset Value and Redemption Price Per Share:* | ||||||||||||||||||||||||
| Class A | $ | 19.94 | $ | 18.05 | $ | 21.81 | $ | 19.44 | $ | 22.54 | ||||||||||||||
| Class C | 19.87 | — | 21.58 | — | 22.34 | |||||||||||||||||||
| Class R | 19.65 | 17.94 | 21.80 | 19.37 | 22.38 | |||||||||||||||||||
| Class P | 20.11 | 18.02 | 22.03 | 19.53 | 22.64 | |||||||||||||||||||
| Institutional Class | — | — | — | — | — | |||||||||||||||||||
| Class R6 | 20.14 | 18.05 | 22.10 | 19.56 | 22.69 | |||||||||||||||||||
| Administrative Class | 20.08 | 18.11 | 22.09 | 19.60 | 22.53 | |||||||||||||||||||
| * | Net asset value and redemption price per share may not recalculate exactly due to rounding. |
| 200 | Semiannual Report | | March 31, 2018 | | See accompanying Notes to Financial Statements |
Table of Contents
| AllianzGI Retirement 2045 | AllianzGI Retirement 2050 | AllianzGI Retirement 2055 | AllianzGI Multi Asset Income | AllianzGI Global Allocation | AllianzGI Best Styles Emerging Markets Equity | AllianzGI Best Styles Global Equity | ||||||||||||||||||||||||
| $ | 30,902,061 | $ | 30,647,627 | $ | 16,177,563 | $ | 48,628,854 | $ | 320,743,012 | $ | 4,770,949 | $ | 517,084,206 | |||||||||||||||||
| | (1,147,359 | ) | (1,139,269 | ) | (551,720 | ) | 57,317 | (8,197,783 | ) | (22,060 | ) | 215,187 | ||||||||||||||||||
| 2,523,702 | 2,550,292 | 1,179,712 | (992,214 | ) | 22,709,727 | 524,437 | 30,954,529 | |||||||||||||||||||||||
| 2,497,161 | 2,261,213 | 782,766 | (462,983 | ) | 21,341,963 | 1,583,782 | 73,104,609 | |||||||||||||||||||||||
| $ | 34,775,565 | $ | 34,319,863 | $ | 17,588,321 | $ | 47,230,974 | $ | 356,596,919 | $ | 6,857,108 | $ | 621,358,531 | |||||||||||||||||
| $ | 687,821 | $ | 659,151 | $ | 359,723 | $ | 14,230,273 | $ | 32,294,127 | $ | 4,595,643 | $ | 545,672,842 | |||||||||||||||||
| $ | 30,671,790 | $ | 30,470,072 | $ | 15,939,488 | $ | 30,195,224 | $ | 300,320,354 | $ | — | $ | — | |||||||||||||||||
| $ | — | $ | — | $ | — | $ | 816 | $ | — | $ | 541,435 | $ | 1,718,454 | |||||||||||||||||
| $ | 4,867,008 | $ | 3,358,988 | $ | 2,431,191 | $ | 10,431,433 | $ | 44,216,580 | $ | 292,155 | $ | 1,442,030 | |||||||||||||||||
| — | 173,443 | — | 3,238,372 | 31,567,383 | 48,635 | 59,143 | ||||||||||||||||||||||||
| 216,370 | 109,012 | 114,845 | 127,791 | 28,426 | — | — | ||||||||||||||||||||||||
| 15,298,163 | 12,148,791 | 6,654,209 | 13,487,031 | 3,550,290 | 56,046 | 2,336,638 | ||||||||||||||||||||||||
| — | — | — | 35,460 | 7,052,447 | 97,792 | 2,385,543 | ||||||||||||||||||||||||
| 13,829,240 | 17,673,552 | 8,025,523 | 19,406,034 | 270,155,037 | 6,362,480 | 615,135,177 | ||||||||||||||||||||||||
| 564,784 | 856,077 | 362,553 | 504,853 | 26,756 | — | — | ||||||||||||||||||||||||
| 246,329 | 153,019 | 128,117 | 597,859 | 3,877,652 | 16,706 | 85,203 | ||||||||||||||||||||||||
| — | 8,032 | — | 185,617 | 2,716,682 | 2,794 | 3,564 | ||||||||||||||||||||||||
| 11,045 | 4,965 | 6,068 | 7,012 | 2,521 | — | — | ||||||||||||||||||||||||
| 772,934 | 549,310 | 347,972 | 764,930 | 313,873 | 3,188 | 138,124 | ||||||||||||||||||||||||
| — | — | — | 2,063 | 619,937 | 5,573 | 142,391 | ||||||||||||||||||||||||
| 696,728 | 796,008 | 417,900 | 1,129,086 | 24,206,033 | 360,712 | 36,441,020 | ||||||||||||||||||||||||
| 28,691 | 38,895 | 19,055 | 28,454 | 2,287 | — | — | ||||||||||||||||||||||||
| $ | 19.76 | $ | 21.95 | $ | 18.98 | $ | 17.45 | $ | 11.40 | $ | 17.49 | $ | 16.92 | |||||||||||||||||
| — | 21.59 | — | 17.45 | 11.62 | 17.41 | 16.59 | ||||||||||||||||||||||||
| 19.59 | 21.96 | 18.93 | 18.22 | 11.28 | — | — | ||||||||||||||||||||||||
| 19.79 | 22.12 | 19.12 | 17.63 | 11.31 | 17.58 | 16.92 | ||||||||||||||||||||||||
| — | — | — | 17.19 | 11.38 | 17.55 | 16.75 | ||||||||||||||||||||||||
| 19.85 | 22.20 | 19.20 | 17.19 | 11.16 | 17.64 | 16.88 | ||||||||||||||||||||||||
| 19.68 | 22.01 | 19.03 | 17.74 | 11.70 | — | — | ||||||||||||||||||||||||
| See accompanying Notes to Financial Statements | | March 31, 2018 | | Semiannual Report | 201 |
Table of Contents
Statements of Assets and Liabilities (cont’d)
March 31, 2018 (Unaudited)
| AllianzGI Best Styles International Equity | AllianzGI Best Styles U.S. Equity | AllianzGI Convertible | AllianzGI Emerging Markets Consumer | AllianzGI Emerging Markets Debt | ||||||||||||||||||||
| Assets: | ||||||||||||||||||||||||
| Investments, at value | $ | 26,410,055 | $ | 126,031,752 | $ | 477,090,212 | $ | 50,840,686 | $ | 32,389,344 | ||||||||||||||
| Investments in Affiliates, at value | — | — | — | — | — | |||||||||||||||||||
| Cash | 22,232 | 21,793 | 60 | 211 | 200,133 | |||||||||||||||||||
| Foreign currency, at value | 36,438 | 24,527 | — | 49,329 | 133,450 | |||||||||||||||||||
| Unrealized appreciation of forward foreign currency contracts | — | — | — | — | 7,412 | |||||||||||||||||||
| Dividends and interest receivable (net of foreign withholding taxes) | 113,698 | 180,689 | 1,580,479 | 140,862 | 511,707 | |||||||||||||||||||
| Receivable for investments sold | — | — | 1,095,885 | 53,483 | — | |||||||||||||||||||
| Deposits with brokers for derivatives collateral | 9 | 48,201 | — | — | 405 | |||||||||||||||||||
| Receivable for Fund shares sold | 487 | 12,875 | 445,193 | 800,000 | — | |||||||||||||||||||
| Receivable from Investment Manager | 11,517 | — | — | — | — | |||||||||||||||||||
| Deferred offering costs | — | — | — | — | — | |||||||||||||||||||
| Tax reclaims receivable | 78,761 | — | — | 1,763 | 655 | |||||||||||||||||||
| Investments in Affiliated Funds — Trustees Deferred Compensation Plan (see Note 5) | 4,435 | 9,233 | 129,474 | 3,200 | 3,401 | |||||||||||||||||||
| Receivable for variation margin on futures contracts | — | 8,850 | — | — | — | |||||||||||||||||||
| Prepaid expenses and other assets | 45,041 | 45,968 | 72,578 | 19,780 | 28,485 | |||||||||||||||||||
Total Assets | 26,722,673 | 126,383,888 | 480,413,881 | 51,909,314 | 33,274,992 | |||||||||||||||||||
| Liabilities: | ||||||||||||||||||||||||
| Payable for investments purchased | — | — | 6,723,938 | — | 399,300 | |||||||||||||||||||
| Payable for Fund shares redeemed | — | — | 543,178 | — | — | |||||||||||||||||||
| Payable for TBA investments purchased | — | — | — | — | — | |||||||||||||||||||
| Payable for variation margin on futures contracts | — | — | — | — | — | |||||||||||||||||||
| Options written, at value | — | — | — | — | — | |||||||||||||||||||
| Investment management fees payable | — | 25,480 | 230,876 | 33,030 | 9,251 | |||||||||||||||||||
| Distribution fees payable | 49 | 22 | 30,580 | — | 71 | |||||||||||||||||||
| Servicing fees payable | 126 | 37 | 23,661 | 31 | 74 | |||||||||||||||||||
| Unrealized depreciation of forward foreign currency contracts | 11 | — | — | — | — | |||||||||||||||||||
| Due to Investment Manager | — | — | — | — | — | |||||||||||||||||||
| Trustees Deferred Compensation Plan payable (see Note 5) | 4,435 | 9,233 | 129,474 | 3,200 | 3,401 | |||||||||||||||||||
| Accrued expenses and other liabilities | 79,282 | 67,977 | 346,344 | 98,515 | 58,149 | |||||||||||||||||||
Total Liabilities | 83,903 | 102,749 | 8,028,051 | 134,776 | 470,246 | |||||||||||||||||||
| Net Assets | $ | 26,638,770 | $ | 126,281,139 | $ | 472,385,830 | $ | 51,774,538 | $ | 32,804,746 | ||||||||||||||
| 202 | Semiannual Report | | March 31, 2018 | | See accompanying Notes to Financial Statements |
Table of Contents
| AllianzGI Emerging Markets Small-Cap | AllianzGI Europe Equity Dividend | AllianzGI Global Dynamic Allocation | AllianzGI Global Fundamental Strategy | AllianzGI Global High Yield | AllianzGI Global Sustainability | AllianzGI Global Water | ||||||||||||||||||||||||
| $ | 10,998,873 | $ | 8,335,820 | $ | 297,059,392 | $ | 16,123,837 | $ | 21,925,800 | $ | 29,056,697 | $ | 655,591,457 | |||||||||||||||||
| — | — | — | 215,834 | — | — | — | ||||||||||||||||||||||||
| 94,420 | 62 | 53,994 | 2,843 | 108,635 | 664 | 3,915,755 | ||||||||||||||||||||||||
| 89,853 | 9,489 | 198,207 | 210,964 | 259,195 | 4 | 470,130 | ||||||||||||||||||||||||
| | — | — | — | 22,926 | 15,382 | — | 23 | |||||||||||||||||||||||
| | 41,133 | 20,104 | 975,890 | 125,291 | 365,403 | 50,633 | 506,246 | |||||||||||||||||||||||
| 21,621 | 7,458 | 13,715,063 | — | 214,728 | — | 7,225,331 | ||||||||||||||||||||||||
| — | — | 1,734,399 | 404,327 | 2,242 | — | — | ||||||||||||||||||||||||
| — | — | 14,974 | — | — | 32 | 1,091,058 | ||||||||||||||||||||||||
| 7,054 | 19,252 | — | 4,986 | — | — | — | ||||||||||||||||||||||||
| — | — | — | — | 10,177 | — | — | ||||||||||||||||||||||||
| — | 7,787 | 44,782 | 9,477 | 3,920 | 23,594 | 881,642 | ||||||||||||||||||||||||
| | 962 | 491 | 13,619 | 1,646 | 694 | 1,812 | 45,696 | |||||||||||||||||||||||
| | — | — | 579,129 | — | — | — | — | |||||||||||||||||||||||
| 19,349 | 39,340 | 69,551 | 22,086 | 24,877 | 26,125 | 54,302 | ||||||||||||||||||||||||
| 11,273,265 | 8,439,803 | 314,459,000 | 17,144,217 | 22,931,053 | 29,159,561 | 669,781,640 | ||||||||||||||||||||||||
| — | 21,544 | 14,999,987 | — | 602,074 | — | 3,915,095 | ||||||||||||||||||||||||
| — | 39 | 5,598 | — | — | 576 | 249,967 | ||||||||||||||||||||||||
| — | — | 19,308,684 | — | — | — | — | ||||||||||||||||||||||||
| | — | — | — | 38,904 | 438 | — | — | |||||||||||||||||||||||
| — | — | — | 30,909 | — | — | — | ||||||||||||||||||||||||
| — | — | 123,961 | — | 39 | 4,305 | 411,720 | ||||||||||||||||||||||||
| — | 37 | 1,365 | 11 | — | — | 56,926 | ||||||||||||||||||||||||
| 39 | 195 | 829 | 19 | — | 102 | 59,656 | ||||||||||||||||||||||||
| | — | 6 | — | 50,449 | 73 | — | 1,159 | |||||||||||||||||||||||
| — | — | — | — | 10,297 | — | — | ||||||||||||||||||||||||
| | 962 | 491 | 13,619 | 1,646 | 694 | 1,812 | 45,696 | |||||||||||||||||||||||
| 110,741 | 89,003 | 225,265 | 47,380 | 69,427 | 56,706 | 387,801 | ||||||||||||||||||||||||
| 111,742 | 111,315 | 34,679,308 | 169,318 | 683,042 | 63,501 | 5,128,020 | ||||||||||||||||||||||||
| $ | 11,161,523 | $ | 8,328,488 | $ | 279,779,692 | $ | 16,974,899 | $ | 22,248,011 | $ | 29,096,060 | $ | 664,653,620 | |||||||||||||||||
| See accompanying Notes to Financial Statements | | March 31, 2018 | | Semiannual Report | 203 |
Table of Contents
Statements of Assets and Liabilities (cont’d)
March 31, 2018 (Unaudited)
| AllianzGI Best Styles International Equity | AllianzGI Best Styles U.S. Equity | AllianzGI Convertible | AllianzGI Emerging Markets Consumer | AllianzGI Emerging Markets Debt | ||||||||||||||||||||
| Net Assets Consist of: | ||||||||||||||||||||||||
| Paid-in-capital | $ | 23,875,922 | $ | 104,041,821 | $ | 383,165,173 | $ | 41,526,035 | $ | 33,216,846 | ||||||||||||||
| Undistributed (dividends in excess of) net investment income | (41,942 | ) | 593,335 | (899,082 | ) | 20,947 | (110,642 | ) | ||||||||||||||||
| Accumulated net realized gain (loss) | (445,040 | ) | 3,000,670 | 30,552,712 | 1,372,535 | (35,414 | ) | |||||||||||||||||
| Net unrealized appreciation (depreciation) | 3,249,830 | 18,645,313 | 59,567,027 | 8,855,021 | (266,044 | ) | ||||||||||||||||||
| Net Assets | $ | 26,638,770 | $ | 126,281,139 | $ | 472,385,830 | $ | 51,774,538 | $ | 32,804,746 | ||||||||||||||
| Cost of Investments | $ | 23,165,003 | $ | 107,357,401 | $ | 417,523,185 | $ | 41,974,319 | $ | 32,659,272 | ||||||||||||||
| Cost of Investments in Affiliates | $ | — | $ | — | $ | — | $ | — | $ | — | ||||||||||||||
| Cost of Foreign Currency | $ | 36,151 | $ | 25,479 | $ | — | $ | 49,321 | $ | 137,158 | ||||||||||||||
| Premiums Received for Options Written | $ | — | $ | — | $ | — | $ | — | $ | — | ||||||||||||||
| Net Assets: | ||||||||||||||||||||||||
| Class A | $ | 566,817 | $ | 136,660 | $ | 63,752,435 | $ | 144,091 | $ | 671,343 | ||||||||||||||
| Class C | 112,490 | 33,841 | 46,796,971 | — | 111,981 | |||||||||||||||||||
| Class R | — | — | 71,463 | — | — | |||||||||||||||||||
| Class P | 117,281 | 508,024 | 86,748,832 | — | 11,526 | |||||||||||||||||||
| Institutional Class | 177,204 | 107,056 | 274,078,833 | 51,630,447 | 32,009,896 | |||||||||||||||||||
| Class R6 | 25,664,978 | 125,495,558 | — | — | — | |||||||||||||||||||
| Administrative Class | — | — | 937,296 | — | — | |||||||||||||||||||
| Shares Issued and Outstanding: | ||||||||||||||||||||||||
| Class A | 36,625 | 7,364 | 2,131,599 | 8,924 | 46,665 | |||||||||||||||||||
| Class C | 7,332 | 1,863 | 1,555,887 | — | 7,698 | |||||||||||||||||||
| Class R | — | — | 2,309 | — | — | |||||||||||||||||||
| Class P | 7,568 | 27,658 | 2,958,406 | — | 803 | |||||||||||||||||||
| Institutional Class | 11,402 | 5,811 | 9,264,332 | 3,164,940 | 2,233,236 | |||||||||||||||||||
| Class R6 | 1,647,893 | 6,781,353 | — | — | — | |||||||||||||||||||
| Administrative Class | — | — | 31,641 | — | — | |||||||||||||||||||
| Net Asset Value and Redemption Price Per Share:* | ||||||||||||||||||||||||
| Class A | $ | 15.48 | $ | 18.56 | $ | 29.91 | $ | 16.15 | $ | 14.39 | ||||||||||||||
| Class C | 15.34 | 18.16 | 30.08 | — | 14.55 | |||||||||||||||||||
| Class R | — | — | 30.95 | — | — | |||||||||||||||||||
| Class P | 15.50 | 18.37 | 29.32 | — | 14.35 | |||||||||||||||||||
| Institutional Class | 15.54 | 18.42 | 29.58 | 16.31 | 14.33 | |||||||||||||||||||
| Class R6 | 15.57 | 18.51 | — | — | — | |||||||||||||||||||
| Administrative Class | — | — | 29.62 | — | — | |||||||||||||||||||
| * | Net asset value and redemption price per share may not recalculate exactly due to rounding. |
| 204 | Semiannual Report | | March 31, 2018 | | See accompanying Notes to Financial Statements |
Table of Contents
| AllianzGI Emerging Markets Small-Cap | AllianzGI Europe Equity Dividend | AllianzGI Global Dynamic Allocation | AllianzGI Global Fundamental Strategy | AllianzGI Global High Yield | AllianzGI Global Sustainability | AllianzGI Global Water | ||||||||||||||||||||||||
| $ | 8,998,908 | $ | 7,876,078 | $ | 258,479,508 | $ | 16,922,833 | $ | 22,215,555 | $ | 23,570,772 | $ | 555,375,660 | |||||||||||||||||
| | (134,933 | ) | 14 | 450,379 | (372,131 | ) | 140,758 | 107,491 | 47,286 | |||||||||||||||||||||
| 835,163 | (33,160 | ) | 3,274,237 | (192,148 | ) | (299,291 | ) | 371,868 | 7,097,875 | |||||||||||||||||||||
| 1,462,385 | 485,556 | 17,575,568 | 616,345 | 190,989 | 5,045,929 | 102,132,799 | ||||||||||||||||||||||||
| $ | 11,161,523 | $ | 8,328,488 | $ | 279,779,692 | $ | 16,974,899 | $ | 22,248,011 | $ | 29,096,060 | $ | 664,653,620 | |||||||||||||||||
| $ | 9,519,091 | $ | 7,850,672 | $ | 278,781,143 | $ | 15,634,870 | $ | 21,749,862 | $ | 24,011,698 | $ | 553,466,082 | |||||||||||||||||
| $ | — | $ | — | $ | — | $ | 166,185 | $ | — | $ | — | $ | — | |||||||||||||||||
| $ | 89,848 | $ | 9,514 | $ | 198,797 | $ | 213,686 | $ | 259,473 | $ | 4 | $ | 469,911 | |||||||||||||||||
| $ | — | $ | — | $ | — | $ | 30,548 | $ | — | $ | — | $ | — | |||||||||||||||||
| $ | 184,056 | $ | 748,832 | $ | 2,163,161 | $ | 71,314 | $ | — | $ | 481,321 | $ | 191,025,767 | |||||||||||||||||
| — | 57,246 | 1,368,105 | 17,692 | — | — | 88,946,115 | ||||||||||||||||||||||||
| — | — | 148,591 | — | — | — | — | ||||||||||||||||||||||||
| — | 112,853 | 13,561,374 | 11,763 | 10,284 | 64,147 | 229,681,325 | ||||||||||||||||||||||||
| 10,977,467 | 7,409,557 | 31,778,867 | 16,874,130 | 22,237,727 | 28,550,592 | 155,000,413 | ||||||||||||||||||||||||
| — | — | 230,736,824 | — | — | — | — | ||||||||||||||||||||||||
| — | — | 22,770 | — | — | — | — | ||||||||||||||||||||||||
| 10,023 | 47,935 | 108,761 | 4,776 | — | 26,553 | 12,599,112 | ||||||||||||||||||||||||
| — | 3,653 | 70,712 | 1,187 | — | — | 6,144,550 | ||||||||||||||||||||||||
| — | — | 7,537 | — | — | — | — | ||||||||||||||||||||||||
| — | 7,201 | 686,337 | 782 | 683 | 3,502 | 15,126,556 | ||||||||||||||||||||||||
| 604,639 | 469,945 | 1,597,142 | 1,117,127 | 1,478,392 | 1,556,397 | 10,393,293 | ||||||||||||||||||||||||
| — | — | 11,639,996 | — | — | — | — | ||||||||||||||||||||||||
| — | — | 1,147 | — | — | — | — | ||||||||||||||||||||||||
| $ | 18.36 | $ | 15.62 | $ | 19.89 | $ | 14.93 | $ | — | $ | 18.13 | $ | 15.16 | |||||||||||||||||
| — | 15.67 | 19.35 | 14.91 | — | — | 14.48 | ||||||||||||||||||||||||
| — | — | 19.71 | — | — | — | — | ||||||||||||||||||||||||
| — | 15.67 | 19.76 | 15.05 | 15.05 | 18.32 | 15.18 | ||||||||||||||||||||||||
| 18.16 | 15.77 | 19.90 | 15.10 | 15.04 | 18.34 | 14.91 | ||||||||||||||||||||||||
| — | — | 19.82 | — | — | — | — | ||||||||||||||||||||||||
| — | — | 19.84 | — | — | — | — | ||||||||||||||||||||||||
| See accompanying Notes to Financial Statements | | March 31, 2018 | | Semiannual Report | 205 |
Table of Contents
Statements of Assets and Liabilities (cont’d)
March 31, 2018 (Unaudited)
| AllianzGI High Yield Bond | AllianzGI International Growth | AllianzGI International Small-Cap | AllianzGI Micro Cap | AllianzGI NFJ Emerging Markets Value | ||||||||||||||||||||
| Assets: | ||||||||||||||||||||||||
| Investments, at value | $ | 208,833,345 | $ | 20,088,797 | $ | 187,239,395 | $ | 25,430,344 | $ | 143,647,327 | ||||||||||||||
| Cash | 295 | 339 | — | — | 47,318 | |||||||||||||||||||
| Foreign currency, at value | — | 5,266 | 93,442 | — | 1,854,913 | |||||||||||||||||||
| Unrealized appreciation of forward foreign currency contracts | — | — | 182 | — | 337 | |||||||||||||||||||
| Dividends and interest receivable (net of foreign withholding taxes) | 3,521,611 | 21,364 | 425,457 | 3,758 | 330,870 | |||||||||||||||||||
| Receivable for investments sold | 4,528,381 | — | 2,432,496 | 164,426 | 591,814 | |||||||||||||||||||
| Swap premiums paid | — | — | — | — | — | |||||||||||||||||||
| Deposits with brokers for derivatives collateral | — | — | — | — | — | |||||||||||||||||||
| Receivable for Fund shares sold | 141,760 | — | 240,374 | 29,430 | 1,165,908 | |||||||||||||||||||
| Receivable from Investment Manager | — | — | — | — | — | |||||||||||||||||||
| Deferred offering costs | — | — | — | — | — | |||||||||||||||||||
| Tax reclaims receivable | — | 18,653 | 149,761 | — | — | |||||||||||||||||||
| Investments in Affiliated Funds — Trustees Deferred Compensation Plan (see Note 5) | 29,979 | 26 | 11,063 | 3,342 | 3,040 | |||||||||||||||||||
| Receivable for principal paydowns | — | — | — | — | — | |||||||||||||||||||
| Receivable for variation margin on futures contracts | — | — | — | — | — | |||||||||||||||||||
| Receivable for variation margin on centrally cleared swaps | — | — | — | — | — | |||||||||||||||||||
| Prepaid expenses and other assets | 69,675 | 23,410 | 65,851 | 32,568 | 49,303 | |||||||||||||||||||
Total Assets | 217,125,046 | 20,157,855 | 190,658,021 | 25,663,868 | 147,690,830 | |||||||||||||||||||
| Liabilities: | ||||||||||||||||||||||||
| Payable for investments purchased | 6,175,677 | — | 33,524 | 25,220 | 1,473,662 | |||||||||||||||||||
| Payable for Fund shares redeemed | 1,548,098 | — | 107,858 | — | 49,070 | |||||||||||||||||||
| Payable to custodian for cash overdraft | — | — | 275,203 | 1,601 | — | |||||||||||||||||||
| Payable for variation margin on futures contracts | — | — | — | — | — | |||||||||||||||||||
| Options written, at value | — | — | — | — | — | |||||||||||||||||||
| Investment management fees payable | 87,442 | 242 | 135,994 | 24,258 | 49,544 | |||||||||||||||||||
| Distribution fees payable | 6,340 | — | 2,330 | — | 728 | |||||||||||||||||||
| Servicing fees payable | 10,664 | 38 | 2,821 | 574 | 12,960 | |||||||||||||||||||
| Unrealized depreciation of forward foreign currency contracts | — | — | 9 | — | 33 | |||||||||||||||||||
| Due to Investment Manager | — | — | — | — | — | |||||||||||||||||||
| Trustees Deferred Compensation Plan payable (see Note 5) | 29,979 | 26 | 11,063 | 3,342 | 3,040 | |||||||||||||||||||
| Accrued expenses and other liabilities | 170,143 | 40,483 | 160,275 | 62,717 | 169,746 | |||||||||||||||||||
Total Liabilities | 8,028,343 | 40,789 | 729,077 | 117,712 | 1,758,783 | |||||||||||||||||||
| Net Assets | $ | 209,096,703 | $ | 20,117,066 | $ | 189,928,944 | $ | 25,546,156 | $ | 145,932,047 | ||||||||||||||
| † | The Fund’s financial statements are consolidated to include the accounts of AllianzGI PerformanceFee Managed Futures Strategy Offshore Fund, Ltd., which is a wholly-owned subsidiary of the Fund. See Note 14. |
| 206 | Semiannual Report | | March 31, 2018 | | See accompanying Notes to Financial Statements |
Table of Contents
AllianzGI Value | AllianzGI PerformanceFee Managed Futures Strategy † | AllianzGI PerformanceFee Structured US Equity | AllianzGI PerformanceFee Structured US Fixed Income | AllianzGI Real Estate Debt | AllianzGI Short Duration High Income | AllianzGI Structured Return | ||||||||||||||||||||||||
| $ | 4,244,171 | $ | 13,154,318 | $ | 25,009,582 | $ | 24,707,308 | $ | 9,917,125 | $ | 1,201,143,024 | $ | 669,798,538 | |||||||||||||||||
| — | 42,888 | 451 | 29,589 | 49,058 | 271,710 | 730 | ||||||||||||||||||||||||
| 31,879 | — | — | — | 74,822 | — | — | ||||||||||||||||||||||||
| | 74 | — | — | — | 5,579 | — | — | |||||||||||||||||||||||
| 13,923 | 31,029 | | 3 | — | 29,058 | 18,707,166 | 2,829 | |||||||||||||||||||||||
| 73,057 | 360,872 | 47,754 | 24,097 | — | 5,325,348 | 16,899,962 | ||||||||||||||||||||||||
| — | 187,014 | — | — | — | — | — | ||||||||||||||||||||||||
| | — | 1,195,321 | 98,348 | 50,797 | 2,808 | — | 11,555,197 | |||||||||||||||||||||||
| — | 60,000 | — | — | — | 1,155,354 | 1,178,683 | ||||||||||||||||||||||||
| 11,639 | 20,305 | 18,582 | 17,877 | 12,072 | — | — | ||||||||||||||||||||||||
| — | 41,692 | 41,692 | 41,692 | 34,147 | — | — | ||||||||||||||||||||||||
| 3,680 | — | — | — | — | — | — | ||||||||||||||||||||||||
| 824 | | — | 106 | 350 | 73 | 115,264 | 27,852 | |||||||||||||||||||||||
| — | — | — | — | 15,839 | — | — | ||||||||||||||||||||||||
| | — | 230,454 | — | — | — | — | — | |||||||||||||||||||||||
| | — |
| 10,238 | — | — | — | — | — | ||||||||||||||||||||||
| 25,287 | 4,245 | 4,246 | 4,247 | 4,046 | 82,422 | 70,165 | ||||||||||||||||||||||||
| 4,404,534 | 15,338,376 | 25,220,764 | 24,875,957 | 10,144,627 | 1,226,800,288 | 699,533,956 | ||||||||||||||||||||||||
| 207,755 | — | 38,404 | 20,091 | — | 21,306,805 | 46,933,345 | ||||||||||||||||||||||||
| — | — | — | — | — | 2,366,413 | 1,263,807 | ||||||||||||||||||||||||
| 29,827 | — | — | — | — | — | — | ||||||||||||||||||||||||
| | — | — | — | — | 546 | — | — | |||||||||||||||||||||||
| — | — | 398,005 | 202,277 | — | — | 45,348,093 | ||||||||||||||||||||||||
| — | — | — | — | — | 489,824 | 288,521 | ||||||||||||||||||||||||
| 197 | — | — | — | — | 29,657 | 11,469 | ||||||||||||||||||||||||
| 360 | — | — | — | — | 72,291 | 31,618 | ||||||||||||||||||||||||
| 1,260 | | — | — | — | 1,030 | — | — | |||||||||||||||||||||||
| — | 41,692 | 41,692 | 41,692 | 34,147 | — | — | ||||||||||||||||||||||||
| 824 | | — | 106 | 350 | 73 | 115,264 | 27,852 | |||||||||||||||||||||||
| 68,543 | 7,944 | 19,387 | 17,518 | 22,065 | 441,996 | 288,644 | ||||||||||||||||||||||||
| 308,766 | 49,636 | 497,594 | 281,928 | 57,861 | 24,822,250 | 94,193,349 | ||||||||||||||||||||||||
| $ | 4,095,768 | $ | 15,288,740 | $ | 24,723,170 | $ | 24,594,029 | $ | 10,086,766 | $ | 1,201,978,038 | $ | 605,340,607 | |||||||||||||||||
| See accompanying Notes to Financial Statements | | March 31, 2018 | | Semiannual Report | 207 |
Table of Contents
Statements of Assets and Liabilities (cont’d)
March 31, 2018 (Unaudited)
| AllianzGI High Yield Bond | AllianzGI International Growth | AllianzGI International Small-Cap | AllianzGI Micro Cap | AllianzGI NFJ Emerging Markets Value | ||||||||||||||||||||
| Net Assets Consist of: | ||||||||||||||||||||||||
| Paid-in-capital | $ | 244,585,924 | $ | 15,252,085 | $ | 140,822,293 | $ | 16,593,793 | $ | 135,655,450 | ||||||||||||||
| Undistributed (dividends in excess of) net investment income | (1,081,593 | ) | (13,662 | ) | (1,733,909 | ) | (530,234 | ) | (77,856 | ) | ||||||||||||||
| Accumulated net realized gain (loss) | (27,472,365 | ) | 156,500 | 8,140,604 | 2,380,783 | 1,780,845 | ||||||||||||||||||
| Net unrealized appreciation (depreciation) | (6,935,263 | ) | 4,722,143 | 42,699,956 | 7,101,814 | 8,573,608 | ||||||||||||||||||
| Net Assets | $ | 209,096,703 | $ | 20,117,066 | $ | 189,928,944 | $ | 25,546,156 | $ | 145,932,047 | ||||||||||||||
| Cost of Investments | $ | 215,768,608 | $ | 15,367,745 | $ | 144,546,267 | $ | 18,328,530 | $ | 135,074,074 | ||||||||||||||
| Cost of Foreign Currency | $ | — | $ | 5,122 | $ | 93,773 | $ | — | $ | 1,854,578 | ||||||||||||||
| Premiums Received for Options Written | $ | — | $ | — | $ | — | $ | — | $ | — | ||||||||||||||
| Net Assets: | ||||||||||||||||||||||||
| Class A | $ | 36,737,763 | $ | 218,464 | $ | 9,518,064 | $ | 2,594,929 | $ | 63,132,007 | ||||||||||||||
| Class C | 9,835,993 | — | 3,515,696 | — | 1,165,268 | |||||||||||||||||||
| Class R | 820,464 | — | 359,534 | — | — | |||||||||||||||||||
| Class P | 20,700,197 | — | 65,371,122 | 1,490,492 | 24,107,830 | |||||||||||||||||||
| Institutional Class | 140,941,747 | 19,898,602 | 71,443,212 | 21,460,735 | 57,526,942 | |||||||||||||||||||
| Class R6 | — | — | 39,721,316 | — | — | |||||||||||||||||||
| Administrative Class | 60,539 | — | — | — | — | |||||||||||||||||||
| Shares Issued and Outstanding: | ||||||||||||||||||||||||
| Class A | 4,121,384 | 12,034 | 213,260 | 173,663 | 3,390,180 | |||||||||||||||||||
| Class C | 1,105,495 | — | 81,201 | — | 61,927 | |||||||||||||||||||
| Class R | 95,951 | — | 8,270 | — | — | |||||||||||||||||||
| Class P | 2,417,222 | — | 1,466,644 | 99,101 | 1,295,891 | |||||||||||||||||||
| Institutional Class | 16,411,999 | 1,072,566 | 1,546,489 | 1,419,329 | 3,041,955 | |||||||||||||||||||
| Class R6 | — | — | 860,100 | — | — | |||||||||||||||||||
| Administrative Class | 7,169 | — | — | — | — | |||||||||||||||||||
| Net Asset Value and Redemption Price Per Share:* | ||||||||||||||||||||||||
| Class A | $ | 8.91 | $ | 18.15 | $ | 44.63 | $ | 14.94 | $ | 18.62 | ||||||||||||||
| Class C | 8.90 | — | 43.30 | — | 18.82 | |||||||||||||||||||
| Class R | 8.55 | — | 43.48 | — | — | |||||||||||||||||||
| Class P | 8.56 | — | 44.57 | 15.04 | 18.60 | |||||||||||||||||||
| Institutional Class | 8.59 | 18.55 | 46.20 | 15.12 | 18.91 | |||||||||||||||||||
| Class R6 | — | — | 46.18 | — | — | |||||||||||||||||||
| Administrative Class | 8.44 | — | — | — | — | |||||||||||||||||||
| † | The Fund’s financial statements are consolidated to include the accounts of AllianzGI PerformanceFee Managed Futures Strategy Offshore Fund, Ltd., which is a wholly-owned subsidiary of the Fund. See Note 14. |
| * | Net asset value and redemption price per share may not recalculate exactly due to rounding. |
| 208 | Semiannual Report | | March 31, 2018 | | See accompanying Notes to Financial Statements |
Table of Contents
AllianzGI Value | AllianzGI PerformanceFee Managed Futures Strategy † | AllianzGI PerformanceFee Structured US Equity | AllianzGI PerformanceFee Structured US Fixed Income | AllianzGI Real Estate Debt | AllianzGI Short Duration High Income | AllianzGI Structured Return | ||||||||||||||||||||||||
| $ | 3,861,540 | $ | 15,798,304 | $ | 25,325,332 | $ | 25,049,559 | $ | 10,101,927 | $ | 1,274,394,674 | $ | 617,708,476 | |||||||||||||||||
| | (27,394 | ) | 66,903 | 226,684 | 117,184 | (2,483 | ) | (13,227,232 | ) | 400,948 | ||||||||||||||||||||
| (331,256 | ) | (514,185 | ) | (315,511 | ) | (148,821 | ) | (59,902 | ) | (40,964,760 | ) | 3,756,521 | ||||||||||||||||||
| 592,878 | (62,282 | ) | (513,335 | ) | (423,893 | ) | 47,224 | (18,224,644 | ) | (16,525,338 | ) | |||||||||||||||||||
| $ | 4,095,768 | $ | 15,288,740 | $ | 24,723,170 | $ | 24,594,029 | $ | 10,086,766 | $ | 1,201,978,038 | $ | 605,340,607 | |||||||||||||||||
| $ | 3,650,986 | $ | 13,162,248 | $ | 25,612,697 | $ | 25,169,789 | $ | 9,871,967 | $ | 1,219,367,668 | $ | 688,131,449 | |||||||||||||||||
| $ | 31,853 | $ | — | $ | — | $ | — | $ | 75,120 | $ | — | $ | — | |||||||||||||||||
| $ | — | $ | — | $ | 487,785 | $ | 240,865 | $ | — | $ | — | $ | 47,155,666 | |||||||||||||||||
| $ | 1,362,272 | $ | — | $ | — | $ | — | $ | — | $ | 197,581,228 | $ | 129,425,944 | |||||||||||||||||
| 294,037 | — | — | — | — | 138,310,357 | 17,907,500 | ||||||||||||||||||||||||
| — | — | — | — | — | — | — | ||||||||||||||||||||||||
| 49,723 | 9,662 | 9,763 | 9,817 | 10,026 | 383,874,785 | 145,950,264 | ||||||||||||||||||||||||
| 1,845,609 | 251,868 | 60,504 | 9,818 | 10,076,740 | 428,635,457 | 275,205,645 | ||||||||||||||||||||||||
| 544,127 | 15,027,210 | 24,652,903 | 24,574,394 | — | 53,576,211 | 36,851,254 | ||||||||||||||||||||||||
| — | — | — | — | — | — | — | ||||||||||||||||||||||||
| 65,748 | — | — | — | — | 13,270,830 | 8,392,372 | ||||||||||||||||||||||||
| 14,683 | — | — | — | — | 9,307,293 | 1,199,309 | ||||||||||||||||||||||||
| — | — | — | — | — | — | — | ||||||||||||||||||||||||
| 2,478 | 1,000 | 1,000 | 1,000 | 670 | 25,866,062 | 9,482,810 | ||||||||||||||||||||||||
| 89,113 | 26,087 | 6,199 | 1,000 | 672,800 | 28,871,890 | 17,694,674 | ||||||||||||||||||||||||
| 27,323 | 1,554,781 | 2,525,063 | 2,503,083 | — | 3,606,517 | 2,380,520 | ||||||||||||||||||||||||
| — | — | — | — | — | — | — | ||||||||||||||||||||||||
| $ | 20.72 | $ | — | $ | — | $ | — | $ | — | $ | 14.89 | $ | 15.42 | |||||||||||||||||
| 20.03 | — | — | — | — | 14.86 | 14.93 | ||||||||||||||||||||||||
| — | — | — | — | — | — | — | ||||||||||||||||||||||||
| 20.06 | 9.66 | 9.76 | 9.82 | 14.98 | 14.84 | 15.39 | ||||||||||||||||||||||||
| 20.71 | 9.65 | 9.76 | 9.82 | 14.98 | 14.85 | 15.55 | ||||||||||||||||||||||||
| 19.91 | 9.67 | 9.76 | 9.82 | — | 14.86 | 15.48 | ||||||||||||||||||||||||
| — | — | — | — | — | — | — | ||||||||||||||||||||||||
| See accompanying Notes to Financial Statements | | March 31, 2018 | | Semiannual Report | 209 |
Table of Contents
Statements of Assets and Liabilities (cont’d)
March 31, 2018 (Unaudited)
| AllianzGI U.S. Equity Hedged | AllianzGI Ultra Micro Cap | |||||||
| Assets: | ||||||||
| Investments, at value | $ | 2,335,033 | $ | 32,716,459 | ||||
| Cash | 135 | 623 | ||||||
| Dividends and interest receivable (net of foreign withholding taxes) | 9,454 | 6,216 | ||||||
| Receivable for investments sold | — | 112,888 | ||||||
| Deposits with brokers for derivatives collateral | 13,772 | — | ||||||
| Receivable for Fund shares sold | — | 6,661 | ||||||
| Receivable from Investment Manager | 12,418 | — | ||||||
| Investments in Affiliated Funds — Trustees Deferred Compensation Plan (see Note 5) | 638 | 5,054 | ||||||
| Prepaid expenses and other assets | 34,298 | 32,774 | ||||||
Total Assets | 2,405,748 | 32,880,675 | ||||||
| Liabilities: | ||||||||
| Payable for investments purchased | — | 71,021 | ||||||
| Payable for Fund shares redeemed | — | 67,700 | ||||||
| Options written, at value | 7,060 | — | ||||||
| Investment management fees payable | — | 32,252 | ||||||
| Distribution fees payable | 174 | — | ||||||
| Servicing fees payable | 169 | 2,149 | ||||||
| Trustees Deferred Compensation Plan payable (see Note 5) | 638 | 5,054 | ||||||
| Accrued expenses and other liabilities | 43,066 | 77,912 | ||||||
Total Liabilities | 51,107 | 256,088 | ||||||
| Net Assets | $ | 2,354,641 | $ | 32,624,587 | ||||
| Net Assets Consist of: | ||||||||
| Paid-in-capital | $ | 2,618,699 | $ | 21,064,317 | ||||
| Undistributed (dividends in excess of) net investment income | 6,875 | (859,931 | ) | |||||
| Accumulated net realized gain (loss) | (751,301 | ) | 2,236,272 | |||||
| Net unrealized appreciation | 480,368 | 10,183,929 | ||||||
| Net Assets | $ | 2,354,641 | $ | 32,624,587 | ||||
| Cost of Investments | $ | 1,856,166 | $ | 22,532,530 | ||||
| Premiums Received for Options Written | $ | 8,561 | $ | — | ||||
| 210 | Semiannual Report | | March 31, 2018 | | See accompanying Notes to Financial Statements |
Table of Contents
| AllianzGI U.S. Equity Hedged | AllianzGI Ultra Micro Cap | |||||||
| Net Assets: | ||||||||
| Class A | $ | 518,760 | $ | 9,763,847 | ||||
| Class C | 261,616 | — | ||||||
| Class P | 13,958 | 4,099,725 | ||||||
| Institutional Class | 1,560,307 | 18,761,015 | ||||||
| Shares Issued and Outstanding: | ||||||||
| Class A | 29,505 | 545,339 | ||||||
| Class C | 15,516 | — | ||||||
| Class P | 805 | 224,190 | ||||||
| Institutional Class | 87,565 | 1,023,510 | ||||||
| Net Asset Value and Redemption Price Per Share:* | ||||||||
| Class A | $ | 17.58 | $ | 17.90 | ||||
| Class C | 16.86 | — | ||||||
| Class P | 17.34 | 18.29 | ||||||
| Institutional Class | 17.82 | 18.33 | ||||||
| * | Net asset value and redemption price per share may not recalculate exactly due to rounding. |
| See accompanying Notes to Financial Statements | | March 31, 2018 | | Semiannual Report | 211 |
Table of Contents
Six Months ended March 31, 2018 (Unaudited)
| AllianzGI Retirement 2020 | AllianzGI Retirement 2025 | AllianzGI Retirement 2030 | AllianzGI Retirement 2035 | AllianzGI Retirement 2040 | ||||||||||||||||||||
| Investment Income: | ||||||||||||||||||||||||
| Dividends from investments in Affiliates | $ | 794,336 | $ | 1,054,260 | $ | 1,338,084 | $ | 1,296,976 | $ | 1,355,222 | ||||||||||||||
| Dividends, net of foreign withholding taxes* | 49,781 | 5,405 | 125 | 181 | 200 | |||||||||||||||||||
| Contribution from Investment Manager (see Note 6) | 4,575 | 9,194 | 10,038 | 809 | — | |||||||||||||||||||
| Interest | 2,171 | 3,060 | 3,994 | 3,180 | 2,808 | |||||||||||||||||||
| Miscellaneous | 10 | 10 | 10 | 10 | 10 | |||||||||||||||||||
Total Investment Income | 850,873 | 1,071,929 | 1,352,251 | 1,301,156 | 1,358,240 | |||||||||||||||||||
| Expenses: | ||||||||||||||||||||||||
| Investment management | 13,268 | 16,400 | 18,682 | 15,023 | 13,970 | |||||||||||||||||||
| Administration | 40,978 | 45,231 | 51,871 | 44,434 | 35,207 | |||||||||||||||||||
| Distribution — Class C | 1,572 | — | 3,042 | — | 542 | |||||||||||||||||||
| Distribution — Class R | 94 | 284 | 609 | 895 | 476 | |||||||||||||||||||
| Servicing — Class A | 16,598 | 10,127 | 12,332 | 11,544 | 8,143 | |||||||||||||||||||
| Servicing — Class C | 524 | — | 1,014 | — | 181 | |||||||||||||||||||
| Servicing — Class R | 94 | 284 | 609 | 895 | 476 | |||||||||||||||||||
| Administrative servicing — Class P | — | — | — | — | — | |||||||||||||||||||
| Distribution and/or servicing — Administrative Class | 862 | 448 | 792 | 501 | 566 | |||||||||||||||||||
| Sub-transfer agent — Class A | — | — | — | — | — | |||||||||||||||||||
| Sub-transfer agent — Class C | — | — | — | — | — | |||||||||||||||||||
| Sub-transfer agent — Class R | — | — | — | — | — | |||||||||||||||||||
| Sub-transfer agent — Institutional Class | — | — | — | — | — | |||||||||||||||||||
| Line of credit commitment | 682 | 840 | 944 | 753 | 704 | |||||||||||||||||||
| Legal | 68 | 83 | 93 | 74 | 69 | |||||||||||||||||||
| Trustees | — | — | — | — | — | |||||||||||||||||||
| Custodian and accounting agent | — | — | — | — | — | |||||||||||||||||||
| Shareholder communications | — | — | — | — | — | |||||||||||||||||||
| Transfer agent | — | — | — | — | — | |||||||||||||||||||
| Insurance | — | — | — | — | — | |||||||||||||||||||
| Audit and tax services | — | — | — | — | — | |||||||||||||||||||
| Registration | — | — | — | — | — | |||||||||||||||||||
| Miscellaneous | 513 | 615 | 740 | 670 | 683 | |||||||||||||||||||
Total Expenses | 75,253 | 74,312 | 90,728 | 74,789 | 61,017 | |||||||||||||||||||
Less: Fee Waiver/Reimbursement from Investment Manager | (42,658 | ) | (57,874 | ) | (63,390 | ) | (37,604 | ) | (20,846 | ) | ||||||||||||||
Net Expenses | 32,595 | 16,438 | 27,338 | 37,185 | 40,171 | |||||||||||||||||||
| Net Investment Income | 818,278 | 1,055,491 | 1,324,913 | 1,263,971 | 1,318,069 | |||||||||||||||||||
| 212 | Semiannual Report | | March 31, 2018 | | See accompanying Notes to Financial Statements |
Table of Contents
| AllianzGI Retirement 2045 | AllianzGI Retirement 2050 | AllianzGI Retirement 2055 | AllianzGI Multi Asset Income | AllianzGI Global Allocation | AllianzGI Best Styles Emerging Markets Equity | AllianzGI Best Styles Global Equity | ||||||||||||||||||||||||
| $ | 888,484 | $ | 886,098 | $ | 427,297 | $ | 804,452 | $ | 7,871,515 | $ | — | $ | — | |||||||||||||||||
| 150 | 160 | 81 | 538,987 | 239,907 | 40,990 | 6,211,599 | ||||||||||||||||||||||||
| — | — | — | 993 | — | — | — | ||||||||||||||||||||||||
| 1,976 | 1,884 | 1,104 | 4,885 | 47,942 | 664 | 4,306 | ||||||||||||||||||||||||
| 10 | 10 | 10 | 10 | 10 | 10 | 11 | ||||||||||||||||||||||||
| 890,620 | 888,152 | 428,492 | 1,349,327 | 8,159,374 | 41,664 | 6,215,916 | ||||||||||||||||||||||||
| 8,716 | 8,523 | 4,123 | 12,368 | 1,261,653 | 14,541 | 929,945 | ||||||||||||||||||||||||
| 23,192 | 19,793 | 10,472 | 37,696 | — | — | — | ||||||||||||||||||||||||
| — | 680 | — | 13,261 | 127,547 | 197 | 279 | ||||||||||||||||||||||||
| 271 | 130 | 131 | 159 | 34 | — | — | ||||||||||||||||||||||||
| 6,039 | 4,357 | 2,830 | 12,955 | 58,322 | 216 | 1,823 | ||||||||||||||||||||||||
| — | 227 | — | 4,421 | 42,516 | 66 | 93 | ||||||||||||||||||||||||
| 271 | 130 | 131 | 159 | 34 | — | — | ||||||||||||||||||||||||
| — | — | — | — | 1,265 | 7 | 1,429 | ||||||||||||||||||||||||
| 747 | 1,072 | 468 | 1,769 | 34 | — | — | ||||||||||||||||||||||||
| — | — | — | — | 14,477 | 2 | 5,652 | ||||||||||||||||||||||||
| — | — | — | — | 10,427 | 8 | 11 | ||||||||||||||||||||||||
| — | — | — | — | 1 | — | — | ||||||||||||||||||||||||
| — | — | — | — | 30,752 | — | 728 | ||||||||||||||||||||||||
| 435 | 419 | 195 | 647 | 4,829 | 93 | 8,051 | ||||||||||||||||||||||||
| 43 | 41 | 18 | 65 | 16,092 | 7,279 | 28,675 | ||||||||||||||||||||||||
| — | — | — | — | 21,929 | 389 | 35,632 | ||||||||||||||||||||||||
| — | — | — | — | 27,510 | 49,510 | 269,022 | ||||||||||||||||||||||||
| — | — | — | — | 21,479 | 6,331 | 20,863 | ||||||||||||||||||||||||
| — | — | — | — | 36,610 | 2,646 | 14,904 | ||||||||||||||||||||||||
| — | — | — | — | 8,976 | 2,760 | 12,634 | ||||||||||||||||||||||||
| — | — | — | — | 20,889 | 20,225 | 18,365 | ||||||||||||||||||||||||
| — | — | — | — | 47,424 | 35,701 | 36,699 | ||||||||||||||||||||||||
| 472 | 474 | 158 | 1,170 | 8,693 | 2,455 | 8,168 | ||||||||||||||||||||||||
| 40,186 | 35,846 | 18,526 | 84,670 | 1,761,493 | 142,426 | 1,392,973 | ||||||||||||||||||||||||
| (6,418 | ) | (4,013 | ) | (2,081 | ) | (34,402 | ) | (965,128 | ) | (120,021 | ) | (139,727 | ) | |||||||||||||||||
| 33,768 | 31,833 | 16,445 | 50,268 | 796,365 | 22,405 | 1,253,246 | ||||||||||||||||||||||||
| 856,852 | 856,319 | 412,047 | 1,299,059 | 7,363,009 | 19,259 | 4,962,670 | ||||||||||||||||||||||||
| See accompanying Notes to Financial Statements | | March 31, 2018 | | Semiannual Report | 213 |
Table of Contents
Statements of Operations (cont’d)
Six Months ended March 31, 2018 (Unaudited)
| AllianzGI Retirement 2020 | AllianzGI Retirement 2025 | AllianzGI Retirement 2030 | AllianzGI Retirement 2035 | AllianzGI Retirement 2040 | ||||||||||||||||||||
| Realized and Change in Unrealized Gain (Loss): | ||||||||||||||||||||||||
| Net realized gain (loss) on: | ||||||||||||||||||||||||
Investments | $ | (69,187 | ) | $ | (14,364 | ) | $ | 11,740 | $ | 13,762 | $ | 16,923 | ||||||||||||
Investments in Affiliates | 156,607 | 154,218 | 47,336 | 2,950 | (25,170 | ) | ||||||||||||||||||
Futures contracts | (130,772 | ) | 305,741 | 370,647 | 310,585 | 328,550 | ||||||||||||||||||
Forward foreign currency contracts | — | — | — | — | — | |||||||||||||||||||
Foreign currency transactions | (718 | ) | (1,027 | ) | 540 | 5,630 | 5,858 | |||||||||||||||||
| Net capital gain distributions received from underlying Affiliated funds | 1,390,219 | 2,009,460 | 2,973,019 | 3,233,941 | 3,594,785 | |||||||||||||||||||
| Net capital gain distributions received from underlying funds | — | — | — | — | — | |||||||||||||||||||
| Net change in unrealized appreciation/depreciation of: | ||||||||||||||||||||||||
Investments | (43,454 | ) | 790 | (14,575 | ) | (19,084 | ) | (23,433 | ) | |||||||||||||||
Investments in Affiliates | (1,625,932 | ) | (1,998,464 | ) | (2,590,359 | ) | (2,844,767 | ) | (3,155,126 | ) | ||||||||||||||
Futures contracts | 13,945 | (190,739 | ) | (256,849 | ) | (230,579 | ) | (221,247 | ) | |||||||||||||||
Forward foreign currency contracts | — | — | — | — | — | |||||||||||||||||||
Foreign currency transactions | 748 | 465 | (3,057 | ) | 886 | 560 | ||||||||||||||||||
| Net realized and change in unrealized gain (loss) | (308,544 | ) | 266,080 | 538,442 | 473,324 | 521,700 | ||||||||||||||||||
| Net Increase (Decrease) in Net Assets Resulting from Investment Operations | $ | 509,734 | $ | 1,321,571 | $ | 1,863,355 | $ | 1,737,295 | $ | 1,839,769 | ||||||||||||||
| * Foreign withholding taxes | $ | — | $ | — | $ | — | $ | — | $ | — | ||||||||||||||
| 214 | Semiannual Report | | March 31, 2018 | | See accompanying Notes to Financial Statements |
Table of Contents
| AllianzGI Retirement 2045 | AllianzGI Retirement 2050 | AllianzGI Retirement 2055 | AllianzGI Multi Asset Income | AllianzGI Global Allocation | AllianzGI Best Styles Emerging Markets Equity | AllianzGI Best Styles Global Equity | ||||||||||||||||||||||||
| $ | 13,178 | $ | 12,641 | $ | 6,399 | $ | (860,506 | ) | $ | 33,540 | $ | 582,706 | $ | 32,327,559 | ||||||||||||||||
| (40,623 | ) | (38,792 | ) | (56,164 | ) | (44,097 | ) | 1,375,717 | — | — | ||||||||||||||||||||
| 188,589 | 198,628 | 99,779 | 420,210 | 3,371,899 | 24,949 | 285,255 | ||||||||||||||||||||||||
| — | — | — | 2,618 | — | (462 | ) | 28,331 | |||||||||||||||||||||||
| 3,513 | 4,195 | 2,052 | 3,415 | 24,486 | 5,630 | (125,317 | ) | |||||||||||||||||||||||
| | 2,415,540 | 2,433,934 | 1,177,491 | 35,581 | 17,757,144 | — | — | |||||||||||||||||||||||
| — | — | — | 44,501 | — | — | — | ||||||||||||||||||||||||
| (18,099 | ) | (17,037 | ) | (8,558 | ) | (522,403 | ) | (522,575 | ) | 47,347 | (18,018,121 | ) | ||||||||||||||||||
| (2,123,423 | ) | (2,169,021 | ) | (1,037,836 | ) | (861,397 | ) | �� | (20,815,363 | ) | — | — | ||||||||||||||||||
| (141,396 | ) | (143,040 | ) | (77,862 | ) | (210,291 | ) | (1,562,737 | ) | 6,292 | (54,669 | ) | ||||||||||||||||||
| — | — | — | — | — | — | 69 | ||||||||||||||||||||||||
| 1,037 | 239 | (2,398 | ) | (735 | ) | 1,425 | 6,849 | 9,538 | ||||||||||||||||||||||
| 298,316 | 281,747 | 102,903 | (1,993,104 | ) | (336,464 | ) | 673,311 | 14,452,645 | ||||||||||||||||||||||
| $ | 1,155,168 | $ | 1,138,066 | $ | 514,950 | $ | (694,045 | ) | $ | 7,026,545 | $ | 692,570 | $ | 19,415,315 | ||||||||||||||||
| $ | — | $ | — | $ | — | $ | 2,134 | $ | — | $ | 6,032 | $ | 392,123 | |||||||||||||||||
| See accompanying Notes to Financial Statements | | March 31, 2018 | | Semiannual Report | 215 |
Table of Contents
Statements of Operations (cont’d)
Six Months ended March 31, 2018 (Unaudited)
| AllianzGI Best Styles International Equity | AllianzGI Best Styles U.S. Equity | AllianzGI Convertible | AllianzGI Emerging Markets Consumer | AllianzGI Emerging Markets Debt | ||||||||||||||||||||
| Investment Income: | ||||||||||||||||||||||||
| Dividends, net of foreign withholding taxes* | $ | 266,354 | $ | 1,358,328 | $ | 1,688,578 | $ | 340,073 | $ | — | ||||||||||||||
| Dividends from investments in Affiliates | — | — | — | — | — | |||||||||||||||||||
| Interest, net of foreign withholding taxes* | 187 | 1,015 | 3,344,531 | 791 | 1,121,740 | |||||||||||||||||||
| Non-cash income | — | — | — | — | — | |||||||||||||||||||
| Miscellaneous | 10 | 10 | 10 | 10 | 10 | |||||||||||||||||||
Total Investment Income | 266,551 | 1,359,353 | 5,033,119 | 340,874 | 1,121,750 | |||||||||||||||||||
| Expenses: | ||||||||||||||||||||||||
| Investment management | 39,985 | 184,544 | 1,387,655 | 217,113 | 134,685 | |||||||||||||||||||
| Distribution — Class C | 473 | 109 | 175,139 | — | 423 | |||||||||||||||||||
| Distribution — Class R | — | — | 115 | — | — | |||||||||||||||||||
| Servicing — Class A | 598 | 139 | 86,439 | 202 | 198 | |||||||||||||||||||
| Servicing — Class C | 158 | 36 | 58,380 | — | 141 | |||||||||||||||||||
| Servicing — Class R | — | — | 115 | — | — | |||||||||||||||||||
| Administrative servicing — Class P | 5 | 53 | 20,511 | — | — | |||||||||||||||||||
| Distribution and/or servicing — Administrative Class | — | — | 1,222 | — | — | |||||||||||||||||||
| Sub-transfer agent — Class A | 49 | 274 | 30,119 | 5,936 | 50 | |||||||||||||||||||
| Sub-transfer agent — Class C | 30 | 4 | 18,759 | — | 20 | |||||||||||||||||||
| Sub-transfer agent — Class R | — | — | 101 | — | — | |||||||||||||||||||
| Sub-transfer agent — Institutional Class | — | — | 55,383 | 1,493 | 348 | |||||||||||||||||||
| Sub-transfer agent — Administrative Class | — | — | 45 | — | — | |||||||||||||||||||
| Custodian and accounting agent | 114,652 | 42,350 | 47,144 | 82,984 | 39,631 | |||||||||||||||||||
| Registration | 35,904 | 36,155 | 42,029 | 17,089 | 28,384 | |||||||||||||||||||
| Audit and tax services | 18,511 | 21,183 | 38,259 | 22,298 | 27,058 | |||||||||||||||||||
| Shareholder communications | 5,585 | 8,220 | 43,096 | 5,608 | 5,132 | |||||||||||||||||||
| Legal | 5,487 | 5,725 | 16,810 | 5,535 | 5,975 | |||||||||||||||||||
| Insurance | 3,322 | 4,539 | 14,349 | 3,383 | 3,365 | |||||||||||||||||||
| Transfer agent | 3,287 | 4,767 | 19,406 | 2,338 | 2,824 | |||||||||||||||||||
| Trustees | 1,645 | 6,537 | 28,662 | 2,331 | 2,084 | |||||||||||||||||||
| Line of credit commitment | 364 | 1,518 | 6,488 | 576 | 494 | |||||||||||||||||||
| Offering | — | — | — | — | — | |||||||||||||||||||
| Miscellaneous | 2,650 | 3,619 | 17,952 | 2,440 | 7,681 | |||||||||||||||||||
Total Expenses | 232,705 | 319,772 | 2,108,178 | 369,326 | 258,493 | |||||||||||||||||||
Less: Fee Waiver/Reimbursement from Investment Manager | (171,075 | ) | (71,596 | ) | — | (78,564 | ) | (84,047 | ) | |||||||||||||||
Net Expenses | 61,630 | 248,176 | 2,108,178 | 290,762 | 174,446 | |||||||||||||||||||
| Net Investment Income | 204,921 | 1,111,177 | 2,924,941 | 50,112 | 947,304 | |||||||||||||||||||
| 216 | Semiannual Report | | March 31, 2018 | | See accompanying Notes to Financial Statements |
Table of Contents
| AllianzGI Emerging Markets Small-Cap | AllianzGI Europe Equity Dividend | AllianzGI Global Dynamic Allocation | AllianzGI Global Fundamental Strategy | AllianzGI Global High Yield | AllianzGI Global Sustainability | AllianzGI Global Water | ||||||||||||||||||||||||
| $ | 95,954 | $ | 140,203 | $ | 2,096,581 | $ | 186,123 | $ | — | $ | 252,122 | $ | 3,970,837 | |||||||||||||||||
| — | — | — | 9,559 | — | — | — | ||||||||||||||||||||||||
| 70 | 94 | 887,786 | 175,315 | 564,918 | 702 | 13,844 | ||||||||||||||||||||||||
| — | 8,418 | — | — | — | — | — | ||||||||||||||||||||||||
| 10 | 10 | 10 | 20 | 2,198 | 10 | 10 | ||||||||||||||||||||||||
| 96,034 | 148,725 | 2,984,377 | 371,017 | 567,116 | 252,834 | 3,984,691 | ||||||||||||||||||||||||
| 69,097 | 37,279 | 998,785 | 63,923 | 65,482 | 113,591 | 3,132,208 | ||||||||||||||||||||||||
| — | 220 | 5,394 | 68 | — | — | 340,773 | ||||||||||||||||||||||||
| — | — | 182 | — | — | — | — | ||||||||||||||||||||||||
| 263 | 1,486 | 3,078 | 104 | — | 572 | 241,188 | ||||||||||||||||||||||||
| — | 73 | 1,798 | 23 | — | — | 113,591 | ||||||||||||||||||||||||
| — | — | 182 | — | — | — | — | ||||||||||||||||||||||||
| — | — | 6,579 | — | — | 14 | 83,076 | ||||||||||||||||||||||||
| — | — | 29 | — | — | — | — | ||||||||||||||||||||||||
| 5,987 | 506 | 1,291 | — | — | 5,936 | 82,782 | ||||||||||||||||||||||||
| — | 20 | 425 | 4 | — | — | 45,578 | ||||||||||||||||||||||||
| — | — | 158 | — | — | — | — | ||||||||||||||||||||||||
| 727 | 1,657 | 4,627 | 298 | — | 2,144 | 44,586 | ||||||||||||||||||||||||
| — | — | — | — | — | — | — | ||||||||||||||||||||||||
| 80,576 | 96,668 | 206,259 | 41,763 | 35,719 | 37,973 | 137,432 | ||||||||||||||||||||||||
| 16,900 | 28,047 | 48,181 | 28,815 | 5,451 | 23,257 | 36,332 | ||||||||||||||||||||||||
| 24,276 | 19,010 | 16,489 | 19,045 | 26,337 | 18,515 | 26,400 | ||||||||||||||||||||||||
| 5,172 | 5,341 | 13,399 | 5,568 | 5,975 | 5,920 | 64,983 | ||||||||||||||||||||||||
| 5,269 | 4,897 | 16,393 | 11,236 | 6,734 | 5,060 | 18,264 | ||||||||||||||||||||||||
| 2,879 | 2,760 | 6,579 | 2,948 | 3,017 | 3,131 | 10,650 | ||||||||||||||||||||||||
| 1,447 | 2,310 | 9,129 | 2,405 | 1,418 | 1,889 | 29,913 | ||||||||||||||||||||||||
| 657 | 458 | 14,688 | 903 | 1,122 | 1,432 | 33,344 | ||||||||||||||||||||||||
| 153 | 107 | 3,603 | 217 | 273 | 341 | 8,173 | ||||||||||||||||||||||||
| — | — | — | — | 56,246 | — | — | ||||||||||||||||||||||||
| 3,074 | 2,368 | 9,065 | 5,753 | 2,717 | 2,215 | 9,935 | ||||||||||||||||||||||||
| 216,477 | 203,207 | 1,366,313 | 183,073 | 210,491 | 221,990 | 4,459,208 | ||||||||||||||||||||||||
| | (129,504 | ) | (156,993 | ) | (346,046 | ) | (106,461 | ) | (133,228 | ) | (101,774 | ) | (725,354 | ) | ||||||||||||||||
| 86,973 | 46,214 | 1,020,267 | 76,612 | 77,263 | 120,216 | 3,733,854 | ||||||||||||||||||||||||
| 9,061 | 102,511 | 1,964,110 | 294,405 | 489,853 | 132,618 | 250,837 | ||||||||||||||||||||||||
| See accompanying Notes to Financial Statements | | March 31, 2018 | | Semiannual Report | 217 |
Table of Contents
Statements of Operations (cont’d)
Six Months ended March 31, 2018 (Unaudited)
| AllianzGI Best Styles International Equity | AllianzGI Best Styles U.S. Equity | AllianzGI Convertible | AllianzGI Emerging Markets Consumer | AllianzGI Emerging Markets Debt | ||||||||||||||||||||
| Realized and Change in Unrealized Gain (Loss): | ||||||||||||||||||||||||
| Net realized gain (loss) on: | ||||||||||||||||||||||||
Investments | $ | 1,135,677 | $ | 3,098,704 | $ | 37,764,482 | $ | 2,849,699 | $ | 161,759 | ||||||||||||||
Investments in Affiliates | — | — | — | — | — | |||||||||||||||||||
Futures contracts | — | 10,307 | — | — | 21,019 | |||||||||||||||||||
Options written | — | — | — | — | — | |||||||||||||||||||
Forward foreign currency contracts | (846 | ) | — | — | 23,470 | (79,744 | ) | |||||||||||||||||
Foreign currency transactions | 3,547 | (324 | ) | — | (24,252 | ) | 12,955 | |||||||||||||||||
| Net capital gain distributions received from underlying Affiliated funds | — | — | — | — | — | |||||||||||||||||||
| Net change in unrealized appreciation/depreciation of: | ||||||||||||||||||||||||
Investments | (436,661 | ) | 2,834,111 | (11,179,857 | ) | 750,905 | (1,015,792 | ) | ||||||||||||||||
Investments in Affiliates | — | — | — | — | — | |||||||||||||||||||
Futures contracts | — | 7,648 | — | — | — | |||||||||||||||||||
Options written | — | — | — | — | — | |||||||||||||||||||
Forward foreign currency contracts | (11 | ) | — | — | (144 | ) | 19,912 | |||||||||||||||||
Foreign currency transactions | 1,711 | (711 | ) | — | 3,802 | (4,103 | ) | |||||||||||||||||
| Net realized and change in unrealized gain (loss) | 703,417 | 5,949,735 | 26,584,625 | 3,603,480 | (883,994 | ) | ||||||||||||||||||
| Net Increase (Decrease) in Net Assets Resulting from Investment Operations | $ | 908,338 | $ | 7,060,912 | $ | 29,509,566 | $ | 3,653,592 | $ | 63,310 | ||||||||||||||
| * Foreign withholding taxes | $ | 27,569 | $ | 6,145 | $ | — | $ | 48,885 | $ | 2,932 | ||||||||||||||
| 218 | Semiannual Report | | March 31, 2018 | | See accompanying Notes to Financial Statements |
Table of Contents
| AllianzGI Emerging Markets Small-Cap | AllianzGI Europe Equity Dividend | AllianzGI Global Dynamic Allocation | AllianzGI Global Fundamental Strategy | AllianzGI Global High Yield | AllianzGI Global Sustainability | AllianzGI Global Water | ||||||||||||||||||||||||
| $ | 1,027,528 | $ | 138,725 | $ | 2,362,093 | $ | 372,235 | $ | 76,440 | $ | 374,440 | $ | 10,634,082 | |||||||||||||||||
| — | — | — | 73,598 | — | — | — | ||||||||||||||||||||||||
| — | — | 1,779,101 | (483,462 | ) | 9,664 | — | — | |||||||||||||||||||||||
| — | — | — | (98,111 | ) | — | — | — | |||||||||||||||||||||||
| 5,469 | — | 2,224 | (86,636 | ) | (325,906 | ) | 1,534 | (107,376 | ) | |||||||||||||||||||||
| (17,473 | ) | (2,687 | ) | 29,934 | 24,369 | 18,907 | (1,245 | ) | (112,057 | ) | ||||||||||||||||||||
| | — | — | — | 780 | — | — | — | |||||||||||||||||||||||
| (149,899 | ) | (334,252 | ) | (771,971 | ) | (542,662 | ) | (361,293 | ) | 752,592 | (7,642,927 | ) | ||||||||||||||||||
| — | — | — | (30,305 | ) | — | — | — | |||||||||||||||||||||||
| — | — | (868,478 | ) | 161,458 | (2,032 | ) | — | — | ||||||||||||||||||||||
| — | — | — | (2,625 | ) | — | — | — | |||||||||||||||||||||||
| — | (6 | ) | — | (75,738 | ) | 100,392 | — | (1,136 | ) | |||||||||||||||||||||
| 1,457 | (4,264 | ) | (4,909 | ) | (1,083 | ) | (5,618 | ) | 229 | 13,374 | ||||||||||||||||||||
| 867,082 | (202,484 | ) | 2,527,994 | (688,182 | ) | (489,446 | ) | 1,127,550 | 2,783,960 | |||||||||||||||||||||
| $ | 876,143 | $ | (99,973 | ) | $ | 4,492,104 | $ | (393,777 | ) | $ | 407 | $ | 1,260,168 | $ | 3,034,797 | |||||||||||||||
| $ | 12,184 | $ | 13,306 | $ | 100,425 | $ | 8,028 | $ | — | $ | 12,418 | $ | 194,377 | |||||||||||||||||
| See accompanying Notes to Financial Statements | | March 31, 2018 | | Semiannual Report | 219 |
Table of Contents
Statements of Operations (cont’d)
Period or Six Months ended March 31, 2018 (Unaudited)
| AllianzGI High Yield Bond | AllianzGI International Growth | AllianzGI International Small-Cap | AllianzGI Micro Cap | AllianzGI NFJ Emerging Markets Value | ||||||||||||||||||||
| Investment Income: | ||||||||||||||||||||||||
| Interest | $ | 7,168,557 | $ | 175 | $ | 6,134 | $ | 459 | $ | 3,484 | ||||||||||||||
| Dividends, net of foreign withholding taxes* | — | 80,581 | 701,151 | 32,797 | 988,019 | |||||||||||||||||||
| Miscellaneous | 9,063 | 10 | 10 | 10 | 10 | |||||||||||||||||||
Total Investment Income | 7,177,620 | 80,766 | 707,295 | 33,266 | 991,513 | |||||||||||||||||||
| Expenses: | ||||||||||||||||||||||||
| Investment management | 574,406 | 68,675 | 872,847 | 196,130 | 427,372 | |||||||||||||||||||
| Distribution — Class C | 40,816 | — | 12,097 | — | 2,892 | |||||||||||||||||||
| Distribution — Class R | 1,137 | — | 373 | — | — | |||||||||||||||||||
| Servicing — Class A | 56,719 | 195 | 9,555 | 3,489 | 42,259 | |||||||||||||||||||
| Servicing — Class C | 13,605 | — | 4,032 | — | 964 | |||||||||||||||||||
| Servicing — Class R | 1,137 | — | 373 | — | — | |||||||||||||||||||
| Administrative servicing — Class P | 6,222 | — | 14,815 | 717 | 9,540 | |||||||||||||||||||
| Distribution and/or servicing — Administrative Class | 1,505 | — | — | — | — | |||||||||||||||||||
| Sub-transfer agent — Class A | 44,912 | 13 | 7,597 | 1,388 | 7,273 | |||||||||||||||||||
| Sub-transfer agent — Class C | 4,897 | — | 950 | — | 208 | |||||||||||||||||||
| Sub-transfer agent — Class R | 2,101 | — | 133 | — | — | |||||||||||||||||||
| Sub-transfer agent — Institutional Class | 65,124 | 166 | 16,760 | 13,723 | 5,606 | |||||||||||||||||||
| Registration | 40,310 | 16,040 | 39,975 | 21,631 | 31,988 | |||||||||||||||||||
| Custodian and accounting agent | 39,286 | 43,065 | 114,743 | 30,392 | 258,147 | |||||||||||||||||||
| Audit and tax services | 26,582 | 18,901 | 21,042 | 19,201 | 35,700 | |||||||||||||||||||
| Shareholder communications | 21,800 | 5,669 | 9,162 | 5,534 | 9,249 | |||||||||||||||||||
| Trustees | 15,360 | 1,277 | 8,122 | 1,755 | 3,096 | |||||||||||||||||||
| Transfer agent | 15,139 | 1,534 | 9,024 | 3,264 | 3,430 | |||||||||||||||||||
| Legal | 11,557 | 5,318 | 9,487 | 4,283 | 5,915 | |||||||||||||||||||
| Insurance | 6,564 | 3,184 | 4,737 | 3,260 | 3,363 | |||||||||||||||||||
| Line of credit commitment | 3,228 | 270 | 2,025 | 400 | 962 | |||||||||||||||||||
| Excise tax | — | — | — | — | — | |||||||||||||||||||
| Organizational | — | — | — | — | — | |||||||||||||||||||
| Offering | — | — | — | — | — | |||||||||||||||||||
| Recoupment | — | — | — | — | — | |||||||||||||||||||
| Miscellaneous | 8,235 | 1,553 | 5,537 | 1,993 | 2,327 | |||||||||||||||||||
Total Expenses | 1,000,642 | 165,860 | 1,163,386 | 307,160 | 850,291 | |||||||||||||||||||
Less: Fee Waiver/Reimbursement from Investment Manager | — | (86,908 | ) | (207,005 | ) | (63,999 | ) | (345,900 | ) | |||||||||||||||
Net Expenses | 1,000,642 | 78,952 | 956,381 | 243,161 | 504,391 | |||||||||||||||||||
| Net Investment Income (Loss) | 6,176,978 | 1,814 | (249,086 | ) | (209,895 | ) | 487,122 | |||||||||||||||||
| † | The Fund’s financial statements are consolidated to include the accounts of AllianzGI PerformanceFee Managed Futures Strategy Offshore Fund, Ltd., which is a wholly-owned subsidiary of the Fund. See Note 14. |
| (1) | Commencement of operations was December 18, 2017. Information represents the period from December 18, 2017 through March 31, 2018. |
| (2) | Commencement of operations was December 27, 2017. Information represents the period from December 27, 2017 through March 31, 2018. |
| 220 | Semiannual Report | | March 31, 2018 | | See accompanying Notes to Financial Statements |
Table of Contents
| AllianzGI NFJ International Small-Cap Value | AllianzGI PerformanceFee Managed Futures Strategy †(1) | AllianzGI PerformanceFee Structured US Equity (1) | AllianzGI PerformanceFee Structured US Fixed Income (1) | AllianzGI Real Estate Debt (2) | AllianzGI Short Duration High Income | AllianzGI Structured Return | ||||||||||||||||||||||||
| $ | 74 | $ | 60,719 | $ | 159 | $ | 139 | $ | 56,491 | $ | 32,459,440 | $ | 69,285 | |||||||||||||||||
| 45,602 | 10,435 | 230,906 | 117,244 | — | — | 4,434,948 | ||||||||||||||||||||||||
| 10 | 10 | 133 | 67 | 10 | 687 | 19,481 | ||||||||||||||||||||||||
| 45,686 | 71,164 | 231,198 | 117,450 | 56,501 | 32,460,127 | 4,523,714 | ||||||||||||||||||||||||
| 18,373 | 31,954 | 42,791 | 20,821 | 11,622 | 3,284,350 | 1,738,590 | ||||||||||||||||||||||||
| 1,389 | — | — | — | — | 180,976 | 66,229 | ||||||||||||||||||||||||
| — | — | — | — | — | — | — | ||||||||||||||||||||||||
| 1,749 | — | — | — | — | 265,036 | 170,797 | ||||||||||||||||||||||||
| 463 | — | — | — | — | 180,976 | 22,077 | ||||||||||||||||||||||||
| — | — | — | — | — | — | — | ||||||||||||||||||||||||
| 14 | — | — | — | — | 228,344 | 48,620 | ||||||||||||||||||||||||
| — | — | — | — | — | — | — | ||||||||||||||||||||||||
| 6,195 | — | — | — | — | 74,658 | 55,289 | ||||||||||||||||||||||||
| 687 | — | — | — | — | 46,093 | 7,602 | ||||||||||||||||||||||||
| — | — | — | — | — | — | — | ||||||||||||||||||||||||
| 365 | — | — | — | — | 101,232 | 59,577 | ||||||||||||||||||||||||
| 34,392 | 887 | 887 | 887 | 2,276 | 64,924 | 53,570 | ||||||||||||||||||||||||
| 48,523 | 28,949 | 28,248 | 28,248 | 20,855 | 84,837 | 65,641 | ||||||||||||||||||||||||
| 16,437 | 18,430 | 13,707 | 13,013 | 17,011 | 19,769 | 18,044 | ||||||||||||||||||||||||
| 4,541 | 4,355 | 3,380 | 3,380 | 3,700 | 78,624 | 45,425 | ||||||||||||||||||||||||
| 262 | 4,527 | 790 | 790 | 323 | 83,678 | 27,699 | ||||||||||||||||||||||||
| 2,651 | 1,164 | 1,171 | 1,172 | 1,462 | 59,586 | 31,038 | ||||||||||||||||||||||||
| 4,263 | 4,268 | 4,268 | 4,268 | 2,341 | 41,900 | 37,899 | ||||||||||||||||||||||||
| 2,735 | — | — | — | — | 24,143 | 9,262 | ||||||||||||||||||||||||
| 57 | — | — | — | — | 19,559 | 7,024 | ||||||||||||||||||||||||
| — | 378 | 4,419 | 243 | — | — | — | ||||||||||||||||||||||||
| — | 165,000 | 77,500 | 77,500 | 75,000 | — | — | ||||||||||||||||||||||||
| — | 16,390 | 16,390 | 16,390 | 11,845 | — | — | ||||||||||||||||||||||||
| — | — | — | — | — | — | 1,437 | ||||||||||||||||||||||||
| 2,490 | 4,073 | 2,807 | 2,722 | 2,060 | 20,561 | 6,333 | ||||||||||||||||||||||||
| 145,586 | 280,375 | 196,358 | 169,434 | 148,495 | 4,859,246 | 2,472,153 | ||||||||||||||||||||||||
| | (119,973 | ) | (276,114 | ) | (191,844 | ) | (169,168 | ) | (133,513 | ) | — | (116,556 | ) | |||||||||||||||||
| 25,613 | 4,261 | 4,514 | 266 | 14,982 | 4,859,246 | 2,355,597 | ||||||||||||||||||||||||
| 20,073 | 66,903 | 226,684 | 117,184 | 41,519 | 27,600,881 | 2,168,117 | ||||||||||||||||||||||||
| See accompanying Notes to Financial Statements | | March 31, 2018 | | Semiannual Report | 221 |
Table of Contents
Statements of Operations (cont’d)
Period or Six Months ended March 31, 2018 (Unaudited)
| AllianzGI High Yield Bond | AllianzGI International Growth | AllianzGI International Small-Cap | AllianzGI Micro Cap | AllianzGI NFJ Emerging Markets Value | ||||||||||||||||||||
| Realized and Change in Unrealized Gain (Loss): | ||||||||||||||||||||||||
| Net realized gain (loss) on: | ||||||||||||||||||||||||
Investments | $ | 3,092,105 | $ | 175,123 | $ | 8,391,803 | $ | 2,819,951 | $ | 2,106,744 | ||||||||||||||
Futures contracts | — | — | — | — | — | |||||||||||||||||||
Options written | — | — | — | — | — | |||||||||||||||||||
Swaps | — | — | — | — | — | |||||||||||||||||||
Forward foreign currency contracts | — | (1,245 | ) | 57,243 | — | 16,427 | ||||||||||||||||||
Foreign currency transactions | — | 2,509 | (86,010 | ) | — | (117,554 | ) | |||||||||||||||||
| Net change in unrealized appreciation/depreciation of: | ||||||||||||||||||||||||
Investments | (13,010,990 | ) | 923,247 | 8,712,393 | (2,437,357 | ) | 4,106,569 | |||||||||||||||||
Futures contracts | — | — | — | — | — | |||||||||||||||||||
Options written | — | — | — | — | — | |||||||||||||||||||
Swaps | — | — | — | — | — | |||||||||||||||||||
Forward foreign currency contracts | — | 69 | 2,539 | — | 362 | |||||||||||||||||||
Foreign currency transactions | — | 614 | 6,254 | — | 2,851 | |||||||||||||||||||
| Net realized and change in unrealized gain (loss) | (9,918,885 | ) | 1,100,317 | 17,084,222 | 382,594 | 6,115,399 | ||||||||||||||||||
| Net Increase (Decrease) in Net Assets Resulting from Investment Operations | $ | (3,741,907 | ) | $ | 1,102,131 | $ | 16,835,136 | $ | 172,699 | $ | 6,602,521 | |||||||||||||
| * Foreign withholding taxes | $ | — | $ | 9,450 | $ | 64,122 | $ | — | $ | 134,081 | ||||||||||||||
| † | The Fund’s financial statements are consolidated to include the accounts of AllianzGI PerformanceFee Managed Futures Strategy Offshore Fund, Ltd., which is a wholly-owned subsidiary of the Fund. See Note 14. |
| (1) | Commencement of operations was December 18, 2017. Information represents the period from December 18, 2017 through March 31, 2018. |
| (2) | Commencement of operations was December 27, 2017. Information represents the period from December 27, 2017 through March 31, 2018. |
| 222 | Semiannual Report | | March 31, 2018 | | See accompanying Notes to Financial Statements |
Table of Contents
| AllianzGI NFJ International Small-Cap Value | AllianzGI PerformanceFee Managed Futures Strategy †(1) | AllianzGI PerformanceFee Structured US Equity (1) | AllianzGI PerformanceFee Structured US Fixed Income (1) | AllianzGI Real Estate Debt (2) | AllianzGI Short Duration High Income | AllianzGI Structured Return | ||||||||||||||||||||||||
| $ | 222,112 | $ | (42,065 | ) | $ | (388,340 | ) | $ | (230,545 | ) | $ | 5,695 | $ | 4,329,505 | $ | 70,764,064 | ||||||||||||||
| — | (488,493 | ) | — | — | — | — | 207,276 | |||||||||||||||||||||||
| — | — | 72,829 | 81,724 | — | — | (61,987,567 | ) | |||||||||||||||||||||||
| — | 8,313 | — | — | — | — | — | ||||||||||||||||||||||||
| (53 | ) | — | — | — | (72,898 | ) | — | — | ||||||||||||||||||||||
| (272 | ) | 8,060 | — | — | 7,301 | — | — | |||||||||||||||||||||||
| (132,127 | ) | (7,930 | ) | (603,115 | ) | (462,481 | ) | 45,158 | (23,492,169 | ) | (24,912,869 | ) | ||||||||||||||||||
| — | (27,095 | ) | — | — | (2,734 | ) | — | — | ||||||||||||||||||||||
| — | — | 89,780 | 38,588 | — | — | 4,975,449 | ||||||||||||||||||||||||
| — | (28,066 | ) | — | — | — | — | — | |||||||||||||||||||||||
| (1,186 | ) | — | — | — | 4,549 | — | — | |||||||||||||||||||||||
| 891 | 809 | — | — | 251 | — | — | ||||||||||||||||||||||||
| 89,365 | (576,467 | ) | (828,846 | ) | (572,714 | ) | (12,678 | ) | (19,162,664 | ) | (10,953,647 | ) | ||||||||||||||||||
| $ | 109,438 | $ | (509,564 | ) | $ | (602,162 | ) | $ | (455,530 | ) | $ | 28,841 | $ | 8,438,217 | $ | (8,785,530 | ) | |||||||||||||
| $ | 4,561 | $ | — | $ | — | $ | — | $ | — | $ | — | $ | — | |||||||||||||||||
| See accompanying Notes to Financial Statements | | March 31, 2018 | | Semiannual Report | 223 |
Table of Contents
Statements of Operations (cont’d)
Six Months ended March 31, 2018 (Unaudited)
| AllianzGI U.S. Equity Hedged | AllianzGI Ultra Micro Cap | |||||||
| Investment Income: | ||||||||
| Dividends | $ | 22,495 | $ | 34,704 | ||||
| Interest | 3 | 515 | ||||||
| Miscellaneous | 45 | 10 | ||||||
Total Investment Income | 22,543 | 35,229 | ||||||
| Expenses: | ||||||||
| Investment management | 9,006 | 260,703 | ||||||
| Distribution — Class C | 1,060 | — | ||||||
| Servicing — Class A | 697 | 13,818 | ||||||
| Servicing — Class C | 353 | — | ||||||
| Administrative servicing — Class P | 2 | 1,923 | ||||||
| Sub-transfer agent — Class A | 5,934 | 10,994 | ||||||
| Sub-transfer agent — Class C | 114 | — | ||||||
| Sub-transfer agent — Institutional Class | 878 | 9,968 | ||||||
| Custodian and accounting agent | 29,910 | 32,999 | ||||||
| Registration | 27,996 | 22,437 | ||||||
| Audit and tax services | 15,392 | 19,201 | ||||||
| Legal | 8,430 | 5,470 | ||||||
| Shareholder communications | 4,442 | 7,767 | ||||||
| Insurance | 2,691 | 3,345 | ||||||
| Transfer agent | 2,034 | 4,328 | ||||||
| Trustees | 177 | 1,988 | ||||||
| Line of credit commitment | 33 | 453 | ||||||
| Excise tax | — | 2,013 | ||||||
| Miscellaneous | 2,386 | 2,359 | ||||||
Total Expenses | 111,535 | 399,766 | ||||||
Less: Fee Waiver/Reimbursement from Investment Manager | (96,504 | ) | (53,819 | ) | ||||
Net Expenses | 15,031 | 345,947 | ||||||
| Net Investment Income (Loss) | 7,512 | (310,718 | ) | |||||
| Realized and Change in Unrealized Gain (Loss): | ||||||||
| Net realized gain (loss) on: | ||||||||
Investments | 134,583 | 3,152,444 | ||||||
Options written | (204,130 | ) | — | |||||
| Net change in unrealized appreciation/depreciation of: | ||||||||
Investments | 90,133 | (3,152,320 | ) | |||||
Options written | (9,103 | ) | — | |||||
| Net realized and change in unrealized gain | 11,483 | 124 | ||||||
| Net Increase (Decrease) in Net Assets Resulting from Investment Operations | $ | 18,995 | $ | (310,594 | ) | |||
| 224 | Semiannual Report | | March 31, 2018 | | See accompanying Notes to Financial Statements |
Table of Contents
(THIS PAGE INTENTIONALLY LEFT BLANK)
| See accompanying Notes to Financial Statements | | March 31, 2018 | | Semiannual Report | 225 |
Table of Contents
Statements of Changes in Net Assets
| AllianzGI Retirement 2020 | AllianzGI Retirement 2025 | |||||||||||||||||||
| Six Months ended March 31, 2018 (Unaudited) | Year ended September 30, 2017 | Six Months ended March 31, 2018 (Unaudited) | Year ended September 30, 2017 | |||||||||||||||||
| Increase (Decrease) in Net Assets from: | ||||||||||||||||||||
Investment Operations: | ||||||||||||||||||||
| Net investment income | $ | 818,278 | $ | 677,592 | $ | 1,055,491 | $ | 514,767 | ||||||||||||
| Net realized gain | 1,346,149 | 1,528,270 | 2,454,028 | 2,385,481 | ||||||||||||||||
| Net change in unrealized appreciation/depreciation | (1,654,693 | ) | 2,525,980 | (2,187,948 | ) | 4,005,924 | ||||||||||||||
| Net increase in net assets resulting from investment operations | 509,734 | 4,731,842 | 1,321,571 | 6,906,172 | ||||||||||||||||
| Dividends and Distributions to Shareholders from: | ||||||||||||||||||||
| Net investment income: | ||||||||||||||||||||
Class A | (429,547 | ) | (314,038 | ) | (265,118 | ) | (122,193 | ) | ||||||||||||
Class C | (9,782 | ) | (8,548 | ) | — | — | ||||||||||||||
Class R | (2,388 | ) | (9,351 | ) | (5,956 | ) | (18,282 | ) | ||||||||||||
Class P | (689,953 | ) | (724,018 | ) | (1,319,540 | ) | (951,555 | ) | ||||||||||||
Class R6 | (642,466 | ) | (368,801 | ) | (748,472 | ) | (348,228 | ) | ||||||||||||
Administrative Class | (21,720 | ) | (14,448 | ) | (8,971 | ) | (12,039 | ) | ||||||||||||
| Net realized capital gains: | ||||||||||||||||||||
Class A | — | — | (93,182 | ) | (5,755 | ) | ||||||||||||||
Class C | — | — | — | — | ||||||||||||||||
Class R | — | — | (2,604 | ) | (754 | ) | ||||||||||||||
Class P | — | — | (426,716 | ) | (30,725 | ) | ||||||||||||||
Class R6 | — | — | (240,362 | ) | (10,972 | ) | ||||||||||||||
Administrative Class | — | — | (3,437 | ) | (496 | ) | ||||||||||||||
| Total dividends and distributions to shareholders | (1,795,856 | ) | (1,439,204 | ) | (3,114,358 | ) | (1,500,999 | ) | ||||||||||||
| Fund Share Transactions: | ||||||||||||||||||||
| Net proceeds from the sale of shares | 5,693,450 | 13,960,071 | 5,245,503 | 17,262,317 | ||||||||||||||||
| Issued in reinvestment of dividends and distributions | 1,786,940 | 1,435,552 | 3,071,244 | 1,486,604 | ||||||||||||||||
| Cost of shares redeemed | (9,901,651 | ) | (19,103,594 | ) | (8,563,818 | ) | (13,632,799 | ) | ||||||||||||
| Net increase (decrease) from Fund share transactions | (2,421,261 | ) | (3,707,971 | ) | (247,071 | ) | 5,116,122 | |||||||||||||
| Total increase (decrease) in net assets | (3,707,383 | ) | (415,333 | ) | (2,039,858 | ) | 10,521,295 | |||||||||||||
| Net Assets: | ||||||||||||||||||||
| Beginning of period | 52,886,534 | 53,301,867 | 65,772,720 | 55,251,425 | ||||||||||||||||
| End of period* | $ | 49,179,151 | $ | 52,886,534 | $ | 63,732,862 | $ | 65,772,720 | ||||||||||||
* Including undistributed (dividends in excess of) net investment income of: | $ | (701,829 | ) | $ | 275,749 | $ | (1,192,006 | ) | $ | 100,560 | ||||||||||
| 226 | Semiannual Report | | March 31, 2018 | | See accompanying Notes to Financial Statements |
Table of Contents
| AllianzGI Retirement 2030 | AllianzGI Retirement 2035 | AllianzGI Retirement 2040 | ||||||||||||||||||||||||
| Six Months ended March 31, 2018 (Unaudited) | Year ended September 30, 2017 | Six Months ended March 31, 2018 (Unaudited) | Year ended September 30, 2017 | Six Months ended March 31, 2018 (Unaudited) | Year ended September 30, 2017 | |||||||||||||||||||||
| $ | 1,324,913 | $ | 420,535 | $ | 1,263,971 | $ | 458,050 | $ | 1,318,069 | $ | 469,488 | |||||||||||||||
| 3,403,282 | 2,619,216 | 3,566,868 | 1,847,947 | 3,920,946 | 1,400,334 | |||||||||||||||||||||
| (2,864,840 | ) | 5,993,521 | (3,093,544 | ) | 5,872,838 | (3,399,246 | ) | 6,096,844 | ||||||||||||||||||
| 1,863,355 | 9,033,272 | 1,737,295 | 8,178,835 | 1,839,769 | 7,966,666 | |||||||||||||||||||||
| (376,946 | ) | (128,753 | ) | (411,856 | ) | (167,435 | ) | (325,293 | ) | (72,361 | ) | |||||||||||||||
| (25,448 | ) | (9,739 | ) | — | — | (6,454 | ) | (1,802 | ) | |||||||||||||||||
| (16,572 | ) | (42,799 | ) | (29,228 | ) | (30,051 | ) | (17,560 | ) | (33,676 | ) | |||||||||||||||
| (1,570,040 | ) | (812,248 | ) | (1,627,325 | ) | (734,209 | ) | (1,347,233 | ) | (547,161 | ) | |||||||||||||||
| (1,034,346 | ) | (420,128 | ) | (809,649 | ) | (241,355 | ) | (1,298,750 | ) | (408,413 | ) | |||||||||||||||
| (17,872 | ) | (25,169 | ) | (11,447 | ) | (14,178 | ) | (22,531 | ) | (7,153 | ) | |||||||||||||||
| (138,007 | ) | (27,656 | ) | (111,637 | ) | (43,348 | ) | (56,377 | ) | (72,948 | ) | |||||||||||||||
| (11,486 | ) | (2,597 | ) | — | — | (1,296 | ) | (2,318 | ) | |||||||||||||||||
| (7,361 | ) | (8,838 | ) | (8,810 | ) | (8,219 | ) | (3,589 | ) | (30,988 | ) | |||||||||||||||
| (537,211 | ) | (126,596 | ) | (415,098 | ) | (149,417 | ) | (222,482 | ) | (388,536 | ) | |||||||||||||||
| (351,127 | ) | (63,529 | ) | (202,496 | ) | (46,996 | ) | (210,722 | ) | (280,126 | ) | |||||||||||||||
| (7,203 | ) | (4,716 | ) | (3,486 | ) | (3,283 | ) | (3,880 | ) | (6,053 | ) | |||||||||||||||
| (4,093,619 | ) | (1,672,768 | ) | (3,631,032 | ) | (1,438,491 | ) | (3,516,167 | ) | (1,851,535 | ) | |||||||||||||||
| 7,589,354 | 19,651,781 | 5,680,087 | 14,086,259 | 4,575,369 | 15,052,248 | |||||||||||||||||||||
| 4,047,095 | 1,653,530 | 3,582,038 | 1,421,045 | 3,407,291 | 1,838,433 | |||||||||||||||||||||
| (8,889,244 | ) | (17,363,253 | ) | (5,772,128 | ) | (14,404,979 | ) | (7,523,923 | ) | (10,458,454 | ) | |||||||||||||||
| 2,747,205 | 3,942,058 | 3,489,997 | 1,102,325 | 458,737 | 6,432,227 | |||||||||||||||||||||
| 516,941 | 11,302,562 | 1,596,260 | 7,842,669 | (1,217,661 | ) | 12,547,358 | ||||||||||||||||||||
| 73,403,006 | 62,100,444 | 58,489,018 | 50,646,349 | 55,241,855 | 42,694,497 | |||||||||||||||||||||
| $ | 73,919,947 | $ | 73,403,006 | $ | 60,085,278 | $ | 58,489,018 | $ | 54,024,194 | $ | 55,241,855 | |||||||||||||||
| $ | (1,733,354 | ) | $ | (17,043 | ) | $ | (1,666,434 | ) | $ | (40,900 | ) | $ | (1,750,865 | ) | $ | (51,113 | ) | |||||||||
| See accompanying Notes to Financial Statements | | March 31, 2018 | | Semiannual Report | 227 |
Table of Contents
Statements of Changes in Net Assets (cont’d)
| AllianzGI Retirement 2045 | AllianzGI Retirement 2050 | |||||||||||||||||||
| Six Months ended March 31, 2018 (Unaudited) | Year ended September 30, 2017 | Six Months ended March 31, 2018 (Unaudited) | Year ended September 30, 2017 | |||||||||||||||||
| Increase (Decrease) in Net Assets from: | ||||||||||||||||||||
Investment Operations: | ||||||||||||||||||||
| Net investment income | $ | 856,852 | $ | 294,229 | $ | 856,319 | $ | 292,375 | ||||||||||||
| Net realized gain (loss) | 2,580,197 | 884,214 | 2,610,606 | 737,298 | ||||||||||||||||
| Net change in unrealized appreciation/depreciation | (2,281,881 | ) | 3,865,175 | (2,328,859 | ) | 3,915,169 | ||||||||||||||
| Net increase (decrease) in net assets resulting from investment operations | 1,155,168 | 5,043,618 | 1,138,066 | 4,944,842 | ||||||||||||||||
| Dividends and Distributions to Shareholders from: | ||||||||||||||||||||
| Net investment income: | ||||||||||||||||||||
Class A | (254,165 | ) | (66,804 | ) | (176,735 | ) | (38,744 | ) | ||||||||||||
Class C | — | — | (8,975 | ) | (2,598 | ) | ||||||||||||||
Class R | (10,769 | ) | (13,061 | ) | (4,528 | ) | (16,335 | ) | ||||||||||||
Class P | (904,187 | ) | (339,225 | ) | (727,423 | ) | (288,099 | ) | ||||||||||||
Institutional Class | — | — | — | — | ||||||||||||||||
Class R6 | (765,942 | ) | (221,167 | ) | (993,958 | ) | (298,199 | ) | ||||||||||||
Administrative Class | (30,818 | ) | (13,206 | ) | (47,281 | ) | (15,717 | ) | ||||||||||||
| Net realized capital gains: | ||||||||||||||||||||
Class A | (33,656 | ) | (106,108 | ) | (28,008 | ) | (48,414 | ) | ||||||||||||
Class C | — | — | (1,614 | ) | (4,166 | ) | ||||||||||||||
Class R | (1,567 | ) | (19,230 | ) | (900 | ) | (21,175 | ) | ||||||||||||
Class P | (113,942 | ) | (390,158 | ) | (108,978 | ) | (291,835 | ) | ||||||||||||
Institutional Class | — | — | — | — | ||||||||||||||||
Class R6 | (94,904 | ) | (243,478 | ) | (146,497 | ) | (291,783 | ) | ||||||||||||
Administrative Class | (4,100 | ) | (15,955 | ) | (7,361 | ) | (17,726 | ) | ||||||||||||
| Total dividends and distributions to shareholders | (2,214,050 | ) | (1,428,392 | ) | (2,252,258 | ) | (1,334,791 | ) | ||||||||||||
| Fund Share Transactions: | ||||||||||||||||||||
| Net proceeds from the sale of shares | 3,680,233 | 9,936,787 | 4,413,298 | 10,942,394 | ||||||||||||||||
| Issued in reinvestment of dividends and distributions | 2,198,799 | 1,426,631 | 2,245,722 | 1,332,075 | ||||||||||||||||
| Cost of shares redeemed | (3,761,917 | ) | (6,681,204 | ) | (3,841,677 | ) | (6,977,683 | ) | ||||||||||||
| Net increase (decrease) from Fund share transactions | 2,117,115 | 4,682,214 | 2,817,343 | 5,296,786 | ||||||||||||||||
| Total increase (decrease) in net assets | 1,058,233 | 8,297,440 | 1,703,151 | 8,906,837 | ||||||||||||||||
| Net Assets: | ||||||||||||||||||||
| Beginning of period | 33,717,332 | 25,419,892 | 32,616,712 | 23,709,875 | ||||||||||||||||
| End of period* | $ | 34,775,565 | $ | 33,717,332 | $ | 34,319,863 | $ | 32,616,712 | ||||||||||||
* Including undistributed (dividends in excess of) net investment income of: | $ | (1,147,359 | ) | $ | (38,330 | ) | $ | (1,139,269 | ) | $ | (36,688 | ) | ||||||||
| 228 | Semiannual Report | | March 31, 2018 | | See accompanying Notes to Financial Statements |
Table of Contents
| AllianzGI Retirement 2055 | AllianzGI Multi Asset Income | AllianzGI Global Allocation | ||||||||||||||||||||||||
| Six Months ended March 31, 2018 (Unaudited) | Year ended September 30, 2017 | Six Months ended March 31, 2018 (Unaudited) | Year ended September 30, 2017 | Six Months ended March 31, 2018 (Unaudited) | Year ended September 30, 2017 | |||||||||||||||||||||
| $ | 412,047 | $ | 99,776 | $ | 1,299,059 | $ | 2,731,650 | $ | 7,363,009 | $ | 8,696,193 | |||||||||||||||
| 1,229,557 | 357,084 | (398,278 | ) | 1,085,399 | 22,562,786 | 23,385,340 | ||||||||||||||||||||
| (1,126,654 | ) | 1,557,701 | (1,594,826 | ) | (459,088 | ) | (22,899,250 | ) | 19,235,026 | |||||||||||||||||
| 514,950 | 2,014,561 | (694,045 | ) | 3,357,961 | 7,026,545 | 51,316,559 | ||||||||||||||||||||
| (120,244 | ) | (20,979 | ) | (329,359 | ) | (464,817 | ) | (1,975,707 | ) | (814,701 | ) | |||||||||||||||
| — | — | (98,256 | ) | (109,153 | ) | (1,113,566 | ) | (342,699 | ) | |||||||||||||||||
| (4,957 | ) | (6,391 | ) | (3,581 | ) | (8,919 | ) | (1,145 | ) | (362 | ) | |||||||||||||||
| (381,688 | ) | (91,959 | ) | (463,836 | ) | (802,502 | ) | (166,705 | ) | (66,393 | ) | |||||||||||||||
| — | — | (193 | ) | — | (211,167 | ) | (1,517,436 | ) | ||||||||||||||||||
| (420,410 | ) | (79,203 | ) | (674,992 | ) | (1,059,163 | ) | (12,431,160 | ) | (8,106,799 | ) | |||||||||||||||
| (20,338 | ) | (6,244 | ) | (44,138 | ) | (64,921 | ) | (1,133 | ) | (499 | ) | |||||||||||||||
| (12,344 | ) | (23,081 | ) | (132,625 | ) | (51,561 | ) | (2,428,368 | ) | — | ||||||||||||||||
| — | — | (44,503 | ) | (16,672 | ) | (1,816,068 | ) | — | ||||||||||||||||||
| (583 | ) | (7,752 | ) | (1,491 | ) | (2,534 | ) | (1,420 | ) | — | ||||||||||||||||
| (37,447 | ) | (84,131 | ) | (180,106 | ) | (86,955 | ) | (187,713 | ) | — | ||||||||||||||||
| — | — | — | — | (367,350 | ) | — | ||||||||||||||||||||
| (40,646 | ) | (70,689 | ) | (259,862 | ) | (96,314 | ) | (14,074,804 | ) | — | ||||||||||||||||
| (2,098 | ) | (6,450 | ) | (19,159 | ) | (4,003 | ) | (1,361 | ) | — | ||||||||||||||||
| (1,040,755 | ) | (396,879 | ) | (2,252,101 | ) | (2,767,514 | ) | (34,777,667 | ) | (10,848,889 | ) | |||||||||||||||
| 4,414,017 | 7,237,690 | 5,684,790 | 13,306,288 | 131,234,910 | 125,983,370 | |||||||||||||||||||||
| 1,036,298 | 395,033 | 2,225,016 | 2,736,065 | 33,440,281 | 10,623,150 | |||||||||||||||||||||
| (2,043,515 | ) | (2,665,826 | ) | (7,945,991 | ) | (17,509,593 | ) | (136,906,413 | ) | (314,160,178 | ) | |||||||||||||||
| 3,406,800 | 4,966,897 | (36,185 | ) | (1,467,240 | ) | 27,768,778 | (177,553,658 | ) | ||||||||||||||||||
| 2,880,995 | 6,584,579 | (2,982,331 | ) | (876,793 | ) | 17,656 | (137,085,988 | ) | ||||||||||||||||||
| 14,707,326 | 8,122,747 | 50,213,305 | 51,090,098 | 356,579,263 | 493,665,251 | |||||||||||||||||||||
| $ | 17,588,321 | $ | 14,707,326 | $ | 47,230,974 | $ | 50,213,305 | $ | 356,596,919 | $ | 356,579,263 | |||||||||||||||
| $ | (551,720 | ) | $ | (16,130 | ) | $ | 57,317 | $ | 372,613 | $ | (8,197,783 | ) | $ | 339,791 | ||||||||||||
| See accompanying Notes to Financial Statements | | March 31, 2018 | | Semiannual Report | 229 |
Table of Contents
Statements of Changes in Net Assets (cont’d)
AllianzGI Best Styles Emerging Markets Equity | AllianzGI Best Styles Global Equity | |||||||||||||||||||
| Six Months ended March 31, 2018 (Unaudited) | Year ended September 30, 2017 | Six Months ended March 31, 2018 (Unaudited) | Year ended September 30, 2017 | |||||||||||||||||
| Increase (Decrease) in Net Assets from: | ||||||||||||||||||||
Investment Operations: | ||||||||||||||||||||
| Net investment income | $ | 19,259 | $ | 124,266 | $ | 4,962,670 | $ | 15,589,126 | ||||||||||||
| Net realized gain | 612,823 | 758,254 | 32,515,828 | 61,691,991 | ||||||||||||||||
| Net change in unrealized appreciation/depreciation | 60,488 | 405,955 | (18,063,183 | ) | 62,269,728 | |||||||||||||||
Net increase in net assets resulting from investment operations | 692,570 | 1,288,475 | 19,415,315 | 139,550,845 | ||||||||||||||||
| Dividends and Distributions to Shareholders from: | ||||||||||||||||||||
| Net investment income: | ||||||||||||||||||||
Class A | (3,065 | ) | (652 | ) | (47,878 | ) | — | # | ||||||||||||
Class C | (728 | ) | (747 | ) | (1,723 | ) | (119 | ) | ||||||||||||
Class R | — | — | — | — | ||||||||||||||||
Class P | (742 | ) | (580 | ) | (98,193 | ) | (44,546 | ) | ||||||||||||
Institutional Class | (1,450 | ) | (590 | ) | (84,016 | ) | (36,578 | ) | ||||||||||||
Class R6 | (137,439 | ) | (307,036 | ) | (20,163,132 | ) | (11,674,739 | ) | ||||||||||||
Administrative Class | — | — | — | — | ||||||||||||||||
| Net realized capital gains: | ||||||||||||||||||||
Class A | — | — | (146,104 | ) | (8,143 | ) | ||||||||||||||
Class C | — | — | (5,864 | ) | (64 | ) | ||||||||||||||
Class R | — | — | — | — | ||||||||||||||||
Class P | — | — | (294,525 | ) | (18,098 | ) | ||||||||||||||
Institutional Class | — | — | (240,948 | ) | (13,368 | ) | ||||||||||||||
Class R6 | — | — | (59,212,379 | ) | (4,047,266 | ) | ||||||||||||||
Administrative Class | — | — | — | — | ||||||||||||||||
| Total dividends and distributions to shareholders | (143,424 | ) | (309,605 | ) | (80,294,762 | ) | (15,842,921 | ) | ||||||||||||
| Fund Share Transactions: | ||||||||||||||||||||
| Net proceeds from the sale of shares | 789,258 | 1,004,077 | 88,250,311 | 241,623,115 | ||||||||||||||||
| Issued in reinvestment of dividends and distributions | 143,204 | 309,605 | 80,186,951 | 15,823,164 | ||||||||||||||||
| Cost of shares redeemed | (1,819,469 | ) | (7,583,407 | ) | (87,410,696 | ) | (381,516,959 | ) | ||||||||||||
| Net increase (decrease) from Fund share transactions | (887,007 | ) | (6,269,725 | ) | 81,026,566 | (124,070,680 | ) | |||||||||||||
| Total increase (decrease) in net assets | (337,861 | ) | (5,290,855 | ) | 20,147,119 | (362,756 | ) | |||||||||||||
| Net Assets: | ||||||||||||||||||||
| Beginning of period | 7,194,969 | 12,485,824 | 601,211,412 | 601,574,168 | ||||||||||||||||
| End of period* | $ | 6,857,108 | $ | 7,194,969 | $ | 621,358,531 | $ | 601,211,412 | ||||||||||||
* Including undistributed (dividends in excess of) net investment income of: | $ | (22,060 | ) | $ | 102,105 | $ | 215,187 | $ | 15,647,459 | |||||||||||
| # | Actual amount rounds to less than $1. |
| 230 | Semiannual Report | | March 31, 2018 | | See accompanying Notes to Financial Statements |
Table of Contents
AllianzGI Best Styles International Equity | AllianzGI Best Styles U.S. Equity | AllianzGI Convertible | ||||||||||||||||||||||||
| Six Months ended March 31, 2018 (Unaudited) | Year ended September 30, 2017 | Six Months ended March 31, 2018 (Unaudited) | Year ended September 30, 2017 | Six Months ended March 31, 2018 (Unaudited) | Year ended September 30, 2017 | |||||||||||||||||||||
| $ | 204,921 | $ | 831,211 | $ | 1,111,177 | $ | 1,972,846 | $ | 2,924,941 | $ | 16,495,219 | |||||||||||||||
| 1,138,378 | 1,114,879 | 3,108,687 | 6,912,312 | 37,764,482 | 225,191,544 | |||||||||||||||||||||
| (434,961 | ) | 4,666,207 | 2,841,048 | 12,166,518 | (11,179,857 | ) | (99,079,360 | ) | ||||||||||||||||||
| 908,338 | 6,612,297 | 7,060,912 | 21,051,676 | 29,509,566 | 142,607,403 | |||||||||||||||||||||
| (19,333 | ) | (1,126 | ) | (695 | ) | (7,605 | ) | (2,310,876 | ) | (3,826,287 | ) | |||||||||||||||
| (4,603 | ) | (1,403 | ) | (477 | ) | (148 | ) | (1,311,553 | ) | (1,127,814 | ) | |||||||||||||||
| — | — | — | — | (20 | ) | (16,881 | ) | |||||||||||||||||||
| (5,511 | ) | (898 | ) | (9,438 | ) | (820 | ) | (3,394,622 | ) | (2,494,302 | ) | |||||||||||||||
| (4,124 | ) | (3,340 | ) | (2,215 | ) | (1,298 | ) | (9,421,131 | ) | (27,101,588 | ) | |||||||||||||||
| (1,061,586 | ) | (2,758,648 | ) | (2,170,496 | ) | (1,625,434 | ) | — | — | |||||||||||||||||
| — | — | — | — | (34,024 | ) | (38,602 | ) | |||||||||||||||||||
| — | — | (4,673 | ) | — | (10,075,757 | ) | — | |||||||||||||||||||
| — | — | (1,495 | ) | — | (6,889,990 | ) | — | |||||||||||||||||||
| — | — | — | — | (13,642 | ) | — | ||||||||||||||||||||
| — | — | (21,694 | ) | — | (11,775,650 | ) | — | |||||||||||||||||||
| — | — | (5,451 | ) | — | (41,936,097 | ) | — | |||||||||||||||||||
| — | — | (5,229,407 | ) | — | — | — | ||||||||||||||||||||
| — | — | — | — | (136,134 | ) | — | ||||||||||||||||||||
| (1,095,157 | ) | (2,765,415 | ) | (7,446,041 | ) | (1,635,305 | ) | (87,299,496 | ) | (34,605,474 | ) | |||||||||||||||
| 2,966,698 | 6,699,316 | 10,847,604 | 68,128,385 | 44,787,355 | 68,306,058 | |||||||||||||||||||||
| 1,094,713 | 2,765,415 | 7,445,631 | 1,634,905 | 81,944,701 | 17,841,764 | |||||||||||||||||||||
| (3,739,945 | ) | (57,968,959 | ) | (5,363,805 | ) | (76,517,718 | ) | (126,524,932 | ) | (1,172,762,231 | ) | |||||||||||||||
| 321,466 | (48,504,228 | ) | 12,929,430 | (6,754,428 | ) | 207,124 | (1,086,614,409 | ) | ||||||||||||||||||
| 134,647 | (44,657,346 | ) | 12,544,301 | 12,661,943 | (57,582,806 | ) | (978,612,480 | ) | ||||||||||||||||||
| 26,504,123 | 71,161,469 | 113,736,838 | 101,074,895 | 529,968,636 | 1,508,581,116 | |||||||||||||||||||||
| $ | 26,638,770 | $ | 26,504,123 | $ | 126,281,139 | $ | 113,736,838 | $ | 472,385,830 | $ | 529,968,636 | |||||||||||||||
| $ | (41,942 | ) | $ | 848,294 | $ | 593,335 | $ | 1,665,479 | $ | (899,082 | ) | $ | 12,648,203 | |||||||||||||
| See accompanying Notes to Financial Statements | | March 31, 2018 | | Semiannual Report | 231 |
Table of Contents
Statements of Changes in Net Assets (cont’d)
| AllianzGI Emerging Markets Consumer | AllianzGI Emerging Markets Debt | |||||||||||||||||||
| Six Months ended March 31, 2018 (Unaudited) | Year ended September 30, 2017 | Six Months ended March 31, 2018 (Unaudited) | Year ended September 30, 2017 | |||||||||||||||||
| Increase (Decrease) in Net Assets from: | ||||||||||||||||||||
Investment Operations: | ||||||||||||||||||||
| Net investment income | $ | 50,112 | $ | 617,137 | $ | 947,304 | $ | 2,205,009 | ||||||||||||
| Net realized gain (loss) | 2,848,917 | 2,951,588 | 115,989 | 1,722,429 | ||||||||||||||||
| Net change in unrealized appreciation/depreciation | 754,563 | 2,781,594 | (999,983 | ) | (1,398,893 | ) | ||||||||||||||
Net increase (decrease) in net assets resulting from investment operations | 3,653,592 | 6,350,319 | 63,310 | 2,528,545 | ||||||||||||||||
| Dividends and Distributions to Shareholders from: | ||||||||||||||||||||
| Net investment income: | ||||||||||||||||||||
Class A | (2,687 | ) | (441 | ) | (3,710 | ) | (7,943 | ) | ||||||||||||
Class C | — | — | (1,701 | ) | (5,583 | ) | ||||||||||||||
Class R | — | — | — | — | ||||||||||||||||
Class P | — | — | (304 | ) | (725 | ) | ||||||||||||||
Institutional Class | (615,766 | ) | (458,572 | ) | (919,457 | ) | (2,628,852 | ) | ||||||||||||
Class R6 | — | — | — | — | ||||||||||||||||
Administrative Class | — | — | — | — | ||||||||||||||||
| Net realized capital gains: | ||||||||||||||||||||
Class A | (6,222 | ) | — | (1,002 | ) | (139 | ) | |||||||||||||
Class C | — | — | (797 | ) | (114 | ) | ||||||||||||||
Class R | — | — | — | — | ||||||||||||||||
Class P | — | — | (82 | ) | (12 | ) | ||||||||||||||
Institutional Class | (1,582,936 | ) | — | (266,499 | ) | (36,925 | ) | |||||||||||||
Class R6 | — | — | — | — | ||||||||||||||||
Administrative Class | — | — | — | — | ||||||||||||||||
| Total dividends and distributions to shareholders | (2,207,611 | ) | (459,013 | ) | (1,193,552 | ) | (2,680,293 | ) | ||||||||||||
| Fund Share Transactions: | ||||||||||||||||||||
| Net proceeds from the sale of shares | 11,039,590 | 9,259,598 | 3,053,171 | 5,965,805 | ||||||||||||||||
| Issued in reinvestment of dividends and distributions | 1,373,524 | 306,003 | 1,193,066 | 2,679,340 | ||||||||||||||||
| Cost of shares redeemed | (5,726,199 | ) | (16,493,497 | ) | (6,889,075 | ) | (15,528,516 | ) | ||||||||||||
| Net increase (decrease) from Fund share transactions | 6,686,915 | (6,927,896 | ) | (2,642,838 | ) | (6,883,371 | ) | |||||||||||||
| Total increase (decrease) in net assets | 8,132,896 | (1,036,590 | ) | (3,773,080 | ) | (7,035,119 | ) | |||||||||||||
| Net Assets: | ||||||||||||||||||||
| Beginning of period | 43,641,642 | 44,678,232 | 36,577,826 | 43,612,945 | ||||||||||||||||
| End of period* | $ | 51,774,538 | $ | 43,641,642 | $ | 32,804,746 | $ | 36,577,826 | ||||||||||||
* Including undistributed (dividends in excess of) net investment income of: | $ | 20,947 | $ | 589,288 | $ | (110,642 | ) | $ | (132,774 | ) | ||||||||||
| # | Actual amount rounds to less than $1. |
| 232 | Semiannual Report | | March 31, 2018 | | See accompanying Notes to Financial Statements |
Table of Contents
AllianzGI Emerging Markets Small-Cap | AllianzGI Europe Equity Dividend | AllianzGI Global Dynamic Allocation | ||||||||||||||||||||||||
| Six Months ended March 31, 2018 (Unaudited) | Year ended September 30, 2017 | Six Months ended March 31, 2018 (Unaudited) | Year ended September 30, 2017 | Six Months ended March 31, 2018 (Unaudited) | Year ended September 30, 2017 | |||||||||||||||||||||
| $ | 9,061 | $ | 186,581 | $ | 102,511 | $ | 251,344 | $ | 1,964,110 | $ | 3,697,905 | |||||||||||||||
| 1,015,524 | 1,743,176 | 136,038 | (33,022 | ) | 4,173,352 | 9,548,039 | ||||||||||||||||||||
| (148,442 | ) | 614,855 | (338,522 | ) | 933,032 | (1,645,358 | ) | 18,097,162 | ||||||||||||||||||
| 876,143 | 2,544,612 | (99,973 | ) | 1,151,354 | 4,492,104 | 31,343,106 | ||||||||||||||||||||
| (9,888 | ) | — | # | (26,604 | ) | (24,388 | ) | (24,659 | ) | (2 | ) | |||||||||||||||
| — | — | (809 | ) | (1,227 | ) | (14,067 | ) | (2 | ) | |||||||||||||||||
| — | — | — | — | (1,182 | ) | — | # | |||||||||||||||||||
| — | — | (3,278 | ) | (1,844 | ) | (196,920 | ) | (58,830 | ) | |||||||||||||||||
| (467,711 | ) | (364,501 | ) | (174,800 | ) | (222,697 | ) | (505,218 | ) | (21,336 | ) | |||||||||||||||
| — | — | — | — | (3,914,489 | ) | (887,497 | ) | |||||||||||||||||||
| — | — | — | — | (309 | ) | — | # | |||||||||||||||||||
| (5,443 | ) | — | — | — | (84,389 | ) | — | |||||||||||||||||||
| — | — | — | — | (51,999 | ) | — | ||||||||||||||||||||
| — | — | — | — | (5,028 | ) | — | ||||||||||||||||||||
| — | — | — | — | (445,085 | ) | — | ||||||||||||||||||||
| (290,538 | ) | — | — | — | (1,127,734 | ) | — | |||||||||||||||||||
| — | — | — | — | (8,240,789 | ) | — | ||||||||||||||||||||
| — | — | — | — | (790 | ) | — | ||||||||||||||||||||
| (773,580 | ) | (364,501 | ) | (205,491 | ) | (250,156 | ) | (14,612,658 | ) | (967,667 | ) | |||||||||||||||
| 1,082,354 | 1,310,369 | 487,423 | 5,123,521 | 16,225,906 | 248,412,748 | |||||||||||||||||||||
| 773,580 | 364,501 | 205,491 | 250,156 | 14,610,041 | 967,667 | |||||||||||||||||||||
| (2,252,089 | ) | (5,834,176 | ) | (2,395,607 | ) | (2,285,342 | ) | (20,938,887 | ) | (53,095,861 | ) | |||||||||||||||
| (396,155 | ) | (4,159,306 | ) | (1,702,693 | ) | 3,088,335 | 9,897,060 | 196,284,554 | ||||||||||||||||||
| (293,592 | ) | (1,979,195 | ) | (2,008,157 | ) | 3,989,533 | (223,494 | ) | 226,659,993 | |||||||||||||||||
| 11,455,115 | 13,434,310 | 10,336,645 | 6,347,112 | 280,003,186 | 53,343,193 | |||||||||||||||||||||
| $ | 11,161,523 | $ | 11,455,115 | $ | 8,328,488 | $ | 10,336,645 | $ | 279,779,692 | $ | 280,003,186 | |||||||||||||||
| $ | (134,933 | ) | $ | 333,605 | $ | 14 | $ | 102,994 | $ | 450,379 | $ | 3,143,113 | ||||||||||||||
| See accompanying Notes to Financial Statements | | March 31, 2018 | | Semiannual Report | 233 |
Table of Contents
Statements of Changes in Net Assets (cont’d)
| AllianzGI Global Fundamental Strategy | AllianzGI Global High Yield | |||||||||||||||||||
| Six Months ended March 31, 2018 (Unaudited) | Year ended September 30, 2017 | Six Months ended March 31, 2018 (Unaudited) | Period from through | |||||||||||||||||
| Increase (Decrease) in Net Assets from: | ||||||||||||||||||||
Investment Operations: | ||||||||||||||||||||
| Net investment income | $ | 294,405 | $ | 379,654 | $ | 489,853 | $ | 360,997 | ||||||||||||
| Net realized gain (loss) | (197,227 | ) | 291,985 | (220,895 | ) | (224,870 | ) | |||||||||||||
| Net change in unrealized appreciation/depreciation | (490,955 | ) | 533,098 | (268,551 | ) | 459,540 | ||||||||||||||
Net increase (decrease) in net assets resulting from investment operations | (393,777 | ) | 1,204,737 | 407 | 595,667 | |||||||||||||||
| Dividends and Distributions to Shareholders from: | ||||||||||||||||||||
| Net investment income: | ||||||||||||||||||||
Class A | (590 | ) | (3,055 | ) | — | — | ||||||||||||||
Class C | (31 | ) | (267 | ) | — | — | ||||||||||||||
Class R | — | — | — | — | ||||||||||||||||
Class P | (93 | ) | (271 | ) | (203 | ) | (51 | ) | ||||||||||||
Institutional Class | (146,618 | ) | (365,717 | ) | (445,413 | ) | (117,951 | ) | ||||||||||||
Administrative Class | — | — | — | — | ||||||||||||||||
| Net realized capital gains: | ||||||||||||||||||||
Class A | (1,784 | ) | (1,806 | ) | — | — | ||||||||||||||
Class C | (385 | ) | (182 | ) | — | — | ||||||||||||||
Class P | (251 | ) | (146 | ) | — | — | ||||||||||||||
Institutional Class | (352,785 | ) | (206,259 | ) | — | — | ||||||||||||||
| Total dividends and distributions to shareholders | (502,537 | ) | (577,703 | ) | (445,616 | ) | (118,002 | ) | ||||||||||||
| Fund Share Transactions: | ||||||||||||||||||||
| Net proceeds from the sale of shares | 418,974 | 188,345 | 649,537 | 1,029,723 | ||||||||||||||||
| Issued in reinvestment of dividends and distributions | 502,537 | 577,703 | 445,616 | 118,002 | ||||||||||||||||
| Cost of shares redeemed | (124,686 | ) | (319,255 | ) | (37,323 | ) | — | |||||||||||||
| Net increase (decrease) from Fund share transactions | 796,825 | 446,793 | 1,057,830 | 1,147,725 | ||||||||||||||||
| Total increase (decrease) in net assets | (99,489 | ) | 1,073,827 | 612,621 | 1,625,390 | |||||||||||||||
| Net Assets: | ||||||||||||||||||||
| Beginning of period | 17,074,388 | 16,000,561 | 21,635,390 | 20,010,000 | ||||||||||||||||
| End of period* | $ | 16,974,899 | $ | 17,074,388 | $ | 22,248,011 | $ | 21,635,390 | ||||||||||||
* Including undistributed (dividends in excess of) net investment income of: | $ | (372,131 | ) | $ | (519,204 | ) | $ | 140,758 | $ | 96,521 | ||||||||||
| ** | Commencement of operations. |
| 234 | Semiannual Report | | March 31, 2018 | | See accompanying Notes to Financial Statements |
Table of Contents
AllianzGI Global Sustainability | AllianzGI Global Water | AllianzGI High Yield Bond | ||||||||||||||||||||||||
Six Months ended | Year ended September 30, 2017 | Six Months ended March 31, 2018 (Unaudited) | Year ended September 30, 2017 | Six Months ended March 31, 2018 (Unaudited) | Year ended September 30, 2017 | |||||||||||||||||||||
| $ | 132,618 | $ | 278,971 | $ | 250,837 | $ | 3,968,672 | $ | 6,176,978 | $ | 18,226,931 | |||||||||||||||
| 374,729 | 664,724 | 10,414,649 | 16,185,686 | 3,092,105 | 1,718,603 | |||||||||||||||||||||
| 752,821 | 2,748,428 | (7,630,689 | ) | 28,457,574 | (13,010,990 | ) | 5,111,712 | |||||||||||||||||||
| 1,260,168 | 3,692,123 | 3,034,797 | 48,611,932 | (3,741,907 | ) | 25,057,246 | ||||||||||||||||||||
| (5,086 | ) | (1,050 | ) | (498,672 | ) | (789,589 | ) | (1,122,846 | ) | (3,041,549 | ) | |||||||||||||||
| — | — | (61 | ) | (64 | ) | (236,932 | ) | (603,972 | ) | |||||||||||||||||
| — | — | — | — | (20,978 | ) | (63,000 | ) | |||||||||||||||||||
| (726 | ) | (86 | ) | (1,808,809 | ) | (754,192 | ) | (797,349 | ) | (2,935,892 | ) | |||||||||||||||
| (279,480 | ) | (232,687 | ) | (1,381,477 | ) | (626,991 | ) | (4,213,060 | ) | (12,336,030 | ) | |||||||||||||||
| — | — | — | — | (33,806 | ) | (100,961 | ) | |||||||||||||||||||
| (10,836 | ) | (240 | ) | (4,581,284 | ) | (1,387,866 | ) | — | — | |||||||||||||||||
| — | — | (2,305,128 | ) | (545,689 | ) | — | — | |||||||||||||||||||
| (1,497 | ) | (20 | ) | (5,384,582 | ) | (783,556 | ) | — | — | |||||||||||||||||
| (649,089 | ) | (45,540 | ) | (3,686,101 | ) | (456,756 | ) | — | — | |||||||||||||||||
| (946,714 | ) | (279,623 | ) | (19,646,114 | ) | (5,344,703 | ) | (6,424,971 | ) | (19,081,404 | ) | |||||||||||||||
| 1,434,862 | 6,773,635 | 99,547,105 | 277,825,094 | 36,779,208 | 170,359,810 | |||||||||||||||||||||
| 946,714 | 279,623 | 15,686,646 | 4,160,836 | 5,958,977 | 18,212,460 | |||||||||||||||||||||
| (680,307 | ) | (4,130,560 | ) | (67,011,040 | ) | (216,105,791 | ) | (87,213,456 | ) | (291,550,996 | ) | |||||||||||||||
| 1,701,269 | 2,922,698 | 48,222,711 | 65,880,139 | (44,475,271 | ) | (102,978,726 | ) | |||||||||||||||||||
| 2,014,723 | 6,335,198 | 31,611,394 | 109,147,368 | (54,642,149 | ) | (97,002,884 | ) | |||||||||||||||||||
| 27,081,337 | 20,746,139 | 633,042,226 | 523,894,858 | 263,738,852 | 360,741,736 | |||||||||||||||||||||
| $ | 29,096,060 | $ | 27,081,337 | $ | 664,653,620 | $ | 633,042,226 | $ | 209,096,703 | $ | 263,738,852 | |||||||||||||||
| $ | 107,491 | $ | 260,165 | $ | 47,286 | $ | 3,485,468 | $ | (1,081,593 | ) | $ | (833,600 | ) | |||||||||||||
| See accompanying Notes to Financial Statements | | March 31, 2018 | | Semiannual Report | 235 |
Table of Contents
Statements of Changes in Net Assets (cont’d)
AllianzGI International Growth | AllianzGI International Small-Cap | |||||||||||||||||||
| Six Months ended March 31, 2018 (Unaudited) | Year ended September 30, 2017 | Six Months ended March 31, 2018 (Unaudited) | Year ended September 30, 2017 | |||||||||||||||||
| Increase (Decrease) in Net Assets from: | ||||||||||||||||||||
Investment Operations: | ||||||||||||||||||||
| Net investment income (loss) | $ | 1,814 | $ | 136,923 | $ | (249,086 | ) | $ | 713,604 | |||||||||||
| Net realized gain | 176,387 | 2,290,578 | 8,363,036 | 6,210,831 | ||||||||||||||||
| Net change in unrealized appreciation/depreciation | 923,930 | 3,097,495 | 8,721,186 | 18,195,669 | ||||||||||||||||
| Net increase in net assets resulting from investment operations | 1,102,131 | 5,524,996 | 16,835,136 | 25,120,104 | ||||||||||||||||
| Dividends and Distributions to Shareholders from: | ||||||||||||||||||||
| Net investment income: | ||||||||||||||||||||
Class A | (2,843 | ) | (1 | ) | (38,693 | ) | (80,265 | ) | ||||||||||||
Class C | — | — | (7,053 | ) | (18,676 | ) | ||||||||||||||
Class R | — | — | (3,390 | ) | (1,374 | ) | ||||||||||||||
Class P | — | — | (673,499 | ) | (403,029 | ) | ||||||||||||||
Institutional Class | (113,272 | ) | (29,197 | ) | (814,972 | ) | (225,723 | ) | ||||||||||||
Class R6 | — | — | (462,006 | ) | (147,555 | ) | ||||||||||||||
| Net realized capital gains: | ||||||||||||||||||||
Class A | (21,356 | ) | — | (106,972 | ) | — | ||||||||||||||
Class C | — | — | (49,125 | ) | — | |||||||||||||||
Class R | — | — | (4,527 | ) | — | |||||||||||||||
Class P | — | — | (950,784 | ) | — | |||||||||||||||
Institutional Class | (2,191,171 | ) | — | (1,011,463 | ) | — | ||||||||||||||
Class R6 | — | — | (495,127 | ) | — | |||||||||||||||
| Total dividends and distributions to shareholders | (2,328,642 | ) | (29,198 | ) | (4,617,611 | ) | (876,622 | ) | ||||||||||||
| Fund Share Transactions: | ||||||||||||||||||||
| Net proceeds from the sale of shares | 1,755,278 | 381,263 | 44,216,926 | 62,753,688 | ||||||||||||||||
| Issued in reinvestment of dividends and distributions | 2,328,642 | 29,198 | 4,554,911 | 846,217 | ||||||||||||||||
| Cost of shares redeemed | (1,394,783 | ) | (15,688,736 | ) | (21,789,377 | ) | (38,748,657 | ) | ||||||||||||
| Net increase (decrease) from Fund share transactions | 2,689,137 | (15,278,275 | ) | 26,982,460 | 24,851,248 | |||||||||||||||
| Total increase (decrease) in net assets | 1,462,626 | (9,782,477 | ) | 39,199,985 | 49,094,730 | |||||||||||||||
| Net Assets: | ||||||||||||||||||||
| Beginning of period | 18,654,440 | 28,436,917 | 150,728,959 | 101,634,229 | ||||||||||||||||
| End of period* | $ | 20,117,066 | $ | 18,654,440 | $ | 189,928,944 | $ | 150,728,959 | ||||||||||||
* Including undistributed (dividends in excess of) net investment income of: | $ | (13,662 | ) | $ | 100,639 | $ | (1,733,909 | ) | $ | 514,790 | ||||||||||
| 236 | Semiannual Report | | March 31, 2018 | | See accompanying Notes to Financial Statements |
Table of Contents
| AllianzGI Micro Cap | AllianzGI NFJ Emerging Markets Value | AllianzGI NFJ International Small-Cap Value | ||||||||||||||||||||||||
| Six Months ended March 31, 2018 (Unaudited) | Year ended September 30, 2017 | Six Months ended March 31, 2018 (Unaudited) | Year ended September 30, 2017 | Six Months ended March 31, 2018 (Unaudited) | Year ended September 30, 2017 | |||||||||||||||||||||
| $ | (209,895 | ) | $ | (413,520 | ) | $ | 487,122 | $ | 833,737 | $ | 20,073 | $ | 82,270 | |||||||||||||
| 2,819,951 | 4,445,191 | 2,005,617 | 2,010,346 | 221,787 | 190,218 | |||||||||||||||||||||
| (2,437,357 | ) | 1,839,617 | 4,109,782 | 3,462,798 | (132,422 | ) | 274,913 | |||||||||||||||||||
| 172,699 | 5,871,288 | 6,602,521 | 6,306,881 | 109,438 | 547,401 | |||||||||||||||||||||
| — | — | (280,087 | ) | (140,853 | ) | (27,432 | ) | (52,747 | ) | |||||||||||||||||
| — | — | (2 | ) | (3,055 | ) | (1 | ) | (47,236 | ) | |||||||||||||||||
| — | — | — | — | — | — | |||||||||||||||||||||
| — | — | (84,584 | ) | (401,473 | ) | (1,130 | ) | (4,723 | ) | |||||||||||||||||
| — | — | (387,365 | ) | (373,904 | ) | (48,804 | ) | (86,365 | ) | |||||||||||||||||
| — | — | — | — | (16,040 | ) | (123,590 | ) | |||||||||||||||||||
| (154,402 | ) | (308,525 | ) | (108,232 | ) | — | — | — | ||||||||||||||||||
| — | — | (2,326 | ) | — | — | — | ||||||||||||||||||||
| — | — | — | — | — | — | |||||||||||||||||||||
| (79,191 | ) | (116,680 | ) | (77,312 | ) | — | — | — | ||||||||||||||||||
| (1,524,827 | ) | (2,920,919 | ) | (155,046 | ) | — | — | — | ||||||||||||||||||
| — | — | — | — | — | — | |||||||||||||||||||||
| (1,758,420 | ) | (3,346,124 | ) | (1,094,954 | ) | (919,285 | ) | (93,407 | ) | (314,661 | ) | |||||||||||||||
| 2,712,207 | 6,704,989 | 93,512,686 | 79,864,675 | 620,196 | 1,304,594 | |||||||||||||||||||||
| 1,752,466 | 3,336,639 | 1,091,984 | 919,174 | 92,630 | 313,688 | |||||||||||||||||||||
| (9,915,895 | ) | (15,428,523 | ) | (20,076,526 | ) | (29,037,849 | ) | (1,224,746 | ) | (9,209,506 | ) | |||||||||||||||
| (5,451,222 | ) | (5,386,895 | ) | 74,528,144 | 51,746,000 | (511,920 | ) | (7,591,224 | ) | |||||||||||||||||
| (7,036,943 | ) | (2,861,731 | ) | 80,035,711 | 57,133,596 | (495,889 | ) | (7,358,484 | ) | |||||||||||||||||
| 32,583,099 | 35,444,830 | 65,896,336 | 8,762,740 | 4,591,657 | 11,950,141 | |||||||||||||||||||||
| $ | 25,546,156 | $ | 32,583,099 | $ | 145,932,047 | $ | 65,896,336 | $ | 4,095,768 | $ | 4,591,657 | |||||||||||||||
| $ | (530,234 | ) | $ | (320,339 | ) | $ | (77,856 | ) | $ | 187,060 | $ | (27,394 | ) | $ | 45,940 | |||||||||||
| See accompanying Notes to Financial Statements | | March 31, 2018 | | Semiannual Report | 237 |
Table of Contents
Statements of Changes in Net Assets (cont’d)
AllianzGI PerformanceFee Managed Futures Strategy† | AllianzGI PerformanceFee Structured US Equity | |||||||||||||||
Period from through March 31, 2018 | Period from March 31, 2018 | |||||||||||||||
| Increase (Decrease) in Net Assets from: | ||||||||||||||||
Investment Operations: | ||||||||||||||||
| Net investment income | $ | 66,903 | $ | 226,684 | ||||||||||||
| Net realized gain (loss) | (514,185 | ) | (315,511 | ) | ||||||||||||
| Net change in unrealized appreciation/depreciation | (62,282 | ) | (513,335 | ) | ||||||||||||
Net increase (decrease) in net assets resulting from investment operations | (509,564 | ) | (602,162 | ) | ||||||||||||
| Dividends to Shareholders from: | ||||||||||||||||
| Net investment income: | ||||||||||||||||
Class A | — | — | ||||||||||||||
Class C | — | — | ||||||||||||||
Class P | — | — | ||||||||||||||
Institutional Class | — | — | ||||||||||||||
Class R6 | — | — | ||||||||||||||
| Total dividends to shareholders | — | — | ||||||||||||||
| Fund Share Transactions: | ||||||||||||||||
| Net proceeds from the sale of shares | 15,748,304 | 325,332 | ||||||||||||||
| Issued in reinvestment of dividends | — | — | ||||||||||||||
| Cost of shares redeemed | — | — | ||||||||||||||
| Net increase (decrease) from Fund share transactions | 15,748,304 | 325,332 | ||||||||||||||
| Total increase (decrease) in net assets | 15,238,740 | (276,830 | ) | |||||||||||||
| Net Assets: | ||||||||||||||||
| Beginning of period | 50,000 | 25,000,000 | ||||||||||||||
| End of period* | $ | 15,288,740 | $ | 24,723,170 | ||||||||||||
* Including undistributed (dividends in excess of) net investment income of: | $ | 66,903 | $ | 226,684 | ||||||||||||
| † | The Fund’s financial statements are consolidated to include the accounts of AllianzGI PerformanceFee Managed Futures Strategy Offshore Fund, Ltd., which is a wholly-owned subsidiary of the Fund. See Note 14. |
| ** | Commencement of operations. |
| 238 | Semiannual Report | | March 31, 2018 | | See accompanying Notes to Financial Statements |
Table of Contents
AllianzGI PerformanceFee Structured US Fixed Income | AllianzGI Real Estate Debt | AllianzGI Short Duration High Income | ||||||||||||||||
Period from through March 31, 2018 | Period from through March 31, 2018 | Six Months ended March 31, 2018 (Unaudited) | Year ended September 30, 2017 | |||||||||||||||
| $ | 117,184 | $ | 41,519 | $ | 27,600,881 | $ | 64,867,227 | |||||||||||
| (148,821 | ) | (59,902 | ) | 4,329,505 | 2,643,778 | |||||||||||||
| (423,893 | ) | 47,224 | (23,492,169 | ) | 2,238,404 | |||||||||||||
| (455,530 | ) | 28,841 | 8,438,217 | 69,749,409 | ||||||||||||||
| — | — | (4,983,758 | ) | (10,760,253 | ) | |||||||||||||
| — | — | (3,239,990 | ) | (6,804,346 | ) | |||||||||||||
| — | (41 | ) | (11,069,346 | ) | (36,952,063 | ) | ||||||||||||
| — | (43,961 | ) | (12,531,101 | ) | (23,289,155 | ) | ||||||||||||
| — | — | (1,390,486 | ) | (2,094,252 | ) | |||||||||||||
| — | (44,002 | ) | (33,214,681 | ) | (79,900,069 | ) | ||||||||||||
| 49,559 | 47,925 | 274,512,230 | 1,246,095,121 | |||||||||||||||
| — | 44,002 | 28,945,363 | 70,636,506 | |||||||||||||||
| — | — | (753,651,044 | ) | (963,151,673 | ) | |||||||||||||
| 49,559 | 91,927 | (450,193,451 | ) | 353,579,954 | ||||||||||||||
| (405,971 | ) | 76,766 | (474,969,915 | ) | 343,429,294 | |||||||||||||
| 25,000,000 | 10,010,000 | 1,676,947,953 | 1,333,518,659 | |||||||||||||||
| $ | 24,594,029 | $ | 10,086,766 | $ | 1,201,978,038 | $ | 1,676,947,953 | |||||||||||
| $ | 117,184 | $ | (2,483 | ) | $ | (13,227,232 | ) | $ | (7,613,432 | ) | ||||||||
| See accompanying Notes to Financial Statements | | March 31, 2018 | | Semiannual Report | 239 |
Table of Contents
Statements of Changes in Net Assets (cont’d)
| AllianzGI Structured Return | AllianzGI U.S. Equity Hedged | |||||||||||||||||||
| Six Months ended March 31, 2018 (Unaudited) | Year ended September 30, 2017 | Six Months ended March 31, 2018 (Unaudited) | Year ended September 30, 2017 | |||||||||||||||||
| Increase (Decrease) in Net Assets from: | ||||||||||||||||||||
Investment Operations: | ||||||||||||||||||||
| Net investment income (loss) | $ | 2,168,117 | $ | 3,156,737 | $ | 7,512 | $ | 31,993 | ||||||||||||
| Net realized gain (loss) | 8,983,773 | 13,597,189 | (69,547 | ) | 82,203 | |||||||||||||||
| Net change in unrealized appreciation/depreciation | (19,937,420 | ) | 4,469,662 | 81,030 | 339,772 | |||||||||||||||
Net increase (decrease) in net assets resulting from investment operations | (8,785,530 | ) | 21,223,588 | 18,995 | 453,968 | |||||||||||||||
| Dividends and Distributions to Shareholders from: | ||||||||||||||||||||
| Net investment income: | ||||||||||||||||||||
Class A | (905,338 | ) | (451,149 | ) | (8,868 | ) | (8,563 | ) | ||||||||||||
Class C | (11 | ) | (9 | ) | (3,555 | ) | (2,502 | ) | ||||||||||||
Class P | (1,388,484 | ) | (255,992 | ) | (409 | ) | (428 | ) | ||||||||||||
Institutional Class | (2,212,374 | ) | (445,419 | ) | (19,371 | ) | (46,862 | ) | ||||||||||||
Class R6 | (264,046 | ) | (430,190 | ) | — | — | ||||||||||||||
| Net realized capital gains: | ||||||||||||||||||||
Class A | (4,555,468 | ) | (2,431,302 | ) | — | — | ||||||||||||||
Class C | (575,053 | ) | (318,922 | ) | — | — | ||||||||||||||
Class P | (4,777,171 | ) | (667,014 | ) | — | — | ||||||||||||||
Institutional Class | (7,439,086 | ) | (2,447,379 | ) | — | — | ||||||||||||||
Class R6 | (1,103,918 | ) | (836,738 | ) | — | — | ||||||||||||||
| Total dividends and distributions to shareholders | (23,220,949 | ) | (8,284,114 | ) | (32,203 | ) | (58,355 | ) | ||||||||||||
| Fund Share Transactions: | ||||||||||||||||||||
| Net proceeds from the sale of shares | 213,740,493 | 403,391,041 | 339,891 | 390,793 | ||||||||||||||||
| Issued in reinvestment of dividends and distributions | 23,050,742 | 8,240,525 | 32,203 | 58,355 | ||||||||||||||||
| Cost of shares redeemed | (127,565,416 | ) | (172,783,052 | ) | (588,313 | ) | (3,912,329 | ) | ||||||||||||
| Net increase (decrease) from Fund share transactions | 109,225,819 | 238,848,514 | (216,219 | ) | (3,463,181 | ) | ||||||||||||||
| Total increase (decrease) in net assets | 77,219,340 | 251,787,988 | (229,427 | ) | (3,067,568 | ) | ||||||||||||||
| Net Assets: | ||||||||||||||||||||
| Beginning of period | 528,121,267 | 276,333,279 | 2,584,068 | 5,651,636 | ||||||||||||||||
| End of period* | $ | 605,340,607 | $ | 528,121,267 | $ | 2,354,641 | $ | 2,584,068 | ||||||||||||
* Including undistributed (dividends in excess of) net investment income of: | $ | 400,948 | $ | 3,003,084 | $ | 6,875 | $ | 31,566 | ||||||||||||
| 240 | Semiannual Report | | March 31, 2018 | | See accompanying Notes to Financial Statements |
Table of Contents
| AllianzGI Ultra Micro Cap | ||||||||||
| Six Months ended March 31, 2018 (unaudited) | Year ended September 30, 2017 | |||||||||
| $ | (310,718 | ) | $ | (730,174 | ) | |||||
| 3,152,444 | 8,438,404 | |||||||||
| (3,152,320 | ) | (1,019,739 | ) | |||||||
| (310,594 | ) | 6,688,491 | ||||||||
| — | — | |||||||||
| — | — | |||||||||
| — | — | |||||||||
| — | — | |||||||||
| — | — | |||||||||
| (2,712,561 | ) | (1,391,792 | ) | |||||||
| — | — | |||||||||
| (922,434 | ) | (447,225 | ) | |||||||
| (4,891,933 | ) | (1,792,480 | ) | |||||||
| — | — | |||||||||
| (8,526,928 | ) | (3,631,497 | ) | |||||||
| 4,001,333 | 6,945,592 | |||||||||
| 8,438,235 | 3,563,191 | |||||||||
| (8,994,110 | ) | (23,708,498 | ) | |||||||
| 3,445,458 | (13,199,715 | ) | ||||||||
| (5,392,064 | ) | (10,142,721 | ) | |||||||
| 38,016,651 | 48,159,372 | |||||||||
| $ | 32,624,587 | $ | 38,016,651 | |||||||
| $ | (859,931 | ) | $ | (549,213 | ) | |||||
| See accompanying Notes to Financial Statements | | March 31, 2018 | | Semiannual Report | 241 |
Table of Contents
For a Share Outstanding for the Period ended:
| Net Asset Value, Beginning of Period | Net Investment Income (a) | and Change in Unrealized Gain (Loss) | Total from Investment Operations | Dividends from Net Investment Income | Distributions from Net Realized Capital Gains | |||||||||||||||||||||||
| AllianzGI Retirement 2020: | ||||||||||||||||||||||||||||
| Class A | ||||||||||||||||||||||||||||
3/31/2018+ | $ | 20.42 | $ | 0.29 | $ | (0.12 | ) | $ | 0.17 | $ | (0.65 | ) | $ | — | ||||||||||||||
9/30/2017 | 19.20 | 0.20 | 1.48 | 1.68 | (0.46 | ) | — | |||||||||||||||||||||
9/30/2016 | 18.09 | 0.46 | 1.23 | 1.69 | (0.58 | ) | — | |||||||||||||||||||||
12/1/2014 - 9/30/2015# | 19.72 | 0.46 | (1.45 | ) | (0.99 | ) | (0.56 | ) | (0.08 | ) | ||||||||||||||||||
11/30/2014 | 19.32 | 0.41 | 0.37 | 0.78 | (0.38 | ) | — | |||||||||||||||||||||
11/30/2013 | 19.15 | 0.49 | 0.21 | 0.70 | (0.48 | ) | (0.05 | ) | ||||||||||||||||||||
11/30/2012 | 18.82 | 0.44 | 1.34 | 1.78 | (0.70 | ) | (0.75 | ) | ||||||||||||||||||||
| Class C | ||||||||||||||||||||||||||||
3/31/2018+ | $ | 20.27 | $ | 0.21 | $ | (0.13 | ) | $ | 0.08 | $ | (0.48 | ) | $ | — | ||||||||||||||
9/30/2017 | 19.10 | 0.05 | 1.50 | 1.55 | (0.38 | ) | — | |||||||||||||||||||||
9/30/2016 | 18.02 | 0.31 | 1.22 | 1.53 | (0.45 | ) | — | |||||||||||||||||||||
12/1/2014 - 9/30/2015# | 19.60 | 0.36 | (1.47 | ) | (1.11 | ) | (0.39 | ) | (0.08 | ) | ||||||||||||||||||
11/30/2014 | 19.16 | 0.27 | 0.35 | 0.62 | (0.18 | ) | — | |||||||||||||||||||||
11/30/2013 | 18.78 | 0.31 | 0.26 | 0.57 | (0.14 | ) | (0.05 | ) | ||||||||||||||||||||
11/30/2012 | 18.53 | 0.37 | 1.23 | 1.60 | (0.60 | ) | (0.75 | ) | ||||||||||||||||||||
| Class R | ||||||||||||||||||||||||||||
3/31/2018+ | $ | 20.09 | $ | 0.28 | $ | (0.15 | ) | $ | 0.13 | $ | (0.57 | ) | $ | — | ||||||||||||||
9/30/2017 | 19.21 | 0.32 | 0.94 | 1.26 | (0.38 | ) | — | |||||||||||||||||||||
9/30/2016 | 18.10 | 0.40 | 1.22 | 1.62 | (0.51 | ) | — | |||||||||||||||||||||
12/1/2014 - 9/30/2015# | 19.70 | 0.39 | (1.43 | ) | (1.04 | ) | (0.48 | ) | (0.08 | ) | ||||||||||||||||||
11/30/2014 | 19.27 | 0.35 | 0.36 | 0.71 | (0.28 | ) | — | |||||||||||||||||||||
11/30/2013 | 19.14 | 0.43 | 0.21 | 0.64 | (0.46 | ) | (0.05 | ) | ||||||||||||||||||||
11/30/2012 | 18.81 | 0.18 | 1.54 | 1.72 | (0.64 | ) | (0.75 | ) | ||||||||||||||||||||
| Class P | ||||||||||||||||||||||||||||
3/31/2018+ | $ | 20.62 | $ | 0.32 | $ | (0.13 | ) | $ | 0.19 | $ | (0.70 | ) | $ | — | ||||||||||||||
9/30/2017 | 19.41 | 0.28 | 1.48 | 1.76 | (0.55 | ) | — | |||||||||||||||||||||
9/30/2016 | 18.34 | 0.52 | 1.24 | 1.76 | (0.69 | ) | — | |||||||||||||||||||||
12/1/2014 - 9/30/2015# | 19.98 | 0.46 | (1.42 | ) | (0.96 | ) | (0.60 | ) | (0.08 | ) | ||||||||||||||||||
11/30/2014 | 19.53 | 0.47 | 0.38 | 0.85 | (0.40 | ) | — | |||||||||||||||||||||
11/30/2013 | 19.30 | 0.47 | 0.30 | 0.77 | (0.49 | ) | (0.05 | ) | ||||||||||||||||||||
11/30/2012 | 18.94 | 0.37 | 1.47 | 1.84 | (0.73 | ) | (0.75 | ) | ||||||||||||||||||||
| Class R6 | ||||||||||||||||||||||||||||
3/31/2018+ | $ | 20.66 | $ | 0.33 | $ | (0.13 | ) | $ | 0.20 | $ | (0.72 | ) | $ | — | ||||||||||||||
9/30/2017 | 19.43 | 0.26 | 1.53 | 1.79 | (0.56 | ) | — | |||||||||||||||||||||
9/30/2016 | 18.37 | 0.54 | 1.23 | 1.77 | (0.71 | ) | — | |||||||||||||||||||||
12/1/2014 - 9/30/2015# | 20.01 | 0.51 | (1.45 | ) | (0.94 | ) | (0.62 | ) | (0.08 | ) | ||||||||||||||||||
11/30/2014 | 19.57 | 0.51 | 0.35 | 0.86 | (0.42 | ) | — | |||||||||||||||||||||
11/30/2013 | 19.32 | 0.58 | 0.21 | 0.79 | (0.49 | ) | (0.05 | ) | ||||||||||||||||||||
11/30/2012 | 18.96 | 0.55 | 1.31 | 1.86 | (0.75 | ) | (0.75 | ) | ||||||||||||||||||||
| Administrative Class | ||||||||||||||||||||||||||||
3/31/2018+ | $ | 20.56 | $ | 0.29 | $ | (0.11 | ) | $ | 0.18 | $ | (0.66 | ) | $ | — | ||||||||||||||
9/30/2017 | 19.28 | 0.24 | 1.47 | 1.71 | (0.43 | ) | — | |||||||||||||||||||||
9/30/2016 | 18.22 | 0.51 | 1.18 | 1.69 | (0.63 | ) | — | |||||||||||||||||||||
12/1/2014 - 9/30/2015# | 19.84 | 0.87 | (1.86 | ) | (0.99 | ) | (0.55 | ) | (0.08 | ) | ||||||||||||||||||
11/30/2014 | 19.42 | 0.43 | 0.36 | 0.79 | (0.37 | ) | — | |||||||||||||||||||||
11/30/2013 | 19.25 | 0.24 | 0.47 | 0.71 | (0.49 | ) | (0.05 | ) | ||||||||||||||||||||
11/30/2012 | 18.90 | 0.51 | 1.28 | 1.79 | (0.69 | ) | (0.75 | ) | ||||||||||||||||||||
| + | Unaudited |
| # | Fiscal year end changed from November 30th to September 30th. |
| (a) | Calculated on average shares outstanding during the period. |
| (b) | Total return is calculated assuming a purchase of a share on the first day of the period and a sale of a share on the last day of each period reported. Dividends and distributions, if any, are assumed, for purposes of this calculation, to be reinvested. Total return does not reflect sales charges and includes the effect of fee waivers and reimbursements. Total return may reflect adjustments to conform to U.S. GAAP. Total return for a period of less than one year is not annualized. |
| 242 | Semiannual Report | | March 31, 2018 | | See accompanying Notes to Financial Statements |
Table of Contents
| Total Dividends and Distributions | Net Asset Value, End of Period | Total Return (b) | Net Assets, End of Period (000s) | Ratio of Expenses to Average Net Assets with Fee Waiver/ Reimbursement (c) | Ratio of Expenses to Average Net Assets without Fee Waiver/ Reimbursement (c) | Ratio of Net Investment Income to Average Net Assets (c) | Portfolio Turnover Rate | |||||||||||||||||||||||||||
| $ | (0.65 | ) | $ | 19.94 | 0.74 | % | $ | 10,004 | 0.35 | %(d) | 0.60 | %(d) | 2.87 | %(d) | 12 | % | ||||||||||||||||||
| (0.46 | ) | 20.42 | 9.02 | 13,645 | 0.36 | 0.60 | 1.04 | 143 | ||||||||||||||||||||||||||
| (0.58 | ) | 19.20 | 9.57 | 12,715 | 0.48 | 0.60 | 2.51 | 106 | ||||||||||||||||||||||||||
| (0.64 | ) | 18.09 | (5.13 | ) | 30,401 | 0.47 | (d)(e) | 0.62 | (d)(e) | 2.93 | (d)(e) | 144 | ||||||||||||||||||||||
| (0.38 | ) | 19.72 | 4.11 | 34,624 | 0.42 | 0.60 | 2.08 | 89 | ||||||||||||||||||||||||||
| (0.53 | ) | 19.32 | 3.75 | 9,102 | 0.40 | 0.60 | 2.60 | 86 | ||||||||||||||||||||||||||
| (1.45 | ) | 19.15 | 10.23 | 985 | 0.38 | 0.60 | 2.40 | 55 | ||||||||||||||||||||||||||
| $ | (0.48 | ) | $ | 19.87 | 0.33 | % | $ | 403 | 1.10 | %(d) | 1.35 | %(d) | 2.02 | %(d) | 12 | % | ||||||||||||||||||
| (0.38 | ) | 20.27 | 8.31 | 454 | 1.11 | 1.35 | 0.28 | 143 | ||||||||||||||||||||||||||
| (0.45 | ) | 19.10 | 8.68 | 408 | 1.23 | 1.35 | 1.71 | 106 | ||||||||||||||||||||||||||
| (0.47 | ) | 18.02 | (5.72 | ) | 327 | 1.22 | (d)(e) | 1.37 | (d)(e) | 2.28 | (d)(e) | 144 | ||||||||||||||||||||||
| (0.18 | ) | 19.60 | 3.29 | 468 | 1.17 | 1.35 | 1.39 | 89 | ||||||||||||||||||||||||||
| (0.19 | ) | 19.16 | 3.02 | 438 | 1.15 | 1.35 | 1.64 | 86 | ||||||||||||||||||||||||||
| (1.35 | ) | 18.78 | 9.29 | 364 | 1.13 | 1.35 | 2.07 | 55 | ||||||||||||||||||||||||||
| $ | (0.57 | ) | $ | 19.65 | 0.58 | % | $ | 86 | 0.70 | %(d) | 0.85 | %(d) | 2.80 | %(d) | 12 | % | ||||||||||||||||||
| (0.38 | ) | 20.09 | 6.70 | 43 | 0.71 | 0.86 | 1.71 | 143 | ||||||||||||||||||||||||||
| (0.51 | ) | 19.21 | 9.12 | 649 | 0.83 | 0.85 | 2.18 | 106 | ||||||||||||||||||||||||||
| (0.56 | ) | 18.10 | (5.39 | ) | 1,043 | 0.82 | (d)(e) | 0.87 | (d)(e) | 2.49 | (d)(e) | 144 | ||||||||||||||||||||||
| (0.28 | ) | 19.70 | 3.72 | 1,008 | 0.77 | 0.85 | 1.81 | 89 | ||||||||||||||||||||||||||
| (0.51 | ) | 19.27 | 3.40 | 1,022 | 0.75 | 0.85 | 2.26 | 86 | ||||||||||||||||||||||||||
| (1.39 | ) | 19.14 | 9.84 | 938 | 0.73 | 0.85 | 0.97 | 55 | ||||||||||||||||||||||||||
| $ | (0.70 | ) | $ | 20.11 | 0.87 | % | $ | 20,629 | 0.05 | %(d) | 0.20 | %(d) | 3.13 | %(d) | 12 | % | ||||||||||||||||||
| (0.55 | ) | 20.62 | 9.37 | 20,137 | 0.06 | 0.20 | 1.42 | 143 | ||||||||||||||||||||||||||
| (0.69 | ) | 19.41 | 9.88 | 25,879 | 0.18 | 0.20 | 2.82 | 106 | ||||||||||||||||||||||||||
| (0.68 | ) | 18.34 | (4.89 | ) | 21,193 | 0.17 | (d)(e) | 0.22 | (d)(e) | 2.91 | (d)(e) | 144 | ||||||||||||||||||||||
| (0.40 | ) | 19.98 | 4.43 | 12,665 | 0.12 | 0.20 | 2.38 | 89 | ||||||||||||||||||||||||||
| (0.54 | ) | 19.53 | 4.06 | 7,643 | 0.10 | 0.20 | 2.44 | 86 | ||||||||||||||||||||||||||
| (1.48 | ) | 19.30 | 10.55 | 5,323 | 0.08 | 0.20 | 1.95 | 55 | ||||||||||||||||||||||||||
| $ | (0.72 | ) | $ | 20.14 | 0.90 | % | $ | 17,365 | — | %(d)(f)(g) | 0.10 | %(d) | 3.22 | %(d) | 12 | % | ||||||||||||||||||
| (0.56 | ) | 20.66 | 9.54 | 17,943 | — | (f) | 0.10 | 1.31 | 143 | |||||||||||||||||||||||||
| (0.71 | ) | 19.43 | 9.94 | 13,274 | 0.08 | 0.10 | 2.93 | 106 | ||||||||||||||||||||||||||
| (0.70 | ) | 18.37 | (4.82 | ) | 11,847 | 0.07 | (d)(e) | 0.12 | (d)(e) | 3.22 | (d)(e) | 144 | ||||||||||||||||||||||
| (0.42 | ) | 20.01 | 4.48 | 5,574 | 0.02 | 0.10 | 2.59 | 89 | ||||||||||||||||||||||||||
| (0.54 | ) | 19.57 | 4.19 | 7,457 | — | 0.12 | 3.00 | 86 | ||||||||||||||||||||||||||
| (1.50 | ) | 19.32 | 10.62 | 7,708 | — | (f) | 0.15 | 2.98 | 55 | |||||||||||||||||||||||||
| $ | (0.66 | ) | $ | 20.08 | 0.80 | % | $ | 692 | 0.30 | %(d) | 0.45 | %(d) | 2.82 | %(d) | 12 | % | ||||||||||||||||||
| (0.43 | ) | 20.56 | 9.10 | 665 | 0.31 | 0.45 | 1.22 | 143 | ||||||||||||||||||||||||||
| (0.63 | ) | 19.28 | 9.55 | 377 | 0.43 | 0.45 | 2.76 | 106 | ||||||||||||||||||||||||||
| (0.63 | ) | 18.22 | (5.09 | ) | 1,747 | 0.41 | (d)(e) | 0.46 | (d)(e) | 5.41 | (d)(e) | 144 | ||||||||||||||||||||||
| (0.37 | ) | 19.84 | 4.15 | 7,974 | 0.37 | 0.45 | 2.19 | 89 | ||||||||||||||||||||||||||
| (0.54 | ) | 19.42 | 3.79 | 7,210 | 0.35 | 0.45 | 1.27 | 86 | ||||||||||||||||||||||||||
| (1.44 | ) | 19.25 | 10.20 | 15 | 0.33 | 0.45 | 2.73 | 55 | ||||||||||||||||||||||||||
| (c) | Does not include expenses of the investment companies in which the Fund invests. |
| (d) | Annualized, unless otherwise noted. |
| (e) | Certain expenses incurred by the Fund were not annualized. |
| (f) | See Note 6 in the Notes to Financial Statements. |
| (g) | Actual amount rounds to less than 0.01%. |
| See accompanying Notes to Financial Statements | | March 31, 2018 | | Semiannual Report | 243 |
Table of Contents
Financial Highlights (cont’d)
For a Share Outstanding for the Period ended:
Net Asset Value, Beginning of Period | Net Investment Income (a) | Net Realized and Change in Unrealized Gain (Loss) | Total from Investment Operations | Dividends from Net Investment Income | Distributions from Net Realized Capital Gains | |||||||||||||||||||||||
| AllianzGI Retirement 2025: | ||||||||||||||||||||||||||||
| Class A | ||||||||||||||||||||||||||||
3/31/2018+ | $ | 18.54 | $ | 0.27 | $ | 0.07 | $ | 0.34 | $ | (0.61 | ) | $ | (0.22 | ) | ||||||||||||||
9/30/2017 | 16.95 | 0.10 | 1.81 | 1.91 | (0.31 | ) | (0.01 | ) | ||||||||||||||||||||
9/30/2016 | 15.89 | 0.40 | 1.16 | 1.56 | (0.50 | ) | — | |||||||||||||||||||||
12/1/2014 - 9/30/2015# | 17.30 | 0.41 | (1.31 | ) | (0.90 | ) | (0.50 | ) | (0.01 | ) | ||||||||||||||||||
11/30/2014 | 16.92 | 0.37 | 0.33 | 0.70 | (0.32 | ) | — | |||||||||||||||||||||
11/30/2013 | 16.63 | 0.41 | 0.32 | 0.73 | (0.40 | ) | (0.04 | ) | ||||||||||||||||||||
12/19/2011* - 11/30/2012 | 15.00 | 0.34 | 1.43 | 1.77 | (0.14 | ) | — | |||||||||||||||||||||
| Class R | ||||||||||||||||||||||||||||
3/31/2018+ | $ | 18.35 | $ | 0.23 | $ | 0.07 | $ | 0.30 | $ | (0.49 | ) | $ | (0.22 | ) | ||||||||||||||
9/30/2017 | 16.89 | 0.14 | 1.69 | 1.83 | (0.36 | ) | (0.01 | ) | ||||||||||||||||||||
9/30/2016 | 15.83 | 0.34 | 1.16 | 1.50 | (0.44 | ) | — | |||||||||||||||||||||
12/1/2014 - 9/30/2015# | 17.21 | 0.34 | (1.29 | ) | (0.95 | ) | (0.42 | ) | (0.01 | ) | ||||||||||||||||||
11/30/2014 | 16.84 | 0.32 | 0.32 | 0.64 | (0.27 | ) | — | |||||||||||||||||||||
11/30/2013 | 16.57 | 0.48 | 0.19 | 0.67 | (0.36 | ) | (0.04 | ) | ||||||||||||||||||||
12/19/2011* - 11/30/2012 | 15.00 | 0.18 | 1.53 | 1.71 | (0.14 | ) | — | |||||||||||||||||||||
| Class P | ||||||||||||||||||||||||||||
| 3/31/2018+ | $ | 18.54 | $ | 0.30 | $ | 0.07 | $ | 0.37 | $ | (0.67 | ) | $ | (0.22 | ) | ||||||||||||||
| 9/30/2017 | 17.05 | 0.16 | 1.80 | 1.96 | (0.46 | ) | (0.01 | ) | ||||||||||||||||||||
| 9/30/2016 | 16.01 | 0.44 | 1.19 | 1.63 | (0.59 | ) | — | |||||||||||||||||||||
| 12/1/2014 - 9/30/2015# | 17.43 | 0.38 | (1.24 | ) | (0.86 | ) | (0.55 | ) | (0.01 | ) | ||||||||||||||||||
| 11/30/2014 | 17.02 | 0.40 | 0.35 | 0.75 | (0.34 | ) | — | |||||||||||||||||||||
| 11/30/2013 | 16.67 | 0.48 | 0.31 | 0.79 | (0.40 | ) | (0.04 | ) | ||||||||||||||||||||
| 12/19/2011* - 11/30/2012 | 15.00 | 0.38 | 1.44 | 1.82 | (0.15 | ) | — | |||||||||||||||||||||
| Class R6 | ||||||||||||||||||||||||||||
| 3/31/2018+ | $ | 18.57 | $ | 0.31 | $ | 0.06 | $ | 0.37 | $ | (0.67 | ) | $ | (0.22 | ) | ||||||||||||||
| 9/30/2017 | 17.07 | 0.15 | 1.83 | 1.98 | (0.47 | ) | (0.01 | ) | ||||||||||||||||||||
| 9/30/2016 | 16.03 | 0.45 | 1.19 | 1.64 | (0.60 | ) | — | |||||||||||||||||||||
| 12/1/2014 - 9/30/2015# | 17.45 | 0.45 | (1.30 | ) | (0.85 | ) | (0.56 | ) | (0.01 | ) | ||||||||||||||||||
| 11/30/2014 | 17.04 | 0.44 | 0.33 | 0.77 | (0.36 | ) | — | |||||||||||||||||||||
| 11/30/2013 | 16.68 | 0.50 | 0.30 | 0.80 | (0.40 | ) | (0.04 | ) | ||||||||||||||||||||
| 12/19/2011* - 11/30/2012 | 15.00 | 0.45 | 1.38 | 1.83 | (0.15 | ) | — | |||||||||||||||||||||
| Administrative Class | ||||||||||||||||||||||||||||
3/31/2018+ | $ | 18.55 | $ | 0.22 | $ | 0.12 | $ | 0.34 | $ | (0.56 | ) | $ | (0.22 | ) | ||||||||||||||
9/30/2017 | 17.00 | 0.11 | 1.81 | 1.92 | (0.36 | ) | (0.01 | ) | ||||||||||||||||||||
9/30/2016 | 15.96 | 0.41 | 1.17 | 1.58 | (0.54 | ) | — | |||||||||||||||||||||
12/1/2014 - 9/30/2015# | 17.37 | 1.16 | (2.06 | ) | (0.90 | ) | (0.50 | ) | (0.01 | ) | ||||||||||||||||||
11/30/2014 | 16.98 | 0.38 | 0.33 | 0.71 | (0.32 | ) | — | |||||||||||||||||||||
11/30/2013 | 16.62 | 0.20 | 0.55 | 0.75 | (0.35 | ) | (0.04 | ) | ||||||||||||||||||||
12/19/2011* - 11/30/2012 | 15.00 | 0.41 | 1.35 | 1.76 | (0.14 | ) | — | |||||||||||||||||||||
| + | Unaudited |
| # | Fiscal year end changed from November 30th to September 30th. |
| * | Commencement of operations. |
| (a) | Calculated on average shares outstanding during the period. |
| (b) | Total return is calculated assuming a purchase of a share on the first day of the period and a sale of a share on the last day of each period reported. Dividends and distributions, if any, are assumed, for purposes of this calculation, to be reinvested. Total return does not reflect sales charges and includes the effect of fee waivers and reimbursements. Total return may reflect adjustments to conform to U.S. GAAP. Total return for a period of less than one year is not annualized. |
| 244 | Semiannual Report | | March 31, 2018 | | See accompanying Notes to Financial Statements |
Table of Contents
Total Dividends and Distributions | Net Asset Value, End of Period | Total Return (b) | Net Assets, End of Period (000s) | Ratio of Expenses to Average Net Assets with Fee Waiver/ Reimbursement (c) | Ratio of Expenses to Average Net Assets without Fee Waiver/ Reimbursement (c) | Ratio of Net Investment Income to Average Net Assets (c) | Portfolio Turnover Rate | |||||||||||||||||||||||||||
| $ | (0.83 | ) | $ | 18.05 | 1.76 | % | $ | 8,051 | 0.31 | %(d) | 0.60 | %(d) | 2.88 | %(d) | 12 | % | ||||||||||||||||||
| (0.32 | ) | 18.54 | 11.55 | 7,843 | 0.32 | 0.60 | 0.56 | 129 | ||||||||||||||||||||||||||
| (0.50 | ) | 16.95 | 10.02 | 6,663 | 0.48 | 0.60 | 2.48 | 115 | ||||||||||||||||||||||||||
| (0.51 | ) | 15.89 | (5.28 | ) | 26,916 | 0.45 | (d)(e) | 0.62 | (d)(e) | 2.98 | (d)(e) | 147 | ||||||||||||||||||||||
| (0.32 | ) | 17.30 | 4.22 | 31,358 | 0.41 | 0.60 | 2.16 | 93 | ||||||||||||||||||||||||||
| (0.44 | ) | 16.92 | 4.54 | 13,058 | 0.40 | 0.60 | 2.48 | 76 | ||||||||||||||||||||||||||
| (0.14 | ) | 16.63 | 11.86 | 335 | 0.38 | (d) | 0.60 | (d) | 2.22 | (d) | 55 | |||||||||||||||||||||||
| $ | (0.71 | ) | $ | 17.94 | 1.57 | % | $ | 230 | 0.66 | %(d) | 0.85 | %(d) | 2.48 | %(d) | 12 | % | ||||||||||||||||||
| (0.37 | ) | 18.35 | 11.11 | 219 | 0.67 | 0.86 | 0.79 | 129 | ||||||||||||||||||||||||||
| (0.44 | ) | 16.89 | 9.67 | 835 | 0.83 | 0.85 | 2.08 | 115 | ||||||||||||||||||||||||||
| (0.43 | ) | 15.83 | (5.59 | ) | 1,066 | 0.80 | (d)(e) | 0.87 | (d)(e) | 2.43 | (d)(e) | 147 | ||||||||||||||||||||||
| (0.27 | ) | 17.21 | 3.83 | 1,004 | 0.76 | 0.85 | 1.89 | 93 | ||||||||||||||||||||||||||
| (0.40 | ) | 16.84 | 4.16 | 753 | 0.75 | 0.85 | 2.88 | 76 | ||||||||||||||||||||||||||
| (0.14 | ) | 16.57 | 11.51 | 1,284 | 0.73 | (d) | 0.85 | (d) | 1.19 | (d) | 55 | |||||||||||||||||||||||
| $ | (0.89 | ) | $ | 18.02 | 1.88 | % | $ | 35,522 | 0.01 | %(d) | 0.20 | %(d) | 3.23 | %(d) | 12 | % | ||||||||||||||||||
| (0.47 | ) | 18.54 | 11.85 | 36,000 | 0.02 | 0.20 | 0.92 | 129 | ||||||||||||||||||||||||||
| (0.59 | ) | 17.05 | 10.43 | 34,729 | 0.18 | 0.20 | 2.70 | 115 | ||||||||||||||||||||||||||
| (0.56 | ) | 16.01 | (5.04 | ) | 29,233 | 0.15 | (d)(e) | 0.22 | (d)(e) | 2.71 | (d)(e) | 147 | ||||||||||||||||||||||
| (0.34 | ) | 17.43 | 4.49 | 13,866 | 0.11 | 0.20 | 2.32 | 93 | ||||||||||||||||||||||||||
| (0.44 | ) | 17.02 | 4.84 | 4,336 | 0.10 | 0.20 | 2.88 | 76 | ||||||||||||||||||||||||||
| (0.15 | ) | 16.67 | 12.21 | 3,873 | 0.08 | (d) | 0.20 | (d) | 2.47 | (d) | 55 | |||||||||||||||||||||||
| $ | (0.89 | ) | $ | 18.05 | 1.91 | % | $ | 19,675 | — | %(d)(f)(g) | 0.10 | %(d) | 3.36 | %(d) | 12 | % | ||||||||||||||||||
| (0.48 | ) | 18.57 | 11.97 | 20,971 | — | (f) | 0.10 | 0.87 | 129 | |||||||||||||||||||||||||
| (0.60 | ) | 17.07 | 10.55 | 12,439 | 0.08 | 0.10 | 2.78 | 115 | ||||||||||||||||||||||||||
| (0.57 | ) | 16.03 | (4.97 | ) | 10,047 | 0.05 | (d)(e) | 0.12 | (d)(e) | 3.25 | (d)(e) | 147 | ||||||||||||||||||||||
| (0.36 | ) | 17.45 | 4.60 | 6,745 | 0.01 | 0.10 | 2.54 | 93 | ||||||||||||||||||||||||||
| (0.44 | ) | 17.04 | 4.93 | 5,058 | — | 0.12 | 3.02 | 76 | ||||||||||||||||||||||||||
| (0.15 | ) | 16.68 | 12.28 | 5,375 | — | (d)(f) | 0.15 | (d) | 2.94 | (d) | 55 | |||||||||||||||||||||||
| $ | (0.78 | ) | $ | 18.11 | 1.76 | % | $ | 255 | 0.26 | %(d) | 0.45 | %(d) | 2.38 | %(d) | 12 | % | ||||||||||||||||||
| (0.37 | ) | 18.55 | 11.57 | 740 | 0.27 | 0.45 | 0.61 | 129 | ||||||||||||||||||||||||||
| (0.54 | ) | 17.00 | 10.12 | 585 | 0.43 | 0.45 | 2.56 | 115 | ||||||||||||||||||||||||||
| (0.51 | ) | 15.96 | (5.26 | ) | 1,165 | 0.39 | (d)(e) | 0.46 | (d)(e) | 8.16 | (d)(e) | 147 | ||||||||||||||||||||||
| (0.32 | ) | 17.37 | 4.26 | 12,135 | 0.36 | 0.45 | 2.23 | 93 | ||||||||||||||||||||||||||
| (0.39 | ) | 16.98 | 4.60 | 10,606 | 0.35 | 0.45 | 1.23 | 76 | ||||||||||||||||||||||||||
| (0.14 | ) | 16.62 | 11.86 | 11 | 0.33 | (d) | 0.45 | (d) | 2.72 | (d) | 55 | |||||||||||||||||||||||
| (c) | Does not include expenses of the investment companies in which the Fund invests. |
| (d) | Annualized, unless otherwise noted. |
| (e) | Certain expenses incurred by the Fund were not annualized. |
| (f) | See Note 6 in the Notes to Financial Statements. |
| (g) | Actual amount rounds to less than 0.01%. |
| See accompanying Notes to Financial Statements | | March 31, 2018 | | Semiannual Report | 245 |
Table of Contents
Financial Highlights (cont’d)
For a Share Outstanding for the Period ended:
Net Asset Value, Beginning of Period | Net Investment Income (Loss) (a) | Net Realized and Change in Unrealized Gain (Loss) | Total from Investment Operations | Dividends from Net Investment Income | Distributions from Net Realized Capital | |||||||||||||||||||||||
| AllianzGI Retirement 2030: | ||||||||||||||||||||||||||||
| Class A | ||||||||||||||||||||||||||||
3/31/2018+ | $ | 22.48 | $ | 0.36 | $ | 0.18 | $ | 0.54 | $ | (0.89 | ) | $ | (0.32 | ) | ||||||||||||||
9/30/2017 | 20.14 | 0.07 | 2.70 | 2.77 | (0.35 | ) | (0.08 | ) | ||||||||||||||||||||
9/30/2016 | 18.84 | 0.44 | 1.39 | 1.83 | (0.53 | ) | — | |||||||||||||||||||||
12/1/2014 - 9/30/2015# | 21.05 | 0.50 | (1.75 | ) | (1.25 | ) | (0.69 | ) | (0.27 | ) | ||||||||||||||||||
11/30/2014 | 20.66 | 0.48 | 0.38 | 0.86 | (0.47 | ) | — | |||||||||||||||||||||
11/30/2013 | 19.80 | 0.52 | 0.92 | 1.44 | (0.54 | ) | (0.04 | ) | ||||||||||||||||||||
11/30/2012 | 19.77 | 0.29 | 1.61 | 1.90 | (0.70 | ) | (1.17 | ) | ||||||||||||||||||||
| Class C | ||||||||||||||||||||||||||||
3/31/2018+ | $ | 22.17 | $ | 0.27 | $ | 0.18 | $ | 0.45 | $ | (0.72 | ) | $ | (0.32 | ) | ||||||||||||||
9/30/2017 | 19.96 | (0.09 | ) | 2.66 | 2.57 | (0.28 | ) | (0.08 | ) | |||||||||||||||||||
9/30/2016 | 18.70 | 0.27 | 1.41 | 1.68 | (0.42 | ) | — | |||||||||||||||||||||
12/1/2014 - 9/30/2015# | 20.83 | 0.36 | (1.72 | ) | (1.36 | ) | (0.50 | ) | (0.27 | ) | ||||||||||||||||||
11/30/2014 | 20.42 | 0.33 | 0.36 | 0.69 | (0.28 | ) | — | |||||||||||||||||||||
11/30/2013 | 19.53 | 0.35 | 0.93 | 1.28 | (0.35 | ) | (0.04 | ) | ||||||||||||||||||||
11/30/2012 | 19.51 | 0.43 | 1.30 | 1.73 | (0.54 | ) | (1.17 | ) | ||||||||||||||||||||
| Class R | ||||||||||||||||||||||||||||
3/31/2018+ | $ | 22.35 | $ | 0.35 | $ | 0.15 | $ | 0.50 | $ | (0.73 | ) | $ | (0.32 | ) | ||||||||||||||
9/30/2017 | 20.11 | 0.15 | 2.54 | 2.69 | (0.37 | ) | (0.08 | ) | ||||||||||||||||||||
9/30/2016 | 18.89 | 0.36 | 1.40 | 1.76 | (0.54 | ) | — | |||||||||||||||||||||
12/1/2014 - 9/30/2015# | 21.07 | 0.42 | (1.72 | ) | (1.30 | ) | (0.61 | ) | (0.27 | ) | ||||||||||||||||||
11/30/2014 | 20.65 | 0.41 | 0.37 | 0.78 | (0.36 | ) | — | |||||||||||||||||||||
11/30/2013 | 19.85 | 0.46 | 0.91 | 1.37 | (0.53 | ) | (0.04 | ) | ||||||||||||||||||||
11/30/2012 | 19.81 | 0.18 | 1.67 | 1.85 | (0.64 | ) | (1.17 | ) | ||||||||||||||||||||
| Class P | ||||||||||||||||||||||||||||
3/31/2018+ | $ | 22.72 | $ | 0.41 | $ | 0.17 | $ | 0.58 | $ | (0.95 | ) | $ | (0.32 | ) | ||||||||||||||
9/30/2017 | 20.43 | 0.15 | 2.71 | 2.86 | (0.49 | ) | (0.08 | ) | ||||||||||||||||||||
9/30/2016 | 19.14 | 0.48 | 1.44 | 1.92 | (0.63 | ) | — | |||||||||||||||||||||
12/1/2014 - 9/30/2015# | 21.37 | 0.47 | (1.69 | ) | (1.22 | ) | (0.74 | ) | (0.27 | ) | ||||||||||||||||||
11/30/2014 | 20.93 | 0.51 | 0.43 | 0.94 | (0.50 | ) | — | |||||||||||||||||||||
11/30/2013 | 20.02 | 0.51 | 1.00 | 1.51 | (0.56 | ) | (0.04 | ) | ||||||||||||||||||||
11/30/2012 | 19.95 | 0.41 | 1.57 | 1.98 | (0.74 | ) | (1.17 | ) | ||||||||||||||||||||
| Class R6 | ||||||||||||||||||||||||||||
3/31/2018+ | $ | 22.78 | $ | 0.42 | $ | 0.18 | $ | 0.60 | $ | (0.96 | ) | $ | (0.32 | ) | ||||||||||||||
9/30/2017 | 20.48 | 0.15 | 2.73 | 2.88 | (0.50 | ) | (0.08 | ) | ||||||||||||||||||||
9/30/2016 | 19.19 | 0.50 | 1.44 | 1.94 | (0.65 | ) | — | |||||||||||||||||||||
12/1/2014 - 9/30/2015# | 21.42 | 0.54 | (1.74 | ) | (1.20 | ) | (0.76 | ) | (0.27 | ) | ||||||||||||||||||
11/30/2014 | 20.98 | 0.59 | 0.36 | 0.95 | (0.51 | ) | — | |||||||||||||||||||||
11/30/2013 | 20.04 | 0.62 | 0.92 | 1.54 | (0.56 | ) | (0.04 | ) | ||||||||||||||||||||
11/30/2012 | 19.97 | 0.61 | 1.38 | 1.99 | (0.75 | ) | (1.17 | ) | ||||||||||||||||||||
| Administrative Class | ||||||||||||||||||||||||||||
3/31/2018+ | $ | 22.66 | $ | 0.30 | $ | 0.26 | $ | 0.56 | $ | (0.81 | ) | $ | (0.32 | ) | ||||||||||||||
9/30/2017 | 20.34 | 0.09 | 2.72 | 2.81 | (0.41 | ) | (0.08 | ) | ||||||||||||||||||||
9/30/2016 | 19.06 | 0.45 | 1.41 | 1.86 | (0.58 | ) | — | |||||||||||||||||||||
12/1/2014 - 9/30/2015# | 21.28 | 1.21 | (2.47 | ) | (1.26 | ) | (0.69 | ) | (0.27 | ) | ||||||||||||||||||
11/30/2014 | 20.87 | 0.50 | 0.38 | 0.88 | (0.47 | ) | — | |||||||||||||||||||||
11/30/2013 | 19.96 | 0.26 | 1.21 | 1.47 | (0.52 | ) | (0.04 | ) | ||||||||||||||||||||
11/30/2012 | 19.91 | 0.57 | 1.35 | 1.92 | (0.70 | ) | (1.17 | ) | ||||||||||||||||||||
| + | Unaudited |
| # | Fiscal year end changed from November 30th to September 30th. |
| (a) | Calculated on average shares outstanding during the period. |
| (b) | Annualized, unless otherwise noted. |
| (c) | Total return is calculated assuming a purchase of a share on the first day of the period and a sale of a share on the last day of each period reported. Dividends and distributions, if any, are assumed, for purposes of this calculation, to be reinvested. Total return does not reflect sales charges and includes the effect of fee waivers and reimbursements. Total return may reflect adjustments to conform to U.S. GAAP. Total return for a period of less than one year is not annualized. |
| 246 | Semiannual Report | | March 31, 2018 | | See accompanying Notes to Financial Statements |
Table of Contents
Total Dividends and Distributions | Net Asset Value, End of Period | Total Return (c) | Net Assets, End of Period (000s) | Ratio of Expenses to Average Net Assets with Fee Waiver/ Reimbursement (d) | Ratio of Expenses to Average Net Assets without Fee Waiver/ Reimbursement (d) | Ratio of Net Investment Income (Loss) to Average Net Assets (d) | Portfolio Turnover Rate | |||||||||||||||||||||||||||
| $ | (1.21 | ) | $ | 21.81 | 2.31 | % | $ | 9,486 | 0.32 | %(b) | 0.60 | %(b) | 3.21 | %(b) | 7 | % | ||||||||||||||||||
| (0.43 | ) | 22.48 | 14.04 | 9,633 | 0.33 | 0.60 | 0.32 | 125 | ||||||||||||||||||||||||||
| (0.53 | ) | 20.14 | 9.91 | 7,473 | 0.47 | 0.60 | 2.26 | 105 | ||||||||||||||||||||||||||
| (0.96 | ) | 18.84 | (6.16 | ) | 22,695 | 0.42 | (b)(f) | 0.62 | (b)(f) | 3.01 | (b)(f) | 147 | ||||||||||||||||||||||
| (0.47 | ) | 21.05 | 4.26 | 25,487 | 0.39 | 0.60 | 2.28 | 93 | ||||||||||||||||||||||||||
| (0.58 | ) | 20.66 | 7.48 | 10,080 | 0.35 | 0.60 | 2.58 | 79 | ||||||||||||||||||||||||||
| (1.87 | ) | 19.80 | 10.68 | 10,692 | 0.29 | 0.60 | 1.48 | 47 | ||||||||||||||||||||||||||
| $ | (1.04 | ) | $ | 21.58 | 1.95 | % | $ | 803 | 1.07 | %(b) | 1.35 | %(b) | 2.45 | %(b) | 7 | % | ||||||||||||||||||
| (0.36 | ) | 22.17 | 13.11 | 790 | 1.08 | 1.35 | (0.42 | ) | 125 | |||||||||||||||||||||||||
| (0.42 | ) | 19.96 | 9.11 | 696 | 1.22 | 1.35 | 1.44 | 105 | ||||||||||||||||||||||||||
| (0.77 | ) | 18.70 | (6.72 | ) | 608 | 1.17 | (b)(f) | 1.37 | (b)(f) | 2.19 | (b)(f) | 147 | ||||||||||||||||||||||
| (0.28 | ) | 20.83 | 3.43 | 680 | 1.14 | 1.35 | 1.59 | 93 | ||||||||||||||||||||||||||
| (0.39 | ) | 20.42 | 6.63 | 736 | 1.10 | 1.35 | 1.77 | 79 | ||||||||||||||||||||||||||
| (1.71 | ) | 19.53 | 9.80 | 605 | 1.04 | 1.35 | 2.26 | 47 | ||||||||||||||||||||||||||
| $ | (1.05 | ) | $ | 21.80 | 2.17 | % | $ | 437 | 0.67 | %(b) | 0.85 | %(b) | 3.10 | %(b) | 7 | % | ||||||||||||||||||
| (0.45 | ) | 22.35 | 13.64 | 500 | 0.68 | 0.86 | 0.73 | 125 | ||||||||||||||||||||||||||
| (0.54 | ) | 20.11 | 9.48 | 2,295 | 0.82 | 0.85 | 1.87 | 105 | ||||||||||||||||||||||||||
| (0.88 | ) | 18.89 | (6.38 | ) | 1,445 | 0.77 | (b)(f) | 0.87 | (b)(f) | 2.49 | (b)(f) | 147 | ||||||||||||||||||||||
| (0.36 | ) | 21.07 | 3.85 | 1,420 | 0.74 | 0.85 | 1.94 | 93 | ||||||||||||||||||||||||||
| (0.57 | ) | 20.65 | 7.09 | 1,199 | 0.70 | 0.85 | 2.28 | 79 | ||||||||||||||||||||||||||
| (1.81 | ) | 19.85 | 10.23 | 1,103 | 0.64 | (e) | 0.85 | 0.95 | 47 | |||||||||||||||||||||||||
| $ | (1.27 | ) | $ | 22.03 | 2.46 | % | $ | 37,881 | 0.02 | %(b) | 0.20 | %(b) | 3.59 | %(b) | 7 | % | ||||||||||||||||||
| (0.57 | ) | 22.72 | 14.34 | 36,184 | 0.03 | 0.20 | 0.70 | 125 | ||||||||||||||||||||||||||
| (0.63 | ) | 20.43 | 10.25 | 33,628 | 0.17 | 0.20 | 2.49 | 105 | ||||||||||||||||||||||||||
| (1.01 | ) | 19.14 | (5.91 | ) | 28,597 | 0.12 | (b)(f) | 0.22 | (b)(f) | 2.80 | (b)(f) | 147 | ||||||||||||||||||||||
| (0.50 | ) | 21.37 | 4.58 | 17,741 | 0.09 | 0.20 | 2.42 | 93 | ||||||||||||||||||||||||||
| (0.60 | ) | 20.93 | 7.77 | 7,748 | 0.05 | 0.20 | 2.54 | 79 | ||||||||||||||||||||||||||
| (1.91 | ) | 20.02 | 10.97 | 5,103 | — | (e) | 0.20 | 2.06 | 47 | |||||||||||||||||||||||||
| $ | (1.28 | ) | $ | 22.10 | 2.54 | % | $ | 24,871 | — | %(b)(e)(g) | 0.10 | %(b) | 3.67 | %(b) | 7 | % | ||||||||||||||||||
| (0.58 | ) | 22.78 | 14.44 | 24,904 | — | (e) | 0.10 | 0.69 | 125 | |||||||||||||||||||||||||
| (0.65 | ) | 20.48 | 10.34 | 16,758 | 0.07 | 0.10 | 2.54 | 105 | ||||||||||||||||||||||||||
| (1.03 | ) | 19.19 | (5.81 | ) | 12,883 | 0.02 | (b)(f) | 0.12 | (b)(f) | 3.19 | (b)(f) | 147 | ||||||||||||||||||||||
| (0.51 | ) | 21.42 | 4.63 | 8,752 | — | (e) | 0.10 | 2.79 | 93 | |||||||||||||||||||||||||
| (0.60 | ) | 20.98 | 7.87 | 10,854 | — | (e) | 0.12 | 3.05 | 79 | |||||||||||||||||||||||||
| (1.92 | ) | 20.04 | 11.07 | 9,182 | — | (e) | 0.15 | 3.14 | 47 | |||||||||||||||||||||||||
| $ | (1.13 | ) | $ | 22.09 | 2.38 | % | $ | 442 | 0.27 | %(b) | 0.45 | %(b) | 2.62 | %(b) | 7 | % | ||||||||||||||||||
| (0.49 | ) | 22.66 | 14.09 | 1,392 | 0.28 | 0.45 | 0.44 | 125 | ||||||||||||||||||||||||||
| (0.58 | ) | 20.34 | 9.96 | 1,250 | 0.42 | 0.45 | 2.33 | 105 | ||||||||||||||||||||||||||
| (0.96 | ) | 19.06 | (6.11 | ) | 1,817 | 0.36 | (b)(f) | 0.46 | (b)(f) | 7.07 | (b)(f) | 147 | ||||||||||||||||||||||
| (0.47 | ) | 21.28 | 4.29 | 9,586 | 0.34 | 0.45 | 2.37 | 93 | ||||||||||||||||||||||||||
| (0.56 | ) | 20.87 | 7.55 | 8,939 | 0.30 | 0.45 | 1.29 | 79 | ||||||||||||||||||||||||||
| (1.87 | ) | 19.96 | 10.60 | 16 | 0.24 | (e) | 0.45 | 2.95 | 47 | |||||||||||||||||||||||||
| (d) | Does not include expenses of the investment companies in which the Fund invests. |
| (e) | See Note 6 in the Notes to Financial Statements. |
| (f) | Certain expenses incurred by the Fund were not annualized. |
| (g) | Actual amount rounds to less than 0.01%. |
| See accompanying Notes to Financial Statements | | March 31, 2018 | | Semiannual Report | 247 |
Table of Contents
For a Share Outstanding for the Period ended:
| Net Asset Value, Beginning of Period | Net Investment Income (a) | Net Realized | Total from Investment Operations | Dividends from Net Investment Income | Distributions from Net Realized Capital Gains | |||||||||||||||||||||||
| AllianzGI Retirement 2035: | ||||||||||||||||||||||||||||
| Class A | ||||||||||||||||||||||||||||
3/31/2018+ | $ | 20.05 | $ | 0.39 | $ | 0.19 | $ | 0.58 | $ | (0.94 | ) | $ | (0.25 | ) | ||||||||||||||
9/30/2017 | 17.69 | 0.12 | 2.67 | 2.79 | (0.34 | ) | (0.09 | ) | ||||||||||||||||||||
9/30/2016 | 16.52 | 0.28 | 1.32 | 1.60 | (0.43 | ) | — | |||||||||||||||||||||
12/1/2014 - 9/30/2015# | 18.49 | 0.43 | (1.58 | ) | (1.15 | ) | (0.61 | ) | (0.21 | ) | ||||||||||||||||||
11/30/2014 | 18.09 | 0.41 | 0.39 | 0.80 | (0.40 | ) | — | |||||||||||||||||||||
11/30/2013 | 16.94 | 0.43 | 1.20 | 1.63 | (0.42 | ) | (0.06 | ) | ||||||||||||||||||||
12/19/2011* - 11/30/2012 | 15.00 | 0.37 | 1.74 | 2.11 | (0.17 | ) | — | |||||||||||||||||||||
| Class R | ||||||||||||||||||||||||||||
3/31/2018+ | $ | 19.92 | $ | 0.35 | $ | 0.19 | $ | 0.54 | $ | (0.84 | ) | $ | (0.25 | ) | ||||||||||||||
9/30/2017 | 17.62 | 0.17 | 2.55 | 2.72 | (0.33 | ) | (0.09 | ) | ||||||||||||||||||||
9/30/2016 | 16.48 | 0.22 | 1.31 | 1.53 | (0.39 | ) | — | |||||||||||||||||||||
12/1/2014 - 9/30/2015# | 18.43 | 0.30 | (1.50 | ) | (1.20 | ) | (0.54 | ) | (0.21 | ) | ||||||||||||||||||
11/30/2014 | 18.00 | 0.35 | 0.38 | 0.73 | (0.30 | ) | — | |||||||||||||||||||||
11/30/2013 | 16.89 | 0.41 | 1.15 | 1.56 | (0.39 | ) | (0.06 | ) | ||||||||||||||||||||
12/19/2011* - 11/30/2012 | 15.00 | 0.16 | 1.90 | 2.06 | (0.17 | ) | — | |||||||||||||||||||||
| Class P | ||||||||||||||||||||||||||||
3/31/2018+ | $ | 20.16 | $ | 0.43 | $ | 0.19 | $ | 0.62 | $ | (1.00 | ) | $ | (0.25 | ) | ||||||||||||||
9/30/2017 | 17.82 | 0.17 | 2.70 | 2.87 | (0.44 | ) | (0.09 | ) | ||||||||||||||||||||
9/30/2016 | 16.67 | 0.33 | 1.33 | 1.66 | (0.51 | ) | — | |||||||||||||||||||||
12/1/2014 - 9/30/2015# | 18.65 | 0.38 | (1.50 | ) | (1.12 | ) | (0.65 | ) | (0.21 | ) | ||||||||||||||||||
11/30/2014 | 18.20 | 0.43 | 0.43 | 0.86 | (0.41 | ) | — | |||||||||||||||||||||
11/30/2013 | 16.99 | 0.49 | 1.20 | 1.69 | (0.42 | ) | (0.06 | ) | ||||||||||||||||||||
12/19/2011* - 11/30/2012 | 15.00 | 0.38 | 1.79 | 2.17 | (0.18 | ) | — | |||||||||||||||||||||
| Class R6 | ||||||||||||||||||||||||||||
3/31/2018+ | $ | 20.20 | $ | 0.45 | $ | 0.18 | $ | 0.63 | $ | (1.02 | ) | $ | (0.25 | ) | ||||||||||||||
9/30/2017 | 17.86 | 0.16 | 2.73 | 2.89 | (0.46 | ) | (0.09 | ) | ||||||||||||||||||||
9/30/2016 | 16.70 | 0.33 | 1.35 | 1.68 | (0.52 | ) | — | |||||||||||||||||||||
12/1/2014 - 9/30/2015# | 18.68 | 0.48 | (1.58 | ) | (1.10 | ) | (0.67 | ) | (0.21 | ) | ||||||||||||||||||
11/30/2014 | 18.23 | 0.49 | 0.38 | 0.87 | (0.42 | ) | — | |||||||||||||||||||||
11/30/2013 | 17.00 | 0.54 | 1.17 | 1.71 | (0.42 | ) | (0.06 | ) | ||||||||||||||||||||
12/19/2011* - 11/30/2012 | 15.00 | 0.46 | 1.72 | 2.18 | (0.18 | ) | — | |||||||||||||||||||||
| Administrative Class | ||||||||||||||||||||||||||||
3/31/2018+ | $ | 20.11 | $ | 0.28 | $ | 0.29 | $ | 0.57 | $ | (0.83 | ) | $ | (0.25 | ) | ||||||||||||||
9/30/2017 | 17.77 | 0.11 | 2.70 | 2.81 | (0.38 | ) | (0.09 | ) | ||||||||||||||||||||
9/30/2016 | 16.60 | 0.29 | 1.33 | 1.62 | (0.45 | ) | — | |||||||||||||||||||||
12/1/2014 - 9/30/2015# | 18.58 | 1.63 | (2.79 | ) | (1.16 | ) | (0.61 | ) | (0.21 | ) | ||||||||||||||||||
11/30/2014 | 18.15 | 0.43 | 0.39 | 0.82 | (0.39 | ) | — | |||||||||||||||||||||
11/30/2013 | 16.94 | 0.22 | 1.43 | 1.65 | (0.38 | ) | (0.06 | ) | ||||||||||||||||||||
12/19/2011* - 11/30/2012 | 15.00 | 0.42 | 1.69 | 2.11 | (0.17 | ) | — | |||||||||||||||||||||
| + | Unaudited |
| # | Fiscal year end changed from November 30th to September 30th. |
| * | Commencement of operations. |
| (a) | Calculated on average shares outstanding during the period. |
| (b) | Total return is calculated assuming a purchase of a share on the first day of the period and a sale of a share on the last day of each period reported. Dividends and distributions, if any, are assumed, for purposes of this calculation, to be reinvested. Total return does not reflect sales charges and includes the effect of fee waivers and reimbursements. Total return may reflect adjustments to conform to U.S. GAAP. Total return for a period of less than one year is not annualized. |
| (c) | Does not include expenses of the investment companies in which the Fund invests. |
| 248 | Semiannual Report | | March 31, 2018 | | See accompanying Notes to Financial Statements |
Table of Contents
| Total Dividends and Distributions | Net Asset Value, End of Period | Total Return (b) | Net Assets, End of Period (000s) | Ratio of Expenses to Average Net Assets with Fee Waiver/ Reimbursement (c) | Ratio of Expenses to Average Net Assets without Fee Waiver/ Reimbursement (c) | Ratio of Net Investment Income to Average Net Assets (c) | Portfolio Turnover Rate | |||||||||||||||||||||||||||
| $ | (1.19 | ) | $ | 19.44 | 2.78 | % | $ | 9,487 | 0.39 | %(d) | 0.60 | %(d) | 3.83 | %(d) | 5 | % | ||||||||||||||||||
| (0.43 | ) | 20.05 | 16.14 | 8,683 | 0.40 | 0.60 | 0.66 | 122 | ||||||||||||||||||||||||||
| (0.43 | ) | 17.69 | 9.83 | 9,173 | 0.50 | 0.60 | 1.66 | 97 | ||||||||||||||||||||||||||
| (0.82 | ) | 16.52 | (6.46 | ) | 19,205 | 0.41 | (d)(e) | 0.61 | (d)(e) | 2.93 | (d)(e) | 138 | ||||||||||||||||||||||
| (0.40 | ) | 18.49 | 4.49 | 20,351 | 0.39 | 0.60 | 2.27 | 90 | ||||||||||||||||||||||||||
| (0.48 | ) | 18.09 | 9.83 | 6,939 | 0.35 | 0.60 | 2.48 | 67 | ||||||||||||||||||||||||||
| (0.17 | ) | 16.94 | 14.23 | 104 | 0.30 | (d) | 0.60 | (d) | 2.36 | (d) | 38 | |||||||||||||||||||||||
| $ | (1.09 | ) | $ | 19.37 | 2.63 | % | $ | 725 | 0.74 | %(d) | 0.85 | %(d) | 3.52 | %(d) | 5 | % | ||||||||||||||||||
| (0.42 | ) | 19.92 | 15.74 | 672 | 0.75 | 0.86 | 0.92 | 122 | ||||||||||||||||||||||||||
| (0.39 | ) | 17.62 | 9.45 | 1,575 | 0.85 | 0.85 | 1.30 | 97 | ||||||||||||||||||||||||||
| (0.75 | ) | 16.48 | (6.76 | ) | 1,600 | 0.76 | (d)(e) | 0.87 | (d)(e) | 2.07 | (d)(e) | 138 | ||||||||||||||||||||||
| (0.30 | ) | 18.43 | 4.14 | 1,089 | 0.74 | 0.85 | 1.93 | 90 | ||||||||||||||||||||||||||
| (0.45 | ) | 18.00 | 9.46 | 961 | 0.70 | 0.85 | 2.38 | 67 | ||||||||||||||||||||||||||
| (0.17 | ) | 16.89 | 13.88 | 893 | 0.65 | (d) | 0.85 | (d) | 1.04 | (d) | 38 | |||||||||||||||||||||||
| $ | (1.25 | ) | $ | 19.53 | 2.96 | % | $ | 33,389 | 0.09 | %(d) | 0.20 | %(d) | 4.25 | %(d) | 5 | % | ||||||||||||||||||
| (0.53 | ) | 20.16 | 16.52 | 32,371 | 0.10 | 0.20 | 0.93 | 122 | ||||||||||||||||||||||||||
| (0.51 | ) | 17.82 | 10.13 | 29,994 | 0.20 | 0.20 | 1.96 | 97 | ||||||||||||||||||||||||||
| (0.86 | ) | 16.67 | (6.23 | ) | 26,729 | 0.11 | (d)(e) | 0.21 | (d)(e) | 2.58 | (d)(e) | 138 | ||||||||||||||||||||||
| (0.41 | ) | 18.65 | 4.84 | 14,105 | 0.09 | 0.20 | 2.32 | 90 | ||||||||||||||||||||||||||
| (0.48 | ) | 18.20 | 10.19 | 5,333 | 0.05 | 0.20 | 2.83 | 67 | ||||||||||||||||||||||||||
| (0.18 | ) | 16.99 | 14.58 | 4,090 | — | (d) | 0.20 | (d) | 2.43 | (d) | 38 | |||||||||||||||||||||||
| $ | (1.27 | ) | $ | 19.56 | 3.00 | % | $ | 16,145 | — | %(d)(f)(g) | 0.10 | %(d) | 4.40 | %(d) | 5 | % | ||||||||||||||||||
| (0.55 | ) | 20.20 | 16.61 | 15,879 | — | (g) | 0.10 | 0.86 | 122 | |||||||||||||||||||||||||
| (0.52 | ) | 17.86 | 10.29 | 9,265 | 0.10 | 0.10 | 1.94 | 97 | ||||||||||||||||||||||||||
| (0.88 | ) | 16.70 | (6.15 | ) | 6,172 | — | (d)(e)(g) | 0.12 | (d)(e) | 3.22 | (d)(e) | 138 | ||||||||||||||||||||||
| (0.42 | ) | 18.68 | 4.89 | 6,587 | — | (f) | 0.10 | 2.66 | 90 | |||||||||||||||||||||||||
| (0.48 | ) | 18.23 | 10.24 | 5,850 | — | (f) | 0.12 | 3.10 | 67 | |||||||||||||||||||||||||
| (0.18 | ) | 17.00 | 14.65 | 5,132 | — | (d)(f) | 0.15 | (d) | 3.00 | (d) | 38 | |||||||||||||||||||||||
| $ | (1.08 | ) | $ | 19.60 | 2.77 | % | $ | 339 | 0.34 | %(d) | 0.45 | %(d) | 2.71 | %(d) | 5 | % | ||||||||||||||||||
| (0.47 | ) | 20.11 | 16.22 | 884 | 0.35 | 0.45 | 0.57 | 122 | ||||||||||||||||||||||||||
| (0.45 | ) | 17.77 | 9.93 | 639 | 0.45 | 0.45 | 1.74 | 97 | ||||||||||||||||||||||||||
| (0.82 | ) | 16.60 | (6.50 | ) | 719 | 0.35 | (d)(e) | 0.46 | (d)(e) | 10.75 | (d)(e) | 138 | ||||||||||||||||||||||
| (0.39 | ) | 18.58 | 4.60 | 11,550 | 0.34 | 0.45 | 2.33 | 90 | ||||||||||||||||||||||||||
| (0.44 | ) | 18.15 | 9.95 | 10,427 | 0.30 | 0.45 | 1.29 | 67 | ||||||||||||||||||||||||||
| (0.17 | ) | 16.94 | 14.23 | 12 | 0.25 | (d) | 0.45 | (d) | 2.76 | (d) | 38 | |||||||||||||||||||||||
| (d) | Annualized, unless otherwise noted. |
| (e) | Certain expenses incurred by the Fund were not annualized. |
| (f) | See Note 6 in the Notes to Financial Statements. |
| (g) | Actual amount rounds to less than 0.01%. |
| See accompanying Notes to Financial Statements | | March 31, 2018 | | Semiannual Report | 249 |
Table of Contents
Financial Highlights (cont’d)
For a Share Outstanding for the Period ended:
| Net Asset Value, Beginning of Period | Net Investment Income (a) | Net Realized (Loss) | Total from Investment Operations | Dividends from Net Investment Income | Distributions from Net Realized Capital Gains | |||||||||||||||||||||||
| AllianzGI Retirement 2040: | ||||||||||||||||||||||||||||
| Class A | ||||||||||||||||||||||||||||
3/31/2018+ | $ | 23.24 | $ | 0.50 | $ | 0.24 | $ | 0.74 | $ | (1.23 | ) | $ | (0.21 | ) | ||||||||||||||
9/30/2017 | 20.51 | 0.12 | 3.35 | 3.47 | (0.37 | ) | (0.37 | ) | ||||||||||||||||||||
9/30/2016 | 19.04 | 0.27 | 1.61 | 1.88 | (0.38 | ) | (0.03 | ) | ||||||||||||||||||||
12/1/2014 - 9/30/2015# | 21.91 | 0.49 | (1.94 | ) | (1.45 | ) | (0.83 | ) | (0.59 | ) | ||||||||||||||||||
11/30/2014 | 21.45 | 0.48 | 0.50 | 0.98 | (0.51 | ) | (0.01 | ) | ||||||||||||||||||||
11/30/2013 | 19.71 | 0.49 | 1.82 | 2.31 | (0.53 | ) | (0.04 | ) | ||||||||||||||||||||
11/30/2012 | 20.22 | 0.29 | 1.61 | 1.90 | (0.69 | ) | (1.72 | ) | ||||||||||||||||||||
| Class C | ||||||||||||||||||||||||||||
3/31/2018+ | $ | 22.97 | $ | 0.42 | $ | 0.22 | $ | 0.64 | $ | (1.06 | ) | $ | (0.21 | ) | ||||||||||||||
9/30/2017 | 20.36 | 0.01 | 3.26 | 3.27 | (0.29 | ) | (0.37 | ) | ||||||||||||||||||||
9/30/2016 | 18.94 | 0.19 | 1.54 | 1.73 | (0.28 | ) | (0.03 | ) | ||||||||||||||||||||
12/1/2014 - 9/30/2015# | 21.68 | 0.38 | (1.94 | ) | (1.56 | ) | (0.59 | ) | (0.59 | ) | ||||||||||||||||||
11/30/2014 | 21.21 | 0.33 | 0.48 | 0.81 | (0.33 | ) | (0.01 | ) | ||||||||||||||||||||
11/30/2013 | 19.53 | 0.34 | 1.80 | 2.14 | (0.42 | ) | (0.04 | ) | ||||||||||||||||||||
11/30/2012 | 20.07 | 0.31 | 1.43 | 1.74 | (0.56 | ) | (1.72 | ) | ||||||||||||||||||||
| Class R | ||||||||||||||||||||||||||||
3/31/2018+ | $ | 22.94 | $ | 0.49 | $ | 0.20 | $ | 0.69 | $ | (1.04 | ) | $ | (0.21 | ) | ||||||||||||||
9/30/2017 | 20.37 | 0.33 | 3.01 | 3.34 | (0.40 | ) | (0.37 | ) | ||||||||||||||||||||
9/30/2016 | 18.97 | 0.18 | 1.63 | 1.81 | (0.38 | ) | (0.03 | ) | ||||||||||||||||||||
12/1/2014 - 9/30/2015# | 21.80 | 0.42 | (1.91 | ) | (1.49 | ) | (0.75 | ) | (0.59 | ) | ||||||||||||||||||
11/30/2014 | 21.31 | 0.41 | 0.49 | 0.90 | (0.40 | ) | (0.01 | ) | ||||||||||||||||||||
11/30/2013 | 19.63 | 0.44 | 1.80 | 2.24 | (0.52 | ) | (0.04 | ) | ||||||||||||||||||||
11/30/2012 | 20.16 | 0.16 | 1.66 | 1.82 | (0.63 | ) | (1.72 | ) | ||||||||||||||||||||
| Class P | ||||||||||||||||||||||||||||
3/31/2018+ | $ | 23.36 | $ | 0.57 | $ | 0.21 | $ | 0.78 | $ | (1.29 | ) | $ | (0.21 | ) | ||||||||||||||
9/30/2017 | 20.70 | 0.23 | 3.32 | 3.55 | (0.52 | ) | (0.37 | ) | ||||||||||||||||||||
9/30/2016 | 19.26 | 0.32 | 1.65 | 1.97 | (0.50 | ) | (0.03 | ) | ||||||||||||||||||||
12/1/2014 - 9/30/2015# | 22.15 | 0.46 | (1.87 | ) | (1.41 | ) | (0.89 | ) | (0.59 | ) | ||||||||||||||||||
11/30/2014 | 21.63 | 0.50 | 0.56 | 1.06 | (0.53 | ) | (0.01 | ) | ||||||||||||||||||||
11/30/2013 | 19.82 | 0.49 | 1.90 | 2.39 | (0.54 | ) | (0.04 | ) | ||||||||||||||||||||
11/30/2012 | 20.31 | 0.39 | 1.57 | 1.96 | (0.73 | ) | (1.72 | ) | ||||||||||||||||||||
| Class R6 | ||||||||||||||||||||||||||||
3/31/2018+ | $ | 23.42 | $ | 0.56 | $ | 0.23 | $ | 0.79 | $ | (1.31 | ) | $ | (0.21 | ) | ||||||||||||||
9/30/2017 | 20.75 | 0.21 | 3.37 | 3.58 | (0.54 | ) | (0.37 | ) | ||||||||||||||||||||
9/30/2016 | 19.30 | 0.33 | 1.66 | 1.99 | (0.51 | ) | (0.03 | ) | ||||||||||||||||||||
12/1/2014 - 9/30/2015# | 22.19 | 0.53 | (1.92 | ) | (1.39 | ) | (0.91 | ) | (0.59 | ) | ||||||||||||||||||
11/30/2014 | 21.66 | 0.61 | 0.47 | 1.08 | (0.54 | ) | (0.01 | ) | ||||||||||||||||||||
11/30/2013 | 19.83 | 0.60 | 1.81 | 2.41 | (0.54 | ) | (0.04 | ) | ||||||||||||||||||||
11/30/2012 | 20.33 | 0.56 | 1.41 | 1.97 | (0.75 | ) | (1.72 | ) | ||||||||||||||||||||
| Administrative Class | ||||||||||||||||||||||||||||
3/31/2018+ | $ | 23.24 | $ | 0.50 | $ | 0.24 | $ | 0.74 | $ | (1.24 | ) | $ | (0.21 | ) | ||||||||||||||
9/30/2017 | 20.57 | 0.16 | 3.32 | 3.48 | (0.44 | ) | (0.37 | ) | ||||||||||||||||||||
9/30/2016 | 19.14 | 0.31 | 1.60 | 1.91 | (0.45 | ) | (0.03 | ) | ||||||||||||||||||||
12/1/2014 - 9/30/2015# | 22.02 | 1.71 | (3.16 | ) | (1.45 | ) | (0.84 | ) | (0.59 | ) | ||||||||||||||||||
11/30/2014 | 21.53 | 0.50 | 0.49 | 0.99 | (0.49 | ) | (0.01 | ) | ||||||||||||||||||||
11/30/2013 | 19.75 | 0.26 | 2.07 | 2.33 | (0.51 | ) | (0.04 | ) | ||||||||||||||||||||
11/30/2012 | 20.26 | 0.52 | 1.38 | 1.90 | (0.69 | ) | (1.72 | ) | ||||||||||||||||||||
| + | Unaudited |
| # | Fiscal year end changed from November 30th to September 30th. |
| (a) | Calculated on average shares outstanding during the period. |
| (b) | Total return is calculated assuming a purchase of a share on the first day of the period and a sale of a share on the last day of each period reported. Dividends and distributions, if any, are assumed, for purposes of this calculation, to be reinvested. Total return does not reflect sales charges and includes the effect of fee waivers and reimbursements. Total return may reflect adjustments to conform to U.S. GAAP. Total return for a period of less than one year is not annualized. |
| 250 | Semiannual Report | | March 31, 2018 | | See accompanying Notes to Financial Statements |
Table of Contents
| Total Dividends and Distributions | Net Asset Value, End of Period | Total Return (b) | Net Assets, End of Period (000s) | Ratio of Expenses to Average Net Assets with Fee Waiver/ Reimbursement (c) | Ratio of Expenses to Average Net Assets without Fee Waiver/ Reimbursement (c) | Ratio of Net Investment Income to Average Net Assets (c) | Portfolio Turnover Rate | |||||||||||||||||||||||||||
| $ | (1.44 | ) | $ | 22.54 | 3.08 | % | $ | 6,013 | 0.44 | %(d) | 0.61 | %(d) | 4.25 | %(d) | 7 | % | ||||||||||||||||||
| (0.74 | ) | 23.24 | 17.46 | 6,480 | 0.46 | 0.60 | 0.57 | 103 | ||||||||||||||||||||||||||
| (0.41 | ) | 20.51 | 9.99 | 4,106 | 0.51 | 0.60 | 1.36 | 101 | ||||||||||||||||||||||||||
| (1.42 | ) | 19.04 | (6.99 | ) | 13,551 | 0.37 | (d)(e) | 0.60 | (d)(e) | 2.87 | (d)(e) | 143 | ||||||||||||||||||||||
| (0.52 | ) | 21.91 | 4.65 | 16,631 | 0.38 | 0.60 | 2.22 | 84 | ||||||||||||||||||||||||||
| (0.57 | ) | 21.45 | 12.11 | 5,513 | 0.35 | 0.60 | 2.40 | 61 | ||||||||||||||||||||||||||
| (2.41 | ) | 19.71 | 10.61 | 1,915 | 0.28 | 0.60 | 1.52 | 45 | ||||||||||||||||||||||||||
| $ | (1.27 | ) | $ | 22.34 | 2.69 | % | $ | 141 | 1.19 | %(d) | 1.36 | %(d) | 3.61 | %(d) | 7 | % | ||||||||||||||||||
| (0.66 | ) | 22.97 | 16.53 | 139 | 1.21 | 1.36 | 0.03 | 103 | ||||||||||||||||||||||||||
| (0.31 | ) | 20.36 | 9.20 | 126 | 1.26 | 1.35 | 0.99 | 101 | ||||||||||||||||||||||||||
| (1.18 | ) | 18.94 | (7.54 | ) | 202 | 1.12 | (d)(e) | 1.35 | (d)(e) | 2.22 | (d)(e) | 143 | ||||||||||||||||||||||
| (0.34 | ) | 21.68 | 3.90 | 269 | 1.13 | 1.35 | 1.51 | 84 | ||||||||||||||||||||||||||
| (0.46 | ) | 21.21 | 11.20 | 317 | 1.10 | 1.35 | 1.66 | 61 | ||||||||||||||||||||||||||
| (2.28 | ) | 19.53 | 9.80 | 195 | 1.03 | 1.35 | 1.66 | 45 | ||||||||||||||||||||||||||
| $ | (1.25 | ) | $ | 22.38 | 2.93 | % | $ | 313 | 0.79 | %(d) | 0.86 | %(d) | 4.25 | %(d) | 7 | % | ||||||||||||||||||
| (0.77 | ) | 22.94 | 16.98 | 416 | 0.81 | 0.86 | 1.55 | 103 | ||||||||||||||||||||||||||
| (0.41 | ) | 20.37 | 9.64 | 1,648 | 0.86 | 0.86 | 0.94 | 101 | ||||||||||||||||||||||||||
| (1.34 | ) | 18.97 | (7.22 | ) | 1,272 | 0.72 | (d)(e) | 0.85 | (d)(e) | 2.48 | (d)(e) | 143 | ||||||||||||||||||||||
| (0.41 | ) | 21.80 | 4.31 | 1,343 | 0.73 | 0.85 | 1.88 | 84 | ||||||||||||||||||||||||||
| (0.56 | ) | 21.31 | 11.70 | 1,167 | 0.70 | 0.85 | 2.15 | 61 | ||||||||||||||||||||||||||
| (2.35 | ) | 19.63 | 10.24 | 848 | 0.63 | 0.85 | 0.87 | 45 | ||||||||||||||||||||||||||
| $ | (1.50 | ) | $ | 22.64 | 3.24 | % | $ | 23,215 | 0.14 | %(d) | 0.21 | %(d) | 4.82 | %(d) | 7 | % | ||||||||||||||||||
| (0.89 | ) | 23.36 | 17.83 | 24,077 | 0.16 | 0.21 | 1.06 | 103 | ||||||||||||||||||||||||||
| (0.53 | ) | 20.70 | 10.36 | 20,628 | 0.21 | 0.21 | 1.61 | 101 | ||||||||||||||||||||||||||
| (1.48 | ) | 19.26 | (6.76 | ) | 16,997 | 0.07 | (d)(e) | 0.20 | (d)(e) | 2.67 | (d)(e) | 143 | ||||||||||||||||||||||
| (0.54 | ) | 22.15 | 4.99 | 11,734 | 0.08 | 0.20 | 2.27 | 84 | ||||||||||||||||||||||||||
| (0.58 | ) | 21.63 | 12.42 | 4,704 | 0.05 | 0.20 | 2.37 | 61 | ||||||||||||||||||||||||||
| (2.45 | ) | 19.82 | 10.99 | 2,343 | — | (f) | 0.20 | 2.00 | 45 | |||||||||||||||||||||||||
| $ | (1.52 | ) | $ | 22.69 | 3.28 | % | $ | 23,863 | 0.04 | %(d) | 0.11 | %(d) | 4.76 | %(d) | 7 | % | ||||||||||||||||||
| (0.91 | ) | 23.42 | 17.95 | 23,705 | 0.06 | 0.10 | 0.98 | 103 | ||||||||||||||||||||||||||
| (0.54 | ) | 20.75 | 10.47 | 15,812 | 0.11 | 0.11 | 1.65 | 101 | ||||||||||||||||||||||||||
| (1.50 | ) | 19.30 | (6.67 | ) | 12,053 | — | (d)(e)(f) | 0.10 | (d)(e) | 3.09 | (d)(e) | 143 | ||||||||||||||||||||||
| (0.55 | ) | 22.19 | 5.09 | 8,071 | — | (f) | 0.10 | 2.78 | 84 | |||||||||||||||||||||||||
| (0.58 | ) | 21.66 | 12.51 | 9,939 | — | (f) | 0.12 | 2.93 | 61 | |||||||||||||||||||||||||
| (2.47 | ) | 19.83 | 11.04 | 7,782 | — | (f) | 0.15 | 2.95 | 45 | |||||||||||||||||||||||||
| $ | (1.45 | ) | $ | 22.53 | 3.07 | % | $ | 479 | 0.39 | %(d) | 0.46 | %(d) | 4.26 | %(d) | 7 | % | ||||||||||||||||||
| (0.81 | ) | 23.24 | 17.52 | 425 | 0.41 | 0.45 | 0.73 | 103 | ||||||||||||||||||||||||||
| (0.48 | ) | 20.57 | 10.09 | 374 | 0.46 | 0.46 | 1.58 | 101 | ||||||||||||||||||||||||||
| (1.43 | ) | 19.14 | (7.00 | ) | 488 | 0.32 | (d)(e) | 0.45 | (d)(e) | 9.63 | (d)(e) | 143 | ||||||||||||||||||||||
| (0.50 | ) | 22.02 | 4.72 | 5,278 | 0.33 | 0.45 | 2.31 | 84 | ||||||||||||||||||||||||||
| (0.55 | ) | 21.53 | 12.13 | 5,054 | 0.30 | 0.45 | 1.27 | 61 | ||||||||||||||||||||||||||
| (2.41 | ) | 19.75 | 10.67 | 17 | 0.23 | 0.45 | 2.72 | 45 | ||||||||||||||||||||||||||
| (c) | Does not include expenses of the investment companies in which the Fund invests. |
| (d) | Annualized, unless otherwise noted. |
| (e) | Certain expenses incurred by the Fund were not annualized. |
| (f) | See Note 6 in the Notes to Financial Statements. |
| See accompanying Notes to Financial Statements | | March 31, 2018 | | Semiannual Report | 251 |
Table of Contents
Financial Highlights (cont’d)
For a Share Outstanding for the Period ended:
| Net Asset Value, Beginning of Period | Net Investment Income (a) | Net Realized and Change in Unrealized Gain (Loss) | Total from Investment Operations | Dividends from Net Investment Income | Distributions from Net Realized Capital Gains | |||||||||||||||||||||||
| AllianzGI Retirement 2045: | ||||||||||||||||||||||||||||
| Class A | ||||||||||||||||||||||||||||
3/31/2018+ | $ | 20.36 | $ | 0.46 | $ | 0.21 | $ | 0.67 | $ | (1.12 | ) | $ | (0.15 | ) | ||||||||||||||
9/30/2017 | 18.07 | 0.13 | 3.04 | 3.17 | (0.34 | ) | (0.54 | ) | ||||||||||||||||||||
9/30/2016 | 16.71 | 0.20 | 1.54 | 1.74 | (0.34 | ) | (0.04 | ) | ||||||||||||||||||||
12/1/2014 - 9/30/2015# | 19.09 | 0.41 | (1.75 | ) | (1.34 | ) | (0.70 | ) | (0.34 | ) | ||||||||||||||||||
11/30/2014 | 18.67 | 0.41 | 0.49 | 0.90 | (0.45 | ) | (0.03 | ) | ||||||||||||||||||||
11/30/2013 | 17.02 | 0.41 | 1.79 | 2.20 | (0.46 | ) | (0.09 | ) | ||||||||||||||||||||
12/19/2011* - 11/30/2012 | 15.00 | 0.32 | 1.92 | 2.24 | (0.22 | ) | — | |||||||||||||||||||||
| Class R | ||||||||||||||||||||||||||||
3/31/2018+ | $ | 20.14 | $ | 0.43 | $ | 0.19 | $ | 0.62 | $ | (1.02 | ) | $ | (0.15 | ) | ||||||||||||||
9/30/2017 | 17.97 | 0.30 | 2.78 | 3.08 | (0.37 | ) | (0.54 | ) | ||||||||||||||||||||
9/30/2016 | 16.65 | 0.13 | 1.55 | 1.68 | (0.32 | ) | (0.04 | ) | ||||||||||||||||||||
12/1/2014 - 9/30/2015# | 19.01 | 0.36 | (1.74 | ) | (1.38 | ) | (0.64 | ) | (0.34 | ) | ||||||||||||||||||
11/30/2014 | 18.57 | 0.34 | 0.49 | 0.83 | (0.36 | ) | (0.03 | ) | ||||||||||||||||||||
11/30/2013 | 16.96 | 0.38 | 1.75 | 2.13 | (0.43 | ) | (0.09 | ) | ||||||||||||||||||||
12/19/2011* - 11/30/2012 | 15.00 | 0.16 | 2.02 | 2.18 | (0.22 | ) | — | |||||||||||||||||||||
| Class P | ||||||||||||||||||||||||||||
3/31/2018+ | $ | 20.42 | $ | 0.51 | $ | 0.19 | $ | 0.70 | $ | (1.18 | ) | $ | (0.15 | ) | ||||||||||||||
9/30/2017 | 18.19 | 0.21 | 3.03 | 3.24 | (0.47 | ) | (0.54 | ) | ||||||||||||||||||||
9/30/2016 | 16.84 | 0.26 | 1.56 | 1.82 | (0.43 | ) | (0.04 | ) | ||||||||||||||||||||
12/1/2014 - 9/30/2015# | 19.24 | 0.43 | (1.74 | ) | (1.31 | ) | (0.75 | ) | (0.34 | ) | ||||||||||||||||||
11/30/2014 | 18.77 | 0.40 | 0.57 | 0.97 | (0.47 | ) | (0.03 | ) | ||||||||||||||||||||
11/30/2013 | 17.06 | 0.47 | 1.79 | 2.26 | (0.46 | ) | (0.09 | ) | ||||||||||||||||||||
12/19/2011* - 11/30/2012 | 15.00 | 0.39 | 1.89 | 2.28 | (0.22 | ) | — | |||||||||||||||||||||
| Class R6 | ||||||||||||||||||||||||||||
3/31/2018+ | $ | 20.48 | $ | 0.51 | $ | 0.21 | $ | 0.72 | $ | (1.20 | ) | $ | (0.15 | ) | ||||||||||||||
9/30/2017 | 18.25 | 0.19 | 3.07 | 3.26 | (0.49 | ) | (0.54 | ) | ||||||||||||||||||||
9/30/2016 | 16.89 | 0.22 | 1.62 | 1.84 | (0.44 | ) | (0.04 | ) | ||||||||||||||||||||
12/1/2014 - 9/30/2015# | 19.28 | 0.65 | (1.94 | ) | (1.29 | ) | (0.76 | ) | (0.34 | ) | ||||||||||||||||||
11/30/2014 | 18.80 | 0.49 | 0.49 | 0.98 | (0.47 | ) | (0.03 | ) | ||||||||||||||||||||
11/30/2013 | 17.07 | 0.52 | 1.76 | 2.28 | (0.46 | ) | (0.09 | ) | ||||||||||||||||||||
12/19/2011* - 11/30/2012 | 15.00 | 0.50 | 1.79 | 2.29 | (0.22 | ) | — | |||||||||||||||||||||
| Administrative Class | ||||||||||||||||||||||||||||
3/31/2018+ | $ | 20.28 | $ | 0.46 | $ | 0.21 | $ | 0.67 | $ | (1.12 | ) | $ | (0.15 | ) | ||||||||||||||
9/30/2017 | 18.10 | 0.16 | 3.01 | 3.17 | (0.45 | ) | (0.54 | ) | ||||||||||||||||||||
9/30/2016 | 16.76 | 0.22 | 1.55 | 1.77 | (0.39 | ) | (0.04 | ) | ||||||||||||||||||||
12/1/2014 - 9/30/2015# | 19.15 | 1.22 | (2.56 | ) | (1.34 | ) | (0.71 | ) | (0.34 | ) | ||||||||||||||||||
11/30/2014 | 18.71 | 0.42 | 0.49 | 0.91 | (0.44 | ) | (0.03 | ) | ||||||||||||||||||||
11/30/2013 | 17.01 | 0.22 | 1.99 | 2.21 | (0.42 | ) | (0.09 | ) | ||||||||||||||||||||
12/19/2011* - 11/30/2012 | 15.00 | 0.44 | 1.79 | 2.23 | (0.22 | ) | — | |||||||||||||||||||||
| + | Unaudited |
| # | Fiscal year end changed from November 30th to September 30th. |
| * | Commencement of operations. |
| (a) | Calculated on average shares outstanding during the period. |
| (b) | Total return is calculated assuming a purchase of a share on the first day of the period and a sale of a share on the last day of each period reported. Dividends and distributions, if any, are assumed, for purposes of this calculation, to be reinvested. Total return does not reflect sales charges and includes the effect of fee waivers and reimbursements. Total return may reflect adjustments to conform to U.S. GAAP. Total return for a period of less than one year is not annualized. |
| 252 | Semiannual Report | | March 31, 2018 | | See accompanying Notes to Financial Statements |
Table of Contents
| Total Dividends and Distributions | Net Asset Value, End of Period | Total Return (b) | Net Assets, End of Period (000s) | Ratio of Expenses to Average Net Assets with Fee Waiver/ Reimbursement (c) | Ratio of Expenses to Average Net Assets without Fee Waiver/ Reimbursement (c) | Ratio of Net Investment Income to Average Net Assets (c) | Portfolio Turnover Rate | |||||||||||||||||||||||||||
| $ | (1.27 | ) | $ | 19.76 | 3.20 | % | $ | 4,867 | 0.48 | %(d) | 0.61 | %(d) | 4.50 | %(d) | 5 | % | ||||||||||||||||||
| (0.88 | ) | 20.36 | 18.35 | 4,630 | 0.49 | 0.60 | 0.70 | 97 | ||||||||||||||||||||||||||
| (0.38 | ) | 18.07 | 10.55 | 3,753 | 0.51 | 0.60 | 1.17 | 103 | ||||||||||||||||||||||||||
| (1.04 | ) | 16.71 | (7.35 | ) | 10,022 | 0.37 | (d)(e) | 0.61 | (d)(e) | 2.74 | (d)(e) | 149 | ||||||||||||||||||||||
| (0.48 | ) | 19.09 | 4.89 | 10,080 | 0.37 | 0.60 | 2.17 | 69 | ||||||||||||||||||||||||||
| (0.55 | ) | 18.67 | 13.33 | 4,313 | 0.33 | 0.60 | 2.31 | 51 | ||||||||||||||||||||||||||
| (0.22 | ) | 17.02 | 15.09 | 61 | 0.29 | (d) | 0.60 | (d) | 2.08 | (d) | 38 | |||||||||||||||||||||||
| $ | (1.17 | ) | $ | 19.59 | 2.98 | % | $ | 216 | 0.83 | %(d) | 0.86 | %(d) | 4.25 | %(d) | 5 | % | ||||||||||||||||||
| (0.91 | ) | 20.14 | 17.94 | 193 | 0.84 | 0.86 | 1.64 | 97 | ||||||||||||||||||||||||||
| (0.36 | ) | 17.97 | 10.20 | 625 | 0.86 | 0.86 | 0.78 | 103 | ||||||||||||||||||||||||||
| (0.98 | ) | 16.65 | (7.59 | ) | 464 | 0.72 | (d)(e) | 0.86 | (d)(e) | 2.38 | (d)(e) | 149 | ||||||||||||||||||||||
| (0.39 | ) | 19.01 | 4.52 | 449 | 0.72 | 0.85 | 1.82 | 69 | ||||||||||||||||||||||||||
| (0.52 | ) | 18.57 | 12.94 | 356 | 0.68 | 0.85 | 2.17 | 51 | ||||||||||||||||||||||||||
| (0.22 | ) | 16.96 | 14.67 | 293 | 0.64 | (d) | 0.85 | (d) | 1.07 | (d) | 38 | |||||||||||||||||||||||
| $ | (1.33 | ) | $ | 19.79 | 3.32 | % | $ | 15,298 | 0.18 | %(d) | 0.21 | %(d) | 5.01 | %(d) | 5 | % | ||||||||||||||||||
| (1.01 | ) | 20.42 | 18.74 | 15,458 | 0.19 | 0.21 | 1.10 | 97 | ||||||||||||||||||||||||||
| (0.47 | ) | 18.19 | 10.95 | 12,764 | 0.21 | 0.21 | 1.49 | 103 | ||||||||||||||||||||||||||
| (1.09 | ) | 16.84 | (7.15 | ) | 10,650 | 0.07 | (d)(e) | 0.21 | (d)(e) | 2.88 | (d)(e) | 149 | ||||||||||||||||||||||
| (0.50 | ) | 19.24 | 5.26 | 8,793 | 0.07 | 0.20 | 2.10 | 69 | ||||||||||||||||||||||||||
| (0.55 | ) | 18.77 | 13.68 | 2,286 | 0.03 | 0.20 | 2.63 | 51 | ||||||||||||||||||||||||||
| (0.22 | ) | 17.06 | 15.37 | 1,584 | — | (d)(f) | 0.20 | (d) | 2.46 | (d) | 38 | |||||||||||||||||||||||
| $ | (1.35 | ) | $ | 19.85 | 3.41 | % | $ | 13,830 | 0.08 | %(d) | 0.11 | %(d) | 4.99 | %(d) | 5 | % | ||||||||||||||||||
| (1.03 | ) | 20.48 | 18.82 | 12,770 | 0.09 | 0.10 | 1.01 | 97 | ||||||||||||||||||||||||||
| (0.48 | ) | 18.25 | 11.06 | 7,919 | 0.11 | 0.11 | 1.25 | 103 | ||||||||||||||||||||||||||
| (1.10 | ) | 16.89 | (7.02 | ) | 3,563 | — | (d)(e)(f) | 0.10 | (d)(e) | 4.23 | (d)(e) | 149 | ||||||||||||||||||||||
| (0.50 | ) | 19.28 | 5.33 | 5,477 | — | (f) | 0.10 | 2.55 | 69 | |||||||||||||||||||||||||
| (0.55 | ) | 18.80 | 13.80 | 4,587 | — | (f) | 0.12 | 2.91 | 51 | |||||||||||||||||||||||||
| (0.22 | ) | 17.07 | 15.44 | 3,733 | — | (d)(f) | 0.15 | (d) | 3.23 | (d) | 38 | |||||||||||||||||||||||
| $ | (1.27 | ) | $ | 19.68 | 3.19 | % | $ | 565 | 0.43 | %(d) | 0.46 | %(d) | 4.46 | %(d) | 5 | % | ||||||||||||||||||
| (0.99 | ) | 20.28 | 18.40 | 666 | 0.44 | 0.45 | 0.85 | 97 | ||||||||||||||||||||||||||
| (0.43 | ) | 18.10 | 10.67 | 359 | 0.46 | 0.46 | 1.27 | 103 | ||||||||||||||||||||||||||
| (1.05 | ) | 16.76 | (7.37 | ) | 346 | 0.32 | (d)(e) | 0.46 | (d)(e) | 7.95 | (d)(e) | 149 | ||||||||||||||||||||||
| (0.47 | ) | 19.15 | 4.95 | 1,763 | 0.32 | 0.45 | 2.24 | 69 | ||||||||||||||||||||||||||
| (0.51 | ) | 18.71 | 13.40 | 1,542 | 0.28 | 0.45 | 1.23 | 51 | ||||||||||||||||||||||||||
| (0.22 | ) | 17.01 | 15.02 | 12 | 0.24 | (d) | 0.45 | (d) | 2.84 | (d) | 38 | |||||||||||||||||||||||
| (c) | Does not include expenses of the investment companies in which the Fund invests. |
| (d) | Annualized, unless otherwise noted. |
| (e) | Certain expenses incurred by the Fund were not annualized. |
| (f) | See Note 6 in the Notes to Financial Statements. |
| See accompanying Notes to Financial Statements | | March 31, 2018 | | Semiannual Report | 253 |
Table of Contents
Financial Highlights (cont’d)
For a Share Outstanding for the Period ended:
| Net Asset Value, Beginning of Period | Net Investment Income (a) | Net Realized and Change in Unrealized Gain (Loss) | Total from Investment Operations | Dividends from Net Investment Income | Distributions from Net Realized Capital Gains | |||||||||||||||||||||||
| AllianzGI Retirement 2050: | ||||||||||||||||||||||||||||
| Class A | ||||||||||||||||||||||||||||
3/31/2018+ | $ | 22.66 | $ | 0.49 | $ | 0.28 | $ | 0.77 | $ | (1.28 | ) | $ | (0.20 | ) | ||||||||||||||
9/30/2017 | 20.10 | 0.09 | 3.46 | 3.55 | (0.44 | ) | (0.55 | ) | ||||||||||||||||||||
9/30/2016 | 18.72 | 0.20 | 1.78 | 1.98 | (0.23 | ) | (0.37 | ) | ||||||||||||||||||||
12/1/2014 - 9/30/2015# | 21.87 | 0.44 | (2.04 | ) | (1.60 | ) | (0.87 | ) | (0.68 | ) | ||||||||||||||||||
11/30/2014 | 21.55 | 0.44 | 0.58 | 1.02 | (0.57 | ) | (0.13 | ) | ||||||||||||||||||||
11/30/2013 | 19.48 | 0.42 | 2.32 | 2.74 | (0.60 | ) | (0.07 | ) | ||||||||||||||||||||
11/30/2012 | 20.16 | 0.28 | 1.59 | 1.87 | (0.76 | ) | (1.79 | ) | ||||||||||||||||||||
| Class C | ||||||||||||||||||||||||||||
3/31/2018+ | $ | 22.25 | $ | 0.45 | $ | 0.22 | $ | 0.67 | $ | (1.13 | ) | $ | (0.20 | ) | ||||||||||||||
9/30/2017 | 19.80 | 0.01 | 3.33 | 3.34 | (0.34 | ) | (0.55 | ) | ||||||||||||||||||||
9/30/2016 | 18.52 | 0.11 | 1.71 | 1.82 | (0.17 | ) | (0.37 | ) | ||||||||||||||||||||
12/1/2014 - 9/30/2015# | 21.62 | 0.31 | (2.03 | ) | (1.72 | ) | (0.70 | ) | (0.68 | ) | ||||||||||||||||||
11/30/2014 | 21.34 | 0.30 | 0.55 | 0.85 | (0.44 | ) | (0.13 | ) | ||||||||||||||||||||
11/30/2013 | 19.25 | 0.30 | 2.27 | 2.57 | (0.41 | ) | (0.07 | ) | ||||||||||||||||||||
11/30/2012 | 19.92 | 0.27 | 1.44 | 1.71 | (0.59 | ) | (1.79 | ) | ||||||||||||||||||||
| Class R | ||||||||||||||||||||||||||||
3/31/2018+ | $ | 22.46 | $ | 0.49 | $ | 0.23 | $ | 0.72 | $ | (1.02 | ) | $ | (0.20 | ) | ||||||||||||||
9/30/2017 | 19.99 | 0.44 | 3.00 | 3.44 | (0.42 | ) | (0.55 | ) | ||||||||||||||||||||
9/30/2016 | 18.68 | 0.15 | 1.76 | 1.91 | (0.23 | ) | (0.37 | ) | ||||||||||||||||||||
12/1/2014 - 9/30/2015# | 21.80 | 0.37 | (2.03 | ) | (1.66 | ) | (0.78 | ) | (0.68 | ) | ||||||||||||||||||
11/30/2014 | 21.46 | 0.39 | 0.53 | 0.92 | (0.45 | ) | (0.13 | ) | ||||||||||||||||||||
11/30/2013 | 19.47 | 0.37 | 2.29 | 2.66 | (0.60 | ) | (0.07 | ) | ||||||||||||||||||||
11/30/2012 | 20.12 | 0.18 | 1.64 | 1.82 | (0.68 | ) | (1.79 | ) | ||||||||||||||||||||
| Class P | ||||||||||||||||||||||||||||
3/31/2018+ | $ | 22.86 | $ | 0.59 | $ | 0.23 | $ | 0.82 | $ | (1.36 | ) | $ | (0.20 | ) | ||||||||||||||
9/30/2017 | 20.31 | 0.25 | 3.39 | 3.64 | (0.54 | ) | (0.55 | ) | ||||||||||||||||||||
9/30/2016 | 18.97 | 0.27 | 1.80 | 2.07 | (0.36 | ) | (0.37 | ) | ||||||||||||||||||||
12/1/2014 - 9/30/2015# | 22.14 | 0.47 | (2.04 | ) | (1.57 | ) | (0.92 | ) | (0.68 | ) | ||||||||||||||||||
11/30/2014 | 21.77 | 0.45 | 0.64 | 1.09 | (0.59 | ) | (0.13 | ) | ||||||||||||||||||||
11/30/2013 | 19.64 | 0.48 | 2.35 | 2.83 | (0.63 | ) | (0.07 | ) | ||||||||||||||||||||
11/30/2012 | 20.27 | 0.38 | 1.56 | 1.94 | (0.78 | ) | (1.79 | ) | ||||||||||||||||||||
| Class R6 | ||||||||||||||||||||||||||||
3/31/2018+ | $ | 22.96 | $ | 0.59 | $ | 0.23 | $ | 0.82 | $ | (1.38 | ) | $ | (0.20 | ) | ||||||||||||||
9/30/2017 | 20.39 | 0.23 | 3.45 | 3.68 | (0.56 | ) | (0.55 | ) | ||||||||||||||||||||
9/30/2016 | 19.03 | 0.30 | 1.79 | 2.09 | (0.36 | ) | (0.37 | ) | ||||||||||||||||||||
12/1/2014 - 9/30/2015# | 22.20 | 0.57 | (2.13 | ) | (1.56 | ) | (0.93 | ) | (0.68 | ) | ||||||||||||||||||
11/30/2014 | 21.80 | 0.57 | 0.55 | 1.12 | (0.59 | ) | (0.13 | ) | ||||||||||||||||||||
11/30/2013 | 19.66 | 0.55 | 2.29 | 2.84 | (0.63 | ) | (0.07 | ) | ||||||||||||||||||||
11/30/2012 | 20.30 | 0.58 | 1.38 | 1.96 | (0.81 | ) | (1.79 | ) | ||||||||||||||||||||
| Administrative Class | ||||||||||||||||||||||||||||
3/31/2018+ | $ | 22.74 | $ | 0.54 | $ | 0.23 | $ | 0.77 | $ | (1.30 | ) | $ | (0.20 | ) | ||||||||||||||
9/30/2017 | 20.20 | 0.18 | 3.40 | 3.58 | (0.49 | ) | (0.55 | ) | ||||||||||||||||||||
9/30/2016 | 18.87 | 0.24 | 1.77 | 2.01 | (0.31 | ) | (0.37 | ) | ||||||||||||||||||||
12/1/2014 - 9/30/2015# | 22.03 | 0.80 | (2.42 | ) | (1.62 | ) | (0.86 | ) | (0.68 | ) | ||||||||||||||||||
11/30/2014 | 21.69 | 0.49 | 0.54 | 1.03 | (0.56 | ) | (0.13 | ) | ||||||||||||||||||||
11/30/2013 | 19.58 | 0.22 | 2.55 | 2.77 | (0.59 | ) | (0.07 | ) | ||||||||||||||||||||
11/30/2012 | 20.23 | 0.53 | 1.36 | 1.89 | (0.75 | ) | (1.79 | ) | ||||||||||||||||||||
| + | Unaudited |
| # | Fiscal year end changed from November 30th to September 30th. |
| (a) | Calculated on average shares outstanding during the period. |
| (b) | Total return is calculated assuming a purchase of a share on the first day of the period and a sale of a share on the last day of each period reported. Dividends and distributions, if any, are assumed, for purposes of this calculation, to be reinvested. Total return does not reflect sales charges and includes the effect of fee waivers and reimbursements. Total return may reflect adjustments to conform to U.S. GAAP. Total return for a period of less than one year is not annualized. |
| 254 | Semiannual Report | | March 31, 2018 | | See accompanying Notes to Financial Statements |
Table of Contents
| Total Dividends and Distributions | Net Asset Value, End of Period | Total Return (b) | Net Assets, End of Period (000s) | Ratio of Expenses to Average Net Assets | Ratio of Expenses Net Assets | Ratio of Net Investment Income to Average Net Assets (c) | Portfolio Turnover Rate | |||||||||||||||||||||||||||
| $ | (1.48 | ) | $ | 21.95 | 3.31 | % | $ | 3,359 | 0.49 | %(d) | 0.61 | %(d) | 4.31 | %(d) | 5 | % | ||||||||||||||||||
| (0.99 | ) | 22.66 | 18.45 | 3,713 | 0.50 | 0.60 | 0.41 | 94 | ||||||||||||||||||||||||||
| (0.60 | ) | 20.10 | 10.74 | 1,633 | 0.50 | 0.60 | 1.03 | 89 | ||||||||||||||||||||||||||
| (1.55 | ) | 18.72 | (7.79 | ) | 4,863 | 0.34 | (d)(e) | 0.61 | (d)(e) | 2.62 | (d)(e) | 147 | ||||||||||||||||||||||
| (0.70 | ) | 21.87 | 4.85 | 4,772 | 0.35 | 0.60 | 2.02 | 78 | ||||||||||||||||||||||||||
| (0.67 | ) | 21.55 | 14.50 | 1,014 | 0.30 | 0.60 | 2.08 | 54 | ||||||||||||||||||||||||||
| (2.55 | ) | 19.48 | 10.64 | 1,371 | 0.26 | 0.60 | 1.45 | 47 | ||||||||||||||||||||||||||
| $ | (1.33 | ) | $ | 21.59 | 2.91 | % | $ | 173 | 1.24 | %(d) | 1.36 | %(d) | 3.99 | %(d) | 5 | % | ||||||||||||||||||
| (0.89 | ) | 22.25 | 17.58 | 175 | 1.25 | 1.35 | 0.04 | 94 | ||||||||||||||||||||||||||
| (0.54 | ) | 19.80 | 9.96 | 145 | 1.25 | 1.35 | 0.56 | 89 | ||||||||||||||||||||||||||
| (1.38 | ) | 18.52 | (8.40 | ) | 148 | 1.09 | (d)(e) | 1.36 | (d)(e) | 1.83 | (d)(e) | 147 | ||||||||||||||||||||||
| (0.57 | ) | 21.62 | 4.08 | 138 | 1.10 | 1.35 | 1.38 | 78 | ||||||||||||||||||||||||||
| (0.48 | ) | 21.34 | 13.64 | 119 | 1.05 | 1.35 | 1.48 | 54 | ||||||||||||||||||||||||||
| (2.38 | ) | 19.25 | 9.78 | 60 | 1.01 | 1.35 | 1.44 | 47 | ||||||||||||||||||||||||||
| $ | (1.22 | ) | $ | 21.96 | 3.13 | % | $ | 109 | 0.84 | %(d) | 0.86 | %(d) | 4.32 | %(d) | 5 | % | ||||||||||||||||||
| (0.97 | ) | 22.46 | 17.99 | 95 | 0.85 | 0.85 | 2.13 | 94 | ||||||||||||||||||||||||||
| (0.60 | ) | 19.99 | 10.41 | 740 | 0.85 | 0.85 | 0.80 | 89 | ||||||||||||||||||||||||||
| (1.46 | ) | 18.68 | (8.07 | ) | 608 | 0.69 | (d)(e) | 0.86 | (d)(e) | 2.20 | (d)(e) | 147 | ||||||||||||||||||||||
| (0.58 | ) | 21.80 | 4.41 | 584 | 0.70 | 0.85 | 1.79 | 78 | ||||||||||||||||||||||||||
| (0.67 | ) | 21.46 | 14.11 | 497 | 0.65 | 0.85 | 1.85 | 54 | ||||||||||||||||||||||||||
| (2.47 | ) | 19.47 | 10.30 | 359 | 0.61 | 0.85 | 0.96 | 47 | ||||||||||||||||||||||||||
| $ | (1.56 | ) | $ | 22.12 | 3.47 | % | $ | 12,149 | 0.19 | %(d) | 0.21 | %(d) | 5.17 | %(d) | 5 | % | ||||||||||||||||||
| (1.09 | ) | 22.86 | 18.81 | 11,758 | 0.20 | 0.20 | 1.18 | 94 | ||||||||||||||||||||||||||
| (0.73 | ) | 20.31 | 11.12 | 10,021 | 0.20 | 0.20 | 1.42 | 89 | ||||||||||||||||||||||||||
| (1.60 | ) | 18.97 | (7.55 | ) | 7,750 | 0.04 | (d)(e) | 0.21 | (d)(e) | 2.74 | (d)(e) | 147 | ||||||||||||||||||||||
| (0.72 | ) | 22.14 | 5.13 | 5,234 | 0.05 | 0.20 | 2.06 | 78 | ||||||||||||||||||||||||||
| (0.70 | ) | 21.77 | 14.90 | 1,397 | — | 0.20 | 2.34 | 54 | ||||||||||||||||||||||||||
| (2.57 | ) | 19.64 | 11.00 | 762 | — | (f) | 0.20 | 1.98 | 47 | |||||||||||||||||||||||||
| $ | (1.58 | ) | $ | 22.20 | 3.47 | % | $ | 17,674 | 0.09 | %(d) | 0.11 | %(d) | 5.09 | %(d) | 5 | % | ||||||||||||||||||
| (1.11 | ) | 22.96 | 18.96 | 16,063 | 0.10 | 0.10 | 1.07 | 94 | ||||||||||||||||||||||||||
| (0.73 | ) | 20.39 | 11.23 | 10,525 | 0.10 | 0.10 | 1.54 | 89 | ||||||||||||||||||||||||||
| (1.61 | ) | 19.03 | (7.49 | ) | 8,110 | — | (d)(e)(f) | 0.10 | (d)(e) | 3.31 | (d)(e) | 147 | ||||||||||||||||||||||
| (0.72 | ) | 22.20 | 5.27 | 9,227 | — | (f) | 0.10 | 2.58 | 78 | |||||||||||||||||||||||||
| (0.70 | ) | 21.80 | 14.94 | 8,935 | — | (f) | 0.12 | 2.68 | 54 | |||||||||||||||||||||||||
| (2.60 | ) | 19.66 | 11.06 | 6,431 | — | (f) | 0.15 | 3.03 | 47 | |||||||||||||||||||||||||
| $ | (1.50 | ) | $ | 22.01 | 3.31 | % | $ | 856 | 0.44 | %(d) | 0.46 | %(d) | 4.73 | %(d) | 5 | % | ||||||||||||||||||
| (1.04 | ) | 22.74 | 18.54 | 813 | 0.45 | 0.45 | 0.86 | 94 | ||||||||||||||||||||||||||
| (0.68 | ) | 20.20 | 10.87 | 646 | 0.45 | 0.45 | 1.23 | 89 | ||||||||||||||||||||||||||
| (1.54 | ) | 18.87 | (7.80 | ) | 605 | 0.29 | (d)(e) | 0.46 | (d)(e) | 4.66 | (d)(e) | 147 | ||||||||||||||||||||||
| (0.69 | ) | 22.03 | 4.87 | 1,245 | 0.30 | 0.45 | 2.25 | 78 | ||||||||||||||||||||||||||
| (0.66 | ) | 21.69 | 14.66 | 1,194 | 0.25 | 0.45 | 1.07 | 54 | ||||||||||||||||||||||||||
| (2.54 | ) | 19.58 | 10.62 | 17 | 0.21 | 0.45 | 2.77 | 47 | ||||||||||||||||||||||||||
| (c) | Does not include expenses of the investment companies in which the Fund invests. |
| (d) | Annualized, unless otherwise noted. |
| (e) | Certain expenses incurred by the Fund were not annualized. |
| (f) | See Note 6 in the Notes to Financial Statements. |
| See accompanying Notes to Financial Statements | | March 31, 2018 | | Semiannual Report | 255 |
Table of Contents
3
Financial Highlights (cont’d)
For a Share Outstanding for the Period ended:
| Net Asset Value, Beginning of Period | Net Investment Income (a) | Net Realized and Change in Unrealized Gain (Loss) | Total from Investment Operations | Dividends from Net Investment Income | Distributions from Net Realized Capital Gains | |||||||||||||||||||||||
| AllianzGI Retirement 2055: | ||||||||||||||||||||||||||||
| Class A | ||||||||||||||||||||||||||||
3/31/2018+ | $ | 19.52 | $ | 0.44 | $ | 0.24 | $ | 0.68 | $ | (1.11 | ) | $ | (0.11 | ) | ||||||||||||||
9/30/2017 | 17.17 | 0.09 | 2.95 | 3.04 | (0.33 | ) | (0.36 | ) | ||||||||||||||||||||
9/30/2016 | 16.02 | 0.17 | 1.49 | 1.66 | (0.28 | ) | (0.23 | ) | ||||||||||||||||||||
12/1/2014 - 9/30/2015# | 18.70 | 0.33 | (1.69 | ) | (1.36 | ) | (0.76 | ) | (0.56 | ) | ||||||||||||||||||
11/30/2014 | 18.51 | 0.39 | 0.50 | 0.89 | (0.49 | ) | (0.21 | ) | ||||||||||||||||||||
11/30/2013 | 17.02 | 0.26 | 2.11 | 2.37 | (0.59 | ) | (0.29 | ) | ||||||||||||||||||||
12/19/2011* - 11/30/2012 | 15.00 | 0.44 | 1.80 | 2.24 | (0.22 | ) | — | |||||||||||||||||||||
| Class R | ||||||||||||||||||||||||||||
3/31/2018+ | $ | 19.37 | $ | 0.41 | $ | 0.23 | $ | 0.64 | $ | (0.97 | ) | $ | (0.11 | ) | ||||||||||||||
9/30/2017 | 17.07 | 0.29 | 2.67 | 2.96 | (0.30 | ) | (0.36 | ) | ||||||||||||||||||||
9/30/2016 | 15.97 | 0.10 | 1.48 | 1.58 | (0.25 | ) | (0.23 | ) | ||||||||||||||||||||
12/1/2014 - 9/30/2015# | 18.63 | 0.26 | (1.66 | ) | (1.40 | ) | (0.70 | ) | (0.56 | ) | ||||||||||||||||||
11/30/2014 | 18.42 | 0.30 | 0.53 | 0.83 | (0.41 | ) | (0.21 | ) | ||||||||||||||||||||
11/30/2013 | 16.97 | 0.30 | 2.00 | 2.30 | (0.56 | ) | (0.29 | ) | ||||||||||||||||||||
12/19/2011* - 11/30/2012 | 15.00 | 0.31 | 1.88 | 2.19 | (0.22 | ) | — | |||||||||||||||||||||
| Class P | ||||||||||||||||||||||||||||
3/31/2018+ | $ | 19.68 | $ | 0.51 | $ | 0.20 | $ | 0.71 | $ | (1.16 | ) | $ | (0.11 | ) | ||||||||||||||
9/30/2017 | 17.32 | 0.17 | 2.94 | 3.11 | (0.39 | ) | (0.36 | ) | ||||||||||||||||||||
9/30/2016 | 16.17 | 0.20 | 1.52 | 1.72 | (0.34 | ) | (0.23 | ) | ||||||||||||||||||||
12/1/2014 - 9/30/2015# | 18.85 | 0.35 | (1.68 | ) | (1.33 | ) | (0.79 | ) | (0.56 | ) | ||||||||||||||||||
11/30/2014 | 18.61 | 0.38 | 0.57 | 0.95 | (0.50 | ) | (0.21 | ) | ||||||||||||||||||||
11/30/2013 | 17.08 | 0.34 | 2.09 | 2.43 | (0.61 | ) | (0.29 | ) | ||||||||||||||||||||
12/19/2011* - 11/30/2012 | 15.00 | 0.43 | 1.87 | 2.30 | (0.22 | ) | — | |||||||||||||||||||||
| Class R6 | ||||||||||||||||||||||||||||
3/31/2018+ | $ | 19.77 | $ | 0.50 | $ | 0.21 | $ | 0.71 | $ | (1.17 | ) | $ | (0.11 | ) | ||||||||||||||
9/30/2017 | 17.38 | 0.17 | 2.98 | 3.15 | (0.40 | ) | (0.36 | ) | ||||||||||||||||||||
9/30/2016 | 16.22 | 0.26 | 1.48 | 1.74 | (0.35 | ) | (0.23 | ) | �� | |||||||||||||||||||
12/1/2014 - 9/30/2015# | 18.90 | 0.46 | (1.78 | ) | (1.32 | ) | (0.80 | ) | (0.56 | ) | ||||||||||||||||||
11/30/2014 | 18.64 | 0.47 | 0.50 | 0.97 | (0.50 | ) | (0.21 | ) | ||||||||||||||||||||
11/30/2013 | 17.09 | 0.49 | 1.96 | 2.45 | (0.61 | ) | (0.29 | ) | ||||||||||||||||||||
12/19/2011* - 11/30/2012 | 15.00 | 0.50 | 1.81 | 2.31 | (0.22 | ) | — | |||||||||||||||||||||
| Administrative Class | ||||||||||||||||||||||||||||
3/31/2018+ | $ | 19.56 | $ | 0.48 | $ | 0.20 | $ | 0.68 | $ | (1.10 | ) | $ | (0.11 | ) | ||||||||||||||
9/30/2017 | 17.21 | 0.14 | 2.92 | 3.06 | (0.35 | ) | (0.36 | ) | ||||||||||||||||||||
9/30/2016 | 16.08 | 0.18 | 1.49 | 1.67 | (0.31 | ) | (0.23 | ) | ||||||||||||||||||||
12/1/2014 - 9/30/2015# | 18.76 | 0.62 | (1.98 | ) | (1.36 | ) | (0.76 | ) | (0.56 | ) | ||||||||||||||||||
11/30/2014 | 18.55 | 0.38 | 0.52 | 0.90 | (0.48 | ) | (0.21 | ) | ||||||||||||||||||||
11/30/2013 | 17.03 | 0.22 | 2.16 | 2.38 | (0.57 | ) | (0.29 | ) | ||||||||||||||||||||
12/19/2011* - 11/30/2012 | 15.00 | 0.44 | 1.81 | 2.25 | (0.22 | ) | — | |||||||||||||||||||||
| + | Unaudited |
| # | Fiscal year end changed from November 30th to September 30th. |
| * | Commencement of operations. |
| (a) | Calculated on average shares outstanding during the period. |
| (b) | Total return is calculated assuming a purchase of a share on the first day of the period and a sale of a share on the last day of each period reported. Dividends and distributions, if any, are assumed, for purposes of this calculation, to be reinvested. Total return does not reflect sales charges and includes the effect of fee waivers and reimbursements. Total return may reflect adjustments to conform to U.S. GAAP. Total return for a period of less than one year is not annualized. |
| 256 | Semiannual Report | | March 31, 2018 | | See accompanying Notes to Financial Statements |
Table of Contents
| Total Dividends and Distributions | Net Asset Value, End of Period | Total Return (b) | Net Assets, End of Period (000s) | Ratio of Expenses with Fee Waiver/ | Ratio of Expenses | Ratio of Net Investment Income to Average Net Assets (c) | Portfolio Turnover Rate | |||||||||||||||||||||||||||
| $ | (1.22 | ) | $ | 18.98 | 3.38 | % | $ | 2,431 | 0.49 | %(d) | 0.60 | %(d) | 4.49 | %(d) | 6 | % | ||||||||||||||||||
| (0.69 | ) | 19.52 | 18.34 | 2,063 | 0.50 | 0.60 | 0.48 | 76 | ||||||||||||||||||||||||||
| (0.51 | ) | 17.17 | 10.52 | 1,036 | 0.51 | 0.60 | 1.02 | 92 | ||||||||||||||||||||||||||
| (1.32 | ) | 16.02 | (7.75 | ) | 1,399 | 0.34 | (d)(e) | 0.60 | (d)(e) | 2.26 | (d)(e) | 153 | ||||||||||||||||||||||
| (0.70 | ) | 18.70 | 4.96 | 1,089 | 0.35 | 0.60 | 2.11 | 74 | ||||||||||||||||||||||||||
| (0.88 | ) | 18.51 | 14.59 | 135 | 0.30 | 0.60 | 1.52 | 41 | ||||||||||||||||||||||||||
| (0.22 | ) | 17.02 | 15.10 | 11 | 0.27 | (d) | 0.60 | (d) | 2.82 | (d) | 31 | |||||||||||||||||||||||
| $ | (1.08 | ) | $ | 18.93 | 3.20 | % | $ | 115 | 0.84 | %(d) | 0.85 | %(d) | 4.18 | %(d) | 6 | % | ||||||||||||||||||
| (0.66 | ) | 19.37 | 17.93 | 91 | 0.85 | 0.85 | 1.64 | 76 | ||||||||||||||||||||||||||
| (0.48 | ) | 17.07 | 10.06 | 350 | 0.86 | 0.86 | 0.64 | 92 | ||||||||||||||||||||||||||
| (1.26 | ) | 15.97 | (7.98 | ) | 217 | 0.69 | (d)(e) | 0.85 | (d)(e) | 1.78 | (d)(e) | 153 | ||||||||||||||||||||||
| (0.62 | ) | 18.63 | 4.61 | 144 | 0.70 | 0.85 | 1.61 | 74 | ||||||||||||||||||||||||||
| (0.85 | ) | 18.42 | 14.22 | 72 | 0.65 | 0.85 | 1.75 | 41 | ||||||||||||||||||||||||||
| (0.22 | ) | 16.97 | 14.75 | 39 | 0.62 | (d) | 0.85 | (d) | 1.99 | (d) | 31 | |||||||||||||||||||||||
| $ | (1.27 | ) | $ | 19.12 | 3.51 | % | $ | 6,654 | 0.19 | %(d) | 0.20 | %(d) | 5.17 | %(d) | 6 | % | ||||||||||||||||||
| (0.75 | ) | 19.68 | 18.69 | 5,934 | 0.20 | 0.20 | 0.95 | 76 | ||||||||||||||||||||||||||
| (0.57 | ) | 17.32 | 10.84 | 3,457 | 0.21 | 0.21 | 1.21 | 92 | ||||||||||||||||||||||||||
| (1.35 | ) | 16.17 | (7.51 | ) | 1,762 | 0.04 | (d)(e) | 0.20 | (d)(e) | 2.42 | (d)(e) | 153 | ||||||||||||||||||||||
| (0.71 | ) | 18.85 | 5.27 | 1,362 | 0.05 | 0.20 | 2.04 | 74 | ||||||||||||||||||||||||||
| (0.90 | ) | 18.61 | 14.88 | 240 | — | 0.20 | 1.96 | 41 | ||||||||||||||||||||||||||
| (0.22 | ) | 17.08 | 15.52 | 59 | — | (d)(f) | 0.20 | (d) | 2.77 | (d) | 31 | |||||||||||||||||||||||
| $ | (1.28 | ) | $ | 19.20 | 3.53 | % | $ | 8,025 | 0.09 | %(d) | 0.10 | %(d) | 5.02 | %(d) | 6 | % | ||||||||||||||||||
| (0.76 | ) | 19.77 | 18.87 | 6,215 | 0.10 | 0.10 | 0.92 | 76 | ||||||||||||||||||||||||||
| (0.58 | ) | 17.38 | 10.91 | 2,982 | 0.11 | 0.11 | 1.60 | 92 | ||||||||||||||||||||||||||
| (1.36 | ) | 16.22 | (7.45 | ) | 2,591 | — | (d)(e)(f) | 0.10 | (d)(e) | 3.09 | (d)(e) | 153 | ||||||||||||||||||||||
| (0.71 | ) | 18.90 | 5.37 | 4,934 | — | (f) | 0.10 | 2.52 | 74 | |||||||||||||||||||||||||
| (0.90 | ) | 18.64 | 15.06 | 4,388 | — | (f) | 0.12 | 2.77 | 41 | |||||||||||||||||||||||||
| (0.22 | ) | 17.09 | 15.52 | 3,509 | — | (d)(f) | 0.15 | (d) | 3.21 | (d) | 31 | |||||||||||||||||||||||
| $ | (1.21 | ) | $ | 19.03 | 3.39 | % | $ | 363 | 0.44 | %(d) | 0.45 | %(d) | 4.91 | %(d) | 6 | % | ||||||||||||||||||
| (0.71 | ) | 19.56 | 18.44 | 404 | 0.45 | 0.45 | 0.78 | 76 | ||||||||||||||||||||||||||
| (0.54 | ) | 17.21 | 10.54 | 298 | 0.46 | 0.46 | 1.10 | 92 | ||||||||||||||||||||||||||
| (1.32 | ) | 16.08 | (7.75 | ) | 216 | 0.29 | (d)(e) | 0.45 | (d)(e) | 4.23 | (d)(e) | 153 | ||||||||||||||||||||||
| (0.69 | ) | 18.76 | 5.00 | 357 | 0.30 | 0.45 | 2.06 | 74 | ||||||||||||||||||||||||||
| (0.86 | ) | 18.55 | 14.67 | 221 | 0.25 | 0.45 | 1.22 | 41 | ||||||||||||||||||||||||||
| (0.22 | ) | 17.03 | 15.17 | 11 | 0.22 | (d) | 0.46 | (d) | 2.87 | (d) | 31 | |||||||||||||||||||||||
| (c) | Does not include expenses of the investment companies in which the Fund invests. |
| (d) | Annualized, unless otherwise noted. |
| (e) | Certain expenses incurred by the Fund were not annualized. |
| (f) | See Note 6 in the Notes to Financial Statements. |
| See accompanying Notes to Financial Statements | | March 31, 2018 | | Semiannual Report | 257 |
Table of Contents
Financial Highlights (cont’d)
For a Share Outstanding for the Period ended:
Net Asset | Net Investment Income (a) | Net Realized and Change in Unrealized Gain (Loss) | Total from Investment Operations | Dividends from Net Investment Income | Distributions from Net Realized Capital Gains | |||||||||||||||||||||||
| AllianzGI Multi Asset Income: | ||||||||||||||||||||||||||||
| Class A | ||||||||||||||||||||||||||||
3/31/2018+ | $ | 18.53 | $ | 0.46 | $ | (0.73 | ) | $ | (0.27 | ) | $ | (0.58 | ) | $ | (0.23 | ) | ||||||||||||
9/30/2017 | 18.31 | 0.94 | 0.22 | 1.16 | (0.85 | ) | (0.09 | ) | ||||||||||||||||||||
9/30/2016 | 17.34 | 0.75 | 1.09 | 1.84 | (0.80 | ) | (0.07 | ) | ||||||||||||||||||||
12/1/2014 - 9/30/2015# | 19.35 | 0.48 | (1.32 | ) | (0.84 | ) | (0.67 | ) | (0.50 | ) | ||||||||||||||||||
11/30/2014 | 18.96 | 0.42 | 0.31 | 0.73 | (0.34 | ) | — | |||||||||||||||||||||
11/30/2013 | 19.20 | 0.50 | 0.03 | 0.53 | (0.66 | ) | (0.08 | ) | ||||||||||||||||||||
11/30/2012 | 18.27 | 0.48 | 1.23 | 1.71 | (0.58 | ) | (0.20 | ) | ||||||||||||||||||||
| Class C | ||||||||||||||||||||||||||||
3/31/2018+ | $ | 18.53 | $ | 0.39 | $ | (0.73 | ) | $ | (0.34 | ) | $ | (0.51 | ) | $ | (0.23 | ) | ||||||||||||
9/30/2017 | 18.21 | 0.80 | 0.22 | 1.02 | (0.61 | ) | (0.09 | ) | ||||||||||||||||||||
9/30/2016 | 17.16 | 0.66 | 1.04 | 1.70 | (0.58 | ) | (0.07 | ) | ||||||||||||||||||||
12/1/2014 - 9/30/2015# | 19.14 | 0.38 | (1.33 | ) | (0.95 | ) | (0.53 | ) | (0.50 | ) | ||||||||||||||||||
11/30/2014 | 18.76 | 0.27 | 0.31 | 0.58 | (0.20 | ) | — | |||||||||||||||||||||
11/30/2013 | 18.99 | 0.37 | 0.01 | 0.38 | (0.50 | ) | (0.08 | ) | ||||||||||||||||||||
11/30/2012 | 18.09 | 0.31 | 1.24 | 1.55 | (0.45 | ) | (0.20 | ) | ||||||||||||||||||||
| Class R | ||||||||||||||||||||||||||||
3/31/2018+ | $ | 19.31 | $ | 0.44 | $ | (0.76 | ) | $ | (0.32 | ) | $ | (0.54 | ) | $ | (0.23 | ) | ||||||||||||
9/30/2017 | 18.97 | 0.84 | 0.30 | 1.14 | (0.71 | ) | (0.09 | ) | ||||||||||||||||||||
9/30/2016 | 17.92 | 0.73 | 1.11 | 1.84 | (0.72 | ) | (0.07 | ) | ||||||||||||||||||||
12/1/2014 - 9/30/2015# | 19.95 | 0.44 | (1.36 | ) | (0.92 | ) | (0.61 | ) | (0.50 | ) | ||||||||||||||||||
11/30/2014 | 19.53 | 0.36 | 0.33 | 0.69 | (0.27 | ) | — | |||||||||||||||||||||
11/30/2013 | 19.74 | 0.46 | 0.01 | 0.47 | (0.57 | ) | (0.08 | ) | ||||||||||||||||||||
11/30/2012 | 18.77 | 0.24 | 1.45 | 1.69 | (0.52 | ) | (0.20 | ) | ||||||||||||||||||||
| Class P | ||||||||||||||||||||||||||||
3/31/2018+ | $ | 18.71 | $ | 0.49 | $ | (0.74 | ) | $ | (0.25 | ) | $ | (0.60 | ) | $ | (0.23 | ) | ||||||||||||
9/30/2017 | 18.51 | 0.99 | 0.23 | 1.22 | (0.93 | ) | (0.09 | ) | ||||||||||||||||||||
9/30/2016 | 17.58 | 0.83 | 1.09 | 1.92 | (0.92 | ) | (0.07 | ) | ||||||||||||||||||||
12/1/2014 - 9/30/2015# | 19.61 | 0.51 | (1.31 | ) | (0.80 | ) | (0.73 | ) | (0.50 | ) | ||||||||||||||||||
11/30/2014 | 19.20 | 0.47 | 0.34 | 0.81 | (0.40 | ) | — | |||||||||||||||||||||
11/30/2013 | 19.44 | 0.46 | 0.13 | 0.59 | (0.72 | ) | (0.08 | ) | ||||||||||||||||||||
11/30/2012 | 18.49 | 0.32 | 1.48 | 1.80 | (0.65 | ) | (0.20 | ) | ||||||||||||||||||||
| Institutional Class | ||||||||||||||||||||||||||||
2/1/2018* - 3/31/2018+ | $ | 17.87 | $ | 0.19 | $ | (0.49 | ) | $ | (0.30 | ) | $ | (0.15 | ) | $ | (0.23 | ) | ||||||||||||
| Class R6 | ||||||||||||||||||||||||||||
3/31/2018+ | $ | 18.26 | $ | 0.49 | $ | (0.72 | ) | $ | (0.23 | ) | $ | (0.61 | ) | $ | (0.23 | ) | ||||||||||||
9/30/2017 | 18.08 | 1.00 | 0.21 | 1.21 | (0.94 | ) | (0.09 | ) | ||||||||||||||||||||
9/30/2016 | 17.21 | 0.82 | 1.07 | 1.89 | (0.95 | ) | (0.07 | ) | ||||||||||||||||||||
12/1/2014 - 9/30/2015# | 19.23 | 0.56 | (1.33 | ) | (0.77 | ) | (0.75 | ) | (0.50 | ) | ||||||||||||||||||
11/30/2014 | 18.83 | 0.49 | 0.33 | 0.82 | (0.42 | ) | — | |||||||||||||||||||||
11/30/2013 | 19.08 | 0.56 | 0.03 | 0.59 | (0.73 | ) | (0.08 | ) | ||||||||||||||||||||
11/30/2012 | 18.16 | 0.49 | 1.28 | 1.77 | (0.65 | ) | (0.20 | ) | ||||||||||||||||||||
| Administrative Class | ||||||||||||||||||||||||||||
3/31/2018+ | $ | 18.82 | $ | 0.45 | $ | (0.73 | ) | $ | (0.28 | ) | $ | (0.58 | ) | $ | (0.23 | ) | ||||||||||||
9/30/2017 | 18.61 | 1.00 | 0.19 | 1.19 | (0.89 | ) | (0.09 | ) | ||||||||||||||||||||
9/30/2016 | 17.60 | 0.75 | 0.94 | 1.69 | (0.61 | ) | (0.07 | ) | ||||||||||||||||||||
12/1/2014 - 9/30/2015# | 19.56 | 1.70 | (2.55 | ) | (0.85 | ) | (0.61 | ) | (0.50 | ) | ||||||||||||||||||
11/30/2014 | 19.15 | 0.43 | 0.33 | 0.76 | (0.35 | ) | — | |||||||||||||||||||||
11/30/2013 | 19.41 | 0.22 | 0.32 | 0.54 | (0.69 | ) | (0.08 | ) | ||||||||||||||||||||
11/30/2012 | 18.46 | 0.49 | 1.26 | 1.75 | (0.60 | ) | (0.20 | ) | ||||||||||||||||||||
| + | Unaudited |
| # | Fiscal year end changed from November 30th to September 30th. |
| * | Commencement of operations. |
| (a) | Calculated on average shares outstanding during the period. |
| (b) | Total return is calculated assuming a purchase of a share on the first day of the period and a sale of a share on the last day of each period reported. Dividends and distributions, if any, are assumed, for purposes of this calculation, to be reinvested. Total return does not reflect sales charges and includes the effect of fee waivers and reimbursements. Total return may reflect adjustments to conform to U.S. GAAP. Total return for a period of less than one year is not annualized. |
| 258 | Semiannual Report | | March 31, 2018 | | See accompanying Notes to Financial Statements |
Table of Contents
| Distributions from Return of Capital | Total Dividends and Distributions | Net Asset Value, End of Period | Total Return (b) | Net Assets, End of Period (000s) | Ratio of Expenses to Assets with Fee Waiver/ | Ratio of Expenses to Assets without Fee Waiver/ | Ratio of Net Investment Income to Average Net Assets (c) | Portfolio Turnover Rate | ||||||||||||||||||||||||||||||
| $ | — | $ | (0.81 | ) | $ | 17.45 | (1.59 | )% | $ | 10,432 | 0.39 | %(d) | 0.61 | %(d) | 5.08 | %(d) | 84 | % | ||||||||||||||||||||
| — | (0.94 | ) | 18.53 | 6.55 | 10,145 | 0.35 | 0.61 | 5.12 | 151 | |||||||||||||||||||||||||||||
| — | (0.87 | ) | 18.31 | 10.97 | 10,140 | 0.40 | 0.60 | 4.25 | 116 | |||||||||||||||||||||||||||||
| — | (1.17 | ) | 17.34 | (4.53 | ) | 6,006 | 0.44 | (d)(e) | 0.62 | (d)(e) | 3.15 | (d)(e) | 179 | |||||||||||||||||||||||||
| — | (0.34 | ) | 19.35 | 3.88 | 6,324 | 0.40 | 0.60 | 2.18 | 101 | |||||||||||||||||||||||||||||
| (0.03 | ) | (0.77 | ) | 18.96 | 2.78 | 4,326 | 0.39 | 0.60 | 2.64 | 81 | ||||||||||||||||||||||||||||
| — | (0.78 | ) | 19.20 | 9.68 | 4,891 | 0.40 | 0.60 | 2.57 | 51 | |||||||||||||||||||||||||||||
| $ | — | $ | (0.74 | ) | $ | 17.45 | (1.95 | )% | $ | 3,238 | 1.14 | %(d) | 1.36 | %(d) | 4.30 | %(d) | 84 | % | ||||||||||||||||||||
| — | (0.70 | ) | 18.53 | 5.78 | 3,435 | 1.10 | 1.36 | 4.37 | 151 | |||||||||||||||||||||||||||||
| — | (0.65 | ) | 18.21 | 10.16 | 3,361 | 1.15 | 1.35 | 3.75 | 116 | |||||||||||||||||||||||||||||
| — | (1.03 | ) | 17.16 | (5.16 | ) | 2,988 | 1.19 | (d)(e) | 1.37 | (d)(e) | 2.49 | (d)(e) | 179 | |||||||||||||||||||||||||
| — | (0.20 | ) | 19.14 | 3.12 | 3,984 | 1.15 | 1.35 | 1.42 | 101 | |||||||||||||||||||||||||||||
| (0.03 | ) | (0.61 | ) | 18.76 | 2.03 | 4,359 | 1.14 | 1.35 | 1.99 | 81 | ||||||||||||||||||||||||||||
| — | (0.65 | ) | 18.99 | 8.84 | 6,935 | 1.15 | 1.35 | 1.70 | 51 | |||||||||||||||||||||||||||||
| $ | — | $ | (0.77 | ) | $ | 18.22 | (1.76 | )% | $ | 128 | 0.74 | %(d) | 0.86 | %(d) | 4.69 | %(d) | 84 | % | ||||||||||||||||||||
| — | (0.80 | ) | 19.31 | 6.17 | 128 | 0.70 | 0.86 | 4.38 | 151 | |||||||||||||||||||||||||||||
| — | (0.79 | ) | 18.97 | 10.59 | 519 | 0.75 | 0.85 | 4.00 | 116 | |||||||||||||||||||||||||||||
| — | (1.11 | ) | 17.92 | (4.83 | ) | 238 | 0.79 | (d)(e) | 0.87 | (d)(e) | 2.78 | (d)(e) | 179 | |||||||||||||||||||||||||
| — | (0.27 | ) | 19.95 | 3.55 | 215 | 0.75 | 0.85 | 1.80 | 101 | |||||||||||||||||||||||||||||
| (0.03 | ) | (0.68 | ) | 19.53 | 2.46 | 152 | 0.74 | 0.85 | 2.36 | 81 | ||||||||||||||||||||||||||||
| — | (0.72 | ) | 19.74 | 9.28 | 183 | 0.75 | 0.85 | 1.29 | 51 | |||||||||||||||||||||||||||||
| $ | — | $ | (0.83 | ) | $ | 17.63 | (1.43 | )% | $ | 13,487 | 0.09 | %(d) | 0.21 | %(d) | 5.35 | %(d) | 84 | % | ||||||||||||||||||||
| — | (1.02 | ) | 18.71 | 6.86 | 14,507 | 0.05 | 0.21 | 5.37 | 151 | |||||||||||||||||||||||||||||
| — | (0.99 | ) | 18.51 | 11.32 | 17,120 | 0.10 | 0.20 | 4.63 | 116 | |||||||||||||||||||||||||||||
| — | (1.23 | ) | 17.58 | (4.31 | ) | 5,450 | 0.14 | (d)(e) | 0.22 | (d)(e) | 3.31 | (d)(e) | 179 | |||||||||||||||||||||||||
| — | (0.40 | ) | 19.61 | 4.23 | 6,349 | 0.11 | 0.21 | 2.39 | 101 | |||||||||||||||||||||||||||||
| (0.03 | ) | (0.83 | ) | 19.20 | 3.12 | 4,427 | 0.09 | (f) | 0.20 | 2.42 | 81 | |||||||||||||||||||||||||||
| — | (0.85 | ) | 19.44 | 10.05 | 4,751 | 0.10 | 0.20 | 1.71 | 51 | |||||||||||||||||||||||||||||
| $ | — | $ | (0.38 | ) | $ | 17.19 | (2.98 | )% | $ | 35 | 0.04 | %(d) | 0.16 | %(d) | 6.90 | %(d) | 84 | % | ||||||||||||||||||||
| $ | — | $ | (0.84 | ) | $ | 17.19 | (1.37 | )% | $ | 19,406 | — | %(d)(f)(g) | 0.11 | %(d) | 5.47 | %(d) | 84 | % | ||||||||||||||||||||
| — | (1.03 | ) | 18.26 | 6.99 | 20,448 | — | (f) | 0.11 | 5.54 | 151 | ||||||||||||||||||||||||||||
| — | (1.02 | ) | 18.08 | 11.40 | 19,128 | — | 0.10 | 4.70 | 116 | |||||||||||||||||||||||||||||
| — | (1.25 | ) | 17.21 | (4.23 | ) | 8,058 | 0.04 | (d)(e) | 0.12 | (d)(e) | 3.69 | (d)(e) | 179 | |||||||||||||||||||||||||
| — | (0.42 | ) | 19.23 | 4.36 | 9,496 | — | (f)(g) | 0.10 | 2.56 | 101 | ||||||||||||||||||||||||||||
| (0.03 | ) | (0.84 | ) | 18.83 | 3.23 | 9,487 | — | (f) | 0.12 | 2.96 | 81 | |||||||||||||||||||||||||||
| — | (0.85 | ) | 19.08 | 10.11 | 11,294 | — | 0.15 | 2.64 | 51 | |||||||||||||||||||||||||||||
| $ | — | $ | (0.81 | ) | $ | 17.74 | (1.57 | )% | $ | 505 | 0.34 | %(d) | 0.46 | %(d) | 4.85 | %(d) | 84 | % | ||||||||||||||||||||
| — | (0.98 | ) | 18.82 | 6.62 | 1,550 | 0.30 | 0.46 | 5.38 | 151 | |||||||||||||||||||||||||||||
| — | (0.68 | ) | 18.61 | 9.87 | 822 | 0.35 | 0.45 | 4.13 | 116 | |||||||||||||||||||||||||||||
| — | (1.11 | ) | 17.60 | (4.53 | ) | 24 | 0.37 | (d)(e) | 0.45 | (d)(e) | 10.47 | (d)(e) | 179 | |||||||||||||||||||||||||
| — | (0.35 | ) | 19.56 | 3.97 | 2,001 | 0.35 | 0.45 | 2.20 | 101 | |||||||||||||||||||||||||||||
| (0.03 | ) | (0.80 | ) | 19.15 | 2.92 | 2,461 | 0.34 | 0.45 | 1.16 | 81 | ||||||||||||||||||||||||||||
| — | (0.80 | ) | 19.41 | 9.71 | 15 | 0.35 | 0.45 | 2.59 | 51 | |||||||||||||||||||||||||||||
| (c) | Does not include expenses of the investment companies in which the Fund invests. |
| (d) | Annualized, unless otherwise noted. |
| (e) | Certain expenses incurred by the Fund were not annualized. |
| (f) | See Note 6 in the Notes to Financial Statements. |
| (g) | Actual amount rounds to less than 0.01%. |
| See accompanying Notes to Financial Statements | | March 31, 2018 | | Semiannual Report | 259 |
Table of Contents
Financial Highlights (cont’d)
For a Share Outstanding for the Period ended:
Net Asset | Net Investment (Loss) (a) | Net Realized and Change in Unrealized Gain (Loss) | Total from Investment Operations | Dividends from Net Investment Income | Distributions from Net Realized Capital Gains | |||||||||||||||||||||||
| AllianzGI Global Allocation: | ||||||||||||||||||||||||||||
| Class A | ||||||||||||||||||||||||||||
3/31/2018+ | $ | 12.34 | $ | 0.24 | $ | — | $ | 0.24 | $ | (0.53 | ) | $ | (0.65 | ) | ||||||||||||||
9/30/2017 | 11.23 | 0.20 | 1.11 | 1.31 | (0.20 | ) | — | |||||||||||||||||||||
9/30/2016 | 10.98 | 0.07 | 0.63 | 0.70 | (0.05 | ) | (0.40 | ) | ||||||||||||||||||||
12/1/2014 - 9/30/2015# | 12.18 | 0.25 | (0.89 | ) | (0.64 | ) | (0.42 | ) | (0.14 | ) | ||||||||||||||||||
11/30/2014 | 11.90 | 0.30 | 0.25 | 0.55 | (0.27 | ) | — | |||||||||||||||||||||
11/30/2013 | 11.07 | 0.31 | 0.95 | 1.26 | (0.43 | ) | — | |||||||||||||||||||||
11/30/2012 | 10.30 | 0.25 | 0.84 | 1.09 | (0.32 | ) | — | |||||||||||||||||||||
| Class C | ||||||||||||||||||||||||||||
3/31/2018+ | $ | 12.47 | $ | 0.19 | $ | 0.01 | $ | 0.20 | $ | (0.40 | ) | $ | (0.65 | ) | ||||||||||||||
9/30/2017 | 11.32 | 0.13 | 1.12 | 1.25 | (0.10 | ) | — | |||||||||||||||||||||
9/30/2016 | 11.13 | (0.01 | ) | 0.63 | 0.62 | (0.03 | ) | (0.40 | ) | |||||||||||||||||||
12/1/2014 - 9/30/2015# | 12.33 | 0.18 | (0.91 | ) | (0.73 | ) | (0.33 | ) | (0.14 | ) | ||||||||||||||||||
11/30/2014 | 12.04 | 0.22 | 0.24 | 0.46 | (0.17 | ) | — | |||||||||||||||||||||
11/30/2013 | 11.19 | 0.23 | 0.96 | 1.19 | (0.34 | ) | — | |||||||||||||||||||||
11/30/2012 | 10.41 | 0.17 | 0.85 | 1.02 | (0.24 | ) | — | |||||||||||||||||||||
| Class R | ||||||||||||||||||||||||||||
3/31/2018+ | $ | 12.22 | $ | 0.23 | $ | — | $ | 0.23 | $ | (0.52 | ) | $ | (0.65 | ) | ||||||||||||||
9/30/2017 | 11.15 | 0.18 | 1.11 | 1.29 | (0.22 | ) | — | |||||||||||||||||||||
9/30/2016 | 10.93 | 0.05 | 0.62 | 0.67 | (0.05 | ) | (0.40 | ) | ||||||||||||||||||||
12/1/2014 - 9/30/2015# | 12.13 | 0.22 | (0.88 | ) | (0.66 | ) | (0.40 | ) | (0.14 | ) | ||||||||||||||||||
11/30/2014 | 11.84 | 0.28 | 0.26 | 0.54 | (0.25 | ) | — | |||||||||||||||||||||
11/30/2013 | 11.02 | 0.28 | 0.95 | 1.23 | (0.41 | ) | — | |||||||||||||||||||||
11/30/2012 | 10.26 | 0.21 | 0.84 | 1.05 | (0.29 | ) | — | |||||||||||||||||||||
| Class P | ||||||||||||||||||||||||||||
3/31/2018+ | $ | 12.28 | $ | 0.24 | $ | 0.02 | $ | 0.26 | $ | (0.58 | ) | $ | (0.65 | ) | ||||||||||||||
9/30/2017 | 11.24 | 0.24 | 1.11 | 1.35 | (0.31 | ) | — | |||||||||||||||||||||
9/30/2016 | 10.98 | 0.12 | 0.61 | 0.73 | (0.07 | ) | (0.40 | ) | ||||||||||||||||||||
12/1/2014 - 9/30/2015# | 12.19 | 0.25 | (0.87 | ) | (0.62 | ) | (0.45 | ) | (0.14 | ) | ||||||||||||||||||
11/30/2014 | 11.90 | 0.32 | 0.26 | 0.58 | (0.29 | ) | — | |||||||||||||||||||||
11/30/2013 | 11.07 | 0.32 | 0.96 | 1.28 | (0.45 | ) | — | |||||||||||||||||||||
11/30/2012 | 10.28 | 0.29 | 0.81 | 1.10 | (0.31 | ) | — | |||||||||||||||||||||
| Institutional Class | ||||||||||||||||||||||||||||
3/31/2018+ | $ | 12.15 | $ | 0.25 | $ | — | $ | 0.25 | $ | (0.37 | ) | $ | (0.65 | ) | ||||||||||||||
9/30/2017 | 11.11 | 0.26 | 1.05 | 1.31 | (0.27 | ) | — | |||||||||||||||||||||
9/30/2016 | 10.86 | 0.10 | 0.61 | 0.71 | (0.06 | ) | (0.40 | ) | ||||||||||||||||||||
12/1/2014 - 9/30/2015# | 12.07 | 0.25 | (0.87 | ) | (0.62 | ) | (0.45 | ) | (0.14 | ) | ||||||||||||||||||
11/30/2014 | 11.78 | 0.32 | 0.27 | 0.59 | (0.30 | ) | — | |||||||||||||||||||||
11/30/2013 | 10.97 | 0.32 | 0.95 | 1.27 | (0.46 | ) | — | |||||||||||||||||||||
11/30/2012 | 10.21 | 0.26 | 0.84 | 1.10 | (0.34 | ) | — | |||||||||||||||||||||
| Class R6 | ||||||||||||||||||||||||||||
3/31/2018+ | $ | 12.13 | $ | 0.25 | $ | — | $ | 0.25 | $ | (0.57 | ) | $ | (0.65 | ) | ||||||||||||||
9/30/2017 | 11.10 | 0.23 | 1.11 | 1.34 | (0.31 | ) | — | |||||||||||||||||||||
9/30/2016 | 10.85 | 0.05 | 0.67 | 0.72 | (0.07 | ) | (0.40 | ) | ||||||||||||||||||||
9/8/2015* - 9/30/2015# | 11.01 | 0.01 | (0.13 | ) | (0.12 | ) | (0.04 | ) | — | |||||||||||||||||||
| Administrative Class | ||||||||||||||||||||||||||||
3/31/2018+ | $ | 12.64 | $ | 0.25 | $ | — | $ | 0.25 | $ | (0.54 | ) | $ | (0.65 | ) | ||||||||||||||
9/30/2017 | 11.52 | 0.22 | 1.15 | 1.37 | (0.25 | ) | — | |||||||||||||||||||||
9/30/2016 | 11.25 | 0.08 | 0.64 | 0.72 | (0.05 | ) | (0.40 | ) | ||||||||||||||||||||
12/1/2014 - 9/30/2015# | 12.47 | 0.23 | (0.89 | ) | (0.66 | ) | (0.42 | ) | (0.14 | ) | ||||||||||||||||||
11/30/2014 | 12.17 | 0.30 | 0.27 | 0.57 | (0.27 | ) | — | |||||||||||||||||||||
11/30/2013 | 11.30 | 0.43 | 0.85 | 1.28 | (0.41 | ) | — | |||||||||||||||||||||
11/30/2012 | 10.51 | 0.26 | 0.84 | 1.10 | (0.31 | ) | — | |||||||||||||||||||||
| + | Unaudited |
| # | Fiscal year end changed from November 30th to September 30th. |
| * | Commencement of operations. |
| (a) | Calculated on average shares outstanding during the period. |
| 260 | Semiannual Report | | March 31, 2018 | | See accompanying Notes to Financial Statements |
Table of Contents
| Total Dividends and Distributions | Net Asset Value, End of Period | Total Return (b) | Net Assets, End of Period (000s) | Ratio of Expenses to Assets with Fee Waiver/ | Ratio of Expenses to Assets without Fee Waiver/ | Ratio of Net Investment Income (Loss) to Average Net Assets (c) | Portfolio Turnover Rate | |||||||||||||||||||||||||||
| $ | (1.18 | ) | $ | 11.40 | 1.80 | % | $ | 44,217 | 0.60 | %(d) | 1.13 | %(d) | 3.95 | %(d) | 8 | % | ||||||||||||||||||
| (0.20 | ) | 12.34 | 11.88 | 47,170 | 0.60 | 1.12 | 1.73 | 15 | ||||||||||||||||||||||||||
| (0.45 | ) | 11.23 | 6.55 | 84,852 | 0.60 | 1.13 | 0.68 | 57 | ||||||||||||||||||||||||||
| (0.56 | ) | 10.98 | (5.45 | ) | 88,132 | 0.55 | (d)(e) | 1.30 | (d)(e) | 2.52 | (d)(e) | 113 | ||||||||||||||||||||||
| (0.27 | ) | 12.18 | 4.62 | 65,499 | 0.40 | 1.34 | 2.48 | 48 | ||||||||||||||||||||||||||
| (0.43 | ) | 11.90 | 11.79 | 69,565 | 0.41 | 1.36 | 2.68 | 45 | ||||||||||||||||||||||||||
| (0.32 | ) | 11.07 | 10.64 | 70,312 | 0.43 | 1.38 | 2.32 | 57 | ||||||||||||||||||||||||||
| $ | (1.05 | ) | $ | 11.62 | 1.47 | % | $ | 31,567 | 1.36 | %(d) | 1.88 | %(d) | 3.18 | %(d) | 8 | % | ||||||||||||||||||
| (0.10 | ) | 12.47 | 11.09 | 34,670 | 1.35 | 1.87 | 1.12 | 15 | ||||||||||||||||||||||||||
| (0.43 | ) | 11.32 | 5.72 | 46,387 | 1.38 | 1.90 | (0.06 | ) | 57 | |||||||||||||||||||||||||
| (0.47 | ) | 11.13 | (6.07 | ) | 51,322 | 1.29 | (d)(e) | 2.04 | (d)(e) | 1.78 | (d)(e) | 113 | ||||||||||||||||||||||
| (0.17 | ) | 12.33 | 3.88 | 62,275 | 1.13 | 2.08 | 1.78 | 48 | ||||||||||||||||||||||||||
| (0.34 | ) | 12.04 | 10.81 | 68,756 | 1.14 | 2.10 | 1.98 | 45 | ||||||||||||||||||||||||||
| (0.24 | ) | 11.19 | 9.90 | 71,375 | 1.18 | 2.11 | 1.59 | 57 | ||||||||||||||||||||||||||
| $ | (1.17 | ) | $ | 11.28 | 1.77 | % | $ | 28 | 0.80 | %(d) | 1.32 | %(d) | 3.80 | %(d) | 8 | % | ||||||||||||||||||
| (0.22 | ) | 12.22 | 11.78 | 24 | 0.78 | 1.31 | 1.55 | 15 | ||||||||||||||||||||||||||
| (0.45 | ) | 11.15 | 6.25 | 17 | 0.81 | 1.33 | 0.45 | 57 | ||||||||||||||||||||||||||
| (0.54 | ) | 10.93 | (5.61 | ) | 16 | 0.72 | (d)(e) | 1.50 | (d)(e) | 2.23 | (d)(e) | 113 | ||||||||||||||||||||||
| (0.25 | ) | 12.13 | 4.57 | 17 | 0.56 | 1.53 | 2.32 | 48 | ||||||||||||||||||||||||||
| (0.41 | ) | 11.84 | 11.44 | 17 | 0.59 | 1.54 | 2.42 | 45 | ||||||||||||||||||||||||||
| (0.29 | ) | 11.02 | 10.44 | 15 | 0.67 | 1.56 | 2.02 | 57 | ||||||||||||||||||||||||||
| $ | (1.23 | ) | $ | 11.31 | 1.96 | % | $ | 3,550 | 0.37 | %(d) | 0.89 | %(d) | 4.03 | %(d) | 8 | % | ||||||||||||||||||
| (0.31 | ) | 12.28 | 12.31 | 3,563 | 0.32 | 0.85 | 2.05 | 15 | ||||||||||||||||||||||||||
| (0.47 | ) | 11.24 | 6.78 | 1,901 | 0.30 | 0.83 | 1.10 | 57 | ||||||||||||||||||||||||||
| (0.59 | ) | 10.98 | (5.30 | ) | 2,069 | 0.33 | (d)(e) | 1.06 | (d)(e) | 2.52 | (d)(e) | 113 | ||||||||||||||||||||||
| (0.29 | ) | 12.19 | 4.96 | 2,139 | 0.16 | 1.12 | 2.68 | 48 | ||||||||||||||||||||||||||
| (0.45 | ) | 11.90 | 11.92 | 1,960 | 0.19 | 1.13 | 2.81 | 45 | ||||||||||||||||||||||||||
| (0.31 | ) | 11.07 | 10.91 | 1,340 | 0.25 | 1.37 | 2.75 | 57 | ||||||||||||||||||||||||||
| $ | (1.02 | ) | $ | 11.38 | 1.97 | % | $ | 7,053 | 0.40 | %(d) | 1.70 | %(d) | 4.14 | %(d) | 8 | % | ||||||||||||||||||
| (0.27 | ) | 12.15 | 12.08 | 6,871 | 0.40 | 0.95 | 2.35 | 15 | ||||||||||||||||||||||||||
| (0.46 | ) | 11.11 | 6.72 | 68,709 | 0.40 | 0.92 | 0.89 | 57 | ||||||||||||||||||||||||||
| (0.59 | ) | 10.86 | (5.34 | ) | 74,024 | 0.32 | (d)(e) | 1.07 | (d)(e) | 2.58 | (d)(e) | 113 | ||||||||||||||||||||||
| (0.30 | ) | 12.07 | 5.01 | 74,957 | 0.16 | 1.11 | 2.69 | 48 | ||||||||||||||||||||||||||
| (0.46 | ) | 11.78 | 11.90 | 68,675 | 0.16 | 1.11 | 2.81 | 45 | ||||||||||||||||||||||||||
| (0.34 | ) | 10.97 | 11.01 | 57,357 | 0.15 | 1.14 | 2.47 | 57 | ||||||||||||||||||||||||||
| $ | (1.22 | ) | $ | 11.16 | 1.95 | % | $ | 270,155 | 0.30 | %(d) | 0.82 | %(d) | 4.22 | %(d) | 8 | % | ||||||||||||||||||
| (0.31 | ) | 12.13 | 12.40 | 264,255 | 0.28 | 0.80 | 1.99 | 15 | ||||||||||||||||||||||||||
| (0.47 | ) | 11.10 | 6.81 | 291,767 | 0.30 | 0.83 | 0.48 | 57 | ||||||||||||||||||||||||||
| (0.04 | ) | 10.85 | (1.14 | ) | 91,912 | 0.30 | (d)(e) | 1.31 | (d)(e) | 2.07 | (d)(e) | 113 | ||||||||||||||||||||||
| $ | (1.19 | ) | $ | 11.70 | 1.85 | % | $ | 27 | 0.55 | %(d) | 1.07 | %(d) | 4.00 | %(d) | 8 | % | ||||||||||||||||||
| (0.25 | ) | 12.64 | 12.07 | 26 | 0.53 | 1.06 | 1.86 | 15 | ||||||||||||||||||||||||||
| (0.45 | ) | 11.52 | 6.58 | 32 | 0.56 | 1.08 | 0.67 | 57 | ||||||||||||||||||||||||||
| (0.56 | ) | 11.25 | (5.50 | ) | 27 | 0.57 | (d)(e) | 1.23 | (d)(e) | 2.35 | (d)(e) | 113 | ||||||||||||||||||||||
| (0.27 | ) | 12.47 | 4.68 | 33 | 0.41 | 1.27 | 2.45 | 48 | ||||||||||||||||||||||||||
| (0.41 | ) | 12.17 | 11.59 | 24 | 0.41 | 1.48 | 3.73 | 45 | ||||||||||||||||||||||||||
| (0.31 | ) | 11.30 | 10.70 | 1,653 | 0.40 | 1.42 | 2.35 | 57 | ||||||||||||||||||||||||||
| (b) | Total return is calculated assuming a purchase of a share on the first day of the period and a sale of a share on the last day of each period reported. Dividends and distributions, if any, are assumed, for purposes of this calculation, to be reinvested. Total return does not reflect sales charges and includes the effect of fee waivers and reimbursements. Total return may reflect adjustments to conform to U.S. GAAP. Total return for a period of less than one year is not annualized. |
| (c) | Does not include expenses of the investment companies in which the Fund invests. |
| (d) | Annualized, unless otherwise noted. |
| (e) | Certain expenses incurred by the Fund were not annualized. |
| See accompanying Notes to Financial Statements | | March 31, 2018 | | Semiannual Report | 261 |
Table of Contents
Financial Highlights (cont’d)
For a Share Outstanding for the Period ended:
Net Asset | Net Investment Income (Loss) (a) | Net Realized and Change in Unrealized Gain (Loss) | Total from Investment Operations | Dividends from Net Investment Income | Distributions from Net Realized Capital Gains | |||||||||||||||||||||||
| AllianzGI Best Styles Emerging Markets Equity: | ||||||||||||||||||||||||||||
| Class A | ||||||||||||||||||||||||||||
3/31/2018+ | $ | 16.34 | $ | 0.03 | $ | 1.46 | $ | 1.49 | $ | (0.34 | ) | $ | — | |||||||||||||||
9/30/2017 | 14.44 | 0.38 | 2.37 | 2.75 | (0.85 | ) | — | |||||||||||||||||||||
4/26/2016* - 9/30/2016 | 13.08 | 0.18 | 1.18 | 1.36 | — | — | ||||||||||||||||||||||
| Class C | ||||||||||||||||||||||||||||
3/31/2018+ | $ | 16.24 | $ | (0.04 | ) | $ | 1.45 | $ | 1.41 | $ | (0.24 | ) | $ | — | ||||||||||||||
9/30/2017 | 14.40 | 0.20 | 2.43 | 2.63 | (0.79 | ) | — | |||||||||||||||||||||
4/26/2016* - 9/30/2016 | 13.08 | 0.12 | 1.20 | 1.32 | — | — | ||||||||||||||||||||||
| Class P | ||||||||||||||||||||||||||||
3/31/2018+ | $ | 16.41 | $ | 0.04 | $ | 1.46 | $ | 1.50 | $ | (0.33 | ) | $ | — | |||||||||||||||
9/30/2017 | 14.47 | 0.38 | 2.40 | 2.78 | (0.84 | ) | — | |||||||||||||||||||||
9/30/2016 | 12.75 | 0.22 | 1.93 | 2.15 | (0.17 | ) | (0.26 | ) | ||||||||||||||||||||
12/9/2014* - 9/30/2015# | 15.00 | 0.34 | (2.59 | ) | (2.25 | ) | — | (f) | — | |||||||||||||||||||
| Institutional Class | ||||||||||||||||||||||||||||
3/31/2018+ | $ | 16.40 | $ | 0.06 | $ | 1.45 | $ | 1.51 | $ | (0.36 | ) | $ | — | |||||||||||||||
9/30/2017 | 14.46 | 0.21 | 2.58 | 2.79 | (0.85 | ) | — | |||||||||||||||||||||
9/30/2016 | 12.76 | 0.25 | 1.90 | 2.15 | (0.19 | ) | (0.26 | ) | ||||||||||||||||||||
12/9/2014* - 9/30/2015# | 15.00 | 0.36 | (2.60 | ) | (2.24 | ) | — | (f) | — | |||||||||||||||||||
| Class R6 | ||||||||||||||||||||||||||||
3/31/2018+ | $ | 16.45 | $ | 0.05 | $ | 1.47 | $ | 1.52 | $ | (0.33 | ) | $ | — | |||||||||||||||
9/30/2017 | 14.44 | 0.29 | 2.52 | 2.81 | (0.80 | ) | — | |||||||||||||||||||||
9/30/2016 | 12.77 | 0.30 | 1.87 | 2.17 | (0.24 | ) | (0.26 | ) | ||||||||||||||||||||
12/9/2014* - 9/30/2015# | 15.00 | 0.37 | (2.60 | ) | (2.23 | ) | — | (f) | — | |||||||||||||||||||
| AllianzGI Best Styles Global Equity: | ||||||||||||||||||||||||||||
| Class A | ||||||||||||||||||||||||||||
3/31/2018+ | $ | 18.83 | $ | 0.12 | $ | 0.48 | $ | 0.60 | $ | (0.62 | ) | $ | (1.89 | ) | ||||||||||||||
9/30/2017 | 15.62 | 0.19 | 3.12 | 3.31 | — | (f) | (0.10 | ) | ||||||||||||||||||||
9/30/2016 | 14.60 | 0.28 | 0.89 | 1.17 | (0.15 | ) | — | |||||||||||||||||||||
12/1/2014 - 9/30/2015# | 16.57 | 0.52 | (1.65 | ) | (1.13 | ) | (0.43 | ) | (0.41 | ) | ||||||||||||||||||
9/2/2014* - 11/30/2014 | 16.51 | 0.05 | 0.01 | 0.06 | — | — | ||||||||||||||||||||||
| Class C | ||||||||||||||||||||||||||||
3/31/2018+ | $ | 18.51 | $ | 0.04 | $ | 0.49 | $ | 0.53 | $ | (0.56 | ) | $ | (1.89 | ) | ||||||||||||||
9/30/2017 | 15.61 | 0.27 | 2.91 | 3.18 | (0.18 | ) | (0.10 | ) | ||||||||||||||||||||
4/26/2016* - 9/30/2016 | 15.29 | 0.11 | 0.21 | 0.32 | — | — | ||||||||||||||||||||||
| Class P | ||||||||||||||||||||||||||||
3/31/2018+ | $ | 18.82 | $ | 0.13 | $ | 0.49 | $ | 0.62 | $ | (0.63 | ) | $ | (1.89 | ) | ||||||||||||||
9/30/2017 | 15.79 | 0.36 | 3.01 | 3.37 | (0.24 | ) | (0.10 | ) | ||||||||||||||||||||
9/30/2016 | 14.68 | 0.32 | 0.89 | 1.21 | (0.10 | ) | — | |||||||||||||||||||||
12/22/2014* - 9/30/2015# | 15.68 | 0.27 | (1.27 | ) | (1.00 | ) | — | (f) | — | (f) | ||||||||||||||||||
| Institutional Class | ||||||||||||||||||||||||||||
3/31/2018+ | $ | 18.68 | $ | 0.14 | $ | 0.48 | $ | 0.62 | $ | (0.66 | ) | $ | (1.89 | ) | ||||||||||||||
9/30/2017 | 15.68 | 0.36 | 3.01 | 3.37 | (0.27 | ) | (0.10 | ) | ||||||||||||||||||||
9/30/2016 | 14.63 | 0.37 | 0.84 | 1.21 | (0.16 | ) | — | |||||||||||||||||||||
12/1/2014 - 9/30/2015# | 16.58 | 0.28 | (1.38 | ) | (1.10 | ) | (0.44 | ) | (0.41 | ) | ||||||||||||||||||
9/2/2014* - 11/30/2014 | 16.51 | 0.06 | 0.01 | 0.07 | — | — | ||||||||||||||||||||||
| Class R6 | ||||||||||||||||||||||||||||
3/31/2018+ | $ | 18.79 | $ | 0.14 | $ | 0.48 | $ | 0.62 | $ | (0.64 | ) | $ | (1.89 | ) | ||||||||||||||
9/30/2017 | 15.78 | 0.37 | 3.02 | 3.39 | (0.28 | ) | (0.10 | ) | ||||||||||||||||||||
9/30/2016 | 14.70 | 0.37 | 0.86 | 1.23 | (0.15 | ) | — | |||||||||||||||||||||
12/1/2014 - 9/30/2015# | 16.58 | 0.31 | (1.40 | ) | (1.09 | ) | (0.38 | ) | (0.41 | ) | ||||||||||||||||||
12/2/2013* - 11/30/2014 | 15.00 | 0.38 | 1.20 | 1.58 | — | — | ||||||||||||||||||||||
| + | Unaudited |
| * | Commencement of operations. |
| # | Fiscal year end changed from November 30th to September 30th. |
| (a) | Calculated on average shares outstanding during the period. |
| (b) | Total return is calculated assuming a purchase of a share on the first day of the period and a sale of a share on the last day of each period reported. Dividends and distributions, if any, are assumed, for purposes of this calculation, to be reinvested. Total return does not reflect sales charges and includes the effect of fee waivers and reimbursements. Total return may reflect adjustments to conform to U.S. GAAP. Total return for a period of less than one year is not annualized. |
| 262 | Semiannual Report | | March 31, 2018 | | See accompanying Notes to Financial Statements |
Table of Contents
| Total Dividends and Distributions | Net Asset Value, End of Period | Total Return (b) | Net Assets, End of Period (000s) | Ratio of Fee Waiver/ | Ratio of Expenses to Average Net Assets without Fee Waiver/ Reimbursement | Ratio of Net Investment Income (Loss) to Average Net Assets | Portfolio Turnover Rate | |||||||||||||||||||||||||||
| $ | (0.34 | ) | $ | 17.49 | 9.19 | % | $ | 292 | 0.85 | %(c) | 4.13 | %(c) | 0.36 | %(c) | 10 | % | ||||||||||||||||||
| (0.85 | ) | 16.34 | 20.85 | 143 | 0.86 | 4.96 | 2.53 | 44 | ||||||||||||||||||||||||||
| — | 14.44 | 10.40 | 11 | 0.95 | (c) | 4.30 | (c) | 3.03 | (c) | 95 | ||||||||||||||||||||||||
| $ | (0.24 | ) | $ | 17.41 | 8.75 | % | $ | 49 | 1.60 | %(c) | 4.94 | %(c) | (0.44 | )%(c) | 10 | % | ||||||||||||||||||
| (0.79 | ) | 16.24 | 19.91 | 49 | 1.62 | 6.05 | 1.37 | 44 | ||||||||||||||||||||||||||
| — | 14.40 | 10.09 | 14 | 1.70 | (c) | 5.13 | (c) | 2.08 | (c) | 95 | ||||||||||||||||||||||||
| $ | (0.33 | ) | $ | 17.58 | 9.24 | % | $ | 56 | 0.70 | %(c) | 3.93 | %(c) | 0.50 | %(c) | 10 | % | ||||||||||||||||||
| (0.84 | ) | 16.41 | 20.99 | 37 | 0.72 | 5.09 | 2.53 | 44 | ||||||||||||||||||||||||||
| (0.43 | ) | 14.47 | (e) | 17.42 | (e) | 10 | 0.80 | 3.94 | 1.72 | 95 | ||||||||||||||||||||||||
| — | (f) | 12.75 | (14.98 | ) | 8 | 0.80 | (c)(d) | 5.81 | (c)(d) | 2.88 | (c)(d) | 29 | ||||||||||||||||||||||
| $ | (0.36 | ) | $ | 17.55 | 9.32 | % | $ | 98 | 0.60 | %(c) | 3.94 | %(c) | 0.65 | %(c) | 10 | % | ||||||||||||||||||
| (0.85 | ) | 16.40 | 21.12 | 12 | 0.61 | 6.68 | 1.46 | 44 | ||||||||||||||||||||||||||
| (0.45 | ) | 14.46 | (e) | 17.52 | (e) | 10 | 0.70 | 3.89 | 1.97 | 95 | ||||||||||||||||||||||||
| — | (f) | 12.76 | (14.91 | ) | 9 | 0.70 | (c)(d) | 5.82 | (c)(d) | 2.98 | (c)(d) | 29 | ||||||||||||||||||||||
| $ | (0.33 | ) | $ | 17.64 | 9.33 | % | $ | 6,362 | 0.60 | %(c) | 3.90 | %(c) | 0.54 | %(c) | 10 | % | ||||||||||||||||||
| (0.80 | ) | 16.45 | 21.15 | 6,954 | 0.60 | 5.62 | 1.98 | 44 | ||||||||||||||||||||||||||
| (0.50 | ) | 14.44 | (e) | 17.66 | (e) | 12,441 | 0.60 | 3.88 | 2.34 | 95 | ||||||||||||||||||||||||
| — | (f) | 12.77 | (14.84 | ) | 4,745 | 0.60 | (c)(d) | 5.79 | (c)(d) | 3.13 | (c)(d) | 29 | ||||||||||||||||||||||
| $ | (2.51 | ) | $ | 16.92 | 3.02 | % | $ | 1,442 | 0.70 | %(c) | 1.47 | %(c) | 1.31 | %(c) | 49 | % | ||||||||||||||||||
| (0.10 | ) | 18.83 | 21.29 | 1,317 | 0.74 | (g) | 1.07 | (g) | 1.15 | (g) | 81 | (h) | ||||||||||||||||||||||
| (0.15 | ) | 15.62 | 8.09 | 36,257 | 0.75 | 0.79 | 1.88 | 70 | ||||||||||||||||||||||||||
| (0.84 | ) | 14.60 | (7.13 | ) | 32,383 | 0.75 | (c)(d) | 1.22 | (c)(d) | 4.64 | (c)(d) | 35 | ||||||||||||||||||||||
| — | 16.57 | 0.36 | 10 | 0.75 | (c) | 2.53 | (c) | 1.31 | (c) | 76 | ||||||||||||||||||||||||
| $ | (2.45 | ) | $ | 16.59 | 2.65 | % | $ | 59 | 1.40 | %(c) | 1.48 | %(c) | 0.46 | %(c) | 49 | % | ||||||||||||||||||
| (0.28 | ) | 18.51 | 20.68 | 102 | 1.40 | (g) | 1.44 | (g) | 1.62 | (g) | 81 | (h) | ||||||||||||||||||||||
| — | 15.61 | 2.09 | 10 | 1.49 | (c) | 1.49 | (c) | 1.68 | (c) | 70 | ||||||||||||||||||||||||
| $ | (2.52 | ) | $ | 16.92 | 3.15 | % | $ | 2,337 | 0.50 | %(c) | 0.55 | %(c) | 1.44 | %(c) | 49 | % | ||||||||||||||||||
| (0.34 | ) | 18.82 | 21.72 | 2,835 | 0.53 | (g) | 0.56 | (g) | 2.09 | (g) | 81 | (h) | ||||||||||||||||||||||
| (0.10 | ) | 15.79 | 8.28 | 2,851 | 0.60 | 0.62 | 2.13 | 70 | ||||||||||||||||||||||||||
| — | (f) | 14.68 | (6.35 | ) | 4,069 | 0.61 | (c)(d) | 0.69 | (c)(d) | 2.20 | (c)(d) | 35 | ||||||||||||||||||||||
| $ | (2.55 | ) | $ | 16.75 | 3.16 | % | $ | 2,386 | 0.40 | %(c) | 0.51 | %(c) | 1.60 | %(c) | 49 | % | ||||||||||||||||||
| (0.37 | ) | 18.68 | 21.88 | 2,323 | 0.42 | (g) | 0.54 | (g) | 2.15 | (g) | 81 | (h) | ||||||||||||||||||||||
| (0.16 | ) | 15.68 | 8.31 | 2,390 | 0.50 | 0.51 | 2.44 | 70 | ||||||||||||||||||||||||||
| (0.85 | ) | 14.63 | (6.92 | ) | 366 | 0.51 | (c)(d) | 0.68 | (c)(d) | 2.17 | (c)(d) | 35 | ||||||||||||||||||||||
| — | 16.58 | 0.42 | 10 | 0.50 | (c) | 2.27 | (c) | 1.56 | (c) | 76 | ||||||||||||||||||||||||
| $ | (2.53 | ) | $ | 16.88 | 3.17 | % | $ | 615,135 | 0.40 | %(c) | 0.45 | %(c) | 1.60 | %(c) | 49 | % | ||||||||||||||||||
| (0.38 | ) | 18.79 | 21.92 | 594,634 | 0.40 | (g) | 0.43 | (g) | 2.20 | (g) | 81 | (h) | ||||||||||||||||||||||
| (0.15 | ) | 15.78 | 8.41 | 560,066 | 0.40 | 0.49 | 2.42 | 70 | ||||||||||||||||||||||||||
| (0.79 | ) | 14.70 | (6.83 | ) | 250,203 | 0.40 | (c)(d) | 0.70 | (c)(d) | 2.39 | (c)(d) | 35 | ||||||||||||||||||||||
| — | 16.58 | 10.53 | 33,422 | (c) | 0.40 | 1.80(c | ) | 2.40 | (c) | 76 | ||||||||||||||||||||||||
| (c) | Annualized, unless otherwise noted. |
| (d) | Certain expenses incurred by the Fund were not annualized. |
| (e) | Payments from Affiliates increased the end of period net asset value and total return by less than $0.01 and 0.01%, respectively. |
| (f) | Actual amount rounds to less than $(0.01) per share. |
| (g) | Does not include expenses of the investment companies in which the Fund invests. |
| (h) | Portfolio turnover rate excludes securities received or delivered from in-kind fund share transactions. |
| See accompanying Notes to Financial Statements | | March 31, 2018 | | Semiannual Report | 263 |
Table of Contents
Financial Highlights (cont’d)
For a Share Outstanding for the Period ended:
Net Asset | Net Investment Income (a) | Net Realized and Change in Unrealized Gain (Loss) | Total from Investment Operations | Dividends from Net Investment Income | Distributions from Net Realized Capital Gains | |||||||||||||||||||||||
| AllianzGI Best Styles International Equity: | ||||||||||||||||||||||||||||
| Class A | ||||||||||||||||||||||||||||
3/31/2018+ | $ | 15.71 | $ | 0.11 | $ | 0.38 | $ | 0.49 | $ | (0.72 | ) | $ | — | |||||||||||||||
9/30/2017 | 14.21 | 0.38 | 2.44 | 2.82 | (1.32 | ) | — | |||||||||||||||||||||
4/26/2016* - 9/30/2016 | 14.20 | 0.23 | (0.22 | ) | 0.01 | — | — | |||||||||||||||||||||
| Class C | ||||||||||||||||||||||||||||
3/31/2018+ | $ | 15.58 | $ | 0.04 | $ | 0.37 | $ | 0.41 | $ | (0.65 | ) | $ | — | |||||||||||||||
9/30/2017 | 14.16 | 0.27 | 2.44 | 2.71 | (1.29 | ) | — | |||||||||||||||||||||
4/26/2016* - 9/30/2016 | 14.20 | 0.17 | (0.21 | ) | (0.04 | ) | — | — | ||||||||||||||||||||
| Class P | ||||||||||||||||||||||||||||
3/31/2018+ | $ | 15.74 | $ | 0.11 | $ | 0.38 | $ | 0.49 | $ | (0.73 | ) | $ | — | |||||||||||||||
9/30/2017 | 14.21 | 0.35 | 2.50 | 2.85 | (1.32 | ) | — | |||||||||||||||||||||
9/30/2016 | 13.83 | 0.40 | 0.23 | 0.63 | (0.12 | ) | (0.13 | ) | ||||||||||||||||||||
12/9/2014* - 9/30/2015# | 15.00 | 0.37 | (1.53 | ) | (1.16 | ) | (0.01 | ) | — | |||||||||||||||||||
| Institutional Class | ||||||||||||||||||||||||||||
3/31/2018+ | $ | 15.76 | $ | 0.16 | $ | 0.34 | $ | 0.50 | $ | (0.72 | ) | $ | — | |||||||||||||||
9/30/2017 | 14.22 | 0.38 | 2.49 | 2.87 | (1.33 | ) | — | |||||||||||||||||||||
9/30/2016 | 13.84 | 0.48 | 0.16 | 0.64 | (0.13 | ) | (0.13 | ) | ||||||||||||||||||||
12/9/2014* - 9/30/2015# | 15.00 | 0.38 | (1.53 | ) | (1.15 | ) | (0.01 | ) | — | |||||||||||||||||||
| Class R6 | ||||||||||||||||||||||||||||
3/31/2018+ | $ | 15.74 | $ | 0.12 | $ | 0.38 | $ | 0.50 | $ | (0.67 | ) | $ | — | |||||||||||||||
9/30/2017 | 14.20 | 0.36 | 2.51 | 2.87 | (1.33 | ) | — | |||||||||||||||||||||
9/30/2016 | 13.85 | 0.45 | 0.21 | 0.66 | (0.18 | ) | (0.13 | ) | ||||||||||||||||||||
12/9/2014* - 9/30/2015# | 15.00 | 0.40 | (1.54 | ) | (1.14 | ) | (0.01 | ) | — | |||||||||||||||||||
| AllianzGI Best Styles U.S. Equity: | ||||||||||||||||||||||||||||
| Class A | ||||||||||||||||||||||||||||
3/31/2018+ | $ | 18.42 | $ | 0.15 | $ | 0.96 | $ | 1.11 | $ | (0.13 | ) | $ | (0.84 | ) | ||||||||||||||
9/30/2017 | 15.47 | 0.25 | 2.93 | 3.18 | (0.23 | ) | — | |||||||||||||||||||||
4/26/2016* - 9/30/2016 | 14.91 | 0.11 | 0.45 | 0.56 | — | — | ||||||||||||||||||||||
| Class C | ||||||||||||||||||||||||||||
3/31/2018+ | $ | 18.24 | $ | 0.08 | $ | 0.95 | $ | 1.03 | $ | (0.27 | ) | $ | (0.84 | ) | ||||||||||||||
9/30/2017 | 15.42 | 0.12 | 2.92 | 3.04 | (0.22 | ) | — | |||||||||||||||||||||
4/26/2016* - 9/30/2016 | 14.91 | 0.06 | 0.45 | 0.51 | — | — | ||||||||||||||||||||||
| Class P | ||||||||||||||||||||||||||||
3/31/2018+ | $ | 18.45 | $ | 0.16 | $ | 0.97 | $ | 1.13 | $ | (0.37 | ) | $ | (0.84 | ) | ||||||||||||||
9/30/2017 | 15.46 | 0.28 | 2.94 | 3.22 | (0.23 | ) | — | |||||||||||||||||||||
9/30/2016 | 14.19 | 0.24 | 1.30 | 1.54 | (0.22 | ) | (0.05 | ) | ||||||||||||||||||||
12/1/2014* - 9/30/2015# | 15.00 | 0.18 | (0.97 | ) | (0.79 | ) | (0.02 | ) | — | |||||||||||||||||||
| Institutional Class | ||||||||||||||||||||||||||||
3/31/2018+ | $ | 18.48 | $ | 0.16 | $ | 0.96 | $ | 1.12 | $ | (0.34 | ) | $ | (0.84 | ) | ||||||||||||||
9/30/2017 | 15.49 | 0.28 | 2.94 | 3.22 | (0.23 | ) | — | |||||||||||||||||||||
9/30/2016 | 14.20 | 0.25 | 1.32 | 1.57 | (0.23 | ) | (0.05 | ) | ||||||||||||||||||||
12/1/2014* - 9/30/2015# | 15.00 | 0.18 | (0.96 | ) | (0.78 | ) | (0.02 | ) | — | |||||||||||||||||||
| Class R6 | ||||||||||||||||||||||||||||
3/31/2018+ | $ | 18.56 | $ | 0.17 | $ | 0.97 | $ | 1.14 | $ | (0.35 | ) | $ | (0.84 | ) | ||||||||||||||
9/30/2017 | 15.53 | 0.30 | 2.97 | 3.27 | (0.24 | ) | — | |||||||||||||||||||||
9/30/2016 | 14.21 | 0.27 | 1.31 | 1.58 | (0.21 | ) | (0.05 | ) | ||||||||||||||||||||
12/1/2014* - 9/30/2015# | 15.00 | 0.20 | (0.97 | ) | (0.77 | ) | (0.02 | ) | — | |||||||||||||||||||
| + | Unaudited |
| * | Commencement of operations. |
| # | Fiscal year end changed from November 30th to September 30th. |
| (a) | Calculated on average shares outstanding during the period. |
| (b) | Total return is calculated assuming a purchase of a share on the first day of the period and a sale of a share on the last day of each period reported. Dividends and distributions, if any, are assumed, for purposes of this calculation, to be reinvested. Total return does not reflect sales charges and includes the effect of fee waivers and reimbursements. Total return may reflect adjustments to conform to U.S. GAAP. Total return for a period of less than one year is not annualized. |
| 264 | Semiannual Report | | March 31, 2018 | | See accompanying Notes to Financial Statements |
Table of Contents
| Total Dividends and Distributions | Net Asset Value, End of Period | Total Return (b) | Net Assets, End of Period (000s) | Ratio of Fee Waiver/ | Ratio of Expenses to Average Net Assets without Fee Waiver/ Reimbursement | Ratio of Net Investment Income to Average Net Assets | Portfolio Turnover Rate | |||||||||||||||||||||||||||
| $ | (0.72 | ) | $ | 15.48 | 3.11 | % | $ | 567 | 0.70 | %(c) | 2.00 | %(c) | 1.40 | %(c) | 27 | % | ||||||||||||||||||
| (1.32 | ) | 15.71 | 21.83 | 506 | 0.70 | (d) | 1.99 | (d) | 2.54 | (d) | 70 | |||||||||||||||||||||||
| — | 14.21 | 0.07 | 12 | 0.80 | (c) | 1.24 | (c) | 3.88 | (c) | 103 | ||||||||||||||||||||||||
| $ | (0.65 | ) | $ | 15.34 | 2.64 | % | $ | 113 | 1.45 | %(c) | 2.80 | %(c) | 0.48 | %(c) | 27 | % | ||||||||||||||||||
| (1.29 | ) | 15.58 | 21.06 | 146 | 1.46 | (d) | 2.69 | (d) | 1.84 | (d) | 70 | |||||||||||||||||||||||
| — | 14.16 | (0.28 | ) | 15 | 1.55 | (c) | 2.02 | (c) | 2.79 | (c) | 103 | |||||||||||||||||||||||
| $ | (0.73 | ) | $ | 15.50 | 3.12 | % | $ | 117 | 0.55 | %(c) | 1.74 | %(c) | 1.44 | %(c) | 27 | % | ||||||||||||||||||
| (1.32 | ) | 15.74 | 22.11 | 119 | 0.56 | (d) | 1.73 | (d) | 2.32 | (d) | 70 | |||||||||||||||||||||||
| (0.25 | ) | 14.21 | 4.57 | 10 | 0.65 | 0.97 | 2.87 | 103 | ||||||||||||||||||||||||||
| (0.01 | ) | 13.83 | (7.74 | ) | 9 | 0.65 | (c)(e) | 2.06 | (c)(e) | 2.99 | (c)(e) | 29 | ||||||||||||||||||||||
| $ | (0.72 | ) | $ | 15.54 | 3.18 | % | $ | 177 | 0.45 | %(c) | 1.71 | %(c) | 2.03 | %(c) | 27 | % | ||||||||||||||||||
| (1.33 | ) | 15.76 | 22.20 | 90 | 0.48 | (d) | 1.66 | (d) | 2.62 | (d) | 70 | |||||||||||||||||||||||
| (0.26 | ) | 14.22 | 4.66 | 36 | 0.55 | 1.01 | 3.49 | 103 | ||||||||||||||||||||||||||
| (0.01 | ) | 13.84 | (7.66 | ) | 9 | 0.55 | (c)(e) | 2.06 | (c)(e) | 3.09 | (c)(e) | 29 | ||||||||||||||||||||||
| $ | (0.67 | ) | $ | 15.57 | 3.15 | % | $ | 25,665 | 0.45 | %(c) | 1.74 | %(c) | 1.54 | %(c) | 27 | % | ||||||||||||||||||
| (1.33 | ) | 15.74 | 22.25 | 25,643 | 0.45 | (d) | 1.50 | (d) | 2.50 | (d) | 70 | |||||||||||||||||||||||
| (0.31 | ) | 14.20 | 4.74 | 71,088 | 0.45 | 0.99 | 3.25 | 103 | ||||||||||||||||||||||||||
| (0.01 | ) | 13.85 | (7.59 | ) | 56,210 | 0.45 | (c)(e) | 1.62 | (c)(e) | 3.31 | (c)(e) | 29 | ||||||||||||||||||||||
| $ | (0.97 | ) | $ | 18.56 | 5.95 | % | $ | 136 | 0.65 | %(c) | 1.26 | %(c) | 1.61 | %(c) | 26 | % | ||||||||||||||||||
| (0.23 | ) | 18.42 | 20.80 | 46 | 0.68 | 1.02 | 1.49 | 55 | (f) | |||||||||||||||||||||||||
| — | 15.47 | 3.76 | 47 | 0.75 | (c) | 0.93 | (c) | 1.75 | (c) | 64 | ||||||||||||||||||||||||
| $ | (1.11 | ) | $ | 18.16 | 5.56 | % | $ | 34 | 1.40 | %(c) | 1.54 | %(c) | 0.81 | %(c) | 26 | % | ||||||||||||||||||
| (0.22 | ) | 18.24 | 19.92 | 20 | 1.42 | 1.56 | 0.74 | 55 | (f) | |||||||||||||||||||||||||
| — | 15.42 | 3.42 | 10 | 1.50 | (c) | 1.61 | (c) | 0.88 | (c) | 64 | ||||||||||||||||||||||||
| $ | (1.21 | ) | $ | 18.37 | 6.04 | % | $ | 508 | 0.50 | %(c) | 0.54 | %(c) | 1.71 | %(c) | 26 | % | ||||||||||||||||||
| (0.23 | ) | 18.45 | 21.07 | 476 | 0.51 | 0.57 | 1.62 | 55 | (f) | |||||||||||||||||||||||||
| (0.27 | ) | 15.46 | 10.95 | 54 | 0.60 | 0.71 | 1.63 | 64 | ||||||||||||||||||||||||||
| (0.02 | ) | 14.19 | (5.27 | ) | 25 | 0.60 | (c)(e) | 1.32 | (c)(e) | 1.40 | (c)(e) | 51 | ||||||||||||||||||||||
| $ | (1.18 | ) | $ | 18.42 | 6.00 | % | $ | 107 | 0.50 | %(c) | 0.52 | %(c) | 1.69 | %(c) | 26 | % | ||||||||||||||||||
| (0.23 | ) | 18.48 | 21.04 | 121 | 0.50 | 0.66 | 1.64 | 55 | (f) | |||||||||||||||||||||||||
| (0.28 | ) | 15.49 | 11.20 | 86 | 0.50 | 0.75 | 1.72 | 64 | ||||||||||||||||||||||||||
| (0.02 | ) | 14.20 | (5.20 | ) | 1,771 | 0.50 | (c)(e) | 1.45 | (c)(e) | 1.51 | (c)(e) | 51 | ||||||||||||||||||||||
| $ | (1.19 | ) | $ | 18.51 | 6.07 | % | $ | 125,496 | 0.40 | %(c) | 0.52 | %(c) | 1.81 | %(c) | 26 | % | ||||||||||||||||||
| (0.24 | ) | 18.56 | 21.26 | 113,074 | 0.40 | 0.56 | 1.78 | 55 | (f) | |||||||||||||||||||||||||
| (0.26 | ) | 15.53 | 11.23 | 100,878 | 0.40 | 0.62 | 1.80 | 64 | ||||||||||||||||||||||||||
| (0.02 | ) | 14.21 | (5.12 | ) | 86,456 | 0.40 | (c)(e) | 0.74 | (c)(e) | 1.63 | (c)(e) | 51 | ||||||||||||||||||||||
| (c) | Annualized, unless otherwise noted. |
| (d) | Does not include expenses of the investment companies in which the Fund invests. |
| (e) | Certain expenses incurred by the Fund were not annualized. |
| (f) | Portfolio turnover rate excludes securities received or delivered from in-kind fund share transactions. |
| See accompanying Notes to Financial Statements | | March 31, 2018 | | Semiannual Report | 265 |
Table of Contents
Financial Highlights (cont’d)
For a Share Outstanding for the Period ended:
| Net Asset Value, Beginning of Period | Net Investment Income (a) | Unrealized Gain (Loss) | Total from Investment Operations | Dividends from Net Investment Income | Distributions from Net Realized Capital Gains | |||||||||||||||||||||||
| AllianzGI Convertible: | ||||||||||||||||||||||||||||
| Class A | ||||||||||||||||||||||||||||
3/31/2018+ | $ | 34.27 | $ | 0.17 | $ | 1.72 | $ | 1.89 | $ | (1.16 | ) | $ | (5.09 | ) | ||||||||||||||
9/30/2017 | 31.02 | 0.38 | 3.64 | 4.02 | (0.77 | ) | — | |||||||||||||||||||||
9/30/2016 | 32.13 | 0.64 | 1.29 | 1.93 | (0.53 | ) | (2.51 | ) | ||||||||||||||||||||
12/1/2014 - 9/30/2015# | 36.54 | 0.31 | (1.88 | ) | (1.57 | ) | (0.55 | ) | (2.29 | ) | ||||||||||||||||||
11/30/2014 | 34.91 | 0.39 | 2.81 | 3.20 | (0.73 | ) | (0.84 | ) | ||||||||||||||||||||
11/30/2013 | 28.27 | 0.54 | 6.59 | 7.13 | (0.49 | ) | — | |||||||||||||||||||||
11/30/2012 | 28.11 | 0.53 | 1.95 | 2.48 | (0.75 | ) | (1.57 | ) | ||||||||||||||||||||
| Class C | ||||||||||||||||||||||||||||
3/31/2018+ | $ | 34.36 | $ | 0.05 | $ | 1.72 | $ | 1.77 | $ | (0.96 | ) | $ | (5.09 | ) | ||||||||||||||
9/30/2017 | 31.19 | 0.17 | 3.65 | 3.82 | (0.65 | ) | — | |||||||||||||||||||||
9/30/2016 | 32.20 | 0.42 | 1.30 | 1.72 | (0.22 | ) | (2.51 | ) | ||||||||||||||||||||
12/1/2014 - 9/30/2015# | 36.55 | 0.10 | (1.88 | ) | (1.78 | ) | (0.28 | ) | (2.29 | ) | ||||||||||||||||||
11/30/2014 | 34.93 | 0.13 | 2.80 | 2.93 | (0.47 | ) | (0.84 | ) | ||||||||||||||||||||
11/30/2013 | 28.30 | 0.30 | 6.60 | 6.90 | (0.27 | ) | — | |||||||||||||||||||||
11/30/2012 | 28.15 | 0.32 | 1.96 | 2.28 | (0.56 | ) | (1.57 | ) | ||||||||||||||||||||
| Class R | ||||||||||||||||||||||||||||
3/31/2018+ | $ | 34.19 | $ | 0.11 | $ | 1.75 | $ | 1.86 | $ | (0.01 | ) | $ | (5.09 | ) | ||||||||||||||
9/30/2017 | 30.97 | 0.26 | 3.64 | 3.90 | (0.68 | ) | — | |||||||||||||||||||||
9/30/2016 | 32.08 | 0.52 | 1.27 | 1.79 | (0.39 | ) | (2.51 | ) | ||||||||||||||||||||
12/1/2014 - 9/30/2015# | 36.45 | 0.20 | (1.87 | ) | (1.67 | ) | (0.41 | ) | (2.29 | ) | ||||||||||||||||||
11/30/2014 | 34.87 | 0.26 | 2.81 | 3.07 | (0.65 | ) | (0.84 | ) | ||||||||||||||||||||
11/30/2013 | 28.20 | 0.34 | 6.61 | 6.95 | (0.28 | ) | — | |||||||||||||||||||||
11/30/2012 | 28.08 | 0.43 | 1.95 | 2.38 | (0.69 | ) | (1.57 | ) | ||||||||||||||||||||
| Class P | ||||||||||||||||||||||||||||
3/31/2018+ | $ | 33.95 | $ | 0.21 | $ | 1.69 | $ | 1.90 | $ | (1.44 | ) | $ | (5.09 | ) | ||||||||||||||
9/30/2017 | 30.84 | 0.48 | 3.61 | 4.09 | (0.98 | ) | — | |||||||||||||||||||||
9/30/2016 | 32.07 | 0.72 | 1.27 | 1.99 | (0.71 | ) | (2.51 | ) | ||||||||||||||||||||
12/1/2014 - 9/30/2015# | 36.47 | 0.39 | (1.87 | ) | (1.48 | ) | (0.63 | ) | (2.29 | ) | ||||||||||||||||||
11/30/2014 | 34.84 | 0.47 | 2.80 | 3.27 | (0.80 | ) | (0.84 | ) | ||||||||||||||||||||
11/30/2013 | 28.20 | 0.63 | 6.55 | 7.18 | (0.54 | ) | — | |||||||||||||||||||||
11/30/2012 | 28.04 | 0.58 | 1.94 | 2.52 | (0.79 | ) | (1.57 | ) | ||||||||||||||||||||
| Institutional Class | ||||||||||||||||||||||||||||
3/31/2018+ | $ | 33.89 | $ | 0.21 | $ | 1.70 | $ | 1.91 | $ | (1.13 | ) | $ | (5.09 | ) | ||||||||||||||
9/30/2017 | 30.76 | 0.49 | 3.61 | 4.10 | (0.97 | ) | — | |||||||||||||||||||||
9/30/2016 | 32.02 | 0.74 | 1.26 | 2.00 | (0.75 | ) | (2.51 | ) | ||||||||||||||||||||
12/1/2014 - 9/30/2015# | 36.42 | 0.40 | (1.86 | ) | (1.46 | ) | (0.65 | ) | (2.29 | ) | ||||||||||||||||||
11/30/2014 | 34.80 | 0.50 | 2.79 | 3.29 | (0.83 | ) | (0.84 | ) | ||||||||||||||||||||
11/30/2013 | 28.16 | 0.61 | 6.59 | 7.20 | (0.56 | ) | — | |||||||||||||||||||||
11/30/2012 | 28.00 | 0.62 | 1.94 | 2.56 | (0.83 | ) | (1.57 | ) | ||||||||||||||||||||
| Administrative Class | ||||||||||||||||||||||||||||
3/31/2018+ | $ | 34.08 | $ | 0.18 | $ | 1.71 | $ | 1.89 | $ | (1.26 | ) | $ | (5.09 | ) | ||||||||||||||
9/30/2017 | 30.96 | 0.42 | 3.62 | 4.04 | (0.92 | ) | — | |||||||||||||||||||||
9/30/2016 | 32.14 | 0.66 | 1.29 | 1.95 | (0.62 | ) | (2.51 | ) | ||||||||||||||||||||
12/1/2014 - 9/30/2015# | 36.54 | 0.33 | (1.88 | ) | (1.55 | ) | (0.56 | ) | (2.29 | ) | ||||||||||||||||||
11/30/2014 | 34.84 | 0.43 | 2.79 | 3.22 | (0.68 | ) | (0.84 | ) | ||||||||||||||||||||
11/30/2013 | 28.20 | 0.53 | 6.59 | 7.12 | (0.48 | ) | — | |||||||||||||||||||||
11/30/2012 | 28.04 | 0.55 | 1.94 | 2.49 | (0.76 | ) | (1.57 | ) | ||||||||||||||||||||
| + | Unaudited |
| # | Fiscal year end changed from November 30th to September 30th. |
| (a) | Calculated on average shares outstanding during the period. |
| (b) | Total return is calculated assuming a purchase of a share on the first day of the period and a sale of a share on the last day of each period reported. Dividends and distributions, if any, are assumed, for purposes of this calculation, to be reinvested. Total return does not reflect sales charges and includes the effect of fee waivers and reimbursements. Total return may reflect adjustments to conform to U.S. GAAP. Total return for a period of less than one year is not annualized. |
| 266 | Semiannual Report | | March 31, 2018 | | See accompanying Notes to Financial Statements |
Table of Contents
| Total Dividends and Distributions | Net Asset Value, End of Period | Total Return (b) | Net Assets, End of Period (000s) | Ratio of Expenses to Average Net Assets with Fee Waiver/ Reimbursement | Ratio of Expenses to Average Net Assets without Fee Waiver/ Reimbursement | Ratio of Net Investment Income to Average Net Assets | Portfolio Turnover Rate | |||||||||||||||||||||||||||
| $ | (6.25 | ) | $ | 29.91 | 6.14 | % | $ | 63,753 | 1.02 | %(c) | 1.02 | %(c) | 1.05 | %(c) | 62 | % | ||||||||||||||||||
| (0.77 | ) | 34.27 | 13.14 | 76,586 | 1.02 | 1.02 | 1.19 | 124 | (d) | |||||||||||||||||||||||||
| (3.04 | ) | 31.02 | 6.42 | 259,711 | 0.99 | 0.99 | 2.12 | 101 | ||||||||||||||||||||||||||
| (2.84 | ) | 32.13 | (4.56 | ) | 465,080 | 0.98 | (c)(e) | 0.98 | (c)(e) | 1.08 | (c)(e) | 73 | ||||||||||||||||||||||
| (1.57 | ) | 36.54 | (f) | 9.47 | (f) | 483,863 | 0.97 | 0.97 | 1.09 | 94 | ||||||||||||||||||||||||
| (0.49 | ) | 34.91 | 25.49 | 319,778 | 0.96 | 0.96 | 1.67 | 81 | ||||||||||||||||||||||||||
| (2.32 | ) | 28.27 | 9.64 | 94,347 | 1.01 | 1.01 | 1.91 | 108 | ||||||||||||||||||||||||||
| $ | (6.05 | ) | $ | 30.08 | 5.73 | % | $ | 46,797 | 1.76 | %(c) | 1.76 | %(c) | 0.30 | %(c) | 62 | % | ||||||||||||||||||
| (0.65 | ) | 34.36 | 12.41 | 48,905 | 1.69 | 1.69 | 0.51 | 124 | (d) | |||||||||||||||||||||||||
| (2.73 | ) | 31.19 | 5.65 | 67,423 | 1.71 | 1.71 | 1.40 | 101 | ||||||||||||||||||||||||||
| (2.57 | ) | 32.20 | (5.11 | ) | 101,326 | 1.71 | (c)(e) | 1.71 | (c)(e) | 0.34 | (c)(e) | 73 | ||||||||||||||||||||||
| (1.31 | ) | 36.55 | (f) | 8.66 | (f) | 127,201 | 1.70 | 1.70 | 0.36 | 94 | ||||||||||||||||||||||||
| (0.27 | ) | 34.93 | 24.55 | 113,799 | 1.70 | 1.70 | 0.94 | 81 | ||||||||||||||||||||||||||
| (2.13 | ) | 28.30 | 8.81 | 36,917 | 1.76 | 1.76 | 1.16 | 108 | ||||||||||||||||||||||||||
| $ | (5.10 | ) | $ | 30.95 | 5.92 | % | $ | 71 | 1.40 | %(c) | 1.40 | %(c) | 0.68 | %(c) | 62 | % | ||||||||||||||||||
| (0.68 | ) | 34.19 | 12.79 | 114 | 1.42 | 1.42 | 0.82 | 124 | (d) | |||||||||||||||||||||||||
| (2.90 | ) | 30.97 | 5.95 | 1,145 | 1.43 | 1.43 | 1.73 | 101 | ||||||||||||||||||||||||||
| (2.70 | ) | 32.08 | (4.82 | ) | 1,592 | 1.36 | (c)(e) | 1.36 | (c)(e) | 0.70 | (c)(e) | 73 | ||||||||||||||||||||||
| (1.49 | ) | 36.45 | (f) | 9.10 | (f) | 1,440 | 1.30 | 1.30 | 0.74 | 94 | ||||||||||||||||||||||||
| (0.28 | ) | 34.87 | 24.86 | 394 | 1.51 | 1.51 | 1.06 | 81 | ||||||||||||||||||||||||||
| (2.26 | ) | 28.20 | 9.25 | 210 | 1.36 | 1.36 | 1.58 | 108 | ||||||||||||||||||||||||||
| $ | (6.53 | ) | $ | 29.32 | 6.27 | % | $ | 86,749 | 0.73 | %(c) | 0.73 | %(c) | 1.33 | %(c) | 62 | % | ||||||||||||||||||
| (0.98 | ) | 33.95 | 13.52 | 80,392 | 0.72 | 0.72 | 1.49 | 124 | (d) | |||||||||||||||||||||||||
| (3.22 | ) | 30.84 | 6.67 | 88,900 | 0.73 | 0.73 | 2.38 | 101 | ||||||||||||||||||||||||||
| (2.92 | ) | 32.07 | (4.32 | ) | 160,998 | 0.69 | (c)(e) | 0.69 | (c)(e) | 1.36 | (c)(e) | 73 | ||||||||||||||||||||||
| (1.64 | ) | 36.47 | (f) | 9.71 | (f) | 224,860 | 0.74 | 0.74 | 1.32 | 94 | ||||||||||||||||||||||||
| (0.54 | ) | 34.84 | 25.76 | 251,377 | 0.75 | 0.75 | 1.96 | 81 | ||||||||||||||||||||||||||
| (2.36 | ) | 28.20 | 9.84 | 53,368 | 0.80 | 0.86 | 2.12 | 108 | ||||||||||||||||||||||||||
| $ | (6.22 | ) | $ | 29.58 | 6.27 | % | $ | 274,079 | 0.72 | %(c) | 0.72 | %(c) | 1.35 | %(c) | 62 | % | ||||||||||||||||||
| (0.97 | ) | 33.89 | 13.58 | 322,732 | 0.68 | 0.68 | 1.54 | 124 | (d) | |||||||||||||||||||||||||
| (3.26 | ) | 30.76 | 6.73 | 1,089,974 | 0.67 | 0.67 | 2.47 | 101 | ||||||||||||||||||||||||||
| (2.94 | ) | 32.02 | (4.27 | ) | 1,428,098 | 0.66 | (c)(e) | 0.66 | (c)(e) | 1.40 | (c)(e) | 73 | ||||||||||||||||||||||
| (1.67 | ) | 36.42 | (f) | 9.79 | (f) | 1,781,193 | 0.65 | 0.65 | 1.41 | 94 | ||||||||||||||||||||||||
| (0.56 | ) | 34.80 | 25.88 | 1,583,824 | 0.65 | 0.65 | 1.93 | 81 | ||||||||||||||||||||||||||
| (2.40 | ) | 28.16 | 10.00 | 804,646 | 0.67 | 0.67 | 2.26 | 108 | ||||||||||||||||||||||||||
| $ | (6.35 | ) | $ | 29.62 | 6.17 | % | $ | 937 | 0.94 | %(c) | 0.94 | %(c) | 1.14 | %(c) | 62 | % | ||||||||||||||||||
| (0.92 | ) | 34.08 | 13.30 | 1,240 | 0.89 | 0.89 | 1.32 | 124 | (d) | |||||||||||||||||||||||||
| (3.13 | ) | 30.96 | 6.52 | 1,428 | 0.90 | 0.90 | 2.20 | 101 | ||||||||||||||||||||||||||
| (2.85 | ) | 32.14 | (4.49 | ) | 1,998 | 0.89 | (c)(e) | 0.89 | (c)(e) | 1.15 | (c)(e) | 73 | ||||||||||||||||||||||
| (1.52 | ) | 36.54 | (f) | 9.57 | (f) | 3,783 | 0.89 | 0.89 | 1.22 | 94 | ||||||||||||||||||||||||
| (0.48 | ) | 34.84 | 25.55 | 12,951 | 0.90 | 0.90 | 1.65 | 81 | ||||||||||||||||||||||||||
| (2.33 | ) | 28.20 | 9.70 | 2,199 | 0.92 | 0.92 | 2.00 | 108 | ||||||||||||||||||||||||||
| (c) | Annualized, unless otherwise noted. |
| (d) | Portfolio turnover rate excludes securities received or delivered from in-kind fund share transactions. |
| (e) | Certain expenses incurred by the Fund were not annualized. |
| (f) | Payments from Affiliates increased the end of period net asset value and total return by less than $0.01 and 0.01%, respectively. |
| See accompanying Notes to Financial Statements | | March 31, 2018 | | Semiannual Report | 267 |
Table of Contents
Financial Highlights (cont’d)
For a Share Outstanding for the Period ended:
Net Asset Value, Beginning of Period | Net Investment Income (Loss) (a) | Net Realized and Change in Unrealized Gain (Loss) | Total from Investment Operations | Dividends from Net Investment Income | Distributions from Net Realized Capital Gains | |||||||||||||||||||||||
| AllianzGI Emerging Markets Consumer: | ||||||||||||||||||||||||||||
| Class A | ||||||||||||||||||||||||||||
3/31/2018+ | $ | 15.76 | $ | (0.01 | ) | $ | 1.28 | $ | 1.27 | $ | (0.26 | ) | $ | (0.62 | ) | |||||||||||||
9/30/2017 | 13.60 | 0.21 | 2.07 | 2.28 | (0.12 | ) | — | |||||||||||||||||||||
9/30/2016 | 12.24 | 0.11 | 1.31 | 1.42 | (0.06 | ) | — | |||||||||||||||||||||
12/1/2014* - 9/30/2015# | 15.00 | 0.13 | (2.89 | ) | (2.76 | ) | — | — | ||||||||||||||||||||
| Institutional Class | ||||||||||||||||||||||||||||
3/31/2018+ | $ | 15.86 | $ | 0.02 | $ | 1.28 | $ | 1.30 | $ | (0.23 | ) | $ | (0.62 | ) | ||||||||||||||
9/30/2017 | 13.68 | 0.22 | 2.11 | 2.33 | (0.15 | ) | — | |||||||||||||||||||||
9/30/2016 | 12.28 | 0.19 | 1.28 | 1.47 | (0.07 | ) | — | |||||||||||||||||||||
12/1/2014* - 9/30/2015# | 15.00 | 0.13 | (2.85 | ) | (2.72 | ) | — | — | ||||||||||||||||||||
| AllianzGI Emerging Markets Debt: | ||||||||||||||||||||||||||||
| Class A | ||||||||||||||||||||||||||||
3/31/2018+ | $ | 14.87 | $ | 0.33 | $ | (0.33 | ) | $ | — | $ | (0.37 | ) | $ | (0.11 | ) | |||||||||||||
9/30/2017 | 14.89 | 0.75 | 0.16 | 0.91 | (0.91 | ) | (0.02 | ) | ||||||||||||||||||||
9/30/2016 | 13.51 | 0.71 | 1.32 | 2.03 | (0.65 | ) | — | |||||||||||||||||||||
12/1/2014 - 9/30/2015# | 14.92 | 0.47 | (1.35 | ) | (0.88 | ) | (0.53 | ) | — | |||||||||||||||||||
9/15/2014* - 11/30/2014 | 15.00 | 0.11 | (0.19 | ) | (0.08 | ) | — | — | ||||||||||||||||||||
| Class C | ||||||||||||||||||||||||||||
3/31/2018+ | $ | 14.95 | $ | 0.32 | $ | (0.39 | ) | $ | (0.07 | ) | $ | (0.22 | ) | $ | (0.11 | ) | ||||||||||||
9/30/2017 | 14.96 | 0.64 | 0.17 | 0.81 | (0.80 | ) | (0.02 | ) | ||||||||||||||||||||
9/30/2016 | 13.51 | 0.61 | 1.32 | 1.93 | (0.48 | ) | — | |||||||||||||||||||||
12/1/2014 - 9/30/2015# | 14.90 | 0.39 | (1.36 | ) | (0.97 | ) | (0.42 | ) | — | |||||||||||||||||||
9/15/2014* - 11/30/2014 | 15.00 | 0.09 | (0.19 | ) | (0.10 | ) | — | — | ||||||||||||||||||||
| Class P | ||||||||||||||||||||||||||||
3/31/2018+ | $ | 14.84 | $ | 0.38 | $ | (0.38 | ) | $ | — | $ | (0.38 | ) | $ | (0.11 | ) | |||||||||||||
9/30/2017 | 14.90 | 0.77 | 0.16 | 0.93 | (0.97 | ) | (0.02 | ) | ||||||||||||||||||||
9/30/2016 | 13.51 | 0.70 | 1.35 | 2.05 | (0.66 | ) | — | |||||||||||||||||||||
12/1/2014 - 9/30/2015# | 14.92 | 0.49 | (1.34 | ) | (0.85 | ) | (0.56 | ) | — | |||||||||||||||||||
9/15/2014* - 11/30/2014 | 15.00 | 0.12 | (0.20 | ) | (0.08 | ) | — | — | ||||||||||||||||||||
| Institutional Class | ||||||||||||||||||||||||||||
3/31/2018+ | $ | 14.83 | $ | 0.39 | $ | (0.39 | ) | $ | — | $ | (0.39 | ) | $ | (0.11 | ) | |||||||||||||
9/30/2017 | 14.88 | 0.79 | 0.16 | 0.95 | (0.98 | ) | (0.02 | ) | ||||||||||||||||||||
9/30/2016 | 13.51 | 0.72 | 1.34 | 2.06 | (0.69 | ) | — | |||||||||||||||||||||
12/1/2014 - 9/30/2015# | 14.93 | 0.50 | (1.35 | ) | (0.85 | ) | (0.57 | ) | — | |||||||||||||||||||
9/15/2014* - 11/30/2014 | 15.00 | 0.12 | (0.19 | ) | (0.07 | ) | — | — | ||||||||||||||||||||
| + | Unaudited |
| # | Fiscal year end changed from November 30th to September 30th. |
| * | Commencement of operations. |
| (a) | Calculated on average shares outstanding during the period. |
| (b) | Total return is calculated assuming a purchase of a share on the first day of the period and a sale of a share on the last day of each period reported. Dividends and distributions, if any, are assumed, for purposes of this calculation, to be reinvested. Total return does not reflect sales charges and includes the effect of fee waivers and reimbursements. Total return may reflect adjustments to conform to U.S. GAAP. Total return for a period of less than one year is not annualized. |
| (c) | Annualized, unless otherwise noted. |
| (d) | Certain expenses incurred by the Fund were not annualized. |
| 268 | Semiannual Report | | March 31, 2018 | | See accompanying Notes to Financial Statements |
Table of Contents
Total Dividends and Distributions | Net Asset Value, End of Period | Total Return (b) | Net Assets, End of Period (000s) | Ratio of Expenses to Average Net Assets with Fee Waiver/ Reimbursement | Ratio of Expenses to Average Net Assets without Fee Waiver/ Reimbursement | Ratio of Net Investment Income (Loss) to Average Net Assets | Portfolio Turnover Rate | |||||||||||||||||||||||||||
| $ | (0.88 | ) | $ | 16.15 | 8.17 | % | $ | 144 | 1.55 | %(c) | 9.08 | %(c) | (0.13 | )%(c) | 57 | % | ||||||||||||||||||
| (0.12 | ) | 15.76 | 16.97 | 155 | 1.55 | 16.84 | 1.47 | 122 | ||||||||||||||||||||||||||
| (0.06 | ) | 13.60 | 11.67 | 48 | 1.58 | 38.88 | 0.90 | 91 | ||||||||||||||||||||||||||
| — | 12.24 | (18.40 | ) | 37 | 1.65 | (c)(d) | 9.30 | (c)(d) | 1.15 | (c)(d) | 77 | |||||||||||||||||||||||
| $ | (0.85 | ) | $ | 16.31 | 8.32 | % | $ | 51,631 | 1.20 | %(c) | 1.51 | %(c) | 0.21 | %(c) | 57 | % | ||||||||||||||||||
| (0.15 | ) | 15.86 | 17.37 | 43,487 | 1.20 | 1.64 | 1.55 | 122 | ||||||||||||||||||||||||||
| (0.07 | ) | 13.68 | 12.06 | 44,630 | 1.22 | 2.04 | 1.49 | 91 | ||||||||||||||||||||||||||
| — | 12.28 | (18.13 | ) | 15,591 | 1.30 | (c)(d) | 3.55 | (c)(d) | 1.14 | (c)(d) | 77 | |||||||||||||||||||||||
| $ | (0.48 | ) | $ | 14.39 | (0.05 | )% | $ | 671 | 1.22 | %(c) | 1.75 | %(c) | 4.56 | %(c) | 49 | % | ||||||||||||||||||
| (0.93 | ) | 14.87 | 6.41 | 140 | 1.20 | 1.66 | 5.05 | 118 | ||||||||||||||||||||||||||
| (0.65 | ) | 14.89 | 15.39 | 175 | 1.20 | 1.68 | 5.01 | 123 | ||||||||||||||||||||||||||
| (0.53 | ) | 13.51 | (6.00 | ) | 9 | 1.23 | (c)(d) | 2.32 | (c)(d) | 3.97 | (c)(d) | 125 | ||||||||||||||||||||||
| — | 14.92 | (0.53 | ) | 10 | 1.20 | (c) | 2.51 | (c) | 3.65 | (c) | 27 | |||||||||||||||||||||||
| $ | (0.33 | ) | $ | 14.55 | (0.48 | )% | $ | 112 | 1.97 | %(c) | 2.47 | %(c) | 4.28 | %(c) | 49 | % | ||||||||||||||||||
| (0.82 | ) | 14.95 | 5.64 | 113 | 1.95 | 2.41 | 4.33 | 118 | ||||||||||||||||||||||||||
| (0.48 | ) | 14.96 | 14.56 | 109 | 1.95 | 2.34 | 4.28 | 123 | ||||||||||||||||||||||||||
| (0.42 | ) | 13.51 | (6.61 | ) | 9 | 1.98 | (c)(d) | 3.06 | (c)(d) | 3.23 | (c)(d) | 125 | ||||||||||||||||||||||
| — | 14.90 | (0.67 | ) | 10 | 1.95 | (c) | 3.25 | (c) | 2.90 | (c) | 27 | |||||||||||||||||||||||
| $ | (0.49 | ) | $ | 14.35 | (0.01 | )% | $ | 12 | 1.07 | %(c) | 1.43 | %(c) | 5.17 | %(c) | 49 | % | ||||||||||||||||||
| (0.99 | ) | 14.84 | 6.55 | 12 | 1.05 | 1.34 | 5.26 | 118 | ||||||||||||||||||||||||||
| (0.66 | ) | 14.90 | 15.57 | 11 | 1.05 | 1.40 | 5.02 | 123 | ||||||||||||||||||||||||||
| (0.56 | ) | 13.51 | (5.86 | ) | 10 | 1.08 | (c)(d) | 2.06 | (c)(d) | 4.12 | (c)(d) | 125 | ||||||||||||||||||||||
| — | 14.92 | (0.53 | ) | 10 | 1.05 | (c) | 2.25 | (c) | 3.80 | (c) | 27 | |||||||||||||||||||||||
| $ | (0.50 | ) | $ | 14.33 | (0.05 | )% | $ | 32,010 | 0.97 | %(c) | 1.43 | %(c) | 5.28 | %(c) | 49 | % | ||||||||||||||||||
| (1.00 | ) | 14.83 | 6.73 | 36,313 | 0.95 | 1.35 | 5.35 | 118 | ||||||||||||||||||||||||||
| (0.69 | ) | 14.88 | 15.67 | 43,318 | 0.95 | 1.40 | 5.15 | 123 | ||||||||||||||||||||||||||
| (0.57 | ) | 13.51 | (5.82 | ) | 28,557 | 0.97 | (c)(d) | 2.07 | (c)(d) | 4.22 | (c)(d) | 125 | ||||||||||||||||||||||
| — | 14.93 | (0.47 | ) | 29,856 | 0.95 | (c) | 2.28 | (c) | 3.91 | (c) | 27 | |||||||||||||||||||||||
| See accompanying Notes to Financial Statements | | March 31, 2018 | | Semiannual Report | 269 |
Table of Contents
Financial Highlights (cont’d)
For a Share Outstanding for the Period ended:
Net Asset Value, Beginning of Period | Net Investment Income (Loss) (a) | Net Realized and Change in Unrealized Gain (Loss) | Total from Investment Operations | Dividends from Net Investment Income | Distributions from Net Realized Capital Gains | |||||||||||||||||||||||
| AllianzGI Emerging Markets Small-Cap: | ||||||||||||||||||||||||||||
| Class A | ||||||||||||||||||||||||||||
3/31/2018+ | $ | 18.36 | $ | (0.02 | ) | $ | 1.34 | $ | 1.32 | $ | (0.85 | ) | $ | (0.47 | ) | |||||||||||||
9/30/2017 | 15.15 | 0.23 | 2.98 | 3.21 | — | (d) | — | |||||||||||||||||||||
9/30/2016 | 14.04 | 0.16 | 1.16 | 1.32 | (0.21 | ) | — | |||||||||||||||||||||
12/1/2014* - 9/30/2015# | 15.00 | 0.26 | (1.22 | ) | (0.96 | ) | — | (d) | — | |||||||||||||||||||
| Institutional Class | ||||||||||||||||||||||||||||
3/31/2018+ | $ | 18.04 | $ | 0.01 | $ | 1.34 | $ | 1.35 | $ | (0.76 | ) | $ | (0.47 | ) | ||||||||||||||
9/30/2017 | 15.30 | 0.24 | 2.95 | 3.19 | (0.45 | ) | — | |||||||||||||||||||||
9/30/2016 | 14.08 | 0.30 | 1.06 | 1.36 | (0.14 | ) | — | |||||||||||||||||||||
12/1/2014* - 9/30/2015# | 15.00 | 0.22 | (1.14 | ) | (0.92 | ) | — | (d) | — | |||||||||||||||||||
| AllianzGI Europe Equity Dividend: | ||||||||||||||||||||||||||||
| Class A | ||||||||||||||||||||||||||||
3/31/2018+ | $ | 16.24 | $ | 0.15 | $ | (0.39 | ) | $ | (0.24 | ) | $ | (0.38 | ) | $ | — | |||||||||||||
9/30/2017 | 14.32 | 0.48 | 2.06 | 2.54 | (0.62 | ) | — | |||||||||||||||||||||
9/30/2016 | 13.59 | 0.53 | 0.60 | 1.13 | (0.40 | ) | — | |||||||||||||||||||||
2/2/2015* - 9/30/2015# | 15.00 | 0.37 | (1.78 | ) | (1.41 | ) | — | — | ||||||||||||||||||||
| Class C | ||||||||||||||||||||||||||||
3/31/2018+ | $ | 16.19 | $ | 0.10 | $ | (0.40 | ) | $ | (0.30 | ) | $ | (0.22 | ) | $ | — | |||||||||||||
9/30/2017 | 14.24 | 0.50 | 1.91 | 2.41 | (0.46 | ) | — | |||||||||||||||||||||
9/30/2016 | 13.52 | 0.43 | 0.60 | 1.03 | (0.31 | ) | — | |||||||||||||||||||||
2/2/2015* - 9/30/2015# | 15.00 | 0.28 | (1.76 | ) | (1.48 | ) | — | — | ||||||||||||||||||||
| Class P | ||||||||||||||||||||||||||||
3/31/2018+ | $ | 16.35 | $ | 0.18 | $ | (0.40 | ) | $ | (0.22 | ) | $ | (0.46 | ) | $ | — | |||||||||||||
9/30/2017 | 14.37 | 0.46 | 2.11 | 2.57 | (0.59 | ) | — | |||||||||||||||||||||
9/30/2016 | 13.60 | 0.44 | 0.72 | 1.16 | (0.39 | ) | — | |||||||||||||||||||||
2/2/2015* - 9/30/2015# | 15.00 | 0.40 | (1.80 | ) | (1.40 | ) | — | — | ||||||||||||||||||||
| Institutional Class | ||||||||||||||||||||||||||||
3/31/2018+ | $ | 16.37 | $ | 0.18 | $ | (0.39 | ) | $ | (0.21 | ) | $ | (0.39 | ) | $ | — | |||||||||||||
9/30/2017 | 14.34 | 0.58 | 2.01 | 2.59 | (0.56 | ) | — | |||||||||||||||||||||
9/30/2016 | 13.61 | 0.55 | 0.62 | 1.17 | (0.44 | ) | — | |||||||||||||||||||||
2/2/2015* - 9/30/2015# | 15.00 | 0.39 | (1.78 | ) | (1.39 | ) | — | — | ||||||||||||||||||||
| + | Unaudited |
| # | Fiscal year end changed from November 30th to September 30th. |
| * | Commencement of operations. |
| (a) | Calculated on average shares outstanding during the period. |
| (b) | Total return is calculated assuming a purchase of a share on the first day of the period and a sale of a share on the last day of each period reported. Dividends and distributions, if any, are assumed, for purposes of this calculation, to be reinvested. Total return does not reflect sales charges and includes the effect of fee waivers and reimbursements. Total return may reflect adjustments to conform to U.S. GAAP. Total return for a period of less than one year is not annualized. |
| (c) | Annualized, unless otherwise noted. |
| (d) | Actual amount rounds to less than $(0.01) per share. |
| (e) | Certain expenses incurred by the Fund were not annualized. |
| 270 | Semiannual Report | | March 31, 2018 | | See accompanying Notes to Financial Statements |
Table of Contents
Total Dividends and Distributions | Net Asset Value, End of Period | Total Return (b) | Net Assets, End of Period (000s) | Ratio of Expenses to Average Net Assets with Fee Waiver/ Reimbursement | Ratio of Expenses to Average Net Assets without Fee Waiver/ Reimbursement | Ratio of Net Investment Income (Loss) to Average Net Assets | Portfolio Turnover Rate | |||||||||||||||||||||||||||
| $ | (1.32 | ) | $ | 18.36 | 7.53 | % | $ | 184 | 1.85 | %(c) | 9.58 | %(c) | (0.17 | )%(c) | 69 | % | ||||||||||||||||||
| — | (d) | 18.36 | 21.19 | 204 | 1.85 | 15.72 | 1.39 | 121 | ||||||||||||||||||||||||||
| (0.21 | ) | 15.15 | 9.54 | 67 | 1.85 | 6.84 | 1.14 | 147 | ||||||||||||||||||||||||||
| — | (d) | 14.04 | (6.39 | ) | 621 | 1.85 | (c)(e) | 9.40 | (c)(e) | 2.12 | (c)(e) | 103 | ||||||||||||||||||||||
| $ | (1.23 | ) | $ | 18.16 | 7.77 | % | $ | 10,978 | 1.50 | %(c) | 3.65 | %(c) | 0.16 | %(c) | 69 | % | ||||||||||||||||||
| — | 18.04 | 21.69 | 11,251 | 1.50 | 3.38 | 1.47 | 121 | |||||||||||||||||||||||||||
| (0.14 | ) | 15.30 | 9.80 | 13,367 | 1.50 | 4.72 | 2.08 | 147 | ||||||||||||||||||||||||||
| — | (d) | 14.08 | (6.11 | ) | 7,921 | 1.50 | (c)(e) | 7.77 | (c)(e) | 1.78 | (c)(e) | 103 | ||||||||||||||||||||||
| $ | (0.38 | ) | $ | 15.62 | (1.50 | )% | $ | 749 | 1.20 | %(c) | 4.59 | %(c) | 1.88 | %(c) | 29 | % | ||||||||||||||||||
| (0.62 | ) | 16.24 | 18.19 | 1,475 | 1.21 | 5.64 | 3.08 | 71 | ||||||||||||||||||||||||||
| (0.40 | ) | 14.32 | 8.45 | 49 | 1.21 | 10.11 | 3.81 | 35 | ||||||||||||||||||||||||||
| — | 13.59 | (9.40 | ) | 9 | 1.20 | (c)(e) | 11.69 | (c)(e) | 3.86 | (c)(e) | 16 | |||||||||||||||||||||||
| $ | (0.22 | ) | $ | 15.67 | (1.85 | )% | $ | 57 | 1.95 | %(c) | 5.38 | %(c) | 1.28 | %(c) | 29 | % | ||||||||||||||||||
| (0.46 | ) | 16.19 | 17.25 | 59 | 1.99 | 6.70 | 3.33 | 71 | ||||||||||||||||||||||||||
| (0.31 | ) | 14.24 | 7.70 | 15 | 1.96 | 11.04 | 3.10 | 35 | ||||||||||||||||||||||||||
| — | 13.52 | (9.87 | ) | 11 | 1.95 | (c)(e) | 11.78 | (c)(e) | 2.93 | (c)(e) | 16 | |||||||||||||||||||||||
| $ | (0.46 | ) | $ | 15.67 | (1.39 | )% | $ | 113 | 1.05 | %(c) | 4.31 | %(c) | 2.18 | %(c) | 29 | % | ||||||||||||||||||
| (0.59 | ) | 16.35 | 18.32 | 116 | 1.08 | 5.34 | 3.03 | 71 | ||||||||||||||||||||||||||
| (0.39 | ) | 14.37 | 8.59 | 10 | 1.05 | 10.71 | 3.13 | 35 | ||||||||||||||||||||||||||
| — | 13.60 | (9.33 | ) | 22 | 1.05 | (c)(e) | 11.62 | (c)(e) | 4.12 | (c)(e) | 16 | |||||||||||||||||||||||
| $ | (0.39 | ) | $ | 15.77 | (1.33 | )% | $ | 7,409 | 0.95 | %(c) | 4.32 | %(c) | 2.25 | %(c) | 29 | % | ||||||||||||||||||
| (0.56 | ) | 16.37 | 18.50 | 8,687 | 1.00 | 5.74 | 3.92 | 71 | ||||||||||||||||||||||||||
| (0.44 | ) | 14.34 | 8.73 | 6,273 | 0.95 | 9.97 | 3.90 | 35 | ||||||||||||||||||||||||||
| — | 13.61 | (9.27 | ) | 2,915 | 0.95 | (c)(e) | 11.18 | (c)(e) | 4.00 | (c)(e) | 16 | |||||||||||||||||||||||
| See accompanying Notes to Financial Statements | | March 31, 2018 | | Semiannual Report | 271 |
Table of Contents
Financial Highlights (cont’d)
For a Share Outstanding for the Period ended:
Net Asset Value, Beginning of Period | Net Investment Income (a) | Net Realized and Change in Unrealized Gain (Loss) | Total from Investment Operations | Dividends from Net Investment Income | Distributions from Net Realized Capital Gains | |||||||||||||||||||||||
| AllianzGI Global Dynamic Allocation: | ||||||||||||||||||||||||||||
| Class A | ||||||||||||||||||||||||||||
3/31/2018+ | $ | 20.52 | $ | 0.11 | $ | 0.19 | $ | 0.30 | $ | (0.21 | ) | $ | (0.72 | ) | ||||||||||||||
9/30/2017 | 18.32 | 0.20 | 2.00 | 2.20 | — | (e) | — | |||||||||||||||||||||
9/30/2016 | 17.99 | 0.17 | 0.66 | 0.83 | (0.22 | ) | (0.28 | ) | ||||||||||||||||||||
12/1/2014 - 9/30/2015# | 21.93 | 0.39 | (1.43 | ) | (1.04 | ) | (0.81 | ) | (2.09 | ) | ||||||||||||||||||
11/30/2014 | 24.70 | 0.44 | 0.31 | 0.75 | (0.66 | ) | (2.86 | ) | ||||||||||||||||||||
11/30/2013 | 22.04 | 0.42 | 3.07 | 3.49 | (0.61 | ) | (0.22 | ) | ||||||||||||||||||||
11/30/2012 | 20.72 | 0.51 | 1.71 | 2.22 | (0.59 | ) | (0.31 | ) | ||||||||||||||||||||
| Class C | ||||||||||||||||||||||||||||
3/31/2018+ | $ | 20.05 | $ | 0.04 | $ | 0.18 | $ | 0.22 | $ | (0.20 | ) | $ | (0.72 | ) | ||||||||||||||
9/30/2017 | 18.05 | 0.08 | 1.92 | 2.00 | — | (e) | — | |||||||||||||||||||||
9/30/2016 | 17.63 | 0.08 | 0.62 | 0.70 | — | (e) | (0.28 | ) | ||||||||||||||||||||
12/1/2014 - 9/30/2015# | 21.52 | 0.30 | (1.45 | ) | (1.15 | ) | (0.65 | ) | (2.09 | ) | ||||||||||||||||||
11/30/2014 | 24.28 | 0.25 | 0.32 | 0.57 | (0.47 | ) | (2.86 | ) | ||||||||||||||||||||
11/30/2013 | 21.71 | 0.30 | 2.97 | 3.27 | (0.48 | ) | (0.22 | ) | ||||||||||||||||||||
11/30/2012 | 20.49 | 0.30 | 1.74 | 2.04 | (0.51 | ) | (0.31 | ) | ||||||||||||||||||||
| Class R | ||||||||||||||||||||||||||||
3/31/2018+ | $ | 20.35 | $ | 0.08 | $ | 0.17 | $ | 0.25 | $ | (0.17 | ) | $ | (0.72 | ) | ||||||||||||||
9/30/2017 | 18.23 | 0.16 | 1.96 | 2.12 | — | (e) | — | |||||||||||||||||||||
9/30/2016 | 17.84 | 0.16 | 0.63 | 0.79 | (0.12 | ) | (0.28 | ) | ||||||||||||||||||||
12/1/2014 - 9/30/2015# | 21.79 | 0.36 | (1.45 | ) | (1.09 | ) | (0.77 | ) | (2.09 | ) | ||||||||||||||||||
11/30/2014 | 24.62 | 0.40 | 0.30 | 0.70 | (0.67 | ) | (2.86 | ) | ||||||||||||||||||||
11/30/2013 | 21.90 | 0.23 | 3.20 | 3.43 | (0.49 | ) | (0.22 | ) | ||||||||||||||||||||
11/30/2012 | 20.73 | 0.39 | 1.77 | 2.16 | (0.68 | ) | (0.31 | ) | ||||||||||||||||||||
| Class P | ||||||||||||||||||||||||||||
3/31/2018+ | $ | 20.48 | $ | 0.13 | $ | 0.19 | $ | 0.32 | $ | (0.32 | ) | $ | (0.72 | ) | ||||||||||||||
9/30/2017 | 18.36 | 0.28 | 1.94 | 2.22 | (0.10 | ) | — | |||||||||||||||||||||
9/30/2016 | 17.97 | 0.16 | 0.71 | 0.87 | (0.20 | ) | (0.28 | ) | ||||||||||||||||||||
12/1/2014 - 9/30/2015# | 21.94 | 0.40 | (1.42 | ) | (1.02 | ) | (0.86 | ) | (2.09 | ) | ||||||||||||||||||
11/30/2014 | 24.71 | 0.46 | 0.33 | 0.79 | (0.70 | ) | (2.86 | ) | ||||||||||||||||||||
11/30/2013 | 22.08 | 0.38 | 3.14 | 3.52 | (0.67 | ) | (0.22 | ) | ||||||||||||||||||||
11/30/2012 | 20.85 | 0.49 | 1.77 | 2.26 | (0.72 | ) | (0.31 | ) | ||||||||||||||||||||
| + | Unaudited |
| # | Fiscal year end changed from November 30th to September 30th. |
| * | Commencement of operations. |
| (a) | Calculated on average shares outstanding during the period. |
| (b) | Total return is calculated assuming a purchase of a share on the first day of the period and a sale of a share on the last day of each period reported. Dividends and distributions, if any, are assumed, for purposes of this calculation, to be reinvested. Total return does not reflect sales charges and includes the effect of fee waivers and reimbursements. Total return may reflect adjustments to conform to U.S. GAAP. Total return for a period of less than one year is not annualized. |
| (c) | Does not include expenses of the investment companies in which the Fund invests. |
| (d) | Annualized, unless otherwise noted. |
| (e) | Actual amount rounds to less than $(0.01) per share. |
| (f) | Certain expenses incurred by the Fund were not annualized. |
| 272 | Semiannual Report | | March 31, 2018 | | See accompanying Notes to Financial Statements |
Table of Contents
Total Dividends and Distributions | Net Asset Value, End of Period | Total Return (b) | Net Assets, End of Period (000s) | Ratio of Expenses to Average Net Assets with Fee Waiver/ Reimbursement (c) | Ratio of Expenses to Average Net Assets without Fee Waiver/ Reimbursement (c) | Ratio of Net Investment Income to Average Net Assets (c) | Portfolio Turnover Rate | |||||||||||||||||||||||||||
| $ | (0.93 | ) | $ | 19.89 | 1.40 | % | $ | 2,163 | 0.97 | %(d) | 1.30 | %(d) | 1.10 | %(d) | 84 | % | ||||||||||||||||||
| — | (e) | 20.52 | 12.01 | 2,421 | 1.02 | 1.35 | 1.05 | 192 | ||||||||||||||||||||||||||
| (0.50 | ) | 18.32 | 4.69 | 5,198 | 0.76 | 1.73 | (d) | 0.96 | 79 | |||||||||||||||||||||||||
| (2.90 | ) | 17.99 | (5.30 | ) | 1,324 | 0.63 | (d)(f) | 4.38 | (d)(f) | 2.46 | (d)(f) | 121 | ||||||||||||||||||||||
| (3.52 | ) | 21.93 | 3.40 | 1,042 | 0.40 | 4.53 | 2.00 | 62 | ||||||||||||||||||||||||||
| (0.83 | ) | 24.70 | 16.42 | 1,344 | 0.40 | 3.84 | 1.82 | 101 | ||||||||||||||||||||||||||
| (0.90 | ) | 22.04 | 11.17 | 841 | 0.41 | 4.12 | 2.40 | 51 | ||||||||||||||||||||||||||
| $ | (0.92 | ) | $ | 19.35 | 1.00 | % | $ | 1,368 | 1.74 | %(d) | 2.00 | %(d) | 0.35 | %(d) | 84 | % | ||||||||||||||||||
| — | (e) | 20.05 | 11.08 | 1,325 | 1.77 | 2.08 | 0.42 | 192 | ||||||||||||||||||||||||||
| (0.28 | ) | 18.05 | 4.02 | 1,029 | 1.49 | 2.69 | 0.45 | 79 | ||||||||||||||||||||||||||
| (2.74 | ) | 17.63 | (5.95 | ) | 1,194 | 1.37 | (d)(f) | 5.05 | (d)(f) | 1.90 | (d)(f) | 121 | ||||||||||||||||||||||
| (3.33 | ) | 21.52 | 2.57 | 1,346 | 1.18 | 5.31 | 1.16 | 62 | ||||||||||||||||||||||||||
| (0.70 | ) | 24.28 | 15.52 | 1,455 | 1.18 | 4.53 | 1.33 | 101 | ||||||||||||||||||||||||||
| (0.82 | ) | 21.71 | 10.34 | 1,277 | 1.18 | 4.65 | 1.44 | 51 | ||||||||||||||||||||||||||
| $ | (0.89 | ) | $ | 19.71 | 1.16 | % | $ | 149 | 1.34 | %(d) | 1.66 | %(d) | 0.76 | %(d) | 84 | % | ||||||||||||||||||
| — | (e) | 20.35 | 11.63 | 137 | 1.35 | 1.70 | 0.84 | 192 | ||||||||||||||||||||||||||
| (0.40 | ) | 18.23 | 4.50 | 159 | 1.01 | 2.25 | 0.90 | 79 | ||||||||||||||||||||||||||
| (2.86 | ) | 17.84 | (5.55 | ) | 152 | 0.87 | (d)(f) | 4.80 | (d)(f) | 2.27 | (d)(f) | 121 | ||||||||||||||||||||||
| (3.53 | ) | 21.79 | 3.17 | 145 | 0.63 | 4.99 | 1.79 | 62 | ||||||||||||||||||||||||||
| (0.71 | ) | 24.62 | 16.13 | 111 | 0.63 | 4.28 | 1.00 | 101 | ||||||||||||||||||||||||||
| (0.99 | ) | 21.90 | 10.89 | 38 | 0.65 | 4.16 | 1.87 | 51 | ||||||||||||||||||||||||||
| $ | (1.04 | ) | $ | 19.76 | 1.49 | % | $ | 13,561 | 0.80 | %(d) | 1.04 | %(d) | 1.30 | %(d) | 84 | % | ||||||||||||||||||
| (0.10 | ) | 20.48 | 12.18 | 12,730 | 0.82 | 1.11 | 1.44 | 192 | ||||||||||||||||||||||||||
| (0.48 | ) | 18.36 | 4.89 | 186 | 0.61 | 1.47 | 0.90 | 79 | ||||||||||||||||||||||||||
| (2.95 | ) | 17.97 | (5.19 | ) | 53 | 0.47 | (d)(f) | 4.07 | (d)(f) | 2.53 | (d)(f) | 121 | ||||||||||||||||||||||
| (3.56 | ) | 21.94 | 3.57 | 43 | 0.23 | 4.40 | 2.06 | 62 | ||||||||||||||||||||||||||
| (0.89 | ) | 24.71 | 16.62 | 41 | 0.23 | 3.76 | 1.65 | 101 | ||||||||||||||||||||||||||
| (1.03 | ) | 22.08 | 11.35 | 17 | 0.23 | 3.67 | 2.32 | 51 | ||||||||||||||||||||||||||
| See accompanying Notes to Financial Statements | | March 31, 2018 | | Semiannual Report | 273 |
Table of Contents
Financial Highlights (cont’d)
For a Share Outstanding for the Period ended:
Net Asset Value, Beginning of Period | Net Investment Income (a) | Net Realized and Change in Unrealized Gain (Loss) | Total from Investment Operations | Dividends from Net Investment Income | Distributions from Net Realized Capital Gains | |||||||||||||||||||||||
| AllianzGI Global Dynamic Allocation (cont’d) | ||||||||||||||||||||||||||||
| Institutional Class | ||||||||||||||||||||||||||||
3/31/2018+ | $ | 20.61 | $ | 0.14 | $ | 0.20 | $ | 0.34 | $ | (0.33 | ) | $ | (0.72 | ) | ||||||||||||||
9/30/2017 | 18.37 | 0.27 | 1.98 | 2.25 | (0.01 | ) | — | |||||||||||||||||||||
9/30/2016 | 18.02 | 0.23 | 0.65 | 0.88 | (0.25 | ) | (0.28 | ) | ||||||||||||||||||||
12/1/2014 - 9/30/2015# | 22.00 | 0.36 | (1.37 | ) | (1.01 | ) | (0.88 | ) | (2.09 | ) | ||||||||||||||||||
11/30/2014 | 24.74 | 0.48 | 0.34 | 0.82 | (0.70 | ) | (2.86 | ) | ||||||||||||||||||||
11/30/2013 | 22.10 | 0.56 | 2.99 | 3.55 | (0.69 | ) | (0.22 | ) | ||||||||||||||||||||
11/30/2012 | 20.87 | 0.51 | 1.78 | 2.29 | (0.75 | ) | (0.31 | ) | ||||||||||||||||||||
| Class R6 | ||||||||||||||||||||||||||||
3/31/2018+ | $ | 20.56 | $ | 0.14 | $ | 0.19 | $ | 0.33 | $ | (0.35 | ) | $ | (0.72 | ) | ||||||||||||||
9/30/2017 | 18.38 | 0.28 | 1.99 | 2.27 | (0.09 | ) | — | |||||||||||||||||||||
2/1/2016* - 9/30/2016 | 17.30 | 0.09 | 0.99 | 1.08 | — | — | ||||||||||||||||||||||
| Administrative Class | ||||||||||||||||||||||||||||
3/31/2018+ | $ | 20.55 | $ | 0.12 | $ | 0.18 | $ | 0.30 | $ | (0.29 | ) | $ | (0.72 | ) | ||||||||||||||
9/30/2017 | 18.35 | 0.23 | 1.97 | 2.20 | — | (e) | — | |||||||||||||||||||||
9/30/2016 | 17.93 | 0.21 | 0.63 | 0.84 | (0.14 | ) | (0.28 | ) | ||||||||||||||||||||
12/1/2014 - 9/30/2015# | 21.90 | 0.42 | (1.46 | ) | (1.04 | ) | (0.84 | ) | (2.09 | ) | ||||||||||||||||||
11/30/2014 | 24.67 | 0.42 | 0.33 | 0.75 | (0.66 | ) | (2.86 | ) | ||||||||||||||||||||
11/30/2013 | 22.04 | 0.48 | 3.01 | 3.49 | (0.64 | ) | (0.22 | ) | ||||||||||||||||||||
11/30/2012 | 20.81 | 0.46 | 1.77 | 2.23 | (0.69 | ) | (0.31 | ) | ||||||||||||||||||||
| + | Unaudited |
| # | Fiscal year end changed from November 30th to September 30th. |
| * | Commencement of operations. |
| (a) | Calculated on average shares outstanding during the period. |
| (b) | Total return is calculated assuming a purchase of a share on the first day of the period and a sale of a share on the last day of each period reported. Dividends and distributions, if any, are assumed, for purposes of this calculation, to be reinvested. Total return does not reflect sales charges and includes the effect of fee waivers and reimbursements. Total return may reflect adjustments to conform to U.S. GAAP. Total return for a period of less than one year is not annualized. |
| (c) | Does not include expenses of the investment companies in which the Fund invests. |
| (d) | Annualized, unless otherwise noted. |
| (e) | Actual amount rounds to less than $(0.01) per share. |
| (f) | Certain expenses incurred by the Fund were not annualized. |
| 274 | Semiannual Report | | March 31, 2018 | | See accompanying Notes to Financial Statements |
Table of Contents
Total Dividends and Distributions | Net Asset Value, End of Period | Total Return (b) | Net Assets, End of Period (000s) | Ratio of Expenses to Average Net Assets with Fee Waiver/ Reimbursement (c) | Ratio of Expenses to Average Net Assets without Fee Waiver/ Reimbursement (c) | Ratio of Net Investment Income to Average Net Assets (c) | Portfolio Turnover Rate | |||||||||||||||||||||||||||
| $ | (1.05 | ) | $ | 19.90 | 1.55 | % | $ | 31,779 | 0.70 | %(d) | 0.97 | %(d) | 1.39 | %(d) | 84 | % | ||||||||||||||||||
| (0.01 | ) | 20.61 | 12.27 | 31,783 | 0.75 | 1.03 | 1.42 | 192 | ||||||||||||||||||||||||||
| (0.53 | ) | 18.37 | 4.98 | 37,722 | 0.51 | 1.45 | 1.27 | 79 | ||||||||||||||||||||||||||
| (2.97 | ) | 18.02 | (5.12 | ) | 4,714 | 0.39 | (d)(f) | 4.10 | (d)(f) | 2.27 | (d)(f) | 121 | ||||||||||||||||||||||
| (3.56 | ) | 22.00 | 3.69 | 3,401 | 0.13 | 4.30 | 2.16 | 62 | ||||||||||||||||||||||||||
| (0.91 | ) | 24.74 | 16.71 | 3,296 | 0.13 | 3.48 | 2.43 | 101 | ||||||||||||||||||||||||||
| (1.06 | ) | 22.10 | 11.51 | 5,008 | 0.13 | 3.84 | 2.42 | 51 | ||||||||||||||||||||||||||
| $ | (1.07 | ) | $ | 19.82 | 1.50 | % | $ | 230,737 | 0.70 | %(d) | 0.94 | %(d) | 1.39 | %(d) | 84 | % | ||||||||||||||||||
| (0.09 | ) | 20.56 | 12.39 | 231,584 | 0.70 | 0.99 | 1.49 | 192 | ||||||||||||||||||||||||||
| — | 18.38 | 6.24 | 9,029 | 0.36 | (d) | 1.36 | (d) | 0.77 | (d) | 79 | ||||||||||||||||||||||||
| $ | (1.01 | ) | $ | 19.84 | 1.35 | % | $ | 23 | 0.97 | %(d) | 1.19 | %(d) | 1.13 | %(d) | 84 | % | ||||||||||||||||||
| — | (e) | 20.55 | 11.99 | 23 | 1.00 | 1.25 | 1.18 | 192 | ||||||||||||||||||||||||||
| (0.42 | ) | 18.35 | 4.73 | 20 | 0.76 | 1.89 | 1.15 | 79 | ||||||||||||||||||||||||||
| (2.93 | ) | 17.93 | (5.29 | ) | 19 | 0.61 | (d)(f) | 4.29 | (d)(f) | 2.64 | (d)(f) | 121 | ||||||||||||||||||||||
| (3.52 | ) | 21.90 | 3.38 | 26 | 0.38 | 4.55 | 1.90 | 62 | ||||||||||||||||||||||||||
| (0.86 | ) | 24.67 | 16.48 | 20 | 0.38 | 3.79 | 2.09 | 101 | ||||||||||||||||||||||||||
| (1.00 | ) | 22.04 | 11.20 | 17 | 0.38 | 3.82 | 2.17 | 51 | ||||||||||||||||||||||||||
| See accompanying Notes to Financial Statements | | March 31, 2018 | | Semiannual Report | 275 |
Table of Contents
Financial Highlights (cont’d)
For a Share Outstanding for the Period ended:
Net Asset Value, Beginning of Period | Net Investment Income (a) | Net Realized and Change in Unrealized Gain (Loss) | Total from Investment Operations | Dividends from Net Investment Income | Distributions from Net Realized Capital Gains | |||||||||||||||||||||||
| AllianzGI Global Fundamental Strategy: | ||||||||||||||||||||||||||||
| Class A | ||||||||||||||||||||||||||||
3/31/2018+ | $ | 15.74 | $ | 0.25 | $ | (0.62 | ) | $ | (0.37 | ) | $ | (0.11 | ) | $ | (0.33 | ) | ||||||||||||
9/30/2017 | 15.21 | 0.31 | 0.75 | 1.06 | (0.33 | ) | (0.20 | ) | ||||||||||||||||||||
9/30/2016 | 14.71 | 0.25 | 0.95 | 1.20 | (0.61 | ) | (0.09 | ) | ||||||||||||||||||||
12/1/2014 - 9/30/2015# | 15.95 | 0.17 | (0.85 | ) | (0.68 | ) | (0.56 | ) | — | |||||||||||||||||||
11/30/2014 | 15.45 | 0.26 | 0.42 | 0.68 | (0.12 | ) | (0.06 | ) | ||||||||||||||||||||
7/1/2013* - 11/30/2013 | 15.00 | 0.06 | 0.39 | 0.45 | — | — | ||||||||||||||||||||||
| Class C | ||||||||||||||||||||||||||||
3/31/2018+ | $ | 15.69 | $ | 0.19 | $ | (0.61 | ) | $ | (0.42 | ) | $ | (0.03 | ) | $ | (0.33 | ) | ||||||||||||
9/30/2017 | 15.23 | 0.21 | 0.74 | 0.95 | (0.29 | ) | (0.20 | ) | ||||||||||||||||||||
9/30/2016 | 14.66 | 0.15 | 0.94 | 1.09 | (0.43 | ) | (0.09 | ) | ||||||||||||||||||||
12/1/2014 - 9/30/2015# | 15.84 | 0.10 | (0.88 | ) | (0.78 | ) | (0.40 | ) | — | |||||||||||||||||||
11/30/2014 | 15.40 | 0.14 | 0.42 | 0.56 | (0.06 | ) | (0.06 | ) | ||||||||||||||||||||
7/1/2013* - 11/30/2013 | 15.00 | 0.01 | 0.39 | 0.40 | — | — | ||||||||||||||||||||||
| Class P | ||||||||||||||||||||||||||||
3/31/2018+ | $ | 15.86 | $ | 0.26 | $ | (0.62 | ) | $ | (0.36 | ) | $ | (0.12 | ) | $ | (0.33 | ) | ||||||||||||
9/30/2017 | 15.34 | 0.34 | 0.75 | 1.09 | (0.37 | ) | (0.20 | ) | ||||||||||||||||||||
9/30/2016 | 14.77 | 0.28 | 0.94 | 1.22 | (0.56 | ) | (0.09 | ) | ||||||||||||||||||||
12/1/2014 - 9/30/2015# | 15.98 | 0.21 | (0.88 | ) | (0.67 | ) | (0.54 | ) | — | |||||||||||||||||||
11/30/2014 | 15.46 | 0.28 | 0.43 | 0.71 | (0.13 | ) | (0.06 | ) | ||||||||||||||||||||
7/1/2013* - 11/30/2013 | 15.00 | 0.07 | 0.39 | 0.46 | — | — | ||||||||||||||||||||||
| Institutional Class | ||||||||||||||||||||||||||||
3/31/2018+ | $ | 15.93 | $ | 0.27 | $ | (0.63 | ) | $ | (0.36 | ) | $ | (0.14 | ) | $ | (0.33 | ) | ||||||||||||
9/30/2017 | 15.36 | 0.36 | 0.76 | 1.12 | (0.35 | ) | (0.20 | ) | ||||||||||||||||||||
9/30/2016 | 14.78 | 0.31 | 0.93 | 1.24 | (0.57 | ) | (0.09 | ) | ||||||||||||||||||||
12/1/2014 - 9/30/2015# | 15.99 | 0.22 | (0.88 | ) | (0.66 | ) | (0.55 | ) | — | |||||||||||||||||||
11/30/2014 | 15.47 | 0.30 | 0.42 | 0.72 | (0.14 | ) | (0.06 | ) | ||||||||||||||||||||
7/1/2013* - 11/30/2013 | 15.00 | 0.08 | 0.39 | 0.47 | — | — | ||||||||||||||||||||||
| AllianzGI Global High Yield: | ||||||||||||||||||||||||||||
| Class P | ||||||||||||||||||||||||||||
3/31/2018+ | $ | 15.36 | $ | 0.33 | $ | (0.34 | ) | $ | (0.01 | ) | $ | (0.30 | ) | $ | — | |||||||||||||
5/3/2017* - 9/30/2017 | 15.00 | 0.26 | 0.18 | 0.44 | (0.08 | ) | — | |||||||||||||||||||||
| Institutional Class | ||||||||||||||||||||||||||||
3/31/2018+ | $ | 15.36 | $ | 0.34 | $ | (0.34 | ) | $ | — | $ | (0.32 | ) | $ | — | ||||||||||||||
5/3/2017* - 9/30/2017 | 15.00 | 0.27 | 0.17 | 0.44 | (0.08 | ) | — | |||||||||||||||||||||
| + | Unaudited |
| # | Fiscal year end changed from November 30th to September 30th. |
| * | Commencement of operations. |
| (a) | Calculated on average shares outstanding during the period. |
| (b) | Total return is calculated assuming a purchase of a share on the first day of the period and a sale of a share on the last day of each period reported. Dividends and distributions, if any, are assumed, for purposes of this calculation, to be reinvested. Total return does not reflect sales charges and includes the effect of fee waivers and reimbursements. Total return may reflect adjustments to conform to U.S. GAAP. Total return for a period of less than one year is not annualized. |
| (c) | Annualized, unless otherwise noted. |
| (d) | Does not include expenses of the investment companies in which the Fund invests. |
| (e) | Certain expenses incurred by the Fund were not annualized. |
| (f) | Payments from Affiliates increased the end of period net asset value and total return by less than $0.01 and 0.01%, respectively. |
| 276 | Semiannual Report | | March 31, 2018 | | See accompanying Notes to Financial Statements |
Table of Contents
Total Dividends and Distributions | Net Asset Value, End of Period | Total Return (b) | Net Assets, End of Period (000s) | Ratio of Expenses to Average Net Assets with Fee Waiver/ Reimbursement | Ratio of Expenses to Average Net Assets without Fee Waiver/ Reimbursement | Ratio of Net Investment Income to Average Net Assets | Portfolio Turnover Rate | |||||||||||||||||||||||||||
| $ | (0.44 | ) | $ | 14.93 | (2.43 | )% | $ | 71 | 1.15 | %(c) | 2.40 | %(c) | 3.21 | %(c) | 51 | % | ||||||||||||||||||
| (0.53 | ) | 15.74 | 7.34 | 84 | 1.20 | (d) | 2.37 | (d) | 2.04 | (c) | 49 | |||||||||||||||||||||||
| (0.70 | ) | 15.21 | 8.46 | 134 | 1.25 | 2.27 | 1.71 | 37 | ||||||||||||||||||||||||||
| (0.56 | ) | 14.71 | (4.37 | ) | 140 | 1.25 | (c)(e) | 2.29 | (c)(e) | 1.37 | (c)(e) | 16 | ||||||||||||||||||||||
| (0.18 | ) | 15.95 | (f) | 4.45 | (f) | 16 | 1.25 | 2.36 | 1.62 | 28 | ||||||||||||||||||||||||
| — | 15.45 | 3.00 | 10 | 1.25 | (c) | 2.41 | (c) | 0.96 | (c) | 2 | ||||||||||||||||||||||||
| $ | (0.36 | ) | $ | 14.91 | (2.76 | )% | $ | 18 | 1.90 | %(c) | 3.19 | %(c) | 2.46 | %(c) | 51 | % | ||||||||||||||||||
| (0.49 | ) | 15.69 | 6.53 | 18 | 1.93 | (d) | 3.18 | (d) | 1.37 | (d) | 49 | |||||||||||||||||||||||
| (0.52 | ) | 15.23 | 7.64 | 14 | 2.00 | 2.98 | 1.01 | 37 | ||||||||||||||||||||||||||
| (0.40 | ) | 14.66 | (5.03 | ) | 10 | 2.00 | (c)(e) | 2.81 | (c)(e) | 0.75 | (c)(e) | 16 | ||||||||||||||||||||||
| (0.12 | ) | 15.84 | (f) | 3.69 | (f) | 11 | 2.00 | 3.14 | 0.88 | 28 | ||||||||||||||||||||||||
| — | 15.40 | 2.67 | 10 | 2.00 | (c) | 3.16 | (c) | 0.21 | (c) | 2 | ||||||||||||||||||||||||
| $ | (0.45 | ) | $ | 15.05 | (2.33 | )% | $ | 12 | 1.00 | %(c) | 2.11 | %(c) | 3.34 | %(c) | 51 | % | ||||||||||||||||||
| (0.57 | ) | 15.86 | 7.46 | 12 | 1.03 | (d) | 2.11 | (d) | 2.24 | (d) | 49 | |||||||||||||||||||||||
| (0.65 | ) | 15.34 | 8.59 | 11 | 1.10 | 1.96 | 1.92 | 37 | ||||||||||||||||||||||||||
| (0.54 | ) | 14.77 | (4.31 | ) | 10 | 1.10 | (c)(e) | 1.82 | (c)(e) | 1.66 | (c)(e) | 16 | ||||||||||||||||||||||
| (0.19 | ) | 15.98 | (f) | 4.66 | (f) | 11 | 1.10 | 2.14 | 1.79 | 28 | ||||||||||||||||||||||||
| — | 15.46 | 3.07 | 10 | 1.10 | (c) | 2.16 | (c) | 1.12 | (c) | 2 | ||||||||||||||||||||||||
| $ | (0.47 | ) | $ | 15.10 | (2.36 | )% | $ | 16,874 | 0.90 | %(c) | 2.15 | %(c) | 3.46 | %(c) | 51 | % | ||||||||||||||||||
| (0.55 | ) | 15.93 | 7.65 | 16,960 | 0.93 | (d) | 2.12 | (d) | 2.35 | (d) | 49 | |||||||||||||||||||||||
| (0.66 | ) | 15.36 | 8.69 | 15,842 | 1.00 | 1.93 | 2.07 | 37 | ||||||||||||||||||||||||||
| (0.55 | ) | 14.78 | (4.20 | ) | 19,317 | 1.00 | (c)(e) | 1.80 | (c)(e) | 1.76 | (c)(e) | 16 | ||||||||||||||||||||||
| (0.20 | ) | 15.99 | (f) | 4.72 | (f) | 22,115 | 1.00 | 2.15 | 1.90 | 28 | ||||||||||||||||||||||||
| — | 15.47 | 3.13 | 20,682 | 1.00 | (c) | 2.14 | (c) | 1.23 | (c) | 2 | ||||||||||||||||||||||||
| $ | (0.30 | ) | $ | 15.05 | (0.05 | )% | $ | 10 | 0.81 | %(c) | 1.94 | %(c) | 4.38 | %(c) | 55 | % | ||||||||||||||||||
| (0.08 | ) | 15.36 | 2.91 | 10 | 0.80 | (c)(e) | 2.76 | (c)(e) | 4.22 | (c)(e) | 107 | |||||||||||||||||||||||
| $ | (0.32 | ) | $ | 15.04 | (0.04 | )% | $ | 22,238 | 0.71 | %(c) | 1.93 | %(c) | 4.49 | %(c) | 55 | % | ||||||||||||||||||
| (0.08 | ) | 15.36 | 2.96 | 21,625 | 0.70 | (c)(e) | 2.79 | (c)(e) | 4.32 | (c)(e) | 107 | |||||||||||||||||||||||
| See accompanying Notes to Financial Statements | | March 31, 2018 | | Semiannual Report | 277 |
Table of Contents
Financial Highlights (cont’d)
For a Share Outstanding for the Period ended:
Net Asset | Net Investment Income (Loss) (a) | Net Realized and Change in Unrealized Gain (Loss) | Total from Investment Operations | Dividends from Net Investment Income | Distributions from Net Realized Capital Gains | |||||||||||||||||||||||
| AllianzGI Global Sustainability: | ||||||||||||||||||||||||||||
| Class A | ||||||||||||||||||||||||||||
3/31/2018+ | $ | 17.96 | $ | 0.06 | $ | 0.76 | $ | 0.82 | $ | (0.21 | ) | $ | (0.44 | ) | ||||||||||||||
9/30/2017 | 15.80 | 0.13 | 2.20 | 2.33 | (0.14 | ) | (0.03 | ) | ||||||||||||||||||||
9/30/2016 | 14.10 | 0.14 | 1.76 | 1.90 | (0.20 | ) | — | |||||||||||||||||||||
12/9/2014* - 9/30/2015# | 15.00 | 0.11 | (1.01 | ) | (0.90 | ) | — | — | ||||||||||||||||||||
| Class P | ||||||||||||||||||||||||||||
3/31/2018+ | $ | 18.13 | $ | 0.08 | $ | 0.77 | $ | 0.85 | $ | (0.22 | ) | $ | (0.44 | ) | ||||||||||||||
9/30/2017 | 15.91 | 0.15 | 2.23 | 2.38 | (0.13 | ) | (0.03 | ) | ||||||||||||||||||||
9/30/2016 | 14.12 | 0.17 | 1.75 | 1.92 | (0.13 | ) | — | |||||||||||||||||||||
12/9/2014* - 9/30/2015# | 15.00 | 0.15 | (1.03 | ) | (0.88 | ) | — | — | ||||||||||||||||||||
| Institutional Class | ||||||||||||||||||||||||||||
3/31/2018+ | $ | 18.13 | $ | 0.09 | $ | 0.75 | $ | 0.84 | $ | (0.19 | ) | $ | (0.44 | ) | ||||||||||||||
9/30/2017 | 15.92 | 0.19 | 2.20 | 2.39 | (0.15 | ) | (0.03 | ) | ||||||||||||||||||||
9/30/2016 | 14.13 | 0.22 | 1.71 | 1.93 | (0.14 | ) | — | |||||||||||||||||||||
12/9/2014* - 9/30/2015# | 15.00 | 0.16 | (1.03 | ) | (0.87 | ) | — | — | ||||||||||||||||||||
| AllianzGI Global Water: | ||||||||||||||||||||||||||||
| Class A | ||||||||||||||||||||||||||||
3/31/2018+ | $ | 15.49 | $ | — | (f) | $ | 0.09 | $ | 0.09 | $ | (0.04 | ) | $ | (0.38 | ) | |||||||||||||
9/30/2017 | 14.46 | 0.08 | 1.08 | 1.16 | (0.05 | ) | (0.08 | ) | ||||||||||||||||||||
9/30/2016 | 11.99 | 0.08 | 2.44 | 2.52 | (0.03 | ) | (0.02 | ) | ||||||||||||||||||||
12/1/2014 - 9/30/2015# | 12.70 | 0.06 | (0.74 | ) | (0.68 | ) | (0.03 | ) | — | |||||||||||||||||||
11/30/2014 | 12.41 | 0.07 | 0.25 | 0.32 | (0.03 | ) | — | |||||||||||||||||||||
11/30/2013 | 10.26 | 0.07 | 2.20 | 2.27 | (0.12 | ) | — | |||||||||||||||||||||
11/30/2012 | 8.89 | 0.12 | 1.30 | 1.42 | (0.05 | ) | — | |||||||||||||||||||||
| Class C | ||||||||||||||||||||||||||||
3/31/2018+ | $ | 14.82 | $ | (0.06 | ) | $ | 0.10 | $ | 0.04 | $ | — | (e) | $ | (0.38 | ) | |||||||||||||
9/30/2017 | 13.90 | (0.01 | ) | 1.01 | 1.00 | — | (e) | (0.08 | ) | |||||||||||||||||||
9/30/2016 | 11.59 | (0.02 | ) | 2.35 | 2.33 | — | (e) | (0.02 | ) | |||||||||||||||||||
12/1/2014 - 9/30/2015# | 12.33 | (0.02 | ) | (0.72 | ) | (0.74 | ) | — | (e) | — | ||||||||||||||||||
11/30/2014 | 12.11 | (0.03 | ) | 0.25 | 0.22 | — | (e) | — | ||||||||||||||||||||
11/30/2013 | 10.02 | (0.02 | ) | 2.16 | 2.14 | (0.05 | ) | — | ||||||||||||||||||||
11/30/2012 | 8.70 | 0.05 | 1.27 | 1.32 | — | (e) | — | |||||||||||||||||||||
| Class P | ||||||||||||||||||||||||||||
3/31/2018+ | $ | 15.57 | $ | 0.02 | $ | 0.10 | $ | 0.12 | $ | (0.13 | ) | $ | (0.38 | ) | ||||||||||||||
9/30/2017 | 14.54 | 0.15 | 1.04 | 1.19 | (0.08 | ) | (0.08 | ) | ||||||||||||||||||||
9/30/2016 | 12.05 | 0.11 | 2.45 | 2.56 | (0.05 | ) | (0.02 | ) | ||||||||||||||||||||
12/1/2014 - 9/30/2015# | 12.80 | 0.09 | (0.75 | ) | (0.66 | ) | (0.09 | ) | — | |||||||||||||||||||
11/30/2014 | 12.49 | 0.09 | 0.27 | 0.36 | (0.05 | ) | — | |||||||||||||||||||||
11/30/2013 | 10.30 | 0.09 | 2.21 | 2.30 | (0.11 | ) | — | |||||||||||||||||||||
11/30/2012 | 8.93 | 0.14 | 1.30 | 1.44 | (0.07 | ) | — | |||||||||||||||||||||
| Institutional Class | ||||||||||||||||||||||||||||
3/31/2018+ | $ | 15.32 | $ | 0.02 | $ | 0.09 | $ | 0.11 | $ | (0.14 | ) | $ | (0.38 | ) | ||||||||||||||
9/30/2017 | 14.33 | 0.16 | 1.02 | 1.18 | (0.11 | ) | (0.08 | ) | ||||||||||||||||||||
9/30/2016 | 11.90 | 0.11 | 2.41 | 2.52 | (0.07 | ) | (0.02 | ) | ||||||||||||||||||||
12/1/2014 - 9/30/2015# | 12.61 | 0.09 | (0.73 | ) | (0.64 | ) | (0.07 | ) | — | |||||||||||||||||||
11/30/2014 | 12.37 | 0.11 | 0.24 | 0.35 | (0.11 | ) | — | |||||||||||||||||||||
11/30/2013 | 10.25 | 0.09 | 2.21 | 2.30 | (0.18 | ) | — | |||||||||||||||||||||
11/30/2012 | 8.88 | 0.12 | 1.32 | 1.44 | (0.07 | ) | — | |||||||||||||||||||||
| + | Unaudited |
| # | Fiscal year end changed from November 30th to September 30th. |
| * | Commencement of operations. |
| (a) | Calculated on average shares outstanding during the period. |
| (b) | Total return is calculated assuming a purchase of a share on the first day of the period and a sale of a share on the last day of each period reported. Dividends and distributions, if any, are assumed, for purposes of this calculation, to be reinvested. Total return does not reflect sales charges and includes the effect of fee waivers and reimbursements. Total return may reflect adjustments to conform to U.S. GAAP. Total return for a period of less than one year is not annualized. |
| 278 | Semiannual Report | | March 31, 2018 | | See accompanying Notes to Financial Statements |
Table of Contents
| Total Dividends and Distributions | Net Asset Value, End of Period | Total Return (b) | Net Assets, End of Period (000s) | Ratio of Fee Waiver/ | Ratio of Expenses to Average Net Assets without Fee Waiver/ Reimbursement | Ratio of Net Investment Income (Loss) to Average Net Assets | Portfolio Turnover Rate | |||||||||||||||||||||||||||
| $ | (0.65 | ) | $ | 18.13 | 4.56 | % | $ | 481 | 1.09 | %(c) | 4.35 | %(c) | 0.70 | %(c) | 6 | % | ||||||||||||||||||
| (0.17 | ) | 17.96 | 14.94 | 402 | 1.12 | 7.55 | 0.79 | 27 | ||||||||||||||||||||||||||
| (0.20 | ) | 15.80 | 13.54 | 125 | 1.20 | 21.93 | 0.94 | 20 | ||||||||||||||||||||||||||
| — | 14.10 | (6.00 | ) | 62 | 1.20 | (c)(d) | 15.36 | (c)(d) | 0.89 | (c)(d) | 25 | |||||||||||||||||||||||
| $ | (0.66 | ) | $ | 18.32 | 4.67 | % | $ | 64 | 0.94 | %(c) | 1.55 | %(c) | 0.83 | %(c) | 6 | % | ||||||||||||||||||
| (0.16 | ) | 18.13 | 15.13 | 64 | 0.96 | 1.62 | 0.88 | 27 | ||||||||||||||||||||||||||
| (0.13 | ) | 15.91 | 13.67 | 11 | 1.05 | 3.44 | 1.15 | 20 | ||||||||||||||||||||||||||
| — | 14.12 | (5.87 | ) | 9 | 1.05 | (c)(d) | 8.70 | (c)(d) | 1.22 | (c)(d) | 25 | |||||||||||||||||||||||
| $ | (0.63 | ) | $ | 18.34 | 4.64 | % | $ | 28,551 | 0.84 | %(c) | 1.52 | %(c) | 0.94 | %(c) | 6 | % | ||||||||||||||||||
| (0.18 | ) | 18.13 | 15.25 | 26,615 | 0.89 | 1.63 | 1.16 | 27 | ||||||||||||||||||||||||||
| (0.14 | ) | 15.92 | 13.77 | 20,610 | 0.95 | 2.04 | 1.47 | 20 | ||||||||||||||||||||||||||
| — | 14.13 | (5.80 | ) | 2,826 | 0.95 | (c)(d) | 8.70 | (c)(d) | 1.32 | (c)(d) | 25 | |||||||||||||||||||||||
| $ | (0.42 | ) | $ | 15.16 | 0.53 | % | $ | 191,026 | 1.18 | %(c) | 1.40 | %(c) | 0.03 | %(c) | 22 | % | ||||||||||||||||||
| (0.13 | ) | 15.49 | 8.18 | 190,693 | 1.33 | 1.44 | 0.59 | 29 | ||||||||||||||||||||||||||
| (0.05 | ) | 14.46 | 21.06 | 237,785 | 1.49 | 1.49 | 0.62 | 55 | ||||||||||||||||||||||||||
| (0.03 | ) | 11.99 | (5.37 | ) | 128,465 | 1.44 | (c)(d) | 1.44 | (c)(d) | 0.58 | (c)(d) | 66 | ||||||||||||||||||||||
| — | 12.70 | 2.57 | 138,219 | 1.46 | 1.46 | 0.55 | 28 | |||||||||||||||||||||||||||
| (0.12 | ) | 12.41 | 22.31 | 118,252 | 1.54 | 1.54 | 0.63 | 28 | ||||||||||||||||||||||||||
| (0.05 | ) | 10.26 | 16.12 | 59,611 | 1.57 | 1.60 | 1.27 | 73 | ||||||||||||||||||||||||||
| $ | (0.38 | ) | $ | 14.48 | 0.21 | % | $ | 88,946 | 1.94 | %(c) | 2.16 | %(c) | (0.74 | )%(c) | 22 | % | ||||||||||||||||||
| (0.08 | ) | 14.82 | 7.32 | 89,250 | 2.07 | 2.19 | (0.07 | ) | 29 | |||||||||||||||||||||||||
| (0.02 | ) | 13.90 | 20.13 | 92,028 | 2.25 | 2.25 | (0.18 | ) | 55 | |||||||||||||||||||||||||
| — | 11.59 | (6.00 | ) | 69,700 | 2.23 | (c)(d) | 2.23 | (c)(d) | (0.21 | )(c)(d) | 66 | |||||||||||||||||||||||
| — | 12.33 | 1.82 | 77,082 | 2.23 | 2.23 | (0.26 | ) | 28 | ||||||||||||||||||||||||||
| (0.05 | ) | 12.11 | 21.41 | 51,767 | 2.33 | 2.33 | (0.18 | ) | 28 | |||||||||||||||||||||||||
| — | 10.02 | 15.17 | 25,870 | 2.33 | 2.41 | 0.48 | 73 | |||||||||||||||||||||||||||
| $ | (0.51 | ) | $ | 15.18 | 0.68 | % | $ | 229,681 | 0.92 | %(c) | 1.14 | %(c) | 0.29 | %(c) | 22 | % | ||||||||||||||||||
| (0.16 | ) | 15.57 | 8.40 | 210,746 | 1.04 | 1.16 | 1.02 | 29 | ||||||||||||||||||||||||||
| (0.07 | ) | 14.54 | 21.37 | 125,532 | 1.24 | 1.24 | 0.82 | 55 | ||||||||||||||||||||||||||
| (0.09 | ) | 12.05 | (5.17 | ) | 82,847 | 1.16 | (c)(d) | 1.16 | (c)(d) | 0.84 | (c)(d) | 66 | ||||||||||||||||||||||
| (0.05 | ) | 12.80 | 2.87 | 84,835 | 1.21 | 1.21 | 0.67 | 28 | ||||||||||||||||||||||||||
| (0.11 | ) | 12.49 | 22.58 | 42,448 | 1.34 | 1.34 | 0.81 | 28 | ||||||||||||||||||||||||||
| (0.07 | ) | 10.30 | 16.22 | 16,820 | 1.41 | 1.47 | 1.49 | 73 | ||||||||||||||||||||||||||
| $ | (0.52 | ) | $ | 14.91 | 0.66 | % | $ | 155,001 | 0.90 | %(c) | 1.12 | %(c) | 0.31 | %(c) | 22 | % | ||||||||||||||||||
| (0.19 | ) | 15.32 | 8.49 | 142,353 | 1.01 | 1.15 | 1.13 | 29 | ||||||||||||||||||||||||||
| (0.09 | ) | 14.33 | 21.32 | 68,550 | 1.21 | 1.21 | 0.86 | 55 | ||||||||||||||||||||||||||
| (0.07 | ) | 11.90 | (5.08 | ) | 30,004 | 1.17 | (c)(d) | 1.17 | (c)(d) | 0.87 | (c)(d) | 66 | ||||||||||||||||||||||
| (0.11 | ) | 12.61 | 2.82 | 23,685 | 1.15 | 1.15 | 0.84 | 28 | ||||||||||||||||||||||||||
| (0.18 | ) | 12.37 | 22.77 | 14,429 | 1.19 | 1.19 | 0.77 | 28 | ||||||||||||||||||||||||||
| (0.07 | ) | 10.25 | 16.44 | 3,105 | 1.29 | 1.29 | 1.28 | 73 | ||||||||||||||||||||||||||
| (c) | Annualized, unless otherwise noted. |
| (d) | Certain expenses incurred by the Fund were not annualized. |
| (e) | Actual amount rounds to less than $(0.01) per share. |
| (f) | Actual amount rounds to less than $0.01 per share. |
| See accompanying Notes to Financial Statements | | March 31, 2018 | | Semiannual Report | 279 |
Table of Contents
Financial Highlights (cont’d)
For a Share Outstanding for the Period ended:
| Net Asset Value, Beginning of Period | Net Investment Income (a) | Unrealized Gain (Loss) | Total from Investment Operations | Dividends from Net Investment Income | Distributions from Net Realized Capital Gains | |||||||||||||||||||||||
| AllianzGI High Yield Bond: | ||||||||||||||||||||||||||||
| Class A | ||||||||||||||||||||||||||||
3/31/2018+ | $ | 9.31 | $ | 0.23 | $ | (0.40 | ) | $ | (0.17 | ) | $ | (0.23 | ) | $ | — | |||||||||||||
9/30/2017 | 9.14 | 0.48 | 0.18 | 0.66 | (0.49 | ) | — | |||||||||||||||||||||
9/30/2016 | 8.92 | 0.53 | 0.24 | 0.77 | (0.55 | ) | — | |||||||||||||||||||||
12/1/2014 - 9/30/2015# | 9.85 | 0.47 | (0.91 | ) | (0.44 | ) | (0.49 | ) | — | |||||||||||||||||||
11/30/2014 | 10.36 | 0.61 | (0.36 | ) | 0.25 | (0.67 | ) | (0.09 | ) | |||||||||||||||||||
11/30/2013 | 10.16 | 0.67 | 0.22 | 0.89 | (0.68 | ) | (0.01 | ) | ||||||||||||||||||||
11/30/2012 | 9.69 | 0.72 | 0.61 | 1.33 | (0.73 | ) | (0.13 | ) | ||||||||||||||||||||
| Class C | ||||||||||||||||||||||||||||
3/31/2018+ | $ | 9.30 | $ | 0.20 | $ | (0.40 | ) | $ | (0.20 | ) | $ | (0.20 | ) | $ | — | |||||||||||||
9/30/2017 | 9.12 | 0.42 | 0.20 | 0.62 | (0.44 | ) | — | |||||||||||||||||||||
9/30/2016 | 8.90 | 0.46 | 0.24 | 0.70 | (0.48 | ) | — | |||||||||||||||||||||
12/1/2014 - 9/30/2015# | 9.83 | 0.42 | (0.91 | ) | (0.49 | ) | (0.44 | ) | — | |||||||||||||||||||
11/30/2014 | 10.35 | 0.54 | (0.37 | ) | 0.17 | (0.60 | ) | (0.09 | ) | |||||||||||||||||||
11/30/2013 | 10.15 | 0.59 | 0.22 | 0.81 | (0.60 | ) | (0.01 | ) | ||||||||||||||||||||
11/30/2012 | 9.68 | 0.64 | 0.62 | 1.26 | (0.66 | ) | (0.13 | ) | ||||||||||||||||||||
| Class R | ||||||||||||||||||||||||||||
3/31/2018+ | $ | 8.94 | $ | 0.19 | $ | (0.37 | ) | $ | (0.18 | ) | $ | (0.21 | ) | $ | — | |||||||||||||
9/30/2017 | 8.79 | 0.43 | 0.18 | 0.61 | (0.46 | ) | — | |||||||||||||||||||||
9/30/2016 | 8.61 | 0.48 | 0.22 | 0.70 | (0.52 | ) | — | |||||||||||||||||||||
12/1/2014 - 9/30/2015# | 9.53 | 0.43 | (0.90 | ) | (0.47 | ) | (0.45 | ) | — | |||||||||||||||||||
11/30/2014 | 10.05 | 0.54 | (0.34 | ) | 0.20 | (0.63 | ) | (0.09 | ) | |||||||||||||||||||
11/30/2013 | 9.88 | 0.63 | 0.21 | 0.84 | (0.66 | ) | (0.01 | ) | ||||||||||||||||||||
11/30/2012 | 9.45 | 0.67 | 0.60 | 1.27 | (0.71 | ) | (0.13 | ) | ||||||||||||||||||||
| Class P | ||||||||||||||||||||||||||||
3/31/2018+ | $ | 8.96 | $ | 0.23 | $ | (0.38 | ) | $ | (0.15 | ) | $ | (0.25 | ) | $ | — | |||||||||||||
9/30/2017 | 8.80 | 0.50 | 0.19 | 0.69 | (0.53 | ) | — | |||||||||||||||||||||
9/30/2016 | 8.62 | 0.53 | 0.23 | 0.76 | (0.58 | ) | — | |||||||||||||||||||||
12/1/2014 - 9/30/2015# | 9.53 | 0.49 | (0.88 | ) | (0.39 | ) | (0.52 | ) | — | |||||||||||||||||||
11/30/2014 | 10.05 | 0.62 | (0.35 | ) | 0.27 | (0.70 | ) | (0.09 | ) | |||||||||||||||||||
11/30/2013 | 9.87 | 0.66 | 0.23 | 0.89 | (0.70 | ) | (0.01 | ) | ||||||||||||||||||||
11/30/2012 | 9.44 | 0.72 | 0.58 | 1.30 | (0.74 | ) | (0.13 | ) | ||||||||||||||||||||
| Institutional Class | ||||||||||||||||||||||||||||
3/31/2018+ | $ | 8.98 | $ | 0.23 | $ | (0.37 | ) | $ | (0.14 | ) | $ | (0.25 | ) | $ | — | |||||||||||||
9/30/2017 | �� | 8.83 | 0.50 | 0.18 | 0.68 | (0.53 | ) | — | ||||||||||||||||||||
9/30/2016 | 8.64 | 0.53 | 0.24 | 0.77 | (0.58 | ) | — | |||||||||||||||||||||
12/1/2014 - 9/30/2015# | 9.55 | 0.49 | (0.88 | ) | (0.39 | ) | (0.52 | ) | — | |||||||||||||||||||
11/30/2014 | 10.08 | 0.62 | (0.35 | ) | 0.27 | (0.71 | ) | (0.09 | ) | |||||||||||||||||||
11/30/2013 | 9.90 | 0.68 | 0.22 | 0.90 | (0.71 | ) | (0.01 | ) | ||||||||||||||||||||
11/30/2012 | 9.46 | 0.73 | 0.60 | 1.33 | (0.76 | ) | (0.13 | ) | ||||||||||||||||||||
| Administrative Class | ||||||||||||||||||||||||||||
3/31/2018+ | $ | 8.84 | $ | 0.22 | $ | (0.38 | ) | $ | (0.16 | ) | $ | (0.24 | ) | $ | — | |||||||||||||
9/30/2017 | 8.70 | 0.48 | 0.17 | 0.65 | (0.51 | ) | — | |||||||||||||||||||||
9/30/2016 | 8.52 | 0.50 | 0.22 | 0.72 | (0.54 | ) | — | |||||||||||||||||||||
12/1/2014 - 9/30/2015# | 9.51 | 0.46 | (0.94 | ) | (0.48 | ) | (0.51 | ) | — | |||||||||||||||||||
11/30/2014 | 10.04 | 0.59 | (0.36 | ) | 0.23 | (0.67 | ) | (0.09 | ) | |||||||||||||||||||
11/30/2013 | 9.87 | 0.65 | 0.22 | 0.87 | (0.69 | ) | (0.01 | ) | ||||||||||||||||||||
11/30/2012 | 9.43 | 0.70 | 0.61 | 1.31 | (0.74 | ) | (0.13 | ) | ||||||||||||||||||||
| + | Unaudited |
| # | Fiscal year end changed from November 30th to September 30th. |
| (a) | Calculated on average shares outstanding during the period. |
| (b) | Total return is calculated assuming a purchase of a share on the first day of the period and a sale of a share on the last day of each period reported. Dividends and distributions, if any, are assumed, for purposes of this calculation, to be reinvested. Total return does not reflect sales charges and includes the effect of fee waivers and reimbursements. Total return may reflect adjustments to conform to U.S. GAAP. Total return for a period of less than one year is not annualized. |
| 280 | Semiannual Report | | March 31, 2018 | | See accompanying Notes to Financial Statements |
Table of Contents
| Total Dividends and Distributions | Net Asset Value, End of Period | Total Return (b) | Net Assets, End of Period (000s) | Ratio of Expenses to Average Net Assets with Fee Waiver/ Reimbursement | Ratio of Expenses to Average Net Assets without Fee Waiver/ Reimbursement | Ratio of Net Investment Income to Average Net Assets | Portfolio Turnover Rate | |||||||||||||||||||||||||||
| $ | (0.23 | ) | $ | 8.91 | (1.88 | )% | $ | 36,738 | 1.08 | %(c) | 1.08 | %(c) | 4.91 | %(c) | 21 | % | ||||||||||||||||||
| (0.49 | ) | 9.31 | 7.42 | 58,525 | 1.09 | 1.09 | 5.19 | 37 | ||||||||||||||||||||||||||
| (0.55 | ) | 9.14 | 9.08 | 58,004 | 0.98 | 0.98 | 6.02 | 59 | ||||||||||||||||||||||||||
| (0.49 | ) | 8.92 | (4.72 | ) | 34,151 | 1.03 | (c)(d) | 1.03 | (c)(d) | 5.88 | (c)(d) | 47 | ||||||||||||||||||||||
| (0.76 | ) | 9.85 | (e) | 2.39 | (e) | 76,274 | 0.94 | 0.94 | 5.93 | 66 | ||||||||||||||||||||||||
| (0.69 | ) | 10.36 | 8.98 | 73,920 | 0.91 | 0.91 | 6.49 | 67 | ||||||||||||||||||||||||||
| (0.86 | ) | 10.16 | 14.34 | 109,668 | 0.89 | 0.90 | 7.21 | 86 | ||||||||||||||||||||||||||
| $ | (0.20 | ) | $ | 8.90 | (2.18 | )% | $ | 9,836 | 1.73 | %(c) | 1.73 | %(c) | 4.27 | %(c) | 21 | % | ||||||||||||||||||
| (0.44 | ) | 9.30 | 6.90 | 11,723 | 1.70 | 1.70 | 4.59 | 37 | ||||||||||||||||||||||||||
| (0.48 | ) | 9.12 | 8.32 | 14,815 | 1.71 | 1.71 | 5.28 | 59 | ||||||||||||||||||||||||||
| (0.44 | ) | 8.90 | (5.24 | ) | 17,866 | 1.68 | (c)(d) | 1.68 | (c)(d) | 5.24 | (c)(d) | 47 | ||||||||||||||||||||||
| (0.69 | ) | 9.83 | (e) | 1.57 | (e) | 23,249 | 1.68 | 1.68 | 5.23 | 66 | ||||||||||||||||||||||||
| (0.61 | ) | 10.35 | 8.14 | 27,525 | 1.70 | 1.70 | 5.68 | 67 | ||||||||||||||||||||||||||
| (0.79 | ) | 10.15 | 13.54 | 30,692 | 1.68 | 1.68 | 6.43 | 86 | ||||||||||||||||||||||||||
| $ | (0.21 | ) | $ | 8.55 | (2.09 | )% | $ | 820 | 1.60 | %(c) | 1.60 | %(c) | 4.40 | %(c) | 21 | % | ||||||||||||||||||
| (0.46 | ) | 8.94 | 7.12 | 1,048 | 1.44 | 1.44 | 4.84 | 37 | ||||||||||||||||||||||||||
| (0.52 | ) | 8.79 | 8.62 | 1,310 | 1.34 | 1.34 | 5.65 | 59 | ||||||||||||||||||||||||||
| (0.45 | ) | 8.61 | (5.20 | ) | 1,126 | 1.46 | (c)(d) | 1.46 | (c)(d) | 5.47 | (c)(d) | 47 | ||||||||||||||||||||||
| (0.72 | ) | 9.53 | (e) | 1.91 | (e) | 2,823 | 1.43 | 1.45 | 5.48 | 66 | ||||||||||||||||||||||||
| (0.67 | ) | 10.05 | 8.72 | 2,851 | 1.15 | 1.32 | 6.24 | 67 | ||||||||||||||||||||||||||
| (0.84 | ) | 9.88 | 14.05 | 2,111 | 1.15 | 1.25 | 6.95 | 86 | ||||||||||||||||||||||||||
| $ | (0.25 | ) | $ | 8.56 | (1.75 | )% | $ | 20,700 | 0.68 | %(c) | 0.68 | %(c) | 5.30 | %(c) | 21 | % | ||||||||||||||||||
| (0.53 | ) | 8.96 | 8.07 | 35,931 | 0.67 | 0.67 | 5.62 | 37 | ||||||||||||||||||||||||||
| (0.58 | ) | 8.80 | 9.31 | 57,378 | 0.69 | 0.69 | 6.30 | 59 | ||||||||||||||||||||||||||
| (0.52 | ) | 8.62 | (4.36 | ) | 63,324 | 0.64 | (c)(d) | 0.64 | (c)(d) | 6.29 | (c)(d) | 47 | ||||||||||||||||||||||
| (0.79 | ) | 9.53 | (e) | 2.63 | (e) | 47,385 | 0.71 | 0.71 | 6.21 | 66 | ||||||||||||||||||||||||
| (0.71 | ) | 10.05 | 9.27 | 77,649 | 0.74 | 0.74 | 6.64 | 67 | ||||||||||||||||||||||||||
| (0.87 | ) | 9.87 | 14.48 | 19,497 | 0.74 | 0.79 | 7.39 | 86 | ||||||||||||||||||||||||||
| $ | (0.25 | ) | $ | 8.59 | (1.62 | )% | $ | 140,942 | 0.72 | %(c) | 0.72 | %(c) | 5.28 | %(c) | 21 | % | ||||||||||||||||||
| (0.53 | ) | 8.98 | 7.91 | 155,022 | 0.69 | 0.69 | 5.61 | 37 | ||||||||||||||||||||||||||
| (0.58 | ) | 8.83 | 9.41 | 227,149 | 0.66 | 0.66 | 6.31 | 59 | ||||||||||||||||||||||||||
| (0.52 | ) | 8.64 | (4.32 | ) | 173,030 | 0.63 | (c)(d) | 0.63 | (c)(d) | 6.29 | (c)(d) | 47 | ||||||||||||||||||||||
| (0.80 | ) | 9.55 | (e) | 2.59 | (e) | 163,567 | 0.64 | 0.64 | 6.27 | 66 | ||||||||||||||||||||||||
| (0.72 | ) | 10.08 | 9.35 | 139,306 | 0.62 | 0.62 | 6.76 | 67 | ||||||||||||||||||||||||||
| (0.89 | ) | 9.90 | 14.68 | 121,362 | 0.63 | 0.63 | 7.47 | 86 | ||||||||||||||||||||||||||
| $ | (0.24 | ) | $ | 8.44 | (1.84 | )% | $ | 61 | 0.88 | %(c) | 0.88 | %(c) | 5.02 | %(c) | 21 | % | ||||||||||||||||||
| (0.51 | ) | 8.84 | 7.75 | 1,490 | 0.86 | 0.86 | 5.45 | 37 | ||||||||||||||||||||||||||
| (0.54 | ) | 8.70 | 8.97 | 2,086 | 1.07 | 1.07 | 5.94 | 59 | ||||||||||||||||||||||||||
| (0.51 | ) | 8.52 | (5.30 | ) | 2,073 | 0.98 | (c)(d) | 0.98 | (c)(d) | 5.90 | (c)(d) | 47 | ||||||||||||||||||||||
| (0.76 | ) | 9.51 | (e) | 2.27 | (e) | 34,714 | 0.97 | 0.97 | 5.93 | 66 | ||||||||||||||||||||||||
| (0.70 | ) | 10.04 | 9.02 | 32,789 | 0.90 | 0.91 | 6.49 | 67 | ||||||||||||||||||||||||||
| (0.87 | ) | 9.87 | 14.54 | 27,274 | 0.90 | 1.14 | 8.92 | 86 | ||||||||||||||||||||||||||
| (c) | Annualized, unless otherwise noted. |
| (d) | Certain expenses incurred by the Fund were not annualized. |
| (e) | Payments from Affiliates increased the end of period net asset value and total return by less than $0.01 and 0.01%, respectively. |
| See accompanying Notes to Financial Statements | | March 31, 2018 | | Semiannual Report | 281 |
Table of Contents
Financial Highlights (cont’d)
For a Share Outstanding for the Period ended:
| Net Asset Value, Beginning of Period | Net Investment Income (Loss) (a) | Unrealized Gain (Loss) | Total from Investment Operations | Dividends from Net Investment Income | Distributions from Net Realized Capital Gains | |||||||||||||||||||||||
| AllianzGI International Growth: | ||||||||||||||||||||||||||||
| Class A | ||||||||||||||||||||||||||||
3/31/2018+ | $ | 19.73 | $ | (0.01 | ) | $ | 1.09 | $ | 1.08 | $ | (0.31 | ) | $ | (2.35 | ) | |||||||||||||
9/30/2017 | 16.37 | 0.04 | 3.32 | 3.36 | — | (d) | — | |||||||||||||||||||||
9/30/2016 | 14.13 | 0.09 | 2.29 | 2.38 | (0.14 | ) | — | |||||||||||||||||||||
2/2/2015* - 9/30/2015# | 15.00 | 0.11 | (0.98 | ) | (0.87 | ) | — | — | ||||||||||||||||||||
| Institutional Class | ||||||||||||||||||||||||||||
3/31/2018+ | $ | 19.90 | $ | — | (f) | $ | 1.12 | $ | 1.12 | $ | (0.12 | ) | $ | (2.35 | ) | |||||||||||||
9/30/2017 | 16.49 | 0.08 | 3.35 | 3.43 | (0.02 | ) | — | |||||||||||||||||||||
9/30/2016 | 14.15 | 0.11 | 2.33 | 2.44 | (0.10 | ) | — | |||||||||||||||||||||
2/2/2015* - 9/30/2015# | 15.00 | 0.14 | (0.99 | ) | (0.85 | ) | — | — | ||||||||||||||||||||
| + | Unaudited |
| # | Fiscal year end changed from November 30th to September 30th. |
| * | Commencement of operations. |
| (a) | Calculated on average shares outstanding during the period. |
| (b) | Total return is calculated assuming a purchase of a share on the first day of the period and a sale of a share on the last day of each period reported. Dividends and distributions, if any, are assumed, for purposes of this calculation, to be reinvested. Total return does not reflect sales charges and includes the effect of fee waivers and reimbursements. Total return may reflect adjustments to conform to U.S. GAAP. Total return for a period of less than one year is not annualized. |
| (c) | Annualized, unless otherwise noted. |
| (d) | Actual amount rounds to less than $(0.01) per share. |
| (e) | Certain expenses incurred by the Fund were not annualized. |
| (f) | Actual amount rounds to less than $0.01 per share. |
| 282 | Semiannual Report | | March 31, 2018 | | See accompanying Notes to Financial Statements |
Table of Contents
| Total Dividends and Distributions | Net Asset Value, End of Period | Total Return (b) | Net Assets, End of Period (000s) | Ratio of Expenses to Average Net Assets with Fee Waiver/ Reimbursement | Ratio of Expenses to Average Net Assets without Fee Waiver/ Reimbursement | Ratio of Net Investment Income (Loss) to Average Net Assets | Portfolio Turnover Rate | |||||||||||||||||||||||||||
| $ | (2.66 | ) | $ | 18.15 | 5.71 | % | $ | 218 | 1.05 | %(c) | 1.96 | %(c) | (0.13 | )%(c) | 10 | % | ||||||||||||||||||
| — | (d) | 19.73 | 20.53 | 72 | 1.12 | 1.82 | 0.23 | 18 | ||||||||||||||||||||||||||
| (0.14 | ) | 16.37 | 16.97 | 51 | 1.20 | 6.68 | 0.60 | 20 | ||||||||||||||||||||||||||
| — | 14.13 | (5.80 | ) | 10 | 1.20 | (c)(e) | 8.22 | (c)(e) | 1.12 | (c)(e) | 3 | |||||||||||||||||||||||
| $ | (2.47 | ) | $ | 18.55 | 5.85 | % | $ | 19,899 | 0.80 | %(c) | 1.69 | %(c) | 0.02 | %(c) | 10 | % | ||||||||||||||||||
| (0.02 | ) | 19.90 | 20.82 | 18,582 | 0.87 | 1.49 | 0.49 | 18 | ||||||||||||||||||||||||||
| (0.10 | ) | 16.49 | 17.34 | 28,386 | 0.95 | 5.77 | 0.75 | 20 | ||||||||||||||||||||||||||
| — | 14.15 | (5.67 | ) | 2,874 | 0.95 | (c)(e) | 7.99 | (c)(e) | 1.38 | (c)(e) | 3 | |||||||||||||||||||||||
| See accompanying Notes to Financial Statements | | March 31, 2018 | | Semiannual Report | 283 |
Table of Contents
Financial Highlights (cont’d)
For a Share Outstanding for the Period ended:
| Net Asset Value, Beginning of Period | Net Investment Income (Loss) (a) | Unrealized Gain (Loss) | Total from Investment Operations | Dividends from Net Investment Income | Distributions from Net Realized Capital Gains | |||||||||||||||||||||||
| AllianzGI International Small-Cap: | ||||||||||||||||||||||||||||
| Class A | ||||||||||||||||||||||||||||
3/31/2018+ | $ | 41.19 | $ | (0.09 | ) | $ | 4.46 | $ | 4.37 | $ | (0.25 | ) | $ | (0.68 | ) | |||||||||||||
9/30/2017 | 34.57 | — | (d) | 6.93 | 6.93 | (0.31 | ) | — | ||||||||||||||||||||
9/30/2016 | 34.53 | 0.10 | 1.67 | 1.77 | (0.28 | ) | (1.45 | ) | ||||||||||||||||||||
12/1/2014 - 9/30/2015# | 35.77 | 0.26 | 2.24 | 2.50 | (0.14 | ) | (3.60 | ) | ||||||||||||||||||||
11/30/2014 | 42.30 | 0.09 | (2.41 | ) | (2.32 | ) | (0.64 | ) | (3.57 | ) | ||||||||||||||||||
11/30/2013 | 31.89 | 0.09 | 10.32 | 10.41 | — | (g) | — | |||||||||||||||||||||
11/30/2012 | 28.31 | 0.16 | 4.06 | 4.22 | (0.64 | ) | — | |||||||||||||||||||||
| Class C | ||||||||||||||||||||||||||||
3/31/2018+ | $ | 40.01 | $ | (0.27 | ) | $ | 4.34 | $ | 4.07 | $ | (0.10 | ) | $ | (0.68 | ) | |||||||||||||
9/30/2017 | 33.78 | (0.19 | ) | 6.67 | 6.48 | (0.25 | ) | — | ||||||||||||||||||||
9/30/2016 | 33.94 | (0.12 | ) | 1.61 | 1.49 | (0.20 | ) | (1.45 | ) | |||||||||||||||||||
12/1/2014 - 9/30/2015# | 35.33 | 0.06 | 2.18 | 2.24 | (0.03 | ) | (3.60 | ) | ||||||||||||||||||||
11/30/2014 | 41.78 | (0.18 | ) | (2.39 | ) | (2.57 | ) | (0.31 | ) | (3.57 | ) | |||||||||||||||||
11/30/2013 | 31.75 | (0.17 | ) | 10.22 | 10.05 | (0.02 | ) | — | ||||||||||||||||||||
11/30/2012 | 28.01 | (0.07 | ) | 4.04 | 3.97 | (0.23 | ) | — | ||||||||||||||||||||
| Class R | ||||||||||||||||||||||||||||
3/31/2018+ | $ | 40.46 | $ | (0.16 | ) | $ | 4.37 | $ | 4.21 | $ | (0.51 | ) | $ | (0.68 | ) | |||||||||||||
9/30/2017 | 34.07 | 0.01 | 6.70 | 6.71 | (0.32 | ) | — | |||||||||||||||||||||
9/30/2016 | 34.03 | 0.03 | 1.63 | 1.66 | (0.17 | ) | (1.45 | ) | ||||||||||||||||||||
12/1/2014 - 9/30/2015# | 35.30 | 0.16 | 2.23 | 2.39 | (0.06 | ) | (3.60 | ) | ||||||||||||||||||||
11/30/2014 | 42.23 | 0.07 | (2.47 | ) | (2.40 | ) | (0.96 | ) | (3.57 | ) | ||||||||||||||||||
11/30/2013 | 32.25 | 0.02 | 10.32 | 10.34 | (0.36 | ) | — | |||||||||||||||||||||
11/30/2012 | 28.27 | 0.08 | 4.10 | 4.18 | (0.20 | ) | — | |||||||||||||||||||||
| Class P | ||||||||||||||||||||||||||||
3/31/2018+ | $ | 41.33 | $ | (0.07 | ) | $ | 4.48 | $ | 4.41 | $ | (0.49 | ) | $ | (0.68 | ) | |||||||||||||
9/30/2017 | 34.66 | 0.19 | 6.82 | 7.01 | (0.34 | ) | — | |||||||||||||||||||||
9/30/2016 | 34.49 | 0.18 | 1.64 | 1.82 | (0.20 | ) | (1.45 | ) | ||||||||||||||||||||
12/1/2014 - 9/30/2015# | 35.65 | 0.28 | 2.25 | 2.53 | (0.09 | ) | (3.60 | ) | ||||||||||||||||||||
11/30/2014 | 41.97 | 0.16 | (2.41 | ) | (2.25 | ) | (0.50 | ) | (3.57 | ) | ||||||||||||||||||
11/30/2013 | 31.92 | 0.16 | 10.24 | 10.40 | (0.35 | ) | — | |||||||||||||||||||||
11/30/2012 | 27.86 | 0.20 | 4.05 | 4.25 | (0.19 | ) | — | |||||||||||||||||||||
| Institutional Class | ||||||||||||||||||||||||||||
3/31/2018+ | $ | 42.85 | $ | (0.07 | ) | $ | 4.65 | $ | 4.58 | $ | (0.55 | ) | $ | (0.68 | ) | |||||||||||||
9/30/2017 | 35.91 | 0.36 | 6.92 | 7.28 | (0.34 | ) | — | |||||||||||||||||||||
9/30/2016 | 35.65 | 0.10 | 1.81 | 1.91 | (0.20 | ) | (1.45 | ) | ||||||||||||||||||||
12/1/2014 - 9/30/2015# | 36.68 | 0.29 | 2.34 | 2.63 | (0.06 | ) | (3.60 | ) | ||||||||||||||||||||
11/30/2014 | 42.94 | 0.21 | (2.49 | ) | (2.28 | ) | (0.41 | ) | (3.57 | ) | ||||||||||||||||||
11/30/2013 | 32.60 | 0.17 | 10.48 | 10.65 | (0.31 | ) | — | |||||||||||||||||||||
11/30/2012 | 28.58 | 0.24 | 4.15 | 4.39 | (0.37 | ) | — | |||||||||||||||||||||
| Class R6 | ||||||||||||||||||||||||||||
3/31/2018+ | $ | 42.90 | $ | (0.02 | ) | $ | 4.62 | $ | 4.60 | $ | (0.64 | ) | $ | (0.68 | ) | |||||||||||||
9/30/2017 | 35.94 | 0.22 | 7.09 | 7.31 | (0.35 | ) | — | |||||||||||||||||||||
2/1/2016* - 9/30/2016 | 33.52 | 0.34 | 2.08 | 2.42 | — | — | ||||||||||||||||||||||
| + | Unaudited |
| # | Fiscal year end changed from November 30th to September 30th. |
| * | Commencement of operations. |
| (a) | Calculated on average shares outstanding during the period. |
| (b) | Total return is calculated assuming a purchase of a share on the first day of the period and a sale of a share on the last day of each period reported. Dividends and distributions, if any, are assumed, for purposes of this calculation, to be reinvested. Total return does not reflect sales charges and includes the effect of fee waivers and reimbursements. Total return may reflect adjustments to conform to U.S. GAAP. Total return for a period of less than one year is not annualized. |
| 284 | Semiannual Report | | March 31, 2018 | | See accompanying Notes to Financial Statements |
Table of Contents
| Total Dividends and Distributions | Net Asset Value, End of Period | Total Return (b) | Net Assets, End of Period (000s) | Ratio of Expenses to Average Net Assets with Fee Waiver/ Reimbursement | Ratio of Expenses to Average Net Assets without Fee Waiver/ Reimbursement | Ratio of Net Investment Income (Loss) to Average Net Assets | Portfolio Turnover Rate | |||||||||||||||||||||||||||
| $ | (0.93 | ) | $ | 44.63 | 10.70 | % | $ | 9,518 | 1.25 | %(c) | 1.71 | %(c) | (0.39 | )%(c) | 23 | % | ||||||||||||||||||
| (0.31 | ) | 41.19 | (e) | 20.34 | (e) | 6,068 | 1.36 | 1.93 | 0.01 | 67 | ||||||||||||||||||||||||
| (1.73 | ) | 34.57 | 5.07 | 13,524 | 1.45 | 1.68 | 0.30 | 76 | ||||||||||||||||||||||||||
| (3.74 | ) | 34.53 | 7.83 | 11,816 | 1.45 | (c)(f) | 1.63 | (c)(f) | 0.88 | (c)(f) | 39 | |||||||||||||||||||||||
| (4.21 | ) | 35.77 | (5.84 | ) | 5,290 | 1.45 | 1.76 | 0.23 | 77 | |||||||||||||||||||||||||
| — | (g) | 42.30 | 32.64 | 4,569 | 1.45 | 1.83 | 0.23 | 92 | ||||||||||||||||||||||||||
| (0.64 | ) | 31.89 | 15.13 | 2,773 | 1.50 | 1.76 | 0.53 | 117 | ||||||||||||||||||||||||||
| $ | (0.78 | ) | $ | 43.30 | 10.25 | % | $ | 3,516 | 2.08 | %(c) | 2.32 | %(c) | (1.28 | )%(c) | 23 | % | ||||||||||||||||||
| (0.25 | ) | 40.01 | (e) | 19.39 | (e) | 2,829 | 2.14 | 2.50 | (0.56 | ) | 67 | |||||||||||||||||||||||
| (1.65 | ) | 33.78 | 4.30 | 3,232 | 2.19 | 2.54 | (0.35 | ) | 76 | |||||||||||||||||||||||||
| (3.63 | ) | 33.94 | 7.14 | 2,837 | 2.19 | (c)(f) | 2.42 | (c)(f) | 0.20 | (c)(f) | 39 | |||||||||||||||||||||||
| (3.88 | ) | 35.33 | (6.52 | ) | 1,135 | 2.19 | 2.45 | (0.47 | ) | 77 | ||||||||||||||||||||||||
| (0.02 | ) | 41.78 | 31.67 | 702 | 2.20 | 2.43 | (0.46 | ) | 92 | |||||||||||||||||||||||||
| (0.23 | ) | 31.75 | 14.26 | 531 | 2.26 | 2.37 | (0.24 | ) | 117 | |||||||||||||||||||||||||
| $ | (1.19 | ) | $ | 43.48 | 10.53 | % | $ | 360 | 1.59 | %(c) | 1.84 | %(c) | (0.74 | )%(c) | 23 | % | ||||||||||||||||||
| (0.32 | ) | 40.46 | (e) | 19.98 | (e) | 264 | 1.64 | 2.11 | 0.02 | 67 | ||||||||||||||||||||||||
| (1.62 | ) | 34.07 | 4.81 | 130 | 1.70 | 2.17 | 0.09 | 76 | ||||||||||||||||||||||||||
| (3.66 | ) | 34.03 | 7.60 | 100 | 1.70 | (c)(f) | 2.09 | (c)(f) | 0.57 | (c)(f) | 39 | |||||||||||||||||||||||
| (4.53 | ) | 35.30 | (6.06 | ) | 73 | 1.70 | 2.10 | 0.19 | 77 | |||||||||||||||||||||||||
| (0.36 | ) | 42.23 | 32.29 | 27 | 1.70 | 1.96 | 0.05 | 92 | ||||||||||||||||||||||||||
| (0.20 | ) | 32.25 | 14.86 | 12 | 1.74 | 1.90 | 0.26 | 117 | ||||||||||||||||||||||||||
| $ | (1.17 | ) | $ | 44.57 | 10.77 | % | $ | 65,371 | 1.10 | %(c) | 1.31 | %(c) | (0.31 | )%(c) | 23 | % | ||||||||||||||||||
| (0.34 | ) | 41.33 | (e) | 20.55 | (e) | 55,843 | 1.17 | 1.42 | 0.55 | 67 | ||||||||||||||||||||||||
| (1.65 | ) | 34.66 | 5.25 | 40,183 | 1.28 | 1.44 | 0.54 | 76 | ||||||||||||||||||||||||||
| (3.69 | ) | 34.49 | 7.96 | 36,377 | 1.28 | (c)(f) | 1.37 | (c)(f) | 0.97 | (c)(f) | 39 | |||||||||||||||||||||||
| (4.07 | ) | 35.65 | (5.68 | ) | 27,882 | 1.29 | 1.54 | 0.41 | 77 | |||||||||||||||||||||||||
| (0.35 | ) | 41.97 | 32.86 | 33,574 | 1.30 | 1.52 | 0.45 | 92 | ||||||||||||||||||||||||||
| (0.19 | ) | 31.92 | 15.32 | 28,996 | 1.31 | 1.52 | 0.68 | 117 | ||||||||||||||||||||||||||
| $ | (1.23 | ) | $ | 46.20 | 10.81 | % | $ | 71,443 | 1.06 | %(c) | 1.30 | %(c) | (0.29 | )%(c) | 23 | % | ||||||||||||||||||
| (0.34 | ) | 42.85 | (e) | 20.58 | (e) | 67,921 | 1.11 | 1.43 | 0.94 | 67 | ||||||||||||||||||||||||
| (1.65 | ) | 35.91 | 5.31 | 29,031 | 1.21 | 1.48 | 0.28 | 76 | ||||||||||||||||||||||||||
| (3.66 | ) | 35.65 | 8.04 | 59,061 | 1.21 | (c)(f) | 1.39 | (c)(f) | 0.97 | (c)(f) | 39 | |||||||||||||||||||||||
| (3.98 | ) | 36.68 | (5.61 | ) | 55,743 | 1.21 | 1.46 | 0.53 | 77 | |||||||||||||||||||||||||
| (0.31 | ) | 42.94 | 32.96 | 71,875 | 1.21 | 1.44 | 0.46 | 92 | ||||||||||||||||||||||||||
| (0.37 | ) | 32.60 | 15.50 | 88,301 | 1.20 | 1.38 | 0.80 | 117 | ||||||||||||||||||||||||||
| $ | (1.32 | ) | $ | 46.18 | 10.84 | % | $ | 39,721 | 1.00 | %(c) | 1.25 | %(c) | (0.09 | )%(c) | 23 | % | ||||||||||||||||||
| (0.35 | ) | 42.90 | (e) | 20.66 | (e) | 17,804 | 1.05 | 1.42 | 0.60 | 67 | ||||||||||||||||||||||||
| — | 35.94 | 7.22 | 15,534 | 1.11 | (c) | 1.56 | (c) | 1.48 | (c) | 76 | ||||||||||||||||||||||||
| (c) | Annualized, unless otherwise noted. |
| (d) | Actual amount rounds to less than $0.01 per share. |
| (e) | Payments from Affiliates increased the end of period net asset value and total return by less than $0.01 and 0.01%, respectively. |
| (f) | Certain expenses incurred by the Fund were not annualized. |
| (g) | Actual amount rounds to less than $(0.01) per share. |
| See accompanying Notes to Financial Statements | | March 31, 2018 | | Semiannual Report | 285 |
Table of Contents
Financial Highlights (cont’d)
For a Share Outstanding for the Period ended:
| Net Asset Value, Beginning of Period | Net Investment Loss (a) | Unrealized Gain (Loss) | Total from Investment Operations | Distributions from Net Realized Capital Gains | ||||||||||||||||||||
| AllianzGI Micro Cap: | ||||||||||||||||||||||||
| Class A | ||||||||||||||||||||||||
3/31/2018+ | $ | 15.85 | $ | (0.11 | ) | $ | 0.09 | $ | (0.02 | ) | $ | (0.89 | ) | |||||||||||
9/30/2017 | 14.73 | (0.18 | ) | 2.72 | 2.54 | (1.42 | ) | |||||||||||||||||
9/30/2016 | 13.99 | (0.18 | ) | 1.75 | 1.57 | (0.83 | ) | |||||||||||||||||
12/1/2014 - 9/30/2015# | 14.88 | (0.17 | ) | 0.54 | 0.37 | (1.26 | ) | |||||||||||||||||
11/30/2014 | 16.06 | (0.21 | ) | — | (e) | (0.21 | ) | (0.97 | ) | |||||||||||||||
11/30/2013 | 11.62 | (0.20 | ) | 5.57 | 5.37 | (0.93 | ) | |||||||||||||||||
12/19/2011* - 11/30/2012 | 9.84 | (0.07 | ) | 1.85 | 1.78 | — | ||||||||||||||||||
| Class P | ||||||||||||||||||||||||
3/31/2018+ | $ | 15.94 | $ | (0.10 | ) | $ | 0.09 | $ | (0.01 | ) | $ | (0.89 | ) | |||||||||||
9/30/2017 | 14.80 | (0.17 | ) | 2.73 | 2.56 | (1.42 | ) | |||||||||||||||||
9/30/2016 | 14.05 | (0.16 | ) | 1.74 | 1.58 | (0.83 | ) | |||||||||||||||||
12/1/2014 - 9/30/2015# | 14.92 | (0.16 | ) | 0.55 | 0.39 | (1.26 | ) | |||||||||||||||||
11/30/2014 | 16.08 | (0.19 | ) | — | (e) | (0.19 | ) | (0.97 | ) | |||||||||||||||
11/30/2013 | 11.61 | (0.17 | ) | 5.57 | 5.40 | (0.93 | ) | |||||||||||||||||
11/30/2012 | 12.20 | (0.10 | ) | 1.47 | 1.37 | (1.96 | ) | |||||||||||||||||
| Institutional Class | ||||||||||||||||||||||||
3/31/2018+ | $ | 16.03 | $ | (0.10 | ) | $ | 0.08 | $ | (0.02 | ) | $ | (0.89 | ) | |||||||||||
9/30/2017 | 14.87 | (0.17 | ) | 2.75 | 2.58 | (1.42 | ) | |||||||||||||||||
9/30/2016 | 14.11 | (0.16 | ) | 1.75 | 1.59 | (0.83 | ) | |||||||||||||||||
12/1/2014 - 9/30/2015# | 14.99 | (0.16 | ) | 0.54 | 0.38 | (1.26 | ) | |||||||||||||||||
11/30/2014 | 16.15 | (0.19 | ) | — | (e) | (0.19 | ) | (0.97 | ) | |||||||||||||||
11/30/2013 | 11.65 | (0.15 | ) | 5.58 | 5.43 | (0.93 | ) | |||||||||||||||||
11/30/2012 | 12.22 | (0.10 | ) | 1.49 | 1.39 | (1.96 | ) | |||||||||||||||||
| + | Unaudited |
| # | Fiscal year end changed from November 30th to September 30th. |
| * | Commencement of operations. |
| (a) | Calculated on average shares outstanding during the period. |
| (b) | Total return is calculated assuming a purchase of a share on the first day of the period and a sale of a share on the last day of each period reported. Dividends and distributions, if any, are assumed, for purposes of this calculation, to be reinvested. Total return does not reflect sales charges and includes the effect of fee waivers and reimbursements. Total return may reflect adjustments to conform to U.S. GAAP. Total return for a period of less than one year is not annualized. |
| (c) | Annualized, unless otherwise noted. |
| (d) | Certain expenses incurred by the Fund were not annualized. |
| (e) | Actual amount rounds to less than $0.01 per share. |
| 286 | Semiannual Report | | March 31, 2018 | | See accompanying Notes to Financial Statements |
Table of Contents
| Net Asset Value, End of Period | Total Return (b) | Net Assets, End of Period (000s) | Ratio of Expenses to Average Net Assets with Fee Waiver/ Reimbursement | Ratio of Expenses to Average Net Assets without Fee Waiver/ Reimbursement | Ratio of Net Investment Loss to Average Net Assets | Portfolio Turnover Rate | ||||||||||||||||||||||||
| $ | 14.94 | (0.19 | )% | $ | 2,595 | 1.62 | %(c) | 2.18 | %(c) | (1.41 | )%(c) | 21 | % | |||||||||||||||||
| 15.85 | 18.74 | 3,031 | 1.62 | 2.18 | (1.27 | ) | 32 | |||||||||||||||||||||||
| 14.73 | 11.47 | 3,388 | 1.62 | 2.16 | (1.26 | ) | 39 | |||||||||||||||||||||||
| 13.99 | 2.77 | 15,305 | 1.62 | (c)(d) | 2.07 | (c)(d) | (1.35 | )(c)(d) | 55 | |||||||||||||||||||||
| 14.88 | (1.11 | ) | 4,684 | 1.66 | 2.10 | (1.40 | ) | 48 | ||||||||||||||||||||||
| 16.06 | 50.11 | 1,065 | 1.80 | 2.07 | (1.45 | ) | 63 | |||||||||||||||||||||||
| 11.62 | 18.09 | 135 | 1.82 | (c) | 2.18 | (c) | (0.62 | )(c) | 62 | |||||||||||||||||||||
| $ | 15.04 | (0.12 | )% | $ | 1,490 | 1.54 | %(c) | 1.93 | %(c) | (1.33 | )%(c) | 21 | % | |||||||||||||||||
| 15.94 | 18.79 | 1,568 | 1.54 | 1.89 | (1.19 | ) | 32 | |||||||||||||||||||||||
| 14.80 | 11.50 | 1,289 | 1.54 | 1.85 | (1.17 | ) | 39 | |||||||||||||||||||||||
| 14.05 | 2.91 | 2,264 | 1.51 | (c)(d) | 1.80 | (c)(d) | (1.24 | )(c)(d) | 55 | |||||||||||||||||||||
| 14.92 | (0.98 | ) | 1,550 | 1.52 | 1.81 | (1.21 | ) | 48 | ||||||||||||||||||||||
| 16.08 | 50.42 | 2,192 | 1.63 | 1.90 | (1.25 | ) | 63 | |||||||||||||||||||||||
| 11.61 | 13.90 | 332 | 1.65 | 1.99 | (0.85 | ) | 62 | |||||||||||||||||||||||
| $ | 15.12 | (0.18 | )% | $ | 21,461 | 1.54 | %(c) | 1.94 | %(c) | (1.33 | )%(c) | 21 | % | |||||||||||||||||
| 16.03 | 18.84 | 27,984 | 1.54 | 1.93 | (1.20 | ) | 32 | |||||||||||||||||||||||
| 14.87 | 11.53 | 30,768 | 1.54 | 1.91 | (1.17 | ) | 39 | |||||||||||||||||||||||
| 14.11 | 2.83 | 34,575 | 1.54 | (c)(d) | 1.80 | (c)(d) | (1.26 | )(c)(d) | 55 | |||||||||||||||||||||
| 14.99 | (0.97 | ) | 33,513 | 1.54 | 1.80 | (1.25 | ) | 48 | ||||||||||||||||||||||
| 16.15 | 50.51 | 41,713 | 1.54 | 2.01 | (1.10 | ) | 63 | |||||||||||||||||||||||
| 11.65 | 14.09 | 27,343 | 1.54 | 1.84 | (0.90 | ) | 62 | |||||||||||||||||||||||
| See accompanying Notes to Financial Statements | | March 31, 2018 | | Semiannual Report | 287 |
Table of Contents
Financial Highlights (cont’d)
For a Share Outstanding for the Period ended:
| Net Asset Value, Beginning of Period | Net Investment Income (a) | Net Realized Unrealized Gain (Loss) | Total from Investment Operations | Dividends from Net Investment Income | Distributions from Net Realized Capital Gains | |||||||||||||||||||||||
| AllianzGI NFJ Emerging Markets Value: | ||||||||||||||||||||||||||||
| Class A | ||||||||||||||||||||||||||||
3/31/2018+ | $ | 17.24 | $ | 0.09 | $ | 1.52 | $ | 1.61 | $ | (0.16 | ) | $ | (0.07 | ) | ||||||||||||||
9/30/2017 | 14.31 | 0.40 | 2.85 | 3.25 | (0.32 | ) | — | |||||||||||||||||||||
9/30/2016 | 12.34 | 0.47 | 1.90 | 2.37 | (0.40 | ) | — | |||||||||||||||||||||
12/1/2014 - 9/30/2015# | 15.45 | 0.49 | (2.74 | ) | (2.25 | ) | (0.62 | ) | (0.24 | ) | ||||||||||||||||||
11/30/2014 | 15.42 | 0.37 | 0.08 | 0.45 | (0.42 | ) | — | |||||||||||||||||||||
12/18/2012* - 11/30/2013 | 15.00 | 0.35 | 0.27 | 0.62 | (0.20 | ) | — | |||||||||||||||||||||
| Class C | ||||||||||||||||||||||||||||
3/31/2018+ | $ | 17.33 | $ | 0.01 | $ | 1.55 | $ | 1.56 | $ | —(h | ) | $ | (0.07 | ) | ||||||||||||||
9/30/2017 | 14.29 | 0.34 | 2.81 | 3.15 | (0.11 | ) | — | |||||||||||||||||||||
9/30/2016 | 12.31 | 0.32 | 1.96 | 2.28 | (0.30 | ) | — | |||||||||||||||||||||
12/1/2014 - 9/30/2015# | 15.40 | 0.36 | (2.68 | ) | (2.32 | ) | (0.53 | ) | (0.24 | ) | ||||||||||||||||||
11/30/2014 | 15.35 | 0.28 | 0.05 | 0.33 | (0.28 | ) | — | |||||||||||||||||||||
12/18/2012* - 11/30/2013 | 15.00 | 0.14 | 0.36 | 0.50 | (0.15 | ) | — | |||||||||||||||||||||
| Class P | ||||||||||||||||||||||||||||
3/31/2018+ | $ | 17.13 | $ | 0.08 | $ | 1.53 | $ | 1.61 | $ | (0.07 | ) | $ | (0.07 | ) | ||||||||||||||
9/30/2017 | 14.31 | 0.46 | 2.78 | 3.24 | (0.42 | ) | — | |||||||||||||||||||||
9/30/2016 | 12.46 | 0.62 | 1.80 | 2.42 | (0.57 | ) | — | |||||||||||||||||||||
12/1/2014 - 9/30/2015# | 15.56 | 0.49 | (2.74 | ) | (2.25 | ) | (0.61 | ) | (0.24 | ) | ||||||||||||||||||
11/30/2014 | 15.45 | 0.43 | 0.05 | 0.48 | (0.37 | ) | — | |||||||||||||||||||||
12/18/2012* - 11/30/2013 | 15.00 | 0.36 | 0.27 | 0.63 | (0.18 | ) | — | |||||||||||||||||||||
| Institutional Class | ||||||||||||||||||||||||||||
3/31/2018+ | $ | 17.49 | $ | 0.09 | $ | 1.57 | $ | 1.66 | $ | (0.17 | ) | $ | (0.07 | ) | ||||||||||||||
9/30/2017 | 14.46 | 0.44 | 2.91 | 3.35 | (0.32 | ) | — | |||||||||||||||||||||
9/30/2016 | 12.47 | 0.43 | 2.01 | 2.44 | (0.45 | ) | — | |||||||||||||||||||||
12/1/2014 - 9/30/2015# | 15.57 | 0.51 | (2.74 | ) | (2.23 | ) | (0.63 | ) | (0.24 | ) | ||||||||||||||||||
11/30/2014 | 15.46 | 0.46 | 0.03 | 0.49 | (0.38 | ) | — | |||||||||||||||||||||
12/18/2012* - 11/30/2013 | 15.00 | 0.39 | 0.26 | 0.65 | (0.19 | ) | — | |||||||||||||||||||||
| + | Unaudited |
| # | Fiscal year end changed from November 30th to September 30th. |
| * | Commencement of operations. |
| (a) | Calculated on average shares outstanding during the period. |
| (b) | Total return is calculated assuming a purchase of a share on the first day of the period and a sale of a share on the last day of each period reported. Dividends and distributions, if any, are assumed, for purposes of this calculation, to be reinvested. Total return does not reflect sales charges and includes the effect of fee waivers and reimbursements. Total return may reflect adjustments to conform to U.S. GAAP. Total return for a period of less than one year is not annualized. |
| (c) | Annualized, unless otherwise noted. |
| (d) | Payments from Affiliates increased the end of year net asset value (“NAV”) and total return by $0.02 and 0.15%, respectively, for Class A, $0.02 and 0.14%, respectively, for Class C, $0.02 and 0.14%, respectively, for Class P and $0.01 and 0.07%, respectively for Institutional Class. If the Affiliates had not made these payments, the end of year NAV and total return would have been $17.22 and 22.92%, respectively, for Class A, $17.31 and 21.92%, respectively, for Class C, $17.11 and 23.08%, respectively, for Class P and $17.48 and 23.26%, respectively for Institutional Class. See Note 7(a) in the Notes to Financial Statements. |
| (e) | Does not include expenses of the investment companies in which the Fund invests. |
| (f) | Payments from Affiliates increased the end of period net asset value and total return by less than $0.01 and 0.01%, respectively. |
| (g) | Certain expenses incurred by the Fund were not annualized. |
| (h) | Actual amount rounds to less than $(0.01) per share. |
| 288 | Semiannual Report | | March 31, 2018 | | See accompanying Notes to Financial Statements |
Table of Contents
| Total Dividends and Distributions | Net Asset Value, End of Period | Total Return (b) | Net Assets, End of Period (000s) | Ratio of Expenses to Average Net Assets with Fee Waiver/ Reimbursement | Ratio of Expenses to Average Net Assets without Fee Waiver/ Reimbursement | Ratio of Net Investment Income to Average Net Assets | Portfolio Turnover Rate | |||||||||||||||||||||||||||
| $ | (0.23 | ) | $ | 18.62 | 9.41 | % | $ | 63,132 | 1.14 | %(c) | 1.82 | %(c) | 0.99 | %(c) | 62 | % | ||||||||||||||||||
| (0.32 | ) | 17.24 | (d) | 23.07 | (d) | 11,026 | 1.22 | (e) | 3.32 | (e) | 2.58 | (e) | 120 | |||||||||||||||||||||
| (0.40 | ) | 14.31 | (f) | 19.57 | (f) | 2,141 | 1.39 | 7.84 | 3.62 | 104 | ||||||||||||||||||||||||
| (0.86 | ) | 12.34 | (15.12 | ) | 207 | 1.55 | (c)(g) | 6.55 | (c)(g) | 4.13 | (c)(g) | 93 | ||||||||||||||||||||||
| (0.42 | ) | 15.45 | 2.94 | 110 | 1.55 | 4.86 | 2.33 | 85 | ||||||||||||||||||||||||||
| (0.20 | ) | 15.42 | 4.14 | 19 | 1.55 | (c) | 17.07 | (c) | 2.41 | (c) | 67 | |||||||||||||||||||||||
| $ | (0.07 | ) | $ | 18.82 | 9.01 | % | $ | 1,165 | 1.89 | %(c) | 2.61 | %(c) | 0.06 | %(c) | 62 | % | ||||||||||||||||||
| (0.11 | ) | 17.33 | (d) | 22.06 | (d) | 527 | 1.95 | (e) | 4.00 | (e) | 2.16 | (e) | 120 | |||||||||||||||||||||
| (0.30 | ) | 14.29 | (f) | 18.80 | (f) | 113 | 2.16 | 8.01 | 2.49 | 104 | ||||||||||||||||||||||||
| (0.77 | ) | 12.31 | (15.62 | ) | 104 | 2.30 | (c)(g) | 7.39 | (c)(g) | 3.12 | (c)(g) | 93 | ||||||||||||||||||||||
| (0.28 | ) | 15.40 | 2.19 | 73 | 2.30 | 5.60 | 1.82 | 85 | ||||||||||||||||||||||||||
| (0.15 | ) | 15.35 | 3.40 | 25 | 2.30 | (c) | 19.41 | (c) | 1.00 | (c) | 67 | |||||||||||||||||||||||
| $ | (0.14 | ) | $ | 18.60 | 9.46 | % | $ | 24,108 | 0.98 | %(c) | 1.66 | %(c) | 0.87 | %(c) | 62 | % | ||||||||||||||||||
| (0.42 | ) | 17.13 | (d) | 23.22 | (d) | 19,899 | 1.05 | (e) | 3.00 | (e) | 2.99 | (e) | 120 | |||||||||||||||||||||
| (0.57 | ) | 14.31 | (f) | 19.95 | (f) | 139 | 1.20 | 7.47 | 4.67 | 104 | ||||||||||||||||||||||||
| (0.85 | ) | 12.46 | (15.03 | ) | 9 | 1.39 | (c)(g) | 5.87 | (c)(g) | 4.12 | (c)(g) | 93 | ||||||||||||||||||||||
| (0.37 | ) | 15.56 | 3.13 | 11 | 1.39 | 4.64 | 2.77 | 85 | ||||||||||||||||||||||||||
| (0.18 | ) | 15.45 | 4.25 | 11 | 1.41 | (c) | 7.72 | (c) | 2.49 | (c) | 67 | |||||||||||||||||||||||
| $ | (0.24 | ) | $ | 18.91 | 9.53 | % | $ | 57,527 | 0.89 | %(c) | 1.59 | %(c) | 1.02 | %(c) | 62 | % | ||||||||||||||||||
| (0.32 | ) | 17.49 | (d) | 23.33 | (d) | 34,444 | 0.95 | (e) | 2.87 | (e) | 2.71 | (e) | 120 | |||||||||||||||||||||
| (0.45 | ) | 14.46 | (f) | 19.95 | (f) | 6,370 | 1.17 | 6.98 | 3.35 | 104 | ||||||||||||||||||||||||
| (0.87 | ) | 12.47 | (14.91 | ) | 6,688 | 1.30 | (c)(g) | 5.93 | (c)(g) | 4.25 | (c)(g) | 93 | ||||||||||||||||||||||
| (0.38 | ) | 15.57 | 3.18 | 7,889 | 1.30 | 4.63 | 2.96 | 85 | ||||||||||||||||||||||||||
| (0.19 | ) | 15.46 | 4.38 | 6,470 | 1.30 | (c) | 7.78 | (c) | 2.70 | (c) | 67 | |||||||||||||||||||||||
| See accompanying Notes to Financial Statements | | March 31, 2018 | | Semiannual Report | 289 |
Table of Contents
Financial Highlights (cont’d)
For a Share Outstanding for the Period ended:
| Net Asset Value, Beginning of Period | Net Investment Income (a) | Net Realized | Total from Investment Operations | Dividends from Net Investment Income | Distributions from Net Realized Capital Gains | |||||||||||||||||||||||
| AllianzGI NFJ International Small-Cap Value: | ||||||||||||||||||||||||||||
| Class A | ||||||||||||||||||||||||||||
3/31/2018+ | $ | 20.71 | $ | 0.08 | $ | 0.34 | $ | 0.42 | $ | (0.41 | ) | $ | — | |||||||||||||||
9/30/2017 | 18.19 | 0.22 | 2.86 | 3.08 | (0.56 | ) | — | |||||||||||||||||||||
9/30/2016 | 18.19 | 0.46 | 0.61 | 1.07 | (0.68 | ) | (0.39 | ) | ||||||||||||||||||||
12/1/2014 - 9/30/2015# | 21.37 | 0.40 | (1.22 | ) | (0.82 | ) | (0.57 | ) | (1.79 | ) | ||||||||||||||||||
11/30/2014 | 21.06 | 0.39 | 0.62 | 1.01 | (0.26 | ) | (0.44 | ) | ||||||||||||||||||||
11/30/2013 | 17.10 | 0.35 | 4.03 | 4.38 | (0.33 | ) | (0.09 | ) | ||||||||||||||||||||
6/1/2012* - 11/30/2012 | 15.00 | 0.07 | 2.03 | 2.10 | — | — | ||||||||||||||||||||||
| Class C | ||||||||||||||||||||||||||||
3/31/2018+ | $ | 19.70 | $ | — | (e) | $ | 0.33 | $ | 0.33 | $ | — | (e) | $ | — | ||||||||||||||
9/30/2017 | 17.90 | 0.14 | 2.63 | 2.77 | (0.97 | ) | — | |||||||||||||||||||||
9/30/2016 | 17.91 | 0.26 | 0.66 | 0.92 | (0.54 | ) | (0.39 | ) | ||||||||||||||||||||
12/1/2014 - 9/30/2015# | 21.11 | 0.28 | (1.21 | ) | (0.93 | ) | (0.48 | ) | (1.79 | ) | ||||||||||||||||||
11/30/2014 | 21.04 | 0.23 | 0.63 | 0.86 | (0.35 | ) | (0.44 | ) | ||||||||||||||||||||
11/30/2013 | 17.04 | 0.16 | 4.09 | 4.25 | (0.16 | ) | (0.09 | ) | ||||||||||||||||||||
6/1/2012* - 11/30/2012 | 15.00 | 0.09 | 1.95 | 2.04 | — | — | ||||||||||||||||||||||
| Class P | ||||||||||||||||||||||||||||
3/31/2018+ | $ | 20.05 | $ | 0.11 | $ | 0.32 | $ | 0.43 | $ | (0.42 | ) | $ | — | |||||||||||||||
9/30/2017 | 18.33 | 0.39 | 2.58 | 2.97 | (1.25 | ) | — | |||||||||||||||||||||
9/30/2016 | 18.40 | 0.46 | 0.63 | 1.09 | (0.77 | ) | (0.39 | ) | ||||||||||||||||||||
12/1/2014 - 9/30/2015# | 21.70 | 0.46 | (1.27 | ) | (0.81 | ) | (0.70 | ) | (1.79 | ) | ||||||||||||||||||
11/30/2014 | 21.27 | 0.44 | 0.62 | 1.06 | (0.19 | ) | (0.44 | ) | ||||||||||||||||||||
11/30/2013 | 17.11 | 0.39 | 4.05 | 4.44 | (0.19 | ) | (0.09 | ) | ||||||||||||||||||||
6/1/2012* - 11/30/2012 | 15.00 | 0.16 | 1.95 | 2.11 | — | — | ||||||||||||||||||||||
| Institutional Class | ||||||||||||||||||||||||||||
3/31/2018+ | $ | 20.81 | $ | 0.12 | $ | 0.33 | $ | 0.45 | $ | (0.55 | ) | $ | — | |||||||||||||||
9/30/2017 | 18.69 | 0.35 | 2.77 | 3.12 | (1.00 | ) | — | |||||||||||||||||||||
9/30/2016 | 18.49 | 0.42 | 0.71 | 1.13 | (0.54 | ) | (0.39 | ) | ||||||||||||||||||||
12/1/2014 - 9/30/2015# | 21.59 | 0.46 | (1.25 | ) | (0.79 | ) | (0.52 | ) | (1.79 | ) | ||||||||||||||||||
11/30/2014 | 21.28 | 0.45 | 0.63 | 1.08 | (0.33 | ) | (0.44 | ) | ||||||||||||||||||||
11/30/2013 | 17.12 | 0.43 | 4.03 | 4.46 | (0.21 | ) | (0.09 | ) | ||||||||||||||||||||
6/1/2012* - 11/30/2012 | 15.00 | 0.17 | 1.95 | 2.12 | — | — | ||||||||||||||||||||||
| Class R6 | ||||||||||||||||||||||||||||
3/31/2018+ | $ | 19.90 | $ | 0.12 | $ | 0.32 | $ | 0.44 | $ | (0.43 | ) | $ | — | |||||||||||||||
9/30/2017 | 18.35 | 0.35 | 2.61 | 2.96 | (1.41 | ) | — | |||||||||||||||||||||
9/30/2016 | 18.49 | 0.52 | 0.62 | 1.14 | (0.89 | ) | (0.39 | ) | ||||||||||||||||||||
9/8/2015* - 9/30/2015# | 19.04 | 0.04 | (0.59 | ) | (0.55 | ) | — | — | ||||||||||||||||||||
| + | Unaudited |
| # | Fiscal year end changed from November 30th to September 30th. |
| * | Commencement of operations. |
| (a) | Calculated on average shares outstanding during the period. |
| 290 | Semiannual Report | | March 31, 2018 | | See accompanying Notes to Financial Statements |
Table of Contents
| Total Dividends and Distributions | Net Asset Value, End of Period | Total Return (b) | Net Assets, End of Period (000s) | Ratio of Expenses to Average Net Assets with Fee Waiver/ Reimbursement | Ratio of Expenses to Average Net Assets without Fee Waiver/ Reimbursement | Ratio of Net Investment Income to Average Net Assets | Portfolio Turnover Rate | |||||||||||||||||||||||||||
| $ | (0.41 | ) | $ | 20.72 | 2.02 | % | $ | 1,362 | 1.30 | %(c) | 7.37 | %(c) | 0.81 | %(c) | 22 | % | ||||||||||||||||||
| (0.56 | ) | 20.71 | 17.71 | 1,362 | 1.30 | 7.02 | 1.21 | 48 | ||||||||||||||||||||||||||
| (1.07 | ) | 18.19 | 6.04 | 7,397 | 1.30 | 4.50 | 2.62 | 95 | ||||||||||||||||||||||||||
| (2.36 | ) | 18.19 | (4.14 | ) | 1,657 | 1.46 | (c)(d) | 3.08 | (c)(d) | 2.43 | (c)(d) | 74 | ||||||||||||||||||||||
| (0.70 | ) | 21.37 | 4.98 | 2,736 | 1.45 | 2.64 | 1.80 | 76 | ||||||||||||||||||||||||||
| (0.42 | ) | 21.06 | 26.08 | 2,272 | 1.45 | 4.81 | 1.81 | 50 | ||||||||||||||||||||||||||
| — | 17.10 | 14.00 | 1,049 | 1.45 | (c) | 4.22 | (c) | 0.82 | (c) | 19 | ||||||||||||||||||||||||
| $ | — | (e) | $ | 20.03 | 1.67 | % | $ | 294 | 2.05 | %(c) | 7.63 | %(c) | — | %(c)(f) | 22 | % | ||||||||||||||||||
| (0.97 | ) | 19.70 | 16.83 | 488 | 2.05 | 7.31 | 0.78 | 48 | ||||||||||||||||||||||||||
| (0.93 | ) | 17.90 | 5.26 | 928 | 2.07 | 5.04 | 1.49 | 95 | ||||||||||||||||||||||||||
| (2.27 | ) | 17.91 | (4.78 | ) | 1,250 | 2.21 | (c)(d) | 3.91 | (c)(d) | 1.73 | (c)(d) | 74 | ||||||||||||||||||||||
| (0.79 | ) | 21.11 | 4.24 | 1,340 | 2.20 | 3.40 | 1.07 | 76 | ||||||||||||||||||||||||||
| (0.25 | ) | 21.04 | 25.20 | 521 | 2.20 | 5.66 | 0.80 | 50 | ||||||||||||||||||||||||||
| — | 17.04 | 13.60 | 11 | 2.20 | (c) | 9.92 | (c) | 1.08 | (c) | 19 | ||||||||||||||||||||||||
| $ | (0.42 | ) | $ | 20.06 | 2.15 | % | $ | 50 | 1.05 | %(c) | 6.29 | %(c) | 1.04 | %(c) | 22 | % | ||||||||||||||||||
| (1.25 | ) | 20.05 | 17.98 | 62 | 1.08 | 6.63 | 2.20 | 48 | ||||||||||||||||||||||||||
| (1.16 | ) | 18.33 | 6.14 | 69 | 1.16 | 4.08 | 2.58 | 95 | ||||||||||||||||||||||||||
| (2.49 | ) | 18.40 | (4.03 | ) | 47 | 1.31 | (c)(d) | 2.92 | (c)(d) | 2.74 | (c)(d) | 74 | ||||||||||||||||||||||
| (0.63 | ) | 21.70 | 5.17 | 39 | 1.30 | 2.39 | 1.98 | 76 | ||||||||||||||||||||||||||
| (0.28 | ) | 21.27 | 26.28 | 14 | 1.31 | 4.63 | 2.04 | 50 | ||||||||||||||||||||||||||
| — | 17.11 | 14.07 | 12 | 1.30 | (c) | 8.92 | (c) | 1.98 | (c) | 19 | ||||||||||||||||||||||||
| $ | (0.55 | ) | $ | 20.71 | 2.18 | % | $ | 1,846 | 1.01 | %(c) | 6.26 | %(c) | 1.11 | %(c) | 22 | % | ||||||||||||||||||
| (1.00 | ) | 20.81 | 18.11 | 1,928 | 1.03 | 6.32 | 1.88 | 48 | ||||||||||||||||||||||||||
| (0.93 | ) | 18.69 | 6.25 | 1,889 | 1.08 | 3.84 | 2.29 | 95 | ||||||||||||||||||||||||||
| (2.31 | ) | 18.49 | (3.92 | ) | 6,832 | 1.21 | (c)(d) | 2.82 | (c)(d) | 2.75 | (c)(d) | 74 | ||||||||||||||||||||||
| (0.77 | ) | 21.59 | 5.27 | 13,979 | 1.20 | 2.31 | 2.03 | 76 | ||||||||||||||||||||||||||
| (0.30 | ) | 21.28 | 26.40 | 11,873 | 1.21 | 4.66 | 2.22 | 50 | ||||||||||||||||||||||||||
| — | 17.12 | 14.13 | 3,551 | 1.20 | (c) | 8.90 | (c) | 2.08 | (c) | 19 | ||||||||||||||||||||||||
| $ | (0.43 | ) | $ | 19.91 | 2.20 | % | $ | 544 | 0.95 | %(c) | 6.24 | %(c) | 1.17 | %(c) | 22 | % | ||||||||||||||||||
| (1.41 | ) | 19.90 | 18.10 | 752 | 0.95 | 6.18 | 1.96 | 48 | ||||||||||||||||||||||||||
| (1.28 | ) | 18.35 | 6.41 | 1,667 | 0.95 | 4.92 | 2.90 | 95 | ||||||||||||||||||||||||||
| — | 18.49 | (2.89 | ) | 10 | 1.10 | (c)(d) | 3.29 | (c)(d) | 3.68 | (c)(d) | 74 | |||||||||||||||||||||||
| (b) | Total return is calculated assuming a purchase of a share on the first day of the period and a sale of a share on the last day of each period reported. Dividends and distributions, if any, are assumed, for purposes of this calculation, to be reinvested. Total return does not reflect sales charges and includes the effect of fee waivers and reimbursements. Total return may reflect adjustments to conform to U.S. GAAP. Total return for a period of less than one year is not annualized. |
| (c) | Annualized, unless otherwise noted. |
| (d) | Certain expenses incurred by the Fund were not annualized. |
| (e) | Actual amount rounds to less than $(0.01) per share. |
| (f) | Actual amount rounds to less than 0.01% |
| See accompanying Notes to Financial Statements | | March 31, 2018 | | Semiannual Report | 291 |
Table of Contents
Financial Highlights (cont’d)
For a Share Outstanding for the Period ended:
Net Asset | Net Investment Income (a) | Net Realized and Unrealized Loss | Total from Investment Operations | Dividends from Net Investment Income | ||||||||||||||||||||
| AllianzGI Performance Fee Managed Futures Strategy†: | ||||||||||||||||||||||||
| Class P | ||||||||||||||||||||||||
12/18/2017* - 3/31/2018+ | $ | 10.00 | $ | 0.04 | $ | (0.38 | ) | $ | (0.34 | ) | $ | — | ||||||||||||
| Institutional Class | ||||||||||||||||||||||||
12/18/2017* - 3/31/2018+ | $ | 10.00 | $ | 0.04 | $ | (0.39 | ) | $ | (0.35 | ) | $ | — | ||||||||||||
| Class R6 | ||||||||||||||||||||||||
12/18/2017* - 3/31/2018+ | $ | 10.00 | $ | 0.04 | $ | (0.37 | ) | $ | (0.33 | ) | $ | — | ||||||||||||
| AllianzGI Performance Fee Structured US Equity: | ||||||||||||||||||||||||
| Class P | ||||||||||||||||||||||||
12/18/2017* - 3/31/2018+ | $ | 10.00 | $ | 0.09 | $ | (0.33 | ) | $ | (0.24 | ) | $ | — | ||||||||||||
| Institutional Class | ||||||||||||||||||||||||
12/18/2017* - 3/31/2018+ | $ | 10.00 | $ | 0.20 | $ | (0.44 | ) | $ | (0.24 | ) | $ | — | ||||||||||||
| Class R6 | ||||||||||||||||||||||||
12/18/2017* - 3/31/2018+ | $ | 10.00 | $ | 0.09 | $ | (0.33 | ) | $ | (0.24 | ) | $ | — | ||||||||||||
| AllianzGI Performance Fee Structured US Fixed Income: | ||||||||||||||||||||||||
| Class P | ||||||||||||||||||||||||
12/18/2017* - 3/31/2018+ | $ | 10.00 | $ | 0.05 | $ | (0.23 | ) | $ | (0.18 | ) | $ | — | ||||||||||||
| Institutional Class | ||||||||||||||||||||||||
12/18/2017* - 3/31/2018+ | $ | 10.00 | $ | 0.05 | $ | (0.23 | ) | $ | (0.18 | ) | $ | — | ||||||||||||
| Class R6 | ||||||||||||||||||||||||
12/18/2017* - 3/31/2018+ | $ | 10.00 | $ | 0.05 | $ | (0.23 | ) | $ | (0.18 | ) | $ | — | ||||||||||||
| AllianzGI Real Estate Debt: | ||||||||||||||||||||||||
| Class P | ||||||||||||||||||||||||
12/27/2017* - 3/31/2018+ | $ | 15.00 | $ | 0.06 | $ | (0.02 | ) | $ | 0.04 | $ | (0.06 | ) | ||||||||||||
| Institutional Class | ||||||||||||||||||||||||
12/27/2017* - 3/31/2018+ | $ | 15.00 | $ | 0.06 | $ | (0.01 | ) | $ | 0.05 | $ | (0.07 | ) | ||||||||||||
| † | The Fund’s financial statements are consolidated to include the accounts of AllianzGI PerformanceFee Managed Futures Strategy Offshore Fund, Ltd., which is a wholly-owned subsidiary of the Fund. See Note 14. |
| + | Unaudited |
| * | Commencement of operations. |
| (a) | Calculated on average shares outstanding during the period. |
| (b) | Total return is calculated assuming a purchase of a share on the first day of the period and a sale of a share on the last day of each period reported. Dividends and distributions, if any, are assumed, for purposes of this calculation, to be reinvested. Total return does not reflect sales charges and includes the effect of fee waivers and reimbursements. Total return may reflect adjustments to conform to U.S. GAAP. Total return for a period of less than one year is not annualized. |
| (c) | Annualized, unless otherwise noted. |
| (d) | Certain expenses incurred by the Fund were not annualized. |
| (e) | Actual amount rounds to less than 0.01%. |
| (f) | Actual amount rounds to less than 1%. |
| 292 | Semiannual Report | | March 31, 2018 | | See accompanying Notes to Financial Statements |
Table of Contents
| Net Asset Value, End of Period | Total Return (b) | Net Assets, End of Period (000s) | Ratio of Expenses to Average Net Assets with Fee Waiver/ Reimbursement | Ratio of Expenses to Average Net Assets without Fee Waiver/ Reimbursement | Ratio of Net Investment Income to Average Net Assets | Portfolio Turnover Rate | ||||||||||||||||||||||||
| $ | 9.66 | (3.40 | )% | $ | 10 | 0.19 | %(c)(d) | 3.70 | %(c)(d) | 1.46 | %(c)(d) | 152 | % | |||||||||||||||||
| $ | 9.65 | (3.50 | )% | $ | 252 | 0.15 | %(c)(d) | 3.27 | %(c)(d) | 1.60 | %(c)(d) | 152 | % | |||||||||||||||||
| $ | 9.67 | (3.30 | )% | $ | 15,027 | 0.09 | %(c)(d) | 3.70 | %(c)(d) | 1.56 | %(c)(d) | 152 | % | |||||||||||||||||
| $ | 9.76 | (2.40 | )% | $ | 10 | 0.02 | %(c)(d) | 1.87 | %(c)(d) | 3.17 | %(c)(d) | 1 | % | |||||||||||||||||
| $ | 9.76 | (2.40 | )% | $ | 60 | 0.07 | %(c)(d) | 2.01 | %(c)(d) | 7.27 | %(c)(d) | 1 | % | |||||||||||||||||
| $ | 9.76 | (2.40 | )% | $ | 24,653 | 0.02 | %(c)(d) | 1.89 | %(d)(c) | 3.18 | %(c)(d) | 1 | % | |||||||||||||||||
| $ | 9.82 | (1.80 | )% | $ | 10 | — | %(c)(d)(e) | 1.58 | %(c)(d) | 1.69 | %(c)(d) | — | %(f) | |||||||||||||||||
| $ | 9.82 | (1.80 | )% | $ | 10 | — | %(c)(d)(e) | 1.58 | %(c)(d) | 1.69 | %(c)(d) | — | %(f) | |||||||||||||||||
| $ | 9.82 | (1.80 | )% | $ | 24,574 | — | %(c)(d)(e) | 1.61 | %(c)(d) | 1.69 | %(c)(d) | — | %(f) | |||||||||||||||||
| $ | 14.98 | 0.28 | % | $ | 10 | 0.68 | %(c)(d) | 3.57 | %(c)(d) | 1.50 | %(c)(d) | 15 | % | |||||||||||||||||
| $ | 14.98 | 0.31 | % | $ | 10,077 | 0.58 | %(c)(d) | 3.59 | %(c)(d) | 1.61 | %(c)(d) | 15 | % | |||||||||||||||||
| See accompanying Notes to Financial Statements | | March 31, 2018 | | Semiannual Report | 293 |
Table of Contents
Financial Highlights (cont’d)
For a Share Outstanding for the Period ended:
| Net Asset Value, Beginning of Period | Net Investment Income (a) | Net Realized and Change in Unrealized Gain (Loss) | Total from Investment Operations | Dividends from Net Investment Income | Distributions from Net Realized Capital Gains | |||||||||||||||||||||||
| AllianzGI Short Duration High Income: | ||||||||||||||||||||||||||||
| Class A | ||||||||||||||||||||||||||||
3/31/2018+ | $ | 15.18 | $ | 0.29 | $ | (0.23 | ) | $ | 0.06 | $ | (0.35 | ) | $ | — | ||||||||||||||
9/30/2017 | 15.29 | 0.60 | 0.04 | 0.64 | (0.75 | ) | — | |||||||||||||||||||||
9/30/2016 | 15.04 | 0.72 | 0.38 | 1.10 | (0.85 | ) | — | |||||||||||||||||||||
12/1/2014 - 9/30/2015# | 15.59 | 0.57 | (0.46 | ) | 0.11 | (0.66 | ) | — | ||||||||||||||||||||
11/30/2014 | 15.92 | 0.64 | (0.23 | ) | 0.41 | (0.74 | ) | — | ||||||||||||||||||||
11/30/2013 | 15.97 | 0.63 | 0.09 | 0.72 | (0.76 | ) | (0.01 | ) | ||||||||||||||||||||
11/30/2012 | 15.32 | 0.64 | 0.68 | 1.32 | (0.67 | ) | — | |||||||||||||||||||||
| Class C | ||||||||||||||||||||||||||||
3/31/2018+ | $ | 15.15 | $ | 0.27 | $ | (0.22 | ) | $ | 0.05 | $ | (0.34 | ) | $ | — | ||||||||||||||
9/30/2017 | 15.27 | 0.56 | 0.03 | 0.59 | (0.71 | ) | — | |||||||||||||||||||||
9/30/2016 | 15.00 | 0.68 | 0.38 | 1.06 | (0.79 | ) | — | |||||||||||||||||||||
12/1/2014 - 9/30/2015# | 15.56 | 0.53 | (0.46 | ) | 0.07 | (0.63 | ) | — | ||||||||||||||||||||
11/30/2014 | 15.89 | 0.60 | (0.23 | ) | 0.37 | (0.70 | ) | — | ||||||||||||||||||||
11/30/2013 | 15.94 | 0.59 | 0.09 | 0.68 | (0.72 | ) | (0.01 | ) | ||||||||||||||||||||
11/30/2012 | 15.31 | 0.58 | 0.64 | 1.22 | (0.59 | ) | — | |||||||||||||||||||||
| Class P | ||||||||||||||||||||||||||||
3/31/2018+ | $ | 15.13 | $ | 0.31 | $ | (0.23 | ) | $ | 0.08 | $ | (0.37 | ) | $ | — | ||||||||||||||
9/30/2017 | 15.24 | 0.63 | 0.05 | 0.68 | (0.79 | ) | — | |||||||||||||||||||||
9/30/2016 | 15.03 | 0.74 | 0.38 | 1.12 | (0.91 | ) | — | |||||||||||||||||||||
12/1/2014 - 9/30/2015# | 15.58 | 0.60 | (0.47 | ) | 0.13 | (0.68 | ) | — | ||||||||||||||||||||
11/30/2014 | 15.92 | 0.66 | (0.23 | ) | 0.43 | (0.77 | ) | — | ||||||||||||||||||||
11/30/2013 | 15.96 | 0.66 | 0.10 | 0.76 | (0.79 | ) | (0.01 | ) | ||||||||||||||||||||
11/30/2012 | 15.32 | 0.66 | 0.68 | 1.34 | (0.70 | ) | — | |||||||||||||||||||||
| Institutional Class | ||||||||||||||||||||||||||||
3/31/2018+ | $ | 15.14 | $ | 0.31 | $ | (0.22 | ) | $ | 0.09 | $ | (0.38 | ) | $ | — | ||||||||||||||
9/30/2017 | 15.25 | 0.64 | 0.04 | 0.68 | (0.79 | ) | — | |||||||||||||||||||||
9/30/2016 | 15.05 | 0.76 | 0.37 | 1.13 | (0.93 | ) | — | |||||||||||||||||||||
12/1/2014 - 9/30/2015# | 15.60 | 0.60 | (0.45 | ) | 0.15 | (0.70 | ) | — | ||||||||||||||||||||
11/30/2014 | 15.94 | 0.68 | (0.24 | ) | 0.44 | (0.78 | ) | — | ||||||||||||||||||||
11/30/2013 | 15.99 | 0.67 | 0.09 | 0.76 | (0.80 | ) | (0.01 | ) | ||||||||||||||||||||
11/30/2012 | 15.32 | 0.70 | 0.67 | 1.37 | (0.70 | ) | — | |||||||||||||||||||||
| Class R6 | ||||||||||||||||||||||||||||
3/31/2018+ | $ | 15.14 | $ | 0.31 | $ | (0.21 | ) | $ | 0.10 | $ | (0.38 | ) | $ | — | ||||||||||||||
2/1/2017* - 9/30/2017 | 15.18 | 0.42 | 0.03 | 0.45 | (0.49 | ) | — | |||||||||||||||||||||
| + | Unaudited |
| # | Fiscal year end changed from November 30th to September 30th. |
| * | Commencement of operations. |
| (a) | Calculated on average shares outstanding during the period. |
| (b) | Total return is calculated assuming a purchase of a share on the first day of the period and a sale of a share on the last day of each period reported. Dividends and distributions, if any, are assumed, for purposes of this calculation, to be reinvested. Total return does not reflect sales charges and includes the effect of fee waivers and reimbursements. Total return may reflect adjustments to conform to U.S. GAAP. Total return for a period of less than one year is not annualized. |
| (c) | Annualized, unless otherwise noted. |
| (d) | Certain expenses incurred by the Fund were not annualized. |
| 294 | Semiannual Report | | March 31, 2018 | | See accompanying Notes to Financial Statements |
Table of Contents
| Total Dividends and Distributions | Net Asset Value, End of Period | Total Return (b) | Net Assets, End of Period (000s) | Ratio of Expenses to Average Net Assets with Fee Waiver/ Reimbursement | Ratio of Expenses to Average Net Assets without Fee Waiver/ Reimbursement | Ratio of Net Investment Income to Average Net Assets | Portfolio Turnover Rate | |||||||||||||||||||||||||||
| $ | (0.35 | ) | $ | 14.89 | 0.43 | % | $ | 197,581 | 0.87 | %(c) | 0.87 | %(c) | 3.89 | %(c) | 27 | % | ||||||||||||||||||
| (0.75 | ) | 15.18 | 4.27 | 218,312 | 0.89 | 0.89 | 3.94 | 88 | ||||||||||||||||||||||||||
| (0.85 | ) | 15.29 | 7.65 | 226,149 | 0.85 | 0.85 | 4.85 | 63 | ||||||||||||||||||||||||||
| (0.66 | ) | 15.04 | 0.67 | 164,978 | 0.86 | (c)(d) | 0.86 | (c)(d) | 4.44 | (c)(d) | 65 | |||||||||||||||||||||||
| (0.74 | ) | 15.59 | 2.60 | 163,070 | 0.85 | 0.88 | 4.01 | 94 | ||||||||||||||||||||||||||
| (0.77 | ) | 15.92 | 4.60 | 168,536 | 0.85 | 0.90 | 3.98 | 63 | ||||||||||||||||||||||||||
| (0.67 | ) | 15.97 | 8.78 | 80,995 | 0.89 | 1.09 | 4.09 | 51 | ||||||||||||||||||||||||||
| $ | (0.34 | ) | $ | 14.86 | 0.31 | % | $ | 138,310 | 1.12 | %(c) | 1.12 | %(c) | 3.65 | %(c) | 27 | % | ||||||||||||||||||
| (0.71 | ) | 15.15 | 4.00 | 148,587 | 1.12 | 1.12 | 3.70 | 88 | ||||||||||||||||||||||||||
| (0.79 | ) | 15.27 | 7.42 | 132,649 | 1.13 | 1.13 | 4.58 | 63 | ||||||||||||||||||||||||||
| (0.63 | ) | 15.00 | 0.38 | 100,557 | 1.15 | (c)(d) | 1.15 | (c)(d) | 4.15 | (c)(d) | 65 | |||||||||||||||||||||||
| (0.70 | ) | 15.56 | 2.38 | 89,801 | 1.10 | 1.13 | 3.78 | 94 | ||||||||||||||||||||||||||
| (0.73 | ) | 15.89 | 4.36 | 63,680 | 1.10 | 1.16 | 3.74 | 63 | ||||||||||||||||||||||||||
| (0.59 | ) | 15.94 | 8.18 | 28,567 | 1.29 | 1.50 | 3.73 | 51 | ||||||||||||||||||||||||||
| $ | (0.37 | ) | $ | 14.84 | 0.53 | % | $ | 383,875 | 0.65 | %(c) | 0.65 | %(c) | 4.07 | %(c) | 27 | % | ||||||||||||||||||
| (0.79 | ) | 15.13 | 4.56 | 700,376 | 0.63 | 0.63 | 4.19 | 88 | ||||||||||||||||||||||||||
| (0.91 | ) | 15.24 | 7.84 | 554,281 | 0.66 | 0.66 | 4.97 | 63 | ||||||||||||||||||||||||||
| (0.68 | ) | 15.03 | 0.83 | 330,431 | 0.64 | (c)(d) | 0.64 | (c)(d) | 4.65 | (c)(d) | 65 | |||||||||||||||||||||||
| (0.77 | ) | 15.58 | 2.74 | 248,345 | 0.70 | 0.70 | 4.20 | 94 | ||||||||||||||||||||||||||
| (0.80 | ) | 15.92 | 4.83 | 121,747 | 0.70 | 0.71 | 4.14 | 63 | ||||||||||||||||||||||||||
| (0.70 | ) | 15.96 | 8.91 | 52,932 | 0.70 | 0.92 | 4.24 | 51 | ||||||||||||||||||||||||||
| $ | (0.38 | ) | $ | 14.85 | 0.57 | % | $ | 428,636 | 0.59 | %(c) | 0.59 | %(c) | 4.15 | %(c) | 27 | % | ||||||||||||||||||
| (0.79 | ) | 15.14 | 4.61 | 539,078 | 0.59 | 0.59 | 4.22 | 88 | ||||||||||||||||||||||||||
| (0.93 | ) | 15.25 | 7.90 | 420,440 | 0.58 | 0.58 | 5.10 | 63 | ||||||||||||||||||||||||||
| (0.70 | ) | 15.05 | 0.91 | 445,473 | 0.60 | (c)(d) | 0.60 | (c)(d) | 4.70 | (c)(d) | 65 | |||||||||||||||||||||||
| (0.78 | ) | 15.60 | 2.81 | 225,643 | 0.60 | 0.60 | 4.28 | 94 | ||||||||||||||||||||||||||
| (0.81 | ) | 15.94 | 4.87 | 179,676 | 0.61 | 0.61 | 4.23 | 63 | ||||||||||||||||||||||||||
| (0.70 | ) | 15.99 | 9.13 | 38,247 | 0.60 | 0.89 | 4.48 | 51 | ||||||||||||||||||||||||||
| $ | (0.38 | ) | $ | 14.86 | 0.63 | % | $ | 53,576 | 0.56 | %(c) | 0.56 | %(c) | 4.20 | %(c) | 27 | % | ||||||||||||||||||
| (0.49 | ) | 15.14 | 3.04 | 70,595 | 0.56 | (c) | 0.56 | (c) | 4.25 | (c) | 88 | |||||||||||||||||||||||
| See accompanying Notes to Financial Statements | | March 31, 2018 | | Semiannual Report | 295 |
Table of Contents
Financial Highlights (cont’d)
For a Share Outstanding for the Period ended:
| Net Asset Value, Beginning of Period | Net Investment Income (Loss) (a) | Net Realized and Change in Unrealized Gain (Loss) | Total from Investment Operations | Dividends from Net Investment Income | Distributions from Net Realized Capital Gains | |||||||||||||||||||||||
| AllianzGI Structured Return: | ||||||||||||||||||||||||||||
| Class A | ||||||||||||||||||||||||||||
3/31/2018+ | $ | 16.26 | $ | 0.04 | $ | (0.27 | ) | $ | (0.23 | ) | $ | (0.10 | ) | $ | (0.51 | ) | ||||||||||||
9/30/2017 | 15.85 | 0.09 | 0.74 | 0.83 | (0.06 | ) | (0.36 | ) | ||||||||||||||||||||
9/30/2016 | 15.47 | 0.15 | 0.51 | 0.66 | (0.10 | ) | (0.18 | ) | ||||||||||||||||||||
12/1/2014 - 9/30/2015# | 15.64 | 0.16 | 0.28 | 0.44 | — | (f) | (0.61 | ) | ||||||||||||||||||||
11/30/2014 | 15.87 | (0.12 | ) | 0.65 | 0.53 | — | (0.76 | ) | ||||||||||||||||||||
12/3/2012* - 11/30/2013 | 15.00 | (0.28 | ) | 1.15 | 0.87 | — | — | |||||||||||||||||||||
| Class C | ||||||||||||||||||||||||||||
3/31/2018+ | $ | 15.73 | $ | (0.02 | ) | $ | (0.27 | ) | $ | (0.29 | ) | $ | — | (f) | $ | (0.51 | ) | |||||||||||
9/30/2017 | 15.39 | (0.04 | ) | 0.74 | 0.70 | — | (f) | (0.36 | ) | |||||||||||||||||||
9/30/2016 | 15.12 | 0.02 | 0.51 | 0.53 | (0.08 | ) | (0.18 | ) | ||||||||||||||||||||
12/1/2014 - 9/30/2015# | 15.39 | 0.09 | 0.25 | 0.34 | — | (f) | (0.61 | ) | ||||||||||||||||||||
11/30/2014 | 15.73 | (0.25 | ) | 0.67 | 0.42 | — | (0.76 | ) | ||||||||||||||||||||
12/3/2012* - 11/30/2013 | 15.00 | (0.39 | ) | 1.12 | 0.73 | — | — | |||||||||||||||||||||
| Class P | ||||||||||||||||||||||||||||
3/31/2018+ | $ | 16.26 | $ | 0.06 | $ | (0.27 | ) | $ | (0.21 | ) | $ | (0.15 | ) | $ | (0.51 | ) | ||||||||||||
9/30/2017 | 15.87 | 0.18 | 0.69 | 0.87 | (0.12 | ) | (0.36 | ) | ||||||||||||||||||||
9/30/2016 | 15.53 | 0.17 | 0.53 | 0.70 | (0.18 | ) | (0.18 | ) | ||||||||||||||||||||
12/1/2014 - 9/30/2015# | 15.69 | 0.21 | 0.24 | 0.45 | — | (f) | (0.61 | ) | ||||||||||||||||||||
11/30/2014 | 15.89 | (0.15 | ) | 0.71 | 0.56 | — | (0.76 | ) | ||||||||||||||||||||
12/3/2012* - 11/30/2013 | 15.00 | (0.26 | ) | 1.15 | 0.89 | — | — | |||||||||||||||||||||
| Institutional Class | ||||||||||||||||||||||||||||
3/31/2018+ | $ | 16.42 | $ | 0.07 | $ | (0.28 | ) | $ | (0.21 | ) | $ | (0.15 | ) | $ | (0.51 | ) | ||||||||||||
9/30/2017 | 15.96 | 0.14 | 0.74 | 0.88 | (0.06 | ) | (0.36 | ) | ||||||||||||||||||||
9/30/2016 | 15.54 | 0.19 | 0.52 | 0.71 | (0.11 | ) | (0.18 | ) | ||||||||||||||||||||
12/1/2014 - 9/30/2015# | 15.72 | 0.22 | 0.24 | 0.46 | (0.03 | ) | (0.61 | ) | ||||||||||||||||||||
11/30/2014 | 15.90 | (0.08 | ) | 0.66 | 0.58 | — | (0.76 | ) | ||||||||||||||||||||
12/3/2012* - 11/30/2013 | 15.00 | (0.24 | ) | 1.14 | 0.90 | — | — | |||||||||||||||||||||
| Class R6 | ||||||||||||||||||||||||||||
3/31/2018+ | $ | 16.32 | $ | 0.07 | $ | (0.28 | ) | $ | (0.21 | ) | $ | (0.12 | ) | $ | (0.51 | ) | ||||||||||||
12/5/2016* - 9/30/2017 | 16.13 | 0.15 | 0.58 | 0.73 | (0.18 | ) | (0.36 | ) | ||||||||||||||||||||
| + | Unaudited |
| # | Fiscal year end changed from November 30th to September 30th. |
| * | Commencement of operations. |
| (a) | Calculated on average shares outstanding during the period. |
| (b) | Total return is calculated assuming a purchase of a share on the first day of the period and a sale of a share on the last day of each period reported. Dividends and distributions, if any, are assumed, for purposes of this calculation, to be reinvested. Total return does not reflect sales charges and includes the effect of fee waivers and reimbursements. Total return may reflect adjustments to conform to U.S. GAAP. Total return for a period of less than one year is not annualized. |
| (c) | Annualized, unless otherwise noted. |
| (d) | Payments from Affiliates increased the end of period net asset value and total return by less than $0.01 and 0.01%, respectively. |
| (e) | Does not include expenses of the investment companies in which the Fund invests. |
| (f) | Actual amount rounds to less than $(0.01) per share. |
| (g) | Certain expenses incurred by the Fund were not annualized. |
| 296 | Semiannual Report | | March 31, 2018 | | See accompanying Notes to Financial Statements |
Table of Contents
| Total Dividends and Distributions | Net Asset Value, End of Period | Total Return (b) | Net Assets, End of Period (000s) | Ratio of Expenses to Average Net Assets with Fee Waiver/ Reimbursement | Ratio of Expenses to Average Net Assets without Fee Waiver/ Reimbursement | Ratio of Net Investment Income (Loss) to Average Net Assets | Portfolio Turnover Rate | |||||||||||||||||||||||||||
| $ | (0.61 | ) | $ | 15.42 | (1.50 | )% | $ | 129,425 | 0.98 | %(c) | 1.03 | %(c) | 0.56 | %(c) | 306 | % | ||||||||||||||||||
| (0.42 | ) | 16.26 | (d) | 5.35 | (d) | 136,344 | 1.02 | (e) | 1.15 | (e) | 0.57 | (e) | 680 | |||||||||||||||||||||
| (0.28 | ) | 15.85 | 4.32 | 96,870 | 1.15 | (e) | 1.17 | (e) | 0.95 | (e) | 500 | |||||||||||||||||||||||
| (0.61 | ) | 15.47 | 2.93 | 8,014 | 1.15 | (c)(e)(g) | 1.58 | (c)(e)(g) | 1.28 | (c)(e)(g) | 34 | |||||||||||||||||||||||
| (0.76 | ) | 15.64 | 3.52 | 2,551 | 1.52 | 4.22 | (0.75 | ) | 229 | |||||||||||||||||||||||||
| — | 15.87 | 5.80 | 517 | 1.90 | (c) | 7.34 | (c) | (1.86 | )(c) | — | ||||||||||||||||||||||||
| $ | (0.51 | ) | $ | 14.93 | (1.93 | )% | $ | 17,908 | 1.78 | %(c) | 1.79 | %(c) | (0.25 | )%(c) | 306 | % | ||||||||||||||||||
| (0.36 | ) | 15.73 | (d) | 4.61 | (d) | 16,535 | 1.80 | (e) | 1.87 | (e) | (0.24 | )(e) | 680 | |||||||||||||||||||||
| (0.26 | ) | 15.39 | 3.52 | 12,605 | 1.90 | (e) | 1.97 | (e) | 0.10 | (e) | 500 | |||||||||||||||||||||||
| (0.61 | ) | 15.12 | 2.31 | 3,803 | 1.90 | (c)(e)(g) | 2.09 | (c)(e)(g) | 0.70 | (c)(e)(g) | 34 | |||||||||||||||||||||||
| (0.76 | ) | 15.39 | 2.82 | 138 | 2.31 | 4.74 | (1.64 | ) | 229 | |||||||||||||||||||||||||
| — | 15.73 | 4.87 | 74 | 2.65 | (c) | 6.91 | (c) | (2.60 | )(c) | — | ||||||||||||||||||||||||
| $ | (0.66 | ) | $ | 15.39 | (1.40 | )% | $ | 145,950 | 0.77 | %(c) | 0.77 | %(c) | 0.78 | %(c) | 306 | % | ||||||||||||||||||
| (0.48 | ) | 16.26 | (d) | 5.59 | (d) | 136,127 | 0.79 | (e) | 0.83 | (e) | 1.12 | (e) | 680 | |||||||||||||||||||||
| (0.36 | ) | 15.87 | 4.55 | 20,664 | 0.96 | (e) | 0.96 | (e) | 1.11 | (e) | 500 | |||||||||||||||||||||||
| (0.61 | ) | 15.53 | 2.99 | 503 | 1.00 | (c)(e)(g) | 1.16 | (c)(e)(g) | 1.67 | (c)(e)(g) | 34 | |||||||||||||||||||||||
| (0.76 | ) | 15.69 | 3.72 | 37 | 1.50 | 3.73 | (1.00 | ) | 229 | |||||||||||||||||||||||||
| — | 15.89 | 5.93 | 61 | 1.75 | (c) | 5.97 | (c) | (1.69 | )(c) | — | ||||||||||||||||||||||||
| $ | (0.66 | ) | $ | 15.55 | (1.37 | )% | $ | 275,206 | 0.69 | %(c) | 0.75 | %(c) | 0.89 | %(c) | 306 | % | ||||||||||||||||||
| (0.42 | ) | 16.42 | (d) | 5.62 | (d) | 205,068 | 0.74 | (e) | 0.87 | (e) | 0.86 | (e) | 680 | |||||||||||||||||||||
| (0.29 | ) | 15.96 | 4.60 | 146,194 | 0.90 | (e) | 0.90 | (e) | 1.21 | (e) | 500 | |||||||||||||||||||||||
| (0.64 | ) | 15.54 | 3.08 | 55,028 | 0.90 | (c)(e)(g) | 1.22 | (c)(e)(g) | 1.71 | (c)(e)(g) | 34 | |||||||||||||||||||||||
| (0.76 | ) | 15.72 | 3.84 | 15,142 | 1.28 | 3.65 | (0.54 | ) | 229 | |||||||||||||||||||||||||
| — | 15.90 | 6.00 | 7,978 | 1.65 | (c) | 5.64 | (c) | (1.60 | )(c) | — | ||||||||||||||||||||||||
| $ | (0.63 | ) | $ | 15.48 | (1.37 | )% | $ | 36,851 | 0.67 | %(c) | 0.70 | %(c) | 0.85 | %(c) | 306 | % | ||||||||||||||||||
| (0.54 | ) | 16.32 | (d) | 4.64 | (d) | 34,047 | 0.68 | (c)(e) | 0.76 | (c)(e) | 1.17 | (c)(e) | 680 | |||||||||||||||||||||
| See accompanying Notes to Financial Statements | | March 31, 2018 | | Semiannual Report | 297 |
Table of Contents
Financial Highlights (cont’d)
For a Share Outstanding for the Period ended:
| Net Asset Value, Beginning of Period | Net Investment Income (Loss) (a) | and Change in Unrealized Gain | Total from Investment Operations | Dividends from Net Investment Income | Distributions from Net Realized Capital Gains | |||||||||||||||||||||||
| AllianzGI U.S. Equity Hedged: | ||||||||||||||||||||||||||||
| Class A | ||||||||||||||||||||||||||||
3/31/2018+ | $ | 17.80 | $ | 0.04 | $ | 0.04 | $ | 0.08 | $ | (0.30 | ) | $ | — | |||||||||||||||
9/30/2017 | 16.20 | 0.13 | 1.71 | 1.84 | (0.24 | ) | — | |||||||||||||||||||||
9/30/2016 | 15.79 | 0.11 | 0.53 | 0.64 | (0.23 | ) | — | |||||||||||||||||||||
12/1/2014 - 9/30/2015# | 17.74 | 0.14 | (1.09 | ) | (0.95 | ) | (0.02 | ) | (0.98 | ) | ||||||||||||||||||
11/30/2014 | 17.26 | 0.12 | 1.45 | 1.57 | (0.15 | ) | (0.94 | ) | ||||||||||||||||||||
12/3/2012* - 11/30/2013 | 15.00 | 0.12 | 2.14 | 2.26 | — | — | ||||||||||||||||||||||
| Class C | ||||||||||||||||||||||||||||
3/31/2018+ | $ | 17.06 | $ | (0.02 | ) | $ | 0.04 | $ | 0.02 | $ | (0.22 | ) | $ | — | ||||||||||||||
9/30/2017 | 15.59 | — | (g) | 1.63 | 1.63 | (0.16 | ) | — | ||||||||||||||||||||
9/30/2016 | 15.43 | 0.01 | 0.51 | 0.52 | (0.36 | ) | — | |||||||||||||||||||||
12/1/2014 - 9/30/2015# | 17.45 | 0.05 | (1.09 | ) | (1.04 | ) | — | (g) | (0.98 | ) | ||||||||||||||||||
11/30/2014 | 17.14 | (0.01 | ) | 1.44 | 1.43 | (0.18 | ) | (0.94 | ) | |||||||||||||||||||
12/3/2012* - 11/30/2013 | 15.00 | — | (g) | 2.14 | 2.14 | — | — | |||||||||||||||||||||
| Class P | ||||||||||||||||||||||||||||
3/31/2018+ | $ | 17.61 | $ | 0.05 | $ | 0.06 | $ | 0.11 | $ | (0.38 | ) | $ | — | |||||||||||||||
9/30/2017 | 16.18 | 0.18 | 1.65 | 1.83 | (0.40 | ) | — | |||||||||||||||||||||
9/30/2016 | 15.92 | 0.14 | 0.54 | 0.68 | (0.42 | ) | — | |||||||||||||||||||||
12/1/2014 - 9/30/2015# | 17.90 | 0.15 | (1.10 | ) | (0.95 | ) | (0.05 | ) | (0.98 | ) | ||||||||||||||||||
11/30/2014 | 17.29 | 0.15 | 1.47 | 1.62 | (0.07 | ) | (0.94 | ) | ||||||||||||||||||||
12/3/2012* - 11/30/2013 | 15.00 | 0.15 | 2.14 | 2.29 | — | — | ||||||||||||||||||||||
| Institutional Class | ||||||||||||||||||||||||||||
3/31/2018+ | $ | 17.92 | $ | 0.07 | $ | 0.03 | $ | 0.10 | $ | (0.20 | ) | $ | — | |||||||||||||||
9/30/2017 | 16.24 | 0.14 | 1.74 | 1.88 | (0.20 | ) | — | |||||||||||||||||||||
9/30/2016 | 15.86 | 0.11 | 0.59 | 0.70 | (0.32 | ) | — | |||||||||||||||||||||
12/1/2014 - 9/30/2015# | 17.89 | 0.18 | (1.11 | ) | (0.93 | ) | (0.12 | ) | (0.98 | ) | ||||||||||||||||||
11/30/2014 | 17.31 | 0.17 | 1.46 | 1.63 | (0.11 | ) | (0.94 | ) | ||||||||||||||||||||
12/3/2012* - 11/30/2013 | 15.00 | 0.17 | 2.14 | 2.31 | — | — | ||||||||||||||||||||||
| + | Unaudited |
| # | Fiscal year end changed from November 30th to September 30th. |
| * | Commencement of operations. |
| (a) | Calculated on average shares outstanding during the period. |
| (b) | Total return is calculated assuming a purchase of a share on the first day of the period and a sale of a share on the last day of each period reported. Dividends and distributions, if any, are assumed, for purposes of this calculation, to be reinvested. Total return does not reflect sales charges and includes the effect of fee waivers and reimbursements. Total return may reflect adjustments to conform to U.S. GAAP. Total return for a period of less than one year is not annualized. |
| (c) | Annualized, unless otherwise noted. |
| (d) | Does not include expenses of the investment companies in which the Fund invests. |
| (e) | Payments from Affiliates increased the end of period net asset value and total return by less than $0.01 and 0.01%, respectively. |
| (f) | Certain expenses incurred by the Fund were not annualized. |
| (g) | Actual amount rounds to less than $(0.01) per share. |
| 298 | Semiannual Report | | March 31, 2018 | | See accompanying Notes to Financial Statements |
Table of Contents
| Total Dividends and Distributions | Net Asset Value, End of Period | Total Return (b) | Net Assets, End of Period (000s) | Ratio of Expenses to Average Net Assets with Fee Waiver/ Reimbursement | Ratio of Expenses to Average Net Assets without Fee Waiver/ Reimbursement | Ratio of Net Investment Income (Loss) to Average Net Assets | Portfolio Turnover Rate | |||||||||||||||||||||||||||
| $ | (0.30 | ) | $ | 17.58 | 0.37 | % | $ | 519 | 1.25 | %(c) | 10.34 | %(c) | 0.46 | %(c) | 3 | % | ||||||||||||||||||
| (0.24 | ) | 17.80 | 11.44 | 582 | 1.25 | (d) | 8.26 | (d) | 0.75 | (d) | — | |||||||||||||||||||||||
| (0.23 | ) | 16.20 | (e) | 4.11 | (e) | 624 | 1.25 | (d) | 3.63 | (d) | 0.70 | (d) | 6 | |||||||||||||||||||||
| (1.00 | ) | 15.79 | (5.68 | ) | 1,067 | 1.26 | (c)(d)(f) | 2.31 | (c)(d)(f) | 0.98 | (c)(d)(f) | 98 | ||||||||||||||||||||||
| (1.09 | ) | 17.74 | (e) | 9.57 | (e) | 1,491 | 1.25 | 3.70 | 0.70 | 5 | ||||||||||||||||||||||||
| — | 17.26 | 15.07 | 1,416 | 1.25 | (c) | 9.81 | (c) | 0.74 | (c) | 6 | ||||||||||||||||||||||||
| $ | (0.22 | ) | $ | 16.86 | 0.05 | % | $ | 262 | 2.00 | %(c) | 9.05 | %(c) | (0.26 | )%(c) | 3 | % | ||||||||||||||||||
| (0.16 | ) | 17.06 | 10.51 | 278 | 2.00 | (d) | 6.58 | (d) | (0.01 | )(d) | — | |||||||||||||||||||||||
| (0.36 | ) | 15.59 | (e) | 3.42 | (e) | 271 | 2.00 | (d) | 4.37 | (d) | 0.06 | (d) | 6 | |||||||||||||||||||||
| (0.98 | ) | 15.43 | (6.31 | ) | 280 | 2.01 | (c)(d)(f) | 2.93 | (c)(d)(f) | 0.36 | (c)(d)(f) | 98 | ||||||||||||||||||||||
| (1.12 | ) | 17.45 | (e) | 8.78 | (e) | 180 | 2.00 | 4.48 | (0.05 | ) | 5 | |||||||||||||||||||||||
| — | 17.14 | 14.27 | 122 | 2.00 | (c) | 11.10 | (c) | (0.01 | )(c) | 6 | ||||||||||||||||||||||||
| $ | (0.38 | ) | $ | 17.34 | 0.51 | % | $ | 14 | 1.10 | %(c) | 7.99 | %(c) | 0.59 | %(c) | 3 | % | ||||||||||||||||||
| (0.40 | ) | 17.61 | 11.51 | 19 | 1.10 | (d) | 5.59 | (d) | 1.05 | (d) | — | |||||||||||||||||||||||
| (0.42 | ) | 16.18 | (e) | 4.31 | (e) | 12 | 1.10 | (d) | 3.29 | (d) | 0.91 | (d) | 6 | |||||||||||||||||||||
| (1.03 | ) | 15.92 | (5.62 | ) | 12 | 1.11 | (c)(d)(f) | 1.91 | (c)(d)(f) | 1.06 | (c)(d)(f) | 98 | ||||||||||||||||||||||
| (1.01 | ) | 17.90 | (e) | 9.77 | (e) | 13 | 1.10 | 3.38 | 0.85 | 5 | ||||||||||||||||||||||||
| — | 17.29 | 15.27 | 12 | 1.11 | (c) | 8.71 | (c) | 0.96 | (c) | 6 | ||||||||||||||||||||||||
| $ | (0.20 | ) | $ | 17.82 | 0.52 | % | $ | 1,560 | 1.00 | %(c) | 8.07 | %(c) | 0.76 | %(c) | 3 | % | ||||||||||||||||||
| (0.20 | ) | 17.92 | 11.66 | 1,705 | 1.00 | (d) | 5.12 | (d) | 0.81 | (d) | — | |||||||||||||||||||||||
| (0.32 | ) | 16.24 | (e) | 4.45 | (e) | 4,745 | 1.00 | (d) | 3.09 | (d) | 0.68 | (d) | 6 | |||||||||||||||||||||
| (1.10 | ) | 15.86 | (5.55 | ) | 12,973 | 1.01 | (c)(d)(f) | 1.98 | (c)(d)(f) | 1.27 | (c)(d)(f) | 98 | ||||||||||||||||||||||
| (1.05 | ) | 17.89 | (e) | 9.87 | (e) | 12,678 | 1.00 | 3.04 | 1.00 | 5 | ||||||||||||||||||||||||
| — | 17.31 | 15.40 | 5,395 | 1.00 | (c) | 8.82 | (c) | 1.05 | (c) | 6 | ||||||||||||||||||||||||
| See accompanying Notes to Financial Statements | | March 31, 2018 | | Semiannual Report | 299 |
Table of Contents
Financial Highlights (cont’d)
For a Share Outstanding for the Period ended:
| Net Asset Value, Beginning of Period | Net Investment Income (Loss) (a) | Unrealized Gain (Loss) | Total from Investment Operations | Distributions from Net Realized Capital Gains | ||||||||||||||||||||
| AllianzGI Ultra Micro Cap: | ||||||||||||||||||||||||
| Class A | ||||||||||||||||||||||||
3/31/2018+ | $ | 23.68 | $ | (0.20 | ) | $ | — | $ | (0.20 | ) | $ | (5.58 | ) | |||||||||||
9/30/2017 | 21.85 | (0.42 | ) | 4.04 | 3.62 | (1.79 | ) | |||||||||||||||||
9/30/2016 | 22.58 | (0.38 | ) | 1.64 | 1.26 | (1.99 | ) | |||||||||||||||||
12/1/2014 - 9/30/2015# | 23.75 | (0.35 | ) | (0.61 | ) | (0.96 | ) | (0.21 | ) | |||||||||||||||
11/30/2014 | 24.34 | (0.44 | ) | (0.04 | ) | (0.48 | ) | (0.11 | ) | |||||||||||||||
11/30/2013 | 15.53 | (0.29 | ) | 9.11 | 8.82 | (0.01 | ) | |||||||||||||||||
12/19/2011* - 11/30/2012 | 12.82 | (0.14 | ) | 2.85 | 2.71 | — | ||||||||||||||||||
| Class P | ||||||||||||||||||||||||
3/31/2018+ | $ | 24.03 | $ | (0.17 | ) | $ | 0.01 | $ | (0.16 | ) | $ | (5.58 | ) | |||||||||||
9/30/2017 | 22.08 | (0.35 | ) | 4.09 | 3.74 | (1.79 | ) | |||||||||||||||||
9/30/2016 | 22.74 | (0.32 | ) | 1.65 | 1.33 | (1.99 | ) | |||||||||||||||||
12/1/2014 - 9/30/2015# | 23.86 | (0.30 | ) | (0.61 | ) | (0.91 | ) | (0.21 | ) | |||||||||||||||
11/30/2014 | 24.40 | (0.39 | ) | (0.04 | ) | (0.43 | ) | (0.11 | ) | |||||||||||||||
11/30/2013 | 15.54 | (0.24 | ) | 9.11 | 8.87 | (0.01 | ) | |||||||||||||||||
11/30/2012 | 13.26 | (0.20 | ) | 2.71 | 2.51 | (0.23 | ) | |||||||||||||||||
| Institutional Class | ||||||||||||||||||||||||
3/31/2018+ | $ | 24.08 | $ | (0.17 | ) | $ | — | $ | (0.17 | ) | $ | (5.58 | ) | |||||||||||
9/30/2017 | 22.13 | (0.36 | ) | 4.10 | 3.74 | (1.79 | ) | |||||||||||||||||
9/30/2016 | 22.77 | (0.32 | ) | 1.67 | 1.35 | (1.99 | ) | |||||||||||||||||
12/1/2014 - 9/30/2015# | 23.93 | (0.34 | ) | (0.61 | ) | (0.95 | ) | (0.21 | ) | |||||||||||||||
11/30/2014 | 24.49 | (0.40 | ) | (0.05 | ) | (0.45 | ) | (0.11 | ) | |||||||||||||||
11/30/2013 | 15.59 | (0.26 | ) | 9.17 | 8.91 | (0.01 | ) | |||||||||||||||||
11/30/2012 | 13.29 | (0.19 | ) | 2.72 | 2.53 | (0.23 | ) | |||||||||||||||||
| + | Unaudited |
| # | Fiscal year end changed from November 30th to September 30th. |
| * | Commencement of operations. |
| (a) | Calculated on average shares outstanding during the period. |
| (b) | Total return is calculated assuming a purchase of a share on the first day of the period and a sale of a share on the last day of each period reported. Dividends and distributions, if any, are assumed, for purposes of this calculation, to be reinvested. Total return does not reflect sales charges and includes the effect of fee waivers and reimbursements. Total return may reflect adjustments to conform to U.S. GAAP. Total return for a period of less than one year is not annualized. |
| (c) | Annualized, unless otherwise noted. |
| (d) | Payments from Affiliates increased the end of period net asset value and total return by less than $0.01 and 0.01%, respectively. |
| (e) | Certain expenses incurred by the Fund were not annualized. |
| 300 | Semiannual Report | | March 31, 2018 | | See accompanying Notes to Financial Statements |
Table of Contents
| Net Asset Value, End of Period | Total Return (b) | Net Assets, End of Period (000s) | Ratio of Expenses to Average Net Assets with Fee Waiver/ Reimbursement | Ratio of Expenses to Average Net Assets without Fee Waiver/ Reimbursement | Ratio of Net Investment Income (Loss) to Average Net Assets | Portfolio Turnover Rate | ||||||||||||||||||||||||
| $ | 17.90 | (0.89 | )% | $ | 9,764 | 2.22 | %(c) | 2.53 | %(c) | (2.02 | )%(c) | 20 | % | |||||||||||||||||
| 23.68 | (d) | 17.69 | (d) | 12,331 | 2.35 | 2.40 | (1.93 | ) | 33 | |||||||||||||||||||||
| 21.85 | 5.73 | 19,312 | 2.26 | 2.26 | (1.83 | ) | 32 | |||||||||||||||||||||||
| 22.58 | (4.08 | ) | 41,119 | 2.08 | (c)(e) | 2.08 | (c)(e) | (1.70 | )(c)(e) | 43 | ||||||||||||||||||||
| 23.75 | (1.98 | ) | 53,192 | 2.16 | 2.16 | (1.81 | ) | 66 | ||||||||||||||||||||||
| 24.34 | 56.82 | 61,525 | 2.20 | 2.30 | (1.41 | ) | 59 | |||||||||||||||||||||||
| 15.53 | 21.14 | 6,862 | 2.36 | (c) | 3.36 | (c) | (0.96 | )(c) | 114 | |||||||||||||||||||||
| $ | 18.29 | (0.68 | )% | $ | 4,100 | 1.88 | %(c) | 2.18 | %(c) | (1.68 | )%(c) | 20 | % | |||||||||||||||||
| 24.03 | (d) | 18.07 | (d) | 4,478 | 2.02 | 2.07 | (1.62 | ) | 33 | |||||||||||||||||||||
| 22.08 | 6.02 | 5,343 | 1.97 | 1.97 | (1.54 | ) | 32 | |||||||||||||||||||||||
| 22.74 | (3.84 | ) | 7,710 | 1.81 | (c)(e) | 1.81 | (c)(e) | (1.42 | )(c)(e) | 43 | ||||||||||||||||||||
| 23.86 | (1.77 | ) | 10,561 | 1.94 | 1.94 | (1.67 | ) | 66 | ||||||||||||||||||||||
| 24.40 | 57.10 | 858 | 2.01 | 2.07 | (1.19 | ) | 59 | |||||||||||||||||||||||
| 15.54 | 19.26 | 252 | 2.18 | 3.08 | (1.38 | ) | 114 | |||||||||||||||||||||||
| $ | 18.33 | (0.72 | )% | $ | 18,761 | 1.88 | %(c) | 2.18 | %(c) | (1.68 | )%(c) | 20 | % | |||||||||||||||||
| 24.08 | (d) | 18.04 | (d) | 21,208 | 2.06 | 2.12 | (1.65 | ) | 33 | |||||||||||||||||||||
| 22.13 | 6.10 | 23,504 | 1.94 | 1.94 | (1.52 | ) | 32 | |||||||||||||||||||||||
| 22.77 | (4.00 | ) | 43,621 | 1.97 | (c)(e) | 1.97 | (c)(e) | (1.60 | )(c)(e) | 43 | ||||||||||||||||||||
| 23.93 | (1.84 | ) | 49,525 | 2.00 | 2.00 | (1.65 | ) | 66 | ||||||||||||||||||||||
| 24.49 | 57.18 | 62,641 | 2.00 | 2.00 | (1.24 | ) | 59 | |||||||||||||||||||||||
| 15.59 | 19.37 | 9,296 | 2.08 | 3.15 | (1.32 | ) | 114 | |||||||||||||||||||||||
| See accompanying Notes to Financial Statements | | March 31, 2018 | | Semiannual Report | 301 |
Table of Contents
March 31, 2018 (Unaudited)
| 1. | ORGANIZATION AND SIGNIFICANT ACCOUNTING POLICIES |
Allianz Funds Multi-Strategy Trust (the “Trust”) is registered under the Investment Company Act of 1940, as amended, (the “1940 Act”), as an open-end registered investment management company organized as a Massachusetts business trust and accordingly, follows the investment company accounting and reporting guidance of the Financial Accounting Standards Board (“FASB”) Accounting Standards Codification Topic 946 Financial Services-Investment Companies. As of March 31, 2018, the Trust consisted of thirty-eight separate investment series (each a “Fund” and together the “Funds”). Allianz Global Investors U.S. LLC (“AllianzGI U.S.” or the “Investment Manager”) serves as the Funds’ investment manager. The Investment Manager is an indirect wholly-owned subsidiary of Allianz Asset Management of America L.P. (“AAM”). AAM is an indirect, wholly-owned subsidiary of Allianz SE, a publicly traded European insurance and financial services company. Currently, the Trust offers up to seven classes of shares to new and existing investors: A, C, R, P, Institutional, R6 and Administrative. Shares of AllianzGI Convertible are currently not available for purchase by any new investor, and shareholders of other series of the Trust or series of Allianz Funds are no longer permitted to exchange any of their shares for shares of AllianzGI Convertible, with certain exceptions.
The following Funds sold and issued shares of beneficial interest to Allianz Funds Investments, Inc. (“AFI”) during the period ended March 31, 2018 and year ended September 30, 2017. AFI is an indirect, wholly-owned subsidiary of Allianz SE.
| AllianzGI Global High Yield | ||||||||||||
| Class | Date | Shares | Amount | |||||||||
P | 5/3/17 | 667 | $ | 10,000 | ||||||||
Institutional | 5/3/17 | 1,333,333 | 20,000,000 | |||||||||
Totals | 1,334,000 | $ | 20,010,000 | |||||||||
| AllianzGI Multi Asset Income | ||||||||||||
| Class | Date | Shares | Amount | |||||||||
Institutional | 2/1/18 | 560 | $ | 10,000 | ||||||||
| AllianzGI PerformanceFee Managed Futures Strategy | ||||||||||||
| Class | Date | Shares | Amount | |||||||||
P | 12/18/17 | 1,000 | $ | 10,000 | ||||||||
Institutional | 12/18/17 | 1,000 | 10,000 | |||||||||
R6 | 12/18/17 | 3,000 | 30,000 | |||||||||
Totals | 5,000 | $ | 50,000 | |||||||||
| AllianzGI Real Estate Debt | ||||||||||||
| Class | Date | Shares | Amount | |||||||||
P | 12/27/17 | 667 | $ | 10,000 | ||||||||
Institutional | 12/27/17 | 666,666 | 10,000,000 | |||||||||
Totals | 667,333 | $ | 10,010,000 | |||||||||
| AllianzGI Short Duration High Income | ||||||||||||
| Class | Date | Shares | Amount | |||||||||
R6 | 2/1/17 | 659 | $ | 10,000 | ||||||||
| AllianzGI Structured Return | ||||||||||||
| Class | Date | Shares | Amount | |||||||||
R6 | 12/2/16 | 620 | $ | 10,000 | ||||||||
The following Funds sold and issued shares of beneficial interest to Allianz of America, Inc. (“Allianz of America”) during the period ended March 31, 2018. Allianz of America is an indirect, wholly-owned subsidiary of Allianz SE.
| AllianzGI PerformanceFee Structured US Equity | ||||||||||||
| Class | Date | Shares | Amount | |||||||||
P | 12/18/17 | 1,000 | $ | 10,000 | ||||||||
Institutional | 12/18/17 | 1,000 | 10,000 | |||||||||
R6 | 12/18/17 | 2,498,000 | 24,980,000 | |||||||||
Totals | 2,500,000 | $ | 25,000,000 | |||||||||
| AllianzGI PerformanceFee Structured US Fixed Income | ||||||||||||
| Class | Date | Shares | Amount | |||||||||
P | 12/18/17 | 1,000 | $ | 10,000 | ||||||||
Institutional | 12/18/17 | 1,000 | 10,000 | |||||||||
R6 | 12/18/17 | 2,498,000 | 24,980,000 | |||||||||
Totals | 2,500,000 | $ | 25,000,000 | |||||||||
| 302 | March 31, 2018 | | Semiannual Report |
Table of Contents
The investment objective of each Fund is disclosed below. There can be no assurance that the Funds will meet their stated objectives.
| Investment Objective | ||
| AllianzGI Retirement 2020 | The Funds seek capital growth and preservation consistent with its asset allocation as the target date in the Fund name approaches, and thereafter current income and, secondarily, capital appreciation. | |
| AllianzGI Retirement 2025 | ||
| AllianzGI Retirement 2030 | ||
| AllianzGI Retirement 2035 | ||
| AllianzGI Retirement 2040 | ||
| AllianzGI Retirement 2045 | ||
| AllianzGI Retirement 2050 | ||
| AllianzGI Retirement 2055 | ||
| AllianzGI Multi Asset Income | The Fund seeks current income, and secondarily, capital appreciation. The Fund is intended for investors who have already retired or begun withdrawing portions of their investments, or are seeking a conservative allocation fund. | |
| AllianzGI Global Allocation | The Fund seeks after-inflation capital appreciation and current income. | |
| AllianzGI Best Styles Emerging Markets Equity | The Funds seek long-term capital appreciation. | |
| AllianzGI Best Styles Global Equity | ||
| AllianzGI Best Styles International Equity | ||
| AllianzGI Best Styles U.S. Equity | ||
| AllianzGI Emerging Markets Consumer | ||
| AllianzGI Emerging Markets Small-Cap | ||
| AllianzGI Europe Equity Dividend | ||
| AllianzGI Global Dynamic Allocation | ||
| AllianzGI Global Sustainability | ||
| AllianzGI Global Water | ||
| AllianzGI International Growth | ||
| AllianzGI NFJ Emerging Markets Value | ||
| AllianzGI NFJ International Small-Cap Value | ||
| AllianzGI PerformanceFee Managed Futures Strategy | ||
| AllianzGI Structured Return | ||
| AllianzGI Convertible | The Fund seeks maximum total return, consisting of capital appreciation and current income. | |
| AllianzGI Emerging Markets Debt | The Fund seeks long-term capital appreciation and current income. | |
| AllianzGI Global Fundamental Strategy | The Fund seeks to generate positive real absolute returns through a complete market cycle (rolling 3-year period) by investing in a broad range of global asset classes. | |
| AllianzGI Global High Yield | The Fund seeks total return with a controlled level of portfolio risk. | |
| AllianzGI High Yield Bond | The Fund seeks a high level of current income and capital growth. | |
| AllianzGI International Small-Cap | The Funds seek maximum long-term capital appreciation. | |
| AllianzGI Micro Cap | ||
| AllianzGI Ultra Micro Cap | ||
| AllianzGI PerformanceFee Structured US Equity | The Fund seeks to earn total return that exceeds the return of the S&P 500 Index. | |
| AllianzGI PerformanceFee Structured US Fixed Income | The Fund seeks to earn total return that exceeds the return of the Bloomberg Barclays U.S. Aggregate Bond Index. | |
| AllianzGI Real Estate Debt | The Fund seeks to achieve total return in excess of traditional, shorter-duration debt products while managing portfolio risk. | |
| AllianzGI Short Duration High Income | The Fund seeks a high level of current income with lower volatility than the broader high yield market. | |
| AllianzGI U.S. Equity Hedged | The Fund seeks capital appreciation, with added emphasis on the protection of capital during unfavorable market conditions. |
| Semiannual Report | | March 31, 2018 | 303 |
Table of Contents
Notes to Financial Statements (cont’d)
March 31, 2018 (Unaudited)
The preparation of the Funds’ financial statements in accordance with accounting principles generally accepted in the United States of America (“U.S. GAAP”) requires the Funds’ management to make estimates and assumptions that affect the reported amounts and disclosures in each Fund’s financial statements. Actual results could differ from those estimates.
In the normal course of business, the Funds enter into contracts that contain a variety of representations that provide general indemnifications. The Funds’ maximum exposures under these arrangements are unknown as this would involve future claims that may be made against the Funds that have not yet occurred. However, based on experience, the risk of loss is expected to be remote.
In March 2017, the FASB issued Accounting Standards update (“ASU”) 2017-08 which changes the amortization period for a callable debt security from the maturity date to the earliest call date. The ASU is effective for annual periods beginning after December 15, 2018, and interim periods within those annual periods. At this time, management is evaluating the implications of these changes on the financial statements.
The following is a summary of significant accounting policies consistently followed by the Funds:
(a) Valuation of Investments. Portfolio securities and other financial instruments for which market quotations are readily available are stated at market value. Market value is generally determined on the basis of official closing prices, last reported sales prices, or if no sales or closing prices are reported, on the basis of quotes obtained from a quotation reporting system, established market makers, or independent pricing services. Investments in mutual funds are valued at the net asset value per share (“NAV”) as reported on each business day. The Funds’ investments are valued daily using prices supplied by an independent pricing service or broker/dealer quotations, or by using the last sale or settlement price on the exchange that is the primary market for such securities, or the mean between the last bid and ask quotations. The market value for NASDAQ Global Market and NASDAQ Capital Market securities may also be calculated using the NASDAQ Official Closing Price instead of the last reported sales price. Independent pricing services use information provided by market makers or estimates of market values obtained from yield data relating to investments or securities with similar characteristics. Centrally cleared swaps and exchange traded futures are valued at the price determined by the relevant exchange. Securities purchased on a when-issued or delayed-delivery basis are marked to market daily until settlement at the forward settlement date.
The Board of Trustees of each Fund (together the “Board”) has adopted procedures for valuing portfolio securities and other financial instruments in circumstances where market quotations are not readily available (including in cases where available market quotations are deemed to be unreliable), and has delegated primary responsibility for applying the valuation methods to the Investment Manager. The Trust’s Valuation Committee was established by the Board to oversee the implementation of the Funds’ valuation methods and to make fair
value determinations on behalf of the Board, as necessary. The Investment Manager monitors the continued appropriateness of methods applied and identifies circumstances and events that may require fair valuation. The Investment Manager determines if adjustments should be made in light of market changes, events affecting the issuer or other factors. If the Investment Manager determines that a valuation method may no longer be appropriate, another valuation method previously approved by the Trust’s Valuation Committee may be selected or the Trust’s Valuation Committee will be convened to consider the matter and take any appropriate action in accordance with procedures adopted by the Board. The Board shall review and ratify the appropriateness of the valuation methods and these methods may be amended or supplemented from time to time by the Trust’s Valuation Committee.
Synthetic convertible securities are valued based on quotations obtained from unaffiliated brokers who are the principal market-makers in such securities. Such valuations are derived by the brokers from proprietary models which are generally based on readily available market information including valuations of the common stock underlying the synthetic security.
Short-term debt instruments maturing in 60 days or less are valued at amortized cost, if their original term to maturity was 60 days or less, or by amortizing premiums or discounts based on their value on the 61st day prior to maturity, if the original term to maturity exceeded 60 days.
Investments initially valued in currencies other than the U.S. dollar are converted to the U.S. dollar using exchange rates obtained from pricing services. As a result, the NAV of each share class of a Fund may be affected by changes in the value of currencies in relation to the U.S. dollar. The value of securities traded in markets outside the United States or denominated in currencies other than the U.S. dollar may be affected significantly on a day that the New York Stock Exchange (“NYSE”) is closed.
The prices used by the Funds to value investments may differ from the value that would be realized if the investments were sold, and these differences could be material to the Funds’ financial statements. The NAV of each share class of a Fund is normally determined as of the close of regular trading (normally, 4:00 p.m., Eastern Time) on the NYSE on each day the NYSE is open for business. In unusual circumstances, the Board or the Valuation Committee may in good faith determine the NAV as of 4:00 p.m., Eastern Time, notwithstanding an earlier, unscheduled close or halt of trading on the NYSE.
The prices of certain portfolio securities or financial instruments may be determined at a time prior to the close of regular trading on the NYSE. When fair-valuing the securities, the Funds may, among other things, consider significant events (which may be considered to include changes in the value of U.S. securities or securities indices) that occur after the close of the relevant market and before the time the NAV of each share class of a Fund is calculated. With respect to
| 304 | March 31, 2018 | | Semiannual Report |
Table of Contents
certain foreign securities, the Funds may fair-value securities using modeling tools provided by third-party vendors. The Funds have retained a statistical research service to assist in determining the fair value of foreign securities. This service utilizes statistics and programs based on historical performance of markets and other economic data to assist in making fair value estimates. Fair value estimates used by the Funds for foreign securities may differ from the value realized from the sale of those securities and the difference could be material to the financial statements. Fair value pricing may require subjective determinations about the value of a security or other assets, and fair values used to determine the NAV of each share class of a Fund may differ from quoted or published prices, or from prices that are used by others, for the same investments. In addition, the use of fair value pricing may not always result in adjustments to the prices of securities or other assets held by a Fund.
(b) Fair Value Measurements. Fair value is defined as the price that would be received to sell an asset or paid to transfer a liability (i.e., the “exit price”) in an orderly transaction between market participants. The three levels of the fair value hierarchy are described below:
| ∎ | Level 1—quoted prices in active markets for identical investments that the Funds have the ability to access |
| ∎ | Level 2—valuations based on other significant observable inputs, which may include, but are not limited to, quoted prices for similar assets or liabilities, interest rates, yield curves, volatilities, prepayment speeds, loss severities, credit risks and default rates or other market corroborated inputs |
| ∎ | Level 3—valuations based on significant unobservable inputs (including the Investment Manager’s or Trust’s Valuation Committee’s own assumptions and securities whose price was determined by using a single broker’s quote) |
The valuation techniques used by the Funds to measure fair value during the six months ended March 31, 2018 were intended to maximize the use of observable inputs and to minimize the use of unobservable inputs.
The Funds’ policy is to recognize transfers between levels at the end of the reporting period. An investment asset’s or liability’s level within the fair value hierarchy is based on the lowest level input, individually or in aggregate, that is significant to the fair value measurement. The objective of fair value measurement remains the same even when there is a significant decrease in the volume and level of activity for an asset or liability and regardless of the valuation techniques used. Investments categorized as Level 1 or 2 as of period end may have been transferred between Levels 1 and 2 since the prior period due to changes in the valuation method utilized in valuing the investments.
The inputs or methodology used for valuing securities are not necessarily an indication of the risk associated with investing in those securities. The following are certain inputs and techniques that the Funds generally use to evaluate how to classify each major category of assets and liabilities within Level 2 and Level 3, in accordance with U.S. GAAP.
Equity Securities (Common and Preferred Stock and Warrants)—Equity securities traded in inactive markets and certain foreign equity securities are valued using inputs which include broker-dealer quotes, recently executed transactions adjusted for changes in the benchmark index, or evaluated price quotes received from independent pricing services that take into account the integrity of the market sector and issuer, the individual characteristics of the security, and information received from broker-dealers and other market sources pertaining to the issuer or security. To the extent that these inputs are observable, the values of equity securities are categorized as Level 2. To the extent that these inputs are unobservable, the values are categorized as Level 3.
U.S. Treasury Obligations—U.S. Treasury obligations are valued by independent pricing services based on pricing models that evaluate the mean between the most recently quoted bid and ask price. The models also take into consideration data received from active market makers and broker-dealers, yield curves, and the spread over comparable U.S. Treasury issues. The spreads change daily in response to market conditions and are generally obtained from the new issue market and broker-dealer sources. To the extent that these inputs are observable, the values of U.S. Treasury obligations are categorized as Level 2. To the extent that these inputs are unobservable, the values are categorized as Level 3.
Government Sponsored Enterprise and Mortgage-Backed Securities—Government sponsored enterprise and mortgage-backed securities are valued by independent pricing services using pricing models based on inputs that include issuer type, coupon, cash flows, mortgage prepayment projection tables and Adjustable Rate Mortgage evaluations that incorporate index data, periodic life caps and the next coupon reset date. To the extent that these inputs are observable, the values of government sponsored enterprise and mortgage-backed securities are categorized as Level 2. To the extent that these inputs are unobservable, the values are categorized as Level 3.
Sovereign Debt Obligations—Sovereign debt obligations are valued by independent pricing services based on discounted cash flow models that incorporate option adjusted spreads along with benchmark curves and credit spreads. In addition, international bond markets are monitored regularly for information pertaining to the issuer and/or the specific issue. To the extent that these inputs are observable, the values of sovereign debt obligations are categorized as Level 2. To the extent that these inputs are unobservable, the values are categorized as Level 3.
Corporate Bonds & Notes—Corporate bonds & notes are generally comprised of two main categories: investment grade bonds and high yield bonds. Investment grade bonds are valued by independent pricing services using various inputs and techniques, which include broker-dealer quotations, live trading levels, recently executed transactions in securities of the issuer or comparable issuers, and option adjusted spread models that include base curve and spread curve inputs. Adjustments to individual bonds can be applied to
| Semiannual Report | | March 31, 2018 | 305 |
Table of Contents
Notes to Financial Statements (cont’d)
March 31, 2018 (Unaudited)
recognize trading differences compared to other bonds issued by the same issuer. High yield bonds are valued by independent pricing services based primarily on broker-dealer quotations from relevant market makers and recently executed transactions in securities of the issuer or comparable issuers. The broker-dealer quotations received are supported by credit analysis of the issuer that takes into consideration credit quality assessments, daily trading activity, and the activity of the underlying equities, listed bonds and sector-specific trends. To the extent that these inputs are observable, the values of corporate bonds & notes are categorized as Level 2. To the extent that these inputs are unobservable, the values are categorized as Level 3.
Convertible Bonds & Notes—Convertible bonds & notes are valued by independent pricing services based on various inputs and techniques, which include broker-dealer quotations from relevant market makers and recently executed transactions in securities of the issuer or comparable issuers. The broker-dealer quotations received are supported by credit analysis of the issuer that takes into consideration credit quality assessments, daily trading activity, and the activity of the underlying equities, listed bonds and sector-specific trends. To the extent that these inputs are observable, the values of convertible bonds & notes are categorized as Level 2. To the extent that these inputs are unobservable, the values are categorized as Level 3.
Option Contracts—Option contracts traded over-the-counter (“OTC”) and FLexible EXchange (“FLEX”) options are valued by independent pricing services based on pricing models that incorporate various inputs such as interest rates, credit spreads, currency exchange rates and volatility measurements for in-the-money, at-the-money, and out-of-the-money contracts based on a given strike price. To the extent that these inputs are observable, the values of OTC and FLEX
option contracts are categorized as Level 2. To the extent that these inputs are unobservable, the values are categorized as Level 3.
Forward Foreign Currency Contracts—Forward foreign currency contracts are valued by independent pricing services using various inputs and techniques, which include broker-dealer quotations, actual trading information and foreign currency exchange rates gathered from leading market makers and foreign currency exchange trading centers throughout the world. To the extent that these inputs are observable, the values of forward foreign currency contracts are categorized as Level 2. To the extent that these inputs are unobservable, the values are categorized as Level 3.
Credit Default Swaps—OTC credit default swaps are valued by independent pricing services using pricing models that take into account, among other factors, information received from market makers and broker/dealers, default probabilities from index specific credit spread curves, recovery rates, and cash flows. Centrally cleared credit default swaps are valued at the price determined by the relevant exchange. To the extent that these inputs are observable, the values of credit default swaps are categorized as Level 2. To the extent that these inputs are unobservable, the values are categorized as Level 3.
Senior Loans—Senior Loans generally are valued by independent pricing services based on the average of quoted prices received from multiple dealers or valued relative to other benchmark securities when broker-dealer quotes are unavailable. These quoted prices are based on interest rates, yield curves, option adjusted spreads, credit spreads and/or other criteria. To the extent that these inputs are observable, the values of Senior Loans are categorized as Level 2. To the extent that these inputs are unobservable, the values are categorized as Level 3.
A summary of the inputs used at March 31, 2018 in valuing each Fund’s assets and liabilities is listed below (refer to the Schedules of Investments and Notes to the Schedules of Investments for more detailed information on Investments in Securities and Other Financial Instruments):
| AllianzGI Retirement 2020: | ||||||||||||||||
| Investments in Securities – Assets | Level 1– Quoted Prices | Level 2– Other Significant Observable Inputs | Level 3– Significant Unobservable Inputs | Value at 3/31/18 | ||||||||||||
Mutual Funds | $ | 43,653,024 | — | — | $ | 43,653,024 | ||||||||||
Exchange-Traded Funds | 2,272,304 | — | — | 2,272,304 | ||||||||||||
Repurchase Agreements | — | $ | 2,905,000 | — | 2,905,000 | |||||||||||
| 45,925,328 | 2,905,000 | — | 48,830,328 | |||||||||||||
Other Financial Instruments* – Assets | ||||||||||||||||
Foreign Exchange Contracts | 1,042 | — | — | 1,042 | ||||||||||||
Interest Rate Contracts | 32,832 | — | — | 32,832 | ||||||||||||
Market Price | 19,055 | — | — | 19,055 | ||||||||||||
| 52,929 | — | — | 52,929 | |||||||||||||
Other Financial Instruments* – Liabilities | ||||||||||||||||
Foreign Exchange Contracts | (1,689 | ) | — | — | (1,689 | ) | ||||||||||
Interest Rate Contracts | (5,392 | ) | — | — | (5,392 | ) | ||||||||||
Market Price | (87,327 | ) | — | — | (87,327 | ) | ||||||||||
| (94,408 | ) | — | — | (94,408 | ) | |||||||||||
Totals | $ | 45,883,849 | $ | 2,905,000 | — | $ | 48,788,849 | |||||||||
| 306 | March 31, 2018 | | Semiannual Report |
Table of Contents
| AllianzGI Retirement 2025: | ||||||||||||||||
| Investments in Securities – Assets | Level 1– Quoted Prices | Level 2– Other Significant Observable Inputs | Level 3– Significant Unobservable Inputs | Value at 3/31/18 | ||||||||||||
Mutual Funds | $ | 61,436,650 | — | — | $ | 61,436,650 | ||||||||||
Exchange-Traded Funds | 324,679 | — | — | 324,679 | ||||||||||||
Repurchase Agreements | — | $ | 1,288,000 | — | 1,288,000 | |||||||||||
| 61,761,329 | 1,288,000 | — | 63,049,329 | |||||||||||||
Other Financial Instruments* – Assets | ||||||||||||||||
Foreign Exchange Contracts | 1,389 | — | — | 1,389 | ||||||||||||
Market Price | 5,797 | — | — | 5,797 | ||||||||||||
| 7,186 | — | — | 7,186 | |||||||||||||
Other Financial Instruments* – Liabilities |
| |||||||||||||||
Foreign Exchange Contracts | (2,117 | ) | — | — | (2,117 | ) | ||||||||||
Interest Rate Contracts | (12,297 | ) | — | — | (12,297 | ) | ||||||||||
Market Price | (192,434 | ) | — | — | (192,434 | ) | ||||||||||
| (206,848 | ) | — | — | (206,848 | ) | |||||||||||
Totals | $ | 61,561,667 | $ | 1,288,000 | — | $ | 62,849,667 | |||||||||
| AllianzGI Retirement 2030: | ||||||||||||||||
| Investments in Securities – Assets | Level 1– Quoted Prices | Level 2– Other Significant Observable Inputs | Level 3– Significant Unobservable Inputs | Value at 3/31/18 | ||||||||||||
Mutual Funds | $ | 71,375,974 | — | — | $ | 71,375,974 | ||||||||||
Exchange-Traded Funds | 374,771 | — | — | 374,771 | ||||||||||||
Repurchase Agreements | — | $ | 1,377,000 | — | 1,377,000 | |||||||||||
| 71,750,745 | 1,377,000 | — | 73,127,745 | |||||||||||||
Other Financial Instruments* – Assets |
| |||||||||||||||
Foreign Exchange Contracts | 1,737 | — | — | 1,737 | ||||||||||||
Market Price | 8,422 | — | — | 8,422 | ||||||||||||
| 10,159 | — | — | 10,159 | |||||||||||||
Other Financial Instruments* – Liabilities |
| |||||||||||||||
Foreign Exchange Contracts | (2,557 | ) | — | — | (2,557 | ) | ||||||||||
Interest Rate Contracts | (2,400 | ) | — | — | (2,400 | ) | ||||||||||
Market Price | (233,790 | ) | — | — | (233,790 | ) | ||||||||||
| (238,747 | ) | — | — | (238,747 | ) | |||||||||||
Totals | $ | 71,522,157 | $ | 1,377,000 | — | $ | 72,899,157 | |||||||||
| AllianzGI Retirement 2035: | ||||||||||||||||
| Investments in Securities – Assets | Level 1– Quoted Prices | Level 2– Other Significant Observable Inputs | Level 3– Significant Unobservable Inputs | Value at 3/31/18 | ||||||||||||
Mutual Funds | $ | 57,971,869 | — | — | $ | 57,971,869 | ||||||||||
Exchange-Traded Funds | 548,027 | — | — | 548,027 | ||||||||||||
Repurchase Agreements | — | $ | 631,000 | — | 631,000 | |||||||||||
| 58,519,896 | 631,000 | — | 59,150,896 | |||||||||||||
Other Financial Instruments* – Assets | ||||||||||||||||
Foreign Exchange Contracts | 1,389 | — | — | 1,389 | ||||||||||||
Market Price | 14,584 | — | — | 14,584 | ||||||||||||
| 15,973 | — | — | 15,973 | |||||||||||||
Other Financial Instruments* – Liabilities | ||||||||||||||||
Foreign Exchange Contracts | (2,130 | ) | — | — | (2,130 | ) | ||||||||||
Market Price | (235,972 | ) | — | — | (235,972 | ) | ||||||||||
| (238,102 | ) | — | — | (238,102 | ) | |||||||||||
Totals | $ | 58,297,767 | $ | 631,000 | — | $ | 58,928,767 | |||||||||
| Semiannual Report | | March 31, 2018 | 307 |
Table of Contents
Notes to Financial Statements (cont’d)
March 31, 2018 (Unaudited)
| AllianzGI Retirement 2040: | ||||||||||||||||
| Investments in Securities – Assets | Level 1– Quoted Prices | Level 2– Other Significant Observable Inputs | Level 3– Significant Unobservable Inputs | Value at 3/31/18 | ||||||||||||
Mutual Funds | $ | 52,248,191 | — | — | $ | 52,248,191 | ||||||||||
Exchange-Traded Funds | 604,666 | — | — | 604,666 | ||||||||||||
| 52,852,857 | — | — | 52,852,857 | |||||||||||||
Other Financial Instruments* – Assets |
| |||||||||||||||
Foreign Exchange Contracts | 1,389 | — | — | 1,389 | ||||||||||||
Market Price | 16,010 | — | — | 16,010 | ||||||||||||
| 17,399 | — | — | 17,399 | |||||||||||||
Other Financial Instruments* – Liabilities |
| |||||||||||||||
Foreign Exchange Contracts | (2,117 | ) | — | — | (2,117 | ) | ||||||||||
Market Price | (232,819 | ) | — | — | (232,819 | ) | ||||||||||
| (234,936 | ) | — | — | (234,936 | ) | |||||||||||
Totals | $ | 52,635,320 | — | — | $ | 52,635,320 | ||||||||||
| AllianzGI Retirement 2045: | ||||||||||||||||
| Investments in Securities – Assets | Level 1– Quoted Prices | Level 2– Other Significant Observable Inputs | Level 3– Significant Unobservable Inputs | Value at 3/31/18 | ||||||||||||
Mutual Funds | $ | 33,315,057 | — | — | $ | 33,315,057 | ||||||||||
Exchange-Traded Funds | 455,855 | — | — | 455,855 | ||||||||||||
Repurchase Agreements | — | $ | 227,000 | — | 227,000 | |||||||||||
| 33,770,912 | 227,000 | — | 33,997,912 | |||||||||||||
Other Financial Instruments* – Assets |
| |||||||||||||||
Foreign Exchange Contracts | 1,042 | — | — | 1,042 | ||||||||||||
Market Price | 13,506 | — | — | 13,506 | ||||||||||||
| 14,548 | — | — | 14,548 | |||||||||||||
Other Financial Instruments* – Liabilities |
| |||||||||||||||
Foreign Exchange Contracts | (1,689 | ) | — | — | (1,689 | ) | ||||||||||
Market Price | (157,144 | ) | — | — | (157,144 | ) | ||||||||||
| (158,833 | ) | — | — | (158,833 | ) | |||||||||||
Totals | $ | 33,626,627 | $ | 227,000 | — | $ | 33,853,627 | |||||||||
| AllianzGI Retirement 2050: | ||||||||||||||||
| Investments in Securities – Assets | Level 1– Quoted Prices | Level 2– Other Significant Observable Inputs | Level 3– Significant Unobservable Inputs | Value at 3/31/18 | ||||||||||||
Mutual Funds | $ | 32,884,513 | — | — | $ | 32,884,513 | ||||||||||
Exchange-Traded Funds | 484,710 | — | — | 484,710 | ||||||||||||
Repurchase Agreements | — | $ | 170,000 | — | 170,000 | |||||||||||
| 33,369,223 | 170,000 | — | 33,539,223 | |||||||||||||
Other Financial Instruments* – Assets |
| |||||||||||||||
Foreign Exchange Contracts | 1,389 | — | — | 1,389 | ||||||||||||
Market Price | 11,623 | — | — | 11,623 | ||||||||||||
| 13,012 | — | — | 13,012 | |||||||||||||
Other Financial Instruments* – Liabilities |
| |||||||||||||||
Foreign Exchange Contracts | (1,689 | ) | — | — | (1,689 | ) | ||||||||||
Market Price | (162,395 | ) | — | — | (162,395 | ) | ||||||||||
| (164,084 | ) | — | — | (164,084 | ) | |||||||||||
Totals | $ | 33,218,151 | $ | 170,000 | — | $ | 33,388,151 | |||||||||
| 308 | March 31, 2018 | | Semiannual Report |
Table of Contents
| AllianzGI Retirement 2055: | ||||||||||||||||
| Investments in Securities – Assets | Level 1– Quoted Prices | Level 2– Other Significant Observable Inputs | Level 3– Significant Unobservable Inputs | Value at 3/31/18 | ||||||||||||
Mutual Funds | $ | 16,806,630 | — | — | $ | 16,806,630 | ||||||||||
Exchange-Traded Funds | 247,542 | — | — | 247,542 | ||||||||||||
Repurchase Agreements | — | $ | 110,000 | — | 110,000 | |||||||||||
| 17,054,172 | 110,000 | — | 17,164,172 | |||||||||||||
Other Financial Instruments* – Assets |
| |||||||||||||||
Foreign Exchange Contracts | 695 | — | — | 695 | ||||||||||||
Market Price | 6,996 | — | — | 6,996 | ||||||||||||
| 7,691 | — | — | 7,691 | |||||||||||||
Other Financial Instruments* – Liabilities |
| |||||||||||||||
Foreign Exchange Contracts | (1,262 | ) | — | — | (1,262 | ) | ||||||||||
Market Price | (88,613 | ) | — | — | (88,613 | ) | ||||||||||
| (89,875 | ) | — | — | (89,875 | ) | |||||||||||
Totals | $ | 16,971,988 | $ | 110,000 | — | $ | 17,081,988 | |||||||||
| AllianzGI Multi Asset Income: | ||||||||||||||||
| Investments in Securities – Assets | Level 1– Quoted Prices | Level 2– Other Significant Observable Inputs | Level 3– Significant Unobservable Inputs | Value at 3/31/18 | ||||||||||||
Mutual Funds | $ | 27,993,788 | — | — | $ | 27,993,788 | ||||||||||
Exchange-Traded Funds | 8,068,444 | — | — | 8,068,444 | ||||||||||||
Common Stock: | ||||||||||||||||
Equity Real Estate Investment Trusts (REITs) | 4,043,138 | $ | 254,504 | — | 4,297,642 | |||||||||||
Real Estate Management & Development | 140,014 | 155,451 | — | 295,465 | ||||||||||||
All Other | 731,675 | — | — | 731,675 | ||||||||||||
Rights | — | — | $ | 9 | 9 | |||||||||||
Repurchase Agreements | — | 2,779,000 | — | 2,779,000 | ||||||||||||
| 40,977,059 | 3,188,955 | 9 | 44,166,023 | |||||||||||||
Other Financial Instruments* – Assets |
| |||||||||||||||
Interest Rate Contracts | 272,145 | — | — | 272,145 | ||||||||||||
Other Financial Instruments* – Liabilities |
| |||||||||||||||
Interest Rate Contracts | (108,676 | ) | �� | — | — | (108,676 | ) | |||||||||
Market Price | (315,964 | ) | — | — | (315,964 | ) | ||||||||||
| (424,640 | ) | — | — | (424,640 | ) | |||||||||||
Totals | $ | 40,824,564 | $ | 3,188,955 | $ | 9 | $ | 44,013,528 | ||||||||
| AllianzGI Global Allocation: | ||||||||||||||||
| Investments in Securities – Assets | Level 1– Quoted Prices | Level 2– Other Significant Observable Inputs | Level 3– Significant Unobservable Inputs | Value at 3/31/18 | ||||||||||||
Mutual Funds | $ | 323,706,760 | — | — | $ | 323,706,760 | ||||||||||
Exchange-Traded Funds | 17,175,231 | — | — | 17,175,231 | ||||||||||||
U.S. Treasury Obligations | — | $ | 5,026,953 | — | 5,026,953 | |||||||||||
Repurchase Agreements | — | 9,665,000 | — | 9,665,000 | ||||||||||||
| 340,881,991 | 14,691,953 | — | 355,573,944 | |||||||||||||
Other Financial Instruments* – Assets |
| |||||||||||||||
Foreign Exchange Contracts | 62,182 | — | — | 62,182 | ||||||||||||
Interest Rate Contracts | 129,949 | — | — | 129,949 | ||||||||||||
| 192,131 | — | — | 192,131 | |||||||||||||
| Semiannual Report | | March 31, 2018 | 309 |
Table of Contents
Notes to Financial Statements (cont’d)
March 31, 2018 (Unaudited)
| AllianzGI Global Allocation (cont’d) | ||||||||||||||||
| Investments in Securities – Assets | Level 1– Quoted Prices | Level 2– Other Significant Observable Inputs | Level 3– Significant Unobservable Inputs | Value at 3/31/18 | ||||||||||||
Other Financial Instruments* – Liabilities |
| |||||||||||||||
Foreign Exchange Contracts | $ | (133,530 | ) | — | — | $ | (133,530 | ) | ||||||||
Interest Rate Contracts | (290,126 | ) | — | — | (290,126 | ) | ||||||||||
Market Price | (1,399,502 | ) | — | — | (1,399,502 | ) | ||||||||||
| (1,823,158 | ) | — | — | (1,823,158 | ) | |||||||||||
Totals | $ | 339,250,964 | $ | 14,691,953 | — | $ | 353,942,917 | |||||||||
| AllianzGI Best Styles Emerging Markets Equity: | ||||||||||||||||
| Investments in Securities – Assets | Level 1– Quoted Prices | Level 2– Other Significant Observable Inputs | Level 3– Significant Unobservable Inputs | Value at 3/31/18 | ||||||||||||
Common Stock: |
| |||||||||||||||
China | $ | 289,856 | $ | 1,857,963 | — | $ | 2,147,819 | |||||||||
Czech Republic | — | 20,645 | — | 20,645 | ||||||||||||
Hungary | — | 56,270 | — | 56,270 | ||||||||||||
Indonesia | 26,394 | 14,269 | — | 40,663 | ||||||||||||
Korea (Republic of) | 55,165 | 952,492 | — | 1,007,657 | ||||||||||||
Malaysia | 8,885 | 107,242 | — | 116,127 | ||||||||||||
Norway | — | 19,232 | — | 19,232 | ||||||||||||
Philippines | — | 9,004 | — | 9,004 | ||||||||||||
Russian Federation | 38,271 | 65,676 | — | 103,947 | ||||||||||||
Singapore | 2,263 | 10,306 | — | 12,569 | ||||||||||||
South Africa | 141,854 | 111,726 | — | 253,580 | ||||||||||||
Taiwan | 24,862 | 574,882 | — | 599,744 | ||||||||||||
Thailand | — | 19,759 | $ | 251,811 | 271,570 | |||||||||||
Turkey | — | 173,633 | — | 173,633 | ||||||||||||
All Other | 732,566 | — | — | 732,566 | ||||||||||||
Preferred Stock: |
| |||||||||||||||
Korea (Republic of) | — | 34,612 | — | 34,612 | ||||||||||||
All Other | 170,789 | — | — | 170,789 | ||||||||||||
Warrants | 241 | — | — | 241 | ||||||||||||
Repurchase Agreements | — | 397,000 | — | 397,000 | ||||||||||||
| 1,491,146 | 4,424,711 | 251,811 | 6,167,668 | |||||||||||||
Other Financial Instruments* – Assets |
| |||||||||||||||
Market Price | 1,761 | — | — | 1,761 | ||||||||||||
Other Financial Instruments* – Liabilities |
| |||||||||||||||
Market Price | (3,005 | ) | — | — | (3,005 | ) | ||||||||||
Totals | $ | 1,489,902 | $ | 4,424,711 | $ | 251,811 | $ | 6,166,424 | ||||||||
| AllianzGI Best Styles Global Equity: | ||||||||||||||||
| Investments in Securities – Assets | Level 1– Quoted Prices | Level 2– Other Significant Observable Inputs | Level 3– Significant Unobservable Inputs | Value at 3/31/18 | ||||||||||||
Common Stock: |
| |||||||||||||||
Australia | — | $ | 2,835,428 | — | $ | 2,835,428 | ||||||||||
Austria | $ | 501,763 | 2,952,892 | — | 3,454,655 | |||||||||||
Belgium | — | 191,055 | — | 191,055 | ||||||||||||
China | 4,637,739 | 25,989,276 | $ | 1,151 | 30,628,166 | |||||||||||
Finland | — | 2,036,447 | — | 2,036,447 | ||||||||||||
France | 109,144 | 27,445,845 | — | 27,554,989 | ||||||||||||
| 310 | March 31, 2018 | | Semiannual Report |
Table of Contents
| AllianzGI Best Styles Global Equity (cont’d): | ||||||||||||||||
| Investments in Securities – Assets | Level 1– Quoted Prices | Level 2– Other Significant Observable Inputs | Level 3– Significant Unobservable Inputs | Value at 3/31/18 | ||||||||||||
Germany | — | $ | 8,251,606 | — | $ | 8,251,606 | ||||||||||
Greece | $ | 377,430 | 1,154,319 | — | 1,531,749 | |||||||||||
Hong Kong | — | 4,060,591 | — | 4,060,591 | ||||||||||||
Hungary | — | 1,497,821 | — | 1,497,821 | ||||||||||||
Indonesia | — | 3,240,480 | — | 3,240,480 | ||||||||||||
Israel | 199,724 | 1,457,126 | — | 1,656,850 | ||||||||||||
Italy | — | 7,804,515 | — | 7,804,515 | ||||||||||||
Japan | — | 49,305,304 | — | 49,305,304 | ||||||||||||
Korea (Republic of) | 3,259,293 | 11,934,592 | — | 15,193,885 | ||||||||||||
Malaysia | — | 1,937,035 | — | 1,937,035 | ||||||||||||
Netherlands | 549,298 | 9,977,039 | — | 10,526,337 | ||||||||||||
New Zealand | — | 1,519,990 | — | 1,519,990 | ||||||||||||
Norway | 190,714 | 3,679,750 | — | 3,870,464 | ||||||||||||
Philippines | 613,517 | 862,764 | — | 1,476,281 | ||||||||||||
Qatar | 309,666 | 296,813 | — | 606,479 | ||||||||||||
Russian Federation | 279,274 | 426,501 | — | 705,775 | ||||||||||||
Singapore | 272,433 | 4,256,723 | — | 4,529,156 | ||||||||||||
South Africa | — | 1,999,017 | — | 1,999,017 | ||||||||||||
Spain | — | 7,995,391 | — | 7,995,391 | ||||||||||||
Sweden | — | 5,961,940 | — | 5,961,940 | ||||||||||||
Switzerland | — | 5,715,647 | — | 5,715,647 | ||||||||||||
Taiwan | 1,876,341 | 7,228,358 | — | 9,104,699 | ||||||||||||
Thailand | — | 497,132 | $ | 4,337,306 | 4,834,438 | |||||||||||
Turkey | 121,483 | 3,593,608 | — | 3,715,091 | ||||||||||||
United Kingdom | 3,277,984 | 27,376,122 | — | 30,654,106 | ||||||||||||
All Other | 352,259,618 | — | — | 352,259,618 | ||||||||||||
Exchange-Traded Funds | 5,267,714 | — | — | 5,267,714 | ||||||||||||
Preferred Stock: | ||||||||||||||||
Brazil | 115,333 | — | — | 115,333 | ||||||||||||
Chile | 338,822 | — | — | 338,822 | ||||||||||||
Colombia | 495,279 | — | — | 495,279 | ||||||||||||
All Other | — | 3,328,418 | — | 3,328,418 | ||||||||||||
Repurchase Agreements | — | 2,648,000 | — | 2,648,000 | ||||||||||||
| 375,052,569 | 239,457,545 | 4,338,457 | 618,848,571 | |||||||||||||
Other Financial Instruments* – Assets | ||||||||||||||||
Foreign Exchange Contracts | — | 324 | — | 324 | ||||||||||||
Other Financial Instruments* – Liabilities | ||||||||||||||||
Foreign Exchange Contracts | — | (255 | ) | — | (255 | ) | ||||||||||
Market Price | (54,669 | ) | — | — | (54,669 | ) | ||||||||||
| (54,669 | ) | (255 | ) | — | (54,924 | ) | ||||||||||
Totals | $ | 374,997,900 | $ | 239,457,614 | $ | 4,338,457 | $ | 618,793,971 | ||||||||
| Semiannual Report | | March 31, 2018 | 311 |
Table of Contents
Notes to Financial Statements (cont’d)
March 31, 2018 (Unaudited)
| AllianzGI Best Styles International Equity: | ||||||||||||||||
| Investments in Securities – Assets | Level 1– Quoted Prices | Level 2– Other Significant Observable Inputs | Level 3– Significant | Value at 3/31/18 | ||||||||||||
Common Stock: | ||||||||||||||||
Australia | $ | 20,157 | $ | 715,685 | — | $ | 735,842 | |||||||||
Brazil | 167,065 | — | — | 167,065 | ||||||||||||
Canada | 221,173 | — | — | 221,173 | ||||||||||||
China | 32,118 | 174,643 | — | 206,761 | ||||||||||||
Greece | 24,942 | 139,084 | — | 164,026 | ||||||||||||
Ireland | 28,401 | 84,119 | — | 112,520 | ||||||||||||
Mexico | 14,528 | — | — | 14,528 | ||||||||||||
Netherlands | 48,539 | 826,060 | — | 874,599 | ||||||||||||
Thailand | — | — | 77,986 | 77,986 | ||||||||||||
United Kingdom | 53,771 | 4,172,515 | — | 4,226,286 | ||||||||||||
All Other | — | 18,728,391 | — | 18,728,391 | ||||||||||||
Exchange-Traded Funds | 742,599 | — | — | 742,599 | ||||||||||||
Preferred Stock: | ||||||||||||||||
Brazil | 24,643 | — | — | 24,643 | ||||||||||||
Germany | — | 110,619 | — | 110,619 | ||||||||||||
Rights | 3,017 | — | — | 3,017 | ||||||||||||
| 1,380,953 | 24,951,116 | $ | 77,986 | 26,410,055 | ||||||||||||
Other Financial Instruments* – Liabilities | ||||||||||||||||
Foreign Exchange Contracts | — | (11 | ) | — | (11 | ) | ||||||||||
Totals | $ | 1,380,953 | $ | 24,951,105 | $ | 77,986 | $ | 26,410,044 | ||||||||
| AllianzGI Best Styles U.S. Equity: | ||||||||||||||||
| Investments in Securities – Assets | Level 1– Quoted Prices | Level 2– Other Significant Observable Inputs | Level 3– Significant | Value at 3/31/18 | ||||||||||||
Common Stock | $ | 122,931,916 | — | — | $ | 122,931,916 | ||||||||||
Exchange-Traded Funds | 1,117,739 | — | — | 1,117,739 | ||||||||||||
Rights | — | — | $ | 97 | 97 | |||||||||||
Repurchase Agreements | — | $ | 1,982,000 | — | 1,982,000 | |||||||||||
| 124,049,655 | 1,982,000 | 97 | 126,031,752 | |||||||||||||
Other Financial Instruments* – Assets | ||||||||||||||||
Market Price | 12,051 | — | — | 12,051 | ||||||||||||
Totals | $ | 124,061,706 | $ | 1,982,000 | $ | 97 | $ | 126,043,803 | ||||||||
| AllianzGI Convertible: | ||||||||||||||||
| Investments in Securities – Assets | Level 1– Quoted Prices | Level 2– Other Significant | Level 3– Significant | Value at 3/31/18 | ||||||||||||
Convertible Bonds & Notes: | ||||||||||||||||
Healthcare-Products | — | $ | 9,525,461 | $ | 814,892 | $ | 10,340,353 | |||||||||
IT Services | — | — | 3,386,844 | 3,386,844 | ||||||||||||
All Other | — | 384,020,350 | — | 384,020,350 | ||||||||||||
Convertible Preferred Stock: | ||||||||||||||||
Diversified Financial Services | — | 6,940,147 | — | 6,940,147 | ||||||||||||
Healthcare-Products | — | 8,016,269 | — | 8,016,269 | ||||||||||||
All Other | $ | 43,448,249 | — | — | 43,448,249 | |||||||||||
Repurchase Agreements | — | 20,938,000 | — | 20,938,000 | ||||||||||||
Totals | $ | 43,448,249 | $ | 429,440,227 | $ | 4,201,736 | $ | 477,090,212 | ||||||||
| 312 | March 31, 2018 | | Semiannual Report |
Table of Contents
| AllianzGI Emerging Markets Consumer: | ||||||||||||||||
| Investments in Securities – Assets | Level 1– Quoted Prices | Level 2– Other Significant | Level 3– Significant | Value at 3/31/18 | ||||||||||||
Common Stock: | ||||||||||||||||
Brazil | $ | 2,720,993 | — | — | $ | 2,720,993 | ||||||||||
China | 2,709,204 | $ | 11,834,991 | — | 14,544,195 | |||||||||||
Hong Kong | 988,363 | 829,914 | — | 1,818,277 | ||||||||||||
India | 1,448,462 | 617,197 | — | 2,065,659 | ||||||||||||
Mexico | 162,932 | — | — | 162,932 | ||||||||||||
Russian Federation | 1,545,381 | — | — | 1,545,381 | ||||||||||||
South Africa | 196,775 | 3,319,168 | — | 3,515,943 | ||||||||||||
Thailand | — | — | $ | 3,026,159 | 3,026,159 | |||||||||||
United States | 4,984,413 | — | — | 4,984,413 | ||||||||||||
All Other | — | 14,750,668 | — | 14,750,668 | ||||||||||||
Preferred Stock | 547,066 | — | — | 547,066 | ||||||||||||
Repurchase Agreements | — | 1,159,000 | — | 1,159,000 | ||||||||||||
Totals | $ | 15,303,589 | $ | 32,510,938 | $ | 3,026,159 | $ | 50,840,686 | ||||||||
| AllianzGI Emerging Markets Debt: | ||||||||||||||||
| Investments in Securities – Assets | Level 1– Quoted Prices | Level 2– Other Significant | Level 3– Significant | Value at 3/31/18 | ||||||||||||
Corporate Bonds & Notes | — | $ | 15,872,621 | — | $ | 15,872,621 | ||||||||||
Sovereign Debt Obligations | — | 14,024,723 | — | 14,024,723 | ||||||||||||
Repurchase Agreements | — | 2,492,000 | — | 2,492,000 | ||||||||||||
| — | 32,389,344 | — | 32,389,344 | |||||||||||||
Other Financial Instruments* – Assets | ||||||||||||||||
Foreign Exchange Contracts | — | 7,412 | — | 7,412 | ||||||||||||
Totals | — | $ | 32,396,756 | — | $ | 32,396,756 | ||||||||||
| AllianzGI Emerging Markets Small-Cap: | ||||||||||||||||
| Investments in Securities – Assets | Level 1– Quoted Prices | Level 2– Other Significant | Level 3– Significant | Value at 3/31/18 | ||||||||||||
Common Stock: | ||||||||||||||||
Brazil | $ | 316,857 | — | — | $ | 316,857 | ||||||||||
China | 44,718 | $ | 1,127,434 | — | 1,172,152 | |||||||||||
Colombia | 68,607 | — | — | 68,607 | ||||||||||||
Czech Republic | 91,034 | — | — | 91,034 | ||||||||||||
India | 313,078 | 909,911 | — | 1,222,989 | ||||||||||||
Korea (Republic of) | 148,057 | 1,777,525 | — | 1,925,582 | ||||||||||||
Malaysia | 24,292 | 639,018 | — | 663,310 | ||||||||||||
Mexico | 55,278 | — | — | 55,278 | ||||||||||||
Peru | 25,457 | — | — | 25,457 | ||||||||||||
Philippines | 22,264 | — | — | 22,264 | ||||||||||||
Russian Federation | — | — | $ | 65,966 | 65,966 | |||||||||||
South Africa | 464,264 | 50,796 | — | 515,060 | ||||||||||||
Taiwan | 22,430 | 1,712,876 | — | 1,735,306 | ||||||||||||
Thailand | — | 177,797 | 553,362 | 731,159 | ||||||||||||
Turkey | 22,125 | 458,823 | — | 480,948 | ||||||||||||
| Semiannual Report | | March 31, 2018 | 313 |
Table of Contents
Notes to Financial Statements (cont’d)
March 31, 2018 (Unaudited)
| AllianzGI Emerging Markets Small-Cap (cont’d) | ||||||||||||||||
| Investments in Securities – Assets | Level 1– Quoted Prices | Level 2– Other Significant | Level 3– Significant | Value at 3/31/18 | ||||||||||||
United Arab Emirates | $ | 36,500 | — | — | $ | 36,500 | ||||||||||
All Other | — | $ | 1,507,760 | — | 1,507,760 | |||||||||||
Preferred Stock: | ||||||||||||||||
Brazil | 100,221 | — | — | 100,221 | ||||||||||||
Russian Federation | — | — | $ | 262,423 | 262,423 | |||||||||||
Totals | $ | 1,755,182 | $ | 8,361,940 | $ | 881,751 | $ | 10,998,873 | ||||||||
| AllianzGI Europe Equity Dividend: | ||||||||||||||||
| Investments in Securities – Assets | Level 1– Quoted Prices | Level 2– Other Significant Observable Inputs | Level 3– Significant Unobservable Inputs | Value at 3/31/18 | ||||||||||||
Common Stock | — | $ | 8,008,820 | — | $ | 8,008,820 | ||||||||||
Repurchase Agreements | — | 327,000 | — | 327,000 | ||||||||||||
| — | 8,335,820 | — | 8,335,820 | |||||||||||||
Other Financial Instruments* – Liabilities | ||||||||||||||||
Foreign Exchange Contracts | — | (6 | ) | — | (6 | ) | ||||||||||
Totals | — | $ | 8,335,814 | — | $ | 8,335,814 | ||||||||||
| AllianzGI Global Dynamic Allocation: | ||||||||||||||||
| Investments in Securities – Assets | Level 1– Quoted Prices | Level 2– Other Significant Observable Inputs | Level 3– Significant Unobservable Inputs | Value at 3/31/18 | ||||||||||||
Common Stock: | ||||||||||||||||
Australia | — | $ | 990,668 | — | $ | 990,668 | ||||||||||
Austria | $ | 134,034 | 698,415 | — | 832,449 | |||||||||||
Belgium | — | 80,149 | — | 80,149 | ||||||||||||
China | 1,074,811 | 6,603,529 | $ | 34 | 7,678,374 | |||||||||||
Denmark | 7,310 | 174,093 | — | 181,403 | ||||||||||||
Finland | — | 645,632 | — | 645,632 | ||||||||||||
France | 56,747 | 6,507,346 | — | 6,564,093 | ||||||||||||
Germany | 4,952 | 1,937,769 | — | 1,942,721 | ||||||||||||
Greece | 96,594 | 266,758 | — | 363,352 | ||||||||||||
Hong Kong | — | 1,616,156 | — | 1,616,156 | ||||||||||||
Hungary | — | 463,953 | — | 463,953 | ||||||||||||
Indonesia | — | 889,559 | — | 889,559 | ||||||||||||
Ireland | 14,607 | 8,889 | — | 23,496 | ||||||||||||
Israel | 63,071 | 624,016 | — | 687,087 | ||||||||||||
Italy | — | 1,617,689 | — | 1,617,689 | ||||||||||||
Japan | — | 14,718,104 | — | 14,718,104 | ||||||||||||
Korea (Republic of) | 765,075 | 2,865,905 | — | 3,630,980 | ||||||||||||
Malaysia | — | 878,064 | — | 878,064 | ||||||||||||
Netherlands | 140,089 | 2,185,454 | — | 2,325,543 | ||||||||||||
New Zealand | 7,859 | 498,124 | — | 505,983 | ||||||||||||
Norway | 40,757 | 849,600 | — | 890,357 | ||||||||||||
Philippines | 149,131 | 212,382 | — | 361,513 | ||||||||||||
Poland | — | 94,919 | — | 94,919 | ||||||||||||
Russian Federation | 90,224 | 94,541 | — | 184,765 | ||||||||||||
Singapore | 68,179 | 1,523,031 | — | 1,591,210 | ||||||||||||
| 314 | March 31, 2018 | | Semiannual Report |
Table of Contents
| AllianzGI Global Dynamic Allocation (cont’d) | ||||||||||||||||
| Investments in Securities – Assets | Level 1– Quoted Prices | Level 2– Other Significant Observable Inputs | Level 3– Significant Unobservable Inputs | Value at 3/31/18 | ||||||||||||
South Africa | — | $ | 439,511 | — | $ | 439,511 | ||||||||||
Spain | $ | 1,644 | 1,768,118 | — | 1,769,762 | |||||||||||
Sweden | — | 1,282,535 | — | 1,282,535 | ||||||||||||
Switzerland | 8,927 | 1,962,395 | — | 1,971,322 | ||||||||||||
Taiwan | — | 2,698,040 | — | 2,698,040 | ||||||||||||
Thailand | — | 357,133 | $ | 1,198,661 | 1,555,794 | |||||||||||
Turkey | 25,892 | 778,658 | — | 804,550 | ||||||||||||
United Kingdom | 826,554 | 6,102,080 | — | 6,928,634 | ||||||||||||
All Other | 95,010,738 | — | — | 95,010,738 | ||||||||||||
Corporate Bonds & Notes | — | 37,773,950 | — | 37,773,950 | ||||||||||||
Exchange-Traded Funds | 36,904,505 | — | — | 36,904,505 | ||||||||||||
U.S. Treasury Obligations | — | 25,301,615 | — | 25,301,615 | ||||||||||||
U.S. Government Agency Securities | — | 19,422,642 | — | 19,422,642 | ||||||||||||
Sovereign Debt Obligations | — | 9,746,715 | — | 9,746,715 | ||||||||||||
Preferred Stock: | ||||||||||||||||
Brazil | 33,968 | — | — | 33,968 | ||||||||||||
Colombia | 110,252 | — | — | 110,252 | ||||||||||||
All Other | — | 645,548 | — | 645,548 | ||||||||||||
Rights | — | — | 92 | 92 | ||||||||||||
Repurchase Agreements | — | 4,901,000 | — | 4,901,000 | ||||||||||||
| 135,635,920 | 160,224,685 | 1,198,787 | 297,059,392 | |||||||||||||
Other Financial Instruments* – Assets | ||||||||||||||||
Foreign Exchange Contracts | 2,736 | — | — | 2,736 | ||||||||||||
Interest Rate Contracts | 163,387 | — | — | 163,387 | ||||||||||||
Market Price | 55,512 | — | — | 55,512 | ||||||||||||
| 221,635 | — | — | 221,635 | |||||||||||||
Other Financial Instruments* – Liabilities | ||||||||||||||||
Foreign Exchange Contracts | (13,900 | ) | — | — | (13,900 | ) | ||||||||||
Interest Rate Contracts | (9,949 | ) | — | — | (9,949 | ) | ||||||||||
Market Price | (878,324 | ) | — | — | (878,324 | ) | ||||||||||
| (902,173 | ) | — | — | (902,173 | ) | |||||||||||
Totals | $ | 134,955,382 | $ | 160,224,685 | $ | 1,198,787 | $ | 296,378,854 | ||||||||
| AllianzGI Global Fundamental Strategy: | ||||||||||||||||
| Investments in Securities – Assets | Level 1– Quoted Prices | Level 2– Other Significant Observable Inputs | Level 3– Significant Unobservable Inputs | Value at 3/31/18 | ||||||||||||
Common Stock: | ||||||||||||||||
United Kingdom | $ | 85,709 | $ | 2,277,059 | — | $ | 2,362,768 | |||||||||
United States | 1,982,530 | — | — | 1,982,530 | ||||||||||||
All Other | — | 3,997,109 | — | 3,997,109 | ||||||||||||
Sovereign Debt Obligations | — | 5,741,108 | — | 5,741,108 | ||||||||||||
Corporate Bonds & Notes | — | 1,270,369 | — | 1,270,369 | ||||||||||||
Exchange-Traded Funds | 320,822 | — | — | 320,822 | ||||||||||||
Mutual Funds | 215,834 | — | — | 215,834 | ||||||||||||
Repurchase Agreements | — | 357,000 | — | 357,000 | ||||||||||||
Options Purchased: | ||||||||||||||||
Market Price | 92,131 | — | — | 92,131 | ||||||||||||
| 2,697,026 | 13,642,645 | — | 16,339,671 | |||||||||||||
| Semiannual Report | | March 31, 2018 | 315 |
Table of Contents
Notes to Financial Statements (cont’d)
March 31, 2018 (Unaudited)
| AllianzGI Global Fundamental Strategy (cont’d) | ||||||||||||||||
| Investments in Securities – Liabilities | Level 1– Quoted Prices | Level 2– Other Significant Observable Inputs | Level 3– Significant Unobservable Inputs | Value at 3/31/18 | ||||||||||||
Options Written: | ||||||||||||||||
Market Price | $ | (30,909 | ) | — | — | $ | (30,909 | ) | ||||||||
Other Financial Instruments* – Assets | ||||||||||||||||
Foreign Exchange Contracts | — | $ | 22,926 | — | 22,926 | |||||||||||
Market Price | 157,773 | — | — | 157,773 | ||||||||||||
| 157,773 | 22,926 | — | 180,699 | |||||||||||||
Other Financial Instruments* – Liabilities | ||||||||||||||||
Foreign Exchange Contracts | — | (50,449 | ) | — | (50,449 | ) | ||||||||||
Interest Rate Contracts | (49,597 | ) | — | — | (49,597 | ) | ||||||||||
| (49,597 | ) | (50,449 | ) | — | (100,046 | ) | ||||||||||
Totals | $ | 2,774,293 | $ | 13,615,122 | — | $ | 16,389,415 | |||||||||
| AllianzGI Global High Yield: | ||||||||||||||||
| Investments in Securities – Assets | Level 1– Quoted Prices | Level 2– Other Significant Observable Inputs | Level 3– Significant Unobservable Inputs | Value at 3/31/18 | ||||||||||||
Corporate Bonds & Notes | — | $ | 21,275,390 | — | $ | 21,275,390 | ||||||||||
Repurchase Agreements | — | 501,000 | — | 501,000 | ||||||||||||
U.S. Treasury Obligations | — | 149,410 | — | 149,410 | ||||||||||||
| — | 21,925,800 | — | 21,925,800 | |||||||||||||
Other Financial Instruments* – Assets | ||||||||||||||||
Foreign Exchange Contracts | — | 15,382 | — | 15,382 | ||||||||||||
Other Financial Instruments* – Liabilities | ||||||||||||||||
Foreign Exchange Contracts | — | (73 | ) | — | (73 | ) | ||||||||||
Interest Rate Contracts | $ | (2,688 | ) | — | — | (2,688 | ) | |||||||||
| (2,688 | ) | (73 | ) | — | (2,761 | ) | ||||||||||
Totals | $ | (2,688 | ) | $ | 21,941,109 | — | $ | 21,938,421 | ||||||||
| AllianzGI Global Sustainability: | ||||||||||||||||
| Investments in Securities – Assets | Level 1– Quoted Prices | Level 2– Other Significant Observable Inputs | Level 3– Significant Unobservable Inputs | Value at 3/31/18 | ||||||||||||
Common Stock: | ||||||||||||||||
Australia | — | $ | 433,354 | — | $ | 433,354 | ||||||||||
Denmark | — | 394,323 | — | 394,323 | ||||||||||||
France | — | 405,689 | — | 405,689 | ||||||||||||
Germany | — | 2,641,606 | — | 2,641,606 | ||||||||||||
Japan | — | 1,405,039 | — | 1,405,039 | ||||||||||||
Korea (Republic of) | — | 502,027 | — | 502,027 | ||||||||||||
Spain | — | 1,259,534 | — | 1,259,534 | ||||||||||||
Sweden | — | 1,459,462 | — | 1,459,462 | ||||||||||||
Switzerland | — | 908,062 | — | 908,062 | ||||||||||||
United Kingdom | — | 3,881,021 | — | 3,881,021 | ||||||||||||
All Other | $ | 14,303,580 | — | — | 14,303,580 | |||||||||||
Repurchase Agreements | — | 1,463,000 | — | 1,463,000 | ||||||||||||
Totals | $ | 14,303,580 | $ | 14,753,117 | — | $ | 29,056,697 | |||||||||
| 316 | March 31, 2018 | | Semiannual Report |
Table of Contents
| AllianzGI Global Water: | ||||||||||||||||
| Investments in Securities – Assets | Level 1– Quoted Prices | Level 2– Other Significant Observable Inputs | Level 3– Significant Unobservable Inputs | Value at 3/31/18 | ||||||||||||
Common Stock: | ||||||||||||||||
Austria | — | $ | 25,411,478 | — | $ | 25,411,478 | ||||||||||
China | — | 15,325,603 | — | 15,325,603 | ||||||||||||
Finland | — | 26,005,762 | — | 26,005,762 | ||||||||||||
France | — | 67,992,174 | — | 67,992,174 | ||||||||||||
Germany | — | 4,173,400 | — | 4,173,400 | ||||||||||||
Japan | — | 26,975,100 | — | 26,975,100 | ||||||||||||
Netherlands | — | 26,613,309 | — | 26,613,309 | ||||||||||||
Sweden | — | 23,777,457 | — | 23,777,457 | ||||||||||||
Switzerland | — | 41,034,345 | — | 41,034,345 | ||||||||||||
United Kingdom | — | 61,416,945 | — | 61,416,945 | ||||||||||||
All Other | $ | 331,920,884 | — | — | 331,920,884 | |||||||||||
Repurchase Agreements | — | 4,945,000 | — | 4,945,000 | ||||||||||||
| 331,920,884 | 323,670,573 | — | 655,591,457 | |||||||||||||
Other Financial Instruments* – Assets | ||||||||||||||||
Foreign Exchange Contracts | — | 23 | — | 23 | ||||||||||||
Other Financial Instruments* – Liabilities | ||||||||||||||||
Foreign Exchange Contracts | — | (1,159 | ) | — | (1,159 | ) | ||||||||||
Totals | $ | 331,920,884 | $ | 323,669,437 | — | $ | 655,590,321 | |||||||||
| AllianzGI High Yield Bond: | ||||||||||||||||
| Investments in Securities – Assets | Level 1– Quoted Prices | Level 2– Other Significant Observable Inputs | Level 3– Significant Unobservable Inputs | Value at 3/31/18 | ||||||||||||
Corporate Bonds & Notes | — | $ | 195,732,835 | — | $ | 195,732,835 | ||||||||||
Preferred Stock | — | — | $ | 6,385,000 | 6,385,000 | |||||||||||
Common Stock | — | — | 664,493 | 664,493 | ||||||||||||
Warrants | — | — | 17 | 17 | ||||||||||||
Repurchase Agreements | — | 6,051,000 | — | 6,051,000 | ||||||||||||
Totals | — | $ | 201,783,835 | $ | 7,049,510 | $ | 208,833,345 | |||||||||
| AllianzGI International Growth: | ||||||||||||||||
| Investments in Securities – Assets | Level 1– Quoted Prices | Level 2– Other Significant Observable Inputs | Level 3– Significant Unobservable Inputs | Value at 3/31/18 | ||||||||||||
Common Stock: | ||||||||||||||||
Brazil | $ | 747,869 | — | — | $ | 747,869 | ||||||||||
Canada | 1,769,358 | — | — | 1,769,358 | ||||||||||||
China | 1,513,777 | $ | 854,632 | — | 2,368,409 | |||||||||||
India | 353,103 | 280,673 | — | 633,776 | ||||||||||||
Indonesia | 196,697 | 185,368 | — | 382,065 | ||||||||||||
Ireland | 685,989 | — | — | 685,989 | ||||||||||||
Mexico | 201,038 | — | — | 201,038 | ||||||||||||
All Other | — | 12,998,293 | — | 12,998,293 | ||||||||||||
Repurchase Agreements | — | 302,000 | — | 302,000 | ||||||||||||
Totals | $ | 5,467,831 | $ | 14,620,966 | — | $ | 20,088,797 | |||||||||
| Semiannual Report | | March 31, 2018 | 317 |
Table of Contents
Notes to Financial Statements (cont’d)
March 31, 2018 (Unaudited)
| AllianzGI International Small-Cap: | ||||||||||||||||
| Investments in Securities – Assets | Level 1– Quoted Prices | Level 2– Other Significant Observable Inputs | Level 3– Significant Unobservable Inputs | Value at 3/31/18 | ||||||||||||
Common Stock: | ||||||||||||||||
Philippines | $ | 397,971 | $ | 386,411 | — | $ | 784,382 | |||||||||
United Kingdom | 2,726,012 | 20,191,639 | — | 22,917,651 | ||||||||||||
All Other | — | 160,643,083 | — | 160,643,083 | ||||||||||||
Preferred Stock | — | 2,894,279 | — | 2,894,279 | ||||||||||||
| 3,123,983 | 184,115,412 | — | 187,239,395 | |||||||||||||
Other Financial Instruments* – Assets | ||||||||||||||||
Foreign Exchange Contracts | — | 182 | — | 182 | ||||||||||||
Other Financial Instruments* – Liabilities | ||||||||||||||||
Foreign Exchange Contracts | — | (9 | ) | — | (9 | ) | ||||||||||
Totals | $ | 3,123,983 | $ | 184,115,585 | — | $ | 187,239,568 | |||||||||
| AllianzGI Micro Cap: | ||||||||||||||||
| Investments in Securities – Assets | Level 1– Quoted Prices | Level 2– Other Significant Observable Inputs | Level 3– Significant Unobservable Inputs | Value at 3/31/18 | ||||||||||||
Common Stock | $ | 25,430,344 | — | — | $ | 25,430,344 | ||||||||||
| AllianzGI NFJ Emerging Markets Value: | ||||||||||||||||
| Investments in Securities – Assets | Level 1– Quoted Prices | Level 2– Other Significant Observable Inputs | Level 3– Significant Unobservable Inputs | Value at 3/31/18 | ||||||||||||
Common Stock: | ||||||||||||||||
Argentina | $ | 1,037,592 | — | — | $ | 1,037,592 | ||||||||||
Brazil | 6,401,421 | — | — | 6,401,421 | ||||||||||||
China | 2,980,406 | $ | 36,039,723 | $ | 610,253 | 39,630,382 | ||||||||||
Czech Republic | 1,056,494 | — | — | 1,056,494 | ||||||||||||
India | 999,832 | 12,075,250 | — | 13,075,082 | ||||||||||||
Mexico | 3,785,787 | — | — | 3,785,787 | ||||||||||||
Russian Federation | 3,107,267 | — | 2,055,847 | 5,163,114 | ||||||||||||
South Africa | 6,036,202 | 2,881,426 | — | 8,917,628 | ||||||||||||
Taiwan | 993,352 | 16,739,039 | — | 17,732,391 | ||||||||||||
United Arab Emirates | 948,418 | — | — | 948,418 | ||||||||||||
All Other | — | 33,790,837 | — | 33,790,837 | ||||||||||||
Preferred Stock: | ||||||||||||||||
Brazil | 4,205,026 | — | — | 4,205,026 | ||||||||||||
Korea (Republic of) | 1,070,881 | 2,669,166 | — | 3,740,047 | ||||||||||||
Exchange-Traded Funds | 53,108 | — | — | 53,108 | ||||||||||||
Repurchase Agreements | — | 4,110,000 | — | 4,110,000 | ||||||||||||
| 32,675,786 | 108,305,441 | 2,666,100 | 143,647,327 | |||||||||||||
Other Financial Instruments* – Assets | ||||||||||||||||
Foreign Exchange Contracts | — | 337 | — | 337 | ||||||||||||
Other Financial Instruments* – Liabilities | ||||||||||||||||
Foreign Exchange Contracts | — | (33 | ) | — | (33 | ) | ||||||||||
Totals | $ | 32,675,786 | $ | 108,305,745 | $ | 2,666,100 | $ | 143,647,631 | ||||||||
| 318 | March 31, 2018 | | Semiannual Report |
Table of Contents
| AllianzGI NFJ International Small-Cap Value: | ||||||||||||||||
| Investments in Securities – Assets | Level 1– Quoted Prices | Level 2– Other Significant Observable Inputs | Level 3– Significant Unobservable Inputs | Value at 3/31/18 | ||||||||||||
Common Stock: | ||||||||||||||||
Canada | $ | 293,491 | — | — | $ | 293,491 | ||||||||||
Mexico | 70,516 | — | — | 70,516 | ||||||||||||
South Africa | 60,375 | $ | 41,572 | — | 101,947 | |||||||||||
Spain | 42,733 | 132,331 | — | 175,064 | ||||||||||||
United Kingdom | 252,915 | 707,124 | — | 960,039 | ||||||||||||
United States | 40,850 | — | — | 40,850 | ||||||||||||
All Other | — | 2,448,264 | — | 2,448,264 | ||||||||||||
Repurchase Agreements | — | 154,000 | — | 154,000 | ||||||||||||
| 760,880 | 3,483,291 | — | 4,244,171 | |||||||||||||
Other Financial Instruments* – Assets | ||||||||||||||||
Foreign Exchange Contracts | — | 74 | — | 74 | ||||||||||||
Other Financial Instruments* – Liabilities | ||||||||||||||||
Foreign Exchange Contracts | — | (1,260 | ) | — | (1,260 | ) | ||||||||||
Totals | $ | 760,880 | $ | 3,482,105 | — | $ | 4,242,985 | |||||||||
| AllianzGI PerformanceFee Managed Futures Strategy: | ||||||||||||||||
| Investments in Securities – Assets | Level 1– Quoted Prices | Level 2– Other Significant Observable Inputs | Level 3– Significant Unobservable Inputs | Value at 3/31/18 | ||||||||||||
U.S. Treasury Obligations | — | $ | 12,802,211 | — | $ | 12,802,211 | ||||||||||
Exchange-Traded Funds | $ | 148,107 | — | — | 148,107 | |||||||||||
Repurchase Agreements | — | 204,000 | — | 204,000 | ||||||||||||
| 148,107 | 13,006,211 | — | 13,154,318 | |||||||||||||
Other Financial Instruments* – Assets | ||||||||||||||||
Commodity Contracts | 135,126 | — | — | 135,126 | ||||||||||||
Foreign Exchange Contracts | 7,102 | — | — | 7,102 | ||||||||||||
Interest Rate Contracts | 56,431 | — | — | 56,431 | ||||||||||||
Market Price | 29,990 | — | — | 29,990 | ||||||||||||
| 228,649 | — | — | 228,649 | |||||||||||||
Other Financial Instruments* – Liabilities | ||||||||||||||||
Commodity Contracts | (45,906 | ) | — | — | (45,906 | ) | ||||||||||
Credit Contracts | — | (28,066 | ) | — | (28,066 | ) | ||||||||||
Foreign Exchange Contracts | (25,328 | ) | — | — | (25,328 | ) | ||||||||||
Interest Rate Contracts | (89,263 | ) | — | — | (89,263 | ) | ||||||||||
Market Price | (95,247 | ) | — | — | (95,247 | ) | ||||||||||
| (255,744 | ) | (28,066 | ) | — | (283,810 | ) | ||||||||||
Totals | $ | 121,012 | $ | 12,978,145 | — | $ | 13,099,157 | |||||||||
| AllianzGI PerformanceFee Structured US Equity: | ||||||||||||||||
| Investments in Securities – Assets | Level 1– Quoted Prices | Level 2– Other Significant Observable Inputs | Level 3– Significant Unobservable Inputs | Value at 3/31/18 | ||||||||||||
Exchange-Traded Funds | $ | 24,586,265 | — | — | $ | 24,586,265 | ||||||||||
Repurchase Agreements | — | $ | 113,000 | — | 113,000 | |||||||||||
Options Purchased: | ||||||||||||||||
Market Price | 306,846 | 3,471 | — | 310,317 | ||||||||||||
| 24,893,111 | 116,471 | — | 25,009,582 | |||||||||||||
Investments in Securities – Liabilities | ||||||||||||||||
Options Written: | ||||||||||||||||
Market Price | (395,724 | ) | (2,281 | ) | — | (398,005 | ) | |||||||||
Totals | $ | 24,497,387 | $ | 114,190 | — | $ | 24,611,577 | |||||||||
| Semiannual Report | | March 31, 2018 | 319 |
Table of Contents
Notes to Financial Statements (cont’d)
March 31, 2018 (Unaudited)
| AllianzGI PerformanceFee Structured US Fixed Income: | ||||||||||||||||
| Investments in Securities – Assets | Level 1– Quoted Prices | Level 2– Other Significant Observable Inputs | Level 3– Significant Unobservable Inputs | Value at 3/31/18 | ||||||||||||
Exchange-Traded Funds | $ | 24,544,806 | — | — | $ | 24,544,806 | ||||||||||
Options Purchased: | ||||||||||||||||
Market Price | 162,502 | — | — | 162,502 | ||||||||||||
| 24,707,308 | — | — | 24,707,308 | |||||||||||||
Investments in Securities – Liabilities | ||||||||||||||||
Options Written: | ||||||||||||||||
Market Price | (202,277 | ) | — | — | (202,277 | ) | ||||||||||
Totals | $ | 24,505,031 | — | — | $ | 24,505,031 | ||||||||||
| AllianzGI Real Estate Debt: | ||||||||||||||||
| Investments in Securities – Assets | Level 1– Quoted Prices | Level 2– Other Significant Observable Inputs | Level 3– Significant Unobservable Inputs | Value at 3/31/18 | ||||||||||||
Mortgage-Backed Securities | — | $ | 7,955,863 | $ | 99,650 | $ | 8,055,513 | |||||||||
Corporate Bonds & Notes | — | 1,012,333 | — | 1,012,333 | ||||||||||||
Asset-Backed Securities | — | 201,834 | — | 201,834 | ||||||||||||
U.S. Treasury Obligations | — | 647,445 | — | 647,445 | ||||||||||||
| — | 9,817,475 | 99,650 | 9,917,125 | |||||||||||||
Other Financial Instruments* – Assets | ||||||||||||||||
Foreign Exchange Contracts | — | 5,579 | — | 5,579 | ||||||||||||
Other Financial Instruments* – Liabilities | ||||||||||||||||
Foreign Exchange Contracts | — | (1,030 | ) | — | (1,030 | ) | ||||||||||
Interest Rate Contracts | (2,734 | ) | — | — | (2,734 | ) | ||||||||||
| (2,734 | ) | (1,030 | ) | — | (3,764 | ) | ||||||||||
Totals | $ | (2,734 | ) | $ | 9,822,024 | $ | 99,650 | $ | 9,918,940 | |||||||
| AllianzGI Short Duration High Income: | ||||||||||||||||
| Investments in Securities – Assets | Level 1– Quoted Prices | Level 2– Other Significant Observable Inputs | Level 3– Significant Unobservable Inputs | Value at 3/31/18 | ||||||||||||
Corporate Bonds & Notes | — | $ | 1,052,342,474 | — | $ | 1,052,342,474 | ||||||||||
Senior Loans | — | 92,102,550 | — | 92,102,550 | ||||||||||||
Repurchase Agreements | — | 56,698,000 | — | 56,698,000 | ||||||||||||
Totals | — | $ | 1,201,143,024 | — | $ | 1,201,143,024 | ||||||||||
| AllianzGI Structured Return: | ||||||||||||||||
| Investments in Securities – Assets | Level 1– Quoted Prices | Level 2– Other Significant Observable Inputs | Level 3– Significant Unobservable Inputs | Value at 3/31/18 | ||||||||||||
Exchange-Traded Funds | $ | 542,947,020 | — | — | $ | 542,947,020 | ||||||||||
Repurchase Agreements | — | $ | 121,234,000 | — | 121,234,000 | |||||||||||
Options Purchased: |
| |||||||||||||||
Market Price | 5,617,518 | — | — | 5,617,518 | ||||||||||||
| 548,564,538 | 121,234,000 | — | 669,798,538 | |||||||||||||
Investments in Securities – Liabilities | ||||||||||||||||
Options Written: | ||||||||||||||||
Market Price | (45,348,093 | ) | — | — | (45,348,093 | ) | ||||||||||
Totals | $ | 503,216,445 | $ | 121,234,000 | — | $ | 624,450,445 | |||||||||
| 320 | March 31, 2018 | | Semiannual Report |
Table of Contents
| AllianzGI U.S. Equity Hedged: | ||||||||||||||||
| Investments in Securities – Assets | Level 1– Quoted Prices | Level 2– Other Significant Observable Inputs | Level 3– Significant Unobservable Inputs | Value at 3/31/18 | ||||||||||||
Exchange-Traded Funds | $ | 2,268,353 | — | — | $ | 2,268,353 | ||||||||||
Options Purchased: |
| |||||||||||||||
Market Price | 66,680 | — | — | 66,680 | ||||||||||||
| 2,335,033 | — | — | 2,335,033 | |||||||||||||
Investments in Securities – Liabilities | ||||||||||||||||
Options Written: | ||||||||||||||||
Market Price | (7,060 | ) | — | — | (7,060 | ) | ||||||||||
Totals | $ | 2,327,973 | — | — | $ | 2,327,973 | ||||||||||
| AllianzGI Ultra Micro Cap: | ||||||||||||||||
| Investments in Securities – Assets | Level 1– Quoted Prices | Level 2– Other Significant Observable Inputs | Level 3– Significant Unobservable Inputs | Value at 3/31/18 | ||||||||||||
Common Stock | $ | 32,421,459 | — | — | $ | 32,421,459 | ||||||||||
Repurchase Agreements | — | $ | 295,000 | — | 295,000 | |||||||||||
Totals | $ | 32,421,459 | $ | 295,000 | — | $ | 32,716,459 | |||||||||
At March 31, 2018, the following Funds had transfers between Levels 1 and 2:
| Transfers | ||||||||
| Level 1 to Level 2(a) | Level 2 to Level 1(b) | |||||||
AllianzGI Multi Asset Income | $ | 254,504 | — | |||||
AllianzGI Best Styles Emerging Markets Equity | 154,839 | $ | 119,499 | |||||
AllianzGI Best Styles Global Equity | 6,525,485 | 781,897 | ||||||
AllianzGI Best Styles International Equity | 1,053,832 | 73,928 | ||||||
AllianzGI Emerging Markets Consumer | 88,046 | — | ||||||
AllianzGI Emerging Markets Small-Cap | 788,498 | 77,422 | ||||||
AllianzGI Global Dynamic Allocation | 1,717,162 | 175,804 | ||||||
AllianzGI Global Fundamental Strategy | 279,644 | — | ||||||
AllianzGI Global Water | — | 15,969,224 | ||||||
AllianzGI International Growth | 690,119 | — | ||||||
AllianzGI International Small-Cap | 9,818,388 | — | ||||||
AllianzGI NFJ Emerging Markets Value | 6,109,373 | 1,998,000 | ||||||
AllianzGI NFJ International Small-Cap Value | 795,843 | 42,733 | ||||||
| (a) | This transfer was a result of securities trading outside the U.S. whose values were not adjusted by the application of a modeling tool at September 30, 2017, which was applied on March 31, 2018. |
| (b) | This transfer was a result of securities trading outside the U.S. whose values were adjusted by the application of a modeling tool at September 30, 2017, which was not applied on March 31, 2018. |
A roll forward of fair value measurements using significant unobservable inputs (Level 3) for the period or six months ended March 31, 2018, was as follows:
| AllianzGI Multi Asset Income: | ||||||||||||||||||||||||||||||||||||
| Investments in Securities – Assets | Beginning Balance 9/30/17 | Purchases | Sales | Accrued Discount (Premiums) | Net Realized Gain (Loss) | Net Change in Unrealized Appreciation/ Depreciation | Transfers into Level 3 | Transfers out of Level 3 | Ending Balance 3/31/18 | |||||||||||||||||||||||||||
Rights: | ||||||||||||||||||||||||||||||||||||
Food & Staples Retailing | $ | 9 | — | — | — | — | — | — | — | $ | 9 | |||||||||||||||||||||||||
| Semiannual Report | | March 31, 2018 | 321 |
Table of Contents
Notes to Financial Statements (cont’d)
March 31, 2018 (Unaudited)
| AllianzGI Best Styles Emerging Markets Equity: | ||||||||||||||||||||||||||||||||||||
| Investments in Securities – Assets | Beginning Balance 9/30/17 | Purchases | Sales | Accrued Discount (Premiums) | Net Realized Gain (Loss) | Net Change in Unrealized Appreciation/ Depreciation | Transfers into Level 3 | Transfers out of Level 3*** | Ending Balance 3/31/18 | |||||||||||||||||||||||||||
Common Stock: | ||||||||||||||||||||||||||||||||||||
Thailand | $ | 195,153 | — | — | — | — | $ | 56,658 | — | — | $ | 251,811 | ||||||||||||||||||||||||
Rights: | ||||||||||||||||||||||||||||||||||||
Korea (Republic of) | 125 | — | — | — | — | (125 | ) | — | — | — | ||||||||||||||||||||||||||
Warrants: | ||||||||||||||||||||||||||||||||||||
Malaysia | — | — | — | — | — | 241 | — | $ | (241 | ) | — | |||||||||||||||||||||||||
Totals | $ | 195,278 | — | — | — | — | $ | 56,774 | — | $ | (241 | ) | $ | 251,811 | ||||||||||||||||||||||
| AllianzGI Best Styles Global Equity: | ||||||||||||||||||||||||||||||||||||
| Investments in Securities – Assets | Beginning Balance 9/30/17 | Purchases | Sales | Accrued Discount (Premiums) | Net Realized Gain (Loss) | Net Change in Unrealized Appreciation/ Depreciation | Transfers into Level 3 | Transfers out of Level 3 | Ending Balance 3/31/18 | |||||||||||||||||||||||||||
Common Stock: | ||||||||||||||||||||||||||||||||||||
China | $ | 327,578 | — | $ | (291,658 | ) | — | $ | 7,461 | $ | (42,230 | ) | — | — | $ | 1,151 | ||||||||||||||||||||
Thailand | 4,713,778 | $ | 1,972,352 | (3,128,579 | ) | — | 835,170 | (55,415 | ) | — | — | 4,337,306 | ||||||||||||||||||||||||
Totals | $ | 5,041,356 | $ | 1,972,352 | $ | (3,420,237 | ) | — | $ | 842,631 | $ | (97,645 | ) | — | — | $ | 4,338,457 | |||||||||||||||||||
| AllianzGI Best Styles International Equity: | ||||||||||||||||||||||||||||||||||||
| Investments in Securities – Assets | Beginning Balance 9/30/17 | Purchases | Sales | Accrued Discount (Premiums) | Net Realized Gain (Loss) | Net Change in Unrealized Appreciation/ Depreciation | Transfers into Level 3 | Transfers out of Level 3 | Ending Balance 3/31/18 | |||||||||||||||||||||||||||
Common Stock: | ||||||||||||||||||||||||||||||||||||
Thailand | — | $ | 77,804 | $ | (17,179 | ) | — | $ | 3,156 | $ | 14,205 | — | — | $ | 77,986 | |||||||||||||||||||||
| AllianzGI Best Styles U.S. Equity: | ||||||||||||||||||||||||||||||||||||
| Investments in Securities – Assets | Beginning Balance 9/30/17 | Purchases | Sales | Accrued Discount (Premiums) | Net Realized Gain (Loss) | Net Change in Unrealized Appreciation/ Depreciation | Transfers into Level 3 | Transfers out of Level 3 | Ending Balance 3/31/18 | |||||||||||||||||||||||||||
Rights: | ||||||||||||||||||||||||||||||||||||
Food & Staples Retailing | $ | 97 | — | — | — | — | — | — | — | $ | 97 | |||||||||||||||||||||||||
| AllianzGI Convertible: | ||||||||||||||||||||||||||||||||||||
| Investments in Securities – Assets | Beginning Balance 9/30/17 | Purchases | Sales | Accrued Discount (Premiums) | Net Realized Gain (Loss) | Net Change in Unrealized Appreciation/ Depreciation | Transfers into Level 3 | Transfers out of Level 3 | Ending Balance 3/31/18 | |||||||||||||||||||||||||||
Convertible Bonds & Notes: | ||||||||||||||||||||||||||||||||||||
Healthcare-Products | — | $ | 3,391,994 | $ | (2,110,270 | ) | — | $ | (340,610 | ) | $ | (126,222 | ) | — | — | $ | 814,892 | |||||||||||||||||||
IT Services | $ | 5,583,172 | — | (2,175,571 | ) | $ | 349 | 140,570 | (161,676 | ) | — | — | 3,386,844 | |||||||||||||||||||||||
Totals | $ | 5,583,172 | $ | 3,391,994 | $ | (4,285,841 | ) | $ | 349 | $ | (200,040 | ) | $ | (287,898 | ) | — | — | $ | 4,201,736 | |||||||||||||||||
The table above for AllianzGI Convertible includes Level 3 investments that are valued by brokers and pricing services. The inputs for these investments are not readily available or cannot be reasonably estimated and are generally those inputs described in Note 1(b).
| 322 | March 31, 2018 | | Semiannual Report |
Table of Contents
| AllianzGI Emerging Markets Consumer: | ||||||||||||||||||||||||||||||||||||
| Investments in Securities – Assets | Beginning Balance 9/30/17 | Purchases | Sales | Accrued Discount (Premiums) | Net Realized Gain (Loss) | Net Change in Unrealized Appreciation/ Depreciation | Transfers into Level 3 | Transfers out of Level 3 | Ending Balance 3/31/18 | |||||||||||||||||||||||||||
Common Stock: | ||||||||||||||||||||||||||||||||||||
China | $ | 568,706 | — | $ | (587,099 | ) | — | $ | 101,375 | $ | (82,982 | ) | — | — | — | |||||||||||||||||||||
Russian Federation | 420,761 | $ | 2,806 | (383,601 | ) | — | 218,208 | (258,174 | ) | — | — | — | ||||||||||||||||||||||||
Thailand | 1,685,931 | 1,445,590 | (392,874 | ) | — | 33,329 | 254,183 | — | — | $ | 3,026,159 | |||||||||||||||||||||||||
Totals | $ | 2,675,398 | $ | 1,448,396 | $ | (1,363,574 | ) | — | $ | 352,912 | $ | (86,973 | ) | — | — | $ | 3,026,159 | |||||||||||||||||||
| AllianzGI Emerging Markets Small-Cap: | ||||||||||||||||||||||||||||||||||||
| Investments in Securities – Assets | Beginning Balance 9/30/17 | Purchases | Sales | Accrued Discount (Premiums) | Net Realized Gain (Loss) | Net Change in Unrealized Appreciation/ Depreciation | Transfers into Level 3 | Transfers out of Level 3 | Ending Balance 3/31/18 | |||||||||||||||||||||||||||
Common Stock: | ||||||||||||||||||||||||||||||||||||
Russian Federation | $ | 186,376 | $ | 85,791 | $ | (204,362 | ) | — | $ | 19,058 | $ | (20,897 | ) | — | — | $ | 65,966 | |||||||||||||||||||
Thailand | 281,516 | 444,399 | (190,695 | ) | — | 7,618 | 10,524 | — | — | 553,362 | ||||||||||||||||||||||||||
Preferred Stock: | ||||||||||||||||||||||||||||||||||||
Russian Federation | — | 280,399 | (15,073 | ) | — | 333 | (3,236 | ) | — | — | 262,423 | |||||||||||||||||||||||||
Rights: | ||||||||||||||||||||||||||||||||||||
Korea (Republic of) | 1,533 | — | — | — | — | (1,533 | ) | — | — | — | ||||||||||||||||||||||||||
Totals | $ | 469,425 | $ | 810,589 | $ | (410,130 | ) | — | $ | 27,009 | $ | (15,142 | ) | — | — | $ | 881,751 | |||||||||||||||||||
| AllianzGI Global Dynamic Allocation: | ||||||||||||||||||||||||||||||||||||
| Investments in Securities – Assets | Beginning Balance 9/30/17 | Purchases | Sales | Accrued Discount (Premiums) | Net Realized Gain (Loss) | Net Change in Unrealized Appreciation/ Depreciation | Transfers into Level 3 | Transfers out of Level 3 | Ending Balance 3/31/18 | |||||||||||||||||||||||||||
Common Stock: | ||||||||||||||||||||||||||||||||||||
China | $ | 55,432 | — | $ | (49,499 | ) | — | $ | 3,525 | $ | (9,424 | ) | — | — | $ | 34 | ||||||||||||||||||||
Thailand | 891,846 | $ | 470,934 | (347,184 | ) | — | 47,886 | 135,179 | — | — | 1,198,661 | |||||||||||||||||||||||||
Rights: | ||||||||||||||||||||||||||||||||||||
Thailand | 133 | — | — | — | — | (133 | ) | — | — | — | ||||||||||||||||||||||||||
United States | 83 | — | †† | — | — | — | 9 | — | — | 92 | ||||||||||||||||||||||||||
Totals | $ | 947,494 | $ | 470,934 | $ | (396,683 | ) | — | $ | 51,411 | $ | 125,631 | — | — | $ | 1,198,787 | ||||||||||||||||||||
| AllianzGI High Yield Bond: | ||||||||||||||||||||||||||||||||||||
| Investments in Securities – Assets | Beginning Balance 9/30/17 | Purchases | Sales | Accrued Discount (Premiums) | Net Realized Gain (Loss) | Net Change in Unrealized Appreciation/ Depreciation | Transfers into Level 3 | Transfers out of Level 3*** | Ending Balance 3/31/18 | |||||||||||||||||||||||||||
Corporate Bonds & Notes: | ||||||||||||||||||||||||||||||||||||
Media | $ | 17,256 | — | — | — | — | $ | (17,201 | ) | — | $ | (55 | ) | — | ||||||||||||||||||||||
Preferred Stock | 6,385,000 | — | — | — | — | — | — | — | $ | 6,385,000 | ||||||||||||||||||||||||||
Common Stock: | ||||||||||||||||||||||||||||||||||||
Advertising | 489,997 | — | — | — | — | 90,708 | — | — | 580,705 | |||||||||||||||||||||||||||
Aerospace & Defense | 77,816 | — | — | — | — | 5,965 | — | — | 83,781 | |||||||||||||||||||||||||||
Media | 7 | — | — | — | — | — | — | — | 7 | |||||||||||||||||||||||||||
| Semiannual Report | | March 31, 2018 | 323 |
Table of Contents
Notes to Financial Statements (cont’d)
March 31, 2018 (Unaudited)
| AllianzGI High Yield Bond (cont’d) | ||||||||||||||||||||||||||||||||||||
| Investments in Securities – Assets | Beginning Balance 9/30/17 | Purchases | Sales | Accrued Discount (Premiums) | Net Realized Gain (Loss) | Net Change in Unrealized Appreciation/ Depreciation | Transfers into Level 3 | Transfers out of Level 3*** | Ending Balance 3/31/18 | |||||||||||||||||||||||||||
Warrants: | ||||||||||||||||||||||||||||||||||||
Commercial Services | $ | 45,640 | — | — | — | — | $ | (45,624 | ) | — | — | $ | 16 | |||||||||||||||||||||||
Media | 1 | — | — | — | — | — | — | — | 1 | |||||||||||||||||||||||||||
Totals | $ | 7,015,717 | $ | — | — | — | — | $ | 33,848 | — | $ | (55 | ) | $ | 7,049,510 | |||||||||||||||||||||
| AllianzGI NFJ Emerging Markets Value: | ||||||||||||||||||||||||||||||||||||
| Investments in Securities – Assets | Beginning Balance 9/30/17 | Purchases | Sales | Accrued Discount (Premiums) | Net Realized Gain (Loss) | Net Change in Unrealized Appreciation/ Depreciation | Transfers into Level 3† | Transfers out of Level 3 | Ending Balance 3/31/18 | |||||||||||||||||||||||||||
Common Stock: | ||||||||||||||||||||||||||||||||||||
China | — | — | — | — | — | — | $ | 610,253 | — | $ | 610,253 | |||||||||||||||||||||||||
Russian Federation | — | $ | 1,862,913 | $ | (13,621 | ) | — | $ | 2,941 | $ | 203,614 | — | — | 2,055,847 | ||||||||||||||||||||||
Preferred Stock: | ||||||||||||||||||||||||||||||||||||
Russian Federation | $ | 471,283 | 96,839 | (550,756 | ) | — | (26,229 | ) | 8,863 | — | — | — | ||||||||||||||||||||||||
Totals | $ | 471,283 | $ | 1,959,752 | $ | (564,377 | ) | — | $ | (23,288 | ) | $ | 212,477 | $ | 610,253 | — | $ | 2,666,100 | ||||||||||||||||||
| AllianzGI NFJ International Small-Cap Value: | ||||||||||||||||||||||||||||||||||||
| Investments in Securities – Assets | Beginning Balance 9/30/17 | Purchases | Sales | Accrued Discount (Premiums) | Net Realized Gain (Loss) | Net Change in Unrealized Appreciation/ Depreciation | Transfers into Level 3 | Transfers out of Level 3*** | Ending Balance 3/31/18 | |||||||||||||||||||||||||||
Common Stock: | ||||||||||||||||||||||||||||||||||||
Australia | $ | 39,195 | — | $ | (22,667 | ) | — | $ | 9,959 | $ | 11,057 | — | $ | (37,544 | ) | — | ||||||||||||||||||||
| AllianzGI Real Estate Debt: | ||||||||||||||||||||||||||||||||||||
| Investments in Securities – Assets | Beginning Balance 12/27/17** | Purchases | Sales | Accrued Discount (Premiums) | Net Realized Gain (Loss) | Net Change in Unrealized Appreciation/ Depreciation | Transfers into Level 3 | Transfers out of Level 3 | Ending Balance 3/31/18 | |||||||||||||||||||||||||||
Mortgage-Backed Securities | — | $ | 99,397 | — | — | — | $ | 253 | — | — | $ | 99,650 | ||||||||||||||||||||||||
The following tables present additional information about valuation techniques and inputs used for investments that are measured at fair value and categorized within Level 3 at March 31, 2018:
| AllianzGI Best Styles Emerging Markets Equity: | ||||||||||||
| Investments in Securities – Assets | Ending Balance at 3/31/18 | Valuation Technique Used | Unobservable Inputs | Input Values | ||||||||
Common Stock | $ | 251,811 | Market/Value of Foreign Security Traded on Foreign Exchange | Price of Non-Resident Shares on Foreign Exchange | THB 13.44-550.73 | |||||||
| AllianzGI Best Styles Global Equity: | ||||||||||||
| Investments in Securities – Assets | Ending Balance at 3/31/18 | Valuation Technique Used | Unobservable Inputs | Input Values | ||||||||
Common Stock | $ | 4,337,306 | Market/Value of Foreign Security Traded on Foreign Exchange | Price of Non-Resident Shares on Foreign Exchange | THB | 20.92-550.73 | ||||||
| 1,151 | Market/Discount on Publicly Traded Quote | Discount to Publicly Traded Quote | 88 | % | ||||||||
| 324 | March 31, 2018 | | Semiannual Report |
Table of Contents
| AllianzGI Best Styles International Equity: | ||||||||||||
| Investments in Securities – Assets | Ending Balance at 3/31/18 | Valuation Technique Used | Unobservable Inputs | Input Values | ||||||||
Common Stock | $ | 77,986 | Market/Value of Foreign Security Traded on Foreign Exchange | Price of Non-Resident Shares on Foreign Exchange | THB | 72.15-550.73 | ||||||
| AllianzGI Convertible: | ||||||||||||
| Investments in Securities – Assets | Ending Balance at 3/31/18 | Valuation Technique Used | Unobservable Inputs | Input Values | ||||||||
Convertible Bonds & Notes | $ | 814,892 | Fundamental Analytical Data Relating to the Investment | Price from Independent Pricing Evaluator | $ | 119.837 | ||||||
| AllianzGI Emerging Markets Consumer: | ||||||||||||
| Investments in Securities – Assets | Ending Balance at 3/31/18 | Valuation Technique Used | Unobservable Inputs | Input Values | ||||||||
Common Stock | $ | 3,026,159 | Market/Value of Foreign Security Traded on Foreign Exchange | Price of Non-Resident Shares on Foreign Exchange | THB | 13.93-206.50 | ||||||
| AllianzGI Emerging Markets Small-Cap: | ||||||||||||
| Investments in Securities – Assets | Ending Balance at 3/31/18 | Valuation Technique Used | Unobservable Inputs | Input Values (Ranges) | ||||||||
Common Stock | $ | 65,966 | Market/Value of Foreign Security Traded on Foreign Exchange | Price of Non-Resident Shares on Foreign Exchange | $ | 0.0494-$5.51 | ||||||
Common Stock | 553,362 | Market/Value of Foreign Security Traded on Foreign Exchange | Price of Non-Resident Shares on Foreign Exchange | THB | 4.75-52.15 | |||||||
Preferred Stock | 262,423 | Market/Value of Foreign Security Traded on Foreign Exchange | Price of Non-Resident Shares on Foreign Exchange | $ | 0.52 | |||||||
| AllianzGI Global Dynamic Allocation: | ||||||||||||
| Investments in Securities – Assets | Ending Balance at 3/31/18 | Valuation Technique Used | Unobservable Inputs | Input Values | ||||||||
Common Stock | $ | 1,198,661 | Market/Value of Foreign Security Traded on Foreign Exchange | Price of Non-Resident Shares on Foreign Exchange | THB 11.05-550.73 | |||||||
| AllianzGI High Yield Bond: | ||||||||||||
| Investments in Securities – Assets | Ending Balance at 3/31/18 | Valuation Technique Used | Unobservable Inputs | Input Values (Ranges) | ||||||||
Preferred Stock | $ | 6,385,000 | Market and Company Comparables | EV Multiples | 0.67x (1.10x-0.24x | ) | ||||||
| Illiquidity Discount | 30 | % | ||||||||||
Common Stock | 580,705 | Market and Company Comparables | EV Multiples | 4.01x (2.13x-10.91x | ) | |||||||
| Illiquidity Discount | 30 | % | ||||||||||
| 83,781 | Market and Company Comparables | EV Multiples | 0.72x (0.49x-1.09x | ) | ||||||||
| M&A Transaction Multiples | 0.87x (0.32x-2.12x | ) | ||||||||||
| Illiquidity Discount | 40 | % | ||||||||||
| AllianzGI NFJ Emerging Markets Value: | ||||||||||||
| Investments in Securities – Assets | Ending Balance at 3/31/18 | Valuation Technique Used | Unobservable Inputs | Input Values | ||||||||
Common Stock | $ | 610,253 | Market/Last Exchange-Traded Price | Discount to Last Exchange-Traded Price | 0 | % | ||||||
| 2,055,847 | Market/Value of Foreign Security Traded on Foreign Exchange | Price of Non-Resident Shares on Foreign Exchange | $ | 10.69-$69.38 | ||||||||
THB – Thai Baht
| * | Other financial instruments are derivatives, such as swap agreements, futures contracts, and forward foreign currency contracts which are valued at the unrealized appreciation (depreciation) of the instrument. |
| Semiannual Report | | March 31, 2018 | 325 |
Table of Contents
Notes to Financial Statements (cont’d)
March 31, 2018 (Unaudited)
| ** | Commencement of operations. |
| *** | Transferred out of Level 3 and into Level 2 because an evaluated price from a third-party independent pricing vendor was used on March 31, 2018. |
| † | Transferred out of Level 2 and into Level 3 because the trading was halted. |
| †† | Issued via corporate action. |
The net change in unrealized appreciation/depreciation of Level 3 investments which the following Funds held at March 31, 2018 was:
AllianzGI Best Styles Emerging Markets Equity | $ | 56,658 | ||
AllianzGI Best Styles Global Equity | 1,210,998 | |||
AllianzGI Best Styles International Equity | 14,205 | |||
AllianzGI Convertible | 430,028 | |||
AllianzGI Emerging Markets Consumer | 343,888 | |||
AllianzGI Emerging Markets Small-Cap | 33,119 | |||
AllianzGI Global Dynamic Allocation | 154,164 | |||
AllianzGI High Yield Bond | 51,049 | |||
AllianzGI NFJ Emerging Markets Value | 203,614 | |||
AllianzGI Real Estate Debt | 253 |
Net realized gain (loss) and net change in unrealized appreciation/depreciation are reflected on the Statements of Operations.
(c) Investment Transactions and Investment Income. Investment transactions are accounted for on the trade date. Securities purchased and sold on a when-issued or delayed-delivery basis may be settled beyond a standard settlement period for the security after the trade date. Realized gains and losses on investments are determined on an identified cost basis. Estimated tax liabilities on certain foreign securities are recorded on an accrual basis and are reflected as a component of net change in unrealized appreciation (depreciation) of investments on the Statements of Operations. Tax liabilities realized as a result of such security sales are reflected as a component of net realized gain (loss) on investments on the Statements of Operations. Interest income adjusted for the accretion of discounts and amortization of premiums is recorded on an accrual basis. Discounts or premiums on debt securities purchased are accreted or amortized, respectively, to interest income. Conversion premium is not amortized. Dividend income is recorded on the ex-dividend date, except for certain dividends from foreign securities where the ex-dividend date may have passed, and then are recorded as soon after the ex-dividend date as the Funds, using reasonable diligence, become aware of such dividends. Payments received on synthetic convertible securities are generally included in dividends. Dividend and interest income on the Statements of Operations are shown net of any foreign taxes withheld on income from foreign securities. Payments received from real estate investment trust securities may be comprised of dividends, realized gains and return of capital. The payment may initially be recorded as dividend income and may subsequently be reclassified as realized gains and/or return of capital upon receipt of information from the issuer. Payments considered return of capital reduce the cost basis of the respective security. Distributions, if any, in excess of the cost basis of a security are recognized as capital gains. Dividends from underlying funds are recorded as dividend income, while capital gain distributions are recorded as net capital gain distributions received from underlying
funds on the Statements of Operations. Facility fees and other fees (such as origination fees) received on settlement date are amortized as income over the expected term of the senior loan. Facility fees and other fees received after settlement date relating to senior loans, commitment fees received relating to unfunded purchase or lending commitments and consent fees relating to corporate actions are recorded as miscellaneous income upon receipt. Paydown gains and losses are netted and recorded as interest income on the Statements of Operations. Expenses are recorded on an accrual basis and such expenses exclude those of the underlying funds. Expenses of the underlying funds are reflected in the net asset values of those funds.
(d) Federal Income Taxes. The Funds intend to distribute all of their taxable income and to comply with the other requirements of Subchapter M of the U.S. Internal Revenue Code of 1986, as amended, applicable to regulated investment companies. Accordingly, no provision for U.S. federal income taxes is required. The Funds may be subject to excise tax based on distributions to shareholders.
Accounting for uncertainty in income taxes establishes for all entities, including pass-through entities such as the Funds, a minimum threshold for financial statement recognition of the benefit of positions taken in filing tax returns (including whether an entity is taxable in a particular jurisdiction), and requires certain expanded tax disclosures. In accordance with provisions set forth under U.S. GAAP, the Investment Manager has reviewed the Funds’ tax positions for all open tax years. As of March 31, 2018, the Funds have recorded no liability for net unrecognized tax benefits relating to uncertain income tax positions they have taken. The Funds’ federal income tax returns for the prior three years, as applicable, remain subject to examination by the Internal Revenue Service.
(e) Dividends and Distributions to Shareholders. The Funds (except AllianzGI Multi Asset Income, AllianzGI Global Allocation, AllianzGI Convertible, AllianzGI Emerging Markets Debt, AllianzGI Europe Equity Dividend, AllianzGI Global High Yield, AllianzGI High Yield Bond, AllianzGI NFJ Emerging Markets Value and AllianzGI Short Duration High Income) declare dividends and distributions from net investment income and net realized capital gains, if any, annually. AllianzGI Global Allocation, AllianzGI Convertible, AllianzGI Emerging Markets Debt, AllianzGI Europe Equity Dividend, AllianzGI Global High Yield and AllianzGI NFJ Emerging Markets Value declare dividends from net investment income quarterly and distributions from net realized capital gains, if any, annually. AllianzGI High Yield Bond, AllianzGI Short Duration High Income and AllianzGI Real Estate Debt declare dividends from net investment income monthly and distributions from net realized capital gains, if any, annually. AllianzGI Multi Asset Income declares dividends from net investment income and/or distributions from short-term capital gains monthly. Net realized capital gains, if any, will continue to be distributed annually by the Fund. The Funds record dividends and distributions to their respective shareholders on the ex-dividend date. The amount of
| 326 | March 31, 2018 | | Semiannual Report |
Table of Contents
dividends from net investment income and distributions from net realized capital gains is determined in accordance with federal income tax regulations, which may differ from U.S. GAAP. These “book-tax” differences are considered either temporary or permanent in nature. To the extent these differences are permanent in nature, such amounts are reclassified within the capital accounts based on their federal income tax treatment. Temporary differences do not require reclassification. To the extent dividends and/or distributions exceed current and accumulated earnings and profits for federal income tax purposes, they are reported as dividends and/or distributions to shareholders from return of capital.
(f) Multi-Class Operations. Each class offered by the Trust has equal rights as to assets and voting privileges (except that shareholders of a class have exclusive voting rights regarding any matter relating solely to that class of shares). Income, non-class specific expenses, and realized and unrealized capital gains and losses of each Fund are allocated daily to each class of shares based on the relative net assets of each class. Class specific expenses, where applicable, include administration, administrative servicing, distribution, recoupment, servicing and sub-transfer agent fees.
(g) Foreign Currency Translation. The Funds’ accounting records are maintained in U.S. dollars as follows: (1) the foreign currency market values of investments and other assets and liabilities denominated in foreign currencies are translated at the prevailing exchange rate at the end of the period; and (2) purchases and sales, income and expenses are translated at the prevailing exchange rate on the respective dates of such transactions. The resulting net foreign currency gain (loss) is included in the Funds’ Statements of Operations.
The Funds do not generally isolate that portion of the results of operations arising as a result of changes in foreign currency exchange rates from the fluctuations arising from changes in the market prices of securities. Accordingly, such foreign currency gain (loss) is included in net realized and unrealized gain (loss) on investments. However, the Funds do isolate the effect of fluctuations in foreign currency exchange rates when determining the gain (loss) upon the sale or maturity of foreign currency denominated debt obligations pursuant to U.S. federal income tax regulations; such amount is categorized as foreign currency gain (loss) for both financial reporting and income tax reporting purposes.
(h) Repurchase Agreements. The Funds are parties to Master Repurchase Agreements (“Master Repo Agreements”) with select counterparties. The Master Repo Agreements include provisions for initiation of repurchase transactions, income payments, events of default, and maintenance of collateral.
The Funds enter into transactions, under the Master Repo Agreements, with their custodian bank or securities brokerage firms whereby they purchase securities under agreements (i.e., repurchase agreements) to resell such securities at an agreed upon price and date. The Funds, through their custodian, take possession of securities collateralizing the repurchase agreement. Such agreements are
carried at the contract amount in the financial statements, which is considered to represent fair value. The collateral that is pledged (i.e. the securities received by the Funds), which consists primarily of U.S. government obligations and asset-backed securities, is held by the custodian bank for the benefit of the Funds until maturity of the repurchase agreement. Provisions of the repurchase agreements and the procedures adopted by the Funds require that the market value of the collateral, including accrued interest thereon, be sufficient in the event of default by the counterparty. If the counterparty defaults under the Master Repo Agreements and the value of the collateral declines or if the counterparty enters an insolvency proceeding, realization of the collateral by the Funds may be delayed or limited. The gross values are included in the Funds’ Schedules of Investments. As of March 31, 2018, the value of the related collateral exceeded the value of the repurchase agreements.
(i) Equity-Linked Securities. Certain Funds invest in equity-linked securities such as participatory notes (“P-Notes”). P-Notes are used to gain exposure to issuers in certain countries with a costly or lengthy registration process. They are generally traded over-the-counter and constitute general unsecured contractual obligations of the banks or broker-dealers that issue them. Generally, banks and broker-dealers associated with non-U.S.-based brokerage firms buy securities listed on certain foreign exchanges and then issue P-Notes which are designed to replicate the performance of certain issuers and markets. To the extent that the Funds invest in equity-linked securities whose return corresponds to the performance of a foreign securities index or one or more foreign stocks, investing in equity-linked securities will involve risks similar to the risks of investing in foreign securities. In addition, the Funds bear the risk that the issuer of an equity-linked security may default on its obligation under the terms of the arrangement with the counterparty.
(j) Warrants. The Funds may receive warrants. Warrants are securities that are usually issued together with a debt security or preferred stock and that give the holder the right to buy a proportionate amount of common stock at a specified price. Warrants may be freely transferable and are often traded on major exchanges. Warrants normally have a life that is measured in years and entitle the holder to buy common stock of a company at a price that is usually higher than the market price at the time the warrant is issued. Warrants may entail greater risks than certain other types of investments. Generally, warrants do not carry the right to receive dividends or exercise voting rights with respect to the underlying securities, and they do not represent any rights in the assets of the issuer. In addition, their value does not necessarily change with the value of the underlying securities, and they cease to have value if they are not exercised on or before their expiration date. If the market price of the underlying stock does not exceed the exercise price during the life of the warrant, the warrant will expire worthless. Warrants may increase the potential profit or loss to be realized from the investment as compared with investing the same amount in the underlying securities. Similarly, the percentage increase or decrease in the value of an equity security warrant may be greater than the percentage
| Semiannual Report | | March 31, 2018 | 327 |
Table of Contents
Notes to Financial Statements (cont’d)
March 31, 2018 (Unaudited)
increase or decrease in the value of the underlying common stock. Warrants may relate to the purchase of equity or debt securities. Debt obligations with warrants attached to purchase equity securities have many characteristics of convertible securities and their prices may, to some degree, reflect the performance of the underlying stock. Debt obligations also may be issued with warrants attached to purchase additional debt securities at the same coupon rate. A decline in interest rates would permit a Fund to sell such warrants at a profit. If interest rates rise, these warrants would generally expire with no value.
(k) Rights. The Funds may receive rights. A right is a privilege granted to existing shareholders of a corporation to subscribe for shares of a new issue of common stock before it is issued. Rights normally have a short life, usually two to four weeks, are freely transferable and entitle the holder to buy the new common stock at a lower price than the public offering price. Rights may entail greater risks than certain other types of investments. Generally, rights do not carry the right to receive dividends or exercise voting rights with respect to the underlying securities, and they do not represent any rights in the assets of the issuer. In addition, their value does not necessarily change with the value of the underlying securities, and they cease to have value if they are not exercised on or before their expiration date. If the market price of the underlying stock does not exceed the exercise price during the life of the right, the right will expire worthless. Rights may increase the potential profit or loss to be realized from the investment as compared with investing the same amount in the underlying securities.
(l) Senior Loans. The Funds may purchase assignments of, and participations in, Senior Loans originated, negotiated and structured by a U.S. or foreign commercial bank, insurance company, finance company or other financial institution for a lending syndicate of financial institutions (the “Lender”). When purchasing an assignment, the Funds succeed to all the rights and obligations under the loan agreement with the same rights and obligations as the assigning Lender. Assignments may, however, be arranged through private negotiations between potential assignees and potential assignors, and the rights and obligations acquired by the purchaser of an assignment may differ from, and be more limited than, those held by the assigning Lender. The Funds may also enter into lending arrangements involving unfunded loan commitments, which are contractual obligations for future funding. Unfunded loan commitments may include revolving credit facilities, which may obligate the Funds to supply additional cash to the borrower on demand. Unfunded loan commitments represent a future obligation, even though a percentage of the principal amounts may never be utilized by the borrower.
Certain Funds may purchase the securities of distressed companies (including assignments or direct investments), including companies engaged in restructurings or bankruptcy proceedings. Investments in distressed companies may include senior obligations of an issuer issued in connection with a restructuring under Chapter 11 of the U.S. Bankruptcy Code (commonly known as “debtor-in-possession” or “DIP” financings). Debtor-in-possession financings generally allow the
issuer to continue its operations while reorganizing. Such financings constitute senior liens on unencumbered collateral (i.e., collateral not subject to other creditors’ claims). There is risk that the issuer under a debtor-in-possession financing will not emerge from Chapter 11 and be forced to liquidate its assets under Chapter 7 of the U.S. Bankruptcy Code. In the event of liquidation, the Funds’ only recourse would be against the collateral securing the debtor-in-possession financing.
(m) Payment In-Kind Securities. The Funds may invest in payment in-kind securities, which are debt or preferred stock securities that require or permit payment of interest in the form of additional securities. Payment in-kind securities allow the issuer to avoid or delay the need to generate cash to meet current interest payments and, as a result, may involve greater risk than securities that pay interest currently or in cash.
(n) U.S. Government Agencies or Government-Sponsored Enterprises. Securities issued by U.S. Government agencies or government-sponsored enterprises may not be guaranteed by the U.S. Treasury. The Government National Mortgage Association (“GNMA” or “Ginnie Mae”), a wholly-owned U.S. Government corporation, is authorized to guarantee, with the full faith and credit of the U.S. Government, the timely payment of principal and interest on securities issued by institutions approved by GNMA and backed by pools of mortgages insured by the Federal Housing Administration or guaranteed by the Department of Veterans Affairs. Government-related guarantors not backed by the full faith and credit of the U.S. Government include the Federal National Mortgage Association (“FNMA” or “Fannie Mae”) and the Federal Home Loan Mortgage Corporation (“FHLMC” or “Freddie Mac”). Pass-through securities issued by FNMA are guaranteed as to timely payment of principal and interest by FNMA, but are not backed by the full faith and credit of the U.S. Government. FHLMC guarantees the timely payment of interest and ultimate collection of principal, but its participation certificates are not backed by the full faith and credit of the U.S. Government.
(o) Exchange-Traded Funds. Certain Funds may invest in exchange-traded funds (“ETFs”), which typically are index-based investment companies that hold substantially all of their assets in securities representing their specific index, but may also be actively-managed investment companies. Shares of ETFs trade throughout the day on an exchange and represent an investment in a portfolio of securities and other assets. As a shareholder of another investment company, the Funds would bear their pro rata portion of the other investment company’s expenses, including advisory fees, in addition to the expenses the Funds bear directly in connection with their own operations.
(p) Inflation-Indexed Bonds. Certain Funds may invest in inflation-indexed bonds. Inflation-indexed bonds are fixed income securities whose principal value is periodically adjusted to the rate of inflation. The interest rate on these bonds is generally fixed at issuance at a rate lower than typical bonds. Over the life of an inflation-indexed bond, however, interest will be paid based on a principal value which is adjusted for inflation.
| 328 | March 31, 2018 | | Semiannual Report |
Table of Contents
(q) Convertible Securities. Certain Funds’ may invest a portion of their assets in convertible securities. Although convertible securities derive part of their value from that of the securities into which they are convertible, they are not considered derivative financial instruments. However, certain of the Funds’ investments in convertible securities include features which render them sensitive to price changes in their underlying securities. The value of structured/synthetic convertible securities can be affected by interest rate changes and credit risks of the issuer. Such securities may be structured in ways that limit their potential for capital appreciation and the entire value of the security may be at risk of loss depending on the performance of the underlying equity security. Consequently, the Funds are exposed to greater downside risk than traditional convertible securities, but typically still less than that of the underlying stock.
(r) When-Issued/Delayed-Delivery Transactions. When-issued or delayed-delivery transactions involve a commitment to purchase or sell securities for a predetermined price or yield, with payment and delivery taking place beyond the customary settlement period. When delayed-delivery purchases are outstanding, the Funds will set aside and maintain until the settlement date in a designated account, liquid assets in an amount sufficient to meet the purchase price. When purchasing a security on a delayed-delivery basis, the Funds assume the rights and risks of ownership of the security, including the risk of price and yield fluctuations; consequently, such fluctuations are taken into account when determining the NAV. The Funds may dispose of or renegotiate a delayed-delivery transaction after it is entered into, and may sell when-issued securities before they are delivered, which may result in a realized gain or loss. When a security is sold on a delayed-delivery basis, the Funds do not participate in future gains and losses with respect to the security.
(s) Securities Traded on To-Be-Announced Basis. The Funds may from time to time purchase securities on a to-be-announced (“TBA”) basis. In a TBA transaction, the Fund commits to purchasing or selling securities for which all specific information is not yet known at the time of the trade, particularly the face amount and maturity date of the underlying security transactions. Securities purchased on a TBA basis are not settled until they are delivered to the Fund, normally 15 to 45 days later. Beginning on the date the Fund enters into a TBA transaction, cash, U.S. government securities or other liquid securities are segregated in an amount equal in value to the purchase price of the TBA security. These transactions are subject to market fluctuations, and their current value is determined in the same manner as for other securities.
(t) Contingent Value Rights. A Fund may invest in contingent value rights (“CVRs”). A CVR gives the holder the right to receive an amount (which may be a fixed amount or determined by a formula) in the event that a specified corporate action, business milestone, or other trigger occurs (or does not occur) which is often subject to an expiration date. CVRs often are awarded to shareholders in the context of a corporate acquisition or major restructuring. For example, shareholders of an acquired company may receive a CVR that enables them to receive additional shares of the acquiring company in the
event that the acquiring company’s share price falls below a certain level by a specified date. Risks associated with the use of CVRs are generally similar to risks associated with the use of options, such as the risk that the required trigger does not (or does) occur prior to a CVR’s expiration, causing the CVR to expire with no value. CVRs also present illiquidity risk, as they may not be registered securities or may otherwise be non-transferable or difficult to transfer, as well as counterparty risk and credit risk. Further, because CVRs are valued based on the likelihood of the occurrence of a trigger, valuation often requires modeling and judgment, which increases the risk of mispricing or improper valuation.
(u) Restricted Securities. The Funds are permitted to invest in securities that are subject to legal or contractual restrictions on resale. These securities generally may be resold in transactions exempt from registration or to the public if the securities are registered. Disposal of these securities may involve time-consuming negotiations and expenses, and prompt sale at an acceptable price may be difficult.
(v) Organizational and Offering Costs. Organizational costs are expensed at the inception of the Fund. Offering costs are amortized over a twelve-month period from the inception of the Fund.
(w) Loan Interest Expense. Loan interest expense relates to the amounts borrowed under the credit facility (See Note 12). Loan interest expense is recorded as it is incurred.
| 2. | PRINCIPAL RISKS |
In the normal course of business, the Funds trade financial instruments and enter into financial transactions where risk of potential loss exists due to, among other things, changes in the market (market risk) or failure of the other party to a transaction to perform (counterparty risk).
The Funds are also exposed to other risks such as, but not limited to, interest rate, foreign currency, credit and leverage risks.
Interest rate risk is the risk that fixed income securities’ valuations will change because of changes in interest rates. During periods of rising nominal interest rates, the values of fixed income instruments are generally expected to decline. Conversely, during periods of declining nominal interest rates, the values of fixed income instruments are generally expected to rise. To the extent that a Fund effectively has short positions with respect to fixed income instruments, the values of such short positions would generally be expected to rise when nominal interest rates rise and to decline when nominal interest rates decline. A nominal interest rate can be described as the sum of a real interest rate and an expected inflation rate. Fixed income securities with longer durations tend to be more sensitive to changes in interest rates, usually making them more volatile than securities with shorter durations. Duration is used primarily as a measure of the sensitivity of a fixed income security’s market price to interest rate (i.e., yield) movements. Interest rate changes can be sudden and unpredictable, and the Funds may lose money as a result of movements in interest rates. High-yield or junk bonds are subject to greater levels of credit and liquidity risk, may be speculative and may decline in value due to
| Semiannual Report | | March 31, 2018 | 329 |
Table of Contents
Notes to Financial Statements (cont’d)
March 31, 2018 (Unaudited)
increase in interest rates or an issuer’s deterioration or default. The Funds may not be able to hedge against changes in interest rates or may choose not to do so for cost or other reasons. In addition, any hedges may not work as intended. The values of equity and other non-fixed income securities may also decline due to fluctuations in interest rates.
Variable and floating rate securities generally are less sensitive to interest rate changes but may decline in value if their interest rates do not rise as much, or as quickly, as interest rates in general. Conversely, floating rate securities will not generally increase in value if interest rates decline. Inverse floating rate securities may decrease in value if interest rates increase. Inverse floating rate securities may also exhibit greater price volatility than a fixed rate obligation with similar credit quality. When the Funds hold variable or floating rate securities, a decrease (or, in the case of inverse floating rate securities, an increase) in market interest rates will adversely affect the income received from such securities and the NAV of the Funds’ shares.
The Funds are exposed to credit risk, which is the risk of losing money if the issuer or guarantor of a fixed income security is unable or unwilling, or is perceived (whether by market participants, rating agencies, pricing services or otherwise) as unable or unwilling, to make timely principal and/or interest payments, or to otherwise honor its obligations. Securities are subject to varying degrees of credit risk, which are often reflected in credit ratings.
To the extent the Funds directly invest in foreign currencies or in securities that trade in, and receive revenues in, foreign currencies, or in derivatives that provide exposure to foreign currencies, they will be subject to the risk that those currencies will decline in value relative to the U.S. dollar, or, in the case of hedging positions, that the U.S. dollar will decline in value relative to the currency being hedged. Currency rates in foreign countries may fluctuate significantly over short periods of time for a number of reasons, including economic growth, inflation, changes in interest rates, intervention (or the failure to intervene) by U.S. or foreign governments, central banks or supranational entities such as the International Monetary Fund, or the imposition of currency controls or other political developments in the United States or abroad. As a result, the Funds’ investments in foreign currency-denominated securities may reduce the returns of the Funds. The local emerging market currencies in which the Funds may be invested may experience substantially greater volatility against the U.S. dollar than the major convertible currencies in developed countries.
The Funds are subject to elements of risk not typically associated with investments in the U.S., due to concentrated investments in foreign issuers located in a specific country or region. Such concentrations will subject the Funds to additional risks resulting from future political or economic conditions in such country or region and the possible imposition of adverse governmental laws or currency exchange restrictions affecting such country or region, which could cause the securities and their markets to be less liquid and prices more volatile than those of comparable U.S. companies.
The market values of securities may decline due to general market conditions (market risk) which are not specifically related to a particular company, such as real or perceived adverse economic conditions, changes in the general outlook for corporate earnings, changes in interest or currency rates, adverse changes to credit markets or adverse investor sentiment. They may also decline due to factors that affect a particular industry or industries, such as labor shortages or increased production costs and competitive conditions within an industry. Equity securities and equity-related investments generally have greater market price volatility than fixed income securities, although under certain market conditions fixed income securities may have comparable or greater price volatility. Credit ratings downgrades may also negatively affect securities held by the Funds. Even when markets perform well, there is no assurance that the investments held by the Funds will increase in value along with the broader market. In addition, market risk includes the risk that geopolitical events will disrupt the economy on a national or global level.
The Funds are exposed to counterparty risk, or the risk that an institution or other entity with which the Funds have unsettled or open transactions will default. The potential loss to the Funds could exceed the value of the financial assets recorded in the Funds’ financial statements. Financial assets, which potentially expose the Funds to counterparty risk, consist principally of cash due from counterparties and investments. The Investment Manager seeks to minimize the Funds’ counterparty risk by performing reviews of each counterparty and by minimizing concentration of counterparty risk by undertaking transactions with multiple customers and counterparties on recognized and reputable exchanges. Delivery of securities sold is only made once the Funds have received payment. Payment is made on a purchase once the securities have been delivered by the counterparty. The trade will fail if either party fails to meet its obligation.
The Funds are exposed to risks associated with leverage. Leverage may cause the value of the Funds’ shares to be more volatile than if the Funds did not use leverage. This is because leverage tends to exaggerate the effect of any increase or decrease in the value of the Funds’ portfolio securities. The Funds may engage in transactions or purchase instruments that give rise to forms of leverage. In addition, to the extent the Funds employ leverage, dividend and interest costs on such leverage may not be recovered by any appreciation of the securities purchased with the leverage proceeds and could exceed the Funds’ investment returns, resulting in greater losses.
The Funds may hold defaulted securities that may involve special considerations including bankruptcy proceedings, other regulatory and legal restrictions affecting the Funds’ ability to trade, and the availability of prices from independent pricing services or dealer quotations. Defaulted securities are often illiquid and may not be actively traded. Sale of securities in bankrupt companies at an acceptable price may be difficult and differences compared to the value of the securities used by the Funds could be material. A Fund may incur additional expenses to the extent it is required to seek
| 330 | March 31, 2018 | | Semiannual Report |
Table of Contents
recovery upon a portfolio security’s default in the payment of principal or interest. In any bankruptcy proceeding relating to a defaulted investment, a Fund may lose its entire investment or may be required to accept cash or securities with a value substantially less than its original investment.
Investments in senior loans and repurchase agreements also involve special risks. Although typically secured, senior loans may not be backed by sufficient collateral to satisfy their issuers’ obligations in the event of bankruptcy or similar scenarios. Senior loans may also be illiquid. Similarly, repurchase agreements may result in losses if the collateral associated with such positions is insufficient in the event of a counterparty default or similar scenario. Repurchase agreement positions may also be illiquid.
AllianzGI PerformanceFee Managed Futures Strategy may gain exposure to commodity markets by investing in a subsidiary of the Trust, the AllianzGI PerformanceFee Managed Futures Strategy Offshore Fund, Ltd. (the “Subsidiary”). By investing in the Subsidiary, the Fund is indirectly exposed to the risks associated with the Subsidiary’s investments. AllianzGI Performance Managed Futures Strategy may invest no more than 25% of its assets in the Subsidiary.
The Funds are party to International Swaps and Derivatives Association, Inc. Master Agreements (“ISDA Master Agreements”) with select counterparties that govern transactions, over-the-counter derivatives and foreign exchange contracts entered into by the Funds and those counterparties. The ISDA Master Agreements contain provisions for general obligations, representations, agreements, collateral and events of default or termination. Events of termination include conditions that may entitle counterparties to elect to terminate early and cause settlement of all outstanding transactions under the applicable ISDA Master Agreement. Any election to terminate early could be material to the financial statements of the Funds.
The considerations and factors surrounding the settlement of certain purchases and sales made on a delayed-delivery basis are governed by Master Securities Forward Transaction Agreements (“Master Forward Agreements”) between the Funds and select counterparties. The Master Forward Agreements maintain provisions for, among other things, initiation and confirmation, payment and transfer, events of default, termination, and maintenance of collateral.
The counterparty risk associated with certain contracts may be reduced by master netting arrangements to the extent that if an event of default occurs, all amounts with the counterparty are terminated and settled on a net basis. The Funds’ overall exposure to counterparty risk with respect to transactions subject to master netting arrangements can change substantially within a short period, as it is affected by each transaction subject to the arrangement.
| 3. | UNDERLYING FUNDS |
AllianzGI Retirement 2020, AllianzGI Retirement 2025, AllianzGI Retirement 2030, AllianzGI Retirement 2035, AllianzGI Retirement 2040, AllianzGI Retirement 2045, AllianzGI Retirement 2050, AllianzGI Retirement 2055, AllianzGI Multi Asset Income (collectively the
“Target Funds”) and Global Allocation, intend to invest their assets significantly or primarily in series of the Trust, Allianz Funds, AllianzGI Institutional Multi-Series Trust, PIMCO Funds and PIMCO ETF Trust (together, “Affiliated Underlying Funds”). The Target Funds and Global Allocation may also invest a portion of their assets in ETFs and mutual funds and pooled vehicles other than Affiliated Underlying Funds (collectively, with the Affiliated Underlying Funds, the “Underlying Funds”). Global Fundamental Strategy, PerformanceFee Structured US Equity, PerformanceFee Structured US Fixed Income, Structured Return and U.S. Equity Hedged may have substantial exposure to Underlying Funds. Accordingly, the investment performance of the Funds depends upon a favorable allocation among the Underlying Funds as well as the ability of the Underlying Funds to achieve their objectives. There can be no assurance that the investment objective of any Underlying Fund will be achieved. The risks associated with investing in each Fund are closely related to the risks associated with the securities and other investments held by the Underlying Funds.
Investing in the Underlying Funds involves certain additional expenses and tax results that would not be present in a direct investment in the securities and other investments held by the Underlying Funds. Each Fund’s NAV will fluctuate in response to changes in the NAVs of the Underlying Funds in which it invests. The extent to which the investment performance and risks associated with each Fund correlate to those of a particular Underlying Fund will depend upon the extent to which each Fund’s assets are allocated from time to time for investments in the Underlying Fund, which will vary. To the extent that a Fund invests a significant portion of its assets in an Underlying Fund it will be particularly sensitive to the risks associated with that Underlying Fund.
| 4. | FINANCIAL DERIVATIVE INSTRUMENTS |
Disclosure about derivatives and hedging activities requires qualitative disclosure regarding objectives and strategies for using derivatives, quantitative disclosure about fair value amounts of gains and losses on derivatives, and disclosure about credit-risk-related contingent features in derivative agreements. The disclosure requirements distinguish between derivatives which are accounted for as “hedges”, and those that do not qualify for such accounting. Although the Funds at times use derivatives for hedging purposes, the Funds reflect derivatives at fair value and recognize changes in fair value through the Funds’ Statements of Operations, and such derivatives do not qualify for hedge accounting treatment.
The U.S. Commodity Futures Trading Commission (the “CFTC”) has adopted regulations that subject registered investment companies and their investment advisers to regulation by the CFTC if the registered investment company invests more than a prescribed level of its liquidation value in commodity futures, options on commodities or commodity futures, swaps, or other financial instruments regulated under the Commodity Exchange Act, or if the fund markets itself as providing investment exposure to such instruments. The Investment Manager is registered as a commodity pool operator with respect to AllianzGI PerformanceFee Managed Futures Strategy and the Subsidiary.
| Semiannual Report | | March 31, 2018 | 331 |
Table of Contents
Notes to Financial Statements (cont’d)
March 31, 2018 (Unaudited)
Option Transactions. The Funds purchase put and call options on securities and indices for hedging purposes, risk management purposes or otherwise as part of their investment strategies. The risks associated with purchasing an option include the risk that the Funds pay a premium whether or not the option is exercised. Additionally, the Funds bear the risk of loss of premiums and changes in market value should the counterparty not perform under the contract. Put and call options purchased are accounted for in the same manner as portfolio securities. The cost of securities acquired through the exercise of call options is increased by the premiums paid. The proceeds from securities sold through the exercise of put options are decreased by the premiums paid.
The Funds may write (sell) put and call options on securities and indices to earn premiums, for hedging purposes, risk management purposes or otherwise as part of their investment strategies. When an option is written, the premium received is recorded as an asset with an equal liability that is subsequently marked to market to reflect the market value of the option written. These liabilities, if any, are reflected as options written in the Funds’ Statements of Assets and Liabilities. Premiums received from writing options which expire unexercised are recorded on the expiration date as a realized gain. The difference between the premium received and the amount paid on effecting a closing purchase transaction, including brokerage commissions, is also treated as a realized gain, or if the premium is less than the amount paid for the closing purchase transaction, as a realized loss. If a call option written is exercised, the premium is added to the proceeds from the sale of the underlying security in determining whether there has been a realized gain or loss. If a put option written is exercised, the premium reduces the cost basis of the security. In writing an option, the Funds bear the market risk of an unfavorable change in the price of the security underlying the written option. Exercise of a written option could result in the Funds purchasing a security at a price different from its current market value.
There are several risks associated with option transactions on securities. For example, there are significant differences between the securities and options markets that could result in an imperfect correlation between these markets, causing a given transaction not to achieve its objective. The Funds’ ability to use options successfully will depend on the Investment Manager’s ability to predict pertinent market movements, which cannot be assured. As the writer of a covered call option, a Fund foregoes, during the option’s life, the opportunity to profit from increases in the market value of the security covering the call option above the sum of the premium and the strike price of the call, but has retained the risk of loss should the price of the underlying security decline.
Futures Contracts. The Funds use futures contracts to manage their exposure to the securities markets or the movements in interest rates and currency values. A futures contract is an agreement between two parties to buy and sell a financial instrument at a set price on a future date. Upon entering into such a contract, the Funds are required to pledge to the broker an amount of cash or securities equal to the minimum “initial margin” requirements of the exchange. Pursuant to the contracts, the Funds agree to receive from or pay to the broker an
amount of cash or securities equal to the daily fluctuation in the value of the contracts. Such receipts or payments are known as “variation margin” and are recorded by the Funds as unrealized appreciation or depreciation. When the contracts are closed, the Funds record a realized gain or loss equal to the difference between the value of the contracts at the time they were opened and the value at the time they were closed. Any unrealized appreciation or depreciation recorded is simultaneously reversed. The use of futures transactions involves various risks, including the risk of an imperfect correlation in the movements in the price of futures contracts, interest rates and underlying hedging assets, and possible inability or unwillingness of counterparties to meet the terms of their contracts.
Swap Agreements. Swap agreements are bilaterally negotiated agreements between the Funds and a counterparty to exchange or swap investment cash flows, assets, foreign currencies or market or event-linked returns at specified, future intervals. Swap agreements may be privately negotiated in the over-the-counter market (“OTC swaps”) or may be executed in a multilateral or other trade facility platform, such as a registered commodities exchange (“centrally cleared swaps”). The Funds may enter into credit default, cross-currency, interest rate, total return, variance and other forms of swap agreements in order, among other things, manage their exposure to credit, currency and interest rate risk. In connection with these agreements, securities or cash may be identified as collateral or margin in accordance with the terms of the respective swap agreements to provide assets of value and recourse in the event of default or bankruptcy/insolvency.
OTC swap payments received or made at the beginning of the measurement period, if any, are reflected as such on the Funds’ Statements of Assets and Liabilities and represent payments made or received upon entering into the swap agreement to compensate for differences between the stated terms of the swap agreement and prevailing market conditions (credit spreads, currency exchange rates, interest rates, and other relevant factors). These upfront payments are recorded as realized gains or losses on the Funds’ Statements of Operations upon termination or maturity of the swap. A liquidation payment received or made at the termination of the swap is recorded as realized gain or loss on the Funds’ Statements of Operations. Net periodic payments received or paid by the Funds are included as part of realized gains or losses on the Funds’ Statements of Operations. Changes in market value, if any, are reflected as a component of net changes in unrealized appreciation/depreciation on the Funds’ Statements of Operations. Daily changes in valuation of centrally cleared swaps, if any, are recorded as receivable or payable, as applicable, for variation margin on centrally cleared swaps on the Funds’ Statements of Assets and Liabilities.
Entering into these agreements involves, to varying degrees, elements of credit, legal, market and documentation risk in excess of the amounts recognized on the Funds’ Statements of Assets and Liabilities. Such risks include the possibility that there will be no liquid market for these agreements, that the counterparties to the agreements may default on their obligation to perform or disagree as to the meaning of contractual terms in the agreements and that there may be unfavorable changes in interest rates.
| 332 | March 31, 2018 | | Semiannual Report |
Table of Contents
Credit Default Swap Agreements. Credit default swap agreements involve one party (referred to as the buyer of protection) making a stream of payments to another party (the seller of protection) in exchange for the right to receive a specified return in the event of a default or other credit event for the referenced entity, obligation or index. As the sellers of protection on credit default swap agreements, the Funds will generally receive from the buyer of protection a fixed rate of income throughout the term of the swap provided that there is no credit event. As the sellers, the Funds would effectively add leverage to their investment portfolios because, in addition to their total net assets, the Funds would be subject to investment exposure on the notional amount of the swap.
If the Funds are sellers of protection and a credit event occurs, as defined under the terms of that particular swap agreement, a Fund will either (i) pay to the buyer of protection an amount equal to the notional amount of the swap and take delivery of the referenced obligation, other deliverable obligations or underlying securities comprising the referenced index or (ii) pay a net settlement amount in the form of cash or securities equal to the notional amount of the swap less the recovery value of the referenced obligation or underlying securities comprising the referenced index. If the Funds are buyers of protection and a credit event occurs, as defined under the terms of that particular swap agreement, a Fund will either (i) receive from the seller of protection an amount equal to the notional amount of the swap and deliver the referenced obligation, other deliverable obligations or underlying securities comprising the referenced index or (ii) receive a net settlement amount in the form of cash or securities equal to the notional amount of the swap less the recovery value of the referenced obligation or underlying securities comprising the referenced index. Recovery values are assumed by market makers considering either industry standard recovery rates or entity specific factors and considerations until a credit event occurs. If a credit event has occurred, the recovery value is determined by a facilitated auction whereby a minimum number of allowable broker bids, together with a specified valuation method, are used to calculate the settlement value.
Credit default swap agreements on credit indices involve one party making a stream of payments to another party in exchange for the right to receive a specified return in the event of a write-down, principal shortfall, interest shortfall or default of all or part of the referenced entities comprising the credit index. A credit index is a basket of credit instruments or exposures designed to be representative of some part of the credit market as a whole. These indices are made up of reference credits that are judged by a poll of dealers to be the most liquid entities in the credit default swap market based on the sector of the index. Components of the indices may include, but are not limited to, investment grade securities, high yield securities, asset backed securities, emerging markets, and/or various credit ratings within each sector. Credit indices are traded using credit default swaps with standardized terms including a fixed spread and standard maturity dates. An index credit default swap references all the names in the index, and if there is a default, the credit event is settled based on that name’s weight in the index, or in the case of a tranched index credit default swap, the credit event is settled based on the name’s weight in the index that falls within the tranche for which
the Funds bear exposure. The composition of the indices changes periodically, usually every six months, and for most indices, each name has an equal weight in the index. The Funds use credit default swaps on credit indices to hedge a portfolio of credit default swaps or bonds, which is less expensive than it would be to buy many credit default swaps to achieve a similar effect. Credit default swaps on indices are benchmarks for protecting investors owning bonds against default, and traders use them to speculate on changes in credit quality.
Implied credit spreads, represented in absolute terms, utilized in determining the market value of credit default swap agreements on corporate or sovereign issues serve as an indicator of the current status of the payment/performance risk, and represent the likelihood or risk of default for the credit derivative. The implied credit spread of a particular referenced entity reflects the cost of buying/selling protection and may include upfront payments required to be made to enter into the agreement. For credit default swap agreements on asset-backed securities and credit indices, the quoted market prices and resulting values serve as the indicator of the current status of the payment/performance risk. Wider credit spreads and increasing market values, in absolute terms when compared to the notional amount of the swap, represent a deterioration of the referenced entity’s credit soundness and a greater likelihood or risk of default or other credit event occurring as defined under the terms of the agreement.
The maximum potential amount of future payments (undiscounted) that the Funds as sellers of protection could be required to make under a credit default swap agreement would be an amount equal to the notional amount of the agreement. These potential amounts would be partially offset by any recovery values of the respective referenced obligations, upfront payments received upon entering into the agreement, or net amounts received from the settlement of buy protection credit default swap agreements entered into by the Funds for the same referenced entity or entities.
Forward Foreign Currency Contracts. A forward foreign currency contract is an agreement between two parties to buy and sell a currency at a set exchange rate on a future date. The Funds enter into forward foreign currency contracts for the purpose of hedging against foreign currency risk arising from the investment or anticipated investment in securities denominated in foreign currencies. The Funds also enter into these contracts for purposes of increasing exposure to a foreign currency or shifting exposure to foreign currency fluctuations from one country to another. The market value of a forward foreign currency contract fluctuates with changes in foreign currency exchange rates. All commitments are marked to market daily at the applicable exchange rates and any resulting unrealized appreciation or depreciation is recorded. Realized gains or losses are recorded at the time the forward contract matures or by delivery of the currency. Risks may arise upon entering into these contracts from the potential inability of counterparties to meet the terms of their contracts and from unanticipated movements in the value of a foreign currency relative to the U.S. dollar. In addition, these contracts may involve market risk in excess of the unrealized appreciation (depreciation) reflected in the Funds’ Statements of Assets and Liabilities.
The following is a summary of the Funds’ derivatives categorized by risk exposure.
| Semiannual Report | | March 31, 2018 | 333 |
Table of Contents
Notes to Financial Statements (cont’d)
March 31, 2018 (Unaudited)
The effect of derivatives on the Statements of Assets and Liabilities at March 31, 2018:
| AllianzGI Retirement 2020: | ||||||||||||||||
| Location | Market Price | Interest Rate Contracts | Foreign Exchange Contracts | Total | ||||||||||||
Asset derivatives: | ||||||||||||||||
Unrealized appreciation on futures contracts* | $ | 19,055 | $ | 32,832 | $ | 1,042 | $ | 52,929 | ||||||||
Liability derivatives: | ||||||||||||||||
Unrealized depreciation on futures contracts* | $ | (87,327 | ) | $ | (5,392 | ) | $ | (1,689 | ) | $ | (94,408 | ) | ||||
| * | Included in net unrealized depreciation of $41,479 on futures contracts as reported in the Fund’s Notes to Schedule of Investments. Only variation margin is reported within the Statements of Assets and Liabilities. |
| AllianzGI Retirement 2025: | ||||||||||||||||
| Location | Market Price | Interest Rate Contracts | Foreign Exchange Contracts | Total | ||||||||||||
Asset derivatives: | ||||||||||||||||
Unrealized appreciation on futures contracts* | $ | 5,797 | — | $ | 1,389 | $ | 7,186 | |||||||||
Liability derivatives: | ||||||||||||||||
Unrealized depreciation on futures contracts* | $ | (192,434 | ) | $ | (12,297 | ) | $ | (2,117 | ) | $ | (206,848 | ) | ||||
| * | Included in net unrealized depreciation of $199,662 on futures contracts as reported in the Fund’s Notes to Schedule of Investments. Only variation margin is reported within the Statements of Assets and Liabilities. |
| AllianzGI Retirement 2030: | ||||||||||||||||
| Location | Market Price | Interest Rate Contracts | Foreign Exchange Contracts | Total | ||||||||||||
Asset derivatives: | ||||||||||||||||
Unrealized appreciation on futures contracts* | $ | 8,422 | — | $ | 1,737 | $ | 10,159 | |||||||||
Liability derivatives: | ||||||||||||||||
Unrealized depreciation on futures contracts* | $ | (233,790 | ) | $ | (2,400 | ) | $ | (2,557 | ) | $ | (238,747 | ) | ||||
| * | Included in net unrealized depreciation of $228,588 on futures contracts as reported in the Fund’s Notes to Schedule of Investments. Only variation margin is reported within the Statements of Assets and Liabilities. |
| AllianzGI Retirement 2035: | ||||||||||||
| Location | Market Price | Foreign Exchange Contracts | Total | |||||||||
Asset derivatives: | ||||||||||||
Unrealized appreciation on futures contracts* | $ | 14,584 | $ | 1,389 | $ | 15,973 | ||||||
Liability derivatives: | ||||||||||||
Unrealized depreciation on futures contracts* | $ | (235,972 | ) | $ | (2,130 | ) | $ | (238,102 | ) | |||
| * | Included in net unrealized depreciation of $222,129 on futures contracts as reported in the Fund’s Notes to Schedule of Investments. Only variation margin is reported within the Statements of Assets and Liabilities. |
| AllianzGI Retirement 2040: | ||||||||||||
| Location | Market Price | Foreign Exchange Contracts | Total | |||||||||
Asset derivatives: | ||||||||||||
Unrealized appreciation on futures contracts* | $ | 16,010 | $ | 1,389 | $ | 17,399 | ||||||
Liability derivatives: | ||||||||||||
Unrealized depreciation on futures contracts* | $ | (232,819 | ) | $ | (2,117 | ) | $ | (234,936 | ) | |||
| * | Included in net unrealized depreciation of $217,537 on futures contracts as reported in the Fund’s Notes to Schedule of Investments. Only variation margin is reported within the Statements of Assets and Liabilities. |
| 334 | March 31, 2018 | | Semiannual Report |
Table of Contents
| AllianzGI Retirement 2045: | ||||||||||||
| Location | Market Price | Foreign Exchange Contracts | Total | |||||||||
Asset derivatives: | ||||||||||||
Unrealized appreciation on futures contracts* | $ | 13,506 | $ | 1,042 | $ | 14,548 | ||||||
Liability derivatives: | ||||||||||||
Unrealized depreciation on futures contracts* | $ | (157,144 | ) | $ | (1,689 | ) | $ | (158,833 | ) | |||
| * | Included in net unrealized depreciation of $144,285 on futures contracts as reported in the Fund’s Notes to Schedule of Investments. Only variation margin is reported within the Statements of Assets and Liabilities. |
| AllianzGI Retirement 2050: | ||||||||||||
| Location | Market Price | Foreign Exchange Contracts | Total | |||||||||
Asset derivatives: | ||||||||||||
Unrealized appreciation on futures contracts* | $ | 11,623 | $ | 1,389 | $ | 13,012 | ||||||
Liability derivatives: | ||||||||||||
Unrealized depreciation on futures contracts* | $ | (162,395 | ) | $ | (1,689 | ) | $ | (164,084 | ) | |||
| * | Included in net unrealized depreciation of $151,072 on futures contracts as reported in the Fund’s Notes to Schedule of Investments. Only variation margin is reported within the Statements of Assets and Liabilities. |
| AllianzGI Retirement 2055: | ||||||||||||
| Location | Market Price | Foreign Exchange Contracts | Total | |||||||||
Asset derivatives: | ||||||||||||
Unrealized appreciation on futures contracts* | $ | 6,996 | $ | 695 | $ | 7,691 | ||||||
Liability derivatives: | ||||||||||||
Unrealized depreciation on futures contracts* | $ | (88,613 | ) | $ | (1,262 | ) | $ | (89,875 | ) | |||
| * | Included in net unrealized depreciation of $82,184 on futures contracts as reported in the Fund’s Notes to Schedule of Investments. Only variation margin is reported within the Statements of Assets and Liabilities. |
| AllianzGI Multi Asset Income: | ||||||||||||
| Location | Market Price | Interest Rate Contracts | Total | |||||||||
Asset derivatives: | ||||||||||||
Unrealized appreciation on futures contracts* | — | $ | 272,145 | $ | 272,145 | |||||||
Liability derivatives: | ||||||||||||
Unrealized depreciation on futures contracts* | $ | (315,964 | ) | $ | (108,676 | ) | $ | (424,640 | ) | |||
| * | Included in net unrealized depreciation of $152,495 on futures contracts as reported in the Fund’s Notes to Schedule of Investments. Only variation margin is reported within the Statements of Assets and Liabilities. |
| AllianzGI Global Allocation: | ||||||||||||||||
| Location | Market Price | Interest Rate Contracts | Foreign Exchange Contracts | Total | ||||||||||||
Asset derivatives: | ||||||||||||||||
Unrealized appreciation on futures contracts* | — | $ | 129,949 | $ | 62,182 | $ | 192,131 | |||||||||
Liability derivatives: | ||||||||||||||||
Unrealized depreciation on futures contracts* | $ | (1,399,502 | ) | $ | (290,126 | ) | $ | (133,530 | ) | $ | (1,823,158 | ) | ||||
| * | Included in net unrealized depreciation of $1,631,027 on futures contracts as reported in the Fund’s Notes to Schedule of Investments. Only variation margin is reported within the Statements of Assets and Liabilities. |
| Semiannual Report | | March 31, 2018 | 335 |
Table of Contents
Notes to Financial Statements (cont’d)
March 31, 2018 (Unaudited)
| AllianzGI Best Styles Emerging Markets Equity: | ||||
| Location | Market Price | |||
Asset derivatives: | ||||
Unrealized appreciation on futures contracts* | $ | 1,761 | ||
Liability derivatives: | ||||
Unrealized depreciation on futures contracts* | $ | (3,005 | ) | |
| * | Included in net unrealized depreciation of $1,244 on futures contracts as reported in the Fund’s Notes to Schedule of Investments. Only variation margin is reported within the Statements of Assets and Liabilities. |
| AllianzGI Best Styles Global Equity: | ||||||||||||
| Location | Market Price | Foreign Exchange Contracts | Total | |||||||||
Asset derivatives: | ||||||||||||
Unrealized appreciation of forward foreign currency contracts | — | $ | 324 | $ | 324 | |||||||
Liability derivatives: | ||||||||||||
Unrealized depreciation on futures contracts* | $ | (54,669 | ) | — | $ | (54,669 | ) | |||||
Unrealized depreciation of forward foreign currency contracts | — | $ | (255 | ) | (255 | ) | ||||||
Total liability derivatives | $ | (54,669 | ) | $ | (255 | ) | $ | (54,924 | ) | |||
| * | Included in net unrealized depreciation of $54,669 on futures contracts as reported in the Fund’s Notes to Schedule of Investments. Only variation margin is reported within the Statements of Assets and Liabilities. |
| AllianzGI Best Styles International Equity: | ||||
| Location | Foreign Exchange Contracts | |||
Liability derivatives: | ||||
Unrealized depreciation of forward foreign currency contracts | $ | (11 | ) | |
| AllianzGI Best Styles U.S. Equity: | ||||
| Location | Market Price | |||
Asset derivatives: | ||||
Unrealized appreciation on futures contracts* | $ | 12,051 | ||
| * | Included in net unrealized appreciation of $12,051 on futures contracts as reported in the Fund’s Notes to Schedule of Investments. Only variation margin is reported within the Statements of Assets and Liabilities. |
| AllianzGI Emerging Markets Debt: | ||||
| Location | Foreign Exchange Contracts | |||
Asset derivatives: | ||||
Unrealized appreciation of forward foreign currency contracts | $ | 7,412 | ||
| AllianzGI Europe Equity Dividend: | ||||
| Location | Foreign Exchange Contracts | |||
Liability derivatives: | ||||
Unrealized depreciation of forward foreign currency contracts | $ | (6 | ) | |
| AllianzGI Global Dynamic Allocation: | ||||||||||||||||
| Location | Market Price | Interest Rate Contracts | Foreign Exchange Contracts | Total | ||||||||||||
Asset derivatives: | ||||||||||||||||
Unrealized appreciation on futures contracts* | $ | 55,512 | $ | 163,387 | $ | 2,736 | $ | 221,635 | ||||||||
Liability derivatives: | ||||||||||||||||
Unrealized depreciation on futures contracts* | $ | (878,324 | ) | $ | (9,949 | ) | $ | (13,900 | ) | $ | (902,173 | ) | ||||
| * | Included in net unrealized depreciation of $680,538 on futures contracts as reported in the Fund’s Notes to Schedule of Investments. Only variation margin is reported within the Statements of Assets and Liabilities. |
| 336 | March 31, 2018 | | Semiannual Report |
Table of Contents
| AllianzGI Global Fundamental Strategy: | ||||||||||||||||
| Location | Market Price | Interest Rate Contracts | Foreign Exchange Contracts | Total | ||||||||||||
Asset derivatives: | ||||||||||||||||
Investments, at value (options purchased) | $ | 92,131 | — | — | $ | 92,131 | ||||||||||
Unrealized appreciation on futures contracts* | 157,773 | — | — | 157,773 | ||||||||||||
Unrealized appreciation of forward foreign currency contracts | — | — | $ | 22,926 | 22,926 | |||||||||||
Total asset derivatives | $ | 249,904 | — | $ | 22,926 | $ | 272,830 | |||||||||
Liability derivatives: | ||||||||||||||||
Unrealized depreciation on futures contracts* | — | $ | (49,597 | ) | — | $ | (49,597 | ) | ||||||||
Options written, at value | $ | (30,909 | ) | — | — | (30,909 | ) | |||||||||
Unrealized depreciation of forward foreign currency contracts | — | — | $ | (50,449 | ) | (50,449 | ) | |||||||||
Total liability derivatives | $ | (30,909 | ) | $ | (49,597 | ) | $ | (50,449 | ) | $ | (130,955 | ) | ||||
| * | Included in net unrealized appreciation of $108,176 on futures contracts as reported in the Fund’s Notes to Schedule of Investments. Only variation margin is reported within the Statements of Assets and Liabilities. |
| AllianzGI Global High Yield: | ||||||||||||
| Location | Interest Rate Contracts | Foreign Exchange Contracts | Total | |||||||||
Asset derivatives: | ||||||||||||
Unrealized appreciation of forward foreign currency contracts | — | $ | 15,382 | $ | 15,382 | |||||||
Liability derivatives: | ||||||||||||
Unrealized depreciation on futures contracts* | $ | (2,688 | ) | — | $ | (2,688 | ) | |||||
Unrealized depreciation of forward foreign currency contracts | — | $ | (73 | ) | (73 | ) | ||||||
Total liability derivatives | $ | (2,688 | ) | $ | (73 | ) | $ | (2,761 | ) | |||
| * | Included in net unrealized depreciation of $2,668 on futures contracts as reported in the Fund’s Notes to Schedule of Investments. Only variation margin is reported within the Statements of Assets and Liabilities. |
| AllianzGI Global Water: | ||||
| Location | Foreign Exchange Contracts | |||
Asset derivatives: | ||||
Unrealized appreciation of forward foreign currency contracts | $ | 23 | ||
Liability derivatives: | ||||
Unrealized depreciation of forward foreign currency contracts | $ | (1,159 | ) | |
| AllianzGI International Small-Cap: | ||||
| Location | Foreign Exchange Contracts | |||
Asset derivatives: | ||||
Unrealized appreciation of forward foreign currency contracts | $ | 182 | ||
Liability derivatives: | ||||
Unrealized depreciation of forward foreign currency contracts | $ | (9 | ) | |
| AllianzGI NFJ Emerging Markets Value: | ||||
| Location | Foreign Exchange Contracts | |||
Asset derivatives: | ||||
Unrealized appreciation of forward foreign currency contracts | $ | 337 | ||
Liability derivatives: | ||||
Unrealized depreciation of forward foreign currency contracts | $ | (33 | ) | |
| AllianzGI NFJ International Small-Cap Value: | ||||
| Location | Foreign Exchange Contracts | |||
Asset derivatives: | ||||
Unrealized appreciation of forward foreign currency contracts | $ | 74 | ||
Liability derivatives: | ||||
Unrealized depreciation of forward foreign currency contracts | $ | (1,260 | ) | |
| Semiannual Report | | March 31, 2018 | 337 |
Table of Contents
Notes to Financial Statements (cont’d)
March 31, 2018 (Unaudited)
| AllianzGI PerformanceFee Managed Futures Strategy: | ||||||||||||||||||||||||
| Location | Commodity Contracts | Market Price | Interest Rate Contracts | Credit Contracts | Foreign Exchange Contracts | Total | ||||||||||||||||||
Asset derivatives: | ||||||||||||||||||||||||
Unrealized appreciation on futures contracts* | $ | 135,126 | $ | 29,990 | $ | 56,431 | — | $ | 7,102 | $ | 228,649 | |||||||||||||
Liability derivatives: | ||||||||||||||||||||||||
Unrealized depreciation of swaps** | — | — | — | $ | (28,066 | ) | — | (28,066 | ) | |||||||||||||||
Unrealized depreciation on futures contracts* | $ | (45,906 | ) | $ | (95,247 | ) | $ | (89,263 | ) | — | $ | (25,328 | ) | $ | (255,744 | ) | ||||||||
Total liability derivatives | $ | (45,906 | ) | $ | (95,247 | ) | $ | (89,263 | ) | $ | (28,066 | ) | $ | (25,328 | ) | $ | (283,810 | ) | ||||||
| * | Included in net unrealized depreciation of $27,095 on futures contracts as reported in the Fund’s Notes to Schedule of Investments. Only variation margin is reported within the Statements of Assets and Liabilities. |
| ** | Included in net unrealized depreciation of $28,066 on swaps as reported in the Fund’s Notes to Schedule of Investments. Only variation margin is reported within the Statements of Assets and Liabilities. |
| AllianzGI PerformanceFee Structured US Equity: | ||||
| Location | Market Price | |||
Asset derivatives: | ||||
Investments, at value (options purchased) | $ | 310,317 | ||
Liability derivatives: | ||||
Options written, at value | $ | (398,005 | ) | |
| AllianzGI PerformanceFee Structured US Fixed Income: | ||||
| Location | Market Price | |||
Asset derivatives: | ||||
Investments, at value (options purchased) | $ | 162,502 | ||
Liability derivatives: | ||||
Options written, at value | $ | (202,277 | ) | |
| AllianzGI Real Estate Debt: | ||||||||||||
| Location | Interest Rate Contracts | Foreign Exchange Contracts | Total | |||||||||
Asset derivatives: | ||||||||||||
Unrealized appreciation of forward foreign currency contracts | — | $ | 5,579 | $ | 5,579 | |||||||
Liability derivatives: | ||||||||||||
Unrealized depreciation on futures contracts* | $ | (2,734 | ) | — | $ | (2,734 | ) | |||||
Unrealized depreciation of forward foreign currency contracts | — | $ | (1,030 | ) | (1,030 | ) | ||||||
Total liability derivatives | $ | (2,734 | ) | $ | (1,030 | ) | $ | (3,764 | ) | |||
| * | Included in net unrealized depreciation of $2,734 on futures contracts as reported in the Fund’s Notes to Schedule of Investments. Only variation margin is reported within the Statements of Assets and Liabilities. |
| AllianzGI Structured Return: | ||||
| Location | Market Price | |||
Asset derivatives: | ||||
Investments, at value (options purchased) | $ | 5,617,518 | ||
Liability derivatives: | ||||
Options written, at value | $ | (45,348,093 | ) | |
| AllianzGI U.S. Equity Hedged: | ||||
| Location | Market Price | |||
Asset derivatives: | ||||
Investments, at value (options purchased) | $ | 66,680 | ||
Liability derivatives: | ||||
Options written, at value | $ | (7,060 | ) | |
The effect of derivatives on the Statements of Operations for the six months ended March 31, 2018:
| AllianzGI Retirement 2020: | ||||||||||||||||
| Location | Market Price | Interest Rate Contracts | Foreign Exchange Contracts | Total | ||||||||||||
Net realized gain(loss) on: | ||||||||||||||||
Futures contracts | $ | 87,387 | $ | (167,958 | ) | $ | (50,201 | ) | $ | (130,772 | ) | |||||
Net change in unrealized appreciation/depreciation of: | ||||||||||||||||
Futures contracts | $ | (78,945 | ) | $ | 77,819 | $ | 15,071 | $ | 13,945 | |||||||
| 338 | March 31, 2018 | | Semiannual Report |
Table of Contents
| AllianzGI Retirement 2025: | ||||||||||||||||
| Location | Market Price | Interest Rate Contracts | Foreign Exchange Contracts | Total | ||||||||||||
Net realized gain(loss) on: | ||||||||||||||||
Futures contracts | $ | 367,864 | $ | (5,320 | ) | $ | (56,803 | ) | $ | 305,741 | ||||||
Net change in unrealized appreciation/depreciation of: | ||||||||||||||||
Futures contracts | $ | (221,439 | ) | $ | 12,360 | $ | 18,340 | $ | (190,739 | ) | ||||||
| AllianzGI Retirement 2030: | ||||||||||||||||
| Location | Market Price | Interest Rate Contracts | Foreign Exchange Contracts | Total | ||||||||||||
Net realized gain(loss) on: | ||||||||||||||||
Futures contracts | $ | 426,488 | $ | (222 | ) | $ | (55,619 | ) | $ | 370,647 | ||||||
Net change in unrealized appreciation/depreciation of: | ||||||||||||||||
Futures contracts | $ | (271,965 | ) | $ | (2,400 | ) | $ | 17,516 | $ | (256,849 | ) | |||||
| AllianzGI Retirement 2035: | ||||||||||||
| Location | Market Price | Foreign Exchange Contracts | Total | |||||||||
Net realized gain(loss) on: | ||||||||||||
Futures contracts | $ | 359,857 | $ | (49,272 | ) | $ | 310,585 | |||||
Net change in unrealized appreciation/depreciation of: | ||||||||||||
Futures contracts | $ | (245,082 | ) | $ | 14,503 | $ | (230,579 | ) | ||||
| AllianzGI Retirement 2040: | ||||||||||||
| Location | Market Price | Foreign Exchange Contracts | Total | |||||||||
Net realized gain(loss) on: | ||||||||||||
Futures contracts | $ | 376,054 | $ | (47,504 | ) | $ | 328,550 | |||||
Net change in unrealized appreciation/depreciation of: | ||||||||||||
Futures contracts | $ | (233,817 | ) | $ | 12,570 | $ | (221,247 | ) | ||||
| AllianzGI Retirement 2045: | ||||||||||||
| Location | Market Price | Foreign Exchange Contracts | Total | |||||||||
Net realized gain(loss) on: | ||||||||||||
Futures contracts | $ | 228,950 | $ | (40,361 | ) | $ | 188,589 | |||||
Net change in unrealized appreciation/depreciation of: | ||||||||||||
Futures contracts | $ | (153,633 | ) | $ | 12,237 | $ | (141,396 | ) | ||||
| AllianzGI Retirement 2050: | ||||||||||||
| Location | Market Price | Foreign Exchange Contracts | Total | |||||||||
Net realized gain(loss) on: | ||||||||||||
Futures contracts | $ | 235,723 | $ | (37,095 | ) | $ | 198,628 | |||||
Net change in unrealized appreciation/depreciation of: | ||||||||||||
Futures contracts | $ | (155,624 | ) | $ | 12,584 | $ | (143,040 | ) | ||||
| Semiannual Report | | March 31, 2018 | 339 |
Table of Contents
Notes to Financial Statements (cont’d)
March 31, 2018 (Unaudited)
| AllianzGI Retirement 2055: | ||||||||||||
| Location | Market Price | Foreign Exchange Contracts | Total | |||||||||
Net realized gain(loss) on: | ||||||||||||
Futures contracts | $ | 120,105 | $ | (20,326 | ) | $ | 99,779 | |||||
Net change in unrealized appreciation/depreciation of: | ||||||||||||
Futures contracts | $ | (83,737 | ) | $ | 5,875 | $ | (77,862 | ) | ||||
| AllianzGI Multi Asset Income: | ||||||||||||||||
| Location | Market Price | Interest Rate Contracts | Foreign Exchange Contracts | Total | ||||||||||||
Net realized gain(loss) on: | ||||||||||||||||
Futures contracts | $ | 970,470 | $ | (602,854 | ) | $ | 52,594 | $ | 420,210 | |||||||
Forward foreign currency contracts | — | — | 2,618 | 2,618 | ||||||||||||
Total net realized gain(loss) | $ | 970,470 | $ | (602,854 | ) | $ | 55,212 | $ | 422,828 | |||||||
Net change in unrealized appreciation/depreciation of: | ||||||||||||||||
Futures contracts | $ | (491,525 | ) | $ | 317,881 | $ | (36,647 | ) | $ | (210,291 | ) | |||||
| AllianzGI Global Allocation: | ||||||||||||||||
| Location | Market Price | Interest Rate Contracts | Foreign Exchange Contracts | Total | ||||||||||||
Net realized gain(loss) on: | ||||||||||||||||
Futures contracts | $ | 4,917,929 | $ | (880,584 | ) | $ | (665,446 | ) | $ | 3,371,899 | ||||||
Net change in unrealized appreciation/depreciation of: | ||||||||||||||||
Futures contracts | $ | (2,006,495 | ) | $ | 275,866 | $ | 167,892 | $ | (1,562,737 | ) | ||||||
| AllianzGI Best Styles Emerging Markets Equity: | ||||||||||||
| Location | Market Price | Foreign Exchange Contracts | Total | |||||||||
Net realized gain(loss) on: | ||||||||||||
Futures contracts | $ | 24,949 | — | $ | 24,949 | |||||||
Forward foreign currency contracts | — | $ | (462 | ) | (462 | ) | ||||||
Total net realized gain(loss) | $ | 24,949 | $ | (462 | ) | $ | 24,487 | |||||
Net change in unrealized appreciation/depreciation of: | ||||||||||||
Futures contracts | $ | 6,292 | $ | — | $ | 6,292 | ||||||
| AllianzGI Best Styles Global Equity: | ||||||||||||
| Location | Market Price | Foreign Exchange Contracts | Total | |||||||||
Net realized gain on: | ||||||||||||
Futures contracts | $ | 285,255 | — | $ | 285,255 | |||||||
Forward foreign currency contracts | — | $ | 28,331 | 28,331 | ||||||||
Total net realized gain | $ | 285,255 | $ | 28,331 | $ | 313,586 | ||||||
Net change in unrealized appreciation/depreciation of: | ||||||||||||
Futures contracts | $ | (54,669 | ) | — | $ | (54,669 | ) | |||||
Forward foreign currency contracts | — | $ | 69 | 69 | ||||||||
Total net change in unrealized appreciation/depreciation | $ | (54,669 | ) | $ | 69 | $ | (54,600 | ) | ||||
| 340 | March 31, 2018 | | Semiannual Report |
Table of Contents
| AllianzGI Best Styles International Equity: | ||||
| Location | Foreign Exchange Contracts | |||
Net realized loss on: | ||||
Forward foreign currency contracts | $ | (846 | ) | |
Net change in unrealized appreciation/depreciation of: | ||||
Forward foreign currency contracts | $ | (11 | ) | |
| AllianzGI Best Styles U.S. Equity: | ||||
| Location | Market Price | |||
Net realized gain on: | ||||
Futures contracts | $ | 10,307 | ||
Net change in unrealized appreciation/depreciation of: | ||||
Futures contracts | $ | 7,648 | ||
| AllianzGI Emerging Markets Consumer: | ||||
| Location | Foreign Exchange Contracts | |||
Net realized gain on: | ||||
Forward foreign currency contracts | $ | 23,470 | ||
Net change in unrealized appreciation/depreciation of: | ||||
Forward foreign currency contracts | $ | (144 | ) | |
| AllianzGI Emerging Markets Debt: | ||||||||||||
| Location | Interest Rate Contracts | Foreign Exchange Contracts | Total | |||||||||
Net realized gain(loss) on: | ||||||||||||
Futures contracts | $ | 21,019 | — | $ | 21,019 | |||||||
Forward foreign currency contracts | — | $ | (79,744 | ) | (79,744 | ) | ||||||
Total net realized gain(loss) | $ | 21,019 | $ | (79,744 | ) | $ | (58,725 | ) | ||||
Net change in unrealized appreciation/depreciation of: | ||||||||||||
Forward foreign currency contracts | — | $ | 19,912 | $ | 19,912 | |||||||
| AllianzGI Emerging Markets Small-Cap: | ||||
| Location | Foreign Exchange Contracts | |||
Net realized gain on: | ||||
Forward foreign currency contracts | $ | 5,469 | ||
| AllianzGI Europe Equity Dividend: | ||||
| Location | Foreign Exchange Contracts | |||
Net change in unrealized appreciation/depreciation of: | ||||
Forward foreign currency contracts | $ | (6 | ) | |
| AllianzGI Global Dynamic Allocation: | ||||||||||||||||
| Location | Market Price | Interest Rate Contracts | Foreign Exchange Contracts | Total | ||||||||||||
Net realized gain(loss) on: | ||||||||||||||||
Futures contracts | $ | 3,188,118 | $ | (551,278 | ) | $ | (857,739 | ) | $ | 1,779,101 | ||||||
Forward foreign currency contracts | — | — | 2,224 | 2,224 | ||||||||||||
Total net realized gain(loss) | $ | 3,188,118 | $ | (551,278 | ) | $ | (855,515 | ) | $ | 1,781,325 | ||||||
Net change in unrealized appreciation/depreciation of: | ||||||||||||||||
Futures contracts | $ | (1,506,206 | ) | $ | 342,887 | $ | 294,841 | $ | (868,478 | ) | ||||||
| Semiannual Report | | March 31, 2018 | 341 |
Table of Contents
Notes to Financial Statements (cont’d)
March 31, 2018 (Unaudited)
| AllianzGI Global Fundamental Strategy: | ||||||||||||||||
| Location | Market Price | Interest Rate Contracts | Foreign Exchange Contracts | Total | ||||||||||||
Net realized gain(loss) on: | ||||||||||||||||
Investments (options purchased) | $ | 47,293 | — | — | $ | 47,293 | ||||||||||
Futures contracts | (484,475 | ) | $ | 1,013 | — | (483,462 | ) | |||||||||
Options written | (98,111 | ) | — | — | (98,111 | ) | ||||||||||
Forward foreign currency contracts | — | — | $ | (86,636 | ) | (86,636 | ) | |||||||||
Total net realized gain(loss) | $ | (535,293 | ) | $ | 1,013 | $ | (86,636 | ) | $ | (620,916 | ) | |||||
Net change in unrealized appreciation/depreciation of: | ||||||||||||||||
Investments (options purchased) | $ | (81,582 | ) | — | — | $ | (81,582 | ) | ||||||||
Futures contracts | 221,869 | $ | (60,411 | ) | — | 161,458 | ||||||||||
Options written | (2,625 | ) | — | — | (2,625 | ) | ||||||||||
Forward foreign currency contracts | — | — | $ | (75,738 | ) | (75,738 | ) | |||||||||
Total net change in unrealized appreciation/depreciation | $ | 137,662 | $ | (60,411 | ) | $ | (75,738 | ) | $ | 1,513 | ||||||
| AllianzGI Global High Yield: | ||||||||||||||||
| Location | Market Price | Interest Rate Contracts | Foreign Exchange Contracts | Total | ||||||||||||
Net realized gain(loss) on: | ||||||||||||||||
Futures contracts | $ | (55 | ) | $ | 9,719 | — | $ | 9,664 | ||||||||
Forward foreign currency contracts | — | — | $ | (325,906 | ) | (325,906 | ) | |||||||||
Total net realized gain(loss) | $ | (55 | ) | $ | 9,719 | $ | (325,906 | ) | $ | (316,242 | ) | |||||
Net change in unrealized appreciation/depreciation of: | ||||||||||||||||
Futures contracts | — | $ | (2,032 | ) | — | (2,032 | ) | |||||||||
Forward foreign currency contracts | — | — | $ | 100,392 | 100,392 | |||||||||||
Total net change in unrealized appreciation/depreciation | — | $ | (2,032 | ) | $ | 100,392 | $ | 98,360 | ||||||||
| AllianzGI Global Sustainability: | ||||
| Location | Foreign Exchange Contracts | |||
Net realized gain on: | ||||
Forward foreign currency contracts | $ | 1,534 | ||
| AllianzGI Global Water: | ||||
| Location | Foreign Exchange Contracts | |||
Net realized loss on: | ||||
Forward foreign currency contracts | $ | (107,376 | ) | |
Net change in unrealized appreciation/depreciation of: | ||||
Forward foreign currency contracts | $ | (1,136 | ) | |
| AllianzGI International Growth: | ||||
| Location | Foreign Exchange Contracts | |||
Net realized loss on: | ||||
Forward foreign currency contracts | $ | (1,245 | ) | |
Net change in unrealized appreciation/depreciation of: | ||||
Forward foreign currency contracts | $ | 69 | ||
| AllianzGI International Small-Cap: | ||||
| Location | Foreign Exchange Contracts | |||
Net realized gain on: | ||||
Forward foreign currency contracts | $ | 57,243 | ||
Net change in unrealized appreciation/depreciation of: | ||||
Forward foreign currency contracts | $ | 2,539 | ||
| AllianzGI NFJ Emerging Markets Value: | ||||
| Location | Foreign Exchange Contracts | |||
Net realized gain on: | ||||
Forward foreign currency contracts | $ | 16,427 | ||
Net change in unrealized appreciation/depreciation of: | ||||
Forward foreign currency contracts | $ | 362 | ||
| 342 | March 31, 2018 | | Semiannual Report |
Table of Contents
| AllianzGI NFJ International Small-Cap Value: | ||||
| Location | Foreign Exchange Contracts | |||
Net realized loss on: | ||||
Forward foreign currency contracts | $ | (53 | ) | |
Net change in unrealized appreciation/depreciation of: | ||||
Forward foreign currency contracts | $ | (1,186 | ) | |
| AllianzGI PerformanceFee Managed Futures Strategy: | ||||||||||||||||||||||||
| Location | Commodity Contracts | Market Price | Interest Rate Contracts | Credit Contracts | Foreign Exchange Contracts | Total | ||||||||||||||||||
Net realized gain(loss) on: | ||||||||||||||||||||||||
Futures contracts | $ | (115,163 | ) | $ | (202,861 | ) | $ | (175,546 | ) | — | $ | 5,077 | $ | (488,493 | ) | |||||||||
Swaps | — | — | — | $ | 8,313 | — | 8,313 | |||||||||||||||||
Total net realized gain(loss) | $ | (115,163 | ) | $ | (202,861 | ) | $ | (175,546 | ) | $ | 8,313 | $ | 5,077 | $ | (480,180 | ) | ||||||||
Net change in unrealized appreciation/depreciation of: | ||||||||||||||||||||||||
Futures contracts | $ | 89,220 | $ | (65,257 | ) | $ | (32,832 | ) | — | $ | (18,226 | ) | $ | (27,095 | ) | |||||||||
Swaps | — | — | $ | (28,066 | ) | — | (28,066 | ) | ||||||||||||||||
Total net change in unrealized appreciation/depreciation | $ | 89,220 | $ | (65,257 | ) | $ | (32,832 | ) | $ | (28,066 | ) | $ | (18,226 | ) | $ | (55,161 | ) | |||||||
| AllianzGI PerformanceFee Structured US Equity: | ||||
| Location | Market Price | |||
Net realized loss on: | ||||
Investments (options purchased) | $ | (386,864 | ) | |
Options written | 72,829 | |||
Total net realized loss | $ | (314,035 | ) | |
Net change in unrealized appreciation/depreciation of: | ||||
Investments (options purchased) | $ | (31,105 | ) | |
Options written | 89,780 | |||
Total net change in unrealized appreciation/depreciation | $ | 58,675 | ||
| AllianzGI PerformanceFee Structured US Fixed Income: | ||||
| Location | Market Price | |||
Net realized loss on: | ||||
Investments (options purchased) | $ | (230,426 | ) | |
Options written | 81,724 | |||
Total net realized loss | $ | (148,702 | ) | |
Net change in unrealized appreciation/depreciation of: | ||||
Investments (options purchased) | $ | 14,473 | ||
Options written | 38,588 | |||
Total net change in unrealized appreciation/depreciation | $ | 53,061 | ||
| AllianzGI Real Estate Debt: | ||||||||||||
| Location | Interest Rate Contracts | Foreign Exchange Contracts | Total | |||||||||
Net realized loss on: | ||||||||||||
Forward foreign currency contracts | — | $ | (72,898 | ) | $ | (72,898 | ) | |||||
Net change in unrealized appreciation/depreciation of: | ||||||||||||
Futures contracts | $ | (2,734 | ) | — | $ | (2,734 | ) | |||||
Forward foreign currency contracts | — | $ | 4,549 | 4,549 | ||||||||
Total net change in unrealized appreciation/depreciation | $ | (2,734 | ) | $ | 4,549 | $ | 1,815 | |||||
| Semiannual Report | | March 31, 2018 | 343 |
Table of Contents
Notes to Financial Statements (cont’d)
March 31, 2018 (Unaudited)
| AllianzGI Structured Return: | ||||
| Location | Market Price | |||
Net realized loss on: | ||||
Investments (options purchased) | $ | 8,920,418 | ||
Futures contracts | 207,276 | |||
Options written | (61,987,567 | ) | ||
Total net realized loss | $ | (52,859,873 | ) | |
Net change in unrealized appreciation/depreciation of: | ||||
Investments (options purchased) | $ | 535,008 | ||
Options written | 4,975,449 | |||
Total net change in unrealized appreciation/depreciation | $ | 5,510,457 | ||
| AllianzGI U.S. Equity Hedged: | ||||
| Location | Market Price | |||
Net realized loss on: | ||||
Investments (options purchased) | $ | 30,242 | ||
Options written | (204,130 | ) | ||
Total net realized loss | $ | (173,888 | ) | |
Net change in unrealized appreciation/depreciation of: | ||||
Investments (options purchased) | $ | 66,473 | ||
Options written | (9,103 | ) | ||
Total net change in unrealized appreciation/depreciation | $ | 57,370 | ||
The average volume (based on the open positions at each month-end) of derivative activity for the period or six months ended March 31, 2018:
| Options Purchased Contracts (1) | Options Written Contracts (1) | Forward Foreign Currency Contracts (2) | Futures Contracts (1) | Credit Default Swap Agreements (3) | ||||||||||||||||||||||||||||
| Purchased | Sold | Long | Short | Buy | Sell | |||||||||||||||||||||||||||
AllianzGI Retirement 2020 | — | — | — | — | 45 | 28 | — | — | ||||||||||||||||||||||||
AllianzGI Retirement 2025 | — | — | — | — | 44 | 21 | — | — | ||||||||||||||||||||||||
AllianzGI Retirement 2030 | — | — | — | — | 51 | 24 | — | — | ||||||||||||||||||||||||
AllianzGI Retirement 2035 | — | — | — | — | 52 | 29 | — | — | ||||||||||||||||||||||||
AllianzGI Retirement 2040 | — | — | — | — | 57 | 34 | — | — | ||||||||||||||||||||||||
AllianzGI Retirement 2045 | — | — | — | — | 41 | 25 | — | — | ||||||||||||||||||||||||
AllianzGI Retirement 2050 | — | — | — | — | 43 | 26 | — | — | ||||||||||||||||||||||||
AllianzGI Retirement 2055 | — | — | — | — | 22 | 13 | — | — | ||||||||||||||||||||||||
AllianzGI Multi Asset Income | — | — | $ | 20,917 | $ | 21,746 | 231 | 143 | — | — | ||||||||||||||||||||||
AllianzGI Global Allocation | — | — | — | — | 882 | 58 | — | — | ||||||||||||||||||||||||
AllianzGI Best Styles Emerging Markets Equity | — | — | — | † | — | † | 37 | — | — | — | ||||||||||||||||||||||
AllianzGI Best Styles Global Equity | — | — | 30,476 | 25,282 | 23 | — | — | — | ||||||||||||||||||||||||
AllianzGI Best Styles International Equity | — | — | — | † | 8,856 | — | — | — | — | |||||||||||||||||||||||
AllianzGI Best Styles U.S. Equity | — | — | — | — | 1 | — | — | — | ||||||||||||||||||||||||
AllianzGI Emerging Markets Consumer | — | — | 56,547 | 128,664 | — | — | — | — | ||||||||||||||||||||||||
AllianzGI Emerging Markets Debt | — | — | 1,098,071 | 1,780,119 | 3 | 13 | — | — | ||||||||||||||||||||||||
AllianzGI Emerging Markets Small-Cap | — | — | — | † | — | † | — | — | — | — | ||||||||||||||||||||||
AllianzGI Europe Equity Dividend | — | — | — | 1,784 | — | — | — | — | ||||||||||||||||||||||||
AllianzGI Global Dynamic Allocation | — | — | 183,436 | 100,263 | 926 | 168 | — | — | ||||||||||||||||||||||||
AllianzGI Global Fundamental Strategy | 111 | 560 | 15,888 | 3,325,558 | 2 | 39 | — | — | ||||||||||||||||||||||||
AllianzGI Global High Yield | — | — | 208,159 | 7,109,400 | — | † | 3 | — | — | |||||||||||||||||||||||
AllianzGI Global Sustainability | — | — | — | † | — | † | — | — | — | — | ||||||||||||||||||||||
AllianzGI Global Water | — | — | — | † | 1,099,351 | — | — | — | — | |||||||||||||||||||||||
AllianzGI International Growth | — | — | 8,386 | 6,403 | — | — | — | — | ||||||||||||||||||||||||
AllianzGI International Small-Cap | — | — | 274,109 | 188,700 | — | — | — | — | ||||||||||||||||||||||||
AllianzGI NFJ Emerging Markets Value | — | — | 210,357 | 25,240 | — | — | — | — | ||||||||||||||||||||||||
AllianzGI NFJ International Small-Cap Value | — | — | 17,210 | 5,216 | — | — | — | — | ||||||||||||||||||||||||
AllianzGI PerformanceFee Managed Futures Strategy | — | — | — | — | 156 | 59 | $ | 1,434,977 | $ | 1,328,571 | ||||||||||||||||||||||
AllianzGI PerformanceFee Structured US Equity | 300 | 316 | — | — | — | — | — | — | ||||||||||||||||||||||||
| 344 | March 31, 2018 | | Semiannual Report |
Table of Contents
| Options Purchased Contracts (1) | Options Written Contracts (1) | Forward Foreign Currency Contracts (2) | Futures Contracts (1) | Credit Default Swap Agreements (3) | ||||||||||||||||||||||||||||
| Purchased | Sold | Long | Short | Buy | Sell | |||||||||||||||||||||||||||
AllianzGI PerformanceFee Structured US Fixed Income | 148 | 151 | — | — | — | — | — | — | ||||||||||||||||||||||||
AllianzGI Real Estate Debt | — | — | 32,114 | 1,525,688 | — | 1 | — | — | ||||||||||||||||||||||||
AllianzGI Structured Return | 15,376 | 6,527 | — | — | — | † | — | — | — | |||||||||||||||||||||||
AllianzGI U.S. Equity Hedged | 44 | 29 | — | — | — | — | — | — | ||||||||||||||||||||||||
| † | Fund had derivative activity during the period but it did not have open positions at any month-end in the period. |
| (1) | Number of contracts |
| (2) | U.S. $ value on origination date |
| (3) | Notional amount (in thousands) |
The following tables present by counterparty, the Funds’ derivative assets and liabilities net of related collateral held by the Funds at March 31, 2018 which has not been offset in the Statements of Assets and Liabilities, but would be available for offset to the extent of a default by the counterparty to the transaction.
Financial Assets and Derivative Assets, and Collateral Received at March 31, 2018:
| AllianzGI Best Styles Global Equity: | ||||||||||||||||
| Gross Amounts Not Offset in the Statement of Assets and Liabilities | ||||||||||||||||
| Counterparty | Gross Asset Derivatives Presented in Statement of Assets and Liabilities | Financial Instrument/ Derivative Offset | Cash Collateral Received | Net Amount | ||||||||||||
Forward Foreign Currency Contracts |
| |||||||||||||||
Northern Trust Company | $ | 136 | $ | — | $ | — | $ | 136 | ||||||||
State Street Bank & Trust Co. | 188 | — | — | 188 | ||||||||||||
Totals | $ | 324 | $ | — | $ | — | $ | 324 | ||||||||
| AllianzGI Emerging Markets Debt: | ||||||||||||||||
| Gross Amounts Not Offset in the Statement of Assets and Liabilities | ||||||||||||||||
| Counterparty | Gross Asset Derivatives Presented in Statement of Assets and Liabilities | Financial Instrument/ Derivative Offset | Cash Collateral Received | Net Amount | ||||||||||||
Forward Foreign Currency Contracts |
| |||||||||||||||
JPMorgan Chase | $ | 7,412 | $ | — | $ | — | $ | 7,412 | ||||||||
| AllianzGI Global Fundamental Strategy: | ||||||||||||||||
| Gross Amounts Not Offset in the Statement of Assets and Liabilities | ||||||||||||||||
| Counterparty | Gross Asset Derivatives Presented in Statement of Assets and Liabilities | Financial Instrument/ Derivative Offset | Cash Collateral Received | Net Amount | ||||||||||||
Forward Foreign Currency Contracts |
| |||||||||||||||
State Street Bank & Trust Co. | $ | 22,926 | $ | (22,926 | ) | $ | — | $ | — | |||||||
| AllianzGI Global High Yield: | ||||||||||||||||
| Gross Amounts Not Offset in the Statement of Assets and Liabilities | ||||||||||||||||
| Counterparty | Gross Asset Derivatives Presented in Statement of Assets and Liabilities | Financial Instrument/ Derivative Offset | Cash Collateral Received | Net Amount | ||||||||||||
Forward Foreign Currency Contracts |
| |||||||||||||||
Goldman Sachs | $ | 14,448 | $ | — | $ | — | $ | 14,448 | ||||||||
JPMorgan Chase | 934 | (73 | ) | — | 861 | |||||||||||
Totals | $ | 15,382 | $ | (73 | ) | $ | — | $ | 15,309 | |||||||
| Semiannual Report | | March 31, 2018 | 345 |
Table of Contents
Notes to Financial Statements (cont’d)
March 31, 2018 (Unaudited)
| AllianzGI Global Water: | ||||||||||||||||
| Gross Amounts Not Offset in the Statement of Assets and Liabilities | ||||||||||||||||
| Counterparty | Gross Asset Derivatives Presented in Statement of Assets and Liabilities | Financial Instrument/ Derivative Offset | Cash Collateral Received | Net Amount | ||||||||||||
Forward Foreign Currency Contracts |
| |||||||||||||||
State Street Bank & Trust Co. | $ | 23 | $ | (23 | ) | $ | — | $ | — | |||||||
| AllianzGI International Small-Cap: | ||||||||||||||||
| Gross Amounts Not Offset in the Statement of Assets and Liabilities | ||||||||||||||||
| Counterparty | Gross Asset Derivatives Presented in Statement of Assets and Liabilities | Financial Instrument/ Derivative Offset | Cash Collateral Received | Net Amount | ||||||||||||
Forward Foreign Currency Contracts |
| |||||||||||||||
Income Repatriation Boston IBS | $ | 182 | $ | — | $ | — | $ | 182 | ||||||||
| AllianzGI NFJ Emerging Markets Value: | ||||||||||||||||
| Gross Amounts Not Offset in the Statement of Assets and Liabilities | ||||||||||||||||
| Counterparty | Gross Asset Derivatives Presented in Statement of Assets and Liabilities | Financial Instrument/ Derivative Offset | Cash Collateral Received | Net Amount | ||||||||||||
Forward Foreign Currency Contracts |
| |||||||||||||||
Northern Trust Company | $ | 337 | $ | (33 | ) | $ | — | $ | 304 | |||||||
| AllianzGI NFJ International Small-Cap Value: | ||||||||||||||||
| Gross Amounts Not Offset in the Statement of Assets and Liabilities | ||||||||||||||||
| Counterparty | Gross Asset Derivatives Presented in Statement of Assets and Liabilities | Financial Instrument/ Derivative Offset | Cash Collateral Received | Net Amount | ||||||||||||
Forward Foreign Currency Contracts |
| |||||||||||||||
Northern Trust Company | $ | 74 | $ | (74 | ) | $ | — | $ | — | |||||||
| AllianzGI Real Estate Debt: | ||||||||||||||||
| Gross Amounts Not Offset in the Statement of Assets and Liabilities | ||||||||||||||||
| Counterparty | Gross Asset Derivatives Presented in Statement of Assets and Liabilities | Financial Instrument/ Derivative Offset | Cash Collateral Received | Net Amount | ||||||||||||
Forward Foreign Currency Contracts |
| |||||||||||||||
Barclays Bank PLC | $ | 4,484 | $ | (1,011 | ) | $ | — | $ | 3,473 | |||||||
Citibank N.A. | 1,095 | (19 | ) | — | 1,076 | |||||||||||
Totals | $ | 5,579 | $ | (1,030 | ) | $ | — | $ | 4,549 | |||||||
Financial Liabilities and Derivative Liabilities, and Collateral Received (Pledged) at March 31, 2018:
| AllianzGI Best Styles Global Equity: | ||||||||||||||||
| Gross Amounts Not Offset in the Statement of Assets and Liabilities | ||||||||||||||||
| Counterparty | Gross Liability Derivatives Presented in Statement of Assets and Liabilities | Financial Instrument/ Derivative Offset | Cash Collateral Received (Pledged) | Net Amount | ||||||||||||
Forward Foreign Currency Contracts |
| |||||||||||||||
Income Repatriation Boston IBS | $ | 255 | $ | — | $ | — | $ | 255 | ||||||||
| 346 | March 31, 2018 | | Semiannual Report |
Table of Contents
| AllianzGI Best Styles International Equity: | ||||||||||||||||
| Gross Amounts Not Offset in the Statement of Assets and Liabilities | ||||||||||||||||
| Counterparty | Gross Liability Derivatives Presented in Statement of Assets and Liabilities | Financial Instrument/ Derivative Offset | Cash Collateral Received (Pledged) | Net Amount | ||||||||||||
Forward Foreign Currency Contracts |
| |||||||||||||||
Income Repatriation Boston IBS | $ | 11 | $ | — | $ | — | $ | 11 | ||||||||
| AllianzGI Europe Equity Dividend: | ||||||||||||||||
| Gross Amounts Not Offset in the Statement of Assets and Liabilities | ||||||||||||||||
| Counterparty | Gross Liability Derivatives Presented in Statement of Assets and Liabilities | Financial Instrument/ Derivative Offset | Cash Collateral Received (Pledged) | Net Amount | ||||||||||||
Forward Foreign Currency Contracts |
| |||||||||||||||
Income Repatriation Boston IBS | $ | 6 | $ | — | $ | — | $ | 6 | ||||||||
| AllianzGI Global Fundamental Strategy: | ||||||||||||||||
| Gross Amounts Not Offset in the Statement of Assets and Liabilities | ||||||||||||||||
| Counterparty | Gross Liability Derivatives Presented in Statement of Assets and Liabilities | Financial Instrument/ Derivative Offset | Cash Collateral Received (Pledged) | Net Amount | ||||||||||||
Forward Foreign Currency Contracts |
| |||||||||||||||
Income Repatriation Boston IBS | $ | 5 | $ | — | $ | — | $ | 5 | ||||||||
State Street Bank & Trust Co. | 50,444 | (22,926 | ) | — | 27,518 | |||||||||||
Totals | $ | 50,449 | $ | (22,926 | ) | $ | — | $ | 27,523 | |||||||
| AllianzGI Global High Yield: | ||||||||||||||||
| Gross Amounts Not Offset in the Statement of Assets and Liabilities | ||||||||||||||||
| Counterparty | Gross Liability Derivatives Presented in Statement of Assets and Liabilities | Financial Instrument/ Derivative Offset | Cash Collateral Received (Pledged) | Net Amount | ||||||||||||
Forward Foreign Currency Contracts |
| |||||||||||||||
JPMorgan Chase | $ | 73 | $ | (73 | ) | $ | — | $ | — | |||||||
| AllianzGI Global Water: | ||||||||||||||||
| Gross Amounts Not Offset in the Statement of Assets and Liabilities | ||||||||||||||||
| Counterparty | Gross Liability Derivatives Presented in Statement of Assets and Liabilities | Financial Instrument/ Derivative Offset | Cash Collateral Received (Pledged) | Net Amount | ||||||||||||
Forward Foreign Currency Contracts |
| |||||||||||||||
Income Repatriation Boston IBS | $ | 902 | $ | — | $ | — | $ | 902 | ||||||||
State Street Bank & Trust Co. | 257 | (23 | ) | — | 234 | |||||||||||
Totals | $ | 1,159 | $ | (23 | ) | $ | — | $ | 1,136 | |||||||
| AllianzGI International Small-Cap: | ||||||||||||||||
| Gross Amounts Not Offset in the Statement of Assets and Liabilities | ||||||||||||||||
| Counterparty | Gross Liability Derivatives Presented in Statement of Assets and Liabilities | Financial Instrument/ Derivative Offset | Cash Collateral Received (Pledged) | Net Amount | ||||||||||||
Forward Foreign Currency Contracts |
| |||||||||||||||
State Street Bank & Trust Co. | $ | 9 | $ | — | $ | — | $ | 9 | ||||||||
| Semiannual Report | | March 31, 2018 | 347 |
Table of Contents
Notes to Financial Statements (cont’d)
March 31, 2018 (Unaudited)
| AllianzGI NFJ Emerging Markets Value: | ||||||||||||||||
| Gross Amounts Not Offset in the Statement of Assets and Liabilities | ||||||||||||||||
| Counterparty | Gross Liability Derivatives Presented in Statement of Assets and Liabilities | Financial Instrument/ Derivative Offset | Cash Collateral Received (Pledged) | Net Amount | ||||||||||||
Forward Foreign Currency Contracts |
| |||||||||||||||
Northern Trust Company | $ | 33 | $ | (33 | ) | $ | — | $ | — | |||||||
| AllianzGI NFJ International Small-Cap Value: | ||||||||||||||||
| Gross Amounts Not Offset in the Statement of Assets and Liabilities | ||||||||||||||||
| Counterparty | Gross Liability Derivatives Presented in Statement of Assets and Liabilities | Financial Instrument/ Derivative Offset | Cash Collateral Received (Pledged) | Net Amount | ||||||||||||
Forward Foreign Currency Contracts |
| |||||||||||||||
Northern Trust Company | $ | 1,260 | $ | (74 | ) | $ | — | $ | 1,186 | |||||||
| AllianzGI Real Estate Debt: | ||||||||||||||||
| Gross Amounts Not Offset in the Statement of Assets and Liabilities | ||||||||||||||||
| Counterparty | Gross Liability Derivatives Presented in Statement of Assets and Liabilities | Financial Instrument/ Derivative Offset | Cash Collateral Received (Pledged) | Net Amount | ||||||||||||
Forward Foreign Currency Contracts |
| |||||||||||||||
Barclays Bank PLC | $ | 1,011 | $ | (1,011 | ) | $ | — | $ | — | |||||||
Citibank N.A. | 19 | (19 | ) | — | — | |||||||||||
Totals | $ | 1,030 | $ | (1,030 | ) | $ | — | $ | — | |||||||
| 5. | INVESTMENT MANAGER/ADMINISTRATOR/DISTRIBUTOR FEES/ DEFERRED COMPENSATION |
Investment Management Fee. Each Fund has an Investment Management Agreement (for the purpose of this section, the “Agreement”) with the Investment Manager. Subject to the supervision of the Trust’s Board, the Investment Manager is responsible for managing, either directly or through others selected by it, each Fund’s investment activities, business affairs and administrative matters. Pursuant to the Agreement, the Investment Manager receives an annual fee, payable monthly (net of any fee waivers, reimbursements and recoupment), at an annual rate of each Fund’s average daily net assets (the “Investment Management Fee”). With respect to AllianzGI PerformanceFee Managed Futures Strategy, the Investment Manager also serves as investment manager to the Subsidiary pursuant to an investment management agreement. The Investment Manager does not receive a fee for its services to the Subsidiary.
“Due to Investment Manager” on the Statements of Assets and Liabilities represents the remaining amounts payable related to offering costs for AllianzGI Global High Yield, AllianzGI PerformanceFee Managed Futures Strategy, AllianzGI PerformanceFee Structured US Equity, AllianzGI PerformanceFee Structured US Fixed Income and AllianzGI Real Estate Debt that were paid by the Investment Manager.
Administration Fee. The Investment Manager provides administrative services to the Target Funds and also bears the cost of most third-party administrative services required by the Target Funds, and in return it receives from each share class of each Target Fund a monthly administration fee based on each share class’ average daily net assets (the “Administration Fee”).
The Investment Management Fee and Administration Fee for all outstanding share classes are charged at an annual rate as indicated in the following table:
| All Classes | Class A,C and R | Class P and Administrative | Class R6 | |||||||||||||||||
| Management Fee | Effective Management Fee | Administration Fee | ||||||||||||||||||
AllianzGI Retirement 2020 | 0.05 | % | 0.05 | % | 0.30 | % | 0.15 | % | 0.05 | % | ||||||||||
AllianzGI Retirement 2025 | 0.05 | 0.05 | 0.30 | 0.15 | 0.05 | |||||||||||||||
AllianzGI Retirement 2030 | 0.05 | 0.05 | 0.30 | 0.15 | 0.05 | |||||||||||||||
| 348 | March 31, 2018 | | Semiannual Report |
Table of Contents
| All Classes | Class A,C and R | Class P and Administrative | Class R6 | |||||||||||||||||
| Management Fee | Effective Management Fee | Administration Fee | ||||||||||||||||||
AllianzGI Retirement 2035 | 0.05 | 0.05 | 0.30 | 0.15 | 0.05 | |||||||||||||||
AllianzGI Retirement 2040 | 0.05 | 0.05 | 0.30 | 0.15 | 0.05 | |||||||||||||||
AllianzGI Retirement 2045 | 0.05 | 0.05 | 0.30 | 0.15 | 0.05 | |||||||||||||||
AllianzGI Retirement 2050 | 0.05 | 0.05 | 0.30 | 0.15 | 0.05 | |||||||||||||||
AllianzGI Retirement 2055 | 0.05 | 0.05 | 0.30 | 0.15 | 0.05 | |||||||||||||||
AllianzGI Multi Asset Income | 0.05 | 0.05 | 0.30 | 0.15 | 0.05 | |||||||||||||||
AllianzGI Global Allocation | 0.70 | * | 0.18 | N/A | N/A | N/A | ||||||||||||||
AllianzGI Best Styles Emerging Markets Equity | 0.40 | 0.40 | N/A | N/A | N/A | |||||||||||||||
AllianzGI Best Styles Global Equity | 0.30 | 0.30 | N/A | N/A | N/A | |||||||||||||||
AllianzGI Best Styles International Equity | 0.30 | 0.30 | N/A | N/A | N/A | |||||||||||||||
AllianzGI Best Styles U.S. Equity | 0.30 | 0.30 | N/A | N/A | N/A | |||||||||||||||
AllianzGI Convertible | 0.57 | 0.57 | N/A | N/A | N/A | |||||||||||||||
AllianzGI Emerging Markets Consumer | 0.90 | 0.90 | N/A | N/A | N/A | |||||||||||||||
AllianzGI Emerging Markets Debt | 0.75 | 0.75 | N/A | N/A | N/A | |||||||||||||||
AllianzGI Emerging Markets Small-Cap | 1.20 | 1.20 | N/A | N/A | N/A | |||||||||||||||
AllianzGI Europe Equity Dividend | 0.80 | 0.80 | N/A | N/A | N/A | |||||||||||||||
AllianzGI Global Dynamic Allocation | 0.70 | * | 0.66 | N/A | N/A | N/A | ||||||||||||||
AllianzGI Global Fundamental Strategy | 0.75 | * | 0.61 | N/A | N/A | N/A | ||||||||||||||
AllianzGI Global High Yield | 0.60 | 0.60 | N/A | N/A | N/A | |||||||||||||||
AllianzGI Global Sustainability | 0.80 | * | 0.69 | N/A | N/A | N/A | ||||||||||||||
AllianzGI Global Water | 0.95 | * | 0.73 | N/A | N/A | N/A | ||||||||||||||
AllianzGI High Yield Bond | 0.48 | 0.48 | N/A | N/A | N/A | |||||||||||||||
AllianzGI International Growth | 0.70 | 0.70 | N/A | N/A | N/A | |||||||||||||||
AllianzGI International Small-Cap | 1.00 | * | 0.89 | N/A | N/A | N/A | ||||||||||||||
AllianzGI Micro Cap | 1.25 | 1.25 | N/A | N/A | N/A | |||||||||||||||
AllianzGI NFJ Emerging Markets Value | 0.85 | * | 0.65 | N/A | N/A | N/A | ||||||||||||||
AllianzGI NFJ International Small-Cap Value | 0.85 | 0.85 | N/A | N/A | N/A | |||||||||||||||
AllianzGI PerformanceFee Managed Futures Strategy | 0.75 | * | 0.00 | N/A | N/A | N/A | ||||||||||||||
AllianzGI PerformanceFee Structured US Equity | 0.60 | * | 0.00 | N/A | N/A | N/A | ||||||||||||||
AllianzGI PerformanceFee Structured US Fixed Income | 0.30 | * | 0.00 | N/A | N/A | N/A | ||||||||||||||
AllianzGI Real Estate Debt | 0.45 | 0.45 | N/A | N/A | N/A | |||||||||||||||
AllianzGI Short Duration High Income | 0.48 | 0.48 | N/A | N/A | N/A | |||||||||||||||
AllianzGI Structured Return | 0.60 | 0.60 | N/A | N/A | N/A | |||||||||||||||
AllianzGI U.S. Equity Hedged | 0.70 | 0.70 | N/A | N/A | N/A | |||||||||||||||
AllianzGI Ultra Micro Cap | 1.50 | * | 1.33 | N/A | N/A | N/A | ||||||||||||||
| * | See Note 6 for management fee waivers. |
Distribution and Servicing Fees. Allianz Global Investors Distributors LLC (the “Distributor”), an affiliate of AAM and the Investment Manager, serves as the distributor of the Funds’ shares pursuant to separate Distribution Servicing Plans for Class A, C and R. The Distributor, for each of the Funds, receives (i) servicing fees of 0.25% of the average daily net assets of each of Class A, C and R in connection with services rendered to shareholders of each class and the maintenance of shareholder accounts, and (ii) distribution fees of 0.75% of the average daily net assets of Class C (with the exception for
AllianzGI Short Duration High Income which is 0.25%) and 0.25% of average daily net assets of Class R in connection with the distribution of Class C and R shares.
Pursuant to the Distribution and Servicing Plans adopted by the A, C and R classes, the Funds compensate the Distributor for services provided and expenses incurred in connection with assistance rendered in the sale of shares and services rendered to shareholders and for maintenance of shareholder accounts.
| Semiannual Report | | March 31, 2018 | 349 |
Table of Contents
Notes to Financial Statements (cont’d)
March 31, 2018 (Unaudited)
Pursuant to the Distribution Plan for the Administrative Class shares, the Funds are permitted to reimburse the Distributor out of the Administrative Class’ assets of each Fund offering Administrative Class shares, in an amount up to 0.25% on an annual basis of the average net assets of the Administrative Class, for payments made to financial intermediaries that provide services in connection with the distribution of shares or administration plans or programs that use fund shares as their funding medium. Unreimbursed costs may be carried forward for reimbursement for up to twelve months beyond the date in which they are incurred, subject always to the limit that no more than 0.25% of the average daily net assets attributable to the Administrative Class may be expensed.
The Distributor also receives the proceeds of the initial sales charges paid by the shareholders upon the purchase of Class A shares and contingent deferred sales charges (“CDSC”) paid by the shareholders upon certain redemptions of Class A and C shares. For the period or six
months ended March 31, 2018, the Distributor received $105,446, representing commissions (sales charges) and CDSC from the Funds.
Deferred Compensation. Trustees do not currently receive any pension or retirement benefits from the Trust. The Trust has adopted a deferred compensation plan (the “Plan”) for the Trustees, which permits the Trustees to defer their receipt of compensation from the Trust, at their election, in accordance with the terms of the Plan. Under the Plan, each Trustee may elect not to receive all or a portion of his or her fees from the Trust on a current basis but to receive in a subsequent period chosen by the Trustee an amount equal to the value of such compensation if such compensation had been invested in one or more series of the Trust or Allianz Funds selected by the Trustees from and after the normal payment dates for such compensation. The deferred compensation program is structured such that the Trust remains in substantially the same financial position whether Trustee fees are paid when earned or deferred.
| 6. | EXPENSE LIMITATION/MANAGEMENT FEE WAIVER AND RECOUPMENT |
The Trust and the Investment Manager have entered into Expense Limitation and Management Fee Waiver Agreements as indicated below:
| Expense Limitation | ||||||||||||||||||||||||||||||||
| Management Fee Waiver | Class A | Class C | Class R | Class P | Institutional Class | Class R6 | Administrative Class | |||||||||||||||||||||||||
AllianzGI Retirement 2020(3) | N/A | 0.95 | % | 1.70 | % | 1.30 | % | 0.65 | % | N/A | 0.55 | %* | 0.90 | % | ||||||||||||||||||
AllianzGI Retirement 2025(3) | N/A | 0.95 | N/A | 1.30 | 0.65 | N/A | 0.55 | * | 0.90 | |||||||||||||||||||||||
AllianzGI Retirement 2030(3) | N/A | 0.95 | 1.70 | 1.30 | 0.65 | N/A | 0.55 | * | 0.90 | |||||||||||||||||||||||
AllianzGI Retirement 2035(3) | N/A | 0.95 | N/A | 1.30 | 0.65 | N/A | 0.55 | * | 0.90 | |||||||||||||||||||||||
AllianzGI Retirement 2040(3) | N/A | 0.95 | 1.70 | 1.30 | 0.65 | N/A | 0.55 | 0.90 | ||||||||||||||||||||||||
AllianzGI Retirement 2045(3) | N/A | 0.95 | N/A | 1.30 | 0.65 | N/A | 0.55 | 0.90 | ||||||||||||||||||||||||
AllianzGI Retirement 2050(3) | N/A | 0.95 | 1.70 | 1.30 | 0.65 | N/A | 0.55 | 0.90 | ||||||||||||||||||||||||
AllianzGI Retirement 2055(3) | N/A | 0.95 | N/A | 1.30 | 0.65 | N/A | 0.55 | 0.90 | ||||||||||||||||||||||||
AllianzGI Multi Asset Income(3) | N/A | 0.95 | 1.70 | 1.30 | 0.65 | 0.60 | % | 0.55 | * | 0.90 | ||||||||||||||||||||||
AllianzGI Global Allocation(4) | 0.55 | %(1) | 0.60 | 1.37 | 0.80 | 0.40 | 0.40 | 0.30 | 0.55 | |||||||||||||||||||||||
AllianzGI Best Styles Emerging Markets Equity(5) | N/A | 0.85 | 1.60 | N/A | 0.70 | 0.60 | 0.60 | N/A | ||||||||||||||||||||||||
AllianzGI Best Styles Global Equity(5) | N/A | 0.70 | 1.40 | N/A | 0.50 | 0.40 | 0.40 | N/A | ||||||||||||||||||||||||
AllianzGI Best Styles International Equity(5) | N/A | 0.70 | 1.45 | N/A | 0.55 | 0.45 | 0.45 | N/A | ||||||||||||||||||||||||
AllianzGI Best Styles U.S. Equity(5) | N/A | 0.65 | 1.40 | N/A | 0.50 | 0.50 | 0.40 | N/A | ||||||||||||||||||||||||
AllianzGI Convertible | N/A | N/A | N/A | N/A | N/A | N/A | N/A | N/A | ||||||||||||||||||||||||
AllianzGI Emerging Markets Consumer(6) | N/A | 1.55 | N/A | N/A | N/A | 1.20 | N/A | N/A | ||||||||||||||||||||||||
AllianzGI Emerging Markets Debt(5) | N/A | 1.20 | 1.95 | N/A | 1.05 | 0.95 | N/A | N/A | ||||||||||||||||||||||||
AllianzGI Emerging Markets Small-Cap(5) | N/A | 1.85 | N/A | N/A | N/A | 1.50 | N/A | N/A | ||||||||||||||||||||||||
AllianzGI Europe Equity Dividend(5) | N/A | 1.20 | 1.95 | N/A | 1.05 | 0.95 | N/A | N/A | ||||||||||||||||||||||||
AllianzGI Global Dynamic Allocation(4) | 0.55(1 | ) | 0.97 | 1.74 | 1.34 | 0.80 | 0.70 | 0.70 | 0.95 | |||||||||||||||||||||||
AllianzGI Global Fundamental Strategy(6) | 0.14(2 | ) | 1.11 | 1.86 | N/A | 0.96 | 0.86 | N/A | N/A | |||||||||||||||||||||||
AllianzGI Global High Yield(5) | N/A | N/A | N/A | N/A | 0.80 | 0.70 | N/A | N/A | ||||||||||||||||||||||||
AllianzGI Global Sustainability(5) | 0.11(2 | ) | 1.09 | N/A | N/A | 0.94 | 0.84 | N/A | N/A | |||||||||||||||||||||||
AllianzGI Global Water | 0.22(2 | ) | N/A | N/A | N/A | N/A | N/A | N/A | N/A | |||||||||||||||||||||||
AllianzGI High Yield Bond | N/A | N/A | N/A | N/A | N/A | N/A | N/A | N/A | ||||||||||||||||||||||||
AllianzGI International Growth(5) | N/A | 1.05 | N/A | N/A | N/A | 0.80 | N/A | N/A | ||||||||||||||||||||||||
AllianzGI International Small-Cap(5) | 0.11(2 | ) | 1.25 | 2.08 | 1.59 | 1.10 | 1.04 | 1.00 | N/A | |||||||||||||||||||||||
AllianzGI Micro Cap(6) | N/A | 1.62 | N/A | N/A | 1.54 | 1.54 | N/A | N/A | ||||||||||||||||||||||||
AllianzGI NFJ Emerging Markets Value(6) | 0.20(2 | ) | 1.14 | 1.89 | N/A | 0.98 | 0.89 | N/A | N/A | |||||||||||||||||||||||
AllianzGI NFJ International Small-Cap | N/A | 1.30 | 2.05 | N/A | 1.05 | 0.99 | 0.95 | N/A | ||||||||||||||||||||||||
AllianzGI PerformanceFee Managed Futures Strategy(8) | 0.75(7 | ) | N/A | N/A | N/A | 0.19 | 0.14 | 0.09 | N/A | |||||||||||||||||||||||
| 350 | March 31, 2018 | | Semiannual Report |
Table of Contents
| Expense Limitation | ||||||||||||||||||||||||||||||||
| Management Fee Waiver | Class A | Class C | Class R | Class P | Institutional Class | Class R6 | Administrative Class | |||||||||||||||||||||||||
AllianzGI PerformanceFee Structured US Equity(8) | 0.60 | %(7) | N/A | N/A | N/A | 0.00 | % | 0.00 | % | 0.00 | % | N/A | ||||||||||||||||||||
AllianzGI PerformanceFee Structured US Fixed Income(8) | 0.30 | (7) | N/A | N/A | N/A | 0.00 | 0.00 | 0.00 | N/A | |||||||||||||||||||||||
AllianzGI Real Estate Debt(5) | N/A | N/A | N/A | N/A | 0.68 | 0.58 | N/A | N/A | ||||||||||||||||||||||||
AllianzGI Short Duration High Income | N/A | N/A | N/A | N/A | N/A | N/A | N/A | N/A | ||||||||||||||||||||||||
AllianzGI Structured Return(6) | N/A | 0.98 | % | 1.77 | % | N/A | 0.77 | 0.69 | 0.67 | N/A | ||||||||||||||||||||||
AllianzGI U.S. Equity Hedged(6) | N/A | 1.25 | 2.00 | N/A | 1.10 | 1.00 | N/A | N/A | ||||||||||||||||||||||||
AllianzGI Ultra Micro Cap(5) | N/A | (2) | 2.01 | N/A | N/A | 1.72 | 1.69 | N/A | N/A | |||||||||||||||||||||||
| (1) | The Investment Manager has contractually agreed to irrevocably waive a portion of its management fee equal to 0.55% of the average daily net assets of each applicable Fund that are attributable to investments in Underlying Funds. This waiver with respect to investments in Underlying Funds for which the Investment Manager or an affiliated person thereof serves as investment adviser, is terminable only by the Board of Trustees of the Trust, and the waiver with respect to investments in unaffiliated Underlying Funds will continue through at least January 31, 2019. |
| (2) | The Investment Manager has agreed to waive a portion of the investment management fee, which reduces the annual percentage rate by the rate disclosed in the table above through January 31, 2019. AllianzGI Ultra Micro Cap had a waiver of 0.25% through January 31, 2018. Amounts waived pursuant to each of the investment management fee waivers are separate from and would not be included with the amounts subject to potential recoupment under the Expense Limitation Agreement. |
| (3) | The Investment Manager has contractually agreed, until January 31, 2020, to irrevocably waive its management and administrative fees and reimburse any additional Other Expenses or Acquired Fund Fees and Expenses, to the extent that Total Annual Fund Operating Expenses after Expense Reductions, excluding, interest, taxes, and extraordinary expenses, exceed the rates noted in the table above based on the Fund’s average net assets attributable to each share class. Under the Expense Limitation Agreement, the Investment Manager may recoup waived or reimbursed amounts for three years, provided total expenses, including such recoupment, do not exceed the annual expense limit in effect at the time of such waiver or reimbursement. The Expense Limitation Agreement is terminable by the Trust upon 90 days’ prior written notice to the Investment Manager or at any time by mutual agreement of the parties. |
| (4) | Effective February 1, 2018, the Investment Manager has contractually agreed, until January 31, 2019, to irrevocably waive its management fee, or reimburse the Fund, to the extent that, after the application of the fee waiver described in footnote (1) above, Total Annual Fund Operating Expenses, excluding interest, tax, and extraordinary expenses, Acquired Fund Fees and Expenses and certain credits and other expenses, exceed the rates noted in the table above based on the Fund’s average net assets attributable to each share class. Under the Expense Limitation Agreement, the Investment Manager may recoup waived or reimbursed amounts for three years, provided total expenses, including such recoupment, do not exceed the annual expense limit in effect at the time of such waiver/reimbursement or recoupment. The Expense Limitation Agreement is terminable by the Trust upon 90 days’ prior written notice to the Investment Manager or at any time by mutual agreement of the parties. |
| (5) | Effective February 1, 2018, the Investment Manager has contractually agreed to irrevocably waive its management fee and/or reimburse the Fund through January 31, 2019 to the extent that Total Annual Fund Operating Expenses, excluding interest, tax, and extraordinary expenses (after giving effect to the management fee waiver, if any, referred to in footnote (2) above), and certain credits and other expenses, exceed the rates noted in the table above based upon the Fund’s average net assets attributable to each share class. Under the Expense Limitation Agreement, the Investment Manager may recoup waived or reimbursed amounts for three years, provided total expenses, including such recoupment, do not exceed the annual expense limit in effect at the time of such waiver/reimbursement or recoupment. The Expense Limitation Agreement is terminable by the Trust upon 90 days’ prior written notice to the Investment Manager or at any time by mutual agreement of the parties. |
| (6) | Effective February 1, 2018, the Investment Manager has contractually agreed to irrevocably waive its management fee and/or reimburse the Fund through January 31, 2019 to the extent that Total Annual Fund Operating Expenses excluding interest, tax, and extraordinary expenses, Acquired Fund Fees and Expenses, and certain credits and other expenses (after giving effect to the management fee waiver, if any, referred to in footnote (2) above), exceed the rates noted in the table above based upon the Fund’s average net assets attributable to each share class. Under the Expense Limitation Agreement, the Investment Manager may recoup waived or reimbursed amounts for three years, provided total expenses, including such recoupment, do not exceed the annual expense limit in effect at the time of such waiver/reimbursement or recoupment. The Expense Limitation Agreement is terminable by the Trust upon 90 days’ prior written notice to the Investment Manager or at any time by mutual agreement of the parties. |
| (7) | The Investment Manager has agreed to waive its investment management fee for AllianzGI PerformanceFee Managed Futures up to 0.75% for any negative performance relative to the ICE BofAML 3-Month US T-Bill Index plus 5.00% (annualized). The Investment Manager has agreed to waive its investment management fee for AllianzGI PerformanceFee Structured US Equity up to 0.60% for any negative performance relative to the S&P 500 Index plus 1.25% (annualized). The Investment Manager has agreed to waive its investment management fee for AllianzGI PerformanceFee Structured US Fixed Income up to 0.30% for any negative performance relative to the Bloomberg Barclays U.S. Aggregate Bond Index plus 0.625% (annualized). The waivers are in effect through December 31, 2018. |
| (8) | Effective February 1, 2018, the Investment Manager has contractually agreed to irrevocably waive its management fee and/or reimburse the Fund through January 31, 2019 to the extent that Other Expenses, excluding interest, tax, and extraordinary expenses, Acquired Fund Fees and Expenses, and certain credits and other expenses, exceed the rates noted in the table above based on the Fund’s average net assets attributable to each share class. The Expense Limitation Agreement is terminable by the Trust upon 90 days’ prior written notice to the Manager or at any time by mutual agreement of the parties. |
| * | As a result of reimbursing expenses inclusive of acquired fund fees and expenses, the Investment Manager reimbursed amounts in excess of the respective share class’ operating expenses. The aggregate excess reimbursement of each share class is accounted for as “Contribution from Investment Manager” on the Statements of Operations. |
The following Funds revised their expense limitation rates during the six months ended March 31, 2018. The expense limitation rates in effect during the period (except as noted in the tables below) and at March 31, 2018 for all the Funds are disclosed in the table above.
| Expense Limitation (10/1/17 - 1/31/18) | ||||||||||||||||||||||||||||
| Class A | Class C | Class R | Class P | Institutional Class | Class R6 | Administrative Class | ||||||||||||||||||||||
AllianzGI Global Dynamic Allocation | 0.97 | % | 1.74 | % | 1.34 | % | 0.80 | % | 0.70 | % | 0.70 | % | 0.97 | % | ||||||||||||||
AllianzGI International Small-Cap | 1.25 | 2.08 | 1.59 | 1.10 | 1.07 | 1.00 | N/A | |||||||||||||||||||||
AllianzGI NFJ International Small-Cap Value | 1.30 | 2.05 | N/A | 1.05 | 1.01 | 0.95 | N/A | |||||||||||||||||||||
AllianzGI Short Duration High Income | N/A | N/A | N/A | N/A | N/A | 0.57 | N/A | |||||||||||||||||||||
AllianzGI Structured Return | 0.98 | 1.78 | N/A | 0.77 | 0.69 | 0.67 | N/A | |||||||||||||||||||||
AllianzGI Ultra Micro Cap | N/A | N/A | N/A | N/A | N/A | N/A | N/A | |||||||||||||||||||||
| Semiannual Report | | March 31, 2018 | 351 |
Table of Contents
Notes to Financial Statements (cont’d)
March 31, 2018 (Unaudited)
The Investment Manager, per the expense limitation agreements, may recoup waived/reimbursed amounts for a period of up to three years, provided total expenses, including such recoupment, do not exceed the annual expense limit in effect at the time of such waiver/reimbursement. During the period or six months ended March 31, 2018, the Investment Manager recouped a total of $1,437 from the Funds as disclosed on the Statements of Operations. The following represents the amounts that still can be recouped by the Investment Manager as of March 31, 2018.
| Unrecouped Expenses Waived/Reimbursed through Fiscal Period or Year ended | ||||||||||||||||
| 9/30/2015 | 9/30/2016 | 9/30/2017 | Totals | |||||||||||||
AllianzGI Retirement 2020 | $ | 54,591 | $ | 32,277 | $ | 88,906 | $ | 175,774 | ||||||||
AllianzGI Retirement 2025 | 64,766 | 30,952 | 116,776 | 212,494 | ||||||||||||
AllianzGI Retirement 2030 | 76,424 | 36,276 | 123,768 | 236,468 | ||||||||||||
AllianzGI Retirement 2035 | 66,388 | 14,422 | 63,406 | 144,216 | ||||||||||||
AllianzGI Retirement 2040 | 60,282 | 8,160 | 25,645 | 94,087 | ||||||||||||
AllianzGI Retirement 2045 | 38,645 | 6,546 | 7,838 | 53,029 | ||||||||||||
AllianzGI Retirement 2050 | 34,200 | 3,046 | 3,702 | 40,948 | ||||||||||||
AllianzGI Retirement 2055 | 11,552 | 1,064 | 1,712 | 14,328 | ||||||||||||
AllianzGI Multi Asset Income | 25,007 | 35,990 | 92,776 | 153,773 | ||||||||||||
AllianzGI Global Allocation | 326,730 | — | 14,256 | 340,986 | ||||||||||||
AllianzGI Best Styles Emerging Markets Equity | 236,953 | 318,110 | 314,955 | 870,018 | ||||||||||||
AllianzGI Best Styles Global Equity | 265,504 | 416,897 | 222,208 | 904,609 | ||||||||||||
AllianzGI Best Styles International Equity | 342,608 | 394,405 | 348,158 | 1,085,171 | ||||||||||||
AllianzGI Best Styles U.S. Equity | 184,303 | 195,811 | 174,158 | 554,272 | ||||||||||||
AllianzGI Emerging Markets Consumer | 244,097 | 257,727 | 185,526 | 687,350 | ||||||||||||
AllianzGI Emerging Markets Debt | 305,163 | 162,697 | 162,523 | 630,383 | ||||||||||||
AllianzGI Emerging Markets Small-Cap | 293,821 | 305,798 | 251,209 | 850,828 | ||||||||||||
AllianzGI Europe Equity Dividend | 230,355 | 321,812 | 307,860 | 860,027 | ||||||||||||
AllianzGI Global Dynamic Allocation | 204,882 | 199,996 | 650,337 | 1,055,215 | ||||||||||||
AllianzGI Global Fundamental Strategy | 153,697 | 173,706 | 180,413 | 507,816 | ||||||||||||
AllianzGI Global High Yield | — | — | 236,455 | 236,455 | ||||||||||||
AllianzGI Global Sustainability | 202,111 | 190,206 | 175,647 | 567,964 | ||||||||||||
AllianzGI International Growth | 161,358 | 187,039 | 172,093 | 520,490 | ||||||||||||
AllianzGI International Small-Cap | 141,751 | 258,005 | 279,258 | 679,014 | ||||||||||||
AllianzGI Micro Cap | 115,570 | 153,921 | 137,352 | 406,843 | ||||||||||||
AllianzGI NFJ Emerging Markets Value | 303,098 | 465,793 | 548,032 | 1,316,923 | ||||||||||||
AllianzGI NFJ International Small-Cap Value | 214,424 | 349,447 | 287,899 | 851,770 | ||||||||||||
AllianzGI Short Duration High Income | 10,170 | — | — | 10,170 | ||||||||||||
AllianzGI Structured Return | 88,615 | 16,609 | 408,444 | 513,668 | ||||||||||||
AllianzGI U.S. Equity Hedged | 129,361 | 188,026 | 193,599 | 510,986 | ||||||||||||
| 7. | RELATED PARTY TRANSACTIONS |
The Investment Manager and the Distributor are related parties. Fees payable to and amounts due from these parties are disclosed in Note 5 and Note 6 and the accrued related party fee and receivable amounts are disclosed on the Statements of Assets and Liabilities.
(a) Payments from Affiliates
There were not payments from affiliates for the period ended March 31, 2018.
During the year ended September 30, 2017, AllianzGI U.S. reimbursed AllianzGI International Small-Cap, AllianzGI NFJ Emerging Markets Value, AllianzGI Structured Return and AllianzGI Ultra Micro Cap $1,442, $52,591, $5,650, and $2,886, respectively, for realized losses resulting from trading errors.
(b) In-Kind Fund Share Transactions
There were no in-kind fund share transactions during the six months ended March 31, 2018.
During the year ended September 30, 2017, AllianzGI Best Styles Global Equity, AllianzGI Best Styles U.S. Equity and AllianzGI Convertible transferred securities and cash to affiliated entities in connection with redemption in-kind transactions. These transactions were treated as a sale of securities for U.S. GAAP, and the resulting gains and losses as shown in the table below were recognized based on the market value of the securities on the date of the transfer. For tax purposes, no gains or losses were recognized. The realized gains and losses from the redemption in-kind are netted and recorded as net realized gain on investments. The number of shares redeemed
| 352 | March 31, 2018 | | Semiannual Report |
Table of Contents
in-kind and redemption value as shown in the table below are included in the “Cost of shares redeemed” in Note 9.
During the year ended September 30, 2017, AllianzGI Global Dynamic Allocation accepted securities from affiliated entities in connection with subscription in-kind transactions. For financial reporting and tax
purposes, the cost basis of contributed securities is equal to the market value of the securities on the date of contribution. The Fund sold 1,985,501 shares of Class R6 in-kind with a subscription value of $36,374,375. The number of shares sold and subscription value are included in “Shares sold” in Note 9.
| Shares Redeemed In-Kind | Redemption Value | Realized Gains | Realized Losses | |||||||||||||
AllianzGI Best Styles Global Equity (Class R6) | 1,002,664 | $ | 15,791,959 | $ | 1,133,858 | $ | 438,244 | |||||||||
AllianzGI Best Styles U.S. Equity (Class R6) | 2,918,758 | 45,202,958 | 3,159,994 | 1,690,309 | ||||||||||||
AllianzGI Convertible (Institutional Class) | 16,579,709 | 552,103,654 | 64,931,264 | 6,282,257 | ||||||||||||
(c) Affiliated Transactions
The following tables show the transactions in and earnings from affiliates for the six months ended March 31, 2018:
| AllianzGI Retirement 2020: | ||||||||||||||||||||||||||||||||||||
| Market Value 9/30/2017 | Purchases at Cost | Proceeds from Sales | Change in Unrealized Appreciation (Depreciation) | Market Value 3/31/2018 | Dividend Income | Shares as of 3/31/2018 | Net Realized Gain (Loss) | Net Capital Gain Distributions Received | ||||||||||||||||||||||||||||
AllianzGI Advanced Core Bond | $ | 8,339,779 | $ | 1,275,700 | $ | 923,647 | $ | (193,638 | ) | $ | 8,451,358 | $ | 108,471 | 584,061 | $ | (46,836 | ) | — | ||||||||||||||||||
AllianzGI Best Styles U.S. Equity | 3,541,309 | 227,249 | 827,362 | (78,511 | ) | 2,961,843 | 66,655 | 160,013 | 99,158 | $ | 160,593 | |||||||||||||||||||||||||
AllianzGI Emerging Markets Debt | 687,359 | 299,986 | 769,892 | (6,967 | ) | 201,885 | 15,029 | 14,088 | (8,601 | ) | 6,881 | |||||||||||||||||||||||||
AllianzGI Emerging Markets Small-Cap | 320,480 | 21,775 | — | 3,136 | 345,391 | 13,432 | 19,019 | — | 8,344 | |||||||||||||||||||||||||||
AllianzGI Global Dynamic Allocation | 34,086,296 | 2,254,074 | 4,004,003 | (1,339,402 | ) | 31,109,851 | 576,857 | 1,569,619 | 112,886 | 1,214,401 | ||||||||||||||||||||||||||
AllianzGI Short Duration High Income | 543,501 | 49,745 | — | (10,550 | ) | 582,696 | 13,892 | 39,212 | — | — | ||||||||||||||||||||||||||
Totals | $ | 47,518,724 | $ | 4,128,529 | $ | 6,524,904 | $ | (1,625,932 | ) | $ | 43,653,024 | $ | 794,336 | 2,386,012 | $ | 156,607 | $ | 1,390,219 | ||||||||||||||||||
| AllianzGI Retirement 2025: | ||||||||||||||||||||||||||||||||||||
| Market Value 9/30/2017 | Purchases at Cost | Proceeds from Sales | Change in Unrealized Appreciation (Depreciation) | Market Value 3/31/2018 | Dividend Income | Shares as of 3/31/2018 | Net Realized Gain (Loss) | Net Capital Gain Distributions Received | ||||||||||||||||||||||||||||
AllianzGI Advanced Core Bond | $ | 7,019,821 | $ | 2,156,341 | $ | 293,063 | $ | (205,816 | ) | $ | 8,663,760 | $ | 96,957 | 598,739 | $ | (13,523 | ) | — | ||||||||||||||||||
AllianzGI Best Styles U.S. Equity | 6,231,430 | 509,028 | 750,810 | (23,889 | ) | 6,012,434 | 117,289 | 324,821 | 46,675 | $ | 282,587 | |||||||||||||||||||||||||
AllianzGI Emerging Markets Debt | 648,718 | 11,860 | 458,754 | (6,774 | ) | 194,401 | 8,564 | 13,566 | (649 | ) | 3,296 | |||||||||||||||||||||||||
AllianzGI Emerging Markets Small-Cap | 344,099 | 23,380 | — | 3,367 | 370,846 | 14,422 | 20,421 | — | 8,959 | |||||||||||||||||||||||||||
AllianzGI Global Dynamic Allocation | 48,368,729 | 4,103,670 | 4,967,520 | (1,761,817 | ) | 45,864,777 | 814,468 | 2,314,065 | 121,715 | 1,714,618 | ||||||||||||||||||||||||||
AllianzGI Short Duration High Income | 381 | 333,586 | — | (3,535 | ) | 330,432 | 2,560 | 22,236 | — | — | ||||||||||||||||||||||||||
Totals | $ | 62,613,178 | $ | 7,137,865 | $ | 6,470,147 | $ | (1,998,464 | ) | $ | 61,436,650 | $ | 1,054,260 | 3,293,848 | $ | 154,218 | $ | 2,009,460 | ||||||||||||||||||
| Semiannual Report | | March 31, 2018 | 353 |
Table of Contents
Notes to Financial Statements (cont’d)
March 31, 2018 (Unaudited)
| AllianzGI Retirement 2030: | ||||||||||||||||||||||||||||||||||||
| Market Value 9/30/2017 | Purchases at Cost | Proceeds from Sales | Change in Unrealized Appreciation (Depreciation) | Market Value 3/31/2018 | Dividend Income | Shares as of | Net Realized | Net Capital Gain Distributions Received | ||||||||||||||||||||||||||||
AllianzGI Advanced Core Bond | $ | 690,578 | $ | 1,552,690 | — | $ | (43,058 | ) | $ | 2,200,210 | $ | 17,153 | 152,053 | — | — | |||||||||||||||||||||
AllianzGI Best Styles Global Equity | 6,572,616 | 1,128,943 | $ | 374,389 | (650,560 | ) | 6,681,525 | 225,116 | 395,825 | $ | 4,915 | $ | 661,092 | |||||||||||||||||||||||
AllianzGI Best Styles U.S. Equity | 9,461,330 | 833,384 | 689,069 | (24,568 | ) | 9,603,905 | 176,115 | 518,850 | 22,828 | 424,317 | ||||||||||||||||||||||||||
AllianzGI Emerging Markets Small-Cap | 780,480 | 53,031 | — | 7,635 | 841,146 | 32,711 | 46,319 | — | 20,320 | |||||||||||||||||||||||||||
AllianzGI Global Dynamic Allocation | 52,549,025 | 5,051,752 | 3,691,374 | (1,879,808 | ) | 52,049,188 | 886,989 | 2,626,094 | 19,593 | 1,867,290 | ||||||||||||||||||||||||||
Totals | $ | 70,054,029 | $ | 8,619,800 | $ | 4,754,832 | $ | (2,590,359 | ) | $ | 71,375,974 | $ | 1,338,084 | 3,739,141 | $ | 47,336 | $ | 2,973,019 | ||||||||||||||||||
| AllianzGI Retirement 2035: | ||||||||||||||||||||||||||||||||||||
| Market Value 9/30/2017 | Purchases at Cost | Proceeds from Sales | Change in Unrealized Appreciation (Depreciation) | Market Value 3/31/2018 | Dividend Income | Shares as of 3/31/2018 | Net Realized Gain (Loss) | Net Capital Gain Distributions Received | ||||||||||||||||||||||||||||
AllianzGI Advanced Core Bond | $ | 550,305 | $ | 960,473 | — | $ | (28,111 | ) | $ | 1,482,667 | $ | 12,117 | 102,465 | — | — | |||||||||||||||||||||
AllianzGI Best Styles Global Equity | 18,125,278 | 3,159,765 | $ | 1,064,996 | (1,787,461 | ) | 18,398,905 | 620,803 | 1,089,983 | $ | (33,681 | ) | $ | 1,823,090 | ||||||||||||||||||||||
AllianzGI Best Styles U.S. Equity | 9,332,798 | 836,274 | 869,441 | (30,519 | ) | 9,304,493 | 173,531 | 502,674 | 35,381 | 418,092 | ||||||||||||||||||||||||||
AllianzGI Emerging Markets Small-Cap | 641,417 | 43,582 | — | 6,275 | 691,274 | 26,883 | 38,066 | — | 16,699 | |||||||||||||||||||||||||||
AllianzGI Global Dynamic Allocation | 27,457,885 | 2,677,927 | 1,037,581 | (1,004,951 | ) | 28,094,530 | 463,642 | 1,417,484 | 1,250 | 976,060 | ||||||||||||||||||||||||||
Totals | $ | 56,107,683 | $ | 7,678,021 | $ | 2,972,018 | $ | (2,844,767 | ) | $ | 57,971,869 | $ | 1,296,976 | 3,150,672 | $ | 2,950 | $ | 3,233,941 | ||||||||||||||||||
| AllianzGI Retirement 2040: | ||||||||||||||||||||||||||||||||||||
| Market Value 9/30/2017 | Purchases at Cost | Proceeds from Sales | Change in Unrealized Appreciation (Depreciation) | Market Value 3/31/2018 | Dividend Income | Shares as of 3/31/2018 | Net Realized | Net Capital Gain Distributions Received | ||||||||||||||||||||||||||||
AllianzGI Best Styles Global Equity | $ | 25,070,493 | $ | 3,879,427 | $ | 2,231,904 | $ | (2,492,909 | ) | $ | 24,179,939 | $ | 866,190 | 1,432,461 | $ | (45,168 | ) | $ | 2,543,710 | |||||||||||||||||
AllianzGI Best Styles U.S. Equity | 9,687,342 | 621,645 | 541,721 | (27,226 | ) | 9,760,730 | 182,337 | 527,322 | 20,690 | 439,307 | ||||||||||||||||||||||||||
AllianzGI Emerging Markets Small-Cap | 544,837 | 37,020 | — | 5,330 | 587,187 | 22,835 | 32,334 | — | 14,185 | |||||||||||||||||||||||||||
AllianzGI Global Dynamic Allocation | 16,998,199 | 1,957,312 | 594,163 | (640,321 | ) | 17,720,335 | 283,860 | 894,063 | (692 | ) | 597,583 | |||||||||||||||||||||||||
Totals | $ | 52,300,871 | $ | 6,495,404 | $ | 3,367,788 | $ | (3,155,126 | ) | $ | 52,248,191 | $ | 1,355,222 | 2,886,180 | $ | (25,170 | ) | $ | 3,594,785 | |||||||||||||||||
| 354 | March 31, 2018 | | Semiannual Report |
Table of Contents
| AllianzGI Retirement 2045: | ||||||||||||||||||||||||||||||||||||
| Market Value 9/30/2017 | Purchases at Cost | Proceeds from Sales | Change in Unrealized Appreciation (Depreciation) | Market Value 3/31/2018 | Dividend Income | Shares as of 3/31/2018 | Net Realized Gain (Loss) | Net Capital Gain Distributions Received | ||||||||||||||||||||||||||||
AllianzGI Best Styles Global Equity | $ | 18,313,605 | $ | 3,309,969 | $ | 984,906 | $ | (1,841,635 | ) | $ | 18,751,288 | $ | 636,383 | 1,110,858 | $ | (45,745 | ) | $ | 1,868,844 | |||||||||||||||||
AllianzGI Best Styles U.S. Equity | 6,284,793 | 508,833 | 219,418 | (17,111 | ) | 6,565,411 | 118,295 | 354,695 | 8,314 | 285,006 | ||||||||||||||||||||||||||
AllianzGI Emerging Markets Small-Cap | 321,547 | 21,848 | — | 3,146 | 346,541 | 13,476 | 19,083 | — | 8,371 | |||||||||||||||||||||||||||
AllianzGI Global Dynamic Allocation | 7,059,343 | 1,061,170 | 197,681 | (267,823 | ) | 7,651,817 | 120,330 | 386,065 | (3,192 | ) | 253,319 | |||||||||||||||||||||||||
Totals | $ | 31,979,288 | $ | 4,901,820 | $ | 1,402,005 | $ | (2,123,423 | ) | $ | 33,315,057 | $ | 888,484 | 1,870,701 | $ | (40,623 | ) | $ | 2,415,540 | |||||||||||||||||
| AllianzGI Retirement 2050: | ||||||||||||||||||||||||||||||||||||
| Market Value 9/30/2017 | Purchases at Cost | Proceeds from Sales | Change in Unrealized Appreciation (Depreciation) | Market Value 3/31/2018 | Dividend Income | Shares as of 3/31/2018 | Net Realized Gain (Loss) | Net Capital Gain Distributions Received | ||||||||||||||||||||||||||||
AllianzGI Best Styles Global Equity | $ | 19,134,566 | $ | 4,011,035 | $ | 926,409 | $ | (1,943,710 | ) | $ | 20,229,646 | $ | 666,437 | 1,198,439 | $ | (45,836 | ) | $ | 1,957,103 | |||||||||||||||||
AllianzGI Best Styles U.S. Equity | 5,857,590 | 824,086 | 361,398 | (17,609 | ) | 6,311,887 | 110,562 | 340,999 | 9,218 | 266,379 | ||||||||||||||||||||||||||
AllianzGI Emerging Markets Small-Cap | 309,055 | 20,999 | — | 3,024 | 333,078 | 12,953 | 18,341 | — | 8,046 | |||||||||||||||||||||||||||
AllianzGI Global Dynamic Allocation | 5,658,483 | 803,817 | 239,498 | (210,726 | ) | 6,009,902 | 96,146 | 303,224 | (2,174 | ) | 202,406 | |||||||||||||||||||||||||
Totals | $ | 30,959,694 | $ | 5,659,937 | $ | 1,527,305 | $ | (2,169,021 | ) | $ | 32,884,513 | $ | 886,098 | 1,861,003 | $ | (38,792 | ) | $ | 2,433,934 | |||||||||||||||||
| AllianzGI Retirement 2055: | ||||||||||||||||||||||||||||||||||||
| Market Value 9/30/2017 | Purchases at Cost | Proceeds from Sales | Change in Unrealized Appreciation (Depreciation) | Market Value 3/31/2018 | Dividend Income | Shares as of 3/31/2018 | Net Realized Gain (Loss) | Net Capital Gain Distributions Received | ||||||||||||||||||||||||||||
AllianzGI Best Styles Global Equity | $ | 8,609,987 | $ | 3,266,395 | $ | 561,397 | $ | (926,061 | ) | $ | 10,335,635 | $ | 322,995 | 612,301 | $ | (53,289 | ) | $ | 948,529 | |||||||||||||||||
AllianzGI Best Styles U.S. Equity | 2,713,120 | 653,835 | 133,667 | (6,784 | ) | 3,226,038 | 53,326 | 174,286 | (466 | ) | 128,479 | |||||||||||||||||||||||||
AllianzGI Emerging Markets Small-Cap | 109,816 | 63,200 | — | 1,663 | 174,679 | 4,603 | 9,619 | — | 2,859 | |||||||||||||||||||||||||||
AllianzGI Global Dynamic Allocation | 2,546,142 | 775,105 | 141,906 | (106,654 | ) | 3,070,278 | 46,373 | 154,908 | (2,409 | ) | 97,624 | |||||||||||||||||||||||||
Totals | $ | 13,979,065 | $ | 4,758,535 | $ | 836,970 | $ | (1,037,836 | ) | $ | 16,806,630 | $ | 427,297 | 951,114 | $ | (56,164 | ) | $ | 1,177,491 | |||||||||||||||||
| Semiannual Report | | March 31, 2018 | 355 |
Table of Contents
Notes to Financial Statements (cont’d)
March 31, 2018 (Unaudited)
| AllianzGI Multi Asset Income: | ||||||||||||||||||||||||||||||||||||
| Market Value 9/30/2017 | Purchases at Cost | Proceeds from Sales | Change in Unrealized Appreciation (Depreciation) | Market Value 3/31/2018 | Dividend Income | Shares as of | Net Realized | Net Capital Gain Distributions Received | ||||||||||||||||||||||||||||
AllianzGI Emerging Markets Debt | $ | 2,791,922 | $ | 1,129,159 | $ | 282,361 | $ | (123,434 | ) | $ | 3,511,309 | $ | 93,473 | 245,032 | $ | (3,977 | ) | $ | 25,065 | |||||||||||||||||
AllianzGI Europe Equity Dividend | 3,273,342 | 77,782 | — | (121,269 | ) | 3,229,855 | 77,783 | 204,810 | — | — | ||||||||||||||||||||||||||
AllianzGI Global High Yield | 1,024,740 | 593,222 | — | (20,699 | ) | 1,597,263 | 21,060 | 106,201 | — | — | ||||||||||||||||||||||||||
AllianzGI High Yield Bond | 3,294,971 | 2,399,243 | 3,172,098 | (119,393 | ) | 2,366,721 | 88,265 | 275,520 | (36,002 | ) | — | |||||||||||||||||||||||||
AllianzGI Short Duration High Income | 8,402,079 | 127,708 | 3,627,151 | (64,971 | ) | 4,811,287 | 127,708 | 323,774 | (26,378 | ) | — | |||||||||||||||||||||||||
PIMCO Income | 5,767,960 | 1,654,904 | 1,282,186 | (130,762 | ) | 6,025,668 | 155,643 | 493,503 | 15,752 | — | ||||||||||||||||||||||||||
PIMCO Investment Grade Corporate Bond Index | — | 5,477,071 | 1,747,316 | (115,488 | ) | 3,559,098 | 68,580 | 34,801 | (55,169 | ) | 3,326 | |||||||||||||||||||||||||
PIMCO Long-Term Credit | 3,036,362 | — | 3,055,604 | (91,091 | ) | — | 4,922 | — | 110,333 | — | ||||||||||||||||||||||||||
PIMCO Mortgage Opportunities | 3,810,026 | 1,301,977 | 2,666,191 | (37,832 | ) | 2,371,962 | 93,569 | 215,242 | (36,018 | ) | — | |||||||||||||||||||||||||
PIMCO Preferred and Capital Securities | 2,013,097 | 1,873,979 | 998,843 | (36,458 | ) | 2,839,137 | 73,449 | 275,377 | (12,638 | ) | 7,190 | |||||||||||||||||||||||||
Totals | $ | 33,414,499 | $ | 14,635,045 | $ | 16,831,750 | $ | (861,397 | ) | $ | 30,312,300 | $ | 804,452 | 2,174,260 | $ | (44,097 | ) | $ | 35,581 | |||||||||||||||||
| AllianzGI Global Allocation: | ||||||||||||||||||||||||||||||||||||
| Market Value 9/30/2017 | Purchases at Cost | Proceeds from Sales | Change in Unrealized Appreciation (Depreciation) | Market Value 3/31/2018 | Dividend Income | Shares as of 3/31/2018 | Net Realized Gain (Loss) | Net Capital Gain Distributions Received | ||||||||||||||||||||||||||||
AllianzGI Advanced Core Bond | $ | 87,446,693 | $ | 10,147,377 | $ | 3,944,592 | $ | (2,135,542 | ) | $ | 91,333,469 | $ | 1,098,252 | 6,311,919 | $ | (180,467 | ) | — | ||||||||||||||||||
AllianzGI Best Styles Global Equity | 144,308,772 | 22,377,737 | 11,129,601 | (15,329,832 | ) | 141,681,670 | 4,807,230 | 8,393,464 | 1,454,594 | $ | 14,117,227 | |||||||||||||||||||||||||
AllianzGI Best Styles Global Managed Volatility | 35,385,401 | 2,482,013 | — | (972,792 | ) | 36,894,622 | 1,187,383 | 2,125,266 | — | 1,294,630 | ||||||||||||||||||||||||||
AllianzGI Emerging Markets Debt | 15,413,937 | 520,450 | — | (517,731 | ) | 15,416,656 | 410,400 | 1,075,831 | — | 110,051 | ||||||||||||||||||||||||||
AllianzGI Emerging Markets Small-Cap | 4,609,381 | 313,190 | — | 45,094 | 4,967,665 | 193,185 | 273,550 | — | 120,005 | |||||||||||||||||||||||||||
AllianzGI High Yield Bond | 4,928,245 | 65,719 | 4,907,844 | (187,710 | ) | — | 65,719 | — | 101,590 | — | ||||||||||||||||||||||||||
AllianzGI International Growth | 17,904,950 | 2,224,578 | — | (1,176,850 | ) | 18,952,678 | 109,346 | 1,021,708 | — | 2,115,231 | ||||||||||||||||||||||||||
AllianzGI PerformanceFee Managed Futures Strategy | — | 15,000,000 | — | (540,000 | ) | 14,460,000 | — | 1,500,000 | — | — | ||||||||||||||||||||||||||
Totals | $ | 309,997,379 | $ | 53,131,064 | $ | 19,982,037 | $ | (20,815,363 | ) | $ | 323,706,760 | $ | 7,871,515 | 20,701,738 | $ | 1,375,717 | $ | 17,757,144 | ||||||||||||||||||
| 356 | March 31, 2018 | | Semiannual Report |
Table of Contents
| AllianzGI Global Fundamental Strategy: | ||||||||||||||||||||||||||||||||||||
| Market Value 9/30/2017 | Purchases at Cost | Proceeds from Sales | Change in Unrealized Appreciation (Depreciation) | Market Value 3/31/2018 | Dividend Income | Shares as of 3/31/2018 | Net Realized Gain (Loss) | Net Capital Gain Distributions Received | ||||||||||||||||||||||||||||
AllianzGI Best Styles Emerging Markets Equity | $ | 383,978 | $ | 7,668 | $ | 418,836 | $ | (46,408 | ) | — | $ | 7,668 | — | $ | 73,598 | — | ||||||||||||||||||||
AllianzGI NFJ Emerging Markets Value | 197,060 | 2,671 | — | 16,103 | $ | 215,834 | 1,891 | 11,414 | — | $ | 780 | |||||||||||||||||||||||||
Totals | $ | 581,038 | $ | 10,339 | $ | 418,836 | $ | (30,305 | ) | $ | 215,834 | $ | 9,559 | 11,414 | $ | 73,598 | $ | 780 | ||||||||||||||||||
Certain Funds are permitted to purchase or sell securities from or to certain related affiliated funds under specified conditions outlined in procedures adopted by the Board. The procedures have been designed to ensure that any purchase or sale of securities by the Funds from or to another fund or portfolio that are, or could be, considered an affiliate by virtue of having a common investment adviser (or affiliated investment advisers), common Trustees and/or common officers comply with Rule 17a-7 of the 1940 Act. Further, as defined under the procedures, each transaction is effected at the current market price.
During the six months ended March 31, 2018, the following Funds engaged in sales of securities pursuant to Rule 17a-7 of the 1940 Act:
| Purchases | Sales | |||||||
AllianzGI Short Duration High Income | — | $ | 39,257,236 | |||||
| 8. | SIGNIFICANT ACCOUNT HOLDERS |
From time to time, a Fund may have a concentration of shareholders, which may include the Investment Manager or affiliates of the Investment Manager, holding a significant percentage of shares outstanding. Investment activities of these shareholders could have a material impact to a Fund.
At March 31, 2018, the significant account-holders, owners of 5% or greater of each respective Fund’s outstanding shares were as follows:
| Unaffiliated | Affiliated | |||||||||||||||||||
| Number of Account Holders | Approximate Ownership | Number of Account Holders | Approximate Ownership* | AFI/Allianz of America | ||||||||||||||||
AllianzGI Retirement 2020 | 4 | 75 | % | — | — | — | ||||||||||||||
AllianzGI Retirement 2025 | 3 | 75 | % | — | — | — | ||||||||||||||
AllianzGI Retirement 2030 | 3 | 73 | % | — | — | — | ||||||||||||||
AllianzGI Retirement 2035 | 4 | 78 | % | — | — | — | ||||||||||||||
AllianzGI Retirement 2040 | 3 | 74 | % | — | — | — | ||||||||||||||
AllianzGI Retirement 2045 | 3 | 70 | % | — | — | — | ||||||||||||||
AllianzGI Retirement 2050 | 4 | 77 | % | — | — | — | ||||||||||||||
AllianzGI Retirement 2055 | 4 | 75 | % | — | — | — | ||||||||||||||
AllianzGI Multi Asset Income | 6 | 66 | % | — | — | — | ||||||||||||||
AllianzGI Global Allocation | 1 | 23 | % | 2 | 53 | % | — | |||||||||||||
AllianzGI Best Styles Emerging Markets Equity | 1 | 12 | % | — | 0 | % | 80 | % | ||||||||||||
AllianzGI Best Styles Global Equity | — | — | 3 | 77 | % | — | ||||||||||||||
AllianzGI Best Styles International Equity | 1 | 42 | % | 2 | 54 | % | — | |||||||||||||
AllianzGI Best Styles U.S. Equity | 1 | 5 | % | 6 | 80 | % | — | |||||||||||||
AllianzGI Convertible | 4 | 36 | % | — | — | — | ||||||||||||||
AllianzGI Emerging Markets Consumer | 6 | 98 | % | — | — | — | ||||||||||||||
AllianzGI Emerging Markets Debt | — | — | 2 | 58 | % | 34 | % | |||||||||||||
AllianzGI Emerging Markets Small-Cap | 1 | 19 | % | 4 | 63 | % | — | |||||||||||||
AllianzGI Europe Equity Dividend | 3 | 54 | % | 1 | 39 | % | — | |||||||||||||
AllianzGI Global Dynamic Allocation | 2 | 19 | % | 5 | 63 | % | — | |||||||||||||
AllianzGI Global Fundamental Strategy | 1 | 5 | % | — | — | 94 | % | |||||||||||||
AllianzGI Global High Yield | — | — | 1 | 7 | % | 93 | % | |||||||||||||
AllianzGI Global Sustainability | 2 | 98 | % | — | — | — | ||||||||||||||
AllianzGI Global Water | 5 | 41 | % | — | — | — | ||||||||||||||
AllianzGI High Yield Bond | 5 | 67 | % | — | — | — | ||||||||||||||
| Semiannual Report | | March 31, 2018 | 357 |
Table of Contents
Notes to Financial Statements (cont’d)
March 31, 2018 (Unaudited)
| Unaffiliated | Affiliated | |||||||||||||||||||
| Number of Account Holders | Approximate Ownership | Number of Account Holders | Approximate Ownership* | AFI/Allianz of America | ||||||||||||||||
AllianzGI International Growth | — | — | — | 94 | % | — | ||||||||||||||
AllianzGI International Small-Cap | 3 | 76 | % | — | — | — | ||||||||||||||
AllianzGI Micro Cap | 1 | 73 | % | — | — | — | ||||||||||||||
AllianzGI NFJ Emerging Markets Value | 3 | 83 | % | — | — | — | ||||||||||||||
AllianzGI NFJ International Small-Cap Value | 6 | 87 | % | — | — | — | ||||||||||||||
AllianzGI PerformanceFee Managed Futures Strategy | — | — | 1 | 95 | % | — | ||||||||||||||
AllianzGI PerformanceFee Structured US Equity | — | — | — | — | 99 | % | ||||||||||||||
AllianzGI PerformanceFee Structured US Fixed Income | — | — | — | — | 100 | % | ||||||||||||||
AllianzGI Real Estate Debt | — | — | — | — | 99 | % | ||||||||||||||
AllianzGI Short Duration High Income | 7 | 50 | % | — | — | — | ||||||||||||||
AllianzGI Structured Return | 7 | 68 | % | — | — | — | ||||||||||||||
AllianzGI U.S. Equity Hedged | 5 | 83 | % | — | — | — | ||||||||||||||
AllianzGI Ultra Micro Cap | 4 | 66 | % | — | — | — | ||||||||||||||
| * | This represents the aggregate percentage of affiliated entities that own 5% or more of the Fund’s outstanding shares. These affiliated entities include funds/portfolios of the Trust, CollegeAccess 529 Plan, OklahomaDream 529 Plan and Allianz Multi-Series Collective Investment Trust. |
| 358 | March 31, 2018 | | Semiannual Report |
Table of Contents
(THIS PAGE INTENTIONALLY LEFT BLANK)
| Semiannual Report | | March 31, 2018 | 359 |
Table of Contents
Notes to Financial Statements (cont’d)
March 31, 2018 (Unaudited)
| 9. | SHARES OF BENEFICIAL INTEREST |
The Trust may issue an unlimited number of shares of beneficial interest with $0.0001 par value. Changes in shares of beneficial interest were as follows:
| AllianzGI Retirement 2020 | AllianzGI Retirement 2025 | |||||||||||||||||||||||||||||||||||
| Six Months ended March 31, 2018 (unaudited) | Year ended September 30, 2017 | Six Months ended March 31, 2018 (unaudited) | Year ended September 30, 2017 | |||||||||||||||||||||||||||||||||
| Shares | Amount | Shares | Amount | Shares | Amount | Shares | Amount | |||||||||||||||||||||||||||||
Shares sold: | ||||||||||||||||||||||||||||||||||||
Class A | 17,672 | $ | 361,503 | 76,737 | $ | 1,476,887 | 45,994 | $ | 845,666 | 58,086 | $ | 1,010,886 | ||||||||||||||||||||||||
Class C | 689 | 14,090 | 6,921 | 131,602 | — | — | — | — | ||||||||||||||||||||||||||||
Class R | 2,235 | 45,184 | 3,269 | 64,108 | 867 | 15,990 | 4,122 | 69,053 | ||||||||||||||||||||||||||||
Class P | 127,613 | 2,624,604 | 133,356 | 2,600,760 | 112,765 | 2,094,664 | 246,556 | 4,280,682 | ||||||||||||||||||||||||||||
Class R6 | 125,568 | 2,600,484 | 481,151 | 9,346,062 | 122,214 | 2,268,581 | 673,832 | 11,717,365 | ||||||||||||||||||||||||||||
Administrative Class | 2,295 | 47,585 | 17,680 | 340,652 | 1,102 | 20,602 | 10,689 | 184,331 | ||||||||||||||||||||||||||||
Issued in reinvestment of dividends and distributions: | ||||||||||||||||||||||||||||||||||||
Class A | 20,754 | 422,972 | 16,725 | 310,416 | 17,564 | 323,180 | 7,078 | 117,498 | ||||||||||||||||||||||||||||
Class C | 481 | 9,782 | 462 | 8,548 | — | — | — | — | ||||||||||||||||||||||||||||
Class R | 2 | 47 | 500 | 9,321 | 31 | 566 | 915 | 15,091 | ||||||||||||||||||||||||||||
Class P | 33,591 | 689,953 | 38,717 | 724,018 | 95,060 | 1,746,256 | 59,281 | 982,280 | ||||||||||||||||||||||||||||
Class R6 | 31,248 | 642,466 | 19,701 | 368,801 | 53,770 | 988,834 | 21,665 | 359,200 | ||||||||||||||||||||||||||||
Administrative Class | 1,059 | 21,720 | 773 | 14,448 | 672 | 12,408 | 755 | 12,535 | ||||||||||||||||||||||||||||
Cost of shares redeemed: | ||||||||||||||||||||||||||||||||||||
Class A | (204,874 | ) | (4,108,569 | ) | (87,720 | ) | (1,678,659 | ) | (40,418 | ) | (746,807 | ) | (35,255 | ) | (615,697 | ) | ||||||||||||||||||||
Class C | (3,305 | ) | (67,623 | ) | (6,362 | ) | (122,830 | ) | — | — | — | — | ||||||||||||||||||||||||
Class R | (2 | ) | (31 | ) | (35,437 | ) | (678,453 | ) | (10 | ) | (185 | ) | (42,549 | ) | (723,563 | ) | ||||||||||||||||||||
Class P | (112,193 | ) | (2,329,959 | ) | (528,913 | ) | (10,285,749 | ) | (178,154 | ) | (3,311,397 | ) | (401,873 | ) | (6,967,829 | ) | ||||||||||||||||||||
Class R6 | (163,413 | ) | (3,370,280 | ) | (315,208 | ) | (6,228,636 | ) | (215,429 | ) | (3,986,205 | ) | (295,135 | ) | (5,224,988 | ) | ||||||||||||||||||||
Administrative Class | (1,218 | ) | (25,189 | ) | (5,654 | ) | (109,267 | ) | (27,579 | ) | (519,224 | ) | (5,975 | ) | (100,722 | ) | ||||||||||||||||||||
Net increase (decrease) resulting from Fund share transactions | (121,798 | ) | $ | (2,421,261 | ) | (183,302 | ) | $ | (3,707,971 | ) | (11,551 | ) | $ | (247,071 | ) | 302,192 | $ | 5,116,122 | ||||||||||||||||||
| 360 | March 31, 2018 | | Semiannual Report |
Table of Contents
| AllianzGI Retirement 2030 | AllianzGI Retirement 2035 | AllianzGI Retirement 2040 | ||||||||||||||||||||||||||||||||||||||||||||||||
| Six Months ended March 31, 2018 (unaudited) | Year ended September 30, 2017 | Six Months ended March 31, 2018 (unaudited) | Year ended September 30, 2017 | Six Months ended March 31, 2018 (unaudited) | Year ended September 30, 2017 | |||||||||||||||||||||||||||||||||||||||||||||
| Shares | Amount | Shares | Amount | Shares | Amount | Shares | Amount | Shares | Amount | Shares | Amount | |||||||||||||||||||||||||||||||||||||||
| 65,562 | $ | 1,483,206 | 169,366 | $ | 3,631,028 | 59,961 | $ | 1,206,084 | 82,607 | $ | 1,535,318 | 29,601 | $ | 688,275 | 129,442 | $ | 2,832,313 | |||||||||||||||||||||||||||||||||
| 3,168 | 70,132 | 9,201 | 194,249 | — | — | — | — | 145 | 3,376 | 556 | 11,727 | |||||||||||||||||||||||||||||||||||||||
| 2,129 | 48,153 | 8,384 | 169,358 | 3,784 | 75,431 | 9,140 | 164,152 | 1,625 | 37,500 | 8,299 | 170,224 | |||||||||||||||||||||||||||||||||||||||
| 153,385 | 3,497,173 | 231,370 | 4,891,963 | 111,014 | 2,246,828 | 214,806 | 3,980,036 | 66,725 | 1,569,926 | 194,498 | 4,120,583 | |||||||||||||||||||||||||||||||||||||||
| 105,203 | 2,403,618 | 494,594 | 10,525,400 | 103,020 | 2,081,696 | 423,923 | 7,975,286 | 94,220 | 2,216,392 | 364,045 | 7,862,454 | |||||||||||||||||||||||||||||||||||||||
| 3,782 | 87,072 | 11,561 | 239,783 | 3,431 | 70,048 | 23,561 | 431,467 | 2,524 | 59,900 | 2,570 | 54,947 | |||||||||||||||||||||||||||||||||||||||
| 21,750 | 483,287 | 7,285 | 144,389 | 25,634 | 506,781 | 11,790 | 206,201 | 12,615 | 289,017 | 7,063 | 142,180 | |||||||||||||||||||||||||||||||||||||||
| 1,677 | 36,934 | 627 | 12,336 | — | — | — | — | 341 | 7,750 | 206 | 4,120 | |||||||||||||||||||||||||||||||||||||||
| 408 | 9,075 | 2,247 | 44,419 | 292 | 5,756 | 1,458 | 25,406 | 216 | 4,926 | 2,744 | 54,691 | |||||||||||||||||||||||||||||||||||||||
| 93,948 | 2,107,251 | 46,942 | 938,844 | 102,945 | 2,042,423 | 50,349 | 883,626 | 68,278 | 1,569,715 | 46,345 | 935,697 | |||||||||||||||||||||||||||||||||||||||
| 61,604 | 1,385,473 | 24,135 | 483,657 | 50,938 | 1,012,145 | 16,412 | 288,351 | 65,515 | 1,509,472 | 34,052 | 688,539 | |||||||||||||||||||||||||||||||||||||||
| 1,114 | 25,075 | 1,496 | 29,885 | 749 | 14,933 | 996 | 17,461 | 1,153 | 26,411 | 656 | 13,206 | |||||||||||||||||||||||||||||||||||||||
| (80,891 | ) | (1,846,370 | ) | (119,163 | ) | (2,553,450 | ) | (30,776 | ) | (614,666 | ) | (179,788 | ) | (3,296,808 | ) | (54,315 | ) | (1,279,424 | ) | (57,829 | ) | (1,260,230 | ) | |||||||||||||||||||||||||||
| (3,277 | ) | (72,962 | ) | (9,054 | ) | (193,558 | ) | — | — | — | — | (199 | ) | (4,632 | ) | (894 | ) | (18,693 | ) | |||||||||||||||||||||||||||||||
| (4,871 | ) | (111,436 | ) | (102,367 | ) | (2,095,862 | ) | (346 | ) | (6,946 | ) | (66,259 | ) | (1,205,411 | ) | (5,946 | ) | (140,628 | ) | (73,837 | ) | (1,538,720 | ) | |||||||||||||||||||||||||||
| (120,736 | ) | (2,734,837 | ) | (331,551 | ) | (6,996,835 | ) | (109,888 | ) | (2,218,109 | ) | (342,148 | ) | (6,368,482 | ) | (140,262 | ) | (3,268,168 | ) | (206,337 | ) | (4,392,618 | ) | |||||||||||||||||||||||||||
| (134,627 | ) | (3,056,458 | ) | (243,782 | ) | (5,253,796 | ) | (114,656 | ) | (2,302,163 | ) | (172,855 | ) | (3,231,813 | ) | (120,210 | ) | (2,814,595 | ) | (147,672 | ) | (3,185,036 | ) | |||||||||||||||||||||||||||
| (46,332 | ) | (1,067,181 | ) | (13,077 | ) | (269,752 | ) | (30,816 | ) | (630,244 | ) | (16,571 | ) | (302,465 | ) | (703 | ) | (16,476 | ) | (3,134 | ) | (63,157 | ) | |||||||||||||||||||||||||||
| | 122,996 | $ | 2,747,205 | 188,214 | $ | 3,942,058 | 175,286 | $ | 3,489,997 | 57,421 | $ | 1,102,325 | 21,323 | $ | 458,737 | 300,773 | $ | 6,432,227 | ||||||||||||||||||||||||||||||||
| Semiannual Report | | March 31, 2018 | 361 |
Table of Contents
Notes to Financial Statements (cont’d)
March 31, 2018 (Unaudited)
| AllianzGI Retirement 2045 | AllianzGI Retirement 2050 | |||||||||||||||||||||||||||||||||||
| Six Months ended March 31, 2018 (unaudited) | Year ended September 30, 2017 | Six Months ended March 31, 2018 (unaudited) | Year ended September 30, 2017 | |||||||||||||||||||||||||||||||||
| Shares | Amount | Shares | Amount | Shares | Amount | Shares | Amount | |||||||||||||||||||||||||||||
Shares sold: | ||||||||||||||||||||||||||||||||||||
Class A | 24,910 | $ | 505,087 | 48,719 | $ | 918,326 | 20,915 | $ | 473,986 | 106,379 | $ | 2,166,114 | ||||||||||||||||||||||||
Class C | — | — | — | — | 248 | 5,547 | 1,093 | 22,259 | ||||||||||||||||||||||||||||
Class R | 1,894 | 38,604 | 7,653 | 140,162 | 681 | 15,428 | 3,766 | 75,483 | ||||||||||||||||||||||||||||
Class P | 66,109 | 1,358,208 | 150,381 | 2,830,332 | 60,935 | 1,404,998 | 139,562 | 2,913,729 | ||||||||||||||||||||||||||||
Institutional Class | — | — | — | — | — | — | — | — | ||||||||||||||||||||||||||||
Class R6 | 83,614 | 1,719,619 | 306,694 | 5,779,643 | 107,016 | 2,469,680 | 267,214 | 5,625,406 | ||||||||||||||||||||||||||||
Administrative Class | 2,844 | 58,715 | 14,449 | 268,324 | 1,902 | 43,659 | 6,581 | 139,403 | ||||||||||||||||||||||||||||
Issued in reinvestment of dividends and distributions: | ||||||||||||||||||||||||||||||||||||
Class A | 13,781 | 276,721 | 9,827 | 172,359 | 9,057 | 201,877 | 4,463 | 87,120 | ||||||||||||||||||||||||||||
Class C | — | — | — | — | 482 | 10,589 | 351 | 6,764 | ||||||||||||||||||||||||||||
Class R | 411 | 8,185 | 1,786 | 31,083 | 79 | 1,758 | 1,794 | 34,832 | ||||||||||||||||||||||||||||
Class P | 50,653 | 1,018,129 | 41,537 | 729,383 | 37,273 | 836,401 | 29,513 | 579,934 | ||||||||||||||||||||||||||||
Institutional Class | — | — | — | — | — | — | — | — | ||||||||||||||||||||||||||||
Class R6 | 42,722 | 860,846 | 26,400 | 464,645 | 50,642 | 1,140,455 | 29,933 | 589,982 | �� | |||||||||||||||||||||||||||
Administrative Class | 1,746 | 34,918 | 1,669 | 29,161 | 2,445 | 54,642 | 1,708 | 33,443 | ||||||||||||||||||||||||||||
Cost of shares redeemed: | ||||||||||||||||||||||||||||||||||||
Class A | (19,737 | ) | (408,760 | ) | (38,843 | ) | (721,757 | ) | (40,739 | ) | (945,407 | ) | (28,279 | ) | (578,951 | ) | ||||||||||||||||||||
Class C | — | — | — | — | (540 | ) | (11,784 | ) | (917 | ) | (19,414 | ) | ||||||||||||||||||||||||
Class R | (844 | ) | (17,173 | ) | (34,653 | ) | (631,153 | ) | (28 | ) | (647 | ) | (38,340 | ) | (780,732 | ) | ||||||||||||||||||||
Class P | (100,913 | ) | (2,069,937 | ) | (136,429 | ) | (2,543,429 | ) | (63,202 | ) | (1,446,244 | ) | (148,241 | ) | (3,094,457 | ) | ||||||||||||||||||||
Institutional Class | — | — | — | — | — | — | — | — | ||||||||||||||||||||||||||||
Class R6 | (53,086 | ) | (1,085,565 | ) | (143,527 | ) | (2,725,283 | ) | (61,380 | ) | (1,409,740 | ) | (113,709 | ) | (2,410,543 | ) | ||||||||||||||||||||
Administrative Class | (8,759 | ) | (180,482 | ) | (3,069 | ) | (59,582 | ) | (1,228 | ) | (27,855 | ) | (4,474 | ) | (93,586 | ) | ||||||||||||||||||||
Net increase (decrease) resulting from Fund share transactions | 105,345 | $ | 2,117,115 | 252,594 | $ | 4,682,214 | 124,558 | $ | 2,817,343 | 258,397 | $ | 5,296,786 | ||||||||||||||||||||||||
| # | For the period February 1, 2018 (commencement of share class) through March 31, 2018. “Shares sold” includes shares sold to AFI. |
| 362 | March 31, 2018 | | Semiannual Report |
Table of Contents
| AllianzGI Retirement 2055 | AllianzGI Multi Asset Income | AllianzGI Global Allocation | ||||||||||||||||||||||||||||||||||||||||||||||||
| Six Months ended March 31, 2018 (unaudited) | Year ended September 30, 2017 | Six Months ended March 31, 2018 (unaudited) | Year ended September 30, 2017 | Six Months ended March 31, 2018 (unaudited) | Year ended September 30, 2017 | |||||||||||||||||||||||||||||||||||||||||||||
| Shares | Amount | Shares | Amount | Shares | Amount | Shares | Amount | Shares | Amount | Shares | Amount | |||||||||||||||||||||||||||||||||||||||
| 23,628 | $ | 464,480 | 66,447 | $ | 1,173,048 | 79,312 | $ | 1,432,266 | 109,682 | $ | 2,004,214 | 186,331 | $ | 2,226,474 | 586,530 | $ | 6,839,242 | |||||||||||||||||||||||||||||||||
| — | — | — | — | 29,371 | 537,361 | 35,951 | 658,716 | 221,157 | 2,761,108 | 165,667 | 1,943,750 | |||||||||||||||||||||||||||||||||||||||
| 1,170 | 22,957 | 5,173 | 89,205 | 622 | 11,813 | 1,401 | 26,397 | 708 | 8,651 | 335 | 3,936 | |||||||||||||||||||||||||||||||||||||||
| 76,835 | 1,525,644 | 133,236 | 2,403,596 | 45,270 | 831,233 | 211,230 | 3,897,798 | 64,011 | 779,071 | 228,639 | 2,651,584 | |||||||||||||||||||||||||||||||||||||||
| — | — | — | — | 2,052 | # | 35,656 | # | — | — | 46,924 | 551,640 | 661,698 | 7,440,593 | |||||||||||||||||||||||||||||||||||||
| 115,452 | 2,299,862 | 191,577 | 3,479,666 | 157,008 | 2,821,002 | 325,863 | 5,861,899 | 10,295,053 | 124,907,521 | 9,283,971 | 107,103,765 | |||||||||||||||||||||||||||||||||||||||
| 5,166 | 101,074 | 5,130 | 92,175 | 839 | 15,459 | 46,447 | 857,264 | 35 | 445 | 44 | 500 | |||||||||||||||||||||||||||||||||||||||
| 6,743 | 129,807 | 2,569 | 43,180 | 24,149 | 438,587 | 26,950 | 488,639 | 308,428 | 3,579,147 | 61,309 | 692,252 | |||||||||||||||||||||||||||||||||||||||
| — | — | — | — | 7,856 | 142,748 | 6,922 | 125,825 | 223,198 | 2,640,304 | 25,252 | 286,502 | |||||||||||||||||||||||||||||||||||||||
| 201 | 3,864 | 788 | 13,177 | 74 | 1,395 | 418 | 7,743 | 224 | 2,565 | 32 | 362 | |||||||||||||||||||||||||||||||||||||||
| 21,627 | 419,135 | 10,413 | 176,090 | 35,087 | 643,942 | 48,673 | 889,457 | 11,500 | 132,278 | 1,725 | 19,327 | |||||||||||||||||||||||||||||||||||||||
| — | — | — | — | 11 | # | 193 | # | — | — | 49,908 | 577,529 | 138,604 | 1,517,409 | |||||||||||||||||||||||||||||||||||||
| 23,693 | 461,056 | 8,828 | 149,892 | 52,249 | 934,854 | 64,655 | 1,155,477 | 2,334,806 | 26,505,964 | 733,174 | 8,106,799 | |||||||||||||||||||||||||||||||||||||||
| 1,162 | 22,436 | 754 | 12,694 | 3,419 | 63,297 | 3,729 | 68,924 | 209 | 2,494 | 43 | 499 | |||||||||||||||||||||||||||||||||||||||
| (7,949 | ) | (154,980 | ) | (23,665 | ) | (414,439 | ) | (53,206 | ) | (963,839 | ) | (142,903 | ) | (2,614,625 | ) | (439,643 | ) | (5,243,285 | ) | (4,383,743 | ) | (49,002,154 | ) | |||||||||||||||||||||||||||
| — | — | — | — | (37,025 | ) | (660,551 | ) | (42,029 | ) | (766,759 | ) | (507,363 | ) | (6,123,045 | ) | (1,509,265 | ) | (17,572,955 | ) | |||||||||||||||||||||||||||||||
| (13 | ) | (260 | ) | (21,770 | ) | (381,938 | ) | (316 | ) | (6,110 | ) | (22,534 | ) | (424,120 | ) | (346 | ) | (4,243 | ) | (1 | ) | (9 | ) | |||||||||||||||||||||||||||
| (51,966 | ) | (1,027,153 | ) | (41,744 | ) | (759,078 | ) | (90,660 | ) | (1,669,487 | ) | (409,501 | ) | (7,528,815 | ) | (51,760 | ) | (637,821 | ) | (109,354 | ) | (1,256,218 | ) | |||||||||||||||||||||||||||
| — | — | — | — | — | # | — | # | — | — | (42,444 | ) | (504,474 | ) | (6,417,388 | ) | (74,424,026 | ) | |||||||||||||||||||||||||||||||||
| (35,629 | ) | (703,029 | ) | (57,561 | ) | (1,064,620 | ) | (199,940 | ) | (3,610,398 | ) | (328,549 | ) | (5,951,323 | ) | (10,216,269 | ) | (124,393,321 | ) | (14,502,725 | ) | (171,896,055 | ) | |||||||||||||||||||||||||||
| (7,911 | ) | (158,093 | ) | (2,563 | ) | (45,751 | ) | (58,147 | ) | (1,035,606 | ) | (11,971 | ) | (223,951 | ) | (18 | ) | (224 | ) | (765 | ) | (8,761 | ) | |||||||||||||||||||||||||||
| 172,209 |
| $ | 3,406,800 | 277,612 | $ | 4,966,897 | (1,975 | ) | $ | (36,185 | ) | (75,566 | ) | $ | (1,467,240 | ) | 2,484,649 | $ | 27,768,778 | (15,036,218 | ) | $ | (177,553,658 | ) | |||||||||||||||||||||||||
| Semiannual Report | | March 31, 2018 | 363 |
Table of Contents
Notes to Financial Statements (cont’d)
March 31, 2018 (Unaudited)
| AllianzGI Best Styles Emerging Markets Equity | AllianzGI Best Styles Global Equity | |||||||||||||||||||||||||||||||||||
| Six Months ended March 31, 2018 (unaudited) | Year ended September 30, 2017 | Six Months ended March 31, 2018 (unaudited) | Year ended September 30, 2017 | |||||||||||||||||||||||||||||||||
| Shares | Amount | Shares | Amount | Shares | Amount | Shares | Amount | |||||||||||||||||||||||||||||
Shares sold: | ||||||||||||||||||||||||||||||||||||
Class A | 7,814 | $ | 138,952 | 7,900 | $ | 118,678 | 15,177 | $ | 278,191 | 68,959 | $ | 1,130,618 | ||||||||||||||||||||||||
Class C | 74 | 1,300 | 2,080 | 31,589 | 1,513 | 28,158 | 4,830 | 87,436 | ||||||||||||||||||||||||||||
Class R | — | — | — | — | — | — | — | — | ||||||||||||||||||||||||||||
Class P | 896 | 15,500 | 1,512 | 21,893 | 33,298 | 603,818 | 164,630 | 2,742,675 | ||||||||||||||||||||||||||||
Institutional Class | 4,748 | 80,501 | 4,412 | 60,000 | 11,572 | 212,462 | 11,025 | 192,141 | ||||||||||||||||||||||||||||
Class R6 | 30,693 | 553,005 | 53,277 | 771,917 | 4,782,254 | 87,127,682 | 14,837,402 | 237,470,245 | ||||||||||||||||||||||||||||
Administrative Class | — | — | — | — | — | — | — | — | ||||||||||||||||||||||||||||
Issued in reinvestment of dividends and distributions: | ||||||||||||||||||||||||||||||||||||
Class A | 175 | 2,927 | 52 | 652 | 9,117 | 156,176 | 396 | 6,286 | ||||||||||||||||||||||||||||
Class C | 39 | 646 | 60 | 747 | 451 | 7,587 | 12 | 183 | ||||||||||||||||||||||||||||
Class R | — | — | — | — | — | — | — | — | ||||||||||||||||||||||||||||
Class P | 44 | 742 | 46 | 580 | 18,861 | 322,713 | 2,814 | 44,744 | ||||||||||||||||||||||||||||
Institutional Class | 87 | 1,450 | 47 | 590 | 19,183 | 324,964 | 3,166 | 49,946 | ||||||||||||||||||||||||||||
Class R6 | 8,161 | 137,439 | 24,368 | 307,036 | 4,650,001 | 79,375,511 | 991,084 | 15,722,005 | ||||||||||||||||||||||||||||
Administrative Class | — | — | — | — | — | — | — | — | ||||||||||||||||||||||||||||
Cost of shares redeemed: | ||||||||||||||||||||||||||||||||||||
Class A | — | — | — | — | (9,037 | ) | (159,065 | ) | (2,321,093 | ) | (35,682,819 | ) | ||||||||||||||||||||||||
Class C | (340 | ) | (5,892 | ) | (62 | ) | (1,007 | ) | (3,896 | ) | (72,616 | ) | — | — | ||||||||||||||||||||||
Class R | — | — | — | — | — | — | — | — | ||||||||||||||||||||||||||||
Class P | — | — | — | — | (64,696 | ) | (1,129,034 | ) | (197,393 | ) | (3,329,411 | ) | ||||||||||||||||||||||||
Institutional Class | — | — | (4,413 | ) | (64,544 | ) | (12,717 | ) | (229,320 | ) | (42,235 | ) | (691,732 | ) | ||||||||||||||||||||||
Class R6 | (100,781 | ) | (1,813,577 | ) | (516,686 | ) | (7,517,856 | ) | (4,639,554 | ) | (85,820,661 | ) | (19,667,990 | ) | (341,812,997 | ) | ||||||||||||||||||||
Administrative Class | — | — | — | — | — | — | — | — | ||||||||||||||||||||||||||||
Net increase (decrease) resulting from Fund share transactions | (48,390 | ) | $ | (887,007 | ) | (427,407 | ) | $ | (6,269,725 | ) | 4,811,527 | $ | 81,026,566 | (6,144,393 | ) | $ | (124,070,680 | ) | ||||||||||||||||||
| * | Actual amount rounds to less than one share. |
| 364 | March 31, 2018 | | Semiannual Report |
Table of Contents
| AllianzGI Best Styles International Equity | AllianzGI Best Styles U.S. Equity | AllianzGI Convertible | ||||||||||||||||||||||||||||||||||||||||||||||||
| Six Months ended March 31, 2018 (unaudited) | Year ended September 30, 2017 | Six Months ended March 31, 2018 (unaudited) | Year ended September 30, 2017 | Six Months ended March 31, 2018 (unaudited) | Year ended September 30, 2017 | |||||||||||||||||||||||||||||||||||||||||||||
| Shares | Amount | Shares | Amount | Shares | Amount | Shares | Amount | Shares | Amount | Shares | Amount | |||||||||||||||||||||||||||||||||||||||
| 15,559 | $ | 244,130 | 31,284 | $ | 462,837 | 4,730 | $ | 90,264 | 30,990 | $ | 493,185 | 69,599 | $ | 2,142,682 | 421,297 | $ | 13,241,563 | |||||||||||||||||||||||||||||||||
| 946 | 14,935 | 8,186 | 119,746 | 942 | 18,015 | 595 | 9,956 | 150,162 | 4,543,593 | 18,986 | 604,884 | |||||||||||||||||||||||||||||||||||||||
| — | — | — | — | — | — | — | — | 201 | 6,320 | 2,394 | 74,613 | |||||||||||||||||||||||||||||||||||||||
| — | — | 6,784 | 100,000 | 208 | 4,000 | 27,172 | 477,904 | 726,538 | 21,622,885 | 1,100,204 | 34,977,199 | |||||||||||||||||||||||||||||||||||||||
| 6,055 | 95,576 | 3,275 | 50,000 | 1,292 | 24,521 | 2,923 | 49,389 | 543,327 | 16,467,843 | 608,383 | 19,377,376 | |||||||||||||||||||||||||||||||||||||||
| 164,061 | 2,612,057 | 413,391 | 5,966,733 | 566,874 | 10,710,804 | 4,161,911 | 67,097,951 | — | — | — | — | |||||||||||||||||||||||||||||||||||||||
| — | — | — | — | — | — | — | — | 136 | 4,032 | 944 | 30,423 | |||||||||||||||||||||||||||||||||||||||
| 1,219 | 18,889 | 87 | 1,126 | 264 | 4,958 | 474 | 7,605 | 406,738 | 11,784,003 | 117,142 | 3,690,187 | |||||||||||||||||||||||||||||||||||||||
| 299 | 4,603 | 109 | 1,403 | 107 | 1,972 | 9 | 148 | 228,011 | 6,644,280 | 26,301 | 841,210 | |||||||||||||||||||||||||||||||||||||||
| — | — | — | — | — | — | — | — | 374 | 11,192 | 394 | 12,358 | |||||||||||||||||||||||||||||||||||||||
| 356 | 5,511 | 70 | 898 | 1,675 | 31,132 | 26 | 420 | 424,059 | 12,051,717 | 61,160 | 1,946,532 | |||||||||||||||||||||||||||||||||||||||
| 265 | 4,124 | 258 | 3,340 | 411 | 7,666 | 81 | 1,298 | 1,788,916 | 51,283,351 | 357,366 | 11,312,875 | |||||||||||||||||||||||||||||||||||||||
| 68,138 | 1,061,586 | 213,849 | 2,758,648 | 395,294 | 7,399,903 | 100,771 | 1,625,434 | — | — | — | — | |||||||||||||||||||||||||||||||||||||||
| — | — | — | — | — | — | — | — | 5,928 | 170,158 | 1,210 | 38,602 | |||||||||||||||||||||||||||||||||||||||
| (12,379 | ) | (197,686 | ) | — | * | (1 | ) | (104 | ) | (1,950 | ) | (31,989 | ) | (555,810 | ) | (579,485 | ) | (18,501,953 | ) | (6,677,007 | ) | (212,830,762 | ) | |||||||||||||||||||||||||||
| (3,295 | ) | (51,854 | ) | — | — | (278 | ) | (5,174 | ) | (183 | ) | (3,200 | ) | (245,802 | ) | (7,712,998 | ) | (783,707 | ) | (25,010,423 | ) | |||||||||||||||||||||||||||||
| — | — | — | — | — | — | — | — | (1,607 | ) | (52,517 | ) | (36,419 | ) | (1,168,769 | ) | |||||||||||||||||||||||||||||||||||
| (321 | ) | (4,963 | ) | — | — | — | — | (4,942 | ) | (87,116 | ) | (560,297 | ) | (17,004,262 | ) | (1,675,570 | ) | (53,087,878 | ) | |||||||||||||||||||||||||||||||
| (637 | ) | (10,362 | ) | (333 | ) | (5,000 | ) | (2,465 | ) | (47,143 | ) | (1,967 | ) | (32,581 | ) | (2,591,317 | ) | (82,887,414 | ) | (26,875,233 | ) | (880,281,948 | ) | |||||||||||||||||||||||||||
| (213,526 | ) | (3,475,080 | ) | (4,003,229 | ) | (57,963,958 | ) | (274,580 | ) | (5,309,538 | ) | (4,662,780 | ) | (75,839,011 | ) | — | — | — | — | |||||||||||||||||||||||||||||||
| — | — | — | — | — | — | — | — | (10,800 | ) | (365,788 | ) | (11,893 | ) | (382,451 | ) | |||||||||||||||||||||||||||||||||||
| 26,740 |
| $ | 321,466 | (3,326,269 | ) | $ | (48,504,228 | ) | 694,370 | $ | 12,929,430 | (376,909 | ) | $ | (6,754,428 | ) | 354,681 | $ | 207,124 | (33,344,048 | ) | $ | (1,086,614,409 | ) | |||||||||||||||||||||||||
| Semiannual Report | | March 31, 2018 | 365 |
Table of Contents
Notes to Financial Statements (cont’d)
March 31, 2018 (Unaudited)
| AllianzGI Emerging Markets Consumer | AllianzGI Emerging Markets Debt | |||||||||||||||||||||||||||||||||||
| Six Months ended March 31, 2018 (unaudited) | Year ended September 30, 2017 | Six Months ended March 31, 2018 (unaudited) | Year ended September 30, 2017 | |||||||||||||||||||||||||||||||||
| Shares | Amount | Shares | Amount | Shares | Amount | Shares | Amount | |||||||||||||||||||||||||||||
Shares sold: | ||||||||||||||||||||||||||||||||||||
Class A | 433 | $ | 7,100 | 6,214 | $ | 92,436 | 37,243 | $ | 533,757 | 5,430 | $ | 79,259 | ||||||||||||||||||||||||
Class C | — | — | — | — | — | — | 1,552 | 23,000 | ||||||||||||||||||||||||||||
Class R | — | — | — | — | — | — | — | — | ||||||||||||||||||||||||||||
Class P | — | — | — | — | — | — | — | — | ||||||||||||||||||||||||||||
Institutional Class | 678,691 | 11,032,490 | 651,142 | 9,167,162 | 170,116 | 2,519,414 | 395,365 | 5,863,546 | ||||||||||||||||||||||||||||
Class R6 | — | — | — | — | — | — | — | — | ||||||||||||||||||||||||||||
Issued in reinvestment of dividends and distributions: | ||||||||||||||||||||||||||||||||||||
Class A | 562 | 8,909 | 36 | 441 | 290 | 4,226 | 489 | 7,129 | ||||||||||||||||||||||||||||
Class C | — | — | — | — | 170 | 2,498 | 389 | 5,697 | ||||||||||||||||||||||||||||
Class R | — | — | — | — | — | — | — | — | ||||||||||||||||||||||||||||
Class P | — | — | — | — | 26 | 386 | 51 | 737 | ||||||||||||||||||||||||||||
Institutional Class | 85,235 | 1,364,615 | 24,662 | 305,562 | 81,378 | 1,185,956 | 183,791 | 2,665,777 | ||||||||||||||||||||||||||||
Class R6 | — | — | — | — | — | — | — | — | ||||||||||||||||||||||||||||
Administrative Class | — | — | — | — | — | — | — | — | ||||||||||||||||||||||||||||
Cost of shares redeemed: |
| |||||||||||||||||||||||||||||||||||
Class A | (1,857 | ) | (30,851 | ) | (29 | ) | (366 | ) | (342 | ) | (5,062 | ) | (8,178 | ) | (118,777 | ) | ||||||||||||||||||||
Class C | — | — | — | — | — | — | (1,698 | ) | (25,335 | ) | ||||||||||||||||||||||||||
Class R | — | — | — | — | — | — | — | — | ||||||||||||||||||||||||||||
Class P | — | — | — | — | — | — | — | — | ||||||||||||||||||||||||||||
Institutional Class | (341,522 | ) | (5,695,348 | ) | (1,196,133 | ) | (16,493,131 | ) | (467,661 | ) | (6,884,013 | ) | (1,041,227 | ) | (15,384,404 | ) | ||||||||||||||||||||
Class R6 | — | — | — | — | — | — | — | — | ||||||||||||||||||||||||||||
Net increase (decrease) resulting from Fund share transactions | 421,542 | $ | 6,686,915 | (514,108 | ) | $ | (6,927,896 | ) | (178,780 | ) | $ | (2,642,838 | ) | (464,036 | ) | $ | (6,883,371 | ) | ||||||||||||||||||
| * | Actual amount rounds to less than one share. |
| † | Actual amount rounds to less than $1. |
| 366 | March 31, 2018 | | Semiannual Report |
Table of Contents
| AllianzGI Emerging Markets Small-Cap | AllianzGI Europe Equity Dividend | AllianzGI Global Dynamic Allocation | ||||||||||||||||||||||||||||||||||||||||||||||||
| Six Months ended March 31, 2018 (unaudited) | Year ended September 30, 2017 | Six Months ended March 31, 2018 (unaudited) | Year ended September 30, 2017 | Six Months ended March 31, 2018 (unaudited) | Year ended September 30, 2017 | |||||||||||||||||||||||||||||||||||||||||||||
| Shares | Amount | Shares | Amount | Shares | Amount | Shares | Amount | Shares | Amount | Shares | Amount | |||||||||||||||||||||||||||||||||||||||
| 1,072 | $ | 20,134 | 17,014 | $ | 272,123 | 12,679 | $ | 207,358 | 90,062 | $ | 1,397,356 | 16,492 | $ | 342,361 | 82,230 | $ | 1,550,091 | |||||||||||||||||||||||||||||||||
| — | — | — | — | — | — | 2,524 | 35,599 | 11,709 | 236,914 | 21,177 | 406,739 | |||||||||||||||||||||||||||||||||||||||
| — | — | — | — | — | — | — | — | 499 | 10,174 | 2,093 | 39,383 | |||||||||||||||||||||||||||||||||||||||
| — | — | — | — | — | — | 7,868 | 129,886 | 77,232 | 1,589,164 | 637,412 | 11,545,607 | |||||||||||||||||||||||||||||||||||||||
| 58,366 | 1,062,220 | 66,508 | 1,038,246 | 17,372 | 280,065 | 221,432 | 3,560,680 | 143,395 | 2,951,847 | 250,537 | 4,749,438 | |||||||||||||||||||||||||||||||||||||||
| — | — | — | — | — | — | — | — | 544,518 | 11,095,446 | 12,476,865 | 230,121,490 | |||||||||||||||||||||||||||||||||||||||
| 873 | 15,331 | — | * | — | † | 1,661 | 26,604 | 1,557 | 24,388 | 5,385 | 109,048 | — | * | 2 | ||||||||||||||||||||||||||||||||||||
| — | — | — | — | 51 | 809 | 82 | 1,227 | 3,347 | 66,066 | — | * | 2 | ||||||||||||||||||||||||||||||||||||||
| — | — | — | — | — | — | — | — | 309 | 6,210 | — | * | — | † | |||||||||||||||||||||||||||||||||||||
| — | — | — | — | 205 | 3,278 | 115 | 1,844 | 31,925 | 642,005 | 3,236 | 58,830 | |||||||||||||||||||||||||||||||||||||||
| 43,678 | 758,249 | 25,796 | 364,501 | 10,904 | 174,800 | 15,021 | 222,697 | 80,510 | 1,630,335 | 1,167 | 21,336 | |||||||||||||||||||||||||||||||||||||||
| — | — | — | — | — | — | — | — | 602,641 | 12,155,278 | 48,683 | 887,497 | |||||||||||||||||||||||||||||||||||||||
| — | — | — | — | — | — | — | — | 54 | 1,099 | — | * | — | † | |||||||||||||||||||||||||||||||||||||
| (3,030 | ) | (55,503 | ) | (10,327 | ) | (156,324 | ) | (57,263 | ) | (928,331 | ) | (4,236 | ) | (64,704 | ) | (31,070 | ) | (629,342 | ) | (247,960 | ) | (4,695,890 | ) | |||||||||||||||||||||||||||
| — | — | — | — | (12 | ) | (190 | ) | (19 | ) | (281 | ) | (10,432 | ) | (203,547 | ) | (12,099 | ) | (223,903 | ) | |||||||||||||||||||||||||||||||
| — | — | — | — | — | — | — | — | (11 | ) | (223 | ) | (4,069 | ) | (79,817 | ) | |||||||||||||||||||||||||||||||||||
| — | — | — | — | (126 | ) | (2,003 | ) | (1,546 | ) | (25,003 | ) | (44,318 | ) | (901,002 | ) | (29,299 | ) | (584,729 | ) | |||||||||||||||||||||||||||||||
| (120,987 | ) | (2,196,586 | ) | (342,154 | ) | (5,677,852 | ) | (89,014 | ) | (1,465,083 | ) | (143,068 | ) | (2,195,354 | ) | (168,620 | ) | (3,455,392 | ) | (763,320 | ) | (14,560,400 | ) | |||||||||||||||||||||||||||
| — | — | — | — | — | — | — | — | (771,382 | ) | (15,749,381 | ) | (1,752,455 | ) | (32,951,122 | ) | |||||||||||||||||||||||||||||||||||
| (20,028 | ) | $ | (396,155 | ) | (243,163 | ) | $ | (4,159,306 | ) | (103,543 | ) | $ | (1,702,693 | ) | 189,792 | $ | 3,088,335 | 492,183 | $ | 9,897,060 | 10,714,198 | $ | 196,284,554 | ||||||||||||||||||||||||||
| Semiannual Report | | March 31, 2018 | 367 |
Table of Contents
Notes to Financial Statements (cont’d)
March 31, 2018 (Unaudited)
| AllianzGI Global Fundamental Strategy | AllianzGI Global High Yield | |||||||||||||||||||||||||||||||||||
| Six Months ended March 31, 2018 (unaudited) | Year ended September 30, 2017 | Six Months ended March 31, 2018 (unaudited) | Period from 5/3/2017** through September 30, 2017 | |||||||||||||||||||||||||||||||||
| Shares | Amount | Shares | Amount | Shares | Amount | Shares | Amount | |||||||||||||||||||||||||||||
Shares sold: | ||||||||||||||||||||||||||||||||||||
Class A | 69 | $ | 1,050 | 937 | $ | 14,114 | — | $ | — | — | $ | — | ||||||||||||||||||||||||
Class C | — | — | 222 | 3,489 | — | — | — | — | ||||||||||||||||||||||||||||
Class R | — | — | — | — | — | — | — | — | ||||||||||||||||||||||||||||
Class P | — | — | — | — | — | — | — | — | ||||||||||||||||||||||||||||
Institutional Class | 27,258 | 417,924 | 11,284 | 170,742 | 43,161 | 649,537 | 67,178 | 1,029,723 | ||||||||||||||||||||||||||||
Administrative Class | — | — | — | — | — | — | — | — | ||||||||||||||||||||||||||||
Issued in reinvestment of dividends and distributions: | ||||||||||||||||||||||||||||||||||||
Class A | 154 | 2,374 | 338 | 4,861 | — | — | — | — | ||||||||||||||||||||||||||||
Class C | 27 | 416 | 31 | 449 | — | — | — | — | ||||||||||||||||||||||||||||
Class R | — | — | — | — | — | — | — | — | ||||||||||||||||||||||||||||
Class P | 22 | 344 | 29 | 417 | 13 | 203 | 3 | 51 | ||||||||||||||||||||||||||||
Institutional Class | 32,137 | 499,403 | 39,329 | 571,976 | 29,459 | 445,413 | 7,704 | 117,951 | ||||||||||||||||||||||||||||
Administrative Class | — | — | — | — | — | — | — | — | ||||||||||||||||||||||||||||
Cost of shares redeemed: | ||||||||||||||||||||||||||||||||||||
Class A | (810 | ) | (12,179 | ) | (4,706 | ) | (67,989 | ) | — | — | — | — | ||||||||||||||||||||||||
Class C | (5 | ) | (79 | ) | — | — | — | — | — | — | ||||||||||||||||||||||||||
Class R | — | — | — | — | — | — | — | — | ||||||||||||||||||||||||||||
Class P | — | — | — | — | — | — | — | — | ||||||||||||||||||||||||||||
Institutional Class | (7,167 | ) | (112,428 | ) | (16,873 | ) | (251,266 | ) | (2,443 | ) | (37,323 | ) | — | — | ||||||||||||||||||||||
Administrative Class | — | — | — | — | — | — | — | — | ||||||||||||||||||||||||||||
Net increase (decrease) resulting from Fund share transactions | 51,685 | $ | 796,825 | 30,591 | $ | 446,793 | 70,190 | $ | 1,057,830 | 74,885 | $ | 1,147,725 | ||||||||||||||||||||||||
| ** | Commencement of operations. |
| 368 | March 31, 2018 | | Semiannual Report |
Table of Contents
| AllianzGI Global Sustainability | AllianzGI Global Water | AllianzGI High Yield Bond | ||||||||||||||||||||||||||||||||||||||||||||||||
| Six Months ended March 31, 2018 (unaudited) | Year ended September 30, 2017 | Six Months ended March 31, 2018 (unaudited) | Year ended September 30, 2017 | Six Months ended March 31, 2018 (unaudited) | Year ended September 30, 2017 | |||||||||||||||||||||||||||||||||||||||||||||
| Shares | Amount | Shares | Amount | Shares | Amount | Shares | Amount | Shares | Amount | Shares | Amount | |||||||||||||||||||||||||||||||||||||||
| 4,306 | $ | 79,422 | 15,373 | $ | 260,568 | 1,568,478 | $ | 24,560,860 | 4,227,699 | $ | 59,392,168 | 574,976 | $ | 5,264,430 | 2,250,464 | $ | 20,779,212 | |||||||||||||||||||||||||||||||||
| — | — | — | — | 548,844 | 8,216,981 | 936,509 | 12,595,838 | 61,958 | 571,088 | 150,153 | 1,383,378 | |||||||||||||||||||||||||||||||||||||||
| — | — | — | — | — | — | — | — | 42,117 | 372,815 | 85,090 | 753,460 | |||||||||||||||||||||||||||||||||||||||
| — | — | 2,876 | 49,080 | 2,436,899 | 38,264,617 | 9,292,311 | 128,906,188 | 356,070 | 3,156,730 | 1,002,277 | 8,939,017 | |||||||||||||||||||||||||||||||||||||||
| 72,819 | 1,355,440 | 394,593 | 6,463,987 | 1,855,188 | 28,504,647 | 5,545,111 | 76,930,900 | 3,074,354 | 27,328,361 | 15,548,838 | 137,965,322 | |||||||||||||||||||||||||||||||||||||||
| — | — | — | — | — | — | — | — | 9,808 | 85,784 | 61,696 | 539,421 | |||||||||||||||||||||||||||||||||||||||
| 877 | 15,922 | 85 | 1,290 | 273,441 | 4,252,010 | 142,511 | 1,875,321 | 116,218 | 1,063,515 | 313,793 | 2,891,255 | |||||||||||||||||||||||||||||||||||||||
| — | — | — | — | 117,917 | 1,754,605 | 30,215 | 381,618 | 24,027 | 219,263 | 59,067 | 543,497 | |||||||||||||||||||||||||||||||||||||||
| — | — | — | — | — | — | — | — | 1,467 | 12,874 | 3,630 | 32,166 | |||||||||||||||||||||||||||||||||||||||
| 121 | 2,223 | 7 | 106 | 297,452 | 4,628,355 | 66,753 | 881,850 | 87,655 | 771,373 | 321,038 | 2,846,471 | |||||||||||||||||||||||||||||||||||||||
| 50,576 | 928,569 | 18,115 | 278,227 | 330,391 | 5,051,676 | 78,608 | 1,022,047 | 438,658 | 3,864,672 | 1,327,427 | 11,798,372 | |||||||||||||||||||||||||||||||||||||||
| — | — | — | — | — | — | — | — | 3,118 | 27,280 | 11,500 | 100,699 | |||||||||||||||||||||||||||||||||||||||
| (1,015 | ) | (18,367 | ) | (1,021 | ) | (16,215 | ) | (1,554,412 | ) | (24,357,465 | ) | (8,498,821 | ) | (116,648,884 | ) | (2,853,986 | ) | (26,259,393 | ) | (2,629,012 | ) | (24,298,880 | ) | |||||||||||||||||||||||||||
| — | — | — | — | (543,835 | ) | (8,109,792 | ) | (1,566,970 | ) | (21,242,249 | ) | (241,314 | ) | (2,212,919 | ) | (572,619 | ) | (5,267,230 | ) | |||||||||||||||||||||||||||||||
| — | — | — | — | — | — | — | — | (64,792 | ) | (573,791 | ) | (120,559 | ) | (1,072,503 | ) | |||||||||||||||||||||||||||||||||||
| (175 | ) | (3,257 | ) | — | — | (1,139,022 | ) | (17,841,791 | ) | (4,462,141 | ) | (62,679,947 | ) | (2,038,555 | ) | (18,121,428 | ) | (3,828,084 | ) | (34,059,826 | ) | |||||||||||||||||||||||||||||
| (35,364 | ) | (658,683 | ) | (239,136 | ) | (4,114,345 | ) | (1,084,730 | ) | (16,701,992 | ) | (1,114,186 | ) | (15,534,711 | ) | (4,355,912 | ) | (38,555,642 | ) | (25,343,034 | ) | (225,586,100 | ) | |||||||||||||||||||||||||||
| — | — | — | — | — | — | — | — | (174,285 | ) | (1,490,283 | ) | (144,305 | ) | (1,266,457 | ) | |||||||||||||||||||||||||||||||||||
| 92,145 | $ | 1,701,269 | 190,892 | $ | 2,922,698 | 3,106,611 | $ | 48,222,711 | 4,677,599 | $ | 65,880,139 | (4,938,418 | ) | $ | (44,475,271 | ) | (11,502,640 | ) | $ | (102,978,726 | ) | |||||||||||||||||||||||||||||
| Semiannual Report | | March 31, 2018 | 369 |
Table of Contents
Notes to Financial Statements (cont’d)
March 31, 2018 (Unaudited)
| AllianzGI International Growth | AllianzGI International Small-Cap | |||||||||||||||||||||||||||||||||||
| Six Months ended March 31, 2018 (unaudited) | Year ended September 30, 2017 | Six Months ended March 31, 2018 (unaudited) | Year ended September 30, 2017 | |||||||||||||||||||||||||||||||||
| Shares | Amount | Shares | Amount | Shares | Amount | Shares | Amount | |||||||||||||||||||||||||||||
Shares sold: | ||||||||||||||||||||||||||||||||||||
Class A | 11,894 | $ | 227,763 | 599 | $ | 10,884 | 78,661 | $ | 3,513,637 | 31,376 | $ | 1,116,483 | ||||||||||||||||||||||||
Class C | — | — | — | — | 16,773 | 729,785 | 11,600 | 411,156 | ||||||||||||||||||||||||||||
Class R | — | — | — | — | 2,930 | 128,697 | 3,789 | 142,713 | ||||||||||||||||||||||||||||
Class P | — | — | — | — | 160,131 | 6,980,961 | 465,348 | 16,224,172 | ||||||||||||||||||||||||||||
Institutional Class | 76,307 | 1,527,515 | 22,007 | 370,379 | 215,657 | 10,062,488 | 1,175,684 | 42,123,503 | ||||||||||||||||||||||||||||
Class R6 | — | — | — | — | 507,106 | 22,801,358 | 74,515 | 2,735,661 | ||||||||||||||||||||||||||||
Issued in reinvestment of dividends and distributions: | ||||||||||||||||||||||||||||||||||||
Class A | 1,355 | 24,199 | — | * | 1 | 2,914 | 125,294 | 2,339 | 73,368 | |||||||||||||||||||||||||||
Class C | — | — | — | — | 1,313 | 54,903 | 545 | 16,705 | ||||||||||||||||||||||||||||
Class R | — | — | — | — | 189 | 7,917 | 44 | 1,374 | ||||||||||||||||||||||||||||
Class P | — | — | — | — | 36,896 | 1,583,229 | 12,138 | 381,492 | ||||||||||||||||||||||||||||
Institutional Class | 126,340 | 2,304,443 | 1,973 | 29,197 | 41,071 | 1,826,435 | 6,928 | 225,723 | ||||||||||||||||||||||||||||
Class R6 | — | — | — | — | 21,533 | 957,133 | 4,526 | 147,555 | ||||||||||||||||||||||||||||
Cost of shares redeemed: | ||||||||||||||||||||||||||||||||||||
Class A | (4,885 | ) | (88,150 | ) | (29 | ) | (532 | ) | (15,637 | ) | (688,756 | ) | (277,593 | ) | (9,438,563 | ) | ||||||||||||||||||||
Class C | — | — | — | — | (7,592 | ) | (326,489 | ) | (37,121 | ) | (1,208,650 | ) | ||||||||||||||||||||||||
Class R | — | — | — | — | (1,370 | ) | (60,642 | ) | (1,128 | ) | (37,215 | ) | ||||||||||||||||||||||||
Class P | — | — | — | — | (81,642 | ) | (3,578,295 | ) | (285,444 | ) | (9,839,257 | ) | ||||||||||||||||||||||||
Institutional Class | (64,078 | ) | (1,306,633 | ) | (811,506 | ) | (15,688,204 | ) | (295,412 | ) | (13,301,180 | ) | (405,869 | ) | (14,772,977 | ) | ||||||||||||||||||||
Class R6 | — | — | — | — | (83,539 | ) | (3,834,015 | ) | (96,287 | ) | (3,451,995 | ) | ||||||||||||||||||||||||
Net increase (decrease) resulting from Fund share transactions | 146,933 | $ | 2,689,137 | (786,956 | ) | $ | (15,278,275 | ) | 599,982 | $ | 26,982,460 | 685,390 | $ | 24,851,248 | ||||||||||||||||||||||
| * | Actual amount rounds to less than one share. |
| 370 | March 31, 2018 | | Semiannual Report |
Table of Contents
| AllianzGI Micro Cap | AllianzGI NFJ Emerging Markets Value | AllianzGI NFJ International Small-Cap Value | ||||||||||||||||||||||||||||||||||||||||||||||||
| Six Months ended March 31, 2018 (unaudited) | Year ended September 30, 2017 | Six Months ended March 31, 2018 (unaudited) | Year ended September 30, 2017 | Six Months ended March 31, 2018 (unaudited) | Year ended September 30, 2017 | |||||||||||||||||||||||||||||||||||||||||||||
| Shares | Amount | Shares | Amount | Shares | Amount | Shares | Amount | Shares | Amount | Shares | Amount | |||||||||||||||||||||||||||||||||||||||
| 5,487 | $ | 83,959 | 34,984 | $ | 510,734 | 3,108,318 | $ | 57,713,905 | 1,888,401 | $ | 28,562,394 | 10,830 | $ | 227,373 | 7,174 | $ | 136,780 | |||||||||||||||||||||||||||||||||
| — | — | — | — | 34,447 | 652,776 | 27,622 | 427,818 | 15 | 300 | 322 | 5,400 | |||||||||||||||||||||||||||||||||||||||
| — | — | — | — | — | — | — | — | — | — | — | — | |||||||||||||||||||||||||||||||||||||||
| 49,190 | 759,057 | 66,792 | 948,739 | 488,751 | 9,108,004 | 1,308,844 | 18,773,451 | 261 | 5,248 | 4,670 | 78,549 | |||||||||||||||||||||||||||||||||||||||
| 121,050 | 1,869,191 | 364,033 | 5,245,516 | 1,372,348 | 26,038,001 | 1,882,527 | 32,101,012 | 4,655 | 97,975 | 46,804 | 888,387 | |||||||||||||||||||||||||||||||||||||||
| — | — | — | — | — | — | — | — | 14,377 | 289,300 | 11,524 | 195,478 | |||||||||||||||||||||||||||||||||||||||
| 9,998 | 150,676 | 21,951 | 301,824 | 21,449 | 385,349 | 8,888 | 140,742 | 1,288 | 26,655 | 3,144 | 51,774 | |||||||||||||||||||||||||||||||||||||||
| — | — | — | — | 129 | 2,328 | 180 | 3,055 | — | * | 1 | 2,997 | 47,236 | ||||||||||||||||||||||||||||||||||||||
| — | — | — | — | — | — | — | — | — | — | — | — | |||||||||||||||||||||||||||||||||||||||
| 5,224 | 79,191 | 8,443 | 116,680 | 9,051 | 161,896 | 27,031 | 401,473 | 56 | 1,130 | 297 | 4,723 | |||||||||||||||||||||||||||||||||||||||
| 99,908 | 1,522,599 | 210,089 | 2,918,135 | 29,779 | 542,411 | 21,879 | 373,904 | 2,362 | 48,804 | 5,231 | 86,365 | |||||||||||||||||||||||||||||||||||||||
| — | — | — | — | — | — | — | — | 808 | 16,040 | 7,827 | 123,590 | |||||||||||||||||||||||||||||||||||||||
| (33,007 | ) | (510,235 | ) | (95,730 | ) | (1,363,748 | ) | (379,064 | ) | (7,110,930 | ) | (1,407,408 | ) | (20,527,829 | ) | (12,134 | ) | (254,853 | ) | (351,203 | ) | (6,208,049 | ) | |||||||||||||||||||||||||||
| — | — | — | — | (3,050 | ) | (56,712 | ) | (5,274 | ) | (86,437 | ) | (10,100 | ) | (202,604 | ) | (30,377 | ) | (529,550 | ) | |||||||||||||||||||||||||||||||
| — | — | — | — | — | — | — | — | — | — | — | — | |||||||||||||||||||||||||||||||||||||||
| (53,645 | ) | (825,439 | ) | (64,013 | ) | (928,658 | ) | (363,675 | ) | (6,697,815 | ) | (183,841 | ) | (2,931,998 | ) | (915 | ) | (18,547 | ) | (5,663 | ) | (100,466 | ) | |||||||||||||||||||||||||||
| (547,682 | ) | (8,580,221 | ) | (897,902 | ) | (13,136,117 | ) | (329,591 | ) | (6,211,069 | ) | (375,482 | ) | (5,491,585 | ) | (10,550 | ) | (222,905 | ) | (60,439 | ) | (1,093,151 | ) | |||||||||||||||||||||||||||
| — | — | — | — | — | — | — | — | (25,671 | ) | (525,837 | ) | (72,389 | ) | (1,278,290 | ) | |||||||||||||||||||||||||||||||||||
| (343,477 | ) | $ | (5,451,222 | ) | (351,353 | ) | $ | (5,386,895 | ) | 3,988,892 | $ | 74,528,144 | 3,193,367 | $ | 51,746,000 | (24,718 | ) | $ | (511,920 | ) | (430,081 | ) | $ | (7,591,224 | ) | |||||||||||||||||||||||||
| Semiannual Report | | March 31, 2018 | 371 |
Table of Contents
Notes to Financial Statements (cont’d)
March 31, 2018 (Unaudited)
| AllianzGI PerformanceFee Managed Futures Strategy† | AllianzGI PerformanceFee Structured US Equity | |||||||||||||||||||
| Period from December 18, 2017** through March 31, 2018 (unaudited) | Period from December 18, 2017** through March 31, 2018 (unaudited) | |||||||||||||||||||
| Shares | Amount | Shares | Amount | |||||||||||||||||
Shares sold: | ||||||||||||||||||||
Class A | — | $ | — | — | $ | — | ||||||||||||||
Class C | — | — | — | — | ||||||||||||||||
Class P | — | — | — | — | ||||||||||||||||
Institutional Class | 25,087 | 244,478 | 5,199 | 52,270 | ||||||||||||||||
Class R6 | 1,551,781 | 15,503,826 | 27,063 | 273,062 | ||||||||||||||||
Issued in reinvestment of dividends and distributions: | ||||||||||||||||||||
Class A | — | — | — | — | ||||||||||||||||
Class C | — | — | — | — | ||||||||||||||||
Class P | — | — | — | — | ||||||||||||||||
Institutional Class | — | — | — | — | ||||||||||||||||
Class R6 | — | — | — | — | ||||||||||||||||
Cost of shares redeemed: | ||||||||||||||||||||
Class A | — | — | — | — | ||||||||||||||||
Class C | — | — | — | — | ||||||||||||||||
Class P | — | — | — | — | ||||||||||||||||
Institutional Class | — | — | — | — | ||||||||||||||||
Class R6 | — | — | — | — | ||||||||||||||||
Net increase (decrease) resulting from Fund share transactions | 1,576,868 | $ | 15,748,304 | 32,262 | $ | 325,332 | ||||||||||||||
| † | The Fund’s financial statements are consolidated to include the accounts of AllianzGI PerformanceFee Managed Futures Strategy Offshore Fund, Ltd., which is a wholly-owned subsidiary of the Fund. See Note 14. |
| ** | Commencement of operations. |
| # | For the period February 1, 2017 (commencement of share class) through September 30, 2017. “Shares sold” include shares sold to AFI. |
| 372 | March 31, 2018 | | Semiannual Report |
Table of Contents
| AllianzGI PerformanceFee Structured US Fixed Income | AllianzGI Real Estate Debt | AllianzGI Short Duration High Income | ||||||||||||||||||||||||||||||||
| Period from December 18, 2017** through March 31, 2018 (unaudited) | Period from December 27, 2017** through March 31, 2018 (unaudited) | Six Months ended March 31, 2018 (unaudited) | Year ended September 30, 2017 | |||||||||||||||||||||||||||||||
| Shares | Amount | Shares | Amount | Shares | Amount | Shares | Amount | |||||||||||||||||||||||||||
| — | $ | — | — | $ | — | 2,022,209 | $ | 30,482,288 | 7,663,673 | $ | 116,660,118 | |||||||||||||||||||||||
| — | — | — | — | 1,069,580 | 16,102,669 | 3,717,496 | 56,510,414 | |||||||||||||||||||||||||||
| — | — | — | — | 6,459,126 | 97,089,017 | 36,888,448 | 559,642,113 | |||||||||||||||||||||||||||
| — | — | 3,197 | 47,925 | 6,530,958 | 98,109,786 | 27,724,398 | 420,876,270 | |||||||||||||||||||||||||||
| 5,083 | 49,559 | — | — | 2,179,696 | 32,728,470 | 6,115,096 | # | 92,406,206 | # | |||||||||||||||||||||||||
| — | — | — | — | 302,561 | 4,546,697 | 637,033 | 9,673,820 | |||||||||||||||||||||||||||
| — | — | — | — | 185,749 | 2,786,445 | 375,917 | 5,698,961 | |||||||||||||||||||||||||||
| — | — | 3 | 41 | 572,093 | 8,577,677 | 2,090,855 | 31,643,057 | |||||||||||||||||||||||||||
| — | — | 2,937 | 43,961 | 776,730 | 11,644,058 | 1,421,324 | 21,526,416 | |||||||||||||||||||||||||||
| — | — | — | — | 92,736 | 1,390,486 | 138,225 | # | 2,094,252 | # | |||||||||||||||||||||||||
| — | — | — | — | (3,437,881 | ) | (51,730,785 | ) | (8,708,544 | ) | (132,690,291 | ) | |||||||||||||||||||||||
| — | — | — | — | (1,755,865 | ) | (26,396,930 | ) | (2,975,169 | ) | (45,203,613 | ) | |||||||||||||||||||||||
| — | — | — | — | (27,457,343 | ) | (414,386,998 | ) | (29,048,159 | ) | (441,308,927 | ) | |||||||||||||||||||||||
| — | — | — | — | (14,050,466 | ) | (211,013,921 | ) | (21,096,420 | ) | (319,802,070 | ) | |||||||||||||||||||||||
| — | — | — | — | (3,329,191 | ) | (50,122,410 | ) | (1,590,045 | )# | (24,146,772 | )# | |||||||||||||||||||||||
| 5,083 | $ | 49,559 | 6,137 | $ | 91,927 | (29,839,308 | ) | $ | (450,193,451 | ) | 23,354,128 | $ | 353,579,954 | |||||||||||||||||||||
| Semiannual Report | | March 31, 2018 | 373 |
Table of Contents
Notes to Financial Statements (cont’d)
March 31, 2018 (Unaudited)
| AllianzGI Structured Return | AllianzGI U.S. Equity Hedged | |||||||||||||||||||||||||||||||||||
| Six Months ended March 31, 2018 (unaudited) | Year ended September 30, 2017 | Six Months ended March 31, 2018 (unaudited) | Year ended September 30, 2017 | |||||||||||||||||||||||||||||||||
| Shares | Amount | Shares | Amount | Shares | Amount | Shares | Amount | |||||||||||||||||||||||||||||
Shares sold: | ||||||||||||||||||||||||||||||||||||
Class A | 2,583,330 | $ | 41,069,622 | 5,646,557 | $ | 89,901,498 | 3,600 | $ | 65,518 | 2,816 | $ | 46,637 | ||||||||||||||||||||||||
Class C | 258,803 | 4,010,257 | 449,604 | 6,938,013 | — | — | 1,414 | 22,050 | ||||||||||||||||||||||||||||
Class P | 3,303,088 | 52,663,729 | 8,847,535 | 140,373,611 | — | — | 300 | 5,000 | ||||||||||||||||||||||||||||
Institutional Class | 6,960,883 | 111,487,846 | 7,856,826 | 126,112,229 | 14,630 | 274,373 | 18,779 | 317,106 | ||||||||||||||||||||||||||||
Class R6 | 281,572 | 4,509,039 | 2,478,327 | # | 40,065,690 | # | — | — | — | — | ||||||||||||||||||||||||||
Issued in reinvestment of dividends and distributions: | ||||||||||||||||||||||||||||||||||||
Class A | 344,893 | 5,452,751 | 183,601 | 2,875,299 | 484 | 8,868 | 519 | 8,563 | ||||||||||||||||||||||||||||
Class C | 37,382 | 573,444 | 20,935 | 317,799 | 202 | 3,555 | 157 | 2,502 | ||||||||||||||||||||||||||||
Class P | 390,379 | 6,156,276 | 58,661 | 919,019 | 23 | 409 | 26 | 428 | ||||||||||||||||||||||||||||
Institutional Class | 596,378 | 9,500,307 | 181,425 | 2,861,480 | 1,044 | 19,371 | 2,825 | 46,862 | ||||||||||||||||||||||||||||
Class R6 | 86,252 | 1,367,964 | 80,499 | # | 1,266,928 | # | — | — | — | — | ||||||||||||||||||||||||||
Cost of shares redeemed: | ||||||||||||||||||||||||||||||||||||
Class A | (2,919,047 | ) | (46,116,382 | ) | (3,558,616 | ) | (56,347,413 | ) | (7,271 | ) | (133,011 | ) | (9,170 | ) | (154,485 | ) | ||||||||||||||||||||
Class C | (148,241 | ) | (2,284,704 | ) | (237,960 | ) | (3,669,265 | ) | (955 | ) | (16,726 | ) | (2,702 | ) | (42,843 | ) | ||||||||||||||||||||
Class P | (2,581,101 | ) | (40,620,927 | ) | (1,837,863 | ) | (29,260,855 | ) | (307 | ) | (5,607 | ) | (7 | ) | (120 | ) | ||||||||||||||||||||
Institutional Class | (2,348,251 | ) | (37,382,370 | ) | (4,712,189 | ) | (75,867,393 | ) | (23,297 | ) | (432,969 | ) | (218,551 | ) | (3,714,881 | ) | ||||||||||||||||||||
Class R6 | (73,459 | ) | (1,161,033 | ) | (472,671 | )# | (7,638,126 | )# | — | — | — | — | ||||||||||||||||||||||||
Net increase (decrease) resulting from Fund share transactions | 6,772,861 | $ | 109,225,819 | 14,984,671 | $ | 238,848,514 | (11,847 | ) | $ | (216,219 | ) | (203,594 | ) | $ | (3,463,181 | ) | ||||||||||||||||||||
| # | For the period December 2, 2016 (commencement of share class) through September 30, 2017. “Shares sold” include shares sold to AFI. |
| 374 | March 31, 2018 | | Semiannual Report |
Table of Contents
| AllianzGI Ultra Micro Cap | ||||||||||||||||||
| Six Months ended March 31, 2018 (unaudited) | Year ended September 30, 2017 | |||||||||||||||||
| Shares | Amount | Shares | Amount | |||||||||||||||
| 29,802 | $ | 578,401 | 43,791 | $ | 946,724 | |||||||||||||
| — | — | — | — | |||||||||||||||
| 35,417 | 650,900 | 111,746 | 2,392,918 | |||||||||||||||
| 127,184 | 2,772,032 | 163,895 | 3,605,950 | |||||||||||||||
| — | — | — | — | |||||||||||||||
| 146,421 | 2,623,868 | 63,450 | 1,323,561 | |||||||||||||||
| — | — | — | — | |||||||||||||||
| 50,434 | 922,434 | 21,175 | 447,225 | |||||||||||||||
| 266,881 | 4,891,933 | 84,707 | 1,792,405 | |||||||||||||||
| — | — | — | — | |||||||||||||||
| (151,524 | ) | (2,939,376 | ) | (470,286 | ) | (10,130,252 | ) | |||||||||||
| — | — | — | — | |||||||||||||||
| (47,988 | ) | (993,857 | ) | (188,518 | ) | (4,182,585 | ) | |||||||||||
| (251,356 | ) | (5,060,877 | ) | (429,905 | ) | (9,395,661 | ) | |||||||||||
| — | — | — | — | |||||||||||||||
| 205,271 | $ | 3,445,458 | (599,945 | ) | $ | (13,199,715 | ) | |||||||||||
| Semiannual Report | | March 31, 2018 | 375 |
Table of Contents
Notes to Financial Statements (cont’d)
March 31, 2018 (Unaudited)
| 10. | INVESTMENTS IN SECURITIES |
For the period or six months ended March 31, 2018, purchases and sales of investments, other than short-term securities and U.S. government obligations were:
| Purchases | Sales | |||||||
AllianzGI Retirement 2020 | $ | 6,086,423 | $ | 9,746,381 | ||||
AllianzGI Retirement 2025 | 7,926,690 | 7,361,678 | ||||||
AllianzGI Retirement 2030 | 8,997,448 | 4,900,145 | ||||||
AllianzGI Retirement 2035 | 8,231,418 | 3,142,393 | ||||||
AllianzGI Retirement 2040 | 7,106,640 | 3,577,249 | ||||||
AllianzGI Retirement 2045 | 5,362,642 | 1,565,137 | ||||||
AllianzGI Retirement 2050 | 6,149,088 | 1,683,768 | ||||||
AllianzGI Retirement 2055 | 5,008,258 | 916,179 | ||||||
AllianzGI Multi Asset Income | 38,191,027 | 41,244,284 | ||||||
AllianzGI Global Allocation | 56,740,472 | 27,864,026 | ||||||
AllianzGI Best Styles Emerging Markets Equity | 640,059 | 2,056,391 | ||||||
AllianzGI Best Styles Global Equity | 308,040,749 | 303,779,520 | ||||||
AllianzGI Best Styles International Equity | 7,020,773 | 7,522,185 | ||||||
AllianzGI Best Styles U.S. Equity | 36,691,228 | 31,592,362 | ||||||
AllianzGI Convertible | 294,920,879 | 378,673,219 | ||||||
AllianzGI Emerging Markets Consumer | 30,687,208 | 27,188,766 | ||||||
AllianzGI Emerging Markets Debt | 16,405,137 | 20,448,361 | ||||||
AllianzGI Emerging Markets Small-Cap | 7,946,064 | 9,097,867 | ||||||
AllianzGI Europe Equity Dividend | 2,605,496 | 4,012,309 | ||||||
AllianzGI Global Dynamic Allocation | 130,865,118 | 105,522,004 | ||||||
AllianzGI Global Fundamental Strategy | 7,761,875 | 7,749,761 | ||||||
AllianzGI Global High Yield | 11,940,392 | 11,609,696 | ||||||
AllianzGI Global Sustainability | 1,577,275 | 1,558,310 | ||||||
AllianzGI Global Water | 189,797,142 | 142,050,460 | ||||||
AllianzGI High Yield Bond | 49,762,000 | 92,466,064 | ||||||
AllianzGI International Growth | 2,059,874 | 1,931,409 | ||||||
AllianzGI International Small-Cap | 62,470,985 | 38,600,675 | ||||||
AllianzGI Micro Cap | 6,359,576 | 13,404,198 | ||||||
AllianzGI NFJ Emerging Markets Value | 130,217,320 | 61,310,740 | ||||||
AllianzGI NFJ International Small-Cap Value | 938,637 | 1,388,013 | ||||||
AllianzGI PerformanceFee Managed Futures Strategy | 1,775,602 | 1,200,373 | ||||||
AllianzGI PerformanceFee Structured US Equity | 25,402,607 | 242,856 | ||||||
AllianzGI PerformanceFee Structured US Fixed Income | 25,026,680 | 4,801 | ||||||
AllianzGI Real Estate Debt | 9,894,784 | 673,979 | ||||||
AllianzGI Short Duration High Income | 353,789,458 | 774,378,992 | ||||||
AllianzGI Structured Return | 1,707,623,136 | 1,657,364,832 | ||||||
AllianzGI U.S. Equity Hedged | 74,787 | 441,899 | ||||||
AllianzGI Ultra Micro Cap | 6,956,428 | 12,263,318 | ||||||
Purchases and sales in U.S. government obligations were:
| Purchases | Sales | |||||||
AllianzGI Global Dynamic Allocation | $ | 123,239,016 | $ | 132,177,964 | ||||
AllianzGI Global Fundamental Strategy | — | 619,999 | ||||||
| 376 | March 31, 2018 | | Semiannual Report |
Table of Contents
| 11. | INCOME TAX INFORMATION |
At March 31, 2018, the aggregate cost basis and the net unrealized appreciation (depreciation) of investments in securities and other financial instruments for federal income tax purposes were:
| Federal Tax Cost Basis(1) | Unrealized Appreciation | Unrealized Depreciation | Net Unrealized Appreciation (Depreciation) | |||||||||||||
AllianzGI Retirement 2020 | $ | 46,480,032 | $ | 2,739,014 | $ | 430,197 | $ | 2,308,817 | ||||||||
AllianzGI Retirement 2025 | 59,260,438 | 4,097,722 | 508,493 | 3,589,229 | ||||||||||||
AllianzGI Retirement 2030 | 67,795,881 | 5,388,422 | 285,146 | 5,103,276 | ||||||||||||
AllianzGI Retirement 2035 | 54,731,269 | 4,469,450 | 271,952 | 4,197,498 | ||||||||||||
AllianzGI Retirement 2040 | 48,700,781 | 4,176,045 | 241,506 | 3,934,539 | ||||||||||||
AllianzGI Retirement 2045 | 31,422,494 | 2,594,932 | 163,799 | 2,431,133 | ||||||||||||
AllianzGI Retirement 2050 | 31,197,968 | 2,358,709 | 168,526 | 2,190,183 | ||||||||||||
AllianzGI Retirement 2055 | 16,390,091 | 783,952 | 92,055 | 691,897 | ||||||||||||
AllianzGI Multi Asset Income | 45,228,959 | 83,607 | 1,299,038 | (1,215,431 | ) | |||||||||||
AllianzGI Global Allocation | 332,886,099 | 26,840,599 | 5,783,781 | 21,056,818 | ||||||||||||
AllianzGI Best Styles Emerging Markets Equity | 4,612,944 | 1,711,647 | 158,167 | 1,553,480 | ||||||||||||
AllianzGI Best Styles Global Equity | 546,237,057 | 84,420,417 | 11,863,503 | 72,556,914 | ||||||||||||
AllianzGI Best Styles International Equity | 23,221,590 | 3,859,280 | 670,826 | 3,188,454 | ||||||||||||
AllianzGI Best Styles U.S. Equity | 107,426,705 | 21,590,972 | 2,973,874 | 18,617,098 | ||||||||||||
AllianzGI Convertible | 418,919,531 | 61,965,499 | 3,794,818 | 58,170,681 | ||||||||||||
AllianzGI Emerging Markets Consumer | 42,299,885 | 8,884,788 | 343,987 | 8,540,801 | ||||||||||||
AllianzGI Emerging Markets Debt | 32,718,026 | 478,179 | 799,449 | (321,270 | ) | |||||||||||
AllianzGI Emerging Markets Small-Cap | 9,549,372 | 1,643,456 | 193,955 | 1,449,501 | ||||||||||||
AllianzGI Europe Equity Dividend | 7,909,363 | 745,790 | 319,339 | 426,451 | ||||||||||||
AllianzGI Global Dynamic Allocation | 279,421,128 | 22,932,464 | 5,974,738 | 16,957,726 | ||||||||||||
AllianzGI Global Fundamental Strategy | 15,964,635 | 1,224,361 | 799,581 | 424,780 | ||||||||||||
AllianzGI Global High Yield | 21,814,486 | 482,285 | 358,350 | 123,935 | ||||||||||||
AllianzGI Global Sustainability | 24,014,546 | 5,602,794 | 560,643 | 5,042,151 | ||||||||||||
AllianzGI Global Water | 554,508,651 | 120,802,351 | 19,720,681 | 101,081,670 | ||||||||||||
AllianzGI High Yield Bond | 216,522,181 | 4,400,373 | 12,089,209 | (7,688,836 | ) | |||||||||||
AllianzGI International Growth | 15,372,189 | 4,879,628 | 163,020 | 4,716,608 | ||||||||||||
AllianzGI International Small-Cap | 144,687,749 | 44,226,073 | 1,674,254 | 42,551,819 | ||||||||||||
AllianzGI Micro Cap | 18,604,452 | 7,926,947 | 1,101,055 | 6,825,892 | ||||||||||||
AllianzGI NFJ Emerging Markets Value | 135,118,018 | 11,814,716 | 3,285,103 | 8,529,613 | ||||||||||||
AllianzGI NFJ International Small-Cap Value | 3,671,166 | 678,765 | 106,946 | 571,819 | ||||||||||||
AllianzGI PerformanceFee Managed Futures Strategy† | 13,171,718 | 219,240 | 291,801 | (72,561 | ) | |||||||||||
AllianzGI PerformanceFee Structured US Equity | 25,126,387 | 277,123 | 791,933 | (514,810 | ) | |||||||||||
AllianzGI PerformanceFee Structured US Fixed Income | 24,929,043 | 149,367 | 573,379 | (424,012 | ) | |||||||||||
AllianzGI Real Estate Debt | 9,874,112 | 70,752 | 25,924 | 44,828 | ||||||||||||
AllianzGI Short Duration High Income | 1,229,506,468 | 1,442,381 | 29,805,825 | (28,363,444 | ) | |||||||||||
AllianzGI Structured Return | 643,247,988 | 6,805,714 | 25,603,257 | (18,797,543 | ) | |||||||||||
AllianzGI U.S. Equity Hedged | 1,847,605 | 491,402 | 11,034 | 480,368 | ||||||||||||
AllianzGI Ultra Micro Cap | 22,920,821 | 11,082,044 | 1,286,406 | 9,795,638 | ||||||||||||
| † | The Fund’s financial statements are consolidated to include the accounts of AllianzGI PerformanceFee Managed Futures Strategy Offshore Fund Ltd., which is a wholly-owned subsidiary of the Fund. See Note 14. |
| (1) | Differences, if any, between book and tax cost basis are primarily attributable to wash sale loss deferrals and differing treatment of bond premium amortization. |
| 12. | BORROWINGS |
The Trust has entered into a credit agreement (the “State Street Agreement”), among the Trust, AllianzGI Institutional Multi-Series Trust, Allianz Funds and Premier Multi-Series VIT, as borrowers
(collectively, the “AllianzGI Borrowers” and each series thereof, an “AllianzGI Borrower Fund”), and State Street Bank and Trust Company, as agent and lender, for a committed line of credit. The State Street
| Semiannual Report | | March 31, 2018 | 377 |
Table of Contents
Notes to Financial Statements (cont’d)
March 31, 2018 (Unaudited)
Agreement was amended on October 26, 2017 and has a term through October 25, 2018 and permits the AllianzGI Borrowers to borrow up to $200 million in aggregate, subject to (i) a requirement that each AllianzGI Borrower Fund’s asset coverage with respect to senior securities representing indebtedness be 300% or higher, and (ii) certain other limitations and conditions. Each AllianzGI Borrower Fund must pay interest on any amounts borrowed under the facility at a rate per annum equal to 1.25% plus the higher of the then-current federal funds overnight rate or the one-month LIBOR rate, subject to upward adjustment when any past due payments are outstanding. The AllianzGI Borrowers will also pay a usage fee at an annualized rate of 0.25% on undrawn amounts, allocated pro rata among the AllianzGI Borrower Funds on the basis of net assets. Amounts borrowed may be repaid and reborrowed on a revolving basis during the term of the facility.
The Funds did not utilize the line of credit during the six months ended March 31, 2018.
Pursuant to an exemptive order issued by the SEC (the “Order”), the Funds are authorized to enter into a master interfund lending agreement (the “Interfund Program”) with each other and certain funds advised by the Investment Manager. The Interfund Program permits certain Funds to lend money directly to and borrow money directly from other Funds for temporary purposes.
During the period or six months ended March 31, 2018, the Funds did not participate as a borrower or lender in the Interfund Program.
| 13. | FUND EVENTS |
(a) New Funds
On December 18, 2017, AllianzGI PerformanceFee Managed Futures Strategy Fund, AllianzGI PerformanceFee Structured U.S. Equity Fund and AllianzGI PerformanceFee Structured U.S. Fixed Income Fund commenced operations as series of the Trust, offering Class P, Institutional Class and Class R6 shares.
On December 27, 2017, AllianzGI Real Estate Debt Fund commenced operations as a series of the Trust, offering Class P and Institutional Class shares.
(b) Transfer Agency Services Provider
On December 28, 2017, AllianzGI U.S. as Administrator, on behalf of the Trust, entered into a Novation Framework Agreement with State Street Bank and Trust Company (“SSB”) and DST Asset Manager Solutions, Inc. (“DST”) (formerly known as Boston Financial Data Services, Inc.) whereby SSB replaced DST as the named provider of transfer agency services to the Funds. SSB then delegated its duties and obligations as transfer agent to DST. This transition was undertaken solely to promote efficiency and administrative simplicity, allowing SSB and DST to consolidate certain contracts and streamline their relationship, and had no effect on the services provided to the Trust.
(c) Name Change
Effective February 1, 2018, AllianzGI Retirement Income Fund changed its name to AllianzGI Multi Asset Income Fund.
(d) New Share Class
Effective February 1, 2018, AllianzGI Multi Asset Income Fund began offering Institutional Class shares.
| 14. | BASIS FOR CONSOLIDATION |
The Subsidiary is a wholly-owned and controlled subsidiary of AllianzGI PerformanceFee Managed Futures Strategy (the “Consolidated Fund”). The Consolidated Fund is the sole shareholder of the Subsidiary and will continue to control the Subsidiary. The Consolidated Fund’s investment portfolio has been consolidated and includes the portfolio holdings of the Consolidated Fund and the Subsidiary. The consolidated financial statements include the accounts of the Consolidated Fund and the Subsidiary. All inter-company transactions and balances have been eliminated. As of March 31, 2018, consolidated net assets of the Consolidated Fund were $15,288,740, of which $364,487, or 2.4%, represented the Consolidated Fund’s ownership of all issued shares and voting rights of the Subsidiary.
| 15. | SUBSEQUENT EVENTS |
In preparing these financial statements, the Funds’ management has evaluated events and transactions for potential recognition or disclosure through the date the financial statements were issued.
On April 19, 2018, the following Funds declared per-share net investment income dividends to shareholders, payable April 19, 2018 to shareholders of record on April 18, 2018.
| Net Investment Income | ||||||||||||||||||||||||||||
| Class A | Class C | Class R | Class P | Institutional Class | Class R6 | Administrative Class | ||||||||||||||||||||||
AllianzGI Multi Asset Income | $ | 0.06622 | $ | 0.05493 | $ | 0.06071 | $ | 0.07048 | $ | 0.07123 | $ | 0.07192 | $ | 0.06682 | ||||||||||||||
AllianzGI High Yield Bond | $ | 0.03898 | $ | 0.03431 | $ | 0.03763 | $ | 0.04173 | $ | 0.04125 | N/A | $ | 0.04063 | |||||||||||||||
AllianzGI Short Duration High Income | $ | 0.05500 | $ | 0.05246 | N/A | $ | 0.05817 | $ | 0.05864 | $ | 0.05921 | N/A | ||||||||||||||||
| 378 | March 31, 2018 | | Semiannual Report |
Table of Contents
On May 17, 2018, the following Funds declared per-share net investment income dividends to shareholders, payable May 17, 2018 to shareholders of record on May 16, 2018.
| Net Investment Income | ||||||||||||||||||||||||||||
| Class A | Class C | Class R | Class P | Institutional Class | Class R6 | Administrative Class | ||||||||||||||||||||||
AllianzGI Multi Asset Income | $ | 0.06593 | $ | 0.05495 | $ | 0.06037 | $ | 0.07042 | $ | 0.07116 | $ | 0.07190 | $ | 0.06667 | ||||||||||||||
AllianzGI High Yield Bond | $ | 0.03886 | $ | 0.03415 | $ | 0.03758 | $ | 0.04180 | $ | 0.04125 | N/A | $ | 0.03233 | |||||||||||||||
AllianzGI Short Duration High Income | $ | 0.05500 | $ | 0.05237 | N/A | $ | 0.05824 | $ | 0.05874 | $ | 0.05950 | N/A | ||||||||||||||||
On May 18, 2018, the AllianzGI Global Fundamental Strategy Fund liquidated as a series of the Trust.
There were no other subsequent events identified that require recognition or disclosure.
| Semiannual Report | | March 31, 2018 | 379 |
Table of Contents
Unaudited
Changes to the Board of Trustees and Fund Officers
Effective December 12, 2017, Barbara R. Claussen resigned as a Trustee of the Funds and Erick R. Holt became a Trustee of the Funds. Mr. Holt is an “interested person” of the Funds, as defined in Section 2(a) (19) of the 1940 Act, due to his positions with the Investment Adviser and its affiliates.
Effective December 12, 2017, Craig A. Ruckman was appointed Assistant Secretary to the Funds.
Effective April 13, 2018, Lawrence G. Altadonna resigned as the Treasurer, Principal Financial and Accounting Officer of the Funds.
Effective April 13, 2018, Scott Whisten was appointed Treasurer, Principal Financial and Accounting Officer of the Funds.
Effective May 2, 2018, Morley D. Campbell resigned as Assistant Secretary to the Funds.
| 380 | March 31, 2018 | | Semiannual Report |
Table of Contents
Unaudited
Matters Relating to the Trustees’ Consideration of the Investment Management Agreements
The Investment Company Act of 1940, as amended, requires that both the full Board of Trustees (the “Board” or the “Trustees”) and a majority of the Trustees who are not interested persons of the Trust (the “Independent Trustees”), voting separately, initially approve the investment management agreement for a new fund.
New agreements approved for Funds covered by this report relate to the organization of (i) AllianzGI Real Estate Debt Fund (the “Real Estate Debt Fund”) and (ii) AllianzGI PerformanceFee Managed Futures Strategy Fund (“Managed Futures Strategy”), AllianzGI PerformanceFee Structured US Equity Fund (“Structured US Equity”) and AllianzGI PerformanceFee Structured US Fixed Income Fund (“Structured US Fixed Income” and, together with Managed Futures Strategy and Structured US Equity, the “PerformanceFee Funds”), each a new series of the Trust.
At an in-person meeting held on June 6, 2017, the Board and the Independent Trustees unanimously approved, for an initial 2-year term, the Trust’s Amended and Restated Investment Management Agreement (the “Investment Management Agreement”) with Allianz Global Investors U.S. LLC (“AllianzGI U.S.”) on behalf of the Real Estate Debt Fund. At an in-person meeting held on October 10-11, 2017, the Board and the Independent Trustees unanimously approved, for an initial 2-year term, the Trust’s Amended and Restated Investment Management Agreement with AllianzGI U.S. on behalf of the PerformanceFee Funds (together with the Real Estate Debt Fund, the “New Funds”). The PerformanceFee Funds commenced operations on December 18, 2017. The Real Estate Debt Fund commenced operations on December 27, 2017. The Investment Management Agreements are collectively referred to herein as the “New Fund Agreements.”
The material factors and conclusions that formed the basis of these approvals for each of the Real Estate Debt Fund and the PerformanceFee Funds are discussed below.
The Independent Trustees were assisted in their evaluation of the New Fund Agreements and the factors that they deemed to be material, including those factors described below, by independent legal counsel, from whom they received separate legal advice and with whom they met separately from Fund management during their contract review meetings.
In connection with their deliberations regarding the proposed approvals of the New Fund Agreements, the Trustees, including the Independent Trustees, considered such information and factors as they believed, in light of the legal advice furnished to them and their own business judgment, to be relevant. As described below, the Trustees considered the nature, quality and extent of the various investment management, administrative and other services to be performed by AllianzGI U.S., the New Funds’ investment manager (the “Investment Manager”), under the New Fund Agreements.
Real Estate Debt Fund
In connection with their deliberations, the Trustees received and relied upon materials provided by the Investment Manager including, among other items: (i) information compiled from Morningstar Direct (“Morningstar”), an independent third party, on the investment performance for various time periods, including annualized return performance information for certain time periods, of a group of funds with investment classifications and/or objectives comparable to those proposed for the Real Estate Debt Fund, (ii) information on the Real Estate Debt Fund’s management fees and other anticipated expenses and information compiled from Morningstar on the management fees and other expenses of comparable funds, (iii) information regarding the investment performance and fees for other funds and accounts managed by the Investment Manager or an affiliate, including institutional and separate accounts, with similar investment objective(s) and policies to those of the Real Estate Debt Fund, (iv) an estimate of the profitability to the Investment Manager from its relationship with the Real Estate Debt Fund during its first year, (v) descriptions of various functions to be performed by the Investment Manager for the Real Estate Debt Fund, such as portfolio management, compliance monitoring and portfolio trading practices, and (vi) information regarding the overall organization and business functions of the Investment Manager, including, without limitation, information regarding senior management, portfolio managers and other personnel proposed to provide investment management, administrative and other services to the Real Estate Debt Fund.
The Trustees’ conclusions as to the approval of the Investment Management Agreement were based on a comprehensive consideration of all information provided to the Trustees and were not the result of any single factor. Some of the factors that figured particularly in the Trustees’ deliberations are described below, although individual Trustees may have evaluated the information presented differently from one another, giving different weights to various factors. The Trustees also took into account that AllianzGI U.S. had proposed to observe certain advisory fee waivers and/or expense limitations for the Real Estate Debt Fund. The Trustees also considered the risk profile of the Real Estate Debt Fund.
As part of their review, the Trustees examined the ability of the Investment Manager to provide high-quality investment management and other services to the Real Estate Debt Fund. Among other information, the Trustees considered the investment philosophy and research and decision making processes of the Investment Manager and its affiliates, taking into account that the Real Estate Debt Fund would be managed by personnel formerly of Rogge Global Partners Limited (“Rogge”), an advisory firm recently acquired by an affiliate of the Investment Manager, acting in their capacities as “associated persons” of the Investment Manager. The Trustees considered, among other information, the experience of key advisory personnel and associated persons of the Investment Manager who would be responsible for portfolio management of the Real Estate Debt Fund;
| Semiannual Report | | March 31, 2018 | 381 |
Table of Contents
Unaudited
Matters Relating to the Trustees’ Consideration of the Investment Management Agreements (cont’d)
the ability of the Investment Manager to attract and retain capable personnel; and the capability of the senior management and staff of the Investment Manager. In addition, the Trustees reviewed the quality of the Investment Manager’s expected services with respect to regulatory compliance and ability to comply with the investment and compliance policies and procedures of the Real Estate Debt Fund; the nature, extent and quality of certain administrative services the Investment Manager would be responsible for providing to the Real Estate Debt Fund; and conditions that might affect the Investment Manager’s ability to provide high quality services to the Real Estate Debt Fund in the future under the Investment Management Agreement, including the Investment Manager’s financial condition and operational stability. The Trustees also considered the historical investment performance information of accounts that had been managed by Rogge in the short duration, global real estate bond strategy to be used for the Real Estate Debt Fund. Based on the foregoing, the Trustees concluded that the Investment Manager and Rogge’s investment process, research capabilities and philosophy were well-suited to the Real Estate Debt Fund, given the Real Estate Debt Fund’s investment objectives and policies, and that the Investment Manager would be able to meet any reasonably foreseeable obligations under the Investment Management Agreement.
In assessing the reasonableness of the Real Estate Debt Fund’s proposed fees and expenses under the Investment Management Agreement, the Trustees considered, among other information, the Real Estate Debt Fund’s proposed management fee and its expected net expense ratio as a percentage of anticipated average daily net assets, taking into account the management fee waiver and/or expense limitation arrangements that the Investment Manager would observe, and the advisory fees and net expense ratios of peer groups of funds based on information provided by Morningstar.
The Trustees considered how the net expense ratio of the Real Estate Debt Fund was expected to compare to its Morningstar peers, and considered comparisons of the Real Estate Debt Fund’s proposed management fee with the advisory fees of the peer funds compiled from Morningstar. The Trustees noted that the proposed management fees and estimated net expense ratio for Institutional Class shares of the Real Estate Debt Fund were lower than both the average and median for Institutional Class shares of funds in the Morningstar peer group.
The Trustees also considered the management fees charged by the Investment Manager to other funds and accounts with similar investment strategies to the Real Estate Debt Fund. Among other topics, the Trustees considered various risks AllianzGI U.S will bear as sponsoring adviser to the Real Estate Debt Fund, which exceed or are in addition to those associated with the management of institutional accounts, including entrepreneurial, reputational, legal and regulatory risks.
The Trustees also considered the estimated profitability to the Investment Manager from its relationship with the Real Estate Debt
Fund and noted that such profitability was expected to be negative for the Real Estate Debt Fund’s first year of operations based on average net asset assumptions.
The Trustees considered the extent to which the Investment Manager may realize economies of scale or other efficiencies in managing and supporting the Real Estate Debt Fund. The Trustees took into account that, as an open-end investment company, the Real Estate Debt Fund intends to raise additional assets, so as the assets of the Real Estate Debt Fund increase over time, certain economies of scale and other efficiencies may be realized through spreading certain fixed costs over a larger asset base or across a variety of products and services. In this regard, they also took into account the management fee waiver and/or expense limitation arrangements proposed to be observed by the Investment Manager for the Real Estate Debt Fund.
Additionally, the Trustees considered so-called “fall-out benefits” to the Investment Manager and its affiliates, such as reputational value derived from serving as investment manager to the Real Estate Debt Fund.
After reviewing these and other factors described herein, the Trustees concluded, within the context of their overall conclusions regarding the Investment Management Agreement, that the proposed fees payable under the Investment Management Agreement represent reasonable compensation in light of the nature, extent and quality of the services to be provided by the Investment Manager and should be approved for an initial two-year period. After further discussion, and based on their evaluation of factors they deemed to be material, including those factors described above, the Trustees, including the Independent Trustees, unanimously concluded that the initial approval of the Investment Management Agreement was in the interests of the Real Estate Debt Fund and its shareholders and should be approved.
PerformanceFee Funds
In connection with their deliberations, the Trustees received and relied upon materials provided by the Investment Manager including, among other items: (i) information compiled from Morningstar, an independent third party, on the investment performance for various time periods, including annualized return performance information for certain time periods, of groups of funds with investment classifications and/or objectives comparable to those proposed for the PerformanceFee Funds, (ii) information on the PerformanceFee Funds’ management fees, management fee structures and other anticipated expenses and information compiled from Morningstar on the management fees, management fee structures and other expenses of comparable funds, (iii) information regarding the investment performance and fees for other funds and/or accounts managed by the Investment Manager or an affiliate with similar investment objective(s) and policies to those of the PerformanceFee Funds, (iv) an estimate of the profitability to the Investment Manager from its relationship with each of the PerformanceFee Funds during its
| 382 | March 31, 2018 | | Semiannual Report |
Table of Contents
first year of operations, (v) descriptions of various functions to be performed by the Investment Manager for the PerformanceFee Funds, such as portfolio management, compliance monitoring, portfolio trading practices and oversight of third-party service providers, (vi) information regarding the overall organization and business functions of the Investment Manager, including, without limitation, information regarding senior management, portfolio managers and other personnel proposed to provide investment management, administrative and other services to the PerformanceFee Funds, and information related to corporate ownership and business operations unrelated to the PerformanceFee Funds and (vii) commentary and analysis regarding the performance-based component of the proposed management fee payable under the Investment Management Agreement.
The Trustees’ conclusions as to the approval of the Investment Management Agreement were based on a comprehensive consideration of all information provided to the Trustees and were not the result of any single factor. Some of the factors that figured particularly in the Trustees’ deliberations are described below, although individual Trustees may have evaluated the information presented differently from one another, attributing different weights to various factors. The Trustees also took into account that AllianzGI U.S. had proposed to observe certain advisory fee waivers and/or expense limitations for the PerformanceFee Funds. The Trustees also considered the risk profile of the PerformanceFee Funds.
As part of their review, the Trustees examined the ability of the Investment Manager to provide high-quality investment management and other services to the PerformanceFee Funds. Among other information, the Trustees considered the investment philosophy and research and decision making processes of the Investment Manager and its affiliates. The Trustees considered, among other information, the experience of key advisory personnel of the Investment Manager who would be responsible for portfolio management of the PerformanceFee Funds; the ability of the Investment Manager to attract and retain capable personnel; the capabilities of the senior management and staff of the Investment Manager; employee compensation; and the operational infrastructure, including technology and systems, of the Investment Manager. In addition, the Trustees reviewed the extent and quality of the Investment Manager’s expected services with respect to regulatory compliance and ability to comply with the investment and compliance policies and procedures of the PerformanceFee Funds; the compliance programs and risk controls of the Investment Manager; the specific contractual obligations of the Investment Manager under the Investment Management Agreement; the nature, extent and quality of certain administrative services the Investment Manager would be responsible for providing to the PerformanceFee Funds; and conditions that might affect the Investment Manager’s ability to provide high quality services to the PerformanceFee Funds in the future under the Investment Management Agreement, including the Investment Manager’s financial condition and operational stability. The Trustees also
considered the historical investment performance information of accounts managed by the Investment Manager and/or affiliated advisers in strategies similar to those of the PerformanceFee Funds. Based on the foregoing, the Trustees concluded that the Investment Manager’s investment process, research capabilities and philosophy were well-suited to the PerformanceFee Funds, given the investment objectives and policies of the PerformanceFee Funds, that the Investment Manager would be able to meet any reasonably foreseeable obligations under the Investment Management Agreement and that the Investment Manager would otherwise be able to provide services to the PerformanceFee Funds of sufficient extent and quality.
In assessing the reasonableness of the PerformanceFee Funds’ proposed fees and expenses under the Investment Management Agreement, the Trustees considered, among other information, each
PerformanceFee Fund’s proposed management fee and its expected net expense ratio as a percentage of anticipated average daily net assets, taking into account the management fee waiver and/or expense limitation arrangements that the Investment Manager would observe. The Trustees considered how the management fee and gross and net expense ratio of each PerformanceFee Fund were expected to compare to those of its Morningstar peers. The Trustees noted that the estimated net expense ratio (which presumes that the PerformanceFee Funds perform in-line with their respective performance hurdles and therefore are not affected by performance-based adjustments) was at or below the Morningstar peer group median for each PerformanceFee Fund. The Trustees also noted that the estimated management fee (which likewise presumes that the PerformanceFee Funds perform in-line with their respective performance hurdles and therefore are not affected by performance-based adjustments) was above the Morningstar peer group median for the Structured US Equity Fund, but below the peer group median for the Managed Futures Strategy Fund and Structured US Fixed Income Fund. However, the Trustees also considered that the proposed management fee for each PerformanceFee Fund was subject to performance-based adjustment based on out- or underperformance relative to a hurdle set materially higher than the benchmark index performance, and considered the effect of potential adjustments in different scenarios. Among other information, the Trustees noted that the Investment Manager would be entitled to receive a management fee for its management of a PerformanceFee Fund only if the PerformanceFee Fund outperformed its benchmark index during the applicable trailing twelve-month performance period (assuming Fund assets are generally constant or decreasing, or else pursuant to a waiver in instances where Fund assets are increasing). The Trustees noted that, for Structured US Equity Fund and Structured US Fixed Income Fund, management fees would have been in the top decile of the Morningstar peer group during the periods reflected in the Morgningstar data assuming the maximum positive performance adjustment and in the bottom decile assuming the maximum negative performance adjustment. The Trustees noted that the
| Semiannual Report | | March 31, 2018 | 383 |
Table of Contents
Unaudited
Matters Relating to the Trustees’ Consideration of the Investment Management Agreements (cont’d)
Managed Futures Strategy Fund’s management fee would have been above the peer group median during the periods reflected in the Morningstar data assuming the maximum positive performance adjustment and in the bottom decile assuming the maximum negative performance adjustment. The Trustees noted, further, that the estimated total expense ratio for each PerformanceFee Fund, assuming relatively modest assets in the first year of operations and performance meeting applicable hurdles, would be in the top decile of the respective Morningstar peer group prior to giving effect to the fee waivers that the Investment Manager has agreed to undertake.
The Trustees also considered the management fees charged by the Investment Manager and/or its affiliates to other funds and accounts with similar investment strategies to those of the PerformanceFee Funds.
The Trustees also considered the estimated profitability to the Investment Manager from its relationship with the PerformanceFee Funds and noted that such profitability was expected to be negative for the PerformanceFee Funds’ first year of operations based on average net asset assumptions. The Trustees also considered the potential impact of performance-based adjustments on the profitability to the Investment Manager in the future, noting that, in general, the Investment Manager would be more likely to profit from its management of a new fund following periods in which the fund outperformed its benchmark than following periods of underperformance, and that the Investment Manager could achieve a relatively high profit margin with respect to periods of significant outperformance.
The Trustees considered the extent to which the Investment Manager may realize economies of scale or other efficiencies in managing and supporting the PerformanceFee Funds. The Trustees took into account that, as an open-end investment company, the PerformanceFee Funds intends to raise additional assets, so as the assets of the PerformanceFee Funds increase over time, certain economies of scale and other efficiencies may be realized through spreading certain fixed costs over a larger asset base or across a variety of products and services. In this regard, they also took into account the management fee waiver and/or expense limitation arrangements proposed to be observed by the Investment Manager for the PerformanceFee Funds.
Additionally, the Trustees considered so-called “fall-out benefits” to the Investment Manager and its affiliates derived from serving as investment manager to the PerformanceFee Funds. The Trustees also took into account the entrepreneurial, legal, regulatory and business risks the Investment Manager would undertake as investment manager and sponsor of the PerformanceFee Funds.
The Trustees weighed certain additional considerations and factors related to the PerformanceFee Funds’ proposed performance-based fee structure. The Trustees reviewed the terms and structures of performance-based fees employed by other mutual funds that are currently operating. The Trustees noted that, depending on
performance, the management fee paid by each PerformanceFee Fund could be materially lower or materially higher than the unadjusted base fee to be paid by each PerformanceFee Fund. The Trustees considered specific factors relating to the appropriateness of the reference benchmark index selected for each of the PerformanceFee Funds, including the expected volatility, diversification of holdings, types of securities owned and objectives of the PerformanceFee Funds, taking into account that the hurdle rate required to achieve the base management fee (and avoid a downward performance adjustment) was set materially higher than the reference benchmark index against which the Fund would typically be compared. The Trustees also considered specific factors related to: the appropriateness of the base fee to be applied to each PerformanceFee Fund; the rolling, trailing twelve-month performance period upon which each PerformanceFee Fund’s performance adjustment is expected to be based; the “bifurcated” methodology according to which each PerformanceFee Fund’s base fee will be a percentage of a Fund’s average net assets over a shorter period than the performance period; the magnitude of the proposed performance-based adjustments; the proposed margin by which each PerformanceFee Fund must outperform its benchmark index in order for the Investment Manager to earn its full base fee; the amount by which each PerformanceFee Fund must outperform or underperform its benchmark index in order to trigger the maximum performance-based adjustment; the methodology for measuring the performance of the PerformanceFee Funds and their benchmarks; and the selection of the Fund’s most expensive share class as the reference share class whose performance will determine the performance-based adjustments to which each PerformanceFee Fund will be subject. In reviewing these factors the Trustees took into account ways in which fluctuations in Fund assets over different time periods could significantly impact the level of fees payable under their management agreement and acknowledged undertakings by the Investment Manager to implement expense waivers in an effort to mitigate disproportionately disadvantageous potential outcomes for shareholders. The Trustees considered that the base fee for each of the PerformanceFee Funds will not be subject to a performance-based adjustment until after completion of such Fund’s twelfth full calendar month of operations, but noted, further, that the Investment Manager has agreed to waive its fees with respect to each PerformanceFee Fund during the Fund’s initial year of operations in an amount equal to any negative performance-based adjustment that would have applied had the Fund been subject to a performance-based adjustment during the period. The Trustees concluded that the performance-based management fee adjustments contemplated by the Investment Management Agreement would tend to align the interests of the Investment Manager and the PerformanceFee Funds’ shareholders in an appropriate manner.
After reviewing these and other factors described herein, the Trustees concluded, within the context of their overall conclusions regarding the Investment Management Agreement, that the proposed fees
| 384 | March 31, 2018 | | Semiannual Report |
Table of Contents
payable under the Investment Management Agreement represent reasonable compensation in light of the nature, extent and quality of the services to be provided by the Investment Manager and should be approved for an initial two-year period.
After further discussion, and based on their evaluation of factors they deemed to be material, including those factors described above, the Trustees, including the Independent Trustees, unanimously concluded that the initial approval of the Investment Management Agreement was in the interests of each PerformanceFee Fund and its shareholders and should be approved. The Trustees noted that the Investment Manager would continue to review and assess certain features of the Investment Management Agreement and that they would, if necessary, review and consider updated versions of the Investment Management Agreement at a future meeting.
| Semiannual Report | | March 31, 2018 | 385 |
Table of Contents
Unaudited
Please read this Policy carefully. It gives you important information about how Allianz Global Investors U.S. and its U.S. affiliates (“AllianzGI US,” “we” or “us”) handle non-public personal information (“Personal Information”) that we may receive about you. It applies to all of our past, present and future clients and shareholders of AllianzGI US and the funds and accounts it manages, advises, sub-advises, administers or distributes, and will continue to apply when you are no longer a client or shareholder. As used throughout this Policy, “AllianzGI US” means Allianz Global Investors U.S. LLC, Allianz Global Investors Distributors LLC, and the family of registered and unregistered funds managed by one or more of these firms. AllianzGI US is part of a global investment management group, and the privacy policies of other Allianz Global Investors entities outside of the United States may have provisions in their policies that differ from this Privacy Policy. Please refer to the website of the specific non-US Allianz Global Investors entity for its policy on privacy.
We Care about Your Privacy
We consider your privacy to be a fundamental aspect of our relationship with you, and we strive to maintain the confidentiality, integrity and security of your Personal Information. To ensure your privacy, we have developed policies that are designed to protect your Personal Information while allowing your needs to be served.
Information We May Collect
In the course of providing you with products and services, we may obtain Personal Information about you, which may come from sources such as account application and other forms, from other written, electronic, or verbal communications, from account transactions, from a brokerage or financial advisory firm, financial advisor or consultant, and/or from information you provide on our website.
You are not required to supply any of the Personal Information that we may request. However, failure to do so may result in us being unable to open and maintain your account, or to provide services to you.
How Your Information Is Shared
We do not disclose your Personal Information to anyone for marketing purposes. We disclose your Personal Information only to those service providers, affiliated and non-affiliated, who need the information for everyday business purposes, such as to respond to your inquiries, to perform services, and/or to service and maintain your account. This applies to all of the categories of Personal Information we collect about you. The affiliated and non-affiliated service providers who receive your Personal Information also may use it to process your transactions, provide you with materials (including preparing and mailing prospectuses and shareholder reports and gathering shareholder proxies), and provide you with account statements and other materials relating to your account. These service providers provide services at our direction, and under their agreements with us, are required to keep your Personal Information confidential and to use it only for providing the contractually required services. Our service providers may not use your Personal Information to market products and services to you except in conformance with applicable laws and regulations. We also may provide your Personal Information to your respective brokerage or financial advisory firm, custodian, and/or to your financial advisor or consultant.
In addition, we reserve the right to disclose or report Personal Information to non-affiliated third parties, in limited circumstances, where we believe in good faith that disclosure is required under law, to cooperate with regulators or law enforcement authorities or pursuant to other legal process, or to protect our rights or property, including to enforce our Privacy Policy or other agreements with you. Personal Information collected by us may also be transferred as part of a corporate sale, restructuring, bankruptcy, or other transfer of assets.
Security of Your Information
We maintain your Personal Information for as long as necessary for legitimate business purposes or otherwise as required by law. In maintaining this information, we have implemented appropriate procedures that are designed to restrict access to your Personal Information only to those who need to know that information in order to provide products and/or services to you. In addition, we have implemented physical, electronic and procedural safeguards to help protect your Personal Information.
Privacy and the Internet
The Personal Information that you provide through our website, as applicable, is handled in the same way as the Personal Information that you provide by any other means, as described above. This section of the Policy gives you additional information about the way in which Personal Information that is obtained online is handled.
| ∎ | Online Enrollment, Account Access and Transactions: When you visit our website, you can visit pages that are open to the general public, or, where available, log into protected pages to enroll online, access information about your account, or conduct certain transactions. Access to the secure pages of our website is permitted only after you have created a User ID and Password. The User ID and Password must be supplied each time |
| 386 | March 31, 2018 | | Semiannual Report |
Table of Contents
Unaudited
Privacy Policy (cont’d)
| you want to access your account information online. This information serves to verify your identity. When you enter Personal Information into our website to enroll or access your account online, you will log into secure pages. By using our website, you consent to this Privacy Policy and to the use of your Personal Information in accordance with the practices described in this Policy. If you provide Personal Information to effect transactions, a record of the transactions you have performed while on the site is retained by us. For additional terms and conditions governing your use of our website, please refer to the Investor Mutual Fund Access – Disclaimer which is incorporated herein by reference and is available on our website. |
| ∎ | Cookies and Similar Technologies: Cookies are small text files stored in your computer’s hard drive when you visit certain web pages. Clear GIFs (also known as Web Beacons) are typically transparent very small graphic images (usually 1 pixel x 1 pixel) that are placed on a website that may be included on our services provided via our website and typically work in conjunction with cookies to identify our users and user behavior. We may use cookies and automatically collected information to: (i) personalize our website and the services provided via our website, such as remembering your information so that you will not have to re-enter it during your use of, or the next time you use, our website and the services provided via our website; (ii) provide customized advertisements, content, and information; (iii) monitor and analyze the effectiveness of our website and the services provided via our website and third-party marketing activities; (iv) monitor aggregate site usage metrics such as total number of visitors and pages viewed; and (v) track your entries, submissions, and status in any promotions or other activities offered through our website and the services provided via our website. Tracking technology also helps us manage and improve the usability of our website, (i) detecting whether there has been any contact between your computer and us in the past and (ii) to identify the most popular sections of our website. Because an industry-standard Do-Not-Track protocol is not yet established, our website will continue to operate as described in this Privacy Policy and will not be affected by any Do-Not-Track signals from any browser. |
| ∎ | Use of Social Media Plugins Our website uses the following Social Media Plugins (“Plugins”): |
| ∎ | Facebook Share Button operated by Facebook Inc., 1601 S. California Ave, Palo Alto, CA 94304, USA |
| ∎ | Tweet Button operated by Twitter Inc., 795 Folsom St., Suite 600, San Francisco, CA 94107, USA |
| ∎ | LinkedIn Share Button operated by LinkedIn Corporation, 2029 Stierlin Court, Mountain View, CA 94043, USA |
All Plugins are marked with the brand of the respective operators Facebook, Twitter and LinkedIn (“Operators”). When you visit our website that contains a social plugin, your browser establishes a direct connection to the servers of the Operator. The Operator directly transfers the plugin content to your browser which embeds the latter into our website, enabling the Operator to receive information about you having accessed the respective page of our website. Thus, AllianzGI US has no influence on the data gathered by the plugin and we inform you according to our state of knowledge: The embedded plugins provide the Operator with the information that you have accessed the corresponding page of our website. If you do not wish to have such data transferred to the Operators, you need to log out of your respective account before visiting our website. Please see the Operators’ data privacy statements in order to get further information about purpose and scope of the data collection and the processing and use:
| ∎ | Facebook: https://de-de.facebook.com/about/privacy/ |
| ∎ | Twitter: https://twitter.com/privacy |
| ∎ | Linked In: https://www.linkedin.com/legal/privacy-policy |
Changes to Our Privacy Policy
We may modify this Privacy Policy from time-to-time to reflect changes in related practices and procedures, or applicable laws and regulations. If we make changes, we will notify you on our website and the revised Policy will become effective immediately upon posting to our website. We also will provide account owners with a copy of our Privacy Policy annually if required. We encourage you to visit our website periodically to remain up to date on our Privacy Policy. You acknowledge that by using our website after we have posted changes to this Privacy Policy, you are agreeing to the terms of the Privacy Policy as modified.
Obtaining Additional Information
If you have any questions about this Privacy Policy or our privacy related practices in the United States, you may contact us via our dedicated email at PrivacyUS@allianzgi.com.
| Semiannual Report | | March 31, 2018 | 387 |
Table of Contents
(THIS PAGE INTENTIONALLY LEFT BLANK)
Table of Contents
Allianz Multi-Strategy Funds
Trustees
Davey S. Scoon
Chairman of the Board of Trustees
Deborah A. DeCotis
F. Ford Drummond
A. Douglas Eu
Bradford K. Gallagher
Erick R. Holt
James A. Jacobson
Hans W. Kertess
James S. MacLeod
William B. Ogden, IV
Alan Rappaport
Officers
Thomas J. Fuccillo
President and Chief Executive Officer
Scott Whisten
Treasurer, Principal Financial and Accounting Officer
Angela Borreggine
Chief Legal Officer and Secretary
Thomas L. Harter
Chief Compliance Officer, CFA
Richard J. Cochran
Assistant Treasurer
Orhan Dzemaili
Assistant Treasurer
Debra Rubano
Assistant Secretary
Paul Koo(1)
Assistant Secretary
Craig Ruckman
Assistant Secretary
Thomas W. Oliver(2)
Assistant Secretary
Investment Manager
Allianz Global Investors U.S. LLC
1633 Broadway
New York, NY 10019
Distributor
Allianz Global Investors Distributors LLC
1633 Broadway
New York, NY 10019
Custodian & Accounting Agent
State Street Bank & Trust Co.
801 Pennsylvania Avenue
Kansas City, MO 64105
Shareholder Servicing and Transfer Agents
State Street Bank & Trust Company, which has delegated its obligations
as transfer agent to:
DST Asset Management Solutions, Inc.
(Class A, Class C and Class R shares)
P.O. Box 8050
Boston, MA 02266-8050
(Class P, Institutional Class, Class R6 and Administrative Class shares)
330 West 9th Street, 5th Floor
Kansas City, MO 64105
Independent Registered Public Accounting Firm
PricewaterhouseCoopers LLP
300 Madison Avenue
New York, NY 10017
Legal Counsel
Ropes & Gray LLP
Prudential Tower
800 Boylston Street
Boston, MA 02199
This report, including the financial information herein, is transmitted to the shareholders of the Funds for their information. It is not a prospectus, circular or representation intended for use in the purchase of shares of each Fund or any securities mentioned in this report.
The financial information included herein is taken from the records of the Funds without examination by an independent registered public accounting firm, who did not express an opinion herein.
| (1) | Paul Koo is Assistant Secretary of the Trust with a limited authority to open, maintain and close certain custodial and trading accounts for all series of the Trust. |
| (2) | Thomas W. Oliver Assistant Secretary of the Trust with a limited authority to open, maintain and close certain custodial and training accounts for the AllianzGI NFJ Emerging Markets Value Fund. |
For Account Information
Contact your financial adviser, or if you receive account statements directly from Allianz Global Investors, you can also call (800) 988-8380 for Class A, C and R shares or (800) 498-5413 for Class P, Institutional, R6 and Administrative shares. Telephone representatives are available Monday-Friday 8:30 am to 6:00 pm Eastern Time. Or visit our website, us.allianzgi.com.
Table of Contents
About Allianz Global Investors
Allianz Global Investors is a leading active asset manager with over 700 investment professionals* in 25 offices worldwide and managing more than $630 billion in assets for individuals, families and institutions.
Active is the most important word in our vocabulary. Active is how we create and share value with clients. We believe in solving, not selling, and in adding value beyond pure economic gain. We invest for the long term, employing our innovative investment expertise and global resources. Our goal is to ensure a superior experience for our clients, wherever they are based and whatever their investment needs.
Active is: Allianz Global Investors
* Data as of March 31, 2018 (*as of December 31, 2017).
For more information about any of our investment solutions or client services, call your financial advisor or visit us.allianzgi.com.
Investors should consider the investment objectives, risks, charges and expenses of the above mentioned Funds carefully before investing. This and other information is contained in the Fund’s prospectus, which may be obtained by contacting your financial advisor, by visiting us.allianzgi.com or by calling 1-800-988-8380 (retail classes: A, C & R) or 1-800-498-5413 (Class P, Class R6, Institutional & Administrative classes). Please read the prospectus carefully before you invest or send money.
Allianz Global Investors U.S. LLC serves as the investment manager for the Allianz Funds and the Allianz Multi-Strategy Funds. Allianz Funds and the Allianz Multi-Strategy Funds are distributed by Allianz Global Investors Distributors LLC. © 2018. For information about any product, contact your financial advisor.
us.allianzgi.com
Receive this report electronically and eliminate paper mailings.
To enroll, go to us.allianzgi.com/edelivery
| AZ750SA_033118 |
460246
Table of Contents
| ITEM 2. | CODE OF ETHICS |
| (a) | Not required in this filing. |
| ITEM 3. | AUDIT COMMITTEE FINANCIAL EXPERT |
Not required in this filing.
| ITEM 4. | PRINCIPAL ACCOUNTANT FEES AND SERVICES |
Not required in this filing.
| ITEM 5. | AUDIT COMMITTEE OF LISTED REGISTRANT |
Disclosure not required for open-end management investment companies.
| ITEM 6. | SCHEDULE OF INVESTMENTS |
| (a) | Schedule of Investments is included as part of the report to shareholders filed under Item 1 of this form. |
| (b) | Not applicable. |
| ITEM 7. | DISCLOSURE OF PROXY VOTING POLICIES AND PROCEDURES FOR CLOSED-END MANAGEMENT INVESTMENT COMPANIES |
Disclosure not required for open-end management investment companies.
| ITEM 8. | PORTFOLIO MANAGERS OF CLOSED-END MANAGEMENT INVESTMENT COMPANIES |
Disclosure not required for open-end management investment companies.
| ITEM 9. | PURCHASES OF EQUITY SECURITIES BY CLOSED-END MANAGEMENT INVESTMENT COMPANY AND AFFILIATED COMPANIES. |
Disclosure not required for open-end management investment companies.
| ITEM 10. | SUBMISSION OF MATTERS TO A VOTE OF SECURITY HOLDERS |
There were no material changes to the procedures by which shareholders may recommend nominees to the Funds’ Board of Trustees since the Funds’ last provided disclosure in response to this item.
| ITEM 11. | CONTROLS AND PROCEDURES |
| (a) | The registrant’s President & Chief Executive Officer and Treasurer, Principal Financial & Accounting Officer have concluded that the registrant’s disclosure controls and procedures (as defined in Rule 30a-3(c) under the Act (17 CFR 270.30a-3(c))), are effective based on their evaluation of these controls and procedures as of a date within 90 days of the filing date of this document. |
| (b) | There were no significant changes in the registrant’s internal control over financial reporting (as defined in Rule 30a-3(d) under the Act (17 CFR 270.30a-3(d))) that occurred during the second fiscal quarter of the period covered by this report that has materially affected, or is reasonably likely to materially affect, the registrant’s internal control over financial reporting. |
Table of Contents
| ITEM 12. | EXHIBITS |
| (a) (1) | Not required in this filing. |
| (a) (2) | Exhibit 99_ Cert. — Certification pursuant to Section 302 of the Sarbanes-Oxley Act of 2002 |
| (a) (3) | Not applicable |
| (b) | Exhibit 99.906 Cert. — Certification pursuant to Section 906 of the Sarbanes-Oxley Act of 2002 |
Table of Contents
Signatures
Pursuant to the requirements of the Securities Exchange Act of 1934 and the Investment Company Act of 1940, the registrant has duly caused this report to be signed on its behalf by the undersigned, thereunto duly authorized.
| Allianz Funds Multi-Strategy Trust | ||
| By: | /s/ Thomas J. Fuccillo | |
| Thomas J. Fuccillo | ||
| President & Chief Executive Officer | ||
| Date: | June 1, 2018 | |
| By: | /s/ Scott Whisten | |
| Scott Whisten | ||
| Treasurer, Principal Financial & Accounting Officer | ||
| Date: | June 1, 2018 | |
Pursuant to the requirements of the Securities Exchange Act of 1934 and the Investment Company Act of 1940, this report has been signed below by the following persons on behalf of the registrant and in the capacities and on the dates indicated.
| By: | /s/ Thomas J. Fuccillo | |
| Thomas J. Fuccillo | ||
| President & Chief Executive Officer | ||
| Date: | June 1, 2018 | |
| By: | /s/ Scott Whisten | |
| Scott Whisten | ||
| Treasurer, Principal Financial & Accounting Officer | ||
| Date: | June 1, 2018 | |