Table of Contents
UNITED STATES
SECURITIES AND EXCHANGE COMMISSION
Washington, D.C. 20549
FORM N-CSR
CERTIFIED SHAREHOLDER REPORT OF
REGISTERED MANAGEMENT INVESTMENT COMPANIES
Investment Company Act file number: 811-22167
Allianz Funds Multi-Strategy Trust
(Exact name of registrant as specified in charter)
1633 Broadway, New York, NY 10019
(Address of principal executive offices) (Zip code)
Lawrence G. Altadonna
1633 Broadway, New York, NY 10019
(Name and address of agent for service)
Registrant’s telephone number, including area code: 212-739-3371
Date of fiscal year end: November 30, 2014
Date of reporting period: May 31, 2014
Table of Contents
Item 1. Report to Shareholders

Allianz Multi-Strategy Funds
SHARE CLASSES A, B, C, D, R, P, INSTITUTIONAL, R6, ADMINISTRATIVE
Semiannual Report
May 31, 2014
AllianzGI Retirement 2015 Fund
AllianzGI Retirement 2020 Fund
AllianzGI Retirement 2025 Fund
AllianzGI Retirement 2030 Fund
AllianzGI Retirement 2035 Fund
AllianzGI Retirement 2040 Fund
AllianzGI Retirement 2045 Fund
AllianzGI Retirement 2050 Fund
AllianzGI Retirement 2055 Fund
AllianzGI Retirement Income Fund
AllianzGI Global Allocation Fund
AllianzGI Global Growth Allocation Fund
AllianzGI Behavioral Advantage Large Cap Fund
AllianzGI Best Styles Global Equity Fund
AllianzGI China Equity Fund
AllianzGI Convertible Fund
AllianzGI Global Fundamental Strategy Fund
AllianzGI Global Managed Volatility Fund
AllianzGI Global Water Fund
AllianzGI High Yield Bond Fund
AllianzGI International Small-Cap Fund
AllianzGI Micro Cap Fund
AllianzGI Multi-Asset Real Return Fund
AllianzGI NFJ Emerging Markets Value Fund
AllianzGI NFJ Global Dividend Value Fund
AllianzGI NFJ International Small-Cap Value Fund
AllianzGI NFJ International Value Fund II
AllianzGI Short Duration High Income Fund
AllianzGI Structured Return Fund (formerly AllianzGI Structured Alpha Fund)
AllianzGI Ultra Micro Cap Fund
AllianzGI U.S. Equity Hedged Fund
AllianzGI U.S. Small-Cap Growth Fund (formerly AllianzGI U.S. Emerging Growth Fund)
This material is authorized for use only when preceded or accompanied by the current Allianz Multi-Strategy Funds prospectus. Investors should consider the investment objectives, risks, charges and expenses of each Fund carefully before investing. This and other information is contained in the Funds’ prospectuses and summary prospectuses. Please read the prospectus carefully before you invest or send money.

Receive this report electronically and eliminate paper mailings.
To enroll, go to http://us.allianzgi.com/edelivery.
Table of Contents
A Word About Risk: A fund may be subject to various risks as described in its prospectus. Some of those risks may include, but are not limited to, the following: derivatives risk, smaller company risk, non-US investment risk, focused investment risk and specific sector investment risks. Use of derivative instruments may involve certain costs and risks such as liquidity risk, interest rate risk, market risk, credit risk, counterparty risk, management risk and the risk that a fund is unable to close out a position when it is most advantageous to do so. Portfolios investing in derivatives could lose more than the principal amount invested in those instruments. Investing in foreign securities may entail risk due to foreign economic and political developments; this risk may be enhanced when investing in emerging markets. Smaller companies may be more volatile than larger companies and may entail more risk. Concentrating investments in individual sectors may add additional risk and additional volatility compared to a diversified equity portfolio. AllianzGI target-date funds seek to manage risk and return by blending two separately-managed portfolios: a return-generating portfolio for growth potential, and a defensive portfolio for principal protection. The balance grows increasingly defensive over time until the target date is reached, after which the Fund’s assets roll into a retirement income strategy. The principal values of the Funds are not guaranteed at any time, including the target date. Please refer to the Fund’s applicable current prospectus for complete details.
Table of Contents
Letter from the President

Julian Sluyters
President & CEO
After three years of generally moderate growth, the US economy contracted toward the end of the six-month fiscal reporting period ended May 31, 2014. Despite this, US equities rallied sharply. The US bond market it also posted a positive return during the reporting period.
Six Months in Review
For the six-month fiscal reporting period ended May 31, 2014, US stocks rose 7.62% as measured by the Standard & Poor’s 500 Index. Two measures of stock performance in developed international and global markets, the MSCI EAFE (Europe, Australasia and Far East) Index and the MSCI World Index, rose 5.33% and 6.52%, respectively, in dollar-denominated terms. In Emerging Markets, the MSCI Emerging Markets Index rose 1.89%.
With respect to bonds, the Barclays US Credit Index returned 5.35%, whereas the Barclays Global High Yield Index rose 5.86%. The Barclays US Government Bond Index returned 1.90%, while the broader bond market index, as measured by the Barclays US Aggregate Index, gained 3.28%.
After several years of positive growth, severe winter weather in parts of the United States constrained the US economy throughout the reporting period. Gross domestic product (“GDP”), the value of goods and services produced in the country, the broadest measure of economic activity, expanded at a 2.6% annual pace during the fourth quarter of 2013, but GDP contracted at an annual pace of 2.9% during the first quarter of 2014.
The Federal Reserve (the “Fed”) maintained an accommodative monetary stance during the reporting period. Announcements and actions related to the reduction of the Fed’s monthly asset purchase program contributed to bond-yield volatility over the December to May period. The markets have also been scrutinizing Fed statements related to when interest rates would begin to rise. In April the Fed repeated that it would not raise rates in the near future, saying that it “likely will be appropriate to maintain the current target range for the federal funds rate for a considerable time after the asset purchase program ends, especially if projected inflation continues to run below the Federal Open Market Committee’s 2 percent longer-run goal, and provided that longer-term inflation expectations remain well anchored.”
| 2 | May 31, 2014 | | Semiannual Report |
Table of Contents
Outlook
We remain constructive on the US economic recovery and expect the first-quarter GDP decline to be followed by a meaningful bounce during the second quarter.
Federal Reserve officials have tied the outlook for monetary policy to incoming economic data. Based on our forecasts for growth, we believe that Fed asset purchases will end in the fourth quarter of 2014, with an increase in the Fed funds rate possible in mid-2015.
Additional Information
For many of our shareholders, especially those who are nearing or in retirement, income-generation is a top priority. But with continued low yields on investment-grade core bonds and the growing threat of interest-rate hikes, an overallocation to low-yielding, rate-sensitive securities may threaten today’s scarce income streams and put long-term goals in jeopardy.
If you’d like more information about this issue, talk to your financial advisor and consider reading our educational white paper, Strategies to Generate a Diversified Income Stream in a Low-Yield Environment.
Visit http://us.allianzgi.com/whitepaper to download a copy.
On behalf of Allianz Global Investors Fund Management and our Sub-Advisers, thank you for investing with us. We remain dedicated to serving your investment needs.
Sincerely,

Julian Sluyters
President & CEO
Past performance is no guarantee of future results. Unless otherwise noted, index returns reflect the reinvestment of income dividends and capital gains, if any, but do not reflect fees, brokerage commissions or other expenses of investing. It is not possible to invest directly in an index.
Receive this report electronically and eliminate paper mailings.
To enroll, go to http://us.allianzgi.com/edelivery.
| Semiannual Report | | May 31, 2014 | 3 |
Table of Contents
Unaudited
AllianzGI Target-Date and Target Risk Funds*
For the period of December 1, 2013, through May 31, 2014, as provided by the US Multi-Asset Group.
Market Review and Outlook
What Happened
The Fellowship of the Central Bankers
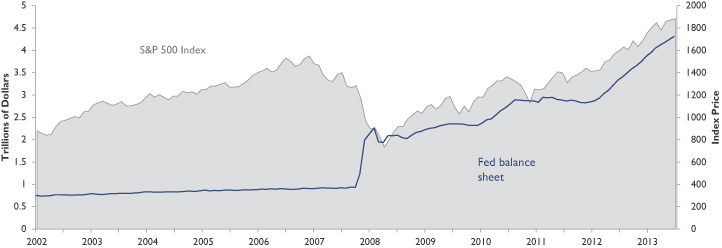
For the six months ending May 31, 2014, a handful of central banks and their leaders—what we have termed, the fellowship of the central bankers—remained a key driver of market returns. As has been the case for recent periods, we believe that this fellowship contributed to most risk assets around the world rising and most government bond yields around the world falling. This is evident in the chart below that tracks the unprecedented expansion of the Fed’s balance sheet and the persistent upward march of the S&P 500 Index.
In the US, the taper announcement came at the December Federal Open Market Committee (FOMC) meeting and was implemented in January with a $10 billion reduction to Treasury bonds and mortgage-backed security purchases. The new Chair of the Federal Reserve, Janet Yellen, assumed her position at the helm of the FOMC and did not waste time making changes. At her first meeting in March, she both changed the nature of the Fed’s forward guidance from quantitative (targeted at least in part to achieving 6.5% unemployment) to qualitative and refocused market attention on speculating about the end of the Fed’s Zero Interest Rate Policy (ZIRP), which has been in place now for five years. In the wake of the changes, US 10-year Treasury yields continued to plummet from their recent high of 3.00% in late December to a low of 2.44% on May 28, 2014.
Around the world, the fellowship of the central bankers continued to influence markets with the result similar to that of the chart below. In Europe, during the period, European Central Bank (ECB) president Mario Draghi’s comments about the appreciation of the Euro and his reference to the possibility of further quantitative easing contributed to peripheral bond yields falling. In Spain, the yield on 10-year government bonds fell from 4.24% on December 5, 2013 to 2.82% on May 28, 2014 and in Italy, the yield on such bonds fell from a high of 4.22% on December 5, 2013 to 2.91% on May 14, 2014. (Yields in each moved steadily downward in June as well). Evidence of an economic recovery in both the core countries of Europe, including Germany and France, as well as the periphery also contributed to bond price appreciation. Elsewhere, the Bank of Japan (BOJ) continued its aggressive quantitative easing program. In the United Kingdom, the Bank of England maintained its record low interest rate and left unchanged its stimulus program of holding 375 billion pounds in government bonds.
United States, Europe and Emerging Markets
In the US, in the period from January through March, market observers had two big questions: First, would US growth continue despite a soft patch related to bad weather throughout parts of the country; and second, would markets avoid a repeat of the “taper tantrum” episode observed last spring. As it turned out, we learned in April that the answer to both was “yes.” The employment, retail sales and manufacturing data for March showed significant improvement compared with February, and most major asset classes posted positive returns for the quarter.
For the six-month period ending May 31, 2014, US equities were up 7.62% based on the S&P 500 Index and 5 to 10-year Treasuries were up 2.28% based on the Barclays US Treasury 5-10Yr Index.
Globally, in broad terms, equities and bonds were up as well: MSCI ACWI returned 6.02% and the Barclays Global Aggregate Index returned 3.55%. In fixed income, as with the previous period, the “fellowship of the central bankers” influenced all bond markets—including US Treasuries, where yields fluctuated, but remained in a range.
Global equities benefited from a steady recovery in Europe, which attracted both attention and capital inflows and drove up the value of the euro. The core and periphery of Europe saw positive equity performance. The periphery outperformed, with Spain up 12.99% and Italy up 15.96% (each based on respective MSCI dollar-denominated indexes). In the developed world, Japan was an underperformer, returning -3.56% in dollar terms.
For the period, emerging markets (EM) underperformed developed markets. Performance in EM was mixed for the period. From December 1, 2013 through early February, the MSCI Emerging Markets Index lost roughly 9.5%. However, from February 5 through May 23, the index was up 13.8%. Overall, emerging market stocks finished the period up 1.89%. Despite uncertainties surrounding growth in several key emerging-market countries, commodity prices, which are generally tightly linked to EM, finished the period up 7.77% led by energy, including Natural Gas which was up 23.03% and petroleum up 6.03%, based on the Dow Jones UBS Commodity Index.
* The “Target-Date Funds” are the AllianzGI Retirement 2015 Fund, the AllianzGI Retirement 2020 Fund, the AllianzGI Retirement 2025 Fund, the AllianzGI Retirement 2030 Fund, the AllianzGI Retirement 2035 Fund, the AllianzGI Retirement 2040 Fund, the AllianzGI Retirement 2045 Fund, the AllianzGI Retirement 2050 Fund and the AllianzGI Retirement 2055 Fund. The “Target Risk Funds” are the AllianzGI Retirement Income Fund, the AllianzGI Global Allocation Fund and the AllianzGI Global Allocation Fund.
| 4 | May 31, 2014 | | Semiannual Report |
Table of Contents
Unaudited
AllianzGI Target-Date and Target Risk Funds (cont’d)
Outlook
At the close of the reporting period, we believe that investors are left with few options. The first is simply waiting out the central banks’ financial repression strategy, and slowly losing money in real terms with the losses adding up over time. At a 2.5% inflation rate, an account earning a zero nominal rate loses 14.0% of its value after six years.
Alternatively, investors can buy risky assets and follow the “Don’t Fight the Fed, ECB, BOE and BOJ” rule. Such an approach relies on further price/earnings expansion (or at least no contraction) and some earnings growth. This is an increasingly difficult proposition as global central banks push asset prices up and bond yields below inflation. This strategy involves hunting for still-undervalued assets to realize both earnings growth and expansions in valuation, as well as for sustainable and growing dividends. We believe that the opportunity set is limited.
Patience may turn out to be the best investment strategy during what is now the sixth year of financial repression. When spreads are tight, shorter-term real rates are negative and valuations are high almost everywhere, a slow but small loss of purchasing power is not the worst outcome. And recovering economies have pockets of value and opportunities for growth.
As a result, our favored investment themes are short-duration credit risk, high-quality dividends with growth and the few remaining value opportunities. Carefully building portfolios around these themes, while waiting out the recovery and central-bank normalization, is expected to pay off eventually. This is a global exercise. There will be times of stress that will be accompanied by sharp sell-offs. Since evidence indicates that the economy and equity markets could be in a long-term uptrend, these sell-offs, when acute, can be the time to buy.
At the end of the period, AllianzGI Target-Date Funds and AllianzGI Retirement Income Fund remain underweight hard duration and exposed to fixed-income strategies that may benefit in rising-rate environments. The portfolios remain modestly underweight commodities and real estate relative to their benchmarks. All of the portfolios are within their benchmark-determined risk budgets.
During the reporting period, several changes to the Target-Date and Target Risk Funds’ portfolios were made including, in the fixed income portion, a net reduction to hard duration through trimming the PIMCO Real Return Fund and the PIMCO Mortgage Opportunities Fund. To this end, the PIMCO Senior Floating Rate Fund was also added. There was an increase in the Funds’ exposure to equities in Spain, given the recovery in Europe and based on the team’s work to find opportunities based on valuations. Exposure to emerging market equities was reduced in early January and further reduced later in the period at least in part to further underweight markets that have not yet implemented what we believe are needed structural reforms.
| Semiannual Report | | May 31, 2014 | 5 |
Table of Contents
Unaudited
AllianzGI Retirement 2015 Fund
For the period of December 1, 2013 through May 31, 2014, as provided by the US Multi-Asset Group.
Fund Insights
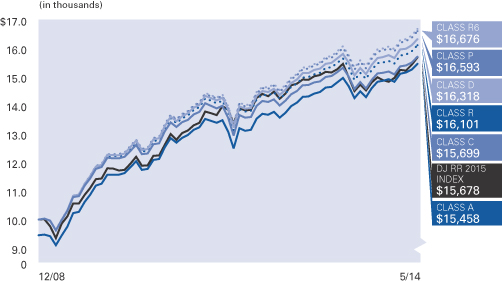
For the reporting period ended May 31, 2014, Class A shares at Net Asset Value (“NAV”) of the AllianzGI Retirement 2015 Fund (the “Fund”) returned 4.04% underperforming the Dow Jones Real Return 2015 Index (the “benchmark index”) which returned 5.31%.
Portfolio Review
The Fund finished the six-month period ended May 31, 2014 within its risk budget but trailed the benchmark index. The underperformance was primarily a result of asset allocation positioning and security selection decisions.
During the reporting period, and relative to the benchmark index, the Fund held underweights in real-return assets (including real estate and commodities futures), and Treasury inflation-protected securities (TIPS). Although the Fund was underweight these asset classes relative to its benchmark index, it remains among the most diversified within its Morningstar category, with relatively higher allocations to real estate and commodities. The Fund held an overweight position to global equities because it is overweight US large-cap and international large-cap equities. The Fund is underweight duration and the fixed income portion of the portfolio held off-benchmark exposure in international sovereign bonds and short-term US nominal bonds.
From an asset-class perspective, allocations away from global equities into commodities and real
estate helped the Fund relative to its peers however it was underweight these asset classes relative to its benchmark index, which was a detractor from the reporting period’s relative return. Commodities and real estate both rebounded and outperformed the global equity market after underperforming earlier in 2013. The DJ UBS Commodity Index was up 7.77% and the DJ US Select REIT Index rose 17.88% during the reporting period.
Positioning within the Fund’s fixed income portfolio also detracted from relative returns, in part due to an off benchmark exposure in international bonds. An underweight in duration further detracted as the long end of the US Treasury curve outperformed the short end. (The US Treasury 10-20 Year Index returned 6.26% versus the Barclays US Aggregate Index which returned 3.28%). While yields fell during the period, the negative effect on the portfolio was partially offset by the Fund’s positioning within inflation-protected bonds. An underweight to intermediate-term TIPS contributed to overall performance.
Within the equity component of the portfolio, the Fund’s overweight to US and international large-cap equities helped relative returns with the S&P 500 and MSCI EAFE both posting strong absolute returns of 7.62% and 5.33%, respectively. Selection within the global equity component of the Fund detracted from the reporting period’s relative return which was to a large part driven by the AllianzGI International
Small-Cap Fund underperforming the MSCI World ex-US Small Cap Index.
Exposure to underlying funds implementing managed-volatility strategies had a mixed effect on relative returns with the AllianzGI International Managed Volatility Fund outperforming its respective benchmark, while the AllianzGI U.S. Managed Volatility Fund and AllianzGI Global Managed Volatility Fund underperformed their respective benchmarks. The AllianzGI U.S. Managed Volatility Fund was hindered by the outperformance of higher-volatility equities over their lower-volatility counterparts during December 2013 and in May 2014.
In aggregate, an underweight in the Fund’s duration and positioning within commodities and real estate were the primary detractors for relative returns during the reporting period. The AllianzGI Target-Date Funds place a strong emphasis on the Department of Labor’s guidelines for a qualified default investment alternative (QDIA), which states that a QDIA should be “diversified as to minimize the risk of large losses.” It is within this framework that the Funds continue to allocate to commodities, real estate, convertible bonds, high yield-bonds, emerging-market equities, frontier-market equities and emerging-market bonds within the return-generating segment of the portfolio to help provide diversification benefits to investors’ retirement assets.
| 6 | May 31, 2014 | | Semiannual Report |
Table of Contents
Unaudited
AllianzGI Retirement 2015 Fund (cont’d)
Average Annual Total Return for the period ended May 31, 2014
| 6 Month* | 1 Year | 5 Year | Since Inception† | |||||||||||||||
| AllianzGI Retirement 2015 Fund Class A | 4.04% | 5.39% | 8.60% | 9.50% | ||||||||||||||
| AllianzGI Retirement 2015 Fund Class A (adjusted) | –1.68% | –0.41% | 7.38% | 8.37% | |||||||||||||
| AllianzGI Retirement 2015 Fund Class C | 3.68% | 4.61% | 7.79% | 8.68% | ||||||||||||||
| AllianzGI Retirement 2015 Fund Class C (adjusted) | 2.68% | 3.61% | 7.79% | 8.68% | |||||||||||||
| AllianzGI Retirement 2015 Fund Class D | 3.99% | 5.28% | 8.54% | 9.45% | |||||||||||||
| AllianzGI Retirement 2015 Fund Class R | 3.90% | 5.04% | 8.28% | 9.19% | |||||||||||||
| AllianzGI Retirement 2015 Fund Class P | 4.22% | 5.72% | 8.89% | 9.79% | |||||||||||||
| AllianzGI Retirement 2015 Fund Class R6 | 4.27% | 5.83% | 8.98% | 9.89% | |||||||||||||
| AllianzGI Retirement 2015 Fund Administrative Class | 4.12% | 5.46% | 8.65% | 9.56% | ||||||||||||||
| Dow Jones Real Return 2015 Index | 5.31% | 4.67% | 8.20% | 8.65% | |||||||||||||
| Lipper Mixed-Asset Target 2015 Funds Average | 4.28% | 8.63% | 10.43% | 10.96% | ||||||||||||||
† The Fund began operations on 12/29/08. Benchmark return comparisons began on the fund inception date. Lipper performance comparisons began on 12/31/08.
* Cumulative return.
Performance quoted represents past performance and is no guarantee of future results. Current performance may be lower or higher than performance shown. For performance current to the most recent month-end, visit our website at us.allianzgi.com. Investment return and the principal value will fluctuate. Shares may be worth more or less than original cost when redeemed. The adjusted returns take into account the maximum initial sales charge of 5.50% on Class A shares and the contingent deferred sales charge (CDSC) of 1% on Class C shares, which may apply to shares redeemed during the first year of ownership. Returns do not reflect deduction of taxes that a shareholder would pay on fund distributions or redemption of fund shares. See pages 86 and 87 for more information. The Fund’s gross expense ratios are 1.17% for Class A shares, 1.92% for Class C shares, 1.17% for Class D shares, 1.42% for Class R shares, 0.77% for Class P shares, 0.67% for Class R6 shares and 1.02% for Administrative Class shares. These ratios do not include an expense reduction, contractually guaranteed through at least 3/31/15. The Fund’s expense ratios net of this reduction are 0.97% for Class A shares, 1.72% for Class C shares, 1.07% for Class D shares, 1.32% for Class R shares, 0.67% for Class P shares, 0.57% for Class R6 shares and 0.92% for Administrative Class shares. Expense ratio information is as of the Fund’s current prospectus dated April 1, 2014, as supplemented to date.
Cumulative Returns Through May 31, 2014
Fund Allocation (as of May 31, 2014)
| PIMCO 1-5 Year U.S. TIPS Index | 12.0% | |||
| PIMCO Income | 10.0% | |||
| PIMCO Real Return | 9.0% | |||
| PIMCO Short-term | 8.0% | |||
| PIMCO Senior Floating Rate | 5.5% | |||
| AllianzGI Short Duration High Income | 5.5% | |||
| PIMCO Floating Income | 5.0% | |||
| PIMCO Mortgage Opportunities | 4.0% | |||
| Other | 40.3% | |||
| Cash & Equivalents — Net | 0.7% |
| Semiannual Report | | May 31, 2014 | 7 |
Table of Contents
Unaudited
AllianzGI Retirement 2015 Fund (cont’d)
| Shareholder Expense Example | Actual Performance | |||||||||||||
| Class A | Class C | Class D | Class R | Class P | Class R6 | Administrative Class | ||||||||
| Beginning Account Value (12/1/13) | $1,000.00 | $1,000.00 | $1,000.00 | $1,000.00 | $1,000.00 | $1,000.00 | $1,000.00 | |||||||
| Ending Account Value (5/31/14) | $1,040.40 | $1,036.80 | $1,039.90 | $1,039.00 | $1,042.20 | $1,042.70 | $1,041.20 | |||||||
| Expenses Paid During Period | $2.03 | $5.84 | $2.54 | $3.81 | $0.51 | $— | $1.78 | |||||||
| Hypothetical Performance | ||||||||||||||
| (5% return before expenses) | ||||||||||||||
| Class A | Class C | Class D | Class R | Class P | Class R6 | Administrative Class | ||||||||
| Beginning Account Value (12/1/13) | $1,000.00 | $1,000.00 | $1,000.00 | $1,000.00 | $1,000.00 | $1,000.00 | $1,000.00 | |||||||
| Ending Account Value (5/31/14) | $1,022.94 | $1,019.20 | $1,022.44 | $1,021.19 | $1,024.43 | $1,024.93 | $1,023.19 | |||||||
| Expenses Paid During Period | $2.02 | $5.79 | $2.52 | $3.78 | $0.50 | $— | $1.77 | |||||||
For each class of the Fund, expenses (net of fee waiver and reimbursement, if any) are equal to the annualized expense ratio for the class (0.40% for Class A, 1.15% for Class C, 0.50% for Class D, 0.75% for Class R, 0.10% for Class P, 0.00% for Class R6 and 0.35% for Administrative Class), multiplied by the average account value over the period, multiplied by 182/365. The expense ratio does not include the expenses of the Underlying Funds, which based upon the allocation of the Fund’s assets among the Underlying Funds are indirectly borne by the shareholders of the Fund.
| 8 | May 31, 2014 | | Semiannual Report |
Table of Contents
Unaudited
AllianzGI Retirement 2020 Fund
For the period of December 1, 2013 through May 31, 2014, as provided by the US Multi Asset Group.
Fund Insights
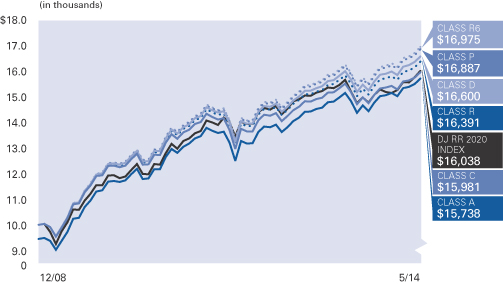
For the reporting period ended May 31, 2014, Class A shares at NAV of the AllianzGI Retirement 2020 Fund (the “Fund”) returned 4.33% underperforming the Dow Jones Real Return 2020 Index (the “benchmark index”) which returned 5.45%.
Portfolio Review
The Fund finished the six month period ended May 31, 2014 within its risk budget but trailed the benchmark index. The underperformance was primarily a result of asset allocation positioning and security selection decisions.
During the reporting period, and relative to the benchmark index, the Fund held underweights in real-return assets (including real estate and commodities futures), and Treasury inflation-protected securities (TIPS). Although the Fund was underweight these asset classes relative to its benchmark index, it remains among the most diversified within its Morningstar category, with relatively higher allocations to real estate and commodities. The Fund held an overweight position to global equities because it is overweight US large-cap and international large-cap equities. The Fund is underweight duration and the fixed income portion of the portfolio held off-benchmark exposure in international sovereign bonds and short-term US nominal bonds.
From an asset-class perspective, allocations away from global equities into commodities and real
estate helped the Fund relative to its peers however it was underweight these asset classes relative to its benchmark index, which was a detractor from the reporting period’s relative return. Commodities and real estate both rebounded and outperformed the global equity market after underperforming earlier in 2013. The DJ UBS Commodity Index was up 7.77% and the DJ US Select REIT Index rose 17.88% during the reporting period.
Positioning within the Fund’s fixed income portfolio also detracted from relative returns, in part due to an off benchmark exposure in international bonds. An underweight in duration further detracted as the long end of the US Treasury curve outperformed the short end. (The US Treasury 10-20 Year Index returned 6.26% versus the Barclays US Aggregate Index which returned 3.28%). While yields fell during the period, the negative effect on the portfolio was partially offset by the Fund’s positioning within inflation-protected bonds. An underweight to intermediate-term TIPS contributed to overall performance.
Within the equity component of the portfolio, the Fund’s overweight to US and international large-cap equities helped relative returns with the S&P 500 and MSCI EAFE both posting strong absolute returns of 7.62% and 5.33%, respectively. Selection within the global equity component of the Fund detracted from the reporting period’s relative return which was to a large part driven by the AllianzGI International
Small-Cap Fund underperforming the MSCI World ex-US Small Cap Index.
Exposure to underlying funds implementing managed-volatility strategies had a mixed effect on relative returns with the AllianzGI International Managed Volatility Fund outperforming its respective benchmark index, while the AllianzGI U.S. Managed Volatility Fund and AllianzGI Global Managed Volatility Fund underperformed their respective benchmarks. The AllianzGI U.S. Managed Volatility Fund was hindered by the outperformance of higher-volatility equities over their lower-volatility counterparts during December 2013 and in May 2014.
In aggregate, an underweight in the Fund’s duration and positioning within commodities and real estate were the primary detractors for relative returns during the reporting period. The AllianzGI Target-Date Funds place a strong emphasis on the Department of Labor’s guidelines for a qualified default investment alternative (QDIA), which states that a QDIA should be “diversified as to minimize the risk of large losses.” It is within this framework that the Funds continue to allocate to commodities, real estate, convertible bonds, high yield-bonds, emerging-market equities, frontier-market equities and emerging-market bonds within the return-generating segment of the portfolio to help provide diversification benefits to investors’ retirement assets.
| Semiannual Report | | May 31, 2014 | 9 |
Table of Contents
Unaudited
AllianzGI Retirement 2020 Fund (cont’d)
Average Annual Total Return for the period ended May 31, 2014
| 6 Month* | 1 Year | 5 Year | Since Inception† | |||||||||||||||
| AllianzGI Retirement 2020 Fund Class A | 4.33% | 5.93% | 8.95% | 9.87% | ||||||||||||||
| AllianzGI Retirement 2020 Fund Class A (adjusted) | –1.41% | 0.10% | 7.73% | 8.73% | |||||||||||||
| AllianzGI Retirement 2020 Fund Class C | 3.92% | 5.14% | 8.12% | 9.03% | ||||||||||||||
| AllianzGI Retirement 2020 Fund Class C (adjusted) | 2.92% | 4.14% | 8.12% | 9.03% | |||||||||||||
| AllianzGI Retirement 2020 Fund Class D | 4.24% | 5.78% | 8.88% | 9.80% | |||||||||||||
| AllianzGI Retirement 2020 Fund Class R | 4.14% | 5.58% | 8.63% | 9.55% | |||||||||||||
| AllianzGI Retirement 2020 Fund Class P | 4.48% | 6.24% | 9.24% | 10.15% | |||||||||||||
| AllianzGI Retirement 2020 Fund Class R6 | 4.53% | 6.40% | 9.34% | 10.26% | |||||||||||||
| AllianzGI Retirement 2020 Fund Administrative Class | 4.36% | 5.96% | 9.00% | 9.92% | ||||||||||||||
| Dow Jones Real Return 2020 Index | 5.45% | 5.28% | 8.61% | 9.11% | |||||||||||||
| Lipper Mixed-Asset Target 2020 Funds Average | 4.49% | 9.69% | 11.16% | 11.59% | ||||||||||||||
† The Fund began operations on 12/29/08. Benchmark return comparisons began on the fund inception date. Lipper performance comparisons began on 12/31/08.
* Cumulative return.
Performance quoted represents past performance and is no guarantee of future results. Current performance may be lower or higher than performance shown. For performance current to the most recent month-end, visit our website at us.allianzgi.com. Investment return and the principal value will fluctuate. Shares may be worth more or less than original cost when redeemed. The adjusted returns take into account the maximum initial sales charge of 5.50% on Class A shares and the contingent deferred sales charge (CDSC) of 1% on Class C shares, which may apply to shares redeemed during the first year of ownership. Returns do not reflect deduction of taxes that a shareholder would pay on fund distributions or redemption of fund shares. See pages 86 and 87 for more information. The Fund’s gross expense ratios are 1.19% for Class A shares, 1.94% for Class C shares, 1.19% for Class D shares, 1.44% for Class R shares, 0.79% for Class P shares, 0.69% for Class R6 shares and 1.04% for Administrative Class shares. These ratios do not include an expense reduction, contractually guaranteed through at least 3/31/15. The Fund’s expense ratios net of this reduction are 0.99% for Class A shares, 1.74% for Class C shares, 1.09% for Class D shares, 1.34% for Class R shares, 0.69% for Class P shares, 0.59% for Class R6 shares and 0.94% for Administrative Class shares. Expense ratio information is as of the Fund’s current prospectus dated April 1, 2014, as supplemented to date.
Cumulative Returns Through May 31, 2014
Fund Allocation (as of May 31, 2014)
| PIMCO 1-5 Year U.S. TIPS Index | 11.5% | |||
| PIMCO Income | 9.0% | |||
| PIMCO Real Return | 9.0% | |||
| PIMCO Senior Floating rate | 5.5% | |||
| AllianzGI Short Duration High Income | 5.5% | |||
| PIMCO Short-Term | 5.5% | |||
| PIMCO Floating Income | 5.0% | |||
| AllianzGI Best Styles Global Equity | 4.0% | |||
| Other | 44.2% | |||
| Cash & Equivalents — Net | 0.8% |
| 10 | May 31, 2014 | | Semiannual Report |
Table of Contents
Unaudited
AllianzGI Retirement 2020 Fund (cont’d)
| Shareholder Expense Example | Actual Performance | |||||||||||||
| Class A | Class C | Class D | Class R | Class P | Class R6 | Administrative Class | ||||||||
| Beginning Account Value (12/1/13) | $1,000.00 | $1,000.00 | $1,000.00 | $1,000.00 | $1,000.00 | $1,000.00 | $1,000.00 | |||||||
| Ending Account Value (5/31/14) | $1,043.30 | $1,039.20 | $1,042.40 | $1,041.40 | $1,044.80 | $1,045.30 | $1,043.60 | |||||||
| Expenses Paid During Period | $2.04 | $5.85 | $2.55 | $3.82 | $0.51 | $— | $1.78 | |||||||
| Hypothetical Performance | ||||||||||||||
| (5% return before expenses) | ||||||||||||||
| Class A | Class C | Class D | Class R | Class P | Class R6 | Administrative Class | ||||||||
| Beginning Account Value (12/1/13) | $1,000.00 | $1,000.00 | $1,000.00 | $1,000.00 | $1,000.00 | $1,000.00 | $1,000.00 | |||||||
| Ending Account Value (5/31/14) | $1,022.94 | $1,019.20 | $1,022.44 | $1,021.19 | $1,024.43 | $1,024.93 | $1,023.19 | |||||||
| Expenses Paid During Period | $2.02 | $5.79 | $2.52 | $3.78 | $0.50 | $— | $1.77 | |||||||
For each class of the Fund, expenses (net of fee waiver and reimbursement, if any) are equal to the annualized expense ratio for the class (0.40% for Class A, 1.15% for Class C, 0.50% for Class D, 0.75% for Class R, 0.10% for Class P, 0.00% for Class R6 and 0.35% for Administrative Class), multiplied by the average account value over the period, multiplied by 182/365. The expense ratio does not include the expenses of the Underlying Funds, which based upon the allocation of the Fund’s assets among the Underlying Funds are indirectly borne by the shareholders of the Fund.
| Semiannual Report | | May 31, 2014 | 11 |
Table of Contents
Unaudited
AllianzGI Retirement 2025 Fund
For the period of December 1, 2013 through May 31, 2014, as provided by the US Multi Asset Group.
Fund Insights
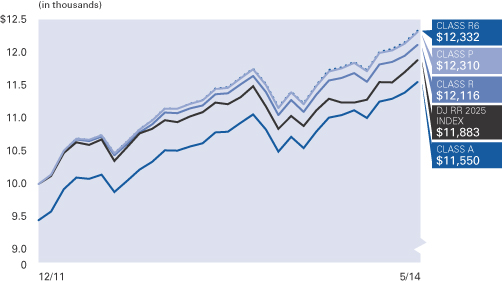
For the reporting period ended May 31, 2014, Class A shares at NAV of the AllianzGI Retirement 2025 Fund (the “Fund”) returned 4.52% underperforming the Dow Jones Real Return 2025 Index (the “benchmark index”) which returned 5.71%.
Portfolio Review
The Fund finished the six month period ended May 31, 2014 within its risk budget but trailed the benchmark index. The underperformance was primarily a result of asset allocation positioning and security selection decisions.
During the reporting period, and relative to the benchmark index, the Fund held underweights in real-return assets (including real estate and commodities futures), and Treasury inflation-protected securities (TIPS). Although the Fund was underweight these asset classes relative to its benchmark index, it remains among the most diversified within its Morningstar category, with relatively higher allocations to real estate and commodities. The Fund held an overweight position to global equities because it is overweight US large-cap and international large-cap equities. The Fund is underweight duration and the fixed income portion of the portfolio held off-benchmark exposure in international sovereign bonds and short-term US nominal bonds.
From an asset-class perspective, allocations away from global equities into commodities and real
estate helped the fund relative to its peers however it was underweight these asset classes relative to its benchmark index, which was a detractor from the reporting period’s relative return. Commodities and real estate both rebounded and outperformed the global equity market after underperforming earlier in 2013. The DJ UBS Commodity Index was up 7.77% and the DJ US Select REIT index rose 17.88% during the reporting period.
Positioning within the Fund’s fixed income portfolio also detracted from relative returns, in part due to an off benchmark exposure in international bonds. An underweight in duration further detracted as the long end of the US Treasury curve outperformed the short end. (The US Treasury 10-20 Year Index returned 6.26% versus the Barclays US Aggregate Index which returned 3.28%). While yields fell during the period, the negative effect on the portfolio was partially offset by the Fund’s positioning within inflation-protected bonds. An underweight to intermediate-term TIPS contributed to overall performance.
Within the equity component of the portfolio, the Fund’s overweight to US and international large-cap equities helped relative returns with the S&P 500 and MSCI EAFE both posting strong absolute returns of 7.62% and 5.33%, respectively. Selection within the global equity component of the Fund detracted from the reporting period’s relative return which was to a large part driven by the AllianzGI International
Small-Cap Fund underperforming the MSCI World ex-US Small Cap Index.
Exposure to underlying funds implementing managed-volatility strategies had a mixed effect on relative returns with the AllianzGI International Managed Volatility Fund outperforming its respective benchmark, while the AllianzGI U.S. Managed Volatility Fund and AllianzGI Global Managed Volatility Fund underperformed their respective benchmarks. The AllianzGI U.S. Managed Volatility Fund was hindered by the outperformance of higher-volatility equities over their lower-volatility counterparts during December 2013 and in May 2014.
In aggregate, an underweight in the Fund’s duration and positioning within commodities and real estate were the primary detractors for relative returns during the reporting period. The AllianzGI Target-Date Funds place a strong emphasis on the Department of Labor’s guidelines for a qualified default investment alternative (QDIA), which states that a QDIA should be “diversified as to minimize the risk of large losses.” It is within this framework that the Funds continue to allocate to commodities, real estate, convertible bonds, high yield-bonds, emerging-market equities, frontier-market equities and emerging-market bonds within the return-generating segment of the portfolio to help provide diversification benefits to investors’ retirement assets.
| 12 | May 31, 2014 | | Semiannual Report |
Table of Contents
Unaudited
AllianzGI Retirement 2025 Fund (cont’d)
Average Annual Total Return for the period ended May 31, 2014
6 Month* | 1 Year | Since Inception† | ||||||||||||
| AllianzGI Retirement 2025 Fund Class A | 4.52% | 6.67% | 8.54% | |||||||||||
| AllianzGI Retirement 2025 Fund Class A (adjusted) | –1.23% | 0.80% | 6.06% | ||||||||||
| AllianzGI Retirement 2025 Fund Class R | 4.31% | 6.27% | 8.15% | ||||||||||
| AllianzGI Retirement 2025 Fund Class P | 4.67% | 7.00% | 8.87% | ||||||||||
| AllianzGI Retirement 2025 Fund Class R6 | 4.72% | 7.05% | 8.95% | ||||||||||
| AllianzGI Retirement 2025 Fund Administrative Class | 4.56% | 6.70% | 8.58% | |||||||||||
| Dow Jones Real Return 2025 Index | 5.71% | 6.27% | 7.30% | ||||||||||
| Lipper Mixed-Asset Target 2025 Funds Average | 5.06% | 12.06% | 13.19% | |||||||||||
† The Fund began operations on 12/19/11. Benchmark return comparisons began on the fund inception date. Lipper performance comparisons began on 12/31/11.
* Cumulative return.
Performance quoted represents past performance and is no guarantee of future results. Current performance may be lower or higher than performance shown. For performance current to the most recent month-end, visit our website at us.allianzgi.com. Investment return and the principal value will fluctuate. Shares may be worth more or less than original cost when redeemed. The adjusted returns take into account the maximum initial sales charge of 5.50% on Class A shares. Returns do not reflect deduction of taxes that a shareholder would pay on fund distributions or redemption of fund shares. See pages 86 and 87 for more information. The Fund’s gross expense ratios are 1.21% for Class A shares, 1.46% for Class R shares, 0.81% for Class P shares, 0.71% for Class R6 shares and 1.06% for Administrative Class shares. These ratios do not include an expense reduction, contractually guaranteed through at least 3/31/15. The Fund’s expense ratios net of this reduction are 1.01% for Class A shares, 1.36% for Class R shares, 0.71% for Class P shares, 0.61% for Class R6 shares and 0.96% for Administrative Class shares. Expense ratio information is as of the Fund’s current prospectus dated April 1, 2014, as supplemented to date.
Cumulative Returns Through May 31, 2014
Fund Allocation (as of May 31, 2014)
| PIMCO Income | 8.5% | |||
| PIMCO Real Return | 8.0% | |||
| PIMCO 1-5 Year U.S. TIPS Index | 7.9% | |||
| PIMCO Senior Floating Rate | 5.5% | |||
| AllianzGI Short Duration High Income | 5.4% | |||
| PIMCo Floating Income | 5.0% | |||
| PIMCO Short-Term | 4.9% | |||
| AllianzGI Best Styles Global Equity | 4.5% | |||
| Other | 49.3% | |||
| Cash & Equivalents — Net | 1.0% |
| Semiannual Report | | May 31, 2014 | 13 |
Table of Contents
Unaudited
AllianzGI Retirement 2025 Fund (cont’d)
| Shareholder Expense Example | Actual Performance | |||||||||
| Class A | Class R | Class P | Class R6 | Administrative Class | ||||||
| Beginning Account Value (12/1/13) | $1,000.00 | $1,000.00 | $1,000.00 | $1,000.00 | $1,000.00 | |||||
| Ending Account Value (5/31/14) | $1,045.20 | $1,043.10 | $1,046.70 | $1,047.20 | $1,045.60 | |||||
| Expenses Paid During Period | $2.04 | $3.82 | $0.51 | $— | $1.78 | |||||
| Hypothetical Performance | ||||||||||
| (5% return before expenses) | ||||||||||
| Class A | Class R | Class P | Class R6 | Administrative Class | ||||||
| Beginning Account Value (12/1/13) | $1,000.00 | $1,000.00 | $1,000.00 | $1,000.00 | $1,000.00 | |||||
| Ending Account Value (5/31/14) | $1,022.94 | $1,021.19 | $1,024.43 | $1,024.93 | $1,023.19 | |||||
| Expenses Paid During Period | $2.02 | $3.78 | $0.50 | $— | $1.77 | |||||
For each class of the Fund, expenses (net of fee waiver and reimbursement, if any) are equal to the annualized expense ratio for the class (0.40% for Class A, 0.75% for Class R, 0.10% for Class P, 0.00% for Class R6 and 0.35% for Administrative Class), multiplied by the average account value over the period, multiplied by 182/365. The expense ratio does not include the expenses of the Underlying Funds, which based upon the allocation of the Fund’s assets among the Underlying Funds are indirectly borne by the shareholders of the Fund.
| 14 | May 31, 2014 | | Semiannual Report |
Table of Contents
Unaudited
AllianzGI Retirement 2030 Fund
For the period of December 1, 2013 through May 31, 2014, as provided by the US Multi Asset Group.
Fund Insights
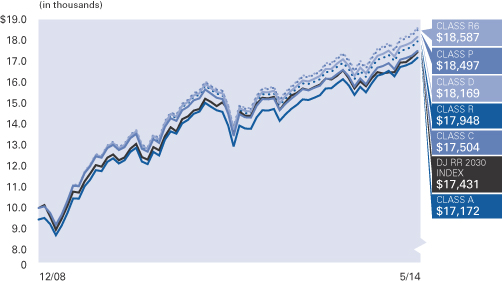
For the reporting period ended May 31, 2014, Class A shares at NAV of the AllianzGI Retirement 2030 Fund (the “Fund”) returned 4.71% underperforming the Dow Jones Real Return 2030 Index (the “benchmark index”) which returned 6.10%.
Portfolio Review
The Fund finished the six month period ended May 31, 2014 within its risk budget but trailed its benchmark index. The underperformance was primarily a result of asset allocation positioning and security selection decisions.
During the reporting period, and relative to the benchmark index, the Fund held underweights in real-return assets (including real estate and commodities futures), and Treasury inflation-protected securities (TIPS). Although the Fund was underweight these asset classes relative to its benchmark index, it remains among the most diversified within its Morningstar category, with relatively higher allocations to real estate and commodities. The Fund held an overweight position to global equities because it is overweight international large-cap equities, international small-cap equities, and US small-cap equities. The Fund is underweight duration. The fixed income portion of the portfolio held off-benchmark exposure in international sovereign bonds and short-term US nominal bonds.
From an asset-class perspective, allocations away from global equities into commodities and real
estate helped the Fund relative to its peers however it was underweight these asset classes relative to its benchmark, which was a detractor from the reporting period’s relative return. Commodities and real estate both rebounded and outperformed the global equity market after underperforming earlier in 2013. The DJ UBS Commodity Index was up 7.77% and the DJ US Select REIT Index rose 17.88% during the reporting period.
Positioning within the Fund’s fixed income portfolio also detracted from relative returns, in part due to an off benchmark exposure in international bonds. An underweight in duration further detracted as the long end of the US Treasury curve outperformed the short end. (The US Treasury 10-20 Year Index returned 6.26% versus the Barclays US Aggregate Index which returned 3.28%). While yields fell during the period, the negative effect on the portfolio was partially offset by the Fund’s positioning within inflation-protected bonds. An underweight to intermediate-term TIPS contributed to overall performance.
Within the equity component of the portfolio, the Fund’s overweight to international large-cap equities helped relative returns with the MSCI EAFE posting a strong absolute return of 5.33%. Selection within the global equity component of the Fund detracted from the reporting period’s relative return which was to a large part driven by the AllianzGI International Small-Cap Fund
underperforming the MSCI World ex-US Small Cap Index.
Exposure to underlying funds implementing managed-volatility strategies had a mixed effect on relative returns with the AllianzGI International Managed Volatility Fund outperforming its respective benchmark, while the AllianzGI U.S. Managed Volatility Fund and AllianzGI Global Managed Volatility Fund underperformed their respective benchmarks. The AllianzGI U.S. Managed Volatility Fund was hindered by the outperformance of higher-volatility equities over their lower-volatility counterparts during December 2013 and in May 2014.
In aggregate, an underweight in the Fund’s duration and positioning within commodities and real estate were the primary detractors for relative returns during the reporting period. The AllianzGI Target-Date Funds place a strong emphasis on the Department of Labor’s guidelines for a qualified default investment alternative (QDIA), which states that a QDIA should be “diversified as to minimize the risk of large losses.” It is within this framework that the Funds continue to allocate to commodities, real estate, convertible bonds, high yield-bonds, emerging-market equities, frontier-market equities and emerging-market bonds within the return-generating segment of the portfolio to help provide diversification benefits to investors’ retirement assets.
| Semiannual Report | | May 31, 2014 | 15 |
Table of Contents
Unaudited
AllianzGI Retirement 2030 Fund (cont’d)
Average Annual Total Return for the period ended May 31, 2014
| 6 Month* | 1 Year | 5 Year | Since Inception† | |||||||||||||||
| AllianzGI Retirement 2030 Fund Class A | 4.71% | 8.28% | 10.44% | 11.65% | ||||||||||||||
| AllianzGI Retirement 2030 Fund Class A (adjusted) | –1.05% | 2.32% | 9.20% | 10.49% | |||||||||||||
| AllianzGI Retirement 2030 Fund Class C | 4.37% | 7.48% | 9.62% | 10.89% | ||||||||||||||
| AllianzGI Retirement 2030 Fund Class C (adjusted) | 3.37% | 6.48% | 9.62% | 10.89% | |||||||||||||
| AllianzGI Retirement 2030 Fund Class D | 4.71% | 8.21% | 10.39% | 11.65% | |||||||||||||
| AllianzGI Retirement 2030 Fund Class R | 4.59% | 7.89% | 10.11% | 11.40% | |||||||||||||
| AllianzGI Retirement 2030 Fund Class P | 4.92% | 8.61% | 10.73% | 12.01% | |||||||||||||
| AllianzGI Retirement 2030 Fund Class R6 | 4.97% | 8.71% | 10.83% | 12.11% | |||||||||||||
| AllianzGI Retirement 2030 Fund Administrative Class | 4.78% | 8.32% | 10.50% | 11.78% | ||||||||||||||
| Dow Jones Real Return 2030 Index | 6.10% | 7.66% | 10.09% | 10.80% | |||||||||||||
| Lipper Mixed-Asset Target 2030 Funds Average | 5.16% | 13.00% | 12.98% | 13.44% | ||||||||||||||
† The Fund began operations on 12/29/08. Benchmark return comparisons began on the fund inception date. Lipper performance comparisons began on 12/31/08.
* Cumulative return.
Performance quoted represents past performance and is no guarantee of future results. Current performance may be lower or higher than performance shown. For performance current to the most recent month-end, visit our website at us.allianzgi.com. Investment return and the principal value will fluctuate. Shares may be worth more or less than original cost when redeemed. The adjusted returns take into account the maximum initial sales charge of 5.50% on Class A shares and the contingent deferred sales charge (CDSC) of 1% on Class C shares, which may apply to shares redeemed during the first year of ownership. Returns do not reflect deduction of taxes that a shareholder would pay on fund distributions or redemption of fund shares. See pages 86 and 87 for more information. The Fund’s gross expense ratios are 1.28% for Class A shares, 2.03% for Class C shares, 1.28% for Class D shares, 1.53% for Class R shares, 0.88% for Class P shares, 0.78% for Class R6 shares and 1.13% for Administrative Class shares. These ratios do not include an expense reduction, contractually guaranteed through at least 3/31/15. The Fund’s expense ratios net of this reduction are 1.03% for Class A shares, 1.78% for Class C shares, 1.13% for Class D shares, 1.38% for Class R shares, 0.73% for Class P shares, 0.63% for Class R6 shares and 0.98% for Administrative Class shares. Expense ratio information is as of the Fund’s current prospectus dated April 1, 2014, as supplemented to date.
Cumulative Returns Through May 31, 2014
Fund Allocation (as of May 31, 2014)
| PIMCO Income | 8.5% | |||
| AllianzGI Best Styles Global Equity | 5.5% | |||
| PIMCO Senior Floating Rate | 5.5% | |||
| PIMCO 1-5 Year U.S. TIPS Index | 5.5% | |||
| AllianzGI Short Duration High Income | 5.5% | |||
| PIMCO Floating Income | 5.0% | |||
| PIMCO Short-Term | 4.5% | |||
| AllianzGI U.S. Managed Volatility | 4.0% | |||
| Other | 55.2% | |||
| Cash & Equivalents — Net | 0.8% |
| 16 | May 31, 2014 | | Semiannual Report |
Table of Contents
Unaudited
AllianzGI Retirement 2030 Fund (cont’d)
| Shareholder Expense Example | Actual Performance | |||||||||||||
| Class A | Class C | Class D | Class R | Class P | Class R6 | Administrative Class | ||||||||
| Beginning Account Value (12/1/13) | $1,000.00 | $1,000.00 | $1,000.00 | $1,000.00 | $1,000.00 | $1,000.00 | $1,000.00 | |||||||
| Ending Account Value (5/31/14) | $1,047.10 | $1,043.70 | $1,047.10 | $1,045.90 | $1,049.20 | $1,049.70 | $1,047.80 | |||||||
| Expenses Paid During Period | $1.79 | $5.60 | $2.30 | $3.57 | $0.26 | $— | $1.53 | |||||||
| Hypothetical Performance | ||||||||||||||
| (5% return before expenses) | ||||||||||||||
| Class A | Class C | Class D | Class R | Class P | Class R6 | Administrative Class | ||||||||
| Beginning Account Value (12/1/13) | $1,000.00 | $1,000.00 | $1,000.00 | $1,000.00 | $1,000.00 | $1,000.00 | $1,000.00 | |||||||
| Ending Account Value (5/31/14) | $1,023.19 | $1,019.45 | $1,022.69 | $1,021.44 | $1,024.68 | $1,024.93 | $1,023.44 | |||||||
| Expenses Paid During Period | $1.77 | $5.54 | $2.27 | $3.53 | $0.25 | $— | $1.51 | |||||||
For each class of the Fund, expenses (net of fee waiver and reimbursement, if any) are equal to the annualized expense ratio for the class (0.35% for Class A, 1.10% for Class C, 0.45% for Class D, 0.70% for Class R, 0.05% for Class P, 0.00% for Class R6 and 0.30% for Administrative Class), multiplied by the average account value over the period, multiplied by 182/365. The expense ratio does not include the expenses of the Underlying Funds, which based upon the allocation of the Fund’s assets among the Underlying Funds are indirectly borne by the shareholders of the Fund.
| Semiannual Report | | May 31, 2014 | 17 |
Table of Contents
Unaudited
AllianzGI Retirement 2035 Fund
For the period of December 1, 2013 through May 31, 2014, as provided by the US Multi Asset Group.
Fund Insights
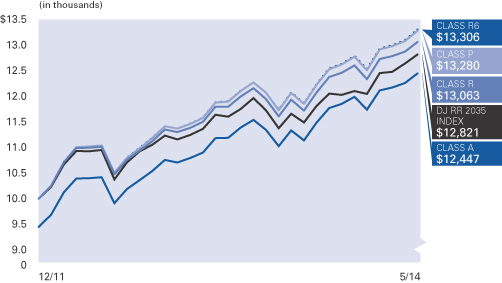
For the reporting period ended May 31, 2014, Class A shares at NAV of the AllianzGI Retirement 2035 Fund (the “Fund”) returned 5.00% underperforming the Dow Jones Real Return 2035 Index (the “benchmark index”) which returned 6.57%.
Portfolio Review
The Fund finished the six-month period ended May 31, 2014 within its risk budget but trailed benchmark index. The underperformance was primarily a result of asset allocation positioning and security selection decisions.
During the reporting period, and relative to the benchmark index, the Fund held underweights in real-return assets (including real estate and commodities futures), and Treasury inflation-protected securities (TIPS). Although the Fund was underweight these asset classes relative to its benchmark index, it remains among the most diversified within its Morningstar category, with relatively higher allocations to real estate and commodities. The Fund held an overweight position to global equities because it is overweight international large-cap equities, international small-cap equities, and US small-cap equities. The Fund is underweight duration and the fixed income portion of the portfolio held off-benchmark exposure in international sovereign bonds and short-term US nominal bonds.
From an asset-class perspective, allocations away from global equities into commodities
and real estate helped the Fund relative to its peers however it was underweight these asset classes relative to its benchmark index, which was a detractor from the reporting period’s relative return. Commodities and real estate both rebounded and outperformed the global equity market after underperforming earlier in 2013. The DJ UBS Commodity Index was up 7.77% and the DJ US Select REIT Index rose 17.88% during the reporting period.
Positioning within the Fund’s fixed income portfolio also detracted from relative returns, in part due to an off benchmark exposure in international bonds. An underweight in duration further detracted as the long end of the US Treasury curve outperformed the short end. (The US Treasury 10-20 Year Index returned 6.26% versus the Barclays US Aggregate Index which returned 3.28%). While yields fell during the period, the negative effect on the portfolio was partially offset by the Fund’s positioning within inflation-protected bonds. An underweight to intermediate-term TIPS contributed to overall performance.
Within the equity component of the portfolio, the Fund’s overweight to international large-cap equities helped relative returns with the MSCI EAFE posting a strong absolute return of 5.33%. Selection within the global equity component of the Fund detracted from the reporting period’s relative return which was to a large part driven by the AllianzGI International
Small-Cap Fund underperforming the MSCI World ex-US Small Cap Index.
Exposure to underlying funds implementing managed-volatility strategies had a mixed effect on relative returns with the AllianzGI International Managed Volatility Fund outperforming its respective benchmark, while the AllianzGI U.S. Managed Volatility Fund and AllianzGI Global Managed Volatility Fund underperformed their respective benchmarks. The AllianzGI US Managed Volatility Fund was hindered by the outperformance of higher-volatility equities over their lower-volatility counterparts during December 2013 and in May 2014.
In aggregate, an underweight in the Fund’s duration and positioning within commodities and real estate were the primary detractors for relative returns during the reporting period. The AllianzGI Target-Date Funds place a strong emphasis on the Department of Labor’s guidelines for a qualified default investment alternative (QDIA), which states that a QDIA should be “diversified as to minimize the risk of large losses.” It is within this framework that the Funds continue to allocate to commodities, real estate, convertible bonds, high yield-bonds, emerging-market equities, frontier-market equities and emerging-market bonds within the return-generating segment of the portfolio to help provide diversification benefits to investors’ retirement assets.
| 18 | May 31, 2014 | | Semiannual Report |
Table of Contents
Unaudited
AllianzGI Retirement 2035 Fund (cont’d)
Average Annual Total Return for the period ended May 31, 2014
| 6 Month* | 1 Year | Since Inception† | ||||||||||||
| AllianzGI Retirement 2035 Fund Class A | 5.00% | 9.68% | 11.91% | |||||||||||
| AllianzGI Retirement 2035 Fund Class A (adjusted) | –0.77% | 3.65% | 9.36% | ||||||||||
| AllianzGI Retirement 2035 Fund Class R | 4.81% | 9.32% | 11.54% | ||||||||||
| AllianzGI Retirement 2035 Fund Class P | 5.18% | 10.03% | 12.28% | ||||||||||
| AllianzGI Retirement 2035 Fund Class R6 | 5.29% | 10.20% | 12.37% | ||||||||||
| AllianzGI Retirement 2035 Fund Administrative Class | 5.05% | 9.78% | 11.98% | |||||||||||
| Dow Jones Real Return 2035 Index | 6.57% | 9.34% | 10.69% | ||||||||||
| Lipper Mixed-Asset Target 2035 Funds Average | 5.40% | 14.54% | 15.70% | |||||||||||
† The Fund began operations on 12/19/11. Benchmark return comparisons began on the fund inception date. Lipper performance comparisons began on 12/31/11.
* Cumulative return.
Performance quoted represents past performance and is no guarantee of future results. Current performance may be lower or higher than performance shown. For performance current to the most recent month-end, visit our website at us.allianzgi.com. Investment return and the principal value will fluctuate. Shares may be worth more or less than original cost when redeemed. The adjusted returns take into account the maximum initial sales charge of 5.50% on Class A shares. Returns do not reflect deduction of taxes that a shareholder would pay on fund distributions or redemption of fund shares. See pages 86 and 87 for more information. The Fund’s gross expense ratios are 1.31% for Class A shares, 1.56% for Class R shares, 0.91% for Class P shares, 0.81% for Class R6 shares and 1.16% for Administrative Class shares. These ratios do not include an expense reduction, contractually guaranteed through at least 3/31/15. The Fund’s expense ratios net of this reduction are 1.06% for Class A shares, 1.41% for Class R shares, 0.76% for Class P shares, 0.66% for Class R6 shares and 1.01% for Administrative Class shares. Expense ratio information is as of the Fund’s current prospectus dated April 1, 2014, as supplemented to date.
Cumulative Returns Through May 31, 2014
Fund Allocation (as of
May 31, 2014)
| AllianzGI Best Styles Global Equity | 7.6% | |||
| PIMCO Income | 7.0% | |||
| PIMCO Floating Income | 5.0% | |||
| PIMCO Senior Floating Rate | 4.9% | |||
| AllianzGI Short Duration High Income | 4.9% | |||
| AllianzGI U.S. Managed Volatility | 4.5% | |||
| AllianzGI Behavioral Advantage Large Cap | 4.2% | |||
| PIMCO International StocksPLUS® AR Strategy (U.S. Dollar-Hedged) | 4.1% | |||
| Other | 57.0% | |||
| Cash & Equivalents — Net | 0.8% |
| Semiannual Report | | May 31, 2014 | 19 |
Table of Contents
Unaudited
AllianzGI Retirement 2035 Fund (cont’d)
| Shareholder Expense Example | Actual Performance | |||||||||
| Class A | Class R | Class P | Class R6 | Administrative Class | ||||||
| Beginning Account Value (12/1/13) | $1,000.00 | $1,000.00 | $1,000.00 | $1,000.00 | $1,000.00 | |||||
| Ending Account Value (5/31/14) | $1,050.00 | $1,048.10 | $1,051.80 | $1,052.90 | $1,050.50 | |||||
| Expenses Paid During Period | $1.79 | $3.57 | $0.26 | $— | $1.53 | |||||
| Hypothetical Performance | ||||||||||
| (5% return before expenses) | ||||||||||
| Class A | Class R | Class P | Class R6 | Administrative Class | ||||||
| Beginning Account Value (12/1/13) | $1,000.00 | $1,000.00 | $1,000.00 | $1,000.00 | $1,000.00 | |||||
| Ending Account Value (5/31/14) | $1,023.19 | $1,021.44 | $1,024.68 | $1,024.93 | $1,023.44 | |||||
| Expenses Paid During Period | $1.77 | $3.53 | $0.25 | $— | $1.51 | |||||
For each class of the Fund, expenses (net of fee waiver and reimbursement, if any) are equal to the annualized expense ratio for the class (0.35% for Class A, 0.70% for Class R, 0.05% for Class P, 0.00% for Class R6 and 0.30% for Administrative Class), multiplied by the average account value over the period, multiplied by 182/365. The expense ratio does not include the expenses of the Underlying Funds, which based upon the allocation of the Fund’s assets among the Underlying Funds are indirectly borne by the shareholders of the Fund.
| 20 | May 31, 2014 | | Semiannual Report |
Table of Contents
Unaudited
AllianzGI Retirement 2040 Fund
For the period of December 1, 2013 through May 31, 2014, as provided by the US Multi Asset Group.
Fund Insights
For the reporting period ended May 31, 2014, Class A shares at NAV of the AllianzGI Retirement 2040 Fund (the “Fund”) returned 5.26% underperforming the Dow Jones Real Return 2040 Index (the “benchmark index”) which returned 6.99%.
Portfolio Review
The Fund finished the six-month period ended May 31, 2014 within its risk budget but trailed benchmark index. The underperformance was primarily a result of asset allocation positioning and security selection decisions.
During the reporting period, and relative to the benchmark index, the Fund held underweights in real-return assets (including real estate and commodities futures), and Treasury inflation-protected securities (TIPS). Although the Fund was underweight these asset classes relative to its benchmark index, it remains among the most diversified within its Morningstar category, with relatively higher allocations to real estate and commodities. The Fund held an overweight position to global equities because it is overweight international large-cap equities, international small-cap equities, and US small-cap equities. The Fund is underweight duration. The fixed income portfolio held off-benchmark exposure in international sovereign bonds and short-term US nominal bonds.
From an asset-class perspective, allocations away from global equities into commodities
and real estate helped the Fund relative to its peers but the Fund was underweight these asset classes relative to its benchmark index, which was a detractor from the reporting period’s relative return. Commodities and real estate both rebounded and outperformed the global equity market after underperforming earlier in 2013. The DJ UBS Commodity Index was up 7.77% and the DJ US Select REIT Index rose 17.88% during the reporting period.
Positioning within the Fund’s fixed income portfolio also detracted from relative returns, in part due to an off benchmark exposure in international bonds. An underweight in duration further detracted as the long end of the US Treasury curve outperformed the short end. (The US Treasury 10-20 Year Index returned 6.26% versus the Barclays US Aggregate Index which returned 3.28%). While yields fell during the period, the negative effect on the portfolio was partially offset by the Fund’s positioning within inflation-protected bonds. An underweight to intermediate-term TIPS contributed to overall performance.
Within the equity component of the portfolio, the Fund’s overweight to international large-cap equities helped relative returns with the MSCI EAFE posting a strong absolute return of 5.33%. Selection within the global equity component of the Fund detracted from the reporting period’s relative return which was to a large part driven by the AllianzGI International
Small-Cap Fund underperforming the MSCI World ex-US Small Cap Index.
Exposure to underlying funds implementing managed-volatility strategies had a mixed effect on relative returns with the AllianzGI International Managed Volatility Fund outperforming its respective benchmark, while the AllianzGI U.S. Managed Volatility Fund and AllianzGI Global Managed Volatility Fund underperformed their respective benchmarks. The AllianzGI U.S. Managed Volatility Fund was hindered by the outperformance of higher-volatility equities over their lower-volatility counterparts during December 2013 and in May 2014.
In aggregate, an underweight in the Fund’s duration and positioning within commodities and real estate were the primary detractors for relative returns during the reporting period. The AllianzGI Target-Date Funds place a strong emphasis on the Department of Labor’s guidelines for a qualified default investment alternative (QDIA), which states that a QDIA should be “diversified as to minimize the risk of large losses.” It is within this framework that the Funds continue to allocate to commodities, real estate, convertible bonds, high yield-bonds, emerging-market equities, frontier-market equities and emerging-market bonds within the return-generating segment of the portfolio to help provide diversification benefits to investors’ retirement assets.
| Semiannual Report | | May 31, 2014 | 21 |
Table of Contents
Unaudited
AllianzGI Retirement 2040 Fund (cont’d)
Average Annual Total Return for the period ended May 31, 2014
6 Month* | 1 Year | 5 Year | Since Inception† | |||||||||||||||
| AllianzGI Retirement 2040 Fund Class A | 5.26% | 10.90% | 12.08% | 13.45% | ||||||||||||||
| AllianzGI Retirement 2040 Fund Class A (adjusted) | –0.53% | 4.80% | 10.82% | 12.27% | |||||||||||||
| AllianzGI Retirement 2040 Fund Class C | 4.94% | 10.13% | 11.25% | 12.58% | ||||||||||||||
| AllianzGI Retirement 2040 Fund Class C (adjusted) | 3.94% | 9.13% | 11.25% | 12.58% | |||||||||||||
| AllianzGI Retirement 2040 Fund Class D | 5.28% | 10.82% | 12.00% | 13.35% | |||||||||||||
| AllianzGI Retirement 2040 Fund Class R | 5.11% | 10.56% | 11.75% | 13.11% | |||||||||||||
| AllianzGI Retirement 2040 Fund Class P | 5.45% | 11.27% | 12.38% | 13.74% | |||||||||||||
| AllianzGI Retirement 2040 Fund Class R6 | 5.50% | 11.36% | 12.47% | 13.83% | |||||||||||||
| AllianzGI Retirement 2040 Fund Administrative Class | 5.32% | 10.99% | 12.14% | 13.50% | ||||||||||||||
| Dow Jones Real Return 2040 Index | 6.99% | 10.93% | 11.77% | 12.72% | |||||||||||||
| Lipper Mixed-Asset Target 2040 Funds Average | 5.38% | 14.57% | 13.93% | 14.38% | ||||||||||||||
† The Fund began operations on 12/29/08. Benchmark return comparisons began on the fund inception date. Lipper performance comparisons began on 12/31/08.
* Cumulative return.
Performance quoted represents past performance and is no guarantee of future results. Current performance may be lower or higher than performance shown. For performance current to the most recent month-end, visit our website at us.allianzgi.com. Investment return and the principal value will fluctuate. Shares may be worth more or less than original cost when redeemed. The adjusted returns take into account the maximum initial sales charge of 5.50% on Class A shares and the contingent deferred sales charge (CDSC) of 1% on Class C shares, which may apply to shares redeemed during the first year of ownership. Returns do not reflect deduction of taxes that a shareholder would pay on fund distributions or redemption of fund shares. See pages 86 and 87 for more information. The Fund’s gross expense ratios are 1.34% for Class A shares, 2.09% for Class C shares, 1.34% for Class D shares, 1.59% for Class R shares, 0.94% for Class P shares, 0.84% for Class R6 shares and 1.19% for Administrative Class shares. These ratios do not include an expense reduction, contractually guaranteed through at least 3/31/15. The Fund’s expense ratios net of this reduction are 1.09% for Class A shares, 1.84% for Class C shares, 1.19% for Class D shares, 1.44% for Class R shares, 0.79% for Class P shares, 0.69% for Class R6 shares and 1.04% for Administrative Class shares. Expense ratio information is as of the Fund’s current prospectus dated April 1, 2014, as supplemented to date.
Cumulative Returns Through May 31, 2014

Fund Allocation (as of May 31, 2014)
| AllianzGI Best Styles Global Equity | 8.1% | |||
| PIMCO Income | 5.4% | |||
| PIMCO International StocksPLUS® AR Strategy (U.S. Dollar-Hedged) | 5.3% | |||
| AllianzGI Behavioral Advantage Large Cap | 5.1% | |||
| AllianzGI U.S. Managed Volatility | 5.0% | |||
| PIMCO Floating Income | 5.0% | |||
| AllianzGI Short Duration High Income | 4.9% | |||
| AllianzGI Income & Growth | 4.5% | |||
| Other | 55.8% | |||
| Cash & Equivalents — Net | 0.9% |
| 22 | May 31, 2014 | | Semiannual Report |
Table of Contents
Unaudited
AllianzGI Retirement 2040 Fund (cont’d)
| Shareholder Expense Example | Actual Performance | |||||||||||||
| Class A | Class C | Class D | Class R | Class P | Class R6 | Administrative Class | ||||||||
| Beginning Account Value (12/1/13) | $1,000.00 | $1,000.00 | $1,000.00 | $1,000.00 | $1,000.00 | $1,000.00 | $1,000.00 | |||||||
| Ending Account Value (5/31/14) | $1,052.60 | $1,049.40 | $1,052.80 | $1,051.10 | $1,054.50 | $1,055.00 | $1,053.20 | |||||||
| Expenses Paid During Period | $1.74 | $5.57 | $2.25 | $3.53 | $0.20 | $— | $1.48 | |||||||
| Hypothetical Performance | ||||||||||||||
| (5% return before expenses) | ||||||||||||||
| Class A | Class C | Class D | Class R | Class P | Class R6 | Administrative Class | ||||||||
| Beginning Account Value (12/1/13) | $1,000.00 | $1,000.00 | $1,000.00 | $1,000.00 | $1,000.00 | $1,000.00 | $1,000.00 | |||||||
| Ending Account Value (5/31/14) | $1,023.24 | $1,019.50 | $1,022.74 | $1,021.49 | $1,024.73 | $1,024.93 | $1,023.49 | |||||||
| Expenses Paid During Period | $1.72 | $5.49 | $2.22 | $3.48 | $0.20 | $— | $1.46 | |||||||
For each class of the Fund, expenses (net of fee waiver and reimbursement, if any) are equal to the annualized expense ratio for the class (0.34% for Class A, 1.09% for Class C, 0.44% for Class D, 0.69% for Class R, 0.04% for Class P, 0.00% for Class R6 and 0.29% for Administrative Class), multiplied by the average account value over the period, multiplied by 182/365. The expense ratio does not include the expenses of the Underlying Funds, which based upon the allocation of the Fund’s assets among the Underlying Funds are indirectly borne by the shareholders of the Fund.
| Semiannual Report | | May 31, 2014 | 23 |
Table of Contents
Unaudited
AllianzGI Retirement 2045 Fund
For the period of December 1, 2013 through May 31, 2014, as provided by the US Multi Asset Group.
Fund Insights
For the reporting period ended May 31, 2014, Class A shares at NAV of the AllianzGI Retirement 2045 Fund (the “Fund”) returned 5.38% underperforming the Dow Jones Real Return 2045 Index (the “benchmark index”) which returned 7.26%.
Portfolio Review
The Fund finished the six-month period ended May 31, 2014 within its risk budget but trailed benchmark index. The underperformance was primarily a result of asset allocation positioning and security selection decisions.
During the reporting period, and relative to the Dow Jones Real Return benchmark, the Fund held underweights in real-return assets (including real estate and commodities futures), and Treasury inflation-protected securities (TIPS). Although the Fund was underweight these asset classes relative to its benchmark index, it remains among the most diversified within its Morningstar category, with relatively higher allocations to real estate and commodities. The Fund held an overweight position to global equities because it is overweight international large-cap equities, international small-cap equities, and US small-cap equities. The Fund is underweight duration and the fixed income portion of the portfolio held off-benchmark exposure in international sovereign bonds and short-term US nominal bonds.
From an asset-class perspective, allocations away from global equities into commodities
and real estate helped the Fund relative to its peers but the Fund was underweight these asset classes relative to its benchmark, which was a detractor from the reporting period’s relative return. Commodities and real estate both rebounded and outperformed the global equity market after underperforming earlier in 2013. The DJ UBS Commodity Index was up 7.77% and the DJ US Select REIT Index rose 17.88% during the reporting period.
Positioning within the Fund’s fixed income portfolio also detracted from relative returns, in part due to an off benchmark exposure in international bonds. An underweight in duration further detracted as the long end of the US Treasury curve outperformed the short end. (The US Treasury 10-20 Year Index returned 6.26% versus the Barclays US Aggregate Index which returned 3.28%). While yields fell during the period, the negative effect on the portfolio was partially offset by the Fund’s positioning within inflation-protected bonds. An underweight to intermediate-term TIPS contributed to overall performance.
Within the equity component of the portfolio, the Fund’s overweight to international large-cap equities helped relative returns with the MSCI EAFE posting a strong absolute return of 5.33%. Selection within the global equity component of the Fund detracted from the reporting period’s relative return which was to a large part driven by the AllianzGI International
Small-Cap Fund underperforming the MSCI World ex-US Small Cap Index.
Exposure to underlying funds implementing managed-volatility strategies had a mixed effect on relative returns with the AllianzGI International Managed Volatility Fund outperforming its respective benchmark, while the AllianzGI U.S. Managed Volatility Fund and AllianzGI Global Managed Volatility Fund underperformed their respective benchmarks. The AllianzGI U.S. Managed Volatility Fund was hindered by the outperformance of higher-volatility equities over their lower-volatility counterparts during December 2013 and in May 2014.
In aggregate, an underweight in the Fund’s underweight in real estate and stock selection within global equities were the primary detractors for relative returns during the reporting period. The AllianzGI Target-Date Funds place a strong emphasis on the Department of Labor’s guidelines for a qualified default investment alternative (QDIA), which states that a QDIA should be “diversified as to minimize the risk of large losses.” It is within this framework that the Funds continue to allocate to commodities, real estate, convertible bonds, high yield-bonds, emerging-market equities, frontier-market equities and emerging-market bonds within the return-generating segment of the portfolio to help provide diversification benefits to investors’ retirement assets.
| 24 | May 31, 2014 | | Semiannual Report |
Table of Contents
Unaudited
AllianzGI Retirement 2045 Fund (cont’d)
Average Annual Total Return for the period ended May 31, 2014
| 6 Month* | 1 Year | Since Inception† | ||||||||||||
| AllianzGI Retirement 2045 Fund Class A | 5.38% | 11.69% | 13.87% | |||||||||||
| AllianzGI Retirement 2045 Fund Class A (adjusted) | –0.41% | 5.54% | 11.27% | ||||||||||
| AllianzGI Retirement 2045 Fund Class R | 5.23% | 11.31% | 13.47% | ||||||||||
| AllianzGI Retirement 2045 Fund Class P | 5.58% | 12.05% | 14.21% | ||||||||||
| AllianzGI Retirement 2045 Fund Class R6 | 5.60% | 12.13% | 14.30% | ||||||||||
| AllianzGI Retirement 2045 Fund Administrative Class | 5.44% | 11.80% | 13.89% | |||||||||||
| Dow Jones Real Return 2045 Index | 7.26% | 12.18% | 13.74% | ||||||||||
| Lipper Mixed-Asset Target 2045 Funds Average | 5.53% | 15.59% | 17.07% | |||||||||||
† The Fund began operations on 12/19/11. Benchmark return comparisons began on the fund inception date. Lipper performance comparisons began on 12/31/11.
* Cumulative return.
Performance quoted represents past performance and is no guarantee of future results. Current performance may be lower or higher than performance shown. For performance current to the most recent month-end, visit our website at us.allianzgi.com. Investment return and the principal value will fluctuate. Shares may be worth more or less than original cost when redeemed. The adjusted returns take into account the maximum initial sales charge of 5.50% on Class A shares. Returns do not reflect deduction of taxes that a shareholder would pay on fund distributions or redemption of fund shares. See pages 86 and 87 for more information. The Fund’s gross expense ratios are 1.37% for Class A shares, 1.62% for Class R shares, 0.97% for Class P shares, 0.87% for Class R6 shares and 1.22% for Administrative Class shares. These ratios do not include an expense reduction, contractually guaranteed through at least 3/31/15. The Fund’s expense ratios net of this reduction are 1.10% for Class A shares, 1.45% for Class R shares, 0.80% for Class P shares, 0.70% for Class R6 shares and 1.05% for Administrative Class shares. Expense ratio information is as of the Fund’s current prospectus dated April 1, 2014, as supplemented to date.
Cumulative Returns Through May 31, 2014
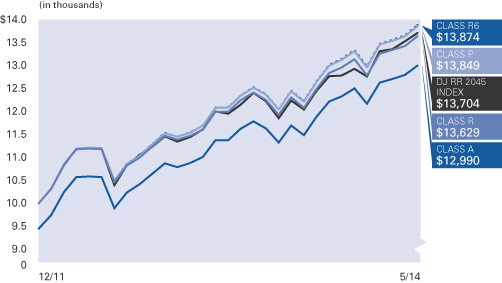
Fund Allocation (as of May 31, 2014)
| AllianzGI Best Styles Global Equity | 9.5% | |||
| PIMCO International StocksPLUS® AR Strategy (U.S. Dollar-Hedged) | 5.7% | |||
| AllianzGI Behavioral Advantage Large Cap | 5.0% | |||
| AllianzGI U.S. Managed Volatility | 5.0% | |||
| AllianzGI Short Duration High Income | 5.0% | |||
| AllianzGI NFJ International Value | 4.9% | |||
| AllianzGI NFJ Global Dividend Value | 4.8% | |||
| AllianzGI Income & Growth | 4.5% | |||
| Other | 54.5% | |||
| Cash & Equivalents — Net | 1.1% |
| Semiannual Report | | May 31, 2014 | 25 |
Table of Contents
Unaudited
AllianzGI Retirement 2045 Fund (cont’d)
| Shareholder Expense Example | Actual Performance | |||||||||
| Class A | Class R | Class P | Class R6 | Administrative Class | ||||||
| Beginning Account Value (12/1/13) | $1,000.00 | $1,000.00 | $1,000.00 | $1,000.00 | $1,000.00 | |||||
| Ending Account Value (5/31/14) | $1,053.80 | $1,052.30 | $1,055.80 | $1,056.00 | $1,054.40 | |||||
| Expenses Paid During Period | $1.69 | $3.48 | $0.15 | $— | $1.43 | |||||
| Hypothetical Performance | ||||||||||
| (5% return before expenses) | ||||||||||
| Class A | Class R | Class P | Class R6 | Administrative Class | ||||||
| Beginning Account Value (12/1/13) | $1,000.00 | $1,000.00 | $1,000.00 | $1,000.00 | $1,000.00 | |||||
| Ending Account Value (5/31/14) | $1,023.29 | $1,021.54 | $1,024.78 | $1,024.93 | $1,023.54 | |||||
| Expenses Paid During Period | $1.66 | $3.43 | $0.15 | $— | $1.41 | |||||
For each class of the Fund, expenses (net of fee waiver and reimbursement, if any) are equal to the annualized expense ratio for the class (0.33% for Class A, 0.68% for Class R, 0.03% for Class P, 0.00% for Class R6 and 0.28% for Administrative Class), multiplied by the average account value over the period, multiplied by 182/365. The expense ratio excludes the expenses of the Underlying Funds, which based upon the allocation of the Fund’s assets among the Underlying Funds are indirectly borne by the shareholders of the Fund.
| 26 | May 31, 2014 | | Semiannual Report |
Table of Contents
Unaudited
AllianzGI Retirement 2050 Fund
For the period of December 1, 2013 through May 31, 2014, as provided by the US Multi Asset Group.
Fund Insights
For the reporting period ended May 31, 2014, Class A shares at NAV of the AllianzGI Retirement 2050 Fund (the “Fund”) returned 5.49% underperforming the Dow Jones Real Return 2050 Index (the “benchmark index”) which returned 7.38%.
Portfolio Review
The Fund finished the six-month period ended May 31, 2014 within its risk budget but trailed its benchmark index. The underperformance was primarily a result of asset allocation positioning and security selection decisions.
During the reporting period, and relative to the benchmark index, the Fund held underweights in real-return assets (including real estate and commodities futures), and Treasury inflation-protected securities (TIPS). Although the Fund was underweight these asset classes relative to its benchmark index, it remains among the most diversified within its Morningstar category, with relatively higher allocations to real estate and commodities. The Fund held an overweight position to global equities because it is overweight international large-cap equities, international small-cap equities, and US small-cap equities. The Fund is underweight duration and the fixed income portion of the portfolio held off-benchmark exposure in international sovereign bonds and short-term US nominal bonds.
From an asset-class perspective, allocations away from global equities into commodities
and real estate helped the Fund relative to its peers but the Fund was underweight these asset classes relative to its benchmark, which was a detractor from the reporting period’s relative return. Commodities and real estate both rebounded and outperformed the global equity market after underperforming earlier in 2013. The DJ UBS Commodity Index was up 7.77% and the DJ US Select REIT Index rose 17.88% during the reporting period.
Positioning within the Fund’s fixed income portfolio also detracted from relative returns, in part due to an off benchmark exposure in international bonds. An underweight in duration further detracted as the long end of the US Treasury curve outperformed the short end. (The US Treasury 10-20 Year Index returned 6.26% versus the Barclays US Aggregate Index which returned 3.28%). While yields fell during the period, the negative effect on the portfolio was partially offset by the Fund’s positioning within inflation-protected bonds. An underweight to intermediate-term TIPS contributed to overall performance.
Within the equity component of the portfolio, the Fund’s overweight to international large-cap equities helped relative returns with the MSCI EAFE posting a strong absolute return of 5.33%. Selection within the global equity component of the Fund detracted from the reporting period’s relative return which was to a large part driven by the AllianzGI International
Small-Cap Fund underperforming the MSCI World ex-US Small Cap Index.
Exposure to underlying funds implementing managed-volatility strategies had a mixed effect on relative returns with the AllianzGI International Managed Volatility Fund outperforming its respective benchmark, while the AllianzGI U.S. Managed Volatility Fund and AllianzGI Global Managed Volatility Fund underperformed their respective benchmarks. The AllianzGI U.S. Managed Volatility Fund was hindered by the outperformance of higher-volatility equities over their lower-volatility counterparts during December 2013 and in May 2014.
In aggregate, an underweight in the Fund’s underweight in real estate and stock selection within global equities were the primary detractors for relative returns during the reporting period. The AllianzGI Target-Date Funds place a strong emphasis on the Department of Labor’s guidelines for a qualified default investment alternative (QDIA), which states that a QDIA should be “diversified as to minimize the risk of large losses.” It is within this framework that the Funds continue to allocate to commodities, real estate, convertible bonds, high yield-bonds, emerging-market equities, frontier-market equities and emerging-market bonds within the return-generating segment of the portfolio to help provide diversification benefits to investors’ retirement assets.
| Semiannual Report | | May 31, 2014 | 27 |
Table of Contents
Unaudited
AllianzGI Retirement 2050 Fund (cont’d)
Average Annual Total Return for the period ended May 31, 2014
6 Month* | 1 Year | 5 Year | Since Inception† | |||||||||||||||
| AllianzGI Retirement 2050 Fund Class A | 5.49% | 12.10% | 12.73% | 14.03% | ||||||||||||||
| AllianzGI Retirement 2050 Fund Class A (adjusted) | –0.31% | 5.94% | 11.47% | 12.85% | |||||||||||||
| AllianzGI Retirement 2050 Fund Class C | 5.11% | 11.27% | 11.88% | 13.20% | ||||||||||||||
| AllianzGI Retirement 2050 Fund Class C (adjusted) | 4.11% | 10.27% | 11.88% | 13.20% | |||||||||||||
| AllianzGI Retirement 2050 Fund Class D | 5.41% | 12.01% | 12.67% | 13.98% | |||||||||||||
| AllianzGI Retirement 2050 Fund Class R | 5.34% | 11.75% | 12.40% | 13.73% | |||||||||||||
| AllianzGI Retirement 2050 Fund Class P | 5.63% | 12.45% | 13.02% | 14.35% | |||||||||||||
| AllianzGI Retirement 2050 Fund Class R6 | 5.71% | 12.53% | 13.12% | 14.45% | |||||||||||||
| AllianzGI Retirement 2050 Fund Administrative Class | 5.46% | 12.14% | 12.78% | 14.11% | ||||||||||||||
| Dow Jones Real Return 2050 Index | 7.38% | 13.03% | 12.68% | 13.74% | |||||||||||||
| Lipper Mixed-Asset Target 2050+ Funds Average | 5.52% | 15.15% | 14.18% | 14.59% | ||||||||||||||
† The Fund began operations on 12/29/08. Benchmark return comparisons began on the fund inception date. Lipper performance comparisons began on 12/31/08.
* Cumulative return.
Performance quoted represents past performance and is no guarantee of future results. Current performance may be lower or higher than performance shown. For performance current to the most recent month-end, visit our website at us.allianzgi.com. Investment return and the principal value will fluctuate. Shares may be worth more or less than original cost when redeemed. The adjusted returns take into account the maximum initial sales charge of 5.50% on Class A shares and the contingent deferred sales charge (CDSC) of 1% on Class C shares, which may apply to shares redeemed during the first year of ownership. Returns do not reflect deduction of taxes that a shareholder would pay on fund distributions or redemption of fund shares. See pages 86 and 87 for more information. The Fund’s gross expense ratios are 1.40% for Class A shares, 2.15% for Class C shares, 1.40% for Class D shares, 1.65% for Class R shares, 1.00% for Class P shares, 0.90% for Class R6 shares and 1.25% for Administrative Class shares. These ratios do not include an expense reduction, contractually guaranteed through at least 3/31/15. The Fund’s expense ratios net of this reduction are 1.10% for Class A shares, 1.85% for Class C shares, 1.20% for Class D shares, 1.45% for Class R shares, 0.80% for Class P shares, 0.70% for Class R6 shares and 1.05% for Administrative Class shares. Expense ratio information is as of the Fund’s current prospectus dated April 1, 2014, as supplemented to date.
The Dow Jones Real Return 2050 Index inception date was 12/31/2009. Accordingly, Dow Jones Real Return 40+ Index performance is used for periods prior to 12/31/2009.
Cumulative Returns Through May 31, 2014
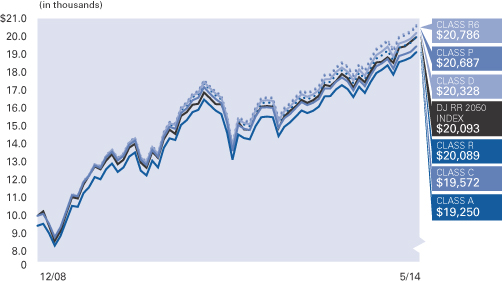
Fund Allocation (as of May 31, 2014)
| AllianzGI Best Styles Global Equity | 10.0% | |||
| PIMCO International StocksPLUS® AR Strategy (U.S. Dollar-Hedged) | 6.0% | |||
| AllianzGI Behavioral Advantage Large Cap | 5.6% | |||
| AllianzGI NFJ International Value | 5.4% | |||
| AllianzGI U.S. Managed Volatility | 5.2% | |||
| AllianzGI Income & Growth | 5.0% | |||
| AllianzGI NFJ Mid-Cap Value | 5.0% | |||
| AllianzGI NFJ Global Dividend Value | 5.0% | |||
| Other | 51.6% | |||
| Cash & Equivalents — Net | 1.2% |
| 28 | May 31, 2014 | | Semiannual Report |
Table of Contents
Unaudited
AllianzGI Retirement 2050 Fund (cont’d)
| Shareholder Expense Example | Actual Performance | |||||||||||||
| Class A | Class C | Class D | Class R | Class P | Class R6 | Administrative Class | ||||||||
| Beginning Account Value (12/1/13) | $1,000.00 | $1,000.00 | $1,000.00 | $1,000.00 | $1,000.00 | $1,000.00 | $1,000.00 | |||||||
| Ending Account Value (5/31/14) | $1,054.90 | $1,051.10 | $1,054.10 | $1,053.40 | $1,056.30 | $1,057.10 | $1,054.60 | |||||||
| Expenses Paid During Period | $1.59 | $5.42 | $2.10 | $3.38 | $0.05 | $— | $1.33 | |||||||
| Hypothetical Performance | ||||||||||||||
| (5% return before expenses) | ||||||||||||||
| Class A | Class C | Class D | Class R | Class P | Class R6 | Administrative Class | ||||||||
| Beginning Account Value (12/1/13) | $1,000.00 | $1,000.00 | $1,000.00 | $1,000.00 | $1,000.00 | $1,000.00 | $1,000.00 | |||||||
| Ending Account Value (5/31/14) | $1,023.39 | $1,019.65 | $1,022.89 | $1,021.64 | $1,024.88 | $1,024.93 | $1,023.64 | |||||||
| Expenses Paid During Period | $1.56 | $5.34 | $2.07 | $3.33 | $0.05 | $— | $1.31 | |||||||
For each class of the Fund, expenses (net of fee waiver and reimbursement, if any) are equal to the annualized expense ratio for the class (0.31% for Class A, 1.06% for Class C, 0.41% for Class D, 0.66% for Class R, 0.01% for Class P, 0.00% for Class R6 and 0.26% for Administrative Class), multiplied by the average account value over the period, multiplied by 182/365. The expense ratio does not include the expenses of the Underlying Funds, which based upon the allocation of the Fund’s assets among the Underlying Funds are indirectly borne by the shareholders of the Fund.
| Semiannual Report | | May 31, 2014 | 29 |
Table of Contents
Unaudited
AllianzGI Retirement 2055 Fund
For the period of December 1, 2013 through May 31, 2014, as provided by the US Multi Asset Group.
Fund Insights
For the reporting period ended May 31, 2014, Class A shares at NAV of the AllianzGI Retirement 2055 Fund (the “Fund”) returned 5.63% underperforming the Dow Jones Real Return 2040+ Index (the “benchmark index”) which returned 7.24%.
Portfolio Review
The Fund finished the six-month period ended May 31, 2014 within its risk budget but trailed its benchmark index. The underperformance was primarily a result of asset allocation positioning and security selection decisions.
During the reporting period, and relative to the benchmark index, the Fund held underweights in real-return assets (including real estate and commodities futures), and Treasury inflation-protected securities (TIPS). Although the Fund was underweight these asset classes relative to its benchmark, it remains among the most diversified within its Morningstar category, with relatively higher allocations to real estate and commodities. The Fund held an overweight position in international large-cap equities, international small-cap equities, and US small-cap equities, while underweighting US large-cap equities. The Fund’s fixed income portion of the portfolio held off-benchmark exposure in international sovereign bonds and an underweight position in TIPS.
From an asset-class perspective, allocations away from global equities into real estate helped the
Fund relative to its peers but the Fund was underweight this asset classes relative to its benchmark, which was a detractor from the reporting period’s relative return. Real estate rebounded and outperformed the global equity market after underperforming earlier in 2013. The DJ US Select REIT Index rose 17.88% during the reporting period.
Positioning within the Fund’s fixed income portfolio also detracted from relative returns, in part due to an off benchmark exposure in international bonds. Within fixed income, the Fund maintained an underweight position in duration and an overweight in credit. While yields fell during the reporting period, the negative effect on the portfolio was partially offset by positioning within inflation-protected bonds. The underweight to intermediate-term TIPS contributed to performance.
Within the equity component of the portfolio, the Fund’s overweight to international large-cap equities helped relative returns with the MSCI EAFE posting a strong absolute return of 5.33%. Selection within the global equity component of the Fund detracted from the reporting period’s relative return which was to a large part driven by the AllianzGI International Small-Cap Fund underperforming the MSCI World ex-US Small Cap Index.
Exposure to underlying funds implementing managed-volatility strategies had a mixed effect on relative returns with the AllianzGI International Managed Volatility Fund outperforming its respective benchmark, while the AllianzGI U.S. Managed Volatility Fund and AllianzGI Global Managed Volatility Fund underperformed their respective benchmarks. The AllianzGI U.S. Managed Volatility Fund was hindered by the outperformance of higher-volatility equities over their lower-volatility counterparts during December 2013 and in May 2014.
In aggregate, an underweight in the Fund’s positioning within real estate and stock selection in global equities were the primary detractors from relative return during the reporting period. The AllianzGI Target-Date Funds place a strong emphasis on the Department of Labor’s guidelines for a qualified default investment alternative (QDIA), which states that a QDIA should be “diversified as to minimize the risk of large losses.” It is within this framework that the Funds continue to allocate to commodities, real estate, convertible bonds, high yield-bonds, emerging-market equities, frontier-market equities and emerging-market bonds within the return-generating segment of the portfolio to help provide diversification benefits to investors’ retirement assets.
Average Annual Total Return for the period ended May 31, 2014
| 6 Month* | 1 Year | Since Inception† | ||||||||||||
| AllianzGI Retirement 2055 Fund Class A | 5.63% | 12.28% | 14.50% | |||||||||||
| AllianzGI Retirement 2055 Fund Class A (adjusted) | –0.18% | 6.11% | 11.88% | ||||||||||
| AllianzGI Retirement 2055 Fund Class R | 5.45% | 11.94% | 14.13% | ||||||||||
| AllianzGI Retirement 2055 Fund Class P | 5.82% | 12.65% | 14.87% | ||||||||||
| AllianzGI Retirement 2055 Fund Class R6 | 5.87% | 12.75% | 14.97% | ||||||||||
| AllianzGI Retirement 2055 Fund Administrative Class | 5.66% | 12.44% | 14.57% | |||||||||||
| Dow Jones Real Return 2040+ Index | 7.24% | 13.53% | 15.04% | ||||||||||
| Lipper Mixed-Asset Target 2055+ Funds Average | 5.66% | 16.30% | 17.44% | |||||||||||
† The Fund began operations on 12/19/11. Benchmark return comparisons began on the fund inception date. Lipper performance comparisons began on 12/31/11.
* Cumulative return.
Performance quoted represents past performance and is no guarantee of future results. Current performance may be lower or higher than performance shown. For performance current to the most recent month-end, visit our website at us.allianzgi.com. Investment return and the principal value will fluctuate. Shares may be worth more or less than original cost when redeemed. The adjusted returns take into account the maximum initial sales charge of 5.50% on Class A shares. Returns do not reflect deduction of taxes that a shareholder would pay on fund distributions or redemption of fund shares. See pages 86 and 87 for more information. The Fund’s gross expense ratios are 1.40% for Class A shares, 1.65% for Class R shares, 1.00% for Class P shares, 0.90% for Class R6 shares and 1.25% for Administrative Class shares. These ratios do not include an expense reduction, contractually guaranteed through at least 3/31/15. The Fund’s expense ratios net of this reduction are 1.10% for Class A shares, 1.45% for Class R shares, 0.80% for Class P shares, 0.70% for Class R6 shares and 1.05% for Administrative Class shares. Expense ratio information is as of the Fund’s current prospectus dated April 1, 2014, as supplemented to date.
| 30 | May 31, 2014 | | Semiannual Report |
Table of Contents
Unaudited
AllianzGI Retirement 2055 Fund (cont’d)
Cumulative Returns Through May 31, 2014
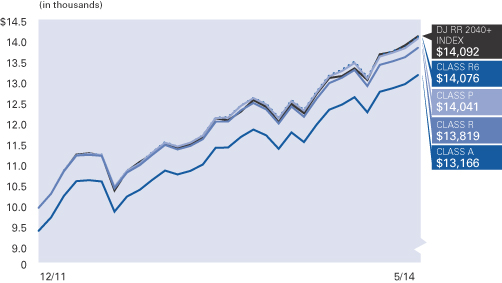
Fund Allocation (as of May 31, 2014)
AllianzGI Best Syles Global Equity | 10.0% | |||
| PIMCO International StocksPLUS® AR Strategy (U.S. Dollar-Hedged) | 6.0% | |||
| AllianzGI Behavioral Advantage Large Cap | 5.6% | |||
| AllianzGI NFJ International Value | 5.4% | |||
| AllianzGI U.S. Managed Volatility | 5.3% | |||
| AllianzGI NFJ Mid-Cap Value | 5.0% | |||
| AllianzGI Income & Growth | 5.0% | |||
| AllianzGI NFJ Global Dividend Value | 4.9% | |||
| Other | 51.7% | |||
| Cash & Equivalents — Net | 1.1% |
| Shareholder Expense Example | Actual Performance | |||||||||
| Class A | Class R | Class P | Class R6 | Administrative Class | ||||||
| Beginning Account Value (12/1/13) | $1,000.00 | $1,000.00 | $1,000.00 | $1,000.00 | $1,000.00 | |||||
| Ending Account Value (5/31/14) | $1,056.30 | $1,054.50 | $1,058.20 | $1,058.70 | $1,056.60 | |||||
| Expenses Paid During Period | $1.54 | $3.33 | $— | $— | $1.28 | |||||
| Hypothetical Performance | ||||||||||
| (5% return before expenses) | ||||||||||
| Class A | Class R | Class P | Class R6 | Administrative Class | ||||||
| Beginning Account Value (12/1/13) | $1,000.00 | $1,000.00 | $1,000.00 | $1,000.00 | $1,000.00 | |||||
| Ending Account Value (5/31/14) | $1,023.44 | $1,021.69 | $1,024.93 | $1,024.93 | $1,023.68 | |||||
| Expenses Paid During Period | $1.51 | $3.28 | $— | $— | $1.26 | |||||
For each class of the Fund, expenses (net of fee waiver and reimbursement, if any) are equal to the annualized expense ratio for the class (0.30% for Class A, 0.65% for Class R, 0.00% for Class P, 0.00% for Class R6 and 0.25% for Administrative Class), multiplied by the average account value over the period, multiplied by 182/365. The expense ratio does not include the expenses of the Underlying Funds, which based upon the allocation of the Fund’s assets among the Underlying Funds are indirectly borne by the shareholders of the Fund.
| Semiannual Report | | May 31, 2014 | 31 |
Table of Contents
Unaudited
AllianzGI Retirement Income Fund
For the period of December 1, 2013 through May 31, 2014, as provided by the US Multi Asset Group.
Fund Insights
For the reporting period ended May 31, 2014, Class A shares at NAV of the AllianzGI Retirement Income Fund (the “Fund”) returned 3.85% underperforming the Dow Jones Real Return Today Index (the “benchmark index”) which returned 5.32%.
Portfolio Review
The Fund finished the six-month period ended May 31, 2014 within its risk budget but trailed its benchmark index. The underperformance was primarily a result of asset allocation positioning and security selection decisions.
During the reporting period, and relative to the benchmark index, the Fund held underweights in real-return assets (including real estate and commodities futures), and Treasury inflation-protected securities (TIPS). Although the Fund was underweight these asset classes relative to its benchmark index, it remains among the most diversified within its Morningstar category, with relatively higher allocations to real estate and commodities. The Fund held an overweight position to global equities because it is overweight international large-cap equities, international small-cap equities, and US small-cap equities. The Fund is underweight duration and the fixed income portfolio held off-benchmark exposure in international sovereign bonds and short-term US nominal bonds.
From an asset-class perspective, allocations away from global equities into commodities and real
estate helped the Fund relative to its peers but the Fund was underweight these asset classes relative to its benchmark, which was a detractor from the reporting period’s relative return. Commodities and real estate both rebounded and outperformed the global equity market after underperforming earlier in 2013. The DJ UBS Commodity Index was up 7.77% and the DJ US Select REIT Index rose 17.88% during the reporting period.
Positioning within the Fund’s fixed income portfolio also detracted from relative returns, in part due to an off benchmark exposure in international bonds. An underweight in duration further detracted as the long end of the US Treasury curve outperformed the short end. (The US Treasury 10-20 Year Index returned 6.26% versus the Barclays US Aggregate Index which returned 3.28%). While yields fell during the period, the negative effect on the portfolio was partially offset by the Fund’s positioning within inflation-protected bonds. An underweight to intermediate-term TIPS contributed to overall performance.
Within the equity component of the portfolio, the Fund’s overweight to international large-cap equities helped relative returns with the MSCI EAFE posting a strong absolute return of 5.33%. Selection within the global equity component of the Fund detracted from the reporting period’s relative return which was to a large part driven by the AllianzGI International Small-Cap Fund
underperforming the MSCI World ex-US Small Cap Index.
Exposure to underlying funds implementing managed-volatility strategies had a mixed effect on relative returns with the AllianzGI International Managed Volatility Fund outperforming its respective benchmark, while the AllianzGI U.S. Managed Volatility Fund and AllianzGI Global Managed Volatility Fund underperformed their respective benchmarks. The AllianzGI U.S. Managed Volatility Fund was hindered by the outperformance of higher-volatility equities over their lower-volatility counterparts during December 2013 and in May 2014.
In aggregate, an underweight in the Fund’s underweight in real estate and stock selection within global equities were the primary detractors for relative returns during the reporting period. The AllianzGI Target-Date Funds place a strong emphasis on the Department of Labor’s guidelines for a qualified default investment alternative (QDIA), which states that a QDIA should be “diversified as to minimize the risk of large losses.” It is within this framework that the Funds continue to allocate to commodities, real estate, convertible bonds, high yield-bonds, emerging-market equities, frontier-market equities and emerging-market bonds within the return-generating segment of the portfolio to help provide diversification benefits to investors’ retirement assets.
| 32 | May 31, 2014 | | Semiannual Report |
Table of Contents
Unaudited
AllianzGI Retirement Income Fund (cont’d)
Average Annual Total Return for the period ended May 31, 2014
| 6 Month* | 1 Year | 5 Year | Since Inception† | |||||||||||||||
AllianzGI Retirement Income Fund Class A | 3.85% | 4.92% | 8.24% | 9.16% | ||||||||||||||
| AllianzGI Retirement Income Fund Class A (adjusted) | –1.86% | –0.85% | 7.02% | 8.03% | |||||||||||||
AllianzGI Retirement Income Fund Class C | 3.50% | 4.15% | 7.45% | 8.36% | ||||||||||||||
| AllianzGI Retirement Income Fund Class C (adjusted) | 2.50% | 3.15% | 7.45% | 8.36% | |||||||||||||
| AllianzGI Retirement Income Fund Class D | 3.80% | 4.78% | 8.19% | 9.10% | |||||||||||||
| AllianzGI Retirement Income Fund Class R | 3.64% | 4.54% | 7.91% | 8.84% | |||||||||||||
| AllianzGI Retirement Income Fund Class P | 3.98% | 5.25% | 8.54% | 9.45% | |||||||||||||
| AllianzGI Retirement Income Fund Class R6 | 4.05% | 5.34% | 8.64% | 9.56% | |||||||||||||
AllianzGI Retirement Income Fund Administrative Class | 3.85% | 4.97% | 8.30% | 9.23% | ||||||||||||||
| Dow Jones Real Return Today Index | 5.32% | 4.81% | 8.11% | 8.52% | |||||||||||||
Lipper Mixed-Asset Target Today Funds Average | 3.72% | 6.24% | 8.16% | 8.57% | ||||||||||||||
† The Fund began operations on 12/29/08. Benchmark return comparisons began on the fund inception date. Lipper performance comparisons began on 12/31/08.
* Cumulative return.
Performance quoted represents past performance and is no guarantee of future results. Current performance may be lower or higher than performance shown. For performance current to the most recent month-end, visit our website at us.allianzgi.com. Investment return and the principal value will fluctuate. Shares may be worth more or less than original cost when redeemed. The adjusted returns take into account the maximum initial sales charge of 5.50% on Class A shares and the contingent deferred sales charge (CDSC) of 1% on Class C shares, which may apply to shares redeemed during the first year of ownership. Returns do not reflect deduction of taxes that a shareholder would pay on fund distributions or redemption of fund shares. See pages 86 and 87 for more information. The Fund’s gross expense ratios are 1.16% for Class A shares, 1.91% for Class C shares, 1.16% for Class D shares, 1.41% for Class R shares, 0.76% for Class P shares, 0.66% for Class R6 shares and 1.01% for Administrative Class shares. These ratios do not include an expense reduction, contractually guaranteed through at least 3/31/15. The Fund’s expense ratios net of this reduction are 0.95% for Class A shares, 1.70% for Class C shares, 1.05% for Class D shares, 1.30% for Class R shares, 0.65% for Class P shares, 0.55% for Class R6 shares and 0.90% for Administrative Class shares. Expense ratio information is as of the Fund’s current prospectus dated April 1, 2014, as supplemented to date.
Cumulative Returns Through May 31, 2014
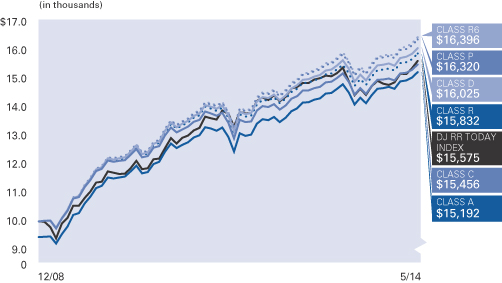
Fund Allocation (as of May 31, 2014)
PIMCO 1-5 Year U.S. TIPS Index | 13.1% | |||
| PIMCO Income | 10.0% | |||
| PIMCO Short-Term | 9.9% | |||
| PIMCO Real Return | 8.8% | |||
| PIMCO Senior Floating Rate | 5.5% | |||
| AllianzGI Short Duration High Income | 5.4% | |||
| PIMCO Floating Income | 5.0% | |||
| PIMCO Mortgage Opportunities | 4.0% | |||
| Other | 37.4% | |||
| Cash & Equivalents — Net | 0.9% |
| Semiannual Report | | May 31, 2014 | 33 |
Table of Contents
Unaudited
AllianzGI Retirement Income Fund (cont’d)
| Shareholder Expense Example | Actual Performance | |||||||||||||
| Class A | Class C | Class D | Class R | Class P | Class R6 | Administrative Class | ||||||||
| Beginning Account Value (12/1/13) | $1,000.00 | $1,000.00 | $1,000.00 | $1,000.00 | $1,000.00 | $1,000.00 | $1,000.00 | |||||||
| Ending Account Value (5/31/14) | $1,038.50 | $1,035.00 | $1,038.00 | $1,036.40 | $1,039.80 | $1,040.50 | $1,038.50 | |||||||
| Expenses Paid During Period | $1.93 | $5.73 | $2.44 | $3.71 | $0.46 | $— | $1.68 | |||||||
| Hypothetical Performance | ||||||||||||||
| (5% return before expenses) | ||||||||||||||
| Class A | Class C | Class D | Class R | Class P | Class R6 | Administrative Class | ||||||||
| Beginning Account Value (12/1/13) | $1,000.00 | $1,000.00 | $1,000.00 | $1,000.00 | $1,000.00 | $1,000.00 | $1,000.00 | |||||||
| Ending Account Value (5/31/14) | $1,023.04 | $1,019.30 | $1,022.54 | $1,021.29 | $1,024.48 | $1,024.93 | $1,023.29 | |||||||
| Expenses Paid During Period | $1.92 | $5.69 | $2.42 | $3.68 | $0.45 | $— | $1.66 | |||||||
For each class of the Fund, expenses (net of fee waiver and reimbursement, if any) are equal to the annualized expense ratio for the class (0.38% for Class A, 1.13% for Class C, 0.48% for Class D, 0.73% for Class R, 0.09% for Class P, 0.00% for Class R6 and 0.33% for Administrative Class), multiplied by the average account value over the period, multiplied by 182/365. The expense ratio does not include the expenses of the Underlying Funds, which based upon the allocation of the Fund’s assets among the Underlying Funds are indirectly borne by the shareholders of the Fund.
| 34 | May 31, 2014 | | Semiannual Report |
Table of Contents
Unaudited
AllianzGI Global Allocation Fund
For the period of December 1, 2013 through May 31, 2014, as provided by the US Multi Asset Group.
Fund Insights
For the reporting period ended May 31, 2014, Class A shares at NAV of the AllianzGI Global Allocation Fund (the “Fund”) returned 4.66% underperforming the 60% MSCI AC World Index / 40% Barclays US Aggregate Index (the “benchmark index”) which returned 4.98%.
Portfolio Review
The Fund finished the reporting period within its risk budget but underperformed its benchmark index. The underperformance was driven primarily by stock selection, while asset allocation positioning contributed positively to the reporting period’s relative return.
During the reporting period, and relative to the benchmark index, the Fund held off-benchmark exposure to commodities, real estate, international small cap equities, frontier market equities, US small-cap equities, and international bonds. The Fund remains among the most diversified within its Morningstar category. The Fund held an underweight to global equities because it is underweight US large-cap equities, and is also underweight fixed income.
From an asset class perspective, allocations away from global equities and into commodities and real estate contributed positively to the reporting period’s relative return as commodities and real estate both rebounded after underperforming earlier in 2013 with the DJ UBS Commodity Index up 7.77% and the DJ US Select REIT Index rising 17.88%. Within the equity component, the Fund’s underweight to US large-cap stocks detracted from returns as the S&P 500 outperformed the MSCI AC World Index. Stock selection in US large-cap equities and international small-cap equities were the primary detractors from the reporting period’s relative return.
Exposure to underlying Funds implementing managed-volatility strategies had a mixed effect on relative returns with the AllianzGI International Managed Volatility Fund outperforming its respective benchmark index, while the AllianzGI U.S. Managed Volatility Fund and AllianzGI Global Managed Volatility Fund underperformed their respective benchmarks.
The AllianzGI US Managed Volatility Fund was hindered by the outperformance of higher-volatility equities over their lower-volatility counterparts during December 2013 and in May 2014.
Within fixed income, the Fund maintained an underweight position in duration and an overweight in credit. Stock selection decisions within international fixed income and short-term US bonds detracted from returns and were the primary detractors from the reporting period’s relative return.
In aggregate, positioning within commodities and real estate were the primary contributors to returns but were offset by stock selection decisions in international fixed income, short-term US fixed income, and US large-cap equities. The Fund maintains its focus on diversification with continued exposure to return-generating asset classes outside of equities with exposure to commodities, real estate, high yield bonds, emerging market bonds, and convertible bonds.
| Semiannual Report | | May 31, 2014 | 35 |
Table of Contents
Unaudited
AllianzGI Global Allocation Fund (cont’d)
Average Annual Total Return for the period ended May 31, 2014
| 6 Month* | 1 Year | 5 Year | 10 Year | Since Inception† | ||||||||||||||||||
| AllianzGI Global Allocation Fund Class A | 4.66% | 10.02% | 11.21% | 6.35% | 6.24% | |||||||||||||||||
| AllianzGI Global Allocation Fund Class A (adjusted) | –1.10% | 3.97% | 9.96% | 5.75% | 5.86% | ||||||||||||||||
| AllianzGI Global Allocation Fund Class B | 4.32% | 9.22% | 10.41% | 5.79% | 5.88% | |||||||||||||||||
| AllianzGI Global Allocation Fund Class B (adjusted) | –0.68% | 4.22% | 10.14% | 5.79% | 5.88% | ||||||||||||||||
| AllianzGI Global Allocation Fund Class C | 4.39% | 9.27% | 10.40% | 5.57% | 5.45% | |||||||||||||||||
| AllianzGI Global Allocation Fund Class C (adjusted) | 3.39% | 8.27% | 10.40% | 5.57% | 5.45% | ||||||||||||||||
| AllianzGI Global Allocation Fund Class D | 4.72% | 10.09% | 11.20% | 6.36% | 6.25% | ||||||||||||||||
| AllianzGI Global Allocation Fund Class R | 4.60% | 9.81% | 10.95% | 6.11% | 5.99% | ||||||||||||||||
| AllianzGI Global Allocation Fund Class P | 4.79% | 10.30% | 11.43% | 6.58% | 6.46% | ||||||||||||||||
| AllianzGI Global Allocation Fund Institutional Class | 4.84% | 10.31% | 11.53% | 6.80% | 6.71% | ||||||||||||||||
| AllianzGI Global Allocation Fund Administrative Class | 4.71% | 9.93% | 11.23% | 6.40% | 6.29% | |||||||||||||||||
| MSCI All Country World Index | 6.02% | 17.15% | 13.73% | 7.47% | 5.97% | ||||||||||||||||
| 60% MSCI AC World Index/40% Barclays U.S. Aggregate Index | 4.98% | 11.29% | 10.46% | 6.84% | 6.06% | ||||||||||||||||
| Barclays U.S. Aggregate Index | 3.28% | 2.71% | 4.96% | 4.99% | 5.28% | ||||||||||||||||
| Lipper Mixed-Asset Target Allocation Moderate Funds Average | 5.09% | 11.11% | 11.38% | 6.08% | 5.71% | |||||||||||||||||
† The Fund began operations on 9/30/98. Benchmark return comparisons began on the fund inception date. Lipper performance comparisons began on 9/30/98.
* Cumulative return.
Performance quoted represents past performance and is no guarantee of future results. Current performance may be lower or higher than performance shown. For performance current to the most recent month-end, visit our website at us.allianzgi.com. Investment return and the principal value will fluctuate. Shares may be worth more or less than original cost when redeemed. The adjusted returns take into account the maximum sales charge of 5.50% on Class A shares, 5% contingent deferred sales charge (CDSC) on Class B shares and 1% CDSC on Class C shares. Returns do not reflect deduction of taxes that a shareholder would pay on fund distributions or redemption of fund shares. See pages 86 and 87 for more information. The Fund’s gross expense ratios are 2.09% for Class A shares, 2.91% for Class B shares, 2.83% for Class C shares, 2.12% for Class D shares, 2.27% for Class R shares, 1.86% for Class P shares, 1.84% for Institutional Class shares and 2.21% for Administrative Class shares. These ratios do not include an expense reduction, contractually guaranteed through at least 3/31/15. The Fund’s expense ratios net of this reduction are 1.13% for Class A shares, 1.84% for Class B shares, 1.86% for Class C shares, 1.13% for Class D shares, 1.29% for Class R shares, 0.89% for Class P shares, 0.89% for Institutional Class shares and 1.14% for Administrative Class shares. Expense ratio information is as of the Fund’s current prospectus dated April 1, 2014, as supplemented to date.
Cumulative Returns Through May 31, 2014
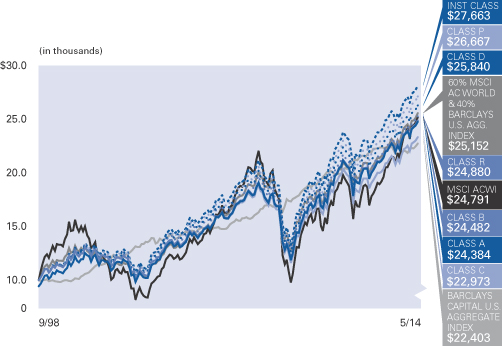
Fund Allocation (as of May 31, 2014)
PIMCO Income | 8.0% | |||
| PIMCO Short-Term | 7.0% | |||
| AllianzGI NFJ International Value | 6.0% | |||
| AllianzGI NFJ Global Dividend Value | 5.5% | |||
| PIMCO International StocksPLUS® AR Strategy (U.S. Dollar-Hedged) | 5.1% | |||
| PIMCO Floating Income | 5.0% | |||
| AllianzGI Short Duration High Income | 5.0% | |||
| AllianzGI NFJ Dividend Value | 4.8% | |||
| Other | 53.7% | |||
| Cash & Equivalents — Net | –0.1% |
| 36 | May 31, 2014 | | Semiannual Report |
Table of Contents
Unaudited
AllianzGI Global Allocation Fund (cont’d)
| Shareholder Expense Example | Actual Performance | |||||||||||||||
| Class A | Class B | Class C | Class D | Class R | Class P | Institutional Class | Administrative Class | |||||||||
| Beginning Account Value (12/1/13) | $1,000.00 | $1,000.00 | $1,000.00 | $1,000.00 | $1,000.00 | $1,000.00 | $1,000.00 | $1,000.00 | ||||||||
| Ending Account Value (5/31/14) | $1,046.60 | $1,043.20 | $1,043.90 | $1,047.20 | $1,046.00 | $1,047.90 | $1,048.40 | $1,047.10 | ||||||||
| Expenses Paid During Period | $2.04 | $5.65 | $5.76 | $1.89 | $2.86 | $0.82 | $0.82 | $2.09 | ||||||||
| Hypothetical Performance | ||||||||||||||||
| (5% return before expenses) | ||||||||||||||||
| Class A | Class B | Class C | Class D | Class R | Class P | Institutional Class | Administrative Class | |||||||||
| Beginning Account Value (12/1/13) | $1,000.00 | $1,000.00 | $1,000.00 | $1,000.00 | $1,000.00 | $1,000.00 | $1,000.00 | $1,000.00 | ||||||||
| Ending Account Value (5/31/14) | $1,022.94 | $1,019.40 | $1,019.30 | $1,023.09 | $1,022.14 | $1,024.13 | $1,024.13 | $1,022.89 | ||||||||
| Expenses Paid During Period | $2.02 | $5.59 | $5.69 | $1.86 | $2.82 | $0.81 | $0.81 | $2.07 | ||||||||
For each class of the Fund, expenses (net of fee waiver and reimbursement, if any) are equal to the annualized expense ratio for the class (0.40% for Class A, 1.11% for Class B, 1.13% for Class C, 0.37% for Class D, 0.56% for Class R, 0.16% for Class P, 0.16% for Institutional Class and 0.41% for Administrative Class), multiplied by the average account value over the period, multiplied by 182/365. The expense ratio does not include the expenses of the Underlying Funds, which based upon the allocation of the Fund’s assets among the Underlying Funds are indirectly borne by the shareholders of the Fund.
| Semiannual Report | | May 31, 2014 | 37 |
Table of Contents
Unaudited
AllianzGI Global Growth Allocation Fund
For the period of December 1, 2013 through May 31, 2014, as provided by the US Multi Asset Group.
Fund Insights
For the reporting period ended May 31, 2014, Class A shares at NAV of the AllianzGI Global Growth Allocation Fund (the “Fund”) returned 5.08% underperforming the MSCI ACWI (the “benchmark index”) which returned 6.02%.
The Fund finished the quarter within its risk budget but underperformed its benchmark index. Asset allocation decisions were the primary detractor from the reporting period’s relative return with an underweight to global equities and off-benchmark exposure to fixed income negatively impacted the period’s relative return.
During the first quarter, and relative to the benchmark, the Fund held off-benchmark exposure to commodities, real estate, international small cap equities, frontier-market equities, US small-cap equities, international fixed income, and short-term US fixed income. The Fund remains among the most diversified within its Morningstar category. The Fund held an underweight to global equities because it is
underweight US large-cap equities and international large-cap equities.
From an asset class perspective, allocations away from global equities and into commodities and real estate contributed positively to the reporting period’s relative return as commodities and real estate both rebounded after underperforming earlier in 2013, with the DJ UBS Commodity Index up 7.77% and the DJ US Select REIT Index rising 17.88%.
Within the equity component of the portfolio, the Fund’s underweight to US large-cap equities detracted from returns as the S&P 500 outperformed the MSCI AC World Index. The Fund’s off-benchmark exposure in US small-cap equities also detracted from relative returns as the Russell 2000 fell -0.10% during the reporting period.
Exposure to underlying Funds implementing managed-volatility strategies had a mixed effect on relative returns with the AllianzGI
International Managed Volatility Fund outperforming its respective benchmark, while the AllianzGI U.S. Managed Volatility Fund and AllianzGI Global Managed Volatility Fund underperformed their respective benchmarks. The AllianzGI U.S. Managed Volatility Fund was hindered by the outperformance of higher-volatility equities over their lower-volatility counterparts during December 2013 and in May 2014.
In aggregate, positioning within commodities and real estate were the primary contributors to returns but the Fund’s off-benchmark exposure to fixed income detracted from the reporting period’s relative return as equities outperformed fixed income. The Fund maintains its focus on diversification with continued exposure to return-generating asset classes outside of equities with exposure to commodities, real estate, high yield bonds, emerging market bonds, and convertible bonds.
Average Annual Total Return for the period ended May 31, 2014
| 6 Month* | 1 Year | 5 Year | Since Inception† | |||||||||||||||
| AllianzGI Global Growth Allocation Fund Class A | 5.08% | 12.54% | 12.94% | 15.13% | ||||||||||||||
| AllianzGI Global Growth Allocation Fund Class A (adjusted) | –0.70% | 6.35% | 11.67% | 13.86% | |||||||||||||
| AllianzGI Global Growth Allocation Fund Class C | 4.65% | 11.69% | 12.13% | 14.29% | ||||||||||||||
| AllianzGI Global Growth Allocation Fund Class C (adjusted) | 3.75% | 10.72% | 12.13% | 14.29% | |||||||||||||
| AllianzGI Global Growth Allocation Fund Class D | 5.10% | 12.56% | 12.96% | 15.15% | |||||||||||||
| AllianzGI Global Growth Allocation Fund Class R | 4.95% | 12.29% | 12.69% | 14.87% | |||||||||||||
| AllianzGI Global Growth Allocation Fund Class P | 5.16% | 12.73% | 13.17% | 15.36% | |||||||||||||
| AllianzGI Global Growth Allocation Fund Institutional Class | 5.23% | 12.84% | 13.29% | 15.48% | |||||||||||||
| AllianzGI Global Growth Allocation Fund Administrative Class | 5.07% | 12.54% | 13.00% | 15.19% | ||||||||||||||
| MSCI AC World Index | 6.02% | 17.15% | 13.73% | 16.11% | |||||||||||||
| 80% MSCI ACWI 20% Barclays US Agg. Index | 5.51% | 14.21% | 12.14% | 14.04% | |||||||||||||
| Lipper Global Flexible Port Fund Average | 4.53% | 8.72% | 10.50% | 11.92% | ||||||||||||||
† The Fund began operations on 4/27/09. Benchmark return comparisons began on the fund inception date. Lipper performance comparisons began on 4/30/09.
* Cumulative return.
Performance quoted represents past performance and is no guarantee of future results. Current performance may be lower or higher than performance shown. For performance current to the most recent month-end, visit our website at us.allianzgi.com. Investment return and the principal value will fluctuate. Shares may be worth more or less than original cost when redeemed. The adjusted returns take into account the maximum initial sales charge of 5.50% on Class A shares and the contingent deferred sales charge (CDSC) of 1% on Class C shares, which may apply to shares redeemed during the first year of ownership. Returns do not reflect deduction of taxes that a shareholder would pay on fund distributions or redemption of fund shares. See pages 86 and 87 for more information. The Fund’s gross expense ratios are 4.67% for Class A shares, 5.36% for Class C shares, 4.99% for Class D shares, 5.11% for Class R shares, 4.59% for Class P shares, 4.31% for Institutional Class shares and 4.62% for Administrative Class shares. These ratios do not include an expense reduction, contractually guaranteed through at least 3/31/15. The Fund’s expense ratios net of this reduction are 1.23% for Class A shares, 2.01% for Class C shares, 1.23% for Class D shares, 1.46% for Class R shares, 1.06% for Class P shares, 0.96% for Institutional Class shares and 1.21% for Administrative Class shares. Expense ratio information is as of the Fund’s current prospectus dated April 1, 2014, as supplemented to date.
| 38 | May 31, 2014 | | Semiannual Report |
Table of Contents
Unaudited
AllianzGI Global Growth Allocation Fund (cont’d)
Cumulative Returns Through May 31, 2014
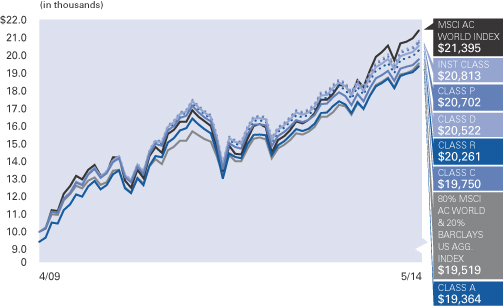
Fund Allocation (as of May 31, 2014)
AllianzGI Best Styles Global Equity | 8.2% | |||
| PIMCO Short-Term | 7.6% | |||
| AllianzGI U.S. Managed Volatility | 6.1% | |||
| PIMCO International StocksPLUS® AR Strategy (U.S. Dollar-Hedged) | 6.1% | |||
| AllianzGI NFJ International Value | 6.1% | |||
| AllianzGI Behavioral Advantage Large Cap | 4.9% | |||
| AllianzGI NFJ Mid-Cap Value | 4.6% | |||
| AllianzGI Global Managed Volatility | 4.1% | |||
| Other | 53.4% | |||
| Cash & Equivalents — Net | –1.1% |
| Shareholder Expense Example | Actual Performance | |||||||||||||
| Class A | Class C | Class D | Class R | Class P | Institutional Class | Administrative Class | ||||||||
| Beginning Account Value (12/1/13) | $1,000.00 | $1,000.00 | $1,000.00 | $1,000.00 | $1,000.00 | $1,000.00 | $1,000.00 | |||||||
| Ending Account Value (5/31/14) | $1,050.80 | $1,046.50 | $1,051.00 | $1,049.50 | $1,051.60 | $1,052.30 | $1,050.70 | |||||||
| Expenses Paid During Period | $2.05 | $6.02 | $2.05 | $3.22 | $1.18 | $0.67 | $1.94 | |||||||
| Hypothetical Performance | ||||||||||||||
| (5% return before expenses) | ||||||||||||||
| Class A | Class C | Class D | Class R | Class P | Institutional Class | Administrative Class | ||||||||
| Beginning Account Value (12/1/13) | $1,000.00 | $1,000.00 | $1,000.00 | $1,000.00 | $1,000.00 | $1,000.00 | $1,000.00 | |||||||
| Ending Account Value (5/31/14) | $1,022.94 | $1,019.05 | $1,022.94 | $1,021.79 | $1,023.78 | $1,024.28 | $1,023.04 | |||||||
| Expenses Paid During Period | $2.02 | $5.94 | $2.02 | $3.18 | $1.16 | $0.66 | $1.92 | |||||||
For each class of the Fund, expenses (net of fee waiver and reimbursement, if any) are equal to the annualized expense ratio for the class (0.40% for Class A, 1.18% for Class C, 0.40% for Class D, 0.63% for Class R, 0.23% for Class P, 0.13% for Institutional Class and 0.38% for Administrative Class), multiplied by the average account value over the period, multiplied by 182/365. The expense ratio does not include the expenses of the Underlying Funds, which based upon the allocation of the Fund’s assets among the Underlying Funds are indirectly borne by the shareholders of the Fund.
| Semiannual Report | | May 31, 2014 | 39 |
Table of Contents
Unaudited
AllianzGI Behavioral Advantage Large Cap Fund
For the period of December 1, 2013 through May 31, 2014, as provided by Raife Giovinazzo, CFA, PhD, Portfolio Manager.
Fund Insights
For the reporting period ended May 31, 2014, Class A shares at NAV of the AllianzGI Behavioral Advantage Large Cap Fund (the “Fund”) returned 5.25% underperforming the S&P 500 Index (the “benchmark index”) which returned 7.62%.
On an absolute basis, this was a good six months for the Fund, and the economy continues to improve. On a relative basis, these six months were a disappointment since we underperformed the S&P 500.
Performance
About a third of our relative performance was due to sector allocation, and about two-thirds was due to stock selection.
We follow a two-step investment process: we begin with a proprietary “smart-beta” index that weights stocks proportionally to size and valuation, and then we add an overlay based on behavioral finance. In our behavioral overlay, we buy stocks where we believe investors are over-reacting to past bad performance or under-reacting to good news. For the six months ending May 31, our proprietary smart-beta index outperformed, but our behavioral overlay under-performed. Within the behavioral overlay, our over-reaction strategies outperformed, but our
under-reaction strategies significantly underperformed—especially in March and April. While never expected, this is not unusual; performance of each step will (of course) vary from period to period. In the long run, we expect our proprietary smart-beta index and both parts of our behavioral overlay to add alpha relative to the S&P 500.
Our stock picks in Industrials, Materials and Telecom Services were positive, but dragged down by poor selection in Consumer Discretionary, Financials and Information Technology. On a stock basis, Hewlett Packard was our biggest contributor; our overweight to Hewlett Packard was primarily determined by our proprietary smart-beta starting index. Our biggest detractor came from NuSkin, a seller of anti-aging products. We owned NuSkin because we thought investors were under-reacting to good performance and strong productivity. But in January, NuSkin was unexpectedly investigated by Chinese authorities for its marketing practices, and the stock dropped precipitously. Thanks to our diversification, our portfolio only lost a relative 0.12%—less than an eighth of a percent—on this, our worst-performing investment this period.
Outlook
Our short-term outlook for the stock market is typically neutral, while our long-term outlook is optimistic. In the near term, the American economy is continuing its recovery, but we see significant near-term risks to the global economy from the Middle East. Over the long run, we continue to expect the stock market to provide superior returns for investors.
Our portfolio is constructed using a “bottom-up” approach that forms an indirect view of the market, but we purposely do not try to base our portfolio on macroeconomic or “top-down” forecasts. Most recently, our bottom-up approach has built a portfolio that is slightly more aggressive than average, suggesting a slightly more-positive-than-usual outlook for the market. We continue to have a very positive outlook for our stock-picking approach. Our stock selection process starts with a proprietary “smart beta” index based on accounting-level measures of size and value, and then adds an active overlay driven by Behavioral Finance-based strategies. We believe our disciplined approach used in the Fund’s stock selection and portfolio construction processes helps to provide a repeatable source of above-benchmark returns over the long-term.
Average Annual Total Return for the period ended May 31, 2014
| 6 Month* | 1 Year | Since Inception† | ||||||||||||
| AllianzGI Behavioral Advantage Large Cap Fund Class A | 5.25% | 20.09% | 23.83% | |||||||||||
| AllianzGI Behavioral Advantage Large Cap Fund Class A (adjusted) | –0.54% | 13.48% | 21.28% | ||||||||||
| AllianzGI Behavioral Advantage Large Cap Fund Class C | 4.87% | 19.17% | 22.88% | |||||||||||
| AllianzGI Behavioral Advantage Large Cap Fund Class C (adjusted) | 3.87% | 18.17% | 22.88% | ||||||||||
| AllianzGI Behavioral Advantage Large Cap Fund Class D | 5.26% | 20.08% | 23.81% | ||||||||||
| AllianzGI Behavioral Advantage Large Cap Fund Class P | 5.37% | 20.32% | 24.09% | ||||||||||
| AllianzGI Behavioral Advantage Large Cap Fund Institutional Class | 5.42% | 20.43% | 24.21% | ||||||||||
| S&P 500 Index | 7.62% | 20.45% | 22.05% | ||||||||||
| Lipper Multi-Cap Core Fund Average | 6.27% | 19.48% | 18.85% | |||||||||||
† The Fund began operations on 9/8/11. Benchmark return comparisons began on the fund inception date. Lipper performance comparisons began on 8/31/11.
* Cumulative return.
Performance quoted represents past performance and is no guarantee of future results. Current performance may be lower or higher than performance shown. For performance current to the most recent month-end, visit our website at us.allianzgi.com. Investment return and the principal value will fluctuate. Shares may be worth more or less than original cost when redeemed. The adjusted returns take into account the maximum initial sales charge of 5.50% on Class A shares and the contingent deferred sales charge (CDSC) of 1% on Class C shares, which may apply to shares redeemed during the first year of ownership. Returns do not reflect deduction of taxes that a shareholder would pay on fund distributions or redemption of fund shares. See pages 86 and 87 for more information. The Fund’s gross expense ratios are 1.25% for Class A shares, 2.08% for Class C shares, 2.08% for Class D shares, 1.20% for Class P shares and 1.05% for Institutional Class shares. These ratios do not include an expense reduction, contractually guaranteed through at least 3/31/15. The Fund’s expense ratios net of this reduction are 0.81% for Class A shares, 1.57% for Class C shares, 0.81% for Class D shares, 0.65% for Class P shares and 0.55% for Institutional Class shares. Expense ratio information is as of the Fund’s current prospectus dated April 1, 2014, as supplemented to date.
| 40 | May 31, 2014 | | Semiannual Report |
Table of Contents
Unaudited
AllianzGI Behavioral Advantage Large Cap Fund (cont’d)
Cumulative Returns Through May 31, 2014
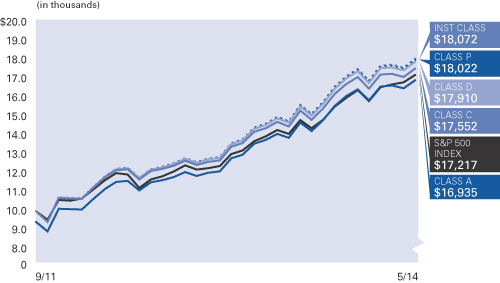
Industry Allocation (as of May 31, 2014)
Oil, Gas & Consumable Fuels | 7.6% | |||
IT Services | 6.1% | |||
Software | 5.5% | |||
Pharmaceuticals | 5.2% | |||
Aerospace & Defense | 4.7% | |||
Insurance | 4.3% | |||
Banks | 4.2% | |||
Technology Hardware, Storage & Peripherals | 3.5% | |||
Other | 58.4% | |||
Cash & Equivalents — Net | 0.5% |
| Shareholder Expense Example | Actual Performance | |||||||||
| Class A | Class C | Class D | Class P | Institutional Class | ||||||
| Beginning Account Value (12/1/13) | $1,000.00 | $1,000.00 | $1,000.00 | $1,000.00 | $1,000.00 | |||||
| Ending Account Value (5/31/14) | $1,052.50 | $1,048.70 | $1,052.60 | $1,053.70 | $1,054.20 | |||||
| Expenses Paid During Period | $4.20 | $8.02 | $4.15 | $3.33 | $2.82 | |||||
| Hypothetical Performance | ||||||||||
| (5% return before expenses) | ||||||||||
| Class A | Class C | Class D | Class P | Institutional Class | ||||||
| Beginning Account Value (12/1/13) | $1,000.00 | $1,000.00 | $1,000.00 | $1,000.00 | $1,000.00 | |||||
| Ending Account Value (5/31/14) | $1,020.84 | $1,017.10 | $1,020.89 | $1,021.69 | $1,022.19 | |||||
| Expenses Paid During Period | $4.13 | $7.90 | $4.08 | $3.28 | $2.77 | |||||
For each class of the Fund, expenses (net of fee waiver and reimbursement, if any) are equal to the annualized expense ratio for the class (0.82% for Class A, 1.57% for Class C, 0.81% for Class D, 0.65% for Class P and 0.55% for Institutional Class), multiplied by the average account value over the period, multiplied by 182/365.
| Semiannual Report | | May 31, 2014 | 41 |
Table of Contents
Unaudited
AllianzGI Best Styles Global Equity Fund
Since the Fund’s inception on December 2, 2013 through May 31, 2014, as provided by Klaus Teloeken, Portfolio Manager.
Fund Insights
For the reporting period ended May 31, 2014, Class R6 shares at NAV of the AllianzGI Best Styles Global Equity Fund (the “Fund”) returned 6.80% outperforming the MSCI ACWI (the “benchmark index”) which returned 6.48%.
Market Environment for Style Investing
The past six months after launch of the Fund on December 2, 2013 were a solid period for style investing. The Fund seeks to harvest the risk premiums of investment styles and implements a diversified mix of investment styles, thereby balancing the cyclicality of the individual investment styles in order to deliver stable outperformance and high Information Ratio across the business cycle.
Best Styles Performance Review
The trend-following investments styles Momentum and Earnings were well ahead of the benchmark in January and February, partly compensating for any negative contributions from Value. The contrarian Investment Style Value underperformed quite meaningfully at the beginning of the year, mainly driven by the US and the Emerging Markets, while Value still outperformed significantly across Europe, indicating the European economy is still in an earlier stage of the business cycle with Value stocks offering higher potential for recovery as compared to other regions of the World. As a
consequence, relative performance of the Fund suffered between mid of January and mid of February.
This investment style pattern reversed to some extent from March onwards as Value solidly returned to outperformance in the US and remained positive in Europe, overcompensating for weaker contributions from the trend-following investment styles, bringing the Fund’s year-to-date performance as well as the performance since inception well ahead of the benchmark.
With the market correction in early April, the trend-following investment styles temporarily hurt relative performance of the Fund, however, with markets trending upwards again the Fund’s relative performance picked-up to close at the highest level since inception.
The Best Styles strategy aims at generating an outperformance of 1-2% p.a. before costs on rolling three-year windows, thus the relative performance of the fund was fully in line with expectations, reflecting a solid environment for styles investors.
The Best Styles strategy has only moderate leeway for sector and regional allocation with a maximum deviation of 3% vs. the benchmark for active sector weightings. The overall
contribution from active sector allocation was about flat. Underweighting Consumer Staples and Financials helped, as did overweighting Utilities and Health Care, while overweighting Consumer Discretionary and Telecoms as well as underweighting IT and Industrials detracted to some extent. The overall contributions from active country weightings were also flat.
Investment Style Outlook
From an economic point of view, on our measures Europe and Japan are still early mid-cycle, while the US and Emerging Markets are later mid cycle. Typically, in the mid stage of an economic recovery, all major investment styles like Value, Momentum, Revisions and Small Caps are generally expected to do well, with the investment style Value taking the lead, in the run-up to the mid-cycle peak as well as thereafter.
The Fund will continue to be overweight in stocks with attractive valuation and positive momentum/positive revisions, in line with the long-term investment style allocation of the Best Styles strategy. The Best Styles investment style mix has helped to generate stable and reliable outperformance since the inception of the Fund. We believe outperformance has proven to be largely independent from the general economic environment and particular market conditions.
Cumulative Return for the period ended May 31, 2014
| Since Inception† | ||||||
| AllianzGI Best Styles Global Equity Fund Class R6 | 6.80% | ||||
| MSCI AC World Index | 6.48% | ||||
| Lipper Global Multi-Cap Core Fund Avg. | 5.12% | |||||
† The Fund began operations on 12/2/2013. Benchmark return comparisons began on the fund inception date. Lipper performance comparisons began on 11/30/2013.
Performance quoted represents past performance and is no guarantee of future results. Current performance may be lower or higher than performance shown. For performance current to the most recent month-end, visit our website at us.allianzgi.com. Investment return and the principal value will fluctuate. Shares may be worth more or less than original cost when redeemed. Returns do not reflect deduction of taxes that a shareholder would pay on fund distributions or redemption of fund shares. See pages 86 and 87 for more information. The Fund’s gross expense ratio is 3.25% for Class R6 shares. This ratio does not include an expense reduction, contractually guaranteed through at least 3/31/15. The Fund’s expense ratio net of this reduction ratio is 0.40% for Class R6 shares. Expense ratio information is as of the Fund’s current prospectus dated April 1, 2014, as supplemented to date.
| 42 | May 31, 2014 | | Semiannual Report |
Table of Contents
Unaudited
AllianzGI Best Styles Global Equity Fund (cont’d)
Cumulative Returns Through May 31, 2014
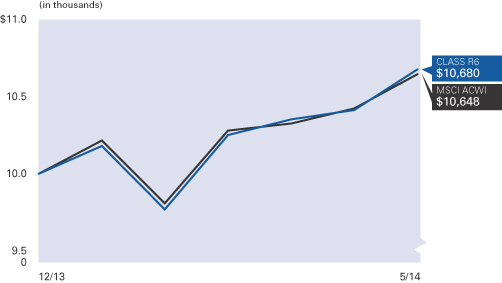
Country Allocation (as of May 31, 2014)
| United States | 49.3% | |||
| Japan | 10.7% | |||
| United Kingdom | 6.4% | |||
| Canada | 4.0% | |||
| Germany | 3.8% | |||
| France | 2.5% | |||
| China | 2.4% | |||
| Korea (Republic of) | 2.2% | |||
| Other | 15.3% | |||
| Cash & Equivalents — Net | 3.4% |
| Shareholder Expense Example | Actual Performance | |
| Class R6 | ||
| Beginning Account Value (12/2/13) | $1,000.00 | |
| Ending Account Value (5/31/14) | $1,068.00 | |
| Expenses Paid During Period | $2.04 | |
| Hypothetical Performance | ||
| (5% return before expenses) | ||
| Class R6 | ||
| Beginning Account Value (12/1/13) | $1,000.00 | |
| Ending Account Value (5/31/14) | $1,022.94 | |
| Expenses Paid During Period | $2.02 |
The Fund commenced operations on December 2, 2013. The Actual expense example is based on the period since inception; the Hypothetical expense example is based on the period beginning December 1, 2013. If the Hypothetical expense example had been based on the period since inception, the Ending Account Value and Expenses Paid During Period would have been $1,022.68 and $1.99.
Expenses (net of fee waiver and reimbursement, if any) are equal to the annualized expense ratio of 0.40% multiplied by the average account value over the period, multiplied by 180/365 for the Actual expense example and 182/365 for the Hypothetical expense example.
| Semiannual Report | | May 31, 2014 | 43 |
Table of Contents
Unaudited
AllianzGI China Equity Fund
For the period of December 1, 2013, through May 31, 2014, as provided by Christina Chung, Portfolio Manager.
Fund Insights
For the reporting period ended May 31, 2014, the Class A shares at NAV of the AllianzGI China Equity Fund (the “Fund”) returned -6.71% outperforming the MSCI China Index (the “benchmark index”) which returned -7.02% for the same period.
The relative outperformance was largely attributed to positive sector allocation, in particular our underweight in Financials and overweight in Information Technology. In contrast, stock selection in Information Technology and Materials were areas of weakness and detracted from performance. Our stock picks in the Industrials sector partially offset the negative attribution from stock selection in the above sectors. Our holdings in China Everbright International continued to add to relative performance. Its share price continued to be supported by positive sentiment on environment protection related names. The company also delivered inline earnings in contrast to many others from the same sector. Another stock pick from the Consumer Discretionary sector, Future Bright Holdings, also contributed positively to relative performance in part because of our stock positioning in the
Macau casino catering business. On the negative side, the Information Technology sector detracted from relative performance for the period in part because of our position in Digital China whose valuation was derated because of its flattish growth. However, we believe the company should recover in the second half of 2014 driven by continued revenue growth in IT services as well as margin enhancement. Within the Materials sector, our holding in Tiangong International was the largest detractor to performance.
With China’s macroeconomic data suggesting a moderation in economic activities, the China equity markets experienced a pull-back in the first quarter of 2014. The decline reaffirmed the weaker growth momentum in the past few months which was likely heightened by pollution control, anti-corruption measures, as well as the relatively tight monetary and fiscal policy stances.
The announcement of the “Shanghai-Hong Kong Stock Connect” scheme on April 10th lifted market sentiment briefly, but the equity markets pulled back in the second half of April. Investors focused on the rising risk of non-performing loans and the exposure to
property developers. New “economy” stocks generally had a meaningful share price consolidation after a strong run in the first quarter. In May, macroeconomic data from China showed signs of stabilization, mainly helped by the relatively strong export data.
Coupling this with selective policy fine-tuning in an attempt to engineer an economic soft landing in China will help to underpin market sentiment. However, market upside could be capped by the relatively weak economic outlook in China and continued geo-political risks in the Asian region. While there are talks of reform initiatives in various areas like state-owned enterprise (SOE) reform, the opening up of industries to private participation, etc., there is still a lack of visibility in the implementation of these reforms. Against this backdrop, we continue to focus on structural growth sectors but will be very selective in stock positioning. We will focus on market leaders which demonstrate relatively better execution ability. Meanwhile, as the Chinese economy shows signs of stabilization and the global economy posts moderate recovery, we will selectively position in some cyclical stocks that have been oversold and hence we believe are at trough valuations.
Average Annual Total Return for the period ended May 31, 2014
| 6 Month* | 1 Year | Since Inception† | ||||||||||||
AllianzGI China Equity Fund Class A | –6.71% | 3.29% | 5.28% | |||||||||||
| AllianzGI China Equity Fund Class A (adjusted) | –11.84% | –2.40% | 3.80% | ||||||||||
AllianzGI China Equity Fund Class C | –7.09% | 2.43% | 4.53% | |||||||||||
| AllianzGI China Equity Fund Class C (adjusted) | –8.02% | 1.43% | 4.53% | ||||||||||
| AllianzGI China Equity Fund Class D | –6.76% | 3.22% | 5.32% | ||||||||||
| AllianzGI China Equity Fund Class P | –6.65% | 3.53% | 5.59% | ||||||||||
| AllianzGI China Equity Fund Institutional Class | –6.62% | 3.60% | 5.68% | ||||||||||
| MSCI China Index | –7.02% | 4.27% | 3.88% | ||||||||||
Lipper China Region Funds Average | –4.17% | 5.34% | 5.89% | |||||||||||
† The Fund began operations on 6/7/10. Benchmark return comparisons began on the fund inception date. Lipper performance comparisons began on 5/31/2010.
* Cumulative return.
Performance quoted represents past performance and is no guarantee of future results. Current performance may be lower or higher than performance shown. For performance current to the most recent month-end, visit our website at us.allianzgi.com. Investment return and the principal value will fluctuate. Shares may be worth more or less than original cost when redeemed. The adjusted returns take into account the maximum initial sales charge of 5.50% on Class A shares and the contingent deferred sales charge (CDSC) of 1% on Class C shares, which may apply to shares redeemed during the first year of ownership. Returns do not reflect deduction of taxes that a shareholder would pay on fund distributions or redemption of fund shares. See pages 86 and 87 for more information. The Fund’s gross expense ratios are 5.88% for Class A shares, 6.59% for Class C shares, 13.23% for Class D shares, 5.73% for Class P shares and 5.69% for Institutional Class shares. These ratios do not include an expense reduction, contractually guaranteed through at least 3/31/15. The Fund’s expense ratios net of this reduction are 1.70% for Class A shares, 2.45% for Class C shares, 1.77% for Class D shares, 1.51% for Class P shares and 1.45% for Institutional Class shares. Expense ratio information is as of the Fund’s current prospectus dated April 1, 2014, as supplemented to date.
| 44 | May 31, 2014 | | Semiannual Report |
Table of Contents
Unaudited
AllianzGI China Equity Fund (cont’d)
Cumulative Returns Through May 31, 2014
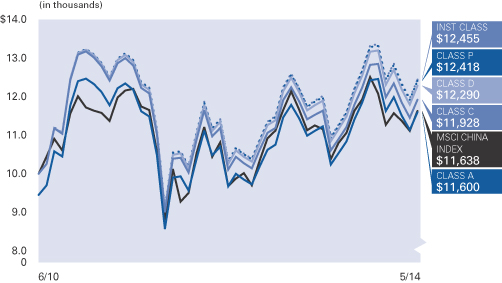
Industry Allocation (as of May 31, 2014)
| Banks | 18.9% | |||
| Oil, Gas & Consumable Fuels | 14.0% | |||
| Internet Software & Services | 7.2% | |||
| Insurance | 6.8% | |||
| Wireless Telecommunication Services | 5.7% | |||
| Industrial Conglomerates | 5.4% | |||
| Transportation Infrastructure | 3.9% | |||
| Automobiles | 3.9% | |||
| Other | 30.0% | |||
| Cash & Equivalents — Net | 4.2% |
| Shareholder Expense Example | Actual Performance | |||||||||
| Class A | Class C | Class D | Class P | Institutional Class | ||||||
| Beginning Account Value (12/1/13) | $1,000.00 | $1,000.00 | $1,000.00 | $1,000.00 | $1,000.00 | |||||
| Ending Account Value (5/31/14) | $932.90 | $929.10 | $932.40 | $933.50 | $933.80 | |||||
| Expenses Paid During Period | $8.29 | $12.17 | $8.53 | $7.28 | $6.99 | |||||
| Hypothetical Performance | ||||||||||
| (5% return before expenses) | ||||||||||
| Class A | Class C | Class D | Class P | Institutional Class | ||||||
| Beginning Account Value (12/1/13) | $1,000.00 | $1,000.00 | $1,000.00 | $1,000.00 | $1,000.00 | |||||
| Ending Account Value (5/31/14) | $1,016.36 | $1,012.32 | $1,016.11 | $1,017.40 | $1,017.70 | |||||
| Expenses Paid During Period | $8.65 | $12.69 | $8.90 | $7.59 | $7.29 | |||||
For each class of the Fund, expenses (net of fee waiver and reimbursement, if any) are equal to the annualized expense ratio for the class (1.72% for Class A, 2.53% for Class C, 1.77% for Class D, 1.51% for Class P and 1.45% for Institutional Class), multiplied by the average account value over the period, multiplied by 182/365.
| Semiannual Report | | May 31, 2014 | 45 |
Table of Contents
Unaudited
AllianzGI Convertible Fund
For the period of December 1, 2013, through May 31, 2014, as provided by Douglas Forsyth, Portfolio Manager.
Fund Insights
For the reporting period ended May 31, 2014, Class A shares at NAV of the AllianzGI Convertible Fund (the “Fund”) returned 7.09%, underperforming the BofA Merrill Lynch All Convertibles Index (the “benchmark index”) which returned 8.63%.
In the reporting period, convertible bonds benefited from higher equity prices and credit spread tightening. The S&P 500 index reached a new all-time high in May with the majority of corporate earnings meeting or exceeding expectations. Growing optimism on the US economic outlook and ongoing accommodative global central bank policies supported the stock market’s advance.
Several forces combated one another for the role of having the most dominant impact on the convertible market. With credit risk continuing to be minimal, the external factors that held the greatest identifiable influence on the market’s psychology and direction during the period included Treasury rates, geopolitical uncertainty from Russia, economic data points and the Fed outlook.
One factor that influenced the convertible market was Treasury yields. Many believed that 2014 would be the beginning of an inevitable path of rising Treasury yields and interest rates. In the period, however, the opposite occurred. The 10-year Treasury yield fell from approximately 3.00% at the start of the year to less than 2.50% by the end of May in a move that was generally unexpected. Convertible bonds generally have a low or even negative correlation with Treasury bonds on a historical basis.
However, some parts of the convertible market (the bond-like or busted convertibles) are positively correlated with Treasuries. This combination of higher correlation and the unexpected nature of the interest-rate move had a meaningfully positive influence on this part of the convertible market.
In terms of geopolitical uncertainty related to Russia and Ukraine, troop movements, the rhetoric quoted by the media and the unsettling idea of war in Ukraine kept most investors off-balance. The added day-to-day volatility did not help the equity market or convertible bonds directly, but it did create a flight-to-quality bid for the Treasury market beginning in late February.
The third external factor that influenced convertible markets was economic statistics, which rebounded in April and May after a very harsh winter. The employment picture improved, as did several other economic indicators including auto and housing sales and manufacturing and services surveys. At the same time, inflation remained at bay.
Finally, Janet Yellen took over the spotlight as the new Fed chair. The vast majority of the comments from the Fed during this time were designed to remove any fear about change as the committee transitioned away from former Fed chair Ben Bernanke. Nevertheless, Yellen managed to make headlines during a March 19 press conference by commenting on the timeline for when the Fed would shift to a tightening position and raise the target Fed funds rate. This is only notable longer term in a convertible context as it relates to the economic
outlook and the Treasury rate impact. In the short term, however, Yellen’s comments added uncertainty for shorter-dated interest rates and broadly added to market uncertainty.
Against this backdrop, non-investment-grade issuers outperformed investment-grade issuers and total-return convertibles outperformed yield or busted categories. 2014 new issuance was elevated and on pace with 2013 levels.
Performance
The Fund rallied with the market in the reporting period. The attribution for the period included several positive single-name performers from a variety of sectors. The majority of the Fund’s issuers exceeded earnings expectations, which helped contribute to absolute performance.
Sector allocations that helped relative performance in the period included Energy, Industrials and Consumer Staples. A lower-than-benchmark weight and positive security selection in the Industrials and Consumer Staples sectors were beneficial, while stronger issue-specific performance within the Energy sector had a positive impact on a relative basis.
In contrast, the Fund’s Technology, Financials and Consumer Discretionary exposure weighed on relative performance during the reporting period. In particular, an overweight and negative security selection within the Technology sector detracted. An underweight in Financials was additive, but only partially offset weaker issue-specific performance. Relative underperformance in Consumer Discretionary hindered performance although an overweight in this sector helped to minimize the impact.
| 46 | May 31, 2014 | | Semiannual Report |
Table of Contents
Unaudited
AllianzGI Convertible Fund (cont’d)
Average Annual Total Return for the period ended May 31, 2014
| 6 Month* | 1 Year | 5 Year | 10 Year | Since Inception† | ||||||||||||||||
| AllianzGI Convertible Fund Class A | 7.09% | 16.49% | 16.00% | 9.83% | 10.75% | |||||||||||||||
| AllianzGI Convertible Fund Class A (adjusted) | 1.20% | 10.08% | 14.69% | 9.21% | 10.45% | ||||||||||||||
| AllianzGI Convertible Fund Class C | 6.69% | 15.60% | 15.15% | 9.02% | 9.92% | |||||||||||||||
| AllianzGI Convertible Fund Class C (adjusted) | 5.69% | 14.60% | 15.15% | 9.02% | 9.92% | ||||||||||||||
| AllianzGI Convertible Fund Class D | 7.05% | 16.39% | 15.97% | 9.82% | 10.74% | ||||||||||||||
| AllianzGI Convertible Fund Class R | 6.91% | 15.87% | 15.63% | 9.52% | 10.45% | ||||||||||||||
| AllianzGI Convertible Fund Class P | 7.18% | 16.72% | 16.22% | 10.06% | 10.98% | ||||||||||||||
| AllianzGI Convertible Fund Institutional Class | 7.25% | 16.80% | 16.35% | 10.17% | 11.09% | ||||||||||||||
| AllianzGI Convertible Fund Administrative Class | 7.13% | 16.53% | 16.04% | 9.85% | 10.76% | |||||||||||||||
| BofA Merrill Lynch All Convertibles Index | 8.63% | 18.66% | 16.32% | 7.60% | 8.63% | ||||||||||||||
| Lipper Conv. Securities Fund Average | 6.52% | 14.81% | 13.59% | 6.67% | 8.74% | |||||||||||||||
† The Fund began operations on 4/19/93. Benchmark return comparisons began on the fund inception date. Lipper performance comparisons began on 4/30/93.
* Cumulative return.
Performance quoted represents past performance and is no guarantee of future results. Current performance may be lower or higher than performance shown. For performance current to the most recent month-end, visit our website at us.allianzgi.com. Investment return and the principal value will fluctuate. Shares may be worth more or less than original cost when redeemed. The adjusted returns take into account the maximum initial sales charge of 5.50% on Class A shares and the contingent deferred sales charge (CDSC) of 1% on Class C shares, which may apply to shares redeemed during the first year of ownership. Returns do not reflect deduction of taxes that a shareholder would pay on fund distributions or redemption of fund shares. See pages 86 and 87 for more information. The Fund’s expense ratios are 0.96% for Class A shares, 1.70% for Class C shares, 1.02% for Class D shares, 1.51% for Class R shares, 0.75% for Class P shares, 0.65% for Institutional Class shares and 0.90% for Administrative Class shares. Expense ratio information is as of the Fund’s current prospectus dated April 1, 2014, as supplemented to date.
Cumulative Returns Through May 31, 2014
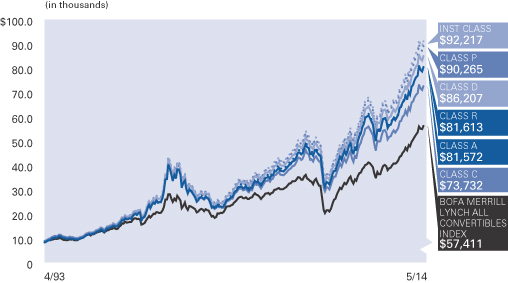
Industry Allocation (as of May 31, 2014)
Semiconductors | 10.6% | |||
| Oil & Gas | 8.3% | |||
| Pharmaceuticals | 7.0% | |||
| Biotechnology | 6.5% | |||
| Software | 6.3% | |||
| Internet | 6.1% | |||
| Real Estate Investment Trust | 5.2% | |||
| Insurance | 5.0% | |||
| Other | 43.6% | |||
| Cash & Equivalents — Net | 1.4% |
Moody’s Ratings* (as of May 31, 2014)

* As a percentage of total investments. Bond ratings refer to the underlying holdings of the Fund and are categorized from highest to lowest credit quality using ratings provided by Moody’s. Moody’s ratings have been selected for several reasons, including the access to information and materials provided by Moody’s, as well as the Fund’s consideration of industry practice. See “Important Information” for more detail on the selection of Moody’s for the Fund’s ratings presentation. Bonds not rated by Moody’s are designated in the chart above as “NR.”
| Semiannual Report | | May 31, 2014 | 47 |
Table of Contents
Unaudited
AllianzGI Convertible Fund (cont’d)
| Shareholder Expense Example | Actual Performance | |||||||||||||
| Class A | Class C | Class D | Class R | Class P | Institutional Class | Administrative Class | ||||||||
| Beginning Account Value (12/1/13) | $1,000.00 | $1,000.00 | $1,000.00 | $1,000.00 | $1,000.00 | $1,000.00 | $1,000.00 | |||||||
| Ending Account Value (5/31/14) | $1,070.90 | $1,066.90 | $1,070.50 | $1,069.10 | $1,071.80 | $1,072.50 | $1,071.30 | |||||||
| Expenses Paid During Period | $4.80 | $8.66 | $4.96 | $6.45 | $3.77 | $3.31 | $4.54 | |||||||
| Hypothetical Performance | ||||||||||||||
| (5% return before expenses) | ||||||||||||||
| Class A | Class C | Class D | Class R | Class P | Institutional Class | Administrative Class | ||||||||
| Beginning Account Value (12/1/13) | $1,000.00 | $1,000.00 | $1,000.00 | $1,000.00 | $1,000.00 | $1,000.00 | $1,000.00 | |||||||
| Ending Account Value (5/31/14) | $1,020.29 | $1,016.55 | $1,020.14 | $1,018.70 | $1,021.29 | $1,021.74 | $1,020.54 | |||||||
| Expenses Paid During Period | $4.68 | $8.45 | $4.84 | $6.29 | $3.68 | $3.23 | $4.43 | |||||||
For each class of the Fund, expenses are equal to the annualized expense ratio for the class (0.93% for Class A, 1.68% for Class C, 0.96% for Class D, 1.25% for Class R, 0.73% for Class P, 0.64% for Institutional Class and 0.88% for Administrative Class), multiplied by the average account value over the period, multiplied by 182/365.
| 48 | May 31, 2014 | | Semiannual Report |
Table of Contents
Unaudited
AllianzGI Global Fundamental Strategy Fund
For the period of December 1, 2013 through May 31, 2014, as provided by Andreas Utermann, Portfolio Manager.
Fund Insights
For reporting period ended May 31, 2014, Class A shares at NAV of the AllianzGI Global Fundamental Strategy Fund (the “Fund”) returned 5.37%.
The recovery in the US contributed to a notable improvement in equity markets. Increased speculation about a potential package of measures expected to be announced at the ECB meeting in June gave European equities a boost, too. Emerging markets equities had a performance run in May, detaching themselves from a lackluster first quarter of 2014. Emerging Markets bonds remained in positive territory and institutional investors seem to be returning to the asset class.
The political unrest in the Ukraine put a strain on the markets in the first half of 2014 but this effect has eased in recent times, partially due to good economic figures from the US in April and May. In the Euro area, consumer confidence is
markedly up and the mood of purchasing managers has risen to a three year high.
The performance of the Fund was helped in recent times by blue chip stocks and emerging markets equities. During the reporting period, emerging markets local currency bonds contributed strongly to performance while earlier in this period some holdings in emerging markets equities detracted from the Fund’s performance. At the close of the reporting period, the Fund held approximately 56% of the portfolio in fixed income securities, 32% in equities and the remaining holdings in cash.
Financial markets seem to have called off fears of a backlash towards recession which was prevalent in the first quarter of 2014. All signs are pointing to a global recovery with consumer confidence up almost everywhere, the US PMI at 56 and good numbers reported by China. We believe that as long as Central Banks stick to
accommodative policies economic fundamentals will be supported.
Our risk exposure is geared to a global recovery so this environment is serving the Fund well. We believe that emerging markets still have a strong showing ahead as they historically have been late-comers in the cycle and that they will continue to be a significant source of returns over the course of 2014. Local bond yields are high and currencies are depressed. Moreover, there is a large gap between the performance of emerging market and developed market equities which we believe should narrow in the future.
Despite the exceptionally good run of government bonds in the US and in Europe we remain suspicious of duration. In the light of continuously improving economic data financial markets at some point in time will try to pro-actively be ahead of Central Banks. This is likely to hit high-quality high-duration bonds in particular.
Cumulative Return for the period ended May 31, 2014
| 6 Month | Since Inception† | |||||||||
| AllianzGI Global Fundamental Strategy Fund Class A | 5.37% | 8.53% | ||||||||
| AllianzGI Global Fundamental Strategy Fund Class A (adjusted) | –0.43% | 2.56% | |||||||
| AllianzGI Global Fundamental Strategy Fund Class C | 4.99% | 7.79% | ||||||||
| AllianzGI Global Fundamental Strategy Fund Class C (adjusted) | 3.99% | 6.79% | |||||||
| AllianzGI Global Fundamental Strategy Fund Class D | 5.37% | 8.53% | |||||||
| AllianzGI Global Fundamental Strategy Fund Class P | 5.44% | 8.68% | |||||||
| AllianzGI Global Fundamental Strategy Fund Institutional Class | 5.49% | 8.80% | |||||||
| USD Overnight LIBOR | 0.05% | 0.09% | |||||||
| 70% MSCI ACWI/30% Barclays Global Aggregate Index | 5.32% | 15.78% | |||||||
| USD Overnight LIBOR + 4% | 2.09% | 3.87% | |||||||
| Lipper Absolute Return Funds Average | 1.69% | 4.16% | ||||||||
† The Fund began operations on 7/1/13. Benchmark return comparisons began on the fund inception date. Lipper performance comparisons began on 6/30/13.
Performance quoted represents past performance and is no guarantee of future results. Current performance may be lower or higher than performance shown. For performance current to the most recent month-end, visit our website at us.allianzgi.com. Investment return and the principal value will fluctuate. Shares may be worth more or less than original cost when redeemed. The adjusted returns take into account the maximum initial sales charge of 5.50% on Class A shares and the contingent deferred sales charge (CDSC) of 1% on Class C shares, which may apply to shares redeemed during the first year of ownership. Returns do not reflect deduction of taxes that a shareholder would pay on fund distributions or redemption of fund shares. See pages 86 and 87 for more information. The Fund’s gross expense ratios are 1.94% for Class A shares, 2.69% for Class C shares, 1.94% for Class D shares, 1.69% for Class P shares and 1.67% for Institutional Class shares. These ratios do not include an expense reduction, contractually guaranteed through at least 3/31/15. The Fund’s expense ratios net of this reduction are 1.25% for Class A shares, 2.00% for Class C shares, 1.25% for Class D shares, 1.10% for Class P shares and 1.00% for Institutional Class shares. Expense ratio information is as of the Fund’s current prospectus dated April 1, 2014, as supplemented to date.
| Semiannual Report | | May 31, 2014 | 49 |
Table of Contents
Unaudited
AllianzGI Global Fundamental Strategy Fund (cont’d)
Cumulative Returns Through May 31, 2014
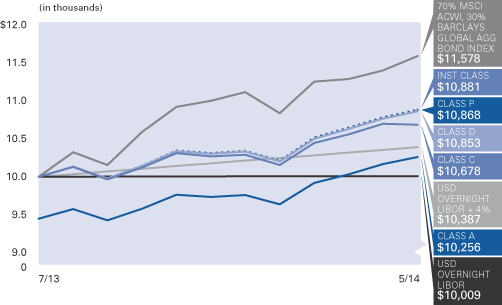
Country Allocation (as of May 31, 2014)
| United States | 24.8% | |||
| Supranational | 8.3% | |||
| Switzerland | 7.9% | |||
| United Kingtom | 7.0% | |||
| Germany | 6.5% | |||
| Italy | 6.3% | |||
| Spain | 4.6% | |||
| France | 3.6% | |||
| Other | 24.2% | |||
| Cash & Equivalents — Net (including Options Purchased) | 6.8% |
Moody’s Ratings* (as of May 31, 2014)
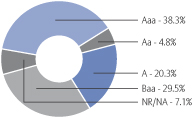
* As a percentage of fixed-income investments. Bond ratings refer to the underlying holdings of the Fund and are categorized from highest to lowest credit quality using ratings provided by Moody’s. Moody’s ratings have been selected for several reasons, including the access to information and materials provided by Moody’s, as well as the Fund’s consideration of industry practice. See “Important Information” for more detail on the selection of Moody’s for the Fund’s ratings presentation. Bonds not rated by Moody’s are designated in the chart above as “NR.”
| Shareholder Expense Example | Actual Performance | |||||||||
| Class A | Class C | Class D | Class P | Institutional Class | ||||||
| Beginning Account Value (12/1/13) | $1,000.00 | $1,000.00 | $1,000.00 | $1,000.00 | $1,000.00 | |||||
| Ending Account Value (5/31/14) | $1,053.70 | $1,049.90 | $1,053.70 | $1,054.40 | $1,054.90 | |||||
| Expenses Paid During Period | $6.40 | $10.22 | $6.40 | $5.63 | $5.12 | |||||
| Hypothetical Performance | ||||||||||
| (5% return before expenses) | ||||||||||
| Class A | Class C | Class D | Class P | Institutional Class | ||||||
| Beginning Account Value (12/1/13) | $1,000.00 | $1,000.00 | $1,000.00 | $1,000.00 | $1,000.00 | |||||
| Ending Account Value (5/31/14) | $1,018.70 | $1,014.96 | $1,018.70 | $1,019.45 | $1,019.95 | |||||
| Expenses Paid During Period | $6.29 | $10.05 | $6.29 | $5.54 | $5.04 | |||||
For each class of the Fund, expenses (net of fee waiver and reimbursement, if any) are equal to the annualized expense ratio for the class (1.25% for Class A, 2.00% for Class C, 1.25% for Class D, 1.10% for Class P and 1.00% for Institutional Class), multiplied by the average account value over the period, multiplied by 182/365.
| 50 | May 31, 2014 | | Semiannual Report |
Table of Contents
Unaudited
AllianzGI Global Managed Volatility Fund
For the period of December 1, 2013 to May 31, 2014, as provided by Kunal Ghosh, Portfolio Manager.
Fund Insights
For the reporting period ended May 31, 2014, Class A shares at NAV of the AllianzGI Global Managed Volatility Fund (the “Fund”) returned 5.75%, underperforming the MSCI World Index (the “benchmark index”) which returned 6.52%.
Market Environment
During the reporting period, developed market stocks advanced as investors weighed a benign US Federal Reserve guidance and moderate increases in global growth expectations alongside mounting geopolitical tensions between Russia and the Ukraine.
European stocks were among the best benchmark index performers thanks to greater economic stability in the region as countries continue to recover from the recent debt-crisis recession. Smaller index weights, including Denmark, Israel, Italy and Norway were best performers for the benchmark index. The United States, which represents the largest weight in the benchmark index, performed near the middle of the pack in terms of returns as cold winter temperatures were to blame for a decline in consumer spending. Meanwhile, Japan declined for the period as investors took profits following a strong 2013 and braced for the potential impact of a sales tax hike. Other Asian
economies, including Singapore and Hong Kong, advanced on an absolute basis but trailed the broader benchmark.
Sector performance was broad-based, with each of the 10 benchmark index sectors reporting positive results. Cyclical stocks, including Utilities and Energy, were among the top benchmark performers, while Consumer Discretionary stocks managed only modest gains during the reporting period.
Volatility and market risk are increasingly important given the rapidly adjusting macroeconomic environment, and we anticipate continued “risk on/risk off” periods for the foreseeable future. Like previous periods, we anticipate that macro events will likely continue having significant influence on equity markets.
Performance Driven by Stock Selection at the Sector Level
The managed volatility investment process takes advantage of the fact that stocks can have complementary risk characteristics and seeks to create a portfolio with lower expected risk than the benchmark index over time. Our expectation is that this lower risk profile will result in outperformance over time by avoiding the impact of market downturns and allowing our
clients to benefit by the role of compounding. During the reporting period, the Fund achieved its goal of lower risk with only 8.8% annualized standard deviation compared to 12.2% for the benchmark index. Despite modestly trailing the benchmark from a pure performance standpoint, the Fund produced attractive risk-adjusted returns given similar levels of performance alongside a meaningful reduction in risk.
The Fund’s performance relative to the benchmark index was primarily due to more conservative stock selection. The primary sector detractors were Energy and Consumer Staples, with lower risk stocks in the sectors generally trailing higher risk stocks. Meanwhile, a relative underweight to Financials contributed to results as did positive stock selections in Industrials and Health Care sectors. From a county perspective, the Fund’s more conservative stockpicking in the United States offset results, as did selections in Hong Kong/China. Meanwhile, a relative underweight and stockpicking in Japan contributed positively to results. A relative overweight allocation to Israel and bottom-up selections in Singapore also added to performance during the reporting period.
Average Annual Total Return for the period ended May 31, 2014
| 6 Month* | 1 Year | Since Inception† | ||||||||||||
| AllianzGI Global Managed Volatility Fund Class A | 5.75% | 10.68% | 12.17% | |||||||||||
| AllianzGI Global Managed Volatility Fund Class A (adjusted) | –0.07% | 4.59% | 9.61% | ||||||||||
| AllianzGI Global Managed Volatility Fund Class C | 5.33% | 9.92% | 11.35% | |||||||||||
| AllianzGI Global Managed Volatility Fund Class C (adjusted) | 4.33% | 8.92% | 11.35% | ||||||||||
| AllianzGI Global Managed Volatility Fund Class D | 5.74% | 10.73% | 12.20% | ||||||||||
| AllianzGI Global Managed Volatility Fund Class P | 5.85% | 10.97% | 12.45% | ||||||||||
| AllianzGI Global Managed Volatility Fund Institutional Class | 5.90% | 11.08% | 12.55% | ||||||||||
| MSCI World Index | 6.52% | 18.87% | 21.02% | ||||||||||
| MSCI World Minimum Volatility Index | 5.75% | 12.92% | 14.61% | ||||||||||
| Lipper Global Multi-Cap Value Funds Average | 6.08% | 17.65% | 17.68% | |||||||||||
† The Fund began operations on 12/19/11. Benchmark return comparisons began on the fund inception date. Lipper performance comparisons began on 12/31/11.
* Cumulative return.
Performance quoted represents past performance and is no guarantee of future results. Current performance may be lower or higher than performance shown. For performance current to the most recent month-end, visit our website at us.allianzgi.com. Investment return and the principal value will fluctuate. Shares may be worth more or less than original cost when redeemed. The adjusted returns take into account the maximum initial sales charge of 5.50% on Class A shares and the contingent deferred sales charge (CDSC) of 1% on Class C shares, which may apply to shares redeemed during the first year of ownership. Returns do not reflect deduction of taxes that a shareholder would pay on fund distributions or redemption of fund shares. See pages 86 and 87 for more information. The Fund’s gross expense ratios are 2.63% for Class A shares, 3.26% for Class C shares, 2.84% for Class D shares, 2.38% for Class P shares and 2.32% for Institutional Class shares. These ratios do not include an expense reduction, contractually guaranteed through at least 3/31/15. The Fund’s expense ratios net of this reduction are 0.94% for Class A shares, 1.62% for Class C shares, 0.94% for Class D shares, 0.69% for Class P shares and 0.60% for Institutional Class shares. Expense ratio information is as of the Fund’s current prospectus dated April 1, 2014, as supplemented to date.
| Semiannual Report | | May 31, 2014 | 51 |
Table of Contents
Unaudited
AllianzGI Global Managed Volatility Fund (cont’d)
Cumulative Returns Through May 31, 2014
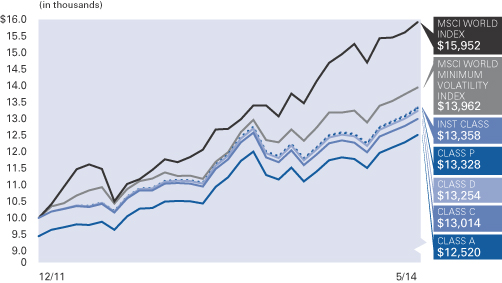
Country Allocation (as of May 31, 2014)
United States | 55.5% | |||
| Canada | 12.6% | |||
| United Kingdom | 6.0% | |||
| Hong Kong | 4.0% | |||
| Japan | 3.9% | |||
| Singapore | 3.7% | |||
| Israel | 3.6% | |||
| China | 2.7% | |||
| Other | 6.5% | |||
| Cash & Equivalents — Net | 1.5% |
| Shareholder Expense Example | Actual Performance | |||||||||
| Class A | Class C | Class D | Class P | Institutional Class | ||||||
| Beginning Account Value (12/1/13) | $1,000.00 | $1,000.00 | $1,000.00 | $1,000.00 | $1,000.00 | |||||
| Ending Account Value (5/31/14) | $1,057.50 | $1,053.30 | $1,057.40 | $1,058.50 | $1,059.00 | |||||
| Expenses Paid During Period | $4.87 | $8.34 | $4.62 | $3.59 | $3.08 | |||||
| Hypothetical Performance | ||||||||||
| (5% return before expenses) | ||||||||||
| Class A | Class C | Class D | Class P | Institutional Class | ||||||
| Beginning Account Value (12/1/13) | $1,000.00 | $1,000.00 | $1,000.00 | $1,000.00 | $1,000.00 | |||||
| Ending Account Value (5/31/14) | $1,020.19 | $1,016.80 | $1,020.44 | $1,021.44 | $1,021.94 | |||||
| Expenses Paid During Period | $4.78 | $8.20 | $4.53 | $3.53 | $3.02 | |||||
For each class of the Fund, expenses (net of fee waiver and reimbursement, if any) are equal to the annualized expense ratio for the class (0.95% for Class A, 1.63% for Class C, 0.90% for Class D, 0.70% for Class P and 0.60% for Institutional Class), multiplied by the average account value over the period, multiplied by 182/365.
| 52 | May 31, 2014 | | Semiannual Report |
Table of Contents
Unaudited
For the period of December 1, 2013 to May 31, 2014, as provided by Andreas Fruschki, Portfolio Manager.
Fund Insights
For the reporting period ended May 31, 2014, Class A shares at NAV of the AllianzGI Global Water Fund (the “Fund”) returned 6.77%, underperforming the S&P Global Water Index (the “benchmark index”) which returned 11.11%.
Markets
While the S&P Global Water Index has outperformed the S&P 500, the relative performance of the Fund lagged the benchmark due to an underweight in utilities in favor of water technology.
Amongst the best performing stocks in the past 6 months were the UK and French Water utilities, which the Fund did own but not to the extent of the benchmark weight. The UK water utilities are a compelling investment as they earn a guaranteed allowed rate of return on investments they make in the water
infrastructure. This return is inflation protected and reviewed every 5 years. Going into the current review we took a cautious stance as we preferred to await the outcome of the current review first before getting more positive.
In France, water operator Veolia has seen its stock increase strongly in anticipation of restructuring achievements and end-market growth. We do not think the company qualifies as best-in-class, given their history of internal problems, level of debt and limited organic growth options and have therefore opted not to invest. The underweight in both countries’ water utilities has resulted in less appreciation compared to the benchmark.
We prefer the US water utilities instead and leading suppliers of water technology equipment needed to build out or replace existing water infrastructure in the emerging
markets and the US. The current drought in California along with water shortages reported in Latin America underscore the importance of functioning water supply networks, with low leakage rates and sufficient reserve capacity. With tax revenues increasing, we expect municipalities to invest in their neglected water networks again after what is now 5 years of austerity. Along with industrial companies investing in water efficiency technology and government spending addressing water shortages, the market for water supply equipment should see growth acceleration.
Core holdings of the Fund remain the leading water pump companies such as Xylem and companies with differentiated products for water infrastructure construction.
Average Annual Total Return for the period ended May 31, 2014
| 6 Month* | 1 Year | 5 Year | Since Inception† | |||||||||||||||
| AllianzGI Global Water Fund Class A | 6.77% | 18.41% | 14.63% | 5.47% | ||||||||||||||
| AllianzGI Global Water Fund Class A (adjusted) | 0.90% | 11.90% | 13.34% | 4.51% | |||||||||||||
| AllianzGI Global Water Fund Class C | 6.36% | 17.52% | 13.76% | 4.68% | ||||||||||||||
| AllianzGI Global Water Fund Class C (adjusted) | 5.36% | 16.52% | 13.76% | 4.68% | |||||||||||||
| AllianzGI Global Water Fund Class D | 6.62% | 18.28% | 14.58% | 5.43% | |||||||||||||
| AllianzGI Global Water Fund Class P | 6.89% | 18.67% | 14.88% | 5.70% | |||||||||||||
| AllianzGI Global Water Fund Institutional Class | | 6.90% | | | 18.91% | | | 15.02% | | | 5.82% | | |||||
| MSCI AC World Index | 6.02% | 17.15% | 13.73% | 4.75% | |||||||||||||
| S&P Global Water Index | 11.11% | 23.78% | 17.34% | 7.77% | |||||||||||||
| Lipper Global Natural Resources Funds Average | 9.03% | 17.40% | 6.75% | –1.03% | ||||||||||||||
† The Fund began operations on 3/31/08. Benchmark return comparisons began on the fund inception date. Lipper performance comparisons began on 3/31/08.
* Cumulative return.
Performance quoted represents past performance and is no guarantee of future results. Current performance may be lower or higher than performance shown. For performance current to the most recent month-end, visit our website at us.allianzgi.com. Investment return and the principal value will fluctuate. Shares may be worth more or less than original cost when redeemed. The adjusted returns take into account the maximum initial sales charge of 5.50% on Class A shares and the contingent deferred sales charge (CDSC) of 1% on Class C shares, which may apply to shares redeemed during the first year of ownership. Returns do not reflect deduction of taxes that a shareholder would pay on fund distributions or redemption of fund shares. See pages 86 and 87 for more information. The Fund’s expense ratios are 1.52% for Class A shares, 2.29% for Class C shares, 1.60% for Class D shares, 1.26% for Class P shares and 1.18% for Institutional Class shares. Expense ratio information is as of the Fund’s current prospectus dated April 1, 2014, as supplemented to date.
| Semiannual Report | | May 31, 2014 | 53 |
Table of Contents
Unaudited
AllianzGI Global Water Fund (cont’d)
Cumulative Returns Through May 31, 2014
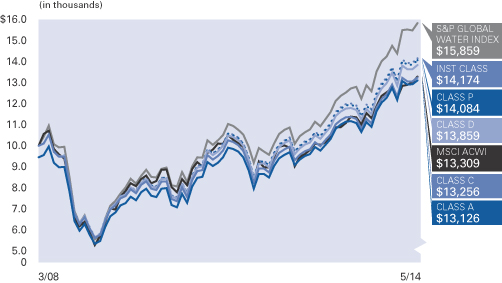
Country Allocation (as of May 31, 2014)
United States | 29.7% | |||
| United Kingdom | 17.3% | |||
| Switzerland | 14.5% | |||
| China | 5.4% | |||
| Netherlands | 4.3% | |||
| France | 3.8% | |||
| Japan | 3.7% | |||
| Sweden | 3.6% | |||
| Other | 12.1% | |||
| Cash & Equivalents — Net | 5.6% |
| Shareholder Expense Example | Actual Performance | |||||||||
| Class A | Class C | Class D | Class P | Institutional Class | ||||||
| Beginning Account Value (12/1/13) | $1,000.00 | $1,000.00 | $1,000.00 | $1,000.00 | $1,000.00 | |||||
| Ending Account Value (5/31/14) | $1,067.70 | $1,063.60 | $1,066.20 | $1,068.90 | $1,069.00 | |||||
| Expenses Paid During Period | $7.37 | $11.37 | $8.24 | $6.19 | $5.73 | |||||
| Hypothetical Performance | ||||||||||
| (5% return before expenses) | ||||||||||
| Class A | Class C | Class D | Class P | Institutional Class | ||||||
| Beginning Account Value (12/1/13) | $1,000.00 | $1,000.00 | $1,000.00 | $1,000.00 | $1,000.00 | |||||
| Ending Account Value (5/31/14) | $1,017.80 | $1,013.91 | $1,016.95 | $1,018.95 | $1,019.40 | |||||
| Expenses Paid During Period | $7.19 | $11.10 | $8.05 | $6.04 | $5.59 | |||||
For each class of the Fund, expenses are equal to the annualized expense ratio for the class (1.43% for Class A, 2.21% for Class C, 1.60% for Class D, 1.20% for Class P and 1.11% for Institutional Class), multiplied by the average account value over the period, multiplied by 182/365.
| 54 | May 31, 2014 | | Semiannual Report |
Table of Contents
Unaudited
AllianzGI High Yield Bond Fund
For the period of December 1, 2013, through May 31, 2014, as provided by Doug Forsyth, Portfolio Manager.
Fund Insights
For the reporting period ended May 31, 2014, Class A shares at NAV of the AllianzGI High Yield Bond Fund (the “Fund”) returned 4.26%, underperforming the BofA Merrill Lynch US High Yield Master II Index (the “benchmark index”), which returned 5.33%.
Several forces combated one another for the role of having the most dominant impact on the high-yield market. With credit risk continuing to be minimal, the external factors that held the greatest identifiable influence on the market’s psychology and direction during the period included Treasury rates, geopolitical uncertainty from Russia, economic data points and the Fed outlook.
The first factor that significantly influenced the high-yield market was Treasury yields. Many believed that 2014 would be the beginning of an inevitable path of rising Treasury yields and interest rates. In the period, however, the opposite occurred. The 10-year Treasury yield fell from approximately 3.00% at the start of the year to less than 2.50% by the end of May in a move that was generally unexpected. High-yield bonds generally have a low correlation with Treasury bonds on a historical basis. However, as discussed in previous commentaries, BB rated issuers are far more correlated with Treasuries today compared with previous cycles. This combination of higher correlation and the unexpected nature of the interest-rate move had a meaningfully positive influence on high-yield prices.
In terms of geopolitical uncertainty related to Russia and Ukraine, troop movements, the
rhetoric quoted by the media and the unsettling idea of war in Ukraine kept most investors off balance. The added day-to-day volatility did not help the equity market or high-yield bonds directly, but it did create a flight-to-quality bid for the Treasury market beginning in late February.
The third external factor that influenced high-yield markets was economic statistics, which rebounded in April and May after a very harsh winter. The employment picture improved, as did several other economic indicators, and inflation remained at bay. At the same time, the majority of corporate earnings continued to meet or exceed expectations. These factors created renewed optimism about the prospects for the continued low default rate and the constructive economic environment for US corporations.
Finally, Janet Yellen took over the spotlight as the new Fed chair. The vast majority of the comments from the Fed during this time were designed to remove any fear about change as the committee transitioned away from Ben Bernanke. Nevertheless, Yellen managed to make headlines during a March 19 press conference by commenting on the timeline for when the Fed would shift to a tightening position and raise the target Fed funds rate. This is only notable longer term in a high-yield context as it relates to the economic outlook and the Treasury rate impact. In the short term, however, Yellen’s comments added uncertainty for shorter-dated interest rates and broadly added to market uncertainty.
Performance
Performance relative to the benchmark return was driven by factors that were similar in many ways to the market environment of 2012. The Fund had solid upside participation with the market rally in the period. The CCCs were the best performing ratings category of the benchmark index, followed by the BBs and the Bs. The BB rated issuers benefited significantly from the Treasury market performance. The portfolio has been structured to specifically avoid low-coupon (4%-5%) bonds, as they are poised to underperform in both a flat and rising interest-rate environment. The CCCs typically move higher with broad market demand and a bullish outlook for credit. An underweight in these rating categories did not help relative performance.
Industry positions that helped relative performance during the period included Metals/Mining, Technology and Printing/Publishing. An underweight and positive relative performance in Metals/Mining was beneficial. Technology was aided by stronger issue-specific performance. An overweight in Printing/Publishing helped as that industry outperformed the overall market.
Industry allocations that hurt relative performance during the period included Services, Energy and Super Retail. All of the aforementioned industries exhibited weaker issue-specific performance. The impact of relative weights among the three industries was negligible from an attribution standpoint.
| Semiannual Report | | May 31, 2014 | 55 |
Table of Contents
Unaudited
AllianzGI High Yield Bond Fund (cont’d)
Average Annual Total Return for the period ended May 31, 2014
| 6 Month* | 1 Year | 5 Year | 10 Year | Since Inception† | ||||||||||||||||||
| AllianzGI High Yield Bond Fund Class A | 4.26% | 6.96% | 12.60% | 8.21% | 8.17% | |||||||||||||||||
| AllianzGI High Yield Bond Fund Class A (adjusted) | 0.35% | 2.95% | 11.74% | 7.79% | 7.94% | ||||||||||||||||
| AllianzGI High Yield Bond Fund Class C | 3.78% | 6.05% | 11.78% | 7.41% | 7.37% | |||||||||||||||||
| AllianzGI High Yield Bond Fund Class C (adjusted) | 2.78% | 5.06% | 11.78% | 7.41% | 7.37% | ||||||||||||||||
| AllianzGI High Yield Bond Fund Class D | 4.07% | 6.76% | 12.58% | 8.20% | 8.16% | ||||||||||||||||
| AllianzGI High Yield Bond Fund Class R | 4.17% | 6.77% | 12.34% | 7.95% | 7.91% | ||||||||||||||||
| AllianzGI High Yield Bond Fund Class P | 4.30% | 7.13% | 12.81% | 8.39% | 8.34% | ||||||||||||||||
| AllianzGI High Yield Bond Fund Institutional Class | 4.33% | 7.18% | 13.02% | 8.66% | 8.65% | ||||||||||||||||
| AllianzGI High Yield Bond Fund Administrative Class | 4.23% | 6.98% | 12.64% | 8.23% | 8.18% | |||||||||||||||||
| BofA Merrill Lynch US High Yield Master II Index | 5.33% | 7.94% | 14.47% | 8.97% | 7.74% | ||||||||||||||||
| Lipper High Yield Funds Average | 4.56% | 6.95% | 13.04% | 7.69% | 6.73% | |||||||||||||||||
† The Fund began operations on 7/31/96. Benchmark return comparisons began on the fund inception date. Lipper performance comparisons began on 7/31/96.
* Cumulative return.
Performance quoted represents past performance and is no guarantee of future results. Current performance may be lower or higher than performance shown. For performance current to the most recent month-end, visit our website at us.allianzgi.com. Investment return and the principal value will fluctuate. Shares may be worth more or less than original cost when redeemed. The adjusted returns take into account the maximum initial sales charge of 3.75% on Class A shares and the contingent deferred sales charge (CDSC) of 1% on Class C shares, which may apply to shares redeemed during the first year of ownership. Returns do not reflect deduction of taxes that a shareholder would pay on fund distributions or redemption of fund shares. See pages 86 and 87 for more information. The Fund’s expense ratios are 0.91% for Class A shares, 1.70% for Class C shares, 1.02% for Class D shares, 1.32% for Class R shares, 0.71% for Class P shares, 0.62% for Institutional Class shares and 0.90% for Administrative Class shares. Expense ratio information is as of the Fund’s current prospectus dated April 1, 2014, as supplemented to date.
Cumulative Returns Through May 31, 2014
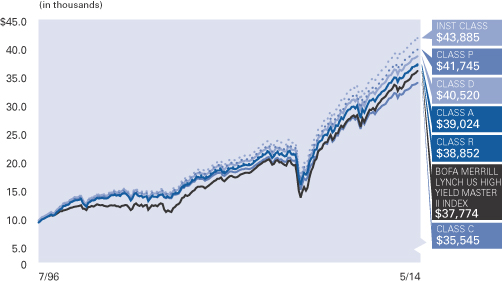
Industry Allocation (as of May 31, 2014)
| Oil & Gas | 11.2% | |||
| Commercial Services | 9.8% | |||
| Telecommunications | 8.6% | |||
| Media | 7.0% | |||
| Diversified Financial Services | 6.3% | |||
| Retail | 5.5% | |||
| Healthcare — Services | 3.3% | |||
| Home Builders | 3.3% | |||
| Other | 41.0% | |||
| Cash & Equivalents — Net | 4.0% |
Moody’s Ratings* (as of May 31, 2014)
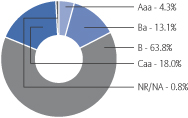
* As a percentage of total investments. Bond ratings refer to the underlying holdings of the Fund and are categorized from highest to lowest credit quality using ratings provided by Moody’s. Moody’s ratings have been selected for several reasons, including the access to information and materials provided by Moody’s, as well as the Fund’s consideration of industry practice. See “Important Information” for more detail on the selection of Moody’s for the Fund’s ratings presentation. Bonds not rated by Moody’s are designated in the chart above as “NR.”
| 56 | May 31, 2014 | | Semiannual Report |
Table of Contents
Unaudited
AllianzGI High Yield Bond Fund (cont’d)
| Shareholder Expense Example | Actual Performance | |||||||||||||
| Class A | Class C | Class D | Class R | Class P | Institutional Class | Administrative Class | ||||||||
| Beginning Account Value (12/1/13) | $1,000.00 | $1,000.00 | $1,000.00 | $1,000.00 | $1,000.00 | $1,000.00 | $1,000.00 | |||||||
| Ending Account Value (5/31/14) | $1,042.60 | $1,037.80 | $1,040.70 | $1,041.70 | $1,043.00 | $1,043.30 | $1,042.30 | |||||||
| Expenses Paid During Period | $4.74 | $8.64 | $5.19 | $6.21 | $3.67 | $3.21 | $4.58 | |||||||
| Hypothetical Performance | ||||||||||||||
| (5% return before expenses) | ||||||||||||||
| Class A | Class C | Class D | Class R | Class P | Institutional Class | Administrative Class | ||||||||
| Beginning Account Value (12/1/13) | $1,000.00 | $1,000.00 | $1,000.00 | $1,000.00 | $1,000.00 | $1,000.00 | $1,000.00 | |||||||
| Ending Account Value (5/31/14) | $1,020.29 | $1,016.45 | $1,019.85 | $1,018.85 | $1,021.34 | $1,021.79 | $1,020.44 | |||||||
| Expenses Paid During Period | $4.68 | $8.55 | $5.14 | $6.14 | $3.63 | $3.18 | $4.53 | |||||||
For each class of the Fund, expenses (net of fee waiver and reimbursement, if any) are equal to the annualized expense ratio for the class (0.93% for Class A, 1.70% for Class C, 1.02% for Class D, 1.22% for Class R, 0.72% for Class P, 0.63% for Institutional Class and 0.90% for Administrative Class), multiplied by the average account value over the period, multiplied by 182/365.
| Semiannual Report | | May 31, 2014 | 57 |
Table of Contents
Unaudited
AllianzGI International Small-Cap Fund
For the period of December 1, 2013, through May 31, 2014 as provided by Andrew Neville, Portfolio Manager.
Fund Insights
For the reporting period ended May 31, 2014, Class A shares at NAV of the AllianzGI International Small-Cap Fund (the “Fund”) returned 1.81% lagging the MSCI World ex-US Small Cap Index (the “benchmark index”) which returned 6.88%.
International small-cap companies continued to show positive returns over the six month period. European smaller companies registered the strongest gains followed by smaller companies from the Asia ex Japan region. Japanese smaller cap companies closed as relative laggards nearly unchanged over the course of the reporting period.
During the early part of the reporting period, markets experienced a setback mainly on the back of unfavorable news from the emerging markets. Emerging markets assets lost across the board as leading indicators from China came in weaker, monetary policy failed to stabilize the currencies of several emerging markets and Egypt, Thailand and Ukraine suffered from political unrest. Later on, concerns about the impact of the Crimean crisis and disappointing growth data from China dampened investor sentiment temporarily. In particular, the dip in Chinese exports raised doubts about the strength of the second-largest economy world-wide. However, markets turned back into positive territory as sentiment benefited from the fact that US monetary policy looks set to remain
loose for a longer time to come. Investors increasingly believed that US growth would pick up and that the Chinese government would support the country’s economy. In the Euro area, sentiment brightened further. Consumer confidence continued to rise, and the Purchasing Manager’s Index (PMI) reached a three-year high in April. This confirms that the Euro area has embarked on a moderate growth path. Both, the individual countries and the EU as a whole made progress in dealing with the debt crisis (one example is that important steps towards a banking union were made). Investors assumed that the European Central Bank would launch new stimulus measures soon, including options that might tamp down regional borrowing costs. The outcome of the European elections and the elections in Ukraine caused relief at the political level. China’s Purchasing Managers’ Index for April indicated a continued slow and soft recovery of China’s economy. In Japan, the core CPI hit a 23-year high, as the increase in Japan’s national sales tax boosted prices across the board.
Stock selection was the main driver of the Fund’s relative performance. Geographically, stock selection detracted within all three sleeve portfolios, Europe, Japan and Asia ex Japan. Sector-wise, selection detracted most within Information Technology, Industrials and Financials. Sector structure also detracted
slightly due to the overweight position in Consumer Discretionary and the underweight in Energy and Financials.
During the reporting period, the Fund’s largest overweights relative to the benchmark index were in Information Technology, Consumer Discretionary and Industrials while the largest underweights were in Financials followed by Materials. Geographically the largest overweights were in China and Denmark while the largest underweights were in Canada and Australia.
The strongest stock contributors to performance were the positions in Hikma Pharmaceuticals (UK), Aareal Bank (Germany) and Opap (Greece) whilst the positions in Yoox (Italy), Jafco (Japan) and Axis Communications (Sweden) were the largest detractors. Hikma is a multinational generic company that focuses on the development, manufacturing, and marketing of branded and non-branded generics with a leading presence in the MENA region, Europe and the US. The stock was supported by latest quarterly results, which surprised positively and confirmed that the strong growth in the MENA region continues. Yoox which designs and operates Internet trading platforms for fashion and designer products saw profit taking after UK peer Asos slightly disappointed with their quarterly results.
| 58 | May 31, 2014 | | Semiannual Report |
Table of Contents
Unaudited
AllianzGI International Small-Cap Fund (cont’d)
Average Annual Total Return for the period ended May 31, 2014
| 6 Month* | 1 Year | 5 Year | 10 Year | Since Inception† | ||||||||||||||||||
| AllianzGI International Small-Cap Fund Class A | 1.81% | 15.67% | 16.22% | 11.37% | 13.06% | |||||||||||||||||
| AllianzGI International Small-Cap Fund Class A (adjusted) | –3.79% | 9.31% | 14.92% | 10.74% | 12.67% | ||||||||||||||||
| AllianzGI International Small-Cap Fund Class C | 1.43% | 14.82% | 15.36% | 10.54% | 12.22% | |||||||||||||||||
| AllianzGI International Small-Cap Fund Class C (adjusted) | 0.50% | 13.82% | 15.36% | 10.54% | 12.22% | ||||||||||||||||
| AllianzGI International Small-Cap Fund Class D | 1.83% | 15.69% | 16.21% | 11.36% | 13.06% | ||||||||||||||||
| AllianzGI International Small-Cap Fund Class R | 1.71% | 15.40% | 15.93% | 11.09% | 12.78% | ||||||||||||||||
| AllianzGI International Small-Cap Fund Class P | 1.90% | 15.89% | 16.47% | 11.64% | 13.40% | ||||||||||||||||
| AllianzGI International Small-Cap Fund Institutional Class | 1.94% | 15.99% | 16.61% | 11.78% | 13.50% | ||||||||||||||||
| MSCI World ex-US Small Cap Index | 6.88% | 21.66% | 15.07% | 9.03% | 8.49% | ||||||||||||||||
| MSCI EAFE Small Cap Index | 6.39% | 22.53% | 15.31% | 9.14% | 8.41% | ||||||||||||||||
| Lipper International Small/Mid-Cap Growth Funds Average | 5.76% | 19.25% | 16.22% | 10.10% | 9.60% | |||||||||||||||||
† The Fund began operations on 12/31/97. Benchmark return comparisons began on the fund inception date. Lipper performance comparisons began on 12/31/97.
* Cumulative return.
Performance quoted represents past performance and is no guarantee of future results. Current performance may be lower or higher than performance shown. For performance current to the most recent month-end, visit our website at us.allianzgi.com. Investment return and the principal value will fluctuate. Shares may be worth more or less than original cost when redeemed. The adjusted returns take into account the maximum initial sales charge of 5.50% on Class A shares and the contingent deferred sales charge (CDSC) of 1% on Class C shares, which may apply to shares redeemed during the first year of ownership. Returns do not reflect deduction of taxes that a shareholder would pay on fund distributions or redemption of fund shares. See pages 86 and 87 for more information. The Fund’s gross expense ratios are 1.83% for Class A shares, 2.43% for Class C shares, 1.73% for Class D shares, 1.96% for Class R shares, 1.52% for Class P shares and 1.44% for Institutional Class shares. These ratios do not include an expense reduction, contractually guaranteed through at least 3/31/15. The Fund’s expense ratios net of this reduction are 1.45% for Class A shares, 2.19% for Class C shares, 1.45% for Class D shares, 1.70% for Class R shares, 1.28% for Class P shares and 1.21% for Institutional Class shares. Expense ratio information is as of the Fund’s current prospectus dated April 1, 2014, as supplemented to date.
Cumulative Returns Through May 31, 2014
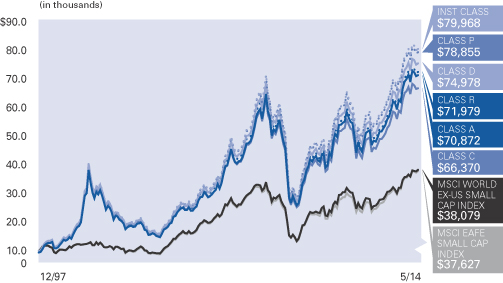
Country Allocation (as of May 31, 2014)
Japan | 22.7% | |||
| United Kingdom | 16.7% | |||
| Sweden | 7.0% | |||
| Germany | 6.8% | |||
| France | 5.5% | |||
| Italy | 5.3% | |||
| Hong Kong | 4.3% | |||
| Spain | 3.5% | |||
| Other | 25.5% | |||
| Cash & Equivalents — Net | 2.7% |
| Semiannual Report | | May 31, 2014 | 59 |
Table of Contents
Unaudited
AllianzGI International Small-Cap Fund (cont’d)
| Shareholder Expense Example | Actual Performance | |||||||||||
| Class A | Class C | Class D | Class R | Class P | Institutional Class | |||||||
| Beginning Account Value (12/1/13) | $1,000.00 | $1,000.00 | $1,000.00 | $1,000.00 | $1,000.00 | $1,000.00 | ||||||
| Ending Account Value (5/31/14) | $1,018.10 | $1,014.30 | $1,018.30 | $1,017.10 | $1,019.00 | $1,019.40 | ||||||
| Expenses Paid During Period | $7.30 | $11.05 | $7.30 | $8.55 | $6.49 | $6.09 | ||||||
| Hypothetical Performance | ||||||||||||
| (5% return before expenses) | ||||||||||||
| Class A | Class C | Class D | Class R | Class P | Institutional Class | |||||||
| Beginning Account Value (12/1/13) | $1,000.00 | $1,000.00 | $1,000.00 | $1,000.00 | $1,000.00 | $1,000.00 | ||||||
| Ending Account Value (5/31/14) | $1,017.70 | $1,013.96 | $1,017.70 | $1,016.45 | $1,018.50 | $1,018.90 | ||||||
| Expenses Paid During Period | $7.29 | $11.05 | $7.29 | $8.55 | $6.49 | $6.09 | ||||||
For each class of the Fund, expenses (net of fee waiver and reimbursement, if any) are equal to the annualized expense ratio for the class (1.45% for Class A, 2.20% for Class C, 1.45% for Class D, 1.70% for Class R, 1.29% for Class P and 1.21% for Institutional Class), multiplied by the average account value over the period, multiplied by 182/365.
| 60 | May 31, 2014 | | Semiannual Report |
Table of Contents
Unaudited
AllianzGI Micro Cap Fund
For the period of December 1, 2013, through May 31, 2014, as provided by Robert Marren, Portfolio Manager.
Fund Insights
For the reporting period ended May 31, 2014, Class A shares at NAV of the AllianzGI Micro Cap Fund (the “Fund”) returned -0.85%, outperforming the Russell Microcap Growth Index (the “benchmark index”) which returned -2.22%.
In general, the stock market continued its ascent into early 2014, then corrected before moving higher into the end of the reporting period.
In December, the Fed announced plans to reduce asset purchases beginning in January, but reinforced expectations for continued accommodative central bank policies. These remarks were construed as bullish and provided a boost to equities. Subsequent to major US indexes reaching new all-time highs, correction ensued. Global economic uncertainty and geopolitical tensions were sources of concern. However, depressed investor sentiment coincided with a near-term stock-market bottom and a sharp rally in US equities that lasted through March. During this period, US corporations reported healthy fourth-quarter results.
Throughout April strength in large-cap, broad-based indexes masked pockets of weakness and investor rotation. Select Information Technology and Health Care shares, in particular
biotechnology, underperformed as well as high-valuation and momentum-oriented companies. Furthermore, investors rotated out of small-cap and growth stocks and into large-cap and value-oriented equities. Outside of general market activity, US economic reports signaled improvement, while Ukraine-related headlines and China growth fears continued to garner attention.
As the end of the reporting period drew closer, investors once again gravitated toward growth stocks despite falling interest rates, reversing a two-month trend. On the other hand, the appetite for large caps relative to small caps remained unchanged. Beyond stocks, a resilient bid for US Treasuries confounded investors in light of equity market strength and improving economic conditions. Furthermore, first-quarter earnings were better-than-expected, M&A activity continued at an elevated pace and the Fed remained on track with plans to reduce asset purchases.
Against this backdrop, the Russell Microcap Index returned -1.13% and underperformed the Russell 2000 Index, which returned -0.10%. Within the micro-cap universe, growth-oriented stocks trailed value-oriented stocks.
Specific to the Russell Microcap Growth Index, sector performance was mixed. Utilities, Health Care and Energy were the strongest-performing sectors followed by Financials. In contrast, Consumer Staples, Information Technology and Telecom Services stocks closed lower and underperformed the overall universe by the greatest magnitude.
Performance
The Fund outperformed the benchmark index, providing downside protection in a declining market. Strength was evident in a variety of holdings and across many sectors. From an attribution perspective, security selection positively impacted relative returns whereas asset weighting effects contributed but to a slightly lesser degree. In particular, stock picking in the Industrials, Consumer Discretionary and Health Care sectors had the greatest positive impact on relative returns. Conversely, security selection within the Financials and Information Technology sectors detracted and negatively influenced relative performance. Separately, an overweight in Energy and Financials and an underweight in Consumer Staples aided relative performance, but were partially offset by an underweight in Health Care.
Average Annual Total Return for the period ended May 31, 2014
| 6 Month* | 1 Year | 5 Year | 10 Year | Since Inception† | ||||||||||||||||||
| AllianzGI Micro Cap Fund Class A | –0.85% | 23.74% | 20.07% | 8.17% | 11.78% | |||||||||||||||||
| AllianzGI Micro Cap Fund Class A (adjusted) | –6.30% | 16.94% | 18.72% | 7.56% | 11.45% | ||||||||||||||||
| AllianzGI Micro Cap Fund Class P | –0.78% | 23.89% | 20.28% | 8.40% | 12.02% | ||||||||||||||||
| AllianzGI Micro Cap Fund Institutional Class | –0.78% | 23.95% | 20.41% | 8.51% | 12.14% | ||||||||||||||||
| Russell Microcap Growth Index | –2.22% | 19.53% | 19.64% | 6.40% | 6.73% | ||||||||||||||||
| Lipper Small-Cap Core Funds Average | –2.85% | 15.77% | 19.28% | 8.22% | 9.04% | |||||||||||||||||
† The Fund began operations on 7/12/95. Benchmark return comparisons began on the fund inception date. Lipper performance comparisons began on 6/30/95.
* Cumulative return.
Performance quoted represents past performance and is no guarantee of future results. Current performance may be lower or higher than performance shown. For performance current to the most recent month-end, visit our website at us.allianzgi.com. Investment return and the principal value will fluctuate. Shares may be worth more or less than original cost when redeemed. The adjusted returns take into account the maximum initial sales charge of 5.50% on Class A shares. Returns do not reflect deduction of taxes that a shareholder would pay on fund distributions or redemption of fund shares. See pages 86 and 87 for more information. The Fund’s gross expense ratios are 2.07% for Class A shares, 1.90% for Class P shares and 2.01% for Institutional Class shares. This ratio does not include an expense reduction, contractually guaranteed through at least 3/31/15. The Fund’s expense ratios net of this reduction are 1.62% for Class A shares, 1.44% for Class P shares and 1.54% for Institutional Class shares. Expense ratio information is as of the Fund’s current prospectus dated April 1, 2014, as supplemented to date.
| Semiannual Report | | May 31, 2014 | 61 |
Table of Contents
Unaudited
AllianzGI Micro Cap Fund (cont’d)
Cumulative Returns Through May 31, 2014
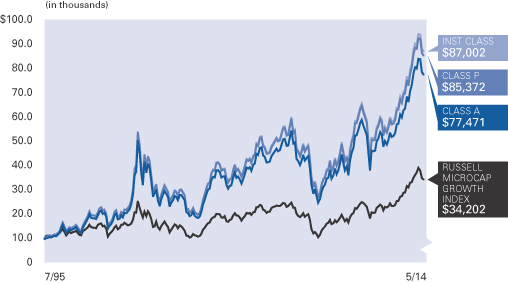
Industry Allocation (as of May 31, 2014)
| Biotechnology | 8.0% | |||
| Health Care Equipment & Supplies | 7.8% | |||
| Oil, Gas & Consumable Fuels | 6.6% | |||
| Road & Rail | 5.5% | |||
| Pharmaceuticals | 5.3% | |||
| Semiconductors & Semiconductor Equipment | 4.4% | |||
| Capital Markets | 4.0% | |||
| Auto Components | 4.0% | |||
| Other | 52.7% | |||
| Cash & Equivalents — Net | 1.7% |
| Shareholder Expense Example | Actual Performance | |||||
| Class A | Class P | Institutional Class | ||||
| Beginning Account Value (12/1/13) | $1,000.00 | $1,000.00 | $1,000.00 | |||
| Ending Account Value (5/31/14) | $991.50 | $992.20 | $992.20 | |||
| Expenses Paid During Period | $8.49 | $7.80 | $7.65 | |||
| Hypothetical Performance | ||||||
| (5% return before expenses) | ||||||
| Class A | Class P | Institutional Class | ||||
| Beginning Account Value (12/1/13) | $1,000.00 | $1,000.00 | $1,000.00 | |||
| Ending Account Value (5/31/14) | $1,016.40 | $1,017.10 | $1,017.25 | |||
| Expenses Paid During Period | $8.60 | $7.90 | $7.75 | |||
For each class of the Fund, expenses (net of fee waiver and reimbursement, if any) are equal to the annualized expense ratio for the class (1.71% for Class A, 1.57% for Class P and 1.54% for Institutional Class), multiplied by the average account value over the period, multiplied by 182/365.
| 62 | May 31, 2014 | | Semiannual Report |
Table of Contents
Unaudited
AllianzGI Multi-Asset Real Return Fund
For the period of December 1, 2013, through May 31, 2014 as provided by Dr. Michael Stamos, CFA, Ph.D., Portfolio Manager.
Fund Insights
For the reporting period ended May 31, 2014, Class A shares at NAV of the AllianzGI Multi-Asset Real Return Fund (the “Fund”) returned 7.11% outperforming the Barclays US Government Inflation-Linked Bond Index (the “benchmark index”) which returned 4.42%.
Returns on assets deemed highly correlated to inflation generally gained ground during the reporting period, with Global Real Estate, Global Resource Equities, Commodities, and US Treasury Inflation Protected Securities (TIPs) all posting positive returns. The Fund’s diversification into asset classes outside of TIPs for inflation protection benefited returns as Global Real Estate, Global Resource Equities and Commodities all outperformed the 4.42% return in the US TIPs market. The three outperforming asset classes generally gained ground on the
back of improving news flow out of the developed economies and continued easy monetary policies of leading central banks. The portfolio increased exposure to Commodities throughout the reporting period which was mainly motivated by the assessment of the portfolio management team’s Market Cycle Analysis which identified a positive trend in Commodities entering 2014 with the DJ UBS Commodity Index returning 7.77% over the reporting period. While the Fund increased exposure to Commodities, exposure to the US TIPs market was reduced as soft readings on the US Consumer Price Index (CPI) dampened demand for the asset class. Average year-over-year change in CPI throughout the reporting period ran at 1.48% but CPI has picked up in recent months with April’s reading coming in at 1.98%, driven by rising energy costs.
Within the Fund, a relatively high exposure to Global Resource Equities, Commodities, and Real Estate, and a smaller allocation to TIPS have helped returns relative to the benchmark index. Throughout the reporting period, the Fund has reduced exposure to TIPS and more recently has brought down the portfolio’s allocation to Global Resource Equities based on the strong returns in the asset class over the past year. The Fund maintains a diversified portfolio allocation to all four asset classes with a 29% allocation to Global Resource Equities, 25% in Commodities, 25% in Global Real Estate, 11% in US TIPs, and 9% in opportunistic asset class including U.S. Short-Term High Yield bonds and Emerging Market bonds as of May 31, 2014.
Average Annual Total Return for the period ended May 31, 2014
| 6 Month* | 1 Year | Since Inception† | ||||||||||||
| AllianzGI Multi-Asset Real Return Fund Class A | 7.11% | 8.52% | 6.47% | |||||||||||
| AllianzGI Multi-Asset Real Return Fund Class A (adjusted) | 1.21% | 2.55% | 2.40% | ||||||||||
| AllianzGI Multi-Asset Real Return Fund Class C | 6.71% | 7.77% | 5.72% | |||||||||||
| AllianzGI Multi-Asset Real Return Fund Class C (adjusted) | 5.71% | 6.77% | 5.72% | ||||||||||
| AllianzGI Multi-Asset Real Return Fund Class D | 7.11% | 8.53% | 6.48% | ||||||||||
| AllianzGI Multi-Asset Real Return Fund Class P | 7.20% | 8.68% | 6.63% | ||||||||||
| AllianzGI Multi-Asset Real Return Fund Institutional Class | 7.27% | 8.76% | 6.73% | ||||||||||
| Barclays US Government Inflation-Linked Bond Index | 4.42% | 0.47% | –2.76% | ||||||||||
| Lipper Global Flexible Port Fund Average | 4.53% | 8.72% | 9.10% | |||||||||||
† The Fund began operations on 12/17/12. Benchmark return comparisons began on the fund inception date. Lipper performance comparisons began on 12/31/12.
* Cumulative return
Performance quoted represents past performance and is no guarantee of future results. Current performance may be lower or higher than performance shown. For performance current to the most recent month-end, visit our website at us.allianzgi.com. Investment return and the principal value will fluctuate. Shares may be worth more or less than original cost when redeemed. The adjusted returns take into account the maximum initial sales charge of 5.50% on Class A shares and the contingent deferred sales charge (CDSC) of 1% on Class C shares, which may apply to shares redeemed during the first year of ownership. Returns do not reflect deduction of taxes that a shareholder would pay on fund distributions or redemption of fund shares. See pages 86 and 87 for more information. The Fund’s gross expense ratios are 5.58% for Class A shares, 6.71% for Class C shares, 16.68% for Class D shares, 4.91% for Class P shares and 4.90% for Institutional Class shares. These ratios do not include an expense reduction, contractually guaranteed through at least 3/31/15. The Fund’s expense ratios net of this reduction are 1.26% for Class A shares, 2.01% for Class C shares, 1.26% for Class D shares, 1.11% for Class P shares and 1.01% for Institutional Class shares. Expense ratio information is as of the Fund’s current prospectus dated April 1, 2014, as supplemented to date.
| Semiannual Report | | May 31, 2014 | 63 |
Table of Contents
Unaudited
AllianzGI Multi-Asset Real Return Fund (cont’d)
Cumulative Returns Through May 31, 2014
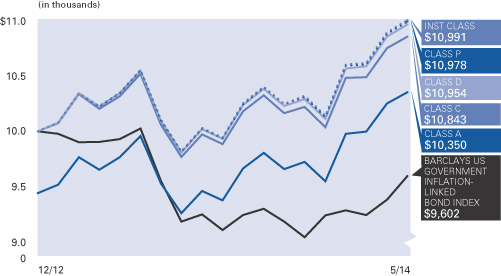
Asset Allocation (as of May 31, 2014)
| Mutual Funds | 53.6% | |||
| Common Stock | 24.5% | |||
| U.S. Treasury Obligations | 11.0% | |||
| Exchange-Traded Funds | 9.3% | |||
| Cash & Equivalents — Net | 1.6% |
| Shareholder Expense Example | Actual Performance | |||||||||
| Class A | Class C | Class D | Class P | Institutional Class | ||||||
| Beginning Account Value (12/1/13) | $1,000.00 | $1,000.00 | $1,000.00 | $1,000.00 | $1,000.00 | |||||
| Ending Account Value (5/31/14) | $1,071.10 | $1,067.10 | $1,071.10 | $1,072.00 | $1,072.70 | |||||
| Expenses Paid During Period | $4.39 | $8.25 | $4.39 | $3.62 | $3.10 | |||||
| Hypothetical Performance | ||||||||||
| (5% return before expenses) | ||||||||||
| Class A | Class C | Class D | Class P | Institutional Class | ||||||
| Beginning Account Value (12/1/13) | $1,000.00 | $1,000.00 | $1,000.00 | $1,000.00 | $1,000.00 | |||||
| Ending Account Value (5/31/14) | $1,020.69 | $1,016.95 | $1,020.69 | $1,021.44 | $1,021.94 | |||||
| Expenses Paid During Period | $4.28 | $8.05 | $4.28 | $3.53 | $3.02 | |||||
For each class of the Fund, expenses (net of fee waiver and reimbursement, if any) are equal to the annualized expense ratio for the class (0.85% for Class A, 1.60% for Class C, 0.85% for Class D, 0.70% for Class P and 0.60% for Institutional Class), multiplied by the average account value over the period, multiplied by 182/365. The expense ratio does not include the expenses of the Underlying Funds, which based upon the allocation of the Fund’s assets among the Underlying Funds are indirectly borne by the shareholders of the Fund.
| 64 | May 31, 2014 | | Semiannual Report |
Table of Contents
Unaudited
AllianzGI NFJ Emerging Markets Value Fund
For the period of December 1, 2013, through May 31, 2014, as reviewed by Morley Campbell CFA, Portfolio Manager.
Fund Insights
For the reporting period ended May 31, 2014, Class A shares at NAV of the AllianzGI NFJ Emerging Markets Value Fund (the “Fund”) returned 4.02% outperforming the MSCI Emerging Markets Index (the “benchmark index”) which returned 1.89%.
Emerging market equities closed out 2013 with a -1.4% return during December and a decline of -2.3% for the year, as measured by the MSCI Emerging Markets Index. The new calendar year brought about a rocky start as investors followed tapering of the US Federal Reserve’s monthly stimulus, fears of slowing growth in China and turbulent conditions in the emerging markets. In the first quarter of 2014, central banks took action to help boost the currencies and lower inflation in Turkey, South Africa and India by increasing interest rates. Tensions flared in countries including Russia, Ukraine, Thailand and Venezuela. As the US Federal Reserve continued to taper its quantitative easing program, making higher interest rates a more pressing concern for many, countries with current account deficits remain vulnerable versus economies with improved budget and current account balances. Despite some trepidation exhibited by investors early in the year, the major MSCI ACWI, World, EAFE and Emerging indices all finished higher by the end of this six month period. The US and
more developed markets, as measured by the S&P 500 (+7.62%) and MSCI EAFE (+5.33%) fared better than the emerging markets during the six month period, with the MSCI Emerging Markets Index up 1.89%. The period ended with familiar central bank undertones of continued easing. In Europe, the UK, France and Germany rose as optimism surrounding more stimulus from the EU prevailed.
The spread between the best (IT) and worst (Energy) performing sectors within the MSCI EM Index was vast at 15.0%. Six of ten sectors generated positive returns across the reporting period with IT and Utilities the best performers. In contrast, the Energy, Materials, Telecom Services and Consumer Staples sectors dipped into negative territory. On an MSCI country basis, the strongest results were generated from Egypt, Indonesia, India and Peru. Conversely, five of 21 countries in the index ended the period with negative results, including Russia, China, Poland, Mexico and Chile.
Stock Selection Drove the Fund’s Outperformance
The Fund’s outperformance versus the benchmark index was due to favorable stock selection, though sector and country allocation were also positive.
Stock selection added value across the Financials, Materials and Consumer Staples sectors. This was somewhat offset by the Fund’s holdings in the Consumer Discretionary, Utilities and Industrials sectors.
By country, selection was stronger in India, Taiwan and China, but slightly offset by weaker selection in Thailand, Russia and South Africa.
From a sector allocation perspective, overweight positions in Utilities and Consumer Discretionary contributed to results. The Fund’s underweight in the IT and Materials sectors detracted somewhat during the reporting period.
Overweights in Singapore and Egypt contributed to relative performance, while an overweight in Hong Kong and underweight in South Africa muted results during the period.
Sector weight deviations are a result of NFJ’s bottom-up investment process. On average during the reporting period, the Fund’s largest overweights relative to the benchmark index were in the Consumer Discretionary and Industrials sectors, whereas the largest relative underweights were in the Consumer Staples and Financials sectors.
Average Annual Total Return for the period ended May 31, 2014
| 6 Month* | 1 Year | Since Inception† | ||||||||||||
AllianzGI NFJ Emerging Markets Value Fund Class A | 4.02% | 2.77% | 5.68% | |||||||||||
| AllianzGI NFJ Emerging Markets Value Fund Class A (adjusted) | –1.70% | –2.88% | 1.63% | ||||||||||
AllianzGI NFJ Emerging Markets Value Fund Class C | 3.66% | 2.00% | 4.90% | |||||||||||
| AllianzGI NFJ Emerging Markets Value Fund Class C (adjusted) | 2.66% | 1.01% | 4.90% | ||||||||||
| AllianzGI NFJ Emerging Markets Value Fund Class D | 4.09% | 2.74% | 5.70% | ||||||||||
| AllianzGI NFJ Emerging Markets Value Fund Class P | 4.13% | 2.93% | 5.83% | ||||||||||
| AllianzGI NFJ Emerging Markets Value Fund Institutional Class | 4.22% | 3.06% | 5.98% | ||||||||||
| MSCI Emerging Markets Index | 1.89% | 4.27% | 1.13% | ||||||||||
Lipper Emerging Markets Fund Average | 2.87% | 4.38% | 2.43% | |||||||||||
† The Fund began operations on 12/18/12. Benchmark return comparisons began on the fund inception date. Lipper performance comparisons began on 12/31/12.
* Cumulative return
Performance quoted represents past performance and is no guarantee of future results. Current performance may be lower or higher than performance shown. For performance current to the most recent month-end, visit our website at us.allianzgi.com. Investment return and the principal value will fluctuate. Shares may be worth more or less than original cost when redeemed. The adjusted returns take into account the maximum initial sales charge of 5.50% on Class A shares and the contingent deferred sales charge (CDSC) of 1% on Class C shares, which may apply to shares redeemed during the first year of ownership. Returns do not reflect deduction of taxes that a shareholder would pay on fund distributions or redemption of fund shares. See pages 86 and 87 for more information. The Fund’s gross expense ratios are 15.72% for Class A shares, 18.06% for Class C shares, 7.13% for Class D shares, 6.37% for Class P shares and 6.43% for Institutional Class shares. These ratios do not include an expense reduction, contractually guaranteed through at least 3/31/15. The Fund’s expense ratios net of this reduction are 1.55% for Class A shares, 2.30% for Class C shares, 1.55% for Class D shares, 1.39% for Class P shares and 1.30% for Institutional Class shares. Expense ratio information is as of the Fund’s current prospectus dated April 1, 2014, as supplemented to date.
| Semiannual Report | | May 31, 2014 | 65 |
Table of Contents
Unaudited
AllianzGI NFJ Emerging Markets Value Fund (cont’d)
Cumulative Returns Through May 31, 2014
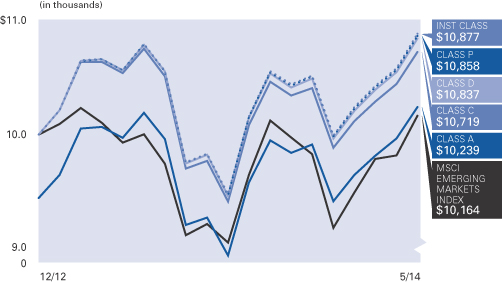
Country Allocation (as of May 31, 2014)
| China | 17.7% | |||
| Korea (Republic of) | 11.5% | |||
| Taiwan | 10.2% | |||
| Brazil | 9.4% | |||
| India | 8.3% | |||
| Russian Federation | 6.8% | |||
| South Africa | 5.7% | |||
| Thailand | 4.4% | |||
| Other | 23.0% | |||
| Cash & Equivalents — Net | 3.0% |
| Shareholder Expense Example | Actual Performance | |||||||||
| Class A | Class C | Class D | Class P | Institutional Class | ||||||
| Beginning Account Value (12/1/13) | $1,000.00 | $1,000.00 | $1,000.00 | $1,000.00 | $1,000.00 | |||||
| Ending Account Value (5/31/14) | $1,040.20 | $1,036.60 | $1,040.90 | $1,041.30 | $1,042.20 | |||||
| Expenses Paid During Period | $7.88 | $11.68 | $7.89 | $7.12 | $6.62 | |||||
| Hypothetical Performance | ||||||||||
| (5% return before expenses) | ||||||||||
| Class A | Class C | Class D | Class P | Institutional Class | ||||||
| Beginning Account Value (12/1/13) | $1,000.00 | $1,000.00 | $1,000.00 | $1,000.00 | $1,000.00 | |||||
| Ending Account Value (5/31/14) | $1,017.20 | $1,013.46 | $1,017.20 | $1,017.95 | $1,018.45 | |||||
| Expenses Paid During Period | $7.80 | $11.55 | $7.80 | $7.04 | $6.54 | |||||
For each class of the Fund, expenses (net of fee waiver and reimbursement, if any) are equal to the annualized expense ratio for the class (1.55% for Class A, 2.30% for Class C, 1.55% for Class D, 1.40% for Class P and 1.30% for Institutional Class), multiplied by the average account value over the period, multiplied by 182/365.
| 66 | May 31, 2014 | | Semiannual Report |
Table of Contents
Unaudited
AllianzGI NFJ Global Dividend Value Fund
For the period of December 1, 2013, through May 31, 2014 as reviewed by R. Burns McKinney, CFA, Portfolio Manager.
Fund Insights
For the reporting period ended May 31, 2014, Class A shares at NAV of the AllianzGI NFJ Global Dividend Value Fund (the “Fund”) returned 4.48% underperforming the MSCI ACWI (the “benchmark index”) which returned 6.02%.
Global equities closed out 2013 with a 1.78% return during December and gains of 23.4% for the year, as measured by the MSCI ACWI. The significant rise in equities in 2013 was propelled in part by continued extraordinary accommodative monetary policy across the globe. The new calendar year brought about a rocky start as investors followed tapering of the US Federal Reserve’s monthly stimulus, fears of slowing growth in China and turbulent conditions in the emerging markets. In the month of February, Italy’s unemployment rate soared to 13%, its highest level since record keeping began in 1977. Contrary to Italy, Germany’s locally defined unemployment rate fell to a two-decade low. In the first quarter of 2014, the UK declined -0.7%, while Japan was the Index’s fourth weakest country, stumbling -5.4%. Despite some trepidation exhibited by investors early in the year, the major MSCI ACWI, World, EAFE and Emerging indices all finished higher by the end of the six month period. The US and more developed markets, as measured by the S&P 500 (+7.62%) and MSCI EAFE (+5.33%) fared better than the emerging markets during the 6 month period, with the MSCI Emerging Markets Index up 1.89%. The period ended with familiar central bank
undertones of continued easing. In Europe, the UK, France and Germany rose higher as optimism surrounding more stimulus from the EU prevailed. Additionally, Japan reaffirmed its record program of financial stimulus.
The spread between the best (Utilities) and worst (Consumer Discretionary) performing sectors within the MSCI All Country World Index was over 11%. All sectors generated positive returns across the six month period with Utilities and Energy delivering double digit returns of 12.9% and 10% respectively. Information Technology and Health Care just finished below the double digit mark. In contrast, Consumer Discretionary, Financials and Telecom sectors returns fell below the overall benchmark. On an MSCI country basis, the strongest results were generated from countries that comprise only a small portion of the benchmark: Egypt, Indonesia, India and Denmark. Conversely, the weakest returns were experienced by several emerging countries, including Russia and China as well as Japan and Austria.
Stock selection drove the Fund’s underperformance
The Fund’s underperformance versus the benchmark index was largely due to stock selection. Conversely, sector allocation was positive during the period and contributed to the Fund’s relative results; country allocation detracted.
In terms of stock selection, the Fund’s holdings in Financials, Materials and Consumer Discretionary were the primary laggards versus sector counterparts. This was somewhat offset by the Fund’s holdings in Health Care and Information Technology.
From a sector allocation perspective, an underweight in Consumer Discretionary and overweight in Energy—the second best performing sector—helped relatively. An underweight in Health Care and overweight in Materials were negative relative contributors for the period.
By country, relative allocation weakness was sourced from overweights in Russian, South Korean and Brazilian holdings, but somewhat offset by strength from overweights in Israel and Spain as well as an underweight in Japan.
Selection within the United States and Russia dampened relative results while stock picks in the United Kingdom and China benefited the Fund’s relative performance.
Sector weight deviations are a result of NFJ’s bottom-up investment process. On average during the reporting period, the Fund’s largest overweights relative to the benchmark index were in the Energy and Telecommunication Services sectors, whereas the largest relative underweights were in the Consumer Staples and Consumer Discretionary sectors.
| Semiannual Report | | May 31, 2014 | 67 |
Table of Contents
Unaudited
AllianzGI NFJ Global Dividend Value Fund (cont’d)
Average Annual Total Return for the period ended May 31, 2014
6 Month* | 1 Year | Since Inception† | ||||||||||||
| AllianzGI NFJ Global Dividend Value Fund Class A | 4.48% | 13.17% | 13.16% | |||||||||||
| AllianzGI NFJ Global Dividend Value Fund Class A (adjusted) | –1.27% | 6.94% | 11.87% | ||||||||||
| AllianzGI NFJ Global Dividend Value Fund Class C | 4.07% | 12.29% | 12.30% | |||||||||||
| AllianzGI NFJ Global Dividend Value Fund Class C (adjusted) | 3.07% | 11.29% | 12.30% | ||||||||||
| AllianzGI NFJ Global Dividend Value Fund Class D | 4.40% | 13.06% | 13.11% | ||||||||||
| AllianzGI NFJ Global Dividend Value Fund Class P | 4.55% | 13.34% | 13.37% | ||||||||||
| AllianzGI NFJ Global Dividend Value Fund Institutional Class | 4.62% | 13.44% | 13.48% | ||||||||||
| MSCI ACWI | 6.02% | 17.15% | 14.08% | ||||||||||
| Lipper Global Equity Income Average | 7.12% | 16.16% | 13.77% | |||||||||||
† The Fund began operations on 6/26/09. Benchmark return comparisons began on the fund inception date. Lipper performance comparisons began on 6/30/09.
* Cumulative return.
Performance quoted represents past performance and is no guarantee of future results. Current performance may be lower or higher than performance shown. For performance current to the most recent month-end, visit our website at us.allianzgi.com. Investment return and the principal value will fluctuate. Shares may be worth more or less than original cost when redeemed. The adjusted returns take into account the maximum initial sales charge of 5.50% on Class A shares and the contingent deferred sales charge (CDSC) of 1% on Class C shares, which may apply to shares redeemed during the first year of ownership. Returns do not reflect deduction of taxes that a shareholder would pay on fund distributions or redemption of fund shares. See pages 86 and 87 for more information. The Fund’s gross expense ratios are 1.51% for Class A shares, 2.27% for Class C shares, 1.55% for Class D shares, 1.32% for Class P shares and 1.21% for Institutional Class shares. These ratios do not include an expense reduction, contractually guaranteed through at least 3/31/15. The Fund’s expense ratios net of this reduction are 1.20% for Class A shares, 1.99% for Class C shares, 1.28% for Class D shares, 1.04% for Class P shares and 0.95% for Institutional Class shares. Expense ratio information is as of the Fund’s current prospectus dated April 1, 2014, as supplemented to date.
Cumulative Returns Through May 31, 2014
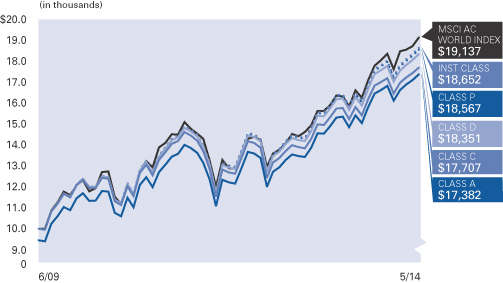
Country Allocation (as of May 31, 2014)
| United States | 42.8% | |||
| United Kingdom | 7.8% | |||
| Japan | 5.8% | |||
| Russian Federation | 5.6% | |||
| Brazil | 4.8% | |||
| Spain | 4.3% | |||
| Korea (Republic of) | 4.1% | |||
| France | 4.0% | |||
| Other | 18.3% | |||
| Cash & Equivalents — Net | 2.5% |
| 68 | May 31, 2014 | | Semiannual Report |
Table of Contents
Unaudited
AllianzGI NFJ Global Dividend Value Fund (cont’d)
| Shareholder Expense Example | Actual Performance | |||||||||
| Class A | Class C | Class D | Class P | Institutional Class | ||||||
| Beginning Account Value (12/1/13) | $1,000.00 | $1,000.00 | $1,000.00 | $1,000.00 | $1,000.00 | |||||
| Ending Account Value (5/31/14) | $1,044.80 | $1,040.70 | $1,044.00 | $1,045.50 | $1,046.20 | |||||
| Expenses Paid During Period | $6.12 | $10.12 | $6.57 | $5.30 | $4.85 | |||||
| Hypothetical Performance | ||||||||||
| (5% return before expenses) | ||||||||||
| Class A | Class C | Class D | Class P | Institutional Class | ||||||
| Beginning Account Value (12/1/13) | $1,000.00 | $1,000.00 | $1,000.00 | $1,000.00 | $1,000.00 | |||||
| Ending Account Value (5/31/14) | $1,018.95 | $1,015.01 | $1,018.50 | $1,019.75 | $1,020.19 | |||||
| Expenses Paid During Period | $6.04 | $10.00 | $6.49 | $5.24 | $4.78 | |||||
For each class of the Fund, expenses (net of fee waiver and reimbursement, if any) are equal to the annualized expense ratio for the class (1.20% for Class A, 1.99% for Class C, 1.29% for Class D, 1.04% for Class P and 0.95% for Institutional Class), multiplied by the average account value over the period, multiplied by 182/365.
| Semiannual Report | | May 31, 2014 | 69 |
Table of Contents
Unaudited
AllianzGI NFJ International Small-Cap Value Fund
For the period of December 1, 2013 through May 31, 2014, as reviewed by L. Baxter Hines, CFA, Portfolio Manager.
Fund Insights
For the reporting period ended May 31, 2014, Class A shares at NAV of the AllianzGI NFJ International Small-Cap Value Fund (the “Fund”) returned 9.34% outperforming the MSCI World ex-US Small Cap Index (the “benchmark index”) which returned 6.88%.
Global equities closed out 2013 with a 1.78% return during December and gains of 23.4% for the year, as measured by the MSCI ACWI. The significant rise in equities in 2013 was propelled in part by continued extraordinary accommodative monetary policy across the globe. The new calendar year brought about a rocky start as investors followed tapering of the US Federal Reserve’s monthly stimulus, fears of slowing growth in China and turbulent conditions in the emerging markets. In the month of February, Italy’s unemployment rate soared to 13%, its highest level since record keeping began in 1977. Contrary to Italy, Germany’s locally defined unemployment rate fell to a two-decade low. In the first quarter of 2014, the UK declined -0.7%, while Japan was the Index’s fourth weakest country, stumbling -5.4%. Despite some trepidation exhibited by investors early in the year, the major MSCI ACWI, World, EAFE and Emerging indices all finished higher by the end of this 6 month period. The US and more developed markets, as measured by the S&P 500 (+7.62%) and MSCI EAFE (+5.33%) fared better than the emerging markets during the 6 month period, with the MSCI EM Index up 1.89%. The period ended with familiar central bank
undertones of continued easing. In Europe, the UK, France and Germany rose higher as optimism surrounding more stimulus from the EU prevailed.
The benchmark index return (6.88%) bested the MSCI World (6.18%) and MSCI EAFE (5.33%) indexes which capture larger capped names across developed markets. Within the benchmark index the spread between the best (Telecom Services) and worst (Consumer Discretionary) performing was vast at 14.5%. All sectors generated positive returns across the 6 month period with Telecom, Utilities and Energy delivering double digit returns. Health Care, IT and Materials neared a dead heat while finishing within 20 basis points of one another. In contrast, Consumer Discretionary—which comprises 18% of the benchmark index—lagged the closest sector by over 320 basis points. On an MSCI country basis, the strongest results were generated from EU countries Denmark, Portugal, Sweden and Spain. Conversely, Hong Kong was the lone country to end the period lower while Japan was flat. Beyond Hong Kong and Japan, the weakest returns were experienced by Ireland and the Netherlands which delivered 2.3% and 2.5% respectively.
Stock Selection Drove The Fund’s Outperformance
The Fund’s outperformance versus the benchmark index was due primarily to positive stock selection while sector allocation also contributed to a lesser
extent. Country allocation was slightly negative during the period.
In terms of stock selection, the Fund’s holdings in the IT, Health Care and Consumer Staples sectors contributed to performance during the reporting period. This was somewhat offset by the Fund’s holdings in the Materials and Utilities sectors.
By country, selection was strong in Japan and the United Kingdom, but partially diminished by poor selection in Canada and Switzerland.
From a sector allocation perspective, an overweighting to Telecom and Utilities sectors contributed to results. An overweight in Consumer Staples and underweight in Financials detracted during the reporting period.
The portfolio’s underweighting to Japan and overweights to off benchmark countries Taiwan and Argentina were the primary contributors to relative returns. These positive results were largely offset by the Fund’s underweight in Sweden and Denmark as well as an overweight to Hong Kong, which hindered relative performance.
Sector weight deviations are a result of NFJ’s bottom-up investment process. On average during the reporting period, the Fund’s largest overweights relative to the benchmark index were in the Utilities and Health Care sectors, whereas the largest relative underweights were in the Financials and Materials sectors.
| 70 | May 31, 2014 | | Semiannual Report |
Table of Contents
Unaudited
AllianzGI NFJ International Small-Cap Value Fund (cont’d)
Average Annual Total Return for the period ended May 31, 2014
| 6 Month* | 1 Year | Since Inception† | ||||||||||
| AllianzGI NFJ International Small-Cap Value Fund Class A | 9.34% | 22.90% | 25.40% | |||||||||
| AllianzGI NFJ International Small-Cap Value Fund Class A (adjusted) | 3.33% | 16.15% | 21.90% | ||||||||
| AllianzGI NFJ International Small-Cap Value Fund Class C | 8.98% | 22.07% | 24.53% | |||||||||
| AllianzGI NFJ International Small-Cap Value Fund Class C (adjusted) | 7.98% | 21.07% | 24.53% | ||||||||
| AllianzGI NFJ International Small-Cap Value Fund Class D | 9.38% | 22.91% | 25.43% | ||||||||
| AllianzGI NFJ International Small-Cap Value Fund Class P | 9.47% | 23.15% | 25.61% | ||||||||
| AllianzGI NFJ International Small-Cap Value Fund Institutional Class | 9.50% | 23.22% | 25.73% | ||||||||
| MSCI World ex-US Small Cap Index | 6.88% | 21.66% | 25.54% | ||||||||
Lipper International Small/Mid-Cap Value Fund Average | 8.16% | 22.91% | 27.47% | |||||||||
† The Fund began operations on 6/1/12. Benchmark return comparisons began on the fund inception date. Lipper performance comparisons began on 5/31/12.
* Cumulative return.
Performance quoted represents past performance and is no guarantee of future results. Current performance may be lower or higher than performance shown. For performance current to the most recent month-end, visit our website at us.allianzgi.com. Investment return and the principal value will fluctuate. Shares may be worth more or less than original cost when redeemed. The adjusted returns take into account the maximum initial sales charge of 5.50% on Class A shares and the contingent deferred sales charge (CDSC) of 1% on Class C shares, which may apply to shares redeemed during the first year of ownership. Returns do not reflect deduction of taxes that a shareholder would pay on fund distributions or redemption of fund shares. See pages 86 and 87 for more information. The Fund’s gross expense ratios are 4.06% for Class A shares, 4.91% for Class C shares, 5.81% for Class D shares, 3.88% for Class P shares and 3.91% for Institutional Class shares. These ratios do not include an expense reduction, contractually guaranteed through at least 3/31/15. The Fund’s expense ratios net of this reduction are 1.45% for Class A shares, 2.20% for Class C shares, 1.45% for Class D shares, 1.30% for Class P shares and 1.20% for Institutional Class shares. Expense ratio information is as of the Fund’s current prospectus dated April 1, 2014, as supplemented to date.
Cumulative Returns Through May 31, 2014
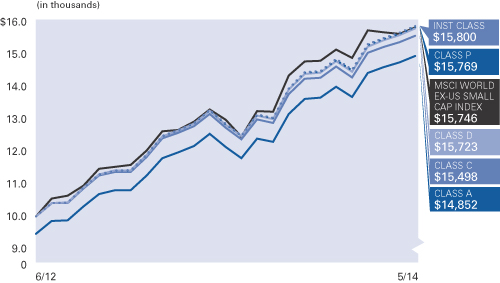
Country Allocation (as of May 31, 2014)
United Kingdom | 17.2% | |||
| Japan | 17.0% | |||
| Canada | 7.8% | |||
| Australia | 6.6% | |||
| Hong Kong | 6.1% | |||
| China | 6.1% | |||
| Germany | 5.1% | |||
| Norway | 4.5% | |||
| Other | 28.1% | |||
| Cash & Equivalents — Net | 1.5% |
| Semiannual Report | | May 31, 2014 | 71 |
Table of Contents
Unaudited
AllianzGI NFJ International Small-Cap Value Fund (cont’d)
| Shareholder Expense Example | Actual Performance | |||||||||
| Class A | Class C | Class D | Class P | Institutional Class | ||||||
| Beginning Account Value (12/1/13) | $1,000.00 | $1,000.00 | $1,000.00 | $1,000.00 | $1,000.00 | |||||
| Ending Account Value (5/31/14) | $1,093.40 | $1,089.80 | $1,093.80 | $1,094.70 | $1,095.00 | |||||
| Expenses Paid During Period | $7.57 | $11.46 | $7.57 | $6.79 | $6.27 | |||||
| Hypothetical Performance | ||||||||||
| (5% return before expenses) | ||||||||||
| Class A | Class C | Class D | Class P | Institutional Class | ||||||
| Beginning Account Value (12/1/13) | $1,000.00 | $1,000.00 | $1,000.00 | $1,000.00 | $1,000.00 | |||||
| Ending Account Value (5/31/14) | $1,017.70 | $1,013.96 | $1,017.70 | $1,018.45 | $1,018.95 | |||||
| Expenses Paid During Period | $7.29 | $11.05 | $7.29 | $6.54 | $6.04 | |||||
For each class of the Fund, expenses (net of fee waiver and reimbursement, if any) are equal to the annualized expense ratio for the class (1.45% for Class A, 2.20% for Class C, 1.45% for Class D, 1.30% for Class P and 1.20% for Institutional Class), multiplied by the average account value over the period, multiplied by 182/365.
| 72 | May 31, 2014 | | Semiannual Report |
Table of Contents
Unaudited
AllianzGI NFJ International Value II Fund
For the period of December 1, 2013 through May 31, 2014, as reviewed by L. Baxter Hines, CFA, Portfolio Manager.
Fund Insights
For the reporting period ended May 31, 2014, Class A shares at NAV of the AllianzGI NFJ International Value II Fund (the “Fund”) returned 6.03% outperforming the MSCI EAFE Index (the “benchmark index”) which returned 5.33%.
Global equities closed out 2013 with a 1.78% return during December and gains of 23.4% for the year, as measured by the MSCI ACWI. The significant rise in equities in 2013 was propelled in part by continued extraordinary accommodative monetary policy across the globe. The new calendar year brought about a rocky start as investors followed tapering of the US Federal Reserve’s monthly stimulus, fears of slowing growth in China and turbulent conditions in the emerging markets. In the month of February, Italy’s unemployment rate soared to 13%, its highest level since record keeping began in 1977. Contrary to Italy, Germany’s locally defined unemployment rate fell to a two-decade low. In the first quarter of 2014, the UK declined -0.7%, while Japan was the Index’s fourth weakest country, stumbling -5.4%. Despite some trepidation exhibited by investors early in the year, the major MSCI ACWI, World, EAFE and Emerging indices all finished higher by the end of the 6 month period. The US and more developed markets, as measured by the S&P 500 (+7.62%) and MSCI EAFE (+5.33%) fared better than the emerging markets during the 6 month
period, with the MSCI EM Index up 1.89%. The period ended with familiar central bank undertones of continued easing. In Europe, the UK, France and Germany rose higher as optimism surrounding more stimulus from the EU prevailed. Additionally, Japan reaffirmed its record program of financial stimulus.
The spread between the best (Energy) and worst (Information Technology) performing sectors within the MSCI EAFE Index was over 11%. All sectors generated positive returns across the 6 month period with Energy, Utilities and Health Care delivering double digit returns of 12.4%, 11.9% and 10.6% respectively. Six of the ten sectors delivered returns below the overall benchmark, as IT and Consumer Discretionary lagged most on a relative basis. On an MSCI country basis, the strongest results were generated from EU countries Denmark, Italy and Norway and also Israel. Conversely, the weakest returns were led by Japan—the second largest constituent—as well as Austria, Netherlands and Singapore.
Together sector allocation and stock selection drove the Fund’s outperformance
The Fund’s outperformance versus the benchmark index was due to all three facets of attribution contributing positively; stock selection, sector and country allocation.
In terms of stock selection, the Fund’s holdings in Consumer Discretionary, IT and Health Care sectors added to relative performance during the reporting period. This was somewhat offset by negative selection in the Financials, Energy and Utilities sectors.
By country, selection was strong in Japan and the United Kingdom, but somewhat offset by negative selection in Hong Kong and Denmark.
From a sector allocation perspective, an overweight in Energy as well as underweights in Information Technology and Industrials, contributed. Conversely, underweights to Health Care and Consumer Staples sectors hindered results during the reporting period.
The portfolio’s underweight to Japan and overweight in an off benchmark India added to gains. Emerging countries Brazil and Mexico—both off benchmark— hindered relative performance.
Sector weight deviations are a result of NFJ’s bottom-up investment process. On average during the reporting period, the Fund’s largest overweights relative to the benchmark index were in the Energy and Telecommunication Services sectors, whereas the largest relative underweights were in the Industrials and Financials.
Average Annual Total Return for the period ended May 31, 2014
| 6 Month* | 1 Year | Since Inception† | ||||||||||||
| AllianzGI NFJ International Value II Fund Class A | 6.03% | 16.88% | 14.39% | |||||||||||
| AllianzGI NFJ International Value II Fund Class A (adjusted) | 0.20% | 10.45% | 11.83% | ||||||||||
| AllianzGI NFJ International Value II Fund Class C | 5.60% | 16.02% | 13.52% | |||||||||||
| AllianzGI NFJ International Value II Fund Class C (adjusted) | 4.60% | 15.02% | 13.52% | ||||||||||
| AllianzGI NFJ International Value II Fund Class D | 6.00% | 16.89% | 14.38% | ||||||||||
| AllianzGI NFJ International Value II Fund Class P | 6.11% | 17.07% | 14.62% | ||||||||||
| AllianzGI NFJ International Value II Fund Institutional Class | 6.14% | 17.15% | 14.73% | ||||||||||
| MSCI EAFE Index | 5.33% | 18.04% | 16.88% | ||||||||||
| Lipper International Multi-Cap Value Average | 5.80% | 19.69% | 15.72% | |||||||||||
† The Fund began operations on 12/1/11. Benchmark return comparisons began on the fund inception date. Lipper performance comparisons began on 11/30/11.
* Cumulative return.
Performance quoted represents past performance and is no guarantee of future results. Current performance may be lower or higher than performance shown. For performance current to the most recent month-end, visit our website at us.allianzgi.com. Investment return and the principal value will fluctuate. Shares may be worth more or less than original cost when redeemed. The adjusted returns take into account the maximum initial sales charge of 5.50% on Class A shares and the contingent deferred sales charge (CDSC) of 1% on Class C shares, which may apply to shares redeemed during the first year of ownership. Returns do not reflect deduction of taxes that a shareholder would pay on fund distributions or redemption of fund shares. See pages 86 and 87 for more information. The Fund’s gross expense ratios are 7.16% for Class A shares, 8.26% for Class C shares, 7.04% for Class D shares, 6.87% for Class P shares and 6.77% for Institutional Class shares. These ratios do not include an expense reduction, contractually guaranteed through at least 3/31/15. The Fund’s expense ratios net of this reduction are 1.20% for Class A shares, 1.95% for Class C shares, 1.20% for Class D shares, 1.00% for Class P shares and 0.95% for Institutional Class shares. Expense ratio information is as of the Fund’s current prospectus dated April 1, 2014, as supplemented to date.
| Semiannual Report | | May 31, 2014 | 73 |
Table of Contents
Unaudited
AllianzGI NFJ International Value II Fund (cont’d)
Cumulative Returns Through May 31, 2014
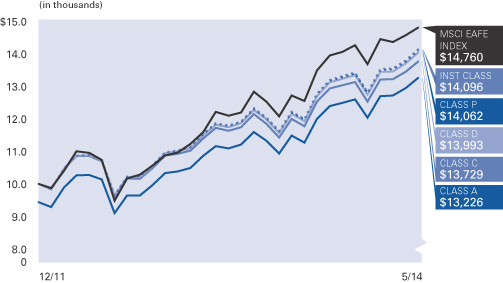
Country Allocation (as of May 31, 2014)
| United Kingdom | 23.2% | |||
| Japan | 12.1% | |||
| Canada | 7.9% | |||
| Hong Kong | 7.0% | |||
| France | 5.1% | |||
| Norway | 5.0% | |||
| China | 4.7% | |||
| Russian Federation | 4.5% | |||
| Other | 27.9% | |||
| Cash & Equivalents — Net | 2.6% |
| Shareholder Expense Example | Actual Performance | |||||||||
| Class A | Class C | Class D | Class P | Institutional Class | ||||||
| Beginning Account Value (12/1/13) | $1,000.00 | $1,000.00 | $1,000.00 | $1,000.00 | $1,000.00 | |||||
| Ending Account Value (5/31/14) | $1,060.30 | $1,056.00 | $1,060.00 | $1,061.10 | $1,061.40 | |||||
| Expenses Paid During Period | $6.16 | $10.00 | $6.16 | $5.29 | $4.88 | |||||
| Hypothetical Performance | ||||||||||
| (5% return before expenses) | ||||||||||
| Class A | Class C | Class D | Class P | Institutional Class | ||||||
| Beginning Account Value (12/1/13) | $1,000.00 | $1,000.00 | $1,000.00 | $1,000.00 | $1,000.00 | |||||
| Ending Account Value (5/31/14) | $1,018.95 | $1,015.21 | $1,018.95 | $1,019.80 | $1,020.19 | |||||
| Expenses Paid During Period | $6.04 | $9.80 | $6.04 | $5.19 | $4.78 | |||||
For each class of the Fund, expenses (net of fee waiver and reimbursement, if any) are equal to the annualized expense ratio for the class (1.20% for Class A, 1.95% for Class C, 1.20% for Class D, 1.03% for Class P and 0.95% for Institutional Class), multiplied by the average account value over the period, multiplied by 182/365.
| 74 | May 31, 2014 | | Semiannual Report |
Table of Contents
Unaudited
AllianzGI Short Duration High Income Fund
For the period of December 1, 2013 through May 31, 2014 as provided by Douglas Forsyth, Portfolio Manager.
Fund Insights
For the reporting period ended May 31, 2014, Class A shares at NAV of the AllianzGI Short Duration High Income Fund (the “Fund”) returned 2.40%, outperforming the BofA Merrill Lynch 1-3 Year BB US Cash Pay High Yield Index (the “benchmark index”) which returned 2.13%.
Performance
The Fund seeks a high level of current income while emphasizing the preservation of capital. The Fund’s outperformance these past six months can be largely attributed to the yield generated from the portfolio versus that of the benchmark index. Yield to worst for the Fund was consistently over 100 basis points higher than that of the benchmark index over the period. At the same time, duration for the Fund was lower than that of the benchmark index over the period to balance our objectives of maintaining high current income while attempting to preserve capital in the event of rising interest rates.
Contributors
Asurion LLC, a provider of wireless insurance, refinanced their high cost unsecured debt and continues to deliver significant free cash flow from their business model.
Alliance Data Systems, customer loyalty and consumer credit lender, experienced lower charge offs and strong operating metrics during the period.
NRG Energy, owner of power generating facilities, benefitted from an improving economic environment and increased demand for electricity in the markets that they serve.
Detractors
Tops Markets, a regional operator of grocery
stores, was the worst performing holding in the Fund. The company’s debt was negatively impacted by a management led buyout of the company.
Jeld-Wen, a manufacturer of windows of doors, underperformed based on relative value considerations compared to other building materials companies.
Ainsworth Lumber, a building products company, was negatively impacted by the termination of a previously announced merger with Louisiana-Pacific. The two companies cited a lack of US regulatory approval as the primary reason for the merger termination.
Outlook
Limited market volatility, low rates and modest growth are three of the factors that contribute to a prolonged positive outlook for the high-yield bond market. Fundamentals have not changed materially from the previous quarter, which is positive. Credit statistics support investment in the asset class. Balance sheets are solid. Leverage ratios and interest coverage ratios are near, or better than, levels seen in the past 25 years. Corporate cash levels remain high, and acquisition activity is ongoing. Lower-coupon new issues have produced a lower semi-annual interest expense burden.
The economic outlook is positive for the US as economic statistics continue to support a slow trend higher. The level of asset purchases by the Fed continues to be reduced based on the Fed’s confidence in the economic trajectory. After each FOMC meeting during the quarter, the Fed announced it would continue cutting purchases of Treasuries and mortgages by an additional $10 billion per month. The pace of future
reductions of asset purchases and the eventual tighter stance by the Fed will be data- dependent.
For the balance of 2014, interest rates will continue to be a factor. The direction remains difficult to predict. However, unless there is specific credit deterioration, spreads will continue to tighten. Total market spreads ended the quarter at approximately 350 basis points over comparable Treasuries. This stage of the market cycle from a statistical perspective is best compared to the mid-1990s and mid-2000s—market environments that exhibited economic stability, low defaults and ample liquidity. The high-yield market has priced in a default-rate forecast that is higher than the current rate. Among fixed-income alternatives, high-yield bonds will continue to be a contributor from both a diversification and a relative-performance perspective.
Nearly all strategists agree that the outlook for credit is constructive, with minimal defaults projected for both the remainder of 2014 and 2015. Interest rates have been additive thus far this year. Therefore, unless there is a significant move in Treasury rates, coupon-like return is probable for the balance of 2014.
We continue to build your portfolio one company at a time, by identifying companies that are opportunistically capitalizing on change. At Allianz Global Investors, we recognize that the long-term driver of total return in a high-yield portfolio is company fundamentals. Because fundamentals can only be discovered and monitored through rigorous credit analysis, which is the cornerstone of our approach, we will continue to apply our successful philosophy and process to managing change and information.
Average Annual Total Return for the period ended May 31, 2014
| 6 Month* | 1 Year | Since Inception† | ||||||||||||
| AllianzGI Short Duration High Income Fund Class A | 2.40% | 4.76% | 6.90% | |||||||||||
| AllianzGI Short Duration High Income Fund Class A (adjusted) | 0.10% | 2.40% | 5.99% | ||||||||||
| AllianzGI Short Duration High Income Fund Class C | 2.29% | 4.53% | 6.47% | |||||||||||
| AllianzGI Short Duration High Income Fund Class C (adjusted) | 1.29% | 3.53% | 6.47% | ||||||||||
| AllianzGI Short Duration High Income Fund Class D | 2.41% | 4.78% | 6.91% | ||||||||||
| AllianzGI Short Duration High Income Fund Class P | 2.49% | 5.00% | 7.07% | ||||||||||
| AllianzGI Short Duration High Income Fund Institutional Class | 2.53% | 5.10% | 7.20% | ||||||||||
| BofA Merrill Lynch 1-3 Year BB US Cash Pay High Yield Index | 2.13% | 5.12% | 8.17% | ||||||||||
† The Fund began operations on 10/3/11. Benchmark return comparisons began on the fund inception date.
* Cumulative return.
Performance quoted represents past performance and is no guarantee of future results. Current performance may be lower or higher than performance shown. For performance current to the most recent month-end, visit our website at us.allianzgi.com. Investment return and the principal value will fluctuate. Shares may be worth more or less than original cost when redeemed. The adjusted returns take into account the maximum initial sales charge of 2.25% on Class A shares and the contingent deferred sales charge (CDSC) of 1% on Class C shares, which may apply to shares redeemed during the first year of ownership. Returns do not reflect deduction of taxes that a shareholder would pay on fund distributions or redemption of fund shares. See pages 86 and 87 for more information. The Fund’s gross expense ratios are 0.90% for Class A shares, 1.16% for Class C shares, 1.08% for Class D shares, 0.71% for Class P shares and 0.61% for Institutional Class shares. These ratios do not include an expense reduction, contractually guaranteed through at least 3/31/15. The Fund’s expense ratios net of this reduction are 0.85% for Class A shares, 1.10% for Class C shares, 0.85% for Class D shares, 0.70% for Class P shares and 0.61% for Institutional Class shares. Expense ratio information is as of the Fund’s current prospectus dated April 1, 2014, as supplemented to date.
| Semiannual Report | | May 31, 2014 | 75 |
Table of Contents
Unaudited
AllianzGI Short Duration High Income Fund (cont’d)
Cumulative Returns Through May 31, 2014
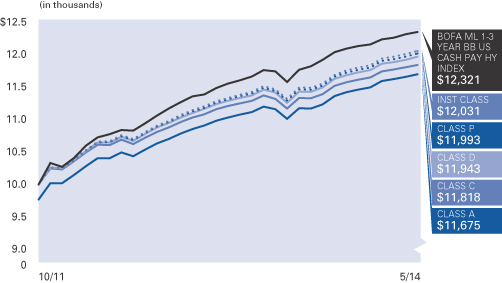
Industry Allocation (as of May 31, 2014)
Telecommunications | 14.4% | |||
Media | 8.9% | |||
Commercial Services | 7.0% | |||
Building Materials | 5.4% | |||
Mining | 5.4% | |||
Oil & Gas | 3.9% | |||
Electric Utilities | 3.8% | |||
Pharmaceuticals | 3.7% | |||
Other | 45.5% | |||
Cash & Equivalents — Net | 2.0% |
Moody’s Ratings* (as of May 31, 2014)
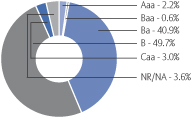
* As a percentage of total investments. Bond ratings refer to the underlying holdings of the Fund and are categorized from highest to lowest credit quality using ratings provided by Moody’s. Moody’s ratings have been selected for several reasons, including the access to information and materials provided by Moody’s, as well as the Fund’s consideration of industry practice. See “Important Information” for more detail on the selection of Moody’s for the Fund’s ratings presentation. Bonds not rated by Moody’s are designated in the chart above as “NR.”
| Shareholder Expense Example | Actual Performance | |||||||||
| Class A | Class C | Class D | Class P | Institutional Class | ||||||
| Beginning Account Value (12/1/13) | $1,000.00 | $1,000.00 | $1,000.00 | $1,000.00 | $1,000.00 | |||||
| Ending Account Value (5/31/14) | $1,024.00 | $1,022.90 | $1,024.10 | $1,024.90 | $1,025.30 | |||||
| Expenses Paid During Period | $4.29 | $5.55 | $4.29 | $3.53 | $3.03 | |||||
| Hypothetical Performance | ||||||||||
| (5% return before expenses) | ||||||||||
| Class A | Class C | Class D | Class P | Institutional Class | ||||||
| Beginning Account Value (12/1/13) | $1,000.00 | $1,000.00 | $1,000.00 | $1,000.00 | $1,000.00 | |||||
| Ending Account Value (5/31/14) | $1,020.69 | $1,019.45 | $1,020.69 | $1,021.44 | $1,021.94 | |||||
| Expenses Paid During Period | $4.28 | $5.54 | $4.28 | $3.53 | $3.02 | |||||
For each class of the Fund, expenses (net of fee waiver and reimbursement, if any) are equal to the annualized expense ratio for the class (0.85% for Class A, 1.10% for Class C, 0.85% for Class D, 0.70% for Class P and 0.60% for Institutional Class), multiplied by the average account value over the period, multiplied by 182/365.
| 76 | May 31, 2014 | | Semiannual Report |
Table of Contents
Unaudited
AllianzGI Structured Return Fund (formerly AllianzGI Structured Alpha Fund)
For the period of December 1, 2013 through May 31, 2014, as provided by Greg Tournant, Portfolio Manager.
Fund Insights
For the reporting period ended May 31, 2014, Class A shares at NAV of the AllianzGI Structured Return Fund (the “Fund”) returned 1.41% outperforming the BofA Merrill Lynch 3-month US Treasury Bill Index (the “benchmark index”) which returned 0.03%.
While equity indexes rose in the first quarter, the path was anything but straight. The S&P 500 Index’s 3.5% decline in January, its largest one-month loss since May 2012, gave way to a 4.6% rebound in February. Meanwhile, the VIX, a measure of implied volatility on S&P 500 Index options, fluctuated sharply in conjunction with the equity-market moves, only to finish the quarter near where it began, at approximately 14.
While the magnitude of the market’s moves was quite typical, the speed of the rebound made it difficult for the portfolio to fully capitalize on opportunities to generate stronger excess returns, for several reasons.
First, the VIX’s spike did not last long enough for the portfolio to take advantage of the additional alpha potential associated with higher levels of implied volatility. Elevated option prices normally enable us to build safer and more lucrative
positions as they rotate over several months. With the VIX round-tripping from 13 to 21 back to 15 over just a two-week period from late January to early February, there was not enough time for the benefit to take hold. (The fluctuating VIX also caused Structured Return U.S. Equity 500’s mark-to-market excess returns to appear more volatile than they were on a realized basis, as is typical.)
Second, the market’s zigzag prevented the portfolio’s directional spread positions from generating any incremental gains. Our directional spreads, which are designed to profit when equity indexes move sharply up or down, missed out on profitable expirations due to the speed of the market’s decline and recovery. Normally with equity-market moves of this magnitude, we would expect our directional positions to carry more of the alpha-generating load than usual, but this was not the case during the first quarter.
Our range-bound spreads delivered steady gains, with minimal portfolio restructuring necessary.
Equity indexes were mixed in April, as the S&P 500 Index gained 74 bps while the Russell 200
and the Nasdaq 100 declined 3.88% and 0.34%, respectively. Volatility remained low for the month, as the VIX rose to 17 briefly, but largely stayed in the 13 to 14 range.
In May, equity indexes were modestly higher, and the VIX declined from approximately 13 to 11, quite a low level. Still, the steepening of the volatility term structure and skew has enabled us to build positions more favorably than this VIX regime would otherwise indicate. In addition, we continue to construct positions on the Russell 2000 and Nasdaq 100 indexes, which have featured comparatively higher implied volatility. The portfolio’s gains were attributable to our range-bound spreads.
Effective July 1, 2014, the Fund changed its name from “AllianzGI Structured Alpha Fund” to “AllianzGI Structured Return Fund.” In connection with this change, on July 1, 2014, changes to the Fund’s investment objective, principal investment strategies, management fee and operating expenses also took effect. For more information, please see the Fund’s prospectus and Note 14 of the Notes to Financial Statements.
Average Annual Total Return for the period ended May 31, 2014
| 6 Month* | 1 Year | Since Inception† | ||||||||||||
| AllianzGI Structured Return Fund Class A | 1.41% | 5.94% | 4.88% | |||||||||||
| AllianzGI Structured Return Fund Class A (adjusted) | –4.17% | 0.12% | 0.97% | ||||||||||
| AllianzGI Structured Return Fund Class C | 1.03% | 5.03% | 4.04% | |||||||||||
| AllianzGI Structured Return Fund Class C (adjusted) | 0.06% | 4.03% | 4.04% | ||||||||||
| AllianzGI Structured Return Fund Class D | 1.41% | 6.08% | 4.97% | ||||||||||
| AllianzGI Structured Return Fund Class P | 1.47% | 6.08% | 5.01% | ||||||||||
| AllianzGI Structured Return Fund Institutional Class | 1.60% | 6.21% | 5.15% | ||||||||||
| BofA Merrill Lynch 3-Month US Treasury Bill Index | 0.03% | 0.06% | 0.07% | ||||||||||
| Lipper Absolute Return Funds Average | 1.69% | 2.64% | 4.08% | |||||||||||
† The Fund began operations on 12/3/12. Benchmark return comparisons began on the fund inception date. Lipper performance comparisons began on 11/30/12.
* Cumulative return.
Performance quoted represents past performance and is no guarantee of future results. Current performance may be lower or higher than performance shown. For performance current to the most recent month-end, visit our website at us.allianzgi.com. Investment return and the principal value will fluctuate. Shares may be worth more or less than original cost when redeemed. The adjusted returns take into account the maximum initial sales charge of 5.50% on Class A shares and the contingent deferred sales charge (CDSC) of 1% on Class C shares, which may apply to shares redeemed during the first year of ownership. Returns do not reflect deduction of taxes that a shareholder would pay on fund distributions or redemption of fund shares. See pages 86 and 87 for more information. The Fund’s gross expense ratios are 5.34% for Class A shares, 4.91% for Class C shares, 4.29% for Class D shares, 3.97% for Class P shares and 3.64% for Institutional Class shares. These ratios do not include an expense reduction, contractually guaranteed through at least 7/31/15. The Fund’s expense ratios net of this reduction are 1.15% for Class A shares, 1.90% for Class C shares, 1.15% for Class D shares, 1.00% for Class P shares and 0.90% for Institutional Class shares. Expense ratio information is as of the Fund’s current prospectus dated April 1, 2014, as supplemented to date.
| Semiannual Report | | May 31, 2014 | 77 |
Table of Contents
Unaudited
AllianzGI Structured Return Fund (formerly AllianzGI Structured Alpha Fund) (cont’d)
Cumulative Returns Through May 31, 2014
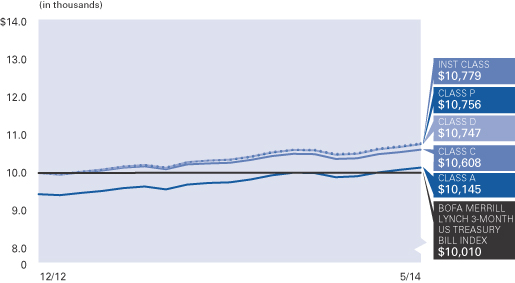
| Shareholder Expense Example | Actual Performance | |||||||||
| Class A | Class C | Class D | Class P | Institutional Class | ||||||
| Beginning Account Value (12/1/13) | $1,000.00 | $1,000.00 | $1,000.00 | $1,000.00 | $1,000.00 | |||||
| Ending Account Value (5/31/14) | $1,014.10 | $1,010.30 | $1,014.10 | $1,014.70 | $1,016.00 | |||||
| Expenses Paid During Period | $9.54 | $13.28 | $9.54 | $8.79 | $8.29 | |||||
| Hypothetical Performance | ||||||||||
| (5% return before expenses) | ||||||||||
| Class A | Class C | Class D | Class P | Institutional Class | ||||||
| Beginning Account Value (12/1/13) | $1,000.00 | $1,000.00 | $1,000.00 | $1,000.00 | $1,000.00 | |||||
| Ending Account Value (5/31/14) | $1,015.46 | $1,011.72 | $1,015.46 | $1,016.21 | $1,016.70 | |||||
| Expenses Paid During Period | $9.55 | $13.29 | $9.55 | $8.80 | $8.30 | |||||
For each class of the Fund, expenses (net of fee waiver and reimbursement, if any) are equal to the annualized expense ratio for the class (1.90% for Class A, 2.65% for Class C, 1.90% for Class D, 1.75% for Class P and 1.65% for Institutional Class), multiplied by the average account value over the period, multiplied by 182/365.
| 78 | May 31, 2014 | | Semiannual Report |
Table of Contents
Unaudited
AllianzGI Ultra Micro Cap Fund
For the period of December 1, 2013 through May 31, 2014, as provided by Robert Marren, Portfolio Manager.
Fund Insights
For the reporting period ended May 31, 2014, Class A shares at NAV of the AllianzGI Ultra Micro Cap Fund (the “Fund”) returned -1.84%, outperforming the Russell Microcap Growth Index (the “benchmark index”) which returned -2.22%.
In general, the stock market continued its ascent into early 2014, then corrected before moving higher into the end of the reporting period.
In December, the Fed announced plans to reduce asset purchases beginning in January, but reinforced expectations for continued accommodative central bank policies. These remarks were construed as bullish and provided a boost to equities. Subsequent to major US indexes reaching new all-time highs, correction ensued. Global economic uncertainty and geopolitical tensions were sources of concern. However, depressed investor sentiment coincided with a near-term stock-market bottom and a sharp rally in US equities that lasted through March. During this period, US corporations reported healthy fourth-quarter results.
Throughout April strength in large-cap, broad-based indexes masked pockets of weakness and investor rotation. Select Information Technology
and Health Care shares, in particular biotechnology, underperformed as well as high-valuation and momentum-oriented companies. Furthermore, investors rotated out of small-cap and growth stocks and into large-cap and value-oriented equities. Outside of general market activity, US economic reports signaled improvement, while Ukraine-related headlines and China growth fears continued to garner attention.
As the end of the reporting period drew closer, investors once again gravitated toward growth stocks despite falling interest rates, reversing a two-month trend. On the other hand, the appetite for large caps relative to small caps remained unchanged. Beyond stocks, a resilient bid for US Treasuries confounded investors in light of equity market strength and improving economic conditions. Furthermore, first-quarter earnings were better-than-expected, M&A activity continued at an elevated pace and the Fed remained on track with plans to reduce asset purchases.
Against this backdrop, the Russell Microcap Index returned -1.13% and underperformed the Russell 2000 Index, which returned -0.10%. Within the
micro-cap universe, growth-oriented stocks trailed value-oriented stocks.
Specific to the Russell Microcap Growth Index, sector performance was mixed. Utilities, Health Care and Energy were the strongest-performing sectors followed by Financials. In contrast, Consumer Staples, Information Technology and Telecom Services stocks closed lower and underperformed the overall universe by the greatest magnitude.
Performance
The Fund outperformed the benchmark, providing downside protection in a declining market. Strength was evident in a variety of holdings and across many sectors. From an attribution perspective, security selection positively impacted relative returns whereas asset weighting effects contributed but to a lesser degree. In particular, stock picking in the Industrials, Consumer Discretionary and Health Care sectors had the greatest positive impact on relative returns. Conversely, security selection within the Financials and Energy sectors detracted and negatively influenced relative performance. Separately, an overweight in Energy aided relative performance, but was partially offset by an underweight in Health Care.
Average Annual Total Return for the period ended May 31, 2014
| 6 Month* | 1 Year | 5 Year | Since Inception† | |||||||||||||
| AllianzGI Ultra Micro Cap Fund Class A | –1.84% | 21.22% | 28.12% | 15.80% | ||||||||||||
| AllianzGI Ultra Micro Cap Fund Class A (adjusted) | –7.24% | 14.55% | 26.68% | 14.77% | |||||||||||
| AllianzGI Ultra Micro Cap Fund Class P | –1.80% | 21.39% | 28.40% | 16.07% | |||||||||||
| AllianzGI Ultra Micro Cap Fund Institutional Class | –1.83% | 21.36% | 28.52% | 16.18% | |||||||||||
| Russell Microcap Growth Index | –2.22% | 19.53% | 19.64% | 8.93% | |||||||||||
| Lipper Small-Cap Core Fund Average | –2.85% | 15.77% | 19.28% | 8.79% | ||||||||||||
† The Fund began operations on 1/28/08. Benchmark return comparisons began on the fund inception date. Lipper performance comparisons began on 1/31/08.
* Cumulative return.
Performance quoted represents past performance and is no guarantee of future results. Current performance may be lower or higher than performance shown. For performance current to the most recent month-end, visit our website at us.allianzgi.com. Investment return and the principal value will fluctuate. Shares may be worth more or less than original cost when redeemed. The adjusted returns take into account the maximum initial sales charge of 5.50% on Class A shares. Returns do not reflect deduction of taxes that a shareholder would pay on fund distributions or redemption of fund shares. See pages 86 and 87 for more information. The Fund’s expense ratios are 2.30% for Class A shares, 2.07% for Class P shares and 2.00% for Institutional Class shares. Expense ratio information is as of the Fund’s current prospectus dated April 1, 2014, as supplemented to date.
| Semiannual Report | | May 31, 2014 | 79 |
Table of Contents
Unaudited
AllianzGI Ultra Micro Cap Fund (cont’d)
Cumulative Returns Through May 31, 2014
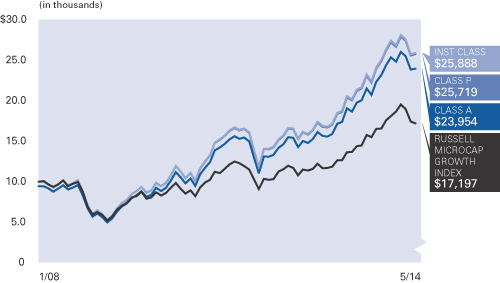
Industry Allocation (as of May 31, 2014)
| Health Care Equipment & Supplies | 11.1% | |||
| Oil, Gas & Consumable Fuels | 6.9% | |||
| Semiconductors & Semiconductor Equipment | 6.6% | |||
| Communications Equipment | 4.9% | |||
| Internet Software & Services | 4.8% | |||
| Pharmaceuticals | 4.7% | |||
| Machinery | 4.6% | |||
| Health Care Providers & Services | 4.1% | |||
| Other | 52.0% | |||
| Cash & Equivalents — Net | 0.3% |
| Shareholder Expense Example | Actual Performance | |||||
| Class A | Class P | Institutional Class | ||||
| Beginning Account Value (12/1/13) | $1,000.00 | $1,000.00 | $1,000.00 | |||
| Ending Account Value (5/31/14) | $981.60 | $982.00 | $981.70 | |||
| Expenses Paid During Period | $10.47 | $9.88 | $9.88 | |||
| Hypothetical Performance | ||||||
| (5% return before expenses) | ||||||
| Class A | Class P | Institutional Class | ||||
| Beginning Account Value (12/1/13) | $1,000.00 | $1,000.00 | $1,000.00 | |||
| Ending Account Value (5/31/14) | $1,014.36 | $1,014.96 | $1,014.96 | |||
| Expenses Paid During Period | $10.65 | $10.05 | $10.05 | |||
For each class of the Fund, expenses are equal to the annualized expense ratio for the class (2.12% for Class A, 2.00% for Class P and 2.00% for Institutional Class), multiplied by the average account value over the period, multiplied by 182/365.
| 80 | May 31, 2014 | | Semiannual Report |
Table of Contents
Unaudited
AllianzGI U.S. Equity Hedged Fund
For the period of December 1, 2013 through May 31, 2014, as provided by Robert Marren, Portfolio Manager.
Fund Insights
For the reporting period ended May 31, 2014, Class A shares at NAV of the AllianzGI U.S. Equity Hedged Fund (the “Fund”) returned 4.41% underperforming the S&P 500 Index (the “benchmark index”) which returned 7.62%.
The Fund performed in line with expectations during the period, smoothing out the volatility of the broad equity market but lagging on a relative basis. Compared with equities, the Fund held up better during January’s 3.46% S&P 500 Index decline, but could not keep pace due to the rate of ascent of February’s 4.57% index rebound.
As a reminder, the Fund seeks to provide protection against downside equity-market moves while asymmetrically preserving the upside potential of the underlying equity portfolio. The strategy seeks this objective by buying laddered, long-duration index put options and selling short-duration index calls, all at varying strike distances.
In the prevailing low volatility environment, our near term short call positions had generally been written around 3% to 4% out-of-the-money. So while our option positions added value in January, our short call strikes were unable to
avoid truncating the index’s rapid February run-up. The duration mismatch and dynamic strike selection of our option positions creates a return profile that is designed to maximize upside participation even as the downside is protected. The Fund continued to generate positive performance in April and May, positively participating in the equity market rise while providing downside protection.
Average Annual Total Return for the period ended May 31, 2014
6 Month* | 1 Year | Since Inception† | ||||||||||||
AllianzGI U.S. Equity Hedged Fund Class A | 4.41% | 10.56% | 13.06% | |||||||||||
| AllianzGI U.S. Equity Hedged Fund Class A (adjusted) | –1.33% | 4.48% | 8.85% | ||||||||||
AllianzGI U.S. Equity Hedged Fund Class C | 4.07% | 9.77% | 12.28% | |||||||||||
| AllianzGI U.S. Equity Hedged Fund Class C (adjusted) | 3.07% | 8.77% | 12.28% | ||||||||||
| AllianzGI U.S. Equity Hedged Fund Class D | 4.40% | 10.55% | 13.09% | ||||||||||
| AllianzGI U.S. Equity Hedged Fund Class P | 4.47% | 10.75% | 13.28% | ||||||||||
| AllianzGI U.S. Equity Hedged Fund Institutional Class | 4.56% | 10.84% | 13.39% | ||||||||||
| S&P 500 Index | 7.62% | 20.45% | 25.89% | ||||||||||
Lipper Equity Market Neutral Funds Average | 2.58% | 9.61% | 12.13% | |||||||||||
† The Fund began operations on 12/3/12. Benchmark return comparisons began on the fund inception date. Lipper performance comparisons began on 11/30/12.
* Cumulative return
Performance quoted represents past performance and is no guarantee of future results. Current performance may be lower or higher than performance shown. For performance current to the most recent month-end, visit our website at us.allianzgi.com. Investment return and the principal value will fluctuate. Shares may be worth more or less than original cost when redeemed. The adjusted returns take into account the maximum initial sales charge of 5.50% on Class A shares and the contingent deferred sales charge (CDSC) of 1% on Class C shares, which may apply to shares redeemed during the first year of ownership. Returns do not reflect deduction of taxes that a shareholder would pay on fund distributions or redemption of fund shares. See pages 86 and 87 for more information. The Fund’s gross expense ratios are 7.48% for Class A shares, 8.77% for Class C shares, 7.44% for Class D shares, 6.38% for Class P shares and 6.49% for Institutional Class shares. These ratios do not include an expense reduction, contractually guaranteed through at least 3/31/15. The Fund’s expense ratios net of this reduction are 1.25% for Class A shares, 2.00% for Class C shares, 1.25% for Class D shares, 1.10% for Class P shares and 1.00% for Institutional Class shares. Expense ratio information is as of the Fund’s current prospectus dated April 1, 2014, as supplemented to date.
| Semiannual Report | | May 31, 2014 | 81 |
Table of Contents
Unaudited
AllianzGI U.S. Equity Hedged Fund (cont’d)
Cumulative Returns Through May 31, 2014
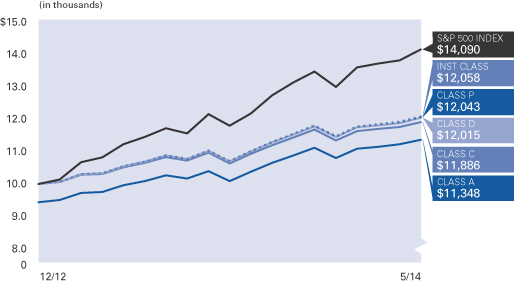
Industry Allocation (as of May 31, 2014)
| Oil, Gas & Consumable Fuels | 8.0% | |||
| Pharmaceuticals | 5.8% | |||
| Banks | 5.6% | |||
| Technology Hardware, Storage & Peripherals | 4.2% | |||
| Media | 3.4% | |||
| Software | 3.3% | |||
| IT Services | 3.2% | |||
| Internet Software & Services | 3.0% | |||
| Other | 58.2% | |||
| Cash & Equivalents — Net (including Options Purchased and Written) | 5.3% |
| Shareholder Expense Example | Actual Performance | |||||||||
| Class A | Class C | Class D | Class P | Institutional Class | ||||||
| Beginning Account Value (12/1/13) | $1,000.00 | $1,000.00 | $1,000.00 | $1,000.00 | $1,000.00 | |||||
| Ending Account Value (5/31/14) | $1,044.10 | $1,040.70 | $1,044.00 | $1,044.70 | $1,045.60 | |||||
| Expenses Paid During Period | $6.37 | $10.18 | $6.37 | $5.61 | $5.10 | |||||
| Hypothetical Performance | ||||||||||
| (5% return before expenses) | ||||||||||
| Class A | Class C | Class D | Class P | Institutional Class | ||||||
| Beginning Account Value (12/1/13) | $1,000.00 | $1,000.00 | $1,000.00 | $1,000.00 | $1,000.00 | |||||
| Ending Account Value (5/31/14) | $1,018.70 | $1,014.96 | $1,018.70 | $1,019.45 | $1,019.95 | |||||
| Expenses Paid During Period | $6.29 | $10.05 | $6.29 | $5.54 | $5.04 | |||||
For each class of the Fund, expenses (net of fee waiver and reimbursement, if any) are equal to the annualized expense ratio for the class (1.25% for Class A, 2.00% for Class C, 1.25% for Class D, 1.10% for Class P and 1.00% for Institutional Class), multiplied by the average account value over the period, multiplied by 182/365.
| 82 | May 31, 2014 | | Semiannual Report |
Table of Contents
Unaudited
AllianzGI U.S. Small-Cap Growth Fund (formerly AllianzGI U.S. Emerging Growth Fund)
For the period of December 1, 2013 through May 31, 2014, as provided by John McCraw, Portfolio Manager.
Fund Insights
For the reporting period ended May 31, 2014, Class A shares at NAV of the AllianzGI U.S. Small-Cap Growth Fund (the “Fund”) returned -0.80% outperforming the Russell 2000 Growth Index (the “benchmark index”) which returned -1.79%.
In general, the stock market continued its ascent into early 2014, then corrected before moving higher into the end of the reporting period.
In December, the Fed announced plans to reduce asset purchases beginning in January, but reinforced expectations for continued accommodative central bank policies. These remarks were construed as bullish and provided a boost to equities. Subsequent to major US indexes reaching new all-time highs, correction ensued. Global economic uncertainty and geopolitical tensions were sources of concern. However, depressed investor sentiment coincided with a near-term stock-market bottom and a sharp rally in US equities that lasted through March. During this period, US corporations reported healthy fourth-quarter results.
Throughout April strength in large-cap, broad-based indexes masked pockets of weakness and investor rotation. Select Information Technology
and Health Care shares, in particular biotechnology, underperformed as well as high-valuation and momentum-oriented companies. Furthermore, investors rotated out of small-cap and growth stocks and into large-cap and value-oriented equities. Outside of general market activity, US economic reports signaled improvement, while Ukraine-related headlines and China growth fears continued to garner attention.
As the end of the reporting period drew closer, investors once again gravitated toward growth stocks despite falling interest rates, reversing a two-month trend. On the other hand, the appetite for large caps relative to small caps remained unchanged. Beyond stocks, a resilient bid for US Treasuries confounded investors in light of equity market strength and improving economic conditions. Furthermore, first-quarter earnings were better-than-expected, M&A activity continued at an elevated pace and the Fed remained on track with plans to reduce asset purchases.
Against this backdrop, the Russell 2000 Index returned -0.10% and underperformed the Russell 1000 Index, which returned 7.71%. Within the small-cap universe, growth-oriented stocks trailed value-oriented stocks.
Specific to the Russell 2000 Growth Index, sector performance was mixed. Energy and Consumer Staples were the strongest-performing sectors followed by Utilities and Materials. In contrast, Consumer Discretionary, Information Technology, Telecom Services and Financials stocks closed lower and underperformed the overall universe by the greatest magnitude.
Performance
The Fund outperformed the benchmark, providing downside protection in a declining market. Strength was evident in a variety of holdings and across many sectors. From an attribution perspective, security selection positively impacted relative returns whereas asset weighting effects contributed but to a lesser degree. In particular, stock picking in the Industrials, Consumer Discretionary, Health Care and Information Technology sectors had a positive impact on relative returns. Conversely, security selection within the Financials, Telecom Services, Energy and Consumer Staples sectors detracted and negatively influenced relative performance. Separately, an overweight in Energy aided relative performance, but was partially offset by an underweight in Consumer Staples.
| Semiannual Report | | May 31, 2014 | 83 |
Table of Contents
Unaudited
AllianzGI U.S. Small-Cap Growth Fund (formerly AllianzGI U.S. Emerging Growth Fund) (cont’d)
Average Annual Total Return for the period ended May 31, 2014
| 6 Month* | 1 Year | 5 Year | 10 Year | Since Inception† | ||||||||||||||||||
| AllianzGI U.S. Small-Cap Growth Fund Class A | –0.80% | 19.27% | 19.49% | 9.89% | 7.90% | |||||||||||||||||
| AllianzGI U.S. Small-Cap Growth Fund Class A (adjusted) | –6.26% | 12.71% | 18.15% | 9.27% | 7.60% | ||||||||||||||||
| AllianzGI U.S. Small-Cap Growth Fund Class C | –1.16% | 18.37% | 18.63% | 9.09% | 7.10% | |||||||||||||||||
| AllianzGI U.S. Small-Cap Growth Fund Class C (adjusted) | –2.08% | 17.37% | 18.63% | 9.09% | 7.10% | ||||||||||||||||
| AllianzGI U.S. Small-Cap Growth Fund Class D | –0.80% | 19.32% | 19.52% | 9.90% | 7.90% | ||||||||||||||||
| AllianzGI U.S. Small-Cap Growth Fund Class R | –0.92% | 19.05% | 19.24% | 9.64% | 7.64% | ||||||||||||||||
| AllianzGI U.S. Small-Cap Growth Fund Class P | –0.74% | 19.52% | 19.79% | 10.17% | 8.17% | ||||||||||||||||
| AllianzGI U.S. Small-Cap Growth Fund Institutional Class | –0.62% | 19.67% | 19.92% | 10.28% | 8.27% | ||||||||||||||||
| Russell 2000 Growth Index | –1.79% | 16.71% | 19.82% | 8.74% | 7.09% | ||||||||||||||||
| Lipper Small-Cap Growth Funds Average | –2.85% | 15.77% | 19.28% | 8.22% | 9.27% | |||||||||||||||||
† The Fund began operations on 10/1/93. Benchmark return comparisons began on the fund inception date. Lipper performance comparisons began on 9/30/93.
* Cumulative return.
Performance quoted represents past performance and is no guarantee of future results. Current performance may be lower or higher than performance shown. For performance current to the most recent month-end, visit our website at us.allianzgi.com. Investment return and the principal value will fluctuate. Shares may be worth more or less than original cost when redeemed. The adjusted returns take into account the maximum initial sales charge of 5.50% on Class A shares and the contingent deferred sales charge (CDSC) of 1% on Class C shares, which may apply to shares redeemed during the first year of ownership. Returns do not reflect deduction of taxes that a shareholder would pay on fund distributions or redemption of fund shares. See pages 86 and 87 for more information. The Fund’s gross expense ratios are 1.91% for Class A shares, 2.73% for Class C shares, 2.00% for Class D shares, 2.16% for Class R shares, 1.74% for Class P shares and 1.69% for Institutional Class shares. These ratios do not include an expense reduction, contractually guaranteed through at least 3/31/15. The Fund’s expense ratios net of this reduction are 1.40% for Class A shares, 2.20% for Class C shares, 1.42% for Class D shares, 1.65% for Class R shares, 1.25% for Class P shares and 1.16% for Institutional Class shares. Expense ratio information is as of the Fund’s current prospectus dated April 1, 2014, as supplemented to date.
Cumulative Returns Through May 31, 2014
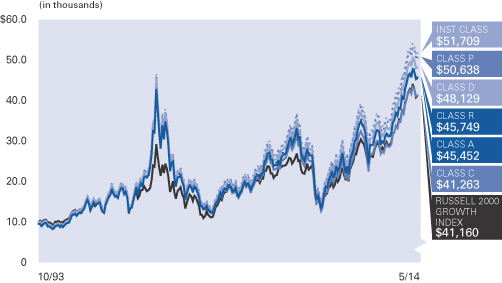
Industry Allocation (as of May 31, 2014)
Oil, Gas & Consumable Fuels | 7.6% | |||
| Software | 7.5% | |||
| Road & Rail | 5.5% | |||
| Health Care Providers & Services | 4.5% | |||
| Hotels, Restaurants & Leisure | 4.2% | |||
| Communications Equipment | 4.1% | |||
| Banks | 3.9% | |||
| Semiconductors & Semiconductor Equipment | 3.6% | |||
| Other | 56.1% | |||
| Cash & Equivalents — Net | 3.0% |
| 84 | May 31, 2014 | | Semiannual Report |
Table of Contents
Unaudited
AllianzGI U.S. Small-Cap Growth Fund (formerly AllianzGI U.S. Emerging Growth Fund) (cont’d)
| Shareholder Expense Example | Actual Performance | |||||||||||
| Class A | Class C | Class D | Class R | Class P | Institutional Class | |||||||
| Beginning Account Value (12/1/13) | $1,000.00 | $1,000.00 | $1,000.00 | $1,000.00 | $1,000.00 | $1,000.00 | ||||||
| Ending Account Value (5/31/14) | $992.00 | $988.40 | $992.00 | $990.80 | $992.60 | $993.80 | ||||||
| Expenses Paid During Period | $7.30 | $10.96 | $7.05 | $8.24 | $6.21 | $5.77 | ||||||
| Hypothetical Performance | ||||||||||||
| (5% return before expenses) | ||||||||||||
| Class A | Class C | Class D | Class R | Class P | Institutional Class | |||||||
| Beginning Account Value (12/1/13) | $1,000.00 | $1,000.00 | $1,000.00 | $1,000.00 | $1,000.00 | $1,000.00 | ||||||
| Ending Account Value (5/31/14) | $1,017.60 | $1,013.91 | $1,017.85 | $1,016.65 | $1,018.70 | $1,019.15 | ||||||
| Expenses Paid During Period | $7.39 | $11.10 | $7.14 | $8.35 | $6.29 | $5.84 | ||||||
For each class of the Fund, expenses (net of fee waiver and reimbursement, if any) are equal to the annualized expense ratio for the class (1.47% for Class A, 2.21% for Class C, 1.42% for Class D, 1.66% for Class R, 1.25% for Class P and 1.16% for Institutional Class), multiplied by the average account value over the period, multiplied by 182/365.
| Semiannual Report | | May 31, 2014 | 85 |
Table of Contents
Unaudited
The inception date on each Fund Summary page is the inception date of the Fund’s oldest share class or classes. The oldest share classes for AllianzGI Global Water Fund are A, C, D, and P, and the Institutional Class shares were first offered in 7/08. The AllianzGI Global Allocation Fund reorganized on May 4, 2009 when its predecessor merged into the Trust. The Global Allocation Fund’s shares were first offered in 9/98. On April 12, 2010, the following funds reorganized when their predecessors merged into series of the Trust (including fund’s inception date): AllianzGI Convertible Fund (4/93), AllianzGI High Yield Bond Fund (7/96), AllianzGI International Small-Cap Fund (12/97), AllianzGI U.S. Small-Cap Growth Fund (10/93), AllianzGI Micro Cap Fund (7/95), AllianzGI Ultra Micro Cap Fund (1/08). For each of the reorganized funds, Institutional Class is the oldest share class, except that for AllianzGI International Small-Cap Fund, the oldest share class of the predecessor fund merged into Class P.
The Target-Date Funds are designed to offer individual investors comprehensive asset allocation strategies tailored to the approximate date when they expect to begin withdrawing assets. The target date included in the Fund’s name does not necessarily represent the specific year an investor will begin withdrawing assets. It is intended only as a general guide. Each Fund follows a target asset allocation schedule that changes over time to help reduce portfolio risk, increasing its exposure to conservative investments as the target date approaches. The principal value of a Fund is not guaranteed at any time, including the target date. A Fund’s shareholders may experiences losses, including losses near, at, or after the target year indicated in the Fund’s name.
Returns measure performance from the inception of the oldest share class to the present, so some returns predate the inception of the actual share class. Those returns are calculated by adjusting the returns of the oldest share class to reflect the indicated share class’s different operating expenses. Total return performance assumes that all dividend and capital gain distributions were reinvested on the payable date.
Class A shares are subject to an initial sales charge. Class C shares are subject to a 1% contingent deferred sales charge (“CDSC”) for shares redeemed in the first year. Class D shares are continuously offered through financial service firms, such as broker-dealers or registered investment advisers. Class R shares are generally available only to 401(k) plans, 457 plans, employer sponsored 403(b) plans, profit sharing and money purchase pension plans, defined benefit plans, non-qualified deferred compensation plans and healthcare benefit funding plans. Class P shares are offered primarily through certain asset allocation, wrap fee and other similar programs offered by broker-dealers and other intermediaries. Institutional Class shares are offered primarily for direct investment by investors such as pension and profit sharing plans, employee benefit trusts, endowments, foundations, corporations and high net worth individuals. Administrative Class shares are offered primarily through employee benefit plan alliances, broker-dealers and other intermediaries. Class R6 shares are offered primarily for 401(k) plans, 457 plans, employer sponsored 403(b) plans, profit sharing and money purchase
pension plans, defined benefit plans, non-qualified deferred compensation plans, healthcare benefit funding plans and other specified benefit plans and accounts whereby the plan or the plan’s broker, dealer or other financial Intermediary has an agreement with the Distributor or the Investment Manager to utilize Class R6 shares In certain Investment products or programs.
Class B shares of Allianz Multi-Strategy Funds are not available for purchase, except through exchanges and dividend reinvestments for any Funds with Class B shares outstanding (currently only AllianzGI Global Allocation Fund).
The Lipper Averages are calculated by Lipper, Inc. They are based on the total return performance, with distributions reinvested and operating expenses deducted, of funds included by Lipper in the stated category. Lipper does not take into account sales charges.
The Cumulative Returns charts for each Fund assume the initial investment was made on the first day of the Fund’s initial fiscal year. The charts reflect any sales load that would have applied at the time of purchase or any CDSC that would have applied if a full redemption occurred on the last business day of the most recent fiscal year. Results assume that all dividends and capital gain distributions were reinvested. They do not take into account the effect of taxes. The benchmark cumulative return began on the last day of the month of the respective Fund’s inception date.
Proxy Voting
The Funds’ Investment Manager and Sub-Advisers have adopted written proxy voting policies and procedures (“Proxy Policy”) as required by Rule 206(4)-6 under the Investment Advisers Act of 1940. The Proxy Policy has been adopted by Allianz Funds Multi-Strategy Trust (the “Trust”) as the policies and procedures that the Sub-Advisers will use when voting proxies on behalf of the Funds. Copies of the written Proxy Policy and the factors that the Sub-Advisers may consider in determining how to vote proxies for each Fund, and information about how each Fund voted proxies relating to portfolio securities held during the most recent twelve-month period ended June 30, are available without charge, upon request, by calling 1-800-988-8380 (retail classes: A, B, C & R) or 1-800-498-5413 (Class P, R6, D, Institutional & Administrative classes), on the Allianz Global Investors Distributors website at us.allianzgi.com, and on the Securities and Exchange Commission’s (“SEC”) website at http://www.sec.gov.
Form N-Q
The Trust files complete schedules of each Fund’s portfolio holdings with the SEC on Form N-Q for the first and third quarters of each fiscal year, which are available on the SEC’s website at http://www.sec.gov. A copy of the Trust’s Form N-Q is available without charge, upon request, by calling 1-800-988-8380 (retail classes: A, B, C & R) or 1-800-498-5413 (Class P, R6, D, Institutional & Administrative classes). In addition, the Trust’s Form N-Q may be reviewed and copied at the SEC’s Public Reference Room in Washington, DC. Information on the operation of the Public Reference Room may be obtained by calling 1-800-SEC-0330.
| 86 | May 31, 2014 | | Semiannual Report |
Table of Contents
Unaudited
Important Information (cont’d)
The following disclosure provides important information regarding each Fund’s Shareholder Expense Example, which appears on each Fund Summary page in this Semiannual Report. Please refer to this information when reviewing the Shareholder Expense Example for a Fund.
Shareholder Expense Example
Shareholders of a Fund incur two types of costs: (1) transaction costs; and (2) ongoing costs, including investment management fees; distribution and/or service (12b-1) fees and other Fund expenses. The Shareholder Expense Example is intended to help shareholders understand ongoing costs (in dollars) of investing in a Fund and to compare these costs with the ongoing costs of investing in other mutual funds. The Shareholder Expense Example is based on an investment of $1,000.00 invested at the beginning of the period, as indicated, and held for the entire period through May 31, 2014.
Actual Expenses
The information in the table under the heading “Actual Performance” provides information about actual account values and actual expenses. You may use the information in these columns, together with the amount you invested, to estimate the expenses that you paid over the period. Simply divide your account value by $1,000.00 (for example, an $8,600.00 account value divided by $1,000.00 = 8.6), then multiply the result by the number in the appropriate column for your share class, in the row entitled “Expenses Paid During Period” to estimate the expenses you paid on your account during this period.
Hypothetical Example for Comparison Purposes
The information in the table under the heading “Hypothetical Performance (5% return before expenses)” provides information about hypothetical account values and hypothetical expenses based on a Fund’s actual expense ratio and an assumed rate of return of 5% per year before expenses, which is not the Fund’s actual return. The hypothetical account values and expenses may not be used to estimate the actual ending account balance or expenses you paid for the period. You may use this information to compare the ongoing costs of investing in a Fund and other funds. To do so, compare this 5% hypothetical example with the 5% hypothetical examples that appear in the shareholder reports of other funds.
Please note that the expenses shown in the table are meant to highlight your ongoing costs only and do not reflect any transactional costs. Therefore, the information under the heading “Hypothetical Performance (5% return before expenses)” is useful in comparing ongoing costs only, and will not help you determine the relative total costs of owning different funds. In addition, if these transactional costs were included, your costs would have been higher.
Credit Ratings
Bond ratings apply to the underlying holdings of a Fund and not the Fund itself and are divided into categories ranging from highest to lowest credit quality, determined for purposes of presentations in this report by using ratings provided by Moody’s Investors Service, Inc. (“Moody’s”). Presentations of credit ratings information in this report use ratings provided by Moody’ for this purpose, among other reasons, because of the access to background information and other materials provided by Moody’s, as well as the Funds’ considerations of industry practice. When a bond is not rated by Moody’s, it is designated as “NR” for not rated. Credit quality ratings assigned by a rating agency are subjective opinions, not statements of fact, and are subject to change periodically, even as frequently as daily. Ratings assigned by Moody’s or another rating agency are not absolute standards of credit quality and do not evaluate market risk. Rating agencies may fail to make timely changes in credit ratings, and an issuer’s current financial condition may be better or worse than a rating indicates. In formulating investment decisions for the applicable Funds, Allianz Global Investors US LLC, the sub-adviser to the applicable Funds, develops its own analysis of the credit quality and risks associated with individual debt instruments, rather than relying exclusively on rating agencies or third-party research.
All the information on the Fund Summary pages, including Portfolio Insights, Average Annual Total/Cumulative Return Tables, Cumulative Return Charts, Shareholder Expense Examples and Allocation/Credit Rating Summaries, is unaudited.
Allianz Global Investors Distributors LLC, 1633 Broadway, New York, NY, 10019, us.allianzgi.com, 1-800-988-8380 (retail classes: A, B, C & R) or 1-800-498-5413 (Class P, R6, D, Institutional & Administrative classes).
| Semiannual Report | | May 31, 2014 | 87 |
Table of Contents
Unaudited
Unless otherwise noted, index returns reflect the reinvestment of income dividends and capital gains, if any, but do not reflect fees, brokerage commissions or other expenses of investing. It is not possible to invest directly in an index.
Prior to November 1, 2006, performance data for the MSCI Indices was calculated gross of dividend tax withholding. Performance data presently shown for the Indices is net of dividend tax withholding. This recalculation results in lower performance for the Indices.
| Index | Description | |
| Barclays Global Aggregate Index | The Barclays Global Aggregate Index provides a broad-based measure of the global investment-grade fixed income markets. The three major components of this index are the U.S. Aggregate, the Pan-European Aggregate, and the Asian-Pacific Aggregate Indices. The index also includes Eurodollar and Euro-Yen corporate bonds, Canadian government, agency and corporate securities, and USD investment grade 144A securities. | |
| Barclays Global High Yield Index | The Barclays Global High Yield Index is an unmanaged index considered representative of fixed rate, non-investment-grade debt of companies in the US, developed markets and emerging markets. | |
| Barclays US Aggregate Index | The Barclays US Aggregate Index is composed of securities from the Barclays Government/Credit Bond Index, Mortgage-Backed Securities Index, and Asset-Backed Securities Index. It is generally considered to be representative of the domestic, investment-grade, fixed-rate, taxable bond market. | |
| Barclays US Credit Index | The Barclays US Credit Index is the credit component of the U.S. Government/Credit index. It includes publicly issued U.S. corporate and specified foreign debentures and secured notes that meet the specified maturity, liquidity and quality requirements. To qualify, securities must be rated investment grade (Baa3 or better) by Moody’s. | |
| Barclays US Government Bond Index | The Barclays US Government Bond Index is composed of all publicly issued, nonconvertible, domestic debt of the U.S. Government or any agency thereof, quasi-federal corporations or corporate debt guaranteed by the U.S. Government. | |
| Barclays US Government Inflation-Linked Bond Index | Barclays US Government Inflation-Linked Bond Index measures the performance of the US Treasury Inflation Protected Securities (“TIPS”) market. The index includes TIPS with one or more years remaining maturity with total outstanding issue size of $500m or more. | |
| Barclays US Treasury 10-20 Year Index | The Barclays US Treasury 10-20 Year Index measures the performance of US Treasury securities that have remaining maturity of at least 10 years and less than 20 years. | |
| BofA Merrill Lynch 1-3 Year BB US Cash Pay High Yield Index | The BofA Merrill Lynch 1-3 Year BB US Cash Pay High Yield Index is a subset of The BofA Merrill Lynch U.S. Cash Pay High Yield Index including all securities with a remaining term to final maturity less than 3 years and rated BB1 through BB3, inclusive. The BofA Merrill Lynch US Cash Pay High Yield Index tracks the performance of U.S. dollar denominated below investment grade corporate debt, currently in a coupon paying period, that is publicly issued in the US domestic market. | |
| BofA Merrill Lynch 3-Month US Treasury Bill Index | The BofA Merrill Lynch 3-Month US Treasury Bill Index tracks the performance of the 3-month U.S. Treasury markets. | |
| BofA Merrill Lynch All Convertibles Index | The BofA Merrill Lynch All Convertibles Index is a widely used, unmanaged index that measures the performance of US dollar-denominated convertible securities not currently in bankruptcy with a total market value greater than $50 million at issuance. | |
| BofA Merrill Lynch US High Yield Master II Index | The BofA Merrill Lynch US High Yield Master II Index is an unmanaged index consisting of US dollar denominated bonds that are issued in countries having a BBB3 or higher debt rating with at least one year remaining until maturity. All bonds must have a credit rating below investment grade but not in default. | |
| 88 | May 31, 2014 | | Semiannual Report |
Table of Contents
Unaudited
Benchmark Descriptions (cont’d)
| Index | Description | |
| Dow Jones Real Return Target Date Index; DJ RR 2015 Index; DJ RR 2020 Index; DJ RR 2025 Index; DJ RR 2030 Index; DJ RR 2035 Index; DJ RR 2040 Index; DJ RR 2045 Index; DJ RR 2050 Index; DJ RR 2040+ Index; DJ RR Today Index | Each Dow Jones Real Return Target Date Index is a composite of other indexes. The sub-indexes represent traditional stocks and bonds in addition to real return assets such as inflation-linked bonds, commodities and real estate securities that are considered to potentially counterbalance inflation. The component asset classes are weighted within each index to reflect a targeted level of risk at the beginning and end of the investment horizon. Over time, the weights are adjusted based on predetermined formulas to systematically reduce the level of potential risk as the index’s maturity date approaches. | |
| Dow Jones UBS Commodity Index | The Dow Jones UBS Commodity Index is composed of futures contracts on 19 physical commodities. | |
| Dow Jones US Select REIT Index | The Dow Jones US Select REIT index is comprised of companies whose charters are the equity ownership and operation of commercial real estate and which operate under the REIT Act of 1960. | |
| MSCI All Country World Index (Also known as: MSCI AC World Index and MSCI ACWI) | The MSCI All Country World Index (MSCI ACWI) is a free float-adjusted market capitalization weighted index that is designed to measure the equity market performance of developed and emerging markets. The MSCI ACWI consists of 45 country indices comprising 24 developed and 21 emerging market country indices. | |
| MSCI China Index | The MSCI China Index is a free float-adjusted market capitalization-weighted index of Chinese equities that includes China-affiliated corporations (“Red-chips” or “P-chips”) and China-incorporated corporations listed as “H-shares” on the Hong Kong Exchange or listed as B-shares on the Shanghai and Shenzhen exchanges. | |
| MSCI EAFE Index | The MSCI EAFE Index (Europe, Australasia, Far East) is a free float-adjusted market capitalization index that is designed to measure the equity market performance of developed markets, excluding the US & Canada. | |
| MSCI EAFE Small Cap Index | The MSCI EAFE Small Cap Index captures small cap representation across Developed Markets countries around the world, excluding the US and Canada. | |
| MSCI Emerging Markets Index | The MSCI Emerging Markets Index is a free float-adjusted market capitalization index that is designed to measure equity market performance in emerging markets. | |
| MSCI World ex-US Small Cap Index | The MSCI World ex-US Small Cap Index captures small cap representation across 23 of 24 of Developed Markets (DM) countries (excluding the United States). | |
| MSCI World Index | The MSCI World Index is a free float-adjusted market capitalization weighted index that is designed to measure the equity market performance of developed markets. | |
| MSCI World Minimum Volatility Index | MSCI World Minimum Volatility Index aims to reflect the performance characteristics of a minimum variance strategy applied to the MSCI large and mid cap equity universe across 24 Developed Markets countries. The index is calculated by optimizing the MSCI World Index, its parent index, for the lowest absolute risk (within a given set of constraints). Historically, the index has shown lower beta and volatility characteristics relative to the MSCI World Index. | |
| Russell 1000 Index | The Russell 1000 Index is an unmanaged index that consists of the 1,000 largest companies in the Russell 3000 Index and represents approximately 90% of the total market capitalization of the Russell 3000 Index. It is highly correlated with the S&P 500 Index. | |
| Russell 2000 Growth Index | The Russell 2000 Growth Index is an unmanaged index composed of those Russell 2000 companies with higher price-to-book ratios and higher forecasted growth values. | |
| Russell 2000 Index | The Russell 2000 Index measures the performance of the small-cap segment of the US equity universe. The Russell 2000 is a subset of the Russell 3000 Index representing approximately 10% of total market capitalization of that index. | |
| Semiannual Report | | May 31, 2014 | 89 |
Table of Contents
| Index | Description | |
| Russell Microcap Growth Index | The Russell Microcap Growth Index measures the performance of the microcap growth segment of the U.S. Equity market. It includes those Russell Microcap Index companies with higher price-to-book ratios and higher forecasted growth values. | |
| S&P 500 Index | The Standard & Poor’s 500 Index is an unmanaged market index generally considered representative of the stock market as a whole. The Index focuses on the large-cap segment of the U.S. equities market. | |
| S&P Global Water Index | The Standard & Poor’s Global Water Index is comprised of 50 of the largest publicly traded companies in water-related businesses that meet specific investability requirements. The Index is designed to provide liquid exposure to the leading publicly-listed companies in the global water industry, from both developed markets and emerging markets. | |
| USD Overnight LIBOR | USD Overnight LIBOR (London Interbank Offered Rate) is the average interest rate at which leading banks in London borrow US dollar funds from one another with a maturity of one day (overnight). | |
| 90 | May 31, 2014 | | Semiannual Report |
Table of Contents
May 31, 2014 (Unaudited)
AllianzGI Retirement 2015 Fund
| Shares | Value | |||||||
| Mutual Funds—84.5% | ||||||||
AllianzGI Behavioral Advantage Large Cap (a)(b) | 24,033 | $575,119 | ||||||
AllianzGI Best Styles Global Equity (a)(e)(g) | 65,058 | 1,042,229 | ||||||
AllianzGI Global Managed | 16,031 | 290,155 | ||||||
AllianzGI Global Natural | 11,342 | 230,916 | ||||||
AllianzGI Income & Growth (a)(b) | 66,350 | 868,525 | ||||||
AllianzGI International Managed Volatility (a)(b) | 19,301 | 289,897 | ||||||
AllianzGI International Small-Cap (a)(b) | 6,726 | 270,836 | ||||||
AllianzGI NFJ Dividend Value (a)(b) | 34,652 | 580,761 | ||||||
AllianzGI NFJ Global Dividend | 13,130 | 289,244 | ||||||
AllianzGI NFJ International Small-Cap Value (a)(b) | 6,431 | 144,949 | ||||||
AllianzGI NFJ International Value (a)(b) | 29,994 | 722,258 | ||||||
AllianzGI NFJ Mid-Cap Value (a)(b) | 22,083 | 579,463 | ||||||
AllianzGI Short Duration High Income (a)(b) | 99,956 | 1,593,301 | ||||||
AllianzGI U.S. Managed Volatility (a)(b) | 56,992 | 871,401 | ||||||
PIMCO CommoditiesPLUS® Strategy (a)(b) | 37,926 | 431,598 | ||||||
PIMCO Commodity RealReturn Strategy (a)(b) | 72,013 | 430,636 | ||||||
PIMCO Floating Income (a)(b) | 162,890 | 1,456,233 | ||||||
PIMCO Foreign Bond (U.S. Dollar-Hedged) (a)(b) | 80,481 | 870,004 | ||||||
PIMCO Income (a)(b) | 229,456 | 2,911,796 | ||||||
PIMCO International StocksPLUS® AR Strategy (U.S. Dollar-Hedged) (a)(b) | 87,200 | 722,891 | ||||||
PIMCO Mortgage Opportunities (a)(b) | 104,321 | 1,163,179 | ||||||
PIMCO Real Return (a)(b) | 224,132 | 2,597,685 | ||||||
PIMCO Senior Floating Rate (a)(b) | 156,149 | 1,597,406 | ||||||
PIMCO Short-Term (a)(b) | 234,374 | 2,317,957 | ||||||
Templeton Frontier Markets (d) | 18,172 | 349,992 | ||||||
Voya Global Real Estate (c) | 21,757 | 436,664 | ||||||
Wells Fargo Advantage Short-Term High Yield Bond (f) | 105,601 | 871,206 | ||||||
|
| |||||||
| Total Mutual Funds (cost—$22,731,981) | 24,506,301 | |||||||
|
| |||||||
| Shares | Value | |||||||
| Exchange-Traded Funds—14.8% | ||||||||
iShares Core S&P 500 | 3,019 | $ | 585,294 | |||||
iShares MSCI Spain Capped | 5,188 | 222,046 | ||||||
PIMCO 1-5 Year U.S. TIPS Index (a) | 65,019 | 3,481,768 | ||||||
|
| |||||||
| Total Exchange-Traded Funds (cost—$4,191,061) | 4,289,108 | |||||||
|
| |||||||
| Total Investments (cost—$26,923,042)—99.3% | 28,795,409 | |||||||
|
| |||||||
| Other assets less liabilities—0.7% | 205,780 | |||||||
|
| |||||||
| Net Assets—100.0% | $29,001,189 | |||||||
|
| |||||||
Notes to Schedule of Investments:
(a) Affiliated fund.
(b) Institutional Class share.
(c) Class I share.
(d) Advisor Class share.
(e) Non-income producing.
(f) Administrator Class share.
(g) Class R6 share.
Glossary:
MSCI—Morgan Stanley Capital International
TIPS—Treasury Inflation Protected Securities
AllianzGI Retirement 2020 Fund
| Shares | Value | |||||||
| Mutual Funds—84.6% | ||||||||
AllianzGI Behavioral Advantage Large Cap (a)(b) | 51,589 | $1,234,531 | ||||||
AllianzGI Best Styles Global Equity (a)(e)(g) | 125,267 | 2,006,781 | ||||||
AllianzGI Global Managed Volatility (a)(b) | 41,648 | 753,828 | ||||||
AllianzGI Global Natural Resources (a)(b) | 24,689 | 502,676 | ||||||
AllianzGI Income & Growth (a)(b) | 114,917 | 1,504,268 | ||||||
AllianzGI International Managed Volatility (a)(b) | 33,366 | 501,156 | ||||||
AllianzGI International Small-Cap (a)(b) | 11,763 | 473,703 | ||||||
AllianzGI NFJ Dividend Value (a)(b) | 59,892 | 1,003,794 | ||||||
AllianzGI NFJ Global Dividend Value (a)(b) | 33,979 | 748,557 | ||||||
AllianzGI NFJ International Small-Cap Value (a)(b) | 13,350 | 300,905 | ||||||
AllianzGI NFJ International Value (a)(b) | 56,054 | 1,349,775 | ||||||
AllianzGI NFJ Mid-Cap Value (a)(b) | 38,350 | 1,006,301 | ||||||
AllianzGI Short Duration High Income (a)(b) | 172,569 | 2,750,748 | ||||||
AllianzGI U.S. Managed Volatility (a)(b) | 115,170 | 1,760,944 | ||||||
PIMCO CommoditiesPLUS® Strategy (a)(b) | 91,454 | 1,040,741 | ||||||
PIMCO Commodity RealReturn Strategy (a)(b) | 174,245 | 1,041,982 | ||||||
PIMCO Floating Income (a)(b) | 281,332 | 2,515,105 | ||||||
PIMCO Foreign Bond (U.S. Dollar-Hedged) (a)(b) | 138,961 | 1,502,173 | ||||||
PIMCO Income (a)(b) | 357,025 | 4,530,641 | ||||||
PIMCO International StocksPLUS® AR Strategy (U.S. Dollar-Hedged) (a)(b) | 150,995 | 1,251,747 | ||||||
PIMCO Mortgage Opportunities (a)(b) | 157,596 | 1,757,192 | ||||||
PIMCO Real Return (a)(b) | 388,295 | 4,500,335 | ||||||
PIMCO Senior Floating Rate (a)(b) | 269,353 | 2,755,484 | ||||||
PIMCO Short-Term (a)(b) | 277,981 | 2,749,227 | ||||||
Templeton Frontier Markets (d) | 47,472 | 914,314 | ||||||
Voya Global Real Estate (c) | 37,477 | 752,155 | ||||||
Wells Fargo Advantage Short-Term High Yield Bond (f) | 151,798 | 1,252,335 | ||||||
|
| |||||||
| Total Mutual Funds (cost—$39,853,957) | 42,461,398 | |||||||
|
| |||||||
| Exchange-Traded Funds—14.6% | ||||||||
iShares Core S&P 500 | 5,292 | 1,025,960 | ||||||
iShares MSCI Spain Capped | 12,449 | 532,817 | ||||||
PIMCO 1-5 Year U.S. TIPS Index (a) | 107,338 | 5,747,950 | ||||||
|
| |||||||
| Total Exchange-Traded Funds (cost—$7,131,724) | 7,306,727 | |||||||
|
| |||||||
| See accompanying Notes to Financial Statements | | May 31, 2014 | | Semiannual Report | 91 |
Table of Contents
Schedule of Investments
May 31, 2014 (Unaudited)
| Principal Amount (000s) | Value | |||||||
| Repurchase Agreements—0.8% | ||||||||
State Street Bank and Trust Co., dated 5/30/14, 0.00%, due 6/2/14, proceeds $379,000; collateralized by U.S. Treasury Notes, 0.75%, due 3/31/18, valued at $389,420 including accrued interest |
| |||||||
(cost—$379,000) | $379 | $ | 379,000 | |||||
|
| |||||||
| Total Investments (cost—$47,364,681)—100.0% | 50,147,125 | |||||||
|
| |||||||
| Other assets less liabilities—0.0% | 11,534 | |||||||
|
| |||||||
| Net Assets—100.0% | $50,158,659 | |||||||
|
| |||||||
Notes to Schedule of Investments:
(a) Affiliated fund.
(b) Institutional Class share.
(c) Class I share.
(d) Advisor Class share.
(e) Non-income producing.
(f) Administrator Class share.
(g) Class R6 share.
Glossary:
MSCI—Morgan Stanley Capital International
TIPS—Treasury Inflation Protected Securities
AllianzGI Retirement 2025 Fund
| Shares | Value | |||||||
| Mutual Funds—87.3% | ||||||||
AllianzGI Behavioral Advantage Large Cap (a)(b) | 84,969 | $2,033,305 | ||||||
AllianzGI Best Styles Global Equity (a)(e)(g) | 162,887 | 2,609,450 | ||||||
AllianzGI Global Managed Volatility (a)(b) | 70,029 | 1,267,530 | ||||||
AllianzGI Global Natural Resources (a)(b) | 42,759 | 870,578 | ||||||
AllianzGI Income & Growth (a)(b) | 132,369 | 1,732,715 | ||||||
AllianzGI International Managed Volatility (a)(b) | 38,345 | 575,946 | ||||||
AllianzGI International | 21,528 | 866,919 | ||||||
AllianzGI NFJ Dividend Value (a)(b) | 68,521 | 1,148,404 | ||||||
AllianzGI NFJ Global | 46,871 | 1,032,566 | ||||||
AllianzGI NFJ International Small-Cap Value (a)(b) | 20,518 | 462,475 | ||||||
AllianzGI NFJ International Value (a)(b) | 71,044 | 1,710,738 | ||||||
AllianzGI NFJ Mid-Cap Value (a)(b) | 44,557 | 1,169,175 | ||||||
AllianzGI Short Duration | 196,776 | 3,136,614 | ||||||
AllianzGI U.S. Managed Volatility (a)(b) | 150,737 | 2,304,768 | ||||||
PIMCO CommoditiesPLUS® Strategy (a)(b) | 108,991 | 1,240,323 | ||||||
PIMCO Commodity RealReturn | 206,163 | 1,232,856 | ||||||
PIMCO Floating Income (a)(b) | 321,318 | 2,872,587 | ||||||
PIMCO Foreign Bond (U.S. Dollar-Hedged) (a)(b) | 158,516 | 1,713,555 | ||||||
PIMCO Income (a)(b) | 385,260 | 4,888,949 | ||||||
PIMCO International StocksPLUS® AR Strategy (U.S. Dollar-Hedged) | 209,478 | 1,736,571 | ||||||
PIMCO Mortgage Opportunities (a)(b) | 179,943 | 2,006,366 | ||||||
PIMCO Real Return (a)(b) | 398,824 | 4,622,373 | ||||||
PIMCO Senior Floating Rate (a)(b) | 306,962 | 3,140,217 | ||||||
PIMCO Short-Term (a)(b) | 286,263 | 2,831,141 | ||||||
Templeton Frontier Markets (d) | 55,207 | 1,063,282 | ||||||
Voya Global Real Estate (c) | 44,231 | 887,714 | ||||||
Wells Fargo Advantage Short-Term High Yield Bond (f) | 139,363 | 1,149,742 | ||||||
|
| |||||||
| Total Mutual Funds (cost—$47,522,362) | 50,306,859 | |||||||
|
| |||||||
| Exchange-Traded Funds—11.7% | ||||||||
iShares Core S&P 500 | 6,045 | 1,171,944 | ||||||
iShares MSCI Spain Capped | 24,396 | 1,044,149 | ||||||
PIMCO 1-5 Year U.S. TIPS Index (a) | 85,170 | 4,560,853 | ||||||
|
| |||||||
| Total Exchange-Traded Funds (cost—$6,552,390) | 6,776,946 | |||||||
|
| |||||||
| Principal Amount (000s) | Value | |||||||
| Repurchase Agreements—1.0% | ||||||||
State Street Bank and Trust Co., dated 5/30/14, 0.00%, due 6/2/14, proceeds $553,000; collateralized by U.S. Treasury Notes, 0.75%, due 3/31/18, valued at $566,877 including accrued interest |
| |||||||
(cost—$553,000) | $553 | $ | 553,000 | |||||
|
| |||||||
| Total Investments (cost—$54,627,752)—100.0% | 57,636,805 | |||||||
|
| |||||||
| Other assets less liabilities—0.0% | 3,706 | |||||||
|
| |||||||
| Net Assets—100.0% | $57,640,511 | |||||||
|
| |||||||
Notes to Schedule of Investments:
(a) Affiliated fund.
(b) Institutional Class share.
(c) Class I share.
(d) Advisor Class share.
(e) Non-income producing.
(f) Administrator Class share.
(g) Class R6 share.
Glossary:
MSCI—Morgan Stanley Capital International
TIPS—Treasury Inflation Protected Securities
| 92 | Semiannual Report | | May 31, 2014 | | See accompanying Notes to Financial Statements |
Table of Contents
Schedule of Investments
May 31, 2014 (Unaudited)
AllianzGI Retirement 2030 Fund
| Shares | Value | |||||||
| Mutual Funds—89.9% | ||||||||
AllianzGI Behavioral Advantage Large Cap (a)(b) | 89,221 | $2,135,066 | ||||||
AllianzGI Best Styles Global Equity (a)(e)(g) | 206,523 | 3,308,501 | ||||||
AllianzGI Emerging Markets Opportunities (a)(b) | 22,548 | 592,329 | ||||||
AllianzGI Global Managed Volatility (a)(b) | 83,038 | 1,502,980 | ||||||
AllianzGI Global Natural Resources (a)(b) | 44,402 | 904,024 | ||||||
AllianzGI Income & Growth (a)(b) | 183,490 | 2,401,885 | ||||||
AllianzGI International Managed Volatility (a)(b) | 111,680 | 1,677,428 | ||||||
AllianzGI International | 29,793 | 1,199,762 | ||||||
AllianzGI NFJ Dividend Value (a)(b) | 78,829 | 1,321,171 | ||||||
AllianzGI NFJ Global | 54,048 | 1,190,681 | ||||||
AllianzGI NFJ International Small-Cap Value (a)(b) | 26,626 | 600,139 | ||||||
AllianzGI NFJ International Value (a)(b) | 74,206 | 1,786,872 | ||||||
AllianzGI NFJ Mid-Cap Value (a)(b) | 57,429 | 1,506,944 | ||||||
AllianzGI Short Duration | 205,863 | 3,281,462 | ||||||
AllianzGI U.S. Managed Volatility (a)(b) | 157,534 | 2,408,699 | ||||||
AllianzGI U.S. Small-Cap Growth (a)(b) | 33,613 | 602,340 | ||||||
PIMCO CommoditiesPLUS® Strategy (a)(b) | 129,194 | 1,470,233 | ||||||
PIMCO Commodity RealReturn Strategy | 245,828 | 1,470,052 | ||||||
PIMCO Floating Income (a)(b) | 336,042 | 3,004,215 | ||||||
PIMCO Foreign Bond (U.S. Dollar-Hedged) (a)(b) | 138,523 | 1,497,431 | ||||||
PIMCO Income (a)(b) | 402,247 | 5,104,510 | ||||||
PIMCO International StocksPLUS® AR Strategy (U.S. Dollar-Hedged) (a)(b) | 254,367 | 2,108,702 | ||||||
PIMCO Mortgage Opportunities (a)(b) | 161,160 | 1,796,938 | ||||||
PIMCO Real Return (a)(b) | 154,329 | 1,788,672 | ||||||
PIMCO Senior Floating Rate (a)(b) | 321,315 | 3,287,048 | ||||||
PIMCO Short-Term (a)(b) | 271,319 | 2,683,346 | ||||||
Templeton Frontier Markets (d) | 63,392 | 1,220,934 | ||||||
Voya Global Real Estate (c) | 60,046 | 1,205,120 | ||||||
Wells Fargo Advantage Short-Term High Yield Bond (f) | 108,650 | 896,360 | ||||||
|
| |||||||
Total Mutual Funds (cost—$50,044,785) | 53,953,844 | |||||||
|
| |||||||
| Exchange-Traded Funds—9.3% | ||||||||
iShares Core S&P 500 | 6,072 | 1,177,179 | ||||||
iShares MSCI Spain Capped | 25,730 | 1,101,244 | ||||||
PIMCO 1-5 Year U.S. TIPS Index (a) | 61,290 | 3,282,079 | ||||||
|
| |||||||
Total Exchange-Traded (cost—$5,343,193) |
| 5,560,502 | ||||||
|
| |||||||
| Principal Amount (000s) | Value | |||||||
| Repurchase Agreements—0.8% | ||||||||
State Street Bank and Trust Co., dated 5/30/14, 0.00%, due 6/2/14, proceeds $490,000; collateralized by U.S. Treasury Notes, 0.75%, due 3/31/18, valued at $502,795 including accrued interest |
| |||||||
(cost—$490,000) | $490 | $ | 490,000 | |||||
|
| |||||||
| Total Investments (cost—$55,877,978)—100.0% | 60,004,346 | |||||||
|
| |||||||
| Liabilities in excess of other assets—(0.0)% | (17,999 | ) | ||||||
|
| |||||||
| Net Assets—100.0% | $59,986,347 | |||||||
|
| |||||||
Notes to Schedule of Investments:
(a) Affiliated fund.
(b) Institutional Class share.
(c) Class I share.
(d) Advisor Class share.
(e) Non-income producing.
(f) Administrator Class share.
(g) Class R6 share.
Glossary:
MSCI—Morgan Stanley Capital International
TIPS—Treasury Inflation Protected Securities
AllianzGI Retirement 2035 Fund
| Shares | Value | |||||||
| Mutual Funds—90.7% | ||||||||
AllianzGI Behavioral Advantage Large Cap (a)(b) | 87,962 | $2,104,930 | ||||||
AllianzGI Best Styles Global Equity (a)(e)(g) | 235,708 | 3,776,046 | ||||||
AllianzGI Emerging Markets Opportunities (a)(b) | 19,133 | 502,612 | ||||||
AllianzGI Global Managed Volatility (a)(b) | 68,770 | 1,244,739 | ||||||
AllianzGI Global Natural Resources (a)(b) | 36,869 | 750,648 | ||||||
AllianzGI Income & Growth (a)(b) | 151,897 | 1,988,328 | ||||||
AllianzGI International Managed Volatility (a)(b) | 110,684 | 1,662,479 | ||||||
AllianzGI International Small-Cap (a)(b) | 30,600 | 1,232,253 | ||||||
AllianzGI NFJ Dividend Value (a)(b) | 95,322 | 1,597,591 | ||||||
AllianzGI NFJ Global Dividend Value (a)(b) | 90,906 | 2,002,661 | ||||||
AllianzGI NFJ International Small-Cap Value (a)(b) | 26,526 | 597,887 | ||||||
AllianzGI NFJ International Value (a)(b) | 62,307 | 1,500,342 | ||||||
AllianzGI NFJ Mid-Cap Value (a)(b) | 57,059 | 1,497,220 | ||||||
AllianzGI Short Duration High Income (a)(b) | 152,957 | 2,438,130 | ||||||
AllianzGI U.S. Managed Volatility (a)(b) | 145,889 | 2,230,638 | ||||||
AllianzGI U.S. Small-Cap Growth (a)(b) | 35,200 | 630,775 | ||||||
PIMCO CommoditiesPLUS® Strategy (a)(b) | 119,838 | 1,363,759 | ||||||
PIMCO Commodity RealReturn Strategy (a)(b) | 222,818 | 1,332,454 | ||||||
PIMCO Floating Income (a)(b) | 277,608 | 2,481,817 | ||||||
PIMCO Income (a)(b) | 273,458 | 3,470,183 | ||||||
PIMCO International StocksPLUS® AR Strategy (U.S. Dollar-Hedged) (a)(b) | 243,455 | 2,018,239 | ||||||
PIMCO Mortgage Opportunities (a)(b) | 133,000 | 1,482,944 | ||||||
PIMCO Real Return (a)(b) | 86,227 | 999,367 | ||||||
PIMCO Senior Floating Rate (a)(b) | 238,459 | 2,439,436 | ||||||
PIMCO Short-Term (a)(b) | 124,211 | 1,228,443 | ||||||
Templeton Frontier Markets (d) | 52,280 | 1,006,915 | ||||||
Voya Global Real Estate (c) | 50,566 | 1,014,865 | ||||||
Wells Fargo Advantage Short-Term High Yield Bond (f) | 59,077 | 487,388 | ||||||
|
| |||||||
| Total Mutual Funds (cost—$41,981,214) | 45,083,089 | |||||||
|
| |||||||
| Exchange-Traded Funds—8.5% | ||||||||
iShares Core S&P 500 | 6,457 | 1,251,819 | ||||||
iShares MSCI Spain Capped | 22,878 | 979,178 | ||||||
PIMCO 1-5 Year U.S. TIPS Index (a) | 36,736 | 1,967,213 | ||||||
|
| |||||||
| Total Exchange-Traded Funds (cost—$3,992,967) | 4,198,210 | |||||||
|
| |||||||
| See accompanying Notes to Financial Statements | | May 31, 2014 | | Semiannual Report | 93 |
Table of Contents
Schedule of Investments
May 31, 2014 (Unaudited)
| Principal Amount (000s) | Value | |||||||
| Repurchase Agreements—0.8% | ||||||||
State Street Bank and Trust Co., dated 5/30/14, 0.00%, due 6/2/14, proceeds $403,000; collateralized by U.S. Treasury Notes, 0.75%, due 3/31/18, valued at $414,067 including accrued interest |
| |||||||
(cost—$403,000) | $403 | $ | 403,000 | |||||
|
| |||||||
| Total Investments (cost—$46,377,181)—100.0% | 49,684,299 | |||||||
|
| |||||||
| Other assets less liabilities—0.0% | 4,619 | |||||||
|
| |||||||
| Net Assets—100.0% | $49,688,918 | |||||||
|
| |||||||
Notes to Schedule of Investments:
(a) Affiliated fund.
(b) Institutional Class share.
(c) Class I share.
(d) Advisor Class share.
(e) Non-income producing.
(f) Administrator Class share.
(g) Class R6 share.
Glossary:
MSCI—Morgan Stanley Capital International
TIPS—Treasury Inflation Protected Securities
AllianzGI Retirement 2040 Fund
| Shares | Value | |||||||
| Mutual Funds—90.9% | ||||||||
AllianzGI Behavioral Advantage Large Cap (a)(b) | 91,320 | $2,185,287 | ||||||
AllianzGI Best Styles Global Equity (a)(e)(f) | 213,423 | 3,419,029 | ||||||
AllianzGI Emerging Markets Opportunities (a)(b) | 24,225 | 636,387 | ||||||
AllianzGI Global Managed Volatility (a)(b) | 58,587 | 1,060,421 | ||||||
AllianzGI Global Natural Resources (a)(b) | 31,546 | 642,276 | ||||||
AllianzGI Income & Growth (a)(b) | 145,575 | 1,905,578 | ||||||
AllianzGI International Managed Volatility (a)(b) | 98,353 | 1,477,260 | ||||||
AllianzGI International Small-Cap (a)(b) | 35,299 | 1,421,501 | ||||||
AllianzGI NFJ Dividend Value (a)(b) | 81,054 | 1,358,471 | ||||||
AllianzGI NFJ Global Dividend Value (a)(b) | 86,004 | 1,894,660 | ||||||
AllianzGI NFJ International Small-Cap Value (a)(b) | 37,974 | 855,927 | ||||||
AllianzGI NFJ International Value (a)(b) | 69,961 | 1,684,657 | ||||||
AllianzGI NFJ Mid-Cap Value (a)(b) | 56,868 | 1,492,226 | ||||||
AllianzGI Short Duration High Income (a)(b) | 130,738 | 2,083,970 | ||||||
AllianzGI U.S. Managed Volatility (a)(b) | 138,625 | 2,119,571 | ||||||
AllianzGI U.S. Small-Cap Growth (a)(b) | 36,234 | 649,318 | ||||||
PIMCO CommoditiesPLUS® Strategy (a)(b) | 119,921 | 1,364,704 | ||||||
PIMCO Commodity RealReturn Strategy (a)(b) | 227,522 | 1,360,584 | ||||||
PIMCO Floating Income (a)(b) | 235,378 | 2,104,283 | ||||||
PIMCO Income (a)(b) | 182,144 | 2,311,411 | ||||||
PIMCO International StocksPLUS® AR Strategy (U.S. Dollar-Hedged) (a)(b) | 269,055 | 2,230,465 | ||||||
PIMCO Mortgage Opportunities (a)(b) | 56,361 | 628,425 | ||||||
PIMCO Senior Floating Rate (a)(b) | 122,486 | 1,253,029 | ||||||
PIMCO Short-Term (a)(b) | 63,186 | 624,912 | ||||||
Templeton Frontier Markets (d) | 49,466 | 952,721 | ||||||
Voya Global Real Estate (c) | 42,235 | 847,650 | ||||||
|
| |||||||
Total Mutual Funds (cost—$34,990,067) | 38,564,723 | |||||||
|
| |||||||
| Exchange-Traded Funds—8.2% | ||||||||
iShares Core S&P 500 | 7,018 | 1,360,580 | ||||||
iShares MSCI Spain Capped | 20,034 | 857,455 | ||||||
PIMCO 1-5 Year U.S. TIPS Index (a) | 23,524 | 1,259,710 | ||||||
|
| |||||||
Total Exchange-Traded Funds (cost—$3,269,977) |
| 3,477,745 | ||||||
|
| |||||||
| Principal Amount (000s) | Value | |||||||
| Repurchase Agreements—0.9% | ||||||||
State Street Bank and Trust Co., dated 5/30/14, 0.00%, due 6/2/14, proceeds $395,000; collateralized by U.S. Treasury Notes, 0.75%, due 3/31/18, valued at $404,208 including accrued interest |
| |||||||
(cost—$395,000) | $395 | $ | 395,000 | |||||
|
| |||||||
| Total Investments (cost—$38,655,044)—100.0% | 42,437,468 | |||||||
|
| |||||||
| Other assets less liabilities—0.0% | 7,754 | |||||||
|
| |||||||
| Net Assets—100.0% | $42,445,222 | |||||||
|
| |||||||
Notes to Schedule of Investments:
(a) Affiliated fund.
(b) Institutional Class share.
(c) Class I share.
(d) Advisor Class share.
(e) Non-income producing.
(f) Class R6 share.
Glossary:
MSCI—Morgan Stanley Capital International
TIPS—Treasury Inflation Protected Securities
| 94 | Semiannual Report | | May 31, 2014 | | See accompanying Notes to Financial Statements |
Table of Contents
Schedule of Investments
May 31, 2014 (Unaudited)
AllianzGI Retirement 2045 Fund
| Shares | Value | |||||||
| Mutual Funds—93.7% | ||||||||
AllianzGI Behavioral Advantage Large Cap (a)(b) | 51,832 | $1,240,344 | ||||||
AllianzGI Best Styles Global Equity (a)(e)(f) | 147,515 | 2,363,189 | ||||||
AllianzGI Emerging Markets Opportunities (a)(b) | 14,277 | 375,059 | ||||||
AllianzGI Global Managed Volatility (a)(b) | 41,040 | 742,827 | ||||||
AllianzGI Global Natural Resources (a)(b) | 24,457 | 497,951 | ||||||
AllianzGI Income & Growth (a)(b) | 85,075 | 1,113,627 | ||||||
AllianzGI International Managed Volatility (a)(b) | 57,716 | 866,890 | ||||||
AllianzGI International Small-Cap (a)(b) | 24,490 | 986,205 | ||||||
AllianzGI NFJ Dividend Value (a)(b) | 61,583 | 1,032,138 | ||||||
AllianzGI NFJ Global Dividend Value (a)(b) | 53,622 | 1,181,294 | ||||||
AllianzGI NFJ International Small-Cap Value (a)(b) | 21,990 | 495,658 | ||||||
AllianzGI NFJ International Value (a)(b) | 50,889 | 1,225,403 | ||||||
AllianzGI NFJ Mid-Cap Value (a)(b) | 42,397 | 1,112,491 | ||||||
AllianzGI Short Duration High Income (a)(b) | 77,061 | 1,228,349 | ||||||
AllianzGI U.S. Managed Volatility (a)(b) | 80,616 | 1,232,614 | ||||||
AllianzGI U.S. Small-Cap Growth (a)(b) | 25,201 | 451,598 | ||||||
PIMCO CommoditiesPLUS® Strategy (a)(b) | 72,718 | 827,531 | ||||||
PIMCO Commodity RealReturn Strategy (a)(b) | 137,689 | 823,378 | ||||||
PIMCO Floating Income (a)(b) | 124,358 | 1,111,758 | ||||||
PIMCO Income (a)(b) | 78,178 | 992,078 | ||||||
PIMCO International StocksPLUS® AR Strategy (U.S. Dollar-Hedged) (a)(b) | 170,205 | 1,411,001 | ||||||
PIMCO Senior Floating Rate (a)(b) | 48,039 | 491,440 | ||||||
PIMCO Short-Term (a)(b) | 37,117 | 367,085 | ||||||
Templeton Frontier Markets (d) | 28,603 | 550,893 | ||||||
Voya Global Real Estate (c) | 25,148 | 504,711 | ||||||
|
| |||||||
Total Mutual Funds (cost—$21,189,849) | 23,225,512 | |||||||
|
| |||||||
| Exchange-Traded Funds—5.2% | ||||||||
iShares Core S&P 500 | 4,160 | 806,499 | ||||||
iShares MSCI Spain Capped | 11,596 | 496,309 | ||||||
|
| |||||||
Total Exchange-Traded Funds (cost—$1,186,594) |
| 1,302,808 | ||||||
|
| |||||||
| Principal Amount (000s) | Value | |||||||
| Repurchase Agreements—1.1% | ||||||||
State Street Bank and Trust Co., dated 5/30/14, 0.00%, due 6/2/14, proceeds $264,000; collateralized by U.S. Treasury Notes, 0.75%, due 3/31/18, valued at $271,115 including accrued interest |
| |||||||
(cost—$264,000) | $264 | $ | 264,000 | |||||
|
| |||||||
| Total Investments (cost—$22,640,443)—100.0% | 24,792,320 | |||||||
|
| |||||||
| Other assets less liabilities—0.0% | 3,838 | |||||||
|
| |||||||
| Net Assets—100.0% | $24,796,158 | |||||||
|
| |||||||
Notes to Schedule of Investments:
(a) Affiliated fund.
(b) Institutional Class share.
(c) Class I share.
(d) Advisor Class share.
(e) Non-income producing.
(f) Class R6 share.
Glossary:
MSCI—Morgan Stanley Capital International
AllianzGI Retirement 2050 Fund
| Shares | Value | |||||||
| Mutual Funds—93.9% | ||||||||
AllianzGI Behavioral Advantage Large Cap (a)(b) | 46,798 | $1,119,873 | ||||||
AllianzGI Best Styles Global Equity (a)(e)(f) | 125,448 | 2,009,676 | ||||||
AllianzGI Emerging Markets Opportunities (a)(b) | 15,428 | 405,291 | ||||||
AllianzGI Global Managed Volatility (a)(b) | 33,098 | 599,078 | ||||||
AllianzGI Global Natural Resources (a)(b) | 21,575 | 439,274 | ||||||
AllianzGI Income & Growth (a)(b) | 76,378 | 999,787 | ||||||
AllianzGI International Managed Volatility (a)(b) | 46,629 | 700,363 | ||||||
AllianzGI International Small-Cap (a)(b) | 19,997 | 805,283 | ||||||
AllianzGI NFJ Dividend Value (a)(b) | 49,782 | 834,341 | ||||||
AllianzGI NFJ Global Dividend Value (a)(b) | 45,118 | 993,944 | ||||||
AllianzGI NFJ International Small-Cap Value (a)(b) | 18,560 | 418,339 | ||||||
AllianzGI NFJ International Value (a)(b) | 45,327 | 1,091,466 | ||||||
AllianzGI NFJ Mid-Cap Value (a)(b) | 38,064 | 998,807 | ||||||
AllianzGI Short Duration High Income (a)(b) | 49,687 | 792,012 | ||||||
AllianzGI U.S. Managed Volatility (a)(b) | 68,938 | 1,054,069 | ||||||
AllianzGI U.S. Small-Cap Growth (a)(b) | 22,417 | 401,706 | ||||||
PIMCO CommoditiesPLUS® Strategy (a)(b) | 60,697 | 690,730 | ||||||
PIMCO Commodity RealReturn Strategy (a)(b) | 114,562 | 685,083 | ||||||
PIMCO Floating Income (a)(b) | 88,996 | 795,624 | ||||||
PIMCO Income (a)(b) | 55,114 | 699,395 | ||||||
PIMCO International StocksPLUS® AR Strategy (U.S. Dollar-Hedged) (a)(b) | 145,194 | 1,203,658 | ||||||
PIMCO Short-Term (a)(b) | 19,960 | 197,409 | ||||||
Templeton Frontier Markets (d) | 26,405 | 508,562 | ||||||
Voya Global Real Estate (c) | 20,011 | 401,616 | ||||||
|
| |||||||
Total Mutual Funds (cost—$16,590,970) | 18,845,386 | |||||||
|
| |||||||
| Exchange-Traded Funds—4.9% | ||||||||
iShares Core S&P 500 | 3,008 | 583,161 | ||||||
iShares MSCI Spain Capped | 9,135 | 390,978 | ||||||
|
| |||||||
Total Exchange-Traded Funds (cost—$882,677) |
| 974,139 | ||||||
|
| |||||||
| See accompanying Notes to Financial Statements | | May 31, 2014 | | Semiannual Report | 95 |
Table of Contents
Schedule of Investments
May 31, 2014 (Unaudited)
| Principal Amount (000s) | Value | |||||||
| Repurchase Agreements—1.2% | ||||||||
State Street Bank and Trust Co., dated 5/30/14, 0.00%, due 6/2/14, proceeds $239,000; collateralized by U.S. Treasury Notes, 0.75%, due 3/31/18, valued at $246,468 including accrued interest |
| |||||||
(cost—$239,000) | $239 | $ | 239,000 | |||||
|
| |||||||
| Total Investments (cost—$17,712,647)—100.0% | 20,058,525 | |||||||
|
| |||||||
| Other assets less liabilities—0.0% | 8,059 | |||||||
|
| |||||||
| Net Assets—100.0% | $20,066,584 | |||||||
|
| |||||||
Notes to Schedule of Investments:
(a) Affiliated fund.
(b) Institutional Class share.
(c) Class I share.
(d) Advisor Class share.
(e) Non-income producing.
(f) Class R6 share.
Glossary:
MSCI—Morgan Stanley Capital International
AllianzGI Retirement 2055 Fund
| Shares | Value | |||||||
| Mutual Funds—94.1% | ||||||||
AllianzGI Behavioral Advantage Large Cap (a)(b) | 15,902 | $380,535 | ||||||
AllianzGI Best Styles Global Equity (a)(e)(f) | 42,064 | 673,872 | ||||||
AllianzGI Emerging Markets Opportunities (a)(b) | 5,094 | 133,807 | ||||||
AllianzGI Global Managed Volatility (a)(b) | 11,087 | 200,680 | ||||||
AllianzGI Global Natural Resources (a)(b) | 7,283 | 148,291 | ||||||
AllianzGI Income & Growth (a)(b) | 25,571 | 334,730 | ||||||
AllianzGI International Managed Volatility (a)(b) | 15,544 | 233,469 | ||||||
AllianzGI International Small-Cap (a)(b) | 6,983 | 281,198 | ||||||
AllianzGI NFJ Dividend Value (a)(b) | 16,740 | 280,559 | ||||||
AllianzGI NFJ Global Dividend Value (a)(b) | 15,070 | 332,002 | ||||||
AllianzGI NFJ International Small-Cap Value (a)(b) | 6,299 | 141,970 | ||||||
AllianzGI NFJ International Value (a)(b) | 15,127 | 364,263 | ||||||
AllianzGI NFJ Mid-Cap Value (a)(b) | 12,809 | 336,106 | ||||||
AllianzGI Short Duration High Income (a)(b) | 16,596 | 264,547 | ||||||
AllianzGI U.S. Managed Volatility (a)(b) | 23,180 | 354,419 | ||||||
AllianzGI U.S. Small-Cap Growth (a)(b) | 7,559 | 135,463 | ||||||
PIMCO CommoditiesPLUS® Strategy (a)(b) | 20,169 | 229,521 | ||||||
PIMCO Commodity RealReturn Strategy (a)(b) | 38,267 | 228,838 | ||||||
PIMCO Floating Income (a)(b) | 29,794 | 266,357 | ||||||
PIMCO Income (a)(b) | 18,380 | 233,245 | ||||||
PIMCO International StocksPLUS® AR Strategy (U.S. Dollar-Hedged) (a)(b) | 48,859 | 405,041 | ||||||
PIMCO Short-Term (a)(b) | 6,680 | 66,066 | ||||||
Templeton Frontier Markets (d) | 8,872 | 170,875 | ||||||
Voya Global Real Estate (c) | 6,664 | 133,737 | ||||||
|
| |||||||
Total Mutual Funds (cost—$5,513,380) | 6,329,591 | |||||||
|
| |||||||
| Exchange-Traded Funds—4.8% | ||||||||
iShares Core S&P 500 | 998 | 193,482 | ||||||
iShares MSCI Spain Capped | 3,030 | 129,684 | ||||||
|
| |||||||
Total Exchange-Traded Funds (cost—$293,460) |
| 323,166 | ||||||
|
| |||||||
| Total Investments (cost—$5,806,840)—98.9% | 6,652,757 | |||||||
|
| |||||||
| Other assets less liabilities—1.1% | 75,834 | |||||||
|
| |||||||
| Net Assets—100.0% | $6,728,591 | |||||||
|
| |||||||
Notes to Schedule of Investments:
(a) Affiliated fund.
(b) Institutional Class share.
(c) Class I share.
(d) Advisor Class share.
(e) Non-income producing.
(f) Class R6 share.
Glossary:
MSCI—Morgan Stanley Capital International
| 96 | Semiannual Report | | May 31, 2014 | | See accompanying Notes to Financial Statements |
Table of Contents
Schedule of Investments
May 31, 2014 (Unaudited)
AllianzGI Retirement Income Fund
| Shares | Value | |||||||
| Mutual Funds—82.9% | ||||||||
AllianzGI Behavioral Advantage Large Cap (a)(b) | 22,712 | $543,507 | ||||||
AllianzGI Best Styles Global Equity (a)(e)(g) | 58,238 | 932,965 | ||||||
AllianzGI Global Managed Volatility (a)(b) | 17,048 | 308,569 | ||||||
AllianzGI Global Natural Resources (a)(b) | 7,650 | 155,745 | �� | |||||
AllianzGI Income & Growth (a)(b) | 70,619 | 924,407 | ||||||
AllianzGI International Managed Volatility (a)(b) | 20,478 | 307,581 | ||||||
AllianzGI International Small-Cap (a)(b) | 6,890 | 277,464 | ||||||
AllianzGI NFJ Dividend Value (a)(b) | 27,648 | 463,381 | ||||||
AllianzGI NFJ Global Dividend Value (a)(b) | 13,907 | 306,372 | ||||||
AllianzGI NFJ International Small-Cap Value (a)(b) | 6,908 | 155,716 | ||||||
AllianzGI NFJ International Value (a)(b) | 25,453 | 612,904 | ||||||
AllianzGI NFJ Mid-Cap Value (a)(b) | 17,735 | 465,365 | ||||||
AllianzGI Short Duration High Income (a)(b) | 104,646 | 1,668,056 | ||||||
AllianzGI U.S. Managed Volatility (a)(b) | 50,437 | 771,179 | ||||||
PIMCO CommoditiesPLUS® Strategy (a)(b) | 39,664 | 451,372 | ||||||
PIMCO Commodity RealReturn Strategy (a)(b) | 75,254 | 450,017 | ||||||
PIMCO Floating Income (a)(b) | 171,152 | 1,530,097 | ||||||
PIMCO Foreign Bond (U.S. Dollar-Hedged) (a)(b) | 84,805 | 916,741 | ||||||
PIMCO Income (a)(b) | 241,037 | 3,058,764 | ||||||
PIMCO International StocksPLUS® AR Strategy (U.S. Dollar-Hedged) (a)(b) | 94,103 | 780,110 | ||||||
PIMCO Mortgage Opportunities (a)(b) | 109,279 | 1,218,460 | ||||||
PIMCO Real Return (a)(b) | 232,331 | 2,692,711 | ||||||
PIMCO Senior Floating Rate (a)(b) | 163,404 | 1,671,623 | ||||||
PIMCO Short-Term (a)(b) | 306,626 | 3,032,535 | ||||||
Templeton Frontier Markets (d) | 17,998 | 346,632 | ||||||
Voya Global Real Estate (c) | 23,067 | 462,963 | ||||||
Wells Fargo Advantage Short-Term High Yield Bond (f) | 110,507 | 911,686 | ||||||
|
| |||||||
| Total Mutual Funds (cost—$23,578,645) | 25,416,922 | |||||||
|
| |||||||
| Exchange-Traded Funds—16.2% | ||||||||
iShares Core S&P 500 | 3,603 | 698,514 | ||||||
iShares MSCI Spain Capped | 5,934 | 253,975 | ||||||
PIMCO 1-5 Year U.S. TIPS Index (a) | 74,677 | 3,998,953 | ||||||
|
| |||||||
| Total Exchange-Traded Funds (cost—$4,835,960) | 4,951,442 | |||||||
|
| |||||||
| Principal Amount (000s) | Value | |||||||
| Repurchase Agreements—0.9% | ||||||||
State Street Bank and Trust Co., dated 5/30/14, 0.00%, due 6/2/14, proceeds $282,000; collateralized by U.S. Treasury Notes, 0.75%, due 3/31/18, valued at $290,832 including accrued interest |
| |||||||
(cost—$282,000) | $282 | $ | 282,000 | |||||
|
| |||||||
| Total Investments (cost—$28,696,605)—100.0% | 30,650,364 | |||||||
|
| |||||||
| Other assets less liabilities—0.0% | 1,141 | |||||||
|
| |||||||
| Net Assets—100.0% | $30,651,505 | |||||||
|
| |||||||
Notes to Schedule of Investments:
(a) Affiliated fund.
(b) Institutional Class share.
(c) Class I share.
(d) Advisor Class share.
(e) Non-income producing.
(f) Administrator Class share.
(g) Class R6 share.
Glossary:
MSCI—Morgan Stanley Capital International
TIPS—Treasury Inflation Protected Securities
AllianzGI Global Allocation Fund
| Shares | Value | |||||||
| Mutual Funds—95.4% | ||||||||
AllianzGI | 364,044 | $8,711,571 | ||||||
AllianzGI | 546,186 | 8,749,900 | ||||||
AllianzGI | 170,450 | 4,477,712 | ||||||
AllianzGI Global Managed Volatility (a)(b) | 363,492 | 6,579,207 | ||||||
AllianzGI | 214,449 | 4,366,184 | ||||||
AllianzGI Income & | 335,656 | 4,393,737 | ||||||
AllianzGI International Managed | 577,948 | 8,680,774 | ||||||
AllianzGI | 212,932 | 8,574,773 | ||||||
AllianzGI NFJ Dividend Value (a)(b) | 628,316 | 10,530,574 | ||||||
AllianzGI NFJ | 542,793 | 11,957,740 | ||||||
AllianzGI NFJ International Small-Cap Value (a)(b) | 96,993 | 2,186,221 | ||||||
AllianzGI NFJ | 541,663 | 13,043,240 | ||||||
AllianzGI | 244,162 | 6,406,819 | ||||||
AllianzGI Short | 681,046 | 10,855,868 | ||||||
AllianzGI U.S. Managed Volatility (a)(b) | 587,151 | 8,977,544 | ||||||
AllianzGI U.S. | 60,242 | 1,079,531 | ||||||
PIMCO | 559,922 | 6,371,914 | ||||||
PIMCO Floating | 1,220,202 | 10,908,606 | ||||||
PIMCO Foreign Bond | 301,540 | 3,259,644 | ||||||
PIMCO | 1,366,666 | 17,342,995 | ||||||
PIMCO | 1,324,367 | 10,979,000 | ||||||
PIMCO Mortgage Opportunities | 587,923 | 6,555,347 | ||||||
PIMCO Senior Floating Rate (a)(b) | 743,255 | 7,603,497 | ||||||
PIMCO Short-Term | 1,545,488 | 15,284,875 | ||||||
Templeton Frontier Markets (d) | 57,888 | 1,114,925 | ||||||
Voya Global Real | 111,252 | 2,232,824 | ||||||
Wells Fargo Advantage Short-Term High | 784,252 | 6,470,077 | ||||||
|
| |||||||
| Total Mutual Funds (cost—$180,164,276) | 207,695,099 | |||||||
|
| |||||||
| Exchange-Traded Funds—4.7% | ||||||||
iShares Core S&P 500 | 23,421 | 4,540,629 | ||||||
iShares MSCI Spain Capped | 135,260 | 5,789,128 | ||||||
|
| |||||||
| Total Exchange-Traded Funds (cost—$9,247,129) | 10,329,757 | |||||||
|
| |||||||
| See accompanying Notes to Financial Statements | | May 31, 2014 | | Semiannual Report | 97 |
Table of Contents
Schedule of Investments
May 31, 2014 (Unaudited)
Principal | Value | |||||||
| Repurchase Agreements—0.3% | ||||||||
State Street Bank and Trust Co., dated 5/30/14, 0.00%, due 6/2/14, proceeds $582,000; collateralized by U.S. Treasury Notes, 0.75%, due 3/31/18, valued at $596,453 including accrued interest |
| |||||||
(cost—$582,000) | $582 | $ | 582,000 | |||||
|
| |||||||
| Total Investments (cost—$189,993,405)—100.4% | 218,606,856 | |||||||
|
| |||||||
| Liabilities in excess of other assets—(0.4)% | (872,430 | ) | ||||||
|
| |||||||
| Net Assets—100.0% | $217,734,426 | |||||||
|
| |||||||
Notes to Schedule of Investments:
(a) Affiliated fund.
(b) Institutional Class share.
(c) Class I share.
(d) Advisor Class share.
(e) Non-income producing.
(f) Administrator Class share.
(g) Class R6 share.
Glossary:
MSCI—Morgan Stanley Capital International
AllianzGI Global Growth Allocation Fund
| Shares | Value | |||||||
| Mutual Funds—95.1% | ||||||||
AllianzGI Behavioral Advantage Large Cap (a)(b) | 13,369 | $319,931 | ||||||
AllianzGI Best Styles Global Equity (a)(e)(f) | 33,027 | 529,097 | ||||||
AllianzGI Emerging Markets Opportunities (a)(b) | 5,789 | 152,086 | ||||||
AllianzGI Global Managed Volatility (a)(b) | 14,641 | 265,004 | ||||||
AllianzGI Global Natural Resources (a)(b) | 9,770 | 198,912 | ||||||
AllianzGI Income & Growth (a)(b) | 12,624 | 165,252 | ||||||
AllianzGI International Managed Volatility (a)(b) | 17,595 | 264,272 | ||||||
AllianzGI International Small-Cap (a)(b) | 6,271 | 252,547 | ||||||
AllianzGI NFJ Dividend Value (a)(b) | 7,895 | 132,327 | ||||||
AllianzGI NFJ Emerging Markets Value (a)(b) | 4,164 | 66,046 | ||||||
AllianzGI NFJ Global Dividend Value (a)(b) | 11,945 | 263,152 | ||||||
AllianzGI NFJ International Small-Cap Value (a)(b) | 11,732 | 264,448 | ||||||
AllianzGI NFJ International Value (a)(b) | 16,421 | 395,421 | ||||||
AllianzGI NFJ Mid-Cap Value (a)(b) | 11,375 | 298,480 | ||||||
AllianzGI Short Duration High Income (a)(b) | 12,409 | 197,793 | ||||||
AllianzGI U.S. Managed Volatility (a)(b) | 26,027 | 397,954 | ||||||
AllianzGI Ultra Micro Cap (a)(b) | 9,661 | 231,761 | ||||||
PIMCO CommoditiesPLUS® Strategy (a)(b) | 17,218 | 195,938 | ||||||
PIMCO Commodity RealReturn Strategy (a)(b) | 10,907 | 65,222 | ||||||
PIMCO Income (a)(b) | 18,275 | 231,908 | ||||||
PIMCO International StocksPLUS® AR Strategy (U.S. Dollar-Hedged) (a)(b) | 47,772 | 396,033 | ||||||
PIMCO Mortgage Opportunities (a)(b) | 11,839 | 132,009 | ||||||
PIMCO Short-Term (a)(b) | 49,975 | 494,253 | ||||||
Templeton Frontier Markets (d) | 10,430 | 200,885 | ||||||
Voya Global Real Estate (c) | 3,299 | 66,206 | ||||||
|
| |||||||
| Total Mutual Funds (cost—$5,143,090) | 6,176,937 | |||||||
|
| |||||||
| Exchange-Traded Funds—6.0% | ||||||||
iShares Core S&P 500 | 1,083 | 209,961 | ||||||
iShares MSCI Spain Capped | 4,172 | 178,562 | ||||||
|
| |||||||
| Total Exchange-Traded Funds (cost—$352,810) | 388,523 | |||||||
|
| |||||||
| Total Investments (cost—$5,495,900)—101.1% | 6,565,460 | |||||||
|
| |||||||
| Liabilities in excess of other assets—(1.1)% | (72,877 | ) | ||||||
|
| |||||||
| Net Assets—100.0% | $6,492,583 | |||||||
|
| |||||||
Notes to Schedule of Investments:
(a) Affiliated fund.
(b) Institutional Class share.
(c) Class I share.
(d) Advisor Class share.
(e) Non-income producing.
(f) Class R6 share.
Glossary:
MSCI—Morgan Stanley Capital International
| 98 | Semiannual Report | | May 31, 2014 | | See accompanying Notes to Financial Statements |
Table of Contents
Schedule of Investments
May 31, 2014 (Unaudited)
AllianzGI Behavioral Advantage Large Cap Fund
| Shares | Value | |||||||
| Common Stock—99.5% | ||||||||
| Aerospace & Defense—4.7% | ||||||||
Boeing Co. | 8,000 | $1,082,000 | ||||||
General Dynamics Corp. | 3,600 | 425,232 | ||||||
Hexcel Corp. (a) | 1,200 | 49,260 | ||||||
Honeywell International, Inc. | 4,200 | 391,230 | ||||||
Huntington Ingalls Industries, Inc. | 900 | 89,847 | ||||||
L-3 Communications Holdings, Inc. | 950 | 115,112 | ||||||
Lockheed Martin Corp. | 4,050 | 662,782 | ||||||
Northrop Grumman Corp. | 1,750 | 212,712 | ||||||
Precision Castparts Corp. | 400 | 101,192 | ||||||
Raytheon Co. | 2,400 | 234,168 | ||||||
United Technologies Corp. | 4,200 | 488,124 | ||||||
|
| |||||||
| 3,851,659 | ||||||||
|
| |||||||
| Air Freight & Logistics—1.5% | ||||||||
Expeditors International of Washington, Inc. | 1,400 | 63,714 | ||||||
FedEx Corp. | 1,800 | 259,488 | ||||||
United Parcel Service, Inc., Class B | 8,300 | 862,204 | ||||||
|
| |||||||
| 1,185,406 | ||||||||
|
| |||||||
| Airlines—1.3% | ||||||||
Alaska Air Group, Inc. | 1,100 | 108,306 | ||||||
Allegiant Travel Co. | 400 | 46,000 | ||||||
Delta Air Lines, Inc. | 13,350 | 532,798 | ||||||
Southwest Airlines Co. | 10,300 | 272,435 | ||||||
Spirit Airlines, Inc. (a) | 900 | 53,163 | ||||||
United Continental Holdings, Inc. (a) | 800 | 35,496 | ||||||
|
| |||||||
| 1,048,198 | ||||||||
|
| |||||||
| Auto Components—0.6% | ||||||||
BorgWarner, Inc. | 1,600 | 100,624 | ||||||
Delphi Automotive PLC | 1,300 | 89,778 | ||||||
Gentex Corp. | 2,100 | 60,732 | ||||||
Lear Corp. | 1,400 | 123,270 | ||||||
TRW Automotive Holdings Corp. (a) | 1,100 | 93,357 | ||||||
|
| |||||||
| 467,761 | ||||||||
|
| |||||||
| Automobiles—0.5% | ||||||||
Harley-Davidson, Inc. | 1,600 | 113,984 | ||||||
Tesla Motors, Inc. (a) | 1,500 | 311,655 | ||||||
|
| |||||||
| 425,639 | ||||||||
|
| |||||||
| Banks—4.2% | ||||||||
Bank of America Corp. | 41,800 | 632,852 | ||||||
Comerica, Inc. | 1,700 | 81,549 | ||||||
Cullen/Frost Bankers, Inc. | 700 | 52,402 | ||||||
East West Bancorp, Inc. | 2,000 | 66,960 | ||||||
Fifth Third Bancorp | 6,200 | 128,278 | ||||||
First Citizens BancShares, Inc., Class A | 200 | 43,956 | ||||||
Hancock Holding Co. | 1,300 | 43,914 | ||||||
JPMorgan Chase & Co. | 10,800 | 600,156 | ||||||
KeyCorp | 3,900 | 53,391 | ||||||
Regions Financial Corp. | 6,100 | 62,159 | ||||||
U.S. Bancorp | 3,350 | 141,336 | ||||||
Wells Fargo & Co. | 29,400 | 1,492,932 | ||||||
|
| |||||||
| 3,399,885 | ||||||||
|
| |||||||
| Beverages—1.1% | ||||||||
Brown-Forman Corp., Class B | 900 | 83,403 | ||||||
Coca-Cola Co. | 4,300 | 175,913 | ||||||
Coca-Cola Enterprises, Inc. | 1,600 | 73,024 | ||||||
Dr. Pepper Snapple Group, Inc. | 1,400 | 80,780 | ||||||
Molson Coors Brewing Co., Class B | 2,200 | 144,606 | ||||||
| Shares | Value | |||||||
Monster Beverage Corp. (a) | 2,000 | $ | 138,760 | |||||
PepsiCo, Inc. | 1,950 | 172,244 | ||||||
|
| |||||||
| 868,730 | ||||||||
|
| |||||||
| Biotechnology—1.9% | ||||||||
Alexion Pharmaceuticals, Inc. (a) | 1,100 | 182,952 | ||||||
Amgen, Inc. | 550 | 63,795 | ||||||
Biogen Idec, Inc. (a) | 500 | 159,685 | ||||||
Celgene Corp. (a) | 2,150 | 329,014 | ||||||
Gilead Sciences, Inc. (a) | 7,800 | 633,438 | ||||||
Myriad Genetics, Inc. (a) | 2,600 | 86,216 | ||||||
Regeneron Pharmaceuticals, Inc. (a) | 200 | 61,392 | ||||||
United Therapeutics Corp. (a) | 400 | 38,296 | ||||||
|
| |||||||
| 1,554,788 | ||||||||
|
| |||||||
| Building Products—0.1% | ||||||||
AO Smith Corp. | 900 | 44,442 | ||||||
Lennox International, Inc. | 600 | 50,952 | ||||||
|
| |||||||
| 95,394 | ||||||||
|
| |||||||
| Capital Markets—1.3% | ||||||||
Ameriprise Financial, Inc. | 1,250 | 140,762 | ||||||
Bank of New York Mellon Corp. | 5,900 | 203,904 | ||||||
Charles Schwab Corp. | 2,500 | 63,025 | ||||||
Federated Investors, Inc., Class B | 1,700 | 48,059 | ||||||
Franklin Resources, Inc. | 950 | 52,450 | ||||||
LPL Financial Holdings, Inc. | 1,600 | 75,040 | ||||||
Northern Trust Corp. | 1,300 | 78,520 | ||||||
SEI Investments Co. | 2,250 | 74,093 | ||||||
State Street Corp. | 1,500 | 97,905 | ||||||
T Rowe Price Group, Inc. | 600 | 48,918 | ||||||
TD Ameritrade Holding Corp. | 2,200 | 66,748 | ||||||
Waddell & Reed Financial, Inc., Class A | 1,400 | 84,532 | ||||||
|
| |||||||
| 1,033,956 | ||||||||
|
| |||||||
| Chemicals—2.7% | ||||||||
CF Industries Holdings, Inc. | 200 | 48,662 | ||||||
Cytec Industries, Inc. | 600 | 59,610 | ||||||
Dow Chemical Co. | 9,300 | 484,716 | ||||||
Eastman Chemical Co. | 800 | 70,608 | ||||||
EI du Pont de Nemours & Co. | 3,200 | 221,792 | ||||||
International Flavors & Fragrances, Inc. | 800 | 79,408 | ||||||
LyondellBasell Industries NV, Class A | 3,200 | 318,624 | ||||||
Monsanto Co. | 550 | 67,017 | ||||||
NewMarket Corp. | 200 | 78,302 | ||||||
PPG Industries, Inc. | 1,183 | 238,505 | ||||||
Praxair, Inc. | 650 | 85,956 | ||||||
Rockwood Holdings, Inc. | 2,000 | 152,740 | ||||||
Scotts Miracle-Gro Co., Class A | 900 | 53,955 | ||||||
Sherwin-Williams Co. | 600 | 122,766 | ||||||
Sigma-Aldrich Corp. | 900 | 88,677 | ||||||
|
| |||||||
| 2,171,338 | ||||||||
|
| |||||||
| Commercial Services & Supplies—0.5% | ||||||||
Cintas Corp. | 1,100 | 68,332 | ||||||
Pitney Bowes, Inc. | 4,000 | 110,520 | ||||||
Rollins, Inc. | 2,300 | 70,541 | ||||||
Tyco International Ltd. | 2,700 | 117,828 | ||||||
West Corp. | 3,000 | 80,400 | ||||||
|
| |||||||
| 447,621 | ||||||||
|
| |||||||
| Communications Equipment—2.4% | ||||||||
Brocade Communications Systems, Inc. (a) | 7,600 | 69,312 | ||||||
Cisco Systems, Inc. | 28,500 | 701,670 | ||||||
Harris Corp. | 1,900 | 146,775 | ||||||
| Shares | Value | |||||||
Motorola Solutions, Inc. | 3,600 | $ | 242,712 | |||||
Polycom, Inc. (a) | 3,600 | 45,900 | ||||||
QUALCOMM, Inc. | 9,200 | 740,140 | ||||||
Ubiquiti Networks, Inc. (a) | 800 | 27,968 | ||||||
|
| |||||||
| 1,974,477 | ||||||||
|
| |||||||
| Construction & Engineering—0.1% | ||||||||
Fluor Corp. | 700 | 52,556 | ||||||
URS Corp. | 1,200 | 54,000 | ||||||
|
| |||||||
| 106,556 | ||||||||
|
| |||||||
| Consumer Finance—0.4% | ||||||||
Credit Acceptance Corp. (a) | 400 | 52,240 | ||||||
Discover Financial Services | 4,050 | 239,477 | ||||||
Springleaf Holdings, Inc. (a) | 2,200 | 51,634 | ||||||
|
| |||||||
| 343,351 | ||||||||
|
| |||||||
| Containers & Packaging—0.5% | ||||||||
AptarGroup, Inc. | 800 | 53,272 | ||||||
Avery Dennison Corp. | 1,000 | 50,700 | ||||||
Ball Corp. | 1,500 | 90,540 | ||||||
Crown Holdings, Inc. (a) | 1,200 | 58,620 | ||||||
Graphic Packaging Holding Co. (a) | 5,500 | 60,445 | ||||||
Sonoco Products Co. | 1,900 | 80,256 | ||||||
|
| |||||||
| 393,833 | ||||||||
|
| |||||||
| Distributors—0.1% | ||||||||
Genuine Parts Co. | 850 | 73,381 | ||||||
|
| |||||||
| Diversified Consumer Services—0.3% | ||||||||
Apollo Education Group, Inc., Class A (a) | 4,300 | 115,240 | ||||||
Graham Holdings Co., Class B | 100 | 67,694 | ||||||
Grand Canyon Education, Inc. (a) | 1,300 | 57,265 | ||||||
H&R Block, Inc. | 1,550 | 46,159 | ||||||
|
| |||||||
| 286,358 | ||||||||
|
| |||||||
| Diversified Financial Services—1.4% | ||||||||
CBOE Holdings, Inc. | 2,800 | 141,904 | ||||||
MarketAxess Holdings, Inc. | 900 | 48,015 | ||||||
McGraw Hill Financial, Inc. | 3,700 | 302,549 | ||||||
Moody’s Corp. | 6,150 | 526,071 | ||||||
MSCI, Inc. (a) | 1,100 | 47,476 | ||||||
Voya Financial, Inc. | 1,900 | 68,020 | ||||||
|
| |||||||
| 1,134,035 | ||||||||
|
| |||||||
| Diversified Telecommunication Services—1.1% | ||||||||
AT&T, Inc. | 12,250 | 434,508 | ||||||
CenturyLink, Inc. | 3,700 | 139,379 | ||||||
Frontier Communications Corp. | 18,200 | 105,378 | ||||||
Time Warner Telecom, Inc. (a) | 1,800 | 59,022 | ||||||
Verizon Communications, Inc. | 3,500 | 174,860 | ||||||
|
| |||||||
| 913,147 | ||||||||
|
| |||||||
| Electric Utilities—0.1% | ||||||||
OGE Energy Corp. | 1,600 | 58,768 | ||||||
|
| |||||||
| Electrical Equipment—0.6% | ||||||||
Acuity Brands, Inc. | 600 | 75,306 | ||||||
AMETEK, Inc. | 1,350 | 71,658 | ||||||
Emerson Electric Co. | 2,950 | 196,854 | ||||||
Hubbell, Inc., Class B | 550 | 64,350 | ||||||
Rockwell Automation, Inc. | 900 | 108,972 | ||||||
|
| |||||||
| 517,140 | ||||||||
|
| |||||||
| Electronic Equipment, Instruments & Components—0.8% | ||||||||
Amphenol Corp., Class A | 950 | 91,010 | ||||||
CDW Corp. | 6,200 | 182,342 | ||||||
| See accompanying Notes to Financial Statements | | May 31, 2014 | | Semiannual Report | 99 |
Table of Contents
Schedule of Investments
May 31, 2014 (Unaudited)
| Shares | Value | |||||||
Corning, Inc. | 7,000 | $ | 149,100 | |||||
Ingram Micro, Inc., Class A (a) | 2,800 | 77,756 | ||||||
TE Connectivity Ltd. | 2,100 | 124,866 | ||||||
Zebra Technologies Corp., Class A (a) | 900 | 66,870 | ||||||
|
| |||||||
| 691,944 | ||||||||
|
| |||||||
| Energy Equipment & Services—1.5% | ||||||||
Baker Hughes, Inc. | 3,300 | 232,716 | ||||||
Frank’s International NV | 3,300 | 78,672 | ||||||
Halliburton Co. | 8,100 | 523,584 | ||||||
Patterson-UTI Energy, Inc. | 2,000 | 66,180 | ||||||
RPC, Inc. | 3,500 | 77,315 | ||||||
Schlumberger Ltd. | 2,600 | 270,504 | ||||||
|
| |||||||
| 1,248,971 | ||||||||
|
| |||||||
| Food & Staples Retailing—2.5% | ||||||||
Costco Wholesale Corp. | 1,300 | 150,826 | ||||||
Kroger Co. | 4,100 | 195,734 | ||||||
Rite Aid Corp. (a) | 15,900 | 132,924 | ||||||
Safeway, Inc. | 4,800 | 164,832 | ||||||
Sysco Corp. | 1,400 | 52,542 | ||||||
Wal-Mart Stores, Inc. | 13,600 | 1,044,072 | ||||||
Walgreen Co. | 3,800 | 273,258 | ||||||
|
| |||||||
| 2,014,188 | ||||||||
|
| |||||||
| Food Products—3.2% | ||||||||
Archer-Daniels-Midland Co. | 14,500 | 651,630 | ||||||
Bunge Ltd. | 2,300 | 178,733 | ||||||
Dean Foods Co. | 8,600 | 149,468 | ||||||
General Mills, Inc. | 2,900 | 159,297 | ||||||
Hershey Co. | 900 | 87,606 | ||||||
Hormel Foods Corp. | 2,150 | 105,802 | ||||||
Keurig Green Mountain, Inc. | 1,400 | 157,892 | ||||||
Lancaster Colony Corp. | 600 | 53,574 | ||||||
Mead Johnson Nutrition Co. | 2,550 | 228,148 | ||||||
Mondelez International, Inc., Class A | 12,800 | 481,536 | ||||||
Pilgrim’s Pride Corp. (a) | 3,000 | 76,320 | ||||||
Sanderson Farms, Inc. | 600 | 55,506 | ||||||
Tyson Foods, Inc., Class A | 6,200 | 263,252 | ||||||
|
| |||||||
| 2,648,764 | ||||||||
|
| |||||||
| Gas Utilities—0.1% | ||||||||
National Fuel Gas Co. | 700 | 52,500 | ||||||
|
| |||||||
| Health Care Equipment & Supplies—2.4% | ||||||||
Abbott Laboratories | 10,350 | 414,103 | ||||||
Alere, Inc. (a) | 1,800 | 64,386 | ||||||
Align Technology, Inc. (a) | 800 | 43,688 | ||||||
Becton Dickinson and Co. | 1,200 | 141,240 | ||||||
Boston Scientific Corp. (a) | 3,900 | 50,037 | ||||||
Covidien PLC | 3,350 | 244,918 | ||||||
CR Bard, Inc. | 800 | 118,328 | ||||||
Globus Medical, Inc., Class A (a) | 3,600 | 87,048 | ||||||
IDEXX Laboratories, Inc. (a) | 600 | 77,088 | ||||||
Medtronic, Inc. | 4,800 | 292,944 | ||||||
St. Jude Medical, Inc. | 1,100 | 71,390 | ||||||
Stryker Corp. | 1,650 | 139,409 | ||||||
Varian Medical Systems, Inc. (a) | 900 | 74,205 | ||||||
West Pharmaceutical Services, Inc. | 1,100 | 46,299 | ||||||
Zimmer Holdings, Inc. | 700 | 73,045 | ||||||
|
| |||||||
| 1,938,128 | ||||||||
|
| |||||||
| Health Care Providers & Services—3.2% | ||||||||
Cardinal Health, Inc. | 3,900 | 275,457 | ||||||
Centene Corp. (a) | 700 | 52,164 | ||||||
Cigna Corp. | 2,900 | 260,362 | ||||||
Express Scripts Holding Co. (a) | 1,100 | 78,617 | ||||||
HCA Holdings, Inc. (a) | 3,150 | 166,918 | ||||||
Health Net, Inc. (a) | 1,400 | 55,972 | ||||||
Henry Schein, Inc. (a) | 750 | 89,738 | ||||||
Humana, Inc. | 2,000 | 248,920 | ||||||
| Shares | Value | |||||||
McKesson Corp. | 1,500 | $ | 284,460 | |||||
MEDNAX, Inc. (a) | 900 | 51,867 | ||||||
Molina Healthcare, Inc. (a) | 1,300 | 56,017 | ||||||
UnitedHealth Group, Inc. | 7,200 | 573,336 | ||||||
WellPoint, Inc. | 3,600 | 390,096 | ||||||
|
| |||||||
| 2,583,924 | ||||||||
|
| |||||||
| Hotels, Restaurants & Leisure—2.3% | ||||||||
Brinker International, Inc. | 1,100 | 54,615 | ||||||
Burger King Worldwide, Inc. | 2,000 | 51,380 | ||||||
Chipotle Mexican Grill, Inc. (a) | 400 | 218,836 | ||||||
Choice Hotels International, Inc. | 1,700 | 76,517 | ||||||
Cracker Barrel Old Country Store, Inc. | 400 | 40,220 | ||||||
Domino’s Pizza, Inc. | 1,550 | 112,297 | ||||||
Hilton Worldwide Holdings, Inc. (a) | 14,400 | 325,728 | ||||||
Las Vegas Sands Corp. | 600 | 45,912 | ||||||
Marriott International, Inc., Class A | 4,550 | 280,371 | ||||||
McDonald’s Corp. | 1,790 | 181,560 | ||||||
Wyndham Worldwide Corp. | 1,100 | 81,323 | ||||||
Wynn Resorts Ltd. | 900 | 193,473 | ||||||
Yum! Brands, Inc. | 3,000 | 231,930 | ||||||
|
| |||||||
| 1,894,162 | ||||||||
|
| |||||||
| Household Durables—0.3% | ||||||||
Garmin Ltd. | 1,700 | 100,147 | ||||||
Harman International Industries, Inc. | 700 | 73,521 | ||||||
Newell Rubbermaid, Inc. | 1,700 | 49,776 | ||||||
NVR, Inc. (a) | 50 | 55,682 | ||||||
|
| |||||||
| 279,126 | ||||||||
|
| |||||||
| Household Products—0.9% | ||||||||
Colgate-Palmolive Co. | 6,000 | 410,400 | ||||||
Kimberly-Clark Corp. | 2,950 | 331,433 | ||||||
|
| |||||||
| 741,833 | ||||||||
|
| |||||||
| Independent Power Producers & Energy Traders—0.1% | ||||||||
AES Corp. | 7,300 | 102,930 | ||||||
|
| |||||||
| Industrial Conglomerates—1.4% | ||||||||
3M Co. | 5,000 | 712,750 | ||||||
Danaher Corp. | 1,200 | 94,116 | ||||||
General Electric Co. | 12,850 | 344,251 | ||||||
|
| |||||||
| 1,151,117 | ||||||||
|
| |||||||
| Insurance—4.3% | ||||||||
Aflac, Inc. | 4,200 | 257,166 | ||||||
Allstate Corp. | 3,950 | 230,127 | ||||||
American Financial Group, Inc. | 1,200 | 70,056 | ||||||
American International Group, Inc. | 2,800 | 151,396 | ||||||
American National Insurance Co. | 600 | 68,700 | ||||||
Amtrust Financial Services, Inc. | 1,800 | 76,860 | ||||||
Aon PLC | 1,300 | 116,922 | ||||||
Arch Capital Group Ltd. (a) | 900 | 51,237 | ||||||
Assurant, Inc. | 800 | 54,248 | ||||||
Everest Re Group Ltd. | 400 | 64,008 | ||||||
Hanover Insurance Group, Inc. | 700 | 42,035 | ||||||
Hartford Financial Services Group, Inc. | 12,600 | 436,590 | ||||||
Hilltop Holdings, Inc. (a) | 3,400 | 70,550 | ||||||
Marsh & McLennan Cos., Inc. | 2,850 | 143,269 | ||||||
MBIA, Inc. (a) | 10,800 | 127,008 | ||||||
MetLife, Inc. | 10,800 | 550,044 | ||||||
PartnerRe Ltd. | 600 | 64,422 | ||||||
Principal Financial Group, Inc. | 1,300 | 60,801 | ||||||
Progressive Corp. | 2,850 | 71,336 | ||||||
Prudential Financial, Inc. | 2,500 | 205,400 | ||||||
Reinsurance Group of America, Inc. | 800 | 62,528 | ||||||
| Shares | Value | |||||||
RenaissanceRe Holdings Ltd. | 600 | $ | 62,502 | |||||
StanCorp Financial Group, Inc. | 900 | 54,090 | ||||||
Symetra Financial Corp. | 3,200 | 66,720 | ||||||
Torchmark Corp. | 1,200 | 97,116 | ||||||
Travelers Cos., Inc. | 1,850 | 172,882 | ||||||
Unum Group | 1,900 | 64,429 | ||||||
WR Berkley Corp. | 1,300 | 57,941 | ||||||
|
| |||||||
| 3,550,383 | ||||||||
|
| |||||||
| Internet & Catalog Retail—1.3% | ||||||||
Amazon.com, Inc. (a) | 200 | 62,510 | ||||||
Expedia, Inc. | 2,000 | 146,600 | ||||||
Liberty Ventures, Ser. A (a) | 1,400 | 92,960 | ||||||
Netflix, Inc. (a) | 400 | 167,132 | ||||||
Priceline Group, Inc. (a) | 425 | 543,418 | ||||||
TripAdvisor, Inc. (a) | 700 | 68,019 | ||||||
|
| |||||||
| 1,080,639 | ||||||||
|
| |||||||
| Internet Software & Services—1.8% | ||||||||
Akamai Technologies, Inc. (a) | 1,200 | 65,208 | ||||||
Facebook, Inc., Class A (a) | 7,600 | 481,080 | ||||||
Google, Inc., Class A (a) | 765 | 437,312 | ||||||
Google, Inc., Class C (a) | 765 | 429,150 | ||||||
WebMD Health Corp. (a) | 1,200 | 51,360 | ||||||
|
| |||||||
| 1,464,110 | ||||||||
|
| |||||||
| IT Services—6.1% | ||||||||
Accenture PLC, Class A | 6,400 | 521,280 | ||||||
Amdocs Ltd. | 1,650 | 79,398 | ||||||
Automatic Data Processing, Inc. | 3,100 | 247,008 | ||||||
Blackhawk Network Holdings, Inc., Class B (a) | 788 | 19,330 | ||||||
Booz Allen Hamilton Holding Corp. | 2,700 | 59,751 | ||||||
Broadridge Financial Solutions, Inc. | 2,100 | 86,142 | ||||||
Cognizant Technology Solutions Corp., Class A (a) | 3,600 | 174,996 | ||||||
Computer Sciences Corp. | 1,100 | 69,179 | ||||||
Convergys Corp. | 2,100 | 45,822 | ||||||
DST Systems, Inc. | 900 | 82,035 | ||||||
Euronet Worldwide, Inc. (a) | 1,100 | 51,854 | ||||||
Fiserv, Inc. (a) | 2,900 | 174,319 | ||||||
Gartner, Inc. (a) | 1,400 | 99,526 | ||||||
Global Payments, Inc. | 900 | 61,704 | ||||||
International Business Machines Corp. | 5,300 | 977,108 | ||||||
Jack Henry & Associates, Inc. | 1,200 | 69,588 | ||||||
Leidos Holdings, Inc. | 1,075 | 41,011 | ||||||
Mastercard, Inc., Class A | 9,450 | 722,452 | ||||||
Paychex, Inc. | 3,250 | 133,608 | ||||||
Sapient Corp. (a) | 3,000 | 49,350 | ||||||
Syntel, Inc. (a) | 700 | 56,630 | ||||||
Visa, Inc., Class A | 4,300 | 923,769 | ||||||
Western Union Co. | 4,900 | �� | 79,233 | |||||
Xerox Corp. | 13,300 | 164,255 | ||||||
|
| |||||||
| 4,989,348 | ||||||||
|
| |||||||
| Leisure Equipment & Products—0.1% | ||||||||
Polaris Industries, Inc. | 700 | 90,244 | ||||||
|
| |||||||
| Life Sciences Tools & Services—0.6% | ||||||||
Agilent Technologies, Inc. | 1,000 | 56,940 | ||||||
Illumina, Inc. (a) | 1,200 | 189,900 | ||||||
Mettler-Toledo International, Inc. (a) | 150 | 36,753 | ||||||
PAREXEL International Corp. (a) | 900 | 45,405 | ||||||
Quintiles Transnational Holdings, Inc. (a) | 2,400 | 122,352 | ||||||
|
| |||||||
| 451,350 | ||||||||
|
| |||||||
| Machinery—2.3% | ||||||||
Allison Transmission Holdings, Inc. | 1,800 | 55,746 | ||||||
Caterpillar, Inc. | 6,300 | 644,049 | ||||||
Cummins, Inc. | 600 | 91,758 | ||||||
| 100 | Semiannual Report | | May 31, 2014 | | See accompanying Notes to Financial Statements |
Table of Contents
Schedule of Investments
May 31, 2014 (Unaudited)
| Shares | Value | |||||||
Donaldson Co., Inc. | 1,400 | $ | 57,022 | |||||
Dover Corp. | 1,400 | 122,052 | ||||||
Flowserve Corp. | 500 | 36,870 | ||||||
Graco, Inc. | 600 | 43,788 | ||||||
IDEX Corp. | 1,000 | 76,680 | ||||||
Illinois Tool Works, Inc. | 2,100 | 181,755 | ||||||
Ingersoll-Rand PLC | 2,050 | 122,631 | ||||||
ITT Corp. | 1,300 | 56,784 | ||||||
Lincoln Electric Holdings, Inc. | 1,000 | 65,690 | ||||||
PACCAR, Inc. | 1,000 | 63,360 | ||||||
Pall Corp. | 650 | 55,081 | ||||||
Toro Co. | 1,000 | 64,580 | ||||||
WABCO Holdings, Inc. (a) | 1,000 | 106,770 | ||||||
|
| |||||||
| 1,844,616 | ||||||||
|
| |||||||
| Marine—0.1% | ||||||||
Kirby Corp. (a) | 600 | 66,330 | ||||||
|
| |||||||
| Media—2.7% | ||||||||
Cablevision Systems Corp., Class A | 8,000 | 141,040 | ||||||
Comcast Corp., Class A | 3,200 | 167,040 | ||||||
DIRECTV (a) | 5,950 | 490,518 | ||||||
DISH Network Corp., Class A (a) | 2,400 | 140,784 | ||||||
Interpublic Group of Cos., Inc. | 4,600 | 87,952 | ||||||
John Wiley & Sons, Inc., Class A | 1,100 | 60,258 | ||||||
Liberty Media Corp., Class A (a) | 700 | 88,991 | ||||||
Live Nation Entertainment, Inc. (a) | 2,400 | 56,928 | ||||||
Morningstar, Inc. | 850 | 60,469 | ||||||
Scripps Networks Interactive, Inc., Class A | 800 | 61,168 | ||||||
Viacom, Inc., Class B | 1,350 | 115,196 | ||||||
Walt Disney Co. | 9,150 | 768,691 | ||||||
|
| |||||||
| 2,239,035 | ||||||||
|
| |||||||
| Metals & Mining—0.0% | ||||||||
Cliffs Natural Resources, Inc. | 2,000 | 31,360 | ||||||
|
| |||||||
| Multi-line Retail—1.1% | ||||||||
Burlington Stores, Inc. (a) | 2,200 | 62,524 | ||||||
Dollar General Corp. (a) | 1,600 | 86,048 | ||||||
Dollar Tree, Inc. (a) | 1,800 | 95,454 | ||||||
Kohl’s Corp. | 1,300 | 70,772 | ||||||
Macy’s, Inc. | 3,200 | 191,648 | ||||||
Nordstrom, Inc. | 1,200 | 81,672 | ||||||
Target Corp. | 5,400 | 306,504 | ||||||
|
| |||||||
| 894,622 | ||||||||
|
| |||||||
| Multi-Utilities—0.5% | ||||||||
Ameren Corp. | 1,800 | 70,830 | ||||||
CenterPoint Energy, Inc. | 4,400 | 106,128 | ||||||
MDU Resources Group, Inc. | 2,100 | 71,148 | ||||||
Public Service Enterprise Group, Inc. | 2,200 | 85,712 | ||||||
Vectren Corp. | 1,200 | 47,856 | ||||||
|
| |||||||
| 381,674 | ||||||||
|
| |||||||
| Oil, Gas & Consumable Fuels—7.6% | ||||||||
Apache Corp. | 3,800 | 354,236 | ||||||
Chesapeake Energy Corp. | 2,200 | 63,184 | ||||||
Chevron Corp. | 4,730 | 580,797 | ||||||
ConocoPhillips | 8,790 | 702,672 | ||||||
Continental Resources, Inc. (a) | 300 | 42,108 | ||||||
Devon Energy Corp. | 800 | 59,120 | ||||||
EOG Resources, Inc. | 3,700 | 391,460 | ||||||
EQT Corp. | 1,000 | 106,880 | ||||||
Exxon Mobil Corp. | 15,970 | 1,605,464 | ||||||
Hess Corp. | 5,100 | 465,630 | ||||||
Marathon Petroleum Corp. | 4,700 | 420,133 | ||||||
Occidental Petroleum Corp. | 3,100 | 309,039 | ||||||
Phillips 66 | 7,800 | 661,362 | ||||||
SandRidge Energy, Inc. (a) | 13,100 | 87,377 | ||||||
Southwestern Energy Co. (a) | 1,500 | 68,205 | ||||||
| Shares | Value | |||||||
Valero Energy Corp. | 5,700 | $ | 319,485 | |||||
|
| |||||||
| 6,237,152 | ||||||||
|
| |||||||
| Paper & Forest Products—0.1% | ||||||||
International Paper Co. | 1,700 | 80,971 | ||||||
|
| |||||||
| Personal Products—0.4% | ||||||||
Estee Lauder Cos., Inc., Class A | 2,200 | 168,564 | ||||||
Herbalife Ltd. | 1,700 | 110,211 | ||||||
Nu Skin Enterprises, Inc., Class A | 800 | 59,072 | ||||||
|
| |||||||
| 337,847 | ||||||||
|
| |||||||
| Pharmaceuticals—5.2% | ||||||||
AbbVie, Inc. | 12,200 | 662,826 | ||||||
Akorn, Inc. (a) | 1,700 | 47,549 | ||||||
Bristol-Myers Squibb Co. | 6,250 | 310,875 | ||||||
Eli Lilly & Co. | 5,200 | 311,272 | ||||||
Jazz Pharmaceuticals PLC (a) | 700 | 99,302 | ||||||
Johnson & Johnson | 10,228 | 1,037,733 | ||||||
Merck & Co., Inc. | 12,600 | 729,036 | ||||||
Pfizer, Inc. | 29,100 | 862,233 | ||||||
Questcor Pharmaceuticals, Inc. | 1,400 | 126,182 | ||||||
Salix Pharmaceuticals Ltd. (a) | 600 | 68,448 | ||||||
|
| |||||||
| 4,255,456 | ||||||||
|
| |||||||
| Professional Services—0.3% | ||||||||
Equifax, Inc. | 900 | 63,711 | ||||||
Huron Consulting Group, Inc. (a) | 700 | 47,516 | ||||||
Robert Half International, Inc. | 1,200 | 54,708 | ||||||
Verisk Analytics, Inc., Class A (a) | 1,100 | 65,109 | ||||||
|
| |||||||
| 231,044 | ||||||||
|
| |||||||
| Real Estate Investment Trust—0.2% | ||||||||
Brixmor Property Group, Inc. | 6,800 | 147,900 | ||||||
|
| |||||||
| Road & Rail—1.2% | ||||||||
AMERCO | 200 | 55,220 | ||||||
CSX Corp. | 4,100 | 120,540 | ||||||
Heartland Express, Inc. | 2,300 | 49,738 | ||||||
Landstar System, Inc. | 700 | 45,451 | ||||||
Norfolk Southern Corp. | 1,000 | 100,750 | ||||||
Old Dominion Freight Line, Inc. (a) | 900 | 57,564 | ||||||
Union Pacific Corp. | 2,900 | 577,883 | ||||||
|
| |||||||
| 1,007,146 | ||||||||
|
| |||||||
| Semiconductors & Semiconductor Equipment—2.6% | ||||||||
Analog Devices, Inc. | 3,200 | 167,616 | ||||||
Avago Technologies Ltd. | 2,400 | 169,608 | ||||||
Intel Corp. | 25,000 | 683,000 | ||||||
KLA-Tencor Corp. | 1,000 | 65,520 | ||||||
Lam Research Corp. (a) | 1,100 | 68,244 | ||||||
Linear Technology Corp. | 5,600 | 258,496 | ||||||
Marvell Technology Group Ltd. | 4,100 | 63,837 | ||||||
Micron Technology, Inc. (a) | 5,600 | 160,104 | ||||||
NVIDIA Corp. | 4,900 | 93,100 | ||||||
Skyworks Solutions, Inc. | 2,000 | 86,620 | ||||||
Texas Instruments, Inc. | 7,000 | 328,860 | ||||||
|
| |||||||
| 2,145,005 | ||||||||
|
| |||||||
| Software—5.5% | ||||||||
Activision Blizzard, Inc. | 18,000 | 374,040 | ||||||
Adobe Systems, Inc. (a) | 2,750 | 177,485 | ||||||
Aspen Technology, Inc. (a) | 1,400 | 60,186 | ||||||
Autodesk, Inc. (a) | 1,400 | 73,318 | ||||||
CA, Inc. | 2,800 | 80,332 | ||||||
Electronic Arts, Inc. (a) | 5,100 | 179,163 | ||||||
FactSet Research Systems, Inc. | 600 | 64,284 | ||||||
Interactive Intelligence Group, Inc. (a) | 600 | 30,414 | ||||||
Intuit, Inc. | 4,900 | 388,521 | ||||||
Manhattan Associates, Inc. (a) | 2,800 | 90,888 | ||||||
| Shares | Value | |||||||
MICROS Systems, Inc. (a) | 1,200 | $ | 64,104 | |||||
Microsoft Corp. | 29,200 | 1,195,448 | ||||||
NetSuite, Inc. (a) | 1,500 | 120,735 | ||||||
Oracle Corp. | 27,300 | 1,147,146 | ||||||
Red Hat, Inc. (a) | 2,200 | 110,264 | ||||||
ServiceNow, Inc. (a) | 700 | 36,617 | ||||||
Take-Two Interactive Software, Inc. (a) | 2,800 | 57,764 | ||||||
Verint Systems, Inc. (a) | 1,200 | 55,596 | ||||||
VMware, Inc., Class A (a) | 2,000 | 193,000 | ||||||
|
| |||||||
| 4,499,305 | ||||||||
|
| |||||||
| Specialty Retail—3.1% | ||||||||
Advance Auto Parts, Inc. | 800 | 99,336 | ||||||
AutoZone, Inc. (a) | 475 | 252,937 | ||||||
Bed Bath & Beyond, Inc. (a) | 1,000 | 60,850 | ||||||
Best Buy Co., Inc. | 2,800 | 77,448 | ||||||
Container Store Group, Inc. (a) | 1,900 | 54,454 | ||||||
Foot Locker, Inc. | 1,600 | 77,088 | ||||||
GameStop Corp., Class A | 1,700 | 64,345 | ||||||
Gap, Inc. | 2,700 | 111,321 | ||||||
Home Depot, Inc. | 6,900 | 553,587 | ||||||
L Brands, Inc. | 1,600 | 91,824 | ||||||
Lowe’s Cos., Inc. | 5,000 | 235,400 | ||||||
Murphy USA, Inc. (a) | 1,075 | 54,696 | ||||||
O’Reilly Automotive, Inc. (a) | 950 | 140,553 | ||||||
Ross Stores, Inc. | 1,800 | 123,210 | ||||||
TJX Cos., Inc. | 8,200 | 446,490 | ||||||
Williams-Sonoma, Inc. | 900 | 60,228 | ||||||
|
| |||||||
| 2,503,767 | ||||||||
|
| |||||||
| Technology Hardware, Storage & Peripherals—3.5% | ||||||||
Apple, Inc. | 1,650 | 1,044,450 | ||||||
Hewlett-Packard Co. | 30,100 | 1,008,350 | ||||||
Lexmark International, Inc., Class A | 1,200 | 52,308 | ||||||
NetApp, Inc. | 3,900 | 144,339 | ||||||
SanDisk Corp. | 2,300 | 222,249 | ||||||
Seagate Technology PLC | 3,000 | 161,190 | ||||||
Western Digital Corp. | 2,250 | 197,662 | ||||||
|
| |||||||
| 2,830,548 | ||||||||
|
| |||||||
| Textiles, Apparel & Luxury Goods—1.2% | ||||||||
Columbia Sportswear Co. | 700 | 58,499 | ||||||
Fossil Group, Inc. (a) | 600 | 62,856 | ||||||
Hanesbrands, Inc. | 1,400 | 118,762 | ||||||
Iconix Brand Group, Inc. (a) | 1,400 | 58,716 | ||||||
Michael Kors Holdings Ltd. (a) | 2,000 | 188,760 | ||||||
NIKE, Inc., Class B | 4,300 | 330,713 | ||||||
V.F. Corp. | 2,800 | 176,456 | ||||||
|
| |||||||
| 994,762 | ||||||||
|
| |||||||
| Tobacco—1.5% | ||||||||
Altria Group, Inc. | 7,100 | 295,076 | ||||||
Philip Morris International, Inc. | 7,570 | 670,248 | ||||||
Reynolds American, Inc. | 2,700 | 161,001 | ||||||
Vector Group Ltd. | 3,200 | 66,912 | ||||||
|
| |||||||
| 1,193,237 | ||||||||
|
| |||||||
| Trading Companies & Distributors—0.1% | ||||||||
HD Supply Holdings, Inc. (a) | 2,900 | 76,183 | ||||||
|
| |||||||
| Total Investments (cost—$71,748,886)—99.5% | 81,323,042 | |||||||
|
| |||||||
| Other assets less liabilities—0.5% | 368,705 | |||||||
|
| |||||||
| Net Assets—100.0% | $81,691,747 | |||||||
|
| |||||||
Notes to Schedule of Investments:
(a) Non-income producing.
| See accompanying Notes to Financial Statements | | May 31, 2014 | | Semiannual Report | 101 |
Table of Contents
Schedule of Investments
May 31, 2014 (Unaudited)
AllianzGI Best Styles Global Equity Fund
| Shares | Value | |||||||
| Common Stock—95.4% | ||||||||
| Australia—0.6% | ||||||||
Australia & New Zealand Banking Group Ltd. | 4,160 | $129,965 | ||||||
Bendigo and Adelaide Bank Ltd. | 4,583 | 50,080 | ||||||
Macquarie Group Ltd. | 672 | 37,663 | ||||||
|
| |||||||
| 217,708 | ||||||||
|
| |||||||
| Austria—0.3% | ||||||||
Flughafen Wien AG | 147 | 13,829 | ||||||
OMV AG | 1,365 | 56,572 | ||||||
Voestalpine AG | 752 | 34,835 | ||||||
|
| |||||||
| 105,236 | ||||||||
|
| |||||||
| Belgium—0.4% | ||||||||
Ageas | 1,700 | 71,511 | ||||||
Barco NV | 395 | 30,337 | ||||||
Befimmo S.A. REIT | 260 | 19,404 | ||||||
Delhaize Group S.A. | 603 | 42,925 | ||||||
|
| |||||||
| 164,177 | ||||||||
|
| |||||||
| Bermuda—0.3% | ||||||||
Aspen Insurance Holdings Ltd. | 758 | 34,830 | ||||||
Everest Re Group Ltd. | 333 | 53,287 | ||||||
Montpelier Re Holdings Ltd. | 994 | 31,251 | ||||||
|
| |||||||
| 119,368 | ||||||||
|
| |||||||
| Brazil—0.9% | ||||||||
Banco Bradesco S.A. | 2,900 | 41,371 | ||||||
Banco do Brasil S.A. | 2,300 | 23,377 | ||||||
Cia Brasileira de Distribuicao Grupo Pao de Acucar ADR | 472 | 21,405 | ||||||
Cia de Saneamento Basico do Estado de Sao Paulo | 1,800 | 17,499 | ||||||
Cia Energetica de Minas Gerais ADR | 4,705 | 33,029 | ||||||
Cielo S.A. | 2,400 | 42,884 | ||||||
Duratex S.A. | 1,760 | 7,243 | ||||||
Embraer S.A. | 1,100 | 10,012 | ||||||
Energias do Brasil S.A. | 4,300 | 18,023 | ||||||
JBS S.A. | 14,500 | 48,543 | ||||||
Petroleo Brasileiro S.A. ADR | 2,106 | 29,695 | ||||||
Porto Seguro S.A. | 900 | 12,530 | ||||||
Tractebel Energia S.A. | 1,400 | 20,747 | ||||||
|
| |||||||
| 326,358 | ||||||||
|
| |||||||
| Canada—4.0% | ||||||||
Agrium, Inc. | 817 | 73,359 | ||||||
Artis Real Estate Investment Trust REIT | 2,041 | 29,609 | ||||||
Atco Ltd., Class I | 776 | 37,022 | ||||||
Bank of Montreal | 2,316 | 162,929 | ||||||
Bank of Nova Scotia | 1,725 | 110,774 | ||||||
Baytex Energy Corp. | 262 | 10,943 | ||||||
BCE, Inc. | 1,031 | 47,390 | ||||||
Canadian Natural Resources Ltd. | 711 | 28,937 | ||||||
Canadian Tire Corp. Ltd., Class A | 599 | 57,779 | ||||||
Canfor Corp. (e) | 641 | 14,147 | ||||||
Cogeco Cable, Inc. | 229 | 13,217 | ||||||
Corus Entertainment, Inc., Class B | 476 | 11,001 | ||||||
Empire Co., Ltd. | 1,251 | 75,558 | ||||||
Genworth MI Canada, Inc. | 501 | 17,789 | ||||||
George Weston Ltd. | 463 | 33,733 | ||||||
Home Capital Group, Inc. | 376 | 16,908 | ||||||
Imperial Oil Ltd. | 999 | 49,190 | ||||||
Linamar Corp. | 452 | 25,116 | ||||||
Magna International, Inc. | 937 | 95,869 | ||||||
Metro, Inc. | 643 | 39,714 | ||||||
National Bank of Canada | 2,035 | 85,394 | ||||||
| Shares | Value | |||||||
Norbord, Inc. | 505 | $ | 12,733 | |||||
Royal Bank of Canada | 2,199 | 151,373 | ||||||
Stantec, Inc. | 610 | 37,754 | ||||||
Transcontinental, Inc., Class A | 635 | 8,691 | ||||||
Valeant Pharmaceuticals International, Inc. (e) | 1,602 | 210,300 | ||||||
|
| |||||||
| 1,457,229 | ||||||||
|
| |||||||
| Cayman Islands—0.0% | ||||||||
Home Loan Servicing Solutions Ltd. (d) | 613 | 13,670 | ||||||
|
| |||||||
| China—2.4% | ||||||||
Agricultural Bank of China Ltd., Class H | 30,000 | 13,380 | ||||||
Bank of China Ltd., Class H | 62,000 | 29,653 | ||||||
Bank of Communications Co., Ltd., Class H | 28,000 | 18,809 | ||||||
BBMG Corp., Class H | 17,000 | 11,422 | ||||||
China Citic Bank Corp. Ltd., Class H | 114,000 | 66,294 | ||||||
China Communications Construction Co., Ltd., Class H | 45,000 | 30,082 | ||||||
China Communications Services Corp. Ltd., Class H | 62,000 | 29,385 | ||||||
China Construction Bank Corp., Class H | 85,000 | 62,419 | ||||||
China Lumena New Materials Corp. (c) | 62,000 | 9,996 | ||||||
China Merchants Bank Co., Ltd., Class H | 17,500 | 32,309 | ||||||
China Mobile Ltd. | 8,000 | 78,356 | ||||||
China Oilfield Services Ltd., Class H | 6,000 | 14,811 | ||||||
China Petroleum & Chemical Corp., Class H | 88,000 | 79,580 | ||||||
China Railway Construction Corp. Ltd., Class H | 13,000 | 11,002 | ||||||
China Resources Cement Holdings Ltd. | 18,000 | 11,302 | ||||||
China Resources Power Holdings Co., Ltd. | 20,000 | 52,649 | ||||||
CNOOC Ltd. | 29,000 | 49,556 | ||||||
Great Wall Motor Co., Ltd., Class H | 12,000 | 49,519 | ||||||
Guangdong Investment Ltd. | 26,000 | 28,760 | ||||||
Huadian Power International Corp. Ltd., Class H | 36,000 | 20,248 | ||||||
Industrial & Commercial Bank of China Ltd., Class H | 105,000 | 68,193 | ||||||
Kaisa Group Holdings Ltd. | 48,000 | 14,945 | ||||||
Ping An Insurance Group Co. of China Ltd., Class H | 3,000 | 23,215 | ||||||
Shimao Property Holdings Ltd. | 14,500 | 29,188 | ||||||
Wasion Group Holdings Ltd. | 14,000 | 9,925 | ||||||
WuXi PharmaTech Cayman, Inc. ADR (e) | 457 | 15,250 | ||||||
Yuexiu Transport Infrastructure Ltd. | 26,000 | 14,195 | ||||||
|
| |||||||
| 874,443 | ||||||||
|
| |||||||
| Colombia—0.1% | ||||||||
Copa Holdings S.A., Class A | 238 | 34,017 | ||||||
|
| |||||||
| Denmark—0.3% | ||||||||
Pandora A/S | 540 | 40,071 | ||||||
Royal UNIBREW (e) | 49 | 7,886 | ||||||
TDC A/S | 5,885 | 57,298 | ||||||
|
| |||||||
| 105,255 | ||||||||
|
| |||||||
| Shares | Value | |||||||
| Finland—0.4% | ||||||||
Elisa Oyj | 1,622 | $48,289 | ||||||
Stora Enso Oyj, Class R | 4,503 | 46,194 | ||||||
UPM-Kymmene Oyj | 3,687 | 64,975 | ||||||
|
| |||||||
| 159,458 | ||||||||
|
| |||||||
| France—2.5% | ||||||||
BNP Paribas S.A. | 426 | 29,824 | ||||||
Cap Gemini S.A. | 511 | 37,175 | ||||||
Credit Agricole S.A. | 7,046 | 109,970 | ||||||
Natixis | 2,454 | 16,731 | ||||||
Plastic Omnium S.A. | 652 | 22,171 | ||||||
Rallye S.A. | 228 | 11,872 | ||||||
Safran S.A. | 651 | 44,198 | ||||||
Sanofi | 416 | 44,476 | ||||||
SCOR SE | 952 | 33,220 | ||||||
Societe Generale S.A. | 1,627 | 93,781 | ||||||
Teleperformance | 521 | 32,616 | ||||||
Thales S.A. | 842 | 50,431 | ||||||
Total S.A. | 4,264 | 299,361 | ||||||
UBISOFT Entertainment (e) | 594 | 11,881 | ||||||
Valeo S.A. | 625 | 83,961 | ||||||
|
| |||||||
| 921,668 | ||||||||
|
| |||||||
| Germany—3.4% | ||||||||
Bayer AG | 1,101 | 159,371 | ||||||
Bayerische Motoren Werke AG | 923 | 115,883 | ||||||
Daimler AG | 1,344 | 127,682 | ||||||
Deutsche Lufthansa AG | 2,561 | 67,678 | ||||||
Deutsche Post AG | 3,450 | 128,138 | ||||||
Deutsche Telekom AG | 2,049 | 34,599 | ||||||
Duerr AG | 98 | 8,397 | ||||||
Freenet AG | 1,589 | 49,392 | ||||||
Fresenius SE & Co. KGaA | 639 | 95,351 | ||||||
Hannover Rueck SE | 1,710 | 152,153 | ||||||
Jenoptik AG (d) | 728 | 12,523 | ||||||
Merck KGaA | 535 | 92,008 | ||||||
Muenchener Rueckversicherungs AG | 620 | 137,555 | ||||||
Stada Arzneimittel AG | 729 | 34,271 | ||||||
Talanx AG | 623 | 22,575 | ||||||
|
| |||||||
| 1,237,576 | ||||||||
|
| |||||||
| Hong Kong—0.6% | ||||||||
Chaowei Power Holdings Ltd. | 17,000 | 9,955 | ||||||
Cheung Kong Holdings Ltd. | 1,000 | 17,901 | ||||||
China Hongqiao Group Ltd. | 19,000 | 13,418 | ||||||
China Overseas Land & Investment Ltd. | 12,000 | 31,505 | ||||||
China Power International Development Ltd. | 53,000 | 18,691 | ||||||
Country Garden Holdings Co., Ltd. | 81,000 | 34,211 | ||||||
Geely Automobile Holdings Ltd. | 80,000 | 29,996 | ||||||
Kingboard Chemical Holdings Ltd. | 7,000 | 13,169 | ||||||
MGM China Holdings Ltd. | 8,400 | 29,273 | ||||||
Truly International Holdings Ltd. | 10,000 | 6,110 | ||||||
|
| |||||||
| 204,229 | ||||||||
|
| |||||||
| India—0.2% | ||||||||
Reliance Industries Ltd. GDR (a) | 535 | 19,137 | ||||||
Tata Motors Ltd. ADR | 1,598 | 59,509 | ||||||
|
| |||||||
| 78,646 | ||||||||
|
| |||||||
| Indonesia—0.3% | ||||||||
Bank Negara Indonesia Persero Tbk PT | 121,100 | 49,615 | ||||||
Bank Rakyat Indonesia Persero Tbk PT | 42,300 | 37,018 | ||||||
| 102 | Semiannual Report | | May 31, 2014 | | See accompanying Notes to Financial Statements |
Table of Contents
Schedule of Investments
May 31, 2014 (Unaudited)
| Shares | Value | |||||||
Indofood Sukses Makmur Tbk PT | 20,400 | $11,949 | ||||||
|
| |||||||
| 98,582 | ||||||||
|
| |||||||
| Ireland—0.6% | ||||||||
Dragon Oil PLC | 2,025 | 20,681 | ||||||
Greencore Group PLC | 8,338 | 40,737 | ||||||
Smurfit Kappa Group PLC | 5,818 | 140,450 | ||||||
|
| |||||||
| 201,868 | ||||||||
|
| |||||||
| Italy—0.8% | ||||||||
Azimut Holding SpA | 215 | 5,892 | ||||||
Enel SpA | 20,812 | 117,880 | ||||||
Gtech SpA | 1,937 | 53,360 | ||||||
Recordati SpA | 4,079 | 68,714 | ||||||
Telecom Italia SpA (e) | 30,100 | 37,415 | ||||||
Vittoria Assicurazioni SpA | 2,083 | 28,522 | ||||||
|
| |||||||
| 311,783 | ||||||||
|
| |||||||
| Japan—10.7% | ||||||||
Aeon Co., Ltd. | 9,800 | 118,623 | ||||||
Aisin Seiki Co., Ltd. | 2,000 | 73,069 | ||||||
Alfresa Holdings Corp. | 500 | 30,319 | ||||||
Asahi Kasei Corp. | 10,000 | 75,045 | ||||||
Bridgestone Corp. | 2,100 | 76,281 | ||||||
Central Japan Railway Co. | 1,100 | 146,278 | ||||||
COMSYS Holdings Corp. | 3,300 | 59,767 | ||||||
Daicel Corp. | 2,000 | 18,301 | ||||||
Daihatsu Motor Co., Ltd. | 6,100 | 105,733 | ||||||
Daiwa House Industry Co., Ltd. | 1,000 | 18,797 | ||||||
Exedy Corp. | 1,300 | 35,176 | ||||||
Fuji Heavy Industries Ltd. | 6,100 | 162,673 | ||||||
FUJIFILM Holdings Corp. | 4,500 | 116,909 | ||||||
Fukuoka Financial Group, Inc. | 11,000 | 47,912 | ||||||
H2O Retailing Corp. | 1,000 | 7,974 | ||||||
Hakuhodo DY Holdings, Inc. | 3,200 | 29,068 | ||||||
Hino Motors Ltd. | 800 | 10,157 | ||||||
Hogy Medical Co., Ltd. | 100 | 5,377 | ||||||
Idemitsu Kosan Co., Ltd. | 1,000 | 20,815 | ||||||
Inpex Corp. | 5,900 | 85,467 | ||||||
ITOCHU Corp. | 12,800 | 151,961 | ||||||
Izumi Co., Ltd. | 700 | 21,965 | ||||||
Japan Petroleum Exploration Co. | 200 | 8,333 | ||||||
JFE Holdings, Inc. | 3,000 | 57,241 | ||||||
JTEKT Corp. | 3,600 | 55,352 | ||||||
Kaneka Corp. | 2,000 | 12,542 | ||||||
KDDI Corp. | 3,300 | 197,185 | ||||||
Kinden Corp. | 1,000 | 8,612 | ||||||
Koito Manufacturing Co., Ltd. | 1,000 | 23,887 | ||||||
KYORIN Holdings, Inc. | 400 | 7,747 | ||||||
Kyowa Exeo Corp. | 2,200 | 30,360 | ||||||
Marubeni Corp. | 17,000 | 116,473 | ||||||
Matsumotokiyoshi Holdings Co., Ltd. | 600 | 20,563 | ||||||
MEIJI Holdings Co., Ltd. | 700 | 44,277 | ||||||
Mitsubishi UFJ Financial Group, Inc. | 20,000 | 112,886 | ||||||
Mitsui & Co., Ltd. | 7,200 | 109,566 | ||||||
Mizuho Financial Group, Inc. | 25,500 | 49,807 | ||||||
NHK Spring Co., Ltd. | 1,400 | 13,059 | ||||||
Nippon Telegraph & Telephone Corp. | 1,900 | 112,483 | ||||||
Nippon Yusen KK | 12,000 | 35,526 | ||||||
Nissan Motor Co., Ltd. | 12,500 | 112,813 | ||||||
ORIX Corp. | 4,800 | 76,781 | ||||||
Osaka Gas Co., Ltd. | 16,000 | 63,806 | ||||||
Resona Holdings, Inc. | 18,500 | 97,194 | ||||||
Ricoh Co., Ltd. | 6,400 | 78,622 | ||||||
Sankyu, Inc. | 3,000 | 13,396 | ||||||
Sanwa Holdings Corp. | 4,000 | 27,359 | ||||||
Seiko Epson Corp. | 1,900 | 66,332 | ||||||
Seino Holdings Co., Ltd. | 2,000 | 21,982 | ||||||
Sekisui House Ltd. | 9,400 | 124,228 | ||||||
Seven & I Holdings Co., Ltd. | 2,300 | 92,376 | ||||||
| Shares | Value | |||||||
Sumitomo Corp. | 6,200 | $81,485 | ||||||
Sumitomo Mitsui Financial Group, Inc. | 2,000 | 81,157 | ||||||
Sumitomo Osaka Cement Co., Ltd. | 5,000 | 18,101 | ||||||
Sumitomo Rubber Industries Ltd. | 6,100 | 90,997 | ||||||
Suzuki Motor Corp. | 2,800 | 83,668 | ||||||
Takashimaya Co., Ltd. | 2,000 | 19,729 | ||||||
Tokai Rika Co., Ltd. | 500 | 8,892 | ||||||
Tokyo Gas Co., Ltd. | 5,000 | 28,381 | ||||||
Tosoh Corp. | 7,000 | 33,522 | ||||||
Toyoda Gosei Co., Ltd. | 400 | 7,978 | ||||||
Toyota Motor Corp. | 4,300 | 243,534 | ||||||
Tsubakimoto Chain Co. | 1,000 | 7,754 | ||||||
Yokohama Rubber Co., Ltd. | 4,000 | 35,597 | ||||||
|
| |||||||
| 3,949,250 | ||||||||
|
| |||||||
| Korea (Republic of)—2.0% | ||||||||
GS Home Shopping, Inc. | 50 | 11,820 | ||||||
Hana Financial Group, Inc. | 1,080 | 39,288 | ||||||
Hyundai Motor Co. | 369 | 81,371 | ||||||
Kia Motors Corp. | 1,358 | 78,426 | ||||||
Korean Reinsurance Co. | 1,870 | 18,336 | ||||||
KT Corp. | 1,350 | 40,161 | ||||||
Samsung Electronics Co., Ltd. GDR | 576 | 409,536 | ||||||
SK Telecom Co., Ltd. | 349 | 75,017 | ||||||
|
| |||||||
| 753,955 | ||||||||
|
| |||||||
| Malaysia—0.2% | ||||||||
Tenaga Nasional Bhd. | 18,100 | 67,990 | ||||||
|
| |||||||
| Mexico—0.1% | ||||||||
Grupo Aeroportuario del Sureste S.A.B. de C.V. ADR | 87 | 11,190 | ||||||
Industrias Bachoco S.A.B. de C.V. ADR | 348 | 17,953 | ||||||
|
| |||||||
| 29,143 | ||||||||
|
| |||||||
| Netherlands—1.1% | ||||||||
Aegon NV | 3,049 | 26,492 | ||||||
AerCap Holdings NV (e) | 939 | 44,265 | ||||||
Airbus Group NV | 1,767 | 126,753 | ||||||
BinckBank NV | 970 | 11,342 | ||||||
Chicago Bridge & Iron Co. NV | 433 | 35,246 | ||||||
Reed Elsevier NV | 4,232 | 94,662 | ||||||
Royal Dutch Shell PLC, Class A | 2,006 | 78,906 | ||||||
|
| |||||||
| 417,666 | ||||||||
|
| |||||||
| New Zealand—0.0% | ||||||||
Air New Zealand Ltd. | 6,290 | 11,707 | ||||||
|
| |||||||
| Norway—0.8% | ||||||||
Bakkafrost P/F | 1,076 | 20,071 | ||||||
DNB ASA | 6,821 | 128,289 | ||||||
Fred Olsen Energy ASA | 378 | 10,358 | ||||||
SpareBank 1 SMN | 1,751 | 15,462 | ||||||
Telenor ASA | 3,912 | 92,785 | ||||||
Yara International ASA | 473 | 21,601 | ||||||
|
| |||||||
| 288,566 | ||||||||
|
| |||||||
| Philippines—0.2% | ||||||||
Alliance Global Group, Inc. | 75,600 | 51,322 | ||||||
Universal Robina Corp. | 11,280 | 38,474 | ||||||
|
| |||||||
| 89,796 | ||||||||
|
| |||||||
| Poland—0.0% | ||||||||
Tauron Polska Energia S.A. | 9,583 | 16,886 | ||||||
|
| |||||||
| Russian Federation—0.4% | ||||||||
Gazprom Neft OAO ADR | 558 | 11,272 | ||||||
Lukoil OAO ADR | 1,292 | 73,075 | ||||||
Sberbank of Russia ADR | 2,975 | 30,137 | ||||||
Sistema JSFC GDR | 493 | 14,124 | ||||||
Surgutneftegas OAO ADR | 4,947 | 35,866 | ||||||
|
| |||||||
| 164,474 | ||||||||
|
| |||||||
| Shares | Value | |||||||
| Singapore—0.1% | ||||||||
AIMS AMP Capital Industrial REIT | 8,000 | $ | 9,254 | |||||
DBS Group Holdings Ltd. | 1,000 | 13,483 | ||||||
Wing Tai Holdings Ltd. | 4,000 | 6,222 | ||||||
|
| |||||||
| 28,959 | ||||||||
|
| |||||||
| South Africa—0.3% | ||||||||
Imperial Holdings Ltd. | 923 | 17,494 | ||||||
Liberty Holdings Ltd. | 1,156 | 14,146 | ||||||
Sasol Ltd. | 934 | 52,566 | ||||||
Telkom S.A. SOC Ltd. (e) | 5,598 | 20,484 | ||||||
|
| |||||||
| 104,690 | ||||||||
|
| |||||||
| Spain—0.6% | ||||||||
Enagas S.A. | 1,652 | 48,617 | ||||||
Gas Natural SDG S.A. | 2,515 | 72,487 | ||||||
Repsol S.A. | 3,361 | 94,710 | ||||||
|
| |||||||
| 215,814 | ||||||||
|
| |||||||
| Sweden—1.1% | ||||||||
Holmen AB, Class B | 501 | 18,257 | ||||||
Loomis AB, Class B | 666 | 18,736 | ||||||
NCC AB, Class B | 482 | 16,894 | ||||||
Skandinaviska Enskilda Banken AB, Class A | 10,508 | 142,872 | ||||||
Swedbank AB, Class A | 4,435 | 118,095 | ||||||
TeliaSonera AB | 14,337 | 106,253 | ||||||
|
| |||||||
| 421,107 | ||||||||
|
| |||||||
| Switzerland—2.1% | ||||||||
ACE Ltd. | 1,162 | 120,511 | ||||||
Baloise Holding AG | 419 | 50,344 | ||||||
Bucher Industries AG | 149 | 49,324 | ||||||
Credit Suisse Group AG (e) | 1,474 | 43,776 | ||||||
Georg Fischer AG (e) | 49 | 36,978 | ||||||
Givaudan S.A. (e) | 57 | 93,585 | ||||||
Roche Holdings AG | 512 | 150,913 | ||||||
Swiss Life Holding AG (e) | 166 | 39,924 | ||||||
Swiss Re AG | 1,448 | 128,858 | ||||||
TE Connectivity Ltd. | 727 | 43,227 | ||||||
|
| |||||||
| 757,440 | ||||||||
|
| |||||||
| Taiwan—1.0% | ||||||||
Asustek Computer, Inc. | 3,000 | 33,052 | ||||||
Chailease Holding Co., Ltd. | 14,000 | 35,258 | ||||||
Lite-On Technology Corp. | 29,000 | 47,034 | ||||||
Mega Financial Holding Co., Ltd. | 66,000 | 55,156 | ||||||
Taishin Financial Holding Co., Ltd. | 65,000 | 32,323 | ||||||
Taiwan Semiconductor Manufacturing Co., Ltd. | 32,000 | 128,256 | ||||||
Vanguard International Semiconductor Corp. | 26,000 | 40,373 | ||||||
|
| |||||||
| 371,452 | ||||||||
|
| |||||||
| Thailand—0.3% | ||||||||
Advanced Info Service PCL (c) | 4,500 | 31,442 | ||||||
Kasikornbank PCL | 6,500 | 37,097 | ||||||
Krung Thai Bank PCL (c) | 17,500 | 10,098 | ||||||
PTT Global Chemical PCL (c) | 9,900 | 20,758 | ||||||
|
| |||||||
| 99,395 | ||||||||
|
| |||||||
| Turkey—0.6% | ||||||||
Eregli Demir ve Celik Fabrikalari TAS | 27,132 | 40,388 | ||||||
Haci Omer Sabanci Holding AS | 4,425 | 21,501 | ||||||
TAV Havalimanlari Holding AS | 3,195 | 25,458 | ||||||
Turk Hava Yollari | 14,823 | 50,401 | ||||||
Turkcell Iletisim Hizmetleri AS (e) | 4,186 | 26,157 | ||||||
Turkiye Halk Bankasi AS | 4,361 | 33,867 | ||||||
Turkiye Vakiflar Bankasi Tao | 6,726 | 16,219 | ||||||
|
| |||||||
| 213,991 | ||||||||
|
| |||||||
| See accompanying Notes to Financial Statements | | May 31, 2014 | | Semiannual Report | 103 |
Table of Contents
Schedule of Investments
May 31, 2014 (Unaudited)
| Shares | Value | |||||||
| United Kingdom—6.4% | ||||||||
Aberdeen Asset Management PLC | 2,975 | $ | 22,234 | |||||
Barclays PLC | 34,359 | 142,137 | ||||||
Barratt Developments PLC | 2,117 | 12,689 | ||||||
Beazley PLC | 4,079 | 16,744 | ||||||
Berendsen PLC | 1,729 | 28,855 | ||||||
Berkeley Group Holdings PLC | 816 | 30,900 | ||||||
Bovis Homes Group PLC | 2,303 | 29,314 | ||||||
BP PLC | 13,598 | 114,625 | ||||||
Britvic PLC | 2,511 | 31,411 | ||||||
BT Group PLC | 16,022 | 106,709 | ||||||
Centrica PLC | 12,567 | 70,792 | ||||||
Connect Group PLC | 10,090 | 34,671 | ||||||
DCC PLC | 667 | 39,243 | ||||||
Delphi Automotive PLC | 573 | 39,571 | ||||||
easyJet PLC | 5,319 | 136,594 | ||||||
EnQuest PLC (e) | 30,918 | 72,987 | ||||||
Galliford Try PLC | 635 | 12,050 | ||||||
Great Portland Estates PLC REIT | 3,075 | 33,593 | ||||||
Greene King PLC | 2,184 | 31,344 | ||||||
Home Retail Group PLC | 8,702 | 27,511 | ||||||
HSBC Holdings PLC | 10,024 | 105,737 | ||||||
Interserve PLC | 1,950 | 21,147 | ||||||
ITV PLC | 14,717 | 44,954 | ||||||
J Sainsbury PLC | 9,129 | 53,012 | ||||||
Jupiter Fund Management PLC | 2,462 | 16,580 | ||||||
Keller Group PLC | 1,251 | 20,017 | ||||||
Legal & General Group PLC | 40,703 | 157,320 | ||||||
Lookers PLC | 3,923 | 9,338 | ||||||
Marston’s PLC | 4,585 | 11,618 | ||||||
Mondi PLC | 8,118 | 146,032 | ||||||
Next PLC | 728 | 81,256 | ||||||
Old Mutual PLC | 19,593 | 66,439 | ||||||
Pace PLC | 2,436 | 15,306 | ||||||
Paragon Group of Cos. PLC | 2,121 | 13,380 | ||||||
Persimmon PLC (e) | 1,538 | 34,517 | ||||||
Royal Dutch Shell PLC, Class B | 2,864 | 117,073 | ||||||
Shire PLC | 2,332 | 134,495 | ||||||
SSE PLC | 998 | 26,048 | ||||||
Tate & Lyle PLC | 3,382 | 39,280 | ||||||
Taylor Wimpey PLC | 25,864 | 47,004 | ||||||
TUI Travel PLC | 4,549 | 31,312 | ||||||
WH Smith PLC | 7,265 | 126,382 | ||||||
|
| |||||||
| 2,352,221 | ||||||||
|
| |||||||
| United States—49.3% | ||||||||
Actavis PLC (e) | 874 | 184,886 | ||||||
Activision Blizzard, Inc. | 3,254 | 67,618 | ||||||
AES Corp. | 3,799 | 53,566 | ||||||
Aetna, Inc. | 1,737 | 134,704 | ||||||
AG Mortgage Investment Trust, Inc. REIT | 467 | 8,873 | ||||||
AGCO Corp. | 293 | 15,810 | ||||||
Air Lease Corp. | 386 | 15,926 | ||||||
Alaska Air Group, Inc. | 1,265 | 124,552 | ||||||
Alliance Data Systems Corp. (e) | 490 | 125,465 | ||||||
Allstate Corp. | 1,749 | 101,897 | ||||||
Altria Group, Inc. | 906 | 37,653 | ||||||
Amdocs Ltd. | 1,373 | 66,069 | ||||||
Ameren Corp. | 3,412 | 134,262 | ||||||
American Airlines Group, Inc. (e) | 2,263 | 90,882 | ||||||
American Capital Mortgage Investment Corp. REIT | 1,135 | 23,188 | ||||||
American Electric Power Co., Inc. | 1,825 | 97,364 | ||||||
American Financial Group, Inc. | 612 | 35,729 | ||||||
AmerisourceBergen Corp. | 665 | 48,665 | ||||||
Amgen, Inc. | 2,109 | 244,623 | ||||||
Amtrust Financial Services, Inc. | 766 | 32,708 | ||||||
Andersons, Inc. (d) | 229 | 11,665 | ||||||
| Shares | Value | |||||||
Annaly Capital Management, Inc. REIT | 2,864 | $ | 33,767 | |||||
Apple, Inc. | 1,007 | 637,431 | ||||||
Archer-Daniels-Midland Co. | 1,812 | 81,431 | ||||||
Arrow Electronics, Inc. (e) | 199 | 11,482 | ||||||
AT&T, Inc. | 8,482 | 300,857 | ||||||
Avery Dennison Corp. | 720 | 36,504 | ||||||
Avista Corp. | 630 | 19,725 | ||||||
Avnet, Inc. | 779 | 33,941 | ||||||
Bank of America Corp. | 13,256 | 200,696 | ||||||
BB&T Corp. | 2,368 | 89,795 | ||||||
Becton Dickinson and Co. | 903 | 106,283 | ||||||
Blackhawk Network Holdings, Inc., Class B (e) | 524 | 12,854 | ||||||
Capital One Financial Corp. | 1,044 | 82,361 | ||||||
CenturyLink, Inc. | 3,552 | 133,804 | ||||||
CF Industries Holdings, Inc. | 411 | 100,000 | ||||||
Chemed Corp. | 249 | 21,932 | ||||||
Chesapeake Utilities Corp. | 573 | 37,480 | ||||||
Chevron Corp. | 3,643 | 447,324 | ||||||
Chubb Corp. | 516 | 47,813 | ||||||
Cigna Corp. | 1,204 | 108,095 | ||||||
Cinemark Holdings, Inc. | 420 | 13,238 | ||||||
Cisco Systems, Inc. | 12,138 | 298,838 | ||||||
Citigroup, Inc. | 4,843 | 230,382 | ||||||
CMS Energy Corp. | 3,849 | 114,508 | ||||||
CNA Financial Corp. | 675 | 27,122 | ||||||
CNO Financial Group, Inc. | 2,138 | 34,486 | ||||||
Comcast Corp., Class A | 6,054 | 314,941 | ||||||
Computer Sciences Corp. | 644 | 40,501 | ||||||
CONMED Corp. | 325 | 14,593 | ||||||
ConocoPhillips | 4,259 | 340,464 | ||||||
Consolidated Edison, Inc. | 1,277 | 70,248 | ||||||
Convergys Corp. | 1,816 | 39,625 | ||||||
Cooper Cos., Inc. | 872 | 112,505 | ||||||
Corning, Inc. | 6,417 | 136,682 | ||||||
Crane Co. | 448 | 33,201 | ||||||
CVS Caremark Corp. | 2,832 | 221,802 | ||||||
DaVita HealthCare Partners, Inc. (e) | 599 | 42,283 | ||||||
Deluxe Corp. | 1,038 | 58,221 | ||||||
Dillard’s, Inc., Class A | 663 | 74,753 | ||||||
Discover Financial Services | 2,533 | 149,776 | ||||||
Dr. Pepper Snapple Group, Inc. | 879 | 50,718 | ||||||
DST Systems, Inc. | 301 | 27,436 | ||||||
DTE Energy Co. | 2,012 | 153,153 | ||||||
Duke Energy Corp. | 722 | 51,320 | ||||||
Edison International | 2,102 | 115,904 | ||||||
EMC Corp. | 3,296 | 87,542 | ||||||
Ensco PLC, Class A | 643 | 33,860 | ||||||
Ensign Group, Inc. | 176 | 8,254 | ||||||
Entergy Corp. | 1,474 | 111,169 | ||||||
Enterprise Financial Services Corp. | 629 | 10,989 | ||||||
Euronet Worldwide, Inc. (e) | 230 | 10,842 | ||||||
Exelon Corp. | 1,677 | 61,764 | ||||||
Exxon Mobil Corp. | 4,181 | 420,316 | ||||||
Fidelity National Information Services, Inc. | 644 | 34,873 | ||||||
Fifth Third Bancorp | 5,465 | 113,071 | ||||||
First Interstate Bancsystem, Inc. | 542 | 13,913 | ||||||
First Merchants Corp. | 499 | 9,900 | ||||||
GameStop Corp., Class A | 913 | 34,557 | ||||||
Gap, Inc. | 1,887 | 77,801 | ||||||
GATX Corp. | 1,502 | 98,907 | ||||||
General Electric Co. | 4,734 | 126,824 | ||||||
Global Cash Access Holdings, Inc. (e) | 1,093 | 9,728 | ||||||
GNC Holdings, Inc., Class A | 407 | 15,026 | ||||||
Goldman Sachs Group, Inc. | 839 | 134,081 | ||||||
Google, Inc., Class A (e) | 80 | 45,732 | ||||||
Google, Inc., Class C (e) | 80 | 44,878 | ||||||
Grand Canyon Education, Inc. (e) | 787 | 34,667 | ||||||
| Shares | Value | |||||||
Hanesbrands, Inc. | 854 | $ | 72,445 | |||||
Hanger, Inc. (e) | 345 | 10,481 | ||||||
Hanover Insurance Group, Inc. | 527 | 31,646 | ||||||
HCC Insurance Holdings, Inc. | 755 | 35,470 | ||||||
Heartland Payment Systems, Inc. | 2,058 | 85,304 | ||||||
Helmerich & Payne, Inc. | 963 | 105,882 | ||||||
Hewlett-Packard Co. | 4,215 | 141,203 | ||||||
HollyFrontier Corp. | 1,813 | 89,290 | ||||||
Home Depot, Inc. | 1,743 | 139,841 | ||||||
Humana, Inc. | 602 | 74,925 | ||||||
Huntington Ingalls Industries, Inc. | 564 | 56,304 | ||||||
Ingram Micro, Inc., Class A (e) | 1,630 | 45,265 | ||||||
Intel Corp. | 7,535 | 205,856 | ||||||
International Business Machines Corp. | 1,572 | 289,814 | ||||||
Investment Technology Group, Inc. (e) | 1,086 | 20,775 | ||||||
j2 Global, Inc. (d) | 343 | 16,245 | ||||||
Jarden Corp. (e) | 542 | 30,666 | ||||||
Jazz Pharmaceuticals PLC (e) | 567 | 80,435 | ||||||
Johnson & Johnson | 4,063 | 412,232 | ||||||
JPMorgan Chase & Co. | 5,394 | 299,745 | ||||||
Kaiser Aluminum Corp. | 149 | 10,202 | ||||||
Kimberly-Clark Corp. | 1,143 | 128,416 | ||||||
Kroger Co. | 3,802 | 181,508 | ||||||
Laclede Group, Inc. | 332 | 15,498 | ||||||
Lam Research Corp. (e) | 1,506 | 93,432 | ||||||
Lannett Co., Inc. (e) | 331 | 13,829 | ||||||
Lear Corp. | 464 | 40,855 | ||||||
Lennox International, Inc. | 333 | 28,278 | ||||||
Lincoln National Corp. | 2,162 | 103,690 | ||||||
Lorillard, Inc. | 1,611 | 100,156 | ||||||
Macy’s, Inc. | 1,992 | 119,301 | ||||||
Maiden Holdings Ltd. | 1,323 | 16,194 | ||||||
MainSource Financial Group, Inc. | 731 | 12,171 | ||||||
Manpowergroup, Inc. | 701 | 57,468 | ||||||
Marathon Petroleum Corp. | 1,440 | 128,722 | ||||||
Marriott Vacations Worldwide Corp. (e) | 247 | 13,993 | ||||||
McKesson Corp. | 1,135 | 215,241 | ||||||
Medtronic, Inc. | 1,999 | 121,999 | ||||||
Mentor Graphics Corp. (d) | 1,801 | 38,163 | ||||||
MetLife, Inc. | 339 | 17,265 | ||||||
Micron Technology, Inc. (e) | 1,165 | 33,307 | ||||||
Microsoft Corp. | 4,123 | 168,796 | ||||||
Molson Coors Brewing Co., Class B | 1,358 | 89,261 | ||||||
Morgan Stanley | 3,103 | 95,759 | ||||||
Murphy Oil Corp. | 326 | 20,104 | ||||||
Mylan, Inc. (e) | 4,160 | 207,334 | ||||||
NeuStar, Inc., Class A (e) | 418 | 11,712 | ||||||
Northrop Grumman Corp. | 1,721 | 209,188 | ||||||
Nu Skin Enterprises, Inc., Class A | 1,006 | 74,283 | ||||||
O’Reilly Automotive, Inc. (e) | 420 | 62,139 | ||||||
Ocwen Financial Corp. (e) | 330 | 11,573 | ||||||
Olin Corp. (d) | 608 | 16,568 | ||||||
Omega Healthcare Investors, Inc. REIT | 1,097 | 40,468 | ||||||
Omnicare, Inc. | 1,960 | 124,558 | ||||||
Oracle Corp. | 5,776 | 242,708 | ||||||
Packaging Corp. of America | 453 | 31,330 | ||||||
PAREXEL International Corp. (e) | 282 | 14,227 | ||||||
PartnerRe Ltd. | 511 | 54,866 | ||||||
PerkinElmer, Inc. | 696 | 31,299 | ||||||
PharMerica Corp. (e) | 4,655 | 126,337 | ||||||
Phillips 66 | 1,890 | 160,253 | ||||||
Pinnacle West Capital Corp. | 899 | 49,823 | ||||||
PNC Financial Services Group, Inc. | 1,339 | 114,177 | ||||||
| 104 | Semiannual Report | | May 31, 2014 | | See accompanying Notes to Financial Statements |
Table of Contents
Schedule of Investments
May 31, 2014 (Unaudited)
| Shares | Value | |||||||
Popular, Inc. (e) | 502 | $ | 15,150 | |||||
Portland General Electric Co. | 3,380 | 111,777 | ||||||
Protective Life Corp. | 1,503 | 78,607 | ||||||
QUALCOMM, Inc. | 3,293 | 264,922 | ||||||
Questcor Pharmaceuticals, Inc. | 1,415 | 127,534 | ||||||
Republic Airways Holdings, Inc. (e) | 1,105 | 11,625 | ||||||
ResMed, Inc. | 813 | 40,699 | ||||||
Reynolds American, Inc. | 988 | 58,914 | ||||||
Rock-Tenn Co., Class A | 355 | 35,866 | ||||||
Safeway, Inc. | 3,194 | 109,682 | ||||||
Salix Pharmaceuticals Ltd. (e) | 257 | 29,319 | ||||||
Sanderson Farms, Inc. (d) | 387 | 35,801 | ||||||
SanDisk Corp. | 1,403 | 135,572 | ||||||
Seagate Technology PLC | 2,039 | 109,555 | ||||||
SkyWest, Inc. | 571 | 6,532 | ||||||
Skyworks Solutions, Inc. | 769 | 33,305 | ||||||
Smith & Wesson Holding Corp. (e) | 837 | 13,292 | ||||||
Snap-on, Inc. | 92 | 10,789 | ||||||
Southwest Gas Corp. | 617 | 32,306 | ||||||
SS&C Technologies Holdings, Inc. (e) | 733 | 31,262 | ||||||
St. Jude Medical, Inc. | 1,247 | 80,930 | ||||||
Starwood Property Trust, Inc. REIT | 1,384 | 33,756 | ||||||
SunTrust Banks, Inc. | 402 | 15,405 | ||||||
Susquehanna Bancshares, Inc. | 1,006 | 9,939 | ||||||
Symetra Financial Corp. | 1,066 | 22,226 | ||||||
Synaptics, Inc. (e) | 250 | 17,020 | ||||||
Syntel, Inc. (e) | 171 | 13,834 | ||||||
Thermo Fisher Scientific, Inc. | 1,020 | 119,248 | ||||||
Time Warner Cable, Inc. | 326 | 46,018 | ||||||
Travelers Cos., Inc. | 1,476 | 137,932 | ||||||
Trinity Industries, Inc. | 834 | 72,166 | ||||||
Triumph Group, Inc. | 229 | 15,870 | ||||||
Tyson Foods, Inc., Class A | 2,277 | 96,681 | ||||||
Umpqua Holdings Corp. | 1,086 | 17,995 | ||||||
UniFirst Corp. | 145 | 14,348 | ||||||
Union Pacific Corp. | 1,442 | 287,347 | ||||||
United Rentals, Inc. (e) | 285 | 28,799 | ||||||
United Therapeutics Corp. (e) | 476 | 45,572 | ||||||
UnitedHealth Group, Inc. | 1,986 | 158,145 | ||||||
USANA Health Sciences, Inc. (e) | 107 | 7,694 | ||||||
Valero Energy Corp. | 1,708 | 95,733 | ||||||
Validus Holdings Ltd. | 1,403 | 52,374 | ||||||
Valmont Industries, Inc. | 246 | 38,118 | ||||||
Verizon Communications, Inc. | 7,456 | 372,502 | ||||||
Viacom, Inc., Class B | 731 | 62,376 | ||||||
Webster Financial Corp. | 594 | 17,773 | ||||||
WellPoint, Inc. | 634 | 68,700 | ||||||
Wells Fargo & Co. | 6,163 | 312,957 | ||||||
WesBanco, Inc. | 400 | 11,776 | ||||||
Westar Energy, Inc. | 2,045 | 73,722 | ||||||
Western Alliance Bancorp (e) | 866 | 19,814 | ||||||
Western Digital Corp. | 1,507 | 132,390 | ||||||
Westlake Chemical Corp. | 274 | 22,153 | ||||||
Whirlpool Corp. | 261 | 37,467 | ||||||
WSFS Financial Corp. | 144 | 9,780 | ||||||
Zimmer Holdings, Inc. | 850 | 88,698 | ||||||
|
| |||||||
| 18,145,116 | ||||||||
|
| |||||||
| Total Common Stock (cost—$33,204,612) | 35,130,889 | |||||||
|
| |||||||
| Shares | Value | |||||||
| Preferred Stock—1.2% | ||||||||
| Brazil—0.6% | ||||||||
Cia Energetica de Sao Paulo, Class B | 1,700 | $ | 20,397 | |||||
Itau Unibanco Holding S.A. | 3,500 | 54,524 | ||||||
Oi S.A. | 15,000 | 12,989 | ||||||
Usinas Siderurgicas de Minas Gerais S.A., Class A (e) | 7,000 | 24,653 | ||||||
Vale S.A. | 8,800 | 100,715 | ||||||
|
| |||||||
| 213,278 | ||||||||
|
| |||||||
| Germany—0.4% | ||||||||
Henkel AG & Co. KGaA | 324 | 37,427 | ||||||
Volkswagen AG | 388 | 103,319 | ||||||
|
| |||||||
| 140,746 | ||||||||
|
| |||||||
| Korea (Republic of)—0.2% | ||||||||
Hyundai Motor Co. | 566 | 79,969 | ||||||
|
| |||||||
| Total Preferred Stock (cost—$451,046) | 433,993 | |||||||
|
| |||||||
| Principal Amount (000s) | ||||||||
| Repurchase Agreements—1.3% | ||||||||
State Street Bank and Trust Co., dated 5/30/14, 0.00%, due 6/2/14, proceeds $465,000; collateralized by U.S. Treasury Notes, 0.75%, due 3/31/18, valued at $478,148 including accrued interest |
| |||||||
(cost—$465,000) | $465 | 465,000 | ||||||
|
| |||||||
| Total Investments (cost—$34,120,658) (b)—97.9% | 36,029,882 | |||||||
|
| |||||||
| Other assets less liabilities—2.1% | 786,836 | |||||||
|
| |||||||
| Net Assets—100.0% | $36,816,718 | |||||||
|
| |||||||
Notes to Schedule of Investments:
(a) 144A—Exempt from registration under Rule 144A of the Securities Act of 1933. These securities may be resold in transactions exempt from registration, typically only to qualified institutional buyers. Unless otherwise indicated, these securities are not considered to be illiquid.
(b) Securities with an aggregate value of $14,000,501, representing 38.0% of net assets, were valued utilizing modeling tools provided by a third-party vendor. See Note 1(a) and Note 1(b) in the Notes to Financial Statements.
(c) Fair-Valued—Securities with an aggregate value of $72,294, representing 0.2% of net assets. See Note 1(a) and Note 1(b) in the Notes to Financial Statements.
(d) Affiliated security.
(e) Non-income producing.
Glossary:
ADR—American Depositary Receipt
GDR—Global Depositary Receipt
REIT—Real Estate Investment Trust
The industry classification of portfolio holdings and other assets less liabilities shown as a percentage of net assets were as follows:
Banks | 11.7% | |||
Oil, Gas & Consumable Fuels | 8.4% | |||
Insurance | 5.9% | |||
Pharmaceuticals | 5.4% | |||
Diversified Telecommunication Services | 4.3% | |||
Technology Hardware, Storage & Peripherals | 4.0% | |||
Health Care Providers & Services | 3.4% | |||
Automobiles | 3.2% | |||
Food & Staples Retailing | 2.7% | |||
Electric Utilities | 2.7% | |||
Semiconductors & Semiconductor Equipment | 2.7% | |||
IT Services | 2.1% | |||
Auto Components | 1.8% | |||
Trading Companies & Distributors | 1.7% | |||
Multi-Utilities | 1.7% | |||
Media | 1.6% | |||
Software | 1.6% | |||
Chemicals | 1.6% | |||
Communications Equipment | 1.5% | |||
Health Care Equipment & Supplies | 1.4% | |||
Airlines | 1.4% | |||
Food Products | 1.4% | |||
Aerospace & Defense | 1.3% | |||
Road & Rail | 1.3% | |||
Wireless Telecommunication Services | 1.2% | |||
Specialty Retail | 1.2% | |||
Electronic Equipment, Instruments & Components | 1.1% | |||
Capital Markets | 1.1% | |||
Multi-line Retail | 1.1% | |||
Household Durables | 0.9% | |||
Machinery | 0.8% | |||
Gas Utilities | 0.8% | |||
Biotechnology | 0.8% | |||
Metals & Mining | 0.8% | |||
Paper & Forest Products | 0.7% | |||
Construction & Engineering | 0.7% | |||
Containers & Packaging | 0.7% | |||
Real Estate Investment Trust | 0.7% | |||
Independent Power Producers & Energy Traders | 0.7% | |||
Consumer Finance | 0.6% | |||
Industrial Conglomerates | 0.6% | |||
Tobacco | 0.6% | |||
Auto Manufacturers | 0.5% | |||
Life Sciences Tools & Services | 0.5% | |||
Real Estate Management & Development | 0.5% | |||
Beverages | 0.4% | |||
Hotels, Restaurants & Leisure | 0.4% | |||
Energy Equipment & Services | 0.4% | |||
Diversified Financial Services | 0.4% | |||
Commercial Services & Supplies | 0.4% | |||
Household Products | 0.4% | |||
Air Freight & Logistics | 0.4% | |||
Professional Services | 0.4% | |||
Textiles, Apparel & Luxury Goods | 0.3% | |||
Internet Software & Services | 0.3% | |||
Thrifts & Mortgage Finance | 0.2% | |||
Personal Products | 0.2% | |||
Building Products | 0.2% | |||
Distributors | 0.2% |
| See accompanying Notes to Financial Statements | | May 31, 2014 | | Semiannual Report | 105 |
Table of Contents
Schedule of Investments
May 31, 2014 (Unaudited)
Transportation Infrastructure | 0.1% | |||
Water Utilities | 0.1% | |||
Internet & Catalog Retail | 0.1% | |||
Household Products/Wares | 0.1% | |||
Marine | 0.1% | |||
Diversified Consumer Services | 0.1% | |||
Construction Materials | 0.0% | |||
Leisure Equipment & Products | 0.0% | |||
Telecommunications | 0.0% | |||
Repurchase Agreements | 1.3% | |||
Other assets less liabilities | 2.1% | |||
|
| |||
| 100.0% | ||||
|
|
AllianzGI China Equity Fund
| Shares | Value | |||||||
| Common Stock—95.8% | ||||||||
| China—81.4% | ||||||||
Bank of China Ltd., Class H | 481,500 | $230,285 | ||||||
Beijing Enterprises Holdings Ltd. | 26,000 | 224,712 | ||||||
China Everbright International Ltd. | 103,000 | 131,579 | ||||||
China Life Insurance Co., Ltd., Class H | 36,500 | 100,264 | ||||||
China Merchants Bank Co., Ltd., Class H | 52,500 | 96,926 | ||||||
China Minsheng Banking Corp. Ltd., Class H | 237,000 | 243,863 | ||||||
China Mobile Ltd. | 24,500 | 239,964 | ||||||
China Petroleum & Chemical Corp., Class H | 96,200 | 86,995 | ||||||
China Suntien Green Energy Corp. Ltd., Class H (c) | 168,000 | 57,207 | ||||||
China Telecom Corp. Ltd., Class H | 130,000 | 65,680 | ||||||
CNOOC Ltd. | 113,000 | 193,099 | ||||||
Comba Telecom Systems Holdings Ltd. (d) | 176,600 | 49,329 | ||||||
Digital China Holdings Ltd. (b)(c) | 105,000 | 95,751 | ||||||
Industrial & Commercial Bank of China Ltd., Class H | 339,335 | 220,384 | ||||||
PetroChina Co., Ltd., Class H | 208,000 | 248,357 | ||||||
Ping An Insurance Group Co. of China Ltd., Class H | 24,000 | 185,717 | ||||||
Qingling Motors Co., Ltd., Class H (c) | 522,000 | 161,590 | ||||||
Semiconductor Manufacturing International Corp. (d) | 1,145,000 | 97,212 | ||||||
Shui On Land Ltd. | 275,500 | 72,616 | ||||||
Tencent Holdings Ltd. | 21,500 | 302,659 | ||||||
Tiangong International Co., Ltd. | 328,000 | 60,240 | ||||||
Yuexiu Transport Infrastructure Ltd. | 302,000 | 164,879 | ||||||
Zhuzhou CSR Times Electric Co., Ltd., Class H | 28,700 | 84,079 | ||||||
|
| |||||||
| 3,413,387 | ||||||||
|
| |||||||
| Hong Kong—14.4% | ||||||||
Aeon Stores Hong Kong Co., Ltd. | 104,000 | 125,423 | ||||||
Beijing Jingneng Clean Energy Co., Ltd., Class H (c) | 140,000 | 63,426 | ||||||
Future Bright Holdings Ltd. | 276,000 | 134,073 | ||||||
Goldpac Group Ltd. (d) | 104,000 | 95,042 | ||||||
Hong Kong Exchanges and Clearing Ltd. | 6,800 | 127,055 | ||||||
Natural Beauty Bio-Technology Ltd. | 350,000 | 16,519 | ||||||
Sa Sa International Holdings Ltd. | 60,000 | 40,772 | ||||||
|
| |||||||
| 602,310 | ||||||||
|
| |||||||
| Total Investments (cost—$3,976,633) (a)—95.8% | 4,015,697 | |||||||
|
| |||||||
| Other assets less liabilities—4.2% | 176,456 | |||||||
|
| |||||||
| Net Assets—100.0% | $4,192,153 | |||||||
|
| |||||||
Notes to Schedule of Investments:
(a) Securities with an aggregate value of $3,575,726, representing 85.3% of net assets, were valued utilizing modeling tools provided by a third-party vendor. See Note 1(a) and Note 1(b) in the Notes to Financial Statements.
(b) Fair-Valued—Security with a value of $95,751, representing 2.3% of net assets. See Note 1(a) and Note 1(b) in the Notes to Financial Statements.
(c) Affiliated security.
(d) Non-income producing.
| 106 | Semiannual Report | | May 31, 2014 | | See accompanying Notes to Financial Statements |
Table of Contents
Schedule of Investments
May 31, 2014 (Unaudited)
The industry classification of portfolio holdings and other assets less liabilities shown as a percentage of net assets were as follows:
Banks | 18.9% | |||
Oil, Gas & Consumable Fuels | 14.0% | |||
Internet Software & Services | 7.2% | |||
Insurance | 6.8% | |||
Wireless Telecommunication Services | 5.7% | |||
Industrial Conglomerates | 5.4% | |||
Transportation Infrastructure | 3.9% | |||
Automobiles | 3.9% | |||
Hotels, Restaurants & Leisure | 3.2% | |||
Commercial Services & Supplies | 3.1% | |||
Diversified Financial Services | 3.0% | |||
Multi-line Retail | 3.0% | |||
Semiconductors & Semiconductor Equipment | 2.3% | |||
Electronic Equipment, Instruments & Components | 2.3% | |||
Technology Hardware, Storage & Peripherals | 2.3% | |||
Electrical Equipment | 2.0% | |||
Real Estate Management & Development | 1.7% | |||
Diversified Telecommunication Services | 1.6% | |||
Independent Power Producers & Energy Traders | 1.5% | |||
Metals & Mining | 1.4% | |||
Communications Equipment | 1.2% | |||
Specialty Retail | 1.0% | |||
Personal Products | 0.4% | |||
Other assets less liabilities | 4.2% | |||
|
| |||
| 100.0% | ||||
|
|
AllianzGI Convertible Fund
| Principal Amount (000s) | Value | |||||||
| Convertible Bonds—83.5% | ||||||||
| Aerospace & Defense—0.5% | ||||||||
Alliant Techsystems, Inc., |
| |||||||
3.00%, 8/15/24 | $7,180 | $11,923,288 | ||||||
|
| |||||||
| Airlines—1.0% | ||||||||
United Airlines, Inc., |
| |||||||
4.50%, 1/15/15 | 7,135 | 16,901,031 | ||||||
United Continental Holdings, Inc., |
| |||||||
6.00%, 10/15/29 | 1,915 | 9,803,603 | ||||||
|
| |||||||
| 26,704,634 | ||||||||
|
| |||||||
| Apparel & Textiles—1.0% | ||||||||
Iconix Brand Group, Inc., |
| |||||||
1.50%, 3/15/18 | 18,650 | 26,856,000 | ||||||
|
| |||||||
| Auto Components—0.9% | ||||||||
Meritor, Inc., |
| |||||||
7.875%, 3/1/26 | 13,625 | 22,557,891 | ||||||
|
| |||||||
| Auto Manufacturers—2.9% | ||||||||
Ford Motor Co., |
| |||||||
4.25%, 11/15/16 | 14,390 | 27,601,819 | ||||||
Tesla Motors, Inc., |
| |||||||
0.25%, 3/1/19 | 34,085 | 32,018,597 | ||||||
Wabash National Corp., |
| |||||||
3.375%, 5/1/18 | 12,145 | 16,851,187 | ||||||
|
| |||||||
| 76,471,603 | ||||||||
|
| |||||||
| Biotechnology—6.5% | ||||||||
Cubist Pharmaceuticals, Inc. (a)(b), |
| |||||||
1.125%, 9/1/18 | 12,615 | 14,120,916 | ||||||
1.875%, 9/1/20 | 16,068 | 18,046,372 | ||||||
Emergent Biosolutions, Inc. (a)(b), |
| |||||||
2.875%, 1/15/21 | 18,960 | 19,718,400 | ||||||
Gilead Sciences, Inc., |
| |||||||
1.625%, 5/1/16 | 13,815 | 49,354,156 | ||||||
Illumina, Inc. (a)(b), |
| |||||||
0.25%, 3/15/16 | 15,430 | 29,808,908 | ||||||
Incyte Corp. Ltd. (a)(b), |
| |||||||
0.375%, 11/15/18 | 10,505 | 13,242,866 | ||||||
1.25%, 11/15/20 | 4,250 | 5,341,719 | ||||||
Regeneron Pharmaceuticals, Inc., |
| |||||||
1.875%, 10/1/16 | 5,485 | 20,040,819 | ||||||
United Therapeutics Corp., |
| |||||||
1.00%, 9/15/16 | 710 | 1,444,850 | ||||||
|
| |||||||
| 171,119,006 | ||||||||
|
| |||||||
| Chemicals—0.8% | ||||||||
RPM International, Inc., |
| |||||||
2.25%, 12/15/20 | 16,780 | 20,398,188 | ||||||
|
| |||||||
| Commercial Services—1.9% | ||||||||
Ascent Capital Group, Inc., |
| |||||||
4.00%, 7/15/20 | 10,100 | 9,437,187 | ||||||
Avis Budget Group, Inc., |
| |||||||
3.50%, 10/1/14 | 4,155 | 14,703,506 | ||||||
Cardtronics, Inc. (a)(b), |
| |||||||
1.00%, 12/1/20 | 10,340 | 9,060,477 | ||||||
Live Nation Entertainment, Inc. (a)(b), |
| |||||||
2.50%, 5/15/19 | 15,970 | 16,608,800 | ||||||
|
| |||||||
| 49,809,970 | ||||||||
|
| |||||||
| Computers—2.1% | ||||||||
SanDisk Corp., |
| |||||||
0.50%, 10/15/20 (a)(b) | 31,570 | 38,633,787 | ||||||
1.50%, 8/15/17 | 7,850 | 15,052,375 | ||||||
|
| |||||||
| 53,686,162 | ||||||||
|
| |||||||
| Distribution/Wholesale—1.1% | ||||||||
WESCO International, Inc., |
| |||||||
6.00%, 9/15/29 | 9,250 | 28,108,438 | ||||||
|
| |||||||
| Principal Amount (000s) | Value | |||||||
| Diversified Financial Services—3.1% | ||||||||
Air Lease Corp., |
| |||||||
3.875%, 12/1/18 | $ | 14,845 | $ | 23,399,431 | ||||
Cowen Group, Inc. (a)(b), |
| |||||||
3.00%, 3/15/19 | 12,670 | 13,307,681 | ||||||
Encore Capital Group, Inc. (a)(b), |
| |||||||
3.00%, 7/1/20 | 17,690 | 20,000,756 | ||||||
Portfolio Recovery Associates, Inc. (a)(b), |
| |||||||
3.00%, 8/1/20 | 21,510 | 25,139,813 | ||||||
|
| |||||||
| 81,847,681 | ||||||||
|
| |||||||
| Electrical Equipment—0.6% | ||||||||
SunPower Corp., |
| |||||||
4.50%, 3/15/15 | 9,820 | 15,116,663 | ||||||
|
| |||||||
| Electronics—0.8% | ||||||||
Fluidigm Corp., |
| |||||||
2.75%, 2/1/34 | 10,250 | 9,807,969 | ||||||
InvenSense, Inc. (a)(b), |
| |||||||
1.75%, 11/1/18 | 9,405 | 10,662,919 | ||||||
|
| |||||||
| 20,470,888 | ||||||||
|
| |||||||
| Energy-Alternate Sources—0.3% | ||||||||
SolarCity Corp., |
| |||||||
2.75%, 11/1/18 | 5,985 | 7,208,184 | ||||||
|
| |||||||
| Healthcare-Products—4.3% | ||||||||
Cepheid, Inc. (a)(b), |
| |||||||
1.25%, 2/1/21 | 19,660 | 20,237,513 | ||||||
Hologic, Inc., |
| |||||||
2.00%, 12/15/37 | 12,960 | 15,957,000 | ||||||
NuVasive, Inc., |
| |||||||
2.75%, 7/1/17 | 20,645 | 23,251,431 | ||||||
Teleflex, Inc., |
| |||||||
3.875%, 8/1/17 | 15,655 | 27,885,469 | ||||||
Wright Medical Group, Inc., |
| |||||||
2.00%, 8/15/17 | 19,170 | 25,807,612 | ||||||
|
| |||||||
| 113,139,025 | ||||||||
|
| |||||||
| Healthcare-Services—3.7% | ||||||||
Brookdale Senior Living, Inc., |
| |||||||
2.75%, 6/15/18 | 19,400 | 26,590,125 | ||||||
Molina Healthcare, Inc., |
| |||||||
1.125%, 1/15/20 | 28,295 | 35,174,222 | ||||||
WellPoint, Inc., |
| |||||||
2.75%, 10/15/42 | 22,830 | 35,557,725 | ||||||
|
| |||||||
| 97,322,072 | ||||||||
|
| |||||||
| Home Builders—1.2% | ||||||||
Lennar Corp. (a)(b), |
| |||||||
3.25%, 11/15/21 | 18,020 | 32,672,512 | ||||||
|
| |||||||
| Household Products/Wares—1.2% | ||||||||
Jarden Corp., |
| |||||||
1.125%, 3/15/34 (a)(b) | 16,145 | 16,225,725 | ||||||
1.875%, 9/15/18 | 11,875 | 15,957,031 | ||||||
|
| |||||||
| 32,182,756 | ||||||||
|
| |||||||
| Insurance—3.1% | ||||||||
Amtrust Financial Services, Inc., |
| |||||||
5.50%, 12/15/21 | 11,985 | 20,067,384 | ||||||
Fidelity National Financial, Inc., |
| |||||||
4.25%, 8/15/18 | 18,205 | 30,470,619 | ||||||
Radian Group, Inc., |
| |||||||
2.25%, 3/1/19 | 21,425 | 31,749,172 | ||||||
|
| |||||||
| 82,287,175 | ||||||||
|
| |||||||
| Internet—6.1% | ||||||||
Dealertrack Technologies, Inc., |
| |||||||
1.50%, 3/15/17 | 11,675 | 14,688,609 | ||||||
priceline.com, Inc., |
| |||||||
0.35%, 6/15/20 (a)(b) | 18,320 | 22,716,800 | ||||||
1.00%, 3/15/18 | 21,120 | 31,772,400 | ||||||
| See accompanying Notes to Financial Statements | | May 31, 2014 | | Semiannual Report | 107 |
Table of Contents
Schedule of Investments
May 31, 2014 (Unaudited)
| Principal Amount (000s) | Value | |||||||
Qihoo 360 Technology Co., Ltd. (a)(b), |
| |||||||
2.50%, 9/15/18 | $ | 16,250 | $ | 18,860,156 | ||||
VeriSign, Inc., | ||||||||
3.25%, 8/15/37 | 9,815 | 15,262,325 | ||||||
Web.com Group, Inc., | ||||||||
1.00%, 8/15/18 | 19,325 | 23,250,391 | ||||||
Yahoo!, Inc. (a)(b), | ||||||||
zero coupon, 12/1/18 | 31,900 | 32,657,625 | ||||||
|
| |||||||
| 159,208,306 | ||||||||
|
| |||||||
| Lodging—1.3% | ||||||||
MGM Resorts International, |
| |||||||
4.25%, 4/15/15 | 23,720 | 34,497,775 | ||||||
|
| |||||||
| Media—0.5% | ||||||||
Liberty Media Corp. (a)(b), | ||||||||
1.375%, 10/15/23 | 13,910 | 13,510,088 | ||||||
|
| |||||||
| Mining—0.8% | ||||||||
Kaiser Aluminum Corp., | ||||||||
4.50%, 4/1/15 | 13,925 | 20,226,063 | ||||||
|
| |||||||
| Oil & Gas—5.2% | ||||||||
Cobalt International Energy, Inc., |
| |||||||
3.125%, 5/15/24 | 19,650 | 21,172,875 | ||||||
Exterran Holdings, Inc., | ||||||||
4.25%, 6/15/14 | 8,365 | 15,260,897 | ||||||
Helix Energy Solutions Group, Inc., |
| |||||||
3.25%, 3/15/32 | 12,725 | 16,264,141 | ||||||
Hornbeck Offshore Services, Inc., |
| |||||||
1.50%, 9/1/19 | 16,480 | 19,796,600 | ||||||
SEACOR Holdings, Inc. (a)(b), |
| |||||||
3.00%, 11/15/28 | 19,835 | 19,661,444 | ||||||
Stone Energy Corp., | ||||||||
1.75%, 3/1/17 | 22,200 | 28,110,750 | ||||||
Western Refining, Inc., | ||||||||
5.75%, 6/15/14 | 3,765 | 16,347,159 | ||||||
|
| |||||||
| 136,613,866 | ||||||||
|
| |||||||
| Pharmaceuticals—7.0% | ||||||||
Akorn, Inc., | ||||||||
3.50%, 6/1/16 | 5,655 | 18,194,962 | ||||||
Auxilium Pharmaceuticals, Inc., |
| |||||||
1.50%, 7/15/18 | 4,015 | 4,695,041 | ||||||
Endo Health Solutions, Inc., | ||||||||
1.75%, 4/15/15 | 10,500 | 25,423,125 | ||||||
Medivation, Inc., | ||||||||
2.625%, 4/1/17 | 10,655 | 16,561,866 | ||||||
Mylan, Inc., | ||||||||
3.75%, 9/15/15 | 6,395 | 23,993,240 | ||||||
Omnicare, Inc., | ||||||||
3.50%, 2/15/44 | 38,550 | 42,332,719 | ||||||
Pacira Pharmaceuticals, Inc., |
| |||||||
3.25%, 2/1/19 | 6,155 | 19,630,603 | ||||||
Salix Pharmaceuticals Ltd., | ||||||||
1.50%, 3/15/19 | 17,525 | 32,256,953 | ||||||
|
| |||||||
| 183,088,509 | ||||||||
|
| |||||||
| Real Estate Investment Trust—3.3% | ||||||||
Host Hotels & Resorts L.P. (a)(b), |
| |||||||
2.50%, 10/15/29 | 15,705 | 26,610,159 | ||||||
iStar Financial, Inc., | ||||||||
1.50%, 11/15/16 (a)(b) | 4,000 | 4,290,120 | ||||||
3.00%, 11/15/16 | 18,730 | 25,917,638 | ||||||
Starwood Property Trust, Inc., |
| |||||||
4.55%, 3/1/18 | 24,930 | 28,794,150 | ||||||
|
| |||||||
| 85,612,067 | ||||||||
|
| |||||||
| Semiconductors—10.6% | ||||||||
GT Advanced Technologies, Inc., |
| |||||||
3.00%, 12/15/20 | 11,360 | 18,509,700 | ||||||
Intel Corp., | ||||||||
3.25%, 8/1/39 | 30,325 | 43,364,901 | ||||||
Lam Research Corp., | ||||||||
1.25%, 5/15/18 | 12,130 | 16,185,969 | ||||||
| Principal Amount (000s) | Value | |||||||
Microchip Technology, Inc., |
| |||||||
2.125%, 12/15/37 | $ | 18,665 | $ | 34,903,550 | ||||
Micron Technology, Inc., |
| |||||||
3.00%, 11/15/43 | 44,592 | 52,785,780 | ||||||
Novellus Systems, Inc., |
| |||||||
2.625%, 5/15/41 | 12,945 | 24,538,866 | ||||||
NVIDIA Corp. (a)(b), |
| |||||||
1.00%, 12/1/18 | 24,865 | 28,346,100 | ||||||
SunEdison, Inc. (a)(b), |
| |||||||
2.00%, 10/1/18 | 10,980 | 16,826,850 | ||||||
2.75%, 1/1/21 | 8,265 | 12,945,056 | ||||||
Xilinx, Inc., |
| |||||||
2.625%, 6/15/17 | 17,905 | 29,755,872 | ||||||
|
| |||||||
| 278,162,644 | ||||||||
|
| |||||||
| Software—6.3% | ||||||||
Akamai Technologies, Inc. (a)(b), |
| |||||||
zero coupon, 2/15/19 | 32,835 | 32,835,164 | ||||||
Allscripts Healthcare Solutions, Inc. (a)(b), |
| |||||||
1.25%, 7/1/20 | 19,375 | 21,227,734 | ||||||
Bottomline Technologies, Inc., |
| |||||||
1.50%, 12/1/17 | 15,405 | 17,812,031 | ||||||
Concur Technologies, Inc. (a)(b), |
| |||||||
0.50%, 6/15/18 | 14,830 | 16,275,925 | ||||||
NetSuite, Inc. (a)(b), |
| |||||||
0.25%, 6/1/18 | 17,565 | 18,168,797 | ||||||
Salesforce.com, Inc., |
| |||||||
0.25%, 4/1/18 | 28,510 | 31,824,288 | ||||||
0.75%, 1/15/15 | 3,570 | 8,869,219 | ||||||
Workday, Inc. (a)(b), |
| |||||||
0.75%, 7/15/18 | 13,710 | 16,546,256 | ||||||
|
| |||||||
| 163,559,414 | ||||||||
|
| |||||||
| Telecommunications—3.6% | ||||||||
Ciena Corp., |
| |||||||
0.875%, 6/15/17 | 17,455 | 17,214,994 | ||||||
Finisar Corp. (a)(b), |
| |||||||
0.50%, 12/15/33 | 19,325 | 21,293,734 | ||||||
Level 3 Communications, Inc., |
| |||||||
7.00%, 3/15/15 | 14,220 | 23,774,062 | ||||||
SBA Communications Corp., |
| |||||||
4.00%, 10/1/14 | 9,485 | 31,519,841 | ||||||
|
| |||||||
| 93,802,631 | ||||||||
|
| |||||||
| Transportation—1.8% | ||||||||
Bristow Group, Inc., |
| |||||||
3.00%, 6/15/38 | 15,885 | 19,488,909 | ||||||
Greenbrier Cos., Inc., |
| |||||||
3.50%, 4/1/18 | 16,555 | 27,253,669 | ||||||
|
| |||||||
| 46,742,578 | ||||||||
|
| |||||||
| Total Convertible Bonds (cost—$1,851,426,151) | 2,184,906,077 | |||||||
|
| |||||||
| Shares | ||||||||
| Convertible Preferred Stock—15.1% | ||||||||
| Aerospace & Defense—1.4% | ||||||||
United Technologies Corp., |
| |||||||
7.50%, 8/1/15 | 550,445 | 36,219,281 | ||||||
|
| |||||||
| Banks—2.5% | ||||||||
Bank of America Corp., Ser. L (c), |
| |||||||
7.25% | 26,960 | 32,084,018 | ||||||
Wells Fargo & Co., Ser. L (c), |
| |||||||
7.50% | 26,120 | 32,003,530 | ||||||
|
| |||||||
| 64,087,548 | ||||||||
|
| |||||||
| Food Products—1.1% | ||||||||
Post Holdings, Inc. (a)(b)(c), |
| |||||||
2.50%, Ser. C | 147,080 | 14,937,813 | ||||||
3.75% | 122,325 | 14,396,429 | ||||||
|
| |||||||
| 29,334,242 | ||||||||
|
| |||||||
| Shares | Value | |||||||
| Insurance—1.9% | ||||||||
Maiden Holdings Ltd., Ser. B, |
| |||||||
7.25%, 9/15/16 | 341,665 | $ | 16,570,752 | |||||
MetLife, Inc., | ||||||||
5.00%, 10/8/14 | 1,125,940 | 33,271,527 | ||||||
|
| |||||||
| 49,842,279 | ||||||||
|
| |||||||
| Iron/Steel—0.4% | ||||||||
ArcelorMittal, |
| |||||||
6.00%, 1/15/16 | 445,900 | 10,464,738 | ||||||
|
| |||||||
| Machinery—1.3% | ||||||||
Stanley Black & Decker Inc, UNIT, |
| |||||||
6.25%, 11/17/16 | 25,400 | 2,890,012 | ||||||
Stanley Black & Decker, Inc., |
| |||||||
4.75%, 11/17/15 | 238,785 | 32,102,255 | ||||||
|
| |||||||
| 34,992,267 | ||||||||
|
| |||||||
| Oil & Gas—3.1% | ||||||||
Chesapeake Energy Corp. (c), |
| |||||||
5.00% | 91,000 | 9,168,250 | ||||||
5.75% (a)(b) | 34,750 | 42,547,031 | ||||||
Sanchez Energy Corp., Ser. B (c), |
| |||||||
6.50% | 322,125 | 29,091,109 | ||||||
|
| |||||||
| 80,806,390 | ||||||||
|
| |||||||
| Real Estate—0.1% | ||||||||
Forestar Group, Inc., |
| |||||||
6.00%, 12/15/16 | 159,530 | 3,814,362 | ||||||
|
| |||||||
| Real Estate Investment Trust—1.9% | ||||||||
American Tower Corp., Ser. A, |
| |||||||
5.25%, 5/15/17 | 179,950 | 19,310,884 | ||||||
Crown Castle International Corp., Ser. A, |
| |||||||
4.50%, 11/1/16 | 299,730 | 31,396,718 | ||||||
|
| |||||||
| 50,707,602 | ||||||||
|
| |||||||
| Telecommunications—0.3% | ||||||||
Intelsat S.A., Ser. A, |
| |||||||
5.75%, 5/1/16 | 131,095 | 6,878,555 | ||||||
|
| |||||||
| Transportation—1.1% | ||||||||
Genesee & Wyoming, Inc., |
| |||||||
5.00%, 10/1/15 | 215,150 | 27,580,078 | ||||||
|
| |||||||
| Total Convertible Preferred Stock (cost—$357,207,465) | 394,727,342 | |||||||
|
| |||||||
| Principal Amount (000s) | ||||||||
| Repurchase Agreements—1.4% | ||||||||
State Street Bank and Trust Co., dated 5/30/14, 0.00%, due 6/2/14, proceeds $37,807,000; collateralized by U.S. Treasury Notes, 0.75%, due 3/31/18, valued at $38,567,346 including accrued interest |
| |||||||
(cost—$37,807,000) | $37,807 | 37,807,000 | ||||||
|
| |||||||
Total Investments (cost—$2,246,440,616)—100.0% |
| 2,617,440,419 | ||||||
|
| |||||||
| Liabilities in excess of other assets—(0.0)% | (1,129,292 | ) | ||||||
|
| |||||||
| Net Assets—100.0% | $2,616,311,127 | |||||||
|
| |||||||
| 108 | Semiannual Report | | May 31, 2014 | | See accompanying Notes to Financial Statements |
Table of Contents
Schedule of Investments
May 31, 2014 (Unaudited)
Notes to Schedule of Investments:
(a) Private Placement—Restricted as to resale and may not have a readily available market. Securities with an aggregate value of $697,482,445, representing 26.7% of net assets.
(b) 144A—Exempt from registration under Rule 144A of the Securities Act of 1933. These securities may be resold in transactions exempt from registration, typically only to qualified institutional buyers. Unless otherwise indicated, these securities are not considered to be illiquid.
(c) Perpetual maturity. The date shown, if any, is the next call date. For Corporate Bonds & Notes the interest rate is fixed until the first call date and variable thereafter.
Glossary:
UNIT—More than one class of securities traded together.
AllianzGI Global Fundamental Strategy Fund
| Principal Amount (000s) | Value | |||||||||||
| Corporate Bonds & Notes—34.6% | ||||||||||||
| Germany—4.2% | ||||||||||||
KFW, |
| |||||||||||
4.125%, 10/15/14 | $ | 1,000 | $1,014,531 | |||||||||
|
| |||||||||||
| Israel—0.9% | ||||||||||||
Israel Electric Corp. Ltd. (a)(b), |
| |||||||||||
7.25%, 1/15/19 | 200 | 227,750 | ||||||||||
|
| |||||||||||
| Mexico—0.9% | ||||||||||||
Controladora Mabe S.A. de C.V. (a)(b), |
| |||||||||||
7.875%, 10/28/19 | 200 | 229,000 | ||||||||||
|
| |||||||||||
| Spain—2.3% | ||||||||||||
AyT Cedulas Cajas X Fondo de Titulizacion, |
| |||||||||||
3.75%, 6/30/25 | € | 200 | 271,968 | |||||||||
Cedulas TDA 6 Fondo de Titulizacion de Activos, |
| |||||||||||
4.25%, 4/10/31 | 200 | 276,874 | ||||||||||
|
| |||||||||||
| 548,842 | ||||||||||||
|
| |||||||||||
| Supranational—8.3% | ||||||||||||
European Investment Bank, |
| |||||||||||
1.625%, 9/1/15 | $ | 1,000 | 1,017,116 | |||||||||
Inter-American Development Bank, |
| |||||||||||
4.50%, 9/15/14 | 1,000 | 1,012,246 | ||||||||||
|
| |||||||||||
| 2,029,362 | ||||||||||||
|
| |||||||||||
| Switzerland—5.8% | ||||||||||||
Credit Suisse, |
| |||||||||||
5.30%, 8/13/19 | 500 | 573,947 | ||||||||||
EUROFIMA, |
| |||||||||||
4.50%, 3/6/15 | 800 | 826,078 | ||||||||||
|
| |||||||||||
| 1,400,025 | ||||||||||||
|
| |||||||||||
| United States—12.2% | ||||||||||||
AT&T, Inc., |
| |||||||||||
5.80%, 2/15/19 | 500 | 582,471 | ||||||||||
Daimler Finance North America LLC (a)(b), |
| |||||||||||
1.25%, 1/11/16 | 250 | 252,711 | ||||||||||
EI du Pont de Nemours & Co., |
| |||||||||||
3.25%, 1/15/15 | 200 | 203,716 | ||||||||||
HSBC USA, Inc., |
| |||||||||||
1.625%, 1/16/18 | 500 | 502,298 | ||||||||||
Morgan Stanley, |
| |||||||||||
4.00%, 7/24/15 | 500 | 518,628 | ||||||||||
Oracle Corp., |
| |||||||||||
5.75%, 4/15/18 | 600 | 695,764 | ||||||||||
Petrobras International Finance Co., |
| |||||||||||
5.375%, 1/27/21 | 200 | 208,465 | ||||||||||
|
| |||||||||||
| 2,964,053 | ||||||||||||
|
| |||||||||||
Total Corporate Bonds & Notes (cost—$8,225,826) |
| 8,413,563 | ||||||||||
|
| |||||||||||
| Shares | ||||||||||||
| Common Stock—34.3% | ||||||||||||
| France—0.3% | ||||||||||||
Schneider Electric S.A. | 700 | 65,943 | ||||||||||
|
| |||||||||||
| Germany—2.3% | ||||||||||||
BASF SE | 2,100 | 242,016 | ||||||||||
Muenchener Rueckversicherungs AG | 1,000 | 221,862 | ||||||||||
SAP AG | 1,200 | 91,866 | ||||||||||
|
| |||||||||||
| 555,744 | ||||||||||||
|
| |||||||||||
| Greece—0.2% | ||||||||||||
Piraeus Bank S.A. (f) | 22,000 | 54,217 | ||||||||||
|
| |||||||||||
| Shares | Value | |||||||
| Hong Kong—2.0% | ||||||||
HKT Trust | 241,000 | $ | 258,788 | |||||
Power Assets Holdings Ltd. | 26,000 | 226,453 | ||||||
|
| |||||||
| 485,241 | ||||||||
|
| |||||||
| Indonesia—1.4% | ||||||||
Bank Negara Indonesia Persero Tbk PT | 130,000 | 53,261 | ||||||
Indocement Tunggal Prakarsa Tbk PT | 30,000 | 58,253 | ||||||
Telekomunikasi Indonesia Persero Tbk PT | 1,062,500 | 234,949 | ||||||
|
| |||||||
| 346,463 | ||||||||
|
| |||||||
| Italy—1.0% | ||||||||
Eni SpA | 9,900 | 252,136 | ||||||
|
| |||||||
| New Zealand—1.1% | ||||||||
Telecom Corp. of New Zealand Ltd. | 115,000 | 262,854 | ||||||
|
| |||||||
| Norway—1.9% | ||||||||
Telenor ASA | 10,300 | 244,297 | ||||||
Yara International ASA | 4,900 | 223,774 | ||||||
|
| |||||||
| 468,071 | ||||||||
|
| |||||||
| Spain—0.3% | ||||||||
Ferrovial S.A. | 3,000 | 64,955 | ||||||
|
| |||||||
| Switzerland—2.1% | ||||||||
Nestle S.A. | 3,400 | 266,941 | ||||||
Roche Holdings AG | 800 | 235,802 | ||||||
|
| |||||||
| 502,743 | ||||||||
|
| |||||||
| Turkey—1.2% | ||||||||
Tupras Turkiye Petrol Rafinerileri AS | 12,500 | 303,600 | ||||||
|
| |||||||
| United Arab Emirates—0.9% | ||||||||
Dragon Oil PLC | 22,500 | 229,618 | ||||||
|
| |||||||
| United Kingdom—7.0% | ||||||||
BHP Billiton PLC | 7,500 | 235,147 | ||||||
BP PLC | 28,000 | 236,027 | ||||||
Centrica PLC | 38,100 | 214,622 | ||||||
GlaxoSmithKline PLC | 8,000 | 214,692 | ||||||
Reckitt Benckiser Group PLC | 2,900 | 248,248 | ||||||
Royal Dutch Shell PLC, Class A | 6,400 | 251,668 | ||||||
TESCO PLC | 47,400 | 241,324 | ||||||
WPP PLC | 3,000 | 64,878 | ||||||
|
| |||||||
| 1,706,606 | ||||||||
|
| |||||||
| United States—12.6% | ||||||||
Amazon.com, Inc. (f) | 350 | 109,392 | ||||||
Apple, Inc. | 400 | 253,200 | ||||||
Cisco Systems, Inc. | 9,200 | 226,504 | ||||||
Eli Lilly & Co. | 4,200 | 251,412 | ||||||
General Electric Co. | 9,100 | 243,789 | ||||||
Intel Corp. | 9,000 | 245,880 | ||||||
Johnson & Johnson | 2,500 | 253,650 | ||||||
Maxim Integrated Products, Inc. | 7,135 | 244,374 | ||||||
Merck & Co., Inc. | 4,500 | 260,370 | ||||||
Microchip Technology, Inc. (e) | 5,800 | 276,080 | ||||||
Microsoft Corp. | 6,400 | 262,016 | ||||||
Pfizer, Inc. | 7,400 | 219,262 | ||||||
Verizon Communications, Inc. | 4,300 | 214,828 | ||||||
|
| |||||||
| 3,060,757 | ||||||||
|
| |||||||
| Total Common Stock (cost—$7,401,586) | 8,358,948 | |||||||
|
| |||||||
| See accompanying Notes to Financial Statements | | May 31, 2014 | | Semiannual Report | 109 |
Table of Contents
Schedule of Investments
May 31, 2014 (Unaudited)
| Principal Amount (000s) | Value | |||||||||||
| Sovereign Debt Obligations—23.3% | ||||||||||||
| Brazil—2.3% | ||||||||||||
Brazil Notas do Tesouro |
| |||||||||||
10.00%, 1/1/18 | BRL | 1,300 | $551,897 | |||||||||
|
| |||||||||||
| France—3.3% | ||||||||||||
Caisse d’Amortissement |
| |||||||||||
1.25%, 7/11/14 | $ | 800 | 800,895 | |||||||||
|
| |||||||||||
| Indonesia—1.7% | ||||||||||||
Indonesia Treasury Bond, |
| |||||||||||
7.375%, 9/15/16 | IDR | 4,900,000 | 420,120 | |||||||||
|
| |||||||||||
| Italy—5.3% | ||||||||||||
Italy Buoni Poliennali Del Tesoro (d), |
| |||||||||||
1.65%, 4/23/20 | € | 440 | 605,584 | |||||||||
3.10%, 9/15/26 | 446 | 684,654 | ||||||||||
|
| |||||||||||
| 1,290,238 | ||||||||||||
|
| |||||||||||
| Mexico—2.2% | ||||||||||||
Mexican Bonos, Ser. M, |
| |||||||||||
6.50%, 6/9/22 | MXN | 6,600 | 543,127 | |||||||||
|
| |||||||||||
| Poland—2.1% | ||||||||||||
Poland |
| |||||||||||
3.75%, 4/25/18 | PLN | 1,500 | 506,791 | |||||||||
|
| |||||||||||
| Russia—0.8% | ||||||||||||
Russian Federation Bond (a)(b), |
| |||||||||||
4.50%, 4/4/22 | $ | 200 | 205,500 | |||||||||
|
| |||||||||||
| South Africa—1.8% | ||||||||||||
South Africa Government Bond, |
| |||||||||||
8.00%, 12/21/18 | ZAR | 4,500 | 432,780 | |||||||||
|
| |||||||||||
| Spain—2.0% | ||||||||||||
Spain Government Bond, |
| |||||||||||
1.80%, 11/30/24 | € | 351 | 487,424 | |||||||||
|
| |||||||||||
| Turkey—1.8% | ||||||||||||
Turkey Government Bond, |
| |||||||||||
9.00%, 3/8/17 | TRY | 900 | 436,826 | |||||||||
|
| |||||||||||
| Total Sovereign Debt Obligations (cost—$5,548,706) | 5,675,598 | |||||||||||
|
| |||||||||||
| Shares | ||||||||||||
| Exchange-Traded Funds—1.0% | ||||||||||||
iShares MSCI |
| |||||||||||
(cost—$231,660) |
| 5,400 | 229,770 | |||||||||
|
| |||||||||||
| Principal Amount (000s) | ||||||||||||
| Repurchase Agreements—10.1% | ||||||||||||
State Street Bank and Trust Co., dated 5/30/14, 0.00%, due 6/2/14, proceeds $2,465,000; collateralized by U.S. Treasury Notes, 0.75%, due 3/31/18, valued at $2,518,905 including accrued interest |
| |||||||||||
(cost—$2,465,000) | $ | 2,465 | 2,465,000 | |||||||||
|
| |||||||||||
| Contracts | Value | |||||||||||
| Options Purchased (f)(g)—0.1% | ||||||||||||
| Call Options—0.1% | ||||||||||||
Euro Stoxx 50 Index, strike price $3,150.00, expires 6/20/14 | ||||||||||||
(cost—$21,774) | € | 20 | $28,872 | |||||||||
|
| |||||||||||
| Total Investments (cost—$23,894,552) (c)—103.4% | 25,171,751 | |||||||||||
|
| |||||||||||
| Liabilities in excess of other assets—(3.4)% | (827,680 | ) | ||||||||||
|
| |||||||||||
| Net Assets—100.0% | $24,344,071 | |||||||||||
|
| |||||||||||
Notes to Schedule of Investments:
(a) Private Placement—Restricted as to resale and may not have a readily available market. Securities with an aggregate value of $1,715,856, representing 7.0% of net assets.
(b) 144A—Exempt from registration under Rule 144A of the Securities Act of 1933. These securities may be resold in transactions exempt from registration, typically only to qualified institutional buyers. Unless otherwise indicated, these securities are not considered to be illiquid.
(c) Securities with an aggregate value of $5,074,417, representing 20.8% of net assets, were valued utilizing modeling tools provided by a third-party vendor. See Note 1(a) and Note 1(b) in the Notes to Financial Statements.
(d) Inflationary Bonds—Principal amount of security is adjusted for inflation/deflation.
(e) All or partial amount segregated for the benefit of the counterparty as collateral for derivatives.
(f) Non-income producing.
(g) Exchange traded-Chicago Board Options Exchange.
Glossary:
BRL—Brazilian Real
€—Euro
IDR—Indonesian Rupiah
MSCI—Morgan Stanley Capital International
MXN—Mexican Peso
PLN—Polish Zloty
TRY—Turkish Lira
ZAR—South African Rand
The industry classification of portfolio holdings and liabilities in excess of other assets shown as a percentage of net assets were as follows:
Sovereign Debt Obligations | 23.3% | |||
Banking | 22.5% | |||
Pharmaceuticals | 6.0% | |||
Oil, Gas & Consumable Fuels | 5.1% | |||
Diversified Telecommunication Services | 5.1% | |||
Software | 4.4% | |||
Semiconductors & Semiconductor Equipment | 3.1% | |||
Chemicals | 2.7% | |||
Telecommunications | 2.4% | |||
Diversified Financial Services | 2.3% | |||
Electric Utilities | 1.8% | |||
Food Products | 1.1% | |||
Technology Hardware, Storage & Peripherals | 1.0% | |||
Auto Manufacturers | 1.0% | |||
Household Products | 1.0% | |||
Industrial Conglomerates | 1.0% | |||
Food & Staples Retailing | 1.0% | |||
Exchange-Traded Funds | 1.0% | |||
Metals & Mining | 0.9% | |||
Household Products/Wares | 0.9% | |||
Communications Equipment | 0.9% | |||
Insurance | 0.9% | |||
Multi-Utilities | 0.9% | |||
Oil & Gas | 0.9% | |||
Internet & Catalog Retail | 0.5% | |||
Banks | 0.4% | |||
Electrical Equipment | 0.3% | |||
Construction & Engineering | 0.3% | |||
Media | 0.3% | |||
Construction Materials | 0.2% | |||
Repurchase Agreements | 10.1% | |||
Options Purchased | 0.1% | |||
Liabilities in excess of other assets | (3.4)% | |||
|
| |||
| 100.0% | ||||
|
|
| 110 | Semiannual Report | | May 31, 2014 | | See accompanying Notes to Financial Statements |
Table of Contents
Schedule of Investments
May 31, 2014 (Unaudited)
AllianzGI Global Managed Volatility Fund
| Shares | Value | |||||||
| Common Stock—98.5% | ||||||||
| Australia—1.1% | ||||||||
Amcor Ltd. | 9,202 | $91,046 | ||||||
Newcrest Mining Ltd. (b) | 4,667 | 42,468 | ||||||
Sonic Healthcare Ltd. | 3,812 | 62,919 | ||||||
|
| |||||||
| 196,433 | ||||||||
|
| |||||||
| Canada—12.6% | ||||||||
BCE, Inc. | 14,694 | 675,412 | ||||||
Bell Aliant, Inc. | 7,115 | 187,406 | ||||||
Canadian Apartment Properties REIT | 3,157 | 64,986 | ||||||
Cineplex, Inc. | 1,214 | 44,841 | ||||||
Dollarama, Inc. | 2,543 | 214,524 | ||||||
Empire Co., Ltd. | 810 | 48,923 | ||||||
Fairfax Financial Holdings Ltd. | 481 | 216,616 | ||||||
Intact Financial Corp. | 3,954 | 261,096 | ||||||
Manitoba Telecom Services, Inc. | 3,890 | 115,699 | ||||||
Metro, Inc. | 706 | 43,605 | ||||||
Rogers Communications, Inc., Class B | 1,060 | 42,838 | ||||||
Sun Life Financial, Inc. | 1,319 | 44,644 | ||||||
TELUS Corp. | 7,265 | 274,372 | ||||||
Transcontinental, Inc., Class A | 3,447 | 47,176 | ||||||
|
| |||||||
| 2,282,138 | ||||||||
|
| |||||||
| China—2.7% | ||||||||
Bank of Communications Co., Ltd., Class H | 107,000 | 71,877 | ||||||
China Mobile Ltd. | 6,700 | 65,623 | ||||||
China Petroleum & Chemical Corp., Class H | 48,000 | 43,407 | ||||||
Datang International Power Generation Co., Ltd., Class H | 194,000 | 75,388 | ||||||
PetroChina Co., Ltd., Class H | 196,000 | 234,028 | ||||||
|
| |||||||
| 490,323 | ||||||||
|
| |||||||
| France—1.3% | ||||||||
Dassault Systemes | 740 | 93,918 | ||||||
Iliad S.A. | 168 | 53,702 | ||||||
SES S.A. | 2,286 | 83,046 | ||||||
|
| |||||||
| 230,666 | ||||||||
|
| |||||||
| Germany—1.4% | ||||||||
Fresenius Medical Care AG & Co. KGaA | 2,609 | 172,865 | ||||||
Suedzucker AG | 4,285 | 87,063 | ||||||
|
| |||||||
| 259,928 | ||||||||
|
| |||||||
| Hong Kong—4.0% | ||||||||
CLP Holdings Ltd. | 46,100 | 379,862 | ||||||
Esprit Holdings Ltd. | 41,300 | 60,927 | ||||||
Jardine Matheson Holdings Ltd. | 800 | 49,261 | ||||||
Power Assets Holdings Ltd. | 9,700 | 84,484 | ||||||
Yue Yuen Industrial Holdings Ltd. | 48,500 | 150,131 | ||||||
|
| |||||||
| 724,665 | ||||||||
|
| |||||||
| Israel—3.6% | ||||||||
Bank Leumi Le-Israel BM (b) | 11,454 | 45,371 | ||||||
Israel Chemicals Ltd. | 14,268 | 125,925 | ||||||
Israel Corp. Ltd. (b) | 80 | 46,692 | ||||||
Mizrahi Tefahot Bank Ltd. | 4,620 | 62,775 | ||||||
Teva Pharmaceutical Industries Ltd. | 7,119 | 359,313 | ||||||
|
| |||||||
| 640,076 | ||||||||
|
| |||||||
| Japan—3.9% | ||||||||
ABC-Mart, Inc. | 1,100 | 56,342 | ||||||
Benesse Holdings, Inc. | 5,600 | 235,089 | ||||||
| Shares | Value | |||||||
Capcom Co., Ltd. | 4,400 | $ | 74,696 | |||||
FamilyMart Co., Ltd. | 1,200 | 51,583 | ||||||
McDonald’s Holdings Co. Japan Ltd. | 2,600 | 73,591 | ||||||
Oriental Land Co., Ltd. | 1,000 | 166,904 | ||||||
Square Enix Holdings Co., Ltd. | 3,400 | 53,146 | ||||||
|
| |||||||
| 711,351 | ||||||||
|
| |||||||
| Netherlands—0.7% | ||||||||
Koninklijke DSM NV | 1,618 | 116,766 | ||||||
|
| |||||||
| Norway—0.7% | ||||||||
Subsea 7 S.A. | 3,546 | 70,885 | ||||||
Telenor ASA | 2,644 | 62,711 | ||||||
|
| |||||||
| 133,596 | ||||||||
|
| |||||||
| Singapore—3.7% | ||||||||
CapitaMall Trust REIT | 50,000 | 82,603 | ||||||
ComfortDelGro Corp. Ltd. | 43,000 | 79,954 | ||||||
Hutchison Port Holdings Trust UNIT | 93,000 | 69,785 | ||||||
Singapore Airlines Ltd. | 25,000 | 207,075 | ||||||
Singapore Post Ltd. | 109,000 | 142,952 | ||||||
Singapore Press Holdings Ltd. | 23,000 | 75,222 | ||||||
|
| |||||||
| 657,591 | ||||||||
|
| |||||||
| Switzerland—1.3% | ||||||||
Nestle S.A. | 958 | 75,214 | ||||||
Novartis AG | 856 | 77,018 | ||||||
Transocean Ltd. | 1,960 | 82,804 | ||||||
|
| |||||||
| 235,036 | ||||||||
|
| |||||||
| United Kingdom—6.0% | ||||||||
BP PLC | 60,403 | 509,170 | ||||||
Randgold Resources Ltd. | 4,707 | 347,029 | ||||||
Royal Dutch Shell PLC, Class A | 1,965 | 77,270 | ||||||
Royal Dutch Shell PLC, Class B | 1,116 | 45,619 | ||||||
Smith & Nephew PLC | 5,506 | 96,537 | ||||||
|
| |||||||
| 1,075,625 | ||||||||
|
| |||||||
| United States—55.5% | ||||||||
Alleghany Corp. (b) | 200 | 84,224 | ||||||
Apple, Inc. | 400 | 253,200 | ||||||
Ares Capital Corp. | 13,400 | 231,016 | ||||||
AutoZone, Inc. (b) | 500 | 266,250 | ||||||
Capitol Federal Financial, Inc. | 24,700 | 298,870 | ||||||
Capstead Mortgage Corp. REIT | 3,500 | 46,095 | ||||||
Chevron Corp. | 500 | 61,395 | ||||||
Chimera Investment Corp. REIT | 23,900 | 75,285 | ||||||
Cigna Corp. | 1,300 | 116,714 | ||||||
Clorox Co. | 2,100 | 188,202 | ||||||
CME Group, Inc. | 600 | 43,200 | ||||||
CommonWealth REIT | 4,100 | 107,871 | ||||||
Consolidated Edison, Inc. | 7,700 | 423,577 | ||||||
DIRECTV (b) | 700 | 57,708 | ||||||
Dollar Tree, Inc. (b) | 1,100 | 58,333 | ||||||
DSW, Inc., Class A | 4,400 | 110,220 | ||||||
Duke Energy Corp. | 7,366 | 523,575 | ||||||
Exelon Corp. | 9,600 | 353,568 | ||||||
Express Scripts Holding Co. (b) | 5,600 | 400,232 | ||||||
FirstEnergy Corp. | 4,500 | 152,190 | ||||||
General Mills, Inc. | 9,800 | 538,314 | ||||||
HCA Holdings, Inc. (b) | 1,400 | 74,186 | ||||||
Humana, Inc. | 2,000 | 248,920 | ||||||
Integra LifeSciences Holdings Corp. (b) | 1,500 | 67,425 | ||||||
Juniper Networks, Inc. (b) | 1,800 | 44,028 | ||||||
Kellogg Co. | 6,700 | 462,166 | ||||||
Laboratory Corp. of America Holdings (b) | 3,200 | 328,256 | ||||||
| Shares | Value | |||||||
McDonald’s Corp. | 3,700 | $ | 375,291 | |||||
MEDNAX, Inc. (b) | 1,100 | 63,393 | ||||||
Merck & Co., Inc. | 5,300 | 306,658 | ||||||
Morningstar, Inc. | 1,800 | 128,052 | ||||||
PartnerRe Ltd. | 500 | 53,685 | ||||||
Patterson Cos., Inc. | 1,800 | 70,488 | ||||||
PepsiCo, Inc. | 6,000 | 529,980 | ||||||
Pinnacle Foods, Inc. | 2,200 | 68,882 | ||||||
PPL Corp. | 12,900 | 452,661 | ||||||
Procter & Gamble Co. | 1,600 | 129,264 | ||||||
Quest Diagnostics, Inc. | 6,500 | 389,285 | ||||||
Quintiles Transnational Holdings, Inc. (b) | 800 | 40,784 | ||||||
RenaissanceRe Holdings Ltd. | 500 | 52,085 | ||||||
Southern Co. | 11,700 | 512,226 | ||||||
Target Corp. | 2,400 | 136,224 | ||||||
TransDigm Group, Inc. | 1,000 | 188,710 | ||||||
Validus Holdings Ltd. | 3,200 | 119,456 | ||||||
Vector Group Ltd. | 4,200 | 87,822 | ||||||
VeriSign, Inc. (b) | 1,200 | 60,096 | ||||||
Wal-Mart Stores, Inc. | 7,000 | 537,390 | ||||||
WellPoint, Inc. | 400 | 43,344 | ||||||
Zoetis, Inc. | 1,600 | 49,120 | ||||||
|
| |||||||
| 10,009,916 | ||||||||
|
| |||||||
| Total Common Stock (cost—$16,158,272) | 17,764,110 | |||||||
|
| |||||||
| Principal Amount (000s) | ||||||||
| Repurchase Agreements—1.2% | ||||||||
State Street Bank and Trust Co., dated 5/30/14, 0.00%, due 6/2/14, proceeds $225,000; collateralized by U.S. Treasury Notes, 0.75%, due 3/31/18, valued at $231,680 including accrued interest |
| |||||||
(cost—$225,000) | $225 | 225,000 | ||||||
|
| |||||||
| Total Investments (cost—$16,383,272) (a)—99.7% | 17,989,110 | |||||||
|
| |||||||
| Other assets less liabilities—0.3% | 62,591 | |||||||
|
| |||||||
| Net Assets—100.0% | $18,051,701 | |||||||
|
| |||||||
Notes to Schedule of Investments:
(a) Securities with an aggregate value of $5,121,471, representing 28.4% of net assets, were valued utilizing modeling tools provided by a third-party vendor. See Note 1(a) and Note 1(b) in the Notes to Financial Statements.
(b) Non-income producing.
Glossary:
REIT—Real Estate Investment Trust
UNIT—More than one class of securities traded together.
| See accompanying Notes to Financial Statements | | May 31, 2014 | | Semiannual Report | 111 |
Table of Contents
Schedule of Investments
May 31, 2014 (Unaudited)
The industry classification of portfolio holdings and other assets less liabilities shown as a percentage of net assets were as follows:
Electric Utilities | 13.6% | |||
Health Care Providers & Services | 11.0% | |||
Diversified Telecommunication Services | 7.4% | |||
Food Products | 6.9% | |||
Oil, Gas & Consumable Fuels | 5.3% | |||
Insurance | 4.7% | |||
Pharmaceuticals | 4.4% | |||
Food & Staples Retailing | 3.8% | |||
Hotels, Restaurants & Leisure | 3.4% | |||
Beverages | 2.9% | |||
Specialty Retail | 2.7% | |||
Multi-Utilities | 2.3% | |||
Multi-line Retail | 2.3% | |||
Media | 2.2% | |||
Real Estate Investment Trust | 2.2% | |||
Metals & Mining | 2.1% | |||
Household Products | 1.7% | |||
Thrifts & Mortgage Finance | 1.7% | |||
Chemicals | 1.7% | |||
Technology Hardware, Storage & Peripherals | 1.4% | |||
Diversified Consumer Services | 1.3% | |||
Capital Markets | 1.3% | |||
Software | 1.2% | |||
Airlines | 1.2% | |||
Aerospace & Defense | 1.0% | |||
Banks | 1.0% | |||
Health Care Equipment & Supplies | 1.0% | |||
Energy Equipment & Services | 0.9% | |||
Textiles, Apparel & Luxury Goods | 0.8% | |||
Air Freight & Logistics | 0.8% | |||
Wireless Telecommunication Services | 0.6% | |||
Containers & Packaging | 0.5% | |||
Tobacco | 0.5% | |||
Road & Rail | 0.4% | |||
Independent Power Producers & Energy Traders | 0.4% | |||
Transportation Infrastructure | 0.4% | |||
Internet Software & Services | 0.3% | |||
Industrial Conglomerates | 0.3% | |||
Commercial Services & Supplies | 0.3% | |||
Communications Equipment | 0.2% | |||
Diversified Financial Services | 0.2% | |||
Life Sciences Tools & Services | 0.2% | |||
Repurchase Agreements | 1.2% | |||
Other assets less liabilities | 0.3% | |||
|
| |||
| 100.0% | ||||
|
|
AllianzGI Global Water Fund
| Shares | Value | |||||||
| Common Stock—94.4% | ||||||||
| Austria—3.3% | ||||||||
Andritz AG | 184,044 | $10,962,238 | ||||||
|
| |||||||
| Brazil—2.1% | ||||||||
Cia de Saneamento Basico do Estado de Sao Paulo ADR | 714,938 | 6,999,243 | ||||||
|
| |||||||
| China—5.4% | ||||||||
China Everbright International Ltd. | 3,042,000 | 3,886,040 | ||||||
Guangdong Investment Ltd. | 12,648,000 | 13,990,703 | ||||||
|
| |||||||
| 17,876,743 | ||||||||
|
| |||||||
| France—3.8% | ||||||||
Suez Environnement Co. | 621,383 | 12,490,099 | ||||||
|
| |||||||
| Germany—2.8% | ||||||||
CENTROTEC Sustainable AG | 239,389 | 5,990,288 | ||||||
Norma Group SE (b) | 61,124 | 3,333,047 | ||||||
|
| |||||||
| 9,323,335 | ||||||||
|
| |||||||
| Hong Kong—0.9% | ||||||||
Beijing Enterprises Water Group Ltd. | 4,470,000 | 2,876,600 | ||||||
|
| |||||||
| Italy—2.0% | ||||||||
Hera SpA | 2,266,254 | 6,487,413 | ||||||
|
| |||||||
| Japan—3.7% | ||||||||
Ebara Corp. | 1,989,000 | 12,111,423 | ||||||
|
| |||||||
| Korea (Republic of)—1.0% | ||||||||
Coway Co., Ltd. | 40,000 | 3,365,748 | ||||||
|
| |||||||
| Netherlands—4.3% | ||||||||
Aalberts Industries NV | 183,212 | 6,031,868 | ||||||
Arcadis NV | 234,043 | 8,274,350 | ||||||
| �� |
|
| ||||||
| 14,306,218 | ||||||||
|
| |||||||
| Sweden—3.6% | ||||||||
Alfa Laval AB | 459,017 | 12,036,894 | ||||||
|
| |||||||
| Switzerland—14.5% | ||||||||
Belimo Holding AG | 1,010 | 2,713,635 | ||||||
Geberit AG | 37,378 | 12,387,648 | ||||||
Georg Fischer AG (c) | 3,844 | 2,900,880 | ||||||
Pentair Ltd. | 209,485 | 15,635,961 | ||||||
Sulzer AG | 93,320 | 14,189,601 | ||||||
|
| |||||||
| 47,827,725 | ||||||||
|
| |||||||
| United Kingdom—17.3% | ||||||||
Halma PLC | 988,579 | 9,814,542 | ||||||
Intertek Group PLC | 52,500 | 2,568,317 | ||||||
Pennon Group PLC | 300,731 | 3,955,171 | ||||||
Rotork PLC | 217,358 | 9,496,647 | ||||||
Severn Trent PLC | 416,339 | 13,752,409 | ||||||
Spectris PLC (b) | 91,719 | 3,534,534 | ||||||
United Utilities Group PLC | 967,416 | 14,094,341 | ||||||
|
| |||||||
| 57,215,961 | ||||||||
|
| |||||||
| United States—29.7% | ||||||||
American Water Works Co., Inc. | 345,706 | 16,804,769 | ||||||
AMETEK, Inc. | 56,472 | 2,997,534 | ||||||
Aqua America, Inc. | 381,475 | 9,681,835 | ||||||
Danaher Corp. | 176,017 | 13,805,013 | ||||||
Flowserve Corp. | 42,939 | 3,166,322 | ||||||
Franklin Electric Co., Inc. | 168,582 | 6,456,691 | ||||||
IDEX Corp. | 189,371 | 14,520,968 | ||||||
Mueller Water Products, Inc., Class A | 627,892 | 5,293,130 | ||||||
Roper Industries, Inc. | 38,011 | 5,385,398 | ||||||
| Shares | Value | |||||||
Watts Water Technologies, Inc., Class A | 119,877 | $ | 6,684,342 | |||||
Xylem, Inc. | 354,944 | 13,239,411 | ||||||
|
| |||||||
| 98,035,413 | ||||||||
|
| |||||||
Total Common Stock (cost—$258,812,164) | 311,915,053 | |||||||
|
| |||||||
| Principal Amount (000s) | ||||||||
| Repurchase Agreements—4.8% | ||||||||
State Street Bank and Trust Co., dated 5/30/14, 0.00%, due 6/2/14, proceeds $15,757,000; collateralized by U.S. Treasury Notes, 0.75%, due 3/31/18, valued at $16,074,657 including accrued interest |
| |||||||
(cost— | $15,757 | 15,757,000 | ||||||
|
| |||||||
Total Investments (cost—$274,569,164) (a)—99.2% |
| 327,672,053 | ||||||
|
| |||||||
| Other assets less liabilities—0.8% | 2,688,462 | |||||||
|
| |||||||
| Net Assets—100.0% | $330,360,515 | |||||||
|
| |||||||
Notes to Schedule of Investments:
(a) Securities with an aggregate value of $182,043,388, representing 55.1% of net assets, were valued utilizing modeling tools provided by a third-party vendor. See Note 1(a) and Note 1(b) in the Notes to Financial Statements.
(b) Affiliated security.
(c) Non-income producing.
Glossary:
ADR—American Depositary Receipt
| 112 | Semiannual Report | | May 31, 2014 | | See accompanying Notes to Financial Statements |
Table of Contents
Schedule of Investments
May 31, 2014 (Unaudited)
The industry classification of portfolio holdings and other assets less liabilities shown as a percentage of net assets were as follows:
Machinery | 39.2% | |||
Water Utilities | 24.7% | |||
Building Products | 6.4% | |||
Industrial Conglomerates | 5.8% | |||
Multi-Utilities | 5.8% | |||
Electronic Equipment, Instruments & Components | 4.1% | |||
Electrical Equipment | 2.9% | |||
Construction & Engineering | 2.5% | |||
Commercial Services & Supplies | 1.2% | |||
Household Durables | 1.0% | |||
Professional Services | 0.8% | |||
Repurchase Agreements | 4.8% | |||
Other assets less liabilities | 0.8% | |||
|
| |||
| 100.0% | ||||
|
|
AllianzGI High Yield Bond Fund
| Principal Amount (000s) | Value | |||||||
| Corporate Bonds & Notes—96.0% | ||||||||
| Advertising—0.5% | ||||||||
Affinion Group, Inc., |
| |||||||
7.875%, 12/15/18 | $2,500 | $2,300,000 | ||||||
|
| |||||||
| Aerospace & Defense—2.6% | ||||||||
AAR Corp., |
| |||||||
7.25%, 1/15/22 | 4,665 | 5,108,175 | ||||||
Erickson Air-Crane, Inc. (a)(b), |
| |||||||
8.25%, 5/1/20 | 3,421 | 3,506,525 | ||||||
Kratos Defense & Security Solutions, Inc. (a)(b), |
| |||||||
7.00%, 5/15/19 | 1,537 | 1,577,346 | ||||||
TransDigm, Inc., | ||||||||
7.75%, 12/15/18 | 1,620 | 1,743,525 | ||||||
|
| |||||||
| 11,935,571 | ||||||||
|
| |||||||
| Airlines—0.3% | ||||||||
United Continental Holdings, Inc., |
| |||||||
6.00%, 7/15/28 | 1,510 | 1,472,250 | ||||||
|
| |||||||
| Apparel & Textiles—0.7% | ||||||||
Quiksilver, Inc., |
| |||||||
7.875%, 8/1/18 (a)(b) | 1,915 | 2,087,350 | ||||||
10.00%, 8/1/20 | 1,000 | 1,140,000 | ||||||
|
| |||||||
| 3,227,350 | ||||||||
|
| |||||||
| Auto Components—3.0% | ||||||||
American Axle & Manufacturing, Inc., |
| |||||||
6.625%, 10/15/22 | 1,665 | 1,819,013 | ||||||
7.75%, 11/15/19 | 1,980 | 2,289,375 | ||||||
Chassix, Inc. (a)(b), |
| |||||||
9.25%, 8/1/18 | 2,440 | 2,653,500 | ||||||
Commercial Vehicle Group, Inc., |
| |||||||
7.875%, 4/15/19 | 3,435 | 3,555,225 | ||||||
Goodyear Tire & Rubber Co., |
| |||||||
8.25%, 8/15/20 | 3,030 | 3,363,300 | ||||||
|
| |||||||
| 13,680,413 | ||||||||
|
| |||||||
| Auto Manufacturers—1.6% | ||||||||
Chrysler Group LLC, |
| |||||||
8.25%, 6/15/21 | 3,305 | 3,784,225 | ||||||
Navistar International Corp., |
| |||||||
8.25%, 11/1/21 | 3,245 | 3,378,856 | ||||||
|
| |||||||
| 7,163,081 | ||||||||
|
| |||||||
| Banking—0.8% | ||||||||
Ally Financial, Inc., |
| |||||||
8.00%, 3/15/20 | 2,940 | 3,572,100 | ||||||
|
| |||||||
| Building Materials—1.5% | ||||||||
Louisiana-Pacific Corp., |
| |||||||
7.50%, 6/1/20 | 3,540 | 3,929,400 | ||||||
U.S. Concrete, Inc. (a)(b), |
| |||||||
8.50%, 12/1/18 | 2,930 | 3,186,375 | ||||||
|
| |||||||
| 7,115,775 | ||||||||
|
| |||||||
| Chemicals—0.6% | ||||||||
Omnova Solutions, Inc., |
| |||||||
7.875%, 11/1/18 | 2,620 | 2,780,475 | ||||||
|
| |||||||
| Coal—0.9% | ||||||||
Arch Coal, Inc., |
| |||||||
9.875%, 6/15/19 | 3,485 | 2,997,100 | ||||||
CONSOL Energy, Inc. (a)(b), |
| |||||||
5.875%, 4/15/22 | 950 | 988,000 | ||||||
|
| |||||||
| 3,985,100 | ||||||||
|
| |||||||
| Commercial Services—9.8% | ||||||||
Avis Budget Car Rental LLC, |
| |||||||
9.75%, 3/15/20 | 500 | 570,000 | ||||||
Cardtronics, Inc., |
| |||||||
8.25%, 9/1/18 | 2,690 | 2,854,762 | ||||||
| Principal Amount (000s) | Value | |||||||
Cenveo Corp., |
| |||||||
11.50%, 5/15/17 | $ | 3,610 | $ | 3,628,050 | ||||
Deluxe Corp., |
| |||||||
7.00%, 3/15/19 | 1,650 | 1,773,750 | ||||||
Envision Healthcare Corp., |
| |||||||
8.125%, 6/1/19 | 2,084 | 2,219,460 | ||||||
ExamWorks Group, Inc., |
| |||||||
9.00%, 7/15/19 | 3,695 | 4,036,787 | ||||||
H&E Equipment Services, Inc., |
| |||||||
7.00%, 9/1/22 | 3,380 | 3,734,900 | ||||||
Harland Clarke Holdings Corp. (a)(b), |
| |||||||
9.25%, 3/1/21 | 1,855 | 1,910,650 | ||||||
9.75%, 8/1/18 | 2,550 | 2,824,125 | ||||||
Hertz Corp., |
| |||||||
6.75%, 4/15/19 | 2,305 | 2,474,994 | ||||||
Monitronics International, Inc., |
| |||||||
9.125%, 4/1/20 | 3,430 | 3,670,100 | ||||||
RR Donnelley & Sons Co., |
| |||||||
6.00%, 4/1/24 | 1,305 | 1,321,313 | ||||||
7.00%, 2/15/22 | 3,470 | 3,817,000 | ||||||
SFX Entertainment, Inc. (a)(b), |
| |||||||
9.625%, 2/1/19 | 2,761 | 2,899,050 | ||||||
United Rentals North America, Inc., |
| |||||||
8.25%, 2/1/21 | 2,980 | 3,352,500 | ||||||
8.375%, 9/15/20 | 3,610 | 4,007,100 | ||||||
|
| |||||||
| 45,094,541 | ||||||||
|
| |||||||
| Computers—1.6% | ||||||||
j2 Global, Inc., |
| |||||||
8.00%, 8/1/20 | 4,395 | 4,790,550 | ||||||
Unisys Corp., |
| |||||||
6.25%, 8/15/17 | 2,150 | 2,348,875 | ||||||
|
| |||||||
| 7,139,425 | ||||||||
|
| |||||||
| Distribution/Wholesale—1.3% | ||||||||
HD Supply, Inc., |
| |||||||
7.50%, 7/15/20 | 1,540 | 1,678,600 | ||||||
11.00%, 4/15/20 | 3,620 | 4,298,750 | ||||||
|
| |||||||
| 5,977,350 | ||||||||
|
| |||||||
| Diversified Financial Services—6.3% | ||||||||
Affinion Investments LLC (a)(b), |
| |||||||
13.50%, 8/15/18 | 2,443 | 2,577,260 | ||||||
Community Choice Financial, Inc., |
| |||||||
10.75%, 5/1/19 | 3,275 | 2,677,312 | ||||||
International Lease Finance Corp., |
| |||||||
8.25%, 12/15/20 | 2,480 | 3,010,100 | ||||||
8.75%, 3/15/17 | 3,550 | 4,155,719 | ||||||
Nationstar Mortgage LLC, |
| |||||||
7.875%, 10/1/20 | 2,265 | 2,298,975 | ||||||
9.625%, 5/1/19 | 2,640 | 2,910,600 | ||||||
SLM Corp., |
| |||||||
8.45%, 6/15/18 | 2,750 | 3,243,281 | ||||||
Springleaf Finance Corp., |
| |||||||
6.90%, 12/15/17 | 3,735 | 4,099,162 | ||||||
8.25%, 10/1/23 | 3,585 | 4,068,975 | ||||||
|
| |||||||
| 29,041,384 | ||||||||
|
| |||||||
| Electric Utilities—1.0% | ||||||||
NRG Energy, Inc. (a)(b), |
| |||||||
6.25%, 5/1/24 | 4,231 | 4,384,374 | ||||||
|
| |||||||
| Electrical Equipment—0.9% | ||||||||
WireCo WorldGroup, Inc., |
| |||||||
9.50%, 5/15/17 | 4,000 | 4,110,000 | ||||||
|
| |||||||
| Electronics—2.2% | ||||||||
Kemet Corp., |
| |||||||
10.50%, 5/1/18 | 5,419 | 5,757,688 | ||||||
Viasystems, Inc. (a)(b), |
| |||||||
7.875%, 5/1/19 | 4,050 | 4,303,125 | ||||||
|
| |||||||
| 10,060,813 | ||||||||
|
| |||||||
| See accompanying Notes to Financial Statements | | May 31, 2014 | | Semiannual Report | 113 |
Table of Contents
Schedule of Investments
May 31, 2014 (Unaudited)
| Principal Amount (000s) | Value | |||||||
| Engineering & Construction—0.5% | ||||||||
Dycom Investments, Inc., | ||||||||
7.125%, 1/15/21 | $ | 2,175 | $ | 2,349,000 | ||||
|
| |||||||
| Entertainment—1.0% | ||||||||
AMC Entertainment, Inc., | ||||||||
9.75%, 12/1/20 | 2,900 | 3,335,000 | ||||||
Cedar Fair L.P. (a)(b), | ||||||||
5.375%, 6/1/24 | 1,160 | 1,171,600 | ||||||
|
| |||||||
| 4,506,600 | ||||||||
|
| |||||||
| Food & Beverage—0.8% | ||||||||
SUPERVALU, Inc., | ||||||||
8.00%, 5/1/16 | 3,350 | 3,714,313 | ||||||
|
| |||||||
| Healthcare-Products—2.0% | ||||||||
Kinetic Concepts, Inc., | ||||||||
10.50%, 11/1/18 | 3,945 | 4,485,820 | ||||||
Teleflex, Inc. (a)(b), | ||||||||
5.25%, 6/15/24 | 4,480 | 4,552,800 | ||||||
|
| |||||||
| 9,038,620 | ||||||||
|
| |||||||
| Healthcare-Services—3.3% | ||||||||
Community Health Systems, Inc., |
| |||||||
7.125%, 7/15/20 | 2,500 | 2,715,625 | ||||||
8.00%, 11/15/19 | 2,745 | 3,019,500 | ||||||
HCA, Inc., | ||||||||
7.50%, 2/15/22 | 4,000 | 4,620,000 | ||||||
Kindred Healthcare, Inc. (a)(b), |
| |||||||
6.375%, 4/15/22 | 1,628 | 1,662,595 | ||||||
Tenet Healthcare Corp., | ||||||||
8.125%, 4/1/22 | 2,940 | 3,351,600 | ||||||
|
| |||||||
| 15,369,320 | ||||||||
|
| |||||||
| Home Builders—3.3% | ||||||||
Beazer Homes USA, Inc., | ||||||||
7.25%, 2/1/23 | 2,000 | 2,075,000 | ||||||
9.125%, 5/15/19 | 2,280 | 2,456,700 | ||||||
Brookfield Residential Properties, Inc. (a)(b), |
| |||||||
6.50%, 12/15/20 | 2,445 | 2,591,700 | ||||||
KB Home, | ||||||||
8.00%, 3/15/20 | 2,610 | 2,988,450 | ||||||
Standard Pacific Corp., | ||||||||
8.375%, 5/15/18 | 3,615 | 4,283,775 | ||||||
William Lyon Homes, Inc., | ||||||||
8.50%, 11/15/20 | 680 | 763,300 | ||||||
|
| |||||||
| 15,158,925 | ||||||||
|
| |||||||
| Household Products/Wares—1.0% | ||||||||
Jarden Corp., | ||||||||
7.50%, 5/1/17 | 930 | 1,062,525 | ||||||
Reynolds Group Issuer, Inc., | ||||||||
9.875%, 8/15/19 | 3,115 | 3,445,969 | ||||||
|
| |||||||
| 4,508,494 | ||||||||
|
| |||||||
| Internet—1.0% | ||||||||
Mood Media Corp. (a)(b), | ||||||||
9.25%, 10/15/20 | 1,260 | 1,159,200 | ||||||
Zayo Group LLC, | ||||||||
8.125%, 1/1/20 | 3,005 | 3,294,231 | ||||||
|
| |||||||
| 4,453,431 | ||||||||
|
| |||||||
| Iron/Steel—1.6% | ||||||||
AK Steel Corp., | ||||||||
7.625%, 5/15/20 | 755 | 764,437 | ||||||
8.375%, 4/1/22 | 1,800 | 1,876,500 | ||||||
8.75%, 12/1/18 | 895 | 1,003,519 | ||||||
ArcelorMittal, | ||||||||
10.35%, 6/1/19 | 2,980 | 3,792,050 | ||||||
|
| |||||||
| 7,436,506 | ||||||||
|
| |||||||
| Lodging—1.6% | ||||||||
Caesars Entertainment Operating Co., Inc., |
| |||||||
11.25%, 6/1/17 | 1,660 | 1,469,100 | ||||||
| Principal Amount (000s) | Value | |||||||
MGM Resorts International, | ||||||||
11.375%, 3/1/18 | $ | 4,550 | $ | 5,892,250 | ||||
|
| |||||||
| 7,361,350 | ||||||||
|
| |||||||
| Machinery-Construction & Mining—0.5% | ||||||||
BlueLine Rental Finance Corp. (a)(b), |
| |||||||
7.00%, 2/1/19 | 2,180 | 2,338,050 | ||||||
|
| |||||||
| Media—7.0% | ||||||||
American Media, Inc., | ||||||||
11.50%, 12/15/17 | 3,565 | 3,876,937 | ||||||
Cablevision Systems Corp., | ||||||||
8.625%, 9/15/17 | 2,960 | 3,470,600 | ||||||
Cambium Learning Group, Inc., |
| |||||||
9.75%, 2/15/17 | 1,045 | 1,071,125 | ||||||
Clear Channel Worldwide Holdings, Inc., |
| |||||||
6.50%, 11/15/22 | 4,315 | 4,638,625 | ||||||
Columbus International, Inc. (a)(b), |
| |||||||
7.375%, 3/30/21 | 1,500 | 1,593,750 | ||||||
DISH DBS Corp., | ||||||||
5.875%, 7/15/22 | 1,480 | 1,591,000 | ||||||
Gray Television, Inc., | ||||||||
7.50%, 10/1/20 | 3,540 | 3,814,350 | ||||||
McClatchy Co., | ||||||||
9.00%, 12/15/22 | 4,000 | 4,595,000 | ||||||
McGraw-Hill Global Education Holdings LLC (a)(b), |
| |||||||
10.00%, 4/1/21 | 3,205 | 3,677,738 | ||||||
Nexstar Broadcasting, Inc., | ||||||||
6.875%, 11/15/20 | 2,780 | 2,981,550 | ||||||
Sinclair Television Group, Inc., |
| |||||||
6.375%, 11/1/21 | 940 | 987,000 | ||||||
|
| |||||||
| 32,297,675 | ||||||||
|
| |||||||
| Mining—1.4% | ||||||||
Alcoa, Inc., | ||||||||
5.90%, 2/1/27 | 1,295 | 1,350,306 | ||||||
HudBay Minerals, Inc., | ||||||||
9.50%, 10/1/20 | 2,085 | 2,262,225 | ||||||
Thompson Creek Metals Co., Inc., |
| |||||||
7.375%, 6/1/18 | 2,735 | 2,673,462 | ||||||
|
| |||||||
| 6,285,993 | ||||||||
|
| |||||||
| Miscellaneous Manufacturing—1.4% | ||||||||
Bombardier, Inc. (a)(b), | ||||||||
6.00%, 10/15/22 | 2,355 | 2,399,156 | ||||||
Park-Ohio Industries, Inc., | ||||||||
8.125%, 4/1/21 | 3,680 | 4,075,600 | ||||||
|
| |||||||
| 6,474,756 | ||||||||
|
| |||||||
| Oil & Gas—11.2% | ||||||||
BreitBurn Energy Partners L.P., |
| |||||||
7.875%, 4/15/22 | 1,555 | 1,679,400 | ||||||
8.625%, 10/15/20 | 2,745 | 3,012,638 | ||||||
Calumet Specialty Products Partners L.P. (a)(b), |
| |||||||
6.50%, 4/15/21 | 3,145 | 3,200,037 | ||||||
Carrizo Oil & Gas, Inc., | ||||||||
8.625%, 10/15/18 | 3,115 | 3,325,262 | ||||||
Chesapeake Energy Corp., | ||||||||
6.625%, 8/15/20 | 3,205 | 3,709,787 | ||||||
Concho Resources, Inc., | ||||||||
7.00%, 1/15/21 | 2,100 | 2,336,250 | ||||||
CVR Refining LLC, | ||||||||
6.50%, 11/1/22 | 3,045 | 3,216,281 | ||||||
Endeavour International Corp., |
| |||||||
12.00%, 3/1/18 | 3,270 | 3,171,900 | ||||||
Energy XXI Gulf Coast, Inc., | ||||||||
6.875%, 3/15/24 (a)(b) | 1,355 | 1,368,550 | ||||||
9.25%, 12/15/17 | 2,990 | 3,232,937 | ||||||
EP Energy LLC, | ||||||||
9.375%, 5/1/20 | 3,325 | 3,836,219 | ||||||
Hercules Offshore, Inc. (a)(b), |
| |||||||
6.75%, 4/1/22 | 1,500 | 1,460,625 | ||||||
8.75%, 7/15/21 | 2,290 | 2,461,750 | ||||||
Laredo Petroleum, Inc., | ||||||||
7.375%, 5/1/22 | 2,025 | 2,252,813 | ||||||
| Principal Amount (000s) | Value | |||||||
Northern Oil and Gas, Inc., | ||||||||
8.00%, 6/1/20 | $ | 2,695 | $ | 2,876,913 | ||||
Pioneer Energy Services Corp., |
| |||||||
6.125%, 3/15/22 (a)(b) | 1,615 | 1,663,450 | ||||||
9.875%, 3/15/18 | 415 | 437,327 | ||||||
Rice Energy, Inc. (a)(b), | ||||||||
6.25%, 5/1/22 | 3,150 | 3,181,500 | ||||||
United Refining Co., | ||||||||
10.50%, 2/28/18 | 1,664 | 1,838,720 | ||||||
Vanguard Natural Resources LLC, |
| |||||||
7.875%, 4/1/20 | 3,025 | 3,282,125 | ||||||
|
| |||||||
| 51,544,484 | ||||||||
|
| |||||||
| Pharmaceuticals—1.3% | ||||||||
Endo Finance LLC & Endo Finco, Inc. (a)(b), |
| |||||||
7.00%, 12/15/20 | 2,855 | 3,076,263 | ||||||
Salix Pharmaceuticals Ltd. (a)(b), |
| |||||||
6.00%, 1/15/21 | 2,780 | 2,988,500 | ||||||
|
| |||||||
| 6,064,763 | ||||||||
|
| |||||||
| Pipelines—1.0% | ||||||||
Energy Transfer Equity L.P. (a)(b), |
| |||||||
5.875%, 1/15/24 | 2,040 | 2,121,600 | ||||||
Sabine Pass Liquefaction LLC (a)(b), |
| |||||||
5.75%, 5/15/24 | 2,069 | 2,128,484 | ||||||
Tesoro Logistics L.P., |
| |||||||
6.125%, 10/15/21 | 350 | 371,000 | ||||||
|
| |||||||
| 4,621,084 | ||||||||
|
| |||||||
| Real Estate—0.2% | ||||||||
Kennedy-Wilson, Inc., |
| |||||||
5.875%, 4/1/24 | 726 | 728,723 | ||||||
|
| |||||||
| Real Estate Investment Trust—0.6% | ||||||||
iStar Financial, Inc., | ||||||||
7.125%, 2/15/18 | 2,580 | 2,902,500 | ||||||
|
| |||||||
| Retail—5.5% | ||||||||
Brown Shoe Co., Inc., |
| |||||||
7.125%, 5/15/19 | 3,890 | 4,118,615 | ||||||
Claire’s Stores, Inc. (a)(b), |
| |||||||
9.00%, 3/15/19 | 3,110 | 3,218,850 | ||||||
DineEquity, Inc., |
| |||||||
9.50%, 10/30/18 | 3,600 | 3,901,500 | ||||||
Neiman Marcus Group LTD, Inc. (a)(b), |
| |||||||
8.00%, 10/15/21 | 4,030 | 4,453,150 | ||||||
Rite Aid Corp., | ||||||||
9.25%, 3/15/20 | 2,000 | 2,285,000 | ||||||
10.25%, 10/15/19 | 2,570 | 2,798,088 | ||||||
Sonic Automotive, Inc., |
| |||||||
7.00%, 7/15/22 | 3,265 | 3,615,987 | ||||||
Toys R Us, Inc., |
| |||||||
10.375%, 8/15/17 | 1,242 | 1,006,020 | ||||||
|
| |||||||
| 25,397,210 | ||||||||
|
| |||||||
| Semiconductors—2.4% | ||||||||
Advanced Micro Devices, Inc., |
| |||||||
6.75%, 3/1/19 (a)(b) | 2,160 | 2,284,200 | ||||||
7.50%, 8/15/22 | 1,030 | 1,089,225 | ||||||
8.125%, 12/15/17 | 1,205 | 1,266,756 | ||||||
Freescale Semiconductor, Inc. (a)(b), |
| |||||||
6.00%, 1/15/22 | 3,846 | 4,115,220 | ||||||
Micron Technology, Inc. (a)(b), |
| |||||||
5.875%, 2/15/22 | 2,235 | 2,391,450 | ||||||
|
| |||||||
| 11,146,851 | ||||||||
|
| |||||||
| Software—1.9% | ||||||||
Activision Blizzard, Inc. (a)(b), |
| |||||||
6.125%, 9/15/23 | 2,880 | 3,182,400 | ||||||
First Data Corp., | ||||||||
10.625%, 6/15/21 | 3,305 | 3,804,881 | ||||||
12.625%, 1/15/21 | 1,640 | 1,976,200 | ||||||
|
| |||||||
| 8,963,481 | ||||||||
|
| |||||||
| 114 | Semiannual Report | | May 31, 2014 | | See accompanying Notes to Financial Statements |
Table of Contents
Schedule of Investments
May 31, 2014 (Unaudited)
| Principal Amount (000s) | Value | |||||||
| Telecommunications—8.6% | ||||||||
Cincinnati Bell, Inc., |
| |||||||
8.75%, 3/15/18 | $ | 3,090 | $ | 3,246,431 | ||||
Consolidated Communications Finance Co., |
| |||||||
10.875%, 6/1/20 | 3,000 | 3,498,750 | ||||||
EarthLink, Inc., | ||||||||
7.375%, 6/1/20 | 2,565 | 2,696,456 | ||||||
8.875%, 5/15/19 | 3,477 | 3,468,308 | ||||||
Hughes Satellite Systems Corp., |
| |||||||
7.625%, 6/15/21 | 3,260 | 3,732,700 | ||||||
Intelsat Jackson Holdings S.A., |
| |||||||
7.25%, 4/1/19 | 3,695 | 3,967,506 | ||||||
Level 3 Financing, Inc., |
| |||||||
8.625%, 7/15/20 | 3,245 | 3,658,737 | ||||||
MetroPCS Wireless, Inc., |
| |||||||
6.625%, 11/15/20 | 1,250 | 1,335,938 | ||||||
NII International Telecom SCA (a)(b), |
| |||||||
11.375%, 8/15/19 | 2,000 | 1,710,000 | ||||||
Sprint Communications, Inc., |
| |||||||
6.00%, 11/15/22 | 1,235 | 1,281,313 | ||||||
11.50%, 11/15/21 | 3,085 | 4,211,025 | ||||||
T-Mobile USA, Inc., |
| |||||||
6.836%, 4/28/23 | 1,935 | 2,106,731 | ||||||
West Corp., |
| |||||||
7.875%, 1/15/19 | 2,340 | 2,497,950 | ||||||
Windstream Corp., |
| |||||||
7.50%, 6/1/22 | 2,000 | 2,160,000 | ||||||
|
| |||||||
| 39,571,845 | ||||||||
|
| |||||||
| Transportation—1.3% | ||||||||
Quality Distribution LLC, | ||||||||
9.875%, 11/1/18 | 2,035 | 2,192,712 | ||||||
Swift Services Holdings, Inc., | ||||||||
10.00%, 11/15/18 | 3,505 | 3,816,069 | ||||||
|
| |||||||
| 6,008,781 | ||||||||
|
| |||||||
Total Corporate Bonds & Notes (cost—$419,764,458) |
| 441,282,757 | ||||||
|
| |||||||
| Repurchase Agreements—4.3% | ||||||||
State Street Bank and Trust Co., dated 5/30/14, 0.00%, due 6/2/14, proceeds $19,808,000; collateralized by U.S. Treasury Notes, 0.75%, due 3/31/18, valued at $20,205,464 including accrued interest |
| |||||||
(cost—$19,808,000) | 19,808 | 19,808,000 | ||||||
|
| |||||||
| Total Investments (cost—$439,572,458)—100.3% | 461,090,757 | |||||||
|
| |||||||
| Liabilities in excess of other assets—(0.3)% | (1,429,505 | ) | ||||||
|
| |||||||
| Net Assets—100.0% | $459,661,252 | |||||||
|
| |||||||
Notes to Schedule of Investments:
(a) Private Placement—Restricted as to resale and may not have a readily available market. Securities with an aggregate value of $99,050,298, representing 21.5% of net assets.
(b) 144A—Exempt from registration under Rule 144A of the Securities Act of 1933. These securities may be resold in transactions exempt from registration, typically only to qualified institutional buyers. Unless otherwise indicated, these securities are not considered to be illiquid.
AllianzGI International Small-Cap Fund
| Shares | Value | |||||||
| Common Stock—97.3% | ||||||||
| Australia—1.9% | ||||||||
BlueScope Steel Ltd. (d) | 145,300 | $792,189 | ||||||
Spotless Group Holdings Ltd. (d) | 272,201 | 467,383 | ||||||
Vocation Ltd. (d) | 283,400 | 792,550 | ||||||
|
| |||||||
| 2,052,122 | ||||||||
|
| |||||||
| Austria—1.7% | ||||||||
Schoeller-Bleckmann Oilfield Equipment AG (c) | 15,608 | 1,860,298 | ||||||
|
| |||||||
| China—1.7% | ||||||||
China Everbright International Ltd. | 621,000 | 793,304 | ||||||
China Machinery Engineering Corp., Class H | 937,000 | 604,108 | ||||||
Sunny Optical Technology Group Co., Ltd. | 383,000 | 458,803 | ||||||
|
| |||||||
| 1,856,215 | ||||||||
|
| |||||||
| Denmark—3.2% | ||||||||
SimCorp A/S (c) | 62,687 | 2,122,534 | ||||||
Topdanmark A/S (d) | 45,830 | 1,402,821 | ||||||
|
| |||||||
| 3,525,355 | ||||||||
|
| |||||||
| Finland—3.1% | ||||||||
Amer Sports Oyj | 59,202 | 1,204,335 | ||||||
Vacon PLC (c) | 53,892 | 2,225,925 | ||||||
|
| |||||||
| 3,430,260 | ||||||||
|
| |||||||
| France—5.5% | ||||||||
GameLoft SE (c)(d) | 173,142 | 1,619,487 | ||||||
Sartorius Stedim Biotech | 14,481 | 2,616,203 | ||||||
Virbac S.A. | 7,585 | 1,773,441 | ||||||
|
| |||||||
| 6,009,131 | ||||||||
|
| |||||||
| Germany—6.8% | ||||||||
Aareal Bank AG (c) | 41,005 | 1,943,809 | ||||||
Bechtle AG (c) | 20,683 | 1,829,317 | ||||||
CANCOM SE (c) | 34,073 | 1,711,863 | ||||||
Wirecard AG | 45,898 | 2,004,011 | ||||||
|
| |||||||
| 7,489,000 | ||||||||
|
| |||||||
| Greece—1.6% | ||||||||
OPAP S.A. | 105,912 | 1,801,186 | ||||||
|
| |||||||
| Hong Kong—4.3% | ||||||||
Future Bright Holdings Ltd. | 1,560,000 | 757,805 | ||||||
Ju Teng International Holdings Ltd. (c) | 1,544,000 | 1,180,079 | ||||||
Nexteer Automotive Group Ltd. (d) | 1,569,000 | 1,129,213 | ||||||
Playmates Toys Ltd. | 1,220,000 | 398,584 | ||||||
Techtronic Industries Co. | 128,500 | 402,772 | ||||||
Xinyi Glass Holdings Ltd. | 1,206,000 | 844,682 | ||||||
|
| |||||||
| 4,713,135 | ||||||||
|
| |||||||
| Indonesia—0.5% | ||||||||
Erajaya Swasembada Tbk PT (d) | 4,550,000 | 525,221 | ||||||
|
| |||||||
| Ireland—1.4% | ||||||||
Glanbia PLC | 98,375 | 1,495,884 | ||||||
|
| |||||||
| Italy—5.3% | ||||||||
Banca Popolare di Milano Scarl (d) | 2,008,844 | 1,837,683 | ||||||
Mediolanum SpA | 174,189 | 1,496,088 | ||||||
World Duty Free SpA (d) | 128,047 | 1,783,217 | ||||||
Yoox SpA (d) | 20,638 | 662,189 | ||||||
|
| |||||||
| 5,779,177 | ||||||||
|
| |||||||
| Shares | Value | |||||||
| Japan—22.7% | ||||||||
Aica Kogyo Co., Ltd. | 88,500 | $ | 1,929,988 | |||||
Coca-Cola East Japan Co., Ltd. | 47,400 | 1,124,600 | ||||||
Don Quijote Holdings Co., Ltd. | 17,600 | 1,041,783 | ||||||
Fukushima Industries Corp. | 39,400 | 578,703 | ||||||
Hitachi Transport System Ltd. | 54,600 | 876,365 | ||||||
Hoshizaki Electric Co., Ltd. | 31,700 | 1,460,105 | ||||||
Inaba Denki Sangyo Co., Ltd. | 28,200 | 884,293 | ||||||
Japan Airport Terminal Co., Ltd. | 55,900 | 1,444,206 | ||||||
Kakaku.com, Inc. | 56,600 | 996,632 | ||||||
Kusuri No Aoki Co., Ltd. | 23,400 | 827,588 | ||||||
Maeda Road Construction Co., Ltd. | 33,000 | 533,080 | ||||||
Obayashi Corp. | 123,000 | 827,924 | ||||||
Paramount Bed Holdings Co., Ltd. | 45,800 | 1,491,077 | ||||||
Rohto Pharmaceutical Co., Ltd. | 70,000 | 1,076,840 | ||||||
Sanwa Holdings Corp. | 190,000 | 1,299,573 | ||||||
Shinmaywa Industries Ltd. | 59,000 | 503,241 | ||||||
Tachi-S Co., Ltd. | 50,200 | 801,888 | ||||||
Takata Corp. | 44,400 | 994,845 | ||||||
Takuma Co., Ltd. | 151,000 | 912,984 | ||||||
Teijin Ltd. | 430,000 | 980,469 | ||||||
THK Co., Ltd. | 36,800 | 816,504 | ||||||
Tokyo Tatemono Co., Ltd. | 57,000 | 523,359 | ||||||
Tsukui Corp. | 86,600 | 839,530 | ||||||
United Arrows Ltd. | 31,700 | 1,318,507 | ||||||
Yamaha Motor Co., Ltd. | 52,000 | 823,106 | ||||||
|
| |||||||
| 24,907,190 | ||||||||
|
| |||||||
| Korea (Republic of)—0.9% | ||||||||
Duksan Hi-Metal Co., Ltd. (d) | 25,200 | 408,515 | ||||||
Grand Korea Leisure Co., Ltd. | 14,860 | 600,282 | ||||||
|
| |||||||
| 1,008,797 | ||||||||
|
| |||||||
| Netherlands—1.6% | ||||||||
Delta Lloyd NV | 74,344 | 1,806,172 | ||||||
|
| |||||||
| New Zealand—0.4% | ||||||||
Metlifecare Ltd. | 118,180 | 442,069 | ||||||
|
| |||||||
| Norway—1.4% | ||||||||
TGS Nopec Geophysical Co. ASA | 46,254 | 1,509,625 | ||||||
|
| |||||||
| Philippines—0.8% | ||||||||
Century Properties Group, Inc. | 6,824,000 | 220,500 | ||||||
Cosco Capital, Inc. (d) | 2,790,000 | 625,911 | ||||||
|
| |||||||
| 846,411 | ||||||||
|
| |||||||
| Spain—3.5% | ||||||||
Gamesa Corp. Tecnologica S.A. (d) | 170,300 | 1,994,590 | ||||||
Melia Hotels International S.A. | 144,086 | 1,844,233 | ||||||
|
| |||||||
| 3,838,823 | ||||||||
|
| |||||||
| Sweden—7.0% | ||||||||
Axis Communications AB | 48,479 | 1,389,465 | ||||||
Betsson AB (d) | 57,273 | 1,978,889 | ||||||
Betsson AB, Redemption Shares (d) | 57,273 | 78,310 | ||||||
JM AB | 33,332 | 1,226,348 | ||||||
Nibe Industrier AB, Class B | 47,558 | 1,378,952 | ||||||
Trelleborg AB, Class B (c) | 74,432 | 1,625,373 | ||||||
|
| |||||||
| 7,677,337 | ||||||||
|
| |||||||
| See accompanying Notes to Financial Statements | | May 31, 2014 | | Semiannual Report | 115 |
Table of Contents
Schedule of Investments
May 31, 2014 (Unaudited)
| Shares | Value | |||||||
| Switzerland—3.4% | ||||||||
AMS AG (c) | 11,142 | $ | 1,829,992 | |||||
Georg Fischer AG (d) | 2,445 | 1,845,123 | ||||||
|
| |||||||
| 3,675,115 | ||||||||
|
| |||||||
| Taiwan—1.9% | ||||||||
AIC, Inc. | 67,000 | 413,966 | ||||||
Epistar Corp. | 285,000 | 646,812 | ||||||
Hermes Microvision, Inc. | 20,000 | 802,137 | ||||||
Hermes Microvision, Inc. GDR (a) | 4,830 | 193,176 | ||||||
|
| |||||||
| 2,056,091 | ||||||||
|
| |||||||
| United Kingdom—16.7% | ||||||||
Aveva Group PLC (c) | 30,662 | 1,152,634 | ||||||
Booker Group PLC | 456,413 | 1,091,417 | ||||||
DS Smith PLC | 314,721 | 1,677,660 | ||||||
Elementis PLC | 232,754 | 1,117,212 | ||||||
Hikma Pharmaceuticals PLC | 97,941 | 2,801,316 | ||||||
IG Group Holdings PLC | 163,634 | 1,651,599 | ||||||
Michael Page International PLC | 173,198 | 1,332,637 | ||||||
Restaurant Group PLC | 193,116 | 1,936,265 | ||||||
Rotork PLC | 40,624 | 1,774,914 | ||||||
Spirax-Sarco Engineering PLC | 46,060 | 2,211,631 | ||||||
Victrex PLC | 49,705 | 1,506,406 | ||||||
|
| |||||||
| 18,253,691 | ||||||||
|
| |||||||
Total Common Stock (cost—$87,912,760) | 106,558,305 | |||||||
|
| |||||||
| Principal Amount (000s) | ||||||||
| Repurchase Agreements—1.9% | ||||||||
State Street Bank and Trust Co., dated 5/30/14, 0.00%, due 6/2/14, proceeds $2,070,000; collateralized by U.S. Treasury Notes, 0.75%, due 3/31/18, valued at $2,114,697 including accrued interest |
| |||||||
(cost—$2,070,000) | $2,070 | 2,070,000 | ||||||
|
| |||||||
| Total Investments (cost—$89,982,760) (b)—99.2% | 108,628,305 | |||||||
|
| |||||||
| Other assets less liabilities—0.8% | 870,355 | |||||||
|
| |||||||
| Net Assets—100.0% | $109,498,660 | |||||||
|
| |||||||
Notes to Schedule of Investments:
(a) 144A—Exempt from registration under Rule 144A of the Securities Act of 1933. These securities may be resold in transactions exempt from registration, typically only to qualified institutional buyers. Unless otherwise indicated, these securities are not considered to be illiquid.
(b) Securities with an aggregate value of $102,097,627, representing 93.2% of net assets, were valued utilizing modeling tools provided by a third-party vendor. See Note 1(a) and Note 1(b) in the Notes to Financial Statements.
(c) Affiliated security.
(d) Non-income producing.
Glossary:
GDR—Global Depositary Receipt
The industry classification of portfolio holdings and other assets less liabilities shown as a percentage of net assets were as follows:
Machinery | 10.6% | |||
Hotels, Restaurants & Leisure | 8.2% | |||
Pharmaceuticals | 5.2% | |||
IT Services | 5.0% | |||
Software | 4.5% | |||
Insurance | 4.3% | |||
Building Products | 4.2% | |||
Electrical Equipment | 3.8% | |||
Health Care Equipment & Supplies | 3.8% | |||
Electronic Equipment, Instruments & Components | 3.7% | |||
Semiconductors & Semiconductor Equipment | 3.6% | |||
Auto Components | 3.4% | |||
Chemicals | 3.3% | |||
Energy Equipment & Services | 3.1% | |||
Specialty Retail | 2.8% | |||
Food & Staples Retailing | 2.4% | |||
Construction & Engineering | 1.9% | |||
Thrifts & Mortgage Finance | 1.8% | |||
Banks | 1.7% | |||
Containers & Packaging | 1.5% | |||
Diversified Financial Services | 1.5% | |||
Household Durables | 1.5% | |||
Leisure Equipment & Products | 1.4% | |||
Food Products | 1.4% | |||
Transportation Infrastructure | 1.3% | |||
Professional Services | 1.2% | |||
Health Care Providers & Services | 1.2% | |||
Commercial Services & Supplies | 1.2% | |||
Beverages | 1.0% | |||
Multi-line Retail | 0.9% | |||
Internet Software & Services | 0.9% | |||
Trading Companies & Distributors | 0.8% | |||
Road & Rail | 0.8% | |||
Automobiles | 0.7% | |||
Diversified Consumer Services | 0.7% | |||
Metals & Mining | 0.7% | |||
Real Estate Management & Development | 0.7% | |||
Internet & Catalog Retail | 0.6% | |||
Repurchase Agreements | 1.9% | |||
Other assets less liabilities | 0.8% | |||
|
| |||
| 100.0% | ||||
|
|
AllianzGI Micro Cap Fund
| Shares | Value | |||||||
| Common Stock—98.3% | ||||||||
| Aerospace & Defense—1.7% | ||||||||
Astronics Corp. (b) | 6,815 | $373,871 | ||||||
Kratos Defense & Security Solutions, Inc. (b) | 39,100 | 332,741 | ||||||
|
| |||||||
| 706,612 | ||||||||
|
| |||||||
| Air Freight & Logistics—0.4% | ||||||||
XPO Logistics, Inc. (b) | 6,739 | 169,351 | ||||||
|
| |||||||
| Auto Components—4.0% | ||||||||
Cooper-Standard Holding, Inc. (b) | 3,774 | 241,536 | ||||||
Gentherm, Inc. (b) | 10,391 | 427,382 | ||||||
Motorcar Parts of America, Inc. (b) | 21,742 | 517,894 | ||||||
Tower International, Inc. (b) | 16,042 | 491,527 | ||||||
|
| |||||||
| 1,678,339 | ||||||||
|
| |||||||
| Banks—3.5% | ||||||||
Banner Corp. | 10,170 | 388,189 | ||||||
Eagle Bancorp, Inc. (b) | 11,879 | 379,772 | ||||||
First Merchants Corp. | 17,405 | 345,315 | ||||||
First NBC Bank Holding Co. (b) | 10,760 | 364,764 | ||||||
|
| |||||||
| 1,478,040 | ||||||||
|
| |||||||
| Biotechnology—8.0% | ||||||||
Anacor Pharmaceuticals, Inc. (b) | 5,871 | 79,259 | ||||||
Array BioPharma, Inc. (b) | 29,674 | 124,631 | ||||||
Arrowhead Research Corp. (b) | 12,900 | 162,282 | ||||||
Dyax Corp. (b) | 23,487 | 193,768 | ||||||
Exact Sciences Corp. (b) | 17,091 | 230,387 | ||||||
Galectin Therapeutics, Inc. (b) | 7,780 | 100,595 | ||||||
Insmed, Inc. (b) | 10,485 | 137,773 | ||||||
Insys Therapeutics, Inc. (b) | 9,100 | 235,144 | ||||||
Keryx Biopharmaceuticals, Inc. (b) | 20,341 | 268,501 | ||||||
Ligand Pharmaceuticals, Inc., Class B (b) | 10,149 | 677,040 | ||||||
Orexigen Therapeutics, Inc. (b) | 28,835 | 186,274 | ||||||
Raptor Pharmaceutical Corp. (b) | 12,372 | 101,203 | ||||||
Repligen Corp. (b) | 30,827 | 593,111 | ||||||
Sangamo Biosciences, Inc. (b) | 18,974 | 249,318 | ||||||
|
| |||||||
| 3,339,286 | ||||||||
|
| |||||||
| Building Products—2.8% | ||||||||
Builders FirstSource, Inc. (b) | 46,871 | 336,534 | ||||||
Patrick Industries, Inc. (b) | 14,574 | 550,897 | ||||||
PGT, Inc. (b) | 34,707 | 298,827 | ||||||
|
| |||||||
| 1,186,258 | ||||||||
|
| |||||||
| Capital Markets—4.0% | ||||||||
Cowen Group, Inc., Class A (b) | 81,828 | 337,950 | ||||||
HFF, Inc., Class A | 15,805 | 510,817 | ||||||
ICG Group, Inc. (b) | 22,753 | 439,588 | ||||||
Investment Technology Group, Inc. (b) | 20,446 | 391,132 | ||||||
|
| |||||||
| 1,679,487 | ||||||||
|
| |||||||
| Commercial Services & Supplies—0.6% | ||||||||
Ceco Environmental Corp. | 17,511 | 250,758 | ||||||
|
| |||||||
| Communications Equipment—3.9% | ||||||||
Alliance Fiber Optic Products, Inc. | 10,900 | 221,052 | ||||||
Applied Optoelectronics, Inc. (b) | 14,200 | 304,022 | ||||||
CalAmp Corp. (b) | 16,997 | 324,643 | ||||||
Mitel Networks Corp. (b) | 37,853 | 418,654 | ||||||
ShoreTel, Inc. (b) | 50,727 | 353,060 | ||||||
|
| |||||||
| 1,621,431 | ||||||||
|
| |||||||
| 116 | Semiannual Report | | May 31, 2014 | | See accompanying Notes to Financial Statements |
Table of Contents
Schedule of Investments
May 31, 2014 (Unaudited)
| Shares | Value | |||||||
| Consumer Finance—0.5% | ||||||||
JGWPT Holdings, Inc., Class A (b) | 17,721 | $ | 188,906 | |||||
|
| |||||||
| Diversified Consumer Services—0.7% | ||||||||
Carriage Services, Inc. | 15,413 | 283,137 | ||||||
|
| |||||||
| Diversified Telecommunication Services—1.4% | ||||||||
8x8, Inc. (b) | 32,550 | 244,776 | ||||||
inContact, Inc. (b) | 40,055 | 339,266 | ||||||
|
| |||||||
| 584,042 | ||||||||
|
| |||||||
| Electrical Equipment—0.2% | ||||||||
PowerSecure International, Inc. (b) | 8,283 | 67,009 | ||||||
|
| |||||||
| Electronic Equipment, Instruments & Components—3.5% | ||||||||
Control4 Corp. (b) | 15,989 | 271,333 | ||||||
Fabrinet (b) | 16,567 | 315,105 | ||||||
Measurement Specialties, Inc. (b) | 5,976 | 379,655 | ||||||
Methode Electronics, Inc. | 16,357 | 509,521 | ||||||
|
| |||||||
| 1,475,614 | ||||||||
|
| |||||||
| Energy Equipment & Services—2.2% | ||||||||
ION Geophysical Corp. (b) | 87,051 | 363,003 | ||||||
Matrix Service Co. (b) | 17,196 | 561,449 | ||||||
|
| |||||||
| 924,452 | ||||||||
|
| |||||||
| Food Products—0.7% | ||||||||
Boulder Brands, Inc. (b) | 22,439 | 304,497 | ||||||
|
| |||||||
| Health Care Equipment & Supplies—7.8% | ||||||||
Anika Therapeutics, Inc. (b) | 16,881 | 790,537 | ||||||
Antares Pharma, Inc. (b) | 56,518 | 166,728 | ||||||
Cardiovascular Systems, Inc. (b) | 13,001 | 364,678 | ||||||
Cynosure, Inc., Class A (b) | 12,162 | 264,889 | ||||||
Spectranetics Corp. (b) | 20,027 | 429,379 | ||||||
Staar Surgical Co. (b) | 24,746 | 381,831 | ||||||
SurModics, Inc. (b) | 12,058 | 258,162 | ||||||
Trinity Biotech PLC ADR | 16,684 | 400,249 | ||||||
Unilife Corp. (b) | 71,198 | 205,050 | ||||||
|
| |||||||
| 3,261,503 | ||||||||
|
| |||||||
| Health Care Providers & Services—3.5% | ||||||||
BioTelemetry, Inc. (b) | 32,086 | 235,511 | ||||||
Capital Senior Living Corp. (b) | 20,866 | 495,359 | ||||||
Cross Country Healthcare, Inc. (b) | 23,907 | 137,943 | ||||||
Five Star Quality Care, Inc. (b) | 51,695 | 272,950 | ||||||
Providence Service Corp. (b) | 7,432 | 298,766 | ||||||
|
| |||||||
| 1,440,529 | ||||||||
|
| |||||||
| Health Care Technology—1.0% | ||||||||
Omnicell, Inc. (b) | 14,889 | 395,005 | ||||||
|
| |||||||
| Hotels, Restaurants & Leisure—0.8% | ||||||||
Popeyes Louisiana Kitchen, Inc. (b) | 7,759 | 333,016 | ||||||
|
| |||||||
| Household Durables—0.8% | ||||||||
Libbey, Inc. (b) | 3,700 | 99,715 | ||||||
M/I Homes, Inc. (b) | 10,526 | 240,098 | ||||||
|
| |||||||
| 339,813 | ||||||||
|
| |||||||
| Insurance—2.3% | ||||||||
eHealth, Inc. (b) | 8,598 | 316,578 | ||||||
HCI Group, Inc. | 11,010 | 426,858 | ||||||
United Insurance Holdings Corp. | 12,600 | 222,390 | ||||||
|
| |||||||
| 965,826 | ||||||||
|
| |||||||
| Internet Software & Services—3.7% | ||||||||
Autobytel, Inc. (b) | 21,181 | 275,353 | ||||||
Internap Network Services Corp. (b) | 36,909 | 264,268 | ||||||
| Shares | Value | |||||||
IntraLinks Holdings, Inc. (b) | 26,142 | $ | 227,697 | |||||
Points International Ltd. (b) | 12,162 | 298,577 | ||||||
SPS Commerce, Inc. (b) | 4,613 | 262,434 | ||||||
Zix Corp. (b) | 69,416 | 229,073 | ||||||
|
| |||||||
| 1,557,402 | ||||||||
|
| |||||||
| IT Services—1.2% | ||||||||
Virtusa Corp. (b) | 14,365 | 491,427 | ||||||
|
| |||||||
| Leisure Equipment & Products—0.9% | ||||||||
Nautilus, Inc. (b) | 34,183 | 370,202 | ||||||
|
| |||||||
| Life Sciences Tools & Services—2.4% | ||||||||
Albany Molecular Research, Inc. (b) | 27,052 | 427,151 | ||||||
Cambrex Corp. (b) | 21,391 | 459,693 | ||||||
Fluidigm Corp. (b) | 4,275 | 118,588 | ||||||
|
| |||||||
| 1,005,432 | ||||||||
|
| |||||||
| Machinery—1.5% | ||||||||
Lydall, Inc. (b) | 1,100 | 30,349 | ||||||
Manitex International, Inc. (b) | 21,285 | 354,395 | ||||||
Wabash National Corp. (b) | 18,454 | 252,636 | ||||||
|
| |||||||
| 637,380 | ||||||||
|
| |||||||
| Marine—0.9% | ||||||||
Baltic Trading Ltd. | 55,365 | 354,890 | ||||||
|
| |||||||
| Media—2.9% | ||||||||
Carmike Cinemas, Inc. (b) | 17,511 | 602,378 | ||||||
Entravision Communications Corp., Class A | 51,904 | 278,206 | ||||||
MDC Partners, Inc., Class A | 15,466 | 325,095 | ||||||
|
| |||||||
| 1,205,679 | ||||||||
|
| |||||||
| Oil, Gas & Consumable Fuels—6.6% | ||||||||
Emerald Oil, Inc. (b) | 37,223 | 241,949 | ||||||
Gastar Exploration, Inc. (b) | 68,472 | 508,747 | ||||||
Penn Virginia Corp. (b) | 40,894 | 620,771 | ||||||
PetroQuest Energy, Inc. (b) | 61,700 | 377,604 | ||||||
StealthGas, Inc. (b) | 28,625 | 300,562 | ||||||
Synergy Resources Corp. (b) | 33,344 | 391,459 | ||||||
Vertex Energy, Inc. (b) | 32,400 | 317,844 | ||||||
|
| |||||||
| 2,758,936 | ||||||||
|
| |||||||
| Paper & Forest Products—0.9% | ||||||||
Neenah Paper, Inc. (a) | 7,759 | 378,484 | ||||||
|
| |||||||
| Personal Products—0.7% | ||||||||
IGI Laboratories, Inc. (b) | 57,300 | 301,971 | ||||||
|
| |||||||
| Pharmaceuticals—5.3% | ||||||||
AcelRx Pharmaceuticals, Inc. (b) | 15,728 | 144,697 | ||||||
AVANIR Pharmaceuticals, Inc., Class A (b) | 44,984 | 237,515 | ||||||
Depomed, Inc. (b) | 37,434 | 446,588 | ||||||
Horizon Pharma, Inc. (b) | 53,257 | 755,717 | ||||||
Lannett Co., Inc. (b) | 12,687 | 530,063 | ||||||
Repros Therapeutics, Inc. (b) | 7,024 | 114,140 | ||||||
|
| |||||||
| 2,228,720 | ||||||||
|
| |||||||
| Professional Services—1.5% | ||||||||
Barrett Business Services, Inc. | 7,444 | 351,059 | ||||||
GP Strategies Corp. (b) | 11,848 | 286,129 | ||||||
|
| |||||||
| 637,188 | ||||||||
|
| |||||||
| Road & Rail—5.5% | ||||||||
ArcBest Corp. | 12,897 | 551,605 | ||||||
Celadon Group, Inc. | 13,777 | 321,831 | ||||||
Quality Distribution, Inc. (b) | 25,067 | 360,714 | ||||||
Roadrunner Transportation Systems, Inc. (b) | 11,251 | 293,876 | ||||||
Saia, Inc. (b) | 17,301 | 753,977 | ||||||
|
| |||||||
| 2,282,003 | ||||||||
|
| |||||||
| Shares | Value | |||||||
| Semiconductors & Semiconductor Equipment—4.4% | ||||||||
Ambarella, Inc. (b) | 13,420 | $ | 348,115 | |||||
Exar Corp. (b) | 18,559 | 201,922 | ||||||
FormFactor, Inc. (b) | 50,436 | 366,165 | ||||||
PDF Solutions, Inc. (b) | 26,528 | 528,438 | ||||||
Tower Semiconductor Ltd. (b) | 43,509 | 413,335 | ||||||
|
| |||||||
| 1,857,975 | ||||||||
|
| |||||||
| Software—1.8% | ||||||||
Callidus Software, Inc. (b) | 25,584 | 268,888 | ||||||
ePlus, Inc. (b) | 4,764 | 270,166 | ||||||
PROS Holdings, Inc. (b) | 8,590 | 197,570 | ||||||
|
| |||||||
| 736,624 | ||||||||
|
| |||||||
| Specialty Retail—0.5% | ||||||||
Kirkland’s, Inc. (b) | 11,762 | 208,776 | ||||||
|
| |||||||
| Thrifts & Mortgage Finance—1.6% | ||||||||
BofI Holding, Inc. (b) | 5,242 | 402,743 | ||||||
Tree.com, Inc. (b) | 10,904 | 276,416 | ||||||
|
| |||||||
| 679,159 | ||||||||
|
| |||||||
| Trading Companies & Distributors—1.7% | ||||||||
Aceto Corp. | 19,281 | 336,068 | ||||||
H&E Equipment Services, Inc. (b) | 11,131 | 385,689 | ||||||
|
| |||||||
| 721,757 | ||||||||
|
| |||||||
Total Common Stock (cost—$27,375,917) | 41,086,916 | |||||||
|
| |||||||
| Principal Amount (000s) | ||||||||
| Repurchase Agreements—1.0% | ||||||||
State Street Bank and Trust Co., dated 5/30/14, 0.00%, due 6/2/14, proceeds $419,000; collateralized by U.S. Treasury Notes, 0.75%, due 3/31/18, valued at $428,855 including accrued interest |
| |||||||
(cost—$419,000) | $419 | 419,000 | ||||||
|
| |||||||
Total Investments (cost—$27,794,917)—99.3% |
| 41,505,916 | ||||||
|
| |||||||
| Other assets less liabilities—0.7% | 296,554 | |||||||
|
| |||||||
| Net Assets—100.0% | $41,802,470 | |||||||
|
| |||||||
Notes to Schedule of Investments:
(a) Affiliated security.
(b) Non-income producing.
Glossary:
ADR—American Depositary Receipt
| See accompanying Notes to Financial Statements | | May 31, 2014 | | Semiannual Report | 117 |
Table of Contents
Schedule of Investments
May 31, 2014 (Unaudited)
AllianzGI Multi-Asset Real Return Fund
| Shares | Value | |||||||
| Mutual Funds (d)(e)—53.6% | ||||||||
AllianzGI Global Natural Resources | 83,408 | $1,698,193 | ||||||
PIMCO Commodity RealReturn Strategy | 276,866 | 1,655,659 | ||||||
|
| |||||||
Total Mutual Funds (cost—$2,966,589) | 3,353,852 | |||||||
|
| |||||||
| Common Stock—24.5% | ||||||||
| Australia—2.2% | ||||||||
CFS Retail Property Trust Group REIT | 4,280 | 8,175 | ||||||
Dexus Property Group REIT | 9,690 | 10,073 | ||||||
Federation Centres Ltd. REIT | 2,930 | 6,880 | ||||||
Goodman Group REIT | 2,778 | 13,185 | ||||||
GPT Group REIT | 3,240 | 11,768 | ||||||
Lend Lease Group | 1,120 | 14,007 | ||||||
Mirvac Group REIT | 5,641 | 9,519 | ||||||
Stockland REIT | 3,686 | 13,399 | ||||||
Westfield Group REIT | 3,419 | 34,095 | ||||||
Westfield Retail Trust REIT | 5,032 | 14,954 | ||||||
|
| |||||||
| 136,055 | ||||||||
|
| |||||||
| Austria—0.2% | ||||||||
BUWOG AG (f) | 101 | 1,893 | ||||||
IMMOFINANZ AG (f) | 2,020 | 7,181 | ||||||
|
| |||||||
| 9,074 | ||||||||
|
| |||||||
| Canada—1.0% | ||||||||
Brookfield Asset Management, Inc., Class A | 848 | 36,444 | ||||||
Brookfield Office Properties, Inc. | 450 | 8,989 | ||||||
First Capital Realty, Inc. | 157 | 2,702 | ||||||
H&R Real Estate Investment Trust REIT | 220 | 4,736 | ||||||
RioCan REIT | 320 | 8,066 | ||||||
|
| |||||||
| 60,937 | ||||||||
|
| |||||||
| France—1.1% | ||||||||
Fonciere Des Regions REIT | 60 | 6,006 | ||||||
Gecina S.A. REIT | 50 | 7,138 | ||||||
ICADE REIT | 60 | 6,006 | ||||||
Klepierre REIT | 164 | 7,964 | ||||||
Unibail-Rodamco SE REIT | 154 | 43,066 | ||||||
|
| |||||||
| 70,180 | ||||||||
|
| |||||||
| Hong Kong—3.2% | ||||||||
Cheung Kong Holdings Ltd. | 2,296 | 41,099 | ||||||
Hang Lung Properties Ltd. | 3,871 | 12,332 | ||||||
Henderson Land Development Co., Ltd. | 2,156 | 14,052 | ||||||
Hysan Development Co., Ltd. | 1,450 | 7,222 | ||||||
Kerry Properties Ltd. | 1,052 | 3,462 | ||||||
Link REIT | 3,821 | 20,379 | ||||||
New World Development Co., Ltd. | 10,440 | 11,985 | ||||||
Sino Land Co., Ltd. | 5,271 | 8,159 | ||||||
Sun Hung Kai Properties Ltd. | 2,610 | 35,757 | ||||||
Swire Pacific Ltd., Class A | 1,100 | 13,090 | ||||||
Swire Properties Ltd. | 1,993 | 6,206 | ||||||
Wharf Holdings Ltd. | 2,649 | 18,841 | ||||||
Wheelock & Co., Ltd. | 1,556 | 6,305 | ||||||
|
| |||||||
| 198,889 | ||||||||
|
| |||||||
| Japan—3.1% | ||||||||
Aeon Mall Co., Ltd. | 130 | 3,283 | ||||||
Daito Trust Construction Co., Ltd. | 110 | 11,946 | ||||||
Daiwa House Industry Co., Ltd. | 836 | 15,714 | ||||||
Hulic Co., Ltd. | 325 | 4,277 | ||||||
Japan Prime Realty Investment Corp. REIT | 1 | 3,600 | ||||||
| Shares | Value | |||||||
Japan Real Estate Investment Corp. REIT | 2 | $ | 11,722 | |||||
Japan Retail Fund Investment Corp. REIT | 3 | 6,610 | ||||||
Mitsubishi Estate Co., Ltd. | 1,721 | 42,034 | ||||||
Mitsui Fudosan Co., Ltd. | 1,156 | 36,822 | ||||||
Nippon Building Fund, Inc. REIT | 2 | 11,745 | ||||||
Nomura Real Estate Holdings, Inc. | 200 | 3,866 | ||||||
Nomura Real Estate Office Fund, Inc. REIT | 1 | 4,670 | ||||||
NTT Urban Development Corp. | 200 | 2,016 | ||||||
Sumitomo Realty & Development Co., Ltd. | 490 | 21,164 | ||||||
Tokyo Tatemono Co., Ltd. | 562 | 5,160 | ||||||
Tokyu Fudosan Holdings Corp. | 600 | 4,750 | ||||||
United Urban Investment Corp. REIT | 4 | 6,412 | ||||||
|
| |||||||
| 195,791 | ||||||||
|
| |||||||
| Netherlands—0.1% | ||||||||
Corio NV REIT | 150 | 7,507 | ||||||
|
| |||||||
| Singapore—1.1% | ||||||||
Ascendas Real Estate Investment Trust REIT | 4,520 | 8,873 | ||||||
CapitaCommercial Trust REIT | 3,940 | 5,311 | ||||||
CapitaLand Ltd. | 4,675 | 11,904 | ||||||
CapitaMall Trust REIT | 5,170 | 8,541 | ||||||
CapitaMalls Asia Ltd. | 3,240 | 6,086 | ||||||
City Developments Ltd. | 651 | 5,380 | ||||||
Global Logistic Properties Ltd. | 4,700 | 10,432 | ||||||
Keppel Land Ltd. | 1,600 | 4,445 | ||||||
UOL Group Ltd. | 1,110 | 5,845 | ||||||
|
| |||||||
| 66,817 | ||||||||
|
| |||||||
| Switzerland—0.1% | ||||||||
Swiss Prime Site AG (f) | 110 | 8,846 | ||||||
|
| |||||||
| United Kingdom—1.0% | ||||||||
British Land Co. PLC REIT | 1,494 | 17,926 | ||||||
Hammerson PLC REIT | 1,081 | 10,774 | ||||||
Intu Properties PLC REIT | 1,220 | 6,446 | ||||||
Land Securities Group PLC REIT | 1,241 | 22,245 | ||||||
Segro PLC REIT | 1,150 | 7,130 | ||||||
|
| |||||||
| 64,521 | ||||||||
|
| |||||||
| United States—11.4% | ||||||||
American Capital Agency Corp. REIT | 750 | 17,798 | ||||||
American Tower Corp. REIT | 672 | 60,231 | ||||||
Annaly Capital Management, Inc. REIT | 1,723 | 20,314 | ||||||
AvalonBay Communities, Inc. REIT | 195 | 27,659 | ||||||
Boston Properties, Inc. REIT | 246 | 29,687 | ||||||
Brookfield Property Partners L.P. | 70 | 1,401 | ||||||
Camden Property Trust REIT | 131 | 9,201 | ||||||
CBRE Group, Inc., Class A (f) | 429 | 12,801 | ||||||
Digital Realty Trust, Inc. REIT | 210 | 12,075 | ||||||
Duke Realty Corp. REIT | 519 | 9,186 | ||||||
Equity Residential REIT | 539 | 33,310 | ||||||
Federal Realty Investment Trust REIT | 107 | 12,789 | ||||||
General Growth Properties, Inc. REIT | 747 | 17,801 | ||||||
HCP, Inc. REIT | 760 | 31,730 | ||||||
Health Care REIT, Inc. REIT | 463 | 29,275 | ||||||
Host Hotels & Resorts, Inc. REIT | 1,111 | 24,520 | ||||||
Kimco Realty Corp. REIT | 638 | 14,623 | ||||||
Liberty Property Trust REIT | 250 | 9,678 | ||||||
Macerich Co. REIT | 215 | 14,199 | ||||||
Plum Creek Timber Co., Inc. REIT | 257 | 11,591 | ||||||
Prologis, Inc. REIT | 807 | 33,499 | ||||||
| Shares | Value | |||||||
Public Storage REIT | 229 | $ | 39,475 | |||||
Rayonier, Inc. REIT | 197 | 9,377 | ||||||
Realogy Holdings Corp. (f) | 178 | 6,618 | ||||||
Realty Income Corp. REIT | 300 | 12,990 | ||||||
Regency Centers Corp. REIT | 142 | 7,583 | ||||||
Simon Property Group, Inc. REIT | 506 | 84,229 | ||||||
SL Green Realty Corp. REIT | 137 | 15,000 | ||||||
UDR, Inc. REIT | 379 | 10,430 | ||||||
Ventas, Inc. REIT | 477 | 31,864 | ||||||
Vornado Realty Trust REIT | 251 | 26,877 | ||||||
Washington Prime Group, Inc. REIT (f) | 253 | 5,032 | ||||||
Weyerhaeuser Co. REIT | 860 | 27,021 | ||||||
|
| |||||||
| 709,864 | ||||||||
|
| |||||||
Total Common Stock (cost—$1,412,045) | 1,528,481 | |||||||
|
| |||||||
| Principal Amount (000s) | ||||||||
| U.S. Treasury Obligations (b)—11.0% | ||||||||
U.S. Treasury Inflation Indexed Bonds, |
| |||||||
2.125%, 2/15/40 | $55 | 69,176 | ||||||
2.375%, 1/15/25 | 123 | 149,452 | ||||||
3.875%, 4/15/29 | 86 | 126,514 | ||||||
U.S. Treasury Inflation Indexed Notes, |
| |||||||
0.625%, 7/15/21 | 218 | 229,776 | ||||||
2.375%, 1/15/17 (c) | 103 | 112,964 | ||||||
|
| |||||||
Total U.S. Treasury Obligations (cost—$733,784) | 687,882 | |||||||
|
| |||||||
| Shares | ||||||||
| Exchange-Traded Funds—9.3% | ||||||||
iShares JPMorgan USD Emerging Markets Bond | 2,500 | 289,075 | ||||||
Market Vectors Gold Miners | 4,500 | 101,250 | ||||||
Schwab U.S. TIPS | 100 | 5,564 | ||||||
SPDR Barclays Short Term High Yield Bond | 6,000 | 185,820 | ||||||
|
| |||||||
Total Exchange-Traded Funds (cost—$583,458) | 581,709 | |||||||
|
| |||||||
| Units | ||||||||
| Warrants—0.0% | ||||||||
| Hong Kong—0.0% | ||||||||
Sun Hung Kai Properties Ltd.,strike price $98.60, expires 4/22/16 (f) | 217 | 277 | ||||||
|
| |||||||
| Total Investments (cost—$5,695,876) (a)—98.4% | 6,152,201 | |||||||
|
| |||||||
| Other assets less liabilities—1.6% | 102,780 | |||||||
|
| |||||||
| Net Assets—100.0% | $6,254,981 | |||||||
|
| |||||||
| 118 | Semiannual Report | | May 31, 2014 | | See accompanying Notes to Financial Statements |
Table of Contents
Schedule of Investments
May 31, 2014 (Unaudited)
Notes to Schedule of Investments:
(a) Securities with an aggregate value of $748,606, representing 12.0% of net assets, were valued utilizing modeling tools provided by a third-party vendor. See Note 1(a) and Note 1(b) in the Notes to Financial Statements.
(b) Inflationary Bonds—Principal amount of security is adjusted for inflation/deflation.
(c) All or partial amount segregated for the benefit of the counterparty as collateral for derivatives.
(d) Affiliated fund.
(e) Institutional Class share.
(f) Non-income producing.
Glossary:
REIT—Real Estate Investment Trust
TIPS—Treasury Inflation Protected Securities
The industry classification of portfolio holdings and other assets less liabilities shown as a percentage of net assets were as follows:
Mutual Funds | 53.6% | |||
Real Estate Investment Trust | 16.9% | |||
U.S. Treasury Obligations | 11.0% | |||
Exchange-Traded Funds | 9.3% | |||
Real Estate Management & Development | 7.6% | |||
Other assets less liabilities | 1.6% | |||
|
| |||
| 100.0% | ||||
|
|
AllianzGI NFJ Emerging Markets Value Fund
| Shares | Value | |||||||
| Common Stock—91.9% | ||||||||
| Brazil—6.0% | ||||||||
Banco do Brasil S.A. | 5,600 | $56,917 | ||||||
Cia de Saneamento de Minas Gerais | 3,700 | 63,849 | ||||||
Cia Energetica de Minas Gerais | 6,924 | 49,451 | ||||||
Cia Paranaense de Energia | 6,100 | 59,767 | ||||||
Direcional Engenharia S.A. | 11,600 | 57,733 | ||||||
JBS S.A. | 18,100 | 60,595 | ||||||
Light S.A. | 7,000 | 61,898 | ||||||
Mahle-Metal Leve S.A. Industria e Comercio | 6,100 | 61,945 | ||||||
Transmissora Alianca de Energia Eletrica S.A. UNIT | 7,000 | 60,617 | ||||||
Vale S.A. | 4,400 | 55,778 | ||||||
|
| |||||||
| 588,550 | ||||||||
|
| |||||||
| Chile—1.8% | ||||||||
Administrada de Fondos de Pensiones Habitat S.A. | 46,349 | 60,399 | ||||||
Inversiones Aguas Metropolitanas S.A. | 36,809 | 60,629 | ||||||
Inversiones La Construccion S.A. | 4,756 | 58,948 | ||||||
|
| |||||||
| 179,976 | ||||||||
|
| |||||||
| China—17.7% | ||||||||
Agricultural Bank of China Ltd., Class H | 142,000 | 63,331 | ||||||
Anhui Expressway Co., Ltd., Class H | 117,000 | 67,155 | ||||||
Asia Cement China Holdings Corp. | 92,000 | 62,383 | ||||||
Bank of China Ltd., Class H | 143,000 | 68,392 | ||||||
Bank of Communications Co., Ltd., Class H | 95,000 | 63,816 | ||||||
China Construction Bank Corp., Class H | 88,000 | 64,622 | ||||||
China Merchants Bank Co., Ltd., Class H | 35,600 | 65,725 | ||||||
China Mobile Ltd. | 6,900 | 67,582 | ||||||
China Petroleum & Chemical Corp., Class H | 74,000 | 66,919 | ||||||
China South City Holdings Ltd. | 138,000 | 67,451 | ||||||
Guangdong Electric Power Development Co., Ltd., Class B | 105,400 | 59,545 | ||||||
Huabao International Holdings Ltd. | 130,000 | 60,600 | ||||||
Industrial & Commercial Bank of China Ltd., Class H | 100,000 | 64,946 | ||||||
Jiangling Motors Corp. Ltd., Class B | 17,400 | 62,868 | ||||||
Kingboard Laminates Holdings Ltd. | 158,500 | 58,550 | ||||||
Luthai Textile Co., Ltd., Class B | 48,100 | 63,964 | ||||||
Peak Sport Products Co., Ltd. | 226,000 | 61,564 | ||||||
PetroChina Co., Ltd., Class H | 58,000 | 69,253 | ||||||
Shenzhen Expressway Co., Ltd., Class H | 146,000 | 69,514 | ||||||
Shenzhen International Holdings Ltd. | 57,000 | 67,900 | ||||||
Sichuan Expressway Co., Ltd., Class H | 212,000 | 65,428 | ||||||
Skyworth Digital Holdings Ltd. | 100,000 | 47,842 | ||||||
Springland International Holdings Ltd. | 151,000 | 63,524 | ||||||
Tianjin Port Development Holdings Ltd. | 398,000 | 62,217 | ||||||
Travelsky Technology Ltd., Class H | 77,000 | 64,915 | ||||||
Shares | Value | |||||||
Wasion Group Holdings Ltd. | 94,000 | $66,641 | ||||||
Xinhua Winshare Publishing and Media Co., Ltd., Class H | 106,000 | 68,224 | ||||||
|
| |||||||
| 1,734,871 | ||||||||
|
| |||||||
| Czech Republic—0.6% | ||||||||
Philip Morris CR AS | 120 | 61,021 | ||||||
|
| |||||||
| Egypt—1.3% | ||||||||
Eastern Tobacco | 2,791 | 60,306 | ||||||
Orascom Telecom Media And Technology Holding SAE | 381,520 | 66,227 | ||||||
|
| |||||||
| 126,533 | ||||||||
|
| |||||||
| Greece—0.7% | ||||||||
Metka S.A. | 3,945 | 71,010 | ||||||
|
| |||||||
| Hong Kong—3.1% | ||||||||
Emperor Entertainment Hotel Ltd. | 152,000 | 60,667 | ||||||
Emperor International Holdings Ltd. | 278,000 | 61,043 | ||||||
NagaCorp Ltd. | 70,000 | 64,112 | ||||||
Pacific Textile Holdings Ltd. | 46,000 | 56,484 | ||||||
SITC International Holdings Co., Ltd. | 138,000 | 60,042 | ||||||
|
| |||||||
| 302,348 | ||||||||
|
| |||||||
| India—7.2% | ||||||||
Great Eastern Shipping Co., Ltd. | 10,964 | 68,653 | ||||||
Hexaware Technologies Ltd. | 23,592 | 57,411 | ||||||
Hindustan Zinc Ltd. | 26,837 | 71,150 | ||||||
Indiabulls Housing Finance Ltd. | 10,893 | 71,678 | ||||||
Jubilant Life Sciences Ltd. | 19,919 | 58,654 | ||||||
KPIT Technologies Ltd. | 22,111 | 59,950 | ||||||
McLeod Russel India Ltd. | 13,524 | 61,330 | ||||||
Mphasis Ltd. | 2,206 | 16,398 | ||||||
Muthoot Finance Ltd. | 17,625 | 58,417 | ||||||
Power Finance Corp. Ltd. | 11,826 | 58,258 | ||||||
Rural Electrification Corp. Ltd. | 10,485 | 56,508 | ||||||
Tata Motors Ltd. ADR | 1,750 | 65,170 | ||||||
|
| |||||||
| 703,577 | ||||||||
|
| |||||||
| Indonesia—2.4% | ||||||||
Adaro Energy Tbk PT | 562,000 | 59,069 | ||||||
Bank Pembangunan Daerah Jawa Barat Dan Banten Tbk PT | 748,400 | 55,486 | ||||||
Bank Pembangunan Daerah Jawa Timur Tbk PT | 1,683,000 | 61,319 | ||||||
Perusahaan Gas Negara Persero Tbk PT | 132,500 | 61,627 | ||||||
|
| |||||||
| 237,501 | ||||||||
|
| |||||||
| Korea (Republic of)—11.5% | ||||||||
Dongbu Insurance Co., Ltd. | 1,146 | 64,907 | ||||||
Hanil Cement Co., Ltd. | 520 | 57,632 | ||||||
Hankook Tire Co., Ltd. | 1,063 | 63,122 | ||||||
Hanwha Corp. | 2,190 | 58,255 | ||||||
Hyundai Marine & Fire Insurance Co., Ltd. | 2,150 | 61,066 | ||||||
Hyundai Motor Co. | 267 | 58,878 | ||||||
Kia Motors Corp. | 1,205 | 69,590 | ||||||
Korean Reinsurance Co. | 6,255 | 61,333 | ||||||
KT&G Corp. | 827 | 67,282 | ||||||
LG Uplus Corp. | 6,610 | 62,216 | ||||||
LIG Insurance Co., Ltd. | 2,100 | 58,422 | ||||||
| See accompanying Notes to Financial Statements | | May 31, 2014 | | Semiannual Report | 119 |
Table of Contents
Schedule of Investments
May 31, 2014 (Unaudited)
| Shares | Value | |||||||
Meritz Fire & Marine Insurance Co., Ltd. | 4,670 | $ | 58,406 | |||||
Samsung Electronics Co., Ltd. | 48 | 67,996 | ||||||
Seah Besteel Corp. | 2,220 | 61,539 | ||||||
SeAH Steel Corp. | 550 | 69,560 | ||||||
SK Holdings Co., Ltd. | 343 | 61,957 | ||||||
Sungwoo Hitech Co., Ltd. | 4,750 | 68,108 | ||||||
Tongyang Life Insurance | 5,990 | 59,044 | ||||||
|
| |||||||
| 1,129,313 | ||||||||
|
| |||||||
| Malaysia—2.5% | ||||||||
Kossan Rubber Industries | 47,700 | 59,548 | ||||||
Star Publications Malaysia Bhd. | 77,500 | 63,923 | ||||||
Supermax Corp. Bhd. | 80,700 | 60,299 | ||||||
UOA Development Bhd. | 89,800 | 60,415 | ||||||
|
| |||||||
| 244,185 | ||||||||
|
| |||||||
| Mexico—2.8% | ||||||||
America Movil S.A.B. de C.V., Ser. L | 61,900 | 59,847 | ||||||
Credito Real S.A.B. de C.V. | 34,000 | 71,589 | ||||||
Industrias Bachoco S.A.B. de C.V., Ser. B | 17,400 | 75,790 | ||||||
TF Administradora Industrial S de RL de C.V. REIT | 31,400 | 63,672 | ||||||
|
| |||||||
| 270,898 | ||||||||
|
| |||||||
| Peru—0.7% | ||||||||
Intercorp Financial Services, Inc. | 1,946 | 64,179 | ||||||
|
| |||||||
| Poland—1.9% | ||||||||
Asseco Poland S.A. | 4,559 | 61,484 | ||||||
Powszechny Zaklad Ubezpieczen S.A. | 448 | 65,958 | ||||||
Synthos S.A. | 40,087 | 58,289 | ||||||
|
| |||||||
| 185,731 | ||||||||
|
| |||||||
| Russian Federation—6.2% | ||||||||
Acron JSC (b)(c) | 1,802 | 70,314 | ||||||
Bashneft OAO (b)(c) | 931 | 60,254 | ||||||
Gazprom Neft OAO ADR | 2,900 | 58,580 | ||||||
Gazprom OAO (b) | 16,866 | 68,645 | ||||||
Lukoil OAO (b)(c) | 995 | 56,188 | ||||||
Mobile Telesystems OJSC (b)(c) | 7,100 | 57,581 | ||||||
Rosneft OAO (b)(c) | 8,162 | 52,890 | ||||||
Sistema JSFC (b)(c) | 58,186 | 72,151 | ||||||
Surgutneftegas OAO ADR | 7,513 | 54,469 | ||||||
Tatneft OAO (b)(c) | 9,423 | 54,653 | ||||||
|
| |||||||
| 605,725 | ||||||||
|
| |||||||
| Singapore—1.2% | ||||||||
Cambridge Industrial Trust REIT | 100,000 | 61,854 | ||||||
Lippo Malls Indonesia Retail Trust REIT | 182,000 | 58,762 | ||||||
|
| |||||||
| 120,616 | ||||||||
|
| |||||||
| South Africa—5.7% | ||||||||
DataTec Ltd. | 13,214 | 64,674 | ||||||
Fountainhead Property Trust UNIT REIT | 83,825 | 59,640 | ||||||
Imperial Holdings Ltd. | 3,223 | 61,087 | ||||||
Reunert Ltd. | 10,654 | 66,615 | ||||||
S.A. Corporate Real Estate Fund Nominees Pty Ltd. UNIT REIT | 164,262 | 63,479 | ||||||
Sibanye Gold Ltd. | 24,041 | 59,222 | ||||||
Telkom S.A. SOC Ltd. (c) | 17,275 | 63,211 | ||||||
Vukile Property Fund Ltd. REIT | 39,565 | 64,062 | ||||||
Wilson Bayly Holmes-Ovcon Ltd. | 4,809 | 60,904 | ||||||
|
| |||||||
| 562,894 | ||||||||
|
| |||||||
| Shares | Value | |||||||
| Taiwan—10.2% | ||||||||
Casetek Holdings Ltd. | 12,000 | $ | 66,499 | |||||
Chicony Electronics Co., Ltd. | 23,150 | 62,667 | ||||||
Chimei Materials Technology Corp. | 54,000 | 65,300 | ||||||
Compeq Manufacturing Co., Ltd. | 100,000 | 69,461 | ||||||
Gigabyte Technology Co., Ltd. | 43,000 | 74,084 | ||||||
Hon Hai Precision Industry Co., Ltd. GDR | 11,702 | 72,904 | ||||||
Inventec Corp. | 68,000 | 63,584 | ||||||
King Yuan Electronics Co., Ltd. | 79,000 | 68,603 | ||||||
King’s Town Bank | 65,000 | 62,074 | ||||||
Lite-On Technology Corp. | 41,129 | 66,705 | ||||||
Micro-Star International Co., Ltd. | 48,000 | 71,524 | ||||||
Phison Electronics Corp. | 8,000 | 58,726 | ||||||
Sinyi Realty Co. | 35,000 | 60,194 | ||||||
Tripod Technology Corp. | 32,000 | 62,868 | ||||||
Wistron NeWeb Corp. | 29,000 | 69,560 | ||||||
|
| |||||||
| 994,753 | ||||||||
|
| |||||||
| Thailand—4.4% | ||||||||
Delta Electronics Thailand PCL (b) | 34,400 | 59,710 | ||||||
Delta Electronics Thailand PCL NVDR | 3,800 | 6,596 | ||||||
GFPT PCL NVDR | 147,400 | 60,687 | ||||||
PTT Exploration & Production PCL (b) | 10,700 | 50,075 | ||||||
PTT Exploration & Production PCL NVDR | 1,900 | 8,892 | ||||||
PTT Global Chemical PCL (b) | 22,300 | 46,758 | ||||||
PTT Global Chemical PCL NVDR | 6,700 | 14,048 | ||||||
PTT PCL NVDR | 6,600 | 59,157 | ||||||
Siamgas & Petrochemicals PCL NVDR | 119,600 | 61,931 | ||||||
Thanachart Capital PCL (b) | 48,100 | 49,910 | ||||||
Thanachart Capital PCL NVDR | 8,200 | 8,509 | ||||||
|
| |||||||
| 426,273 | ||||||||
|
| |||||||
| Turkey—4.0% | ||||||||
Aksa Akrilik Kimya Sanayii | 17,627 | 60,810 | ||||||
Aygaz AS | 14,521 | 64,143 | ||||||
Cimsa Cimento Sanayi VE Tica | 10,517 | 67,446 | ||||||
Selcuk Ecza Deposu Ticaret ve Sanayi A.S. | 68,801 | 63,636 | ||||||
Soda Sanayii AS | 41,152 | 69,621 | ||||||
Turk Traktor ve Ziraat Makineleri AS | 2,228 | 67,660 | ||||||
|
| |||||||
| 393,316 | ||||||||
|
| |||||||
| Total Common Stock (cost—$8,720,709) | 9,003,270 | |||||||
|
| |||||||
| Preferred Stock—4.0% | ||||||||
| Brazil—3.4% | ||||||||
AES Tiete S.A. | 7,700 | 58,808 | ||||||
Banco ABC Brasil S.A. | 11,634 | 68,081 | ||||||
Banco Daycoval S.A. | 15,400 | 62,691 | ||||||
Cia Energetica de Minas Gerais | 2,492 | 17,329 | ||||||
Itausa - Investimentos Itau S.A. | 17,446 | 66,504 | ||||||
Petroleo Brasileiro S.A. | 8,800 | 65,559 | ||||||
|
| |||||||
| 338,972 | ||||||||
|
| |||||||
| Russian Federation—0.6% | ||||||||
AK Transneft OAO (b)(c) | 24 | 55,016 | ||||||
|
| |||||||
| Total Preferred Stock (cost—$407,020) | 393,988 | |||||||
|
| |||||||
| Shares | Value | |||||||
| Equity-Linked Securities—1.1% | ||||||||
| India—1.1% | ||||||||
CLSA Financial Products, Ltd.,Mphasis Ltd., expires 8/13/18 | 6,983 | $ | 52,024 | |||||
Merrill Lynch International & Co.,Oil & Natural Gas Corp. Ltd., expires 5/13/15 | 8,800 | 56,232 | ||||||
|
| |||||||
| Total Equity-Linked Securities (cost—$88,010) | 108,256 | |||||||
|
| |||||||
Total Investments (cost—$9,215,739) (a)—97.0% |
| 9,505,514 | ||||||
|
| |||||||
| Other assets less liabilities—3.0% | 294,064 | |||||||
|
| |||||||
| Net Assets—100.0% | $9,799,578 | |||||||
|
| |||||||
Notes to Schedule of Investments:
(a) Securities with an aggregate value of $6,110,659, representing 62.4% of net assets, were valued utilizing modeling tools provided by a third-party vendor. See Note 1(a) and Note 1(b) in the Notes to Financial Statements.
(b) Fair-Valued—Securities with an aggregate value of $754,145, representing 7.7% of net assets. See Note 1(a) and Note 1(b) in the Notes to Financial Statements.
(c) Non-income producing.
Glossary:
ADR—American Depositary Receipt
GDR—Global Depositary Receipt
NVDR—Non-Voting Depository Receipt
REIT—Real Estate Investment Trust
UNIT—More than one class of securities traded together.
| 120 | Semiannual Report | | May 31, 2014 | | See accompanying Notes to Financial Statements |
Table of Contents
Schedule of Investments
May 31, 2014 (Unaudited)
The industry classification of portfolio holdings and other assets less liabilities shown as a percentage of net assets were as follows:
Banks | 9.7% | |||
Oil, Gas & Consumable Fuels | 9.3% | |||
Electronic Equipment, Instruments & Components | 5.5% | |||
Insurance | 4.4% | |||
Technology Hardware, Storage & Peripherals | 4.2% | |||
Chemicals | 3.9% | |||
Real Estate Investment Trust | 3.8% | |||
Transportation Infrastructure | 3.4% | |||
Wireless Telecommunication Services | 3.3% | |||
Metals & Mining | 3.2% | |||
Electric Utilities | 3.1% | |||
Food Products | 2.6% | |||
Automobiles | 2.6% | |||
Real Estate Management & Development | 2.5% | |||
Textiles, Apparel & Luxury Goods | 2.5% | |||
Semiconductors & Semiconductor Equipment | 2.0% | |||
Auto Components | 2.0% | |||
IT Services | 2.0% | |||
Tobacco | 1.9% | |||
Construction Materials | 1.9% | |||
Diversified Financial Services | 1.8% | |||
Machinery | 1.4% | |||
Consumer Finance | 1.3% | |||
Distributors | 1.3% | |||
Industrial Conglomerates | 1.3% | |||
Gas Utilities | 1.3% | |||
Hotels, Restaurants & Leisure | 1.3% | |||
Water Utilities | 1.3% | |||
Diversified Telecommunication Services | 1.2% | |||
Software | 1.2% | |||
Health Care Equipment & Supplies | 1.2% | |||
Household Durables | 1.1% | |||
Thrifts & Mortgage Finance | 0.7% | |||
Communications Equipment | 0.7% | |||
Media | 0.7% | |||
Oil & Gas | 0.6% | |||
Health Care Providers & Services | 0.6% | |||
Multi-line Retail | 0.6% | |||
Construction & Engineering | 0.6% | |||
Capital Markets | 0.6% | |||
Marine | 0.6% | |||
Independent Power Producers & Energy Traders | 0.6% | |||
Pharmaceuticals | 0.6% | |||
Pipelines | 0.6% | |||
Other assets less liabilities | 3.0% | |||
|
| |||
| 100.0% | ||||
|
|
AllianzGI NFJ Global Dividend Value Fund
| Shares | Value | |||||||
| Common Stock—97.5% | ||||||||
| Brazil—4.8% | ||||||||
Cia de Saneamento Basico do Estado de Sao Paulo ADR | 124,400 | $1,217,876 | ||||||
Cia Energetica de Minas Gerais ADR | 162,289 | 1,139,269 | ||||||
Vale S.A. ADR | 94,600 | 1,206,150 | ||||||
|
| |||||||
| 3,563,295 | ||||||||
|
| |||||||
| Canada—1.1% | ||||||||
Barrick Gold Corp. | 53,400 | 860,274 | ||||||
|
| |||||||
| China—3.9% | ||||||||
China Mobile Ltd. | 152,600 | 1,494,637 | ||||||
China Petroleum & Chemical Corp., Class H | 1,534,000 | 1,387,219 | ||||||
|
| |||||||
| 2,881,856 | ||||||||
|
| |||||||
| France—4.0% | ||||||||
Total S.A. | 42,999 | 3,018,811 | ||||||
|
| |||||||
| Germany—2.0% | ||||||||
Siemens AG | 11,100 | 1,475,246 | ||||||
|
| |||||||
| Hong Kong—1.8% | ||||||||
First Pacific Co., Ltd. | 1,224,600 | 1,387,115 | ||||||
|
| |||||||
| Israel—3.7% | ||||||||
Israel Chemicals Ltd. | 147,300 | 1,300,027 | ||||||
Teva Pharmaceutical Industries Ltd. ADR | 28,400 | 1,433,916 | ||||||
|
| |||||||
| 2,733,943 | ||||||||
|
| |||||||
| Japan—5.8% | ||||||||
Daihatsu Motor Co., Ltd. | 90,900 | 1,575,587 | ||||||
ITOCHU Corp. | 117,400 | 1,393,768 | ||||||
Mizuho Financial Group, Inc. | 710,300 | 1,387,354 | ||||||
|
| |||||||
| 4,356,709 | ||||||||
|
| |||||||
| Korea (Republic of)—4.1% | ||||||||
POSCO | 4,900 | 1,389,122 | ||||||
SK Telecom Co., Ltd. | 7,739 | 1,663,479 | ||||||
|
| |||||||
| 3,052,601 | ||||||||
|
| |||||||
| Russian Federation—5.6% | ||||||||
Lukoil OAO ADR | 25,000 | 1,414,000 | ||||||
Mobile Telesystems OJSC ADR | 78,579 | 1,452,926 | ||||||
Sberbank of Russia ADR | 131,000 | 1,327,030 | ||||||
|
| |||||||
| 4,193,956 | ||||||||
|
| |||||||
| South Africa—2.0% | ||||||||
Sasol Ltd. ADR | 26,221 | 1,475,980 | ||||||
|
| |||||||
| Spain—4.3% | ||||||||
Banco Santander S.A. | 163,549 | 1,674,685 | ||||||
Enagas S.A. | 52,700 | 1,550,906 | ||||||
|
| |||||||
| 3,225,591 | ||||||||
|
| |||||||
| Switzerland—3.8% | ||||||||
Credit Suisse Group AG (b) | 49,129 | 1,459,057 | ||||||
Swiss Re AG | 15,303 | 1,361,818 | ||||||
|
| |||||||
| 2,820,875 | ||||||||
|
| |||||||
| United Kingdom—7.8% | ||||||||
BAE Systems PLC | 203,500 | 1,445,650 | ||||||
GlaxoSmithKline PLC | 52,268 | 1,402,688 | ||||||
Imperial Tobacco Group PLC | 35,000 | 1,580,519 | ||||||
TESCO PLC | 268,000 | 1,364,448 | ||||||
|
| |||||||
| 5,793,305 | ||||||||
|
| |||||||
| Shares | Value | |||||||
| United States—42.8% | ||||||||
Axis Capital Holdings Ltd. | 33,500 | $ | 1,540,665 | |||||
Baxter International, Inc. | 19,800 | 1,473,318 | ||||||
CA, Inc. | 44,200 | 1,268,098 | ||||||
Cisco Systems, Inc. | 129,000 | 3,175,980 | ||||||
ConocoPhillips | 22,300 | 1,782,662 | ||||||
Deere & Co. | 16,200 | 1,476,954 | ||||||
Ford Motor Co. | 96,400 | 1,584,816 | ||||||
Intel Corp. | 58,700 | 1,603,684 | ||||||
JPMorgan Chase & Co. | 25,500 | 1,417,035 | ||||||
MetLife, Inc. | 28,600 | 1,456,598 | ||||||
Microsoft Corp. | 39,300 | 1,608,942 | ||||||
Navient Corp. | 62,100 | 981,180 | ||||||
Norfolk Southern Corp. | 16,300 | 1,642,225 | ||||||
Northrop Grumman Corp. | 11,900 | 1,446,445 | ||||||
Pfizer, Inc. | 44,200 | 1,309,646 | ||||||
PNC Financial Services Group, Inc. | 17,800 | 1,517,806 | ||||||
Seagate Technology PLC | 26,000 | 1,396,980 | ||||||
SLM Corp. | 62,100 | 534,681 | ||||||
Verizon Communications, Inc. | 31,200 | 1,558,752 | ||||||
Wal-Mart Stores, Inc. | 19,200 | 1,473,984 | ||||||
Xerox Corp. | 135,200 | 1,669,720 | ||||||
|
| |||||||
| 31,920,171 | ||||||||
|
| |||||||
| Total Common Stock (cost—$65,320,557) | 72,759,728 | |||||||
|
| |||||||
| Principal Amount (000s) | ||||||||
| Repurchase Agreements—1.6% | ||||||||
State Street Bank and Trust Co., dated 5/30/14, 0.00%, due 6/2/14, proceeds $1,170,000; collateralized by U.S. Treasury Notes, 0.75%, due 3/31/18, valued at $1,197,836 including accrued interest |
| |||||||
(cost—$1,170,000) | $1,170 | 1,170,000 | ||||||
|
| |||||||
| Total Investments (cost—$66,490,557) (a)—99.1% | 73,929,728 | |||||||
|
| |||||||
| Other assets less liabilities—0.9% | 671,752 | |||||||
|
| |||||||
| Net Assets—100.0% | $74,601,480 | |||||||
|
| |||||||
Notes to Schedule of Investments:
(a) Securities with an aggregate value of $29,312,136, representing 39.3% of net assets, were valued utilizing modeling tools provided by a third-party vendor. See Note 1(a) and Note 1(b) in the Notes to Financial Statements.
(b) Non-income producing.
Glossary:
ADR—American Depositary Receipt
| See accompanying Notes to Financial Statements | | May 31, 2014 | | Semiannual Report | 121 |
Table of Contents
Schedule of Investments
May 31, 2014 (Unaudited)
The industry classification of portfolio holdings and other assets less liabilities shown as a percentage of net assets were as follows:
Oil, Gas & Consumable Fuels | 12.2% | |||
Banks | 9.7% | |||
Wireless Telecommunication Services | 6.1% | |||
Insurance | 5.8% | |||
Pharmaceuticals | 5.6% | |||
Metals & Mining | 4.6% | |||
Communications Equipment | 4.3% | |||
Automobiles | 4.2% | |||
Aerospace & Defense | 3.9% | |||
Software | 3.9% | |||
Food & Staples Retailing | 3.8% | |||
IT Services | 2.2% | |||
Road & Rail | 2.2% | |||
Semiconductors & Semiconductor Equipment | 2.1% | |||
Tobacco | 2.1% | |||
Diversified Telecommunication Services | 2.1% | |||
Gas Utilities | 2.1% | |||
Consumer Finance | 2.0% | |||
Machinery | 2.0% | |||
Industrial Conglomerates | 2.0% | |||
Health Care Equipment & Supplies | 2.0% | |||
Capital Markets | 2.0% | |||
Technology Hardware, Storage & Peripherals | 1.9% | |||
Trading Companies & Distributors | 1.9% | |||
Diversified Financial Services | 1.8% | |||
Chemicals | 1.8% | |||
Water Utilities | 1.7% | |||
Electric Utilities | 1.5% | |||
Repurchase Agreements | 1.6% | |||
Other assets less liabilities | 0.9% | |||
|
| |||
| 100.0% | ||||
|
|
AllianzGI NFJ International Small-Cap Value Fund
| Shares | Value | |||||||
| Common Stock—96.2% | ||||||||
| Australia—6.6% | ||||||||
Abacus Property Group REIT | 76,900 | $173,276 | ||||||
Beach Energy Ltd. | 98,600 | 152,212 | ||||||
Bendigo and Adelaide Bank Ltd. | 11,200 | 122,386 | ||||||
Cabcharge Australia Ltd. | 45,200 | 170,729 | ||||||
Charter Hall Retail REIT | 39,200 | 146,123 | ||||||
Mermaid Marine Australia Ltd. | 40,600 | 78,297 | ||||||
Primary Health Care Ltd. | 48,400 | 201,711 | ||||||
Seven West Media Ltd. | 80,800 | 140,305 | ||||||
SP AusNet | 187,400 | 241,156 | ||||||
|
| |||||||
| 1,426,195 | ||||||||
|
| |||||||
| Austria—2.3% | ||||||||
EVN AG | 6,100 | 83,410 | ||||||
RHI AG | 5,600 | 182,212 | ||||||
UNIQA Insurance Group AG | 17,321 | 233,965 | ||||||
|
| |||||||
| 499,587 | ||||||||
|
| |||||||
| Belgium—1.0% | ||||||||
Befimmo S.A. REIT | 2,800 | 208,971 | ||||||
|
| |||||||
| Brazil—2.3% | ||||||||
CETIP S.A. - Mercados Organizados | 14,000 | 181,101 | ||||||
Cia de Saneamento Basico do Estado de Sao Paulo ADR | 20,200 | 197,758 | ||||||
Ez Tec Empreendimentos e Participacoes S.A. | 11,500 | 118,270 | ||||||
|
| |||||||
| 497,129 | ||||||||
|
| |||||||
| Canada—7.8% | ||||||||
Cogeco, Inc. | 4,700 | 252,057 | ||||||
Genworth MI Canada, Inc. | 5,000 | 177,534 | ||||||
Horizon North Logistics, Inc. | 21,900 | 157,539 | ||||||
Linamar Corp. | 2,700 | 150,028 | ||||||
Martinrea International, Inc. | 16,300 | 176,184 | ||||||
Methanex Corp. | 2,500 | 142,750 | ||||||
Norbord, Inc. | 4,100 | 103,379 | ||||||
ShawCor Ltd. | 3,500 | 177,469 | ||||||
Total Energy Services, Inc. | 10,100 | 198,870 | ||||||
Transcontinental, Inc., Class A | 12,000 | 164,235 | ||||||
|
| |||||||
| 1,700,045 | ||||||||
|
| |||||||
| China—6.1% | ||||||||
Guangdong Investment Ltd. | 202,300 | 223,776 | ||||||
Guangshen Railway Co., Ltd., Class H | 400,100 | 150,990 | ||||||
Huabao International Holdings Ltd. | 357,000 | 166,416 | ||||||
Lonking Holdings Ltd. | 807,000 | 143,796 | ||||||
Springland International Holdings Ltd. | 387,100 | 162,848 | ||||||
Travelsky Technology Ltd., Class H | 199,000 | 167,767 | ||||||
Wasion Group Holdings Ltd. | 258,400 | 183,191 | ||||||
Zhejiang Expressway Co., Ltd., Class H | 136,900 | 135,374 | ||||||
|
| |||||||
| 1,334,158 | ||||||||
|
| |||||||
| Denmark—0.8% | ||||||||
Schouw & Co. | 3,200 | 163,064 | ||||||
|
| |||||||
| Finland—1.3% | ||||||||
Lassila & Tikanoja Oyj | 7,371 | 144,990 | ||||||
Tieto Oyj | 5,200 | 144,484 | ||||||
|
| |||||||
| 289,474 | ||||||||
|
| |||||||
| France—2.2% | ||||||||
Alten S.A. | 3,100 | 159,183 | ||||||
Groupe Steria SCA | 3,400 | 92,308 | ||||||
Shares | Value | |||||||
Ipsen S.A. | 4,500 | $ | 220,741 | |||||
|
| |||||||
| 472,232 | ||||||||
|
| |||||||
| Germany—3.7% | ||||||||
Indus Holding AG | 3,300 | 161,049 | ||||||
Norma Group SE (b) | 2,300 | 125,417 | ||||||
Wacker Neuson SE | 13,500 | 285,419 | ||||||
Wincor Nixdorf AG | 3,542 | 230,721 | ||||||
|
| |||||||
| 802,606 | ||||||||
|
| |||||||
| Greece—1.0% | ||||||||
Costamare, Inc. | 10,400 | 226,408 | ||||||
|
| |||||||
| Hong Kong—6.1% | ||||||||
First Pacific Co., Ltd. | 192,000 | 217,480 | ||||||
Johnson Electric Holdings Ltd. | 207,700 | 179,987 | ||||||
Luk Fook Holdings International Ltd. | 48,000 | 121,806 | ||||||
PCCW Ltd. | 437,000 | 237,863 | ||||||
Shun Tak Holdings Ltd. | 215,800 | 103,177 | ||||||
Singamas Container Holdings Ltd. | 575,500 | 121,203 | ||||||
Television Broadcasts Ltd. | 31,400 | 197,846 | ||||||
Yue Yuen Industrial Holdings Ltd. | 51,100 | 158,179 | ||||||
|
| |||||||
| 1,337,541 | ||||||||
|
| |||||||
| Israel—0.6% | ||||||||
Elbit Systems Ltd. | 2,200 | 137,280 | ||||||
|
| |||||||
| Italy—0.8% | ||||||||
Recordati SpA | 10,400 | 175,197 | ||||||
|
| |||||||
| Japan—17.0% | ||||||||
Aida Engineering Ltd. | 15,300 | 135,292 | ||||||
Ain Pharmaciez, Inc. | 3,100 | 141,442 | ||||||
Canon Electronics, Inc. | 5,000 | 87,865 | ||||||
Dynam Japan Holdings Co., Ltd. | 52,700 | 164,874 | ||||||
Enplas Corp. | 2,600 | 170,452 | ||||||
Fields Corp. | 7,700 | 103,255 | ||||||
Heiwado Co., Ltd. | 9,100 | 133,306 | ||||||
Japan Aviation Electronics Industry Ltd. | 9,700 | 181,099 | ||||||
Kaken Pharmaceutical Co., Ltd. | 11,900 | 237,894 | ||||||
Kato Sangyo Co., Ltd. | 9,700 | 205,740 | ||||||
KYORIN Holdings, Inc. | 5,300 | 102,652 | ||||||
Mitsubishi Gas Chemical Co., Inc. | 15,300 | 89,945 | ||||||
Mitsubishi Pencil Co., Ltd. | 6,600 | 191,990 | ||||||
Nippon Flour Mills Co., Ltd. | 28,000 | 148,364 | ||||||
Nippon Synthetic Chemical Industry Co., Ltd. | 13,100 | 94,971 | ||||||
Nitto Kogyo Corp. | 8,800 | 170,980 | ||||||
Paramount Bed Holdings Co., Ltd. | 5,300 | 172,548 | ||||||
Showa Corp. | 11,300 | 123,753 | ||||||
Sumitomo Osaka Cement Co., Ltd. | 39,000 | 141,188 | ||||||
Toho Holdings Co., Ltd. | 10,700 | 207,204 | ||||||
Tosoh Corp. | 44,800 | 214,543 | ||||||
Towa Pharmaceutical Co., Ltd. | 3,900 | 157,235 | ||||||
Toyo Suisan Kaisha Ltd. | 4,600 | 140,245 | ||||||
Yamaguchi Financial Group, Inc. | 18,700 | 178,915 | ||||||
|
| |||||||
| 3,695,752 | ||||||||
|
| |||||||
| Korea (Republic of)—1.2% | ||||||||
KT Skylife Co., Ltd. | 7,200 | 162,172 | ||||||
Sung Kwang Bend Co., Ltd. | 5,000 | 101,940 | ||||||
|
| |||||||
| 264,112 | ||||||||
|
| |||||||
| 122 | Semiannual Report | | May 31, 2014 | | See accompanying Notes to Financial Statements |
Table of Contents
Schedule of Investments
May 31, 2014 (Unaudited)
| Shares | Value | |||||||
| New Zealand—2.5% | ||||||||
Air New Zealand Ltd. | 114,200 | $ | 212,552 | |||||
Goodman Property Trust REIT | 189,000 | 171,818 | ||||||
Telecom Corp. of New Zealand Ltd. | 65,100 | 148,799 | ||||||
|
| |||||||
| 533,169 | ||||||||
|
| |||||||
| Norway—4.5% | ||||||||
BW Offshore Ltd. | 139,800 | 192,579 | ||||||
Ekornes ASA | 8,900 | 129,064 | ||||||
Leroy Seafood Group ASA | 5,100 | 170,741 | ||||||
Petroleum Geo-Services ASA | 5,800 | 62,621 | ||||||
SpareBank 1 SMN | 26,500 | 234,001 | ||||||
TGS Nopec Geophysical Co. ASA | 5,900 | 192,562 | ||||||
|
| |||||||
| 981,568 | ||||||||
|
| |||||||
| Panama—1.0% | ||||||||
Banco Latinoamericano de Comercio Exterior S.A. | 8,000 | 213,920 | ||||||
|
| |||||||
| Russian Federation—0.5% | ||||||||
CTC Media, Inc. | 11,500 | 116,955 | ||||||
|
| |||||||
| Singapore—0.6% | ||||||||
Lippo Malls Indonesia Retail Trust REIT | 423,900 | 136,863 | ||||||
|
| |||||||
| South Africa—2.0% | ||||||||
African Rainbow Minerals Ltd. | 8,200 | 144,242 | ||||||
Investec Ltd. | 12,200 | 104,781 | ||||||
JSE Ltd. | 20,600 | 188,802 | ||||||
|
| |||||||
| 437,825 | ||||||||
|
| |||||||
| Spain—0.5% | ||||||||
Grupo Catalana Occidente S.A. | 3,100 | 116,899 | ||||||
|
| |||||||
| Sweden—0.7% | ||||||||
Loomis AB, Class B | 5,200 | 146,283 | ||||||
|
| |||||||
| Switzerland—3.0% | ||||||||
BKW AG | 4,900 | 169,626 | ||||||
GAM Holding AG (c) | 9,300 | 171,664 | ||||||
Helvetia Holding AG | 300 | 142,968 | ||||||
Siegfried Holding AG (c) | 1,000 | 179,229 | ||||||
|
| |||||||
| 663,487 | ||||||||
|
| |||||||
| Taiwan—2.4% | ||||||||
Gigabyte Technology Co., Ltd. | 110,700 | 190,724 | ||||||
King Yuan Electronics Co., Ltd. | 194,200 | 168,643 | ||||||
King’s Town Bank | 172,000 | 164,258 | ||||||
|
| |||||||
| 523,625 | ||||||||
|
| |||||||
| United Kingdom—17.2% | ||||||||
Bank of Georgia Holdings PLC | 4,100 | 174,090 | ||||||
Beazley PLC | 49,800 | 204,430 | ||||||
Berendsen PLC | 11,100 | 185,244 | ||||||
Bodycote PLC | 13,700 | 171,498 | ||||||
Catlin Group Ltd. | 14,000 | 122,992 | ||||||
Crest Nicholson Holdings PLC | 25,674 | 144,769 | ||||||
Debenhams PLC | 107,900 | 137,827 | ||||||
Go-Ahead Group PLC | 3,500 | 129,135 | ||||||
Inchcape PLC | 19,100 | 199,839 | ||||||
Interserve PLC | 18,400 | 199,544 | ||||||
ITE Group PLC | 31,530 | 123,797 | ||||||
Kcom Group PLC | 93,800 | 145,935 | ||||||
Marston’s PLC | 75,100 | 190,297 | ||||||
Micro Focus International PLC | 11,900 | 167,370 | ||||||
Mondi PLC | 9,300 | 167,295 | ||||||
Morgan Advanced Materials PLC | 35,700 | 202,978 | ||||||
Premier Oil PLC | 29,300 | 173,103 | ||||||
RPC Group PLC | 15,800 | 161,443 | ||||||
Soco International PLC (c) | 22,100 | 155,820 | ||||||
Synergy Health PLC | 6,800 | 144,545 | ||||||
| Shares | Value | |||||||
Synthomer PLC | 34,100 | $ | 150,393 | |||||
UDG Healthcare PLC | 34,400 | 198,355 | ||||||
William Hill PLC | 15,700 | 93,672 | ||||||
|
| |||||||
| 3,744,371 | ||||||||
|
| |||||||
| United States—0.5% | ||||||||
Maiden Holdings Ltd. | 8,400 | 102,816 | ||||||
|
| |||||||
| Total Common Stock (cost—$18,733,376) | 20,947,532 | |||||||
|
| |||||||
| Preferred Stock—2.3% | ||||||||
| Brazil—0.9% | ||||||||
Banco ABC Brasil S.A. | 34,600 | 202,475 | ||||||
|
| |||||||
| Germany—1.4% | ||||||||
Hornbach Holding AG | 1,600 | 154,854 | ||||||
Jungheinrich AG | 1,900 | 137,902 | ||||||
|
| |||||||
| 292,756 | ||||||||
|
| |||||||
| Total Preferred Stock (cost—$368,051) | 495,231 | |||||||
|
| |||||||
| Rights—0.0% | ||||||||
| Brazil—0.0% | ||||||||
CETIP S.A. - Mercados Organizados, exercise price BRL 24.5, expires 6/19/14 (c) | 10 | 18 | ||||||
|
| |||||||
| Total Investments (cost—$19,101,427) (a)—98.5% | 21,442,781 | |||||||
|
| |||||||
| Other assets less liabilities—1.5% | 317,504 | |||||||
|
| |||||||
| Net Assets—100.0% | $21,760,285 | |||||||
|
| |||||||
Notes to Schedule of Investments:
(a) Securities with an aggregate value of $16,217,452, representing 74.5% of net assets, were valued utilizing modeling tools provided by a third-party vendor. See Note 1(a) and Note 1(b) in the Notes to Financial Statements.
(b) Affiliated security.
(c) Non-income producing.
Glossary:
ADR—American Depositary Receipt
BRL—Brazilian Real
REIT—Real Estate Investment Trust
The industry classification of portfolio holdings and other assets less liabilities shown as a percentage of net assets were as follows:
Machinery | 6.1% | |||
Banks | 5.8% | |||
Commercial Services & Supplies | 5.3% | |||
Media | 4.5% | |||
Insurance | 4.2% | |||
Pharmaceuticals | 4.1% | |||
Chemicals | 4.0% | |||
Real Estate Investment Trust | 3.9% | |||
Energy Equipment & Services | 3.8% | |||
Health Care Providers & Services | 3.5% | |||
Food Products | 2.9% | |||
Electronic Equipment, Instruments & Components | 2.8% | |||
IT Services | 2.6% | |||
Diversified Telecommunication Services | 2.5% | |||
Electric Utilities | 2.3% | |||
Oil, Gas & Consumable Fuels | 2.2% | |||
Food & Staples Retailing | 2.2% | |||
Capital Markets | 2.1% | |||
Auto Components | 2.1% | |||
Hotels, Restaurants & Leisure | 2.1% | |||
Technology Hardware, Storage & Peripherals | 2.0% | |||
Water Utilities | 1.9% | |||
Diversified Financial Services | 1.9% | |||
Household Durables | 1.9% | |||
Electrical Equipment | 1.6% | |||
Construction Materials | 1.4% | |||
Marine | 1.4% | |||
Multi-line Retail | 1.3% | |||
Road & Rail | 1.3% | |||
Specialty Retail | 1.3% | |||
Paper & Forest Products | 1.3% | |||
Industrial Conglomerates | 1.2% | |||
Airlines | 1.0% | |||
Distributors | 0.9% | |||
Construction & Engineering | 0.9% | |||
Life Sciences Tools & Services | 0.8% | |||
Thrifts & Mortgage Finance | 0.8% | |||
Health Care Equipment & Supplies | 0.8% | |||
Semiconductors & Semiconductor Equipment | 0.8% | |||
Software | 0.8% | |||
Containers & Packaging | 0.7% | |||
Textiles, Apparel & Luxury Goods | 0.7% | |||
Metals & Mining | 0.6% | |||
Aerospace & Defense | 0.6% | |||
Transportation Infrastructure | 0.6% | |||
Leisure Equipment & Products | 0.5% | |||
Building Products | 0.5% | |||
Other assets less liabilities | 1.5% | |||
|
| |||
| 100.0% | ||||
|
|
| See accompanying Notes to Financial Statements | | May 31, 2014 | | Semiannual Report | 123 |
Table of Contents
Schedule of Investments
May 31, 2014 (Unaudited)
AllianzGI NFJ International Value II Fund
| Shares | Value | |||||||
| Common Stock—97.4% | ||||||||
| Australia—1.4% | ||||||||
AMP Ltd. | 57,475 | $283,482 | ||||||
SP AusNet | 117,400 | 151,076 | ||||||
|
| |||||||
| 434,558 | ||||||||
|
| |||||||
| Austria—1.2% | ||||||||
EVN AG | 13,608 | 186,072 | ||||||
OMV AG | 4,794 | 198,688 | ||||||
|
| |||||||
| 384,760 | ||||||||
|
| |||||||
| Brazil—2.8% | ||||||||
Cia de Saneamento Basico do Estado de Sao Paulo ADR | 46,200 | 452,298 | ||||||
Vale S.A. ADR | 32,300 | 411,825 | ||||||
|
| |||||||
| 864,123 | ||||||||
|
| |||||||
| Canada—7.9% | ||||||||
Atco Ltd., Class I | 6,700 | 319,645 | ||||||
Barrick Gold Corp. | 5,400 | 87,651 | ||||||
Canadian Imperial Bank of Commerce | 3,600 | 317,602 | ||||||
Cogeco Cable, Inc. | 4,700 | 271,259 | ||||||
Genworth MI Canada, Inc. | 6,700 | 237,895 | ||||||
Manulife Financial Corp. | 15,400 | 281,924 | ||||||
Power Financial Corp. | 9,500 | 286,060 | ||||||
Shaw Communications, Inc., Class B | 12,500 | 310,750 | ||||||
Suncor Energy, Inc. | 9,600 | 369,888 | ||||||
|
| |||||||
| 2,482,674 | ||||||||
|
| |||||||
| China—4.7% | ||||||||
China Construction Bank Corp., Class H | 420,200 | 308,569 | ||||||
China Mobile Ltd. | 27,300 | 267,389 | ||||||
China Petroleum & Chemical Corp., Class H | 363,000 | 328,266 | ||||||
CNOOC Ltd. | 158,300 | 270,509 | ||||||
Guangdong Investment Ltd. | 276,400 | 305,743 | ||||||
|
| |||||||
| 1,480,476 | ||||||||
|
| |||||||
| Denmark—0.9% | ||||||||
Carlsberg A/S, Class B | 2,600 | 271,221 | ||||||
|
| |||||||
| France—5.1% | ||||||||
Arkema S.A. | 2,600 | 266,094 | ||||||
AXA S.A. | 10,600 | 261,987 | ||||||
Christian Dior S.A. | 1,500 | 313,864 | ||||||
Cie Generale des Etablissements Michelin | 2,100 | 258,605 | ||||||
Sanofi | 4,500 | 481,108 | ||||||
|
| |||||||
| 1,581,658 | ||||||||
|
| |||||||
| Germany—2.4% | ||||||||
Deutsche Boerse AG | 2,800 | 213,877 | ||||||
Muenchener Rueckversicherungs AG | 900 | 199,676 | ||||||
Talanx AG | 8,900 | 322,494 | ||||||
|
| |||||||
| 736,047 | ||||||||
|
| |||||||
| Hong Kong—7.0% | ||||||||
BOC Hong Kong Holdings Ltd. | �� | 89,800 | 269,527 | |||||
First Pacific Co., Ltd. | 346,100 | 392,030 | ||||||
Jardine Strategic Holdings Ltd. | 9,000 | 327,888 | ||||||
PCCW Ltd. | 621,000 | 338,016 | ||||||
Television Broadcasts Ltd. | 47,600 | 299,919 | ||||||
Wheelock & Co., Ltd. | 72,300 | 292,947 | ||||||
Yue Yuen Industrial Holdings Ltd. | 89,300 | 276,426 | ||||||
|
| |||||||
| 2,196,753 | ||||||||
|
| |||||||
| India—2.5% | ||||||||
Sesa Sterlite Ltd. ADR | 23,100 | 433,356 | ||||||
| Shares | Value | |||||||
Tata Motors Ltd. ADR | 9,700 | $ | 361,228 | |||||
|
| |||||||
| 794,584 | ||||||||
|
| |||||||
| Ireland—0.8% | ||||||||
Smurfit Kappa Group PLC | 10,568 | 255,117 | ||||||
|
| |||||||
| Israel—2.2% | ||||||||
Israel Chemicals Ltd. ADR | 29,600 | 262,552 | ||||||
Teva Pharmaceutical Industries Ltd. ADR | 8,200 | 414,018 | ||||||
|
| |||||||
| 676,570 | ||||||||
|
| |||||||
| Japan—12.1% | ||||||||
Central Japan Railway Co. | 2,800 | 372,343 | ||||||
Daiwa Securities Group, Inc. | 27,600 | 224,187 | ||||||
Isuzu Motors Ltd. | 44,700 | 274,442 | ||||||
Japan Airlines Co., Ltd. | 3,900 | 203,996 | ||||||
Kaken Pharmaceutical Co., Ltd. | 10,500 | 209,906 | ||||||
KYORIN Holdings, Inc. | 6,100 | 118,146 | ||||||
Mitsui & Co., Ltd. | 31,300 | 476,306 | ||||||
Mizuho Financial Group, Inc. | 187,800 | 366,810 | ||||||
Nippon Telegraph & Telephone Corp. | 8,000 | 473,614 | ||||||
Nissan Motor Co., Ltd. | 23,700 | 213,894 | ||||||
Nitori Holdings Co., Ltd. | 6,500 | 319,802 | ||||||
Otsuka Holdings Co., Ltd. | 7,600 | 215,198 | ||||||
Suruga Bank Ltd. | 12,200 | 211,150 | ||||||
Toyo Suisan Kaisha Ltd. | 3,800 | 115,855 | ||||||
|
| |||||||
| 3,795,649 | ||||||||
|
| |||||||
| Mexico—1.0% | ||||||||
America Movil S.A.B. de C.V., Ser. L ADR | 16,700 | 322,811 | ||||||
|
| |||||||
| Norway—5.0% | ||||||||
Leroy Seafood Group ASA | 6,700 | 224,307 | ||||||
SpareBank 1 SR Bank ASA | 28,851 | 284,794 | ||||||
Statoil ASA | 17,800 | 545,530 | ||||||
Telenor ASA | 9,400 | 222,951 | ||||||
Yara International ASA | 6,300 | 287,710 | ||||||
|
| |||||||
| 1,565,292 | ||||||||
|
| |||||||
| Russian Federation—4.5% | ||||||||
Gazprom OAO ADR | 47,600 | 388,892 | ||||||
Lukoil OAO ADR | 6,100 | 345,016 | ||||||
Mobile Telesystems OJSC ADR | 16,400 | 303,236 | ||||||
Sberbank of Russia ADR | 36,900 | 373,797 | ||||||
|
| |||||||
| 1,410,941 | ||||||||
|
| |||||||
| Singapore—4.3% | ||||||||
DBS Group Holdings Ltd. | 26,136 | 352,376 | ||||||
First Resources Ltd. | 77,100 | 154,500 | ||||||
Golden Agri-Resources Ltd. | 636,943 | 292,552 | ||||||
Mapletree Industrial Trust REIT | 219,000 | 251,587 | ||||||
Sembcorp Industries Ltd. | 67,300 | 290,425 | ||||||
|
| |||||||
| 1,341,440 | ||||||||
|
| |||||||
| South Africa—1.1% | ||||||||
Sasol Ltd. ADR | 6,000 | 337,740 | ||||||
|
| |||||||
| Spain—1.5% | ||||||||
Enagas S.A. | 6,000 | 176,574 | ||||||
Mapfre S.A. | 69,800 | 285,247 | ||||||
|
| |||||||
| 461,821 | ||||||||
|
| |||||||
| Switzerland—2.8% | ||||||||
GAM Holding AG | 12,100 | 223,347 | ||||||
Helvetia Holding AG | 600 | 285,936 | ||||||
Roche Holdings AG | 1,200 | 353,703 | ||||||
|
| |||||||
| 862,986 | ||||||||
|
| |||||||
| Taiwan—1.3% | ||||||||
Advanced Semiconductor Engineering, Inc. ADR | 62,200 | 400,568 | ||||||
|
| |||||||
| Shares | Value | |||||||
| Turkey—1.1% | ||||||||
KOC Holding AS ADR | 14,700 | $ | 360,003 | |||||
|
| |||||||
| United Kingdom—23.2% | ||||||||
Aberdeen Asset Management PLC | 22,400 | 167,409 | ||||||
BAE Systems PLC | 40,800 | 289,840 | ||||||
BP PLC | 34,600 | 291,662 | ||||||
BT Group PLC | 57,200 | 380,962 | ||||||
Centrica PLC | 35,800 | 201,666 | ||||||
Crest Nicholson Holdings PLC | 49,978 | 281,812 | ||||||
GlaxoSmithKline PLC | 16,400 | 440,118 | ||||||
HSBC Holdings PLC | 28,400 | 299,574 | ||||||
Imperial Tobacco Group PLC | 11,500 | 519,313 | ||||||
Inchcape PLC | 30,300 | 317,022 | ||||||
Kingfisher PLC | 49,100 | 323,371 | ||||||
Marks & Spencer Group PLC | 38,500 | 290,667 | ||||||
Mondi PLC | 18,100 | 325,595 | ||||||
Old Mutual PLC | 97,600 | 330,955 | ||||||
Persimmon PLC (b) | 13,705 | 307,576 | ||||||
Reckitt Benckiser Group PLC | 3,900 | 333,850 | ||||||
Rio Tinto PLC | 6,800 | 348,735 | ||||||
Royal Dutch Shell PLC, Class A | 12,100 | 475,809 | ||||||
Sage Group PLC | 43,300 | 297,669 | ||||||
Serco Group PLC | 31,300 | 194,960 | ||||||
Smith & Nephew PLC | 19,500 | 341,892 | ||||||
TESCO PLC | 53,700 | 273,399 | ||||||
William Hill PLC | 35,000 | 208,823 | ||||||
|
| |||||||
| 7,242,679 | ||||||||
|
| |||||||
| United States—0.6% | ||||||||
Ensco PLC, Class A | 3,800 | 200,108 | ||||||
|
| |||||||
| Total Common Stock (cost—$28,370,765) | 30,460,579 | |||||||
|
| |||||||
| Principal Amount (000s) | ||||||||
| Repurchase Agreements—11.6% | ||||||||
State Street Bank and Trust Co., dated 5/30/14, 0.00%, due 6/2/14, proceeds $3,620,000; collateralized by U.S. Treasury Notes, 0.75%, due 3/31/18, valued at $3,697,023 including accrued interest |
| |||||||
(cost—$3,620,000) | $3,620 | 3,620,000 | ||||||
|
| |||||||
| Total Investments (cost—$31,990,765) (a)—109.0% | 34,080,579 | |||||||
|
| |||||||
| Liabilities in excess of other assets—(9.0)% | (2,824,027 | ) | ||||||
|
| |||||||
| Net Assets—100.0% | $31,256,552 | |||||||
|
| |||||||
Notes to Schedule of Investments:
(a) Securities with an aggregate value of $21,208,040, representing 67.9% of net assets, were valued utilizing modeling tools provided by a third-party vendor. See Note 1(a) and Note 1(b) in the Notes to Financial Statements.
(b) Non-income producing.
Glossary:
ADR—American Depositary Receipt
REIT—Real Estate Investment Trust
| 124 | Semiannual Report | | May 31, 2014 | | See accompanying Notes to Financial Statements |
Table of Contents
Schedule of Investments
May 31, 2014 (Unaudited)
The industry classification of portfolio holdings and liabilities in excess of other assets shown as a percentage of net assets were as follows:
Oil, Gas & Consumable Fuels | 11.3% | |||
Banks | 9.0% | |||
Insurance | 8.1% | |||
Pharmaceuticals | 7.3% | |||
Diversified Telecommunication Services | 4.5% | |||
Metals & Mining | 4.1% | |||
Industrial Conglomerates | 3.0% | |||
Media | 2.9% | |||
Wireless Telecommunication Services | 2.8% | |||
Automobiles | 2.7% | |||
Chemicals | 2.7% | |||
Food Products | 2.5% | |||
Water Utilities | 2.5% | |||
Specialty Retail | 2.0% | |||
Capital Markets | 1.9% | |||
Diversified Financial Services | 1.9% | |||
Textiles, Apparel & Luxury Goods | 1.9% | |||
Household Durables | 1.9% | |||
Multi-Utilities | 1.7% | |||
Tobacco | 1.7% | |||
Trading Companies & Distributors | 1.5% | |||
Semiconductors & Semiconductor Equipment | 1.3% | |||
Road & Rail | 1.2% | |||
Health Care Equipment & Supplies | 1.1% | |||
Electric Utilities | 1.1% | |||
Household Products | 1.1% | |||
Paper & Forest Products | 1.0% | |||
Distributors | 1.0% | |||
Software | 1.0% | |||
Real Estate Management & Development | 0.9% | |||
Multi-line Retail | 0.9% | |||
Aerospace & Defense | 0.9% | |||
Food & Staples Retailing | 0.9% | |||
Beverages | 0.9% | |||
Auto Components | 0.8% | |||
Containers & Packaging | 0.8% | |||
Real Estate Investment Trust | 0.8% | |||
Thrifts & Mortgage Finance | 0.7% | |||
Hotels, Restaurants & Leisure | 0.7% | |||
Airlines | 0.6% | |||
Energy Equipment & Services | 0.6% | |||
Commercial Services & Supplies | 0.6% | |||
Gas Utilities | 0.6% | |||
Repurchase Agreements | 11.6% | |||
Liabilities in excess of other assets | (9.0)% | |||
|
| |||
| 100.0% | ||||
|
|
AllianzGI Short Duration High Income Fund
| Principal Amount (000s) | Value | |||||||
| Corporate Bonds & Notes—80.6% | ||||||||
| Aerospace & Defense—0.9% | ||||||||
TransDigm, Inc., |
| |||||||
7.75%, 12/15/18 | $5,700 | $6,134,625 | ||||||
Triumph Group, Inc., |
| |||||||
8.625%, 7/15/18 | 340 | 357,646 | ||||||
|
| |||||||
| 6,492,271 | ||||||||
|
| |||||||
| Auto Manufacturers—0.3% | ||||||||
Chrysler Group LLC, |
| |||||||
8.25%, 6/15/21 | 2,000 | 2,290,000 | ||||||
|
| |||||||
| Banking—1.0% | ||||||||
Ally Financial, Inc., |
| |||||||
3.125%, 1/15/16 | 720 | 741,600 | ||||||
3.50%, 7/18/16 | 3,000 | 3,101,250 | ||||||
4.75%, 9/10/18 | 930 | 990,450 | ||||||
5.50%, 2/15/17 | 1,535 | 1,670,272 | ||||||
CIT Group, Inc., |
| |||||||
5.00%, 5/15/17 | 567 | 607,399 | ||||||
|
| |||||||
| 7,110,971 | ||||||||
|
| |||||||
| Building Materials—5.4% | ||||||||
Ainsworth Lumber Co., Ltd. (a)(c), |
| |||||||
7.50%, 12/15/17 | 15,491 | 16,381,733 | ||||||
Jeld-Wen, Inc. (a)(c), |
| |||||||
12.25%, 10/15/17 | 20,665 | 22,576,512 | ||||||
|
| |||||||
| 38,958,245 | ||||||||
|
| |||||||
| Chemicals—1.1% | ||||||||
Ashland, Inc., |
| |||||||
3.00%, 3/15/16 | 3,025 | 3,096,844 | ||||||
3.875%, 4/15/18 | 4,840 | 4,997,300 | ||||||
|
| |||||||
| 8,094,144 | ||||||||
|
| |||||||
| Commercial Services—7.0% | ||||||||
ADT Corp., |
| |||||||
4.125%, 4/15/19 | 15,650 | 15,689,125 | ||||||
Alliance Data Systems Corp. (a)(c), |
| |||||||
5.25%, 12/1/17 | 22,441 | 23,675,255 | ||||||
Hertz Corp., |
| |||||||
4.25%, 4/1/18 | 85 | 88,825 | ||||||
7.50%, 10/15/18 | 10,933 | 11,575,314 | ||||||
|
| |||||||
| 51,028,519 | ||||||||
|
| |||||||
| Computers—0.1% | ||||||||
Seagate HDD Cayman (a)(c), |
| |||||||
3.75%, 11/15/18 | 1,000 | 1,032,500 | ||||||
|
| |||||||
| Containers & Packaging—3.1% | ||||||||
Ardagh Packaging Finance PLC (a)(c), |
| |||||||
7.375%, 10/15/17 | 20,713 | 21,917,651 | ||||||
Beverage Packaging Holdings Luxembourg II S.A. (a)(c), |
| |||||||
5.625%, 12/15/16 | 250 | 254,688 | ||||||
|
| |||||||
| 22,172,339 | ||||||||
|
| |||||||
| Diversified Financial Services—2.7% | ||||||||
Aircastle Ltd., | 2,695 | 3,025,137 | ||||||
Ford Motor Credit Co. LLC, |
| |||||||
3.875%, 1/15/15 | 1,300 | 1,326,520 | ||||||
General Motors Financial Co., Inc., |
| |||||||
2.75%, 5/15/16 | 500 | 509,063 | ||||||
3.25%, 5/15/18 | 250 | 254,375 | ||||||
4.75%, 8/15/17 | 5,555 | 5,943,850 | ||||||
6.75%, 6/1/18 | 1,725 | 1,972,969 | ||||||
International Lease Finance Corp., |
| |||||||
4.875%, 4/1/15 | 1,900 | 1,957,000 | ||||||
5.65%, 6/1/14 | 750 | 750,000 | ||||||
| Principal Amount (000s) | Value | |||||||
SLM Corp., |
| |||||||
5.00%, 4/15/15 | $ | 175 | $ | 180,906 | ||||
5.00%, 6/15/18 | 2,220 | 2,226,298 | ||||||
6.00%, 1/25/17 | 1,500 | 1,638,750 | ||||||
|
| |||||||
| 19,784,868 | ||||||||
|
| |||||||
| Electric Utilities—3.8% | ||||||||
AES Corp., |
| |||||||
7.75%, 10/15/15 | 300 | 324,750 | ||||||
Ipalco Enterprises, Inc. (a)(c), |
| |||||||
7.25%, 4/1/16 | 2,300 | 2,518,500 | ||||||
NRG Energy, Inc., |
| |||||||
7.625%, 1/15/18 | 21,348 | 24,470,145 | ||||||
|
| |||||||
| 27,313,395 | ||||||||
|
| |||||||
| Electrical Equipment—0.9% | ||||||||
General Cable Corp. (e), |
| |||||||
2.608%, 4/1/15 | 6,167 | 6,190,126 | ||||||
|
| |||||||
| Entertainment—1.5% | ||||||||
Scientific Games International, Inc., |
| |||||||
9.25%, 6/15/19 | 9,983 | 10,544,544 | ||||||
|
| |||||||
| Food & Beverage—1.5% | ||||||||
Constellation Brands, Inc., |
| |||||||
8.375%, 12/15/14 | 73 | 75,920 | ||||||
Delhaize Group S.A., |
| |||||||
6.50%, 6/15/17 | 760 | 861,258 | ||||||
Stater Bros. Holdings, Inc., |
| |||||||
7.375%, 11/15/18 | 2,213 | 2,338,311 | ||||||
7.75%, 4/15/15 | 7,495 | 7,509,053 | ||||||
|
| |||||||
| 10,784,542 | ||||||||
|
| |||||||
| Healthcare-Products—0.3% | ||||||||
Hanger, Inc., |
| |||||||
7.125%, 11/15/18 | 2,072 | 2,191,140 | ||||||
|
| |||||||
| Healthcare-Services—1.2% | ||||||||
DaVita HealthCare Partners, Inc., |
| |||||||
6.375%, 11/1/18 | 8,115 | 8,530,894 | ||||||
|
| |||||||
| Holding Companies-Diversified—0.1% | ||||||||
Leucadia National Corp., |
| |||||||
8.125%, 9/15/15 | 860 | 934,390 | ||||||
|
| |||||||
| Home Builders—1.8% | ||||||||
Meritage Homes Corp., |
| |||||||
4.50%, 3/1/18 | 10,010 | 10,285,275 | ||||||
William Lyon Homes, Inc. (a)(c), |
| |||||||
5.75%, 4/15/19 | 2,500 | 2,568,750 | ||||||
|
| |||||||
| 12,854,025 | ||||||||
|
| |||||||
| Household Products/Wares—2.0% | ||||||||
Jarden Corp., |
| |||||||
7.50%, 5/1/17 | 695 | 794,037 | ||||||
Reynolds Group Issuer, Inc., |
| |||||||
8.50%, 5/15/18 | 12,900 | 13,496,625 | ||||||
|
| |||||||
| 14,290,662 | ||||||||
|
| |||||||
| Internet—0.7% | ||||||||
IAC, |
| |||||||
4.875%, 11/30/18 | 5,060 | 5,325,650 | ||||||
|
| |||||||
| Iron/Steel—0.9% | ||||||||
ArcelorMittal, |
| |||||||
4.25%, 2/25/15 | 4,650 | 4,743,000 | ||||||
Commercial Metals Co., |
| |||||||
6.50%, 7/15/17 | 1,775 | 1,980,234 | ||||||
|
| |||||||
| 6,723,234 | ||||||||
|
| |||||||
| Leisure—0.1% | ||||||||
NCL Corp. Ltd., |
| |||||||
5.00%, 2/15/18 | 650 | 674,375 | ||||||
|
| |||||||
| See accompanying Notes to Financial Statements | | May 31, 2014 | | Semiannual Report | 125 |
Table of Contents
Schedule of Investments
May 31, 2014 (Unaudited)
| Principal Amount (000s) | Value | |||||||
| Lodging—0.9% | ||||||||
Felcor Lodging L.P., |
| |||||||
6.75%, 6/1/19 | $ | 2,795 | $ | 2,990,650 | ||||
MGM Resorts International, |
| |||||||
6.625%, 7/15/15 | 3,619 | 3,836,140 | ||||||
|
| |||||||
| 6,826,790 | ||||||||
|
| |||||||
| Machinery-Diversified—0.9% | ||||||||
CNH Capital LLC, |
| |||||||
3.625%, 4/15/18 | 3,370 | 3,471,100 | ||||||
3.875%, 11/1/15 | 2,620 | 2,698,600 | ||||||
|
| |||||||
| 6,169,700 | ||||||||
|
| |||||||
| Media—8.9% | ||||||||
Allbritton Communications Co., |
| |||||||
8.00%, 5/15/18 | 1,194 | 1,249,222 | ||||||
Cablevision Systems Corp., |
| |||||||
7.75%, 4/15/18 | 11,728 | 13,296,620 | ||||||
CCO Holdings LLC, |
| |||||||
7.25%, 10/30/17 | 18,816 | 19,968,480 | ||||||
DISH DBS Corp., |
| |||||||
4.25%, 4/1/18 | 4,235 | 4,436,162 | ||||||
4.625%, 7/15/17 | 6,355 | 6,768,075 | ||||||
6.625%, 10/1/14 | 65 | 66,138 | ||||||
Numericable Group S.A. (a)(c), |
| |||||||
4.875%, 5/15/19 | 18,200 | 18,586,750 | ||||||
|
| |||||||
| 64,371,447 | ||||||||
|
| |||||||
| Mining—5.4% | ||||||||
Alcoa, Inc., |
| |||||||
6.75%, 7/15/18 | 8,900 | 10,199,382 | ||||||
FMG Resources August 206 Pty Ltd. (a)(c), |
| |||||||
6.875%, 2/1/18 | 12,005 | 12,605,250 | ||||||
Novelis, Inc., |
| |||||||
8.375%, 12/15/17 | 15,105 | 16,143,469 | ||||||
|
| |||||||
| 38,948,101 | ||||||||
|
| |||||||
| Oil & Gas—3.9% | ||||||||
Chesapeake Energy Corp., |
| |||||||
3.25%, 3/15/16 | 3,125 | 3,152,344 | ||||||
Newfield Exploration Co., |
| |||||||
7.125%, 5/15/18 | 1,150 | 1,185,937 | ||||||
Sabine Pass LNG L.P., |
| |||||||
7.50%, 11/30/16 | 18,480 | 20,559,000 | ||||||
Whiting Petroleum Corp., |
| |||||||
6.50%, 10/1/18 | 2,900 | 3,041,375 | ||||||
|
| |||||||
| 27,938,656 | ||||||||
|
| |||||||
| Paper & Forest Products—2.2% | ||||||||
Cascades, Inc., |
| |||||||
7.75%, 12/15/17 | 15,550 | 16,220,205 | ||||||
|
| |||||||
| Pharmaceuticals—3.7% | ||||||||
Valeant Pharmaceuticals International (a)(c), |
| |||||||
6.875%, 12/1/18 | 25,230 | 26,649,187 | ||||||
|
| |||||||
| Pipelines—3.6% | ||||||||
Eagle Rock Energy Partners L.P., |
| |||||||
8.375%, 6/1/19 | 12,860 | 14,001,325 | ||||||
Kinder Morgan Finance Co. LLC (a)(c), |
| |||||||
6.00%, 1/15/18 | 1,800 | 1,981,649 | ||||||
Targa Resources Partners L.P., |
| |||||||
7.875%, 10/15/18 | 9,419 | 10,031,235 | ||||||
|
| |||||||
| 26,014,209 | ||||||||
|
| |||||||
| Real Estate Investment Trust—0.0% | ||||||||
Felcor Lodging L.P., |
| |||||||
10.00%, 10/1/14 | 278 | 285,645 | ||||||
|
| |||||||
| Retail—2.5% | ||||||||
Limited Brands, Inc., |
| |||||||
5.25%, 11/1/14 | 125 | 127,500 | ||||||
Tops Holding Corp., |
| |||||||
8.875%, 12/15/17 | 16,695 | 18,301,894 | ||||||
|
| |||||||
| 18,429,394 | ||||||||
|
| |||||||
| Principal Amount (000s) | Value | |||||||
| Semiconductors—0.3% | ||||||||
NXP BV (a)(c), |
| |||||||
3.50%, 9/15/16 | $ | 2,000 | $ | 2,052,500 | ||||
|
| |||||||
| Telecommunications—11.7% | ||||||||
Brightstar Corp. (a)(c), |
| |||||||
7.25%, 8/1/18 | 8,540 | 9,458,050 | ||||||
9.50%, 12/1/16 | 1,000 | 1,086,250 | ||||||
CenturyLink, Inc., |
| |||||||
5.15%, 6/15/17 | 1,010 | 1,103,425 | ||||||
6.00%, 4/1/17 | 6,035 | 6,683,763 | ||||||
Inmarsat Finance PLC (a)(c), |
| |||||||
7.375%, 12/1/17 | 6,540 | 6,815,661 | ||||||
Intelsat Jackson Holdings S.A., |
| |||||||
7.25%, 4/1/19 | 13,250 | 14,227,187 | ||||||
Intelsat Luxembourg S.A., |
| |||||||
6.75%, 6/1/18 | 1,730 | 1,844,613 | ||||||
SBA Communications Corp., |
| |||||||
5.625%, 10/1/19 | 3,745 | 3,974,381 | ||||||
Sprint Communications, Inc., |
| |||||||
6.00%, 12/1/16 | 3,160 | 3,464,150 | ||||||
8.375%, 8/15/17 | 9,862 | 11,612,505 | ||||||
T-Mobile USA, Inc., |
| |||||||
6.464%, 4/28/19 | 23,346 | 24,775,942 | ||||||
|
| |||||||
| 85,045,927 | ||||||||
|
| |||||||
| Transportation—0.2% | ||||||||
AWAS Aviation Capital Ltd. (a)(c), |
| |||||||
7.00%, 10/17/16 | 1,381 | 1,431,186 | ||||||
|
| |||||||
| Total Corporate Bonds & Notes (cost—$577,825,172) | 583,703,781 | |||||||
|
| |||||||
| Senior Loans (a)(b)—17.4% | ||||||||
| Aerospace & Defense—1.8% | ||||||||
Transdigm, Inc., Term C (d), |
| |||||||
3.75%, 2/28/20 | 12,974 | 12,931,033 | ||||||
|
| |||||||
| Auto Manufacturers—0.8% | ||||||||
Chrysler Group LLC, Term B, |
| |||||||
3.50%, 5/24/17 | 5,969 | 5,981,994 | ||||||
|
| |||||||
| Financial Services—3.2% | ||||||||
Capital Automotive L.P., |
| |||||||
4.00%, 4/10/19, Term B | 2,599 | 2,611,396 | ||||||
6.00%, 4/29/20 (d) | 5,687 | 5,800,842 | ||||||
Delos Finance Sarl, Term B, |
| |||||||
3.50%, 3/6/21 | 15,000 | 15,022,770 | ||||||
|
| |||||||
| 23,435,008 | ||||||||
|
| |||||||
| Food & Beverage—1.7% | ||||||||
Sprouts Farmers Markets Holdings LLC, |
| |||||||
4.00%, 4/23/20 | 12,084 | 12,102,689 | ||||||
|
| |||||||
| Health Care Providers & Services—0.4% | ||||||||
Community Health Systems, Inc., Term B, |
| |||||||
3.40% - 3.478%, 1/25/17 | 2,993 | 3,001,376 | ||||||
|
| |||||||
| Insurance—3.6% | ||||||||
Asurion LLC, |
| |||||||
5.00%, 5/24/19, Term B1 | 9,708 | 9,746,103 | ||||||
8.50%, 2/28/21 | 16,000 | 16,440,000 | ||||||
|
| |||||||
| 26,186,103 | ||||||||
|
| |||||||
| IT Services—0.4% | ||||||||
Blue Coat Systems, Inc., |
| |||||||
4.00%, 5/31/19 | 2,978 | 2,979,828 | ||||||
|
| |||||||
| Software—1.9% | ||||||||
First Data Corp., |
| |||||||
3.65%, 3/24/17, Term B | 8,500 | 8,505,313 | ||||||
4.15%, 3/24/18, Term C1 | 5,000 | 5,015,605 | ||||||
|
| |||||||
| 13,520,918 | ||||||||
|
| |||||||
| Principal Amount (000s) | Value | |||||||
| Specialty Retail—0.9% | ||||||||
J Crew Group, Inc., Term B, |
| |||||||
4.00% - 5.25%, 3/5/21 | $ | 6,518 | $ | 6,491,021 | ||||
|
| |||||||
| Telecommunications—2.7% | ||||||||
Univision Communications, Inc., |
| |||||||
4.00%, 3/1/20, Term C3 | 4,975 | 4,966,581 | ||||||
4.00%, 3/1/20, Term C4 | 14,960 | 14,932,025 | ||||||
|
| |||||||
| 19,898,606 | ||||||||
|
| |||||||
| Total Senior Loans (cost—$126,330,023) | 126,528,576 | |||||||
|
| |||||||
| Repurchase Agreements—2.2% | ||||||||
State Street Bank and Trust Co., dated 5/30/14, 0.00%, due 6/2/14, proceeds $15,596,000; collateralized by U.S. Treasury Notes, 0.75%, due 3/31/18, valued at $15,911,988 including accrued interest |
| |||||||
(cost—$15,596,000) | 15,596 | 15,596,000 | ||||||
|
| |||||||
| Total Investments (cost—$719,751,195)—100.2% | 725,828,357 | |||||||
|
| |||||||
| Liabilities in excess of other assets—(0.2)% | (1,367,687 | ) | ||||||
|
| |||||||
| Net Assets—100.0% | $724,460,670 | |||||||
|
| |||||||
Notes to Schedule of Investments:
(a) Private Placement—Restricted as to resale and may not have a readily available market. Securities with an aggregate value of $298,120,648, representing 41.2% of net assets.
(b) These securities generally pay interest at rates which are periodically pre-determined by reference to a base lending rate plus a premium. These base lending rates are generally either the lending rate offered by one or more major European banks, such as the “LIBOR” or the prime rate offered by one or more major United States banks, or the certificate of deposit rate. These securities are generally considered to be restricted as the Fund is ordinarily contractually obligated to receive approval from the Agent bank and/or borrower prior to disposition. Remaining maturities of senior loans may be less than the stated maturities shown as a result of contractual or optional payments by the borrower. Such prepayments cannot be predicted with certainty. The interest rate disclosed reflects the rate in effect on May 31, 2014.
(c) 144A—Exempt from registration under Rule 144A of the Securities Act of 1933. These securities may be resold in transactions exempt from registration, typically only to qualified institutional buyers. Unless otherwise indicated, these securities are not considered to be illiquid.
(d) When-issued or delayed-delivery. To be settled/delivered after May 31, 2014.
(e) Variable or Floating Rate Security—Security with an interest rate that changes periodically. The interest rate disclosed reflects the rate in effect on May 31, 2014.
| 126 | Semiannual Report | | May 31, 2014 | | See accompanying Notes to Financial Statements |
Table of Contents
Schedule of Investments
May 31, 2014 (Unaudited)
AllianzGI Structured Return Fund
| Principal Amount (000s) | Value | |||||||
| Short-Term Investments—99.0% | ||||||||
| U.S. Treasury Obligations—77.4% | ||||||||
U.S. Treasury Bills (a)(b), | ||||||||
0.025%, 8/21/14 | $13,000 | $12,999,207 | ||||||
|
| |||||||
| Repurchase Agreements—21.6% | ||||||||
State Street Bank and Trust Co., dated 5/30/14, 0.00%, due 6/2/14, proceeds $3,638,000; collateralized by U.S. Treasury Notes, 0.75%, due 3/31/18, valued at $3,711,811 including accrued interest |
| |||||||
(cost—$3,638,000) | 3,638 | 3,638,000 | ||||||
|
| |||||||
| Total Short-Term Investments (cost—$16,637,269) | 16,637,207 | |||||||
|
| |||||||
| Contracts | ||||||||
| Options Purchased (c)(e)— 0.2% | ||||||||
| Call Options—0.1% | ||||||||
Nasdaq 100 Stock Index, | 1 | 39 | ||||||
strike price $4,000.00, expires 6/21/14 | 5 | 250 | ||||||
Russell 2000 Index, | 2 | 45 | ||||||
strike price $1,210.00, expires 6/21/14 | 2 | 65 | ||||||
strike price $1,320.00, expires 6/21/14 | 17 | 340 | ||||||
strike price $1,350.00, expires 6/21/14 | 10 | 250 | ||||||
strike price $1,380.00, expires 6/21/14 | 10 | 261 | ||||||
strike price $1,500.00, expires 6/21/14 | 9 | 145 | ||||||
strike price $1,160.00, expires 6/27/14 | 2 | 1,610 | ||||||
strike price $1,170.00, expires 6/30/14 | 2 | 1,180 | ||||||
strike price $1,180.00, expires 6/30/14 | 2 | 750 | ||||||
strike price $1,320.00, expires 6/30/14 | 8 | 209 | ||||||
Russell 2000 Index Flex, | 1 | —(d | ) | |||||
strike price $1,225.00, expires 6/2/14 | 4 | —(d | ) | |||||
strike price $1,290.00, expires 6/2/14 | 2 | —(d | ) | |||||
strike price $1,350.00, expires 6/2/14 | 8 | —(d | ) | |||||
strike price $1,247.00, expires 6/4/14 | 4 | —(d | ) | |||||
strike price $1,370.00, expires 6/4/14 | 8 | —(d | ) | |||||
strike price $1,236.00, expires 6/6/14 | 4 | —(d | ) | |||||
strike price $1,370.00, expires 6/6/14 | 8 | —(d | ) | |||||
strike price $1,180.00, expires 6/9/14 | 1 | 56 | ||||||
strike price $1,215.00, expires 6/9/14 | 4 | 5 | ||||||
strike price $1,290.00, expires 6/9/14 | 2 | —(d | ) | |||||
| Contracts | Value | |||||||
strike price $1,350.00, expires 6/9/14 | 8 | $ | —(d | ) | ||||
strike price $1,215.00, expires 6/11/14 | 4 | 13 | ||||||
strike price $1,360.00, expires 6/11/14 | 8 | —(d | ) | |||||
strike price $1,200.00, expires 6/16/14 | 4 | 168 | ||||||
strike price $1,320.00, expires 6/16/14 | 8 | —(d | ) | |||||
strike price $1,219.00, expires 6/23/14 | 4 | 130 | ||||||
strike price $1,320.00, expires 6/23/14 | 8 | 1 | ||||||
strike price $1,160.00, expires 6/25/14 | 2 | 1,707 | ||||||
strike price $1,210.00, expires 6/25/14 | 5 | 350 | ||||||
strike price $1,330.00, expires 6/25/14 | 10 | 1 | ||||||
strike price $1,190.00, expires 6/27/14 | 5 | 1,174 | ||||||
strike price $1,330.00, expires 6/27/14 | 10 | 2 | ||||||
strike price $1,180.00, expires 7/2/14 | 5 | 2,410 | ||||||
strike price $1,340.00, expires 7/2/14 | 10 | 3 | ||||||
strike price $1,180.00, expires 7/3/14 | 5 | 2,519 | ||||||
strike price $1,340.00, expires 7/3/14 | 10 | 4 | ||||||
strike price $1,168.00, expires 7/7/14 | 5 | 4,561 | ||||||
strike price $1,330.00, expires 7/7/14 | 10 | 9 | ||||||
strike price $1,300.00, expires 7/9/14 | 10 | 37 | ||||||
S&P 500 Index, | 3 | 5,670 | ||||||
strike price $2,150.00, expires 6/30/14 | 7 | 70 | ||||||
|
| |||||||
| 24,034 | ||||||||
|
| |||||||
| Put Options—0.1% | ||||||||
Nasdaq 100 Stock Index, | 1 | 8 | ||||||
strike price $2,800.00, expires 6/6/14 | 2 | 15 | ||||||
strike price $3,525.00, expires 6/6/14 | 2 | 105 | ||||||
strike price $2,750.00, expires 6/13/14 | 13 | 671 | ||||||
strike price $2,775.00, expires 6/13/14 | 2 | 15 | ||||||
strike price $3,525.00, expires 6/13/14 | 2 | 445 | ||||||
strike price $2,400.00, expires 6/21/14 | 4 | 50 | ||||||
strike price $2,700.00, expires 6/21/14 | 5 | 38 | ||||||
strike price $2,750.00, expires 6/21/14 | 5 | 62 | ||||||
strike price $2,725.00, expires 6/27/14 | 3 | 109 | ||||||
Russell 2000 Index, | 5 | 175 | ||||||
| Contracts | Value | |||||||
strike price $1,075.00, expires 6/13/14 | 5 | $ | 837 | |||||
strike price $700.00, expires 6/21/14 | 3 | 23 | ||||||
strike price $800.00, expires 6/21/14 | 10 | 75 | ||||||
strike price $830.00, expires 6/21/14 | 10 | 100 | ||||||
strike price $840.00, expires 6/21/14 | 17 | 170 | ||||||
strike price $1,030.00, expires 6/21/14 | 5 | 500 | ||||||
strike price $1,120.00, expires 6/27/14 | 2 | 3,180 | ||||||
S&P 500 Index, | 11 | 110 | ||||||
strike price $1,350.00, expires 6/6/14 | 12 | 90 | ||||||
strike price $1,375.00, expires 6/6/14 | 12 | 90 | ||||||
strike price $1,425.00, expires 6/6/14 | 35 | 350 | ||||||
strike price $1,450.00, expires 6/6/14 | 84 | 840 | ||||||
strike price $1,840.00, expires 6/6/14 | 4 | 170 | ||||||
strike price $1,865.00, expires 6/6/14 | 2 | 125 | ||||||
strike price $1,325.00, expires 6/13/14 | 12 | 180 | ||||||
strike price $1,375.00, expires 6/13/14 | 36 | 270 | ||||||
strike price $1,400.00, expires 6/13/14 | 29 | 217 | ||||||
strike price $1,425.00, expires 6/13/14 | 24 | 180 | ||||||
strike price $1,840.00, expires 6/13/14 | 5 | 537 | ||||||
strike price $1,865.00, expires 6/13/14 | 2 | 405 | ||||||
strike price $1,250.00, expires 6/21/14 | 5 | 38 | ||||||
strike price $1,325.00, expires 6/21/14 | 12 | 90 | ||||||
strike price $1,365.00, expires 6/21/14 | 11 | 82 | ||||||
strike price $1,475.00, expires 6/21/14 | 22 | 220 | ||||||
strike price $1,840.00, expires 6/21/14 | 5 | 1,100 | ||||||
strike price $1,860.00, expires 6/21/14 | 2 | 700 | ||||||
strike price $1,350.00, expires 6/27/14 | 24 | 180 | ||||||
strike price $1,375.00, expires 6/27/14 | 10 | 75 | ||||||
strike price $1,425.00, expires 6/27/14 | 20 | 150 | ||||||
strike price $1,475.00, expires 6/27/14 | 10 | 125 | ||||||
strike price $1,835.00, expires 6/27/14 | 5 | 1,750 | ||||||
strike price $1,275.00, expires 6/30/14 | 10 | 150 | ||||||
strike price $1,300.00, expires 6/30/14 | 12 | 150 | ||||||
strike price $1,425.00, expires 6/30/14 | 10 | 100 | ||||||
|
| |||||||
| 15,052 | ||||||||
|
| |||||||
| Total Options Purchased (cost—$169,168) | 39,086 | |||||||
|
| |||||||
| Total Investments, before options written (cost—$16,806,437)—99.2% | 16,676,293 | |||||||
|
| |||||||
| See accompanying Notes to Financial Statements | | May 31, 2014 | | Semiannual Report | 127 |
Table of Contents
Schedule of Investments
May 31, 2014 (Unaudited)
| Contracts | Value | |||||||
| Options Written (c)(e)—(0.3)% | ||||||||
| Call Options—(0.1)% | ||||||||
iPath S&P 500 VIX, | 43 | $(129 | ) | |||||
strike price $64.00, expires 6/21/14 | 69 | (207 | ) | |||||
strike price $67.00, expires 6/21/14 | 21 | (2,594 | ) | |||||
strike price $69.00, expires 6/21/14 | 19 | (142 | ) | |||||
Nasdaq 100 Stock Index, | 1 | (675 | ) | |||||
Russell 2000 Index, | 12 | (1 | ) | |||||
strike price $1,220.00, expires 6/21/14 | 15 | (338 | ) | |||||
strike price $1,240.00, expires 6/21/14 | 10 | (125 | ) | |||||
strike price $1,250.00, expires 6/21/14 | 10 | (75 | ) | |||||
strike price $1,280.00, expires 6/21/14 | 9 | (135 | ) | |||||
strike price $1,310.00, expires 6/21/14 | 7 | (175 | ) | |||||
strike price $1,180.00, expires 6/27/14 | 4 | (1,290 | ) | |||||
strike price $1,210.00, expires 6/30/14 | 12 | (990 | ) | |||||
Russell 2000 Index Flex, | 3 | —(d | ) | |||||
strike price $1,262.00, expires 6/2/14 | 12 | —(d | ) | |||||
strike price $1,280.00, expires 6/4/14 | 12 | —(d | ) | |||||
strike price $1,270.00, expires 6/6/14 | 12 | —(d | ) | |||||
strike price $1,210.00, expires 6/9/14 | 3 | (7 | ) | |||||
strike price $1,250.00, expires 6/9/14 | 12 | —(d | ) | |||||
strike price $1,235.00, expires 6/16/14 | 12 | (32 | ) | |||||
strike price $1,250.00, expires 6/23/14 | 12 | (57 | ) | |||||
strike price $1,185.00, expires 6/25/14 | 4 | (1,104 | ) | |||||
strike price $1,240.00, expires 6/25/14 | 15 | (182 | ) | |||||
strike price $1,225.00, expires 6/27/14 | 15 | (527 | ) | |||||
strike price $1,215.00, expires 7/2/14 | 15 | (1,402 | ) | |||||
strike price $1,215.00, expires 7/3/14 | 15 | (1,511 | ) | |||||
strike price $1,205.00, expires 7/7/14 | 15 | (3,129 | ) | |||||
S&P 500 Index, | 1 | (520 | ) | |||||
strike price $1,970.00, expires 6/30/14 | 8 | (2,560 | ) | |||||
|
| |||||||
| (17,907 | ) | |||||||
|
| |||||||
| Put Options—(0.2)% | ||||||||
Nasdaq 100 Stock Index, | 1 | (25 | ) | |||||
strike price $3,450.00, expires 6/6/14 | 4 | (120 | ) | |||||
| Contracts | Value | |||||||
strike price $3,400.00, expires 6/13/14 | 4 | $ | (250 | ) | ||||
strike price $3,425.00, expires 6/13/14 | 4 | (310 | ) | |||||
strike price $3,450.00, expires 6/13/14 | 4 | (390 | ) | |||||
strike price $3,000.00, expires 6/21/14 | 8 | (280 | ) | |||||
strike price $3,325.00, expires 6/21/14 | 5 | (463 | ) | |||||
strike price $3,350.00, expires 6/21/14 | 2 | (220 | ) | |||||
strike price $3,400.00, expires 6/21/14 | 4 | (660 | ) | |||||
strike price $3,460.00, expires 6/27/14 | 3 | (1,320 | ) | |||||
Russell 2000 Index, | 3 | (52 | ) | |||||
strike price $1,060.00, expires 6/6/14 | 7 | (157 | ) | |||||
strike price $1,040.00, expires 6/13/14 | 3 | (172 | ) | |||||
strike price $1,050.00, expires 6/13/14 | 7 | (578 | ) | |||||
strike price $960.00, expires 6/21/14 | 7 | (157 | ) | |||||
strike price $990.00, expires 6/21/14 | 2 | (80 | ) | |||||
strike price $1,010.00, expires 6/21/14 | 10 | (625 | ) | |||||
strike price $1,035.00, expires 6/21/14 | 10 | (1,125 | ) | |||||
strike price $1,080.00, expires 6/21/14 | 8 | (3,240 | ) | |||||
strike price $1,090.00, expires 6/27/14 | 4 | (3,180 | ) | |||||
S&P 500 Index, | 1 | (7 | ) | |||||
strike price $1,725.00, expires 6/6/14 | 6 | (60 | ) | |||||
strike price $1,755.00, expires 6/6/14 | 14 | (210 | ) | |||||
strike price $1,760.00, expires 6/6/14 | 7 | (140 | ) | |||||
strike price $1,790.00, expires 6/6/14 | 15 | (375 | ) | |||||
strike price $1,795.00, expires 6/6/14 | 7 | (192 | ) | |||||
strike price $1,830.00, expires 6/6/14 | 4 | (140 | ) | |||||
strike price $1,750.00, expires 6/13/14 | 14 | (490 | ) | |||||
strike price $1,755.00, expires 6/13/14 | 7 | (262 | ) | |||||
strike price $1,765.00, expires 6/13/14 | 17 | (723 | ) | |||||
strike price $1,775.00, expires 6/13/14 | 14 | (630 | ) | |||||
strike price $1,785.00, expires 6/13/14 | 7 | (368 | ) | |||||
strike price $1,795.00, expires 6/13/14 | 10 | (575 | ) | |||||
strike price $1,825.00, expires 6/13/14 | 4 | (340 | ) | |||||
strike price $1,640.00, expires 6/21/14 | 1 | (25 | ) | |||||
strike price $1,675.00, expires 6/21/14 | 7 | (210 | ) | |||||
strike price $1,790.00, expires 6/21/14 | 10 | (900 | ) | |||||
strike price $1,795.00, expires 6/21/14 | 7 | (665 | ) | |||||
| Contracts | Value | |||||||
strike price $1,805.00, expires 6/21/14 | 6 | $ | (690 | ) | ||||
strike price $1,815.00, expires 6/21/14 | 4 | (540 | ) | |||||
strike price $1,755.00, expires 6/27/14 | 7 | (788 | ) | |||||
strike price $1,760.00, expires 6/27/14 | 13 | (1,528 | ) | |||||
strike price $1,775.00, expires 6/27/14 | 6 | (840 | ) | |||||
strike price $1,785.00, expires 6/27/14 | 16 | (2,560 | ) | |||||
strike price $1,680.00, expires 6/30/14 | 6 | (390 | ) | |||||
strike price $1,720.00, expires 6/30/14 | 7 | (665 | ) | |||||
strike price $1,795.00, expires 6/30/14 | 6 | (1,260 | ) | |||||
strike price $1,805.00, expires 6/30/14 | 6 | (1,470 | ) | |||||
|
| |||||||
| (30,447 | ) | |||||||
|
| |||||||
| Total Options Written (premiums received—$394,176) | (48,354 | ) | ||||||
|
| |||||||
| Total Investments, net of options written (cost—$16,412,261)—98.9% | 16,627,939 | |||||||
|
| |||||||
| Other assets less other liabilities—1.1% | 178,803 | |||||||
|
| |||||||
| Net Assets—100.0% | $16,806,742 | |||||||
|
| |||||||
Notes to Schedule of Investments:
(a) All or partial amount segregated for the benefit of the counterparty as collateral for options written.
(b) Rates reflect the effective yields at purchase date.
(c) Non-income producing.
(d) Value less than $1.
(e) Exchange traded-Chicago Board Options Exchange.
Glossary:
VIX—Volatility Index
| 128 | Semiannual Report | | May 31, 2014 | | See accompanying Notes to Financial Statements |
Table of Contents
Schedule of Investments
May 31, 2014 (Unaudited)
AllianzGI Ultra Micro Cap Fund
| Shares | Value | |||||||
| Common Stock—99.7% | ||||||||
| Aerospace & Defense—2.6% | ||||||||
Astronics Corp. (a) | 38,279 | $2,099,986 | ||||||
Sparton Corp. (a) | 46,810 | 1,378,086 | ||||||
|
| |||||||
| 3,478,072 | ||||||||
|
| |||||||
| Air Freight & Logistics—1.5% | ||||||||
Park-Ohio Holdings Corp. | 37,666 | 1,984,245 | ||||||
|
| |||||||
| Auto Components—2.5% | ||||||||
Motorcar Parts of America, Inc. (a) | 97,669 | 2,326,476 | ||||||
Strattec Security Corp. | 14,304 | 944,064 | ||||||
|
| |||||||
| 3,270,540 | ||||||||
|
| |||||||
| Banks—1.8% | ||||||||
Park Sterling Corp. | 146,512 | 945,002 | ||||||
Southwest Bancorp, Inc. | 81,362 | 1,399,427 | ||||||
|
| |||||||
| 2,344,429 | ||||||||
|
| |||||||
| Biotechnology—3.1% | ||||||||
Durata Therapeutics, Inc. (a) | 32,491 | 517,257 | ||||||
Galectin Therapeutics, Inc. (a) | 24,160 | 312,389 | ||||||
Insys Therapeutics, Inc. (a) | 26,096 | 674,321 | ||||||
Repligen Corp. (a) | 139,136 | 2,676,976 | ||||||
|
| |||||||
| 4,180,943 | ||||||||
|
| |||||||
| Building Products—1.4% | ||||||||
Patrick Industries, Inc. (a) | 47,849 | 1,808,692 | ||||||
|
| |||||||
| Commercial Services & Supplies—0.9% | ||||||||
Ceco Environmental Corp. | 87,625 | 1,254,790 | ||||||
|
| |||||||
| Communications Equipment—4.9% | ||||||||
Alliance Fiber Optic Products, Inc. | 62,578 | 1,269,082 | ||||||
Bel Fuse, Inc., Class B | 58,860 | 1,615,118 | ||||||
CalAmp Corp. (a) | 61,044 | 1,165,940 | ||||||
ShoreTel, Inc. (a) | 168,912 | 1,175,628 | ||||||
Westell Technologies, Inc., Class A (a) | 262,063 | 644,675 | ||||||
Zhone Technologies, Inc. (a) | 208,735 | 647,079 | ||||||
|
| |||||||
| 6,517,522 | ||||||||
|
| |||||||
| Consumer Finance—0.5% | ||||||||
Consumer Portfolio Services, Inc. (a) | 92,113 | 676,109 | ||||||
|
| |||||||
| Diversified Consumer Services—1.3% | ||||||||
Carriage Services, Inc. | 91,339 | 1,677,897 | ||||||
|
| |||||||
| Diversified Financial Services—0.5% | ||||||||
Marlin Business Services Corp. | 31,045 | 646,667 | ||||||
|
| |||||||
| Diversified Telecommunication Services—2.0% | ||||||||
8x8, Inc. (a) | 123,605 | 929,510 | ||||||
inContact, Inc. (a) | 208,537 | 1,766,308 | ||||||
|
| |||||||
| 2,695,818 | ||||||||
|
| |||||||
| Electrical Equipment—0.3% | ||||||||
PowerSecure International, Inc. (a) | 47,428 | 383,692 | ||||||
|
| |||||||
| Electronic Equipment, Instruments & Components—1.7% | ||||||||
CUI Global, Inc. (a) | 117,830 | 977,989 | ||||||
Speed Commerce, Inc. (a) | 347,355 | 1,253,952 | ||||||
|
| |||||||
| 2,231,941 | ||||||||
|
| |||||||
| Energy Equipment & Services—1.4% | ||||||||
RigNet, Inc. (a) | 39,190 | 1,858,390 | ||||||
|
| |||||||
| Shares | Value | |||||||
| Food Products—1.8% | ||||||||
Inventure Foods, Inc. (a) | 96,866 | $ | 1,191,452 | |||||
John B Sanfilippo & Son, Inc. | 44,307 | 1,138,690 | ||||||
|
| |||||||
| 2,330,142 | ||||||||
|
| |||||||
| Health Care Equipment & Supplies—11.1% | ||||||||
Anika Therapeutics, Inc. (a) | 55,029 | 2,577,008 | ||||||
Antares Pharma, Inc. (a) | 186,597 | 550,461 | ||||||
AtriCure, Inc. (a) | 64,013 | 1,057,495 | ||||||
Cardiovascular Systems, Inc. (a) | 60,475 | 1,696,324 | ||||||
Cynosure, Inc., Class A (a) | 44,307 | 965,006 | ||||||
Digirad Corp. | 182,676 | 644,846 | ||||||
Iridex Corp. (a) | 74,959 | 655,142 | ||||||
Rockwell Medical, Inc. (a) | 99,239 | 1,117,431 | ||||||
Staar Surgical Co. (a) | 90,141 | 1,390,876 | ||||||
SurModics, Inc. (a) | 46,483 | 995,201 | ||||||
Trinity Biotech PLC ADR | 74,770 | 1,793,732 | ||||||
Vascular Solutions, Inc. (a) | 62,922 | 1,288,643 | ||||||
|
| |||||||
| 14,732,165 | ||||||||
|
| |||||||
| Health Care Providers & Services—4.1% | ||||||||
BioTelemetry, Inc. (a) | 121,336 | 890,606 | ||||||
Capital Senior Living Corp. (a) | 65,486 | 1,554,638 | ||||||
Cross Country Healthcare, Inc. (a) | 85,219 | 491,714 | ||||||
Five Star Quality Care, Inc. (a) | 216,387 | 1,142,523 | ||||||
Providence Service Corp. (a) | 34,250 | 1,376,850 | ||||||
|
| |||||||
| 5,456,331 | ||||||||
|
| |||||||
| Health Care Technology—0.7% | ||||||||
Icad, Inc. (a) | 132,816 | 879,242 | ||||||
|
| |||||||
| Hotels, Restaurants & Leisure—0.6% | ||||||||
Monarch Casino & Resort, Inc. (a) | 51,710 | 846,493 | ||||||
|
| |||||||
| Household Durables—0.9% | ||||||||
Dixie Group, Inc. (a) | 107,243 | 1,260,105 | ||||||
|
| |||||||
| Household Products—0.9% | ||||||||
Orchids Paper Products Co. | 41,041 | 1,237,386 | ||||||
|
| |||||||
| Insurance—3.6% | ||||||||
Federated National Holding Co. | 95,591 | 2,240,653 | ||||||
HCI Group, Inc. | 47,438 | 1,839,171 | ||||||
United Insurance Holdings Corp. | 39,800 | 702,470 | ||||||
|
| |||||||
| 4,782,294 | ||||||||
|
| |||||||
| Internet Software & Services—4.8% | ||||||||
Autobytel, Inc. (a) | 112,022 | 1,456,286 | ||||||
GTT Communications, Inc. (a) | 82,074 | 878,192 | ||||||
Internap Network Services Corp. (a) | 141,552 | 1,013,512 | ||||||
Points International Ltd. (a) | 78,177 | 1,919,245 | ||||||
TechTarget, Inc. (a) | 32,865 | 261,606 | ||||||
Zix Corp. (a) | 264,981 | 874,437 | ||||||
|
| |||||||
| 6,403,278 | ||||||||
|
| |||||||
| IT Services—1.1% | ||||||||
Information Services Group, Inc. (a) | 293,561 | 1,505,968 | ||||||
|
| |||||||
| Leisure Equipment & Products—1.8% | ||||||||
Nautilus, Inc. (a) | 222,212 | 2,406,556 | ||||||
|
| |||||||
| Life Sciences Tools & Services—2.3% | ||||||||
Albany Molecular Research, Inc. (a) | 136,095 | 2,148,940 | ||||||
| Shares | Value | |||||||
Enzo Biochem, Inc. (a) | 233,704 | $ | 960,523 | |||||
|
| |||||||
| 3,109,463 | ||||||||
|
| |||||||
| Machinery—4.6% | ||||||||
Accuride Corp. (a) | 214,400 | 1,179,200 | ||||||
Manitex International, Inc. (a) | 111,516 | 1,856,741 | ||||||
NN, Inc. | 70,054 | 1,718,425 | ||||||
Xerium Technologies, Inc. (a) | 101,027 | 1,392,152 | ||||||
|
| |||||||
| 6,146,518 | ||||||||
|
| |||||||
| Media—2.5% | ||||||||
Carmike Cinemas, Inc. (a) | 56,063 | 1,928,567 | ||||||
Entravision Communications Corp., Class A | 254,982 | 1,366,704 | ||||||
|
| |||||||
| 3,295,271 | ||||||||
|
| |||||||
| Oil, Gas & Consumable Fuels—6.9% | ||||||||
Abraxas Petroleum Corp. (a) | 173,415 | 870,543 | ||||||
Emerald Oil, Inc. (a) | 160,796 | 1,045,174 | ||||||
Evolution Petroleum Corp. | 97,466 | 1,094,543 | ||||||
Gastar Exploration, Inc. (a) | 228,401 | 1,697,019 | ||||||
PetroQuest Energy, Inc. (a) | 214,595 | 1,313,321 | ||||||
Ring Energy, Inc. (a) | 53,002 | 1,026,119 | ||||||
StealthGas, Inc. (a) | 112,133 | 1,177,397 | ||||||
Vertex Energy, Inc. (a) | 103,900 | 1,019,259 | ||||||
|
| |||||||
| 9,243,375 | ||||||||
|
| |||||||
| Personal Products—0.8% | ||||||||
IGI Laboratories, Inc. (a) | 211,900 | 1,116,713 | ||||||
|
| |||||||
| Pharmaceuticals—4.7% | ||||||||
AcelRx Pharmaceuticals, Inc. (a) | 66,407 | 610,944 | ||||||
Cempra, Inc. (a) | 43,873 | 415,039 | ||||||
Horizon Pharma, Inc. (a) | 162,988 | 2,312,800 | ||||||
Lannett Co., Inc. (a) | 47,732 | 1,994,243 | ||||||
Pernix Therapeutics Holdings, Inc. (a) | 139,800 | 993,978 | ||||||
|
| |||||||
| 6,327,004 | ||||||||
|
| |||||||
| Professional Services—2.1% | ||||||||
Barrett Business Services, Inc. | 29,957 | 1,412,772 | ||||||
GP Strategies Corp. (a) | 55,412 | 1,338,200 | ||||||
|
| |||||||
| 2,750,972 | ||||||||
|
| |||||||
| Road & Rail—3.6% | ||||||||
Celadon Group, Inc. | 50,946 | 1,190,098 | ||||||
Quality Distribution, Inc. (a) | 100,570 | 1,447,202 | ||||||
Saia, Inc. (a) | 48,446 | 2,111,277 | ||||||
|
| |||||||
| 4,748,577 | ||||||||
|
| |||||||
| Semiconductors & Semiconductor Equipment—6.6% | ||||||||
Amtech Systems, Inc. (a) | 104,048 | 1,027,994 | ||||||
Cascade Microtech, Inc. (a) | 87,963 | 1,052,917 | ||||||
FormFactor, Inc. (a) | 161,959 | 1,175,823 | ||||||
MaxLinear, Inc., Class A (a) | 158,855 | 1,502,768 | ||||||
PDF Solutions, Inc. (a) | 86,328 | 1,719,654 | ||||||
Pixelworks, Inc. (a) | 133,950 | 833,169 | ||||||
Tower Semiconductor Ltd. (a) | 153,828 | 1,461,366 | ||||||
|
| |||||||
| 8,773,691 | ||||||||
|
| |||||||
| Software—3.6% | ||||||||
Attunity Ltd. (a) | 115,391 | 995,824 | ||||||
ePlus, Inc. (a) | 19,920 | 1,129,663 | ||||||
Evolving Systems, Inc. | 54,250 | 441,595 | ||||||
Mavenir Systems, Inc. (a) | 70,538 | 938,861 | ||||||
Park City Group, Inc. (a) | 110,591 | 1,344,787 | ||||||
|
| |||||||
| 4,850,730 | ||||||||
|
| |||||||
| See accompanying Notes to Financial Statements | | May 31, 2014 | | Semiannual Report | 129 |
Table of Contents
Schedule of Investments
May 31, 2014 (Unaudited)
| Shares | Value | |||||||
| Specialty Retail—1.4% | ||||||||
Destination Maternity Corp. | 40,134 | $ | 928,300 | |||||
Kirkland’s, Inc. (a) | 52,707 | 935,549 | ||||||
|
| |||||||
| 1,863,849 | ||||||||
|
| |||||||
| Thrifts & Mortgage Finance—1.8% | ||||||||
BofI Holding, Inc. (a) | 12,499 | 960,298 | ||||||
Tree.com, Inc. (a) | 55,083 | 1,396,354 | ||||||
|
| |||||||
| 2,356,652 | ||||||||
|
| |||||||
| Trading Companies & Distributors—1.0% | ||||||||
Aceto Corp. | 78,939 | 1,375,907 | ||||||
|
| |||||||
| Total Common Stock (cost—$106,242,061) | 132,808,429 | |||||||
|
| |||||||
| Principal Amount (000s) | ||||||||
| Repurchase Agreements—0.5% | ||||||||
State Street Bank and Trust Co., dated 5/30/14, 0.00%, due 6/2/14, proceeds $642,000; collateralized by U.S. Treasury Notes, 0.75%, due 3/31/18, valued at $655,605 including accrued interest |
| |||||||
(cost—$642,000) | $642 | 642,000 | ||||||
|
| |||||||
| Total Investments (cost—$106,884,061)—100.2% | 133,450,429 | |||||||
|
| |||||||
| Liabilities in excess of other assets—(0.2)% | (202,729 | ) | ||||||
|
| |||||||
| Net Assets—100.0% | $133,247,700 | |||||||
|
| |||||||
Notes to Schedule of Investments:
(a) Non-income producing.
Glossary:
ADR—American Depositary Receipt
AllianzGI U.S. Equity Hedged Fund
| Shares | Value | |||||||
| Common Stock—94.7% | ||||||||
| Aerospace & Defense—2.6% | ||||||||
Boeing Co. (a) | 293 | $39,628 | ||||||
General Dynamics Corp. (a) | 139 | 16,419 | ||||||
Honeywell International, Inc. (a) | 336 | 31,298 | ||||||
L-3 Communications Holdings, Inc. (a) | 37 | 4,483 | ||||||
Lockheed Martin Corp. (a) | 116 | 18,983 | ||||||
Northrop Grumman Corp. (a) | 93 | 11,304 | ||||||
Precision Castparts Corp. (a) | 62 | 15,685 | ||||||
Raytheon Co. (a) | 135 | 13,172 | ||||||
Rockwell Collins, Inc. (a) | 58 | 4,584 | ||||||
Textron, Inc. (a) | 121 | 4,746 | ||||||
United Technologies Corp. (a) | 361 | 41,956 | ||||||
|
| |||||||
| 202,258 | ||||||||
|
| |||||||
| Air Freight & Logistics—0.7% | ||||||||
C.H. Robinson Worldwide, Inc. (a) | 64 | 3,831 | ||||||
Expeditors International of Washington, Inc. (a) | 87 | 3,959 | ||||||
FedEx Corp. (a) | 119 | 17,155 | ||||||
United Parcel Service, Inc., Class B (a) | 304 | 31,580 | ||||||
|
| |||||||
| 56,525 | ||||||||
|
| |||||||
| Airlines—0.3% | ||||||||
Delta Air Lines, Inc. (a) | 364 | 14,527 | ||||||
Southwest Airlines Co. (a) | 301 | 7,962 | ||||||
|
| |||||||
| 22,489 | ||||||||
|
| |||||||
| Auto Components—0.4% | ||||||||
BorgWarner, Inc. (a) | 98 | 6,163 | ||||||
Delphi Automotive PLC (a) | 119 | 8,218 | ||||||
Goodyear Tire & Rubber Co. (a) | 118 | 3,112 | ||||||
Johnson Controls, Inc. (a) | 285 | 13,783 | ||||||
|
| |||||||
| 31,276 | ||||||||
|
| |||||||
| Automobiles—0.7% | ||||||||
Ford Motor Co. (a) | 1,690 | 27,784 | ||||||
General Motors Co. (a) | 559 | 19,330 | ||||||
Harley-Davidson, Inc. (a) | 94 | 6,696 | ||||||
|
| |||||||
| 53,810 | ||||||||
|
| |||||||
| Banks—5.6% | ||||||||
Bank of America Corp. (a) | 4,528 | 68,554 | ||||||
BB&T Corp. (a) | 305 | 11,566 | ||||||
Citigroup, Inc. (a) | 1,301 | 61,889 | ||||||
Comerica, Inc. (a) | 78 | 3,742 | ||||||
Fifth Third Bancorp (a) | 365 | 7,552 | ||||||
Huntington Bancshares, Inc. (a) | 356 | 3,300 | ||||||
JPMorgan Chase & Co. (a) | 1,622 | 90,134 | ||||||
KeyCorp (a) | 381 | 5,216 | ||||||
M&T Bank Corp. (a) | 56 | 6,797 | ||||||
PNC Financial Services Group, Inc. (a) | 229 | 19,527 | ||||||
Regions Financial Corp. (a) | 608 | 6,195 | ||||||
SunTrust Banks, Inc. (a) | 229 | 8,775 | ||||||
U.S. Bancorp (a) | 781 | 32,950 | ||||||
Wells Fargo & Co. (a) | 2,052 | 104,200 | ||||||
Zions Bancorporation (a) | 79 | 2,259 | ||||||
|
| |||||||
| 432,656 | ||||||||
|
| |||||||
| Beverages—2.0% | ||||||||
Brown-Forman Corp., Class B (a) | 69 | 6,394 | ||||||
Coca-Cola Co. (a) | 1,623 | 66,397 | ||||||
Coca-Cola Enterprises, Inc. (a) | 102 | 4,655 | ||||||
Constellation Brands, Inc., Class A (a)(b) | 72 | 6,057 | ||||||
Dr. Pepper Snapple Group, Inc. (a) | 85 | 4,905 | ||||||
| Shares | Value | |||||||
Molson Coors Brewing Co., Class B (a) | 68 | $ | 4,470 | |||||
Monster Beverage Corp. (a)(b) | 58 | 4,024 | ||||||
PepsiCo, Inc. (a) | 652 | 57,591 | ||||||
|
| |||||||
| 154,493 | ||||||||
|
| |||||||
| Biotechnology—2.3% | ||||||||
Alexion Pharmaceuticals, Inc. (a)(b) | 85 | 14,137 | ||||||
Amgen, Inc. (a) | 323 | 37,465 | ||||||
Biogen Idec, Inc. (a)(b) | 101 | 32,256 | ||||||
Celgene Corp. (a)(b) | 174 | 26,627 | ||||||
Gilead Sciences, Inc. (a)(b) | 659 | 53,518 | ||||||
Regeneron Pharmaceuticals, Inc. (a)(b) | 34 | 10,437 | ||||||
Vertex Pharmaceuticals, Inc. (a)(b) | 101 | 7,298 | ||||||
|
| |||||||
| 181,738 | ||||||||
|
| |||||||
| Building Products—0.1% | ||||||||
Allegion PLC (a) | 38 | 1,991 | ||||||
Masco Corp. (a) | 153 | 3,259 | ||||||
|
| |||||||
| 5,250 | ||||||||
|
| |||||||
| Capital Markets—1.9% | ||||||||
Ameriprise Financial, Inc. (a) | 82 | 9,234 | ||||||
Bank of New York Mellon Corp. (a) | 486 | 16,796 | ||||||
BlackRock, Inc. (a) | 54 | 16,465 | ||||||
Charles Schwab Corp. (a) | 501 | 12,630 | ||||||
E*TRADE Financial Corp. (a)(b) | 124 | 2,526 | ||||||
Franklin Resources, Inc. (a) | 173 | 9,551 | ||||||
Goldman Sachs Group, Inc. (a) | 180 | 28,766 | ||||||
Invesco Ltd. (a) | 186 | 6,826 | ||||||
Legg Mason, Inc. (a) | 45 | 2,198 | ||||||
Morgan Stanley (a) | 601 | 18,547 | ||||||
Northern Trust Corp. (a) | 96 | 5,799 | ||||||
State Street Corp. (a) | 185 | 12,075 | ||||||
T Rowe Price Group, Inc. (a) | 112 | 9,131 | ||||||
|
| |||||||
| 150,544 | ||||||||
|
| |||||||
| Chemicals—2.5% | ||||||||
Air Products & Chemicals, Inc. (a) | 91 | 10,917 | ||||||
Airgas, Inc. (a) | 29 | 3,083 | ||||||
CF Industries Holdings, Inc. (a) | 22 | 5,353 | ||||||
Dow Chemical Co. (a) | 521 | 27,155 | ||||||
Eastman Chemical Co. (a) | 65 | 5,737 | ||||||
Ecolab, Inc. (a) | 116 | 12,666 | ||||||
EI du Pont de Nemours & Co. (a) | 397 | 27,516 | ||||||
FMC Corp. (a) | 57 | 4,364 | ||||||
International Flavors & Fragrances, Inc. (a) | 35 | 3,474 | ||||||
LyondellBasell Industries NV, Class A (a) | 185 | 18,420 | ||||||
Monsanto Co. (a) | 225 | 27,416 | ||||||
Mosaic Co. (a) | 145 | 7,249 | ||||||
PPG Industries, Inc. (a) | 59 | 11,895 | ||||||
Praxair, Inc. (a) | 126 | 16,662 | ||||||
Sherwin-Williams Co. (a) | 37 | 7,571 | ||||||
Sigma-Aldrich Corp. (a) | 51 | 5,025 | ||||||
|
| |||||||
| 194,503 | ||||||||
|
| |||||||
| Commercial Services & Supplies—0.5% | ||||||||
ADT Corp. (a) | 79 | 2,544 | ||||||
Cintas Corp. (a) | 43 | 2,671 | ||||||
Iron Mountain, Inc. (a) | 73 | 2,273 | ||||||
Pitney Bowes, Inc. (a) | 87 | 2,404 | ||||||
Republic Services, Inc. (a) | 116 | 4,107 | ||||||
Stericycle, Inc. (a)(b) | 36 | 4,117 | ||||||
Tyco International Ltd. (a) | 197 | 8,597 | ||||||
Waste Management, Inc. (a) | 185 | 8,266 | ||||||
|
| |||||||
| 34,979 | ||||||||
|
| |||||||
| 130 | Semiannual Report | | May 31, 2014 | | See accompanying Notes to Financial Statements |
Table of Contents
Schedule of Investments
May 31, 2014 (Unaudited)
| Shares | Value | |||||||
| Communications Equipment—1.7% | ||||||||
Cisco Systems, Inc. (a) | 2,207 | $ | 54,336 | |||||
F5 Networks, Inc. (a)(b) | 32 | 3,474 | ||||||
Harris Corp. (a) | 46 | 3,554 | ||||||
Juniper Networks, Inc. (a)(b) | 203 | 4,965 | ||||||
Motorola Solutions, Inc. (a) | 97 | 6,540 | ||||||
QUALCOMM, Inc. (a) | 725 | 58,326 | ||||||
|
| |||||||
| 131,195 | ||||||||
|
| |||||||
| Construction & Engineering—0.2% | ||||||||
Fluor Corp. (a) | 69 | 5,181 | ||||||
Jacobs Engineering Group, Inc. (a)(b) | 57 | 3,139 | ||||||
Quanta Services, Inc. (a)(b) | 93 | 3,157 | ||||||
|
| |||||||
| 11,477 | ||||||||
|
| |||||||
| Construction Materials—0.0% | ||||||||
Vulcan Materials Co. (a) | 56 | 3,414 | ||||||
|
| |||||||
| Consumer Finance—0.9% | ||||||||
American Express Co. (a) | 392 | 35,868 | ||||||
Capital One Financial Corp. (a) | 245 | 19,328 | ||||||
Discover Financial Services (a) | 202 | 11,945 | ||||||
Navient Corp. (b) | 184 | 2,907 | ||||||
|
| |||||||
| 70,048 | ||||||||
|
| |||||||
| Containers & Packaging—0.2% | ||||||||
Avery Dennison Corp. (a) | 41 | 2,079 | ||||||
Ball Corp. (a) | 60 | 3,622 | ||||||
Bemis Co., Inc. (a) | 44 | 1,822 | ||||||
MeadWestvaco Corp. (a) | 75 | 3,043 | ||||||
Owens-Illinois, Inc. (a)(b) | 71 | 2,359 | ||||||
Sealed Air Corp. (a) | 84 | 2,766 | ||||||
|
| |||||||
| 15,691 | ||||||||
|
| |||||||
| Distributors—0.1% | ||||||||
Genuine Parts Co. (a) | 66 | 5,698 | ||||||
|
| |||||||
| Diversified Consumer Services—0.1% | ||||||||
Graham Holdings Co., Class B (a) | 2 | 1,354 | ||||||
H&R Block, Inc. (a) | 117 | 3,484 | ||||||
|
| |||||||
| 4,838 | ||||||||
|
| |||||||
| Diversified Financial Services—1.8% | ||||||||
Berkshire Hathaway, Inc., Class B (a)(b) | 771 | 98,950 | ||||||
CME Group, Inc. (a) | 135 | 9,720 | ||||||
IntercontinentalExchange Group, Inc. (a) | 49 | 9,624 | ||||||
Leucadia National Corp. (a) | 134 | 3,437 | ||||||
McGraw Hill Financial, Inc. (a) | 116 | 9,485 | ||||||
Moody’s Corp. (a) | 81 | 6,929 | ||||||
NASDAQ OMX Group, Inc. (a) | 50 | 1,895 | ||||||
|
| |||||||
| 140,040 | ||||||||
|
| |||||||
| Diversified Telecommunication Services—2.3% | ||||||||
AT&T, Inc. (a) | 2,231 | 79,134 | ||||||
CenturyLink, Inc. (a) | 248 | 9,342 | ||||||
Frontier Communications Corp. (a) | 428 | 2,478 | ||||||
Verizon Communications, Inc. (a) | 1,774 | 88,629 | ||||||
Windstream Holdings, Inc. (a) | 255 | 2,440 | ||||||
|
| |||||||
| 182,023 | ||||||||
|
| |||||||
| Electric Utilities—1.7% | ||||||||
American Electric Power Co., Inc. (a) | 209 | 11,150 | ||||||
Duke Energy Corp. (a) | 303 | 21,537 | ||||||
Edison International (a) | 140 | 7,720 | ||||||
Entergy Corp. (a) | 77 | 5,807 | ||||||
Exelon Corp. (a) | 367 | 13,517 | ||||||
FirstEnergy Corp. (a) | 179 | 6,054 | ||||||
NextEra Energy, Inc. (a) | 187 | 18,206 | ||||||
Northeast Utilities (a) | 135 | 6,129 | ||||||
| Shares | Value | |||||||
Pepco Holdings, Inc. (a) | 107 | $ | 2,964 | |||||
Pinnacle West Capital Corp. (a) | 47 | 2,605 | ||||||
PPL Corp. (a) | 270 | 9,474 | ||||||
Southern Co. (a) | 380 | 16,636 | ||||||
Xcel Energy, Inc. (a) | 213 | 6,552 | ||||||
|
| |||||||
| 128,351 | ||||||||
|
| |||||||
| Electrical Equipment—0.6% | ||||||||
AMETEK, Inc. (a) | 105 | 5,573 | ||||||
Eaton Corp. PLC (a) | 204 | 15,033 | ||||||
Emerson Electric Co. (a) | 301 | 20,086 | ||||||
Rockwell Automation, Inc. (a) | 59 | 7,144 | ||||||
|
| |||||||
| 47,836 | ||||||||
|
| |||||||
| Electronic Equipment, Instruments & Components—0.4% | ||||||||
Amphenol Corp., Class A (a) | 68 | 6,514 | ||||||
Corning, Inc. (a) | 561 | 11,949 | ||||||
FLIR Systems, Inc. (a) | 60 | 2,095 | ||||||
Jabil Circuit, Inc. (a) | 80 | 1,506 | ||||||
TE Connectivity Ltd. (a) | 176 | 10,465 | ||||||
|
| |||||||
| 32,529 | ||||||||
|
| |||||||
| Energy Equipment & Services—1.9% | ||||||||
Baker Hughes, Inc. (a) | 187 | 13,187 | ||||||
Cameron International Corp. (a)(b) | 87 | 5,564 | ||||||
Diamond Offshore Drilling, Inc. (a) | 30 | 1,532 | ||||||
Ensco PLC, Class A (a) | 100 | 5,266 | ||||||
FMC Technologies, Inc. (a)(b) | 101 | 5,864 | ||||||
Halliburton Co. (a) | 365 | 23,593 | ||||||
Helmerich & Payne, Inc. (a) | 46 | 5,058 | ||||||
Nabors Industries Ltd. (a) | 112 | 2,938 | ||||||
National Oilwell Varco, Inc. (a) | 184 | 15,064 | ||||||
Noble Corp. PLC (a) | 109 | 3,429 | ||||||
Rowan Cos. PLC, Class A (a) | 53 | 1,641 | ||||||
Schlumberger Ltd. (a) | 560 | 58,262 | ||||||
Transocean Ltd. (a) | 145 | 6,161 | ||||||
|
| |||||||
| 147,559 | ||||||||
|
| |||||||
| Food & Staples Retailing—2.2% | ||||||||
Costco Wholesale Corp. (a) | 188 | 21,812 | ||||||
CVS Caremark Corp. (a) | 507 | 39,708 | ||||||
Kroger Co. (a) | 221 | 10,550 | ||||||
Safeway, Inc. (a) | 99 | 3,400 | ||||||
Sysco Corp. (a) | 251 | 9,420 | ||||||
Wal-Mart Stores, Inc. (a) | 693 | 53,202 | ||||||
Walgreen Co. (a) | 375 | 26,966 | ||||||
Whole Foods Market, Inc. (a) | 159 | 6,080 | ||||||
|
| |||||||
| 171,138 | ||||||||
|
| |||||||
| Food Products—1.6% | ||||||||
Archer-Daniels-Midland Co. (a) | 282 | 12,673 | ||||||
Campbell Soup Co. (a) | 77 | 3,534 | ||||||
ConAgra Foods, Inc. (a) | 180 | 5,814 | ||||||
General Mills, Inc. (a) | 268 | 14,721 | ||||||
Hershey Co. (a) | 64 | 6,230 | ||||||
Hormel Foods Corp. (a) | 58 | 2,854 | ||||||
JM Smucker Co. (a) | 44 | 4,515 | ||||||
Kellogg Co. (a) | 110 | 7,588 | ||||||
Keurig Green Mountain, Inc. (a) | 55 | 6,203 | ||||||
Kraft Foods Group, Inc. (a) | 255 | 15,162 | ||||||
McCormick & Co., Inc. (a) | 56 | 4,049 | ||||||
Mead Johnson Nutrition Co. (a) | 86 | 7,695 | ||||||
Mondelez International, Inc., Class A (a) | 729 | 27,425 | ||||||
Tyson Foods, Inc., Class A (a) | 115 | 4,883 | ||||||
|
| |||||||
| 123,346 | ||||||||
|
| |||||||
| Gas Utilities—0.0% | ||||||||
AGL Resources, Inc. (a) | 51 | 2,722 | ||||||
|
| |||||||
| Health Care Equipment & Supplies—2.0% | ||||||||
Abbott Laboratories (a) | 661 | 26,446 | ||||||
Baxter International, Inc. (a) | 233 | 17,337 | ||||||
| Shares | Value | |||||||
Becton Dickinson and Co. (a) | 83 | $ | 9,769 | |||||
Boston Scientific Corp. (a)(b) | 567 | 7,275 | ||||||
CareFusion Corp. (a)(b) | 89 | 3,821 | ||||||
Covidien PLC (a) | 193 | 14,110 | ||||||
CR Bard, Inc. (a) | 33 | 4,881 | ||||||
DENTSPLY International, Inc. (a) | 61 | 2,885 | ||||||
Edwards Lifesciences Corp. (a)(b) | 46 | 3,735 | ||||||
Intuitive Surgical, Inc. (a)(b) | 16 | 5,916 | ||||||
Medtronic, Inc. (a) | 429 | 26,182 | ||||||
St. Jude Medical, Inc. (a) | 122 | 7,918 | ||||||
Stryker Corp. (a) | 126 | 10,646 | ||||||
Varian Medical Systems, Inc. (a)(b) | 44 | 3,628 | ||||||
Zimmer Holdings, Inc. (a) | 73 | 7,617 | ||||||
|
| |||||||
| 152,166 | ||||||||
|
| |||||||
| Health Care Providers & Services—2.0% | ||||||||
Aetna, Inc. (a) | 155 | 12,020 | ||||||
AmerisourceBergen Corp. (a) | 98 | 7,172 | ||||||
Cardinal Health, Inc. (a) | 147 | 10,383 | ||||||
Cigna Corp. (a) | 117 | 10,504 | ||||||
DaVita HealthCare Partners, Inc. (a)(b) | 76 | 5,365 | ||||||
Express Scripts Holding Co. (a)(b) | 332 | 23,728 | ||||||
Humana, Inc. (a) | 66 | 8,214 | ||||||
Laboratory Corp. of America Holdings (a)(b) | 37 | 3,795 | ||||||
McKesson Corp. (a) | 99 | 18,774 | ||||||
Patterson Cos., Inc. (a) | 35 | 1,371 | ||||||
Quest Diagnostics, Inc. (a) | 62 | 3,713 | ||||||
Tenet Healthcare Corp. (a)(b) | 42 | 1,974 | ||||||
UnitedHealth Group, Inc. (a) | 424 | 33,763 | ||||||
WellPoint, Inc. (a) | 121 | 13,112 | ||||||
|
| |||||||
| 153,888 | ||||||||
|
| |||||||
| Health Care Technology—0.1% | ||||||||
Cerner Corp. (a)(b) | 127 | 6,864 | ||||||
|
| |||||||
| Hotels, Restaurants & Leisure—1.6% | ||||||||
Carnival Corp. (a) | 188 | 7,526 | ||||||
Chipotle Mexican Grill, Inc. (a)(b) | 13 | 7,112 | ||||||
Darden Restaurants, Inc. (a) | 56 | 2,807 | ||||||
International Game Technology (a) | 106 | 1,330 | ||||||
Marriott International, Inc., Class A (a) | 95 | 5,854 | ||||||
McDonald’s Corp. (a) | 424 | 43,006 | ||||||
Starbucks Corp. (a) | 324 | 23,730 | ||||||
Starwood Hotels & Resorts Worldwide, Inc. (a) | 82 | 6,548 | ||||||
Wyndham Worldwide Corp. (a) | 55 | 4,066 | ||||||
Wynn Resorts Ltd. (a) | 35 | 7,524 | ||||||
Yum! Brands, Inc. (a) | 190 | 14,689 | ||||||
|
| |||||||
| 124,192 | ||||||||
|
| |||||||
| Household Durables—0.4% | ||||||||
DR Horton, Inc. (a) | 122 | 2,889 | ||||||
Garmin Ltd. (a) | 53 | 3,122 | ||||||
Harman International Industries, Inc. (a) | 29 | 3,046 | ||||||
Leggett & Platt, Inc. (a) | 60 | 2,035 | ||||||
Lennar Corp., Class A (a) | 75 | 3,068 | ||||||
Mohawk Industries, Inc. (a)(b) | 26 | 3,527 | ||||||
Newell Rubbermaid, Inc. (a) | 119 | 3,485 | ||||||
PulteGroup, Inc. (a) | 147 | 2,875 | ||||||
Whirlpool Corp. (a) | 33 | 4,737 | ||||||
|
| |||||||
| 28,784 | ||||||||
|
| |||||||
| Household Products—1.8% | ||||||||
Clorox Co. (a) | 56 | 5,019 | ||||||
Colgate-Palmolive Co. (a) | 374 | 25,581 | ||||||
Kimberly-Clark Corp. (a) | 163 | 18,313 | ||||||
| See accompanying Notes to Financial Statements | | May 31, 2014 | | Semiannual Report | 131 |
Table of Contents
Schedule of Investments
May 31, 2014 (Unaudited)
| Shares | Value | |||||||
Procter & Gamble Co. (a) | 1,162 | $ | 93,878 | |||||
|
| |||||||
| 142,791 | ||||||||
|
| |||||||
| Independent Power Producers & Energy Traders—0.1% | ||||||||
AES Corp. (a) | 282 | 3,976 | ||||||
NRG Energy, Inc. (a) | 139 | 4,954 | ||||||
|
| |||||||
| 8,930 | ||||||||
|
| |||||||
| Industrial Conglomerates—2.3% | ||||||||
3M Co. (a) | 270 | 38,489 | ||||||
Danaher Corp. (a) | 257 | 20,157 | ||||||
General Electric Co. (a) | 4,299 | 115,170 | ||||||
Roper Industries, Inc. (a) | 43 | 6,092 | ||||||
|
| |||||||
| 179,908 | ||||||||
|
| |||||||
| Insurance—2.7% | ||||||||
ACE Ltd. (a) | 144 | 14,934 | ||||||
Aflac, Inc. (a) | 195 | 11,940 | ||||||
Allstate Corp. (a) | 192 | 11,186 | ||||||
American International Group, Inc. (a) | 627 | 33,902 | ||||||
Aon PLC (a) | 129 | 11,602 | ||||||
Assurant, Inc. (a) | 31 | 2,102 | ||||||
Chubb Corp. (a) | 105 | 9,729 | ||||||
Cincinnati Financial Corp. (a) | 63 | 3,088 | ||||||
Genworth Financial, Inc., Class A (a)(b) | 212 | 3,602 | ||||||
Hartford Financial Services Group, Inc. (a) | 191 | 6,618 | ||||||
Lincoln National Corp. (a) | 113 | 5,420 | ||||||
Loews Corp. (a) | 131 | 5,650 | ||||||
Marsh & McLennan Cos., Inc. (a) | 235 | 11,814 | ||||||
MetLife, Inc. (a) | 481 | 24,497 | ||||||
Principal Financial Group, Inc. (a) | 118 | 5,519 | ||||||
Progressive Corp. (a) | 235 | 5,882 | ||||||
Prudential Financial, Inc. (a) | 198 | 16,268 | ||||||
Torchmark Corp. (a) | 38 | 3,075 | ||||||
Travelers Cos., Inc. (a) | 151 | 14,111 | ||||||
Unum Group (a) | 111 | 3,764 | ||||||
XL Group PLC (a) | 118 | 3,830 | ||||||
|
| |||||||
| 208,533 | ||||||||
|
| |||||||
| Internet & Catalog Retail—1.2% | ||||||||
Amazon.com, Inc. (a)(b) | 159 | 49,695 | ||||||
Expedia, Inc. (a) | 44 | 3,225 | ||||||
Netflix, Inc. (a)(b) | 26 | 10,864 | ||||||
Priceline Group, Inc. (a)(b) | 22 | 28,130 | ||||||
TripAdvisor, Inc. (a)(b) | 48 | 4,664 | ||||||
|
| |||||||
| 96,578 | ||||||||
|
| |||||||
| Internet Software & Services—3.0% | ||||||||
Akamai Technologies, Inc. (a)(b) | 76 | 4,130 | ||||||
eBay, Inc. (a)(b) | 499 | 25,314 | ||||||
Facebook, Inc., Class A (a)(b) | 732 | 46,336 | ||||||
Google, Inc., Class A (a)(b) | 121 | 69,170 | ||||||
Google, Inc., Class C (a)(b) | 121 | 67,879 | ||||||
VeriSign, Inc. (a)(b) | 54 | 2,704 | ||||||
Yahoo!, Inc. (a)(b) | 402 | 13,929 | ||||||
|
| |||||||
| 229,462 | ||||||||
|
| |||||||
| IT Services—3.2% | ||||||||
Accenture PLC, Class A (a) | 273 | 22,236 | ||||||
Alliance Data Systems Corp. (a)(b) | 23 | 5,889 | ||||||
Automatic Data Processing, Inc. (a) | 206 | 16,414 | ||||||
Cognizant Technology Solutions Corp., Class A (a)(b) | 260 | 12,639 | ||||||
Computer Sciences Corp. (a) | 62 | 3,899 | ||||||
Fidelity National Information Services, Inc. (a) | 125 | 6,769 | ||||||
Fiserv, Inc. (a)(b) | 109 | 6,552 | ||||||
| Shares | Value | |||||||
International Business Machines Corp. (a) | 419 | $ | 77,247 | |||||
Mastercard, Inc., Class A (a) | 437 | 33,409 | ||||||
Paychex, Inc. (a) | 139 | 5,714 | ||||||
Teradata Corp. (a)(b) | 68 | 2,855 | ||||||
Total System Services, Inc. (a) | 71 | 2,148 | ||||||
Visa, Inc., Class A (a) | 217 | 46,618 | ||||||
Western Union Co. (a) | 235 | 3,800 | ||||||
Xerox Corp. (a) | 477 | 5,891 | ||||||
|
| |||||||
| 252,080 | ||||||||
|
| |||||||
| Leisure Equipment & Products—0.1% | ||||||||
Hasbro, Inc. (a) | 50 | 2,685 | ||||||
Mattel, Inc. (a) | 146 | 5,669 | ||||||
|
| |||||||
| 8,354 | ||||||||
|
| |||||||
| Life Sciences Tools & Services—0.4% | ||||||||
Agilent Technologies, Inc. (a) | 143 | 8,142 | ||||||
PerkinElmer, Inc. (a) | 48 | 2,159 | ||||||
Thermo Fisher Scientific, Inc. (a) | 168 | 19,641 | ||||||
Waters Corp. (a)(b) | 36 | 3,606 | ||||||
|
| |||||||
| 33,548 | ||||||||
|
| |||||||
| Machinery—1.6% | ||||||||
Caterpillar, Inc. (a) | 273 | 27,909 | ||||||
Cummins, Inc. (a) | 74 | 11,317 | ||||||
Deere & Co. (a) | 158 | 14,405 | ||||||
Dover Corp. (a) | 73 | 6,364 | ||||||
Flowserve Corp. (a) | 59 | 4,350 | ||||||
Illinois Tool Works, Inc. (a) | 167 | 14,454 | ||||||
Ingersoll-Rand PLC (a) | 111 | 6,640 | ||||||
Joy Global, Inc. (a) | 43 | 2,457 | ||||||
PACCAR, Inc. (a) | 152 | 9,631 | ||||||
Pall Corp. (a) | 47 | 3,983 | ||||||
Parker Hannifin Corp. (a) | 64 | 8,015 | ||||||
Pentair Ltd. (a) | 85 | 6,344 | ||||||
Snap-on, Inc. (a) | 25 | 2,932 | ||||||
Stanley Black & Decker, Inc. (a) | 67 | 5,856 | ||||||
Xylem, Inc. (a) | 79 | 2,946 | ||||||
|
| |||||||
| 127,603 | ||||||||
|
| |||||||
| Media—3.4% | ||||||||
Cablevision Systems Corp., Class A (a) | 92 | 1,622 | ||||||
CBS Corp., Class B (a) | 236 | 14,068 | ||||||
Comcast Corp., Class A (a) | 1,117 | 58,307 | ||||||
DIRECTV (a)(b) | 203 | 16,735 | ||||||
Discovery Communications, Inc., Class A (a)(b) | 95 | 7,311 | ||||||
Gannett Co., Inc. (a) | 97 | 2,696 | ||||||
Interpublic Group of Cos., Inc. (a) | 182 | 3,480 | ||||||
News Corp., Class A (a)(b) | 213 | 3,634 | ||||||
Omnicom Group, Inc. (a) | 111 | 7,898 | ||||||
Scripps Networks Interactive, Inc., Class A (a) | 47 | 3,594 | ||||||
Time Warner Cable, Inc. (a) | 119 | 16,798 | ||||||
Time Warner, Inc. (a) | 382 | 26,675 | ||||||
Twenty-First Century Fox, Inc. (a) | 832 | 29,461 | ||||||
Viacom, Inc., Class B (a) | 171 | 14,591 | ||||||
Walt Disney Co. (a) | 698 | 58,639 | ||||||
|
| |||||||
| 265,509 | ||||||||
|
| |||||||
| Metals & Mining—0.5% | ||||||||
Alcoa, Inc. (a) | 502 | 6,832 | ||||||
Allegheny Technologies, Inc. (a) | 46 | 1,889 | ||||||
Freeport-McMoRan Copper & Gold, Inc. (a) | 445 | 15,152 | ||||||
Newmont Mining Corp. (a) | 213 | 4,876 | ||||||
Nucor Corp. (a) | 136 | 6,886 | ||||||
U.S. Steel Corp. (a) | 62 | 1,428 | ||||||
|
| |||||||
| 37,063 | ||||||||
|
| |||||||
| Shares | Value | |||||||
| Multi-line Retail—0.6% | ||||||||
Dollar General Corp. (a)(b) | 126 | $ | 6,776 | |||||
Dollar Tree, Inc. (a)(b) | 89 | 4,720 | ||||||
Family Dollar Stores, Inc. (a) | 41 | 2,402 | ||||||
Kohl’s Corp. (a) | 86 | 4,682 | ||||||
Macy’s, Inc. (a) | 158 | 9,463 | ||||||
Nordstrom, Inc. (a) | 61 | 4,152 | ||||||
Target Corp. (a) | 271 | 15,382 | ||||||
|
| |||||||
| 47,577 | ||||||||
|
| |||||||
| Multi-Utilities—1.1% | ||||||||
Ameren Corp. (a) | 104 | 4,092 | ||||||
CenterPoint Energy, Inc. (a) | 184 | 4,438 | ||||||
CMS Energy Corp. (a) | 114 | 3,392 | ||||||
Consolidated Edison, Inc. (a) | 125 | 6,876 | ||||||
Dominion Resources, Inc. (a) | 249 | 17,171 | ||||||
DTE Energy Co. (a) | 76 | 5,785 | ||||||
Integrys Energy Group, Inc. (a) | 34 | 1,972 | ||||||
NiSource, Inc. (a) | 135 | 5,045 | ||||||
PG&E Corp. (a) | 196 | 8,991 | ||||||
Public Service Enterprise Group, Inc. (a) | 217 | 8,454 | ||||||
SCANA Corp. (a) | 60 | 3,120 | ||||||
Sempra Energy (a) | 97 | 9,734 | ||||||
TECO Energy, Inc. (a) | 88 | 1,520 | ||||||
Wisconsin Energy Corp. (a) | 97 | 4,415 | ||||||
|
| |||||||
| 85,005 | ||||||||
|
| |||||||
| Oil, Gas & Consumable Fuels—8.0% | ||||||||
Anadarko Petroleum Corp. (a) | 216 | 22,218 | ||||||
Apache Corp. (a) | 169 | 15,754 | ||||||
Cabot Oil & Gas Corp. (a) | 181 | 6,559 | ||||||
Chesapeake Energy Corp. (a) | 217 | 6,232 | ||||||
Chevron Corp. (a) | 818 | 100,442 | ||||||
ConocoPhillips (a) | 525 | 41,969 | ||||||
CONSOL Energy, Inc. (a) | 98 | 4,329 | ||||||
Denbury Resources, Inc. (a) | 153 | 2,584 | ||||||
Devon Energy Corp. (a) | 164 | 12,120 | ||||||
EOG Resources, Inc. (a) | 234 | 24,757 | ||||||
EQT Corp. (a) | 65 | 6,947 | ||||||
Exxon Mobil Corp. (a) | 1,851 | 186,081 | ||||||
Hess Corp. (a) | 117 | 10,682 | ||||||
Kinder Morgan, Inc. (a) | 287 | 9,583 | ||||||
Marathon Oil Corp. (a) | 299 | 10,961 | ||||||
Marathon Petroleum Corp. (a) | 126 | 11,263 | ||||||
Murphy Oil Corp. (a) | 74 | 4,564 | ||||||
Newfield Exploration Co. (a)(b) | 58 | 2,116 | ||||||
Noble Energy, Inc. (a) | 154 | 11,099 | ||||||
Occidental Petroleum Corp. (a) | 341 | 33,994 | ||||||
ONEOK, Inc. (a) | 89 | 5,740 | ||||||
Peabody Energy Corp. (a) | 116 | 1,875 | ||||||
Phillips 66 (a) | 252 | 21,367 | ||||||
Pioneer Natural Resources Co. (a) | 61 | 12,820 | ||||||
QEP Resources, Inc. (a) | 77 | 2,459 | ||||||
Range Resources Corp. (a) | 70 | 6,507 | ||||||
Southwestern Energy Co. (a)(b) | 151 | 6,866 | ||||||
Spectra Energy Corp. (a) | 287 | 11,646 | ||||||
Tesoro Corp. (a) | 56 | 3,147 | ||||||
Valero Energy Corp. (a) | 228 | 12,779 | ||||||
Williams Cos., Inc. (a) | 293 | 13,759 | ||||||
|
| |||||||
| 623,219 | ||||||||
|
| |||||||
| Paper & Forest Products—0.1% | ||||||||
International Paper Co. (a) | 188 | 8,954 | ||||||
|
| |||||||
| Personal Products—0.1% | ||||||||
Avon Products, Inc. (a) | 186 | 2,658 | ||||||
Estee Lauder Cos., Inc., Class A (a) | 110 | 8,428 | ||||||
|
| |||||||
| 11,086 | ||||||||
|
| |||||||
| Pharmaceuticals—5.8% | ||||||||
AbbVie, Inc. (a) | 681 | 36,999 | ||||||
Actavis PLC (a)(b) | 75 | 15,865 | ||||||
| 132 | Semiannual Report | | May 31, 2014 | | See accompanying Notes to Financial Statements |
Table of Contents
Schedule of Investments
May 31, 2014 (Unaudited)
| Shares | Value | |||||||
Allergan, Inc. (a) | 128 | $ | 21,435 | |||||
Bristol-Myers Squibb Co. (a) | 704 | 35,017 | ||||||
Eli Lilly & Co. (a) | 422 | 25,261 | ||||||
Forest Laboratories, Inc. (a)(b) | 102 | 9,668 | ||||||
Hospira, Inc. (a)(b) | 71 | 3,491 | ||||||
Johnson & Johnson (a) | 1,212 | 122,969 | ||||||
Merck & Co., Inc. (a) | 1,260 | 72,904 | ||||||
Mylan, Inc. (a)(b) | 159 | 7,925 | ||||||
Perrigo Co. PLC (a) | 57 | 7,877 | ||||||
Pfizer, Inc. (a) | 2,735 | 81,038 | ||||||
Zoetis, Inc. (a) | 214 | 6,570 | ||||||
|
| |||||||
| 447,019 | ||||||||
|
| |||||||
| Professional Services—0.2% | ||||||||
Dun & Bradstreet Corp. (a) | 16 | 1,652 | ||||||
Equifax, Inc. (a) | 52 | 3,681 | ||||||
Nielsen NV (a) | 122 | 5,888 | ||||||
Robert Half International, Inc. (a) | 59 | 2,690 | ||||||
|
| |||||||
| 13,911 | ||||||||
|
| |||||||
| Real Estate Investment Trust—2.1% | ||||||||
American Tower Corp. (a) | 169 | 15,147 | ||||||
Apartment Investment & Management Co., Class A (a) | 63 | 1,983 | ||||||
AvalonBay Communities, Inc. (a) | 52 | 7,376 | ||||||
Boston Properties, Inc. (a) | 66 | 7,965 | ||||||
Crown Castle International Corp. (a) | 143 | 10,972 | ||||||
Equity Residential (a) | 144 | 8,899 | ||||||
Essex Property Trust, Inc. (a) | 26 | 4,705 | ||||||
General Growth Properties, Inc. (a) | 223 | 5,314 | ||||||
HCP, Inc. (a) | 196 | 8,183 | ||||||
Health Care REIT, Inc. (a) | 124 | 7,840 | ||||||
Host Hotels & Resorts, Inc. (a) | 324 | 7,151 | ||||||
Kimco Realty Corp. (a) | 176 | 4,034 | ||||||
Macerich Co. (a) | 60 | 3,962 | ||||||
Plum Creek Timber Co., Inc. (a) | 76 | 3,428 | ||||||
Prologis, Inc. (a) | 214 | 8,883 | ||||||
Public Storage (a) | 62 | 10,688 | ||||||
Simon Property Group, Inc. (a) | 135 | 22,472 | ||||||
Ventas, Inc. (a) | 126 | 8,417 | ||||||
Vornado Realty Trust (a) | 75 | 8,031 | ||||||
Washington Prime Group, Inc. (b) | 68 | 1,343 | ||||||
Weyerhaeuser Co. (a) | 250 | 7,855 | ||||||
|
| |||||||
| 164,648 | ||||||||
|
| |||||||
| Real Estate Management & Development—0.0% | ||||||||
CBRE Group, Inc., Class A (a)(b) | 119 | 3,551 | ||||||
|
| |||||||
| Road & Rail—0.9% | ||||||||
CSX Corp. (a) | 432 | 12,701 | ||||||
Kansas City Southern (a) | 47 | 5,053 | ||||||
Norfolk Southern Corp. (a) | 133 | 13,400 | ||||||
Ryder System, Inc. (a) | 23 | 1,996 | ||||||
Union Pacific Corp. (a) | 195 | 38,858 | ||||||
|
| |||||||
| 72,008 | ||||||||
|
| |||||||
| Semiconductors & Semiconductor Equipment—2.1% | ||||||||
Altera Corp. (a) | 136 | 4,506 | ||||||
Analog Devices, Inc. (a) | 134 | 7,019 | ||||||
Applied Materials, Inc. (a) | 519 | 10,479 | ||||||
Avago Technologies Ltd. | 107 | 7,562 | ||||||
Broadcom Corp., Class A (a) | 236 | 7,521 | ||||||
First Solar, Inc. (a)(b) | 30 | 1,853 | ||||||
Intel Corp. (a) | 2,130 | 58,192 | ||||||
KLA-Tencor Corp. (a) | 71 | 4,652 | ||||||
Lam Research Corp. (a)(b) | 70 | 4,343 | ||||||
Linear Technology Corp. (a) | 101 | 4,662 | ||||||
Microchip Technology, Inc. (a) | 85 | 4,046 | ||||||
Micron Technology, Inc. (a)(b) | 455 | 13,008 | ||||||
NVIDIA Corp. (a) | 237 | 4,503 | ||||||
| Shares | Value | |||||||
Texas Instruments, Inc. (a) | 465 | $ | 21,846 | |||||
Xilinx, Inc. (a) | 114 | 5,353 | ||||||
|
| |||||||
| 159,545 | ||||||||
|
| |||||||
| Software—3.3% | ||||||||
Adobe Systems, Inc. (a)(b) | 199 | 12,843 | ||||||
Autodesk, Inc. (a)(b) | 97 | 5,080 | ||||||
CA, Inc. (a) | 138 | 3,959 | ||||||
Citrix Systems, Inc. (a)(b) | 70 | 4,338 | ||||||
Electronic Arts, Inc. (a)(b) | 133 | 4,672 | ||||||
Intuit, Inc. (a) | 121 | 9,594 | ||||||
Microsoft Corp. (a) | 3,236 | 132,482 | ||||||
Oracle Corp. (a) | 1,484 | 62,358 | ||||||
Red Hat, Inc. (a)(b) | 81 | 4,060 | ||||||
Salesforce.com, Inc. (a)(b) | 240 | 12,631 | ||||||
Symantec Corp. (a) | 296 | 6,509 | ||||||
|
| |||||||
| 258,526 | ||||||||
|
| |||||||
| Specialty Retail—1.9% | ||||||||
AutoNation, Inc. (a)(b) | 27 | 1,544 | ||||||
AutoZone, Inc. (a)(b) | 14 | 7,455 | ||||||
Bed Bath & Beyond, Inc. (a)(b) | 91 | 5,537 | ||||||
Best Buy Co., Inc. (a) | 117 | 3,236 | ||||||
CarMax, Inc. (a)(b) | 96 | 4,254 | ||||||
GameStop Corp., Class A (a) | 50 | 1,892 | ||||||
Gap, Inc. (a) | 113 | 4,659 | ||||||
Home Depot, Inc. (a) | 603 | 48,379 | ||||||
L Brands, Inc. (a) | 104 | 5,969 | ||||||
Lowe’s Cos., Inc. (a) | 448 | 21,092 | ||||||
O’Reilly Automotive, Inc. (a)(b) | 46 | 6,806 | ||||||
PetSmart, Inc. (a) | 44 | 2,529 | ||||||
Ross Stores, Inc. (a) | 92 | 6,297 | ||||||
Staples, Inc. (a) | 279 | 3,139 | ||||||
Tiffany & Co. (a) | 47 | 4,672 | ||||||
TJX Cos., Inc. (a) | 305 | 16,607 | ||||||
Tractor Supply Co. (a) | 60 | 3,901 | ||||||
Urban Outfitters, Inc. (a)(b) | 44 | 1,475 | ||||||
|
| |||||||
| 149,443 | ||||||||
|
| |||||||
| Technology Hardware, Storage & Peripherals—4.2% | ||||||||
Apple, Inc. (a) | 382 | 241,806 | ||||||
EMC Corp. (a) | 868 | 23,054 | ||||||
Hewlett-Packard Co. (a) | 812 | 27,202 | ||||||
NetApp, Inc. (a) | 142 | 5,255 | ||||||
SanDisk Corp. (a) | 97 | 9,373 | ||||||
Seagate Technology PLC (a) | 141 | 7,576 | ||||||
Western Digital Corp. (a) | 90 | 7,907 | ||||||
|
| |||||||
| 322,173 | ||||||||
|
| |||||||
| Textiles, Apparel & Luxury Goods—0.8% | ||||||||
Coach, Inc. (a) | 119 | 4,845 | ||||||
Fossil Group, Inc. (a)(b) | 21 | 2,200 | ||||||
Michael Kors Holdings Ltd. (a)(b) | 77 | 7,267 | ||||||
NIKE, Inc., Class B (a) | 319 | 24,534 | ||||||
PVH Corp. (a) | 35 | 4,607 | ||||||
Ralph Lauren Corp. (a) | 25 | 3,837 | ||||||
Under Armour, Inc., Class A (b) | 69 | 3,505 | ||||||
V.F. Corp. (a) | 151 | 9,516 | ||||||
|
| |||||||
| 60,311 | ||||||||
|
| |||||||
| Thrifts & Mortgage Finance—0.1% | ||||||||
Hudson City Bancorp, Inc. (a) | 204 | 1,993 | ||||||
People’s United Financial, Inc. (a) | 133 | 1,911 | ||||||
|
| |||||||
| 3,904 | ||||||||
|
| |||||||
| Tobacco—1.5% | ||||||||
Altria Group, Inc. (a) | 854 | 35,492 | ||||||
Lorillard, Inc. (a) | 155 | 9,636 | ||||||
Philip Morris International, Inc. (a) | 679 | 60,119 | ||||||
Reynolds American, Inc. (a) | 133 | 7,931 | ||||||
|
| |||||||
| 113,178 | ||||||||
|
| |||||||
| Shares | Value | |||||||
| Trading Companies & Distributors—0.2% | ||||||||
Fastenal Co. (a) | 117 | $ | 5,704 | |||||
WW Grainger, Inc. (a) | 26 | 6,717 | ||||||
|
| |||||||
| 12,421 | ||||||||
|
| |||||||
| Total Common Stock (cost—$5,857,617) | 7,351,158 | |||||||
|
| |||||||
| Principal Amount (000s) | ||||||||
| Repurchase Agreements—5.2% | ||||||||
State Street Bank and Trust Co., dated 5/30/14, 0.00%, due 6/2/14, proceeds $402,000; collateralized by U.S. Treasury Notes, 0.75%, due 3/31/18, valued at $414,067 including accrued interest |
| |||||||
(cost—$402,000) | $402 | 402,000 | ||||||
|
| |||||||
| Contracts | ||||||||
| Options Purchased (b)(c)—0.3% | ||||||||
| Put Options—0.3% | ||||||||
S&P 500 Index, | 20 | 1,200 | ||||||
strike price $1,725.00, expires 9/30/14 | 18 | 25,380 | ||||||
|
| |||||||
| Total Options Purchased (cost—$127,412) | 26,580 | |||||||
|
| |||||||
| Total Investments, before options written (cost—$6,387,029)—100.2% | 7,779,738 | |||||||
|
| |||||||
| Options Written (b)(c)—(0.2)% | ||||||||
| Call Options—(0.2)% | ||||||||
S&P 500 Index, | 38 | (19,760 | ) | |||||
|
| |||||||
| Total Investments, net of options written (cost—$6,367,405)—100.0% | 7,759,978 | |||||||
|
| |||||||
| Other assets less other liabilities—0.0% | 1,574 | |||||||
|
| |||||||
| Net Assets—100.0% | $7,761,552 | |||||||
|
| |||||||
Notes to Schedule of Investments:
(a) All or partial amount segregated for the benefit of the counterparty as collateral for option written.
(b) Non-income producing.
(c) Exchange traded-Chicago Board Options Exchange.
| See accompanying Notes to Financial Statements | | May 31, 2014 | | Semiannual Report | 133 |
Table of Contents
Schedule of Investments
May 31, 2014 (Unaudited)
AllianzGI U.S. Small-Cap Growth Fund
| Shares | Value | |||||||
| Common Stock—97.0% | ||||||||
| Aerospace & Defense—1.0% | ||||||||
Curtiss-Wright Corp. | 5,672 | $377,925 | ||||||
|
| |||||||
| Air Freight & Logistics—0.8% | ||||||||
XPO Logistics, Inc. (b) | 11,012 | 276,732 | ||||||
|
| |||||||
| Airlines—1.1% | ||||||||
Spirit Airlines, Inc. (b) | 7,011 | 414,140 | ||||||
|
| |||||||
| Auto Components—2.9% | ||||||||
Gentherm, Inc. (b) | 10,046 | 413,192 | ||||||
Motorcar Parts of America, Inc. (b) | 9,637 | 229,553 | ||||||
Tower International, Inc. (b) | 12,901 | 395,287 | ||||||
|
| |||||||
| 1,038,032 | ||||||||
|
| |||||||
| Banks—3.9% | ||||||||
Cathay General Bancorp | 12,008 | 288,552 | ||||||
First Financial Holdings, Inc. | 4,452 | 262,089 | ||||||
PrivateBancorp, Inc. | 12,691 | 338,977 | ||||||
Umpqua Holdings Corp. | 11,716 | 194,134 | ||||||
Western Alliance Bancorp (b) | 14,945 | 341,942 | ||||||
|
| |||||||
| 1,425,694 | ||||||||
|
| |||||||
| Biotechnology—3.6% | ||||||||
Cubist Pharmaceuticals, Inc. (b) | 3,338 | 222,311 | ||||||
Insys Therapeutics, Inc. (b) | 6,305 | 162,921 | ||||||
Keryx Biopharmaceuticals, Inc. (b) | 15,348 | 202,594 | ||||||
Ligand Pharmaceuticals, Inc., Class B (b) | 5,002 | 333,683 | ||||||
NPS Pharmaceuticals, Inc. (b) | 11,760 | 366,089 | ||||||
|
| |||||||
| 1,287,598 | ||||||||
|
| |||||||
| Capital Markets—0.8% | ||||||||
ICG Group, Inc. (b) | 15,570 | 300,812 | ||||||
|
| |||||||
| Chemicals—2.7% | ||||||||
Chemtura Corp. (b) | 10,232 | 255,595 | ||||||
Kraton Performance Polymers, Inc. (b) | 11,401 | 283,543 | ||||||
PolyOne Corp. | 10,550 | 423,372 | ||||||
|
| |||||||
| 962,510 | ||||||||
|
| |||||||
| Commercial Services & Supplies—0.4% | ||||||||
Tetra Tech, Inc. | 4,779 | 127,169 | ||||||
|
| |||||||
| Communications Equipment—4.1% | ||||||||
ARRIS Group, Inc. (b) | 12,723 | 421,259 | ||||||
EchoStar Corp., Class A (b) | 6,119 | 312,497 | ||||||
Finisar Corp. (b) | 9,720 | 230,850 | ||||||
Polycom, Inc. (b) | 20,333 | 259,246 | ||||||
Ubiquiti Networks, Inc. (b) | 7,225 | 252,586 | ||||||
|
| |||||||
| 1,476,438 | ||||||||
|
| |||||||
| Construction & Engineering—3.0% | ||||||||
Dycom Industries, Inc. (b) | 9,898 | 294,465 | ||||||
Primoris Services Corp. | 12,549 | 363,545 | ||||||
Tutor Perini Corp. (b) | 14,129 | 432,771 | ||||||
|
| |||||||
| 1,090,781 | ||||||||
|
| |||||||
| Construction Materials—0.8% | ||||||||
Eagle Materials, Inc. | 3,113 | 270,738 | ||||||
|
| |||||||
| Consumer Finance—0.7% | ||||||||
Portfolio Recovery Associates, Inc. (b) | 4,685 | 261,376 | ||||||
|
| |||||||
| Distributors—1.1% | ||||||||
Core-Mark Holding Co., Inc. | 4,891 | 404,388 | ||||||
|
| |||||||
| Diversified Telecommunication Services—1.1% | ||||||||
8x8, Inc. (b) | 18,784 | 141,256 | ||||||
| Shares | Value | |||||||
Vonage Holdings Corp. (b) | 68,394 | $ | 259,897 | |||||
|
| |||||||
| 401,153 | ||||||||
|
| |||||||
| Electrical Equipment—0.1% | ||||||||
PowerSecure International, Inc. (b) | 5,271 | 42,642 | ||||||
|
| |||||||
| Electronic Equipment, Instruments & Components—1.8% | ||||||||
Control4 Corp. (b) | 12,527 | 212,583 | ||||||
Methode Electronics, Inc. | 6,686 | 208,269 | ||||||
Newport Corp. (b) | 12,442 | 230,550 | ||||||
|
| |||||||
| 651,402 | ||||||||
|
| |||||||
| Energy Equipment & Services—1.5% | ||||||||
ION Geophysical Corp. (b) | 63,814 | 266,104 | ||||||
Parker Drilling Co. (b) | 43,484 | 281,342 | ||||||
|
| |||||||
| 547,446 | ||||||||
|
| |||||||
| Food Products—1.5% | ||||||||
B&G Foods, Inc. | 7,784 | 266,680 | ||||||
Boulder Brands, Inc. (b) | 20,353 | 276,190 | ||||||
|
| |||||||
| 542,870 | ||||||||
|
| |||||||
| Health Care Equipment & Supplies—3.1% | ||||||||
Anika Therapeutics, Inc. (b) | 6,475 | 303,224 | ||||||
Antares Pharma, Inc. (b) | 50,442 | 148,804 | ||||||
Cynosure, Inc., Class A (b) | 9,439 | 205,582 | ||||||
Endologix, Inc. (b) | 14,135 | 184,603 | ||||||
Globus Medical, Inc., Class A (b) | 11,800 | 285,324 | ||||||
|
| |||||||
| 1,127,537 | ||||||||
|
| |||||||
| Health Care Providers & Services—4.5% | ||||||||
Acadia Healthcare Co., Inc. (b) | 7,614 | 324,661 | ||||||
Centene Corp. (b) | 4,831 | 360,006 | ||||||
ExamWorks Group, Inc. (b) | 6,731 | 199,372 | ||||||
Hanger, Inc. (b) | 7,195 | 218,584 | ||||||
MWI Veterinary Supply, Inc. (b) | 1,311 | 182,898 | ||||||
Team Health Holdings, Inc. (b) | 6,907 | 350,668 | ||||||
|
| |||||||
| 1,636,189 | ||||||||
|
| |||||||
| Hotels, Restaurants & Leisure—4.2% | ||||||||
Cheesecake Factory, Inc. | 6,342 | 290,908 | ||||||
Marriott Vacations Worldwide Corp. (b) | 5,560 | 314,974 | ||||||
Pinnacle Entertainment, Inc. (b) | 11,236 | 277,304 | ||||||
Six Flags Entertainment Corp. | 8,900 | 360,094 | ||||||
Sonic Corp. (b) | 13,622 | 283,338 | ||||||
|
| |||||||
| 1,526,618 | ||||||||
|
| |||||||
| Insurance—1.0% | ||||||||
Hilltop Holdings, Inc. (b) | 16,902 | 350,717 | ||||||
|
| |||||||
| Internet Software & Services—2.6% | ||||||||
Borderfree, Inc. (b) | 7,085 | 105,708 | ||||||
Constant Contact, Inc. (b) | 9,484 | 280,157 | ||||||
Global Eagle Entertainment, Inc. (b) | 18,179 | 202,332 | ||||||
Web.com Group, Inc. (b) | 9,992 | 344,125 | ||||||
|
| |||||||
| 932,322 | ||||||||
|
| |||||||
| IT Services—2.4% | ||||||||
Convergys Corp. | 10,288 | 224,484 | ||||||
MAXIMUS, Inc. | 7,450 | 332,866 | ||||||
WEX, Inc. (b) | 3,174 | 305,625 | ||||||
|
| |||||||
| 862,975 | ||||||||
|
| |||||||
| Life Sciences Tools & Services—2.8% | ||||||||
Albany Molecular Research, Inc. (b) | 17,238 | 272,188 | ||||||
Fluidigm Corp. (b) | 4,767 | 132,236 | ||||||
ICON PLC (b) | 7,784 | 329,030 | ||||||
| Shares | Value | |||||||
PAREXEL International Corp. (b) | 5,338 | $ | 269,302 | |||||
|
| |||||||
| 1,002,756 | ||||||||
|
| |||||||
| Machinery—2.8% | ||||||||
Manitowoc Co., Inc. | 8,504 | 230,033 | ||||||
Meritor, Inc. (b) | 15,502 | 214,082 | ||||||
Middleby Corp. (b) | 740 | 176,727 | ||||||
TriMas Corp. (b) | 3,616 | 126,958 | ||||||
Wabash National Corp. (b) | 17,907 | 245,147 | ||||||
|
| |||||||
| 992,947 | ||||||||
|
| |||||||
| Media—1.2% | ||||||||
Cumulus Media, Inc., Class A (b) | 51,716 | 326,845 | ||||||
Lions Gate Entertainment Corp. | 3,594 | 93,911 | ||||||
|
| |||||||
| 420,756 | ||||||||
|
| |||||||
| Metals & Mining—1.6% | ||||||||
Kaiser Aluminum Corp. | 3,896 | 266,759 | ||||||
Worthington Industries, Inc. | 7,671 | 309,141 | ||||||
|
| |||||||
| 575,900 | ||||||||
|
| |||||||
| Oil, Gas & Consumable Fuels—7.6% | ||||||||
Bonanza Creek Energy, Inc. (b) | 6,432 | 344,884 | ||||||
Carrizo Oil & Gas, Inc. (b) | 7,011 | 402,852 | ||||||
Diamondback Energy, Inc. (b) | 5,560 | 419,669 | ||||||
Matador Resources Co. (b) | 15,124 | 376,285 | ||||||
Oasis Petroleum, Inc. (b) | 6,566 | 325,017 | ||||||
Penn Virginia Corp. (b) | 18,108 | 274,879 | ||||||
Sanchez Energy Corp. (b) | 10,120 | 348,432 | ||||||
Synergy Resources Corp. (b) | 20,601 | 241,856 | ||||||
|
| |||||||
| 2,733,874 | ||||||||
|
| |||||||
| Paper & Forest Products—1.7% | ||||||||
Boise Cascade Co. (b) | 9,422 | 246,479 | ||||||
KapStone Paper and Packaging Corp. (b) | 13,016 | 378,115 | ||||||
|
| |||||||
| 624,594 | ||||||||
|
| |||||||
| Pharmaceuticals—3.2% | ||||||||
Horizon Pharma, Inc. (b) | 19,092 | 270,915 | ||||||
Nektar Therapeutics (b) | 20,577 | 241,368 | ||||||
Pacira Pharmaceuticals, Inc. (b) | 5,672 | 440,204 | ||||||
Salix Pharmaceuticals Ltd. (b) | 1,710 | 195,077 | ||||||
|
| |||||||
| 1,147,564 | ||||||||
|
| |||||||
| Professional Services—1.8% | ||||||||
Huron Consulting Group, Inc. (b) | 5,226 | 354,741 | ||||||
On Assignment, Inc. (b) | 8,341 | 294,020 | ||||||
|
| |||||||
| 648,761 | ||||||||
|
| |||||||
| Real Estate Management & Development—0.5% | ||||||||
Kennedy-Wilson Holdings, Inc. | 7,037 | 174,307 | ||||||
|
| |||||||
| Road & Rail—5.5% | ||||||||
ArcBest Corp. | 7,797 | 333,478 | ||||||
Genesee & Wyoming, Inc., Class A (b) | 3,002 | 292,245 | ||||||
Roadrunner Transportation Systems, Inc. (b) | 11,236 | 293,484 | ||||||
Ryder System, Inc. | 4,452 | 386,389 | ||||||
Saia, Inc. (b) | 6,677 | 290,984 | ||||||
Swift Transportation Co. (b) | 15,237 | 377,268 | ||||||
|
| |||||||
| 1,973,848 | ||||||||
|
| |||||||
| Semiconductors & Semiconductor Equipment—3.6% | ||||||||
GT Advanced Technologies, Inc. (b) | 19,625 | 330,878 | ||||||
Kulicke & Soffa Industries, Inc. (b) | 19,238 | 271,063 | ||||||
| 134 | Semiannual Report | | May 31, 2014 | | See accompanying Notes to Financial Statements |
Table of Contents
Schedule of Investments
May 31, 2014 (Unaudited)
| Shares | Value | |||||||
SunEdison, Inc. (b) | 12,849 | $ | 252,997 | |||||
Synaptics, Inc. (b) | 6,404 | 435,984 | ||||||
|
| |||||||
| 1,290,922 | ||||||||
|
| |||||||
| Software—7.5% | ||||||||
ACI Worldwide, Inc. (b) | 4,637 | 251,835 | ||||||
Aspen Technology, Inc. (b) | 9,401 | 404,149 | ||||||
Cadence Design Systems, Inc. (b) | 16,902 | 282,094 | ||||||
Guidewire Software, Inc. (b) | 5,313 | 200,672 | ||||||
Mentor Graphics Corp. (a) | 17,013 | 360,506 | ||||||
PTC, Inc. (b) | 8,900 | 327,520 | ||||||
Synchronoss Technologies, Inc. (b) | 10,120 | 321,310 | ||||||
Ultimate Software Group, Inc. (b) | 2,109 | 268,117 | ||||||
Verint Systems, Inc. (b) | 6,581 | 304,898 | ||||||
|
| |||||||
| 2,721,101 | ||||||||
|
| |||||||
| Technology Hardware, Storage & Peripherals—0.9% | ||||||||
Electronics for Imaging, Inc. (b) | 8,231 | 334,919 | ||||||
|
| |||||||
| Textiles, Apparel & Luxury Goods—0.7% | ||||||||
Deckers Outdoor Corp. (b) | 3,493 | 269,974 | ||||||
|
| |||||||
| Thrifts & Mortgage Finance—1.5% | ||||||||
BofI Holding, Inc. (b) | 2,855 | 219,350 | ||||||
EverBank Financial Corp. | 16,741 | 318,916 | ||||||
|
| |||||||
| 538,266 | ||||||||
|
| |||||||
| Trading Companies & Distributors—2.5% | ||||||||
Air Lease Corp. | 9,123 | 376,415 | ||||||
Aircastle Ltd. | 17,013 | 285,478 | ||||||
H&E Equipment Services, Inc. (b) | 7,451 | 258,177 | ||||||
|
| |||||||
| 920,070 | ||||||||
|
| |||||||
| Transportation Infrastructure—0.9% | ||||||||
Macquarie Infrastructure Co. LLC | 5,560 | 341,829 | ||||||
|
| |||||||
| Total Common Stock (cost—$25,333,400) | 35,048,592 | |||||||
|
| |||||||
| Principal Amount (000s) | ||||||||
| Repurchase Agreements—1.9% | ||||||||
State Street Bank and Trust Co., dated 5/30/14, 0.00%, due 6/2/14, proceeds $702,000; collateralized by U.S. Treasury Notes, 0.75%, due 3/31/18, valued at $719,687 including accrued interest |
| |||||||
(cost—$702,000) | $702 | 702,000 | ||||||
|
| |||||||
| Total Investments (cost—$26,035,400)—98.9% | 35,750,592 | |||||||
|
| |||||||
| Other assets less liabilities—1.1% | 393,552 | |||||||
|
| |||||||
| Net Assets—100.0% | $36,144,144 | |||||||
|
| |||||||
Notes to Schedule of Investments:
(a) Affiliated security.
(b) Non-income producing.
| See accompanying Notes to Financial Statements | | May 31, 2014 | | Semiannual Report | 135 |
Table of Contents
Statements of Assets and Liabilities
May 31, 2014 (Unaudited)
| AllianzGI Retirement 2015 | AllianzGI Retirement 2020 | AllianzGI Retirement 2025 | AllianzGI Retirement 2030 | AllianzGI Retirement 2035 | ||||||||||||||||||
| Assets: | ||||||||||||||||||||||
| Investments, at value | $ | 2,465,202 | $ | 4,477,581 | $ | 5,316,831 | $ | 5,600,837 | $ | 4,740,165 | ||||||||||||
| Investments in Affiliates, at value | 26,330,207 | 45,290,544 | 51,766,974 | 53,913,509 | 44,541,134 | |||||||||||||||||
| Repurchase agreements, at value | — | 379,000 | 553,000 | 490,000 | 403,000 | |||||||||||||||||
| Cash | 16,346 | 617 | 546 | 293 | 282 | |||||||||||||||||
| Receivable for investments in Affiliates sold | 174,817 | — | — | — | — | |||||||||||||||||
| Receivable for investments sold | 11,373 | — | — | — | — | |||||||||||||||||
| Dividends receivable from Affiliates | 7,802 | 12,881 | 10,220 | 7,355 | 4,408 | |||||||||||||||||
| Receivable for Fund shares sold | 1,835 | 9,336 | 5,966 | 7,655 | 9,928 | |||||||||||||||||
| Receivable from Investment Manager | — | — | — | — | — | |||||||||||||||||
| Prepaid expenses | — | — | — | — | — | |||||||||||||||||
Total Assets | 29,007,582 | 50,169,959 | 57,653,537 | 60,019,649 | 49,698,917 | |||||||||||||||||
| Liabilities: | ||||||||||||||||||||||
| Payable for investments in Affiliates purchased | — | — | — | — | — | |||||||||||||||||
| Payable for Fund shares redeemed | 151 | 9 | 5 | 23,223 | 2,107 | |||||||||||||||||
| Servicing fees payable | 2,314 | 4,557 | 5,212 | 4,669 | 3,300 | |||||||||||||||||
| Administration fees payable | 2,134 | 4,582 | 5,304 | 2,723 | 2,124 | |||||||||||||||||
| Distribution fees payable | 1,794 | 2,152 | 2,505 | 2,687 | 2,468 | |||||||||||||||||
| Accrued expenses | — | — | — | — | — | |||||||||||||||||
Total Liabilities | 6,393 | 11,300 | 13,026 | 33,302 | 9,999 | |||||||||||||||||
| Net Assets | $ | 29,001,189 | $ | 50,158,659 | $ | 57,640,511 | $ | 59,986,347 | $ | 49,688,918 | ||||||||||||
| Net Assets Consist of: | ||||||||||||||||||||||
| Paid-in-capital | $ | 27,048,473 | $ | 47,449,674 | $ | 54,958,135 | $ | 55,474,445 | $ | 46,155,601 | ||||||||||||
| Undistributed (dividends in excess of) net investment income | 180,430 | 273,370 | 269,467 | 264,733 | 159,393 | |||||||||||||||||
| Accumulated net realized gain (loss) | (100,081 | ) | (346,829 | ) | (596,144 | ) | 120,801 | 66,806 | ||||||||||||||
| Net unrealized appreciation | 1,872,367 | 2,782,444 | 3,009,053 | 4,126,368 | 3,307,118 | |||||||||||||||||
| Net Assets | $ | 29,001,189 | $ | 50,158,659 | $ | 57,640,511 | $ | 59,986,347 | $ | 49,688,918 | ||||||||||||
| Cost of Investments | $ | 2,269,330 | $ | 4,157,109 | $ | 4,916,377 | $ | 5,109,724 | $ | 4,328,658 | ||||||||||||
| Cost of Investments in Affiliates | $ | 24,653,712 | $ | 42,828,572 | $ | 49,158,375 | $ | 50,278,254 | $ | 41,645,523 | ||||||||||||
| Cost of Repurchase Agreements | $ | — | $ | 379,000 | $ | 553,000 | $ | 490,000 | $ | 403,000 | ||||||||||||
| 136 | Semiannual Report | | May 31, 2014 | | See accompanying Notes to Financial Statements |
Table of Contents
| AllianzGI Retirement 2040 | AllianzGI Retirement 2045 | AllianzGI Retirement 2050 | AllianzGI Retirement 2055 | AllianzGI Retirement Income | AllianzGI Global Allocation | AllianzGI Global Growth Allocation | ||||||||||||||||||||||
| $ | 4,018,406 | $ | 2,358,412 | $ | 1,884,317 | $ | 627,778 | $ | 2,673,770 | $ | 20,147,583 | $ | 655,614 | |||||||||||||||
| 38,024,062 | 22,169,908 | 17,935,208 | 6,024,979 | 27,694,594 | 197,877,273 | 5,909,846 | ||||||||||||||||||||||
| 395,000 | 264,000 | 239,000 | — | 282,000 | 582,000 | — | ||||||||||||||||||||||
| 914 | 739 | 523 | 77,139 | 736 | 597 | 55,521 | ||||||||||||||||||||||
| — | — | — | — | — | — | — | ||||||||||||||||||||||
| — | — | — | — | — | — | — | ||||||||||||||||||||||
| 2,823 | — | — | — | 8,961 | — | — | ||||||||||||||||||||||
| 11,757 | 5,973 | 8,786 | 4,712 | 2,247 | 21,529 | 622 | ||||||||||||||||||||||
| — | — | 329 | 356 | — | 3,966 | 24,375 | ||||||||||||||||||||||
| — | — | — | — | — | 43,256 | 39,943 | ||||||||||||||||||||||
| 42,452,962 | 24,799,032 | 20,068,163 | 6,734,964 | 30,662,308 | 218,676,204 | 6,685,921 | ||||||||||||||||||||||
| — | — | — | — | — | 150,696 | — | ||||||||||||||||||||||
| 1,491 | 1 | 4 | 6,079 | 3,510 | 535,432 | 150,551 | ||||||||||||||||||||||
| 3,166 | 1,831 | 915 | 146 | 2,277 | 29,609 | 646 | ||||||||||||||||||||||
| 1,340 | 554 | — | — | 1,758 | — | — | ||||||||||||||||||||||
| 1,743 | 488 | 660 | 148 | 3,258 | 43,506 | 1,122 | ||||||||||||||||||||||
| — | — | — | — | — | 182,535 | 41,019 | ||||||||||||||||||||||
| 7,740 | 2,874 | 1,579 | 6,373 | 10,803 | 941,778 | 193,338 | ||||||||||||||||||||||
| $ | 42,445,222 | $ | 24,796,158 | $ | 20,066,584 | $ | 6,728,591 | $ | 30,651,505 | $ | 217,734,426 | $ | 6,492,583 | |||||||||||||||
| $ | 38,026,710 | $ | 22,414,367 | $ | 17,246,478 | $ | 5,708,101 | $ | 28,330,062 | $ | 190,419,322 | $ | 5,018,631 | |||||||||||||||
| | 94,710 | | 37,897 | 21,045 | 8,051 | 115,661 | (34,442 | ) | (13,891 | ) | ||||||||||||||||||
| 541,378 | 192,017 | 453,183 | 166,522 | 252,023 | (1,263,905 | ) | 418,283 | |||||||||||||||||||||
| 3,782,424 | 2,151,877 | 2,345,878 | 845,917 | 1,953,759 | 28,613,451 | 1,069,560 | ||||||||||||||||||||||
| $ | 42,445,222 | $ | 24,796,158 | $ | 20,066,584 | $ | 6,728,591 | $ | 30,651,505 | $ | 217,734,426 | $ | 6,492,583 | |||||||||||||||
| $ | 3,600,323 | $ | 2,124,038 | $ | 1,670,779 | $ | 551,857 | $ | 2,436,703 | $ | 18,101,575 | $ | 577,269 | |||||||||||||||
| $ | 34,659,721 | $ | 20,252,405 | $ | 15,802,868 | $ | 5,254,983 | $ | 25,977,902 | $ | 171,309,830 | $ | 4,918,631 | |||||||||||||||
| $ | 395,000 | $ | 264,000 | $ | 239,000 | $ | — | $ | 282,000 | $ | 582,000 | $ | — | |||||||||||||||
| See accompanying Notes to Financial Statements | | May 31, 2014 | | Semiannual Report | 137 |
Table of Contents
Statements of Assets and Liabilities (cont’d)
May 31, 2014 (Unaudited)
| AllianzGI Retirement 2015 | AllianzGI Retirement 2020 | AllianzGI Retirement 2025 | AllianzGI Retirement 2030 | AllianzGI Retirement 2035 | ||||||||||||||||||
| Net Assets: | ||||||||||||||||||||||
| Class A | $ | 9,176,318 | $ | 19,778,126 | $ | 23,431,510 | $ | 19,542,004 | $ | 14,709,183 | ||||||||||||
| Class B | — | — | — | — | — | |||||||||||||||||
| Class C | 1,451,376 | 455,188 | — | 724,986 | — | |||||||||||||||||
| Class D | 111,664 | 365,052 | — | 678,659 | — | |||||||||||||||||
| Class R | 200,314 | 1,088,980 | 1,068,944 | 1,320,230 | 1,045,218 | |||||||||||||||||
| Class P | 4,547,641 | 12,866,095 | 13,546,024 | 18,244,642 | 14,362,799 | |||||||||||||||||
| Institutional Class | — | — | — | — | — | |||||||||||||||||
| Class R6 | 9,956,822 | 8,332,152 | 8,303,817 | 10,844,180 | 8,458,280 | |||||||||||||||||
| Administrative Class | 3,557,054 | 7,273,066 | 11,290,216 | 8,631,646 | 11,113,438 | |||||||||||||||||
| Shares Issued and Outstanding: | ||||||||||||||||||||||
| Class A | 460,356 | 1,000,703 | 1,350,444 | 924,140 | 791,462 | |||||||||||||||||
| Class B | — | — | — | — | — | |||||||||||||||||
| Class C | 73,526 | 23,081 | — | 34,505 | — | |||||||||||||||||
| Class D | 5,563 | 18,384 | — | 31,908 | — | |||||||||||||||||
| Class R | 9,981 | 55,055 | 61,819 | 62,246 | 56,327 | |||||||||||||||||
| Class P | 225,932 | 643,541 | 775,784 | 850,993 | 767,552 | |||||||||||||||||
| Institutional Class | — | — | — | — | — | |||||||||||||||||
| Class R6 | 494,181 | 416,230 | 475,288 | 504,781 | 451,432 | |||||||||||||||||
| Administrative Class | 177,166 | 365,844 | 648,072 | 403,854 | 595,526 | |||||||||||||||||
| Net Asset Value and Redemption Price Per Share:* | ||||||||||||||||||||||
| Class A | $ | 19.93 | $ | 19.76 | $ | 17.35 | $ | 21.15 | $ | 18.58 | ||||||||||||
| Class B | — | — | — | — | — | |||||||||||||||||
| Class C | 19.74 | 19.72 | — | 21.01 | — | |||||||||||||||||
| Class D | 20.07 | 19.86 | — | 21.27 | — | |||||||||||||||||
| Class R | 20.07 | 19.78 | 17.29 | 21.21 | 18.56 | |||||||||||||||||
| Class P | 20.13 | 19.99 | 17.46 | 21.44 | 18.71 | |||||||||||||||||
| Institutional Class | — | — | — | — | — | |||||||||||||||||
| Class R6 | 20.15 | 20.02 | 17.47 | 21.48 | 18.74 | |||||||||||||||||
| Administrative Class | 20.08 | 19.88 | 17.42 | 21.37 | 18.66 | |||||||||||||||||
| * | Net asset value and redemption price per share may not recalculate exactly due to rounding. |
| 138 | Semiannual Report | | May 31, 2014 | | See accompanying Notes to Financial Statements |
Table of Contents
| AllianzGI Retirement 2040 | AllianzGI Retirement 2045 | AllianzGI Retirement 2050 | AllianzGI Retirement 2055 | AllianzGI Retirement Income | AllianzGI Global Allocation | AllianzGI Global Growth Allocation | ||||||||||||||||||||||
| $ | 13,179,288 | $ | 8,273,519 | $ | 3,420,532 | $ | 631,770 | $ | 5,069,108 | $ | 70,164,700 | $ | 1,212,871 | |||||||||||||||
| — | — | — | — | — | 2,223,439 | — | ||||||||||||||||||||||
| 369,072 | — | 135,790 | — | 4,263,756 | 65,953,678 | 1,424,841 | ||||||||||||||||||||||
| 208,629 | — | 285,012 | — | 1,035,925 | 1,558,155 | 219,720 | ||||||||||||||||||||||
| 1,340,238 | 414,061 | 572,185 | 105,926 | 204,642 | 17,457 | 136,528 | ||||||||||||||||||||||
| 11,957,775 | 8,793,948 | 5,329,943 | 997,526 | 7,544,377 | 1,916,927 | 43,552 | ||||||||||||||||||||||
| — | — | — | — | — | 75,867,093 | 3,434,521 | ||||||||||||||||||||||
| 10,090,860 | 5,627,497 | 9,034,119 | 4,705,463 | 10,540,334 | — | — | ||||||||||||||||||||||
| 5,299,360 | 1,687,133 | 1,289,003 | 287,906 | 1,993,363 | 32,977 | 20,550 | ||||||||||||||||||||||
| 597,610 | 430,576 | 154,478 | 33,336 | 259,348 | 5,707,866 | 54,317 | ||||||||||||||||||||||
| — | — | — | — | — | 177,294 | — | ||||||||||||||||||||||
| 16,846 | — | 6,181 | — | 220,490 | 5,302,303 | 64,771 | ||||||||||||||||||||||
| 9,445 | — | 12,838 | — | 52,733 | 127,297 | 9,903 | ||||||||||||||||||||||
| 60,969 | 21,599 | 25,872 | 5,601 | 10,158 | 1,427 | 6,147 | ||||||||||||||||||||||
| 537,201 | 454,877 | 238,162 | 52,304 | 381,005 | 155,934 | 1,951 | ||||||||||||||||||||||
| — | — | — | — | — | 6,232,028 | 153,538 | ||||||||||||||||||||||
| 452,581 | 290,622 | 402,802 | 246,214 | 542,667 | — | — | ||||||||||||||||||||||
| 239,156 | 87,564 | 57,815 | 15,148 | 100,900 | 2,621 | 921 | ||||||||||||||||||||||
| $ | 22.05 | $ | 19.22 | $ | 22.14 | $ | 18.95 | $ | 19.55 | $ | 12.29 | $ | 22.33 | |||||||||||||||
| — | — | — | — | — | 12.54 | — | ||||||||||||||||||||||
| 21.91 | — | 21.97 | — | 19.34 | 12.44 | 22.00 | ||||||||||||||||||||||
| 22.09 | — | 22.20 | — | 19.64 | 12.24 | 22.19 | ||||||||||||||||||||||
| 21.98 | 19.17 | 22.12 | 18.91 | 20.15 | 12.24 | 22.21 | ||||||||||||||||||||||
| 22.26 | 19.33 | 22.38 | 19.07 | 19.80 | 12.29 | 22.32 | ||||||||||||||||||||||
| — | — | — | — | — | 12.17 | 22.37 | ||||||||||||||||||||||
| 22.30 | 19.36 | 22.43 | 19.11 | 19.42 | — | — | ||||||||||||||||||||||
| 22.16 | 19.27 | 22.30 | 19.01 | 19.76 | 12.58 | 22.30 | ||||||||||||||||||||||
| See accompanying Notes to Financial Statements | | May 31, 2014 | | Semiannual Report | 139 |
Table of Contents
Statements of Assets and Liabilities (cont’d)
May 31, 2014 (Unaudited)
| AllianzGI Behavioral Advantage Large Cap | AllianzGI Best Styles Global Equity Fund | AllianzGI China Equity | AllianzGI Convertible | AllianzGI Global Fundamental Strategy | ||||||||||||||||||
| Assets: | ||||||||||||||||||||||
| Investments, at value | $ | 81,323,042 | $ | 35,420,247 | $ | 3,637,723 | $ | 2,579,633,419 | $ | 22,706,751 | ||||||||||||
| Investments in Affiliates, at value | — | 144,635 | 377,974 | — | — | |||||||||||||||||
| Repurchase agreements, at value | — | 465,000 | — | 37,807,000 | 2,465,000 | |||||||||||||||||
| Cash | — | 331 | 94,496 | 436 | 372 | |||||||||||||||||
| Foreign currency, at value | — | 23,417 | 1,227 | — | 12,342 | |||||||||||||||||
| Unrealized appreciation of forward foreign currency contracts | — | — | — | — | 12,031 | |||||||||||||||||
| Dividends and interest receivable (net of foreign taxes) | 168,472 | 121,929 | 20,155 | 10,540,310 | 199,565 | |||||||||||||||||
| Receivable for investments sold | 238,978 | — | — | 28,703,377 | — | |||||||||||||||||
| Deposits with brokers for derivatives collateral | — | 587,206 | — | — | 116,897 | |||||||||||||||||
| Receivable for Fund shares sold | 38,016 | — | 100 | 3,828,593 | — | |||||||||||||||||
| Receivable from Investment Manager | — | 14,037 | 18,719 | — | — | |||||||||||||||||
| Deferred offering costs | — | 65,990 | — | — | 13,242 | |||||||||||||||||
| Tax reclaims receivable | 122 | 12,189 | — | — | 6,238 | |||||||||||||||||
| Dividends receivable from Affiliates | — | 312 | 6,754 | — | — | |||||||||||||||||
| Receivable for variation margin on futures contracts | — | 38,446 | — | — | — | |||||||||||||||||
| Prepaid expenses and other assets | 15,048 | 1,066 | 69,021 | 65,415 | 23,991 | |||||||||||||||||
Total Assets | 81,783,678 | 36,894,805 | 4,226,169 | 2,660,578,550 | 25,556,429 | |||||||||||||||||
| Liabilities: | ||||||||||||||||||||||
| Payable for investments purchased | — | — | — | 40,071,594 | 1,114,339 | |||||||||||||||||
| Payable for Fund shares redeemed | 40,401 | 10,141 | — | 2,353,111 | 195 | |||||||||||||||||
| Payable to custodian for cash overdraft | 3,936 | — | — | — | — | |||||||||||||||||
| Payable for variation margin on futures contracts | — | — | — | — | 44,838 | |||||||||||||||||
| Investment management fees payable | 13,355 | — | — | 1,247,712 | 2,102 | |||||||||||||||||
| Distribution fees payable | 235 | — | 27 | 86,772 | 7 | |||||||||||||||||
| Servicing fees payable | 2,206 | — | 79 | 150,955 | 446 | |||||||||||||||||
| Unrealized depreciation of forward foreign currency contracts | — | — | — | — | 464 | |||||||||||||||||
| Due to Investment Manager | — | 49,893 | — | — | 13,242 | |||||||||||||||||
| Accrued expenses | 31,798 | 18,053 | 33,910 | 357,279 | 36,725 | |||||||||||||||||
Total Liabilities | 91,931 | 78,087 | 34,016 | 44,267,423 | 1,212,358 | |||||||||||||||||
| Net Assets | $ | 81,691,747 | $ | 36,816,718 | $ | 4,192,153 | $ | 2,616,311,127 | $ | 24,344,071 | ||||||||||||
| 140 | Semiannual Report | | May 31, 2014 | | See accompanying Notes to Financial Statements |
Table of Contents
| AllianzGI Global Managed Volatility | AllianzGI Global Water | AllianzGI High Yield Bond | AllianzGI International Small-Cap | AllianzGI Micro Cap | AllianzGI Multi-Asset Real Return | AllianzGI NFJ Emerging Markets Value | ||||||||||||||||||||||
| $ | 17,764,110 | $ | 305,047,472 | $ | 441,282,757 | $ | 87,456,994 | $ | 40,708,432 | $ | 2,798,349 | $ | 9,505,514 | |||||||||||||||
| — | 6,867,581 | — | 19,101,311 | 378,484 | 3,353,852 | — | ||||||||||||||||||||||
| 225,000 | 15,757,000 | 19,808,000 | 2,070,000 | 419,000 | — | — | ||||||||||||||||||||||
| 64 | 448 | 143 | 620 | 972 | 67,690 | 58,957 | ||||||||||||||||||||||
| 3,450 | 487,614 | — | 447,530 | — | 817 | 231,919 | ||||||||||||||||||||||
| — |
| — | — | — | — | — | — | ||||||||||||||||||||
| 63,833 |
| 693,412 | 7,985,159 | 287,033 | 4,753 | 6,685 | 35,894 | ||||||||||||||||||||
| — | — | 635,254 | 342,491 | 578,797 | — | 319,955 | ||||||||||||||||||||||
| — | — | — | — | — | 11,509 | — | ||||||||||||||||||||||
| — | 1,978,719 | 679,800 | 39,901 | 114,774 | — | — | ||||||||||||||||||||||
| 15,373 | — | — | — | — | 20,394 | 17,920 | ||||||||||||||||||||||
| — | — | — | — | — | — | — | ||||||||||||||||||||||
| 7,943 | 257,129 | — | 75,351 | — | 87 | — | ||||||||||||||||||||||
| — | 42,903 | — | — | 1,862 | — | — | ||||||||||||||||||||||
| — |
| — | — | — | — | 12,431 | — | ||||||||||||||||||||
| 26,024 | 22,434 | 24,997 | 19,750 | 17,722 | 26,341 | 23,851 | ||||||||||||||||||||||
| 18,105,797 | 331,154,712 | 470,416,110 | 109,840,981 | 42,224,796 | 6,298,155 | 10,194,010 | ||||||||||||||||||||||
| 4 | — | 7,467,720 | 61,960 | 254,270 | — | 270,947 | ||||||||||||||||||||||
| 2,651 | 266,728 | 2,916,056 | 13,349 | 79,571 | — | 70,330 | ||||||||||||||||||||||
| — | — | — | — | — | — | — | ||||||||||||||||||||||
| — |
| — | — | — | — | — | — | ||||||||||||||||||||
| — | 264,556 | 185,317 | 57,836 | 32,719 | — | — | ||||||||||||||||||||||
| 116 | 44,607 | 23,990 | 656 | — | 58 | 27 | ||||||||||||||||||||||
| 79 | 50,747 | 33,858 | 1,575 | 843 | 48 | 325 | ||||||||||||||||||||||
| — |
| — | — | — | — | — | — | ||||||||||||||||||||
| — | — | — | — | — | — | — | ||||||||||||||||||||||
| 51,246 | 167,559 | 127,917 | 206,945 | 54,923 | 43,068 | 52,803 | ||||||||||||||||||||||
| 54,096 | 794,197 | 10,754,858 | 342,321 | 422,326 | 43,174 | 394,432 | ||||||||||||||||||||||
| $ | 18,051,701 | $ | 330,360,515 | $ | 459,661,252 | $ | 109,498,660 | $ | 41,802,470 | $ | 6,254,981 | $ | 9,799,578 | |||||||||||||||
| See accompanying Notes to Financial Statements | | May 31, 2014 | | Semiannual Report | 141 |
Table of Contents
Statements of Assets and Liabilities (cont’d)
May 31, 2014 (Unaudited)
| AllianzGI Behavioral Advantage Large Cap | AllianzGI Best Styles Global Equity Fund | AllianzGI China Equity | AllianzGI Convertible | AllianzGI Global Fundamental Strategy | ||||||||||||||||||
| Net Assets Consist of: | ||||||||||||||||||||||
| Paid-in-capital | $ | 68,247,301 | $ | 34,204,591 | $ | 4,210,025 | $ | 2,115,308,105 | $ | 22,802,394 | ||||||||||||
| Undistributed (dividends in excess of) net investment income | 399,501 | 473,189 | (8,733 | ) | 7,719,170 | 130,201 | ||||||||||||||||
| Accumulated net realized gain (loss) | 3,470,789 | 191,599 | (48,199 | ) | 122,284,049 | 166,464 | ||||||||||||||||
| Net unrealized appreciation | 9,574,156 | 1,947,339 | 39,060 | 370,999,803 | 1,245,012 | |||||||||||||||||
| Net Assets | $ | 81,691,747 | $ | 36,816,718 | $ | 4,192,153 | $ | 2,616,311,127 | $ | 24,344,071 | ||||||||||||
| Cost of Investments | $ | 71,748,886 | $ | 33,517,401 | $ | 3,540,267 | $ | 2,208,633,616 | $ | 21,429,552 | ||||||||||||
| Cost of Investments in Affiliates | $ | — | $ | 138,257 | $ | 436,366 | $ | — | $ | — | ||||||||||||
| Cost of Repurchase Agreements | $ | — | $ | 465,000 | $ | — | $ | 37,807,000 | $ | 2,465,000 | ||||||||||||
| Cost of Foreign Currency | $ | — | $ | 23,451 | $ | 1,227 | $ | — | $ | 12,316 | ||||||||||||
| Net Assets: | ||||||||||||||||||||||
| Class A | $ | 9,701,530 | $ | — | $ | 128,831 | $ | 483,918,061 | $ | 10,852 | ||||||||||||
| Class C | 385,837 | — | 32,948 | 135,599,355 | 10,777 | |||||||||||||||||
| Class D | 303,403 | — | 201,497 | 118,535,411 | 2,094,078 | |||||||||||||||||
| Class R | — | — | — | 1,295,344 | — | |||||||||||||||||
| Class P | 18,018 | — | 12,418 | 221,327,312 | 10,867 | |||||||||||||||||
| Institutional Class | 71,282,959 | — | 3,816,459 | 1,651,273,276 | 22,217,497 | |||||||||||||||||
| Administrative Class | — | — | — | 4,362,368 | — | |||||||||||||||||
| Class R6 | — | 36,816,718 | — | — | — | |||||||||||||||||
| Shares Issued and Outstanding: | ||||||||||||||||||||||
| Class A | 407,305 | — | 8,233 | 13,305,619 | 675 | |||||||||||||||||
| Class C | 16,463 | — | 2,114 | 3,726,817 | 672 | |||||||||||||||||
| Class D | 12,757 | — | 12,816 | 3,262,367 | 130,164 | |||||||||||||||||
| Class R | — | — | — | 35,670 | — | |||||||||||||||||
| Class P | 752 | — | 783 | 6,096,866 | 675 | |||||||||||||||||
| Institutional Class | 2,978,591 | — | 244,813 | 45,539,784 | 1,379,324 | |||||||||||||||||
| Administrative Class | — | — | — | 120,134 | — | |||||||||||||||||
| Class R6 | — | 2,297,484 | — | — | — | |||||||||||||||||
| Net Asset Value and Redemption Price Per Share:* | ||||||||||||||||||||||
| Class A | $ | 23.82 | $ | — | $ | 15.65 | $ | 36.37 | $ | 16.09 | ||||||||||||
| Class C | 23.44 | — | 15.59 | 36.38 | 16.04 | |||||||||||||||||
| Class D | 23.78 | — | 15.72 | 36.33 | 16.09 | |||||||||||||||||
| Class R | — | — | — | 36.31 | — | |||||||||||||||||
| Class P | 23.96 | — | 15.86 | 36.30 | 16.10 | |||||||||||||||||
| Institutional Class | 23.93 | — | 15.59 | 36.26 | 16.11 | |||||||||||||||||
| Administrative Class | — | — | — | 36.31 | — | |||||||||||||||||
| Class R6 | — | 16.02 | — | — | — | |||||||||||||||||
| * | Net asset value and redemption price per share may not recalculate exactly due to rounding. |
| 142 | Semiannual Report | | May 31, 2014 | | See accompanying Notes to Financial Statements |
Table of Contents
| AllianzGI Global Managed Volatility | AllianzGI Global Water | AllianzGI High Yield Bond | AllianzGI International Small-Cap | AllianzGI Micro Cap | AllianzGI Multi-Asset Real Return | AllianzGI NFJ Emerging Markets Value | ||||||||||||||||||||||
| $ | 15,509,177 | $ | 289,627,065 | $ | 442,590,037 | $ | 81,886,454 | $ | 32,486,451 | $ | 5,825,506 | $ | 9,381,781 | |||||||||||||||
| 135,317 |
| 1,068,991 | (2,577,346 | ) | 450,610 | (682,766 | ) | (8,785 | ) | 74,170 | |||||||||||||||||
| 801,244 | (13,439,762 | ) | (1,869,738 | ) | 8,511,701 | (3,712,214 | ) | (30,419 | ) | 55,450 | ||||||||||||||||||
| 1,605,963 | 53,104,221 | 21,518,299 | 18,649,895 | 13,710,999 | 468,679 | 288,177 | ||||||||||||||||||||||
| $ | 18,051,701 | $ | 330,360,515 | $ | 459,661,252 | $ | 109,498,660 | $ | 41,802,470 | $ | 6,254,981 | $ | 9,799,578 | |||||||||||||||
| $ | 16,158,272 | $ | 252,747,322 | $ | 419,764,458 | $ | 73,632,273 | $ | 27,241,317 | $ | 2,729,287 | $ | 9,215,739 | |||||||||||||||
| $ | — | $ | 6,064,842 | $ | — | $ | 14,280,487 | $ | 134,600 | $ | 2,966,589 | $ | — | |||||||||||||||
| $ | 225,000 | $ | 15,757,000 | $ | 19,808,000 | $ | 2,070,000 | $ | 419,000 | $ | — | $ | — | |||||||||||||||
| $ | 3,450 | $ | 486,612 | $ | — | $ | 445,331 | $ | — | $ | 819 | $ | 231,272 | |||||||||||||||
| $ | 156,650 | $ | 151,277,261 | �� | $ | 59,167,350 | $ | 5,003,489 | $ | 4,150,824 | $ | 116,889 | $ | 28,685 | ||||||||||||||
| 183,329 | 72,004,515 | 26,054,911 | 1,064,198 | — | 112,116 | 43,236 | ||||||||||||||||||||||
| 122,062 | 22,310,798 | 74,880,304 | 1,451,779 | — | 29,748 | 1,496,439 | ||||||||||||||||||||||
| — | — | 3,007,130 | 81,259 | — | — | — | ||||||||||||||||||||||
| 13,326 | 60,880,843 | 86,750,807 | 30,725,956 | 2,133,202 | 10,979 | 10,859 | ||||||||||||||||||||||
| 17,576,334 | 23,887,098 | 174,619,893 | 71,171,979 | 35,518,444 | 5,985,249 | 8,220,359 | ||||||||||||||||||||||
| — | — | 35,180,857 | — | — | — | — | ||||||||||||||||||||||
| — | — | — | — | — | — | — | ||||||||||||||||||||||
| 8,700 | 11,439,382 | 5,712,526 | 126,764 | 275,252 | 7,250 | 1,815 | ||||||||||||||||||||||
| 10,404 | 5,590,033 | 2,519,599 | 27,203 | — | 7,010 | 2,752 | ||||||||||||||||||||||
| 6,783 | 1,692,361 | 7,448,434 | 36,070 | — | 1,842 | 94,465 | ||||||||||||||||||||||
| — | — | 299,661 | 2,067 | — | — | — | ||||||||||||||||||||||
| 736 | 4,575,878 | 8,647,084 | 783,687 | 141,213 | 679 | 685 | ||||||||||||||||||||||
| 971,300 | 1,821,863 | 17,356,084 | 1,767,535 | 2,340,244 | 370,309 | 518,467 | ||||||||||||||||||||||
| — | — | 3,511,556 | — | — | — | — | ||||||||||||||||||||||
| — | — | — | — | — | — | — | ||||||||||||||||||||||
| $ | 18.01 | $ | 13.22 | $ | 10.36 | $ | 39.47 | $ | 15.08 | $ | 16.12 | $ | 15.80 | |||||||||||||||
| 17.62 | 12.88 | 10.34 | 39.12 | — | 15.99 | 15.71 | ||||||||||||||||||||||
| 18.00 | 13.18 | 10.05 | 40.25 | — | 16.15 | 15.84 | ||||||||||||||||||||||
| — | — | 10.04 | 39.32 | — | — | — | ||||||||||||||||||||||
| 18.11 | 13.30 | 10.03 | 39.21 | 15.11 | 16.16 | 15.84 | ||||||||||||||||||||||
| 18.10 | 13.11 | 10.06 | 40.27 | 15.18 | 16.16 | 15.86 | ||||||||||||||||||||||
| — | — | 10.02 | — | — | — | — | ||||||||||||||||||||||
| — | — | — | — | — | — | — | ||||||||||||||||||||||
| See accompanying Notes to Financial Statements | | May 31, 2014 | | Semiannual Report | 143 |
Table of Contents
Statements of Assets and Liabilities (cont’d)
May 31, 2014 (Unaudited)
| AllianzGI NFJ Global Dividend Value | AllianzGI NFJ International Small-Cap Value | AllianzGI NFJ International Value II | AllianzGI Short Duration High Income | AllianzGI Structured Return | ||||||||||||||||||
| Assets: | ||||||||||||||||||||||
| Investments, at value | $ | 72,759,728 | $ | 21,317,364 | $ | 30,460,579 | $ | 710,232,357 | $ | 13,038,293 | ||||||||||||
| Investments in Affiliates, at value | — | 125,417 | — | — | — | |||||||||||||||||
| Repurchase agreements, at value | 1,170,000 | — | 3,620,000 | 15,596,000 | 3,638,000 | |||||||||||||||||
| Cash | 351 | 31,465 | 797 | 171,261 | 300 | |||||||||||||||||
| Foreign currency, at value | 209,053 | 134,640 | 34,014 | — | — | |||||||||||||||||
| Dividends and interest receivable (net of foreign taxes) | 467,941 | 105,072 | 163,879 | 10,941,615 | — | |||||||||||||||||
| Receivable for investments sold | — | — | 6,492 | 8,585,195 | — | |||||||||||||||||
| Deposits with brokers for derivatives collateral | — | — | — | — | 164,030 | |||||||||||||||||
| Receivable for Fund shares sold | 45,666 | 30,731 | 10,000 | 2,567,233 | 6,916 | |||||||||||||||||
| Receivable from Investment Manager | — | 5,854 | 75 | — | 49,569 | |||||||||||||||||
| Tax reclaims receivable | 9,607 | 13,435 | 13,878 | — | — | |||||||||||||||||
| Prepaid expenses | 39,722 | 71,030 | 17,017 | 43,837 | 14,934 | |||||||||||||||||
Total Assets | 74,702,068 | 21,835,008 | 34,326,731 | 748,137,498 | 16,912,042 | |||||||||||||||||
| Liabilities: | ||||||||||||||||||||||
| Payable for investments purchased | — | — | 3,041,311 | 21,641,263 | — | |||||||||||||||||
| Payable for Fund shares redeemed | 8,437 | 21,595 | — | 1,488,485 | 44,921 | |||||||||||||||||
| Options written, at value | — | — | — | — | 48,354 | |||||||||||||||||
| Investment management fees payable | 32,118 | — | — | 303,915 | — | |||||||||||||||||
| Distribution fees payable | 3,724 | 750 | 30 | 17,558 | 69 | |||||||||||||||||
| Servicing fees payable | 3,911 | 1,117 | 37 | 67,727 | 758 | |||||||||||||||||
| Accrued expenses | 52,398 | 51,261 | 28,801 | 157,880 | 11,198 | |||||||||||||||||
Total Liabilities | 100,588 | 74,723 | 3,070,179 | 23,676,828 | 105,300 | |||||||||||||||||
| Net Assets | $ | 74,601,480 | $ | 21,760,285 | $ | 31,256,552 | $ | 724,460,670 | $ | 16,806,742 | ||||||||||||
| Net Assets Consist of: | ||||||||||||||||||||||
| Paid-in-capital | $ | 62,104,341 | $ | 18,295,784 | $ | 28,616,155 | $ | 723,836,374 | $ | 16,468,959 | ||||||||||||
| Undistributed (dividends in excess of) net investment income | 962,161 | 181,559 | 326,421 | (4,829,594 | ) | (112,759 | ) | |||||||||||||||
| Accumulated net realized gain (loss) | 4,098,666 | 941,143 | 223,507 | (623,272 | ) | 234,864 | ||||||||||||||||
| Net unrealized appreciation | 7,436,312 | 2,341,799 | 2,090,469 | 6,077,162 | 215,678 | |||||||||||||||||
| Net Assets | $ | 74,601,480 | $ | 21,760,285 | $ | 31,256,552 | $ | 724,460,670 | $ | 16,806,742 | ||||||||||||
| Cost of Investments | $ | 65,320,557 | $ | 19,017,591 | $ | 28,370,765 | $ | 704,155,195 | $ | 13,168,437 | ||||||||||||
| Cost of Investments in Affiliates | $ | — | $ | 83,836 | $ | — | $ | — | $ | — | ||||||||||||
| Cost of Repurchase Agreements | $ | 1,170,000 | $ | — | $ | 3,620,000 | $ | 15,596,000 | $ | 3,638,000 | ||||||||||||
| Cost of Foreign Currency | $ | 211,687 | $ | 134,302 | $ | 34,000 | $ | — | $ | — | ||||||||||||
| Premiums Received for Options Written | $ | — | $ | — | $ | — | $ | — | $ | 394,176 | ||||||||||||
| 144 | Semiannual Report | | May 31, 2014 | | See accompanying Notes to Financial Statements |
Table of Contents
| AllianzGI Ultra Micro Cap | AllianzGI U.S. Equity Hedged | AllianzGI U.S. Small-Cap Growth | ||||||||||
| $ | 132,808,429 | $ | 7,377,738 | $ | 34,688,086 | |||||||
| — | — | 360,506 | ||||||||||
| 642,000 | 402,000 | 702,000 | ||||||||||
| 772 | 732 | 114 | ||||||||||
| — | — | — | ||||||||||
| | 28,950 | | 14,776 | 11,601 | ||||||||
| 763,579 | 19,724 | 362,819 | ||||||||||
| | — | | 2,773 | — | ||||||||
| 86,878 | — | 39,514 | ||||||||||
| — | 17,634 | — | ||||||||||
| — | 10 | �� | — | |||||||||
| 14,302 | 14,961 | 33,448 | ||||||||||
| 134,344,910 | 7,850,348 | 36,198,088 | ||||||||||
| 618,808 | — | — | ||||||||||
| 248,527 | — | 20,661 | ||||||||||
| — | 19,760 | — | ||||||||||
| 186,753 | — | 8,226 | ||||||||||
| — | 110 | 416 | ||||||||||
| 15,850 | 426 | 1,275 | ||||||||||
| 27,272 | 68,500 | 23,366 | ||||||||||
| 1,097,210 | 88,796 | 53,944 | ||||||||||
| $ | 133,247,700 | $ | 7,761,552 | $ | 36,144,144 | |||||||
| $ | 110,704,907 | $ | 6,879,866 | $ | 23,808,266 | |||||||
| | (1,973,989 | ) | 27,126 | (274,039 | ) | |||||||
| (2,049,586 | ) | (538,013 | ) | 2,894,725 | ||||||||
| 26,566,368 | 1,392,573 | 9,715,192 | ||||||||||
| $ | 133,247,700 | $ | 7,761,552 | $ | 36,144,144 | |||||||
| $ | 106,242,061 | $ | 5,985,029 | $ | 25,137,422 | |||||||
| $ | — | $ | — | $ | 195,978 | |||||||
| $ | 642,000 | $ | 402,000 | $ | 702,000 | |||||||
| $ | — | $ | — | $ | — | |||||||
| $ | — | $ | 19,624 | $ | — | |||||||
| See accompanying Notes to Financial Statements | | May 31, 2014 | | Semiannual Report | 145 |
Table of Contents
Statements of Assets and Liabilities (cont’d)
May 31, 2014 (Unaudited)
| AllianzGI NFJ Global Dividend Value | AllianzGI NFJ International Small-Cap Value | AllianzGI NFJ International Value II | AllianzGI Short Duration High Income | AllianzGI Structured Return | ||||||||||||||||||
| Net Assets: | ||||||||||||||||||||||
| Class A | $ | 11,877,386 | $ | 2,759,021 | $ | 106,520 | $ | 207,334,490 | $ | 2,260,987 | ||||||||||||
| Class C | 5,932,697 | 1,224,451 | 48,353 | 84,328,784 | 117,396 | |||||||||||||||||
| Class D | 837,719 | 1,108,647 | 14,030 | 37,432,463 | 1,159,694 | |||||||||||||||||
| Class R | — | — | — | — | — | |||||||||||||||||
| Class P | 1,909,707 | 23,593 | 24,034 | 166,996,062 | 61,596 | |||||||||||||||||
| Institutional Class | 54,043,971 | 16,644,573 | 31,063,615 | 228,368,871 | 13,207,069 | |||||||||||||||||
| Shares Issued and Outstanding: | ||||||||||||||||||||||
| Class A | 536,649 | 123,534 | 5,541 | 13,020,305 | 146,713 | |||||||||||||||||
| Class C | 271,369 | 55,265 | 2,535 | 5,305,980 | 7,712 | |||||||||||||||||
| Class D | 37,474 | 49,480 | 729 | 2,351,205 | 75,150 | |||||||||||||||||
| Class R | — | — | — | — | — | |||||||||||||||||
| Class P | 85,788 | 1,041 | 1,246 | 10,491,596 | 3,989 | |||||||||||||||||
| Institutional Class | 2,453,450 | 738,334 | 1,610,005 | 14,328,687 | 853,925 | |||||||||||||||||
| Net Asset Value and Redemption Price Per Share:* | ||||||||||||||||||||||
| Class A | $ | 22.13 | $ | 22.33 | $ | 19.22 | $ | 15.92 | $ | 15.41 | ||||||||||||
| Class C | 21.86 | 22.16 | 19.07 | 15.89 | 15.22 | |||||||||||||||||
| Class D | 22.35 | 22.41 | 19.24 | 15.92 | 15.43 | |||||||||||||||||
| Class R | — | — | — | — | — | |||||||||||||||||
| Class P | 22.26 | 22.66 | 19.29 | 15.92 | 15.44 | |||||||||||||||||
| Institutional Class | 22.03 | 22.54 | 19.29 | 15.94 | 15.47 | |||||||||||||||||
| * | Net asset value and redemption price per share may not recalculate exactly due to rounding. |
| 146 | Semiannual Report | | May 31, 2014 | | See accompanying Notes to Financial Statements |
Table of Contents
| AllianzGI Ultra Micro Cap | AllianzGI U.S. Equity Hedged | AllianzGI U.S. Small-Cap Growth | ||||||||||
| $ | 74,572,330 | $ | 1,541,666 | $ | 5,348,595 | |||||||
| — | 175,215 | 653,225 | ||||||||||
| — | 317,060 | 94,839 | ||||||||||
| — | — | 26,208 | ||||||||||
| 1,436,930 | 12,045 | 149,499 | ||||||||||
| 57,238,440 | 5,715,566 | 29,871,778 | ||||||||||
| 3,128,333 | 87,504 | 302,541 | ||||||||||
| — | 10,068 | 37,957 | ||||||||||
| — | 17,907 | 5,357 | ||||||||||
| — | — | 1,494 | ||||||||||
| 60,098 | 678 | 8,374 | ||||||||||
| 2,385,992 | 322,260 | 1,667,296 | ||||||||||
| $ | 23.84 | $ | 17.62 | $ | 17.68 | |||||||
| — | 17.40 | 17.21 | ||||||||||
| — | 17.71 | 17.70 | ||||||||||
| — | — | 17.55 | ||||||||||
| 23.91 | 17.75 | 17.85 | ||||||||||
| 23.99 | 17.74 | 17.92 | ||||||||||
| See accompanying Notes to Financial Statements | | May 31, 2014 | | Semiannual Report | 147 |
Table of Contents
Six Months ended May 31, 2014 (Unaudited)
| AllianzGI Retirement 2015 | AllianzGI Retirement 2020 | AllianzGI Retirement 2025 | AllianzGI Retirement 2030 | AllianzGI Retirement 2035 | ||||||||||||||||||
| Investment Income: | ||||||||||||||||||||||
| Dividends from investments in Affiliates | $ | 330,840 | $ | 541,428 | $ | 596,539 | $ | 693,123 | $ | 521,385 | ||||||||||||
| Dividends | 30,792 | 48,265 | 50,350 | 52,459 | 39,540 | |||||||||||||||||
| Contribution from Investment Manager (see Note 6) | — | — | — | 2,557 | 1,615 | |||||||||||||||||
Total Investment Income | 361,632 | 589,693 | 646,889 | 748,139 | 562,540 | |||||||||||||||||
| Expenses: | ||||||||||||||||||||||
| Investment management | 7,021 | 11,487 | 12,578 | 13,375 | 10,460 | |||||||||||||||||
| Administration | 24,670 | 45,793 | 52,031 | 50,605 | 39,041 | |||||||||||||||||
| Distribution — Class B | — | — | — | — | — | |||||||||||||||||
| Distribution — Class C | 5,175 | 1,660 | — | 2,733 | — | |||||||||||||||||
| Distribution — Class R | 240 | 1,290 | 1,365 | 1,558 | 1,248 | |||||||||||||||||
| Administrative servicing — Class P | — | — | — | — | — | |||||||||||||||||
| Servicing — Class A | 11,289 | 23,047 | 27,742 | 22,708 | 16,930 | |||||||||||||||||
| Servicing — Class B | — | — | — | — | — | |||||||||||||||||
| Servicing — Class C | 1,725 | 553 | — | 911 | — | |||||||||||||||||
| Servicing — Class D | 207 | 387 | — | 818 | — | |||||||||||||||||
| Servicing — Class R | 240 | 1,290 | 1,365 | 1,558 | 1,248 | |||||||||||||||||
| Distribution and/or servicing — Administrative Class | 4,563 | 9,071 | 13,608 | 11,027 | 13,279 | |||||||||||||||||
| Sub-transfer agent — Class A | — | — | — | — | — | |||||||||||||||||
| Sub-transfer agent — Class B | — | — | — | — | — | |||||||||||||||||
| Sub-transfer agent — Class C | — | — | — | — | — | |||||||||||||||||
| Sub-transfer agent — Class D | — | — | — | — | — | |||||||||||||||||
| Sub-transfer agent — Class R | — | — | — | — | — | |||||||||||||||||
| Sub-transfer agent — Institutional Class | — | — | — | — | — | |||||||||||||||||
| Excise tax | — | — | — | — | — | |||||||||||||||||
| Trustees | — | — | — | — | — | |||||||||||||||||
| Custodian and accounting agent | — | — | — | — | — | |||||||||||||||||
| Shareholder communications | — | — | — | — | — | |||||||||||||||||
| Transfer agent | — | — | — | — | — | |||||||||||||||||
| Legal | — | — | — | — | — | |||||||||||||||||
| Insurance | — | — | — | — | — | |||||||||||||||||
| Audit and tax services | — | — | — | — | — | |||||||||||||||||
| Registration | — | — | — | — | — | |||||||||||||||||
| Miscellaneous | — | — | — | — | — | |||||||||||||||||
Total Expenses | 55,130 | 94,578 | 108,689 | 105,293 | 82,206 | |||||||||||||||||
Less: Fee Waiver/Reimbursement from Investment Manager | (19,248 | ) | (32,415 | ) | (36,253 | ) | (47,015 | ) | (36,538 | ) | ||||||||||||
Net Expenses | 35,882 | 62,163 | 72,436 | 58,278 | 45,668 | |||||||||||||||||
| Net Investment Income | 325,750 | 527,530 | 574,453 | 689,861 | 516,872 | |||||||||||||||||
| 148 | Semiannual Report | | May 31, 2014 | | See accompanying Notes to Financial Statements |
Table of Contents
| AllianzGI Retirement 2040 | AllianzGI Retirement 2045 | AllianzGI Retirement 2050 | AllianzGI Retirement 2055 | AllianzGI Retirement Income | AllianzGI Global Allocation | AllianzGI Global Growth Allocation | ||||||||||||||||||||||
| $ | 475,110 | $ | 234,466 | $ | 199,356 | $ | 70,090 | $ | 353,352 | $ | 2,991,510 | $ | 82,679 | |||||||||||||||
| 31,986 | 16,514 | 15,618 | 5,535 | 32,727 | 229,369 | 8,431 | ||||||||||||||||||||||
| 2,922 | 1,746 | 4,058 | 2,239 | 600 | — | — | ||||||||||||||||||||||
| 510,018 | 252,726 | 219,032 | 77,864 | 386,679 | 3,220,879 | 91,110 | ||||||||||||||||||||||
| 9,388 | 5,108 | 4,357 | 1,466 | 7,544 | 907,496 | 27,980 | ||||||||||||||||||||||
| 33,799 | 18,812 | 11,403 | 2,571 | 26,122 | — | — | ||||||||||||||||||||||
| — | — | — | — | — | 9,228 | — | ||||||||||||||||||||||
| 1,243 | — | 474 | — | 15,646 | 249,736 | 5,180 | ||||||||||||||||||||||
| 1,546 | 476 | 656 | 105 | 203 | 21 | 157 | ||||||||||||||||||||||
| — | — | — | — | — | 1,029 | 21 | ||||||||||||||||||||||
| 15,287 | 9,495 | 3,515 | 579 | 7,298 | 86,846 | 1,641 | ||||||||||||||||||||||
| — | — | — | — | — | 3,076 | — | ||||||||||||||||||||||
| 414 | — | 158 | — | 5,215 | 83,245 | 1,727 | ||||||||||||||||||||||
| 266 | — | 404 | — | 1,308 | 1,783 | 427 | ||||||||||||||||||||||
| 1,546 | 476 | 656 | 105 | 203 | 21 | 157 | ||||||||||||||||||||||
| 6,397 | 2,011 | 1,508 | 310 | 2,718 | 31 | 25 | ||||||||||||||||||||||
| — | — | — | — | — | 41,632 | 231 | ||||||||||||||||||||||
| — | — | — | — | — | 4,191 | — | ||||||||||||||||||||||
| — | — | — | — | — | 24,507 | 160 | ||||||||||||||||||||||
| — | — | — | — | — | 673 | 214 | ||||||||||||||||||||||
| — | — | — | — | — | — | 17 | ||||||||||||||||||||||
| — | — | — | — | — | 38,223 | 13 | ||||||||||||||||||||||
| — | — | — | — | 1,281 | — | — | ||||||||||||||||||||||
| — | — | — | — | — | 13,591 | 524 | ||||||||||||||||||||||
| — | — | — | — | — | 25,069 | 29,965 | ||||||||||||||||||||||
| — | — | — | — | — | 16,223 | 6,810 | ||||||||||||||||||||||
| — | — | — | — | — | 34,370 | 4,853 | ||||||||||||||||||||||
| — | — | — | — | — | 15,715 | 6,729 | ||||||||||||||||||||||
| — | — | — | — | — | 6,267 | 3,361 | ||||||||||||||||||||||
| — | — | — | — | — | 18,607 | 14,256 | ||||||||||||||||||||||
| — | — | — | — | — | 47,086 | 38,134 | ||||||||||||||||||||||
| — | — | — | — | — | 2,911 | 2,992 | ||||||||||||||||||||||
| 69,886 | 36,378 | 23,131 | 5,136 | 67,538 | 1,631,577 | 145,574 | ||||||||||||||||||||||
| (33,402 | ) | (19,421 | ) | (13,969 | ) | (3,858 | ) | (22,510 | ) | (1,041,229 | ) | (131,452 | ) | ||||||||||||||
| 36,484 | 16,957 | 9,162 | 1,278 | 45,028 | 590,348 | 14,122 | ||||||||||||||||||||||
| 473,534 | 235,769 | 209,870 | 76,586 | 341,651 | 2,630,531 | 76,988 | ||||||||||||||||||||||
| See accompanying Notes to Financial Statements | | May 31, 2014 | | Semiannual Report | 149 |
Table of Contents
Statements of Operations (cont’d)
Six Months ended May 31, 2014 (Unaudited)
| AllianzGI Retirement 2015 | AllianzGI Retirement 2020 | AllianzGI Retirement 2025 | AllianzGI Retirement 2030 | AllianzGI Retirement 2035 | ||||||||||||||||||
| Realized and Change in Unrealized Gain (Loss): | ||||||||||||||||||||||
| Net realized gain (loss) on: | ||||||||||||||||||||||
Investments | $ | 4,943 | $ | 4,453 | $ | 6,665 | $ | 13,925 | $ | 7,557 | ||||||||||||
Investments in Affiliates | 246,417 | 52,154 | (205,290 | ) | 285,005 | 108,411 | ||||||||||||||||
| Net capital gain distributions received from underlying funds | 2,889 | 4,248 | 3,864 | 4,581 | 3,032 | |||||||||||||||||
| Net capital gain distributions received from underlying Affiliated funds | 111,474 | 189,927 | 243,090 | 330,608 | 292,363 | |||||||||||||||||
| Net change in unrealized appreciation/depreciation of: | ||||||||||||||||||||||
Investments | 124,606 | 245,299 | 328,337 | 361,635 | 324,804 | |||||||||||||||||
Investments in Affiliates | 426,072 | 1,148,165 | 1,647,947 | 1,165,183 | 1,173,833 | |||||||||||||||||
| Net Realized and Change in Unrealized Gain | 916,401 | 1,644,246 | 2,024,613 | 2,160,937 | 1,910,000 | |||||||||||||||||
| Net Increase in Net Assets Resulting from Investment Operations | $ | 1,242,151 | $ | 2,171,776 | $ | 2,599,066 | $ | 2,850,798 | $ | 2,426,872 | ||||||||||||
| 150 | Semiannual Report | | May 31, 2014 | | See accompanying Notes to Financial Statements |
Table of Contents
| AllianzGI Retirement 2040 | AllianzGI Retirement 2045 | AllianzGI Retirement 2050 | AllianzGI Retirement 2055 | AllianzGI Retirement Income | AllianzGI Global Allocation | AllianzGI Global Growth Allocation | ||||||||||||||||||||||
| $ | 595 | $ | 774 | $ | 5,547 | $ | 8,831 | $ | 1,246 | $ | 42,180 | $ | 27,558 | |||||||||||||||
| 421,406 | 29,653 | 308,927 | 52,427 | 325,234 | 6,657,460 | 346,239 | ||||||||||||||||||||||
| 2,606 |
| 1,267 | 1,614 | 610 | 3,475 | 22,692 | 1,598 | ||||||||||||||||||||
| 300,911 |
| 173,758 | 164,810 | 58,385 | 124,698 | 1,861,747 | 63,306 | ||||||||||||||||||||
| 308,864 | 179,650 | 137,587 | 37,183 | 137,500 | 1,126,244 | 20,698 | ||||||||||||||||||||||
| 786,321 | 726,340 | 280,632 | 127,194 | 307,079 | (2,623,746 | ) | (211,182 | ) | ||||||||||||||||||||
| 1,820,703 | 1,111,442 | 899,117 | 284,630 | 899,232 | 7,086,577 | 248,217 | ||||||||||||||||||||||
$ | 2,294,237 |
| $ | 1,347,211 | $ | 1,108,987 | $ | 361,216 | $ | 1,240,883 | $ | 9,717,108 | $ | 325,205 | ||||||||||||||
| See accompanying Notes to Financial Statements | | May 31, 2014 | | Semiannual Report | 151 |
Table of Contents
Statements of Operations (cont’d)
Period or Six Months ended May 31, 2014 (Unaudited)
| AllianzGI Behavioral Advantage Large Cap | AllianzGI Best Styles Global Equity Fund (1) | AllianzGI China Equity | AllianzGI Convertible | AllianzGI Global Fundamental Strategy | ||||||||||||||||||
| Investment Income: | ||||||||||||||||||||||
| Interest, net of foreign withholding taxes* | $ | — | $ | — | $ | — | $ | 18,216,312 | $ | 184,578 | ||||||||||||
| Dividends, net of foreign withholding taxes* | 666,524 | 532,408 | 25,313 | 9,796,522 | 167,447 | |||||||||||||||||
| Dividends from investments in Affiliates | — | 1,327 | 7,315 | — | — | |||||||||||||||||
| Miscellaneous | 2 | — | — | — | — | |||||||||||||||||
Total Investment Income | 666,526 | 533,735 | 32,628 | 28,012,834 | 352,025 | |||||||||||||||||
| Expenses: | ||||||||||||||||||||||
| Investment management | 143,962 | 44,541 | 23,268 | 7,326,289 | 81,342 | |||||||||||||||||
| Distribution — Class C | 1,261 | — | 184 | 486,868 | 39 | |||||||||||||||||
| Distribution — Class R | — | — | — | 1,270 | — | |||||||||||||||||
| Administrative servicing — Class P | 9 | — | 6 | 120,863 | — | |||||||||||||||||
| Servicing — Class A | 11,459 | — | 160 | 498,798 | 13 | |||||||||||||||||
| Servicing — Class C | 420 | — | 61 | 162,289 | 13 | |||||||||||||||||
| Servicing — Class D | 280 | — | 264 | 163,966 | 584 | |||||||||||||||||
| Servicing — Class R | — | — | — | 1,270 | — | |||||||||||||||||
| Distribution and/or servicing — Administrative Class | — | — | — | 13,461 | — | |||||||||||||||||
| Sub-transfer agent — Class A | 223 | — | 83 | 95,691 | — | |||||||||||||||||
| Sub-transfer agent — Class C | 40 | — | 19 | 32,469 | — | |||||||||||||||||
| Sub-transfer agent — Class D | 311 | — | 5,658 | 53,054 | — | |||||||||||||||||
| Sub-transfer agent — Class R | — | — | — | 583 | — | |||||||||||||||||
| Sub-transfer agent — Institutional Class | 72 | — | 20 | 49,097 | 2 | |||||||||||||||||
| Sub-transfer agent — Administrative Class | — | — | — | 204 | — | |||||||||||||||||
| Legal | 6,358 | 6,094 | 5,256 | 71,985 | 4,155 | |||||||||||||||||
| Trustees | 3,616 | 2,061 | 307 | 150,364 | 1,373 | |||||||||||||||||
| Audit and tax services | 13,099 | 15,876 | 13,077 | 33,782 | 16,251 | |||||||||||||||||
| Registration | 42,194 | 4,278 | 24,432 | 262,790 | 20,160 | |||||||||||||||||
| Custodian and accounting agent | 49,193 | 82,686 | 44,579 | 118,186 | 41,313 | |||||||||||||||||
| Shareholder communications | 7,838 | 11,840 | 6,153 | 63,093 | 2,804 | |||||||||||||||||
| Transfer agent | 4,576 | 3,828 | 2,815 | 58,682 | 2,548 | |||||||||||||||||
| Organizational | — | 30,000 | — | — | — | |||||||||||||||||
| Offering | — | 64,206 | — | — | 77,746 | |||||||||||||||||
| Excise tax | — | 1,158 | — | — | — | |||||||||||||||||
| Recoupment expense | — | — | — | 4,802 | — | |||||||||||||||||
| Insurance | 3,892 | — | 3,115 | 28,414 | 3,145 | |||||||||||||||||
| Miscellaneous | 2,180 | 2,222 | 2,119 | 6,994 | 1,360 | |||||||||||||||||
Total Expenses | 290,983 | 268,790 | 131,576 | 9,805,264 | 252,848 | |||||||||||||||||
Less: Fee Waiver/Reimbursement from Investment Manager | (78,506 | ) | (208,244 | ) | (100,127 | ) | — | (143,666 | ) | |||||||||||||
Net Expenses | 212,477 | 60,546 | 31,449 | 9,805,264 | 109,182 | |||||||||||||||||
| Net Investment Income (Loss) | 454,049 | 473,189 | 1,179 | 18,207,570 | 242,843 | |||||||||||||||||
| (1) | Commencement of operations December 2, 2013. |
| 152 | Semiannual Report | | May 31, 2014 | | See accompanying Notes to Financial Statements |
Table of Contents
| AllianzGI Global Managed Volatility | AllianzGI Global Water | AllianzGI High Yield Bond | AllianzGI International Small-Cap | AllianzGI Micro Cap | AllianzGI Multi-Asset Real Return | AllianzGI NFJ Emerging Markets Value | ||||||||||||||||||||||
| $ | — | $ | — | $ | 15,709,084 | $ | — | $ | — | $ | 10,660 | $ | — | |||||||||||||||
| 235,247 | 3,296,610 | — | 843,453 | 72,937 | 30,761 | 170,230 | ||||||||||||||||||||||
| — | 105,541 | — | 229,209 | 4,138 | 10,980 | — | ||||||||||||||||||||||
| 1 | — | 46,013 | — | — | — | 846 | ||||||||||||||||||||||
| 235,248 | 3,402,151 | 15,755,097 | 1,072,662 | 77,075 | 52,401 | 171,076 | ||||||||||||||||||||||
| 33,232 | 1,363,813 | 1,068,200 | 538,529 | 276,681 | 21,650 | 42,899 | ||||||||||||||||||||||
| 676 | 231,230 | 99,756 | 3,239 | — | 313 | 135 | ||||||||||||||||||||||
| — | — | 3,688 | 57 | — | — | — | ||||||||||||||||||||||
| 6 | 25,546 | 40,081 | 16,146 | 1,201 | — | — | ||||||||||||||||||||||
| 150 | 165,656 | 73,600 | 6,025 | 3,455 | 76 | 25 | ||||||||||||||||||||||
| 225 | 77,076 | 33,252 | 1,080 | — | 104 | 45 | ||||||||||||||||||||||
| 65 | 24,583 | 101,399 | 1,214 | — | 19 | 1,650 | ||||||||||||||||||||||
| — | — | 3,688 | 57 | — | — | — | ||||||||||||||||||||||
| | — | | — | 42,292 | — | — | — | — | ||||||||||||||||||||
| 56 | 48,266 | 16,631 | 2,074 | 215 | 10 | 1 | ||||||||||||||||||||||
| 18 | 24,888 | 8,025 | 26 | — | 8 | — | ||||||||||||||||||||||
| 67 | 7,847 | 43,091 | 17 | — | 5,250 | 4,540 | ||||||||||||||||||||||
| — | — | 2,019 | 7 | — | — | — | ||||||||||||||||||||||
| 15 | 1,226 | 9,565 | 4,439 | 17,474 | 4 | 341 | ||||||||||||||||||||||
| — | — | 3,060 | — | — | — | — | ||||||||||||||||||||||
| 5,156 | 10,526 | 19,359 | 7,326 | 4,887 | 16,005 | 3,830 | ||||||||||||||||||||||
| 1,093 | 15,601 | 29,020 | 7,440 | 2,858 | 391 | 526 | ||||||||||||||||||||||
| 16,251 | 22,926 | 23,699 | 17,942 | 16,448 | 14,755 | 16,250 | ||||||||||||||||||||||
| 32,159 | 54,927 | 112,241 | 60,998 | 23,680 | 32,345 | 30,436 | ||||||||||||||||||||||
| 68,849 | 76,241 | 45,355 | 128,242 | 34,933 | 44,226 | 86,122 | ||||||||||||||||||||||
| 7,134 | 19,503 | 19,472 | 8,338 | 7,099 | 8,327 | 7,897 | ||||||||||||||||||||||
| 3,343 | 12,442 | 21,650 | 9,152 | 4,749 | 2,344 | 2,407 | ||||||||||||||||||||||
| — | — | — | — | — | — | — | ||||||||||||||||||||||
| — | — | — | — | — | 6,226 | 3,794 | ||||||||||||||||||||||
| — | — | 46,272 | — | — | — | 65 | ||||||||||||||||||||||
| — | 24,577 | 28,707 | 90 | — | — | — | ||||||||||||||||||||||
| 3,356 | 6,057 | 7,995 | 4,835 | 3,388 | 3,162 | 3,177 | ||||||||||||||||||||||
| 2,441 | 2,662 | 3,538 | 3,152 | 2,130 | 2,369 | 2,750 | ||||||||||||||||||||||
| 174,292 | 2,215,593 | 1,905,655 | 820,425 | 399,198 | 157,584 | 206,890 | ||||||||||||||||||||||
| (123,177 | ) | — | (508 | ) | (144,040 | ) | (55,597 | ) | (139,747 | ) | (149,198 | ) | |||||||||||||||
| 51,115 | 2,215,593 | 1,905,147 | 676,385 | 343,601 | 17,837 | 57,692 | ||||||||||||||||||||||
| 184,133 | 1,186,558 | 13,849,950 | 396,277 | (266,526 | ) | 34,564 | 113,384 | |||||||||||||||||||||
| See accompanying Notes to Financial Statements | | May 31, 2014 | | Semiannual Report | 153 |
Table of Contents
Statements of Operations (cont’d)
Period or Six Months ended May 31, 2014 (Unaudited)
| AllianzGI Behavioral Advantage Large Cap | AllianzGI Best Styles Global Equity Fund (1) | AllianzGI China Equity | AllianzGI Convertible | AllianzGI Global Fundamental Strategy | ||||||||||||||||||
| Realized and Change in Unrealized Gain (Loss): | ||||||||||||||||||||||
| Net realized gain (loss) on: | ||||||||||||||||||||||
Investments | $ | 3,455,359 | $ | 107,037 | $ | 61,390 | $ | 96,085,731 | $ | 151,156 | ||||||||||||
Investments in Affiliates | — | (3,744 | ) | 144,059 | — | — | ||||||||||||||||
Futures contracts | — | 91,663 | — | — | (8,361 | ) | ||||||||||||||||
Options written | — | — | — | — | 35,097 | |||||||||||||||||
Foreign currency transactions | — | (3,357 | ) | (18 | ) | — | (14,771 | ) | ||||||||||||||
| Payments from Affiliates (See Note 13) | — | — | — | 475,282 | — | |||||||||||||||||
| Net capital gain distributions received from underlying Affiliated funds | — | — | — | — | — | |||||||||||||||||
| Net change in unrealized appreciation/depreciation of: | ||||||||||||||||||||||
Investments | 59,273 | 1,902,846 | (286,588 | ) | 63,683,510 | 789,415 | ||||||||||||||||
Investments in Affiliates | — | 6,378 | (216,309 | ) | — | — | ||||||||||||||||
Futures contracts | — | 38,446 | — | — | (39,099 | ) | ||||||||||||||||
Options written | — | — | — | — | 12,316 | |||||||||||||||||
Foreign currency transactions | — | (331 | ) | (4 | ) | — | 12,690 | |||||||||||||||
| Net Realized and Change in Unrealized Gain (Loss) | 3,514,632 | 2,138,938 | (297,470 | ) | 160,244,523 | 938,443 | ||||||||||||||||
| Net Increase (Decrease) in Net Assets Resulting from Investment Operations | 3,968,681 | 2,612,127 | $ | (296,291 | ) | $ | 178,452,093 | $ | 1,181,286 | |||||||||||||
| * Foreign withholding taxes | 312 | 32,578 | 1,273 | — | 20,217 | |||||||||||||||||
| (1) | Commencement of operations, December 2, 2013 |
| 154 | Semiannual Report | | May 31, 2014 | | See accompanying Notes to Financial Statements |
Table of Contents
| AllianzGI Global Managed Volatility | AllianzGI Global Water | AllianzGI High Yield Bond | AllianzGI International Small-Cap | AllianzGI Micro Cap | AllianzGI Multi-Asset Real Return | AllianzGI NFJ Emerging Markets Value | ||||||||||||||||||||||
| $ | 666,727 | $ | 6,929,983 | $ | (1,945,327 | ) | $ | 4,942,493 | $ | 2,283,339 | $ | (39,269 | ) | $ | 221,502 | |||||||||||||
| — | — | — | 2,274,291 | 155,127 | 440 | — | ||||||||||||||||||||||
| — | — | — | — | — | (4,572 | ) | — | |||||||||||||||||||||
| — | — | — | — | — | — | — | ||||||||||||||||||||||
| (2,977 | ) | (69,588 | ) | — | (63,874 | ) | — | (4 | ) | (6,264 | ) | |||||||||||||||||
| — | — | 174,513 | — | — | — | — | ||||||||||||||||||||||
| — |
| — | — | — | — | 18,182 | — | ||||||||||||||||||||
| 209,349 | 12,141,843 | 6,314,622 | (4,350,028 | ) | (2,383,868 | ) | 182,888 | 105,565 | ||||||||||||||||||||
| — | (1,347,250 | ) | — | (1,310,657 | ) | 36,589 | 221,152 | — | ||||||||||||||||||||
| — | — | — | — | — | (1,330 | ) | — | |||||||||||||||||||||
| — | — | — | — | — | — | — | ||||||||||||||||||||||
| 268 | (12,392 | ) | — | 5,443 | — | (48 | ) | 1,553 | ||||||||||||||||||||
| | 873,367 | | 17,642,596 | 4,543,808 | 1,497,668 | 91,187 | 377,439 | 322,356 | ||||||||||||||||||||
$ | 1,057,500 |
| $ | 18,829,154 | $ | 18,393,758 | $ | 1,893,945 | $ | (175,339 | ) | $ | 412,003 | $ | 435,740 | |||||||||||||
| 13,232 | 322,502 | — | 97,317 | 816 | 1,680 | 20,130 | ||||||||||||||||||||||
| See accompanying Notes to Financial Statements | | May 31, 2014 | | Semiannual Report | 155 |
Table of Contents
Statements of Operations (cont’d)
Six Months ended May 31, 2014 (Unaudited)
| AllianzGI NFJ Global Dividend Value | AllianzGI NFJ International Small-Cap Value | AllianzGI NFJ International Value II | AllianzGI Short Duration High Income | AllianzGI Structured Return | ||||||||||||||||||
| Investment Income: | ||||||||||||||||||||||
| Interest | $ | 1 | $ | — | $ | — | $ | 14,547,634 | $ | 3,094 | ||||||||||||
| Dividends, net of foreign withholding taxes* | 1,657,709 | 346,730 | 598,401 | — | — | |||||||||||||||||
| Dividends from investments in Affiliates | — | 1,619 | — | — | — | |||||||||||||||||
| Miscellaneous | — | — | — | 600,338 | — | |||||||||||||||||
Total Investment Income | 1,657,710 | 348,349 | 598,401 | 15,147,972 | 3,094 | |||||||||||||||||
| Expenses: | ||||||||||||||||||||||
| Investment management | 288,116 | 91,875 | 72,293 | 1,519,228 | 84,517 | |||||||||||||||||
| Distribution — Class C | 21,605 | 3,531 | 175 | 90,808 | 413 | |||||||||||||||||
| Distribution — Class R | — | — | — | — | — | |||||||||||||||||
| Administrative servicing — Class P | 908 | — | 7 | 71,817 | — | |||||||||||||||||
| Servicing — Class A | 13,863 | 3,134 | 131 | 226,689 | 2,053 | |||||||||||||||||
| Servicing — Class C | 7,202 | 1,177 | 58 | 90,808 | 137 | |||||||||||||||||
| Servicing — Class D | 969 | 1,272 | 16 | 32,241 | 1,641 | |||||||||||||||||
| Servicing — Class R | — | — | — | — | — | |||||||||||||||||
| Sub-transfer agent — Class A | 1,614 | 104 | 15 | 29,395 | 349 | |||||||||||||||||
| Sub-transfer agent — Class C | 1,444 | 173 | 17 | 12,489 | 22 | |||||||||||||||||
| Sub-transfer agent — Class D | 22 | 4,834 | — | 15,616 | 5,109 | |||||||||||||||||
| Sub-transfer agent — Class R | — | — | — | — | — | |||||||||||||||||
| Sub-transfer agent — Institutional Class | 1,354 | 183 | — | 9,440 | 168 | |||||||||||||||||
| Legal | 5,815 | 4,986 | 2,284 | 20,641 | 51,529 | |||||||||||||||||
| Trustees | 4,888 | 811 | 352 | 34,335 | 756 | |||||||||||||||||
| Audit and tax services | 16,251 | 13,952 | 17,499 | 17,262 | 15,905 | |||||||||||||||||
| Registration | 23,422 | 26,673 | 22,984 | 98,431 | 21,986 | |||||||||||||||||
| Custodian and accounting agent | 55,401 | 78,671 | 48,721 | 48,486 | 65,948 | |||||||||||||||||
| Shareholder communications | 8,590 | 5,694 | 6,742 | 27,082 | 6,488 | |||||||||||||||||
| Transfer agent | 7,393 | 3,338 | 2,462 | 30,712 | 2,439 | |||||||||||||||||
| Offering | — | — | — | — | 795 | |||||||||||||||||
| Recoupment expense | — | — | — | 36,771 | — | |||||||||||||||||
| Insurance | 4,275 | 3,245 | 3,116 | 9,486 | 3,231 | |||||||||||||||||
| Miscellaneous | 2,463 | 2,516 | 2,176 | 1,756 | 3,481 | |||||||||||||||||
Total Expenses | 465,595 | 246,169 | 179,048 | 2,423,493 | 266,967 | |||||||||||||||||
Less: Fee Waiver/Reimbursement from Investment Manager | (77,496 | ) | (120,955 | ) | (92,814 | ) | (17,531 | ) | (151,114 | ) | ||||||||||||
Net Expenses | 388,099 | 125,214 | 86,234 | 2,405,962 | 115,853 | |||||||||||||||||
| Net Investment Income (Loss) | 1,269,611 | 223,135 | 512,167 | 12,742,010 | (112,759 | ) | ||||||||||||||||
| 156 | Semiannual Report | | May 31, 2014 | | See accompanying Notes to Financial Statements |
Table of Contents
AllianzGI Ultra | AllianzGI U.S. Equity Hedged | AllianzGI U.S. Small-Cap Growth | ||||||||||
| $ | — | $ | — | $ | — | |||||||
| 288,717 | 72,113 | 63,629 | ||||||||||
| — | — | 2,602 | ||||||||||
| — | — | — | ||||||||||
| 288,717 | 72,113 | 66,231 | ||||||||||
| 1,097,943 | 26,163 | 167,290 | ||||||||||
| — | 634 | 2,393 | ||||||||||
| — | — | 32 | ||||||||||
| 690 | — | 64 | ||||||||||
| 97,533 | 1,842 | 6,610 | ||||||||||
| — | 211 | 798 | ||||||||||
| — | 365 | 111 | ||||||||||
| — | — | 32 | ||||||||||
| 13,736 | 267 | 142 | ||||||||||
| — | 31 | 79 | ||||||||||
| — | 5,076 | 7 | ||||||||||
| — | — | 3 | ||||||||||
| 3,658 | 30 | 928 | ||||||||||
| 9,830 | 6,280 | 5,957 | ||||||||||
| 6,620 | 483 | 2,443 | ||||||||||
| 16,450 | 13,881 | 13,453 | ||||||||||
| 44,200 | 21,855 | 42,284 | ||||||||||
| 45,661 | 78,237 | 44,159 | ||||||||||
| 13,059 | 6,098 | 6,845 | ||||||||||
| 7,383 | 2,435 | 6,498 | ||||||||||
| — | 782 | — | ||||||||||
| 147,056 | — | — | ||||||||||
| 4,137 | 3,144 | 3,711 | ||||||||||
| 2,368 | 2,552 | 2,618 | ||||||||||
| 1,510,324 | 170,366 | 306,457 | ||||||||||
| — | (129,968 | ) | (79,160 | ) | ||||||||
| 1,510,324 | 40,398 | 227,297 | ||||||||||
| (1,221,607 | ) | 31,715 | (161,066 | ) | ||||||||
| See accompanying Notes to Financial Statements | | May 31, 2014 | | Semiannual Report | 157 |
Table of Contents
Statements of Operations (cont’d)
Six Months ended May 31, 2014 (Unaudited)
| AllianzGI NFJ Global Dividend Value | AllianzGI NFJ International Small-Cap Value | AllianzGI NFJ International Value II | AllianzGI Short Duration High Income | AllianzGI Structured Return | ||||||||||||||||||
| Realized and Change in Unrealized Gain (Loss): | ||||||||||||||||||||||
| Net realized gain (loss) on: | ||||||||||||||||||||||
Investments | $ | 2,871,587 | $ | 863,281 | $ | 203,215 | $ | 2,387,723 | $ | (1,032,654 | ) | |||||||||||
Investments in Affiliates | — | — | — | — | — | |||||||||||||||||
Options written | — | — | — | — | 1,314,585 | |||||||||||||||||
Foreign currency transactions | 5,831 | (2,187 | ) | 6,931 | — | — | ||||||||||||||||
| Payments from Affiliates (See Note 13) | — | — | — | — | — | |||||||||||||||||
| Net change in unrealized appreciation/depreciation of: | ||||||||||||||||||||||
Investments | (795,321 | ) | 683,360 | 1,331,686 | 269,288 | (102,741 | ) | |||||||||||||||
Investments in Affiliates | — | 6,305 | — | — | — | |||||||||||||||||
Options written | — | — | — | — | 231,360 | |||||||||||||||||
Foreign currency transactions | (3,792 | ) | 1,473 | 560 | — | — | ||||||||||||||||
| Net Realized and Change in Unrealized Gain (Loss) | 2,078,305 | 1,552,232 | 1,542,392 | 2,657,011 | 410,550 | |||||||||||||||||
| Net Increase (Decrease) in Net Assets Resulting from Investment Operations | $ | 3,347,916 | $ | 1,775,367 | $ | 2,054,559 | $ | 15,399,021 | $ | 297,791 | ||||||||||||
| * Foreign withholding taxes | 95,387 | 27,575 | 43,695 | — | — | |||||||||||||||||
| 158 | Semiannual Report | | May 31, 2014 | | See accompanying Notes to Financial Statements |
Table of Contents
| AllianzGI Ultra Micro Cap | AllianzGI U.S. Equity Hedged | AllianzGI U.S. Small-Cap Growth | ||||||||||
| $ | (1,964,388 | ) | $ | (221,986 | ) | $ | 1,809,509 | |||||
| — | — | 6,173 | ||||||||||
| — | 8,302 | — | ||||||||||
| — | — | — | ||||||||||
| — | 317 | — | ||||||||||
| (697,852 | ) | 513,071 | (2,035,098 | ) | ||||||||
| — | — | 90,612 | ||||||||||
| — | (758 | ) | — | |||||||||
| — | — | — | ||||||||||
| (2,662,240 | ) | 298,946 | (128,804 | ) | ||||||||
| $ | (3,883,847 | ) | $ | 330,661 | $ | (289,870 | ) | |||||
| — | — | 125 | ||||||||||
| See accompanying Notes to Financial Statements | | May 31, 2014 | | Semiannual Report | 159 |
Table of Contents
Statements of Changes in Net Assets
| AllianzGI Retirement 2015 | AllianzGI Retirement 2020 | |||||||||||||||||
| Six Months ended May 31, 2014 (Unaudited) | Year ended November 30, 2013 | Six Months ended May 31, 2014 (Unaudited) | Year ended November 30, 2013 | |||||||||||||||
| Increase in Net Assets from: | ||||||||||||||||||
Investment Operations: | ||||||||||||||||||
| Net investment income | $ | 325,750 | $ | 550,150 | $ | 527,530 | $ | 741,668 | ||||||||||
| Net realized gain (loss) | 365,723 | (35,747 | ) | 250,782 | (330,343 | ) | ||||||||||||
| Net change in unrealized appreciation/depreciation | 550,678 | 71,953 | 1,393,464 | 542,205 | ||||||||||||||
Net increase in net assets resulting from investment operations | 1,242,151 | 586,356 | 2,171,776 | 953,530 | ||||||||||||||
| Dividends and Distributions to Shareholders from: | ||||||||||||||||||
| Net investment income: | ||||||||||||||||||
Class A | (202,351 | ) | (151,229 | ) | (376,596 | ) | (216,157 | ) | ||||||||||
Class C | (14,041 | ) | (38,226 | ) | (4,276 | ) | (2,686 | ) | ||||||||||
Class D | (2,326 | ) | (36,338 | ) | (5,007 | ) | (6,077 | ) | ||||||||||
Class R | (1,465 | ) | (13,152 | ) | (14,740 | ) | (22,640 | ) | ||||||||||
Class P | (84,782 | ) | (110,299 | ) | (154,714 | ) | (124,213 | ) | ||||||||||
Class R6 | (178,596 | ) | (219,816 | ) | (160,647 | ) | (176,616 | ) | ||||||||||
Administrative Class | (73,602 | ) | (397 | ) | (138,300 | ) | (3,255 | ) | ||||||||||
| Net realized capital gains: | ||||||||||||||||||
Class A | — | — | — | (20,593 | ) | |||||||||||||
Class C | — | — | — | (926 | ) | |||||||||||||
Class D | — | — | — | (647 | ) | |||||||||||||
Class R | — | — | — | (2,281 | ) | |||||||||||||
Class P | — | — | — | (12,116 | ) | |||||||||||||
Class R6 | — | — | — | (16,558 | ) | |||||||||||||
Administrative Class | — | — | — | (1,258 | ) | |||||||||||||
| Total dividends and distributions to shareholders | (557,163 | ) | (569,457 | ) | (854,280 | ) | (606,023 | ) | ||||||||||
| Fund Share Transactions: | ||||||||||||||||||
| Net proceeds from the sale of shares | 15,324,020 | 14,415,003 | 20,304,848 | 27,968,920 | ||||||||||||||
| Issued in reinvestment of dividends and distributions | 556,498 | 563,101 | 854,232 | 606,023 | ||||||||||||||
| Cost of shares redeemed | (9,573,278 | ) | (10,695,386 | ) | (5,509,387 | ) | (11,330,116 | ) | ||||||||||
| Net increase from Fund share transactions | 6,307,240 | 4,282,718 | 15,649,693 | 17,244,827 | ||||||||||||||
| Total increase in net assets | 6,992,228 | 4,299,617 | 16,967,189 | 17,592,334 | ||||||||||||||
| Net Assets: | ||||||||||||||||||
| Beginning of period | 22,008,961 | 17,709,344 | 33,191,470 | 15,599,136 | ||||||||||||||
| End of period* | $ | 29,001,189 | $ | 22,008,961 | $ | 50,158,659 | $ | 33,191,470 | ||||||||||
* Including undistributed net investment income of: | $ | 180,430 | $ | 208,894 | $ | 273,370 | $ | 600,120 | ||||||||||
| 160 | Semiannual Report | | May 31, 2014 | | See accompanying Notes to Financial Statements |
Table of Contents
| AllianzGI Retirement 2025 | AllianzGI Retirement 2030 | AllianzGI Retirement 2035 | ||||||||||||||||||||||
| Six Months ended May 31, 2014 (Unaudited) | Year ended November 30, 2013 | Six Months ended May 31, 2014 (Unaudited) | Year ended November 30, 2013 | Six Months ended May 31, 2014 (Unaudited) | Year ended November 30, 2013 | |||||||||||||||||||
| $ | 574,453 | $ | 665,521 | $ | 689,861 | $ | 870,675 | $ | 516,872 | $ | 535,740 | |||||||||||||
| 48,329 | (416,905 | ) | 634,119 | (136,941 | ) | 411,363 | (178,620 | ) | ||||||||||||||||
| 1,976,284 | 786,392 | 1,526,818 | 1,586,487 | 1,498,637 | 1,557,091 | |||||||||||||||||||
| 2,599,066 | 1,035,008 | 2,850,798 | 2,320,221 | 2,426,872 | 1,914,211 | |||||||||||||||||||
| (426,739 | ) | (236,114 | ) | (428,196 | ) | (221,948 | ) | (300,338 | ) | (101,742 | ) | |||||||||||||
| — | — | (10,033 | ) | (10,874 | ) | — | — | |||||||||||||||||
| — | — | (13,222 | ) | (10,072 | ) | — | — | |||||||||||||||||
| (18,248 | ) | (21,077 | ) | (21,599 | ) | (29,886 | ) | (16,445 | ) | (19,990 | ) | |||||||||||||
| (80,183 | ) | (92,938 | ) | (184,881 | ) | (144,236 | ) | (113,126 | ) | (102,453 | ) | |||||||||||||
| (108,975 | ) | (106,062 | ) | (258,616 | ) | (263,982 | ) | (137,282 | ) | (127,515 | ) | |||||||||||||
| (200,811 | ) | (233 | ) | (200,325 | ) | (420 | ) | (224,389 | ) | (260 | ) | |||||||||||||
| — | (24,277 | ) | — | (16,870 | ) | — | (13,242 | ) | ||||||||||||||||
| — | — | — | (1,227 | ) | — | — | ||||||||||||||||||
| — | — | — | (845 | ) | — | — | ||||||||||||||||||
| — | (2,419 | ) | — | (2,202 | ) | — | (2,812 | ) | ||||||||||||||||
| — | (9,853 | ) | — | (10,688 | ) | — | (13,606 | ) | ||||||||||||||||
| — | (11,103 | ) | — | (19,278 | ) | — | (16,780 | ) | ||||||||||||||||
| — | (904 | ) | — | (562 | ) | — | (1,181 | ) | ||||||||||||||||
| (834,956 | ) | (504,980 | ) | (1,116,872 | ) | (733,090 | ) | (791,580 | ) | (399,581 | ) | |||||||||||||
| 26,830,617 | 28,907,362 | 25,365,464 | 27,480,286 | 20,803,207 | 20,515,998 | |||||||||||||||||||
| 829,681 | 496,764 | 1,113,004 | 730,493 | 788,966 | 396,954 | |||||||||||||||||||
| (5,594,929 | ) | (7,000,861 | ) | (8,425,540 | ) | (16,818,734 | ) | (3,048,242 | ) | (3,148,704 | ) | |||||||||||||
| 22,065,369 | 22,403,265 | 18,052,928 | 11,392,045 | 18,543,931 | 17,764,248 | |||||||||||||||||||
| 23,829,479 | 22,933,293 | 19,786,854 | 12,979,176 | 20,179,223 | 19,278,878 | |||||||||||||||||||
| 33,811,032 | 10,877,739 | 40,199,493 | 27,220,317 | 29,509,695 | 10,230,817 | |||||||||||||||||||
| $ | 57,640,511 | $ | 33,811,032 | $ | 59,986,347 | $ | 40,199,493 | $ | 49,688,918 | $ | 29,509,695 | |||||||||||||
| $ | 269,467 | $ | 529,970 | $ | 264,733 | $ | 691,744 | $ | 159,393 | $ | 434,101 | |||||||||||||
| See accompanying Notes to Financial Statements | | May 31, 2014 | | Semiannual Report | 161 |
Table of Contents
Statements of Changes in Net Assets (cont’d)
| AllianzGI Retirement 2040 | AllianzGI Retirement 2045 | |||||||||||||||||
| Six Months ended May 31, 2014 (Unaudited) | Year ended November 30, 2013 | Six Months ended May 31, 2014 (Unaudited) | Year ended November 30, 2013 | |||||||||||||||
| Increase (Decrease) in Net Assets from: | ||||||||||||||||||
Investment Operations: | ||||||||||||||||||
| Net investment income | $ | 473,534 | $ | 547,945 | $ | 235,769 | $ | 261,082 | ||||||||||
| Net realized gain | 725,518 | 90,776 | 205,452 | 74,538 | ||||||||||||||
| Net change in unrealized appreciation/depreciation | 1,095,185 | 1,818,068 | 905,990 | 952,639 | ||||||||||||||
Net increase in net assets resulting from investment operations | 2,294,237 | 2,456,789 | 1,347,211 | 1,288,259 | ||||||||||||||
| Dividends and Distributions to Shareholders from: | ||||||||||||||||||
| Net investment income: | ||||||||||||||||||
Class A | (299,358 | ) | (100,875 | ) | (181,709 | ) | (62,334 | ) | ||||||||||
Class C | (4,849 | ) | (4,540 | ) | — | — | ||||||||||||
Class D | (4,271 | ) | (5,385 | ) | — | — | ||||||||||||
Class R | (22,265 | ) | (22,878 | ) | (6,954 | ) | (7,644 | ) | ||||||||||
Class P | (113,845 | ) | (64,785 | ) | (56,921 | ) | (43,843 | ) | ||||||||||
Class R6 | (262,190 | ) | (214,057 | ) | (115,794 | ) | (101,568 | ) | ||||||||||
Administrative Class | (116,327 | ) | (654 | ) | (36,633 | ) | (308 | ) | ||||||||||
| Net realized capital gains: | ||||||||||||||||||
Class A | — | (7,682 | ) | — | (12,389 | ) | ||||||||||||
Class C | — | (439 | ) | — | — | |||||||||||||
Class D | — | (476 | ) | — | — | |||||||||||||
Class R | — | (1,677 | ) | — | (1,606 | ) | ||||||||||||
Class P | — | (4,871 | ) | — | (8,687 | ) | ||||||||||||
Class R6 | — | (15,947 | ) | — | (19,921 | ) | ||||||||||||
Administrative Class | — | (212 | ) | — | (343 | ) | ||||||||||||
| Return of Capital: | ||||||||||||||||||
Class A | — | — | — | — | ||||||||||||||
Class C | — | — | — | — | ||||||||||||||
Class D | — | — | — | — | ||||||||||||||
Class R | — | — | — | — | ||||||||||||||
Class P | — | — | — | — | ||||||||||||||
Class R6 | — | — | — | — | ||||||||||||||
Administrative Class | — | — | — | — | ||||||||||||||
| Total dividends and distributions to shareholders | (823,105 | ) | (444,478 | ) | (398,011 | ) | (258,643 | ) | ||||||||||
| Fund Share Transactions: | ||||||||||||||||||
| Net proceeds from the sale of shares | 19,762,687 | 16,759,032 | 11,512,061 | 7,291,721 | ||||||||||||||
| Issued in reinvestment of dividends and distributions | 821,263 | 441,636 | 397,833 | 258,522 | ||||||||||||||
| Cost of shares redeemed | (6,532,761 | ) | (5,635,221 | ) | (1,146,991 | ) | (1,178,869 | ) | ||||||||||
| Net increase (decrease) from Fund share transactions | 14,051,189 | 11,565,447 | 10,762,903 | 6,371,374 | ||||||||||||||
| Total increase (decrease) in net assets | 15,522,321 | 13,577,758 | 11,712,103 | 7,400,990 | ||||||||||||||
| Net Assets: | ||||||||||||||||||
| Beginning of period | 26,922,901 | 13,345,143 | 13,084,055 | 5,683,065 | ||||||||||||||
| End of period* | $ | 42,445,222 | $ | 26,922,901 | $ | 24,796,158 | $ | 13,084,055 | ||||||||||
* Including undistributed net investment income of: | $ | 94,710 | $ | 444,281 | $ | 37,897 | $ | 200,139 | ||||||||||
| 162 | Semiannual Report | | May 31, 2014 | | See accompanying Notes to Financial Statements |
Table of Contents
| AllianzGI Retirement 2050 | AllianzGI Retirement 2055 | AllianzGI Retirement Income | ||||||||||||||||||||||
| Six Months ended May 31, 2014 (Unaudited) | Year ended November 30, 2013 | Six Months ended May 31, 2014 (Unaudited) | Year ended November 30, 2013 | Six Months ended May 31, 2014 (Unaudited) | Year ended November 30, 2013 | |||||||||||||||||||
| $ | 209,870 | $ | 274,886 | $ | 76,586 | $ | 114,335 | $ | 341,651 | $ | 744,927 | |||||||||||||
| 480,898 | 168,103 | 120,253 | 96,730 | 454,653 | 311,964 | |||||||||||||||||||
| 418,219 | 1,054,220 | 164,377 | 383,798 | 444,579 | (278,951 | ) | ||||||||||||||||||
| 1,108,987 | 1,497,209 | 361,216 | 594,863 | 1,240,883 | 777,940 | |||||||||||||||||||
| (68,062 | ) | (16,717 | ) | (14,622 | ) | (842 | ) | (43,408 | ) | (179,152 | ) | |||||||||||||
| (2,510 | ) | (1,272 | ) | — | — | (14,168 | ) | (167,944 | ) | |||||||||||||||
| (8,335 | ) | (5,883 | ) | — | — | (6,476 | ) | (52,448 | ) | |||||||||||||||
| (10,670 | ) | (11,240 | ) | (1,766 | ) | (1,333 | ) | (716 | ) | (3,837 | ) | |||||||||||||
| (37,456 | ) | (24,444 | ) | (6,860 | ) | (2,203 | ) | (62,745 | ) | (208,689 | ) | |||||||||||||
| (245,688 | ) | (208,847 | ) | (124,091 | ) | (124,983 | ) | (84,779 | ) | (402,626 | ) | |||||||||||||
| (30,843 | ) | (511 | ) | (6,128 | ) | (386 | ) | (15,482 | ) | (27,354 | ) | |||||||||||||
| — | (1,929 | ) | (1,662 | ) | (448 | ) | — | (23,086 | ) | |||||||||||||||
| — | (214 | ) | — | — | — | (28,517 | ) | |||||||||||||||||
| — | (724 | ) | — | — | — | (7,188 | ) | |||||||||||||||||
| — | (1,290 | ) | (239 | ) | (698 | ) | — | (554 | ) | |||||||||||||||
| — | (2,680 | ) | (765 | ) | (1,113 | ) | — | (24,955 | ) | |||||||||||||||
| — | (22,716 | ) | (13,839 | ) | (59,925 | ) | — | (46,558 | ) | |||||||||||||||
| — | (118 | ) | (712 | ) | (249 | ) | — | (1,013 | ) | |||||||||||||||
| — | — | — | — | — | (7,402 | ) | ||||||||||||||||||
| — | — | — | — | — | (8,593 | ) | ||||||||||||||||||
| — | — | — | — | — | (2,420 | ) | ||||||||||||||||||
| — | — | — | — | — | (205 | ) | ||||||||||||||||||
| — | — | — | — | — | (9,769 | ) | ||||||||||||||||||
| — | — | — | — | — | (15,564 | ) | ||||||||||||||||||
| — | — | — | — | — | (2,004 | ) | ||||||||||||||||||
| (403,564 | ) | (298,585 | ) | (170,684 | ) | (192,180 | ) | (227,774 | ) | (1,219,878 | ) | |||||||||||||
| 8,182,692 | 5,500,024 | 1,535,570 | 908,455 | 9,926,189 | 10,247,332 | |||||||||||||||||||
| 403,508 | 298,585 | 170,684 | 192,180 | 227,712 | 1,202,902 | |||||||||||||||||||
| (2,713,996 | ) | (2,709,799 | ) | (223,711 | ) | (77,253 | ) | (6,838,452 | ) | (14,307,606 | ) | |||||||||||||
| 5,872,204 | 3,088,810 | 1,482,543 | 1,023,382 | 3,315,449 | (2,857,372 | ) | ||||||||||||||||||
| 6,577,627 | 4,287,434 | 1,673,075 | 1,426,065 | 4,328,558 | (3,299,310 | ) | ||||||||||||||||||
| 13,488,957 | 9,201,523 | 5,055,516 | 3,629,451 | 26,322,947 | 29,622,257 | |||||||||||||||||||
| $ | 20,066,584 | $ | 13,488,957 | $ | 6,728,591 | $ | 5,055,516 | $ | 30,651,505 | $ | 26,322,947 | |||||||||||||
| $ | 21,045 | $ | 214,739 | $ | 8,051 | $ | 84,932 | $ | 115,661 | $ | 1,784 | |||||||||||||
| See accompanying Notes to Financial Statements | | May 31, 2014 | | Semiannual Report | 163 |
Table of Contents
Statements of Changes in Net Assets (cont’d)
| AllianzGI Global Allocation | AllianzGI Global Growth Allocation | |||||||||||||||||
| Six Months ended May 31, 2014 (Unaudited) | Year ended November 30, 2013 | Six Months ended May 31, 2014 (Unaudited) | Year ended November 30, 2013 | |||||||||||||||
| Increase (Decrease) in Net Assets from: | ||||||||||||||||||
Investment Operations: | ||||||||||||||||||
| Net investment income | $ | 2,630,531 | $ | 5,183,796 | $ | 76,988 | $ | 170,061 | ||||||||||
| Net realized gain (loss) | 8,584,079 | 10,540,301 | 438,701 | 832,100 | ||||||||||||||
| Net change in unrealized appreciation/depreciation | (1,497,502 | ) | 7,007,440 | (190,484 | ) | 176,941 | ||||||||||||
Net increase (decrease) in net assets resulting from investment operations | 9,717,108 | 22,731,537 | 325,205 | 1,179,102 | ||||||||||||||
| Dividends and Distributions to Shareholders from: | ||||||||||||||||||
| Net investment income: | ||||||||||||||||||
Class A | (918,926 | ) | (2,664,819 | ) | (39,156 | ) | (23,226 | ) | ||||||||||
Class B | (22,362 | ) | (115,538 | ) | — | — | ||||||||||||
Class C | (629,790 | ) | (2,114,389 | ) | (30,091 | ) | (28,575 | ) | ||||||||||
Class D | (18,801 | ) | (13,156 | ) | (11,558 | ) | (3,362 | ) | ||||||||||
Class R | (211 | ) | (563 | ) | (3,379 | ) | (517 | ) | ||||||||||
Class P | (29,991 | ) | (55,750 | ) | (1,268 | ) | (513 | ) | ||||||||||
Institutional Class | (1,044,588 | ) | (2,475,717 | ) | (99,671 | ) | (156,839 | ) | ||||||||||
Administrative Class | (304 | ) | (54,859 | ) | (568 | ) | (487 | ) | ||||||||||
| Net realized capital gains: | ||||||||||||||||||
Class A | — | — | (149,637 | ) | (8,641 | ) | ||||||||||||
Class C | — | — | (157,668 | ) | (13,353 | ) | ||||||||||||
Class D | — | — | (43,047 | ) | (1,183 | ) | ||||||||||||
Class R | — | — | (12,794 | ) | (236 | ) | ||||||||||||
Class P | — | — | (4,617 | ) | (179 | ) | ||||||||||||
Institutional Class | — | — | (363,860 | ) | (50,786 | ) | ||||||||||||
Administrative Class | — | — | (2,184 | ) | (171 | ) | ||||||||||||
| Total dividends and distributions to shareholders | (2,664,973 | ) | (7,494,791 | ) | (919,498 | ) | (288,068 | ) | ||||||||||
| Fund Share Transactions: | ||||||||||||||||||
| Net proceeds from the sale of shares | 17,885,007 | 30,248,337 | 592,199 | 1,723,271 | ||||||||||||||
| Issued in reinvestment of dividends and distributions | 2,388,805 | 6,677,559 | 918,399 | 288,068 | ||||||||||||||
| Cost of shares redeemed | (22,651,066 | ) | (45,728,016 | ) | (1,103,432 | ) | (3,525,932 | ) | ||||||||||
| Net increase (decrease) from Fund share transactions | (2,377,254 | ) | (8,802,120 | ) | 407,166 | (1,514,593 | ) | |||||||||||
| Total increase (decrease) in net assets | 4,674,881 | 6,434,626 | (187,127 | ) | (623,559 | ) | ||||||||||||
| Net Assets: | ||||||||||||||||||
| Beginning of period | 213,059,545 | 206,624,919 | 6,679,710 | 7,303,269 | ||||||||||||||
| End of period* | $ | 217,734,426 | $ | 213,059,545 | $ | 6,492,583 | $ | 6,679,710 | ||||||||||
* Including undistributed (dividends in excess of) net investment income of: | $ | (34,442 | ) | $ | — | $ | (13,891 | ) | $ | 94,812 | ||||||||
| ** | Commencement of operations. |
| 164 | Semiannual Report | | May 31, 2014 | | See accompanying Notes to Financial Statements |
Table of Contents
| AllianzGI Behavioral Advantage Large Cap | AllianzGI Best Styles Global Equity Fund | AllianzGI China Equity | ||||||||||||||||||
| Six Months ended May 31, 2014 (Unaudited) | Year ended November 30, 2013 | Period from December 2, 2013** through May 31, 2014 (Unaudited) | Six Months ended May 31, 2014 (Unaudited) | Year ended November 30, 2013 | ||||||||||||||||
| $ | 454,049 | $ | 513,865 | $ | 473,189 | $ | 1,179 | $ | 50,999 | |||||||||||
| 3,455,359 | 2,100,176 | 191,599 | 205,431 | (23,662 | ) | |||||||||||||||
| 59,273 | 7,931,802 | 1,947,339 | (502,901 | ) | 599,575 | |||||||||||||||
| | 3,968,681 | | 10,545,843 | 2,612,127 | (296,291 | ) | 626,912 | |||||||||||||
| (90,468 | ) | (538 | ) | — | (596 | ) | (2,022 | ) | ||||||||||||
| — | — | — | — | — | ||||||||||||||||
| (1,785 | ) | (753 | ) | — | (1 | ) | (1 | ) | ||||||||||||
| (454 | ) | (3,323 | ) | — | (1 | ) | (11,196 | ) | ||||||||||||
| — | — | — | — | — | ||||||||||||||||
| (111 | ) | (187 | ) | — | — | (226 | ) | |||||||||||||
| (412,898 | ) | (298,276 | ) | — | (29,159 | ) | (76,243 | ) | ||||||||||||
| — | — | — | — | — | ||||||||||||||||
| (306,253 | ) | (2,833 | ) | — | — | — | ||||||||||||||
| (8,823 | ) | (3,716 | ) | — | — | — | ||||||||||||||
| (6,512 | ) | (3,966 | ) | — | — | — | ||||||||||||||
| — | — | — | — | — | ||||||||||||||||
| (603 | ) | (733 | ) | — | — | — | ||||||||||||||
| (1,758,815 | ) | (1,029,278 | ) | — | — | — | ||||||||||||||
| — | — | — | — | — | ||||||||||||||||
| (2,586,722 | ) | (1,343,603 | ) | — | (29,757 | ) | (89,688 | ) | ||||||||||||
| 31,969,325 | 34,306,842 | 31,348,406 | 75,254 | 896,237 | ||||||||||||||||
| 2,232,454 | 1,342,737 | — | 29,757 | 89,688 | ||||||||||||||||
| (11,183,827 | ) | (4,876,491 | ) | (2,143,815 | ) | (84,667 | ) | (1,094,747 | ) | |||||||||||
| 23,017,952 | 30,773,088 | 29,204,591 | 20,344 | (108,822 | ) | |||||||||||||||
| 24,399,911 | 39,975,328 | 31,816,718 | (305,704 | ) | 428,402 | |||||||||||||||
| 57,291,836 | 17,316,508 | 5,000,000 | 4,497,857 | 4,069,455 | ||||||||||||||||
| $ | 81,691,747 | $ | 57,291,836 | $ | 36,816,718 | $ | 4,192,153 | $ | 4,497,857 | |||||||||||
| $ | 399,501 | | $ | 451,168 | $ | 473,189 | $ | (8,733 | ) | $ | 19,845 | |||||||||
| See accompanying Notes to Financial Statements | | May 31, 2014 | | Semiannual Report | 165 |
Table of Contents
Statements of Changes in Net Assets (cont’d)
| AllianzGI Convertible | AllianzGI Global Fundamental Strategy | |||||||||||||||||
| Six Months ended May 31, 2014 (Unaudited) | Year ended | Six Months ended May 31, 2014 (Unaudited) | Period from July 1, 2013** through November 30, 2013 | |||||||||||||||
| Increase (Decrease) in Net Assets from: | ||||||||||||||||||
Investment Operations: | ||||||||||||||||||
| Net investment income | $ | 18,207,570 | $ | 29,827,103 | $ | 242,843 | $ | 104,947 | ||||||||||
| Net realized gain (loss) | 96,561,013 | 106,379,772 | 163,121 | 51,753 | ||||||||||||||
| Net change in unrealized appreciation/depreciation | 63,683,510 | 213,706,272 | 775,322 | 469,690 | ||||||||||||||
Net increase in net assets resulting from investment operations | 178,452,093 | 349,913,147 | 1,181,286 | 626,390 | ||||||||||||||
| Dividends and Distributions to Shareholders from: | ||||||||||||||||||
| Net investment income: | ||||||||||||||||||
Class A | (5,206,205 | ) | (2,361,786 | ) | (78 | ) | — | |||||||||||
Class C | (1,372,489 | ) | (461,374 | ) | (40 | ) | — | |||||||||||
Class D | (1,835,823 | ) | (829,104 | ) | (78 | ) | — | |||||||||||
Class R | (9,542 | ) | (2,662 | ) | — | — | ||||||||||||
Class P | (3,925,258 | ) | (1,432,561 | ) | (86 | ) | — | |||||||||||
Institutional Class | (26,509,214 | ) | (19,878,839 | ) | (183,029 | ) | — | |||||||||||
Administrative Class | (191,580 | ) | (106,752 | ) | — | — | ||||||||||||
| Net realized capital gains: | ||||||||||||||||||
Class A | (4,018,964 | ) | — | (41 | ) | — | ||||||||||||
Class C | (1,431,664 | ) | — | (41 | ) | — | ||||||||||||
Class D | (1,565,855 | ) | — | (41 | ) | — | ||||||||||||
Class R | (4,891 | ) | — | — | — | |||||||||||||
Class P | (3,104,927 | ) | — | (41 | ) | — | ||||||||||||
Institutional Class | (19,542,203 | ) | — | (82,562 | ) | — | ||||||||||||
Administrative Class | (160,290 | ) | — | — | — | |||||||||||||
| Total dividends and distributions to shareholders | (68,878,905 | ) | (25,073,078 | ) | (266,037 | ) | — | |||||||||||
| Fund Share Transactions: | ||||||||||||||||||
| Net proceeds from the sale of shares | 744,092,840 | 1,660,827,670 | 2,475,182 | 56,000 | ||||||||||||||
| Issued in reinvestment of dividends and distributions | 46,018,849 | 15,664,611 | 266,037 | — | ||||||||||||||
| Cost of shares redeemed | (687,159,760 | ) | (625,119,587 | ) | (34,787 | ) | — | |||||||||||
| Net increase (decrease) from Fund share transactions | 102,951,929 | 1,051,372,694 | 2,706,432 | 56,000 | ||||||||||||||
| Total increase (decrease) in net assets | 212,525,117 | 1,376,212,763 | 3,621,681 | 682,390 | ||||||||||||||
| Net Assets: | ||||||||||||||||||
| Beginning of period | 2,403,786,010 | 1,027,573,247 | 20,722,390 | 20,040,000 | ||||||||||||||
| End of period* | $ | 2,616,311,127 | $ | 2,403,786,010 | $ | 24,344,071 | $ | 20,722,390 | ||||||||||
* Including undistributed (dividends in excess of) net investment income of: | $ | 7,719,170 | $ | 28,561,711 | $ | 130,201 | $ | 70,669 | ||||||||||
| ** | Commencement of operations. |
| 166 | Semiannual Report | | May 31, 2014 | | See accompanying Notes to Financial Statements |
Table of Contents
| AllianzGI Global Managed Volatility | AllianzGI Global Water | AllianzGI High Yield Bond | ||||||||||||||||||||||
| Six Months ended May 31, 2014 (Unaudited) | Year ended | Six Months ended May 31, 2014 (Unaudited) | Year ended November 30, 2013 | Six Months ended May 31, 2014 (Unaudited) | Year ended November 30, 2013 | |||||||||||||||||||
| $ | 184,133 | $ | 444,751 | $ | 1,186,558 | $ | 838,937 | $ | 13,849,950 | $ | 25,667,127 | |||||||||||||
| 663,750 | 619,199 | 6,860,395 | 3,254,498 | (1,770,814 | ) | 4,650,471 | ||||||||||||||||||
| 209,617 | 762,994 | 10,782,201 | 30,353,142 | 6,314,622 | 3,318,437 | |||||||||||||||||||
| 1,057,500 | 1,826,944 | 18,829,154 | 34,446,577 | 18,393,758 | 33,636,035 | |||||||||||||||||||
| (3,851 | ) | (1,861 | ) | (269,464 | ) | (679,198 | ) | (1,970,792 | ) | (6,143,161 | ) | |||||||||||||
| (5,765 | ) | (2,023 | ) | (44 | ) | (121,278 | ) | (791,808 | ) | (1,688,305 | ) | |||||||||||||
| (1,625 | ) | (1,690 | ) | (27,063 | ) | (75,427 | ) | (2,832,310 | ) | (4,839,632 | ) | |||||||||||||
| — | — | — | — | (98,356 | ) | (159,730 | ) | |||||||||||||||||
| (427 | ) | (392 | ) | (164,700 | ) | (186,883 | ) | (2,852,785 | ) | (2,457,369 | ) | |||||||||||||
| (539,014 | ) | (55,613 | ) | (175,053 | ) | (56,569 | ) | (5,793,523 | ) | (9,203,696 | ) | |||||||||||||
| — | — | — | — | (1,184,974 | ) | (2,036,554 | ) | |||||||||||||||||
| (2,166 | ) | (493 | ) | — | — | (611,065 | ) | (145,971 | ) | |||||||||||||||
| (3,464 | ) | (468 | ) | — | — | (225,704 | ) | (37,627 | ) | |||||||||||||||
| (1,049 | ) | (385 | ) | — | — | (931,903 | ) | (105,921 | ) | |||||||||||||||
| — | — | — | — | (24,613 | ) | (3,114 | ) | |||||||||||||||||
| (231 | ) | (100 | ) | — | — | (662,779 | ) | (18,364 | ) | |||||||||||||||
| (282,476 | ) | (133,935 | ) | — | — | (1,204,907 | ) | (175,436 | ) | |||||||||||||||
| — | — | — | — | (283,544 | ) | (41,582 | ) | |||||||||||||||||
| (840,068 | ) | (697,477 | ) | (636,324 | ) | (1,119,355 | ) | (19,469,063 | ) | (27,056,462 | ) | |||||||||||||
| 3,326,436 | 3,589,444 | 94,352,525 | 139,501,638 | 130,986,226 | 365,187,121 | |||||||||||||||||||
| 839,874 | 697,477 | 446,287 | 655,954 | 15,429,046 | 20,848,984 | |||||||||||||||||||
| (859,242 | ) | (5,585,663 | ) | (27,150,709 | ) | (40,240,156 | ) | (147,729,318 | ) | (285,089,695 | ) | |||||||||||||
| 3,307,068 | (1,298,742 | ) | 67,648,103 | 99,917,436 | (1,314,046 | ) | 100,946,410 | |||||||||||||||||
| 3,524,500 | (169,275 | ) | 85,840,933 | 133,244,658 | (2,389,351 | ) | 107,525,983 | |||||||||||||||||
| 14,527,201 | 14,696,476 | 244,519,582 | 111,274,924 | 462,050,603 | 354,524,620 | |||||||||||||||||||
| $ | 18,051,701 | $ | 14,527,201 | $ | 330,360,515 | $ | 244,519,582 | $ | 459,661,252 | $ | 462,050,603 | |||||||||||||
| $ | 135,317 | | $ | 501,866 | $ | 1,068,991 | $ | 518,757 | $ | (2,577,346 | ) | $ | (902,748 | ) | ||||||||||
| See accompanying Notes to Financial Statements | | May 31, 2014 | | Semiannual Report | 167 |
Table of Contents
Statements of Changes in Net Assets (cont’d)
| AllianzGI International Small-Cap | AllianzGI Micro Cap | |||||||||||||||||
| Six Months ended May 31, 2014 (Unaudited) | Year ended November 30, 2013 | Six Months ended May 31, 2014 (Unaudited) | Year ended November 30, 2013 | |||||||||||||||
| Increase (Decrease) in Net Assets from: | ||||||||||||||||||
Investment Operations: | ||||||||||||||||||
| Net investment income (loss) | $ | 396,277 | $ | 485,853 | $ | (266,526 | ) | $ | (393,228 | ) | ||||||||
| Net realized gain (loss) | 7,152,910 | 22,157,689 | 2,438,466 | 5,183,506 | ||||||||||||||
| Net change in unrealized appreciation/depreciation | (5,655,242 | ) | 9,127,239 | (2,347,279 | ) | 9,903,699 | ||||||||||||
Net increase (decrease) in net assets resulting from investment operations | 1,893,945 | 31,770,781 | (175,339 | ) | 14,693,977 | |||||||||||||
| Dividends and Distributions to Shareholders from: | ||||||||||||||||||
| Net investment income: | ||||||||||||||||||
Class A | (52,727 | ) | (5 | ) | — | — | ||||||||||||
Class C | (2,372 | ) | (323 | ) | — | — | ||||||||||||
Class D | (5,303 | ) | (11 | ) | — | — | ||||||||||||
Class R | (338 | ) | (153 | ) | — | — | ||||||||||||
Class P | (339,167 | ) | (314,004 | ) | — | — | ||||||||||||
Institutional Class | (616,345 | ) | (835,561 | ) | — | — | ||||||||||||
Administrative Class*** | (143 | ) | (1 | ) | — | — | ||||||||||||
| Net realized capital gains: | ||||||||||||||||||
Class A | (330,077 | ) | — | (55,508 | ) | (13,432 | ) | |||||||||||
Class C | (50,491 | ) | — | — | — | |||||||||||||
Class D | (23,504 | ) | — | — | — | |||||||||||||
Class R | (1,948 | ) | — | — | — | |||||||||||||
Class P | (2,400,832 | ) | — | (110,432 | ) | (31,638 | ) | |||||||||||
Institutional Class | (4,844,051 | ) | — | (2,112,388 | ) | (2,184,800 | ) | |||||||||||
Administrative Class*** | (1,090 | ) | — | — | — | |||||||||||||
| Total dividends and distributions to shareholders | (8,668,388 | ) | (1,150,058 | ) | (2,278,328 | ) | (2,229,870 | ) | ||||||||||
| Fund Share Transactions: | ||||||||||||||||||
| Net proceeds from the sale of shares | 19,750,960 | 38,103,115 | 10,267,702 | 13,526,507 | ||||||||||||||
| Issued in reinvestment of dividends and distributions | 8,355,332 | 1,138,431 | 2,274,870 | 2,215,649 | ||||||||||||||
| Cost of shares redeemed | (22,935,161 | ) | (79,496,990 | ) | (13,256,034 | ) | (11,046,819 | ) | ||||||||||
| Net increase (decrease) from Fund share transactions | 5,171,131 | (40,255,444 | ) | (713,462 | ) | 4,695,337 | ||||||||||||
| Total increase (decrease) in net assets | (1,603,312 | ) | (9,634,721 | ) | (3,167,129 | ) | 17,159,444 | |||||||||||
| Net Assets: | ||||||||||||||||||
| Beginning of period | 111,101,972 | 120,736,693 | 44,969,599 | 27,810,155 | ||||||||||||||
| End of period* | $ | 109,498,660 | $ | 111,101,972 | $ | 41,802,470 | $ | 44,969,599 | ||||||||||
* Including undistributed (dividends in excess of) net investment income of: | $ | 450,610 | $ | 1,070,728 | $ | (682,766 | ) | $ | (416,240 | ) | ||||||||
| ** | Commencement of operations. |
| *** | The Administrative Class of AllianzGI International Small-Cap liquidated on May 21, 2014. |
| 168 | Semiannual Report | | May 31, 2014 | | See accompanying Notes to Financial Statements |
Table of Contents
| AllianzGI Multi-Asset Real Return | AllianzGI NFJ Emerging Markets Value | AllianzGI NFJ Global Dividend Value | ||||||||||||||||||||||
| Six Months ended May 31, 2014 (Unaudited) | Period from December 17, 2012** through November 30, 2013 | Six Months ended May 31, 2014 (Unaudited) | Period from December 18, 2012** through November 30, 2013 | Six Months ended May 31, 2014 (Unaudited) | Year ended November 30, 2013 | |||||||||||||||||||
| $ | 34,564 | $ | 59,725 | $ | 113,384 | $ | 149,989 | $ | 1,269,611 | $ | 1,899,401 | |||||||||||||
| (25,223 | ) | 1,210 | 215,238 | (158,705 | ) | 2,877,418 | 3,737,570 | |||||||||||||||||
| 402,662 | 67,838 | 107,118 | 181,059 | (799,113 | ) | 8,506,884 | ||||||||||||||||||
| 412,003 | 128,773 | 435,740 | 172,343 | 3,347,916 | 14,143,855 | |||||||||||||||||||
| (799 | ) | — | (272 | ) | (258 | ) | (145,298 | ) | (198,998 | ) | ||||||||||||||
| (1,271 | ) | — | (315 | ) | (99 | ) | (54,749 | ) | (60,674 | ) | ||||||||||||||
| (164 | ) | — | (15,551 | ) | (4,846 | ) | (9,880 | ) | (11,466 | ) | ||||||||||||||
| — | — | — | — | — | — | |||||||||||||||||||
| (180 | ) | — | (153 | ) | (122 | ) | (25,239 | ) | (29,012 | ) | ||||||||||||||
| (103,079 | ) | — | (95,709 | ) | (73,371 | ) | (761,964 | ) | (1,218,754 | ) | ||||||||||||||
| — | — | — | — | — | — | |||||||||||||||||||
| (51 | ) | — | — | — | (289,188 | ) | (15,289 | ) | ||||||||||||||||
| (93 | ) | — | — | — | (156,211 | ) | (8,154 | ) | ||||||||||||||||
| (12 | ) | — | — | — | (20,067 | ) | (958 | ) | ||||||||||||||||
| — | — | — | — | — | — | |||||||||||||||||||
| (12 | ) | — | — | — | (47,916 | ) | (2,174 | ) | ||||||||||||||||
| (6,240 | ) | — | — | — | (1,403,066 | ) | (86,720 | ) | ||||||||||||||||
| — | — | — | — | — | — | |||||||||||||||||||
| (111,901 | ) | — | (112,000 | ) | (78,696 | ) | (2,913,578 | ) | (1,632,199 | ) | ||||||||||||||
| 592,783 | 137,728 | 2,395,315 | 5,003,054 | 10,489,445 | 22,951,780 | |||||||||||||||||||
| 111,901 | — | 112,000 | 78,696 | 2,650,906 | 1,512,963 | |||||||||||||||||||
| (51,072 | ) | (5,234 | ) | (642,226 | ) | (604,648 | ) | (9,154,601 | ) | (18,882,275 | ) | |||||||||||||
| 653,612 | 132,494 | 1,865,089 | 4,477,102 | 3,985,750 | 5,582,468 | |||||||||||||||||||
| 953,714 | 261,267 | 2,188,829 | 4,570,749 | 4,420,088 | 18,094,124 | |||||||||||||||||||
| 5,301,267 | 5,040,000 | 7,610,749 | 3,040,000 | 70,181,392 | 52,087,268 | |||||||||||||||||||
| $ | 6,254,981 | $ | 5,301,267 | $ | 9,799,578 | $ | 7,610,749 | $ | 74,601,480 | $ | 70,181,392 | |||||||||||||
| $ | (8,785 | ) | $ | 62,144 | $ | 74,170 | $ | 72,786 | $ | 962,161 | $ | 689,680 | ||||||||||||
| See accompanying Notes to Financial Statements | | May 31, 2014 | | Semiannual Report | 169 |
Table of Contents
Statements of Changes in Net Assets (cont’d)
| AllianzGI NFJ International Small-Cap Value | AllianzGI NFJ International Value II | |||||||||||||||||
| Six Months ended May 31, 2014 (Unaudited) | Year ended November 30, 2013 | Six Months ended May 31, 2014 (Unaudited) | Year ended November 30, 2013 | |||||||||||||||
| Increase (Decrease) in Net Assets from: | ||||||||||||||||||
Investment Operations: | ||||||||||||||||||
| Net investment income (loss) | $ | 223,135 | $ | 184,098 | $ | 512,167 | $ | 85,369 | ||||||||||
| Net realized gain (loss) | 861,094 | 417,518 | 210,146 | 191,143 | ||||||||||||||
| Net change in unrealized appreciation/depreciation | 691,138 | 1,265,550 | 1,332,246 | 468,866 | ||||||||||||||
Net increase (decrease) in net assets resulting from investment operations | 1,775,367 | 1,867,166 | 2,054,559 | 745,378 | ||||||||||||||
| Dividends and Distributions to Shareholders from: | ||||||||||||||||||
| Net investment income: | ||||||||||||||||||
Class A | (28,504 | ) | (20,797 | ) | (1,680 | ) | (668 | ) | ||||||||||
Class C | (11,996 | ) | (1,215 | ) | (811 | ) | (115 | ) | ||||||||||
Class D | (7,957 | ) | (5,602 | ) | (272 | ) | (136 | ) | ||||||||||
Class P | (133 | ) | (128 | ) | (282 | ) | (143 | ) | ||||||||||
Institutional Class | (188,554 | ) | (45,319 | ) | (238,666 | ) | (57,743 | ) | ||||||||||
| Net realized capital gains: | ||||||||||||||||||
Class A | (40,040 | ) | (5,301 | ) | (2,506 | ) | (70 | ) | ||||||||||
Class C | (9,712 | ) | (57 | ) | (1,594 | ) | (16 | ) | ||||||||||
Class D | (16,838 | ) | (607 | ) | (442 | ) | (16 | ) | ||||||||||
Class P | (251 | ) | (57 | ) | (442 | ) | (16 | ) | ||||||||||
Institutional Class | (215,346 | ) | (17,772 | ) | (138,919 | ) | (6,282 | ) | ||||||||||
| Total dividends and distributions to shareholders | (519,331 | ) | (96,855 | ) | (385,614 | ) | (65,205 | ) | ||||||||||
| Fund Share Transactions: | ||||||||||||||||||
| Net proceeds from the sale of shares | 5,945,932 | 11,135,989 | 24,985,131 | 341,684 | ||||||||||||||
| Issued in reinvestment of dividends and distributions | 518,387 | 96,234 | 385,614 | 65,204 | ||||||||||||||
| Cost of shares redeemed | (1,590,890 | ) | (2,078,411 | ) | (101,359 | ) | (1,246,435 | ) | ||||||||||
| Net increase (decrease) from Fund share transactions | 4,873,429 | 9,153,812 | 25,269,386 | (839,547 | ) | |||||||||||||
| Total increase (decrease) in net assets | 6,129,465 | 10,924,123 | 26,938,331 | (159,374 | ) | |||||||||||||
| Net Assets: | ||||||||||||||||||
| Beginning of period | 15,630,820 | 4,706,697 | 4,318,221 | 4,477,595 | ||||||||||||||
| End of period* | $ | 21,760,285 | $ | 15,630,820 | $ | 31,256,552 | $ | 4,318,221 | ||||||||||
| * Including undistributed (dividends in excess of) net investment income of: | $ | 181,559 | $ | 195,568 | $ | 326,421 | $ | 55,965 | ||||||||||
| ** | Commencement of operations. |
| 170 | Semiannual Report | | May 31, 2014 | | See accompanying Notes to Financial Statements |
Table of Contents
| AllianzGI Short Duration High Income | AllianzGI Structured Return | AllianzGI Ultra Micro Cap | ||||||||||||||||||||||
| Six Months ended May 31, 2014 (Unaudited) | Year ended November 30, 2013 | Six Months ended May 31, 2014 (Unaudited) | Period from December 3, 2012** through November 30, 2013 | Six Months ended May 31, 2014 (Unaudited) | Year ended November 30, 2013 | |||||||||||||||||||
| $ | 12,742,010 | $ | 15,626,920 | $ | (112,759 | ) | $ | (126,988 | ) | $ | (1,221,607 | ) | $ | (716,570 | ) | |||||||||
| 2,387,723 | (1,886,608 | ) | 281,931 | 508,983 | (1,964,388 | ) | 263,637 | |||||||||||||||||
| 269,288 | 3,327,579 | 128,619 | 87,059 | (697,852 | ) | 24,719,725 | ||||||||||||||||||
| 15,399,021 | 17,067,891 | 297,791 | 469,054 | (3,883,847 | ) | 24,266,792 | ||||||||||||||||||
| (4,289,355 | ) | (6,075,369 | ) | — | — | (102 | ) | — | ||||||||||||||||
| (1,645,585 | ) | (2,115,400 | ) | — | — | — | — | |||||||||||||||||
| (621,121 | ) | (739,149 | ) | — | — | — | — | |||||||||||||||||
| (3,569,436 | ) | (4,408,587 | ) | — | — | — | — | |||||||||||||||||
| (5,260,064 | ) | (5,527,917 | ) | — | — | — | — | |||||||||||||||||
| — | (27,576 | ) | (24,284 | ) | — | (133,608 | ) | (16,345 | ) | |||||||||||||||
| — | (9,938 | ) | (4,872 | ) | — | — | — | |||||||||||||||||
| — | (3,477 | ) | (60,855 | ) | — | — | — | |||||||||||||||||
| — | (18,635 | ) | (2,607 | ) | — | (1,822 | ) | (314 | ) | |||||||||||||||
| — | (13,278 | ) | (336,705 | ) | — | (131,893 | ) | (22,004 | ) | |||||||||||||||
| (15,385,561 | ) | (18,939,326 | ) | (429,323 | ) | — | (267,425 | ) | (38,663 | ) | ||||||||||||||
| 295,757,817 | 501,029,596 | 7,822,501 | 4,819,307 | 51,334,167 | 114,937,995 | |||||||||||||||||||
| 12,616,458 | 15,566,518 | 429,323 | — | 262,278 | 36,319 | |||||||||||||||||||
| (136,468,245 | ) | (172,942,850 | ) | (1,359,687 | ) | (1,282,224 | ) | (39,220,992 | ) | (30,589,080 | ) | |||||||||||||
| 171,906,030 | 343,653,264 | 6,892,137 | 3,537,083 | 12,375,453 | 84,385,234 | |||||||||||||||||||
| 171,919,490 | 341,781,829 | 6,760,605 | 4,006,137 | 8,224,181 | 108,613,363 | |||||||||||||||||||
| 552,541,180 | 210,759,351 | 10,046,137 | 6,040,000 | 125,023,519 | 16,410,156 | |||||||||||||||||||
| $ | 724,460,670 | $ | 552,541,180 | $ | 16,806,742 | $ | 10,046,137 | $ | 133,247,700 | $ | 125,023,519 | |||||||||||||
| $ | (4,829,594 | ) | $ | (2,186,043 | ) | $ | (112,759 | ) | $ | — | $ | (1,973,989 | ) | $ | (752,280 | ) | ||||||||
| See accompanying Notes to Financial Statements | | May 31, 2014 | | Semiannual Report | 171 |
Table of Contents
Statements of Changes in Net Assets (cont’d)
| AllianzGI U.S. Equity Hedged | AllianzGI U.S. Small-Cap Growth | |||||||||||||||
| Six Months ended May 31, 2014 (Unaudited) | Period from December 3, 2012** through November 30, 2013 | Six Months ended May 31, 2014 (Unaudited) | Year ended November 30, 2013 | |||||||||||||
| Increase in Net Assets from: | ||||||||||||||||
Investment Operations: | ||||||||||||||||
| Net investment income (loss) | $ | 31,715 | $ | 47,172 | $ | (161,066 | ) | $ | (161,572 | ) | ||||||
| Net realized gain (loss) | (213,367 | ) | (228,900 | ) | 1,815,682 | 3,685,227 | ||||||||||
| Net change in unrealized appreciation/depreciation | 512,313 | 880,477 | (1,944,486 | ) | 8,171,710 | |||||||||||
Net increase (decrease) in net assets resulting from investment operations | 330,661 | 698,749 | (289,870 | ) | 11,695,365 | |||||||||||
| Dividends and Distributions to Shareholders from: | ||||||||||||||||
| Net investment income: | ||||||||||||||||
Class A | (13,056 | ) | — | — | — | |||||||||||
Class C | (1,801 | ) | — | — | — | |||||||||||
Class D | (1,167 | ) | — | — | — | |||||||||||
Class P | (47 | ) | — | — | — | |||||||||||
Institutional Class | (36,196 | ) | — | — | — | |||||||||||
| Net realized capital gains: | ||||||||||||||||
Class A | (18,994 | ) | — | (332,389 | ) | (31,876 | ) | |||||||||
Class C | (2,235 | ) | — | (40,221 | ) | (4,670 | ) | |||||||||
Class D | (3,490 | ) | — | (4,379 | ) | (1,186 | ) | |||||||||
Class R | — | — | (1,768 | ) | (232 | ) | ||||||||||
Class P | (152 | ) | — | (6,673 | ) | (477 | ) | |||||||||
Institutional Class | (70,875 | ) | — | (1,863,982 | ) | (440,662 | ) | |||||||||
| Total dividends and distributions to shareholders | (148,013 | ) | — | (2,249,412 | ) | (479,103 | ) | |||||||||
| Fund Share Transactions: | ||||||||||||||||
| Net proceeds from the sale of shares | 669,909 | 3,572,078 | 8,963,363 | 16,516,133 | ||||||||||||
| Issued in reinvestment of dividends and distributions | 148,013 | — | 1,990,519 | 451,442 | ||||||||||||
| Cost of shares redeemed | (449,054 | ) | (100,791 | ) | (7,167,195 | ) | (15,100,256 | ) | ||||||||
| Net increase from Fund share transactions | 368,868 | 3,471,287 | 3,786,687 | 1,867,319 | ||||||||||||
| Total increase in net assets | 551,516 | 4,170,036 | 1,247,405 | 13,083,581 | ||||||||||||
| Net Assets: | ||||||||||||||||
| Beginning of period | 7,210,036 | 3,040,000 | 34,896,739 | 21,813,158 | ||||||||||||
| End of period* | $ | 7,761,552 | $ | 7,210,036 | $ | 36,144,144 | $ | 34,896,739 | ||||||||
* Including undistributed (dividends in excess of) net investment income of: | $ | 27,126 | $ | 47,678 | $ | (274,039 | ) | $ | (112,973 | ) | ||||||
| ** | Commencement of operations. |
| 172 | Semiannual Report | | May 31, 2014 | | See accompanying Notes to Financial Statements |
Table of Contents
(THIS PAGE INTENTIONALLY LEFT BLANK)
| See accompanying Notes to Financial Statements | | May 31, 2014 | | Semiannual Report | 173 |
Table of Contents
For a Share Outstanding for the Period ended:
| Net Asset Value, Beginning of Period | Net Investment Income (a) | Net Realized and Change in Unrealized Gain (Loss) | Total from Investment Operations | Dividends from Net Investment Income | Distributions from Net Realized Capital Gains | |||||||||||||||||||||
| AllianzGI Retirement 2015: | ||||||||||||||||||||||||||
| Class A | ||||||||||||||||||||||||||
5/31/2014+ | $ | 19.56 | $ | 0.22 | $ | 0.55 | $ | 0.77 | $ | (0.40 | ) | $ | — | |||||||||||||
11/30/2013 | 19.52 | 0.49 | 0.10 | 0.59 | (0.55 | ) | — | |||||||||||||||||||
11/30/2012 | 18.86 | 0.48 | 1.27 | 1.75 | (0.70 | ) | (0.39 | ) | ||||||||||||||||||
11/30/2011 | 19.28 | 0.38 | 0.23 | 0.61 | (0.74 | ) | (0.29 | ) | ||||||||||||||||||
11/30/2010 | 18.38 | 0.48 | 1.22 | 1.70 | (0.68 | ) | (0.12 | ) | ||||||||||||||||||
12/29/2008* - 11/30/2009 | 15.00 | 0.53 | 2.85 | 3.38 | — | — | ||||||||||||||||||||
| Class C | ||||||||||||||||||||||||||
5/31/2014+ | $ | 19.23 | $ | 0.14 | $ | 0.56 | $ | 0.70 | $ | (0.19 | ) | $ | — | |||||||||||||
11/30/2013 | 19.15 | 0.38 | 0.05 | 0.43 | (0.35 | ) | — | |||||||||||||||||||
11/30/2012 | 18.53 | 0.35 | 1.24 | 1.59 | (0.58 | ) | (0.39 | ) | ||||||||||||||||||
11/30/2011 | 19.09 | 0.31 | 0.14 | 0.45 | (0.72 | ) | (0.29 | ) | ||||||||||||||||||
11/30/2010 | 18.25 | 0.36 | 1.19 | 1.55 | (0.59 | ) | (0.12 | ) | ||||||||||||||||||
12/29/2008* - 11/30/2009 | 15.00 | 0.40 | 2.85 | 3.25 | — | — | ||||||||||||||||||||
| Class D | ||||||||||||||||||||||||||
5/31/2014+ | $ | 19.54 | $ | 0.21 | $ | 0.56 | $ | 0.77 | $ | (0.24 | ) | $ | — | |||||||||||||
11/30/2013 | 19.52 | 0.88 | (0.32 | ) | 0.56 | (0.54 | ) | — | ||||||||||||||||||
11/30/2012 | 18.87 | 0.41 | 1.34 | 1.75 | (0.71 | ) | (0.39 | ) | ||||||||||||||||||
11/30/2011 | 19.30 | 0.58 | — | 0.58 | (0.72 | ) | (0.29 | ) | ||||||||||||||||||
11/30/2010 | 18.40 | 0.52 | 1.18 | 1.70 | (0.68 | ) | (0.12 | ) | ||||||||||||||||||
12/29/2008* - 11/30/2009 | 15.00 | 0.53 | 2.87 | 3.40 | — | — | ||||||||||||||||||||
| Class R | ||||||||||||||||||||||||||
5/31/2014+ | $ | 19.48 | $ | 0.18 | $ | 0.56 | $ | 0.74 | $ | (0.15 | ) | $ | — | |||||||||||||
11/30/2013 | 19.50 | 0.46 | 0.05 | 0.51 | (0.53 | ) | — | |||||||||||||||||||
11/30/2012 | 18.85 | 0.19 | 1.51 | 1.70 | (0.66 | ) | (0.39 | ) | ||||||||||||||||||
11/30/2011 | 19.27 | 0.55 | — | 0.55 | (0.68 | ) | (0.29 | ) | ||||||||||||||||||
11/30/2010 | 18.35 | 0.53 | 1.13 | 1.66 | (0.62 | ) | (0.12 | ) | ||||||||||||||||||
12/29/2008* - 11/30/2009 | 15.00 | 0.47 | 2.88 | 3.35 | — | — | ||||||||||||||||||||
| Class P | ||||||||||||||||||||||||||
5/31/2014+ | $ | 19.74 | $ | 0.24 | $ | 0.58 | $ | 0.82 | $ | (0.43 | ) | $ | — | |||||||||||||
11/30/2013 | 19.66 | 0.51 | 0.14 | 0.65 | (0.57 | ) | — | |||||||||||||||||||
11/30/2012 | 18.97 | 0.34 | 1.49 | 1.83 | (0.75 | ) | (0.39 | ) | ||||||||||||||||||
11/30/2011 | 19.37 | 0.65 | (0.01 | ) | 0.64 | (0.75 | ) | (0.29 | ) | |||||||||||||||||
11/30/2010 | 18.43 | 0.61 | 1.13 | 1.74 | (0.68 | ) | (0.12 | ) | ||||||||||||||||||
12/29/2008* - 11/30/2009 | 15.00 | 0.53 | 2.90 | 3.43 | — | — | ||||||||||||||||||||
| Class R6 | ||||||||||||||||||||||||||
5/31/2014+ | $ | 19.77 | $ | 0.25 | $ | 0.58 | $ | 0.83 | $ | (0.45 | ) | $ | — | |||||||||||||
11/30/2013 | 19.68 | 0.54 | 0.12 | 0.66 | (0.57 | ) | — | |||||||||||||||||||
11/30/2012 | 18.99 | 0.54 | 1.31 | 1.85 | (0.77 | ) | (0.39 | ) | ||||||||||||||||||
11/30/2011 | 19.39 | 0.66 | — | 0.66 | (0.77 | ) | (0.29 | ) | ||||||||||||||||||
11/30/2010 | 18.45 | 0.61 | 1.14 | 1.75 | (0.69 | ) | (0.12 | ) | ||||||||||||||||||
12/29/2008* - 11/30/2009 | 15.00 | 0.55 | 2.90 | 3.45 | — | — | ||||||||||||||||||||
| Administrative Class | ||||||||||||||||||||||||||
5/31/2014+ | $ | 19.68 | $ | 0.22 | $ | 0.58 | $ | 0.80 | $ | (0.40 | ) | $ | — | |||||||||||||
11/30/2013 | 19.60 | 0.22 | 0.37 | 0.59 | (0.51 | ) | — | |||||||||||||||||||
11/30/2012 | 18.94 | 0.48 | 1.29 | 1.77 | (0.72 | ) | (0.39 | ) | ||||||||||||||||||
11/30/2011 | 19.34 | 0.61 | — | 0.61 | (0.72 | ) | (0.29 | ) | ||||||||||||||||||
11/30/2010 | 18.40 | 0.58 | 1.14 | 1.72 | (0.66 | ) | (0.12 | ) | ||||||||||||||||||
12/29/2008* - 11/30/2009 | 15.00 | 0.51 | 2.89 | 3.40 | — | — | �� | |||||||||||||||||||
| + | unaudited |
| * | Commencement of operations. |
| (a) | Calculated on average shares outstanding during the period. |
| 174 | Semiannual Report | | May 31, 2014 | | See accompanying Notes to Financial Statements |
Table of Contents
| Total Dividends and Distributions | Net Asset Value, End of Period | Total Return (b) | Net Assets, End of Period (000s) | Ratio of Expenses to Average Net Assets with Fee Waiver/ Reimbursement (c) | Ratio of Expenses to Average Net Assets without Fee Waiver/ Reimbursement (c) | Ratio of Net Investment Income to Average Net Assets (c) | Portfolio Turnover Rate | |||||||||||||||||||||||||
| $ | (0.40 | ) | $ | 19.93 | 4.04 | % | $ | 9,176 | 0.40 | %(d) | 0.60 | %(d) | 2.25 | %(d) | 61 | % | ||||||||||||||||
| (0.55 | ) | 19.56 | 3.10 | 4,900 | 0.40 | 0.60 | 2.55 | 94 | ||||||||||||||||||||||||
| (1.09 | ) | 19.52 | 9.88 | 1,798 | 0.40 | 0.60 | 2.57 | 70 | ||||||||||||||||||||||||
| (1.03 | ) | 18.86 | 3.27 | 1,564 | 0.47 | 2.06 | 2.03 | 108 | ||||||||||||||||||||||||
| (0.80 | ) | 19.28 | 9.67 | 229 | 0.50 | 5.47 | 2.62 | 24 | ||||||||||||||||||||||||
| — | 18.38 | 22.53 | 78 | 0.50 | (d) | 9.98 | (d) | 3.36 | (d) | 21 | ||||||||||||||||||||||
| $ | (0.19 | ) | $ | 19.74 | 3.68 | % | $ | 1,451 | 1.15 | %(d) | 1.35 | %(d) | 1.45 | %(d) | 61 | % | ||||||||||||||||
| (0.35 | ) | 19.23 | 2.29 | 1,445 | 1.15 | 1.35 | 2.01 | 94 | ||||||||||||||||||||||||
| (0.97 | ) | 19.15 | 9.08 | 2,049 | 1.15 | 1.35 | 1.91 | 70 | ||||||||||||||||||||||||
| (1.01 | ) | 18.53 | 2.44 | 2,347 | 1.22 | 2.66 | 1.65 | 108 | ||||||||||||||||||||||||
| (0.71 | ) | 19.09 | 8.88 | 305 | 1.25 | 7.23 | 1.99 | 24 | ||||||||||||||||||||||||
| — | 18.25 | 21.67 | 71 | 1.25 | (d) | 8.61 | (d) | 2.61 | (d) | 21 | ||||||||||||||||||||||
| $ | (0.24 | ) | $ | 20.07 | 3.99 | % | $ | 112 | 0.50 | %(d) | 0.60 | %(d) | 2.14 | %(d) | 61 | % | ||||||||||||||||
| (0.54 | ) | 19.54 | 2.95 | 191 | 0.50 | 0.60 | 4.52 | 94 | ||||||||||||||||||||||||
| (1.10 | ) | 19.52 | 9.82 | 1,290 | 0.50 | 0.60 | 2.19 | 70 | ||||||||||||||||||||||||
| (1.01 | ) | 18.87 | 3.20 | 251 | 0.50 | 2.22 | 3.07 | 108 | ||||||||||||||||||||||||
| (0.80 | ) | 19.30 | 9.62 | 204 | 0.50 | 5.74 | 2.84 | 24 | ||||||||||||||||||||||||
| — | 18.40 | 22.67 | 91 | 0.50 | (d) | 8.84 | (d) | 3.36 | (d) | 21 | ||||||||||||||||||||||
| $ | (0.15 | ) | $ | 20.07 | 3.90 | % | $ | 200 | 0.75 | %(d) | 0.85 | %(d) | 1.81 | %(d) | 61 | % | ||||||||||||||||
| (0.53 | ) | 19.48 | 2.71 | 227 | 0.75 | 0.85 | 2.39 | 94 | ||||||||||||||||||||||||
| (1.05 | ) | 19.50 | 9.50 | 469 | 0.75 | 0.85 | 1.01 | 70 | ||||||||||||||||||||||||
| (0.97 | ) | 18.85 | 2.94 | 14 | 0.75 | 2.46 | 2.91 | 108 | ||||||||||||||||||||||||
| (0.74 | ) | 19.27 | 9.43 | 13 | 0.75 | 5.77 | 2.87 | 24 | ||||||||||||||||||||||||
| — | 18.35 | 22.33 | 12 | 0.75 | (d) | 7.76 | (d) | 3.11 | (d) | 21 | ||||||||||||||||||||||
| $ | (0.43 | ) | $ | 20.13 | 4.22 | % | $ | 4,548 | 0.10 | %(d) | 0.20 | %(d) | 2.40 | %(d) | 61 | % | ||||||||||||||||
| (0.57 | ) | 19.74 | 3.39 | 3,925 | 0.10 | 0.20 | 2.65 | 94 | ||||||||||||||||||||||||
| (1.14 | ) | 19.66 | 10.27 | 3,845 | 0.10 | 0.20 | 1.78 | 70 | ||||||||||||||||||||||||
| (1.04 | ) | 18.97 | 3.44 | 14 | 0.25 | 2.00 | 3.41 | 108 | ||||||||||||||||||||||||
| (0.80 | ) | 19.37 | 9.88 | 14 | 0.30 | 5.38 | 3.32 | 24 | ||||||||||||||||||||||||
| — | 18.43 | 22.87 | 12 | 0.30 | (d) | 6.52 | (d) | 3.56 | (d) | 21 | ||||||||||||||||||||||
| $ | (0.45 | ) | $ | 20.15 | 4.27 | % | $ | 9,957 | — | %(d) | 0.10 | %(d) | 2.54 | %(d) | 61 | % | ||||||||||||||||
| (0.57 | ) | 19.77 | 3.52 | 7,675 | — | 0.12 | 2.77 | 94 | ||||||||||||||||||||||||
| (1.16 | ) | 19.68 | 10.31 | 8,243 | — | 0.15 | 2.84 | 70 | ||||||||||||||||||||||||
| (1.06 | ) | 18.99 | 3.53 | 5,885 | 0.15 | 1.90 | 3.48 | 108 | ||||||||||||||||||||||||
| (0.81 | ) | 19.39 | 10.02 | 5,553 | 0.20 | 5.26 | 3.32 | 24 | ||||||||||||||||||||||||
| — | 18.45 | 23.00 | 4,306 | 0.20 | (d) | 6.42 | (d) | 3.66 | (d) | 21 | ||||||||||||||||||||||
| $ | (0.40 | ) | $ | 20.08 | 4.12 | % | $ | 3,557 | 0.35 | %(d) | 0.45 | %(d) | 2.23 | %(d) | 61 | % | ||||||||||||||||
| (0.51 | ) | 19.68 | 3.08 | 3,646 | 0.35 | 0.45 | 1.13 | 94 | ||||||||||||||||||||||||
| (1.11 | ) | 19.60 | 9.97 | 15 | 0.35 | 0.45 | 2.57 | 70 | ||||||||||||||||||||||||
| (1.01 | ) | 18.94 | 3.23 | 14 | 0.42 | 2.17 | 3.23 | 108 | ||||||||||||||||||||||||
| (0.78 | ) | 19.34 | 9.75 | 13 | 0.45 | 5.54 | 3.17 | 24 | ||||||||||||||||||||||||
| — | 18.40 | 22.67 | 12 | 0.45 | (d) | 6.67 | (d) | 3.41 | (d) | 21 | ||||||||||||||||||||||
| (b) | Total return is calculated assuming a purchase of a share on the first day of the period and a sale of a share on the last day of each period reported. Dividends and distributions, if any, are assumed, for purposes of this calculation, to be reinvested. Total return does not reflect sales charges and includes the effect of fee waivers and reimbursements. Total return may reflect adjustments to conform to generally accepted accounting principles. Total return for a period of less than one year is not annualized. |
| (c) | Does not include expenses of the investment companies in which the Fund invests. |
| (d) | Annualized. |
| See accompanying Notes to Financial Statements | | May 31, 2014 | | Semiannual Report | 175 |
Table of Contents
Financial Highlights (cont’d)
For a Share Outstanding for the Period ended:
| Net Asset Value, Beginning of Period | Net Investment Income (a) | Net Realized and Change in Unrealized Gain (Loss) | Total from Investment Operations | Dividends from Net Investment Income | Distributions from Net Realized Capital Gains | |||||||||||||||||||||
| AllianzGI Retirement 2020: | ||||||||||||||||||||||||||
| Class A | ||||||||||||||||||||||||||
5/31/2014+ | $ | 19.32 | $ | 0.21 | $ | 0.61 | $ | 0.82 | $ | (0.38 | ) | $ | — | |||||||||||||
11/30/2013 | 19.15 | 0.49 | 0.21 | 0.70 | (0.48 | ) | (0.05 | ) | ||||||||||||||||||
11/30/2012 | 18.82 | 0.44 | 1.34 | 1.78 | (0.70 | ) | (0.75 | ) | ||||||||||||||||||
11/30/2011 | 19.43 | 0.49 | 0.04 | 0.53 | (0.83 | ) | (0.31 | ) | ||||||||||||||||||
11/30/2010 | 18.58 | 0.52 | 1.18 | 1.70 | (0.66 | ) | (0.19 | ) | ||||||||||||||||||
12/29/2008* - 11/30/2009 | 15.00 | 0.53 | 3.05 | 3.58 | — | — | ||||||||||||||||||||
| Class C | ||||||||||||||||||||||||||
5/31/2014+ | $ | 19.16 | $ | 0.14 | $ | 0.60 | $ | 0.74 | $ | (0.18 | ) | $ | — | |||||||||||||
11/30/2013 | 18.78 | 0.31 | 0.26 | 0.57 | (0.14 | ) | (0.05 | ) | ||||||||||||||||||
11/30/2012 | 18.53 | 0.37 | 1.23 | 1.60 | (0.60 | ) | (0.75 | ) | ||||||||||||||||||
11/30/2011 | 19.21 | 0.30 | 0.09 | 0.39 | (0.76 | ) | (0.31 | ) | ||||||||||||||||||
11/30/2010 | 18.46 | 0.32 | 1.22 | 1.54 | (0.60 | ) | (0.19 | ) | ||||||||||||||||||
12/29/2008* - 11/30/2009 | 15.00 | 0.40 | 3.06 | 3.46 | — | — | ||||||||||||||||||||
| Class D | ||||||||||||||||||||||||||
5/31/2014+ | $ | 19.37 | $ | 0.20 | $ | 0.62 | $ | 0.82 | $ | (0.33 | ) | $ | — | |||||||||||||
11/30/2013 | 19.16 | 0.49 | 0.20 | 0.69 | (0.43 | ) | (0.05 | ) | ||||||||||||||||||
11/30/2012 | 18.84 | 0.39 | 1.36 | 1.75 | (0.68 | ) | (0.75 | ) | ||||||||||||||||||
11/30/2011 | 19.43 | 0.72 | (0.19 | ) | 0.53 | (0.81 | ) | (0.31 | ) | |||||||||||||||||
11/30/2010 | 18.59 | 0.52 | 1.17 | 1.69 | (0.66 | ) | (0.19 | ) | ||||||||||||||||||
12/29/2008* - 11/30/2009 | 15.00 | 0.53 | 3.06 | 3.59 | — | — | ||||||||||||||||||||
| Class R | ||||||||||||||||||||||||||
5/31/2014+ | $ | 19.27 | $ | 0.18 | $ | 0.61 | �� | $ | 0.79 | $ | (0.28 | ) | $ | — | ||||||||||||
11/30/2013 | 19.14 | 0.43 | 0.21 | 0.64 | (0.46 | ) | (0.05 | ) | ||||||||||||||||||
11/30/2012 | 18.81 | 0.18 | 1.54 | 1.72 | (0.64 | ) | (0.75 | ) | ||||||||||||||||||
11/30/2011 | 19.40 | 0.53 | (0.05 | ) | 0.48 | (0.76 | ) | (0.31 | ) | |||||||||||||||||
11/30/2010 | 18.55 | 0.55 | 1.09 | 1.64 | (0.60 | ) | (0.19 | ) | ||||||||||||||||||
12/29/2008* - 11/30/2009 | 15.00 | 0.47 | 3.08 | 3.55 | — | — | ||||||||||||||||||||
| Class P | ||||||||||||||||||||||||||
5/31/2014+ | $ | 19.53 | $ | 0.23 | $ | 0.63 | $ | 0.86 | $ | (0.40 | ) | $ | — | |||||||||||||
11/30/2013 | 19.30 | 0.47 | 0.30 | 0.77 | (0.49 | ) | (0.05 | ) | ||||||||||||||||||
11/30/2012 | 18.94 | 0.37 | 1.47 | 1.84 | (0.73 | ) | (0.75 | ) | ||||||||||||||||||
11/30/2011 | 19.51 | 0.42 | 0.16 | 0.58 | (0.84 | ) | (0.31 | ) | ||||||||||||||||||
11/30/2010 | 18.62 | 0.64 | 1.10 | 1.74 | (0.66 | ) | (0.19 | ) | ||||||||||||||||||
12/29/2008* - 11/30/2009 | 15.00 | 0.54 | 3.08 | 3.62 | — | — | ||||||||||||||||||||
| + | Unaudited |
| * | Commencement of operations. |
| (a) | Calculated on average shares outstanding during the period. |
| (b) | Total return is calculated assuming a purchase of a share on the first day of the period and a sale of a share on the last day of each period reported. Dividends and distributions, if any, are assumed, for purposes of this calculation, to be reinvested. Total return does not reflect sales charges and includes the effect of fee waivers and reimbursements. Total return may reflect adjustments to conform to generally accepted accounting principles. Total return for a period of less than one year is not annualized. |
| (c) | Does not include expenses of the investment companies in which the Fund invests. |
| (d) | Annualized. |
| (e) | See Note 6 in the Notes to Financial Statements. |
| 176 | Semiannual Report | | May 31, 2014 | | See accompanying Notes to Financial Statements |
Table of Contents
| Total Dividends and Distributions | Net Asset Value, End of Period | Total Return (b) | Net Assets, End of Period (000s) | Ratio of Expenses to Average Net Assets with Fee Waiver/ Reimbursement (c) | Ratio of Expenses to Average Net Assets without Fee Waiver/ Reimbursement (c) | Ratio of Net Investment Income to Average Net Assets (c) | Portfolio Turnover Rate | |||||||||||||||||||||||||
| $ | (0.38 | ) | $ | 19.76 | 4.33 | % | $ | 19,778 | 0.40 | %(d) | 0.60 | %(d) | 2.23 | %(d) | 44 | % | ||||||||||||||||
| (0.53 | ) | 19.32 | 3.75 | 9,102 | 0.40 | 0.60 | 2.60 | 86 | ||||||||||||||||||||||||
| (1.45 | ) | 19.15 | 10.23 | 985 | 0.38 | 0.60 | 2.40 | 55 | ||||||||||||||||||||||||
| (1.14 | ) | 18.82 | 2.82 | 351 | 0.48 | 2.71 | 2.56 | 56 | ||||||||||||||||||||||||
| (0.85 | ) | 19.43 | 9.60 | 154 | 0.53 | 6.52 | 2.79 | 23 | ||||||||||||||||||||||||
| — | 18.58 | 23.87 | 40 | 0.53 | (d) | 10.16 | (d) | 3.38 | (d) | 25 | ||||||||||||||||||||||
| $ | (0.18 | ) | $ | 19.72 | 3.92 | % | $ | 456 | 1.15 | %(d) | 1.35 | %(d) | 1.45 | %(d) | 44 | % | ||||||||||||||||
| (0.19 | ) | 19.16 | 3.02 | 438 | 1.15 | 1.35 | 1.64 | 86 | ||||||||||||||||||||||||
| (1.35 | ) | 18.78 | 9.29 | 364 | 1.13 | 1.35 | 2.07 | 55 | ||||||||||||||||||||||||
| (1.07 | ) | 18.53 | 2.07 | 669 | 1.23 | 3.40 | 1.61 | 56 | ||||||||||||||||||||||||
| (0.79 | ) | 19.21 | 8.72 | 204 | 1.28 | 8.05 | 1.72 | 23 | ||||||||||||||||||||||||
| — | 18.46 | 23.07 | 30 | 1.28 | (d) | 10.57 | (d) | 2.63 | (d) | 25 | ||||||||||||||||||||||
| $ | (0.33 | ) | $ | 19.86 | 4.24 | % | $ | 365 | 0.50 | %(d) | 0.60 | %(d) | 2.07 | %(d) | 44 | % | ||||||||||||||||
| (0.48 | ) | 19.37 | 3.67 | 319 | 0.50 | 0.60 | 2.58 | 86 | ||||||||||||||||||||||||
| (1.43 | ) | 19.16 | 10.02 | 266 | 0.48 | 0.60 | 2.12 | 55 | ||||||||||||||||||||||||
| (1.12 | ) | 18.84 | 2.85 | 115 | 0.52 | 2.91 | 3.80 | 56 | ||||||||||||||||||||||||
| (0.85 | ) | 19.43 | 9.54 | 187 | 0.53 | 5.95 | 2.80 | 23 | ||||||||||||||||||||||||
| — | 18.59 | 23.93 | 65 | 0.53 | (d) | 10.35 | (d) | 3.38 | (d) | 25 | ||||||||||||||||||||||
| $ | (0.28 | ) | $ | 19.78 | 4.14 | % | $ | 1,089 | 0.75 | %(d) | 0.85 | %(d) | 1.84 | %(d) | 44 | % | ||||||||||||||||
| (0.51 | ) | 19.27 | 3.40 | 1,022 | 0.75 | 0.85 | 2.26 | 86 | ||||||||||||||||||||||||
| (1.39 | ) | 19.14 | 9.84 | 938 | 0.73 | 0.85 | 0.97 | 55 | ||||||||||||||||||||||||
| (1.07 | ) | 18.81 | 2.57 | 14 | 0.77 | 3.09 | 2.77 | 56 | ||||||||||||||||||||||||
| (0.79 | ) | 19.40 | 9.25 | 13 | 0.78 | 6.30 | 2.99 | 23 | ||||||||||||||||||||||||
| — | 18.55 | 23.67 | 12 | 0.78 | (d) | 8.76 | (d) | 3.13 | (d) | 25 | ||||||||||||||||||||||
| $ | (0.40 | ) | $ | 19.99 | 4.48 | % | $ | 12,866 | 0.10 | %(d) | 0.20 | %(d) | 2.33 | %(d) | 44 | % | ||||||||||||||||
| (0.54 | ) | 19.53 | 4.06 | 7,643 | 0.10 | 0.20 | 2.44 | 86 | ||||||||||||||||||||||||
| (1.48 | ) | 19.30 | 10.55 | 5,323 | 0.08 | 0.20 | 1.95 | 55 | ||||||||||||||||||||||||
| (1.15 | ) | 18.94 | 3.07 | 42 | 0.17 | 1.39 | 2.24 | 56 | ||||||||||||||||||||||||
| (0.85 | ) | 19.51 | 9.81 | 14 | 0.33 | 5.93 | 3.44 | 23 | ||||||||||||||||||||||||
| — | 18.62 | 24.13 | 13 | 0.33 | (d) | 6.56 | (d) | 3.58 | (d) | 25 | ||||||||||||||||||||||
| See accompanying Notes to Financial Statements | | May 31, 2014 | | Semiannual Report | 177 |
Table of Contents
Financial Highlights (cont’d)
For a Share Outstanding for the Period ended:
| Net Asset Value, Beginning of Period | Net Investment Income (a) | Net Realized and Change in Unrealized Gain (Loss) | Total from Investment Operations | Dividends from Net Investment Income | Distributions from Net Realized Capital Gains | |||||||||||||||||||||
| AllianzGI Retirement 2020 (cont’d) | ||||||||||||||||||||||||||
| Class R6 | ||||||||||||||||||||||||||
5/31/2014+ | $ | 19.57 | $ | 0.25 | $ | 0.62 | $ | 0.87 | $ | (0.42 | ) | $ | — | |||||||||||||
11/30/2013 | 19.32 | 0.58 | 0.21 | 0.79 | (0.49 | ) | (0.05 | ) | ||||||||||||||||||
11/30/2012 | 18.96 | 0.55 | 1.31 | 1.86 | (0.75 | ) | (0.75 | ) | ||||||||||||||||||
11/30/2011 | 19.53 | 0.64 | (0.04 | ) | 0.60 | (0.86 | ) | (0.31 | ) | |||||||||||||||||
11/30/2010 | 18.64 | 0.64 | 1.12 | 1.76 | (0.68 | ) | (0.19 | ) | ||||||||||||||||||
12/29/2008* - 11/30/2009 | 15.00 | 0.55 | 3.09 | 3.64 | — | — | ||||||||||||||||||||
| Administrative Class | ||||||||||||||||||||||||||
5/31/2014+ | $ | 19.42 | $ | 0.22 | $ | 0.61 | $ | 0.83 | $ | (0.37 | ) | $ | — | |||||||||||||
11/30/2013 | 19.25 | 0.24 | 0.47 | 0.71 | (0.49 | ) | (0.05 | ) | ||||||||||||||||||
11/30/2012 | 18.90 | 0.51 | 1.28 | 1.79 | (0.69 | ) | (0.75 | ) | ||||||||||||||||||
11/30/2011 | 19.48 | 0.59 | (0.05 | ) | 0.54 | (0.81 | ) | (0.31 | ) | |||||||||||||||||
11/30/2010 | 18.60 | 0.61 | 1.10 | 1.71 | (0.64 | ) | (0.19 | ) | ||||||||||||||||||
12/29/2008* - 11/30/2009 | 15.00 | 0.52 | 3.08 | 3.60 | — | — | ||||||||||||||||||||
| AllianzGI Retirement 2025: | ||||||||||||||||||||||||||
| Class A | ||||||||||||||||||||||||||
5/31/2014+ | $ | 16.92 | $ | 0.19 | $ | 0.56 | $ | 0.75 | $ | (0.32 | ) | $ | — | |||||||||||||
11/30/2013 | 16.63 | 0.41 | 0.32 | 0.73 | (0.40 | ) | (0.04 | ) | ||||||||||||||||||
12/19/2011* - 11/30/2012 | 15.00 | 0.34 | 1.43 | 1.77 | (0.14 | ) | — | |||||||||||||||||||
| Class R | ||||||||||||||||||||||||||
5/31/2014+ | $ | 16.84 | $ | 0.16 | $ | 0.56 | $ | 0.72 | $ | (0.27 | ) | $ | — | |||||||||||||
11/30/2013 | 16.57 | 0.48 | 0.19 | 0.67 | (0.36 | ) | (0.04 | ) | ||||||||||||||||||
12/19/2011* - 11/30/2012 | 15.00 | 0.18 | 1.53 | 1.71 | (0.14 | ) | — | |||||||||||||||||||
| Class P | ||||||||||||||||||||||||||
5/31/2014+ | $ | 17.02 | $ | 0.18 | $ | 0.60 | $ | 0.78 | $ | (0.34 | ) | $ | — | |||||||||||||
11/30/2013 | 16.67 | 0.48 | 0.31 | 0.79 | (0.40 | ) | (0.04 | ) | ||||||||||||||||||
12/19/2011* - 11/30/2012 | 15.00 | 0.38 | 1.44 | 1.82 | (0.15 | ) | — | |||||||||||||||||||
| Class R6 | ||||||||||||||||||||||||||
5/31/2014+ | $ | 17.04 | $ | 0.21 | $ | 0.58 | $ | 0.79 | $ | (0.36 | ) | $ | — | |||||||||||||
11/30/2013 | 16.68 | 0.50 | 0.30 | 0.80 | (0.40 | ) | (0.04 | ) | ||||||||||||||||||
12/19/2011* - 11/30/2012 | 15.00 | 0.45 | 1.38 | 1.83 | (0.15 | ) | — | |||||||||||||||||||
| Administrative Class | ||||||||||||||||||||||||||
5/31/2014+ | $ | 16.98 | $ | 0.19 | $ | 0.57 | $ | 0.76 | $ | (0.32 | ) | $ | — | |||||||||||||
11/30/2013 | 16.62 | 0.20 | 0.55 | 0.75 | (0.35 | ) | (0.04 | ) | ||||||||||||||||||
12/19/2011* - 11/30/2012 | 15.00 | 0.41 | 1.35 | 1.76 | (0.14 | ) | — | |||||||||||||||||||
| + | Unaudited |
| * | Commencement of operations. |
| (a) | Calculated on average shares outstanding during the period. |
| (b) | Total return is calculated assuming a purchase of a share on the first day of the period and a sale of a share on the last day of each period reported. Dividends and distributions, if any, are assumed, for purposes of this calculation, to be reinvested. Total return does not reflect sales charges and includes the effect of fee waivers and reimbursements. Total return may reflect adjustments to conform to generally accepted accounting principles. Total return for a period of less than one year is not annualized. |
| (c) | Does not include expenses of the investment companies in which the Fund invests. |
| (d) | Annualized. |
| (e) | See Note 6 in the Notes to Financial Statements. |
| 178 | Semiannual Report | | May 31, 2014 | | See accompanying Notes to Financial Statements |
Table of Contents
| Total Dividends and Distributions | Net Asset Value, End of Period | Total Return (b) | Net Assets, End of Period (000s) | Ratio of Expenses to Average Net Assets with Fee Waiver/ Reimbursement (c) | Ratio of Expenses to Average Net Assets without Fee Waiver/ Reimbursement (c) | Ratio of Net Investment Income to Average Net Assets (c) | Portfolio Turnover Rate | |||||||||||||||||||||||||
| $ | (0.42 | ) | $ | 20.02 | 4.53 | % | $ | 8,332 | — | %(d) | 0.10 | %(d) | 2.58 | %(d) | 44 | % | ||||||||||||||||
| (0.54 | ) | 19.57 | 4.19 | 7,457 | — | 0.12 | 3.00 | 86 | ||||||||||||||||||||||||
| (1.50 | ) | 19.32 | 10.62 | 7,708 | — | (e) | 0.15 | 2.98 | 55 | |||||||||||||||||||||||
| (1.17 | ) | 18.96 | 3.16 | 5,157 | 0.17 | 2.51 | 3.34 | 56 | ||||||||||||||||||||||||
| (0.87 | ) | 19.53 | 9.90 | 4,834 | 0.23 | 5.80 | 3.44 | �� | 23 | |||||||||||||||||||||||
| — | 18.64 | 24.27 | 3,654 | 0.23 | (d) | 6.46 | (d) | 3.68 | (d) | 25 | ||||||||||||||||||||||
| $ | (0.37 | ) | $ | 19.88 | 4.36 | % | $ | 7,273 | 0.35 | %(d) | 0.45 | %(d) | 2.24 | %(d) | 44 | % | ||||||||||||||||
| (0.54 | ) | 19.42 | 3.79 | 7,210 | 0.35 | 0.45 | 1.27 | 86 | ||||||||||||||||||||||||
| (1.44 | ) | 19.25 | 10.20 | 15 | 0.33 | 0.45 | 2.73 | 55 | ||||||||||||||||||||||||
| (1.12 | ) | 18.90 | 2.87 | 14 | 0.44 | 2.78 | 3.09 | 56 | ||||||||||||||||||||||||
| (0.83 | ) | 19.48 | 9.63 | 14 | 0.48 | 6.08 | 3.29 | 23 | ||||||||||||||||||||||||
| — | 18.60 | 24.00 | 12 | 0.48 | (d) | 6.71 | (d) | 3.43 | (d) | 25 | ||||||||||||||||||||||
| $ | (0.32 | ) | $ | 17.35 | 4.52 | % | $ | 23,432 | 0.40 | %(d) | 0.60 | %(d) | 2.28 | %(d) | 44 | % | ||||||||||||||||
| (0.44 | ) | 16.92 | 4.54 | 13,058 | 0.40 | 0.60 | 2.48 | 76 | ||||||||||||||||||||||||
| (0.14 | ) | 16.63 | 11.86 | 335 | 0.38 | (d) | 0.60 | (d) | 2.22 | (d) | 55 | |||||||||||||||||||||
| $ | (0.27 | ) | $ | 17.29 | 4.31 | % | $ | 1,069 | 0.75 | %(d) | 0.85 | %(d) | 1.96 | %(d) | 44 | % | ||||||||||||||||
| (0.40 | ) | 16.84 | 4.16 | 753 | 0.75 | 0.85 | 2.88 | 76 | ||||||||||||||||||||||||
| (0.14 | ) | 16.57 | 11.51 | 1,284 | 0.73 | (d) | 0.85 | (d) | 1.19 | (d) | 55 | |||||||||||||||||||||
| $ | (0.34 | ) | $ | 17.46 | 4.67 | % | $ | 13,546 | 0.10 | %(d) | 0.20 | %(d) | 2.15 | %(d) | 44 | % | ||||||||||||||||
| (0.44 | ) | 17.02 | 4.84 | 4,336 | 0.10 | 0.20 | 2.88 | 76 | ||||||||||||||||||||||||
| (0.15 | ) | 16.67 | 12.21 | 3,873 | 0.08 | (d) | 0.20 | (d) | 2.47 | (d) | 55 | |||||||||||||||||||||
| $ | (0.36 | ) | $ | 17.47 | 4.72 | % | $ | 8,304 | — | %(d) | 0.10 | %(d) | 2.53 | %(d) | 44 | % | ||||||||||||||||
| (0.44 | ) | 17.04 | 4.93 | 5,058 | — | 0.12 | 3.02 | 76 | ||||||||||||||||||||||||
| (0.15 | ) | 16.68 | 12.28 | 5,375 | — | (d)(e) | 0.15 | (d) | 2.94 | (d) | 55 | |||||||||||||||||||||
| $ | (0.32 | ) | $ | 17.42 | 4.56 | % | $ | 11,290 | 0.35 | %(d) | 0.45 | %(d) | 2.30 | %(d) | 44 | % | ||||||||||||||||
| (0.39 | ) | 16.98 | 4.60 | 10,606 | 0.35 | 0.45 | 1.23 | 76 | ||||||||||||||||||||||||
| (0.14 | ) | 16.62 | 11.86 | 11 | 0.33 | (d) | 0.45 | (d) | 2.72 | (d) | 55 | |||||||||||||||||||||
| See accompanying Notes to Financial Statements | | May 31, 2014 | | Semiannual Report | 179 |
Table of Contents
Financial Highlights (cont’d)
For a Share Outstanding for the Period ended:
| Net Asset Value, Beginning of Period | Net Investment Income (a) | Net Realized and Change in Unrealized Gain (Loss) | Total from Investment Operations | Dividends from Net Investment Income | Distributions from Net Realized Capital Gains | |||||||||||||||||||||
| AllianzGI Retirement 2030: | ||||||||||||||||||||||||||
| Class A | ||||||||||||||||||||||||||
5/31/2014+ | $ | 20.66 | $ | 0.26 | $ | 0.70 | $ | 0.96 | $ | (0.47 | ) | $ | — | |||||||||||||
11/30/2013 | 19.80 | 0.52 | 0.92 | 1.44 | (0.54 | ) | (0.04 | ) | ||||||||||||||||||
11/30/2012 | 19.77 | 0.29 | 1.61 | 1.90 | (0.70 | ) | (1.17 | ) | ||||||||||||||||||
11/30/2011 | 20.78 | 0.50 | (0.10 | ) | 0.40 | (0.85 | ) | (0.56 | ) | |||||||||||||||||
11/30/2010 | 19.36 | 0.50 | 1.59 | 2.09 | (0.51 | ) | (0.16 | ) | ||||||||||||||||||
12/29/2008* - 11/30/2009 | 15.00 | 0.41 | 3.95 | 4.36 | — | — | ||||||||||||||||||||
| Class C | ||||||||||||||||||||||||||
5/31/2014+ | $ | 20.42 | $ | 0.18 | $ | 0.69 | $ | 0.87 | $ | (0.28 | ) | $ | — | |||||||||||||
11/30/2013 | 19.53 | 0.35 | 0.93 | 1.28 | (0.35 | ) | (0.04 | ) | ||||||||||||||||||
11/30/2012 | 19.51 | 0.43 | 1.30 | 1.73 | (0.54 | ) | (1.17 | ) | ||||||||||||||||||
11/30/2011 | 20.59 | 0.37 | (0.09 | ) | 0.28 | (0.80 | ) | (0.56 | ) | |||||||||||||||||
11/30/2010 | 19.28 | 0.26 | 1.66 | 1.92 | (0.45 | ) | (0.16 | ) | ||||||||||||||||||
12/29/2008* - 11/30/2009 | 15.00 | 0.28 | 4.00 | 4.28 | — | — | ||||||||||||||||||||
| Class D | ||||||||||||||||||||||||||
5/31/2014+ | $ | 20.74 | $ | 0.25 | $ | 0.71 | $ | 0.96 | $ | (0.43 | ) | $ | — | |||||||||||||
11/30/2013 | 19.84 | 0.52 | 0.90 | 1.42 | (0.48 | ) | (0.04 | ) | ||||||||||||||||||
11/30/2012 | 19.82 | 0.52 | 1.36 | 1.88 | (0.69 | ) | (1.17 | ) | ||||||||||||||||||
11/30/2011 | 20.82 | 0.53 | (0.12 | ) | 0.41 | (0.85 | ) | (0.56 | ) | |||||||||||||||||
11/30/2010 | 19.40 | 0.47 | 1.62 | 2.09 | (0.51 | ) | (0.16 | ) | ||||||||||||||||||
12/29/2008* - 11/30/2009 | 15.00 | 0.41 | 3.99 | 4.40 | — | — | ||||||||||||||||||||
| Class R | ||||||||||||||||||||||||||
5/31/2014+ | $ | 20.65 | $ | 0.22 | $ | 0.70 | $ | 0.92 | $ | (0.36 | ) | $ | — | |||||||||||||
11/30/2013 | 19.85 | 0.46 | 0.91 | 1.37 | (0.53 | ) | (0.04 | ) | ||||||||||||||||||
11/30/2012 | 19.81 | 0.18 | 1.67 | 1.85 | (0.64 | ) | (1.17 | ) | ||||||||||||||||||
11/30/2011 | 20.80 | 0.52 | (0.15 | ) | 0.37 | (0.80 | ) | (0.56 | ) | |||||||||||||||||
11/30/2010 | 19.37 | 0.49 | 1.54 | 2.03 | (0.44 | ) | (0.16 | ) | ||||||||||||||||||
12/29/2008* - 11/30/2009 | 15.00 | 0.34 | 4.03 | 4.37 | — | — | ||||||||||||||||||||
| Class P | ||||||||||||||||||||||||||
5/31/2014+ | $ | 20.93 | $ | 0.25 | $ | 0.76 | $ | 1.01 | $ | (0.50 | ) | $ | — | |||||||||||||
11/30/2013 | 20.02 | 0.51 | 1.00 | 1.51 | (0.56 | ) | (0.04 | ) | ||||||||||||||||||
11/30/2012 | 19.95 | 0.41 | 1.57 | 1.98 | (0.74 | ) | (1.17 | ) | ||||||||||||||||||
11/30/2011 | 20.92 | 0.58 | (0.12 | ) | 0.46 | (0.87 | ) | (0.56 | ) | |||||||||||||||||
11/30/2010 | 19.45 | 0.58 | 1.56 | 2.14 | (0.51 | ) | (0.16 | ) | ||||||||||||||||||
12/29/2008* - 11/30/2009 | 15.00 | 0.41 | 4.04 | 4.45 | — | — | ||||||||||||||||||||
| + | Unaudited |
| * | Commencement of operations. |
| (a) | Calculated on average shares outstanding during the period. |
| (b) | Total return is calculated assuming a purchase of a share on the first day of the period and a sale of a share on the last day of each period reported. Dividends and distributions, if any, are assumed, for purposes of this calculation, to be reinvested. Total return does not reflect sales charges and includes the effect of fee waivers and reimbursements. Total return may reflect adjustments to conform to generally accepted accounting principles. Total return for a period of less than one year is not annualized. |
| (c) | Does not include expenses of the investment companies in which the Fund invests. |
| (d) | Annualized. |
| (e) | See Note 6 in the Notes to Financial Statements. |
| 180 | Semiannual Report | | May 31, 2014 | | See accompanying Notes to Financial Statements |
Table of Contents
| Total Dividends and Distributions | Net Asset Value, End of Period | Total Return (b) | Net Assets, End of Period (000s) | Ratio of Expenses to Average Net Assets with Fee Waiver/ Reimbursement (c) | Ratio of Expenses to Average Net Assets without Fee Waiver/ Reimbursement (c) | Ratio of Net Investment Income to Average Net Assets (c) | Portfolio Turnover Rate | |||||||||||||||||||||||||
| $ | (0.47 | ) | $ | 21.15 | 4.71 | % | $ | 19,542 | 0.35 | %(d) | 0.60 | %(d) | 2.57 | %(d) | 46 | % | ||||||||||||||||
| (0.58 | ) | 20.66 | 7.48 | 10,080 | 0.35 | 0.60 | 2.58 | 79 | ||||||||||||||||||||||||
| (1.87 | ) | 19.80 | 10.68 | 10,692 | 0.29 | 0.60 | 1.48 | 47 | ||||||||||||||||||||||||
| (1.41 | ) | 19.77 | 1.76 | 460 | 0.45 | 2.50 | 2.43 | 52 | ||||||||||||||||||||||||
| (0.67 | ) | 20.78 | 11.07 | 286 | 0.63 | 5.46 | 2.57 | 33 | ||||||||||||||||||||||||
| — | 19.36 | 29.07 | 179 | 0.63 | (d) | 9.16 | (d) | 2.47 | (d) | 11 | ||||||||||||||||||||||
| $ | (0.28 | ) | $ | 21.01 | 4.37 | % | $ | 725 | 1.10 | %(d) | 1.35 | %(d) | 1.77 | %(d) | 46 | % | ||||||||||||||||
| (0.39 | ) | 20.42 | 6.63 | 736 | 1.10 | 1.35 | 1.77 | 79 | ||||||||||||||||||||||||
| (1.71 | ) | 19.53 | 9.80 | 605 | 1.04 | 1.35 | 2.26 | 47 | ||||||||||||||||||||||||
| (1.36 | ) | 19.51 | 1.20 | 654 | 1.21 | 3.34 | 1.84 | 52 | ||||||||||||||||||||||||
| (0.61 | ) | 20.59 | 10.17 | 542 | 1.38 | 7.39 | 1.32 | 33 | ||||||||||||||||||||||||
| — | 19.28 | 28.53 | 78 | 1.38 | (d) | 9.74 | (d) | 1.72 | (d) | 11 | ||||||||||||||||||||||
| $ | (0.43 | ) | $ | 21.27 | 4.71 | % | $ | 679 | 0.45 | %(d) | 0.60 | %(d) | 2.40 | %(d) | 46 | % | ||||||||||||||||
| (0.52 | ) | 20.74 | 7.34 | 643 | 0.45 | 0.60 | 2.60 | 79 | ||||||||||||||||||||||||
| (1.86 | ) | 19.84 | 10.48 | 519 | 0.39 | 0.60 | 2.69 | 47 | ||||||||||||||||||||||||
| (1.41 | ) | 19.82 | 1.89 | 377 | 0.48 | 2.51 | 2.59 | 52 | ||||||||||||||||||||||||
| (0.67 | ) | 20.82 | 11.04 | 295 | 0.63 | 5.63 | 2.41 | 33 | ||||||||||||||||||||||||
| — | 19.40 | 29.33 | 123 | 0.63 | (d) | 8.98 | (d) | 2.47 | (d) | 11 | ||||||||||||||||||||||
| $ | (0.36 | ) | $ | 21.21 | 4.59 | % | $ | 1,320 | 0.70 | %(d) | 0.85 | %(d) | 2.16 | %(d) | 46 | % | ||||||||||||||||
| (0.57 | ) | 20.65 | 7.09 | 1,199 | 0.70 | 0.85 | 2.28 | 79 | ||||||||||||||||||||||||
| (1.81 | ) | 19.85 | 10.23 | 1,103 | 0.64 | 0.85 | 0.95 | 47 | ||||||||||||||||||||||||
| (1.36 | ) | 19.81 | 1.66 | 14 | 0.74 | 2.82 | 2.54 | 52 | ||||||||||||||||||||||||
| (0.60 | ) | 20.80 | 10.73 | 14 | 0.88 | 5.79 | 2.53 | 33 | ||||||||||||||||||||||||
| — | 19.37 | 29.13 | 13 | 0.88 | (d) | 7.74 | (d) | 2.22 | (d) | 11 | ||||||||||||||||||||||
| $ | (0.50 | ) | $ | 21.44 | 4.92 | % | $ | 18,244 | 0.05 | %(d) | 0.20 | %(d) | 2.40 | %(d) | 46 | % | ||||||||||||||||
| (0.60 | ) | 20.93 | 7.77 | 7,748 | 0.05 | 0.20 | 2.54 | 79 | ||||||||||||||||||||||||
| (1.91 | ) | 20.02 | 10.97 | 5,103 | — | (e) | 0.20 | 2.06 | 47 | |||||||||||||||||||||||
| (1.43 | ) | 19.95 | 2.13 | 19 | 0.22 | 2.27 | 2.84 | 52 | ||||||||||||||||||||||||
| (0.67 | ) | 20.92 | 11.27 | 14 | 0.43 | 5.41 | 2.97 | 33 | ||||||||||||||||||||||||
| — | 19.45 | 29.67 | 13 | 0.43 | (d) | 6.37 | (d) | 2.67 | (d) | 11 | ||||||||||||||||||||||
| See accompanying Notes to Financial Statements | | May 31, 2014 | | Semiannual Report | 181 |
Table of Contents
Financial Highlights (cont’d)
For a Share Outstanding for the Period ended:
| Net Asset Value, Beginning of Period | Net Investment Income (a) | Net Realized and Change in Unrealized Gain (Loss) | Total from Investment Operations | Dividends from Net Investment Income | Distributions from Net Realized Capital Gains | |||||||||||||||||||||
| AllianzGI Retirement 2030 (cont’d) | ||||||||||||||||||||||||||
| Class R6 | ||||||||||||||||||||||||||
5/31/2014+ | $ | 20.98 | $ | 0.31 | $ | 0.70 | $ | 1.01 | $ | (0.51 | ) | $ | — | |||||||||||||
11/30/2013 | 20.04 | 0.62 | 0.92 | 1.54 | (0.56 | ) | (0.04 | ) | ||||||||||||||||||
11/30/2012 | 19.97 | 0.61 | 1.38 | 1.99 | (0.75 | ) | (1.17 | ) | ||||||||||||||||||
11/30/2011 | 20.94 | 0.62 | (0.14 | ) | 0.48 | (0.89 | ) | (0.56 | ) | |||||||||||||||||
11/30/2010 | 19.47 | 0.59 | 1.56 | 2.15 | (0.52 | ) | (0.16 | ) | ||||||||||||||||||
12/29/2008* - 11/30/2009 | 15.00 | 0.43 | 4.04 | 4.47 | — | — | ||||||||||||||||||||
| Administrative Class | ||||||||||||||||||||||||||
5/31/2014+ | $ | 20.87 | $ | 0.27 | $ | 0.70 | $ | 0.97 | $ | (0.47 | ) | $ | — | |||||||||||||
11/30/2013 | 19.96 | 0.26 | 1.21 | 1.47 | (0.52 | ) | (0.04 | ) | ||||||||||||||||||
11/30/2012 | 19.91 | 0.57 | 1.35 | 1.92 | (0.70 | ) | (1.17 | ) | ||||||||||||||||||
11/30/2011 | 20.88 | 0.58 | (0.14 | ) | 0.44 | (0.85 | ) | (0.56 | ) | |||||||||||||||||
11/30/2010 | 19.43 | 0.55 | 1.54 | 2.09 | (0.48 | ) | (0.16 | ) | ||||||||||||||||||
12/29/2008* - 11/30/2009 | 15.00 | 0.39 | 4.04 | 4.43 | — | — | ||||||||||||||||||||
| AllianzGI Retirement 2035: | ||||||||||||||||||||||||||
| Class A | ||||||||||||||||||||||||||
5/31/2014+ | $ | 18.09 | $ | 0.23 | $ | 0.66 | $ | 0.89 | $ | (0.40 | ) | $ | — | |||||||||||||
11/30/2013 | 16.94 | 0.43 | 1.20 | 1.63 | (0.42 | ) | (0.06 | ) | ||||||||||||||||||
12/19/2011* - 11/30/2012 | 15.00 | 0.37 | 1.74 | 2.11 | (0.17 | ) | — | |||||||||||||||||||
| Class R | ||||||||||||||||||||||||||
5/31/2014+ | $ | 18.00 | $ | 0.19 | $ | 0.67 | $ | 0.86 | $ | (0.30 | ) | $ | — | |||||||||||||
11/30/2013 | 16.89 | 0.41 | 1.15 | 1.56 | (0.39 | ) | (0.06 | ) | ||||||||||||||||||
12/19/2011* - 11/30/2012 | 15.00 | 0.16 | 1.90 | 2.06 | (0.17 | ) | — | |||||||||||||||||||
| Class P | ||||||||||||||||||||||||||
5/31/2014+ | $ | 18.20 | $ | 0.20 | $ | 0.72 | $ | 0.92 | $ | (0.41 | ) | $ | — | |||||||||||||
11/30/2013 | 16.99 | 0.49 | 1.20 | 1.69 | (0.42 | ) | (0.06 | ) | ||||||||||||||||||
12/19/2011* - 11/30/2012 | 15.00 | 0.38 | 1.79 | 2.17 | (0.18 | ) | — | |||||||||||||||||||
| Class R6 | ||||||||||||||||||||||||||
5/31/2014+ | $ | 18.23 | $ | 0.25 | $ | 0.68 | $ | 0.93 | $ | (0.42 | ) | $ | — | |||||||||||||
11/30/2013 | 17.00 | 0.54 | 1.17 | 1.71 | (0.42 | ) | (0.06 | ) | ||||||||||||||||||
12/19/2011* - 11/30/2012 | 15.00 | 0.46 | 1.72 | 2.18 | (0.18 | ) | — | |||||||||||||||||||
| Administrative Class | ||||||||||||||||||||||||||
5/31/2014+ | $ | 18.15 | $ | 0.23 | $ | 0.67 | $ | 0.90 | $ | (0.39 | ) | $ | — | |||||||||||||
11/30/2013 | 16.94 | 0.22 | 1.43 | 1.65 | (0.38 | ) | (0.06 | ) | ||||||||||||||||||
12/19/2011* - 11/30/2012 | 15.00 | 0.42 | 1.69 | 2.11 | (0.17 | ) | — | |||||||||||||||||||
| + | Unaudited |
| * | Commencement of operations. |
| (a) | Calculated on average shares outstanding during the period. |
| (b) | Total return is calculated assuming a purchase of a share on the first day of the period and a sale of a share on the last day of each period reported. Dividends and distributions, if any, are assumed, for purposes of this calculation, to be reinvested. Total return does not reflect sales charges and includes the effect of fee waivers and reimbursements. Total return may reflect adjustments to conform to generally accepted accounting principles. Total return for a period of less than one year is not annualized. |
| (c) | Does not include expenses of the investment companies in which the Fund invests. |
| (d) | Annualized. |
| (e) | See Note 6 in the Notes to Financial Statements. |
| 182 | Semiannual Report | | May 31, 2014 | | See accompanying Notes to Financial Statements |
Table of Contents
| Total Dividends and Distributions | Net Asset Value, End of Period | Total Return (b) | Net Assets, End of Period (000s) | Ratio of Expenses to Average Net Assets with Fee Waiver/ Reimbursement (c) | Ratio of Expenses to Average Net Assets without Fee Waiver/ Reimbursement (c) | Ratio of Net Investment Income to Average Net Assets (c) | Portfolio Turnover Rate | |||||||||||||||||||||||||
| $ | (0.51 | ) | $ | 21.48 | 4.97 | % | $ | 10,844 | — | %(d)(e) | 0.10 | %(d) | 2.95 | %(d) | 46 | % | ||||||||||||||||
| (0.60 | ) | 20.98 | 7.87 | 10,854 | — | (e) | 0.12 | 3.05 | 79 | |||||||||||||||||||||||
| (1.92 | ) | 20.04 | 11.07 | 9,182 | — | (e) | 0.15 | 3.14 | 47 | |||||||||||||||||||||||
| (1.45 | ) | 19.97 | 2.23 | 5,813 | 0.13 | 2.24 | 3.04 | 52 | ||||||||||||||||||||||||
| (0.68 | ) | 20.94 | 11.35 | 5,145 | 0.33 | 5.29 | 3.02 | 33 | ||||||||||||||||||||||||
| — | 19.47 | 29.80 | 4,163 | 0.33 | (d) | 6.27 | (d) | 2.77 | (d) | 11 | ||||||||||||||||||||||
| $ | (0.47 | ) | $ | 21.37 | 4.78 | % | $ | 8,632 | 0.30 | %(d) | 0.45 | %(d) | 2.59 | %(d) | 46 | % | ||||||||||||||||
| (0.56 | ) | 20.87 | 7.55 | 8,939 | 0.30 | 0.45 | 1.29 | 79 | ||||||||||||||||||||||||
| (1.87 | ) | 19.96 | 10.60 | 16 | 0.24 | 0.45 | 2.95 | 47 | ||||||||||||||||||||||||
| (1.41 | ) | 19.91 | 1.99 | 15 | 0.41 | 2.52 | 2.85 | 52 | ||||||||||||||||||||||||
| (0.64 | ) | 20.88 | 11.04 | 14 | 0.58 | 5.55 | 2.82 | 33 | ||||||||||||||||||||||||
| — | 19.43 | 29.53 | 13 | 0.58 | (d) | 6.52 | (d) | 2.52 | (d) | 11 | ||||||||||||||||||||||
| $ | (0.40 | ) | $ | 18.58 | 5.00 | % | $ | 14,709 | 0.35 | %(d) | 0.60 | %(d) | 2.53 | %(d) | 40 | % | ||||||||||||||||
| (0.48 | ) | 18.09 | 9.83 | 6,939 | 0.35 | 0.60 | 2.48 | 67 | ||||||||||||||||||||||||
| (0.17 | ) | 16.94 | 14.23 | 104 | 0.30 | (d) | 0.60 | (d) | 2.36 | (d) | 38 | |||||||||||||||||||||
| $ | (0.30 | ) | $ | 18.56 | 4.81 | % | $ | 1,045 | 0.70 | %(d) | 0.85 | %(d) | 2.11 | %(d) | 40 | % | ||||||||||||||||
| (0.45 | ) | 18.00 | 9.46 | 961 | 0.70 | 0.85 | 2.38 | 67 | ||||||||||||||||||||||||
| (0.17 | ) | 16.89 | 13.88 | 893 | 0.65 | (d) | 0.85 | (d) | 1.04 | (d) | 38 | |||||||||||||||||||||
| $ | (0.41 | ) | $ | 18.71 | 5.18 | % | $ | 14,363 | 0.05 | %(d) | 0.20 | %(d) | 2.18 | %(d) | 40 | % | ||||||||||||||||
| (0.48 | ) | 18.20 | 10.19 | 5,333 | 0.05 | 0.20 | 2.83 | 67 | ||||||||||||||||||||||||
| (0.18 | ) | 16.99 | 14.58 | 4,090 | — | (d) | 0.20 | (d) | 2.43 | (d) | 38 | |||||||||||||||||||||
| $ | (0.42 | ) | $ | 18.74 | 5.29 | % | $ | 8,458 | — | %(d)(e) | 0.10 | %(d) | 2.79 | %(d) | 40 | % | ||||||||||||||||
| (0.48 | ) | 18.23 | 10.24 | 5,850 | — | (e) | 0.12 | 3.10 | 67 | |||||||||||||||||||||||
| (0.18 | ) | 17.00 | 14.65 | 5,132 | — | (d)(e) | 0.15 | (d) | 3.00 | (d) | 38 | |||||||||||||||||||||
| $ | (0.39 | ) | $ | 18.66 | 5.05 | % | $ | 11,114 | 0.30 | %(d) | �� | 0.45 | %(d) | 2.52 | %(d) | 40 | % | |||||||||||||||
| (0.44 | ) | 18.15 | 9.95 | 10,427 | 0.30 | 0.45 | 1.29 | 67 | ||||||||||||||||||||||||
| (0.17 | ) | 16.94 | 14.23 | 12 | 0.25 | (d) | 0.45 | (d) | 2.76 | (d) | 38 | |||||||||||||||||||||
| See accompanying Notes to Financial Statements | | May 31, 2014 | | Semiannual Report | 183 |
Table of Contents
Financial Highlights (cont’d)
For a Share Outstanding for the Period ended:
| Net Asset Value, Beginning of Period | Net Investment Income (a) | Net Realized and Change in Unrealized Gain (Loss) | Total from Investment Operations | Dividends from Net Investment Income | Distributions from Net Realized Capital Gains | |||||||||||||||||||||
| AllianzGI Retirement 2040: | ||||||||||||||||||||||||||
| Class A | ||||||||||||||||||||||||||
5/31/2014+ | $ | 21.45 | $ | 0.27 | $ | 0.84 | $ | 1.11 | $ | (0.51 | ) | $ | — | |||||||||||||
11/30/2013 | 19.71 | 0.49 | 1.82 | 2.31 | (0.53 | ) | (0.04 | ) | ||||||||||||||||||
11/30/2012 | 20.22 | 0.29 | 1.61 | 1.90 | (0.69 | ) | (1.72 | ) | ||||||||||||||||||
11/30/2011 | 21.88 | 0.52 | (0.27 | ) | 0.25 | (0.97 | ) | (0.94 | ) | |||||||||||||||||
11/30/2010 | 20.08 | 0.73 | 1.71 | 2.44 | (0.49 | ) | (0.15 | ) | ||||||||||||||||||
12/29/2008* - 11/30/2009 | 15.00 | 0.30 | 4.78 | 5.08 | — | — | ||||||||||||||||||||
| Class C | ||||||||||||||||||||||||||
5/31/2014+ | $ | 21.21 | $ | 0.17 | $ | 0.86 | $ | 1.03 | $ | (0.33 | ) | $ | — | |||||||||||||
11/30/2013 | 19.53 | 0.34 | 1.80 | 2.14 | (0.42 | ) | (0.04 | ) | ||||||||||||||||||
11/30/2012 | 20.07 | 0.31 | 1.43 | 1.74 | (0.56 | ) | (1.72 | ) | ||||||||||||||||||
11/30/2011 | 21.65 | 0.27 | (0.18 | ) | 0.09 | (0.73 | ) | (0.94 | ) | |||||||||||||||||
11/30/2010 | 19.92 | 0.57 | 1.69 | 2.26 | (0.38 | ) | (0.15 | ) | ||||||||||||||||||
12/29/2008* - 11/30/2009 | 15.00 | 0.19 | 4.73 | 4.92 | — | — | ||||||||||||||||||||
| Class D | ||||||||||||||||||||||||||
5/31/2014+ | $ | 21.42 | $ | 0.25 | $ | 0.85 | $ | 1.10 | $ | (0.43 | ) | $ | — | |||||||||||||
11/30/2013 | 19.61 | 0.56 | 1.74 | 2.30 | (0.45 | ) | (0.04 | ) | ||||||||||||||||||
11/30/2012 | 20.16 | 0.41 | 1.44 | 1.85 | (0.68 | ) | (1.72 | ) | ||||||||||||||||||
11/30/2011 | 21.88 | 0.76 | (0.51 | ) | 0.25 | (1.03 | ) | (0.94 | ) | |||||||||||||||||
11/30/2010 | 20.05 | 0.52 | 1.92 | 2.44 | (0.46 | ) | (0.15 | ) | ||||||||||||||||||
12/29/2008* - 11/30/2009 | 15.00 | 0.32 | 4.73 | 5.05 | — | — | ||||||||||||||||||||
| Class R | ||||||||||||||||||||||||||
5/31/2014+ | $ | 21.31 | $ | 0.22 | $ | 0.85 | $ | 1.07 | $ | (0.40 | ) | $ | — | |||||||||||||
11/30/2013 | 19.63 | 0.44 | 1.80 | 2.24 | (0.52 | ) | (0.04 | ) | ||||||||||||||||||
11/30/2012 | 20.16 | 0.16 | 1.66 | 1.82 | (0.63 | ) | (1.72 | ) | ||||||||||||||||||
11/30/2011 | 21.85 | 0.56 | (0.36 | ) | 0.20 | (0.95 | ) | (0.94 | ) | |||||||||||||||||
11/30/2010 | 20.03 | 0.59 | 1.80 | 2.39 | (0.42 | ) | (0.15 | ) | ||||||||||||||||||
12/29/2008* - 11/30/2009 | 15.00 | 0.26 | 4.77 | 5.03 | — | — | ||||||||||||||||||||
| Class P | ||||||||||||||||||||||||||
5/31/2014+ | $ | 21.63 | $ | 0.23 | $ | 0.93 | $ | 1.16 | $ | (0.53 | ) | $ | — | |||||||||||||
11/30/2013 | 19.82 | 0.49 | 1.90 | 2.39 | (0.54 | ) | (0.04 | ) | ||||||||||||||||||
11/30/2012 | 20.31 | 0.39 | 1.57 | 1.96 | (0.73 | ) | (1.72 | ) | ||||||||||||||||||
11/30/2011 | 21.97 | 0.67 | (0.36 | ) | 0.31 | (1.03 | ) | (0.94 | ) | |||||||||||||||||
11/30/2010 | 20.12 | 0.68 | 1.80 | 2.48 | (0.48 | ) | (0.15 | ) | ||||||||||||||||||
12/29/2008* - 11/30/2009 | 15.00 | 0.33 | 4.79 | 5.12 | — | — | ||||||||||||||||||||
| + | Unaudited |
| * | Commencement of operations. |
| (a) | Calculated on average shares outstanding during the period. |
| (b) | Total return is calculated assuming a purchase of a share on the first day of the period and a sale of a share on the last day of each period reported. Dividends and distributions, if any, are assumed, for purposes of this calculation, to be reinvested. Total return does not reflect sales charges and includes the effect of fee waivers and reimbursements. Total return may reflect adjustments to conform to generally accepted accounting principles. Total return for a period of less than one year is not annualized. |
| (c) | Does not include expenses of the investment companies in which the Fund invests. |
| (d) | Annualized. |
| (e) | See Note 6 in the Notes to Financial Statements. |
| 184 | Semiannual Report | | May 31, 2014 | | See accompanying Notes to Financial Statements |
Table of Contents
| Total Dividends and Distributions | Net Asset Value, End of Period | Total Return (b) | Net Assets, End of Period (000s) | Ratio of Expenses to Average Net Assets with Fee Waiver/ Reimbursement (c) | Ratio of Expenses to Average Net Assets without Fee Waiver/ Reimbursement (c) | Ratio of Net Investment Income to Average Net Assets (c) | Portfolio Turnover Rate | |||||||||||||||||||||||||
| $ | (0.51 | ) | $ | 22.05 | 5.26 | % | $ | 13,179 | 0.34 | %(d) | 0.60 | %(d) | 2.53 | %(d) | 38 | % | ||||||||||||||||
| (0.57 | ) | 21.45 | 12.11 | 5,513 | 0.35 | 0.60 | 2.40 | 61 | ||||||||||||||||||||||||
| (2.41 | ) | 19.71 | 10.61 | 1,915 | 0.28 | 0.60 | 1.52 | 45 | ||||||||||||||||||||||||
| (1.91 | ) | 20.22 | 0.81 | 151 | 0.42 | 2.96 | 2.42 | 53 | ||||||||||||||||||||||||
| (0.64 | ) | 21.88 | 12.48 | 79 | 0.56 | 5.99 | 3.57 | 44 | ||||||||||||||||||||||||
| — | 20.08 | 33.87 | 23 | 0.56 | (d) | 11.53 | (d) | 1.93 | (d) | 13 | ||||||||||||||||||||||
| $ | (0.33 | ) | $ | 21.91 | 4.94 | % | $ | 369 | 1.09 | %(d) | 1.35 | %(d) | 1.63 | %(d) | 38 | % | ||||||||||||||||
| (0.46 | ) | 21.21 | 11.20 | 317 | 1.10 | 1.35 | 1.66 | 61 | ||||||||||||||||||||||||
| (2.28 | ) | 19.53 | 9.80 | 195 | 1.03 | 1.35 | 1.66 | 45 | ||||||||||||||||||||||||
| (1.67 | ) | 20.07 | 0.07 | 87 | 1.15 | 3.56 | 1.30 | 53 | ||||||||||||||||||||||||
| (0.53 | ) | 21.65 | 11.61 | 22 | 1.31 | 6.66 | 2.82 | 44 | ||||||||||||||||||||||||
| — | 19.92 | 32.80 | 42 | 1.31 | (d) | 11.89 | (d) | 1.18 | (d) | 13 | ||||||||||||||||||||||
| $ | (0.43 | ) | $ | 22.09 | 5.28 | % | $ | 209 | 0.44 | %(d) | 0.60 | %(d) | 2.33 | %(d) | 38 | % | ||||||||||||||||
| (0.49 | ) | 21.42 | 11.94 | 229 | 0.45 | 0.60 | 2.76 | 61 | ||||||||||||||||||||||||
| (2.40 | ) | 19.61 | 10.42 | 245 | 0.38 | 0.60 | 2.16 | 45 | ||||||||||||||||||||||||
| (1.97 | ) | 20.16 | 0.77 | 187 | 0.46 | 3.00 | 3.57 | 53 | ||||||||||||||||||||||||
| (0.61 | ) | 21.88 | 12.49 | 177 | 0.56 | 6.58 | 2.51 | 44 | ||||||||||||||||||||||||
| — | 20.05 | 33.67 | 45 | 0.56 | (d) | 10.43 | (d) | 1.93 | (d) | 13 | ||||||||||||||||||||||
| $ | (0.40 | ) | $ | 21.98 | 5.11 | % | $ | 1,340 | 0.69 | %(d) | 0.85 | %(d) | 2.05 | %(d) | 38 | % | ||||||||||||||||
| (0.56 | ) | 21.31 | 11.70 | 1,167 | 0.70 | 0.85 | 2.15 | 61 | ||||||||||||||||||||||||
| (2.35 | ) | 19.63 | 10.24 | 848 | 0.63 | 0.85 | 0.87 | 45 | ||||||||||||||||||||||||
| (1.89 | ) | 20.16 | 0.54 | 15 | 0.70 | 3.22 | 2.63 | 53 | ||||||||||||||||||||||||
| (0.57 | ) | 21.85 | 12.19 | 15 | 0.81 | 6.50 | 2.90 | 44 | ||||||||||||||||||||||||
| — | 20.03 | 33.53 | 14 | 0.81 | (d) | 10.01 | (d) | 1.68 | (d) | 13 | ||||||||||||||||||||||
| $ | (0.53 | ) | $ | 22.26 | 5.45 | % | $ | 11,958 | 0.04 | %(d) | 0.20 | %(d) | 2.12 | %(d) | 38 | % | ||||||||||||||||
| (0.58 | ) | 21.63 | 12.42 | 4,704 | 0.05 | 0.20 | 2.37 | 61 | ||||||||||||||||||||||||
| (2.45 | ) | 19.82 | 10.99 | 2,343 | — | (e) | 0.20 | 2.00 | 45 | |||||||||||||||||||||||
| (1.97 | ) | 20.31 | 1.06 | 15 | 0.21 | 2.75 | 3.11 | 53 | ||||||||||||||||||||||||
| (0.63 | ) | 21.97 | 12.64 | 15 | 0.36 | 6.10 | 3.35 | 44 | ||||||||||||||||||||||||
| — | 20.12 | 34.13 | 13 | 0.36 | (d) | 6.43 | (d) | 2.13 | (d) | 13 | ||||||||||||||||||||||
| See accompanying Notes to Financial Statements | | May 31, 2014 | | Semiannual Report | 185 |
Table of Contents
Financial Highlights (cont’d)
For a Share Outstanding for the Period ended:
| Net Asset Value, Beginning of Period | Net Investment Income (a) | Net Realized and Change in Unrealized Gain (Loss) | Total from Investment Operations | Dividends from Net Investment Income | Distributions from Net Realized Capital Gains | |||||||||||||||||||||
| AllianzGI Retirement 2040 (cont’d) | ||||||||||||||||||||||||||
| Class R6 | ||||||||||||||||||||||||||
5/31/2014+ | $ | 21.66 | $ | 0.32 | $ | 0.86 | $ | 1.18 | $ | (0.54 | ) | $ | — | |||||||||||||
11/30/2013 | 19.83 | 0.60 | 1.81 | 2.41 | (0.54 | ) | (0.04 | ) | ||||||||||||||||||
11/30/2012 | 20.33 | 0.56 | 1.41 | 1.97 | (0.75 | ) | (1.72 | ) | ||||||||||||||||||
11/30/2011 | 22.00 | 0.68 | (0.36 | ) | 0.32 | (1.05 | ) | (0.94 | ) | |||||||||||||||||
11/30/2010 | 20.13 | 0.70 | 1.82 | 2.52 | (0.50 | ) | (0.15 | ) | ||||||||||||||||||
12/29/2008* - 11/30/2009 | 15.00 | 0.35 | 4.78 | 5.13 | — | — | ||||||||||||||||||||
| Administrative Class | ||||||||||||||||||||||||||
5/31/2014+ | $ | 21.53 | $ | 0.27 | $ | 0.85 | $ | 1.12 | $ | (0.49 | ) | $ | — | |||||||||||||
11/30/2013 | 19.75 | 0.26 | 2.07 | 2.33 | (0.51 | ) | (0.04 | ) | ||||||||||||||||||
11/30/2012 | 20.26 | 0.52 | 1.38 | 1.90 | (0.69 | ) | (1.72 | ) | ||||||||||||||||||
11/30/2011 | 21.93 | 0.63 | (0.36 | ) | 0.27 | (1.00 | ) | (0.94 | ) | |||||||||||||||||
11/30/2010 | 20.09 | 0.65 | 1.80 | 2.45 | (0.46 | ) | (0.15 | ) | ||||||||||||||||||
12/29/2008* - 11/30/2009 | 15.00 | 0.31 | 4.78 | 5.09 | — | — | ||||||||||||||||||||
| AllianzGI Retirement 2045: | ||||||||||||||||||||||||||
| Class A | ||||||||||||||||||||||||||
5/31/2014+ | $ | 18.67 | $ | 0.23 | $ | 0.77 | $ | 1.00 | $ | (0.45 | ) | $ | — | |||||||||||||
11/30/2013 | 17.02 | 0.41 | 1.79 | 2.20 | (0.46 | ) | (0.09 | ) | ||||||||||||||||||
12/19/2011* - 11/30/2012 | 15.00 | 0.32 | 1.92 | 2.24 | (0.22 | ) | — | |||||||||||||||||||
| Class R | ||||||||||||||||||||||||||
5/31/2014+ | $ | 18.57 | $ | 0.19 | $ | 0.77 | $ | 0.96 | $ | (0.36 | ) | $ | — | |||||||||||||
11/30/2013 | 16.96 | 0.38 | 1.75 | 2.13 | (0.43 | ) | (0.09 | ) | ||||||||||||||||||
12/19/2011* - 11/30/2012 | 15.00 | 0.16 | 2.02 | 2.18 | (0.22 | ) | — | |||||||||||||||||||
| Class P | ||||||||||||||||||||||||||
5/31/2014+ | $ | 18.77 | $ | 0.16 | $ | 0.87 | $ | 1.03 | $ | (0.47 | ) | $ | — | |||||||||||||
11/30/2013 | 17.06 | 0.47 | 1.79 | 2.26 | (0.46 | ) | (0.09 | ) | ||||||||||||||||||
12/19/2011* - 11/30/2012 | 15.00 | 0.39 | 1.89 | 2.28 | (0.22 | ) | — | |||||||||||||||||||
| Class R6 | ||||||||||||||||||||||||||
5/31/2014+ | $ | 18.80 | $ | 0.25 | $ | 0.78 | $ | 1.03 | $ | (0.47 | ) | $ | — | |||||||||||||
11/30/2013 | 17.07 | 0.52 | 1.76 | 2.28 | (0.46 | ) | (0.09 | ) | ||||||||||||||||||
12/19/2011* - 11/30/2012 | 15.00 | 0.50 | 1.79 | 2.29 | (0.22 | ) | — | |||||||||||||||||||
| Administrative Class | ||||||||||||||||||||||||||
5/31/2014+ | $ | 18.71 | $ | 0.23 | $ | 0.77 | $ | 1.00 | $ | (0.44 | ) | $ | — | |||||||||||||
11/30/2013 | 17.01 | 0.22 | 1.99 | 2.21 | (0.42 | ) | (0.09 | ) | ||||||||||||||||||
12/19/2011* - 11/30/2012 | 15.00 | 0.44 | 1.79 | 2.23 | (0.22 | ) | — | |||||||||||||||||||
| + | Unaudited |
| * | Commencement of operations. |
| (a) | Calculated on average shares outstanding during the period. |
| (b) | Total return is calculated assuming a purchase of a share on the first day of the period and a sale of a share on the last day of each period reported. Dividends and distributions, if any, are assumed, for purposes of this calculation, to be reinvested. Total return does not reflect sales charges and includes the effect of fee waivers and reimbursements. Total return may reflect adjustments to conform to generally accepted accounting principles. Total return for a period of less than one year is not annualized. |
| (c) | Does not include expenses of the investment companies in which the Fund invests. |
| (d) | Annualized. |
| (e) | See Note 6 in the Notes to Financial Statements. |
| 186 | Semiannual Report | | May 31, 2014 | | See accompanying Notes to Financial Statements |
Table of Contents
| Total Dividends and Distributions | Net Asset Value, End of Period | Total Return (b) | Net Assets, End of Period (000s) | Ratio of Expenses to Average Net Assets with Fee Waiver/ Reimbursement (c) | Ratio of Expenses to Average Net Assets without Fee Waiver/ Reimbursement (c) | Ratio of Net Investment Income to Average Net Assets (c) | Portfolio Turnover Rate | |||||||||||||||||||||||||
| $ | (0.54 | ) | $ | 22.30 | 5.50 | % | $ | 10,091 | — | %(d)(e) | 0.10 | %(d) | 2.97 | %(d) | 38 | % | ||||||||||||||||
| (0.58 | ) | 21.66 | 12.51 | 9,939 | — | (e) | 0.12 | 2.93 | 61 | |||||||||||||||||||||||
| (2.47 | ) | 19.83 | 11.04 | 7,782 | — | (e) | 0.15 | 2.95 | 45 | |||||||||||||||||||||||
| (1.99 | ) | 20.33 | 1.11 | 5,315 | 0.10 | 2.65 | 3.15 | 53 | ||||||||||||||||||||||||
| (0.65 | ) | 22.00 | 12.83 | 4,769 | 0.26 | 5.98 | 3.43 | 44 | ||||||||||||||||||||||||
| — | 20.13 | 34.20 | 4,100 | 0.26 | (d) | 6.33 | (d) | 2.23 | (d) | 13 | ||||||||||||||||||||||
| $ | (0.49 | ) | $ | 22.16 | 5.32 | % | $ | 5,299 | 0.29 | %(d) | 0.45 | %(d) | 2.50 | %(d) | 38 | % | ||||||||||||||||
| (0.55 | ) | 21.53 | 12.13 | 5,054 | 0.30 | 0.45 | 1.27 | 61 | ||||||||||||||||||||||||
| (2.41 | ) | 19.75 | 10.67 | 17 | 0.23 | 0.45 | 2.72 | 45 | ||||||||||||||||||||||||
| (1.94 | ) | 20.26 | 0.87 | 15 | 0.38 | 2.93 | 2.94 | 53 | ||||||||||||||||||||||||
| (0.61 | ) | 21.93 | 12.48 | 15 | 0.51 | 6.24 | 3.20 | 44 | ||||||||||||||||||||||||
| — | 20.09 | 33.93 | 13 | 0.51 | (d) | 6.58 | (d) | 1.98 | (d) | 13 | ||||||||||||||||||||||
| $ | (0.45 | ) | $ | 19.22 | 5.38 | % | $ | 8,274 | 0.33 | %(d) | 0.60 | %(d) | 2.44 | %(d) | 20 | % | ||||||||||||||||
| (0.55 | ) | 18.67 | 13.33 | 4,313 | 0.33 | 0.60 | 2.31 | 51 | ||||||||||||||||||||||||
| (0.22 | ) | 17.02 | 15.09 | 61 | 0.29 | (d) | 0.60 | (d) | 2.08 | (d) | 38 | |||||||||||||||||||||
| $ | (0.36 | ) | $ | 19.17 | 5.23 | % | $ | 414 | 0.68 | %(d) | 0.85 | %(d) | 2.01 | %(d) | 20 | % | ||||||||||||||||
| (0.52 | ) | 18.57 | 12.94 | 356 | 0.68 | 0.85 | 2.17 | 51 | ||||||||||||||||||||||||
| (0.22 | ) | 16.96 | 14.67 | 293 | 0.64 | (d) | 0.85 | (d) | 1.07 | (d) | 38 | |||||||||||||||||||||
| $ | (0.47 | ) | $ | 19.33 | 5.58 | % | $ | 8,794 | 0.03 | %(d) | 0.20 | %(d) | 1.77 | %(d) | 20 | % | ||||||||||||||||
| (0.55 | ) | 18.77 | 13.68 | 2,286 | 0.03 | 0.20 | 2.63 | 51 | ||||||||||||||||||||||||
| (0.22 | ) | 17.06 | 15.37 | 1,584 | — | (d)(e) | 0.20 | (d) | 2.46 | (d) | 38 | |||||||||||||||||||||
| $ | (0.47 | ) | $ | 19.36 | 5.60 | % | $ | 5,627 | — | %(d)(e) | 0.10 | %(d) | 2.72 | %(d) | 20 | % | ||||||||||||||||
| (0.55 | ) | 18.80 | 13.80 | 4,587 | — | (e) | 0.12 | 2.91 | 51 | |||||||||||||||||||||||
| (0.22 | ) | 17.07 | 15.44 | 3,733 | — | (d)(e) | 0.15 | (d) | 3.23 | (d) | 38 | |||||||||||||||||||||
| $ | (0.44 | ) | $ | 19.27 | 5.44 | % | $ | 1,687 | 0.28 | %(d) | 0.45 | %(d) | 2.44 | %(d) | 20 | % | ||||||||||||||||
| (0.51 | ) | 18.71 | 13.40 | 1,542 | 0.28 | 0.45 | 1.23 | 51 | ||||||||||||||||||||||||
| (0.22 | ) | 17.01 | 15.02 | 12 | 0.24 | (d) | 0.45 | (d) | 2.84 | (d) | 38 | |||||||||||||||||||||
| See accompanying Notes to Financial Statements | | May 31, 2014 | | Semiannual Report | 187 |
Table of Contents
Financial Highlights (cont’d)
For a Share Outstanding for the Period ended:
| Net Asset Value, Beginning of Period | Net Investment Income (a) | Net Realized and Change in Unrealized Gain (Loss) | Total from Investment Operations | Dividends from Net Investment Income | Distributions from Net Realized Capital Gains | |||||||||||||||||||||
| AllianzGI Retirement 2050: | ||||||||||||||||||||||||||
| Class A | ||||||||||||||||||||||||||
5/31/2014+ | $ | 21.55 | $ | 0.24 | $ | 0.92 | $ | 1.16 | $ | (0.57 | ) | $ | — | |||||||||||||
11/30/2013 | 19.48 | 0.42 | 2.32 | 2.74 | (0.60 | ) | (0.07 | ) | ||||||||||||||||||
11/30/2012 | 20.16 | 0.28 | 1.59 | 1.87 | (0.76 | ) | (1.79 | ) | ||||||||||||||||||
11/30/2011 | 22.00 | 0.61 | (0.34 | ) | 0.27 | (1.09 | ) | (1.02 | ) | |||||||||||||||||
11/30/2010 | 20.07 | 0.62 | 1.93 | 2.55 | (0.43 | ) | (0.19 | ) | ||||||||||||||||||
12/29/2008* - 11/30/2009 | 15.00 | 0.31 | 4.76 | 5.07 | — | — | ||||||||||||||||||||
| Class C | ||||||||||||||||||||||||||
5/31/2014+ | $ | 21.34 | $ | 0.17 | $ | 0.90 | $ | 1.07 | $ | (0.44 | ) | $ | — | |||||||||||||
11/30/2013 | 19.25 | 0.30 | 2.27 | 2.57 | (0.41 | ) | (0.07 | ) | ||||||||||||||||||
11/30/2012 | 19.92 | 0.27 | 1.44 | 1.71 | (0.59 | ) | (1.79 | ) | ||||||||||||||||||
11/30/2011 | 21.85 | 0.44 | (0.34 | ) | 0.10 | (1.01 | ) | (1.02 | ) | |||||||||||||||||
11/30/2010 | 19.96 | 0.43 | 1.96 | 2.39 | (0.31 | ) | (0.19 | ) | ||||||||||||||||||
12/29/2008* - 11/30/2009 | 15.00 | 0.18 | 4.78 | 4.96 | — | — | ||||||||||||||||||||
| Class D | ||||||||||||||||||||||||||
5/31/2014+ | $ | 21.58 | $ | 0.25 | $ | 0.89 | $ | 1.14 | $ | (0.52 | ) | $ | — | |||||||||||||
11/30/2013 | 19.48 | 0.45 | 2.28 | 2.73 | (0.56 | ) | (0.07 | ) | ||||||||||||||||||
11/30/2012 | 20.15 | 0.48 | 1.37 | 1.85 | (0.73 | ) | (1.79 | ) | ||||||||||||||||||
11/30/2011 | 22.01 | 0.59 | (0.34 | ) | 0.25 | (1.09 | ) | (1.02 | ) | |||||||||||||||||
11/30/2010 | 20.09 | 0.62 | 1.93 | 2.55 | (0.44 | ) | (0.19 | ) | ||||||||||||||||||
12/29/2008* - 11/30/2009 | 15.00 | 0.32 | 4.77 | 5.09 | — | — | ||||||||||||||||||||
| Class R | ||||||||||||||||||||||||||
5/31/2014+ | $ | 21.46 | $ | 0.21 | $ | 0.90 | $ | 1.11 | $ | (0.45 | ) | $ | — | |||||||||||||
11/30/2013 | 19.47 | 0.37 | 2.29 | 2.66 | (0.60 | ) | (0.07 | ) | ||||||||||||||||||
11/30/2012 | 20.12 | 0.18 | 1.64 | 1.82 | (0.68 | ) | (1.79 | ) | ||||||||||||||||||
11/30/2011 | 21.97 | 0.58 | (0.37 | ) | 0.21 | (1.04 | ) | (1.02 | ) | |||||||||||||||||
11/30/2010 | 20.06 | 0.61 | 1.88 | 2.49 | (0.39 | ) | (0.19 | ) | ||||||||||||||||||
12/29/2008* - 11/30/2009 | 15.00 | 0.26 | 4.80 | 5.06 | — | — | ||||||||||||||||||||
| Class P | ||||||||||||||||||||||||||
5/31/2014+ | $ | 21.77 | $ | 0.18 | $ | 1.02 | $ | 1.20 | $ | (0.59 | ) | $ | — | |||||||||||||
11/30/2013 | 19.64 | 0.48 | 2.35 | 2.83 | (0.63 | ) | (0.07 | ) | ||||||||||||||||||
11/30/2012 | 20.27 | 0.38 | 1.56 | 1.94 | (0.78 | ) | (1.79 | ) | ||||||||||||||||||
11/30/2011 | 22.10 | 0.69 | (0.39 | ) | 0.30 | (1.11 | ) | (1.02 | ) | |||||||||||||||||
11/30/2010 | 20.14 | 0.71 | 1.89 | 2.60 | (0.45 | ) | (0.19 | ) | ||||||||||||||||||
12/29/2008* - 11/30/2009 | 15.00 | 0.33 | 4.81 | 5.14 | — | — | ||||||||||||||||||||
| + | Unaudited |
| * | Commencement of operations. |
| (a) | Calculated on average shares outstanding during the period. |
| (b) | Total return is calculated assuming a purchase of a share on the first day of the period and a sale of a share on the last day of each period reported. Dividends and distributions, if any, are assumed, for purposes of this calculation, to be reinvested. Total return does not reflect sales charges and includes the effect of fee waivers and reimbursements. Total return may reflect adjustments to conform to generally accepted accounting principles. Total return for a period of less than one year is not annualized. |
| (c) | Does not include expenses of the investment companies in which the Fund invests. |
| (d) | Annualized. |
| (e) | See Note 6 in the Notes to Financial Statements. |
| 188 | Semiannual Report | | May 31, 2014 | | See accompanying Notes to Financial Statements |
Table of Contents
| Total Dividends and Distributions | Net Asset Value, End of Period | Total Return (b) | Net Assets, End of Period (000s) | Ratio of Expenses to Average Net Assets with Fee Waiver/ Reimbursement (c) | Ratio of Expenses to Average Net Assets without Fee Waiver/ Reimbursement (c) | Ratio of Net Investment Income to Average Net Assets (c) | Portfolio Turnover Rate | |||||||||||||||||||||||||
| $ | (0.57 | ) | $ | 22.14 | 5.49 | % | $ | 3,421 | 0.31 | %(d) | 0.60 | %(d) | 2.22 | %(d) | 28 | % | ||||||||||||||||
| (0.67 | ) | 21.55 | 14.50 | 1,014 | 0.30 | 0.60 | 2.08 | 54 | ||||||||||||||||||||||||
| (2.55 | ) | 19.48 | 10.64 | 1,371 | 0.26 | 0.60 | 1.45 | 47 | ||||||||||||||||||||||||
| (2.11 | ) | 20.16 | 0.80 | 71 | 0.41 | 2.92 | 2.85 | 51 | ||||||||||||||||||||||||
| (0.62 | ) | 22.00 | 13.02 | 57 | 0.56 | 6.28 | 3.05 | 37 | ||||||||||||||||||||||||
| — | 20.07 | 33.80 | 30 | 0.56 | (d) | 9.92 | (d) | 1.91 | (d) | 11 | ||||||||||||||||||||||
| $ | (0.44 | ) | $ | 21.97 | 5.11 | % | $ | 136 | 1.06 | %(d) | 1.35 | %(d) | 1.56 | %(d) | 28 | % | ||||||||||||||||
| (0.48 | ) | 21.34 | 13.64 | 119 | 1.05 | 1.35 | 1.48 | 54 | ||||||||||||||||||||||||
| (2.38 | ) | 19.25 | 9.78 | 60 | 1.01 | 1.35 | 1.44 | 47 | ||||||||||||||||||||||||
| (2.03 | ) | 19.92 | (0.01 | ) | 48 | 1.17 | 3.70 | 2.09 | 51 | |||||||||||||||||||||||
| (0.50 | ) | 21.85 | 12.21 | 35 | 1.31 | 7.37 | 2.11 | 37 | ||||||||||||||||||||||||
| — | 19.96 | 33.07 | 13 | 1.31 | (d) | 10.64 | (d) | 1.16 | (d) | 11 | ||||||||||||||||||||||
| $ | (0.52 | ) | $ | 22.20 | 5.41 | % | $ | 285 | 0.41 | %(d) | 0.60 | %(d) | 2.34 | %(d) | 28 | % | ||||||||||||||||
| (0.63 | ) | 21.58 | 14.42 | 333 | 0.40 | 0.60 | 2.21 | 54 | ||||||||||||||||||||||||
| (2.52 | ) | 19.48 | 10.51 | 202 | 0.36 | 0.60 | 2.55 | 47 | ||||||||||||||||||||||||
| (2.11 | ) | 20.15 | 0.75 | 189 | 0.44 | 3.02 | 2.74 | 51 | ||||||||||||||||||||||||
| (0.63 | ) | 22.01 | 12.99 | 166 | 0.56 | 6.36 | 3.04 | 37 | ||||||||||||||||||||||||
| — | 20.09 | 33.93 | 91 | 0.56 | (d) | 11.64 | (d) | 1.91 | (d) | 11 | ||||||||||||||||||||||
| $ | (0.45 | ) | $ | 22.12 | 5.34 | % | $ | 572 | 0.66 | %(d) | 0.85 | %(d) | 1.96 | %(d) | 28 | % | ||||||||||||||||
| (0.67 | ) | 21.46 | 14.11 | 497 | 0.65 | 0.85 | 1.85 | 54 | ||||||||||||||||||||||||
| (2.47 | ) | 19.47 | 10.30 | 359 | 0.61 | 0.85 | 0.96 | 47 | ||||||||||||||||||||||||
| (2.06 | ) | 20.12 | 0.51 | 17 | 0.69 | 3.21 | 2.71 | 51 | ||||||||||||||||||||||||
| (0.58 | ) | 21.97 | 12.75 | 17 | 0.81 | 6.49 | 2.98 | 37 | ||||||||||||||||||||||||
| — | 20.06 | 33.73 | 13 | 0.81 | (d) | 10.14 | (d) | 1.66 | (d) | 11 | ||||||||||||||||||||||
| $ | (0.59 | ) | $ | 22.38 | 5.63 | % | $ | 5,330 | 0.01 | %(d) | 0.20 | %(d) | 1.68 | %(d) | 28 | % | ||||||||||||||||
| (0.70 | ) | 21.77 | 14.90 | 1,397 | — | 0.20 | 2.34 | 54 | ||||||||||||||||||||||||
| (2.57 | ) | 19.64 | 11.00 | 762 | — | (e) | 0.20 | 1.98 | 47 | |||||||||||||||||||||||
| (2.13 | ) | 20.27 | 0.96 | 15 | 0.19 | 2.75 | 3.21 | 51 | ||||||||||||||||||||||||
| (0.64 | ) | 22.10 | 13.26 | 15 | 0.36 | 6.08 | 3.48 | 37 | ||||||||||||||||||||||||
| — | 20.14 | 34.27 | 14 | 0.36 | (d) | 7.10 | (d) | 2.11 | (d) | 11 | ||||||||||||||||||||||
| See accompanying Notes to Financial Statements | | May 31, 2014 | | Semiannual Report | 189 |
Table of Contents
Financial Highlights (cont’d)
For a Share Outstanding for the Period ended:
| Net Asset Value, Beginning of Period | Net Investment Income (a) | Net Realized and Change in Unrealized Gain (Loss) | Total from Investment Operations | Dividends from Net Investment Income | Distributions from Net Realized Capital Gains | |||||||||||||||||||||
| AllianzGI Retirement 2050 (cont’d) | ||||||||||||||||||||||||||
| Class R6 | ||||||||||||||||||||||||||
5/31/2014+ | $ | 21.80 | $ | 0.30 | $ | 0.92 | $ | 1.22 | $ | (0.59 | ) | $ | — | |||||||||||||
11/30/2013 | 19.66 | 0.55 | 2.29 | 2.84 | (0.63 | ) | (0.07 | ) | ||||||||||||||||||
11/30/2012 | 20.30 | 0.58 | 1.38 | 1.96 | (0.81 | ) | (1.79 | ) | ||||||||||||||||||
11/30/2011 | 22.12 | 0.69 | (0.35 | ) | 0.34 | (1.14 | ) | (1.02 | ) | |||||||||||||||||
11/30/2010 | 20.16 | 0.73 | 1.89 | 2.62 | (0.47 | ) | (0.19 | ) | ||||||||||||||||||
12/29/2008* - 11/30/2009 | 15.00 | 0.34 | 4.82 | 5.16 | — | — | ||||||||||||||||||||
| Administrative Class | ||||||||||||||||||||||||||
5/31/2014+ | $ | 21.69 | $ | 0.26 | $ | 0.91 | $ | 1.17 | $ | (0.56 | ) | $ | — | |||||||||||||
11/30/2013 | 19.58 | 0.22 | 2.55 | 2.77 | (0.59 | ) | (0.07 | ) | ||||||||||||||||||
11/30/2012 | 20.23 | 0.53 | 1.36 | 1.89 | (0.75 | ) | (1.79 | ) | ||||||||||||||||||
11/30/2011 | 22.06 | 0.65 | (0.38 | ) | 0.27 | (1.08 | ) | (1.02 | ) | |||||||||||||||||
11/30/2010 | 20.11 | 0.68 | 1.89 | 2.57 | (0.43 | ) | (0.19 | ) | ||||||||||||||||||
12/29/2008* - 11/30/2009 | 15.00 | 0.30 | 4.81 | 5.11 | — | — | ||||||||||||||||||||
| AllianzGI Retirement 2055: | ||||||||||||||||||||||||||
| Class A | ||||||||||||||||||||||||||
5/31/2014+ | $ | 18.51 | $ | 0.24 | $ | 0.78 | $ | 1.02 | $ | (0.52 | ) | $ | (0.06 | ) | ||||||||||||
11/30/2013 | 17.02 | 0.26 | 2.11 | 2.37 | (0.59 | ) | (0.29 | ) | ||||||||||||||||||
12/19/2011* - 11/30/2012 | 15.00 | 0.44 | 1.80 | 2.24 | (0.22 | ) | — | |||||||||||||||||||
| Class R | ||||||||||||||||||||||||||
5/31/2014+ | $ | 18.42 | $ | 0.17 | $ | 0.81 | $ | 0.98 | $ | (0.43 | ) | $ | (0.06 | ) | ||||||||||||
11/30/2013 | 16.97 | 0.30 | 2.00 | 2.30 | (0.56 | ) | (0.29 | ) | ||||||||||||||||||
12/19/2011* - 11/30/2012 | 15.00 | 0.31 | 1.88 | 2.19 | (0.22 | ) | — | |||||||||||||||||||
| Class P | ||||||||||||||||||||||||||
5/31/2014+ | $ | 18.61 | $ | 0.16 | $ | 0.89 | $ | 1.05 | $ | (0.53 | ) | $ | (0.06 | ) | ||||||||||||
11/30/2013 | 17.08 | 0.34 | 2.09 | 2.43 | (0.61 | ) | (0.29 | ) | ||||||||||||||||||
12/19/2011* - 11/30/2012 | 15.00 | 0.43 | 1.87 | 2.30 | (0.22 | ) | — | |||||||||||||||||||
| Class R6 | ||||||||||||||||||||||||||
5/31/2014+ | $ | 18.64 | $ | 0.25 | $ | 0.81 | $ | 1.06 | $ | (0.53 | ) | $ | (0.06 | ) | ||||||||||||
11/30/2013 | 17.09 | 0.49 | 1.96 | 2.45 | (0.61 | ) | (0.29 | ) | ||||||||||||||||||
12/19/2011* - 11/30/2012 | 15.00 | 0.50 | 1.81 | 2.31 | (0.22 | ) | — | |||||||||||||||||||
| Administrative Class | ||||||||||||||||||||||||||
5/31/2014+ | $ | 18.55 | $ | 0.21 | $ | 0.82 | $ | 1.03 | $ | (0.51 | ) | $ | (0.06 | ) | ||||||||||||
11/30/2013 | 17.03 | 0.22 | 2.16 | 2.38 | (0.57 | ) | (0.29 | ) | ||||||||||||||||||
12/19/2011* - 11/30/2012 | 15.00 | 0.44 | 1.81 | 2.25 | (0.22 | ) | — | |||||||||||||||||||
| + | Unaudited |
| * | Commencement of operations. |
| (a) | Calculated on average shares outstanding during the period. |
| (b) | Total return is calculated assuming a purchase of a share on the first day of the period and a sale of a share on the last day of each period reported. Dividends and distributions, if any, are assumed, for purposes of this calculation, to be reinvested. Total return does not reflect sales charges and includes the effect of fee waivers and reimbursements. Total return may reflect adjustments to conform to generally accepted accounting principles. Total return for a period of less than one year is not annualized. |
| (c) | Does not include expenses of the investment companies in which the Fund invests. |
| (d) | Annualized. |
| (e) | See Note 6 in the Notes to Financial Statements. |
| 190 | Semiannual Report | | May 31, 2014 | | See accompanying Notes to Financial Statements |
Table of Contents
| Total Dividends and Distributions | Net Asset Value, End of Period | Total Return (b) | Net Assets, End of Period (000s) | Ratio of Expenses to Average Net Assets with Fee Waiver/ Reimbursement (c) | Ratio of Expenses to Average Net Assets without Fee Waiver/ Reimbursement (c) | Ratio of Net Investment Income to Average Net Assets (c) | Portfolio Turnover Rate | |||||||||||||||||||||||||
| $ | (0.59 | ) | $ | 22.43 | 5.71 | % | $ | 9,034 | — | %(d)(e) | 0.10 | %(d) | 2.78 | %(d) | 28 | % | ||||||||||||||||
| (0.70 | ) | 21.80 | 14.94 | 8,935 | — | (e) | 0.12 | 2.68 | 54 | |||||||||||||||||||||||
| (2.60 | ) | 19.66 | 11.06 | 6,431 | — | (e) | 0.15 | 3.03 | 47 | |||||||||||||||||||||||
| (2.16 | ) | 20.30 | 1.11 | 5,149 | 0.09 | 2.65 | 3.22 | 51 | ||||||||||||||||||||||||
| (0.66 | ) | 22.12 | 13.34 | 4,619 | 0.26 | 5.97 | 3.56 | 37 | ||||||||||||||||||||||||
| — | 20.16 | 34.40 | 3,963 | 0.26 | (d) | 7.00 | (d) | 2.21 | (d) | 11 | ||||||||||||||||||||||
| $ | (0.56 | ) | $ | 22.30 | 5.46 | % | $ | 1,289 | 0.26 | %(d) | 0.45 | %(d) | 2.42 | %(d) | 28 | % | ||||||||||||||||
| (0.66 | ) | 21.69 | 14.66 | 1,194 | 0.25 | 0.45 | 1.07 | 54 | ||||||||||||||||||||||||
| (2.54 | ) | 19.58 | 10.62 | 17 | 0.21 | 0.45 | 2.77 | 47 | ||||||||||||||||||||||||
| (2.10 | ) | 20.23 | 0.82 | 15 | 0.37 | 2.93 | 3.04 | 51 | ||||||||||||||||||||||||
| (0.62 | ) | 22.06 | 13.09 | 15 | 0.51 | 6.23 | 3.32 | 37 | ||||||||||||||||||||||||
| — | 20.11 | 34.07 | 14 | 0.51 | (d) | 7.25 | (d) | 1.96 | (d) | 11 | ||||||||||||||||||||||
| $ | (0.58 | ) | $ | 18.95 | 5.63 | % | $ | 632 | 0.30 | %(d) | 0.60 | %(d) | 2.60 | %(d) | 26 | % | ||||||||||||||||
| (0.88 | ) | 18.51 | 14.59 | 135 | 0.30 | 0.60 | 1.52 | 41 | ||||||||||||||||||||||||
| (0.22 | ) | 17.02 | 15.10 | 11 | 0.27 | (d) | 0.60 | (d) | 2.82 | (d) | 31 | |||||||||||||||||||||
| $ | (0.49 | ) | $ | 18.91 | 5.45 | % | $ | 106 | 0.65 | %(d) | 0.85 | %(d) | 1.82 | %(d) | 26 | % | ||||||||||||||||
| (0.85 | ) | 18.42 | 14.22 | 72 | 0.65 | 0.85 | 1.75 | 41 | ||||||||||||||||||||||||
| (0.22 | ) | 16.97 | 14.75 | 39 | 0.62 | (d) | 0.85 | (d) | 1.99 | (d) | 31 | |||||||||||||||||||||
| $ | (0.59 | ) | $ | 19.07 | 5.82 | % | $ | 998 | — | %(d) | 0.20 | %(d) | 1.71 | %(d) | 26 | % | ||||||||||||||||
| (0.90 | ) | 18.61 | 14.88 | 240 | — | 0.20 | 1.96 | 41 | ||||||||||||||||||||||||
| (0.22 | ) | 17.08 | 15.52 | 59 | — | (d)(e) | 0.20 | (d) | 2.77 | (d) | 31 | |||||||||||||||||||||
| $ | (0.59 | ) | $ | 19.11 | 5.87 | % | $ | 4,705 | — | %(d)(e) | 0.10 | %(d) | 2.77 | %(d) | 26 | % | ||||||||||||||||
| (0.90 | ) | 18.64 | 15.06 | 4,388 | — | (e) | 0.12 | 2.77 | 41 | |||||||||||||||||||||||
| (0.22 | ) | 17.09 | 15.52 | 3,509 | — | (d)(e) | 0.15 | (d) | 3.21 | (d) | 31 | |||||||||||||||||||||
| $ | (0.57 | ) | $ | 19.01 | 5.66 | % | $ | 288 | 0.25 | %(d) | 0.45 | %(d) | 2.27 | %(d) | 26 | % | ||||||||||||||||
| (0.86 | ) | 18.55 | 14.67 | 221 | 0.25 | 0.45 | 1.22 | 41 | ||||||||||||||||||||||||
| (0.22 | ) | 17.03 | 15.17 | 11 | 0.22 | (d) | 0.46 | (d) | 2.87 | (d) | 31 | |||||||||||||||||||||
| See accompanying Notes to Financial Statements | | May 31, 2014 | | Semiannual Report | 191 |
Table of Contents
Financial Highlights (cont’d)
For a Share Outstanding for the Period ended:
| Net Asset Value, Beginning of Period | Net Investment Income (a) | Net Realized and Change in Unrealized Gain | Total from Investment Operations | Dividends from Net Investment Income | Distributions from Net Realized Capital Gains | |||||||||||||||||||||
| AllianzGI Retirement Income: | ||||||||||||||||||||||||||
| Class A | ||||||||||||||||||||||||||
5/31/2014+ | $ | 18.96 | $ | 0.22 | $ | 0.51 | $ | 0.73 | $ | (0.14 | ) | $ | — | |||||||||||||
11/30/2013 | 19.20 | 0.50 | 0.03 | 0.53 | (0.66 | ) | (0.08 | ) | ||||||||||||||||||
11/30/2012 | 18.27 | 0.48 | 1.23 | 1.71 | (0.58 | ) | (0.20 | ) | ||||||||||||||||||
11/30/2011 | 18.52 | 0.37 | 0.25 | 0.62 | (0.67 | ) | (0.20 | ) | ||||||||||||||||||
11/30/2010 | 17.81 | 0.47 | 1.05 | 1.52 | (0.61 | ) | (0.20 | ) | ||||||||||||||||||
12/29/2008* - 11/30/2009 | 15.00 | 0.53 | 2.71 | 3.24 | (0.43 | ) | — | |||||||||||||||||||
| Class C | ||||||||||||||||||||||||||
5/31/2014+ | $ | 18.76 | $ | 0.14 | $ | 0.51 | $ | 0.65 | $ | (0.07 | ) | $ | — | |||||||||||||
11/30/2013 | 18.99 | 0.37 | 0.01 | 0.38 | (0.50 | ) | (0.08 | ) | ||||||||||||||||||
11/30/2012 | 18.09 | 0.31 | 1.24 | 1.55 | (0.45 | ) | (0.20 | ) | ||||||||||||||||||
11/30/2011 | 18.36 | 0.27 | 0.21 | 0.48 | (0.55 | ) | (0.20 | ) | ||||||||||||||||||
11/30/2010 | 17.83 | 0.28 | 1.11 | 1.39 | (0.66 | ) | (0.20 | ) | ||||||||||||||||||
12/29/2008* - 11/30/2009 | 15.00 | 0.41 | 2.72 | 3.13 | (0.30 | ) | — | |||||||||||||||||||
| Class D | ||||||||||||||||||||||||||
5/31/2014+ | $ | 19.05 | $ | 0.20 | $ | 0.51 | $ | 0.71 | $ | (0.12 | ) | $ | — | |||||||||||||
11/30/2013 | 19.29 | 0.45 | 0.05 | 0.50 | (0.63 | ) | (0.08 | ) | ||||||||||||||||||
11/30/2012 | 18.36 | 0.30 | 1.41 | 1.71 | (0.58 | ) | (0.20 | ) | ||||||||||||||||||
11/30/2011 | 18.60 | 0.49 | 0.13 | 0.62 | (0.66 | ) | (0.20 | ) | ||||||||||||||||||
11/30/2010 | 17.83 | 0.49 | 1.04 | 1.53 | (0.56 | ) | (0.20 | ) | ||||||||||||||||||
12/29/2008* - 11/30/2009 | 15.00 | 0.52 | 2.72 | 3.24 | (0.41 | ) | — | |||||||||||||||||||
| Class R | ||||||||||||||||||||||||||
5/31/2014+ | $ | 19.53 | $ | 0.18 | $ | 0.54 | $ | 0.72 | $ | (0.10 | ) | $ | — | |||||||||||||
11/30/2013 | 19.74 | 0.46 | 0.01 | 0.47 | (0.57 | ) | (0.08 | ) | ||||||||||||||||||
11/30/2012 | 18.77 | 0.24 | 1.45 | 1.69 | (0.52 | ) | (0.20 | ) | ||||||||||||||||||
11/30/2011 | 18.73 | 0.53 | 0.05 | 0.58 | (0.34 | ) | (0.20 | ) | ||||||||||||||||||
11/30/2010 | 17.86 | 0.49 | 1.01 | 1.50 | (0.43 | ) | (0.20 | ) | ||||||||||||||||||
12/29/2008* - 11/30/2009 | 15.00 | 0.47 | 2.74 | 3.21 | (0.35 | ) | — | |||||||||||||||||||
| Class P | ||||||||||||||||||||||||||
5/31/2014+ | $ | 19.20 | $ | 0.23 | $ | 0.53 | $ | 0.76 | $ | (0.16 | ) | $ | — | |||||||||||||
11/30/2013 | 19.44 | 0.46 | 0.13 | 0.59 | (0.72 | ) | (0.08 | ) | ||||||||||||||||||
11/30/2012 | 18.49 | 0.32 | 1.48 | 1.80 | (0.65 | ) | (0.20 | ) | ||||||||||||||||||
11/30/2011 | 18.41 | 0.63 | 0.03 | 0.66 | (0.38 | ) | (0.20 | ) | ||||||||||||||||||
11/30/2010 | 17.85 | 0.57 | 0.99 | 1.56 | (0.80 | ) | (0.20 | ) | ||||||||||||||||||
12/29/2008* - 11/30/2009 | 15.00 | 0.54 | 2.74 | 3.28 | (0.43 | ) | — | |||||||||||||||||||
| Class R6 | ||||||||||||||||||||||||||
5/31/2014+ | $ | 18.83 | $ | 0.24 | $ | 0.52 | $ | 0.76 | $ | (0.17 | ) | $ | — | |||||||||||||
11/30/2013 | 19.08 | 0.56 | 0.03 | 0.59 | (0.73 | ) | (0.08 | ) | ||||||||||||||||||
11/30/2012 | 18.16 | 0.49 | 1.28 | 1.77 | (0.65 | ) | (0.20 | ) | ||||||||||||||||||
11/30/2011 | 18.40 | 0.65 | 0.02 | 0.67 | (0.71 | ) | (0.20 | ) | ||||||||||||||||||
11/30/2010 | 17.85 | 0.57 | 1.01 | 1.58 | (0.83 | ) | (0.20 | ) | ||||||||||||||||||
12/29/2008* - 11/30/2009 | 15.00 | 0.55 | 2.74 | 3.29 | (0.44 | ) | — | |||||||||||||||||||
| Administrative Class | ||||||||||||||||||||||||||
5/31/2014+ | $ | 19.15 | $ | 0.22 | $ | 0.52 | $ | 0.74 | $ | (0.13 | ) | $ | — | |||||||||||||
11/30/2013 | 19.41 | 0.22 | 0.32 | 0.54 | (0.69 | ) | (0.08 | ) | ||||||||||||||||||
11/30/2012 | 18.46 | 0.49 | 1.26 | 1.75 | (0.60 | ) | (0.20 | ) | ||||||||||||||||||
11/30/2011 | 18.40 | 0.59 | 0.03 | 0.62 | (0.36 | ) | (0.20 | ) | ||||||||||||||||||
11/30/2010 | 17.83 | 0.54 | 0.99 | 1.53 | (0.76 | ) | (0.20 | ) | ||||||||||||||||||
12/29/2008* - 11/30/2009 | 15.00 | 0.52 | 2.74 | 3.26 | (0.43 | ) | — | |||||||||||||||||||
| + | Unaudited |
| * | Commencement of operations. |
| (a) | Calculated on average shares outstanding during the period. |
| 192 | Semiannual Report | | May 31, 2014 | | See accompanying Notes to Financial Statements |
Table of Contents
| Distributions from Return of Capital | Total Dividends and Distributions | Net Asset Value, End of Period | Total Return (b) | Net Assets, End of Period (000s) | Ratio of Expenses to Average Net Assets with Fee Waiver/ Reimburse ment (c) | Ratio of Expenses to Average Net Assets without Fee Waiver/ Reimburse ment (c) | Ratio of Net Investment Income to Average Net Assets (c) | Portfolio Turnover Rate | ||||||||||||||||||||||||||||
| $ | — | $ | (0.14 | ) | $ | 19.55 | 3.85 | % | $ | 5,069 | 0.38 | %(d) | 0.60 | %(d) | 2.26 | %(d) | 51 | % | ||||||||||||||||||
| (0.03 | ) | (0.77 | ) | 18.96 | 2.78 | 4,326 | 0.39 | 0.60 | 2.64 | 81 | ||||||||||||||||||||||||||
| — | (0.78 | ) | 19.20 | 9.68 | 4,891 | 0.40 | 0.60 | 2.57 | 51 | |||||||||||||||||||||||||||
| — | (0.87 | ) | 18.27 | 3.45 | 4,427 | 0.46 | 1.60 | 2.01 | 74 | |||||||||||||||||||||||||||
| — | (0.81 | ) | 18.52 | 8.86 | 595 | 0.52 | 5.29 | 2.65 | 22 | |||||||||||||||||||||||||||
| — | (0.43 | ) | 17.81 | 21.95 | 256 | 0.52 | (d) | 8.79 | (d) | 3.42 | (d) | 26 | ||||||||||||||||||||||||
| $ | — | $ | (0.07 | ) | $ | 19.34 | 3.50 | % | $ | 4,264 | 1.13 | %(d) | 1.35 | %(d) | 1.46 | %(d) | 51 | % | ||||||||||||||||||
| (0.03 | ) | (0.61 | ) | 18.76 | 2.03 | 4,359 | 1.14 | 1.35 | 1.99 | 81 | ||||||||||||||||||||||||||
| — | (0.65 | ) | 18.99 | 8.84 | 6,935 | 1.15 | 1.35 | 1.70 | 51 | |||||||||||||||||||||||||||
| — | (0.75 | ) | 18.09 | 2.71 | 5,820 | 1.22 | 2.48 | 1.50 | 74 | |||||||||||||||||||||||||||
| — | (0.86 | ) | 18.36 | 8.09 | 1,398 | 1.27 | 6.16 | 1.56 | 22 | |||||||||||||||||||||||||||
| — | (0.30 | ) | 17.83 | 21.11 | 133 | 1.27 | (d) | 10.38 | (d) | 2.67 | (d) | 26 | ||||||||||||||||||||||||
| $ | — | $ | (0.12 | ) | $ | 19.64 | 3.80 | % | $ | 1,036 | 0.48 | %(d) | 0.60 | %(d) | 2.11 | %(d) | 51 | % | ||||||||||||||||||
| (0.03 | ) | (0.74 | ) | 19.05 | 2.70 | 1,111 | 0.49 | 0.60 | 2.37 | 81 | ||||||||||||||||||||||||||
| — | (0.78 | ) | 19.29 | 9.53 | 1,553 | 0.50 | 0.60 | 1.59 | 51 | |||||||||||||||||||||||||||
| — | (0.86 | ) | 18.36 | 3.42 | 326 | 0.51 | 2.21 | 2.65 | 74 | |||||||||||||||||||||||||||
| — | (0.76 | ) | 18.60 | 8.89 | 179 | 0.52 | 5.75 | 2.75 | 22 | |||||||||||||||||||||||||||
| — | (0.41 | ) | 17.83 | 21.93 | 73 | 0.52 | (d) | 8.81 | (d) | 3.42 | (d) | 26 | ||||||||||||||||||||||||
| $ | — | $ | (0.10 | ) | $ | 20.15 | 3.64 | % | $ | 205 | 0.73 | %(d) | 0.85 | %(d) | 1.85 | %(d) | 51 | % | ||||||||||||||||||
| (0.03 | ) | (0.68 | ) | 19.53 | 2.46 | 152 | 0.74 | 0.85 | 2.36 | 81 | ||||||||||||||||||||||||||
| — | (0.72 | ) | 19.74 | 9.28 | 183 | 0.75 | 0.85 | 1.29 | 51 | |||||||||||||||||||||||||||
| — | (0.54 | ) | 18.77 | 3.18 | 17 | 0.76 | 4.59 | 2.82 | 74 | |||||||||||||||||||||||||||
| — | (0.63 | ) | 18.73 | 8.61 | 15 | 0.77 | 5.62 | 2.70 | 22 | |||||||||||||||||||||||||||
| — | (0.35 | ) | 17.86 | 21.72 | 12 | 0.77 | (d) | 7.31 | (d) | 3.17 | (d) | 26 | ||||||||||||||||||||||||
| $ | — | $ | (0.16 | ) | $ | 19.80 | 3.98 | % | $ | 7,544 | 0.09 | %(d) | 0.21 | %(d) | 2.33 | %(d) | 51 | % | ||||||||||||||||||
| (0.03 | ) | (0.83 | ) | 19.20 | 3.12 | 4,427 | 0.09 | 0.20 | 2.42 | 81 | ||||||||||||||||||||||||||
| — | (0.85 | ) | 19.44 | 10.05 | 4,751 | 0.10 | 0.20 | 1.71 | 51 | |||||||||||||||||||||||||||
| — | (0.58 | ) | 18.49 | 3.69 | 14 | 0.26 | 4.47 | 3.38 | 74 | |||||||||||||||||||||||||||
| — | (1.00 | ) | 18.41 | 9.13 | 13 | 0.32 | 5.13 | 3.20 | 22 | |||||||||||||||||||||||||||
| — | (0.43 | ) | 17.85 | 22.19 | 12 | 0.32 | (d) | 6.06 | (d) | 3.62 | (d) | 26 | ||||||||||||||||||||||||
| $ | — | $ | (0.17 | ) | $ | 19.42 | 4.05 | % | $ | 10,540 | — | %(d)(e) | 0.10 | %(d) | 2.59 | %(d) | 51 | % | ||||||||||||||||||
| (0.03 | ) | (0.84 | ) | 18.83 | 3.23 | 9,487 | — | (e) | 0.12 | 2.96 | 81 | |||||||||||||||||||||||||
| — | (0.85 | ) | 19.08 | 10.11 | 11,294 | — | 0.15 | 2.64 | 51 | |||||||||||||||||||||||||||
| — | (0.91 | ) | 18.16 | 3.77 | 4,904 | 0.16 | 1.81 | 3.53 | 74 | |||||||||||||||||||||||||||
| — | (1.03 | ) | 18.40 | 9.24 | 4,803 | 0.22 | 5.04 | 3.22 | 22 | |||||||||||||||||||||||||||
| — | (0.44 | ) | 17.85 | 22.30 | 3,779 | 0.22 | (d) | 5.96 | (d) | 3.72 | (d) | 26 | ||||||||||||||||||||||||
| $ | — | $ | (0.13 | ) | $ | 19.76 | 3.85 | % | $ | 1,994 | 0.33 | %(d) | 0.45 | %(d) | 2.23 | %(d) | 51 | % | ||||||||||||||||||
| (0.03 | ) | (0.80 | ) | 19.15 | 2.92 | 2,461 | 0.34 | 0.45 | 1.16 | 81 | ||||||||||||||||||||||||||
| — | (0.80 | ) | 19.41 | 9.71 | 15 | 0.35 | 0.45 | 2.59 | 51 | |||||||||||||||||||||||||||
| — | (0.56 | ) | 18.46 | 3.49 | 14 | 0.44 | 4.65 | 3.21 | 74 | |||||||||||||||||||||||||||
| — | (0.96 | ) | 18.40 | 8.94 | 13 | 0.47 | 5.28 | 3.05 | 22 | |||||||||||||||||||||||||||
| — | (0.43 | ) | 17.83 | 22.03 | 12 | 0.47 | (d) | 6.21 | (d) | 3.47 | (d) | 26 | ||||||||||||||||||||||||
| (b) | Total return is calculated assuming a purchase of a share on the first day of the period and a sale of a share on the last day of each period reported. Dividends and distributions, if any, are assumed, for purposes of this calculation, to be reinvested. Total return does not reflect sales charges and includes the effect of fee waivers and reimbursements. Total return may reflect adjustments to conform to generally accepted accounting principles. Total return for a period of less than one year is not annualized. |
| (c) | Does not include expenses of the investment companies in which the Fund invests. |
| (d) | Annualized. |
| (e) | See Note 6 in the Notes to Financial Statements. |
| See accompanying Notes to Financial Statements | | May 31, 2014 | | Semiannual Report | 193 |
Table of Contents
Financial Highlights (cont’d)
For a Share Outstanding for the Period ended:
| Net Asset Value, Beginning of Period | Net Investment Income (a) | Net Realized and Change in Unrealized Gain (Loss) | Total from Investment Operations | Dividends from Net Investment Income | Distributions from Return of Capital | |||||||||||||||||||||
| AllianzGI Global Allocation: | ||||||||||||||||||||||||||
| Class A | ||||||||||||||||||||||||||
5/31/2014+ | $ | 11.90 | $ | 0.16 | $ | 0.39 | $ | 0.55 | $ | (0.16 | ) | $ | — | |||||||||||||
11/30/2013 | 11.07 | 0.31 | 0.95 | 1.26 | (0.43 | ) | — | |||||||||||||||||||
11/30/2012 | 10.30 | 0.25 | 0.84 | 1.09 | (0.32 | ) | — | |||||||||||||||||||
11/30/2011 | 10.58 | 0.25 | (0.14 | ) | 0.11 | (0.39 | ) | — | ||||||||||||||||||
11/30/2010 | 9.84 | 0.26 | 0.85 | 1.11 | (0.37 | ) | — | |||||||||||||||||||
7/1/2009** - 11/30/2009 | 8.45 | 0.08 | 1.35 | 1.43 | (0.04 | ) | — | |||||||||||||||||||
6/30/2009 | 10.62 | 0.30 | (1.98 | ) | (1.68 | ) | (0.40 | ) | (0.09 | ) | ||||||||||||||||
| Class B | ||||||||||||||||||||||||||
5/31/2014+ | $ | 12.13 | $ | 0.13 | $ | 0.39 | $ | 0.52 | $ | (0.11 | ) | $ | — | |||||||||||||
11/30/2013 | 11.27 | 0.26 | 0.94 | 1.20 | (0.34 | ) | — | |||||||||||||||||||
11/30/2012 | 10.48 | 0.21 | 0.81 | 1.02 | (0.23 | ) | — | |||||||||||||||||||
11/30/2011 | 10.74 | 0.22 | (0.20 | ) | 0.02 | (0.28 | ) | — | ||||||||||||||||||
11/30/2010 | 9.92 | 0.22 | 0.83 | 1.05 | (0.23 | ) | — | |||||||||||||||||||
7/1/2009** - 11/30/2009 | 8.53 | 0.05 | 1.36 | 1.41 | (0.02 | ) | — | |||||||||||||||||||
6/30/2009 | 10.70 | 0.23 | (1.99 | ) | (1.76 | ) | (0.33 | ) | (0.08 | ) | ||||||||||||||||
| Class C | ||||||||||||||||||||||||||
5/31/2014+ | $ | 12.04 | $ | 0.12 | $ | 0.39 | $ | 0.51 | $ | (0.11 | ) | $ | — | |||||||||||||
11/30/2013 | 11.19 | 0.23 | 0.96 | 1.19 | (0.34 | ) | — | |||||||||||||||||||
11/30/2012 | 10.41 | 0.17 | 0.85 | 1.02 | (0.24 | ) | — | |||||||||||||||||||
11/30/2011 | 10.69 | 0.18 | (0.16 | ) | 0.02 | (0.30 | ) | — | ||||||||||||||||||
11/30/2010 | 9.89 | 0.19 | 0.85 | 1.04 | (0.24 | ) | — | |||||||||||||||||||
7/1/2009** - 11/30/2009 | 8.50 | 0.05 | 1.36 | 1.41 | (0.02 | ) | — | |||||||||||||||||||
6/30/2009 | 10.68 | 0.24 | (2.01 | ) | (1.77 | ) | (0.33 | ) | (0.08 | ) | ||||||||||||||||
| Class D | ||||||||||||||||||||||||||
5/31/2014+ | $ | 11.85 | $ | 0.14 | $ | 0.41 | $ | 0.55 | $ | (0.16 | ) | $ | — | |||||||||||||
11/30/2013 | 11.03 | 0.23 | 1.03 | 1.26 | (0.44 | ) | — | |||||||||||||||||||
11/30/2012 | 10.27 | 0.24 | 0.84 | 1.08 | (0.32 | ) | — | |||||||||||||||||||
11/30/2011 | 10.56 | 0.17 | (0.06 | ) | 0.11 | (0.40 | ) | — | ||||||||||||||||||
11/30/2010 | 9.83 | 0.23 | 0.87 | 1.10 | (0.37 | ) | — | |||||||||||||||||||
7/1/2009** - 11/30/2009 | 8.44 | 0.08 | 1.35 | 1.43 | (0.04 | ) | — | |||||||||||||||||||
5/4/2009* - 6/30/2009 | 8.20 | 0.02 | 0.27 | 0.29 | (0.04 | ) | (0.01 | ) | ||||||||||||||||||
| + | Unaudited |
| * | Commencement of operations. |
| ** | On April 14, 2009, the Board of Trustees approved a change in the Fund’s fiscal year from June 30 to November 30. |
| (a) | Calculated on average shares outstanding during the period. |
| (b) | Effective May 1, 2009, Fund redemption fees were eliminated. |
| (c) | Total return is calculated assuming a purchase of a share on the first day of the period and a sale of a share on the last day of each period reported. Dividends and distributions, if any, are assumed, for purposes of this calculation, to be reinvested. Total return does not reflect sales charges and includes the effect of fee waivers and reimbursements. Total return may reflect adjustments to conform to generally accepted accounting principles. Total return for a period of less than one year is not annualized. |
| (d) | Does not include expenses of the investment companies in which the Fund invests. |
| (e) | Annualized. |
| (f) | Less than $0.01 per share. |
| 194 | Semiannual Report | | May 31, 2014 | | See accompanying Notes to Financial Statements |
Table of Contents
| Total Dividends and Distributions | Fund Redemption Fees (a)(b) | Net Asset Value, End of Period | Total Return (c) | Net Assets, End of Period (000s) | Ratio of Expenses to Average Net Assets with Fee Waiver/ Reimburse ment (d) | Ratio of Expenses to Average Net Assets without Fee Waiver/ Reimburse ment (d) | Ratio of Net Investment Income to Average Net Assets (d) | Portfolio Turnover Rate | ||||||||||||||||||||||||||||
| $ | (0.16 | ) | $ | — | $ | 12.29 | 4.66 | % | $ | 70,165 | 0.40 | % | 1.39 | % | 2.62 | % | 28 | % | ||||||||||||||||||
| (0.43 | ) | — | 11.90 | 11.79 | 69,565 | 0.41 | 1.36 | 2.68 | 45 | |||||||||||||||||||||||||||
| (0.32 | ) | — | 11.07 | 10.64 | 70,312 | 0.43 | 1.38 | 2.32 | 57 | |||||||||||||||||||||||||||
| (0.39 | ) | — | 10.30 | 0.95 | 73,816 | 0.47 | 1.35 | 2.32 | 64 | |||||||||||||||||||||||||||
| (0.37 | ) | — | 10.58 | 11.56 | 72,415 | 0.51 | 1.42 | 2.58 | 46 | |||||||||||||||||||||||||||
| (0.04 | ) | — | 9.84 | 16.93 | 57,225 | 0.52 | (e) | 1.39 | (e) | 1.98 | (e) | 11 | ||||||||||||||||||||||||
| (0.49 | ) | — | (f) | 8.45 | (15.51 | ) | 47,224 | 0.63 | 0.76 | 3.51 | 69 | |||||||||||||||||||||||||
| $ | (0.11 | ) | $ | — | $ | 12.54 | 4.32 | % | $ | 2,223 | 1.11 | % | 2.36 | % | 2.07 | % | 28 | % | ||||||||||||||||||
| (0.34 | ) | — | 12.13 | 10.84 | 2,874 | 1.14 | 2.18 | 2.25 | 45 | |||||||||||||||||||||||||||
| (0.23 | ) | — | 11.27 | 9.90 | 4,307 | 1.19 | 2.09 | 1.96 | 57 | |||||||||||||||||||||||||||
| (0.28 | ) | — | 10.48 | 0.15 | 9,467 | 1.22 | 2.10 | 1.95 | 64 | |||||||||||||||||||||||||||
| (0.23 | ) | — | 10.74 | 10.86 | 18,030 | 1.26 | 2.19 | 2.13 | 46 | |||||||||||||||||||||||||||
| (0.02 | ) | — | 9.92 | 16.44 | 31,698 | 1.27 | (e) | 2.11 | (e) | 1.23 | (e) | 11 | ||||||||||||||||||||||||
| (0.41 | ) | — | (f) | 8.53 | (16.12 | ) | 29,177 | 1.39 | 1.50 | 2.67 | 69 | |||||||||||||||||||||||||
| $ | (0.11 | ) | $ | — | $ | 12.44 | 4.39 | % | $ | 65,954 | 1.13 | % | 2.09 | % | 1.93 | % | 28 | % | ||||||||||||||||||
| (0.34 | ) | — | 12.04 | 10.81 | 68,756 | 1.14 | 2.10 | 1.98 | 45 | |||||||||||||||||||||||||||
| (0.24 | ) | — | 11.19 | 9.90 | 71,375 | 1.18 | 2.11 | 1.59 | 57 | |||||||||||||||||||||||||||
| (0.30 | ) | — | 10.41 | 0.15 | 78,367 | 1.22 | 2.09 | 1.64 | 64 | |||||||||||||||||||||||||||
| (0.24 | ) | — | 10.69 | 10.65 | 87,546 | 1.26 | 2.16 | 1.93 | 46 | |||||||||||||||||||||||||||
| (0.02 | ) | — | 9.89 | 16.62 | 89,277 | 1.27 | (e) | 2.14 | (e) | 1.23 | (e) | 11 | ||||||||||||||||||||||||
| (0.41 | ) | — | (f) | 8.50 | (16.21 | ) | 80,857 | 1.39 | 1.50 | 2.74 | 69 | |||||||||||||||||||||||||
| $ | (0.16 | ) | $ | — | $ | 12.24 | 4.72 | % | $ | 1,558 | 0.37 | % | 1.37 | % | 2.37 | % | 28 | % | ||||||||||||||||||
| (0.44 | ) | — | 11.85 | 11.70 | 1,189 | 0.37 | 1.39 | 1.99 | 45 | |||||||||||||||||||||||||||
| (0.32 | ) | — | 11.03 | 10.68 | 266 | 0.46 | 1.33 | 2.25 | 57 | |||||||||||||||||||||||||||
| (0.40 | ) | — | 10.27 | 0.95 | 197 | 0.45 | 1.38 | 1.56 | 64 | |||||||||||||||||||||||||||
| (0.37 | ) | — | 10.56 | 11.48 | 34 | 0.51 | 1.41 | 2.28 | 46 | |||||||||||||||||||||||||||
| (0.04 | ) | — | 9.83 | 16.95 | 13 | 0.52 | (e) | 1.38 | (e) | 1.98 | (e) | 11 | ||||||||||||||||||||||||
| (0.05 | ) | — | 8.44 | 3.55 | 10 | 0.52 | (e) | 1.34 | (e) | 1.85 | (e) | 69 | ||||||||||||||||||||||||
| See accompanying Notes to Financial Statements | | May 31, 2014 | | Semiannual Report | 195 |
Table of Contents
Financial Highlights (cont’d)
For a Share Outstanding for the Period ended:
| Net Asset Value, Beginning of Period | Net Investment Income (a) | Net Realized and Change in Unrealized Gain (Loss) | Total from Investment Operations | Dividends from Net Investment Income | Distributions from Return of Capital | |||||||||||||||||||||
| AllianzGI Global Allocation (cont’d) | ||||||||||||||||||||||||||
| Class R | ||||||||||||||||||||||||||
5/31/2014+ | $ | 11.84 | $ | 0.15 | $ | 0.40 | $ | 0.55 | $ | (0.15 | ) | $ | — | |||||||||||||
11/30/2013 | 11.02 | 0.28 | 0.95 | 1.23 | (0.41 | ) | — | |||||||||||||||||||
11/30/2012 | 10.26 | 0.21 | 0.84 | 1.05 | (0.29 | ) | — | |||||||||||||||||||
11/30/2011 | 10.54 | 0.23 | (0.15 | ) | 0.08 | (0.36 | ) | — | ||||||||||||||||||
11/30/2010 | 9.81 | 0.24 | 0.84 | 1.08 | (0.35 | ) | — | |||||||||||||||||||
7/1/2009** - 11/30/2009 | 8.44 | 0.07 | 1.34 | 1.41 | (0.04 | ) | — | |||||||||||||||||||
5/4/2009* - 6/30/2009 | 8.20 | 0.02 | 0.27 | 0.29 | (0.04 | ) | (0.01 | ) | ||||||||||||||||||
| Class P | ||||||||||||||||||||||||||
5/31/2014+ | $ | 11.90 | $ | 0.17 | $ | 0.39 | $ | 0.56 | $ | (0.17 | ) | $ | — | |||||||||||||
11/30/2013 | 11.07 | 0.32 | 0.96 | 1.28 | (0.45 | ) | — | |||||||||||||||||||
11/30/2012 | 10.28 | 0.29 | 0.81 | 1.10 | (0.31 | ) | — | |||||||||||||||||||
11/30/2011 | 10.56 | 0.27 | (0.14 | ) | 0.13 | (0.41 | ) | — | ||||||||||||||||||
11/30/2010 | 9.84 | 0.26 | 0.86 | 1.12 | (0.40 | ) | — | |||||||||||||||||||
7/1/2009** - 11/30/2009 | 8.44 | 0.08 | 1.36 | 1.44 | (0.04 | ) | — | |||||||||||||||||||
5/4/2009* - 6/30/2009 | 8.20 | 0.03 | 0.26 | 0.29 | (0.04 | ) | (0.01 | ) | ||||||||||||||||||
| Institutional Class | ||||||||||||||||||||||||||
5/31/2014+ | $ | 11.78 | $ | 0.17 | $ | 0.39 | $ | 0.56 | $ | (0.17 | ) | $ | — | |||||||||||||
11/30/2013 | 10.97 | 0.32 | 0.95 | 1.27 | (0.46 | ) | — | |||||||||||||||||||
11/30/2012 | 10.21 | 0.26 | 0.84 | 1.10 | (0.34 | ) | — | |||||||||||||||||||
11/30/2011 | 10.48 | 0.27 | (0.13 | ) | 0.14 | (0.41 | ) | — | ||||||||||||||||||
11/30/2010 | 9.77 | 0.29 | 0.83 | 1.12 | (0.41 | ) | — | |||||||||||||||||||
7/1/2009** - 11/30/2009 | 8.38 | 0.09 | 1.34 | 1.43 | (0.04 | ) | — | |||||||||||||||||||
6/30/2009 | 10.55 | 0.33 | (1.97 | ) | (1.64 | ) | (0.43 | ) | (0.10 | ) | ||||||||||||||||
| Administrative Class | ||||||||||||||||||||||||||
5/31/2014+ | $ | 12.17 | $ | 0.16 | $ | 0.41 | $ | 0.57 | $ | (0.16 | ) | $ | — | |||||||||||||
11/30/2013 | 11.30 | 0.43 | 0.85 | 1.28 | (0.41 | ) | — | |||||||||||||||||||
11/30/2012 | 10.51 | 0.26 | 0.84 | 1.10 | (0.31 | ) | — | |||||||||||||||||||
11/30/2011 | 10.78 | 0.13 | (0.01 | ) | 0.12 | (0.39 | ) | — | ||||||||||||||||||
11/30/2010 | 9.83 | 0.27 | 0.86 | 1.13 | (0.18 | ) | — | |||||||||||||||||||
7/1/2009** - 11/30/2009 | 8.44 | 0.08 | 1.35 | 1.43 | (0.04 | ) | — | |||||||||||||||||||
5/4/2009* - 6/30/2009 | 8.20 | 0.03 | 0.26 | 0.29 | (0.04 | ) | (0.01 | ) | ||||||||||||||||||
| + | Unaudited |
| * | Commencement of operations. |
| ** | On April 14, 2009, the Board of Trustees approved a change in the Fund’s fiscal year from June 30 to November 30. |
| (a) | Calculated on average shares outstanding during the period. |
| (b) | Effective May 1, 2009, Fund redemption fees were eliminated. |
| (c) | Total return is calculated assuming a purchase of a share on the first day of the period and a sale of a share on the last day of each period reported. Dividends and distributions, if any, are assumed, for purposes of this calculation, to be reinvested. Total return does not reflect sales charges and includes the effect of fee waivers and reimbursements. Total return may reflect adjustments to conform to generally accepted accounting principles. Total return for a period of less than one year is not annualized. |
| (d) | Does not include expenses of the investment companies in which the Fund invests. |
| (e) | Annualized. |
| (f) | Less than $0.01 per share. |
| 196 | Semiannual Report | | May 31, 2014 | | See accompanying Notes to Financial Statements |
Table of Contents
| Total Dividends and Distributions | Fund Redemption Fees (a)(b) | Net Asset Value, End of Period | Total Return (c) | Net Assets, End of Period (000s) | Ratio of Expenses to Average Net Assets with Fee Waiver/ Reimbursement (d) | Ratio of Expenses to Average Net Assets without Fee Waiver/ Reimbursement (d) | Ratio of Net Investment Income to Average Net Assets (d) | Portfolio Turnover Rate | ||||||||||||||||||||||||||||
| $ | (0.15 | ) | $ | — | $ | 12.24 | 4.60 | % | $ | 17 | 0.56 | % | 1.53 | % | 2.46 | % | 28 | % | ||||||||||||||||||
| (0.41 | ) | — | 11.84 | 11.44 | 17 | 0.59 | 1.54 | 2.42 | 45 | |||||||||||||||||||||||||||
| (0.29 | ) | — | 11.02 | 10.44 | 15 | 0.67 | 1.56 | 2.02 | 57 | |||||||||||||||||||||||||||
| (0.36 | ) | — | 10.26 | 0.73 | 14 | 0.72 | 1.59 | 2.11 | 64 | |||||||||||||||||||||||||||
| (0.35 | ) | — | 10.54 | 11.30 | 13 | 0.76 | 1.64 | 2.38 | 46 | |||||||||||||||||||||||||||
| (0.04 | ) | — | 9.81 | 16.78 | 12 | 0.77 | (e) | 1.63 | (e) | 1.73 | (e) | 11 | ||||||||||||||||||||||||
| (0.05 | ) | — | 8.44 | 3.52 | 10 | 0.77 | (e) | 1.68 | (e) | 1.61 | (e) | 69 | ||||||||||||||||||||||||
| $ | (0.17 | ) | $ | — | $ | 12.29 | 4.79 | % | $ | 1,917 | 0.16 | % | 1.12 | % | 2.81 | % | 28 | % | ||||||||||||||||||
| (0.45 | ) | — | 11.90 | 11.92 | 1,960 | 0.19 | 1.13 | 2.81 | 45 | |||||||||||||||||||||||||||
| (0.31 | ) | — | 11.07 | 10.91 | 1,340 | 0.25 | 1.37 | 2.75 | 57 | |||||||||||||||||||||||||||
| (0.41 | ) | — | 10.28 | 1.13 | 1,996 | 0.27 | 1.22 | 2.52 | 64 | |||||||||||||||||||||||||||
| (0.40 | ) | — | 10.56 | 11.77 | 6,433 | 0.31 | 1.39 | 2.54 | 46 | |||||||||||||||||||||||||||
| (0.04 | ) | — | 9.84 | 16.99 | 1,658 | 0.31 | (e) | 1.21 | (e) | 2.19 | (e) | 11 | ||||||||||||||||||||||||
| (0.05 | ) | — | 8.44 | 3.55 | 1,477 | 0.27 | (e) | 1.37 | (e) | 2.04 | (e) | 69 | ||||||||||||||||||||||||
| $ | (0.17 | ) | $ | — | $ | 12.17 | 4.84 | % | $ | 75,867 | 0.16 | % | 1.13 | % | 2.81 | % | 28 | % | ||||||||||||||||||
| (0.46 | ) | — | 11.78 | 11.90 | 68,675 | 0.16 | 1.11 | 2.81 | 45 | |||||||||||||||||||||||||||
| (0.34 | ) | — | 10.97 | 11.01 | 57,357 | 0.15 | 1.14 | 2.47 | 57 | |||||||||||||||||||||||||||
| (0.41 | ) | — | 10.21 | 1.31 | 47,916 | 0.16 | 1.12 | 2.50 | 64 | |||||||||||||||||||||||||||
| (0.41 | ) | — | 10.48 | 11.88 | 37,093 | 0.21 | 1.15 | 2.91 | 46 | |||||||||||||||||||||||||||
| (0.04 | ) | — | 9.77 | 17.14 | 31,841 | 0.20 | (e) | 1.11 | (e) | 2.30 | (e) | 11 | ||||||||||||||||||||||||
| (0.53 | ) | — | (f) | 8.38 | (15.16 | ) | 16,150 | 0.13 | 0.30 | 3.89 | 69 | |||||||||||||||||||||||||
| $ | (0.16 | ) | $ | — | $ | 12.58 | 4.71 | % | $ | 33 | 0.41 | % | 1.27 | % | 2.62 | % | 28 | % | ||||||||||||||||||
| (0.41 | ) | — | 12.17 | 11.59 | 24 | 0.41 | 1.48 | 3.73 | 45 | |||||||||||||||||||||||||||
| (0.31 | ) | — | 11.30 | 10.70 | 1,653 | 0.40 | 1.42 | 2.35 | 57 | |||||||||||||||||||||||||||
| (0.39 | ) | — | 10.51 | 1.05 | 1,649 | 0.41 | 1.36 | 1.19 | 64 | |||||||||||||||||||||||||||
| (0.18 | ) | — | 10.78 | 11.62 | 14 | 0.46 | 1.37 | 2.68 | 46 | |||||||||||||||||||||||||||
| (0.04 | ) | — | 9.83 | 17.07 | 12 | 0.52 | (e) | 1.36 | (e) | 1.98 | (e) | 11 | ||||||||||||||||||||||||
| (0.05 | ) | — | 8.44 | 3.57 | 10 | 0.32 | (e) | 1.20 | (e) | 2.05 | (e) | 69 | ||||||||||||||||||||||||
| See accompanying Notes to Financial Statements | | May 31, 2014 | | Semiannual Report | 197 |
Table of Contents
Financial Highlights (cont’d)
For a Share Outstanding for the Period ended:
| Net Asset Value, Beginning of Period | Net Investment Income (a) | Net Realized and Change in Unrealized Gain (Loss) | Total from Investment Operations | Dividends from Net Investment Income | Distributions from Net Realized Capital Gains | |||||||||||||||||||||
| AllianzGI Global Growth Allocation: | ||||||||||||||||||||||||||
| Class A | ||||||||||||||||||||||||||
5/31/2014+ | $ | 24.70 | $ | 0.27 | $ | 0.84 | $ | 1.11 | $ | (0.72 | ) | $ | (2.76 | ) | ||||||||||||
11/30/2013 | 22.04 | 0.42 | 3.07 | 3.49 | (0.61 | ) | (0.22 | ) | ||||||||||||||||||
11/30/2012 | 20.72 | 0.51 | 1.71 | 2.22 | (0.59 | ) | (0.31 | ) | ||||||||||||||||||
11/30/2011 | 22.03 | 0.45 | (0.33 | ) | 0.12 | (0.91 | ) | (0.52 | ) | |||||||||||||||||
11/30/2010 | 19.96 | 0.47 | 2.09 | 2.56 | (0.35 | ) | (0.14 | ) | ||||||||||||||||||
4/27/2009* - 11/30/2009 | 15.00 | 0.17 | 4.79 | 4.96 | — | — | ||||||||||||||||||||
| Class C | ||||||||||||||||||||||||||
5/31/2014+ | $ | 24.28 | $ | 0.17 | $ | 0.84 | $ | 1.01 | $ | (0.53 | ) | $ | (2.76 | ) | ||||||||||||
11/30/2013 | 21.71 | 0.30 | 2.97 | 3.27 | (0.48 | ) | (0.22 | ) | ||||||||||||||||||
11/30/2012 | 20.49 | 0.30 | 1.74 | 2.04 | (0.51 | ) | (0.31 | ) | ||||||||||||||||||
11/30/2011 | 21.81 | 0.24 | (0.28 | ) | (0.04 | ) | (0.76 | ) | (0.52 | ) | ||||||||||||||||
11/30/2010 | 19.87 | 0.44 | 1.96 | 2.40 | (0.32 | ) | (0.14 | ) | ||||||||||||||||||
4/27/2009* - 11/30/2009 | 15.00 | 0.09 | 4.78 | 4.87 | — | — | ||||||||||||||||||||
| Class D | ||||||||||||||||||||||||||
5/31/2014+ | $ | 24.58 | $ | 0.29 | $ | 0.82 | $ | 1.11 | $ | (0.74 | ) | $ | (2.76 | ) | ||||||||||||
11/30/2013 | 22.00 | 0.31 | 3.16 | 3.47 | (0.67 | ) | (0.22 | ) | ||||||||||||||||||
11/30/2012 | 20.78 | 0.37 | 1.85 | 2.22 | (0.69 | ) | (0.31 | ) | ||||||||||||||||||
11/30/2011 | 22.06 | 0.48 | (0.36 | ) | 0.12 | (0.88 | ) | (0.52 | ) | |||||||||||||||||
11/30/2010 | 19.96 | 0.63 | 1.94 | 2.57 | (0.33 | ) | (0.14 | ) | ||||||||||||||||||
4/27/2009* - 11/30/2009 | 15.00 | 0.17 | 4.79 | 4.96 | — | — | ||||||||||||||||||||
| Class R | ||||||||||||||||||||||||||
5/31/2014+ | $ | 24.62 | $ | 0.27 | $ | 0.81 | $ | 1.08 | $ | (0.73 | ) | $ | (2.76 | ) | ||||||||||||
11/30/2013 | 21.90 | 0.23 | 3.20 | 3.43 | (0.49 | ) | (0.22 | ) | ||||||||||||||||||
11/30/2012 | 20.73 | 0.39 | 1.77 | 2.16 | (0.68 | ) | (0.31 | ) | ||||||||||||||||||
11/30/2011 | 22.01 | 0.40 | (0.34 | ) | 0.06 | (0.82 | ) | (0.52 | ) | |||||||||||||||||
11/30/2010 | 19.93 | 0.62 | 1.91 | 2.53 | (0.31 | ) | (0.14 | ) | ||||||||||||||||||
4/27/2009* - 11/30/2009 | 15.00 | 0.14 | 4.79 | 4.93 | — | — | ||||||||||||||||||||
| Class P | ||||||||||||||||||||||||||
5/31/2014+ | $ | 24.71 | $ | 0.28 | $ | 0.85 | $ | 1.13 | $ | (0.76 | ) | $ | (2.76 | ) | ||||||||||||
11/30/2013 | 22.08 | 0.38 | 3.14 | 3.52 | (0.67 | ) | (0.22 | ) | ||||||||||||||||||
11/30/2012 | 20.85 | 0.49 | 1.77 | 2.26 | (0.72 | ) | (0.31 | ) | ||||||||||||||||||
11/30/2011 | 22.12 | 0.63 | (0.48 | ) | 0.15 | (0.90 | ) | (0.52 | ) | |||||||||||||||||
11/30/2010 | 19.99 | 0.71 | 1.91 | 2.62 | (0.35 | ) | (0.14 | ) | ||||||||||||||||||
4/27/2009* - 11/30/2009 | 15.00 | 0.19 | 4.80 | 4.99 | — | — | ||||||||||||||||||||
| Institutional Class | ||||||||||||||||||||||||||
5/31/2014+ | $ | 24.74 | $ | 0.28 | $ | 0.86 | $ | 1.14 | $ | (0.75 | ) | $ | (2.76 | ) | ||||||||||||
11/30/2013 | 22.10 | 0.56 | 2.99 | 3.55 | (0.69 | ) | (0.22 | ) | ||||||||||||||||||
11/30/2012 | 20.87 | 0.51 | 1.78 | 2.29 | (0.75 | ) | (0.31 | ) | ||||||||||||||||||
11/30/2011 | 22.14 | 0.65 | (0.48 | ) | 0.17 | (0.92 | ) | (0.52 | ) | |||||||||||||||||
11/30/2010 | 20.00 | 0.73 | 1.91 | 2.64 | (0.36 | ) | (0.14 | ) | ||||||||||||||||||
4/27/2009* - 11/30/2009 | 15.00 | 0.20 | 4.80 | 5.00 | — | — | ||||||||||||||||||||
| Administrative Class | ||||||||||||||||||||||||||
5/31/2014+ | $ | 24.67 | $ | 0.26 | $ | 0.85 | $ | 1.11 | $ | (0.72 | ) | $ | (2.76 | ) | ||||||||||||
11/30/2013 | 22.04 | 0.48 | 3.01 | 3.49 | (0.64 | ) | (0.22 | ) | ||||||||||||||||||
11/30/2012 | 20.81 | 0.46 | 1.77 | 2.23 | (0.69 | ) | (0.31 | ) | ||||||||||||||||||
11/30/2011 | 22.08 | 0.59 | (0.47 | ) | 0.12 | (0.87 | ) | (0.52 | ) | |||||||||||||||||
11/30/2010 | 19.97 | 0.68 | 1.90 | 2.58 | (0.33 | ) | (0.14 | ) | ||||||||||||||||||
4/27/2009* - 11/30/2009 | 15.00 | 0.17 | 4.80 | 4.97 | — | — | ||||||||||||||||||||
| + | Unaudited |
| * | Commencement of operations. |
| (a) | Calculated on average shares outstanding during the period. |
| (b) | Total return is calculated assuming a purchase of a share on the first day of the period and a sale of a share on the last day of each period reported. Dividends and distributions, if any, are assumed, for purposes of this calculation, to be reinvested. Total return does not reflect sales charges and includes the effect of fee waivers and reimbursements. Total return may reflect adjustments to conform to generally accepted accounting principles. Total return for a period of less than one year is not annualized. |
| 198 | Semiannual Report | | May 31, 2014 | | See accompanying Notes to Financial Statements |
Table of Contents
| Total Dividends and Distributions | Net Asset Value, End of Period | Total Return (b) | Net Assets, End of Period (000s) | Ratio of Expenses to Average Net Assets with Fee Waiver/ Reimbursement (c) | Ratio of Expenses to Average Net Assets without Fee Waiver/ Reimbursement (c) | Ratio of Net Investment Income to Average Net Assets (c) | Portfolio Turnover Rate | |||||||||||||||||||||||||
| $ | (3.48 | ) | $ | 22.33 | 5.08 | % | $ | 1,213 | 0.40 | %(d) | 4.38 | %(d) | 2.43 | %(d) | 31 | % | ||||||||||||||||
| (0.83 | ) | 24.70 | 16.42 | 1,344 | 0.40 | 3.84 | 1.82 | 101 | ||||||||||||||||||||||||
| (0.90 | ) | 22.04 | 11.17 | 841 | 0.41 | 4.12 | 2.40 | 51 | ||||||||||||||||||||||||
| (1.43 | ) | 20.72 | 0.17 | 1,283 | 0.47 | 3.23 | 2.02 | 85 | ||||||||||||||||||||||||
| (0.49 | ) | 22.03 | 13.08 | 815 | 0.54 | 5.64 | 2.29 | 66 | ||||||||||||||||||||||||
| — | 19.96 | 33.07 | 41 | 0.54 | (d) | 6.46 | (d) | 1.57 | (d) | 6 | ||||||||||||||||||||||
| $ | (3.29 | ) | $ | 22.00 | 4.65 | % | $ | 1,425 | 1.18 | %(d) | 5.13 | %(d) | 1.61 | %(d) | 31 | % | ||||||||||||||||
| (0.70 | ) | 24.28 | 15.52 | 1,455 | 1.18 | 4.53 | 1.33 | 101 | ||||||||||||||||||||||||
| (0.82 | ) | 21.71 | 10.34 | 1,277 | 1.18 | 4.65 | 1.44 | 51 | ||||||||||||||||||||||||
| (1.28 | ) | 20.49 | (0.53 | ) | 1,241 | 1.20 | 4.46 | 1.13 | 85 | |||||||||||||||||||||||
| (0.46 | ) | 21.81 | 12.34 | 497 | 1.29 | 6.28 | 2.18 | 66 | ||||||||||||||||||||||||
| — | 19.87 | 32.47 | 181 | 1.29 | (d) | 7.21 | (d) | 0.82 | (d) | 6 | ||||||||||||||||||||||
| $ | (3.50 | ) | $ | 22.19 | 5.10 | % | $ | 220 | 0.40 | %(d) | 4.40 | %(d) | 2.63 | %(d) | 31 | % | ||||||||||||||||
| (0.89 | ) | 24.58 | 16.43 | 413 | 0.40 | 4.16 | 1.36 | 101 | ||||||||||||||||||||||||
| (1.00 | ) | 22.00 | 11.13 | 105 | 0.41 | 3.95 | 1.73 | 51 | ||||||||||||||||||||||||
| (1.40 | ) | 20.78 | 0.19 | 37 | 0.45 | 3.60 | 2.20 | 85 | ||||||||||||||||||||||||
| (0.47 | ) | 22.06 | 13.15 | 22 | 0.54 | 5.48 | 3.05 | 66 | ||||||||||||||||||||||||
| — | 19.96 | 33.07 | 13 | 0.54 | (d) | 6.46 | (d) | 1.57 | (d) | 6 | ||||||||||||||||||||||
| $ | (3.49 | ) | $ | 22.21 | 4.95 | % | $ | 136 | 0.63 | %(d) | 4.65 | %(d) | 2.47 | %(d) | 31 | % | ||||||||||||||||
| (0.71 | ) | 24.62 | 16.13 | 111 | 0.63 | 4.28 | 1.00 | 101 | ||||||||||||||||||||||||
| (0.99 | ) | 21.90 | 10.89 | 38 | 0.65 | 4.16 | 1.87 | 51 | ||||||||||||||||||||||||
| (1.34 | ) | 20.73 | (0.08 | ) | 36 | 0.71 | 3.90 | 1.84 | 85 | |||||||||||||||||||||||
| (0.45 | ) | 22.01 | 12.91 | 15 | 0.79 | 5.61 | 3.04 | 66 | ||||||||||||||||||||||||
| — | 19.93 | 32.87 | 13 | 0.79 | (d) | 6.71 | (d) | 1.32 | (d) | 6 | ||||||||||||||||||||||
| $ | (3.52 | ) | $ | 22.32 | 5.16 | % | $ | 44 | 0.23 | %(d) | 4.22 | %(d) | 2.53 | %(d) | 31 | % | ||||||||||||||||
| (0.89 | ) | 24.71 | 16.62 | 41 | 0.23 | 3.76 | 1.65 | 101 | ||||||||||||||||||||||||
| (1.03 | ) | 22.08 | 11.35 | 17 | 0.23 | 3.67 | 2.32 | 51 | ||||||||||||||||||||||||
| (1.42 | ) | 20.85 | 0.34 | 15 | 0.27 | 3.26 | 2.84 | 85 | ||||||||||||||||||||||||
| (0.49 | ) | 22.12 | 13.38 | 15 | 0.34 | 5.21 | 3.48 | 66 | ||||||||||||||||||||||||
| — | 19.99 | 33.27 | 13 | 0.34 | (d) | 6.31 | (d) | 1.77 | (d) | 6 | ||||||||||||||||||||||
| $ | (3.51 | ) | $ | 22.37 | 5.23 | % | $ | 3,434 | 0.13 | %(d) | 4.14 | %(d) | 2.57 | %(d) | 31 | % | ||||||||||||||||
| (0.91 | ) | 24.74 | 16.71 | 3,296 | 0.13 | 3.48 | 2.43 | 101 | ||||||||||||||||||||||||
| (1.06 | ) | 22.10 | 11.51 | 5,008 | 0.13 | 3.84 | 2.42 | 51 | ||||||||||||||||||||||||
| (1.44 | ) | 20.87 | 0.43 | 4,483 | 0.17 | 3.16 | 2.95 | 85 | ||||||||||||||||||||||||
| (0.50 | ) | 22.14 | 13.49 | 4,484 | 0.24 | 5.11 | 3.58 | 66 | ||||||||||||||||||||||||
| — | 20.00 | 33.33 | 3,920 | 0.24 | (d) | 6.21 | (d) | 1.87 | (d) | 6 | ||||||||||||||||||||||
| $ | (3.48 | ) | $ | 22.30 | 5.07 | % | $ | 21 | 0.38 | %(d) | 4.38 | %(d) | 2.38 | %(d) | 31 | % | ||||||||||||||||
| (0.86 | ) | 24.67 | 16.48 | 20 | 0.38 | 3.79 | 2.09 | 101 | ||||||||||||||||||||||||
| (1.00 | ) | 22.04 | 11.20 | 17 | 0.38 | 3.82 | 2.17 | 51 | ||||||||||||||||||||||||
| (1.39 | ) | 20.81 | 0.20 | 15 | 0.42 | 3.41 | 2.69 | 85 | ||||||||||||||||||||||||
| (0.47 | ) | 22.08 | 13.20 | 15 | 0.49 | 5.36 | 3.33 | 66 | ||||||||||||||||||||||||
| — | 19.97 | 33.13 | 13 | 0.49 | (d) | 6.46 | (d) | 1.62 | (d) | 6 | ||||||||||||||||||||||
| (c) | Does not include expenses of the investment companies in which the Fund invests. |
| (d) | Annualized. |
| See accompanying Notes to Financial Statements | | May 31, 2014 | | Semiannual Report | 199 |
Table of Contents
Financial Highlights (cont’d)
For a Share Outstanding for the Period ended:
Net Asset | Net Investment Income (a) | Net Realized and Change in Unrealized Gain | Total from Investment Operations | Dividends from Net Investment Income | Distributions from Net Realized Capital Gains | |||||||||||||||||||||
| AllianzGI Behavioral Advantage Large Cap: | ||||||||||||||||||||||||||
| Class A | ||||||||||||||||||||||||||
5/31/2014+ | $ | 23.72 | $ | 0.12 | $ | 1.06 | $ | 1.18 | $ | (0.24 | ) | $ | (0.84 | ) | ||||||||||||
11/30/2013 | 19.04 | 0.24 | 5.73 | 5.97 | (0.20 | ) | (1.09 | ) | ||||||||||||||||||
11/30/2012 | 16.05 | 0.29 | 2.76 | 3.05 | (0.06 | ) | — | |||||||||||||||||||
9/8/2011* - 11/30/2011 | 15.00 | 0.04 | 1.01 | 1.05 | — | — | ||||||||||||||||||||
| Class C | ||||||||||||||||||||||||||
5/31/2014+ | $ | 23.34 | $ | 0.03 | $ | 1.05 | $ | 1.08 | $ | (0.14 | ) | $ | (0.84 | ) | ||||||||||||
11/30/2013 | 18.90 | 0.09 | 5.65 | 5.74 | (0.21 | ) | (1.09 | ) | ||||||||||||||||||
11/30/2012 | 16.02 | 0.16 | 2.74 | 2.90 | (0.02 | ) | — | |||||||||||||||||||
9/8/2011* - 11/30/2011 | 15.00 | 0.01 | 1.01 | 1.02 | — | — | ||||||||||||||||||||
| Class D | ||||||||||||||||||||||||||
5/31/2014+ | $ | 23.50 | $ | 0.12 | $ | 1.06 | $ | 1.18 | $ | (0.06 | ) | $ | (0.84 | ) | ||||||||||||
11/30/2013 | 19.04 | 0.23 | 5.68 | 5.91 | (0.36 | ) | (1.09 | ) | ||||||||||||||||||
11/30/2012 | 16.05 | 0.28 | 2.77 | 3.05 | (0.06 | ) | — | |||||||||||||||||||
9/8/2011* - 11/30/2011 | 15.00 | 0.04 | 1.01 | 1.05 | — | — | ||||||||||||||||||||
| Class P | ||||||||||||||||||||||||||
5/31/2014+ | $ | 23.74 | $ | 0.14 | $ | 1.07 | $ | 1.21 | $ | (0.15 | ) | $ | (0.84 | ) | ||||||||||||
11/30/2013 | 19.09 | 0.29 | 5.71 | 6.00 | (0.26 | ) | (1.09 | ) | ||||||||||||||||||
11/30/2012 | 16.05 | 0.32 | 2.79 | 3.11 | (0.07 | ) | — | |||||||||||||||||||
9/8/2011* - 11/30/2011 | 15.00 | 0.05 | 1.00 | 1.05 | — | — | ||||||||||||||||||||
| Institutional Class | ||||||||||||||||||||||||||
5/31/2014+ | $ | 23.74 | $ | 0.15 | $ | 1.07 | $ | 1.22 | $ | (0.19 | ) | $ | (0.84 | ) | ||||||||||||
11/30/2013 | 19.10 | 0.30 | 5.73 | 6.03 | (0.30 | ) | (1.09 | ) | ||||||||||||||||||
11/30/2012 | 16.06 | 0.34 | 2.77 | 3.11 | (0.07 | ) | — | |||||||||||||||||||
9/8/2011* - 11/30/2011 | 15.00 | 0.05 | 1.01 | 1.06 | — | — | ||||||||||||||||||||
| AllianzGI Best Styles Global Equity: | ||||||||||||||||||||||||||
| Class R6 | ||||||||||||||||||||||||||
12/2/2013* - 5/31/2014+ | $ | 15.00 | $ | 0.24 | $ | 0.78 | $ | 1.02 | $ | — | $ | — | ||||||||||||||
| + | Unaudited |
| * | Commencement of operations. |
| (a) | Calculated on average shares outstanding during the period. |
| (b) | Total return is calculated assuming a purchase of a share on the first day of the period and a sale of a share on the last day of each period reported. Dividends and distributions, if any, are assumed, for purposes of this calculation, to be reinvested. Total return does not reflect sales charges and includes the effect of fee waivers and reimbursements. Total return may reflect adjustments to conform to generally accepted accounting principles. Total return for a period of less than one year is not annualized. |
| (c) | Annualized. |
| (d) | Less than 1%. |
| 200 | Semiannual Report | | May 31, 2014 | | See accompanying Notes to Financial Statements |
Table of Contents
| Total Dividends and Distributions | Net Asset Value, End of Period | Total Return (b) | Net Assets, End of Period (000s) | Ratio of Expenses to Average Net Assets with Fee Waiver/ Reimbursement | Ratio of Expenses to Average Net Assets without Fee Waiver/ Reimbursement | Ratio of Net Investment Income to Average Net Assets | Portfolio Turnover Rate | |||||||||||||||||||||||||
| $ | (1.08 | ) | $ | 23.82 | 5.25 | % | $ | 9,702 | 0.82 | %(c) | 1.03 | %(c) | 1.02 | %(c) | 50 | % | ||||||||||||||||
| (1.29 | ) | 23.72 | 33.61 | 8,607 | 0.83 | 1.25 | 1.09 | 64 | ||||||||||||||||||||||||
| (0.06 | ) | 19.04 | 19.07 | 49 | 0.90 | 2.76 | 1.59 | 76 | ||||||||||||||||||||||||
| — | 16.05 | 7.00 | 11 | 0.90 | (c) | 2.84 | (c) | 1.14 | (c) | — | (d) | |||||||||||||||||||||
| $ | (0.98 | ) | $ | 23.44 | 4.87 | % | $ | 386 | 1.57 | %(c) | 1.79 | %(c) | 0.27 | %(c) | 50 | % | ||||||||||||||||
| (1.30 | ) | 23.34 | 32.60 | 204 | 1.59 | 2.08 | 0.44 | 64 | ||||||||||||||||||||||||
| (0.02 | ) | 18.90 | 18.15 | 64 | 1.65 | 3.62 | 0.89 | 76 | ||||||||||||||||||||||||
| — | 16.02 | 6.80 | 10 | 1.65 | (c) | 3.59 | (c) | 0.38 | (c) | — | (d) | |||||||||||||||||||||
| $ | (0.90 | ) | $ | 23.78 | 5.26 | % | $ | 303 | 0.81 | %(c) | 1.30 | %(c) | 1.07 | %(c) | 50 | % | ||||||||||||||||
| (1.45 | ) | 23.50 | 33.57 | 183 | 0.85 | 2.08 | 1.15 | 64 | ||||||||||||||||||||||||
| (0.06 | ) | 19.04 | 19.07 | 19 | 0.90 | 2.61 | 1.55 | 76 | ||||||||||||||||||||||||
| — | 16.05 | 7.00 | 11 | 0.90 | (c) | 2.84 | (c) | 1.14 | (c) | — | (d) | |||||||||||||||||||||
| $ | (0.99 | ) | $ | 23.96 | 5.37 | % | $ | 18 | 0.65 | %(c) | 0.87 | %(c) | 1.18 | %(c) | 50 | % | ||||||||||||||||
| (1.35 | ) | 23.74 | 33.83 | 17 | 0.65 | 1.20 | 1.42 | 64 | ||||||||||||||||||||||||
| (0.07 | ) | 19.09 | 19.43 | 13 | 0.65 | 2.38 | 1.76 | 76 | ||||||||||||||||||||||||
| — | 16.05 | 7.00 | 11 | 0.65 | (c) | 2.70 | (c) | 1.39 | (c) | — | (d) | |||||||||||||||||||||
| $ | (1.03 | ) | $ | 23.93 | 5.42 | % | $ | 71,283 | 0.55 | %(c) | 0.77 | %(c) | 1.30 | %(c) | 50 | % | ||||||||||||||||
| (1.39 | ) | 23.74 | 34.02 | 48,281 | 0.55 | 1.05 | 1.44 | 64 | ||||||||||||||||||||||||
| (0.07 | ) | 19.10 | 19.46 | 17,172 | 0.55 | 2.32 | 1.88 | 76 | ||||||||||||||||||||||||
| — | 16.06 | 7.07 | 10,705 | 0.55 | (c) | 2.58 | (c) | 1.48 | (c) | — | (d) | |||||||||||||||||||||
| $ | — | $ | 16.02 | 6.80 | % | $ | 36,817 | 0.40 | %(c) | 1.48 | %(c) | 3.19 | %(c) | 21 | % | |||||||||||||||||
| See accompanying Notes to Financial Statements | | May 31, 2014 | | Semiannual Report | 201 |
Table of Contents
Financial Highlights (cont’d)
For a Share Outstanding for the Period ended:
| Net Asset Value, Beginning of Period | Net Investment Income (Loss) (a) | Net Realized and Change in Unrealized Gain (Loss) | Total from Investment Operations | Dividends from Net Investment Income | Distributions from Net Realized Capital Gains | |||||||||||||||||||||
| AllianzGI China Equity: | ||||||||||||||||||||||||||
| Class A | ||||||||||||||||||||||||||
5/31/2014+ | $ | 16.85 | $ | (0.01 | ) | $ | (1.12 | ) | $ | (1.13 | ) | $ | (0.07 | ) | $ | — | ||||||||||
11/30/2013 | 14.78 | 0.15 | 2.13 | 2.28 | (0.21 | ) | — | |||||||||||||||||||
11/30/2012 | 15.01 | 0.16 | 0.91 | 1.07 | (0.10 | ) | (1.20 | ) | ||||||||||||||||||
11/30/2011 | 19.81 | 0.60 | (4.58 | ) | (3.98 | ) | — | (e) | (0.82 | ) | ||||||||||||||||
6/7/2010* - 11/30/2010 | 15.00 | (0.09 | ) | 4.90 | 4.81 | — | — | |||||||||||||||||||
| Class C | ||||||||||||||||||||||||||
5/31/2014+ | $ | 16.78 | $ | (0.11 | ) | $ | (1.08 | ) | $ | (1.19 | ) | $ | — | (e) | $ | — | ||||||||||
11/30/2013 | 14.63 | (0.03 | ) | 2.18 | 2.15 | — | (e) | — | ||||||||||||||||||
11/30/2012 | 14.88 | 0.06 | 0.89 | 0.95 | — | (e) | (1.20 | ) | ||||||||||||||||||
11/30/2011 | 19.78 | (0.10 | ) | (3.98 | ) | (4.08 | ) | — | (e) | (0.82 | ) | |||||||||||||||
6/7/2010* - 11/30/2010 | 15.00 | (0.17 | ) | 4.95 | 4.78 | — | — | |||||||||||||||||||
| Class D | ||||||||||||||||||||||||||
5/31/2014+ | $ | 16.86 | $ | (0.02 | ) | $ | (1.12 | ) | $ | (1.14 | ) | $ | — | (e) | $ | — | ||||||||||
11/30/2013 | 14.91 | 0.07 | 2.23 | 2.30 | (0.35 | ) | — | |||||||||||||||||||
11/30/2012 | 15.04 | 0.16 | 0.91 | 1.07 | — | (e) | (1.20 | ) | ||||||||||||||||||
11/30/2011 | 19.84 | 0.02 | (3.99 | ) | (3.97 | ) | (0.01 | ) | (0.82 | ) | ||||||||||||||||
6/7/2010* - 11/30/2010 | 15.00 | (0.08 | ) | 4.92 | 4.84 | — | — | |||||||||||||||||||
| Class P | ||||||||||||||||||||||||||
5/31/2014+ | $ | 16.99 | $ | — | (f) | $ | (1.13 | ) | $ | (1.13 | ) | $ | — | (e) | $ | — | ||||||||||
11/30/2013 | 14.78 | 0.23 | 2.11 | 2.34 | (0.13 | ) | — | |||||||||||||||||||
11/30/2012 | 15.10 | 0.01 | 1.08 | 1.09 | (0.21 | ) | (1.20 | ) | ||||||||||||||||||
11/30/2011 | 19.87 | 0.12 | (4.06 | ) | (3.94 | ) | (0.01 | ) | (0.82 | ) | ||||||||||||||||
6/7/2010* - 11/30/2010 | 15.00 | (0.02 | ) | 4.89 | 4.87 | — | — | |||||||||||||||||||
| Institutional Class | ||||||||||||||||||||||||||
5/31/2014+ | $ | 16.82 | $ | 0.01 | $ | (1.12 | ) | $ | (1.11 | ) | $ | (0.12 | ) | $ | — | |||||||||||
11/30/2013 | 14.81 | 0.20 | 2.13 | 2.33 | (0.32 | ) | — | |||||||||||||||||||
11/30/2012 | 15.12 | 0.20 | 0.90 | 1.10 | (0.21 | ) | (1.20 | ) | ||||||||||||||||||
11/30/2011 | 19.88 | 0.18 | (4.10 | ) | (3.92 | ) | (0.02 | ) | (0.82 | ) | ||||||||||||||||
6/7/2010* - 11/30/2010 | 15.00 | (0.01 | ) | 4.89 | 4.88 | — | — | |||||||||||||||||||
| + | Unaudited |
| * | Commencement of operations. |
| (a) | Calculated on average shares outstanding during the period. |
| (b) | Total return is calculated assuming a purchase of a share on the first day of the period and a sale of a share on the last day of each period reported. Dividends and distributions, if any, are assumed, for purposes of this calculation, to be reinvested. Total return does not reflect sales charges and includes the effect of fee waivers and reimbursements. Total return may reflect adjustments to conform to generally accepted accounting principles. Total return for a period of less than one year is not annualized. |
| (c) | Annualized. |
| (d) | Payments from Affiliates increased the net asset value and the total return by $0.12 and 0.82%, respectively. |
| (e) | Less than $(0.01) per share. |
| (f) | Less than $0.01 per share. |
| 202 | Semiannual Report | | May 31, 2014 | | See accompanying Notes to Financial Statements |
Table of Contents
| Total Dividends and Distributions | Net Asset Value, End of Period | Total Return (b) | Net Assets, End of Period (000s) | Ratio of Expenses to Average Net Assets with Fee Waiver/ Reimbursement | Ratio of Expenses to Average Net Assets without Fee Waiver/ Reimbursement | Ratio of Net Investment Income (Loss) to Average Net Assets | Portfolio Turnover Rate | |||||||||||||||||||||||||
| $ | (0.07 | ) | $ | 15.65 | (6.71 | )% | $ | 129 | 1.72 | %(c) | 6.29 | %(c) | (0.16 | )%(c) | 33 | % | ||||||||||||||||
| (0.21 | ) | 16.85 | (d) | 15.58 | (d) | 137 | 1.73 | 5.88 | 0.96 | 36 | ||||||||||||||||||||||
| (1.30 | ) | 14.78 | 8.35 | 137 | 1.72 | 6.54 | 1.15 | 36 | ||||||||||||||||||||||||
| (0.82 | ) | 15.01 | (20.45 | ) | 191 | 1.73 | 5.29 | 3.25 | 132 | |||||||||||||||||||||||
| — | 19.81 | 32.07 | 239 | 1.90 | (c) | 8.21 | (c) | (0.99 | )(c) | 21 | ||||||||||||||||||||||
| $ | — | (e) | $ | 15.59 | (7.09 | )% | $ | 33 | 2.53 | %(c) | 6.93 | %(c) | (1.40 | )%(c) | 33 | % | ||||||||||||||||
| — | (e) | 16.78 | (d) | 14.70 | (d) | 52 | 2.56 | 6.59 | (0.20 | ) | 36 | |||||||||||||||||||||
| (1.20 | ) | 14.63 | 7.49 | 55 | 2.52 | 8.46 | 0.43 | 36 | ||||||||||||||||||||||||
| (0.82 | ) | 14.88 | (21.02 | ) | 108 | 2.56 | 6.74 | (0.56 | ) | 132 | ||||||||||||||||||||||
| — | 19.78 | 31.87 | 387 | 2.65 | (c) | 8.88 | (c) | (1.88 | )(c) | 21 | ||||||||||||||||||||||
| $ | — | (e) | $ | 15.72 | (6.76 | )% | $ | 201 | 1.77 | %(c) | 11.52 | %(c) | (0.24 | )%(c) | 33 | % | ||||||||||||||||
| (0.35 | ) | 16.86 | (d) | 15.64 | (d) | 220 | 1.77 | 13.23 | 0.42 | 36 | ||||||||||||||||||||||
| (1.20 | ) | 14.91 | 8.26 | 362 | 1.74 | 15.31 | 1.14 | 36 | ||||||||||||||||||||||||
| (0.83 | ) | 15.04 | (20.40 | ) | 232 | 1.77 | 6.76 | 0.14 | 132 | |||||||||||||||||||||||
| — | 19.84 | 32.27 | 386 | 1.90 | (c) | 8.10 | (c) | (0.91 | )(c) | 21 | ||||||||||||||||||||||
| $ | — | (e) | $ | 15.86 | (6.65 | )% | $ | 12 | 1.51 | %(c) | 6.01 | %(c) | 0.03 | %(c) | 33 | % | ||||||||||||||||
| (0.13 | ) | 16.99 | (d) | 15.93 | (d) | 13 | 1.51 | 5.73 | 1.53 | 36 | ||||||||||||||||||||||
| (1.41 | ) | 14.78 | 8.51 | 25 | 1.50 | 5.74 | 0.08 | 36 | ||||||||||||||||||||||||
| (0.83 | ) | 15.10 | (20.18 | ) | 124 | 1.51 | 8.18 | 0.79 | 132 | |||||||||||||||||||||||
| — | 19.87 | 32.47 | 13 | 1.65 | (c) | 8.13 | (c) | (0.19 | )(c) | 21 | ||||||||||||||||||||||
| $ | (0.12 | ) | $ | 15.59 | (6.62 | )% | $ | 3,817 | 1.45 | %(c) | 5.92 | %(c) | 0.10 | %(c) | 33 | % | ||||||||||||||||
| (0.32 | ) | 16.82 | (d) | 15.99 | (d) | 4,076 | 1.45 | 5.69 | 1.31 | 36 | ||||||||||||||||||||||
| (1.41 | ) | 14.81 | 8.64 | 3,490 | 1.43 | 6.19 | 1.41 | 36 | ||||||||||||||||||||||||
| (0.84 | ) | 15.12 | (20.11 | ) | 3,216 | 1.45 | 5.96 | 1.04 | 132 | |||||||||||||||||||||||
| — | 19.88 | 32.53 | 3,923 | 1.55 | (c) | 8.01 | (c) | (0.08 | )(c) | 21 | ||||||||||||||||||||||
| See accompanying Notes to Financial Statements | | May 31, 2014 | | Semiannual Report | 203 |
Table of Contents
Financial Highlights (cont’d)
For a Share Outstanding for the Period ended:
| Net Asset Value, Beginning of Period | Net Investment Income (a) | Net Realized and Change in Unrealized Gain (Loss) | Total from Investment Operations | Dividends from Net Investment Income | Distributions from Net Realized Capital Gains | |||||||||||||||||||||
| AllianzGI Convertible: | ||||||||||||||||||||||||||
| Class A | ||||||||||||||||||||||||||
5/31/2014+ | $ | 34.91 | $ | 0.22 | $ | 2.19 | $ | 2.41 | $ | (0.52 | ) | $ | (0.43 | ) | ||||||||||||
11/30/2013 | 28.27 | 0.54 | 6.59 | 7.13 | (0.49 | ) | — | |||||||||||||||||||
11/30/2012 | 28.11 | 0.53 | 1.95 | 2.48 | (0.75 | ) | (1.57 | ) | ||||||||||||||||||
11/30/2011 | 28.21 | 0.55 | 0.01 | 0.56 | (0.66 | ) | — | |||||||||||||||||||
4/12/2010* - 11/30/2010 | 26.22 | 0.38 | 1.82 | 2.20 | (0.21 | ) | — | |||||||||||||||||||
| Class C | ||||||||||||||||||||||||||
5/31/2014+ | $ | 34.93 | $ | 0.09 | $ | 2.18 | $ | 2.27 | $ | (0.39 | ) | $ | (0.43 | ) | ||||||||||||
11/30/2013 | 28.30 | 0.30 | 6.60 | 6.90 | (0.27 | ) | — | |||||||||||||||||||
11/30/2012 | 28.15 | 0.32 | 1.96 | 2.28 | (0.56 | ) | (1.57 | ) | ||||||||||||||||||
11/30/2011 | 28.30 | 0.34 | 0.03 | 0.37 | (0.52 | ) | — | |||||||||||||||||||
4/12/2010* - 11/30/2010 | 26.22 | 0.24 | 1.84 | 2.08 | — | (d) | — | |||||||||||||||||||
| Class D | ||||||||||||||||||||||||||
5/31/2014+ | $ | 34.86 | $ | 0.22 | $ | 2.18 | $ | 2.40 | $ | (0.50 | ) | $ | (0.43 | ) | ||||||||||||
11/30/2013 | 28.22 | 0.52 | 6.57 | 7.09 | (0.45 | ) | — | |||||||||||||||||||
11/30/2012 | 28.08 | 0.51 | 1.95 | 2.46 | (0.75 | ) | (1.57 | ) | ||||||||||||||||||
11/30/2011 | 28.16 | 0.54 | 0.03 | 0.57 | (0.65 | ) | — | |||||||||||||||||||
4/12/2010* - 11/30/2010 | 26.22 | 0.40 | 1.79 | 2.19 | (0.25 | ) | — | |||||||||||||||||||
| Class R | ||||||||||||||||||||||||||
5/31/2014+ | $ | 34.87 | $ | 0.16 | $ | 2.19 | $ | 2.35 | $ | (0.48 | ) | $ | (0.43 | ) | ||||||||||||
11/30/2013 | 28.20 | 0.34 | 6.61 | 6.95 | (0.28 | ) | — | |||||||||||||||||||
11/30/2012 | 28.08 | 0.43 | 1.95 | 2.38 | (0.69 | ) | (1.57 | ) | ||||||||||||||||||
11/30/2011 | 28.17 | 0.48 | 0.02 | 0.50 | (0.59 | ) | — | |||||||||||||||||||
4/12/2010* - 11/30/2010 | 26.22 | 0.33 | 1.82 | 2.15 | (0.20 | ) | — | |||||||||||||||||||
| Class P | ||||||||||||||||||||||||||
5/31/2014+ | $ | 34.84 | $ | 0.25 | $ | 2.18 | $ | 2.43 | $ | (0.54 | ) | $ | (0.43 | ) | ||||||||||||
11/30/2013 | 28.20 | 0.63 | 6.55 | 7.18 | (0.54 | ) | — | |||||||||||||||||||
11/30/2012 | 28.04 | 0.58 | 1.94 | 2.52 | (0.79 | ) | (1.57 | ) | ||||||||||||||||||
11/30/2011 | 28.12 | 0.60 | 0.01 | 0.61 | (0.69 | ) | — | |||||||||||||||||||
6/7/2010* - 11/30/2010 | 24.02 | 0.27 | 4.11 | 4.38 | (0.28 | ) | — | |||||||||||||||||||
| Institutional Class | ||||||||||||||||||||||||||
5/31/2014+ | $ | 34.80 | $ | 0.27 | $ | 2.18 | $ | 2.45 | $ | (0.56 | ) | $ | (0.43 | ) | ||||||||||||
11/30/2013 | 28.16 | 0.61 | 6.59 | 7.20 | (0.56 | ) | — | |||||||||||||||||||
11/30/2012 | 28.00 | 0.62 | 1.94 | 2.56 | (0.83 | ) | (1.57 | ) | ||||||||||||||||||
11/30/2011 | 28.08 | 0.63 | 0.01 | 0.64 | (0.72 | ) | — | |||||||||||||||||||
11/30/2010 | 23.92 | 0.62 | 4.20 | 4.82 | (0.66 | ) | — | |||||||||||||||||||
4/1/2009** - 11/30/2009 | 19.01 | 0.50 | 4.77 | 5.27 | (0.36 | ) | — | |||||||||||||||||||
3/31/2009 | 24.88 | 0.43 | (5.73 | ) | (5.30 | ) | (0.43 | ) | (0.14 | ) | ||||||||||||||||
| Administrative Class | ||||||||||||||||||||||||||
5/31/2014+ | $ | 34.84 | $ | 0.23 | $ | 2.19 | $ | 2.42 | $ | (0.52 | ) | $ | (0.43 | ) | ||||||||||||
11/30/2013 | 28.20 | 0.53 | 6.59 | 7.12 | (0.48 | ) | — | |||||||||||||||||||
11/30/2012 | 28.04 | 0.55 | 1.94 | 2.49 | (0.76 | ) | (1.57 | ) | ||||||||||||||||||
11/30/2011 | 28.14 | 0.55 | 0.01 | 0.56 | (0.66 | ) | — | |||||||||||||||||||
4/12/2010* - 11/30/2010 | 26.22 | 0.37 | 1.83 | 2.20 | (0.28 | ) | — | |||||||||||||||||||
| + | Unaudited |
| * | Commencement of operations. |
| ** | On November 13, 2009, the Board of Trustees approved a change in the Fund’s fiscal year from March 31 to November 30. |
| (a) | Calculated on average shares outstanding during the period. |
| (b) | Total return is calculated assuming a purchase of a share on the first day of the period and a sale of a share on the last day of each period reported. Dividends and distributions, if any, are assumed, for purposes of this calculation, to be reinvested. Total return does not reflect sales charges and includes the effect of fee waivers and reimbursements. Total return may reflect adjustments to conform to generally accepted accounting principles. Total return for a period of less than one year is not annualized. |
| 204 | Semiannual Report | | May 31, 2014 | | See accompanying Notes to Financial Statements |
Table of Contents
| Total Dividends and Distributions | Net Asset Value, End of Period | Total Return (b) | Net Assets, End of Period (000s) | Ratio of Expenses to Average Net Assets with Fee Waiver/ Reimbursement | Ratio of Expenses to Average Net Assets without Fee Waiver/ Reimbursement | Ratio of Net Investment Income to Average Net Assets | Portfolio Turnover Rate | |||||||||||||||||||||||||
| $ | (0.95 | ) | $ | 36.37 | (f) | 7.09 | %(f) | $ | 483,918 | 0.93 | %(c) | 0.93 | %(c) | 1.26 | %(c) | 45 | % | |||||||||||||||
| (0.49 | ) | 34.91 | 25.49 | 319,778 | 0.96 | 0.96 | 1.67 | 81 | ||||||||||||||||||||||||
| (2.32 | ) | 28.27 | 9.64 | 94,347 | 1.01 | 1.01 | 1.91 | 108 | ||||||||||||||||||||||||
| (0.66 | ) | 28.11 | 1.95 | 64,857 | 0.97 | 0.97 | 1.89 | 129 | ||||||||||||||||||||||||
| (0.21 | ) | 28.21 | 8.46 | 10,500 | 0.96 | (c) | 0.97 | (c) | 2.25 | (c) | 116 | |||||||||||||||||||||
| $ | (0.82 | ) | $ | 36.38 | (f) | 6.69 | %(f) | $ | 135,599 | 1.68 | %(c) | 1.68 | %(c) | 0.50 | %(c) | 45 | % | |||||||||||||||
| (0.27 | ) | 34.93 | 24.55 | 113,799 | 1.70 | 1.70 | 0.94 | 81 | ||||||||||||||||||||||||
| (2.13 | ) | 28.30 | 8.81 | 36,917 | 1.76 | 1.76 | 1.16 | 108 | ||||||||||||||||||||||||
| (0.52 | ) | 28.15 | 1.26 | 27,465 | 1.74 | 1.74 | 1.17 | 129 | ||||||||||||||||||||||||
| — | (d) | 28.30 | 7.94 | 227 | 1.77 | (c) | 1.77 | (c) | 1.40 | (c) | 116 | |||||||||||||||||||||
| $ | (0.93 | ) | $ | 36.33 | (f) | 7.05 | %(f) | $ | 118,536 | 0.96 | %(c) | 0.96 | %(c) | 1.22 | %(c) | 45 | % | |||||||||||||||
| (0.45 | ) | 34.86 | 25.41 | 121,663 | 1.02 | 1.02 | 1.60 | 81 | ||||||||||||||||||||||||
| (2.32 | ) | 28.22 | 9.57 | 35,886 | 1.06 | 1.06 | 1.85 | 108 | ||||||||||||||||||||||||
| (0.65 | ) | 28.08 | 1.99 | 30,176 | 0.98 | 0.98 | 1.83 | 129 | ||||||||||||||||||||||||
| (0.25 | ) | 28.16 | 8.46 | 2,180 | 0.93 | (c) | 0.94 | (c) | 2.31 | (c) | 116 | |||||||||||||||||||||
| $ | (0.91 | ) | $ | 36.31 | (f) | 6.91 | %(f) | $ | 1,295 | 1.25 | %(c) | 1.25 | %(c) | 0.92 | %(c) | 45 | % | |||||||||||||||
| (0.28 | ) | 34.87 | 24.86 | 394 | 1.51 | 1.51 | 1.06 | 81 | ||||||||||||||||||||||||
| (2.26 | ) | 28.20 | 9.25 | 210 | 1.36 | 1.36 | 1.58 | 108 | ||||||||||||||||||||||||
| (0.59 | ) | 28.08 | 1.76 | 37 | 1.22 | 1.22 | 1.67 | 129 | ||||||||||||||||||||||||
| (0.20 | ) | 28.17 | 8.29 | 11 | 1.25 | (c) | 1.26 | (c) | 1.97 | (c) | 116 | |||||||||||||||||||||
| $ | (0.97 | ) | $ | 36.30 | (f) | 7.18 | %(f) | $ | 221,327 | 0.73 | %(c) | 0.73 | %(c) | 1.44 | %(c) | 45 | % | |||||||||||||||
| (0.54 | ) | 34.84 | 25.76 | 251,377 | 0.75 | 0.75 | 1.96 | 81 | ||||||||||||||||||||||||
| (2.36 | ) | 28.20 | 9.84 | 53,368 | 0.80 | 0.86 | 2.12 | 108 | ||||||||||||||||||||||||
| (0.69 | ) | 28.04 | 2.14 | 37,551 | 0.80 | 0.83 | 2.07 | 129 | ||||||||||||||||||||||||
| (0.28 | ) | 28.12 | 18.34 | 21,417 | 0.84 | (c) | 0.87 | (c) | 2.35 | (c) | 116 | |||||||||||||||||||||
| $ | (0.99 | ) | $ | 36.26 | (f) | 7.25 | %(f) | $ | 1,651,273 | 0.64 | %(c) | 0.64 | %(c) | 1.54 | %(c) | 45 | % | |||||||||||||||
| (0.56 | ) | 34.80 | 25.88 | 1,583,824 | 0.65 | 0.65 | 1.93 | 81 | ||||||||||||||||||||||||
| (2.40 | ) | 28.16 | 10.00 | 804,646 | 0.67 | 0.67 | 2.26 | 108 | ||||||||||||||||||||||||
| (0.72 | ) | 28.00 | 2.24 | 521,854 | 0.70 | 0.70 | 2.16 | 129 | ||||||||||||||||||||||||
| (0.66 | ) | 28.08 | 20.46 | 471,226 | 0.77 | 0.80 | 2.42 | 116 | ||||||||||||||||||||||||
| (0.36 | ) | 23.92 | 27.85 | 64,996 | 1.00 | (c)(e) | 1.00 | (c) | 3.34 | (c) | 84 | |||||||||||||||||||||
| (0.57 | ) | 19.01 | (21.30 | ) | 20,664 | 1.03 | (e) | 1.03 | 1.86 | 91 | ||||||||||||||||||||||
| $ | (0.95 | ) | $ | 36.31 | (f) | 7.13 | %(f) | $ | 4,363 | 0.88 | %(c) | 0.88 | %(c) | 1.28 | %(c) | 45 | % | |||||||||||||||
| (0.48 | ) | 34.84 | 25.55 | 12,951 | 0.90 | 0.90 | 1.65 | 81 | ||||||||||||||||||||||||
| (2.33 | ) | 28.20 | 9.70 | 2,199 | 0.92 | 0.92 | 2.00 | 108 | ||||||||||||||||||||||||
| (0.66 | ) | 28.04 | 2.00 | 1,352 | 0.97 | 0.97 | 1.90 | 129 | ||||||||||||||||||||||||
| (0.28 | ) | 28.14 | 8.45 | 11 | 0.98 | (c) | 0.99 | (c) | 2.23 | (c) | 116 | |||||||||||||||||||||
| (c) | Annualized. |
| (d) | Less than $(0.01) per share. |
| (e) | Ratio of expenses to average net assets net of reimbursement/recoupment offset was 0.99% and 0.98% for the period ended November 30, 2009 and the year ended March 31, 2009, respectively. |
| (f) | Payments from Affiliates increased the net asset value and total return by less than $0.01 and 0.01%, respectively. |
| See accompanying Notes to Financial Statements | | May 31, 2014 | | Semiannual Report | 205 |
Table of Contents
Financial Highlights (cont’d)
For a Share Outstanding for the Period ended:
| Net Asset Value, Beginning of Period | Net Investment Income (a) | Net Realized and Change in Unrealized Gain | Total from Investment Operations | Dividends from Net Investment Income | Distributions | |||||||||||||||||||||
| AllianzGI Global Fundamental Strategy: | ||||||||||||||||||||||||||
| Class A | ||||||||||||||||||||||||||
5/31/2014+ | $ | 15.45 | $ | 0.15 | $ | 0.67 | $ | 0.82 | $ | (0.12 | ) | $ | (0.06 | ) | ||||||||||||
7/1/2013* - 11/30/2013 | 15.00 | 0.06 | 0.39 | 0.45 | — | — | ||||||||||||||||||||
| Class C | ||||||||||||||||||||||||||
5/31/2014+ | $ | 15.40 | $ | 0.09 | $ | 0.67 | $ | 0.76 | $ | (0.06 | ) | $ | (0.06 | ) | ||||||||||||
7/1/2013* - 11/30/2013 | 15.00 | 0.01 | 0.39 | 0.40 | — | — | ||||||||||||||||||||
| Class D | ||||||||||||||||||||||||||
5/31/2014+ | $ | 15.45 | $ | 0.29 | $ | 0.53 | $ | 0.82 | $ | (0.12 | ) | $ | (0.06 | ) | ||||||||||||
7/1/2013* - 11/30/2013 | 15.00 | 0.06 | 0.39 | 0.45 | — | — | ||||||||||||||||||||
| Class P | ||||||||||||||||||||||||||
5/31/2014+ | $ | 15.46 | $ | 0.16 | $ | 0.67 | $ | 0.83 | $ | (0.13 | ) | $ | (0.06 | ) | ||||||||||||
7/1/2013* - 11/30/2013 | 15.00 | 0.07 | 0.39 | 0.46 | — | — | ||||||||||||||||||||
| Institutional Class | ||||||||||||||||||||||||||
5/31/2014+ | $ | 15.47 | $ | 0.17 | $ | 0.67 | $ | 0.84 | $ | (0.14 | ) | $ | (0.06 | ) | ||||||||||||
7/1/2013* - 11/30/2013 | 15.00 | 0.08 | 0.39 | 0.47 | — | — | ||||||||||||||||||||
| AllianzGI Global Managed Volatility: | ||||||||||||||||||||||||||
| Class A | ||||||||||||||||||||||||||
5/31/2014+ | $ | 17.96 | $ | 0.16 | $ | 0.80 | $ | 0.96 | $ | (0.58 | ) | $ | (0.33 | ) | ||||||||||||
11/30/2013 | 16.68 | 0.39 | 1.63 | 2.02 | (0.59 | ) | (0.15 | ) | ||||||||||||||||||
12/19/2011* - 11/30/2012 | 15.00 | 0.39 | 1.29 | 1.68 | — | — | ||||||||||||||||||||
| Class C | ||||||||||||||||||||||||||
5/31/2014+ | $ | 17.62 | $ | 0.10 | $ | 0.77 | $ | 0.87 | $ | (0.54 | ) | $ | (0.33 | ) | ||||||||||||
11/30/2013 | 16.56 | 0.24 | 1.64 | 1.88 | (0.67 | ) | (0.15 | ) | ||||||||||||||||||
12/19/2011* - 11/30/2012 | 15.00 | 0.33 | 1.23 | 1.56 | — | — | ||||||||||||||||||||
| Class D | ||||||||||||||||||||||||||
5/31/2014+ | $ | 17.88 | $ | 0.15 | $ | 0.81 | $ | 0.96 | $ | (0.51 | ) | $ | (0.33 | ) | ||||||||||||
11/30/2013 | 16.68 | 0.45 | 1.58 | 2.03 | (0.68 | ) | (0.15 | ) | ||||||||||||||||||
12/19/2011* - 11/30/2012 | 15.00 | 0.39 | 1.29 | 1.68 | — | — | ||||||||||||||||||||
| Class P | ||||||||||||||||||||||||||
5/31/2014+ | $ | 18.06 | $ | 0.18 | $ | 0.80 | $ | 0.98 | $ | (0.60 | ) | $ | (0.33 | ) | ||||||||||||
11/30/2013 | 16.71 | 0.48 | 1.61 | 2.09 | (0.59 | ) | (0.15 | ) | ||||||||||||||||||
12/19/2011* - 11/30/2012 | 15.00 | 0.48 | 1.23 | 1.71 | — | — | ||||||||||||||||||||
| Institutional Class | ||||||||||||||||||||||||||
5/31/2014+ | $ | 18.06 | $ | 0.19 | $ | 0.80 | $ | 0.99 | $ | (0.62 | ) | $ | (0.33 | ) | ||||||||||||
11/30/2013 | 16.73 | 0.50 | 1.60 | 2.10 | (0.62 | ) | (0.15 | ) | ||||||||||||||||||
12/19/2011* - 11/30/2012 | 15.00 | 0.49 | 1.24 | 1.73 | — | — | ||||||||||||||||||||
| + | Unaudited |
| * | Commencement of operations. |
| (a) | Calculated on average shares outstanding during the period. |
| (b) | Total return is calculated assuming a purchase of a share on the first day of the period and a sale of a share on the last day of each period reported. Dividends and distributions, if any, are assumed, for purposes of this calculation, to be reinvested. Total return does not reflect sales charges and includes the effect of fee waivers and reimbursements. Total return may reflect adjustments to conform to generally accepted accounting principles. Total return for a period of less than one year is not annualized. |
| (c) | Annualized. |
| 206 | Semiannual Report | | May 31, 2014 | | See accompanying Notes to Financial Statements |
Table of Contents
| Total Dividends and Distributions | Net Asset Value, End of Period | Total Return (b) | Net Assets, End of Period (000s) | Ratio of Expenses to Average Net Assets with Fee Waiver/ Reimbursement | Ratio of Expenses to Average Net Assets without Fee Waiver/ Reimbursement | Ratio of Net Investment Income to Average Net Assets | Portfolio Turnover Rate | |||||||||||||||||||||||||
| $ | (0.18 | ) | $ | 16.09 | 5.37 | % | $ | 11 | 1.25 | %(c) | 2.20 | %(c) | 1.95 | %(c) | 6 | % | ||||||||||||||||
| — | 15.45 | 3.00 | 10 | 1.25 | (c) | 2.41 | (c) | 0.96 | (c) | 2 | ||||||||||||||||||||||
| $ | (0.12 | ) | $ | 16.04 | 4.99 | % | $ | 11 | 2.00 | %(c) | 2.95 | %(c) | 1.19 | %(c) | 6 | % | ||||||||||||||||
| — | 15.40 | 2.67 | 10 | 2.00 | (c) | 3.16 | (c) | 0.21 | (c) | 2 | ||||||||||||||||||||||
| $ | (0.18 | ) | $ | 16.09 | 5.37 | % | $ | 2,094 | 1.25 | %(c) | 2.25 | %(c) | 3.77 | %(c) | 6 | % | ||||||||||||||||
| — | 15.45 | 3.00 | 10 | 1.25 | (c) | 2.41 | (c) | 0.97 | (c) | 2 | ||||||||||||||||||||||
| $ | (0.19 | ) | $ | 16.10 | 5.44 | % | $ | 11 | 1.10 | %(c) | 1.96 | %(c) | 2.09 | %(c) | 6 | % | ||||||||||||||||
| — | 15.46 | 3.07 | 10 | 1.10 | (c) | 2.16 | (c) | 1.12 | (c) | 2 | ||||||||||||||||||||||
| $ | (0.20 | ) | $ | 16.11 | 5.49 | % | $ | 22,217 | 1.00 | %(c) | 1.97 | %(c) | 2.21 | %(c) | 6 | % | ||||||||||||||||
| — | 15.47 | 3.13 | 20,682 | 1.00 | (c) | 2.14 | (c) | 1.23 | (c) | 2 | ||||||||||||||||||||||
| $ | (0.91 | ) | $ | 18.01 | 5.75 | % | $ | 157 | 0.95 | %(c) | 2.42 | %(c) | 1.91 | %(c) | 43 | % | ||||||||||||||||
| (0.74 | ) | 17.96 | 12.66 | 117 | 0.95 | 2.63 | 2.28 | 92 | ||||||||||||||||||||||||
| — | 16.68 | 11.20 | 50 | 0.95 | (c) | 3.24 | (c) | 2.56 | (c) | 92 | ||||||||||||||||||||||
| $ | (0.87 | ) | $ | 17.62 | 5.33 | % | $ | 183 | 1.63 | %(c) | 3.10 | %(c) | 1.19 | %(c) | 43 | % | ||||||||||||||||
| (0.82 | ) | 17.62 | 11.90 | 184 | 1.64 | 3.26 | 1.40 | 92 | ||||||||||||||||||||||||
| — | 16.56 | 10.40 | 12 | 1.70 | (c) | 4.02 | (c) | 2.18 | (c) | 92 | ||||||||||||||||||||||
| $ | (0.84 | ) | $ | 18.00 | 5.74 | % | $ | 122 | 0.90 | %(c) | 2.61 | %(c) | 1.82 | %(c) | 43 | % | ||||||||||||||||
| (0.83 | ) | 17.88 | 12.74 | 57 | 0.90 | 2.84 | 2.61 | 92 | ||||||||||||||||||||||||
| — | 16.68 | 11.20 | 38 | 0.95 | (c) | 3.37 | (c) | 2.63 | (c) | 92 | ||||||||||||||||||||||
| $ | (0.93 | ) | $ | 18.11 | 5.85 | % | $ | 13 | 0.70 | %(c) | 2.16 | %(c) | 2.13 | %(c) | 43 | % | ||||||||||||||||
| (0.74 | ) | 18.06 | 13.03 | 13 | 0.70 | 2.38 | 2.78 | 92 | ||||||||||||||||||||||||
| — | 16.71 | 11.40 | 11 | 0.70 | (c) | 3.11 | (c) | 3.19 | (c) | 92 | ||||||||||||||||||||||
| $ | (0.95 | ) | $ | 18.10 | 5.90 | % | $ | 17,577 | 0.60 | %(c) | 2.08 | %(c) | 2.23 | %(c) | 43 | % | ||||||||||||||||
| (0.77 | ) | 18.06 | 13.09 | 14,156 | 0.60 | 2.32 | 2.92 | 92 | ||||||||||||||||||||||||
| — | 16.73 | 11.53 | 14,585 | 0.60 | (c) | 2.98 | (c) | 3.22 | (c) | 92 | ||||||||||||||||||||||
| See accompanying Notes to Financial Statements | | May 31, 2014 | | Semiannual Report | 207 |
Table of Contents
Financial Highlights (cont’d)
For a Share Outstanding for the Period ended:
| Net Asset Value, Beginning of Period | Net Investment Income (Loss) (a) | Net Realized and Change in Unrealized Gain | Total from Investment Operations | Dividends from Net Investment Income | ||||||||||||||||||
| AllianzGI Global Water: | ||||||||||||||||||||||
| Class A | ||||||||||||||||||||||
5/31/2014+ | $ | 12.41 | $ | 0.06 | $ | 0.78 | $ | 0.84 | $ | (0.03 | ) | |||||||||||
11/30/2013 | 10.26 | 0.07 | 2.20 | 2.27 | (0.12 | ) | ||||||||||||||||
11/30/2012 | 8.89 | 0.12 | 1.30 | 1.42 | (0.05 | ) | ||||||||||||||||
11/30/2011 | 8.75 | 0.06 | 0.08 | 0.14 | — | (e) | ||||||||||||||||
11/30/2010 | 7.99 | 0.03 | 0.74 | 0.77 | (0.01 | ) | ||||||||||||||||
11/30/2009 | 6.28 | 0.06 | 1.84 | 1.90 | (0.19 | ) | ||||||||||||||||
| Class C | ||||||||||||||||||||||
5/31/2014+ | $ | 12.11 | $ | 0.01 | $ | 0.76 | $ | 0.77 | $ | — | (e) | |||||||||||
11/30/2013 | 10.02 | (0.02 | ) | 2.16 | 2.14 | (0.05 | ) | |||||||||||||||
11/30/2012 | 8.70 | 0.05 | 1.27 | 1.32 | — | (e) | ||||||||||||||||
11/30/2011 | 8.62 | (0.01 | ) | 0.09 | 0.08 | — | (e) | |||||||||||||||
11/30/2010 | 7.93 | (0.03 | ) | 0.72 | 0.69 | — | (e) | |||||||||||||||
11/30/2009 | 6.24 | 0.01 | 1.84 | 1.85 | (0.16 | ) | ||||||||||||||||
| Class D | ||||||||||||||||||||||
5/31/2014+ | $ | 12.38 | $ | 0.05 | $ | 0.77 | $ | 0.82 | $ | (0.02 | ) | |||||||||||
11/30/2013 | 10.25 | 0.07 | 2.19 | 2.26 | (0.13 | ) | ||||||||||||||||
11/30/2012 | 8.87 | 0.10 | 1.32 | 1.42 | (0.04 | ) | ||||||||||||||||
11/30/2011 | 8.73 | 0.04 | 0.10 | 0.14 | — | (e) | ||||||||||||||||
11/30/2010 | 7.98 | 0.03 | 0.73 | 0.76 | (0.01 | ) | ||||||||||||||||
11/30/2009 | 6.27 | 0.04 | 1.86 | 1.90 | (0.19 | ) | ||||||||||||||||
| Class P | ||||||||||||||||||||||
5/31/2014+ | $ | 12.49 | $ | 0.08 | $ | 0.78 | $ | 0.86 | $ | (0.05 | ) | |||||||||||
11/30/2013 | 10.30 | 0.09 | 2.21 | 2.30 | (0.11 | ) | ||||||||||||||||
11/30/2012 | 8.93 | 0.14 | 1.30 | 1.44 | (0.07 | ) | ||||||||||||||||
11/30/2011 | 8.77 | 0.07 | 0.09 | 0.16 | — | (e) | ||||||||||||||||
11/30/2010 | 7.99 | 0.05 | 0.74 | 0.79 | (0.01 | ) | ||||||||||||||||
11/30/2009 | 6.29 | 0.08 | 1.83 | 1.91 | (0.21 | ) | ||||||||||||||||
| Institutional Class | ||||||||||||||||||||||
5/31/2014+ | $ | 12.37 | $ | 0.08 | $ | 0.77 | $ | 0.85 | $ | (0.11 | ) | |||||||||||
11/30/2013 | 10.25 | 0.09 | 2.21 | 2.30 | (0.18 | ) | ||||||||||||||||
11/30/2012 | 8.88 | 0.12 | 1.32 | 1.44 | (0.07 | ) | ||||||||||||||||
11/30/2011 | 8.71 | 0.08 | 0.09 | 0.17 | — | (e) | ||||||||||||||||
11/30/2010 | 7.94 | 0.05 | 0.74 | 0.79 | (0.02 | ) | ||||||||||||||||
11/30/2009 | 6.29 | 0.09 | 1.82 | 1.91 | (0.26 | ) | ||||||||||||||||
| + | Unaudited |
| (a) | Calculated on average shares outstanding during the period. |
| (b) | Effective May 1, 2009, Fund redemption fees were eliminated. |
| (c) | Total return is calculated assuming a purchase of a share on the first day of the period and a sale of a share on the last day of each period reported. Dividends and distributions, if any, are assumed, for purposes of this calculation, to be reinvested. Total return does not reflect sales charges and includes the effect of fee waivers and reimbursements. Total return may reflect adjustments to conform to generally accepted accounting principles. Total return for a period of less than one year is not annualized. |
| (d) | Annualized. |
| (e) | Less than $(0.01) per share. |
| (f) | Less than $0.01 per share. |
| 208 | Semiannual Report | | May 31, 2014 | | See accompanying Notes to Financial Statements |
Table of Contents
| Fund Redemption Fees (a)(b) | Net Asset Value, End of Period | Total Return (c) | Net Assets, End of Period (000s) | Ratio of Expenses to Average Net Assets with Fee Waiver/ Reimbursement | Ratio of Expenses to Average Net Assets without Fee Waiver/ Reimbursement | Ratio of Net Investment Income (Loss) to Average Net Assets | Portfolio Turnover Rate | |||||||||||||||||||||||||
| $ | — | $ | 13.22 | 6.77 | % | $ | 151,277 | 1.43 | %(d) | 1.43 | %(d) | 0.94 | %(d) | 17 | % | |||||||||||||||||
| — | 12.41 | 22.31 | 118,252 | 1.54 | 1.54 | 0.63 | 28 | |||||||||||||||||||||||||
| — | 10.26 | 16.12 | 59,611 | 1.57 | 1.60 | 1.27 | 73 | |||||||||||||||||||||||||
| — | 8.89 | 1.62 | 27,101 | 1.68 | 1.68 | 0.60 | 73 | |||||||||||||||||||||||||
| — | 8.75 | 9.63 | 22,774 | 1.80 | 1.80 | 0.41 | 40 | |||||||||||||||||||||||||
| — | (f) | 7.99 | 30.93 | 23,787 | 2.04 | 2.04 | 0.90 | 47 | ||||||||||||||||||||||||
| $ | — | $ | 12.88 | 6.36 | % | $ | 72,005 | 2.21 | %(d) | 2.21 | %(d) | 0.17 | %(d) | 17 | % | |||||||||||||||||
| — | 12.11 | 21.41 | 51,767 | 2.33 | 2.33 | (0.18 | ) | 28 | ||||||||||||||||||||||||
| — | 10.02 | 15.17 | 25,870 | 2.33 | 2.41 | 0.48 | 73 | |||||||||||||||||||||||||
| — | 8.70 | 0.93 | 20,842 | 2.44 | 2.44 | (0.15 | ) | 73 | ||||||||||||||||||||||||
| — | 8.62 | 8.70 | 22,225 | 2.56 | 2.60 | (0.37 | ) | 40 | ||||||||||||||||||||||||
| — | (f) | 7.93 | 30.19 | 22,393 | 2.79 | 2.79 | 0.15 | 47 | ||||||||||||||||||||||||
| $ | — | $ | 13.18 | 6.62 | % | $ | 22,311 | 1.60 | %(d) | 1.60 | %(d) | 0.74 | %(d) | 17 | % | |||||||||||||||||
| — | 12.38 | 22.30 | 17,624 | 1.60 | 1.60 | 0.62 | 28 | |||||||||||||||||||||||||
| — | 10.25 | 16.09 | 5,869 | 1.64 | 2.25 | 1.02 | 73 | |||||||||||||||||||||||||
| — | 8.87 | 1.60 | 5,214 | 1.72 | 2.00 | 0.47 | 73 | |||||||||||||||||||||||||
| — | 8.73 | 9.70 | 1,157 | 1.84 | 2.74 | 0.34 | 40 | |||||||||||||||||||||||||
| — | (f) | 7.98 | 31.11 | 156 | 2.40 | 2.40 | 0.55 | 47 | ||||||||||||||||||||||||
| $ | — | $ | 13.30 | 6.89 | % | $ | 60,881 | 1.20 | %(d) | 1.20 | %(d) | 1.19 | %(d) | 17 | % | |||||||||||||||||
| — | 12.49 | 22.58 | 42,448 | 1.34 | 1.34 | 0.81 | 28 | |||||||||||||||||||||||||
| — | 10.30 | 16.22 | 16,820 | 1.41 | 1.47 | 1.49 | 73 | |||||||||||||||||||||||||
| — | 8.93 | 1.85 | 16,118 | 1.49 | 1.52 | 0.79 | 73 | |||||||||||||||||||||||||
| — | 8.77 | 9.95 | 10,432 | 1.56 | 1.64 | 0.62 | 40 | |||||||||||||||||||||||||
| — | (f) | 7.99 | 31.26 | 12,016 | 1.78 | 1.78 | 1.16 | 47 | ||||||||||||||||||||||||
| $ | — | $ | 13.11 | 6.90 | % | $ | 23,887 | 1.11 | %(d) | 1.11 | %(d) | 1.22 | %(d) | 17 | % | |||||||||||||||||
| — | 12.37 | 22.77 | 14,429 | 1.19 | 1.19 | 0.77 | 28 | |||||||||||||||||||||||||
| — | 10.25 | 16.44 | 3,105 | 1.29 | 1.29 | 1.28 | 73 | |||||||||||||||||||||||||
| — | 8.88 | 1.99 | 1,267 | 1.37 | 1.39 | 0.91 | 73 | |||||||||||||||||||||||||
| — | 8.71 | 9.96 | 1,378 | 1.46 | 1.48 | 0.61 | 40 | |||||||||||||||||||||||||
| — | (f) | 7.94 | 31.42 | 544 | 1.68 | 1.68 | 1.26 | 47 | ||||||||||||||||||||||||
| See accompanying Notes to Financial Statements | | May 31, 2014 | | Semiannual Report | 209 |
Table of Contents
Financial Highlights (cont’d)
For a Share Outstanding for the Period ended:
Net Asset | Net Investment Income (a) | Net Realized and Change in Unrealized Gain (Loss) | Total from Investment Operations | Dividends from Net Investment Income | Distributions from Net Realized Capital Gains | |||||||||||||||||||||
| AllianzGI High Yield Bond: | ||||||||||||||||||||||||||
| Class A | ||||||||||||||||||||||||||
5/31/2014+ | $ | 10.36 | $ | 0.32 | $ | 0.12 | $ | 0.44 | $ | (0.35 | ) | $ | (0.09 | ) | ||||||||||||
11/30/2013 | 10.16 | 0.67 | 0.22 | 0.89 | (0.68 | ) | (0.01 | ) | ||||||||||||||||||
11/30/2012 | 9.69 | 0.72 | 0.61 | 1.33 | (0.73 | ) | (0.13 | ) | ||||||||||||||||||
11/30/2011 | 10.03 | 0.72 | (0.28 | ) | 0.44 | (0.78 | ) | — | ||||||||||||||||||
4/12/2010* - 11/30/2010 | 9.65 | 0.49 | 0.19 | 0.68 | (0.30 | ) | — | |||||||||||||||||||
| Class C | ||||||||||||||||||||||||||
5/31/2014+ | $ | 10.35 | $ | 0.28 | $ | 0.11 | $ | 0.39 | $ | (0.31 | ) | $ | (0.09 | ) | ||||||||||||
11/30/2013 | 10.15 | 0.59 | 0.22 | 0.81 | (0.60 | ) | (0.01 | ) | ||||||||||||||||||
11/30/2012 | 9.68 | 0.64 | 0.62 | 1.26 | (0.66 | ) | (0.13 | ) | ||||||||||||||||||
11/30/2011 | 10.02 | 0.65 | (0.29 | ) | 0.36 | (0.70 | ) | — | ||||||||||||||||||
4/12/2010* - 11/30/2010 | 9.65 | 0.45 | 0.19 | 0.64 | (0.27 | ) | — | |||||||||||||||||||
| Class D | ||||||||||||||||||||||||||
5/31/2014+ | $ | 10.08 | $ | 0.30 | $ | 0.11 | $ | 0.41 | $ | (0.35 | ) | $ | (0.09 | ) | ||||||||||||
11/30/2013 | 9.91 | 0.64 | 0.22 | 0.86 | (0.68 | ) | (0.01 | ) | ||||||||||||||||||
11/30/2012 | 9.47 | 0.70 | 0.60 | 1.30 | (0.73 | ) | (0.13 | ) | ||||||||||||||||||
11/30/2011 | 9.79 | 0.72 | (0.28 | ) | 0.44 | (0.76 | ) | — | ||||||||||||||||||
4/12/2010* - 11/30/2010 | 9.65 | 0.48 | 0.18 | 0.66 | (0.52 | ) | — | |||||||||||||||||||
| Class R | ||||||||||||||||||||||||||
5/31/2014+ | $ | 10.05 | $ | 0.29 | $ | 0.12 | $ | 0.41 | $ | (0.33 | ) | $ | (0.09 | ) | ||||||||||||
11/30/2013 | 9.88 | 0.63 | 0.21 | 0.84 | (0.66 | ) | (0.01 | ) | ||||||||||||||||||
11/30/2012 | 9.45 | 0.67 | 0.60 | 1.27 | (0.71 | ) | (0.13 | ) | ||||||||||||||||||
11/30/2011 | 9.80 | 0.68 | (0.28 | ) | 0.40 | (0.75 | ) | — | ||||||||||||||||||
4/12/2010* - 11/30/2010 | 9.65 | 0.47 | 0.18 | 0.65 | (0.50 | ) | — | |||||||||||||||||||
| Class P | ||||||||||||||||||||||||||
5/31/2014+ | $ | 10.05 | $ | 0.32 | $ | 0.11 | $ | 0.43 | $ | (0.36 | ) | $ | (0.09 | ) | ||||||||||||
11/30/2013 | 9.87 | 0.66 | 0.23 | 0.89 | (0.70 | ) | (0.01 | ) | ||||||||||||||||||
11/30/2012 | 9.44 | 0.72 | 0.58 | 1.30 | (0.74 | ) | (0.13 | ) | ||||||||||||||||||
11/30/2011 | 9.78 | 0.72 | (0.27 | ) | 0.45 | (0.79 | ) | — | ||||||||||||||||||
4/12/2010* - 11/30/2010 | 9.65 | 0.50 | 0.17 | 0.67 | (0.54 | ) | — | |||||||||||||||||||
| Institutional Class | ||||||||||||||||||||||||||
5/31/2014+ | $ | 10.08 | $ | 0.32 | $ | 0.11 | $ | 0.43 | $ | (0.36 | ) | $ | (0.09 | ) | ||||||||||||
11/30/2013 | 9.90 | 0.68 | 0.22 | 0.90 | (0.71 | ) | (0.01 | ) | ||||||||||||||||||
11/30/2012 | 9.46 | 0.73 | 0.60 | 1.33 | (0.76 | ) | (0.13 | ) | ||||||||||||||||||
11/30/2011 | 9.80 | 0.76 | (0.30 | ) | 0.46 | (0.80 | ) | — | ||||||||||||||||||
11/30/2010 | 9.17 | 0.83 | 0.61 | 1.44 | (0.81 | ) | — | |||||||||||||||||||
4/1/2009** - 11/30/2009 | 7.40 | 0.52 | 1.77 | 2.29 | (0.52 | ) | — | |||||||||||||||||||
3/31/2009 | 9.36 | 0.71 | (1.90 | ) | (1.19 | ) | (0.77 | ) | — | |||||||||||||||||
| Administrative Class | ||||||||||||||||||||||||||
5/31/2014+ | $ | 10.04 | $ | 0.31 | $ | 0.11 | $ | 0.42 | $ | (0.35 | ) | $ | (0.09 | ) | ||||||||||||
11/30/2013 | 9.87 | 0.65 | 0.22 | 0.87 | (0.69 | ) | (0.01 | ) | ||||||||||||||||||
11/30/2012 | 9.43 | 0.70 | 0.61 | 1.31 | (0.74 | ) | (0.13 | ) | ||||||||||||||||||
11/30/2011 | 9.78 | 0.72 | (0.30 | ) | 0.42 | (0.77 | ) | — | ||||||||||||||||||
4/12/2010* - 11/30/2010 | 9.65 | 0.49 | 0.17 | 0.66 | (0.53 | ) | — | |||||||||||||||||||
| + | Unaudited |
| * | Commencement of operations. |
| ** | On November 13, 2009, the Board of Trustees approved a change in the Fund’s fiscal year from March 31 to November 30. |
| (a) | Calculated on average shares outstanding during the period. |
| (b) | Total return is calculated assuming a purchase of a share on the first day of the period and a sale of a share on the last day of each period reported. Dividends and distributions, if any, are assumed, for purposes of this calculation, to be reinvested. Total return does not reflect sales charges and includes the effect of fee waivers and reimbursements. Total return may reflect adjustments to conform to generally accepted accounting principles. Total return for a period of less than one year is not annualized. |
| 210 | Semiannual Report | | May 31, 2014 | | See accompanying Notes to Financial Statements |
Table of Contents
| Total Dividends and Distributions | Net Asset Value, End of Period | Total Return (b) | Net Assets, End of Period (000s) | Ratio of Expenses to Average Net Assets with Fee Waiver/ Reimbursement | Ratio of Expenses to Average Net Assets without Fee Waiver/ Reimbursement | Ratio of Net Investment Income to Average Net Assets | Portfolio Turnover Rate | |||||||||||||||||||||||||
| $ | (0.44 | ) | $ | 10.36(e | ) | 4.26 | %(e) | $ | 59,167 | 0.93 | %(c) | 0.93 | %(c) | 6.14 | %(c) | 30 | % | |||||||||||||||
| (0.69 | ) | 10.36 | 8.98 | 73,920 | 0.91 | 0.91 | 6.49 | 67 | ||||||||||||||||||||||||
| (0.86 | ) | 10.16 | 14.34 | 109,668 | 0.89 | 0.90 | 7.21 | 86 | ||||||||||||||||||||||||
| (0.78 | ) | 9.69 | 4.29 | 61,339 | 1.05 | 1.05 | 7.19 | 168 | ||||||||||||||||||||||||
| (0.30 | ) | 10.03 | 7.07 | 1,296 | 1.11 | (c) | 1.47 | (c) | 7.70 | (c) | 144 | |||||||||||||||||||||
| $ | (0.40 | ) | $ | 10.34(e | ) | 3.78 | %(e) | $ | 26,055 | 1.70 | %(c) | 1.70 | %(c) | 5.38 | %(c) | 30 | % | |||||||||||||||
| (0.61 | ) | 10.35 | 8.14 | 27,525 | 1.70 | 1.70 | 5.68 | 67 | ||||||||||||||||||||||||
| (0.79 | ) | 10.15 | 13.54 | 30,692 | 1.68 | 1.68 | 6.43 | 86 | ||||||||||||||||||||||||
| (0.70 | ) | 9.68 | 3.53 | 12,443 | 1.82 | 1.87 | 6.56 | 168 | ||||||||||||||||||||||||
| (0.27 | ) | 10.02 | 6.73 | 311 | 1.87 | (c) | 2.21 | (c) | 7.12 | (c) | 144 | |||||||||||||||||||||
| $ | (0.44 | ) | $ | 10.05(e | ) | 4.07 | %(e) | $ | 74,880 | 1.02 | %(c) | 1.02 | %(c) | 6.02 | %(c) | 30 | % | |||||||||||||||
| (0.69 | ) | 10.08 | 8.92 | 108,011 | 1.00 | 1.02 | 6.40 | 67 | ||||||||||||||||||||||||
| (0.86 | ) | 9.91 | 14.33 | 43,921 | 0.96 | 1.07 | 7.14 | 86 | ||||||||||||||||||||||||
| (0.76 | ) | 9.47 | 4.42 | 20,378 | 1.07 | 1.12 | 7.36 | 168 | ||||||||||||||||||||||||
| (0.52 | ) | 9.79 | 7.09 | 169 | 1.11 | (c) | 1.47 | (c) | 7.84 | (c) | 144 | |||||||||||||||||||||
| $ | (0.42 | ) | $ | 10.04(e | ) | 4.17 | %(e) | $ | 3,007 | 1.22 | %(c) | 1.26 | %(c) | 5.86 | %(c) | 30 | % | |||||||||||||||
| (0.67 | ) | 10.05 | 8.72 | 2,851 | 1.15 | 1.32 | 6.24 | 67 | ||||||||||||||||||||||||
| (0.84 | ) | 9.88 | 14.05 | 2,111 | 1.15 | 1.25 | 6.95 | 86 | ||||||||||||||||||||||||
| (0.75 | ) | 9.45 | 4.02 | 342 | 1.33 | 1.37 | 7.23 | 168 | ||||||||||||||||||||||||
| (0.50 | ) | 9.80 | 6.97 | 11 | 1.36 | (c) | 1.63 | (c) | 7.74 | (c) | 144 | |||||||||||||||||||||
| $ | (0.45 | ) | $ | 10.03(e | ) | 4.30 | %(e) | $ | 86,751 | 0.72 | %(c) | 0.72 | %(c) | 6.35 | %(c) | �� | 30 | % | ||||||||||||||
| (0.71 | ) | 10.05 | 9.27 | 77,649 | 0.74 | 0.74 | 6.64 | 67 | ||||||||||||||||||||||||
| (0.87 | ) | 9.87 | 14.48 | 19,497 | 0.74 | 0.79 | 7.39 | 86 | ||||||||||||||||||||||||
| (0.79 | ) | 9.44 | 4.57 | 11,096 | 0.88 | 0.88 | 7.49 | 168 | ||||||||||||||||||||||||
| (0.54 | ) | 9.78 | 7.22 | 11 | 0.97 | (c) | 1.14 | (c) | 8.13 | (c) | 144 | |||||||||||||||||||||
| $ | (0.45 | ) | $ | 10.06(e | ) | 4.33 | %(e) | $ | 174,620 | 0.63 | %(c) | 0.63 | %(c) | 6.45 | %(c) | 30 | % | |||||||||||||||
| (0.72 | ) | 10.08 | 9.35 | 139,306 | 0.62 | 0.62 | 6.76 | 67 | ||||||||||||||||||||||||
| (0.89 | ) | 9.90 | 14.68 | 121,362 | 0.63 | 0.63 | 7.47 | 86 | ||||||||||||||||||||||||
| (0.80 | ) | 9.46 | 4.66 | 70,174 | 0.61 | 0.77 | 7.65 | 168 | ||||||||||||||||||||||||
| (0.81 | ) | 9.80 | 16.23 | 93,782 | 0.63 | 0.93 | 8.65 | 144 | ||||||||||||||||||||||||
| (0.52 | ) | 9.17 | 31.50 | 69,667 | 0.61 | (c) | 0.61 | (c)(d) | 9.08 | (c) | 120 | |||||||||||||||||||||
| (0.77 | ) | 7.40 | (13.01 | ) | 49,233 | 0.64 | 0.64 | (d) | 8.56 | 55 | ||||||||||||||||||||||
| $ | (0.44 | ) | $ | 10.02(e | ) | 4.23 | %(e) | $ | 35,181 | 0.90 | %(c) | 0.90 | %(c) | 6.18 | %(c) | 30 | % | |||||||||||||||
| (0.70 | ) | 10.04 | 9.02 | 32,789 | 0.90 | 0.91 | 6.49 | 67 | ||||||||||||||||||||||||
| (0.87 | ) | 9.87 | 14.54 | 27,274 | 0.90 | 1.14 | 8.92 | 86 | ||||||||||||||||||||||||
| (0.77 | ) | 9.43 | 4.27 | 11 | 1.03 | 1.03 | 7.25 | 168 | ||||||||||||||||||||||||
| (0.53 | ) | 9.78 | 7.12 | 11 | 1.12 | (c) | 1.28 | (c) | 7.98 | (c) | 144 | |||||||||||||||||||||
| (c) | Annualized. |
| (d) | Ratio of expenses to average net assets net of reimbursement/recoupment offset was 0.61% and 0.61% for the period ended November 30, 2009 and the year ended March 31, 2009, respectively. |
| (e) | Payments from Affiliates increased net asset value and total return by less than $0.01 and 0.01%, respectively. |
| See accompanying Notes to Financial Statements | | May 31, 2014 | | Semiannual Report | 211 |
Table of Contents
Financial Highlights (cont’d)
For a Share Outstanding for the Period ended:
| Net Asset Value, Beginning of Period | Net Investment Income (Loss) (a) | Net Realized | Total from Investment Operations | Dividends from Net Investment Income | Distributions from Net Realized Capital Gains | |||||||||||||||||||||
| AllianzGI International Small-Cap: | ||||||||||||||||||||||||||
| Class A | ||||||||||||||||||||||||||
5/31/2014+ | $ | 42.30 | $ | 0.11 | $ | 0.50 | $ | 0.61 | $ | (0.44 | ) | $ | (3.00 | ) | ||||||||||||
11/30/2013 | 31.89 | 0.09 | 10.32 | 10.41 | — | (d) | — | |||||||||||||||||||
11/30/2012 | 28.31 | 0.16 | 4.06 | 4.22 | (0.64 | ) | — | |||||||||||||||||||
11/30/2011 | 31.36 | 0.12 | (2.56 | ) | (2.44 | ) | (0.61 | ) | — | |||||||||||||||||
4/12/2010* - 11/30/2010 | 28.30 | (0.01 | ) | 3.07 | 3.06 | — | — | |||||||||||||||||||
| Class C | ||||||||||||||||||||||||||
5/31/2014+ | $ | 41.78 | $ | (0.01 | ) | $ | 0.48 | $ | 0.47 | $ | (0.13 | ) | $ | (3.00 | ) | |||||||||||
11/30/2013 | 31.75 | (0.17 | ) | 10.22 | 10.05 | (0.02 | ) | — | ||||||||||||||||||
11/30/2012 | 28.01 | (0.07 | ) | 4.04 | 3.97 | (0.23 | ) | — | ||||||||||||||||||
11/30/2011 | 31.22 | 0.06 | (2.72 | ) | (2.66 | ) | (0.55 | ) | — | |||||||||||||||||
4/12/2010* - 11/30/2010 | 28.30 | (0.24 | ) | 3.16 | 2.92 | — | — | |||||||||||||||||||
| Class D | ||||||||||||||||||||||||||
5/31/2014+ | $ | 43.24 | $ | 0.22 | $ | 0.41 | $ | 0.63 | $ | (0.62 | ) | $ | (3.00 | ) | ||||||||||||
11/30/2013 | 32.60 | 0.05 | 10.59 | 10.64 | — | (d) | — | |||||||||||||||||||
11/30/2012 | 28.33 | 0.24 | 4.03 | 4.27 | — | (d) | — | |||||||||||||||||||
11/30/2011 | 31.37 | 0.07 | (2.53 | ) | (2.46 | ) | (0.58 | ) | — | |||||||||||||||||
4/12/2010* - 11/30/2010 | 28.30 | 0.04 | 3.03 | 3.07 | — | — | ||||||||||||||||||||
| Class R | ||||||||||||||||||||||||||
5/31/2014+ | $ | 42.23 | $ | 0.20 | $ | 0.37 | $ | 0.57 | $ | (0.48 | ) | $ | (3.00 | ) | ||||||||||||
11/30/2013 | 32.25 | 0.02 | 10.32 | 10.34 | (0.36 | ) | — | |||||||||||||||||||
11/30/2012 | 28.27 | 0.08 | 4.10 | 4.18 | (0.20 | ) | — | |||||||||||||||||||
11/30/2011 | 31.32 | 0.16 | (2.70 | ) | (2.54 | ) | (0.51 | ) | — | |||||||||||||||||
4/12/2010* - 11/30/2010 | 28.30 | 0.05 | 2.97 | 3.02 | — | — | ||||||||||||||||||||
| Class P | ||||||||||||||||||||||||||
5/31/2014+ | $ | 41.97 | $ | 0.13 | $ | 0.51 | $ | 0.64 | $ | (0.40 | ) | $ | (3.00 | ) | ||||||||||||
11/30/2013 | 31.92 | 0.16 | 10.24 | 10.40 | (0.35 | ) | — | |||||||||||||||||||
11/30/2012 | 27.86 | 0.20 | 4.05 | 4.25 | (0.19 | ) | — | |||||||||||||||||||
11/30/2011 | 30.35 | 0.30 | (2.67 | ) | (2.37 | ) | (0.12 | ) | — | |||||||||||||||||
11/30/2010 | 25.86 | 0.20 | 4.45 | 4.65 | (0.16 | ) | — | |||||||||||||||||||
4/1/2009** - 11/30/2009 | 16.29 | 0.14 | 9.43 | 9.57 | — | — | ||||||||||||||||||||
3/31/2009 | 40.10 | 0.33 | (19.44 | ) | (19.11 | ) | — | (4.70 | ) | |||||||||||||||||
| Institutional Class | ||||||||||||||||||||||||||
5/31/2014+ | $ | 42.94 | $ | 0.16 | $ | 0.52 | $ | 0.68 | $ | (0.35 | ) | $ | (3.00 | ) | ||||||||||||
11/30/2013 | 32.60 | 0.17 | 10.48 | 10.65 | (0.31 | ) | — | |||||||||||||||||||
11/30/2012 | 28.58 | 0.24 | 4.15 | 4.39 | (0.37 | ) | — | |||||||||||||||||||
11/30/2011 | 31.45 | 0.37 | (2.74 | ) | (2.37 | ) | (0.50 | ) | — | |||||||||||||||||
11/30/2010 | 26.91 | 0.24 | 4.94 | 5.18 | (0.64 | ) | — | |||||||||||||||||||
4/1/2009** - 11/30/2009 | 16.93 | 0.17 | 9.81 | 9.98 | — | — | ||||||||||||||||||||
3/31/2009 | 41.28 | 0.34 | (19.99 | ) | (19.65 | ) | — | (4.70 | ) | |||||||||||||||||
| + | Unaudited |
| * | Commencement of operations. |
| ** | On November 13, 2009, the Board of Trustees approved a change in the Fund’s fiscal year from March 31 to November 30. |
| (a) | Calculated on average shares outstanding during the period. |
| (b) | Total return is calculated assuming a purchase of a share on the first day of the period and a sale of a share on the last day of each period reported. Dividends and distributions, if any, are assumed, for purposes of this calculation, to be reinvested. Total return does not reflect sales charges and includes the effect of fee waivers and reimbursements. Total return may reflect adjustments to conform to generally accepted accounting principles. Total return for a period of less than one year is not annualized. |
| (c) | Annualized. |
| (d) | Less than $(0.01) per share. |
| (e) | Ratio of expenses to average net assets net of reimbursement/recoupment offset was 1.41% and 1.17% for the period ended November 30, 2009 and the year ended March 31, 2009, respectively. |
| (f) | Ratio of expenses to average net assets net of reimbursement/recoupment offset was 1.26% and 1.01% for the period ended November 30, 2009 and the year ended March 31, 2009, respectively. |
| 212 | Semiannual Report | | May 31, 2014 | | See accompanying Notes to Financial Statements |
Table of Contents
| Total Dividends and Distributions | Net Asset Value, End of Period | Total Return (b) | Net Assets, End of Period (000s) | Ratio of Expenses to Average Net Assets with Fee Waiver/ Reimbursement | Ratio of Expenses to Average Net Assets without Fee Waiver/ Reimbursement | Ratio of Net Investment Income (Loss) to Average Net Assets | Portfolio Turnover Rate | |||||||||||||||||||||||||
| $ | (3.44 | ) | $ | 39.47 | 1.81 | % | $ | 5,004 | 1.45 | %(c) | 1.80 | %(c) | 0.54 | %(c) | 47 | % | ||||||||||||||||
| — | (d) | 42.30 | 32.64 | 4,569 | 1.45 | 1.83 | 0.23 | 92 | ||||||||||||||||||||||||
| (0.64 | ) | 31.89 | 15.13 | 2,773 | 1.50 | 1.76 | 0.53 | 117 | ||||||||||||||||||||||||
| (0.61 | ) | 28.31 | (8.03 | ) | 4,103 | 1.60 | 1.83 | 0.40 | 66 | |||||||||||||||||||||||
| — | 31.36 | 10.81 | 97 | 1.66 | (c) | 1.70 | (c) | (0.07 | )(c) | 57 | ||||||||||||||||||||||
| $ | (3.13 | ) | $ | 39.12 | 1.43 | % | $ | 1,064 | 2.20 | %(c) | 2.48 | %(c) | (0.03 | )%(c) | 47 | % | ||||||||||||||||
| (0.02 | ) | 41.78 | 31.67 | 702 | 2.20 | 2.43 | (0.46 | ) | 92 | |||||||||||||||||||||||
| (0.23 | ) | 31.75 | 14.26 | 531 | 2.26 | 2.37 | (0.24 | ) | 117 | |||||||||||||||||||||||
| (0.55 | ) | 28.01 | (8.75 | ) | 455 | 2.34 | 2.86 | 0.19 | 66 | |||||||||||||||||||||||
| — | 31.22 | 10.32 | 176 | 2.44 | (c) | 2.48 | (c) | (1.23 | )(c) | 57 | ||||||||||||||||||||||
| $ | (3.62 | ) | $ | 40.25 | 1.83 | % | $ | 1,452 | 1.45 | %(c) | 1.76 | %(c) | 1.09 | %(c) | 47 | % | ||||||||||||||||
| — | (d)�� | 43.24 | 32.65 | 339 | 1.45 | 1.73 | 0.13 | 92 | ||||||||||||||||||||||||
| — | (d) | 32.60 | 15.07 | 112 | 1.56 | 5.66 | 0.77 | 117 | ||||||||||||||||||||||||
| (0.58 | ) | 28.33 | (8.08 | ) | 1,440 | 1.61 | 2.83 | 0.22 | 66 | |||||||||||||||||||||||
| — | 31.37 | 10.85 | 38 | 1.66 | (c) | 1.83 | (c) | 0.22 | (c) | 57 | ||||||||||||||||||||||
| $ | (3.48 | ) | $ | 39.32 | 1.71 | % | $ | 81 | 1.70 | %(c) | 2.03 | %(c) | 1.02 | %(c) | 47 | % | ||||||||||||||||
| (0.36 | ) | 42.23 | 32.29 | 27 | 1.70 | 1.96 | 0.05 | 92 | ||||||||||||||||||||||||
| (0.20 | ) | 32.25 | 14.86 | 12 | 1.74 | 1.90 | 0.26 | 117 | ||||||||||||||||||||||||
| (0.51 | ) | 28.27 | (8.32 | ) | 10 | 1.82 | 1.84 | 0.51 | 66 | |||||||||||||||||||||||
| — | 31.32 | 10.67 | 11 | 1.91 | (c) | 2.35 | (c) | 0.27 | (c) | 57 | ||||||||||||||||||||||
| $ | (3.40 | ) | $ | 39.21 | 1.90 | % | $ | 30,726 | 1.29 | %(c) | 1.56 | %(c) | 0.65 | %(c) | 47 | % | ||||||||||||||||
| (0.35 | ) | 41.97 | 32.86 | 33,574 | 1.30 | 1.52 | 0.45 | 92 | ||||||||||||||||||||||||
| (0.19 | ) | 31.92 | 15.32 | 28,996 | 1.31 | 1.52 | 0.68 | 117 | ||||||||||||||||||||||||
| (0.12 | ) | 27.86 | (7.86 | ) | 34,772 | 1.32 | 1.47 | 0.95 | 66 | |||||||||||||||||||||||
| (0.16 | ) | 30.35 | 18.12 | 46,636 | 1.37 | 1.77 | 0.74 | 57 | ||||||||||||||||||||||||
| — | 25.86 | 58.75 | 66,137 | 1.41 | (c) | 1.41 | (c)(e) | 0.90 | (c) | 64 | ||||||||||||||||||||||
| (4.70 | ) | 16.29 | (48.16 | ) | 39,680 | 1.44 | 1.44 | (e) | 1.14 | 106 | ||||||||||||||||||||||
| $ | (3.35 | ) | $ | 40.27 | 1.94 | % | $ | 71,172 | 1.21 | %(c) | 1.47 | %(c) | 0.79 | %(c) | 47 | % | ||||||||||||||||
| (0.31 | ) | 42.94 | 32.96 | 71,875 | 1.21 | 1.44 | 0.46 | 92 | ||||||||||||||||||||||||
| (0.37 | ) | 32.60 | 15.50 | 88,301 | 1.20 | 1.38 | 0.80 | 117 | ||||||||||||||||||||||||
| (0.50 | ) | 28.58 | (7.74 | ) | 84,026 | 1.20 | 1.34 | 1.14 | 66 | |||||||||||||||||||||||
| (0.64 | ) | 31.45 | 18.22 | 89,186 | 1.23 | 1.70 | 0.86 | 57 | ||||||||||||||||||||||||
| — | 26.91 | 58.95 | 14,224 | 1.26 | (c) | 1.26 | (c)(f) | 1.09 | (c) | 64 | ||||||||||||||||||||||
| (4.70 | ) | 16.93 | (48.08 | ) | 6,828 | 1.29 | 1.29 | (f) | 1.27 | 106 | ||||||||||||||||||||||
| See accompanying Notes to Financial Statements | | May 31, 2014 | | Semiannual Report | 213 |
Table of Contents
Financial Highlights (cont’d)
For a Share Outstanding for the Period ended:
| Net Asset Value, Beginning of Period | Net Investment Income (Loss) (a) | Net Realized and Change in Unrealized Gain (Loss) | Total from Investment Operations | Dividends from Net Investment Income | Distributions from Net Realized Capital Gains | |||||||||||||||||||||
| AllianzGI Micro Cap: | ||||||||||||||||||||||||||
| Class A | ||||||||||||||||||||||||||
5/31/2014+ | $ | 16.06 | $ | (0.11 | ) | $ | (0.05 | ) | $ | (0.16 | ) | $ | — | $ | (0.82 | ) | ||||||||||
11/30/2013 | 11.62 | (0.20 | ) | 5.57 | 5.37 | — | (0.93 | ) | ||||||||||||||||||
12/19/2011* - 11/30/2012 | 9.84 | (0.07 | ) | 1.85 | 1.78 | — | — | |||||||||||||||||||
| Class P | ||||||||||||||||||||||||||
5/31/2014+ | $ | 16.08 | $ | (0.09 | ) | $ | (0.06 | ) | $ | (0.15 | ) | $ | — | $ | (0.82 | ) | ||||||||||
11/30/2013 | 11.61 | (0.17 | ) | 5.57 | 5.40 | — | (0.93 | ) | ||||||||||||||||||
11/30/2012 | 12.20 | (0.10 | ) | 1.47 | 1.37 | — | (1.96 | ) | ||||||||||||||||||
12/27/2010* - 11/30/2011 | 14.20 | (0.15 | ) | (1.64 | ) | (1.79 | ) | — | (0.21 | ) | ||||||||||||||||
| Institutional Class | ||||||||||||||||||||||||||
5/31/2014+ | $ | 16.15 | $ | (0.09 | ) | $ | (0.06 | ) | $ | (0.15 | ) | $ | — | $ | (0.82 | ) | ||||||||||
11/30/2013 | 11.65 | (0.15 | ) | 5.58 | 5.43 | — | (0.93 | ) | ||||||||||||||||||
11/30/2012 | 12.22 | (0.10 | ) | 1.49 | 1.39 | — | (1.96 | ) | ||||||||||||||||||
11/30/2011 | 13.80 | (0.17 | ) | (0.16 | ) | (0.33 | ) | — | (1.25 | ) | ||||||||||||||||
11/30/2010 | 10.44 | (0.15 | ) | 3.51 | 3.36 | — | — | |||||||||||||||||||
4/1/2009** - 11/30/2009 | 7.58 | (0.07 | ) | 2.93 | 2.86 | — | — | |||||||||||||||||||
3/31/2009 | 11.60 | (0.07 | ) | (3.95 | ) | (4.02 | ) | — | — | (e) | ||||||||||||||||
| AllianzGI Multi-Asset Real Return: | ||||||||||||||||||||||||||
| Class A | ||||||||||||||||||||||||||
5/31/2014+ | $ | 15.34 | $ | 0.08 | $ | 0.99 | $ | 1.07 | $ | (0.27 | ) | $ | (0.02 | ) | ||||||||||||
12/17/2012* - 11/30/2013 | 15.00 | 0.12 | 0.22 | 0.34 | — | — | ||||||||||||||||||||
| Class C | ||||||||||||||||||||||||||
5/31/2014+ | $ | 15.24 | $ | 0.02 | $ | 0.99 | $ | 1.01 | $ | (0.24 | ) | $ | (0.02 | ) | ||||||||||||
12/17/2012* - 11/30/2013 | 15.00 | (0.03 | ) | 0.27 | 0.24 | — | — | |||||||||||||||||||
| Class D | ||||||||||||||||||||||||||
5/31/2014+ | $ | 15.34 | $ | 0.07 | $ | 1.01 | $ | 1.08 | $ | (0.25 | ) | $ | (0.02 | ) | ||||||||||||
12/17/2012* - 11/30/2013 | 15.00 | 0.14 | 0.20 | 0.34 | — | — | ||||||||||||||||||||
| Class P | ||||||||||||||||||||||||||
5/31/2014+ | $ | 15.36 | $ | 0.09 | $ | 1.00 | $ | 1.09 | $ | (0.27 | ) | $ | (0.02 | ) | ||||||||||||
12/17/2012* - 11/30/2013 | 15.00 | 0.16 | 0.20 | 0.36 | — | — | ||||||||||||||||||||
| Institutional Class | ||||||||||||||||||||||||||
5/31/2014+ | $ | 15.37 | $ | 0.09 | $ | 1.01 | $ | 1.10 | $ | (0.29 | ) | $ | (0.02 | ) | ||||||||||||
12/17/2012* - 11/30/2013 | 15.00 | 0.18 | 0.19 | 0.37 | — | — | ||||||||||||||||||||
| + | Unaudited |
| * | Commencement of operations. |
| ** | On November 13, 2009, the Board of Trustees approved a change in the Fund’s fiscal year from March 31 to November 30. |
| (a) | Calculated on average shares outstanding during the period. |
| (b) | Total return is calculated assuming a purchase of a share on the first day of the period and a sale of a share on the last day of each period reported. Dividends and distributions, if any, are assumed, for purposes of this calculation, to be reinvested. Total return does not reflect sales charges and includes the effect of fee waivers and reimbursements. Total return may reflect adjustments to conform to generally accepted accounting principles. Total return for a period of less than one year is not annualized. |
| (c) | Annualized. |
| (d) | Ratio of expenses to average net assets net of reimbursement/recoupment offset was 1.63% and 0.91% for the period ended November 30, 2009 and the year ended March 31, 2009, respectively. |
| (e) | Less than $(0.01) per share. |
| (f) | Does not include expenses of the investment companies in which the Fund invests. |
| 214 | Semiannual Report | | May 31, 2014 | | See accompanying Notes to Financial Statements |
Table of Contents
| Total Dividends and Distributions | Net Asset Value, End of Period | Total Return (b) | Net Assets, End of Period (000s) | Ratio of Expenses to Average Net Assets with Fee Waiver/ Reimbursement | Ratio of Expenses to Average Net Assets without Fee Waiver/ Reimbursement | Ratio of Net Investment Income (Loss) to Average Net Assets | Portfolio Turnover Rate | |||||||||||||||||||||||||
| $ | (0.82 | ) | $ | 15.08 | (0.85 | )% | $ | 4,151 | 1.71 | %(c) | 2.01 | %(c) | (1.42 | )%(c) | 22 | % | ||||||||||||||||
| (0.93 | ) | 16.06 | 50.11 | 1,065 | 1.80 | 2.07 | (1.45 | ) | 63 | |||||||||||||||||||||||
| — | 11.62 | 18.09 | 135 | 1.82 | (c) | 2.18 | (c) | (0.62 | )(c) | 62 | ||||||||||||||||||||||
| $ | (0.82 | ) | $ | 15.11 | (0.78 | )% | $ | 2,133 | 1.57 | %(c) | 1.80 | %(c) | (1.21 | )%(c) | 22 | % | ||||||||||||||||
| (0.93 | ) | 16.08 | 50.42 | 2,192 | 1.63 | 1.90 | (1.25 | ) | 63 | |||||||||||||||||||||||
| (1.96 | ) | 11.61 | 13.90 | 332 | 1.65 | 1.99 | (0.85 | ) | 62 | |||||||||||||||||||||||
| (0.21 | ) | 12.20 | (12.43 | ) | 426 | 1.65 | (c) | 1.85 | (c) | (1.35 | )(c) | 74 | ||||||||||||||||||||
| $ | (0.82 | ) | $ | 15.18 | (0.78 | )% | $ | 35,518 | 1.54 | %(c) | 1.79 | %(c) | (1.19 | )%(c) | 22 | % | ||||||||||||||||
| (0.93 | ) | 16.15 | 50.51 | 41,713 | 1.54 | 2.01 | (1.10 | ) | 63 | |||||||||||||||||||||||
| (1.96 | ) | 11.65 | 14.09 | 27,343 | 1.54 | 1.84 | (0.90 | ) | 62 | |||||||||||||||||||||||
| (1.25 | ) | 12.22 | (2.88 | ) | 46,514 | 1.54 | 1.65 | (1.24 | ) | 74 | ||||||||||||||||||||||
| — | 13.80 | 32.18 | 57,591 | 1.57 | 1.64 | (1.25 | ) | 112 | ||||||||||||||||||||||||
| — | 10.44 | 37.73 | 53,994 | 1.55 | (c) | 1.55 | (c)(d) | (1.14 | )(c) | 86 | ||||||||||||||||||||||
| — | (e) | 7.58 | (34.63 | ) | 40,178 | 1.58 | 1.58 | (d) | (0.64 | ) | 104 | |||||||||||||||||||||
| $ | (0.29 | ) | $ | 16.12 | 7.11 | % | $ | 117 | 0.85 | %(c)(f) | 5.51 | %(c)(f) | 1.06 | %(c)(f) | 10 | % | ||||||||||||||||
| — | 15.34 | 2.27 | 45 | 0.86 | (c)(f) | 8.42 | (c)(f) | 0.83 | (c)(f) | 46 | ||||||||||||||||||||||
| $ | (0.26 | ) | $ | 15.99 | 6.71 | % | $ | 112 | 1.60 | %(c)(f) | 6.20 | %(c)(f) | 0.21 | %(c)(f) | 10 | % | ||||||||||||||||
| — | 15.24 | 1.60 | 81 | 1.60 | (c)(f) | 9.55 | (c)(f) | (0.17 | )(c)(f) | 46 | ||||||||||||||||||||||
| $ | (0.27 | ) | $ | 16.15 | 7.11 | % | $ | 30 | 0.85 | %(c)(f) | 76.06 | %(c)(f) | 0.94 | %(c)(f) | 10 | % | ||||||||||||||||
| — | 15.34 | 2.27 | 10 | 0.86 | (c)(f) | 19.52 | (c)(f) | 0.96 | (c)(f) | 46 | ||||||||||||||||||||||
| $ | (0.29 | ) | $ | 16.16 | 7.20 | % | $ | 11 | 0.70 | %(c)(f) | 5.15 | %(c)(f) | 1.11 | %(c)(f) | 10 | % | ||||||||||||||||
| — | 15.36 | 2.40 | 10 | 0.71 | (c)(f) | 7.75 | (c)(f) | 1.11 | (c)(f) | 46 | ||||||||||||||||||||||
| $ | (0.31 | ) | $ | 16.16 | 7.27 | % | $ | 5,985 | 0.60 | %(c)(f) | 5.15 | %(c)(f) | 1.21 | %(c)(f) | 10 | % | ||||||||||||||||
| — | 15.37 | 2.47 | 5,155 | 0.61 | (c)(f) | 7.74 | (c)(f) | 1.21 | (c)(f) | 46 | ||||||||||||||||||||||
| See accompanying Notes to Financial Statements | | May 31, 2014 | | Semiannual Report | 215 |
Table of Contents
Financial Highlights (cont’d)
For a Share Outstanding for the Period ended:
| Net Asset Value, Beginning of Period | Net Investment Income (a) | Net Realized and Change in Unrealized Gain (Loss) | Total from Investment Operations | Dividends from Net Investment Income | Distributions from Net Realized Capital Gains | |||||||||||||||||||||
| AllianzGI NFJ Emerging Markets Value: | ||||||||||||||||||||||||||
| Class A | ||||||||||||||||||||||||||
5/31/2014+ | $ | 15.42 | $ | 0.19 | $ | 0.41 | $ | 0.60 | $ | (0.22 | ) | $ | — | |||||||||||||
12/18/2012* - 11/30/2013 | 15.00 | 0.35 | 0.27 | 0.62 | (0.20 | ) | — | |||||||||||||||||||
| Class C | ||||||||||||||||||||||||||
5/31/2014+ | $ | 15.35 | $ | 0.13 | $ | 0.42 | $ | 0.55 | $ | (0.19 | ) | $ | — | |||||||||||||
12/18/2012* - 11/30/2013 | 15.00 | 0.14 | 0.36 | 0.50 | (0.15 | ) | — | |||||||||||||||||||
| Class D | ||||||||||||||||||||||||||
5/31/2014+ | $ | 15.45 | $ | 0.18 | $ | 0.43 | $ | 0.61 | $ | (0.22 | ) | $ | — | |||||||||||||
12/18/2012* - 11/30/2013 | 15.00 | 0.25 | 0.36 | 0.61 | (0.16 | ) | — | |||||||||||||||||||
| Class P | ||||||||||||||||||||||||||
5/31/2014+ | $ | 15.45 | $ | 0.18 | $ | 0.44 | $ | 0.62 | $ | (0.23 | ) | $ | — | |||||||||||||
12/18/2012* - 11/30/2013 | 15.00 | 0.36 | 0.27 | 0.63 | (0.18 | ) | — | |||||||||||||||||||
| Institutional Class | ||||||||||||||||||||||||||
5/31/2014+ | $ | 15.46 | $ | 0.20 | $ | 0.43 | $ | 0.63 | $ | (0.23 | ) | $ | — | |||||||||||||
12/18/2012* - 11/30/2013 | 15.00 | 0.39 | 0.26 | 0.65 | (0.19 | ) | — | |||||||||||||||||||
| AllianzGI NFJ Global Dividend Value: | ||||||||||||||||||||||||||
| Class A | ||||||||||||||||||||||||||
5/31/2014+ | $ | 22.08 | $ | 0.36 | $ | 0.56 | $ | 0.92 | $ | (0.28 | ) | $ | (0.59 | ) | ||||||||||||
11/30/2013 | 18.27 | 0.54 | 3.75 | 4.29 | (0.44 | ) | (0.04 | ) | ||||||||||||||||||
11/30/2012 | 17.35 | 0.56 | 1.10 | 1.66 | (0.40 | ) | (0.34 | ) | ||||||||||||||||||
11/30/2011 | 17.91 | 0.55 | (0.19 | ) | 0.36 | (0.64 | ) | (0.28 | ) | |||||||||||||||||
11/30/2010 | 18.16 | 0.43 | 0.38 | 0.81 | (0.71 | ) | (0.35 | ) | ||||||||||||||||||
6/26/2009* - 11/30/2009 | 15.00 | 0.15 | 3.04 | 3.19 | (0.03 | ) | — | |||||||||||||||||||
| Class C | ||||||||||||||||||||||||||
5/31/2014+ | $ | 21.82 | $ | 0.27 | $ | 0.56 | $ | 0.83 | $ | (0.20 | ) | $ | (0.59 | ) | ||||||||||||
11/30/2013 | 18.05 | 0.37 | 3.72 | 4.09 | (0.28 | ) | (0.04 | ) | ||||||||||||||||||
11/30/2012 | 17.19 | 0.42 | 1.07 | 1.49 | (0.29 | ) | (0.34 | ) | ||||||||||||||||||
11/30/2011 | 17.76 | 0.43 | (0.20 | ) | 0.23 | (0.52 | ) | (0.28 | ) | |||||||||||||||||
11/30/2010 | 18.12 | 0.28 | 0.41 | 0.69 | (0.70 | ) | (0.35 | ) | ||||||||||||||||||
6/26/2009* - 11/30/2009 | 15.00 | 0.10 | 3.02 | 3.12 | — | (d) | — | |||||||||||||||||||
| Class D | ||||||||||||||||||||||||||
5/31/2014+ | $ | 22.30 | $ | 0.36 | $ | 0.56 | $ | 0.92 | $ | (0.28 | ) | $ | (0.59 | ) | ||||||||||||
11/30/2013 | 18.44 | 0.52 | 3.80 | 4.32 | (0.42 | ) | (0.04 | ) | ||||||||||||||||||
11/30/2012 | 17.38 | 0.60 | 1.05 | 1.65 | (0.25 | ) | (0.34 | ) | ||||||||||||||||||
11/30/2011 | 17.86 | 0.61 | (0.23 | ) | 0.38 | (0.58 | ) | (0.28 | ) | |||||||||||||||||
11/30/2010 | 18.17 | 0.43 | 0.37 | 0.80 | (0.76 | ) | (0.35 | ) | ||||||||||||||||||
6/26/2009* - 11/30/2009 | 15.00 | 0.15 | 3.04 | 3.19 | (0.02 | ) | — | |||||||||||||||||||
| + | Unaudited |
| * | Commencement of operations. |
| (a) | Calculated on average shares outstanding during the period. |
| (b) | Total return is calculated assuming a purchase of a share on the first day of the period and a sale of a share on the last day of each period reported. Dividends and distributions, if any, are assumed, for purposes of this calculation, to be reinvested. Total return does not reflect sales charges and includes the effect of fee waivers and reimbursements. Total return may reflect adjustments to conform to generally accepted accounting principles. Total return for a period of less than one year is not annualized. |
| (c) | Annualized. |
| (d) | Less than $(0.01) per share. |
| 216 | Semiannual Report | | May 31, 2014 | | See accompanying Notes to Financial Statements |
Table of Contents
| Total Dividends and Distributions | Net Asset Value, End of Period | Total Return (b) | Net Assets, End of Period (000s) | Ratio of Expenses to Average Net Assets with Fee Waiver/ Reimbursement | Ratio of Expenses to Average Net Assets without Fee Waiver/ Reimbursement | Ratio of Net Investment Income to Average Net Assets | Portfolio Turnover Rate | |||||||||||||||||||||||||
| $ | (0.22 | ) | $ | 15.80 | 4.02 | % | $ | 29 | 1.55 | %(c) | 4.92 | %(c) | 2.50 | %(c) | 50 | % | ||||||||||||||||
| (0.20 | ) | 15.42 | 4.14 | 19 | 1.55 | (c) | 17.07 | (c) | 2.41 | (c) | 67 | |||||||||||||||||||||
| $ | (0.19 | ) | $ | 15.71 | 3.66 | % | $ | 43 | 2.30 | %(c) | 5.59 | %(c) | 1.76 | %(c) | 50 | % | ||||||||||||||||
| (0.15 | ) | 15.35 | 3.40 | 25 | 2.30 | (c) | 19.41 | (c) | 1.00 | (c) | 67 | |||||||||||||||||||||
| $ | (0.22 | ) | $ | 15.84 | 4.09 | % | $ | 1,497 | 1.55 | %(c) | 5.59 | %(c) | 2.39 | %(c) | 50 | % | ||||||||||||||||
| (0.16 | ) | 15.45 | 4.10 | 1,086 | 1.55 | (c) | 8.48 | (c) | 1.75 | (c) | 67 | |||||||||||||||||||||
| $ | (0.23 | ) | $ | 15.84 | 4.13 | % | $ | 11 | 1.40 | %(c) | 4.66 | %(c) | 2.42 | %(c) | 50 | % | ||||||||||||||||
| (0.18 | ) | 15.45 | 4.25 | 11 | 1.41 | (c) | 7.72 | (c) | 2.49 | (c) | 67 | |||||||||||||||||||||
| $ | (0.23 | ) | $ | 15.86 | 4.22 | % | $ | 8,220 | 1.30 | %(c) | 4.62 | %(c) | 2.70 | %(c) | 50 | % | ||||||||||||||||
| (0.19 | ) | 15.46 | 4.38 | 6,470 | 1.30 | (c) | 7.78 | (c) | 2.70 | (c) | 67 | |||||||||||||||||||||
| $ | (0.87 | ) | $ | 22.13 | 4.48 | % | $ | 11,877 | 1.20 | %(c) | 1.44 | %(c) | 3.41 | %(c) | 20 | % | ||||||||||||||||
| (0.48 | ) | 22.08 | 23.80 | 10,705 | 1.21 | 1.51 | 2.68 | 43 | ||||||||||||||||||||||||
| (0.74 | ) | 18.27 | 9.98 | 7,355 | 1.32 | 1.71 | 3.13 | 41 | ||||||||||||||||||||||||
| (0.92 | ) | 17.35 | 1.85 | 6,821 | 1.50 | 1.92 | 3.01 | 66 | ||||||||||||||||||||||||
| (1.06 | ) | 17.91 | 4.71 | 1,469 | 1.50 | 4.55 | 2.41 | 40 | ||||||||||||||||||||||||
| (0.03 | ) | 18.16 | 21.24 | 282 | 1.50 | (c) | 9.11 | (c) | 2.04 | (c) | 22 | |||||||||||||||||||||
| $ | (0.79 | ) | $ | 21.86 | 4.07 | % | $ | 5,932 | 1.99 | %(c) | 2.21 | %(c) | 2.60 | %(c) | 20 | % | ||||||||||||||||
| (0.32 | ) | 21.82 | 22.88 | 5,720 | 2.00 | 2.27 | 1.83 | 43 | ||||||||||||||||||||||||
| (0.63 | ) | 18.05 | 9.03 | 3,948 | 2.07 | 2.46 | 2.34 | 41 | ||||||||||||||||||||||||
| (0.80 | ) | 17.19 | 1.12 | 3,020 | 2.25 | 2.71 | 2.39 | 66 | ||||||||||||||||||||||||
| (1.05 | ) | 17.76 | 3.99 | 1,210 | 2.25 | 5.11 | 1.57 | 40 | ||||||||||||||||||||||||
| — | (d) | 18.12 | 20.80 | 89 | 2.25 | (c) | 9.86 | (c) | 1.29 | (c) | 22 | |||||||||||||||||||||
| $ | (0.87 | ) | $ | 22.35 | 4.40 | % | $ | 838 | 1.29 | %(c) | 1.41 | %(c) | 3.37 | %(c) | 20 | % | ||||||||||||||||
| (0.46 | ) | 22.30 | 23.72 | 753 | 1.31 | 1.55 | 2.53 | 43 | ||||||||||||||||||||||||
| (0.59 | ) | 18.44 | 9.83 | 480 | 1.38 | 3.04 | 3.31 | 41 | ||||||||||||||||||||||||
| (0.86 | ) | 17.38 | 1.91 | 558 | 1.50 | 3.74 | 3.27 | 66 | ||||||||||||||||||||||||
| (1.11 | ) | 17.86 | 4.68 | 203 | 1.50 | 4.53 | 2.44 | 40 | ||||||||||||||||||||||||
| (0.02 | ) | 18.17 | 21.27 | 35 | 1.50 | (c) | 9.11 | (c) | 2.04 | (c) | 22 | |||||||||||||||||||||
| See accompanying Notes to Financial Statements | | May 31, 2014 | | Semiannual Report | 217 |
Table of Contents
Financial Highlights (cont’d)
For a Share Outstanding for the Period ended:
| Net Asset Value, Beginning of Period | Net Investment Income (a) | Net Realized and Change in Unrealized Gain | Total from Investment Operations | Dividends from Net Investment Income | Distributions from Net Realized Capital Gains | |||||||||||||||||||||
| AllianzGI NFJ Global Dividend Value (cont’d) | ||||||||||||||||||||||||||
| Class P | ||||||||||||||||||||||||||
5/31/2014+ | $ | 22.21 | $ | 0.38 | $ | 0.56 | $ | 0.94 | $ | (0.30 | ) | $ | (0.59 | ) | ||||||||||||
11/30/2013 | 18.36 | 0.57 | 3.78 | 4.35 | (0.46 | ) | (0.04 | ) | ||||||||||||||||||
11/30/2012 | 17.45 | 0.60 | 1.10 | 1.70 | (0.45 | ) | (0.34 | ) | ||||||||||||||||||
11/30/2011 | 17.82 | 0.42 | (0.02 | ) | 0.40 | (0.49 | ) | (0.28 | ) | |||||||||||||||||
11/30/2010 | 18.17 | 0.46 | 0.38 | 0.84 | (0.84 | ) | (0.35 | ) | ||||||||||||||||||
6/26/2009* - 11/30/2009 | 15.00 | 0.16 | 3.04 | 3.20 | (0.03 | ) | — | |||||||||||||||||||
| Institutional Class | ||||||||||||||||||||||||||
5/31/2014+ | $ | 21.98 | $ | 0.39 | $ | 0.56 | $ | 0.95 | $ | (0.31 | ) | $ | (0.59 | ) | ||||||||||||
11/30/2013 | 18.18 | 0.60 | 3.73 | 4.33 | (0.49 | ) | (0.04 | ) | ||||||||||||||||||
11/30/2012 | 17.29 | 0.60 | 1.09 | 1.69 | (0.46 | ) | (0.34 | ) | ||||||||||||||||||
11/30/2011 | 17.83 | 0.64 | (0.21 | ) | 0.43 | (0.69 | ) | (0.28 | ) | |||||||||||||||||
11/30/2010 | 18.17 | 0.41 | 0.46 | 0.87 | (0.86 | ) | (0.35 | ) | ||||||||||||||||||
6/26/2009* - 11/30/2009 | 15.00 | 0.17 | 3.03 | 3.20 | (0.03 | ) | — | |||||||||||||||||||
| AllianzGI NFJ International Small-Cap Value: | ||||||||||||||||||||||||||
| Class A | ||||||||||||||||||||||||||
5/31/2014+ | $ | 21.06 | $ | 0.23 | $ | 1.67 | $ | 1.90 | $ | (0.26 | ) | $ | (0.37 | ) | ||||||||||||
11/30/2013 | 17.10 | 0.35 | 4.03 | 4.38 | (0.33 | ) | (0.09 | ) | ||||||||||||||||||
6/1/2012* - 11/30/2012 | 15.00 | 0.07 | 2.03 | 2.10 | — | — | ||||||||||||||||||||
| Class C | ||||||||||||||||||||||||||
5/31/2014+ | $ | 21.04 | $ | 0.17 | $ | 1.65 | $ | 1.82 | $ | (0.33 | ) | $ | (0.37 | ) | ||||||||||||
11/30/2013 | 17.04 | 0.16 | 4.09 | 4.25 | (0.16 | ) | (0.09 | ) | ||||||||||||||||||
6/1/2012* - 11/30/2012 | 15.00 | 0.09 | 1.95 | 2.04 | — | — | ||||||||||||||||||||
| Class D | ||||||||||||||||||||||||||
5/31/2014+ | $ | 21.04 | $ | 0.22 | $ | 1.69 | $ | 1.91 | $ | (0.17 | ) | $ | (0.37 | ) | ||||||||||||
11/30/2013 | 17.11 | 0.42 | 3.95 | 4.37 | (0.35 | ) | (0.09 | ) | ||||||||||||||||||
6/1/2012* - 11/30/2012 | 15.00 | 0.13 | 1.98 | 2.11 | — | — | ||||||||||||||||||||
| Class P | ||||||||||||||||||||||||||
5/31/2014+ | $ | 21.27 | $ | 0.26 | $ | 1.69 | $ | 1.95 | $ | (0.19 | ) | $ | (0.37 | ) | ||||||||||||
11/30/2013 | 17.11 | 0.39 | 4.05 | 4.44 | (0.19 | ) | (0.09 | ) | ||||||||||||||||||
6/1/2012* - 11/30/2012 | 15.00 | 0.16 | 1.95 | 2.11 | — | — | ||||||||||||||||||||
| Institutional Class | ||||||||||||||||||||||||||
5/31/2014+ | $ | 21.28 | $ | 0.26 | $ | 1.69 | $ | 1.95 | $ | (0.32 | ) | $ | (0.37 | ) | ||||||||||||
11/30/2013 | 17.12 | 0.43 | 4.03 | 4.46 | (0.21 | ) | (0.09 | ) | ||||||||||||||||||
6/1/2012* - 11/30/2012 | 15.00 | 0.17 | 1.95 | 2.12 | — | — | ||||||||||||||||||||
| + | Unaudited |
| * | Commencement of operations. |
| (a) | Calculated on average shares outstanding during the period. |
| (b) | Total return is calculated assuming a purchase of a share on the first day of the period and a sale of a share on the last day of each period reported. Dividends and distributions, if any, are assumed, for purposes of this calculation, to be reinvested. Total return does not reflect sales charges and includes the effect of fee waivers and reimbursements. Total return may reflect adjustments to conform to generally accepted accounting principles. Total return for a period of less than one year is not annualized. |
| (c) | Annualized. |
| 218 | Semiannual Report | | May 31, 2014 | | See accompanying Notes to Financial Statements |
Table of Contents
| Total Dividends and Distributions | Net Asset Value, End of Period | Total Return (b) | Net Assets, End of Period (000s) | Ratio of Expenses to Average Net Assets with Fee Waiver/ Reimbursement | Ratio of Expenses to Average Net Assets without Fee Waiver/ Reimbursement | Ratio of Net Investment Income to Average Net Assets | Portfolio Turnover Rate | |||||||||||||||||||||||||
| $ | (0.89 | ) | $ | 22.26 | 4.55 | % | $ | 1,910 | 1.04 | %(c) | 1.26 | %(c) | 3.60 | %(c) | 20 | % | ||||||||||||||||
| (0.50 | ) | 22.21 | 24.06 | 1,685 | 1.05 | 1.32 | 2.77 | 43 | ||||||||||||||||||||||||
| (0.79 | ) | 18.36 | 10.11 | 1,089 | 1.12 | 1.51 | 3.32 | 41 | ||||||||||||||||||||||||
| (0.77 | ) | 17.45 | 2.13 | 718 | 1.30 | 1.99 | 2.41 | 66 | ||||||||||||||||||||||||
| (1.19 | ) | 17.82 | 4.90 | 13 | 1.30 | 4.45 | 2.63 | 40 | ||||||||||||||||||||||||
| (0.03 | ) | 18.17 | 21.31 | 12 | 1.30 | (c) | 8.96 | (c) | 2.24 | (c) | 22 | |||||||||||||||||||||
| $ | (0.90 | ) | $ | 22.03 | 4.62 | % | $ | 54,044 | 0.95 | %(c) | 1.16 | %(c) | 3.65 | %(c) | 20 | % | ||||||||||||||||
| (0.53 | ) | 21.98 | 24.16 | 51,318 | 0.96 | 1.21 | 2.96 | 43 | ||||||||||||||||||||||||
| (0.80 | ) | 18.18 | 10.19 | 39,215 | 1.02 | 1.40 | 3.38 | 41 | ||||||||||||||||||||||||
| (0.97 | ) | 17.29 | 2.21 | 20,556 | 1.20 | 1.68 | 3.51 | 66 | ||||||||||||||||||||||||
| (1.21 | ) | 17.83 | 5.07 | 15,211 | 1.20 | 3.40 | 2.32 | 40 | ||||||||||||||||||||||||
| (0.03 | ) | 18.17 | 21.34 | 2,986 | 1.20 | (c) | 8.86 | (c) | 2.34 | (c) | 22 | |||||||||||||||||||||
| $ | (0.63 | ) | $ | 22.33 | 9.34 | % | $ | 2,759 | 1.45 | %(c) | 2.66 | %(c) | 2.15 | %(c) | 21 | % | ||||||||||||||||
| (0.42 | ) | 21.06 | 26.08 | 2,272 | 1.45 | 4.81 | 1.81 | 50 | ||||||||||||||||||||||||
| — | 17.10 | 14.00 | 1,049 | 1.45 | (c) | 4.22 | (c) | 0.82 | (c) | 19 | ||||||||||||||||||||||
| $ | (0.70 | ) | $ | 22.16 | 8.98 | % | $ | 1,224 | 2.20 | %(c) | 3.43 | %(c) | 1.58 | %(c) | 21 | % | ||||||||||||||||
| (0.25 | ) | 21.04 | 25.20 | 521 | 2.20 | 5.66 | 0.80 | 50 | ||||||||||||||||||||||||
| — | 17.04 | 13.60 | 11 | 2.20 | (c) | 9.92 | (c) | 1.08 | (c) | 19 | ||||||||||||||||||||||
| $ | (0.54 | ) | $ | 22.41 | 9.38 | % | $ | 1,109 | 1.45 | %(c) | 3.60 | %(c) | 2.09 | %(c) | 21 | % | ||||||||||||||||
| (0.44 | ) | 21.04 | 26.03 | 951 | 1.45 | 6.56 | 2.17 | 50 | ||||||||||||||||||||||||
| — | 17.11 | 14.07 | 84 | 1.45 | (c) | 7.85 | (c) | 1.59 | (c) | 19 | ||||||||||||||||||||||
| $ | (0.56 | ) | $ | 22.66 | 9.47 | % | $ | 24 | 1.30 | %(c) | 2.38 | %(c) | 2.38 | %(c) | 21 | % | ||||||||||||||||
| (0.28 | ) | 21.27 | 26.28 | 14 | 1.31 | 4.63 | 2.04 | 50 | ||||||||||||||||||||||||
| — | 17.11 | 14.07 | 12 | 1.30 | (c) | 8.92 | (c) | 1.98 | (c) | 19 | ||||||||||||||||||||||
| $ | (0.69 | ) | $ | 22.54 | 9.50 | % | $ | 16,644 | 1.20 | %(c) | 2.40 | %(c) | 2.39 | %(c) | 21 | % | ||||||||||||||||
| (0.30 | ) | 21.28 | 26.40 | 11,873 | 1.21 | 4.66 | 2.22 | 50 | ||||||||||||||||||||||||
| — | 17.12 | 14.13 | 3,551 | 1.20 | (c) | 8.90 | (c) | 2.08 | (c) | 19 | ||||||||||||||||||||||
| See accompanying Notes to Financial Statements | | May 31, 2014 | | Semiannual Report | 219 |
Table of Contents
Financial Highlights (cont’d)
For a Share Outstanding for the Period ended:
Net Asset | Net Investment Income (Loss) (a) | Net Realized and Change in Unrealized Gain | Total from Investment Operations | Dividends from Net Investment Income | Distributions from Net Realized Capital Gains | |||||||||||||||||||||
| AllianzGI NFJ International Value II: | ||||||||||||||||||||||||||
| Class A | ||||||||||||||||||||||||||
5/31/2014+ | $ | 19.17 | $ | 0.36 | $ | 0.71 | $ | 1.07 | $ | (0.38 | ) | $ | (0.64 | ) | ||||||||||||
11/30/2013 | 16.36 | 0.34 | 2.71 | 3.05 | (0.22 | ) | (0.02 | ) | ||||||||||||||||||
12/1/2011* - 11/30/2012 | 15.00 | 0.29 | 1.33 | 1.62 | (0.26 | ) | — | |||||||||||||||||||
| Class C | ||||||||||||||||||||||||||
5/31/2014+ | $ | 19.04 | $ | 0.29 | $ | 0.69 | $ | 0.98 | $ | (0.31 | ) | $ | (0.64 | ) | ||||||||||||
11/30/2013 | 16.32 | 0.18 | 2.73 | 2.91 | (0.17 | ) | (0.02 | ) | ||||||||||||||||||
12/1/2011* - 11/30/2012 | 15.00 | 0.22 | 1.28 | 1.50 | (0.18 | ) | — | |||||||||||||||||||
| Class D | ||||||||||||||||||||||||||
5/31/2014+ | $ | 19.20 | $ | 0.36 | $ | 0.70 | $ | 1.06 | $ | (0.38 | ) | $ | (0.64 | ) | ||||||||||||
11/30/2013 | 16.36 | 0.33 | 2.73 | 3.06 | (0.20 | ) | (0.02 | ) | ||||||||||||||||||
12/1/2011* - 11/30/2012 | 15.00 | 0.34 | 1.28 | 1.62 | (0.26 | ) | — | |||||||||||||||||||
| Class P | ||||||||||||||||||||||||||
5/31/2014+ | $ | 19.24 | $ | 0.37 | $ | 0.71 | $ | 1.08 | $ | (0.39 | ) | $ | (0.64 | ) | ||||||||||||
11/30/2013 | 16.38 | 0.36 | 2.73 | 3.09 | (0.21 | ) | (0.02 | ) | ||||||||||||||||||
12/1/2011* - 11/30/2012 | 15.00 | 0.38 | 1.28 | 1.66 | (0.28 | ) | — | |||||||||||||||||||
| Institutional Class | ||||||||||||||||||||||||||
5/31/2014+ | $ | 19.26 | $ | 0.52 | $ | 0.57 | $ | 1.09 | $ | (0.42 | ) | $ | (0.64 | ) | ||||||||||||
11/30/2013 | 16.38 | 0.36 | 2.76 | 3.12 | (0.22 | ) | (0.02 | ) | ||||||||||||||||||
12/1/2011* - 11/30/2012 | 15.00 | 0.39 | 1.29 | 1.68 | (0.30 | ) | — | |||||||||||||||||||
| AllianzGI Short Duration High Income: | ||||||||||||||||||||||||||
| Class A | ||||||||||||||||||||||||||
5/31/2014+ | $ | 15.92 | $ | 0.31 | $ | 0.07 | $ | 0.38 | $ | (0.38 | ) | $ | — | |||||||||||||
11/30/2013 | 15.97 | 0.63 | 0.09 | 0.72 | (0.76 | ) | (0.01 | ) | ||||||||||||||||||
11/30/2012 | 15.32 | 0.64 | 0.68 | 1.32 | (0.67 | ) | — | |||||||||||||||||||
10/3/2011* - 11/30/2011 | 15.00 | 0.12 | 0.25 | 0.37 | (0.05 | ) | — | |||||||||||||||||||
| Class C | ||||||||||||||||||||||||||
5/31/2014+ | $ | 15.89 | $ | 0.29 | $ | 0.07 | $ | 0.36 | $ | (0.36 | ) | $ | — | |||||||||||||
11/30/2013 | 15.94 | 0.59 | 0.09 | 0.68 | (0.72 | ) | (0.01 | ) | ||||||||||||||||||
11/30/2012 | 15.31 | 0.58 | 0.64 | 1.22 | (0.59 | ) | — | |||||||||||||||||||
10/3/2011* - 11/30/2011 | 15.00 | 0.10 | 0.25 | 0.35 | (0.04 | ) | — | |||||||||||||||||||
| Class D | ||||||||||||||||||||||||||
5/31/2014+ | $ | 15.92 | $ | 0.31 | $ | 0.07 | $ | 0.38 | $ | (0.38 | ) | $ | — | |||||||||||||
11/30/2013 | 15.97 | 0.63 | 0.09 | 0.72 | (0.76 | ) | (0.01 | ) | ||||||||||||||||||
11/30/2012 | 15.32 | 0.65 | 0.67 | 1.32 | (0.67 | ) | — | |||||||||||||||||||
10/3/2011* - 11/30/2011 | 15.00 | 0.12 | 0.25 | 0.37 | (0.05 | ) | — | |||||||||||||||||||
| + | Unaudited |
| * | Commencement of operations. |
| (a) | Calculated on average shares outstanding during the period. |
| (b) | Total return is calculated assuming a purchase of a share on the first day of the period and a sale of a share on the last day of each period reported. Dividends and distributions, if any, are assumed, for purposes of this calculation, to be reinvested. Total return does not reflect sales charges and includes the effect of fee waivers and reimbursements. Total return may reflect adjustments to conform to generally accepted accounting principles. Total return for a period of less than one year is not annualized. |
| (c) | Annualized. |
| 220 | Semiannual Report | | May 31, 2014 | | See accompanying Notes to Financial Statements |
Table of Contents
| Total Dividends and Distributions | Net Asset Value, End of Period | Total Return (b) | Net Assets, End of Period (000s) | Ratio of Expenses to Average Net Assets with Fee Waiver/ Reimbursement | Ratio of Expenses to Average Net Assets without Fee Waiver/ Reimbursement | Ratio of Net Investment Income (Loss) to Average Net Assets | Portfolio Turnover Rate | |||||||||||||||||||||||||
| $ | (1.02 | ) | $ | 19.22 | 6.03 | % | $ | 107 | 1.20 | %(c) | 3.05 | %(c) | 3.97 | %(c) | 12 | % | ||||||||||||||||
| (0.24 | ) | 19.17 | 18.89 | 75 | 1.23 | 7.16 | 1.93 | 20 | ||||||||||||||||||||||||
| (0.26 | ) | 16.36 | 10.99 | 49 | 1.30 | (c) | 10.98 | (c) | 1.89 | (c) | 22 | |||||||||||||||||||||
| $ | (0.95 | ) | $ | 19.07 | 5.60 | % | $ | 48 | 1.95 | %(c) | 3.85 | %(c) | 3.14 | %(c) | 12 | % | ||||||||||||||||
| (0.19 | ) | 19.04 | 18.02 | 47 | 1.97 | 8.26 | 1.02 | 20 | ||||||||||||||||||||||||
| (0.18 | ) | 16.32 | 10.17 | 11 | 2.05 | (c) | 10.82 | (c) | 1.45 | (c) | 22 | |||||||||||||||||||||
| $ | (1.02 | ) | $ | 19.24 | 6.00 | % | $ | 14 | 1.20 | %(c) | 3.02 | %(c) | 3.92 | %(c) | 12 | % | ||||||||||||||||
| (0.22 | ) | 19.20 | 18.93 | 13 | 1.23 | 7.04 | 1.87 | 20 | ||||||||||||||||||||||||
| (0.26 | ) | 16.36 | 10.97 | 11 | 1.30 | (c) | 10.07 | (c) | 2.20 | (c) | 22 | |||||||||||||||||||||
| $ | (1.03 | ) | $ | 19.29 | 6.11 | % | $ | 24 | 1.03 | %(c) | 2.90 | %(c) | 4.09 | %(c) | 12 | % | ||||||||||||||||
| (0.23 | ) | 19.24 | 19.10 | 13 | 1.05 | 6.87 | 2.05 | 20 | ||||||||||||||||||||||||
| (0.28 | ) | 16.38 | 11.28 | 11 | 1.05 | (c) | 9.92 | (c) | 2.45 | (c) | 22 | |||||||||||||||||||||
| $ | (1.06 | ) | $ | 19.29 | 6.14 | % | $ | 31,064 | 0.95 | %(c) | 1.97 | %(c) | 5.69 | %(c) | 12 | % | ||||||||||||||||
| (0.24 | ) | 19.26 | 19.25 | 4,170 | 0.95 | 6.77 | 2.06 | 20 | ||||||||||||||||||||||||
| (0.30 | ) | 16.38 | 11.36 | 4,396 | 0.95 | (c) | 9.93 | (c) | 2.50 | (c) | 22 | |||||||||||||||||||||
| $ | (0.38 | ) | $ | 15.92 | 2.40 | % | $ | 207,335 | 0.85 | %(c) | 0.85 | %(c) | 3.93 | %(c) | 54 | % | ||||||||||||||||
| (0.77 | ) | 15.92 | 4.60 | 168,536 | 0.85 | 0.90 | 3.98 | 63 | ||||||||||||||||||||||||
| (0.67 | ) | 15.97 | 8.78 | 80,995 | 0.89 | 1.09 | 4.09 | 51 | ||||||||||||||||||||||||
| (0.05 | ) | 15.32 | 2.50 | 532 | 0.95 | (c) | 2.99 | (c) | 4.97 | (c) | 10 | |||||||||||||||||||||
| $ | (0.36 | ) | $ | 15.89 | 2.29 | % | $ | 84,329 | 1.10 | %(c) | 1.11 | %(c) | 3.69 | %(c) | 54 | % | ||||||||||||||||
| (0.73 | ) | 15.89 | 4.36 | 63,680 | 1.10 | 1.16 | 3.74 | 63 | ||||||||||||||||||||||||
| (0.59 | ) | 15.94 | 8.18 | 28,567 | 1.29 | 1.50 | 3.73 | 51 | ||||||||||||||||||||||||
| (0.04 | ) | 15.31 | 2.36 | 1,245 | 1.70 | (c) | 3.72 | (c) | 4.26 | (c) | 10 | |||||||||||||||||||||
| $ | (0.38 | ) | $ | 15.92 | 2.41 | % | $ | 37,432 | 0.85 | %(c) | 0.94 | %(c) | 3.96 | %(c) | 54 | % | ||||||||||||||||
| (0.77 | ) | 15.92 | 4.61 | 18,902 | 0.85 | 1.08 | 3.99 | 63 | ||||||||||||||||||||||||
| (0.67 | ) | 15.97 | 8.78 | 10,018 | 0.90 | 1.18 | 4.16 | 51 | ||||||||||||||||||||||||
| (0.05 | ) | 15.32 | 2.50 | 65 | 0.95 | (c) | 2.88 | (c) | 4.95 | (c) | 10 | |||||||||||||||||||||
| See accompanying Notes to Financial Statements | | May 31, 2014 | | Semiannual Report | 221 |
Table of Contents
Financial Highlights (cont’d)
For a Share Outstanding for the Period ended:
Net Asset | Net Investment Income (Loss) (a) | Net Realized and Change in Unrealized Gain | Total from Investment Operations | Dividends from Net Investment Income | Distributions from Net Realized Capital Gains | |||||||||||||||||||||
| AllianzGI Short Duration High Income (cont’d) | ||||||||||||||||||||||||||
| Class P | ||||||||||||||||||||||||||
5/31/2014+ | $ | 15.92 | $ | 0.32 | $ | 0.07 | $ | 0.39 | $ | (0.39 | ) | $ | — | |||||||||||||
11/30/2013 | 15.96 | 0.66 | 0.10 | 0.76 | (0.79 | ) | (0.01 | ) | ||||||||||||||||||
11/30/2012 | 15.32 | 0.66 | 0.68 | 1.34 | (0.70 | ) | — | |||||||||||||||||||
10/3/2011* - 11/30/2011 | 15.00 | 0.10 | 0.28 | 0.38 | (0.06 | ) | — | |||||||||||||||||||
| Institutional Class | ||||||||||||||||||||||||||
5/31/2014+ | $ | 15.94 | $ | 0.33 | $ | 0.07 | $ | 0.40 | $ | (0.40 | ) | $ | — | |||||||||||||
11/30/2013 | 15.99 | 0.67 | 0.09 | 0.76 | (0.80 | ) | (0.01 | ) | ||||||||||||||||||
11/30/2012 | 15.32 | 0.70 | 0.67 | 1.37 | (0.70 | ) | — | |||||||||||||||||||
10/3/2011* - 11/30/2011 | 15.00 | 0.11 | 0.27 | 0.38 | (0.06 | ) | — | |||||||||||||||||||
| AllianzGI Structured Return: | ||||||||||||||||||||||||||
| Class A | ||||||||||||||||||||||||||
5/31/2014+ | $ | 15.87 | $ | (0.14 | ) | $ | 0.36 | $ | 0.22 | $ | — | $ | (0.68 | ) | ||||||||||||
12/3/2012* - 11/30/2013 | 15.00 | (0.28 | ) | 1.15 | 0.87 | — | — | |||||||||||||||||||
| Class C | ||||||||||||||||||||||||||
5/31/2014+ | $ | 15.73 | $ | (0.19 | ) | $ | 0.36 | $ | 0.17 | $ | — | $ | (0.68 | ) | ||||||||||||
12/3/2012* - 11/30/2013 | 15.00 | (0.39 | ) | 1.12 | 0.73 | — | — | |||||||||||||||||||
| Class D | ||||||||||||||||||||||||||
5/31/2014+ | $ | 15.89 | $ | (0.14 | ) | $ | 0.36 | $ | 0.22 | $ | — | $ | (0.68 | ) | ||||||||||||
12/3/2012* - 11/30/2013 | 15.00 | (0.28 | ) | 1.17 | 0.89 | — | — | |||||||||||||||||||
| Class P | ||||||||||||||||||||||||||
5/31/2014+ | $ | 15.89 | $ | (0.13 | ) | $ | 0.36 | $ | 0.23 | $ | — | $ | (0.68 | ) | ||||||||||||
12/3/2012* - 11/30/2013 | 15.00 | (0.26 | ) | 1.15 | 0.89 | — | — | |||||||||||||||||||
| Institutional Class | ||||||||||||||||||||||||||
5/31/2014+ | $ | 15.90 | $ | (0.12 | ) | $ | 0.37 | $ | 0.25 | $ | — | $ | (0.68 | ) | ||||||||||||
12/3/2012* - 11/30/2013 | 15.00 | (0.24 | ) | 1.14 | 0.90 | — | — | |||||||||||||||||||
| + | Unaudited |
| * | Commencement of operations. |
| ** | On November 13, 2009, the Board of Trustees approved a change in the Fund’s fiscal year from March 31 to November 30. |
| (a) | Calculated on average shares outstanding during the period. |
| (b) | Total return is calculated assuming a purchase of a share on the first day of the period and a sale of a share on the last day of each period reported. Dividends and distributions, if any, are assumed, for purposes of this calculation, to be reinvested. Total return does not reflect sales charges and includes the effect of fee waivers and reimbursements. Total return may reflect adjustments to conform to generally accepted accounting principles. Total return for a period of less than one year is not annualized. |
| (c) | Annualized. |
| 222 | Semiannual Report | | May 31, 2014 | | See accompanying Notes to Financial Statements |
Table of Contents
| Total Dividends and Distributions | Net Asset Value, End of Period | Total Return (b) | Net Assets, End of Period (000s) | Ratio of Expenses to Average Net Assets with Fee Waiver/ Reimbursement | Ratio of Expenses to Average Net Assets without Fee Waiver/ Reimbursement | Ratio of Net Investment Income (Loss) to Average Net Assets | Portfolio Turnover Rate | |||||||||||||||||||||||||
| $ | (0.39 | ) | $ | 15.92 | 2.49 | % | $ | 166,996 | 0.70 | %(c) | 0.70 | %(c) | 4.09 | %(c) | 54 | % | ||||||||||||||||
| (0.80 | ) | 15.92 | 4.83 | 121,747 | 0.70 | 0.71 | 4.14 | 63 | ||||||||||||||||||||||||
| (0.70 | ) | 15.96 | 8.91 | 52,932 | 0.70 | 0.92 | 4.24 | 51 | ||||||||||||||||||||||||
| (0.06 | ) | 15.32 | 2.50 | 10 | 0.70 | (c) | 2.84 | (c) | 4.22 | (c) | 10 | |||||||||||||||||||||
| $ | (0.40 | ) | $ | 15.94 | 2.53 | % | $ | 228,369 | 0.60 | %(c) | 0.60 | %(c) | 4.19 | %(c) | 54 | % | ||||||||||||||||
| (0.81 | ) | 15.94 | 4.87 | 179,676 | 0.61 | 0.61 | 4.23 | 63 | ||||||||||||||||||||||||
| (0.70 | ) | 15.99 | 9.13 | 38,247 | 0.60 | 0.89 | 4.48 | 51 | ||||||||||||||||||||||||
| (0.06 | ) | 15.32 | 2.52 | 8,055 | 0.60 | (c) | 2.72 | (c) | 4.58 | (c) | 10 | |||||||||||||||||||||
| $ | (0.68 | ) | $ | 15.41 | 1.41 | % | $ | 2,261 | 1.90 | %(c) | 4.16 | %(c) | (1.86 | )%(c) | N/A | |||||||||||||||||
| — | 15.87 | 5.80 | 517 | 1.90 | (c) | 7.34 | (c) | (1.86 | )(c) | N/A | ||||||||||||||||||||||
| $ | (0.68 | ) | $ | 15.22 | 1.03 | % | $ | 117 | 2.65 | %(c) | 4.76 | %(c) | (2.60 | )%(c) | N/A | |||||||||||||||||
| — | 15.73 | 4.87 | 74 | 2.65 | (c) | 6.91 | (c) | (2.60 | )(c) | N/A | ||||||||||||||||||||||
| $ | (0.68 | ) | $ | 15.43 | 1.41 | % | $ | 1,160 | 1.90 | %(c) | 4.64 | %(c) | (1.85 | )%(c) | N/A | |||||||||||||||||
| — | 15.89 | 5.93 | 1,416 | 1.90 | (c) | 6.29 | (c) | (1.85 | )(c) | N/A | ||||||||||||||||||||||
| $ | (0.68 | ) | $ | 15.44 | 1.47 | % | $ | 62 | 1.75 | %(c) | 3.69 | %(c) | (1.70 | )%(c) | N/A | |||||||||||||||||
| — | 15.89 | 5.93 | 61 | 1.75 | (c) | 5.97 | (c) | (1.69 | )(c) | N/A | ||||||||||||||||||||||
| $ | (0.68 | ) | $ | 15.47 | 1.60 | % | $ | 13,207 | 1.65 | %(c) | 3.81 | %(c) | (1.60 | )%(c) | N/A | |||||||||||||||||
| — | 15.90 | 6.00 | 7,978 | 1.65 | (c) | 5.64 | (c) | (1.60 | )(c) | N/A | ||||||||||||||||||||||
| See accompanying Notes to Financial Statements | | May 31, 2014 | | Semiannual Report | 223 |
Table of Contents
Financial Highlights (cont’d)
For a Share Outstanding for the Period ended:
Net Asset | Net Investment Income (Loss) (a) | Net Realized and Change in Unrealized Gain (Loss) | Total from Investment Operations | Dividends from Net Investment Income | Distributions from Net Realized Capital Gains | |||||||||||||||||||||
| AllianzGI Ultra Micro Cap: | ||||||||||||||||||||||||||
| Class A | ||||||||||||||||||||||||||
5/31/2014+ | $ | 24.34 | $ | (0.21) | $ | (0.24) | $ | (0.45) | $ | — | $ | (0.05) | ||||||||||||||
11/30/2013 | 15.53 | (0.29 | ) | 9.11 | 8.82 | — | (0.01 | ) | ||||||||||||||||||
12/19/2011* - 11/30/2012 | 12.82 | (0.14 | ) | 2.85 | 2.71 | — | — | |||||||||||||||||||
| Class P | ||||||||||||||||||||||||||
5/31/2014+ | $ | 24.40 | $ | (0.20 | ) | $ | (0.24 | ) | $ | (0.44 | ) | $ | — | $ | (0.05 | ) | ||||||||||
11/30/2013 | 15.54 | (0.24 | ) | 9.11 | 8.87 | — | (0.01 | ) | ||||||||||||||||||
11/30/2012 | 13.26 | (0.20 | ) | 2.71 | 2.51 | — | (0.23 | ) | ||||||||||||||||||
12/27/2010* - 11/30/2011 | 13.80 | (0.29 | ) | (0.22 | ) | (0.51 | ) | — | (0.03 | ) | ||||||||||||||||
| Institutional Class | ||||||||||||||||||||||||||
5/31/2014+ | $ | 24.49 | $ | (0.20 | ) | $ | (0.25 | ) | $ | (0.45 | ) | $ | — | $ | (0.05 | ) | ||||||||||
11/30/2013 | 15.59 | (0.26 | ) | 9.17 | 8.91 | — | (0.01 | ) | ||||||||||||||||||
11/30/2012 | 13.29 | (0.19 | ) | 2.72 | 2.53 | — | (0.23 | ) | ||||||||||||||||||
11/30/2011 | 13.25 | (0.29 | ) | 1.08 | 0.79 | — | (0.75 | ) | ||||||||||||||||||
11/30/2010 | 8.93 | (0.22 | ) | 4.54 | 4.32 | — | — | |||||||||||||||||||
4/1/2009** - 11/30/2009 | 5.78 | (0.10 | ) | 3.25 | 3.15 | — | — | |||||||||||||||||||
3/31/2009 | 9.28 | (0.16 | ) | (3.34 | ) | (3.50 | ) | — | — | |||||||||||||||||
| AllianzGI U.S. Equity Hedged: | ||||||||||||||||||||||||||
| Class A | ||||||||||||||||||||||||||
5/31/2014+ | $ | 17.26 | $ | 0.06 | $ | 0.68 | $ | 0.74 | $ | (0.15 | ) | $ | (0.23 | ) | ||||||||||||
12/3/2012* - 11/30/2013 | 15.00 | 0.12 | 2.14 | 2.26 | — | — | ||||||||||||||||||||
| Class C | ||||||||||||||||||||||||||
5/31/2014+ | $ | 17.14 | $ | (0.01 | ) | $ | 0.68 | $ | 0.67 | $ | (0.18 | ) | $ | (0.23 | ) | |||||||||||
12/3/2012* - 11/30/2013 | 15.00 | — | (e) | 2.14 | 2.14 | — | — | |||||||||||||||||||
| Class D | ||||||||||||||||||||||||||
5/31/2014+ | $ | 17.26 | $ | 0.06 | $ | 0.70 | $ | 0.76 | $ | (0.08 | ) | $ | (0.23 | ) | ||||||||||||
12/3/2012* - 11/30/2013 | 15.00 | 0.12 | 2.14 | 2.26 | — | — | ||||||||||||||||||||
| Class P | ||||||||||||||||||||||||||
5/31/2014+ | $ | 17.29 | $ | 0.07 | $ | 0.69 | $ | 0.76 | $ | (0.07 | ) | $ | (0.23 | ) | ||||||||||||
12/3/2012* - 11/30/2013 | 15.00 | 0.15 | 2.14 | 2.29 | — | — | ||||||||||||||||||||
| Institutional Class | ||||||||||||||||||||||||||
5/31/2014+ | $ | 17.31 | $ | 0.08 | $ | 0.69 | $ | 0.77 | $ | (0.11 | ) | $ | (0.23 | ) | ||||||||||||
12/3/2012* - 11/30/2013 | 15.00 | 0.17 | 2.14 | 2.31 | — | — | ||||||||||||||||||||
| + | Unaudited |
| * | Commencement of operations. |
| ** | On November 13, 2009, the Board of Trustees approved a change in the Fund’s fiscal year from March 31 to November 30. |
| (a) | Calculated on average shares outstanding during the period. |
| (b) | Total return is calculated assuming a purchase of a share on the first day of the period and a sale of a share on the last day of each period reported. Dividends and distributions, if any, are assumed, for purposes of this calculation, to be reinvested. Total return does not reflect sales charges and includes the effect of fee waivers and reimbursements. Total return may reflect adjustments to conform to generally accepted accounting principles. Total return for a period of less than one year is not annualized. |
| (c) | Annualized. |
| (d) | Ratio of expenses to average net assets net of reimbursement/recoupment offset was 2.22% and 2.31% for the period ended November 30, 2009 and the year ended March 31, 2009, respectively. |
| (e) | Less than $(0.01) per share. |
| (f) | Payments from Affiliates increased the net asset value and total return by less than $0.01 and 0.01%, respectively. |
| 224 | Semiannual Report | | May 31, 2014 | | See accompanying Notes to Financial Statements |
Table of Contents
| Total Dividends and Distributions | Net Asset Value, End of Period | Total Return(b) | Net Assets, End of Period (000s) | Ratio of Expenses to Average Net Assets with Fee Waiver/ Reimbursement | Ratio of Expenses to Average Net Assets without Fee Waiver/ Reimbursement | Ratio of Net Investment Income (Loss) to Average Net Assets | Portfolio Turnover Rate | |||||||||||||||||||||||||
| $ | (0.05 | ) | $ | 23.84 | (1.84 | )% | $ | 74,572 | 2.12 | %(c) | 2.12 | %(c) | (1.72 | )%(c) | 34 | % | ||||||||||||||||
| (0.01 | ) | 24.34 | 56.82 | 61,525 | 2.20 | 2.30 | (1.41 | ) | 59 | |||||||||||||||||||||||
| — | 15.53 | 21.14 | 6,862 | 2.36 | (c) | 3.36 | (c) | (0.96 | )(c) | 114 | ||||||||||||||||||||||
| $ | (0.05 | ) | $ | 23.91 | (1.80 | )% | $ | 1,437 | 2.00 | %(c) | 2.00 | %(c) | (1.60 | )%(c) | 34 | % | ||||||||||||||||
| (0.01 | ) | 24.40 | 57.10 | 858 | 2.01 | 2.07 | (1.19 | ) | 59 | |||||||||||||||||||||||
| (0.23 | ) | 15.54 | 19.26 | 252 | 2.18 | 3.08 | (1.38 | ) | 114 | |||||||||||||||||||||||
| (0.03 | ) | 13.26 | (3.64 | ) | 230 | 2.41 | (c) | 3.48 | (c) | (2.23 | )(c) | 101 | ||||||||||||||||||||
| $ | (0.05 | ) | $ | 23.99 | (1.83 | )% | $ | 57,239 | 2.00 | %(c) | 2.00 | %(c) | (1.61 | )%(c) | 34 | % | ||||||||||||||||
| (0.01 | ) | 24.49 | 57.18 | 62,641 | 2.00 | 2.00 | (1.24 | ) | 59 | |||||||||||||||||||||||
| (0.23 | ) | 15.59 | 19.37 | 9,296 | 2.08 | 3.15 | (1.32 | ) | 114 | |||||||||||||||||||||||
| (0.75 | ) | 13.29 | 6.04 | 9,757 | 2.24 | 3.53 | (2.06 | ) | 101 | |||||||||||||||||||||||
| — | 13.25 | 48.38 | 4,629 | 2.29 | 5.40 | (1.99 | ) | 123 | ||||||||||||||||||||||||
| — | 8.93 | 54.50 | 1,781 | 2.31 | (c) | 2.31 | (c)(d) | (1.81 | )(c) | 87 | ||||||||||||||||||||||
| — | 5.78 | (37.72 | ) | 1,084 | 2.40 | 2.40 | (d) | (2.05 | ) | 109 | ||||||||||||||||||||||
| $ | (0.38 | ) | $ | 17.62 | (f) | 4.41 | %(f) | $ | 1,542 | 1.25 | %(c) | 4.61 | %(c) | 0.68 | %(c) | 3 | % | |||||||||||||||
| — | 17.26 | 15.07 | 1,416 | 1.25 | (c) | 9.81 | (c) | 0.74 | (c) | 6 | ||||||||||||||||||||||
| $ | (0.41 | ) | $ | 17.40 | (f) | 4.07 | %(f) | $ | 175 | 2.00 | %(c) | 5.36 | %(c) | (0.06 | )%(c) | 3 | % | |||||||||||||||
| — | 17.14 | 14.27 | 122 | 2.00 | (c) | 11.10 | (c) | (0.01 | )(c) | 6 | ||||||||||||||||||||||
| $ | (0.31 | ) | $ | 17.71 | (f) | 4.40 | %(f) | $ | 317 | 1.25 | %(c) | 8.05 | %(c) | 0.68 | %(c) | 3 | % | |||||||||||||||
| — | 17.26 | 15.07 | 265 | 1.25 | (c) | 9.77 | (c) | 0.76 | (c) | 6 | ||||||||||||||||||||||
| $ | (0.30 | ) | $ | 17.75 | (f) | 4.47 | %(f) | $ | 12 | 1.10 | %(c) | 4.31 | %(c) | 0.83 | %(c) | 3 | % | |||||||||||||||
| — | 17.29 | 15.27 | 12 | 1.11 | (c) | 8.71 | (c) | 0.96 | (c) | 6 | ||||||||||||||||||||||
| $ | (0.34 | ) | $ | 17.74 | (f) | 4.56 | %(f) | $ | 5,716 | 1.00 | %(c) | 4.32 | %(c) | 0.93 | %(c) | 3 | % | |||||||||||||||
| — | 17.31 | 15.40 | 5,395 | 1.00 | (c) | 8.82 | (c) | 1.05 | (c) | 6 | ||||||||||||||||||||||
| See accompanying Notes to Financial Statements | | May 31, 2014 | | Semiannual Report | 225 |
Table of Contents
Financial Highlights (cont’d)
For a Share Outstanding for the Period ended:
| Net Asset Value, Beginning of Period | Net Investment Loss (a) | Net Realized and Change in Unrealized Gain (Loss) | Total from Investment Operations | Distributions from Net Realized Capital Gains | ||||||||||||||||||
| AllianzGI U.S. Small-Cap Growth: | ||||||||||||||||||||||
| Class A | ||||||||||||||||||||||
5/31/2014+ | $ | 19.09 | $ | (0.10 | ) | $ | (0.08 | ) | $ | (0.18 | ) | $ | (1.23 | ) | ||||||||
11/30/2013 | 13.25 | (0.15 | ) | 6.27 | 6.12 | (0.28 | ) | |||||||||||||||
11/30/2012 | 13.34 | (0.08 | ) | 0.98 | 0.90 | (0.99 | ) | |||||||||||||||
12/20/2010* - 11/30/2011 | 13.77 | (0.11 | ) | (0.32 | ) | (0.43 | ) | — | ||||||||||||||
| Class C | ||||||||||||||||||||||
5/31/2014+ | $ | 18.68 | $ | (0.16 | ) | $ | (0.08 | ) | $ | (0.24 | ) | $ | (1.23 | ) | ||||||||
11/30/2013 | 13.07 | (0.25 | ) | 6.14 | 5.89 | (0.28 | ) | |||||||||||||||
11/30/2012 | 13.25 | (0.18 | ) | 0.99 | 0.81 | (0.99 | ) | |||||||||||||||
12/20/2010* - 11/30/2011 | 13.77 | (0.22 | ) | (0.30 | ) | (0.52 | ) | — | ||||||||||||||
| Class D | ||||||||||||||||||||||
5/31/2014+ | $ | 19.11 | $ | (0.09 | ) | $ | (0.09 | ) | $ | (0.18 | ) | $ | (1.23 | ) | ||||||||
11/30/2013 | 13.25 | (0.11 | ) | 6.25 | 6.14 | (0.28 | ) | |||||||||||||||
11/30/2012 | 13.34 | (0.09 | ) | 0.99 | 0.90 | (0.99 | ) | |||||||||||||||
12/20/2010* - 11/30/2011 | 13.77 | (0.11 | ) | (0.32 | ) | (0.43 | ) | — | ||||||||||||||
| Class R | ||||||||||||||||||||||
5/31/2014+ | $ | 18.98 | $ | (0.12 | ) | $ | (0.08 | ) | $ | (0.20 | ) | $ | (1.23 | ) | ||||||||
11/30/2013 | 13.19 | (0.17 | ) | 6.24 | 6.07 | (0.28 | ) | |||||||||||||||
11/30/2012 | 13.31 | (0.11 | ) | 0.98 | 0.87 | (0.99 | ) | |||||||||||||||
12/20/2010* - 11/30/2011 | 13.77 | (0.15 | ) | (0.31 | ) | (0.46 | ) | — | ||||||||||||||
| Class P | ||||||||||||||||||||||
5/31/2014+ | $ | 19.25 | $ | (0.08 | ) | $ | (0.09 | ) | $ | (0.17 | ) | $ | (1.23 | ) | ||||||||
11/30/2013 | 13.32 | (0.11 | ) | 6.32 | 6.21 | (0.28 | ) | |||||||||||||||
11/30/2012 | 13.37 | (0.04 | ) | 0.98 | 0.94 | (0.99 | ) | |||||||||||||||
12/20/2010* - 11/30/2011 | 13.77 | (0.09 | ) | (0.31 | ) | (0.40 | ) | — | ||||||||||||||
| Institutional Class | ||||||||||||||||||||||
5/31/2014+ | $ | 19.30 | $ | (0.07 | ) | $ | (0.08 | ) | $ | (0.15 | ) | $ | (1.23 | ) | ||||||||
11/30/2013 | 13.35 | (0.08 | ) | 6.31 | 6.23 | (0.28 | ) | |||||||||||||||
11/30/2012 | 13.39 | (0.04 | ) | 0.99 | 0.95 | (0.99 | ) | |||||||||||||||
11/30/2011 | 12.84 | (0.07 | ) | 0.62 | 0.55 | — | ||||||||||||||||
11/30/2010 | 10.05 | (0.06 | ) | 2.85 | 2.79 | — | ||||||||||||||||
4/1/2009** - 11/30/2009 | 6.59 | (0.03 | ) | 3.49 | 3.46 | — | ||||||||||||||||
3/31/2009 | 11.45 | (0.04 | ) | (4.82 | ) | (4.86 | ) | — | ||||||||||||||
| + | Unaudited |
| * | Commencement of operations. |
| ** | On November 13, 2009, the Board of Trustees approved a change in the Fund’s fiscal year from March 31 to November 30. |
| (a) | Calculated on average shares outstanding during the period. |
| (b) | Total return is calculated assuming a purchase of a share on the first day of the period and a sale of a share on the last day of each period reported. Dividends and distributions, if any, are assumed, for purposes of this calculation, to be reinvested. Total return does not reflect sales charges and includes the effect of fee waivers and reimbursements. Total return may reflect adjustments to conform to generally accepted accounting principles. Total return for a period of less than one year is not annualized. |
| (c) | Annualized. |
| (d) | Ratio of expenses to average net assets net of reimbursement/recoupment offset was 1.16% and 0.90% for the period ended November 30, 2009 and the year ended March 31, 2009, respectively. |
| 226 | Semiannual Report | | May 31, 2014 | | See accompanying Notes to Financial Statements |
Table of Contents
| Net Asset Value, End of Period | Total Return (b) | Net Assets, End of Period (000s) | Ratio of Expenses to Average Net Assets with Fee Waiver/ Reimbursement | Ratio of Expenses to Average Net Assets without Fee Waiver/ Reimbursement | Ratio of Net Investment Loss to Average Net Assets | Portfolio Turnover Rate | ||||||||||||||||||||||
| $ | 17.68 | (0.80 | )% | $ | 5,349 | 1.47 | %(c) | 1.85 | %(c) | (1.11 | )%(c) | 35 | % | |||||||||||||||
| 19.09 | 47.16 | 4,971 | 1.50 | 1.91 | (0.90 | ) | 81 | |||||||||||||||||||||
| 13.25 | 7.67 | 1,359 | 1.50 | 2.45 | (0.59 | ) | 92 | |||||||||||||||||||||
| 13.34 | (3.12 | ) | 837 | 1.50 | (c) | 2.70 | (c) | (0.92 | )(c) | 111 | ||||||||||||||||||
| $ | 17.21 | (1.16 | )% | $ | 653 | 2.21 | %(c) | 2.61 | %(c) | (1.85 | )%(c) | 35 | % | |||||||||||||||
| 18.68 | 46.03 | 606 | 2.21 | 2.73 | (1.57 | ) | 81 | |||||||||||||||||||||
| 13.07 | 6.99 | 228 | 2.22 | 3.16 | (1.35 | ) | 92 | |||||||||||||||||||||
| 13.25 | (3.78 | ) | 134 | 2.25 | (c) | 3.04 | (c) | (1.60 | )(c) | 111 | ||||||||||||||||||
| $ | 17.70 | (0.80 | )% | $ | 95 | 1.42 | %(c) | 1.87 | %(c) | (1.05 | )%(c) | 35 | % | |||||||||||||||
| 19.11 | 47.32 | 68 | 1.44 | 2.00 | (0.71 | ) | 81 | |||||||||||||||||||||
| 13.25 | 7.67 | 57 | 1.49 | 2.36 | (0.65 | ) | 92 | |||||||||||||||||||||
| 13.34 | (3.12 | ) | 27 | 1.50 | (c) | 2.31 | (c) | (0.86 | )(c) | 111 | ||||||||||||||||||
| $ | 17.55 | (0.92 | )% | $ | 26 | 1.66 | %(c) | 2.12 | %(c) | (1.30 | )%(c) | 35 | % | |||||||||||||||
| 18.98 | 46.99 | 26 | 1.67 | 2.16 | (1.03 | ) | 81 | |||||||||||||||||||||
| 13.19 | 7.44 | 10 | 1.70 | 2.60 | (0.84 | ) | 92 | |||||||||||||||||||||
| 13.31 | (3.34 | ) | 10 | 1.75 | (c) | 2.50 | (c) | (1.14 | )(c) | 111 | ||||||||||||||||||
| $ | 17.85 | (0.74 | )% | $ | 149 | 1.25 | %(c) | 1.70 | %(c) | (0.90 | )%(c) | 35 | % | |||||||||||||||
| 19.25 | 47.60 | 110 | 1.25 | 1.74 | (0.69 | ) | 81 | |||||||||||||||||||||
| 13.32 | 7.97 | 19 | 1.25 | 2.25 | (0.27 | ) | 92 | |||||||||||||||||||||
| 13.37 | (2.90 | ) | 15 | 1.25 | (c) | 2.13 | (c) | (0.65 | )(c) | 111 | ||||||||||||||||||
| $ | 17.92 | (0.62 | )% | $ | 29,872 | 1.16 | %(c) | 1.59 | %(c) | (0.80 | )%(c) | 35 | % | |||||||||||||||
| 19.30 | 47.64 | 29,116 | 1.16 | 1.69 | (0.48 | ) | 81 | |||||||||||||||||||||
| 13.35 | 8.05 | 20,140 | 1.15 | 2.09 | (0.29 | ) | 92 | |||||||||||||||||||||
| 13.39 | 4.28 | 20,862 | 1.15 | 1.99 | (0.53 | ) | 111 | |||||||||||||||||||||
| 12.84 | 27.76 | 20,079 | 1.19 | 1.71 | (0.57 | ) | 168 | |||||||||||||||||||||
| 10.05 | 52.50 | 13,942 | 1.18 | (c) | 1.18 | (c)(d) | (0.53 | )(c) | 97 | |||||||||||||||||||
| 6.59 | (42.45 | ) | 6,591 | 1.21 | 1.21 | (d) | (0.34 | ) | 146 | |||||||||||||||||||
| See accompanying Notes to Financial Statements | | May 31, 2014 | | Semiannual Report | 227 |
Table of Contents
May 31, 2014 (Unaudited)
| 1. | ORGANIZATION AND SIGNIFICANT ACCOUNTING POLICIES |
Allianz Funds Multi-Strategy Trust (the “Trust”) was organized on January 10, 2008, as an open-end registered investment management company organized as a Massachusetts business trust. As of May 31, 2014, the Trust consisted of thirty-two separate investment series, (each a “Fund” and collectively the “Funds”). Allianz Global Investors Fund Management LLC (“AGIFM” or the “Investment Manager”) serves as the Funds’ investment manager and Allianz Global Investors U.S. LLC (“AllianzGI U.S.”) and NFJ Investment Group LLC (“NFJ”), each an affiliate of the Investment Manager, and Fuller & Thaler Asset Management, Inc. (“Fuller & Thaler”) (collectively the “Sub-Advisers”) serve as the Funds’ sub-advisers. The Investment Manager, AllianzGI U.S. and NFJ are indirect, wholly-owned subsidiaries of Allianz Asset Management of America L.P. (“AAM”). AAM is an indirect, wholly-owned subsidiary of Allianz SE, a publicly traded European insurance and financial services company. Currently, the Trust may offer up to eight classes of shares: A, C, D, P, R, R6, Administrative and Institutional. As of November 1, 2009, Class B shares were no longer available for purchase, except through exchanges and dividend reinvestments.
The following Funds (except for AllianzGI Best Styles Global Equity and AllianzGI Global Fundamental Strategy) sold and issued shares of beneficial interest to AAM during the period ended May 31, 2014 and the year ended November 30, 2013. AllianzGI Best Styles Global Equity and AllianzGI Global Fundamental Strategy sold and issued shares of beneficial interest to Allianz Fund Investments, Inc. (“AFI”).
| AllianzGI Best Styles Global Equity Fund | ||||||||||||
| Class | Date | Shares | Amount | |||||||||
Class R6 | 12/2/13 | 333,333 | $ | 5,000,000 | ||||||||
| AllianzGI Global Fundamental Strategy | ||||||||||||
| Class | Date | Shares | Amount | |||||||||
A | 7/2/13 | 667 | $ | 10,000 | ||||||||
C | 7/2/13 | 667 | 10,000 | |||||||||
D | 7/2/13 | 666 | 10,000 | |||||||||
P | 7/2/13 | 667 | 10,000 | |||||||||
Institutional | 7/2/13 | 1,333,333 | 20,000,000 | |||||||||
| 1,336,000 | $ | 20,040,000 | ||||||||||
| AllianzGI Multi-Asset Real Return | ||||||||||||
| Class | Date | Shares | Amount | |||||||||
A | 12/17/12 | 666 | $ | 10,000 | ||||||||
C | 12/17/12 | 667 | 10,000 | |||||||||
D | 12/17/12 | 667 | 10,000 | |||||||||
P | 12/17/12 | 667 | 10,000 | |||||||||
Institutional | 12/17/12 | 333,333 | 5,000,000 | |||||||||
| 336,000 | $ | 5,040,000 | ||||||||||
| AllianzGI NFJ Emerging Markets Value | ||||||||||||
| Class | Date | Shares | Amount | |||||||||
A | 12/18/12 | 667 | $ | 10,000 | ||||||||
C | 12/18/12 | 667 | 10,000 | |||||||||
D | 12/18/12 | 666 | 10,000 | |||||||||
P | 12/18/12 | 667 | 10,000 | |||||||||
Institutional | 12/18/12 | 200,000 | 3,000,000 | |||||||||
| 202,667 | $ | 3,040,000 | ||||||||||
| AllianzGI Structured Return | ||||||||||||
| Class | Date | Shares | Amount | |||||||||
A | 12/3/12 | 667 | $ | 10,000 | ||||||||
C | 12/3/12 | 667 | 10,000 | |||||||||
D | 12/3/12 | 666 | 10,000 | |||||||||
P | 12/3/12 | 667 | 10,000 | |||||||||
Institutional | 12/3/12 | 400,000 | 6,000,000 | |||||||||
| 402,667 | $ | 6,040,000 | ||||||||||
| AllianzGI U.S. Equity Hedged | ||||||||||||
| Class | Date | Shares | Amount | |||||||||
A | 12/3/12 | 667 | $ | 10,000 | ||||||||
C | 12/3/12 | 667 | 10,000 | |||||||||
D | 12/3/12 | 666 | 10,000 | |||||||||
P | 12/3/12 | 667 | 10,000 | |||||||||
Institutional | 12/3/12 | 200,000 | 3,000,000 | |||||||||
| 202,667 | $ | 3,040,000 | ||||||||||
On March 1, 2013, AAM transferred all shares of beneficial interest it held in the Funds to AFI, an indirect, wholly-owned subsidiary of Allianz SE.
The investment objective of each of AllianzGI Retirement 2015, AllianzGI Retirement 2020, AllianzGI Retirement 2025, AllianzGI Retirement 2030, AllianzGI Retirement 2035, AllianzGI Retirement 2040, AllianzGI Retirement 2045, AllianzGI Retirement 2050 and AllianzGI Retirement 2055 is to seek capital growth and preservation consistent with its asset allocation as the target date in the Fund name approaches, and thereafter current income, and secondarily, capital appreciation. AllianzGI Retirement Income’s investment objective is to seek current income and secondarily, capital appreciation. AllianzGI Global Allocation’s investment objective is to seek after-inflation capital appreciation and current income. The investment objective of AllianzGI Global Growth Allocation is to seek after-inflation capital appreciation and, secondarily, current income. AllianzGI Convertible’s investment objective is to seek maximum total return, consisting of capital appreciation and current income. The investment objective of AllianzGI Behavioral Advantage Large Cap, AllianzGI Best Styles Global Equity, AllianzGI China Equity, AllianzGI Global Managed Volatility, AllianzGI Global Water, AllianzGI NFJ Emerging Markets Value, AllianzGI NFJ International Small-Cap Value, AllianzGI NFJ International Value II and AllianzGI Structured Return is to seek long-term capital appreciation. AllianzGI Global Fundamental Strategy’s investment objective is to seek to generate positive real absolute returns through
| 228 | May 31, 2014 | | Semiannual Report |
Table of Contents
a complete market cycle (rolling 3-year period) by investing in a broad range of global asset classes. AllianzGI High Yield Bond’s investment objective is to seek a high level of current income and capital growth. The investment objective of AllianzGI Short Duration High Income is to seek a high level of current income. The investment objective of AllianzGI International Small-Cap, AllianzGI Micro Cap, AllianzGI Ultra Micro Cap and AllianzGI U.S. Small-Cap Growth is to seek maximum long-term capital appreciation. AllianzGI NFJ Global Dividend Value’s investment objective is to seek long-term growth of capital and income. The investment objective of AllianzGI Multi-Asset Real Return is to seek long-term capital appreciation emphasizing inflation-adjusted returns. The investment objective of AllianzGI U.S. Equity Hedged is to seek capital appreciation, with added emphasis on the protection of capital during unfavorable market conditions. There can be no assurance that the Funds will meet their stated objectives.
The preparation of the Funds’ financial statements in accordance with accounting principles generally accepted in the United States of America requires the Funds’ management to make estimates and assumptions that affect the reported amounts and disclosures in each Fund’s financial statements. Actual results could differ from those estimates.
In the normal course of business, the Funds enter into contracts that contain a variety of representations that provide general indemnifications. The Funds’ maximum exposure under these arrangements is unknown as this would involve future claims that may be made against the Funds that have not yet occurred.
The following is a summary of significant accounting policies consistently followed by the Funds:
(a) Valuation of Investments. Portfolio securities and other financial instruments for which market quotations are readily available are stated at market value. Market value is generally determined on the basis of last reported sales prices, or if no sales are reported, on the basis of quotes obtained from a quotation reporting system, established market makers, or independent pricing services. Investments in underlying funds are valued at the closing net asset value per share (“NAV”) of each underlying fund as reported on each business day. The Funds’ investments are valued daily using prices supplied by an independent pricing service or dealer quotations, or by using the last sale price on the exchange that is the primary market for such securities, or the mean between the last quoted bid and ask price. The market value for NASDAQ Global Market and NASDAQ Capital Market securities may also be calculated using the NASDAQ Official Closing Price instead of the last reported sales price. Independent pricing services use information provided by market makers or estimates of market values obtained from yield data relating to investments or securities with similar characteristics. Exchange traded futures are valued at the price determined by the relevant exchange. Securities purchased on a when-issued or delayed-delivery basis are marked to market daily until settlement at the forward settlement date.
The Board of Trustees (the “Board”) has adopted procedures for valuing portfolio securities and other financial instruments in circumstances where market quotes are not readily available, and has delegated the responsibility for applying the valuation methods to the Investment Manager and the Sub-Advisers. The Trust’s Valuation Committee was established by the Board to oversee the implementation of the Funds’ valuation methods and to make fair value determinations on behalf of the Board, as instructed. Each Sub-Adviser monitors the continued appropriateness of methods applied and determines if adjustments should be made in light of market changes, events affecting the issuer, or other factors. If the Sub-Advisers determine that a valuation method may no longer be appropriate, another valuation method may be selected, or the Valuation Committee will be convened to consider the matter and take any appropriate action in accordance with procedures set forth by the Board. The Board shall review the appropriateness of the valuation methods and these methods may be amended or supplemented from time to time by the Valuation Committee.
Short-term securities maturing in 60 days or less are valued at amortized cost, if their original term to maturity was 60 days or less, or by amortizing premium or discount based on their value on the 61st day prior to maturity, if the original term to maturity exceeded 60 days.
Investments initially valued in currencies other than the U.S. dollar are converted to the U.S. dollar using exchange rates obtained from pricing services. As a result, the NAV of each share class of a Fund may be affected by changes in the value of currencies in relation to the U.S. dollar. The value of securities traded in markets outside the United States or denominated in currencies other than the U.S. dollar may be affected significantly on a day that the New York Stock Exchange (“NYSE”) is closed.
The prices used by the Funds to value investments may differ from the value that would be realized if the investments were sold, and these differences could be material to the Funds’ financial statements. The NAV of each share class of a Fund is normally determined as of the close of regular trading (normally, 4:00 p.m. Eastern time) on the NYSE on each day the NYSE is open for business.
The prices of certain portfolio securities or financial instruments may be determined at a time prior to the close of regular trading on the NYSE. When fair-valuing the securities, the Funds may, among other things, consider significant events (which may be considered to include changes in the value of U.S. securities or securities indices) that occur after the close of the relevant market and before the time the NAV of each share class of a Fund is calculated. With respect to certain foreign securities, the Funds may fair-value securities using modeling tools provided by third-party vendors. The Funds have retained a statistical research service to assist in determining the fair value of foreign securities. This service utilizes statistics and programs based on historical performance of markets and other economic data to assist in making fair value estimates. Fair value estimates used by the Funds for foreign securities may differ from the value realized
| Semiannual Report | | May 31, 2014 | 229 |
Table of Contents
Notes to Financial Statements (cont’d)
May 31, 2014 (Unaudited)
from the sale of those securities and the difference could be material to the financial statements. Fair value pricing may require subjective determinations about the value of a security or other assets, and fair values used to determine the NAV of each share class of a Fund may differ from quoted or published prices, or from prices that are used by others, for the same investments. In addition, the use of fair value pricing may not always result in adjustments to the prices of securities or other assets held by a Fund.
(b) Fair Value Measurements. Fair value is defined as the price that would be received to sell an asset or paid to transfer a liability (i.e. the “exit price”) in an orderly transaction between market participants. The three levels of the fair value hierarchy are described below:
| n | Level 1—quoted prices in active markets for identical investments that the Funds have the ability to access |
| n | Level 2—valuations based on other significant observable inputs, which may include, but are not limited to, quoted prices for similar assets or liabilities, interest rates, yield curves, volatilities, prepayment speeds, loss severities, credit risks and default rates or other market corroborated inputs |
| n | Level 3—valuations based on significant unobservable inputs (including the Sub-Advisers’ or Valuation Committee’s own assumptions and securities whose price was determined by using a single broker’s quote) |
The valuation techniques used by the Funds to measure fair value during the six months ended May 31, 2014 were intended to maximize the use of observable inputs and to minimize the use of unobservable inputs.
The Funds’ policy is to recognize transfers between levels at the end of the reporting period. An investment asset’s or liability’s level within the fair value hierarchy is based on the lowest level input, individually or in aggregate, that is significant to the fair value measurement. The objective of fair value measurement remains the same even when there is a significant decrease in the volume and level of activity for an asset or liability and regardless of the valuation techniques used. Investments categorized as Level 1 or 2 as of period end may have been transferred between Levels 1 and 2 since the prior period due to changes in the valuation method utilized in valuing the investments.
The inputs or methodology used for valuing securities are not necessarily an indication of the risk associated with investing in those securities. The following are certain inputs and techniques that the Funds generally use to evaluate how to classify each major category of assets and liabilities for Level 2 and Level 3, in accordance with Generally Accepted Accounting Principles (“GAAP”).
Equity Securities (Common and Preferred Stock)—Equity securities traded in inactive markets and certain foreign equity securities are valued using inputs which include broker-dealer quotes, recently executed transactions adjusted for changes in the benchmark index, or evaluated price quotes received from independent pricing services that take into account the integrity of the market sector and issuer, the individual characteristics of the security, and information received
from broker-dealers and other market sources pertaining to the issuer or security. To the extent that these inputs are observable, the values of equity securities are categorized as Level 2. To the extent that these inputs are unobservable, the values are categorized as Level 3.
U.S. Treasury Obligations—U.S. Treasury obligations are valued by independent pricing services based on pricing models that evaluate the mean between the most recently quoted bid and ask price. The models also take into consideration data received from active market makers and broker-dealers, yield curves, and the spread over comparable U.S. Treasury issues. The spreads change daily in response to market conditions and are generally obtained from the new issue market and broker-dealer sources. To the extent that these inputs are observable, the values of U.S. Treasury obligations are categorized as Level 2. To the extent that these inputs are unobservable, the values are categorized as Level 3.
Sovereign Debt Obligations—Sovereign debt obligations are valued by independent pricing services based on discounted cash flow models that incorporate option adjusted spreads along with benchmark curves and credit spreads. In addition, international bond markets are monitored regularly for information pertaining to the issuer and/or the specific issue. To the extent that these inputs are observable, the values of sovereign debt obligations are categorized as Level 2. To the extent that these inputs are unobservable, the values are categorized as Level 3.
Corporate Bonds & Notes—Corporate bonds & notes are generally comprised of two main categories: investment grade bonds and high yield bonds. Investment grade bonds are valued by independent pricing services using various inputs and techniques, which include broker-dealer quotations, live trading levels, recently executed transactions in securities of the issuer or comparable issuers, and option adjusted spread models that include base curve and spread curve inputs. Adjustments to individual bonds can be applied to recognize trading differences compared to other bonds issued by the same issuer. High yield bonds are valued by independent pricing services based primarily on broker-dealer quotations from relevant market makers and recently executed transactions in securities of the issuer or comparable issuers. The broker-dealer quotations received are supported by credit analysis of the issuer that takes into consideration credit quality assessments, daily trading activity, and the activity of the underlying equities, listed bonds and sector-specific trends. To the extent that these inputs are observable, the values of corporate bonds & notes are categorized as Level 2. To the extent that these inputs are unobservable, the values are categorized as Level 3.
Convertible Bonds—Convertible bonds are valued by independent pricing services based on various inputs and techniques, which include broker-dealer quotations from relevant market makers and recently executed transactions in securities of the issuer or comparable issuers. The broker-dealer quotations received are supported by credit analysis of the issuer that takes into consideration credit quality assessments, daily trading activity, and the activity of the underlying equities, listed bonds and sector-specific trends. To the
| 230 | May 31, 2014 | | Semiannual Report |
Table of Contents
extent that these inputs are observable, the values of convertible bonds are categorized as Level 2. To the extent that these inputs are unobservable, the values are categorized as Level 3.
Option Contracts—Option contracts traded over-the-counter (“OTC”) and FLexible EXchange (“FLEX”) options are valued by independent pricing services based on pricing models that incorporate various inputs such as interest rates, credit spreads, currency exchange rates and volatility measurements for in-the-money, at-the-money, and out-of-the-money contracts based on a given strike price. To the extent that these inputs are observable, the values of OTC and FLEX option contracts are categorized as Level 2. To the extent that these inputs are unobservable, the values are categorized as Level 3.
Forward Foreign Currency Contracts—Forward foreign currency contracts are valued by independent pricing services using various inputs and techniques, which include broker-dealer quotations, actual
trading information and foreign currency exchange rates gathered from leading market makers and foreign currency exchange trading centers throughout the world. To the extent that these inputs are observable, the values of forward foreign currency contracts are categorized as Level 2. To the extent that these inputs are unobservable, the values are categorized as Level 3.
Senior Loans—Senior Loans are valued by independent pricing services based on the average of quoted prices received from multiple dealers or valued relative to other benchmark securities when broker-dealer quotes are unavailable. These quoted prices are based on interest rates, yield curves, option adjusted spreads and credit spreads. To the extent that these inputs are observable, the values of Senior Loans are categorized as Level 2. To the extent that these inputs are unobservable, the values are categorized as Level 3.
A summary of the inputs used at May 31, 2014 in valuing each Fund’s assets and liabilities is listed below (refer to the Schedules of Investments and Notes 7(a), 7(b) and 7(c) for more detailed information on Investments in Securities and Other Financial Instruments):
| AllianzGI Retirement 2015: | ||||||||||||||||
| Investments in Securities – Assets | Level 1– Quoted Prices | Level 2– Other Significant Observable Inputs | Level 3– Significant Unobservable Inputs | Value at 5/31/14 | ||||||||||||
Mutual Funds | $ | 24,506,301 | — | — | $ | 24,506,301 | ||||||||||
Exchange-Traded Funds | 4,289,108 | — | — | 4,289,108 | ||||||||||||
Totals | $ | 28,795,409 | — | — | $ | 28,795,409 | ||||||||||
| AllianzGI Retirement 2020: | ||||||||||||||||
| Investments in Securities – Assets | Level 1– Quoted Prices | Level 2– Other Significant Observable Inputs | Level 3– Significant Unobservable Inputs | Value at 5/31/14 | ||||||||||||
Mutual Funds | $ | 42,461,398 | — | — | $ | 42,461,398 | ||||||||||
Exchange-Traded Funds | 7,306,727 | — | — | 7,306,727 | ||||||||||||
Repurchase Agreements | — | $ | 379,000 | — | 379,000 | |||||||||||
Totals | $ | 49,768,125 | $ | 379,000 | — | $ | 50,147,125 | |||||||||
| AllianzGI Retirement 2025: | ||||||||||||||||
| Investments in Securities – Assets | Level 1– Quoted Prices | Level 2– Other Significant Observable Inputs | Level 3– Significant Unobservable Inputs | Value at 5/31/14 | ||||||||||||
Mutual Funds | $ | 50,306,859 | — | — | $ | 50,306,859 | ||||||||||
Exchange-Traded Funds | 6,776,946 | — | — | 6,776,946 | ||||||||||||
Repurchase Agreements | — | $ | 553,000 | — | 553,000 | |||||||||||
Totals | $ | 57,083,805 | $ | 553,000 | — | $ | 57,636,805 | |||||||||
| AllianzGI Retirement 2030: | ||||||||||||||||
| Investments in Securities – Assets | Level 1– Quoted Prices | Level 2– Other Significant Observable Inputs | Level 3– Significant Unobservable Inputs | Value at 5/31/14 | ||||||||||||
Mutual Funds | $ | 53,953,844 | — | — | $ | 53,953,844 | ||||||||||
Exchange-Traded Funds | 5,560,502 | — | — | 5,560,502 | ||||||||||||
Repurchase Agreements | — | $ | 490,000 | — | 490,000 | |||||||||||
Totals | $ | 59,514,346 | $ | 490,000 | — | $ | 60,004,346 | |||||||||
| Semiannual Report | | May 31, 2014 | 231 |
Table of Contents
Notes to Financial Statements (cont’d)
May 31, 2014 (Unaudited)
| AllianzGI Retirement 2035: | ||||||||||||||||
| Investments in Securities – Assets | Level 1– Quoted Prices | Level 2– Other Significant Observable Inputs | Level 3– Significant Unobservable Inputs | Value at 5/31/14 | ||||||||||||
Mutual Funds | $ | 45,083,089 | — | — | $ | 45,083,089 | ||||||||||
Exchange-Traded Funds | 4,198,210 | — | — | 4,198,210 | ||||||||||||
Repurchase Agreements | — | $ | 403,000 | — | 403,000 | |||||||||||
Totals | $ | 49,281,299 | $ | 403,000 | — | $ | 49,684,299 | |||||||||
| AllianzGI Retirement 2040: | ||||||||||||||||
| Investments in Securities – Assets | Level 1– Quoted Prices | Level 2– Other Significant Observable Inputs | Level 3– Significant Unobservable Inputs | Value at 5/31/14 | ||||||||||||
Mutual Funds | $ | 38,564,723 | — | — | $ | 38,564,723 | ||||||||||
Exchange-Traded Funds | 3,477,745 | — | — | 3,477,745 | ||||||||||||
Repurchase Agreements | — | $ | 395,000 | — | 395,000 | |||||||||||
Totals | $ | 42,042,468 | $ | 395,000 | — | $ | 42,437,468 | |||||||||
| AllianzGI Retirement 2045: | ||||||||||||||||
| Investments in Securities – Assets | Level 1– Quoted Prices | Level 2– Other Significant Observable Inputs | Level 3– Significant Unobservable Inputs | Value at 5/31/14 | ||||||||||||
Mutual Funds | $ | 23,225,512 | — | — | $ | 23,225,512 | ||||||||||
Exchange-Traded Funds | 1,302,808 | — | — | 1,302,808 | ||||||||||||
Repurchase Agreements | — | $ | 264,000 | — | 264,000 | |||||||||||
Totals | $ | 24,528,320 | $ | 264,000 | — | $ | 24,792,320 | |||||||||
| AllianzGI Retirement 2050: | ||||||||||||||||
| Investments in Securities – Assets | Level 1– Quoted Prices | Level 2– Other Significant Observable Inputs | Level 3– Significant Unobservable Inputs | Value at 5/31/14 | ||||||||||||
Mutual Funds | $ | 18,845,386 | — | — | $ | 18,845,386 | ||||||||||
Exchange-Traded Funds | 974,139 | — | — | 974,139 | ||||||||||||
Repurchase Agreements | — | $ | 239,000 | — | 239,000 | |||||||||||
Totals | $ | 19,819,525 | $ | 239,000 | — | $ | 20,058,525 | |||||||||
| AllianzGI Retirement 2055: | ||||||||||||||||
| Investments in Securities – Assets | Level 1– Quoted Prices | Level 2– Other Significant Observable Inputs | Level 3– Significant Unobservable Inputs | Value at 5/31/14 | ||||||||||||
Mutual Funds | $ | 6,329,591 | — | — | $ | 6,329,591 | ||||||||||
Exchange-Traded Funds | 323,166 | — | — | 323,166 | ||||||||||||
Totals | $ | 6,652,757 | — | — | $ | 6,652,757 | ||||||||||
| AllianzGI Retirement Income: | ||||||||||||||||
| Investments in Securities – Assets | Level 1– Quoted Prices | Level 2– Other Significant Observable Inputs | Level 3– Significant Unobservable Inputs | Value at 5/31/14 | ||||||||||||
Mutual Funds | $ | 25,416,922 | — | — | $ | 25,416,922 | ||||||||||
Exchange-Traded Funds | 4,951,442 | — | — | 4,951,442 | ||||||||||||
Repurchase Agreements | — | $ | 282,000 | — | 282,000 | |||||||||||
Totals | $ | 30,368,364 | $ | 282,000 | — | $ | 30,650,364 | |||||||||
| 232 | May 31, 2014 | | Semiannual Report |
Table of Contents
| AllianzGI Global Allocation: | ||||||||||||||||
| Investments in Securities – Assets | Level 1– Quoted Prices | Level 2– Other Significant Observable Inputs | Level 3– Significant Unobservable Inputs | Value at 5/31/14 | ||||||||||||
Mutual Funds | $ | 207,695,099 | — | — | $ | 207,695,099 | ||||||||||
Exchange-Traded Funds | 10,329,757 | — | — | 10,329,757 | ||||||||||||
Repurchase Agreements | — | $ | 582,000 | — | 582,000 | |||||||||||
Totals | $ | 218,024,856 | $ | 582,000 | — | $ | 218,606,856 | |||||||||
| AllianzGI Global Growth Allocation: | ||||||||||||||||
| Investments in Securities – Assets | Level 1– Quoted Prices | Level 2– Other Significant Observable Inputs | Level 3– Significant Unobservable Inputs | Value at 5/31/14 | ||||||||||||
Mutual Funds | $ | 6,176,937 | — | — | $ | 6,176,937 | ||||||||||
Exchange-Traded Funds | 388,523 | — | — | 388,523 | ||||||||||||
Totals | $ | 6,565,460 | — | — | $ | 6,565,460 | ||||||||||
| AllianzGI Behavioral Advantage Large Cap: | ||||||||||||||||
| Investments in Securities – Assets | Level 1– Quoted Prices | Level 2– Other Significant Observable Inputs | Level 3– Significant Unobservable Inputs | Value at 5/31/14 | ||||||||||||
Common Stock | $ | 81,323,042 | — | — | $ | 81,323,042 | ||||||||||
| AllianzGI Best Styles Global Equity: | ||||||||||||||||
| Investments in Securities – Assets | Level 1– Quoted Prices | Level 2– Other Significant Observable Inputs | Level 3– Significant Unobservable Inputs | Value at 5/31/14 | ||||||||||||
Common Stock: | ||||||||||||||||
Australia | — | $ | 217,708 | — | $ | 217,708 | ||||||||||
Austria | — | 105,236 | — | 105,236 | ||||||||||||
Belgium | $ | 19,404 | 144,773 | — | 164,177 | |||||||||||
China | 15,250 | 849,197 | $ | 9,996 | 874,443 | |||||||||||
Denmark | — | 105,255 | — | 105,255 | ||||||||||||
Finland | 48,289 | 111,169 | — | 159,458 | ||||||||||||
France | — | 921,668 | — | 921,668 | ||||||||||||
Germany | — | 1,237,576 | — | 1,237,576 | ||||||||||||
Hong Kong | 9,955 | 194,274 | — | 204,229 | ||||||||||||
Indonesia | — | 98,582 | — | 98,582 | ||||||||||||
Ireland | 20,681 | 181,187 | — | 201,868 | ||||||||||||
Italy | — | 311,783 | — | 311,783 | ||||||||||||
Japan | — | 3,949,250 | — | 3,949,250 | ||||||||||||
Korea (Republic of) | 409,536 | 344,419 | — | 753,955 | ||||||||||||
Malaysia | — | 67,990 | — | 67,990 | ||||||||||||
Netherlands | 79,511 | 338,155 | — | 417,666 | ||||||||||||
New Zealand | — | 11,707 | — | 11,707 | ||||||||||||
Norway | 21,601 | 266,965 | — | 288,566 | ||||||||||||
Philippines | — | 89,796 | — | 89,796 | ||||||||||||
Poland | — | 16,886 | — | 16,886 | ||||||||||||
Singapore | — | 28,959 | — | 28,959 | ||||||||||||
South Africa | — | 104,690 | — | 104,690 | ||||||||||||
Spain | — | 215,814 | — | 215,814 | ||||||||||||
Sweden | — | 421,107 | — | 421,107 | ||||||||||||
Switzerland | 163,738 | 593,702 | — | 757,440 | ||||||||||||
| Semiannual Report | | May 31, 2014 | 233 |
Table of Contents
Notes to Financial Statements (cont’d)
May 31, 2014 (Unaudited)
| AllianzGI Best Styles Global Equity (cont’d) | ||||||||||||||||
| Investments in Securities – Assets | Level 1– Quoted Prices | Level 2– Other Significant Observable Inputs | Level 3– Significant Unobservable Inputs | Value at 5/31/14 | ||||||||||||
Taiwan | — | $ | 371,452 | — | $ | 371,452 | ||||||||||
Thailand | — | 37,097 | $ | 62,298 | 99,395 | |||||||||||
Turkey | — | 213,991 | — | 213,991 | ||||||||||||
United Kingdom | $ | 122,823 | 2,229,398 | — | 2,352,221 | |||||||||||
All Other | 20,368,021 | — | — | 20,368,021 | ||||||||||||
Preferred Stock: | ||||||||||||||||
Brazil | 213,278 | — | — | 213,278 | ||||||||||||
All Other | — | 220,715 | — | 220,715 | ||||||||||||
Repurchase Agreements | — | 465,000 | — | 465,000 | ||||||||||||
| 21,492,087 | 14,465,501 | 72,294 | 36,029,882 | |||||||||||||
Other Financial Instruments* – Assets | ||||||||||||||||
Market Price | 39,093 | — | — | 39,093 | ||||||||||||
Other Financial Instruments* – Liabilities | ||||||||||||||||
Market Price | (647 | ) | — | — | (647 | ) | ||||||||||
Totals | $ | 21,530,533 | $ | 14,465,501 | $ | 72,294 | $ | 36,068,328 | ||||||||
| AllianzGI China Equity: | ||||||||||||||||
| Investments in Securities – Assets | Level 1– Quoted Prices | Level 2– Other Significant Observable Inputs | Level 3– Significant Unobservable Inputs | Value at 5/31/14 | ||||||||||||
Common Stock: | ||||||||||||||||
China | $ | 218,797 | $ | 3,098,839 | $ | 95,751 | $ | 3,413,387 | ||||||||
Hong Kong | 125,423 | 476,887 | — | 602,310 | ||||||||||||
Totals | $ | 344,220 | $ | 3,575,726 | $ | 95,751 | $ | 4,015,697 | ||||||||
| AllianzGI Convertible: | ||||||||||||||||
| Investments in Securities – Assets | Level 1– Quoted Prices | Level 2– Other Significant Observable Inputs | Level 3– Significant Unobservable Inputs | Value at 5/31/14 | ||||||||||||
Convertible Bonds | — | $ | 2,184,906,077 | — | $ | 2,184,906,077 | ||||||||||
Convertible Preferred Stock: | ||||||||||||||||
Aerospace & Defense | $ | 36,219,281 | — | — | 36,219,281 | |||||||||||
Banks | 32,084,018 | 32,003,530 | — | 64,087,548 | ||||||||||||
Insurance | 49,842,279 | — | — | 49,842,279 | ||||||||||||
Machinery | 2,890,012 | 32,102,255 | — | 34,992,267 | ||||||||||||
Telecommunications | 6,878,555 | — | — | 6,878,555 | ||||||||||||
All Other | — | 202,707,412 | — | 202,707,412 | ||||||||||||
Repurchase Agreements | — | 37,807,000 | — | 37,807,000 | ||||||||||||
Totals | $ | 127,914,145 | $ | 2,489,526,274 | — | $ | 2,617,440,419 | |||||||||
| AllianzGI Global Fundamental Strategy: | ||||||||||||||||
| Investments in Securities – Assets | Level 1– Quoted Prices | Level 2– Other Significant Observable Inputs | Level 3– Significant Unobservable Inputs | Value at 5/31/14 | ||||||||||||
Corporate Bonds & Notes | — | $ | 8,413,563 | — | $ | 8,413,563 | ||||||||||
Common Stock: | ||||||||||||||||
Norway | $ | 223,774 | 244,297 | — | 468,071 | |||||||||||
United States | 3,060,757 | — | — | 3,060,757 | ||||||||||||
All Other | — | 4,830,120 | — | 4,830,120 | ||||||||||||
| 234 | May 31, 2014 | | Semiannual Report |
Table of Contents
| AllianzGI Global Fundamental Strategy (cont’d) | ||||||||||||||||
| Investments in Securities – Assets | Level 1– Quoted Prices | Level 2– Other Significant Observable Inputs | Level 3– Significant Unobservable Inputs | Value at 5/31/14 | ||||||||||||
Sovereign Debt Obligations | — | $ | 5,675,598 | — | $ | 5,675,598 | ||||||||||
Exchange-Traded Funds | $ | 229,770 | — | — | 229,770 | |||||||||||
Repurchase Agreements | — | 2,465,000 | — | 2,465,000 | ||||||||||||
Options Purchased: | ||||||||||||||||
Market Price | 28,872 | — | — | 28,872 | ||||||||||||
| 3,543,173 | 21,628,578 | — | 25,171,751 | |||||||||||||
Other Financial Instruments* – Assets | ||||||||||||||||
Foreign Exchange Contracts | — | 12,031 | — | 12,031 | ||||||||||||
Other Financial Instruments* – Liabilities | ||||||||||||||||
Foreign Exchange Contracts | — | (464 | ) | — | (464 | ) | ||||||||||
Interest Rate Contracts | (2,115 | ) | — | — | (2,115 | ) | ||||||||||
Market Price | (42,723 | ) | — | — | (42,723 | ) | ||||||||||
| (44,838 | ) | (464 | ) | — | (45,302 | ) | ||||||||||
Totals | $ | 3,498,335 | $ | 21,640,145 | — | $ | 25,138,480 | |||||||||
| AllianzGI Global Managed Volatility: | ||||||||||||||||
| Investments in Securities – Assets | Level 1– Quoted Prices | Level 2– Other Significant Observable Inputs | Level 3– Significant Unobservable Inputs | Value at 5/31/14 | ||||||||||||
Common Stock: | ||||||||||||||||
Australia | — | $ | 196,433 | — | $ | 196,433 | ||||||||||
China | — | 490,323 | — | 490,323 | ||||||||||||
France | $ | 136,748 | 93,918 | — | 230,666 | |||||||||||
Germany | — | 259,928 | — | 259,928 | ||||||||||||
Hong Kong | — | 724,665 | — | 724,665 | ||||||||||||
Israel | — | 640,076 | — | 640,076 | ||||||||||||
Japan | — | 711,351 | — | 711,351 | ||||||||||||
Netherlands | — | 116,766 | — | 116,766 | ||||||||||||
Norway | 70,885 | 62,711 | — | 133,596 | ||||||||||||
Singapore | 142,952 | 514,639 | — | 657,591 | ||||||||||||
Switzerland | — | 235,036 | — | 235,036 | ||||||||||||
United Kingdom | — | 1,075,625 | — | 1,075,625 | ||||||||||||
All Other | 12,292,054 | — | — | 12,292,054 | ||||||||||||
Repurchase Agreements | — | 225,000 | — | 225,000 | ||||||||||||
Totals | $ | 12,642,639 | $ | 5,346,471 | — | $ | 17,989,110 | |||||||||
| AllianzGI Global Water: | ||||||||||||||||
| Investments in Securities – Assets | Level 1– Quoted Prices | Level 2– Other Significant Observable Inputs | Level 3– Significant Unobservable Inputs | Value at 5/31/14 | ||||||||||||
Common Stock: | ||||||||||||||||
Brazil | $ | 6,999,243 | — | — | $ | 6,999,243 | ||||||||||
Italy | 6,487,413 | — | — | 6,487,413 | ||||||||||||
Switzerland | 18,349,596 | $ | 29,478,129 | — | 47,827,725 | |||||||||||
United States | 98,035,413 | — | — | 98,035,413 | ||||||||||||
All Other | — | 152,565,259 | — | 152,565,259 | ||||||||||||
Repurchase Agreements | — | 15,757,000 | — | 15,757,000 | ||||||||||||
Totals | $ | 129,871,665 | $ | 197,800,388 | — | $ | 327,672,053 | |||||||||
| Semiannual Report | | May 31, 2014 | 235 |
Table of Contents
Notes to Financial Statements (cont’d)
May 31, 2014 (Unaudited)
| AllianzGI High Yield Bond: | ||||||||||||||||
| Investments in Securities – Assets | Level 1– Quoted Prices | Level 2– Other Significant Observable Inputs | Level 3– Significant Unobservable Inputs | Value at 5/31/14 | ||||||||||||
Corporate Bonds & Notes | — | $ | 441,282,757 | — | $ | 441,282,757 | ||||||||||
Repurchase Agreements | — | 19,808,000 | — | 19,808,000 | ||||||||||||
Totals | — | $ | 461,090,757 | — | $ | 461,090,757 | ||||||||||
| AllianzGI International Small-Cap: | ||||||||||||||||
| Investments in Securities – Assets | Level 1– Quoted Prices | Level 2– Other Significant Observable Inputs | Level 3– Significant Unobservable Inputs | Value at 5/31/14 | ||||||||||||
Common Stock: | ||||||||||||||||
Australia | $ | 467,383 | $ | 1,584,739 | — | $ | 2,052,122 | |||||||||
Finland | 2,225,925 | 1,204,335 | — | 3,430,260 | ||||||||||||
Ireland | 1,495,884 | — | — | 1,495,884 | ||||||||||||
Sweden | 78,310 | 7,599,027 | — | 7,677,337 | ||||||||||||
Taiwan | 193,176 | 1,862,915 | — | 2,056,091 | ||||||||||||
All Other | — | 89,846,611 | — | 89,846,611 | ||||||||||||
Repurchase Agreements | — | 2,070,000 | — | 2,070,000 | ||||||||||||
Totals | $ | 4,460,678 | $ | 104,167,627 | — | $ | 108,628,305 | |||||||||
| AllianzGI Micro Cap: | ||||||||||||||||
| Investments in Securities – Assets | Level 1– Quoted Prices | Level 2– Other Significant Observable Inputs | Level 3– Significant Unobservable Inputs | Value at 5/31/14 | ||||||||||||
Common Stock | $ | 41,086,916 | — | — | $ | 41,086,916 | ||||||||||
Repurchase Agreements | — | $ | 419,000 | — | 419,000 | |||||||||||
Totals | $ | 41,086,916 | $ | 419,000 | — | $ | 41,505,916 | |||||||||
| AllianzGI Multi-Asset Real Return: | ||||||||||||||||
| Investments in Securities – Assets | Level 1– Quoted Prices | Level 2– Other Significant Observable Inputs | Level 3– Significant Unobservable Inputs | Value at 5/31/14 | ||||||||||||
Mutual Funds | $ | 3,353,852 | — | — | $ | 3,353,852 | ||||||||||
Common Stock: | ||||||||||||||||
Australia | — | $ | 136,055 | — | 136,055 | |||||||||||
France | — | 70,180 | — | 70,180 | ||||||||||||
Hong Kong | — | 198,889 | — | 198,889 | ||||||||||||
Japan | — | 195,791 | — | 195,791 | ||||||||||||
Netherlands | — | 7,507 | — | 7,507 | ||||||||||||
Singapore | — | 66,817 | — | 66,817 | ||||||||||||
Switzerland | — | 8,846 | — | 8,846 | ||||||||||||
United Kingdom | — | 64,521 | — | 64,521 | ||||||||||||
All Other | 779,875 | — | — | 779,875 | ||||||||||||
U.S. Treasury Obligations | — | 687,882 | — | 687,882 | ||||||||||||
Exchange-Traded Funds | 581,709 | — | — | 581,709 | ||||||||||||
Warrants | 277 | — | — | 277 | ||||||||||||
| 4,715,713 | 1,436,488 | — | 6,152,201 | |||||||||||||
Other Financial Instruments* – Assets | ||||||||||||||||
Interest Rate Contracts | 7,618 | — | — | 7,618 | ||||||||||||
Market Price | 8,491 | — | — | 8,491 | ||||||||||||
| 16,109 | — | — | 16,109 | |||||||||||||
| 236 | May 31, 2014 | | Semiannual Report |
Table of Contents
| AllianzGI Multi-Asset Real Return (cont’d) | ||||||||||||||||
| Investments in Securities – Assets | Level 1– Quoted Prices | Level 2– Other Significant Observable Inputs | Level 3– Significant Unobservable Inputs | Value at 5/31/14 | ||||||||||||
Other Financial Instruments* – Liabilities | ||||||||||||||||
Interest Rate Contracts | $ | (3,678 | ) | — | — | $ | (3,678 | ) | ||||||||
Totals | $ | 4,728,144 | $ | 1,436,488 | — | $ | 6,164,632 | |||||||||
| AllianzGI NFJ Emerging Markets Value: | ||||||||||||||||
| Investments in Securities – Assets | Level 1– Quoted Prices | Level 2– Other Significant Observable Inputs | Level 3– Significant Unobservable Inputs | Value at 5/31/14 | ||||||||||||
Common Stock: | ||||||||||||||||
Brazil | $ | 588,550 | — | — | $ | 588,550 | ||||||||||
Chile | 179,976 | — | — | 179,976 | ||||||||||||
China | 258,888 | $ | 1,475,983 | — | 1,734,871 | |||||||||||
Czech Republic | 61,021 | — | — | 61,021 | ||||||||||||
Egypt | 60,306 | 66,227 | — | 126,533 | ||||||||||||
Hong Kong | 56,484 | 245,864 | — | 302,348 | ||||||||||||
India | 150,221 | 553,356 | — | 703,577 | ||||||||||||
Korea (Republic of) | 67,282 | 1,062,031 | — | 1,129,313 | ||||||||||||
Mexico | 270,898 | — | — | 270,898 | ||||||||||||
Peru | 64,179 | — | — | 64,179 | ||||||||||||
Russian Federation | 113,049 | — | $ | 492,676 | 605,725 | |||||||||||
South Africa | 187,793 | 375,101 | — | 562,894 | ||||||||||||
Taiwan | 72,904 | 921,849 | — | 994,753 | ||||||||||||
Thailand | 61,931 | 157,889 | 206,453 | 426,273 | ||||||||||||
All Other | — | 1,252,359 | — | 1,252,359 | ||||||||||||
Preferred Stock: | ||||||||||||||||
Brazil | 338,972 | — | — | 338,972 | ||||||||||||
Russian Federation | — | — | 55,016 | 55,016 | ||||||||||||
Equity-Linked Securities | — | 108,256 | — | 108,256 | ||||||||||||
Totals | $ | 2,532,454 | $ | 6,218,915 | $ | 754,145 | $ | 9,505,514 | ||||||||
| AllianzGI NFJ Global Dividend Value: | ||||||||||||||||
| Investments in Securities – Assets | Level 1– Quoted Prices | Level 2– Other Significant Observable Inputs | Level 3– Significant Unobservable Inputs | Value at 5/31/14 | ||||||||||||
Common Stock: | ||||||||||||||||
China | — | $ | 2,881,856 | — | $ | 2,881,856 | ||||||||||
France | — | 3,018,811 | — | 3,018,811 | ||||||||||||
Germany | — | 1,475,246 | — | 1,475,246 | ||||||||||||
Hong Kong | — | 1,387,115 | — | 1,387,115 | ||||||||||||
Israel | $ | 1,433,916 | 1,300,027 | — | 2,733,943 | |||||||||||
Japan | — | 4,356,709 | — | 4,356,709 | ||||||||||||
Korea (Republic of) | — | 3,052,601 | — | 3,052,601 | ||||||||||||
Spain | — | 3,225,591 | — | 3,225,591 | ||||||||||||
Switzerland | — | 2,820,875 | — | 2,820,875 | ||||||||||||
United Kingdom | — | 5,793,305 | — | 5,793,305 | ||||||||||||
All Other | 42,013,676 | — | — | 42,013,676 | ||||||||||||
Repurchase Agreements | — | 1,170,000 | — | 1,170,000 | ||||||||||||
Totals | $ | 43,447,592 | $ | 30,482,136 | — | $ | 73,929,728 | |||||||||
| Semiannual Report | | May 31, 2014 | 237 |
Table of Contents
Notes to Financial Statements (cont’d)
May 31, 2014 (Unaudited)
| AllianzGI NFJ International Small-Cap Value: | ||||||||||||||||
| Investments in Securities – Assets | Level 1– Quoted Prices | Level 2– Other Significant Observable Inputs | Level 3– Significant Unobservable Inputs | Value at 5/31/14 | ||||||||||||
Common Stock: | ||||||||||||||||
Belgium | $ | 208,971 | — | — | $ | 208,971 | ||||||||||
Brazil | 497,129 | — | — | 497,129 | ||||||||||||
Canada | 1,700,045 | — | — | 1,700,045 | ||||||||||||
Finland | 144,990 | $ | 144,484 | — | 289,474 | |||||||||||
Greece | 226,408 | — | — | 226,408 | ||||||||||||
Hong Kong | 435,709 | 901,832 | — | 1,337,541 | ||||||||||||
Israel | 137,280 | — | — | 137,280 | ||||||||||||
Panama | 213,920 | — | — | 213,920 | ||||||||||||
Russian Federation | 116,955 | — | — | 116,955 | ||||||||||||
South Africa | 188,802 | 249,023 | — | 437,825 | ||||||||||||
Switzerland | 348,855 | 314,632 | — | 663,487 | ||||||||||||
United Kingdom | 546,102 | 3,198,269 | — | 3,744,371 | ||||||||||||
United States | 102,816 | — | — | 102,816 | ||||||||||||
All Other | — | 11,271,310 | — | 11,271,310 | ||||||||||||
Preferred Stock: | ||||||||||||||||
Brazil | 202,475 | — | — | 202,475 | ||||||||||||
Germany | 154,854 | 137,902 | — | 292,756 | ||||||||||||
Rights | 18 | — | — | 18 | ||||||||||||
Totals | $ | 5,225,329 | $ | 16,217,452 | — | $ | 21,442,781 | |||||||||
| AllianzGI NFJ International Value II: | ||||||||||||||||
| Investments in Securities – Assets | Level 1– Quoted Prices | Level 2– Other Significant Observable Inputs | Level 3– Significant Unobservable Inputs | Value at 5/31/14 | ||||||||||||
Common Stock: | ||||||||||||||||
Brazil | $ | 864,123 | — | — | $ | 864,123 | ||||||||||
Canada | 2,482,674 | — | — | 2,482,674 | ||||||||||||
Hong Kong | 637,935 | $ | 1,558,818 | — | 2,196,753 | |||||||||||
India | 794,584 | — | — | 794,584 | ||||||||||||
Israel | 676,570 | — | — | 676,570 | ||||||||||||
Mexico | 322,811 | — | — | 322,811 | ||||||||||||
Norway | 287,710 | 1,277,582 | — | 1,565,292 | ||||||||||||
Russian Federation | 1,410,941 | — | — | 1,410,941 | ||||||||||||
South Africa | 337,740 | — | — | 337,740 | ||||||||||||
Taiwan | 400,568 | — | — | 400,568 | ||||||||||||
Turkey | 360,003 | — | — | 360,003 | ||||||||||||
United Kingdom | 476,772 | 6,765,907 | — | 7,242,679 | ||||||||||||
United States | 200,108 | — | — | 200,108 | ||||||||||||
All Other | — | 11,605,733 | — | 11,605,733 | ||||||||||||
Repurchase Agreements | — | 3,620,000 | — | 3,620,000 | ||||||||||||
Totals | $ | 9,252,539 | $ | 24,828,040 | — | $ | 34,080,579 | |||||||||
| 238 | May 31, 2014 | | Semiannual Report |
Table of Contents
| AllianzGI Short Duration High Income: | ||||||||||||||||
| Investments in Securities – Assets | Level 1– Quoted Prices | Level 2– Other Significant Observable Inputs | Level 3– Significant Unobservable Inputs | Value at 5/31/14 | ||||||||||||
Corporate Bonds & Notes | — | $ | 583,703,781 | — | $ | 583,703,781 | ||||||||||
Senior Loans | — | 126,528,576 | — | 126,528,576 | ||||||||||||
Repurchase Agreements | — | 15,596,000 | — | 15,596,000 | ||||||||||||
Totals | — | $ | 725,828,357 | — | $ | 725,828,357 | ||||||||||
| AllianzGI Structured Return: | ||||||||||||||||
| Investments in Securities – Assets | Level 1– Quoted Prices | Level 2– Other Significant Observable Inputs | Level 3– Significant Unobservable Inputs | Value at 5/31/14 | ||||||||||||
Short-Term Investments | — | $ | 16,637,207 | — | $ | 16,637,207 | ||||||||||
Options Purchased: | ||||||||||||||||
Market Price | $ | 25,936 | 13,150 | — | 39,086 | |||||||||||
| 25,936 | 16,650,357 | — | 16,676,293 | |||||||||||||
Investment in Securities – Liabilities | ||||||||||||||||
Options Written, at value: | ||||||||||||||||
Market Price | (40,402 | ) | (7,952 | ) | — | (48,354 | ) | |||||||||
Totals | $ | (14,466 | ) | $ | 16,642,405 | — | $ | 16,627,939 | ||||||||
| AllianzGI Ultra Micro Cap: | ||||||||||||||||
| Investments in Securities – Assets | Level 1– Quoted Prices | Level 2– Other Significant Observable Inputs | Level 3– Significant Unobservable Inputs | Value at 5/31/14 | ||||||||||||
Common Stock | $ | 132,808,429 | — | — | $ | 132,808,429 | ||||||||||
Repurchase Agreements | — | $ | 642,000 | — | 642,000 | |||||||||||
Totals | $ | 132,808,429 | $ | 642,000 | — | $ | 133,450,429 | |||||||||
| AllianzGI U.S. Equity Hedged: | ||||||||||||||||
| Investments in Securities – Assets | Level 1– Quoted Prices | Level 2– Other Significant Observable Inputs | Level 3– Significant Unobservable Inputs | Value at 5/31/14 | ||||||||||||
Common Stock | $ | 7,351,158 | — | — | $ | 7,351,158 | ||||||||||
Repurchase Agreements | — | $ | 402,000 | — | 402,000 | |||||||||||
Options Purchased: | ||||||||||||||||
Market Price | 26,580 | — | — | 26,580 | ||||||||||||
| 7,377,738 | 402,000 | — | 7,779,738 | |||||||||||||
Investment in Securities – Liabilities | ||||||||||||||||
Options Written, at value: | ||||||||||||||||
Market Price | (19,760 | ) | — | — | (19,760 | ) | ||||||||||
Totals | $ | 7,357,978 | $ | 402,000 | — | $ | 7,759,978 | |||||||||
| AllianzGI U.S. Small-Cap Growth: | ||||||||||||||||
| Investments in Securities – Assets | Level 1– Quoted Prices | Level 2– Other Significant Observable Inputs | Level 3– Significant Unobservable Inputs | Value at 5/31/14 | ||||||||||||
Common Stock | $ | 35,048,592 | — | — | $ | 35,048,592 | ||||||||||
Repurchase Agreements | — | $ | 702,000 | — | 702,000 | |||||||||||
Totals | $ | 35,048,592 | $ | 702,000 | — | $ | 35,750,592 | |||||||||
| Semiannual Report | | May 31, 2014 | 239 |
Table of Contents
Notes to Financial Statements (cont’d)
May 31, 2014 (Unaudited)
At May 31, 2014, the following Funds had transfers between Levels 1 and 2:
| Transfers | ||||||||
| Level 1 to Level 2 | Level 2 to Level 1 | |||||||
AllianzGI China Equity | $ | 16,519 | (a) | $ | 161,590 | (b) | ||
AllianzGI Convertible | 32,102,255 | (c) | — | |||||
AllianzGI Global Fundamental Strategy | — | 223,774 | (b) | |||||
AllianzGI Global Managed Volatility | — | 142,952 | (b) | |||||
AllianzGI Global Water | 8,274,350 | (a) | — | |||||
AllianzGI International Small-Cap | 5,779,109 | (a) | — | |||||
AllianzGI Multi-Asset Real Return | 4,750 | (a) | 7,181 | (b) | ||||
AllianzGI NFJ Emerging Markets Value | 304,600 | (a) | 326,170 | (b) | ||||
AllianzGI NFJ International Small-Cap Value | 453,619 | (a) | 372,604 | (b) | ||||
AllianzGI NFJ International Value II | 384,760 | (a) | 287,710 | (b) | ||||
| (a) | This transfer was a result of securities trading outside the U.S. whose values were not adjusted by the application of a modeling tool at November 30, 2013, which was applied on May 31, 2014. |
| (b) | This transfer was a result of securities trading outside the U.S. whose values were adjusted by the application of a modeling tool at November 30, 2013, which was not applied on May 31, 2014. |
| (c) | This transfer was a result of securities with an exchange-traded closing price at November 30, 2013, which was not available on May 31, 2014. |
A roll forward of fair value measurements using significant unobservable inputs (Level 3) for the period or six months ended May 31, 2014, was as follows:
| AllianzGI Best Styles Global Equity: | ||||||||||||||||||||||||||||||||||||
| Investments in Securities – Assets | Beginning Balance 12/2/13** | Purchases | Sales | Accrued Discount (Premiums) | Net Realized Gain (Loss) | Net Change in Unrealized Appreciation/ Depreciation | Transfers into Level 3 | Transfers out of Level 3 | Ending Balance 5/31/14 | |||||||||||||||||||||||||||
Common Stock: | ||||||||||||||||||||||||||||||||||||
China | — | $ | 13,106 | — | — | — | $ | (3,110 | ) | — | — | $ | 9,996 | |||||||||||||||||||||||
Thailand | — | 63,228 | — | — | — | (930 | ) | — | — | 62,298 | ||||||||||||||||||||||||||
Totals | — | $ | 76,334 | — | — | — | $ | (4,040 | ) | — | — | $ | 72,294 | |||||||||||||||||||||||
| AllianzGI China Equity: | ||||||||||||||||||||||||||||||||||||
| Investments in Securities – Assets | Beginning Balance 11/30/13 | Purchases | Sales | Accrued Discount (Premiums) | Net Realized Gain (Loss) | Net Change in Unrealized Appreciation/ Depreciation | Transfers into Level 3*** | Transfers out of Level 3 | Ending Balance 5/31/14 | |||||||||||||||||||||||||||
Common Stock: | ||||||||||||||||||||||||||||||||||||
China | — | — | — | — | — | — | $ | 95,751 | — | $ | 95,751 | |||||||||||||||||||||||||
| AllianzGI Global Water: | ||||||||||||||||||||||||||||||||||||
| Investments in Securities – Assets | Beginning Balance 11/30/13 | Purchases | Sales | Accrued Discount (Premiums) | Net Realized Gain (Loss) | Net Change in Unrealized Appreciation/ Depreciation | Transfers into Level 3 | Transfers out of Level 3 | Ending Balance 5/31/14 | |||||||||||||||||||||||||||
Common Stock: | ||||||||||||||||||||||||||||||||||||
Hong Kong | $ | 41,766 | — | $ | (63,609 | ) | — | $ | (286,541 | ) | $ | 308,384 | — | — | — | |||||||||||||||||||||
| AllianzGI International Small-Cap: | ||||||||||||||||||||||||||||||||||||
| Investments in Securities – Assets | Beginning Balance 11/30/13 | Purchases | Sales | Accrued Discount (Premiums) | Net Realized Gain (Loss) | Net Change in Unrealized Appreciation/ Depreciation | Transfers into Level 3 | Transfers out of Level 3**** | Ending Balance 5/31/14 | |||||||||||||||||||||||||||
Common Stock: | ||||||||||||||||||||||||||||||||||||
Australia | $ | 35,913 | $ | 594,662 | $ | (112,832 | ) | — | $ | 21,616 | $ | 253,191 | — | $ | (792,550 | ) | — | |||||||||||||||||||
| 240 | May 31, 2014 | | Semiannual Report |
Table of Contents
| AllianzGI Multi-Asset Real Return: | ||||||||||||||||||||||||||||||||||||
| Investments in Securities – Assets | Beginning Balance 11/30/13 | Purchases | Sales | Accrued Discount (Premiums) | Net Realized Gain (Loss) | Net Change in Unrealized Appreciation/ Depreciation | Transfers into Level 3 | Transfers out of Level 3 | Ending Balance 5/31/14 | |||||||||||||||||||||||||||
Common Stock: | ||||||||||||||||||||||||||||||||||||
Hong Kong | $ | 550 | $ | 760 | $ | (852 | ) | — | $ | 92 | $ | (550 | ) | — | — | — | ||||||||||||||||||||
| AllianzGI NFJ Emerging Markets Value: | ||||||||||||||||||||||||||||||||||||
| Investments in Securities – Assets | Beginning Balance 11/30/13 | Purchases | Sales | Accrued Discount (Premiums) | Net Realized Gain (Loss) | Net Change in Unrealized Appreciation/ Depreciation | Transfers into Level 3 | Transfers out of Level 3 | Ending Balance 5/31/14 | |||||||||||||||||||||||||||
Common Stock: | ||||||||||||||||||||||||||||||||||||
Russian Federation | $ | 426,579 | $ | 144,905 | $ | (84,588 | ) | — | $ | (1,852 | ) | $ | 7,632 | — | — | $ | 492,676 | |||||||||||||||||||
Thailand | 360,118 | 53,867 | (190,197 | ) | — | (42,148 | ) | 24,813 | — | — | 206,453 | |||||||||||||||||||||||||
Preferred Stock | 48,596 | 11,300 | — | — | — | (4,880 | ) | — | — | 55,016 | ||||||||||||||||||||||||||
Totals | $ | 835,293 | $ | 210,072 | $ | (274,785 | ) | — | $ | (44,000 | ) | $ | 27,565 | — | — | $ | 754,145 | |||||||||||||||||||
| AllianzGI Short Duration High Income: | ||||||||||||||||||||||||||||||||||||
| Investments in Securities – Assets | Beginning Balance 11/30/13 | Purchases | Sales | Accrued Discount (Premiums) | Net Realized Gain (Loss) | Net Change in Unrealized Appreciation/ Depreciation | Transfers into Level 3 | Transfers out of Level 3 | Ending Balance 5/31/14 | |||||||||||||||||||||||||||
Senior Loans: | ||||||||||||||||||||||||||||||||||||
Energy Equipment & Services | $ | 675,000 | — | $ | (675,000 | ) | — | — | — | — | — | — | ||||||||||||||||||||||||
The following tables present additional information about valuation techniques and inputs used for investments that are measured at fair value and categorized within Level 3 at May 31, 2014:
| AllianzGI Best Styles Global Equity: | ||||||||||||
| Investments in Securities – Assets | Ending Balance at 5/31/14 | Valuation Technique Used | Unobservable Inputs | Input Values | ||||||||
Common Stock | $ | 9,996 | Last Exchange-Traded Closing Price | Trading Volume | HKD 1.25 | |||||||
| $ | 62,298 | Value of Foreign Security Traded on Foreign Exchange | Price of Non-Resident Shares on Foreign Exchange | THB 18.94-229.39 | ||||||||
| AllianzGI China Equity: | ||||||||||||
| Investments in Securities – Assets | Ending Balance at 5/31/14 | Valuation Technique Used | Unobservable Inputs | Input Values | ||||||||
Common Stock | $ | 95,751 | Last Exchange-Traded Closing Price | Trading Volume | HKD 7.07 | |||||||
| AllianzGI NFJ Emerging Markets Value: | ||||||||||||
| Investments in Securities – Assets | Ending Balance at 5/31/14 | Valuation Technique Used | Unobservable Inputs | Input Values | ||||||||
Common Stock | $ | 492,676 | Value of Foreign Security Traded on Foreign Exchange | Price of Non-Resident Shares on Foreign Exchange | $ | 1.24-$64.72 | ||||||
| $ | 206,453 | Value of Foreign Security Traded on Foreign Exchange | Price of Non-Resident Shares on Foreign Exchange | THB 34.07-153.64 | ||||||||
Preferred Stock | $ | 55,016 | Value of Foreign Security Traded on Foreign Exchange | Price of Non-Resident Shares on Foreign Exchange | $ | 2,292.34 | ||||||
HKD – Hong Kong Dollar
THB – Thai Baht
| * | Other financial instruments are derivatives, such as futures contracts and forward foreign currency contracts, which are valued at the unrealized appreciation (depreciation) of the instrument. |
| ** | Commencement of operations. |
| *** | Transferred out of Level 2 into Level 3 because an exchange-traded closing price was not available at May 31, 2014. |
| **** | Transferred out of Level 3 into Level 2 because the value of a security trading outside the U.S. was adjusted by the application of a modeling tool at May 31, 2014. |
| Semiannual Report | | May 31, 2014 | 241 |
Table of Contents
Notes to Financial Statements (cont’d)
May 31, 2014 (Unaudited)
The net change in unrealized appreciation/depreciation of Level 3 investments which AllianzGI Best Styles Global Equity, AllianzGI China Equity and AllianzGI NFJ Emerging Markets Value held at May 31, 2014 was $(4,040), $(26,666) and $7,272, respectively.
Net realized gain (loss) and net change in unrealized appreciation/depreciation are reflected on the Statements of Operations.
(c) Investment Transactions and Investment Income. Investment transactions are accounted for on the trade date. Securities purchased and sold on a when-issued or delayed-delivery basis may be settled a month or more after the trade date. Realized gains and losses on investments are determined on an identified cost basis. Interest income adjusted for the accretion of discount and amortization of premiums is recorded on an accrual basis. Discounts or premiums on debt securities purchased are accreted or amortized, respectively, to interest income. Conversion premium is not amortized.
Dividend income is recorded on the ex-dividend date, except for certain dividends from foreign securities where the ex-dividend date may have passed, and then are recorded as soon after the ex-dividend date as the Funds, using reasonable diligence, become aware of such dividends. Dividend and interest income on the Statements of Operations are shown net of any foreign taxes withheld on income from foreign securities. Payments received from real estate investment trust securities may be comprised of dividends, realized gains and return of capital. The payment may initially be recorded as dividend income and may subsequently be reclassified as realized gains and/or return of capital upon receipt of information from the issuer. Payments considered return of capital reduce the cost basis of the respective security. Dividends from underlying funds are recorded as dividend income, while capital gain distributions are recorded as net capital gain distributions received from underlying funds on the Statements of Operations. Facility fees and other fees (such as origination fees) received on settlement date are amortized as income over the expected term of the senior loan. Facility fees and other fees received after settlement date relating to senior loans and consent fees relating to corporate actions are recorded as miscellaneous income upon receipt. Expenses are recorded on an accrual basis and such expenses exclude those of the underlying funds. Expenses of the underlying funds are reflected in the net asset values of those funds.
(d) Federal Income Taxes. The Funds intend to distribute all of their taxable income and to comply with the other requirements of Subchapter M of the U.S. Internal Revenue Code of 1986, as amended, applicable to regulated investment companies. Accordingly, no provision for U.S. federal income taxes is required.
Accounting for uncertainty in income taxes establishes for all entities, including pass-through entities such as the Funds, a minimum threshold for financial statement recognition of the benefit of positions taken in filing tax returns (including whether an entity is taxable in a particular jurisdiction), and requires certain expanded tax disclosures. In accordance with provisions set forth under GAAP, the Investment Manager has reviewed the Funds’ tax positions for all open tax years. As of May 31, 2014, the Funds have recorded no liability for
net unrecognized tax benefits relating to uncertain income tax positions they have taken. The Funds’ federal income tax returns for the prior three years, as applicable, remain subject to examination by the Internal Revenue Service.
(e) Dividends and Distributions to Shareholders. The Funds (except AllianzGI Retirement Income, AllianzGI Global Allocation, AllianzGI Convertible, AllianzGI High Yield Bond, AllianzGI NFJ Emerging Markets Value, AllianzGI NFJ Global Dividend Value, AllianzGI NFJ International Value II and AllianzGI Short Duration High Income) declare dividends and distributions from net investment income and net realized capital gains, if any, annually. AllianzGI Retirement Income, AllianzGI Global Allocation, AllianzGI Convertible, AllianzGI NFJ Emerging Markets Value, AllianzGI NFJ Global Dividend Value and AllianzGI NFJ International Value II declare dividends from net investment income quarterly and distributions from net realized capital gains, if any, annually. AllianzGI High Yield Bond and AllianzGI Short Duration High Income declare dividends from net investment income monthly and distributions from net realized capital gains, if any, annually. The Funds record dividends and distributions to their respective shareholders on the ex-dividend date. The amount of dividends from net investment income and distributions from net realized capital gains is determined in accordance with federal income tax regulations, which may differ from GAAP. These “book-tax” differences are considered either temporary or permanent in nature. To the extent these differences are permanent in nature, such amounts are reclassified within the capital accounts based on their federal income tax treatment; temporary differences do not require reclassification. To the extent dividends and/or distributions exceed current and accumulated earnings and profits for federal income tax purposes, they are reported as dividends and/or distributions to shareholders from return of capital.
(f) Multi-Class Operations. Each class offered by the Trust has equal rights as to assets and voting privileges (except that shareholders of a class have exclusive voting rights regarding any matter relating solely to that class of shares). Income, non-class specific expenses, and realized and unrealized capital gains and losses of each Fund are allocated daily to each class of shares based on the relative net assets of each class. Class specific expenses, where applicable, include administration, administrative servicing, distribution, recoupment, servicing and sub-transfer agent fees.
(g) Foreign Currency Translation. The Funds’ accounting records are maintained in U.S. dollars as follows: (1) the foreign currency market value of investments and other assets and liabilities denominated in foreign currencies are translated at the prevailing exchange rate at the end of the period; and (2) purchases and sales, income and expenses are translated at the prevailing exchange rate on the respective dates of such transactions. The resulting net foreign currency gain (loss) is included in the Funds’ Statements of Operations.
The Funds do not generally isolate that portion of the results of operations arising as a result of changes in foreign currency exchange
| 242 | May 31, 2014 | | Semiannual Report |
Table of Contents
rates from the fluctuations arising from changes in the market prices of securities. Accordingly, such foreign currency gain (loss) is included in net realized and unrealized gain (loss) on investments. However, the Funds do isolate the effect of fluctuations in foreign currency exchange rates when determining the gain (loss) upon the sale or maturity of foreign currency denominated debt obligations pursuant to U.S. federal income tax regulations; such amount is categorized as foreign currency gain (loss) for both financial reporting and income tax reporting purposes.
(h) Repurchase Agreements. The Funds are parties to Master Repurchase Agreements (“Master Repo Agreements”) with select counterparties. The Master Repo Agreements maintain provisions for initiation, income payments, events of default, and maintenance of collateral.
The Funds enter into transactions, under the Master Repo Agreements, with their custodian bank or securities brokerage firms whereby they purchase securities under agreements to resell such securities at an agreed upon price and date (“repurchase agreements”). The Funds, through their custodian, take possession of securities collateralizing the repurchase agreement. Such agreements are carried at the contract amount in the financial statements, which is considered to represent fair value. Collateral pledged (the securities received), which consists primarily of U.S. government obligations and asset-backed securities, is held by the custodian bank for the benefit of the Funds until maturity of the repurchase agreement. Provisions of the repurchase agreements and the procedures adopted by the Funds require that the market value of the collateral, including accrued interest thereon, be sufficient in the event of default by the counterparty. If the counterparty defaults under the Master Repo Agreements, and the value of the collateral declines or if the counterparty enters an insolvency proceeding, realization of the collateral by the Funds may be delayed or limited. The gross values are included in the Funds’ Schedules of Investments. The value of the related collateral exceeded the value of the repurchase agreements at May 31, 2014.
(i) Equity-Linked Securities. Certain Funds purchase equity-linked securities, also known as participation notes. Participatory notes are used to gain exposure to issuers in certain countries with a costly or lengthy registration process. They are generally traded over-the-counter and constitute general unsecured contractual obligations of the banks or broker-dealers that issue them. Generally, banks and broker-dealers associated with non-U.S.-based brokerage firms buy securities listed on certain foreign exchanges and then issue participation notes which are designed to replicate the performance of certain issuers and markets. To the extent that the Funds invest in equity-linked securities whose return corresponds to the performance of a foreign securities index or one or more foreign stocks, investing in equity-linked securities will involve risks similar to the risks of investing in foreign securities. In addition, the Funds bear the risk that the issuer of an equity-linked security may default on its obligation under the terms of the arrangement with the counterparty.
(j) Warrants. The Funds may receive warrants. Warrants are securities that are usually issued together with a debt security or preferred stock and that give the holder the right to buy a proportionate amount of common stock at a specified price. Warrants may be freely transferable and are often traded on major exchanges. Warrants normally have a life that is measured in years and entitle the holder to buy common stock of a company at a price that is usually higher than the market price at the time the warrant is issued. Warrants may entail greater risks than certain other types of investments. Generally, warrants do not carry the right to receive dividends or exercise voting rights with respect to the underlying securities, and they do not represent any rights in the assets of the issuer. In addition, their value does not necessarily change with the value of the underlying securities, and they cease to have value if they are not exercised on or before their expiration date. If the market price of the underlying stock does not exceed the exercise price during the life of the warrant, the warrant will expire worthless. Warrants may increase the potential profit or loss to be realized from the investment as compared with investing the same amount in the underlying securities. Similarly, the percentage increase or decrease in the value of an equity security warrant may be greater than the percentage increase or decrease in the value of the underlying common stock. Warrants may relate to the purchase of equity or debt securities. Debt obligations with warrants attached to purchase equity securities have many characteristics of convertible securities and their prices may, to some degree, reflect the performance of the underlying stock. Debt obligations also may be issued with warrants attached to purchase additional debt securities at the same coupon rate. A decline in interest rates would permit a Fund to sell such warrants at a profit. If interest rates rise, these warrants would generally expire with no value.
(k) Rights. The Funds may receive rights. A right is a privilege granted to existing shareholders of a corporation to subscribe for shares of a new issue of common stock before it is issued. Rights normally have a short life, usually two to four weeks, are freely transferable and entitle the holder to buy the new common stock at a lower price than the public offering price. Rights may entail greater risks than certain other types of investments. Generally, rights do not carry the right to receive dividends or exercise voting rights with respect to the underlying securities, and they do not represent any rights in the assets of the issuer. In addition, their value does not necessarily change with the value of the underlying securities, and they cease to have value if they are not exercised on or before their expiration date. If the market price of the underlying stock does not exceed the exercise price during the life of the right, the right will expire worthless. Rights may increase the potential profit or loss to be realized from the investment as compared with investing the same amount in the underlying securities.
(l) Senior Loans. The Funds may purchase assignments of, and participations in, Senior Loans originated, negotiated and structured by a U.S. or foreign commercial bank, insurance company, finance company or other financial institution (the “Agent”) for a lending
| Semiannual Report | | May 31, 2014 | 243 |
Table of Contents
Notes to Financial Statements (cont’d)
May 31, 2014 (Unaudited)
syndicate of financial institutions (the “Lender”). When purchasing an assignment, the Funds succeed to all the rights and obligations under the loan agreement with the same rights and obligations as the assigning Lender. Assignments may, however, be arranged through private negotiations between potential assignees and potential assignors, and the rights and obligations acquired by the purchaser of an assignment may differ from, and be more limited than, those held by the assigning Lender.
(m) U.S. Government Agencies or Government-Sponsored Enterprises. Securities issued by U.S. Government agencies or government-sponsored enterprises may not be guaranteed by the U.S. Treasury. The Government National Mortgage Association (“GNMA” or “Ginnie Mae”), a wholly-owned U.S. Government corporation, is authorized to guarantee, with the full faith and credit of the U.S. Government, the timely payment of principal and interest on securities issued by institutions approved by GNMA and backed by pools of mortgages insured by the Federal Housing Administration or guaranteed by the Department of Veterans Affairs. Government-related guarantors not backed by the full faith and credit of the U.S. Government include the Federal National Mortgage Association (“FNMA” or “Fannie Mae”) and the Federal Home Loan Mortgage Corporation (“FHLMC” or “Freddie Mac”). Pass-through securities issued by FNMA are guaranteed as to timely payment of principal and interest by FNMA, but are not backed by the full faith and credit of the U.S. Government. FHLMC guarantees the timely payment of interest and ultimate collection of principal, but its participation certificates are not backed by the full faith and credit of the U.S. Government.
(n) When-Issued/Delayed-Delivery Transactions. When-issued or delayed-delivery transactions involve a commitment to purchase or sell securities for a predetermined price or yield, with payment and delivery taking place beyond the customary settlement period. When delayed-delivery purchases are outstanding, the Funds will set aside and maintain until the settlement date in a designated account, liquid assets in an amount sufficient to meet the purchase price. When purchasing a security on a delayed-delivery basis, the Funds assume the rights and risks of ownership of the security, including the risk of price and yield fluctuations; consequently, such fluctuations are taken into account when determining the NAV. The Funds may dispose of or renegotiate a delayed-delivery transaction after it is entered into, and may sell when-issued securities before they are delivered, which may result in a realized gain or loss. When a security is sold on a delayed-delivery basis, the Funds do not participate in future gains and losses with respect to the security.
| 2. | PRINCIPAL RISKS |
In the normal course of business, the Funds trade financial instruments and enter into financial transactions where risk of potential loss exists due to, among other things, changes in the market (market risk) or failure of the other party to a transaction to perform (counterparty risk). The Funds are also exposed to other risks such as, but not limited to, interest rate, foreign currency, credit and leverage risks.
Interest rate risk is the risk that fixed income securities will decline in value because of changes in interest rates. As nominal interest rates rise, the values of certain fixed income securities held by the Funds are likely to decrease. A nominal interest rate can be described as the sum of a real interest rate and an expected inflation rate. Fixed income securities with longer durations tend to be more sensitive to changes in interest rates, usually making them more volatile than securities with shorter durations. Duration is used primarily as a measure of the sensitivity of a fixed income security’s market price to interest rate (i.e. yield) movements. Interest rate changes can be sudden and unpredictable, and the Funds may lose money as a result of movements in interest rates. The Funds may not be able to hedge against changes in interest rates or may choose not to do so for cost or other reasons. In addition, any hedges may not work as intended.
Variable and floating rate securities generally are less sensitive to interest rate changes but may decline in value if their interest rates do not rise as much, or as quickly, as interest rates in general. Conversely, floating rate securities will not generally increase in value if interest rates decline. Inverse floating rate securities may decrease in value if interest rates increase. Inverse floating rate securities may also exhibit greater price volatility than a fixed rate obligation with similar credit quality. When the Funds hold variable or floating rate securities, a decrease (or, in the case of inverse floating rate securities, an increase) in market interest rates will adversely affect the income received from such securities and the NAV of the Funds’ shares.
The Funds are exposed to credit risk, which is the risk of losing money if the issuer or guarantor of a fixed income security is unable or unwilling, or is perceived (whether by market participants, rating agencies, pricing services or otherwise) as unable or unwilling, to make timely principal and/or interest payments, or to otherwise honor its obligations. Securities are subject to varying degrees of credit risk, which are often reflected in credit ratings.
To the extent the Funds directly invest in foreign currencies or in securities that trade in, and receive revenues in, foreign currencies, or in derivatives that provide exposure to foreign currencies, they will be subject to the risk that those currencies will decline in value relative to the U.S. dollar, or, in the case of hedging positions, that the U.S. dollar will decline in value relative to the currency being hedged. Currency rates in foreign countries may fluctuate significantly over short periods of time for a number of reasons, including economic growth, inflation, changes in interest rates, intervention (or the failure to intervene) by U.S. or foreign governments, central banks or supranational entities such as the International Monetary Fund, or the imposition of currency controls or other political developments in the United States or abroad. As a result, the Funds’ investments in foreign currency-denominated securities may reduce the returns of the Funds.
The Funds are subject to elements of risk not typically associated with investments in the U.S., due to concentrated investments in foreign issuers located in a specific country or region. Such concentrations will subject the Funds to additional risks resulting from future political or economic conditions in such country or region and the possible
| 244 | May 31, 2014 | | Semiannual Report |
Table of Contents
imposition of adverse governmental laws or currency exchange restrictions affecting such country or region, which could cause the securities and their markets to be less liquid and prices more volatile than those of comparable U.S. companies.
The market values of securities may decline due to general market conditions (market risk) which are not specifically related to a particular company, such as real or perceived adverse economic conditions, changes in the general outlook for corporate earnings, changes in interest or currency rates, adverse changes to credit markets or adverse investor sentiment. They may also decline due to factors that affect a particular industry or industries, such as labor shortages or increased production costs and competitive conditions within an industry. Equity securities and equity-related investments generally have greater market price volatility than fixed income securities. Credit ratings downgrades may also negatively affect securities held by the Funds. Even when markets perform well, there is no assurance that the investments held by the Funds will increase in value along with the broader market. In addition, market risk includes the risk that geopolitical events will disrupt the economy on a national or global level.
The Funds are exposed to counterparty risk, or the risk that an institution or other entity with which the Funds have unsettled or open transactions will default. The potential loss to the Funds could exceed the value of the financial assets recorded in the Funds’ financial statements. Financial assets, which potentially expose the Funds to counterparty risk, consist principally of cash due from counterparties and investments. The Sub-Advisers seek to minimize the Funds’ counterparty risk by performing reviews of each counterparty and by minimizing concentration of counterparty risk by undertaking transactions with multiple customers and counterparties on recognized and reputable exchanges. Delivery of securities sold is only made once the Funds have received payment. Payment is made on a purchase once the securities have been delivered by the counterparty. The trade will fail if either party fails to meet its obligation.
The Funds are exposed to risks associated with leverage. Leverage may cause the value of the Funds’ shares to be more volatile than if the Funds did not use leverage. This is because leverage tends to exaggerate the effect of any increase or decrease in the value of the Funds’ portfolio securities. The Funds may engage in transactions or purchase instruments that give rise to forms of leverage. In addition, to the extent the Funds employ leverage, dividend and interest costs may not be recovered by any appreciation of the securities purchased with the leverage proceeds and could exceed the Funds’ investment returns, resulting in greater losses.
The considerations and factors surrounding the settlement of certain purchases and sales made on a delayed-delivery basis are governed by Master Securities Forward Transaction Agreements (“Master Forward Agreements”) between the Funds and select counterparties. The Master Forward Agreements maintain provisions for, among other things, initiation and confirmation, payment and transfer, events of default, termination, and maintenance of collateral.
The counterparty risk associated with certain contracts may be reduced by master netting arrangements to the extent that if an event of default occurs, all amounts with the counterparty are terminated and settled on a net basis. The Funds’ overall exposure to counterparty risk with respect to transactions subject to master netting arrangements can change substantially within a short period, as it is affected by each transaction subject to the arrangement.
| 3. | UNDERLYING FUNDS AND OTHER ACQUIRED FUNDS RISK |
AllianzGI Retirement 2015, AllianzGI Retirement 2020, AllianzGI Retirement 2025, AllianzGI Retirement 2030, AllianzGI Retirement 2035, AllianzGI Retirement 2040, AllianzGI Retirement 2045, AllianzGI Retirement 2050, AllianzGI Retirement 2055 and AllianzGI Retirement Income (collectively the “Target Date Funds”) and AllianzGI Global Allocation and AllianzGI Global Growth Allocation invest their assets primarily in series of Allianz Funds, Allianz Funds Multi-Strategy Trust, PIMCO Equity Series, PIMCO Funds and PIMCO sponsored exchange-traded Funds (“ETFs”) (together, “Underlying Funds”). AllianzGI Multi-Asset Real Return and AllianzGI Global Fundamental Strategy may invest their assets partially, significantly or primarily in Underlying Funds. The Funds may also invest a portion of their assets in unaffiliated ETFs and mutual funds and pooled vehicles (together, “Other Acquired Funds”). Accordingly, the investment performance of the Funds depends upon a favorable allocation among the Underlying Funds and Other Acquired Funds as well as the ability of the Underlying Funds and Other Acquired Funds to achieve their objectives. There can be no assurance that the investment objective of any Underlying Fund or Other Acquired Fund will be achieved. The risks associated with investing in each Fund are closely related to the risks associated with the securities and other investments held by the Underlying Funds and Other Acquired Funds.
Investing in the Underlying Funds and Other Acquired Funds involves certain additional expenses and tax results that would not be present in a direct investment in the Underlying Funds or Other Acquired Funds. Each Fund’s net asset value will fluctuate in response to changes in the net asset values of the Underlying Funds and Other Acquired Funds in which it invests. The extent to which the investment performance and risks associated with each Fund correlate to those of a particular Underlying Fund or Other Acquired Fund will depend upon the extent to which each Fund’s assets are allocated from time to time for investment in the Underlying Fund or Other Acquired Fund, which will vary. Each Fund’s investment in a particular Underlying Fund may exceed 25% of its assets. To the extent that a Fund invests a significant portion of its assets in an Underlying Fund, it will be particularly sensitive to the risks associated with that Underlying Fund.
| 4. | FINANCIAL DERIVATIVE INSTRUMENTS |
Disclosure about derivatives and hedging activities requires qualitative disclosure regarding objectives and strategies for using derivatives, quantitative disclosure about fair value amounts of gains and losses on derivatives, and disclosure about credit-risk-related contingent features in derivative agreements. The disclosure requirements
| Semiannual Report | | May 31, 2014 | 245 |
Table of Contents
Notes to Financial Statements (cont’d)
May 31, 2014 (Unaudited)
distinguish between derivatives, which are accounted for as “hedges”, and those that do not qualify for such accounting. Although the Funds at times use derivatives for hedging purposes, the Funds reflect derivatives at fair value and recognize changes in fair value through the Funds’ Statements of Operations, and such derivatives do not qualify for hedge accounting treatment.
Each of AllianzGI Retirement 2015, AllianzGI Retirement 2020, AllianzGI Retirement 2025, AllianzGI Retirement 2030, AllianzGI Retirement Income, AllianzGI Global Fundamental Strategy and AllianzGI Multi-Asset Real Return is subject to regulation as a commodity pool under the Commodity Exchange Act pursuant to recent rule changes by the Commodity Futures Trading Commission (the “CFTC”). The Investment Manager has registered with the CFTC as a Commodity Pool Operator, AllianzGI U.S. has registered with the CFTC as a Commodity Trading Adviser, and both entities are members of the National Futures Association. As a result, additional CFTC-mandated disclosure, reporting and recordkeeping obligations have begun to apply with respect to AllianzGI Retirement 2015, AllianzGI Retirement 2020, AllianzGI Retirement 2025, AllianzGI Retirement 2030, AllianzGI Retirement Income, AllianzGI Global Fundamental Strategy and AllianzGI Multi-Asset Real Return. Compliance with the CFTC’s regulatory requirements could increase these Funds’ expenses, adversely affecting their total returns.
Option Transactions. The Funds purchase put and call options on securities and indices for hedging purposes, risk management purposes or otherwise as part of their investment strategies. The risks associated with purchasing an option include the risk that the Funds pay a premium whether or not the option is exercised. Additionally, the Funds bear the risk of loss of premiums and changes in market value should the counterparty not perform under the contract. Put and call options purchased are accounted for in the same manner as portfolio securities. The cost of securities acquired through the exercise of call options is increased by the premiums paid. The proceeds from securities sold through the exercise of put options are decreased by the premiums paid.
The Funds may write (sell) put and call options on securities and indices to earn premiums, for hedging purposes, risk management purposes or otherwise as part of their investment strategies. When an option is written, the premium received is recorded as an asset with an equal liability that is subsequently marked to market to reflect the market value of the option written. These liabilities, if any, are reflected as options written in the Funds’ Statements of Assets and Liabilities. Premiums received from writing options which expire unexercised are recorded on the expiration date as a realized gain. The difference between the premium received and the amount paid on effecting a closing purchase transaction, including brokerage commissions, is also treated as a realized gain, or if the premium is less than the amount paid for the closing purchase transaction, as a realized loss. If a call option written is exercised, the premium is added to the proceeds
from the sale of the underlying security in determining whether there has been a realized gain or loss. If a put option written is exercised, the premium reduces the cost basis of the security. In writing an option, the Funds bear the market risk of an unfavorable change in the price of the security underlying the written option. Exercise of a written option could result in the Funds purchasing a security at a price different from its current market value.
Futures Contracts. The Funds use futures contracts to manage their exposure to the securities markets or the movements in interest rates and currency values. A futures contract is an agreement between two parties to buy and sell a financial instrument at a set price on a future date. Upon entering into such a contract, the Funds are required to pledge to the broker an amount of cash or securities equal to the minimum “initial margin” requirements of the exchange. Pursuant to the contracts, the Funds agree to receive from or pay to the broker an amount of cash or securities equal to the daily fluctuation in the value of the contracts. Such receipts or payments are known as “variation margin” and are recorded by the Funds as unrealized appreciation or depreciation. When the contracts are closed, the Funds record a realized gain or loss equal to the difference between the value of the contracts at the time they were opened and the value at the time they were closed. Any unrealized appreciation or depreciation recorded is simultaneously reversed. The use of futures transactions involves various risks, including the risk of an imperfect correlation in the movements in the price of futures contracts, interest rates and underlying hedging assets, and possible inability or unwillingness of counterparties to meet the terms of their contracts.
Forward Foreign Currency Contracts. A forward foreign currency contract is an agreement between two parties to buy and sell a currency at a set exchange rate on a future date. The Funds enter into forward foreign currency contracts for the purpose of hedging against foreign currency risk arising from the investment or anticipated investment in securities denominated in foreign currencies. The Funds also enter into these contracts for purposes of increasing exposure to a foreign currency or shifting exposure to foreign currency fluctuations from one country to another. The market value of a forward foreign currency contract fluctuates with changes in foreign currency exchange rates. All commitments are marked to market daily at the applicable exchange rates and any resulting unrealized appreciation or depreciation is recorded. Realized gains or losses are recorded at the time the forward contract matures or by delivery of the currency. Risks may arise upon entering into these contracts from the potential inability of counterparties to meet the terms of their contracts and from unanticipated movements in the value of a foreign currency relative to the U.S. dollar. In addition, these contracts may involve market risk in excess of the unrealized appreciation (depreciation) reflected in the Funds’ Statements of Assets and Liabilities.
The following is a summary of the Funds’ derivatives categorized by risk exposure.
| 246 | May 31, 2014 | | Semiannual Report |
Table of Contents
The effect of derivatives on the Statements of Assets and Liabilities at May 31, 2014:
| AllianzGI Best Styles Global Equity: | ||||
| Location | Market Price | |||
Asset derivatives: | ||||
Receivable for variation margin on futures contracts* | $ | 38,446 | ||
| * | Included in net unrealized appreciation of $38,446 on futures contracts as reported in Note 7(b). |
| AllianzGI Global Fundamental Strategy: | ||||||||||||||||
| Location | Market Price | Interest Rate Contracts | Foreign Exchange Contracts | Total | ||||||||||||
Asset derivatives: | ||||||||||||||||
Investments, at value (options purchased) | $ | 28,872 | — | — | $ | 28,872 | ||||||||||
Unrealized appreciation of forward foreign currency contracts | — | — | $ | 12,031 | 12,031 | |||||||||||
Total asset derivatives | $ | 28,872 | — | $ | 12,031 | $ | 40,903 | |||||||||
Liability derivatives: | ||||||||||||||||
Payable for variation margin on futures contracts* | $ | (42,723 | ) | $ | (2,115 | ) | — | $ | (44,838 | ) | ||||||
Unrealized depreciation of forward foreign currency contracts | — | — | $ | (464 | ) | (464 | ) | |||||||||
Total liability derivatives | $ | (42,723 | ) | $ | (2,115 | ) | $ | (464 | ) | $ | (45,302 | ) | ||||
| * | Included in net unrealized depreciation of $44,838 on futures contracts as reported in Note 7(b). |
| AllianzGI Multi-Asset Real Return: | ||||||||||||
| Location | Market Price | Interest Rate Contracts | Total | |||||||||
Asset derivatives: | ||||||||||||
Receivable for variation margin on futures contracts* | $ | 8,491 | $ | 3,940 | $ | 12,431 | ||||||
| * | Included in net unrealized appreciation of $12,431 on futures contracts as reported in Note 7(b). |
| AllianzGI Structured Return: | ||||
| Location | Market Price | |||
Asset derivatives: | ||||
Investments, at value (options purchased) | $ | 39,086 | ||
Liability derivatives: | ||||
Options written, at value | $ | (48,354 | ) | |
| AllianzGI U.S. Equity Hedged: | ||||
| Location | Market Price | |||
Asset derivatives: | ||||
Investments, at value (options purchased) | $ | 26,580 | ||
Liability derivatives: | ||||
Options written, at value | $ | (19,760 | ) | |
The effect of derivatives on the Statements of Operations for the period or six months ended May 31, 2014:
| AllianzGI Best Styles Global Equity: | ||||||||||||
| Location | Market Price | Foreign Exchange Contracts | Total | |||||||||
Net realized gain (loss) on: | ||||||||||||
Futures contracts | $ | 91,663 | — | $ | 91,663 | |||||||
Foreign currency transactions (forward foreign currency contracts) | — | $ | (329 | ) | (329 | ) | ||||||
Total net realized gain (loss) | $ | 91,663 | $ | (329 | ) | $ | 91,334 | |||||
Net change in unrealized appreciation/depreciation of: | ||||||||||||
Futures contracts | $ | 38,446 | — | $ | 38,446 | |||||||
| Semiannual Report | | May 31, 2014 | 247 |
Table of Contents
Notes to Financial Statements (cont’d)
May 31, 2014 (Unaudited)
| AllianzGI China Equity: | ||||
| Location | Foreign Exchange Contracts | |||
Net realized loss on: | ||||
Foreign currency transactions (forward foreign currency contracts) | $ | (48 | ) | |
| AllianzGI Global Fundamental Strategy: | ||||||||||||||||
| Location | Market Price | Interest Rate Contracts | Foreign Exchange Contracts | Total | ||||||||||||
Net realized gain (loss) on: | ||||||||||||||||
Futures contracts | — | $ | (8,361 | ) | — | $ | (8,361 | ) | ||||||||
Options written | $ | 35,097 | — | — | 35,097 | |||||||||||
Foreign currency transactions (forward foreign currency contracts) | — | — | $ | (17,637 | ) | (17,637 | ) | |||||||||
Total net realized gain (loss) | $ | 35,097 | $ | (8,361 | ) | $ | (17,637 | ) | $ | 9,099 | ||||||
Net change in unrealized appreciation/depreciation of: | ||||||||||||||||
Investments (options purchased) | $ | 4,780 | — | — | $ | 4,780 | ||||||||||
Futures contracts | (42,723 | ) | $ | 3,624 | — | (39,099 | ) | |||||||||
Options written | 12,316 | — | — | 12,316 | ||||||||||||
Foreign currency transactions (forward foreign currency contracts) | — | — | $ | 11,487 | 11,487 | |||||||||||
Total net change in unrealized appreciation/depreciation | $ | (25,627 | ) | $ | 3,624 | $ | 11,487 | $ | (10,516 | ) | ||||||
| AllianzGI Global Water: | ||||
| Location | Foreign Exchange Contracts | |||
Net realized loss on: | ||||
Foreign currency transactions (forward foreign currency contracts) | $ | (2,577 | ) | |
| AllianzGI International Small-Cap: | ||||
| Location | Foreign Exchange Contracts | |||
Net realized loss on: | ||||
Foreign currency transactions (forward foreign currency contracts) | $ | (59 | ) | |
| AllianzGI Multi-Asset Real Return: | ||||||||||||
| Location | Market Price | Interest Rate Contracts | Total | |||||||||
Net realized gain (loss) on: | ||||||||||||
Futures contracts | $ | 4,740 | $ | (9,312 | ) | $ | (4,572 | ) | ||||
Net change in unrealized appreciation/depreciation of: | ||||||||||||
Futures contracts | $ | (5,229 | ) | $ | 3,899 | $ | (1,330 | ) | ||||
| AllianzGI NFJ Emerging Markets Value: | ||||
| Location | Foreign Exchange Contracts | |||
Net realized gain on: | ||||
Foreign currency transactions (forward foreign currency contracts) | $ | 140 | ||
| AllianzGI Structured Return: | ||||
| Location | Market Price | |||
Net realized gain (loss) on: | ||||
Investments (options purchased) | $ | (1,034,483 | ) | |
Options written | 1,314,585 | |||
Total net realized gain | $ | 280,102 | ||
Net change in unrealized appreciation/depreciation of: | ||||
Investments (options purchased) | $ | (102,057 | ) | |
Options written | 231,360 | |||
Total net change in unrealized | $ | 129,303 | ||
| 248 | May 31, 2014 | | Semiannual Report |
Table of Contents
| AllianzGI U.S. Equity Hedged: | ||||
| Location | Market Price | |||
Investments (options purchased) | $ | (255,187 | ) | |
Options written | 8,302 | |||
Total net realized gain (loss) | $ | (246,885 | ) | |
Net change in unrealized appreciation/depreciation of: | ||||
Investments (options purchased) | $ | 101,444 | ||
Options written | (758 | ) | ||
Total net change in unrealized | $ | 100,686 | ||
The average volume (measured at each fiscal quarter-end) of derivative activity during the period or six months ended May 31, 2014:
| Options Purchased Contracts(1) | Options Written Contracts(1) | Forward Foreign Currency Contracts(2) | Futures Contracts(1) | |||||||||||||||||||||
| Purchased | Sold | Long | Short | |||||||||||||||||||||
AllianzGI Best Styles Global Equity | — | — | — | — | 36 | — | ||||||||||||||||||
AllianzGI Global Fundamental Strategy | 20 | 85 | $ | 326,392 | $ | 2,288,263 | 3 | 9 | ||||||||||||||||
AllianzGI Multi-Asset Real Return | — | — | — | — | 5 | 12 | ||||||||||||||||||
AllianzGI Structured Return | 1,126 | 1,102 | — | — | — | — | ||||||||||||||||||
AllianzGI U.S. Equity Hedged | 37 | 37 | — | — | — | — | ||||||||||||||||||
| (1) | Number of contracts |
| (2) | U.S. $ value on origination date |
The following tables present by counterparty, the Funds’ derivative assets and liabilities net of related collateral held by the Funds at May 31, 2014 which has not been offset in the Statements of Assets and Liabilities, but would be available for offset to the extent of a default by the counterparty to the transaction.
Financial Assets and Derivative Assets, and Collateral Received at May 31, 2014:
| AllianzGI Global Fundamental Strategy: | ||||||||||||||||
| Gross Amounts Not Offset in the Statement of Assets and Liabilities | ||||||||||||||||
| Counterparty | Gross Asset Derivatives Presented in Statement of Assets and Liabilities | Financial Instrument/ Derivative Offset | Cash Collateral Received | Net Amount | ||||||||||||
Foreign Currency Exchange Contracts | ||||||||||||||||
State Street Bank | $ | 12,031 | $ | (464 | ) | — | $ | 11,567 | ||||||||
Financial Liabilities and Derivative Liabilities, and Collateral Received at May 31, 2014:
| AllianzGI Global Fundamental Strategy: | ||||||||||||||||
| Gross Amounts Not Offset in the Statement of Assets and Liabilities | ||||||||||||||||
| Counterparty | Gross Liability Derivatives Presented in Statement of Assets and Liabilities | Financial Instrument/ Derivative Offset | Cash Collateral Received (Pledged) | Net Amount | ||||||||||||
Foreign Currency Exchange Contracts | ||||||||||||||||
State Street Bank | $ | 464 | $ | (464 | ) | — | — | |||||||||
| Semiannual Report | | May 31, 2014 | 249 |
Table of Contents
Notes to Financial Statements (cont’d)
May 31, 2014 (Unaudited)
| 5. | INVESTMENT MANAGER/ADMINISTRATOR/DISTRIBUTOR |
Investment Management Fee. Each Fund has an Investment Management Agreement (collectively the “Agreements”) with the Investment Manager. Subject to the supervision of the Trust’s Board, the Investment Manager is responsible for managing, either directly or through others selected by it, each Fund’s investment activities, business affairs and administrative matters. Pursuant to the Agreements, the Investment Manager receives an annual fee, payable monthly (net of any fee waivers, reimbursements and recoupment), at an annual rate of each Fund’s average daily net assets (the “Investment Management Fee”).
“Due to Investment Manager” on the Statements of Assets and Liabilities represents the remaining payable for offering costs paid by the Investment Manager.
The Investment Manager has retained the Sub-Advisers to manage the Funds’ investments. Subject to the supervision of the Investment Manager, the Sub-Advisers are responsible for making all of the investment decisions for the Funds for which they serve as sub-adviser. The Investment Manager, not the Funds, pays a portion of the fees it receives as Investment Manager to the Sub-Advisers in return for their services.
| Sub-Adviser(s) | Funds | |
AllianzGI U.S. | AllianzGI Retirement 2015, AllianzGI Retirement 2020, AllianzGI Retirement 2025, AllianzGI Retirement 2030, AllianzGI Retirement 2035, AllianzGI Retirement 2040, AllianzGI Retirement 2045, AllianzGI Retirement 2050, AllianzGI Retirement 2055, AllianzGI Retirement Income, AllianzGI Global Allocation, AllianzGI Global Growth Allocation, AllianzGI Best Styles Global Equity, AllianzGI China Equity, AllianzGI Convertible, AllianzGI Global Fundamental Strategy, AllianzGI Global Managed Volatility, AllianzGI Global Water, AllianzGI High Yield Bond, AllianzGI International Small-Cap, AllianzGI Micro Cap, AllianzGI Multi-Asset Real Return, AllianzGI Short Duration High Income, AllianzGI Structured Return, AllianzGI Ultra Micro Cap, AllianzGI U.S. Equity Hedged, AllianzGI U.S. Small-Cap Growth | |
Fuller & Thaler | AllianzGI Behavioral Advantage Large Cap | |
NFJ | NFJ Emerging Markets Value, NFJ Global Dividend Value, NFJ International Small-Cap Value, NFJ International Value II |
Administration Fee. The Investment Manager provides administrative services to the Target Date Funds and also bears the cost of most third-party administrative services required by the Target Date Funds, and in return it receives from each share class of each Target Date Fund a monthly administration fee based on each share class’ average daily net assets (the “Administration Fee”).
The Investment Management Fee and Administration Fee for all classes are charged at an annual rate as indicated in the following table:
| All Classes | Class A,C,D and R | Class P and Administrative | Class R6 | |||||||||||||||||
| Management Fee | Effective Management Fee | Administration | ||||||||||||||||||
AllianzGI Retirement 2015 | 0.05 | % | 0.05 | % | 0.30 | % | 0.15 | % | 0.05 | % | ||||||||||
AllianzGI Retirement 2020 | 0.05 | 0.05 | 0.30 | 0.15 | 0.05 | |||||||||||||||
AllianzGI Retirement 2025 | 0.05 | 0.05 | 0.30 | 0.15 | 0.05 | |||||||||||||||
AllianzGI Retirement 2030 | 0.05 | 0.05 | 0.30 | 0.15 | 0.05 | |||||||||||||||
AllianzGI Retirement 2035 | 0.05 | 0.05 | 0.30 | 0.15 | 0.05 | |||||||||||||||
AllianzGI Retirement 2040 | 0.05 | 0.05 | 0.30 | 0.15 | 0.05 | |||||||||||||||
AllianzGI Retirement 2045 | 0.05 | 0.05 | 0.30 | 0.15 | 0.05 | |||||||||||||||
AllianzGI Retirement 2050 | 0.05 | 0.05 | 0.30 | 0.15 | 0.05 | |||||||||||||||
AllianzGI Retirement 2055 | 0.05 | 0.05 | 0.30 | 0.15 | 0.05 | |||||||||||||||
AllianzGI Retirement Income | 0.05 | 0.05 | 0.30 | 0.15 | 0.05 | |||||||||||||||
AllianzGI Global Allocation | 0.85 | 0.15 | N/A | N/A | N/A | |||||||||||||||
AllianzGI Global Growth Allocation | 0.85 | 0.15 | N/A | N/A | N/A | |||||||||||||||
AllianzGI Behavioral Advantage Large Cap | 0.40 | 0.40 | N/A | N/A | N/A | |||||||||||||||
AllianzGI Best Styles Global Equity Fund | 0.30 | 0.30 | N/A | N/A | N/A | |||||||||||||||
AllianzGI China Equity | 1.10 | 1.10 | N/A | N/A | N/A | |||||||||||||||
AllianzGI Convertible | 0.57 | 0.57 | N/A | N/A | N/A | |||||||||||||||
AllianzGI Global Fundamental Strategy | 0.75 | 0.75 | N/A | N/A | N/A | |||||||||||||||
AllianzGI Global Managed Volatility | 0.40 | 0.40 | N/A | N/A | N/A | |||||||||||||||
AllianzGI Global Water | 0.95 | 0.95 | N/A | N/A | N/A | |||||||||||||||
AllianzGI High Yield Bond | 0.48 | 0.48 | N/A | N/A | N/A | |||||||||||||||
AllianzGI International Small-Cap | 1.00 | 1.00 | N/A | N/A | N/A | |||||||||||||||
AllianzGI Micro Cap | 1.25 | 1.25 | N/A | N/A | N/A | |||||||||||||||
AllianzGI Multi-Asset Real Return | 0.75 | 0.75 | N/A | N/A | N/A | |||||||||||||||
| 250 | May 31, 2014 | | Semiannual Report |
Table of Contents
| All Classes | Class A,C,D and R | Class P and Administrative | Class R6 | |||||||||||||||||
| Management Fee | Effective Management Fee | Administration | ||||||||||||||||||
AllianzGI NFJ Emerging Markets Value | 1.00 | % | 1.00 | % | N/A | N/A | N/A | |||||||||||||
AllianzGI NFJ Global Dividend Value | 0.80 | 0.80 | N/A | N/A | N/A | |||||||||||||||
AllianzGI NFJ International Small-Cap Value | 0.95 | 0.95 | N/A | N/A | N/A | |||||||||||||||
AllianzGI NFJ International Value II | 0.80 | 0.80 | N/A | N/A | N/A | |||||||||||||||
AllianzGI Short Duration High Income | 0.48 | 0.48 | N/A | N/A | N/A | |||||||||||||||
AllianzGI Structured Return | 1.25 | * | 1.25 | * | N/A | N/A | N/A | |||||||||||||
AllianzGI Ultra Micro Cap | 1.50 | 1.50 | N/A | N/A | N/A | |||||||||||||||
AllianzGI U.S. Equity Hedged | 0.70 | 0.70 | N/A | N/A | N/A | |||||||||||||||
AllianzGI U.S. Small-Cap Growth | 0.90 | 0.90 | N/A | N/A | N/A | |||||||||||||||
| * | Effective July 1, 2014, the management fee rate was decreased to 0.60% (See Note 14). |
Distribution and Servicing Fees. Allianz Global Investors Distributors LLC (the “Distributor”), an affiliate of AAM, the Investment Manager and the Sub-Advisers (with the exception of Fuller & Thaler), serves as the distributor of the Funds’ shares pursuant to separate Distribution Servicing Plans for Class A, B, C, D and R. The Distributor, for each of the Funds, receives (i) servicing fees of 0.25% of the average daily net assets of each of Class A, B, C, D and R in connection with services rendered to shareholders of each class and the maintenance of shareholder accounts, and (ii) distribution fees of 0.75% of the average daily net assets of each of Class B and C (with the exception of Class C for AllianzGI Short Duration High Income which is 0.25%) and 0.25% of average daily net assets of Class R in connection with the distribution of Class B, C and R shares.
Pursuant to the Distribution and Servicing Plans adopted by the A, B, C, D and R classes, the Funds compensate the Distributor for services provided and expenses incurred in connection with assistance rendered in the sale of shares and services rendered to shareholders and for maintenance of shareholder accounts.
Pursuant to the Distribution Plan for the Administrative Class shares, the Funds are permitted to reimburse the Distributor out of the Administrative Class’ assets of each Fund offering Administrative Class shares, in an amount up to 0.25% on an annual basis of the average net assets of the Administrative Class, for payments made to financial intermediaries that provide services in connection with the distribution of shares or administration plans or programs that use fund shares as their funding medium. Unreimbursed costs may be carried forward for reimbursement for up to twelve months beyond the date in which they are incurred, subject always to the limit that no more than 0.25% of the average daily net assets attributable to the Administrative Class may be expensed.
The Distributor also receives the proceeds of the initial sales charges paid by the shareholders upon the purchase of Class A shares and contingent deferred sales charges (“CDSC”) paid by the shareholders upon certain redemptions of Class A, B and C shares. For the six months ended May 31, 2014, the Distributor received $245,786, representing commissions (sales charges) and CDSC.
| 6. | EXPENSE LIMITATION |
The Trust and the Investment Manager have entered into Expense Limitation and Management Fee Waiver Agreements as indicated below:
| Expense Limitation | ||||||||||||||||||||||||||||||||||||||||
| Management Fee Waiver %(1) | Class A | Class B | Class C | Class D | Class R | Class P | Class R6 | Institutional Class | Administrative Class | |||||||||||||||||||||||||||||||
AllianzGI Retirement 2015(2) | N/A | 0.97 | % | N/A | 1.72 | % | 1.07 | % | 1.32 | % | 0.67 | % | 0.57 | % | N/A | 0.92 | % | |||||||||||||||||||||||
AllianzGI Retirement 2020(2) | N/A | 0.99 | N/A | 1.74 | 1.09 | 1.34 | 0.69 | 0.59 | N/A | 0.94 | ||||||||||||||||||||||||||||||
AllianzGI Retirement 2025(2) | N/A | 1.01 | N/A | N/A | N/A | 1.36 | 0.71 | 0.61 | N/A | 0.96 | ||||||||||||||||||||||||||||||
AllianzGI Retirement 2030(2) | N/A | 1.03 | N/A | 1.78 | 1.13 | 1.38 | 0.73 | 0.63 | * | N/A | 0.98 | |||||||||||||||||||||||||||||
AllianzGI Retirement 2035(2) | N/A | 1.06 | N/A | N/A | N/A | 1.41 | 0.76 | 0.66 | * | N/A | 1.01 | |||||||||||||||||||||||||||||
AllianzGI Retirement 2040(2) | N/A | 1.09 | N/A | 1.84 | 1.19 | 1.44 | 0.79 | 0.69 | * | N/A | 1.04 | |||||||||||||||||||||||||||||
AllianzGI Retirement 2045(2) | N/A | 1.10 | N/A | N/A | N/A | 1.45 | 0.80 | 0.70 | * | N/A | 1.05 | |||||||||||||||||||||||||||||
AllianzGI Retirement 2050(2) | N/A | 1.10 | N/A | 1.85 | 1.20 | 1.45 | 0.80 | 0.70 | * | N/A | 1.05 | |||||||||||||||||||||||||||||
AllianzGI Retirement 2055(2) | N/A | 1.10 | N/A | N/A | N/A | 1.45 | 0.80 | 0.70 | * | N/A | 1.05 | |||||||||||||||||||||||||||||
AllianzGI Retirement Income(2) | N/A | 0.95 | N/A | 1.70 | 1.05 | 1.30 | 0.65 | 0.55 | * | N/A | 0.90 | |||||||||||||||||||||||||||||
AllianzGI Global Allocation(3) | 0.70 | % | 0.40 | 1.11 | % | 1.13 | 0.40 | 0.56 | 0.16 | N/A | 0.16 | % | 0.41 | |||||||||||||||||||||||||||
AllianzGI Global Growth Allocation(3) | 0.70 | 0.40 | N/A | 1.18 | 0.40 | 0.63 | 0.23 | N/A | 0.13 | 0.38 | ||||||||||||||||||||||||||||||
| Semiannual Report | | May 31, 2014 | 251 |
Table of Contents
Notes to Financial Statements (cont’d)
May 31, 2014 (Unaudited)
| Expense Limitation | ||||||||||||||||||||||||||||||||||||||||
| Management Fee Waiver %(1) | Class A | Class B | Class C | Class D | Class R | Class P | Class R6 | Institutional Class | Administrative Class | |||||||||||||||||||||||||||||||
AllianzGI Behavioral Advantage Large Cap(4) | N/A | 0.81 | % | N/A | 1.57 | % | 0.81 | % | N/A | 0.65 | % | N/A | 0.55 | % | N/A | |||||||||||||||||||||||||
AllianzGI Best Styles Global Equity(6) | N/A | N/A | N/A | N/A | N/A | N/A | N/A | 0.40 | % | N/A | N/A | |||||||||||||||||||||||||||||
AllianzGI China Equity(4) | N/A | 1.70 | N/A | 2.45 | 1.77 | N/A | 1.51 | N/A | 1.45 | N/A | ||||||||||||||||||||||||||||||
AllianzGI Convertible | N/A | N/A | N/A | N/A | N/A | N/A | N/A | N/A | N/A | N/A | ||||||||||||||||||||||||||||||
AllianzGI Global Fundamental Strategy(4) | N/A | 1.25 | N/A | 2.00 | 1.25 | N/A | 1.10 | N/A | 1.00 | N/A | ||||||||||||||||||||||||||||||
AllianzGI Global Managed Volatility(4) | N/A | 0.94 | N/A | 1.62 | 0.94 | N/A | 0.69 | N/A | 0.60 | N/A | ||||||||||||||||||||||||||||||
AllianzGI Global Water | N/A | N/A | N/A | N/A | N/A | N/A | N/A | N/A | N/A | N/A | ||||||||||||||||||||||||||||||
AllianzGI High Yield Bond | N/A | N/A | N/A | N/A | N/A | N/A | N/A | N/A | N/A | N/A | ||||||||||||||||||||||||||||||
AllianzGI International Small-Cap(4) | N/A | 1.45 | N/A | 2.19 | 1.45 | 1.70 | % | 1.28 | N/A | 1.21 | N/A | |||||||||||||||||||||||||||||
AllianzGI Micro Cap(4) | N/A | 1.62 | N/A | N/A | N/A | N/A | 1.44 | N/A | 1.54 | N/A | ||||||||||||||||||||||||||||||
AllianzGI Multi-Asset Real Return(7) | N/A | 0.85 | N/A | 1.60 | 0.85 | N/A | 0.70 | N/A | 0.60 | N/A | ||||||||||||||||||||||||||||||
AllianzGI NFJ Emerging Markets Value(4) | N/A | 1.55 | N/A | 2.30 | 1.55 | N/A | 1.39 | N/A | 1.30 | N/A | ||||||||||||||||||||||||||||||
AllianzGI NFJ Global Dividend Value(4) | N/A | 1.20 | N/A | 1.99 | 1.28 | N/A | 1.04 | N/A | 0.95 | N/A | ||||||||||||||||||||||||||||||
AllianzGI NFJ International Small-Cap Value(4) | N/A | 1.45 | N/A | 2.20 | 1.45 | N/A | 1.30 | N/A | 1.20 | N/A | ||||||||||||||||||||||||||||||
AllianzGI NFJ International Value II(4) | N/A | 1.20 | N/A | 1.95 | 1.20 | N/A | 1.00 | N/A | 0.95 | N/A | ||||||||||||||||||||||||||||||
AllianzGI Short Duration High Income(4) | N/A | 0.85 | N/A | 1.10 | 0.85 | N/A | 0.70 | N/A | 0.61 | N/A | ||||||||||||||||||||||||||||||
AllianzGI Structured Return(5) | N/A | 1.90 | N/A | 2.65 | 1.90 | N/A | 1.75 | N/A | 1.65 | N/A | ||||||||||||||||||||||||||||||
AllianzGI Ultra Micro Cap | N/A | N/A | N/A | N/A | N/A | N/A | N/A | N/A | N/A | N/A | ||||||||||||||||||||||||||||||
AllianzGI U.S. Equity Hedged(4) | N/A | 1.25 | N/A | 2.00 | 1.25 | N/A | 1.10 | N/A | 1.00 | N/A | ||||||||||||||||||||||||||||||
AllianzGI U.S. Small-Cap Growth(4) | N/A | 1.40 | N/A | 2.20 | 1.42 | 1.65 | 1.25 | N/A | 1.16 | N/A | ||||||||||||||||||||||||||||||
| (1) | The Investment Manager has contractually agreed to irrevocably waive a portion of its management fee with respect to the noted Funds. The waiver is calculated on the average daily net assets of each applicable Fund that are attributable to investments in either Underlying Funds or Other Acquired Funds based on the rates disclosed in the above table. This waiver with respect to investments in Underlying Funds and Other Acquired Funds for which the Investment Manager or an affiliated person thereof serves as investment adviser is terminable only by the Board of Trustees of the Trust, and the waiver with respect to investments in unaffiliated Other Acquired Funds will continue through at least March 31, 2015. This waiver does not apply to net assets of the Fund not invested in shares of Underlying Funds or Other Acquired Funds (e.g., direct investments in other securities and instruments). |
| (2) | The Investment Manager has contractually agreed, until March 31, 2015, to irrevocably waive its management and administrative fees and reimburse any additional other expenses or acquired fund fees and expenses, to the extent that Total Annual Fund Operating Expenses after Expense Reductions, excluding, interest, taxes, and extraordinary expenses, exceed the rates noted in the table above based on the Fund’s average net assets attributable to each share class. Under the Expense Limitation Agreement, the Investment Manager may recoup waived or reimbursed amounts for three years, provided total expenses, including such recoupment, do not exceed the annual expense limit. The Expense Limitation Agreement is terminable by the Trust upon 90 days’ prior written notice to the Investment Manager or at any time by mutual agreement of the parties. |
| (3) | Effective April 1, 2014, the Investment Manager has contractually agreed, until March 31, 2015, to irrevocably waive its management fee and/or reimburse the Fund, to the extent that, after the application of the fee waiver described in footnote (1) above, Total Annual Fund Operating Expenses, excluding interest, taxes, and extraordinary expenses, acquired fund expenses and certain credits and other expenses, exceed the rates noted in the table above based on the Fund’s average net assets attributable to each share class. Under the Expense Limitation Agreement, the Investment Manager may recoup waived or reimbursed amounts for three years, provided total expenses, including such recoupment, do not exceed the annual expense limit. The Expense Limitation Agreement is terminable by the Trust upon 90 days’ prior written notice to the Investment Manager or at any time by mutual agreement of the parties. |
| (4) | Effective April 1, 2014, the Investment Manager has contractually agreed, until March 31, 2015, to irrevocably waive its management fee and/or reimburse the Fund, to the extent that, Total Annual Fund Operating Expenses, excluding interest, taxes, and extraordinary expenses, and certain credits and other expenses, exceed the rates noted in the table above based upon the Fund’s average net assets attributable to each share class. Under the Expense Limitation Agreement, the Investment Manager may recoup waived or reimbursed amounts for three years, provided total expenses, including such recoupment, do not exceed the annual expense limit. The Expense Limitation Agreement is terminable by the Trust upon 90 days’ prior written notice to the Investment Manager or at any time by mutual agreement of the parties. |
| (5) | Effective April 1, 2014, the Investment Manager had contractually agreed, until March 31, 2015, to irrevocably waive its management fee and/or reimburse the Fund, to the extent that, Total Annual Fund Operating Expenses, excluding interest, taxes, and extraordinary expenses, and certain credits and other expenses, exceed the rates noted in the table above based upon the Fund’s average net assets attributable to each share class. Effective July 1, 2014, the Investment Manager has contractually agreed, until July 31, 2015, to waive its management fee and/or reimburse the Fund to the extent that Total Annual Fund Operating Expenses, excluding interest, taxes, extraordinary expenses, and certain credits and other expenses, exceed 1.15% for Class A shares, 1.90% for Class C shares, 1.15% for Class D shares, 1.00% for Class P shares and 0.90% for Institutional Class shares. Under the Expense Limitation Agreement, the Investment Manager may recoup waived or reimbursed amounts for three years, provided total expenses, including such recoupment, do not exceed the annual expense limit. (See Note 14) The Expense Limitation Agreement is terminable by the Trust upon 90 days’ prior written notice to the Investment Manager or at any time by mutual agreement of the parties. |
| (6) | The Investment Manager has contractually agreed, until March 31, 2015, to irrevocably waive its management fee and/or reimburse the Fund, to the extent that, Total Annual Fund Operating Expenses, including payment of organizational expenses, but excluding interest, taxes, and extraordinary expenses, and certain credits and other expenses, exceed the rates noted in the table above based upon the Fund’s average net assets attributable to each share class. Under the Expense Limitation Agreement, the Investment Manager may recoup waived or reimbursed amounts for three years, provided total expenses, including such recoupment, do not exceed the annual expense limit. The Expense Limitation Agreement is terminable by the Trust upon 90 days’ prior written notice to the Investment Manager or at any time by mutual agreement of the parties. |
| (7) | The Investment Manager has contractually agreed, until March 31, 2015, to irrevocably waive its management fee and/or reimburse the Fund, to the extent that, Total Annual Fund Operating Expenses, excluding interest, taxes, and extraordinary expenses, acquired fund expenses, and certain credits and other expenses, exceed the rates noted in the table above based upon the Fund’s average net assets attributable to each share class. Under the Expense Limitation Agreement, the Investment Manager may recoup waived or reimbursed amounts for three years, provided total expenses, including such recoupment, do not exceed the annual expense limit. The Expense Limitation Agreement is terminable by the Trust upon 90 days’ prior written notice to the Investment Manager or at any time by mutual agreement of the parties. |
| * | As a result of reimbursing expenses inclusive of acquired fund expenses, the Investment Manager reimbursed amounts in excess of the respective share class’ operating expenses. The aggregate excess reimbursement is accounted for as “Contribution from Investment Manager” on the Statements of Operations. |
| 252 | May 31, 2014 | | Semiannual Report |
Table of Contents
The Investment Manager, as per expense limitation agreements, may recoup waived/reimbursed amounts for a period of up to three years, provided total expenses, including such recoupment, do not exceed the annual expense limit. During the six months ended May 31, 2014, the Investment Manager recouped a total of $242,003 from the Funds as disclosed on the Statements of Operations. The following represents the amounts that still can be recouped by the Investment Manager as of May 31, 2014.
| Unrecouped Expenses Waived/Reimbursed through Year ended November 30, | ||||||||||||||||
| 2011 | 2012 | 2013 | Total | |||||||||||||
AllianzGI Retirement 2015 | $ | 115,844 | $ | 18,532 | $ | 30,313 | $ | 164,689 | ||||||||
AllianzGI Retirement 2020 | 111,506 | 14,067 | 41,366 | 166,939 | ||||||||||||
AllianzGI Retirement 2025 | — | 7,439 | 40,739 | 48,178 | ||||||||||||
AllianzGI Retirement 2030 | 114,098 | 30,870 | 64,152 | 209,120 | ||||||||||||
AllianzGI Retirement 2035 | — | 10,573 | 39,569 | 50,142 | ||||||||||||
AllianzGI Retirement 2040 | 117,868 | 20,733 | 40,074 | 178,675 | ||||||||||||
AllianzGI Retirement 2045 | — | 9,262 | 21,258 | 30,520 | ||||||||||||
AllianzGI Retirement 2050 | 114,967 | 19,237 | 24,243 | 158,447 | ||||||||||||
AllianzGI Retirement 2055 | — | 8,988 | 9,226 | 18,214 | ||||||||||||
AllianzGI Retirement Income | 113,571 | 35,421 | 45,280 | 194,272 | ||||||||||||
AllianzGI Global Allocation | 467,765 | 529,000 | 529,090 | 1,525,855 | ||||||||||||
AllianzGI Global Growth Allocation | 207,323 | 211,891 | 215,351 | 634,565 | ||||||||||||
AllianzGI Behavioral Advantage Large Cap | 132,104 | 235,009 | 179,849 | 546,962 | ||||||||||||
AllianzGI Best Styles Global Equity | — | — | — | — | ||||||||||||
AllianzGI China Equity | 211,250 | 217,554 | 198,512 | 627,316 | ||||||||||||
AllianzGI Convertible | — | — | — | — | ||||||||||||
AllianzGI Global Fundamental Strategy | — | — | 172,001 | 172,001 | ||||||||||||
AllianzGI Global Managed Volatility | — | 286,597 | 263,268 | 549,865 | ||||||||||||
AllianzGI Global Water | — | 7,801 | — | 7,801 | ||||||||||||
AllianzGI High Yield Bond | 143,147 | 10,221 | 16,069 | 169,437 | ||||||||||||
AllianzGI International Small-Cap | 210,861 | 266,569 | 259,712 | 737,142 | ||||||||||||
AllianzGI Micro Cap | 64,375 | 131,890 | 162,476 | 358,741 | ||||||||||||
AllianzGI Multi-Asset Real Return | — | — | 366,103 | 366,103 | ||||||||||||
AllianzGI NFJ Emerging Markets Value | — | — | 385,249 | 385,249 | ||||||||||||
AllianzGI NFJ Global Dividend Value | 162,039 | 171,065 | 175,973 | 509,077 | ||||||||||||
AllianzGI NFJ International Small-Cap Value | — | 175,822 | 311,827 | 487,649 | ||||||||||||
AllianzGI NFJ International Value II | — | 302,633 | 242,764 | 545,397 | ||||||||||||
AllianzGI Short Duration High Income | 51,803 | 149,011 | 149,472 | 350,286 | ||||||||||||
AllianzGI Structured Return | — | — | 317,508 | 317,508 | ||||||||||||
AllianzGI Ultra Micro Cap | 1,323 | 119,979 | 266 | 121,568 | ||||||||||||
AllianzGI U.S. Equity Hedged | — | — | 375,759 | 375,759 | ||||||||||||
AllianzGI U.S. Small-Cap Growth | 177,572 | 197,501 | 158,039 | 533,112 | ||||||||||||
| 7. | INVESTMENTS IN SECURITIES |
For the period or six months ended May 31, 2014, purchases and sales of investments, other than short-term securities and U.S. government obligations were:
| Purchases | Sales | |||||||
AllianzGI Retirement 2015 | $ | 22,824,147 | $ | 16,665,587 | ||||
AllianzGI Retirement 2020 | 35,386,509 | 19,934,362 | ||||||
AllianzGI Retirement 2025 | 43,136,765 | 21,386,582 | ||||||
AllianzGI Retirement 2030 | 41,679,879 | 23,901,248 | ||||||
AllianzGI Retirement 2035 | 34,600,955 | 16,225,646 | ||||||
| Purchases | Sales | |||||||
AllianzGI Retirement 2040 | $ | 27,626,255 | $ | 13,907,125 | ||||
AllianzGI Retirement 2045 | 14,614,228 | 4,044,800 | ||||||
AllianzGI Retirement 2050 | 10,522,348 | 4,785,376 | ||||||
AllianzGI Retirement 2055 | 2,940,463 | 1,521,790 | ||||||
AllianzGI Retirement Income | 18,572,846 | 15,162,094 | ||||||
AllianzGI Global Allocation | 60,469,055 | 61,511,127 | ||||||
AllianzGI Global Growth Allocation | 2,032,316 | 2,285,691 | ||||||
AllianzGI Behavioral Advantage Large Cap | 56,932,121 | 36,258,896 | ||||||
| Semiannual Report | | May 31, 2014 | 253 |
Table of Contents
Notes to Financial Statements (cont’d)
May 31, 2014 (Unaudited)
| Purchases | Sales | |||||||
AllianzGI Best Styles Global Equity Fund | $ | 39,803,238 | $ | 6,318,992 | ||||
AllianzGI China Equity | 1,382,437 | 1,518,657 | ||||||
AllianzGI Convertible | 1,187,348,582 | 1,094,596,041 | ||||||
AllianzGI Global Fundamental Strategy | 3,843,899 | 1,144,831 | ||||||
AllianzGI Global Managed Volatility | 9,653,549 | 6,989,292 | ||||||
AllianzGI Global Water | 110,966,526 | 46,137,357 | ||||||
AllianzGI High Yield Bond | 126,553,236 | 129,770,035 | ||||||
AllianzGI International Small-Cap | 50,207,283 | 54,431,675 | ||||||
AllianzGI Micro Cap | 9,404,607 | 12,105,040 | ||||||
AllianzGI Multi-Asset Real Return | 1,130,087 | 572,307 | ||||||
AllianzGI NFJ Emerging Markets Value | 5,949,809 | 4,107,367 | ||||||
AllianzGI NFJ Global Dividend Value | 15,763,157 | 14,111,980 | ||||||
AllianzGI NFJ International Small-Cap Value | 8,676,046 | 4,024,817 | ||||||
AllianzGI NFJ International Value II | 26,810,417 | 2,196,992 | ||||||
AllianzGI Short Duration High Income | 537,750,146 | 332,228,643 | ||||||
AllianzGI Structured Return | 142,416 | * | 147,981 | * | ||||
AllianzGI Ultra Micro Cap | 63,965,786 | 47,868,207 | ||||||
AllianzGI U.S. Equity Hedged | 560,509 | 180,068 | ||||||
AllianzGI U.S. Small-Cap Growth | 14,168,281 | 12,572,933 | ||||||
| * | Exclusive for the purposes of delivery on written options. |
Sales in U.S. government obligations for AllianzGI Multi-Asset Real Return were $396,301.
(a) Transactions in options written for the six months ended May 31, 2014:
| AllianzGI Global Fundamental Strategy: | ||||||||
| Contracts | Premiums | |||||||
Options outstanding, November 30, 2013 | 244 | $ | 16,203 | |||||
Options written | 80 | 21,380 | ||||||
Options terminated in closing transactions | (55 | ) | (19,507 | ) | ||||
Options expired | (269 | ) | (18,076 | ) | ||||
Options outstanding, May 31, 2014 | — | — | ||||||
| AllianzGI Structured Return: | ||||||||
| Contracts | Premiums | |||||||
Options outstanding, November 30, 2013 | 876 | $ | 295,248 | |||||
Options written | 6,574 | 2,612,541 | ||||||
Options terminated in closing transactions | (2,244 | ) | (686,053 | ) | ||||
Options expired | (4,447 | ) | (1,823,978 | ) | ||||
Options exercised | (32 | ) | (3,582 | ) | ||||
Options outstanding, May 31, 2014 | 727 | $ | 394,176 | |||||
| AllianzGI U.S. Equity Hedged: | ||||||||
| Contracts | Premiums | |||||||
Options outstanding, November 30, 2013 | 36 | $ | 17,842 | |||||
Options written | 228 | 135,582 | ||||||
Options terminated in closing transactions | (76 | ) | (45,032 | ) | ||||
Options expired | (150 | ) | (88,768 | ) | ||||
Options outstanding, May 31, 2014 | 38 | $ | 19,624 | |||||
(b) Futures contracts outstanding at May 31, 2014:
| AllianzGI Best Styles Global Equity: | ||||||||||||||||
| Type | Contracts | Market Value (000s) | Expiration Date | Unrealized Appreciation (Depreciation) | ||||||||||||
Long: E-mini S&P 500 Index | 7 | $ | 673 | 6/20/14 | $ | 21,746 | ||||||||||
Euro STOXX 50 Index | 4 | 177 | 6/20/14 | 8,784 | ||||||||||||
FTSE 100 Index | 1 | 114 | 6/20/14 | 4,649 | ||||||||||||
Mini MSCI Emerging Markets Index | 2 | 102 | 6/20/14 | 3,914 | ||||||||||||
TOPIX Index | 1 | 118 | 6/12/14 | (647 | ) | |||||||||||
| $ | 38,446 | |||||||||||||||
| AllianzGI Global Fundamental Strategy: | ||||||||||||||||
| Type | Contracts | Market Value (000s) | Expiration Date | Unrealized Depreciation | ||||||||||||
Short: 10-Year U.S. Treasury Note Futures | (3 | ) | $ | (376 | ) | 9/19/14 | $ | (2,115 | ) | |||||||
E-mini S&P 500 Index | (3 | ) | (288 | ) | 6/20/14 | (14,895 | ) | |||||||||
Euro STOXX 50 Index | (10 | ) | (442 | ) | 6/20/14 | (27,828 | ) | |||||||||
| $ | (44,838 | ) | ||||||||||||||
| 254 | May 31, 2014 | | Semiannual Report |
Table of Contents
| AllianzGI Multi-Asset Real Return: | ||||||||||||||||
| Type | Contracts | Market Value (000s) | Expiration Date | Unrealized Appreciation (Depreciation) | ||||||||||||
Long: Dow Jones U.S. Real Estate Index | 1 | $ | 28 | 6/20/14 | $ | 497 | ||||||||||
Euro-Bund 10-Year Bond | 1 | 171 | 6/6/14 | 7,618 | ||||||||||||
Mini MSCI Emerging Markets Index | 2 | 102 | 6/20/14 | 7,994 | ||||||||||||
Short: 10-Year U.S. Treasury Note Futures | (7 | ) | (879 | ) | 9/19/14 | (3,678 | ) | |||||||||
| $ | 12,431 | |||||||||||||||
(c) Forward foreign currency contracts outstanding at May 31, 2014:
| AllianzGI Global Fundamental Strategy: | ||||||||||||||||
| Counterparty | U.S.$ Value on Origination Date | U.S.$ Value May 31, 2014 | Unrealized Appreciation (Depreciation) | |||||||||||||
Purchased: | ||||||||||||||||
400,000 Euro settling 8/29/14 | State Street Bank | $ | 545,180 | $ | 545,261 | $ | 81 | |||||||||
28,000,000 Indian Rupee settling 4/6/15 | State Street Bank | 433,996 | 443,075 | 9,079 | ||||||||||||
Sold: | ||||||||||||||||
250,000 British Pound settling 8/29/14 | State Street Bank | 420,668 | 418,768 | 1,900 | ||||||||||||
500,000 Euro settling 8/29/14 | State Street Bank | 681,373 | 681,576 | (203 | ) | |||||||||||
1,000,000 Euro settling 8/29/14 | State Street Bank | 1,364,123 | 1,363,152 | 971 | ||||||||||||
487,994 Swiss Franc settling 8/29/14 | State Street Bank | 545,180 | 545,441 | (261 | ) | |||||||||||
| $ | 11,567 | |||||||||||||||
At May 31, 2014, AllianzGI Best Styles Global Equity, AllianzGI Global Fundamental Strategy, AllianzGI Multi-Asset Real Return, AllianzGI Structured Return and AllianzGI U.S. Equity Hedged pledged $587,206, $116,897, $11,509, $164,030 and $2,773, respectively, in cash as collateral for derivatives.
Glossary:
FTSE— Financial Times Stock Exchange
MSCI— Morgan Stanley Capital International
TOPIX—Tokyo Stock Price Index
| 8. | INCOME TAX INFORMATION |
At May 31, 2014, the aggregate cost basis and the net unrealized appreciation (depreciation) of investments (before options written) for federal income tax purposes were:
| Federal Tax Cost Basis | Unrealized Appreciation | Unrealized Depreciation | Net Unrealized Appreciation (Depreciation) | |||||||||||||
AllianzGI Retirement 2015 | $ | 27,129,337 | $ | 1,678,203 | $ | 12,131 | $ | 1,666,072 | ||||||||
AllianzGI Retirement 2020 | 47,621,651 | 2,556,084 | 30,610 | 2,525,474 | ||||||||||||
AllianzGI Retirement 2025 | 54,867,414 | 2,805,216 | 35,825 | 2,769,391 | ||||||||||||
AllianzGI Retirement 2030 | 56,124,424 | 3,923,728 | 43,806 | 3,879,922 | ||||||||||||
AllianzGI Retirement 2035 | 46,490,596 | 3,219,311 | 25,608 | 3,193,703 | ||||||||||||
AllianzGI Retirement 2040 | 38,889,271 | 3,551,253 | 3,056 | 3,548,197 | ||||||||||||
AllianzGI Retirement 2045 | 22,708,719 | 2,085,583 | 1,982 | 2,083,601 | ||||||||||||
AllianzGI Retirement 2050 | 17,854,049 | 2,204,703 | 227 | 2,204,476 | ||||||||||||
AllianzGI Retirement 2055 | 5,815,619 | 837,235 | 97 | 837,138 | ||||||||||||
AllianzGI Retirement Income | 28,853,606 | 1,811,919 | 15,161 | 1,796,758 | ||||||||||||
AllianzGI Global Allocation | 191,408,477 | 27,228,002 | 29,623 | 27,198,379 | ||||||||||||
AllianzGI Global Growth Allocation | 5,542,038 | 1,023,422 | — | 1,023,422 | ||||||||||||
| Semiannual Report | | May 31, 2014 | 255 |
Table of Contents
Notes to Financial Statements (cont’d)
May 31, 2014 (Unaudited)
| Federal Tax Cost Basis | Unrealized Appreciation | Unrealized Depreciation | Net Unrealized Appreciation (Depreciation) | |||||||||||||
AllianzGI Behavioral Advantage Large Cap | $ | 71,790,971 | $ | 10,122,617 | $ | 590,546 | $ | 9,532,071 | ||||||||
AllianzGI Best Styles Global Equity Fund | 34,132,276 | 2,415,681 | 518,075 | 1,897,606 | ||||||||||||
AllianzGI China Equity | 3,996,128 | 413,303 | 393,734 | 19,569 | ||||||||||||
AllianzGI Convertible | 2,251,853,235 | 378,978,888 | 13,391,704 | 365,587,184 | ||||||||||||
AllianzGI Global Fundamental Strategy | 24,069,137 | 1,308,268 | 205,654 | 1,102,614 | ||||||||||||
AllianzGI Global Managed Volatility | 16,439,516 | 1,748,125 | 198,531 | 1,549,594 | ||||||||||||
AllianzGI Global Water | 274,914,387 | 54,018,944 | 1,261,278 | 52,757,666 | ||||||||||||
AllianzGI High Yield Bond | 441,902,185 | 21,832,710 | 2,644,138 | 19,188,572 | ||||||||||||
AllianzGI International Small-Cap | 90,088,579 | 21,095,526 | 2,555,800 | 18,539,726 | ||||||||||||
AllianzGI Micro Cap | 27,869,841 | 14,852,953 | 1,216,878 | 13,636,075 | ||||||||||||
AllianzGI Multi-Asset Real Return | 5,710,848 | 551,328 | 109,975 | 441,353 | ||||||||||||
AllianzGI NFJ Emerging Markets Value | 9,218,593 | 679,484 | 392,563 | 286,921 | ||||||||||||
AllianzGI NFJ Global Dividend Value | 66,811,260 | 11,047,188 | 3,928,720 | 7,118,468 | ||||||||||||
AllianzGI NFJ International Small-Cap Value | 19,101,774 | 2,970,480 | 629,473 | 2,341,007 | ||||||||||||
AllianzGI NFJ International Value II | 31,992,583 | 2,436,474 | 348,478 | 2,087,996 | ||||||||||||
AllianzGI Short Duration High Income | 723,751,658 | 4,408,547 | 2,331,848 | 2,076,699 | ||||||||||||
AllianzGI Structured Return | 16,806,437 | 1,693 | 131,837 | (130,144 | ) | |||||||||||
AllianzGI Ultra Micro Cap | 107,639,778 | 29,656,908 | 3,846,257 | 25,810,651 | ||||||||||||
AllianzGI U.S. Equity Hedged | 6,389,347 | 1,521,101 | 130,710 | 1,390,391 | ||||||||||||
AllianzGI U.S. Small-Cap Growth | 26,129,546 | 10,446,868 | 825,822 | 9,621,046 | ||||||||||||
Differences, if any, between book and tax cost basis were attributable to wash sale loss deferrals and the differing treatment of bond premium amortization.
| 256 | May 31, 2014 | | Semiannual Report |
Table of Contents
(THIS PAGE INTENTIONALLY LEFT BLANK)
| Semiannual Report | | May 31, 2014 | 257 |
Table of Contents
Notes to Financial Statements (cont’d)
May 31, 2014 (Unaudited)
| 9. | SHARES OF BENEFICIAL INTEREST |
The Trust may issue an unlimited number of shares of beneficial interest with $0.0001 par value. Changes in shares of beneficial interest were as follows:
| AllianzGI Retirement 2015 | AllianzGI Retirement 2020 | |||||||||||||||||||||||||||||||
Six Months ended (unaudited) | Year ended November 30, 2013 | Six Months ended (unaudited) | Year ended | |||||||||||||||||||||||||||||
| Shares | Amount | Shares | Amount | Shares | Amount | Shares | Amount | |||||||||||||||||||||||||
Shares sold: | ||||||||||||||||||||||||||||||||
Class A | 313,643 | $ | 6,115,466 | 339,353 | $ | 6,590,045 | 601,099 | $ | 11,585,314 | 603,165 | $ | 11,502,340 | ||||||||||||||||||||
Class C | 11,787 | 229,335 | 9,440 | 180,334 | 902 | 17,337 | 14,893 | 283,810 | ||||||||||||||||||||||||
Class D | — | — | 5,336 | 103,137 | 2,880 | 56,443 | 4,872 | 91,607 | ||||||||||||||||||||||||
Class R | 540 | 10,585 | 2,422 | 46,614 | 3,109 | 60,055 | 5,741 | 108,954 | ||||||||||||||||||||||||
Class P | 160,610 | 3,100,289 | 72,831 | 1,426,157 | 299,250 | 5,716,849 | 309,334 | 5,912,317 | ||||||||||||||||||||||||
Class R6 | 287,897 | 5,672,718 | 72,899 | 1,421,553 | 126,881 | 2,470,269 | 62,648 | 1,201,673 | ||||||||||||||||||||||||
Administrative Class | 9,996 | 195,627 | 236,281 | 4,647,163 | 20,574 | 398,581 | 457,658 | 8,868,219 | ||||||||||||||||||||||||
Issued in reinvestment of dividends and distributions: |
| |||||||||||||||||||||||||||||||
Class A | 10,510 | 201,688 | 7,679 | 146,212 | 19,810 | 376,585 | 12,660 | 236,750 | ||||||||||||||||||||||||
Class C | 736 | 14,041 | 1,957 | 36,887 | 225 | 4,276 | 194 | 3,612 | ||||||||||||||||||||||||
Class D | 120 | 2,326 | 1,909 | 36,338 | 262 | 5,007 | 358 | 6,724 | ||||||||||||||||||||||||
Class R | 76 | 1,463 | 691 | 13,152 | 772 | 14,703 | 1,332 | 24,921 | ||||||||||||||||||||||||
Class P | 4,380 | 84,782 | 5,757 | 110,299 | 8,058 | 154,714 | 7,232 | 136,329 | ||||||||||||||||||||||||
Class R6 | 9,220 | 178,596 | 11,467 | 219,816 | 8,358 | 160,647 | 10,236 | 193,174 | ||||||||||||||||||||||||
Administrative Class | 3,808 | 73,602 | 21 | 397 | 7,237 | 138,300 | 240 | 4,513 | ||||||||||||||||||||||||
Cost of shares redeemed: | ||||||||||||||||||||||||||||||||
Class A | (114,309 | ) | (2,221,842 | ) | (188,595 | ) | (3,639,746 | ) | (91,298 | ) | (1,752,217 | ) | (196,186 | ) | (3,738,689 | ) | ||||||||||||||||
Class C | (14,110 | ) | (271,061 | ) | (43,276 | ) | (822,629 | ) | (904 | ) | (17,286 | ) | (11,623 | ) | (219,671 | ) | ||||||||||||||||
Class D | (4,309 | ) | (84,800 | ) | (63,597 | ) | (1,225,620 | ) | (1,208 | ) | (23,241 | ) | (2,636 | ) | (50,334 | ) | ||||||||||||||||
Class R | (2,294 | ) | (44,557 | ) | (15,487 | ) | (301,376 | ) | (1,892 | ) | (35,804 | ) | (3,012 | ) | (56,238 | ) | ||||||||||||||||
Class P | (137,917 | ) | (2,705,973 | ) | (75,304 | ) | (1,455,480 | ) | (55,099 | ) | (1,079,542 | ) | (201,003 | ) | (3,841,134 | ) | ||||||||||||||||
Class R6 | (191,192 | ) | (3,814,089 | ) | (115,021 | ) | (2,243,140 | ) | (100,083 | ) | (1,953,776 | ) | (90,749 | ) | (1,746,394 | ) | ||||||||||||||||
Administrative Class | (21,841 | ) | (430,956 | ) | (51,879 | ) | (1,007,395 | ) | (33,220 | ) | (647,521 | ) | (87,446 | ) | (1,677,656 | ) | ||||||||||||||||
Net increase resulting from Fund share transactions | 327,351 | $ | 6,307,240 | 214,884 | $ | 4,282,718 | 815,713 | $ | 15,649,693 | 897,908 | $ | 17,244,827 | ||||||||||||||||||||
| 258 | May 31, 2014 | | Semiannual Report |
Table of Contents
| AllianzGI Retirement 2025 | AllianzGI Retirement 2030 | |||||||||||||||||||||||||||||
| Six Months ended May 31, 2014 (unaudited) | Year ended November 30, 2013 | Six Months ended May 31, 2014 (unaudited) | Year ended November 30, 2013 | |||||||||||||||||||||||||||
| Shares | Amount | Shares | Amount | Shares | Amount | Shares | Amount | |||||||||||||||||||||||
| 691,190 | $ | 11,668,050 | 869,581 | $ | 14,411,889 | 507,331 | $ | 10,446,264 | 436,817 | $ | 8,660,866 | |||||||||||||||||||
| — | — | — | — | 1,420 | 28,996 | 14,764 | 291,091 | |||||||||||||||||||||||
| — | — | — | — | 1,501 | 30,356 | 18,337 | 367,695 | |||||||||||||||||||||||
| 32,520 | 545,499 | 16,658 | 275,121 | 7,714 | 158,686 | 28,801 | 576,076 | |||||||||||||||||||||||
| 631,238 | 10,486,837 | 131,727 | 2,202,601 | 505,377 | 10,289,071 | 223,730 | 4,460,149 | |||||||||||||||||||||||
| 204,371 | 3,464,176 | 39,346 | 655,355 | 189,584 | 3,947,112 | 149,676 | 3,028,841 | |||||||||||||||||||||||
| 39,297 | 666,055 | 672,665 | 11,362,396 | 22,375 | 464,979 | 495,163 | 10,095,568 | |||||||||||||||||||||||
| 25,283 | 421,464 | 15,518 | 252,174 | 21,055 | 427,836 | 12,325 | 238,512 | |||||||||||||||||||||||
| — | — | — | — | 495 | 10,033 | 604 | 11,625 | |||||||||||||||||||||||
| — | — | — | — | 637 | 13,023 | 549 | 10,676 | |||||||||||||||||||||||
| 1,097 | 18,248 | 1,448 | 23,496 | 896 | 18,290 | 1,572 | 30,514 | |||||||||||||||||||||||
| 4,784 | 80,183 | 6,306 | 102,792 | 8,988 | 184,881 | 7,920 | 154,924 | |||||||||||||||||||||||
| 6,502 | 108,975 | 7,183 | 117,165 | 12,548 | 258,616 | 14,466 | 283,260 | |||||||||||||||||||||||
| 11,996 | 200,811 | 69 | 1,137 | 9,758 | 200,325 | 50 | 982 | |||||||||||||||||||||||
| (137,711 | ) | (2,336,076 | ) | (133,589 | ) | (2,215,838 | ) | (92,122 | ) | (1,883,531 | ) | (501,231 | ) | (9,937,403 | ) | |||||||||||||||
| — | — | — | — | (3,477 | ) | (71,006 | ) | (10,256 | ) | (203,117 | ) | |||||||||||||||||||
| — | — | — | — | (1,239 | ) | (25,441 | ) | (14,044 | ) | (282,332 | ) | |||||||||||||||||||
| (16,530 | ) | (276,680 | ) | (50,850 | ) | (843,426 | ) | (4,454 | ) | (90,755 | ) | (27,867 | ) | (559,660 | ) | |||||||||||||||
| (115,019 | ) | (1,954,813 | ) | (115,589 | ) | (1,929,703 | ) | (33,505 | ) | (697,722 | ) | (116,414 | ) | (2,350,577 | ) | |||||||||||||||
| (32,389 | ) | (554,608 | ) | (71,932 | ) | (1,201,089 | ) | (214,832 | ) | (4,472,902 | ) | (104,884 | ) | (2,119,284 | ) | |||||||||||||||
| (27,664 | ) | (472,752 | ) | (48,964 | ) | (810,805 | ) | (56,658 | ) | (1,184,183 | ) | (67,647 | ) | 1,366,361 | ) | |||||||||||||||
| 1,318,965 |
| $ | 22,065,369 | 1,339,577 | $ | 22,403,265 | 883,392 | $ | 18,052,928 | 562,431 | $ | 11,392,045 | |||||||||||||||||
| Semiannual Report | | May 31, 2014 | 259 |
Table of Contents
Notes to Financial Statements (cont’d)
May 31, 2014 (Unaudited)
| AllianzGI Retirement 2035 | AllianzGI Retirement 2040 | |||||||||||||||||||||||||||||||
Six Months ended May 31, 2014 (unaudited) | Year ended November 30, 2013 | Six Months ended May 31, 2014 (unaudited) | Year ended November 30, 2013 | |||||||||||||||||||||||||||||
| Shares | Amount | Shares | Amount | Shares | Amount | Shares | Amount | |||||||||||||||||||||||||
Shares sold: | ||||||||||||||||||||||||||||||||
Class A | 453,281 | $ | 8,173,217 | 411,160 | $ | 7,045,369 | 395,456 | $ | 8,437,950 | 265,931 | $ | 5,292,401 | ||||||||||||||||||||
Class C | — | — | — | — | 2,319 | 49,491 | 5,701 | 115,381 | ||||||||||||||||||||||||
Class D | — | — | — | — | 715 | 15,359 | 2,510 | 50,598 | ||||||||||||||||||||||||
Class R | 4,360 | 78,550 | 8,199 | 141,502 | 7,003 | 149,406 | 13,107 | 265,360 | ||||||||||||||||||||||||
Class P | 535,259 | 9,476,744 | 107,100 | 1,859,117 | 358,133 | 7,529,264 | 153,985 | 3,118,212 | ||||||||||||||||||||||||
Class R6 | 138,815 | 2,535,138 | 29,687 | 516,675 | 145,624 | 3,151,000 | 117,735 | 2,407,465 | ||||||||||||||||||||||||
Administrative Class | 29,793 | 539,558 | 624,137 | 10,953,335 | 20,116 | 430,217 | 268,154 | 5,509,615 | ||||||||||||||||||||||||
Issued in reinvestment of dividends and distributions: |
| |||||||||||||||||||||||||||||||
Class A | 16,679 | 297,724 | 6,767 | 112,357 | 14,155 | 299,227 | 5,559 | 107,358 | ||||||||||||||||||||||||
Class C | — | — | — | — | 230 | 4,849 | 258 | 4,979 | ||||||||||||||||||||||||
Class D | — | — | — | — | 198 | 4,183 | 298 | 5,762 | ||||||||||||||||||||||||
Class R | 922 | 16,445 | 1,376 | 22,802 | 978 | 20,642 | 1,195 | 23,011 | ||||||||||||||||||||||||
Class P | 6,302 | 113,126 | 6,969 | 116,059 | 5,342 | 113,845 | 3,587 | 69,656 | ||||||||||||||||||||||||
Class R6 | 7,644 | 137,282 | 8,659 | 144,295 | 12,292 | 262,190 | 11,830 | 230,004 | ||||||||||||||||||||||||
Administrative Class | 12,522 | 224,389 | 83 | 1,441 | 5,479 | 116,327 | 44 | 866 | ||||||||||||||||||||||||
Cost of shares redeemed: | ||||||||||||||||||||||||||||||||
Class A | (62,036 | ) | (1,120,831 | ) | (40,516 | ) | (704,143 | ) | (69,061 | ) | (1,478,109 | ) | (111,633 | ) | (2,233,984 | ) | ||||||||||||||||
Class C | — | — | — | — | (662 | ) | (13,901 | ) | (1,010 | ) | (20,868 | ) | ||||||||||||||||||||
Class D | — | — | — | — | (2,172 | ) | (46,564 | ) | (4,608 | ) | (92,574 | ) | ||||||||||||||||||||
Class R | (2,345 | ) | (42,562 | ) | (9,070 | ) | (155,978 | ) | (1,752 | ) | (37,701 | ) | (2,746 | ) | (55,701 | ) | ||||||||||||||||
Class P | (67,001 | ) | (1,211,792 | ) | (61,753 | ) | (1,071,313 | ) | (43,742 | ) | (945,166 | ) | (58,310 | ) | (1,208,528 | ) | ||||||||||||||||
Class R6 | (16,014 | ) | (287,762 | ) | (19,236 | ) | (334,449 | ) | (164,128 | ) | (3,559,940 | ) | (63,127 | ) | (1,309,076 | ) | ||||||||||||||||
Administrative Class | (21,257 | ) | (385,295 | ) | (50,437 | ) | (882,821 | ) | (21,196 | ) | (451,380 | ) | (34,293 | ) | (714,490 | ) | ||||||||||||||||
Net increase resulting from Fund share transactions | 1,036,924 | $ | 18,543,931 | 1,023,125 | $ | 17,764,248 | 665,327 | $ | 14,051,189 | 574,167 | $ | 11,565,447 | ||||||||||||||||||||
| 260 | May 31, 2014 | | Semiannual Report |
Table of Contents
AllianzGI Retirement 2045 | AllianzGI Retirement 2050 | |||||||||||||||||||||||||||||
Six Months ended May 31, 2014 (unaudited) | Year ended November 30, 2013 | Six Months ended May 31, 2014 (unaudited) | Year ended November 30, 2013 | |||||||||||||||||||||||||||
| Shares | Amount | Shares | Amount | Shares | Amount | Shares | Amount | |||||||||||||||||||||||
| 225,987 | $ | 4,200,471 | 242,384 | $ | 4,226,932 | 109,419 | $ | 2,344,511 | 30,447 | $ | 610,616 | |||||||||||||||||||
| — | — | — | — | 479 | 10,119 | 2,441 | 50,382 | |||||||||||||||||||||||
| — | — | — | — | 1,266 | 27,166 | 6,501 | 131,630 | |||||||||||||||||||||||
| 2,246 | 41,691 | 4,475 | 78,591 | 2,320 | 49,640 | 7,563 | 151,084 | |||||||||||||||||||||||
| 344,556 | 6,262,649 | 58,550 | 1,030,558 | 190,685 | 4,024,716 | 36,217 | 734,226 | |||||||||||||||||||||||
| 43,334 | 810,532 | 22,228 | 394,677 | 74,049 | 1,598,956 | 128,943 | 2,638,528 | |||||||||||||||||||||||
| 10,537 | 196,718 | 88,050 | 1,560,963 | 5,926 | 127,584 | 57,615 | 1,183,558 | |||||||||||||||||||||||
| 9,861 | 181,542 | 4,486 | 74,602 | 3,210 | 68,062 | 980 | 18,646 | |||||||||||||||||||||||
| — | — | — | — | 119 | 2,510 | 79 | 1,486 | |||||||||||||||||||||||
| — | — | — | — | 392 | 8,335 | 347 | 6,607 | |||||||||||||||||||||||
| 377 | 6,943 | 557 | 9,250 | 500 | 10,614 | 660 | 12,530 | |||||||||||||||||||||||
| 3,077 | 56,921 | 3,149 | 52,530 | 1,750 | 37,456 | 1,415 | 27,124 | |||||||||||||||||||||||
| 6,249 | 115,794 | 7,280 | 121,489 | 11,459 | 245,688 | 12,077 | 231,563 | |||||||||||||||||||||||
| 1,984 | 36,633 | 38 | 651 | 1,445 | 30,843 | 33 | 629 | |||||||||||||||||||||||
| (36,284 | ) | (677,106 | ) | (19,411 | ) | (352,039 | ) | (5,212 | ) | (110,729 | ) | (54,766 | ) | (1,068,408 | ) | |||||||||||||||
| — | — | — | — | — | — | (40 | ) | (797 | ) | |||||||||||||||||||||
| — | — | — | — | (4,258 | ) | (92,429 | ) | (1,779 | ) | (35,285 | ) | |||||||||||||||||||
| (220 | ) | (4,163 | ) | (3,130 | ) | (55,001 | ) | (110 | ) | (2,379 | ) | (3,520 | ) | (71,730 | ) | |||||||||||||||
| (14,524 | ) | (271,731 | ) | (32,773 | ) | (581,041 | ) | (18,448 | ) | (399,250 | ) | (12,223 | ) | (247,808 | ) | |||||||||||||||
| (2,970 | ) | (55,219 | ) | (4,148 | ) | (75,514 | ) | (92,473 | ) | (2,011,594 | ) | (58,360 | ) | (1,213,335 | ) | |||||||||||||||
| (7,394 | ) | (138,772 | ) | (6,376 | ) | (115,274 | ) | (4,596 | ) | (97,615 | ) | (3,472 | ) | (72,436 | ) | |||||||||||||||
| 586,816 | $ | 10,762,903 | 365,359 | $ | 6,371,374 | 277,922 | $ | 5,872,204 | 151,158 | $ | 3,088,810 | |||||||||||||||||||
| Semiannual Report | | May 31, 2014 | 261 |
Table of Contents
Notes to Financial Statements (cont’d)
May 31, 2014 (Unaudited)
| AllianzGI Retirement 2055 | AllianzGI Retirement Income | |||||||||||||||||||||||||||||||
| Six Months ended May 31, 2014 (unaudited) | Year ended November 30, 2013 | Six Months ended May 31, 2014 (unaudited) | Year ended November 30, 2013 | |||||||||||||||||||||||||||||
| Shares | Amount | Shares | Amount | Shares | Amount | Shares | Amount | |||||||||||||||||||||||||
Shares sold: | ||||||||||||||||||||||||||||||||
Class A | 34,988 | $ | 643,494 | 7,089 | $ | 123,004 | 156,915 | $ | 2,973,471 | 76,446 | $ | 1,456,041 | ||||||||||||||||||||
Class B | — | — | — | — | — | — | — | — | ||||||||||||||||||||||||
Class C | — | — | — | — | 19,602 | 371,642 | 30,550 | 575,686 | ||||||||||||||||||||||||
Class D | — | — | — | — | 2,870 | 55,356 | 31,610 | 606,234 | ||||||||||||||||||||||||
Class R | 1,852 | 33,996 | 1,870 | 32,596 | 3,166 | 62,319 | 1,521 | 29,649 | ||||||||||||||||||||||||
Class P | 39,948 | 724,041 | 10,234 | 178,050 | 251,703 | 4,798,349 | 168,171 | 3,226,547 | ||||||||||||||||||||||||
Institutional Class | — | — | — | — | — | — | — | — | ||||||||||||||||||||||||
Class R6 | 3,737 | 69,090 | 20,476 | 363,504 | 80,729 | 1,527,579 | 85,636 | 1,611,604 | ||||||||||||||||||||||||
Administrative Class | 3,535 | 64,949 | 11,999 | 211,301 | 7,110 | 137,473 | 141,253 | 2,741,571 | ||||||||||||||||||||||||
Issued in reinvestment of dividends and distributions: | ||||||||||||||||||||||||||||||||
Class A | 899 | 16,284 | 79 | 1,290 | 2,282 | 43,360 | 10,998 | 207,020 | ||||||||||||||||||||||||
Class B | — | — | — | — | — | — | — | — | ||||||||||||||||||||||||
Class C | — | — | — | — | 751 | 14,168 | 10,949 | 204,425 | ||||||||||||||||||||||||
Class D | — | — | — | — | 338 | 6,462 | 3,276 | 61,972 | ||||||||||||||||||||||||
Class R | 111 | 2,005 | 124 | 2,031 | 37 | 716 | 237 | 4,597 | ||||||||||||||||||||||||
Class P | 419 | 7,625 | 202 | 3,316 | 3,259 | 62,745 | 12,790 | 243,413 | ||||||||||||||||||||||||
Institutional Class | — | — | — | — | — | — | — | — | ||||||||||||||||||||||||
Class R6 | 7,562 | 137,930 | 11,280 | 184,908 | 4,492 | 84,779 | 24,141 | 451,103 | ||||||||||||||||||||||||
Administrative Class | 377 | 6,840 | 39 | 636 | 806 | 15,482 | 1,624 | 30,372 | ||||||||||||||||||||||||
Cost of shares redeemed: | ||||||||||||||||||||||||||||||||
Class A | (9,827 | ) | (178,197 | ) | (569 | ) | (10,028 | ) | (128,068 | ) | (2,452,747 | ) | (113,932 | ) | (2,155,720 | ) | ||||||||||||||||
Class B | — | — | — | — | — | — | — | — | ||||||||||||||||||||||||
Class C | — | — | — | — | (32,283 | ) | (607,803 | ) | (174,179 | ) | (3,264,397 | ) | ||||||||||||||||||||
Class D | — | — | — | — | (8,813 | ) | (169,057 | ) | (57,101 | ) | (1,074,324 | ) | ||||||||||||||||||||
Class R | (296 | ) | (5,421 | ) | (343 | ) | (6,079 | ) | (824 | ) | (16,098 | ) | (3,238 | ) | (63,934 | ) | ||||||||||||||||
Class P | (962 | ) | (17,963 | ) | (992 | ) | (17,648 | ) | (104,516 | ) | (2,031,672 | ) | (194,801 | ) | (3,706,715 | ) | ||||||||||||||||
Institutional Class | — | — | — | — | — | — | — | — | ||||||||||||||||||||||||
Class R6 | (512 | ) | (9,367 | ) | (1,691 | ) | (29,665 | ) | (46,318 | ) | (877,312 | ) | (197,843 | ) | (3,758,560 | ) | ||||||||||||||||
Administrative Class | (688 | ) | (12,763 | ) | (790 | ) | (13,833 | ) | (35,507 | ) | (683,763 | ) | (15,164 | ) | (283,956 | ) | ||||||||||||||||
Net increase (decrease) resulting from Fund share transactions | 81,143 | $ | 1,482,543 | 59,007 | $ | 1,023,382 | 177,731 | $ | 3,315,449 | (157,056 | ) | $ | (2,857,372 | ) | ||||||||||||||||||
| 262 | May 31, 2014 | | Semiannual Report |
Table of Contents
| AllianzGI Global Allocation | AllianzGI Global Growth Allocation | |||||||||||||||||||||||||||||
| Six Months ended May 31, 2014 (unaudited) | Year ended November 30, 2013 | Six Months ended May 31, 2014 (unaudited) | Year ended November 30, 2013 | |||||||||||||||||||||||||||
| Shares | Amount | Shares | Amount | Shares | Amount | Shares | Amount | |||||||||||||||||||||||
| 358,832 | $ | 4,277,641 | 650,172 | $ | 7,485,478 | 9,478 | $ | 204,746 | 29,219 | $ | 677,830 | |||||||||||||||||||
| 1,748 | 21,371 | 6,790 | 80,274 | — | — | — | — | |||||||||||||||||||||||
| 130,921 | 1,578,303 | 306,134 | 3,563,605 | 4,129 | 88,141 | 8,519 | 191,618 | |||||||||||||||||||||||
| 46,979 | 553,897 | 84,238 | 964,066 | 2,005 | 44,285 | 13,390 | 311,015 | |||||||||||||||||||||||
| — | — | — | — | 2,561 | 59,784 | 3,818 | 88,855 | |||||||||||||||||||||||
| 34,369 | 411,354 | 140,168 | 1,610,906 | — | — | 879 | 20,000 | |||||||||||||||||||||||
| 929,439 | 11,029,693 | 1,462,202 | 16,475,092 | 8,672 | 195,243 | 19,000 | 433,953 | |||||||||||||||||||||||
| — | — | — | — | — | — | — | — | |||||||||||||||||||||||
| 1,039 | 12,748 | 5,944 | 68,916 | — | — | — | — | |||||||||||||||||||||||
| 65,914 | 783,979 | 202,512 | 2,264,319 | 8,814 | 188,793 | 1,479 | 31,867 | |||||||||||||||||||||||
| 1,705 | 20,714 | 9,534 | 108,471 | — | — | — | — | |||||||||||||||||||||||
| 43,642 | 525,888 | 156,805 | 1,773,598 | 8,817 | 186,660 | 1,968 | 41,928 | |||||||||||||||||||||||
| 1,586 | 18,787 | 1,173 | 13,150 | 2,566 | 54,605 | 212 | 4,545 | |||||||||||||||||||||||
| 18 | 211 | 51 | 563 | 759 | 16,173 | 35 | 753 | |||||||||||||||||||||||
| 665 | 7,908 | 1,957 | 21,872 | 275 | 5,885 | 32 | 692 | |||||||||||||||||||||||
| 87,568 | 1,031,014 | 220,253 | 2,440,727 | 21,630 | 463,530 | 9,653 | 207,625 | |||||||||||||||||||||||
| — | — | — | — | — | — | — | — | |||||||||||||||||||||||
| 25 | 304 | 4,830 | 54,859 | 128 | 2,753 | 31 | 658 | |||||||||||||||||||||||
| (564,426 | ) | (6,747,384 | ) | (1,358,968 | ) | (15,588,863 | ) | (18,395 | ) | (401,241 | ) | (14,440 | ) | (330,565 | ) | |||||||||||||||
| (63,080 | ) | (763,062 | ) | (161,681 | ) | (1,874,028 | ) | — | — | — | — | |||||||||||||||||||
| (585,062 | ) | (7,079,033 | ) | (1,129,703 | ) | (13,058,303 | ) | (8,085 | ) | (179,764 | ) | (9,425 | ) | (213,799 | ) | |||||||||||||||
| (21,591 | ) | (259,673 | ) | (9,214 | ) | (105,094 | ) | (11,465 | ) | (251,467 | ) | (1,572 | ) | (36,382 | ) | |||||||||||||||
| — | — | — | — | (1,674 | ) | (40,504 | ) | (1,097 | ) | (24,512 | ) | |||||||||||||||||||
| (43,830 | ) | (529,754 | ) | (98,504 | ) | (1,120,655 | ) | — | — | — | — | |||||||||||||||||||
| (613,040 | ) | (7,266,962 | ) | (1,084,456 | ) | (12,213,671 | ) | (9,983 | ) | (230,456 | ) | (122,046 | ) | (2,920,674 | ) | |||||||||||||||
| — | — | — | — | — | — | — | — | |||||||||||||||||||||||
| (432 | ) | (5,198 | ) | (155,060 | ) | (1,767,402 | ) | — | — | — | — | |||||||||||||||||||
| (187,011 | ) | $ | (2,377,254 | ) | (744,823 | ) | $ | (8,802,120 | ) | 20,232 | $ | 407,166 | (60,345 | ) | $ | (1,514,593 | ) | |||||||||||||
| Semiannual Report | | May 31, 2014 | 263 |
Table of Contents
Notes to Financial Statements (cont’d)
May 31, 2014 (Unaudited)
| AllianzGI Behavioral Advantage Large Cap | AllianzGI Best Styles Global Equity Fund | |||||||||||||||||||||||
| Six Months ended May 31, 2014 (unaudited) | Year ended November 30, 2013 | Period from December 2, 2013** through May 31, 2014 (unaudited) | ||||||||||||||||||||||
| Shares | Amount | Shares | Amount | Shares | Amount | |||||||||||||||||||
Shares sold: | ||||||||||||||||||||||||
Class A | 92,071 | $ | 2,109,756 | 381,505 | $ | 8,441,306 | — | $ | — | |||||||||||||||
Class C | 8,353 | 188,711 | 5,241 | 111,787 | — | — | ||||||||||||||||||
Class D | 5,098 | 117,997 | 25,397 | 475,978 | — | — | ||||||||||||||||||
Class R | — | — | — | — | — | — | ||||||||||||||||||
Class P | — | — | — | — | — | — | ||||||||||||||||||
Institutional Class | 1,278,249 | 29,552,861 | 1,247,607 | 25,277,771 | — | — | ||||||||||||||||||
Administrative Class | — | — | — | — | — | — | ||||||||||||||||||
Class R6 | — | — | — | — | 2,103,505 | 31,348,406 | ||||||||||||||||||
Issued in reinvestment of dividends and distributions: |
| |||||||||||||||||||||||
Class A | 1,899 | 42,703 | 139 | 2,505 | — | — | ||||||||||||||||||
Class C | 468 | 10,358 | 250 | 4,469 | — | — | ||||||||||||||||||
Class D | 313 | 6,966 | 406 | 7,289 | — | — | ||||||||||||||||||
Class R | — | — | — | — | — | — | ||||||||||||||||||
Class P | 32 | 714 | 51 | 920 | — | — | ||||||||||||||||||
Institutional Class | 96,431 | 2,171,713 | 73,598 | 1,327,554 | — | — | ||||||||||||||||||
Administrative Class | — | — | — | — | — | — | ||||||||||||||||||
Cost of shares redeemed: | ||||||||||||||||||||||||
Class A | (49,574 | ) | (1,147,712 | ) | (21,301 | ) | (478,932 | ) | — | — | ||||||||||||||
Class C | (1,081 | ) | (24,566 | ) | (162 | ) | (3,571 | ) | — | — | ||||||||||||||
Class D | (441 | ) | (10,188 | ) | (19,009 | ) | (388,643 | ) | — | — | ||||||||||||||
Class R | — | — | — | — | — | — | ||||||||||||||||||
Class P | — | — | — | — | — | — | ||||||||||||||||||
Institutional Class | (429,609 | ) | (10,001,361 | ) | (186,572 | ) | (4,005,345 | ) | — | — | ||||||||||||||
Administrative Class | — | — | — | — | — | — | ||||||||||||||||||
Class R6 | — | — | — | — | (139,354 | ) | (2,143,815 | ) | ||||||||||||||||
Net increase (decrease) resulting from Fund share transactions | 1,002,209 | $ | 23,017,952 | 1,507,150 | $ | 30,773,088 | 1,964,151 | $ | 29,204,591 | |||||||||||||||
| * | Actual amount rounds to less than 1. |
| ** | Commencement of operations. |
| 264 | May 31, 2014 | | Semiannual Report |
Table of Contents
| AllianzGI China Equity | AllianzGI Convertible | |||||||||||||||||||||||||||||
| Six Months ended May 31, 2014 (unaudited) | Year ended November 30, 2013 | Six Months ended May 31, 2014 (unaudited) | Year ended November 30, 2013 | |||||||||||||||||||||||||||
| Shares | Amount | Shares | Amount | Shares | Amount | Shares | Amount | |||||||||||||||||||||||
| 970 | $ | 14,997 | 2,710 | $ | 41,971 | 6,163,843 | $ | 217,562,661 | 8,591,634 | $ | 280,372,826 | |||||||||||||||||||
| 312 | 5,166 | 2,030 | 32,377 | 646,006 | 22,613,630 | 2,204,183 | 72,452,081 | |||||||||||||||||||||||
| 1,075 | 17,788 | 46,920 | 725,761 | 1,400,577 | 49,509,927 | 5,516,035 | 178,731,349 | |||||||||||||||||||||||
| — | — | — | — | 26,124 | 914,732 | 9,446 | 291,603 | |||||||||||||||||||||||
| — | — | — | — | 1,455,030 | 50,634,451 | 6,525,498 | 215,786,524 | |||||||||||||||||||||||
| 2,432 | 37,303 | 6,213 | 96,128 | 11,382,103 | 402,032,568 | 28,046,811 | 896,431,887 | |||||||||||||||||||||||
| — | — | — | — | 23,577 | 824,871 | 512,078 | 16,761,400 | |||||||||||||||||||||||
| — | — | — | — | — | — | — | — | |||||||||||||||||||||||
| 37 | 596 | 133 | 2,022 | 252,801 | 8,646,602 | 65,158 | 2,055,284 | |||||||||||||||||||||||
| — | * | 1 | — | * | 1 | 50,768 | 1,727,888 | 8,104 | 254,332 | |||||||||||||||||||||
| — | * | 1 | 733 | 11,196 | 99,535 | 3,397,277 | 26,167 | 828,429 | ||||||||||||||||||||||
| — | — | — | — | 335 | 11,534 | 36 | 1,142 | |||||||||||||||||||||||
| — | * | — | * | 15 | 226 | 121,834 | 4,152,177 | 30,015 | 942,805 | |||||||||||||||||||||
| 1,800 | 29,159 | 5,019 | 76,243 | 814,562 | 27,731,502 | 369,146 | 11,475,867 | |||||||||||||||||||||||
| — | — | — | — | 10,334 | 351,869 | 3,411 | 106,752 | |||||||||||||||||||||||
| (879 | ) | (13,725 | ) | (4,000 | ) | (62,748 | ) | (2,272,213 | ) | (80,126,492 | ) | (2,833,097 | ) | (90,812,118 | ) | |||||||||||||||
| (1,285 | ) | (19,677 | ) | (2,705 | ) | (40,672 | ) | (227,847 | ) | (8,086,060 | ) | (258,945 | ) | (8,315,914 | ) | |||||||||||||||
| (1,280 | ) | (20,715 | ) | (58,913 | ) | (908,783 | ) | (1,727,310 | ) | (60,693,508 | ) | (3,324,374 | ) | (105,812,204 | ) | |||||||||||||||
| — | — | — | — | (2,101 | ) | (74,843 | ) | (5,624 | ) | (175,584 | ) | |||||||||||||||||||
| — | — | (955 | ) | (15,129 | ) | (2,695,980 | ) | (96,208,453 | ) | (1,231,953 | ) | (39,106,476 | ) | |||||||||||||||||
| (1,827 | ) | (30,550 | ) | (4,470 | ) | (67,415 | ) | (12,172,276 | ) | (431,810,344 | ) | (11,470,946 | ) | (373,729,722 | ) | |||||||||||||||
| — | — | — | — | (285,473 | ) | (10,160,060 | ) | (221,785 | ) | (7,167,569 | ) | |||||||||||||||||||
| — | — | — | — | — | — | — | — | |||||||||||||||||||||||
| 1,355 | $ | 20,344 | (7,270 | ) | $ | (108,822 | ) | 3,064,229 | $ | 102,951,929 | 32,560,998 | $ | 1,051,372,694 | |||||||||||||||||
| Semiannual Report | | May 31, 2014 | 265 |
Table of Contents
Notes to Financial Statements (cont’d)
May 31, 2014 (Unaudited)
| AllianzGI Global Fundamental Strategy | AllianzGI Global Managed Volatility | |||||||||||||||||||||||||||||||
| Six Months ended May 31, 2014 (unaudited) | Period from July 1, 2013** through November 30, 2013 | Six Months ended May 31, 2014 (unaudited) | Year ended November 30, 2013 | |||||||||||||||||||||||||||||
| Shares | Amount | Shares | Amount | Shares | Amount | Shares | Amount | |||||||||||||||||||||||||
Shares sold: | ||||||||||||||||||||||||||||||||
Class A | — | $ | — | — | $ | — | 2,260 | $ | 40,102 | 4,688 | $ | 84,338 | ||||||||||||||||||||
Class C | — | — | — | — | — | — | 9,622 | 161,779 | ||||||||||||||||||||||||
Class D | 129,490 | 2,053,320 | — | — | 4,667 | 83,000 | 5,587 | 96,532 | ||||||||||||||||||||||||
Class R | — | — | — | — | — | — | — | — | ||||||||||||||||||||||||
Class P | — | — | — | — | — | — | — | — | ||||||||||||||||||||||||
Institutional Class | 27,104 | 421,862 | 3,670 | 56,000 | 186,215 | 3,203,334 | 187,391 | 3,246,795 | ||||||||||||||||||||||||
Administrative Class | — | — | — | — | — | — | — | — | ||||||||||||||||||||||||
Issued in reinvestment of dividends and distributions: |
| |||||||||||||||||||||||||||||||
Class A | 8 | 119 | — | — | 356 | 6,017 | 145 | 2,354 | ||||||||||||||||||||||||
Class C | 5 | 81 | — | — | 545 | 9,036 | 155 | 2,491 | ||||||||||||||||||||||||
Class D | 8 | 119 | — | — | 159 | 2,674 | 128 | 2,075 | ||||||||||||||||||||||||
Class R | — | — | — | — | — | — | — | — | ||||||||||||||||||||||||
Class P | 8 | 127 | — | — | 39 | 658 | 30 | 492 | ||||||||||||||||||||||||
Institutional Class | 17,464 | 265,591 | — | — | 48,480 | 821,489 | 42,843 | 690,065 | ||||||||||||||||||||||||
Administrative Class | — | — | — | — | — | — | — | — | ||||||||||||||||||||||||
Cost of shares redeemed: |
| |||||||||||||||||||||||||||||||
Class A | — | — | — | — | (452 | ) | (7,782 | ) | (1,278 | ) | (22,099 | ) | ||||||||||||||||||||
Class C | — | — | — | — | (594 | ) | (9,956 | ) | (79 | ) | (1,301 | ) | ||||||||||||||||||||
Class D | — | — | — | — | (1,208 | ) | (20,368 | ) | (4,834 | ) | (83,610 | ) | ||||||||||||||||||||
Class R | — | — | — | — | — | — | — | — | ||||||||||||||||||||||||
Class P | — | — | — | — | — | — | — | — | ||||||||||||||||||||||||
Institutional Class | (2,247 | ) | (34,787 | ) | — | — | (47,283 | ) | (821,136 | ) | (318,308 | ) | (5,478,653 | ) | ||||||||||||||||||
Administrative Class | — | — | — | — | — | — | — | — | ||||||||||||||||||||||||
Net increase (decrease) resulting from Fund share transactions | 171,840 | $ | 2,706,432 | 3,670 | $ | 56,000 | 193,184 | $ | 3,307,068 | (73,910 | ) | $ | (1,298,742 | ) | ||||||||||||||||||
| ** | Commencement of operations. |
| 266 | May 31, 2014 | | Semiannual Report |
Table of Contents
| AllianzGI Global Water | AllianzGI High Yield Bond | |||||||||||||||||||||||||||||
| Six Months ended May 31, 2014 (unaudited) | Year ended November 30, 2013 | Six Months ended | Year ended November 30, 2013 | |||||||||||||||||||||||||||
| Shares | Amount | Shares | Amount | Shares | Amount | Shares | Amount | |||||||||||||||||||||||
| 2,741,773 | $ | 35,159,870 | 5,512,444 | $ | 62,211,861 | 1,735,054 | $ | 17,934,835 | 9,935,430 | $ | 102,263,468 | |||||||||||||||||||
| 1,580,573 | 19,709,185 | 2,018,617 | 22,399,195 | 187,513 | 1,935,940 | 589,098 | 6,095,119 | |||||||||||||||||||||||
| 623,272 | 7,947,317 | 1,334,896 | 14,821,546 | 3,690,641 | 37,094,564 | 10,223,893 | 103,127,026 | |||||||||||||||||||||||
| — | — | — | — | 55,487 | 555,855 | 165,963 | 1,667,040 | |||||||||||||||||||||||
| 1,592,795 | 20,467,291 | 2,464,550 | 27,959,201 | 1,245,690 | 12,476,311 | 7,088,977 | 71,077,404 | |||||||||||||||||||||||
| 887,767 | 11,068,862 | 1,071,185 | 12,109,835 | 5,535,224 | 55,578,777 | 7,108,742 | 71,681,301 | |||||||||||||||||||||||
| — | — | — | — | 540,484 | 5,409,944 | 922,461 | 9,275,763 | |||||||||||||||||||||||
| 16,615 | 206,530 | 40,634 | 423,408 | 227,680 | 2,345,392 | 301,981 | 3,119,863 | |||||||||||||||||||||||
| 2 | 24 | 5,991 | 61,406 | 76,839 | 790,808 | 124,329 | 1,283,135 | |||||||||||||||||||||||
| 2,130 | 26,435 | 7,190 | 74,782 | 372,705 | 3,731,201 | 485,325 | 4,881,638 | |||||||||||||||||||||||
| — | — | — | — | 8,186 | 81,799 | 9,516 | 95,433 | |||||||||||||||||||||||
| 3,092 | 38,644 | 3,988 | 41,753 | 35,775 | 357,370 | 51,149 | 513,053 | |||||||||||||||||||||||
| 14,188 | 174,654 | 5,276 | 54,605 | 664,379 | 6,653,959 | 882,805 | 8,877,726 | |||||||||||||||||||||||
| — | — | — | — | 147,211 | 1,468,517 | 207,370 | 2,078,136 | |||||||||||||||||||||||
| (845,015 | ) | (10,740,990 | ) | (1,838,617 | ) | (20,625,299 | ) | (3,385,623 | ) | (34,850,102 | ) | (13,899,036 | ) | (143,273,425 | ) | |||||||||||||||
| (264,808 | ) | (3,318,673 | ) | (332,044 | ) | (3,662,680 | ) | (404,935 | ) | (4,179,648 | ) | (1,078,374 | ) | (11,147,242 | ) | |||||||||||||||
| (357,046 | ) | (4,578,667 | ) | (490,851 | ) | (5,488,667 | ) | (7,332,776 | ) | (73,390,525 | ) | (4,425,118 | ) | (44,596,498 | ) | |||||||||||||||
| — | — | — | — | (47,596 | ) | (477,233 | ) | (105,584 | ) | (1,059,461 | ) | |||||||||||||||||||
| (417,422 | ) | (5,329,928 | ) | (704,028 | ) | (8,054,166 | ) | (361,386 | ) | (3,619,010 | ) | (1,388,602 | ) | (13,947,242 | ) | |||||||||||||||
| (246,827 | ) | (3,182,451 | ) | (212,810 | ) | (2,409,344 | ) | (2,667,761 | ) | (26,781,110 | ) | (6,427,655 | ) | (64,748,671 | ) | |||||||||||||||
| — | — | — | — | (442,617 | ) | (4,431,690 | ) | (627,488 | ) | (6,317,156 | ) | |||||||||||||||||||
| 5,331,089 |
| $ | 67,648,103 | 8,886,421 | $ | 99,917,436 | (119,826 | ) | $ | (1,314,046 | ) | 10,145,182 | $ | 100,946,410 | |||||||||||||||
| Semiannual Report | | May 31, 2014 | 267 |
Table of Contents
Notes to Financial Statements (cont’d)
May 31, 2014 (Unaudited)
| AllianzGI International Small-Cap | AllianzGI Micro Cap | |||||||||||||||||||||||||||||||
| Six Months ended May 31, 2014 (unaudited) | Year ended November 30, 2013 | Six Months ended May 31, 2014 (unaudited) | Year ended November 30, 2013 | |||||||||||||||||||||||||||||
| Shares | Amount | Shares | Amount | Shares | Amount | Shares | Amount | |||||||||||||||||||||||||
Shares sold: | ||||||||||||||||||||||||||||||||
Class A | 33,178 | $ | 1,302,900 | 103,722 | $ | 4,131,418 | 278,842 | $ | 4,383,147 | 74,399 | $ | 1,015,030 | ||||||||||||||||||||
Class C | 10,041 | 381,643 | 2,889 | 106,966 | — | — | — | — | ||||||||||||||||||||||||
Class D | 30,230 | 1,202,915 | 6,102 | 248,611 | — | — | — | — | ||||||||||||||||||||||||
Class R | 1,385 | 55,137 | 281 | 11,046 | — | — | — | — | ||||||||||||||||||||||||
Class P | 30,558 | 1,188,564 | 250,454 | 8,238,161 | 36,790 | 572,391 | 198,960 | 2,717,307 | ||||||||||||||||||||||||
Institutional Class | 389,821 | 15,619,801 | 691,638 | 25,366,913 | 335,474 | 5,312,164 | 740,624 | 9,794,170 | ||||||||||||||||||||||||
Issued in reinvestment of dividends and distributions: |
| |||||||||||||||||||||||||||||||
Class A | 3,020 | 115,432 | — | * | 5 | 3,648 | 53,258 | 1,001 | 11,489 | |||||||||||||||||||||||
Class C | 1,312 | 49,492 | 9 | 309 | — | — | — | — | ||||||||||||||||||||||||
Class D | 735 | 28,741 | — | * | 11 | — | — | — | — | |||||||||||||||||||||||
Class R | 60 | 2,285 | 4 | 153 | — | — | — | — | ||||||||||||||||||||||||
Class P | 71,169 | 2,697,753 | 9,018 | 302,391 | 7,559 | 110,432 | 2,806 | 31,638 | ||||||||||||||||||||||||
Institutional Class | 140,495 | 5,460,396 | 25,211 | 835,561 | 143,813 | 2,111,180 | 199,097 | 2,172,522 | ||||||||||||||||||||||||
Administrative Class*** | 32 | 1,233 | — | * | 1 | — | — | — | — | |||||||||||||||||||||||
Cost of shares redeemed: | ||||||||||||||||||||||||||||||||
Class A | (17,460 | ) | (684,456 | ) | (82,662 | ) | (3,357,604 | ) | (73,539 | ) | (1,109,872 | ) | (20,683 | ) | (284,391 | ) | ||||||||||||||||
Class C | (951 | ) | (36,898 | ) | (2,842 | ) | (100,112 | ) | — | — | — | — | ||||||||||||||||||||
Class D | (2,725 | ) | (109,414 | ) | (1,704 | ) | (66,604 | ) | — | — | — | — | ||||||||||||||||||||
Class R | (22 | ) | (868 | ) | (4 | ) | (132 | ) | — | — | — | — | ||||||||||||||||||||
Class P | (118,072 | ) | (4,571,959 | ) | (367,738 | ) | (12,280,239 | ) | (39,477 | ) | (605,681 | ) | (94,040 | ) | (1,282,966 | ) | ||||||||||||||||
Institutional Class | (436,830 | ) | (17,515,832 | ) | (1,751,653 | ) | (63,692,299 | ) | (722,149 | ) | (11,540,481 | ) | (703,397 | ) | (9,479,462 | ) | ||||||||||||||||
Administrative Class*** | (395 | ) | (15,734 | ) | — | — | — | — | — | — | ||||||||||||||||||||||
Net increase (decrease) resulting from Fund share transactions | 135,581 | $ | 5,171,131 | (1,117,275 | ) | $ | (40,255,444 | ) | (29,039 | ) | $ | (713,462 | ) | 398,767 | $ | 4,695,337 | ||||||||||||||||
| * | Actual amount rounds to less than 1. |
| ** | Commencement of operations. |
| *** | The Administrative Class of AllianzGI International Small-Cap liquidated on May 21, 2014. |
| 268 | May 31, 2014 | | Semiannual Report |
Table of Contents
| AllianzGI Multi-Asset Real Return | AllianzGI NFJ Emerging Markets Value | |||||||||||||||||||||||||||||
| Six Months ended May 31, 2014 (unaudited) | Period from December 17, 2012** through November 30, 2013 | Six Months ended May 31, 2014 (unaudited) | Period from December 18, 2012** through November 30, 2013 | |||||||||||||||||||||||||||
| Shares | Amount | Shares | Amount | Shares | Amount | Shares | Amount | |||||||||||||||||||||||
| 5,807 | $ | 91,410 | 2,254 | $ | 34,886 | 707 | $ | 10,875 | 659 | $ | 10,519 | |||||||||||||||||||
| 1,614 | 25,670 | 4,638 | 67,431 | 1,090 | 16,000 | 967 | 14,000 | |||||||||||||||||||||||
| 1,163 | 18,423 | — | — | 26,616 | 400,992 | 89,929 | 1,341,066 | |||||||||||||||||||||||
| — | — | — | — | — | — | — | — | |||||||||||||||||||||||
| — | — | — | — | — | — | — | — | |||||||||||||||||||||||
| 29,542 | 457,280 | 2,314 | 35,411 | 132,108 | 1,967,448 | 231,737 | 3,637,469 | |||||||||||||||||||||||
| 56 | 850 | — | — | 18 | 272 | 18 | 258 | |||||||||||||||||||||||
| 91 | 1,364 | — | — | 21 | 315 | 7 | 99 | |||||||||||||||||||||||
| 12 | 176 | — | — | 1,034 | 15,551 | 340 | 4,846 | |||||||||||||||||||||||
| — | — | — | — | — | — | — | — | |||||||||||||||||||||||
| 12 | 192 | — | — | 10 | 153 | 8 | 122 | |||||||||||||||||||||||
| 7,211 | 109,319 | — | — | 6,368 | 95,709 | 5,130 | 73,371 | |||||||||||||||||||||||
| — | — | — | — | — | — | — | — | |||||||||||||||||||||||
| (1,533 | ) | (23,764 | ) | — | — | (154 | ) | (2,275 | ) | (100 | ) | (1,553 | ) | |||||||||||||||||
| — | — | — | — | — | — | — | — | |||||||||||||||||||||||
| — | — | — | — | (3,472 | ) | (51,639 | ) | (20,648 | ) | (323,055 | ) | |||||||||||||||||||
| — | — | — | — | — | — | — | — | |||||||||||||||||||||||
| — | — | — | — | — | — | — | — | |||||||||||||||||||||||
| (1,743 | ) | (27,308 | ) | (348 | ) | (5,234 | ) | (38,592 | ) | (588,312 | ) | (18,284 | ) | (280,040 | ) | |||||||||||||||
| — | — | — | — | — | — | — | — | |||||||||||||||||||||||
| 42,232 | $ | 653,612 | 8,858 | $ | 132,494 | 125,754 | $ | 1,865,089 | 289,763 | $ | 4,477,102 | |||||||||||||||||||
| Semiannual Report | | May 31, 2014 | 269 |
Table of Contents
Notes to Financial Statements (cont’d)
May 31, 2014 (Unaudited)
| AllianzGI NFJ Global Dividend Value | AllianzGI NFJ International Small-Cap Value | |||||||||||||||||||||||||||||||
| Six Months ended May 31, 2014 (unaudited) | Year ended November 30, 2013 | Six Months ended May 31, 2014 (unaudited) | Year ended November 30, 2013 | |||||||||||||||||||||||||||||
| Shares | Amount | Shares | Amount | Shares | Amount | Shares | Amount | |||||||||||||||||||||||||
Shares sold: | ||||||||||||||||||||||||||||||||
Class A | 92,566 | $ | 1,966,027 | 156,809 | $ | 3,135,257 | 34,897 | $ | 756,406 | 47,080 | $ | 949,567 | ||||||||||||||||||||
Class C | 27,086 | 572,376 | 79,235 | 1,580,908 | 30,048 | 629,920 | 24,826 | 475,897 | ||||||||||||||||||||||||
Class D | 5,404 | 115,513 | 12,092 | 249,792 | 9,236 | 201,014 | 122,827 | 2,408,829 | ||||||||||||||||||||||||
Class P | 18,266 | 393,053 | 26,705 | 544,157 | 345 | 7,235 | — | — | ||||||||||||||||||||||||
Institutional Class | 354,066 | 7,442,476 | 889,070 | 17,441,666 | 204,755 | 4,351,357 | 364,978 | 7,301,696 | ||||||||||||||||||||||||
Issued in reinvestment of dividends and distributions: |
| |||||||||||||||||||||||||||||||
Class A | 9,883 | 206,933 | 5,523 | 108,140 | 3,324 | 67,600 | 1,443 | 25,477 | ||||||||||||||||||||||||
Class C | 10,039 | 207,647 | 3,519 | 67,729 | 1,071 | 21,708 | 66 | 1,272 | ||||||||||||||||||||||||
Class D | 1,411 | 29,834 | 627 | 12,397 | 1,219 | 24,795 | 340 | 6,209 | ||||||||||||||||||||||||
Class P | 3,058 | 64,406 | 1,542 | 30,424 | 19 | 384 | 10 | 185 | ||||||||||||||||||||||||
Institutional Class | 102,810 | 2,142,086 | 66,335 | 1,294,273 | 19,676 | 403,900 | 3,582 | 63,091 | ||||||||||||||||||||||||
Cost of shares redeemed: | ||||||||||||||||||||||||||||||||
Class A | (50,553 | ) | (1,078,217 | ) | (80,230 | ) | (1,662,770 | ) | (22,574 | ) | (487,015 | ) | (1,985 | ) | (39,719 | ) | ||||||||||||||||
Class C | (27,858 | ) | (585,747 | ) | (39,317 | ) | (767,938 | ) | (601 | ) | (12,886 | ) | (812 | ) | (15,461 | ) | ||||||||||||||||
Class D | (3,097 | ) | (66,912 | ) | (4,979 | ) | (98,694 | ) | (6,191 | ) | (133,816 | ) | (82,841 | ) | (1,655,878 | ) | ||||||||||||||||
Class P | (11,437 | ) | (244,148 | ) | (11,673 | ) | (229,909 | ) | — | — | — | — | ||||||||||||||||||||
Institutional Class | (338,023 | ) | (7,179,577 | ) | (777,516 | ) | (16,122,964 | ) | (43,974 | ) | (957,173 | ) | (18,106 | ) | (367,353 | ) | ||||||||||||||||
Net increase (decrease) resulting from Fund share transactions | 193,621 | $ | 3,985,750 | 327,742 | $ | 5,582,468 | 231,250 | $ | 4,873,429 | 461,408 | $ | 9,153,812 | ||||||||||||||||||||
| 270 | May 31, 2014 | | Semiannual Report |
Table of Contents
| AllianzGI NFJ International Value II | AllianzGI Short Duration High Income | |||||||||||||||||||||||||||||
| Six Months ended May 31, 2014 (unaudited) | Year ended November 30, 2013 | Six Months ended May 31, 2014 (unaudited) | Year ended November 30, 2013 | |||||||||||||||||||||||||||
| Shares | Amount | Shares | Amount | Shares | Amount | Shares | Amount | |||||||||||||||||||||||
| 4,069 | $ | 73,508 | 918 | $ | 16,009 | 5,862,179 | $ | 93,381,555 | 9,245,767 | $ | 147,457,855 | |||||||||||||||||||
| — | — | 9,102 | 160,912 | 1,636,719 | 26,025,409 | 2,632,258 | 41,876,500 | |||||||||||||||||||||||
| — | — | 2 | 32 | 1,379,954 | 21,980,417 | 1,053,388 | 16,780,609 | |||||||||||||||||||||||
| 517 | 10,000 | — | — | 5,008,567 | 79,785,703 | 8,229,104 | 131,186,076 | |||||||||||||||||||||||
| 1,375,259 | 24,901,623 | 9,647 | 164,731 | 4,678,018 | 74,584,733 | 10,250,970 | 163,728,556 | |||||||||||||||||||||||
| 233 | 4,186 | 44 | 738 | 236,090 | 3,753,184 | 344,340 | 5,467,728 | |||||||||||||||||||||||
| 135 | 2,405 | 8 | 131 | 81,992 | 1,301,013 | 104,122 | 1,650,508 | |||||||||||||||||||||||
| 40 | 714 | 9 | 152 | 38,972 | 619,506 | 46,673 | 741,285 | |||||||||||||||||||||||
| 40 | 724 | 10 | 159 | 115,795 | 1,840,507 | 138,088 | 2,191,585 | |||||||||||||||||||||||
| 21,022 | 377,585 | 3,813 | 64,024 | 320,640 | 5,102,248 | 347,265 | 5,515,412 | |||||||||||||||||||||||
| (2,666 | ) | (47,672 | ) | (60 | ) | (1,050 | ) | (3,664,237 | ) | (58,373,570 | ) | (4,076,260 | ) | (64,767,196 | ) | |||||||||||||||
| (84 | ) | (1,514 | ) | (7,301 | ) | (129,878 | ) | (419,804 | ) | (6,676,229 | ) | (521,072 | ) | (8,275,135 | ) | |||||||||||||||
| — | — | — | — | (255,246 | ) | (4,064,906 | ) | (539,985 | ) | (8,594,224 | ) | |||||||||||||||||||
| — | — | — | — | (2,282,088 | ) | (36,344,278 | ) | (4,033,691 | ) | (64,067,265 | ) | |||||||||||||||||||
| (2,782 | ) | (52,173 | ) | (65,288 | ) | (1,115,507 | ) | (1,945,242 | ) | (31,009,262 | ) | (1,715,578 | ) | (27,239,030 | ) | |||||||||||||||
| | 1,395,783 | | $ | 25,269,386 | (49,096 | ) | $ | (839,547 | ) | 10,792,309 | $ | 171,906,030 | 21,505,389 | $ | 343,653,264 | |||||||||||||||
| Semiannual Report | | May 31, 2014 | 271 |
Table of Contents
Notes to Financial Statements (cont’d)
May 31, 2014 (Unaudited)
| AllianzGI Structured Return | AllianzGI Ultra Micro Cap | |||||||||||||||||||||||||||||||
Six Months ended May 31, 2014 | Period from November 30, 2013 | Six Months ended May 31, 2014 (unaudited) | Year ended November 30, 2013 | |||||||||||||||||||||||||||||
| Shares | Amount | Shares | Amount | Shares | Amount | Shares | Amount | |||||||||||||||||||||||||
Shares sold: | ||||||||||||||||||||||||||||||||
Class A | 135,956 | $ | 2,057,966 | 34,359 | $ | 543,218 | 1,105,713 | $ | 27,549,559 | 2,454,435 | $ | 51,344,593 | ||||||||||||||||||||
Class C | 4,320 | 66,491 | 4,265 | 67,043 | — | — | — | — | ||||||||||||||||||||||||
Class D | 7,819 | 119,550 | 136,002 | 2,095,760 | — | — | — | — | ||||||||||||||||||||||||
Class R | — | — | — | — | — | — | — | — | ||||||||||||||||||||||||
Class P | — | — | 3,150 | 50,000 | 27,935 | 706,220 | 27,501 | 572,135 | ||||||||||||||||||||||||
Institutional Class | 368,177 | 5,578,494 | 134,593 | 2,063,286 | 921,002 | 23,078,388 | 3,066,770 | 63,021,267 | ||||||||||||||||||||||||
Issued in reinvestment of dividends and distributions: |
| |||||||||||||||||||||||||||||||
Class A | 1,601 | 24,284 | — | — | 5,711 | 133,515 | 752 | 16,333 | ||||||||||||||||||||||||
Class C | 324 | 4,872 | — | — | — | — | — | — | ||||||||||||||||||||||||
Class D | 4,006 | 60,855 | — | — | — | — | — | — | ||||||||||||||||||||||||
Class R | — | — | — | — | — | — | — | — | ||||||||||||||||||||||||
Class P | 172 | 2,607 | — | — | 78 | 1,822 | 14 | 314 | ||||||||||||||||||||||||
Institutional Class | 22,151 | 336,705 | — | — | 5,397 | 126,941 | 901 | 19,672 | ||||||||||||||||||||||||
Cost of shares redeemed: |
| |||||||||||||||||||||||||||||||
Class A | (23,423 | ) | (357,222 | ) | (2,447 | ) | (38,784 | ) | (510,372 | ) | (12,370,608 | ) | (369,804 | ) | (7,746,956 | ) | ||||||||||||||||
Class C | (1,669 | ) | (24,806 | ) | (195 | ) | (3,030 | ) | — | — | — | — | ||||||||||||||||||||
Class D | (25,792 | ) | (390,975 | ) | (47,551 | ) | (726,334 | ) | — | — | — | — | ||||||||||||||||||||
Class R | — | — | — | — | — | — | — | — | ||||||||||||||||||||||||
Class P | — | — | — | — | (3,069 | ) | (74,261 | ) | (8,555 | ) | (172,955 | ) | ||||||||||||||||||||
Institutional Class | (38,019 | ) | (586,684 | ) | (32,977 | ) | (514,076 | ) | (1,098,652 | ) | (26,776,123 | ) | (1,105,860 | ) | (22,669,169 | ) | ||||||||||||||||
Net increase resulting from Fund share transactions | 455,623 | $ | 6,892,137 | 229,199 | $ | 3,537,083 | 453,743 | $ | 12,375,453 | 4,066,154 | $ | 84,385,234 | ||||||||||||||||||||
| ** | Commencement of operations. |
| 272 | May 31, 2014 | | Semiannual Report |
Table of Contents
| AllianzGI U.S. Equity Hedged | AllianzGI U.S. Small-Cap Growth | |||||||||||||||||||||||||||||
Six Months ended May 31, 2014 (unaudited) | Period from December 3, 2012** November 30, 2013 | Six Months ended May 31, 2014 (unaudited) | Year ended November 30, 2013 | |||||||||||||||||||||||||||
| Shares | Amount | Shares | Amount | Shares | Amount | Shares | Amount | |||||||||||||||||||||||
| 3,867 | $ | 66,291 | 81,379 | $ | 1,326,639 | 70,020 | $ | 1,254,458 | 197,402 | $ | 3,210,872 | |||||||||||||||||||
| 2,695 | 46,001 | 6,465 | 108,500 | 6,353 | 112,593 | 19,720 | 317,722 | |||||||||||||||||||||||
| 3,659 | 63,350 | 15,315 | 239,042 | 2,877 | 51,117 | 1,225 | 20,872 | |||||||||||||||||||||||
| — | — | — | — | 1,194 | 21,578 | 927 | 15,557 | |||||||||||||||||||||||
| — | — | — | — | 53,868 | 966,695 | 4,343 | 72,862 | |||||||||||||||||||||||
| 28,587 | 494,267 | 117,315 | 1,897,897 | 357,054 | 6,556,922 | 822,774 | 12,878,248 | |||||||||||||||||||||||
| 1,900 | 32,050 | — | — | 4,405 | 75,899 | 347 | 4,676 | |||||||||||||||||||||||
| 241 | 4,036 | — | — | 2,385 | 40,144 | 357 | 4,669 | |||||||||||||||||||||||
| 276 | 4,657 | — | — | 235 | 4,055 | 90 | 1,186 | |||||||||||||||||||||||
| — | — | — | — | 103 | 1,768 | 18 | 232 | |||||||||||||||||||||||
| 11 | 199 | — | — | 384 | 6,673 | 35 | 477 | |||||||||||||||||||||||
| 6,328 | 107,071 | — | — | 106,826 | 1,861,980 | 33,018 | 440,202 | |||||||||||||||||||||||
| (309 | ) | (5,270 | ) | — | — | (32,308 | ) | (582,494 | ) | (39,901 | ) | (660,566 | ) | |||||||||||||||||
| — | — | — | — | (3,226 | ) | (56,686 | ) | (5,072 | ) | (77,126 | ) | |||||||||||||||||||
| (1,373 | ) | (23,582 | ) | (636 | ) | (10,361 | ) | (1,325 | ) | (23,569 | ) | (2,079 | ) | (34,319 | ) | |||||||||||||||
| — | — | — | — | (1,195 | ) | (21,613 | ) | (340 | ) | (5,967 | ) | |||||||||||||||||||
| — | — | — | — | (51,563 | ) | (932,557 | ) | (106 | ) | (1,527 | ) | |||||||||||||||||||
| (24,372 | ) | (420,202 | ) | (5,598 | ) | (90,430 | ) | (305,137 | ) | (5,550,276 | ) | (856,009 | ) | (14,320,751 | ) | |||||||||||||||
| 21,510 |
| $ | 368,868 | 214,240 | $ | 3,471,287 | 210,950 | $ | 3,786,687 | 176,749 | $ | 1,867,319 | |||||||||||||||||
| Semiannual Report | | May 31, 2014 | 273 |
Table of Contents
Notes to Financial Statements (cont’d)
May 31, 2014 (Unaudited)
| 10. | SIGNIFICANT ACCOUNT HOLDERS |
From time to time, a Fund may have a concentration of shareholders, which may include the Investment Manager or affiliates of the Investment Manager, holding a significant percentage of shares outstanding. Investment activities of these shareholders could have a material impact to a Fund.
At May 31, 2014, the significant account-holders, owners of 5% or greater of each respective Fund’s outstanding shares were as follows:
| Unaffiliated | Affiliated Approximate Ownership | |||||||||||||||||||||||||||||||||||||||||||
| Number of Account Holders | Approximate Ownership | AFI | AllianzGI Global Allocation | AllianzGI Retirement 2020 | AllianzGI Retirement 2025 | AllianzGI Retirement 2030 | AllianzGI Retirement 2035 | AllianzGI Retirement 2040 | AllianzGI Retirement 2045 | AllianzGI Retirement 2050 | ||||||||||||||||||||||||||||||||||
AllianzGI Retirement 2015 | 6 | 73 | % | 11 | % | — | — | — | — | — | — | — | — | |||||||||||||||||||||||||||||||
AllianzGI Retirement 2020 | 5 | 83 | % | 6 | % | — | — | — | — | — | — | — | — | |||||||||||||||||||||||||||||||
AllianzGI Retirement 2025 | 5 | 84 | % | 5 | % | — | — | — | — | — | — | — | — | |||||||||||||||||||||||||||||||
AllianzGI Retirement 2030 | 5 | 82 | % | — | — | — | — | — | — | — | — | — | ||||||||||||||||||||||||||||||||
AllianzGI Retirement 2035 | 5 | 79 | % | 8 | % | — | — | — | — | — | — | — | — | |||||||||||||||||||||||||||||||
AllianzGI Retirement 2040 | 5 | 78 | % | 7 | % | — | — | — | — | — | — | — | — | |||||||||||||||||||||||||||||||
AllianzGI Retirement 2045 | 4 | 67 | % | 17 | % | — | — | — | — | — | — | — | — | |||||||||||||||||||||||||||||||
AllianzGI Retirement 2050 | 2 | 56 | % | 23 | % | — | — | — | — | — | — | — | — | |||||||||||||||||||||||||||||||
AllianzGI Retirement 2055 | 2 | 22 | % | 63 | % | — | — | — | — | — | — | — | — | |||||||||||||||||||||||||||||||
AllianzGI Retirement Income | 5 | 61 | % | 14 | % | — | — | — | — | — | — | — | — | |||||||||||||||||||||||||||||||
AllianzGI Global Allocation | 7 | 76 | % | — | — | — | — | — | — | — | — | — | ||||||||||||||||||||||||||||||||
AllianzGI Global Growth Allocation | 2 | 14 | % | 51 | % | — | — | — | — | — | — | — | — | |||||||||||||||||||||||||||||||
AllianzGI Behavioral Advantage Large Cap | 4 | 42 | % | 22 | % | 11 | % | — | — | — | — | — | — | — | ||||||||||||||||||||||||||||||
AllianzGI Best Styles Global Equity | — | — | 15 | % | 24 | % | 5 | % | 7 | % | 9 | % | 10 | % | 9 | % | 6 | % | 5 | % | ||||||||||||||||||||||||
AllianzGI China Equity | — | — | 89 | % | — | — | — | — | — | — | — | — | ||||||||||||||||||||||||||||||||
AllianzGI Convertible | 7 | 70 | % | — | — | — | — | — | — | — | — | — | ||||||||||||||||||||||||||||||||
AllianzGI Global Fundamental Strategy | 1 | 9 | % | 90 | % | — | — | — | — | — | — | — | — | |||||||||||||||||||||||||||||||
AllianzGI Global Managed Volatility | — | — | 15 | % | 36 | % | — | 7 | % | 8 | % | 7 | % | 6 | % | — | — | |||||||||||||||||||||||||||
AllianzGI Global Water | 8 | 84 | % | — | — | — | — | — | — | — | — | — | ||||||||||||||||||||||||||||||||
AllianzGI High Yield Bond | 4 | 64 | % | — | — | — | — | — | — | — | — | — | ||||||||||||||||||||||||||||||||
AllianzGI International Small-Cap | 3 | 59 | % | — | 8 | % | — | — | — | — | — | — | — | |||||||||||||||||||||||||||||||
AllianzGI Micro Cap | 4 | 79 | % | — | — | — | — | — | — | — | — | — | ||||||||||||||||||||||||||||||||
AllianzGI Multi-Asset Real Return | 1 | 8 | % | 89 | % | — | — | — | — | — | — | — | — | |||||||||||||||||||||||||||||||
AllianzGI NFJ Emerging Markets Value | 1 | 59 | % | 34 | % | — | — | — | — | — | — | — | — | |||||||||||||||||||||||||||||||
AllianzGI NFJ Global Dividend Value | 4 | 49 | % | — | 16 | % | — | — | — | — | — | — | — | |||||||||||||||||||||||||||||||
AllianzGI NFJ International Small-Cap Value | 4 | 34 | % | 22 | % | 10 | % | — | — | — | — | — | — | — | ||||||||||||||||||||||||||||||
AllianzGI NFJ International Value II | 1 | 84 | % | 14 | % | — | — | — | — | — | — | — | — | |||||||||||||||||||||||||||||||
AllianzGI Short Duration High Income | 6 | 69 | % | — | — | — | — | — | — | — | — | — | ||||||||||||||||||||||||||||||||
AllianzGI Structured Return | 4 | 58 | % | 39 | % | — | — | — | — | — | — | — | — | |||||||||||||||||||||||||||||||
AllianzGI Ultra Micro Cap | 7 | 87 | % | — | — | — | — | — | — | — | — | — | ||||||||||||||||||||||||||||||||
AllianzGI U.S. Equity-Hedged | 3 | 50 | % | 47 | % | — | — | — | — | — | — | — | — | |||||||||||||||||||||||||||||||
AllianzGI U.S. Small-Cap Growth | 3 | 77 | % | — | — | — | — | — | — | — | — | — | ||||||||||||||||||||||||||||||||
| 274 | May 31, 2014 | | Semiannual Report |
Table of Contents
| 11. | AFFILIATED TRANSACTIONS |
An affiliate includes any company in which a Sub-Adviser owns 5% or more of a company’s outstanding voting securities at any point during the reporting period. The table below represents transactions in and earning from these affiliated issuers during the six months ended May 31, 2014.
| AllianzGI Best Styles Global Equity: | ||||||||||||||||||||||||||||
| Market Value 12/2/2013* | Purchases at Cost | Proceeds from Sales | Unrealized Appreciation (Depreciation) | Market Value 5/31/2014 | Dividend Income | Net Realized Gain(Loss) | ||||||||||||||||||||||
Andersons, Inc. | — | $ | 13,412 | $ | 29 | $ | (1,717 | ) | $ | 11,665 | $ | 50 | $ | (1 | ) | |||||||||||||
Group 1 Automotive, Inc.† | — | 6,079 | 5,720 | — | — | 15 | (359 | ) | ||||||||||||||||||||
Home Loan Servicing Solutions Ltd. | — | 14,260 | — | (590 | ) | 13,670 | 564 | — | ||||||||||||||||||||
Jenoptik AG | — | 11,436 | — | 1,087 | 12,523 | — | — | |||||||||||||||||||||
Ju Teng International Holdings Ltd. | — | 5,462 | 5,536 | — | — | — | 74 | |||||||||||||||||||||
Mentor Graphics Corp. | — | 39,565 | — | (1,402 | ) | 38,163 | 57 | — | ||||||||||||||||||||
Olin Corp. | — | 16,491 | — | 77 | 16,568 | 243 | — | |||||||||||||||||||||
Sanderson Farms, Inc. | — | 27,556 | — | 8,245 | 35,801 | 126 | — | |||||||||||||||||||||
TAL International Group, Inc.† | — | 22,648 | 18,602 | — | — | — | (4,046 | ) | ||||||||||||||||||||
Trelleborg AB | — | 12,636 | 13,677 | — | — | — | 1,041 | |||||||||||||||||||||
Universal Corp.† | — | 5,439 | 5,993 | — | — | 55 | 554 | |||||||||||||||||||||
Westjet Airlines† | — | 5,242 | 4,235 | — | — | 34 | (1,007 | ) | ||||||||||||||||||||
j2 Global, Inc. | — | 15,567 | — | 678 | 16,245 | 183 | — | |||||||||||||||||||||
Totals | — | $ | 195,793 | $ | 53,792 | $ | 6,378 | $ | 144,635 | $ | 1,327 | $ | (3,744 | ) | ||||||||||||||
| AllianzGI China Equity: | ||||||||||||||||||||||||||||
| Market Value 11/30/2013 | Purchases at Cost | Proceeds from Sales | Unrealized Appreciation (Depreciation) | Market Value 5/31/2014 | Dividend Income | Net Realized Gain(Loss) | ||||||||||||||||||||||
Beijing Jingneng Clean Energy Co., Ltd.†† | $ | 47,043 | $ | 22,316 | — | $ | 1,653 | $ | 63,426 | — | — | |||||||||||||||||
China Everbright International Ltd.† | 276,691 | 19,188 | $ | 220,065 | 76,981 | 131,579 | $ | 561 | $ | 154,536 | ||||||||||||||||||
China Suntien Green Energy Corp. Ltd. | 46,433 | 20,502 | — | (7,065 | ) | 57,207 | — | — | ||||||||||||||||||||
Digital China Holdings Ltd. | 99,099 | 21,640 | — | (63,452 | ) | 95,751 | 2,411 | — | ||||||||||||||||||||
Qingling Motors Co., Ltd. | 159,528 | — | — | 10,472 | 161,590 | — | — | |||||||||||||||||||||
Tiangong International Co., Ltd.† | 140,329 | — | 41,156 | (18,897 | ) | 60,240 | 4,343 | (10,477 | ) | |||||||||||||||||||
Totals | $ | 769,123 | $ | 83,646 | $ | 261,221 | $ | (308 | ) | $ | 569,793 | $ | 7,315 | $ | 144,059 | |||||||||||||
| AllianzGI Global Water: | ||||||||||||||||||||||||||||
| Market Value 11/30/2013 | Purchases at Cost | Proceeds from Sales | Unrealized Appreciation (Depreciation) | Market Value 5/31/2014 | Dividend Income | Net Realized Gain(Loss) | ||||||||||||||||||||||
China Everbright International Ltd.† | $ | 3,393,922 | — | — | $ | 1,916,852 | $ | 3,886,040 | $ | 19,618 | — | |||||||||||||||||
Norma Group SE | — | $ | 3,144,910 | — | 188,137 | 3,333,047 | 43,020 | — | ||||||||||||||||||||
Spectris PLC | 3,645,186 | — | — | 614,602 | 3,534,534 | 42,903 | — | |||||||||||||||||||||
Totals | $ | 7,039,108 | $ | 3,144,910 | — | $ | 2,719,591 | $ | 10,753,621 | $ | 105,541 | — | ||||||||||||||||
| AllianzGI International Small-Cap: | ||||||||||||||||||||||||||||
| Market Value 11/30/2013 | Purchases at Cost | Proceeds from Sales | Unrealized Appreciation (Depreciation) | Market Value 5/31/2014 | Dividend Income | Net Realized Gain(Loss) | ||||||||||||||||||||||
AMS AG†† | — | $ | 1,717,760 | — | $ | 112,232 | $ | 1,829,992 | — | — | ||||||||||||||||||
Aareal Bank AG | $ | 1,576,887 | 57,878 | $ | 133,066 | 1,104,682 | 1,943,809 | $ | 30,922 | $ | 35,522 | |||||||||||||||||
Aveva Group PLC | 1,174,443 | 38,595 | 94,140 | 214,051 | 1,152,634 | 2,517 | (13,406 | ) | ||||||||||||||||||||
Bechtle AG†† | — | 1,698,865 | — | 130,453 | 1,829,317 | — | — | |||||||||||||||||||||
Burckhardt Compression Holding AG† | 1,593,121 | 65,308 | 1,923,372 | — | — | — | 584,671 | |||||||||||||||||||||
| Semiannual Report | | May 31, 2014 | 275 |
Table of Contents
Notes to Financial Statements (cont’d)
May 31, 2014 (Unaudited)
| AllianzGI International Small-Cap (cont’d) | ||||||||||||||||||||||||||||
| Market Value 11/30/2013 | Purchases at Cost | Proceeds from Sales | Unrealized Appreciation (Depreciation) | Market Value 5/31/2014 | Dividend Income | Net Realized Gain(Loss) | ||||||||||||||||||||||
CANCOM SE†† | — | $ | 1,637,759 | $ | 44,804 | $ | 118,502 | $ | 1,711,863 | — | $ | 406 | ||||||||||||||||
China Everbright International Ltd.† | $ | 1,371,180 | 117,593 | 911,596 | 436,080 | 793,304 | $ | 3,631 | 543,367 | |||||||||||||||||||
GameLoft SE†† | — | 1,678,794 | — | (59,307 | ) | 1,619,487 | — | — | ||||||||||||||||||||
Ju Teng International Holdings Ltd.†† | 1,103,899 | 118,519 | 206,083 | 522,708 | 1,180,079 | 29,877 | 24,219 | |||||||||||||||||||||
Schoeller-Bleckmann Oilfield Equipment AG†† | 1,721,478 | 63,343 | 142,233 | 499,285 | 1,860,298 | 24,342 | (11,760 | ) | ||||||||||||||||||||
SimCorp A/S | 2,325,489 | — | 133,170 | 988,063 | 2,122,534 | 33,824 | 7,378 | |||||||||||||||||||||
Spectris PLC† | 1,026,442 | 34,637 | 1,021,172 | — | — | — | 57,968 | |||||||||||||||||||||
Spirax-Sarco Engineering PLC† | 2,314,457 | 80,729 | 189,824 | 653,488 | 2,211,631 | 31,888 | (460 | ) | ||||||||||||||||||||
Tiangong International Co., Ltd.† | 411,665 | — | 336,973 | — | — | — | (29,885 | ) | ||||||||||||||||||||
Trelleborg AB | 1,458,571 | 103,848 | 116,544 | 305,442 | 1,625,373 | 31,260 | (3,272 | ) | ||||||||||||||||||||
Unit 4 NV† | 1,347,794 | — | 1,375,398 | — | — | — | 1,075,027 | |||||||||||||||||||||
Vacon PLC | 2,220,157 | 75,619 | 183,595 | 884,713 | 2,225,925 | 40,948 | 4,516 | |||||||||||||||||||||
Totals | $ | 19,645,583 | $ | 7,489,247 | $ | 6,811,970 | $ | 5,910,392 | $ | 22,106,246 | $ | 229,209 | $ | 2,274,291 | ||||||||||||||
| AllianzGI Micro Cap: | ||||||||||||||||||||||||||||
| Market Value 11/30/2013 | Purchases at Cost | Proceeds from Sales | Unrealized Appreciation (Depreciation) | Market Value 5/31/2014 | Dividend Income | Net Realized Gain(Loss) | ||||||||||||||||||||||
Arctic Cat, Inc.†,†† | $ | 315,112 | $ | 5,890 | $ | 239,433 | — | — | $ | 500 | $ | 141,024 | ||||||||||||||||
Neenah Paper, Inc. | 344,318 | 18,013 | 34,539 | $ | 243,884 | $ | 378,484 | 3,638 | 14,103 | |||||||||||||||||||
Totals | $ | 659,430 | $ | 23,903 | $ | 273,972 | $ | 243,884 | $ | 378,484 | $ | 4,138 | $ | 155,127 | ||||||||||||||
| AllianzGI NFJ International Small-Cap Value: | ||||||||||||||||||||||||||||
| Market Value 11/30/2013 | Purchases at Cost | Proceeds from Sales | Unrealized Appreciation (Depreciation) | Market Value 5/31/2014 | Dividend Income | Net Realized Gain(Loss) | ||||||||||||||||||||||
Norma Group SE | $ | 70,666 | $ | 48,446 | — | $ | 41,581 | $ | 125,417 | $ | 1,619 | — | ||||||||||||||||
| AllianzGI U.S. Small-Cap Growth: | ||||||||||||||||||||||||||||
| Market Value 11/30/2013 | Purchases at Cost | Proceeds from Sales | Unrealized Appreciation (Depreciation) | Market Value 5/31/2014 | Dividend Income | Net Realized Gain(Loss) | ||||||||||||||||||||||
Arctic Cat, Inc.†,†† | $ | 191,318 | $ | 18,952 | $ | 155,799 | — | — | $ | 375 | $ | 7,240 | ||||||||||||||||
Curtiss-Wright Corp.† | 258,573 | 58,630 | 11,687 | $ | 145,839 | $ | 377,925 | 729 | 487 | |||||||||||||||||||
Mentor Graphics Corp.†† | 328,865 | 65,361 | 10,682 | 164,528 | 360,506 | 1,498 | (1,554 | ) | ||||||||||||||||||||
Totals | $ | 778,756 | $ | 142,943 | $ | 178,168 | $ | 310,367 | $ | 738,431 | $ | 2,602 | $ | 6,173 | ||||||||||||||
| † | Not affiliated at May 31, 2014. |
| †† | Not affiliated at November 30, 2013. |
| * | Commencement of operations |
Certain additional purchases of existing portfolio holdings that were not considered affiliated in prior years, resulted in the Funds owning in excess of 5% of the outstanding shares of certain issues at May 31, 2014. The percentages and market values of the affiliated transactions represent below include both acquisitions of new investments and prior year holdings that became affiliated during the reporting period.
| AllianzGI Best Styles Global Equity: | ||||||||||||
| Issuer Name | Sub-Adviser’s % Holding | Market Value | Market Value as a % of Fund’s Net Assets | |||||||||
Andersons, Inc. | 8.47 | % | $ | 11,665 | 0.03 | % | ||||||
Home Loan Servicing Solutions Ltd. | 6.85 | % | 13,670 | 0.04 | % | |||||||
| 276 | May 31, 2014 | | Semiannual Report |
Table of Contents
| AllianzGI Best Styles Global Equity (cont’d) | ||||||||||||
| Issuer Name | Sub-Adviser’s % Holding | Market Value | Market Value as a % of Fund’s Net Assets | |||||||||
j2 Global, Inc. | 5.05 | % | $ | 16,245 | 0.04 | % | ||||||
Jenoptik AG | 5.16 | % | 12,523 | 0.03 | % | |||||||
Mentor Graphics Corp. | 5.09 | % | 38,163 | 0.10 | % | |||||||
Olin Corp. | 5.39 | % | 16,568 | 0.05 | % | |||||||
Sanderson Farms, Inc. | 5.84 | % | 35,801 | 0.10 | % | |||||||
Totals | $ | 144,635 | 0.39 | % | ||||||||
| AllianzGI China Equity: | ||||||||||||
| Issuer Name | Sub-Adviser’s % Holding | Market Value | Market Value as a % of Fund’s Net Assets | |||||||||
Beijing Jingneng Clean Energy Co., Ltd. | 6.35 | % | $ | 63,426 | 1.51 | % | ||||||
China Suntien Green Energy Corp. Ltd. | 11.62 | % | 57,207 | 1.36 | % | |||||||
Digital China Holdings Ltd. | 8.79 | % | 95,751 | 2.28 | % | |||||||
Qingling Motors Co., Ltd. | 8.84 | % | 161,590 | 3.85 | % | |||||||
Totals | $ | 377,974 | 9.00 | % | ||||||||
| AllianzGI Global Water: | ||||||||||||
| Issuer Name | Sub-Adviser’s % Holding | Market Value | Market Value as a % of Fund’s Net Assets | |||||||||
Norma Group SE | 6.70 | % | $ | 3,333,047 | 1.01 | % | ||||||
Spectris PLC | 5.49 | % | 3,534,534 | 1.07 | % | |||||||
Totals | $ | 6,867,581 | 2.08 | % | ||||||||
| AllianzGI International Small-Cap: | ||||||||||||
| Issuer Name | Sub-Adviser’s % Holding | Market Value | Market Value as a % of Fund’s Net Assets | |||||||||
Aareal Bank AG | 7.60 | % | $ | 1,943,809 | 1.78 | % | ||||||
AMS AG | 5.27 | % | 1,829,992 | 1.67 | % | |||||||
Aveva Group PLC | 8.61 | % | 1,152,634 | 1.05 | % | |||||||
Bechtle AG | 7.32 | % | 1,829,317 | 1.67 | % | |||||||
CANCOM SE | 16.28 | % | 1,711,863 | 1.56 | % | |||||||
GameLoft SE | 6.41 | % | 1,619,487 | 1.48 | % | |||||||
Ju Teng International Holdings Ltd. | 7.85 | % | 1,180,079 | 1.08 | % | |||||||
Schoeller-Bleckmann Oilfield Equipment AG | 5.76 | % | 1,860,298 | 1.70 | % | |||||||
SimCorp A/S | 13.23 | % | 2,122,534 | 1.94 | % | |||||||
Trelleborg AB | 6.00 | % | 1,625,373 | 1.48 | % | |||||||
Vacon PLC | 6.16 | % | 2,225,925 | 2.03 | % | |||||||
Totals | $ | 19,101,311 | 17.44 | % | ||||||||
| AllianzGI Micro Cap: | ||||||||||||
| Issuer Name | Sub-Adviser’s % Holding | Market Value | Market Value as a % of Fund’s Net Assets | |||||||||
Neenah Paper, Inc. | 6.17 | % | $ | 378,484 | 0.91 | % | ||||||
| Semiannual Report | | May 31, 2014 | 277 |
Table of Contents
Notes to Financial Statements (cont’d)
May 31, 2014 (Unaudited)
| AllianzGI NFJ International Small-Cap Value: | ||||||||||||
| Issuer Name | Sub-Adviser’s % Holding | Market Value | Market Value as a % of Fund’s Net Assets | |||||||||
Norma Group SE | 6.70 | % | $ | 125,417 | 0.58 | % | ||||||
| AllianzGI U.S. Small-Cap Growth: | ||||||||||||
| Issuer Name | Sub-Adviser’s % Holding | Market Value | Market Value as a % of Fund’s Net Assets | |||||||||
Mentors Graphics Corp. | 5.09 | % | $ | 360,506 | 1.00 | % | ||||||
The tables below show the transactions in and earnings from affiliates for the six months ended May 31, 2014:
| AllianzGI Retirement 2015: | ||||||||||||||||||||||||||||
| Market Value 11/30/2013 | Purchases at Cost | Proceeds from Sales | Unrealized Appreciation (Depreciation) | Market Value 5/31/2014 | Dividend Income | Net Realized Gain(Loss) | ||||||||||||||||||||||
AllianzGI Behavioral Advantage Large Cap | $ | 336,451 | $ | 447,493 | $ | 229,384 | $ | 57,772 | $ | 575,119 | $ | 3,306 | $ | 353 | ||||||||||||||
AllianzGI Best Styles Global Equity | — | 1,303,771 | 352,236 | 86,623 | 1,042,229 | — | 4,071 | |||||||||||||||||||||
AllianzGI Emerging Markets Opportunities | 392,169 | 114,361 | 475,608 | — | — | 8,351 | (1,646 | ) | ||||||||||||||||||||
AllianzGI Global Managed Volatility | 220,240 | 144,687 | 79,344 | 40,578 | 290,155 | 9,353 | (769 | ) | ||||||||||||||||||||
AllianzGI Global Natural Resources | 280,678 | 188,559 | 269,339 | 75,886 | 230,916 | 2,446 | 20,684 | |||||||||||||||||||||
AllianzGI Income & Growth | 889,009 | 287,208 | 318,587 | 140,929 | 868,525 | 11,847 | 7,268 | |||||||||||||||||||||
AllianzGI International Managed Volatility | — | 335,696 | 75,929 | 27,986 | 289,897 | — | 2,144 | |||||||||||||||||||||
AllianzGI International Small-Cap | 292,230 | 175,617 | 182,804 | 39,177 | 270,836 | 2,383 | 4,089 | |||||||||||||||||||||
AllianzGI NFJ Dividend Value | 776,229 | 342,293 | 584,578 | 218,123 | 580,761 | 8,870 | 66,440 | |||||||||||||||||||||
AllianzGI NFJ Global Dividend Value | 329,686 | 103,193 | 146,510 | 69,781 | 289,244 | 3,930 | 14,642 | |||||||||||||||||||||
AllianzGI NFJ International Small-Cap Value | 110,071 | 69,634 | 44,327 | 9,846 | 144,949 | 2,033 | 500 | |||||||||||||||||||||
AllianzGI NFJ International Value | 554,557 | 370,346 | 236,510 | 89,495 | 722,258 | 3,912 | 1,221 | |||||||||||||||||||||
AllianzGI NFJ Mid-Cap Value | 204,907 | 548,810 | 218,161 | 95,587 | 579,463 | 6,649 | 3,695 | |||||||||||||||||||||
AllianzGI NFJ Small-Cap Value | 258,530 | — | 254,041 | — | — | — | 89,876 | |||||||||||||||||||||
AllianzGI Short Duration High Income | 658,875 | 1,276,108 | 341,328 | 6,899 | 1,593,301 | 35,683 | (1,187 | ) | ||||||||||||||||||||
AllianzGI U.S. Managed Volatility | 329,212 | 771,380 | 267,804 | 68,448 | 871,401 | 5,830 | 1,222 | |||||||||||||||||||||
PIMCO 1-5 Year U.S. TIPS Index | 2,743,671 | 3,027,301 | 2,294,457 | 19,659 | 3,481,768 | 7,802 | (9,286 | ) | ||||||||||||||||||||
PIMCO CommoditiesPLUS® Strategy | 440,214 | 194,147 | 234,090 | 28,813 | 431,598 | 682 | (4,505 | ) | ||||||||||||||||||||
PIMCO Commodity RealReturn Strategy | — | 491,517 | 50,204 | (9,944 | ) | 430,636 | — | (733 | ) | |||||||||||||||||||
PIMCO Floating Income | 983,990 | 1,084,385 | 639,841 | 21,455 | 1,456,233 | 30,778 | (8,037 | ) | ||||||||||||||||||||
PIMCO Foreign Bond (U.S. Dollar-Hedged) | 879,035 | 545,693 | 571,824 | 44,530 | 870,004 | 13,667 | (1,135 | ) | ||||||||||||||||||||
PIMCO Income | 1,974,076 | 1,918,357 | 1,074,968 | 196,884 | 2,911,796 | 74,050 | 8,463 | |||||||||||||||||||||
PIMCO International StocksPLUS® AR Strategy (U.S. Dollar-Hedged) | 552,298 | 395,499 | 253,981 | 48,222 | 722,891 | 16,273 | 1,199 | |||||||||||||||||||||
PIMCO Mortgage Opportunities | 1,427,913 | 765,907 | 1,050,751 | 13,922 | 1,163,179 | 30,312 | 2,286 | |||||||||||||||||||||
PIMCO Real Return | 2,529,844 | 3,322,276 | 3,402,233 | 256,562 | 2,597,685 | 17,930 | 47,207 | |||||||||||||||||||||
PIMCO Senior Floating Rate | — | 1,954,664 | 352,847 | (2,187 | ) | 1,597,406 | 23,074 | (2,224 | ) | |||||||||||||||||||
PIMCO Short-Term | 2,628,314 | 1,547,051 | 1,858,749 | 31,449 | 2,317,957 | 11,679 | 579 | |||||||||||||||||||||
Totals | $ | 19,792,199 | $ | 21,725,953 | $ | 15,860,435 | $ | 1,676,495 | $ | 26,330,207 | $ | 330,840 | $ | 246,417 | ||||||||||||||
| 278 | May 31, 2014 | | Semiannual Report |
Table of Contents
| AllianzGI Retirement 2020: | ||||||||||||||||||||||||||||
| Market Value 11/30/2013 | Purchases at Cost | Proceeds from Sales | Unrealized Appreciation (Depreciation) | Market Value 5/31/2014 | Dividend Income | Net Realized Gain(Loss) | ||||||||||||||||||||||
AllianzGI Behavioral Advantage Large Cap | $ | 629,058 | $ | 824,277 | $ | 264,053 | $ | 123,970 | $ | 1,234,531 | $ | 7,085 | $ | 1,174 | ||||||||||||||
AllianzGI Best Styles Global Equity | — | 2,097,393 | 254,456 | 160,671 | 2,006,781 | — | 3,173 | |||||||||||||||||||||
AllianzGI Emerging Markets Opportunities | 669,346 | 247,354 | 862,541 | — | — | 14,905 | (1,618 | ) | ||||||||||||||||||||
AllianzGI Global Managed Volatility | 492,989 | 293,245 | 45,939 | 67,941 | 753,828 | 22,538 | (1,548 | ) | ||||||||||||||||||||
AllianzGI Global Natural Resources | 494,549 | 278,158 | 331,614 | 120,779 | 502,676 | 4,534 | 26,115 | |||||||||||||||||||||
AllianzGI Income & Growth | 1,327,442 | 297,369 | 139,189 | 162,129 | 1,504,268 | 19,279 | 2,233 | |||||||||||||||||||||
AllianzGI International Managed Volatility | — | 488,577 | 37,158 | 48,381 | 501,156 | — | 1,356 | |||||||||||||||||||||
AllianzGI International Small-Cap | 497,566 | 246,184 | 247,197 | 59,234 | 473,703 | 3,824 | 11,184 | |||||||||||||||||||||
AllianzGI NFJ Dividend Value | 1,157,014 | 502,923 | 735,146 | 291,024 | 1,003,794 | 14,616 | 68,371 | |||||||||||||||||||||
AllianzGI NFJ Global Dividend Value | 664,056 | 154,872 | 80,978 | 142,432 | 748,557 | 9,682 | 3,637 | |||||||||||||||||||||
AllianzGI NFJ International Small-Cap Value | 199,886 | 116,099 | 34,491 | 20,252 | 300,905 | 3,918 | 568 | |||||||||||||||||||||
AllianzGI NFJ International Value | 894,487 | 549,799 | 158,068 | 123,554 | 1,349,775 | 6,790 | 747 | |||||||||||||||||||||
AllianzGI NFJ Mid-Cap Value | 651,547 | 558,917 | 277,754 | 216,552 | 1,006,301 | 12,159 | 7,377 | |||||||||||||||||||||
AllianzGI NFJ Small-Cap Value | 144,102 | — | 141,600 | — | — | — | 58,016 | |||||||||||||||||||||
AllianzGI Short Duration High Income | 1,157,753 | 1,688,245 | 94,514 | 5,007 | 2,750,748 | 58,949 | (781 | ) | ||||||||||||||||||||
AllianzGI U.S. Managed Volatility | 659,392 | 1,123,957 | 97,741 | 136,761 | 1,760,944 | 12,487 | 9 | |||||||||||||||||||||
PIMCO 1-5 Year U.S. TIPS Index | 4,121,751 | 5,205,250 | 3,582,189 | 26,762 | 5,747,950 | 12,881 | (16,389 | ) | ||||||||||||||||||||
PIMCO CommoditiesPLUS® Strategy | 988,915 | 468,333 | 513,025 | 68,813 | 1,040,741 | 1,631 | 8,778 | |||||||||||||||||||||
PIMCO Commodity RealReturn Strategy | — | 1,066,111 | — | (24,129 | ) | 1,041,982 | — | — | ||||||||||||||||||||
PIMCO Floating Income | 1,823,422 | 1,203,303 | 562,858 | 31,539 | 2,515,105 | 55,869 | (10,956 | ) | ||||||||||||||||||||
PIMCO Foreign Bond (U.S. Dollar-Hedged) | 729,928 | 1,056,468 | 316,432 | 54,895 | 1,502,173 | 19,032 | (1,077 | ) | ||||||||||||||||||||
PIMCO Income | 2,986,303 | 2,571,207 | 1,160,388 | 202,604 | 4,530,641 | 111,812 | (8,151 | ) | ||||||||||||||||||||
PIMCO International StocksPLUS® AR Strategy (U.S. Dollar-Hedged) | 827,471 | 559,786 | 185,038 | 80,446 | 1,251,747 | 26,632 | 170 | |||||||||||||||||||||
PIMCO Mortgage Opportunities | 1,990,319 | 1,567,287 | 1,824,260 | 20,379 | 1,757,192 | 42,940 | (4,322 | ) | ||||||||||||||||||||
PIMCO Real Return | 3,632,445 | 4,945,770 | 4,324,206 | 304,492 | 4,500,335 | 29,152 | (97,321 | ) | ||||||||||||||||||||
PIMCO Senior Floating Rate | — | 2,866,717 | 104,179 | (6,481 | ) | 2,755,484 | 37,898 | (573 | ) | |||||||||||||||||||
PIMCO Short-Term | 2,977,911 | 2,353,173 | 2,583,184 | 23,965 | 2,749,227 | 12,815 | 1,982 | |||||||||||||||||||||
Totals | $ | 29,717,652 | $ | 33,330,774 | $ | 18,958,198 | $ | 2,461,972 | $ | 45,290,544 | $ | 541,428 | $ | 52,154 | ||||||||||||||
| AllianzGI Retirement 2025: | ||||||||||||||||||||||||||||
Market Value | Purchases at Cost | Proceeds from Sales | Unrealized Appreciation (Depreciation) | Market Value | Dividend Income | Net Realized Gain(Loss) | ||||||||||||||||||||||
AllianzGI Behavioral Advantage Large Cap | $ | 1,178,110 | $ | 1,516,629 | $ | 723,432 | $ | 223,865 | $ | 2,033,305 | $ | 12,424 | $ | 2,261 | ||||||||||||||
AllianzGI Best Styles Global Equity | — | 2,642,250 | 227,651 | 195,248 | 2,609,450 | — | (397 | ) | ||||||||||||||||||||
AllianzGI Emerging Markets Opportunities | 856,660 | 280,162 | 1,073,747 | — | — | 18,676 | (31,691 | ) | ||||||||||||||||||||
AllianzGI Global Managed Volatility | 736,362 | 596,533 | 96,993 | 87,812 | 1,267,530 | 33,138 | (4,499 | ) | ||||||||||||||||||||
AllianzGI Global Natural Resources | 663,264 | 513,128 | 400,381 | 165,095 | 870,578 | 6,062 | 21,854 | |||||||||||||||||||||
AllianzGI Income & Growth | 1,356,132 | 528,397 | 172,536 | 116,888 | 1,732,715 | 21,078 | 55 | |||||||||||||||||||||
AllianzGI International Managed Volatility | — | 570,245 | 49,658 | 54,375 | 575,946 | — | 984 | |||||||||||||||||||||
AllianzGI International Small-Cap | 684,996 | 434,680 | 219,633 | 83,734 | 866,919 | 5,754 | 2,608 | |||||||||||||||||||||
AllianzGI NFJ Dividend Value | 1,189,139 | 644,534 | 778,907 | 282,709 | 1,148,404 | 15,244 | 40,507 | |||||||||||||||||||||
AllianzGI NFJ Global Dividend Value | 744,836 | 347,309 | 80,754 | 162,537 | 1,032,566 | 11,331 | 1,354 | |||||||||||||||||||||
AllianzGI NFJ International Small-Cap Value | 271,283 | 206,344 | 45,295 | 32,064 | 462,475 | 5,238 | (9 | ) | ||||||||||||||||||||
AllianzGI NFJ International Value | 1,015,517 | 844,715 | 234,898 | 166,148 | 1,710,738 | 7,563 | 438 | |||||||||||||||||||||
AllianzGI NFJ Mid-Cap Value | 780,199 | 534,975 | 226,459 | 259,340 | 1,169,175 | 11,661 | 4,200 | |||||||||||||||||||||
AllianzGI Short Duration High Income | 1,522,853 | 1,714,668 | 101,505 | 2,745 | 3,136,614 | 64,317 | (919 | ) | ||||||||||||||||||||
| Semiannual Report | | May 31, 2014 | 279 |
Table of Contents
Notes to Financial Statements (cont’d)
May 31, 2014 (Unaudited)
| AllianzGI Retirement 2025 (cont’d) | ||||||||||||||||||||||||||||
Market Value | Purchases at Cost | Proceeds from Sales | Unrealized Appreciation (Depreciation) | Market Value | Dividend Income | Net Realized Gain(Loss) | ||||||||||||||||||||||
AllianzGI U.S. Managed Volatility | $ | 670,782 | $ | 1,704,591 | $ | 178,472 | $ | 163,420 | $ | 2,304,768 | $ | 12,519 | $ | (571 | ) | |||||||||||||
PIMCO 1-5 Year U.S. TIPS Index | 3,031,318 | 5,329,906 | 3,790,115 | 13,689 | 4,560,853 | 10,220 | (18,753 | ) | ||||||||||||||||||||
PIMCO CommoditiesPLUS® Strategy | 1,180,814 | 565,125 | 627,620 | 86,395 | 1,240,323 | 1,935 | 19,328 | |||||||||||||||||||||
PIMCO Commodity RealReturn Strategy | — | 1,275,503 | 13,796 | (28,668 | ) | 1,232,856 | — | (183 | ) | |||||||||||||||||||
PIMCO Floating Income | 1,865,790 | 1,633,941 | 685,784 | 43,224 | 2,872,587 | 61,238 | (13,585 | ) | ||||||||||||||||||||
PIMCO Foreign Bond (U.S. Dollar-Hedged) | 845,846 | 1,210,354 | 373,233 | 29,178 | 1,713,555 | 20,339 | (2,507 | ) | ||||||||||||||||||||
PIMCO Income | 2,703,734 | 3,165,584 | 1,121,074 | 148,111 | 4,888,949 | 115,758 | (12,288 | ) | ||||||||||||||||||||
PIMCO International StocksPLUS® AR Strategy (U.S. Dollar-Hedged) | 1,016,487 | 866,325 | 216,290 | 104,251 | 1,736,571 | 32,280 | (1,967 | ) | ||||||||||||||||||||
PIMCO Mortgage Opportunities | 2,027,310 | 1,711,993 | 1,757,412 | 20,708 | 2,006,366 | 45,515 | (10,897 | ) | ||||||||||||||||||||
PIMCO Real Return | 3,712,884 | 5,359,335 | 4,708,122 | 188,505 | 4,622,373 | 30,169 | (202,264 | ) | ||||||||||||||||||||
PIMCO Senior Floating Rate | — | 3,243,431 | 95,526 | (7,157 | ) | 3,140,217 | 41,793 | (531 | ) | |||||||||||||||||||
PIMCO Short-Term | 2,359,331 | 2,646,263 | 2,176,957 | 14,383 | 2,831,141 | 12,287 | 2,182 | |||||||||||||||||||||
Totals | $ | 30,413,647 | $ | 40,086,920 | $ | 20,176,250 | $ | 2,608,599 | $ | 51,766,974 | $ | 596,539 | $ | (205,290 | ) | |||||||||||||
| AllianzGI Retirement 2030: | ||||||||||||||||||||||||||||
| Market Value 11/30/2013 | Purchases at Cost | Proceeds from Sales | Unrealized Appreciation (Depreciation) | Market Value | Dividend Income | Net Realized Gain(Loss) | ||||||||||||||||||||||
AllianzGI Behavioral Advantage Large Cap | $ | 1,384,263 | $ | 1,156,488 | $ | 464,334 | $ | 270,830 | $ | 2,135,066 | $ | 13,953 | $ | (2,249 | ) | |||||||||||||
AllianzGI Best Styles Global Equity | — | 3,288,149 | 203,759 | 223,420 | 3,308,501 | — | 691 | |||||||||||||||||||||
AllianzGI Emerging Markets Opportunities | 1,421,222 | 423,212 | 1,194,266 | 129,876 | 592,329 | 29,356 | (38,488 | ) | ||||||||||||||||||||
AllianzGI Global Managed Volatility | 878,025 | 665,039 | 70,511 | 116,883 | 1,502,980 | 42,335 | (5,050 | ) | ||||||||||||||||||||
AllianzGI Global Natural Resources | 800,062 | 520,895 | 515,905 | 217,589 | 904,024 | 6,804 | 28,377 | |||||||||||||||||||||
AllianzGI Income & Growth | 1,811,917 | 1,083,046 | 506,587 | 170,722 | 2,401,885 | 28,189 | 12,563 | |||||||||||||||||||||
AllianzGI International Managed Volatility | 521,775 | 1,133,730 | 87,396 | 145,438 | 1,677,428 | 19,136 | (570 | ) | ||||||||||||||||||||
AllianzGI International Small-Cap | 1,011,338 | 487,615 | 248,620 | 187,454 | 1,199,762 | 8,621 | 5,200 | |||||||||||||||||||||
AllianzGI NFJ Dividend Value | 1,604,348 | 927,104 | 1,334,880 | 380,623 | 1,321,171 | 19,646 | 102,276 | |||||||||||||||||||||
AllianzGI NFJ Global Dividend Value | 1,007,783 | 258,599 | 93,717 | 214,276 | 1,190,681 | 14,622 | 4,422 | |||||||||||||||||||||
AllianzGI NFJ International Small-Cap Value | 404,702 | 205,826 | 47,949 | 40,434 | 600,139 | 7,353 | (22 | ) | ||||||||||||||||||||
AllianzGI NFJ International Value | 1,808,711 | 892,617 | 992,037 | 227,039 | 1,786,872 | 12,735 | 24,967 | |||||||||||||||||||||
AllianzGI NFJ Mid-Cap Value | 972,250 | 1,087,027 | 676,336 | 337,455 | 1,506,944 | 19,414 | 23,894 | |||||||||||||||||||||
AllianzGI NFJ Small-Cap Value | 314,934 | — | 309,466 | — | — | — | 128,715 | |||||||||||||||||||||
AllianzGI Short Duration High Income | 2,006,727 | 1,395,930 | 121,792 | 9,108 | 3,281,462 | 68,487 | (1,343 | ) | ||||||||||||||||||||
AllianzGI U.S. Managed Volatility | 1,400,074 | 1,597,986 | 687,994 | 193,691 | 2,408,699 | 24,599 | 5,140 | |||||||||||||||||||||
AllianzGI U.S. Small-Cap Growth | 326,438 | 359,387 | 59,778 | 124,661 | 602,340 | — | (1,506 | ) | ||||||||||||||||||||
PIMCO 1-5 Year U.S. TIPS Index | 2,006,566 | 4,058,973 | 2,768,820 | (1,839 | ) | 3,282,079 | 7,355 | (7,306 | ) | |||||||||||||||||||
PIMCO CommoditiesPLUS® Strategy | 1,599,811 | 547,310 | 826,168 | 102,129 | 1,470,233 | 2,450 | 17,750 | |||||||||||||||||||||
PIMCO Commodity RealReturn Strategy | 200,547 | 1,555,249 | 254,016 | (33,989 | ) | 1,470,052 | — | (17,292 | ) | |||||||||||||||||||
PIMCO Floating Income | 2,212,295 | 1,390,794 | 665,210 | 49,295 | 3,004,215 | 68,682 | (13,594 | ) | ||||||||||||||||||||
PIMCO Foreign Bond (U.S. Dollar-Hedged) | 1,006,020 | 829,374 | 365,861 | 52,253 | 1,497,431 | 19,416 | 1,418 | |||||||||||||||||||||
PIMCO Income | 3,220,368 | 2,815,786 | 1,078,675 | 198,821 | 5,104,510 | 122,483 | (8,235 | ) | ||||||||||||||||||||
PIMCO International StocksPLUS® AR Strategy (U.S. Dollar-Hedged) | 1,405,555 | 870,795 | 246,780 | 117,760 | 2,108,702 | 42,043 | (1,654 | ) | ||||||||||||||||||||
PIMCO Mortgage Opportunities | 2,414,740 | 1,569,973 | 2,213,064 | 21,588 | 1,796,938 | 46,957 | (6,631 | ) | ||||||||||||||||||||
PIMCO Real Return | 1,598,057 | 3,559,261 | 3,499,863 | 138,185 | 1,788,672 | 12,463 | 27,654 | |||||||||||||||||||||
PIMCO Senior Floating Rate | — | 3,424,704 | 128,966 | (7,979 | ) | 3,287,048 | 44,135 | (711 | ) | |||||||||||||||||||
PIMCO Short-Term | 2,810,234 | 2,900,197 | 3,027,756 | 9,532 | 2,683,346 | 11,889 | 6,589 | |||||||||||||||||||||
Totals | $ | 36,148,762 | $ | 39,005,066 | $ | 22,690,506 | $ | 3,635,255 | $ | 53,913,509 | $ | 693,123 | $ | 285,005 | ||||||||||||||
| 280 | May 31, 2014 | | Semiannual Report |
Table of Contents
| AllianzGI Retirement 2035: | ||||||||||||||||||||||||||||
| Market Value 11/30/2013 | Purchases at Cost | Proceeds from Sales | Unrealized Appreciation (Depreciation) | Market Value 5/31/2014 | Dividend Income | Net Realized Gain(Loss) | ||||||||||||||||||||||
AllianzGI Behavioral Advantage Large Cap | $ | 1,288,627 | $ | 1,356,062 | $ | 585,712 | $ | 225,251 | $ | 2,104,930 | $ | 12,705 | $ | 12,893 | ||||||||||||||
AllianzGI Best Styles Global Equity | — | 3,585,528 | 48,830 | 238,317 | 3,776,046 | — | 1,031 | |||||||||||||||||||||
AllianzGI Disciplined Equity | 147,300 | — | 145,604 | — | — | — | 37,820 | |||||||||||||||||||||
AllianzGI Emerging Markets Opportunities | 1,132,234 | 389,395 | 969,463 | 48,929 | 502,612 | 23,631 | (48,799 | ) | ||||||||||||||||||||
AllianzGI Global Managed Volatility | 732,104 | 498,625 | 13,511 | 70,793 | 1,244,739 | 31,350 | (1,077 | ) | ||||||||||||||||||||
AllianzGI Global Natural Resources | 587,046 | 523,671 | 443,442 | 142,855 | 750,648 | 5,045 | 20,350 | |||||||||||||||||||||
AllianzGI Income & Growth | 1,388,609 | 849,404 | 266,751 | 99,514 | 1,988,328 | 22,335 | 5,206 | |||||||||||||||||||||
AllianzGI International Managed Volatility | 589,014 | 1,019,561 | 55,518 | 144,673 | 1,662,479 | 21,827 | (1,238 | ) | ||||||||||||||||||||
AllianzGI International Small-Cap | 1,068,568 | 524,742 | 309,725 | 142,054 | 1,232,253 | 8,303 | 7,673 | |||||||||||||||||||||
AllianzGI NFJ Dividend Value | 1,471,493 | 803,997 | 801,727 | 324,069 | 1,597,591 | 19,083 | 57,695 | |||||||||||||||||||||
AllianzGI NFJ Global Dividend Value | 1,183,158 | 836,864 | 60,775 | 240,639 | 2,002,661 | 22,316 | (630 | ) | ||||||||||||||||||||
AllianzGI NFJ International Small-Cap Value | 356,346 | 229,566 | 24,254 | 38,539 | 597,887 | 6,542 | 202 | |||||||||||||||||||||
AllianzGI NFJ International Value | 1,533,641 | 795,123 | 890,109 | 194,189 | 1,500,342 | 10,911 | 11,974 | |||||||||||||||||||||
AllianzGI NFJ Mid-Cap Value | 1,180,593 | 605,969 | 401,026 | 348,227 | 1,497,220 | 16,884 | 17,764 | |||||||||||||||||||||
AllianzGI Short Duration High Income | 1,472,460 | 1,033,046 | 67,330 | 1,767 | 2,438,130 | 52,291 | (821 | ) | ||||||||||||||||||||
AllianzGI U.S. Managed Volatility | 1,115,379 | 1,576,183 | 554,939 | 164,042 | 2,230,638 | 19,801 | 1,551 | |||||||||||||||||||||
AllianzGI U.S. Small-Cap Growth | 359,343 | 380,486 | 83,956 | 88,278 | 630,775 | — | 953 | |||||||||||||||||||||
PIMCO 1-5 Year U.S. TIPS Index | 1,470,225 | 2,772,919 | 2,265,402 | (1,102 | ) | 1,967,213 | 4,408 | (5,959 | ) | |||||||||||||||||||
PIMCO CommoditiesPLUS® Strategy | 1,320,616 | 492,649 | 566,360 | 93,459 | 1,363,759 | 2,043 | 5,676 | |||||||||||||||||||||
PIMCO Commodity RealReturn Strategy | 294,307 | 1,217,566 | 169,989 | (20,511 | ) | 1,332,454 | — | (20,110 | ) | |||||||||||||||||||
PIMCO Floating Income | 1,623,246 | 1,513,840 | 707,523 | 46,394 | 2,481,817 | 52,045 | (13,504 | ) | ||||||||||||||||||||
PIMCO Income | 2,215,217 | 2,124,433 | 968,947 | 107,292 | 3,470,183 | 81,445 | (16,112 | ) | ||||||||||||||||||||
PIMCO International StocksPLUS® AR Strategy (U.S. Dollar-Hedged) | 1,178,659 | 890,227 | 125,434 | 102,901 | 2,018,239 | 35,867 | 169 | |||||||||||||||||||||
PIMCO Mortgage Opportunities | 1,476,133 | 1,548,734 | 1,560,271 | 16,815 | 1,482,944 | 31,086 | (8,634 | ) | ||||||||||||||||||||
PIMCO Real Return | — | 2,399,332 | 1,479,985 | 41,269 | 999,367 | 5,276 | 38,751 | |||||||||||||||||||||
PIMCO Senior Floating Rate | — | 2,513,653 | 69,868 | (3,996 | ) | 2,439,436 | 31,781 | (353 | ) | |||||||||||||||||||
PIMCO Short-Term | 1,325,591 | 1,689,760 | 1,785,906 | 954 | 1,228,443 | 4,410 | 5,940 | |||||||||||||||||||||
Totals | $ | 26,509,909 | $ | 32,171,335 | $ | 15,422,357 | $ | 2,895,611 | $ | 44,541,134 | $ | 521,385 | $ | 108,411 | ||||||||||||||
| AllianzGI Retirement 2040: | ||||||||||||||||||||||||||||
| Market Value 11/30/2013 | Purchases at Cost | Proceeds from Sales | Unrealized Appreciation (Depreciation) | Market Value 5/31/2014 | Dividend Income | Net Realized Gain(Loss) | ||||||||||||||||||||||
AllianzGI Behavioral Advantage Large Cap | $ | 1,215,745 | $ | 1,531,718 | $ | 615,096 | $ | 241,903 | $ | 2,185,287 | $ | 13,473 | $ | 3,061 | ||||||||||||||
AllianzGI Best Styles Global Equity | — | 3,255,328 | 69,214 | 232,923 | 3,419,029 | — | (8 | ) | ||||||||||||||||||||
AllianzGI Disciplined Equity | 404,320 | 78,796 | 478,690 | — | — | — | 182,364 | |||||||||||||||||||||
AllianzGI Emerging Markets Opportunities | 1,172,234 | 393,429 | 882,892 | 145,232 | 636,387 | 26,030 | (38,633 | ) | ||||||||||||||||||||
AllianzGI Global Managed Volatility | 669,848 | 391,536 | 20,890 | 82,254 | 1,060,421 | 30,670 | (1,103 | ) | ||||||||||||||||||||
AllianzGI Global Natural Resources | 537,124 | 488,270 | 458,035 | 160,891 | 642,276 | 4,886 | 24,397 | |||||||||||||||||||||
AllianzGI Income & Growth | 1,486,763 | 471,294 | 75,097 | 191,906 | 1,905,578 | 23,572 | (228 | ) | ||||||||||||||||||||
AllianzGI International Managed Volatility | 808,387 | 992,738 | 415,165 | 157,378 | 1,477,260 | 31,805 | (4,825 | ) | ||||||||||||||||||||
AllianzGI International Small-Cap | 1,140,050 | 622,372 | 291,022 | 226,404 | 1,421,501 | 10,159 | 11,229 | |||||||||||||||||||||
AllianzGI NFJ Dividend Value | 1,481,021 | 872,071 | 1,109,966 | 408,609 | 1,358,471 | 18,758 | 73,961 | |||||||||||||||||||||
AllianzGI NFJ Global Dividend Value | 1,217,841 | 721,061 | 81,178 | 261,688 | 1,894,660 | 23,603 | (574 | ) | ||||||||||||||||||||
AllianzGI NFJ International Small-Cap Value | 407,559 | 437,867 | 43,739 | 56,283 | 855,927 | 7,889 | 836 | |||||||||||||||||||||
AllianzGI NFJ International Value | 1,538,181 | 878,788 | 813,952 | 205,695 | 1,684,657 | 11,659 | 21,979 | |||||||||||||||||||||
AllianzGI NFJ Mid-Cap Value | 889,721 | 1,015,978 | 531,033 | 307,339 | 1,492,226 | 18,719 | 19,445 | |||||||||||||||||||||
| Semiannual Report | | May 31, 2014 | 281 |
Table of Contents
Notes to Financial Statements (cont’d)
May 31, 2014 (Unaudited)
| AllianzGI Retirement 2040 (cont’d) | ||||||||||||||||||||||||||||
| Market Value 11/30/2013 | Purchases at Cost | Proceeds from Sales | Unrealized Appreciation (Depreciation) | Market Value 5/31/2014 | Dividend Income | Net Realized Gain(Loss) | ||||||||||||||||||||||
AllianzGI NFJ Small-Cap Value | $ | 352,490 | — | $ | 346,370 | — | — | — | $ | 150,431 | ||||||||||||||||||
AllianzGI Short Duration High Income | 1,347,229 | $ | 821,262 | 84,597 | $ | 6,123 | $ | 2,083,970 | $ | 47,183 | (717 | ) | ||||||||||||||||
AllianzGI U.S. Managed Volatility | 1,074,220 | 1,429,569 | 469,060 | 202,695 | 2,119,571 | 20,335 | 1,430 | |||||||||||||||||||||
AllianzGI U.S. Small-Cap Growth | 356,150 | 462,367 | 148,020 | 133,385 | 649,318 | — | 2,733 | |||||||||||||||||||||
PIMCO 1-5 Year U.S. TIPS Index | 790,511 | 1,647,314 | 1,174,896 | (706 | ) | 1,259,710 | 2,823 | 1,972 | ||||||||||||||||||||
PIMCO CommoditiesPLUS® Strategy | 1,208,304 | 505,373 | 467,269 | 93,790 | 1,364,704 | 1,976 | 7,909 | |||||||||||||||||||||
PIMCO Commodity RealReturn Strategy | 538,554 | 1,172,960 | 355,476 | 2,805 | 1,360,584 | — | (41,754 | ) | ||||||||||||||||||||
PIMCO Floating Income | 1,350,158 | 1,164,663 | 454,223 | 34,949 | 2,104,283 | 46,005 | (8,239 | ) | ||||||||||||||||||||
PIMCO Income | 1,756,671 | 1,072,147 | 581,641 | 84,181 | 2,311,411 | 54,687 | (11,497 | ) | ||||||||||||||||||||
PIMCO International StocksPLUS® AR Strategy (U.S. Dollar-Hedged) | 1,267,157 | 1,252,432 | 368,119 | 119,386 | 2,230,465 | 41,061 | (5,906 | ) | ||||||||||||||||||||
PIMCO Mortgage Opportunities | 1,367,448 | 1,108,384 | 1,855,731 | 11,579 | 628,425 | 19,552 | (4,845 | ) | ||||||||||||||||||||
PIMCO Real Return | — | 1,278,415 | 1,316,627 | — | — | 2,421 | 38,212 | |||||||||||||||||||||
PIMCO Senior Floating Rate | — | 1,292,239 | 36,635 | (2,351 | ) | 1,253,029 | 17,579 | (224 | ) | |||||||||||||||||||
PIMCO Short-Term | — | 624,912 | — | — | 624,912 | 265 | — | |||||||||||||||||||||
Totals | $ | 24,377,686 | $ | 25,983,283 | $ | 13,544,633 | $ | 3,364,341 | $ | 38,024,062 | $ | 475,110 | $ | 421,406 | ||||||||||||||
| AllianzGI Retirement 2045: | ||||||||||||||||||||||||||||
| Market Value 11/30/2013 | Purchases at Cost | Proceeds from Sales | Unrealized Appreciation (Depreciation) | Market Value 5/31/2014 | Dividend Income | Net Realized Gain(Loss) | ||||||||||||||||||||||
AllianzGI Behavioral Advantage Large Cap | $ | 739,855 | $ | 703,975 | $ | 238,388 | $ | 150,450 | $ | 1,240,344 | $ | 7,381 | $ | (1,042 | ) | |||||||||||||
AllianzGI Best Styles Global Equity | — | 2,239,767 | 26,222 | 149,596 | 2,363,189 | — | 48 | |||||||||||||||||||||
AllianzGI Disciplined Equity | 196,454 | — | 194,192 | — | — | — | 50,441 | |||||||||||||||||||||
AllianzGI Emerging Markets Opportunities | 593,536 | 232,998 | 431,742 | 41,645 | 375,059 | 12,711 | (19,086 | ) | ||||||||||||||||||||
AllianzGI Global Managed Volatility | 390,406 | 336,407 | 4,160 | 54,376 | 742,827 | 17,085 | (332 | ) | ||||||||||||||||||||
AllianzGI Global Natural Resources | 271,611 | 338,978 | 161,181 | 87,697 | 497,951 | 2,406 | 4,298 | |||||||||||||||||||||
AllianzGI Income & Growth | 723,553 | 397,366 | 19,442 | 67,650 | 1,113,627 | 12,616 | (214 | ) | ||||||||||||||||||||
AllianzGI International Managed Volatility | 444,175 | 611,884 | 244,190 | 100,905 | 866,890 | 16,850 | (2,838 | ) | ||||||||||||||||||||
AllianzGI International Small-Cap | 660,718 | 390,517 | 32,827 | 115,400 | 986,205 | 5,805 | 637 | |||||||||||||||||||||
AllianzGI NFJ Dividend Value | 783,861 | 519,529 | 349,387 | 224,810 | 1,032,138 | 11,311 | 16,802 | |||||||||||||||||||||
AllianzGI NFJ Global Dividend Value | 630,515 | 542,213 | 22,414 | 154,617 | 1,181,294 | 12,563 | 137 | |||||||||||||||||||||
AllianzGI NFJ International Small-Cap Value | 198,194 | 277,101 | 10,985 | 32,704 | 495,658 | 3,713 | 43 | |||||||||||||||||||||
AllianzGI NFJ International Value | 785,510 | 521,614 | 143,482 | 157,354 | 1,225,403 | 5,718 | 1,327 | |||||||||||||||||||||
AllianzGI NFJ Mid-Cap Value | 591,983 | 468,896 | 19,893 | 227,838 | 1,112,491 | 8,626 | 49 | |||||||||||||||||||||
AllianzGI Short Duration High Income | 654,841 | 585,531 | 11,966 | 2,401 | 1,228,349 | 25,710 | (123 | ) | ||||||||||||||||||||
AllianzGI U.S. Managed Volatility | 589,065 | 894,965 | 305,095 | 102,602 | 1,232,614 | 10,649 | 803 | |||||||||||||||||||||
AllianzGI U.S. Small-Cap Growth | 199,596 | 303,611 | 36,823 | 57,158 | 451,598 | — | 77 | |||||||||||||||||||||
PIMCO CommoditiesPLUS® Strategy | 612,280 | 386,698 | 240,362 | 55,839 | 827,531 | 969 | 6,204 | |||||||||||||||||||||
PIMCO Commodity RealReturn Strategy | 262,705 | 708,702 | 148,610 | (761 | ) | 823,378 | — | (22,644 | ) | |||||||||||||||||||
PIMCO Floating Income | 656,517 | 669,503 | 238,074 | 28,516 | 1,111,758 | 23,917 | (2,531 | ) | ||||||||||||||||||||
PIMCO Income | 656,430 | 468,226 | 159,139 | 35,473 | 992,078 | 22,697 | (3,365 | ) | ||||||||||||||||||||
PIMCO International StocksPLUS® AR Strategy (U.S. Dollar-Hedged) | 627,849 | 779,789 | 52,721 | 72,454 | 1,411,001 | 20,039 | 75 | |||||||||||||||||||||
PIMCO Mortgage Opportunities | 590,404 | 192,681 | 785,558 | — | — | 6,951 | 896 | |||||||||||||||||||||
PIMCO Senior Floating Rate | — | 495,296 | 2,626 | (1,221 | ) | 491,440 | 6,592 | (9 | ) | |||||||||||||||||||
PIMCO Short-Term | — | 367,085 | — | — | 367,085 | 157 | — | |||||||||||||||||||||
Totals | $ | 11,860,058 | $ | 13,433,332 | $ | 3,879,479 | $ | 1,917,503 | $ | 22,169,908 | $ | 234,466 | $ | 29,653 | ||||||||||||||
| 282 | May 31, 2014 | | Semiannual Report |
Table of Contents
| AllianzGI Retirement 2050: | ||||||||||||||||||||||||||||
| Market Value 11/30/2013 | Purchases at Cost | Proceeds from Sales | Unrealized Appreciation (Depreciation) | Market Value 5/31/2014 | Dividend Income | Net Realized Gain(Loss) | ||||||||||||||||||||||
AllianzGI Behavioral Advantage Large Cap | $ | 741,199 | $ | 547,347 | $ | 195,098 | $ | 144,409 | $ | 1,119,873 | $ | 6,930 | $ | 1,345 | ||||||||||||||
AllianzGI Best Styles Global Equity | — | 1,916,470 | 35,459 | 128,935 | 2,009,676 | — | (270 | ) | ||||||||||||||||||||
AllianzGI Disciplined Equity | 268,357 | — | 265,267 | — | — | — | 126,739 | |||||||||||||||||||||
AllianzGI Emerging Markets Opportunities | 664,343 | 204,899 | 443,074 | 130,169 | 405,291 | 12,960 | (14,153 | ) | ||||||||||||||||||||
AllianzGI Global Managed Volatility | 399,350 | 195,366 | 7,644 | 57,474 | 599,078 | 15,969 | (568 | ) | ||||||||||||||||||||
AllianzGI Global Natural Resources | 293,556 | 290,635 | 185,876 | 109,811 | 439,274 | 2,304 | 6,274 | |||||||||||||||||||||
AllianzGI Income & Growth | 810,190 | 261,284 | 82,299 | 141,944 | 999,787 | 11,814 | 627 | |||||||||||||||||||||
AllianzGI International Managed Volatility | 467,639 | 442,437 | 252,590 | 84,858 | 700,363 | 15,820 | 608 | |||||||||||||||||||||
AllianzGI International Small-Cap | 681,498 | 298,589 | 142,995 | 185,469 | 805,283 | 5,677 | 9,194 | |||||||||||||||||||||
AllianzGI NFJ Dividend Value | 875,740 | 370,273 | 476,001 | 286,827 | 834,341 | 10,221 | 34,609 | |||||||||||||||||||||
AllianzGI NFJ Global Dividend Value | 671,616 | 326,755 | 23,124 | 158,985 | 993,944 | 11,774 | (466 | ) | ||||||||||||||||||||
AllianzGI NFJ International Small-Cap Value | 228,596 | 174,332 | 10,587 | 27,586 | 418,339 | 3,922 | 30 | |||||||||||||||||||||
AllianzGI NFJ International Value | 800,521 | 354,226 | 110,578 | 132,542 | 1,091,466 | 5,266 | 1,402 | |||||||||||||||||||||
AllianzGI NFJ Mid-Cap Value | 293,815 | 663,011 | 24,639 | 146,634 | 998,807 | 8,763 | 7 | |||||||||||||||||||||
AllianzGI NFJ Small-Cap Value | 383,686 | — | 377,024 | — | — | — | 164,018 | |||||||||||||||||||||
AllianzGI Short Duration High Income | 321,682 | 504,925 | 34,307 | 3,186 | 792,012 | 17,490 | (233 | ) | ||||||||||||||||||||
AllianzGI U.S. Managed Volatility | 669,891 | 722,039 | 380,571 | 128,800 | 1,054,069 | 11,010 | 1,633 | |||||||||||||||||||||
AllianzGI U.S. Small-Cap Growth | 249,068 | 247,892 | 80,111 | 107,496 | 401,706 | — | 1,608 | |||||||||||||||||||||
PIMCO CommoditiesPLUS® Strategy | 634,402 | 205,836 | 208,054 | 47,388 | 690,730 | 907 | 3,450 | |||||||||||||||||||||
PIMCO Commodity RealReturn Strategy | 270,807 | 573,907 | 160,549 | (227 | ) | 685,083 | — | (23,616 | ) | |||||||||||||||||||
PIMCO Floating Income | 604,739 | 396,829 | 223,466 | 16,957 | 795,624 | 18,402 | (1,945 | ) | ||||||||||||||||||||
PIMCO Income | 536,357 | 245,353 | 101,970 | 32,932 | 699,395 | 16,739 | (1,457 | ) | ||||||||||||||||||||
PIMCO International StocksPLUS® AR Strategy (U.S. Dollar-Hedged) | 671,855 | 542,438 | 52,878 | 60,165 | 1,203,658 | 18,940 | (357 | ) | ||||||||||||||||||||
PIMCO Mortgage Opportunities | 536,645 | 88,549 | 626,543 | — | — | 4,365 | 448 | |||||||||||||||||||||
PIMCO Short-Term | — | 197,409 | — | — | 197,409 | 83 | — | |||||||||||||||||||||
Totals | $ | 12,075,552 | $ | 9,770,801 | $ | 4,500,704 | $ | 2,132,340 | $ | 17,935,208 | $ | 199,356 | $ | 308,927 | ||||||||||||||
| AllianzGI Retirement 2055: | ||||||||||||||||||||||||||||
| Market Value 11/30/2013 | Purchases at Cost | Proceeds from Sales | Unrealized Appreciation (Depreciation) | Market Value 5/31/2014 | Dividend Income | Net Realized Gain(Loss) | ||||||||||||||||||||||
AllianzGI Behavioral Advantage Large Cap | $ | 282,983 | $ | 166,471 | $ | 76,483 | $ | 49,929 | $ | 380,535 | $ | 2,519 | $ | 2,884 | ||||||||||||||
AllianzGI Best Styles Global Equity | — | 633,557 | 2,303 | 42,624 | 673,872 | — | (6 | ) | ||||||||||||||||||||
AllianzGI Disciplined Equity | 100,885 | — | 99,724 | — | — | — | 25,903 | |||||||||||||||||||||
AllianzGI Emerging Markets Opportunities | 256,180 | 51,814 | 165,989 | 22,857 | 133,807 | 4,680 | (564 | ) | ||||||||||||||||||||
AllianzGI Global Managed Volatility | 150,382 | 51,249 | 3,584 | 22,872 | 200,680 | 5,765 | (247 | ) | ||||||||||||||||||||
AllianzGI Global Natural Resources | 108,828 | 87,606 | 60,882 | 29,876 | 148,291 | 830 | 1,650 | |||||||||||||||||||||
AllianzGI Income & Growth | 303,141 | 65,417 | 36,672 | 32,891 | 334,730 | 4,103 | 559 | |||||||||||||||||||||
AllianzGI International Managed Volatility | 177,042 | 127,556 | 84,316 | 37,142 | 233,469 | 5,716 | 1,902 | |||||||||||||||||||||
AllianzGI International Small-Cap | 255,363 | 100,438 | 62,992 | 54,795 | 281,198 | 2,053 | 5,799 | |||||||||||||||||||||
AllianzGI NFJ Dividend Value | 328,553 | 82,509 | 151,125 | 89,901 | 280,559 | 3,582 | 21,734 | |||||||||||||||||||||
AllianzGI NFJ Global Dividend Value | 251,212 | 93,919 | 18,068 | 70,866 | 332,002 | 4,165 | (61 | ) | ||||||||||||||||||||
AllianzGI NFJ International Small-Cap Value | 85,549 | 48,513 | 330 | 8,839 | 141,970 | 1,416 | 2 | |||||||||||||||||||||
AllianzGI NFJ International Value | 303,979 | 77,156 | 30,738 | 71,609 | 364,263 | 1,901 | 410 | |||||||||||||||||||||
AllianzGI NFJ Mid-Cap Value | 252,539 | 70,495 | 7,338 | 104,106 | 336,106 | 3,164 | 142 | |||||||||||||||||||||
AllianzGI Short Duration High Income | 125,175 | 145,827 | 6,278 | 1,518 | 264,547 | 5,849 | (41 | ) | ||||||||||||||||||||
AllianzGI U.S. Managed Volatility | 250,525 | 207,864 | 116,013 | 37,922 | 354,419 | 3,975 | 686 | |||||||||||||||||||||
| Semiannual Report | | May 31, 2014 | 283 |
Table of Contents
Notes to Financial Statements (cont’d)
May 31, 2014 (Unaudited)
| AllianzGI Retirement 2055 (cont’d) | ||||||||||||||||||||||||||||
| Market Value 11/30/2013 | Purchases at Cost | Proceeds from Sales | Unrealized Appreciation (Depreciation) | Market Value 5/31/2014 | Dividend Income | Net Realized Gain(Loss) | ||||||||||||||||||||||
AllianzGI U.S. Small-Cap Growth | $ | 91,381 | $ | 64,671 | $ | 14,888 | $ | 29,488 | $ | 135,463 | — | $ | 228 | |||||||||||||||
PIMCO CommoditiesPLUS® Strategy | 235,179 | 55,931 | 80,689 | 16,352 | 229,521 | $ | 318 | 1,191 | ||||||||||||||||||||
PIMCO Commodity RealReturn Strategy | 101,072 | 185,378 | 57,743 | (97 | ) | 228,838 | — | (8,858 | ) | |||||||||||||||||||
PIMCO Floating Income | 223,945 | 108,403 | 71,809 | 14,371 | 266,357 | 6,158 | (350 | ) | ||||||||||||||||||||
PIMCO Income | 200,218 | 57,591 | 31,040 | 12,766 | 233,245 | 5,616 | (346 | ) | ||||||||||||||||||||
PIMCO International StocksPLUS® AR Strategy (U.S. Dollar-Hedged) | 250,886 | 151,142 | 9,826 | 19,369 | 405,041 | 6,761 | (30 | ) | ||||||||||||||||||||
PIMCO Mortgage Opportunities | 200,039 | 21,022 | 221,464 | — | — | 1,492 | (160 | ) | ||||||||||||||||||||
PIMCO Short-Term | — | 66,066 | — | — | 66,066 | 27 | — | |||||||||||||||||||||
Totals | $ | 4,535,056 | $ | 2,720,595 | $ | 1,410,294 | $ | 769,996 | $ | 6,024,979 | $ | 70,090 | $ | 52,427 | ||||||||||||||
| AllianzGI Retirement Income: | ||||||||||||||||||||||||||||
| Market Value 11/30/2013 | Purchases at Cost | Proceeds from Sales | Unrealized Appreciation (Depreciation) | Market Value 5/31/2014 | Dividend Income | Net Realized Gain(Loss) | ||||||||||||||||||||||
AllianzGI Behavioral Advantage Large Cap | $ | 227,996 | $ | 585,646 | $ | 293,515 | $ | 54,559 | $ | 543,507 | $ | 2,330 | $ | (1,663 | ) | |||||||||||||
AllianzGI Best Styles Global Equity | — | 1,038,653 | 188,889 | 81,407 | 932,965 | — | 1,794 | |||||||||||||||||||||
AllianzGI Emerging Markets Opportunities | 479,291 | 62,752 | 507,285 | — | — | 8,808 | 9,024 | |||||||||||||||||||||
AllianzGI Global Managed Volatility | 262,909 | 94,188 | 53,849 | 46,949 | 308,569 | 9,870 | 394 | |||||||||||||||||||||
AllianzGI Global Natural Resources | 261,957 | 92,682 | 223,993 | 58,646 | 155,745 | 1,985 | 35,482 | |||||||||||||||||||||
AllianzGI Income & Growth | 1,056,647 | 219,317 | 362,918 | 143,850 | 924,407 | 12,812 | 17,321 | |||||||||||||||||||||
AllianzGI International Managed Volatility | — | 328,653 | 53,580 | 29,694 | 307,581 | — | 2,814 | |||||||||||||||||||||
AllianzGI International Small-Cap | 261,105 | 153,325 | 123,393 | 40,172 | 277,464 | 2,521 | 1,225 | |||||||||||||||||||||
AllianzGI NFJ Dividend Value | 791,049 | 158,438 | 524,821 | 178,369 | 463,381 | 7,906 | 125,060 | |||||||||||||||||||||
AllianzGI NFJ Global Dividend Value | 397,723 | 78,874 | 172,626 | 76,733 | 306,372 | 4,221 | 27,487 | |||||||||||||||||||||
AllianzGI NFJ International Small-Cap Value | 132,242 | 44,921 | 32,065 | 10,805 | 155,716 | 2,146 | 746 | |||||||||||||||||||||
AllianzGI NFJ International Value | 556,351 | 194,780 | 166,597 | 88,865 | 612,904 | 3,466 | 1,827 | |||||||||||||||||||||
AllianzGI NFJ Mid-Cap Value | 99,450 | 451,392 | 122,105 | 57,161 | 465,365 | 5,363 | 3,216 | |||||||||||||||||||||
AllianzGI NFJ Small-Cap Value | 322,438 | — | 316,840 | — | — | — | 100,659 | |||||||||||||||||||||
AllianzGI Short Duration High Income | 790,527 | 1,053,374 | 177,381 | 12,231 | 1,668,056 | 35,515 | (488 | ) | ||||||||||||||||||||
AllianzGI U.S. Managed Volatility | 395,076 | 470,450 | 128,409 | 72,885 | 771,179 | 6,153 | 1,507 | |||||||||||||||||||||
PIMCO 1-5 Year U.S. TIPS Index | 3,298,666 | 2,776,426 | 2,080,083 | 22,480 | 3,998,953 | 8,961 | (10,983 | ) | ||||||||||||||||||||
PIMCO CommoditiesPLUS® Strategy | 525,669 | 77,754 | 188,920 | 29,198 | 451,372 | 718 | (2,855 | ) | ||||||||||||||||||||
PIMCO Commodity RealReturn Strategy | — | 470,017 | 9,368 | (10,535 | ) | 450,017 | — | (96 | ) | |||||||||||||||||||
PIMCO Floating Income | 661,020 | 1,289,754 | 444,164 | 23,969 | 1,530,097 | 25,896 | (6,066 | ) | ||||||||||||||||||||
PIMCO Foreign Bond (U.S. Dollar-Hedged) | 1,452,209 | 549,201 | 1,101,893 | 40,805 | 916,741 | 17,675 | (1,942 | ) | ||||||||||||||||||||
PIMCO Income | 2,642,952 | 1,164,295 | 846,927 | 275,399 | 3,058,764 | 84,431 | 8,072 | |||||||||||||||||||||
PIMCO International StocksPLUS® AR Strategy (U.S. Dollar-Hedged) | 660,803 | 281,256 | 190,435 | 54,264 | 780,110 | 17,227 | (551 | ) | ||||||||||||||||||||
PIMCO Mortgage Opportunities | 1,846,421 | 483,585 | 1,131,792 | 11,514 | 1,218,460 | 35,418 | 1,649 | |||||||||||||||||||||
PIMCO Real Return | 3,274,921 | 2,481,655 | 3,204,020 | 276,045 | 2,692,711 | 20,049 | 13,050 | |||||||||||||||||||||
PIMCO Senior Floating Rate | — | 1,832,732 | 155,334 | (4,625 | ) | 1,671,623 | 24,671 | (1,150 | ) | |||||||||||||||||||
PIMCO Short-Term | 3,426,639 | 1,440,667 | 1,835,366 | 45,852 | 3,032,535 | 15,210 | (299 | ) | ||||||||||||||||||||
Totals | $ | 23,824,061 | $ | 17,874,787 | $ | 14,636,568 | $ | 1,716,692 | $ | 27,694,594 | $ | 353,352 | $ | 325,234 | ||||||||||||||
| 284 | May 31, 2014 | | Semiannual Report |
Table of Contents
| AllianzGI Global Allocation: | ||||||||||||||||||||||||||||
| Market Value 11/30/2013 | Purchases at Cost | Proceeds from Sales | Unrealized Appreciation (Depreciation) | Market Value 5/31/2014 | Dividend Income | Net Realized Gain(Loss) | ||||||||||||||||||||||
AllianzGI Behavioral Advantage Large Cap | $ | 7,449,347 | $ | 2,681,922 | $ | 1,534,225 | $ | 1,318,898 | $ | 8,711,571 | $ | 60,680 | $ | 22,447 | ||||||||||||||
AllianzGI Best Styles Global Equity | — | 8,750,203 | 675,269 | 664,905 | 8,749,900 | — | 10,061 | |||||||||||||||||||||
AllianzGI Emerging Markets Opportunities | 9,669,974 | 938,928 | 5,838,056 | 1,653,296 | 4,477,712 | 164,858 | 736,739 | |||||||||||||||||||||
AllianzGI Global Managed Volatility | 6,378,835 | 559,340 | 393,235 | 1,051,711 | 6,579,207 | 221,906 | 6,843 | |||||||||||||||||||||
AllianzGI Global Natural Resources | 4,203,259 | 320,124 | 498,128 | 1,568,476 | 4,366,184 | 29,618 | 28,645 | |||||||||||||||||||||
AllianzGI Income & Growth | 6,445,359 | 289,514 | 2,369,593 | 1,007,845 | 4,393,737 | 60,273 | 467,368 | |||||||||||||||||||||
AllianzGI International Managed Volatility | 6,440,234 | 2,584,076 | 806,573 | 1,902,170 | 8,680,774 | 192,695 | 31,599 | |||||||||||||||||||||
AllianzGI International Small-Cap | 10,755,532 | 2,595,766 | 4,249,123 | 2,625,331 | 8,574,773 | 76,394 | 269,078 | |||||||||||||||||||||
AllianzGI NFJ Dividend Value | 8,044,540 | 2,614,047 | 659,729 | 2,968,868 | 10,530,574 | 92,809 | 39,689 | |||||||||||||||||||||
AllianzGI NFJ Global Dividend Value | 11,764,227 | 1,295,086 | 1,164,127 | 2,882,709 | 11,957,740 | 171,423 | 34,945 | |||||||||||||||||||||
AllianzGI NFJ International Small-Cap Value | 2,142,374 | 112,171 | 196,272 | 139,387 | 2,186,221 | 32,431 | 3,663 | |||||||||||||||||||||
AllianzGI NFJ International Value | 18,146,083 | 1,115,327 | 6,508,219 | 2,178,369 | 13,043,240 | 86,420 | 376,602 | |||||||||||||||||||||
AllianzGI NFJ Mid-Cap Value | 100 | 8,799,544 | 2,876,713 | 439,859 | 6,406,819 | 98,258 | 44,086 | |||||||||||||||||||||
AllianzGI NFJ Small-Cap Value | 8,629,862 | — | 8,531,466 | — | — | — | 3,975,885 | |||||||||||||||||||||
AllianzGI Short Duration High Income | 7,489,831 | 3,917,750 | 548,036 | 91,698 | 10,855,868 | 226,523 | (557 | ) | ||||||||||||||||||||
AllianzGI U.S. Managed Volatility | 6,608,615 | 2,701,868 | 636,321 | 1,414,518 | 8,977,544 | 95,138 | 10,395 | |||||||||||||||||||||
AllianzGI U.S. Small-Cap Growth | 2,110,027 | 591,966 | 1,462,871 | 501,211 | 1,079,531 | — | 399,677 | |||||||||||||||||||||
PIMCO CommoditiesPLUS® Strategy | 6,409,958 | 692,507 | 1,228,526 | 382,678 | 6,371,914 | 7,924 | (220,759 | ) | ||||||||||||||||||||
PIMCO Floating Income | 10,727,175 | 816,754 | 852,949 | 166,412 | 10,908,606 | 242,822 | (13,196 | ) | ||||||||||||||||||||
PIMCO Foreign Bond (U.S. Dollar-Hedged) | 6,417,119 | 794,712 | 4,025,560 | 476,350 | 3,259,644 | 73,609 | 266,845 | |||||||||||||||||||||
PIMCO Income | 21,427,275 | 2,169,022 | 6,770,369 | 2,049,647 | 17,342,995 | 465,000 | 153,081 | |||||||||||||||||||||
PIMCO International StocksPLUS® AR Strategy (U.S. Dollar-Hedged) | 10,746,258 | 1,175,851 | 1,214,928 | 864,204 | 10,979,000 | 255,119 | 18,709 | |||||||||||||||||||||
PIMCO Mortgage Opportunities | 10,720,198 | 1,178,036 | 5,439,854 | 64,243 | 6,555,347 | 165,424 | (4,126 | ) | ||||||||||||||||||||
PIMCO Senior Floating Rate | — | 7,891,098 | 256,656 | (29,623 | ) | 7,603,497 | 96,326 | (1,322 | ) | |||||||||||||||||||
PIMCO Short-Term | 14,906,740 | 2,142,214 | 1,780,386 | 184,281 | 15,284,875 | 75,860 | 1,063 | |||||||||||||||||||||
Totals | $ | 197,632,922 | $ | 56,727,826 | $ | 60,517,184 | $ | 26,567,443 | $ | 197,877,273 | $ | 2,991,510 | $ | 6,657,460 | ||||||||||||||
| AllianzGI Global Growth Allocation: | ||||||||||||||||||||||||||||
| Market Value 11/30/2013 | Purchases at Cost | Proceeds from Sales | Unrealized Appreciation (Depreciation) | Market Value 5/31/2014 | Dividend Income | Net Realized Gain(Loss) | ||||||||||||||||||||||
AllianzGI Behavioral Advantage Large Cap | $ | 435,813 | $ | 76,480 | $ | 193,215 | $ | 61,591 | $ | 319,931 | $ | 3,436 | $ | 16,848 | ||||||||||||||
AllianzGI Best Styles Global Equity | — | 543,424 | 47,509 | 32,523 | 529,097 | — | 659 | |||||||||||||||||||||
AllianzGI Emerging Markets Opportunities | 336,314 | 33,664 | 209,775 | 67,179 | 152,086 | 5,650 | 59,531 | |||||||||||||||||||||
AllianzGI Global Managed Volatility | 264,473 | 29,484 | 30,274 | 42,475 | 265,004 | 9,119 | 746 | |||||||||||||||||||||
AllianzGI Global Natural Resources | 198,196 | 11,779 | 26,743 | 84,457 | 198,912 | 1,374 | 4,473 | |||||||||||||||||||||
AllianzGI Income & Growth | 167,161 | 15,529 | 19,027 | 44,238 | 165,252 | 2,337 | 849 | |||||||||||||||||||||
AllianzGI International Managed Volatility | 267,100 | 22,694 | 36,548 | 44,477 | 264,272 | 7,942 | 1,051 | |||||||||||||||||||||
AllianzGI International Small-Cap | 270,124 | 77,461 | 78,772 | 132,999 | 252,547 | 2,326 | 6,086 | |||||||||||||||||||||
AllianzGI NFJ Dividend Value | 134,361 | 6,802 | 16,930 | 67,190 | 132,327 | 1,527 | 4,975 | |||||||||||||||||||||
AllianzGI NFJ Emerging Markets Value | 270,162 | 17,750 | 217,221 | 5,689 | 66,046 | 3,880 | (9,032 | ) | ||||||||||||||||||||
AllianzGI NFJ Global Dividend Value | 267,056 | 28,706 | 33,875 | 65,912 | 263,152 | 3,837 | 1,454 | |||||||||||||||||||||
AllianzGI NFJ International Small-Cap Value | 267,351 | 20,496 | 38,985 | 42,423 | 264,448 | 3,967 | 2,479 | |||||||||||||||||||||
AllianzGI NFJ International Value | 403,684 | 37,961 | 59,034 | 83,133 | 395,421 | 2,286 | 2,405 | |||||||||||||||||||||
AllianzGI NFJ Large Cap Value | 134,688 | 2,227 | 138,301 | — | — | 749 | 8,185 | |||||||||||||||||||||
AllianzGI NFJ Mid-Cap Value | 1,926 | 319,261 | 44,173 | 20,783 | 298,480 | 3,530 | 1,001 | |||||||||||||||||||||
AllianzGI NFJ Small-Cap Value | 540,579 | — | 534,415 | — | — | — | 236,341 | |||||||||||||||||||||
| Semiannual Report | | May 31, 2014 | 285 |
Table of Contents
Notes to Financial Statements (cont’d)
May 31, 2014 (Unaudited)
| AllianzGI Global Growth Allocation (cont’d) | ||||||||||||||||||||||||||||
| Market Value 11/30/2013 | Purchases at Cost | Proceeds from Sales | Unrealized Appreciation (Depreciation) | Market Value 5/31/2014 | Dividend Income | Net Realized Gain(Loss) | ||||||||||||||||||||||
AllianzGI Short Duration High Income | $ | 198,922 | $ | 23,036 | $ | 24,155 | $ | 3,223 | $ | 197,793 | $ | 4,939 | $ | 11 | ||||||||||||||
AllianzGI U.S. Managed Volatility | 399,184 | 39,632 | 50,304 | 83,693 | 397,954 | 5,684 | 1,161 | |||||||||||||||||||||
AllianzGI Ultra Micro Cap | 240,816 | 106,196 | 112,991 | 24,102 | 231,761 | — | 4,809 | |||||||||||||||||||||
PIMCO CommoditiesPLUS® Strategy | 199,450 | 14,952 | 33,867 | 16,739 | 195,938 | 248 | 474 | |||||||||||||||||||||
PIMCO Commodity RealReturn Strategy | 66,612 | 6,418 | 12,404 | 3,564 | 65,222 | — | (14 | ) | ||||||||||||||||||||
PIMCO Income | 186,227 | 67,360 | 28,307 | 25,060 | 231,908 | 5,690 | 638 | |||||||||||||||||||||
PIMCO International StocksPLUS® AR Strategy (U.S. Dollar-Hedged) | 399,319 | 44,474 | 57,366 | 36,339 | 396,033 | 9,467 | 1,172 | |||||||||||||||||||||
PIMCO Mortgage Opportunities | 132,607 | 15,089 | 17,242 | 1,293 | 132,009 | 2,647 | (36 | ) | ||||||||||||||||||||
PIMCO Short-Term | 204,666 | 338,921 | 50,366 | 2,133 | 494,253 | 2,044 | (27 | ) | ||||||||||||||||||||
Totals | $ | 5,986,791 | $ | 1,899,796 | $ | 2,111,799 | $ | 991,215 | $ | 5,909,846 | $ | 82,679 | $ | 346,239 | ||||||||||||||
| AllianzGI Multi-Asset Real Return: | ||||||||||||||||||||||||||||
| Market Value 11/30/2013 | Purchases at Cost | Proceeds from Sales | Unrealized Appreciation (Depreciation) | Market Value 5/31/2014 | Dividend Income | Net Realized Gain(Loss) | ||||||||||||||||||||||
AllianzGI Global Natural Resources | $ | 1,579,890 | $ | 10,980 | $ | 20,000 | $ | 307,708 | $ | 1,698,193 | $ | 10,980 | $ | 440 | ||||||||||||||
PIMCO Commodity RealReturn Strategy | 1,113,208 | 448,182 | — | 79,555 | 1,655,659 | — | — | |||||||||||||||||||||
Totals | $ | 2,693,098 | $ | 459,162 | $ | 20,000 | $ | 387,263 | $ | 3,353,852 | $ | 10,980 | $ | 440 | ||||||||||||||
| 12. | FUND EVENTS |
(a) New Funds
On December 2, 2013, AllianzGI Best Styles Global Equity Fund commenced operations as a series of the Trust, offering Class R6 shares.
(b) Fund Closing
Effective January 16, 2014, shares of AllianzGI Convertible and shares of AllianzGI Ultra Micro Cap are no longer available for purchase by any new investor, and shareholders of other series of the Trust or series of Allianz Funds are no longer permitted to exchange any of their shares for shares of AllianzGI Convertible or AllianzGI Ultra Micro Cap, with certain exceptions.
(c) Name Changes
Effective April 1, 2014, AllianzGI U.S. Emerging Growth Fund changed its name to AllianzGI U.S. Small-Cap Growth Fund. In connection with this change, changes to the Fund’s investment policies also took effect. Effective April 1, 2014, the Fund seeks to achieve its investment objective by normally investing at least 80% of its net assets (plus borrowings made for investment purposes) in equity securities of U.S. companies with smaller market capitalizations.
(d) Policy Change
Effective April 1, 2014, the investment policy for AllianzGI International Value II was revised and is now as follows: The Fund seeks to achieve
its investment objective by normally investing at least 80% of its net assets (plus borrowings made for investment purposes) in non-U.S. equity securities with market capitalizations greater than $1 billion.
(e) Liquidations
On May 16, 2014, AllianzGI Disciplined Equity Fund and AllianzGI Dynamic Emerging Multi-Asset Fund liquidated as series of the Trust.
On May 21, 2014, AllianzGI International Small-Cap Fund liquidated its Administrative Class shares.
On May 29, 2014, AllianzGI Redwood Fund liquidated as a series of the Trust.
13. PAYMENTS FROM AFFILIATES
During the six months ended May 31, 2014, AllianzGI U.S. reimbursed AllianzGI Convertible, AllianzGI High Yield and AllianzGI U.S. Equity Hedged $475,282, $174,513 and $317, respectively for realized losses resulting from trading errors.
14. SUBSEQUENT EVENTS
In preparing these financial statements, the Funds’ management has evaluated events and transactions for potential recognition or disclosure through the date the financial statements were issued.
| 286 | May 31, 2014 | | Semiannual Report |
Table of Contents
On June 19, 2014, the following Funds declared per-share net investment income dividends to shareholders, payable June 19, 2014 to shareholders of record on June 18, 2014:
| Fund Name | Class A | Class B | Class C | Class D | Class R | Class P | Class R6 | Institutional Class | Administrative Class | |||||||||||||||||||||||||||
AllianzGI Retirement Income | $ | 0.11526 | NA | $ | 0.08250 | $ | 0.11211 | $ | 0.09977 | $ | 0.13150 | $ | 0.13569 | NA | $ | 0.11913 | ||||||||||||||||||||
AllianzGI Global Allocation | 0.04464 | $ | 0.02067 | 0.02169 | 0.04498 | 0.04009 | 0.05171 | NA | $ | 0.05211 | 0.04630 | |||||||||||||||||||||||||
AllianzGI Convertible | 0.12185 | NA | 0.04811 | 0.10655 | 0.09430 | 0.13516 | NA | 0.14380 | 0.06582 | |||||||||||||||||||||||||||
AllianzGI High Yield Bond | 0.05734 | NA | 0.05059 | 0.05566 | 0.05104 | 0.05969 | NA | 0.06000 | 0.05653 | |||||||||||||||||||||||||||
AllianzGI NFJ Emerging Markets Value | 0.08816 | NA | 0.02942 | 0.05979 | NA | 0.06430 | NA | 0.06594 | NA | |||||||||||||||||||||||||||
AllianzGI NFJ Global Dividend Value | 0.27479 | NA | 0.23498 | 0.26843 | NA | 0.28221 | NA | 0.29183 | NA | |||||||||||||||||||||||||||
AllianzGI NFJ International Value II | 0.12164 | NA | 0.09297 | 0.13018 | NA | 0.16335 | NA | 0.16426 | NA | |||||||||||||||||||||||||||
AllianzGI Short Duration High Income | 0.06000 | NA | 0.05664 | 0.05992 | NA | 0.06351 | NA | 0.06378 | NA | |||||||||||||||||||||||||||
Effective July 1, 2014, AllianzGI Structured Alpha Fund changed its name to AllianzGI Structured Return Fund. In connection with this change, effective July 1, 2014, the Fund’s investment objective, principal investment strategies, management fee and operating expenses were revised as follows: The Fund seeks long-term capital appreciation. In pursuing its investment objective of long-term capital appreciation, the Fund combines long equity exposure with an in the-money short call overlay strategy. The management fee is now 0.60% and the expense limits are now 1.15% for Class A shares, 1.90% for Class C shares, 1.15% for Class D shares, 1.00% for Class P shares and 0.90% for Institutional Class shares.
On July 17, 2014, the following Funds declared per-share net investment income dividends to shareholders, payable July 17, 2014, to shareholders of record on July 16, 2014:
| Fund Name | Class A | Class C | Class D | Class R | Class P | Institutional Class | Administrative Class | |||||||||||||||||||||
AllianzGI High Yield Bond | $ | 0.05615 | $ | 0.05046 | $ | 0.05484 | $ | 0.05080 | $ | 0.05961 | $ | 0.06000 | $ | 0.05633 | ||||||||||||||
AllianzGI Short Duration High Income | 0.06000 | 0.05785 | 0.06104 | NA | 0.06474 | 0.06499 | NA | |||||||||||||||||||||
It is expected that on or around September 2, 2014 that AllianzGI Emerging Markets Debt Fund will commence operations as a series of the Trust, offering Class A, Class C, Class P and Institutional Class shares. The Fund will seek long-term capital appreciation and current income. The Fund will seek to achieve its investment objective by normally investing at least 80% of its net assets (plus borrowings made for investment purposes) in a diversified portfolio of debt instruments issued by Sovereign, Quasi-Sovereign or Corporate issuers of emerging market countries. The Fund’s investments in derivatives and other synthetic instruments that have economic characteristics similar to these investments will be counted toward satisfaction of the Fund’s 80% investment policy. The instruments in which the Fund may invest may be denominated in non-U.S. currencies and the U.S. dollar.
There were no other subsequent events identified that require recognition or disclosure.
| Semiannual Report | | May 31, 2014 | 287 |
Table of Contents
Unaudited
Matters Relating to the Trustees’ Consideration of the Investment Management and Sub-Advisory Agreements
The Investment Company Act of 1940, as amended (the “1940 Act”), requires that both the full Board of Trustees (the “Trustees”) and a majority of the Trustees who are not interested persons of the Trust (the “Independent Trustees”), voting separately, annually approve the continuation of (i) the Trust’s Amended and Restated Investment Management Agreement (the “Investment Management Agreement”) on behalf of each Renewal Fund (as defined below) with Allianz Global Investors Fund Management LLC (the “Investment Manager”), and (ii) the Sub-Advisory Agreements between the Investment Manager and the applicable sub-adviser for each Renewal Fund. The Investment Management Agreement and the Sub-Advisory Agreements are collectively referred to herein as the “Agreements.” The sub-advisers for the Renewal Funds include Allianz Global Investors U.S. LLC (“AllianzGI U.S.”), Fuller & Thaler Asset Management, Inc. (“F&T”) and NFJ Investment Group LLC (“NFJ”) (collectively, the “Sub-Advisers”).
The 1940 Act also requires that the Trustees and the Independent Trustees initially approve any new investment management or subadvisory agreement for a Fund (as defined below). New agreements approved for Funds covered by this report relate to the organization of AllianzGI Best Styles Global Equity Fund (the “Best Styles Global Equity Fund” or the “New Fund”). At an in-person meeting held on September 18, 2013, the Board and the Independent Trustees unanimously approved, for an initial two-year term, (i) the Investment Management Agreement on behalf of the Best Styles Global Equity Fund, a new series of the Trust, and the Sub-Advisory Agreement between the Investment Manager and AllianzGI U.S. for the Best Styles Global Equity Fund. The Best Styles Global Equity Fund commenced operations on December 2, 2013.
With respect to the Renewal Funds, the Independent Trustees had a pre-meeting on February 24, 2014 with independent counsel to discuss the materials provided by the Investment Manager in response to the Independent Trustees’ written request for information regarding the annual renewals. Representatives from Fund management attended portions of that meeting to, among other topics, review the comparative fee and expense information and comparative performance information prepared and provided by Lipper, Inc. (“Lipper”) for each Renewal Fund and its Lipper peer group.
At an in-person meeting held on March 10, 2014, the Board and the Independent Trustees unanimously approved the continuation of the Agreements for an additional one-year period from April 1, 2014 through March 31, 2015 with respect to AllianzGI Retirement 2015 Fund (the “2015 Fund”), AllianzGI Retirement 2020 Fund (the “2020 Fund”), AllianzGI Retirement 2025 Fund (the “2025 Fund”), AllianzGI Retirement 2030 Fund (the “2030 Fund”), AllianzGI Retirement 2035 Fund (the “2035 Fund”), AllianzGI Retirement 2040 Fund (the “2040 Fund”), AllianzGI Retirement 2045 Fund (the “2045 Fund”), AllianzGI Retirement 2050 Fund (the “2050 Fund”), AllianzGI Retirement 2055 Fund (the “2055 Fund”), AllianzGI Retirement Income Fund (the
“Retirement Income Fund” and, together with the 2015 Fund, the 2020 Fund, the 2025 Fund, the 2030 Fund, the 2035 Fund, the 2040 Fund, the 2045 Fund, the 2050 Fund and the 2055 Fund, the “Retirement Funds”), AllianzGI Global Allocation Fund (the “Global Allocation Fund”), AllianzGI Global Growth Allocation Fund (the “Global Growth Allocation Fund” and, together with the Global Allocation Fund, the “Allocation Funds”), AllianzGI China Equity Fund (the “China Equity Fund”), AllianzGI Convertible Fund (the “Convertible Fund”), AllianzGI Disciplined Equity Fund (the “Disciplined Equity Fund”)1, AllianzGI Dynamic Emerging Multi-Asset Fund (the “Dynamic Emerging Multi-Asset Fund”)1, AllianzGI Global Managed Volatility Fund (the “Global Managed Volatility Fund”), AllianzGI Global Water Fund (the “Global Water Fund”), AllianzGI High Yield Bond Fund (the “High Yield Bond Fund”), AllianzGI International Small-Cap Fund (the “International Small-Cap Fund”), AllianzGI Micro Cap Fund (the “Micro Cap Fund”), AllianzGI Multi-Asset Real Return Fund (the “Multi-Asset Real Return Fund”), AllianzGI Redwood Fund (the “Redwood Fund”)2, AllianzGI Short Duration High Income Fund (the “Short Duration High Income Fund”), AllianzGI Structured Return Fund (the “Structured Return Fund”)3, AllianzGI Ultra Micro Cap Fund (the “Ultra Micro Cap Fund”), AllianzGI U.S. Emerging Growth Fund (the “U.S. Emerging Growth Fund”), AllianzGI U.S. Equity Hedged Fund (the “U.S. Equity Hedged Fund”, and, together with the China Equity Fund, the Convertible Fund, the Disciplined Equity Fund, the Dynamic Emerging Multi-Asset Fund, the Global Managed Volatility Fund, the Global Water Fund, the High Yield Bond Fund, the International Small-Cap Fund, the Micro Cap Fund, the Multi-Asset Real Return Fund, the Redwood Fund, the Short Duration High Income Fund, the Structured Return Fund, the Ultra Micro Cap Fund and the U.S. Emerging Growth Fund, the “AllianzGI Funds”), AllianzGI NFJ Emerging Markets Value Fund (the “NFJ Emerging Markets Value Fund”), AllianzGI NFJ Global Dividend Value Fund (the “NFJ Global Dividend Value Fund”), AllianzGI NFJ International Small-Cap Value Fund (the “NFJ International Small-Cap Value Fund”), AllianzGI NFJ International Value II Fund (the “NFJ International Value II Fund” and, together with the NFJ Emerging Markets Value Fund, the NFJ Global Dividend Fund and the NFJ International Small-Cap Value Fund, the “NFJ Funds”), and AllianzGI Behavioral Advantage Large Cap Fund (the “F&T Fund” and, together with the Retirement Funds, the Allocation Funds, the AllianzGI Funds and the NFJ Funds, the “Renewal Funds” and, together with the New Fund, the “Funds”).
The material factors and conclusions that formed the basis of these approvals for the Funds are discussed below.
The Independent Trustees were assisted in their evaluation of the Agreements and the factors that they deemed to be material, including those factors described below, by independent legal counsel, from whom they received separate legal advice and with whom they met separately from Fund management during their contract review meetings.
| 1 | Each of the Disciplined Equity Fund and Dynamic Emerging Multi-Asset Fund liquidated on May 16, 2014. |
| 2 | The Redwood Fund liquidated on May 29, 2014. |
| 3 | Effective July 1, 2014, the Fund changed its name from “AllianzGI Structured Alpha Fund” to “AllianzGI Structured Return Fund”. |
| 288 | May 31, 2014 | | Semiannual Report |
Table of Contents
In connection with their deliberations regarding the approval of the Agreements, the Trustees, including the Independent Trustees, considered such information and factors as they believed, in light of the legal advice furnished to them and their own business judgment, to be relevant. As described below, the Trustees considered the nature, extent and quality of the various investment management, administrative and other services to be performed by the Investment Manager and the Sub-Advisers under the Agreements.
In connection with their contract review meetings, the Trustees received and relied upon materials provided by the Investment Manager including, among other items: (i) information provided by Lipper, an independent third party, for the Renewal Funds on the investment performance of a group of funds with investment classifications and/or objectives comparable to those of the Renewal Funds identified by Lipper (the “Lipper performance universe”), the performance of applicable benchmark indices and the total return investment performance (based on net assets) of the Renewal Funds for various time periods; (ii) information compiled from Morningstar Direct (“Morningstar”), an independent third party, for the New Fund on the investment performance for various time periods, including annualized return performance information for certain time periods, of a group of funds with investment classifications and/or objectives comparable to those proposed for the New Fund; (iii) information on the New Fund’s management fees and other anticipated expenses and on the Renewal Funds’ management fees and other expenses and information compiled from Morningstar or provided by Lipper, as applicable, on the management fees and other expenses of comparable funds identified by Morningstar or Lipper, as applicable; (iv) to the extent applicable, information regarding the investment performance and fees for other funds and accounts managed by the Investment Manager and the Sub-Advisers, including institutional and separate accounts, with similar investment objective(s) and policies to those of the Renewal Funds; (v) with respect to the New Fund, information regarding the fees of other accounts managed by the Investment Manager, AllianzGI U.S. or an affiliate with similar investment objective(s) and policies to those of the New Fund; (vi) an estimate of the profitability to the Investment Manager from its relationship with the New Fund during its first year and the estimated profitability to the Investment Manager from its relationship with the Renewal Funds for the twelve months ended December 31, 2013; (vii) descriptions of various functions performed or to be performed by the Investment Manager and the Sub-Advisers for the Funds, such as portfolio management, compliance monitoring and portfolio trading practices; and (viii) information regarding the overall organization of the Investment Manager and the Sub-Advisers, including information regarding senior management, portfolio managers and other personnel providing or proposed to provide investment management, administrative and other services to the Funds.
The Trustees’ conclusions as to the approval of the Agreements were based on a comprehensive consideration of all information provided to the Trustees and not the result of any single factor. Some of the
factors that figured particularly in the Trustees’ deliberations are described below, although individual Trustees may have evaluated the information presented differently from one another, giving different weights to various factors. The Trustees recognized that the fee arrangements for the Renewal Funds are the result of years of review and discussion between the Independent Trustees and the Investment Manager, that certain aspects of such arrangements may receive greater scrutiny in some years than in others, and that the Trustees’ conclusions may be based, in part, on their consideration of these same arrangements during the course of the year and in prior years. The Trustees evaluated information available to them on a Fund-by-Fund basis, and their determinations were made separately in respect of each Fund. However, they also took into account the common interests of all series of the Trust in their review. The Trustees also took into account that the Investment Manager had proposed the continuation of certain advisory fee waivers and expense caps for the Renewal Funds, with certain modifications for certain Renewal Funds and individual share classes, and had proposed to observe certain management fee waivers and/or expense limitations for the New Fund. The Trustees also considered the risk profiles of the Funds.
Performance Information
Fund-specific performance results for the Renewal Funds reviewed by the Trustees are discussed below. The comparative performance information was prepared and provided by Lipper and was not independently verified by the Trustees. Due to the passage of time, these performance results may differ from the performance results for more recent periods, including those shown elsewhere in this report. With respect to all Renewal Funds, the Trustees reviewed, among other information, comparative information showing performance for Class A and Institutional Class (or, in the case of the Retirement Funds, Class R6) shares of the Renewal Funds against their respective Lipper performance universes for the one-year, three-year, five-year and ten-year periods (to the extent each such Renewal Fund had been in existence) ended November 30, 2013. For Renewal Funds that commenced operations during the Trust’s fiscal year ended November 30, 2013, the Trustees reviewed comparative information showing performance for Class A and Institutional Class shares of the Renewal Funds against their respective Lipper performance universes for the period from the Renewal Fund’s inception through November 30, 2013. Institutional Class performance (or, in the case of the Retirement Funds, Class R6 performance) relative to the median for each Renewal Fund’s Lipper performance universe is described below, and for those Renewal Funds with performance that ranked below the median for their respective Lipper performance universes, the specific quintile rankings for Institutional Class shares are also noted below with respect to the relevant periods of underperformance.
Retirement Funds and Allocation Funds. For the 2015 Fund, performance was below median (in the fifth quintile) for the one-year and three-year periods. For the 2020 Fund, performance was below median (in the fifth quintile) for the one-year and three-year periods. For the 2025 Fund, performance was below median (in the fifth
| Semiannual Report | | May 31, 2014 | 289 |
Table of Contents
Unaudited
Matters Relating to the Trustees’ Consideration of the Investment Management and Sub-Advisory Agreements (cont’d)
quintile) for the one-year period. For the 2030 Fund, performance was below median (in the fifth quintile) for the one-year and three-year periods. For the 2035 Fund, performance was below median (in the fifth quintile) for the one-year period. For the 2040 Fund, performance was below median (in the fifth quintile) for the one-year and three-year periods. For the 2045 Fund, performance was below median (in the fifth quintile) for the one-year period. For the 2050 Fund, performance was below median (in the fifth quintile) for the one-year and three-year periods. For the 2055 Fund, performance was below median (in the fifth quintile) for the one-year period. For the Retirement Income Fund, performance was below median for the one-year and three-year periods (in the fourth quintile and third quintile, respectively). For the Global Growth Allocation Fund, performance was above median for the one-year and three-year periods. For the Global Allocation Fund, performance was below median (in the fourth quintile) for the one-year and three-year periods and above median for the five-year and ten-year periods.
AllianzGI Funds. For the Convertible Fund, performance was above median for the one-year, three-year, five-year and ten-year periods. For the High Yield Bond Fund, performance was above median for the one-year, three-year, five-year and ten-year periods. For the Dynamic Emerging Multi-Asset Fund, performance was below median (in the fifth quintile) for the period since the Fund’s inception. For the Global Managed Volatility Fund, performance was below median (in the fifth quintile) for the one-year period. For the Micro Cap Fund, performance was above median for the one-year, three-year and five-year periods and at median (in the third quintile) for the ten-year period. For the Multi-Asset Real Return Fund, performance was below median (in the fourth quintile) in the period since the Fund’s inception. For the Structured Return Fund, performance was above median for the period since the Fund’s inception. For the Ultra Micro Cap Fund, performance was above median for the one-year, three-year and five-year periods. For the U.S. Emerging Growth Fund, performance was above median for the one-year, three-year, five-year and ten-year periods. For the U.S. Equity Hedged Fund, performance was above median for the period since the Fund’s inception. For the China Equity Fund, performance was below median (in the fourth quintile) for the one-year and three-year periods. For the Disciplined Equity Fund, performance was below median (in the fifth quintile) for the one-year and three-year periods and above median for the five-year period. For the Global Water Fund, performance was above median for the one-year, three-year and five-year periods. For the International Small-Cap Fund, performance was above median for the one-year, three-year, five-year and ten-year periods. For the Redwood Fund, performance was above median for the one-year period. For the Short Duration High Income Fund, performance was below median (in the fifth quintile) for the one-year period.
NFJ Funds. For the NFJ Emerging Markets Value Fund, performance was above median for the period since the Fund’s inception. For the NFJ Global Dividend Value Fund, performance was above median for the one-year period and below median (in the third quintile) for the
three-year period. For the NFJ International Small-Cap Value Fund, performance was above median for the one-year period. For the NFJ International Value II Fund, performance was below median (in the fifth quintile) for the one-year period.
F&T Fund. For the F&T Fund, performance was above median for the one-year period.
In addition, the Trustees considered matters bearing on the Renewal Funds and their advisory arrangements at their meetings throughout the year, including a review of performance data at each regular meeting.
As part of their review, the Trustees examined the ability of the Investment Manager and the Sub-Advisers to provide high-quality investment management and other services to the Funds. Among other information, the Trustees considered the investment philosophy and research and decision making processes of the Sub-Advisers; the experience of key advisory personnel of the Sub-Advisers or their affiliates, as applicable, responsible for portfolio management of the Funds; the ability of the Investment Manager and the Sub-Advisers to attract and retain capable personnel; and the capability of the senior management and staff of the Investment Manager and the Sub-Advisers. In addition, the Trustees reviewed the quality of the Investment Manager’s and the Sub-Advisers’ services or expected services with respect to regulatory compliance and ability to comply with the investment and compliance policies and procedures of the Funds; the nature, extent and quality of certain administrative services the Investment Manager is responsible for providing to the Renewal Funds and would be responsible for providing to the New Fund; and conditions that might affect the ability of the Investment Manager or the Sub-Advisers to provide high quality services to the Funds in the future under the Agreements, including each organization’s respective financial condition and operational stability. Based on the foregoing, the Trustees concluded that the Sub-Advisers’ investment process, research capabilities and philosophy were well-suited to each Fund given its investment objectives and policies, and that the Investment Manager and the Sub-Advisers would be able to meet and/or continue to meet any reasonably foreseeable obligations under each Agreement.
Fee and Expense Information
In assessing the reasonableness of the Renewal Funds’ fees and expenses under the Agreements, the Trustees considered, among other information, each Renewal Fund’s management fee (or, in the case of the Retirement Funds, each Retirement Fund’s advisory fee) and the Renewal Fund’s total expense ratio as a percentage of average daily net assets and the management fees and total expense ratios of peer groups of funds based on information provided by Lipper. The Trustees also noted the management fee waiver and/or expense limitation agreements observed by the Investment Manager for the Renewal Funds that cap fees or expenses of their various share classes.
In assessing the reasonableness of the New Fund’s proposed fees under the Agreements, the Trustees considered, among other information, the New Fund’s proposed management fee and its
| 290 | May 31, 2014 | | Semiannual Report |
Table of Contents
expected net expense ratio as a percentage of anticipated average daily net assets, taking into account the management fee waiver and/or expense limitation arrangements that the Investment Manager would observe, and the advisory fees and net expense ratios of a peer group of funds based on information compiled from Morningstar.
The Trustees considered how the net expense ratio of the New Fund was expected to compare to its Morningstar peers, and considered comparisons of the New Fund’s proposed management fee with the advisory fees of the peer funds. The Trustees took into account that a comparison of the New Fund’s proposed management fee to the advisory fee of peer funds is complicated because the New Fund’s proposed management fee includes a component for administrative services while many peer funds have separate advisory and administration agreements with separate fees. The Trustees therefore placed significant emphasis on the estimated net expense ratio of the New Fund compared to the net expense ratios of the Morningstar peer funds, recognizing that the fees for investment advisory, administrative services and fund operating expenses would be subsumed within the net expense ratio of all funds.
In comparing the Renewal Funds to their respective Lipper peers, with respect to expenses, the Trustees noted that the Renewal Funds (other than the Retirement Funds) were not charged a separate administration fee, recognizing that their management fee includes a component for administrative services, while many peer funds in the Lipper categories have separate advisory and administration agreements with separate fees. The Trustees also took into account the “unitary” administrative fee structure applicable to the Retirement Funds, under which certain third-party services that are ordinarily the financial responsibility of a mutual fund (e.g., audit, custody, accounting, legal, transfer agency, and printing services) are, in the case of the Retirement Funds, paid for by the Investment Manager out of the administrative fee.
The Trustees also considered information showing the advisory fees charged by the Investment Manager and Sub-Advisers to other funds and accounts, including institutional and separate accounts, with similar investment objective(s) and policies to those of the Renewal Funds, if any. In comparing these fees, the Trustees considered information provided by the Investment Manager as to the generally broader and more extensive services provided to the Renewal Funds in comparison to institutional or separate accounts, the higher demands placed on the Investment Manager’s investment personnel and trading infrastructure as a result of the daily cash in-flows and out-flows of the Renewal Funds, the greater entrepreneurial risk in managing retail mutual funds, and the impact on the Investment Manager and expenses associated with the more extensive regulatory regime to which the Renewal Funds are subject in comparison to institutional or separate accounts.
With respect to the New Fund, the Trustees also considered the management fees charged by the Investment Manager, AllianzGI U.S. or an affiliate to other funds and accounts with similar investment strategies to the New Fund.
The Trustees reviewed information provided by Lipper comparing each Renewal Fund’s advisory fee or management fee, as applicable, and ratios of total expenses to net assets (“total expense ratios”) for two share classes (Class A and Institutional Class share classes (or, in the case of the Retirement Funds, Class R6)) to those of a group of comparable funds for the fiscal year ended November 30, 2013. Class A shares of the applicable Lipper-selected group of comparable funds are referred to below as the “retail expense group,” and Institutional Class or Class R6 shares, as applicable, are referred to as the “institutional expense group.” The Trustees noted that the Lipper data takes into account any fee reductions or expense limitations that were in effect during a Renewal Fund’s last fiscal year. The Fund-specific fee and expense results discussed below were prepared and provided by Lipper and were not independently verified by the Trustees. The Renewal Funds’ fee and expense rankings are discussed below relative to the median of the applicable Lipper-selected group of comparable funds. A Renewal Fund whose fees and expenses were below median had fees and expenses that were less than the median fees and expenses of its peer group, while a Renewal Fund whose fees and expenses were above median had fees and expenses that were higher than the median fees and expenses of its peer group. For those Renewal Funds whose fees or expenses were higher than the median, the specific quintile rankings are also noted below with respect to the relevant above-median fee or expense categories (unless quintile rankings were not provided to the Trustees by Lipper, in which case fund rankings are provided). For these purposes, higher fees and expenses result in a lower quintile ranking—with the first quintile being the highest and the fifth quintile being the lowest ranking. For example, a Renewal Fund with the highest fees and expenses relative to its peer group would rank in the fifth quintile, while a Renewal Fund with the lowest fees and expenses relative to its peer group would rank in the first quintile.
Retirement Funds and Allocation Funds. For the 2015 Fund, 2020 Fund, 2025 Fund, 2030 Fund, 2035 Fund, 2040 Fund, 2045 Fund, 2050 Fund and Retirement Income Fund, advisory fees and total expense ratios (taking the unitary administrative fee and any fee waivers into account) were below median for both the retail and institutional expense groups. For the 2055 Fund, advisory fees were below median for both the retail and institutional expense groups, and total expense ratios (taking the unitary administrative fee and any fee waivers into account) were above median (in the fourth quintile) for the retail expense group and below median for the institutional expense group. For the Global Growth Allocation Fund, management fees were above median (fifth out of five funds in the retail expense group and in the fifth quintile for the institutional expense group) for both the retail and institutional expense groups, and total expense ratios (taking fee waivers into account) were at median for the retail expense group and above median (in the third quintile) for the institutional expense group. For the Global Allocation Fund, management fees were above median for both the retail and institutional expense groups (in the fifth quintile), and total expense ratios (taking fee waivers into account) were below median for both the retail and institutional expense groups.
| Semiannual Report | | May 31, 2014 | 291 |
Table of Contents
Unaudited
Matters Relating to the Trustees’ Consideration of the Investment Management and Sub-Advisory Agreements (cont’d)
AllianzGI Funds. For the U.S. Emerging Growth Fund, the U.S. Equity Hedged Fund, the Global Managed Volatility Fund, the High Yield Bond Fund and the Multi-Asset Real Return Fund, management fees and total expense ratios (taking fee waivers into account) were below median for both the retail and institutional expense groups. For the Micro Cap Fund, management fees were above median for both the retail and institutional expense groups (in the fourth quintile and fifth quintile, respectively), and total expense ratios (taking fee waivers into account) were at median for the retail expense group and above median (in the fifth quintile) for the institutional expense group. For the Structured Return Fund, management fees were below median for the retail expense group and at median for the institutional expense group, and total expense ratios (taking fee waivers into account) were below median for both the retail and institutional expense groups. For the Convertible Fund, management fees were at median for both the retail and institutional expense groups, and total expense ratios (taking fee waivers into account) were below median for both the retail and institutional expense groups. For the Dynamic Emerging Multi-Asset Fund, management fees were below median for both the retail and institutional expense groups, and total expense ratios (taking fee waivers into account) were above median (in the fourth quintile) for both the retail and institutional expense groups. For the Ultra Micro Cap Fund, management fees and total expense ratios (taking fee waivers into account) were above median (in the fifth quintile) for both the retail and institutional expense groups. For the Disciplined Equity Fund and the Short Duration High Income Fund, management fees and total expense ratios (taking fee waivers into account) were below median for both the retail and institutional expense groups. For the China Equity Fund, management fees were below median for the retail expense group and at median for the institutional expense group, and total expense ratios (taking fee waivers into account) were below median for both the retail and institutional expense groups. For the Global Water Fund, management fees were above median (in the fourth quintile and fifth quintile, respectively) for both the retail and institutional expense groups, and total expense ratios (taking fee waivers into account) were at median for the retail expense group and above median (in the fourth quintile) for the institutional expense group. For the International Small-Cap Fund, management fees were below median for both the retail and institutional expense groups, and total expense ratios (taking fee waivers into account) were below median for the retail expense group and above median (in the fourth quintile) for the institutional expense group. For the Redwood Fund, management fees were below median for both the retail and institutional expense groups, and total expense ratios (taking fee waivers into account) were below median for the retail expense group and above median (fourth out of five funds) for the institutional expense group.
NFJ Funds. For the NFJ Emerging Markets Value Fund and the NFJ International Value II Fund, management fees and total expense ratios (taking fee waivers into account) were below median for both the retail and institutional expense groups. For the NFJ Global Dividend Value Fund, management fees were at median for the retail expense group
and above median (in the third quintile) for the institutional expense group, and total expense ratios (taking fee waivers into account) were below median for both the retail and institutional expense groups. For the NFJ International Small-Cap Value Fund, management fees were below median for both the retail and institutional expense groups, and total expense ratios (taking fee waivers into account) were at median for the retail expense group and above median (in the third quintile) for the institutional expense group.
F&T Fund. For the F&T Fund, management fees and total expense ratios (taking fee waivers into account) were below median for both the retail and institutional expense groups.
The Trustees considered the estimated profitability to the Investment Manager of its relationship with each Renewal Fund and the estimated profitability to the Investment Manager of its relationship with the New Fund and determined that such profitability did not appear to be excessive. The Trustees considered the extent to which the Investment Manager and Sub-Advisers may realize economies of scale or other efficiencies in managing and supporting the Funds. The Trustees took into account that, as open-end investment companies, the Funds intend to raise additional assets, so as the assets of the Funds grow over time, certain economies of scale and other efficiencies may be realized through spreading certain fixed costs across a larger asset base or across a variety of products and services, while also taking into account the fee waiver and expense limitation arrangements observed by the Investment Manager for applicable Funds. Additionally, the Trustees considered so-called “fall-out benefits” to the Investment Manager, the Sub-Advisers and their affiliates, such as reputational value derived from serving as Investment Manager and Sub-Advisers to the Funds.
After reviewing these and other factors described herein, the Trustees concluded, within the context of their overall conclusions regarding the Agreements, that they were satisfied with the Investment Manager’s and Sub-Advisers’ responses and efforts relating to the investment performance of the Renewal Funds, including efforts to improve performance for underperforming Renewal Funds. With respect to the Renewal Funds, the Trustees also concluded that the fees payable under each Agreement represent reasonable compensation in light of the nature, extent and quality of services provided by the Investment Manager or Sub-Advisers, as the case may be, and should be continued. With respect to the New Fund, the Trustees also concluded the proposed fees payable under each Agreement represent reasonable compensation in light of the nature, extent and quality of services to be provided by the Investment Manager or the Sub-Adviser, as the case may be, and should be approved for an initial two-year period. Based on their evaluation of factors that they deemed to be material, including those factors described above, the Trustees, including the Independent Trustees, unanimously concluded that the continuation of the Agreements with respect to the Renewal Funds and initial approval of the Agreements with respect to the New Fund were in the interests of the applicable Funds and their shareholders, and should be approved.
| 292 | May 31, 2014 | | Semiannual Report |
Table of Contents
Allianz Multi-Strategy Funds
Trustees
Hans W. Kertess
Chairman of the Board of Trustees
Deborah A. DeCotis
Bradford K. Gallagher
James A. Jacobson
John C. Maney
William B. Ogden, IV
Alan Rappaport
Officers
Julian Sluyters
President & Chief Executive Officer
Lawrence G. Altadonna
Treasurer, Principal Financial & Accounting Officer
Thomas J. Fuccillo
Vice President, Secretary & Chief Legal Officer
Scott Whisten
Assistant Treasurer
Richard J. Cochran
Assistant Treasurer
Orhan Dzemaili
Assistant Treasurer
Thomas L. Harter
Chief Compliance Officer
Lagan Srivastava
Assistant Secretary
Richard H. Kirk
Assistant Secretary
Paul Koo
Assistant Secretary
Morley D. Campbell
Assistant Secretary
Thomas W. Oliver
Assistant Secretary
Investment Manager
Allianz Global Investors Fund Management LLC
1633 Broadway
New York, NY 10019
Sub-Advisers
Allianz Global Investors U.S. LLC
1633 Broadway
New York, NY 10019
Fuller & Thaler Asset Management, Inc.(1)
411 Borel Avenue, Suite 300
San Mateo, CA 94402
NFJ Investment Group LLC
2100 Ross Avenue, Suite 700
Dallas, TX 75201
Distributor
Allianz Global Investors Distributors LLC
1633 Broadway
New York, NY 10019
Custodian & Accounting Agent
State Street Bank & Trust Co.
801 Pennsylvania Avenue
Kansas City, MO 64105
Shareholder Servicing and Transfer Agents
Boston Financial Data Services, Inc.
(Class A, Class B, Class C, Class D and Class R shares)
P.O. Box 8050
Boston, MA 02266-8050
(Class P, Class R6, Institutional Class and Administrative Class shares)
330 West 9th Street, 5th Floor
Kansas City, MO 64105
Independent Registered Public Accounting Firm
PricewaterhouseCoopers LLP
300 Madison Avenue
New York, NY 10017
Legal Counsel
Ropes & Gray LLP
Prudential Tower
800 Boylston Street
Boston, MA 02199
This report, including the financial information herein, is transmitted to the shareholders of the Trust for their information. It is not a prospectus, circular or representation intended for use in the purchase of shares of each Fund or any securities mentioned in this report.
The financial information included herein is taken from the records of the Funds without examination by an independent registered public accounting firm, who did not express an opinion herein.
For Account Information
Contact your financial adviser, or if you receive account statements directly from Allianz Global Investors, you can also call (800) 988-8380 for Class A, B, C and R shares or (800) 498-5413 for Class P, Class R6, D Institutional Class and Administrative Class shares. Telephone representatives are available Monday-Friday 8:30 am to 6:00 pm Eastern Time. Or visit our website, us.allianzgi.com.
| (1) | Fuller & Thaler Asset Management, Inc. is an independently owned investment firm. |
Table of Contents
About Allianz Global Investors
Understand. Act. This two-word philosophy is at the core of what we do. To stand out as the investment partner our clients trust, we listen closely to understand their needs, then act decisively to deliver solutions. We are a diversified active investment manager with a strong parent company, a culture of risk management and $493 billion in AUM.* With 23 offices in 17 countries and over 500 investment professionals, we provide global investment and research capabilities with consultative local delivery.
For more information about any of our investment solutions or client services, call your financial advisor or visit us.allianzgi.com.
Investors should consider the investment objectives, risks, charges and expenses of the above mentioned Funds carefully before investing. This and other information is contained in the Fund’s prospectus, which may be obtained by contacting your financial advisor, by visiting us.allianzgi.com or by calling 1-800-988-8380 (retail classes: A, B, C & R) or 1-800-498-5413 (Class P, Class R6, D Institutional & Administrative classes). Please read the prospectus carefully before you invest or send money.
* Combined worldwide AUM as of March 31, 2014.
Allianz Global Investors Fund Management LLC serves as the investment manager for the Allianz Funds and the Allianz Multi-Strategy Funds. Allianz Funds and the Allianz Multi-Strategy Funds are distributed by Allianz Global Investors Distributors LLC. © 2014. For information about any product, contact your financial advisor.
us.allianzgi.com
| ©2014 Allianz Global Investors Distributors LLC | AZ750SA_053114 |
AGI-2014-06-02-9836
Table of Contents
| ITEM 2. | CODE OF ETHICS |
| (a) | Not required in this filing. |
| ITEM 3. | AUDIT COMMITTEE FINANCIAL EXPERT |
Not required in this filing.
| ITEM 4. | PRINCIPAL ACCOUNTANT FEES AND SERVICES |
Not required in this filing.
| ITEM 5. | AUDIT COMMITTEE OF LISTED REGISTRANT |
Disclosure not required for open-end management investment companies.
| ITEM 6. | SCHEDULE OF INVESTMENTS |
| (a) | Schedule of Investments is included as part of the report to shareholders filed under Item 1 of this form. |
| (b) | Not applicable. |
| ITEM 7. | DISCLOSURE OF PROXY VOTING POLICIES AND PROCEDURES FOR CLOSED-END MANAGEMENT INVESTMENT COMPANIES |
Disclosure not required for open-end management investment companies.
| ITEM 8. | PORTFOLIO MANAGERS OF CLOSED-END MANAGEMENT INVESTMENT COMPANIES |
Disclosure not required for open-end management investment companies.
| ITEM 9. | PURCHASES OF EQUITY SECURITIES BY CLOSED-END MANAGEMENT INVESTMENT COMPANY AND AFFILIATED COMPANIES. |
Disclosure not required for open-end management investment companies.
| ITEM 10. SUBMISSION | OF MATTERS TO A VOTE OF SECURITY HOLDERS |
There were no material changes to the procedures by which shareholders may recommend nominees to the Fund’s Board of Trustees since the Fund’s last provided disclosure in response to this item.
| ITEM 11. CONTROLS | AND PROCEDURES |
| (a) | The registrant’s President and Treasurer, Principal Financial & Accounting Officer have concluded that the registrant’s disclosure controls and procedures (as defined in Rule 30a-3(c) under the Act (17 CFR 270.30a-3(c))), are effective based on their evaluation of these controls and procedures as of a date within 90 days of the filing date of this document. |
| (b) | There were no significant changes in the registrant’s internal control over financial reporting (as defined in Rule 30a-3(d) under the Act (17 CFR 270.30a-3(d))) that occurred during the second fiscal quarter of the period covered by this report that has materially affected, or is reasonably likely to materially affect, the registrant’s internal control over financial reporting. |
| ITEM 12. EXHIBITS |
| (a) (1) | Not required in this filing. |
| (a) (2) | Exhibit 99.302 Cert. — Certification pursuant to Section 302 of the Sarbanes-Oxley Act of 2002 |
| (a) (3) | Not applicable |
| (b) | Exhibit 99.906 Cert. — Certification pursuant to Section 906 of the Sarbanes-Oxley Act of 2002 |
Table of Contents
Signatures
Pursuant to the requirements of the Securities Exchange Act of 1934 and the Investment Company Act of 1940, the registrant has duly caused this report to be signed on its behalf by the undersigned, thereunto duly authorized.
(Registrant) Allianz Funds Multi-Strategy Trust
| By: | /s/ Julian Sluyters | |
| Julian Sluyters, | ||
| President & Chief Executive Officer |
Date: July 31, 2014
| By | /s/ Lawrence G. Altadonna | |
Lawrence G. Altadonna Treasurer, Principal Financial & Accounting Officer |
Date: July 31, 2014
Pursuant to the requirements of the Securities Exchange Act of 1934 and the Investment Company Act of 1940, this report has been signed below by the following persons on behalf of the registrant and in the capacities and on the dates indicated.
| By: | /s/ Julian Sluyters | |
| Julian Sluyters, | ||
| President & Chief Executive Officer |
Date: July 31, 2014
| By | /s/ Lawrence G. Altadonna | |
Lawrence G. Altadonna Treasurer, Principal Financial & Accounting Officer |
Date: July 31, 2014