FIRST TRUST
First Trust Exchange-Traded Fund III
--------------------------------------------------------------------------------
First Trust Preferred Securities and Income ETF
(FPE)
First Trust Institutional Preferred Securities and Income
ETF (FPEI)
Annual Report
October 31, 2017
<PAGE>
--------------------------------------------------------------------------------
TABLE OF CONTENTS
--------------------------------------------------------------------------------
FIRST TRUST EXCHANGE-TRADED FUND III
ANNUAL REPORT
OCTOBER 31, 2017
Shareholder Letter .......................................................... 1
Fund Performance Overview:
First Trust Preferred Securities and Income ETF (FPE)..................... 2
First Trust Institutional Preferred Securities and Income ETF (FPEI)...... 5
Notes to Fund Performance Overview........................................... 8
Portfolio Commentary......................................................... 9
Understanding Your Fund Expenses ............................................ 11
Portfolio of Investments:
First Trust Preferred Securities and Income ETF (FPE)..................... 12
First Trust Institutional Preferred Securities and Income ETF (FPEI)...... 19
Statements of Assets and Liabilities ........................................ 22
Statements of Operations .................................................... 23
Statements of Changes in Net Assets ......................................... 24
Financial Highlights ........................................................ 25
Notes to Financial Statements ............................................... 27
Report of Independent Registered Public Accounting Firm ..................... 35
Additional Information ...................................................... 36
Board of Trustees and Officers .............................................. 43
Privacy Policy .............................................................. 45
CAUTION REGARDING FORWARD-LOOKING STATEMENTS
This report contains certain forward-looking statements within the meaning of
the Securities Act of 1933, as amended, and the Securities Exchange Act of 1934,
as amended. Forward-looking statements include statements regarding the goals,
beliefs, plans or current expectations of First Trust Advisors L.P. ("First
Trust" or the "Advisor") and/or Stonebridge Advisors LLC ("Stonebridge" or the
"Sub-Advisor") and their respective representatives, taking into account the
information currently available to them. Forward-looking statements include all
statements that do not relate solely to current or historical fact. For example,
forward-looking statements include the use of words such as "anticipate,"
"estimate," "intend," "expect," "believe," "plan," "may," "should," "would" or
other words that convey uncertainty of future events or outcomes.
Forward-looking statements involve known and unknown risks, uncertainties and
other factors that may cause the actual results, performance or achievements of
any series of First Trust Exchange-Traded Fund III (the "Trust") described in
this report (each such series is referred to as a "Fund" and collectively, the
"Funds") to be materially different from any future results, performance or
achievements expressed or implied by the forward-looking statements. When
evaluating the information included in this report, you are cautioned not to
place undue reliance on these forward-looking statements, which reflect the
judgment of the Advisor and/or Sub-Advisor and their respective representatives
only as of the date hereof. We undertake no obligation to publicly revise or
update these forward-looking statements to reflect events and circumstances that
arise after the date hereof.
PERFORMANCE AND RISK DISCLOSURE
There is no assurance that any Fund described in this report will achieve its
investment objective. Each Fund is subject to market risk, which is the
possibility that the market values of securities owned by the Fund will decline
and that the value of the Fund shares may therefore be less than what you paid
for them. Accordingly, you can lose money by investing in a Fund. See "Risk
Considerations" in the Additional Information section of this report for a
discussion of certain other risks of investing in the Funds.
Performance data quoted represents past performance, which is no guarantee of
future results, and current performance may be lower or higher than the figures
shown. For the most recent month-end performance figures, please visit
http://www.ftportfolios.com or speak with your financial advisor. Investment
returns, net asset value and share price will fluctuate and Fund shares, when
sold, may be worth more or less than their original cost.
The Advisor may also periodically provide additional information on Fund
performance on each Fund's webpage at http://www.ftportfolios.com.
HOW TO READ THIS REPORT
This report contains information that may help you evaluate your investment. It
includes details about each Fund's portfolio and presents data and analysis that
provide insight into each Fund's performance and investment approach.
By reading the portfolio commentary by the portfolio management team of each
Fund, you may obtain an understanding of how the market environment affected
each Fund. The statistical information that follows may help you understand each
Fund's performance compared to that of relevant market benchmarks.
It is important to keep in mind that the opinions expressed by personnel of the
Advisor or Sub-Advisor are just that: informed opinions. They should not be
considered to be promises or advice. The opinions, like the statistics, cover
the period through the date on the cover of this report. The material risks of
investing in each Fund are spelled out in its prospectus, statement of
additional information, this report and other Fund regulatory filings.
<PAGE>
--------------------------------------------------------------------------------
SHAREHOLDER LETTER
--------------------------------------------------------------------------------
FIRST TRUST EXCHANGE-TRADED FUND III
ANNUAL LETTER FROM THE CHAIRMAN AND CEO
OCTOBER 31, 2017
Dear Shareholders:
Thank you for your investment in First Trust Exchange-Traded Fund III.
First Trust is pleased to provide you with the annual report which contains
detailed information about your investment for the 12 months ended October 31,
2017, including a market overview and a performance analysis for the period. We
encourage you to read this report carefully and discuss it with your financial
advisor.
The U.S. bull market continued through the November 2016 election and the first
nine months of the Trump presidency. During that period, November 8, 2016
(Election Day 2016) through October 31, 2017, the S&P 500(R) Index (the "Index")
posted a total return of 22.73%, according to Bloomberg. Ten of the eleven Index
sectors were up on a total return basis as well. Since the beginning of 2017
through October 31, 2017, the Index has closed its trading sessions at all-time
highs on 50 occasions. Finally, as of October 31, 2017, the Index has spent the
entire year in positive territory. This has only happened in 10 different years
over the past seven decades.
The current bull market, as measured from March 9, 2009 through October 31,
2017, is the second longest in history. While we are optimistic about the U.S.
economy, we are also aware that no one can predict the future or know how
markets will perform in different economic environments. We believe that one
should invest for the long term and be prepared for market volatility by keeping
current on your portfolio and investing goals by speaking regularly with your
investment professional. It is also important to keep in mind that past
performance can never guarantee future results.
Thank you for giving First Trust the opportunity to be a part of your investment
plan. We value our relationship with you and will continue to focus on bringing
the types of investments that we believe can help you reach your financial
goals.
Sincerely,
/s/ James A. Bowen
James A. Bowen
Chairman of the Board of Trustees
Chief Executive Officer of First Trust Advisors L.P.
Page 1
<PAGE>
--------------------------------------------------------------------------------
FUND PERFORMANCE OVERVIEW (UNAUDITED)
--------------------------------------------------------------------------------
FIRST TRUST PREFERRED SECURITIES AND INCOME ETF (FPE)
First Trust Preferred Securities and Income ETF's (the "Fund") investment
objective is to seek total return and to provide current income. Under normal
market conditions, the Fund invests at least 80% of its net assets (including
investment borrowings) in preferred securities ("Preferred Securities") and
income-producing debt securities ("Income Securities"). The Fund invests in
securities that are traded over-the-counter or listed on an exchange. For
purposes of the 80% test set forth above, securities of open-end funds,
closed-end funds or other exchange-traded funds ("ETFs") registered under the
Investment Company Act of 1940, as amended, that invest primarily in Preferred
Securities or Income Securities are deemed to be Preferred Securities or Income
Securities.
Preferred Securities held by the Fund generally pay fixed or adjustable-rate
distributions to investors and have preference over common stock in the payment
of distributions and the liquidation of a company's assets, but are generally
junior to all forms of the company's debt, including both senior and
subordinated debt. Certain of the Preferred Securities may be issued by trusts
or other special purpose entities created by companies specifically for the
purpose of issuing such securities. Income Securities that may be held by the
Fund include corporate bonds, high yield securities (commonly referred to as
"junk" bonds) and convertible securities. The broad category of corporate debt
securities includes debt issued by U.S. and non-U.S. companies of all kinds,
including those with small, mid and large capitalizations. Corporate debt may
carry fixed or floating rates of interest.
<TABLE>
<CAPTION>
----------------------------------------------------------------------------------------------------------------------------------
PERFORMANCE
----------------------------------------------------------------------------------------------------------------------------------
AVERAGE ANNUAL CUMULATIVE
TOTAL RETURNS TOTAL RETURNS
1 Year Ended Inception (2/11/13) Inception (2/11/13)
10/31/17 to 10/31/17 to 10/31/17
<S> <C> <C> <C>
FUND PERFORMANCE
NAV 9.24% 5.89% 31.02%
Market Price 9.01% 5.89% 30.99%
INDEX PERFORMANCE
ICE BofAML Fixed Rate Preferred Securities Index(1) 6.58% 6.26% 33.17%
ICE BofAML U.S. Capital Securities Index(1) 6.57% 6.06% 32.02%
Blended Index(2) 6.58% 6.18% 32.68%
----------------------------------------------------------------------------------------------------------------------------------
</TABLE>
(See Notes to Fund Performance Overview on page 8).
(1) Effective October 22, 2017, the index names changed from BofA Merrill
Lynch Fixed Rate Preferred Securities Index and BofA Merrill Lynch U.S.
Capital Securities Index to ICE BofAML Fixed Rate Preferred Securities
Index and ICE BofAML U.S. Capital Securities Index, respectively.
(2) The Blended Index consists of a 50/50 blend of the ICE BofAML Fixed Rate
Preferred Securities Index and the ICE BofAML U.S. Capital Securities
Index. The Blended Index reflects the diverse allocation of institutional
preferred and hybrid securities in the Fund's portfolio. The indexes do
not charge management fees or brokerage expenses, and no such fees or
expenses were deducted from the performance shown. Indexes are unmanaged
and an investor cannot invest directly in an index.
Page 2
<PAGE>
--------------------------------------------------------------------------------
FUND PERFORMANCE OVERVIEW (UNAUDITED) (CONTINUED)
--------------------------------------------------------------------------------
FIRST TRUST PREFERRED SECURITIES AND INCOME ETF (FPE) (CONTINUED)
-----------------------------------------------------
% OF TOTAL
SECTOR ALLOCATION INVESTMENTS
-----------------------------------------------------
Financials 72.0%
Utilities 6.4
Energy 6.1
Consumer Staples 3.7
Telecommunication Services 3.2
Real Estate 3.1
Industrials 2.1
Materials 1.9
Consumer Discretionary 0.9
Information Technology 0.6
------
Total 100.0%
======
-----------------------------------------------------
% OF TOTAL
CREDIT RATING(2) INVESTMENTS
-----------------------------------------------------
A+ 0.7%
A 0.7
A- 3.0
BBB+ 6.3
BBB 14.5
BBB- 26.8
BB+ 23.7
BB 8.2
BB- 6.3
B+ 4.1
B 0.1
Not Rated 5.6
------
Total 100.0%
======
-----------------------------------------------------
% OF TOTAL
TOP TEN HOLDINGS INVESTMENTS
-----------------------------------------------------
GMAC Capital Trust I, Series 2 2.2%
Emera, Inc., Series 16-A 1.8
Enel S.p.A. 1.7
Barclays PLC 1.6
BHP Billiton Finance USA Ltd. 1.6
Enbridge Energy Partners L.P. 1.5
Credit Agricole S.A. 1.4
Intesa Sanpaolo S.p.A. 1.3
AerCap Global Aviation Trust 1.3
Royal Bank Of Scotland Group PLC 1.3
------
Total 15.7%
======
-----------------------------------------------------
% OF TOTAL
COUNTRY EXPOSURE INVESTMENTS
-----------------------------------------------------
United States 55.0%
France 9.2
United Kingdom 9.1
Italy 4.4
Canada 4.3
Australia 3.7
Netherlands 3.2
Bermuda 2.3
Switzerland 2.2
Cayman Islands 1.9
Spain 1.2
Mexico 0.9
Japan 0.8
Ireland 0.7
Chile 0.4
Denmark 0.3
Belgium 0.3
Jersey 0.1
Brazil 0.0*
------
Total 100.0%
======
* Amount is less than 0.1%.
(2) The credit quality and ratings information presented above reflects the
ratings assigned by one or more nationally recognized statistical rating
organizations (NRSROs), including Standard & Poor's Ratings Group, a
division of the McGraw-Hill Companies, Inc., Moody's Investors Service,
Inc., Fitch Ratings or a comparably rated NRSRO. For situations in which a
security is rated by more than one NRSRO and the ratings are not
equivalent, the highest ratings are used. Sub-investment grade ratings are
those rated BB+/Ba1 or lower. Investment grade ratings are those rated
BBB-/Baa3 or higher. The credit ratings shown relate to the
creditworthiness of the issuers of the underlying securities in the Fund,
and not to the Fund or its shares. Credit ratings are subject to change.
Page 3
<PAGE>
--------------------------------------------------------------------------------
FUND PERFORMANCE OVERVIEW (UNAUDITED) (CONTINUED)
--------------------------------------------------------------------------------
FIRST TRUST PREFERRED SECURITIES AND INCOME ETF (FPE) (CONTINUED)
<TABLE>
<CAPTION>
PERFORMANCE OF A $10,000 INITIAL INVESTMENT
FEBRUARY 11, 2013 - OCTOBER 31, 2017
First Trust ICE BofAML Fixed ICE BofAML
Preferred Securities Rate Preferred U.S. Capital Blended
and Income ETF Securities Index Securities Index Index(1)
<S> <C> <C> <C> <C>
2/11/13 $10,000 $10,000 $10,000 $10,000
4/30/13 10,330 10,253 10,342 10,297
10/31/13 9,426 9,640 10,392 10,010
4/30/14 10,084 10,418 10,992 10,704
10/31/14 10,409 10,841 11,364 11,102
4/30/15 10,810 11,326 11,766 11,547
10/31/15 11,007 11,653 11,546 11,604
4/30/16 11,276 12,083 11,743 11,917
10/31/16 11,994 12,496 12,390 12,448
4/30/17 12,480 12,868 12,630 12,754
10/31/17 13,103 13,317 13,203 13,267
</TABLE>
Performance figures assume reinvestment of all distributions and do not reflect
the deduction of taxes that a shareholder would pay on Fund distributions or the
redemption or sale of Fund shares. An index is a statistical composite that
tracks a specified financial market or sector. Unlike the Fund, the indices do
not actually hold a portfolio of securities and therefore do not incur the
expenses incurred by the Fund. These expenses negatively impact the performance
of the Fund. The Fund's past performance does not predict future performance.
FREQUENCY DISTRIBUTION OF DISCOUNTS AND PREMIUMS
BID/ASK MIDPOINT VS. NAV THROUGH OCTOBER 31, 2017
The following Frequency Distribution of Discounts and Premiums charts are
provided to show the frequency at which the bid/ask midpoint price for the Fund
was at a discount or premium to the daily NAV. The following tables are for
comparative purposes only and represent the period February 12, 2013
(commencement of trading) through October 31, 2017. Shareholders may pay more
than NAV when they buy Fund shares and receive less than NAV when they sell
those shares because shares are bought and sold at current market price. Data
presented represents past performance and cannot be used to predict future
results.
--------------------------------------------------------------------------------
NUMBER OF DAYS BID/ASK MIDPOINT AT/ABOVE NAV
--------------------------------------------------------------------------------
FOR THE PERIOD 0.00%-0.49% 0.50%-0.99% 1.00%-1.99% >=2.00%
2/12/13 - 10/31/13 96 7 0 0
11/1/13 - 10/31/14 140 2 0 0
11/1/14 - 10/31/15 214 16 0 0
11/1/15 - 10/31/16 212 13 0 0
11/1/16 - 10/31/17 232 1 0 0
--------------------------------------------------------------------------------
NUMBER OF DAYS BID/ASK MIDPOINT BELOW NAV
--------------------------------------------------------------------------------
FOR THE PERIOD 0.00%-0.49% 0.50%-0.99% 1.00%-1.99% >=2.00%
2/12/13 - 10/31/13 73 7 0 0
11/1/13 - 10/31/14 101 9 0 0
11/1/14 - 10/31/15 21 0 0 0
11/1/15 - 10/31/16 26 1 0 0
11/1/16 - 10/31/17 19 0 0 0
(1) The Blended Index consists of a 50/50 blend of the ICE BofAML Fixed Rate
Preferred Securities Index and the ICE BofAML U.S. Capital Securities
Index. The Blended Index reflects the diverse allocation of institutional
preferred and hybrid securities in the Fund's portfolio. The indexes do
not charge management fees or brokerage expenses, and no such fees or
expenses were deducted from the performance shown. Indexes are unmanaged
and an investor cannot invest directly in an index.
Page 4
<PAGE>
--------------------------------------------------------------------------------
FUND PERFORMANCE OVERVIEW (UNAUDITED)
--------------------------------------------------------------------------------
FIRST TRUST INSTITUTIONAL PREFERRED SECURITIES AND INCOME ETF (FPEI)
First Trust Institutional Preferred Securities and Income ETF's (the "Fund")
investment objective is to seek total return and to provide current income.
Under normal market conditions, the Fund invests at least 80% of its net assets
(including investment borrowings) in institutional preferred securities
("Preferred Securities") and income-producing debt securities ("Income
Securities"). Preferred securities are a type of equity security that have
preference over common stock in the payment of distributions and the liquidation
of a company's assets, but are generally junior to all forms of the company's
debt, including both senior and subordinated debt. The Fund's investments in
preferred securities will primarily be in institutional preferred securities.
Institutional preferred securities are targeted to institutional, rather than
retail, investors, are generally traded over-the-counter and may also be known
as "$1,000 par preferred securities." They are typically issued in large,
institutional lot sizes by U.S. and non-U.S. financial services companies and
other companies. While all income-producing debt securities will be categorized
as "Income Securities" for purposes of the 80% test above, the Income Securities
in which the Fund intends to invest as part of its principal investment strategy
include hybrid capital securities, contingent capital securities, U.S. and
non-U.S. corporate bonds and convertible securities.
<TABLE>
<CAPTION>
---------------------------------------------------------------------------------------------
PERFORMANCE
---------------------------------------------------------------------------------------------
CUMULATIVE
TOTAL RETURNS
Inception (8/22/17)
to 10/31/17
<S> <C>
FUND PERFORMANCE
NAV 2.00%
Market Price 2.05%
INDEX PERFORMANCE
ICE BofAML US Investment Grade Institutional Capital Securities Index 1.25%
---------------------------------------------------------------------------------------------
</TABLE>
(See Notes to Fund Performance Overview on page 8).
Page 5
<PAGE>
FUND PERFORMANCE OVERVIEW (UNAUDITED)
FIRST TRUST INSTITUTIONAL PREFERRED SECURITIES AND INCOME ETF (FPEI)
-----------------------------------------------------
% OF TOTAL
SECTOR ALLOCATION INVESTMENTS
-----------------------------------------------------
Financials 66.7%
Energy 12.5
Utilities 9.7
Materials 3.9
Consumer Discretionary 3.5
Telecommunication Services 1.9
Industrials 1.8
------
Total 100.0%
======
-----------------------------------------------------
% OF TOTAL
CREDIT RATING(1) INVESTMENTS
-----------------------------------------------------
A 1.7%
A- 8.2
BBB+ 2.6
BBB 16.7
BBB- 26.8
BB+ 28.9
BB 4.7
BB- 7.8
B+ 1.8
Not Rated 0.8
------
Total 100.0%
======
-----------------------------------------------------
% OF TOTAL
TOP TEN HOLDINGS INVESTMENTS
-----------------------------------------------------
Mitsui Sumitomo Insurance Co., Ltd. 4.3%
Enel S.p.A. 4.1
Transcanada Trust, Series 16-A 4.1
Enbridge, Inc., Series 16-A 4.0
BHP Billiton Finance USA Ltd. 3.9
Emera, Inc., Series 16-A 3.8
Metlife, Inc. 3.8
Wells Fargo & Co., Series U 3.7
JPMorgan Chase & Co., Series R 3.7
Citigroup, Inc., Series P 3.7
------
Total 39.1%
======
-----------------------------------------------------
% OF TOTAL
COUNTRY EXPOSURE INVESTMENTS
-----------------------------------------------------
United States 45.8%
United Kingdom 13.2
Canada 12.0
Italy 7.8
France 6.7
Japan 4.3
Australia 3.9
Switzerland 2.4
Bermuda 2.0
Netherlands 1.9
------
Total 100.0%
======
(1) The credit quality and ratings information presented above reflects the
ratings assigned by one or more nationally recognized statistical rating
organizations (NRSROs), including Standard & Poor's Ratings Group, a
division of the McGraw-Hill Companies, Inc., Moody's Investors Service,
Inc., Fitch Ratings or a comparably rated NRSRO. For situations in which a
security is rated by more than one NRSRO and the ratings are not
equivalent, the highest ratings are used. Sub-investment grade ratings are
those rated BB+/Ba1 or lower. Investment grade ratings are those rated
BBB-/Baa3 or higher. The credit ratings shown relate to the
creditworthiness of the issuers of the underlying securities in the Fund,
and not to the Fund or its shares. Credit ratings are subject to change.
Page 6
<PAGE>
--------------------------------------------------------------------------------
FUND PERFORMANCE OVERVIEW (UNAUDITED) (CONTINUED)
--------------------------------------------------------------------------------
FIRST TRUST INSTITUTIONAL PREFERRED SECURITIES AND INCOME ETF (FPEI) (CONTINUED)
PERFORMANCE OF A $10,000 INITIAL INVESTMENT
AUGUST 22, 2017 - OCTOBER 31, 2017
First Trust ICE BofAML US
Institutional Preferred Investment Grade Institutional
Securities and Income ETF Capital Securities Index
8/22/17 $10,000 $10,000
10/31/17 10,200 10,125
Performance figures assume reinvestment of all distributions and do not reflect
the deduction of taxes that a shareholder would pay on Fund distributions or the
redemption or sale of Fund shares. An index is a statistical composite that
tracks a specified financial market or sector. Unlike the Fund, the index does
not actually hold a portfolio of securities and therefore does not incur the
expenses incurred by the Fund. These expenses negatively impact the performance
of the Fund. The Fund's past performance does not predict future performance.
FREQUENCY DISTRIBUTION OF DISCOUNTS AND PREMIUMS
BID/ASK MIDPOINT VS. NAV THROUGH OCTOBER 31, 2017
The following Frequency Distribution of Discounts and Premiums charts are
provided to show the frequency at which the bid/ask midpoint price for the Fund
was at a discount or premium to the daily NAV. The following tables are for
comparative purposes only and represent the period August 23, 2017 (commencement
of trading) through October 31, 2017. Shareholders may pay more than NAV when
they buy Fund shares and receive less than NAV when they sell those shares
because shares are bought and sold at current market price. Data presented
represents past performance and cannot be used to predict future results.
--------------------------------------------------------------------------------
NUMBER OF DAYS BID/ASK MIDPOINT AT/ABOVE NAV
--------------------------------------------------------------------------------
FOR THE PERIOD 0.00%-0.49% 0.50%-0.99% 1.00%-1.99% >=2.00%
8/23/17 - 10/31/17 44 0 0 0
--------------------------------------------------------------------------------
NUMBER OF DAYS BID/ASK MIDPOINT BELOW NAV
--------------------------------------------------------------------------------
FOR THE PERIOD 0.00%-0.49% 0.50%-0.99% 1.00%-1.99% >=2.00%
8/23/17 - 10/31/17 5 0 0 0
Page 7
<PAGE>
--------------------------------------------------------------------------------
NOTES TO FUNDS' PERFORMANCE OVERVIEW (UNAUDITED)
--------------------------------------------------------------------------------
Total returns for the periods since inception are calculated from the inception
date of each Fund. "Average Annual Total Returns" represent the average annual
change in value of an investment over the periods indicated. "Cumulative Total
Returns" represent the total change in value of an investment over the periods
indicated.
Each Fund's per share net asset value ("NAV") is the value of one share of the
Fund and is computed by dividing the value of all assets of the Fund (including
accrued interest and dividends), less all liabilities (including accrued
expenses and dividends declared but unpaid), by the total number of outstanding
shares. The price used to calculate market return ("Market Price") is determined
by using the midpoint between the highest bid and the lowest offer on the stock
exchange on which shares of the Fund are listed for trading as of the time that
the Fund's NAV is calculated. Since shares of each Fund did not trade in the
secondary market until after their inception, for the period from inception to
the first day of secondary market trading in shares of the Fund, the NAV of each
Fund is used as a proxy for the secondary market trading price to calculate
market returns. NAV and market returns assume that all distributions have been
reinvested in each Fund at NAV and Market Price, respectively.
An index is a statistical composite that tracks a specified financial market or
sector. Unlike each Fund, the indices do not actually hold a portfolio of
securities and therefore do not incur the expenses incurred by each Fund. These
expenses negatively impact the performance of each Fund. Also, market returns do
not include brokerage commissions that may be payable on secondary market
transactions. If brokerage commissions were included, market returns would be
lower. The total returns presented reflect the reinvestment of dividends on
securities in the indices. The returns presented do not reflect the deduction of
taxes that a shareholder would pay on Fund distributions or the redemption or
sale of Fund shares. The investment return and principal value of shares of each
Fund will vary with changes in market conditions. Shares of each Fund may be
worth more or less than their original cost when they are redeemed or sold in
the market. Each Fund's past performance is no guarantee of future performance.
Page 8
<PAGE>
--------------------------------------------------------------------------------
PORTFOLIO COMMENTARY
--------------------------------------------------------------------------------
FIRST TRUST EXCHANGE-TRADED FUND III
ANNUAL REPORT
OCTOBER 31, 2017 (UNAUDITED)
ADVISOR
First Trust Advisors L.P. ("First Trust") is the investment advisor to the First
Trust Preferred Securities and Income ETF and the First Trust Institutional
Preferred Securities and Income ETF (each a "Fund" and collectively the
"Funds"). First Trust is responsible for the ongoing monitoring of the Funds'
investment portfolios, managing the Funds' business affairs and providing
certain administrative services necessary for the management of the Funds.
SUB-ADVISOR
STONEBRIDGE ADVISORS LLC
Stonebridge Advisors LLC ("Stonebridge" or the "Sub-Advisor") is the investment
sub-advisor to the Funds and is a registered investment advisor based in Wilton,
Connecticut. Stonebridge specializes in the management of preferred and hybrid
securities.
PORTFOLIO MANAGEMENT TEAM
SCOTT T. FLEMING - PRESIDENT AND CHIEF INVESTMENT OFFICER
ROBERT WOLF - SENIOR VICE PRESIDENT, SENIOR PORTFOLIO MANAGER
DANIELLE SALTERS, CFA - VICE PRESIDENT, PORTFOLIO MANAGER AND CREDIT ANALYST
COMMENTARY
FIRST TRUST PREFERRED SECURITIES AND INCOME ETF (FPE)
MARKET RECAP
The fiscal year ended October 31, 2017 was a period of solid returns for the
preferred and hybrid securities markets. The period began with substantial
volatility following an increase in interest rates in the fourth quarter of 2016
and from the unexpected victory of Donald Trump in the U.S. Presidential
election and the Republican success at keeping control of the U.S. Congress.
Higher rates were also supported by improving economic and employment data,
which allowed the Federal Reserve (the "Fed") to increase short-term interest
rates by 0.25% three times during the period. However, risk assets recovered and
performed well throughout the last three quarters of the period due to
stabilizing long-term interest rates, a flattening yield curve, and significant
spread tightening. Contingent capital securities ("CoCos") were the best
performing part of the preferred and hybrid securities markets during the
period, returning 16.78%. We believe this was due to the improvement in credit
quality of European banks (largest issuers of CoCos), attractive yields and
structures compared to U.S. bank tier 1 capital securities, and the increasing
investor comfort with the securities and more stable investor base. After
initial weakness during the period, the retail preferred market was pushed
higher by inflows into passive preferred exchange-traded funds ("ETFs"), limited
new issuance, and stable rates, which were positive for the fixed for life
structures that make up the majority of the retail market. For the fiscal year,
the retail market earned 6.58% while the institutional market earned 6.57%,
according to the ICE BofAML Fixed Rate Preferred Securities Index ("P0P1") and
the ICE BofAML U.S. Capital Securities Index ("C0CS"), respectively.
PERFORMANCE ANALYSIS
For the fiscal year ended October 31, 2017, the net asset value ("NAV") and
market price total returns for the Fund were 9.24% and 9.01%, respectively. This
compares to a total return of 6.58% for the Fund's benchmark, which is a 50/50
blend of P0P1 and C0CS. The Fund benefited from yield spread tightening and a
flattening Treasury yield curve, as the front end of the Treasury yield curve
was pushed higher by the Fed, which resulted in improvement in both
fixed-to-floats and floating-rate preferred securities. The largest positive
contributors to the Fund's outperformance relative to the benchmark during the
year included security selection and an overweight to CoCos and floating-rate
securities.
Outperformance through security selection was driven by increasing exposure to
institutional securities with attractive yields and structures that appreciated
in value as yield spreads compressed. The Fund also benefited through exposure
to CoCos, which were not part of the benchmark index. CoCos increased in value
during the year due to several factors, including the improvement in credit
quality of European banks, attractive yields and structures compared to U.S.
bank tier 1 capital securities, and an increasing investor base. Floating-rate
securities were also a positive contributor to relative performance as the front
end of the treasury curve and The London Interbank Offered Rate ("LIBOR") reset
higher.
MARKET AND FUND OUTLOOK
The strong macro-economic backdrop, strong corporate earnings and solid
creditworthiness, particularly within financials, continue to support a risk-on
environment, in our opinion. Stable to gradually increasing rates, moderate
issuance, and the continued demand for yield continue to be positive for the
preferred and hybrid securities markets. However, we believe strong performance
across equity and credit markets and increased economic optimism has stretched
valuations of new issuance in some cases, which could become problematic if
interest rates or supply increases. Recently, weaker security structures have
come to market, but the deals were many times oversubscribed, supported by
investor demand for yield and some buyers that are indiscriminate about pricing,
Page 9
<PAGE>
--------------------------------------------------------------------------------
PORTFOLIO COMMENTARY
--------------------------------------------------------------------------------
FIRST TRUST EXCHANGE-TRADED FUND III
ANNUAL REPORT
OCTOBER 31, 2017 (UNAUDITED)
in the form of passive ETFs, taking up a larger share of markets and deals. We
believe this could put pressure on distributions if higher yielding legacy
securities continue to be redeemed and replaced by lower yielding securities.
We continue to believe that the yield curve is likely to remain flat, as
short-term rates are likely to increase and may push long term rates higher. We
have long anticipated, and positioned for, a rising rate environment, and we
continue to hold the view that this process will be gradual. We believe U.S.
fiscal policy and potential tax and regulatory changes have the potential to
boost economic growth, but we also believe this impact is likely to be muted and
slow given political uncertainty and the likelihood that any changes will likely
be phased in over time. We continue to focus on protecting the principal of our
investors and, as such, we believe it is prudent to protect investors against a
potential rise in interest rates through actively managing interest rate risk.
FIRST TRUST INSTITUTIONAL PREFERRED SECURITIES AND INCOME ETF (FPEI)
MARKET RECAP
The fiscal year ended October 31, 2017 was a period of solid returns for the
preferred and hybrid securities markets. Since the inception of the Fund on
August 22, 2017, the institutional market outperformed the retail market,
earning 1.25%, according to the ICE BofAML US Investment Grade Institutional
Capital Securities Index ("CIPS"), whereas the retail market, as measured by the
ICE BofAML Core Plus Fixed Rate Preferred Securities Index ("P0P4"), returned
only 0.67%. We believe the outperformance of the institutional market was
partially driven by an uptick in issuance from U.S. and European issuers. The
flattening yield curve and significant spread tightening experienced by the
preferred and hybrid securities markets throughout 2017 created attractive
conditions for issuers, as newer deals launched with significantly smaller
back-end spreads and yields. This created a strong technical bid in the
institutional market for structurally superior legacy securities, causing the
whole market to trade higher. Contingent capital securities ("CoCos") were the
best performing part of the institutional preferred and hybrid securities
markets during the period, returning 3.78%. We believe this was due to the
improvement in credit quality of European banks (the largest issuers of CoCos),
attractive yields and structures compared to U.S. bank tier 1 capital
securities, the increasing investor comfort with the securities and more stable
investor base.
PERFORMANCE ANALYSIS
For the period from the Fund's inception on August 22, 2017, through October 31,
2017, the net asset value ("NAV") and market price total returns for the Fund
were 2.00% and 2.05%, respectively. This compares to a total return of 1.25% for
the Fund's benchmark, CIPS. The Fund benefited from yield spread tightening and
a flattening Treasury yield curve, as the front end of the Treasury yield curve
was pushed higher by the Federal Reserve (the "Fed"), which resulted in
improvement in both fixed-to-floats and floating-rate preferred securities. The
largest positive contributors to the Fund's outperformance relative to the
benchmark during the period included security selection, an overweight to CoCos,
and an underweight to Japanese preferred and hybrid preferred securities.
The Fund's weighting in CoCos, which are not held in the benchmark, was the
single largest reason for outperformance relative to the benchmark. As spreads
tightened in fixed-income markets, CoCos continued to offer some of the most
attractive yields and structures in the institutional market. Additionally,
security selection within U.S. Banks and Utilities contributed to
outperformance. Finally, the Fund benefited relative to the benchmark from its
underweight in Japanese securities. These securities underperformed due to rich
valuations entering the quarter.
One of the biggest detractors from relative performance was the Fund's security
selection and overweight to property and casualty insurance companies, which
sold off in September 2017 due to hurricane fears. The Fund's security selection
within the energy space hurt relative performance as well.
MARKET AND FUND OUTLOOK
The strong macro-economic backdrop, strong corporate earnings and solid
creditworthiness, particularly within financials, continue to support a risk-on
environment, in our opinion. Stable to gradually increasing rates, moderate
issuance, and the continued demand for yield continue to be positive for the
preferred and hybrid securities markets. However, we believe strong performance
across equity and credit markets and increased economic optimism has stretched
valuations of new issuance in some cases, which could become problematic if
interest rates or supply increases. Recently, weaker security structures have
come to market, but the deals were many times oversubscribed, supported by
investor demand for yield and some buyers that are indiscriminate about pricing,
in the form of passive ETFs, taking up a larger share of markets and deals. We
believe this could put pressure on distributions if higher yielding legacy
securities continue to be redeemed and replaced by lower yielding securities.
We continue to believe that the yield curve is likely to remain flat, as
short-term rates are likely to increase and may push long term rates higher. We
have long anticipated, and positioned for, a rising rate environment, and we
continue to hold the view that this process will be gradual. We believe U.S.
fiscal policy and potential tax and regulatory changes have the potential to
boost economic growth, but we also believe this impact is likely to be muted and
slow given political uncertainty and the likelihood that any changes will likely
be phased in over time. We continue to focus on protecting the principal of our
investors and, as such, we believe it is prudent to protect investors against a
potential rise in interest rates through actively managing interest rate risk.
Page 10
<PAGE>
FIRST TRUST EXCHANGE-TRADED FUND III
UNDERSTANDING YOUR FUND EXPENSES
OCTOBER 31, 2017 (UNAUDITED)
As a shareholder of First Trust Preferred Securities and Income ETF or First
Trust Institutional Preferred Securities and Income ETF (each a "Fund" and
collectively, the "Funds"), you incur two types of costs: (1) transaction costs;
and (2) ongoing costs, including management fees, distribution and/or service
fees, if any, and other Fund expenses. This Example is intended to help you
understand your ongoing costs of investing in the Funds and to compare these
costs with the ongoing costs of investing in other funds.
The Example is based on an investment of $1,000 invested at the beginning of the
period (or since inception) and held through the six-month (or shorter) period
ended October 31, 2017.
ACTUAL EXPENSES
The first line in the following table provides information about actual account
values and actual expenses. You may use the information in this line, together
with the amount you invested, to estimate the expenses that you paid over the
period. Simply divide your account value by $1,000 (for example, an $8,600
account value divided by $1,000 = 8.6), then multiply the result by the number
in the first line under the heading entitled "Expenses Paid During the Six-Month
Period" to estimate the expenses you paid on your account during this six-month
period.
HYPOTHETICAL EXAMPLE FOR COMPARISON PURPOSES
The second line in the following table provides information about hypothetical
account values and hypothetical expenses based on each Fund's actual expense
ratio and an assumed rate of return of 5% per year before expenses, which is not
each Fund's actual return. The hypothetical account values and expenses may not
be used to estimate the actual ending account balance or expenses you paid for
the period. You may use this information to compare the ongoing costs of
investing in the Funds and other funds. To do so, compare this 5% hypothetical
example with the 5% hypothetical examples that appear in the shareholder reports
of the other funds.
Please note that the expenses shown in the table are meant to highlight your
ongoing costs only and do not reflect any transactional costs such as brokerage
commissions. Therefore, the second line in the table is useful in comparing
ongoing costs only, and will not help you determine the relative total costs of
owning different funds. In addition, if these transactional costs were included,
your costs would have been higher.
<TABLE>
<CAPTION>
-----------------------------------------------------------------------------------------------------------------------------
ANNUALIZED
EXPENSE RATIO EXPENSES PAID
BEGINNING ENDING BASED ON THE DURING THE
ACCOUNT VALUE ACCOUNT VALUE SIX-MONTH SIX-MONTH
MAY 1, 2017 OCTOBER 31, 2017 PERIOD PERIOD (a)
-----------------------------------------------------------------------------------------------------------------------------
<S> <C> <C> <C> <C>
FIRST TRUST PREFERRED SECURITIES AND INCOME ETF (FPE)
Actual $1,000.00 $1,049.90 0.85% $4.39
Hypothetical (5% return before expenses) $1,000.00 $1,020.92 0.85% $4.33
-----------------------------------------------------------------------------------------------------------------------------
ANNUALIZED EXPENSES PAID
EXPENSE RATIO DURING THE PERIOD
BEGINNING ENDING BASED ON THE AUGUST 22, 2017 (b)
ACCOUNT VALUE ACCOUNT VALUE NUMBER OF DAYS TO
AUGUST 22, 2017 OCTOBER 31, 2017 IN THE PERIOD OCTOBER 31, 2017 (c)
-----------------------------------------------------------------------------------------------------------------------------
FIRST TRUST INSTITUTIONAL PREFERRED SECURITIES AND INCOME ETF (FPEI)
Actual $1,000.00 $1,020.00 0.85% $1.65
Hypothetical (5% return before expenses) $1,000.00 $1,020.92 0.85% $4.33
</TABLE>
(a) Expenses are equal to the annualized expense ratio as indicated in the
table multiplied by the average account value over the period (May 1, 2017
through October 31, 2017), multiplied by 184/365 (to reflect the one-half
year period).
(b) Inception date.
(c) Actual expenses are equal to the annualized expense ratio as indicated in
the table multiplied by the average account value over the period (August
22, 2017 through October 31, 2017), multiplied by 70/365. Hypothetical
expenses are assumed for the most recent half-year period.
Page 11
<PAGE>
FIRST TRUST PREFERRED SECURITIES AND INCOME ETF (FPE)
PORTFOLIO OF INVESTMENTS
OCTOBER 31, 2017
<TABLE>
<CAPTION>
STATED STATED
SHARES DESCRIPTION RATE MATURITY VALUE
------------- ---------------------------------------------------------------- ------------- ---------- --------------
<S> <C> <C> <C> <C>
$25 PAR PREFERRED SECURITIES - 30.0%
BANKS - 7.9%
279,161 Banc Of California, Inc., Series E.............................. 7.00% (a) $ 7,824,883
200,798 Bank of America Corp., Series CC................................ 6.20% (a) 5,381,386
683,673 Citigroup Capital XIII, 3 Mo. LIBOR + 6.37% (b)................. 7.75% 10/30/40 18,609,579
81,743 Citigroup, Inc., Series S....................................... 6.30% (a) 2,212,783
463,933 Fifth Third Bancorp, Series I (c)............................... 6.63% (a) 13,217,451
152,850 FNB Corp. (c)................................................... 7.25% (a) 4,431,122
2,472,431 GMAC Capital Trust I, Series 2, 3 Mo. LIBOR + 5.79% (b)......... 7.22% 02/15/40 64,926,038
741,423 Huntington Bancshares, Inc., Series D........................... 6.25% (a) 20,581,902
621,814 KeyCorp, Series E (c)........................................... 6.13% (a) 18,150,751
807,503 People's United Financial, Inc., Series A (c)................... 5.63% (a) 21,770,281
215,349 PNC Financial Services Group, Inc., Series P (c)................ 6.13% (a) 6,077,149
301,281 Royal Bank of Scotland Group PLC, Series S...................... 6.60% (a) 7,727,858
571,178 Synovus Financial Corp., Series C (c)........................... 7.88% (a) 14,839,204
162,575 Valley National Bancorp, Series A (c)........................... 6.25% (a) 4,478,941
149,894 Valley National Bancorp, Series B (c)........................... 5.50% (a) 3,957,202
132,227 Wells Fargo & Co., Series Q (c)................................. 5.85% (a) 3,601,863
87,688 Wells Fargo & Co., Series W..................................... 5.70% (a) 2,259,720
55,237 Western Allliance Bancorp....................................... 6.25% 07/01/56 1,458,809
452,679 Wintrust Financial Corp., Series D (c).......................... 6.50% (a) 12,670,485
160,834 Zions Bancorporation, Series G (c).............................. 6.30% (a) 4,427,760
--------------
238,605,167
--------------
CAPITAL MARKETS - 5.6%
700,540 Apollo Investment Corp.......................................... 6.88% 07/15/43 18,101,954
202,404 BGC Partners, Inc............................................... 8.13% 06/15/42 5,252,384
1,302,831 Goldman Sachs Group, Inc., Series K (c)......................... 6.38% (a) 37,417,306
1,063,293 Morgan Stanley, Series E (c).................................... 7.13% (a) 30,782,332
1,331,011 Morgan Stanley, Series F (c).................................... 6.88% (a) 38,000,364
338,748 Morgan Stanley, Series I (c).................................... 6.38% (a) 9,484,944
226,672 Morgan Stanley, Series K (c).................................... 5.85% (a) 6,120,144
205,272 Solar Capital Ltd............................................... 6.75% 11/15/42 5,183,118
422,374 State Street Corp., Series G (c)................................ 5.35% (a) 11,488,573
228,396 Stifel Financial Corp., Series A................................ 6.25% (a) 6,109,593
--------------
167,940,712
--------------
CONSUMER FINANCE - 0.1%
89,758 Capital One Financial Corp., Series D........................... 6.70% (a) 2,427,954
--------------
DIVERSIFIED FINANCIAL SERVICES - 0.6%
773,064 KKR Financial Holdings LLC, Series A............................ 7.38% (a) 19,612,634
--------------
DIVERSIFIED TELECOMMUNICATION SERVICES - 1.3%
797,844 Qwest Corp...................................................... 6.88% 10/01/54 20,512,569
252,220 Qwest Corp...................................................... 6.50% 09/01/56 6,368,555
490,135 Qwest Corp...................................................... 6.75% 06/15/57 12,498,443
--------------
39,379,567
--------------
ELECTRIC UTILITIES - 0.3%
82,877 SCE Trust V, Series K (c)....................................... 5.45% (a) 2,273,316
203,679 Southern (The) Co............................................... 6.25% 10/15/75 5,495,259
--------------
7,768,575
--------------
EQUITY REAL ESTATE INVESTMENT TRUSTS - 3.0%
264,705 American Homes 4 Rent, Series D................................. 6.50% (a) 7,104,682
755,147 American Homes 4 Rent, Series E................................. 6.35% (a) 19,943,432
165,549 Colony NorthStar, Inc., Series J................................ 7.13% (a) 4,216,533
303,656 Colony NorthStar, Inc., Series E................................ 8.75% (a) 8,198,712
</TABLE>
Page 12 See Notes to Financial Statements
<PAGE>
FIRST TRUST PREFERRED SECURITIES AND INCOME ETF (FPE)
PORTFOLIO OF INVESTMENTS (CONTINUED)
OCTOBER 31, 2017
<TABLE>
<CAPTION>
STATED STATED
SHARES DESCRIPTION RATE MATURITY VALUE
------------- ---------------------------------------------------------------- ------------- ---------- --------------
<S> <C> <C> <C> <C>
$25 PAR PREFERRED SECURITIES (CONTINUED)
EQUITY REAL ESTATE INVESTMENT TRUSTS (CONTINUED)
301,385 EPR Properties, Series F........................................ 6.63% (a) $ 7,615,999
244,828 Farmland Partners, Inc., Series B (d)........................... 6.00% (a) 6,606,071
263,851 Global Net Lease, Inc., Series A................................ 7.25% (a) 6,614,745
89,274 Taubman Centers, Inc., Series J................................. 6.50% (a) 2,249,705
157,888 Urstadt Biddle Properties, Inc., Series H....................... 6.25% (a) 4,198,242
973,598 VEREIT, Inc., Series F.......................................... 6.70% (a) 24,894,901
--------------
91,643,022
--------------
FOOD PRODUCTS - 1.2%
546,435 CHS, Inc., Series 2 (c)......................................... 7.10% (a) 15,119,856
564,782 CHS, Inc., Series 3 (c)......................................... 6.75% (a) 15,418,549
204,786 CHS, Inc., Series 4............................................. 7.50% (a) 5,867,119
--------------
36,405,524
--------------
INSURANCE - 5.0%
30,045 Aegon N.V....................................................... 6.38% (a) 778,166
980,558 Aegon N.V....................................................... 8.00% 02/15/42 25,769,064
143,423 AmTrust Financial Services, Inc................................. 7.25% 06/15/55 3,700,313
213,943 AmTrust Financial Services, Inc................................. 7.50% 09/15/55 5,763,624
54,680 AmTrust Financial Services, Inc., Series E...................... 7.75% (a) 1,405,276
151,313 AmTrust Financial Services, Inc., Series F...................... 6.95% (a) 3,495,330
48,051 Aspen Insurance Holdings Ltd.................................... 5.63% (a) 1,217,132
598,279 Aspen Insurance Holdings Ltd. (c)............................... 5.95% (a) 16,117,636
445,203 Delphi Financial Group, Inc., 3 Mo. LIBOR +3.19% (b) (e)........ 4.61% 05/15/37 9,488,389
490,563 Global Indemnity Ltd............................................ 7.75% 08/15/45 12,612,375
412,412 Global Indemnity Ltd............................................ 7.88% 04/15/47 10,763,953
305,250 National General Holdings Corp.................................. 7.63% 09/15/55 7,850,664
114,565 National General Holdings Corp., Series C....................... 7.50% (a) 2,907,660
477,056 PartnerRe Ltd., Series H........................................ 7.25% (a) 13,891,871
148,204 Phoenix Cos., Inc............................................... 7.45% 01/15/32 2,774,201
901,327 Reinsurance Group of America, Inc. (c).......................... 5.75% 06/15/56 25,056,891
206,181 Validus Holdings, Ltd., Series B................................ 5.80% (a) 5,210,194
129,857 WR Berkley Corp................................................. 5.75% 06/01/56 3,415,239
--------------
152,217,978
--------------
INTERNET SOFTWARE & SERVICES - 0.6%
639,832 eBay, Inc....................................................... 6.00% 02/01/56 17,326,651
--------------
MORTGAGE REAL ESTATE INVESTMENT TRUSTS - 1.3%
259,032 AGNC Investment Corp., Series C (c)............................. 7.00% (a) 6,929,106
443,865 Annaly Capital Management, Inc., Series F (c)................... 6.95% (a) 11,718,036
156,277 Invesco Mortgage Capital, Inc., Series B (c).................... 7.75% (a) 4,121,025
383,005 MFA Financial, Inc.............................................. 8.00% 04/15/42 9,827,908
258,893 Two Harbors Investment, Corp., Series B (c)..................... 7.63% (a) 6,876,198
--------------
39,472,273
--------------
MULTI-UTILITIES - 0.7%
364,646 Integrys Holding, Inc. (c)...................................... 6.00% 08/01/73 10,324,040
447,411 Just Energy Group, Inc., Series A (c)........................... 8.50% (a) 11,632,686
--------------
21,956,726
--------------
OIL, GAS & CONSUMABLE FUELS - 0.5%
164,265 NuStar Energy L.P., Series A (c)................................ 8.50% (a) 4,311,956
452,383 NuStar Logistics L.P. (c)....................................... 7.63% 01/15/43 11,363,861
--------------
15,675,817
--------------
THRIFTS & MORTGAGE FINANCE - 1.0%
1,047,748 New York Community Bancorp, Inc., Series A (c).................. 6.38% (a) 29,263,602
--------------
</TABLE>
See Notes to Financial Statements Page 13
<PAGE>
FIRST TRUST PREFERRED SECURITIES AND INCOME ETF (FPE)
PORTFOLIO OF INVESTMENTS (CONTINUED)
OCTOBER 31, 2017
<TABLE>
<CAPTION>
STATED STATED
SHARES DESCRIPTION RATE MATURITY VALUE
------------- ---------------------------------------------------------------- ------------- ---------- --------------
<S> <C> <C> <C> <C>
$25 PAR PREFERRED SECURITIES (CONTINUED)
WIRELESS TELECOMMUNICATION SERVICES - 0.9%
230,199 United States Cellular Corp..................................... 7.25% 12/01/63 $ 6,132,501
811,426 United States Cellular Corp..................................... 7.25% 12/01/64 21,754,331
--------------
27,886,832
--------------
TOTAL $25 PAR PREFERRED SECURITIES........................................................ 907,583,034
(Cost $886,392,126) --------------
$100 PAR PREFERRED SECURITIES - 1.1%
BANKS - 0.3%
21,135 Agribank FCB (c) (e)............................................ 6.88% (a) 2,342,022
13,800 CoBank ACB, Series F (c) (f).................................... 6.25% (a) 1,490,400
11,172 CoBank ACB, Series G............................................ 6.13% (a) 1,142,476
12,197 CoBank ACB, Series H (c)........................................ 6.20% (a) 1,306,985
34,840 Farm Credit Bank Of Texas (c) (g)............................... 6.75% (a) 3,841,110
--------------
10,122,993
--------------
CONSUMER FINANCE - 0.8%
346,818 SLM Corp., Series B, 3 Mo. LIBOR + 1.70% (b).................... 3.02% (a) 23,347,788
--------------
TOTAL $100 PAR PREFERRED SECURITIES....................................................... 33,470,781
(Cost $27,968,764) --------------
$1,000 PAR PREFERRED SECURITIES - 2.5%
BANKS - 1.0%
20,000 Farm Credit Bank Of Texas, Series 1 (g)........................ 10.00% (a) 24,450,000
4,556 Sovereign Real Estate Investment Trust (g)..................... 12.00% (a) 5,712,085
--------------
30,162,085
--------------
CONSUMER FINANCE - 0.1%
2,500 Compeer Financial ACA (c) (g)................................... 6.75% (a) 2,672,812
--------------
DIVERSIFIED FINANCIAL SERVICES - 0.3%
10,000 Kinder Morgan GP, Inc., 3 Mo. LIBOR + 3.90% (b) (g)............. 5.21% 08/18/57 9,394,375
--------------
INSURANCE - 1.1%
33,450 XLIT Ltd., Series D, 3 Mo. LIBOR + 3.12% (b).................... 4.48% (a) 31,923,844
--------------
TOTAL $1,000 PAR PREFERRED SECURITIES..................................................... 74,153,116
(Cost $70,522,223) --------------
PAR STATED STATED
AMOUNT DESCRIPTION RATE MATURITY VALUE
------------- ---------------------------------------------------------------- ------------- ---------- --------------
CAPITAL PREFERRED SECURITIES - 65.0%
AUTOMOBILES - 0.9%
$ 26,300,000 General Motors Financial Co., Inc., Series A (c)................ 5.75% (a) 27,549,250
--------------
BANKS - 33.6%
15,364,000 Australia & New Zealand Banking Group Ltd. (c) (f) (h).......... 6.75% (a) 17,690,110
22,000,000 Banco Bilbao Vizcaya Argentaria S.A. (c) (h).................... 9.00% (a) 22,773,630
1,000,000 Banco do Brasil S.A. (c) (f) (h)................................ 9.00% (a) 1,100,000
10,600,000 Banco Mercantil del Norte S.A. (c) (f) (h)...................... 5.75% 10/04/31 10,812,000
4,900,000 Banco Mercantil del Norte S.A. (c) (f) (h)...................... 6.88% (a) 5,157,250
8,500,000 Banco Mercantil del Norte S.A. (c) (f) (h)...................... 7.63% (a) 9,265,000
13,800,000 Banco Santander S.A. (c) (h).................................... 6.38% (a) 14,383,740
6,725,000 Bank of America Corp., Series AA (c)............................ 6.10% (a) 7,515,187
17,000,000 Bank of America Corp., Series DD (c)............................ 6.30% (a) 19,410,260
10,000,000 Bank of America Corp., Series K (c)............................. 8.00% (a) 10,137,500
14,902,000 Bank of America Corp., Series M (c)............................. 8.13% (a) 15,391,531
8,000,000 Bank of America Corp., Series X (c)............................. 6.25% (a) 8,920,000
</TABLE>
Page 14 See Notes to Financial Statements
<PAGE>
FIRST TRUST PREFERRED SECURITIES AND INCOME ETF (FPE)
PORTFOLIO OF INVESTMENTS (CONTINUED)
OCTOBER 31, 2017
<TABLE>
<CAPTION>
PAR STATED STATED
AMOUNT DESCRIPTION RATE MATURITY VALUE
------------- ---------------------------------------------------------------- ------------- ---------- --------------
<S> <C> <C> <C> <C>
CAPITAL PREFERRED SECURITIES (CONTINUED)
BANKS (CONTINUED)
$ 20,000,000 Bank of America Corp., Series Z (c)............................. 6.50% (a) $ 22,900,000
44,000,000 Barclays PLC (c) (h)............................................ 7.88% (a) 49,151,784
13,400,000 Barclays PLC (c) (h)............................................ 8.25% (a) 14,265,439
566 Barclays PLC (c) (h)............................................ 6.63% (a) 593
10,000,000 BNP Paribas S.A. (c) (f) (h).................................... 6.75% (a) 10,962,500
25,000,000 BNP Paribas S.A. (c) (f) (h).................................... 7.63% (a) 28,093,750
10,498,000 BPCE S.A. (c) (f)............................................... 12.50% (a) 12,407,376
5,797,000 BPCE S.A. (c)................................................... 12.50% (a) 6,851,358
1,986,000 Citigroup, Inc. (c)............................................. 5.95% (a) 2,166,230
15,286,000 Citigroup, Inc., Series O (c)................................... 5.88% (a) 16,022,021
9,000,000 Citigroup, Inc., Series P (c)................................... 5.95% (a) 9,858,240
4,000,000 Citigroup, Inc., Series Q (c)................................... 5.95% (a) 4,228,220
10,000,000 Citigroup, Inc., Series R (c)................................... 6.13% (a) 10,737,500
14,000,000 Citigroup, Inc., Series T (c)................................... 6.25% (a) 15,960,000
2,616,000 Citizens Financial Group, Inc. (c).............................. 5.50% (a) 2,746,800
18,200,000 CoBank ACB, Series I (c)........................................ 6.25% (a) 20,043,332
6,621,000 Cooperatieve Rabobank UA (c) (f)................................ 11.00% (a) 7,539,664
6,850,000 Cooperatieve Rabobank UA (c).................................... 11.00% (a) 7,800,437
30,800,000 Credit Agricole S.A. (c) (f) (h)................................ 7.88% (a) 35,133,221
36,000,000 Credit Agricole S.A. (c) (f) (h)................................ 8.13% (a) 43,401,132
6,000,000 Credit Agricole S.A. (c)........................................ 8.38% (a) 6,660,000
14,651,000 Credit Agricole S.A. (c) (f).................................... 8.38% (a) 16,262,610
9,535,000 Danske Bank A/S (c) (h)......................................... 6.13% (a) 10,366,709
5,000,000 Dresdner Funding Trust I........................................ 8.15% 06/30/31 6,531,310
20,000,000 Fifth Third Bancorp (c)......................................... 5.10% (a) 20,500,000
2,000,000 HBOS Capital Funding L.P........................................ 6.85% (a) 2,056,500
21,359,000 HSBC Holdings PLC (c) (h)....................................... 6.38% (a) 23,414,804
19,500,000 ING Groep N.V. (c) (h).......................................... 6.88% (a) 21,772,569
3,150,000 ING Groep N.V. (c) (h).......................................... 6.50% (a) 3,465,315
36,325,000 Intesa Sanpaolo S.p.A. (c) (f) (h).............................. 7.70% (a) 39,866,687
20,145,000 JPMorgan Chase & Co., Series 1 (c).............................. 7.90% (a) 20,683,879
7,663,000 JPMorgan Chase & Co., Series S (c).............................. 6.75% (a) 8,793,292
2,000,000 JPMorgan Chase & Co., Series U (c).............................. 6.13% (a) 2,222,500
5,270,000 JPMorgan Chase & Co., Series X (c).............................. 6.10% (a) 5,882,638
4,100,000 Lloyds Bank PLC (c) (f)......................................... 12.00% (a) 5,553,106
8,088,000 Lloyds Bank PLC (c)............................................. 12.00% (a) 10,954,517
18,500,000 Lloyds Banking Group PLC (c) (h)................................ 7.50% (a) 21,159,375
6,084,000 Macquarie Bank Ltd./London (c) (f) (h).......................... 6.13% (a) 6,412,536
5,859,000 PNC Financial Services Group, Inc. (c).......................... 6.75% (a) 6,598,699
8,310,000 Royal Bank Of Scotland Group PLC (c) (h)........................ 7.50% (a) 8,924,940
1,000,000 Royal Bank Of Scotland Group PLC (c)............................ 7.65% (a) 1,285,000
29,000,000 Royal Bank Of Scotland Group PLC (c) (h)........................ 8.00% (a) 33,225,300
33,750,000 Royal Bank Of Scotland Group PLC (c) (h)........................ 8.63% (a) 38,302,875
13,000,000 Societe Generale S.A. (c) (h)................................... 8.25% (a) 13,788,125
27,200,000 Societe Generale S.A. (c) (f) (h)............................... 7.38% (a) 30,056,000
20,000,000 Societe Generale S.A. (c) (h)................................... 7.88% (a) 22,725,000
13,000,000 Societe Generale S.A. (c) (f) (h)............................... 7.88% (a) 14,771,250
13,100,000 Standard Chartered PLC (c)...................................... 7.01% (a) 15,444,900
11,000,000 Standard Chartered PLC (c) (f) (h).............................. 7.50% (a) 12,093,950
15,000,000 Standard Chartered PLC (c) (f) (h).............................. 7.75% (a) 16,671,000
10,000,000 Sun Trust Banks, Inc., Series G (c)............................. 5.05% (a) 10,312,500
17,000,000 UniCredit S.p.A. (c) (f)........................................ 5.86% 06/19/32 18,193,740
21,000,000 UniCredit S.p.A. (c) (h)........................................ 8.00% (a) 23,295,174
</TABLE>
See Notes to Financial Statements Page 15
<PAGE>
FIRST TRUST PREFERRED SECURITIES AND INCOME ETF (FPE)
PORTFOLIO OF INVESTMENTS (CONTINUED)
OCTOBER 31, 2017
<TABLE>
<CAPTION>
PAR STATED STATED
AMOUNT DESCRIPTION RATE MATURITY VALUE
------------- ---------------------------------------------------------------- ------------- ---------- --------------
<S> <C> <C> <C> <C>
CAPITAL PREFERRED SECURITIES (CONTINUED)
BANKS (CONTINUED)
$ 34,253,000 Wells Fargo & Co., Series K (c)................................. 7.98% (a) $ 34,991,152
11,000,000 Wells Fargo & Co., Series U (c)................................. 5.88% (a) 12,311,750
7,000,000 Zions Bancorporation, Series J (c).............................. 7.20% (a) 7,997,500
--------------
1,016,373,007
--------------
CAPITAL MARKETS - 3.8%
6,879,000 Aberdeen Asset Management PLC................................... 7.00% (a) 7,005,250
6,000,000 Charles Schwab Corp. (c)........................................ 5.00% (a) 6,075,000
30,350,000 Credit Suisse Group AG (c) (f) (h).............................. 7.50% (a) 35,353,926
19,564,000 E*Trade Financial Corp., Series A (c)........................... 5.88% (a) 20,933,480
7,500,000 Goldman Sachs Group, Inc., Series L (c)......................... 5.70% (a) 7,753,125
3,280,000 Goldman Sachs Group, Inc., Series M (c)......................... 5.38% (a) 3,407,100
3,000,000 Natixis S.A. (c) (f)............................................ 10.00% (a) 3,112,500
1,000,000 Natixis S.A. (c)................................................ 10.00% (a) 1,037,500
10,000,000 UBS Group AG (c) (h)............................................ 7.00% (a) 11,478,650
7,000,000 UBS Group AG (c) (h)............................................ 7.13% (a) 7,555,730
3,000,000 UBS Group AG (c) (h)............................................ 6.88% (a) 3,276,546
6,500,000 UBS Group AG (c) (h)............................................ 6.88% (a) 7,310,414
--------------
114,299,221
--------------
CONSUMER FINANCE - 0.7%
2,591,000 American Express Co., Series C (c).............................. 4.90% (a) 2,662,253
19,150,000 Discover Financial Services, Series C (c)....................... 5.50% (a) 19,556,937
--------------
22,219,190
--------------
DIVERSIFIED FINANCIAL SERVICES - 0.5%
13,971,000 Voya Financial, Inc. (c)........................................ 5.65% 05/15/53 14,774,332
--------------
DIVERSIFIED TELECOMMUNICATION SERVICES - 1.0%
14,310,000 Koninklijke KPN N.V. (c)........................................ 7.00% 03/28/73 16,276,909
11,882,000 Koninklijke KPN N.V. (c) (f).................................... 7.00% 03/28/73 13,515,181
--------------
29,792,090
--------------
ELECTRIC UTILITIES - 5.1%
46,700,000 Emera, Inc., Series 16-A (c).................................... 6.75% 06/15/76 53,709,670
40,575,000 Enel S.p.A. (c) (f)............................................. 8.75% 09/24/73 50,211,563
11,900,000 Nextera Energy Capital Holdings, Inc., Series D,
3 Mo. LIBOR + 3.35% (b)...................................... 4.66% 09/01/67 11,915,488
23,893,000 PPL Capital Funding, Inc., Series A, 3 Mo. LIBOR + 2.67% (b).... 4.00% 03/30/67 23,694,688
14,345,000 Southern (The) Co., Series B (c)................................ 5.50% 03/15/57 15,275,444
359,000 Southern California Edison Co., Series E (c).................... 6.25% (a) 405,221
--------------
155,212,074
--------------
FOOD PRODUCTS - 2.4%
7,700,000 Dairy Farmers of America, Inc. (g).............................. 7.13% (a) 8,614,375
17,854,000 Land O'Lakes Capital Trust I (g)............................... 7.45% 03/15/28 20,978,450
8,800,000 Land O'Lakes, Inc. (f).......................................... 7.25% (a) 9,526,000
31,000,000 Land O'Lakes, Inc. (f).......................................... 8.00% (a) 34,565,000
--------------
73,683,825
--------------
INDEPENDENT POWER AND RENEWABLE ELECTRICITY PRODUCERS - 0.4%
10,750,000 AES Gener S.A. (c).............................................. 8.38% 12/18/73 11,418,328
1,500,000 AES Gener S.A. (c) (f).......................................... 8.38% 12/18/73 1,593,255
--------------
13,011,583
--------------
INDUSTRIAL CONGLOMERATES - 0.7%
20,000,000 General Electric Co., Series D (c).............................. 5.00% (a) 20,900,000
--------------
</TABLE>
Page 16 See Notes to Financial Statements
<PAGE>
FIRST TRUST PREFERRED SECURITIES AND INCOME ETF (FPE)
PORTFOLIO OF INVESTMENTS (CONTINUED)
OCTOBER 31, 2017
<TABLE>
<CAPTION>
PAR STATED STATED
AMOUNT DESCRIPTION RATE MATURITY VALUE
------------- ---------------------------------------------------------------- ------------- ---------- --------------
<S> <C> <C> <C> <C>
CAPITAL PREFERRED SECURITIES (CONTINUED)
INSURANCE - 7.2%
$ 7,800,000 AG Insurance S.A. (c)........................................... 6.75% (a) $ 8,268,000
20,470,000 Aquarius & Investments PLC for Swiss Reinsurance Co., Ltd. (c).. 8.25% (a) 21,458,517
15,234,000 Assured Guaranty Municipal Holdings, Inc. (c) (f)............... 6.40% 12/15/66 14,929,320
33,352,000 Catlin Insurance Co., Ltd., 3 Mo. LIBOR + 2.98% (b) (f)......... 4.33% (a) 31,684,400
1,100,000 Catlin Insurance Co., Ltd., 3 Mo. LIBOR + 2.98% (b)............. 4.33% (a) 1,045,000
500,000 Cloverie PLC for Zurich Insurance Co., Ltd. (c)................. 8.25% (a) 508,055
4,200,000 CNP Assurances (c).............................................. 6.88% (a) 4,504,500
1,100,000 CNP Assurances (c).............................................. 7.50% (a) 1,157,475
5,000,000 Dai-ichi Life Insurance Co., Ltd. (c) (f)....................... 4.00% (a) 4,976,750
10,700,000 Fortegra Financial Corp. (c) (g)................................ 8.50% 10/15/57 10,753,500
6,201,000 Friends Life Holdings PLC (c)................................... 7.88% (a) 6,565,637
5,500,000 Hartford Financial Services Group (The), Inc.,
3 Mo. LIBOR + 2.13% (b) (f).................................. 3.54% 02/12/47 5,293,750
1,000,000 Hartford Financial Services Group, Inc. (c)..................... 8.13% 06/15/38 1,037,500
22,202,000 La Mondiale SAM (c)............................................. 7.63% (a) 23,714,245
6,128,000 Liberty Mutual Group, Inc. (f).................................. 7.80% 03/15/37 7,782,560
465,000 Liberty Mutual Group, Inc. (c) (f).............................. 10.75% 06/15/58 773,063
5,260,000 Liberty Mutual Group, Inc., 3 Mo. LIBOR + 2.91% (b) (f)......... 4.23% 03/15/37 5,167,950
9,000,000 MetLife, Inc. (f)............................................... 9.25% 04/08/38 13,398,750
17,565,000 Mitsui Sumitomo Insurance Co., Ltd. (c) (f)..................... 7.00% 03/15/72 20,197,993
1,100,000 Nationwide Financial Services, Inc.............................. 6.75% 05/15/37 1,234,750
4,435,000 Prudential Financial, Inc. (c).................................. 5.63% 06/15/43 4,824,171
15,000,000 QBE Insurance Group, Ltd. (c) (f)............................... 7.50% 11/24/43 17,392,500
10,506,000 QBE Insurance Group, Ltd. (c)................................... 6.75% 12/02/44 11,937,443
--------------
218,605,829
--------------
METALS & MINING - 1.9%
9,500,000 BHP Billiton Finance USA Ltd. (c) (f)........................... 6.25% 10/19/75 10,431,000
39,773,000 BHP Billiton Finance USA Ltd. (c) (f)........................... 6.75% 10/19/75 46,932,140
--------------
57,363,140
--------------
OIL, GAS & CONSUMABLE FUELS - 5.5%
45,148,441 Enbridge Energy Partners L.P., 3 Mo. LIBOR + 3.80% (b).......... 5.13% 10/01/37 45,148,441
8,800,000 Enbridge, Inc. (c).............................................. 5.50% 07/15/77 9,086,000
11,760,000 Enbridge, Inc., Series 16-A (c)................................. 6.00% 01/15/77 12,614,246
29,460,000 Energy Transfer LP, 3 Mo. LIBOR + 3.02% (b)..................... 4.39% 11/01/66 26,734,950
19,339,594 Enterprise Products Operating LLC, Series A,
3 Mo. LIBOR + 3.71% (b)...................................... 5.08% 08/01/66 19,339,594
10,500,000 Enterprise Products Operating LLC, Series B (c)................. 7.03% 01/15/68 10,552,500
16,500,000 Transcanada Trust (c)........................................... 5.30% 03/15/77 17,199,187
23,397,000 Transcanada Trust, Series 16-A (c).............................. 5.88% 08/15/76 25,619,715
--------------
166,294,633
--------------
TRANSPORTATION INFRASTRUCTURE - 1.3%
35,025,000 AerCap Global Aviation Trust (c) (f)............................ 6.50% 06/15/45 38,352,375
--------------
TOTAL CAPITAL PREFERRED SECURITIES.......................................................... 1,968,430,549
(Cost $1,890,526,585) --------------
PRINCIPAL STATED STATED
VALUE DESCRIPTION COUPON MATURITY VALUE
------------- ---------------------------------------------------------------- ------------- ---------- --------------
CORPORATE BONDS AND NOTES - 0.5%
INSURANCE - 0.5%
14,000,000 AmTrust Financial Services, Inc................................. 6.13% 08/15/23 13,930,000
(Cost $13,961,118) --------------
</TABLE>
See Notes to Financial Statements Page 17
<PAGE>
FIRST TRUST PREFERRED SECURITIES AND INCOME ETF (FPE)
PORTFOLIO OF INVESTMENTS (CONTINUED)
OCTOBER 31, 2017
<TABLE>
<CAPTION>
DESCRIPTION VALUE
------------------------------------------------------------------------------------------ --------------
<S> <C> <C>
TOTAL INVESTMENTS - 99.1%................................................................. $2,997,567,480
(Cost $2,889,370,816) (i)
NET OTHER ASSETS AND LIABILITIES - 0.9%................................................... 28,515,555
--------------
NET ASSETS - 100.0%....................................................................... $3,026,083,035
==============
</TABLE>
-----------------------------
(a) Perpetual maturity.
(b) Floating or variable rate security.
(c) Fixed-to-floating or fixed-to-variable rate security. The interest rate
shown reflects the fixed rate in effect at October 31, 2017. At a
predetermined date, the fixed rate will change to a floating rate or a
variable rate.
(d) Step-up security. A security where the coupon increases or steps up at a
predetermined rate.
(e) Pursuant to procedures adopted by the Trust's Board of Trustees, this
security has been determined to be illiquid by Stonebridge Advisors LLC,
the Fund's sub-advisor (the "Sub-Advisor").
(f) This security, sold within the terms of a private placement memorandum, is
exempt from registration upon resale under Rule 144A under the Securities
Act of 1933, as amended (the "1933 Act"), and may be resold in
transactions exempt from registration, normally to qualified institutional
buyers. Pursuant to procedures adopted by the Trust's Board of Trustees,
this security has been determined to be liquid by the Sub-Advisor.
Although market instability can result in periods of increased overall
market illiquidity, liquidity for each security is determined based on
security-specific factors and assumptions, which require subjective
judgment. At October 31, 2017, securities noted as such amounted to
$708,123,258 or 23.4% of net assets.
(g) This security, sold within the terms of a private placement memorandum, is
exempt from registration upon resale under Rule 144A under the 1933 Act,
and may be resold in transactions exempt from registration, normally to
qualified institutional buyers (see Note 2C - Restricted Securities in the
Notes to Financial Statements).
(h) This security is a contingent convertible capital security which may be
subject to conversion into common stock of the issuer under certain
circumstances. At October 31, 2017, securities noted as such amounted to
$667,477,024 or 22.1% of net assets. Of these securities, 3.9% originated
in emerging markets, and 96.1% originated in foreign markets.
(i) Aggregate cost for federal income tax purposes is $2,888,676,694. As of
October 31, 2017, the aggregate gross unrealized appreciation for all
investments in which there was an excess of value over tax cost was
$121,597,718 and the aggregate gross unrealized depreciation for all
investments in which there was an excess of tax cost over value was
$12,706,932. The net unrealized appreciation was $108,890,786.
LIBOR - London Interbank Offered Rate
-----------------------------
VALUATION INPUTS
A summary of the inputs used to value the Fund's investments as of October 31,
2017 is as follows (see Note 2A - Portfolio Valuation in the Notes to Financial
Statements):
<TABLE>
<CAPTION>
LEVEL 2 LEVEL 3
TOTAL LEVEL 1 SIGNIFICANT SIGNIFICANT
VALUE AT QUOTED OBSERVABLE UNOBSERVABLE
10/31/2017 PRICES INPUTS INPUTS
--------------- --------------- --------------- ---------------
<S> <C> <C> <C> <C>
$25 Par Preferred Securities:
Insurance....................................... $ 152,217,978 $ 139,955,388 $ 12,262,590 $ --
Multi-Utilities................................. 21,956,726 11,632,686 10,324,040 --
Other Industry Categories*...................... 733,408,330 733,408,330 -- --
$100 Par Preferred Securities:
Banks........................................... 10,122,993 -- 10,122,993 --
Consumer Finance................................ 23,347,788 23,347,788 -- --
$1,000 Par Preferred Securities*................... 74,153,116 -- 74,153,116 --
Capital Preferred Securities*...................... 1,968,430,549 -- 1,968,430,549 --
Corporate Bonds and Notes*......................... 13,930,000 -- 13,930,000 --
--------------- --------------- --------------- ---------------
Total Investments.................................. $ 2,997,567,480 $ 908,344,192 $ 2,089,223,288 $ --
=============== =============== =============== ===============
</TABLE>
* See the Portfolio of Investments for industry breakout.
All transfers in and out of the Levels during the period are assumed to occur on
the last day of the period at their current value. There were no transfers
between Levels at October 31, 2017.
Page 18 See Notes to Financial Statements
<PAGE>
FIRST TRUST INSTITUTIONAL PREFERRED SECURITIES AND INCOME ETF (FPEI)
PORTFOLIO OF INVESTMENTS
OCTOBER 31, 2017
<TABLE>
<CAPTION>
PAR STATED STATED
AMOUNT DESCRIPTION RATE MATURITY VALUE
------------- ---------------------------------------------------------------- ------------- ---------- --------------
<S> <C> <C> <C> <C>
CAPITAL PREFERRED SECURITIES - 97.9%
AUTOMOBILES - 3.4%
$ 800,000 General Motors Financial Co., Inc., Series A (a)................ 5.75% (b) $ 838,000
--------------
BANKS - 38.5%
400,000 Bank of America Corp., Series M (a)............................. 8.13% (b) 413,140
300,000 Bank of America Corp., Series X (a)............................. 6.25% (b) 334,500
400,000 Barclays PLC (a) (c)............................................ 7.88% (b) 446,834
400,000 BNP Paribas S.A. (a) (c) (d).................................... 7.63% (b) 449,500
800,000 Citigroup, Inc., Series P (a)................................... 5.95% (b) 876,288
200,000 Credit Agricole S.A. (a) (c) (d)................................ 7.88% (b) 228,138
400,000 Credit Agricole S.A. (a) (c) (d)................................ 8.13% (b) 482,235
300,000 Fifth Third Bancorp (a)......................................... 5.10% (b) 307,500
300,000 HSBC Holdings PLC (a) (c)....................................... 6.38% (b) 328,875
400,000 Intesa Sanpaolo S.p.A. (a) (c) (d).............................. 7.70% (b) 439,000
800,000 JPMorgan Chase & Co., Series R (a).............................. 6.00% (b) 884,000
500,000 Lloyds Bank PLC (a)............................................. 12.00% (b) 677,208
400,000 Royal Bank Of Scotland Group PLC (a) (c)........................ 8.00% (b) 458,280
400,000 Royal Bank Of Scotland Group PLC (a) (c)........................ 8.63% (b) 453,960
400,000 Societe Generale S.A. (a) (c) (d)............................... 7.88% (b) 454,500
300,000 Standard Chartered PLC (a)...................................... 7.01% (b) 353,700
400,000 Standard Chartered PLC (a) (c) (d).............................. 7.75% (b) 444,560
400,000 UniCredit S.p.A. (a) (c)........................................ 8.00% (b) 443,717
800,000 Wells Fargo & Co., Series U (a)................................. 5.88% (b) 895,400
--------------
9,371,335
--------------
CAPITAL MARKETS - 9.9%
40,000 Charles Schwab (The) Corp., Series F (a)........................ 5.00% (b) 40,500
500,000 Credit Suisse Group AG (a) (c) (d).............................. 7.50% (b) 582,437
500,000 E*Trade Financial Corp., Series A (a)........................... 5.88% (b) 535,000
400,000 Goldman Sachs Group (The), Inc., Series M (a)................... 5.38% (b) 415,500
800,000 Morgan Stanley, Series J (a).................................... 5.55% (b) 841,000
--------------
2,414,437
--------------
CONSUMER FINANCE - 3.8%
400,000 American Express Co., Series C (a).............................. 4.90% (b) 411,000
500,000 Discover Financial Services, Series C (a)....................... 5.50% (b) 510,625
--------------
921,625
--------------
DIVERSIFIED FINANCIAL SERVICES - 2.2%
500,000 Voya Financial, Inc. (a)........................................ 5.65% 05/15/53 528,750
--------------
DIVERSIFIED TELECOMMUNICATION SERVICES - 1.9%
400,000 Koninklijke KPN N.V. (a)........................................ 7.00% 03/28/73 454,980
--------------
ELECTRIC UTILITIES - 9.6%
800,000 Emera, Inc., Series 16-A (a).................................... 6.75% 06/15/76 920,080
800,000 Enel S.p.A. (a) (d)............................................. 8.75% 09/24/73 990,000
400,000 Southern (The) Co., Series B (a)................................ 5.50% 03/15/57 425,945
--------------
2,336,025
--------------
INDUSTRIAL CONGLOMERATES - 1.7%
400,000 General Electric Co., Series D (a).............................. 5.00% (b) 418,000
--------------
INSURANCE - 10.6%
150,000 Assured Guaranty Municipal Holdings, Inc. (a) (d)............... 6.40% 12/15/66 147,000
500,000 Catlin Insurance Co., Ltd., 3 Mo. LIBOR + 2.98% (d) (e)......... 4.33% (b) 475,000
550,000 Metlife, Inc.................................................... 10.75% 08/01/39 919,875
900,000 Mitsui Sumitomo Insurance Co., Ltd. (a) (d)..................... 7.00% 03/15/72 1,034,910
--------------
2,576,785
--------------
</TABLE>
See Notes to Financial Statements Page 19
<PAGE>
FIRST TRUST INSTITUTIONAL PREFERRED SECURITIES AND INCOME ETF (FPEI)
PORTFOLIO OF INVESTMENTS (CONTINUED)
OCTOBER 31, 2017
<TABLE>
<CAPTION>
PAR STATED STATED
AMOUNT DESCRIPTION RATE MATURITY VALUE
------------- ---------------------------------------------------------------- ------------- ---------- --------------
<S> <C> <C> <C> <C>
CAPITAL PREFERRED SECURITIES (CONTINUED)
METALS & MINING - 3.9%
$ 800,000 BHP Billiton Finance USA Ltd. (a) (d)........................... 6.75% 10/19/75 $ 944,000
--------------
OIL, GAS & CONSUMABLE FUELS - 12.4%
600,000 Enbridge Energy Partners L.P., 3 Mo. LIBOR + 3.80% (e).......... 5.13% 10/01/37 600,000
900,000 Enbridge, Inc., Series 16-A (a)................................. 6.00% 01/15/77 965,376
500,000 Energy Transfer LP, 3 Mo. LIBOR + 3.02% (e)..................... 4.33% 11/01/66 453,750
900,000 Transcanada Trust, Series 16-A (a).............................. 5.88% 08/15/76 985,500
--------------
3,004,626
--------------
TOTAL CAPITAL PREFERRED SECURITIES........................................................ 23,808,563
(Cost $23,590,853) --------------
PRINCIPAL STATED STATED
VALUE DESCRIPTION COUPON MATURITY VALUE
------------- ---------------------------------------------------------------- ------------- ---------- --------------
CORPORATE BONDS AND NOTES - 0.8%
INSURANCE - 0.8%
200,000 AmTrust Financial Services, Inc................................. 6.13% 08/15/23 199,000
--------------
(Cost $198,527)
TOTAL INVESTMENTS - 98.7%................................................................. 24,007,563
(Cost $23,789,380) (f)
NET OTHER ASSETS AND LIABILITIES - 1.3%................................................... 305,137
--------------
NET ASSETS - 100.0%....................................................................... $ 24,312,700
==============
</TABLE>
-----------------------------
(a) Fixed-to-floating or fixed-to-variable rate security. The interest rate
shown reflects the fixed rate in effect at October 31, 2017. At a
predetermined date, the fixed rate will change to a floating rate or a
variable rate.
(b) Perpetual maturity.
(c) This security is a contingent convertible capital security which may be
subject to conversion into common stock of the issuer under certain
circumstances. At October 31, 2017, securities noted as such amounted to
$5,212,036 or 21.4% of net assets. Of these securities, 0.0% originated in
emerging markets, and 100.0% originated in foreign markets.
(d) This security, sold within the terms of a private placement memorandum, is
exempt from registration upon resale under Rule 144A under the Securities
Act of 1933, as amended, and may be resold in transactions exempt from
registration, normally to qualified institutional buyers. Pursuant to
procedures adopted by the Trust's Board of Trustees, this security has
been determined to be liquid by Stonebridge Advisors LLC, the Fund's
sub-advisor. Although market instability can result in periods of
increased overall market illiquidity, liquidity for each security is
determined based on security-specific factors and assumptions, which
require subjective judgment. At October 31, 2017, securities noted as such
amounted to $6,671,280 or 27.4% of net assets.
(e) Floating or variable rate security.
(f) Aggregate cost for federal income tax purposes is $23,773,604. As of
October 31, 2017, the aggregate gross unrealized appreciation for all
investments in which there was an excess of value over tax cost was
$269,166 and the aggregate gross unrealized depreciation for all
investments in which there was an excess of tax cost over value was
$35,207. The net unrealized appreciation was $233,959.
LIBOR - London Interbank Offered Rate
Page 20 See Notes to Financial Statements
<PAGE>
FIRST TRUST INSTITUTIONAL PREFERRED SECURITIES AND INCOME ETF (FPEI)
PORTFOLIO OF INVESTMENTS (CONTINUED)
OCTOBER 31, 2017
-----------------------------
VALUATION INPUTS
A summary of the inputs used to value the Fund's investments as of October 31,
2017 is as follows (see Note 2A - Portfolio Valuation in the Notes to Financial
Statements):
<TABLE>
<CAPTION>
LEVEL 2 LEVEL 3
TOTAL LEVEL 1 SIGNIFICANT SIGNIFICANT
VALUE AT QUOTED OBSERVABLE UNOBSERVABLE
10/31/2017 PRICES INPUTS INPUTS
--------------- --------------- --------------- ---------------
<S> <C> <C> <C> <C>
Capital Preferred Securities*...................... $ 23,808,563 $ -- $ 23,808,563 $ --
Corporate Bonds and Notes*......................... 199,000 -- 199,000 --
--------------- --------------- --------------- ---------------
Total Investments.................................. $ 24,007,563 $ -- $ 24,007,563 $ --
=============== =============== =============== ===============
</TABLE>
* See Portfolio of Investments for industry breakdown.
All transfers in and out of the Levels during the period are assumed to occur on
the last day of the period at their current value. There were no transfers
between Levels at October 31, 2017.
See Notes to Financial Statements Page 21
<PAGE>
FIRST TRUST EXCHANGE-TRADED FUND III
STATEMENTS OF ASSETS AND LIABILITIES
OCTOBER 31, 2017
<TABLE>
<CAPTION>
FIRST TRUST
FIRST TRUST INSTITUTIONAL
PREFERRED PREFERRED
SECURITIES SECURITIES
AND INCOME AND INCOME
ETF ETF
(FPE) (FPEI)
---------------- ----------------
<S> <C> <C>
ASSETS:
Investments, at value................................................................... $ 2,997,567,480 $ 24,007,563
Cash.................................................................................... 32,142,515 1,341,433
Receivables:
Interest............................................................................. 23,879,598 320,043
Investment securities sold........................................................... 15,859,722 --
Capital shares sold.................................................................. 4,026,020 1,013,160
Dividends............................................................................ 2,262,150 --
Tax reclaims......................................................................... 371,400 5,104
---------------- ----------------
Total Assets......................................................................... 3,076,108,885 26,687,303
---------------- ----------------
LIABILITIES:
Payables:
Investment securities purchased...................................................... 47,928,578 2,359,872
Investment advisory fees............................................................. 2,097,272 14,731
---------------- ----------------
Total Liabilities.................................................................... 50,025,850 2,374,603
---------------- ----------------
NET ASSETS.............................................................................. $ 3,026,083,035 $ 24,312,700
================ ================
NET ASSETS CONSIST OF:
Paid-in capital......................................................................... $ 2,927,418,637 $ 24,045,762
Par value............................................................................... 1,503,050 12,000
Accumulated net investment income (loss)................................................ 1,198,370 47,377
Accumulated net realized gain (loss) on investments..................................... (12,233,686) (10,622)
Net unrealized appreciation (depreciation) on investments............................... 108,196,664 218,183
---------------- ----------------
NET ASSETS.............................................................................. $ 3,026,083,035 $ 24,312,700
================ ================
NET ASSET VALUE, per share.............................................................. $ 20.13 $ 20.26
================ ================
Number of shares outstanding (unlimited number of shares
authorized, par value $0.01 per share)............................................... 150,305,000 1,200,002
================ ================
Investments, at cost.................................................................... $ 2,889,370,816 $ 23,789,380
================ ================
</TABLE>
Page 22 See Notes to Financial Statements
<PAGE>
FIRST TRUST EXCHANGE-TRADED FUND III
STATEMENTS OF OPERATIONS
FOR THE PERIOD ENDED OCTOBER 31, 2017
<TABLE>
<CAPTION>
FIRST TRUST
FIRST TRUST INSTITUTIONAL
PREFERRED PREFERRED
SECURITIES SECURITIES
AND INCOME AND INCOME
ETF ETF
(FPE) (FPEI)
---------------- ----------------
<S> <C> <C>
INVESTMENT INCOME:
Interest................................................................................ $ 78,855,673 $ 220,879
Dividends............................................................................... 52,848,998 --
Foreign tax withholding................................................................. (79,771) --
Other................................................................................... 90,000 --
---------------- ----------------
Total investment income.............................................................. 131,714,900 220,879
---------------- ----------------
EXPENSES:
Investment advisory fees................................................................ 17,538,639 32,455
---------------- ----------------
Total expenses....................................................................... 17,538,639 32,455
---------------- ----------------
NET INVESTMENT INCOME (LOSS)............................................................ 114,176,261 188,424
---------------- ----------------
NET REALIZED AND UNREALIZED GAIN (LOSS):
Net realized gain (loss) on:
Investments.......................................................................... (4,209,698) (11,669)
In-kind redemptions.................................................................. 550,220 --
---------------- ----------------
Net realized gain (loss)................................................................ (3,659,478) (11,669)
---------------- ----------------
Net change in unrealized appreciation (depreciation) on investments..................... 80,709,412 218,183
---------------- ----------------
NET REALIZED AND UNREALIZED GAIN (LOSS)................................................. 77,049,934 206,514
---------------- ----------------
NET INCREASE (DECREASE) IN NET ASSETS RESULTING
FROM OPERATIONS...................................................................... $ 191,226,195 $ 394,938
================ ================
</TABLE>
See Notes to Financial Statements Page 23
<PAGE>
FIRST TRUST EXCHANGE-TRADED FUND III
STATEMENTS OF CHANGES IN NET ASSETS
<TABLE>
<CAPTION>
FIRST TRUST
INSTITUTIONAL
PREFERRED
FIRST TRUST SECURITIES
PREFERRED SECURITIES AND INCOME
AND INCOME ETF ETF
(FPE) (FPEI)
----------------------------------- ----------------
YEAR YEAR PERIOD
ENDED ENDED ENDED
10/31/2017 10/31/2016 10/31/2017 (a)
---------------- ---------------- ----------------
<S> <C> <C> <C>
OPERATIONS:
Net investment income (loss)........................................... $ 114,176,261 $ 50,295,555 $ 188,424
Net realized gain (loss)............................................... (3,659,478) (1,268,137) (11,669)
Net change in unrealized appreciation (depreciation)................... 80,709,412 28,313,723 218,183
---------------- ---------------- ----------------
Net increase (decrease) in net assets resulting from operations........ 191,226,195 77,341,141 394,938
---------------- ---------------- ----------------
DISTRIBUTIONS TO SHAREHOLDERS FROM:
Net investment income.................................................. (114,019,342) (50,469,633) (140,000)
Return of capital...................................................... (292,582) (440,159) --
---------------- ---------------- ----------------
Total distributions to shareholders.................................... (114,311,924) (50,909,792) (140,000)
---------------- ---------------- ----------------
SHAREHOLDER TRANSACTIONS:
Proceeds from shares sold.............................................. 1,605,162,501 955,735,609 24,057,762
Cost of shares redeemed................................................ (31,391,795) (20,474,196) --
---------------- ---------------- ----------------
Net increase (decrease) in net assets resulting from shareholder
transactions........................................................ 1,573,770,706 935,261,413 24,057,762
---------------- ---------------- ----------------
Total increase (decrease) in net assets................................ 1,650,684,977 961,692,762 24,312,700
NET ASSETS:
Beginning of period.................................................... 1,375,398,058 413,705,296 --
---------------- ---------------- ----------------
End of period.......................................................... $ 3,026,083,035 $ 1,375,398,058 $ 24,312,700
================ ================ ================
Accumulated net investment income (loss) at end of period.............. $ 1,198,370 $ 483,198 $ 47,377
================ ================ ================
CHANGES IN SHARES OUTSTANDING:
Shares outstanding, beginning of period................................ 70,655,000 21,805,000 --
Shares sold............................................................ 81,250,000 49,950,000 1,200,002
Shares redeemed........................................................ (1,600,000) (1,100,000) --
---------------- ---------------- ----------------
Shares outstanding, end of period...................................... 150,305,000 70,655,000 1,200,002
================ ================ ================
</TABLE>
(a) Inception date is August 22, 2017, which is consistent with the
commencement of investment operations and is the date the initial creation
units were established.
Page 24 See Notes to Financial Statements
<PAGE>
FIRST TRUST EXCHANGE-TRADED FUND III
FINANCIAL HIGHLIGHTS
FOR A SHARE OUTSTANDING THROUGHOUT EACH PERIOD
FIRST TRUST PREFERRED SECURITIES AND INCOME ETF (FPE)
<TABLE>
<CAPTION>
YEAR ENDED OCTOBER 31, PERIOD
-------------------------------------------------------------------- ENDED
2017 2016 2015 2014 10/31/2013 (a)
-------------- -------------- -------------- -------------- --------------
<S> <C> <C> <C> <C> <C>
Net asset value, beginning of period $ 19.47 $ 18.97 $ 19.04 $ 18.21 $ 19.99
---------- ---------- ---------- ---------- ----------
INCOME FROM INVESTMENT OPERATIONS:
Net investment income (loss) 1.08 1.12 1.16 (b) 1.10 0.65
Net realized and unrealized gain (loss) 0.66 0.52 (0.10) 0.76 (1.78)
---------- ---------- ---------- ---------- ----------
Total from investment operations 1.74 1.64 1.06 1.86 (1.13)
---------- ---------- ---------- ---------- ----------
DISTRIBUTIONS PAID TO SHAREHOLDERS FROM:
Net investment income (1.08) (1.13) (1.13) (1.03) (0.62)
Return of capital (0.00) (c) (0.01) -- -- (0.03)
---------- ---------- ---------- ---------- ----------
Total distributions (1.08) (1.14) (1.13) (1.03) (0.65)
---------- ---------- ---------- ---------- ----------
Net asset value, end of period $ 20.13 $ 19.47 $ 18.97 $ 19.04 $ 18.21
========== ========== ========== ========== ==========
TOTAL RETURN (d) 9.24% 8.97% 5.75% 10.42% (5.74)%
RATIOS/SUPPLEMENTAL DATA:
Net assets, end of period (in 000's) $3,026,083 $1,375,398 $ 413,705 $ 86,718 $ 64,722
RATIOS TO AVERAGE NET ASSETS:
Ratio of total expenses to average
net assets 0.85% 0.85% 0.85% 0.85% 0.85% (e)
Ratio of net investment income (loss) to
average net assets 5.54% 5.97% 6.15% 6.06% 5.44% (e)
Portfolio turnover rate (f) 13% 32% 50% 91% 45%
</TABLE>
(a) Inception date is February 11, 2013, which is consistent with the
commencement of investment operations and is the date the initial creation
units were established.
(b) Based on average shares outstanding.
(c) Amount is less than $0.01.
(d) Total return is calculated assuming an initial investment made at the net
asset value at the beginning of the period, reinvestment of all
distributions at net asset value during the period, and redemption at net
asset value on the last day of the period. The returns presented do not
reflect the deduction of taxes that a shareholder would pay on Fund
distributions or the redemption or sale of Fund shares. Total return is
calculated for the time period presented and is not annualized for periods
of less than a year.
(e) Annualized.
(f) Portfolio turnover is calculated for the time period presented and is not
annualized for periods of less than a year and does not include securities
received or delivered from processing creations or redemptions and in-kind
transactions.
See Notes to Financial Statements Page 25
<PAGE>
FIRST TRUST EXCHANGE-TRADED FUND III
FINANCIAL HIGHLIGHTS (CONTINUED)
FOR A SHARE OUTSTANDING THROUGHOUT THE PERIOD
FIRST TRUST INSTITUTIONAL PREFERRED SECURITIES AND INCOME ETF (FPEI)
<TABLE>
<CAPTION>
PERIOD
ENDED
10/31/2017 (a)
--------------
<S> <C>
Net asset value, beginning of period $ 20.00
----------
INCOME FROM INVESTMENT OPERATIONS:
Net investment income (loss) 0.18
Net realized and unrealized gain (loss) 0.22
----------
Total from investment operations 0.40
----------
DISTRIBUTIONS PAID TO SHAREHOLDERS FROM:
Net investment income (0.14)
----------
Net asset value, end of period $ 20.26
==========
TOTAL RETURN (b) 2.00%
RATIOS/SUPPLEMENTAL DATA:
Net assets, end of period (in 000's) $ 24,313
RATIOS TO AVERAGE NET ASSETS:
Ratio of total expenses to average
net assets 0.85% (c)
Ratio of net investment income (loss) to
average net assets 4.93% (c)
Portfolio turnover rate (d) 13%
</TABLE>
(a) Inception date is August 22, 2017, which is consistent with the
commencement of investment operations and is the date the initial creation
units were established.
(b) Total return is calculated assuming an initial investment made at the net
asset value at the beginning of the period, reinvestment of all
distributions at net asset value during the period, and redemption at net
asset value on the last day of the period. The return presented does not
reflect the deduction of taxes that a shareholder would pay on Fund
distributions or the redemption or sale of Fund shares. Total return is
calculated for the time period presented and is not annualized for periods
of less than a year.
(c) Annualized.
(d) Portfolio turnover is calculated for the time period presented and is not
annualized for periods of less than a year and does not include securities
received or delivered from processing creations or redemptions and in-kind
transactions.
Page 26 See Notes to Financial Statements
<PAGE>
--------------------------------------------------------------------------------
NOTES TO FINANCIAL STATEMENTS
--------------------------------------------------------------------------------
FIRST TRUST EXCHANGE-TRADED FUND III
OCTOBER 31, 2017
1. ORGANIZATION
First Trust Exchange-Traded Fund III (the "Trust") is an open-end management
investment company organized as a Massachusetts business trust on January 9,
2008, and is registered with the Securities and Exchange Commission ("SEC")
under the Investment Company Act of 1940, as amended (the "1940 Act").
The Trust currently consists of twelve exchange-traded funds that are offering
shares. This report covers the following funds, each a non-diversified series of
the Trust:
First Trust Preferred Securities and Income ETF - (NYSE Arca, Inc. ("NYSE
Arca") ticker "FPE")
First Trust Institutional Preferred Securities and Income ETF - (NYSE Arca
ticker "FPEI")(1)
(1) Commenced investment operations on August 22, 2017.
Each fund represents a separate series of shares of beneficial interest in the
Trust (each a "Fund" and collectively, the "Funds"). Each Fund's shares are
currently listed and traded on NYSE Arca. Unlike conventional mutual funds, each
Fund issues and redeems shares on a continuous basis, at net asset value
("NAV"), only in large specified blocks consisting of 50,000 shares called a
"Creation Unit." Creation Units are issued and redeemed in-kind for securities
in which a Fund invests and, in certain circumstances, for cash. Except when
aggregated in Creation Units, the shares are not redeemable securities of a
Fund.
Each Fund is an actively managed exchange-traded fund. The investment objective
of each Fund is to seek total return and to provide current income.
Under normal market conditions, FPE seeks to achieve its investment objective by
investing at least 80% of its net assets (including investment borrowings) in
preferred securities and income-producing debt securities, including corporate
bonds, high-yield securities (commonly referred to as "junk" bonds) and
convertible securities.
Under normal market conditions, FPEI seeks to achieve its investment objective
by investing at least 80% of its net assets (including investment borrowings) in
institutional preferred securities and income-producing debt securities,
including hybrid capital securities, contingent capital securities, U.S. and
non-U.S. corporate bonds and convertible securities.
There can be no assurance that a Fund will achieve its investment objective. The
Funds may not be appropriate for all investors.
2. SIGNIFICANT ACCOUNTING POLICIES
The Funds are each considered an investment company and follow accounting and
reporting guidance under Financial Accounting Standards Board ("FASB")
Accounting Standards Codification ("ASC") Topic 946, "Financial
Services-Investment Companies." The following is a summary of significant
accounting policies consistently followed by the Funds in the preparation of the
financial statements. The preparation of the financial statements in accordance
with accounting principles generally accepted in the United States of America
("U.S. GAAP") requires management to make estimates and assumptions that affect
the reported amounts and disclosures in the financial statements. Actual results
could differ from those estimates.
A. PORTFOLIO VALUATION
Each Fund's NAV is determined daily as of the close of regular trading on the
New York Stock Exchange ("NYSE"), normally 4:00 p.m. Eastern time, on each day
the NYSE is open for trading. If the NYSE closes early on a valuation day, the
NAV is determined as of that time. Domestic debt securities and foreign
securities are priced using data reflecting the earlier closing of the principal
markets for those securities. Each Fund's NAV is calculated by dividing the
value of all assets of the Fund (including accrued interest and dividends), less
all liabilities (including accrued expenses and dividends declared but unpaid),
by the total number of shares outstanding.
Each Fund's investments are valued daily at market value or, in absence of
market value with respect to any portfolio securities, at fair value. Market
value prices represent last sale or official closing prices from a national or
foreign exchange (i.e., a regulated market) and are primarily obtained from
third-party pricing services. Fair value prices represent any prices not
considered market value prices and are either obtained from a third-party
pricing service, or are determined by the Pricing Committee of the Funds'
investment advisor, First Trust Advisors L.P. ("First Trust" or the "Advisor"),
in accordance with valuation procedures adopted by the Trust's Board of
Trustees, and in accordance with provisions of the 1940 Act. Investments valued
by the Advisor's Pricing Committee, if any, are footnoted as such in the
footnotes to the Portfolio of Investments. Each Fund's investments are valued as
follows:
Page 27
<PAGE>
--------------------------------------------------------------------------------
NOTES TO FINANCIAL STATEMENTS (CONTINUED)
--------------------------------------------------------------------------------
FIRST TRUST EXCHANGE-TRADED FUND III
OCTOBER 31, 2017
Preferred stocks, real estate investment trust ("REITs") and other equity
securities listed on any national or foreign exchange (excluding The
Nasdaq Stock Market LLC ("Nasdaq") and the London Stock Exchange
Alternative Investment Market ("AIM")) are valued at the last sale price
on the exchange on which they are principally traded or, for Nasdaq and
AIM securities, the official closing price. Securities traded on more than
one securities exchange are valued at the last sale price or official
closing price, as applicable, at the close of the securities exchange
representing the principal market for such securities.
Bonds, notes, capital preferred securities, and other debt securities are
valued on the basis of valuations provided by dealers who make markets in
such securities or by a third-party pricing service approved by the
Trust's Board of Trustees, which may use the following valuation inputs
when available:
1) benchmark yields;
2) reported trades;
3) broker/dealer quotes;
4) issuer spreads;
5) benchmark securities;
6) bids and offers; and
7) reference data including market research publications.
Securities traded in an over-the-counter market are fair valued at the
mean of their most recent bid and asked price, if available, and otherwise
at their closing bid price.
Fixed income and other debt securities having a remaining maturity of
sixty days or less when purchased are fair valued at cost adjusted for
amortization of premiums and accretion of discounts (amortized cost),
provided the Advisor's Pricing Committee has determined that the use of
amortized cost is an appropriate reflection of fair value given market and
issuer-specific conditions existing at the time of the determination.
Factors that may be considered in determining the appropriateness of the
use of amortized cost include, but are not limited to, the following:
1) the credit conditions in the relevant market and changes thereto;
2) the liquidity conditions in the relevant market and changes thereto;
3) the interest rate conditions in the relevant market and changes
thereto (such as significant changes in interest rates);
4) issuer-specific conditions (such as significant credit
deterioration); and
5) any other market-based data the Advisor's Pricing Committee
considers relevant. In this regard the Advisor's Pricing Committee
may use last-obtained market-based data to assist it when valuing
portfolio securities using amortized cost.
Certain securities may not be able to be priced by pre-established pricing
methods. Such securities may be valued by the Trust's Board of Trustees or its
delegate, the Advisor's Pricing Committee, at fair value. These securities
generally include, but are not limited to, restricted securities (securities
which may not be publicly sold without registration under the Securities Act of
1933, as amended (the "1933 Act")) for which a third-party pricing service is
unable to provide a market price; securities whose trading has been formally
suspended; a security whose market or fair value price is not available from a
pre-established pricing source; a security with respect to which an event has
occurred that is likely to materially affect the value of the security after the
market has closed but before the calculation of a Fund's NAV or make it
difficult or impossible to obtain a reliable market quotation; and a security
whose price, as provided by the third-party pricing service, does not reflect
the security's fair value. As a general principle, the current fair value of a
security would appear to be the amount which the owner might reasonably expect
to receive for the security upon its current sale. When fair value prices are
used, generally they will differ from market quotations or official closing
prices on the applicable exchanges. A variety of factors may be considered in
determining the fair value of such securities, including, but not limited to,
the following:
1) the type of security;
2) the size of the holding;
3) the initial cost of the security;
4) transactions in comparable securities;
5) price quotes from dealers and/or third-party pricing services;
6) relationships among various securities;
7) information obtained by contacting the issuer, analysts, or the
appropriate stock exchange;
8) an analysis of the issuer's financial statements; and
9) the existence of merger proposals or tender offers that might affect
the value of the security.
Page 28
<PAGE>
--------------------------------------------------------------------------------
NOTES TO FINANCIAL STATEMENTS (CONTINUED)
--------------------------------------------------------------------------------
FIRST TRUST EXCHANGE-TRADED FUND III
OCTOBER 31, 2017
If the securities in question are foreign securities, the following additional
information may be considered:
1) the value of similar foreign securities traded on other foreign
markets;
2) ADR trading of similar securities;
3) closed-end fund trading of similar securities;
4) foreign currency exchange activity;
5) the trading prices of financial products that are tied to baskets of
foreign securities;
6) factors relating to the event that precipitated the pricing problem;
7) whether the event is likely to recur; and
8) whether the effects of the event are isolated or whether they affect
entire markets, countries or regions.
The Funds are subject to fair value accounting standards that define fair value,
establish the framework for measuring fair value and provide a three-level
hierarchy for fair valuation based upon the inputs to the valuation as of the
measurement date. The three levels of the fair value hierarchy are as follows:
o Level 1 - Level 1 inputs are quoted prices in active markets for
identical investments. An active market is a market in which
transactions for the investment occur with sufficient frequency and
volume to provide pricing information on an ongoing basis.
o Level 2 - Level 2 inputs are observable inputs, either directly or
indirectly, and include the following:
o Quoted prices for similar investments in active markets.
o Quoted prices for identical or similar investments in markets
that are non-active. A non-active market is a market where
there are few transactions for the investment, the prices are
not current, or price quotations vary substantially either
over time or among market makers, or in which little
information is released publicly.
o Inputs other than quoted prices that are observable for the
investment (for example, interest rates and yield curves
observable at commonly quoted intervals, volatilities,
prepayment speeds, loss severities, credit risks, and default
rates).
o Inputs that are derived principally from or corroborated by
observable market data by correlation or other means.
o Level 3 - Level 3 inputs are unobservable inputs. Unobservable
inputs may reflect the reporting entity's own assumptions about the
assumptions that market participants would use in pricing the
investment.
The inputs or methodologies used for valuing investments are not necessarily an
indication of the risk associated with investing in those investments. A summary
of the inputs used to value the Fund's investments as of October 31, 2017, is
included with each Fund's Portfolio of Investments.
B. SECURITIES TRANSACTIONS AND INVESTMENT INCOME
Securities transactions are recorded as of the trade date. Realized gains and
losses from securities transactions are recorded on the identified cost basis.
Dividend income is recorded on the ex-dividend date. Interest income, if any, is
recorded on the accrual basis. Amortization of premiums and accretion of
discounts are recorded using the effective interest method.
Distributions received from a Fund's investments in REITs may be comprised of
return of capital, capital gains, and income. The actual character of the
amounts received during the year are not known until after the REITs' fiscal
year end. A Fund records the character of distributions received from the REITs
during the year based on estimates available. The characterization of
distributions received by a Fund may be subsequently revised based on
information received from the REITs after their tax reporting periods conclude.
C. RESTRICTED SECURITIES
FPE invests in restricted securities, which are securities that may not be
offered for public sale without first being registered under the 1933 Act. Prior
to registration, restricted securities may only be resold in transactions exempt
from registration under Rule 144A under the 1933 Act, normally to qualified
institutional buyers. As of October 31, 2017, FPE held restricted securities as
shown in the following table that Stonebridge Advisors LLC ("Stonebridge" or the
"Sub-Advisor") has deemed illiquid pursuant to procedures adopted by the Trust's
Board of Trustees. Although market instability can result in periods of
increased overall market illiquidity, liquidity for each security is determined
based on security-specific factors and assumptions, which require subjective
judgment. FPE does not have the right to demand that such securities be
registered. These securities are valued according to the valuation procedures as
stated in the Portfolio Valuation note (Note 2A) and are not expressed as a
discount to the carrying value of a comparable unrestricted security. There are
no unrestricted securities with the same maturity dates and yields for these
issuers.
Page 29
<PAGE>
--------------------------------------------------------------------------------
NOTES TO FINANCIAL STATEMENTS (CONTINUED)
--------------------------------------------------------------------------------
FIRST TRUST EXCHANGE-TRADED FUND III
OCTOBER 31, 2017
<TABLE>
<CAPTION>
SHARES/ % OF
ACQUISITION PAR CURRENT CARRYING NET
SECURITY DATE AMOUNT PRICE COST VALUE ASSETS
------------------------------------------------------------------------------------------------------------------------------
<S> <C> <C> <C> <C> <C> <C>
Compeer Financial ACA, 6.75% 7/31/15 2,500 $ 1,069.12 $ 2,631,250 $ 2,672,812 0.09%
Dairy Farmers of America, Inc.,
7.13% 9/15/16-10/4/16 $ 7,700,000 111.88 7,898,000 8,614,375 0.28
Farm Credit Bank Of Texas, 6.75% 12/8/15-5/11/17 34,840 110.25 3,613,780 3,841,110 0.13
Farm Credit Bank Of Texas,
Series 1, 10.00% 1/30/15-6/5/17 20,000 1,222.50 24,649,650 24,450,000 0.81
Fortegra Financial Corp., 8.50%,
10/15/57 10/12/17 $10,700,000 100.50 10,700,000 10,753,500 0.36
Kinder Morgan GP, Inc., 5.33%,
08/18/57 3/31/17-10/16/17 10,000 939.44 9,215,000 9,394,375 0.31
Land O'Lakes Capital Trust I,
7.45%, 3/15/28 3/2/15-7/7/17 $17,854,000 117.50 19,916,825 20,978,450 0.69
Sovereign Real Estate Investment
Trust, 12.00% 5/12/14-3/22/16 4,556 1,253.75 5,906,010 5,712,085 0.19
------------- ------------- ---------
$ 84,530,515 $ 86,416,707 2.86%
============= ============= =========
</TABLE>
D. DIVIDENDS AND DISTRIBUTIONS TO SHAREHOLDERS
Dividends from net investment income, if any, are declared and paid monthly, or
as the Board of Trustees may determine from time to time. Distributions of net
realized capital gains earned by each Fund, if any, will be distributed at least
annually.
Distributions from income and capital gains are determined in accordance with
income tax regulations, which may differ from U.S. GAAP. Certain capital
accounts in the financial statements are periodically adjusted for permanent
differences in order to reflect their tax character. These permanent differences
are primarily due to the varying treatment of income and gain/loss on portfolio
securities held by the Funds and have no impact on net assets or net asset value
per share. Temporary differences, which arise from recognizing certain items of
income, expense and gain/loss in different periods for financial statement and
tax purposes, will reverse at some time in the future.
The tax character of distributions paid by each Fund during the fiscal period
ended October 31, 2017, was as follows:
<TABLE>
<CAPTION>
Distributions Distributions Distributions
paid from paid from paid from
Ordinary Capital Return of
Income Gains Capital
--------------- --------------- ---------------
<S> <C> <C> <C>
First Trust Preferred Securities and Income ETF $ 114,019,342 $ -- $ 292,582
First Trust Institutional Preferred Securities and Income ETF 140,000 -- --
</TABLE>
The tax character of distributions paid by FPE during the fiscal year ended
October 31, 2016, was as follows:
<TABLE>
<CAPTION>
Distributions Distributions Distributions
paid from paid from paid from
Ordinary Capital Return of
Income Gains Capital
--------------- --------------- ---------------
<S> <C> <C> <C>
First Trust Preferred Securities and Income ETF $ 50,469,633 $ -- $ 440,159
</TABLE>
As of October 31, 2017, the components of distributable earnings on a tax basis
for each Fund were as follows:
<TABLE>
<CAPTION>
Accumulated Net
Undistributed Capital and Unrealized
Ordinary Other Appreciation
Income Gain (Loss) (Depreciation)
--------------- --------------- ---------------
<S> <C> <C> <C>
First Trust Preferred Securities and Income ETF $ -- $ (11,729,438) $ 108,890,786
First Trust Institutional Preferred Securities and Income ETF 28,169 (7,190) 233,959
</TABLE>
Page 30
<PAGE>
--------------------------------------------------------------------------------
NOTES TO FINANCIAL STATEMENTS (CONTINUED)
--------------------------------------------------------------------------------
FIRST TRUST EXCHANGE-TRADED FUND III
OCTOBER 31, 2017
E. INCOME TAXES
Each Fund intends to qualify or continue to qualify as a regulated investment
company by complying with the requirements under Subchapter M of the Internal
Revenue Code of 1986, as amended, which includes distributing substantially all
of its net investment income and net realized gains to shareholders.
Accordingly, no provision has been made for federal and state income taxes.
However, due to the timing and amount of distributions, each Fund may be subject
to an excise tax of 4% of the amount by which approximately 98% of each Fund's
taxable income exceeds the distributions from such taxable income for the
calendar year.
The Funds are subject to accounting standards that establish a minimum threshold
for recognizing, and a system for measuring, the benefits of a tax position
taken or expected to be taken in a tax return. The taxable years ended 2014,
2015, 2016 and 2017 remain open to federal and state audit for FPE. The taxable
year ended 2017 remains open to federal and state audit for FPEI. As of October
31, 2017, management has evaluated the application of these standards to the
Funds, and has determined that no provision for income tax is required in the
Funds' financial statements for uncertain tax positions.
The Funds intend to utilize provisions of the federal income tax laws, which
allow them to carry a realized capital loss forward indefinitely following the
year of the loss and offset such loss against any future realized capital gains.
The Funds are subject to certain limitations under U.S. tax rules on the use of
capital loss carryforwards and net unrealized built-in losses. These limitations
apply when there has been a 50% change in ownership. At October 31, 2017, the
Funds had non-expiring capital loss carryforwards for federal income tax
purposes as follows:
<TABLE>
<CAPTION>
Non-Expiring
Capital Loss
Available
---------------
<S> <C>
First Trust Preferred Securities and Income ETF $ 11,729,438
First Trust Institutional Preferred Securities and Income ETF 7,190
</TABLE>
In order to present paid-in capital, accumulated net investment income (loss),
and accumulated net realized gain (loss) on investments on the Statements of
Assets and Liabilities that more closely represent their tax character, certain
adjustments have been made to paid-in capital, accumulated net investment income
(loss), and accumulated net realized gain (loss) on investments. These
adjustments are primarily due to the difference between book and tax treatments
of income and gains on various investment securities held by the Funds and
in-kind transactions. The results of operations and net assets were not affected
by these adjustments. For the fiscal period ended October 31, 2017, the
adjustments for each Fund were as follows:
<TABLE>
<CAPTION>
Accumulated
Accumulated Net Net Realized
Investment Gain (Loss) on Paid-in
Income (Loss) Investments Capital
--------------- --------------- ---------------
<S> <C> <C> <C>
First Trust Preferred Securities and Income ETF $ 558,253 $ (789,723) $ 231,470
First Trust Institutional Preferred Securities and Income ETF (1,047) 1,047 --
</TABLE>
F. EXPENSES
Expenses, other than the investment advisory fee and other excluded expenses,
are paid by the Advisor (See Note 3).
G. NEW AND AMENDED FINANCIAL REPORTING RULES AND FORMS
On October 13, 2016, the SEC adopted new rules and forms, and amended existing
rules and forms. The new and amended rules and forms are intended to modernize
the reporting of information provided by funds and to improve the quality and
type of information that funds provide to the SEC and investors. In part, the
new and amended rules and forms amend Regulation S-X and require standardized,
enhanced disclosures about derivatives in a fund's financial statements, as well
as other amendments. The compliance date for the amendments of Regulations S-X
was August 1, 2017 and resulted in additional disclosure for variable interest
rate securities within the Portfolio of Investments. The new form types and
other rule amendments will be effective for the First Trust funds, including the
Funds, for reporting periods beginning on and after June 1, 2018. Management is
evaluating the new form types and other rule amendments that are effective on
and after June 1, 2018, to determine the impact to the Funds.
H. NEW ACCOUNTING PRONOUNCEMENT
In December 2016, FASB released Accounting Standards Update ("ASU") 2016-19 that
makes technical changes to various sections of the ASC, including Topic 820,
Fair Value Measurement. The changes to Topic 820 are intended to clarify the
difference between a valuation approach and a valuation technique. The changes
to ASC 820-10-50-2 require a reporting entity to disclose, for Level 2 and
Page 31
<PAGE>
--------------------------------------------------------------------------------
NOTES TO FINANCIAL STATEMENTS (CONTINUED)
--------------------------------------------------------------------------------
FIRST TRUST EXCHANGE-TRADED FUND III
OCTOBER 31, 2017
Level 3 fair value measurements, a change in either or both a valuation approach
and a valuation technique and the reason(s) for the change. The changes to Topic
820 are effective for fiscal years, and interim periods within those fiscal
years, beginning after December 15, 2016. At this time, management is evaluating
the implications of the ASU and has not yet determined its impact on the
financial statements and disclosures.
3. INVESTMENT ADVISORY FEE, AFFILIATED TRANSACTIONS AND OTHER FEE ARRANGEMENTS
First Trust, the investment advisor to the Funds, is a limited partnership with
one limited partner, Grace Partners of DuPage L.P., and one general partner, The
Charger Corporation. The Charger Corporation is an Illinois corporation
controlled by James A. Bowen, Chief Executive Officer of First Trust. First
Trust is responsible for the ongoing monitoring of the securities in each Fund's
portfolio, managing the Funds' business affairs and providing certain
administrative services necessary for the management of the Funds.
Stonebridge, a majority-owned affiliate of First Trust, serves as the Funds'
sub-advisor and manages each Fund's portfolio subject to First Trust's
supervision. Pursuant to the Investment Management Agreement between the Trust
and the Advisor, First Trust will supervise Stonebridge and its management of
the investment of the Funds' assets and will pay Stonebridge for its services as
each Fund's sub-advisor. First Trust and Stonebridge are equally responsible for
the Funds' expenses, including the cost of transfer agency, custody, fund
administration, legal, audit and other services, but excluding fee payments
under the Investment Management Agreement, interest, taxes, acquired fund fees
and expenses, if any, brokerage commissions and other expenses connected with
the execution of portfolio transactions, distribution and service fees pursuant
to a 12b-1 plan, if any, and extraordinary expenses. Each Fund has agreed to pay
First Trust an annual unitary management fee equal to 0.85% of its average daily
net assets. Stonebridge receives a sub-advisory fee equal to 0.425% of the
average daily net assets of each Fund less Stonebridge's share of each Fund's
expenses. The Sub-Advisor's fee is paid by the Advisor out of the Advisor's
management fee. First Trust also provides fund reporting services to each Fund
for a flat annual fee in the amount of $9,250, which is covered under the annual
unitary management fee.
First Trust Capital Partners, LLC ("FTCP"), an affiliate of First Trust, owns,
through a wholly-owned subsidiary, a 51% ownership interest in Stonebridge.
The Trust has multiple service agreements with Brown Brothers Harriman & Co.
("BBH"). Under the service agreements, BBH performs custodial, fund accounting,
certain administrative services, and transfer agency services for each Fund. As
custodian, BBH is responsible for custody of each Fund's assets. As fund
accountant and administrator, BBH is responsible for maintaining the books and
records of each Fund's securities and cash. As transfer agent, BBH is
responsible for maintaining shareholder records for each Fund.
Each Trustee who is not an officer or employee of First Trust, any sub-advisor
or any of their affiliates ("Independent Trustees") is paid a fixed annual
retainer that is allocated equally among each fund in the First Trust Fund
Complex. Each Independent Trustee is also paid an annual per fund fee that
varies based on whether the fund is a closed-end or other actively managed fund,
or is an index fund.
Additionally, the Lead Independent Trustee and the Chairmen of the Audit
Committee, Nominating and Governance Committee and Valuation Committee are paid
annual fees to serve in such capacities, with such compensation allocated pro
rata among each fund in the First Trust Fund Complex based on net assets.
Independent Trustees are reimbursed for travel and out-of-pocket expenses in
connection with all meetings. The Lead Independent Trustee and Committee
Chairmen rotate every three years. The officers and "Interested" Trustee receive
no compensation from the Trust for acting in such capacities.
4. PURCHASES AND SALES OF SECURITIES
For the period ended October 31, 2017, the cost of purchases and proceeds from
sales of investments for each Fund, excluding short-term investments and in-kind
transactions, were as follows:
<TABLE>
<CAPTION>
Purchases Sales
--------------- ---------------
<S> <C> <C>
First Trust Preferred Securities and Income ETF $ 1,594,461,766 $ 254,676,247
First Trust Institutional Preferred Securities and Income ETF 26,516,185 2,713,532
</TABLE>
Page 32
<PAGE>
--------------------------------------------------------------------------------
NOTES TO FINANCIAL STATEMENTS (CONTINUED)
--------------------------------------------------------------------------------
FIRST TRUST EXCHANGE-TRADED FUND III
OCTOBER 31, 2017
For the period ended October 31, 2017, the cost of in-kind purchases and
proceeds from in-kind sales for each Fund were as follows:
<TABLE>
<CAPTION>
Purchases Sales
--------------- ---------------
<S> <C> <C>
First Trust Preferred Securities and Income ETF $ 236,390,286 $ 7,966,580
First Trust Institutional Preferred Securities and Income ETF -- --
</TABLE>
5. CREATIONS, REDEMPTIONS AND TRANSACTION FEES
Shares are created and redeemed by each Fund only in Creation Unit size
aggregations of 50,000 shares in transactions with broker-dealers or large
institutional investors that have entered into a participation agreement (an
"Authorized Participant"). In order to purchase Creation Units of a Fund, an
Authorized Participant must deposit (i) a designated portfolio of securities and
other instruments determined by First Trust (the "Deposit Securities") and
generally make or receive a cash payment referred to as the "Cash Component,"
which is an amount equal to the difference between the NAV of the Fund shares
(per Creation Unit aggregations) and the market value of the Deposit Securities,
and/or (ii) cash in lieu of all or a portion of the Deposit Securities. If the
Cash Component is a positive number (i.e., the NAV per Creation Unit Aggregation
exceeds the Deposit Amount), the Authorized Participant will deliver the Cash
Component. If the Cash Component is a negative number (i.e., the NAV per
Creation Unit Aggregation is less than the Deposit Amount), the Authorized
Participant will receive the Cash Component. Authorized Participants purchasing
Creation Units must pay to BBH, as transfer agent, a creation transaction fee
(the "Creation Transaction Fee") regardless of the number of Creation Units
purchased in the transaction. The Creation Transaction Fee may vary and is based
on the composition of the securities included in each Fund's portfolio and the
countries in which the transactions are settled. The Creation Transaction Fee
may increase or decrease as each Fund's portfolio is adjusted to conform to
changes in the composition of the securities included in each Fund's portfolio
and the countries in which the transactions are settled. The Creation
Transaction Fee is currently $500 for FPE and $500 to $1,500 for FPEI. The price
for each Creation Unit will equal the daily NAV per share times the number of
shares in a Creation Unit plus the fees described above and, if applicable, any
operational processing and brokerage costs, transfer fees or stamp taxes. When
the Funds permit an Authorized Participant to substitute cash or a different
security in lieu of depositing one or more of the requisite Deposit Securities,
the Authorized Participant may also be assessed an amount to cover the cost of
purchasing the Deposit Securities and/or disposing of the substituted
securities, including operational processing and brokerage costs, transfer fees,
stamp taxes, and part or all of the spread between the expected bid and offer
side of the market related to such Deposit Securities and/or substitute
securities.
Authorized Participants redeeming Creation Units must pay to BBH, as transfer
agent, a redemption transaction fee (the "Redemption Transaction Fee"),
regardless of the number of Creation Units redeemed in the transaction. The
Redemption Transaction Fee may vary and is based on the composition of the
securities included in each Fund's portfolio and the countries in which the
transactions are settled. The Redemption Transaction Fee is currently $500 for
FPE and $500 to $1,500 for FPEI. The Funds reserve the right to effect
redemptions in cash. An Authorized Participant may request cash redemption in
lieu of securities; however, each Fund may, in its discretion, reject any such
request.
6. LINE OF CREDIT
First Trust Preferred Securities and Income ETF, along with First Trust Series
Fund and First Trust Exchange-Traded Fund IV entered into a $220 million Credit
Agreement with The Bank of Nova Scotia ("Scotia") as administrative agent for a
group of lenders. Scotia charges a commitment fee of 0.25% of the daily amount
of the excess of the commitment amount over the outstanding principal balance of
the loans and an agency fee. Prior to March 9, 2017, the commitment was $180
million. Prior to December 16, 2016, the commitment amount was $140 million.
First Trust allocates the commitment fee and agency fee amongst the funds that
have access to the credit line. To the extent that a fund accesses the credit
line, there would also be an interest fee charged. The Funds did not have any
borrowings outstanding during the period ended October 31, 2017.
7. DISTRIBUTION PLAN
The Board of Trustees adopted a Distribution and Service Plan pursuant to Rule
12b-1 under the 1940 Act. In accordance with the Rule 12b-1 plan, the Funds are
authorized to pay an amount up to 0.25% of their average daily net assets each
year to reimburse First Trust Portfolios L.P. ("FTP"), the distributor of the
Funds, for amounts expended to finance activities primarily intended to result
in the sale of Creation Units or to provide investor services. FTP may also use
this amount to compensate securities dealers or other persons that are
Authorized Participants for providing distribution assistance, including
broker-dealer and shareholder support and educational and promotional services.
No 12b-1 fees are currently paid by the Funds, and pursuant to a contractual
arrangement, no 12b-1 fees will be paid any time before February 28, 2019, and
August 14, 2019, for FPE and FPEI, respectively.
Page 33
<PAGE>
--------------------------------------------------------------------------------
NOTES TO FINANCIAL STATEMENTS (CONTINUED)
--------------------------------------------------------------------------------
FIRST TRUST EXCHANGE-TRADED FUND III
OCTOBER 31, 2017
8. INDEMNIFICATION
The Trust, on behalf of the Funds, has a variety of indemnification obligations
under contracts with its service providers. The Trust's maximum exposure under
these arrangements is unknown. However, the Trust has not had prior claims or
losses pursuant to these contracts and expects the risk of loss to be remote.
9. SUBSEQUENT EVENTS
Management has evaluated the impact of all subsequent events to the Funds
through the date the financial statements were issued and has determined that
there was the following subsequent event:
On November 2, 2017, First Trust Municipal High Income ETF, an additional series
of the Trust, began trading under the ticker symbol FMHI on Nasdaq.
Page 34
<PAGE>
--------------------------------------------------------------------------------
REPORT OF INDEPENDENT REGISTERED PUBLIC ACCOUNTING FIRM
--------------------------------------------------------------------------------
TO THE SHAREHOLDERS AND BOARD OF TRUSTEES OF FIRST TRUST PREFERRED SECURITIES
AND INCOME ETF AND FIRST TRUST INSTITUTIONAL PREFERRED SECURITIES AND INCOME
ETF:
We have audited the accompanying statements of assets and liabilities of First
Trust Preferred Securities and Income ETF and First Trust Institutional
Preferred Securities and Income ETF (the "Funds"), each a series of the First
Trust Exchange-Traded Fund III, including the portfolios of investments, as of
October 31, 2017, and the related statements of operations and changes in net
assets and the financial highlights for the periods presented. These financial
statements and financial highlights are the responsibility of the Funds'
management. Our responsibility is to express an opinion on these financial
statements and financial highlights based on our audits.
We conducted our audits in accordance with the standards of the Public Company
Accounting Oversight Board (United States). Those standards require that we plan
and perform the audit to obtain reasonable assurance about whether the financial
statements and financial highlights are free of material misstatement. The Funds
are not required to have, nor were we engaged to perform, an audit of its
internal control over financial reporting. Our audits included consideration of
internal control over financial reporting as a basis for designing audit
procedures that are appropriate in the circumstances, but not for the purpose of
expressing an opinion on the effectiveness of the Funds' internal control over
financial reporting. Accordingly, we express no such opinion. An audit also
includes examining, on a test basis, evidence supporting the amounts and
disclosures in the financial statements, assessing the accounting principles
used and significant estimates made by management, as well as evaluating the
overall financial statement presentation. Our procedures included confirmation
of securities owned as of October 31, 2017, by correspondence with the Funds'
custodian and brokers; when replies were not received from brokers, we performed
other auditing procedures. We believe that our audits provide a reasonable basis
for our opinion.
In our opinion, the financial statements and financial highlights referred to
above present fairly, in all material respects, the financial positions of First
Trust Preferred Securities and Income ETF and First Trust Institutional
Preferred Securities and Income ETF as of October 31, 2017, the results of their
operations and changes in their net assets and the financial highlights for the
periods presented, in conformity with accounting principles generally accepted
in the United States of America.
/s/ Deloitte & Touche LLP
Chicago, Illinois
December 21, 2017
Page 35
<PAGE>
--------------------------------------------------------------------------------
ADDITIONAL INFORMATION
--------------------------------------------------------------------------------
FIRST TRUST EXCHANGE-TRADED FUND III
OCTOBER 31, 2017 (UNAUDITED)
PROXY VOTING POLICIES AND PROCEDURES
A description of the policies and procedures that the Trust uses to determine
how to vote proxies and information on how a Fund voted proxies relating to
portfolio investments during the most recent 12-month period ended June 30 will
be available (1) without charge, upon request, by calling (800) 988-5891; (2) on
each Fund's website located at http://www.ftportfolios.com; and (3) on the
Securities and Exchange Commission's ("SEC") website located at
http://www.sec.gov.
PORTFOLIO HOLDINGS
The Trust files its complete schedule of portfolio holdings with the SEC for the
first and third quarters of each fiscal year on Form N-Q. The Trust's Form N-Qs
are available (1) by calling (800) 988-5891; (2) on each Fund's website located
at http://www.ftportfolios.com; (3) on the SEC's website at http://www.sec.gov;
and (4) for review and copying at the SEC's Public Reference Room ("PRR") in
Washington, DC. Information regarding the operation of the PRR may be obtained
by calling (800) SEC-0330.
FEDERAL TAX INFORMATION
For the taxable year ended October 31, 2017, the following percentages of income
dividend paid by the Funds qualify for the dividends received deduction
available to corporations and are hereby designated as qualified dividend
income:
<TABLE>
<CAPTION>
Dividends Received Qualified Dividend
Deduction Income
--------------- ---------------
<S> <C> <C>
First Trust Preferred Securities and Income ETF 33.12% 63.99%
First Trust Institutional Preferred Securities and Income ETF 17.49% 79.47%
</TABLE>
RISK CONSIDERATIONS
You could lose money by investing in the Funds. An investment in the Funds is
not a deposit of a bank and is not insured or guaranteed by the Federal Deposit
Insurance Corporation or any other governmental agency. There can be no
assurance that a Fund's investment objective will be achieved.
CALL RISK. If an issuer calls higher-yielding debt instruments held by a Fund,
performance could be adversely impacted. During periods of falling interest
rates, issuers of callable securities may call (redeem) securities with higher
coupon rates or interest rates before their maturity dates. The Fund would then
lose any price appreciation above the bond's call price and would be forced to
reinvest the unanticipated proceeds at lower interest rates.
CASH TRANSACTIONS RISK. The Funds may under certain circumstances effect a
portion of creations and redemptions for cash, rather than in-kind securities.
As a result, an investment in a Fund may be less tax-efficient than an
investment in an ETF that effects its creations and redemption for in-kind
securities. Because a Fund may effect a portion of redemptions for cash, it may
be required to sell portfolio securities in order to obtain the cash needed to
distribute redemption proceeds. A sale of shares may result in capital gains or
losses, and may also result in higher brokerage costs.
CONCENTRATION RISK. A fund concentrated in a single industry or sector is likely
to present more risks than a fund that is broadly diversified over several
industries or sectors. Compared to the broad market, an individual industry or
sector may be more strongly affected by changes in the economic climate, broad
market shifts, moves in a particular dominant stock, or regulatory changes.
CONTINGENT CONVERTIBLE SECURITIES RISK. Contingent convertible securities
("CoCos") may provide for mandatory conversion into common stock of the issuer
under certain circumstances. Since the common stock of the issuer may not pay a
dividend, investors in these instruments could experience a reduced income rate,
potentially to zero; and conversion would deepen the subordination of the
investor, hence worsening standing in a bankruptcy. In addition, some such
instruments have a set stock conversion rate that would cause a reduction in
value of the security if the price of the stock is below the conversion price on
the conversion date. CoCos may be considered to be high-yield securities (a.k.a.
"junk" bonds) and, to the extent a CoCo held by a Fund undergoes a write down, a
Fund may lose some or all of its original investment in the CoCo. Performance of
a CoCo issuer may, in general, be correlated with the performance of other CoCo
issuers. As a result, negative information regarding one CoCo issuer may cause a
decline in value of other CoCo issuers. Subordinate securities such as CoCos are
more likely to experience credit loss than non-subordinate securities of the
same issuer - even if the CoCos do not convert to equity securities. Any losses
incurred by subordinate securities, such as CoCos, are likely to be
proportionately greater than non-subordinate securities and any recovery of
principal and interest of subordinate securities may take more time. As a
result, any perceived decline in creditworthiness of a CoCo issuer is likely to
have a greater impact on the CoCo, as a subordinate security.
Page 36
<PAGE>
--------------------------------------------------------------------------------
ADDITIONAL INFORMATION (CONTINUED)
--------------------------------------------------------------------------------
FIRST TRUST EXCHANGE-TRADED FUND III
OCTOBER 31, 2017 (UNAUDITED)
CONVERTIBLE SECURITIES RISK. Convertible securities have characteristics of both
equity and debt securities and, as a result, are exposed to certain additional
risks. The market values of convertible securities tend to decline as interest
rates increase and, conversely, to increase as interest rates decline. However,
a convertible security's market value also tends to reflect the market price of
the common stock of the issuing company.
CREDIT RISK. Credit risk is the risk that an issuer of a security will be unable
or unwilling to make dividend, interest and/or principal payments when due and
the related risk that the value of a security may decline because of concerns
about the issuer's ability to make such payments. Credit risk may be heightened
if a Fund invests in "high yield" or "junk" debt; such securities, while
generally offering higher yields than investment grade debt with similar
maturities, involve greater risks, including the possibility of dividend or
interest deferral, default or bankruptcy, and are regarded as predominantly
speculative with respect to the issuer's capacity to pay dividends or interest
and repay principal.
CURRENCY EXCHANGE RATE RISK. Each Fund may hold investments that are denominated
in non-U.S. currencies, or in securities that provide exposure to such
currencies, currency exchange rates or interest rates denominated in such
currencies. Changes in currency exchange rates and the relative value of
non-U.S. currencies will affect the value of a Fund's investment and the value
of your Fund shares. Currency exchange rates can be very volatile and can change
quickly and unpredictably. As a result, the value of an investment in a Fund may
change quickly and without warning and you may lose money.
CYBER SECURITY RISK. As the use of Internet technology has become more prevalent
in the course of business, the Funds have become more susceptible to potential
operational risks through breaches in cyber security. A breach in cyber security
refers to both intentional and unintentional events that may cause the Fund to
lose proprietary information, suffer data corruption or lose operational
capacity. Such events could cause the Fund to incur regulatory penalties,
reputational damage, additional compliance costs associated with corrective
measures and/or financial loss.
DEPOSITARY RECEIPTS RISK. Depositary receipts may be less liquid than the
underlying securities in their primary trading market. Any distributions paid to
the holders of depositary receipts are usually subject to a fee charged by the
depositary. Holders of depositary receipts may have limited voting rights, and
investment restrictions in certain countries may adversely impact the value of
depositary receipts because such restrictions may limit the ability to convert
the securities into depositary receipts and vice versa. Such restrictions may
cause the securities of the underlying issuer to trade at a discount or premium
to the market price of the depositary receipts.
FINANCIAL COMPANIES RISK. Financial companies are especially subject to the
adverse effects of economic recession, currency exchange rates, government
regulation, decreases in the availability of capital, volatile interest rates,
portfolio concentrations in geographic markets and in commercial and residential
real estate loans, and competition from new entrants in their fields of
business.
FLOATING RATE AND FIXED-TO-FLOATING RATE SECURITIES RISK. The market value of
floating rate securities is a reflection of discounted expected cash flows based
on expectations for future interest rate resets. The market value of such
securities may fall in a declining interest rate environment and may also fall
in a rising interest rate environment if there is a lag between the rise in
interest rates and the reset.
HIGH YIELD SECURITIES RISK. High yield securities are subject to greater market
fluctuations and risk of loss than securities with higher ratings. These
securities are issued by companies that may have limited operating history,
narrowly focused operations, and/or other impediments to the timely payment of
periodic interest and principal at maturity. If the economy slows down or dips
into recession, the issuers of high yield securities may not have sufficient
resources to continue making timely payment of periodic interest and principal
at maturity. The market for high yield securities is smaller and less liquid
than that for investment grade securities. High yield securities are generally
not listed on a national securities exchange but trade in the over-the-counter
markets. Due to the smaller, less liquid market for high yield securities, the
bid-offer spread on such securities is generally greater than it is for
investment grade securities and the purchase or sale of such securities may take
longer to complete.
HYBRID CAPITAL SECURITIES RISK. A hybrid capital security may exhibit
characteristics akin to both an equity or debt security or other evidence of
indebtedness on which the value of the interest, or principal of which, is
determined by reference to changes in the value of a reference instrument or
financial strength of a reference entity (e.g., a security or other financial
instrument, asset, currency or interest rate). The price of a hybrid capital
security and any applicable reference instrument may not move in the same
direction or at the same time. An investment in a hybrid capital security may
entail significant risks not associated with a similar investment in a
traditional equity security.
ILLIQUID SECURITIES RISK. Illiquid securities involve the risk that the
securities will not be able to be sold at the time desired by a Fund or at
prices approximately the value at which a Fund is carrying the securities on its
books.
Page 37
<PAGE>
--------------------------------------------------------------------------------
ADDITIONAL INFORMATION (CONTINUED)
--------------------------------------------------------------------------------
FIRST TRUST EXCHANGE-TRADED FUND III
OCTOBER 31, 2017 (UNAUDITED)
INCOME RISK. If interest rates fall, the income from a Fund's portfolio will
decline as a Fund invests the proceeds from new share sales, or from matured or
called debt securities, at interest rates that are below a portfolio's current
earnings rate.
INTEREST RATE RISK. If interest rates rise, the prices of the fixed-rate
instruments held by a Fund may fall.
MANAGEMENT RISK. Each Fund is subject to management risk because it is an
actively managed portfolio. In managing a Fund's investment portfolio, the
sub-advisor will apply investment techniques and risk analyses that may not have
the desired result. There can be no guarantee that a Fund will meet its
investment objective.
MARKET RISK. Market risk is the risk that a particular security owned by a Fund
or shares of a Fund in general may fall in value. Securities are subject to
market fluctuations caused by such factors as economic, political, regulatory or
market developments, changes in interest rates and perceived trends in
securities prices. Overall securities values could decline generally or could
underperform other investments.
NEW FUND RISK. FPEI currently has fewer assets than larger funds, and like other
new funds, large inflows and outflows may impact the Fund's market exposure for
limited periods of time. This impact may be positive or negative, depending on
the direction of market movement during the period affected. Also, during the
initial invest-up period, the Fund may depart from its principal investment
strategies and invest a larger amount or all of its assets in cash equivalents
or it may hold cash.
NON-DIVERSIFICATION RISK. Each Fund is classified as "non-diversified" under the
1940 Act. As a result, each Fund is only limited as to the percentage of its
assets which may be invested in the securities of any one issuer by the
diversification requirements imposed by the Internal Revenue Code of 1986, as
amended. Each Fund may invest a relatively high percentage of its assets in a
limited number of issuers. As a result, a Fund may be more susceptible to a
single adverse economic or regulatory occurrence affecting one or more of these
issuers, experience increased volatility and be highly concentrated in certain
issuers.
NON-U.S. SECURITIES RISK. Each Fund may invest in securities of non-U.S.
issuers. Such securities are subject to higher volatility than securities of
domestic issuers due to possible adverse political, social or economic
developments, restrictions on foreign investment or exchange of securities, lack
of liquidity, currency exchange rates, excessive taxation, government seizure of
assets, different legal or accounting standards, and less government supervision
and regulation of exchanges in foreign countries.
PREFERRED SECURITIES RISK. Preferred Securities combine some of the
characteristics of both common stocks and bonds. Preferred Securities are
typically subordinated to bonds and other debt instruments in a company's
capital structure, in terms of priority to corporate income, and therefore will
be subject to greater credit risk than those debt instruments. Preferred
Securities are also subject to credit risk, interest rate risk and income risk.
REIT RISK. Investing in REITs involves risks related to their structure and
focus, which include, but are not limited to, dependency upon management skills,
limited diversification, the risks of locating and managing financing for
projects, heavy cash flow dependency, possible default by borrowers, the costs
and potential losses of self-liquidation of one or more holdings, the risk of a
possible lack of mortgage funds and associated interest rate risks,
overbuilding, property vacancies, increases in property taxes and operating
expenses, changes in zoning laws, losses due to environmental damages, changes
in neighborhood values and appeal to purchases, the possibility of failing to
maintain exemptions from registration under the 1940 Act and, in many cases,
relatively small market capitalization, which may result in less market
liquidity and greater price volatility. Fund shareholders indirectly pay REIT
fees and expenses.
Page 38
<PAGE>
--------------------------------------------------------------------------------
ADDITIONAL INFORMATION (CONTINUED)
--------------------------------------------------------------------------------
FIRST TRUST EXCHANGE-TRADED FUND III
OCTOBER 31, 2017 (UNAUDITED)
ADVISORY AND SUB-ADVISORY AGREEMENTS
BOARD CONSIDERATIONS REGARDING CONTINUATION OF INVESTMENT MANAGEMENT AGREEMENT
AND INVESTMENT SUB-ADVISORY AGREEMENT
The Board of Trustees of First Trust Exchange-Traded Fund III (the "Trust"),
including the Independent Trustees, unanimously approved the continuation of the
Investment Management Agreement (the "Advisory Agreement") with First Trust
Advisors L.P. (the "Advisor" or "First Trust") on behalf of the First Trust
Preferred Securities and Income ETF (the "Fund") and the Investment Sub-Advisory
Agreement (the "Sub-Advisory Agreement" and together with the Advisory
Agreement, the "Agreements") among the Trust on behalf of the Fund, the Advisor
and Stonebridge Advisors LLC (the "Sub-Advisor"). The Board approved the
continuation of the Agreements for a one-year period ending June 30, 2018 at a
meeting held on June 12, 2017. The Board determined that the continuation of the
Agreements is in the best interests of the Fund in light of the extent and
quality of the services provided and such other matters as the Board considered
to be relevant in the exercise of its reasonable business judgment.
To reach this determination, the Board considered its duties under the
Investment Company Act of 1940, as amended (the "1940 Act"), as well as under
the general principles of state law in reviewing and approving advisory
contracts; the requirements of the 1940 Act in such matters; the fiduciary duty
of investment advisors with respect to advisory agreements and compensation; the
standards used by courts in determining whether investment company boards have
fulfilled their duties; and the factors to be considered by the Board in voting
on such agreements. At meetings held on April 24, 2017 and June 12, 2017, the
Board, including the Independent Trustees, reviewed materials provided by the
Advisor and the Sub-Advisor responding to requests for information from counsel
to the Independent Trustees that, among other things, outlined the services
provided by the Advisor and the Sub-Advisor to the Fund (including the relevant
personnel responsible for these services and their experience); the unitary fee
rate payable by the Fund as compared to fees charged to a peer group of funds
(all of which were index-based exchange-traded funds ("ETFs")) compiled by
Management Practice, Inc. ("MPI"), an independent source (the "MPI Peer Group"),
and as compared to fees charged to other clients of the Advisor, including other
ETFs managed by the Advisor; the sub-advisory fee rate as compared to fees
charged to other clients of the Sub-Advisor; expenses of the Fund as compared to
expense ratios of the funds in the MPI Peer Group; performance information for
the Fund; the nature of expenses incurred in providing services to the Fund and
the potential for economies of scale, if any; financial data on the Advisor and
the Sub-Advisor; any fall-out benefits to the Advisor and its affiliates, First
Trust Portfolios L.P. ("FTP") and First Trust Capital Partners, LLC ("FTCP"),
and the Sub-Advisor; and information on the Advisor's and the Sub-Advisor's
compliance programs. The Board reviewed initial materials with the Advisor at
the meeting held on April 24, 2017, prior to which the Independent Trustees and
their counsel met separately to discuss the information provided by the Advisor
and the Sub-Advisor. Following the April meeting, independent legal counsel on
behalf of the Independent Trustees requested certain clarifications and
supplements to the materials provided, and the information provided in response
to those requests was considered at an executive session of the Independent
Trustees and independent legal counsel held prior to the June 12, 2017 meeting,
as well as at the meeting held that day. The Board applied its business judgment
to determine whether the arrangements between the Trust and the Advisor and
among the Trust, the Advisor and the Sub-Advisor continue to be reasonable
business arrangements from the Fund's perspective as well as from the
perspective of the Fund's shareholders. The Board determined that, given the
totality of the information provided with respect to the Agreements, the Board
had received sufficient information to renew the Agreements. The Board
considered that shareholders chose to invest or remain invested in the Fund
knowing that the Advisor and the Sub-Advisor manage the Fund and knowing the
Fund's unitary fee.
In reviewing the Agreements, the Board considered the nature, extent and quality
of the services provided by the Advisor and the Sub-Advisor under the
Agreements. With respect to the Advisory Agreement, the Board considered that
the Advisor is responsible for the overall management and administration of the
Trust and the Fund and reviewed all of the services provided by the Advisor to
the Fund, including the oversight of the Sub-Advisor, as well as the background
and experience of the persons responsible for such services. The Board noted
that the Advisor oversees the Sub-Advisor's day-to-day management of the Fund's
investments, including portfolio risk monitoring and performance review. In
reviewing the services provided, the Board noted the compliance program that had
been developed by the Advisor and considered that it includes a robust program
for monitoring the Advisor's, the Sub-Advisor's and the Fund's compliance with
the 1940 Act, as well as the Fund's compliance with its investment objective and
policies. The Board also considered a report from the Advisor with respect to
its risk management functions related to the operation of the Fund. Finally, as
part of the Board's consideration of the Advisor's services, the Advisor, in its
written materials and at the April 24, 2017 meeting, described to the Board the
scope of its ongoing investment in additional infrastructure and personnel to
maintain and improve the quality of services provided to the Fund and the other
funds in the First Trust Fund Complex. With respect to the Sub-Advisory
Agreement, the Board noted that the Fund is an actively-managed ETF and the
Sub-Advisor actively manages the Fund's investments. The Board reviewed the
materials provided by the Sub-Advisor and considered the services that the
Sub-Advisor provides to the Fund, including the Sub-Advisor's day-to-day
management of the Fund's investments. In considering the Sub-Advisor's
management of the Fund, the Board noted the background and experience of the
Sub-Advisor's portfolio management team and the Board's prior meetings with
members of the portfolio management team. In light of the information presented
Page 39
<PAGE>
--------------------------------------------------------------------------------
ADDITIONAL INFORMATION (CONTINUED)
--------------------------------------------------------------------------------
FIRST TRUST EXCHANGE-TRADED FUND III
OCTOBER 31, 2017 (UNAUDITED)
and the considerations made, the Board concluded that the nature, extent and
quality of the services provided to the Trust and the Fund by the Advisor and
the Sub-Advisor under the Agreements have been and are expected to remain
satisfactory and that the Sub-Advisor, under the oversight of the Advisor, has
managed the Fund consistent with the Fund's investment objective and policies.
The Board considered the unitary fee rate payable by the Fund under the Advisory
Agreement for the services provided. The Board noted that the sub-advisory fee
is paid by the Advisor from the unitary fee. The Board considered that as part
of the unitary fee the Advisor is responsible for the Fund's expenses, including
the cost of sub-advisory, transfer agency, custody, fund administration, legal,
audit and other services and license fees (if any), but excluding interest,
taxes, brokerage commissions and other expenses connected with the execution of
portfolio transactions, distribution and service fees pursuant to a Rule 12b-1
plan, if any, and extraordinary expenses. The Board received and reviewed
information showing the advisory or unitary fee rates and expense ratios of the
peer funds in the MPI Peer Group, as well as advisory fee rates charged by the
Advisor and the Sub-Advisor to other fund (including ETFs) and non-fund clients,
as applicable. Because the Fund's MPI Peer Group included peer funds that pay a
unitary fee and because the Fund pays a unitary fee, the Board determined that
expense ratios were the most relevant comparative data point. Based on the
information provided, the Board noted that the unitary fee for the Fund was
above the median total (net) expense ratio of the peer funds in the MPI Peer
Group. With respect to the MPI Peer Group, the Board discussed with
representatives of the Advisor how the MPI Peer Group was assembled, limitations
in creating peer groups for actively-managed ETFs, including that there were no
other actively-managed ETFs investing primarily in preferred securities and that
all of the peer funds were index-based ETFs, and different business models that
may affect the pricing of services among ETF sponsors. The Board also noted that
none of the peer funds employed an advisor/sub-advisor management structure. The
Board took these limitations and differences into account in considering the
peer data. With respect to fees charged to other clients, the Board considered
differences between the Fund and other clients that limited their comparability.
In considering the unitary fee rate overall, the Board also considered the
Advisor's statement that it seeks to meet investor needs through innovative and
value-added investment solutions and the Advisor's description of its long-term
commitment to the Fund.
The Board considered performance information for the Fund. The Board noted the
process it has established for monitoring the Fund's performance and portfolio
risk on an ongoing basis, which includes quarterly performance reporting from
the Advisor and Sub-Advisor for the Fund. The Board determined that this process
continues to be effective for reviewing the Fund's performance. The Board
received and reviewed information comparing the Fund's performance for periods
ended December 31, 2016 to the performance of the MPI Peer Group and to that of
benchmark indexes, including a blended benchmark index. Based on the information
provided, the Board noted that the Fund outperformed the MPI Peer Group average
for the one- and three-year periods ended December 31, 2016. The Board also
noted that the Fund outperformed the blended benchmark index for the one- and
three-year periods ended December 31, 2016.
On the basis of all the information provided on the unitary fee and performance
of the Fund and the ongoing oversight by the Board, the Board concluded that the
unitary fee for the Fund (out of which the Sub-Advisor is compensated) continues
to be reasonable and appropriate in light of the nature, extent and quality of
the services provided by the Advisor and the Sub-Advisor to the Fund under the
Agreements.
The Board considered information and discussed with the Advisor whether there
were any economies of scale in connection with providing advisory services to
the Fund and noted the Advisor's statement that it expects its expenses to
increase over the next twelve months as the Advisor continues to make
investments in personnel and infrastructure. The Board noted that any reduction
in fixed costs associated with the management of the Fund would benefit the
Advisor, but that the unitary fee structure provides a level of certainty in
expenses for the Fund. The Board considered the revenues and allocated costs
(including the allocation methodology) of the Advisor in serving as investment
advisor to the Fund for the twelve months ended December 31, 2016 and the
estimated profitability level for the Fund calculated by the Advisor based on
such data, as well as complex-wide and product-line profitability data for the
same period. The Board noted the inherent limitations in the profitability
analysis and concluded that, based on the information provided, the Advisor's
profitability level for the Fund was not unreasonable. In addition, the Board
considered fall-out benefits described by the Advisor that may be realized from
its relationship with the Fund. The Board noted that FTCP, has an ownership
interest in the Sub-Advisor and considered potential fall-out benefits to the
Advisor from such ownership interest. The Board also considered that the Advisor
had identified as a fall-out benefit to the Advisor and FTP their exposure to
investors and brokers who, absent their exposure to the Fund, may have had no
dealings with the Advisor or FTP. The Board considered the Advisor's
compensation for fund reporting services provided to the Fund pursuant to a
separate Fund Reporting Services Agreement, which is paid from the unitary fee.
The Board concluded that the character and amount of potential fall-out benefits
to the Advisor were not unreasonable.
Page 40
<PAGE>
--------------------------------------------------------------------------------
ADDITIONAL INFORMATION (CONTINUED)
--------------------------------------------------------------------------------
FIRST TRUST EXCHANGE-TRADED FUND III
OCTOBER 31, 2017 (UNAUDITED)
The Board considered the Sub-Advisor's expenses in providing investment services
to the Fund and noted the Sub-Advisor's recent hiring of additional personnel to
work on the Fund and commitment to add additional resources if assets increase.
The Board did not review the profitability of the Sub-Advisor with respect to
the Fund. The Board noted that the Advisor pays the Sub-Advisor from the unitary
fee, and its understanding that the Fund's sub-advisory fee rate was the product
of an arm's length negotiation. The Board concluded that the profitability
analysis for the Advisor was more relevant. The Board considered fall-out
benefits that may be realized by the Sub-Advisor from its relationship with the
Fund, including potential fall-out benefits to the Sub-Advisor from the
ownership interest of FTCP in the Sub-Advisor. The Board noted that the
Sub-Advisor does not maintain any soft-dollar arrangements. The Board concluded
that the character and amount of potential fall-out benefits to the Sub-Advisor
were not unreasonable.
Based on all of the information considered and the conclusions reached, the
Board, including the Independent Trustees, unanimously determined that the terms
of the Agreements continue to be fair and reasonable and that the continuation
of the Agreements is in the best interests of the Trust and the Fund. No single
factor was determinative in the Board's analysis.
ADVISORY AND SUB-ADVISORY AGREEMENTS
BOARD CONSIDERATIONS REGARDING APPROVAL OF INVESTMENT MANAGEMENT AGREEMENT AND
INVESTMENT SUB-ADVISORY AGREEMENT
The Board of Trustees of First Trust Exchange-Traded Fund III (the "Trust"),
including the Independent Trustees, unanimously approved the Investment
Management Agreement (the "Advisory Agreement") with First Trust Advisors L.P.
(the "Advisor"), on behalf of the First Trust Institutional Preferred Securities
and Income ETF (the "Fund"), and the Investment Sub-Advisory Agreement (the
"Sub-Advisory Agreement" and together with the Advisory Agreement, the
"Agreements") among the Trust, on behalf of the Fund, the Advisor and
Stonebridge Advisors LLC (the "Sub-Advisor"), for an initial two-year term at a
meeting held on June 11-12, 2017. The Board determined that the Agreements are
in the best interests of the Fund in light of the extent and quality of the
services expected to be provided and such other matters as the Board considered
to be relevant in the exercise of its reasonable business judgment.
To reach this determination, the Board considered its duties under the
Investment Company Act of 1940, as amended (the "1940 Act"), as well as under
the general principles of state law in reviewing and approving advisory
contracts; the requirements of the 1940 Act in such matters; the fiduciary duty
of investment advisors with respect to advisory agreements and compensation; the
standards used by courts in determining whether investment company boards have
fulfilled their duties; and the factors to be considered by the Board in voting
on such agreements. To assist the Board in its evaluation of the Agreements, the
Independent Trustees received a separate report from each of the Advisor and the
Sub-Advisor in advance of the Board meeting responding to a request for
information provided on behalf of the Independent Trustees that, among other
things, outlined the services to be provided by the Advisor and the Sub-Advisor
to the Fund (including the relevant personnel responsible for these services and
their experience); the proposed unitary fee rate payable by the Fund as compared
to fees charged to a peer group of funds (all of which were exchange-traded
funds ("ETFs")) compiled by Management Practice, Inc. ("MPI"), an independent
source (the "MPI Peer Group"), and as compared to fees charged to other clients
of the Advisor, including other ETFs managed by the Advisor, and the
Sub-Advisor; the estimated expenses of the Fund as compared to expense ratios of
the funds in the MPI Peer Group; the nature of the expenses to be incurred in
providing services to the Fund and the potential for economies of scale, if any;
financial data on the Advisor and the Sub-Advisor; any fall-out benefits to the
Advisor and its affiliate, First Trust Portfolios L.P. ("FTP"), and to the
Sub-Advisor; and information on the Advisor's and the Sub-Advisor's compliance
programs. The Independent Trustees also met separately with their independent
legal counsel to discuss the information provided by the Advisor and the
Sub-Advisor. The Board applied its business judgment to determine whether the
arrangements between the Trust and the Advisor and among the Trust, the Advisor
and the Sub-Advisor are reasonable business arrangements from the Fund's
perspective as well as from the perspective of the Fund's shareholders.
In evaluating whether to approve the Agreements for the Fund, the Board
considered the nature, extent and quality of the services to be provided by the
Advisor and the Sub-Advisor under the Agreements. With respect to the Advisory
Agreement, the Board considered that the Advisor will be responsible for the
overall management and administration of the Fund and reviewed all of the
services to be provided by the Advisor to the Fund, including oversight of the
Sub-Advisor, as well as the background and experience of the persons responsible
for such services. The Board considered that the Fund will be an
actively-managed ETF not designed to track the performance of an index and will
employ an advisor/sub-advisor management structure and considered that the
Advisor manages other ETFs with a similar structure in the First Trust fund
complex. The Board noted that the Advisor will oversee the Sub-Advisor's
day-to-day management of the Fund's investments, including portfolio risk
monitoring and performance review. In reviewing the services to be provided, the
Board noted the compliance program that had been developed by the Advisor and
considered that it includes a robust program for monitoring the Advisor's, the
Sub-Advisor's and the Fund's compliance with the 1940 Act, as well as the Fund's
compliance with its investment objective and policies. The Board noted that
Page 41
<PAGE>
--------------------------------------------------------------------------------
ADDITIONAL INFORMATION (CONTINUED)
--------------------------------------------------------------------------------
FIRST TRUST EXCHANGE-TRADED FUND III
OCTOBER 31, 2017 (UNAUDITED)
employees of the Advisor provide management services to other ETFs and to other
investment companies in the First Trust fund complex with diligence and care.
With respect to the Sub-Advisory Agreement, the Board reviewed the materials
provided by the Sub-Advisor and noted the background and experience of the
Sub-Advisor's portfolio management team and the Sub-Advisor's investment style.
The Board noted that the Sub-Advisor manages other similar funds in the First
Trust fund complex. At the meeting, the Trustees received a presentation from
two of the portfolio managers of the Sub-Advisor, and were able to ask questions
about the Sub-Advisor and the Sub-Advisor's proposed investment strategies for
the Fund. Since the Fund had yet to commence investment operations, the Board
could not consider the historical investment performance of the Fund. In light
of the information presented and the considerations made, the Board concluded
that the nature, extent and quality of the services to be provided to the Fund
by the Advisor and the Sub-Advisor under the Agreements are expected to be
satisfactory.
The Board considered the proposed unitary fee rate payable by the Fund under the
Advisory Agreement for the services to be provided. The Board noted that, under
the unitary fee arrangement, the Fund would pay the Advisor a unitary fee equal
to an annual rate of 0.85% of its average daily net assets. The Board considered
that, from the unitary fee for the Fund, the Advisor would pay the Sub-Advisor a
sub-advisory fee equal to 50% of the Fund's unitary fee less 50% of the Fund's
expenses. The Board noted that the Advisor would be responsible for the Fund's
expenses, including the cost of transfer agency, custody, fund administration,
legal, audit and other services and license fees (if any), but excluding the fee
payment under the Advisory Agreement, interest, taxes, brokerage commissions and
other expenses connected with the execution of portfolio transactions,
distribution and service fees pursuant to a Rule 12b-1 plan, if any, and
extraordinary expenses. The Board received and reviewed information for the Fund
showing the advisory or unitary fee rates and expense ratios of the peer funds
in the MPI Peer Group, as well as advisory fee rates charged by the Advisor and
the Sub-Advisor to other fund (including ETFs) and non-fund clients, as
applicable. Because the Fund's MPI Peer Group included peer funds that pay a
unitary fee and because the Fund will pay a unitary fee, the Board determined
that expense ratios were the most relevant comparative data point. Based on the
information provided, the Board noted that the unitary fee for the Fund was
above the median total (net) expense ratio of the peer funds in its MPI Peer
Group. With respect to the MPI Peer Group, the Board discussed with
representatives of the Advisor how the MPI Peer Group was assembled and the
limitations in creating peer groups for actively-managed ETFs, including the
limited number of actively-managed ETFs investing in preferred securities, that
there are no actively-managed ETFs with a primary focus on institutional, $1,000
par preferred securities and that three of the five peer funds in the Fund's MPI
Peer Group were index-based ETFs. The Board took these limitations and
differences into account in considering the peer data. With respect to fees
charged to other clients, the Board considered differences between the Fund and
other clients that limited their comparability. The Board noted that the Fund's
proposed unitary fee rate was the same as that of another actively-managed ETF
in the First Trust fund complex that invests in preferred securities and is
sub-advised by the Sub-Advisor. In light of the information considered and the
nature, extent and quality of the services expected to be provided to the Fund
under the Agreements, the Board determined that the proposed unitary fee for the
Fund, including the fee rate to be paid by the Advisor to the Sub-Advisor from
the unitary fee, was fair and reasonable.
The Board noted that the proposed unitary fee for the Fund was not structured to
pass the benefits of any economies of scale on to shareholders as the Fund's
assets grow. The Board noted that any reduction in fixed costs associated with
the management of the Fund would benefit the Advisor and the Sub-Advisor, but
that the unitary fee structure provides a level of certainty in expenses for the
Fund. The Board noted that the Advisor has continued to invest in personnel and
infrastructure for the First Trust fund complex. The Board took the types of
costs to be borne by the Advisor in connection with its services to be performed
for the Fund under the Advisory Agreement into consideration and noted that the
Advisor was unable to estimate the profitability of the Advisory Agreement for
the Fund to the Advisor. The Board also considered the Sub-Advisor's statement
that the profitability of the Sub-Advisory Agreement for the Fund to the
Sub-Advisor was not estimable and that the Sub-Advisor would be paid by the
Advisor from the Fund's unitary fee and would also bear a portion of the Fund's
expenses. The Board noted its understanding that the sub-advisory fee rate was
the product of an arm's length negotiation. The Board considered fall-out
benefits described by the Advisor that may be realized from its and FTP's
relationship with the Fund and the Advisor's compensation for fund reporting
services to be provided to the Fund pursuant to a separate Fund Reporting
Services Agreement, which would be paid from the unitary fee. The Board also
considered fall-out benefits described by the Sub-Advisor, noting that the
Sub-Advisor does not utilize soft dollar arrangements as a policy. The Board
also considered potential fall-out benefits to the Advisor and the Sub-Advisor
from the ownership interest of an affiliate of the Advisor in the Sub-Advisor.
The Board concluded that the character and amount of potential fall-out benefits
to the Advisor and the Sub-Advisor were not unreasonable.
Based on all of the information considered and the conclusions reached, the
Board, including the Independent Trustees, unanimously determined that the terms
of the Agreements are fair and reasonable and that the approval of the
Agreements is in the best interests of the Fund. No single factor was
determinative in the Board's analysis.
Page 42
<PAGE>
--------------------------------------------------------------------------------
BOARD OF TRUSTEES AND OFFICERS
--------------------------------------------------------------------------------
FIRST TRUST EXCHANGE-TRADED FUND III
OCTOBER 31, 2017 (UNAUDITED)
The Trust's statement of additional information includes additional information
about the Trustees and is available, without charge, upon request, by calling
(800) 988-5891.
<TABLE>
<CAPTION>
NUMBER OF OTHER
PORTFOLIOS IN TRUSTEESHIPS OR
TERM OF OFFICE THE FIRST TRUST DIRECTORSHIPS
NAME, ADDRESS, AND YEAR FIRST FUND COMPLEX HELD BY TRUSTEE
DATE OF BIRTH AND ELECTED OR PRINCIPAL OCCUPATIONS OVERSEEN BY DURING PAST
POSITION WITH THE TRUST APPOINTED DURING PAST 5 YEARS TRUSTEE 5 YEARS
------------------------------------------------------------------------------------------------------------------------------------
INDEPENDENT TRUSTEES
------------------------------------------------------------------------------------------------------------------------------------
<S> <C> <C> <C> <C>
Richard E. Erickson, Trustee o Indefinite Term Physician, Officer, Wheaton Orthopedics; 151 None
c/o First Trust Advisors L.P. Limited Partner, Gundersen Real Estate
120 E. Liberty Drive, o Since Inception Limited Partnership (June 1992 to
Suite 400 December 2016); Member, Sportsmed LLC
Wheaton, IL 60187 (April 2007 to November 2015)
D.O.B.: 04/51
Thomas R. Kadlec, Trustee o Indefinite Term President, ADM Investor Services, Inc. 151 Director of ADM
c/o First Trust Advisors L.P. (Futures Commission Merchant) Investor Services,
120 E. Liberty Drive, o Since Inception Inc., ADM
Suite 400 Investor Services
Wheaton, IL 60187 International,
D.O.B.: 11/57 Futures Industry
Association, and
National Futures
Association
Robert F. Keith, Trustee o Indefinite Term President, Hibs Enterprises (Financial and 151 Director of Trust
c/o First Trust Advisors L.P. Management Consulting) Company of
120 E. Liberty Drive, o Since Inception Illinois
Suite 400
Wheaton, IL 60187
D.O.B.: 11/56
Niel B. Nielson, Trustee o Indefinite Term Managing Director and Chief Operating 151 Director of
c/o First Trust Advisors L.P. Officer (January 2015 to Present), Pelita Covenant
120 E. Liberty Drive, o Since Inception Harapan Educational Foundation Transport, Inc.
Suite 400 (Educational Products and Services); (May 2003 to
Wheaton, IL 60187 President and Chief Executive Officer May 2014)
D.O.B.: 03/54 (June 2012 to September 2014), Servant
Interactive LLC (Educational Products and
Services); President and Chief Executive
Officer (June 2012 to September 2014),
Dew Learning LLC (Educational Products
and Services); President (June 2002 to June
2012), Covenant College
------------------------------------------------------------------------------------------------------------------------------------
INTERESTED TRUSTEE
------------------------------------------------------------------------------------------------------------------------------------
James A. Bowen(1), Trustee, o Indefinite Term Chief Executive Officer, First Trust 151 None
Chairman of the Board Advisors L.P. and First Trust Portfolios L.P.;
120 E. Liberty Drive, o Since Inception Chairman of the Board of Directors,
Suite 400 BondWave LLC (Software Development
Wheaton, IL 60187 Company) and Stonebridge Advisors LLC
D.O.B.: 09/55 (Investment Advisor)
</TABLE>
-----------------------------
(1) Mr. Bowen is deemed an "interested person" of the Trust due to his
position as Chief Executive Officer of First Trust Advisors L.P.,
investment advisor of the Trust.
Page 43
<PAGE>
--------------------------------------------------------------------------------
BOARD OF TRUSTEES AND OFFICERS (CONTINUED)
--------------------------------------------------------------------------------
FIRST TRUST EXCHANGE-TRADED FUND III
OCTOBER 31, 2017 (UNAUDITED)
<TABLE>
<CAPTION>
POSITION AND TERM OF OFFICE
NAME, ADDRESS OFFICES AND LENGTH OF PRINCIPAL OCCUPATIONS
AND DATE OF BIRTH WITH TRUST SERVICE DURING PAST 5 YEARS
------------------------------------------------------------------------------------------------------------------------------------
OFFICERS WHO ARE NOT TRUSTEES(2)
------------------------------------------------------------------------------------------------------------------------------------
<S> <C> <C> <C>
James M. Dykas President and Chief o Indefinite Term Managing Director and Chief Financial Officer
120 E. Liberty Drive, Executive Officer (January 2016 to Present), Controller (January 2011
Suite 400 o Since January 2016 to January 2016), Senior Vice President (April 2007
Wheaton, IL 60187 to January 2016), First Trust Advisors L.P. and First
D.O.B.: 01/66 Trust Portfolios L.P.; Chief Financial Officer
(January 2016 to Present), BondWave LLC
(Software Development Company) and Stonebridge
Advisors LLC (Investment Advisor)
Donald P. Swade Treasurer, Chief Financial o Indefinite Term Senior Vice President (July 2016 to Present), Vice
120 E. Liberty Drive, Officer and Chief President (April 2012 to July 2016), First Trust
Suite 400 Accounting Officer o Since January 2016 Advisors L.P. and First Trust Portfolios L.P.
Wheaton, IL 60187
D.O.B.: 08/72
W. Scott Jardine Secretary and Chief o Indefinite Term General Counsel, First Trust Advisors L.P. and First
120 E. Liberty Drive, Legal Officer Trust Portfolios L.P.; Secretary and General
Suite 400 o Since Inception Counsel, BondWave LLC; Secretary, Stonebridge
Wheaton, IL 60187 Advisors LLC
D.O.B.: 05/60
Daniel J. Lindquist Vice President o Indefinite Term Managing Director, First Trust Advisors L.P. and
120 E. Liberty Drive, First Trust Portfolios L.P.
Suite 400 o Since Inception
Wheaton, IL 60187
D.O.B: 02/70
Kristi A. Maher Chief Compliance o Indefinite Term Deputy General Counsel, First Trust Advisors L.P.
120 E. Liberty Drive, Officer and and First Trust Portfolios L.P.
Suite 400 Assistant Secretary o Since Inception
Wheaton, IL 60187
D.O.B.: 12/66
Roger F. Testin Vice President o Indefinite Term Senior Vice President, First Trust Advisors L.P.
120 E. Liberty Drive, and First Trust Portfolios L.P.
Suite 400 o Since Inception
Wheaton, IL 60187
D.O.B.: 06/66
Stan Ueland Vice President o Indefinite Term Senior Vice President, First Trust Advisors L.P.
120 E. Liberty Drive, and First Trust Portfolios L.P.
Suite 400 o Since Inception
Wheaton, IL 60187
D.O.B.: 11/70
</TABLE>
-----------------------------
(2) The term "officer" means the president, vice president, secretary,
treasurer, controller or any other officer who performs a policy making
function.
Page 44
<PAGE>
--------------------------------------------------------------------------------
PRIVACY POLICY
--------------------------------------------------------------------------------
FIRST TRUST EXCHANGE-TRADED FUND III
OCTOBER 31, 2017 (UNAUDITED)
PRIVACY POLICY
First Trust values our relationship with you and considers your privacy an
important priority in maintaining that relationship. We are committed to
protecting the security and confidentiality of your personal information.
SOURCES OF INFORMATION
We collect nonpublic personal information about you from the following sources:
o Information we receive from you and your broker-dealer, investment
advisor or financial representative through interviews,
applications, agreements or other forms;
o Information about your transactions with us, our affiliates or
others;
o Information we receive from your inquiries by mail, e-mail or
telephone; and
o Information we collect on our website through the use of "cookies".
For example, we may identify the pages on our website that your
browser requests or visits.
INFORMATION COLLECTED
The type of data we collect may include your name, address, social security
number, age, financial status, assets, income, tax information, retirement and
estate plan information, transaction history, account balance, payment history,
investment objectives, marital status, family relationships and other personal
information.
DISCLOSURE OF INFORMATION
We do not disclose any nonpublic personal information about our customers or
former customers to anyone, except as permitted by law. In addition to using
this information to verify your identity (as required under law), the permitted
uses may also include the disclosure of such information to unaffiliated
companies for the following reasons:
o In order to provide you with products and services and to effect
transactions that you request or authorize, we may disclose your
personal information as described above to unaffiliated financial
service providers and other companies that perform administrative or
other services on our behalf, such as transfer agents, custodians
and trustees, or that assist us in the distribution of investor
materials such as trustees, banks, financial representatives, proxy
services, solicitors and printers.
o We may release information we have about you if you direct us to do
so, if we are compelled by law to do so, or in other legally limited
circumstances (for example to protect your account from fraud).
In addition, in order to alert you to our other financial products and services,
we may share your personal information within First Trust.
USE OF WEB ANALYTICS
We currently use third party analytics tools, Google Analytics and AddThis, to
gather information for purposes of improving First Trust's website and marketing
our products and services to you. These tools employ cookies, which are small
pieces of text stored in a file by your web browser and sent to websites that
you visit, to collect information, track website usage and viewing trends such
as the number of hits, pages visited, videos and PDFs viewed and the length of
user sessions in order to evaluate website performance and enhance navigation of
the website. We may also collect other anonymous information, which is generally
limited to technical and web navigation information such as the IP address of
your device, internet browser type and operating system for purposes of
analyzing the data to make First Trust's website better and more useful to our
users. The information collected does not include any personal identifiable
information such as your name, address, phone number or email address unless you
provide that information through the website for us to contact you in order to
answer your questions or respond to your requests. To find out how to opt-out of
these services click on: Google Analytics and AddThis.
CONFIDENTIALITY AND SECURITY
With regard to our internal security procedures, First Trust restricts access to
your nonpublic personal information to those First Trust employees who need to
know that information to provide products or services to you. We maintain
physical, electronic and procedural safeguards to protect your nonpublic
personal information.
POLICY UPDATES AND INQUIRIES
As required by federal law, we will notify you of our privacy policy annually.
We reserve the right to modify this policy at any time, however, if we do change
it, we will tell you promptly. For questions about our policy, or for additional
copies of this notice, please go to www.ftportfolios.com, or contact us at
1-800-621-1675 (First Trust Portfolios) or 1-800-222-6822 (First Trust
Advisors).
May 2017
Page 45
<PAGE>
This page intentionally left blank.
<PAGE>
This page intentionally left blank.
<PAGE>
This page intentionally left blank.
<PAGE>
FIRST TRUST
First Trust Exchange-Traded Fund III
INVESTMENT ADVISOR
First Trust Advisors L.P.
120 E. Liberty Drive, Suite 400
Wheaton, IL 60187
INVESTMENT SUB-ADVISOR
Stonebridge Advisors LLC
10 Westport Road, Suite C101
Wilton, CT 06897
ADMINISTRATOR, CUSTODIAN
FUND ACCOUNTANT &
TRANSFER AGENT
Brown Brothers Harriman & Co.
50 Post Office Square
Boston, MA 02110
INDEPENDENT REGISTERED
PUBLIC ACCOUNTING FIRM
Deloitte & Touche LLP
111 S. Wacker Drive
Chicago, IL 60606
LEGAL COUNSEL
Chapman and Cutler LLP
111 W. Monroe Street
Chicago, IL 60603
<PAGE>
[BLANK BACK COVER]
<PAGE>
FIRST TRUST
First Trust Exchange-Traded Fund III
--------------------------------------------------------------------------------
First Trust Managed Municipal ETF (FMB)
Annual Report
For the
Year Ended
October 31, 2017
<PAGE>
--------------------------------------------------------------------------------
TABLE OF CONTENTS
--------------------------------------------------------------------------------
FIRST TRUST MANAGED MUNICIPAL ETF (FMB)
ANNUAL REPORT
OCTOBER 31, 2017
Shareholder Letter........................................................... 1
Fund Performance Overview.................................................... 2
Portfolio Commentary......................................................... 5
Understanding Your Fund Expenses............................................. 8
Portfolio of Investments..................................................... 9
Statement of Assets and Liabilities.......................................... 21
Statement of Operations...................................................... 22
Statements of Changes in Net Assets.......................................... 23
Financial Highlights......................................................... 24
Notes to Financial Statements................................................ 25
Report of Independent Registered Public Accounting Firm...................... 31
Additional Information....................................................... 32
Board of Trustees and Officers............................................... 37
Privacy Policy............................................................... 39
CAUTION REGARDING FORWARD-LOOKING STATEMENTS
This report contains certain forward-looking statements within the meaning of
the Securities Act of 1933, as amended, and the Securities Exchange Act of 1934,
as amended. Forward-looking statements include statements regarding the goals,
beliefs, plans or current expectations of First Trust Advisors L.P. ("First
Trust" or the "Advisor") and its representatives, taking into account the
information currently available to them. Forward-looking statements include all
statements that do not relate solely to current or historical fact. For example,
forward-looking statements include the use of words such as "anticipate,"
"estimate," "intend," "expect," "believe," "plan," "may," "should," "would," or
other words that convey uncertainty of future events or outcomes.
Forward-looking statements involve known and unknown risks, uncertainties and
other factors that may cause the actual results, performance or achievements of
the series of First Trust Exchange-Traded Fund III (the "Trust") described in
this report (First Trust Managed Municipal ETF; hereinafter referred to as the
"Fund") to be materially different from any future results, performance or
achievements expressed or implied by the forward-looking statements. When
evaluating the information included in this report, you are cautioned not to
place undue reliance on these forward-looking statements, which reflect the
judgment of the Advisor and its representatives only as of the date hereof. We
undertake no obligation to publicly revise or update these forward-looking
statements to reflect events and circumstances that arise after the date hereof.
PERFORMANCE AND RISK DISCLOSURE
There is no assurance that the Fund will achieve its investment objectives. The
Fund is subject to market risk, which is the possibility that the market values
of securities owned by the Fund will decline and that the value of the Fund
shares may therefore be less than what you paid for them. Accordingly, you can
lose money by investing in the Fund. See "Risk Considerations" in the Additional
Information section of this report for a discussion of certain other risks of
investing in the Fund.
Performance data quoted represents past performance, which is no guarantee of
future results, and current performance may be lower or higher than the figures
shown. For the most recent month-end performance figures, please visit
http://www.ftportfolios.com or speak with your financial advisor. Investment
returns, net asset value, and share price will fluctuate and Fund shares, when
sold, may be worth more or less than their original cost.
The Advisor may also periodically provide additional information on Fund
performance on the Fund's webpage at http://www.ftportfolios.com.
HOW TO READ THIS REPORT
This report contains information that may help you evaluate your investment in
the Fund. It includes details about the Fund's portfolio and presents data and
analysis that provide insight into the Fund's performance and investment
approach.
By reading the portfolio commentary by the portfolio management team of the
Fund, you may obtain an understanding of how the market environment affected the
Fund's performance. The statistical information that follows may help you
understand the Fund's performance compared to that of a relevant market
benchmark.
It is important to keep in mind that the opinions expressed by personnel of the
Advisor are just that: informed opinions. They should not be considered to be
promises or advice. The opinions, like the statistics, cover the period through
the date on the cover of this report. The material risks of investing in the
Fund are spelled out in its prospectus, statement of additional information,
this report, and other Fund regulatory filings.
<PAGE>
--------------------------------------------------------------------------------
SHAREHOLDER LETTER
--------------------------------------------------------------------------------
FIRST TRUST MANAGED MUNICIPAL ETF (FMB)
ANNUAL LETTER FROM THE CHAIRMAN AND CEO
OCTOBER 31, 2017
Dear Shareholders:
Thank you for your investment in First Trust Managed Municipal ETF.
First Trust is pleased to provide you with the annual report which contains
detailed information about your investment for the 12 months ended October 31,
2017, including a market overview and a performance analysis for the period. We
encourage you to read this report carefully and discuss it with your financial
advisor.
The U.S. bull market continued through the November 2016 election and the first
nine months of the Trump presidency. During that period, November 8, 2016
(Election Day 2016) through October 31, 2017, the S&P 500(R) Index (the "Index")
posted a total return of 22.73%, according to Bloomberg. Ten of the eleven Index
sectors were up on a total return basis as well. Since the beginning of 2017
through October 31, 2017, the Index has closed its trading sessions at all-time
highs on 50 occasions. Finally, as of October 31, 2017, the Index has spent the
entire year in positive territory. This has only happened in 10 different years
over the past seven decades.
The current bull market, as measured from March 9, 2009 through October 31,
2017, is the second longest in history. While we are optimistic about the U.S.
economy, we are also aware that no one can predict the future or know how
markets will perform in different economic environments. We believe that one
should invest for the long term and be prepared for market volatility by keeping
current on your portfolio and investing goals by speaking regularly with your
investment professional. It is also important to keep in mind that past
performance can never guarantee future results.
Thank you for giving First Trust the opportunity to be a part of your investment
plan. We value our relationship with you and will continue to focus on bringing
the types of investments that we believe can help you reach your financial
goals.
Sincerely,
/s/ James A. Bowen
James A. Bowen
Chairman of the Board of Trustees
Chief Executive Officer of First Trust Advisors L.P.
Page 1
<PAGE>
--------------------------------------------------------------------------------
FUND PERFORMANCE OVERVIEW (UNAUDITED)
--------------------------------------------------------------------------------
FIRST TRUST MANAGED MUNICIPAL ETF (FMB)
The primary investment objective of First Trust Managed Municipal ETF (the
"Fund") is to generate current income that is exempt from regular federal income
taxes and its secondary objective is long-term capital appreciation. The Fund
lists and principally trades its shares on The Nasdaq Stock Market, LLC under
the ticker symbol "FMB." Under normal market conditions, the Fund seeks to
achieve its investment objectives by investing at least 80% of its net assets
(including investment borrowings) in municipal debt securities that pay interest
that is exempt from regular federal income taxes. The Fund is non-diversified.
<TABLE>
<CAPTION>
----------------------------------------------------------------------------------------------------------------------------------
PERFORMANCE
----------------------------------------------------------------------------------------------------------------------------------
AVERAGE ANNUAL CUMULATIVE
TOTAL RETURNS TOTAL RETURNS
1 Year Ended Inception (5/13/14) Inception (5/13/14)
10/31/17 to 10/31/17 to 10/31/17
<S> <C> <C> <C>
FUND PERFORMANCE
NAV 2.59% 4.69% 17.22%
Market Price 2.66% 4.72% 17.35%
INDEX PERFORMANCE
Bloomberg Barclays Municipal 10-Year Revenue Index 2.32% 3.77% 13.68%
----------------------------------------------------------------------------------------------------------------------------------
</TABLE>
Total returns for the periods since inception are calculated from the inception
date of the Fund. "Average Annual Total Returns" represent the average annual
change in value of an investment over the periods indicated. "Cumulative Total
Returns" represent the total change in value of an investment over the periods
indicated.
The Fund's per share net asset value ("NAV") is the value of one share of the
Fund and is computed by dividing the value of all assets of the Fund (including
accrued interest and dividends), less all liabilities (including accrued
expenses and dividends declared but unpaid), by the total number of outstanding
shares. The price used to calculate market return ("Market Price") is determined
by using the midpoint between the highest bid and the lowest offer on the stock
exchange on which shares of the Fund are listed for trading as of the time that
the Fund's NAV is calculated. Since shares of the Fund did not trade in the
secondary market until after the Fund's inception, for the period from inception
to the first day of secondary market trading in shares of the Fund, the NAV of
the Fund is used as a proxy for the secondary market trading price to calculate
market returns. NAV and market returns assume that all distributions have been
reinvested in the Fund at NAV and Market Price, respectively.
An index is a statistical composite that tracks a specified financial market or
sector. Unlike the Fund, the index does not actually hold a portfolio of
securities and therefore does not incur the expenses incurred by the Fund. These
expenses negatively impact the performance of the Fund. Also, market returns do
not include brokerage commissions that may be payable on secondary market
transactions. If brokerage commissions were included, market returns would be
lower. The total returns presented reflect the reinvestment of dividends on
securities in the index. The returns presented do not reflect the deduction of
taxes that a shareholder would pay on Fund distributions or the redemption or
sale of Fund shares. The investment return and principal value of shares of the
Fund will vary with changes in market conditions. Shares of the Fund may be
worth more or less than their original cost when they are redeemed or sold in
the market. The Fund's past performance is no guarantee of future performance.
Page 2
<PAGE>
--------------------------------------------------------------------------------
FUND PERFORMANCE OVERVIEW (UNAUDITED) (CONTINUED)
--------------------------------------------------------------------------------
FIRST TRUST MANAGED MUNICIPAL ETF (FMB)
-----------------------------------------------------------
% OF TOTAL
INVESTMENTS
SECTOR ALLOCATION (INCLUDING CASH)
-----------------------------------------------------------
Hospital 13.3%
Continuing Care Retirement Communities 12.5
Cash 8.4
Education 6.2
Higher Education 6.1
Government Obligation Bond - Unlimited Tax 5.9
Dedicated Tax 5.6
Insured 5.4
Special Assessment 4.2
Water & Sewer 4.1
Government Obligation Bond - Limited Tax 3.8
Toll Road 3.2
Utility 3.0
Certificates of Participation 2.9
Airport 2.5
Gas 2.4
Tax Increment 2.4
Skilled Nursing 1.6
Industrial Development Bond 1.5
Student Housing 1.4
Mass Transit 0.8
Pre-refunded/Escrowed-to-maturity 0.8
Local Housing 0.7
Tobacco 0.5
Other Health 0.5
Port 0.1
Stadium 0.1
Hotel 0.1
-------
Total 100.0%
=======
-----------------------------------------------------------
% OF TOTAL
INVESTMENTS
CREDIT RATING(1) (INCLUDING CASH)
-----------------------------------------------------------
AAA 5.3%
AA 18.5
A 28.0
BBB 19.5
BB 5.2
Not Rated 15.1
Cash 8.4
-------
Total 100.0%
=======
(1) The credit quality information presented reflects the ratings assigned by
one or more nationally recognized statistical rating organizations
(NRSROs), including Standard & Poor's Ratings Group, a division of The
McGraw-Hill Companies, Inc., Moody's Investors Service, Inc., Fitch
Ratings or a comparably rated NRSRO. For situations in which a security is
rated by more than one NRSRO and ratings are not equivalent, the highest
ratings are used. Sub-investment grade ratings are those rated BB+/Ba1 or
lower. Investment grade ratings are those rated BBB-/Baa3 or higher. The
credit ratings shown relate to the creditworthiness of the issuers of the
underlying securities in the Fund, and not to the Fund or its shares.
Credit ratings are subject to change.
Page 3
<PAGE>
--------------------------------------------------------------------------------
FUND PERFORMANCE OVERVIEW (UNAUDITED) (CONTINUED)
--------------------------------------------------------------------------------
FIRST TRUST MANAGED MUNICIPAL ETF (FMB)
PERFORMANCE OF A $10,000 INITIAL INVESTMENT
MAY 13, 2014 - OCTOBER 31, 2017
<TABLE>
<CAPTION>
First Trust Managed Bloomberg Barclays Municipal
Municipal ETF 10-Year Revenue Index
<S> <C> <C>
5/13/14 $10,000 $10,000
10/31/14 10,353 10,297
4/30/15 10,585 10,436
10/31/15 10,732 10,633
4/30/16 11,222 11,065
10/31/16 11,427 11,109
4/30/17 11,324 11,069
10/31/17 11,722 11,368
</TABLE>
Performance figures assume reinvestment of all distributions and do not reflect
the deduction of taxes that a shareholder would pay on Fund distributions or the
redemption or sale of Fund shares. An index is a statistical composite that
tracks a specified financial market or sector. Unlike the Fund, the index does
not actually hold a portfolio of securities and therefore does not incur the
expenses incurred by the Fund. These expenses negatively impact the performance
of the Fund. The Fund's past performance does not predict future performance.
FREQUENCY DISTRIBUTION OF DISCOUNTS AND PREMIUMS
BID/ASK MIDPOINT VS. NAV THROUGH OCTOBER 31, 2017
The following Frequency Distribution of Discounts and Premiums charts are
provided to show the frequency at which the bid/ask midpoint price for the Fund
was at a discount or premium to the daily NAV. The following tables are for
comparative purposes only and represent the period May 14, 2014 (commencement of
trading) through October 31, 2017. Shareholders may pay more than NAV when they
buy Fund shares and receive less than NAV when they sell those shares because
shares are bought and sold at current market price. Data presented represents
past performance and cannot be used to predict future results.
--------------------------------------------------------------------------------
NUMBER OF DAYS BID/ASK MIDPOINT AT/ABOVE NAV
--------------------------------------------------------------------------------
FOR THE PERIOD 0.00%-0.49% 0.50%-0.99% 1.00%-1.99% >=2.00%
5/14/14 - 10/31/14 2 10 0 0
11/1/14 - 10/31/15 178 16 0 0
11/1/15 - 10/31/16 200 0 0 0
11/1/16 - 10/31/17 207 0 0 0
--------------------------------------------------------------------------------
NUMBER OF DAYS BID/ASK MIDPOINT BELOW NAV
--------------------------------------------------------------------------------
FOR THE PERIOD 0.00%-0.49% 0.50%-0.99% 1.00%-1.99% >=2.00%
5/14/14 - 10/31/14 64 43 0 0
11/1/14 - 10/31/15 57 0 0 0
11/1/15 - 10/31/16 51 1 0 0
11/1/16 - 10/31/17 45 0 0 0
Page 4
<PAGE>
--------------------------------------------------------------------------------
PORTFOLIO COMMENTARY
--------------------------------------------------------------------------------
FIRST TRUST MANAGED MUNICIPAL ETF (FMB)
ANNUAL REPORT
OCTOBER 31, 2017 (UNAUDITED)
ADVISOR
First Trust Advisors L.P. ("First Trust") is the investment advisor to the First
Trust Managed Municipal ETF (the "Fund"). First Trust is responsible for the
ongoing monitoring of the Fund's investment portfolio, managing the Fund's
business affairs and providing certain administrative services necessary for the
management of the Fund.
PORTFOLIO MANAGEMENT TEAM
TOM FUTRELL, CFA, SENIOR VICE PRESIDENT, SENIOR PORTFOLIO MANAGER
JOHNATHAN N. WILHELM, SENIOR VICE PRESIDENT, SENIOR PORTFOLIO MANAGER
The First Trust Municipal Securities Team was formed in September of 2013 and is
headed by Tom Futrell, CFA and Johnathan Wilhelm who serve as senior portfolio
managers of the Fund. Messrs. Futrell and Wilhelm have a combined 50+ years of
investment experience and prior to joining First Trust, served as portfolio
managers of municipal bonds at Nuveen Investments and Performance Trust
Investment Advisors. In addition to the Fund, the team manages/consults for a
variety of investment portfolios and separately managed accounts.
COMMENTARY
The Fund is an actively managed exchange-traded fund. The Fund's primary
investment objective seeks to generate current income that is exempt from
regular federal income taxes and its secondary objective is long-term capital
appreciation. Under normal market conditions, the Fund seeks to achieve its
investment objectives by investing at least 80% of its net assets (including
investment borrowings) in municipal debt securities that pay interest that is
exempt from regular federal income taxes. The Fund invests at least 65% of its
net assets in municipal bonds that are investment grade rated at the time of
purchase or that are unrated but deemed by the Fund's advisor to be of
comparable quality. This commentary discusses the 12-month market performance
and the Fund's performance ended October 31, 2017.
MARKET RECAP
For the 12-month period ended October 31, 2017, municipal bonds generated a
total return of 2.19% as measured by the Bloomberg Barclays General Municipal
Bond Index ("BMBI"). During the same period, the Bloomberg Barclays Municipal
10-Year Revenue Index and Bloomberg Barclays Non-Investment Grade Index produced
returns of 2.32% and 2.99%, respectively. By comparison, the Bloomberg Barclays
Municipal Revenue 10-year (8-12) U.S. Treasury Index generated a -0.69% return
during the 12-month period. The following have been major factors in explaining
the municipal bond market's performance:
o After a record setting year in 2016 in which new issue supply
totaled $446 billion, calendar year-to-date new issue supply through
October 31, 2017 totals $322.4 billion versus $394.5 billion for the
same period last year, a decrease of 18.3%. The decline in primary
market issuance was due to a 31.6% decline in refunding activity,
only partially offset by an increase in new capital issuance.
o Municipals experienced consistently strong retail demand, with one
significant exception. After the first ten months in 2016 of inflows
totaling $51 billion, the last two months saw dramatic outflows from
municipal mutual funds. In comparison, through the first ten months
of 2017, municipal fund flows were positive during each month,
ranging from a positive $873 million to $3.8 billion. Calendar
year-to-date, fund flows through October 31, 2017 totaled $23.9
billion. (Source: Barclays, Investment Company Institute)
o During the past year, credit fundamentals remained healthy and
continued to provide stabilizing support for municipal market
performance. Through the first ten months of 2017, the par value of
first-time municipal bond defaults increased to $33.5 billion from
$23.2 billion through the first ten months of 2016, with Puerto Rico
and its corporate affiliates representing a large percentage of the
total. The number of defaults decreased to just 38 versus 59 for the
same period in 2016. We expect the narrative and headline risk to
continue with well-publicized credits because of severe spending and
budget imbalances, dramatic pension underfunding, and politics
around taxation unlikely to be resolved in the near term.
o The past year was marked by politically significant events, both in
the U.S. and globally, which caused a great deal of volatility in
the U.S. rates markets as expressed by treasury yields. After the
election of Donald Trump, the markets began anticipating reduced
regulation and increased fiscal stimulus with the goal of stronger
U.S. growth. Interest rates moved higher, with the 10-year Treasury
bond increasing in yield from 1.87% on October 31, 2016 to 2.51% by
December 31, 2016. Year-to-date, 2017 has witnessed fixed income
markets reassessing their employment and inflation outlooks. Even
though the U.S. has posted 3% (annualized) gross domestic product
("GDP") growth over the past two quarters, lower inflation readings
Page 5
<PAGE>
--------------------------------------------------------------------------------
PORTFOLIO COMMENTARY (CONTINUED)
--------------------------------------------------------------------------------
FIRST TRUST MANAGED MUNICIPAL ETF (FMB)
ANNUAL REPORT
OCTOBER 31, 2017 (UNAUDITED)
and a lack of legislative achievements continue to impact treasury
yields. In addition, global quantitative easing, particularly in
Europe and Asia, continues to be a driving factor in the demand for
U.S. treasuries. The result has been stabilization in bond prices
and a flattening of the yield curve. As of October 31, 2017, the
10-year U.S. Treasury yield stood at a 2.38%, down 13 basis points
("bps") from year-end 2016, but up 51 bps for the trailing 12
months. Ten-year municipal yields outperformed 10-year U.S.
Treasuries as measured by 10-year, "AAA" rated general obligation
bonds. According to data prepared by Municipal Market Data, 10-year
"AAA" municipal yields increased 28 bps from a 1.73% on October 31,
2016 to a 2.01% as of October 31, 2017, but decreased 30 bps from
2.31% as of December 31, 2016.
PERFORMANCE ANALYSIS
The Fund's net asset value ("NAV") and market performance for the 12-month
period ended October 31, 2017 was 2.59% and 2.66%, respectively, versus the
Bloomberg Barclays Municipal 10-year Revenue Index (the "Benchmark") return of
2.32% during the same.
The Fund's monthly distribution of $0.1125 on October 31, 2017 represented a
tax-exempt annualized distribution rate of 2.53% (4.49% taxable equivalent
yield) based on the Fund's closing market price of $53.28. The Fund's
distribution rate is not constant and is subject to change over time based on
the performance of the Fund and general market conditions.
From a portfolio construction perspective, the Fund maintains an underweight
position in the highest quality issuers ("AA" rated and higher) versus the
Benchmark and is overweight the Benchmark in terms of "BBB", as well as below
investment-grade and non-rated bonds. The Fund may allocate up to 35% of its net
assets to credits that are either rated below investment-grade or are non-rated
and deemed to be of comparable quality at the time of purchase. We believe these
bonds tend to carry higher income cushions than their high-quality counterparts
which can help insulate the investment against interest rate risk without
materially increasing default potential. As of October 31, 2017, the Fund's
weighted-average credit quality was approximately "BBB/Baa", which is lower than
the Benchmark with a stated average credit rating of "AA3/A1". The Fund's
investments in "A" and "BBB" rated bonds, as well as, sub-investment grade and
non-rated municipal securities generated strong performance for the trailing
twelve 12 months as investors increasingly searched for yield lower on the
credit rating spectrum given the low nominal rates environment. As a result,
lower investment-grade strategies generally benefited from credit spread
compression throughout most of the trailing 12-month period, positively
contributing to the Fund's NAV outperformance relative to the Benchmark. Given
the fact that investment-grade municipal credit spreads are near their lowest
level since the onset of the financial crisis, we currently favor "A" rated
bonds over "BBB" rated bonds. High-yield municipal risk premiums are still above
the long-term historical average, however, and we continue to find value in
select high-yield bonds after rigorous credit research and selection.
We continued to see value in revenue bonds issued by essential service
providers. Our focus is on issuers that meet basic infrastructure needs and
provide needed essential services within their respective communities. Revenue
bond sectors we overweight include healthcare, education and special tax
district bonds. Beyond the borrower's essentiality, we also look for issuers who
have a growing market share, increasing utilization, and growing cash flow as
this provides added insulation against credit erosion and the potential for
credit rating improvement over time. Revenue bond sectors that positively
contributed to the Fund's performance over the past twelve months included
senior living facilities, education (charter schools), water & sewers,
utilities, airports, toll roads and special assessment districts. We continue to
underweight general obligation bonds relative to our Benchmark.
Over the fiscal year, we continued to maintain the Fund's intermediate duration
profile. The Fund's modified duration was 5.54 as of October 31, 2017, which was
shorter than the Benchmark's at 5.69. The Fund was overweight the Benchmark in
bonds with modified durations of 3 to 6 years and underweight the Benchmark 6
years and longer. Because we believe that the very short end of the municipal
yield curve could be the most vulnerable to the volatility associated with a
Federal Reserve (the "Fed") rate hike, we have limited the Fund's exposure to
bonds that mature in 1 to 4 years. The Fund's underweight in longer duration
bonds relative to the Benchmark is the result of our view that in rising rate
environments, longer duration strategies, which are more interest rate
sensitive, generally see the heaviest fund outflows resulting in their
respective bond valuations being hardest hit.
MARKET OUTLOOK
As we look forward to the remainder of 2017, global rates markets will be
focused on the European Central Bank's discussion of future asset purchases
(i.e. quantitative easing), U.S. jobs and inflation data. We think the Fed is
likely to raise the Fed Funds rate another 25 bps by the end of the year. We
also expect to see the Fed begin to unwind its $4.5 trillion balance sheet. As
the Fed has stated, Fed rate action will be data dependent, with a focus on
supportive economic data and inflation expectations.
We expect continued moderate growth for the U.S. economy through year end. Even
though the personal consumption expenditure (PCE) core price index
year-over-year has trended lower over the past quarter from 1.5% in June to 1.3%
in September, there has seen solid U.S. economic growth with second quarter
gross domestic product ("GDP") of 3.1% (annualized) and third quarter GDP of
Page 6
<PAGE>
--------------------------------------------------------------------------------
PORTFOLIO COMMENTARY (CONTINUED)
--------------------------------------------------------------------------------
FIRST TRUST MANAGED MUNICIPAL ETF (FMB)
ANNUAL REPORT
OCTOBER 31, 2017 (UNAUDITED)
3.0% (annualized). Based on anticipated U.S GDP growth, employment, and
inflation expectations, we believe general municipal yields will increase
approximately 20 to 40 bps between now and year end, with 10-year AAA general
obligation bonds yielding between 2.20% and 2.40% (compared with 2.01% on
October 31, 2017).
We believe technical factors will continue to be positive for the municipal
market. With our expectation for gradually higher interest rates, we believe
flows into municipal bond funds will likely continue to be modestly positive,
but could be somewhat volatile during the remainder of 2017. Given the relative
attractiveness of risk-adjusted municipal yields versus other asset classes, we
believe any sustained outflows which lead to higher yields will ultimately be
viewed by investors as an attractive buying opportunity. Through the first ten
months of 2017, total municipal new issue volume was $322.4 billion versus
$394.5 billion in 2016, a decrease of 18.3%. We think new issue volume for the
year between $350 and $375 billion is still within reason, favoring the higher
end of the range.
We expect municipal credit quality to remain stable. As stated above, the total
number of defaulting issuers through the first ten months of 2017 decreased to
38 defaults versus 59 during the same period in 2016. The par value of defaults
increased from $23.2 billion to $33.5 billion, which reflects Puerto Rico and
its corporate affiliates. Mainland U.S. municipal bond credit quality appears
relatively unaffected by Hurricanes Harvey and Irma; however, the story is very
different in Puerto Rico, where substantial damage to the local economy from
hurricanes Irma and Maria appears severe, and involves a very difficult road
ahead to restoring essential services including electricity. As the U.S. economy
continues to grow at a moderate pace, we expect credit metrics will continue to
improve and the total number of defaults by year end 2017 to be similar to
slightly lower than to that in 2016. We have positive sector outlooks for senior
living, toll roads, airports and special tax districts, and continue to be
cautious on hospitals as we wait to see what is ultimately decided regarding the
Affordable Care Act ("ACA").
We will continue to monitor U.S. Federal tax reform legislation closely. Efforts
to eliminate tax exempt advance refundings and private activity bonds could
dramatically reduce supply. The reduction in the corporate tax rate to 20% from
35% could reduce the appetite for banks, life insurance and property & casualty
insurance companies from purchasing municipal bonds.
Given our expectation for gradually rising rates, we will continue to position
the Fund in the intermediate portion of the yield curve by being modestly below
its benchmark duration. Because we believe yield curve positioning could be an
important source of total return in 2018, our current intention is to
underweight bonds in the short end of the municipal yield curve as they could be
the most vulnerable to volatility associated with Fed tightening, and
underweight long-duration bonds (20+ years to maturity) that could be negatively
impacted in a rising-rate environment. We currently favor bonds with 5 to 12
year maturities, and bonds maturing in 13 to 20 years, but priced to a 6 to
9-year call. We also favor 5% coupon bonds, versus 3% and 4% coupon structures,
that together with our preferred yield curve positioning serves to reduce
overall portfolio duration. On the credit side, we have focused recent purchases
on "A" and "AA" rated bonds and select below investment-grade and non-rated
securities given the current stable municipal credit environment, as well as how
narrow credit spreads are for "BBB" rated bonds. We favor essential service
revenue bond sectors such as special tax, senior living, charter schools and
electric and gas utilities, which have additional default-risk insulation
because of the borrowers' essentiality in their local communities. In addition,
we continue to practice the discipline of our investment process where we
perform fundamental credit analysis and quantitative total return scenario
analysis on individual bonds and the portfolio, looking for bonds that can
provide both high income and attractive total return potential over time.
Page 7
<PAGE>
FIRST TRUST MANAGED MUNICIPAL ETF (FMB)
UNDERSTANDING YOUR FUND EXPENSES
OCTOBER 31, 2017 (UNAUDITED)
As a shareholder of First Trust Managed Municipal ETF (the "Fund") you incur two
types of costs: (1) transaction costs; and (2) ongoing costs, including
management fees, distribution and/or service fees, if any, and other Fund
expenses. This Example is intended to help you understand your ongoing costs of
investing in the Fund and to compare these costs with the ongoing costs of
investing in other funds.
The Example is based on an investment of $1,000 invested at the beginning of the
period and held through the six-month period ended October 31, 2017.
ACTUAL EXPENSES
The first line in the following table provides information about actual account
values and actual expenses. You may use the information in this line, together
with the amount you invested, to estimate the expenses that you paid over the
period. Simply divide your account value by $1,000 (for example, an $8,600
account value divided by $1,000 = 8.6), then multiply the result by the number
in the first line under the heading entitled "Expenses Paid During the Six-Month
Period" to estimate the expenses you paid on your account during this six-month
period.
HYPOTHETICAL EXAMPLE FOR COMPARISON PURPOSES
The second line in the following table provides information about hypothetical
account values and hypothetical expenses based on the Fund's actual expense
ratio and an assumed rate of return of 5% per year before expenses, which is not
the Fund's actual return. The hypothetical account values and expenses may not
be used to estimate the actual ending account balance or expenses you paid for
the period. You may use this information to compare the ongoing costs of
investing in the Fund and other funds. To do so, compare this 5% hypothetical
example with the 5% hypothetical examples that appear in the shareholder reports
of the other funds.
Please note that the expenses shown in the table are meant to highlight your
ongoing costs only and do not reflect any transactional costs such as brokerage
commissions. Therefore, the second line in the table is useful in comparing
ongoing costs only, and will not help you determine the relative total costs of
owning different funds. In addition, if these transactional costs were included,
your costs would have been higher.
<TABLE>
<CAPTION>
-------------------------------------------------------------------------------------------------------------------------
ANNUALIZED
EXPENSE RATIO EXPENSES PAID
BEGINNING ENDING BASED ON THE DURING THE
ACCOUNT VALUE ACCOUNT VALUE SIX-MONTH SIX-MONTH
MAY 1, 2017 OCTOBER 31, 2017 PERIOD (a) PERIOD (b)
-------------------------------------------------------------------------------------------------------------------------
<S> <C> <C> <C> <C>
FIRST TRUST MANAGED MUNICIPAL ETF (FMB)
Actual $1,000.00 $1,035.20 0.50% $2.56
Hypothetical (5% return before expenses) $1,000.00 $1,022.68 0.50% $2.55
</TABLE>
(a) These expense ratios reflect an expense waiver. See Note 3 in the Notes to
Financial Statements.
(b) Expenses are equal to the annualized expense ratio as indicated in the
table, multiplied by the average account value over the period (May 1,
2017 through October 31, 2017), multiplied by 184/365 (to reflect the
one-half year period).
Page 8
<PAGE>
FIRST TRUST MANAGED MUNICIPAL ETF (FMB)
PORTFOLIO OF INVESTMENTS
OCTOBER 31, 2017
<TABLE>
<CAPTION>
PRINCIPAL STATED STATED
VALUE DESCRIPTION COUPON MATURITY VALUE
--------------- ---------------------------------------------------------------- ------------- ------------ --------------
<S> <C> <C> <C> <C>
MUNICIPAL BONDS - 92.7%
ALABAMA - 0.5%
$ 500,000 AL St Port Auth Docks Facs Rev Ref Docks Facs Rev,
Ser A, AGM, AMT.............................................. 5.00% 10/01/25 $ 585,715
600,000 Mobile AL Impt Dist Sales Tax Rev Mcgowin Park Proj, Ser A...... 5.00% 08/01/25 621,660
--------------
1,207,375
--------------
ARIZONA - 1.5%
375,000 AZ St Indl Dev Auth Edu Rev Ref Basis Sch Projs, Ser D (a)...... 5.00% 07/01/37 392,835
250,000 AZ St Indl Dev Auth Edu Rev Ref Basis Schs Projs, Ser A (a)..... 4.00% 07/01/21 257,290
300,000 AZ St Indl Dev Auth Edu Rev Ref Basis Schs Projs, Ser A (a)..... 5.00% 07/01/26 327,507
500,000 Maricopa Cnty AZ Indl Dev Auth Edu Rev Ref Horizon Cmnty
Learning Ctr Proj............................................ 5.00% 07/01/35 511,205
500,000 Maricopa Cnty AZ Indl Dev Auth Edu Rev Ref Paradise Schs
Projs Paragon Mgmt Inc (a)................................... 4.00% 07/01/26 511,385
500,000 Phoenix AZ Indl Dev Auth Edu Rev Fac Legacy Traditional
Schs Projs, Ser A (a)........................................ 4.00% 07/01/26 507,670
450,000 Pima Cnty AZ Indl Dev Auth Edu Rev Ref Fac American
Leadership Academy Proj (a).................................. 4.60% 06/15/25 461,025
275,000 Yavapai Cnty AZ Indl Dev Auth Hosp Fac Ref Yavapai Rgnl
Med Ctr...................................................... 5.00% 08/01/23 315,543
--------------
3,284,460
--------------
CALIFORNIA - 11.8%
320,000 Abag CA Fin Auth For Nonprofit Corps Ref Episcopal Sr Cmntys,
Ser B........................................................ 5.00% 07/01/23 366,374
525,000 Abag CA Fin Auth For Nonprofit Corps Ref Eskaton
Properties Inc............................................... 4.00% 11/15/17 525,536
275,000 CA Pub Fin Auth Rev Ref Henry Mayo Newhall Hosp................. 5.00% 10/15/29 316,965
455,000 CA Sch Fin Auth Sch Fac Rev Ref Hth Learning Proj, Ser A (a).... 4.00% 07/01/26 483,392
800,000 CA Sch Fin Auth Sch Fac Rev Ref Hth Learning Proj, Ser A (a).... 5.00% 07/01/32 900,856
1,000,000 CA St........................................................... 5.00% 08/01/26 1,237,810
700,000 CA St Muni Fin Auth Chrt Sch Rev Palmdale Aerospace
Academy Proj (a)............................................. 4.00% 07/01/26 713,853
200,000 CA St Muni Fin Auth Rev Channing House Proj, Ser B.............. 5.00% 05/15/37 236,402
125,000 CA St Muni Fin Auth Rev Ref Eisenhower Med Ctr, Ser A........... 5.00% 07/01/29 147,790
500,000 CA St Ref, Ser C................................................ 5.00% 09/01/32 593,070
500,000 CA St Sch Fin Auth Chrt Sch Rev Summit Pub Schs (a)............. 5.00% 06/01/37 559,290
550,000 CA Stwd Cmntys Dev Auth Rev Loma Linda Univ Med Ctr,
Ser A (a).................................................... 5.00% 12/01/36 601,717
800,000 CA Stwd Cmntys Dev Auth Rev Ref Ca Baptist Univ, Ser A (a)...... 3.00% 11/01/22 802,344
500,000 CA Stwd Cmntys Dev Auth Rev Ref Ca Baptist Univ, Ser A (a)...... 5.00% 11/01/32 557,005
100,000 CA Stwd Cmntys Dev Auth Rev Ref Front Porch Cmntys & Svcs,
Ser A........................................................ 5.00% 04/01/30 118,184
500,000 CA Stwd Cmntys Dev Auth Rev Ref Lancer Eductnl Student
Hsg Proj, Ser A (b).......................................... 4.00% 06/01/21 515,130
2,000,000 CA St Ref-Various Purpose....................................... 5.00% 11/01/25 2,453,000
1,160,000 Etiwanda CA Sch Dist Cmnty Facs Dist #9 Spl Tax Ref............. 5.00% 09/01/35 1,337,990
500,000 Foothill-De Anza CA Cmnty Clg Dist Ref, COPS.................... 5.00% 04/01/32 585,480
1,360,000 Hawthorne CA Cmnty Redev Agy Successor Agy Tax Allocation
Ref Sub, AGM................................................. 5.00% 09/01/32 1,595,117
1,015,000 Kaweah CA Delta Hlth Care Dist Rev, Ser B....................... 5.00% 06/01/40 1,119,281
210,000 La Verne CA Ref Brethren Hillcrest Homes, COPS.................. 5.00% 05/15/22 235,637
45,000 Long Beach CA Bond Fin Auth Nat Gas Purchase Rev, Ser A......... 5.25% 11/15/23 52,441
</TABLE>
See Notes to Financial Statements Page 9
<PAGE>
FIRST TRUST MANAGED MUNICIPAL ETF (FMB)
PORTFOLIO OF INVESTMENTS (CONTINUED)
OCTOBER 31, 2017
<TABLE>
<CAPTION>
PRINCIPAL STATED STATED
VALUE DESCRIPTION COUPON MATURITY VALUE
--------------- ---------------------------------------------------------------- ------------- ------------ --------------
<S> <C> <C> <C> <C>
MUNICIPAL BONDS (CONTINUED)
CALIFORNIA (CONTINUED)
$ 1,500,000 Los Angeles CA Dept of Wtr & Pwr Wtrwks Rev Ref, Ser B.......... 5.00% 07/01/36 $ 1,760,805
325,000 Menifee CA Union Sch Dist Pub Fing Auth Spl Tax Rev Ref,
Ser A........................................................ 5.00% 09/01/28 375,941
1,110,000 Montebello CA Pub Fing Auth Rev Montebello Home2 Suites
Hilton Hotel Proj, Ser A..................................... 5.00% 06/01/32 1,268,697
560,000 River Islands CA Pub Fing Auth Spl Tax Ref Cmnty Facs
Dist #2003-1................................................. 5.38% 09/01/31 604,794
350,000 San Diego Cnty CA Limited Rev Obligs Ref Sanford Burnham
Prebys Med Discovery Institute, Ser A........................ 5.00% 11/01/25 425,226
600,000 San Diego Cnty CA Limited Rev Obligs Ref Sanford Burnham
Prebys Med Discovery Institute, Ser A........................ 5.00% 11/01/26 722,580
945,000 San Diego Cnty CA Regl Arpt Auth Sr, Ser B, AMT................. 5.00% 07/01/30 1,088,961
775,000 San Diego Cnty CA Regl Arpt Auth Sub Rev, Ser B, AMT............ 5.00% 07/01/31 924,249
1,250,000 San Diego Cnty CA Regl Transprtn Commission, Ser A.............. 5.00% 04/01/35 1,483,687
785,000 San Francisco CA City & Cnty Arpts Commission Intl Arpt Rev
Ref, Ser D, AMT.............................................. 5.00% 05/01/25 950,635
280,000 San Francisco City & Cnty CA Redev Agy Successor Agy Tax
Ref Mission Bay N Redev Proj, Ser A.......................... 5.00% 08/01/35 322,560
--------------
25,982,799
--------------
COLORADO - 5.4%
835,000 Amber Creek Met Dist CO Ref, Ser A (c).......................... 5.00% 12/01/37 836,069
750,000 Amber Creek Met Dist CO Ref, Ser A (c).......................... 5.13% 12/01/47 750,705
500,000 Base Vlg Met Dist #2 CO Ref, Ser A (c).......................... 5.50% 12/01/36 521,695
1,000,000 Canyons Met Dist #5 CO Ref, Ser A (c)........................... 6.00% 12/01/37 1,013,340
500,000 Centerra CO Met Dist #1 Spl Rev (b)............................. 5.00% 12/01/22 551,745
1,000,000 Centerra CO Met Dist #1 Spl Rev (b)............................. 5.00% 12/01/29 1,088,490
300,000 CO St Hlth Facs Auth Hosp Rev Ref Frasier Meadows Retmnt
Cmnty Proj, Ser A............................................ 5.00% 05/15/25 337,398
350,000 CO St Hlth Facs Auth Hosp Rev Ref Frasier Meadows Retmnt
Cmnty Proj, Ser A............................................ 5.00% 05/15/26 394,499
605,000 CO St Hlth Facs Auth Rev Ref Covenant Retmnt Cmntys, Ser A...... 5.00% 12/01/27 662,808
525,000 CO St Hlth Facs Auth Rev Ref Covenant Retmnt Cmntys, Ser A...... 5.00% 12/01/33 562,107
150,000 Conservatory Met Dist CO Arapahoe Cnty Ref, BAM................. 5.00% 12/01/24 178,262
245,000 Conservatory Met Dist CO Arapahoe Cnty Ref, BAM................. 5.00% 12/01/25 294,522
500,000 Copperleaf CO Met Dist #2 Ref (c)............................... 5.25% 12/01/30 529,100
500,000 Cornerstar Met Dist CO Ref, Ser A (c)........................... 3.50% 12/01/21 507,075
90,000 Denver CO Convention Ctr Hotel Auth Rev Ref Sr.................. 5.00% 12/01/24 106,049
55,000 E-470 CO Pub Highway Auth Capital Appreciation Sr, Ser B,
NATL-RE...................................................... (d) 09/01/22 50,103
250,000 Harvest Junction CO Met Dist Ref & Impt......................... 5.00% 12/01/30 261,967
100,000 Lorson Ranch Met Dist #2 CO..................................... 4.00% 12/01/24 109,950
30,000 Park Creek CO Met Dist Rev Sr, Ser A, NATL-RE................... 5.00% 12/01/24 35,072
500,000 Parker Homestead Met Dist CO Ref (c)............................ 5.63% 12/01/44 531,585
1,000,000 Prairie Ctr CO Met Dist #3 Ltd Property Tax Supported Pri Ref,
Ser A (b).................................................... 4.13% 12/15/27 1,005,390
160,000 Pub Auth For CO St Energy Nat Gas Purchase Rev.................. 6.13% 11/15/23 192,406
750,000 Sierra Ridge Met Dist No 2 CO Sr, Ser A (c)..................... 4.50% 12/01/31 743,032
500,000 Southglenn CO Met Dist Spl Rev Ref (c).......................... 5.00% 12/01/30 519,915
165,000 Sterling Hills CO W Met Dist Ref................................ 5.00% 12/01/26 191,199
--------------
11,974,483
--------------
</TABLE>
Page 10 See Notes to Financial Statements
<PAGE>
FIRST TRUST MANAGED MUNICIPAL ETF (FMB)
PORTFOLIO OF INVESTMENTS (CONTINUED)
OCTOBER 31, 2017
<TABLE>
<CAPTION>
PRINCIPAL STATED STATED
VALUE DESCRIPTION COUPON MATURITY VALUE
--------------- ---------------------------------------------------------------- ------------- ------------ --------------
<S> <C> <C> <C> <C>
MUNICIPAL BONDS (CONTINUED)
CONNECTICUT - 0.7%
$ 1,500,000 CT St Hlth & Eductnl Facs Auth Rev Ref Yale Univ, Ser B-2 (e)... 5.00% 07/01/20 $ 1,646,490
--------------
FLORIDA - 7.3%
80,000 Alachua Cnty FL Hlth Facs Auth Shands Teaching Hosp &
Clinics, Ser A............................................... 5.00% 12/01/26 93,081
175,000 Belle Isle FL Chrt Sch Lease Rev Cornerstone Chrt Academy &
Cornerstone Chrt High Sch.................................... 5.50% 10/01/22 185,454
300,000 Bexley CDD FL Spl Assmnt Rev.................................... 4.10% 05/01/26 300,642
210,000 Bonterra Cmnty Dev Dist FL Spl Assmnt Sr, Ser A-1............... 3.13% 05/01/26 205,922
605,000 Broward Cnty FL Fuel Sys Rev Ft Lauderdale Fuel Facs, Ser A,
AGM, AMT..................................................... 5.00% 04/01/22 682,942
250,000 Citizens Property Insurance Corp. FL, Ser A-1................... 5.00% 06/01/22 284,080
25,000 Escambia Cnty FL Hlth Facs Auth Baptist Hosp Inc Proj, Ser A.... 5.00% 08/15/19 26,577
280,000 Escambia Cnty FL Hlth Facs Auth Baptist Hosp Inc Proj, Ser A.... 5.50% 08/15/24 308,554
600,000 Harmony FL CDD Capital Impt Rev Ref, Ser 2015................... 4.75% 05/01/25 607,746
370,000 Heritage Harbour FL N CDD Capital Impt Rev Ref Sr Lien,
Ser A-1, AGM................................................. 5.00% 05/01/25 426,325
125,000 Hollywood FL Cmnty Redev Agy Redev Rev Ref...................... 5.00% 03/01/23 142,308
1,000,000 Jacksonville FL Hlth Care Facs Rev Ref Baptist Hlth............. 5.00% 08/15/35 1,170,550
1,080,000 Lakeland FL Hosp Sys Rev Lakeland Regl Hlth..................... 5.00% 11/15/33 1,223,402
1,400,000 Mediterra FL S CDD Capital Impt Rev Ref......................... 5.10% 05/01/31 1,513,638
500,000 Miami FL Hlth Facs Auth Ref Miami Jewish Hlth Sys Oblig Grp..... 5.00% 07/01/23 557,780
520,000 Miami FL Hlth Facs Auth Ref Miami Jewish Hlth Sys Oblig Grp..... 5.00% 07/01/25 587,673
500,000 Miami FL Spl Oblg Ref (a)....................................... 5.00% 03/01/30 552,795
375,000 Miami World Ctr CDD FL Spl Assmnt............................... 4.00% 11/01/23 384,480
275,000 Miami World Ctr CDD FL Spl Assmnt............................... 4.75% 11/01/27 289,316
515,000 Miami-Dade Cnty FL Aviation Rev Ref, Ser A, AMT................. 5.00% 10/01/27 583,603
1,080,000 Miami-Dade Cnty FL Spl Oblig Sub Ref............................ 5.00% 10/01/35 1,252,400
565,000 Nthrn Palm Beach Cnty FL Impt Dist.............................. 3.25% 08/01/22 569,023
355,000 Nthrn Palm Beach Cnty FL Impt Dist.............................. 5.00% 08/01/37 376,627
345,000 Orange Cnty FL Hlth Facs Auth Rev Presbyterian Retmnt
Cmntys Proj.................................................. 5.00% 08/01/34 376,926
70,000 Orange Cnty FL Hlth Facs Auth Rev Ref Mayflower Retmnt Ctr...... 5.00% 06/01/32 74,449
825,000 Orange Cnty FL Hlth Facs Auth Rev Ref Presbyterian Retmnt
Cmntys....................................................... 5.00% 08/01/31 925,774
55,000 Port Saint Lucie FL Cmnty Redev Agy Rev Ref..................... 5.00% 01/01/23 63,582
120,000 Sarasota Cnty FL Hlth Facs Auth Retmnt Fac Rev Ref Vlg of
Isle Proj.................................................... 5.00% 01/01/26 137,166
1,500,000 SE Overtown Park W Cmnty Redev Agy FL Tax, Ser A-1 (a).......... 5.00% 03/01/30 1,668,645
230,000 Seven Oaks FL Cmnty Dev Dist Spl Assmnt Rev Ref Sr, Ser B-1..... 4.00% 05/01/24 244,883
100,000 UCF Stadium Corp FL Rev Ref, Ser A.............................. 5.00% 03/01/24 118,340
75,000 Vlg FL CDD #6 Spl Assmnt Rev Ref................................ 4.00% 05/01/25 81,260
--------------
16,015,943
--------------
GEORGIA - 1.9%
500,000 Atlanta GA Tax Allocation Ref Eastside Proj..................... 5.00% 01/01/30 580,160
315,000 East Point GA Tax Allocation Ref................................ 5.00% 08/01/21 347,864
1,000,000 Fulton Cnty GA Rsdl Care Facs Elderly Auth Retmnt Fac Rev Ref
Lenbrook Square Fdtn Inc..................................... 5.00% 07/01/31 1,117,590
40,000 Gainesville & Hall Cnty GA Hosp Auth Ref NE GA Hlth Sys Inc
Proj, Ser A.................................................. 5.00% 02/15/26 47,514
</TABLE>
See Notes to Financial Statements Page 11
<PAGE>
FIRST TRUST MANAGED MUNICIPAL ETF (FMB)
PORTFOLIO OF INVESTMENTS (CONTINUED)
OCTOBER 31, 2017
<TABLE>
<CAPTION>
PRINCIPAL STATED STATED
VALUE DESCRIPTION COUPON MATURITY VALUE
--------------- ---------------------------------------------------------------- ------------- ------------ --------------
<S> <C> <C> <C> <C>
MUNICIPAL BONDS (CONTINUED)
GEORGIA (CONTINUED)
$ 470,000 Macon-Bibb Cnty GA Urban Dev Auth Academy Classical Ed Inc,
Ser A (a).................................................... 5.00% 06/15/27 $ 491,136
175,000 Main Street Nat Gas Inc GA Gas Rev, Ser A....................... 5.50% 09/15/23 204,844
775,000 Marietta GA Dev Auth Ref Univ Facs Life Univ, Ser A (a)......... 5.00% 11/01/27 873,859
560,000 Priv Clgs & Univs Auth GA Mercer Univ Proj, Ser C............... 5.25% 10/01/27 621,751
--------------
4,284,718
--------------
GUAM - 0.1%
230,000 Guam Govt Business Privilege Tax Rev, Ser B-1................... 5.00% 01/01/37 239,985
75,000 Guam Pwr Auth Rev Ref, Ser A, AGM............................... 5.00% 10/01/20 82,163
--------------
322,148
--------------
HAWAII - 0.1%
170,000 HI St Dept of Budget & Fin Spl Purpose Rev Ref HI Pacific Hlth
Oblig Grp, Ser B............................................. 5.00% 07/01/30 191,833
110,000 HI St Pacific Hlth Spl Purpose Rev, Ser B....................... 5.63% 07/01/30 119,667
--------------
311,500
--------------
IDAHO - 0.7%
950,000 ID St Hlth Facs Auth Rev St Lukes Hlth Sys Proj, Ser A.......... 5.00% 03/01/44 1,036,042
500,000 ID St Hlth Facs Auth Rev Trinity Hlth Ref, Ser D................ 5.00% 12/01/33 563,745
--------------
1,599,787
--------------
ILLINOIS - 3.7%
305,000 Chicago IL O'Hare International Arpt Rev Ref Gen Sr Lien,
Ser A, AMT................................................... 5.00% 01/01/30 352,211
290,000 Chicago IL O'Hare International Arpt Rev Ref Gen Sr Lien,
Ser C........................................................ 5.00% 01/01/38 331,711
400,000 Chicago IL O'Hare International Arpt Rev, Ser C, AMT............ 5.00% 01/01/34 449,020
110,000 Chicago IL Ref Proj, Ser A...................................... 5.00% 01/01/27 118,692
500,000 Chicago IL Ref, Ser A........................................... 5.63% 01/01/29 571,275
150,000 Chicago IL Ref, Ser C........................................... 4.00% 01/01/22 156,843
35,000 Chicago IL Ref, Ser C........................................... 5.00% 01/01/22 37,991
500,000 Chicago IL Ref, Ser C........................................... 5.00% 01/01/25 553,815
170,000 Chicago IL Ref, Ser C........................................... 5.00% 01/01/26 188,601
285,000 Chicago IL Ref, Ser C, CABS..................................... (d) 01/01/22 245,653
505,000 Hampshire IL Spl Svc Area #14 Spl Tax Ref Lakewood
Crossing, BAM................................................ 4.00% 03/01/25 540,744
490,000 Hampshire IL Spl Svc Area #14 Spl Tax Ref Lakewood
Crossing, BAM................................................ 4.00% 03/01/26 520,292
180,000 IL St........................................................... 5.00% 05/01/23 195,176
15,000 IL St Fin Auth Rev Ref Lifespace Cmntys, Ser A.................. 5.00% 05/15/24 17,534
735,000 IL St Fin Auth Rev Ref Mercy Hth System Obligated Grp........... 5.00% 12/01/33 824,773
1,010,000 IL St Fin Auth Rev Sthrn IL Hlth Care, Ser A.................... 5.00% 03/01/47 1,098,698
845,000 IL St Toll Highway Auth Sr, Ser B............................... 5.00% 01/01/31 994,218
470,000 IL St, Ser A.................................................... 4.00% 01/01/25 479,931
500,000 IL St, Ser D.................................................... 5.00% 11/01/26 546,085
--------------
8,223,263
--------------
INDIANA - 1.4%
125,000 Evansville IN Mf Hsg Rev Silver Birch Evansville Proj........... 4.80% 01/01/28 124,892
1,000,000 Evansville IN Mf Hsg Rev Silver Birch Evansville Proj........... 5.45% 01/01/38 998,710
450,000 IN St Fin Auth Rev BHI Sr Living................................ 5.50% 11/15/26 496,782
</TABLE>
Page 12 See Notes to Financial Statements
<PAGE>
FIRST TRUST MANAGED MUNICIPAL ETF (FMB)
PORTFOLIO OF INVESTMENTS (CONTINUED)
OCTOBER 31, 2017
<TABLE>
<CAPTION>
PRINCIPAL STATED STATED
VALUE DESCRIPTION COUPON MATURITY VALUE
--------------- ---------------------------------------------------------------- ------------- ------------ --------------
<S> <C> <C> <C> <C>
MUNICIPAL BONDS (CONTINUED)
INDIANA - 1.4%
$ 110,000 IN St Fin Auth Rev BHI Sr Living................................ 5.50% 11/15/31 $ 119,768
20,000 IN St Fin Auth Rev Greencroft Oblig Grp, Ser A.................. 5.00% 11/15/23 22,089
460,000 IN St Fin Auth Rev Greencroft Oblig Grp, Ser A.................. 5.75% 11/15/28 506,667
40,000 IN St Fin Auth Rev Greencroft Oblig Grp, Ser A.................. 6.00% 11/15/28 44,592
275,000 IN St Fin Auth Rev Ref Rev Cmnty Fdtn of NW IN.................. 5.00% 09/01/31 320,460
500,000 Mishawaka IN Mf Hsg Rev Silver Birch Mishawaka Proj (a)......... 5.10% 01/01/32 498,465
--------------
3,132,425
--------------
IOWA - 0.5%
385,000 Coralville IA Ref Annual Appropriation, Ser B................... 4.00% 05/01/24 405,062
315,000 Coralville IA Ref Annual Appropriation, Ser B................... 4.00% 05/01/26 328,429
275,000 Coralville IA, Ser E, COPS...................................... 4.00% 06/01/23 293,546
--------------
1,027,037
--------------
KANSAS - 2.0%
475,000 Hutchinson KS Hosp Facs Rev Hutchinson Regl Med Ctr Inc......... 5.00% 12/01/25 539,063
2,020,000 Lawrence KS Wtr & Swr Sys Rev Ref & Impt, Ser A................. 5.00% 11/01/25 2,482,560
440,000 Topeka KS Utility Rev Comb, Ser A............................... 5.00% 08/01/24 530,935
170,000 Topeka KS Utility Rev Comb, Ser A............................... 5.00% 08/01/25 208,480
475,000 Wyandotte Cnty/Kansas City KS Unif Govt Utility Sys Rev Ref
& Impt, Ser A................................................ 5.00% 09/01/29 553,992
--------------
4,315,030
--------------
KENTUCKY - 1.2%
1,000,000 Estrn KY Univ Gen Recpts, Ser A................................. 5.00% 04/01/25 1,198,120
750,000 KY St Econ Dev Fin Auth Owensboro Med Hlth Sys, Ser A........... 6.00% 06/01/30 840,180
300,000 KY St Muni Pwr Agy Pwr Sys Rev Ref, Ser A, NATL-RE.............. 5.00% 09/01/22 343,020
50,000 Russell KY Rev Bon Secours Hlth Sys............................. 5.00% 11/01/22 58,002
100,000 Warren Cnty KY Hosp Rev Ref Bowling Green Warren Cnty
Cmnty Hosp Corp.............................................. 5.00% 04/01/23 112,896
--------------
2,552,218
--------------
LOUISIANA - 1.6%
1,000,000 LA Pub Facs Auth Rev Ref Ochsner Clinic Fdtn Proj............... 5.00% 05/15/36 1,137,230
390,000 LA Stadium & Exposition Dist LA Ref Sr, Ser A................... 5.00% 07/01/30 445,833
380,000 LA Stadium & Exposition Dist LA Ref Sr, Ser A................... 5.00% 07/01/31 434,184
200,000 New Orleans LA Aviation Brd Gen Arpt N Term, Ser B, AMT......... 5.00% 01/01/31 235,162
1,050,000 New Orleans LA Wtr Rev Ref...................................... 5.00% 12/01/28 1,211,994
--------------
3,464,403
--------------
MARYLAND - 5.5%
975,000 Baltimore Cnty MD Consol Pub Impt............................... 5.00% 08/01/21 1,106,888
1,000,000 Baltimore MD Spl Oblig Ref E Baltimore Research Park Proj,
Ser A........................................................ 5.00% 09/01/38 1,076,360
160,000 Howard Cnty MD Retmnt Cmnty Rev Ref Vantage House Fac........... 5.00% 04/01/21 166,475
500,000 Howard Cnty MD Retmnt Cmnty Rev Ref Vantage House Fac........... 5.00% 04/01/26 537,030
220,000 MD St Econ Dev Corp Econ Dev Rev Transn Facs Proj, Ser A........ 5.38% 06/01/25 234,967
600,000 MD St Econ Dev Corp Student Hsg Rev Ref Sr Univ MD Proj......... 4.00% 07/01/24 630,054
1,490,000 MD St Econ Dev Corp Student Hsg Rev Ref Univ MD Clg Park
Projs, AGM................................................... 5.00% 06/01/35 1,727,372
500,000 MD St Hlth & Hgr Eductnl Facs Auth Rev Adventist Hlth Care
Obligated Grp, Ser A......................................... 5.50% 01/01/26 601,940
</TABLE>
See Notes to Financial Statements Page 13
<PAGE>
FIRST TRUST MANAGED MUNICIPAL ETF (FMB)
PORTFOLIO OF INVESTMENTS (CONTINUED)
OCTOBER 31, 2017
<TABLE>
<CAPTION>
PRINCIPAL STATED STATED
VALUE DESCRIPTION COUPON MATURITY VALUE
--------------- ---------------------------------------------------------------- ------------- ------------ --------------
<S> <C> <C> <C> <C>
MUNICIPAL BONDS (CONTINUED)
MARYLAND (CONTINUED)
$ 800,000 MD St Hlth & Hgr Eductnl Facs Auth Rev Ref Anne Arundel
Hlth System, Ser A........................................... 5.00% 07/01/30 $ 942,888
1,000,000 MD St Hlth & Hgr Eductnl Facs Auth Rev Ref Anne Arundel
Hlth System, Ser A........................................... 5.00% 07/01/32 1,165,750
1,000,000 Montgomery Cnty MD, Ser B....................................... 5.00% 12/01/20 1,114,900
1,500,000 Prince Georges Cnty MD Rev Ref Collington Episcopal Life Care
Cmnty Inc.................................................... 5.00% 04/01/25 1,652,970
365,000 Rockville MD Mayor & Council Econ Dev Rev Ref Ingelside at
King Farm Proj, Ser A-1...................................... 5.00% 11/01/27 415,410
250,000 Rockville MD Mayor & Council Econ Dev Rev Ref Ingelside at
King Farm Proj, Ser A-2...................................... 3.38% 11/01/27 249,475
375,000 Rockville MD Mayor & Council Econ Dev Rev Ref Ingelside at
King Farm Proj, Ser A-2...................................... 5.00% 11/01/28 424,504
--------------
12,046,983
--------------
MASSACHUSETTS - 0.5%
325,000 MA St Dev Fin Agy Rev Merrimack Clg............................. 5.00% 07/01/37 360,636
700,000 MA St Dev Fin Agy Rev Umass Boston Student Hsg Proj............. 5.00% 10/01/24 802,809
--------------
1,163,445
--------------
MICHIGAN - 1.8%
1,000,000 Marquette MI Brd of Light & Pwr Elec Utility Sys Rev Ref,
Ser A........................................................ 5.00% 07/01/29 1,171,530
890,000 MI St Fin Auth Ltd Oblig Rev Ref College for Creative Studies
Proj......................................................... 5.00% 12/01/25 992,020
1,000,000 MI St Fin Auth Rev Ref Loc Govt Loan Program Great Lakes
Wtr Auth, Ser D-1............................................ 5.00% 07/01/34 1,127,230
500,000 MI St Fin Auth Rev Ref Loc Govt Loan Program, Ser F1............ 3.80% 10/01/22 519,765
125,000 MI St Fin Auth Rev Ref Loc Govt Loan Program, Ser F1............ 3.88% 10/01/23 130,609
--------------
3,941,154
--------------
MINNESOTA - 2.7%
175,000 Baytown Twp MN Lease Ref, Ser A................................. 3.00% 08/01/22 174,228
1,000,000 MN St, Ser B.................................................... 5.00% 10/01/28 1,251,200
1,000,000 North Oaks MN Sr Hsg Rev Ref Waverly Gardens Proj............... 5.00% 10/01/28 1,124,890
215,000 Nthrn MN Muni Pwr Agy Elec Sys Rev Ref.......................... 5.00% 01/01/32 251,664
1,000,000 Rochester MN Hlth Care & Hsg Rev Ref Samaritan Bethany Inc
Proj, Ser A.................................................. 5.00% 08/01/37 1,046,310
500,000 Saint Paul MN Hsg & Redev Auth Hlth Care Fac Rev Ref
HealthPartners Oblig Grp, Ser A.............................. 5.00% 07/01/30 580,560
500,000 Saint Paul MN Hsg & Redev Auth Hlth Care Fac Rev Ref
HealthPartners Oblig Grp, Ser A.............................. 5.00% 07/01/32 574,005
500,000 St Paul Park MN Sr Hsg & Hlth Care Rev Ref Presbyterian
Homes Bloomington Proj....................................... 3.00% 09/01/24 501,830
475,000 St Paul Park MN Sr Hsg & Hlth Care Rev Ref Presbyterian
Homes Bloomington Proj....................................... 3.13% 09/01/25 474,169
--------------
5,978,856
--------------
MISSISSIPPI - 0.1%
60,000 MS St Dev Bank Spl Oblig Magnolia Regl Hlth Ctr Proj, Ser A..... 5.00% 10/01/20 64,399
150,000 MS St Dev Bank Spl Oblig Magnolia Regl Hlth Ctr Proj, Ser A..... 6.00% 10/01/24 168,324
--------------
232,723
--------------
</TABLE>
Page 14 See Notes to Financial Statements
<PAGE>
FIRST TRUST MANAGED MUNICIPAL ETF (FMB)
PORTFOLIO OF INVESTMENTS (CONTINUED)
OCTOBER 31, 2017
<TABLE>
<CAPTION>
PRINCIPAL STATED STATED
VALUE DESCRIPTION COUPON MATURITY VALUE
--------------- ---------------------------------------------------------------- ------------- ------------ --------------
<S> <C> <C> <C> <C>
MUNICIPAL BONDS (CONTINUED)
MISSOURI - 1.6%
$ 700,000 Jackson Cnty MO Spl Oblg Ref Truman Sports Complex Proj......... 5.00% 12/01/31 $ 814,877
1,270,000 Joplin MO Indl Dev Auth Hlth Facs Rev Ref Freeman Hlth
System....................................................... 5.00% 02/15/26 1,462,354
200,000 MO St Dev Fin Brd Infrastructure Facs Rev Ref Independence MO
Centerpoint Proj, Ser B...................................... 5.00% 04/01/28 227,832
200,000 MO St Hlth & Eductnl Facs Auth Eductnl Facs Rev St Louis Clg
Pharmacy, Ser B.............................................. 5.00% 05/01/30 225,850
10,000 MO St Hlth & Eductnl Facs Auth Lutheran Sr Svcs................. 5.00% 02/01/23 11,396
500,000 MO St Hlth & Eductnl Facs Auth Sr Living Facs Lutheran Sr....... 5.38% 02/01/35 522,820
250,000 Saint Charles Cnty MO Pub Wtr Sply Dist #2 Ref, COPS............ 5.00% 12/01/28 294,668
--------------
3,559,797
--------------
MONTANA - 0.6%
500,000 Kalispell MT Hsg & Hlthcare Facs Rev Ref Immanuel Lutheran
Corp Proj Temps 50, Ser B.................................... 3.40% 11/15/22 502,020
740,000 MT St Fac Fin Auth Rev Ref...................................... 5.00% 02/15/25 880,955
--------------
1,382,975
--------------
NEBRASKA - 1.4%
1,745,000 Central Plains Energy Proj NE Gas Proj Rev Proj #3.............. 5.00% 09/01/27 1,964,277
545,000 Madison Cnty NE Hosp Auth #1 Ref Faith Regl Hlth Svcs Proj...... 5.00% 07/01/28 625,970
500,000 NE St Pub Pwr Dist Rev Gen, Ser C............................... 5.00% 01/01/35 581,350
--------------
3,171,597
--------------
NEVADA - 0.9%
1,120,000 Clark Cnty NV Impt Dist Ref Spl Loc Impt #151................... 4.50% 08/01/23 1,187,984
470,000 Las Vegas NV Spl Impt Dist #808 & #810 Ref...................... 5.00% 06/01/22 505,767
335,000 NV Dept Of Business & Industry NV Doral Academy, Ser A (a)...... 5.00% 07/15/27 360,219
--------------
2,053,970
--------------
NEW JERSEY - 1.3%
250,000 NJ St Econ Dev Auth Mtr Vehcl Surcharge Rev Ref Sub, Ser A,
BAM.......................................................... 5.00% 07/01/28 295,115
500,000 NJ St Econ Dev Auth Ref, Ser A, BAM............................. 5.00% 06/15/23 571,905
1,000,000 NJ St Hlth Care Facs Fing Auth Rev Ref Hackensack Meridian
Hlth, Ser A.................................................. 5.00% 07/01/24 1,182,870
100,000 NJ St Transit Corp, Ser A, GANS................................. 5.00% 09/15/21 109,744
525,000 NJ St Transprtn Trust Fund Auth Transn Sys, Ser D............... 5.25% 12/15/23 599,077
--------------
2,758,711
--------------
NEW YORK - 2.8%
100,000 Buffalo & Erie Cnty NY Indl Land Dev Corp Rev Ref
Orchard Park................................................. 5.00% 11/15/22 113,944
115,000 Buffalo & Erie Cnty NY Indl Land Dev Corp Rev Ref
Orchard Park................................................. 5.00% 11/15/24 134,007
1,000,000 Met Transprtn Auth NY Rev Ref Transptrn, Subser C-1............. 5.00% 11/15/34 1,176,200
1,000,000 New York City NY Transitional Fin Auth Rev Future Tax Secured
Sub Fiscal 2016, Ser A-1..................................... 5.00% 08/01/37 1,168,910
300,000 NY St Dorm Auth Revs Non St Supported Debt Ref Orange Regl
Med Ctr (a).................................................. 5.00% 12/01/25 345,552
195,000 NY St Dorm Auth Revs Non St Supported Debt Unrefunded Pace
Univ, Ser A.................................................. 4.00% 05/01/22 209,344
</TABLE>
See Notes to Financial Statements Page 15
<PAGE>
FIRST TRUST MANAGED MUNICIPAL ETF (FMB)
PORTFOLIO OF INVESTMENTS (CONTINUED)
OCTOBER 31, 2017
<TABLE>
<CAPTION>
PRINCIPAL STATED STATED
VALUE DESCRIPTION COUPON MATURITY VALUE
--------------- ---------------------------------------------------------------- ------------- ------------ --------------
<S> <C> <C> <C> <C>
MUNICIPAL BONDS (CONTINUED)
NEW YORK (CONTINUED)
$ 85,000 NY St Dorm Auth Revs Non St Supported Debt Unrefunded Pace
Univ, Ser A.................................................. 5.00% 05/01/23 $ 96,365
1,400,000 NY St Dorm Auth St Personal Income Tax Rev, Ser B, Grp B........ 5.00% 02/15/34 1,649,116
465,000 Port Auth of New York & New Jersey NY Ref Consol, Ser 186,
AMT.......................................................... 5.00% 10/15/35 535,243
15,000 Suffolk Cnty NY Econ Dev Corp Rev Prerefunded Catholic Hlth
Svcs Long Island Oblig Grp Proj.............................. 5.00% 07/01/28 16,962
85,000 Suffolk Cnty NY Econ Dev Corp Rev Unrefunded Catholic Hlth
Svcs Long Island Oblig Grp Proj.............................. 5.00% 07/01/28 93,912
500,000 TSASC Inc NY Ref, Ser A......................................... 5.00% 06/01/29 584,080
--------------
6,123,635
--------------
NORTH CAROLINA - 0.7%
900,000 NC St Capital Facs Fin Agy Student Rev Ref Hsg NC A&T Univ
Fdtn Proj, Ser A, AGC........................................ 5.00% 06/01/26 1,044,369
430,000 Raleigh Durham NC Arpt Auth Arpt Rev Ref, Ser A, AMT............ 5.00% 05/01/36 501,389
--------------
1,545,758
--------------
NORTH DAKOTA - 0.7%
225,000 Burleigh Cnty ND Hlth Care Rev St Alexius Med Ctr Proj, Ser A... 5.00% 07/01/22 253,312
1,300,000 Grand Forks ND Sr Hsg & Nur Fac Rev Ref Vly Homes Oblig
Grp, Ser A................................................... 5.00% 12/01/23 1,373,827
--------------
1,627,139
--------------
OHIO - 1.8%
1,000,000 Chillicothe OH City Sch Dist Ref, AGM........................... 4.00% 12/01/31 1,085,270
500,000 Cleveland OH Pub Pwr Sys Rev Ref, Ser A, AGM.................... 5.00% 11/15/24 593,660
700,000 Hamilton Cnty OH Hlth Care Facs Rev Christ Hosp Proj............ 5.25% 06/01/27 795,473
1,000,000 OH St Hgr Edu, Ser A............................................ 5.00% 05/01/33 1,186,470
230,000 S Estrn OH Port Auth Hosp Facs Rev Ref Mem Hlth Sys............. 5.00% 12/01/23 251,907
--------------
3,912,780
--------------
OKLAHOMA - 0.7%
1,000,000 Tulsa Cnty OK Indl Auth Sr Living Cmnty Rev Ref Montereau
Inc Proj..................................................... 5.00% 11/15/25 1,154,210
250,000 Tulsa Cnty OK Indl Auth Sr Living Cmnty Rev Ref Montereau
Inc Proj..................................................... 5.00% 11/15/26 289,530
100,000 Tulsa OK Arpts Impt Trust Ref, Ser D, BAM....................... 5.00% 06/01/28 106,182
--------------
1,549,922
--------------
OREGON - 1.6%
1,050,000 Met OR Dedicated Tax Rev OR Convention Ctr Hotel................ 5.00% 06/15/35 1,229,098
275,000 Multnomah Cnty OR Hosp Facs Auth Rev Ref Terwilliger Plaza...... 5.00% 12/01/20 289,534
1,100,000 OR St Facs Auth Rev Ref Univ Portland, Ser A.................... 5.00% 04/01/32 1,260,182
700,000 Yamhill Cnty OR Hosp Auth Ref Friendsview Retmnt Cmnty,
Ser A........................................................ 5.00% 11/15/31 761,712
--------------
3,540,526
--------------
PENNSYLVANIA - 6.6%
600,000 Bucks Cnty PA Indl Dev Auth Ref Sch Lane Chrt Sch Proj.......... 5.00% 03/15/26 667,086
765,000 Chester Cnty PA Indl Dev Auth Renaissance Academy Chrt Sch...... 5.00% 10/01/34 824,670
500,000 Colonial PA Sch Dist............................................ 5.00% 02/15/36 574,510
300,000 Colonial PA Sch Dist, Ser A..................................... 5.00% 02/15/34 349,065
300,000 Cumberland Cnty PA Muni Auth Ref Diakon Lutheran Ministries
Proj......................................................... 5.00% 01/01/30 334,518
</TABLE>
Page 16 See Notes to Financial Statements
<PAGE>
FIRST TRUST MANAGED MUNICIPAL ETF (FMB)
PORTFOLIO OF INVESTMENTS (CONTINUED)
OCTOBER 31, 2017
<TABLE>
<CAPTION>
PRINCIPAL STATED STATED
VALUE DESCRIPTION COUPON MATURITY VALUE
--------------- ---------------------------------------------------------------- ------------- ------------ --------------
<S> <C> <C> <C> <C>
MUNICIPAL BONDS (CONTINUED)
PENNSYLVANIA (CONTINUED)
$ 700,000 Cumberland Cnty PA Muni Auth Ref Diakon Lutheran Ministries
Proj......................................................... 5.00% 01/01/38 $ 759,066
1,095,000 Dallas PA Area Muni Auth Univ Rev Ref Misericordia Univ Proj.... 5.00% 05/01/22 1,218,144
750,000 E Hempfield Twp PA Indl Dev Auth Ref Willow Valley Cmntys
Proj......................................................... 5.00% 12/01/29 866,220
500,000 Middletown PA Sch Dist, Ser A................................... 5.00% 03/01/28 560,810
2,000,000 Montgomery Cnty PA Hgr Edu & Hlth Auth Ref Philadelphia
Presbytery Homes Inc Proj.................................... 5.00% 12/01/32 2,255,220
925,000 Montgomery Cnty PA Indl Dev Auth Acts Retmnt Life Cmntys
Ref.......................................................... 5.00% 11/15/25 1,036,647
50,000 Montgomery Cnty PA Indl Dev Auth Acts Retmnt Life Cmntys
Ref.......................................................... 5.00% 11/15/29 54,968
100,000 Northampton Cnty PA Gen Purpose Auth Clg Rev Ref Moravian
Clg.......................................................... 5.00% 10/01/25 117,221
1,000,000 Northampton Cnty PA Gen Purpose Auth Hosp Rev Ref St Luke's
Univ Hlth Network Proj, Ser A................................ 5.00% 08/15/28 1,171,050
1,000,000 PA St Turnpike Commission Turnpike Rev Ref...................... 5.00% 12/01/33 1,159,180
1,000,000 Philadelphia PA Gas Wks Rev Ref 1998 General Ordinance,
14th Ser..................................................... 5.00% 10/01/34 1,158,780
290,000 Philadelphia PA Gas Works Rev Ref............................... 5.00% 08/01/25 349,143
500,000 Philadelphia PA Ref, Ser A...................................... 5.25% 07/15/28 580,090
405,000 Southcentrl PA General Auth Rev Ref Hanover Hosp Inc............ 5.00% 12/01/23 462,267
--------------
14,498,655
--------------
RHODE ISLAND - 0.9%
1,460,000 RI St Hlth & Eductnl Bldg Corp Reve Ref Hosp Fing Lifespan
Oblig Grp.................................................... 5.00% 05/15/32 1,641,011
265,000 Tobacco Settlement Fing Corp RI Ref, Ser A...................... 5.00% 06/01/24 304,964
--------------
1,945,975
--------------
SOUTH CAROLINA - 1.3%
1,000,000 Greenville SC Hosp Sys Brd Hosp Facs Rev, Ser B................. 5.00% 05/01/30 1,144,410
200,000 Lancaster Cnty SC Assmnt Rev Ref Walnut Creek Impt Dist,
Ser A-1...................................................... 3.13% 12/01/22 200,698
745,000 Piedmont SC Muni Pwr Agy Elec Rev Ref, Ser A-3.................. 5.00% 01/01/23 816,535
30,000 SC St Jobs Econ Dev Auth Hosp Rev Ref Palmetto Hlth, Ser A...... 5.00% 08/01/23 34,077
150,000 SC St Jobs Econ Dev Auth Hosp Rev Ref Palmetto Hlth, Ser A,
AGM.......................................................... 5.50% 08/01/24 169,881
355,000 SC St Pub Svc Auth Rev Santee Cooper Ref, Ser B................. 5.00% 12/01/38 391,696
--------------
2,757,297
--------------
SOUTH DAKOTA - 0.5%
30,000 SD St Hlth & Eductnl Facs Auth Avera Hlth, Ser B................ 5.50% 07/01/35 30,883
1,000,000 SD St Hlth & Eductnl Facs Auth Sanford Oblig Grp, Ser B......... 5.00% 11/01/34 1,116,890
--------------
1,147,773
--------------
TENNESSEE - 1.3%
335,000 Chattanooga TN Hlth Eductnl & Hsg Fac Brd Rev Ref Student
Hsg CDFI Phase I............................................. 5.00% 10/01/23 383,545
600,000 Memphis Shelby Cnty TN Arpt Auth Arpt Rev Ref, Ser B, AMT....... 5.75% 07/01/23 665,166
1,385,000 Met Govt Nashville & Davidson Cnty TN Hlth & Eductnl Fac Brd
Ref Lipscomb Univ Proj, Ser A................................ 5.00% 10/01/29 1,575,825
</TABLE>
See Notes to Financial Statements Page 17
<PAGE>
FIRST TRUST MANAGED MUNICIPAL ETF (FMB)
PORTFOLIO OF INVESTMENTS (CONTINUED)
OCTOBER 31, 2017
<TABLE>
<CAPTION>
PRINCIPAL STATED STATED
VALUE DESCRIPTION COUPON MATURITY VALUE
--------------- ---------------------------------------------------------------- ------------- ------------ --------------
<S> <C> <C> <C> <C>
MUNICIPAL BONDS (CONTINUED)
TENNESSEE (CONTINUED)
$ 25,000 TN St Energy Acquisition Corp Gas Rev, Ser A.................... 5.25% 09/01/21 $ 28,257
120,000 TN St Energy Acquisition Corp Gas Rev, Ser A.................... 5.25% 09/01/22 138,348
--------------
2,791,141
--------------
TEXAS - 8.1%
450,000 Austin TX Arpt Sys Rev, AMT..................................... 5.00% 11/15/33 508,833
600,000 Brd of Managers TX Joint Guadalupe Cnty City of Seguin Hosp
Mtg Ref...................................................... 5.00% 12/01/24 655,992
600,000 Centrl TX Regl Mobility Auth Rev Ref Sub Lien................... 5.00% 01/01/33 663,642
555,000 Flower Mound TX Spl Assmnt Rev River Walk Pub Impt Dist #1...... 6.13% 09/01/28 567,038
1,100,000 Harris Cnty TX Ref Sr Lien Toll Road, Ser B..................... 5.00% 08/15/36 1,274,031
500,000 Houston TX Arpt Sys Rev Ref United Airls Inc Terminal E Proj,
AMT.......................................................... 4.50% 07/01/20 529,985
1,000,000 Houston TX Arpt Sys Rev Ref, Ser B-2, AMT....................... 5.00% 07/15/20 1,072,780
500,000 Mission TX Econ Dev Corp Rev Sr Lien Nat Gasoline Proj, Ser B,
AMT (b)...................................................... 5.75% 10/01/31 525,385
250,000 N TX Tollway Auth Rev Ref 2nd Tier, Ser B....................... 5.00% 01/01/31 292,267
1,560,000 N TX Tollway Auth Rev Ref Sys Second Tier, Ser B................ 5.00% 01/01/31 1,790,100
250,000 N TX Tollway Auth Rev Ref, Ser A................................ 5.00% 01/01/33 292,067
500,000 New Hope Cultural Edu Facs Fin Corp TX Retmnt Fac Rev Ref Cari
llon Lifecare Cmnty Proj..................................... 5.00% 07/01/36 513,770
170,000 New Hope Cultural Edu Facs Fin Corp TX Student Hsg Rev Chf
Collegiate Hsg Corpus Christii LLC TX A&M Univ............... 5.00% 04/01/39 180,219
500,000 New Hope Cultural Edu Facs Fin Corp TX Student Hsg Rev Chf
Collegiate Hsg Galveston I LLC TX A&M Univ Galveston......... 5.00% 04/01/22 551,480
25,000 New Hope Cultural Edu Facs Fin Corp TX Student Hsg Rev Chf
Stephenville-Tarleton St Univ Proj, Ser A.................... 4.25% 04/01/22 26,893
505,000 Newark Hgr Edu Fin Corp TX Edu Rev Austin Achieve Pub Schs
Inc, Ser A................................................... 5.00% 06/15/32 511,408
495,000 Red River TX Hlth Facs Dev Corp Retmnt Fac Rev MRC
Crestview, Ser A............................................. 7.75% 11/15/31 617,705
770,000 Tarrant Cnty TX Cultural Edu Facs Fin Corp Retmnt Fac Rev Ref
Buckner Retmnt Svcs Inc Proj................................. 5.00% 11/15/29 902,602
500,000 Tarrant Cnty TX Cultural Edu Facs Fin Corp Retmnt Fac Rev
Temps 50 Buckner Sr Living Ventana Proj, Ser B-3............. 3.88% 11/15/22 500,695
600,000 TX St Muni Gas Acquisition & Sply Corp III Gas Sply Rev......... 5.00% 12/15/24 695,400
550,000 TX St Muni Gas Acquisition & Sply Corp III Gas Sply Rev......... 5.00% 12/15/31 615,956
525,000 TX St Transprtn Commission Central TX Turnpike Sys Rev Ref,
Ser B........................................................ 5.00% 08/15/37 593,140
1,000,000 Univ of Houston TX Univ Rev Ref, Ser A.......................... 5.00% 02/15/29 1,204,280
1,560,000 Uptown Dev Auth TX Incr Contract Rev, Ser A..................... 5.00% 09/01/36 1,760,382
500,000 Viridian TX Muni Mgmt Dist Ref Utility Impt, BAM................ 6.00% 12/01/26 630,290
155,000 Viridian TX Muni Mgmt Dist Road Impt, BAM....................... 5.00% 12/01/26 178,999
125,000 Viridian TX Muni Mgmt Dist Utility Impt, BAM.................... 5.00% 12/01/26 144,354
--------------
17,799,693
--------------
UTAH - 0.6%
400,000 UT St Chrt Sch Fin Auth Chrt Sch Rev Ref Quest Academy.......... 5.00% 04/15/32 452,948
325,000 UT St Chrt Sch Fin Auth Chrt Sch Rev Ref Quest Academy.......... 5.00% 04/15/37 363,678
500,000 UT St Chrt Sch Fin Auth Chrt Sch Rev Spectrum Academy
Proj (a)..................................................... 6.00% 04/15/45 525,160
--------------
1,341,786
--------------
</TABLE>
Page 18 See Notes to Financial Statements
<PAGE>
FIRST TRUST MANAGED MUNICIPAL ETF (FMB)
PORTFOLIO OF INVESTMENTS (CONTINUED)
OCTOBER 31, 2017
<TABLE>
<CAPTION>
PRINCIPAL STATED STATED
VALUE DESCRIPTION COUPON MATURITY VALUE
--------------- ---------------------------------------------------------------- ------------- ------------ --------------
<S> <C> <C> <C> <C>
MUNICIPAL BONDS (CONTINUED)
VERMONT - 1.2%
$ 550,000 Burlington VT Ref Lakeview Garage Proj, Ser A, COPS............. 5.00% 12/01/24 $ 608,592
745,000 VT St Econ Dev Auth Mtge Rev Ref Wake Robin Corp Proj,
Ser A........................................................ 5.00% 05/01/25 823,299
585,000 VT St Econ Dev Auth Mtge Rev Ref Wake Robin Corp Proj,
Ser A........................................................ 5.00% 05/01/26 646,753
500,000 VT St Econ Dev Auth Mtge Rev Ref Wake Robin Corp Proj,
Ser A........................................................ 5.00% 05/01/27 552,495
--------------
2,631,139
--------------
VIRGINIA - 0.8%
1,580,000 Hampton Roads VA Santn Dist Wstwtr Rev Ref Sub, Ser A........... 5.00% 08/01/35 1,869,488
--------------
WASHINGTON - 2.5%
1,250,000 Centrl Puget Sound WA Regl Transprtn Auth Sales & Use Tax
Green Bond Ref & Impt, Ser S-1............................... 5.00% 11/01/35 1,478,225
1,000,000 Energy NW WA Elec Rev Ref Columbia Generating Sys, Ser A........ 4.00% 07/01/35 1,067,270
1,250,000 Energy NW WA Elec Rev Ref Columbia Generating Sys, Ser A........ 5.00% 07/01/38 1,445,912
155,000 Mason Cnty WA Pub Utility Dist #1 Sys........................... 3.50% 12/01/21 162,511
270,000 Skagit Cnty WA Pub Hosp Dist #1 Ref & Impt Skagit Regl Hlth..... 4.00% 12/01/24 286,573
110,000 Skagit Cnty WA Pub Hosp Dist #1 Ref & Impt, Ser A............... 5.00% 12/01/22 121,604
165,000 Skagit Cnty WA Pub Hosp Dist #1 Skagit Valley Hosp.............. 5.00% 12/01/20 177,154
250,000 Tacoma WA Elec Sys Rev.......................................... 5.00% 01/01/37 292,192
250,000 Tobacco Settlement Auth WA Tobacco Settlement Rev Ref........... 5.00% 06/01/23 290,992
35,000 WA St Hsg Fin Commission Ref Emerald Heights Proj............... 5.00% 07/01/22 39,686
50,000 WA St Hsg Fin Commission Ref Emerald Heights Proj............... 5.00% 07/01/28 55,973
--------------
5,418,092
--------------
WISCONSIN - 3.7%
1,945,000 Pub Fin Auth WI Edu Rev Ref Mountain Island Chrt Sch Ltd........ 4.00% 07/01/27 1,992,886
620,000 Pub Fin Auth WI Edu Rev Ref Mountain Island Chrt Sch Ltd........ 5.00% 07/01/37 661,788
1,000,000 Pub Fin Auth WI Exempt Facs Rev Ref Celanese Proj, Ser B,
AMT (a)...................................................... 5.00% 12/01/25 1,134,870
1,410,000 Pub Fin Auth WI Rev Ref Retmnt Hsg Fdtn Obligated Grp,
Ser B........................................................ 5.00% 11/15/26 1,673,445
500,000 Pub Fin Auth WI Sr Living Rev Ref Mary's Woods At Marylhurst
Proj, Ser B-2 (a)............................................ 3.50% 11/15/23 508,775
500,000 WI St Hlth & Eductnl Facs Auth Rev Ref Marquette Univ........... 5.00% 10/01/28 563,615
1,175,000 WI St Hlth & Eductnl Facs Auth Rev Ref Prohealth Care Oblig
Grp.......................................................... 5.00% 08/15/31 1,332,438
175,000 WI St Hlth & Eductnl Facs Auth Rev Ref Prohealth Care Oblig
Grp.......................................................... 5.00% 08/15/33 196,950
100,000 WI St Hlth & Eductnl Facs Auth Rev Ref St Johns Cmntys
Inc, Ser B................................................... 4.00% 09/15/23 106,835
--------------
8,171,602
--------------
WYOMING - 0.1%
250,000 Natrona Cnty WY Hosp Rev Ref WY Med Ctr Proj.................... 5.00% 09/15/30 290,043
--------------
TOTAL INVESTMENTS - 92.7%.................................................................... 204,596,734
(Cost $200,245,652) (f)
NET OTHER ASSETS AND LIABILITIES - 7.3%...................................................... 16,008,388
--------------
NET ASSETS - 100.0%.......................................................................... $ 220,605,122
==============
</TABLE>
See Notes to Financial Statements Page 19
<PAGE>
FIRST TRUST MANAGED MUNICIPAL ETF (FMB)
PORTFOLIO OF INVESTMENTS (CONTINUED)
OCTOBER 31, 2017
-----------------------------
(a) This security, sold within the terms of a private placement memorandum, is
exempt from registration upon resale under Rule 144A under the Securities
Act of 1933, as amended (the "1933 Act"), and may be resold in
transactions exempt from registration, normally to qualified institutional
buyers. Pursuant to procedures adopted by the Trust's Board of Trustees,
this security has been determined to be liquid by First Trust Advisors
L.P. ("First Trust"), the Fund's advisor. Although market instability can
result in periods of increased overall market illiquidity, liquidity for
each security is determined based on security-specific factors and
assumptions, which require subjective judgment. At October 31, 2017,
securities noted as such amounted to $14,035,645 or 6.4% of net assets.
(b) This security, sold within the terms of a private placement memorandum, is
exempt from registration upon resale under Rule 144A under the 1933 Act,
and may be resold in transactions exempt from registration, normally to
qualified institutional buyers (see Note 2C - Restricted Securities in the
Notes to Financial Statements).
(c) Pursuant to procedures adopted by the Trust's Board of Trustees, this
security has been determined to be illiquid by First Trust.
(d) Zero coupon bond.
(e) Security has a mandatory put by the holder. Maturity date reflects such
put.
(f) Aggregate cost for federal income tax purposes is $200,219,691. As of
October 31, 2017, the aggregate gross unrealized appreciation for all
investments in which there was an excess of value over tax cost was
$4,636,929 and the aggregate gross unrealized depreciation for all
investments in which there was an excess of tax cost over value was
$259,886. The net unrealized appreciation was $4,337,043.
AGC Assured Guaranty Corp.
AGM Assured Guaranty Municipal Corp.
AMT Alternative Minimum Tax
BAM Building America Mutual
CABS Capital Appreciation Bonds
COPS Certificates of Participations
GANS Grant Anticipation Notes
NATL-RE National Public Finance Guarantee Corp.
-----------------------------
VALUATION INPUTS
A summary of the inputs used to value the Fund's investments as of October 31,
2017 is as follows (see Note 2A - Portfolio Valuation in the Notes to Financial
Statements):
<TABLE>
<CAPTION>
LEVEL 2 LEVEL 3
TOTAL LEVEL 1 SIGNIFICANT SIGNIFICANT
VALUE AT QUOTED OBSERVABLE UNOBSERVABLE
10/31/2017 PRICES INPUTS INPUTS
------------- ------------- -------------- --------------
<S> <C> <C> <C> <C>
Municipal Bonds*................................... $ 204,596,734 $ -- $ 204,596,734 $ --
============= ============= ============== ==============
</TABLE>
* See Portfolio of Investments for state breakout.
All transfers in and out of the Levels during the period are assumed to occur on
the last day of the period at their current value. There were no transfers
between Levels at October 31, 2017.
Page 20 See Notes to Financial Statements
<PAGE>
FIRST TRUST MANAGED MUNICIPAL ETF (FMB)
STATEMENT OF ASSETS AND LIABILITIES
OCTOBER 31, 2017
<TABLE>
<CAPTION>
ASSETS:
<S> <C>
Investments, at value.................................................. $ 204,596,734
Cash................................................................... 18,802,514
Receivables:
Capital shares sold................................................. 2,659,197
Interest............................................................ 2,506,000
Investment securities sold.......................................... 916,074
--------------
Total Assets........................................................ 229,480,519
--------------
LIABILITIES:
Payables:
Investment securities purchased..................................... 8,786,951
Investment advisory fees............................................ 88,446
--------------
Total Liabilities................................................... 8,875,397
--------------
NET ASSETS............................................................. $ 220,605,122
==============
NET ASSETS CONSIST OF:
Paid-in capital........................................................ $ 216,850,075
Par value.............................................................. 41,500
Accumulated net investment income (loss)............................... 67,939
Accumulated net realized gain (loss) on investments.................... (705,474)
Net unrealized appreciation (depreciation) on investments.............. 4,351,082
--------------
NET ASSETS............................................................. $ 220,605,122
==============
NET ASSET VALUE, per share............................................. $ 53.16
==============
Number of shares outstanding (unlimited number of shares
authorized, par value $0.01 per share).............................. 4,150,002
==============
Investments, at cost................................................... $ 200,245,652
==============
</TABLE>
See Notes to Financial Statements Page 21
<PAGE>
FIRST TRUST MANAGED MUNICIPAL ETF (FMB)
STATEMENT OF OPERATIONS
FOR THE YEAR ENDED OCTOBER 31, 2017
<TABLE>
<CAPTION>
INVESTMENT INCOME:
<S> <C>
Interest............................................................... $ 4,056,164
Dividends.............................................................. 1,094
--------------
Total investment income............................................. 4,057,258
--------------
EXPENSES:
Investment advisory fees............................................... 843,311
--------------
Total expenses...................................................... 843,311
Less fees waived by the investment advisor.......................... (195,402)
--------------
Net expenses........................................................ 647,909
--------------
NET INVESTMENT INCOME (LOSS)........................................... 3,409,349
--------------
NET REALIZED AND UNREALIZED GAIN (LOSS):
Net realized gain (loss) on investments............................. (725,571)
Net change in unrealized appreciation (depreciation) on
investments...................................................... 2,360,391
--------------
NET REALIZED AND UNREALIZED GAIN (LOSS)................................ 1,634,820
--------------
NET INCREASE (DECREASE) IN NET ASSETS RESULTING
FROM OPERATIONS..................................................... $ 5,044,169
==============
</TABLE>
Page 22 See Notes to Financial Statements
<PAGE>
FIRST TRUST MANAGED MUNICIPAL ETF (FMB)
STATEMENTS OF CHANGES IN NET ASSETS
<TABLE>
<CAPTION>
YEAR YEAR
ENDED ENDED
10/31/2017 10/31/2016
-------------- --------------
<S> <C> <C>
OPERATIONS:
Net investment income (loss)........................................... $ 3,409,349 $ 1,627,430
Net realized gain (loss)............................................... (725,571) 310,495
Net change in unrealized appreciation (depreciation)................... 2,360,391 1,504,202
-------------- --------------
Net increase (decrease) in net assets resulting from operations........ 5,044,169 3,442,127
-------------- --------------
DISTRIBUTIONS TO SHAREHOLDERS FROM:
Net investment income.................................................. (3,340,878) (1,664,003)
Net realized gain...................................................... (259,840) (172,240)
-------------- --------------
Total distributions to shareholders.................................... (3,600,718) (1,836,243)
-------------- --------------
SHAREHOLDER TRANSACTIONS:
Proceeds from shares sold.............................................. 139,111,811 47,515,355
Cost of shares redeemed................................................ (2,600,619) --
-------------- --------------
Net increase (decrease) in net assets resulting from
shareholder transactions............................................ 136,511,192 47,515,355
-------------- --------------
Total increase (decrease) in net assets................................ 137,954,643 49,121,239
NET ASSETS:
Beginning of period.................................................... 82,650,479 33,529,240
-------------- --------------
End of period.......................................................... $ 220,605,122 $ 82,650,479
============== ==============
Accumulated net investment income (loss) at end of period.............. $ 67,939 $ 19,608
============== ==============
CHANGES IN SHARES OUTSTANDING:
Shares outstanding, beginning of period................................ 1,550,002 650,002
Shares sold............................................................ 2,650,000 900,000
Shares redeemed........................................................ (50,000) --
-------------- --------------
Shares outstanding, end of period...................................... 4,150,002 1,550,002
============== ==============
</TABLE>
See Notes to Financial Statements Page 23
<PAGE>
FIRST TRUST MANAGED MUNICIPAL ETF (FMB)
FINANCIAL HIGHLIGHTS
FOR A SHARE OUTSTANDING THROUGHOUT EACH PERIOD
<TABLE>
<CAPTION>
YEAR ENDED OCTOBER 31, PERIOD
----------------------------------------------- ENDED
2017 2016 2015 10/31/2014 (a)
-------------- -------------- -------------- --------------
<S> <C> <C> <C> <C>
Net asset value, beginning of period $ 53.32 $ 51.58 $ 51.11 $ 50.00
---------- ---------- ---------- ----------
INCOME FROM INVESTMENT OPERATIONS:
Net investment income (loss) 1.34 1.32 1.35 0.56
Net realized and unrealized gain (loss) (0.01) 1.99 0.50 1.20
---------- ---------- ---------- ----------
Total from investment operations 1.33 3.31 1.85 1.76
---------- ---------- ---------- ----------
DISTRIBUTIONS PAID TO SHAREHOLDERS FROM:
Net investment income (1.33) (1.35) (1.38) (0.55)
Net realized gain (0.16) (0.22) -- --
Return of capital -- -- -- (0.10)
---------- ---------- ---------- ----------
Total distributions (1.49) (1.57) (1.38) (0.65)
---------- ---------- ---------- ----------
Net asset value, end of period $ 53.16 $ 53.32 $ 51.58 $ 51.11
========== ========== ========== ==========
TOTAL RETURN (b) 2.59% 6.47% 3.66% 3.53%
RATIOS/SUPPLEMENTAL DATA:
Net assets, end of period (in 000's) $ 220,605 $ 82,650 $ 33,529 $ 20,445
RATIOS TO AVERAGE NET ASSETS:
Ratio of total expenses to average net assets 0.65% 0.65% 0.65% 0.65% (c)
Ratio of net expenses to average net assets 0.50% 0.52% 0.65% 0.65% (c)
Ratio of net investment income (loss) to
average net assets 2.63% 2.52% 2.63% 2.40% (c)
Portfolio turnover rate (d) 85% 85% 109% 69%
</TABLE>
(a) Inception date is May 13, 2014, which is consistent with the commencement
of investment operations and is the date the initial creation units were
established.
(b) Total return is calculated assuming an initial investment made at the net
asset value at the beginning of the period, reinvestment of all
distributions at net asset value during the period, and redemption at net
asset value on the last day of the period. The returns presented do not
reflect the deduction of taxes that a shareholder would pay on Fund
distributions or the redemption or sale of Fund shares. Total return is
calculated for the time period presented and is not annualized for periods
of less than a year. For some periods, the total returns would have been
lower if certain fees had not been waived by the advisor.
(c) Annualized.
(d) Portfolio turnover is calculated for the time period presented and is not
annualized for periods of less than a year and does not include securities
received or delivered from processing creations or redemptions and in-kind
transactions.
Page 24 See Notes to Financial Statements
<PAGE>
--------------------------------------------------------------------------------
NOTES TO FINANCIAL STATEMENTS
--------------------------------------------------------------------------------
FIRST TRUST MANAGED MUNICIPAL ETF (FMB)
OCTOBER 31, 2017
1. ORGANIZATION
First Trust Exchange-Traded Fund III (the "Trust") is an open-end management
investment company organized as a Massachusetts business trust on January 9,
2008, and is registered with the Securities and Exchange Commission ("SEC")
under the Investment Company Act of 1940, as amended (the "1940 Act").
The Trust currently consists of twelve exchange-traded funds that are offering
shares. This report covers the First Trust Managed Municipal ETF (the "Fund"), a
non-diversified series of the Trust, which trades under the ticker FMB on The
Nasdaq Stock Market LLC ("Nasdaq"). Unlike conventional mutual funds, the Fund
issues and redeems shares on a continuous basis, at net asset value ("NAV"),
only in large specified blocks consisting of 50,000 shares called a "Creation
Unit." Creation Units are issued and redeemed for cash and, in certain
circumstances, in-kind for securities in which the Fund invests. Except when
aggregated in Creation Units, the Fund's shares are not redeemable securities.
The primary investment objective of the Fund is to generate current income that
is exempt from regular federal income taxes and its secondary objective is
long-term capital appreciation. Under normal market conditions, the Fund seeks
to achieve its investment objectives by investing at least 80% of its net assets
(including investment borrowings) in municipal debt securities that pay interest
that is exempt from regular federal income taxes. There can be no assurance that
the Fund will achieve its investment objectives. The Fund may not be appropriate
for all investors.
2. SIGNIFICANT ACCOUNTING POLICIES
The Fund is considered an investment company and follows accounting and
reporting guidance under Financial Accounting Standards Board ("FASB")
Accounting Standards Codification ("ASC") Topic 946, "Financial
Services-Investment Companies." The following is a summary of significant
accounting policies consistently followed by the Fund in the preparation of the
financial statements. The preparation of the financial statements in accordance
with accounting principles generally accepted in the United States of America
("U.S. GAAP") requires management to make estimates and assumptions that affect
the reported amounts and disclosures in the financial statements. Actual results
could differ from those estimates.
A. PORTFOLIO VALUATION
The Fund's NAV is determined daily as of the close of regular trading on the New
York Stock Exchange ("NYSE"), normally 4:00 p.m. Eastern time, on each day the
NYSE is open for trading. If the NYSE closes early on a valuation day, the NAV
is determined as of that time. Domestic debt securities are priced using data
reflecting the earlier closing of the principal markets for those securities.
The Fund's NAV is calculated by dividing the value of all assets of the Fund
(including accrued interest and dividends), less all liabilities (including
accrued expenses and dividends declared but unpaid), by the total number of
shares outstanding.
The Fund's investments are valued daily at market value or, in the absence of
market value with respect to any portfolio securities, at fair value. Market
value prices represent last sale or official closing prices from a national or
foreign exchange (i.e., a regulated market) and are primarily obtained from
third-party pricing services. Fair value prices represent any prices not
considered market value prices and are either obtained from a third-party
pricing service or are determined by the Pricing Committee of the Fund's
investment advisor, First Trust Advisors L.P. ("First Trust" or the "Advisor"),
in accordance with valuation procedures adopted by the Trust's Board of
Trustees, and in accordance with provisions of the 1940 Act. Investments valued
by the Advisor's Pricing Committee, if any, are footnoted as such in the
footnotes to the Portfolio of Investments. The Fund's investments are valued as
follows:
Municipal securities and other debt securities are fair valued on the
basis of fair valuations provided by dealers who make markets in such
securities or by a third-party pricing service approved by the Trust's
Board of Trustees, which may use the following valuation inputs when
available:
1) benchmark yields;
2) reported trades;
3) broker/dealer quotes;
4) issuer spreads;
5) benchmark securities;
6) bids and offers; and
7) reference data including market research publications.
Fixed income and other debt securities having a remaining maturity of
sixty days or less when purchased are fair valued at cost adjusted for
amortization of premiums and accretion of discounts (amortized cost),
provided the Advisor's Pricing Committee has determined that the use of
amortized cost is an appropriate reflection of fair value given market and
issuer-specific conditions existing at the time of the determination.
Factors that may be considered in determining the appropriateness of the
use of amortized cost include, but are not limited to, the following:
Page 25
<PAGE>
--------------------------------------------------------------------------------
NOTES TO FINANCIAL STATEMENTS (CONTINUED)
--------------------------------------------------------------------------------
FIRST TRUST MANAGED MUNICIPAL ETF (FMB)
OCTOBER 31, 2017
1) the credit conditions in the relevant market and changes thereto;
2) the liquidity conditions in the relevant market and changes thereto;
3) the interest rate conditions in the relevant market and changes
thereto (such as significant changes in interest rates);
4) issuer-specific conditions (such as significant credit
deterioration); and
5) any other market-based data the Advisor's Pricing Committee
considers relevant. In this regard, the Advisor's Pricing Committee
may use last-obtained market-based data to assist it when valuing
portfolio securities using amortized cost.
Certain securities may not be able to be priced by pre-established pricing
methods. Such securities may be valued by the Trust's Board of Trustees or its
delegate, the Advisor's Pricing Committee, at fair value. These securities
generally include, but are not limited to, restricted securities (securities
which may not be publicly sold without registration under the Securities Act of
1933, as amended (the "1933 Act")) for which a third-party pricing service is
unable to provide a market price; securities whose trading has been formally
suspended; a security whose market or fair value price is not available from a
pre-established pricing source; a security with respect to which an event has
occurred that is likely to materially affect the value of the security after the
market has closed but before the calculation of the Fund's NAV or make it
difficult or impossible to obtain a reliable market quotation; and a security
whose price, as provided by the third-party pricing service, does not reflect
the security's fair value. As a general principle, the current fair value of a
security would appear to be the amount which the owner might reasonably expect
to receive for the security upon its current sale. When fair value prices are
used, generally they will differ from market quotations or official closing
prices on the applicable exchanges. A variety of factors may be considered in
determining the fair value of such securities, including, but not limited to,
the following:
1) the fundamental business data relating to the issuer;
2) an evaluation of the forces which influence the market in which
these securities are purchased and sold;
3) the type, size and cost of security;
4) the financial statements of the issuer;
5) the credit quality and cash flow of the issuer, based on the
Advisor's or external analysis;
6) the information as to any transactions in or offers for the
security;
7) the price and extent of public trading in similar securities (or
equity securities) of the issuer/borrower, or comparable companies;
8) the coupon payments;
9) the quality, value and salability of collateral, if any, securing
the security; and
10) other relevant factors.
The Fund is subject to fair value accounting standards that define fair value,
establish the framework for measuring fair value and provide a three-level
hierarchy for fair valuation based upon the inputs to the valuation as of the
measurement date. The three levels of the fair value hierarchy are as follows:
o Level 1 - Level 1 inputs are quoted prices in active markets for
identical investments. An active market is a market in which
transactions for the investment occur with sufficient frequency and
volume to provide pricing information on an ongoing basis.
o Level 2 - Level 2 inputs are observable inputs, either directly or
indirectly, and include the following:
o Quoted prices for similar investments in active markets.
o Quoted prices for identical or similar investments in markets
that are non-active. A non-active market is a market where
there are few transactions for the investment, the prices are
not current, or price quotations vary substantially either
over time or among market makers, or in which little
information is released publicly.
o Inputs other than quoted prices that are observable for the
investment (for example, interest rates and yield curves
observable at commonly quoted intervals, volatilities,
prepayment speeds, loss severities, credit risks, and default
rates).
o Inputs that are derived principally from or corroborated by
observable market data by correlation or other means.
o Level 3 - Level 3 inputs are unobservable inputs. Unobservable
inputs may reflect the reporting entity's own assumptions about the
assumptions that market participants would use in pricing the
investment.
The inputs or methodologies used for valuing investments are not necessarily an
indication of the risk associated with investing in those investments. A summary
of the inputs used to value the Fund's investments as of October 31, 2017, is
included with the Fund's Portfolio of Investments.
B. SECURITIES TRANSACTIONS AND INVESTMENT INCOME
Securities transactions are recorded as of the trade date. Realized gains and
losses from securities transactions are recorded on the identified cost basis.
Dividend income is recorded on the ex-dividend date. Interest income is recorded
daily on the accrual basis. Amortization of premiums and accretion of discounts
are recorded using the effective interest method.
Page 26
<PAGE>
--------------------------------------------------------------------------------
NOTES TO FINANCIAL STATEMENTS (CONTINUED)
--------------------------------------------------------------------------------
FIRST TRUST MANAGED MUNICIPAL ETF (FMB)
OCTOBER 31, 2017
C. RESTRICTED SECURITIES
The Fund invests in restricted securities, which are securities that may not be
offered for public sale without first being registered under the 1933 Act. Prior
to registration, restricted securities may only be resold in transactions exempt
from registration under Rule 144A under the 1933 Act, normally to qualified
institutional buyers. As of October 31, 2017, the Fund held restricted
securities as shown in the following table that the Advisor has deemed illiquid
pursuant to procedures adopted by the Fund's Board of Trustees. Although market
instability can result in periods of increased overall market illiquidity,
liquidity for each security is determined based on security-specific factors and
assumptions, which require subjective judgment. The Fund does not have the right
to demand that such securities be registered. These securities are valued
according to the valuation procedures as stated in the Portfolio Valuation note
(Note 2A) and are not expressed as a discount to the carrying value of a
comparable unrestricted security. There are no unrestricted securities with the
same maturity dates and yields for these issuers.
<TABLE>
<CAPTION>
ACQUISITION PRINCIPAL CURRENT CARRYING % OF NET
SECURITY DATE VALUE PRICE COST VALUE ASSETS
------------------------------------------------------------------------------------------------------------------------------
<S> <C> <C> <C> <C> <C> <C>
CA Stwd Cmntys Dev Auth Rev Ref Lancer
Eductnl Student Hsg Proj, Ser A 11/02/16 $ 500,000 $ 103.03 $ 508,335 $ 515,130 0.23%
Centerra CO Met Dist #1 Spl Rev 04/20/17 500,000 110.35 537,014 551,745 0.25
Centerra CO Met Dist #1 Spl Rev 04/20/17 1,000,000 108.85 1,058,114 1,088,490 0.49
Prairie Center CO Met Dist #3 Ltd Property
Tax Supported Pri Ref, Ser A 10/13/17 1,000,000 100.54 993,813 1,005,390 0.46
Mission TX Econ Dev Corp Rev Sr Lien Nat
Gasoline Proj, Ser B 04/28/16 500,000 105.08 479,165 525,385 0.24
------------- ------------- ---------
$ 3,576,441 $ 3,686,140 1.67%
============= ============= =========
</TABLE>
D. DIVIDENDS AND DISTRIBUTIONS TO SHAREHOLDERS
Dividends from net investment income, if any, are declared and paid monthly, or
as the Board of Trustees may determine from time to time. Distributions of net
realized capital gains earned by the Fund, if any, will be distributed at least
annually.
Distributions from income and capital gains are determined in accordance with
income tax regulations, which may differ from U.S. GAAP. Certain capital
accounts in the financial statements are periodically adjusted for permanent
differences in order to reflect their tax character. These permanent differences
are primarily due to the varying treatment of income and gain/loss on portfolio
securities held by the Fund and have no impact on net assets or net asset value
per share. Temporary differences, which arise from recognizing certain items of
income, expense, and gain/loss in different periods for financial statement and
tax purposes, will reverse at some time in the future.
The tax character of distributions paid during the fiscal years ended October
31, 2017 and 2016, was as follows:
Distributions paid from: 2017 2016
Ordinary income.................................... $ 263,324 $ 171,141
Long-term capital gains............................ -- 53,893
Tax-exempt income.................................. 3,337,394 1,611,209
Return of capital.................................. -- --
As of October 31, 2017, the components of distributable earnings on a tax basis
were as follows:
Undistributed ordinary income...................... $ 34,141
Accumulated capital and other losses............... (697,637)
Net unrealized appreciation (depreciation)......... 4,377,043
E. INCOME TAXES
The Fund intends to continue to qualify as a regulated investment company by
complying with the requirements under Subchapter M of the Internal Revenue Code
of 1986, as amended, which includes distributing substantially all of its net
investment income and net realized gains to shareholders. Accordingly, no
provision has been made for federal and state income taxes. However, due to the
timing and amount of distributions, the Fund may be subject to an excise tax of
4% of the amount by which approximately 98% of the Fund's taxable income exceeds
the distributions from such taxable income for the calendar year.
In addition, the Fund intends to invest in such municipal securities to allow it
to pay shareholders "exempt dividends" as defined in the Internal Revenue Code.
Page 27
<PAGE>
--------------------------------------------------------------------------------
NOTES TO FINANCIAL STATEMENTS (CONTINUED)
--------------------------------------------------------------------------------
FIRST TRUST MANAGED MUNICIPAL ETF (FMB)
OCTOBER 31, 2017
The Fund is subject to accounting standards that establish a minimum threshold
for recognizing, and a system for measuring, the benefits of a tax position
taken or expected to be taken in a tax return. The taxable years ended 2014,
2015, 2016 and 2017 remain open to federal and state audit. As of October 31,
2017, management has evaluated the application of these standards to the Fund,
and has determined that no provision for income tax is required in the Fund's
financial statements for uncertain tax positions.
The Fund intends to utilize provisions of the federal income tax laws, which
allow it to carry a realized capital loss forward indefinitely following the
year of the loss and offset such loss against any future realized capital gains.
The Fund is subject to certain limitations under U.S. tax rules on the use of
capital carryforwards and net unrealized built-in losses. These limitations
apply when there has been a 50% change in ownership. At October 31, 2017, the
Fund had $697,637 of non-expiring capital loss carryforwards for federal income
tax purposes.
Certain losses realized during the current fiscal year may be deferred and
treated as occurring on the first day of the following fiscal year for federal
income tax purposes. For the fiscal year ended October 31, 2017, the Fund had no
net ordinary losses.
In order to present paid-in capital, accumulated net investment income (loss)
and accumulated net realized gain (loss) on investments on the Statement of
Assets and Liabilities that more closely represent their tax character, certain
adjustments have been made to paid-in capital, accumulated net investment income
(loss) and accumulated net realized gain (loss) on investments. These
adjustments are primarily due to the difference between book and tax treatments
of income and gains on various investment securities held by the Fund and
in-kind transactions. The results of operations and net assets were not affected
by these adjustments. For the fiscal year ended October 31, 2017, the
adjustments for the Fund were as follows:
Accumulated
Accumulated Net Realized
Net Investment Gain (Loss) Paid-in
Income (Loss) on Investments Capital
----------------- ----------------- -----------------
$ (20,140) $ 20,140 $ --
F. EXPENSES
Expenses, other than the investment advisory fee and other excluded expenses,
are paid by the Advisor (see Note 3).
G. NEW AND AMENDED FINANCIAL REPORTING RULES AND FORMS
On October 13, 2016, the SEC adopted new rules and forms, and amended existing
rules and forms. The new and amended rules and forms are intended to modernize
the reporting of information provided by funds and to improve the quality and
type of information that funds provide to the SEC and investors. In part, the
new and amended rules and forms amend Regulation S-X and require standardized,
enhanced disclosures about derivatives in a fund's financial statements, as well
as other amendments. The compliance date for the amendments of Regulation S-X
was August 1, 2017, which resulted in no change to the financial statements. The
new form types and other rule amendments will be effective for the First Trust
funds, including the Fund, for reporting periods beginning on and after June 1,
2018. Management is evaluating the new form types and other rule amendments that
are effective on and after June 1, 2018 to determine the impact to the Fund.
H. NEW ACCOUNTING PRONOUNCEMENT
In December 2016, FASB released Accounting Standards Update ("ASU") 2016-19 that
makes technical changes to various sections of the ASC, including Topic 820,
Fair Value Measurement. The changes to Topic 820 are intended to clarify the
difference between a valuation approach and a valuation technique. The changes
to ASC 820-10-50-2 require a reporting entity to disclose, for Level 2 and Level
3 fair value measurements, a change in either or both a valuation approach and a
valuation technique and the reason(s) for the change. The changes to Topic 820
are effective for fiscal years, and interim periods within those fiscal years,
beginning after December 15, 2016. At this time, management is evaluating the
implications of the ASU and has not yet determined its impact on the financial
statements and disclosures.
3. INVESTMENT ADVISORY FEE, AFFILIATED TRANSACTIONS AND OTHER FEE ARRANGEMENTS
First Trust, the investment advisor to the Fund, is a limited partnership with
one limited partner, Grace Partners of DuPage L.P., and one general partner, The
Charger Corporation. The Charger Corporation is an Illinois corporation
controlled by James A. Bowen, Chief Executive Officer of First Trust. First
Trust is responsible for the selection and ongoing monitoring of the securities
in the Fund's portfolio, managing the Fund's business affairs and providing
certain administrative services necessary for the management of the Fund.
Page 28
<PAGE>
--------------------------------------------------------------------------------
NOTES TO FINANCIAL STATEMENTS (CONTINUED)
--------------------------------------------------------------------------------
FIRST TRUST MANAGED MUNICIPAL ETF (FMB)
OCTOBER 31, 2017
Pursuant to the Investment Management Agreement between the Trust and the
Advisor, First Trust manages the investment of the Fund's assets and is
responsible for the Fund's expenses, including the cost of transfer agency,
custody, fund administration, legal, audit, and other services, but excluding
fee payments under the Investment Management Agreement, interest, taxes,
brokerage commissions, and other expenses connected with the execution of
portfolio transactions, distribution and service fees pursuant to a 12b-1 plan,
if any, and extraordinary expenses. The Fund has agreed to pay First Trust an
annual unitary management fee equal to 0.65% of its average daily net assets.
First Trust also provides fund reporting services to the Fund for a flat annual
fee in the amount of $9,250, which is covered under the annual unitary
management fee.
The Trust's Board of Trustees and the Advisor have entered into a Fee Waiver
Agreement for the Fund pursuant to which the Advisor contractually agreed to
waive management fees of 0.15% of average daily net assets until March 1, 2019.
The waiver agreement may be terminated by action of the Trust's Board of
Trustees at any time upon 60 days' written notice by the Trust on behalf of the
Fund or by the Fund's investment advisor only after March 1, 2019. First Trust
does not have the right to recover the fees waived. During the year ended
October 31, 2017, the Advisor waived fees of $195,402.
The Trust has multiple service agreements with Brown Brothers Harriman & Co.
("BBH"). Under the service agreements, BBH performs custodial, fund accounting,
certain administrative services, and transfer agency services for the Fund. As
custodian, BBH is responsible for custody of the Fund's assets. As fund
accountant and administrator, BBH is responsible for maintaining the books and
records of the Fund's securities and cash. As transfer agent, BBH is responsible
for maintaining shareholder records for the Fund.
Each Trustee who is not an officer or employee of First Trust, any sub-advisor
or any of their affiliates ("Independent Trustees") is paid a fixed annual
retainer that is allocated equally among each fund in the First Trust Fund
Complex. Each Independent Trustee is also paid an annual per fund fee that
varies based on whether the fund is a closed-end or other actively managed fund,
or is an index fund.
Additionally, the Lead Independent Trustee and the Chairmen of the Audit
Committee, Nominating and Governance Committee, and Valuation Committee are paid
annual fees to serve in such capacities, with such compensation allocated pro
rata among each fund in the First Trust Fund Complex based on net assets.
Independent Trustees are reimbursed for travel and out-of-pocket expenses in
connection with all meetings. The Lead Independent Trustee and Committee
Chairmen rotate every three years. The officers and "Interested" Trustee receive
no compensation from the Trust for acting in such capacities.
4. PURCHASES AND SALES OF SECURITIES
For the year ended October 31, 2017, the cost of purchases and proceeds from
sales of investments, excluding short-term investments and in-kind transactions,
were $231,030,772 and $103,834,409, respectively.
For the year ended October 31, 2017, the Fund had no in-kind transactions.
5. BORROWINGS
The Trust, on behalf of the Fund, along with First Trust Series Fund and First
Trust Exchange-Traded Fund IV have a $220 million Credit Agreement with The Bank
of Nova Scotia ("Scotia") as administrative agent for a group of lenders. Scotia
charges a commitment fee of 0.25% of the daily amount of excess of the
commitment amount over the outstanding principal balance of the loans and an
agency fee. Prior to March 9, 2017, the commitment amount was $180 million.
Prior to December 16, 2016, the commitment amount was $140 million. First Trust
allocates the commitment fee and agency fee amongst the funds that have access
to the credit line. To the extent that the Fund accesses the credit line, there
would also be an interest fee charged. The Fund did not have any borrowings
outstanding during the year ended October 31, 2017.
6. CREATIONS, REDEMPTIONS AND TRANSACTION FEES
Shares are created and redeemed by the Fund only in Creation Unit size
aggregations of 50,000 shares in transactions with broker-dealers or large
institutional investors that have entered into a participation agreement (an
"Authorized Participant"). In order to purchase Creation Units of the Fund, an
Authorized Participant must deposit (i) a designated portfolio of securities
determined by First Trust (the "Deposit Securities") and generally make or
receive a cash payment referred to as the "Cash Component," which is an amount
equal to the difference between the NAV of the Fund shares (per Creation Unit
Aggregation) and the market value of the Deposit Securities, and/or (ii) cash in
lieu of all or a portion of the Deposit Securities. If the Cash Component is a
positive number (i.e., the NAV per Creation Unit Aggregation exceeds the Deposit
Amount), the Authorized Participant will deliver the Cash Component. If the Cash
Component is a negative number (i.e., the NAV per Creation Unit Aggregation is
less than the Deposit Amount), the Authorized Participant will receive the Cash
Component. Authorized Participants purchasing Creation Units must pay to BBH, as
transfer agent, a creation transaction fee (the "Creation Transaction Fee")
regardless of the number of Creation Units purchased in the transaction. The
Page 29
<PAGE>
--------------------------------------------------------------------------------
NOTES TO FINANCIAL STATEMENTS (CONTINUED)
--------------------------------------------------------------------------------
FIRST TRUST MANAGED MUNICIPAL ETF (FMB)
OCTOBER 31, 2017
Creation Transaction Fee may vary and is based on the composition of the
securities included in the Fund's portfolio and the countries in which the
transactions are settled. The Creation Transaction Fee is currently $500. The
price for each Creation Unit will equal the daily NAV per share times the number
of shares in a Creation Unit plus the fees described above and, if applicable,
any operational processing and brokerage costs, transfer fees or stamp taxes.
When the Fund permits an Authorized Participant to substitute cash or a
different security in lieu of depositing one or more of the requisite Deposit
Securities, the Authorized Participant may also be assessed an amount to cover
the cost of purchasing the Deposit Securities and/or disposing of the
substituted securities, including operational processing and brokerage costs,
transfer fees, stamp taxes, and part or all of the spread between the expected
bid and offer side of the market related to such Deposit Securities and/or
substitute securities.
Authorized Participants redeeming Creation Units must pay to BBH, as transfer
agent, a redemption transaction fee (the "Redemption Transaction Fee"),
regardless of the number of Creation Units redeemed in the transaction. The
Redemption Transaction Fee may vary and is based on the composition of the
securities included in the Fund's portfolio and the countries in which the
transactions are settled. The Redemption Transaction Fee is currently $500. The
Fund reserves the right to effect redemptions in cash. An Authorized Participant
may request cash redemption in lieu of securities; however, the Fund may, in its
discretion, reject any such request.
7. DISTRIBUTION PLAN
The Board of Trustees adopted a Distribution and Service Plan pursuant to Rule
12b-1 under the 1940 Act. In accordance with the Rule 12b-1 plan, the Fund is
authorized to pay an amount up to 0.25% of its average daily net assets each
year to reimburse First Trust Portfolios L.P. ("FTP"), the distributor of the
Fund, for amounts expended to finance activities primarily intended to result in
the sale of Creation Units or the provision of investor services. FTP may also
use this amount to compensate securities dealers or other persons that are
Authorized Participants for providing distribution assistance, including
broker-dealer and shareholder support and educational and promotional services.
No 12b-1 fees are currently paid by the Fund, and pursuant to a contractual
arrangement, no 12b-1 fees will be paid any time before February 28, 2019.
8. INDEMNIFICATION
The Trust, on behalf of the Fund, has a variety of indemnification obligations
under contracts with its service providers. The Trust's maximum exposure under
these arrangements is unknown. However, the Trust has not had prior claims or
losses pursuant to these contracts and expects the risk of loss to be remote.
9. SUBSEQUENT EVENT
Management has evaluated the impact of all subsequent events to the Fund through
the date the financial statements were issued and has determined that there were
the following subsequent events:
On November 2, 2017, First Trust Municipal High Income ETF, an additional series
of the Trust, began trading under the ticker symbol FMHI on Nasdaq.
On December 10, 2017, the Board of Trustees and the Advisor entered into a Fee
Waiver Agreement for the Fund pursuant to which the Advisor contractually agreed
to waive management fees of 0.15% of average daily net assets until March 1,
2019.
Page 30
<PAGE>
--------------------------------------------------------------------------------
REPORT OF INDEPENDENT REGISTERED PUBLIC ACCOUNTING FIRM
--------------------------------------------------------------------------------
TO THE SHAREHOLDERS AND THE BOARD OF TRUSTEES OF FIRST TRUST MANAGED MUNICIPAL
ETF:
We have audited the accompanying statement of assets and liabilities of First
Trust Managed Municipal ETF (the "Fund"), a series of the First Trust
Exchange-Traded Fund III, including the portfolio of investments, as of October
31, 2017, and the related statement of operations for the year then ended, the
statements of changes in net assets for each of the two years in the period then
ended, and the financial highlights for each of the periods presented. These
financial statements and financial highlights are the responsibility of the
Fund's management. Our responsibility is to express an opinion on these
financial statements and financial highlights based on our audits.
We conducted our audits in accordance with the standards of the Public Company
Accounting Oversight Board (United States). Those standards require that we plan
and perform the audit to obtain reasonable assurance about whether the financial
statements and financial highlights are free of material misstatement. The Fund
is not required to have, nor were we engaged to perform, an audit of its
internal control over financial reporting. Our audits included consideration of
internal control over financial reporting as a basis for designing audit
procedures that are appropriate in the circumstances, but not for the purpose of
expressing an opinion on the effectiveness of the Fund's internal control over
financial reporting. Accordingly, we express no such opinion. An audit also
includes examining, on a test basis, evidence supporting the amounts and
disclosures in the financial statements, assessing the accounting principles
used and significant estimates made by management, as well as evaluating the
overall financial statement presentation. Our procedures included confirmation
of securities owned as of October 31, 2017, by correspondence with the Fund's
custodian and brokers; when replies were not received from brokers, we performed
other auditing procedures. We believe that our audits provide a reasonable basis
for our opinion.
In our opinion, the financial statements and financial highlights referred to
above present fairly, in all material respects, the financial position of First
Trust Managed Municipal ETF as of October 31, 2017, the results of its
operations for the year then ended, the changes in its net assets for each of
the two years in the period then ended, and the financial highlights for each of
the periods presented, in conformity with accounting principles generally
accepted in the United States of America.
/s/ Deloitte & Touche LLP
Chicago, Illinois
December 21, 2017
Page 31
<PAGE>
--------------------------------------------------------------------------------
ADDITIONAL INFORMATION
--------------------------------------------------------------------------------
FIRST TRUST MANAGED MUNICIPAL ETF (FMB)
OCTOBER 31, 2017 (UNAUDITED)
PROXY VOTING POLICIES AND PROCEDURES
A description of the policies and procedures that the Trust uses to determine
how to vote proxies and information on how the Fund voted proxies relating to
portfolio investments during the most recent 12-month period ended June 30 is
available (1) without charge, upon request, by calling (800) 988-5891; (2) on
the Fund's website located at http://www.ftportfolios.com; and (3) on the
Securities and Exchange Commission's ("SEC") website located at
http://www.sec.gov.
PORTFOLIO HOLDINGS
The Trust files its complete schedule of portfolio holdings with the SEC for the
first and third quarters of each fiscal year on Form N-Q. The Trust's Form N-Qs
are available (1) by calling (800) 988-5891; (2) on the Fund's website located
at http://www.ftportfolios.com;
(3) on the SEC's website at http://www.sec.gov; and (4) for review and copying
at the SEC's Public Reference Room ("PRR") in Washington, DC. Information
regarding the operation of the PRR may be obtained by calling (800) SEC-0330.
FEDERAL TAX INFORMATION
For the taxable year ended October 31, 2017, the following distribution
information is being provided as required by the Internal Revenue Code or to
meet a specific state's requirement. The Fund designates the following amounts
or, if subsequently determined to be different, the maximum amount allowable for
its fiscal year ended October 31, 2017:
Federal and State Income Tax Percentages
-------------------------------- -------------
Tax-Exempt Interest Dividends 99.90%
Alternative minimum tax (AMT) 6.58%
RISK CONSIDERATIONS
You could lose money by investing in the Fund. An investment in the Fund is not
a deposit of a bank and is not insured or guaranteed by the Federal Deposit
Insurance Corporation or any other governmental agency. There can be no
assurance that the Fund's investment objective will be achieved.
ALTERNATIVE MINIMUM TAX RISK. The Fund has no limit as to the amount that can be
invested in alternative minimum tax bonds. Therefore, all or a portion of the
Fund's otherwise exempt-interest dividends may be taxable to those shareholders
subject to the federal alternative minimum tax.
AUTHORIZED PARTICIPANT CONCENTRATION RISK. Only an authorized participant may
engage in creation or redemption transactions directly with the Fund. The Fund
has a limited number of institutions that act as authorized participants. To the
extent that these institutions exit the business or are unable to proceed with
creation and/or redemption orders with respect to the Fund and no other
authorized participant is able to step forward to create or redeem, in either of
these cases, Fund shares may trade at a discount to the Fund's net asset value
and possibly face delisting.
CALL RISK. If an issuer calls higher-yielding debt instruments held by the Fund,
performance could be adversely impacted.
CASH TRANSACTIONS RISK. The Fund will, under most circumstances, effect a
significant portion of creations and redemptions for cash, rather than in-kind
securities. As a result, an investment in the Fund may be less tax-efficient
than an investment in an exchange-traded fund that effects its creations and
redemption for in-kind securities. Because the Fund may effect a portion of
redemptions for cash, it may be required to sell portfolio securities in order
to obtain the cash needed to distribute redemption proceeds. A sale of shares
may result in capital gains or losses and may also result in higher brokerage
costs.
CREDIT RISK. Credit risk is the risk that an issuer of a security will be unable
or unwilling to make dividend, interest and/or principal payments when due and
the related risk that the value of a security may decline because of concerns
about the issuer's ability to make such payments.
CUSTODIAL RECEIPT TRUSTS RISK. Custodial receipts are financial instruments
similar to tender option bonds ("TOB") sold through private placements that
represent the right to receive future principal and interest payments on
underlying municipal obligations. Custodial receipt trusts may issue inverse
floater securities and if an Underlying Fund were to hold inverse floaters
issued by custodial receipt trusts, the Underlying Fund would be subject to the
risks of inverse floaters described herein. In particular, because the
instruments may be leveraged, their market values may be more volatile than
other types of fixed-income instruments.
CYBER SECURITY RISK. As the use of Internet technology has become more prevalent
in the course of business, the Fund has become more susceptible to potential
operational risks through breaches in cyber security. A breach in cyber security
refers to both intentional and unintentional events that may cause the Fund to
lose proprietary information, suffer data corruption or lose operational
Page 32
<PAGE>
--------------------------------------------------------------------------------
ADDITIONAL INFORMATION (CONTINUED)
--------------------------------------------------------------------------------
FIRST TRUST MANAGED MUNICIPAL ETF (FMB)
OCTOBER 31, 2017 (UNAUDITED)
capacity. Such events could cause the Fund to incur regulatory penalties,
reputational damage, additional compliance costs associated with corrective
measures and/or financial loss. Cyber security breaches may involve unauthorized
access to the Fund's digital information systems through "hacking" or malicious
software coding, but may also result from outside attacks such as
denial-of-service attacks through efforts to make network services unavailable
to intended users. In addition, cyber security breaches of the Fund's third
party service providers, such as its administrator, transfer agent, custodian,
or sub-advisor, as applicable, or issuers in which the Fund invests, can also
subject the Fund to many of the same risks associated with direct cyber security
breaches. The Fund has established risk management systems designed to reduce
the risks associated with cyber security. However, there is no guarantee that
such efforts will succeed, especially because the Fund does not directly control
the cyber security systems of issuers or third party service providers.
FLUCTUATION OF NET ASSET VALUE RISK. The net asset value of shares of the Fund
will generally fluctuate with changes in the market value of the Fund's
holdings. The market prices of shares will generally fluctuate in accordance
with changes in net asset value as well as the relative supply of and demand for
shares on Nasdaq. The Fund's investment advisor cannot predict whether shares
will trade below, at or above their net asset value because the shares trade on
Nasdaq at market prices and not at net asset value. Price differences may be
due, in large part, to the fact that supply and demand forces at work in the
secondary trading market for shares will be closely related to, but not
identical to, the same forces influencing the prices of the holdings of the Fund
trading individually or in the aggregate at any point in time. However, given
that shares can only be purchased and redeemed for cash, or in certain
circumstances, in-kind, in Creation Units, and only to and from broker-dealers
and large institutional investors that have entered into participation
agreements (unlike shares of closed-end funds, which frequently trade at
appreciable discounts from, and sometimes at premiums to, their net asset
value), the Fund's investment advisor believes that large discounts or premiums
to the net asset value of shares should not be sustained.
HIGH YIELD SECURITIES RISK. High yield securities, or "junk" bonds, are subject
to greater market fluctuations and risk of loss than securities with higher
ratings, and therefore, are considered to be highly speculative. These
securities are issued by issuers that may have narrowly focused operations
and/or other impediments to the timely payment of periodic interest and
principal at maturity. If the economy slows down or dips into recession, the
issuers of high yield securities may not have sufficient resources to continue
making timely payment of periodic interest and principal at maturity. The market
for high yield securities is smaller and less liquid than that for investment
grade securities. High yield securities are generally not listed on a national
securities exchange but trade in the over-the-counter markets. Due to the
smaller, less liquid market for high yield securities, the bid-offer spread on
such securities is generally greater than it is for investment grade securities
and the purchase or sale of such securities may take longer to complete. In
general, high yield securities may have a greater risk of default than other
types of securities.
INCOME RISK. Income from the Fund's fixed income investments could decline
during periods of falling interest rates.
INTEREST RATE RISK. Interest rate risk is the risk that the value of the debt
securities in the Fund's portfolio will decline because of rising market
interest rates. Interest rate risk is generally lower for shorter term debt
securities and higher for longer term debt securities. Duration is a measure of
the expected price volatility of a debt security as a result of changes in
market rates of interest, based on, among other factors, the weighted average
timing of the debt security's expected principal and interest payments. In
general, duration represents the expected percentage change in the value of a
security for an immediate 1% change in interest rates. Therefore, prices of debt
securities with shorter durations tend to be less sensitive to interest rate
changes than debt securities with longer durations. As the value of a debt
security changes over time, so will its duration.
INVERSE FLOATERS RISK. Investments in inverse floating rate securities issued by
TOB trusts create effective leverage. Due to the leveraged nature of these
investments, the value of an inverse floater will increase and decrease to a
significantly greater extent than the values of the TOB trust's underlying
municipal bonds in response to changes in market interest rates or credit
quality. In addition, distributions paid to the Fund on its inverse floaters
will be reduced or even eliminated as short-term municipal interest rates rise
and will increase when short-term municipal interest rates fall. An investment
in inverse floaters typically will involve greater risk than an investment in a
fixed rate municipal bond.
LIQUIDITY RISK. The Fund invests a substantial portion of its assets in
lower-quality debt issued by companies that are highly leveraged. Lower-quality
debt tends to be less liquid than higher-quality debt. Moreover, smaller debt
issues tend to be less liquid than larger debt issues. If the economy
experiences a sudden downturn, or if the debt markets for such companies become
distressed, the Fund may have particular difficulty selling its assets in
sufficient amounts, at reasonable prices and in a sufficiently timely manner to
raise the cash necessary to meet any potentially heavy redemption requests by
Fund shareholders. As of the fourth quarter of 2015, the market for high yield
debt has experienced decreased liquidity, and investor perception of increased
risk has caused yield spreads to widen. Decreased liquidity may negatively
affect the Fund's ability to mitigate risk and to meet redemptions.
MANAGEMENT RISK. The Fund is subject to management risk because it is an
actively managed portfolio. In managing the Fund's investment portfolio, the
advisor will apply investment techniques and risk analyses that may not have the
desired result. There can be no guarantee that the Fund will meet its investment
objectives.
Page 33
<PAGE>
--------------------------------------------------------------------------------
ADDITIONAL INFORMATION (CONTINUED)
--------------------------------------------------------------------------------
FIRST TRUST MANAGED MUNICIPAL ETF (FMB)
OCTOBER 31, 2017 (UNAUDITED)
MARKET RISK. Market risk is the risk that a particular security owned by the
Fund or shares of the Fund in general may fall in value. Securities are subject
to market fluctuations caused by such factors as economic, political, regulatory
or market developments, changes in interest rates and perceived trends in
securities prices. Shares of the Fund could decline in value or underperform
other investments.
MARKET MAKER RISK. If the Fund has lower average daily trading volumes, it may
rely on a small number of third-party market makers to provide a market for the
purchase and sale of shares. Any trading halt or other problem relating to the
trading activity of these market makers could result in a dramatic change in the
spread between the Fund's net asset value and the price at which the Fund's
shares are trading on its exchange, which could result in a decrease in value of
the Fund's shares. In addition, decisions by market makers or authorized
participants to reduce their role or step away from these activities in times of
market stress could inhibit the effectiveness of the arbitrage process in
maintaining the relationship between the underlying values of the Fund's
portfolio securities and the Fund's market price. This reduced effectiveness
could result in Fund shares trading at a discount to net asset value and also in
greater than normal intraday bid-ask spreads for Fund shares.
MUNICIPAL LEASE OBLIGATIONS RISK. Participation interests in municipal leases
pose special risks because many leases and contracts contain "non-appropriation"
clauses that provide that the governmental issuer has no obligation to make
future payments under the lease or contract unless money is appropriated for
this purpose by the appropriate legislative body.
MUNICIPAL SECURITIES MARKET LIQUIDITY RISK. Inventories of Municipal Securities
held by brokers and dealers have decreased in recent years, lessening their
ability to make a market in these securities. This reduction in market making
capacity has the potential to decrease the Fund's ability to buy or sell
Municipal Securities, and increase price volatility and trading costs,
particularly during periods of economic or market stress. In addition, as of the
fourth quarter of 2015, the market for high yield debt has experienced decreased
liquidity, and investor perception of increased risk has caused yield spreads to
widen. As a result, the Fund may be forced to accept a lower price to sell a
Municipal Security, to sell other securities to raise cash, or to give up an
investment opportunity, any of which could have a negative effect on
performance.
NON-DIVERSIFICATION RISK. The Fund is classified as "non-diversified" under the
Investment Company Act of 1940 Act, as amended (the "1940 Act"). As a result,
the Fund is only limited as to the percentage of its assets that may be invested
in the securities of any one issuer by the diversification requirements imposed
by the Internal Revenue Code of 1986, as amended (the "Code"). The Fund may
invest a relatively high percentage of its assets in a limited number of
issuers. As a result, the Fund may be more susceptible to a single adverse
economic or regulatory occurrence affecting one or more of these issuers,
experience increased volatility and be highly concentrated in certain issuers.
POLITICAL AND ECONOMIC RISKS. The values of Municipal Securities held by the
Fund may be adversely affected by local political and economic conditions and
developments. Adverse conditions in an industry significant to a local economy
could have a correspondingly adverse effect on the financial condition of local
issuers.
TAX RISK. Interest income from Municipal Securities is normally not subject to
regular federal income tax, but income from Municipal Securities held by the
Fund could be declared taxable because of, among other things, unfavorable
changes in tax laws, adverse interpretations by the Internal Revenue Service or
state tax authorities or noncompliant conduct of a bond issuer. Consequently,
the attractiveness of Municipal Securities in relation to other investment
alternatives is affected by changes in federal income tax rates or changes in
the tax-exempt status of interest income from Municipal Securities.
TRADING ISSUES RISK. Although the shares of the Fund are listed for trading on
Nasdaq, there can be no assurance that an active trading market for such shares
will develop or be maintained. Trading in shares on Nasdaq may be halted due to
market conditions or for reasons that, in the view of Nasdaq, make trading in
shares inadvisable. In addition, trading in shares on Nasdaq is subject to
trading halts caused by extraordinary market volatility pursuant to Nasdaq
"circuit breaker" rules. Market makers are under no obligation to make a market
in the Fund's shares, and authorized participants are not obligated to submit
purchase or redemption orders for Creation Units. There can be no assurance that
the requirements of Nasdaq necessary to maintain the listing of the Fund will
continue to be met or will remain unchanged. In particular, if the Fund does not
comply with any provision of the Nasdaq rule change pursuant to Rule 19b-4 under
the Securities Exchange Act of 1934, as amended approved by the SEC, and cannot
bring itself into compliance within a reasonable period after discovering the
matter, Nasdaq may remove the shares of the Fund from listing. The Fund may have
difficulty maintaining its listing on Nasdaq in the event the Fund's assets are
small or the Fund does not have enough shareholders.
ZERO COUPON BONDS RISK. Zero coupon bonds do not pay interest on a current basis
and may be highly volatile as interest rates rise or fall. In addition, while
such bonds generate income for purposes of generally accepted accounting
standards, they do not generate cash flow and thus could cause the Fund to be
forced to liquidate securities at an inopportune time in order to distribute
cash, as required by tax laws.
Page 34
<PAGE>
--------------------------------------------------------------------------------
ADDITIONAL INFORMATION (CONTINUED)
--------------------------------------------------------------------------------
FIRST TRUST MANAGED MUNICIPAL ETF (FMB)
OCTOBER 31, 2017 (UNAUDITED)
INVESTMENT MANAGEMENT AGREEMENT
BOARD CONSIDERATIONS REGARDING CONTINUATION OF INVESTMENT MANAGEMENT AGREEMENT
The Board of Trustees (the "Board") of First Trust Exchange-Traded Fund III (the
"Trust"), including the Independent Trustees, unanimously approved the
continuation of the Investment Management Agreement (the "Agreement") with First
Trust Advisors L.P. (the "Advisor" or "First Trust") on behalf of the First
Trust Managed Municipal ETF (the "Fund"). The Board approved the continuation of
the Agreement for a one-year period ending June 30, 2018 at a meeting held on
June 12, 2017. The Board determined that the continuation of the Agreement is in
the best interests of the Fund in light of the extent and quality of the
services provided and such other matters as the Board considered to be relevant
in the exercise of its reasonable business judgment.
To reach this determination, the Board considered its duties under the
Investment Company Act of 1940, as amended (the "1940 Act"), as well as under
the general principles of state law in reviewing and approving advisory
contracts; the requirements of the 1940 Act in such matters; the fiduciary duty
of investment advisors with respect to advisory agreements and compensation; the
standards used by courts in determining whether investment company boards have
fulfilled their duties; and the factors to be considered by the Board in voting
on such agreements. At meetings held on April 24, 2017 and June 12, 2017, the
Board, including the Independent Trustees, reviewed materials provided by the
Advisor responding to requests for information from counsel to the Independent
Trustees that, among other things, outlined the services provided by the Advisor
to the Fund (including the relevant personnel responsible for these services and
their experience); the unitary fee rate payable by the Fund as compared to fees
charged to a peer group of funds (most of which were exchange-traded funds
("ETFs")) compiled by Management Practice, Inc. ("MPI"), an independent source
(the "MPI Peer Group"), and as compared to fees charged to other clients of the
Advisor, including other ETFs managed by the Advisor; expenses of the Fund as
compared to expense ratios of the funds in the MPI Peer Group; performance
information for the Fund; the nature of expenses incurred in providing services
to the Fund and the potential for economies of scale, if any; financial data on
the Advisor; any fall-out benefits to the Advisor and its affiliate, First Trust
Portfolios L.P. ("FTP"); and information on the Advisor's compliance program.
The Board reviewed initial materials with the Advisor at the meeting held on
April 24, 2017, prior to which the Independent Trustees and their counsel met
separately to discuss the information provided by the Advisor. Following the
April meeting, independent legal counsel on behalf of the Independent Trustees
requested certain clarifications and supplements to the materials provided, and
the information provided in response to those requests was considered at an
executive session of the Independent Trustees and independent legal counsel held
prior to the June 12, 2017 meeting, as well as at the meeting held that day. The
Board applied its business judgment to determine whether the arrangement between
the Trust and the Advisor continues to be a reasonable business arrangement from
the Fund's perspective as well as from the perspective of the Fund's
shareholders. The Board determined that, given the totality of the information
provided with respect to the Agreement, the Board had received sufficient
information to renew the Agreement. The Board considered that shareholders chose
to invest or remain invested in the Fund knowing that the Advisor manages the
Fund and knowing the Fund's unitary fee.
In reviewing the Agreement, the Board considered the nature, extent and quality
of the services provided by the Advisor under the Agreement. The Board
considered that the Advisor is responsible for the overall management and
administration of the Trust and the Fund and reviewed all of the services
provided by the Advisor to the Fund, as well as the background and experience of
the persons responsible for such services. The Board noted that the Fund is an
actively-managed ETF and noted that the Advisor's Municipal Securities Team is
responsible for the day-to-day management of the Fund's investments. The Board
considered the background and experience of the members of the Municipal
Securities Team and noted the Board's prior meetings with members of the Team.
The Board considered the Advisor's statement that it applies the same oversight
model internally with its Municipal Securities Team as it uses for overseeing
external sub-advisors, including portfolio risk monitoring and performance
review. In reviewing the services provided, the Board noted the compliance
program that had been developed by the Advisor and considered that it includes a
robust program for monitoring the Advisor's and the Fund's compliance with the
1940 Act, as well as the Fund's compliance with its investment objectives and
policies. The Board also considered a report from the Advisor with respect to
its risk management functions related to the operation of the Fund. Finally, as
part of the Board's consideration of the Advisor's services, the Advisor, in its
written materials and at the April 24, 2017 meeting, described to the Board the
scope of its ongoing investment in additional infrastructure and personnel to
maintain and improve the quality of services provided to the Fund and the other
funds in the First Trust Fund Complex. In light of the information presented and
the considerations made, the Board concluded that the nature, extent and quality
of the services provided to the Trust and the Fund by the Advisor under the
Agreement have been and are expected to remain satisfactory and that the Advisor
has managed the Fund consistent with the Fund's investment objectives and
policies.
The Board considered the unitary fee rate payable by the Fund under the
Agreement for the services provided. The Board considered that as part of the
unitary fee the Advisor is responsible for the Fund's expenses, including the
cost of transfer agency, custody, fund administration, legal, audit and other
services and license fees (if any), but excluding interest, taxes, brokerage
commissions and other expenses connected with the execution of portfolio
transactions, distribution and service fees pursuant to a Rule 12b-1 plan, if
any, and extraordinary expenses. The Board noted that the Advisor had previously
agreed to waive a portion of its unitary fee in an amount equal to 0.15% of the
Fund's average daily net assets until at least March 1, 2018. The Board received
and reviewed information showing the advisory or unitary fee rates and expense
ratios of the peer funds in the MPI Peer Group, as well as advisory fee rates
charged by the Advisor to other fund (including ETFs) and non-fund clients, as
applicable. Because the Fund's MPI Peer
Page 35
<PAGE>
--------------------------------------------------------------------------------
ADDITIONAL INFORMATION (CONTINUED)
--------------------------------------------------------------------------------
FIRST TRUST MANAGED MUNICIPAL ETF (FMB)
OCTOBER 31, 2017 (UNAUDITED)
Group included peer funds that pay a unitary fee and because the Fund pays a
unitary fee, the Board determined that expense ratios were the most relevant
comparative data point. Based on the information provided, the Board noted that
the unitary fee for the Fund, after taking into account the contractual fee
waivers, was above the median total (net) expense ratio of the peer funds in the
MPI Peer Group. With respect to the MPI Peer Group, the Board discussed with
representatives of the Advisor how the MPI Peer Group was assembled, limitations
in creating peer groups for actively-managed ETFs, including the limited number
of actively-managed ETFs investing in municipal securities and that most of the
peer funds were index-based ETFs, and different business models that may affect
the pricing of services among ETF sponsors. The Board took these limitations and
differences into account in considering the peer data. With respect to fees
charged to other clients, the Board considered differences between the Fund and
other clients that limited their comparability. In considering the unitary fee
rate overall, the Board also considered the Advisor's statement that it seeks to
meet investor needs through innovative and value-added investment solutions and
the Advisor's description of its long-term commitment to the Fund.
The Board considered performance information for the Fund. The Board noted the
process it has established for monitoring the Fund's performance and portfolio
risk on an ongoing basis, which includes quarterly performance reporting from
the Advisor for the Fund. The Board determined that this process continues to be
effective for reviewing the Fund's performance. The Board received and reviewed
information comparing the Fund's performance for the one-year period ended
December 31, 2016 to the performance of the MPI Peer Group and to a benchmark
index. Based on the information provided, the Board noted that the Fund
outperformed the MPI Peer Group average and the benchmark index for the one-year
period ended December 31, 2016.
On the basis of all the information provided on the unitary fee and performance
of the Fund and the ongoing oversight by the Board, the Board concluded that the
unitary fee for the Fund continues to be reasonable and appropriate in light of
the nature, extent and quality of the services provided by the Advisor to the
Fund under the Agreement.
The Board considered information and discussed with the Advisor whether there
were any economies of scale in connection with providing advisory services to
the Fund and noted the Advisor's statement that it expects its expenses to
increase over the next twelve months as the Advisor continues to make
investments in personnel and infrastructure. The Board noted that any reduction
in fixed costs associated with the management of the Fund would benefit the
Advisor, but that the unitary fee structure provides a level of certainty in
expenses for the Fund. The Board considered the revenues and allocated costs
(including the allocation methodology) of the Advisor in serving as investment
advisor to the Fund for the twelve months ended December 31, 2016 and the
estimated profitability level for the Fund calculated by the Advisor based on
such data, as well as complex-wide and product-line profitability data for the
same period. The Board noted the inherent limitations in the profitability
analysis and concluded that, based on the information provided, the Advisor's
profitability level for the Fund was not unreasonable. In addition, the Board
considered fall-out benefits described by the Advisor that may be realized from
its relationship with the Fund. The Board considered that the Advisor had
identified as a fall-out benefit to the Advisor and FTP their exposure to
investors and brokers who, absent their exposure to the Fund, may have had no
dealings with the Advisor or FTP, and noted that the Advisor does not utilize
soft dollars in connection with its management of the Fund's portfolio. The
Board also considered the Advisor's compensation for fund reporting services
provided to the Fund pursuant to a separate Fund Reporting Services Agreement,
which is paid from the unitary fee. The Board concluded that the character and
amount of potential fall-out benefits to the Advisor were not unreasonable.
Based on all of the information considered and the conclusions reached, the
Board, including the Independent Trustees, unanimously determined that the terms
of the Agreement continue to be fair and reasonable and that the continuation of
the Agreement is in the best interests of the Trust and the Fund. No single
factor was determinative in the Board's analysis.
Page 36
<PAGE>
--------------------------------------------------------------------------------
BOARD OF TRUSTEES AND OFFICERS
--------------------------------------------------------------------------------
FIRST TRUST MANAGED MUNICIPAL ETF (FMB)
OCTOBER 31, 2017 (UNAUDITED)
The Trust's statement of additional information includes additional information
about the Trustees and is available, without charge, upon request, by calling
(800) 988-5891.
<TABLE>
<CAPTION>
NUMBER OF OTHER
PORTFOLIOS IN TRUSTEESHIPS OR
TERM OF OFFICE THE FIRST TRUST DIRECTORSHIPS
NAME, ADDRESS, AND YEAR FIRST FUND COMPLEX HELD BY TRUSTEE
DATE OF BIRTH AND ELECTED OR PRINCIPAL OCCUPATIONS OVERSEEN BY DURING PAST
POSITION WITH THE TRUST APPOINTED DURING PAST 5 YEARS TRUSTEE 5 YEARS
------------------------------------------------------------------------------------------------------------------------------------
INDEPENDENT TRUSTEES
------------------------------------------------------------------------------------------------------------------------------------
<S> <C> <C> <C> <C>
Richard E. Erickson, Trustee o Indefinite Term Physician, Officer, Wheaton Orthopedics; 151 None
c/o First Trust Advisors L.P. Limited Partner, Gundersen Real Estate
120 E. Liberty Drive, o Since Inception Limited Partnership (June 1992 to
Suite 400 December 2016); Member, Sportsmed LLC
Wheaton, IL 60187 (April 2007 to November 2015)
D.O.B.: 04/51
Thomas R. Kadlec, Trustee o Indefinite Term President, ADM Investor Services, Inc. 151 Director of ADM
c/o First Trust Advisors L.P. (Futures Commission Merchant) Investor Services,
120 E. Liberty Drive, o Since Inception Inc., ADM
Suite 400 Investor Services
Wheaton, IL 60187 International,
D.O.B.: 11/57 Futures Industry
Association, and
National Futures
Association
Robert F. Keith, Trustee o Indefinite Term President, Hibs Enterprises (Financial and 151 Director of Trust
c/o First Trust Advisors L.P. Management Consulting) Company of
120 E. Liberty Drive, o Since Inception Illinois
Suite 400
Wheaton, IL 60187
D.O.B.: 11/56
Niel B. Nielson, Trustee o Indefinite Term Managing Director and Chief Operating 151 Director of
c/o First Trust Advisors L.P. Officer (January 2015 to Present), Pelita Covenant
120 E. Liberty Drive, o Since Inception Harapan Educational Foundation Transport, Inc.
Suite 400 (Educational Products and Services); (May 2003 to
Wheaton, IL 60187 President and Chief Executive Officer May 2014)
D.O.B.: 03/54 (June 2012 to September 2014), Servant
Interactive LLC (Educational Products and
Services); President and Chief Executive
Officer (June 2012 to September 2014),
Dew Learning LLC (Educational Products
and Services); President (June 2002 to June
2012), Covenant College
------------------------------------------------------------------------------------------------------------------------------------
INTERESTED TRUSTEE
------------------------------------------------------------------------------------------------------------------------------------
James A. Bowen(1), Trustee, o Indefinite Term Chief Executive Officer, First Trust 151 None
Chairman of the Board Advisors L.P. and First Trust Portfolios L.P.;
120 E. Liberty Drive, o Since Inception Chairman of the Board of Directors,
Suite 400 BondWave LLC (Software Development
Wheaton, IL 60187 Company) and Stonebridge Advisors LLC
D.O.B.: 09/55 (Investment Advisor)
</TABLE>
-----------------------------
(1) Mr. Bowen is deemed an "interested person" of the Trust due to his
position as Chief Executive Officer of First Trust Advisors L.P.,
investment advisor of the Trust.
Page 37
<PAGE>
--------------------------------------------------------------------------------
BOARD OF TRUSTEES AND OFFICERS (CONTINUED)
--------------------------------------------------------------------------------
FIRST TRUST MANAGED MUNICIPAL ETF (FMB)
OCTOBER 31, 2017 (UNAUDITED)
<TABLE>
<CAPTION>
POSITION AND TERM OF OFFICE
NAME, ADDRESS OFFICES AND LENGTH OF PRINCIPAL OCCUPATIONS
AND DATE OF BIRTH WITH TRUST SERVICE DURING PAST 5 YEARS
------------------------------------------------------------------------------------------------------------------------------------
OFFICERS WHO ARE NOT TRUSTEES(2)
------------------------------------------------------------------------------------------------------------------------------------
<S> <C> <C> <C>
James M. Dykas President and Chief o Indefinite Term Managing Director and Chief Financial Officer
120 E. Liberty Drive, Executive Officer (January 2016 to Present), Controller (January 2011
Suite 400 o Since January 2016 to January 2016), Senior Vice President (April 2007
Wheaton, IL 60187 to January 2016), First Trust Advisors L.P. and First
D.O.B.: 01/66 Trust Portfolios L.P.; Chief Financial Officer
(January 2016 to Present), BondWave LLC
(Software Development Company) and Stonebridge
Advisors LLC (Investment Advisor)
Donald P. Swade Treasurer, Chief Financial o Indefinite Term Senior Vice President (July 2016 to Present), Vice
120 E. Liberty Drive, Officer and Chief President (April 2012 to July 2016), First Trust
Suite 400 Accounting Officer o Since January 2016 Advisors L.P. and First Trust Portfolios L.P.
Wheaton, IL 60187
D.O.B.: 08/72
W. Scott Jardine Secretary and Chief o Indefinite Term General Counsel, First Trust Advisors L.P., First
120 E. Liberty Drive, Legal Officer Trust Portfolios L.P.; Secretary and General
Suite 400 o Since Inception Counsel, BondWave LLC; Secretary, Stonebridge
Wheaton, IL 60187 Advisors LLC
D.O.B.: 05/60
Daniel J. Lindquist Vice President o Indefinite Term Managing Director, First Trust Advisors L.P. and
120 E. Liberty Drive, First Trust Portfolios L.P.
Suite 400 o Since Inception
Wheaton, IL 60187
D.O.B: 02/70
Kristi A. Maher Chief Compliance o Indefinite Term Deputy General Counsel, First Trust Advisors L.P.
120 E. Liberty Drive, Officer and and First Trust Portfolios L.P.
Suite 400 Assistant Secretary o Since Inception
Wheaton, IL 60187
D.O.B.: 12/66
Roger F. Testin Vice President o Indefinite Term Senior Vice President, First Trust Advisors L.P.
120 E. Liberty Drive, and First Trust Portfolios L.P.
Suite 400 o Since Inception
Wheaton, IL 60187
D.O.B.: 06/66
Stan Ueland Vice President o Indefinite Term Senior Vice President, First Trust Advisors L.P.
120 E. Liberty Drive, and First Trust Portfolios L.P.
Suite 400 o Since Inception
Wheaton, IL 60187
D.O.B.: 11/70
</TABLE>
-----------------------------
(2) The term "officer" means the president, vice president, secretary,
treasurer, controller or any other officer who performs a policy making
function.
Page 38
<PAGE>
--------------------------------------------------------------------------------
PRIVACY POLICY
--------------------------------------------------------------------------------
FIRST TRUST MANAGED MUNICIPAL ETF (FMB)
OCTOBER 31, 2017 (UNAUDITED)
PRIVACY POLICY
First Trust values our relationship with you and considers your privacy an
important priority in maintaining that relationship. We are committed to
protecting the security and confidentiality of your personal information.
SOURCES OF INFORMATION
We collect nonpublic personal information about you from the following sources:
o Information we receive from you and your broker-dealer, investment
advisor or financial representative through interviews,
applications, agreements or other forms;
o Information about your transactions with us, our affiliates or
others;
o Information we receive from your inquiries by mail, e-mail or
telephone; and
o Information we collect on our website through the use of "cookies".
For example, we may identify the pages on our website that your
browser requests or visits.
INFORMATION COLLECTED
The type of data we collect may include your name, address, social security
number, age, financial status, assets, income, tax information, retirement and
estate plan information, transaction history, account balance, payment history,
investment objectives, marital status, family relationships and other personal
information.
DISCLOSURE OF INFORMATION
We do not disclose any nonpublic personal information about our customers or
former customers to anyone, except as permitted by law. In addition to using
this information to verify your identity (as required under law), the permitted
uses may also include the disclosure of such information to unaffiliated
companies for the following reasons:
o In order to provide you with products and services and to effect
transactions that you request or authorize, we may disclose your
personal information as described above to unaffiliated financial
service providers and other companies that perform administrative or
other services on our behalf, such as transfer agents, custodians
and trustees, or that assist us in the distribution of investor
materials such as trustees, banks, financial representatives, proxy
services, solicitors and printers.
o We may release information we have about you if you direct us to do
so, if we are compelled by law to do so, or in other legally limited
circumstances (for example to protect your account from fraud).
In addition, in order to alert you to our other financial products and services,
we may share your personal information within First Trust.
USE OF WEB ANALYTICS
We currently use third party analytics tools, Google Analytics and AddThis, to
gather information for purposes of improving First Trust's website and marketing
our products and services to you. These tools employ cookies, which are small
pieces of text stored in a file by your web browser and sent to websites that
you visit, to collect information, track website usage and viewing trends such
as the number of hits, pages visited, videos and PDFs viewed and the length of
user sessions in order to evaluate website performance and enhance navigation of
the website. We may also collect other anonymous information, which is generally
limited to technical and web navigation information such as the IP address of
your device, internet browser type and operating system for purposes of
analyzing the data to make First Trust's website better and more useful to our
users. The information collected does not include any personal identifiable
information such as your name, address, phone number or email address unless you
provide that information through the website for us to contact you in order to
answer your questions or respond to your requests. To find out how to opt-out of
these services click on: Google Analytics and AddThis.
CONFIDENTIALITY AND SECURITY
With regard to our internal security procedures, First Trust restricts access to
your nonpublic personal information to those First Trust employees who need to
know that information to provide products or services to you. We maintain
physical, electronic and procedural safeguards to protect your nonpublic
personal information.
POLICY UPDATES AND INQUIRIES
As required by federal law, we will notify you of our privacy policy annually.
We reserve the right to modify this policy at any time, however, if we do change
it, we will tell you promptly. For questions about our policy, or for additional
copies of this notice, please go to www.ftportfolios.com, or contact us at
1-800-621-1675 (First Trust Portfolios) or 1-800-222-6822 (First Trust
Advisors).
May 2017
Page 39
<PAGE>
This page intentionally left blank.
<PAGE>
FIRST TRUST
First Trust Exchange-Traded Fund III
INVESTMENT ADVISOR
First Trust Advisors L.P.
120 E. Liberty Drive, Suite 400
Wheaton, IL 60187
ADMINISTRATOR, CUSTODIAN
FUND ACCOUNTANT &
TRANSFER AGENT
Brown Brothers Harriman & Co.
50 Post Office Square
Boston, MA 02110
INDEPENDENT REGISTERED
PUBLIC ACCOUNTING FIRM
Deloitte & Touche LLP
111 S. Wacker Drive
Chicago, IL 60606
LEGAL COUNSEL
Chapman and Cutler LLP
111 W. Monroe Street
Chicago, IL 60603
<PAGE>
[BLANK BACK COVER]
<PAGE>
FIRST TRUST
First Trust Exchange-Traded Fund III
--------------------------------------------------------------------------------
First Trust Long/Short Equity ETF (FTLS)
Annual Report
For the Year Ended
October 31, 2017
<PAGE>
--------------------------------------------------------------------------------
TABLE OF CONTENTS
--------------------------------------------------------------------------------
FIRST TRUST LONG/SHORT EQUITY ETF (FTLS)
ANNUAL REPORT
OCTOBER 31, 2017
Shareholder Letter........................................................... 1
Fund Performance Overview.................................................... 2
Portfolio Commentary......................................................... 5
Understanding Your Fund Expenses............................................. 7
Portfolio of Investments..................................................... 8
Statement of Assets and Liabilities.......................................... 17
Statement of Operations...................................................... 18
Statements of Changes in Net Assets.......................................... 19
Financial Highlights......................................................... 20
Notes to Financial Statements................................................ 21
Report of Independent Registered Public Accounting Firm...................... 27
Additional Information....................................................... 28
Board of Trustees and Officers............................................... 33
Privacy Policy............................................................... 35
CAUTION REGARDING FORWARD-LOOKING STATEMENTS
This report contains certain forward-looking statements within the meaning of
the Securities Act of 1933, as amended, and the Securities Exchange Act of 1934,
as amended. Forward-looking statements include statements regarding the goals,
beliefs, plans or current expectations of First Trust Advisors L.P. ("First
Trust" or the "Advisor") and its representatives, taking into account the
information currently available to them. Forward-looking statements include all
statements that do not relate solely to current or historical fact. For example,
forward-looking statements include the use of words such as "anticipate,"
"estimate," "intend," "expect," "believe," "plan," "may," "should," "would" or
other words that convey uncertainty of future events or outcomes.
Forward-looking statements involve known and unknown risks, uncertainties and
other factors that may cause the actual results, performance or achievements of
the series of First Trust Exchange-Traded Fund III (the "Trust") described in
this report for the First Trust Long/Short Equity ETF (hereinafter referred to
as the "Fund") to be materially different from any future results, performance
or achievements expressed or implied by the forward-looking statements. When
evaluating the information included in this report, you are cautioned not to
place undue reliance on these forward-looking statements, which reflect the
judgment of the Advisor and its representatives only as of the date hereof. We
undertake no obligation to publicly revise or update these forward-looking
statements to reflect events and circumstances that arise after the date hereof.
PERFORMANCE AND RISK DISCLOSURE
There is no assurance that the Fund will achieve its investment objective. The
Fund is subject to market risk, which is the possibility that the market values
of securities owned by the Fund will decline and that the value of the Fund
shares may therefore be less than what you paid for them. Accordingly, you can
lose money by investing in the Fund. See "Risk Considerations" in the Additional
Information section of this report for a discussion of certain other risks of
investing in the Fund.
Performance data quoted represents past performance, which is no guarantee of
future results, and current performance may be lower or higher than the figures
shown. For the most recent month-end performance figures, please visit
http://www.ftportfolios.com or speak with your financial advisor. Investment
returns, net asset value and share price will fluctuate and Fund shares, when
sold, may be worth more or less than their original cost.
The Advisor may also periodically provide additional information on Fund
performance on the Fund's webpage at http://www.ftportfolios.com.
HOW TO READ THIS REPORT
This report contains information that may help you evaluate your investment in
the Fund. It includes details about the Fund's portfolio and presents data and
analysis that provide insight into the Fund's performance and investment
approach.
By reading the portfolio commentary by the portfolio management team of the
Fund, you may obtain an understanding of how the market environment affected the
Fund's performance. The statistical information that follows may help you
understand the Fund's performance compared to that of a relevant market
benchmark.
It is important to keep in mind that the opinions expressed by personnel of the
Advisor are just that: informed opinions. They should not be considered to be
promises or advice. The opinions, like the statistics, cover the period through
the date on the cover of this report. The material risks of investing in the
Fund are spelled out in its prospectus, statement of additional information,
this report and other Fund regulatory filings.
<PAGE>
--------------------------------------------------------------------------------
SHAREHOLDER LETTER
--------------------------------------------------------------------------------
FIRST TRUST LONG/SHORT EQUITY ETF (FTLS)
ANNUAL LETTER FROM THE CHAIRMAN AND CEO
OCTOBER 31, 2017
Dear Shareholders:
Thank you for your investment in First Trust Long/Short Equity ETF.
First Trust is pleased to provide you with the annual report which contains
detailed information about your investment for the 12 months ended October 31,
2017, including a market overview and a performance analysis for the period. We
encourage you to read this report carefully and discuss it with your financial
advisor.
The U.S. bull market continued through the November 2016 election and the first
nine months of the Trump presidency. During that period, November 8, 2016
(Election Day 2016) through October 31, 2017, the S&P 500(R) Index (the "Index")
posted a total return of 22.73%, according to Bloomberg. Ten of the eleven Index
sectors were up on a total return basis as well. Since the beginning of 2017
through October 31, 2017, the Index has closed its trading sessions at all-time
highs on 50 occasions. Finally, as of October 31, 2017, the Index has spent the
entire year in positive territory. This has only happened in 10 different years
over the past seven decades.
The current bull market, as measured from March 9, 2009 through October 31,
2017, is the second longest in history. While we are optimistic about the U.S.
economy, we are also aware that no one can predict the future or know how
markets will perform in different economic environments. We believe that one
should invest for the long term and be prepared for market volatility by keeping
current on your portfolio and investing goals by speaking regularly with your
investment professional. It is also important to keep in mind that past
performance can never guarantee future results.
Thank you for giving First Trust the opportunity to be a part of your investment
plan. We value our relationship with you and will continue to focus on bringing
the types of investments that we believe can help you reach your financial
goals.
Sincerely,
/s/ James A. Bowen
James A. Bowen
Chairman of the Board of Trustees
Chief Executive Officer of First Trust Advisors L.P.
Page 1
<PAGE>
--------------------------------------------------------------------------------
FUND PERFORMANCE OVERVIEW (UNAUDITED)
--------------------------------------------------------------------------------
FIRST TRUST LONG/SHORT EQUITY ETF (FTLS)
The investment objective of First Trust Long/Short Equity ETF (the "Fund") is to
seek to provide investors with long-term total return. The Fund pursues its
investment objective by establishing long and short positions in a portfolio of
Equity Securities (as defined below). Under normal circumstances, at least 80%
of the Fund's net assets (including investment borrowings) will be exposed to
U.S. exchange-listed equity securities of U.S. and non-U.S. companies by
investing in such securities directly and/or in U.S. exchange-traded funds
("ETFs") that provide exposure to such securities. The securities of the
companies and ETFs in which the Fund will invest are referred to collectively as
"Equity Securities." The Equity Securities held by the Fund may include U.S.
exchange-listed equity securities of non-U.S. issuers, as well as investments in
the equity securities of non-U.S. issuers that are in the form of depositary
receipts.
The Fund takes long and short positions in Equity Securities. As opposed to
taking long positions in which an investor seeks to profit from increases in the
price of a security, short selling is a technique that will be used by the Fund
to try and profit from the falling price of a security. Short selling involves
selling a security that has been borrowed from a third party with the intention
of buying an identical security back at a later date to return to that third
party.
Having both long and short positions in an equity security portfolio is a common
way to create returns that are independent of market moves. One advantage of a
long and short portfolio is that the long and short positions may offset one
another in a manner that results in a lower net exposure to the direction of the
market. In addition, cash balances arising from the use of short selling
typically will be held in money market instruments.
<TABLE>
<CAPTION>
----------------------------------------------------------------------------------------------------------------------------------
PERFORMANCE
----------------------------------------------------------------------------------------------------------------------------------
AVERAGE ANNUAL CUMULATIVE
TOTAL RETURNS TOTAL RETURNS
1 Year Ended Inception (9/8/14) Inception (9/8/14)
10/31/17 to 10/31/17 to 10/31/17
<S> <C> <C> <C>
FUND PERFORMANCE
NAV 17.23% 8.45% 29.07%
Market Price 17.19% 8.46% 29.10%
INDEX PERFORMANCE
S&P 500(R) Index 23.63% 10.62% 37.36%
----------------------------------------------------------------------------------------------------------------------------------
</TABLE>
Total returns for the period since inception are calculated from the inception
date of the Fund. "Average Annual Total Returns" represent the average annual
change in value of an investment over the periods indicated. "Cumulative Total
Returns" represent the total change in value of an investment over the period
indicated.
The Fund's per share net asset value ("NAV") is the value of one share of the
Fund and is computed by dividing the value of all assets of the Fund (including
accrued interest and dividends), less all liabilities (including accrued
expenses and dividends declared but unpaid), by the total number of outstanding
shares. The price used to calculate market return ("Market Price") is determined
by using the midpoint between the highest bid and the lowest offer on the stock
exchange on which shares of the Fund are listed for trading as of the time that
the Fund's NAV is calculated. Since shares of the Fund did not trade in the
secondary market until after its inception, for the period from inception to the
first day of secondary market trading in shares of the Fund, the NAV of the Fund
is used as a proxy for the secondary market trading price to calculate market
returns. NAV and market price returns assume that all distributions have been
reinvested in the Fund at NAV and Market Price, respectively.
An index is a statistical composite that tracks a specified financial market or
sector. Unlike the Fund, the index does not actually hold a portfolio of
securities and therefore does not incur the expenses incurred by the Fund. These
expenses negatively impact the performance of the Fund. Also, market returns do
not include brokerage commissions that may be payable on secondary market
transactions. If brokerage commissions were included, market returns would be
lower. The total returns presented reflect the reinvestment of dividends on
securities in the index. The returns presented do not reflect the deduction of
taxes that a shareholder would pay on Fund distributions or the redemption or
sale of Fund shares. The investment return and principal value of shares of the
Fund will vary with changes in market conditions. Shares of the Fund may be
worth more or less than their original cost when they are redeemed or sold in
the market. The Fund's past performance is no guarantee of future performance.
Page 2
<PAGE>
--------------------------------------------------------------------------------
FUND PERFORMANCE OVERVIEW (UNAUDITED) (CONTINUED)
--------------------------------------------------------------------------------
FIRST TRUST LONG/SHORT EQUITY ETF (FTLS)
-----------------------------------------------------------
% OF
LONG-TERM
PORTFOLIO SECTOR ALLOCATION INVESTMENTS
-----------------------------------------------------------
Financials 17.4%
Information Technology 16.0
Industrials 14.8
Health Care 13.0
Consumer Discretionary 12.1
Consumer Staples 10.5
Energy 6.4
Real Estate 3.5
Telecommunication Services 3.2
Materials 3.1
-------
Total 100.0%
=======
-----------------------------------------------------------
% OF
INVESTMENTS
PORTFOLIO SECTOR ALLOCATION SOLD SHORT
-----------------------------------------------------------
Financials 28.5%
Consumer Discretionary 11.7
Health Care 11.1
Information Technology 10.9
Industrials 10.2
Energy 8.9
Consumer Staples 7.0
Real Estate 5.0
Materials 3.4
Telecommunication Services 3.3
-------
Total 100.0%
=======
-----------------------------------------------------------
TOP TEN LONG-TERM INVESTMENTS % OF NET ASSETS
-----------------------------------------------------------
Apple, Inc. 3.5%
Adobe Systems, Inc. 2.7
Berkshire Hills Bancorp, Inc. 2.6
JPMorgan Chase & Co. 2.5
Boeing (The) Co. 2.5
Capital One Financial Corp. 2.5
Wal-Mart Stores, Inc. 2.5
Visa, Inc., Class A 2.3
Cal-Maine Foods, Inc. 2.2
Equity LifeStyle Properties, Inc. 2.1
-------
Total 25.4%
=======
-----------------------------------------------------------
TOP TEN INVESTMENTS SOLD SHORT % OF NET ASSETS
-----------------------------------------------------------
SPDR S&P 500 ETF Trust -4.8%
Air Products & Chemicals, Inc. -0.4
Ford Motor Co. -0.4
Fulton Financial Corp. -0.4
Occidental Petroleum Corp. -0.4
U.S. Bancorp -0.4
International Business Machines Corp. -0.4
Ironwood Pharmaceuticals, Inc. -0.4
Wesco Aircraft Holdings, Inc. -0.4
Yum! Brands, Inc. -0.4
-------
Total -8.4%
=======
Page 3
<PAGE>
--------------------------------------------------------------------------------
FUND PERFORMANCE OVERVIEW (UNAUDITED) (CONTINUED)
--------------------------------------------------------------------------------
FIRST TRUST LONG/SHORT EQUITY ETF (FTLS)
<TABLE>
<CAPTION>
PERFORMANCE OF A $10,000 INITIAL INVESTMENT
SEPTEMBER 8, 2014 - OCTOBER 31, 2017
First Trust Long/
Short Equity ETF S&P 500 Index
<S> <C> <C>
9/8/14 $10,000 $10,000
10/31/14 10,186 10,105
4/30/15 10,895 10,550
10/31/15 10,960 10,631
4/30/16 10,701 10,676
10/31/16 11,009 11,109
4/30/17 12,086 12,589
10/31/17 12,907 13,735
</TABLE>
Performance figures assume reinvestment of all distributions and do not reflect
the deduction of taxes that a shareholder would pay on Fund distributions or the
redemption or sale of Fund shares. An index is a statistical composite that
tracks a specified financial market or sector. Unlike the Fund, the index does
not actually hold a portfolio of securities and therefore does not incur the
expenses incurred by the Fund. These expenses negatively impact the performance
of the Fund. The Fund's past performance does not predict future performance.
FREQUENCY DISTRIBUTION OF DISCOUNTS AND PREMIUMS
BID/ASK MIDPOINT VS. NAV THROUGH OCTOBER 31, 2017
The following Frequency Distribution of Discounts and Premiums charts are
provided to show the frequency at which the bid/ask midpoint price for the Fund
was at a discount or premium to the daily NAV. The following tables are for
comparative purposes only and represent the period September 9, 2014
(commencement of trading) through October 31, 2017. Shareholders may pay more
than NAV when they buy Fund shares and receive less than NAV when they sell
those shares because shares are bought and sold at current market price. Data
presented represents past performance and cannot be used to predict future
results.
--------------------------------------------------------------------------------
NUMBER OF DAYS BID/ASK MIDPOINT AT/ABOVE NAV
--------------------------------------------------------------------------------
FOR THE PERIOD 0.00%-0.49% 0.50%-0.99% 1.00%-1.99% >=2.00%
9/9/14 - 10/31/14 23 3 0 0
11/1/14 - 10/31/15 190 7 0 1
11/1/15 - 10/31/16 170 0 0 0
11/1/16 - 10/31/17 173 0 0 0
--------------------------------------------------------------------------------
NUMBER OF DAYS BID/ASK MIDPOINT BELOW NAV
--------------------------------------------------------------------------------
FOR THE PERIOD 0.00%-0.49% 0.50%-0.99% 1.00%-1.99% >=2.00%
9/9/14 - 10/31/14 9 4 0 0
11/1/14 - 10/31/15 41 12 0 0
11/1/15 - 10/31/16 81 1 0 0
11/1/16 - 10/31/17 79 0 0 0
Page 4
<PAGE>
--------------------------------------------------------------------------------
PORTFOLIO COMMENTARY
--------------------------------------------------------------------------------
FIRST TRUST LONG/SHORT EQUITY ETF (FTLS)
ANNUAL REPORT
OCTOBER 31, 2017 (UNAUDITED)
INVESTMENT MANAGER
The First Trust Advisors L.P. ("First Trust") Alternatives & Active Management
Team was formed in July of 2011 and is headed by John Gambla, CFA, FRM, PRM and
Rob Guttschow, CFA. Prior to joining First Trust, Messrs. Gambla and Guttschow
were Co-Chief Investment Officers at Nuveen Hyde Park, a quantitative money
manager. The team focuses on systematic and disciplined strategies using a
variety of statistical techniques along with a fundamental overlay based upon
their combined 40+ years of investment experience. Currently the team
manages/consults for a variety of portfolios structured as exchanged-traded
funds and separately managed accounts in the United States.
PORTFOLIO MANAGEMENT TEAM
JOHN GAMBLA - CFA, FRM, PRM, SENIOR PORTFOLIO MANAGER OF FIRST TRUST,
FTA-ALTERNATIVES & ACTIVE MANAGEMENT TEAM
ROB A. GUTTSCHOW - CFA, SENIOR PORTFOLIO MANAGER OF FIRST TRUST,
FTA-ALTERNATIVES & ACTIVE MANAGEMENT TEAM
COMMENTARY
FIRST TRUST LONG/SHORT EQUITY ETF
First Trust Long/Short Equity ETF (the "Fund" or "FTLS") is an actively managed
exchange-traded fund ("ETF"). The Fund's primary investment objective is to seek
to provide investors with long-term total return. The Fund pursues its
investment objective by establishing long and short positions in a portfolio of
equity securities. Under normal circumstances, at least 80% of the Fund's net
assets (including investment borrowings) will be exposed to U.S. exchange-listed
equity securities of U.S. and non-U.S. companies by investing in such securities
directly and/or in U.S. ETFs that provide exposure to such securities.
OVERALL MARKET RECAP
U.S. economic growth remained stuck in the "plow horse economy" as stated by
Brian Wesbury, Chief Economist of First Trust Advisors. For the fiscal period
October 31, 2016 to October 31, 2017, gross domestic product ("GDP") growth
averaged 2.3%, a good uptick from the prior 12-month period of 1.5%, but still
well short of the 3% growth seen in prior recovery periods. The headline U.S.
unemployment rate fell steadily during the period, dropping from 4.8% as of
October 31, 2016 to 4.1% as of October 31, 2017. The total number of non-farm
payroll jobs added to the U.S. economy during the fiscal period, as measured by
the Bureau of Labor Statistics, was approximately 2.0 million.
The steady plow horse performance of the U.S. economy and the decline in the
unemployment rate prompted the Federal Reserve Open Market Committee ("FOMC") to
gradually begin raising interest rates. Short rates increased approximately
0.75% in the fiscal year ended October 31, 2017. For the first time since 2008,
an investor can earn more than 1.0% on an annualized basis by investing in U.S.
3-Month Government Treasury Bills. The FOMC also announced a gradual plan to
reduce the size of their bloated balance sheet, further confirming their view
that the U.S. economy is finally recovering from the Global Financial Crisis of
2008-2009.
The U.S. equity markets posted strong positive performance for the fiscal period
while simultaneously displaying extremely low levels of volatility. Revenue
growth for the S&P 500(R) Index (the "Index" or "Benchmark"), according to
Standard and Poor's, on a year-over-year basis was very strong, with the most
recent year-over-year revenue numbers showing an annual growth rate of 5.7%*.
Revenue growth translated into good earnings growth with Index operating
earnings up by 17.1% for the same year-over-year period. Political risks
abounded during this fiscal period, but did not translate into meaningful
volatility. During this fiscal period, there was only one down month for the
Index, March of 2017. The period ended with the Index up seven months in a row.
FUND PERFORMANCE - FTLS
The Fund returned 17.19% on a market price basis and 17.23% on a net asset value
("NAV") basis for the period from October 31, 2016 through October 31, 2017. The
Benchmark returned 23.63% during the fiscal period.
The Fund's investment process involves constructing both a long and short
portfolio consisting of at least 80% of net assets in U.S. exchange-listed
equity securities of U.S. and non-U.S. companies such as common stocks and ETFs.
The portfolio management team follows a systematic portfolio construction
process designed to balance the drivers of risk and return that exist between
-----------------------------
* Year over year numbers are one year total revenue as of September 17, 2017
versus one year total revenue as of September 17, 2016.
Page 5
<PAGE>
--------------------------------------------------------------------------------
PORTFOLIO COMMENTARY (CONTINUED)
--------------------------------------------------------------------------------
FIRST TRUST LONG/SHORT EQUITY ETF (FTLS)
ANNUAL REPORT
OCTOBER 31, 2017 (UNAUDITED)
the long and short positions. The investment process uses Sabrient/Gradient's
EQR model ranking as an input in determining holdings, both long and short.
Additional proprietary research is used to build the portfolios and to
tactically manage both the overall percentage and composition of the long and
short exposures in the portfolio.
The Fund's net equity exposure varied between 70% and 80% with the long
positions being held at a fully invested position of approximately 98%-100% and
short positions varying between 20% and 30%. During the fiscal period, the
companies held as short positions within the Fund, rose in value substantially
less than the overall market, but, generally speaking, the rising tide of the
market lifted all boats, resulting in the short positions reducing fund
performance. The Fund's long positions, as stand-alone investments, slightly
underperformed the Benchmark with lower average allocations to information
technology and financials hurting performance while overweight's in the consumer
staples and real estate sectors helped performance. Stock selection within the
consumer staples sector was also particularly positive during the fiscal period,
while stock selection within the consumer discretionary hurt overall
performance. Overall, the Fund underperformed the Benchmark but realized returns
and risk commiserate with its overall market exposures of 98%-100% long and 25%
short.
MARKET AND FUND OUTLOOK
Today, we believe the Fund is well positioned to achieve its investment
objectives of seeking to provide investors with long-term total return. The Fund
is invested in a broad array of U.S. equity securities with a net market
exposure of approximately 76% versus its unmanaged Benchmark's exposure of 100%.
We believe the Fund's combination of a broadly diversified portfolio which is
long high-quality stocks and short low-quality stocks, as measured by an
earnings quality model, positions the Fund well to continue to achieve its
investment objective.
Page 6
<PAGE>
FIRST TRUST LONG/SHORT EQUITY ETF (FTLS)
UNDERSTANDING YOUR FUND EXPENSES
OCTOBER 31, 2017 (UNAUDITED)
As a shareholder of First Trust Long/Short Equity ETF (the "Fund") you incur two
types of costs: (1) transaction costs; and (2) ongoing costs, including
management fees, distribution and/or service fees, if any, and other Fund
expenses. This Example is intended to help you understand your ongoing costs of
investing in the Fund and to compare these costs with the ongoing costs of
investing in other funds.
The Example is based on an investment of $1,000 invested at the beginning of the
period and held through the six-month period ended October 31, 2017.
ACTUAL EXPENSES
The first line in the following table provides information about actual account
values and actual expenses. You may use the information in this line, together
with the amount you invested, to estimate the expenses that you paid over the
period. Simply divide your account value by $1,000 (for example, an $8,600
account value divided by $1,000 = 8.6), then multiply the result by the number
in the first line under the heading entitled "Expenses Paid During the Six-Month
Period" to estimate the expenses you paid on your account during this six-month
period.
HYPOTHETICAL EXAMPLE FOR COMPARISON PURPOSES
The second line in the following table provides information about hypothetical
account values and hypothetical expenses based on the Fund's actual expense
ratio and an assumed rate of return of 5% per year before expenses, which is not
the Fund's actual return. The hypothetical account values and expenses may not
be used to estimate the actual ending account balance or expenses you paid for
the period. You may use this information to compare the ongoing costs of
investing in the Fund and other funds. To do so, compare this 5% hypothetical
example with the 5% hypothetical examples that appear in the shareholder reports
of the other funds.
Please note that the expenses shown in the table are meant to highlight your
ongoing costs only and do not reflect any transactional costs such as brokerage
commissions. Therefore, the second line in the table is useful in comparing
ongoing costs only, and will not help you determine the relative total costs of
owning different funds. In addition, if these transactional costs were included,
your costs would have been higher.
<TABLE>
<CAPTION>
----------------------------------------------------------------------------------------------------------------------------
ANNUALIZED EXPENSES PAID
BEGINNING ENDING EXPENSE RATIO DURING THE
ACCOUNT VALUE ACCOUNT VALUE BASED ON THE SIX-MONTH
MAY 1, 2017 OCTOBER 31, 2017 SIX-MONTH PERIOD PERIOD (a)
----------------------------------------------------------------------------------------------------------------------------
FIRST TRUST LONG/SHORT EQUITY ETF
<S> <C> <C> <C> <C>
Actual $1,000.00 $1,067.90 1.52% $7.92
Hypothetical (5% return before expenses) $1,000.00 $1,017.54 1.52% $7.73
</TABLE>
(a) Expenses are equal to the annualized expense ratio as indicated in the
table, multiplied by the average account value over the period (May 1,
2017 through October 31, 2017), and multiplied by 184/365 (to reflect the
one-half year period).
Page 7
<PAGE>
FIRST TRUST LONG/SHORT EQUITY ETF (FTLS)
PORTFOLIO OF INVESTMENTS
OCTOBER 31, 2017
<TABLE>
<CAPTION>
SHARES DESCRIPTION VALUE
------------- ------------------------------------------------------------------------------------------- --------------
<S> <C> <C>
COMMON STOCKS - 85.4%
AEROSPACE & DEFENSE - 3.0%
11,822 Boeing (The) Co. (a)....................................................................... $ 3,049,840
2,242 TransDigm Group, Inc....................................................................... 622,155
--------------
3,671,995
--------------
AIR FREIGHT & LOGISTICS - 0.3%
3,494 United Parcel Service, Inc., Class B....................................................... 410,650
--------------
AIRLINES - 2.8%
4,503 Alaska Air Group, Inc...................................................................... 297,333
3,110 Allegiant Travel Co........................................................................ 424,204
8,555 American Airlines Group, Inc............................................................... 400,545
42,992 Southwest Airlines Co. (a)................................................................. 2,315,549
--------------
3,437,631
--------------
AUTO COMPONENTS - 2.5%
3,824 Cooper-Standard Holdings, Inc (b).......................................................... 426,300
15,337 Delphi Automotive PLC...................................................................... 1,524,191
52,122 Gentex Corp................................................................................ 1,011,688
--------------
2,962,179
--------------
BANKS - 9.1%
81,757 Berkshire Hills Bancorp, Inc............................................................... 3,131,293
41,814 FCB Financial Holdings, Inc., Class A (b).................................................. 1,952,714
59,412 Hilltop Holdings, Inc...................................................................... 1,399,747
30,554 JPMorgan Chase & Co........................................................................ 3,074,038
44,171 People's United Financial, Inc............................................................. 824,231
14,231 ServisFirst Bancshares, Inc................................................................ 583,613
--------------
10,965,636
--------------
BEVERAGES - 0.8%
8,066 Anheuser-Busch InBev S.A./N.V., ADR........................................................ 990,343
--------------
BIOTECHNOLOGY - 4.8%
4,218 Biogen, Inc. (a) (b)....................................................................... 1,314,582
9,658 Esperion Therapeutics, Inc. (b)............................................................ 441,757
8,708 FibroGen, Inc. (b)......................................................................... 486,342
17,471 Gilead Sciences, Inc....................................................................... 1,309,626
4,811 Puma Biotechnology, Inc. (b)............................................................... 612,440
2,964 Shire PLC, ADR............................................................................. 437,575
73,128 Vanda Pharmaceuticals, Inc. (b)............................................................ 1,148,110
--------------
5,750,432
--------------
BUILDING PRODUCTS - 0.3%
4,852 Allegion PLC............................................................................... 404,608
--------------
CHEMICALS - 3.1%
12,910 DowDuPont, Inc............................................................................. 933,522
5,924 Sherwin-Williams (The) Co.................................................................. 2,340,869
6,920 Trinseo S.A................................................................................ 491,320
--------------
3,765,711
--------------
COMMERCIAL SERVICES & SUPPLIES - 0.9%
25,541 Rollins, Inc............................................................................... 1,121,505
--------------
CONSTRUCTION & ENGINEERING - 0.9%
16,163 Argan, Inc................................................................................. 1,111,206
--------------
CONSUMER FINANCE - 2.5%
32,833 Capital One Financial Corp................................................................. 3,026,546
--------------
</TABLE>
Page 8 See Notes to Financial Statements
<PAGE>
FIRST TRUST LONG/SHORT EQUITY ETF (FTLS)
PORTFOLIO OF INVESTMENTS (CONTINUED)
OCTOBER 31, 2017
<TABLE>
<CAPTION>
SHARES DESCRIPTION VALUE
------------- ------------------------------------------------------------------------------------------- --------------
<S> <C> <C>
COMMON STOCKS (CONTINUED)
DIVERSIFIED CONSUMER SERVICES - 0.9%
30,705 Service Corp. International/US............................................................. $ 1,088,799
--------------
DIVERSIFIED TELECOMMUNICATION SERVICES - 1.4%
26,110 AT&T, Inc.................................................................................. 878,601
73,607 Telefonica S.A., ADR....................................................................... 766,249
--------------
1,644,850
--------------
ELECTRICAL EQUIPMENT - 0.6%
3,497 Rockwell Automation, Inc................................................................... 702,268
--------------
FOOD & STAPLES RETAILING - 3.1%
10,572 CVS Health Corp............................................................................ 724,499
34,059 Wal-Mart Stores, Inc....................................................................... 2,973,691
--------------
3,698,190
--------------
FOOD PRODUCTS - 5.8%
58,165 Cal-Maine Foods, Inc. (b).................................................................. 2,617,425
13,479 ConAgra Brands, Inc........................................................................ 460,443
20,234 Hershey (The) Co........................................................................... 2,148,446
17,360 McCormick & Co., Inc....................................................................... 1,727,841
--------------
6,954,155
--------------
HEALTH CARE EQUIPMENT & SUPPLIES - 1.7%
11,734 Danaher Corp............................................................................... 1,082,696
12,531 Medtronic PLC.............................................................................. 1,008,996
--------------
2,091,692
--------------
HEALTH CARE PROVIDERS & SERVICES - 3.0%
10,435 AMN Healthcare Services, Inc. (b).......................................................... 458,097
9,018 Express Scripts Holding Co. (b)............................................................ 552,713
13,011 Laboratory Corp of America Holdings (b).................................................... 1,999,921
3,083 UnitedHealth Group, Inc. (a)............................................................... 648,108
--------------
3,658,839
--------------
HOTELS, RESTAURANTS & LEISURE - 1.0%
8,195 Las Vegas Sands Corp....................................................................... 519,399
3,814 McDonald's Corp............................................................................ 636,595
--------------
1,155,994
--------------
HOUSEHOLD DURABLES - 4.2%
11,664 Lennar Corp., Class A...................................................................... 649,335
487 NVR, Inc. (b).............................................................................. 1,598,027
50,254 PulteGroup, Inc............................................................................ 1,519,178
22,360 Tupperware Brands Corp..................................................................... 1,313,650
--------------
5,080,190
--------------
INDUSTRIAL CONGLOMERATES - 1.5%
7,044 Roper Technologies, Inc.................................................................... 1,818,549
--------------
INTERNET SOFTWARE & SERVICES - 1.3%
8,818 Facebook, Inc., Class A (b)................................................................ 1,587,769
--------------
IT SERVICES - 3.4%
6,381 Accenture PLC, Class A (a)................................................................. 908,399
5,623 Cognizant Technology Solutions Corp., Class A.............................................. 425,493
24,797 Visa, Inc., Class A........................................................................ 2,727,174
--------------
4,061,066
--------------
LEISURE PRODUCTS - 0.3%
6,906 Brunswick Corp............................................................................. 349,789
--------------
</TABLE>
See Notes to Financial Statements Page 9
<PAGE>
FIRST TRUST LONG/SHORT EQUITY ETF (FTLS)
PORTFOLIO OF INVESTMENTS (CONTINUED)
OCTOBER 31, 2017
<TABLE>
<CAPTION>
SHARES DESCRIPTION VALUE
------------- ------------------------------------------------------------------------------------------- --------------
<S> <C> <C>
COMMON STOCKS (CONTINUED)
MACHINERY - 1.9%
36,483 Toro (The) Co. (a)......................................................................... $ 2,292,957
--------------
MEDIA - 0.6%
25,021 Liberty Global PLC, Class A (b)............................................................ 771,898
--------------
MULTILINE RETAIL - 0.8%
9,957 Big Lots, Inc.............................................................................. 510,894
6,898 Target Corp................................................................................ 407,258
--------------
918,152
--------------
OIL, GAS & CONSUMABLE FUELS - 1.8%
52,910 Enbridge Energy Management, LLC (c)........................................................ 761,904
9,422 Exxon Mobil Corp. (a)...................................................................... 785,323
7,284 Valero Energy Corp......................................................................... 574,635
--------------
2,121,862
--------------
PHARMACEUTICALS - 3.4%
2,664 Allergan PLC............................................................................... 472,141
12,924 Catalent, Inc. (b)......................................................................... 550,433
34,192 Merck & Co., Inc. (a)...................................................................... 1,883,637
12,823 Mylan N.V. (b)............................................................................. 457,910
14,137 Novo Nordisk A/S, ADR...................................................................... 703,881
--------------
4,068,002
--------------
PROFESSIONAL SERVICES - 0.4%
4,592 Insperity, Inc............................................................................. 435,781
--------------
SEMICONDUCTORS & SEMICONDUCTOR EQUIPMENT - 0.5%
12,023 Maxim Integrated Products, Inc............................................................. 631,688
--------------
SOFTWARE - 6.1%
18,707 Adobe Systems, Inc. (a) (b)................................................................ 3,276,718
78,598 CA, Inc.................................................................................... 2,545,003
4,342 Electronic Arts, Inc. (b).................................................................. 519,303
10,358 Fortinet, Inc. (b)......................................................................... 408,209
12,673 Oracle Corp................................................................................ 645,056
--------------
7,394,289
--------------
SPECIALTY RETAIL - 1.7%
35,576 Buckle (The), Inc.......................................................................... 585,225
6,834 Home Depot (The), Inc. (a)................................................................. 1,132,940
4,947 Lowe's Cos., Inc........................................................................... 395,513
--------------
2,113,678
--------------
TECHNOLOGY HARDWARE, STORAGE & PERIPHERALS - 4.6%
24,971 Apple, Inc. (a)............................................................................ 4,221,098
43,077 BlackBerry Ltd. (b)........................................................................ 471,262
39,185 HP, Inc. (a)............................................................................... 844,437
--------------
5,536,797
--------------
TOBACCO - 0.7%
13,814 Altria Group, Inc. (a)..................................................................... 887,135
--------------
TRADING COMPANIES & DISTRIBUTORS - 1.5%
21,428 Fastenal Co................................................................................ 1,006,473
5,997 United Rentals, Inc. (b)................................................................... 848,456
--------------
1,854,929
--------------
TRANSPORTATION INFRASTRUCTURE - 0.4%
6,582 Macquarie Infrastructure Corp.............................................................. 457,778
--------------
</TABLE>
Page 10 See Notes to Financial Statements
<PAGE>
FIRST TRUST LONG/SHORT EQUITY ETF (FTLS)
PORTFOLIO OF INVESTMENTS (CONTINUED)
OCTOBER 31, 2017
<TABLE>
<CAPTION>
SHARES/
UNITS DESCRIPTION VALUE
------------- ------------------------------------------------------------------------------------------- --------------
<S> <C> <C>
COMMON STOCKS (CONTINUED)
WIRELESS TELECOMMUNICATION SERVICES - 1.8%
76,715 Vodafone Group PLC, ADR.................................................................... $ 2,223,201
--------------
TOTAL COMMON STOCKS........................................................................ 103,218,739
(Cost $93,199,515) --------------
REAL ESTATE INVESTMENT TRUSTS - 5.3%
EQUITY REAL ESTATE INVESTMENT TRUSTS - 3.5%
29,063 Equity LifeStyle Properties, Inc. (a)...................................................... 2,571,494
34,416 Four Corners Property Trust, Inc........................................................... 849,387
13,806 Hospitality Properties Trust (a)........................................................... 394,575
5,861 Ventas, Inc................................................................................ 367,778
--------------
4,183,234
--------------
MORTGAGE REAL ESTATE INVESTMENT TRUSTS - 1.8%
194,128 Annaly Capital Management, Inc............................................................. 2,224,707
--------------
TOTAL REAL ESTATE INVESTMENT TRUSTS........................................................ 6,407,941
(Cost $5,804,330) --------------
MASTER LIMITED PARTNERSHIPS - 4.6%
OIL, GAS & CONSUMABLE FUELS - 4.6%
55,120 CVR Refining, L.P. (b)..................................................................... 625,612
75,667 Enterprise Products Partners, L.P. (a)..................................................... 1,853,841
26,307 Shell Midstream Partners, L.P.............................................................. 668,461
44,471 TC PipeLines, L.P.......................................................................... 2,369,860
--------------
TOTAL MASTER LIMITED PARTNERSHIPS.......................................................... 5,517,774
(Cost $5,964,826) --------------
EXCHANGE-TRADED FUNDS - 3.8%
CAPITAL MARKETS - 3.8%
12,396 iShares Core S&P Small-Cap ETF (a)......................................................... 927,965
6,193 iShares Russell 2000 ETF (a)............................................................... 924,367
5,128 iShares Russell 2000 Growth ETF (a)........................................................ 931,245
7,395 iShares Russell 2000 Value ETF (a)......................................................... 918,311
6,358 Vanguard Small-Cap ETF (a)................................................................. 912,564
--------------
TOTAL EXCHANGE-TRADED FUNDS................................................................ 4,614,452
(Cost $3,476,957) --------------
TOTAL INVESTMENTS - 99.1%.................................................................. 119,758,906
(Cost $108,445,628) (d) --------------
COMMON STOCKS SOLD SHORT - (17.6%)
AEROSPACE & DEFENSE - (0.5%)
(1,040) Curtiss-Wright Corp........................................................................ (122,980)
(769) United Technologies Corp................................................................... (92,095)
(49,479) Wesco Aircraft Holdings, Inc. (b).......................................................... (447,785)
--------------
(662,860)
--------------
AUTOMOBILES - (0.4%)
(37,704) Ford Motor Co.............................................................................. (462,628)
--------------
BANKS - (1.5%)
(4,598) BB&T Corp.................................................................................. (226,406)
(3,063) Cullen/Frost Bankers, Inc.................................................................. (301,705)
</TABLE>
See Notes to Financial Statements Page 11
<PAGE>
FIRST TRUST LONG/SHORT EQUITY ETF (FTLS)
PORTFOLIO OF INVESTMENTS (CONTINUED)
OCTOBER 31, 2017
<TABLE>
<CAPTION>
SHARES DESCRIPTION VALUE
------------- ------------------------------------------------------------------------------------------- --------------
<S> <C> <C>
COMMON STOCKS SOLD SHORT (CONTINUED)
BANKS (CONTINUED)
(25,308) Fulton Financial Corp...................................................................... $ (460,606)
(8,395) U.S. Bancorp............................................................................... (456,520)
(7,670) Wells Fargo & Co........................................................................... (430,594)
--------------
(1,875,831)
--------------
BEVERAGES - (0.3%)
(3,500) PepsiCo, Inc............................................................................... (385,805)
--------------
BIOTECHNOLOGY - (1.3%)
(8,552) Alkermes PLC (b)........................................................................... (416,996)
(1,072) BioMarin Pharmaceutical, Inc. (b).......................................................... (88,000)
(7,428) Coherus Biosciences, Inc. (b).............................................................. (83,565)
(8,634) Insmed, Inc. (b)........................................................................... (233,204)
(29,447) Ironwood Pharmaceuticals, Inc. (b)......................................................... (452,895)
(5,372) MacroGenics, Inc. (b)...................................................................... (106,312)
(1,158) Spark Therapeutics, Inc. (b)............................................................... (93,682)
(4,310) Xencor, Inc. (b)........................................................................... (85,252)
--------------
(1,559,906)
--------------
BUILDING PRODUCTS - (0.3%)
(8,244) Johnson Controls International PLC......................................................... (341,219)
--------------
CAPITAL MARKETS - (0.1%)
(3,246) Thomson Reuters Corp....................................................................... (152,043)
--------------
CHEMICALS - (0.6%)
(2,942) Air Products & Chemicals, Inc.............................................................. (469,043)
(1,456) Ashland Global Holdings, Inc............................................................... (98,979)
(7,609) Calgon Carbon Corp......................................................................... (165,115)
--------------
(733,137)
--------------
COMMUNICATIONS EQUIPMENT - (0.7%)
(49,763) Infinera Corp. (b)......................................................................... (416,516)
(2,199) Palo Alto Networks, Inc. (b)............................................................... (323,693)
(1,462) ViaSat, Inc. (b)........................................................................... (95,176)
--------------
(835,385)
--------------
CONSTRUCTION & ENGINEERING - (0.3%)
(5,071) Jacobs Engineering Group, Inc.............................................................. (295,183)
(5,891) KBR, Inc................................................................................... (115,640)
--------------
(410,823)
--------------
CONSUMER FINANCE - (0.1%)
(1,479) Discover Financial Services................................................................ (98,398)
--------------
DISTRIBUTORS - (0.3%)
(3,874) Genuine Parts Co........................................................................... (341,803)
--------------
DIVERSIFIED TELECOMMUNICATION SERVICES - (0.4%)
(6,567) ATN International, Inc..................................................................... (356,523)
(2,307) Verizon Communications, Inc................................................................ (110,436)
--------------
(466,959)
--------------
ELECTRICAL EQUIPMENT - (0.3%)
(5,586) Emerson Electric Co........................................................................ (360,074)
--------------
ELECTRONIC EQUIPMENT, INSTRUMENTS & COMPONENTS - (0.1%)
(2,468) Avnet, Inc................................................................................. (98,226)
--------------
</TABLE>
Page 12 See Notes to Financial Statements
<PAGE>
FIRST TRUST LONG/SHORT EQUITY ETF (FTLS)
PORTFOLIO OF INVESTMENTS (CONTINUED)
OCTOBER 31, 2017
<TABLE>
<CAPTION>
SHARES DESCRIPTION VALUE
------------- ------------------------------------------------------------------------------------------- --------------
<S> <C> <C>
COMMON STOCKS SOLD SHORT (CONTINUED)
ENERGY EQUIPMENT & SERVICES - (0.8%)
(9,243) Halliburton Co............................................................................. $ (395,046)
(6,532) Schlumberger, Ltd.......................................................................... (418,048)
(15,132) Superior Energy Services, Inc. (b)......................................................... (133,464)
--------------
(946,558)
--------------
FOOD & STAPLES RETAILING - (0.1%)
(8,615) Kroger (The) Co............................................................................ (178,330)
--------------
FOOD PRODUCTS - (0.9%)
(6,054) Kellogg Co................................................................................. (378,557)
(4,861) Kraft Heinz (The) Co....................................................................... (375,901)
(9,723) Mondelez International, Inc., Class A...................................................... (402,824)
--------------
(1,157,282)
--------------
HEALTH CARE EQUIPMENT & SUPPLIES - (0.9%)
(6,263) Abbott Laboratories........................................................................ (339,642)
(5,082) DENTSPLY SIRONA, Inc....................................................................... (310,358)
(4,413) Insulet Corp. (b).......................................................................... (259,529)
(1,995) Nevro Corp. (b)............................................................................ (174,722)
--------------
(1,084,251)
--------------
HOTELS, RESTAURANTS & LEISURE - (0.6%)
(5,614) Starbucks Corp............................................................................. (307,872)
(5,805) Yum! Brands, Inc........................................................................... (432,182)
--------------
(740,054)
--------------
INDUSTRIAL CONGLOMERATES - (0.3%)
(16,041) General Electric Co........................................................................ (323,387)
--------------
INTERNET & DIRECT MARKETING RETAIL - 0.0%
(40) Amazon.com, Inc. (b)....................................................................... (44,211)
--------------
INTERNET SOFTWARE & SERVICES - (0.5%)
(4,343) Akamai Technologies, Inc. (b).............................................................. (226,922)
(12,295) Hortonworks, Inc. (b)...................................................................... (202,990)
(3,899) Instructure, Inc. (b)...................................................................... (135,685)
--------------
(565,597)
--------------
IT SERVICES - (0.6%)
(1,456) Amdocs Ltd................................................................................. (94,786)
(1,044) FleetCor Technologies, Inc. (b)............................................................ (172,542)
(2,940) International Business Machines Corp....................................................... (452,936)
--------------
(720,264)
--------------
LEISURE PRODUCTS - (0.3%)
(22,543) Mattel, Inc................................................................................ (318,307)
--------------
MACHINERY - (0.5%)
(2,845) Navistar International Corp. (b)........................................................... (120,372)
(4,634) PACCAR, Inc................................................................................ (332,397)
(1,993) Wabtec Corp................................................................................ (152,464)
--------------
(605,233)
--------------
MEDIA - (1.0%)
(20,579) AMC Entertainment Holdings, Inc., Class A.................................................. (286,048)
(4,265) Liberty Broadband Corp., Class A (b)....................................................... (367,686)
(14,839) Time, Inc.................................................................................. (172,132)
(3,428) Walt Disney (The) Co....................................................................... (335,293)
--------------
(1,161,159)
--------------
</TABLE>
See Notes to Financial Statements Page 13
<PAGE>
FIRST TRUST LONG/SHORT EQUITY ETF (FTLS)
PORTFOLIO OF INVESTMENTS (CONTINUED)
OCTOBER 31, 2017
<TABLE>
<CAPTION>
SHARES DESCRIPTION VALUE
------------- ------------------------------------------------------------------------------------------- --------------
<S> <C> <C>
COMMON STOCKS SOLD SHORT (CONTINUED)
METALS & MINING - (0.2%)
(2,604) Carpenter Technology Corp.................................................................. $ (129,653)
(8,015) Freeport-McMoRan, Inc. (b)................................................................. (112,050)
--------------
(241,703)
--------------
OIL, GAS & CONSUMABLE FUELS - (1.3%)
(917) Cimarex Energy Co.......................................................................... (107,225)
(18,746) Gulfport Energy Corp. (b).................................................................. (256,820)
(3,416) Newfield Exploration Co. (b)............................................................... (105,179)
(7,098) Occidental Petroleum Corp.................................................................. (458,318)
(3,187) Phillips 66................................................................................ (290,272)
(815) Pioneer Natural Resources Co............................................................... (121,981)
(12,068) QEP Resources, Inc. (b).................................................................... (108,008)
(6,775) Ring Energy, Inc. (b)...................................................................... (86,788)
(12,505) Sanchez Energy Corp. (b)................................................................... (54,147)
--------------
(1,588,738)
--------------
PERSONAL PRODUCTS - (0.2%)
(4,151) Edgewell Personal Care Co. (b)............................................................. (269,524)
--------------
PHARMACEUTICALS - (0.4%)
(2,681) Eli Lilly & Co............................................................................. (219,681)
(3,693) Medicines (The) Co. (b).................................................................... (106,137)
(2,694) Pfizer, Inc................................................................................ (94,452)
(3,246) Theravance Biopharma, Inc. (b)............................................................. (93,679)
--------------
(513,949)
--------------
ROAD & RAIL - (0.2%)
(4,631) Avis Budget Group, Inc. (b)................................................................ (191,029)
--------------
SEMICONDUCTORS & SEMICONDUCTOR EQUIPMENT - (0.5%)
(11,261) PDF Solutions, Inc. (b).................................................................... (164,974)
(21,817) Veeco Instruments, Inc. (b)................................................................ (393,797)
--------------
(558,771)
--------------
SOFTWARE - (0.3%)
(2,768) Microsoft Corp............................................................................. (230,242)
(500) Ultimate Software Group, Inc. (b).......................................................... (101,295)
--------------
(331,537)
--------------
SPECIALTY RETAIL - (0.2%)
(285) AutoZone, Inc. (b)......................................................................... (168,007)
(444) O'Reilly Automotive, Inc. (b).............................................................. (93,662)
--------------
(261,669)
--------------
THRIFTS & MORTGAGE FINANCE - (0.2%)
(16,298) New York Community Bancorp, Inc............................................................ (204,703)
--------------
WIRELESS TELECOMMUNICATION SERVICES - (0.4%)
(8,285) Telephone & Data Systems, Inc.............................................................. (241,508)
(6,002) United States Cellular Corp. (b)........................................................... (219,613)
--------------
(461,121)
--------------
TOTAL COMMON STOCKS SOLD SHORT............................................................. (21,252,474)
(Cost $(21,296,981)) --------------
</TABLE>
Page 14 See Notes to Financial Statements
<PAGE>
FIRST TRUST LONG/SHORT EQUITY ETF (FTLS)
PORTFOLIO OF INVESTMENTS (CONTINUED)
OCTOBER 31, 2017
<TABLE>
<CAPTION>
SHARES DESCRIPTION VALUE
------------- ------------------------------------------------------------------------------------------- --------------
<S> <C> <C>
REAL ESTATE INVESTMENT TRUSTS SOLD SHORT - (1.2%)
EQUITY REAL ESTATE INVESTMENT TRUSTS - (1.2%)
(4,826) Alexander & Baldwin, Inc................................................................... $ (218,328)
(3,960) Acadia Realty Trust........................................................................ (111,474)
(3,612) Urban Edge Properties...................................................................... (84,738)
(410) Essex Property Trust, Inc.................................................................. (107,596)
(10,412) Retail Properties of America, Inc., Class A................................................ (127,235)
(987) SL Green Realty Corp....................................................................... (94,436)
(2,832) Realty Income Corp......................................................................... (151,993)
(12,663) STORE Capital Corp......................................................................... (312,650)
(2,856) Kilroy Realty Corp......................................................................... (203,433)
--------------
TOTAL REAL ESTATE INVESTMENT TRUSTS SOLD SHORT............................................. (1,411,883)
(Cost $(1,395,596)) --------------
EXCHANGE-TRADED FUNDS SOLD SHORT - (4.8%)
CAPITAL MARKETS - (4.8%)
(22,454) SPDR S&P 500 ETF Trust..................................................................... (5,774,046)
(Cost $(5,402,122)) --------------
TOTAL INVESTMENTS SOLD SHORT - (23.6%)..................................................... (28,438,403)
(Proceeds $28,094,699)
NET OTHER ASSETS AND LIABILITIES - 24.5%................................................... 29,571,709
--------------
NET ASSETS - 100.0%........................................................................ $ 120,892,212
==============
</TABLE>
-----------------------------
(a) All or a portion of this security serves as collateral for the investments
sold short.
(b) Non-income producing security.
(c) Non-income producing security which makes in-kind distributions. For the
fiscal year ended October 31, 2017, the Fund received 1,042 shares of
Enbridge Energy Management, LLC.
(d) Aggregate cost for federal income tax purposes is $80,450,171. As of
October 31, 2017, the aggregate grossly unrealized appreciation for all
investments in which there was an excess of value over tax cost was
$15,082,022 and the aggregate gross unrealized depreciation for all
investments in which there was an excess of tax cost over value was
$4,211,690. The net unrealized appreciation was $10,870,332. The amounts
presented are inclusive of investments sold short.
ADR American Depositary Receipt
See Notes to Financial Statements Page 15
<PAGE>
FIRST TRUST LONG/SHORT EQUITY ETF (FTLS)
PORTFOLIO OF INVESTMENTS (CONTINUED)
OCTOBER 31, 2017
-----------------------------
VALUATION INPUTS
A summary of the inputs used to value the Fund's investments as of October 31,
2017 is as follows (see Note 2A - Portfolio Valuation in the Notes to Financial
Statements):
<TABLE>
<CAPTION>
ASSETS TABLE
LEVEL 2 LEVEL 3
TOTAL LEVEL 1 SIGNIFICANT SIGNIFICANT
VALUE AT QUOTED OBSERVABLE UNOBSERVABLE
10/31/2017 PRICES INPUTS INPUTS
------------- ------------- -------------- --------------
<S> <C> <C> <C> <C>
Common Stocks*..................................... $ 103,218,739 $ 103,218,739 $ -- $ --
Real Estate Investment Trusts*..................... 6,407,941 6,407,941 -- --
Master Limited Partnerships*....................... 5,517,774 5,517,774 -- --
Exchange-Traded Funds*............................. 4,614,452 4,614,452 -- --
------------- ------------- -------------- --------------
Total Investments.................................. $ 119,758,906 $ 119,758,906 $ -- $ --
============= ============= ============== ==============
LIABILITIES TABLE
LEVEL 2 LEVEL 3
TOTAL LEVEL 1 SIGNIFICANT SIGNIFICANT
VALUE AT QUOTED OBSERVABLE UNOBSERVABLE
10/31/2017 PRICES INPUTS INPUTS
------------- ------------- -------------- --------------
Common Stocks Sold Short*.......................... $ (21,252,474) $ (21,252,474) $ -- $ --
Real Estate Investment Trusts Sold Short*.......... (1,411,883) (1,411,883) -- --
Exchange-Traded Funds Sold Short*.................. (5,774,046) (5,774,046) -- --
------------- ------------- -------------- --------------
Total Investments Sold Short....................... $ (28,438,403) $ (28,438,403) $ -- $ --
============= ============= ============== ==============
* See Portfolio of Investments for industry breakout.
All transfers in and out of the Levels during the period are assumed to occur on the last day of the period at their
current value. There were no transfers between Levels at October 31, 2017.
</TABLE>
Page 16 See Notes to Financial Statements
<PAGE>
FIRST TRUST LONG/SHORT EQUITY ETF (FTLS)
STATEMENT OF ASSETS AND LIABILITIES
OCTOBER 31, 2017
<TABLE>
<CAPTION>
ASSETS:
<S> <C>
Investments, at value (Cost $108,445,628).................................. $ 119,758,906
Cash....................................................................... 9,940,240
Restricted Cash............................................................ 19,627,488
Receivables:
Dividends............................................................... 52,508
Dividend reclaims....................................................... 4,546
Miscellaneous receivable................................................ 42,011
--------------
Total Assets............................................................ 149,425,699
--------------
LIABILITIES:
Investments sold short, at value (proceeds $28,094,699).................... 28,438,403
Payables:
Investment advisory fees................................................ 94,484
Dividends payable on investments sold short............................. 600
--------------
Total Liabilities....................................................... 28,533,487
--------------
NET ASSETS................................................................. $ 120,892,212
==============
NET ASSETS CONSIST OF:
Paid-in capital............................................................ $ 121,672,972
Par value.................................................................. 32,000
Accumulated net investment income (loss)................................... 146,880
Accumulated net realized gain (loss) on investments and
investments sold short.................................................. (11,929,214)
Net unrealized appreciation (depreciation) on investments and
investments sold short.................................................. 10,969,574
--------------
NET ASSETS................................................................. $ 120,892,212
==============
NET ASSET VALUE, per share................................................. $ 37.78
==============
Number of shares outstanding (unlimited number of shares authorized,
par value $0.01 per share).............................................. 3,200,002
==============
</TABLE>
See Notes to Financial Statements Page 17
<PAGE>
FIRST TRUST LONG/SHORT EQUITY ETF (FTLS)
STATEMENT OF OPERATIONS
FOR THE YEAR ENDED OCTOBER 31, 2017
<TABLE>
<CAPTION>
INVESTMENT INCOME:
<S> <C>
Dividends.................................................................. $ 2,337,834
Interest................................................................... 165,926
Foreign tax withholding.................................................... (7,409)
--------------
Total investment income................................................. 2,496,351
--------------
EXPENSES:
Investment advisory fees................................................... 1,111,867
Dividend expense on investments sold short................................. 477,368
Margin interest expense.................................................... 102,760
Short sale fees............................................................ 25,889
--------------
Total expenses.......................................................... 1,717,884
--------------
NET INVESTMENT INCOME (LOSS)............................................... 778,467
--------------
NET REALIZED AND UNREALIZED GAIN (LOSS):
Net realized gain (loss) on:
Investments............................................................. 633,347
In-kind redemptions..................................................... 11,928,813
Investments sold short.................................................. (2,017,727)
--------------
Net realized gain (loss)................................................... 10,544,433
--------------
Net change in unrealized appreciation (depreciation) on:
Investments............................................................. 8,048,073
Investments sold short.................................................. (1,116,193)
--------------
Net change in unrealized appreciation (depreciation) ...................... 6,931,880
--------------
NET REALIZED AND UNREALIZED GAIN (LOSS).................................... 17,476,313
--------------
NET INCREASE (DECREASE) IN NET ASSETS RESULTING
FROM OPERATIONS......................................................... $ 18,254,780
==============
</TABLE>
Page 18 See Notes to Financial Statements
<PAGE>
FIRST TRUST LONG/SHORT EQUITY ETF (FTLS)
STATEMENTS OF CHANGES IN NET ASSETS
<TABLE>
<CAPTION>
YEAR YEAR
ENDED ENDED
10/31/2017 10/31/2016
-------------- --------------
<S> <C> <C>
OPERATIONS:
Net investment income (loss)............................................... $ 778,467 $ 1,031,087
Net realized gain (loss)................................................... 10,544,433 (2,055,036)
Net change in unrealized appreciation (depreciation)....................... 6,931,880 3,446,835
-------------- --------------
Net increase (decrease) in net assets resulting from operations............ 18,254,780 2,422,886
-------------- --------------
DISTRIBUTIONS TO SHAREHOLDERS FROM:
Net investment income...................................................... (967,786) (859,016)
-------------- --------------
SHAREHOLDER TRANSACTIONS:
Proceeds from shares sold.................................................. 77,355,076 160,917,356
Cost of shares redeemed.................................................... (93,981,069) (74,857,579)
-------------- --------------
Net increase (decrease) in net assets resulting from shareholder
transactions ........................................................... (16,625,993) 86,059,777
-------------- --------------
Total increase (decrease) in net assets.................................... 661,001 87,623,647
NET ASSETS:
Beginning of period........................................................ 120,231,211 32,607,564
-------------- --------------
End of period.............................................................. $ 120,892,212 $ 120,231,211
============== ==============
Accumulated net investment income (loss) at end of period................. $ 146,880 $ 225,271
============== ==============
CHANGES IN SHARES OUTSTANDING:
Shares outstanding, beginning of period.................................... 3,700,002 1,000,002
Shares sold................................................................ 2,200,000 5,000,000
Shares redeemed............................................................ (2,700,000) (2,300,000)
-------------- --------------
Shares outstanding, end of period.......................................... 3,200,002 3,700,002
============== ==============
</TABLE>
See Notes to Financial Statements Page 19
<PAGE>
FIRST TRUST LONG/SHORT EQUITY ETF (FTLS)
FINANCIAL HIGHLIGHTS
FOR A SHARE OUTSTANDING THROUGHOUT EACH PERIOD
<TABLE>
<CAPTION>
YEAR ENDED OCTOBER 31,
------------------------------------------------ PERIOD ENDED
2017 2016 2015 10/31/2014 (a)
-------------- -------------- -------------- --------------
<S> <C> <C> <C> <C>
Net asset value, beginning of period............ $ 32.49 $ 32.61 $ 30.54 $ 30.00
---------- ---------- ---------- ----------
INCOME FROM INVESTMENT OPERATIONS:
Net investment income (loss).................... 0.24 0.32 0.19 0.05
Net realized and unrealized gain (loss)......... 5.34 (0.17) 2.12 0.51
---------- ---------- ---------- ----------
Total from investment operations................ 5.58 0.15 2.31 0.56
---------- ---------- ---------- ----------
DISTRIBUTIONS PAID TO SHAREHOLDERS FROM:
Net investment income........................... (0.29) (0.27) (0.22) (0.02)
Net realized gain............................... -- -- (0.02) --
---------- ---------- ---------- ----------
Total distributions............................. (0.29) (0.27) (0.24) (0.02)
---------- ---------- ---------- ----------
Net asset value, end of period.................. $ 37.78 $ 32.49 $ 32.61 $ 30.54
========== ========== ========== ==========
TOTAL RETURN (b)................................ 17.23% 0.45% 7.60% 1.86%
RATIOS/SUPPLEMENTAL DATA:
Net assets, end of period (in 000's)............ $ 120,892 $ 120,231 $ 32,608 $ 3,054
RATIOS TO AVERAGE NET ASSETS:
Ratio of total expenses to average net assets... 1.47% 1.40% 1.47% 1.17% (c)
Ratio of total expenses to average net assets...
excluding dividend expense, margin interest
expense and short sale fees.................. 0.95% 0.95% 0.95% 0.95% (c)
Ratio of net investment income (loss) to average
net assets................................... 0.67% 1.00% 0.39% 1.08% (c)
Portfolio turnover rate (d)..................... 176% 201% 267% 1%
</TABLE>
(a) Inception date is September 8, 2014, which is consistent with the
commencement of investment operations and is the date the initial creation
units were established.
(b) Total return is calculated assuming an initial investment made at the net
asset value at the beginning of the period, reinvestment of all
distributions at net asset value during the period, and redemption at net
asset value on the last day of the period. The returns presented do not
reflect the deduction of taxes that a shareholder would pay on Fund
distributions or the redemption or sale of Fund shares. Total return is
calculated for the time period presented and is not annualized for periods
of less than a year.
(c) Annualized.
(d) Portfolio turnover is calculated for the time period presented and is not
annualized for periods of less than a year and does not include securities
received or delivered from processing creations or redemptions and in-kind
transactions.
Page 20 See Notes to Financial Statements
<PAGE>
--------------------------------------------------------------------------------
NOTES TO FINANCIAL STATEMENTS
--------------------------------------------------------------------------------
FIRST TRUST LONG/SHORT EQUITY ETF (FTLS)
OCTOBER 31, 2017
1. ORGANIZATION
First Trust Exchange-Traded Fund III (the "Trust") is an open-end management
investment company organized as a Massachusetts business trust on January 9,
2008, and is registered with the Securities and Exchange Commission ("SEC")
under the Investment Company Act of 1940, as amended (the "1940 Act").
The Trust currently consists of twelve exchange-traded funds that are offering
shares. This report covers First Trust Long/Short Equity ETF (the "Fund"), a
non-diversified series of the Trust, which trades under the ticker "FTLS" on the
NYSE Arca, Inc. Unlike conventional mutual funds, the Fund issues and redeems
shares on a continuous basis, at net asset value ("NAV"), only in large
specified blocks consisting of 50,000 shares called a "Creation Unit." Creation
Units are issued and redeemed in-kind for securities in which the Fund invests
or for cash or, in certain circumstances, a combination of both. Except when
aggregated in Creation Units, the shares are not redeemable securities of the
Fund.
The investment objective of the Fund is to seek to provide investors with
long-term total return. The Fund pursues its investment objective by
establishing long and short positions in a portfolio of equity securities. Under
normal circumstances, at least 80% of the Fund's net assets (including
investment borrowings) will be exposed to U.S. exchange-listed equity securities
of U.S. and non-U.S. companies by investing in such securities directly and/or
in U.S. exchange-traded funds ("ETFs") that provide exposure to such securities.
The equity securities held by the Fund may include U.S. exchange-listed equity
securities of non-U.S. issuers, as well as investments in the equity securities
of non-U.S. issuers that are in the form of depositary receipts. There can be no
assurance that the Fund will achieve its investment objective. The Fund may not
be appropriate for all investors.
2. SIGNIFICANT ACCOUNTING POLICIES
The Fund is considered an investment company and follows accounting and
reporting guidance under Financial Accounting Standards Board ("FASB")
Accounting Standards Codification ("ASC") Topic 946, "Financial
Services-Investment Companies." The following is a summary of significant
accounting policies consistently followed by the Fund in the preparation of the
financial statements. The preparation of the financial statements in accordance
with accounting principles generally accepted in the United States of America
("U.S. GAAP") requires management to make estimates and assumptions that affect
the reported amounts and disclosures in the financial statements. Actual results
could differ from those estimates.
A. PORTFOLIO VALUATION
The Fund's NAV is determined daily as of the close of regular trading on the New
York Stock Exchange ("NYSE"), normally 4:00 p.m. Eastern time, on each day the
NYSE is open for trading. If the NYSE closes early on a valuation day, the NAV
is determined as of that time. Domestic debt securities and foreign securities
are priced using data reflecting the earlier closing of the principal markets
for those securities. The Fund's NAV is calculated by dividing the value of all
assets of the Fund (including accrued interest and dividends), less all
liabilities (including accrued expenses and dividends declared but unpaid), by
the total number of shares outstanding.
The Fund's investments are valued daily at market value or, in the absence of
market value with respect to any portfolio securities, at fair value. Market
value prices represent last sale or official closing prices from a national or
foreign exchange (i.e., a regulated market) and are primarily obtained from
third-party pricing services. Fair value prices represent any prices not
considered market value prices and are either obtained from a third-party
pricing service or are determined by the Pricing Committee of the Fund's
investment advisor, First Trust Advisors L.P. ("First Trust" or the "Advisor"),
in accordance with valuation procedures adopted by the Trust's Board of
Trustees, and in accordance with provisions of the 1940 Act. Investments valued
by the Advisor's Pricing Committee, if any, are footnoted as such in the
footnotes to the Portfolio of Investments. The Fund's investments are valued as
follows:
Common stocks, master limited partnerships ("MLPs"), real estate
investment trusts ("REITs") and other equity securities listed on any
national or foreign exchange (excluding The Nasdaq Stock Market LLC
("Nasdaq") and the London Stock Exchange Alternative Investment Market
("AIM")) are valued at the last sale price on the exchange on which they
are principally traded or, for Nasdaq and AIM securities, the official
closing price. Securities traded on more than one securities exchange are
valued at the last sale price or official closing price, as applicable, at
the close of the securities exchange representing the principal market for
such securities.
Securities traded in an over-the-counter market are fair valued at the
mean of their most recent bid and asked price, if available, and otherwise
at their closing bid price.
Certain securities may not be able to be priced by pre-established pricing
methods. Such securities may be valued by the Trust's Board of Trustees or its
delegate, the Advisor's Pricing Committee, at fair value. These securities
generally include, but are not limited to, restricted securities (securities
which may not be publicly sold without registration under the Securities Act of
Page 21
<PAGE>
--------------------------------------------------------------------------------
NOTES TO FINANCIAL STATEMENTS (CONTINUED)
--------------------------------------------------------------------------------
FIRST TRUST LONG/SHORT EQUITY ETF (FTLS)
OCTOBER 31, 2017
1933, as amended), for which a third-party pricing service is unable to provide
a market price; securities whose trading has been formally suspended; a security
whose market or fair value price is not available from a pre-established pricing
source; a security with respect to which an event has occurred that is likely to
materially affect the value of the security after the market has closed but
before the calculation of the Fund's NAV or make it difficult or impossible to
obtain a reliable market quotation; and a security whose price, as provided by
the third-party pricing service, does not reflect the security's fair value. As
a general principle, the current fair value of a security would appear to be the
amount which the owner might reasonably expect to receive for the security upon
its current sale. When fair value prices are used, generally they will differ
from market quotations or official closing prices on the applicable exchanges. A
variety of factors may be considered in determining the fair value of such
securities, including, but not limited to, the following:
1) the type of security;
2) the size of the holding;
3) the initial cost of the security;
4) transactions in comparable securities;
5) price quotes from dealers and/or third-party pricing services;
6) relationships among various securities;
7) information obtained by contacting the issuer, analysts, or the
appropriate stock exchange;
8) an analysis of the issuer's financial statements; and
9) the existence of merger proposals or tender offers that might affect
the value of the security.
The Fund is subject to fair value accounting standards that define fair value,
establish the framework for measuring fair value and provide a three-level
hierarchy for fair valuation based upon the inputs to the valuation as of the
measurement date. The three levels of the fair value hierarchy are as follows:
o Level 1 - Level 1 inputs are quoted prices in active markets for
identical investments. An active market is a market in which
transactions for the investment occur with sufficient frequency and
volume to provide pricing information on an ongoing basis.
o Level 2 - Level 2 inputs are observable inputs, either directly or
indirectly, and include the following:
o Quoted prices for similar investments in active markets.
o Quoted prices for identical or similar investments in markets
that are non-active. A non-active market is a market where
there are few transactions for the investment, the prices are
not current, or price quotations vary substantially either
over time or among market makers, or in which little
information is released publicly.
o Inputs other than quoted prices that are observable for the
investment (for example, interest rates and yield curves
observable at commonly quoted intervals, volatilities,
prepayment speeds, loss severities, credit risks, and default
rates).
o Inputs that are derived principally from or corroborated by
observable market data by correlation or other means.
o Level 3 - Level 3 inputs are unobservable inputs. Unobservable
inputs may reflect the reporting entity's own assumptions about the
assumptions that market participants would use in pricing the
investment.
The inputs or methodologies used for valuing investments are not necessarily an
indication of the risk associated with investing in those investments. A summary
of the inputs used to value the Fund's investments as of October 31, 2017, is
included with the Fund's Portfolio of Investments.
B. SECURITIES TRANSACTIONS AND INVESTMENT INCOME
Securities transactions are recorded as of the trade date. Realized gains and
losses from securities transactions are recorded on the identified cost basis.
Dividend income is recorded on the ex-dividend date. Interest income, if any, is
recorded on the accrual basis.
Distributions received from the Fund's investments in REITs may be comprised of
return of capital, capital gains and income. The actual character of the amounts
received during the year are not known until after the REIT's fiscal year end.
The Fund records the character of distributions received from the REITs during
the year based on estimates available. The characterization of distributions
received by the Fund may be subsequently revised based on information received
from the REITs after their tax reporting periods conclude.
Distributions received from the Fund's investments in MLPs generally are
comprised of return of capital and investment income. The Fund records estimated
return of capital and investment income based on historical information
available from each MLP. These estimates may subsequently be revised based on
information received from the MLPs after their tax reporting periods are
concluded.
Page 22
<PAGE>
--------------------------------------------------------------------------------
NOTES TO FINANCIAL STATEMENTS (CONTINUED)
--------------------------------------------------------------------------------
FIRST TRUST LONG/SHORT EQUITY ETF (FTLS)
OCTOBER 31, 2017
C. SHORT SALES
Short sales are utilized for investment and risk management purposes and are
transactions in which securities or other instruments (such as options,
forwards, futures or other derivative contracts) are sold that are not currently
owned in the Fund's portfolio. When the Fund engages in a short sale, the Fund
must borrow the security sold short and deliver the security to the
counterparty. Short selling allows the Fund to profit from a decline in a market
price to the extent such decline exceeds the transaction costs and the costs of
borrowing the securities. The Fund will pay a fee or premium to borrow the
securities sold short and is obligated to repay the lenders of the securities.
Any dividends or interest that accrues on the securities during the period of
the loan are due to the lenders. A gain, limited to the price at which the
security was sold short, or a loss, unlimited in size, will be recognized upon
the termination of the short sale; which is effected by the Fund purchasing the
security sold short in the market and delivering the security to the lender. Any
such gain or loss may be offset, completely or in part, by the change in the
value of the long portion of the Fund's portfolio. The Fund is subject to the
risk that it may be unable to reacquire a security to terminate a short position
except at a price substantially in excess of the last quoted price. Also, there
is the risk that the counterparty to a short sale may fail to honor its
contractual terms, causing a loss to the Fund. The Fund has established an
account with Pershing, LLC for the purpose of borrowing securities that the Fund
intends to sell short. The fees that the Fund pays for borrowing such securities
are presented separately as "Short sale fees" on the Statement of Operations.
Restricted cash in the amount of $19,627,488, as shown on the Statement of
Assets and Liabilities, is associated with collateral at the broker as of
October 31, 2017.
D. DIVIDENDS AND DISTRIBUTIONS TO SHAREHOLDERS
Dividends from net investment income, if any, are declared and paid quarterly,
or as the Board of Trustees may determine from time to time. Distributions of
net realized capital gains earned by the Fund, if any, will be distributed at
least annually.
Distributions from income and capital gains are determined in accordance with
income tax regulations, which may differ from U.S. GAAP. Certain capital
accounts in the financial statements are periodically adjusted for permanent
differences in order to reflect their tax character. These permanent differences
are primarily due to the varying treatment of income and gain/loss on portfolio
securities held by the Fund and have no impact on net assets or net asset value
per share. Temporary differences, which arise from recognizing certain items of
income, expense and gain/loss in different periods for financial statement and
tax purposes, will reverse at some time in the future.
The tax character of distributions paid during the fiscal years ended October
31, 2017 and October 31, 2016 was as follows:
Distributions paid from: 2017 2016
Ordinary income................................... $ 967,786 $ 859,016
As of October 31, 2017, the components of distributable earnings on a tax basis
to the Fund were as follows:
Undistributed ordinary income..................... $ 106,935
Accumulated capital and other losses.............. (11,790,027)
Net unrealized appreciation (depreciation)........ 10,870,332
E. INCOME TAXES
The Fund intends to continue to qualify as a regulated investment company by
complying with the requirements under Subchapter M of the Internal Revenue Code
of 1986, as amended, which includes distributing substantially all of its net
investment income and net realized gains to shareholders. Accordingly, no
provision has been made for federal and state income taxes. However, due to the
timing and amount of distributions, the Fund may be subject to an excise tax of
4% of the amount by which approximately 98% of the Fund's taxable income exceeds
the distributions from such taxable income for the calendar year.
The Fund is subject to accounting standards that establish a minimum threshold
for recognizing, and a system for measuring, the benefits of a tax position
taken or expected to be taken in a tax return. The taxable years ended 2014,
2015, 2016 and 2017 remain open to federal and state audit. As of October 31,
2017, management has evaluated the application of these standards to the Fund,
and has determined that no provision for income tax is required in the Fund's
financial statements for uncertain tax positions.
The Fund intends to utilize provisions of the federal income tax laws, which
allow it to carry a realized capital loss forward indefinitely following the
year of the loss and offset such loss against any future realized capital gains.
The Fund is subject to certain limitations under U.S. tax rules on the use of
capital loss carryforwards and net unrealized built-in-losses. These limitations
apply when there has been a 50% change in ownership. At October 31, 2017, the
Fund had non-expiring capital loss carryforwards for federal income tax purposes
of $11,790,027.
Page 23
<PAGE>
--------------------------------------------------------------------------------
NOTES TO FINANCIAL STATEMENTS (CONTINUED)
--------------------------------------------------------------------------------
FIRST TRUST LONG/SHORT EQUITY ETF (FTLS)
OCTOBER 31, 2017
Certain losses realized during the current fiscal year may be deferred and
treated as occurring on the first day of the following fiscal year for federal
income tax purposes. For the fiscal year ended October 31, 2017, the Fund had no
net ordinary losses.
In order to present paid-in capital, accumulated net investment income (loss)
and accumulated net realized gain (loss) on investments on the Statement of
Assets and Liabilities that more closely represent their tax character, certain
adjustments have been made to paid-in capital, accumulated net investment income
(loss) and accumulated net realized gain (loss) on investments. These
adjustments are primarily due to the difference between book and tax treatments
of income and gains on various investment securities held by the Fund and
in-kind transactions. The results of operations and net assets were not affected
by these adjustments. For the fiscal year ended October 31, 2017, the
adjustments for the Fund were as follows:
Accumulated
Accumulated Net Realized
Net Investment Gain (Loss) Paid-in
Income (Loss) on Investments Capital
----------------- ----------------- -----------------
$110,928 $(11,812,996) $11,702,068
F. EXPENSES
Expenses, other than the investment advisory fee, dividend and interest expenses
on investments sold short and other excluded expenses, are paid by the Advisor
(See Note 3).
G. NEW AND AMENDED FINANCIAL REPORTING RULES AND FORMS
On October 13, 2016, the SEC adopted new rules and forms, and amended existing
rules and forms. The new and amended rules and forms are intended to modernize
the reporting of information provided by funds and to improve the quality and
type of information that funds provide to the SEC and investors. In part, the
new and amended rules and forms amend Regulation S-X and require standardized,
enhanced disclosure about derivatives in a fund's financial statements, as well
as other amendments. The compliance date for the amendments of Regulation S-X
was August 1, 2017, which resulted in no change to the financial statements. The
new form types and other rule amendments will be effective for the First Trust
funds, including the Fund, for reporting periods beginning on and after June 1,
2018. Management is evaluating the new form types and other rule amendments that
are effective on and after June 1, 2018 to determine its impact to the Fund.
H. NEW ACCOUNTING PRONOUNCEMENT
In December 2016, FASB released Accounting Standards Update ("ASU") 2016-19 that
makes technical changes to various sections of the ASC, including Topic 820,
Fair Value Measurement. The changes to Topic 820 are intended to clarify the
difference between a valuation approach and a valuation technique. The changes
to ASC 820-10-50-2 require a reporting entity to disclose, for Level 2 and Level
3 fair value measurements, a change in either or both a valuation approach and a
valuation technique and the reason(s) for the change. The changes to Topic 820
are effective for fiscal years, and interim periods within those fiscal years,
beginning after December 15, 2016. At this time, management is evaluating the
implications of the ASU and has not yet determined its impact on the financial
statements and disclosures.
3. INVESTMENT ADVISORY FEE, AFFILIATED TRANSACTIONS AND OTHER FEE ARRANGEMENTS
First Trust, the investment advisor to the Fund, is a limited partnership with
one limited partner, Grace Partners of DuPage L.P., and one general partner, The
Charger Corporation. The Charger Corporation is an Illinois corporation
controlled by James A. Bowen, Chief Executive Officer of First Trust. First
Trust is responsible for the selection and ongoing monitoring of the securities
in the Fund's portfolio, managing the Fund's business affairs and providing
certain administrative services necessary for the management of the Fund.
Pursuant to the Investment Management Agreement, First Trust manages the
investment of the Fund's assets and is responsible for the Fund's expenses,
including the cost of transfer agency, custody, fund administration, legal,
audit and other services, but excluding fee payments under the Investment
Management Agreement, interest, taxes, brokerage commissions and other expenses
connected with the execution of portfolio transactions, distribution and service
fees pursuant to a 12b-1 plan, if any, acquired fund fees and expenses, if any,
dividend expenses on investments sold short, and extraordinary expenses. The
Fund has agreed to pay First Trust an annual unitary management fee equal to
0.95% of its average daily net assets. First Trust also provides fund reporting
services to the Fund for a flat annual fee in the amount of $9,250, which is
covered under the annual unitary management fee.
Page 24
<PAGE>
--------------------------------------------------------------------------------
NOTES TO FINANCIAL STATEMENTS (CONTINUED)
--------------------------------------------------------------------------------
FIRST TRUST LONG/SHORT EQUITY ETF (FTLS)
OCTOBER 31, 2017
The Trust has multiple service agreements with Brown Brothers Harriman & Co.
("BBH"). Under the service agreements, BBH performs custodial, fund accounting,
certain administrative services, and transfer agency services for the Fund. As
custodian, BBH is responsible for custody of the Fund's assets. As fund
accountant and administrator, BBH is responsible for maintaining the books and
records of the Fund's securities and cash. As transfer agent, BBH is responsible
for maintaining shareholder records for the Fund.
Each Trustee who is not an officer or employee of First Trust, any sub-advisor
or any of their affiliates ("Independent Trustees") is paid a fixed annual
retainer that is allocated equally among each fund in the First Trust Fund
Complex. Each Independent Trustee is also paid an annual per fund fee that
varies based on whether the fund is a closed-end or other actively managed fund,
or is an index fund.
Additionally, the Lead Independent Trustee and the Chairmen of the Audit
Committee, Nominating and Governance Committee and Valuation Committee are paid
annual fees to serve in such capacities, with such compensation allocated pro
rata among each fund in the First Trust Fund Complex based on net assets.
Independent Trustees are reimbursed for travel and out-of-pocket expenses in
connection with all meetings. The Lead Independent Trustee and Committee
Chairmen rotate every three years. The officers and "Interested" Trustee receive
no compensation from the Trust for acting in such capacities.
4. PURCHASES AND SALES OF SECURITIES
For the year ended October 31, 2017, the cost of purchases and proceeds from
sales of investments, excluding short-term investment, investments sold shorts
and in-kind transactions, for the Fund were $175,027,640 and $178,997,348,
respectively. The cost of purchases to cover short sales and the proceeds of
short sales were $70,840,969 and $71,837,686, respectively.
For the year ended October 31, 2017, the cost of in-kind purchases and proceeds
from in-kind sales for the Fund were $76,657,079 and $90,395,788, respectively.
5. CREATIONS, REDEMPTIONS AND TRANSACTION FEES
Shares are created and redeemed by the Fund only in Creation Unit size
aggregations of 50,000 shares in transactions with broker-dealers or large
institutional investors that have entered into a participation agreement (an
"Authorized Participant"). In order to purchase Creation Units of the Fund, an
Authorized Participant must deposit (i) a designated portfolio of securities
determined by First Trust (the "Deposit Securities") and generally make or
receive a cash payment referred to as the "Cash Component," which is an amount
equal to the difference between the NAV of the Fund shares (per Creation Unit
aggregations) and the market value of the Deposit Securities, and/or (ii) cash
in lieu of all or a portion of the Deposit Securities. If the Cash Component is
a positive number (i.e., the NAV per Creation Unit Aggregation exceeds the
Deposit Amount), the Authorized Participant will deliver the Cash Component. If
the Cash Component is a negative number (i.e., the NAV per Creation Unit
Aggregation is less than the Deposit Amount), the Authorized Participant will
receive the Cash Component. Authorized Participants purchasing Creation Units
must pay to BBH, as transfer agent, a creation transaction fee (the "Creation
Transaction Fee") regardless of the number of Creation Units purchased in the
transaction. The Creation Transaction Fee may vary and is based on the
composition of the securities included in the Fund's portfolio and the countries
in which the transactions are settled. The Creation Transaction Fee may increase
or decrease as the Fund's portfolio is adjusted to conform to changes in the
composition of the securities included in the Fund's portfolio and the countries
in which the transaction are settled. The Creation Transaction fee is currently
$550. The price for each Creation Unit will equal the daily NAV per share times
the number of shares in a Creation Unit plus the fees described above and, if
applicable, any operational processing and brokerage costs, transfer fees or
stamp taxes. When the Fund permits an Authorized Participant to substitute cash
or a different security in lieu of depositing one or more of the requisite
Deposit Securities, the Authorized Participant may also be assessed an amount to
cover the cost of purchasing the Deposit Securities and/or disposing of the
substituted securities, including operational processing and brokerage costs,
transfer fees, stamp taxes, and part or all of the spread between the expected
bid and offer side of the market related to such Deposit Securities and/or
substitute securities.
Authorized Participants redeeming Creation Units must pay to BBH, as transfer
agent, a redemption transaction fee (the "Redemption Transaction Fee"),
regardless of the number of Creation Units redeemed in the transaction. The
Redemption Transaction Fee may vary and is based on the composition of the
securities included in the Fund's portfolio and the countries in which the
transactions are settled. The Redemption Transaction Fee is currently $550. The
Fund reserves the right to effect redemptions in cash. An Authorized Participant
may request cash redemption in lieu of securities; however, the Fund may, in its
discretion, reject any such request.
Page 25
<PAGE>
--------------------------------------------------------------------------------
NOTES TO FINANCIAL STATEMENTS (CONTINUED)
--------------------------------------------------------------------------------
FIRST TRUST LONG/SHORT EQUITY ETF (FTLS)
OCTOBER 31, 2017
6. DISTRIBUTION PLAN
The Board of Trustees adopted a Distribution and Service Plan pursuant to Rule
12b-1 under the 1940 Act. In accordance with the Rule 12b-1 plan, the Fund is
authorized to pay an amount up to 0.25% of its average daily net assets each
year to reimburse First Trust Portfolios L.P. ("FTP"), the distributor of the
Fund, for amounts expended to finance activities primarily intended to result in
the sale of Creation Units or the provision of investor services. FTP may also
use this amount to compensate securities dealers or other persons that are
Authorized Participants for providing distribution assistance, including
broker-dealer and shareholder support and educational and promotional services.
No 12b-1 fees are currently paid by the Fund, and pursuant to a contractual
arrangement, no 12b-1 fees will be paid any time before February 28, 2019.
7. INDEMNIFICATION
The Trust, on behalf of the Fund, has a variety of indemnification obligations
under contracts with its service providers. The Trust's maximum exposure under
these arrangements is unknown. However, the Trust has not had prior claims or
losses pursuant to these contracts and expects the risk of loss to be remote.
8. SUBSEQUENT EVENTS
Management has evaluated the impact of all subsequent events to the Fund through
the date the financial statements were issued and has determined there was the
following subsequent event:
On November 2, 2017, First Trust Municipal High Income ETF, an additional series
of the Trust, began trading under the ticker symbol FMHI on Nasdaq.
Page 26
<PAGE>
--------------------------------------------------------------------------------
REPORT OF INDEPENDENT REGISTERED PUBLIC ACCOUNTING FIRM
--------------------------------------------------------------------------------
TO THE SHAREHOLDERS AND THE BOARD OF TRUSTEES OF FIRST TRUST LONG/SHORT EQUITY
ETF:
We have audited the accompanying statement of assets and liabilities of First
Trust Long/Short Equity ETF (the "Fund"), a series of the First Trust
Exchange-Traded Fund III, including the portfolio of investments, as of October
31, 2017, and the related statement of operations for the year then ended, the
statements of changes in net assets for each of the two years in the period then
ended, and the financial highlights for each of the periods presented. These
financial statements and financial highlights are the responsibility of the
Fund's management. Our responsibility is to express an opinion on these
financial statements and financial highlights based on our audits.
We conducted our audits in accordance with the standards of the Public Company
Accounting Oversight Board (United States). Those standards require that we plan
and perform the audit to obtain reasonable assurance about whether the financial
statements and financial highlights are free of material misstatement. The Fund
is not required to have, nor were we engaged to perform, an audit of its
internal control over financial reporting. Our audits included consideration of
internal control over financial reporting as a basis for designing audit
procedures that are appropriate in the circumstances, but not for the purpose of
expressing an opinion on the effectiveness of the Fund's internal control over
financial reporting. Accordingly, we express no such opinion. An audit also
includes examining, on a test basis, evidence supporting the amounts and
disclosures in the financial statements, assessing the accounting principles
used and significant estimates made by management, as well as evaluating the
overall financial statement presentation. Our procedures included confirmation
of securities owned as of October 31, 2017, by correspondence with the Fund's
custodian and brokers; when replies were not received from brokers, we performed
other auditing procedures. We believe that our audits provide a reasonable basis
for our opinion.
In our opinion, the financial statements and financial highlights referred to
above present fairly, in all material respects, the financial position of First
Trust Long/Short Equity ETF as of October 31, 2017, the results of its
operations for the year then ended, the changes in its net assets for each of
the two years in the period then ended, and the financial highlights for each of
the periods presented, in conformity with accounting principles generally
accepted in the United States of America.
/s/ Deloitte & Touche LLP
Chicago, Illinois
December 21, 2017
Page 27
<PAGE>
--------------------------------------------------------------------------------
ADDITIONAL INFORMATION
--------------------------------------------------------------------------------
FIRST TRUST LONG/SHORT EQUITY ETF (FTLS)
OCTOBER 31, 2017 (UNAUDITED)
PROXY VOTING POLICIES AND PROCEDURES
A description of the policies and procedures that the Trust uses to determine
how to vote proxies and information on how the Fund voted proxies relating to
portfolio investments during the most recent 12-month period ended June 30 is
available (1) without charge, upon request, by calling (800) 988-5891; (2) on
the Fund's website located at http://www.ftportfolios.com; and (3) on the
Securities and Exchange Commission's ("SEC") website located at
http://www.sec.gov.
PORTFOLIO HOLDINGS
The Trust files its complete schedule of portfolio holdings with the SEC for the
first and third quarters of each fiscal year on Form N-Q. The Trust's Forms N-Q
are available (1) by calling (800) 988-5891; (2) on the Fund's website located
at http://www.ftportfolios.com; (3) on the SEC's website at http://www.sec.gov;
and (4) for review and copying at the SEC's Public Reference Room ("PRR") in
Washington, DC. Information regarding the operation of the PRR may be obtained
by calling (800) SEC-0330.
FEDERAL TAX INFORMATION
For the taxable year ended October 31, 2017, the following percentage of income
dividend paid by the Fund qualifies for the dividends received deduction
available to corporations and is hereby designated as qualified dividend income:
Dividends Received Deduction Qualified Dividend Income
---------------------------- ----------------------------
100% 100%
RISK CONSIDERATIONS
You could lose money by investing in the Fund. An investment in the Fund is not
a deposit of a bank and is not insured or guaranteed by the Federal Deposit
Insurance Corporation or any other governmental agency. There can be no
assurance that the Fund's investment objective will be achieved.
AUTHORIZED PARTICIPANT CONCENTRATION RISK. Only an authorized participant (as
defined in the "Creations, Redemptions and Transaction Fees" section) may engage
in creation or redemption transactions directly with the Fund. The Fund has a
limited number of institutions that act as authorized participants. To the
extent that these institutions exit the business or are unable to proceed with
creation and/or redemption orders with respect to a Fund and no other authorized
participant is able to step forward to create or redeem, in either of these
cases, Fund shares may trade at a discount to the Fund's net asset value and
possibly face delisting.
CYBER SECURITY RISK. As the use of Internet technology has become more prevalent
in the course of business, the Fund has become more susceptible to potential
operational risks through breaches in cyber security. A breach in cyber security
refers to both intentional and unintentional events that may cause the Fund to
lose proprietary information, suffer data corruption or lose operational
capacity. Such events could cause the Fund to incur regulatory penalties,
reputational damage, additional compliance costs associated with corrective
measures and/or financial loss. Cyber security breaches may involve unauthorized
access to the Fund's digital information systems through "hacking" or malicious
software coding, but may also result from outside attacks such as
denial-of-service attacks through efforts to make network services unavailable
to intended users. In addition, cyber security breaches of the Fund's
third-party service providers, such as its administrators, transfer agent,
custodian or sub-advisor, as applicable, or issuers in which the Fund invests,
can also subject the Fund to many of the same risks associated with direct cyber
security breaches. The Fund has established risk management systems designed to
reduce the risks associated with cyber security. However, there is no guarantee
that such efforts will succeed, especially because the Fund does not directly
control the cyber security systems of issuers or third party service providers.
DEPOSITARY RECEIPTS RISK. Depositary receipts may be less liquid than the
underlying shares in their primary trading market. Any distributions paid to the
holders of depositary receipts are usually subject to a fee charged by the
depositary. Holders of depositary receipts may have limited voting rights, and
investment restrictions in certain countries may adversely impact the value of
depositary receipts because such restrictions may limit the ability to convert
the equity shares into depositary receipts and vice versa. Such restrictions may
cause the equity shares of the underlying issuer to trade at a discount or
premium to the market price of the depositary receipts.
Page 28
<PAGE>
--------------------------------------------------------------------------------
ADDITIONAL INFORMATION (CONTINUED)
--------------------------------------------------------------------------------
FIRST TRUST LONG/SHORT EQUITY ETF (FTLS)
OCTOBER 31, 2017 (UNAUDITED)
DERIVATIVES RISK. The use of futures and other derivatives can lead to losses
because of adverse movements in the price or value of the underlying asset,
index or rate, which may be magnified by certain features of the derivatives.
These risks are heightened when the Fund's portfolio managers use derivatives to
enhance the Fund's return or as a substitute for a position or security, rather
than solely to hedge (or offset) the risk of a position or security held by the
Fund.
EQUITY SECURITIES RISK. The Fund invests in equity securities. The value of the
shares will fluctuate with changes in the value of these equity securities.
Equity securities prices fluctuate for several reasons, including changes in
investors' perceptions of the financial condition of an issuer or the general
condition of the relevant stock market, such as the current market volatility,
or when political or economic events affecting the issuers occur. In addition,
common stock prices may be particularly sensitive to rising interest rates, as
the cost of the capital rises and borrowing costs increase.
ETF RISK. The Fund may invest in the shares of other ETFs, and therefore, the
Fund's investment performance and risks may be related to the investment
performance and risks of the underlying ETFs. In general, as a shareholder in
other ETFs, the Fund bears its ratable share of the underlying ETF's expenses,
and would be subject to duplicative expenses to the extent the Fund invests in
other ETFs.
FINANCIAL COMPANIES RISK. Financial companies are especially subject to the
adverse effects of economic recession, currency exchange rates, government
regulation, decreases in the availability of capital, volatile interest rates,
portfolio concentrations in geographic markets and in commercial and residential
real estate loans, and competition from new entrants in their fields of
business.
FLUCTUATION OF NET ASSET VALUE RISK. The net asset value of shares of the Fund
will generally fluctuate with changes in the market value of the Fund's
holdings. The market prices of shares will generally fluctuate in accordance
with changes in net asset value as well as the relative supply of and demand for
shares on NYSE Arca. The Fund's investment advisor cannot predict whether shares
will trade below, at or above their net asset value because the shares trade on
NYSE Arca at market prices and not at net asset value. Price differences may be
due, in large part, to the fact that supply and demand forces at work in the
secondary trading market for shares will be closely related to, but not
identical to, the same forces influencing the prices of the holdings of the Fund
trading individually or in the aggregate at any point in time. However, given
that shares can only be purchased and redeemed in-kind or, in certain
circumstances, for cash, in Creation Units, and only to and from broker-dealers
and large institutional investors that have entered into participation
agreements (unlike shares of closed-end funds, which frequently trade at
appreciable discounts from, and sometimes at premiums to, their net asset
value), the Fund's investment advisor believes that large discounts or premiums
to the net asset value of shares should not be sustained.
INFORMATION TECHNOLOGY COMPANIES RISK. Information technology companies are
generally subject to the following risks: rapidly changing technologies; short
product life cycles; fierce competition; aggressive pricing and reduced profit
margins; the loss of patent, copyright and trademark protections; cyclical
market patterns; evolving industry standards; and frequent new product
introductions. Information technology companies may be smaller and less
experienced companies, with limited product lines, markets or financial
resources and fewer experienced management or marketing personnel. Information
technology company stocks, especially those which are Internet related, have
experienced extreme price and volume fluctuations that are often unrelated to
their operating performance.
MANAGEMENT RISK. The Fund is subject to management risk because it is an
actively managed portfolio. In managing the Fund's investment portfolio, the
Fund's investment advisor will apply investment techniques and risk analyses
that may not have the desired result. There can be no guarantee that the Fund
will meet its investment objective.
MARKET MAKER RISK. If the Fund has lower average daily trading volumes, it may
rely on a small number of third-party market makers to provide a market for the
purchase and sale of shares. Any trading halt or other problem relating to the
trading activity of these market makers could result in a dramatic change in the
spread between the Fund's net asset value and the price at which the Fund's
shares are trading on NYSE Arca, which could result in a decrease in value of
the Fund's shares. In addition, decisions by market makers or authorized
participants to reduce their role or step away from these activities in times of
market stress could inhibit the effectiveness of the arbitrage process in
maintaining the relationship between the underlying values of the Fund's
portfolio securities and the Fund's market price. This reduced effectiveness
could result in Fund shares trading at a discount to net asset value and also in
greater than normal intraday bid-ask spreads for Fund shares.
MARKET RISK. Market risk is the risk that a particular security owned by the
Fund or shares of the Fund in general may fall in value. Securities are subject
to market fluctuations caused by such factors as economic, political, regulatory
or market developments, changes in interest rates and perceived trends in
securities prices. Overall securities values could decline generally or could
underperform other investments.
Page 29
<PAGE>
--------------------------------------------------------------------------------
ADDITIONAL INFORMATION (CONTINUED)
--------------------------------------------------------------------------------
FIRST TRUST LONG/SHORT EQUITY ETF (FTLS)
OCTOBER 31, 2017 (UNAUDITED)
NON-DIVERSIFICATION RISK. The Fund is classified as "non-diversified" under the
Investment Company Act of 1940, as amended (the "1940 Act"). As a result, the
Fund is only limited as to the percentage of its assets that may be invested in
the securities of any one issuer by the diversification requirements imposed by
the Internal Revenue Code of 1986, as amended (the "Code"). The Fund may invest
a relatively high percentage of its assets in a limited number of issuers. As a
result, the Fund may be more susceptible to a single adverse economic or
regulatory occurrence affecting one or more of these issuers, experience
increased volatility and be highly invested in certain issuers.
NON-U.S. SECURITIES RISK. The Fund holds non-U.S. securities that are either
directly listed on a U.S. securities exchange or in the form of depositary
receipts. Non-U.S. securities are subject to higher volatility than securities
of domestic issuers due to possible adverse political, social or economic
developments; restrictions on foreign investment or exchange of securities; lack
of liquidity; currency exchange rates; excessive taxation; government seizure of
assets; different legal or accounting standards; and less government supervision
and regulation of exchanges in foreign countries.
PORTFOLIO TURNOVER RISK. The Fund's strategy may frequently involve buying and
selling portfolio securities to rebalance the Fund's exposure to various market
sectors. High portfolio turnover may result in the Fund paying higher levels of
transaction costs and generating greater tax liabilities for shareholders.
Portfolio turnover risk may cause the Fund's performance to be less than you
expect.
SHORT SALES RISK. The Fund will incur a loss as a result of a short sale if the
price of the security sold short increases in value between the date of the
short sale and the date on which the Fund purchases the security to replace the
borrowed security. In addition, a lender of a security may request, or market
conditions may dictate, that securities sold short be returned to the lender on
short notice, which may result in the Fund having to buy the securities sold
short at an unfavorable price. If this occurs, any anticipated gain to the Fund
may be reduced or eliminated or the short sale may result in a loss. In a rising
stock market, the Fund's short positions may significantly impact the Fund's
overall performance and cause the Fund to underperform traditional long-only
equity funds or to sustain losses, particularly in a sharply rising market. The
use of short sales may also cause the Fund to have higher expenses than other
funds.
TRADING ISSUES RISK. Although the shares of the Fund are listed for trading on
NYSE Arca, there can be no assurance that an active trading market for such
shares will develop or be maintained. Trading in shares on NYSE Arca may be
halted due to market conditions or for reasons that, in the view of NYSE Arca,
make trading in shares inadvisable. In addition, trading in shares on NYSE Arca
is subject to trading halts caused by extraordinary market volatility pursuant
to NYSE Arca "circuit breaker" rules. Market makers are under no obligation to
make a market in the Fund's shares, and authorized participants are not
obligated to submit purchase or redemption orders for Creation Units. There can
be no assurance that the requirements of NYSE Arca necessary to maintain the
listing of the Fund will continue to be met or will remain unchanged. In
particular, if the Fund does not comply with any provision of the NYSE Arca rule
change pursuant to Rule 19b-4 under the Securities Exchange Act of 1934, as
amended (the"1934 Act") approved by the SEC, and cannot bring itself into
compliance within a reasonable period after discovering the matter, NYSE Arca
may remove the shares of the Fund from listing. The Fund may have difficulty
maintaining its listing on NYSE Arca in the event the Fund's assets are small or
the Fund does not have enough shareholders.
ADVISORY AGREEMENT
BOARD CONSIDERATIONS REGARDING CONTINUATION OF INVESTMENT MANAGEMENT AGREEMENT
The Board of Trustees of First Trust Exchange-Traded Fund III (the "Trust"),
including the Independent Trustees, unanimously approved the continuation of the
Investment Management Agreement (the "Agreement") with First Trust Advisors L.P.
(the "Advisor" or "First Trust") on behalf of the First Trust Long/Short Equity
ETF (the "Fund"). The Board approved the continuation of the Agreement for a
one-year period ending June 30, 2018 at a meeting held on June 12, 2017. The
Board determined that the continuation of the Agreement is in the best interests
of the Fund in light of the extent and quality of the services provided and such
other matters as the Board considered to be relevant in the exercise of its
reasonable business judgment.
To reach this determination, the Board considered its duties under the
Investment Company Act of 1940, as amended (the "1940 Act"), as well as under
the general principles of state law in reviewing and approving advisory
contracts; the requirements of the 1940 Act in such matters; the fiduciary duty
of investment advisors with respect to advisory agreements and compensation; the
standards used by courts in determining whether investment company boards have
fulfilled their duties; and the factors to be considered by the Board in voting
on such agreements. At meetings held on April 24, 2017 and June 12, 2017, the
Board, including the Independent Trustees, reviewed materials provided by the
Advisor responding to requests for information from counsel to the Independent
Trustees that, among other things, outlined the services provided by the Advisor
to the Fund (including the relevant personnel responsible for these services and
their experience); the unitary fee rate payable by the Fund as compared to fees
Page 30
<PAGE>
--------------------------------------------------------------------------------
ADDITIONAL INFORMATION (CONTINUED)
--------------------------------------------------------------------------------
FIRST TRUST LONG/SHORT EQUITY ETF (FTLS)
OCTOBER 31, 2017 (UNAUDITED)
charged to a peer group of funds (which were either mutual funds or
exchange-traded funds ("ETFs")) compiled by Management Practice, Inc. ("MPI"),
an independent source (the "MPI Peer Group"), and as compared to fees charged to
other clients of the Advisor, including other ETFs managed by the Advisor;
expenses of the Fund as compared to expense ratios of the funds in the MPI Peer
Group; performance information for the Fund; the nature of expenses incurred in
providing services to the Fund and the potential for economies of scale, if any;
financial data on the Advisor; any fall-out benefits to the Advisor and its
affiliate, First Trust Portfolios L.P. ("FTP"); and information on the Advisor's
compliance program. The Board reviewed initial materials with the Advisor at the
meeting held on April 24, 2017, prior to which the Independent Trustees and
their counsel met separately to discuss the information provided by the Advisor.
Following the April meeting, independent legal counsel on behalf of the
Independent Trustees requested certain clarifications and supplements to the
materials provided, and the information provided in response to those requests
was considered at an executive session of the Independent Trustees and
independent legal counsel held prior to the June 12, 2017 meeting, as well as at
the meeting held that day. The Board applied its business judgment to determine
whether the arrangement between the Trust and the Advisor continues to be a
reasonable business arrangement from the Fund's perspective as well as from the
perspective of the Fund's shareholders. The Board determined that, given the
totality of the information provided with respect to the Agreement, the Board
had received sufficient information to renew the Agreement. The Board considered
that shareholders chose to invest or remain invested in the Fund knowing that
the Advisor manages the Fund and knowing the Fund's unitary fee.
In reviewing the Agreement, the Board considered the nature, extent and quality
of the services provided by the Advisor under the Agreement. The Board
considered that the Advisor is responsible for the overall management and
administration of the Trust and the Fund and reviewed all of the services
provided by the Advisor to the Fund, as well as the background and experience of
the persons responsible for such services. The Board noted that the Fund is an
actively-managed ETF and noted that the Advisor's Alternatives Investment Team
is responsible for the day-to-day management of the Fund's investments. The
Board considered the background and experience of the members of the
Alternatives Investment Team and noted the Board's prior meetings with members
of the Team. The Board considered the Advisor's statement that it applies the
same oversight model internally with its Alternatives Investment Team as it uses
for overseeing external sub-advisors, including portfolio risk monitoring and
performance review. In reviewing the services provided, the Board noted the
compliance program that had been developed by the Advisor and considered that it
includes a robust program for monitoring the Advisor's and the Fund's compliance
with the 1940 Act, as well as the Fund's compliance with its investment
objective and policies. The Board also considered a report from the Advisor with
respect to its risk management functions related to the operation of the Fund.
Finally, as part of the Board's consideration of the Advisor's services, the
Advisor, in its written materials and at the April 24, 2017 meeting, described
to the Board the scope of its ongoing investment in additional infrastructure
and personnel to maintain and improve the quality of services provided to the
Fund and the other funds in the First Trust Fund Complex. In light of the
information presented and the considerations made, the Board concluded that the
nature, extent and quality of the services provided to the Trust and the Fund by
the Advisor under the Agreement have been and are expected to remain
satisfactory and that the Advisor has managed the Fund consistent with the
Fund's investment objective and policies.
The Board considered the unitary fee rate payable by the Fund under the
Agreement for the services provided. The Board considered that as part of the
unitary fee the Advisor is responsible for the Fund's expenses, including the
cost of transfer agency, custody, fund administration, legal, audit and other
services and license fees (if any), but excluding interest, taxes, brokerage
commissions and other expenses connected with the execution of portfolio
transactions, distribution and service fees pursuant to a Rule 12b-1 plan, if
any, and extraordinary expenses. The Board received and reviewed information
showing the advisory fee rates and expense ratios of the peer funds in the MPI
Peer Group, as well as advisory fee rates charged by the Advisor to other fund
(including ETFs) and non-fund clients, as applicable. Because the Fund pays a
unitary fee, the Board determined that expense ratios were the most relevant
comparative data point. Based on the information provided, the Board noted that
the Fund's total (net) expense ratio (including expenses associated with short
sales) was below the median total (net) expense ratio of the peer funds in the
MPI Peer Group. With respect to the MPI Peer Group, the Board discussed with
representatives of the Advisor how the MPI Peer Group was assembled and
limitations in creating peer groups for actively-managed ETFs, including that
there were no other actively-managed ETFs pursuing a long/short strategy and
that most of the peer funds were open-end mutual funds. The Board took these
limitations and differences into account in considering the peer data. With
respect to fees charged to other clients, the Board considered differences
between the Fund and other clients that limited their comparability. In
considering the unitary fee rate overall, the Board also considered the
Advisor's statement that it seeks to meet investor needs through innovative and
value-added investment solutions and the Advisor's description of its long-term
commitment to the Fund.
The Board considered performance information for the Fund. The Board noted the
process it has established for monitoring the Fund's performance and portfolio
risk on an ongoing basis, which includes quarterly performance reporting from
the Advisor for the Fund. The Board determined that this process continues to be
effective for reviewing the Fund's performance. The Board received and reviewed
information comparing the Fund's performance for the one-year period ended
December 31, 2016 to the performance of the MPI Peer Group and to a benchmark
Page 31
<PAGE>
--------------------------------------------------------------------------------
ADDITIONAL INFORMATION (CONTINUED)
--------------------------------------------------------------------------------
FIRST TRUST LONG/SHORT EQUITY ETF (FTLS)
OCTOBER 31, 2017 (UNAUDITED)
index. Based on the information provided, the Board noted that the Fund
underperformed the MPI Peer Group average and the benchmark index for the
one-year period ended December 31, 2016. The Board noted information provided by
the Advisor on reasons for the Fund's underperformance.
On the basis of all the information provided on the unitary fee and performance
of the Fund and the ongoing oversight by the Board, the Board concluded that the
unitary fee for the Fund continues to be reasonable and appropriate in light of
the nature, extent and quality of the services provided by the Advisor to the
Fund under the Agreement.
The Board considered information and discussed with the Advisor whether there
were any economies of scale in connection with providing advisory services to
the Fund and noted the Advisor's statement that it expects its expenses to
increase over the next twelve months as the Advisor continues to make
investments in personnel and infrastructure. The Board noted that any reduction
in fixed costs associated with the management of the Fund would benefit the
Advisor, but that the unitary fee structure provides a level of certainty in
expenses for the Fund. The Board considered the revenues and allocated costs
(including the allocation methodology) of the Advisor in serving as investment
advisor to the Fund for the twelve months ended December 31, 2016 and the
estimated profitability level for the Fund calculated by the Advisor based on
such data, as well as complex-wide and product-line profitability data for the
same period. The Board noted the inherent limitations in the profitability
analysis and concluded that, based on the information provided, the Advisor's
profitability level for the Fund was not unreasonable. In addition, the Board
considered fall-out benefits described by the Advisor that may be realized from
its relationship with the Fund. The Board considered that the Advisor had
identified as a fall-out benefit to the Advisor and FTP their exposure to
investors and brokers who, absent their exposure to the Fund, may have had no
dealings with the Advisor or FTP, and noted that the Advisor does not utilize
soft dollars in connection with its management of the Fund's portfolio. The
Board also considered the Advisor's compensation for fund reporting services
provided to the Fund pursuant to a separate Fund Reporting Services Agreement,
which is paid from the unitary fee. The Board concluded that the character and
amount of potential fall-out benefits to the Advisor were not unreasonable.
Based on all of the information considered and the conclusions reached, the
Board, including the Independent Trustees, unanimously determined that the terms
of the Agreement continue to be fair and reasonable and that the continuation of
the Agreement is in the best interests of the Trust and the Fund. No single
factor was determinative in the Board's analysis.
Page 32
<PAGE>
--------------------------------------------------------------------------------
BOARD OF TRUSTEES AND OFFICERS
--------------------------------------------------------------------------------
FIRST TRUST LONG/SHORT EQUITY ETF (FTLS)
OCTOBER 31, 2017 (UNAUDITED)
The Trust's statement of additional information includes additional information
about the Trustees and is available, without charge, upon request, by calling
(800) 988-5891.
<TABLE>
<CAPTION>
NUMBER OF OTHER
PORTFOLIOS IN TRUSTEESHIPS OR
TERM OF OFFICE THE FIRST TRUST DIRECTORSHIPS
NAME, ADDRESS, AND YEAR FIRST FUND COMPLEX HELD BY TRUSTEE
DATE OF BIRTH AND ELECTED OR PRINCIPAL OCCUPATIONS OVERSEEN BY DURING PAST
POSITION WITH THE TRUST APPOINTED DURING PAST 5 YEARS TRUSTEE 5 YEARS
------------------------------------------------------------------------------------------------------------------------------------
INDEPENDENT TRUSTEES
------------------------------------------------------------------------------------------------------------------------------------
<S> <C> <C> <C> <C>
Richard E. Erickson, Trustee o Indefinite Term Physician; Officer, Wheaton 151 None
c/o First Trust Advisors L.P. Orthopedics; Limited Partner
120 E. Liberty Drive, o Since Inception Gundersen Real Estate Limited
Suite 400 Partnership (June 1992 to December
Wheaton, IL 60187 2016); Member, Sportsmed LLC
D.O.B.: 04/51 (April 2007 to November 2015)
Thomas R. Kadlec, Trustee o Indefinite Term President, ADM Investor Services, Inc. 151 Director of ADM
c/o First Trust Advisors L.P. (Futures Commission Merchant) Investor Services,
120 E. Liberty Drive, o Since Inception Inc., ADM
Suite 400 Investor Services
Wheaton, IL 60187 International,
D.O.B.: 11/57 Futures Industry
Association, and
National Futures
Association
Robert F. Keith, Trustee o Indefinite Term President, Hibs Enterprises 151 Director of Trust
c/o First Trust Advisors L.P. (Financial and Management Consulting) Company of
120 E. Liberty Drive, o Since Inception Illinois
Suite 400
Wheaton, IL 60187
D.O.B.: 11/56
Niel B. Nielson, Trustee o Indefinite Term Managing Director and Chief Operating 151 Director of
c/o First Trust Advisors L.P. Officer (January 2015 to Present), Pelita Covenant
120 E. Liberty Drive, o Since Inception Harapan Educational Foundation (Educational Transport Inc.
Suite 400 Products and Services); President and Chief (May 2003 to
Wheaton, IL 60187 Executive Officer (June 2012 to September May 2014)
D.O.B.: 03/54 2014), Servant Interactive LLC (Educational
Products and Services); President and Chief
Executive Officer (June 2012 to September
2014), Dew Learning LLC (Educational
Products and Services); President (June
2002 to June 2012), Covenant College
------------------------------------------------------------------------------------------------------------------------------------
INTERESTED TRUSTEE
------------------------------------------------------------------------------------------------------------------------------------
James A. Bowen,(1) Trustee, o Indefinite Term Chief Executive Officer, First Trust 151 None
Chairman of the Board Advisors L.P. and First Trust
120 E. Liberty Drive, o Since Inception Portfolios L.P.; Chairman of the
Suite 400 Board of Directors, BondWave LLC
Wheaton, IL 60187 (Software Development Company)
D.O.B.: 09/55 and Stonebridge Advisors LLC
(Investment Advisor)
</TABLE>
-----------------------------
(1) Mr. Bowen is deemed an "interested person" of the Trust due to his
position as Chief Executive Officer of First Trust Advisors L.P.,
investment advisor of the Trust.
Page 33
<PAGE>
--------------------------------------------------------------------------------
BOARD OF TRUSTEES AND OFFICERS (CONTINUED)
--------------------------------------------------------------------------------
FIRST TRUST LONG/SHORT EQUITY ETF (FTLS)
OCTOBER 31, 2017 (UNAUDITED)
<TABLE>
<CAPTION>
POSITION AND TERM OF OFFICE
NAME, ADDRESS OFFICES AND LENGTH OF PRINCIPAL OCCUPATIONS
AND DATE OF BIRTH WITH TRUST SERVICE DURING PAST 5 YEARS
------------------------------------------------------------------------------------------------------------------------------------
OFFICERS WHO ARE NOT TRUSTEES(2)
------------------------------------------------------------------------------------------------------------------------------------
<S> <C> <C> <C>
James M. Dykas President and Chief o Indefinite Term Managing Director and Chief Financial Officer
120 E. Liberty Drive, Executive Officer (January 2016 to Present), Controller (January
Suite 400 o Since January 2016 2011 to January 2016), Senior Vice President
Wheaton, IL 60187 (April 2007 to January 2016), First Trust Advisors
D.O.B.: 01/66 L.P. and First Trust Portfolios L.P.; Chief Financial
Officer (January 2016 to Present), BondWave LLC
(Software Development Company) and
Stonebridge Advisors LLC (Investment Advisor)
Donald P. Swade Treasurer, Chief Financial o Indefinite Term Senior Vice President (July 2016 to Present), Vice
120 E. Liberty Drive, Officer and President (April 2012 to July 2016 ), First Trust
Suite 400 Chief Accounting Officer o Since January 2016 Advisors L.P. and First Trust Portfolios L.P.
Wheaton, IL 60187
D.O.B.: 08/72
W. Scott Jardine Secretary and Chief o Indefinite Term General Counsel, First Trust Advisors L.P. and
120 E. Liberty Drive, Legal Officer First Trust Portfolios L.P.; Secretary and General
Suite 400 Counsel, BondWave LLC; Secretary,
Wheaton, IL 60187 o Since Inception Stonebridge Advisors LLC
D.O.B.: 05/60
Daniel J. Lindquist Vice President o Indefinite Term Managing Director, First Trust Advisors L.P. and
120 E. Liberty Drive, First Trust Portfolios L.P.
Suite 400 o Since Inception
Wheaton, IL 60187
D.O.B.: 02/70
Kristi A. Maher Chief Compliance Officer o Indefinite Term Deputy General Counsel, First Trust Advisors L.P.
120 E. Liberty Drive, and Assistant Secretary and First Trust Portfolios L.P.
Suite 400 o Since Inception
Wheaton, IL 60187
D.O.B.: 12/66
Roger F. Testin Vice President o Indefinite Term Senior Vice President, First Trust Advisors L.P.
120 E. Liberty Drive, and First Trust Portfolios L.P.
Suite 400 o Since Inception
Wheaton, IL 60187
D.O.B.: 06/66
Stan Ueland Vice President o Indefinite Term Senior Vice President, First Trust Advisors L.P.
120 E. Liberty Drive, and First Trust Portfolios L.P.
Suite 400 o Since Inception
Wheaton, IL 60187.
D.O.B.: 11/70
</TABLE>
-----------------------------
(2) The term "officer" means the president, vice president, secretary,
treasurer, controller or any other officer who performs a policy making
function.
Page 34
<PAGE>
--------------------------------------------------------------------------------
PRIVACY POLICY
--------------------------------------------------------------------------------
FIRST TRUST LONG/SHORT EQUITY ETF (FTLS)
OCTOBER 31, 2017 (UNAUDITED)
PRIVACY POLICY
First Trust values our relationship with you and considers your privacy an
important priority in maintaining that relationship. We are committed to
protecting the security and confidentiality of your personal information.
SOURCES OF INFORMATION
We collect nonpublic personal information about you from the following sources:
o Information we receive from you and your broker-dealer, investment
advisor or financial representative through interviews,
applications, agreements or other forms;
o Information about your transactions with us, our affiliates or
others;
o Information we receive from your inquiries by mail, e-mail or
telephone; and
o Information we collect on our website through the use of "cookies".
For example, we may identify the pages on our website that your
browser requests or visits.
INFORMATION COLLECTED
The type of data we collect may include your name, address, social security
number, age, financial status, assets, income, tax information, retirement and
estate plan information, transaction history, account balance, payment history,
investment objectives, marital status, family relationships and other personal
information.
DISCLOSURE OF INFORMATION
We do not disclose any nonpublic personal information about our customers or
former customers to anyone, except as permitted by law. In addition to using
this information to verify your identity (as required under law), the permitted
uses may also include the disclosure of such information to unaffiliated
companies for the following reasons:
o In order to provide you with products and services and to effect
transactions that you request or authorize, we may disclose your
personal information as described above to unaffiliated financial
service providers and other companies that perform administrative or
other services on our behalf, such as transfer agents, custodians
and trustees, or that assist us in the distribution of investor
materials such as trustees, banks, financial representatives, proxy
services, solicitors and printers.
o We may release information we have about you if you direct us to do
so, if we are compelled by law to do so, or in other legally limited
circumstances (for example to protect your account from fraud).
In addition, in order to alert you to our other financial products and services,
we may share your personal information within First Trust.
USE OF WEB ANALYTICS
We currently use third party analytics tools, Google Analytics and AddThis, to
gather information for purposes of improving First Trust's website and marketing
our products and services to you. These tools employ cookies, which are small
pieces of text stored in a file by your web browser and sent to websites that
you visit, to collect information, track website usage and viewing trends such
as the number of hits, pages visited, videos and PDFs viewed and the length of
user sessions in order to evaluate website performance and enhance navigation of
the website. We may also collect other anonymous information, which is generally
limited to technical and web navigation information such as the IP address of
your device, internet browser type and operating system for purposes of
analyzing the data to make First Trust's website better and more useful to our
users. The information collected does not include any personal identifiable
information such as your name, address, phone number or email address unless you
provide that information through the website for us to contact you in order to
answer your questions or respond to your requests. To find out how to opt-out of
these services click on: Google Analytics and AddThis.
CONFIDENTIALITY AND SECURITY
With regard to our internal security procedures, First Trust restricts access to
your nonpublic personal information to those First Trust employees who need to
know that information to provide products or services to you. We maintain
physical, electronic and procedural safeguards to protect your nonpublic
personal information.
POLICY UPDATES AND INQUIRIES
As required by federal law, we will notify you of our privacy policy annually.
We reserve the right to modify this policy at any time, however, if we do change
it, we will tell you promptly. For questions about our policy, or for additional
copies of this notice, please go to www.ftportfolios.com, or contact us at
1-800-621-1675 (First Trust Portfolios) or 1-800-222-6822 (First Trust
Advisors).
May 2017
Page 35
<PAGE>
This page intentionally left blank.
<PAGE>
FIRST TRUST
First Trust Exchange-Traded Fund III
INVESTMENT ADVISOR
First Trust Advisors L.P.
120 E. Liberty Drive, Suite 400
Wheaton, IL 60187
ADMINISTRATOR, CUSTODIAN
FUND ACCOUNTANT &
TRANSFER AGENT
Brown Brothers Harriman & Co.
50 Post Office Square
Boston, MA 02110
INDEPENDENT REGISTERED
PUBLIC ACCOUNTING FIRM
Deloitte & Touche LLP
111 S. Wacker Drive
Chicago, IL 60606
LEGAL COUNSEL
Chapman and Cutler LLP
111 W. Monroe Street
Chicago, IL 60603
<PAGE>
[BLANK BACK COVER]
<PAGE>
FIRST TRUST
First Trust Exchange-Traded Fund III
--------------------------------------------------------------------------------
First Trust Emerging Markets Local Currency Bond ETF (FEMB)
Annual Report
For the
Year Ended
October 31, 2017
<PAGE>
--------------------------------------------------------------------------------
TABLE OF CONTENTS
--------------------------------------------------------------------------------
FIRST TRUST EMERGING MARKETS LOCAL CURRENCY BOND ETF (FEMB)
ANNUAL REPORT
OCTOBER 31, 2017
Shareholder Letter........................................................... 1
Fund Performance Overview.................................................... 2
Portfolio Commentary......................................................... 5
Understanding Your Fund Expenses............................................. 7
Portfolio of Investments..................................................... 8
Statement of Assets and Liabilities.......................................... 12
Statement of Operations...................................................... 13
Statements of Changes in Net Assets.......................................... 14
Financial Highlights......................................................... 15
Notes to Financial Statements................................................ 16
Report of Independent Registered Public Accounting Firm...................... 23
Additional Information....................................................... 24
Board of Trustees and Officers............................................... 28
Privacy Policy............................................................... 30
CAUTION REGARDING FORWARD-LOOKING STATEMENTS
This report contains certain forward-looking statements within the meaning of
the Securities Act of 1933, as amended, and the Securities Exchange Act of 1934,
as amended. Forward-looking statements include statements regarding the goals,
beliefs, plans or current expectations of First Trust Advisors L.P. ("First
Trust" or the "Advisor") or First Trust Global Portfolios Ltd. (the
"Sub-Advisor") and their respective representatives, taking into account the
information currently available to them. Forward-looking statements include all
statements that do not relate solely to current or historical fact. For example,
forward-looking statements include the use of words such as "anticipate,"
"estimate," "intend," "expect," "believe," "plan," "may," "should," "would" or
other words that convey uncertainty of future events or outcomes.
Forward-looking statements involve known and unknown risks, uncertainties and
other factors that may cause the actual results, performance or achievements of
the series of First Trust Exchange-Traded Fund III (the "Trust") described in
this report for the First Trust Emerging Markets Local Currency Bond ETF
(hereinafter referred to as the "Fund") to be materially different from any
future results, performance or achievements expressed or implied by the
forward-looking statements. When evaluating the information included in this
report, you are cautioned not to place undue reliance on these forward-looking
statements, which reflect the judgment of the Advisor and/or Sub-Advisor and
their respective representatives only as of the date hereof. We undertake no
obligation to publicly revise or update these forward-looking statements to
reflect events and circumstances that arise after the date hereof.
PERFORMANCE AND RISK DISCLOSURE
There is no assurance that the Fund will achieve its investment objective. The
Fund is subject to market risk, which is the possibility that the market values
of securities owned by the Fund will decline and that the value of the Fund
shares may therefore be less than what you paid for them. Accordingly, you can
lose money by investing in the Fund. See "Risk Considerations" in the Additional
Information section of this report for a discussion of certain other risks of
investing in the Fund.
Performance data quoted represents past performance, which is no guarantee of
future results, and current performance may be lower or higher than the figures
shown. For the most recent month-end performance figures, please visit
http://www.ftportfolios.com or speak with your financial advisor. Investment
returns, net asset value and share price will fluctuate and Fund shares, when
sold, may be worth more or less than their original cost.
HOW TO READ THIS REPORT
This report contains information that may help you evaluate your investment in
the Fund. It includes details about the Fund's portfolio and presents data and
analysis that provide insight into the Fund's performance and investment
approach.
By reading the portfolio commentary by the portfolio management team of the
Fund, you may obtain an understanding of how the market environment affected the
Fund's performance. The statistical information that follows may help you
understand the Fund's performance compared to that of relevant market
benchmarks.
It is important to keep in mind that the opinions expressed by personnel of the
Advisor and/or Sub-Advisor are just that: informed opinions. They should not be
considered to be promises or advice. The opinions, like the statistics, cover
the period through the date on the cover of this report. The material risks of
investing in the Fund are spelled out in its prospectus, statement of additional
information, this report and other Fund regulatory filings.
<PAGE>
--------------------------------------------------------------------------------
SHAREHOLDER LETTER
--------------------------------------------------------------------------------
FIRST TRUST EMERGING MARKETS LOCAL CURRENCY BOND ETF (FEMB)
ANNUAL LETTER FROM THE CHAIRMAN AND CEO
OCTOBER 31, 2017
Dear Shareholders:
Thank you for your investment in First Trust Emerging Markets Local Currency
Bond ETF.
First Trust is pleased to provide you with the annual report which contains
detailed information about your investment for the 12 months ended October 31,
2017, including a market overview and a performance analysis for the period. We
encourage you to read this report carefully and discuss it with your financial
advisor.
The U.S. bull market continued through the November 2016 election and the first
nine months of the Trump presidency. During that period, November 8, 2016
(Election Day 2016) through October 31, 2017, the S&P 500(R) Index (the "Index")
posted a total return of 22.73%, according to Bloomberg. Ten of the eleven Index
sectors were up on a total return basis as well. Since the beginning of 2017
through October 31, 2017, the Index has closed its trading sessions at all-time
highs on 50 occasions. Finally, as of October 31, 2017, the Index has spent the
entire year in positive territory. This has only happened in 10 different years
over the past seven decades.
The current bull market, as measured from March 9, 2009 through October 31, 2017
is the second longest in history. While we are optimistic about the U.S.
economy, we are aware that no one can know how markets will perform in different
economic environments. We are also upbeat about the potential for world economic
growth turning higher. While no one can predict the future, the International
Monetary Fund sees world real gross domestic product rising by an estimated 0.5
percentage points from the 3.2% posted in 2016 to the 3.7% it is projecting for
2018.
We believe that one should invest for the long term and be prepared for market
volatility by keeping current on your portfolio and investing goals by speaking
regularly with your investment professional. It is also important to keep in
mind that past performance can never guarantee future results.
Thank you for giving First Trust the opportunity to be a part of your investment
plan. We value our relationship with you and will continue to focus on bringing
the types of investments that we believe can help you reach your financial
goals.
Sincerely,
/s/ James A. Bowen
James A. Bowen
Chairman of the Board of Trustees
Chief Executive Officer of First Trust Advisors L.P.
Page 1
<PAGE>
--------------------------------------------------------------------------------
FUND PERFORMANCE OVERVIEW (UNAUDITED)
--------------------------------------------------------------------------------
FIRST TRUST EMERGING MARKETS LOCAL CURRENCY BOND ETF (FEMB)
First Trust Emerging Markets Local Currency Bond ETF (the "Fund") seeks maximum
total return and current income. The Fund lists and principally trades its
shares on The Nasdaq Stock Market LLC ("Nasdaq") under the ticker symbol "FEMB."
Under normal market conditions, the Fund seeks to achieve its investment
objective by investing at least 80% of its net assets (including investment
borrowings) in bonds, notes and bills issued or guaranteed by entities in
emerging market countries (collectively, "Bonds") that are denominated in the
local currency of the issuer. In implementing the Fund's investment strategy,
First Trust Global Portfolios Ltd. (the "Sub-Advisor") will seek to provide
current income and enhance capital, while minimizing volatility.
<TABLE>
<CAPTION>
----------------------------------------------------------------------------------------------------------------------------------
PERFORMANCE
----------------------------------------------------------------------------------------------------------------------------------
AVERAGE ANNUAL CUMULATIVE
TOTAL RETURNS TOTAL RETURNS
1 Year Ended Inception (11/4/14) Inception (11/4/14)
10/31/2017 to 10/31/2017 to 10/31/2017
<S> <C> <C> <C>
FUND PERFORMANCE
NAV 4.00% -0.97% -2.86%
Market Price 4.52% -0.90% -2.67%
INDEX PERFORMANCE
Bloomberg Barclays Emerging Markets Local Currency
Government - 10% Country Capped Index 4.54% -0.23% -0.68%
----------------------------------------------------------------------------------------------------------------------------------
</TABLE>
Total returns for the periods since inception are calculated from the inception
date of the Fund. "Average Annual Total Returns" represent the average annual
change in value of an investment over the periods indicated. "Cumulative Total
Returns" represent the total change in value of an investment over the periods
indicated.
The Fund's per share net asset value ("NAV") is the value of one share of the
Fund and is computed by dividing the value of all assets of the Fund (including
accrued interest and dividends), less all liabilities (including accrued
expenses and dividends declared but unpaid), by the total number of outstanding
shares. The price used to calculate market return ("Market Price") is determined
by using the midpoint between the highest bid and the lowest offer on the stock
exchange on which shares of the Fund are listed for trading as of the time that
the Fund's NAV is calculated. Since shares of the Fund did not trade in the
secondary market until after its inception, for the period from inception to the
first day of secondary market trading in shares of the Fund, the NAV of the Fund
is used as a proxy for the secondary market trading price to calculate market
returns. NAV and market price returns assume that all distributions have been
reinvested in the Fund at NAV and Market Price, respectively.
An index is a statistical composite that tracks a specified financial market or
sector. Unlike the Fund, the index does not actually hold a portfolio of
securities and therefore does not incur the expenses incurred by the Fund. These
expenses negatively impact the performance of the Fund. Also, market returns do
not include brokerage commissions that may be payable on secondary market
transactions. If brokerage commissions were included, market returns would be
lower. The total returns presented reflect the reinvestment of dividends on
securities in the index. The returns presented do not reflect the deduction of
taxes that a shareholder would pay on Fund distributions or the redemption or
sale of Fund shares. The investment return and principal value of shares of the
Fund will vary with changes in market conditions. Shares of the Fund may be
worth more or less than their original cost when they are redeemed or sold in
the market. The Fund's past performance is no guarantee of future performance.
Page 2
<PAGE>
--------------------------------------------------------------------------------
FUND PERFORMANCE OVERVIEW (UNAUDITED) (CONTINUED)
--------------------------------------------------------------------------------
FIRST TRUST EMERGING MARKETS LOCAL CURRENCY BOND ETF (FEMB)
----------------------------------------------------------
% OF TOTAL
SECTOR ALLOCATION INVESTMENTS
----------------------------------------------------------
Sovereigns 94.7%
Supranationals 4.9
Central Bank 0.4
-------
Total 100.0%
=======
----------------------------------------------------------
% OF TOTAL
INVESTMENTS
CREDIT RATING(1) (INCLUDING CASH)
----------------------------------------------------------
AAA 4.8%
AA 0.9
AA- 5.0
A+ 2.5
A 12.5
A- 10.0
BBB+ 4.8
BBB 1.6
BBB- 42.8
BB 14.6
Cash 0.5
-------
Total 100.0%
=======
----------------------------------------------------------
% OF TOTAL
TOP 10 HOLDINGS INVESTMENTS
----------------------------------------------------------
Indonesia Treasury Bond, 8.38%, 9/15/26 7.0%
Brazil Notas do Tesouro Nacional, Series F,
10.00%, 1/1/21 6.8
Republic of South Africa Government Bond,
10.50%, 12/21/26 6.5
Brazil Notas do Tesouro Nacional, Series F,
10.00%, 1/1/25 5.4
Romania Government Bond, 5.85%, 4/26/23 4.9
Thailand Government Bond, 3.63%, 6/16/23 4.7
Chile Government International Bond,
5.50%, 8/5/20 4.6
Indonesia Treasury Bond, 8.38%, 3/15/24 3.7
Mexican Bonos, 10.00%, 12/5/24 3.6
Romania Government Bond, 5.95%, 6/11/21 3.5
-------
Total 50.7%
=======
(1) The credit quality and ratings information presented above reflect the
ratings assigned by one or more nationally recognized statistical rating
organizations ("NRSROs"), including Standard & Poor's Ratings Group, a
division of the McGraw-Hill Companies, Inc., Moody's Investors Service,
Inc., Fitch Ratings or a comparably rated NRSRO. For situations in which a
security is rated by more than one NRSRO and the ratings are not
equivalent, the highest ratings are used. Sub-investment grade ratings are
those rated BB+/Ba1 or lower. Investment grade ratings are those rated
BBB-/Baa3 or higher. The credit ratings shown relate to the
creditworthiness of the issuers of the underlying securities in the Fund,
and not to the Fund or its shares. Credit ratings are subject to change.
Page 3
<PAGE>
--------------------------------------------------------------------------------
FUND PERFORMANCE OVERVIEW (UNAUDITED) (CONTINUED)
--------------------------------------------------------------------------------
FIRST TRUST EMERGING MARKETS LOCAL CURRENCY BOND ETF (FEMB)
<TABLE>
<CAPTION>
PERFORMANCE OF A $10,000 INITIAL INVESTMENT
NOVEMBER 4, 2014 - OCTOBER 31, 2017
First Trust Emerging Bloomberg Barclays Emerging
Markets Local Currency Markets Local Currency Government -
Bond ETF 10% Country Capped Index
<S> <C> <C>
11/4/14 $10,000 $10,000
4/30/15 9,340 9,450
10/31/15 8,517 8,634
4/30/16 9,209 9,390
10/31/16 9,340 9,501
4/30/17 9,535 9,600
10/31/17 9,714 9,932
</TABLE>
Performance figures assume reinvestment of all distributions and do not reflect
the deduction of taxes that a shareholder would pay on Fund distributions or the
redemption or sale of Fund shares. An index is a statistical composite that
tracks a specified financial market or sector. Unlike the Fund, the index does
not actually hold a portfolio of securities and therefore does not incur the
expenses incurred by the Fund. These expenses negatively impact the performance
of the Fund. The Fund's past performance does not predict future performance.
FREQUENCY DISTRIBUTION OF DISCOUNTS AND PREMIUMS
BID/ASK MIDPOINT VS. NAV THROUGH OCTOBER 31, 2017
The following Frequency Distribution of Discounts and Premiums charts are
provided to show the frequency at which the bid/ask midpoint price for the Fund
was at a discount or premium to the daily NAV. The following tables are for
comparative purposes only and represent the period November 5, 2014
(commencement of trading) through October 31, 2017. Shareholders may pay more
than NAV when they buy Fund shares and receive less than NAV when they sell
those shares because shares are bought and sold at current market price. Data
presented represents past performance and cannot be used to predict future
results.
--------------------------------------------------------------------------------
NUMBER OF DAYS BID/ASK MIDPOINT AT/ABOVE NAV
--------------------------------------------------------------------------------
FOR THE PERIOD 0.00%-0.49% 0.50%-0.99% 1.00%-1.99% >=2.00%
11/5/14 - 10/31/15 116 110 7 1
11/1/15 - 10/31/16 80 64 38 3
11/1/16 - 10/31/17 104 89 23 2
--------------------------------------------------------------------------------
NUMBER OF DAYS BID/ASK MIDPOINT BELOW NAV
--------------------------------------------------------------------------------
FOR THE PERIOD 0.00%-0.49% 0.50%-0.99% 1.00%-1.99% >=2.00%
11/5/14 - 10/31/15 15 0 0 1
11/1/15 - 10/31/16 60 7 0 0
11/1/16 - 10/31/17 27 7 0 0
Page 4
<PAGE>
--------------------------------------------------------------------------------
PORTFOLIO COMMENTARY
--------------------------------------------------------------------------------
FIRST TRUST EMERGING MARKETS LOCAL CURRENCY BOND ETF (FEMB)
ANNUAL REPORT
OCTOBER 31, 2017 (UNAUDITED)
ADVISOR
First Trust Advisors L.P. ("First Trust" or the "Advisor"), is the investment
advisor to the First Trust Emerging Markets Local Currency Bond ETF (the
"Fund"). First Trust is responsible for the ongoing management of the Fund's
business affairs and providing certain administrative services necessary for the
management of the Fund.
INVESTMENT SUB-ADVISOR
First Trust Global Portfolios Ltd. ("FTGP"), an affiliate of First Trust, serves
as investment sub-advisor to the Fund and is headed by Derek Fulton, Director,
Chief Executive Officer and Chief Investment Officer of FTGP. Established in
December 2011, FTGP is an SEC-registered investment advisor based in London.
FTGP was established as a United Kingdom-based distributor, advisor and
affiliate of First Trust and First Trust Portfolios L.P. and advises on global
fixed income and currency portfolios. The global fixed income team at FTGP has
experience in managing developing and emerging market fixed income portfolios
for high profile European institutions.
PORTFOLIO MANAGEMENT TEAM
The following portfolio managers are primarily responsible for the day-to-day
management of the Fund. Each portfolio manager has managed the Fund since 2014.
DEREK FULTON, DIRECTOR, CHIEF EXECUTIVE OFFICER AND CHIEF INVESTMENT OFFICER,
FTGP
LEONARDO DA COSTA, DIRECTOR, FTGP
COMMENTARY
MARKET RECAP
The macro-economic environment shifted largely positive for emerging market
economies over the last year, buoyed by stronger commodity prices, robust GDP
growth rates and falling inflation. The upward trend in export growth continued
and we have begun to see foreign currency reserves of these countries increasing
again, building up a war-chest to defend against future volatility. The lower
inflation rates in many of these markets has allowed central banks to institute
more pro-growth monetary policy.
Emerging market treasury bonds posted strong returns for the period covered in
the report despite the volatility induced by the U.S. elections and three
interest rate hikes from the U.S. Federal Reserve. The Bloomberg Barclays
Emerging Markets Local Currency Government-10% Country Capped Index (the
"Index") returned 4.54% for the 12 months ending October 31, 2017. This positive
return materialized despite several challenges which confronted emerging markets
over the period. Early on, there were fears that a Donald Trump presidency would
result in the collapse of global trade with severe repercussions for emerging
economies. This proved to be unfounded and global trade now appears to be on a
firmer footing as compared to a year ago. In addition, the headwind of tighter
monetary policy from the U.S. Federal Reserve and the perceived concern that
this would lead to large scale defaults across emerging markets also never
materialized. Finally, another year has passed in which we avoided a hard
landing in China defying many skeptics. Indeed, the Chinese yuan strengthened
2.12% versus the U.S. dollar over the period. Despite these, mainly external,
concerns, emerging markets continued to perform well, in our opinion, due to the
strong growth rates that emerging markets have experienced.
The country and regional returns were quite mixed over the period. Brazilian
assets performed well as bond yields declined significantly off the back of
falling inflation. There was also strength in Russia, as the Russian ruble
strengthened 8.68% versus the U.S. dollar. Higher commodity prices and improving
terms of trade have supported this strength as WTI Crude Oil futures rose 16.05%
over the period. The other notable performance over the period came from Mexican
assets, where the moderate 1.47% depreciation of the Mexican peso versus the U.S
dollar masked significant volatility. Mexican assets suffered considerably
following the uncertainty created by the election of President Trump, however we
saw the Mexican peso make a full recovery to pre-U.S. election levels as
tensions eased between the Mexican authorities and the Trump administration.
Central and Eastern European countries were relative outperformers over the
period, and the resurgence of growth in the Euro-area along with the strength in
the euro vs the U.S. dollar supported these markets. The euro rallied 6.06%
versus the U.S. dollar over the period.
PERFORMANCE ANALYSIS
The Fund returned 4.00% on a net asset value ("NAV") basis for the 12 months
ending October 31, 2017; the market price return was 4.52% over the same period.
The Fund's return was lower than the Index's return of 4.54% for the period.
Page 5
<PAGE>
--------------------------------------------------------------------------------
PORTFOLIO COMMENTARY (CONTINUED)
--------------------------------------------------------------------------------
FIRST TRUST EMERGING MARKETS LOCAL CURRENCY BOND ETF (FEMB)
ANNUAL REPORT
OCTOBER 31, 2017 (UNAUDITED)
The Fund's most recent distribution, as of October 31, 2017, was $0.21 per share
and the 12-month distribution rate was 6.06% as of October 31, 2017. The
distribution in October 2016 was $0.1816 per share. The increase in the
distribution per share was helped by the Fund's more constructive stance towards
the asset class. Despite the yields decreasing for most constituents of the
emerging market local currency universe, while bond prices rose, the Fund's more
fully invested position and larger exposure to higher yielding countries
contributed to the increase in the distribution.
The Fund was generally overweight relative to the Index in Brazil, Indonesia and
Russia, each of which performed well over the period. The local bonds in these
markets benefitted from the overall trend of lower inflation. The Fund also held
exposure to India which is notably absent from many emerging market local
currency indices making it one of the Fund's larger off-Index exposures. India
has been a favored story in Asia as it is one of the more rapidly reforming
emerging market countries with a demographic dividend that we believe should
drive growth in the years ahead. Negative contributors to the Fund's performance
were led by the exposures to Turkey, Colombia and the Philippines. Turkey
experienced a volatile year with the Turkish Lira depreciating 18.4% versus the
U.S. dollar over the period. Many geo-political events, as well as concerns for
the Turkish Central Bank's reluctance to get ahead of the rising inflation
rates, reduced confidence in Turkish assets. It is now, however, one of the
higher yielding emerging market local bond countries.
The active management of the underlying emerging market currency exposures
remains a focus for the Fund, particularly as the volatility of emerging market
currency returns is a large driver of the asset class volatility. At the end of
the period, the Fund had currency hedges on several Central and Eastern European
currencies and long exposure to a basket of higher yielding emerging market
currencies. We continue to believe that the active management of the Fund's
currency exposures will lead to lower overall volatility and strong
risk-adjusted returns going forward.
MARKET AND FUND OUTLOOK
Our positive outlook for the asset class is underpinned by the longer-term
drivers that we believe are improving fundamentals in emerging market economies.
Supportive demographic profiles, relatively low debt levels and competitive
currencies will be a persistent tailwind, in our view. We also anticipate
stronger productivity growth rates on average in emerging market countries as
they are starting from a lower base when compared to developed market economies
but also as new technologies are assimilated into their economies.
In addition to these positive drivers, we believe current valuations are still
attractive for the asset class. The spread between the yield on the JP Morgan
GBI-EM Global Diversified Index and similar duration 5-year maturity U.S.
Treasuries stood at 405 basis points ("bps") at the end of October. This is
below the long-term average spread of 436 bps since the index inception, but
still far from the low of 175 bps seen before the financial crisis.
Given that, in our view, valuations remain attractive, especially for emerging
market currencies, we maintain a bullish bias. The more hawkish stance recently
indicated by the U.S. Federal Reserve (the "Fed") is raising concern that we may
see another period of emerging market weakness similar to the "taper tantrum"
period of 2013. In our view, however, any knee-jerk weakness in emerging market
assets related to hawkish Fed actions should be temporary. We believe the
underlying fundamentals in emerging countries are in a much better state now as
compared to the period in 2013, when many were experiencing a cyclical slowdown.
In comparison to 2013, we now have a stronger outlook for emerging markets based
on improving Purchasing Managers Index ("PMI") surveys, healthy export growth
numbers, increasing foreign exchange reserves and continued gross domestic
product ("GDP") growth in the larger emerging markets, China, India, Brazil and
Russia. In their October 2017 World Economic Outlook, the International Monetary
Fund ("IMF") upgraded their GDP growth forecast for emerging economies to 4.6%
in 2017 and 4.9% in 2018. We believe that as the positive fundamentals reassert
themselves in these countries we may find that the concerns of tightening U.S.
interest rates start to dissipate.
Fund asset flows were positive over the period which also benefitted the Fund as
assets increased from approximately $14.8 million to approximately $49.8
million. The attractive yields on offer and relatively cheap valuations allow
the asset class to stand out against traditional fixed income asset classes, in
our opinion. Early investors have been rewarded with positive performance over
the period and we expect this positive momentum to help future flows into the
asset class.
Finally, we view an allocation to emerging markets as an attractive opportunity
today. We continue to see value in some of the higher yielding emerging market
credits as long as the volatility derived from the underlying currency exposure
is adequately managed. Having said that, we note that emerging market currencies
are also trading at historically cheap levels which may provide an attractive
entry point for global investors. We believe historically cheap valuations,
exposure to global assets and likely diversification benefits against
traditional fixed income alternatives potentially make the Fund an attractive
addition for investors.
Page 6
<PAGE>
FIRST TRUST EMERGING MARKETS LOCAL CURRENCY BOND ETF (FEMB)
UNDERSTANDING YOUR FUND EXPENSES
OCTOBER 31, 2017 (UNAUDITED)
As a shareholder of First Trust Emerging Markets Local Currency Bond ETF (the
"Fund") you incur two types of costs: (1) transaction costs; and (2) ongoing
costs, including management fees, distribution and/or service fees, if any, and
other Fund expenses. This Example is intended to help you understand your
ongoing costs of investing in the Fund and to compare these costs with the
ongoing costs of investing in other funds.
The Example is based on an investment of $1,000 invested at the beginning of the
period and held through the six-month period ended October 31, 2017.
ACTUAL EXPENSES
The first line in the following table provides information about actual account
values and actual expenses. You may use the information in this line, together
with the amount you invested, to estimate the expenses that you paid over the
period. Simply divide your account value by $1,000 (for example, an $8,600
account value divided by $1,000 = 8.6), then multiply the result by the number
in the first line under the heading entitled "Expenses Paid During the Six-Month
Period" to estimate the expenses you paid on your account during this six-month
period.
HYPOTHETICAL EXAMPLE FOR COMPARISON PURPOSES
The second line in the following table provides information about hypothetical
account values and hypothetical expenses based on the Fund's actual expense
ratio and an assumed rate of return of 5% per year before expenses, which is not
the Fund's actual return. The hypothetical account values and expenses may not
be used to estimate the actual ending account balance or expenses you paid for
the period. You may use this information to compare the ongoing costs of
investing in the Fund and other funds. To do so, compare this 5% hypothetical
example with the 5% hypothetical examples that appear in the shareholder reports
of the other funds.
Please note that the expenses shown in the table are meant to highlight your
ongoing costs only and do not reflect any transactional costs such as brokerage
commissions. Therefore, the second line in the table is useful in comparing
ongoing costs only, and will not help you determine the relative total costs of
owning different funds. In addition, if these transactional costs were included,
your costs would have been higher.
<TABLE>
<CAPTION>
-------------------------------------------------------------------------------------------------------------------------
ANNUALIZED
EXPENSE RATIO EXPENSES PAID
BEGINNING ENDING BASED ON THE DURING THE
ACCOUNT VALUE ACCOUNT VALUE SIX-MONTH SIX-MONTH
MAY 1, 2017 OCTOBER 31, 2017 PERIOD PERIOD (a)
-------------------------------------------------------------------------------------------------------------------------
<S> <C> <C> <C> <C> <C> <C>
FIRST TRUST EMERGING MARKETS LOCAL CURRENCY BOND ETF (FEMB)
Actual $1,000.00 $1,018.80 0.85% $4.33
Hypothetical (5% return before expenses) $1,000.00 $1,020.92 0.85% $4.33
</TABLE>
(a) Expenses are equal to the annualized expense ratio as indicated in the
table multiplied by the average account value over the period (May 1, 2017
through October 31, 2017), multiplied by 184/365 (to reflect the one-half
year period).
Page 7
<PAGE>
FIRST TRUST EMERGING MARKETS LOCAL CURRENCY BOND ETF (FEMB)
PORTFOLIO OF INVESTMENTS
OCTOBER 31, 2017
<TABLE>
<CAPTION>
PRINCIPAL
VALUE
(LOCAL STATED STATED VALUE
CURRENCY) DESCRIPTION COUPON MATURITY (US DOLLARS)
--------------- --------------------------------------------------------------- ------------- ------------ --------------
<S> <C> <C> <C> <C>
FOREIGN SOVEREIGN BONDS AND NOTES - 91.3%
BRAZIL - 14.1%
10,400,000 Brazil Notas do Tesouro Nacional, Series F (BRL)............... 10.00% 01/01/21 $ 3,263,126
8,300,000 Brazil Notas do Tesouro Nacional, Series F (BRL)............... 10.00% 01/01/25 2,566,675
3,900,000 Brazil Notas do Tesouro Nacional, Series F (BRL)............... 10.00% 01/01/27 1,203,405
--------------
7,033,206
--------------
CHILE - 4.8%
120,000,000 Bonos del Banco Central de Chile en Pesos (CLP)................ 6.00% 02/01/21 202,065
1,330,500,000 Chile Government International Bond (CLP)...................... 5.50% 08/05/20 2,211,521
--------------
2,413,586
--------------
COLOMBIA - 4.7%
4,851,000,000 Colombian TES (COP)............................................ 7.00% 05/04/22 1,666,245
1,900,000,000 Colombian TES (COP)............................................ 7.50% 08/26/26 663,198
--------------
2,329,443
--------------
CZECH REPUBLIC - 0.9%
9,250,000 Czech Republic Government Bond (CZK)........................... 2.40% 09/17/25 456,242
--------------
HUNGARY - 2.7%
198,800,000 Hungary Government Bond (HUF).................................. 6.50% 06/24/19 822,400
117,020,000 Hungary Government Bond (HUF).................................. 5.50% 06/24/25 542,135
--------------
1,364,535
--------------
INDONESIA - 12.4%
1,500,000,000 Indonesia Treasury Bond (IDR).................................. 7.88% 04/15/19 113,883
22,164,000,000 Indonesia Treasury Bond (IDR).................................. 8.38% 03/15/24 1,773,344
41,205,000,000 Indonesia Treasury Bond (IDR).................................. 8.38% 09/15/26 3,341,972
11,930,000,000 Indonesia Treasury Bond (IDR).................................. 8.38% 03/15/34 955,280
--------------
6,184,479
--------------
ISRAEL - 2.4%
3,050,000 Israel Government Bond - Fixed (ILS)........................... 6.25% 10/30/26 1,205,517
--------------
MALAYSIA - 3.2%
5,520,000 Malaysia Government Bond (MYR)................................. 4.16% 07/15/21 1,328,597
1,000,000 Malaysia Government Bond (MYR)................................. 4.05% 09/30/21 239,353
--------------
1,567,950
--------------
MEXICO - 4.5%
28,620,000 Mexican Bonos (MXN)............................................ 10.00% 12/05/24 1,732,830
9,290,000 Mexican Bonos (MXN)............................................ 7.75% 05/29/31 500,555
--------------
2,233,385
--------------
PERU - 4.8%
2,230,000 Peru Government Bond (PEN)..................................... 7.84% 08/12/20 760,533
4,300,000 Peru Government Bond (PEN)..................................... 8.20% 08/12/26 1,624,071
--------------
2,384,604
--------------
PHILIPPINES - 1.5%
28,000,000 Philippine Government International Bond (PHP)................. 4.95% 01/15/21 558,915
10,000,000 Philippine Government International Bond (PHP)................. 3.90% 11/26/22 192,378
--------------
751,293
--------------
</TABLE>
Page 8 See Notes to Financial Statements
<PAGE>
FIRST TRUST EMERGING MARKETS LOCAL CURRENCY BOND ETF (FEMB)
PORTFOLIO OF INVESTMENTS (CONTINUED)
OCTOBER 31, 2017
<TABLE>
<CAPTION>
PRINCIPAL
VALUE
(LOCAL STATED STATED VALUE
CURRENCY) DESCRIPTION COUPON MATURITY (US DOLLARS)
--------------- --------------------------------------------------------------- ------------- ------------ --------------
<S> <C> <C> <C> <C>
FOREIGN SOVEREIGN BONDS AND NOTES (CONTINUED)
POLAND - 4.4%
600,000 Republic of Poland Government Bond (PLN)....................... 5.50% 10/25/19 $ 177,349
3,460,000 Republic of Poland Government Bond (PLN)....................... 4.00% 10/25/23 1,006,598
3,015,000 Republic of Poland Government Bond (PLN)....................... 5.75% 04/25/29 1,019,150
--------------
2,203,097
--------------
ROMANIA - 9.8%
6,020,000 Romania Government Bond (RON).................................. 5.95% 06/11/21 1,677,953
8,330,000 Romania Government Bond (RON).................................. 5.85% 04/26/23 2,345,974
3,000,000 Romania Government Bond (RON).................................. 5.80% 07/26/27 848,889
--------------
4,872,816
--------------
SOUTH AFRICA - 11.6%
14,850,000 Republic of South Africa Government Bond (ZAR)................. 7.25% 01/15/20 1,039,497
40,445,000 Republic of South Africa Government Bond (ZAR)................. 10.50% 12/21/26 3,101,768
10,300,000 Republic of South Africa Government Bond (ZAR)................. 8.00% 01/31/30 645,200
0,780,000 Republic of South Africa Government Bond (ZAR)................. 6.25% 03/31/36 1,016,707
--------------
5,803,172
--------------
THAILAND - 4.8%
68,150,000 Thailand Government Bond (THB)................................. 3.63% 06/16/23 2,237,218
4,600,000 Thailand Government Bond (THB)................................. 3.65% 06/20/31 152,880
--------------
2,390,098
--------------
TURKEY - 4.7%
5,710,000 Turkey Government Bond (TRY)................................... 10.50% 01/15/20 1,453,634
4,100,000 Turkey Government Bond (TRY)................................... 8.00% 03/12/25 897,049
--------------
2,350,683
--------------
TOTAL FOREIGN SOVEREIGN BONDS AND NOTES........................ 45,544,106
(Cost $45,993,983) --------------
FOREIGN CORPORATE BONDS AND NOTES - 4.7%
SUPRANATIONALS - 4.7%
4,730,000 European Investment Bank (ZAR)................................. 6.00% 10/21/19 325,353
600,000 International Finance Corp. (BRL).............................. 10.50% 04/17/18 187,562
37,800,000 International Finance Corp. (INR).............................. 7.80% 06/03/19 605,060
77,000,000 International Finance Corp. (INR).............................. 6.30% 11/25/24 1,207,843
--------------
TOTAL FOREIGN CORPORATE BONDS AND NOTES..................................................... 2,325,818
(Cost $2,345,986) --------------
TOTAL INVESTMENTS (A) - 96.0%............................................................... 47,869,924
(Cost $48,339,969)
NET OTHER ASSETS AND LIABILITIES - 4.0%..................................................... 1,992,086
--------------
NET ASSETS - 100.0%......................................................................... $ 49,862,010
==============
</TABLE>
See Notes to Financial Statements Page 9
<PAGE>
FIRST TRUST EMERGING MARKETS LOCAL CURRENCY BOND ETF (FEMB)
PORTFOLIO OF INVESTMENTS (CONTINUED)
OCTOBER 31, 2017
<TABLE>
<CAPTION>
FORWARD FOREIGN CURRENCY CONTRACTS
-------------------------------------------------------
PURCHASE SALE UNREALIZED
SETTLEMENT AMOUNT AMOUNT VALUE AS OF VALUE AS OF APPRECIATION/
DATE COUNTERPARTY PURCHASED SOLD OCTOBER 31, 2017 OCTOBER 31, 2017 (DEPRECIATION)
-------------- -------------- ----------------- --------------- ----------------- ---------------- --------------
<S> <C> <C> <C> <C> <C> <C>
11/24/17 BNS COP 6,000,000,000 USD 2,037,351 $ 1,968,098 $ 2,037,351 $ (69,253)
11/24/17 BNS INR 230,000,000 USD 3,523,231 3,540,371 3,523,231 17,140
11/24/17 BNS KRW 600,000,000 USD 530,012 535,600 530,012 5,588
11/24/17 BBH MXN 16,000,000 USD 836,897 831,218 836,897 (5,679)
11/24/17 BNS PEN 1,000,000 USD 308,261 307,322 308,261 (939)
11/24/17 BNS RUB 388,000,000 USD 6,713,964 6,610,010 6,713,964 (103,954)
11/24/17 BBH USD 1,172,197 HUF 306,000,000 1,172,197 1,145,770 26,427
11/24/17 BBH USD 947,005 PLN 3,400,000 947,005 934,038 12,967
11/24/17 BBH USD 2,731,165 RON 10,650,000 2,731,165 2,694,605 36,560
--------------
Net Unrealized Appreciation (Depreciation).................................................................... $ (81,143)
==============
</TABLE>
Counterparty Abbreviations:
BBH Brown Brothers Harriman & Co.
BNS Bank of Nova Scotia
-----------------------------
(a) Aggregate cost for federal income tax purposes is $48,905,185. As of
October 31, 2017, the aggregate gross unrealized appreciation for all
investments in which there was an excess of value over tax cost was
$559,096 and the aggregate gross unrealized depreciation for all
investments in which there was an excess of tax cost over value was
$1,675,500. The net unrealized depreciation was $1,116,404. The amounts
presented are inclusive of derivative contracts.
Currency Abbreviations:
BRL Brazilian Real
CLP Chilean Peso
COP Colombian Peso
CZK Czech Republic Koruna
HUF Hungarian Forint
IDR Indonesian Rupiah
ILS Israel Shekel
INR Indian Rupee
KRW South Korean Won
MXN Mexican Peso
MYR Malaysian Ringgit
PEN Peruvian New Sol
PHP Philippines Peso
PLN Polish Zloty
RON Romanian Lev
RUB Russian Ruble
THB Thailand Baht
TRY Turkish Lira
ZAR South African Rand
Page 10 See Notes to Financial Statements
<PAGE>
FIRST TRUST EMERGING MARKETS LOCAL CURRENCY BOND ETF (FEMB)
PORTFOLIO OF INVESTMENTS (CONTINUED)
OCTOBER 31, 2017
-----------------------------
VALUATION INPUTS
A summary of the inputs used to value the Fund's investments as of October 31,
2017 is as follows (see Note 2A - Portfolio Valuation in the Notes to Financial
Statements):
<TABLE>
<CAPTION>
ASSETS TABLE
LEVEL 2 LEVEL 3
TOTAL LEVEL 1 SIGNIFICANT SIGNIFICANT
VALUE AT QUOTED OBSERVABLE UNOBSERVABLE
10/31/2017 PRICES INPUTS INPUTS
------------- ------------- -------------- --------------
<S> <C> <C> <C> <C>
Foreign Sovereign Bonds and Notes*................. $ 45,544,106 $ -- $ 45,544,106 $ --
Foreign Corporate Bonds and Notes*................. 2,325,818 -- 2,325,818 --
------------- ------------- -------------- --------------
Total Investments.................................. 47,869,924 -- 47,869,924 --
Other Financial Instruments:
Forward Foreign Currency Contracts**............... 98,682 -- 98,682 --
------------- ------------- -------------- --------------
Total.............................................. $ 47,968,606 $ -- $ 47,968,606 $ --
============= ============= ============== ==============
LIABILITIES TABLE
LEVEL 2 LEVEL 3
TOTAL LEVEL 1 SIGNIFICANT SIGNIFICANT
VALUE AT QUOTED OBSERVABLE UNOBSERVABLE
10/31/2017 PRICES INPUTS INPUTS
------------- ------------- -------------- --------------
Forward Foreign Currency Contracts**............... $ (179,825) $ -- $ (179,825) $ --
============= ============= ============== ==============
</TABLE>
* See the Portfolio of Investments for country breakout.
** See the Schedule of Forward Foreign Currency Contracts for contract and
currency detail.
All transfers in and out of the Levels during the period are assumed to occur on
the last day of the period at their current value. There were no transfers
between Levels at October 31, 2017.
--------------------------------------------
% OF TOTAL
CURRENCY EXPOSURE INVESTMENTS
DIVERSIFICATION (INCLUDING CASH)+
--------------------------------------------
BRL 15.0%
RUB 13.8
IDR 12.9
ZAR 12.8
INR 11.1
COP 8.9
MXN 6.4
PEN 5.6
CLP 5.0
TRY 4.9
THB 4.8
RON 4.5
MYR 3.3
PLN 2.7
ILS 2.6
PHP 1.6
KRW 1.1
CZK 0.9
HUF 0.5
USD -18.4
-------
Total 100.0%
=======
+ The weightings include the impact of currency forwards.
See Notes to Financial Statements Page 11
<PAGE>
FIRST TRUST EMERGING MARKETS LOCAL CURRENCY BOND ETF (FEMB)
STATEMENT OF ASSETS AND LIABILITIES
OCTOBER 31, 2017
<TABLE>
<CAPTION>
ASSETS:
<S> <C>
Investments, at value.................................................. $ 47,869,924
Cash................................................................... 256,675
Foreign currency....................................................... 1,664
Unrealized appreciation on forward foreign currency contracts.......... 98,682
Receivables:
Interest............................................................ 982,242
Investment securities sold.......................................... 920,869
--------------
Total Assets........................................................ 50,130,056
--------------
LIABILITIES:
Unrealized depreciation on forward foreign currency contracts.......... 179,825
Payables:
Investment advisory fees............................................ 36,917
Due to Broker....................................................... 27,642
Deferred capital gains tax.......................................... 23,662
--------------
Total Liabilities................................................... 268,046
--------------
NET ASSETS............................................................. $ 49,862,010
==============
NET ASSETS CONSIST OF:
Paid-in capital........................................................ $ 51,012,145
Par value.............................................................. 12,000
Accumulated net investment income (loss)............................... (352,641)
Accumulated net realized gain (loss) on investments, forward foreign
currency contracts and foreign currency transactions................ (201,900)
Net unrealized appreciation (depreciation) on investments, forward
foreign currency contracts and foreign currency translation......... (607,594)
--------------
NET ASSETS............................................................. $ 49,862,010
==============
NET ASSET VALUE, per share............................................. $ 41.55
==============
Number of shares outstanding (unlimited number of shares authorized,
par value $0.01 per share).......................................... 1,200,002
==============
Investments, at cost................................................... $ 48,339,969
==============
Foreign currency, at cost (proceeds)................................... $ 2,334
==============
</TABLE>
Page 12 See Notes to Financial Statements
<PAGE>
FIRST TRUST EMERGING MARKETS LOCAL CURRENCY BOND ETF (FEMB)
STATEMENT OF OPERATIONS
FOR THE YEAR ENDED OCTOBER 31, 2017
<TABLE>
<CAPTION>
INVESTMENT INCOME:
<S> <C>
Interest............................................................... $ 2,005,076
Foreign tax withholding................................................ (37,005)
--------------
Total investment income............................................. 1,968,071
--------------
EXPENSES:
Investment advisory fees............................................... 288,456
--------------
Total expenses...................................................... 288,456
--------------
NET INVESTMENT INCOME (LOSS)........................................... 1,679,615
--------------
NET REALIZED AND UNREALIZED GAIN (LOSS):
Net realized gain (loss) on:
Investments......................................................... (226,873)
Foreign capital gains tax........................................... (251)
Forward foreign currency contracts.................................. 129,213
Foreign currency transactions....................................... 44,088
--------------
Net realized gain (loss)............................................... (53,823)
--------------
Net change in unrealized appreciation (depreciation) on:
Investments......................................................... (64,681)
Forward foreign currency contracts.................................. (68,391)
Foreign currency translation........................................ (34,324)
Net change in deferred capital gains tax............................ (20,822)
--------------
Net change in unrealized appreciation (depreciation)................... (188,218)
--------------
NET REALIZED AND UNREALIZED GAIN (LOSS)................................ (242,041)
--------------
NET INCREASE (DECREASE) IN NET ASSETS RESULTING
FROM OPERATIONS..................................................... $ 1,437,574
==============
</TABLE>
See Notes to Financial Statements Page 13
<PAGE>
FIRST TRUST EMERGING MARKETS LOCAL CURRENCY BOND ETF (FEMB)
STATEMENTS OF CHANGES IN NET ASSETS
<TABLE>
<CAPTION>
YEAR YEAR
ENDED ENDED
10/31/2017 10/31/2016
-------------- --------------
<S> <C> <C>
OPERATIONS:
Net investment income (loss)........................................... $ 1,679,615 $ 259,919
Net realized gain (loss)............................................... (53,823) (121,079)
Net change in unrealized appreciation (depreciation)................... (188,218) 218,256
-------------- --------------
Net increase (decrease) in net assets resulting from operations........ 1,437,574 357,096
-------------- --------------
DISTRIBUTIONS TO SHAREHOLDERS FROM:
Net investment income.................................................. (2,013,285) (208,381)
Return of capital...................................................... -- (95,214)
-------------- --------------
Total distributions to shareholders.................................... (2,013,285) (303,595)
-------------- --------------
SHAREHOLDER TRANSACTIONS:
Proceeds from shares sold.............................................. 35,625,661 10,681,117
-------------- --------------
Net increase (decrease) in net assets resulting from
shareholder transactions............................................ 35,625,661 10,681,117
-------------- --------------
Total increase (decrease) in net assets................................ 35,049,950 10,734,618
NET ASSETS:
Beginning of period.................................................... 14,812,060 4,077,442
-------------- --------------
End of period.......................................................... $ 49,862,010 $ 14,812,060
============== ==============
Accumulated net investment income (loss) at end of period.............. $ (352,641) $ (77,186)
============== ==============
CHANGES IN SHARES OUTSTANDING:
Shares outstanding, beginning of period................................ 350,002 100,002
Shares sold............................................................ 850,000 250,000
-------------- --------------
Shares outstanding, end of period...................................... 1,200,002 350,002
============== ==============
</TABLE>
Page 14 See Notes to Financial Statements
<PAGE>
FIRST TRUST EMERGING MARKETS LOCAL CURRENCY BOND ETF (FEMB)
FINANCIAL HIGHLIGHTS
FOR A SHARE OUTSTANDING THROUGHOUT EACH PERIOD
<TABLE>
<CAPTION>
YEAR ENDED OCTOBER 31,
------------------------------- PERIOD ENDED
2017 2016 10/31/2015 (a)
-------------- -------------- --------------
<S> <C> <C> <C>
Net asset value, beginning of period $ 42.32 $ 40.77 $ 50.00
---------- ---------- ----------
INCOME FROM INVESTMENT OPERATIONS:
Net investment income (loss) 2.30 1.74 1.94
Net realized and unrealized gain (loss) (0.65) 2.09 (9.23)
---------- ---------- ----------
Total from investment operations 1.65 3.83 (7.29)
---------- ---------- ----------
DISTRIBUTIONS PAID TO SHAREHOLDERS FROM:
Net investment income (2.42) (1.56) --
Return of capital -- (0.72) (1.94)
---------- ---------- ----------
Total distributions (2.42) (2.28) (1.94)
---------- ---------- ----------
Net asset value, end of period $ 41.55 $ 42.32 $ 40.77
========== ========== ==========
TOTAL RETURN (b) 4.00% 9.66% (14.83)%
RATIOS/SUPPLEMENTAL DATA:
Net assets, end of period (in 000's) $ 49,862 $ 14,812 $ 4,077
RATIOS TO AVERAGE NET ASSETS:
Ratio of total expenses to average net assets 0.85% 0.85% 0.85% (c)
Ratio of net investment income (loss) to
average net assets 4.95% 4.70% 4.36% (c)
Portfolio turnover rate (d) 16% 23% 49%
</TABLE>
(a) Inception date is November 4, 2014, which is consistent with the
commencement of investment operations and is the date the initial creation
units were established.
(b) Total return is calculated assuming an initial investment made at the net
asset value at the beginning of the period, reinvestment of all
distributions at net asset value during the period, and redemption at net
asset value on the last day of the period. The returns presented do not
reflect the deduction of taxes that a shareholder would pay on Fund
distributions or the redemption or sale of Fund shares. Total return is
calculated for the time period presented and is not annualized for periods
of less than a year.
(c) Annualized.
(d) Portfolio turnover is calculated for the time period presented and is not
annualized for periods of less than a year and does not include securities
received or delivered from processing creations or redemptions and in-kind
transactions.
See Notes to Financial Statements Page 15
<PAGE>
--------------------------------------------------------------------------------
NOTES TO FINANCIAL STATEMENTS
--------------------------------------------------------------------------------
FIRST TRUST EMERGING MARKETS LOCAL CURRENCY BOND ETF (FEMB)
OCTOBER 31, 2017
1. ORGANIZATION
First Trust Exchange-Traded Fund III (the "Trust") is an open-end management
investment company organized as a Massachusetts business trust on January 9,
2008, and is registered with the Securities and Exchange Commission under the
Investment Company Act of 1940, as amended (the "1940 Act").
The Trust currently consists of twelve exchange-traded funds that are currently
offering shares. This report covers First Trust Emerging Markets Local Currency
Bond ETF (the "Fund"), a non-diversified series of the Trust, which trades under
the ticker FEMB on The Nasdaq Stock Market LLC ("Nasdaq"). Unlike conventional
mutual funds, the Fund issues and redeems shares on a continuous basis, at net
asset value ("NAV"), only in large specified blocks consisting of 50,000 shares
called a "Creation Unit." Creation Units are issued and redeemed in cash and, in
certain circumstances, in-kind for securities in which the Fund invests. Except
when aggregated in Creation Units, the shares are not redeemable securities of
the Fund.
The Fund is an actively managed exchange-traded fund. The investment objective
of the Fund is to seek maximum total return and current income. Under normal
market conditions, the Fund seeks to achieve its investment objective by
investing at least 80% of its net assets (including investment borrowings) in
bonds, notes and bills issued or guaranteed by issuers in emerging market
countries that are denominated in the local currency of the issuer. There can be
no assurance the Fund will achieve its investment objective. The Fund may not be
appropriate for all investors.
2. SIGNIFICANT ACCOUNTING POLICIES
The Fund is considered an investment company and follows accounting and
reporting guidance under Financial Accounting Standards Board ("FASB")
Accounting Standards Codification ("ASC") Topic 946, "Financial
Services-Investment Companies." The following is a summary of significant
accounting policies consistently followed by the Fund in the preparation of the
financial statements. The preparation of financial statements in accordance with
accounting principles generally accepted in the United States of America ("U.S.
GAAP") requires management to make estimates and assumptions that affect the
reported amounts and disclosures in the financial statements. Actual results
could differ from those estimates.
A. PORTFOLIO VALUATION
The Fund's NAV is determined daily as of the close of regular trading on The New
York Stock Exchange ("NYSE"), normally 4:00 p.m. Eastern time, on each day the
NYSE is open for trading. If the NYSE closes early on a valuation day, the
Fund's NAV is determined as of that time. Domestic debt securities and foreign
securities are priced using data reflecting the earlier closing of the principal
markets for those securities. The NAV is calculated by dividing the value of all
assets of the Fund (including accrued interest and dividends), less all
liabilities (including accrued expenses and dividends declared but unpaid), by
the total number of shares outstanding.
The Fund's investments are valued daily at market value or, in the absence of
market value with respect to any portfolio securities, at fair value. Market
value prices represent last sale or official closing prices from a national or
foreign exchange (i.e., a regulated market) and are primarily obtained from
third-party pricing services. Fair value prices represent any prices not
considered market value prices and are either obtained from a third-party
pricing service or are determined by the Pricing Committee of the Fund's
investment advisor, First Trust Advisors L.P. ("First Trust" or the "Advisor"),
in accordance with valuation procedures adopted by the Trust's Board of
Trustees, and in accordance with provisions of the 1940 Act. Investments valued
by the Advisor's Pricing Committee, if any, are footnoted as such in the
footnotes to the Portfolio of Investments. The Fund's investments are valued as
follows:
Bonds, notes and other debt securities are fair valued on the basis of
valuations provided by dealers who make markets in such securities or by a
third-party pricing service approved by the Trust's Board of Trustees,
which may use the following valuation inputs when available:
1) benchmark yields;
2) reported trades;
3) broker/dealer quotes;
4) issuer spreads;
5) benchmark securities;
6) bids and offers; and
7) reference data including market research publications.
Fixed income and other debt securities having a remaining maturity of
sixty days or less when purchased are fair valued at cost adjusted for
amortization of premiums and accretion of discounts (amortized cost),
provided the Advisor's Pricing Committee has determined that the use of
amortized cost is an appropriate reflection of fair value given market and
issuer-specific conditions existing at the time of the determination.
Factors that may be considered in determining the appropriateness of the
use of amortized cost include, but are not limited to, the following:
Page 16
<PAGE>
--------------------------------------------------------------------------------
NOTES TO FINANCIAL STATEMENTS (CONTINUED)
--------------------------------------------------------------------------------
FIRST TRUST EMERGING MARKETS LOCAL CURRENCY BOND ETF (FEMB)
OCTOBER 31, 2017
1) the credit conditions in the relevant market and changes thereto;
2) the liquidity conditions in the relevant market and changes thereto;
3) the interest rate conditions in the relevant market and changes
thereto (such as significant changes in interest rates);
4) issuer-specific conditions (such as significant credit
deterioration); and
5) any other market-based data the Advisor's Pricing Committee
considers relevant. In this regard, the Advisor's Pricing Committee
may use last-obtained market-based data to assist it when valuing
portfolio securities using amortized cost.
Forward foreign currency contracts are fair valued at the current day's
interpolated foreign exchange rate, as calculated using the current day's
spot rate, and the thirty, sixty, ninety, and one-hundred eighty day
forward rates provided by a third-party pricing service.
Certain securities may not be able to be priced by pre-established pricing
methods. Such securities may be valued by the Trust's Board of Trustees or its
delegate, the Advisor's Pricing Committee, at fair value. These securities
generally include, but are not limited to, restricted securities (securities
which may not be publicly sold without registration under the Securities Act of
1933, as amended) for which a third-party pricing service is unable to provide a
market price; securities whose trading has been formally suspended; a security
whose market or fair value price is not available from a pre-established pricing
source; a security with respect to which an event has occurred that is likely to
materially affect the value of the security after the market has closed but
before the calculation of the Fund's NAV or make it difficult or impossible to
obtain a reliable market quotation; and a security whose price, as provided by
the third-party pricing service, does not reflect the security's fair value. As
a general principle, the current fair value of a security would appear to be the
amount which the owner might reasonably expect to receive for the security upon
its current sale. When fair value prices are used, generally they will differ
from market quotations or official closing prices on the applicable exchanges. A
variety of factors may be considered in determining the fair value of such
securities, including, but not limited to, the following:
1) the fundamental business data relating to the issuer, or economic
data relating to the country of issue;
2) an evaluation of the forces which influence the market in which
these securities are purchased and sold;
3) the type, size and cost of security;
4) the financial statements of the issuer, or the financial condition
of the country of issue;
5) the credit quality and cash flow of the issuer, or country of issue,
based on the Advisor's or external analysis;
6) the information as to any transactions in or offers for the
security;
7) the price and extent of public trading in similar securities (or
equity securities) of the issuer/borrower, or comparable companies;
8) the coupon payments;
9) the quality, value and salability of collateral, if any, securing
the security;
10) the business prospects of the issuer, including any ability to
obtain money or resources from a parent or affiliate and an
assessment of the issuer's management (for corporate debt only);
11) the economic, political and social prospects/developments of the
country of issue and the assessment of the country's governmental
leaders/officials (for sovereign debt only);
12) the prospects for the issuer's industry, and multiples (of earnings
and/or cash flows) being paid for similar businesses in that
industry (for corporate debt only); and
13) other relevant factors.
The Fund is subject to fair value accounting standards that define fair value,
establish the framework for measuring fair value and provide a three-level
hierarchy for fair valuation based upon the inputs to the valuation as of the
measurement date. The three levels of the fair value hierarchy are as follows:
o Level 1 - Level 1 inputs are quoted prices in active markets for
identical investments. An active market is a market in which
transactions for the investment occur with sufficient frequency and
volume to provide pricing information on an ongoing basis.
o Level 2 - Level 2 inputs are observable inputs, either directly or
indirectly, and include the following:
o Quoted prices for similar investments in active markets.
o Quoted prices for identical or similar investments in markets
that are non-active. A non-active market is a market where
there are few transactions for the investment, the prices are
not current, or price quotations vary substantially either
over time or among market makers, or in which little
information is released publicly.
o Inputs other than quoted prices that are observable for the
investment (for example, interest rates and yield curves
observable at commonly quoted intervals, volatilities,
prepayment speeds, loss severities, credit risks, and default
rates).
o Inputs that are derived principally from or corroborated by
observable market data by correlation or other means.
o Level 3 - Level 3 inputs are unobservable inputs. Unobservable
inputs may reflect the reporting entity's own assumptions about the
assumptions that market participants would use in pricing the
investment.
The inputs or methodologies used for valuing investments are not necessarily an
indication of the risk associated with investing in those investments. A summary
of the inputs used to value the Fund's investments as of October 31, 2017, is
included with the Fund's Portfolio of Investments.
Page 17
<PAGE>
--------------------------------------------------------------------------------
NOTES TO FINANCIAL STATEMENTS (CONTINUED)
--------------------------------------------------------------------------------
FIRST TRUST EMERGING MARKETS LOCAL CURRENCY BOND ETF (FEMB)
OCTOBER 31, 2017
B. SECURITIES TRANSACTIONS AND INVESTMENT INCOME
Securities transactions are recorded as of the trade date. Realized gains and
losses from securities transactions are recorded on the identified cost basis.
Dividend income is recorded on the ex-dividend date. Interest income is recorded
on the accrual basis. Amortization of premiums and accretion of discounts are
recorded using the effective interest method.
C. FORWARD FOREIGN CURRENCY CONTRACTS
The Fund is subject to foreign currency risk in the normal course of pursuing
its investment objective. Forward foreign currency contracts are agreements
between two parties ("Counterparties") to exchange one currency for another at a
future date and at a specified price. The Fund uses forward foreign currency
contracts to facilitate transactions in foreign securities and to manage the
Fund's foreign currency exposure. These contracts are valued daily, and the
Fund's net equity therein, representing unrealized gain or loss on the contracts
as measured by the difference between the forward foreign exchange rates at the
dates of entry into the contracts and the forward rates at the reporting date,
is included in "Unrealized appreciation (depreciation) on forward foreign
currency contracts" on the Statement of Assets and Liabilities. The change in
unrealized appreciation (depreciation) is included in "Net change in unrealized
appreciation (depreciation) on forward foreign currency contracts" on the
Statement of Operations. When the forward contract is closed, the Fund records a
realized gain or loss equal to the difference between the proceeds from (or the
cost of) the closing transaction and the Fund's basis in the contract. This
realized gain or loss is included in "Net realized gain (loss) on forward
foreign currency contracts" on the Statement of Operations. Risks arise from the
possible inability of Counterparties to meet the terms of their contracts and
from movement in currency, securities values and interest rates. Due to the
risks, the Fund could incur losses in excess of the net unrealized value shown
on the Forward Foreign Currency Contracts table in the Portfolio of Investments.
In the event of default by the Counterparty, the Fund will provide notice to the
Counterparty of the Fund's intent to convert the currency held by the Fund into
the currency that the Counterparty agreed to exchange with the Fund. If a
Counterparty becomes bankrupt or otherwise fails to perform its obligations due
to financial difficulties, the Fund may experience significant delays in
obtaining any recovery in a bankruptcy or other reorganization proceeding. The
Fund may obtain only limited recovery or may obtain no recovery in such
circumstances.
D. OFFSETTING ON THE STATEMENT OF ASSETS AND LIABILITIES
Offsetting assets and liabilities requires entities to disclose both gross and
net information about instruments and transactions eligible for offset on the
Statement of Assets and Liabilities, and disclose instruments and transactions
subject to master netting or similar agreements. These disclosure requirements
are intended to help investors and other financial statement users better assess
the effect or potential effect of offsetting arrangements on a fund's financial
position. The transactions subject to offsetting disclosures are derivative
instruments, repurchase agreements and reverse repurchase agreements, and
securities borrowing and securities lending transactions.
For financial reporting purposes, the Fund does not offset financial assets and
financial liabilities that are subject to master netting arrangements ("MNAs")
or similar agreements on the Statement of Assets and Liabilities. MNAs provide
the right, in the event of default (including bankruptcy and insolvency), for
the non-defaulting Counterparty to liquidate the collateral and calculate the
net exposure to the defaulting party or request additional collateral.
At October 31, 2017, derivative assets and liabilities (by type) on a gross
basis are as follows:
<TABLE>
<CAPTION>
Gross Amounts not
Offset in the
Statement of Assets
Net Amounts of and Liabilities
Gross Amounts Assets -----------------------
Offset in the Presented in the Collateral
Gross Amounts of Statement of Assets Statement of Assets Financial Amounts
Recognized Assets and Liabilities and Liabilities Instruments Received Net Amount
------------------------------------------------------------------------------------------------------------------------------
<S> <C> <C> <C> <C> <C> <C>
Forward Foreign Currency
Contracts* $ 98,682 $ -- $ 98,682 $(28,407) $ -- $ 70,275
Gross Amounts not
Offset in the
the Statement of Assets
Net Amounts of and Liabilities
Gross Amounts Liabilities -----------------------
Offset in the Presented in the Collateral
Gross Amounts of Statement of Assets Statement of Assets Financial Amounts
Recognized Liabilities and Liabilities and Liabilities Instruments Pledged Net Amount
------------------------------------------------------------------------------------------------------------------------------
Forward Foreign Currency
Contracts* $ (179,825) $ -- $ (179,825) $ 28,407 $ -- $ (151,418)
</TABLE>
* The respective Counterparties for each contract are disclosed on the
Forward Foreign Currency Contracts table in the Portfolio of Investments.
Page 18
<PAGE>
--------------------------------------------------------------------------------
NOTES TO FINANCIAL STATEMENTS (CONTINUED)
--------------------------------------------------------------------------------
FIRST TRUST EMERGING MARKETS LOCAL CURRENCY BOND ETF (FEMB)
OCTOBER 31, 2017
E. FOREIGN CURRENCY
The books and records of the Funds are maintained in U.S. dollars. Foreign
currencies, investments and other assets and liabilities are translated into
U.S. dollars at the exchange rates prevailing at the end of the period.
Purchases and sales of investments and items of income and expense are
translated on the respective dates of such transactions. Unrealized gains and
losses on assets and liabilities, other than investments in securities, which
result from changes in foreign currency exchange rates have been included in
"Net change in unrealized appreciation (depreciation) on foreign currency
translation" on the Statement of Operations. Unrealized gains and losses on
investments in securities which result from changes in foreign exchange rates
are included with fluctuations arising from changes in market price and are
shown in "Net change in unrealized appreciation (depreciation) on investments"
on the Statement of Operations. Net realized foreign currency gains and losses
include the effect of changes in exchange rates between trade date and
settlement date on investment security transactions, foreign currency
transactions and interest and dividends received and are shown in "Net realized
gain (loss) on foreign currency transactions" on the Statement of Operations.
The portion of foreign currency gains and losses related to fluctuations in
exchange rates between the initial purchase settlement date and subsequent sale
trade date is included in "Net realized gain (loss) on investments" on the
Statement of Operations.
F. DIVIDENDS AND DISTRIBUTIONS TO SHAREHOLDERS
Dividends from net investment income, if any, are declared and paid monthly, or
as the Board of Trustees may determine from time to time. Distributions of net
realized capital gains earned by the Fund, if any, will be distributed at least
annually.
Distributions from income and capital gains are determined in accordance with
federal income tax regulations, which may differ from U.S. GAAP. Certain capital
accounts in the financial statements are periodically adjusted for permanent
differences in order to reflect their tax character. These permanent differences
are primarily due to the varying treatment of income and gain/loss on portfolio
securities held by the Fund and have no impact on net assets or net asset value
per share. Temporary differences, which arise from recognizing certain items of
income, expense and gain/loss in different periods for financial statement and
tax purposes, will reverse at some time in the future.
The tax character of distributions paid during the fiscal years ended October
31, 2017 and 2016, was as follows:
Distributions paid from: 2017 2016
Ordinary income.................................... $ 2,013,285 $ 208,381
Capital gain....................................... -- --
Return of capital.................................. -- 95,214
As of October 31, 2017, the components of distributable earnings on a tax basis
were as follows:
Undistributed ordinary income...................... $ 206,483
Accumulated capital and other losses............... (195,808)
Net unrealized appreciation (depreciation)......... (1,172,810)
G. INCOME TAXES
The Fund intends to continue to qualify as a regulated investment company by
complying with the requirements under Subchapter M of the Internal Revenue Code
of 1986, as amended, which includes distributing substantially all of its net
investment income and net realized gains to shareholders. Accordingly, no
provision has been made for federal and state income taxes. However, due to the
timing and amount of distributions, the Fund may be subject to an excise tax of
4% of the amount by which approximately 98% of the Fund's taxable income exceeds
the distributions from such taxable income for the calendar year.
The Fund is subject to accounting standards that establish a minimum threshold
for recognizing, and a system for measuring, the benefits of a tax position
taken or expected to be taken in a tax return. The taxable years ended 2015,
2016 and 2017 remain open to federal and state audit. As of October 31, 2017,
management has evaluated the application of these standards to the Fund, and has
determined that no provision for income tax is required in the Fund's financial
statements for uncertain tax positions.
The Fund intends to utilize provisions of the federal income tax laws, which
allow it to carry a realized capital loss forward indefinitely following the
year of the loss and offset such loss against any future realized capital gains.
The Fund is subject to certain limitations under U.S. tax rules on the use of
capital carryforwards and net unrealized built-in losses. These limitations
apply when there has been a 50% change in ownership. At October 31, 2017, the
Fund had non-expiring capital loss carryforwards for federal income tax purposes
of $195,808.
Certain losses realized during the current fiscal year may be deferred and
treated as occurring on the first day of the following fiscal year for federal
income tax purposes. For the fiscal year ended October 31, 2017, the Fund had no
net ordinary losses.
Page 19
<PAGE>
--------------------------------------------------------------------------------
NOTES TO FINANCIAL STATEMENTS (CONTINUED)
--------------------------------------------------------------------------------
FIRST TRUST EMERGING MARKETS LOCAL CURRENCY BOND ETF (FEMB)
OCTOBER 31, 2017
In order to present paid-in capital, accumulated net investment income (loss)
and accumulated net realized gain (loss) on investments on the Statement of
Assets and Liabilities that more closely represent their tax character, certain
adjustments have been made to paid-in capital, accumulated net investment income
(loss) and accumulated net realized gain (loss) on investments. These
adjustments are primarily due to the difference between book and tax treatments
of income and gains on various investment securities held by the Fund and
in-kind transactions. The results of operations and net assets were not affected
by these adjustments. For the fiscal year ended October 31, 2017, the
adjustments for the Fund were as follows:
Accumulated
Accumulated Net Realized
Net Investment Gain (Loss) Paid-in
Income (Loss) on Investments Capital
----------------- ----------------- -----------------
$ 58,215 $ (58,215) $ --
H. EXPENSES
Expenses, other than the investment advisory fee and other excluded expenses,
are paid by the Advisor (See Note 3).
I. NEW AND AMENDED FINANCIAL REPORTING RULES AND FORMS
On October 13, 2016, the SEC adopted new rules and forms, and amended existing
rules and forms. The new and amended rules and forms are intended to modernize
the reporting of information provided by funds and to improve the quality and
type of information that funds provide to the SEC and investors. In part, the
new and amended rules and forms amend Regulation S-X and require standardized,
enhanced disclosures about derivatives in a fund's financial statements, as well
as other amendments. The compliance date for the amendments of Regulation S-X
was August 1, 2017 and resulted in additional disclosure for derivative
instruments within the Portfolio of Investments. The new form types and other
rule amendments will be effective for the First Trust funds, including the Fund,
for reporting periods beginning on and after June 1, 2018. Management is
evaluating the new form types and other rule amendments that are effective on
and after June 1, 2018, to determine the impact on the Fund.
J. NEW ACCOUNTING PRONOUNCEMENT
In December 2016, FASB released Accounting Standards Update ("ASU") 2016-19 that
makes technical changes to various sections of the ASC, including Topic 820,
Fair Value Measurement. The changes to Topic 820 are intended to clarify the
difference between a valuation approach and a valuation technique. The changes
to ASC 820-10-50-2 require a reporting entity to disclose, for Level 2 and Level
3 fair value measurements, a change in either or both a valuation approach and a
valuation technique and the reason(s) for the change. The changes to Topic 820
are effective for fiscal years, and interim periods within those fiscal years,
beginning after December 15, 2016. At this time, management is evaluating the
implications of the ASU and has not yet determined its impact on the financial
statements and disclosures.
3. INVESTMENT ADVISORY FEE, AFFILIATED TRANSACTIONS AND OTHER FEE ARRANGEMENTS
First Trust, the investment advisor to the Fund, is a limited partnership with
one limited partner, Grace Partners of DuPage L.P., and one general partner, The
Charger Corporation. The Charger Corporation is an Illinois corporation
controlled by James A. Bowen, Chief Executive Officer of First Trust. First
Trust is responsible for the selection and ongoing monitoring of the securities
in the Fund's portfolio, managing the Fund's business affairs and providing
certain administrative services necessary for the management of the Fund.
The Trust, on behalf of the Fund, and First Trust have retained First Trust
Global Portfolios Ltd. ("FTGP" or the "Sub-Advisor"), an affiliate of First
Trust, to serve as investment sub-advisor. In this capacity, FTGP is responsible
for the selection and ongoing monitoring of the securities in the Fund's
investment portfolio. First Trust is paid an annual unitary management fee of
0.85% of the Fund's average daily net assets. FTGP receives a sub-advisory fee
equal to 40% of any remaining monthly unitary fee paid to the Advisor after the
Fund's average expenses accrued during the most recent twelve months are
subtracted from the unitary fee for that month. First Trust is responsible for
the expenses of the Fund including the cost of transfer agency, custody, fund
administration, legal, audit and other services, but excluding Rule 12b-1
distribution and service fees, if any, brokerage expenses, taxes, interest,
acquired fund fees and expenses, and extraordinary expenses. First Trust also
provides fund reporting services to the Fund for a flat annual fee in the amount
of $9,250, which is covered under the annual unitary management fee.
The Trust has multiple service agreements with Brown Brothers Harriman & Co.
("BBH"). Under the service agreements, BBH performs custodial, fund accounting,
certain administrative services, and transfer agency services for the Fund. As
custodian, BBH is responsible for custody of the Fund's assets. As fund
accountant and administrator, BBH is responsible for maintaining the books and
records of the Fund's securities and cash. As transfer agent, BBH is responsible
for maintaining shareholder records for the Fund.
Page 20
<PAGE>
--------------------------------------------------------------------------------
NOTES TO FINANCIAL STATEMENTS (CONTINUED)
--------------------------------------------------------------------------------
FIRST TRUST EMERGING MARKETS LOCAL CURRENCY BOND ETF (FEMB)
OCTOBER 31, 2017
Each Trustee who is not an officer or employee of First Trust, any sub-advisor
or any of their affiliates ("Independent Trustees") is paid a fixed annual
retainer that is allocated equally among each fund in the First Trust Fund
Complex. Prior to January 1, 2016, the fixed annual retainer was allocated pro
rata based on each fund's net assets. Each Independent Trustee is also paid an
annual per fund fee that varies based on whether the fund is a closed-end or
other actively managed fund, or is an index fund.
Additionally, the Lead Independent Trustee and the Chairmen of the Audit
Committee, Nominating and Governance Committee and Valuation Committee are paid
annual fees to serve in such capacities, with such compensation allocated pro
rata among each fund in the First Trust Fund Complex based on net assets.
Independent Trustees are reimbursed for travel and out-of-pocket expenses in
connection with all meetings. The Lead Independent Trustee and Committee
Chairmen rotate every three years. The officers and "Interested" Trustee receive
no compensation from the Trust for acting in such capacities.
4. PURCHASES AND SALES OF SECURITIES
For the year ended October 31, 2017, the cost of purchases and proceeds from
sales of investments, excluding short-term investments and in-kind transactions,
for the Fund were $40,373,926 and $5,295,790, respectively.
For the year ended October 31, 2017, the Fund had no in-kind transactions.
5. DERIVATIVE TRANSACTIONS
The following table presents the type of derivatives held by the Fund at October
31, 2017, the primary underlying risk exposure and location of these instruments
as presented on the Statement of Assets and Liabilities.
<TABLE>
<CAPTION>
ASSET DERIVATIVES LIABILITY DERIVATIVES
------------------------------------------ ------------------------------------------
DERIVATIVE STATEMENT OF ASSETS AND STATEMENT OF ASSETS AND
INSTRUMENT RISK EXPOSURE LIABILITIES LOCATION VALUE LIABILITIES LOCATION VALUE
------------------ ------------- ------------------------ ---------------- ------------------------ ----------------
<S> <C> <C> <C> <C> <C>
Unrealized appreciation Unrealized depreciation
Forward foreign on forward foreign on forward foreign
currency contracts Currency Risk currency contracts $ 98,682 currency contracts $ 179,825
</TABLE>
The following table presents the amount of net realized gain (loss) and change
in net unrealized appreciation (depreciation) recognized for the year ended
October 31, 2017, on derivative instruments, as well as the primary underlying
risk exposure associated with each instrument.
STATEMENT OF OPERATIONS LOCATION
--------------------------------------------------------------------------------
CURRENCY RISK
Net realized gain (loss) on forward foreign currency contracts $ 129,213
Net change in unrealized appreciation (depreciation) on forward
foreign currency contracts (68,391)
During the year ended October 31, 2017, the notional values of forward foreign
currency contracts opened and closed were $329,626,258 and $308,851,159,
respectively.
6. CREATIONS, REDEMPTIONS AND TRANSACTION FEES
Shares are created and redeemed by the Fund only in Creation Unit size
aggregations of 50,000 shares in transactions with broker-dealers or large
institutional investors that have entered into a participation agreement (an
"Authorized Participant"). In order to purchase Creation Units of the Fund, an
Authorized Participant must deposit (i) a designated portfolio of securities and
other instruments determined by First Trust (the "Deposit Securities") and
generally make or receive a cash payment referred to as the "Cash Component,"
which is an amount equal to the difference between the NAV of the Fund shares
(per Creation Unit aggregations) and the market value of the Deposit Securities,
and/or (ii) cash in lieu of all or a portion of the Deposit Securities. If the
Cash Component is a positive number (i.e., the NAV per Creation Unit Aggregation
exceeds the Deposit Amount), the Authorized Participant will deliver the Cash
Component. If the Cash Component is a negative number (i.e., the NAV per
Creation Unit Aggregation is less than the Deposit Amount), the Authorized
Participant will receive the Cash Component. Authorized Participants purchasing
Creation Units must pay to BBH, as transfer agent, a creation transaction fee
(the "Creation Transaction Fee") regardless of the number of Creation Units
purchased in the transaction. The Creation Transaction Fee may vary and is based
on the composition of the securities included in the Fund's portfolio and the
countries in which the transactions are settled. The Creation Transaction Fee
may increase or decrease as the Fund's portfolio is adjusted to conform to
changes in the composition of the securities included in the Fund's portfolio
and the countries in which the transaction settled. The Creation Transaction Fee
is currently $500. The price for each Creation Unit will equal the daily NAV per
Page 21
<PAGE>
--------------------------------------------------------------------------------
NOTES TO FINANCIAL STATEMENTS (CONTINUED)
--------------------------------------------------------------------------------
FIRST TRUST EMERGING MARKETS LOCAL CURRENCY BOND ETF (FEMB)
OCTOBER 31, 2017
share times the number of shares in a Creation Unit plus the fees described
above and, if applicable, any operational processing and brokerage costs,
transfer fees or stamp taxes. When the Fund permits an Authorized Participant to
substitute cash or a different security in lieu of depositing one or more of the
requisite Deposit Securities, the Authorized Participant may also be assessed an
amount to cover the cost of purchasing the Deposit Securities and/or disposing
of the substituted securities, including operational processing and brokerage
costs, transfer fees, stamp taxes, and part or all of the spread between the
expected bid and offer side of the market related to such Deposit Securities
and/or substitute securities.
Authorized Participants redeeming Creation Units must pay to BBH, as transfer
agent, a redemption transaction fee (the "Redemption Transaction Fee"),
regardless of the number of Creation Units redeemed in the transaction. The
Redemption Transaction Fee may vary and is based on the composition of the
securities included in the Fund's portfolio and the countries in which the
transactions are settled. The Redemption Transaction Fee is currently $500. The
Fund reserves the right to effect redemptions in cash. An Authorized Participant
may request cash redemption in lieu of securities; however, the Fund may, in its
discretion, reject any such request.
7. LINE OF CREDIT
The Trust, on behalf of the Fund, along with First Trust Series Fund and First
Trust Exchange-Traded Fund IV entered into a $220 million Credit Agreement with
the Bank of Nova Scotia ("Scotia") as administrative agent for a group of
lenders. Scotia charges a commitment fee of 0.25% of the daily amount of the
excess of the commitment amount over the outstanding principal balance of the
loans. Prior to March 9, 2017, the commitment amount was $180 million. Prior to
December 16, 2016, the commitment amount was $140 million. First Trust allocates
the commitment fee amongst the funds that have access to the credit line. To the
extent that the Fund accesses the credit line, there would also be an interest
fee charged. The Fund did not have any borrowings outstanding during the year
ended October 31, 2017.
8. DISTRIBUTION PLAN
The Board of Trustees adopted a Distribution and Service Plan pursuant to Rule
12b-1 under the 1940 Act. In accordance with the Rule 12b-1 plan, the Fund is
authorized to pay an amount up to 0.25% of its average daily net assets each
year to reimburse First Trust Portfolios L.P. ("FTP"), the distributor of the
Fund, for amounts expended to finance activities primarily intended to result in
the sale of Creation Units or to provide investor services. FTP may also use
this amount to compensate securities dealers or other persons that are
Authorized Participants for providing distribution assistance, including
broker-dealer and shareholder support and educational and promotional services.
No 12b-1 fees are currently paid by the Fund, and pursuant to a contractual
arrangement, no 12b-1 fees will be paid any time before February 28, 2019.
9. INDEMNIFICATION
The Trust, on behalf of the Fund, has a variety of indemnification obligations
under contracts with its service providers. The Trust's maximum exposure under
these arrangements is unknown. However, the Trust has not had prior claims or
losses pursuant to these contracts and expects the risk of loss to be remote.
10. SUBSEQUENT EVENTS
Management has evaluated the impact of all subsequent events to the Fund through
the date the financial statements were issued and has determined that there was
the following subsequent event:
On November 2, 2017, First Trust Municipal High Income ETF, an additional series
of the Trust, began trading under the ticker FMHI on Nasdaq.
Page 22
<PAGE>
--------------------------------------------------------------------------------
REPORT OF INDEPENDENT REGISTERED PUBLIC ACCOUNTING FIRM
--------------------------------------------------------------------------------
TO THE SHAREHOLDERS AND THE BOARD OF TRUSTEES OF FIRST TRUST EMERGING MARKETS
LOCAL CURRENCY BOND ETF:
We have audited the accompanying statement of assets and liabilities of First
Trust Emerging Markets Local Currency Bond ETF (the "Fund"), a series of the
First Trust Exchange-Traded Fund III, including the portfolio of investments, as
of October 31, 2017, and the related statement of operations for the year then
ended, the statements of changes in net assets for each of the two years in the
period then ended, and the financial highlights for each of the periods
presented. These financial statements and financial highlights are the
responsibility of the Fund's management. Our responsibility is to express an
opinion on these financial statements and financial highlights based on our
audits.
We conducted our audits in accordance with the standards of the Public Company
Accounting Oversight Board (United States). Those standards require that we plan
and perform the audit to obtain reasonable assurance about whether the financial
statements and financial highlights are free of material misstatement. The Fund
is not required to have, nor were we engaged to perform, an audit of its
internal control over financial reporting. Our audits included consideration of
internal control over financial reporting as a basis for designing audit
procedures that are appropriate in the circumstances, but not for the purpose of
expressing an opinion on the effectiveness of the Fund's internal control over
financial reporting. Accordingly, we express no such opinion. An audit also
includes examining, on a test basis, evidence supporting the amounts and
disclosures in the financial statements, assessing the accounting principles
used and significant estimates made by management, as well as evaluating the
overall financial statement presentation. Our procedures included confirmation
of securities owned as of October 31, 2017, by correspondence with the Fund's
custodian and brokers; when replies were not received from brokers, we performed
other auditing procedures. We believe that our audits provide a reasonable basis
for our opinion.
In our opinion, the financial statements and financial highlights referred to
above present fairly, in all material respects, the financial position of First
Trust Emerging Markets Local Currency Bond ETF as of October 31, 2017, the
results of its operations for the year then ended, the changes in its net assets
for each of the two years in the period then ended, and the financial highlights
for each of the periods presented, in conformity with accounting principles
generally accepted in the United States of America.
/s/ Deloitte & Touche LLP
Chicago, Illinois
December 21, 2017
Page 23
<PAGE>
--------------------------------------------------------------------------------
ADDITIONAL INFORMATION
--------------------------------------------------------------------------------
FIRST TRUST EMERGING MARKETS LOCAL CURRENCY BOND ETF (FEMB)
OCTOBER 31, 2017 (UNAUDITED)
PROXY VOTING POLICIES AND PROCEDURES
A description of the policies and procedures that the Trust uses to determine
how to vote proxies and information on how the Fund voted proxies relating to
portfolio investments during the most recent 12-month period ended June 30 is
available (1) without charge, upon request, by calling (800) 988-5891; (2) on
the Fund's website located at http://www.ftportfolios.com; and (3) on the
Securities and Exchange Commission's ("SEC") website located at
http://www.sec.gov.
PORTFOLIO HOLDINGS
The Trust files its complete schedule of portfolio holdings with the SEC for the
first and third quarters of each fiscal year on Form N-Q. The Trust's Form N-Qs
are available (1) by calling (800) 988-5891; (2) on the Fund's website located
at http://www.ftportfolios.com; (3) on the SEC's website at http://www.sec.gov;
and (4) for review and copying at the SEC's Public Reference Room ("PRR") in
Washington, DC. Information regarding the operation of the PRR may be obtained
by calling (800) SEC-0330.
RISK CONSIDERATIONS
RISKS ARE INHERENT IN ALL INVESTING. YOU SHOULD CONSIDER THE FUND'S INVESTMENT
OBJECTIVE, RISKS, CHARGES AND EXPENSES CAREFULLY BEFORE INVESTING. YOU CAN
DOWNLOAD THE FUND'S PROSPECTUS AT HTTP://WWW.FTPORTFOLIOS.COM OR CONTACT FIRST
TRUST PORTFOLIOS L.P. AT (800) 621-1675 TO REQUEST A PROSPECTUS, WHICH CONTAINS
THIS AND OTHER INFORMATION ABOUT THE FUND. FOR ADDITIONAL INFORMATION ABOUT THE
RISKS ASSOCIATED WITH INVESTING IN THE FUND, PLEASE SEE THE FUND'S STATEMENT OF
ADDITIONAL INFORMATION, AS WELL AS OTHER REGULATORY FILINGS. READ THESE
DOCUMENTS CAREFULLY BEFORE YOU INVEST. FIRST TRUST PORTFOLIOS L.P. IS THE
DISTRIBUTOR OF THE FIRST TRUST EXCHANGE-TRADED FUND III.
The following summarizes some of the risks that should be considered for the
Fund.
CALL RISK. If an issuer calls higher-yielding debt instruments held by the Fund,
performance could be adversely impacted.
CASH TRANSACTIONS RISK. The Fund will, under most circumstances, effect a
portion of creations and redemptions for cash, rather than in-kind securities.
As a result, an investment in the Fund may be less tax-efficient than an
investment in an exchange-traded fund that effects its creations and redemption
for in-kind securities. Because the Fund may effect a portion of redemptions for
cash, it may be required to sell portfolio securities in order to obtain the
cash needed to distribute redemption proceeds. A sale of shares may result in
capital gains or losses and may also result in higher brokerage costs.
CREDIT RISK. Credit risk is the risk that an issuer of a security will be unable
or unwilling to make dividend, interest and/or principal payments when due and
the related risk that the value of a security may decline because of concerns
about the issuer's ability to make such payments.
CURRENCY EXCHANGE RATE RISK. The Fund holds investments that are denominated in
non-U.S. currencies, or in securities that provide exposure to such currencies,
currency exchange rates or interest rates denominated in such currencies.
Changes in currency exchange rates and the relative value of non-U.S. currencies
will affect the value of the Fund's investment and the value of your Fund
shares. Currency exchange rates can be very volatile and can change quickly and
unpredictably. As a result, the value of an investment in the Fund may change
quickly and without warning and you may lose money.
CURRENCY RISK. Because the Fund's net asset value is determined on the basis of
U.S. dollars and the Fund invests in non-U.S. dollar-denominated securities, you
may lose money if the local currency of a foreign market depreciates against the
U.S. dollar, even if the local currency value of the Fund's holdings goes up.
The Fund may hedge certain of its non-U.S. dollar holdings.
DERIVATIVES RISK. The use of options, futures contracts, forward contracts and
other derivative instruments can lead to losses because of adverse movements in
the price or value of the underlying asset, index or rate, which may be
magnified by certain features of the derivatives. These risks are heightened
when the Fund's portfolio managers use derivatives to enhance the Fund's return
or as a substitute for a position or security, rather than solely to hedge (or
offset) the risk of a position or security held by the Fund.
EMERGING MARKETS RISK. Investments in securities and instruments traded in
developing or emerging markets or that provide exposure to such securities or
markets, can involve additional risks relating to political, economic, or
regulatory conditions not associated with investments in U.S. securities and
instruments or investments in more developed international markets. Emerging
market governments may, without prior warning, impose capital controls on the
ability to transfer currency, securities or other assets. The Fund's ability to
access certain developing or emerging markets also may be limited due to a
variety of factors, including currency convertibility issues. Such conditions
may impact the ability of the Fund to buy, sell or otherwise transfer
securities, cause the Fund's returns to differ from those available to domestic
investors, adversely affect the trading market and price for Fund shares, and
cause the Fund to decline in value.
Page 24
<PAGE>
--------------------------------------------------------------------------------
ADDITIONAL INFORMATION (CONTINUED)
--------------------------------------------------------------------------------
FIRST TRUST EMERGING MARKETS LOCAL CURRENCY BOND ETF (FEMB)
OCTOBER 31, 2017 (UNAUDITED)
GLOBAL DEPOSITARY NOTES RISK. Any distributions paid to the holders of global
depositary notes ("GDN") are usually subject to a fee charged by the depositary
bank. Holders of GDNs may have limited rights, and investment restrictions in
certain countries may adversely impact the value of GDNs because such
restrictions may limit the ability to convert the Bonds into GDNs and vice
versa.
HIGH YIELD SECURITIES RISK. High yield securities, or "junk" bonds, are subject
to greater market fluctuations and risk of loss than securities with higher
ratings, and therefore, are considered to be highly speculative. These
securities are issued by issuers that may have narrowly focused operations
and/or other impediments to the timely payment of periodic interest and
principal at maturity. If the global or local economy slows down or dips into
recession, the issuers of high yield securities may not have sufficient
resources to continue making timely payment of periodic interest and principal
at maturity. The market for high yield securities is generally smaller and less
liquid than that for investment grade securities. High yield securities are
generally not listed on a national securities exchange but trade in the
over-the-counter markets.
Due to the smaller, less liquid market for high yield securities, the bid-offer
spread on such securities is generally greater than it is for investment grade
securities and the purchase or sale of such securities may take longer to
complete. In general, high yield securities may have a greater risk of default
than other types of securities.
ILLIQUID SECURITIES RISK. Some of the securities held by the Fund may be
illiquid. Illiquid securities involve the risk that the securities will not be
able to be sold at the time desired by the Fund or at prices approximately the
value at which the Fund is carrying the securities on its books.
INCOME RISK. Income from the Fund's fixed income investments could decline
during periods of falling interest rates.
INTEREST RATE RISK. Interest rate risk is the risk that the value of the fixed
income securities in the Fund will decline because of rising market interest
rates. Interest rate risk is generally lower for shorter term investments and
higher for longer term investments.
LIQUIDITY RISK. The Fund invests a substantial portion of its assets in
lower-quality debt issued by companies that are highly leveraged. Lower-quality
debt tends to be less liquid than higher-quality debt. Moreover, smaller debt
issues tend to be less liquid than larger debt issues. If the economy
experiences a sudden downturn, or if the debt markets for such companies become
distressed, the Fund may have particular difficulty selling its assets in
sufficient amounts, at reasonable prices and in a sufficiently timely manner to
raise the cash necessary to meet any potentially heavy redemption requests by
Fund shareholders.
MANAGEMENT RISK. The Fund is subject to management risk because it is an
actively managed portfolio. In managing the Fund's investment portfolio, the
Fund's investment advisor will apply investment techniques and risk analyses
that may not have the desired result. There can be no guarantee that the Fund
will meet its investment objective.
MARKET RISK. Market risk is the risk that a particular security owned by the
Fund or shares of the Fund in general may fall in value. Securities are subject
to market fluctuations caused by such factors as economic, political, regulatory
or market developments, changes in interest rates and perceived trends in bond
prices. Also, certain of these factors may affect the liquidity of the bonds,
notes, and bills in the Fund's portfolio and make it more difficult for the Fund
to sell them. Overall securities values could decline generally or could
underperform other investments.
NON-DIVERSIFICATION RISK. The Fund is classified as "non-diversified" under the
Investment Company Act of 1940, as amended (the "1940 Act"). As a result, the
Fund is only limited as to the percentage of its assets that may be invested in
the securities of any one issuer by the diversification requirements imposed by
the Internal Revenue Code of 1986, as amended. The Fund may invest a relatively
high percentage of its assets in a limited number of issuers. As a result, the
Fund may be more susceptible to a single adverse economic or regulatory
occurrence affecting one or more of these issuers, experience increased
volatility and be highly invested in certain issuers.
NON-U.S. SECURITIES RISK. Non-U.S. securities are subject to higher volatility
than securities of domestic issuers due to possible adverse political, social or
economic developments; restrictions on foreign investment or exchange of
securities; lack of liquidity; currency exchange rates; excessive taxation;
government seizure of assets; different legal or accounting standards and less
government supervision and regulation of exchanges in foreign countries.
SMALL FUND RISK. The Fund currently has fewer assets than larger funds, and like
other relatively new funds, large inflows and outflows may impact the Fund's
market exposure for limited periods of time. This impact may be positive or
negative, depending on the direction of market movement during the period
affected.
SOVEREIGN DEBT RISK. Investments in sovereign bonds involve special risks
because the governmental authority that controls the repayment of the debt may
be unwilling or unable to repay the principal and/or interest when due in
accordance with the terms of such securities; the availability of sufficient
foreign exchange on the date a payment is due; the relative size of the debt
service burden to the economy as a whole; or the government debtor's policy
towards the International Monetary Fund and the political constraints to which a
Page 25
<PAGE>
--------------------------------------------------------------------------------
ADDITIONAL INFORMATION (CONTINUED)
--------------------------------------------------------------------------------
FIRST TRUST EMERGING MARKETS LOCAL CURRENCY BOND ETF (FEMB)
OCTOBER 31, 2017 (UNAUDITED)
government debtor may be subject. If an issuer of sovereign bonds defaults on
payments of principal and/or interest, the Fund may have limited legal recourse
against the issuer and/or guarantor. In certain cases, remedies must be pursued
in the courts of the defaulting party itself, and the Fund's ability to obtain
recourse may be limited. In times of economic uncertainty, the prices of these
securities may be more volatile than those of corporate debt obligations or of
other government debt obligations.
ADVISORY AGREEMENTS
BOARD CONSIDERATIONS REGARDING CONTINUATION OF INVESTMENT MANAGEMENT AND
SUB-ADVISORY AGREEMENTS
The Board of Trustees of First Trust Exchange-Traded Fund III (the "Trust"),
including the Independent Trustees, unanimously approved the continuation of the
Investment Management Agreement (the "Advisory Agreement") with First Trust
Advisors L.P. (the "Advisor" or "First Trust") on behalf of the First Trust
Emerging Markets Local Currency Bond ETF (the "Fund") and the Investment
Sub-Advisory Agreement (the "Sub-Advisory Agreement" and together with the
Advisory Agreement, the "Agreements") among the Trust, on behalf of the Fund,
the Advisor and First Trust Global Portfolios Ltd. (the "Sub-Advisor"). The
Board approved the continuation of the Agreements for a one-year period ending
June 30, 2018 at a meeting held on June 12, 2017. The Board determined that the
continuation of the Agreements is in the best interests of the Fund in light of
the extent and quality of the services provided and such other matters as the
Board considered to be relevant in the exercise of its reasonable business
judgment.
To reach this determination, the Board considered its duties under the
Investment Company Act of 1940, as amended (the "1940 Act"), as well as under
the general principles of state law in reviewing and approving advisory
contracts; the requirements of the 1940 Act in such matters; the fiduciary duty
of investment advisors with respect to advisory agreements and compensation; the
standards used by courts in determining whether investment company boards have
fulfilled their duties; and the factors to be considered by the Board in voting
on such agreements. At meetings held on April 24, 2017 and June 12, 2017, the
Board, including the Independent Trustees, reviewed materials provided by the
Advisor and the Sub-Advisor responding to requests for information from counsel
to the Independent Trustees that, among other things, outlined the services
provided by the Advisor and the Sub-Advisor to the Fund (including the relevant
personnel responsible for these services and their experience); the unitary fee
rate payable by the Fund as compared to fees charged to a peer group of funds
(which were either mutual funds or exchange-traded funds ("ETFs")) compiled by
Management Practice, Inc. ("MPI"), an independent source (the "MPI Peer Group"),
and as compared to fees charged to other clients of the Advisor, including other
ETFs managed by the Advisor; the sub-advisory fee rate as compared to fees
charged to other clients of the Sub-Advisor; expenses of the Fund as compared to
expense ratios of the funds in the MPI Peer Group; performance information for
the Fund; the nature of expenses incurred in providing services to the Fund and
the potential for economies of scale, if any; financial data on the Advisor and
the Sub-Advisor; any fall-out benefits to the Advisor and its affiliate, First
Trust Portfolios L.P. ("FTP"), and the Sub-Advisor (also an affiliate of the
Advisor); and information on the Advisor's and the Sub-Advisor's compliance
programs. The Board reviewed initial materials with the Advisor at a special
meeting held on April 24, 2017, prior to which the Independent Trustees and
their counsel met separately to discuss the information provided by the Advisor
and the Sub-Advisor. Following the April meeting, independent legal counsel on
behalf of the Independent Trustees requested certain clarifications and
supplements to the materials provided, and the information provided in response
to those requests was considered at an executive session of the Independent
Trustees and independent legal counsel held prior to the June 12, 2017 meeting,
as well as at the meeting held that day. The Board applied its business judgment
to determine whether the arrangements between the Trust and the Advisor and
among the Trust, the Advisor and the Sub-Advisor continue to be reasonable
business arrangements from the Fund's perspective as well as from the
perspective of the Fund's shareholders. The Board determined that, given the
totality of the information provided with respect to the Agreements, the Board
had received sufficient information to renew the Agreements. The Board
considered that shareholders chose to invest or remain invested in the Fund
knowing that the Advisor and the Sub-Advisor manage the Fund and knowing the
Fund's unitary fee.
In reviewing the Agreements, the Board considered the nature, extent and quality
of the services provided by the Advisor and the Sub-Advisor under the
Agreements. With respect to the Advisory Agreement, the Board considered that
the Advisor is responsible for the overall management and administration of the
Trust and the Fund and reviewed all of the services provided by the Advisor to
the Fund, including the oversight of the Sub-Advisor, as well as the background
and experience of the persons responsible for such services. The Board noted
that the Advisor oversees the Sub-Advisor's day-to-day management of the Fund's
investments, including portfolio risk monitoring and performance review. In
reviewing the services provided, the Board noted the compliance program that had
been developed by the Advisor and considered that it includes a robust program
for monitoring the Advisor's, the Sub-Advisor's and the Fund's compliance with
the 1940 Act, as well as the Fund's compliance with its investment objective and
policies. The Board also considered a report from the Advisor with respect to
its risk management functions related to the operation of the Fund. Finally, as
part of the Board's consideration of the Advisor's services, the Advisor, in its
written materials and at the April 24, 2017 meeting, described to the Board the
scope of its ongoing investment in additional infrastructure and personnel to
maintain and improve the quality of services provided to the Fund and the other
funds in the First Trust Fund Complex. With respect to the Sub-Advisory
Agreement, the Board noted that the Fund is an actively-managed ETF and the
Sub-Advisor actively manages the Fund's investments. The Board reviewed the
materials provided by the Sub-Advisor and considered the services that the
Sub-Advisor provides to the Fund, including the Sub-Advisor's day-to-day
management of the Fund's investments. In considering the Sub-Advisor's
management of the Fund, the Board noted the background and experience of the
Sub-Advisor's portfolio management team and the Board's prior meetings with
members of the portfolio management team. In light of the information presented
and the considerations made, the Board concluded that the nature, extent and
Page 26
<PAGE>
--------------------------------------------------------------------------------
ADDITIONAL INFORMATION (CONTINUED)
--------------------------------------------------------------------------------
FIRST TRUST EMERGING MARKETS LOCAL CURRENCY BOND ETF (FEMB)
OCTOBER 31, 2017 (UNAUDITED)
quality of the services provided to the Trust and the Fund by the Advisor and
the Sub-Advisor under the Agreements have been and are expected to remain
satisfactory and that the Sub-Advisor, under the oversight of the Advisor, has
managed the Fund consistent with the Fund's investment objective and policies.
The Board considered the unitary fee rate payable by the Fund under the Advisory
Agreement for the services provided. The Board noted that the sub-advisory fee
is paid by the Advisor from the unitary fee. The Board considered that as part
of the unitary fee the Advisor is responsible for the Fund's expenses, including
the cost of sub-advisory, transfer agency, custody, fund administration, legal,
audit and other services and license fees (if any), but excluding interest,
taxes, brokerage commissions and other expenses connected with the execution of
portfolio transactions, distribution and service fees pursuant to a Rule 12b-1
plan, if any, and extraordinary expenses. The Board received and reviewed
information showing the advisory or unitary fee rates and expense ratios of the
peer funds in the MPI Peer Group, as well as advisory fee rates charged by the
Advisor to other fund (including ETFs) and non-fund clients, as applicable.
Because the Fund's MPI Peer Group included peer funds that pay a unitary fee and
because the Fund pays a unitary fee, the Board determined that expense ratios
were the most relevant comparative data point. Based on the information
provided, the Board noted that the unitary fee for the Fund was above the median
total (net) expense ratio of the peer funds in the MPI Peer Group. With respect
to the MPI Peer Group, the Board discussed with representatives of the Advisor
how the MPI Peer Group was assembled, limitations in creating peer groups for
actively-managed ETFs, including the limited number of actively-managed ETFs
pursuing an emerging markets debt strategy and that most of the peer funds were
either index-based ETFs or open-end mutual funds, and different business models
that may affect the pricing of services among ETF sponsors. The Board also noted
that most of the peer funds did not employ an advisor/sub-advisor management
structure. The Board took these limitations and differences into account in
considering the peer data. With respect to fees charged to other clients, the
Board considered differences between the Fund and other clients that limited
their comparability. In considering the unitary fee rate overall, the Board also
considered the Advisor's statement that it seeks to meet investor needs through
innovative and value-added investment solutions and the Advisor's description of
its long-term commitment to the Fund.
The Board considered performance information for the Fund. The Board noted the
process it has established for monitoring the Fund's performance and portfolio
risk on an ongoing basis, which includes quarterly performance reporting from
the Advisor and Sub-Advisor for the Fund. The Board determined that this process
continues to be effective for reviewing the Fund's performance. The Board
received and reviewed information comparing the Fund's performance for the
one-year period ended December 31, 2016 to the performance of the MPI Peer Group
and to a benchmark index. Based on the information provided, the Board noted
that the Fund underperformed the MPI Peer Group average and outperformed the
benchmark index for the one-year period ended December 31, 2016.
On the basis of all the information provided on the unitary fee and performance
of the Fund and the ongoing oversight by the Board, the Board concluded that the
unitary fee for the Fund (out of which the Sub-Advisor is compensated) continues
to be reasonable and appropriate in light of the nature, extent and quality of
the services provided by the Advisor and the Sub-Advisor to the Fund under the
Agreements.
The Board considered information and discussed with the Advisor whether there
were any economies of scale in connection with providing advisory services to
the Fund and noted the Advisor's statement that it expects its expenses to
increase over the next twelve months as the Advisor continues to make
investments in personnel and infrastructure. The Board noted that any reduction
in fixed costs associated with the management of the Fund would benefit the
Advisor, but that the unitary fee structure provides a level of certainty in
expenses for the Fund. The Board considered the revenues and allocated costs
(including the allocation methodology) of the Advisor in serving as investment
advisor to the Fund for the twelve months ended December 31, 2016 and the
estimated profitability level for the Fund calculated by the Advisor based on
such data, as well as complex-wide and product-line profitability data for the
same period. The Board noted the inherent limitations in the profitability
analysis and concluded that, based on the information provided, the Advisor's
profitability level for the Fund was not unreasonable. In addition, the Board
considered fall-out benefits described by the Advisor that may be realized from
its relationship with the Fund. The Board considered that the Advisor had
identified as a fall-out benefit to the Advisor and FTP their exposure to
investors and brokers who, absent their exposure to the Fund, may have had no
dealings with the Advisor or FTP. The Board also considered the Advisor's
compensation for fund reporting services provided to the Fund pursuant to a
separate Fund Reporting Services Agreement, which is paid from the unitary fee.
The Board also considered information on the affiliations between the Advisor
and the Sub-Advisor and noted the services provided by the Sub-Advisor to
certain First Trust products in Europe. The Board concluded that the character
and amount of potential fall-out benefits to the Advisor were not unreasonable.
The Board considered the Sub-Advisor's statements that expenses incurred in
providing services to the Fund are of a fixed nature and that, at this time, no
economies of scale have been identified in providing services to the Fund. The
Board did not review the profitability of the Sub-Advisor with respect to the
Fund, but noted that the Sub-Advisor waived its entire sub-advisory fee under
the Sub-Advisory Agreement in 2016. The Board concluded that the profitability
analysis for the Advisor was more relevant. The Board considered the Advisor's
confirmation that it is committed to supporting the Sub-Advisor. The Board
considered the potential fall-out benefits to the Sub-Advisor from being
associated with the Advisor and the Fund. The Board noted that the Sub-Advisor
does not utilize soft dollars in connection with its management of the Fund's
portfolio. The Board concluded that the character and amount of potential
fall-out benefits to the Sub-Advisor were not unreasonable.
Based on all of the information considered and the conclusions reached, the
Board, including the Independent Trustees, unanimously determined that the terms
of the Agreements continue to be fair and reasonable and that the continuation
of the Agreements is in the best interests of the Trust and the Fund. No single
factor was determinative in the Board's analysis.
Page 27
<PAGE>
--------------------------------------------------------------------------------
BOARD OF TRUSTEES AND OFFICERS
--------------------------------------------------------------------------------
FIRST TRUST EMERGING MARKETS LOCAL CURRENCY BOND ETF (FEMB)
OCTOBER 31, 2017 (UNAUDITED)
The Trust's statement of additional information includes additional information
about the Trustees and is available, without charge, upon request, by calling
(800) 988-5891.
<TABLE>
<CAPTION>
NUMBER OF OTHER
PORTFOLIOS IN TRUSTEESHIPS OR
TERM OF OFFICE THE FIRST TRUST DIRECTORSHIPS
NAME, ADDRESS, AND YEAR FIRST FUND COMPLEX HELD BY TRUSTEE
DATE OF BIRTH AND ELECTED OR PRINCIPAL OCCUPATIONS OVERSEEN BY DURING PAST
POSITION WITH THE TRUST APPOINTED DURING PAST 5 YEARS TRUSTEE 5 YEARS
------------------------------------------------------------------------------------------------------------------------------------
INDEPENDENT TRUSTEES
------------------------------------------------------------------------------------------------------------------------------------
<S> <C> <C> <C> <C>
Richard E. Erickson, Trustee o Indefinite Term Physician; Officer, Wheaton Orthopedics; 151 None
c/o First Trust Advisors L.P. Limited Partner, Gundersen Real Estate
120 E. Liberty Drive, o Since Inception Limited Partnership (June 1992 to December
Suite 400 2016); Member, Sportsmed LLC (April 2007
Wheaton, IL 60187 to November 2015)
D.O.B.: 04/51
Thomas R. Kadlec, Trustee o Indefinite Term President, ADM Investor Services, Inc. 151 Director of ADM
c/o First Trust Advisors L.P. (Futures Commission Merchant) Investor Services,
120 E. Liberty Drive, o Since Inception Inc., ADM
Suite 400 Investor Services
Wheaton, IL 60187 International,
D.O.B.: 11/57 Futures Industry
Association, and
National Futures
Association
Robert F. Keith, Trustee o Indefinite Term President, Hibs Enterprises (Financial and 151 Director of Trust
c/o First Trust Advisors L.P. Management Consulting) Company of
120 E. Liberty Drive, o Since Inception Illinois
Suite 400
Wheaton, IL 60187
D.O.B.: 11/56
Niel B. Nielson, Trustee o Indefinite Term Managing Director and Chief Operating 151 Director of
c/o First Trust Advisors L.P. Officer (January 2015 to Present), Pelita Covenant
120 E. Liberty Drive, o Since Inception Harapan Educational Foundation (Educational Transport, Inc.
Suite 400 Products and Services); President and Chief (May 2003 to
Wheaton, IL 60187 Executive Officer (June 2012 to September May 2014)
D.O.B.: 03/54 2014), Servant Interactive LLC (Educational
Products and Services); President and Chief
Executive Officer (June 2012 to September
2014), Dew Learning LLC (Educational
Products and Services); President (June 2002
to June 2012), Covenant College
------------------------------------------------------------------------------------------------------------------------------------
INTERESTED TRUSTEE
------------------------------------------------------------------------------------------------------------------------------------
James A. Bowen(1), Trustee, o Indefinite Term Chief Executive Officer, First Trust Advisors 151 None
Chairman of the Board L.P. and First Trust Portfolios L.P.; Chairman
120 E. Liberty Drive, o Since Inception of the Board of Directors, BondWave LLC
Suite 400 (Software Development Company) and
Wheaton, IL 60187 Stonebridge Advisors LLC (Investment
D.O.B.: 09/55 Advisor)
</TABLE>
-----------------------------
(1) Mr. Bowen is deemed an "interested person" of the Trust due to his
position as Chief Executive Officer of First Trust Advisors L.P.,
investment advisor of the Trust.
Page 28
<PAGE>
--------------------------------------------------------------------------------
BOARD OF TRUSTEES AND OFFICERS (CONTINUED)
--------------------------------------------------------------------------------
FIRST TRUST EMERGING MARKETS LOCAL CURRENCY BOND ETF (FEMB)
OCTOBER 31, 2017 (UNAUDITED)
<TABLE>
<CAPTION>
POSITION AND TERM OF OFFICE
NAME, ADDRESS OFFICES AND LENGTH OF PRINCIPAL OCCUPATIONS
AND DATE OF BIRTH WITH TRUST SERVICE DURING PAST 5 YEARS
------------------------------------------------------------------------------------------------------------------------------------
OFFICERS(2)
------------------------------------------------------------------------------------------------------------------------------------
<S> <C> <C> <C>
James M. Dykas President and Chief o Indefinite Term Managing Director and Chief Financial Officer
120 E. Liberty Drive, Executive Officer (January 2016 to Present), Controller (January
Suite 400 o Since January 2016 2011 to January 2016), Senior Vice President
Wheaton, IL 60187 (April 2007 to January 2016), First Trust
D.O.B.: 01/66 Advisors L.P. and First Trust Portfolios L.P.;
Chief Financial Officer (January 2016 to Present),
BondWave LLC (Software Development
Company) and Stonebridge Advisors LLC
(Investment Advisor)
Donald P. Swade Treasurer, Chief Financial o Indefinite Term Senior Vice President (July 2016 to Present),
120 E. Liberty Drive, Officer and Chief Vice President (April 2012 to July 2016), First
Suite 400 Accounting Officer o Since January 2016 Trust Advisors L.P. and First Trust Portfolios L.P.
Wheaton, IL 60187
D.O.B.: 08/72
W. Scott Jardine Secretary and Chief o Indefinite Term General Counsel, First Trust Advisors L.P. and
120 E. Liberty Drive, Legal Officer First Trust Portfolios L.P.; Secretary and General
Suite 400 o Since Inception Counsel, BondWave LLC; Secretary,
Wheaton, IL 60187 Stonebridge Advisors LLC
D.O.B.: 05/60
Daniel J. Lindquist Vice President o Indefinite Term Managing Director, First Trust Advisors L.P. and
120 E. Liberty Drive, First Trust Portfolios L.P.
Suite 400 o Since Inception
Wheaton, IL 60187
D.O.B: 02/70
Kristi A. Maher Chief Compliance Officer o Indefinite Term Deputy General Counsel, First Trust Advisors L.P.
120 E. Liberty Drive, and Assistant Secretary and First Trust Portfolios L.P.
Suite 400 o Since Inception
Wheaton, IL 60187
D.O.B.: 12/66
Roger F. Testin Vice President o Indefinite Term Senior Vice President, First Trust Advisors L.P.
120 E. Liberty Drive, and First Trust Portfolios L.P.
Suite 400 o Since Inception
Wheaton, IL 60187
D.O.B.: 06/66
Stan Ueland Vice President o Indefinite Term Senior Vice President, First Trust Advisors L.P.
120 E. Liberty Drive, and First Trust Portfolios L.P.
Suite 400 o Since Inception
Wheaton, IL 60187
D.O.B.: 11/70
</TABLE>
-----------------------------
(2) The term "officer" means the president, vice president, secretary,
treasurer, controller or any other officer who performs a policy making
function.
Page 29
<PAGE>
--------------------------------------------------------------------------------
PRIVACY POLICY
--------------------------------------------------------------------------------
FIRST TRUST EMERGING MARKETS LOCAL CURRENCY BOND ETF (FEMB)
OCTOBER 31, 2017 (UNAUDITED)
PRIVACY POLICY
First Trust values our relationship with you and considers your privacy an
important priority in maintaining that relationship. We are committed to
protecting the security and confidentiality of your personal information.
SOURCES OF INFORMATION
We collect nonpublic personal information about you from the following sources:
o Information we receive from you and your broker-dealer, investment
advisor or financial representative through interviews,
applications, agreements or other forms;
o Information about your transactions with us, our affiliates or
others;
o Information we receive from your inquiries by mail, e-mail or
telephone; and
o Information we collect on our website through the use of "cookies".
For example, we may identify the pages on our website that your
browser requests or visits.
INFORMATION COLLECTED
The type of data we collect may include your name, address, social security
number, age, financial status, assets, income, tax information, retirement and
estate plan information, transaction history, account balance, payment history,
investment objectives, marital status, family relationships and other personal
information.
DISCLOSURE OF INFORMATION
We do not disclose any nonpublic personal information about our customers or
former customers to anyone, except as permitted by law. In addition to using
this information to verify your identity (as required under law), the permitted
uses may also include the disclosure of such information to unaffiliated
companies for the following reasons:
o In order to provide you with products and services and to effect
transactions that you request or authorize, we may disclose your
personal information as described above to unaffiliated financial
service providers and other companies that perform administrative or
other services on our behalf, such as transfer agents, custodians
and trustees, or that assist us in the distribution of investor
materials such as trustees, banks, financial representatives, proxy
services, solicitors and printers.
o We may release information we have about you if you direct us to do
so, if we are compelled by law to do so, or in other legally limited
circumstances (for example to protect your account from fraud).
In addition, in order to alert you to our other financial products and services,
we may share your personal information within First Trust.
USE OF WEB ANALYTICS
We currently use third party analytics tools, Google Analytics and AddThis, to
gather information for purposes of improving First Trust's website and marketing
our products and services to you. These tools employ cookies, which are small
pieces of text stored in a file by your web browser and sent to websites that
you visit, to collect information, track website usage and viewing trends such
as the number of hits, pages visited, videos and PDFs viewed and the length of
user sessions in order to evaluate website performance and enhance navigation of
the website. We may also collect other anonymous information, which is generally
limited to technical and web navigation information such as the IP address of
your device, internet browser type and operating system for purposes of
analyzing the data to make First Trust's website better and more useful to our
users. The information collected does not include any personal identifiable
information such as your name, address, phone number or email address unless you
provide that information through the website for us to contact you in order to
answer your questions or respond to your requests. To find out how to opt-out of
these services click on: Google Analytics and AddThis.
CONFIDENTIALITY AND SECURITY
With regard to our internal security procedures, First Trust restricts access to
your nonpublic personal information to those First Trust employees who need to
know that information to provide products or services to you. We maintain
physical, electronic and procedural safeguards to protect your nonpublic
personal information.
POLICY UPDATES AND INQUIRIES
As required by federal law, we will notify you of our privacy policy annually.
We reserve the right to modify this policy at any time, however, if we do change
it, we will tell you promptly. For questions about our policy, or for additional
copies of this notice, please go to www.ftportfolios.com, or contact us at
1-800-621-1675 (First Trust Portfolios) or 1-800-222-6822 (First Trust
Advisors).
May 2017
Page 30
<PAGE>
This page intentionally left blank.
<PAGE>
This page intentionally left blank.
<PAGE>
FIRST TRUST
First Trust Exchange-Traded Fund III
INVESTMENT ADVISOR
First Trust Advisors L.P.
120 E. Liberty Drive, Suite 400
Wheaton, IL 60187
INVESTMENT SUB-ADVISOR
First Trust Global Portfolios Ltd.
Floor 2
8 Angel Court
London EC2R 7HJ
England
ADMINISTRATOR, CUSTODIAN,
FUND ACCOUNTANT
& TRANSFER AGENT
Brown Brothers Harriman & Co.
50 Post Office Square
Boston, MA 02110
INDEPENDENT REGISTERED
PUBLIC ACCOUNTING FIRM
Deloitte & Touche LLP
111 S. Wacker Drive
Chicago, IL 60606
LEGAL COUNSEL
Chapman and Cutler LLP
111 W. Monroe Street
Chicago, IL 60603
<PAGE>
[BLANK BACK COVER]
<PAGE>
Table of Contents
First Trust Exchange-Traded Fund III
Annual Report
October 31, 2017
Caution Regarding Forward-Looking Statements
This report contains certain forward-looking statements within the meaning of the Securities Act of 1933, as amended, and the Securities Exchange Act of 1934, as amended. Forward-looking statements include statements regarding the goals, beliefs, plans or current expectations of First Trust Advisors L.P. (“First Trust” or the “Advisor”) and/or RiverFront Investment Group, LLC (“RiverFront” or the “Sub-Advisor”) and their respective representatives, taking into account the information currently available to them. Forward-looking statements include all statements that do not relate solely to current or historical fact. For example, forward-looking statements include the use of words such as “anticipate,” “estimate,” “intend,” “expect,” “believe,” “plan,” “may,” “should,” “would” or other words that convey uncertainty of future events or outcomes.
Forward-looking statements involve known and unknown risks, uncertainties and other factors that may cause the actual results, performance or achievements of any series of First Trust Exchange-Traded Fund III (the “Trust”) described in this report (each such series is referred to as a “Fund” and collectively, the “Funds”) to be materially different from any future results, performance or achievements expressed or implied by the forward-looking statements. When evaluating the information included in this report, you are cautioned not to place undue reliance on these forward-looking statements, which reflect the judgment of the Advisor and/or Sub-Advisor and their respective representatives only as of the date hereof. We undertake no obligation to publicly revise or update these forward-looking statements to reflect events and circumstances that arise after the date hereof.
Performance and Risk Disclosure
There is no assurance that any Fund described in this report will achieve its investment objective. Each Fund is subject to market risk, which is the possibility that the market values of securities owned by the Fund will decline and that the value of the Fund shares may therefore be less than what you paid for them. Accordingly, you can lose money by investing in a Fund. See “Risk Considerations” in the Additional Information section of this report for a discussion of certain other risks of investing in the Funds.
Performance data quoted represents past performance, which is no guarantee of future results, and current performance may be lower or higher than the figures shown. For the most recent month-end performance figures, please visit http://www.ftportfolios.com or speak with your financial advisor. Investment returns, net asset value and share price will fluctuate and Fund shares, when sold, may be worth more or less than their original cost.
The Advisor may also periodically provide additional information on Fund performance on each Fund’s web page at http://www.ftportfolios.com.
How to Read This Report
This report contains information that may help you evaluate your investment. It includes details about each Fund’s portfolio and presents data and analysis that provide insight into each Fund’s performance and investment approach.
By reading the portfolio commentary by the portfolio management team of each Fund, you may obtain an understanding of how the market environment affected each Fund’s performance. The statistical information that follows may help you understand each Fund’s performance compared to that of a relevant market benchmark.
It is important to keep in mind that the opinions expressed by personnel of the Advisor and/or Sub-Advisor are just that: informed opinions. They should not be considered to be promises or advice. The opinions, like the statistics, cover the period through the date on the cover of this report. The material risks of investing in each Fund are spelled out in the prospectus, the statement of additional information, this report and other Fund regulatory filings.
Page 1
Shareholder Letter
First Trust Exchange-Traded Fund III
Annual Letter from the Chairman and CEO
October 31, 2017
Dear Shareholders:
Thank you for your investment in First Trust RiverFront Dynamic International ETFs.
First Trust is pleased to provide you with the annual report which contains detailed information about your investment for the 12 months ended October 31, 2017, including a market overview and a performance analysis for the period. We encourage you to read this report carefully and discuss it with your financial advisor.
The U.S. bull market continued through the November 2016 election and the first nine months of the Trump presidency. During that period, November 8, 2016 (Election Day 2016) through October 31, 2017, the S&P 500® Index (the “Index”) posted a total return of
22.73%, according to Bloomberg. Ten of the eleven Index sectors were up on a total return basis as well. Since the beginning of 2017 through October 31, 2017, the Index has closed its trading sessions at all-time highs on 50 occasions. Finally, as of October 31, 2017, the Index has spent the entire year in positive territory. This has only happened in 10 different years over the past seven decades.
The current bull market, as measured from March 9, 2009 through October 31, 2017 is the second longest in history. While we are optimistic about the U.S. economy, we are aware that no one can know how markets will perform in different economic environments. We are also upbeat about the potential for world economic growth turning higher. While no one can predict the future, the International Monetary Fund sees world real gross domestic product rising by an estimated 0.5 percentage points from the 3.2% posted in 2016 to the 3.7% it is projecting for 2018.
We believe that one should invest for the long term and be prepared for market volatility by keeping current on your portfolio and investing goals by speaking regularly with your investment professional. It is also important to keep in mind that past performance can never guarantee future results.
Thank you for giving First Trust the opportunity to be a part of your investment plan. We value our relationship with you and will continue to focus on bringing the types of investments that we believe can help you reach your financial goals.
|
| Sincerely, |
|
 |
|
| James A. Bowen |
| Chairman of the Board of Trustees |
| Chief Executive Officer of First Trust Advisors L.P. |
Page 2
Fund Performance Overview (Unaudited)
First Trust Riverfront Dynamic Asia Pacific ETF (RFAP)
The investment objective of First Trust RiverFront Dynamic Asia Pacific ETF (the “Fund”) is to provide capital appreciation. Under normal market conditions, the Fund will seek to achieve its investment objective by investing at least 80% of its net assets (including investment borrowings) in a portfolio of equity securities of Asian Pacific companies, including through investments in common stock, depositary receipts, and common and preferred shares of real estate investment trusts (“REITs”), and forward foreign currency exchange contracts and currency spot transactions used to hedge the Fund’s exposure to the currencies in which the equity securities of such Asian Pacific companies are denominated (each, an “Asian Pacific currency” and, collectively, the “Asian Pacific currencies”). Asian Pacific companies are those companies (i) whose securities are traded principally on a stock exchange in an Asian Pacific country, (ii) that have a primary business office in an Asian Pacific country, or (iii) that have at least 50% of their assets in, or derive at least 50% of their revenues or profits from, an Asian Pacific country. Asian Pacific countries include the countries located in Asia and the Pacific Islands as well as Australia and New Zealand. The Fund will generally focus its Asian Pacific company investments in Australia, Hong Kong, Japan, New Zealand and/or Singapore. The Fund is non-diversified. Shares of the Fund are listed on The Nasdaq Stock Market LLC under the ticker symbol “RFAP.”
The Fund will utilize a dynamic currency hedging strategy through the use of forward foreign currency exchange contracts and currency spot transactions to hedge up to 100% of the Fund’s currency exposure. As a result of such dynamic currency hedging strategy, the portion of the Fund’s portfolio securities which are subject to currency hedging transactions may vary widely, from 0% to 100% of the portfolio securities. A forward contract on foreign currency is an obligation to purchase or sell a specific currency at a future date, which may be any fixed number of days agreed upon by the parties from the date of the contract, at a price set on the date of the contract. A forward foreign currency exchange contract may reduce the Fund’s exposure to changes in the value of the currency it will deliver and increase its exposure to changes in the value of the currency it will receive for the duration of the contract. The effect on the value of the Fund is similar to selling securities denominated in one currency and purchasing securities denominated in another currency. The Fund also may enter into currency spot transactions as part of its dynamic currency hedging strategy. A currency spot transaction is an agreement between two parties to buy or sell a specific currency for delivery on a date that is typically two business days from the date of the agreement, as opposed to a date set in the future. The underlying currencies of the forward foreign currency exchange contracts and currency spot transactions included in the Fund’s policy relating to the investment of at least 80% of its net assets (including investment borrowings) will be limited to Asian Pacific currencies.
Performance
| | | | | | | | | | | | |
| | | | | | Average Annual
Total Returns | | Cumulative
Total Returns |
| | | 1 Year Ended 10/31/17 | | Inception (4/13/16) to 10/31/17 | | Inception (4/13/16) to 10/31/17 |
Fund Performance | | | | | | | | | | | | |
NAV | | | 17.77 | % | | | 12.74 | % | | | 20.43 | % |
Market Price | | | 18.30 | % | | | 13.22 | % | | | 21.22 | % |
Index Performance | | | | | | | | | | | | |
MSCI Pacific Index | | | 18.07 | % | | | 17.23 | % | | | 27.96 | % |
(See Notes to Fund Performance Overview on Page 11.)
Page 3
Fund Performance Overview (Unaudited) (Continued)
First Trust Riverfront Dynamic Asia Pacific ETF (RFAP) (Continued)
| | | | |
Sector Allocation | | % of Total
Investments |
Financials | | | 22.7 | % |
Consumer Discretionary | | | 20.2 | |
Information Technology | | | 11.8 | |
Materials | | | 11.6 | |
Industrials | | | 11.2 | |
Consumer Staples | | | 5.3 | |
Utilities | | | 4.4 | |
Energy | | | 4.3 | |
Health Care | | | 3.8 | |
Real Estate | | | 3.1 | |
Telecommunication Services | | | 1.6 | |
| | | | |
Total | | | 100.0 | % |
| | | | |
| | | | |
Top Ten Holdings | | % of Total
Investments |
Commonwealth Bank of Australia | | | 3.2 | % |
Westpac Banking Corp. | | | 2.9 | |
Honda Motor Co., Ltd. | | | 2.2 | |
National Australia Bank Ltd. | | | 2.1 | |
Australia & New Zealand Banking Group Ltd. | | | 2.0 | |
Nintendo Co., Ltd. | | | 1.9 | |
Pengrowth Energy Corp. | | | 1.9 | |
Canon, Inc. | | | 1.8 | |
Sumitomo Mitsui Financial Group, Inc. | | | 1.6 | |
Japan Tobacco, Inc. | | | 1.6 | |
| | | | |
Total | | | 21.2 | % |
| | | | |
| | |
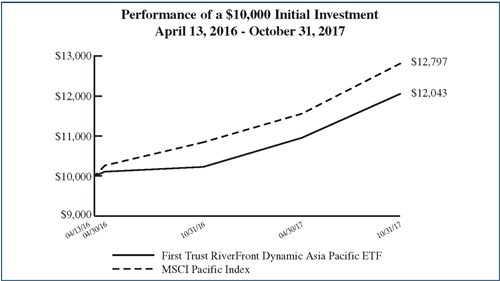 | | Performance figures assume reinvestment of all distributions and do not reflect the deduction of taxes that a shareholder would pay on Fund distributions or the redemption or sale of Fund shares. An index is a statistical composite that tracks a specified financial market or sector. Unlike the Fund, the index does not actually hold a portfolio of securities and therefore does not incur the expenses incurred by the Fund. These expenses negatively impact the performance of the Fund. The Fund’s past performance does not predict future performance. |
Frequency Distribution of Discounts and Premiums
Bid/Ask Midpoint vs. NAV through October 31, 2017
The following Frequency Distribution of Discounts and Premiums charts are provided to show the frequency at which the bid/ask midpoint price for the Fund was at a discount or premium to the daily NAV. The following tables are for comparative purposes only and represent the period April 14, 2016 (commencement of trading) through October 31, 2017. Shareholders may pay more than NAV when they buy Fund shares and receive less than NAV when they sell those shares because shares are bought and sold at current market price. Data presented represents past performance and cannot be used to predict future results.
| | | | | | | | |
| | Number of Days Bid/Ask Midpoint At/Above NAV |
| For the Period | | 0.00%–0.49% | | 0.50%–0.99% | | 1.00%–1.99% | | >=2.00% |
4/14/16 – 10/31/16 | | 65 | | 29 | | 12 | | 2 |
11/1/16 – 10/31/17 | | 127 | | 85 | | 23 | | 0 |
|
| | Number of Days Bid/Ask Midpoint Below NAV |
| For the Period | | 0.00%–0.49% | | 0.50%–0.99% | | 1.00%–1.99% | | >=2.00% |
4/14/16 – 10/31/16 | | 21 | | 8 | | 2 | | 1 |
11/1/16 – 10/31/17 | | 16 | | 1 | | 0 | | 0 |
Page 4
Fund Performance Overview (Unaudited) (Continued)
First Trust Riverfront Dynamic Developed International ETF (RFDI)
The investment objective of First Trust RiverFront Dynamic Developed International ETF (the “Fund”) is to provide capital appreciation. Under normal market conditions, the Fund will seek to achieve its investment objective by investing at least 80% of its net assets (including investment borrowings) in a portfolio of equity securities of developed market companies, including through investments in common stock, depositary receipts, and common and preferred shares of real estate investment trusts (“REITs”), and forward foreign currency exchange contracts and currency spot transactions used to hedge the Fund’s exposure to the currencies in which the equity securities of such developed market companies are denominated (each, a “Developed Market currency” and, collectively, the “Developed Market currencies”). Developed market companies are those companies (i) whose securities are traded principally on a stock exchange in a developed market country, (ii) that have a primary business office in a developed market country, or (iii) that have at least 50% of their assets in, or derive at least 50% of their revenues or profits from, a developed market country. Developed market countries currently include the countries comprising the Morgan Stanley Capital International World Index or countries considered to be developed by the World Bank, the International Finance Corporation or the United Nations. Under normal market conditions, the Fund will invest in at least three countries and at least 40% of its net assets in countries other than the United States. The Fund is non-diversified. Shares of the Fund are listed on The Nasdaq Stock Market LLC under the ticker symbol “RFDI.”
The Fund will utilize a dynamic currency hedging strategy through the use of forward foreign currency exchange contracts and currency spot transactions to hedge up to 100% of the Fund’s currency exposure. As a result of such dynamic currency hedging strategy, the portion of the Fund’s portfolio securities which are subject to currency hedging transactions may vary widely, from 0% to 100% of the portfolio securities. A forward contract on foreign currency is an obligation to purchase or sell a specific currency at a future date, which may be any fixed number of days agreed upon by the parties from the date of the contract, at a price set on the date of the contract. A forward foreign currency exchange contract may reduce the Fund’s exposure to changes in the value of the currency it will deliver and increase its exposure to changes in the value of the currency it will receive for the duration of the contract. The effect on the value of the Fund is similar to selling securities denominated in one currency and purchasing securities denominated in another currency. The Fund also may enter into currency spot transactions as part of its dynamic currency hedging strategy. A currency spot transaction is an agreement between two parties to buy or sell a specific currency for delivery on a date that is typically two business days from the date of the agreement, as opposed to a date set in the future. The underlying currencies of the forward foreign currency exchange contracts and currency spot transactions included in the Fund’s policy relating to the investment of at least 80% of its net assets (including investment borrowings) will be limited to Developed Market currencies.
Performance
| | | | | | | | | | | | |
| | | | | | Average Annual
Total Returns | | Cumulative
Total Returns |
| | | 1 Year Ended
10/31/17 | | Inception (4/13/16)
to 10/31/17 | | Inception (4/13/16)
to 10/31/17 |
Fund Performance | | | | | | | | | | | | |
NAV | | | 26.60 | % | | | 18.42 | % | | | 29.98 | % |
Market Price | | | 27.10 | % | | | 18.77 | % | | | 30.57 | % |
Index Performance | | | | | | | | | | | | |
MSCI EAFE Index | | | 23.44 | % | | | 15.77 | % | | | 25.49 | % |
(See Notes to Fund Performance Overview on Page 11.)
Page 5
Fund Performance Overview (Unaudited) (Continued)
First Trust Riverfront Dynamic Developed International ETF (RFDI) (Continued)
| | | | |
Sector Allocation | | % of Total
Investments |
Financials | | | 20.9 | % |
Consumer Discretionary | | | 15.4 | |
Industrials | | | 12.0 | |
Materials | | | 10.9 | |
Consumer Staples | | | 9.7 | |
Information Technology | | | 9.0 | |
Health Care | | | 8.6 | |
Energy | | | 5.2 | |
Utilities | | | 4.5 | |
Telecommunication Services | | | 2.8 | |
Real Estate | | | 1.0 | |
| | | | |
Total | | | 100.0 | % |
| | | | |
| | | | |
Top Ten Holdings | | % of Total
Investments |
HSBC Holdings PLC | | | 2.1 | % |
British American Tobacco PLC | | | 1.6 | |
Sonova Holding AG | | | 1.5 | |
Banco Bilbao Vizcaya Argentaria S.A. | | | 1.4 | |
Rhi Magnesita N.V. | | | 1.4 | |
Unilever N.V. | | | 1.3 | |
LVMH Moet Hennessy Louis Vuitton SE | | | 1.3 | |
Diageo PLC | | | 1.3 | |
Kering | | | 1.1 | |
STMicroelectronics N.V. | | | 1.1 | |
| | | | |
Total | | | 14.1 | % |
| | | | |
| | |
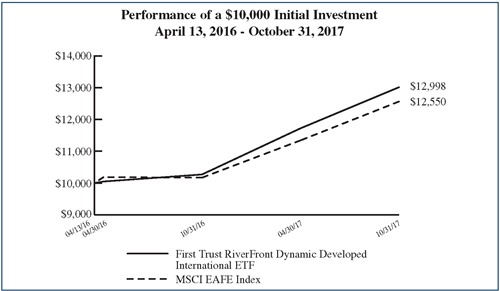 | | Performance figures assume reinvestment of all distributions and do not reflect the deduction of taxes that a shareholder would pay on Fund distributions or the redemption or sale of Fund shares. An index is a statistical composite that tracks a specified financial market or sector. Unlike the Fund, the index does not actually hold a portfolio of securities and therefore does not incur the expenses incurred by the Fund. These expenses negatively impact the performance of the Fund. The Fund’s past performance does not predict future performance. |
Frequency Distribution of Discounts and Premiums
Bid/Ask Midpoint vs. NAV through October 31, 2017
The following Frequency Distribution of Discounts and Premiums charts are provided to show the frequency at which the bid/ask midpoint price for the Fund was at a discount or premium to the daily NAV. The following tables are for comparative purposes only and represent the period April 14, 2016 (commencement of trading) through October 31, 2017. Shareholders may pay more than NAV when they buy Fund shares and receive less than NAV when they sell those shares because shares are bought and sold at current market price. Data presented represents past performance and cannot be used to predict future results.
| | | | | | | | |
| | Number of Days Bid/Ask Midpoint At/Above NAV |
| For the Period | | 0.00%–0.49% | | 0.50%–0.99% | | 1.00%–1.99% | | >=2.00% |
4/14/16 – 10/31/16 | | 46 | | 70 | | 18 | | 2 |
11/1/16 – 10/31/17 | | 157 | | 81 | | 7 | | 0 |
|
| | Number of Days Bid/Ask Midpoint Below NAV |
| For the Period | | 0.00%–0.49% | | 0.50%–0.99% | | 1.00%–1.99% | | >=2.00% |
4/14/16 – 10/31/16 | | 4 | | 0 | | 0 | | 0 |
11/1/16 – 10/31/17 | | 7 | | 0 | | 0 | | 0 |
Page 6
Fund Performance Overview (Unaudited) (Continued)
First Trust Riverfront Dynamic Europe ETF (RFEU)
The investment objective of First Trust RiverFront Dynamic Europe ETF (the “Fund”) is to provide capital appreciation. Under normal market conditions, the Fund will seek to achieve its investment objective by investing at least 80% of its net assets (including investment borrowings) in a portfolio of equity securities of European companies, including through investments in common stock, depositary receipts, and common and preferred shares of real estate investment trusts (“REITs”), and forward foreign currency exchange contracts and currency spot transactions used to hedge the Fund’s exposure to the currencies in which the equity securities of such European companies are denominated (each, a “European currency” and, collectively, the “European currencies”). European companies are those companies (i) whose securities are traded principally on a stock exchange in a European country, (ii) that have a primary business office in a European country, or (iii) that have at least 50% of their assets in, or derive at least 50% of their revenues or profits from, a European country. The Fund considers a European country to be any member country of the European Union or any country included in the FTSE Developed Europe Index or the FTSE Emerging Europe All Cap Index. The Fund will generally focus its European company investments in Austria, Belgium, Denmark, Finland, France, Germany, Ireland, Italy, Luxembourg, the Netherlands, Norway, Portugal, Spain, Sweden, Switzerland and/or the United Kingdom. The Fund is non-diversified. Shares of the Fund are listed on The Nasdaq Stock Market LLC under the ticker symbol “RFEU.”
The Fund will utilize a dynamic currency hedging strategy through the use of forward foreign currency exchange contracts and currency spot transactions to hedge up to 100% of the Fund’s currency exposure. As a result of such dynamic currency hedging strategy, the portion of the Fund’s portfolio securities which are subject to currency hedging transactions may vary widely, from 0% to 100% of the portfolio securities. A forward contract on foreign currency is an obligation to purchase or sell a specific currency at a future date, which may be any fixed number of days agreed upon by the parties from the date of the contract, at a price set on the date of the contract. A forward foreign currency exchange contract may reduce the Fund’s exposure to changes in the value of the currency it will deliver and increase its exposure to changes in the value of the currency it will receive for the duration of the contract. The effect on the value of the Fund is similar to selling securities denominated in one currency and purchasing securities denominated in another currency. The Fund also may enter into currency spot transactions as part of its dynamic currency hedging strategy. A currency spot transaction is an agreement between two parties to buy or sell a specific currency for delivery on a date that is typically two business days from the date of the agreement, as opposed to a date set in the future. The underlying currencies of the forward foreign currency exchange contracts and currency spot transactions included in the Fund’s policy relating to the investment of at least 80% of its net assets (including investment borrowings) will be limited to European currencies.
Performance
| | | | | | | | | | | | |
| | | | | | Average Annual
Total Returns | | Cumulative
Total Returns |
| | | 1 Year Ended
10/31/17 | | Inception (4/13/16)
to 10/31/17 | | Inception (4/13/16)
to 10/31/17 |
Fund Performance | | | | | | | | | | | | |
NAV | | | 31.21 | % | | | 21.18 | % | | | 34.71 | % |
Market Price | | | 30.64 | % | | | 21.42 | % | | | 35.12 | % |
Index Performance | | | | | | | | | | | | |
MSCI Europe Index | | | 27.01 | % | | | 15.34 | % | | | 24.77 | % |
(See Notes to Fund Performance Overview on Page 11.)
Page 7
Fund Performance Overview (Unaudited) (Continued)
First Trust Riverfront Dynamic Europe ETF (RFEU) (Continued)
| | | | |
Sector Allocation | | % of Total
Investments |
Financials | | | 20.0 | % |
Consumer Discretionary | | | 13.1 | |
Industrials | | | 12.5 | |
Consumer Staples | | | 11.9 | |
Health Care | | | 10.9 | |
Materials | | | 10.6 | |
Information Technology | | | 7.5 | |
Energy | | | 5.6 | |
Utilities | | | 4.6 | |
Telecommunication Services | | | 3.3 | |
| | | | |
Total | | | 100.0 | % |
| | | | |
| | | | |
Top Ten Holdings | | % of Total
Investments |
HSBC Holdings PLC | | | 3.1 | % |
British American Tobacco PLC | | | 2.3 | |
Sonova Holding AG | | | 2.3 | |
Banco Bilbao Vizcaya Argentaria S.A. | | | 2.1 | |
Rhi Magnesita N.V. | | | 2.0 | |
Unilever N.V. | | | 2.0 | |
Diageo PLC | | | 1.9 | |
LVMH Moet Hennessy Louis Vuitton SE | | | 1.9 | |
Kering | | | 1.6 | |
STMicroelectronics N.V. | | | 1.6 | |
| | | | |
Total | | | 20.8 | % |
| | | | |
| | |
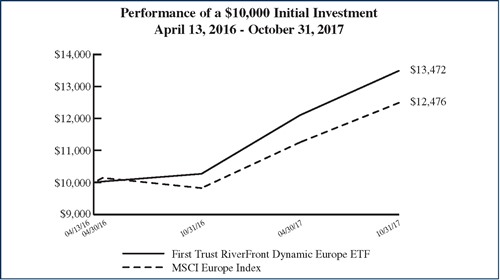 | | Performance figures assume reinvestment of all distributions and do not reflect the deduction of taxes that a shareholder would pay on Fund distributions or the redemption or sale of Fund shares. An index is a statistical composite that tracks a specified financial market or sector. Unlike the Fund, the index does not actually hold a portfolio of securities and therefore does not incur the expenses incurred by the Fund. These expenses negatively impact the performance of the Fund. The Fund’s past performance does not predict future performance. |
Frequency Distribution of Discounts and Premiums
Bid/Ask Midpoint vs. NAV through October 31, 2017
The following Frequency Distribution of Discounts and Premiums charts are provided to show the frequency at which the bid/ask midpoint price for the Fund was at a discount or premium to the daily NAV. The following tables are for comparative purposes only and represent the period April 14, 2016 (commencement of trading) through October 31, 2017. Shareholders may pay more than NAV when they buy Fund shares and receive less than NAV when they sell those shares because shares are bought and sold at current market price. Data presented represents past performance and cannot be used to predict future results.
| | | | | | | | |
| | Number of Days Bid/Ask Midpoint At/Above NAV |
| For the Period | | 0.00%–0.49% | | 0.50%–0.99% | | 1.00%–1.99% | | >=2.00% |
4/14/16 – 10/31/16 | | 39 | | 35 | | 2 | | 0 |
11/1/16 – 10/31/17 | | 134 | | 103 | | 8 | | 0 |
|
| | Number of Days Bid/Ask Midpoint Below NAV |
| For the Period | | 0.00%–0.49% | | 0.50%–0.99% | | 1.00%–1.99% | | >=2.00% |
4/14/16 – 10/31/16 | | 56 | | 8 | | 0 | | 0 |
11/1/16 – 10/31/17 | | 7 | | 0 | �� | 0 | | 0 |
Page 8
Fund Performance Overview (Unaudited) (Continued)
First Trust Riverfront Dynamic Emerging Markets ETF (RFEM)
The investment objective of First Trust RiverFront Dynamic Emerging Markets ETF (the “Fund”) is to provide capital appreciation. Under normal market conditions, the Fund will seek to achieve its investment objective by investing at least 80% of its net assets (including investment borrowings) in a portfolio of equity securities of emerging market companies, including through investments in common stock, depositary receipts, and common and preferred shares of real estate investment trusts (“REITs”), and forward foreign currency exchange contracts and currency spot transactions used to hedge the Fund’s exposure to the currencies in which the equity securities of such emerging market companies are denominated (each, an “Emerging Market currency” and, collectively, the “Emerging Market currencies”). The Fund considers an emerging market company to be one (i) domiciled or with a principal place of business or primary securities trading market in an emerging market country, or (ii) that derives a substantial portion of its total revenues or profits from emerging market countries. The Fund considers an emerging market country to be any country whose issuers are included in the Morgan Stanley Capital International Emerging Markets Index and/or those countries considered to be developing by the World Bank, the International Finance Corporation or the United Nations. The Fund will generally focus its emerging market company investments in Brazil, Chile, China, Colombia, the Czech Republic, Egypt, Greece, Hungary, India, Indonesia, Malaysia, Mexico, Morocco, Nigeria, Peru, the Philippines, Poland, Qatar, Russia, South Africa, South Korea, Taiwan, Thailand, Turkey and/or the United Arab Emirates. The Fund is non-diversified. Shares of the Fund are listed on The Nasdaq Stock Exchange LLC under the ticker symbol “RFEM.”
The Fund will utilize a dynamic currency hedging strategy through the use of forward foreign currency exchange contracts and currency spot transactions to hedge up to 100% of the Fund’s currency exposure. As a result of such dynamic currency hedging strategy, the portion of the Fund’s portfolio securities which are subject to currency hedging transactions may vary widely, from 0% to 100% of the portfolio securities. A forward contract on foreign currency is an obligation to purchase or sell a specific currency at a future date, which may be any fixed number of days agreed upon by the parties from the date of the contract, at a price set on the date of the contract. A forward foreign currency exchange contract may reduce the Fund’s exposure to changes in the value of the currency it will deliver and increase its exposure to changes in the value of the currency it will receive for the duration of the contract. The effect on the value of the Fund is similar to selling securities denominated in one currency and purchasing securities denominated in another currency. The Fund also may enter into currency spot transactions as part of its dynamic currency hedging strategy. A currency spot transaction is an agreement between two parties to buy or sell a specific currency for delivery on a date that is typically two business days from the date of the agreement, as opposed to a date set in the future. The underlying currencies of the forward foreign currency exchange contracts and currency spot transactions included in the Fund’s policy relating to the investment of at least 80% of its net assets (including investment borrowings) will be limited to Emerging Market currencies.
Performance
| | | | | | | | | | | | |
| | | | | | Average Annual
Total Returns | | Cumulative
Total Returns |
| | | 1 Year Ended
10/31/17 | | Inception (6/14/16)
to 10/31/17 | | Inception (6/14/16)
to 10/31/17 |
Fund Performance | | | | | | | | | | | | |
NAV | | | 26.49 | % | | | 30.79 | % | | | 44.86 | % |
Market Price | | | 26.57 | % | | | 31.33 | % | | | 45.69 | % |
Index Performance | | | | | | | | | | | | |
MSCI Emerging Markets Index | | | 26.45 | % | | | 30.40 | % | | | 44.27 | % |
(See Notes to Fund Performance Overview on Page 11.)
Page 9
Fund Performance Overview (Unaudited) (Continued)
First Trust Riverfront Dynamic Emerging Markets ETF (RFEM) (Continued)
| | | | |
Sector Allocation | | % of Total
Investments |
Information Technology | | | 28.8 | % |
Financials | | | 20.9 | |
Consumer Discretionary | | | 11.9 | |
Materials | | | 10.0 | |
Industrials | | | 8.5 | |
Utilities | | | 6.4 | |
Energy | | | 4.5 | |
Real Estate | | | 3.1 | |
Telecommunication Services | | | 2.4 | |
Consumer Staples | | | 2.0 | |
Health Care | | | 1.5 | |
| | | | |
Total | | | 100.0 | % |
| | | | |
| | | | |
Top Ten Holdings | | % of Total
Investments |
Samsung Electronics Co., Ltd. | | | 5.4 | % |
Tencent Holdings Ltd. | | | 4.3 | |
Taiwan Semiconductor Manufacturing Co., Ltd. | | | 3.8 | |
TAL Education Group, ADR | | | 1.9 | |
Industrial & Commercial Bank of China Ltd., Class H | | | 1.9 | |
China Construction Bank Corp., Class H | | | 1.5 | |
Bank of China Ltd., Class H | | | 1.5 | |
CJ Corp. | | | 1.5 | |
KB Financial Group, Inc. | | | 1.5 | |
Koza Altin Isletmeleri A.S. | | | 1.5 | % |
| | | | |
Total | | | 24.8 | % |
| | | | |
| | |
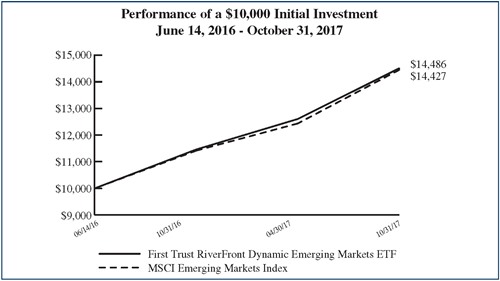 | | Performance figures assume reinvestment of all distributions and do not reflect the deduction of taxes that a shareholder would pay on Fund distributions or the redemption or sale of Fund shares. An index is a statistical composite that tracks a specified financial market or sector. Unlike the Fund, the index does not actually hold a portfolio of securities and therefore does not incur the expenses incurred by the Fund. These expenses negatively impact the performance of the Fund. The Fund’s past performance does not predict future performance. |
Frequency Distribution of Discounts and Premiums
Bid/Ask Midpoint vs. NAV through October 31, 2017
The following Frequency Distribution of Discounts and Premiums charts are provided to show the frequency at which the bid/ask midpoint price for the Fund was at a discount or premium to the daily NAV. The following tables are for comparative purposes only and represent the period June 15, 2016 (commencement of trading) through October 31, 2017. Shareholders may pay more than NAV when they buy Fund shares and receive less than NAV when they sell those shares because shares are bought and sold at current market price. Data presented represents past performance and cannot be used to predict future results.
| | | | | | | | |
| | Number of Days Bid/Ask Midpoint At/Above NAV |
| For the Period | | 0.00%–0.49% | | 0.50%–0.99% | | 1.00%–1.99% | | >=2.00% |
6/15/16 – 10/31/16 | | 31 | | 40 | | 16 | | 1 |
11/1/16 – 10/31/17 | | 130 | | 87 | | 8 | | 0 |
|
| | Number of Days Bid/Ask Midpoint Below NAV |
| For the Period | | 0.00%–0.49% | | 0.50%–0.99% | | 1.00%–1.99% | | >=2.00% |
6/15/16 – 10/31/16 | | 7 | | 2 | | 0 | | 0 |
11/1/16 – 10/31/17 | | 25 | | 1 | | 1 | | 0 |
Page 10
Notes to Fund Performance Overview
Total returns for the periods since inception are calculated from the inception date of each Fund. “Average Annual Total Returns” represent the average annual change in value of an investment over the periods indicated. “Cumulative Total Returns” represent the total change in value of an investment over the periods indicated.
Each Fund’s per share net asset value (“NAV”) is the value of one share of the Fund and is computed by dividing the value of all assets of the Fund (including accrued interest and dividends), less all liabilities (including accrued expenses and dividends declared but unpaid), by the total number of outstanding shares. The price used to calculate market return (“Market Price”) is determined by using the midpoint between the highest bid and the lowest offer on the stock exchange on which shares of the Fund are listed for trading as of the time that the Fund’s NAV is calculated. Since shares of each Fund did not trade in the secondary market until after the Fund’s inception, for the period from inception to the first day of secondary market trading in shares of the Fund, the NAV of each Fund is used as a proxy for the secondary market trading price to calculate market returns. NAV and market returns assume that all distributions have been reinvested in each Fund at NAV and Market Price, respectively.
An index is a statistical composite that tracks a specified financial market or sector. Unlike each Fund, the indices do not actually hold a portfolio of securities and therefore do not incur the expenses incurred by each Fund. These expenses negatively impact the performance of each Fund. Also, market returns do not include brokerage commissions that may be payable on secondary market transactions. If brokerage commissions were included, market returns would be lower. The total returns presented reflect the reinvestment of dividends on securities in the indices. The returns presented do not reflect the deduction of taxes that a shareholder would pay on Fund distributions or the redemption or sale of Fund shares. The investment return and principal value of shares of each Fund will vary with changes in market conditions. Shares of each Fund may be worth more or less than their original cost when they are redeemed or sold in the market. Each Fund’s past performance is no guarantee of future performance.
Page 11
Portfolio Commentary
First Trust Exchange-Traded Fund III
First Trust RiverFront Dynamic International ETFs
Annual Report
October 31, 2017 (Unaudited)
Advisor
First Trust Advisors L.P. (“First Trust”) is the investment advisor. First Trust is responsible for the ongoing monitoring of each Fund’s investment portfolio, managing each Fund’s business affairs and providing certain administrative services necessary for the management of each Fund.
Sub-Advisor
RiverFront Investment Group, LLC
RiverFront Investment Group, LLC is an SEC-registered investment advisor located in Richmond, Virginia. It is majority owned by its employees, and Baird Financial Corporation is a minority owner of RiverFront Investment Holding Group, LLC. The firm provides asset management services to a series of global tactical asset allocation portfolios and registered investment companies, including mutual funds and exchange-traded products.
Portfolio Management Team
Michael Jones, CFA – Chairman and Chief Investment Officer
Doug Sandler, CFA – Chief US Equity Officer
Adam Grossman, CFA – Chief Global Equity Officer
Chris Konstantinos, CFA – Director of International Portfolio Management
Scott Hays – Quantitative Portfolio Manager
Commentary
Market Update
The 12 months ended October 31, 2017 have been a time when growth in the global macro-economy and in corporate earnings has “trumped” political and geopolitical concerns. In the United States, market acceleration began in earnest in November 2016, with the surprise election of Donald Trump. Small and medium-size business optimism skyrocketed in the U.S. as business managers envisioned lower corporate taxes and less onerous regulation. Despite a legislative process that has thus far proved more problematic than first envisioned, corporate managers continue to view the macro backdrop as conducive for growth, as evidenced by increased hiring and capital expenditure.
U.S. interest rates remained contained at a low level relative to historical levels as the U.S. Federal Reserve (the “Fed”) embarked on a series of four small interest rate hikes combined with relatively dovish commentary. In our view, the Fed’s dovish body language is likely due to inflation that has consistently tracked below the Fed’s target. This dynamic, which we believe is likely to persist with Fed Chair Janet Yellen’s successor, Jerome Powell, in 2018, has kept the U.S. dollar contained and manifested itself in low market volatility relative to historical standards. Market gains have been relatively consistent; each of the first three quarters of 2017 brought positive returns as the macro backdrop has led to continued growth in U.S corporate earnings.
Outside of the U.S., equity market action has been even more positive over the last year, as Europe and much of Asia continued to exhibit a synchronized level of economic growth not seen in the better part of a decade. On the manufacturing side, the global Purchasing Manager Index (“PMI”) survey hit a multi-year high, and data releases continue to surprise to the upside in aggregate. Consumer confidence continued to improve in many major economies such as Germany, France, Japan and China. Japan is now in its longest economic expansion in a decade, and we believe forward-looking surveys of business activity across the Eurozone suggest the economic rebound there is sustainable. China’s economy continues to awaken from its 2011-2015 funk, stoking improved growth across many emerging markets. All of this data suggests to us that a recession is not in our immediate sights, helping to boost risk appetite. Despite this synchronized global growth, developed market central banks remain highly accommodative, given the pronounced lack of excess inflation in most parts of the world - a positive scenario for stock market multiples, in our opinion.
First Trust RiverFront Dynamic Asia Pacific ETF (RFAP)
2017 Attribution
For the period October 31, 2016 to October 31, 2017, the First Trust RiverFront Dynamic Asia Pacific ETF (“RFAP”) posted a net asset value (“NAV”) return of 17.77% and a market price return of 18.30%, which were largely in line with the benchmark’s return (MSCI Pacific Index) of 18.07%. The core of RFAP’s selection model is an intra-sector selection model. For the year, the model’s selection was particularly strong in Australia and Hong Kong, as well as allocations to Canadian securities. The major detractors for the year were security selection within Japan and losses from the Japanese Currency Hedge.
Page 12
Portfolio Commentary (Continued)
First Trust Exchange-Traded Fund III
First Trust RiverFront Dynamic International ETFs
Annual Report
October 31, 2017 (Unaudited)
First Trust RiverFront Dynamic Developed International ETF (RFDI)
2017 Attribution
For the period October 31, 2016 to October 31, 2017, the First Trust RiverFront Dynamic Developed International ETF (“RFDI”) posted a NAV return of 26.60% and a market price return of 27.10%, both of which outperformed the benchmark’s return (MSCI EAFE Index) of 23.44%. The core of RFDI’s selection model is an intra-sector selection model. For the 12 months ended October 31, 2017, RFDI’s selection was particularly strong with respect to French, Dutch and Australian securities. Additionally, a tilt towards Austria currency hedges of the euro and British pound contributed positively to performance. The major detractors for the period were security selection within the United Kingdom, currency hedge losses around the Japanese yen, and an overweight to Japanese equities.
First Trust RiverFront Dynamic Developed Europe ETF (RFEU)
2017 Attribution
For the period October 31, 2016 to October 31, 2017, the First Trust RiverFront Dynamic Europe ETF (“RFEU”) posted a NAV return of 31.21% and a market price return of 30.64%, both of which outperformed the benchmark’s return (MSCI Europe Index) of 27.01%. The core of RFEU’s selection model is an intra-sector selection model. For the 12 months ended October 31, 2017, the model’s selection was particularly strong with respect to French, Danish, Italian and Dutch securities. Additionally, a tilt towards Austria and currency hedges of the euro and British pound contributed positively to performance. The only major detractor for the year was security selection within the United Kingdom.
First Trust RiverFront Dynamic Emerging Markets ETF (RFEM)
2017 Attribution
For the period October 31, 2016 to October 31, 2017, the First Trust RiverFront Dynamic Emerging Markets ETF (“RFEM”) posted a NAV return of 26.49% and a market price return of 26.57%, both of which were in line with the benchmark’s return (MSCI EEM Index) of 26.45%. The core of RFEM’s selection model is an intra-sector selection model. For the period, RFEM’s selection was particularly strong with respect to Hong Kong, Indian and Brazilian securities. Additionally, tilts towards South Korea, Israel, Turkey and tilts away from Russia and Mexico contributed positively to performance. The major detractors for the period were security selection inside of China, Poland and South Africa, and country tilts towards Brazil, Turkish lira (by being overweight Turkish companies), and Greece, and away from China. Cash drag was also a major source of underperformance in this portfolio.
Market Outlook
We remain pro-risk, with an emphasis on non-U.S. equity markets. We believe a mild version of a global ‘disinflationary boom’ is possible, given solid growth, modest inflation and accommodative monetary policy. This is the kind of environment that last occurred in the disinflationary growth period from the mid-1980s to the late 1990s in the U.S., though we recognize that growth was likely structurally stronger at the time. We believe this dynamic is supportive of higher valuation multiples in the U.S. and beyond, though we view valuation as more attractive in international markets.
In our view, economic improvement is mainly relevant to investors insofar as it has a positive effect on the trajectory of corporate earnings. To this point, we are seeing global earnings momentum improve to the strongest level since 2010, with a particular emphasis on areas such as the Eurozone, Japan and emerging markets. We view this as positive for global stock markets. According to the International Brokers’ Estimated System (“IBES”) consensus earnings estimates, the world’s major geographic areas are all on track to produce positive earnings in fiscal year 2017, in contrast to the last eight years, where improvement tended to be clustered only in certain geographies.
Page 13
First Trust Exchange-Traded Fund III
Understanding Your Fund Expenses
October 31, 2017 (Unaudited)
As a shareholder of First Trust RiverFront Dynamic Asia Pacific ETF, First Trust RiverFront Dynamic Developed International ETF, First Trust RiverFront Dynamic Europe ETF or First Trust RiverFront Dynamic Emerging Markets ETF (each a “Fund” and collectively, the “Funds”), you incur two types of costs: (1) transaction costs; and (2) ongoing costs, including management fees, distribution and/or service (12b-1) fees, if any, and other Fund expenses. This Example is intended to help you understand your ongoing costs of investing in the Funds and to compare these costs with the ongoing costs of investing in other funds.
The Example is based on an investment of $1,000 invested at the beginning of the period and held through the six-month period ended October 31, 2017.
Actual Expenses
The first line in the following table provides information about actual account values and actual expenses. You may use the information in this line, together with the amount you invested, to estimate the expenses that you paid over the period. Simply divide your account value by $1,000 (for example, an $8,600 account value divided by $1,000 = 8.6), then multiply the result by the number in the first line under the heading entitled “Expenses Paid During the Six-Month Period” to estimate the expenses you paid on your account during this period.
Hypothetical Example for Comparison Purposes
The second line in the following table provides information about hypothetical account values and hypothetical expenses based on each Fund’s actual expense ratio and an assumed rate of return of 5% per year before expenses, which is not each Fund’s actual return. The hypothetical account values and expenses may not be used to estimate the actual ending account balance or expenses you paid for the period. You may use this information to compare the ongoing costs of investing in the Funds and other funds. To do so, compare this 5% hypothetical example with the 5% hypothetical examples that appear in the shareholder reports of the other funds.
Please note that the expenses shown in the table are meant to highlight your ongoing costs only and do not reflect any transactional costs such as brokerage commissions. Therefore, the second line in the table is useful in comparing ongoing costs only, and will not help you determine the relative total costs of owning different funds. In addition, if these transactional costs were included, your costs would have been higher.
| | | | | | | | | | | | | | | | |
| | | Beginning
Account Value
May 1, 2017 | | | Ending
Account Value
October 31, 2017 | | | Annualized
Expense Ratio
Based on the
Six-Month
Period | | | Expenses Paid
During the
Six-Month
Period (a) | |
First Trust RiverFront Dynamic Asia Pacific ETF (RFAP) | | | | | | | | | | | | | | | | |
Actual | | $ | 1,000.00 | | | $ | 1,099.90 | | | | 0.83 | % | | $ | 4.39 | |
Hypothetical (5% return before expenses) | | $ | 1,000.00 | | | $ | 1,021.02 | | | | 0.83 | % | | $ | 4.23 | |
| | | | |
First Trust RiverFront Dynamic Developed International ETF (RFDI) | | | | | | | | | | | | | | | | |
Actual | | $ | 1,000.00 | | | $ | 1,109.90 | | | | 0.83 | % | | $ | 4.41 | |
Hypothetical (5% return before expenses) | | $ | 1,000.00 | | | $ | 1,021.02 | | | | 0.83 | % | | $ | 4.23 | |
| | | | |
First Trust RiverFront Dynamic Europe ETF (RFEU) | | | | | | | | | | | | | | | | |
Actual | | $ | 1,000.00 | | | $ | 1,114.00 | | | | 0.83 | % | | $ | 4.42 | |
Hypothetical (5% return before expenses) | | $ | 1,000.00 | | | $ | 1,021.02 | | | | 0.83 | % | | $ | 4.23 | |
| | | | |
First Trust RiverFront Dynamic Emerging Markets ETF (RFEM) | | | | | | | | | | | | | | | | |
Actual | | $ | 1,000.00 | | | $ | 1,150.60 | | | | 0.95 | % | | $ | 5.15 | |
Hypothetical (5% return before expenses) | | $ | 1,000.00 | | | $ | 1,020.42 | | | | 0.95 | % | | $ | 4.84 | |
| (a) | Expenses are equal to the annualized expense ratios, multiplied by the average account value over the period (May 1, 2017 through October 31, 2017), multiplied by 184/365 (to reflect the one-half year period). |
Page 14
First Trust Riverfront Dynamic Asia Pacific ETF (RFAP)
Portfolio of Investments
October 31, 2017
| | | | | | |
Shares | | Description | | Value | |
| | | | | |
COMMON STOCKS (a) – 98.7% | | | | |
| | |
| | Australia – 16.5% | | | | |
| 105,918 | | AMP Ltd. | | $ | 402,890 | |
| 25,880 | | Australia & New Zealand Banking Group Ltd. | | | 592,633 | |
| 31,509 | | Bank of Queensland Ltd. | | | 322,182 | |
| 4,971 | | BHP Billiton Ltd. | | | 100,973 | |
| 15,773 | | Commonwealth Bank of Australia | | | 937,139 | |
| 13,622 | | Computershare Ltd. | | | 162,431 | |
| 123,881 | | Healthscope Ltd. | | | 185,832 | |
| 24,923 | | National Australia Bank Ltd. | | | 622,983 | |
| 43,690 | | OZ Minerals Ltd. | | | 269,177 | |
| 13,841 | | QBE Insurance Group Ltd. | | | 113,135 | |
| 15,144 | | Treasury Wine Estates Ltd. | | | 181,391 | |
| 5,904 | | Wesfarmers Ltd. | | | 188,879 | |
| 33,637 | | Westpac Banking Corp. | | | 849,297 | |
| | | | | | |
| | | | | 4,928,942 | |
| | | | | | |
| | Bermuda – 2.5% | | | | |
| 530,891 | | BOE Varitronix Ltd. | | | 388,570 | |
| 482,500 | | Giordano International Ltd. | | | 272,749 | |
| 466,800 | | Noble Group Ltd. (b) | | | 99,312 | |
| | | | | | |
| | | | | 760,631 | |
| | | | | | |
| | Canada – 5.0% | | | | |
| 38,793 | | Extendicare, Inc. | | | 281,754 | |
| 6,137 | | Methanex Corp. | | | 299,072 | |
| 498,932 | | Pengrowth Energy Corp. (b) | | | 560,772 | |
| 352,188 | | Sherritt International Corp. (b) | | | 360,350 | |
| | | | | | |
| | | | | 1,501,948 | |
| | | | | | |
| | Cayman Islands – 3.2% | | | | |
| 26,698 | | Kingboard Chemical Holdings Ltd. | | | 158,277 | |
| 1,965,624 | | Parkson Retail Group Ltd. | | | 297,310 | |
| 168,124 | | WH Group Ltd. (c) | | | 170,249 | |
| 123,141 | | Wynn Macau Ltd. | | | 315,690 | |
| | | | | | |
| | | | | 941,526 | |
| | | | | | |
| | Hong Kong – 3.7% | | | | |
| 195,000 | | Cathay Pacific Airways Ltd. (b) | | | 333,440 | |
| 14,822 | | Galaxy Entertainment Group Ltd. | | | 100,886 | |
| 1,107,593 | | Oriental Press Group Ltd. | | | 149,072 | |
| 530,535 | | PCCW Ltd. | | | 292,422 | |
| 262,854 | | SJM Holdings Ltd. | | | 225,744 | |
| | | | | | |
| | | | | 1,101,564 | |
| | | | | | |
| | Japan – 59.7% | | | | |
| 8,080 | | Aozora Bank Ltd. | | | 314,445 | |
| 9,700 | | Asahi Group Holdings Ltd. | | | 440,277 | |
| 25,700 | | Astellas Pharma, Inc. | | | 340,956 | |
| 14,200 | | Canon, Inc. | | | 529,885 | |
| 11,300 | | Capcom Co., Ltd. | | | 285,320 | |
| 13,180 | | Central Glass Co., Ltd. | | | 292,915 | |
| 17,000 | | Chubu Electric Power Co., Inc. | | | 217,836 | |
| 16,150 | | Dai Nippon Printing Co., Ltd. | | | 384,202 | |
| | | | | | |
Shares | | Description | | Value | |
| | | | | | | |
| | Japan (Continued) | | | | |
| 2,100 | | Daito Trust Construction Co., Ltd. | | $ | 366,330 | |
| 52,000 | | Daiwa Securities Group, Inc. | | | 322,733 | |
| 11,400 | | Electric Power Development Co., Ltd. | | | 285,238 | |
| 8,700 | | Haseko Corp. | | | 125,483 | |
| 8,400 | | Hitachi High-Technologies Corp. | | | 348,322 | |
| 20,700 | | Honda Motor Co., Ltd. | | | 641,362 | |
| 12,100 | | Idemitsu Kosan Co., Ltd. | | | 350,640 | |
| 27,800 | | Ishihara Sangyo Kaisha Ltd. (b) | | | 415,148 | |
| 6,200 | | Japan Petroleum Exploration Co., Ltd. | | | 126,994 | |
| 22,300 | | Japan Post Holdings Co., Ltd. | | | 256,527 | |
| 14,200 | | Japan Tobacco, Inc. | | | 467,942 | |
| 13,700 | | JFE Holdings, Inc. | | | 291,579 | |
| 47,400 | | JXTG Holdings, Inc. | | | 243,118 | |
| 39,000 | | Kajima Corp. | | | 402,331 | |
| 24,000 | | Kobe Steel Ltd. (b) | | | 200,519 | |
| 22,200 | | Komori Corp. | | | 310,825 | |
| 7,400 | | Kyudenko Corp. | | | 326,054 | |
| 15,800 | | Kyushu Electric Power Co., Inc. | | | 179,253 | |
| 26,900 | | Matsui Securities Co., Ltd. | | | 224,512 | |
| 27,100 | | Mazda Motor Corp. | | | 386,581 | |
| 8,080 | | Mitsubishi Heavy Industries Ltd. | | | 314,019 | |
| 41,000 | | Mitsubishi Paper Mills Ltd. (b) | | | 275,485 | |
| 15,370 | | Mitsubishi Steel Manufacturing Co., Ltd. | | | 379,840 | |
| 14,300 | | Mitsubishi UFJ Financial Group, Inc. | | | 95,895 | |
| 20,060 | | Mitsui Engineering & Shipbuilding Co., Ltd. | | | 260,222 | |
| 217,400 | | Mizuho Financial Group, Inc. | | | 391,762 | |
| 1,500 | | Nintendo Co., Ltd. | | | 577,811 | |
| 10,700 | | Nippon Paper Industries Co., Ltd. | | | 212,297 | |
| 28,200 | | NTT Data Corp. | | | 326,629 | |
| 60,000 | | Oji Holdings Corp. | | | 349,325 | |
| 19,300 | | Oki Electric Industry Co., Ltd. | | | 267,846 | |
| 10,000 | | Panasonic Corp. | | | 149,554 | |
| 128,800 | | Pioneer Corp. (b) | | | 248,073 | |
| 29,700 | | Rakuten, Inc. | | | 315,793 | |
| 7,200 | | Sankyo Co., Ltd. | | | 231,441 | |
| 21,100 | | Sega Sammy Holdings, Inc. | | | 294,867 | |
| 2,100 | | SoftBank Group Corp. | | | 183,710 | |
| 8,100 | | Square Enix Holdings Co., Ltd. | | | 325,553 | |
| 26,400 | | Sumitomo Electric Industries Ltd. | | | 446,133 | |
| 12,000 | | Sumitomo Mitsui Financial Group, Inc. | | | 476,707 | |
| 6,900 | | Sumitomo Mitsui Trust Holdings, Inc. | | | 269,737 | |
| 7,100 | | Suzuki Motor Corp. | | | 385,581 | |
| 23,300 | | Tohoku Electric Power Co., Inc. | | | 303,686 | |
| 83,000 | | Tokyo Electric Power Co. Holdings,
Inc. (b) | | | 338,701 | |
| 32,000 | | Toppan Printing Co., Ltd. | | | 323,082 | |
| | | | |
| | See Notes to Financial Statements | | Page 15 |
First Trust Riverfront Dynamic Asia Pacific ETF (RFAP)
Portfolio of Investments (Continued)
October 31, 2017
| | | | | | | | |
Shares | | | Description | | Value | |
| | | | | | |
| | COMMON STOCKS (a) (Continued) | | | | |
| | | | Japan (Continued) | | | | |
| | 16,900 | | | Toyo Seikan Group Holdings Ltd. | | $ | 296,220 | |
| | 6,000 | | | Toyota Industries Corp. | | | 364,628 | |
| | 12,800 | | | Yamaha Motor Co., Ltd. | | | 379,368 | |
| | | | | | | | |
| | | | | | | 17,861,292 | |
| | | | | | | | |
| | | | Malaysia – 1.9% | | | | |
| | 283,700 | | | AMMB Holdings Bhd | | | 286,816 | |
| | 126,800 | | | Malayan Banking Bhd | | | 277,052 | |
| | | | | | | | |
| | | | | | | 563,868 | |
| | | | | | | | |
| | | | New Zealand – 1.4% | | | | |
| | 113,531 | | | SKY Network Television Ltd. | | | 194,223 | |
| | 88,840 | | | SKYCITY Entertainment Group Ltd. | | | 236,486 | |
| | | | | | | | |
| | | | | | | 430,709 | |
| | | | | | | | |
| | | | Singapore – 4.8% | | | | |
| | 487,202 | | | Chuan Hup Holdings Ltd. | | | 125,098 | |
| | 35,200 | | | City Developments Ltd | | | 334,156 | |
| | 34,800 | | | Haw Par Corp., Ltd. | | | 311,466 | |
| | 683,800 | | | Hutchison Port Holdings Trust | | | 294,034 | |
| | 120,100 | | | Singapore Press Holdings Ltd. | | | 237,892 | |
| | 53,900 | | | Wilmar International Ltd. | | | 134,048 | |
| | | | | | | | |
| | | | | | | 1,436,694 | |
| | | | | | | | |
| | | | Total Common Stocks | | | 29,527,174 | |
| | | | | | | | |
| | | | | (Cost $28,268,839) | | | | |
| | REAL ESTATE INVESTMENT TRUSTS (a) – 0.7% | |
| | | | Australia – 0.7% | | | | |
| | 54,558 | | | GPT Group (The) | | | 212,538 | |
| | | | | | | | |
| | | | | (Cost $210,881) | | | | |
| | | | Total Investments – 99.4% | | | 29,739,712 | |
| | | | | | | | |
| | | | | (Cost $28,479,720) (d) | | | | |
| | | | Net Other Assets and Liabilities – 0.6% | | | 171,110 | |
| | | | | | | | |
| | | | Net Assets – 100.0% | | $ | 29,910,822 | |
| | | | | | | | |
| (a) | Portfolio securities are categorized based upon their country of incorporation. For a breakdown of the portfolio securities by sector, please see the Fund Performance Overview. |
| (b) | Non-income producing security. |
| (c) | This security is restricted in the U.S. and cannot be offered for public sale without first being registered under the Securities Act of 1933, as amended. This security is not restricted on the foreign exchange where it trades freely without any additional registration. As such, it does not require the additional disclosure required of restricted securities. |
| (d) | Aggregate cost for federal income tax purposes was $29,013,418. As of October 31, 2017, the aggregate gross unrealized appreciation for all investments in which there as an excess of value over tax cost was $1,919,428 and the aggregate gross unrealized depreciation for all investments in which there was an excess of tax cost over value was $1,193,134. The net unrealized appreciation was $726,294. |
Valuation Inputs
A summary of the inputs used to value the Fund’s investments as of October 31, 2017 is as follows (see Note 2A - Portfolio Valuation in the Notes to Financial Statements):
| | | | | | | | | | | | | | | | |
| | | Total
Value at
10/31/2017 | | | Level 1
Quoted
Prices | | | Level 2
Significant
Observable
Inputs | | | Level 3
Significant
Unobservable
Inputs | |
Common Stocks* | | $ | 29,527,174 | | | $ | 29,527,174 | | | $ | — | | | $ | — | |
Real Estate Investment Trusts* | | | 212,538 | | | | 212,538 | | | | — | | | | — | |
| | | | | | | | | | | | | | | | |
Total Investments | | $ | 29,739,712 | | | $ | 29,739,712 | | | $ | — | | | $ | — | |
| | | | | | | | | | | | | | | | |
| * | See Portfolio of Investments for country breakout. |
All transfers in and out of the Levels during the period are assumed to occur on the last day of the period at their current value. There were no transfers between Levels at October 31, 2017.
| | | | |
| Page 16 | | See Notes to Financial Statements | | |
First Trust Riverfront Dynamic Asia Pacific ETF (RFAP)
Portfolio of Investments (Continued)
October 31, 2017
| | | | |
Currency Exposure Diversification | | % of Total
Investments |
JPY | | | 60.1 | % |
AUD | | | 17.3 | |
HKD | | | 9.1 | |
CAD | | | 5.0 | |
SGD | | | 4.2 | |
MYR | | | 1.9 | |
NZD | | | 1.4 | |
USD | | | 1.0 | |
| | | | |
Total | | | 100.0 | % |
| | | | |
Currency Abbreviations
| | |
AUD | | Australian Dollar |
CAD | | Canadian Dollar |
HKD | | Hong Kong Dollar |
JPY | | Japanese Yen |
MYR | | Malaysian Ringgit |
NZD | | New Zealand Dollar |
SGD | | Singapore Dollar |
USD | | United States Dollar |
| | | | |
| | See Notes to Financial Statements | | Page 17 |
First Trust Riverfront Dynamic Developed International ETF (RFDI)
Portfolio of Investments
October 31, 2017
| | | | | | | | |
Shares | | | Description | | Value | |
| | | | | | |
| | COMMON STOCKS (a) – 99.4% | | | | |
| | | | Australia – 5.4% | | | | |
| | 518,595 | | | AMP Ltd. | | $ | 1,972,626 | |
| | 126,722 | | | Australia & New Zealand Banking Group Ltd. | | | 2,901,841 | |
| | 154,273 | | | Bank of Queensland Ltd. | | | 1,577,453 | |
| | 24,449 | | | BHP Billiton Ltd. | | | 496,618 | |
| | 77,238 | | | Commonwealth Bank of Australia | | | 4,589,028 | |
| | 62,565 | | | Computershare Ltd. | | | 746,035 | |
| | 609,253 | | | Healthscope Ltd. | | | 913,932 | |
| | 122,033 | | | National Australia Bank Ltd. | | | 3,050,377 | |
| | 213,912 | | | OZ Minerals Ltd. | | | 1,317,926 | |
| | 68,073 | | | QBE Insurance Group Ltd. | | | 556,424 | |
| | 74,491 | | | Treasury Wine Estates Ltd. | | | 892,233 | |
| | 27,105 | | | Wesfarmers Ltd. | | | 867,133 | |
| | 164,695 | | | Westpac Banking Corp. | | | 4,158,367 | |
| | | | | | | | |
| | | | | | | 24,039,993 | |
| | | | | | | | |
| | | | Austria – 1.3% | | | | |
| | 17,338 | | | Lenzing AG | | | 2,346,795 | |
| | 354,831 | | | Telekom Austria AG | | | 3,328,092 | |
| | | | | | | | |
| | | | | | | 5,674,887 | |
| | | | | | | | |
| | | | Bermuda – 0.9% | | | | |
| | 2,596,343 | | | BOE Varitronix Ltd. | | | 1,900,315 | |
| | 2,370,377 | | | Giordano International Ltd. | | | 1,339,934 | |
| | 2,294,500 | | | Noble Group Ltd. (b) | | | 488,156 | |
| | | | | | | | |
| | | | | | | 3,728,405 | |
| | | | | | | | |
| | | | Canada – 1.7% | | | | |
| | 189,934 | | | Extendicare, Inc. | | | 1,379,491 | |
| | 30,046 | | | Methanex Corp. | | | 1,464,221 | |
| | 2,442,904 | | | Pengrowth Energy Corp. (b) | | | 2,745,687 | |
| | 1,724,405 | | | Sherritt International Corp. (b) | | | 1,764,371 | |
| | | | | | | | |
| | | | | | | 7,353,770 | |
| | | | | | | | |
| | | | Cayman Islands – 1.0% | | | | |
| | 130,409 | | | Kingboard Chemical Holdings Ltd. | | | 773,120 | |
| | 9,624,830 | | | Parkson Retail Group Ltd. | | | 1,455,803 | |
| | 828,025 | | | WH Group Ltd. (c) | | | 838,490 | |
| | 604,595 | | | Wynn Macau Ltd. | | | 1,549,965 | |
| | | | | | | | |
| | | | | | | 4,617,378 | |
| | | | | | | | |
| | | | Cyprus – 0.5% | | | | |
| | 998,044 | | | Prosafe SE (b) | | | 2,016,127 | |
| | | | | | | | |
| | | | Denmark – 1.8% | | | | |
| | 35,996 | | | Coloplast A.S., Class B | | | 3,166,713 | |
| | 49,239 | | | Novo Nordisk A.S., Class B | | | 2,449,521 | |
| | 37,973 | | | Orsted A.S. (c) | | | 2,128,022 | |
| | | | | | | | |
| | | | | | | 7,744,256 | |
| | | | | | | | |
| | | | Finland – 0.6% | | | | |
| | 47,903 | | | Sampo OYJ, Class A | | | 2,509,875 | |
| | | | | | | | |
| | | | France – 8.9% | | | | |
| | 220,498 | | | Air France-KLM (b) | | | 3,454,594 | |
| | | | | | | | |
Shares | | | Description | | Value | |
| | | | | | | | | |
| | | | France (Continued) | | | | |
| | 22,359 | | | Atos SE | | $ | 3,474,387 | |
| | 28,822 | | | AXA S.A. | | | 870,556 | |
| | 12,686 | | | BNP Paribas S.A. | | | 990,669 | |
| | 102,005 | | | Chargeurs S.A. | | | 2,877,833 | |
| | 11,263 | | | Christian Dior SE | | | 3,867,033 | |
| | 214,383 | | | Credit Agricole S.A. | | | 3,740,866 | |
| | 10,417 | | | Kering | | | 4,774,825 | |
| | 19,298 | | | LVMH Moet Hennessy Louis Vuitton SE | | | 5,756,942 | |
| | 61,942 | | | Neopost S.A. | | | 2,282,925 | |
| | 55,455 | | | Societe Generale S.A. | | | 3,087,725 | |
| | 80,022 | | | TOTAL S.A. | | | 4,462,136 | |
| | | | | | | | |
| | | | | | | 39,640,491 | |
| | | | | | | | |
| | | | Germany – 6.6% | | | | |
| | 5,711 | | | Allianz SE | | | 1,326,168 | |
| | 27,970 | | | Bayer AG | | | 3,639,281 | |
| | 41,311 | | | Covestro AG (c) | | | 3,963,255 | |
| | 139,197 | | | Deutsche Lufthansa AG | | | 4,442,735 | |
| | 339,592 | | | Deutz AG | | | 2,879,777 | |
| | 32,819 | | | Fraport AG Frankfurt Airport Services Worldwide | | | 3,114,152 | |
| | 48,187 | | | Fresenius SE & Co., KGaA | | | 4,025,127 | |
| | 30,638 | | | Merck KGaA | | | 3,279,432 | |
| | 5,857 | | | Puma SE | | | 2,651,234 | |
| | | | | | | | |
| | | | | | | 29,321,161 | |
| | | | | | | | |
| | | | Hong Kong – 1.2% | | | | |
| | 955,984 | | | Cathay Pacific Airways Ltd. (b) | | | 1,634,684 | |
| | 72,421 | | | Galaxy Entertainment Group Ltd. | | | 492,931 | |
| | 5,915,984 | | | Oriental Press Group Ltd. | | | 796,240 | |
| | 2,595,662 | | | PCCW Ltd. | | | 1,430,685 | |
| | 1,293,754 | | | SJM Holdings Ltd. | | | 1,111,102 | |
| | | | | | | | |
| | | | | | | 5,465,642 | |
| | | | | | | | |
| | | | Italy – 3.3% | | | | |
| | 1,507,123 | | | Arnoldo Mondadori Editore S.p.A (b) | | | 3,900,881 | |
| | 743,430 | | | Enel S.p.A. | | | 4,611,367 | |
| | 456,648 | | | Intesa Sanpaolo S.p.A. | | | 1,535,140 | |
| | 962,069 | | | Intesa Sanpaolo S.p.A. | | | 3,034,764 | |
| | 201,000 | | | Poste Italiane S.p.A. (c) | | | 1,469,196 | |
| | | | | | | | |
| | | | | | | 14,551,348 | |
| | | | | | | | |
| | | | Japan – 19.7% | | | | |
| | 39,760 | | | Aozora Bank Ltd. | | | 1,547,320 | |
| | 45,800 | | | Asahi Group Holdings Ltd. | | | 2,078,834 | |
| | 125,800 | | | Astellas Pharma, Inc. | | | 1,668,962 | |
| | 69,300 | | | Canon, Inc. | | | 2,585,989 | |
| | 55,600 | | | Capcom Co., Ltd. | | | 1,403,875 | |
| | 64,820 | | | Central Glass Co., Ltd. | | | 1,440,571 | |
| | 82,800 | | | Chubu Electric Power Co., Inc. | | | 1,060,988 | |
| | 79,300 | | | Dai Nippon Printing Co., Ltd. | | | 1,886,518 | |
| | 10,800 | | | Daito Trust Construction Co., Ltd. | | | 1,883,980 | |
| | 259,000 | | | Daiwa Securities Group, Inc. | | | 1,607,460 | |
| | | | |
| Page 18 | | See Notes to Financial Statements | | |
First Trust Riverfront Dynamic Developed International ETF (RFDI)
Portfolio of Investments (Continued)
October 31, 2017
| | | | | | | | |
Shares | | | Description | | Value | |
| | | | | | |
| | COMMON STOCKS (a) (Continued) | | | | |
| | | | Japan (Continued) | | | | |
| | 56,100 | | | Electric Power Development Co., Ltd. | | $ | 1,403,672 | |
| | 42,200 | | | Haseko Corp. | | | 608,663 | |
| | 41,400 | | | Hitachi High-Technologies Corp. | | | 1,716,732 | |
| | 99,900 | | | Honda Motor Co., Ltd. | | | 3,095,270 | |
| | 58,500 | | | Idemitsu Kosan Co., Ltd. | | | 1,695,242 | |
| | 136,600 | | | Ishihara Sangyo Kaisha Ltd. (b) | | | 2,039,900 | |
| | 30,200 | | | Japan Petroleum Exploration Co., Ltd. | | | 618,581 | |
| | 110,200 | | | Japan Post Holdings Co., Ltd. | | | 1,267,680 | |
| | 69,700 | | | Japan Tobacco, Inc. | | | 2,296,873 | |
| | 67,000 | | | JFE Holdings, Inc. | | | 1,425,971 | |
| | 233,300 | | | JXTG Holdings, Inc. | | | 1,196,610 | |
| | 181,000 | | | Kajima Corp. | | | 1,867,227 | |
| | 116,700 | | | Kobe Steel Ltd. (b) | | | 975,023 | |
| | 109,000 | | | Komori Corp. | | | 1,526,125 | |
| | 37,200 | | | Kyudenko Corp. | | | 1,639,084 | |
| | 78,000 | | | Kyushu Electric Power Co., Inc. | | | 884,921 | |
| | 133,100 | | | Matsui Securities Co., Ltd. | | | 1,110,874 | |
| | 134,000 | | | Mazda Motor Corp. | | | 1,911,508 | |
| | 39,960 | | | Mitsubishi Heavy Industries Ltd. | | | 1,552,994 | |
| | 199,900 | | | Mitsubishi Paper Mills Ltd. (b) | | | 1,343,156 | |
| | 74,720 | | | Mitsubishi Steel Manufacturing Co., Ltd. | | | 1,846,561 | |
| | 70,100 | | | Mitsubishi UFJ Financial Group, Inc. | | | 470,087 | |
| | 98,590 | | | Mitsui Engineering & Shipbuilding Co., Ltd. | | | 1,278,926 | |
| | 1,065,500 | | | Mizuho Financial Group, Inc. | | | 1,920,065 | |
| | 8,400 | | | Nintendo Co., Ltd. | | | 3,235,742 | |
| | 52,300 | | | Nippon Paper Industries Co., Ltd. | | | 1,037,675 | |
| | 138,500 | | | NTT Data Corp. | | | 1,604,191 | |
| | 292,000 | | | Oji Holdings Corp. | | | 1,700,048 | |
| | 95,000 | | | Oki Electric Industry Co., Ltd. | | | 1,318,412 | |
| | 49,700 | | | Panasonic Corp. | | | 743,282 | |
| | 629,800 | | | Pioneer Corp. (b) | | | 1,213,018 | |
| | 144,300 | | | Rakuten, Inc. | | | 1,534,310 | |
| | 36,300 | | | Sankyo Co., Ltd. | | | 1,166,848 | |
| | 102,400 | | | Sega Sammy Holdings, Inc. | | | 1,431,015 | |
| | 10,900 | | | SoftBank Group Corp. | | | 953,540 | |
| | 39,900 | | | Square Enix Holdings Co., Ltd. | | | 1,603,650 | |
| | 129,300 | | | Sumitomo Electric Industries Ltd. | | | 2,185,040 | |
| | 58,200 | | | Sumitomo Mitsui Financial Group, Inc. | | | 2,312,030 | |
| | 32,500 | | | Sumitomo Mitsui Trust Holdings, Inc. | | | 1,270,503 | |
| | 33,700 | | | Suzuki Motor Corp. | | | 1,830,153 | |
| | 114,300 | | | Tohoku Electric Power Co., Inc. | | | 1,489,755 | |
| | 407,200 | | | Tokyo Electric Power Co. Holdings, Inc. (b) | | | 1,661,675 | |
| | 154,000 | | | Toppan Printing Co., Ltd. | | | 1,554,830 | |
| | 82,600 | | | Toyo Seikan Group Holdings Ltd. | | | 1,447,797 | |
| | 29,000 | | | Toyota Industries Corp. | | | 1,762,367 | |
| | | | | | | | |
Shares | | | Description | | Value | |
| | | | | | | | | |
| | | | Japan (Continued) | | | | |
| | 61,300 | | | Yamaha Motor Co., Ltd. | | $ | 1,816,815 | |
| | | | | | | | |
| | | | | | | 87,728,938 | |
| | | | | | | | |
| | | | Malaysia – 0.6% | | | | |
| | 1,347,100 | | | AMMB Holdings Bhd | | | 1,361,897 | |
| | 616,400 | | | Malayan Banking Bhd | | | 1,346,805 | |
| | | | | | | | |
| | | | | | | 2,708,702 | |
| | | | | | | | |
| | | | Netherlands – 8.0% | | | | |
| | 49,867 | | | BE Semiconductor Industries N.V. | | | 3,918,007 | |
| | 295,240 | | | CNH Industrial N.V. | | | 3,772,696 | |
| | 34,602 | | | Ferrari N.V. | | | 4,147,502 | |
| | 230,460 | | | Fiat Chrysler Automobiles N.V. | | | 3,983,818 | |
| | 956,011 | | | Koninklijke KPN N.V. | | | 3,300,738 | |
| | 135,914 | | | Rhi Magnesita N.V. (b) | | | 6,035,136 | |
| | 197,915 | | | STMicroelectronics N.V. | | | 4,656,934 | |
| | 100,354 | | | Unilever N.V. | | | 5,833,762 | |
| | | | | | | | |
| | | | | | | 35,648,593 | |
| | | | | | | | |
| | | | New Zealand – 0.5% | | | | |
| | 558,352 | | | SKY Network Television Ltd. | | | 955,201 | |
| | 436,911 | | | SKYCITY Entertainment Group Ltd. | | | 1,163,025 | |
| | | | | | | | |
| | | | | | | 2,118,226 | |
| | | | | | | | |
| | | | Norway – 1.0% | | | | |
| | 67,248 | | | DNB ASA | | | 1,296,714 | |
| | 425,797 | | | Norsk Hydro ASA | | | 3,292,003 | |
| | | | | | | | |
| | | | | | | 4,588,717 | |
| | | | | | | | |
| | | | Portugal – 0.6% | | | | |
| | 191,546 | | | Corticeira Amorim SGPS S.A. | | | 2,670,775 | |
| | | | | | | | |
| | | | Singapore – 1.6% | | | | |
| | 2,693,898 | | | Chuan Hup Holdings Ltd. | | | 691,706 | |
| | 171,900 | | | City Developments Ltd | | | 1,631,858 | |
| | 170,300 | | | Haw Par Corp., Ltd. | | | 1,524,217 | |
| | 3,348,000 | | | Hutchison Port Holdings Trust | | | 1,439,640 | |
| | 587,400 | | | Singapore Press Holdings Ltd. | | | 1,163,509 | |
| | 264,800 | | | Wilmar International Ltd. | | | 658,552 | |
| | | | | | | | |
| | | | | | | 7,109,482 | |
| | | | | | | | |
| | | | Spain – 5.8% | | | | |
| | 706,843 | | | Banco Bilbao Vizcaya Argentaria S.A. | | | 6,185,949 | |
| | 244,048 | | | Banco Santander S.A. | | | 1,655,358 | |
| | 716,743 | | | Ence Energia y Celulosa S.A. | | | 4,157,792 | |
| | 47,852 | | | Endesa S.A. | | | 1,095,299 | |
| | 888,646 | | | Ercros S.A. | | | 2,876,652 | |
| | 130,711 | | | Gas Natural SDG S.A. | | | 2,796,992 | |
| | 387,837 | | | International Consolidated Airlines Group S.A. | | | 3,275,347 | |
| | 204,248 | | | Repsol S.A. | | | 3,826,916 | |
| | | | | | | | |
| | | | | | | 25,870,305 | |
| | | | | | | | |
| | | | Sweden – 6.3% | | | | |
| | 230,301 | | | Elekta AB, Class B | | | 2,214,525 | |
| | | | |
| | See Notes to Financial Statements | | Page 19 |
First Trust Riverfront Dynamic Developed International ETF (RFDI)
Portfolio of Investments (Continued)
October 31, 2017
| | | | | | | | |
Shares | | | Description | | Value | |
| | | | | | |
| | COMMON STOCKS (a) (Continued) | | | | |
| | | | Sweden (Continued) | | | | |
| | 69,603 | | | ICA Gruppen AB | | $ | 2,567,404 | |
| | 312,595 | | | Nordea Bank AB | | | 3,778,779 | |
| | 231,186 | | | Sandvik AB | | | 4,222,386 | |
| | 147,776 | | | Swedbank AB, Class A | | | 3,668,077 | |
| | 25,842 | | | Swedish Match AB | | | 973,591 | |
| | 692,083 | | | Telia Co., AB | | | 3,203,457 | |
| | 164,811 | | | Volvo AB, Class A | | | 3,266,040 | |
| | 212,983 | | | Volvo AB, Class B | | | 4,220,659 | |
| | | | | | | | |
| | | | | | | 28,114,918 | |
| | | | | | | | |
| | | | Switzerland – 7.8% | | | | |
| | 16,369 | | | LafargeHolcim Ltd. | | | 924,566 | |
| | 82,929 | | | Logitech International S.A. | | | 2,962,552 | |
| | 52,027 | | | Nestle S.A. | | | 4,375,347 | |
| | 54,774 | | | Oriflame Holding AG | | | 1,973,962 | |
| | 10,299 | | | Roche Holding AG | | | 2,379,511 | |
| | 461 | | | Sika AG | | | 3,412,504 | |
| | 37,612 | | | Sonova Holding AG | | | 6,789,877 | |
| | 41,829 | | | Swiss Re AG | | | 3,934,899 | |
| | 209,971 | | | Transocean, Ltd. (b) | | | 2,204,695 | |
| | 79,452 | | | UBS Group AG | | | 1,352,273 | |
| | 34,519 | | | Vifor Pharma AG | | | 4,439,220 | |
| | | | | | | | |
| | | | | | | 34,749,406 | |
| | | | | | | | |
| | | | United Kingdom – 14.3% | | | | |
| | 86,379 | | | Anglo American PLC | | | 1,629,085 | |
| | 84,216 | | | Associated British Foods PLC | | | 3,726,891 | |
| | 205,730 | | | BP PLC | | | 1,394,072 | |
| | 107,316 | | | British American Tobacco PLC | | | 6,942,721 | |
| | 48,389 | | | Carnival PLC | | | 3,188,328 | |
| | 1,329,498 | | | Centrica PLC | | | 2,998,282 | |
| | 27,668 | | | Coca-Cola European Partners PLC | | | 1,134,947 | |
| | 168,499 | | | Diageo PLC | | | 5,755,929 | |
| | 325,076 | | | G4S PLC | | | 1,213,217 | |
| | 948,347 | | | HSBC Holdings PLC | | | 9,248,854 | |
| | 756,436 | | | Legal & General Group PLC | | | 2,682,443 | |
| | 383,054 | | | NEX Group PLC | | | 3,228,039 | |
| | 216,243 | | | Oxford Instruments PLC | | | 2,729,866 | |
| | 33,625 | | | Persimmon PLC | | | 1,251,346 | |
| | 84,795 | | | Royal Dutch Shell PLC, Class A | | | 2,664,037 | |
| | 1,809,516 | | | Spirent Communications PLC | | | 2,373,267 | |
| | 673,271 | | | Standard Life PLC | | | 3,843,292 | |
| | 530,011 | | | Taylor Wimpey PLC | | | 1,404,349 | |
| | 900,333 | | | Trinity Mirror PLC | | | 1,010,432 | |
| | 37,716 | | | Unilever PLC | | | 2,138,699 | |
| | 406,885 | | | Vesuvius PLC | | | 3,177,577 | |
| | | | | | | | |
| | | | | | | 63,735,673 | |
| | | | | | | | |
| | | | Total Common Stocks | | | 441,707,068 | |
| | | | | | | | |
| | | | | (Cost $413,286,843) | | | | |
| | | | | | | | | |
| | | | | | | | |
Shares | | | Description | | Value | |
| | | |
| | REAL ESTATE INVESTMENT TRUSTS (a) – 0.2% | |
| | | | Australia – 0.2% | | | | |
| | 268,312 | | | GPT Group (The) | | $ | 1,045,245 | |
| | | | | | | | |
| | | | | (Cost $1,034,813) | | | | |
| | | | Total Investments – 99.6%
| | | 442,752,313 | |
| | | | | (Cost $414,321,656) (d) | | | | |
| | | | Net Other Assets and Liabilities – 0.4% | | | 1,769,246 | |
| | | | | | | | |
| | | | Net Assets – 100.0% | | $ | 444,521,559 | |
| | | | | | | | |
| (a) | Portfolio securities are categorized based upon their country of incorporation. For a breakdown of the portfolio securities by sector, please see the Fund Performance Overview. |
| (b) | Non-income producing security. |
| (c) | This security is restricted in the U.S. and cannot be offered for public sale without first being registered under the Securities Act of 1933, as amended. This security is not restricted on the foreign exchange where it trades freely without any additional registration. As such, it does not require the additional disclosure required of restricted securities. |
| (d) | Aggregate cost for federal income tax purposes was $416,857,534. As of October 31, 2017, the aggregate gross unrealized appreciation for all investments in which there as an excess of value over tax cost was $38,875,665 and the aggregate gross unrealized depreciation for all investments in which there was an excess of tax cost over value was $12,980,886. The net unrealized appreciation was $25,894,779. |
Valuation Inputs
A summary of the inputs used to value the Fund’s investments as of October 31, 2017 is as follows (see Note 2A - Portfolio Valuation in the Notes to Financial Statements):
| | | | | | | | | | | | | | |
| | | Total Value at 10/31/2017 | | Level 1
Quoted
Prices | | | Level 2
Significant
Observable
Inputs | | | Level 3
Significant
Unobservable
Inputs | |
Common
Stocks* | | $441,707,068 | | $ | 441,707,068 | | | $ | — | | | $ | — | |
Real Estate
Investment
Trusts* | | 1,045,245 | | | 1,045,245 | | | | — | | | | — | |
| | | | | | | | | | | | | | |
Total
Investments | | $442,752,313 | | $ | 442,752,313 | | | $ | — | | | $ | — | |
| | | | | | | | | | | | | | |
| * | See Portfolio of Investments for country breakout. |
All transfers in and out of the Levels during the period are assumed to occur on the last day of the period at their current value. There were no transfers between Levels at October 31, 2017.
| | | | |
| Page 20 | | See Notes to Financial Statements | | |
First Trust Riverfront Dynamic Developed International ETF (RFDI)
Portfolio of Investments (Continued)
October 31, 2017
| | | | |
Currency Exposure Diversification | | % of Total
Investments |
EUR | | | 35.5 | % |
JPY | | | 19.8 | |
GBP | | | 14.1 | |
CHF | | | 6.9 | |
SEK | | | 6.8 | |
AUD | | | 5.7 | |
HKD | | | 3.0 | |
DKK | | | 1.7 | |
CAD | | | 1.7 | |
NOK | | | 1.5 | |
SGD | | | 1.4 | |
USD | | | 0.8 | |
MYR | | | 0.6 | |
NZD | | | 0.5 | |
| | | | |
Total | | | 100.0 | % |
| | | | |
Currency Abbreviations
| | |
AUD | | Australian Dollar |
CAD | | Canadian Dollar |
CHF | | Swiss Franc |
DKK | | Danish Krone |
EUR | | Euro |
GBP | | British Pound Sterling |
HKD | | Hong Kong Dollar |
JPY | | Japanese Yen |
MYR | | Malaysian Ringgit |
NOK | | Norwegian Krone |
NZD | | New Zealand Dollar |
SEK | | Swedish Krona |
SGD | | Singapore Dollar |
USD | | United States Dollar |
| | | | |
| | See Notes to Financial Statements | | Page 21 |
First Trust Riverfront Dynamic Europe ETF (RFEU)
Portfolio of Investments
October 31, 2017
| | | | | | | | |
Shares | | | Description | | Value | |
| | | | | | |
| | COMMON STOCKS (a) – 99.7% | | | | |
| | | | Austria – 1.9% | | | | |
| | 7,220 | | | Lenzing AG | | $ | 977,267 | |
| | 147,788 | | | Telekom Austria AG | | | 1,386,159 | |
| | | | | | | | |
| | | | | | | 2,363,426 | |
| | | | | | | | |
| | | | Cyprus – 0.7% | | | | |
| | 415,660 | | | Prosafe SE (b) | | | 839,666 | |
| | | | | | | | |
| | | | Denmark – 2.6% | | | | |
| | 14,988 | | | Coloplast A.S., Class B | | | 1,318,554 | |
| | 20,509 | | | Novo Nordisk A.S., Class B | | | 1,020,273 | |
| | 15,814 | | | Orsted A.S. (c) | | | 886,223 | |
| | | | | | | | |
| | | | | | | 3,225,050 | |
| | | | | | | | |
| | | | Finland – 0.8% | | | | |
| | 19,948 | | | Sampo OYJ, Class A | | | 1,045,174 | |
| | | | | | | | |
| | | | France – 13.3% | | | | |
| | 91,845 | | | Air France-KLM (b) | | | 1,438,957 | |
| | 9,311 | | | Atos SE | | | 1,446,846 | |
| | 11,955 | | | AXA S.A. | | | 361,096 | |
| | 5,266 | | | BNP Paribas S.A. | | | 411,230 | |
| | 42,485 | | | Chargeurs S.A. | | | 1,198,615 | |
| | 4,690 | | | Christian Dior SE | | | 1,610,262 | |
| | 89,298 | | | Credit Agricole S.A. | | | 1,558,201 | |
| | 4,338 | | | Kering | | | 1,988,402 | |
| | 8,034 | | | LVMH Moet Hennessy Louis Vuitton SE | | | 2,396,688 | |
| | 25,797 | | | Neopost S.A. | | | 950,770 | |
| | 23,099 | | | Societe Generale S.A. | | | 1,286,148 | |
| | 33,328 | | | TOTAL S.A. | | | 1,858,415 | |
| | | | | | | | |
| | | | | | | 16,505,630 | |
| | | | | | | | |
| | | | Germany – 9.9% | | | | |
| | 2,368 | | | Allianz SE | | | 549,880 | |
| | 11,652 | | | Bayer AG | | | 1,516,085 | |
| | 17,209 | | | Covestro AG (c) | | | 1,650,981 | |
| | 57,982 | | | Deutsche Lufthansa AG | | | 1,850,605 | |
| | 141,447 | | | Deutz AG | | | 1,199,486 | |
| | 13,670 | | | Fraport AG Frankfurt Airport Services Worldwide | | | 1,297,128 | |
| | 20,067 | | | Fresenius SE & Co., KGaA | | | 1,676,224 | |
| | 12,763 | | | Merck KGaA | | | 1,366,127 | |
| | 2,441 | | | Puma SE | | | 1,104,945 | |
| | | | | | | | |
| | | | | | | 12,211,461 | |
| | | | | | | | |
| | | | Italy – 4.9% | | | | |
| | 627,738 | | | Arnoldo Mondadori Editore S.p.A (b) | | | 1,624,772 | |
| | 309,658 | | | Enel S.p.A. | | | 1,920,755 | |
| | 190,203 | | | Intesa Sanpaolo S.p.A. | | | 639,416 | |
| | 400,720 | | | Intesa Sanpaolo S.p.A. | | | 1,264,037 | |
| | 83,719 | | | Poste Italiane S.p.A. (c) | | | 611,938 | |
| | | | | | | | |
| | | | | | | 6,060,918 | |
| | | | | | | | |
| | | | Netherlands – 12.0% | | | | |
| | 20,770 | | | BE Semiconductor Industries N.V. | | | 1,631,881 | |
| | | | | | | | |
Shares | | | Description | | Value | |
| | | | | | | | | |
| | | | Netherlands (Continued) | | | | |
| | 122,972 | | | CNH Industrial N.V. | | $ | 1,571,386 | |
| | 14,411 | | | Ferrari N.V. | | | 1,727,347 | |
| | 95,991 | | | Fiat Chrysler Automobiles N.V. | | | 1,659,336 | |
| | 398,192 | | | Koninklijke KPN N.V. | | | 1,374,804 | |
| | 56,610 | | | Rhi Magnesita N.V. (b) | | | 2,513,715 | |
| | 82,432 | | | STMicroelectronics N.V. | | | 1,939,622 | |
| | 41,798 | | | Unilever N.V. | | | 2,429,795 | |
| | | | | | | | |
| | | | | | | 14,847,886 | |
| | | | | | | | |
| | | | Norway – 1.5% | | | | |
| | 28,005 | | | DNB ASA | | | 540,008 | |
| | 177,338 | | | Norsk Hydro ASA | | | 1,371,070 | |
| | | | | | | | |
| | | | | | | 1,911,078 | |
| | | | | | | | |
| | | | Portugal – 0.9% | | | | |
| | 79,784 | | | Corticeira Amorim SGPS S.A. | | | 1,112,449 | |
| | | | | | | | |
| | | | Spain – 8.7% | | | | |
| | 294,415 | | | Banco Bilbao Vizcaya Argentaria S.A. | | | 2,576,578 | |
| | 101,648 | | | Banco Santander S.A. | | | 689,470 | |
| | 298,540 | | | Ence Energia y Celulosa S.A. | | | 1,731,817 | |
| | 19,843 | | | Endesa S.A. | | | 454,192 | |
| | 369,415 | | | Ercros S.A. | | | 1,195,840 | |
| | 54,446 | | | Gas Natural SDG S.A. | | | 1,165,052 | |
| | 161,542 | | | International Consolidated Airlines Group S.A. | | | 1,364,248 | |
| | 85,077 | | | Repsol S.A. | | | 1,594,055 | |
| | | | | | | | |
| | | | | | | 10,771,252 | |
| | | | | | | | |
| | | | Sweden – 9.4% | | | | |
| | 95,896 | | | Elekta AB, Class B | | | 922,115 | |
| | 28,980 | | | ICA Gruppen AB | | | 1,068,968 | |
| | 130,159 | | | Nordea Bank AB | | | 1,573,416 | |
| | 96,265 | | | Sandvik AB | | | 1,758,186 | |
| | 61,532 | | | Swedbank AB, Class A | | | 1,527,339 | |
| | 10,713 | | | Swedish Match AB | | | 403,610 | |
| | 288,179 | | | Telia Co., AB | | | 1,333,899 | |
| | 68,624 | | | Volvo AB, Class A | | | 1,359,914 | |
| | 88,688 | | | Volvo AB, Class B | | | 1,757,520 | |
| | | | | | | | |
| | | | | | | 11,704,967 | |
| | | | | | | | |
| | | | Switzerland – 11.7% | | | | |
| | 6,781 | | | LafargeHolcim Ltd. | | | 383,009 | |
| | 34,536 | | | Logitech International S.A. | | | 1,233,762 | |
| | 21,670 | | | Nestle S.A. | | | 1,822,396 | |
| | 22,807 | | | Oriflame Holding AG | | | 821,925 | |
| | 4,290 | | | Roche Holding AG | | | 991,174 | |
| | 196 | | | Sika AG | | | 1,450,870 | |
| | 15,659 | | | Sonova Holding AG | | | 2,826,829 | |
| | 17,420 | | | Swiss Re AG | | | 1,638,718 | |
| | 87,560 | | | Transocean, Ltd. (b) | | | 919,380 | |
| | 32,959 | | | UBS Group AG | | | 560,962 | |
| | 14,378 | | | Vifor Pharma AG | | | 1,849,043 | |
| | | | | | | | |
| | | | | | | 14,498,068 | |
| | | | | | | | |
| | | | |
| Page 22 | | See Notes to Financial Statements | | |
First Trust Riverfront Dynamic Europe ETF (RFEU)
Portfolio of Investments (Continued)
October 31, 2017
| | | | | | | | |
Shares | | | Description | | Value | |
| | | | | | |
| | COMMON STOCKS (a) (Continued) | | | | |
| | | | United Kingdom – 21.4% | | | | |
| | 35,982 | | | Anglo American PLC | | $ | 678,611 | |
| | 35,074 | | | Associated British Foods PLC | | | 1,552,163 | |
| | 85,309 | | | BP PLC | | | 578,073 | |
| | 44,698 | | | British American Tobacco PLC | | | 2,891,701 | |
| | 20,154 | | | Carnival PLC | | | 1,327,937 | |
| | 553,758 | | | Centrica PLC | | | 1,248,834 | |
| | 11,474 | | | Coca-Cola European Partners PLC | | | 470,666 | |
| | 70,183 | | | Diageo PLC | | | 2,397,452 | |
| | 134,792 | | | G4S PLC | | | 503,057 | |
| | 395,002 | | | HSBC Holdings PLC | | | 3,852,299 | |
| | 315,068 | | | Legal & General Group PLC | | | 1,117,282 | |
| | 159,548 | | | NEX Group PLC | | | 1,344,529 | |
| | 90,065 | | | Oxford Instruments PLC | | | 1,136,986 | |
| | 13,945 | | | Persimmon PLC | | | 518,960 | |
| | 35,318 | | | Royal Dutch Shell PLC, Class A | | | 1,109,599 | |
| | 753,695 | | | Spirent Communications PLC | | | 988,507 | |
| | 280,428 | | | Standard Life PLC | | | 1,600,792 | |
| | 220,755 | | | Taylor Wimpey PLC | | | 584,926 | |
| | 371,231 | | | Trinity Mirror PLC | | | 416,628 | |
| | 15,710 | | | Unilever PLC | | | 890,841 | |
| | 169,478 | | | Vesuvius PLC | | | 1,323,542 | |
| | | | | | | | |
| | | | | | | 26,533,385 | |
| | | | | | | | |
| | | | Total Investments – 99.7% | | | 123,630,410 | |
| | | | | (Cost $113,886,597) (d) | | | | |
| | | | Net Other Assets and Liabilities – 0.3% | | | 349,353 | |
| | | | | | | | |
| | | | Net Assets – 100.0% | | $ | 123,979,763 | |
| | | | | | | | |
| (a) | Portfolio securities are categorized based upon their country of incorporation. For a breakdown of the portfolio securities by sector, please see the Fund Performance Overview. |
| (b) | Non-income producing security. |
| (c) | This security is restricted in the U.S. and cannot be offered for public sale without first being registered under the Securities Act of 1933, as amended. This security is not restricted on the foreign exchange where it trades freely without any additional registration. As such, it does not require the additional disclosure required of restricted securities. |
| (d) | Aggregate cost for federal income tax purposes was $114,322,507. As of October 31, 2017, the aggregate gross unrealized appreciation for all investments in which there as an excess of value over tax cost was $12,231,328 and the aggregate gross unrealized depreciation for all investments in which there was an excess of tax cost over value was $2,923,425. The net unrealized appreciation was $9,307,903. |
Valuation Inputs
A summary of the inputs used to value the Fund’s investments as of October 31, 2017 is as follows (see Note 2A - Portfolio Valuation in the Notes to Financial Statements):
| | | | | | | | | | | | | | | | |
| | | Total
Value at
10/31/2017 | | | Level 1
Quoted
Prices | | | Level 2
Significant
Observable
Inputs | | | Level 3
Significant
Unobservable
Inputs | |
Common Stocks* | | $ | 123,630,410 | | | $ | 123,630,410 | | | $ | — | | | $ | — | |
| | | | | | | | | | | | | | | | |
| * | See Portfolio of Investments for country breakout. |
All transfers in and out of the Levels during the period are assumed to occur on the last day of the period at their current value. There were no transfers between Levels at October 31, 2017.
| | | | |
Currency Exposure Diversification | | % of Total
Investments |
EUR | | | 52.9 | % |
GBP | | | 21.1 | |
CHF | | | 10.3 | |
SEK | | | 10.1 | |
DKK | | | 2.6 | |
NOK | | | 2.2 | |
USD | | | 0.8 | |
| | | | |
Total | | | 100.0 | % |
| | | | |
|
Currency Abbreviations | |
| | |
CHF | | Swiss Franc |
DKK | | Danish Krone |
EUR | | Euro |
GBP | | British Pound Sterling |
NOK | | Norwegian Krone |
SEK | | Swedish Krona |
USD | | United States Dollar |
| | | | |
| | See Notes to Financial Statements | | Page 23 |
First Trust Riverfront Dynamic Emerging Markets ETF (RFEM)
Portfolio of Investments
October 31, 2017
| | | | | | | | |
Shares | | | Description | | Value | |
| | | | | | |
| | COMMON STOCKS (a) – 99.0% | | | | |
| | | | Bermuda – 2.4% | | | | |
| | 1,281,750 | | | Alibaba Health Information Technology Ltd. (b) | | $ | 686,763 | |
| | 3,353,201 | | | Alibaba Pictures Group Ltd. (b) | | | 545,872 | |
| | 223,611 | | | Haier Electronics Group Co., Ltd. | | | 589,023 | |
| | | | | | | | |
| | | | | | | 1,821,658 | |
| | | | | | | | |
| | | | Brazil – 9.1% | | | | |
| | 121,328 | | | Banco do Estado do Rio Grande do Sul S.A., Class B (Preference Shares) | | | 565,230 | |
| | 31,244 | | | BB Seguridade Participacoes S.A. | | | 264,848 | |
| | 62,884 | | | Braskem S.A., Class A (Preference Shares) (b) | | | 1,006,513 | |
| | 150,521 | | | Centrais Eletricas Brasileiras S.A. (b) | | | 1,014,578 | |
| | 111,565 | | | Centrais Eletricas Brasileiras S.A., Class B (Preference Shares) | | | 864,200 | |
| | 45,108 | | | Fibria Celulose S.A. | | | 721,717 | |
| | 273,571 | | | JBS S.A. | | | 630,552 | |
| | 370,692 | | | Metalurgica Gerdau S.A. (Preference Shares) | | | 579,047 | |
| | 178,349 | | | Rumo S.A. (b) | | | 692,395 | |
| | 79,814 | | | Transmissora Alianca de Energia Eletrica S.A. | | | 500,164 | |
| | | | | | | | |
| | | | | | | 6,839,244 | |
| | | | | | | | |
| | | | Cayman Islands – 13.7% | | | | |
| | 1,362 | | | Baidu, Inc., ADR (b) | | | 332,246 | |
| | 3,265 | | | NetEase, Inc., ADR | | | 920,469 | |
| | 11,631 | | | New Oriental Education & Technology Group, Inc., ADR | | | 968,164 | |
| | 255,356 | | | Shimao Property Holdings Ltd. | | | 534,842 | |
| | 49,250 | | | Sunny Optical Technology Group Co., Ltd. | | | 720,941 | |
| | 53,283 | | | TAL Education Group, ADR | | | 1,465,282 | |
| | 71,375 | | | Tencent Holdings Ltd. | | | 3,200,320 | |
| | 50,484 | | | Vipshop Holdings Ltd., ADR (b) | | | 398,824 | |
| | 10,187 | | | Weibo Corp., ADR (b) | | | 943,826 | |
| | 9,909 | | | YY, Inc., ADR (b) | | | 895,675 | |
| | | | | | | | |
| | | | | | | 10,380,589 | |
| | | | | | | | |
| | | | Chile – 3.4% | | | | |
| | 50,223 | | | CAP S.A. | | | 545,442 | |
| | 3,130,123 | | | Enel Americas S.A. | | | 671,320 | |
| | 4,522,153 | | | Enel Chile S.A. | | | 527,211 | |
| | 13,143 | | | Sociedad Quimica y Minera de Chile S.A., Class B (Preference Shares) | | | 784,409 | |
| | | | | | | | |
| | | | | | | 2,528,382 | |
| | | | | | | | |
| | | | China – 8.5% | | | | |
| | 1,390,759 | | | Agricultural Bank of China Ltd., Class H | | | 654,253 | |
| | | | | | | | |
Shares | | | Description | | Value | |
| | | | | | | | | |
| | | | China (Continued) | | | | |
| | 2,268,840 | | | Bank of China Ltd., Class H | | $ | 1,131,308 | |
| | 1,302,813 | | | China Construction Bank Corp., Class H | | | 1,162,301 | |
| | 898,565 | | | China Petroleum & Chemical Corp., Class H | | | 659,981 | |
| | 1,621,331 | | | China Telecom Corp., Ltd., Class H | | | 812,598 | |
| | 270,791 | | | Guangzhou R&F Properties Co., Ltd., Class H | | | 576,890 | |
| | 1,788,536 | | | Industrial & Commercial Bank of China Ltd., Class H | | | 1,419,109 | |
| | | | | | | | |
| | | | | | | 6,416,440 | |
| | | | | | | | |
| | | | Colombia – 1.1% | | | | |
| | 155,747 | | | Almacenes Exito S.A. | | | 836,576 | |
| | | | | | | | |
| | | | Egypt – 1.1% | | | | |
| | 124,478 | | | ElSewedy Electric Co. | | | 797,540 | |
| | | | | | | | |
| | | | Greece – 0.6% | | | | |
| | 29,078 | | | JUMBO S.A. | | | 467,427 | |
| | | | | | | | |
| | | | Hong Kong – 3.8% | | | | |
| | 247,626 | | | China Everbright Ltd. | | | 587,212 | |
| | 58,023 | | | China Mobile Ltd. | | | 582,729 | |
| | 186,496 | | | China Resources Power Holdings Co., Ltd. | | | 358,582 | |
| | 2,744,841 | | | China South City Holdings Ltd. | | | 767,010 | |
| | 389,701 | | | CITIC Ltd. | | | 570,460 | |
| | | | | | | | |
| | | | | | | 2,865,993 | |
| | | | | | | | |
| | | | India – 4.3% | | | | |
| | 232,006 | | | Oil & Natural Gas Corp., Ltd. | | | 684,507 | |
| | 229,003 | | | Sterlite Technologies Ltd. | | | 1,012,940 | |
| | 21,833 | | | Tata Consultancy Services Ltd. | | | 882,724 | |
| | 90,331 | | | Tech Mahindra Ltd. | | | 673,599 | |
| | | | | | | | |
| | | | | | | 3,253,770 | |
| | | | | | | | |
| | | | Indonesia – 1.6% | | | | |
| | 335,915 | | | Bank Central Asia Tbk PT | | | 517,650 | |
| | 265,732 | | | United Tractors Tbk PT | | | 679,392 | |
| | | | | | | | |
| | | | | | | 1,197,042 | |
| | | | | | | | |
| | | | Israel – 2.2% | | | | |
| | 110,403 | | | AudioCodes Ltd. (b) | | | 729,764 | |
| | 136,532 | | | Harel Insurance Investments & Financial Services Ltd. | | | 932,508 | |
| | | | | | | | |
| | | | | | | 1,662,272 | |
| | | | | | | | |
| | | | Malaysia – 1.5% | | | | |
| | 849,720 | | | Astro Malaysia Holdings Bhd | | | 564,005 | |
| | 1,542,220 | | | Sapura Energy Bhd | | | 582,863 | |
| | | | | | | | |
| | | | | | | 1,146,868 | |
| | | | | | | | |
| | | | Mexico – 0.7% | | | | |
| | 297,303 | | | Grupo Financiero Santander Mexico SAB de CV, Class B | | | 499,647 | |
| | | | | | | | |
| | | | |
| Page 24 | | See Notes to Financial Statements | | |
First Trust Riverfront Dynamic Emerging Markets ETF (RFEM)
Portfolio of Investments (Continued)
October 31, 2017
| | | | | | | | |
Shares | | | Description | | Value | |
| | | |
| | COMMON STOCKS (a) (Continued) | |
| | | | Philippines – 0.7% | | | | |
| | 252,930 | | | San Miguel Corp. | | $ | 504,635 | |
| | | | | | | | |
| | | | Poland – 3.1% | | | | |
| | 25,491 | | | Bank Handlowy w Warszawie S.A. | | | 521,242 | |
| | 22,413 | | | Bank Pekao S.A. | | | 732,127 | |
| | 257 | | | LPP S.A. | | | 605,360 | |
| | 491,124 | | | Tauron Polska Energia S.A. (b) | | | 474,940 | |
| | | | | | | | |
| | | | | | | 2,333,669 | |
| | | | | | | | |
| | | | Russia – 1.0% | | | | |
| | 14,542 | | | LUKOIL PJSC | | | 769,871 | |
| | | | | | | | |
| | | | South Africa – 3.1% | | | | |
| | 94,887 | | | Coronation Fund Managers Ltd. | | | 478,839 | |
| | 73,699 | | | Investec Ltd. | | | 502,699 | |
| | 2,064 | | | Naspers Ltd. | | | 502,907 | |
| | 38,455 | | | Standard Bank Group Ltd. | | | 446,052 | |
| | 116,485 | | | Telkom SA SOC Ltd. | | | 436,322 | |
| | | | | | | | |
| | | | | | | 2,366,819 | |
| | | | | | | | |
| | | | South Korea – 21.5% | | | | |
| | 33,214 | | | Cheil Worldwide, Inc. | | | 616,639 | |
| | 6,795 | | | CJ Corp. | | | 1,131,135 | |
| | 14,006 | | | Daou Technology, Inc. | | | 229,402 | |
| | 75,444 | | | Dongkuk Steel Mill Co., Ltd. | | | 730,636 | |
| | 21,015 | | | Hanwha Corp. | | | 837,524 | |
| | 5,298 | | | Hyundai Motor Co. (Preference Shares) | | | 534,363 | |
| | 5,497 | | | Hyundai Motor Co. (Preference Shares) | | | 505,370 | |
| | 21,310 | | | KB Financial Group, Inc. | | | 1,110,817 | |
| | 15,086 | | | Kia Motors Corp. | | | 476,676 | |
| | 11,525 | | | Korea Electric Power Corp. | | | 403,249 | |
| | 2,774 | | | LG Chem Ltd. | | | 999,071 | |
| | 8,959 | | | LG Electronics, Inc. | | | 727,691 | |
| | 1,215 | | | NAVER Corp. | | | 969,527 | |
| | 4,488 | | | Netmarble Games Corp. (b) (c) | | | 697,025 | |
| | 1,863 | | | POSCO | | | 541,265 | |
| | 1,647 | | | Samsung Electronics Co., Ltd. | | | 4,048,590 | |
| | 22,265 | | | Shinhan Financial Group Co., Ltd. | | | 997,637 | |
| | 14,659 | | | Woori Bank | | | 214,583 | |
| | 2,589 | | | Yuhan Corp. | | | 471,421 | |
| | | | | | | | |
| | | | | | | 16,242,621 | |
| | | | | | | | |
| | | | Taiwan – 10.4% | | | | |
| | 550,864 | | | Advanced Semiconductor Engineering, Inc. | | | 663,934 | |
| | 78,533 | | | Advantech Co., Ltd. | | | 536,408 | |
| | 236,539 | | | Cathay Financial Holding Co., Ltd. | | | 390,578 | |
| | 2,059,796 | | | China Development Financial Holding Corp. | | | 631,062 | |
| | 563,570 | | | China General Plastics Corp. | | | 527,889 | |
| | 64,854 | | | Hiwin Technologies Corp. | | | 649,411 | |
| | 141,205 | | | Novatek Microelectronics Corp. | | | 522,036 | |
| | | | | | | | |
Shares | | | Description | | Value | |
| | | | | | | | | |
| | | | Taiwan (Continued) | | | | |
| | 207,311 | | | Pegatron Corp. | | $ | 536,158 | |
| | 45,086 | | | Phison Electronics Corp. | | | 535,928 | |
| | 354,008 | | | Taiwan Semiconductor Manufacturing Co., Ltd. | | | 2,852,300 | |
| | | | | | | | |
| | | | | | | 7,845,704 | |
| | | | | | | | |
| | | | Thailand – 0.7% | | | | |
| | 1,019,200 | | | Krung Thai Bank PCL | | | 558,382 | |
| | | | | | | | |
| | | | Turkey – 4.5% | | | | |
| | 106,853 | | | Akbank Turk A.S. | | | 281,952 | |
| | 73,797 | | | Aselsan Elektronik Sanayi Ve Ticaret A.S. | | | 660,244 | |
| | 192,699 | | | Haci Omer Sabanci Holding A.S. | | | 535,395 | |
| | 127,734 | | | Koza Altin Isletmeleri A.S. (b) | | | 1,107,115 | |
| | 113,688 | | | Turkiye Garanti Bankasi A.S. | | | 312,574 | |
| | 441,206 | | | Turkiye Sise ve Cam Fabrikalari A.S. | | | 517,554 | |
| | | | | | | | |
| | | | | | | 3,414,834 | |
| | | | | | | | |
| | | | Total Common Stocks | | | 74,749,983 | |
| | | | | | | | |
| | | | | (Cost $67,873,189) | | | | |
| | REAL ESTATE INVESTMENT TRUSTS (a) – 0.6% | |
| | | | Turkey – 0.6% | | | | |
| | 572,969 | | | AKIS Gayrimenkul Yatirimi A.S. | | | 478,789 | |
| | | | | | | | |
| | | | | (Cost $504,523) | | | | |
| | RIGHTS (a) – 0.0% | | | | |
| | | | Cayman Islands – 0.0% | | | | |
| | 54 | | | China Literature Ltd., expiring 11/7/2017 (b) (d) | | | — | |
| | | | | | | | |
| | | | | (Cost $0) | | | | |
| | | | Total Investments – 99.6%
| | | 75,228,772 | |
| | | | | (Cost $68,377,712) (e) | | | | |
| | | | Net Other Assets and Liabilities – 0.4% | | | 277,412 | |
| | | | | | | | |
| | | | Net Assets – 100.0% | | $ | 75,506,184 | |
| | | | | | | | |
| | | | |
| | See Notes to Financial Statements | | Page 25 |
First Trust Riverfront Dynamic Emerging Markets ETF (RFEM)
Portfolio of Investments (Continued)
October 31, 2017
| (a) | Portfolio securities are categorized based upon their country of incorporation. For a breakdown of the portfolio securities by sector, please see the Fund Performance Overview. |
| (b) | Non-income producing security. |
| (c) | This security is restricted in the U.S. and cannot be offered for public sale without first being registered under the Securities Act of 1933, as amended. This security is not restricted on the foreign exchange where it trades freely without any additional registration. As such, it does not require the additional disclosure required of restricted securities. |
| (d) | This security is fair valued by the Advisor’s Pricing Committee in accordance with procedures adopted by the Fund’s Board of Trustees, and in accordance with the provisions of the Investment Company Act of 1940, as amended. At October 31, 2017, securities noted as such are valued at $0 or 0.0% of net assets. |
| (e) | Aggregate cost for federal income tax purposes was $68,595,121. As of October 31, 2017, the aggregate gross unrealized appreciation for all investments in which there as an excess of value over tax cost was $8,531,720 and the aggregate gross unrealized depreciation for all investments in which there was an excess of tax cost over value was $1,898,069. The net unrealized appreciation was $6,633,651. |
ADR American Depositary Receipt
Valuation Inputs
A summary of the inputs used to value the Fund’s investments as of October 31, 2017 is as follows (see Note 2A - Portfolio Valuation in the Notes to Financial Statements):
| | | | | | | | | | | | | | |
| | | Total Value at 10/31/2017 | | Level 1
Quoted
Prices | | | Level 2
Significant
Observable
Inputs | | | Level 3
Significant
Unobservable
Inputs | |
Common
Stocks* | | $74,749,983 | | $ | 74,749,983 | | | $ | — | | | $ | — | |
Real Estate
Investment
Trusts* | | 478,789 | | | 478,789 | | | | — | | | | — | |
| Rights* | | — ** | | | — | | | | — | ** | | | — | |
| | | | | | | | | | | | | | |
Total
Investments | | $75,228,772 | | $ | 75,228,772 | | | $ | — | ** | | $ | — | |
| | | | | | | | | | | | | | |
| * | See Portfolio of Investments for country breakout. |
| ** | Investment is valued at $0. |
All transfers in and out of the Levels during the period are assumed to occur on the last day of the period at their current value. There were no transfers between Levels at October 31, 2017.
| | | | |
Currency Exposure Diversification | | % of Total
Investments |
KRW | | | 21.6 | % |
HKD | | | 20.7 | |
TWD | | | 10.4 | |
BRL | | | 9.1 | |
USD | | | 8.8 | |
TRY | | | 5.2 | |
INR | | | 4.3 | |
CLP | | | 3.4 | |
ZAR | | | 3.2 | |
PLN | | | 3.1 | |
IDR | | | 1.6 | |
MYR | | | 1.5 | |
ILS | | | 1.2 | |
COP | | | 1.1 | |
EGP | | | 1.1 | |
RUB | | | 1.0 | |
THB | | | 0.7 | |
PHP | | | 0.7 | |
MXN | | | 0.7 | |
EUR | | | 0.6 | |
| | | | |
Total | | | 100.0 | % |
| | | | |
Currency Abbreviations
| | |
BRL | | Brazilian Real |
CLP | | Chilean Peso |
COP | | Colombian Peso |
EGP | | Egyptian Pound |
EUR | | Euro |
HKD | | Hong Kong Dollar |
IDR | | Indonesian Rupiah |
ILS | | Israeli Shekel |
INR | | Indian Rupee |
KRW | | Korean Won |
MXN | | Mexican Peso |
MYR | | Malaysian Ringgit |
PHP | | Philippine Peso |
PLN | | Polish Zloty |
RUB | | Russian Ruble |
THB | | Thai Baht |
TRY | | Turkish Lira |
TWD | | Taiwan New Dollar |
USD | | United States Dollar |
ZAR | | South African Rand |
| | | | |
| Page 26 | | See Notes to Financial Statements | | |
This page intentionally left blank
| | | | |
| | See Notes to Financial Statements | | Page 27 |
First Trust Exchange-Traded Fund III
Statements of Assets and Liabilities
October 31, 2017
| | | | | | | | | | | | | | | | |
| | | First Trust
RiverFront
Dynamic
Asia
Pacific
ETF
(RFAP) | | | First Trust
RiverFront
Dynamic
Developed
International
ETF
(RFDI) | | | First Trust
RiverFront
Dynamic
Europe
ETF
(RFEU) | | | First Trust
RiverFront
Dynamic
Emerging
Markets
ETF
(RFEM) | |
ASSETS: | | | | | | | | | | | | | | | | |
Investments, at value | | $ | 29,739,712 | | | $ | 442,752,313 | | | $ | 123,630,410 | | | $ | 75,228,772 | |
Cash | | | 114,155 | | | | 1,751,640 | | | | 273,864 | | | | 301,714 | |
Foreign currency | | | 721 | | | | 28,555 | | | | 33 | | | | 2,483 | |
Due from authorized participant | | | — | | | | 15,362,969 | | | | 145,448 | | | | — | |
Receivables: | | | | | | | | | | | | | | | | |
Dividends | | | 113,599 | | | | 758,443 | | | | 64,590 | | | | 19,296 | |
Fund shares sold | | | 2,445 | | | | — | | | | — | | | | 3,425,526 | |
Dividend reclaims | | | 906 | | | | 142,906 | | | | 90,476 | | | | 2,333 | |
| | | | | | | | | | | | | | | | |
Total Assets | | | 29,971,538 | | | | 460,796,826 | | | | 124,204,821 | | | | 78,980,124 | |
| | | | | | | | | | | | | | | | |
LIABILITIES: | | | | | | | | | | | | | | | | |
Payables: | | | | | | | | | | | | | | | | |
Investment securities purchased | | | 37,714 | | | | 15,986,670 | | | | 145,454 | | | | 3,416,124 | |
Investment advisory fees | | | 19,266 | | | | 288,488 | | | | 79,604 | | | | 57,816 | |
Due to broker | | | 3,736 | | | | 109 | | | | — | | | | — | |
| | | | | | | | | | | | | | | | |
Total Liabilities | | | 60,716 | | | | 16,275,267 | | | | 225,058 | | | | 3,473,940 | |
| | | | | | | | | | | | | | | | |
NET ASSETS | | $ | 29,910,822 | | | $ | 444,521,559 | | | $ | 123,979,763 | | | $ | 75,506,184 | |
| | | | | | | | | | | | | | | | |
NET ASSETS consist of: | | | | | | | | | | | | | | | | |
Paid-in capital | | $ | 29,279,952 | | | $ | 416,613,399 | | | $ | 115,230,572 | | | $ | 68,335,894 | |
Par value | | | 5,000 | | | | 69,500 | | | | 19,000 | | | | 11,000 | |
Accumulated net investment income (loss) | | | 82,292 | | | | 685,010 | | | | 74,035 | | | | 143,211 | |
Accumulated net realized gain (loss) on investments, forward foreign currency contracts and foreign currency transactions | | | (715,402 | ) | | | (1,275,028 | ) | | | (1,090,063 | ) | | | 165,130 | |
Net unrealized appreciation (depreciation) on investments, forward foreign currency contracts and foreign currency translation | | | 1,258,980 | | | | 28,428,678 | | | | 9,746,219 | | | | 6,850,949 | |
| | | | | | | | | | | | | | | | |
NET ASSETS | | $ | 29,910,822 | | | $ | 444,521,559 | | | $ | 123,979,763 | | | $ | 75,506,184 | |
| | | | | | | | | | | | | | | | |
NET ASSET VALUE, per share | | $ | 59.82 | | | $ | 63.96 | | | $ | 65.25 | | | $ | 68.64 | |
| | | | | | | | | | | | | | | | |
Number of shares outstanding (unlimited number of shares authorized, par value $0.01 per share) | | | 500,002 | | | | 6,950,002 | | | | 1,900,002 | | | | 1,100,002 | |
| | | | | | | | | | | | | | | | |
Investments, at cost | | $ | 28,479,720 | | | $ | 414,321,656 | | | $ | 113,886,597 | | | $ | 68,377,712 | |
| | | | | | | | | | | | | | | | |
Foreign currency, at cost (proceeds) | | $ | 725 | | | $ | 28,789 | | | $ | 20 | | | $ | 2,497 | |
| | | | | | | | | | | | | | | | |
| | | | |
| Page 28 | | See Notes to Financial Statements | | |
First Trust Exchange-Traded Fund III
Statements of Operations
For the Year Ended October 31, 2017
| | | | | | | | | | | | | | | | |
| | | First Trust
RiverFront
Dynamic
Asia
Pacific
ETF
(RFAP) | | | First Trust
RiverFront
Dynamic
Developed
International
ETF
(RFDI) | | | First Trust
RiverFront
Dynamic
Europe
ETF
(RFEU) | | | First Trust
RiverFront
Dynamic
Emerging
Markets
ETF
(RFEM) | |
INVESTMENT INCOME: | | | | | | | | | | | | | | | | |
Dividends | | $ | 503,283 | | | $ | 5,130,958 | | | $ | 1,502,804 | | | $ | 892,938 | |
Interest | | | 314 | | | | 3,458 | | | | 973 | | | | 204 | |
Foreign withholding tax on dividend income | | | (30,435 | ) | | | (404,732 | ) | | | (131,560 | ) | | | (107,226 | ) |
Other | | | — | | | | 3 | | | | 3 | | | | 104 | |
| | | | | | | | | | | | | | | | |
Total investment income | | | 473,162 | | | | 4,729,687 | | | | 1,372,220 | | | | 786,020 | |
| | | | | | | | | | | | | | | | |
EXPENSES: | | | | | | | | | | | | | | | | |
Investment advisory fees | | | 142,425 | | | | 1,461,172 | | | | 447,884 | | | | 297,875 | |
| | | | | | | | | | | | | | | | |
Total expenses | | | 142,425 | | | | 1,461,172 | | | | 447,884 | | | | 297,875 | |
| | | | | | | | | | | | | | | | |
NET INVESTMENT INCOME (LOSS) | | | 330,737 | | | | 3,268,515 | | | | 924,336 | | | | 488,145 | |
| | | | | | | | | | | | | | | | |
NET REALIZED AND UNREALIZED GAIN (LOSS): | | | | | | | | | | | | | | | | |
Net realized gain (loss) on: | | | | | | | | | | | | | | | | |
Investments | | | (604,042 | ) | | | (2,092,740 | ) | | | (1,615,380 | ) | | | 312,578 | |
Foreign capital gains tax | | | — | | | | — | | | | — | | | | (17,961 | ) |
In-kind redemptions | | | 2,423,120 | | | | 9,928,711 | | | | 3,057,875 | | | | 998,733 | |
Forward foreign currency contracts | | | (56,847 | ) | | | 38,879 | | | | 259,055 | | | | — | |
Foreign currency transactions | | | (13,672 | ) | | | 6,283 | | | | 9,470 | | | | (35,048 | ) |
| | | | | | | | | | | | | | | | |
Net realized gain (loss) | | | 1,748,559 | | | | 7,881,133 | | | | 1,711,020 | | | | 1,258,302 | |
| | | | | | | | | | | | | | | | |
Net increase from payment by the advisor | | | 7,644 | | | | 35,978 | | | | — | | | | — | |
| | | | | | | | | | | | | | | | |
Net change in unrealized appreciation (depreciation) on: | | | | | | | | | | | | | | | | |
Investments | | | 688,006 | | | | 28,804,682 | | | | 10,532,568 | | | | 6,380,477 | |
Forward foreign currency contracts | | | — | | | | 40,087 | | | | 57,751 | | | | — | |
Foreign currency translation | | | 3,622 | | | | 420 | | | | 5,211 | | | | 84 | |
| | | | | | | | | | | | | | | | |
Net change in unrealized appreciation (depreciation) | | | 691,628 | | | | 28,845,189 | | | | 10,595,530 | | | | 6,380,561 | |
| | | | | | | | | | | | | | | | |
NET REALIZED AND UNREALIZED GAIN (LOSS) | | | 2,447,831 | | | | 36,762,300 | | | | 12,306,550 | | | | 7,638,863 | |
| | | | | | | | | | | | | | | | |
NET INCREASE (DECREASE) IN NET ASSETS RESULTING FROM OPERATIONS | | $ | 2,778,568 | | | $ | 40,030,815 | | | $ | 13,230,886 | | | $ | 8,127,008 | |
| | | | | | | | | | | | | | | | |
| | | | |
| | See Notes to Financial Statements | | Page 29 |
First Trust Exchange-Traded Fund III
Statements of Changes in Net Assets
| | | | | | | | | | | | | | | | |
| | | First Trust RiverFront
Dynamic Asia Pacific ETF (RFAP) | | | First Trust RiverFront Dynamic
Developed International ETF (RFDI) | |
| | | Year
Ended
10/31/2017 | | | Period
Ended
10/31/2016 (a) | | | Year
Ended
10/31/2017 | | | Period
Ended
10/31/2016 (a) | |
OPERATIONS: | | | | | | | | | | | | | | | | |
Net investment income (loss) | | $ | 330,737 | | | $ | 275,380 | | | $ | 3,268,515 | | | $ | 414,870 | |
Net realized gain (loss) | | | 1,748,559 | | | | (266,297 | ) | | | 7,881,133 | | | | 670,091 | |
Net increase from payment by the advisor | | | 7,644 | | | | — | | | | 35,978 | | | | — | |
Net change in unrealized appreciation (depreciation) | | | 691,628 | | | | 567,352 | | | | 28,845,189 | | | | (416,511 | ) |
| | | | | | | | | | | | | | | | |
Net increase (decrease) in net assets resulting from operations | | | 2,778,568 | | | | 576,435 | | | | 40,030,815 | | | | 668,450 | |
| | | | | | | | | | | | | | | | |
DISTRIBUTIONS TO SHAREHOLDERS FROM: | | | | | | | | | | | | | | | | |
Net investment income | | | (321,623 | ) | | | (162,451 | ) | | | (2,607,367 | ) | | | (351,001 | ) |
Net realized gain | | | — | | | | — | | | | (201,961 | ) | | | — | |
| | | | | | | | | | | | | | | | |
Total distributions to shareholders | | | (321,623 | ) | | | (162,451 | ) | | | (2,809,328 | ) | | | (351,001 | ) |
| | | | | | | | | | | | | | | | |
SHAREHOLDER TRANSACTIONS: | | | | | | | | | | | | | | | | |
Proceeds from shares sold | | | 41,927,847 | | | | 25,656,850 | | | | 488,981,137 | | | | 30,564,880 | |
Cost of shares redeemed | | | (40,544,804 | ) | | | — | | | | (107,360,484 | ) | | | (5,202,910 | ) |
| | | | | | | | | | | | | | | | |
Net increase (decrease) in net assets resulting from shareholder transactions | | | 1,383,043 | | | | 25,656,850 | | | | 381,620,653 | | | | 25,361,970 | |
| | | | | | | | | | | | | | | | |
Total increase (decrease) in net assets | | | 3,839,988 | | | | 26,070,834 | | | | 418,842,140 | | | | 25,679,419 | |
NET ASSETS: | | | | | | | | | | | | | | | | |
Beginning of period | | | 26,070,834 | | | | — | | | | 25,679,419 | | | | — | |
| | | | | | | | | | | | | | | | |
End of period | | $ | 29,910,822 | | | $ | 26,070,834 | | | $ | 444,521,559 | | | $ | 25,679,419 | |
| | | | | | | | | | | | | | | | |
Accumulated net investment income (loss) at end of period | | $ | 82,292 | | | $ | 58,773 | | | $ | 685,010 | | | $ | (6,707 | ) |
| | | | | | | | | | | | | | | | |
CHANGES IN SHARES OUTSTANDING: | | | | | | | | | | | | | | | | |
Shares outstanding, beginning of period | | | 500,002 | | | | — | | | | 500,002 | | | | — | |
Shares sold | | | 750,000 | | | | 500,002 | | | | 8,300,000 | | | | 600,002 | |
Shares redeemed | | | (750,000 | ) | | | — | | | | (1,850,000 | ) | | | (100,000 | ) |
| | | | | | | | | | | | | | | | |
Shares outstanding, end of period | | | 500,002 | | | | 500,002 | | | | 6,950,002 | | | | 500,002 | |
| | | | | | | | | | | | | | | | |
| (a) | Inception date is April 13, 2016, which is consistent with the commencement of investment operations and is the date the initial creation units were established. |
| (b) | Inception date is June 14, 2016, which is consistent with the commencement of investment operations and is the date the initial creation units were established. |
| | | | |
| Page 30 | | See Notes to Financial Statements | | |
| | | | | | | | | | | | | | |
First Trust RiverFront
Dynamic Europe ETF (RFEU) | | | First Trust RiverFront Dynamic
Emerging Markets ETF (RFEM) | |
Year
Ended
10/31/2017 | | | Period
Ended
10/31/2016 (a) | | | Year
Ended
10/31/2017 | | | Period
Ended
10/31/2016 (b) | |
| | | | | | | | | | | | | | | |
| $ | 924,336 | | | $ | 452,842 | | | $ | 488,145 | | | $ | 55,541 | |
| | 1,711,020 | | | | 960,524 | | | | 1,258,302 | | | | 195,085 | |
| | — | | | | | | | | — | | | | — | |
| | | | | | | | | | | | | | | |
| | 10,595,530 | | | | (849,311 | ) | | | 6,380,561 | | | | 470,388 | |
| | | | | | | | | | | | | | |
| |
13,230,886 | | | | 564,055 | | | | 8,127,008 | | | | 721,014 | |
| | | | | | | | | | | | | | |
| |
| | | | | | | | | | | | | |
| | (859,771 | ) | | | (409,752 | ) | | | (489,167 | ) | | | (54,611 | ) |
| | (407,052 | ) | | | — | | | | (190,082 | ) | | | — | |
| | | | | | | | | | | | | | |
| | (1,266,823 | ) | | | (409,752 | ) | | | (679,249 | ) | | | (54,611 | ) |
| | | | | | | | | | | | | | |
| | | | | | | | | | | | | | | |
| | 126,451,387 | | | | 30,664,176 | | | | 71,331,250 | | | | 4,961,180 | |
| | (40,020,606 | ) | | | (5,233,560 | ) | | | (8,900,408 | ) | | | — | |
| | | | | | | | | | | | | | |
| |
86,430,781 | | | | 25,430,616 | | | | 62,430,842 | | | | 4,961,180 | |
| | | | | | | | | | | | | | |
| | 98,394,844 | | | | 25,584,919 | | | | 69,878,601 | | | | 5,627,583 | |
| | | | | | | | | | | | | | | |
| | 25,584,919 | | | | — | | | | 5,627,583 | | | | — | |
| | | | | | | | | | | | | | |
| $ | 123,979,763 | | | $ | 25,584,919 | | | $ | 75,506,184 | | | $ | 5,627,583 | |
| | | | | | | | | | | | | | |
$ |
74,035 | | | $ | — | | | $ | 143,211 | | | $ | 6,171 | |
| | | | | | | | | | | | | | |
| | | | | | | | | | | | | | | |
| | 500,002 | | | | — | | | | 100,002 | | | | — | |
| | 2,100,000 | | | | 600,002 | | | | 1,150,000 | | | | 100,002 | |
| | (700,000 | ) | | | (100,000 | ) | | | (150,000 | ) | | | — | |
| | | | | | | | | | | | | | |
| | 1,900,002 | | | | 500,002 | | | | 1,100,002 | | | | 100,002 | |
| | | | | | | | | | | | | | |
| | | | |
| | See Notes to Financial Statements | | Page 31 |
First Trust Exchange-Traded Fund III
Financial Highlights
For a share outstanding throughout each period
First Trust Riverfront Dynamic Asia Pacific ETF (RFAP)
| | | | | | | | |
| | | Year Ended
10/31/2017 | | | Period
Ended
10/31/2016 (a) | |
Net asset value, beginning of period | | $ | 52.14 | | | $ | 51.31 | |
| | | | | | | | |
Income from investment operations: | | | | | | | | |
Net investment income (loss) | | | 1.42 | | | | 0.55 | |
Net realized and unrealized gain (loss) | | | 7.66 | | | | 0.60 | |
| | | | | | | | |
Total from investment operations | | | 9.08 | | | | 1.15 | |
| | | | | | | | |
Distributions paid to shareholders from: | | | | | | | | |
Net investment income | | | (1.40 | ) | | | (0.32 | ) |
| | | | | | | | |
Net asset value, end of period | | $ | 59.82 | | | $ | 52.14 | |
| | | | | | | | |
Total return (b) | | | 17.77 | % (c) | | | 2.26 | % |
| | |
Ratios to average net assets/supplemental data: | | | | | | | | |
Net assets, end of period (in 000’s) | | $ | 29,911 | | | $ | 26,071 | |
Ratio of total expenses to average net assets | | | 0.83 | % | | | 0.83 | % (d) |
Ratio of net investment income (loss) to average net assets | | | 1.93 | % | | | 1.96 | % (d) |
Portfolio turnover rate (e) | | | 131 | % | | | 49 | % |
| (a) | Inception date is April 13, 2016, which is consistent with the commencement of investment operations and is the date the initial creation units were established. |
| (b) | Total return is calculated assuming an initial investment made at the net asset value at the beginning of the period, reinvestment of all distributions at net asset value during the period, and redemption at net asset value on the last day of the period. The returns presented do not reflect the deduction of taxes that a shareholder would pay on Fund distributions or the redemption or sale of Fund shares. Total return is calculated for the time period presented and is not annualized for periods of less than a year. |
| (c) | The Fund received a reimbursement from the advisor in the amount of $7,644, which represents $0.02 per share. Since the advisor reimbursed the Fund, there was no effect on the Fund’s total return. |
| (e) | Portfolio turnover is calculated for the time period presented and is not annualized for periods of less than a year and does not include securities received or delivered from processing creations or redemptions and in-kind transactions. |
| | | | |
| Page 32 | | See Notes to Financial Statements | | |
First Trust Exchange-Traded Fund III
Financial Highlights (Continued)
For a share outstanding throughout each period
First Trust Riverfront Dynamic Developed International ETF (RFDI)
| | | | | | | | |
| | | Year Ended
10/31/2017 | | | Period
Ended
10/31/2016 (a) | |
Net asset value, beginning of period | | $ | 51.36 | | | $ | 50.73 | |
| | | | | | | | |
Income from investment operations: | | | | | | | | |
Net investment income (loss) | | | 0.82 | | | | 0.83 | |
Net realized and unrealized gain (loss) | | | 12.73 | | | | 0.50 | |
| | | | | | | | |
Total from investment operations | | | 13.55 | | | | 1.33 | |
| | | | | | | | |
Distributions paid to shareholders from: | | | | | | | | |
Net investment income | | | (0.71 | ) | | | (0.70 | ) |
Net realized gain | | | (0.24 | ) | | | — | |
| | | | | | | | |
Total distributions | | | (0.95 | ) | | | (0.70 | ) |
| | | | | | | | |
Net asset value, end of period | | $ | 63.96 | | | $ | 51.36 | |
| | | | | | | | |
Total return (b) | | | 26.60 | % (c) | | | 2.68 | % |
| | |
Ratios to average net assets/supplemental data: | | | | | | | | |
Net assets, end of period (in 000’s) | | $ | 444,522 | | | $ | 25,679 | |
Ratio of total expenses to average net assets | | | 0.83 | % | | | 0.83 | % (d) |
Ratio of net investment income (loss) to average net assets | | | 1.86 | % | | | 2.97 | % (d) |
Portfolio turnover rate (e) | | | 106 | % | | | 44 | % |
| (a) | Inception date is April 13, 2016, which is consistent with the commencement of investment operations and is the date the initial creation units were established. |
| (b) | Total return is calculated assuming an initial investment made at the net asset value at the beginning of the period, reinvestment of all distributions at net asset value during the period, and redemption at net asset value on the last day of the period. The returns presented do not reflect the deduction of taxes that a shareholder would pay on Fund distributions or the redemption or sale of Fund shares. Total return is calculated for the time period presented and is not annualized for periods of less than a year. |
| (c) | The Fund received a reimbursement from the advisor in the amount of $35,978, which represents less than $0.01 per share. Since the advisor reimbursed the Fund, there was no effect on the Fund’s total return. |
| (e) | Portfolio turnover is calculated for the time period presented and is not annualized for periods of less than a year and does not include securities received or delivered from processing creations or redemptions and in-kind transactions. |
| | | | |
| | See Notes to Financial Statements | | Page 33 |
First Trust Exchange-Traded Fund III
Financial Highlights (Continued)
For a share outstanding throughout each period
First Trust Riverfront Dynamic Europe ETF (RFEU)
| | | | | | | | |
| | | Year Ended
10/31/2017 | | | Period
Ended
10/31/2016 (a) | |
Net asset value, beginning of period | | $ | 51.17 | | | $ | 50.67 | |
| | | | | | | | |
Income from investment operations: | | | | | | | | |
Net investment income (loss) | | | 0.82 | | | | 0.91 | |
Net realized and unrealized gain (loss) | | | 14.86 | | | | 0.41 | |
| | | | | | | | |
Total from investment operations | | | 15.68 | | | | 1.32 | |
| | | | | | | | |
Distributions paid to shareholders from: | | | | | | | | |
Net investment income | | | (0.79 | ) | | | (0.82 | ) |
Net realized gain | | | (0.81 | ) | | | — | |
| | | | | | | | |
Total distributions | | | (1.60 | ) | | | (0.82 | ) |
| | | | | | | | |
Net asset value, end of period | | $ | 65.25 | | | $ | 51.17 | |
| | | | | | | | |
Total return (b) | | | 31.21 | % | | | 2.66 | % |
| | |
Ratios to average net assets/supplemental data: | | | | | | | | |
Net assets, end of period (in 000’s) | | $ | 123,980 | | | $ | 25,585 | |
Ratio of total expenses to average net assets | | | 0.83 | % | | | 0.83 | % (c) |
Ratio of net investment income (loss) to average net assets | | | 1.71 | % | | | 3.23 | % (c) |
Portfolio turnover rate (d) | | | 110 | % | | | 41 | % |
| (a) | Inception date is April 13, 2016, which is consistent with the commencement of investment operations and is the date the initial creation units were established. |
| (b) | Total return is calculated assuming an initial investment made at the net asset value at the beginning of the period, reinvestment of all distributions at net asset value during the period, and redemption at net asset value on the last day of the period. The returns presented do not reflect the deduction of taxes that a shareholder would pay on Fund distributions or the redemption or sale of Fund shares. Total return is calculated for the time period presented and is not annualized for periods of less than a year. |
| (d) | Portfolio turnover is calculated for the time period presented and is not annualized for periods of less than a year and does not include securities received or delivered from processing creations or redemptions and in-kind transactions. |
| | | | |
| Page 34 | | See Notes to Financial Statements | | |
First Trust Exchange-Traded Fund III
Financial Highlights (Continued)
For a share outstanding throughout each period
First Trust Riverfront Dynamic Emerging Markets ETF (RFEM)
| | | | | | | | |
| | | Year Ended
10/31/2017 | | | Period
Ended
10/31/2016 (a) | |
Net asset value, beginning of period | | $ | 56.27 | | | $ | 49.61 | |
| | | | | | | | |
Income from investment operations: | | | | | | | | |
Net investment income (loss) | | | 0.71 | | | | 0.55 | |
Net realized and unrealized gain (loss) | | | 13.70 | | | | 6.66 | |
| | | | | | | | |
Total from investment operations | | | 14.41 | | | | 7.21 | |
| | | | | | | | |
Distributions paid to shareholders from: | | | | | | | | |
Net investment income | | | (0.77 | ) | | | (0.55 | ) |
Net realized gain | | | (1.27 | ) | | | — | |
| | | | | | | | |
Total distributions | | | (2.04 | ) | | | (0.55 | ) |
| | | | | | | | |
Net asset value, end of period | | $ | 68.64 | | | $ | 56.27 | |
| | | | | | | | |
Total return (b) | | | 26.49 | % | | | 14.52 | % |
| | |
Ratios to average net assets/supplemental data: | | | | | | | | |
Net assets, end of period (in 000’s) | | $ | 75,506 | | | $ | 5,628 | |
Ratio of total expenses to average net assets | | | 0.95 | % | | | 0.95 | % (c) |
Ratio of net investment income (loss) to average net assets | | | 1.56 | % | | | 2.66 | % (c) |
Portfolio turnover rate (d) | | | 87 | % | | | 81 | % |
| (a) | Inception date is June 14, 2016, which is consistent with the commencement of investment operations and is the date the initial creation units were established. |
| (b) | Total return is calculated assuming an initial investment made at the net asset value at the beginning of the period, reinvestment of all distributions at net asset value during the period, and redemption at net asset value on the last day of the period. The returns presented do not reflect the deduction of taxes that a shareholder would pay on Fund distributions or the redemption or sale of Fund shares. Total return is calculated for the time period presented and is not annualized for periods of less than a year. |
| (d) | Portfolio turnover is calculated for the time period presented and is not annualized for periods of less than a year and does not include securities received or delivered from processing creations or redemptions and in-kind transactions. |
| | | | |
| | See Notes to Financial Statements | | Page 35 |
Notes to Financial Statements
First Trust Exchange-Traded Fund III
October 31, 2017
1. Organization
First Trust Exchange-Traded Fund III (the “Trust”) is an open-end management investment company organized as a Massachusetts business trust on January 9, 2008, and is registered with the Securities and Exchange Commission (“SEC”) under the Investment Company Act of 1940, as amended (the “1940 Act”).
The Trust consists of twelve funds that are currently offering shares. This report covers the following funds, each a non-diversified series of the Trust:
First Trust RiverFront Dynamic Asia Pacific ETF – (The Nasdaq Stock Market LLC (“Nasdaq”) ticker “RFAP”)
First Trust RiverFront Dynamic Developed International ETF – (Nasdaq ticker “RFDI”)
First Trust RiverFront Dynamic Europe ETF – (Nasdaq ticker “RFEU”)
First Trust RiverFront Dynamic Emerging Markets ETF – (Nasdaq ticker “RFEM”)
Each fund represents a separate series of shares of beneficial interest in the Trust (each a “Fund” and collectively, the “Funds”). Each Fund’s shares are currently listed and traded on Nasdaq. Unlike conventional mutual funds, each Fund issues and redeems shares on a continuous basis, at net asset value (“NAV”), only in large specified blocks consisting of 50,000 shares called a “Creation Unit.” Creation Units are generally issued and redeemed in-kind for securities in which a Fund invests and, in certain circumstances, for cash, and only to and from broker-dealers and large institutional investors that have entered into participation agreements. Except when aggregated in Creation Units, the shares are not redeemable securities of a Fund.
Each Fund is an actively managed exchange-traded fund. The investment objective of each Fund is to provide capital appreciation.
Under normal market conditions, RFAP seeks to achieve its investment objective by investing at least 80% of its net assets (including investment borrowings) in a portfolio of equity securities of Asian Pacific companies through investments in common stocks, depositary receipts, real estate investment trusts (“REITs”), and forward foreign currency contracts and currency spot transactions used to hedge the Fund’s exposure to the currencies in which the equity securities of the Asian Pacific companies are denominated.
Under normal market conditions, RFDI seeks to achieve its investment objective by investing at least 80% of its net assets (including investment borrowings) in a portfolio of equity securities of developed market companies through investments in common stocks, depositary receipts, REITs, and forward foreign currency contracts and currency spot transactions used to hedge the Fund’s exposure to the currencies in which the equity securities of the developed market companies are denominated.
Under normal market conditions, RFEU seeks to achieve its investment objective by investing at least 80% of its net assets (including investment borrowings) in a portfolio of equity securities of European companies through investments in common stocks, depositary receipts, REITs, and forward foreign currency contracts and currency spot transactions used to hedge the Fund’s exposure to the currencies in which the equity securities of the European companies are denominated.
Under normal market conditions, RFEM seeks to achieve its investment objective by investing at least 80% of its net assets (including investment borrowings) in a portfolio of equity securities of emerging market companies through investments in common stocks, depositary receipts, REITs, and forward foreign currency contracts and currency spot transactions used to hedge the Fund’s exposure to the currencies in which the equity securities of the emerging market companies are denominated.
There can be no assurance that a Fund will achieve its investment objective. The Funds may not be appropriate for all investors.
2. Significant Accounting Policies
The Funds are each considered an investment company and follow accounting and reporting guidance under Financial Accounting Standards Board (“FASB”) Accounting Standards Codification (“ASC”) Topic 946, “Financial Services-Investment Companies.” The following is a summary of significant accounting policies consistently followed by the Funds in the preparation of the financial statements. The preparation of the financial statements in accordance with accounting principles generally accepted in the United States of America (“U.S. GAAP”) requires management to make estimates and assumptions that affect the reported amounts and disclosures in the financial statements. Actual results could differ from those estimates.
A. Portfolio Valuation
Each Fund’s NAV is determined daily as of the close of regular trading on the New York Stock Exchange (“NYSE”), normally
4:00 p.m. Eastern time, on each day the NYSE is open for trading. If the NYSE closes early on a valuation day, the NAV is determined as of that time. Foreign securities are priced using data reflecting the earlier closing of the principal markets for those securities. Each Fund’s NAV is calculated by dividing the value of all assets of each Fund (including accrued interest and dividends), less all liabilities (including accrued expenses and dividends declared but unpaid), by the total number of shares outstanding.
Page 36
Notes to Financial Statements (Continued)
First Trust Exchange-Traded Fund III
October 31, 2017
Each Fund’s investments are valued daily at market value or, in the absence of market value with respect to any portfolio securities, at fair value. Market value prices represent last sale or official closing prices from a national or foreign exchange (i.e., a regulated market) and are primarily obtained from third-party pricing services. Fair value prices represent any prices not considered market value prices and are either obtained from a third-party pricing service or are determined by the Pricing Committee of the Funds’ investment advisor, First Trust Advisors L.P. (“First Trust” or the “Advisor”), in accordance with valuation procedures adopted by the Trust’s Board of Trustees, and in accordance with provisions of the 1940 Act. Investments valued by the Advisor’s Pricing Committee, if any, are footnoted as such in the footnotes to the Portfolio of Investments. Each Fund’s investments are valued as follows:
Common stocks, REITs, and other equity securities listed on any national or foreign exchange (excluding Nasdaq and the London Stock Exchange Alternative Investment Market (“AIM”)) are valued at the last sale price on the exchange on which they are principally traded or, for Nasdaq and AIM securities, the official closing price. Securities traded on more than one securities exchange are valued at the last sale price or official closing price, as applicable, at the close of the securities exchange representing the principal market for such securities.
Securities traded in an over-the-counter market are fair valued at the mean of their most recent bid and asked price, if available, and otherwise at their closing bid price.
Forward foreign currency contracts are valued at the current day’s interpolated foreign exchange rate, as calculated using the current day’s spot rate, and the thirty, sixty, ninety and one-hundred eighty day forward rates provided by a third-party pricing service.
Certain securities may not be able to be priced by pre-established pricing methods. Such securities may be valued by the Trust’s Board of Trustees or its delegate, the Advisor’s Pricing Committee, at fair value. These securities generally include, but are not limited to, restricted securities (securities which may not be publicly sold without registration under the Securities Act of 1933, as amended) for which a third-party pricing service is unable to provide a market price; securities whose trading has been formally suspended; a security whose market or fair value price is not available from a pre-established pricing source; a security with respect to which an event has occurred that is likely to materially affect the value of the security after the market has closed but before the calculation of a Fund’s NAV or make it difficult or impossible to obtain a reliable market quotation; and a security whose price, as provided by the third-party pricing service, does not reflect the security’s fair value. As a general principle, the current fair value of a security would appear to be the amount which the owner might reasonably expect to receive for the security upon its current sale. When fair value prices are used, generally they will differ from market quotations or official closing prices on the applicable exchanges. A variety of factors may be considered in determining the fair value of such securities, including, but not limited to, the following:
| | 2) | the size of the holding; |
| | 3) | the initial cost of the security; |
| | 4) | transactions in comparable securities; |
| | 5) | price quotes from dealers and/or third-party pricing services; |
| | 6) | relationships among various securities; |
| | 7) | information obtained by contacting the issuer, analysts, or the appropriate stock exchange; |
| | 8) | an analysis of the issuer’s financial statements; and |
| | 9) | the existence of merger proposals or tender offers that might affect the value of the security. |
If the securities in question are foreign securities, the following additional information may be considered:
| | 1) | the value of similar foreign securities traded on other foreign markets; |
| | 2) | ADR trading of similar securities; |
| | 3) | closed-end fund trading of similar securities; |
| | 4) | foreign currency exchange activity; |
| | 5) | the trading prices of financial products that are tied to baskets of foreign securities; |
| | 6) | factors relating to the event that precipitated the pricing problem; |
| | 7) | whether the event is likely to recur; and |
| | 8) | whether the effects of the event are isolated or whether they affect entire markets, countries or regions. |
Because foreign markets may be open on different days than the days during which investors may transact in the shares of a Fund, the value of the Fund’s securities may change on the days when investors are not able to transact in the shares of the Fund. The value of securities denominated in foreign currencies is converted into U.S. dollars using exchange rates determined daily as of the close of regular trading on the NYSE.
Page 37
Notes to Financial Statements (Continued)
First Trust Exchange-Traded Fund III
October 31, 2017
The Funds are subject to fair value accounting standards that define fair value, establish the framework for measuring fair value and provide a three-level hierarchy for fair valuation based upon the inputs to the valuation as of the measurement date. The three levels of the fair value hierarchy are as follows:
| | • | | Level 1 – Level 1 inputs are quoted prices in active markets for identical investments. An active market is a market in which transactions for the investment occur with sufficient frequency and volume to provide pricing information on an ongoing basis. |
| | • | | Level 2 – Level 2 inputs are observable inputs, either directly or indirectly, and include the following: |
| | • | | Quoted prices for similar investments in active markets. |
| | • | | Quoted prices for identical or similar investments in markets that are non-active. A non-active market is a market where there are few transactions for the investment, the prices are not current, or price quotations vary substantially either over time or among market makers, or in which little information is released publicly. |
| | • | | Inputs other than quoted prices that are observable for the investment (for example, interest rates and yield curves observable at commonly quoted intervals, volatilities, prepayment speeds, loss severities, credit risks, and default rates). |
| | • | | Inputs that are derived principally from or corroborated by observable market data by correlation or other means. |
| | • | | Level 3 – Level 3 inputs are unobservable inputs. Unobservable inputs may reflect the reporting entity’s own assumptions about the assumptions that market participants would use in pricing the investment. |
The inputs or methodologies used for valuing investments are not necessarily an indication of the risk associated with investing in those investments. A summary of the inputs used to value each Fund’s investments as of October 31, 2017, is included with each Fund’s Portfolio of Investments.
B. Securities Transactions and Investment Income
Securities transactions are recorded as of the trade date. Realized gains and losses from securities transactions are recorded on the identified cost basis. Dividend income is recorded on the ex-dividend date. Interest income, if any, is recorded on the accrual basis.
Distributions received from a Fund’s investments in REITs may be comprised of return of capital, capital gains and income. The actual character of the amounts received during the year are not known until after the REIT’s fiscal year end. A Fund records the character of distributions received from the REITs during the year based on estimates available. The characterization of distributions received by a Fund may be subsequently revised based on information received from the REITs after their tax reporting periods conclude.
C. Forward Foreign Currency Contracts
The Funds are subject to foreign currency risk in the normal course of pursuing their investment objectives. Forward foreign currency contracts are agreements between two parties (“Counterparties”) to exchange one currency for another at a future date and at a specified price. The Funds use forward foreign currency contracts to facilitate transactions in foreign securities and to manage each Fund’s foreign currency exposure. These contracts are valued daily, and each Fund’s net equity therein, representing unrealized gain or loss on the contracts as measured by the difference between the forward foreign exchange rates at the dates of entry into the contracts and the forward rates at the reporting date, is included in “Unrealized appreciation (depreciation) on forward foreign currency contracts” on the Statements of Assets and Liabilities. The change in unrealized appreciation (depreciation) is included in “Net change in unrealized appreciation (depreciation) on forward foreign currency contracts” on the Statements of Operations. When the forward contract is closed, a Fund records a realized gain or loss equal to the difference between the proceeds from (or the cost of) the closing transaction and the Fund’s basis in the contract. This realized gain or loss is included in “Net realized gain (loss) on forward foreign currency contracts” on the Statements of Operations. Risks arise from the possible inability of counterparties to meet the terms of their contracts and from movement in currency and securities values and interest rates. Due to the risks, the Funds could incur losses in excess of the net unrealized value shown on the Forward Foreign Currency Contracts table in each Fund’s Portfolio of Investments. In the event of default by the Counterparty, a Fund will provide notice to the Counterparty of the Fund’s intent to convert the currency held by the Fund into the currency that the Counterparty agreed to exchange with that Fund. If a Counterparty becomes bankrupt or otherwise fails to perform its obligations due to financial difficulties, the Funds may experience significant delays in obtaining any recovery in a bankruptcy or other reorganization proceeding. The Funds may obtain only limited recovery or may obtain no recovery in such circumstances. The Funds did not hold any forward foreign currency contracts at October 31, 2017.
D. Foreign Currency
The books and records of the Funds are maintained in U.S. dollars. Foreign currencies, investments and other assets and liabilities are translated into U.S. dollars at the exchange rates prevailing at the end of the period. Purchases and sales of investments and items of income and expense are translated on the respective dates of such transactions. Unrealized gains and losses on assets and liabilities,
Page 38
Notes to Financial Statements (Continued)
First Trust Exchange-Traded Fund III
October 31, 2017
other than investments in securities, which result from changes in foreign currency exchange rates have been included in “Net change in unrealized appreciation (depreciation) on foreign currency translation” on the Statements of Operations. Unrealized gains and losses on investments in securities which result from changes in foreign exchange rates are included with fluctuations arising from changes in market price and are shown in “Net change in unrealized appreciation (depreciation) on investments” on the Statements of Operations. Net realized foreign currency gains and losses include the effect of changes in exchange rates between trade date and settlement date on investment security transactions, foreign currency transactions and interest and dividends received and are shown in “Net realized gain (loss) on foreign currency transactions” on the Statements of Operations. The portion of foreign currency gains and losses related to fluctuations in exchange rates between the initial purchase settlement date and subsequent sale trade date is included in “Net realized gain (loss) on investments” on the Statements of Operations.
E. Dividends and Distributions to Shareholders
Dividends from net investment income, if any, are declared and paid quarterly by each Fund, or as the Board of Trustees may determine from time to time. Distributions of net realized capital gains earned by each Fund, if any, are distributed at least annually.
Distributions from income and capital gains are determined in accordance with income tax regulations, which may differ from U.S. GAAP. Certain capital accounts in the financial statements are periodically adjusted for permanent differences in order to reflect their tax character. These permanent differences are primarily due to the varying treatment of income and gain/loss on portfolio securities held by the Funds and have no impact on net assets or NAV per share. Temporary differences, which arise from recognizing certain items of income, expense and gain/loss in different periods for financial statement and tax purposes, will reverse at some time in the future.
The tax character of distributions paid by each Fund during the fiscal year ended October 31, 2017 was as follows:
| | | | | | | | | | | | |
| | | Distributions
paid from
Ordinary
Income | | | Distributions
paid from
Capital
Gains | | | Distributions
paid from
Return of
Capital | |
First Trust RiverFront Dynamic Asia Pacific ETF | | $ | 321,623 | | | $ | — | | | $ | — | |
First Trust RiverFront Dynamic Developed International ETF | | | 2,607,367 | | | | 201,961 | | | | — | |
First Trust RiverFront Dynamic Europe ETF | | | 859,771 | | | | 407,052 | | | | — | |
First Trust RiverFront Dynamic Emerging Markets ETF | | | 679,249 | | | | — | | | | — | |
The tax character of distributions paid by each Fund during the period ended October 31, 2016 was as follows:
| | | | | | | | | | | | |
| | | Distributions
paid from
Ordinary
Income | | | Distributions
paid from
Capital
Gains | | | Distributions
paid from
Return of
Capital | |
First Trust RiverFront Dynamic Asia Pacific ETF | | $ | 162,451 | | | $ | — | | | $ | — | |
First Trust RiverFront Dynamic Developed International ETF | | | 320,767 | | | | 30,234 | | | | — | |
First Trust RiverFront Dynamic Europe ETF | | | 344,889 | | | | 64,863 | | | | — | |
First Trust RiverFront Dynamic Emerging Markets ETF | | | 54,611 | | | | — | | | | — | |
As of October 31, 2017, the components of distributable earnings on a tax basis for each Fund were as follows:
| | | | | | | | | | | | |
| | | Undistributed
Ordinary
Income | | | Accumulated
Capital and
Other
Gain (Loss) | | | Net
Unrealized
Appreciation
(Depreciation) | |
First Trust RiverFront Dynamic Asia Pacific ETF | | $ | 309,722 | | | $ | (409,134 | ) | | $ | 725,282 | |
First Trust RiverFront Dynamic Developed International ETF | | | 1,923,187 | | | | 22,673 | | | | 25,892,800 | |
First Trust RiverFront Dynamic Europe ETF | | | 74,035 | | | | (654,153 | ) | | | 9,310,309 | |
First Trust RiverFront Dynamic Emerging Markets ETF | | | 458,841 | | | | 66,909 | | | | 6,633,540 | |
Page 39
Notes to Financial Statements (Continued)
First Trust Exchange-Traded Fund III
October 31, 2017
F. Income Taxes
Each Fund intends to continue to qualify as a regulated investment company by complying with the requirements under Subchapter M of the Internal Revenue Code of 1986, as amended, which includes distributing substantially all of its net investment income and net realized gains to shareholders. Accordingly, no provision has been made for federal and state income taxes. However, due to the timing and amount of distributions, each Fund may be subject to an excise tax of 4% of the amount by which approximately 98% of each Fund’s taxable income exceeds the distributions from such taxable income for the calendar year.
The Funds are subject to accounting standards that establish a minimum threshold for recognizing, and a system for measuring, the benefits of a tax position taken or expected to be taken in a tax return. The taxable years ended 2016 and 2017 remain open to federal and state audit. As of October 31, 2017, management has evaluated the application of these standards to the Funds and has determined that no provision for income tax is required in the Funds’ financial statements for uncertain tax positions.
The Funds intend to utilize provisions of the federal income tax laws, which allow them to carry a realized capital loss forward indefinitely following the year of the loss and offset such loss against any future realized capital gains. The Funds are subject to certain limitations under U.S. tax rules on the use of capital loss carryforwards and net unrealized built-in losses. These limitations apply when there has been a 50% change in ownership. At October 31, 2017, the Funds had non-expiring capital loss carryforward for federal income tax purposes as follows:
| | | | |
| | | Capital
Loss Available | |
First Trust RiverFront Dynamic Asia Pacific ETF | | $ | 409,134 | |
First Trust RiverFront Dynamic Developed International ETF | | | — | |
First Trust RiverFront Dynamic Europe ETF | | | 654,153 | |
First Trust RiverFront Dynamic Emerging Markets ETF | | | — | |
In order to present paid-in capital, accumulated net investment income (loss) and accumulated net realized gain (loss) on investments on the Statements of Assets and Liabilities that more closely represent their tax character, certain adjustments have been made to paid-in capital, accumulated net investment income (loss) and accumulated net realized gain (loss) on investments. These adjustments are primarily due to the difference between book and tax treatments of income and gains on various investment securities held by the Funds and in-kind transactions. The results of operations and net assets were not affected by these adjustments. For the year ended October 31, 2017, the adjustments for each Fund were as follows:
| | | | | | | | | | | | |
| | | Accumulated
Net
Investment
Income (Loss) | | | Accumulated
Net Realized
Gain (Loss)
on Investments | | | Paid-in
Capital | |
First Trust RiverFront Dynamic Asia Pacific ETF | | $ | 14,405 | | | $ | (2,259,464 | ) | | $ | 2,245,059 | |
First Trust RiverFront Dynamic Developed International ETF | | | 30,569 | | | | (9,177,500 | ) | | | 9,146,931 | |
First Trust RiverFront Dynamic Europe ETF | | | 9,470 | | | | (2,822,199 | ) | | | 2,812,729 | |
First Trust RiverFront Dynamic Emerging Markets ETF | | | 138,062 | | | | (1,092,934 | ) | | | 954,872 | |
G. Expenses
Expenses, other than the investment advisory fee and other excluded expenses, are paid by the Advisor (See Note 3).
H. New and Amended Financial Reporting Rules and Forms
On October 13, 2016, the SEC adopted new rules and forms, and amended existing rules and forms. The new and amended rules and forms are intended to modernize the reporting of information provided by funds and to improve the quality and type of information that funds provide to the SEC and investors. In part, the new and amended rules and forms amend Regulation S-X and require standardized, enhanced disclosures about derivatives in a fund’s financial statements, as well as other amendments. The compliance date for the amendments of Regulation S-X was August 1, 2017, which resulted in no change to the financial statements. The new form types and other rule amendments will be effective for the First Trust funds, including the Funds, for reporting periods beginning on and after June 1, 2018. Management is evaluating the new form types and other rule amendments that are effective on and after June 1, 2018 to determine the impact to the Funds.
Page 40
Notes to Financial Statements (Continued)
First Trust Exchange-Traded Fund III
October 31, 2017
I. New Accounting Pronouncement
In December 2016, FASB released Accounting Standards Update (“ASU”) 2016-19 that makes technical changes to various sections of the ASC, including Topic 820, Fair Value Measurement. The changes to Topic 820 are intended to clarify the difference between a valuation approach and a valuation technique. The changes to ASC 820-10-50-2 require a reporting entity to disclose, for Level 2 and Level 3 fair value measurements, a change in either or both a valuation approach and a valuation technique and the reason(s) for the change. The changes to Topic 820 are effective for fiscal years, and interim periods within those fiscal years, beginning after December 15, 2016. At this time, management is evaluating the implications of the ASU and has not yet determined its impact on the financial statements and disclosures.
3. Investment Advisory Fee, Affiliated Transactions and Other Fee Arrangements
First Trust, the investment advisor to the Funds, is a limited partnership with one limited partner, Grace Partners of DuPage L.P., and one general partner, The Charger Corporation. The Charger Corporation is an Illinois corporation controlled by James A. Bowen, Chief Executive Officer of First Trust. First Trust is responsible for supervising the selection and ongoing monitoring of the securities in each Fund’s portfolio, managing the Funds’ business affairs and providing certain administrative services necessary for the management of the Funds.
Pursuant to the Investment Management Agreement between First Trust and the Trust, First Trust supervises the investment of the Funds’ assets and is responsible for the expenses of each Fund including the cost of transfer agency, sub-advisory, custody, fund administration, legal, audit and other services, including any compensation to Trustees, but excluding fee payments under the Investment Management Agreement, interest, taxes, brokerage commissions, acquired fund fees, if any, distribution and service fees payable pursuant to Rule 12b-1 plan, if any, expenses associated with the execution of portfolio transactions, and extraordinary expenses, which are paid by each respective Fund. RFAP, RFDI and RFEU have each agreed to pay First Trust an annual unitary management fee equal to 0.83% its average daily net assets. RFEM has agreed to pay First Trust an annual unitary management fee equal to 0.95% of its average daily net assets. First Trust also provides fund reporting services to each Fund for a flat annual fee in the amount of $9,250, which is covered under the annual unitary management fee.
RiverFront Investment Group, LLC (“RiverFront” or the “Sub-Advisor”) serves as the Funds’ sub-advisor and manages each Fund’s portfolio subject to First Trust’s supervision. The Sub-Advisor receives a monthly portfolio management fee calculated at an annual rate of 0.35% of each Fund’s average daily net assets that is paid by First Trust out of its investment advisory fee.
During the year ended October 31, 2017, RFAP and RFDI received payments from the Advisor of $7,644 and $35,978, respectively, in connection with trade errors.
The Trust has multiple service agreements with Brown Brothers Harriman & Co. (“BBH”). Under the service agreements, BBH performs custodial, fund accounting, certain administrative services, and transfer agency services for the Funds. As custodian, BBH is responsible for custody of each Fund’s assets. As fund accountant and administrator, BBH is responsible for maintaining the books and records of each Fund’s securities and cash. As transfer agent, BBH is responsible for maintaining shareholder records for each Fund.
Each Trustee who is not an officer or employee of First Trust, any sub-advisor or any of their affiliates (“Independent Trustees”) is paid a fixed annual retainer that is allocated equally among each fund in the First Trust Fund Complex. Each Independent Trustee is also paid an annual per fund fee that varies based on whether the fund is a closed-end or other actively managed fund, or is an index fund.
Additionally, the Lead Independent Trustee and the Chairmen of the Audit Committee, Nominating and Governance Committee and Valuation Committee are paid annual fees to serve in such capacities, with such compensation allocated pro rata among each fund in the First Trust Fund Complex based on net assets. Independent Trustees are reimbursed for travel and out-of-pocket expenses in connection with all meetings. The Lead Independent Trustee and Committee Chairmen rotate every three years. The officers and “Interested” Trustee receive no compensation from the Trust for acting in such capacities.
Page 41
Notes to Financial Statements (Continued)
First Trust Exchange-Traded Fund III
October 31, 2017
4. Purchases and Sales of Securities
For the year ended October 31, 2017, the cost of purchases and proceeds from sales of investment securities for each Fund, excluding short-term investments and in-kind transactions, were as follows:
| | | | | | | | |
| | | Purchases | | | Sales | |
First Trust RiverFront Dynamic Asia Pacific ETF | | $ | 32,102,291 | | | $ | 23,276,296 | |
First Trust RiverFront Dynamic Developed International ETF | | | 259,492,251 | | | | 189,891,997 | |
First Trust RiverFront Dynamic Europe ETF | | | 83,014,008 | | | | 61,605,602 | |
First Trust RiverFront Dynamic Emerging Markets ETF | | | 75,450,563 | | | | 28,186,282 | |
For the year ended October 31, 2017, the cost of in-kind purchases and proceeds from in-kind sales for each Fund were as follows:
| | | | | | | | |
| | | Purchases | | | Sales | |
First Trust RiverFront Dynamic Asia Pacific ETF | | $ | 32,641,095 | | | $ | 40,133,547 | |
First Trust RiverFront Dynamic Developed International ETF | | | 417,254,294 | | | | 106,317,940 | |
First Trust RiverFront Dynamic Europe ETF | | | 102,161,328 | | | | 37,392,536 | |
First Trust RiverFront Dynamic Emerging Markets ETF | | | 22,518,597 | | | | 7,830,977 | |
5. Derivative Transactions
The following table presents the amount of net realized gain (loss) and change in net unrealized appreciation (depreciation) recognized for the year ended October 31, 2017, on derivative instruments, as well as the primary underlying risk exposure associated with each instrument.
| | | | | | | | | | | | |
Statements of Operations Location | | RFAP | | | RFDI | | | RFEU | |
Currency Risk Exposure | | | | | | | | | | | | |
Net realized gain (loss) on forward foreign currency contracts | | $ | (56,847 | ) | | $ | 38,879 | | | $ | 259,055 | |
Net change in unrealized appreciation (depreciation) on forward foreign currency contracts | | | — | | | | 40,087 | | | | 57,751 | |
During the year ended October 31, 2017, the notional values of forward foreign currency contracts opened and closed were as follows:
| | | | | | | | |
| | | Opened | | | Closed | |
First Trust RiverFront Dynamic Asia Pacific ETF | | $ | 9,254,982 | | | $ | 9,254,982 | |
First Trust RiverFront Dynamic Developed International ETF | | | 80,493,868 | | | | 87,393,868 | |
First Trust RiverFront Dynamic Europe ETF | | | 34,486,864 | | | | 44,431,864 | |
The Funds do not have the right to offset financial assets and liabilities related to forward foreign currency contracts on the Statements of Assets and Liabilities.
6. Creations, Redemptions and Transaction Fees
Shares are created and redeemed by the Funds only in Creation Unit size aggregations of 50,000 shares in transactions with broker-dealers or large institutional investors that have entered into a participation agreement (an “Authorized Participant”). In order to purchase Creation Units of each Fund, an Authorized Participant must deposit (i) a designated portfolio of securities and other instruments determined by First Trust (the “Deposit Securities”) and generally make or receive a cash payment referred to as the “Cash Component,” which is an amount equal to the difference between the NAV of the Fund shares (per Creation Unit aggregations) and the market value of the Deposit Securities, and/or (ii) cash in lieu of all or a portion of the Deposit Securities. If the Cash Component is a positive number (i.e., the NAV per Creation Unit Aggregation exceeds the Deposit Amount), the Authorized Participant will deliver the Cash Component. If the Cash Component is a negative number (i.e., the NAV per Creation Unit Aggregation is less than the Deposit Amount), the Authorized Participant will receive the Cash Component. Authorized Participants purchasing Creation Units must pay to BBH, as transfer agent, a creation transaction fee (the “Creation Transaction Fee”) regardless of the number of Creation Units purchased in the transaction. The Creation Transaction Fee may vary and is based on the composition of the securities included in the respective Fund’s portfolio and the countries in which the transactions are settled. The Creation Transaction Fee may increase or decrease as each Fund’s portfolio is adjusted to conform to changes in the composition of the securities included in the Fund’s portfolio and the countries in which the transaction settled. The price for each Creation Unit will equal the daily NAV per share times the number of shares in a Creation Unit plus the fees described above and, if applicable, any operational processing and brokerage
Page 42
Notes to Financial Statements (Continued)
First Trust Exchange-Traded Fund III
October 31, 2017
costs, transfer fees or stamp taxes. When a Fund permits an Authorized Participant to substitute cash or a different security in lieu of depositing one or more of the requisite Deposit Securities, the Authorized Participant may also be assessed an amount to cover the cost of purchasing the Deposit Securities and/or disposing of the substituted securities, including operational processing and brokerage costs, transfer fees, stamp taxes, and part or all of the spread between the expected bid and offer side of the market related to such Deposit Securities and/or substitute securities.
Authorized Participants redeeming Creation Units must pay to BBH, as transfer agent, a redemption transaction fee (the “Redemption Transaction Fee”), regardless of the number of Creation Units redeemed in the transaction. The Redemption Transaction Fee may vary and is based on the composition of the securities included in the respective Fund’s portfolio and the countries in which the transactions are settled. Each Fund reserves the right to effect redemptions in cash. An Authorized Participant may request cash redemption in lieu of securities; however, a Fund may, in its discretion, reject any such request.
The standard Creation Transaction Fees and the Redemption Transaction Fees for each Fund are as follows:
| | | | | | | | |
| | | Creation
Transaction Fees | | | Redemption
Transaction Fees | |
First Trust RiverFront Dynamic Asia Pacific ETF | | $ | 1,650 | | | $ | 1,650 | |
First Trust RiverFront Dynamic Developed International ETF | | | 3,600 | | | | 3,600 | |
First Trust RiverFront Dynamic Europe ETF | | | 2,000 | | | | 2,000 | |
First Trust RiverFront Dynamic Emerging Markets ETF | | | 4,100 | | | | 4,100 | |
7. Distribution Plan
The Board of Trustees adopted a Distribution and Service Plan pursuant to Rule 12b-1 under the 1940 Act. In accordance with the Rule 12b-1 plan, each Fund is authorized to pay an amount up to 0.25% of its average daily net assets each year to reimburse First Trust Portfolios L.P. (“FTP”), the distributor of the Funds, for amounts expended to finance activities primarily intended to result in the sale of Creation Units or to provide investor services. FTP may also use this amount to compensate securities dealers or other persons that are Authorized Participants for providing distribution assistance, including broker-dealer and shareholder support and educational and promotional services.
No 12b-1 fees are currently paid by the Funds, and pursuant to a contractual arrangement, no 12b-1 fees will be paid any time before February 28, 2019.
8. Indemnification
The Trust, on behalf of the Funds, has a variety of indemnification obligations under contracts with its service providers. The Trust’s maximum exposure under these arrangements is unknown. However, the Trust has not had prior claims or losses pursuant to these contracts and expects the risk of loss to be remote.
9. Subsequent Events
Management has evaluated the impact of all subsequent events to the Funds through the date the financial statements were issued, and has determined that there was the following subsequent event:
On November 2, 2017, First Trust Municipal High Income ETF, an additional series of the Trust, began trading under the ticker symbol FMHI on Nasdaq.
Page 43
Report of Independent Registered Public Accounting Firm
To the Shareholders and the Board of Trustees of First Trust RiverFront Dynamic Asia Pacific ETF, First Trust RiverFront Dynamic Developed International ETF, First Trust RiverFront Dynamic Europe ETF, and First TRust RiverFront Dynamic Emerging Markets ETF:
We have audited the accompanying statements of assets and liabilities of First Trust RiverFront Dynamic Asia Pacific ETF, First Trust RiverFront Dynamic Developed International ETF, First Trust RiverFront Dynamic Europe ETF, and First Trust RiverFront Dynamic Emerging Markets ETF (the “Funds”), each a series of the First Trust Exchange-Traded Fund III, including the portfolios of investments, as of October 31, 2017, and the related statements of operations for the year then ended, and the statements of changes in net assets and the financial highlights for each of the periods presented. These financial statements and financial highlights are the responsibility of the Funds’ management. Our responsibility is to express an opinion on these financial statements and financial highlights based on our audits.
We conducted our audits in accordance with the standards of the Public Company Accounting Oversight Board (United States). Those standards require that we plan and perform the audit to obtain reasonable assurance about whether the financial statements and financial highlights are free of material misstatement. The Funds are not required to have, nor were we engaged to perform, an audit of their internal control over financial reporting. Our audits included consideration of internal control over financial reporting as a basis for designing audit procedures that are appropriate in the circumstances, but not for the purpose of expressing an opinion on the effectiveness of the Funds’ internal control over financial reporting. Accordingly, we express no such opinion. An audit also includes examining, on a test basis, evidence supporting the amounts and disclosures in the financial statements, assessing the accounting principles used and significant estimates made by management, as well as evaluating the overall financial statement presentation. Our procedures included confirmation of securities owned as of October 31, 2017, by correspondence with the Funds’ custodian and brokers; when replies were not received from brokers, we performed other auditing procedures. We believe that our audits provide a reasonable basis for our opinion.
In our opinion, the financial statements and financial highlights referred to above present fairly, in all material respects, the financial position of each of the funds listed above included in the First Trust Exchange-Traded Fund III as of October 31, 2017, the results of their operations for the year then ended, and the changes in their net assets and the financial highlights for each of the periods presented, in conformity with accounting principles generally accepted in the United States of America.

Chicago, Illinois
December 22, 2017
Page 44
Additional Information
First Trust Exchange-Traded Fund III
October 31, 2017 (Unaudited)
Proxy Voting Policies and Procedures
A description of the policies and procedures that the Trust uses to determine how to vote proxies and information on how each Fund voted proxies relating to portfolio investments during the most recent 12-month period ended June 30 is available (1) without charge, upon request, by calling (800) 988-5891; (2) on the Fund’s website located at http://www.ftportfolios.com; and (3) on the Securities and Exchange Commission’s (“SEC”) website located at http://www.sec.gov.
Portfolio Holdings
The files its complete schedule of portfolio holdings with the SEC for the first and third quarters of each fiscal year on Form N-Q. The Funds’ Form N-Qs are available (1) by calling (800) 988-5891; (2) on the Fund’s website located at http://www.ftportfolios.com; (3) on the SEC’s website at http://www.sec.gov; and (4) for review and copying at the SEC’s Public Reference Room (“PRR”) in Washington, DC. Information regarding the operation of the PRR may be obtained by calling (800) SEC-0330.
Federal Tax Information
For the taxable year ended October 31, 2017, the following percentages of income dividend paid by the Funds qualify for the dividends received deduction available to corporations:
| | | | |
| | | | Dividends
Received Deduction |
First Trust RiverFront Dynamic Asia Pacific ETF | | | 0.00 | % |
First Trust RiverFront Dynamic Developed International ETF | | | 0.00 | % |
First Trust RiverFront Dynamic Europe ETF | | | 0.00 | % |
First Trust RiverFront Dynamic Emerging Markets ETF | | | 0.00 | % |
For the taxable year ended October 31, 2017, the following percentages of income dividend paid by the Funds is hereby designated as qualified dividend income:
| | | | |
| | | | Qualified
Dividend Income |
First Trust RiverFront Dynamic Asia Pacific ETF | | | 78.15 | % |
First Trust RiverFront Dynamic Developed International ETF | | | 90.53 | % |
First Trust RiverFront Dynamic Europe ETF | | | 100.00 | % |
First Trust RiverFront Dynamic Emerging Markets ETF | | | 42.69 | % |
The following Funds met the requirements of Section 853 of the Internal Revenue Code and elects to pass through to it’s shareholders credit for foreign taxes paid. The total amount of income received by the Fund from sources within foreign countries and possessions of the United States and of taxes paid to such countries are as follows:
| | | | | | | | | | | | | | | | |
| | | Gross Foreign Income | | | Foreign Taxes Paid | |
| | | Amount | | | Per Share | | | Amount | | | Per Share | |
First Trust RiverFront Dynamic Asia Pacific ETF | | $ | 503,283 | | | $ | 1.01 | | | $ | 29,981 | | | $ | 0.06 | |
First Trust RiverFront Dynamic Developed International ETF | | | 5,130,958 | | | | 0.74 | | | | 390,509 | | | | 0.06 | |
First Trust RiverFront Dynamic Europe ETF | | | 1,502,804 | | | | 0.79 | | | | 125,821 | | | | 0.07 | |
First Trust RiverFront Dynamic Emerging Markets ETF | | | 892,918 | | | | 0.81 | | | | 102,364 | | | | 0.09 | |
The foreign taxes paid will be reported to shareholders on Form 1099-DIV which will be sent to shareholders shortly after calendar year end. Gross foreign income and foreign taxes paid will be posted on each Fund’s website and disclosed in the tax letter.
Risk Considerations
You could lose money by investing in the Funds. An investment in one of the Funds is not a deposit of a bank and is not insured or guaranteed by the Federal Deposit Insurance Corporation or any other governmental agency. There can be no assurance that a Fund’s investment objective will be achieved.
Page 45
Additional Information (Continued)
First Trust Exchange-Traded Fund III
October 31, 2017 (Unaudited)
The First Trust RiverFront Dynamic Asia Pacific ETF is more susceptible to the economic, market, regulatory, political, natural disasters and local risks of the Asia Pacific region than a fund that is more geographically diversified. The region has historically been highly dependent on the global trade, with nations taking strong roles in both the importing and exporting of goods; such a relationship created a risk with this dependence on global growth. The respective stock markets tend to have a larger prevalence of smaller companies that are inherently more volatile and less liquid than larger companies. Varying levels of accounting and disclosure standards, restrictions on foreign ownership, minority ownership rights and corporate governance standards are also common for the region.
The Funds may invest in BDCs. Investments in BDCs may be subject to a high degree of risk. A BDC’s portfolio typically will include a substantial amount of securities purchased in private placements and, as a result, its portfolio may carry risks similar to those of a private equity or private debt fund. Securities that are not publicly registered may be difficult to value and may be difficult to sell at a price representative of their intrinsic value. In addition, investments in BDCs are subject to various other risks, including management’s ability to meet the BDC’s investment objective and to manage the BDC’s portfolio when the underlying securities are redeemed or sold during periods of market turmoil and as investors’ perceptions regarding a BDC or its underlying investments change. BDC shares are not redeemable at the option of the BDC shareholder and they may trade in the secondary market at a discount to their net asset value. BDCs may also employ the use of leverage in their portfolios through borrowings or the issuance of preferred stock. Such use of leverage may subject the BDC to increased risks, including the likelihood of increased volatility and the possibility that the BDC’s common share income may fall if the interest rate on any borrowings rises. The Fund will indirectly bear its proportionate share of any management and other operating expenses, and of any performance based or incentive fees, charged by the BDCs in which it invests, in addition to the expenses paid by the Fund.
The Funds may, under certain circumstances, effect creations and redemptions, in whole or in part, for cash, rather than in-kind, because of the nature of such Fund’s underlying investments. As a result, an investment in such Fund may be less tax efficient than it would be through more frequent creations and redemptions in-kind.
Each Fund bears the risk that the counterparty to the Fund’s forward foreign currency exchange contracts and currency spot transactions may default on its obligations or otherwise fail to honor its obligations. If a counterparty defaults on its payment obligations, the Fund will lose money and the value of an investment in Fund shares may decrease. In addition, each Fund may engage in such investment transactions with a limited number of counterparties.
Credit risk is the risk that an issuer of a security will be unable or unwilling to make dividend payments when due and the related risk that the value of a security may decline because of concerns about the issuer’s ability to make such payments.
Each Fund will hold investments that are denominated in non-U.S. currencies, or in securities that provide exposure to such currencies, currency exchange rates or interest rates denominated in such currencies. Changes in currency exchange rates and the relative value of non-U.S. currencies will affect the value of the Fund’s investments and the value of Fund shares. Changes in currency exchange rates also may affect the value of interest earned and gains and losses realized on the sale of securities. Currency exchange rates can be very volatile and can change quickly and unpredictably. As a result, the value of an investment in the Fund may change quickly and without warning and you may lose money.
Because each Fund’s net asset value is determined on the basis of U.S. dollars and the Fund invests in non-U.S. dollar-denominated securities, you may lose money if the local currency of a foreign market depreciates against the U.S. dollar, even if the local currency value of the Fund’s holdings goes up. Each Fund may hedge certain of its non-U.S. dollar holdings.
Depositary receipts may be less liquid than the underlying shares in their primary trading market. Any distributions paid to the holders of depositary receipts are usually subject to a fee charged by the depositary.
Holders of depositary receipts may have limited voting rights, and investment restrictions in certain countries may adversely impact the value of depositary receipts because such restrictions may limit the ability to convert shares into depositary receipts and vice versa. Such restrictions may cause shares of the underlying issuer to trade at a discount or premium to the market price of the depositary receipts.
The use of forward contracts and currency spot transactions can lead to losses because of adverse movements in the price or value of the underlying asset, index or rate, which may be magnified by certain features of the derivatives.
In addition to the above risks, each Fund is “deemed” to have entered into an ISDA Master Agreement (the “ISDA Master Agreement”), a standard umbrella relationship-framework agreement between two parties under which one or more individual derivatives transactions are entered. While most ISDA Master Agreements are highly customized and heavily negotiated, a “deemed” ISDA Master Agreement has predetermined elections. Therefore, the Fund may forego certain protections they would have been afforded had they negotiated the ISDA Master Agreements, such as terms related to choice of law, events of default, termination events, payments on early termination, and calculation agents.
Page 46
Additional Information (Continued)
First Trust Exchange-Traded Fund III
October 31, 2017 (Unaudited)
Each Fund will utilize a dynamic currency hedging strategy and therefore may have lower returns than an equivalent non-currency hedged investment when the component currencies are rising relative to the U.S. dollar. As such, contracts to sell foreign currency will generally be expected to limit any potential gain that might be realized by the Fund if the value of the hedged currency increases. In addition, the use of currency hedging will not necessarily eliminate exposure to all currency fluctuations. Hedging against a decline in the value of a currency does not eliminate fluctuations in the value of a portfolio security traded in that currency or prevent a loss if the value of the security declines. Moreover, it may not be possible for a Fund to hedge against a devaluation that is so generally anticipated that the Fund is not able to contract to sell the currency at a price above the devaluation level it anticipates.
Investments in securities and instruments traded in developing or emerging markets or that provide exposure to such securities or markets can involve additional risks relating to political, economic or regulatory conditions not associated with investments in U.S. securities and instruments or investments in more developed international markets. Emerging market governments may, without prior warning, impose capital controls on the ability to transfer currency, securities or other assets. Each Fund’s ability to access certain developing or emerging markets also may be limited due to a variety of factors, including currency convertibility issues. Such conditions may impact the ability of each Fund to buy, sell or otherwise transfer securities, cause each Fund’s returns to differ from those available to domestic investors, adversely affect the trading market and price for Fund shares, and cause the Fund to decline in value.
Because the Funds invest in equity securities, the value of each Fund’s shares will fluctuate with changes in the value of its equity securities. Equity securities prices fluctuate for several reasons, including changes in investors’ perceptions of the financial condition of an issuer or the general condition of the relevant stock market, such as market volatility, or when political or economic events affecting the issuer occur. In addition, common stock prices may be particularly sensitive to rising interest rates, as the cost of the capital rises and borrowing costs increase.
Investments in a single region, even though representing a number of different countries within the region, may be affected by common economic forces and other factors. The First Trust RiverFront Dynamic Europe ETF is subject to greater risks of adverse events which occur in the European region and may experience greater volatility than a fund that is more broadly diversified geographically. Political or economic disruptions in European countries, even in countries in which the Fund is not invested, may adversely affect security values and thus the Fund’s holdings. A significant number of countries in Europe are member states in the European Union (the “EU”), and the member states no longer control their own monetary policies by directing independent interest rates for their currencies. In these member states, the authority to direct monetary policies, including money supply and official interest rates for the Euro, is exercised by the European Central Bank. Furthermore, the European sovereign debt crisis has had, and continues to have, a significant negative impact on the economies of certain European countries and their future economic outlooks.
Forward foreign currency exchange contracts involve certain risks, including the risk of failure of the counterparty to perform its obligations under the contract and the risk that the use of forward contracts may not serve as a complete hedge because of an imperfect correlation between movements in the prices of the contracts and the prices of the currencies hedged. Forward foreign currency exchange contracts may limit any potential gain that might result should the value of the underlying currencies increase. In addition, because forward currency exchange contracts are privately negotiated transactions, there can be no assurance that the Fund will have flexibility to roll-over a forward currency exchange contract upon its expiration if it desires to do so. Hedging against a decline in the value of a currency does not eliminate fluctuations in the value of a portfolio security traded in that currency or prevent a loss if the value of the security declines.
Each Fund invests in equity securities that may have limited liquidity despite being listed on a securities exchange. Equity securities that are less liquid or that trade less can be more difficult or more costly to buy, or to sell, compared to other more liquid or active investments. This liquidity risk is a factor of the trading volume of a particular security, as well as the size and liquidity of the market for such security. The prices at which the equity securities are held in the Funds will be adversely affected if trading markets for the equity securities are limited or absent.
The Funds are subject to management risk because it is an actively managed portfolio. In managing each Fund’s investment portfolio, the Sub-Advisor will apply investment techniques and risk analyses that may not have the desired result. There can be no guarantee that each Fund will meet its investment objective.
Market risk is the risk that a particular security owned by the Fund or shares of the Fund in general, may fall in value. Securities are subject to market fluctuations caused by such factors as economic, political, regulatory or market developments, changes in interest rates and perceived trends in securities prices. Overall securities values could decline generally or could underperform other investments.
Page 47
Additional Information (Continued)
First Trust Exchange-Traded Fund III
October 31, 2017 (Unaudited)
The Funds currently have fewer assets than larger funds, and like other relatively new funds, large inflows and outflows may impact each Fund’s market exposure for limited periods of time. This impact may be positive or negative, depending on the direction of market movement during the period affected. Also, during the initial invest-up period, the Fund may depart from its principal investment strategies and invest a larger amount or all of its assets in cash equivalents or it may hold cash.
If a Fund has lower average daily trading volumes, it may rely on a small number of third-party market makers to provide a market for the purchase and sale of shares. Any trading halt or other problem relating to the trading activity of these market makers could result in a dramatic change in the spread between the Fund’s net asset value and the price at which the Fund’s shares are trading on Nasdaq which could result in a decrease in value of the Fund’s shares. In addition, decisions by market makers or authorized participants to reduce their role or step away from these activities in times of market stress could inhibit the effectiveness of the arbitrage process in maintaining the relationship between the underlying values of the Fund’s portfolio securities and the Fund’s market price. This reduced effectiveness could result in Fund shares trading at a discount to net asset value and also in greater than normal intraday bid-ask spreads for Fund shares.
Although the shares of each Fund are listed for trading on Nasdaq, there can be no assurance that an active trading market for such shares will develop or be maintained. Trading in shares on Nasdaq may be halted due to market conditions or for reasons that, in the view of Nasdaq make trading in shares inadvisable. In addition, trading in shares on Nasdaq is subject to trading halts caused by extraordinary market volatility pursuant to Nasdaq “circuit breaker” rules. Market makers are under no obligation to make a market in the Fund’s shares, and authorized participants are not obligated to submit purchase or redemption orders for Creation Units. There can be no assurance that the requirements of Nasdaq necessary to maintain the listing of the Fund will continue to be met or will remain unchanged. In particular, if the Fund does not comply with any provision of the Nasdaq rule change pursuant to Rule 19b-4 under the Securities Exchange Act of 1934, as amended, approved by the SEC, and cannot bring itself into compliance within a reasonable period after discovering the matter, Nasdaq may remove the shares of the Fund from listing. The Fund may have difficulty maintaining its listing on Nasdaq in the event the Fund’s assets are small or the Fund does not have enough shareholders.
Each Fund is classified as “non-diversified” under the 1940 Act. As a result, each Fund is only limited as to the percentage of its assets which may be invested in the securities of any one issuer by the diversification requirements imposed by the Internal Revenue Code of 1986, as amended. Each Fund may invest a relatively high percentage of its assets in a limited number of issuers. As a result, each Fund may be more susceptible to a single adverse economic or regulatory occurrence affecting one or more of these issuers, experience increased volatility and be highly concentrated in certain issuers.
Non-U.S. securities are subject to higher volatility than securities of domestic issuers due to possible adverse political, social or economic developments, restrictions on foreign investment or exchange of securities, lack of liquidity, currency exchange rates, excessive taxation, government seizure of assets, different legal or accounting standards, and less government supervision and regulation of exchanges in foreign countries.
High portfolio turnover may result in each Fund paying higher levels of transaction costs and generating greater tax liabilities for shareholders. Portfolio turnover risk may cause each Fund’s performance to be less than expected.
Preferred stocks combine some of the characteristics of both common stocks and bonds. Preferred stocks are typically subordinated to bonds and other debt instruments in a company’s capital structure in terms of priority to corporate income and therefore will be subject to greater credit risk than those debt instruments. Preferred stocks are also subject to credit risk, interest rate risk and income risk.
In addition to risks related to investments in real estate generally, investing in REITs involves certain other risks related to their structure and focus, which include, but are not limited to, dependency upon management skills, limited diversification, the risks of locating and managing financing for projects, heavy cash flow dependency, possible default by borrowers, the costs and potential losses of selfliquidation of one or more holdings, the risk of a possible lack of mortgage funds and associated interest rate risks, overbuilding, property vacancies, increases in property taxes and operating expenses, changes in zoning laws, losses due to environmental damages, changes in neighborhood values and appeal to purchases, the possibility of failing to maintain exemptions from registration under the 1940 Act and, in many cases, relatively small market capitalization, which may result in less market liquidity and greater price volatility. REITs are also subject to the risk that the real estate market may experience an economic downturn generally, which may have a material effect on the real estate in which the REITs invest and their underlying portfolio securities.
Each Fund may invest in small- and mid-capitalization companies. Such companies may be more vulnerable to adverse general market or economic developments, and their securities may be less liquid and may experience greater price volatility than larger, more established companies as a result of several factors, including limited trading volumes, products or financial resources, management inexperience and less publicly available information. Accordingly, such companies are generally subject to greater market risk than larger, more established companies.
Page 48
Additional Information (Continued)
First Trust Exchange-Traded Fund III
October 31, 2017 (Unaudited)
NOT FDIC INSURED NOT BANK GUARANTEED MAY LOSE VALUE
Advisory and Sub-Advisory Agreements
Board Considerations Regarding Approval of Investment Management and Investment Sub-Advisory Agreements
The Board of Trustees (the “Board”) of First Trust Exchange-Traded Fund III (the “Trust”), including the Independent Trustees, unanimously approved the continuation of the Investment Management Agreement (the “Advisory Agreement”) with First Trust Advisors L.P. (the “Advisor” or “First Trust”) and the Investment Sub-Advisory Agreement (the “Sub-Advisory Agreement” and together with the Advisory Agreement, the “Agreements”) among the Trust, the Advisor and RiverFront Investment Group, LLC (the “Sub-Advisor”) on behalf of the following four series of the Trust (each a “Fund” and collectively, the “Funds”):
First Trust RiverFront Dynamic Europe ETF (RFEU)
First Trust RiverFront Dynamic Asia Pacific ETF (RFAP)
First Trust RiverFront Dynamic Developed International ETF (RFDI)
First Trust RiverFront Dynamic Emerging Markets ETF (RFEM)
The Board approved the continuation of the Agreements for each Fund for a one-year period ending June 30, 2018 at a meeting held on June 12, 2017. The Board determined for each Fund that the continuation of the Agreements is in the best interests of the Fund in light of the extent and quality of the services provided and such other matters as the Board considered to be relevant in the exercise of its reasonable business judgment.
To reach this determination for each Fund, the Board considered its duties under the Investment Company Act of 1940, as amended (the “1940 Act”), as well as under the general principles of state law in reviewing and approving advisory contracts; the requirements of the 1940 Act in such matters; the fiduciary duty of investment advisors with respect to advisory agreements and compensation; the standards used by courts in determining whether investment company boards have fulfilled their duties; and the factors to be considered by the Board in voting on such agreements. At meetings held on April 24, 2017 and June 12, 2017, the Board, including the Independent Trustees, reviewed materials provided by the Advisor and the Sub-Advisor responding to requests for information from counsel to the Independent Trustees that, among other things, outlined the services provided by the Advisor and the Sub-Advisor to each Fund (including the relevant personnel responsible for these services and their experience); the unitary fee rate payable by each Fund as compared to fees charged to a peer group of funds (which were either mutual funds or exchange-traded funds (“ETFs”)) compiled by Management Practice, Inc. (“MPI”), an independent source (the “MPI Peer Group”), and as compared to fees charged to other clients of the Advisor, including other ETFs managed by the Advisor; the sub-advisory fee rate as compared to fees charged to other clients of the Sub-Advisor; expenses of each Fund as compared to expense ratios of the funds in the Fund’s MPI Peer Group; performance information for each Fund; the nature of expenses incurred in providing services to each Fund and the potential for economies of scale, if any; financial data on the Advisor and the Sub-Advisor; any fall-out benefits to the Advisor and its affiliate, First Trust Portfolios L.P. (“FTP”), and the Sub-Advisor; and information on the Advisor’s and the Sub-Advisor’s compliance programs. The Board reviewed initial materials with the Advisor at the meeting held on April 24, 2017, prior to which the Independent Trustees and their counsel met separately to discuss the information provided by the Advisor and the Sub-Advisor. Following the April meeting, independent legal counsel on behalf of the Independent Trustees requested certain clarifications and supplements to the materials provided, and the information provided in response to those requests was considered at an executive session of the Independent Trustees and independent legal counsel held prior to the June 12, 2017 meeting, as well as at the meeting held that day. The Board applied its business judgment to determine whether the arrangements between the Trust and the Advisor and among the Trust, the Advisor and the Sub-Advisor continue to be reasonable business arrangements from each Fund’s perspective as well as from the perspective of the Fund’s shareholders. The Board determined that, given the totality of the information provided with respect to the Agreements, the Board had received sufficient information to renew the Agreements. The Board considered that shareholders chose to invest or remain invested in a Fund knowing that the Advisor and the Sub-Advisor manage the Fund and knowing the Fund’s unitary fee.
In reviewing the Agreements for each Fund, the Board considered the nature, extent and quality of the services provided by the Advisor and the Sub-Advisor under the Agreements. With respect to the Advisory Agreement, the Board considered that the Advisor is responsible for the overall management and administration of the Trust and each Fund and reviewed all of the services provided by the Advisor to the Funds, including the oversight of the Sub-Advisor, as well as the background and experience of the persons responsible for such services. The Board noted that the Advisor oversees the Sub-Advisor’s day-to-day management of each Fund’s investments, including portfolio risk monitoring and performance review. The Board considered that the Sub-Advisor is responsible for the selection and ongoing monitoring of the securities in the Funds’ investment portfolios, but that the Advisor executes each Fund’s portfolio trades. In reviewing the services provided, the Board noted the compliance program that had been developed by the Advisor and considered that it includes a robust program for monitoring the Advisor’s, the Sub-Advisor’s and each Fund’s compliance with the
Page 49
Additional Information (Continued)
First Trust Exchange-Traded Fund III
October 31, 2017 (Unaudited)
1940 Act, as well as each Fund’s compliance with its investment objective and policies. The Board also considered a report from the Advisor with respect to its risk management functions related to the operation of the Funds. Finally, as part of the Board’s consideration of the Advisor’s services, the Advisor, in its written materials and at the April 24, 2017 meeting, described to the Board the scope of its ongoing investment in additional infrastructure and personnel to maintain and improve the quality of services provided to the Funds and the other funds in the First Trust Fund Complex. With respect to the Sub-Advisory Agreement, the Board noted that each Fund is an actively-managed ETF and the Sub-Advisor actively manages the Fund’s investments. In addition to the written materials provided by the Sub-Advisor, at the June 12, 2017 meeting, the Board also received a presentation from representatives of the Sub-Advisor, including the portfolio managers, discussing the services that the Sub-Advisor provides to each Fund and how the Sub-Advisor manages each Fund’s investments. In considering the Sub-Advisor’s management of the Funds, the Board noted the background and experience of the Sub-Advisor’s portfolio management team. In light of the information presented and the considerations made, the Board concluded that the nature, extent and quality of the services provided to the Trust and each Fund by the Advisor and the Sub-Advisor under the Agreements have been and are expected to remain satisfactory and that the Sub-Advisor, under the oversight of the Advisor, has managed each Fund consistent with the Fund’s investment objective and policies.
The Board considered the unitary fee rate payable by each Fund under the Advisory Agreement for the services provided. The Board noted that the sub-advisory fee for each Fund is paid by the Advisor from the Fund’s unitary fee. The Board considered that, as part of the unitary fee, the Advisor is responsible for each Fund’s expenses, including the cost of sub-advisory, transfer agency, custody, fund administration, legal, audit and other services and license fees (if any), but excluding interest, taxes, brokerage commissions and other expenses connected with the execution of portfolio transactions, distribution and service fees pursuant to a Rule 12b-1 plan, if any, and extraordinary expenses. The Board received and reviewed information showing the advisory or unitary fee rates and expense ratios of the peer funds in the MPI Peer Groups, as well as advisory fee rates charged by the Advisor and the Sub-Advisor to other fund (including ETFs) and non-fund clients, as applicable. Because each Fund’s MPI Peer Group included peer funds that pay a unitary fee and because each Fund pays a unitary fee, the Board determined that expense ratios were the most relevant comparative data point. Based on the information provided, the Board noted that the unitary fee for RFEU was equal to the median total (net) expense ratio of the peer funds in the Fund’s MPI Peer Group and the unitary fees for RFAP, RFDI and RFEM were above the median total (net) expense ratio of the peer funds in each Fund’s respective MPI Peer Group. With respect to the MPI Peer Groups, the Board discussed with representatives of the Advisor how the MPI Peer Groups were assembled, limitations in creating peer groups for actively-managed ETFs, including that there were no other actively-managed ETFs comparable to the Funds and that the peer funds were either index-based ETFs or open-end mutual funds, and different business models that may affect the pricing of services among ETF sponsors. The Board also noted that, for each Fund, most of the peer funds did not employ an advisor/sub-advisor management structure. The Board took these limitations and differences into account in considering the peer data. With respect to fees charged to other clients, the Board considered differences between the Funds and other clients that limited their comparability. In considering the unitary fee rates overall, the Board also considered the Advisor’s statement that it seeks to meet investor needs through innovative and value-added investment solutions and the Advisor’s description of its long-term commitment to each Fund.
The Board considered performance information for each Fund. The Board noted the process that it has established for monitoring each Fund’s performance and portfolio risk on an ongoing basis, which includes quarterly performance reporting from the Advisor and Sub-Advisor for the Funds. The Board determined that this process continues to be effective for reviewing each Fund’s performance. Because each of RFEU, RFAP and RFDI commenced operations on April 13, 2016 and RFEM commenced operations on June 4, 2016, and therefore each Fund has a limited performance history, performance information for the MPI Peer Group and relevant benchmark indexes was not considered.
On the basis of all the information provided on the unitary fee of each Fund and the ongoing oversight by the Board, the Board concluded that the unitary fee for each Fund (out of which the Sub-Advisor is compensated) continues to be reasonable and appropriate in light of the nature, extent and quality of the services provided by the Advisor and the Sub-Advisor to each Fund under the Agreements.
The Board considered information and discussed with the Advisor whether there were any economies of scale in connection with providing advisory services to the Funds and noted the Advisor’s statement that it expects its expenses to increase over the next twelve months as the Advisor continues to make investments in personnel and infrastructure. The Board noted that any reduction in fixed costs associated with the management of the Funds would benefit the Advisor, but that the unitary fee structure provides a level of certainty in expenses for the Funds. The Board considered the revenues and allocated costs (including the allocation methodology) of the Advisor in serving as investment advisor to each Fund for the period from inception through December 31, 2016 and the estimated profitability level for each Fund calculated by the Advisor based on such data, as well as complex-wide and product-line profitability data for the twelve months ended December 31, 2016. The Board noted the inherent limitations in the profitability analysis and concluded that, based on the information provided, the Advisor’s profitability level for each Fund was not unreasonable. In addition, the Board considered fall-out benefits described by the Advisor that may be realized from its relationship with the Funds. The Board considered that the Advisor had identified as a fall-out benefit to the Advisor and FTP their exposure to investors and brokers who,
Page 50
Additional Information (Continued)
First Trust Exchange-Traded Fund III
October 31, 2017 (Unaudited)
absent their exposure to the Funds, may have had no dealings with the Advisor or FTP, and noted that the Advisor does not utilize soft dollars in connection with the Funds. The Board also considered the Advisor��s compensation for fund reporting services provided to the Funds pursuant to a separate Fund Reporting Services Agreement, which is paid from the unitary fee. The Board concluded that the character and amount of potential fall-out benefits to the Advisor were not unreasonable.
The Board considered the Sub-Advisor’s statement to the effect that while growth of the Funds will provide some economies of scale, the Sub-Advisor believes that expenses will remain the same for the next twelve months. The Board did not review the profitability of the Sub-Advisor with respect to each Fund. The Board noted that the Advisor pays the Sub-Advisor for each Fund from its advisory fee and its understanding that each Fund’s sub-advisory fee rate was the product of an arm’s length negotiation. The Board concluded that the profitability analysis for the Advisor was more relevant. The Board considered the potential fall-out benefits to the Sub-Advisor from being associated with the Advisor and the Funds. The Board concluded that the character and amount of potential fall-out benefits to the Sub-Advisor were not unreasonable.
Based on all of the information considered and the conclusions reached, the Board, including the Independent Trustees, unanimously determined that the terms of the Agreements continue to be fair and reasonable and that the continuation of the Agreements is in the best interests of the Trust and each Fund. No single factor was determinative in the Board’s analysis.
Page 51
Board of Trustees and Officers
First Trust Exchange-Traded Fund III
October 31, 2017 (Unaudited)
The Trust’s statement of additional information includes additional information about the Trustees and is available, without charge, upon request, by calling (800) 988-5891.
| | | | | | | | |
Name, Address, Date of Birth and Position with the Trust | | Term of Office and Year First Elected or Appointed | | Principal Occupations During Past 5 Years | | Number of Portfolios in the First Trust Fund Complex Overseen by Trustee | | Other Trusteeships or Directorships Held by Trustee During Past 5 Years |
| INDEPENDENT TRUSTEES |
| | | | |
Richard E. Erickson, Trustee c/o First Trust Advisors L.P. 120 E. Liberty Drive, Suite 400 Wheaton, IL 60187 D.O.B.: 04/51 | | • Indefinite Term • Since Inception | | Physician; Officer, Wheaton Orthopedics; Limited Partner, Gundersen Real Estate Limited Partnership (June 1992 to December 2016); Member, Sportsmed LLC (April 2007 to November 2015) | | 151 | | None |
| | | | |
Thomas R. Kadlec, Trustee c/o First Trust Advisors L.P. 120 E. Liberty Drive, Suite 400 Wheaton, IL 60187 D.O.B.: 11/57 | | • Indefinite Term • Since Inception | | President, ADM Investor Services, Inc. (Futures Commission Merchant) | | 151 | | Director of ADM Investor Services, Inc., ADM Investor Services International, Futures Industry Association, and National Futures Association |
| | | | |
Robert F. Keith, Trustee c/o First Trust Advisors L.P. 120 E. Liberty Drive, Suite 400 Wheaton, IL 60187 D.O.B.: 11/56 | | • Indefinite Term • Since Inception | | President, Hibs Enterprises (Financial and Management Consulting) | | 151 | | Director of Trust Company of Illinois |
| | | | |
Niel B. Nielson, Trustee c/o First Trust Advisors L.P. 120 E. Liberty Drive, Suite 400 Wheaton, IL 60187 D.O.B.: 03/54 | | • Indefinite Term • Since Inception | | Managing Director and Chief Operating Officer (January 2015 to Present), Pelita Harapan Educational Foundation (Educational Products and Services); President and Chief Executive Officer (June 2012 to September 2014), Servant Interactive LLC (Educational Products and Services); President and Chief Executive Officer (June 2012 to September 2014), Dew Learning LLC (Educational Products and Services); President (June 2002 to June 2012), Covenant College | | 151 | | Director of Covenant Transport, Inc. (May 2003 to May 2014) |
|
| INTERESTED TRUSTEE |
| | | | |
James A. Bowen(1), Trustee and Chairman of the Board 120 E. Liberty Drive, Suite 400 Wheaton, IL 60187 D.O.B.: 09/55 | | • Indefinite Term • Since Inception | | Chief Executive Officer, First Trust Advisors L.P. and First Trust Portfolios L.P.; Chairman of the Board of Directors, BondWave LLC (Software Development Company) and Stonebridge Advisors LLC (Investment Advisor) | | 151 | | None |
| (1) | Mr. Bowen is deemed an “interested person” of the Trust due to his position as CEO of First Trust Advisors, L.P., investment advisor of the Trust. |
Page 52
Board of Trustees and Officers (Continued)
First Trust Exchange-Traded Fund III
October 31, 2017 (Unaudited)
| | | | | | |
Name, Address and Date of Birth | | Position and Offices with Trust | | Term of Office and Length of Service | | Principal Occupations During Past 5 Years |
| OFFICERS(2) |
| | | |
James M. Dykas 120 E. Liberty Drive, Suite 400 Wheaton, IL 60187 D.O.B.: 01/66 | | President and Chief Executive Officer | | • Indefinite Term • Since January 2016 | | Managing Director and Chief Financial Officer (January 2016 to Present), Controller (January 2011 to January 2016), Senior Vice President (April 2007 to January 2016), First Trust Advisors L.P. and First Trust Portfolios L.P.; Chief Financial Officer, BondWave LLC (Software Development Company) (January 2016 to Present) and Stonebridge Advisors LLC (Investment Advisor) (January 2016 to Present) |
| | | |
Donald P. Swade 120 E. Liberty Drive, Suite 400 Wheaton, IL 60187 D.O.B.: 08/72 | | Treasurer, Chief Financial Officer and Chief Accounting Officer | | • Indefinite Term • Since January 2016 | | Senior Vice President (July 2016 to Present), Vice President (April 2012 to July 2016), First Trust Advisors L.P. and First Trust Portfolios L.P. |
| | | |
W. Scott Jardine 120 E. Liberty Drive, Suite 400 Wheaton, IL 60187 D.O.B.: 05/60 | | Secretary and Chief Legal Officer | | • Indefinite Term • Since Inception | | General Counsel, First Trust Advisors L.P. and First Trust Portfolios L.P.; Secretary and General Counsel, BondWave LLC; and Secretary, Stonebridge Advisors LLC |
| | | |
Daniel J. Lindquist 120 E. Liberty Drive, Suite 400 Wheaton, IL 60187 D.O.B: 02/70 | | Vice President | | • Indefinite Term • Since Inception | | Managing Director, First Trust Advisors L.P. and First Trust Portfolios L.P. |
| | | |
Kristi A. Maher 120 E. Liberty Drive, Suite 400 Wheaton, IL 60187 D.O.B.: 12/66 | | Chief Compliance Officer and Assistant Secretary | | • Indefinite Term • Since Inception | | Deputy General Counsel, First Trust Advisors L.P. and First Trust Portfolios L.P. |
| | | |
Roger F. Testin 120 E. Liberty Drive, Suite 400 Wheaton, IL 60187 D.O.B.: 06/66 | | Vice President | | • Indefinite Term • Since Inception | | Senior Vice President, First Trust Advisors L. P. and First Trust Portfolios L.P. |
| | | |
Stan Ueland 120 E. Liberty Drive, Suite 400 Wheaton, IL 60187 D.O.B.: 11/70 | | Vice President | | • Indefinite Term • Since Inception | | Senior Vice President (September 2012 to Present), Vice President (August 2005 to September 2012), First Trust Advisors L.P. and First Trust Portfolios L.P |
| (2) | The term “officer” means the president, vice president, secretary, treasurer, controller or any other officer who performs a policy making function. |
Page 53
Privacy Policy
First Trust Exchange-Traded Fund III
October 31, 2017 (Unaudited)
Privacy Policy
First Trust values our relationship with you and considers your privacy an important priority in maintaining that relationship. We are committed to protecting the security and confidentiality of your personal information.
Sources of Information
We collect nonpublic personal information about you from the following sources:
| | • | | Information we receive from you and your broker-dealer, investment advisor or financial representative through interviews, applications, agreements or other forms; |
| | • | | Information about your transactions with us, our affiliates or others; |
| | • | | Information we receive from your inquiries by mail, e-mail or telephone; and |
| | • | | Information we collect on our website through the use of “cookies”. For example, we may identify the pages on our website that your browser requests or visits. |
Information Collected
The type of data we collect may include your name, address, social security number, age, financial status, assets, income, tax information, retirement and estate plan information, transaction history, account balance, payment history, investment objectives, marital status, family relationships and other personal information.
Disclosure of Information
We do not disclose any nonpublic personal information about our customers or former customers to anyone, except as permitted by law. In addition to using this information to verify your identity (as required under law), the permitted uses may also include the disclosure of such information to unaffiliated companies for the following reasons:
| | • | | In order to provide you with products and services and to effect transactions that you request or authorize, we may disclose your personal information as described above to unaffiliated financial service providers and other companies that perform administrative or other services on our behalf, such as transfer agents, custodians and trustees, or that assist us in the distribution of investor materials such as trustees, banks, financial representatives, proxy services, solicitors and printers. |
| | • | | We may release information we have about you if you direct us to do so, if we are compelled by law to do so, or in other legally limited circumstances (for example to protect your account from fraud). |
In addition, in order to alert you to our other financial products and services, we may share your personal information within First Trust.
Use of Web Analytics
We currently use third party analytics tools, Google Analytics and AddThis, to gather information for purposes of improving First Trust’s website and marketing our products and services to you. These tools employ cookies, which are small pieces of text stored in a file by your web browser and sent to websites that you visit, to collect information, track website usage and viewing trends such as the number of hits, pages visited, videos and PDFs viewed and the length of user sessions in order to evaluate website performance and enhance navigation of the website. We may also collect other anonymous information, which is generally limited to technical and web navigation information such as the IP address of your device, internet browser type and operating system for purposes of analyzing the data to make First Trust’s website better and more useful to our users. The information collected does not include any personal identifiable information such as your name, address, phone number or email address unless you provide that information through the website for us to contact you in order to answer your questions or respond to your requests. To find out how to opt-out of these services click on: Google Analytics and AddThis.
Confidentiality and Security
With regard to our internal security procedures, First Trust restricts access to your nonpublic personal information to those First Trust employees who need to know that information to provide products or services to you. We maintain physical, electronic and procedural safeguards to protect your nonpublic personal information.
Policy Updates and Inquiries
As required by federal law, we will notify you of our privacy policy annually. We reserve the right to modify this policy at any time, however, if we do change it, we will tell you promptly. For questions about our policy, or for additional copies of this notice, please go to www.ftportfolios.com, or contact us at 1-800-621-1675 (First Trust Portfolios) or 1-800-222-6822 (First Trust Advisors).
May 2017
Page 54
This page intentionally left blank
This page intentionally left blank

First Trust Exchange-Traded Fund III
INVESTMENT ADVISOR
First Trust Advisors L.P.
120 E. Liberty Drive, Suite 400
Wheaton, IL 60187
INVESTMENT SUB-ADVISOR
RiverFront Investment Group LLC
1214 E. Cary Street
Richmond, VA 23219
ADMINISTRATOR, CUSTODIAN,
FUND ACCOUNTANT &
TRANSFER AGENT
Brown Brothers Harriman & Co.
50 Post Office Square
Boston, MA 02110
INDEPENDENT REGISTERED
PUBLIC ACCOUNTING FIRM
Deloitte & Touche LLP
111 S. Wacker Drive
Chicago, IL 60606
LEGAL COUNSEL
Chapman and Cutler LLP
111 W. Monroe Street
Chicago, IL 60603
ITEM 2. CODE OF ETHICS.

(a)   The registrant, as of the end of the period covered by this report, has
      adopted a code of ethics that applies to the registrant's principal
      executive officer, principal financial officer, principal accounting
      officer or controller, or persons performing similar functions, regardless
      of whether these individuals are employed by the registrant or a third
      party.

(c)   There have been no amendments, during the period covered by this report,
      to a provision of the code of ethics that applies to the registrant's
      principal executive officer, principal financial officer, principal
      accounting officer or controller, or persons performing similar functions,
      regardless of whether these individuals are employed by the registrant or
      a third party, and that relates to any element of the code of ethics
      description.

(d)   The registrant, during the period covered by this report, has not granted
      any waivers, including an implicit waiver, from a provision of the code of
      ethics that applies to the registrant's principal executive officer,
      principal financial officer, principal accounting officer or controller,
      or persons performing similar functions, regardless of whether these
      individuals are employed by the registrant or a third party, that relates
      to one or more of the items set forth in paragraph (b) of this item's
      instructions.

(e)   Not applicable.

ITEM 3. AUDIT COMMITTEE FINANCIAL EXPERT.

As of the end of the period covered by the report, the registrant's Board of
Trustees has determined that Thomas R. Kadlec and Robert F. Keith are qualified
to serve as audit committee financial experts serving on its audit committee and
that each of them is "independent," as defined by Item 3 of Form N-CSR.

ITEM 4. PRINCIPAL ACCOUNTANT FEES AND SERVICES.

      (a) Audit Fees (Registrant) -- The aggregate fees billed for each of the
last two fiscal years for professional services rendered by the principal
accountant for the audit of the registrant's annual financial statements or
services that are normally provided by the accountant in connection with
statutory and regulatory filings or engagements were $204,500 for the fiscal
year ended October 31, 2016 and $228,500 for fiscal year ended October 31, 2017.

      (b) Audit-Related Fees (Registrant) -- The aggregate fees billed in each
of the last two fiscal years for assurance and related services by the principal
accountant that are reasonably related to the performance of the audit of the
registrant's financial statements and are not reported under paragraph (a) of
this Item were $0 for the fiscal year ended October 31, 2016, and $0 for the
fiscal year ended October 31, 2017.

      Audit-Related Fees (Investment Adviser) -- The aggregate fees billed in
each of the last two fiscal years for assurance and related services by the
principal accountant that are reasonably related to the performance of the audit
of the registrant's financial statements and are not reported under paragraph
(a) of this Item were $0 for the fiscal year ended October 31, 2016, and $0 for
the fiscal year ended October 31, 2017.

      (c) Tax Fees (Registrant) -- The aggregate fees billed in each of the last
two fiscal years for professional services rendered by the principal accountant
for tax compliance, tax advice, and tax planning to the registrant were $15,075
for the fiscal year ended October 31, 2016 and $35,365 for fiscal year ended
October 31, 2017.

      Tax Fees (Investment Adviser and Distributor) -- The aggregate fees billed
in each of the last two fiscal years for professional services rendered by the
principal accountant for tax compliance, tax advice, and tax planning to the
registrant's adviser and distributor were $0 for the fiscal year ended October
31, 2016, and $0 for the fiscal year ended October 31, 2017.

      (d) All Other Fees (Registrant) -- The aggregate fees billed in each of
the last two fiscal years for products and services provided by the principal
accountant to the registrant, other than the services reported in paragraphs (a)
through (c) of this Item were $0 for the fiscal year ended October 31, 2016, and
$0 for the fiscal year ended October 31, 2017.

      All Other Fees (Investment Adviser and Distributor) -- The aggregate fees
billed in each of the last two fiscal years for products and services provided
by the principal accountant to the registrant's investment adviser and
distributor, other than the services reported in paragraphs (a) through (c) of
this Item were $0 for the fiscal year ended October 31, 2016, and $0 for the
fiscal year ended October 31, 2017.

      (e)(1) Disclose the audit committee's pre-approval policies and procedures
described in paragraph (c) (7) of Rule 2-01 of Regulation S-X.

      Pursuant to its charter and its Audit and Non-Audit Services Pre-Approval
Policy, the Audit Committee (the "Committee") is responsible for the
pre-approval of all audit services and permitted non-audit services (including
the fees and terms thereof) to be performed for the registrant by its
independent auditors. The Chairman of the Committee is authorized to give such
pre-approvals on behalf of the Committee up to $25,000 and report any such
pre-approval to the full Committee.

      The Committee is also responsible for the pre-approval of the independent
auditor's engagements for non-audit services with the registrant's adviser (not
including a sub-adviser whose role is primarily portfolio management and is
sub-contracted or overseen by another investment adviser) and any entity
controlling, controlled by or under common control with the investment adviser
that provides ongoing services to the registrant, if the engagement relates
directly to the operations and financial reporting of the registrant, subject to
the de minimis exceptions for non-audit services described in Rule 2-01 of
Regulation S-X. If the independent auditor has provided non-audit services to
the registrant's adviser (other than any sub-adviser whose role is primarily
portfolio management and is sub-contracted with or overseen by another
investment adviser) and any entity controlling, controlled by or under common
control with the investment adviser that provides ongoing services to the
registrant that were not pre-approved pursuant to its policies, the Committee
will consider whether the provision of such non-audit services is compatible
with the auditor's independence.

      (e)(2) The percentage of services described in each of paragraphs (b)
through (d) for the registrant and the registrant's investment adviser and
distributor of this Item that were approved by the audit committee pursuant to
the pre-approval exceptions included in paragraph (c)(7)(i)(C) or
paragraph(C)(7)(ii) of Rule 2-01 of Regulation S-X are as follows:

               Registrant:                      Adviser and Distributor:
               -----------                      ------------------------
                  (b) 0%                                 (b) 0%
                  (c) 0%                                 (c) 0%
                  (d) 0%                                 (d) 0%

      (f) The percentage of hours expended on the principal accountant's
engagement to audit the registrant's financial statements for the most recent
fiscal year that were attributed to work performed by persons other than the
principal accountant's full-time, permanent employees was less than fifty
percent.

      (g) The aggregate non-audit fees billed by the registrant's accountant for
services rendered to the registrant, and rendered to the registrant's investment
adviser (not including any sub-adviser whose role is primarily portfolio
management and is subcontracted with or overseen by another investment adviser),
and any entity controlling, controlled by, or under common control with the
adviser that provides ongoing services to the registrant for fiscal year end
2016 were $15,075 for the registrant, $13,000 for the registrant's investment
adviser, $31,500 for the registrant's distributor and $3,000 for Stonebridge
Advisors LLC, which is under common control with the registrant's investment
adviser and serves as the registrant's sub-advisor for the First Trust Preferred
Securities and Income ETF ("Stonebridge"), and for the registrant's fiscal year
ended October 31, 2017 were $35,365 for the registrant, $44,000 for the
registrant's investment adviser, $63,900 for the registrant's distributor and
$3,000 for Stonebridge.

      (h) The registrant's audit committee of its Board of Trustees has
determined that the provision of non-audit services that were rendered to the
registrant's investment adviser (not including any sub-adviser whose role is
primarily portfolio management and is subcontracted with or overseen by another
investment adviser), and any entity controlling, controlled by, or under common
control with the investment adviser that provides ongoing services to the
registrant that were not pre-approved pursuant to paragraph (c)(7)(ii) of Rule
2-01 of Regulation S-X is compatible with maintaining the principal accountant's
independence.

ITEMS 5. AUDIT COMMITTEE OF LISTED REGISTRANTS.

The registrant has a separately designated standing audit committee established
in accordance with Section 3(a)(58)(A) of the Securities Exchange Act of 1934.
The audit committee of the registrant is comprised of: Richard E. Erickson,
Thomas R. Kadlec, Robert F. Keith and Niel B. Nielson.

ITEM 6. INVESTMENTS.

(a)   Schedule of Investments in securities of unaffiliated issuers as of the
      close of the reporting period is included as part of the report to
      shareholders filed under Item 1 of this form.

(b)   Not applicable.

ITEM 7. DISCLOSURE OF PROXY VOTING POLICIES AND PROCEDURES FOR CLOSED-END
MANAGEMENT INVESTMENT COMPANIES.

Not applicable.

ITEM 8. PORTFOLIO MANAGERS OF CLOSED-END MANAGEMENT INVESTMENT COMPANIES.

Not applicable.

ITEM 9. PURCHASES OF EQUITY SECURITIES BY CLOSED-END MANAGEMENT INVESTMENT
COMPANY AND AFFILIATED PURCHASERS.

Not applicable.

ITEM 10. SUBMISSION OF MATTERS TO A VOTE OF SECURITY HOLDERS.

There have been no material changes to the procedures by which the shareholders
may recommend nominees to the registrant's board of directors, where those
changes were implemented after the registrant last provided disclosure in
response to the requirements of Item 407(c)(2)(iv) of Regulation S-K (17 CFR
229.407) (as required by Item 22(b)(15) of Schedule 14A (17 CFR 240.14a-101)),
or this Item.

ITEM 11. CONTROLS AND PROCEDURES.

(a)   The registrant's principal executive and principal financial officers, or
      persons performing similar functions, have concluded that the registrant's
      disclosure controls and procedures (as defined in Rule 30a-3(c) under the
      Investment Company Act of 1940, as amended (the "1940 Act") (17 CFR
      270.30a-3 (c))) are effective, as of a date within 90 days of the filing
      date of the report that includes the disclosure required by this
      paragraph, based on their evaluation of these controls and procedures
      required by Rule 30a-3(b) under the 1940 Act (17 CFR 270.30a-3(b)) and
      Rules 13a-15(b) or 15d-15(b) under the Securities Exchange Act of 1934, as
      amended (17 CFR 240.13a-15(b) or 240.15d-15 (b)).

(b)   There were no changes in the registrant's internal control over financial
      reporting (as defined in Rule 30a-3(d) under the 1940 Act (17 CFR
      270.30a-3(d)) that occurred during the registrant's last fiscal quarter of
      the period covered by this report that have materially affected, or are
      reasonably likely to materially affect, the registrant's internal control
      over financial reporting.

ITEM 12. EXHIBITS.

(a)(1) Code of ethics, or any amendment thereto, that is the subject of
       disclosure required by Item 2 is attached hereto.

(a)(2) Certifications pursuant to Rule 30a-2(a) under the 1940 Act and Section
       302 of the Sarbanes-Oxley Act of 2002 are attached hereto.

(a)(3) Not Applicable

(b)    Certifications pursuant to Rule 30a-2(b) under the 1940 Act and Section
       906 of the Sarbanes-Oxley Act of 2002 are attached hereto.


<PAGE>


                                   SIGNATURES

Pursuant to the requirements of the Securities Exchange Act of 1934 and the
Investment Company Act of 1940, the registrant has duly caused this report to be
signed on its behalf by the undersigned, thereunto duly authorized.

(registrant)         First Trust Exchange-Traded Fund III
               -------------------------------------------------

By (Signature and Title)*               /s/ James M. Dykas
                                        ----------------------------------------
                                        James M. Dykas, President and
                                        Chief Executive Officer
                                        (principal executive officer)

Date: December 21, 2017
     -------------------

Pursuant to the requirements of the Securities Exchange Act of 1934 and the
Investment Company Act of 1940, this report has been signed below by the
following persons on behalf of the registrant and in the capacities and on the
dates indicated.

By (Signature and Title)*               /s/ James M. Dykas
                                        ----------------------------------------
                                        James M. Dykas, President and
                                        Chief Executive Officer
                                        (principal executive officer)

Date: December 21, 2017
     -------------------

By (Signature and Title)*               /s/ Donald P. Swade
                                        ----------------------------------------
                                        Donald P. Swade, Treasurer,
                                        Chief Financial Officer and
                                        Chief Accounting Officer
                                        (principal financial officer)

Date: December 21, 2017
     -------------------

* Print the name and title of each signing officer under his or her signature.