UNITED STATES
SECURITIES AND EXCHANGE COMMISSION
Washington, D.C. 20549
FORM N-CSR
CERTIFIED SHAREHOLDER REPORT OF REGISTERED MANAGEMENT INVESTMENT COMPANIES
Investment Company Act file number 811-22245
First Trust Exchange-Traded Fund III
(Exact name of registrant as specified in charter)
120 East Liberty Drive, Suite 400
Wheaton, IL 60187
(Address of principal executive offices) (Zip code)
W. Scott Jardine, Esq.
First Trust Portfolios L.P.
120 East Liberty Drive, Suite 400
Wheaton, IL 60187
(Name and address of agent for service)
registrant’s telephone number, including area code: (630) 765-8000
Date of fiscal year end: October 31
Date of reporting period: October 31, 2018
Form N-CSR is to be used by management investment companies to file reports with the Commission not later than 10 days after the transmission to stockholders of any report that is required to be transmitted to stockholders under Rule 30e-1 under the Investment Company Act of 1940 (17 CFR 270.30e-1). The Commission may use the information provided on Form N-CSR in its regulatory, disclosure review, inspection, and policymaking roles.
A registrant is required to disclose the information specified by Form N-CSR, and the Commission will make this information public. A registrant is not required to respond to the collection of information contained in Form N-CSR unless the Form displays a currently valid Office of Management and Budget (“OMB”) control number. Please direct comments concerning the accuracy of the information collection burden estimate and any suggestions for reducing the burden to Secretary, Securities and Exchange Commission, 450 Fifth Street, NW, Washington, DC 20549-0609. The OMB has reviewed this collection of information under the clearance requirements of 44 U.S.C. § 3507.
Item 1. Report to Stockholders.
The registrant’s annual report transmitted to shareholders pursuant to Rule 30e-1 under the Investment Company Act of 1940 is as follows:
First Trust Exchange-Traded Fund III
First Trust Preferred Securities and Income ETF (FPE)
Annual Report
For the Year Ended
October 31, 2018
First Trust Preferred Securities and Income ETF (FPE)
Annual Report
October 31, 2018
Caution Regarding Forward-Looking Statements
This report contains certain forward-looking statements within the meaning of the Securities Act of 1933, as amended, and the Securities Exchange Act of 1934, as amended. Forward-looking statements include statements regarding the goals, beliefs, plans or current expectations of First Trust Advisors L.P. (“First Trust” or the “Advisor”) and/or Stonebridge Advisors LLC (“Stonebridge” or the “Sub-Advisor”) and their respective representatives, taking into account the information currently available to them. Forward-looking statements include all statements that do not relate solely to current or historical fact. For example, forward-looking statements include the use of words such as “anticipate,” “estimate,” “intend,” “expect,” “believe,” “plan,” “may,” “should,” “would” or other words that convey uncertainty of future events or outcomes.
Forward-looking statements involve known and unknown risks, uncertainties and other factors that may cause the actual results, performance or achievements of the series of First Trust Exchange-Traded Fund III (the “Trust”) described in this report (First Trust Preferred Securities and Income ETF; hereinafter referred to as the “Fund”) to be materially different from any future results, performance or achievements expressed or implied by the forward-looking statements. When evaluating the information included in this report, you are cautioned not to place undue reliance on these forward-looking statements, which reflect the judgment of the Advisor and/or Sub-Advisor and their respective representatives only as of the date hereof. We undertake no obligation to publicly revise or update these forward-looking statements to reflect events and circumstances that arise after the date hereof.
Performance and Risk Disclosure
There is no assurance that the Fund will achieve its investment objective. The Fund is subject to market risk, which is the possibility that the market values of securities owned by the Fund will decline and that the value of the Fund shares may therefore be less than what you paid for them. Accordingly, you can lose money by investing in the Fund. See “Risk Considerations” in the Additional Information section of this report for a discussion of certain other risks of investing in the Fund.
Performance data quoted represents past performance, which is no guarantee of future results, and current performance may be lower or higher than the figures shown. For the most recent month-end performance figures, please visit www.ftportfolios.com or speak with your financial advisor. Investment returns, net asset value and share price will fluctuate and Fund shares, when sold, may be worth more or less than their original cost.
The Advisor may also periodically provide additional information on Fund performance on the Fund’s web page at www.ftportfolios.com.
How to Read This Report
This report contains information that may help you evaluate your investment in the Fund. It includes details about the Fund and presents data and analysis that provide insight into the Fund’s performance and investment approach.
By reading the portfolio commentary by the portfolio management team of the Fund, you may obtain an understanding of how the market environment affected the Fund’s performance. The statistical information that follows may help you understand the Fund’s performance compared to that of relevant market benchmarks.
It is important to keep in mind that the opinions expressed by personnel of the Advisor and/or Sub-Advisor are just that: informed opinions. They should not be considered to be promises or advice. The opinions, like the statistics, cover the period through the date on the cover of this report. The material risks of investing in the Fund are spelled out in the prospectus, the statement of additional information, and other Fund regulatory filings.
First Trust Preferred Securities and Income ETF (FPE)
Annual Letter from the Chairman and CEO
October 31, 2018
Dear Shareholders,
First Trust is pleased to provide you with the annual report for the First Trust Preferred Securities and Income ETF (the “Fund”), which contains detailed information about the Fund for the twelve months ended October 31, 2018, including a market overview and a performance analysis. We encourage you to read this report carefully and discuss it with your financial advisor.
As I mentioned in my April 2018 letter, 2017 was a very strong year for U.S. and global markets. Investors were rewarded with rising markets and very little volatility. As 2018 began, investors were hoping for another strong year in the markets. For the entire first quarter, however, increased market volatility was the norm for U.S. and global markets. The markets continued their volatility throughout the second quarter. During April and May, the Dow Jones Industrial Average (“DJIA”) closed out each month slightly down, but ended both June and July slightly up. August was a strong month for stocks, and the DJIA finished August just under its previous high in January of 2018. At the close of the third quarter in September, the markets had moved higher into positive territory. In fact, all three major U.S. indices (the Nasdaq Composite Index, the DJIA and the S& P 500® Index) hit record levels during the third quarter. In October, markets were again very volatile, surprising analysts and investors alike. Both global and U.S. markets fell on fears of slowing growth, trade wars and higher interest rates. The DJIA was down 5% for October and the MSCI EAFE Index, an index of stocks in 21 developed markets (excluding the U.S. and Canada), was down 9% for the same period.
Based on continued strong job growth and the economic outlook in the U.S., the Federal Reserve (the “Fed”) raised interest rates in March, June and September. At their September meeting, the Fed also indicated the possibility of one more rate hike in 2018 as well as three more rate hikes in 2019.
Trade tensions have had an impact on markets around the world and could continue to do so in the future. However, our economists believe that the long-term impact of U.S. tariffs will be to encourage countries to come back to the table and talk about more equal trade. Despite market volatility, we continue to believe that the combination of low interest rates, low inflation and strong corporate earnings still point to a positive economic environment and further growth, though we understand that past performance can never guarantee future performance.
We continue to believe that you should invest for the long term and be prepared for market movements, which can happen at any time. You can do this by keeping current on your portfolio and by speaking regularly with your investment professional. Markets go up and they also go down, but savvy investors are prepared for either through careful attention to investment goals.
Thank you for giving First Trust the opportunity to be a part of your financial plan. We value our relationship with you and will report on the Fund again in six months.
Sincerely,
James A. Bowen
Chairman of the Board of Trustees
Chief Executive Officer of First Trust Advisors L.P.
Fund Performance Overview (Unaudited)
First Trust Preferred Securities and Income ETF (FPE)
First Trust Preferred Securities and Income ETF’s (the “Fund”) investment objective is to seek total return and to provide current income. Under normal market conditions, the Fund invests at least 80% of its net assets (including investment borrowings) in preferred securities (“Preferred Securities”) and income-producing debt securities (“Income Securities”). The Fund invests in securities that are traded over-the-counter or listed on an exchange. For purposes of the 80% test set forth above, securities of open-end funds, closed-end funds or other exchange-traded funds (“ETFs”) registered under the Investment Company Act of 1940, as amended, that invest primarily in Preferred Securities or Income Securities are deemed to be Preferred Securities or Income Securities.
Preferred Securities held by the Fund generally pay fixed or adjustable-rate distributions to investors and have preference over common stock in the payment of distributions and the liquidation of a company’s assets, but are generally junior to all forms of the company’s debt, including both senior and subordinated debt. Certain of the Preferred Securities may be issued by trusts or other special purpose entities created by companies specifically for the purpose of issuing such securities. Income Securities that may be held by the Fund include corporate bonds, high yield securities (commonly referred to as “junk” bonds) and convertible securities. The broad category of corporate debt securities includes debt issued by U.S. and non-U.S. companies of all kinds, including those with small, mid and large capitalizations. Corporate debt may carry fixed or floating rates of interest.
| Performance | | | | | | |
| | | Average Annual Total Returns | | Cumulative Total Returns |
| | 1 Year
Ended
10/31/18 | 5 Years
Ended
10/31/18 | Inception
(2/11/13)
to 10/31/18 | | 5 Years
Ended
10/31/18 | Inception
(2/11/13)
to 10/31/18 |
| Fund Performance | | | | | | |
| NAV | -1.47% | 6.49% | 4.57% | | 36.95% | 29.09% |
| Market Price | -1.57% | 6.42% | 4.54% | | 36.47% | 28.93% |
| Index Performance | | | | | | |
| ICE BofAML Fixed Rate Preferred Securities Index | -1.23% | 6.41% | 4.91% | | 36.44% | 31.53% |
| ICE BofAML U.S. Capital Securities Index | -2.14% | 4.45% | 4.58% | | 24.32% | 29.19% |
| Blended Index(1) | -1.67% | 5.44% | 4.76% | | 30.32% | 30.46% |
Total returns for the period since inception are calculated from the inception date of the Fund. “Average Annual Total Returns” represent the average annual change in value of an investment over the periods indicated. “Cumulative Total Returns” represent the total change in value of an investment over the period indicated.
The Fund’s per share net asset value (“NAV”) is the value of one share of the Fund and is computed by dividing the value of all assets of the Fund (including accrued interest and dividends), less all liabilities (including accrued expenses and dividends declared but unpaid), by the total number of outstanding shares. The price used to calculate market return (“Market Price”) is determined by using the midpoint between the highest bid and the lowest offer on the stock exchange on which shares of the Fund are listed for trading as of the time that the Fund’s NAV is calculated. Since shares of the Fund did not trade in the secondary market until after its inception, for the period from inception to the first day of secondary market trading in shares of the Fund, the NAV of the Fund is used as a proxy for the secondary market trading price to calculate market returns. NAV and market returns assume that all distributions have been reinvested in the Fund at NAV and Market Price, respectively.
An index is a statistical composite that tracks a specified financial market or sector. Unlike the Fund, the index does not actually hold a portfolio of securities and therefore does not incur the expenses incurred by the Fund. These expenses negatively impact the performance of the Fund. Also, market returns do not include brokerage commissions that may be payable on secondary market transactions. If brokerage commissions were included, market returns would be lower. The total returns presented reflect the reinvestment of dividends on securities in the index. The returns presented do not reflect the deduction of taxes that a shareholder would pay on Fund distributions or the redemption or sale of Fund shares. The investment return and principal value of shares of the Fund will vary with changes in market conditions. Shares of the Fund may be worth more or less than their original cost when they are redeemed or sold in the market. The Fund’s past performance is no guarantee of future performance.
| (1) | The Blended Index consists of a 50/50 blend of the ICE BofAML Fixed Rate Preferred Securities Index and the ICE BofAML U.S. Capital Securities Index. The Blended Index reflects the diverse allocation of institutional preferred and hybrid securities in the Fund’s portfolio. The indexes do not charge management fees or brokerage expenses, and no such fees or expenses were deducted from the performance shown. Indexes are unmanaged and an investor cannot invest directly in an index. |
Fund Performance Overview (Unaudited) (Continued)
First Trust Preferred Securities and Income ETF (FPE)
| Sector Allocation | % of Total
Investments |
| Financials | 73.0% |
| Utilities | 7.2 |
| Energy | 6.8 |
| Consumer Staples | 3.8 |
| Communication Services | 3.2 |
| Real Estate | 2.7 |
| Materials | 1.7 |
| Consumer Discretionary | 1.0 |
| Industrials | 0.6 |
| Total | 100.0% |
| Credit Rating(2) | % of Total
Investments |
| A- | 1.1% |
| BBB+ | 9.5 |
| BBB | 15.8 |
| BBB- | 26.0 |
| BB+ | 24.6 |
| BB | 11.0 |
| BB- | 2.2 |
| B+ | 4.2 |
| B | 0.1 |
| Not Rated | 5.5 |
| Total | 100.0% |
| Country Allocation | % of Total
Investments |
| United States | 49.4% |
| United Kingdom | 10.2 |
| France | 8.6 |
| Canada | 5.0 |
| Italy | 4.7 |
| Netherlands | 4.2 |
| Australia | 3.9 |
| Switzerland | 3.5 |
| Bermuda | 3.3 |
| Cayman Islands | 1.8 |
| Japan | 1.5 |
| Spain | 0.9 |
| Denmark | 0.9 |
| Finland | 0.6 |
| Mexico | 0.5 |
| Chile | 0.4 |
| Belgium | 0.2 |
| Sweden | 0.2 |
| Norway | 0.1 |
| Jersey | 0.1 |
| Total | 100.0% |
| Top Ten Holdings | % of Total
Investments |
| Enel S.p.A. | 2.0% |
| GMAC Capital Trust I, Series 2 | 1.9 |
| Enbridge Energy Partners L.P. | 1.8 |
| Barclays PLC | 1.7 |
| Emera, Inc., Series 16-A | 1.6 |
| Credit Agricole S.A. | 1.5 |
| Catlin Insurance Co., Ltd. | 1.5 |
| Farm Credit Bank of Texas, Series 1 | 1.4 |
| BHP Billiton Finance USA Ltd. | 1.3 |
| Wells Fargo & Co., Series K | 1.3 |
| Total | 16.0% |
| (2) | The credit quality and ratings information presented above reflect the ratings assigned by one or more nationally recognized statistical rating organizations (NRSROs), including Standard & Poor’s Ratings Group, a division of the McGraw Hill Companies, Inc., Moody’s Investors Service, Inc., Fitch Ratings or a comparably rated NRSRO. For situations in which a security is rated by more than one NRSRO and the ratings are not equivalent, the highest rating is used. Sub-investment grade ratings are those rated BB+/Ba1 or lower. Investment grade ratings are those rated BBB-/Baa3 or higher. The credit ratings shown relate to the creditworthiness of the issuers of the underlying securities in the Fund, and not to the Fund or its shares. Credit ratings are subject to change. |
Fund Performance Overview (Unaudited) (Continued)
First Trust Preferred Securities and Income ETF (FPE)

Performance figures assume reinvestment of all distributions and do not reflect the deduction of taxes that a shareholder would pay on Fund distributions or the redemption or sale of Fund shares. An index is a statistical composite that tracks a specified financial market or sector. Unlike the Fund, the indices do not actually hold a portfolio of securities and therefore do not incur the expenses incurred by the Fund. These expenses negatively impact the performance of the Fund. The Fund’s past performance does not predict future performance.
Frequency Distribution of Discounts and Premiums
Bid/Ask Midpoint vs. NAV through October 31, 2018
The following Frequency Distribution of Discounts and Premiums charts are provided to show the frequency at which the bid/ask midpoint price for the Fund was at a discount or premium to the daily NAV. The following tables are for comparative purposes only and represent the period November 1, 2013 through October 31, 2018. Shareholders may pay more than NAV when they buy Fund shares and receive less than NAV when they sell those shares because shares are bought and sold at current market price. Data presented represents past performance and cannot be used to predict future results.
| Number of Days Bid/Ask Midpoint At/Above NAV |
| For the Period | 0.00%–0.49% | 0.50%–0.99% | 1.00%–1.99% | >=2.00% |
| 11/1/13 – 10/31/14 | 140 | 2 | 0 | 0 |
| 11/1/14 – 10/31/15 | 214 | 16 | 0 | 0 |
| 11/1/15 – 10/31/16 | 212 | 13 | 0 | 0 |
| 11/1/16 – 10/31/17 | 232 | 1 | 0 | 0 |
| 11/1/17 – 10/31/18 | 174 | 0 | 0 | 0 |
| Number of Days Bid/Ask Midpoint Below NAV |
| For the Period | 0.00%–0.49% | 0.50%–0.99% | 1.00%–1.99% | >=2.00% |
| 11/1/13 – 10/31/14 | 101 | 9 | 0 | 0 |
| 11/1/14 – 10/31/15 | 21 | 0 | 0 | 0 |
| 11/1/15 – 10/31/16 | 26 | 1 | 0 | 0 |
| 11/1/16 – 10/31/17 | 19 | 0 | 0 | 0 |
| 11/1/17 – 10/31/18 | 78 | 0 | 0 | 0 |
| (3) | The Blended Index consists of a 50/50 blend of the ICE BofAML Fixed Rate Preferred Securities Index and the ICE BofAML U.S. Capital Securities Index. The Blended Index reflects the diverse allocation of institutional preferred and hybrid securities in the Fund’s portfolio. The indexes do not charge management fees or brokerage expenses, and no such fees or expenses were deducted from the performance shown. Indexes are unmanaged and an investor cannot invest directly in an index. |
Portfolio Commentary
First Trust Preferred Securities and Income ETF (FPE)
Annual Report
October 31, 2018 (Unaudited)
Advisor
First Trust Advisors L.P. (“First Trust” or the “Advisor”) serves as the investment advisor to the First Trust Preferred Securities and Income ETF (the “Fund”). First Trust is responsible for the ongoing monitoring of the Fund’s investment portfolio, managing the Fund’s business affairs and providing certain administrative services necessary for the management of the Fund.
Sub-Advisor
Stonebridge Advisors LLC
Stonebridge Advisors LLC (“Stonebridge” or the “Sub-Advisor”) is the sub-advisor to the Fund and is a registered investment advisor based in Wilton, Connecticut. Stonebridge specializes in the management of preferred and hybrid securities.
Stonebridge Advisors LLC Portfolio Management Team
Scott T. Fleming - Chief Executive Officer and President
Robert Wolf - Chief Investment Officer, Senior Vice President and Senior Portfolio Manager
Commentary
Market Recap
The fiscal year ended October 31, 2018 was a volatile period for the preferred and hybrid market with all parts of the market experiencing negative performance. This was largely driven by rising interest rates as well as economic and political headlines across the globe. The Federal Reserve (the “Fed”) guided short-term interest rates higher by 0.25% four times during the period as improving economic and employment data in the United States supported further rate hikes. Longer term interest rates also moved higher, but the curve flattened substantially as short-term rates increased at a faster pace. Credit spreads also managed to tighten within the preferred and hybrid market amid continued improvement in credit fundamentals, despite political uncertainty in Turkey, BREXIT negotiations, and trade tensions between China and the United States weighing on fixed income markets overall. These headlines pressured contingent capital securities (“CoCos”) in particular, which are largely issued by European banks. As a result, CoCos, as measured by the ICE BofAML USD Investment Grade Contingent Capital Index (COCU), were the worst performing part of the preferred and hybrid market during the period, earning as COCU was down -2.52%. Finally, the retail $25 par market outperformed the institutional $1000 par market during the period, as limited new issuance and net negative supply supported that part of the market. For the fiscal year, the retail market fell 1.23% while the institutional market lost 2.14% according to the ICE BofAML Fixed Rate Preferred Securities Index (“P0P1”) and the ICE BofAML U.S. Capital Securities Index (“C0CS”), respectively.
Performance Analysis
For the fiscal year ended October 31, 2018, the net asset value (“NAV”) and market price total returns for the Fund were -1.47% and -1.57%, respectively. This compares to a total return of -1.67% for the Fund’s benchmark, which is a 50/50 blend of the P0P1 and C0CS. The Fund’s negative performance for the period was due to an overweight to CoCos. However, the Fund was able to outperform the benchmark through security selection within $25 par securities and non-CoCo institutional securities and an overweight to floating rate securities. CoCos issued by European banks, which are not held in the benchmark, were the primary reason for negative performance during the period. Political volatility in Italy, BREXIT negotiations, and tariffs from the United States all weighed on CoCos throughout the period, despite improvements in European bank capitalization. CoCos continue to offer some of the most attractive yields and structures in the preferred and hybrid market and the Fund’s CoCo holdings are issued by well-capitalized multinational banks with stable credit fundamentals that we believe will outperform longer term.
The Fund’s focus on variable rate securities with wide back-end reset spreads and shorter durations both contributed positively to relative performance. The Fund also benefited from overweighting floating rate securities, which appreciated with rising short-term interest rates, spread tightening and a flattening yield curve. In the current rising interest rate environment, we believe it is prudent to maintain a conservative stance in regard to interest rates relative to the benchmark and peers.
Market and Fund Outlook
As we approach 2019, we believe the preferred and hybrid market will be positively supported by strong issuer credit fundamentals, attractive yields compared to other fixed income asset classes and a positive market technical from limited net new issue supply into 2019. Although we believe headline risks of global trade wars and other geopolitical events will likely persist for the next 6 to 12 months, in our opinion preferred and hybrid valuations already reflect these risks and credit fundamentals of issuers in this asset class are generally strong enough to withstand the possibility of slowing economic growth.
Portfolio Commentary (Continued)
First Trust Preferred Securities and Income ETF (FPE)
Annual Report
October 31, 2018 (Unaudited)
We continue to believe that U.S. interest rates should broadly continue to shift higher and the Treasury yield curve is likely to remain relatively flat into 2019. We believe short-term rates are likely to increase due to Fed normalization, while inflation pressures are likely to slowly push longer term rates higher overall. In the current environment, we believe the best total return and risk profile will likely be achieved by overweighting short to intermediate term securities. Additionally, we believe absolute yields and yield spreads of preferred and hybrid securities relative to U.S. Treasuries and other credit spread products should remain at attractive levels and may continue to provide a cushion against rising interest rates.
The Fund will attempt to position the portfolio to protect against the largest risks in the market and continue to identify the best securities in all parts of the preferred and hybrid securities market to construct balanced portfolios that we believe will lead to long term outperformance.
First Trust Preferred Securities and Income ETF (FPE)
Understanding Your Fund Expenses
October 31, 2018 (Unaudited)
As a shareholder of the First Trust Preferred Securities and Income ETF (the “Fund”), you incur two types of costs: (1) transaction costs; and (2) ongoing costs, including management fees, distribution and/or service (12b-1) fees, if any, and other Fund expenses. This Example is intended to help you understand your ongoing costs of investing in the Fund and to compare these costs with the ongoing costs of investing in other funds.
The Example is based on an investment of $1,000 invested at the beginning of the period and held through the six-month period ended October 31, 2018.
Actual Expenses
The first line in the following table provides information about actual account values and actual expenses. You may use the information in this line, together with the amount you invested, to estimate the expenses that you paid over the period. Simply divide your account value by $1,000 (for example, an $8,600 account value divided by $1,000 = 8.6), then multiply the result by the number in the first line under the heading entitled “Expenses Paid During the Six-Month Period” to estimate the expenses you paid on your account during this six-month period.
Hypothetical Example for Comparison Purposes
The second line in the following table provides information about hypothetical account values and hypothetical expenses based on the Fund’s actual expense ratio and an assumed rate of return of 5% per year before expenses, which is not the Fund’s actual return. The hypothetical account values and expenses may not be used to estimate the actual ending account balance or expenses you paid for the period. You may use this information to compare the ongoing costs of investing in the Fund and other funds. To do so, compare this 5% hypothetical example with the 5% hypothetical examples that appear in the shareholder reports of the other funds.
Please note that the expenses shown in the table are meant to highlight your ongoing costs only and do not reflect any transactional costs such as brokerage commissions. Therefore, the second line in the table is useful in comparing ongoing costs only, and will not help you determine the relative total costs of owning different funds. In addition, if these transactional costs were included, your costs would have been higher.
| | Beginning
Account Value
May 1, 2018 | Ending
Account Value
October 31, 2018 | Annualized
Expense Ratio
Based on the
Six-Month
Period | Expenses Paid
During the
Six-Month
Period (a) |
| First Trust Preferred Securities and Income ETF (FPE) |
| Actual | $1,000.00 | $994.90 | 0.85% | $4.27 |
| Hypothetical (5% return before expenses) | $1,000.00 | $1,020.92 | 0.85% | $4.33 |
| (a) | Expenses are equal to the annualized expense ratios as indicated in the table multiplied by the average account value over the period (May 1, 2018 through October 31, 2018), multiplied by 184/365 (to reflect the six-month period). |
First Trust Preferred Securities and Income ETF (FPE)
Portfolio of Investments
October 31, 2018
| Shares | | Description | | Stated
Rate | | Stated
Maturity | | Value |
| $25 PAR PREFERRED SECURITIES – 26.8% |
| | | Banks – 7.0% | | | | | | |
| 312,799 | | Banc of California, Inc., Series E
| | 7.00% | | (a) | | $8,007,655 |
| 281,626 | | Bank of America Corp., Series CC
| | 6.20% | | (a) | | 7,285,665 |
| 337,023 | | Bank of America Corp., Series HH
| | 5.88% | | (a) | | 8,398,613 |
| 740,156 | | Citigroup Capital XIII, 3 Mo. LIBOR + 6.37% (b)
| | 8.89% | | 10/30/40 | | 19,591,929 |
| 228,873 | | Citigroup, Inc., Series K (c)
| | 6.88% | | (a) | | 6,255,099 |
| 4,784 | | Citigroup, Inc., Series S
| | 6.30% | | (a) | | 124,575 |
| 152,418 | | Fifth Third Bancorp, Series I (c)
| | 6.63% | | (a) | | 4,171,681 |
| 143,953 | | FNB Corp. (c)
| | 7.25% | | (a) | | 3,941,433 |
| 2,384,569 | | GMAC Capital Trust I, Series 2, 3 Mo. LIBOR + 5.79% (b)
| | 8.10% | | 02/15/40 | | 62,618,782 |
| 830,828 | | Huntington Bancshares, Inc., Series D
| | 6.25% | | (a) | | 21,319,047 |
| 274,357 | | ING Groep N.V.
| | 6.13% | | (a) | | 6,930,258 |
| 346,007 | | JPMorgan Chase & Co., Series DD
| | 5.75% | | (a) | | 8,608,654 |
| 126,513 | | KeyCorp, Series E (c)
| | 6.13% | | (a) | | 3,327,292 |
| 130,893 | | MB Financial, Inc., Series C
| | 6.00% | | (a) | | 3,295,886 |
| 645,229 | | People’s United Financial, Inc., Series A (c)
| | 5.63% | | (a) | | 16,150,082 |
| 440,952 | | Regions Financial Corp., Series A
| | 6.38% | | (a) | | 11,160,495 |
| 337,579 | | Royal Bank of Scotland Group PLC, Series S
| | 6.60% | | (a) | | 8,530,621 |
| 278,226 | | Synovus Financial Corp., Series D (c)
| | 6.30% | | (a) | | 7,108,674 |
| 153,035 | | Valley National Bancorp, Series A (c)
| | 6.25% | | (a) | | 3,906,984 |
| 141,170 | | Valley National Bancorp, Series B (c)
| | 5.50% | | (a) | | 3,529,250 |
| 197,541 | | Wells Fargo & Co., Series V
| | 6.00% | | (a) | | 5,055,074 |
| 156 | | Wells Fargo & Co., Series W
| | 5.70% | | (a) | | 3,906 |
| 53,570 | | Western Allliance Bancorp
| | 6.25% | | 07/01/56 | | 1,326,393 |
| 424,387 | | Wintrust Financial Corp., Series D (c)
| | 6.50% | | (a) | | 10,966,160 |
| 180,238 | | Zions Bancorporation, Series G (c)
| | 6.30% | | (a) | | 4,772,702 |
| | | | | 236,386,910 |
| | | Capital Markets – 3.7% | | | | | | |
| 309,717 | | Apollo Global Management, LLC, Series B
| | 6.38% | | (a) | | 7,646,913 |
| 785,003 | | Apollo Investment Corp.
| | 6.88% | | 07/15/43 | | 19,742,826 |
| 181,894 | | Ares Management L.P., Series A
| | 7.00% | | (a) | | 4,727,425 |
| 743,465 | | Goldman Sachs Group, Inc., Series K (c)
| | 6.38% | | (a) | | 19,523,391 |
| 801,340 | | Morgan Stanley, Series E (c)
| | 7.13% | | (a) | | 21,852,542 |
| 1,027,337 | | Morgan Stanley, Series F (c)
| | 6.88% | | (a) | | 27,542,905 |
| 183,500 | | Oaktree Capital Group LLC, Series A
| | 6.63% | | (a) | | 4,607,685 |
| 186,656 | | Oaktree Capital Group LLC, Series B
| | 6.55% | | (a) | | 4,694,398 |
| 473,271 | | State Street Corp., Series G (c)
| | 5.35% | | (a) | | 11,992,687 |
| 128,151 | | Stifel Financial Corp., Series A
| | 6.25% | | (a) | | 3,214,027 |
| | | | | 125,544,799 |
| | | Consumer Finance – 0.2% | | | | | | |
| 100,569 | | Capital One Financial Corp., Series D
| | 6.70% | | (a) | | 2,609,765 |
| 103,209 | | Capital One Financial Corp., Series F
| | 6.20% | | (a) | | 2,632,862 |
| | | | | 5,242,627 |
| | | Diversified Telecommunication Services – 1.3% | | | | | | |
| 900,706 | | Qwest Corp.
| | 6.88% | | 10/01/54 | | 21,797,085 |
| 282,574 | | Qwest Corp.
| | 6.50% | | 09/01/56 | | 6,233,583 |
| 661,225 | | Qwest Corp.
| | 6.75% | | 06/15/57 | | 15,294,134 |
| | | | | 43,324,802 |
| | | Electric Utilities – 0.4% | | | | | | |
| 215,728 | | PPL Capital Funding, Inc., Series B
| | 5.90% | | 04/30/73 | | 5,380,256 |
| 258,242 | | SCE Trust V, Series K (c)
| | 5.45% | | (a) | | 6,316,600 |
Page 8
See Notes to Financial Statements
First Trust Preferred Securities and Income ETF (FPE)
Portfolio of Investments (Continued)
October 31, 2018
| Shares | | Description | | Stated
Rate | | Stated
Maturity | | Value |
| $25 PAR PREFERRED SECURITIES (Continued) |
| | | Electric Utilities (Continued) | | | | | | |
| 106,078 | | Southern (The) Co.
| | 6.25% | | 10/15/75 | | $2,714,536 |
| | | | | 14,411,392 |
| | | Equity Real Estate Investment Trusts – 2.7% | | | | | | |
| 296,682 | | American Homes 4 Rent, Series D
| | 6.50% | | (a) | | 7,096,634 |
| 846,261 | | American Homes 4 Rent, Series E
| | 6.35% | | (a) | | 19,997,148 |
| 341,849 | | Colony Capital, Inc., Series E
| | 8.75% | | (a) | | 8,826,541 |
| 37,613 | | Colony Capital, Inc., Series I
| | 7.15% | | (a) | | 831,247 |
| 523,544 | | Colony Capital, Inc., Series J
| | 7.13% | | (a) | | 11,570,322 |
| 260,018 | | Farmland Partners, Inc., Series B, steps up 10/01/24 to 10.00% (d)
| | 6.00% | | (a) | | 5,694,394 |
| 295,679 | | Global Net Lease, Inc., Series A
| | 7.25% | | (a) | | 7,359,450 |
| 7,722 | | Taubman Centers, Inc., Series J
| | 6.50% | | (a) | | 188,803 |
| 87,349 | | Urstadt Biddle Properties, Inc., Series H
| | 6.25% | | (a) | | 2,022,129 |
| 1,102,671 | | VEREIT, Inc., Series F
| | 6.70% | | (a) | | 27,434,455 |
| | | | | 91,021,123 |
| | | Food Products – 1.2% | | | | | | |
| 7,305 | | CHS, Inc., Series 1
| | 7.88% | | (a) | | 196,943 |
| 612,346 | | CHS, Inc., Series 2 (c)
| | 7.10% | | (a) | | 15,761,786 |
| 655,056 | | CHS, Inc., Series 3 (c)
| | 6.75% | | (a) | | 16,507,411 |
| 279,712 | | CHS, Inc., Series 4
| | 7.50% | | (a) | | 7,420,759 |
| | | | | 39,886,899 |
| | | Insurance – 5.4% | | | | | | |
| 442,768 | | Aegon N.V.
| | 6.38% | | (a) | | 11,202,031 |
| 230,288 | | AmTrust Financial Services, Inc.
| | 7.25% | | 06/15/55 | | 5,319,653 |
| 272,428 | | AmTrust Financial Services, Inc.
| | 7.50% | | 09/15/55 | | 6,472,889 |
| 399,817 | | AmTrust Financial Services, Inc., Series E
| | 7.75% | | (a) | | 6,896,843 |
| 613,591 | | AmTrust Financial Services, Inc., Series F
| | 6.95% | | (a) | | 9,817,456 |
| 53,778 | | Aspen Insurance Holdings Ltd.
| | 5.63% | | (a) | | 1,228,290 |
| 908,448 | | Aspen Insurance Holdings Ltd. (c)
| | 5.95% | | (a) | | 22,747,538 |
| 31,283 | | Berkley (WR) Corp.
| | 5.75% | | 06/01/56 | | 730,458 |
| 500,737 | | Delphi Financial Group, Inc., 3 Mo. LIBOR + 3.19% (b)
| | 5.50% | | 05/15/37 | | 11,391,767 |
| 1,095,194 | | Enstar Group Ltd., Series D (c)
| | 7.00% | | (a) | | 28,135,534 |
| 520,849 | | Global Indemnity Ltd.
| | 7.75% | | 08/15/45 | | 13,031,642 |
| 437,912 | | Global Indemnity Ltd.
| | 7.88% | | 04/15/47 | | 11,070,415 |
| 152,880 | | Hartford Financial Services Group (The), Inc., (c)
| | 7.88% | | 04/15/42 | | 4,202,671 |
| 185,814 | | Maiden Holdings North America Ltd.
| | 7.75% | | 12/01/43 | | 3,785,031 |
| 330,465 | | National General Holdings Corp.
| | 7.63% | | 09/15/55 | | 8,248,406 |
| 128,347 | | National General Holdings Corp., Series C
| | 7.50% | | (a) | | 3,072,627 |
| 350,364 | | PartnerRe Ltd., Series H
| | 7.25% | | (a) | | 9,417,784 |
| 148,356 | | Phoenix Cos., Inc.
| | 7.45% | | 01/15/32 | | 2,540,597 |
| 957,100 | | Reinsurance Group of America, Inc. (c)
| | 5.75% | | 06/15/56 | | 24,061,494 |
| | | | | 183,373,126 |
| | | Internet Software & Services – 0.2% | | | | | | |
| 302,942 | | eBay, Inc.
| | 6.00% | | 02/01/56 | | 7,612,933 |
| | | Mortgage Real Estate Investment Trusts – 1.4% | | | | | | |
| 290,248 | | AGNC Investment Corp., Series C (c)
| | 7.00% | | (a) | | 7,343,274 |
| 497,413 | | Annaly Capital Management, Inc., Series F (c)
| | 6.95% | | (a) | | 12,499,989 |
| 175,062 | | Invesco Mortgage Capital, Inc., Series B (c)
| | 7.75% | | (a) | | 4,507,847 |
| 429,284 | | MFA Financial, Inc.
| | 8.00% | | 04/15/42 | | 10,972,499 |
| 290,069 | | Two Harbors Investment Corp., Series B (c)
| | 7.63% | | (a) | | 7,158,903 |
| 175,651 | | Two Harbors Investment Corp., Series C (c)
| | 7.25% | | (a) | | 4,261,293 |
See Notes to Financial Statements
Page 9
First Trust Preferred Securities and Income ETF (FPE)
Portfolio of Investments (Continued)
October 31, 2018
| Shares | | Description | | Stated
Rate | | Stated
Maturity | | Value |
| $25 PAR PREFERRED SECURITIES (Continued) |
| | | Mortgage Real Estate Investment Trusts (Continued) | | | | | | |
| 19,056 | | Wells Fargo Real Estate Investment Corp., Series A
| | 6.38% | | (a) | | $485,356 |
| | | | | 47,229,161 |
| | | Multi-Utilities – 1.0% | | | | | | |
| 383,318 | | Algonquin Power & Utilities Corp.
| | 6.88% | | 10/17/78 | | 9,779,401 |
| 161,173 | | CMS Energy Corp.
| | 5.88% | | 10/15/78 | | 4,045,442 |
| 429,853 | | Integrys Holding, Inc. (c)
| | 6.00% | | 08/01/73 | | 10,890,326 |
| 501,366 | | Just Energy Group, Inc., Series A (c)
| | 8.50% | | (a) | | 8,979,465 |
| | | | | 33,694,634 |
| | | Oil, Gas & Consumable Fuels – 0.6% | | | | | | |
| 317,570 | | Enbridge, Inc., Series B (c)
| | 6.38% | | 04/15/78 | | 7,837,628 |
| 40,187 | | Energy Transfer Operating L.P., Series D (c)
| | 7.63% | | (a) | | 1,006,684 |
| 519,002 | | NuStar Logistics, L.P., 3 Mo. LIBOR + 6.73% (b)
| | 9.07% | | 01/15/43 | | 13,068,470 |
| | | | | 21,912,782 |
| | | Thrifts & Mortgage Finance – 0.8% | | | | | | |
| 1,001,690 | | New York Community Bancorp, Inc., Series A (c)
| | 6.38% | | (a) | | 25,402,858 |
| | | Wireless Telecommunication Services – 0.9% | | | | | | |
| 257,968 | | United States Cellular Corp.
| | 7.25% | | 12/01/63 | | 6,536,909 |
| 878,515 | | United States Cellular Corp.
| | 7.25% | | 12/01/64 | | 22,200,074 |
| | | | | 28,736,983 |
| | | Total $25 Par Preferred Securities
| | 903,781,029 |
| | | (Cost $934,415,835) | | | | | | |
| $100 PAR PREFERRED SECURITIES – 1.2% |
| | | Banks – 0.4% | | | | | | |
| 24,599 | | Agribank FCB (c) (e)
| | 6.88% | | (a) | | 2,638,243 |
| 13,800 | | CoBank ACB, Series F (c) (e)
| | 6.25% | | (a) | | 1,428,300 |
| 21,840 | | CoBank ACB, Series G (e)
| | 6.13% | | (a) | | 2,191,644 |
| 26,688 | | CoBank ACB, Series H (c) (e)
| | 6.20% | | (a) | | 2,786,227 |
| 39,840 | | Farm Credit Bank of Texas (c) (f)
| | 6.75% | | (a) | | 4,242,960 |
| | | | | 13,287,374 |
| | | Consumer Finance – 0.8% | | | | | | |
| 388,655 | | SLM Corp., Series B, 3 Mo. LIBOR + 1.70% (b)
| | 4.03% | | (a) | | 26,389,674 |
| | | Total $100 Par Preferred Securities
| | 39,677,048 |
| | | (Cost $35,224,854) | | | | | | |
| $1,000 PAR PREFERRED SECURITIES – 2.9% |
| | | Banks – 1.5% | | | | | | |
| 39,800 | | Farm Credit Bank of Texas, Series 1 (e)
| | 10.00% | | (a) | | 45,571,000 |
| 4,556 | | Sovereign Real Estate Investment Trust (f)
| | 12.00% | | (a) | | 5,091,330 |
| | | | | 50,662,330 |
| | | Diversified Financial Services – 0.1% | | | | | | |
| 2,500 | | Compeer Financial ACA (c) (f)
| | 6.75% | | (a) | | 2,675,000 |
| | | Insurance – 1.0% | | | | | | |
| 35,981 | | XLIT Ltd., Series D, 3 Mo. LIBOR + 3.12% (b)
| | 5.56% | | (a) | | 36,160,905 |
| | | Oil, Gas & Consumable Fuels ��� 0.3% | | | | | | |
| 10,000 | | Kinder Morgan GP, Inc., 3 Mo. LIBOR + 3.90% (b) (f)
| | 6.22% | | 08/18/57 | | 9,169,705 |
| | | Total $1,000 Par Preferred Securities
| | 98,667,940 |
| | | (Cost $95,673,413) | | | | | | |
Page 10
See Notes to Financial Statements
First Trust Preferred Securities and Income ETF (FPE)
Portfolio of Investments (Continued)
October 31, 2018
Par
Amount | | Description | | Stated
Rate | | Stated
Maturity | | Value |
| CAPITAL PREFERRED SECURITIES – 67.7% |
| | | Automobiles – 0.7% | | | | | | |
| $4,300,000 | | General Motors Financial Co., Inc., Series A (c)
| | 5.75% | | (a) | | $3,882,814 |
| 22,000,000 | | General Motors Financial Co., Inc., Series B (c)
| | 6.50% | | (a) | | 20,735,000 |
| | | | | 24,617,814 |
| | | Banks – 35.6% | | | | | | |
| 31,464,000 | | Australia & New Zealand Banking Group Ltd. (c) (g) (h)
| | 6.75% | | (a) | | 32,368,590 |
| 12,200,000 | | Banco Bilbao Vizcaya Argentaria S.A. (c) (h)
| | 6.13% | | (a) | | 10,537,750 |
| 8,500,000 | | Banco Mercantil del Norte S.A. (c) (g) (h)
| | 7.63% | | (a) | | 8,351,335 |
| 10,600,000 | | Banco Mercantil del Norte S.A. (c) (g) (h)
| | 5.75% | | 10/04/31 | | 9,738,856 |
| 19,400,000 | | Banco Santander S.A. (c) (h)
| | 6.38% | | (a) | | 19,179,092 |
| 8,725,000 | | Bank of America Corp., Series AA (c)
| | 6.10% | | (a) | | 8,964,938 |
| 5,000,000 | | Bank of America Corp., Series DD (c)
| | 6.30% | | (a) | | 5,281,250 |
| 9,528,000 | | Bank of America Corp., Series X (c)
| | 6.25% | | (a) | | 9,825,750 |
| 20,000,000 | | Bank of America Corp., Series Z (c)
| | 6.50% | | (a) | | 21,234,000 |
| 566 | | Barclays PLC (c) (h)
| | 6.63% | | (a) | | 571 |
| 9,000,000 | | Barclays PLC (c) (h)
| | 7.75% | | (a) | | 9,001,800 |
| 54,000,000 | | Barclays PLC (c) (h)
| | 7.88% | | (a) | | 55,755,000 |
| 12,161,000 | | BNP Paribas S.A. (c) (g) (h)
| | 6.75% | | (a) | | 12,328,214 |
| 10,950,000 | | BNP Paribas S.A. (c) (g) (h)
| | 7.38% | | (a) | | 11,264,813 |
| 37,000,000 | | BNP Paribas S.A. (c) (g) (h)
| | 7.63% | | (a) | | 38,526,250 |
| 10,498,000 | | BPCE S.A. (c) (g)
| | 12.50% | | (a) | | 11,286,190 |
| 5,797,000 | | BPCE S.A. (c)
| | 12.50% | | (a) | | 6,232,239 |
| 1,986,000 | | Citigroup, Inc. (c)
| | 5.95% | | (a) | | 1,988,483 |
| 23,000,000 | | Citigroup, Inc., Series O (c)
| | 5.88% | | (a) | | 23,345,000 |
| 12,000,000 | | Citigroup, Inc., Series P (c)
| | 5.95% | | (a) | | 11,842,500 |
| 4,000,000 | | Citigroup, Inc., Series Q (c)
| | 5.95% | | (a) | | 4,072,500 |
| 10,000,000 | | Citigroup, Inc., Series R (c)
| | 6.13% | | (a) | | 10,237,500 |
| 34,250,000 | | Citigroup, Inc., Series T (c)
| | 6.25% | | (a) | | 35,020,625 |
| 8,616,000 | | Citizens Financial Group, Inc., Series A (c)
| | 5.50% | | (a) | | 8,702,160 |
| 8,875,000 | | Citizens Financial Group, Inc., Series C (c)
| | 6.38% | | (a) | | 8,896,167 |
| 20,474,000 | | CoBank ACB, Series I (c) (e)
| | 6.25% | | (a) | | 21,497,700 |
| 6,621,000 | | Cooperatieve Rabobank UA (c) (g)
| | 11.00% | | (a) | | 6,950,395 |
| 6,850,000 | | Cooperatieve Rabobank UA (c)
| | 11.00% | | (a) | | 7,190,788 |
| 47,700,000 | | Credit Agricole S.A. (c) (g) (h)
| | 7.88% | | (a) | | 49,434,086 |
| 1,000,000 | | Credit Agricole S.A. (c) (h)
| | 7.88% | | (a) | | 1,036,354 |
| 36,000,000 | | Credit Agricole S.A. (c) (g) (h)
| | 8.13% | | (a) | | 38,703,312 |
| 14,651,000 | | Credit Agricole S.A. (c) (g)
| | 8.38% | | (a) | | 15,237,040 |
| 32,713,000 | | Danske Bank A.S. (c) (h)
| | 6.13% | | (a) | | 29,328,578 |
| 3,600,000 | | DNB Bank ASA (c) (h)
| | 5.75% | | (a) | | 3,586,403 |
| 6,000,000 | | Farm Credit Bank of Texas, Series 3 (c) (g)
| | 6.20% | | (a) | | 6,015,000 |
| 2,000,000 | | HBOS Capital Funding L.P.
| | 6.85% | | (a) | | 2,019,134 |
| 37,119,000 | | HSBC Holdings PLC (c) (h)
| | 6.38% | | (a) | | 36,144,626 |
| 23,500,000 | | HSBC Holdings PLC (c) (h)
| | 6.88% | | (a) | | 24,410,625 |
| 22,179,000 | | ING Groep N.V. (c) (h)
| | 6.50% | | (a) | | 21,081,139 |
| 24,500,000 | | ING Groep N.V. (c) (h)
| | 6.88% | | (a) | | 24,790,937 |
| 41,425,000 | | Intesa Sanpaolo S.p.A. (c) (g) (h)
| | 7.70% | | (a) | | 37,644,969 |
| 21,623,000 | | JPMorgan Chase & Co., Series I, 3 Mo. LIBOR + 3.47% (b)
| | 5.99% | | (a) | | 21,765,928 |
| 10,000,000 | | JPMorgan Chase & Co., Series R (c)
| | 6.00% | | (a) | | 10,075,000 |
| 7,663,000 | | JPMorgan Chase & Co., Series S (c)
| | 6.75% | | (a) | | 8,182,168 |
| 2,000,000 | | JPMorgan Chase & Co., Series U (c)
| | 6.13% | | (a) | | 2,035,500 |
| 9,660,000 | | JPMorgan Chase & Co., Series V (c)
| | 5.00% | | (a) | | 9,672,075 |
| 7,270,000 | | JPMorgan Chase & Co., Series X (c)
| | 6.10% | | (a) | | 7,399,406 |
| 18,651,000 | | JPMorgan Chase & Co., Series Z (c)
| | 5.30% | | (a) | | 18,977,392 |
| 12,100,000 | | Lloyds Bank PLC (c) (g)
| | 12.00% | | (a) | | 14,572,768 |
| 8,088,000 | | Lloyds Bank PLC (c)
| | 12.00% | | (a) | | 9,740,872 |
See Notes to Financial Statements
Page 11
First Trust Preferred Securities and Income ETF (FPE)
Portfolio of Investments (Continued)
October 31, 2018
Par
Amount | | Description | | Stated
Rate | | Stated
Maturity | | Value |
| CAPITAL PREFERRED SECURITIES (Continued) |
| | | Banks (Continued) | | | | | | |
| $37,681,000 | | Lloyds Banking Group PLC (c) (h)
| | 7.50% | | (a) | | $38,104,911 |
| 21,000,000 | | Lloyds Banking Group PLC (c) (h)
| | 7.50% | | (a) | | 21,157,500 |
| 14,680,000 | | Nordea Bank Abp (c) (h)
| | 6.13% | | (a) | | 14,147,850 |
| 6,371,000 | | Nordea Bank Abp (c) (g) (h)
| | 6.13% | | (a) | | 6,140,051 |
| 8,310,000 | | Royal Bank of Scotland Group PLC (c) (h)
| | 7.50% | | (a) | | 8,467,890 |
| 35,300,000 | | Royal Bank of Scotland Group PLC (c) (h)
| | 8.00% | | (a) | | 36,513,437 |
| 35,300,000 | | Royal Bank of Scotland Group PLC (c) (h)
| | 8.63% | | (a) | | 37,197,375 |
| 15,000,000 | | Societe Generale S.A. (c) (g) (h)
| | 6.00% | | (a) | | 14,793,900 |
| 27,200,000 | | Societe Generale S.A. (c) (g) (h)
| | 7.38% | | (a) | | 27,642,000 |
| 15,000,000 | | Societe Generale S.A. (c) (g) (h)
| | 7.88% | | (a) | | 15,131,250 |
| 20,000,000 | | Societe Generale S.A. (c) (h)
| | 7.88% | | (a) | | 20,175,000 |
| 20,000,000 | | Standard Chartered PLC (c) (g) (h)
| | 7.50% | | (a) | | 20,275,000 |
| 20,000,000 | | Standard Chartered PLC (c) (g) (h)
| | 7.75% | | (a) | | 20,250,000 |
| 5,600,000 | | Swedbank AB (c) (h)
| | 6.00% | | (a) | | 5,495,000 |
| 43,450,000 | | UniCredit S.p.A. (c) (h)
| | 8.00% | | (a) | | 39,166,264 |
| 17,000,000 | | UniCredit S.p.A. (c) (g)
| | 5.86% | | 06/19/32 | | 14,593,854 |
| 42,877,000 | | Wells Fargo & Co., Series K, 3 Mo. LIBOR + 3.77% (b)
| | 6.10% | | (a) | | 43,252,174 |
| 11,000,000 | | Wells Fargo & Co., Series U (c)
| | 5.88% | | (a) | | 11,343,750 |
| 7,000,000 | | Zions Bancorporation, Series J (c)
| | 7.20% | | (a) | | 7,507,500 |
| | | | | 1,202,828,474 |
| | | Capital Markets – 4.6% | | | | | | |
| 5,175,000 | | Credit Suisse Group AG (c) (h)
| | 7.13% | | (a) | | 5,259,094 |
| 9,000,000 | | Credit Suisse Group AG (c) (g) (h)
| | 7.25% | | (a) | | 8,921,250 |
| 39,138,000 | | Credit Suisse Group AG (c) (g) (h)
| | 7.50% | | (a) | | 40,857,058 |
| 20,000,000 | | Credit Suisse Group AG (c) (g) (h)
| | 7.50% | | (a) | | 20,400,000 |
| 25,648,000 | | E*TRADE Financial Corp., Series A (c)
| | 5.88% | | (a) | | 25,583,880 |
| 13,845,000 | | Goldman Sachs Group (The), Inc., Series M (c)
| | 5.38% | | (a) | | 13,966,144 |
| 500,000 | | Morgan Stanley, Series J (c)
| | 5.55% | | (a) | | 505,625 |
| 3,000,000 | | UBS Group Funding Switzerland AG (c) (h)
| | 6.88% | | (a) | | 3,058,653 |
| 11,820,000 | | UBS Group Funding Switzerland AG (c) (h)
| | 6.88% | | (a) | | 11,701,800 |
| 18,750,000 | | UBS Group Funding Switzerland AG (c) (h)
| | 7.00% | | (a) | | 19,570,312 |
| 7,000,000 | | UBS Group Funding Switzerland AG (c) (h)
| | 7.13% | | (a) | | 7,135,009 |
| | | | | 156,958,825 |
| | | Consumer Finance – 0.2% | | | | | | |
| 6,500,000 | | American Express Co., Series C (c)
| | 4.90% | | (a) | | 6,483,750 |
| | | Diversified Financial Services – 0.4% | | | | | | |
| 14,381,000 | | Voya Financial, Inc. (c)
| | 5.65% | | 05/15/53 | | 14,201,237 |
| | | Diversified Telecommunication Services – 1.1% | | | | | | |
| 11,882,000 | | Koninklijke KPN N.V. (c) (g)
| | 7.00% | | 03/28/73 | | 12,375,103 |
| 22,210,000 | | Koninklijke KPN N.V. (c)
| | 7.00% | | 03/28/73 | | 23,131,715 |
| | | | | 35,506,818 |
| | | Electric Utilities – 4.9% | | | | | | |
| 52,342,000 | | Emera, Inc., Series 16-A (c)
| | 6.75% | | 06/15/76 | | 54,697,390 |
| 61,645,000 | | Enel S.p.A. (c) (g)
| | 8.75% | | 09/24/73 | | 66,730,713 |
| 28,783,000 | | PPL Capital Funding, Inc., Series A, 3 Mo. LIBOR + 2.67% (b)
| | 5.05% | | 03/30/67 | | 28,063,425 |
| 14,345,000 | | Southern (The) Co., Series B (c)
| | 5.50% | | 03/15/57 | | 14,344,589 |
| | | | | 163,836,117 |
| | | Energy Equipment & Services – 0.7% | | | | | | |
| 23,397,000 | | Transcanada Trust, Series 16-A (c)
| | 5.88% | | 08/15/76 | | 23,090,499 |
Page 12
See Notes to Financial Statements
First Trust Preferred Securities and Income ETF (FPE)
Portfolio of Investments (Continued)
October 31, 2018
Par
Amount | | Description | | Stated
Rate | | Stated
Maturity | | Value |
| CAPITAL PREFERRED SECURITIES (Continued) |
| | | Food Products – 2.5% | | | | | | |
| $7,700,000 | | Dairy Farmers of America, Inc. (f)
| | 7.13% | | (a) | | $8,065,750 |
| 23,748,000 | | Land O’Lakes Capital Trust I (f)
| | 7.45% | | 03/15/28 | | 25,736,895 |
| 8,000,000 | | Land O’Lakes, Inc. (g)
| | 7.00% | | (a) | | 8,005,000 |
| 9,720,000 | | Land O’Lakes, Inc. (g)
| | 7.25% | | (a) | | 10,108,800 |
| 31,000,000 | | Land O’Lakes, Inc. (g)
| | 8.00% | | (a) | | 33,790,000 |
| | | | | 85,706,445 |
| | | Independent Power and Renewable Electricity Producers – 0.4% | | | | | | |
| 1,500,000 | | AES Gener S.A. (c) (g)
| | 8.38% | | 12/18/73 | | 1,523,775 |
| 10,750,000 | | AES Gener S.A. (c)
| | 8.38% | | 12/18/73 | | 10,920,388 |
| | | | | 12,444,163 |
| | | Insurance – 8.7% | | | | | | |
| 20,550,000 | | Aegon N.V. (c)
| | 5.50% | | 04/11/48 | | 19,586,719 |
| 7,800,000 | | AG Insurance S.A. (c)
| | 6.75% | | (a) | | 7,888,468 |
| 7,064,000 | | American International Group, Inc., Series A-9 (c)
| | 5.75% | | 04/01/48 | | 6,688,760 |
| 12,900,000 | | Asahi Mutual Life Insurance Co. (c)
| | 7.25% | | (a) | | 13,214,760 |
| 24,000,000 | | Assurant, Inc. (c)
| | 7.00% | | 03/27/48 | | 24,120,000 |
| 49,197,000 | | Catlin Insurance Co., Ltd., 3 Mo. LIBOR + 2.98% (b) (g)
| | 5.42% | | (a) | | 48,459,045 |
| 1,100,000 | | Catlin Insurance Co., Ltd., 3 Mo. LIBOR + 2.98% (b)
| | 5.42% | | (a) | | 1,083,500 |
| 4,200,000 | | CNP Assurances (c)
| | 6.88% | | (a) | | 4,292,039 |
| 5,983,000 | | Everest Reinsurance Holdings, Inc., 3 Mo. LIBOR + 2.39% (b)
| | 4.70% | | 05/15/37 | | 5,833,425 |
| 13,700,000 | | Fortegra Financial Corp. (c) (f)
| | 8.50% | | 10/15/57 | | 13,939,750 |
| 4,020,000 | | Fukoku Mutual Life Insurance Co. (c)
| | 6.50% | | (a) | | 4,293,863 |
| 13,195,000 | | Hartford Financial Services Group (The), Inc., 3 Mo. LIBOR + 2.13% (b) (g)
| | 4.44% | | 02/12/47 | | 12,172,387 |
| 22,202,000 | | La Mondiale SAM (c)
| | 7.63% | | (a) | | 22,629,277 |
| 12,057,000 | | Liberty Mutual Group, Inc. (c) (g)
| | 7.80% | | 03/15/37 | | 13,835,407 |
| 465,000 | | Liberty Mutual Group, Inc. (c) (g)
| | 10.75% | | 06/15/58 | | 684,713 |
| 9,040,000 | | Liberty Mutual Group, Inc., 3 Mo. LIBOR + 2.91% (b) (g)
| | 5.24% | | 03/15/37 | | 8,746,200 |
| 2,680,000 | | Meiji Yasuda Life Insurance, Co. (c) (g)
| | 5.10% | | 04/26/48 | | 2,659,900 |
| 25,440,000 | | Mitsui Sumitomo Insurance Co., Ltd. (c) (g)
| | 7.00% | | 03/15/72 | | 27,475,200 |
| 4,435,000 | | Prudential Financial, Inc. (c)
| | 5.63% | | 06/15/43 | | 4,518,600 |
| 20,300,000 | | QBE Insurance Group, Ltd. (c) (g)
| | 7.50% | | 11/24/43 | | 22,050,875 |
| 19,299,000 | | QBE Insurance Group, Ltd. (c)
| | 6.75% | | 12/02/44 | | 19,829,722 |
| 3,655,000 | | Sumitomo Life Insurance Co. (c) (g)
| | 6.50% | | 09/20/73 | | 3,920,353 |
| 6,000,000 | | VIVAT N.V. (c)
| | 6.25% | | (a) | | 5,993,640 |
| | | | | 293,916,603 |
| | | Metals & Mining – 1.7% | | | | | | |
| 12,200,000 | | BHP Billiton Finance USA Ltd. (c) (g)
| | 6.25% | | 10/19/75 | | 12,739,850 |
| 40,373,000 | | BHP Billiton Finance USA Ltd. (c) (g)
| | 6.75% | | 10/19/75 | | 43,804,705 |
| | | | | 56,544,555 |
| | | Multi-Utilities – 0.5% | | | | | | |
| 9,000,000 | | CenterPoint Energy, Inc., Series A (c)
| | 6.13% | | (a) | | 9,101,250 |
| 8,600,000 | | NiSource, Inc. (c) (g)
| | 5.65% | | (a) | | 8,440,470 |
| | | | | 17,541,720 |
| | | Oil, Gas & Consumable Fuels – 5.1% | | | | | | |
| 11,000,000 | | DCP Midstream L.P., Series A (c)
| | 7.38% | | (a) | | 10,560,000 |
| 61,498,441 | | Enbridge Energy Partners L.P., 3 Mo. LIBOR + 3.80% (b)
| | 6.19% | | 10/01/37 | | 61,197,407 |
| 19,167,000 | | Enbridge, Inc. (c)
| | 5.50% | | 07/15/77 | | 17,091,161 |
| 35,000,000 | | Enbridge, Inc. (c)
| | 6.25% | | 03/01/78 | | 32,855,823 |
| 13,238,000 | | Enbridge, Inc., Series 16-A (c)
| | 6.00% | | 01/15/77 | | 12,443,139 |
| 29,460,000 | | Energy Transfer Operating L.P., 3 Mo. LIBOR + 3.02% (b)
| | 5.36% | | 11/01/66 | | 25,041,000 |
See Notes to Financial Statements
Page 13
First Trust Preferred Securities and Income ETF (FPE)
Portfolio of Investments (Continued)
October 31, 2018
Par
Amount | | Description | | Stated
Rate | | Stated
Maturity | | Value |
| CAPITAL PREFERRED SECURITIES (Continued) |
| | | Oil, Gas & Consumable Fuels (Continued) | | | | | | |
| $6,300,000 | | Energy Transfer Operating L.P., Series B (c)
| | 6.63% | | (a) | | $5,807,813 |
| 7,500,000 | | Enterprise Products Operating LLC, 3 Mo. LIBOR + 2.78% (b)
| | 5.10% | | 06/01/67 | | 7,444,702 |
| | | | | 172,441,045 |
| | | Transportation Infrastructure – 0.6% | | | | | | |
| 20,000,000 | | AerCap Global Aviation Trust (c) (g)
| | 6.50% | | 06/15/45 | | 20,600,000 |
| | | Total Capital Preferred Securities
| | 2,286,718,065 |
| | | (Cost $2,379,987,791) | | | | | | |
Principal
Value | | Description | | Stated
Coupon | | Stated
Maturity | | Value |
| CORPORATE BONDS AND NOTES – 0.4% |
| | | Insurance – 0.4% | | | | | | |
| 14,000,000 | | AmTrust Financial Services, Inc.
| | 6.13% | | 08/15/23 | | 13,152,584 |
| | | (Cost $13,966,886) | | | | | | |
| | Total Investments – 99.0%
| | 3,341,996,666 |
| | (Cost $3,459,268,779) (i) | | |
| | Net Other Assets and Liabilities – 1.0%
| | 32,375,295 |
| | Net Assets – 100.0%
| | $3,374,371,961 |
|
| (a) | Perpetual maturity. |
| (b) | Floating or variable rate security. |
| (c) | Fixed-to-floating or fixed-to-variable rate security. The interest rate shown reflects the fixed rate in effect at October 31, 2018. At a predetermined date, the fixed rate will change to a floating rate or a variable rate. |
| (d) | Step-up security. A security where the coupon increases or steps up at a predetermined date. |
| (e) | Pursuant to procedures adopted by the Trust’s Board of Trustees, this security has been determined to be illiquid by Stonebridge Advisors LLC, the Fund’s sub-advisor (the “Sub-Advisor”). |
| (f) | This security, sold within the terms of a private placement memorandum, is exempt from registration upon resale under Rule 144A under the Securities Act of 1933, as amended (the “1933 Act”), and may be resold in transactions exempt from registration, normally to qualified institutional buyers (see Note 2C - Restricted Securities in the Notes to Financial Statements). |
| (g) | This security, sold within the terms of a private placement memorandum, is exempt from registration upon resale under Rule 144A under the 1933 Act, and may be resold in transactions exempt from registration, normally to qualified institutional buyers. Pursuant to procedures adopted by the Trust’s Board of Trustees, this security has been determined to be liquid by the Sub-Advisor. Although market instability can result in periods of increased overall market illiquidity, liquidity for each security is determined based on security specific factors and assumptions, which require subjective judgment. At October 31, 2018, securities noted as such amounted to $839,548,677 or 24.9% of net assets. |
| (h) | This security is a contingent convertible capital security which may be subject to conversion into common stock of the issuer under certain circumstances. At October 31, 2018, securities noted as such amounted to $914,773,904 or 27.1% of net assets. Of these securities, 2.0% originated in emerging markets, and 98.0% originated in foreign markets. |
| (i) | Aggregate cost for federal income tax purposes was $3,460,558,298. As of October 31, 2018, the aggregate gross unrealized appreciation for all investments in which there was an excess of value over tax cost was $29,996,296 and the aggregate gross unrealized depreciation for all investments in which there was an excess of tax cost over value was $148,557,928. The net unrealized depreciation was $118,561,632. |
| LIBOR | London Interbank Offered Rate |
Page 14
See Notes to Financial Statements
First Trust Preferred Securities and Income ETF (FPE)
Portfolio of Investments (Continued)
October 31, 2018
Valuation Inputs
A summary of the inputs used to value the Fund’s investments as of October 31, 2018 is as follows (see Note 2A - Portfolio Valuation in the Notes to Financial Statements):
| | Total
Value at
10/31/2018 | Level 1
Quoted
Prices | Level 2
Significant
Observable
Inputs | Level 3
Significant
Unobservable
Inputs |
| $25 Par Preferred Securities: | | | | |
Insurance
| $ 183,373,126 | $ 169,440,762 | $ 13,932,364 | $ — |
Multi-Utilities
| 33,694,634 | 22,804,308 | 10,890,326 | — |
Other industry categories*
| 686,713,269 | 686,713,269 | — | — |
| $100 Par Preferred Securities: | | | | |
Banks
| 13,287,374 | — | 13,287,374 | — |
Consumer Finance
| 26,389,674 | 26,389,674 | — | — |
$1,000 Par Preferred Securities*
| 98,667,940 | — | 98,667,940 | — |
Capital Preferred Securities*
| 2,286,718,065 | — | 2,286,718,065 | — |
Corporate Bonds and Notes*
| 13,152,584 | — | 13,152,584 | — |
Total Investments
| $ 3,341,996,666 | $ 905,348,013 | $ 2,436,648,653 | $— |
| * | See Portfolio of Investments for industry breakout. |
See Notes to Financial Statements
Page 15
First Trust Preferred Securities and Income ETF (FPE)
Statement of Assets and Liabilities
October 31, 2018
| ASSETS: | |
Investments, at value
(Cost $3,459,268,779)
| $ 3,341,996,666 |
Cash
| 4,220,193 |
| Receivables: | |
Interest
| 29,083,992 |
Investment securities sold
| 7,454,540 |
Dividends
| 1,166,161 |
Interest reclaims
| 284,753 |
Dividend reclaims
| 146,692 |
Total Assets
| 3,384,352,997 |
| LIABILITIES: | |
| Payables: | |
Capital shares redeemed
| 7,493,664 |
Investment advisory fees
| 2,487,372 |
Total Liabilities
| 9,981,036 |
NET ASSETS
| $3,374,371,961 |
| NET ASSETS consist of: | |
Paid-in capital
| $ 3,520,599,508 |
Par value
| 1,798,550 |
Accumulated distributable earnings (loss)
| (148,026,097) |
NET ASSETS
| $3,374,371,961 |
NET ASSET VALUE, per share
| $18.76 |
Number of shares outstanding (unlimited number of shares authorized, par value $0.01 per share)
| 179,855,000 |
Page 16
See Notes to Financial Statements
First Trust Preferred Securities and Income ETF (FPE)
Statement of Operations
For the Year Ended October 31, 2018
| INVESTMENT INCOME: | |
Interest
| $ 150,020,292 |
Dividends
| 68,863,689 |
Foreign withholding tax
| (179,509) |
Total investment income
| 218,704,472 |
| EXPENSES: | |
Investment advisory fees
| 28,999,666 |
Total expenses
| 28,999,666 |
NET INVESTMENT INCOME (LOSS)
| 189,704,806 |
| NET REALIZED AND UNREALIZED GAIN (LOSS): | |
| Net realized gain (loss) on: | |
Investments
| (19,124,062) |
In-kind redemptions
| 2,500,266 |
Net realized gain (loss)
| (16,623,796) |
Net change in unrealized appreciation (depreciation) on investments
| (225,468,777) |
NET REALIZED AND UNREALIZED GAIN (LOSS)
| (242,092,573) |
NET INCREASE (DECREASE) IN NET ASSETS RESULTING FROM OPERATIONS
| $(52,387,767) |
See Notes to Financial Statements
Page 17
First Trust Preferred Securities and Income ETF (FPE)
Statements of Changes in Net Assets
| | Year
Ended
10/31/2018 | | Year
Ended
10/31/2017 |
| OPERATIONS: | | | |
Net investment income (loss)
| $ 189,704,806 | | $ 114,176,261 |
Net realized gain (loss)
| (16,623,796) | | (3,659,478) |
Net change in unrealized appreciation (depreciation)
| (225,468,777) | | 80,709,412 |
Net increase (decrease) in net assets resulting from operations
| (52,387,767) | | 191,226,195 |
| DISTRIBUTIONS TO SHAREHOLDERS FROM: | | | |
Investment operations
| (190,356,696) | | |
Net investment income
| | | (114,019,342) |
Return of capital
| (54,410) | | (292,582) |
Total distributions to shareholders
| (190,411,106) | | (114,311,924) |
| SHAREHOLDER TRANSACTIONS: | | | |
Proceeds from shares sold
| 798,475,609 | | 1,605,162,501 |
Cost of shares redeemed
| (207,387,810) | | (31,391,795) |
Net increase (decrease) in net assets resulting from shareholder transactions
| 591,087,799 | | 1,573,770,706 |
Total increase (decrease) in net assets
| 348,288,926 | | 1,650,684,977 |
| NET ASSETS: | | | |
Beginning of period
| 3,026,083,035 | | 1,375,398,058 |
End of period
| $3,374,371,961 | | $3,026,083,035 |
Accumulated net investment income (loss) at end of period
| | | $1,198,370 |
| CHANGES IN SHARES OUTSTANDING: | | | |
Shares outstanding, beginning of period
| 150,305,000 | | 70,655,000 |
Shares sold
| 40,400,000 | | 81,250,000 |
Shares redeemed
| (10,850,000) | | (1,600,000) |
Shares outstanding, end of period
| 179,855,000 | | 150,305,000 |
Page 18
See Notes to Financial Statements
First Trust Preferred Securities and Income ETF (FPE)
Financial Highlights
For a share outstanding throughout each period
| | Year Ended October 31, |
| 2018 | | 2017 | | 2016 | | 2015 | | 2014 |
Net asset value, beginning of period
| $ 20.13 | | $ 19.47 | | $ 18.97 | | $ 19.04 | | $ 18.21 |
| Income from investment operations: | | | | | | | | | |
Net investment income (loss)
| 1.08 | | 1.08 | | 1.12 | | 1.16 (a) | | 1.10 |
Net realized and unrealized gain (loss)
| (1.37) | | 0.66 | | 0.52 | | (0.10) | | 0.76 |
Total from investment operations
| (0.29) | | 1.74 | | 1.64 | | 1.06 | | 1.86 |
| Distributions paid to shareholders from: | | | | | | | | | |
Net investment income
| (1.08) | | (1.08) | | (1.13) | | (1.13) | | (1.03) |
Return of capital
| (0.00) (b) | | (0.00) (b) | | (0.01) | | — | | — |
Total distributions
| (1.08) | | (1.08) | | (1.14) | | (1.13) | | (1.03) |
Net asset value, end of period
| $18.76 | | $20.13 | | $19.47 | | $18.97 | | $19.04 |
Total return (c)
| (1.47)% | | 9.24% | | 8.97% | | 5.75% | | 10.42% |
| Ratios to average net assets/supplemental data: | | | | | | | | | |
Net assets, end of period (in 000’s)
| $ 3,374,372 | | $ 3,026,083 | | $ 1,375,398 | | $ 413,705 | | $ 86,718 |
Ratio of total expenses to average net assets
| 0.85% | | 0.85% | | 0.85% | | 0.85% | | 0.85% |
Ratio of net investment income (loss) to average net assets
| 5.56% | | 5.54% | | 5.97% | | 6.15% | | 6.06% |
Portfolio turnover rate (d)
| 24% | | 13% | | 32% | | 50% | | 91% |
| (a) | Based on average shares outstanding. |
| (b) | Amount is less than $0.01. |
| (c) | Total return is calculated assuming an initial investment made at the net asset value at the beginning of the period, reinvestment of all distributions at net asset value during the period, and redemption at net asset value on the last day of the period. The returns presented do not reflect the deduction of taxes that a shareholder would pay on Fund distributions or the redemption or sale of Fund shares. Total return is calculated for the time period presented and is not annualized for periods of less than a year. |
| (d) | Portfolio turnover is calculated for the time period presented and is not annualized for periods of less than a year and does not include securities received or delivered from processing creations or redemptions and in-kind transactions. |
See Notes to Financial Statements
Page 19
Notes to Financial Statements
First Trust Preferred Securities and Income ETF (FPE)
October 31, 2018
1. Organization
First Trust Exchange-Traded Fund III (the “Trust”) is a diversified open-end management investment company organized as a Massachusetts business trust on January 9, 2008, and is registered with the Securities and Exchange Commission (“SEC”) under the Investment Company Act of 1940, as amended (the “1940 Act”).
The Trust currently consists of thirteen funds that are offering shares. This report covers the First Trust Preferred Securities and Income ETF (the “Fund”), which trades under the ticker FPE on the NYSE Arca, Inc. Unlike conventional mutual funds, the Fund issues and redeems shares on a continuous basis, at net asset value (“NAV”), only in large specified blocks consisting of 50,000 shares called a “Creation Unit.” Creation Units are issued and redeemed for securities in which the Fund invests or for cash or, in certain circumstances, a combination of both. Except when aggregated in Creation Units, the shares are not redeemable securities of the Fund.
The Fund is an actively managed exchange-traded fund. The investment objective of the Fund is to seek total return and to provide current income. Under normal market conditions, the Fund invests at least 80% of its net assets (including investment borrowings) in preferred securities and income-producing debt securities, including corporate bonds, high-yield securities (commonly referred to as “junk” bonds) and convertible securities. There can be no assurance that the Fund will achieve its investment objective. The Fund may not be appropriate for all investors.
2. Significant Accounting Policies
The Fund is considered an investment company and follows accounting and reporting guidance under Financial Accounting Standards Board (“FASB”) Accounting Standards Codification (“ASC”) Topic 946, “Financial Services-Investment Companies.” The following is a summary of significant accounting policies consistently followed by the Fund in the preparation of the financial statements. The preparation of the financial statements in accordance with accounting principles generally accepted in the United States of America (“U.S. GAAP”) requires management to make estimates and assumptions that affect the reported amounts and disclosures in the financial statements. Actual results could differ from those estimates.
A. Portfolio Valuation
The Fund’s NAV is determined daily as of the close of regular trading on the New York Stock Exchange (“NYSE”), normally 4:00 p.m. Eastern time, on each day the NYSE is open for trading. If the NYSE closes early on a valuation day, the NAV is determined as of that time. Domestic debt securities and foreign securities are priced using data reflecting the earlier closing of the principal markets for those securities. The Fund’s NAV is calculated by dividing the value of all assets of the Fund (including accrued interest and dividends), less all liabilities (including accrued expenses and dividends declared but unpaid), by the total number of shares outstanding.
The Fund’s investments are valued daily at market value or, in the absence of market value with respect to any portfolio securities, at fair value. Market value prices represent last sale or official closing prices from a national or foreign exchange (i.e., a regulated market) and are primarily obtained from third-party pricing services. Fair value prices represent any prices not considered market value prices and are either obtained from a third-party pricing service or are determined by the Pricing Committee of the Fund’s investment advisor, First Trust Advisors L.P. (“First Trust” or the “Advisor”), in accordance with valuation procedures adopted by the Trust’s Board of Trustees, and in accordance with provisions of the 1940 Act. Investments valued by the Advisor’s Pricing Committee, if any, are footnoted as such in the footnotes to the Portfolio of Investments. The Fund’s investments are valued as follows:
Preferred stocks, real estate investment trusts (“REITs”) and other equity securities listed on any national or foreign exchange (excluding The Nasdaq Stock Market LLC (“Nasdaq”) and the London Stock Exchange Alternative Investment Market (“AIM”)) are valued at the last sale price on the exchange on which they are principally traded or, for Nasdaq and AIM securities, the official closing price. Securities traded on more than one securities exchange are valued at the last sale price or official closing price, as applicable, at the close of the securities exchange representing the principal market for such securities.
Bonds, notes, capital preferred securities, and other debt securities are fair valued on the basis of valuations provided by dealers who make markets in such securities or by a third-party pricing service approved by the Trust’s Board of Trustees, which may use the following valuation inputs when available:
| 1) | benchmark yields; |
| 2) | reported trades; |
| 3) | broker/dealer quotes; |
| 4) | issuer spreads; |
| 5) | benchmark securities; |
| 6) | bids and offers; and |
Notes to Financial Statements (Continued)
First Trust Preferred Securities and Income ETF (FPE)
October 31, 2018
| 7) | reference data including market research publications. |
Securities traded in an over-the-counter market are fair valued at the mean of their most recent bid and asked price, if available, and otherwise at their closing bid price.
Fixed income and other debt securities having a remaining maturity of sixty days or less when purchased are fair valued at cost adjusted for amortization of premiums and accretion of discounts (amortized cost), provided the Advisor’s Pricing Committee has determined that the use of amortized cost is an appropriate reflection of fair value given market and issuer-specific conditions existing at the time of the determination. Factors that may be considered in determining the appropriateness of the use of amortized cost include, but are not limited to, the following:
| 1) | the credit conditions in the relevant market and changes thereto; |
| 2) | the liquidity conditions in the relevant market and changes thereto; |
| 3) | the interest rate conditions in the relevant market and changes thereto (such as significant changes in interest rates); |
| 4) | issuer-specific conditions (such as significant credit deterioration); and |
| 5) | any other market-based data the Advisor’s Pricing Committee considers relevant. In this regard, the Advisor’s Pricing Committee may use last-obtained market-based data to assist it when valuing portfolio securities using amortized cost. |
Certain securities may not be able to be priced by pre-established pricing methods. Such securities may be valued by the Trust’s Board of Trustees or its delegate, the Advisor’s Pricing Committee, at fair value. These securities generally include, but are not limited to, restricted securities (securities which may not be publicly sold without registration under the Securities Act of 1933, as amended (the “1933 Act”)) for which a third-party pricing service is unable to provide a market price; securities whose trading has been formally suspended; a security whose market or fair value price is not available from a pre-established pricing source; a security with respect to which an event has occurred that is likely to materially affect the value of the security after the market has closed but before the calculation of the Fund’s NAV or make it difficult or impossible to obtain a reliable market quotation; and a security whose price, as provided by the third-party pricing service, does not reflect the security’s fair value. As a general principle, the current fair value of a security would appear to be the amount which the owner might reasonably expect to receive for the security upon its current sale. When fair value prices are used, generally they will differ from market quotations or official closing prices on the applicable exchanges. A variety of factors may be considered in determining the fair value of such securities, including, but not limited to, the following:
| 1) | the type of security; |
| 2) | the size of the holding; |
| 3) | the initial cost of the security; |
| 4) | transactions in comparable securities; |
| 5) | price quotes from dealers and/or third-party pricing services; |
| 6) | relationships among various securities; |
| 7) | information obtained by contacting the issuer, analysts, or the appropriate stock exchange; |
| 8) | an analysis of the issuer’s financial statements; and |
| 9) | the existence of merger proposals or tender offers that might affect the value of the security. |
If the securities in question are foreign securities, the following additional information may be considered:
| 1) | the value of similar foreign securities traded on other foreign markets; |
| 2) | ADR trading of similar securities; |
| 3) | closed-end fund trading of similar securities; |
| 4) | foreign currency exchange activity; |
| 5) | the trading prices of financial products that are tied to baskets of foreign securities; |
| 6) | factors relating to the event that precipitated the pricing problem; |
| 7) | whether the event is likely to recur; and |
| 8) | whether the effects of the event are isolated or whether they affect entire markets, countries or regions. |
Notes to Financial Statements (Continued)
First Trust Preferred Securities and Income ETF (FPE)
October 31, 2018
The Fund is subject to fair value accounting standards that define fair value, establish the framework for measuring fair value and provide a three-level hierarchy for fair valuation based upon the inputs to the valuation as of the measurement date. The three levels of the fair value hierarchy are as follows:
| • | Level 1 – Level 1 inputs are quoted prices in active markets for identical investments. An active market is a market in which transactions for the investment occur with sufficient frequency and volume to provide pricing information on an ongoing basis. |
| • | Level 2 – Level 2 inputs are observable inputs, either directly or indirectly, and include the following: |
| o | Quoted prices for similar investments in active markets. |
| o | Quoted prices for identical or similar investments in markets that are non-active. A non-active market is a market where there are few transactions for the investment, the prices are not current, or price quotations vary substantially either over time or among market makers, or in which little information is released publicly. |
| o | Inputs other than quoted prices that are observable for the investment (for example, interest rates and yield curves observable at commonly quoted intervals, volatilities, prepayment speeds, loss severities, credit risks, and default rates). |
| o | Inputs that are derived principally from or corroborated by observable market data by correlation or other means. |
| • | Level 3 – Level 3 inputs are unobservable inputs. Unobservable inputs may reflect the reporting entity’s own assumptions about the assumptions that market participants would use in pricing the investment. |
The inputs or methodologies used for valuing investments are not necessarily an indication of the risk associated with investing in those investments. A summary of the inputs used to value the Fund’s investments as of October 31, 2018, is included with the Fund’s Portfolio of Investments.
B. Securities Transactions and Investment Income
Securities transactions are recorded as of the trade date. Realized gains and losses from securities transactions are recorded on the identified cost basis. Dividend income is recorded on the ex-dividend date. Interest income is recorded daily on the accrual basis. Amortization of premiums and accretion of discounts are recorded using the effective interest method.
Distributions received from the Fund’s investments in REITs may be comprised of return of capital, capital gains, and income. The actual character of the amounts received during the year are not known until after the REITs’ fiscal year end. The Fund records the character of distributions received from the REITs during the year based on estimates available. The characterization of distributions received by the Fund may be subsequently revised based on information received from the REITs after their tax reporting periods conclude.
C. Restricted Securities
The Fund invests in restricted securities, which are securities that may not be offered for public sale without first being registered under the 1933 Act. Prior to registration, restricted securities may only be resold in transactions exempt from registration under Rule 144A under the 1933 Act, normally to qualified institutional buyers. As of October 31, 2018, the Fund held restricted securities as shown in the following table that Stonebridge Advisors LLC (“Stonebridge” or the “Sub-Advisor”), has deemed illiquid pursuant to procedures adopted by the Trust’s Board of Trustees. Although market instability can result in periods of increased overall market illiquidity, liquidity for each security is determined based on security-specific factors and assumptions, which require subjective judgment. The Fund does not have the right to demand that such securities be registered. These securities are valued according to the valuation procedures as stated in the Portfolio Valuation note (Note 2A) and are not expressed as a discount to the carrying value of a comparable unrestricted security. There are no unrestricted securities with the same maturity dates and yields for these issuers.
| Security | Acquisition
Date | Principal
Values/Shares | Current Price | Carrying
Cost | Value | % of
Net
Assets |
| Compeer Financial ACA, 6.75% | 7/31/15 | 2,500 | $1,070.00 | $2,631,250 | $2,675,000 | 0.08% |
| Dairy Farmers of America, Inc., 7.13% | 9/15/16-8/10/17 | $7,700,000 | 104.75 | 7,898,000 | 8,065,750 | 0.24 |
| Farm Credit Bank of Texas, 6.75% | 12/8/15-9/25/18 | 39,840 | 106.50 | 4,147,530 | 4,242,960 | 0.13 |
| Fortegra Financial Corp., 8.50%, 10/15/57 | 10/12/17-3/12/18 | $13,700,000 | 101.75 | 13,719,082 | 13,939,750 | 0.41 |
Notes to Financial Statements (Continued)
First Trust Preferred Securities and Income ETF (FPE)
October 31, 2018
| Security | Acquisition
Date | Principal
Values/Shares | Current Price | Carrying
Cost | | Value | | % of
Net
Assets |
| Kinder Morgan GP, Inc., 6.22%, 8/18/57 | 3/21/17-10/16/17 | 10,000 | 916.97 | $9,215,000 | | $9,169,705 | | 0.27% |
| Land O’Lakes Capital Trust I, 7.45%, 3/15/28 | 3/20/15-5/9/18 | $23,748,000 | 108.38 | 26,427,978 | | 25,736,895 | | 0.76 |
| Sovereign Real Estate Investment Trust, 12.00% | 5/12/14-3/22/16 | 4,556 | 1,117.50 | 5,906,010 | | 5,091,330 | | 0.15 |
| | | | | $69,944,850 | | $68,921,390 | | 2.04% |
D. Dividends and Distributions to Shareholders
Dividends from net investment income, if any, are declared and paid monthly by the Fund, or as the Board of Trustees may determine from time to time. Distributions of net realized capital gains earned by the Fund, if any, are distributed at least annually.
Distributions from income and capital gains are determined in accordance with federal income tax regulations, which may differ from U.S. GAAP. Certain capital accounts in the financial statements are periodically adjusted for permanent differences in order to reflect their tax character. These permanent differences are primarily due to the varying treatment of income and gain/loss on portfolio securities held by the Fund and have no impact on net assets or NAV per share. Temporary differences, which arise from recognizing certain items of income, expense and gain/loss in different periods for financial statement and tax purposes, will reverse at some time in the future.
The tax character of distributions paid by the Fund during the fiscal years ended October 31, 2018 and 2017, was as follows:
| Distributions paid from: | 2018 | 2017 |
Ordinary income
| $190,356,696 | $114,019,342 |
Capital gains
| — | — |
Return of capital
| 54,410 | 292,582 |
As of October 31, 2018, the components of distributable earnings on a tax basis were as follows:
Undistributed ordinary income
| $— |
Accumulated capital and other gain (loss)
| (29,464,465) |
Net unrealized appreciation (depreciation)
| (118,561,632) |
E. Income Taxes
The Fund intends to continue to qualify as a regulated investment company by complying with the requirements under Subchapter M of the Internal Revenue Code of 1986, as amended, which includes distributing substantially all of its net investment income and net realized gains to shareholders. Accordingly, no provision has been made for federal and state income taxes. However, due to the timing and amount of distributions, the Fund may be subject to an excise tax of 4% of the amount by which approximately 98% of the Fund’s taxable income exceeds the distributions from such taxable income for the calendar year.
The Fund is subject to accounting standards that establish a minimum threshold for recognizing, and a system for measuring, the benefits of a tax position taken or expected to be taken in a tax return. Taxable years ended 2015, 2016, 2017, and 2018 remain open to federal and state audit. As of October 31, 2018, management has evaluated the application of these standards to the Fund and has determined that no provision for income tax is required in the Fund’s financial statements for uncertain tax positions.
The Fund intends to utilize provisions of the federal income tax laws, which allow it to carry a realized capital loss forward indefinitely following the year of the loss and offset such loss against any future realized capital gains. The Fund is subject to certain limitations under U.S. tax rules on the use of capital loss carryforwards and net unrealized built-in losses. These limitations apply when there has been a 50% change in ownership. At October 31, 2018, the Fund had $29,464,465 of non-expiring capital loss carryforwards for federal income tax purposes.
In order to present paid-in capital and accumulated distributable earnings (loss) (which consists of accumulated net investment income (loss), accumulated net realized gain (loss) on investments and net unrealized appreciation (depreciation) on investments) on the Statement of Assets and Liabilities that more closely represent their tax character, certain adjustments have been made to paid-in capital, accumulated net investment income (loss) and accumulated net realized gain (loss) on investments. These adjustments are
Notes to Financial Statements (Continued)
First Trust Preferred Securities and Income ETF (FPE)
October 31, 2018
primarily due to the difference between book and tax treatments of income and gains on various investment securities held by the Fund and in-kind transactions. The results of operations and net assets were not affected by these adjustments. For the fiscal year ended October 31, 2018, the adjustments for the Fund were as follows:
Accumulated
Net Investment
Income (Loss) | | Accumulated
Net Realized
Gain (Loss)
on Investments | | Paid-in
Capital |
| $(1,299,811) | | $(1,143,171) | | $2,442,982 |
F. Expenses
Expenses, other than the investment advisory fee and other excluded expenses, are paid by the Advisor (See Note 3).
G. New Accounting Pronouncements
On March 30, 2017, the FASB issued Accounting Standards Update (“ASU”) 2017-08 “Premium Amortization on Purchased Callable Debt Securities,” which amends the amortization period for certain purchased callable debt securities held at a premium by shortening such period to the earliest call date. The new guidance requires an entity to amortize the premium on a callable debt security within its scope to the earliest call date, unless the guidance for considering estimated prepayments is applied. If the call option is not exercised at the earliest call date, the yield is reset to the effective yield using the payment terms of the security. If the security has more than one call date and the premium was amortized to a call price greater than the next call price, any excess of the amortized cost basis over the amount repayable at the next call date will be amortized to that date. If there are no other call dates, any excess of the amortized cost basis over the par amount will be amortized to maturity. Discounts on purchased callable debt securities will continue to be amortized to the security’s maturity date. ASU 2017-08 is effective for public business entities for fiscal years, and interim periods within those fiscal years, beginning after December 15, 2018. Earlier adoption is permitted for all entities, including adoption in an interim period. If an entity early adopts the ASU in an interim period, any adjustments must be reflected as of the beginning of the fiscal year that includes that interim period. Management is still assessing the impact of the adoption of ASU 2017-08 on the financial statements but does not expect it to have a material impact.
On August 28, 2018, the FASB issued ASU 2018-13, “Disclosure Framework – Changes to the Disclosure Requirements for Fair Value Measurement,” which amends the fair value measurement disclosure requirements of ASC 820. The amendments of ASU 2018-13 include new, eliminated, and modified disclosure requirements of ASC 820. In addition, the amendments clarify that materiality is an appropriate consideration of entities when evaluating disclosure requirements. The ASU is effective for fiscal years beginning after December 15, 2019, including interim periods therein. Early adoption is permitted for any eliminated or modified disclosures upon issuance of this ASU. The Fund has early adopted ASU 2018-13 for these financial statements, which did not result in a material impact.
3. Investment Advisory Fee, Affiliated Transactions and Other Fee Arrangements
First Trust, the investment advisor to the Fund, is a limited partnership with one limited partner, Grace Partners of DuPage L.P., and one general partner, The Charger Corporation. The Charger Corporation is an Illinois corporation controlled by James A. Bowen, Chief Executive Officer of First Trust. First Trust is responsible for the ongoing monitoring of the securities in the Fund’s portfolio, managing the Fund’s business affairs and providing certain administrative services necessary for the management of the Fund.
Stonebridge, a majority-owned affiliate of First Trust, serves as the Fund’s sub-advisor and manages the Fund’s portfolio subject to First Trust’s supervision. Pursuant to the Investment Management Agreement between the Trust and the Advisor, First Trust will supervise Stonebridge and its management of the investment of the Fund’s assets and will pay Stonebridge for its services as the Fund’s sub-advisor. First Trust and Stonebridge are equally responsible for the Fund’s expenses, including the cost of transfer agency, custody, fund administration, legal, audit and other services, but excluding fee payments under the Investment Management Agreement, interest, taxes, acquired fund fees and expenses, brokerage commissions and other expenses connected with the execution of portfolio transactions, distribution and service fees pursuant to a 12b-1 plan, if any, and extraordinary expenses. The Fund has agreed to pay First Trust an annual unitary management fee equal to 0.85% of its average daily net assets. Stonebridge receives a sub-advisory fee equal to 0.425% of the average daily net assets of the Fund less Stonebridge’s share of the Fund’s expenses. The Sub-Advisor’s fee is paid by the Advisor out of the Advisor’s management fee. First Trust also provides fund reporting services to the Fund for a flat annual fee in the amount of $9,250, which is covered under the annual unitary management fee.
First Trust Capital Partners, LLC (“FTCP”), an affiliate of First Trust, owns a 51% ownership interest in Stonebridge.
Notes to Financial Statements (Continued)
First Trust Preferred Securities and Income ETF (FPE)
October 31, 2018
The Trust has multiple service agreements with Brown Brothers Harriman & Co. (“BBH”). Under the service agreements, BBH performs custodial, fund accounting, certain administrative services, and transfer agency services for the Fund. As custodian, BBH is responsible for custody of the Fund’s assets. As fund accountant and administrator, BBH is responsible for maintaining the books and records of the Fund’s securities and cash. As transfer agent, BBH is responsible for maintaining shareholder records for the Fund.
Each Trustee who is not an officer or employee of First Trust, any sub-advisor or any of their affiliates (“Independent Trustees”) is paid a fixed annual retainer that is allocated equally among each fund in the First Trust Fund Complex. Each Independent Trustee is also paid an annual per fund fee that varies based on whether the fund is a closed-end or other actively managed fund, or is an index fund.
Additionally, the Lead Independent Trustee and the Chairmen of the Audit Committee, Nominating and Governance Committee and Valuation Committee are paid annual fees to serve in such capacities, with such compensation allocated pro rata among each fund in the First Trust Fund Complex based on net assets. Independent Trustees are reimbursed for travel and out-of-pocket expenses in connection with all meetings. The Lead Independent Trustee and Committee Chairmen rotate every three years. The officers and “Interested” Trustee receive no compensation from the Trust for acting in such capacities.
4. Purchases and Sales of Securities
For the fiscal year ended October 31, 2018, the cost of purchases and proceeds from sales of investments, excluding short term investments and in-kind transactions, were $1,317,669,627 and $808,938,297, respectively.
For the fiscal year ended October 31, 2018, the cost of in-kind purchases and proceeds from in-kind sales were $135,895,101 and $56,112,325, respectively.
5. Creations, Redemptions and Transaction Fees
Shares are created and redeemed by the Fund only in Creation Unit size aggregations of 50,000 shares in transactions with broker-dealers or large institutional investors that have entered into a participation agreement (an “Authorized Participant”). In order to purchase Creation Units of the Fund, an Authorized Participant must deposit (i) a designated portfolio of securities and other instruments determined by First Trust (the “Deposit Securities”) and generally make or receive a cash payment referred to as the “Cash Component,” which is an amount equal to the difference between the NAV of the Fund shares (per Creation Unit Aggregation) and the market value of the Deposit Securities, and/or (ii) cash in lieu of all or a portion of the Deposit Securities. If the Cash Component is a positive number (i.e., the NAV per Creation Unit Aggregation exceeds the Deposit Amount), the Authorized Participant will deliver the Cash Component. If the Cash Component is a negative number (i.e., the NAV per Creation Unit Aggregation is less than the Deposit Amount), the Authorized Participant will receive the Cash Component. Authorized Participants purchasing Creation Units must pay to BBH, as transfer agent, a creation transaction fee (the “Creation Transaction Fee”) regardless of the number of Creation Units purchased in the transaction. The Creation Transaction Fee may vary and is based on the composition of the securities included in the Fund’s portfolio and the countries in which the transactions are settled. The Creation Transaction Fee is currently $500. The price for each Creation Unit will equal the daily NAV per share times the number of shares in a Creation Unit plus the fees described above and, if applicable, any operational processing and brokerage costs, transfer fees or stamp taxes. When the Fund permits an Authorized Participant to substitute cash or a different security in lieu of depositing one or more of the requisite Deposit Securities, the Authorized Participant may also be assessed an amount to cover the cost of purchasing the Deposit Securities and/or disposing of the substituted securities, including operational processing and brokerage costs, transfer fees, stamp taxes, and part or all of the spread between the expected bid and offer side of the market related to such Deposit Securities and/or substitute securities.
Authorized Participants redeeming Creation Units must pay to BBH, as transfer agent, a redemption transaction fee (the “Redemption Transaction Fee”), regardless of the number of Creation Units redeemed in the transaction. The Redemption Transaction Fee may vary and is based on the composition of the securities included in the Fund’s portfolio and the countries in which the transactions are settled. The Redemption Transaction Fee is currently $500. The Fund reserves the right to effect redemptions in cash. An Authorized Participant may request cash redemption in lieu of securities; however, the Fund may, in its discretion, reject any such request.
6. Distribution Plan
The Board of Trustees adopted a Distribution and Service Plan pursuant to Rule 12b-1 under the 1940 Act. In accordance with the Rule 12b-1 plan, the Fund is authorized to pay an amount up to 0.25% of its average daily net assets each year to reimburse First Trust Portfolios L.P. (“FTP”), the distributor of the Fund, for amounts expended to finance activities primarily intended to result in the sale of Creation Units or to provide investor services. FTP may also use this amount to compensate securities dealers or other persons that are Authorized Participants for providing distribution assistance, including broker-dealer and shareholder support and educational and promotional services.
Notes to Financial Statements (Continued)
First Trust Preferred Securities and Income ETF (FPE)
October 31, 2018
No 12b-1 fees are currently paid by the Fund, and pursuant to a contractual arrangement, no 12b-1 fees will be paid any time before February 28, 2020.
7. Line of Credit
First Trust Preferred Securities and Income ETF, along with First Trust Series Fund and First Trust Exchange-Traded Fund IV, has a $360 million Credit Agreement with The Bank of Nova Scotia (“Scotia”) as administrative agent for a group of lenders. Prior to August 28, 2018 and March 7, 2018, the commitment was $320 million and $220 million, respectively. Scotia charges a commitment fee of 0.25% of the daily amount of the excess of the commitment amount over the outstanding principal balance of the loans and an agency fee. First Trust allocates the commitment fee and agency fee amongst the funds that have access to the credit line. To the extent that a fund accesses the credit line, there would also be an interest fee charged. The Funds did not have any borrowings outstanding during the fiscal year ended October 31, 2018.
8. Indemnification
The Trust, on behalf of the Fund, has a variety of indemnification obligations under contracts with its service providers. The Trust’s maximum exposure under these arrangements is unknown. However, the Trust has not had prior claims or losses pursuant to these contracts and expects the risk of loss to be remote.
9. Subsequent Events
Management has evaluated the impact of all subsequent events to the Fund through the date the financial statements were issued, and has determined that there was the following subsequent event:
On November 2, 2018, First Trust Short Duration Managed Municipal ETF and First Trust Ultra Short Duration Municipal ETF, each an additional series of the Trust, began trading under the ticker symbols FSMB and FUMB, respectively, on the NYSE Arca, Inc.
Report of Independent Registered Public Accounting Firm
To the Shareholders and the Board of Trustees of First Trust Exchange-Traded Fund III:
Opinion on the Financial Statements and Financial Highlights
We have audited the accompanying statement of assets and liabilities, including the portfolio of investments, of First Trust Preferred Securities and Income ETF (the “Fund”), one of the funds constituting First Trust Exchange-Traded Fund III, as of October 31, 2018, the related statement of operations for the year then ended, the statements of changes in net assets for each of the two years in the period then ended, the financial highlights for each of the five years in the period then ended, and the related notes. In our opinion, the financial statements and financial highlights present fairly, in all material respects, the financial position of the Fund as of October 31, 2018, and the results of its operations for the year then ended, the changes in its net assets for each of the two years in the period then ended, and the financial highlights for each of the five years in the period then ended, in conformity with accounting principles generally accepted in the United States of America.
Basis for Opinion
These financial statements and financial highlights are the responsibility of the Fund’s management. Our responsibility is to express an opinion on the Fund’s financial statements and financial highlights based on our audits. We are a public accounting firm registered with the Public Company Accounting Oversight Board (United States) (PCAOB) and are required to be independent with respect to the Fund in accordance with the U.S. federal securities laws and the applicable rules and regulations of the Securities and Exchange Commission and the PCAOB.
We conducted our audits in accordance with the standards of the PCAOB. Those standards require that we plan and perform the audit to obtain reasonable assurance about whether the financial statements and financial highlights are free of material misstatement, whether due to error or fraud. The Fund is not required to have, nor were we engaged to perform, an audit of its internal control over financial reporting. As part of our audits we are required to obtain an understanding of internal control over financial reporting but not for the purpose of expressing an opinion on the effectiveness of the Fund’s internal control over financial reporting. Accordingly, we express no such opinion.
Our audits included performing procedures to assess the risks of material misstatement of the financial statements and financial highlights, whether due to error or fraud, and performing procedures that respond to those risks. Such procedures included examining, on a test basis, evidence regarding the amounts and disclosures in the financial statements and financial highlights. Our audits also included evaluating the accounting principles used and significant estimates made by management, as well as evaluating the overall presentation of the financial statements and financial highlights. Our procedures included confirmation of securities owned as of October 31, 2018, by correspondence with the custodian and brokers. We believe that our audits provide a reasonable basis for our opinion.
Chicago, Illinois
December 21, 2018
We have served as the auditor of one or more First Trust investment companies since 2001.
Additional Information
First Trust Preferred Securities and Income ETF (FPE)
October 31, 2018 (Unaudited)
Proxy Voting Policies and Procedures
A description of the policies and procedures that the Trust uses to determine how to vote proxies and information on how the Fund voted proxies relating to portfolio securities during the most recent 12-month period ended June 30 is available (1) without charge, upon request, by calling (800) 988-5891; (2) on the Fund’s website at www.ftportfolios.com; and (3) on the Securities and Exchange Commission’s (“SEC”) website at www.sec.gov.
Portfolio Holdings
The Trust files its complete schedule of the Fund’s portfolio holdings with the SEC for the first and third quarters of each fiscal year on Form N-Q. The Trust’s Form N-Qs are available (1) by calling (800) 988-5891; (2) on the Fund’s website at www.ftportfolios.com; and (3) on the SEC’s website at www.sec.gov.
Beginning in April 2019, the Trust will cease to disclose the Fund’s holdings on Form N-Q and will file Form N-PORT with the SEC on a monthly basis. Part F of Form N-PORT, which contains the complete schedule of the Fund’s portfolio holdings, will be made available in the same manner as Form N-Q discussed above.
Federal Tax Information
For the taxable year ended October 31, 2018, the following percentages of income dividend paid by the Fund qualifies for the dividends received deduction available to corporations and is hereby designated as qualified dividend income:
| Dividends Received Deduction | | Qualified Dividend Income |
| 61.84% | | 26.48% |
Risk Considerations
Risks are inherent in all investing. Certain general risks that may be applicable to some or all of the Funds are identified below, but not all of the material risks relevant to each Fund are included in this report. The material risks of investing in each Fund are spelled out in its prospectus, statement of additional information and other regulatory filings. Before investing, you should consider each Fund’s investment objective, risks, charges and expenses, and read each Fund’s prospectus and statement of additional information carefully. You can download each Fund’s prospectus at www.ftportfolios.com or contact First Trust Portfolios L.P. at (800) 621-1675 to request a prospectus, which contains this and other information about each Fund.
Concentration Risk. To the extent that a Fund is able to invest a large percentage of its assets in a single asset class or the securities of issuers within the same country, state, region, industry or sector, an adverse economic, business or political development may affect the value of the Fund’s investments more than if the Fund were more broadly diversified. A Fund that tracks an index will be concentrated to the extent the Fund’s corresponding index is concentrated. A concentration makes a Fund more susceptible to any single occurrence and may subject the Fund to greater market risk than a fund that is not concentrated.
Credit Risk. Credit risk is the risk that an issuer of a security will be unable or unwilling to make dividend, interest and/or principal payments when due and the related risk that the value of a security may decline because of concerns about the issuer’s ability to make such payments.
Cyber Security Risk. The Funds are susceptible to potential operational risks through breaches in cyber security. A breach in cyber security refers to both intentional and unintentional events that may cause a Fund to lose proprietary information, suffer data corruption or lose operational capacity. Such events could cause a Fund to incur regulatory penalties, reputational damage, additional compliance costs associated with corrective measures and/or financial loss. In addition, cyber security breaches of a Fund’s third-party service providers, such as its administrator, transfer agent, custodian, or sub-advisor, as applicable, or issuers in which the Fund invests, can also subject a Fund to many of the same risks associated with direct cyber security breaches.
Derivatives Risk. To the extent a Fund uses derivative instruments such as futures contracts, options contracts and swaps, the Fund may experience losses because of adverse movements in the price or value of the underlying asset, index or rate, which may be magnified by certain features of the derivative. These risks are heightened when a Fund’s portfolio managers use derivatives to enhance the Fund’s return or as a substitute for a position or security, rather than solely to hedge (or offset) the risk of a position or security held by the Fund.
Equity Securities Risk. To the extent a Fund invests in equity securities, the value of the Fund’s shares will fluctuate with changes in the value of the equity securities. Equity securities prices fluctuate for several reasons, including changes in investors’ perceptions of the financial condition of an issuer or the general condition of the relevant stock market, such as market volatility, or when political or economic events affecting the issuers occur. In addition, common stock prices may be particularly sensitive to rising interest rates, as
Additional Information (Continued)
First Trust Preferred Securities and Income ETF (FPE)
October 31, 2018 (Unaudited)
the cost of capital rises and borrowing costs increase. Equity securities may decline significantly in price over short or extended periods of time, and such declines may occur in the equity market as a whole, or they may occur in only a particular country, company, industry or sector of the market.
ETF Risk. The shares of an ETF trade like common stock and represent an interest in a portfolio of securities. The risks of owning an ETF generally reflect the risks of owning the underlying securities, although lack of liquidity in an ETF could result in it being more volatile and ETFs have management fees that increase their costs. Shares of an ETF trade on an exchange at market prices rather than net asset value, which may cause the shares to trade at a price greater than net asset value (premium) or less than net asset value (discount). In times of market stress, decisions by market makers to reduce or step away from their role of providing a market for an ETF’s shares, or decisions by an ETF’s authorized participants that they are unable or unwilling to proceed with creation and/or redemption orders of an ETF’s shares, could result in shares of the ETF trading at a discount to net asset value and in greater than normal intraday bid-ask spreads.
Fixed Income Securities Risk. To the extent a Fund invests in fixed income securities, the Fund will be subject to credit risk, income risk, interest rate risk, liquidity risk and prepayment risk. Income risk is the risk that income from a Fund’s fixed income investments could decline during periods of falling interest rates. Interest rate risk is the risk that the value of a Fund’s fixed income securities will decline because of rising interest rates. Liquidity risk is the risk that a security cannot be purchased or sold at the time desired, or cannot be purchased or sold without adversely affecting the price. Prepayment risk is the risk that the securities will be redeemed or prepaid by the issuer, resulting in lower interest payments received by the Fund. In addition to these risks, high yield securities, or “junk” bonds, are subject to greater market fluctuations and risk of loss than securities with higher ratings, and the market for high yield securities is generally smaller and less liquid than that for investment grade securities.
Fund of Funds Risk. To the extent a Fund invests in the securities of other investment vehicles, the Fund will incur additional fees and expenses that would not be present in a direct investment in those investment vehicles. Furthermore, the Fund’s investment performance and risks are directly related to the investment performance and risks of the investment vehicles in which the Fund invests.
Index Constituent Risk. Certain Funds may be a constituent of one or more indices. As a result, such a Fund may be included in one or more index-tracking exchange-traded funds or mutual funds. Being a component security of such a vehicle could greatly affect the trading activity involving a Fund, the size of the Fund and the market volatility of the Fund. Inclusion in an index could significantly increase demand for the Fund and removal from an index could result in outsized selling activity in a relatively short period of time. As a result, a Fund’s net asset value could be negatively impacted and the Fund’s market price may be significantly below its net asset value during certain periods.
Index Provider Risk. To the extent a Fund seeks to track an index, it is subject to Index Provider Risk. There is no assurance that the Index Provider will compile the Index accurately, or that the Index will be determined, maintained, constructed, reconstituted, rebalanced, composed, calculated or disseminated accurately. To correct any such error, the Index Provider may carry out an unscheduled rebalance or other modification of the Index constituents or weightings, which may increase the Fund’s costs. The Index Provider does not provide any representation or warranty in relation to the quality, accuracy or completeness of data in the Index, and it does not guarantee that the Index will be calculated in accordance with its stated methodology. Losses or costs associated with any Index Provider errors generally will be borne by the Fund and its shareholders.
Management Risk. To the extent that a Fund is actively managed, it is subject to management risk. In managing an actively-managed Fund’s investment portfolio, the Fund’s portfolio managers will apply investment techniques and risk analyses that may not have the desired result. There can be no guarantee that a Fund will meet its investment objective.
Market Risk. Securities held by a Fund, as well as shares of a Fund itself, are subject to market fluctuations caused by factors such as general economic conditions, political events, regulatory or market developments, changes in interest rates and perceived trends in securities prices. Shares of a Fund could decline in value or underperform other investments as a result of the risk of loss associated with these market fluctuations.
Non-U.S. Securities Risk. To the extent a Fund invests in non-U.S. securities, it is subject to additional risks not associated with securities of domestic issuers. Non-U.S. securities are subject to higher volatility than securities of domestic issuers due to: possible adverse political, social or economic developments; restrictions on foreign investment or exchange of securities; lack of liquidity; currency exchange rates; excessive taxation; government seizure of assets; different legal or accounting standards; and less government supervision and regulation of exchanges in foreign countries. Investments in non-U.S. securities may involve higher costs than investments in U.S. securities, including higher transaction and custody costs, as well as additional taxes imposed by non-U.S. governments. These risks may be heightened for securities of companies located, or with significant operations, in emerging market countries.
Additional Information (Continued)
First Trust Preferred Securities and Income ETF (FPE)
October 31, 2018 (Unaudited)
Passive Investment Risk. To the extent a Fund seeks to track an index, the Fund will invest in the securities included in, or representative of, the index regardless of their investment merit. A Fund generally will not attempt to take defensive positions in declining markets.
| NOT FDIC INSURED | NOT BANK GUARANTEED | MAY LOSE VALUE |
Advisory and Sub-Advisory Agreements
Board Considerations Regarding Approval of Investment Management and Investment Sub-Advisory Agreements
The Board of Trustees of First Trust Exchange-Traded Fund III (the “Trust”), including the Independent Trustees, unanimously approved the continuation of the Investment Management Agreement (the “Advisory Agreement”) with First Trust Advisors L.P. (the “Advisor” or “First Trust”) on behalf of the First Trust Preferred Securities and Income ETF (the “Fund”) and the Investment Sub-Advisory Agreement (the “Sub-Advisory Agreement” and together with the Advisory Agreement, the “Agreements”) among the Trust, on behalf of the Fund, the Advisor and Stonebridge Advisors LLC (the “Sub-Advisor”). The Board approved the continuation of the Agreements for a one-year period ending June 30, 2019 at a meeting held on June 11, 2018. The Board determined that the continuation of the Agreements is in the best interests of the Fund in light of the nature, extent and quality of the services provided and such other matters as the Board considered to be relevant in the exercise of its reasonable business judgment.
To reach this determination, the Board considered its duties under the Investment Company Act of 1940, as amended (the “1940 Act”), as well as under the general principles of state law, in reviewing and approving advisory contracts; the requirements of the 1940 Act in such matters; the fiduciary duty of investment advisors with respect to advisory agreements and compensation; the standards used by courts in determining whether investment company boards have fulfilled their duties; and the factors to be considered by the Board in voting on such agreements. At meetings held on April 23, 2018 and June 11, 2018, the Board, including the Independent Trustees, reviewed materials provided by the Advisor and the Sub-Advisor responding to requests for information from counsel to the Independent Trustees that, among other things, outlined the services provided by the Advisor and the Sub-Advisor to the Fund (including the relevant personnel responsible for these services and their experience); the unitary fee rate payable by the Fund as compared to fees charged to a peer group of funds (all of which were index-based exchange-traded funds (“ETFs”)) compiled by Management Practice, Inc. (“MPI”), an independent source (the “Peer Group”), and as compared to fees charged to other clients of the Advisor, including other ETFs managed by the Advisor; the sub-advisory fee rate as compared to fees charged to other clients of the Sub-Advisor; expenses of the Fund as compared to expense ratios of the funds in the Peer Group; performance information for the Fund; the nature of expenses incurred in providing services to the Fund and the potential for economies of scale, if any; financial data on the Advisor and the Sub-Advisor; any fall-out benefits to the Advisor and its affiliates, First Trust Portfolios L.P. (“FTP”) and First Trust Capital Partners, LLC (“FTCP”), and the Sub-Advisor; and information on the Advisor’s and the Sub-Advisor’s compliance programs. The Board reviewed initial materials with the Advisor at the meeting held on April 23, 2018, prior to which the Independent Trustees and their counsel met separately to discuss the information provided by the Advisor and the Sub-Advisor. Following the April meeting, independent legal counsel on behalf of the Independent Trustees requested certain clarifications and supplements to the materials provided, and the information provided in response to those requests was considered at an executive session of the Independent Trustees and independent legal counsel held prior to the June 11, 2018 meeting, as well as at the meeting held that day. The Board applied its business judgment to determine whether the arrangements between the Trust and the Advisor and among the Trust, the Advisor and the Sub-Advisor continue to be reasonable business arrangements from the Fund’s perspective. The Board determined that, given the totality of the information provided with respect to the Agreements, the Board had received sufficient information to renew the Agreements. The Board considered that shareholders chose to invest or remain invested in the Fund knowing that the Advisor and the Sub-Advisor manage the Fund and knowing the Fund’s unitary fee.
In reviewing the Agreements, the Board considered the nature, extent and quality of the services provided by the Advisor and the Sub-Advisor under the Agreements. With respect to the Advisory Agreement, the Board considered that the Advisor is responsible for the overall management and administration of the Trust and the Fund and reviewed all of the services provided by the Advisor to the Fund, including the oversight of the Sub-Advisor, as well as the background and experience of the persons responsible for such services. The Board noted that the Advisor oversees the Sub-Advisor’s day-to-day management of the Fund’s investments, including portfolio risk monitoring and performance review. In reviewing the services provided, the Board noted the compliance program that had been developed by the Advisor and considered that it includes a robust program for monitoring the Advisor’s, the Sub-Advisor’s and the Fund’s compliance with the 1940 Act, as well as the Fund’s compliance with its investment objective, policies and restrictions. The Board also considered a report from the Advisor with respect to its risk management functions related to the operation of the Fund. Finally, as part of the Board’s consideration of the Advisor’s services, the Advisor, in its written materials and at the April 23, 2018 meeting, described to the Board the scope of its ongoing investment in additional infrastructure and personnel to maintain and improve the quality of services provided to the Fund and the other funds in the First Trust Fund Complex. With respect to the Sub-Advisory Agreement, the Board noted that the Fund is an actively-managed ETF and the Sub-Advisor actively manages the Fund’s investments. The Board reviewed the materials provided by the Sub-Advisor and considered the services that the Sub-Advisor
Additional Information (Continued)
First Trust Preferred Securities and Income ETF (FPE)
October 31, 2018 (Unaudited)
provides to the Fund, including the Sub-Advisor’s day-to-day management of the Fund’s investments. In considering the Sub-Advisor’s management of the Fund, the Board noted the background and experience of the Sub-Advisor’s portfolio management team and the Board’s prior meetings with members of the portfolio management team. In light of the information presented and the considerations made, the Board concluded that the nature, extent and quality of the services provided to the Trust and the Fund by the Advisor and the Sub-Advisor under the Agreements have been and are expected to remain satisfactory and that the Sub-Advisor, under the oversight of the Advisor, has managed the Fund consistent with its investment objective, policies and restrictions.
The Board considered the unitary fee rate payable by the Fund under the Advisory Agreement for the services provided. The Board noted that the sub-advisory fee is paid by the Advisor from the unitary fee. The Board considered that as part of the unitary fee the Advisor is responsible for the Fund’s expenses, including the cost of sub-advisory, transfer agency, custody, fund administration, legal, audit and other services and license fees (if any), but excluding interest, taxes, brokerage commissions and other expenses connected with the execution of portfolio transactions, distribution and service fees pursuant to a Rule 12b-1 plan, if any, and extraordinary expenses. The Board received and reviewed information showing the advisory or unitary fee rates and expense ratios of the peer funds in the Peer Group, as well as advisory and unitary fee rates charged by the Advisor and the Sub-Advisor to other fund (including ETFs) and non-fund clients, as applicable. Because the Fund’s Peer Group included peer funds that pay a unitary fee and because the Fund pays a unitary fee, the Board determined that expense ratios were the most relevant comparative data point. Based on the information provided, the Board noted that the unitary fee for the Fund was above the median total (net) expense ratio of the peer funds in the Peer Group. With respect to the Peer Group, the Board noted its prior discussions with the Advisor and MPI regarding the assembly of the Peer Group and, at the April 23, 2018 meeting, discussed with the Advisor limitations in creating peer groups for actively-managed ETFs, including that there were no other actively-managed ETFs investing primarily in preferred securities and that all of the peer funds were index-based ETFs, and different business models that may affect the pricing of services among ETF sponsors. The Board also noted that none of the peer funds employed an advisor/sub-advisor management structure. The Board took these limitations and differences into account in considering the peer data. With respect to fees charged to other non-ETF clients, the Board considered differences between the Fund and other non-ETF clients that limited their comparability. In considering the unitary fee rate overall, the Board also considered the Advisor’s statement that it seeks to meet investor needs through innovative and value-added investment solutions and the Advisor’s description of its long-term commitment to the Fund.
The Board considered performance information for the Fund. The Board noted the process it has established for monitoring the Fund’s performance and portfolio risk on an ongoing basis, which includes quarterly performance reporting from the Advisor and Sub-Advisor for the Fund. The Board determined that this process continues to be effective for reviewing the Fund’s performance. The Board received and reviewed information comparing the Fund’s performance for periods ended December 31, 2017 to the performance of the peer funds in the Peer Group and to that of benchmark indexes, including a blended benchmark index. Based on the information provided, the Board noted that the Fund outperformed the Peer Group average, each benchmark index and the blended benchmark index for the one- and three-year periods ended December 31, 2017.
On the basis of all the information provided on the unitary fee and performance of the Fund and the ongoing oversight by the Board, the Board concluded that the unitary fee for the Fund (out of which the Sub-Advisor is compensated) continues to be reasonable and appropriate in light of the nature, extent and quality of the services provided by the Advisor and the Sub-Advisor to the Fund under the Agreements.
The Board considered information and discussed with the Advisor whether there were any economies of scale in connection with providing advisory services to the Fund and noted the Advisor’s statement that it believes its expenses will likely increase over the next twelve months as the Advisor continues to make investments in infrastructure and personnel. The Board noted that any reduction in fixed costs associated with the management of the Fund would benefit the Advisor, but that the unitary fee structure provides a level of certainty in expenses for the Fund. The Board considered the revenues and allocated costs (including the allocation methodology) of the Advisor in serving as investment advisor to the Fund for the twelve months ended December 31, 2017 and the estimated profitability level for the Fund calculated by the Advisor based on such data, as well as complex-wide and product-line profitability data, for the same period. The Board noted the inherent limitations in the profitability analysis and concluded that, based on the information provided, the Advisor’s profitability level for the Fund was not unreasonable. In addition, the Board considered fall-out benefits described by the Advisor that may be realized from its relationship with the Fund. The Board noted that FTCP, has an ownership interest in the Sub-Advisor and considered potential fall-out benefits to the Advisor from such ownership interest. The Board also considered that the Advisor had identified as a fall-out benefit to the Advisor and FTP their exposure to investors and brokers who, absent their exposure to the Fund, may have had no dealings with the Advisor or FTP. The Board considered the Advisor’s compensation for fund reporting services provided to the Fund pursuant to a separate Fund Reporting Services Agreement, which is paid from the unitary fee. The Board concluded that the character and amount of potential fall-out benefits to the Advisor were not unreasonable.
Additional Information (Continued)
First Trust Preferred Securities and Income ETF (FPE)
October 31, 2018 (Unaudited)
The Board considered the Sub-Advisor’s expenses in providing sub-advisory services to the Fund and noted the Sub-Advisor’s hiring of additional personnel in recent years and commitment to add additional resources if assets increase. The Board did not review the profitability of the Sub-Advisor with respect to the Fund. The Board noted that the Advisor pays the Sub-Advisor from the unitary fee, and its understanding that the Fund’s sub-advisory fee rate was the product of an arm’s length negotiation. The Board concluded that the profitability analysis for the Advisor was more relevant. The Board considered fall-out benefits that may be realized by the Sub-Advisor from its relationship with the Fund, including potential fall-out benefits to the Sub-Advisor from the ownership interest of FTCP in the Sub-Advisor. The Board noted that the Sub-Advisor does not maintain any soft-dollar arrangements. The Board concluded that the character and amount of potential fall-out benefits to the Sub-Advisor were not unreasonable.
Based on all of the information considered and the conclusions reached, the Board, including the Independent Trustees, unanimously determined that the terms of the Agreements continue to be fair and reasonable and that the continuation of the Agreements is in the best interests of the Fund. No single factor was determinative in the Board’s analysis.
Remuneration
First Trust Advisors L.P. (“First Trust”) is authorized and regulated by the U.S. Securities and Exchange Commission and is entitled to market shares of certain funds it manages, including First Trust Preferred Securities and Income ETF (the “Fund”), in certain member states in the European Economic Area in accordance with the cooperation arrangements in Article 42 of the Alternative Investment Fund Managers Directive (the “Directive”). First Trust is required under the Directive to make disclosures in respect of remuneration. The following disclosures are made in line with First Trust’s interpretation of currently available regulatory guidance on remuneration disclosures.
During the year ended December 31, 2017, the amount of remuneration paid (or to be paid) by First Trust Advisors L.P. in respect of the Fund is $1,236,568. This figure is comprised of $49,763 paid (or to be paid) in fixed compensation and $1,186,805 paid (or to be paid) in variable compensation. There were a total of 14 beneficiaries of the remuneration described above. Those amounts include $865,746 paid (or to be paid) to senior management of First Trust Advisors L.P. and $370,822 paid (or to be paid) to other employees whose professional activities have a material impact on the risk profiles of First Trust Advisors L.P. or the Funds (collectively, “Code Staff”).
Code Staff included in the aggregated figures disclosed above are rewarded in line with First Trust’s remuneration policy (the “Remuneration Policy”) which is determined and implemented by First Trust’s senior management. The Remuneration Policy reflects First Trust’s ethos of good governance and encapsulates the following principal objectives:
i. to provide a clear link between remuneration and performance of First Trust and to avoid rewarding for failure;
ii. to promote sound and effective risk management consistent with the risk profiles of the Funds managed by First Trust; and
iii. to remunerate staff in line with the business strategy, objectives, values and interests of First Trust and the Funds managed by First Trust in a manner that avoids conflicts of interest.
First Trust assesses various risk factors which it is exposed to when considering and implementing remuneration for Code Staff and considers whether any potential award to such person(s) would give rise to a conflict of interest. First Trust does not reward failure, or consider the taking of risk or failure to take risk in its remuneration of Code Staff.
First Trust assesses performance for the purposes of determining payments in respect of performance-related remuneration of Code Staff by reference to a broad range of measures including (i) individual performance (using financial and non-financial criteria), and (ii) the overall performance of First Trust. Remuneration is not based upon the performance of the Funds.
The elements of remuneration are balanced between fixed and variable and the senior management sets fixed salaries at a level sufficient to ensure that variable remuneration incentivises and rewards strong individual performance but does not encourage excessive risk taking.
No individual is involved in setting his or her own remuneration.
Board of Trustees and Officers
First Trust Exchange-Traded Fund III
October 31, 2018 (Unaudited)
The following tables identify the Trustees and Officers of the Trust. Unless otherwise indicated, the address of all persons is 120 E. Liberty Drive, Suite 400, Wheaton, IL 60187.
The Trust’s statement of additional information includes additional information about the Trustees and is available, without charge, upon request, by calling (800) 988-5891.
| Name, Year of Birth and Position with the Trust | Term of Office and Year First Elected or Appointed | Principal Occupations
During Past 5 Years | Number of Portfolios in the First Trust Fund Complex Overseen by Trustee | Other Trusteeships or Directorships Held by Trustee During Past 5 Years |
| INDEPENDENT TRUSTEES |
Richard E. Erickson, Trustee
(1951) | • Indefinite Term
• Since Inception | Physician; Officer, Wheaton Orthopedics; Limited Partner, Gundersen Real Estate Limited Partnership (June 1992 to December 2016); Member, Sportsmed LLC (April 2007 to November 2015) | 159 | None |
Thomas R. Kadlec, Trustee
(1957) | • Indefinite Term
• Since Inception | President, ADM Investor Services, Inc. (Futures Commission Merchant) | 159 | Director of ADM Investor Services, Inc., ADM Investor Services International, Futures Industry Association, and National Futures Association |
Robert F. Keith, Trustee
(1956) | • Indefinite Term
• Since Inception | President, Hibs Enterprises (Financial and Management Consulting) | 159 | Director of Trust Company of Illinois |
Niel B. Nielson, Trustee
(1954) | • Indefinite Term
• Since Inception | Senior Advisor (August 2018 to Present), Managing Director and Chief Operating Officer (January 2015 to August 2018), Pelita Harapan Educational Foundation (Educational Products and Services); President and Chief Executive Officer (June 2012 to September 2014), Servant Interactive LLC (Educational Products and Services); President and Chief Executive Officer (June 2012 to September 2014), Dew Learning LLC (Educational Products and Services) | 159 | Director of Covenant Transport, Inc. (May 2003 to May 2014) |
| INTERESTED TRUSTEE |
James A. Bowen(1), Trustee and
Chairman of the Board
(1955) | • Indefinite Term
• Since Inception | Chief Executive Officer, First Trust Advisors L.P. and First Trust Portfolios L.P.; Chairman of the Board of Directors, BondWave LLC (Software Development Company) and Stonebridge Advisors LLC (Investment Advisor) | 159 | None |
| (1) | Mr. Bowen is deemed an “interested person” of the Trust due to his position as CEO of First Trust Advisors, L.P., investment advisor of the Trust. |
Board of Trustees and Officers (Continued)
First Trust Exchange-Traded Fund III
October 31, 2018 (Unaudited)
| Name and Year of Birth | Position and Offices with Trust | Term of Office and Length of Service | Principal Occupations
During Past 5 Years |
| OFFICERS(2) |
James M. Dykas
(1966) | President and Chief Executive Officer | • Indefinite Term
• Since January 2016 | Managing Director and Chief Financial Officer (January 2016 to Present), Controller (January 2011 to January 2016), Senior Vice President (April 2007 to January 2016), First Trust Advisors L.P. and First Trust Portfolios L.P.; Chief Financial Officer (January 2016 to Present), BondWave LLC (Software Development Company) and Stonebridge Advisors LLC (Investment Advisor) |
Donald P. Swade
(1972) | Treasurer, Chief Financial Officer and Chief Accounting Officer | • Indefinite Term
• Since January 2016 | Senior Vice President (July 2016 to Present), Vice President (April 2012 to July 2016), First Trust Advisors L.P. and First Trust Portfolios L.P. |
W. Scott Jardine
(1960) | Secretary and Chief Legal Officer | • Indefinite Term
• Since Inception | General Counsel, First Trust Advisors L.P. and First Trust Portfolios L.P.; Secretary and General Counsel, BondWave LLC; Secretary, Stonebridge Advisors LLC |
Daniel J. Lindquist
(1970) | Vice President | • Indefinite Term
• Since Inception | Managing Director, First Trust Advisors L.P. and First Trust Portfolios L.P. |
Kristi A. Maher
(1966) | Chief Compliance Officer and Assistant Secretary | • Indefinite Term
• Since Inception | Deputy General Counsel, First Trust Advisors L.P. and First Trust Portfolios L.P. |
Roger F. Testin
(1966) | Vice President | • Indefinite Term
• Since Inception | Senior Vice President, First Trust Advisors L.P. and First Trust Portfolios L.P. |
Stan Ueland
(1970) | Vice President | • Indefinite Term
• Since Inception | Senior Vice President, First Trust Advisors L.P. and First Trust Portfolios L.P |
| (2) | The term “officer” means the president, vice president, secretary, treasurer, controller or any other officer who performs a policy making function. |
Privacy Policy
First Trust Preferred Securities and Income ETF (FPE)
October 31, 2018 (Unaudited)
Privacy Policy
First Trust values our relationship with you and considers your privacy an important priority in maintaining that relationship. We are committed to protecting the security and confidentiality of your personal information.
Sources of Information
We collect nonpublic personal information about you from the following sources:
| • | Information we receive from you and your broker-dealer, investment advisor or financial representative through interviews, applications, agreements or other forms; |
| • | Information about your transactions with us, our affiliates or others; |
| • | Information we receive from your inquiries by mail, e-mail or telephone; and |
| • | Information we collect on our website through the use of “cookies”. For example, we may identify the pages on our website that your browser requests or visits. |
Information Collected
The type of data we collect may include your name, address, social security number, age, financial status, assets, income, tax information, retirement and estate plan information, transaction history, account balance, payment history, investment objectives, marital status, family relationships and other personal information.
Disclosure of Information
We do not disclose any nonpublic personal information about our customers or former customers to anyone, except as permitted by law. In addition to using this information to verify your identity (as required under law), the permitted uses may also include the disclosure of such information to unaffiliated companies for the following reasons:
| • | In order to provide you with products and services and to effect transactions that you request or authorize, we may disclose your personal information as described above to unaffiliated financial service providers and other companies that perform administrative or other services on our behalf, such as transfer agents, custodians and trustees, or that assist us in the distribution of investor materials such as trustees, banks, financial representatives, proxy services, solicitors and printers. |
| • | We may release information we have about you if you direct us to do so, if we are compelled by law to do so, or in other legally limited circumstances (for example to protect your account from fraud). |
In addition, in order to alert you to our other financial products and services, we may share your personal information within First Trust.
Use of Website Analytics
We currently use third party analytics tools, Google Analytics and AddThis, to gather information for purposes of improving First Trust’s website and marketing our products and services to you. These tools employ cookies, which are small pieces of text stored in a file by your web browser and sent to websites that you visit, to collect information, track website usage and viewing trends such as the number of hits, pages visited, videos and PDFs viewed and the length of user sessions in order to evaluate website performance and enhance navigation of the website. We may also collect other anonymous information, which is generally limited to technical and web navigation information such as the IP address of your device, internet browser type and operating system for purposes of analyzing the data to make First Trust’s website better and more useful to our users. The information collected does not include any personal identifiable information such as your name, address, phone number or email address unless you provide that information through the website for us to contact you in order to answer your questions or respond to your requests. To find out how to opt-out of these services click on: Google Analytics and AddThis.
Confidentiality and Security
With regard to our internal security procedures, First Trust restricts access to your nonpublic personal information to those First Trust employees who need to know that information to provide products or services to you. We maintain physical, electronic and procedural safeguards to protect your nonpublic personal information.
Policy Updates and Inquiries
As required by federal law, we will notify you of our privacy policy annually. We reserve the right to modify this policy at any time, however, if we do change it, we will tell you promptly. For questions about our policy, or for additional copies of this notice, please go to www.ftportfolios.com, or contact us at 1-800-621-1675 (First Trust Portfolios) or 1-800-222-6822 (First Trust Advisors).
May 2017
This page intentionally left blank
INVESTMENT ADVISOR
First Trust Advisors L.P.
120 E. Liberty Drive, Suite 400
Wheaton, IL 60187
INVESTMENT SUB-ADVISOR
Stonebridge Advisors LLC
10 Westport Road, Suite C101
Wilton, CT 06897
ADMINISTRATOR, CUSTODIAN,
FUND ACCOUNTANT &
TRANSFER AGENT
Brown Brothers Harriman & Co.
50 Post Office Square
Boston, MA 02110
INDEPENDENT REGISTERED
PUBLIC ACCOUNTING FIRM
Deloitte & Touche LLP
111 S. Wacker Drive
Chicago, IL 60606
LEGAL COUNSEL
Chapman and Cutler LLP
111 W. Monroe Street
Chicago, IL 60603
First Trust Exchange-Traded Fund III
First Trust Managed Municipal ETF (FMB)
Annual Report
For the Year Ended
October 31, 2018
First Trust Managed Municipal ETF (FMB)
Annual Report
October 31, 2018
Caution Regarding Forward-Looking Statements
This report contains certain forward-looking statements within the meaning of the Securities Act of 1933, as amended, and the Securities Exchange Act of 1934, as amended. Forward-looking statements include statements regarding the goals, beliefs, plans or current expectations of First Trust Advisors L.P. (“First Trust” or the “Advisor”) and its representatives, taking into account the information currently available to them. Forward-looking statements include all statements that do not relate solely to current or historical fact. For example, forward-looking statements include the use of words such as “anticipate,” “estimate,” “intend,” “expect,” “believe,” “plan,” “may,” “should,” “would” or other words that convey uncertainty of future events or outcomes.
Forward-looking statements involve known and unknown risks, uncertainties and other factors that may cause the actual results, performance or achievements of the series of First Trust Exchange-Traded Fund III (the “Trust”) described in this report (First Trust Managed Municipal ETF; hereinafter referred to as the “Fund”) to be materially different from any future results, performance or achievements expressed or implied by the forward-looking statements. When evaluating the information included in this report, you are cautioned not to place undue reliance on these forward-looking statements, which reflect the judgment of the Advisor and its representatives only as of the date hereof. We undertake no obligation to publicly revise or update these forward-looking statements to reflect events and circumstances that arise after the date hereof.
Performance and Risk Disclosure
There is no assurance that the Fund will achieve its investment objectives. The Fund is subject to market risk, which is the possibility that the market values of securities owned by the Fund will decline and that the value of the Fund shares may therefore be less than what you paid for them. Accordingly, you can lose money by investing in the Fund. See “Risk Considerations” in the Additional Information section of this report for a discussion of certain other risks of investing in the Fund.
Performance data quoted represents past performance, which is no guarantee of future results, and current performance may be lower or higher than the figures shown. For the most recent month-end performance figures, please visit www.ftportfolios.com or speak with your financial advisor. Investment returns, net asset value and share price will fluctuate and Fund shares, when sold, may be worth more or less than their original cost.
The Advisor may also periodically provide additional information on Fund performance on the Fund’s web page at www.ftportfolios.com.
How to Read This Report
This report contains information that may help you evaluate your investment in the Fund. It includes details about the Fund and presents data and analysis that provide insight into the Fund’s performance and investment approach.
By reading the portfolio commentary by the portfolio management team of the Fund, you may obtain an understanding of how the market environment affected the Fund’s performance. The statistical information that follows may help you understand the Fund’s performance compared to that of a relevant market benchmark.
It is important to keep in mind that the opinions expressed by personnel of the Advisor are just that: informed opinions. They should not be considered to be promises or advice. The opinions, like the statistics, cover the period through the date on the cover of this report. The material risks of investing in the Fund are spelled out in the prospectus, the statement of additional information, and other Fund regulatory filings.
First Trust Managed Municipal ETF (FMB)
Annual Letter from the Chairman and CEO
October 31, 2018
Dear Shareholders,
First Trust is pleased to provide you with the annual report for the First Trust Managed Municipal ETF (the “Fund”), which contains detailed information about the Fund for the twelve months ended October 31, 2018, including a market overview and a performance analysis. We encourage you to read this report carefully and discuss it with your financial advisor.
As I mentioned in my April 2018 letter, 2017 was a very strong year for U.S. and global markets. Investors were rewarded with rising markets and very little volatility. As 2018 began, investors were hoping for another strong year in the markets. For the entire first quarter, however, increased market volatility was the norm for U.S. and global markets. The markets continued their volatility throughout the second quarter. During April and May, the Dow Jones Industrial Average (“DJIA”) closed out each month slightly down, but ended both June and July slightly up. August was a strong month for stocks, and the DJIA finished August just under its previous high in January of 2018. At the close of the third quarter in September, the markets had moved higher into positive territory. In fact, all three major U.S. indices (the Nasdaq Composite Index, the DJIA and the S& P 500® Index) hit record levels during the third quarter. In October, markets were again very volatile, surprising analysts and investors alike. Both global and U.S. markets fell on fears of slowing growth, trade wars and higher interest rates. The DJIA was down 5% for October and the MSCI EAFE Index, an index of stocks in 21 developed markets (excluding the U.S. and Canada), was down 9% for the same period.
Based on continued strong job growth and the economic outlook in the U.S., the Federal Reserve (the “Fed”) raised interest rates in March, June and September. At their September meeting, the Fed also indicated the possibility of one more rate hike in 2018 as well as three more rate hikes in 2019.
Trade tensions have had an impact on markets around the world and could continue to do so in the future. However, our economists believe that the long-term impact of U.S. tariffs will be to encourage countries to come back to the table and talk about more equal trade. Despite market volatility, we continue to believe that the combination of low interest rates, low inflation and strong corporate earnings still point to a positive economic environment and further growth, though we understand that past performance can never guarantee future performance.
We continue to believe that you should invest for the long term and be prepared for market movements, which can happen at any time. You can do this by keeping current on your portfolio and by speaking regularly with your investment professional. Markets go up and they also go down, but savvy investors are prepared for either through careful attention to investment goals.
Thank you for giving First Trust the opportunity to be a part of your financial plan. We value our relationship with you and will report on the Fund again in six months.
Sincerely,
James A. Bowen
Chairman of the Board of Trustees
Chief Executive Officer of First Trust Advisors L.P.
Fund Performance Overview (Unaudited)
First Trust Managed Municipal ETF (FMB)
The primary investment objective of First Trust Managed Municipal ETF (the “Fund”) is to generate current income that is exempt from regular federal income taxes and its secondary objective is long-term capital appreciation. The Fund lists and principally trades its shares on The Nasdaq Stock Market, LLC under the ticker symbol “FMB.” Under normal market conditions, the Fund seeks to achieve its investment objectives by investing at least 80% of its net assets (including investment borrowings) in municipal debt securities that pay interest that is exempt from regular federal income taxes.
| Performance | | | |
| | | Average Annual
Total Returns | Cumulative
Total Returns |
| | 1 Year Ended
10/31/18 | Inception (5/13/14)
to 10/31/18 | Inception (5/13/14)
to 10/31/18 |
| Fund Performance | | | |
| NAV | -0.12% | 3.59% | 17.08% |
| Market Price | -0.14% | 3.61% | 17.18% |
| Index Performance | | | |
| Bloomberg Barclays Revenue 10 Year (8-12) Index | -0.84% | 2.72% | 12.73% |
Total returns for the period since inception are calculated from the inception date of the Fund. “Average Annual Total Returns” represent the average annual change in value of an investment over the period indicated. “Cumulative Total Returns” represent the total change in value of an investment over the period indicated.
The Fund’s per share net asset value (“NAV”) is the value of one share of the Fund and is computed by dividing the value of all assets of the Fund (including accrued interest and dividends), less all liabilities (including accrued expenses and dividends declared but unpaid), by the total number of outstanding shares. The price used to calculate market return (“Market Price”) is determined by using the midpoint between the highest bid and the lowest offer on the stock exchange on which shares of the Fund are listed for trading as of the time that the Fund’s NAV is calculated. Since shares of the Fund did not trade in the secondary market until after its inception, for the period from inception to the first day of secondary market trading in shares of the Fund, the NAV of the Fund is used as a proxy for the secondary market trading price to calculate market returns. NAV and market returns assume that all distributions have been reinvested in the Fund at NAV and Market Price, respectively.
An index is a statistical composite that tracks a specified financial market or sector. Unlike the Fund, the index does not actually hold a portfolio of securities and therefore does not incur the expenses incurred by the Fund. These expenses negatively impact the performance of the Fund. Also, market returns do not include brokerage commissions that may be payable on secondary market transactions. If brokerage commissions were included, market returns would be lower. The total returns presented reflect the reinvestment of dividends on securities in the index. The returns presented do not reflect the deduction of taxes that a shareholder would pay on Fund distributions or the redemption or sale of Fund shares. The investment return and principal value of shares of the Fund will vary with changes in market conditions. Shares of the Fund may be worth more or less than their original cost when they are redeemed or sold in the market. The Fund’s past performance is no guarantee of future performance.
Fund Performance Overview (Unaudited) (Continued)
First Trust Managed Municipal ETF (FMB) (Continued)
| Sector Allocation | % of Total
Investments
(including cash) |
| Hospital | 12.7% |
| Continuing Care Retirement Communities | 12.2 |
| Government Obligation Bond - Unlimited Tax | 8.1 |
| Water & Sewer | 6.8 |
| Insured | 6.7 |
| Higher Education | 6.4 |
| Dedicated Tax | 5.5 |
| Education | 5.3 |
| Certificates of Participation | 5.0 |
| Government Obligation Bond - Limited Tax | 4.6 |
| Gas | 4.3 |
| Special Assessment | 3.3 |
| Industrial Development Bond | 2.6 |
| Utility | 2.5 |
| Toll Road | 2.1 |
| Airport | 2.0 |
| Tax Increment | 1.5 |
| Student Housing | 1.4 |
| Local Housing | 1.1 |
| Tobacco | 1.1 |
| Skilled Nursing | 0.8 |
| Mass Transit | 0.7 |
| Other Health | 0.6 |
| Pre-refunded/Escrowed-to-maturity | 0.6 |
| Port | 0.2 |
| Stadium | 0.0* |
| Hotel | 0.0* |
| Cash | 1.9 |
| Total | 100.0% |
| * | Amount is less than 0.1%. |
| Credit Quality(1) | % of Total
Investments
(including cash) |
| AAA | 7.5% |
| AA+ | 6.4 |
| AA | 12.2 |
| AA- | 5.1 |
| A+ | 9.0 |
| A | 10.2 |
| A- | 11.2 |
| BBB+ | 4.5 |
| BBB | 5.4 |
| BBB- | 6.4 |
| BB+ | 2.5 |
| BB | 2.2 |
| BB- | 1.0 |
| B- | 0.2 |
| Not Rated | 14.3 |
| Cash | 1.9 |
| Total | 100.0% |
| (1) | The credit quality and ratings information presented above reflect the ratings assigned by one or more nationally recognized statistical rating organizations (NRSROs), including Standard & Poor’s Ratings Group, a division of the McGraw Hill Companies, Inc., Moody’s Investors Service, Inc., Fitch Ratings or a comparably rated NRSRO. For situations in which a security is rated by more than one NRSRO and the ratings are not equivalent, the highest rating is used. Sub-investment grade ratings are those rated BB+/Ba1 or lower. Investment grade ratings are those rated BBB-/Baa3 or higher. The credit ratings shown relate to the creditworthiness of the issuers of the underlying securities in the Fund, and not to the Fund or its shares. Credit ratings are subject to change. |
Fund Performance Overview (Unaudited) (Continued)
First Trust Managed Municipal ETF (FMB) (Continued)

Performance figures assume reinvestment of all distributions and do not reflect the deduction of taxes that a shareholder would pay on Fund distributions or the redemption or sale of Fund shares. An index is a statistical composite that tracks a specified financial market or sector. Unlike the Fund, the index does not actually hold a portfolio of securities and therefore does not incur the expenses incurred by the Fund. These expenses negatively impact the performance of the Fund. The Fund’s past performance does not predict future performance.
Frequency Distribution of Discounts and Premiums
Bid/Ask Midpoint vs. NAV through October 31, 2018
The following Frequency Distribution of Discounts and Premiums charts are provided to show the frequency at which the bid/ask midpoint price for the Fund was at a discount or premium to the daily NAV. The following tables are for comparative purposes only and represent the period May 14, 2014 (commencement of trading) through October 31, 2018. Shareholders may pay more than NAV when they buy Fund shares and receive less than NAV when they sell those shares because shares are bought and sold at current market price. Data presented represents past performance and cannot be used to predict future results.
| Number of Days Bid/Ask Midpoint At/Above NAV |
| For the Period | 0.00%–0.49% | 0.50%–0.99% | 1.00%–1.99% | >=2.00% |
| 5/14/14 – 10/31/14 | 2 | 10 | 0 | 0 |
| 11/1/14 – 10/31/15 | 178 | 16 | 0 | 0 |
| 11/1/15 – 10/31/16 | 200 | 0 | 0 | 0 |
| 11/1/16 – 10/31/17 | 207 | 0 | 0 | 0 |
| 11/1/17 – 10/31/18 | 201 | 0 | 0 | 0 |
| Number of Days Bid/Ask Midpoint Below NAV |
| For the Period | 0.00%–0.49% | 0.50%–0.99% | 1.00%–1.99% | >=2.00% |
| 5/14/14 – 10/31/14 | 64 | 43 | 0 | 0 |
| 11/1/14 – 10/31/15 | 57 | 0 | 0 | 0 |
| 11/1/15 – 10/31/16 | 51 | 1 | 0 | 0 |
| 11/1/16 – 10/31/17 | 45 | 0 | 0 | 0 |
| 11/1/17 – 10/31/18 | 51 | 0 | 0 | 0 |
Portfolio Commentary
First Trust Managed Municipal ETF (FMB)
Annual Report
October 31, 2018 (Unaudited)
Advisor
First Trust Advisors L.P. (“First Trust” or the “Advisor”) serves as the investment advisor to the First Trust Managed Municipal ETF (the “Fund”). First Trust is responsible for the ongoing monitoring of the Fund’s investment portfolio, managing the Fund’s business affairs and providing certain administrative services necessary for the management of the Fund.
Portfolio Management Team
Tom Futrell, CFA, Senior Vice President, Senior Portfolio Manager
Johnathan N. Wilhelm, Senior Vice President, Senior Portfolio Manager
The First Trust Municipal Securities Team was formed in September of 2013 and is headed by Tom Futrell, CFA and Johnathan Wilhelm who serve as senior portfolio managers of the Fund. Messrs. Futrell and Wilhelm have a combined 50+ years of investment experience and prior to joining First Trust, served as portfolio managers of municipal bonds at Nuveen Investments and Performance Trust Investment Advisors. In addition to the Fund, the team manages/consults for a variety of investment portfolios and separately managed accounts.
Commentary
The Fund is an actively managed exchange-traded fund (“ETF”). The Fund’s primary investment objective is to generate current income that is exempt from regular federal income taxes and its secondary objective is long-term capital appreciation. Under normal market conditions, the Fund seeks to achieve its investment objectives by investing at least 80% of its net assets (including investment borrowings) in municipal debt securities that pay interest that is exempt from regular federal income taxes. The Fund will invest at least 65% of its net assets in municipal bonds that are investment grade rated at the time of purchase or that are unrated but deemed by the Fund’s advisor to be of comparable quality. This commentary discusses the 12-month market performance and the Fund’s performance for the 12-month period ended October 31, 2018.
Market Recap
For the 12-month period ended October 31, 2018, municipal bonds generated a total return of -0.51% as measured by the Bloomberg Barclay’s Municipal Bond Index (“BMBI”). During the same period, the Bloomberg Barclays Revenue 10 Year (8-12) Index and Bloomberg Barclays Non-Investment Grade Index produced returns of -0.84% and 4.74%, respectively. By comparison, the Bloomberg Barclays U.S. Treasury Index generated a -1.97% return during the 12-month period. The following have been major factors in explaining the municipal bond market’s performance:
| • | After a record-setting year in 2017 in which new issue supply totaled $448 billion, year-to-date new issue supply through October 31, 2018 totaled $286 billion versus $333 billion for the same period last year, a decrease of 14.1%. A major reason for this year’s decline in new issue supply occurred in December 2017 when over $69 billion in new issue supply was rushed to market by issuers in the face of tax reform and the elimination of advance refunding of municipal bonds on a tax-exempt basis. |
| • | Municipals experienced positive, but volatile flows as expressed by retail demand. Over the 12-month period ended October 31, 2018, the municipal market has seen eight months of positive fund flows, and four months of negative fund flows. Over the same period, municipal fund flows totaled $12.6 billion versus $24.0 billion for the same period last year. (Source: Barclays, Investment Company Institute) |
| • | During the past year, credit fundamentals continued to be favorable. Through the 12-month period ended October 31, 2018, the par value of first-time municipal bond defaults totaled just $3.1 billion versus $33.9 billion for the same period last year. Puerto Rico and its corporate affiliates represented an outsized percentage of the total par value in 2017. The number of defaults also decreased, to just 32 versus 49 year-over-year. |
| • | U.S. economic fundamentals continued to be healthy and the U.S. economy has remained strong as witnessed by broad-based improvement over the past year. Inflation accelerated to a six-year high in July 2018 (the Consumer Price Index year-over-year in July was 2.9%), the unemployment rate fell to its lowest level since 1969 (3.7%), and both consumer and small business confidence advanced to multi-decade high levels. Interest rates moved higher, with the 10-year Treasury bond increasing in yield from 2.38% on October 31, 2017 to 3.16% by October 31, 2018, a 78 basis point (“bps”) increase. In comparison, 10-year municipal bonds outperformed 10-year U.S. Treasuries. According to data prepared by Municipal Market Data, 10-year “AAA” municipal yields increased 72 bps from 2.01% on October 31, 2017 to 2.73% by October 31,2018. |
Portfolio Commentary (Continued)
First Trust Managed Municipal ETF (FMB)
Annual Report
October 31, 2018 (Unaudited)
Performance Analysis
The Fund’s net asset value (“NAV”) and market performance for the 12-month period ended October 31, 2018 were -0.12% and -0.14%, respectively, versus the Bloomberg Barclays Revenue 10 Year (8-12) Index (the “Benchmark”) return of -0.84% during the same period.
The Fund’s monthly distribution of $0.1125 on October 31, 2018 represented a tax-exempt annualized distribution rate of 2.60% (4.40% taxable equivalent yield) based on the Fund’s closing market price of $51.83. The Fund’s distribution rate is not constant and is subject to change over time based on the performance of the Fund and general market conditions.
From a portfolio construction perspective, the Fund maintains an underweight position in the highest quality issuers (“AA” rated and higher) versus the Benchmark and is overweight the Benchmark in terms of “BBB”, as well as below investment-grade and non-rated bonds. The Fund may allocate up to 35% of its net assets to credits that are either rated below investment-grade or are non-rated and deemed to be of comparable quality at the time of purchase. We believe these bonds tend to carry higher income cushions than their high-quality counterparts which can help insulate the investment against interest rate risk without materially increasing default potential. As of October 31, 2018, the Fund’s weighted-average credit quality was approximately “A-/A3”, which is lower than the Benchmark with a stated average credit rating of “AA3/A1”. The Fund’s investments in “BBB” rated bonds, as well as, sub-investment grade and non-rated municipal securities generated strong performance for the trailing twelve months. Lower investment-grade and below investment grade and non-rated strategies generally benefited from credit spread compression throughout most of the trailing 12-month period, positively contributing to the Fund’s NAV outperformance relative to the Benchmark. Given the fact that investment-grade municipal credit spreads are near their lowest levels since the onset of the financial crisis, we currently favor “A” rated bonds over “BBB” rated bonds. High-yield municipal risk premiums are currently below their long-term historical average; however, and we continue to find value in select high yield bonds after rigorous credit research and selection.
We continued to see value in revenue bonds issued by essential service providers. Our focus is on issuers that meet basic infrastructure needs and provide needed essential services within their respective communities. Revenue bond sectors we overweight include healthcare, senior living, higher education and charter schools. Beyond the borrower’s essentiality, we also look for issuers who have a growing market share, increasing utilization, and growing cash flow as this provides added insulation against credit erosion and the potential for credit rating improvement over time. Revenue bond sectors that positively contributed to the Fund’s performance over the past twelve months included senior living facilities, education (charter schools), toll roads and special assessment districts. We continue to underweight general obligation bonds relative to our Benchmark.
Over the fiscal year, we continued to maintain the Fund’s intermediate duration profile. The Fund’s modified duration was 5.25 years as of October 31, 2018, which was shorter than the Benchmark’s at 5.65 years. The Fund was overweight the Benchmark in bonds with modified durations of 5 to 7 years and underweight the Benchmark in bonds with modified durations of under 5 years, and 7 years and longer. Because we believe that the very short end of the municipal yield curve could be the most vulnerable to the volatility associated with a Federal Reserve (the “Fed”) rate hike, we have limited the Fund’s exposure to bonds that mature in 1 to 4 years. The Fund’s underweight in longer duration bonds relative to the Benchmark is the result of our view that in rising rate environments, longer duration strategies, which are more interest rate sensitive, generally see the heaviest fund outflows resulting in their respective bond valuations being hardest hit.
Market Outlook
The Federal Open Market Committee (“FOMC”) rounded out the third quarter of 2018 with a 25 bps increase to the federal funds rate in September. This was the third rate hike of 2018 and the eighth increase of the federal funds rate since the Fed began its tightening in December 2015. The FOMC has indicated that it will continue to tighten monetary policy at a gradual pace, supported by future economic data. We expect another increase to the federal funds rate of 25 bps in December 2018, based on strong gross domestic product growth, healthy employment and wage gains, and inflation continuing to be at or above the Fed’s 2% target. In addition, we believe the Fed will continue the process of continuing to shrink its balance sheet in line with its previously announced plan. We also maintain our view that the 10-year U.S. Treasury yield will end the year between 3.00% and 3.25%. The Fed has indicated that continuing rate action will be dependent on supportive economic data, fiscal stimulus, and inflation expectations.
We believe technical factors should be less positive for the municipal bond market. As demonstrated by fund flow data provided by Lipper, mutual fund and ETFs fund flows have recently turned to outflows, which has the effect of pressuring municipal bond prices as funds sell bonds to raise cash to meet shareholder redemptions. With our expectation for gradually higher interest rates, we believe flows into municipal bond funds will likely continue to be volatile during the remainder of 2018. Given the relative attractiveness of risk-adjusted municipal yields versus other asset classes, we believe sustained outflows, which lead to higher yields, will ultimately be viewed by investors as an attractive buying opportunity. Even though year-to-date new issue supply decreased 14.1% from the same
Portfolio Commentary (Continued)
First Trust Managed Municipal ETF (FMB)
Annual Report
October 31, 2018 (Unaudited)
period in 2017, the November-December time frame could bring an increase as historical seasonal trends suggest public finance bankers could bring more deals as year-end approaches, in our opinion.
We expect municipal credit quality to remain stable as trends have been favorable over the past year. Municipal credit quality continued its positive trend year-to-date through October 31, 2018 as evidenced by the fact that just 25 borrowers defaulted for the first time compared to 38 during the same period in 2017. Data available through the second quarter of 2018 also shows favorable credit rating trends, with more Moody’s credit rating upgrades than downgrades.
We maintain positive sector outlooks for senior living, toll roads, airports and special tax districts backed by residential real estate assets. We believe senior living projects, tax increment projects, and special assessment districts should all benefit from a continued recovery and growth in the U.S. residential real estate markets, especially in growing demographic areas such as California, Colorado, Texas and Florida. We continue to exercise caution on hospitals, especially those located in states that adopted the Affordable Care Act and possess high exposures to Medicaid coupled with weak operating cash flow and debt service coverage. We expect expense growth to exceed revenue growth for many hospitals, which should decrease operating cash flow margins and debt service coverage. We are also likely to remain underweight corporate backed municipal bonds due to relatively tight spreads and low yields offered by this sector.
Given our expectation for gradually higher yields, we continue to position the Fund in the intermediate portion of the yield curve. We believe bonds in this area of the curve are typically less interest-rate sensitive, benefit from the steeper yield curve slope, and are less sensitive to Fed rate hikes than shorter dated bonds. Specifically, we currently favor bonds with maturities of 5-12 years, as well as bonds maturing in 13-20 years, but priced to a 6-9 year call. We continue to favor essential service revenue bond sectors such as charter schools, special assessment bonds, senior living, and electric and gas utilities. We will predominantly invest in projects in which we receive a first mortgage or tax lien, as well as a gross revenue pledge. With this as a backdrop, we continue to practice the discipline of our investment process where we perform fundamental credit analysis and quantitative total return scenario analysis on individual bonds and the portfolio as a whole, looking for bonds that can provide both high income and attractive total return potential over time.
First Trust Managed Municipal ETF (FMB)
Understanding Your Fund Expenses
October 31, 2018 (Unaudited)
As a shareholder of the First Trust Managed Municipal ETF (the “Fund”), you incur two types of costs: (1) transaction costs; and (2) ongoing costs, including management fees, distribution and/or service (12b-1) fees, if any, and other Fund expenses. This Example is intended to help you understand your ongoing costs of investing in the Fund and to compare these costs with the ongoing costs of investing in other funds.
The Example is based on an investment of $1,000 invested at the beginning of the period and held through the six-month period ended October 31, 2018.
Actual Expenses
The first line in the following table provides information about actual account values and actual expenses. You may use the information in this line, together with the amount you invested, to estimate the expenses that you paid over the period. Simply divide your account value by $1,000 (for example, an $8,600 account value divided by $1,000 = 8.6), then multiply the result by the number in the first line under the heading entitled “Expenses Paid During the Six-Month Period” to estimate the expenses you paid on your account during this six-month period.
Hypothetical Example for Comparison Purposes
The second line in the following table provides information about hypothetical account values and hypothetical expenses based on the Fund’s actual expense ratio and an assumed rate of return of 5% per year before expenses, which is not the Fund’s actual return. The hypothetical account values and expenses may not be used to estimate the actual ending account balance or expenses you paid for the period. You may use this information to compare the ongoing costs of investing in the Fund and other funds. To do so, compare this 5% hypothetical example with the 5% hypothetical examples that appear in the shareholder reports of the other funds.
Please note that the expenses shown in the table are meant to highlight your ongoing costs only and do not reflect any transactional costs such as brokerage commissions. Therefore, the second line in the table is useful in comparing ongoing costs only, and will not help you determine the relative total costs of owning different funds. In addition, if these transactional costs were included, your costs would have been higher.
| | Beginning
Account Value
May 1, 2018 | Ending
Account Value
October 31, 2018 | Annualized
Expense Ratio
Based on the
Six-Month
Period (a) | Expenses Paid
During the
Six-Month
Period (b) |
| First Trust Managed Municipal ETF (FMB) |
| Actual | $1,000.00 | $1,003.20 | 0.50% | $2.52 |
| Hypothetical (5% return before expenses) | $1,000.00 | $1,022.68 | 0.50% | $2.55 |
| (a) | These expense ratios reflect expense waivers. See Note 3 in the Notes to Financial Statements. |
| (b) | Expenses are equal to the annualized expense ratios as indicated in the table multiplied by the average account value over the period (May 1, 2018 through October 31, 2018), multiplied by 184/365 (to reflect the six-month period). |
First Trust Managed Municipal ETF (FMB)
Portfolio of Investments
October 31, 2018
Principal
Value | | Description | | Stated
Coupon | | Stated
Maturity | | Value |
| MUNICIPAL BONDS – 97.5% |
| | | Alabama – 0.3% | | | | | | |
| $500,000 | | AL St Port Auth Docks Facs Rev Ref Docks Facs Rev, Ser A, AGM, AMT
| | 5.00% | | 10/01/25 | | $553,125 |
| 600,000 | | Mobile AL Impt Dist Sales Tax Rev Mcgowin Park Proj, Ser A
| | 5.00% | | 08/01/25 | | 609,342 |
| | | | | 1,162,467 |
| | | Arizona – 1.9% | | | | | | |
| 1,205,000 | | AZ Brd of Rgts Univ AZ Sys Rev Green Bond, Ser B
| | 5.00% | | 06/01/28 | | 1,384,027 |
| 375,000 | | AZ St Indl Dev Auth Edu Rev Ref Basis Sch Projs, Ser D (a)
| | 5.00% | | 07/01/37 | | 378,124 |
| 750,000 | | AZ St Indl Dev Auth Edu Rev Ref Basis Schs Projs, Ser A (a)
| | 4.00% | | 07/01/21 | | 751,470 |
| 555,000 | | AZ St Indl Dev Auth Edu Rev Ref Basis Schs Projs, Ser A (a)
| | 5.00% | | 07/01/26 | | 581,585 |
| 200,000 | | Maricopa Cnty AZ Indl Dev Auth Edu Rev Greathearts Arizona Projs, Ser C
| | 5.00% | | 07/01/25 | | 224,632 |
| 500,000 | | Maricopa Cnty AZ Indl Dev Auth Edu Rev Ref Horizon Cmnty Learning Ctr Proj
| | 5.00% | | 07/01/35 | | 507,920 |
| 500,000 | | Maricopa Cnty AZ Indl Dev Auth Edu Rev Ref Paradise Schs Projs Paragon Mgmt Inc (a)
| | 4.00% | | 07/01/26 | | 501,390 |
| 1,475,000 | | Maricopa Cnty AZ Spl Hlth Care Dist Aka Maricopa Integrated Hlth Sys, Ser C
| | 5.00% | | 07/01/27 | | 1,699,760 |
| 500,000 | | Phoenix AZ Indl Dev Auth Edu Rev Fac Legacy Traditional Schs Projs, Ser A (a)
| | 4.00% | | 07/01/26 | | 491,230 |
| 200,000 | | Phoenix AZ Indl Dev Auth Student Hsg Rev Ref Downtown Phoenix Student Hsg LLC AZ St Univ Proj, Ser A
| | 5.00% | | 07/01/26 | | 222,134 |
| 510,000 | | Pima Cnty AZ Indl Dev Auth Edu Rev Fac American Leadership Academy Proj (a)
| | 4.00% | | 06/15/22 | | 511,688 |
| 400,000 | | Pima Cnty AZ Indl Dev Auth Edu Rev Ref Fac American Leadership Academy Proj (a)
| | 4.60% | | 06/15/25 | | 408,220 |
| 500,000 | | Tempe AZ Indl Dev Auth Rev Mirabella at ASU Proj, Ser A (a)
| | 6.00% | | 10/01/37 | | 535,585 |
| 275,000 | | Yavapai Cnty AZ Indl Dev Auth Hosp Fac Ref Yavapai Regl Med Ctr
| | 5.00% | | 08/01/23 | | 300,556 |
| | | | | 8,498,321 |
| | | California – 7.7% | | | | | | |
| 320,000 | | Abag CA Fin Auth For Nonprofit Corps Ref Episcopal Sr Cmntys, Ser B
| | 5.00% | | 07/01/23 | | 350,774 |
| 1,000,000 | | CA Sch Fin Auth Sch Fac Rev Alliance Clg Ready Pub Schs Proj, Ser C
| | 4.50% | | 07/01/26 | | 1,068,060 |
| 455,000 | | CA Sch Fin Auth Sch Fac Rev Ref Hlth Learning Proj, Ser A (a)
| | 4.00% | | 07/01/26 | | 471,712 |
| 800,000 | | CA Sch Fin Auth Sch Fac Rev Ref Hlth Learning Proj, Ser A (a)
| | 5.00% | | 07/01/32 | | 864,744 |
| 850,000 | | CA St Cmnty Clg Fing Auth Clg Hsg Rev Orange Coast Pptys LLC Orange Coast Clg Proj
| | 5.25% | | 05/01/43 | | 913,104 |
| 165,000 | | CA St Hlth Facs Fing Auth Rev Adventist Hlth Sys West, Ser A
| | 4.00% | | 03/01/33 | | 167,419 |
| 400,000 | | CA St Hlth Facs Fing Auth Rev Ref Sutter Hlth, Ser B
| | 5.00% | | 11/15/33 | | 453,996 |
| 600,000 | | CA St Hlth Facs Fing Auth Rev Sutter Hlth, Ser A
| | 5.00% | | 11/15/33 | | 687,198 |
| 445,000 | | CA St Muni Fin Auth Chrt Sch Lease Rev Vista Chrt Middle Sch Proj (b)
| | 5.38% | | 07/01/34 | | 445,716 |
| 700,000 | | CA St Muni Fin Auth Chrt Sch Rev Palmdale Aerospace Academy Proj (a)
| | 4.00% | | 07/01/26 | | 706,223 |
| 200,000 | | CA St Muni Fin Auth Rev Channing House Proj, Ser B
| | 5.00% | | 05/15/37 | | 225,850 |
| 500,000 | | CA St Muni Fin Auth Rev Ref Eisenhower Med Ctr, Ser A
| | 5.00% | | 07/01/34 | | 544,685 |
| 680,000 | | CA St Muni Fin Auth Rev Ref Retmnt Hsg Fdtn Oblig Grp, Ser A
| | 5.00% | | 11/15/27 | | 774,234 |
| 650,000 | | CA St Muni Fin Auth Rev Sr Lien Linxs Apm Proj, Ser A, AMT
| | 5.00% | | 06/30/28 | | 731,010 |
| 2,500,000 | | CA St Ref Various Purpose
| | 5.00% | | 10/01/25 | | 2,889,375 |
| 500,000 | | CA St Ref, Ser C
| | 5.00% | | 09/01/32 | | 561,655 |
| 500,000 | | CA St Sch Fin Auth Chrt Sch Rev Summit Pub Schs (a)
| | 5.00% | | 06/01/37 | | 533,750 |
See Notes to Financial Statements
Page 9
First Trust Managed Municipal ETF (FMB)
Portfolio of Investments (Continued)
October 31, 2018
Principal
Value | | Description | | Stated
Coupon | | Stated
Maturity | | Value |
| MUNICIPAL BONDS (Continued) |
| | | California (Continued) | | | | | | |
| $1,000,000 | | CA Stwd Cmntys Dev Auth Rev Loma Linda Univ Med Ctr, Ser A (a)
| | 5.00% | | 12/01/30 | | $1,060,110 |
| 220,000 | | CA Stwd Cmntys Dev Auth Rev Loma Linda Univ Med Ctr, Ser A (a)
| | 5.00% | | 12/01/33 | | 230,571 |
| 800,000 | | CA Stwd Cmntys Dev Auth Rev Ref CA Baptist Univ, Ser A (a)
| | 3.00% | | 11/01/22 | | 800,312 |
| 500,000 | | CA Stwd Cmntys Dev Auth Rev Ref CA Baptist Univ, Ser A (a)
| | 5.00% | | 11/01/32 | | 549,760 |
| 100,000 | | CA Stwd Cmntys Dev Auth Rev Ref Front Porch Cmntys & Svcs, Ser A
| | 5.00% | | 04/01/30 | | 112,555 |
| 195,000 | | CA Stwd Cmntys Dev Auth Rev Ref Front Porch Cmntys & Svcs, Ser A
| | 5.00% | | 04/01/31 | | 218,568 |
| 400,000 | | CA Stwd Cmntys Dev Auth Rev Ref Lancer Eductnl Student Hsg Proj, Ser A (c)
| | 4.00% | | 06/01/21 | | 406,540 |
| 1,160,000 | | Etiwanda CA Sch Dist Cmnty Facs Dist #9 Spl Tax Ref
| | 5.00% | | 09/01/35 | | 1,285,060 |
| 500,000 | | Foothill-De Anza CA Cmnty Clg Dist Ref, COPS
| | 5.00% | | 04/01/32 | | 557,535 |
| 1,000,000 | | Golden St Tobacco Securitization Corp CA Tobacco Settlement Ref, Ser A-1
| | 5.25% | | 06/01/47 | | 1,006,430 |
| 1,360,000 | | Hawthorne CA Cmnty Redev Agy Successor Agy Tax Allocation Ref Sub, AGM
| | 5.00% | | 09/01/32 | | 1,523,241 |
| 2,870,000 | | Kaweah CA Delta Hlth Care Dist Rev, Ser B
| | 5.00% | | 06/01/40 | | 3,049,863 |
| 210,000 | | La Verne CA Ref Brethren Hillcrest Homes, COPS
| | 5.00% | | 05/15/22 | | 227,808 |
| 825,000 | | Lammersville CA Jt Unif Sch Dist Spl Tax Cmnty Facs Dist #2014-1 Impt Area #1 Mountain House Sch Facs
| | 5.00% | | 09/01/42 | | 882,659 |
| 835,000 | | Live Oak CA Sch Dist Santa Cruz Cnty Ref
| | 5.00% | | 08/01/30 | | 946,556 |
| 45,000 | | Long Beach CA Bond Fin Auth Nat Gas Purchase Rev, Ser A
| | 5.25% | | 11/15/23 | | 49,899 |
| 400,000 | | Los Angeles CA Dept of Arpts Arpt Rev Sub Los Angeles Intl Arpt, Ser B, AMT
| | 5.00% | | 05/15/31 | | 444,476 |
| 100,000 | | Marina CA Redev Agy Successor Agy Tax Allocation Hsg, Ser B
| | 5.00% | | 09/01/33 | | 108,565 |
| 325,000 | | Menifee CA Union Sch Dist Pub Fing Auth Spl Tax Rev Ref, Ser A
| | 5.00% | | 09/01/28 | | 364,650 |
| 1,110,000 | | Montebello CA Pub Fing Auth Rev Montebello Home2 Suites Hilton Hotel Proj, Ser A
| | 5.00% | | 06/01/32 | | 1,233,254 |
| 560,000 | | River Islands CA Pub Fing Auth Spl Tax Ref Cmnty Facs Dist #2003-1
| | 5.38% | | 09/01/31 | | 592,374 |
| 200,000 | | Sacramento CA Transient Occupapancy Tax Rev Sub Convention Ctr Complex, Ser C
| | 5.00% | | 06/01/32 | | 229,142 |
| 500,000 | | Sacramento CA Transient Occupapancy Tax Rev Sub Convention Ctr Complex, Ser C
| | 5.00% | | 06/01/35 | | 561,455 |
| 350,000 | | San Diego Cnty CA Limited Rev Obligs Ref Sanford Burnham Prebys Med Discovery Institute, Ser A
| | 5.00% | | 11/01/25 | | 399,816 |
| 600,000 | | San Diego Cnty CA Limited Rev Obligs Ref Sanford Burnham Prebys Med Discovery Institute, Ser A
| | 5.00% | | 11/01/26 | | 680,088 |
| 945,000 | | San Diego Cnty CA Regl Arpt Auth Sr, Ser B, AMT
| | 5.00% | | 07/01/30 | | 1,027,943 |
| 1,250,000 | | San Diego Cnty CA Regl Transprtn Commission, Ser A
| | 5.00% | | 04/01/35 | | 1,418,600 |
| 1,000,000 | | San Francisco CA City & Cnty Arpts Commn Intl Arpt Rev Ref, Ser D, AMT
| | 5.00% | | 05/01/22 | | 1,090,580 |
| 280,000 | | San Francisco City & Cnty CA Redev Agy Successor Agy Tax Ref Mission Bay N Redev Proj, Ser A
| | 5.00% | | 08/01/35 | | 313,104 |
| 100,000 | | Temecula Vly Unif Sch Dist Fing Auth CA Spl Tax Rev, BAM
| | 5.00% | | 09/01/34 | | 110,297 |
| 1,050,000 | | Victor CA Elem Sch Dist Cmnty Facs Dist Spl Tax Ref 2005-1, BAM
| | 5.00% | | 09/01/46 | | 1,147,471 |
| | | | | 35,018,787 |
| | | Colorado – 4.6% | | | | | | |
| 500,000 | | Base Vlg Met Dist #2 CO Ref, Ser A (b)
| | 5.50% | | 12/01/36 | | 495,625 |
| 455,000 | | Buffalo Ridge CO Met Dist Ref & Impt Sr, Ser A, BAM
| | 5.00% | | 12/01/25 | | 512,962 |
Page 10
See Notes to Financial Statements
First Trust Managed Municipal ETF (FMB)
Portfolio of Investments (Continued)
October 31, 2018
Principal
Value | | Description | | Stated
Coupon | | Stated
Maturity | | Value |
| MUNICIPAL BONDS (Continued) |
| | | Colorado (Continued) | | | | | | |
| $250,000 | | Buffalo Ridge CO Met Dist Ref & Impt Sr, Ser A, BAM
| | 5.00% | | 12/01/26 | | $283,145 |
| 500,000 | | Castle Oaks CO Met Dist #3 Ref (b)
| | 5.00% | | 12/01/37 | | 491,530 |
| 500,000 | | Centerra CO Met Dist #1 Spl Rev Dist #1 (c)
| | 5.00% | | 12/01/22 | | 532,975 |
| 1,000,000 | | Centerra CO Met Dist #1 Spl Rev Dist #1 (c)
| | 5.00% | | 12/01/29 | | 1,054,160 |
| 300,000 | | CO St Hlth Facs Auth Hosp Rev Ref Frasier Meadows Retmnt Cmnty Proj, Ser A
| | 5.00% | | 05/15/25 | | 324,807 |
| 350,000 | | CO St Hlth Facs Auth Hosp Rev Ref Frasier Meadows Retmnt Cmnty Proj, Ser A
| | 5.00% | | 05/15/26 | | 378,962 |
| 605,000 | | CO St Hlth Facs Auth Rev Ref Covenant Retmnt Cmntys, Ser A
| | 5.00% | | 12/01/27 | | 646,570 |
| 525,000 | | CO St Hlth Facs Auth Rev Ref Covenant Retmnt Cmntys, Ser A
| | 5.00% | | 12/01/33 | | 552,237 |
| 500,000 | | Copperleaf CO Met Dist #2 Ref (b)
| | 5.25% | | 12/01/30 | | 520,530 |
| 2,000,000 | | Crowfoot Vly Ranch Met Dist #2 CO, Ser A (b)
| | 5.63% | | 12/01/38 | | 1,934,520 |
| 1,000,000 | | Denver CO City & Cnty Dedicated Tax Rev, Ser A-1
| | 5.00% | | 08/01/41 | | 1,098,830 |
| 90,000 | | Denver CO Convention Ctr Hotel Auth Rev Ref Sr
| | 5.00% | | 12/01/24 | | 98,885 |
| 600,000 | | Denver CO Hlth & Hosp Auth 550 Acoma Inc, COPS
| | 5.00% | | 12/01/26 | | 665,082 |
| 55,000 | | E-470 CO Pub Highway Auth Capital Appreciation Sr, Ser B, NATL-RE
| | (d) | | 09/01/22 | | 49,724 |
| 250,000 | | Harvest Junction CO Met Dist Ref & Impt
| | 5.00% | | 12/01/30 | | 256,383 |
| 860,000 | | Lakes at Centerra Met Dist No 2 CO Impt, Ser A (b)
| | 4.63% | | 12/01/27 | | 853,361 |
| 100,000 | | Lorson Ranch Met Dist #2 CO
| | 4.00% | | 12/01/24 | | 106,954 |
| 170,000 | | Lorson Ranch Met Dist #2 CO
| | 5.00% | | 12/01/27 | | 188,312 |
| 1,000,000 | | North Park Met Dist #1 Spl Rev, Ser A-2
| | 5.13% | | 12/01/28 | | 999,570 |
| 2,460,000 | | Park Creek CO Met Dist Rev Ref Sr Limited Property Tax Supported, Ser A
| | 5.00% | | 12/01/24 | | 2,751,854 |
| 150,000 | | Park Creek CO Met Dist Rev Ref Sr Limited Property Tax Supported, Ser A
| | 5.00% | | 12/01/34 | | 163,311 |
| 155,000 | | Park Creek CO Met Dist Rev Ref Sr Limited Property Tax Supported, Ser A
| | 5.00% | | 12/01/35 | | 167,747 |
| 30,000 | | Park Creek CO Met Dist Rev Sr, Ser A, NATL-RE
| | 5.00% | | 12/01/24 | | 33,559 |
| 500,000 | | Parker Homestead Met Dist CO Ref (b)
| | 5.63% | | 12/01/44 | | 518,840 |
| 1,000,000 | | Prairie Ctr CO Met Dist #3 Ltd Property Tax Supported Pri Ref, Ser A (c)
| | 4.13% | | 12/15/27 | | 996,580 |
| 160,000 | | Pub Auth for CO St Energy Nat Gas Purchase Rev
| | 6.13% | | 11/15/23 | | 181,050 |
| 550,000 | | Serenity Ridge CO Met Dist #2 Ref, Ser A (b)
| | 5.13% | | 12/01/37 | | 554,862 |
| 750,000 | | Sierra Ridge Met Dist No 2 CO Sr, Ser A (b)
| | 4.50% | | 12/01/31 | | 717,060 |
| 500,000 | | Southglenn CO Met Dist Spl Rev Ref (b)
| | 5.00% | | 12/01/30 | | 504,150 |
| 175,000 | | Sterling Hills CO W Met Dist Ref
| | 5.00% | | 12/01/32 | | 189,875 |
| 1,800,000 | | Takoda CO Met Dist Ref
| | 6.00% | | 12/01/36 | | 2,030,814 |
| | | | | 20,854,826 |
| | | Connecticut – 1.7% | | | | | | |
| 250,000 | | CT St Hlth & Eductnl Facs Auth Rev Fairfield Univ, Ser Q-1
| | 5.00% | | 07/01/46 | | 268,225 |
| 1,000,000 | | CT St Hlth & Eductnl Facs Auth Rev Quinnipiac Univ Ref, Ser M
| | 5.00% | | 07/01/36 | | 1,088,800 |
| 1,000,000 | | CT St Hlth & Eductnl Facs Auth Rev Ref Fairfield Univ, Ser S
| | 5.00% | | 07/01/26 | | 1,133,060 |
| 2,250,000 | | CT St Hlth & Eductnl Facs Auth Rev Ref Quinnipiac Univ, Ser L
| | 5.00% | | 07/01/31 | | 2,477,048 |
| 1,445,000 | | CT St, Ser A
| | 5.00% | | 04/15/29 | | 1,590,179 |
| 500,000 | | Hamden CT, BAM
| | 6.00% | | 08/15/33 | | 592,310 |
| 500,000 | | Harbor Point CT Infrastructure Impt Dist Spl Oblg Rev Ref Harbor Point Proj Limited (a)
| | 5.00% | | 04/01/39 | | 516,625 |
| | | | | 7,666,247 |
| | | District of Columbia – 0.7% | | | | | | |
| 3,000,000 | | DC Wtr & Swr Auth Pub Utility Rev Ref Sub Lien, Ser A
| | 5.00% | | 10/01/36 | | 3,328,740 |
See Notes to Financial Statements
Page 11
First Trust Managed Municipal ETF (FMB)
Portfolio of Investments (Continued)
October 31, 2018
Principal
Value | | Description | | Stated
Coupon | | Stated
Maturity | | Value |
| MUNICIPAL BONDS (Continued) |
| | | Florida – 7.3% | | | | | | |
| $150,000 | | Belle Isle FL Chrt Sch Lease Rev Cornerstone Chrt Academy & Cornerstone Chrt High Sch
| | 5.50% | | 10/01/22 | | $157,412 |
| 300,000 | | Bexley CDD FL Spl Assmnt Rev
| | 4.10% | | 05/01/26 | | 296,874 |
| 210,000 | | Bonterra Cmnty Dev Dist FL Spl Assmnt Sr, Ser A-1
| | 3.13% | | 05/01/26 | | 203,496 |
| 500,000 | | Brookstone CDD FL Spl Assmnt Rev CDD (a)
| | 3.88% | | 11/01/23 | | 496,300 |
| 605,000 | | Broward Cnty FL Fuel Sys Rev Ft Lauderdale Fuel Facs, Ser A, AGM, AMT
| | 5.00% | | 04/01/22 | | 648,850 |
| 250,000 | | Citizens Property Insurance Corp FL, Ser A-1
| | 5.00% | | 06/01/22 | | 269,495 |
| 25,000 | | Escambia Cnty FL Hlth Facs Auth Baptist Hosp Inc Proj, Ser A
| | 5.00% | | 08/15/19 | | 25,548 |
| 280,000 | | Escambia Cnty FL Hlth Facs Auth Baptist Hosp Inc Proj, Ser A
| | 5.50% | | 08/15/24 | | 294,773 |
| 575,000 | | Harmony FL CDD Capital Impt Rev Ref, Ser 2015
| | 4.75% | | 05/01/25 | | 574,362 |
| 365,000 | | Heritage Harbour FL N CDD Capital Impt Rev Ref Sr Lien, Ser A-1, AGM
| | 5.00% | | 05/01/25 | | 398,565 |
| 125,000 | | Hollywood FL Cmnty Redev Agy Redev Rev Ref
| | 5.00% | | 03/01/23 | | 135,130 |
| 1,000,000 | | Jacksonville FL Hlth Care Facs Rev Ref Baptist Hlth
| | 5.00% | | 08/15/35 | | 1,110,960 |
| 1,500,000 | | Jacksonville FL Spl Rev Ref Spl Rev, Ser A
| | 5.00% | | 10/01/31 | | 1,671,870 |
| 1,000,000 | | Jacksonville FL Spl Rev Ref Spl Rev, Ser B
| | 5.00% | | 10/01/28 | | 1,150,580 |
| 1,230,000 | | Lakeland FL Hosp Sys Rev Lakeland Regl Hlth
| | 5.00% | | 11/15/33 | | 1,331,672 |
| 1,395,000 | | Mediterra FL S CDD Capital Impt Rev Ref
| | 5.10% | | 05/01/31 | | 1,470,218 |
| 500,000 | | Miami FL Hlth Facs Auth Ref Miami Jewish Hlth Sys Oblig Grp
| | 5.00% | | 07/01/23 | | 543,200 |
| 520,000 | | Miami FL Hlth Facs Auth Ref Miami Jewish Hlth Sys Oblig Grp
| | 5.00% | | 07/01/25 | | 572,146 |
| 500,000 | | Miami FL Spl Oblig Ref (a)
| | 5.00% | | 03/01/30 | | 542,635 |
| 375,000 | | Miami World Ctr CDD FL Spl Assmnt (a)
| | 4.00% | | 11/01/23 | | 378,206 |
| 275,000 | | Miami World Ctr CDD FL Spl Assmnt (a)
| | 4.75% | | 11/01/27 | | 280,769 |
| 515,000 | | Miami-Dade Cnty FL Aviation Rev Ref, Ser A, AMT
| | 5.00% | | 10/01/27 | | 554,135 |
| 1,000,000 | | Miami-Dade Cnty FL Eductnl Facs Auth Rev Ref Univ Miami, Ser A
| | 5.00% | | 04/01/31 | | 1,105,430 |
| 445,000 | | Miami-Dade Cnty FL Indl Dev Auth Doral Academy Proj
| | 5.00% | | 01/15/25 | | 479,332 |
| 550,000 | | Miami-Dade Cnty FL Indl Dev Auth Doral Academy Proj
| | 5.00% | | 01/15/32 | | 581,113 |
| 1,210,000 | | Miami-Dade Cnty FL Indl Dev Auth Doral Academy Proj
| | 5.00% | | 01/15/37 | | 1,260,651 |
| 1,080,000 | | Miami-Dade Cnty FL Spl Oblig Sub Ref
| | 5.00% | | 10/01/35 | | 1,185,624 |
| 565,000 | | Nthrn Palm Beach Cnty FL Impt Dist
| | 3.25% | | 08/01/22 | | 563,994 |
| 355,000 | | Nthrn Palm Beach Cnty FL Impt Dist
| | 5.00% | | 08/01/37 | | 364,077 |
| 680,000 | | Orange Cnty FL Hlth Facs Auth Rev Presbyterian Retmnt Cmntys Proj
| | 5.00% | | 08/01/29 | | 729,354 |
| 345,000 | | Orange Cnty FL Hlth Facs Auth Rev Presbyterian Retmnt Cmntys Proj
| | 5.00% | | 08/01/34 | | 364,896 |
| 70,000 | | Orange Cnty FL Hlth Facs Auth Rev Ref Mayflower Retmnt Ctr
| | 5.00% | | 06/01/32 | | 72,270 |
| 4,135,000 | | Orange Cnty FL Hlth Facs Auth Rev Ref Orlando Hlth Inc, Ser A
| | 5.00% | | 10/01/36 | | 4,485,979 |
| 825,000 | | Orange Cnty FL Hlth Facs Auth Rev Ref Presbyterian Retmnt Cmntys
| | 5.00% | | 08/01/31 | | 892,427 |
| 1,000,000 | | Orange Cnty FL Hlth Facs Auth Rev Ref Presbyterian Retmnt Cmntys
| | 5.00% | | 08/01/41 | | 1,062,570 |
| 305,000 | | Palm Beach Cnty FL Hlth Facs Auth Rev Lifespace Cmntys Inc, Ser B
| | 5.00% | | 05/15/31 | | 321,452 |
| 55,000 | | Port Saint Lucie FL Cmnty Redev Agy Rev Ref
| | 5.00% | | 01/01/23 | | 60,198 |
| 725,000 | | Sarasota Cnty FL Hlth Facs Auth Retmnt Fac Rev Ref Vlg of Isle Proj
| | 5.00% | | 01/01/25 | | 776,903 |
| 120,000 | | Sarasota Cnty FL Hlth Facs Auth Retmnt Fac Rev Ref Vlg of Isle Proj
| | 5.00% | | 01/01/26 | | 128,951 |
| 150,000 | | Sarasota Cnty FL Hlth Facs Auth Retmnt Fac Rev Ref Vlg of Isle Proj
| | 5.00% | | 01/01/31 | | 158,213 |
| 100,000 | | Sarasota Cnty FL Hlth Facs Auth Retmnt Fac Rev Ref Vlg of Isle Proj
| | 5.00% | | 01/01/32 | | 105,122 |
| 2,250,000 | | SE Overtown Park W Cmnty Redev Agy FL Tax, Ser A-1 (a)
| | 5.00% | | 03/01/30 | | 2,418,390 |
Page 12
See Notes to Financial Statements
First Trust Managed Municipal ETF (FMB)
Portfolio of Investments (Continued)
October 31, 2018
Principal
Value | | Description | | Stated
Coupon | | Stated
Maturity | | Value |
| MUNICIPAL BONDS (Continued) |
| | | Florida (Continued) | | | | | | |
| $500,000 | | Six Mile Creek FL CDD Capital Impt Rev Ref Assmnt Area 2 Phase 2, Ser B
| | 5.35% | | 11/01/29 | | $486,240 |
| 500,000 | | Tallahassee FL Energy Sys Rev Energy Sys
| | 5.00% | | 10/01/29 | | 565,960 |
| 1,500,000 | | Tallahassee FL Energy Sys Rev Energy Sys
| | 5.00% | | 10/01/30 | | 1,695,255 |
| 250,000 | | Timber Creek CDD FL Spl Assmnt Rev (a)
| | 4.13% | | 11/01/24 | | 247,448 |
| 100,000 | | UCF Stadium Corp FL Rev Ref, Ser A
| | 5.00% | | 03/01/24 | | 111,554 |
| 75,000 | | Vlg FL CDD #6 Spl Assmnt Rev Ref
| | 4.00% | | 05/01/25 | | 77,471 |
| | | | | 33,408,070 |
| | | Georgia – 2.7% | | | | | | |
| 650,000 | | Atlanta GA Tax Allocation Ref Eastside Proj
| | 5.00% | | 01/01/30 | | 716,904 |
| 315,000 | | East Point GA Tax Allocation Ref
| | 5.00% | | 08/01/21 | | 337,507 |
| 1,085,000 | | Fulton Cnty GA Rsdl Care Facs Elderly Auth Retmnt Fac Rev Ref Lenbrook Sq Fdtn Inc
| | 5.00% | | 07/01/31 | | 1,148,603 |
| 2,530,000 | | GA St Ref, Ser F
| | 5.00% | | 07/01/25 | | 2,926,046 |
| 40,000 | | Gainesville & Hall Cnty GA Hosp Auth Ref NE GA Hlth Sys Inc Proj, Ser A
| | 5.00% | | 02/15/26 | | 44,838 |
| 175,000 | | Main Street Nat Gas Inc GA Gas Rev, Ser A
| | 5.50% | | 09/15/23 | | 195,603 |
| 775,000 | | Marietta GA Dev Auth Ref Univ Facs Life Univ, Ser A (a)
| | 5.00% | | 11/01/27 | | 839,782 |
| 560,000 | | Priv Clgs & Univs Auth GA Mercer Univ Proj, Ser C
| | 5.25% | | 10/01/27 | | 596,590 |
| 925,000 | | Priv Clgs & Univs Auth GA Savannah Clg of Art & Design Proj
| | 5.00% | | 04/01/33 | | 990,980 |
| 4,125,000 | | Priv Clgs & Univs Auth GA Savannah Clg of Art & Design Proj
| | 5.00% | | 04/01/44 | | 4,350,555 |
| | | | | 12,147,408 |
| | | Guam – 0.1% | | | | | | |
| 245,000 | | Guam Govt Business Privilege Tax Rev, Ser B-1
| | 5.00% | | 01/01/37 | | 252,274 |
| 300,000 | | Guam Port Auth Port Rev, Ser B, AMT
| | 5.00% | | 07/01/32 | | 317,907 |
| 75,000 | | Guam Pwr Auth Rev Ref, Ser A, AGM
| | 5.00% | | 10/01/20 | | 78,625 |
| | | | | 648,806 |
| | | Hawaii – 0.7% | | | | | | |
| 195,000 | | HI St Dept of Budget & Fin Spl Purpose Rev Ref HI Pacific Hlth Oblig Grp, Ser B
| | 5.00% | | 07/01/30 | | 210,701 |
| 110,000 | | HI St Pacific Hlth Spl Purpose Rev, Ser B
| | 5.63% | | 07/01/30 | | 116,267 |
| 500,000 | | Honolulu City & Cnty HI Wstwtr Sys Rev Ref Junior, Ser A
| | 5.00% | | 07/01/20 | | 523,490 |
| 2,450,000 | | Honolulu City & Cnty HI Wstwtr Sys Rev Ref Sr First Bd Resolution, Ser B
| | 4.00% | | 07/01/32 | | 2,532,467 |
| | | | | 3,382,925 |
| | | Idaho – 0.6% | | | | | | |
| 1,000,000 | | ID St Hlth Facs Auth Rev Ref Madison Memorial Hosp
| | 5.00% | | 09/01/37 | | 1,033,960 |
| 255,000 | | ID St Hlth Facs Auth Rev Ref Vly Vista Care Corp, Ser A
| | 5.00% | | 11/15/32 | | 259,636 |
| 985,000 | | ID St Hlth Facs Auth Rev St Lukes Hlth Sys Proj, Ser A
| | 5.00% | | 03/01/44 | | 1,048,345 |
| 500,000 | | ID St Hlth Facs Auth Rev Trinity Hlth Ref, Ser D
| | 5.00% | | 12/01/33 | | 536,510 |
| | | | | 2,878,451 |
| | | Illinois – 3.8% | | | | | | |
| 1,000,000 | | Bolingbrook IL Ref, Ser A, AGM
| | 5.00% | | 01/01/30 | | 1,110,060 |
| 1,000,000 | | Bolingbrook IL Ref, Ser A, AGM
| | 5.00% | | 01/01/31 | | 1,105,120 |
| 130,000 | | Chicago IL Brd of Edu Cap Apprec Sch Reform, Ser B-1
| | (d) | | 12/01/22 | | 112,657 |
| 500,000 | | Chicago IL Brd of Edu Ref Dedicated, Ser C
| | 5.00% | | 12/01/30 | | 512,825 |
| 1,975,000 | | Chicago IL Brd of Edu Ref, Ser F
| | 5.00% | | 12/01/31 | | 1,983,808 |
| 625,000 | | Chicago IL Brd of Edu, Ser A
| | 5.50% | | 12/01/39 | | 635,219 |
| 305,000 | | Chicago IL O’Hare International Arpt Rev Ref Gen Sr Lien, Ser A, AMT
| | 5.00% | | 01/01/30 | | 331,135 |
| 400,000 | | Chicago IL O’Hare International Arpt Rev, Ser C, AMT
| | 5.00% | | 01/01/34 | | 431,380 |
See Notes to Financial Statements
Page 13
First Trust Managed Municipal ETF (FMB)
Portfolio of Investments (Continued)
October 31, 2018
Principal
Value | | Description | | Stated
Coupon | | Stated
Maturity | | Value |
| MUNICIPAL BONDS (Continued) |
| | | Illinois (Continued) | | | | | | |
| $160,000 | | Chicago IL Ref Proj, Ser A
| | 5.00% | | 01/01/27 | | $167,846 |
| 710,000 | | Chicago IL Ref Proj, Ser A
| | 5.00% | | 01/01/35 | | 729,113 |
| 500,000 | | Chicago IL Ref, Ser A
| | 5.63% | | 01/01/29 | | 556,825 |
| 150,000 | | Chicago IL Ref, Ser C
| | 4.00% | | 01/01/22 | | 151,595 |
| 70,000 | | Chicago IL Ref, Ser C
| | 5.00% | | 01/01/22 | | 73,223 |
| 500,000 | | Chicago IL Ref, Ser C
| | 5.00% | | 01/01/25 | | 534,085 |
| 270,000 | | Chicago IL Ref, Ser C
| | 5.00% | | 01/01/26 | | 289,265 |
| 40,000 | | Chicago IL Ref, Ser C
| | 5.00% | | 01/01/38 | | 41,038 |
| 285,000 | | Chicago IL Ref, Ser C, CABS
| | (d) | | 01/01/22 | | 253,787 |
| 100,000 | | Chicago IL Ref, Ser C, CABS
| | (d) | | 01/01/24 | | 81,257 |
| 505,000 | | Hampshire IL Spl Svc Area #14 Spl Tax Ref Lakewood Crossing, BAM
| | 4.00% | | 03/01/25 | | 519,499 |
| 230,000 | | IL St
| | 5.00% | | 05/01/23 | | 239,669 |
| 500,000 | | IL St Fin Auth Rev Loc Govt Program E Prairie Sch Dist #73 Proj, BAM
| | 5.00% | | 12/01/30 | | 555,025 |
| 70,000 | | IL St Fin Auth Rev Ref Lifespace Cmntys, Ser A
| | 5.00% | | 05/15/24 | | 75,205 |
| 845,000 | | IL St Fin Auth Rev Ref Mercy Hlth System Obligated Grp
| | 5.00% | | 12/01/33 | | 915,853 |
| 1,010,000 | | IL St Fin Auth Rev Sthrn IL Hlth Care, Ser A
| | 5.00% | | 03/01/47 | | 1,070,620 |
| 600,000 | | IL St Fin Auth Student Hsg & Academic Fac Rev Chf Chicago LLC Univ IL Chicago Proj, Ser A
| | 5.00% | | 02/15/26 | | 656,604 |
| 500,000 | | IL St Fin Auth Student Hsg & Academic Fac Rev Chf Chicago LLC Univ IL Chicago Proj, Ser A
| | 5.00% | | 02/15/27 | | 549,365 |
| 315,000 | | IL St Fin Auth Student Hsg & Academic Fac Rev Chf Chicago LLC Univ IL Chicago Proj, Ser A
| | 5.00% | | 02/15/32 | | 339,576 |
| 80,000 | | IL St Ref
| | 4.00% | | 08/01/25 | | 78,695 |
| 470,000 | | IL St, Ser A
| | 4.00% | | 01/01/25 | | 465,173 |
| 1,500,000 | | IL St, Ser A
| | 5.00% | | 12/01/26 | | 1,559,565 |
| 520,000 | | IL St, Ser D
| | 5.00% | | 11/01/24 | | 541,575 |
| 820,000 | | IL St, Ser D
| | 5.00% | | 11/01/26 | | 852,866 |
| | | | | 17,519,528 |
| | | Indiana – 1.3% | | | | | | |
| 1,000,000 | | Evansville IN Mf Hsg Rev Silver Birch Evansville Proj
| | 5.45% | | 01/01/38 | | 960,860 |
| 110,000 | | IN St Fin Auth Rev BHI Sr Living
| | 5.50% | | 11/15/31 | | 116,609 |
| 800,000 | | IN St Fin Auth Rev Eductnl Facs Rock Creek Cmnty Academy Proj, Ser A (a)
| | 5.25% | | 07/01/28 | | 793,368 |
| 1,000,000 | | IN St Fin Auth Rev Eductnl Facs Rock Creek Cmnty Academy Proj, Ser A (a)
| | 5.88% | | 07/01/38 | | 969,880 |
| 20,000 | | IN St Fin Auth Rev Greencroft Oblig Grp, Ser A
| | 5.00% | | 11/15/23 | | 21,156 |
| 460,000 | | IN St Fin Auth Rev Greencroft Oblig Grp, Ser A
| | 5.75% | | 11/15/28 | | 491,192 |
| 40,000 | | IN St Fin Auth Rev Greencroft Oblig Grp, Ser A
| | 6.00% | | 11/15/28 | | 43,162 |
| 275,000 | | IN St Fin Auth Rev Ref Rev Cmnty Fdtn of NW IN
| | 5.00% | | 09/01/31 | | 302,830 |
| 500,000 | | Mishawaka IN Mf Hsg Rev Silver Birch Mishawaka Proj (a)
| | 5.10% | | 01/01/32 | | 487,335 |
| 1,700,000 | | Plainfield IN Mf Hsg Rev Glasswater Creek Proj
| | 5.38% | | 09/01/38 | | 1,654,406 |
| | | | | 5,840,798 |
| | | Iowa – 1.0% | | | | | | |
| 500,000 | | Coralville IA Annual Approp, Ser D
| | 4.00% | | 05/01/24 | | 501,225 |
| 260,000 | | Coralville IA Ref Annual Approp, Ser B
| | 4.00% | | 05/01/24 | | 259,366 |
| 315,000 | | Coralville IA Ref Annual Approp, Ser B
| | 4.00% | | 05/01/26 | | 309,393 |
| 2,385,000 | | Coralville IA Ref, Ser A
| | 5.00% | | 05/01/38 | | 2,408,754 |
| 1,000,000 | | IA St Fin Auth Rev Lifespace Cmntys, Ser A
| | 5.00% | | 05/15/43 | | 1,027,250 |
| | | | | 4,505,988 |
| | | Kansas – 1.6% | | | | | | |
| 475,000 | | Hutchinson KS Hosp Facs Rev Hutchinson Regl Med Ctr Inc
| | 5.00% | | 12/01/25 | | 513,755 |
Page 14
See Notes to Financial Statements
First Trust Managed Municipal ETF (FMB)
Portfolio of Investments (Continued)
October 31, 2018
Principal
Value | | Description | | Stated
Coupon | | Stated
Maturity | | Value |
| MUNICIPAL BONDS (Continued) |
| | | Kansas (Continued) | | | | | | |
| $1,240,000 | | KS Muni Energy Agy Pwr Proj Rev Dogwood Proj, Ser A, BAM
| | 5.00% | | 04/01/29 | | $1,364,756 |
| 1,470,000 | | KS Muni Energy Agy Pwr Proj Rev Dogwood Proj, Ser A, BAM
| | 5.00% | | 04/01/30 | | 1,610,841 |
| 1,045,000 | | Lenexa KS Hlth Care Fac Rev Ref Lakeview Vlg Inc, Ser A
| | 5.00% | | 05/15/26 | | 1,125,779 |
| 1,500,000 | | Wichita KS Hlth Care Facs Rev Ref Presbyterian Manors, Ser I
| | 3.75% | | 05/15/23 | | 1,500,855 |
| 500,000 | | Wichita KS Hlth Care Facs Rev Ref Presbyterian Manors, Ser I
| | 5.00% | | 05/15/33 | | 518,415 |
| 475,000 | | Wyandotte Cnty/Kansas City KS Unif Govt Utility Sys Rev Ref & Impt, Ser A
| | 5.00% | | 09/01/29 | | 525,450 |
| | | | | 7,159,851 |
| | | Kentucky – 1.9% | | | | | | |
| 1,000,000 | | Estrn KY Univ Gen Recpts, Ser A
| | 5.00% | | 04/01/25 | | 1,120,210 |
| 145,000 | | KY St Econ Dev Fin Auth Baptist Hlth Care Sys, Ser B
| | 5.00% | | 08/15/28 | | 159,022 |
| 750,000 | | KY St Econ Dev Fin Auth Owensboro Med Hlth Sys, Ser A
| | 6.00% | | 06/01/30 | | 794,498 |
| 375,000 | | KY St Econ Dev Fin Auth Ref Owensboro Hlth, Ser A
| | 5.00% | | 06/01/19 | | 379,796 |
| 300,000 | | KY St Muni Pwr Agy Pwr Sys Rev Ref, Ser A, NATL-RE
| | 5.00% | | 09/01/22 | | 325,167 |
| 2,925,000 | | KY St Pub Energy Auth Gas Sply Rev Gas Sply, Ser B
| | 4.00% | | 01/01/49 | | 3,074,935 |
| 2,485,000 | | Louisville & Jefferson Cnty KY Met Govt Hlth Sys Rev Ref Norton Healthcare Inc, Ser A
| | 5.00% | | 10/01/30 | | 2,737,029 |
| 50,000 | | Russell KY Rev Bon Secours Hlth Sys
| | 5.00% | | 11/01/22 | | 54,647 |
| 100,000 | | Warren Cnty KY Hosp Rev Ref Bowling Green Warren Cnty Cmnty Hosp Corp
| | 5.00% | | 04/01/23 | | 108,338 |
| | | | | 8,753,642 |
| | | Louisiana – 1.5% | | | | | | |
| 1,000,000 | | LA Pub Facs Auth Rev Ref Ochsner Clinic Fdtn Proj
| | 5.00% | | 05/15/36 | | 1,077,700 |
| 250,000 | | LA St Loc Govt Envrnmntl Facs & Cmnty Dev Auth Rev Ascension Psh Courthouse Proj
| | 5.00% | | 11/01/31 | | 277,617 |
| 390,000 | | LA Stadium & Exposition Dist LA Ref Sr, Ser A
| | 5.00% | | 07/01/30 | | 426,539 |
| 380,000 | | LA Stadium & Exposition Dist LA Ref Sr, Ser A
| | 5.00% | | 07/01/31 | | 413,695 |
| 200,000 | | New Orleans LA Aviation Brd Gen Arpt N Term, Ser B, AMT
| | 5.00% | | 01/01/31 | | 218,756 |
| 1,050,000 | | New Orleans LA Wtr Rev Ref
| | 5.00% | | 12/01/28 | | 1,162,833 |
| 1,305,000 | | New Orleans LA Wtr Rev Wtr Rev
| | 5.00% | | 12/01/34 | | 1,425,073 |
| 1,575,000 | | Shreveport LA Wtr & Swr Rev, Ser B, BAM
| | 5.00% | | 12/01/30 | | 1,734,138 |
| | | | | 6,736,351 |
| | | Maryland – 2.8% | | | | | | |
| 1,120,000 | | Baltimore MD Rev Ref Sr, Ser B
| | 5.00% | | 07/01/33 | | 1,239,840 |
| 1,000,000 | | Baltimore MD Spl Oblig Ref E Baltimore Research Park Proj, Ser A
| | 5.00% | | 09/01/38 | | 1,045,690 |
| 975,000 | | Gaithersburg MD Econ Dev Rev Ref Proj Asbury MD Oblig Grp, Ser A
| | 4.50% | | 01/01/25 | | 1,045,522 |
| 125,000 | | Howard Cnty MD Retmnt Cmnty Rev Ref Vantage House Fac
| | 5.00% | | 04/01/21 | | 128,161 |
| 500,000 | | Howard Cnty MD Retmnt Cmnty Rev Ref Vantage House Fac
| | 5.00% | | 04/01/26 | | 521,760 |
| 220,000 | | MD St Econ Dev Corp Econ Dev Rev Transn Facs Proj, Ser A
| | 5.38% | | 06/01/25 | | 231,279 |
| 600,000 | | MD St Econ Dev Corp Student Hsg Rev Ref Sr Univ MD Proj
| | 4.00% | | 07/01/24 | | 624,348 |
| 2,490,000 | | MD St Econ Dev Corp Student Hsg Rev Ref Univ MD Clg Park Projs, AGM
| | 5.00% | | 06/01/35 | | 2,750,703 |
| 500,000 | | MD St Hlth & Hgr Eductnl Facs Auth Rev Adventist Hlth Care Obligated Grp, Ser A
| | 5.50% | | 01/01/26 | | 570,330 |
| 800,000 | | MD St Hlth & Hgr Eductnl Facs Auth Rev Ref Anne Arundel Hlth System, Ser A
| | 5.00% | | 07/01/30 | | 892,144 |
| 1,000,000 | | MD St Hlth & Hgr Eductnl Facs Auth Rev Ref Anne Arundel Hlth System, Ser A
| | 5.00% | | 07/01/32 | | 1,106,500 |
| 1,500,000 | | Prince Georges Cnty MD Rev Ref Collington Episcopal Life Care Cmnty Inc
| | 5.00% | | 04/01/25 | | 1,593,660 |
See Notes to Financial Statements
Page 15
First Trust Managed Municipal ETF (FMB)
Portfolio of Investments (Continued)
October 31, 2018
Principal
Value | | Description | | Stated
Coupon | | Stated
Maturity | | Value |
| MUNICIPAL BONDS (Continued) |
| | | Maryland (Continued) | | | | | | |
| $365,000 | | Rockville MD Mayor & Council Econ Dev Rev Ref Ingelside at King Farm Proj, Ser A-1
| | 5.00% | | 11/01/27 | | $396,204 |
| 250,000 | | Rockville MD Mayor & Council Econ Dev Rev Ref Ingelside at King Farm Proj, Ser A-2
| | 3.38% | | 11/01/27 | | 240,305 |
| 375,000 | | Rockville MD Mayor & Council Econ Dev Rev Ref Ingelside at King Farm Proj, Ser A-2
| | 5.00% | | 11/01/28 | | 404,869 |
| | | | | 12,791,315 |
| | | Massachusetts – 1.2% | | | | | | |
| 250,000 | | MA St Dev Fin Agy Rev Linden Ponds Inc Fac (a)
| | 5.00% | | 11/15/28 | | 259,568 |
| 325,000 | | MA St Dev Fin Agy Rev Merrimack Clg
| | 5.00% | | 07/01/37 | | 346,915 |
| 500,000 | | MA St Dev Fin Agy Rev Ref Newbridge Charles Inc (a)
| | 5.00% | | 10/01/37 | | 518,545 |
| 700,000 | | MA St Dev Fin Agy Rev Umass Boston Student Hsg Proj
| | 5.00% | | 10/01/24 | | 761,481 |
| 3,425,000 | | MA St, Ser A
| | 5.00% | | 03/01/41 | | 3,730,030 |
| | | | | 5,616,539 |
| | | Michigan – 2.4% | | | | | | |
| 2,500,000 | | Great Lakes MI Wtr Auth Wtr Sply Sys Rev Ref Second Lien, Ser D
| | 5.00% | | 07/01/36 | | 2,720,250 |
| 1,125,000 | | Great Lakes MI Wtr Auth Wtr Sply Sys Rev Ref Sr Lien, Ser C
| | 5.00% | | 07/01/28 | | 1,280,464 |
| 1,000,000 | | Marquette MI Brd of Light & Pwr Elec Utility Sys Rev Ref, Ser A
| | 5.00% | | 07/01/29 | | 1,110,670 |
| 890,000 | | MI St Fin Auth Ltd Oblig Rev Ref College for Creative Studies Proj
| | 5.00% | | 12/01/25 | | 955,477 |
| 325,000 | | MI St Fin Auth Rev Loc Govt Loan Program Great Lakes Wtr Auth Ref, Ser C
| | 5.00% | | 07/01/27 | | 359,639 |
| 1,000,000 | | MI St Fin Auth Rev Ref Loc Govt Loan Program Great Lakes Wtr Auth, Ser D-1
| | 5.00% | | 07/01/34 | | 1,080,400 |
| 500,000 | | MI St Fin Auth Rev Ref Loc Govt Loan Program, Ser F1
| | 3.80% | | 10/01/22 | | 510,575 |
| 125,000 | | MI St Fin Auth Rev Ref Loc Govt Loan Program, Ser F1
| | 3.88% | | 10/01/23 | | 128,176 |
| 2,500,000 | | Wayne Cnty MI Arpt Auth Rev Ref, Ser F, AMT
| | 5.00% | | 12/01/25 | | 2,808,275 |
| | | | | 10,953,926 |
| | | Minnesota – 1.9% | | | | | | |
| 175,000 | | Baytown Twp MN Lease Ref, Ser A
| | 3.00% | | 08/01/22 | | 171,584 |
| 480,000 | | Hugo MN Chtr Sch Lease Rev Noble Academy Proj, Ser A
| | 4.00% | | 07/01/22 | | 489,979 |
| 1,000,000 | | North Oaks MN Sr Hsg Rev Ref Waverly Gardens Proj
| | 5.00% | | 10/01/28 | | 1,088,460 |
| 1,000,000 | | Rochester MN Hlth Care & Hsg Rev Ref Samaritan Bethany Inc Proj, Ser A
| | 5.00% | | 08/01/37 | | 1,021,740 |
| 500,000 | | Saint Paul MN Hsg & Redev Auth Hlth Care Fac Rev Ref HealthPartners Oblig Grp, Ser A
| | 5.00% | | 07/01/30 | | 555,190 |
| 500,000 | | Saint Paul MN Hsg & Redev Auth Hlth Care Fac Rev Ref HealthPartners Oblig Grp, Ser A
| | 5.00% | | 07/01/32 | | 551,080 |
| 980,000 | | Saint Paul MN Hsg & Redev Auth Hlth Care Fac Rev Ref HealthPartners Oblig Grp, Ser A
| | 5.00% | | 07/01/33 | | 1,072,140 |
| 2,000,000 | | Saint Paul MN Hsg & Redev Auth Mf Hsg Rev Pioneer Press Apts Proj, Ser B (a)
| | 3.38% | | 11/01/20 | | 1,965,420 |
| 500,000 | | Saint Paul Park MN Sr Hsg & Hlth Care Rev Ref Presbyterian Homes Bloomington Proj
| | 3.00% | | 09/01/24 | | 502,650 |
| 475,000 | | Saint Paul Park MN Sr Hsg & Hlth Care Rev Ref Presbyterian Homes Bloomington Proj
| | 3.13% | | 09/01/25 | | 476,876 |
| 360,000 | | W Saint Paul MN Hsg & Hlth Care Facs Rev Ref Walker Westwood Ridge Campus Proj
| | 3.25% | | 11/01/24 | | 347,782 |
| 455,000 | | W Saint Paul MN Hsg & Hlth Care Facs Rev Ref Walker Westwood Ridge Campus Proj
| | 3.50% | | 11/01/25 | | 439,343 |
| | | | | 8,682,244 |
Page 16
See Notes to Financial Statements
First Trust Managed Municipal ETF (FMB)
Portfolio of Investments (Continued)
October 31, 2018
Principal
Value | | Description | | Stated
Coupon | | Stated
Maturity | | Value |
| MUNICIPAL BONDS (Continued) |
| | | Mississippi – 0.7% | | | | | | |
| $2,000,000 | | MS St, Ser A
| | 5.00% | | 11/01/33 | | $2,242,860 |
| 500,000 | | West Rankin MS Utility Auth Rev, AGM
| | 5.00% | | 01/01/32 | | 551,435 |
| 400,000 | | West Rankin MS Utility Auth Rev, AGM
| | 5.00% | | 01/01/33 | | 440,912 |
| | | | | 3,235,207 |
| | | Missouri – 1.4% | | | | | | |
| 700,000 | | Jackson Cnty MO Spl Oblig Ref Truman Sports Complex Proj
| | 5.00% | | 12/01/31 | | 775,222 |
| 1,670,000 | | Joplin MO Indl Dev Auth Hlth Facs Rev Ref Freeman Hlth System
| | 5.00% | | 02/15/26 | | 1,829,502 |
| 1,000,000 | | Kansas City MO Land Clearance Redev Auth Proj Rev Convention Ctr Hotel Proj Tif Fing, Ser B (a)
| | 5.00% | | 02/01/40 | | 1,015,880 |
| 1,500,000 | | Maryland Heights MO Indl Dev Auth Rev St Louis Cmnty Ice Ctr Proj, Ser A
| | 5.00% | | 03/15/39 | | 1,507,710 |
| 200,000 | | MO St Dev Fin Brd Infrastructure Facs Rev Ref Independence MO Centerpoint Proj, Ser B
| | 5.00% | | 04/01/28 | | 221,822 |
| 200,000 | | MO St Hlth & Eductnl Facs Auth Eductnl Facs Rev St Louis Clg Pharmacy, Ser B
| | 5.00% | | 05/01/30 | | 216,696 |
| 160,000 | | MO St Hlth & Eductnl Facs Auth Lutheran Sr Svcs
| | 5.00% | | 02/01/23 | | 172,267 |
| 500,000 | | MO St Hlth & Eductnl Facs Auth Sr Living Facs Lutheran Sr
| | 5.38% | | 02/01/35 | | 511,255 |
| 250,000 | | Saint Charles Cnty MO Pub Wtr Sply Dist #2 Ref, COPS
| | 5.00% | | 12/01/28 | | 283,722 |
| | | | | 6,534,076 |
| | | Montana – 0.3% | | | | | | |
| 500,000 | | Kalispell MT Hsg & Hlthcare Facs Rev Ref Immanuel Lutheran Corp Proj Temps 50, Ser B
| | 3.40% | | 11/15/22 | | 498,685 |
| 740,000 | | MT St Fac Fin Auth Rev Ref
| | 5.00% | | 02/15/25 | | 830,946 |
| 130,000 | | MT St Fac Fin Auth Rev Ref
| | 5.00% | | 02/15/29 | | 144,607 |
| | | | | 1,474,238 |
| | | Nebraska – 0.7% | | | | | | |
| 1,745,000 | | Central Plains Energy Proj NE Gas Proj Rev Proj #3
| | 5.00% | | 09/01/27 | | 1,876,224 |
| 545,000 | | Madison Cnty NE Hosp Auth #1 Ref Faith Regl Hlth Svcs Proj
| | 5.00% | | 07/01/28 | | 594,971 |
| 500,000 | | NE St Pub Pwr Dist Rev Gen, Ser C
| | 5.00% | | 01/01/35 | | 552,470 |
| | | | | 3,023,665 |
| | | Nevada – 1.1% | | | | | | |
| 1,075,000 | | Clark Cnty NV Impt Dist Ref Spl Loc Impt #151
| | 4.50% | | 08/01/23 | | 1,116,345 |
| 455,000 | | Las Vegas NV Spl Impt Dist #808 & #810 Ref
| | 5.00% | | 06/01/22 | | 477,768 |
| 335,000 | | NV Dept of Business & Industry NV Doral Academy, Ser A (a)
| | 5.00% | | 07/15/27 | | 347,720 |
| 2,600,000 | | NV St Highway Impt Rev Mtr Vehcl Fuel Tax
| | 5.00% | | 12/01/24 | | 2,933,658 |
| | | | | 4,875,491 |
| | | New Jersey – 1.9% | | | | | | |
| 450,000 | | NJ St Econ Dev Auth Mtr Vehcl Surcharge Rev Ref Sub, Ser A, BAM
| | 5.00% | | 07/01/28 | | 502,902 |
| 500,000 | | NJ St Econ Dev Auth Ref, Ser A, BAM
| | 5.00% | | 06/15/23 | | 544,395 |
| 490,000 | | NJ St Econ Dev Auth Spl Fac Rev Ref Port Newark Container Terminal LLC Proj, AMT
| | 5.00% | | 10/01/25 | | 532,895 |
| 1,000,000 | | NJ St Hlth Care Facs Fing Auth Rev Ref Hackensack Meridian Hlth, Ser A
| | 5.00% | | 07/01/24 | | 1,127,290 |
| 100,000 | | NJ St Transit Corp, Ser A, GANS
| | 5.00% | | 09/15/21 | | 105,937 |
| 2,000,000 | | NJ St Transprtn Trust Fund Auth Ref Transptrn Sys, Ser A
| | 5.00% | | 12/15/26 | | 2,191,120 |
| 500,000 | | NJ St Transprtn Trust Fund Auth Ref Transptrn Sys, Ser A
| | 5.00% | | 12/15/30 | | 538,235 |
| 1,400,000 | | NJ St Transprtn Trust Fund Auth Transn Sys, Ser D
| | 5.25% | | 12/15/23 | | 1,541,428 |
| 1,000,000 | | Tobacco Settlement Fing Corp NJ Ref, Ser A
| | 5.00% | | 06/01/26 | | 1,118,860 |
See Notes to Financial Statements
Page 17
First Trust Managed Municipal ETF (FMB)
Portfolio of Investments (Continued)
October 31, 2018
Principal
Value | | Description | | Stated
Coupon | | Stated
Maturity | | Value |
| MUNICIPAL BONDS (Continued) |
| | | New Jersey (Continued) | | | | | | |
| $500,000 | | Tobacco Settlement Fing Corp NJ Ref, Ser A
| | 5.00% | | 06/01/27 | | $560,280 |
| | | | | 8,763,342 |
| | | New Mexico – 0.4% | | | | | | |
| 600,000 | | Lower Petroglyphs Pub Impt Dist NM Spl Levy Rev Ref Rev
| | 4.00% | | 10/01/23 | | 598,392 |
| 230,000 | | Lower Petroglyphs Pub Impt Dist NM Spl Levy Rev Ref Rev
| | 4.20% | | 10/01/24 | | 229,278 |
| 240,000 | | Lower Petroglyphs Pub Impt Dist NM Spl Levy Rev Ref Rev
| | 4.30% | | 10/01/25 | | 239,141 |
| 250,000 | | Lower Petroglyphs Pub Impt Dist NM Spl Levy Rev Ref Rev
| | 4.45% | | 10/01/26 | | 249,002 |
| 260,000 | | Lower Petroglyphs Pub Impt Dist NM Spl Levy Rev Ref Rev
| | 4.55% | | 10/01/27 | | 258,861 |
| 365,000 | | Lower Petroglyphs Pub Impt Dist NM Spl Levy Rev Ref Rev
| | 5.00% | | 10/01/33 | | 373,687 |
| | | | | 1,948,361 |
| | | New York – 3.8% | | | | | | |
| 100,000 | | Buffalo & Erie Cnty NY Indl Land Dev Corp Rev Ref Orchard Park
| | 5.00% | | 11/15/22 | | 107,430 |
| 115,000 | | Buffalo & Erie Cnty NY Indl Land Dev Corp Rev Ref Orchard Park
| | 5.00% | | 11/15/24 | | 125,553 |
| 3,400,000 | | Build NYC Resource Corp NY Sol Wst Disp Rev Ref Pratt Paper Inc Proj, AMT (a)
| | 5.00% | | 01/01/35 | | 3,582,036 |
| 1,975,000 | | Met Transprtn Auth NY Rev Ref Transptrn, Subser C-1
| | 5.00% | | 11/15/34 | | 2,167,365 |
| 840,000 | | Monroe Cnty NY Indl Dev Corp Rev Ref Nazareth College of Rochester Proj, Ser A
| | 5.00% | | 10/01/23 | | 919,422 |
| 3,000,000 | | New York City NY Muni Wtr Fin Auth Wtr & Swr Sys Rev Adj 2Nd Gen Reslutn Fiscal 2016, Ser Aa-1
| | 1.60% | | 06/15/48 | | 3,000,000 |
| 2,000,000 | | New York City NY Muni Wtr Fin Auth Wtr & Swr Sys Rev Var Gen Resolution Sub Ff-1
| | 1.60% | | 06/15/44 | | 2,000,000 |
| 1,000,000 | | New York City NY Transitional Fin Auth Rev Future Tax Secured Sub Fiscal 2016, Ser A-1
| | 5.00% | | 08/01/37 | | 1,100,120 |
| 1,500,000 | | New York City NY Transitional Fin Auth Rev Future Tax Sub, Subser E-1
| | 5.00% | | 02/01/37 | | 1,646,880 |
| 300,000 | | NY St Dorm Auth Revs Non St Supported Debt Ref Orange Regl Med Ctr (a)
| | 5.00% | | 12/01/25 | | 334,566 |
| 195,000 | | NY St Dorm Auth Revs Non St Supported Debt Unrefunded Pace Univ, Ser A
| | 4.00% | | 05/01/22 | | 203,738 |
| 85,000 | | NY St Dorm Auth Revs Non St Supported Debt Unrefunded Pace Univ, Ser A
| | 5.00% | | 05/01/23 | | 92,888 |
| 500,000 | | Port Auth of New York & New Jersey NY Consol One Hundred Eighty Fifth Ref, AMT
| | 5.00% | | 09/01/23 | | 552,450 |
| 465,000 | | Port Auth of New York & New Jersey NY Ref Consol, Ser 186, AMT
| | 5.00% | | 10/15/35 | | 504,260 |
| 15,000 | | Suffolk Cnty NY Econ Dev Corp Rev Prerefunded Catholic Hlth Svcs Long Island Oblig Grp Proj
| | 5.00% | | 07/01/28 | | 16,105 |
| 85,000 | | Suffolk Cnty NY Econ Dev Corp Rev Unrefunded Catholic Hlth Svcs Long Island Oblig Grp Proj
| | 5.00% | | 07/01/28 | | 90,012 |
| 600,000 | | TSASC Inc NY Ref, Ser A
| | 5.00% | | 06/01/29 | | 654,114 |
| | | | | 17,096,939 |
| | | North Carolina – 1.9% | | | | | | |
| 1,000,000 | | Charlotte NC Wtr & Swr Sys Rev Ref
| | 5.00% | | 07/01/21 | | 1,073,910 |
| 1,775,000 | | Charlotte NC Wtr & Swr Sys Rev Ref
| | 5.00% | | 07/01/22 | | 1,948,329 |
| 575,000 | | Charlotte-Mecklenburg NC Hosp Auth Hlth Care Sys Rev Ref Carolinas Hlth Care Sys, Ser A
| | 5.00% | | 01/15/34 | | 636,019 |
| 750,000 | | Greenville NC Comb Enterprise Sys Rev Ref
| | 5.00% | | 04/01/28 | | 856,522 |
| 1,330,000 | | Monroe NC Comb Enterprise Sys Rev Ref
| | 5.00% | | 03/01/28 | | 1,500,094 |
| 900,000 | | NC St Capital Facs Fin Agy Student Rev Ref Hsg NC A&T Univ Fdtn Proj, Ser A, AGC
| | 5.00% | | 06/01/26 | | 1,002,195 |
Page 18
See Notes to Financial Statements
First Trust Managed Municipal ETF (FMB)
Portfolio of Investments (Continued)
October 31, 2018
Principal
Value | | Description | | Stated
Coupon | | Stated
Maturity | | Value |
| MUNICIPAL BONDS (Continued) |
| | | North Carolina (Continued) | | | | | | |
| $750,000 | | NC St Med Care Commission Retmnt Facs Rev Ref United Methodist Retmnt Homes, Ser A
| | 5.00% | | 10/01/37 | | $786,412 |
| 500,000 | | NC St Med Care Commission Retmnt Facs Rev Ref United Methodist Retmnt Homes, Ser A
| | 5.00% | | 10/01/47 | | 517,145 |
| 430,000 | | Raleigh Durham NC Arpt Auth Arpt Rev Ref, Ser A, AMT
| | 5.00% | | 05/01/36 | | 475,060 |
| | | | | 8,795,686 |
| | | North Dakota – 0.3% | | | | | | |
| 225,000 | | Burleigh Cnty ND Hlth Care Rev St Alexius Med Ctr Proj, Ser A
| | 5.00% | | 07/01/22 | | 240,723 |
| 1,300,000 | | Grand Forks ND Sr Hsg & Nur Fac Rev Ref Vly Homes Oblig Grp, Ser A
| | 5.00% | | 12/01/23 | | 1,348,295 |
| | | | | 1,589,018 |
| | | Ohio – 3.1% | | | | | | |
| 750,000 | | Buckeye OH Tobacco Settlement Fing Auth Asset Bkd Sr Turbo, Ser A-2
| | 5.88% | | 06/01/30 | | 739,140 |
| 135,000 | | Butler Cnty OH Hosp Facs Ref Uc Hlth
| | 5.00% | | 11/15/30 | | 150,680 |
| 1,500,000 | | Butler Cnty OH Hosp Facs Ref Uc Hlth
| | 5.00% | | 11/15/31 | | 1,668,075 |
| 1,000,000 | | Butler Cnty OH Hosp Facs Ref Uc Hlth
| | 5.00% | | 11/15/32 | | 1,108,790 |
| 1,000,000 | | Chillicothe OH City Sch Dist Ref, AGM
| | 4.00% | | 12/01/31 | | 1,034,350 |
| 500,000 | | Cleveland OH Pub Pwr Sys Rev Ref, Ser A, AGM
| | 5.00% | | 11/15/24 | | 561,285 |
| 600,000 | | Cleveland-Cuyahoga Cnty OH Port Auth Cultural Fac Rev Ref Playhouse Sq Fdtn Proj
| | 5.00% | | 12/01/28 | | 638,868 |
| 700,000 | | Cleveland-Cuyahoga Cnty OH Port Auth Cultural Fac Rev Ref Playhouse Sq Fdtn Proj
| | 5.50% | | 12/01/43 | | 754,432 |
| 1,255,000 | | Columbus OH Swr Rev Ref Sys
| | 5.00% | | 06/01/26 | | 1,427,901 |
| 700,000 | | Hamilton Cnty OH Hlth Care Facs Rev Christ Hosp Proj
| | 5.25% | | 06/01/27 | | 757,526 |
| 1,000,000 | | OH St Hgr Edu, Ser A
| | 5.00% | | 05/01/33 | | 1,114,770 |
| 1,000,000 | | OH St Wtr Dev Auth Rev Wtr Dev Fresh Wtr, Ser A
| | 5.00% | | 12/01/21 | | 1,083,250 |
| 2,500,000 | | OH St, Ser T
| | 5.00% | | 05/01/32 | | 2,856,475 |
| 230,000 | | S Estrn OH Port Auth Hosp Facs Rev Ref Mem Hlth Sys
| | 5.00% | | 12/01/23 | | 241,767 |
| | | | | 14,137,309 |
| | | Oklahoma – 1.2% | | | | | | |
| 1,000,000 | | Catoosa OK Indl Auth Sales Tax Rev
| | 4.50% | | 10/01/32 | | 976,710 |
| 750,000 | | OK St Dev Fin Auth Hlth Sys Rev OU Medicine Proj, Ser B
| | 5.25% | | 08/15/48 | | 795,908 |
| 1,000,000 | | Oklahoma Cnty OK Fin Auth Eductnl Facs Lease Rev Midwest City De City Pub Schs Proj
| | 5.00% | | 10/01/25 | | 1,130,680 |
| 1,000,000 | | Oklahoma Cnty OK Fin Auth Eductnl Facs Lease Rev Midwest City De City Pub Schs Proj
| | 5.00% | | 10/01/26 | | 1,133,160 |
| 1,000,000 | | Tulsa Cnty OK Indl Auth Sr Living Cmnty Rev Ref Montereau Inc Proj
| | 5.00% | | 11/15/25 | | 1,092,820 |
| 250,000 | | Tulsa Cnty OK Indl Auth Sr Living Cmnty Rev Ref Montereau Inc Proj
| | 5.00% | | 11/15/26 | | 274,050 |
| 100,000 | | Tulsa OK Arpts Impt Trust Ref, Ser D, BAM
| | 5.00% | | 06/01/28 | | 103,864 |
| | | | | 5,507,192 |
| | | Oregon – 2.6% | | | | | | |
| 170,000 | | Clackamas Cnty OR Hosp Fac Auth Rev Ref Sr Living Willamette View Proj, Ser A
| | 4.00% | | 05/15/26 | | 176,958 |
| 250,000 | | Clackamas Cnty OR Hosp Fac Auth Rev Ref Sr Living Willamette View Proj, Ser A
| | 5.00% | | 11/15/32 | | 270,908 |
| 500,000 | | Clackamas Cnty OR Hosp Fac Auth Rev Ref Sr Living Willamette View Proj, Ser A
| | 5.00% | | 11/15/37 | | 532,135 |
| 210,000 | | Multnomah Cnty OR Hosp Facs Auth Rev Ref Terwilliger Plaza
| | 5.00% | | 12/01/20 | | 215,399 |
See Notes to Financial Statements
Page 19
First Trust Managed Municipal ETF (FMB)
Portfolio of Investments (Continued)
October 31, 2018
Principal
Value | | Description | | Stated
Coupon | | Stated
Maturity | | Value |
| MUNICIPAL BONDS (Continued) |
| | | Oregon (Continued) | | | | | | |
| $1,000,000 | | OR St Business Dev Commission Econ Dev Rev Ref Red Rock Biofuels LLC Clean Energy Proj, Ser 248-D, AMT (c)
| | 6.50% | | 04/01/31 | | $967,730 |
| 2,000,000 | | OR St Dept of Transprtn Highway User Tax Rev Ref Sr Lien, Ser C
| | 5.00% | | 11/15/21 | | 2,164,800 |
| 2,500,000 | | OR St Dept of Transprtn Highway User Tax Rev Ref, Ser A
| | 5.00% | | 11/15/22 | | 2,761,775 |
| 1,100,000 | | OR St Facs Auth Rev Ref Univ Portland, Ser A
| | 5.00% | | 04/01/32 | | 1,223,398 |
| 2,500,000 | | Portland OR Swr Sys Rev 2nd Lien, Ser A
| | 4.50% | | 05/01/31 | | 2,727,300 |
| 700,000 | | Yamhill Cnty OR Hosp Auth Ref Friendsview Retmnt Cmnty, Ser A
| | 5.00% | | 11/15/31 | | 744,723 |
| | | | | 11,785,126 |
| | | Pennsylvania – 7.9% | | | | | | |
| 500,000 | | Allegheny Cnty PA Hosp Dev Auth Ref Allegheny Hlth Network Oblig Grp Issue, Ser A
| | 5.00% | | 04/01/26 | | 558,270 |
| 800,000 | | Allegheny Cnty PA Hosp Dev Auth Ref Allegheny Hlth Network Oblig Grp Issue, Ser A
| | 5.00% | | 04/01/32 | | 876,016 |
| 395,000 | | Bucks Cnty PA Indl Dev Auth Ref Pennswood Vlg Proj, Ser A
| | 5.00% | | 10/01/32 | | 430,250 |
| 415,000 | | Bucks Cnty PA Indl Dev Auth Ref Pennswood Vlg Proj, Ser A
| | 5.00% | | 10/01/33 | | 450,877 |
| 1,000,000 | | Bucks Cnty PA Indl Dev Auth Ref Pennswood Vlg Proj, Ser A
| | 5.00% | | 10/01/37 | | 1,075,100 |
| 600,000 | | Bucks Cnty PA Indl Dev Auth Ref Sch Lane Chrt Sch Proj
| | 5.00% | | 03/15/26 | | 644,280 |
| 765,000 | | Chester Cnty PA Indl Dev Auth Renaissance Academy Chrt Sch
| | 5.00% | | 10/01/34 | | 802,852 |
| 1,000,000 | | Cmwlth Fing Auth PA Tobacco Master Settlement Payment Rev Tobacco Master Settlement Payment Bonds
| | 5.00% | | 06/01/25 | | 1,117,340 |
| 410,000 | | Cmwlth Fing Auth PA Tobacco Master Settlement Payment Rev Tobacco Master Settlement Payment Bonds
| | 5.00% | | 06/01/26 | | 460,787 |
| 500,000 | | Colonial PA Sch Dist
| | 5.00% | | 02/15/36 | | 552,655 |
| 300,000 | | Colonial PA Sch Dist, Ser A
| | 5.00% | | 02/15/34 | | 336,774 |
| 300,000 | | Cumberland Cnty PA Muni Auth Ref Diakon Lutheran Ministries Proj
| | 5.00% | | 01/01/30 | | 321,648 |
| 700,000 | | Cumberland Cnty PA Muni Auth Ref Diakon Lutheran Ministries Proj
| | 5.00% | | 01/01/38 | | 736,309 |
| 1,150,000 | | Cumberland Cnty PA Muni Auth Ref Diakon Lutheran Social Ministries
| | 5.00% | | 01/01/25 | | 1,262,217 |
| 1,000,000 | | Cumberland Cnty PA Muni Auth Ref Diakon Lutheran Social Ministries
| | 5.00% | | 01/01/33 | | 1,067,480 |
| 1,095,000 | | Dallas PA Area Muni Auth Univ Rev Ref Misericordia Univ Proj
| | 5.00% | | 05/01/22 | | 1,166,449 |
| 1,340,000 | | Delaware Cnty PA Auth Ref Elwyn Proj
| | 5.00% | | 06/01/27 | | 1,459,461 |
| 750,000 | | E Hempfield Twp PA Indl Dev Auth Ref Willow Vly Cmntys Proj
| | 5.00% | | 12/01/29 | | 819,990 |
| 500,000 | | Middletown PA Sch Dist, Ser A
| | 5.00% | | 03/01/28 | | 544,370 |
| 2,000,000 | | Montgomery Cnty PA Hgr Edu & Hlth Auth Ref Philadelphia Presbytery Homes Inc Proj
| | 5.00% | | 12/01/32 | | 2,170,020 |
| 980,000 | | Montgomery Cnty PA Indl Dev Auth Acts Retmnt Life Cmntys Ref
| | 5.00% | | 11/15/25 | | 1,042,230 |
| 50,000 | | Montgomery Cnty PA Indl Dev Auth Acts Retmnt Life Cmntys Ref
| | 5.00% | | 11/15/29 | | 52,473 |
| 3,600,000 | | Montgomery Cnty PA Indl Dev Auth Ref Acts Retmnt Life Cmntys Inc Oblig Grp
| | 5.00% | | 11/15/36 | | 3,837,636 |
| 140,000 | | Northampton Cnty PA Gen Purpose Auth Clg Rev Ref Moravian Clg
| | 5.00% | | 10/01/25 | | 155,883 |
| 340,000 | | Northampton Cnty PA Gen Purpose Auth Clg Rev Ref Moravian Clg
| | 5.00% | | 10/01/31 | | 366,686 |
| 1,750,000 | | Northampton Cnty PA Gen Purpose Auth Hosp Rev Ref St Luke’s Univ Hlth Network Proj, Ser A
| | 5.00% | | 08/15/28 | | 1,947,645 |
| 1,000,000 | | PA St Hgr Eductnl Facs Auth Rev Ref Drexel Univ
| | 5.00% | | 05/01/25 | | 1,125,440 |
| 1,000,000 | | PA St Turnpike Commission Turnpike Rev Ref
| | 5.00% | | 12/01/33 | | 1,090,060 |
| 500,000 | | PA St Turnpike Commission Turnpike Rev Subordinate, Ser A-1
| | 5.00% | | 12/01/30 | | 546,005 |
| 290,000 | | Philadelphia PA Gas Wks Rev Ref
| | 5.00% | | 08/01/25 | | 326,308 |
Page 20
See Notes to Financial Statements
First Trust Managed Municipal ETF (FMB)
Portfolio of Investments (Continued)
October 31, 2018
Principal
Value | | Description | | Stated
Coupon | | Stated
Maturity | | Value |
| MUNICIPAL BONDS (Continued) |
| | | Pennsylvania (Continued) | | | | | | |
| $1,625,000 | | Philadelphia PA Gas Wks Rev Ref
| | 5.00% | | 08/01/29 | | $1,804,286 |
| 2,000,000 | | Philadelphia PA Gas Wks Rev Ref 1998 General Ordinance, 14th Ser
| | 5.00% | | 10/01/34 | | 2,195,600 |
| 1,000,000 | | Philadelphia PA Gas Wks Rev Ref 1998 General Ordinance, 14th Series
| | 5.00% | | 10/01/29 | | 1,117,530 |
| 750,000 | | Philadelphia PA Ref, Ser A
| | 5.25% | | 07/15/28 | | 827,655 |
| 405,000 | | Southcentrl PA General Auth Rev Ref Hanover Hosp Inc
| | 5.00% | | 12/01/23 | | 448,331 |
| 1,970,000 | | Westmoreland Cnty PA Muni Auth Ref, BAM
| | 5.00% | | 08/15/42 | | 2,121,119 |
| | | | | 35,858,032 |
| | | Rhode Island – 0.5% | | | | | | |
| 1,460,000 | | RI St Hlth & Eductnl Bldg Corp Rev Ref Hosp Fing Lifespan Oblig Grp
| | 5.00% | | 05/15/32 | | 1,584,815 |
| 480,000 | | Tobacco Settlement Fing Corp RI Ref, Ser A
| | 5.00% | | 06/01/24 | | 526,397 |
| | | | | 2,111,212 |
| | | South Carolina – 0.7% | | | | | | |
| 1,000,000 | | Greenville SC Hosp Sys Brd Hosp Facs Rev, Ser B
| | 5.00% | | 05/01/30 | | 1,091,130 |
| 175,000 | | Lancaster Cnty SC Assmnt Rev Ref Walnut Creek Impt Dist, Ser A-1
| | 3.13% | | 12/01/22 | | 173,507 |
| 1,000,000 | | Lancaster Cnty SC Assmnt Rev Ref Walnut Creek Impt Dist, Ser A-1
| | 5.00% | | 12/01/31 | | 1,021,540 |
| 745,000 | | Piedmont SC Muni Pwr Agy Elec Rev Ref, Ser A-3
| | 5.00% | | 01/01/23 | | 781,393 |
| 30,000 | | SC St Jobs Econ Dev Auth Hosp Rev Ref Palmetto Hlth, Ser A
| | 5.00% | | 08/01/23 | | 33,450 |
| 150,000 | | SC St Jobs Econ Dev Auth Hosp Rev Ref Palmetto Hlth, Ser A, AGM
| | 5.50% | | 08/01/24 | | 163,163 |
| | | | | 3,264,183 |
| | | South Dakota – 0.2% | | | | | | |
| 1,000,000 | | SD St Hlth & Eductnl Facs Auth Sanford Oblig Grp, Ser B
| | 5.00% | | 11/01/34 | | 1,079,950 |
| | | Tennessee – 1.1% | | | | | | |
| 325,000 | | Chattanooga TN Hlth Eductnl & Hsg Fac Brd Rev Ref Student Hsg CDFI Phase I
| | 5.00% | | 10/01/23 | | 356,353 |
| 600,000 | | Memphis Shelby Cnty TN Arpt Auth Arpt Rev Ref, Ser B, AMT
| | 5.75% | | 07/01/23 | | 631,566 |
| 1,385,000 | | Met Govt Nashville & Davidson Cnty TN Hlth & Eductnl Fac Brd Ref Lipscomb Univ Proj, Ser A
| | 5.00% | | 10/01/29 | | 1,516,464 |
| 1,500,000 | | TN St Energy Acquisition Corp Gas Rev Proj, Ser A
| | 4.00% | | 05/01/48 | | 1,556,910 |
| 50,000 | | TN St Energy Acquisition Corp Gas Rev, Ser A
| | 5.25% | | 09/01/22 | | 54,552 |
| 665,000 | | TN St Energy Acquisition Corp Gas Rev, Ser A
| | 5.25% | | 09/01/26 | | 755,779 |
| | | | | 4,871,624 |
| | | Texas – 10.5% | | | | | | |
| 450,000 | | Austin TX Arpt Sys Rev, AMT
| | 5.00% | | 11/15/33 | | 488,988 |
| 250,000 | | Bexar Cnty TX Hlth Facs Dev Corp Ref Army Retmnt Residence Fdtn Proj
| | 5.00% | | 07/15/25 | | 271,288 |
| 235,000 | | Bexar Cnty TX Hlth Facs Dev Corp Ref Army Retmnt Residence Fdtn Proj
| | 5.00% | | 07/15/27 | | 256,263 |
| 600,000 | | Brd of Managers TX Joint Guadalupe Cnty City of Seguin Hosp Mtg Ref
| | 5.00% | | 12/01/24 | | 628,122 |
| 600,000 | | Centrl TX Regl Mobility Auth Rev Ref Sub Lien
| | 5.00% | | 01/01/33 | | 635,994 |
| 850,000 | | Centrl TX Regl Mobility Auth Rev Sr Lien, Ser A
| | 5.00% | | 01/01/29 | | 943,823 |
| 1,460,000 | | Clifton TX Hgr Edu Fin Corp Edu Rev, Ser A
| | 4.00% | | 12/01/25 | | 1,485,127 |
| 725,000 | | Deer Park TX Indep Sch Dist Sch Bldg
| | 5.00% | | 08/15/33 | | 814,276 |
| 600,000 | | Deer Park TX Indep Sch Dist Sch Bldg
| | 5.00% | | 08/15/34 | | 672,126 |
| 1,000,000 | | Deer Park TX Indep Sch Dist Sch Bldg
| | 5.00% | | 08/15/35 | | 1,115,840 |
See Notes to Financial Statements
Page 21
First Trust Managed Municipal ETF (FMB)
Portfolio of Investments (Continued)
October 31, 2018
Principal
Value | | Description | | Stated
Coupon | | Stated
Maturity | | Value |
| MUNICIPAL BONDS (Continued) |
| | | Texas (Continued) | | | | | | |
| $700,000 | | Deer Park TX Indep Sch Dist Sch Bldg
| | 5.00% | | 08/15/36 | | $778,547 |
| 1,675,000 | | Flower Mound TX Ref
| | 5.00% | | 09/01/21 | | 1,801,060 |
| 555,000 | | Flower Mound TX Spl Assmnt Rev River Walk Pub Impt Dist #1
| | 6.13% | | 09/01/28 | | 561,821 |
| 1,100,000 | | Harris Cnty TX Ref Sr Lien Toll Road, Ser B
| | 5.00% | | 08/15/36 | | 1,224,839 |
| 500,000 | | Houston TX Arpt Sys Rev Ref United Airls Inc Terminal E Proj, AMT
| | 4.50% | | 07/01/20 | | 511,410 |
| 100,000 | | Houston TX Arpt Sys Rev Ref United Airls Inc Terminal E Proj, AMT
| | 4.75% | | 07/01/24 | | 105,903 |
| 1,000,000 | | Houston TX Arpt Sys Rev Ref, Ser B-2, AMT
| | 5.00% | | 07/15/20 | | 1,031,570 |
| 1,000,000 | | Houston TX Utility Sys Rev Ref 1st Lien, Ser D
| | 5.00% | | 11/15/29 | | 1,124,650 |
| 990,000 | | La Vernia TX Hgr Edu Fin Corp Edu Rev Meridian World Sch (a)
| | 4.35% | | 08/15/25 | | 995,148 |
| 905,000 | | La Vernia TX Hgr Edu Fin Corp Edu Rev Meridian World Sch, Ser A (a)
| | 4.20% | | 08/15/25 | | 901,778 |
| 1,290,000 | | Leander TX Spl Assmnt Rev Crystal Springs Pub Impt Dist Proj Accd Inv (c)
| | 5.13% | | 09/01/38 | | 1,250,861 |
| 500,000 | | Liberty Hill TX Indep Sch Dist Ref
| | 5.00% | | 08/01/30 | | 568,280 |
| 500,000 | | Mission TX Econ Dev Corp Rev Sr Lien Nat Gasoline Proj, Ser B, AMT (c)
| | 5.75% | | 10/01/31 | | 515,165 |
| 1,105,000 | | Montgomery TX Indep Sch Dist Ref Sch Bldg
| | 5.00% | | 02/15/28 | | 1,247,578 |
| 2,250,000 | | N TX Tollway Auth Rev Ref 2nd Tier, Ser B
| | 5.00% | | 01/01/31 | | 2,495,205 |
| 1,500,000 | | N TX Tollway Auth Rev Ref Sys Second Tier, Ser B
| | 5.00% | | 01/01/31 | | 1,637,970 |
| 250,000 | | N TX Tollway Auth Rev Ref, Ser A
| | 5.00% | | 01/01/33 | | 276,402 |
| 500,000 | | New Hope Cultural Edu Facs Fin Corp TX Retmnt Fac Rev Ref Carillon Lifecare Cmnty Proj
| | 5.00% | | 07/01/36 | | 506,315 |
| 1,415,000 | | New Hope Cultural Edu Facs Fin Corp TX Retmnt Fac Rev Ref Longhorn Vlg Proj
| | 5.00% | | 01/01/31 | | 1,456,955 |
| 1,200,000 | | New Hope Cultural Edu Facs Fin Corp TX Retmnt Fac Rev Ref Longhorn Vlg Proj
| | 5.00% | | 01/01/32 | | 1,230,648 |
| 835,000 | | New Hope Cultural Edu Facs Fin Corp TX Student Hsg Rev Chf Collegiate Hsg Galveston I LLC TX A&M Univ Galveston
| | 5.00% | | 04/01/22 | | 877,694 |
| 25,000 | | New Hope Cultural Edu Facs Fin Corp TX Student Hsg Rev Chf Stephenville-Tarleton St Univ Proj, Ser A
| | 4.25% | | 04/01/22 | | 25,924 |
| 500,000 | | New Hope Cultural Edu Facs Fin Corp TX Student Hsg Rev Chf TX A&M Univ Corpus Christi Island Campus Proj, Ser A
| | 5.00% | | 04/01/29 | | 532,100 |
| 505,000 | | Newark Hgr Edu Fin Corp TX Edu Rev Austin Achieve Pub Schs Inc, Ser A
| | 5.00% | | 06/15/32 | | 500,056 |
| 495,000 | | Red River TX Hlth Facs Dev Corp Retmnt Fac Rev MRC Crestview, Ser A
| | 7.75% | | 11/15/31 | | 573,512 |
| 2,500,000 | | Tarrant Cnty TX Cultural Edu Facs Fin Corp Hosp Rev Ref Baylor Scott & White Hlth Proj, Ser A
| | 5.00% | | 11/15/45 | | 2,706,875 |
| 770,000 | | Tarrant Cnty TX Cultural Edu Facs Fin Corp Retmnt Fac Rev Ref Buckner Retmnt Svcs Inc Proj
| | 5.00% | | 11/15/29 | | 839,485 |
| 525,000 | | Tarrant Cnty TX Cultural Edu Facs Fin Corp Retmnt Fac Rev Temps 50 Buckner Sr Living Ventana Proj, Ser B-3
| | 3.88% | | 11/15/22 | | 519,676 |
| 1,165,000 | | TX St Muni Gas Acquisition & Sply Corp I Gas Sply Rev Sr Lien, Ser A
| | 5.25% | | 12/15/26 | | 1,330,954 |
| 600,000 | | TX St Muni Gas Acquisition & Sply Corp III Gas Sply Rev
| | 5.00% | | 12/15/24 | | 651,246 |
| 2,850,000 | | TX St Muni Gas Acquisition & Sply Corp III Gas Sply Rev
| | 5.00% | | 12/15/30 | | 3,036,219 |
| 1,030,000 | | TX St Muni Gas Acquisition & Sply Corp III Gas Sply Rev
| | 5.00% | | 12/15/31 | | 1,095,261 |
| 525,000 | | TX St Transprtn Commission Central TX Turnpike Sys Rev Ref, Ser B
| | 5.00% | | 08/15/37 | | 568,759 |
| 785,000 | | TX St Wtr Dev Brd St Wtr Implementation Fund, Ser A
| | 5.00% | | 04/15/30 | | 906,118 |
| 3,000,000 | | Univ of Houston TX Univ Rev Ref, Ser A
| | 5.00% | | 02/15/31 | | 3,362,820 |
| 1,560,000 | | Uptown Dev Auth TX Incr Contract Rev, Ser A
| | 5.00% | | 09/01/36 | | 1,683,490 |
| 500,000 | | Viridian TX Muni Mgmt Dist Ref Utility Impt, BAM
| | 6.00% | | 12/01/26 | | 590,405 |
Page 22
See Notes to Financial Statements
First Trust Managed Municipal ETF (FMB)
Portfolio of Investments (Continued)
October 31, 2018
Principal
Value | | Description | | Stated
Coupon | | Stated
Maturity | | Value |
| MUNICIPAL BONDS (Continued) |
| | | Texas (Continued) | | | | | | |
| $155,000 | | Viridian TX Muni Mgmt Dist Road Impt, BAM
| | 5.00% | | 12/01/26 | | $169,427 |
| 125,000 | | Viridian TX Muni Mgmt Dist Utility Impt, BAM
| | 5.00% | | 12/01/26 | | 136,635 |
| | | | | 47,640,608 |
| | | Utah – 0.6% | | | | | | |
| 400,000 | | UT St Chrt Sch Fin Auth Chrt Sch Rev Ref Quest Academy
| | 5.00% | | 04/15/32 | | 436,860 |
| 325,000 | | UT St Chrt Sch Fin Auth Chrt Sch Rev Ref Quest Academy
| | 5.00% | | 04/15/37 | | 350,100 |
| 500,000 | | UT St Chrt Sch Fin Auth Chrt Sch Rev Spectrum Academy Proj (a)
| | 6.00% | | 04/15/45 | | 509,290 |
| 1,145,000 | | UT St Transit Auth Sales Tax Rev Ref Sub, Ser A
| | 5.00% | | 06/15/35 | | 1,264,160 |
| | | | | 2,560,410 |
| | | Vermont – 1.1% | | | | | | |
| 550,000 | | Burlington VT Ref Lakeview Garage Proj, Ser A, COPS
| | 5.00% | | 12/01/24 | | 597,960 |
| 745,000 | | VT St Econ Dev Auth Mtge Rev Ref Wake Robin Corp Proj, Ser A
| | 5.00% | | 05/01/25 | | 795,161 |
| 585,000 | | VT St Econ Dev Auth Mtge Rev Ref Wake Robin Corp Proj, Ser A
| | 5.00% | | 05/01/26 | | 623,352 |
| 2,500,000 | | VT St Eductnl & Hlth Bldgs Fing Agy Rev Ref Univ of VT Med Ctr, Ser A
| | 5.00% | | 12/01/33 | | 2,768,775 |
| | | | | 4,785,248 |
| | | Virginia – 1.3% | | | | | | |
| 2,000,000 | | VA St Pub Bldg Auth Pub Facs Rev, Ser C, AMT
| | 5.00% | | 08/01/33 | | 2,213,360 |
| 800,000 | | Virginia Beach VA Dev Auth Rsdl Care Fac Rev Ref Westminster Canterbury on Chesapeake Bay
| | 5.00% | | 09/01/32 | | 876,816 |
| 2,365,000 | | Wstrn VA Regl Jail Auth Regl Jail Facs Rev Ref
| | 5.00% | | 12/01/34 | | 2,628,579 |
| | | | | 5,718,755 |
| | | Washington – 3.0% | | | | | | |
| 1,250,000 | | Centrl Puget Sound WA Regl Transprtn Auth Sales & Use Tax Green Bond Ref & Impt, Ser S-1
| | 5.00% | | 11/01/35 | | 1,399,200 |
| 1,250,000 | | Energy NW WA Elec Rev Ref Columbia Generating Sys, Ser A
| | 5.00% | | 07/01/38 | | 1,382,437 |
| 1,500,000 | | Energy NW WA Elec Rev Ref, Ser A
| | 5.00% | | 07/01/24 | | 1,700,235 |
| 500,000 | | Grays Harbor Cnty WA Pub Hosp Dist #1 Hosp Rev Pub Hosp Dt, BANS
| | 3.00% | | 08/01/19 | | 498,485 |
| 575,000 | | Kalispel Tribe of Indians Priority Dist WA Rev, Ser A (a)
| | 5.00% | | 01/01/32 | | 597,235 |
| 155,000 | | Mason Cnty WA Pub Utility Dist #1 Sys
| | 3.50% | | 12/01/21 | | 159,520 |
| 270,000 | | Skagit Cnty WA Pub Hosp Dist #1 Ref & Impt Skagit Regl Hlth
| | 4.00% | | 12/01/24 | | 281,540 |
| 110,000 | | Skagit Cnty WA Pub Hosp Dist #1 Ref & Impt, Ser A
| | 5.00% | | 12/01/22 | | 118,652 |
| 165,000 | | Skagit Cnty WA Pub Hosp Dist #1 Skagit Vly Hosp
| | 5.00% | | 12/01/20 | | 170,658 |
| 250,000 | | Tacoma WA Elec Sys Rev
| | 5.00% | | 01/01/37 | | 277,355 |
| 250,000 | | Tobacco Settlement Auth WA Tobacco Settlement Rev Ref
| | 5.00% | | 06/01/23 | | 275,407 |
| 35,000 | | WA St Hsg Fin Commission Ref Emerald Heights Proj
| | 5.00% | | 07/01/22 | | 37,853 |
| 50,000 | | WA St Hsg Fin Commission Ref Emerald Heights Proj
| | 5.00% | | 07/01/28 | | 53,645 |
| 2,025,000 | | WA St Ref, Ser B
| | 5.00% | | 08/01/32 | | 2,280,656 |
| 4,000,000 | | WA St, Ser B
| | 5.00% | | 02/01/36 | | 4,404,560 |
| | | | | 13,637,438 |
| | | Wisconsin – 3.4% | | | | | | |
| 1,250,000 | | Pub Fin Auth WI Chrt Sch Rev Limited American Prep Academy Las Vegas Proj, Ser A (a)
| | 5.13% | | 07/15/37 | | 1,247,662 |
| 1,945,000 | | Pub Fin Auth WI Edu Rev Ref Mountain Island Chrt Sch Ltd
| | 4.00% | | 07/01/27 | | 1,948,832 |
| 620,000 | | Pub Fin Auth WI Edu Rev Ref Mountain Island Chrt Sch Ltd
| | 5.00% | | 07/01/37 | | 634,099 |
| 1,000,000 | | Pub Fin Auth WI Exempt Facs Rev Ref Celanese Proj, Ser B, AMT (a)
| | 5.00% | | 12/01/25 | | 1,095,920 |
| 425,000 | | Pub Fin Auth WI Retmnt Fac Rev Ref Whitestone Retmnt Facs 1st Mortgage Rev Bonds (a)
| | 4.00% | | 03/01/27 | | 430,091 |
See Notes to Financial Statements
Page 23
First Trust Managed Municipal ETF (FMB)
Portfolio of Investments (Continued)
October 31, 2018
Principal
Value | | Description | | Stated
Coupon | | Stated
Maturity | | Value |
| MUNICIPAL BONDS (Continued) |
| | | Wisconsin (Continued) | | | | | | |
| $1,000,000 | | Pub Fin Auth WI Retmnt Fac Rev Southminster (a)
| | 5.00% | | 10/01/43 | | $1,006,170 |
| 1,000,000 | | Pub Fin Auth WI Rev Ref Retmnt Hsg Fdtn Obligated Grp, Ser B
| | 5.00% | | 11/15/26 | | 1,099,130 |
| 500,000 | | Pub Fin Auth WI Rev Sr Maryland Proton Treatment Ctr, Ser A-1 (a)
| | 6.25% | | 01/01/38 | | 506,205 |
| 500,000 | | Pub Fin Auth WI Sr Living Rev Ref Mary’s Woods at Marylhurst Proj (a)
| | 3.50% | | 11/15/23 | | 500,735 |
| 1,300,000 | | WI St Gen Fund Annual Approp Rev Ref, Ser B
| | 5.00% | | 05/01/34 | | 1,453,959 |
| 1,000,000 | | WI St Hlth & Eductnl Facs Auth Rev Ref Ascension Hlth Credit Grp, Ser A
| | 5.00% | | 11/15/36 | | 1,094,440 |
| 500,000 | | WI St Hlth & Eductnl Facs Auth Rev Ref Marquette Univ
| | 5.00% | | 10/01/28 | | 543,790 |
| 1,175,000 | | WI St Hlth & Eductnl Facs Auth Rev Ref Prohealth Care Oblig Grp
| | 5.00% | | 08/15/31 | | 1,279,375 |
| 175,000 | | WI St Hlth & Eductnl Facs Auth Rev Ref Prohealth Care Oblig Grp
| | 5.00% | | 08/15/33 | | 189,014 |
| 435,000 | | WI St Hlth & Eductnl Facs Auth Rev St Johns Cmntys Inc Proj, Ser A
| | 5.00% | | 09/15/30 | | 456,015 |
| 1,015,000 | | WI St Hlth & Eductnl Facs Auth Rev St Johns Cmntys Inc Proj, Ser A
| | 5.00% | | 09/15/31 | | 1,061,741 |
| 595,000 | | WI St Hlth & Eductnl Facs Auth Rev St Johns Cmntys Inc Proj, Ser A
| | 5.00% | | 09/15/32 | | 621,061 |
| 455,000 | | WI St Hlth & Eductnl Facs Auth Rev St Johns Cmntys Inc Proj, Ser A
| | 5.00% | | 09/15/33 | | 473,910 |
| | | | | 15,642,149 |
| | | Wyoming – 0.1% | | | | | | |
| 250,000 | | Natrona Cnty WY Hosp Rev Ref WY Med Ctr Proj
| | 5.00% | | 09/15/30 | | 274,175 |
| | Total Investments – 97.5%
| | 443,764,664 |
| | (Cost $448,491,530) (e) | | |
| | Net Other Assets and Liabilities – 2.5%
| | 11,606,330 |
| | Net Assets – 100.0%
| | $455,370,994 |
Futures Contracts (See Note 2D - Futures Contracts in the Notes to Financial Statements):
| Futures Contracts | | Position | | Number of
Contracts | | Expiration
Date | | Notional
Value | | Unrealized
Appreciation
(Depreciation)/
Value |
| U.S. Treasury 10-Year Notes | | Short | | 68 | | Dec 2018 | | $ (8,053,750) | | $(36,125) |
| U.S. Treasury Ultra 10-Year Notes | | Short | | 80 | | Dec 2018 | | (10,008,750) | | 29,375 |
| Total Futures Contracts | | | | | | | | $ (18,062,500) | | $(6,750) |
|
| (a) | This security, sold within the terms of a private placement memorandum, is exempt from registration upon resale under Rule 144A under the Securities Act of 1933, as amended (the “1933 Act”), and may be resold in transactions exempt from registration, normally to qualified institutional buyers. Pursuant to procedures adopted by the Trust’s Board of Trustees, this security has been determined to be liquid by First Trust Advisors L.P. (the “Advisor”). Although market instability can result in periods of increased overall market illiquidity, liquidity for each security is determined based on security specific factors and assumptions, which require subjective judgment. At October 31, 2018, securities noted as such amounted to $33,161,181 or 7.3% of net assets. |
| (b) | Pursuant to procedures adopted by the Trust’s Board of Trustees, this security has been determined to be illiquid by the Advisor. |
| (c) | This security, sold within the terms of a private placement memorandum, is exempt from registration upon resale under Rule 144A under the 1933 Act, and may be resold in transactions exempt from registration, normally to qualified institutional buyers (see Note 2C - Restricted Securities in the Notes to Financial Statements). |
| (d) | Zero coupon bond. |
Page 24
See Notes to Financial Statements
First Trust Managed Municipal ETF (FMB)
Portfolio of Investments (Continued)
October 31, 2018
| (e) | Aggregate cost for federal income tax purposes was $448,508,894. As of October 31, 2018, the aggregate gross unrealized appreciation for all investments in which there was an excess of value over tax cost was $1,352,960 and the aggregate gross unrealized depreciation for all investments in which there was an excess of tax cost over value was $6,103,940. The net unrealized depreciation was $4,750,980. The amounts presented are inclusive of derivative contracts. |
| AGC | Assured Guaranty Corp. |
| AGM | Assured Guaranty Municipal Corp. |
| AMT | Alternative Minimum Tax |
| BAM | Building America Mutual |
| BANS | Bond Anticipation Notes |
| CABS | Capital Appreciation Bonds |
| COPS | Certificates of Participation |
| GANS | Grant Anticipation Notes |
| NATL-RE | National Public Finance Guarantee Corp. |
Valuation Inputs
A summary of the inputs used to value the Fund’s investments as of October 31, 2018 is as follows (see Note 2A - Portfolio Valuation in the Notes to Financial Statements):
| ASSETS TABLE |
| | Total
Value at
10/31/2018 | Level 1
Quoted
Prices | Level 2
Significant
Observable
Inputs | Level 3
Significant
Unobservable
Inputs |
Municipal Bonds*
| $ 443,764,664 | $ — | $ 443,764,664 | $ — |
Futures
| 29,375 | 29,375 | — | — |
Total
| $ 443,794,039 | $ 29,375 | $ 443,764,664 | $— |
LIABILITIES TABLE |
| | Total
Value at
10/31/2018 | Level 1
Quoted
Prices | Level 2
Significant
Observable
Inputs | Level 3
Significant
Unobservable
Inputs |
Futures
| $ (36,125) | $ (36,125) | $ — | $ — |
| * | See Portfolio of Investments for state breakout. |
See Notes to Financial Statements
Page 25
First Trust Managed Municipal ETF (FMB)
Statement of Assets and Liabilities
October 31, 2018
| ASSETS: | |
Investments, at value
(Cost $448,491,530)
| $ 443,764,664 |
Cash
| 8,465,628 |
Cash held at broker
| 187,894 |
| Receivables: | |
Interest
| 5,980,706 |
Investment securities sold
| 458,648 |
Variation margin
| 29,375 |
Total Assets
| 458,886,915 |
| LIABILITIES: | |
| Payables: | |
Investment securities purchased
| 3,286,039 |
Investment advisory fees
| 192,453 |
Variation margin
| 36,125 |
Other liabilities
| 1,304 |
Total Liabilities
| 3,515,921 |
NET ASSETS
| $455,370,994 |
| NET ASSETS consist of: | |
Paid-in capital
| $ 462,266,548 |
Par value
| 88,000 |
Accumulated distributable earnings (loss)
| (6,983,554) |
NET ASSETS
| $455,370,994 |
NET ASSET VALUE, per share
| $51.75 |
Number of shares outstanding (unlimited number of shares authorized, par value $0.01 per share)
| 8,800,002 |
Page 26
See Notes to Financial Statements
First Trust Managed Municipal ETF (FMB)
Statement of Operations
For the Year Ended October 31, 2018
| INVESTMENT INCOME: | |
Interest
| $ 10,929,031 |
Dividends
| 75,145 |
Total investment income
| 11,004,176 |
| EXPENSES: | |
Investment advisory fees
| 2,304,089 |
Total expenses
| 2,304,089 |
Fees waived by the investment advisor
| (530,921) |
Net expenses
| 1,773,168 |
NET INVESTMENT INCOME (LOSS)
| 9,231,008 |
| NET REALIZED AND UNREALIZED GAIN (LOSS): | |
| Net realized gain (loss) on: | |
Investments
| (1,831,754) |
Futures
| 157,096 |
Net realized gain (loss)
| (1,674,658) |
| Net change in unrealized appreciation (depreciation) on: | |
Investments
| (9,077,948) |
Futures
| (6,750) |
Net change in unrealized appreciation (depreciation)
| (9,084,698) |
NET REALIZED AND UNREALIZED GAIN (LOSS)
| (10,759,356) |
NET INCREASE (DECREASE) IN NET ASSETS RESULTING FROM OPERATIONS
| $(1,528,348) |
See Notes to Financial Statements
Page 27
First Trust Managed Municipal ETF (FMB)
Statements of Changes in Net Assets
| | Year
Ended
10/31/2018 | | Year
Ended
10/31/2017 |
| OPERATIONS: | | | |
Net investment income (loss)
| $ 9,231,008 | | $ 3,409,349 |
Net realized gain (loss)
| (1,674,658) | | (725,571) |
Net change in unrealized appreciation (depreciation)
| (9,084,698) | | 2,360,391 |
Net increase (decrease) in net assets resulting from operations
| (1,528,348) | | 5,044,169 |
| DISTRIBUTIONS TO SHAREHOLDERS FROM: | | | |
Investment operations
| (9,168,753) | | |
Net investment income
| | | (3,340,878) |
Net realized gain
| | | (259,840) |
Total distributions to shareholders
| (9,168,753) | | (3,600,718) |
| SHAREHOLDER TRANSACTIONS: | | | |
Proceeds from shares sold
| 248,070,577 | | 139,111,811 |
Cost of shares redeemed
| (2,607,604) | | (2,600,619) |
Net increase (decrease) in net assets resulting from shareholder transactions
| 245,462,973 | | 136,511,192 |
Total increase (decrease) in net assets
| 234,765,872 | | 137,954,643 |
| NET ASSETS: | | | |
Beginning of period
| 220,605,122 | | 82,650,479 |
End of period
| $455,370,994 | | $220,605,122 |
Accumulated net investment income (loss) at end of period
| | | $67,939 |
| CHANGES IN SHARES OUTSTANDING: | | | |
Shares outstanding, beginning of period
| 4,150,002 | | 1,550,002 |
Shares sold
| 4,700,000 | | 2,650,000 |
Shares redeemed
| (50,000) | | (50,000) |
Shares outstanding, end of period
| 8,800,002 | | 4,150,002 |
Page 28
See Notes to Financial Statements
First Trust Managed Municipal ETF (FMB)
Financial Highlights
For a share outstanding throughout each period
| | Year Ended October 31, | | Period
Ended
10/31/2014 (a) |
| 2018 | | 2017 | | 2016 | | 2015 | |
Net asset value, beginning of period
| $ 53.16 | | $ 53.32 | | $ 51.58 | | $ 51.11 | | $ 50.00 |
| Income from investment operations: | | | | | | | | | |
Net investment income (loss)
| 1.35 | | 1.34 | | 1.32 | | 1.35 | | 0.56 |
Net realized and unrealized gain (loss)
| (1.41) | | (0.01) | | 1.99 | | 0.50 | | 1.20 |
Total from investment operations
| (0.06) | | 1.33 | | 3.31 | | 1.85 | | 1.76 |
| Distributions paid to shareholders from: | | | | | | | | | |
Net investment income
| (1.35) | | (1.33) | | (1.35) | | (1.38) | | (0.55) |
Net realized gain
| — | | (0.16) | | (0.22) | | — | | — |
Return of capital
| — | | — | | — | | — | | (0.10) |
Total distributions
| (1.35) | | (1.49) | | (1.57) | | (1.38) | | (0.65) |
Net asset value, end of period
| $51.75 | | $53.16 | | $53.32 | | $51.58 | | $51.11 |
Total return (b)
| (0.12)% | | 2.59% | | 6.47% | | 3.66% | | 3.53% |
| Ratios to average net assets/supplemental data: | | | | | | | | | |
Net assets, end of period (in 000’s)
| $ 455,371 | | $ 220,605 | | $ 82,650 | | $ 33,529 | | $ 20,445 |
Ratio of total expenses to average net assets
| 0.65% | | 0.65% | | 0.65% | | 0.65% | | 0.65% (c) |
Ratio of net expenses to average net assets
| 0.50% | | 0.50% | | 0.52% | | 0.65% | | 0.65% (c) |
Ratio of net investment income (loss) to average net assets
| 2.60% | | 2.63% | | 2.52% | | 2.63% | | 2.40% (c) |
Portfolio turnover rate (d)
| 42% | | 85% | | 85% | | 109% | | 69% |
| (a) | Inception date is May 13, 2014, which is consistent with the commencement of investment operations and is the date the initial creation units were established. |
| (b) | Total return is calculated assuming an initial investment made at the net asset value at the beginning of the period, reinvestment of all distributions at net asset value during the period, and redemption at net asset value on the last day of the period. The returns presented do not reflect the deduction of taxes that a shareholder would pay on Fund distributions or the redemption or sale of Fund shares. Total return is calculated for the time period presented and is not annualized for periods of less than a year. For some periods, the total returns would have been lower if certain fees had not been waived by the advisor. |
| (c) | Annualized. |
| (d) | Portfolio turnover is calculated for the time period presented and is not annualized for periods of less than a year and does not include securities received or delivered from processing creations or redemptions and in-kind transactions. |
See Notes to Financial Statements
Page 29
Notes to Financial Statements
First Trust Managed Municipal ETF (FMB)
October 31, 2018
1. Organization
First Trust Exchange-Traded Fund III (the “Trust”) is an open-end management investment company organized as a Massachusetts business trust on January 9, 2008, and is registered with the Securities and Exchange Commission (the “SEC”) under the Investment Company Act of 1940, as amended (the “1940 Act”).
The Trust consists of thirteen funds that are currently offering shares. This report covers the First Trust Managed Municipal ETF (the “Fund”), a diversified series of the Trust, which trades under the ticker FMB on The Nasdaq Stock Market LLC. Unlike conventional mutual funds, the Fund issues and redeems shares on a continuous basis, at net asset value (“NAV”), only in large specified blocks consisting of 50,000 shares called a “Creation Unit.” Creation Units are issued and redeemed for cash and, in certain circumstances, in-kind for securities in which the Fund invests. Except when aggregated in Creation Units, the Fund’s shares are not redeemable securities.
The primary investment objective of the Fund is to generate current income that is exempt from regular federal income taxes and its secondary objective is long-term capital appreciation. Under normal market conditions, the Fund seeks to achieve its investment objectives by investing at least 80% of its net assets (including investment borrowings) in municipal debt securities that pay interest that is exempt from regular federal income taxes. There can be no assurance that the Fund will achieve its investment objectives. The Fund may not be appropriate for all investors.
2. Significant Accounting Policies
The Fund is considered an investment company and follows accounting and reporting guidance under Financial Accounting Standards Board (“FASB”) Accounting Standards Codification (“ASC”) Topic 946, “Financial Services-Investment Companies.” The following is a summary of significant accounting policies consistently followed by the Fund in the preparation of the financial statements. The preparation of the financial statements in accordance with accounting principles generally accepted in the United States of America (“U.S. GAAP”) requires management to make estimates and assumptions that affect the reported amounts and disclosures in the financial statements. Actual results could differ from those estimates.
A. Portfolio Valuation
The Fund’s NAV is determined daily as of the close of regular trading on the New York Stock Exchange (“NYSE”), normally 4:00 p.m. Eastern time, on each day the NYSE is open for trading. If the NYSE closes early on a valuation day, the NAV is determined as of that time. Domestic debt securities are priced using data reflecting the earlier closing of the principal markets for those securities. The Fund’s NAV is calculated by dividing the value of all assets of the Fund (including accrued interest and dividends), less all liabilities (including accrued expenses and dividends declared but unpaid), by the total number of shares outstanding.
The Fund’s investments are valued daily at market value or, in the absence of market value with respect to any portfolio securities, at fair value. Market value prices represent last sale or official closing prices from a national or foreign exchange (i.e., a regulated market) and are primarily obtained from third-party pricing services. Fair value prices represent any prices not considered market value prices and are either obtained from a third-party pricing service or are determined by the Pricing Committee of the Fund’s investment advisor, First Trust Advisors L.P. (“First Trust” or the “Advisor”), in accordance with valuation procedures adopted by the Trust’s Board of Trustees, and in accordance with provisions of the 1940 Act. Investments valued by the Advisor’s Pricing Committee, if any, are footnoted as such in the footnotes to the Portfolio of Investments. The Fund’s investments are valued as follows:
Municipal securities and other debt securities are fair valued on the basis of fair valuations provided by dealers who make markets in such securities or by a third-party pricing service approved by the Trust’s Board of Trustees, which may use the following valuation inputs when available:
| 1) | benchmark yields; |
| 2) | reported trades; |
| 3) | broker/dealer quotes; |
| 4) | issuer spreads; |
| 5) | benchmark securities; |
| 6) | bids and offers; and |
| 7) | reference data including market research publications. |
Exchange-traded futures contracts are valued at the closing price in the market where such contracts are principally traded. If no closing price is available, exchange-traded futures contracts are fair valued at the mean of their most recent bid and asked price, if available, and otherwise at their closing bid price.
Notes to Financial Statements (Continued)
First Trust Managed Municipal ETF (FMB)
October 31, 2018
Fixed income and other debt securities having a remaining maturity of sixty days or less when purchased are fair valued at cost adjusted for amortization of premiums and accretion of discounts (amortized cost), provided the Advisor’s Pricing Committee has determined that the use of amortized cost is an appropriate reflection of fair value given market and issuer-specific conditions existing at the time of the determination. Factors that may be considered in determining the appropriateness of the use of amortized cost include, but are not limited to, the following:
| 1) | the credit conditions in the relevant market and changes thereto; |
| 2) | the liquidity conditions in the relevant market and changes thereto; |
| 3) | the interest rate conditions in the relevant market and changes thereto (such as significant changes in interest rates); |
| 4) | issuer-specific conditions (such as significant credit deterioration); and |
| 5) | any other market-based data the Advisor’s Pricing Committee considers relevant. In this regard, the Advisor’s Pricing Committee may use last-obtained market-based data to assist it when valuing portfolio securities using amortized cost. |
Certain securities may not be able to be priced by pre-established pricing methods. Such securities may be valued by the Trust’s Board of Trustees or its delegate, the Advisor’s Pricing Committee, at fair value. These securities generally include, but are not limited to, restricted securities (securities which may not be publicly sold without registration under the Securities Act of 1933, as amended (the “1933 Act”)) for which a third-party pricing service is unable to provide a market price; securities whose trading has been formally suspended; a security whose market or fair value price is not available from a pre-established pricing source; a security with respect to which an event has occurred that is likely to materially affect the value of the security after the market has closed but before the calculation of the Fund’s NAV or make it difficult or impossible to obtain a reliable market quotation; and a security whose price, as provided by the third-party pricing service, does not reflect the security’s fair value. As a general principle, the current fair value of a security would appear to be the amount which the owner might reasonably expect to receive for the security upon its current sale. When fair value prices are used, generally they will differ from market quotations or official closing prices on the applicable exchanges. A variety of factors may be considered in determining the fair value of such securities, including, but not limited to, the following:
| 1) | the fundamental business data relating to the issuer; |
| 2) | an evaluation of the forces which influence the market in which these securities are purchased and sold; |
| 3) | the type, size and cost of the security; |
| 4) | the financial statements of the issuer; |
| 5) | the credit quality and cash flow of the issuer, based on the Advisor’s or external analysis; |
| 6) | the information as to any transactions in or offers for the security; |
| 7) | the price and extent of public trading in similar securities (or equity securities) of the issuer/borrower, or comparable companies; |
| 8) | the coupon payments; |
| 9) | the quality, value and salability of collateral, if any, securing the security; and |
| 10) | other relevant factors. |
The Fund is subject to fair value accounting standards that define fair value, establish the framework for measuring fair value and provide a three-level hierarchy for fair valuation based upon the inputs to the valuation as of the measurement date. The three levels of the fair value hierarchy are as follows:
| • | Level 1 – Level 1 inputs are quoted prices in active markets for identical investments. An active market is a market in which transactions for the investment occur with sufficient frequency and volume to provide pricing information on an ongoing basis. |
| • | Level 2 – Level 2 inputs are observable inputs, either directly or indirectly, and include the following: |
| o | Quoted prices for similar investments in active markets. |
| o | Quoted prices for identical or similar investments in markets that are non-active. A non-active market is a market where there are few transactions for the investment, the prices are not current, or price quotations vary substantially either over time or among market makers, or in which little information is released publicly. |
| o | Inputs other than quoted prices that are observable for the investment (for example, interest rates and yield curves observable at commonly quoted intervals, volatilities, prepayment speeds, loss severities, credit risks, and default rates). |
| o | Inputs that are derived principally from or corroborated by observable market data by correlation or other means. |
| • | Level 3 – Level 3 inputs are unobservable inputs. Unobservable inputs may reflect the reporting entity’s own assumptions about the assumptions that market participants would use in pricing the investment. |
Notes to Financial Statements (Continued)
First Trust Managed Municipal ETF (FMB)
October 31, 2018
The inputs or methodologies used for valuing investments are not necessarily an indication of the risk associated with investing in those investments. A summary of the inputs used to value the Fund’s investments as of October 31, 2018, is included with the Fund’s Portfolio of Investments.
B. Securities Transactions and Investment Income
Securities transactions are recorded as of the trade date. Realized gains and losses from securities transactions are recorded on the identified cost basis. Dividend income is recorded on the ex-dividend date. Interest income is recorded daily on the accrual basis. Amortization of premiums and accretion of discounts are recorded using the effective interest method.
C. Restricted Securities
The Fund invests in restricted securities, which are securities that may not be offered for public sale without first being registered under the 1933 Act. Prior to registration, restricted securities may only be resold in transactions exempt from registration under Rule 144A under the 1933 Act, normally to qualified institutional buyers. As of October 31, 2018, the Fund held restricted securities as shown in the following table that the Advisor has deemed illiquid pursuant to procedures adopted by the Trust’s Board of Trustees. Although market instability can result in periods of increased overall market illiquidity, liquidity for each security is determined based on security-specific factors and assumptions, which require subjective judgment. The Fund does not have the right to demand that such securities be registered. These securities are valued according to the valuation procedures as stated in the Portfolio Valuation note (Note 2A) and are not expressed as a discount to the carrying value of a comparable unrestricted security. There are no unrestricted securities with the same maturity dates and yields for these issuers.
| Security | Acquisition
Date | Principal
Value | Current Price | Carrying
Cost | | Value | | % of
Net
Assets |
| CA Stwd Cmntys Dev Auth Rev Ref Lancer Eductnl Student Hsg Proj, Ser A, 4.00%, 06/01/21 | 11/02/16 | $400,000 | $101.64 | $404,889 | | $406,540 | | 0.09% |
| Centerra CO Met Dist #1 Spl Rev Dist #1, 5.00%, 12/01/22 | 04/20/17 | 500,000 | 106.60 | 530,222 | | 532,975 | | 0.12 |
| Centerra CO Met Dist #1 Spl Rev Dist #1, 5.00%, 12/01/29 | 04/20/17 | 1,000,000 | 105.42 | 1,051,923 | | 1,054,160 | | 0.23 |
| Leander TX Spl Assmnt Rev Crystal Springs Pub Impt Dist Proj Accd Inv, 5.13%, 09/01/38 | 05/04/18 | 1,290,000 | 96.97 | 1,290,000 | | 1,250,861 | | 0.27 |
| Mission TX Econ Dev Corp Rev Sr Lien Nat Gasoline Proj, Ser B, AMT, 5.75%, 10/01/31 | 04/28/16 | 500,000 | 103.03 | 480,145 | | 515,165 | | 0.11 |
| OR St Business Dev Commission Econ Dev Rev Ref Red Rock Biofuels LLC Clean Energy Proj, Ser 248-D, AMT, 6.50%, 04/01/31 | 03/16/18 | 1,000,000 | 96.77 | 1,000,000 | | 967,730 | | 0.21 |
| Prairie Ctr CO Met Dist #3 Ltd Property Tax Supported Pri Ref, Ser A, 4.13%, 12/15/27 | 10/13/17 | 1,000,000 | 99.66 | 994,281 | | 996,580 | | 0.22 |
| | | | | $5,751,460 | | $5,724,011 | | 1.25% |
D. Futures Contracts
The Fund may purchase or sell (i.e., is long or short) exchange-listed futures contracts to hedge against changes in interest rates (interest rate risk). Futures contracts are agreements between the Fund and a counterparty to buy or sell a specific quantity of an underlying instrument at a specified price and at a specified date. Depending on the terms of the contract, futures contracts are settled either through physical delivery of the underlying instrument on the settlement date or by payment of a cash settlement amount on the settlement date. Open futures contracts can also be closed out prior to settlement by entering into an offsetting transaction in a matching futures contract. If the Fund is not able to enter into an offsetting transaction, the Fund will continue to be required to maintain margin deposits on the futures contract. When the contract is closed or expires, the Fund records a realized gain or loss equal to the difference between the value of the contract at the time it was opened and the value at the time it was closed or expired. This gain or loss is included in “Net realized gain (loss) on futures” on the Statement of Operations.
Upon entering into a futures contract, the Fund must deposit funds, called margin, with its custodian in the name of the clearing broker equal to a specified percentage of the current value of the contract. Open futures contacts are marked to market daily with the change in value recognized as a component of “Net change in unrealized appreciation (depreciation) on futures” on the Statement of
Notes to Financial Statements (Continued)
First Trust Managed Municipal ETF (FMB)
October 31, 2018
Operations. This daily fluctuation in the value of the contracts is also known as variation margin and is included in “Variation margin” payable or receivable on the Statement of Assets and Liabilities.
If market conditions change unexpectedly, the Fund may not achieve the anticipated benefits of the futures contract and may realize a loss. The use of futures contracts involves the risk of imperfect correlation in movements in the price of the futures contracts, interest rates and the underlying instruments.
E. Dividends and Distributions to Shareholders
Dividends from net investment income, if any, are declared and paid monthly by the Fund, or as the Board of Trustees may determine from time to time. Distributions of net realized capital gains earned by the Fund, if any, are distributed at least annually.
Distributions from income and capital gains are determined in accordance with federal income tax regulations, which may differ from U.S. GAAP. Certain capital accounts in the financial statements are periodically adjusted for permanent differences in order to reflect their tax character. These permanent differences are primarily due to the varying treatment of income and gain/loss on portfolio securities held by the Fund and have no impact on net assets or NAV per share. Temporary differences, which arise from recognizing certain items of income, expense and gain/loss in different periods for financial statement and tax purposes, will reverse at some time in the future.
The tax character of distributions paid by the Fund during the fiscal years ended October 31, 2018 and 2017, was as follows:
| Distributions paid from: | 2018 | 2017 |
Ordinary income
| $— | $263,324 |
Capital gains
| — | — |
Tax-exempt income
| 9,168,753 | 3,337,394 |
Return of capital
| — | — |
As of October 31, 2018, the components of distributable earnings on a tax basis were as follows:
Undistributed ordinary income
| $— |
Undistributed capital gains
| — |
Total undistributed earnings
| — |
Accumulated capital and other losses
| (2,301,347) |
Net unrealized appreciation (depreciation)
| (4,682,207) |
Total accumulated earnings (losses)
| (6,983,554) |
Other
| — |
Paid-in capital
| 462,354,548 |
Total net assets
| $455,370,994 |
F. Income Taxes
The Fund intends to continue to qualify as a regulated investment company by complying with the requirements under Subchapter M of the Internal Revenue Code of 1986, as amended, which includes distributing substantially all of its net investment income and net realized gains to shareholders. Accordingly, no provision has been made for federal and state income taxes. However, due to the timing and amount of distributions, the Fund may be subject to an excise tax of 4% of the amount by which approximately 98% of the Fund’s taxable income exceeds the distributions from such taxable income for the calendar year.
In addition, the Fund intends to invest in such municipal securities to allow it to pay shareholders “exempt dividends” as defined in the Internal Revenue Code.
The Fund is subject to accounting standards that establish a minimum threshold for recognizing, and a system for measuring, the benefits of a tax position taken or expected to be taken in a tax return. Taxable years ended 2015, 2016, 2017, and 2018 remain open to federal and state audit. As of October 31, 2018, management has evaluated the application of these standards to the Fund and has determined that no provision for income tax is required in the Fund’s financial statements for uncertain tax positions.
The Fund intends to utilize provisions of the federal income tax laws, which allow it to carry a realized capital loss forward indefinitely following the year of the loss and offset such loss against any future realized capital gains. The Fund is subject to certain limitations under U.S. tax rules on the use of capital loss carryforwards and net unrealized built-in losses. These limitations apply
Notes to Financial Statements (Continued)
First Trust Managed Municipal ETF (FMB)
October 31, 2018
when there has been a 50% change in ownership. At October 31, 2018, the Fund had $2,301,347 of non-expiring capital loss carryforwards for federal income tax purposes.
Certain losses realized during the current fiscal year may be deferred and treated as occurring on the first day of the following fiscal year for federal income tax purposes. For the fiscal year ended October 31, 2018, the Fund had no net ordinary losses.
In order to present paid-in capital and accumulated distributable earnings (loss) (which consists of accumulated net investment income (loss), accumulated net realized gain (loss) on investments and net unrealized appreciation (depreciation) on investments) on the Statement of Assets and Liabilities that more closely represent their tax character, certain adjustments have been made to paid-in capital, accumulated net investment income (loss) and accumulated net realized gain (loss) on investments. These adjustments are primarily due to the difference between book and tax treatments of income and gains on various investment securities held by the Fund and in-kind transactions. The results of operations and net assets were not affected by these adjustments. For the fiscal year ended October 31, 2018, the adjustments for the Fund were as follows:
Accumulated
Net Investment
Income (Loss) | | Accumulated
Net Realized
Gain (Loss)
on Investments | | Paid-in
Capital |
| $(261) | | $261 | | $— |
G. Expenses
Expenses, other than the investment advisory fee and other excluded expenses, are paid by the Advisor (See Note 3).
H. New Accounting Pronouncements
On March 30, 2017, the FASB issued Accounting Standards Update (“ASU”) 2017-08 “Premium Amortization on Purchased Callable Debt Securities”, which amends the amortization period for certain purchased callable debt securities held at a premium by shortening such period to the earliest call date. The new guidance requires an entity to amortize the premium on a callable debt security within its scope to the earliest call date, unless the guidance for considering estimated prepayments is applied. If the call option is not exercised at the earliest call date, the yield is reset to the effective yield using the payment terms of the security. If the security has more than one call date and the premium was amortized to a call price greater than the next call price, any excess of the amortized cost basis over the amount repayable at the next call date will be amortized to that date. If there are no other call dates, any excess of the amortized cost basis over the par amount will be amortized to maturity. Discounts on purchased callable debt securities will continue to be amortized to the security’s maturity date. The ASU 2017-08 is effective for public business entities for fiscal years, and interim periods within those fiscal years, beginning after December 15, 2018. Earlier application is permitted for all entities, including adoption in an interim period. If an entity early adopts the ASU in an interim period, any adjustments must be reflected as of the beginning of the fiscal year that includes that interim period. Management is still assessing the impact of the adoption of ASU 2017-08 on the financial statements but does not expect it to have a material impact.
On August 28, 2018, the FASB issued ASU 2018-13, “Disclosure Framework – Changes to the Disclosure Requirements for Fair Value Measurement,” which amends the fair value measurement disclosure requirements of ASC 820. The amendments of ASU 2018-13 include new, eliminated, and modified disclosure requirements of ASC 820. In addition, the amendments clarify that materiality is an appropriate consideration of entities when evaluating disclosure requirements. The ASU is effective for fiscal years beginning after December 15, 2019, including interim periods therein. Early adoption is permitted for any eliminated or modified disclosures upon issuance of this ASU. The Fund has early adopted ASU 2018-13 for these financial statements, which did not result in a material impact.
3. Investment Advisory Fee, Affiliated Transactions and Other Fee Arrangements
First Trust, the investment advisor to the Fund, is a limited partnership with one limited partner, Grace Partners of DuPage L.P., and one general partner, The Charger Corporation. The Charger Corporation is an Illinois corporation controlled by James A. Bowen, Chief Executive Officer of First Trust. First Trust is responsible for the selection and ongoing monitoring of the securities in the Fund’s portfolio, managing the Fund’s business affairs and providing certain administrative services necessary for the management of the Fund.
Pursuant to the Investment Management Agreement between the Trust and the Advisor, First Trust manages the investment of the Fund’s assets and is responsible for the Fund’s expenses, including the cost of transfer agency, custody, fund administration, legal, audit and other services, but excluding fee payments under the Investment Management Agreement, interest, taxes, acquired fund fees and expenses, if any, brokerage commissions and other expenses connected with the execution of portfolio transactions, distribution
Notes to Financial Statements (Continued)
First Trust Managed Municipal ETF (FMB)
October 31, 2018
and service fees pursuant to a 12b-1 plan, if any, and extraordinary expenses. The Fund has agreed to pay First Trust an annual unitary management fee equal to 0.65% of its average daily net assets. First Trust also provides fund reporting services to the Fund for a flat annual fee in the amount of $9,250, which is covered under the annual unitary management fee.
The Trust’s Board of Trustees and the Advisor have entered into a Fee Waiver Agreement for the Fund pursuant to which the Advisor contractually agreed to waive management fees of 0.15% of average daily net assets until March 1, 2020. The waiver agreement may be terminated by action of the Trust’s Board of Trustees at any time upon 60 days’ written notice by the Trust on behalf of the Fund or by the Fund’s investment advisor only after March 1, 2020. First Trust does not have the right to recover the fees waived. During the fiscal year ended October 31, 2018, the Advisor waived fees of $530,921.
The Trust has multiple service agreements with Brown Brothers Harriman & Co. (“BBH”). Under the service agreements, BBH performs custodial, fund accounting, certain administrative services, and transfer agency services for the Fund. As custodian, BBH is responsible for custody of the Fund’s assets. As fund accountant and administrator, BBH is responsible for maintaining the books and records of the Fund’s securities and cash. As transfer agent, BBH is responsible for maintaining shareholder records for the Fund.
Each Trustee who is not an officer or employee of First Trust, any sub-advisor or any of their affiliates (“Independent Trustees”) is paid a fixed annual retainer that is allocated equally among each fund in the First Trust Fund Complex. Each Independent Trustee is also paid an annual per fund fee that varies based on whether the fund is a closed-end or other actively managed fund, or is an index fund.
Additionally, the Lead Independent Trustee and the Chairmen of the Audit Committee, Nominating and Governance Committee and Valuation Committee are paid annual fees to serve in such capacities, with such compensation allocated pro rata among each fund in the First Trust Fund Complex based on net assets. Independent Trustees are reimbursed for travel and out-of-pocket expenses in connection with all meetings. The Lead Independent Trustee and Committee Chairmen rotate every three years. The officers and “Interested” Trustee receive no compensation from the Trust for acting in such capacities.
4. Purchases and Sales of Securities
For the fiscal year ended October 31, 2018, the cost of purchases and proceeds from sales of investments, excluding short term investments and in-kind transactions, were $396,121,426 and $142,181,547, respectively.
For the fiscal year ended October 31, 2018, the Fund had no in-kind transactions.
5. Derivative Transactions
The following table presents the type of derivatives held by the Fund at October 31, 2018, the primary underlying risk exposure and the location of these instruments as presented on the Statement of Assets and Liabilities.
| | | | | Asset Derivatives | | Liability Derivatives |
Derivative
Instrument | | Risk
Exposure | | Statement of Assets and
Liabilities Location | | Value | | Statement of Assets and
Liabilities Location | | Value |
| Futures | | Interest Rate Risk | | Unrealized appreciation
on futures contracts | | $ 29,375 | | Unrealized depreciation
on futures contracts | | $ 36,125 |
The following table presents the amount of net realized gain (loss) and change in net unrealized appreciation (depreciation) recognized for the fiscal year ended October 31, 2018, on derivative instruments, as well as the primary underlying risk exposure associated with each instrument.
| Statement of Operations Location | |
| Interest Rate Risk Exposure | |
| Net realized gain (loss) on futures | $157,096 |
| Net change in unrealized appreciation (depreciation) on futures | (6,750) |
During the fiscal year ended October 31, 2018, the notional value of futures contracts opened and closed were $117,355,967 and $99,300,217, respectively.
The Fund does not have the right to offset financial assets and liabilities related to futures contracts on the Statement of Assets and Liabilities.
Notes to Financial Statements (Continued)
First Trust Managed Municipal ETF (FMB)
October 31, 2018
6. Creations, Redemptions and Transaction Fees
Shares are created and redeemed by the Fund only in Creation Unit size aggregations of 50,000 shares in transactions with broker-dealers or large institutional investors that have entered into a participation agreement (an “Authorized Participant”). In order to purchase Creation Units of the Fund, an Authorized Participant must deposit (i) a designated portfolio of securities determined by First Trust (the “Deposit Securities”) and generally make or receive a cash payment referred to as the “Cash Component,” which is an amount equal to the difference between the NAV of the Fund shares (per Creation Unit Aggregation) and the market value of the Deposit Securities, and/or (ii) cash in lieu of all or a portion of the Deposit Securities. If the Cash Component is a positive number (i.e., the NAV per Creation Unit Aggregation exceeds the Deposit Amount), the Authorized Participant will deliver the Cash Component. If the Cash Component is a negative number (i.e., the NAV per Creation Unit Aggregation is less than the Deposit Amount), the Authorized Participant will receive the Cash Component. Authorized Participants purchasing Creation Units must pay to BBH, as transfer agent, a creation transaction fee (the “Creation Transaction Fee”) regardless of the number of Creation Units purchased in the transaction. The Creation Transaction Fee may vary and is based on the composition of the securities included in the Fund’s portfolio and the countries in which the transactions are settled. The Creation Transaction Fee is currently $500. The price for each Creation Unit will equal the daily NAV per share times the number of shares in a Creation Unit plus the fees described above and, if applicable, any operational processing and brokerage costs, transfer fees or stamp taxes. When the Fund permits an Authorized Participant to substitute cash or a different security in lieu of depositing one or more of the requisite Deposit Securities, the Authorized Participant may also be assessed an amount to cover the cost of purchasing the Deposit Securities and/or disposing of the substituted securities, including operational processing and brokerage costs, transfer fees, stamp taxes, and part or all of the spread between the expected bid and offer side of the market related to such Deposit Securities and/or substitute securities.
Authorized Participants redeeming Creation Units must pay to BBH, as transfer agent, a redemption transaction fee (the “Redemption Transaction Fee”), regardless of the number of Creation Units redeemed in the transaction. The Redemption Transaction Fee may vary and is based on the composition of the securities included in the Fund’s portfolio and the countries in which the transactions are settled. The Redemption Transaction Fee is currently $500. The Fund reserves the right to effect redemptions in cash. An Authorized Participant may request cash redemption in lieu of securities; however, the Fund may, in its discretion, reject any such request.
7. Distribution Plan
The Board of Trustees adopted a Distribution and Service Plan pursuant to Rule 12b-1 under the 1940 Act. In accordance with the Rule 12b-1 plan, the Fund is authorized to pay an amount up to 0.25% of its average daily net assets each year to reimburse First Trust Portfolios L.P. (“FTP”), the distributor of the Fund, for amounts expended to finance activities primarily intended to result in the sale of Creation Units or to provide investor services. FTP may also use this amount to compensate securities dealers or other persons that are Authorized Participants for providing distribution assistance, including broker-dealer and shareholder support and educational and promotional services.
No 12b-1 fees are currently paid by the Fund, and pursuant to a contractual arrangement, no 12b-1 fees will be paid any time before February 28, 2020.
8. Borrowings
The Trust, on behalf of the Fund, along with First Trust Series Fund and First Trust Exchange-Traded Fund IV have a $360 million Credit Agreement with The Bank of Nova Scotia (“Scotia”) as administrative agent for a group of lenders. Prior to August 28, 2018 and March 7, 2018, the commitment amount was $320 million and $220 million, respectively. Scotia charges a commitment fee of 0.25% of the daily amount of the excess of the commitment amount over the outstanding principal balance of the loans and an agency fee. First Trust allocates the commitment fee and agency fee amongst the funds that have access to the credit line. To the extent that the Fund accesses the credit line, there would also be an interest fee charged. The Fund did not have any borrowings outstanding during the fiscal year ended October 31, 2018.
9. Indemnification
The Trust, on behalf of the Fund, has a variety of indemnification obligations under contracts with its service providers. The Trust’s maximum exposure under these arrangements is unknown. However, the Trust has not had prior claims or losses pursuant to these contracts and expects the risk of loss to be remote.
Notes to Financial Statements (Continued)
First Trust Managed Municipal ETF (FMB)
October 31, 2018
10. Subsequent Events
Management has evaluated the impact of all subsequent events to the Fund through the date the financial statements were issued, and has determined that there was the following subsequent event:
On November 2, 2018, First Trust Short Duration Managed Municipal ETF and First Trust Ultra Short Duration Municipal ETF, each an additional series of the Trust, began trading under the ticker symbols FSMB and FUMB, respectively, on the NYSE Arca, Inc.
Report of Independent Registered Public Accounting Firm
To the Shareholders and the Board of Trustees of First Trust Exchange-Traded Fund III:
Opinion on the Financial Statements and Financial Highlights
We have audited the accompanying statement of assets and liabilities, including the portfolio of investments, of First Trust Managed Municipal ETF (the “Fund”), one of the funds constituting the First Trust Exchange-Traded Fund III, as of October 31, 2018, the related statement of operations for the year then ended, the statements of changes in net assets for each of the two years in the period then ended, the financial highlights for the years ended October 31, 2018, 2017, 2016, 2015 and for the period from May 13, 2014 (commencement of operations) through October 31, 2014, and the related notes. In our opinion, the financial statements and financial highlights present fairly, in all material respects, the financial position of the Fund as of October 31, 2018, and the results of its operations for the year then ended, the changes in its net assets for each of the two years in the period then ended, and the financial highlights for the years ended October 31, 2018, 2017, 2016, 2015 and for the period from May 13, 2014 (commencement of operations) through October 31, 2014, in conformity with accounting principles generally accepted in the United States of America.
Basis for Opinion
These financial statements and financial highlights are the responsibility of the Fund’s management. Our responsibility is to express an opinion on the Fund’s financial statements and financial highlights based on our audits. We are a public accounting firm registered with the Public Company Accounting Oversight Board (United States) (PCAOB) and are required to be independent with respect to the Fund in accordance with the U.S. federal securities laws and the applicable rules and regulations of the Securities and Exchange Commission and the PCAOB.
We conducted our audits in accordance with the standards of the PCAOB. Those standards require that we plan and perform the audit to obtain reasonable assurance about whether the financial statements and financial highlights are free of material misstatement, whether due to error or fraud. The Fund is not required to have, nor were we engaged to perform, an audit of its internal control over financial reporting. As part of our audits we are required to obtain an understanding of internal control over financial reporting but not for the purpose of expressing an opinion on the effectiveness of the Fund’s internal control over financial reporting. Accordingly, we express no such opinion.
Our audits included performing procedures to assess the risks of material misstatement of the financial statements and financial highlights, whether due to error or fraud, and performing procedures that respond to those risks. Such procedures included examining, on a test basis, evidence regarding the amounts and disclosures in the financial statements and financial highlights. Our audits also included evaluating the accounting principles used and significant estimates made by management, as well as evaluating the overall presentation of the financial statements and financial highlights. Our procedures included confirmation of securities owned as of October 31, 2018, by correspondence with the custodian and brokers; when replies were not received from brokers, we performed other auditing procedures. We believe that our audits provide a reasonable basis for our opinion.
Chicago, Illinois
December 21, 2018
We have served as the auditor of one or more First Trust investment companies since 2001.
Additional Information
First Trust Managed Municipal ETF (FMB)
October 31, 2018 (Unaudited)
Proxy Voting Policies and Procedures
A description of the policies and procedures that the Trust uses to determine how to vote proxies and information on how the Fund voted proxies relating to portfolio securities during the most recent 12-month period ended June 30 is available (1) without charge, upon request, by calling (800) 988-5891; (2) on the Fund’s website at www.ftportfolios.com; and (3) on the Securities and Exchange Commission’s (“SEC”) website at www.sec.gov.
Portfolio Holdings
The Trust files its complete schedule of the Fund’s portfolio holdings with the SEC for the first and third quarters of each fiscal year on Form N-Q. The Trust’s Form NQs are available (1) by calling (800) 988-5891; (2) on the Fund’s website at www.ftportfolios.com; and (3) on the SEC’s website at www.sec.gov.
Beginning in April 2019, the Trust will cease to disclose the Fund’s holdings on Form N-Q and will file Form N-PORT with the SEC on a monthly basis. Part F of Form N-PORT, which contains the complete schedule of the Fund’s portfolio holdings, will be made available in the same manner as Form N-Q discussed above.
Federal Tax Information
For the taxable year ended October 31, 2018, the following distribution information is being provided as required by the Internal Revenue Code or to meet a specific state’s requirement. The Fund designates the following amounts or, if subsequently determined to be different, the maximum amount allowable for its fiscal year ended October 31, 2018:
| Federal and State Income Tax | | Percentages |
| Tax-Exempt Interest Dividends | | 100.00% |
| Alternative Minimum Tax (AMT) | | 7.46% |
Risk Considerations
Risks are inherent in all investing. Certain general risks that may be applicable to some or all of the Funds are identified below, but not all of the material risks relevant to each Fund are included in this report. The material risks of investing in each Fund are spelled out in its prospectus, statement of additional information and other regulatory filings. Before investing, you should consider each Fund’s investment objective, risks, charges and expenses, and read each Fund’s prospectus and statement of additional information carefully. You can download each Fund’s prospectus at www.ftportfolios.com or contact First Trust Portfolios L.P. at (800) 621-1675 to request a prospectus, which contains this and other information about each Fund.
Concentration Risk. To the extent that a Fund is able to invest a large percentage of its assets in a single asset class or the securities of issuers within the same country, state, region, industry or sector, an adverse economic, business or political development may affect the value of the Fund’s investments more than if the Fund were more broadly diversified. A Fund that tracks an index will be concentrated to the extent the Fund’s corresponding index is concentrated. A concentration makes a Fund more susceptible to any single occurrence and may subject the Fund to greater market risk than a fund that is not concentrated.
Credit Risk. Credit risk is the risk that an issuer of a security will be unable or unwilling to make dividend, interest and/or principal payments when due and the related risk that the value of a security may decline because of concerns about the issuer’s ability to make such payments.
Cyber Security Risk. The Funds are susceptible to potential operational risks through breaches in cyber security. A breach in cyber security refers to both intentional and unintentional events that may cause a Fund to lose proprietary information, suffer data corruption or lose operational capacity. Such events could cause a Fund to incur regulatory penalties, reputational damage, additional compliance costs associated with corrective measures and/or financial loss. In addition, cyber security breaches of a Fund’s third-party service providers, such as its administrator, transfer agent, custodian, or sub-advisor, as applicable, or issuers in which the Fund invests, can also subject a Fund to many of the same risks associated with direct cyber security breaches.
Derivatives Risk. To the extent a Fund uses derivative instruments such as futures contracts, options contracts and swaps, the Fund may experience losses because of adverse movements in the price or value of the underlying asset, index or rate, which may be magnified by certain features of the derivative. These risks are heightened when a Fund’s portfolio managers use derivatives to enhance the Fund’s return or as a substitute for a position or security, rather than solely to hedge (or offset) the risk of a position or security held by the Fund.
Equity Securities Risk. To the extent a Fund invests in equity securities, the value of the Fund’s shares will fluctuate with changes in the value of the equity securities. Equity securities prices fluctuate for several reasons, including changes in investors’ perceptions of
Additional Information (Continued)
First Trust Managed Municipal ETF (FMB)
October 31, 2018 (Unaudited)
the financial condition of an issuer or the general condition of the relevant stock market, such as market volatility, or when political or economic events affecting the issuers occur. In addition, common stock prices may be particularly sensitive to rising interest rates, as the cost of capital rises and borrowing costs increase. Equity securities may decline significantly in price over short or extended periods of time, and such declines may occur in the equity market as a whole, or they may occur in only a particular country, company, industry or sector of the market.
ETF Risk. The shares of an ETF trade like common stock and represent an interest in a portfolio of securities. The risks of owning an ETF generally reflect the risks of owning the underlying securities, although lack of liquidity in an ETF could result in it being more volatile and ETFs have management fees that increase their costs. Shares of an ETF trade on an exchange at market prices rather than net asset value, which may cause the shares to trade at a price greater than net asset value (premium) or less than net asset value (discount). In times of market stress, decisions by market makers to reduce or step away from their role of providing a market for an ETF’s shares, or decisions by an ETF’s authorized participants that they are unable or unwilling to proceed with creation and/or redemption orders of an ETF’s shares, could result in shares of the ETF trading at a discount to net asset value and in greater than normal intraday bid-ask spreads.
Fixed Income Securities Risk. To the extent a Fund invests in fixed income securities, the Fund will be subject to credit risk, income risk, interest rate risk, liquidity risk and prepayment risk. Income risk is the risk that income from a Fund’s fixed income investments could decline during periods of falling interest rates. Interest rate risk is the risk that the value of a Fund’s fixed income securities will decline because of rising interest rates. Liquidity risk is the risk that a security cannot be purchased or sold at the time desired, or cannot be purchased or sold without adversely affecting the price. Prepayment risk is the risk that the securities will be redeemed or prepaid by the issuer, resulting in lower interest payments received by the Fund. In addition to these risks, high yield securities, or “junk” bonds, are subject to greater market fluctuations and risk of loss than securities with higher ratings, and the market for high yield securities is generally smaller and less liquid than that for investment grade securities.
Fund of Funds Risk. To the extent a Fund invests in the securities of other investment vehicles, the Fund will incur additional fees and expenses that would not be present in a direct investment in those investment vehicles. Furthermore, the Fund’s investment performance and risks are directly related to the investment performance and risks of the investment vehicles in which the Fund invests.
Index Constituent Risk. Certain Funds may be a constituent of one or more indices. As a result, such a Fund may be included in one or more index-tracking exchange-traded funds or mutual funds. Being a component security of such a vehicle could greatly affect the trading activity involving a Fund, the size of the Fund and the market volatility of the Fund. Inclusion in an index could significantly increase demand for the Fund and removal from an index could result in outsized selling activity in a relatively short period of time. As a result, a Fund’s net asset value could be negatively impacted and the Fund’s market price may be significantly below its net asset value during certain periods.
Index Provider Risk. To the extent a Fund seeks to track an index, it is subject to Index Provider Risk. There is no assurance that the Index Provider will compile the Index accurately, or that the Index will be determined, maintained, constructed, reconstituted, rebalanced, composed, calculated or disseminated accurately. To correct any such error, the Index Provider may carry out an unscheduled rebalance or other modification of the Index constituents or weightings, which may increase the Fund’s costs. The Index Provider does not provide any representation or warranty in relation to the quality, accuracy or completeness of data in the Index, and it does not guarantee that the Index will be calculated in accordance with its stated methodology. Losses or costs associated with any Index Provider errors generally will be borne by the Fund and its shareholders.
Management Risk. To the extent that a Fund is actively managed, it is subject to management risk. In managing an actively-managed Fund’s investment portfolio, the Fund’s portfolio managers will apply investment techniques and risk analyses that may not have the desired result. There can be no guarantee that a Fund will meet its investment objective.
Market Risk. Securities held by a Fund, as well as shares of a Fund itself, are subject to market fluctuations caused by factors such as general economic conditions, political events, regulatory or market developments, changes in interest rates and perceived trends in securities prices. Shares of a Fund could decline in value or underperform other investments as a result of the risk of loss associated with these market fluctuations.
Non-U.S. Securities Risk. To the extent a Fund invests in non-U.S. securities, it is subject to additional risks not associated with securities of domestic issuers. Non-U.S. securities are subject to higher volatility than securities of domestic issuers due to: possible adverse political, social or economic developments; restrictions on foreign investment or exchange of securities; lack of liquidity; currency exchange rates; excessive taxation; government seizure of assets; different legal or accounting standards; and less government supervision and regulation of exchanges in foreign countries. Investments in non-U.S. securities may involve higher costs
Additional Information (Continued)
First Trust Managed Municipal ETF (FMB)
October 31, 2018 (Unaudited)
than investments in U.S. securities, including higher transaction and custody costs, as well as additional taxes imposed by non-U.S. governments. These risks may be heightened for securities of companies located, or with significant operations, in emerging market countries.
Passive Investment Risk. To the extent a Fund seeks to track an index, the Fund will invest in the securities included in, or representative of, the index regardless of their investment merit. A Fund generally will not attempt to take defensive positions in declining markets.
| NOT FDIC INSURED | NOT BANK GUARANTEED | MAY LOSE VALUE |
Investment Management Agreement
Board Considerations Regarding Continuation of Investment Management Agreement
The Board of Trustees of First Trust Exchange-Traded Fund III (the “Trust”), including the Independent Trustees, unanimously approved the continuation of the Investment Management Agreement (the “Agreement”) with First Trust Advisors L.P. (the “Advisor”) on behalf of the First Trust Managed Municipal ETF (the “Fund”). The Board approved the continuation of the Agreement for a one-year period ending June 30, 2019 at a meeting held on June 11, 2018. The Board determined that the continuation of the Agreement is in the best interests of the Fund in light of the nature, extent and quality of the services provided and such other matters as the Board considered to be relevant in the exercise of its reasonable business judgment.
To reach this determination, the Board considered its duties under the Investment Company Act of 1940, as amended (the “1940 Act”), as well as under the general principles of state law, in reviewing and approving advisory contracts; the requirements of the 1940 Act in such matters; the fiduciary duty of investment advisors with respect to advisory agreements and compensation; the standards used by courts in determining whether investment company boards have fulfilled their duties; and the factors to be considered by the Board in voting on such agreements. At meetings held on April 23, 2018 and June 11, 2018, the Board, including the Independent Trustees, reviewed materials provided by the Advisor responding to requests for information from counsel to the Independent Trustees that, among other things, outlined the services provided by the Advisor to the Fund (including the relevant personnel responsible for these services and their experience); the unitary fee rate payable by the Fund as compared to fees charged to a peer group of funds (most of which were exchange-traded funds (“ETFs”)) compiled by Management Practice, Inc. (“MPI”), an independent source (the “Peer Group”), and as compared to fees charged to other clients of the Advisor, including other ETFs managed by the Advisor; expenses of the Fund as compared to expense ratios of the funds in the Peer Group; performance information for the Fund; the nature of expenses incurred in providing services to the Fund and the potential for economies of scale, if any; financial data on the Advisor; any fall-out benefits to the Advisor and its affiliate, First Trust Portfolios L.P. (“FTP”); and information on the Advisor’s compliance program. The Board reviewed initial materials with the Advisor at the meeting held on April 23, 2018, prior to which the Independent Trustees and their counsel met separately to discuss the information provided by the Advisor. Following the April meeting, independent legal counsel on behalf of the Independent Trustees requested certain clarifications and supplements to the materials provided, and the information provided in response to those requests was considered at an executive session of the Independent Trustees and independent legal counsel held prior to the June 11, 2018 meeting, as well as at the meeting held that day. The Board applied its business judgment to determine whether the arrangement between the Trust and the Advisor continues to be a reasonable business arrangement from the Fund’s perspective. The Board determined that, given the totality of the information provided with respect to the Agreement, the Board had received sufficient information to renew the Agreement. The Board considered that shareholders chose to invest or remain invested in the Fund knowing that the Advisor manages the Fund and knowing the Fund’s unitary fee.
In reviewing the Agreement, the Board considered the nature, extent and quality of the services provided by the Advisor under the Agreement. The Board considered that the Advisor is responsible for the overall management and administration of the Trust and the Fund and reviewed all of the services provided by the Advisor to the Fund, as well as the background and experience of the persons responsible for such services. The Board noted that the Fund is an actively-managed ETF and noted that the Advisor’s Municipal Securities Team is responsible for the day-to-day management of the Fund’s investments. The Board considered the background and experience of the members of the Municipal Securities Team and noted the Board’s prior meetings with members of the Team. The Board considered the Advisor’s statement that it applies the same oversight model internally with its Municipal Securities Team as it uses for overseeing external sub-advisors, including portfolio risk monitoring and performance review. In reviewing the services provided, the Board noted the compliance program that had been developed by the Advisor and considered that it includes a robust program for monitoring the Advisor’s and the Fund’s compliance with the 1940 Act, as well as the Fund’s compliance with its investment objectives, policies and restrictions. The Board also considered a report from the Advisor with respect to its risk management functions related to the operation of the Fund. Finally, as part of the Board’s consideration of the Advisor’s services, the Advisor, in its written materials and at the April 23, 2018 meeting, described to the Board the scope of its ongoing investment in additional infrastructure and personnel to maintain and improve the quality of services provided to the Fund and the other funds in the First Trust Fund Complex. In light of the information presented and the considerations made, the Board concluded that the nature,
Additional Information (Continued)
First Trust Managed Municipal ETF (FMB)
October 31, 2018 (Unaudited)
extent and quality of the services provided to the Trust and the Fund by the Advisor under the Agreement have been and are expected to remain satisfactory and that the Advisor has managed the Fund consistent with the Fund’s investment objectives, policies and restrictions.
The Board considered the unitary fee rate payable by the Fund under the Agreement for the services provided. The Board considered that as part of the unitary fee the Advisor is responsible for the Fund’s expenses, including the cost of transfer agency, custody, fund administration, legal, audit and other services and license fees (if any), but excluding interest, taxes, brokerage commissions and other expenses connected with the execution of portfolio transactions, distribution and service fees pursuant to a Rule 12b-1 plan, if any, and extraordinary expenses. The Board noted that the Advisor had previously agreed to waive a portion of its unitary fee in an amount equal to 0.15% of the Fund’s average daily net assets until at least March 1, 2019. The Board received and reviewed information showing the advisory or unitary fee rates and expense ratios of the peer funds in the Peer Group, as well as advisory and unitary fee rates charged by the Advisor to other fund (including ETFs) and non-fund clients, as applicable. Because the Fund’s Peer Group included peer funds that pay a unitary fee and because the Fund pays a unitary fee, the Board determined that expense ratios were the most relevant comparative data point. Based on the information provided, the Board noted that the unitary fee for the Fund, after taking into account the contractual fee waiver, was above the median total (net) expense ratio of the peer funds in the Peer Group. With respect to the Peer Group, the Board noted its prior discussions with the Advisor and MPI regarding the assembly of the Peer Group and, at the April 23, 2018 meeting, discussed with the Advisor limitations in creating peer groups for actively-managed ETFs, including the limited number of actively-managed ETFs investing in municipal securities and that most of the peer funds were index-based ETFs, and different business models that may affect the pricing of services among ETF sponsors. The Board took these limitations and differences into account in considering the peer data. With respect to fees charged to other non-ETF clients, the Board considered differences between the Fund and other non-ETF clients that limited their comparability. In considering the unitary fee rate overall, the Board also considered the Advisor’s statement that it seeks to meet investor needs through innovative and value-added investment solutions and the Advisor’s description of its long-term commitment to the Fund.
The Board considered performance information for the Fund. The Board noted the process it has established for monitoring the Fund’s performance and portfolio risk on an ongoing basis, which includes quarterly performance reporting from the Advisor for the Fund. The Board determined that this process continues to be effective for reviewing the Fund’s performance. The Board received and reviewed information comparing the Fund’s performance for periods ended December 31, 2017 to the performance of the peer funds in the Peer Group and to that of a benchmark index. Based on the information provided, the Board noted that the Fund outperformed the Peer Group average and the benchmark index for the one- and three-year periods ended December 31, 2017.
On the basis of all the information provided on the unitary fee and performance of the Fund and the ongoing oversight by the Board, the Board concluded that the unitary fee for the Fund continues to be reasonable and appropriate in light of the nature, extent and quality of the services provided by the Advisor to the Fund under the Agreement.
The Board considered information and discussed with the Advisor whether there were any economies of scale in connection with providing advisory services to the Fund and noted the Advisor’s statement that it believes its expenses will likely increase over the next twelve months as the Advisor continues to make investments in additional infrastructure and personnel. The Board noted that any reduction in fixed costs associated with the management of the Fund would benefit the Advisor, but that the unitary fee structure provides a level of certainty in expenses for the Fund. The Board considered the revenues and allocated costs (including the allocation methodology) of the Advisor in serving as investment advisor to the Fund for the twelve months ended December 31, 2017 and the estimated profitability level for the Fund calculated by the Advisor based on such data, as well as complex-wide and product-line profitability data, for the same period. The Board noted the inherent limitations in the profitability analysis and concluded that, based on the information provided, the Advisor’s profitability level for the Fund was not unreasonable. In addition, the Board considered fall-out benefits described by the Advisor that may be realized from its relationship with the Fund. The Board considered that the Advisor had identified as a fall-out benefit to the Advisor and FTP their exposure to investors and brokers who, absent their exposure to the Fund, may have had no dealings with the Advisor or FTP, and noted that the Advisor does not utilize soft dollars in connection with its management of the Fund’s portfolio. The Board also considered the Advisor’s compensation for fund reporting services provided to the Fund pursuant to a separate Fund Reporting Services Agreement, which is paid from the unitary fee. The Board concluded that the character and amount of potential fall-out benefits to the Advisor were not unreasonable.
Based on all of the information considered and the conclusions reached, the Board, including the Independent Trustees, unanimously determined that the terms of the Agreement continue to be fair and reasonable and that the continuation of the Agreement is in the best interests of the Fund. No single factor was determinative in the Board’s analysis.
Board of Trustees and Officers
First Trust Managed Municipal ETF (FMB)
October 31, 2018 (Unaudited)
The following tables identify the Trustees and Officers of the Trust. Unless otherwise indicated, the address of all persons is 120 E. Liberty Drive, Suite 400, Wheaton, IL 60187.
The Trust’s statement of additional information includes additional information about the Trustees and is available, without charge, upon request, by calling (800) 988-5891.
| Name, Year of Birth and Position with the Trust | Term of Office and Year First Elected or Appointed | Principal Occupations
During Past 5 Years | Number of Portfolios in the First Trust Fund Complex Overseen by Trustee | Other Trusteeships or Directorships Held by Trustee During Past 5 Years |
| INDEPENDENT TRUSTEES |
Richard E. Erickson, Trustee
(1951) | • Indefinite Term
• Since Inception | Physician; Officer, Wheaton Orthopedics; Limited Partner, Gundersen Real Estate Limited Partnership (June 1992 to December 2016); Member, Sportsmed LLC (April 2007 to November 2015) | 159 | None |
Thomas R. Kadlec, Trustee
(1957) | • Indefinite Term
• Since Inception | President, ADM Investor Services, Inc. (Futures Commission Merchant) | 159 | Director of ADM Investor Services, Inc., ADM Investor Services International, Futures Industry Association, and National Futures Association |
Robert F. Keith, Trustee
(1956) | • Indefinite Term
• Since Inception | President, Hibs Enterprises (Financial and Management Consulting) | 159 | Director of Trust Company of Illinois |
Niel B. Nielson, Trustee
(1954) | • Indefinite Term
• Since Inception | Senior Advisor (August 2018 to Present), Managing Director and Chief Operating Officer (January 2015 to August 2018), Pelita Harapan Educational Foundation (Educational Products and Services); President and Chief Executive Officer (June 2012 to September 2014), Servant Interactive LLC (Educational Products and Services); President and Chief Executive Officer (June 2012 to September 2014), Dew Learning LLC (Educational Products and Services) | 159 | Director of Covenant Transport, Inc. (May 2003 to May 2014) |
| INTERESTED TRUSTEE |
James A. Bowen(1), Trustee and
Chairman of the Board
(1955) | • Indefinite Term
• Since Inception | Chief Executive Officer, First Trust Advisors L.P. and First Trust Portfolios L.P.; Chairman of the Board of Directors, BondWave LLC (Software Development Company) and Stonebridge Advisors LLC (Investment Advisor) | 159 | None |
| (1) | Mr. Bowen is deemed an “interested person” of the Trust due to his position as CEO of First Trust Advisors L.P., investment advisor of the Trust. |
Board of Trustees and Officers (Continued)
First Trust Managed Municipal ETF (FMB)
October 31, 2018 (Unaudited)
| Name and Year of Birth | Position and Offices with Trust | Term of Office and Length of Service | Principal Occupations
During Past 5 Years |
| OFFICERS(2) |
James M. Dykas
(1966) | President and Chief Executive Officer | • Indefinite Term
• Since January 2016 | Managing Director and Chief Financial Officer (January 2016 to Present), Controller (January 2011 to January 2016), Senior Vice President (April 2007 to January 2016), First Trust Advisors L.P. and First Trust Portfolios L.P.; Chief Financial Officer (January 2016 to Present), BondWave LLC (Software Development Company) and Stonebridge Advisors LLC (Investment Advisor) |
Donald P. Swade
(1972) | Treasurer, Chief Financial Officer and Chief Accounting Officer | • Indefinite Term
• Since January 2016 | Senior Vice President (July 2016 to Present), Vice President (April 2012 to July 2016), First Trust Advisors L.P. and First Trust Portfolios L.P. |
W. Scott Jardine
(1960) | Secretary and Chief Legal Officer | • Indefinite Term
• Since Inception | General Counsel, First Trust Advisors L.P. and First Trust Portfolios L.P.; Secretary and General Counsel, BondWave LLC; Secretary, Stonebridge Advisors LLC |
Daniel J. Lindquist
(1970) | Vice President | • Indefinite Term
• Since Inception | Managing Director, First Trust Advisors L.P. and First Trust Portfolios L.P. |
Kristi A. Maher
(1966) | Chief Compliance Officer and Assistant Secretary | • Indefinite Term
• Since Inception | Deputy General Counsel, First Trust Advisors L.P. and First Trust Portfolios L.P. |
Roger F. Testin
(1966) | Vice President | • Indefinite Term
• Since Inception | Senior Vice President, First Trust Advisors L.P. and First Trust Portfolios L.P. |
Stan Ueland
(1970) | Vice President | • Indefinite Term
• Since Inception | Senior Vice President, First Trust Advisors L.P. and First Trust Portfolios L.P |
| (2) | The term “officer” means the president, vice president, secretary, treasurer, controller or any other officer who performs a policy making function. |
Privacy Policy
First Trust Managed Municipal ETF (FMB)
October 31, 2018 (Unaudited)
Privacy Policy
First Trust values our relationship with you and considers your privacy an important priority in maintaining that relationship. We are committed to protecting the security and confidentiality of your personal information.
Sources of Information
We collect nonpublic personal information about you from the following sources:
| • | Information we receive from you and your broker-dealer, investment advisor or financial representative through interviews, applications, agreements or other forms; |
| • | Information about your transactions with us, our affiliates or others; |
| • | Information we receive from your inquiries by mail, e-mail or telephone; and |
| • | Information we collect on our website through the use of “cookies”. For example, we may identify the pages on our website that your browser requests or visits. |
Information Collected
The type of data we collect may include your name, address, social security number, age, financial status, assets, income, tax information, retirement and estate plan information, transaction history, account balance, payment history, investment objectives, marital status, family relationships and other personal information.
Disclosure of Information
We do not disclose any nonpublic personal information about our customers or former customers to anyone, except as permitted by law. In addition to using this information to verify your identity (as required under law), the permitted uses may also include the disclosure of such information to unaffiliated companies for the following reasons:
| • | In order to provide you with products and services and to effect transactions that you request or authorize, we may disclose your personal information as described above to unaffiliated financial service providers and other companies that perform administrative or other services on our behalf, such as transfer agents, custodians and trustees, or that assist us in the distribution of investor materials such as trustees, banks, financial representatives, proxy services, solicitors and printers. |
| • | We may release information we have about you if you direct us to do so, if we are compelled by law to do so, or in other legally limited circumstances (for example to protect your account from fraud). |
In addition, in order to alert you to our other financial products and services, we may share your personal information within First Trust.
Use of Website Analytics
We currently use third party analytics tools, Google Analytics and AddThis, to gather information for purposes of improving First Trust’s website and marketing our products and services to you. These tools employ cookies, which are small pieces of text stored in a file by your web browser and sent to websites that you visit, to collect information, track website usage and viewing trends such as the number of hits, pages visited, videos and PDFs viewed and the length of user sessions in order to evaluate website performance and enhance navigation of the website. We may also collect other anonymous information, which is generally limited to technical and web navigation information such as the IP address of your device, internet browser type and operating system for purposes of analyzing the data to make First Trust’s website better and more useful to our users. The information collected does not include any personal identifiable information such as your name, address, phone number or email address unless you provide that information through the website for us to contact you in order to answer your questions or respond to your requests. To find out how to opt-out of these services click on: Google Analytics and AddThis.
Confidentiality and Security
With regard to our internal security procedures, First Trust restricts access to your nonpublic personal information to those First Trust employees who need to know that information to provide products or services to you. We maintain physical, electronic and procedural safeguards to protect your nonpublic personal information.
Policy Updates and Inquiries
As required by federal law, we will notify you of our privacy policy annually. We reserve the right to modify this policy at any time, however, if we do change it, we will tell you promptly. For questions about our policy, or for additional copies of this notice, please go to www.ftportfolios.com, or contact us at 1-800-621-1675 (First Trust Portfolios) or 1-800-222-6822 (First Trust Advisors).
May 2017
This page intentionally left blank
This page intentionally left blank
This page intentionally left blank
First Trust Exchange-Traded Fund III
INVESTMENT ADVISOR
First Trust Advisors L.P.
120 E. Liberty Drive, Suite 400
Wheaton, IL 60187
ADMINISTRATOR, CUSTODIAN,
FUND ACCOUNTANT &
TRANSFER AGENT
Brown Brothers Harriman & Co.
50 Post Office Square
Boston, MA 02110
INDEPENDENT REGISTERED
PUBLIC ACCOUNTING FIRM
Deloitte & Touche LLP
111 S. Wacker Drive
Chicago, IL 60606
LEGAL COUNSEL
Chapman and Cutler LLP
111 W. Monroe Street
Chicago, IL 60603
First Trust Exchange-Traded Fund III
First Trust Long/Short Equity ETF (FTLS)
Annual Report
For the Year Ended
October 31, 2018
First Trust Long/Short Equity ETF (FTLS)
Annual Report
October 31, 2018
Caution Regarding Forward-Looking Statements
This report contains certain forward-looking statements within the meaning of the Securities Act of 1933, as amended, and the Securities Exchange Act of 1934, as amended. Forward-looking statements include statements regarding the goals, beliefs, plans or current expectations of First Trust Advisors L.P. (“First Trust” or the “Advisor”) and its representatives, taking into account the information currently available to them. Forward-looking statements include all statements that do not relate solely to current or historical fact. For example, forward-looking statements include the use of words such as “anticipate,” “estimate,” “intend,” “expect,” “believe,” “plan,” “may,” “should,” “would” or other words that convey uncertainty of future events or outcomes.
Forward-looking statements involve known and unknown risks, uncertainties and other factors that may cause the actual results, performance or achievements of the series of First Trust Exchange-Traded Fund III (the “Trust”) described in this report (First Trust Long/Short Equity ETF; hereinafter referred to as the “Fund”) to be materially different from any future results, performance or achievements expressed or implied by the forward-looking statements. When evaluating the information included in this report, you are cautioned not to place undue reliance on these forward-looking statements, which reflect the judgment of the Advisor and its representatives only as of the date hereof. We undertake no obligation to publicly revise or update these forward-looking statements to reflect events and circumstances that arise after the date hereof.
Performance and Risk Disclosure
There is no assurance that the Fund will achieve its investment objective. The Fund is subject to market risk, which is the possibility that the market values of securities owned by the Fund will decline and that the value of the Fund shares may therefore be less than what you paid for them. Accordingly, you can lose money by investing in the Fund. See “Risk Considerations” in the Additional Information section of this report for a discussion of certain other risks of investing in the Fund.
Performance data quoted represents past performance, which is no guarantee of future results, and current performance may be lower or higher than the figures shown. For the most recent month-end performance figures, please visit www.ftportfolios.com or speak with your financial advisor. Investment returns, net asset value and share price will fluctuate and Fund shares, when sold, may be worth more or less than their original cost.
The Advisor may also periodically provide additional information on Fund performance on the Fund’s web page at www.ftportfolios.com.
How to Read This Report
This report contains information that may help you evaluate your investment in the Fund. It includes details about the Fund and presents data and analysis that provide insight into the Fund’s performance and investment approach.
By reading the portfolio commentary by the portfolio management team of the Fund, you may obtain an understanding of how the market environment affected the Fund’s performance. The statistical information that follows may help you understand the Fund’s performance compared to that of a relevant market benchmark.
It is important to keep in mind that the opinions expressed by personnel of the Advisor are just that: informed opinions. They should not be considered to be promises or advice. The opinions, like the statistics, cover the period through the date on the cover of this report. The material risks of investing in the Fund are spelled out in the prospectus, the statement of additional information, and other Fund regulatory filings.
First Trust Long/Short Equity ETF (FTLS)
Annual Letter from the Chairman and CEO
October 31, 2018
Dear Shareholders,
First Trust is pleased to provide you with the annual report for the First Trust Long/Short Equity ETF (the “Fund”), which contains detailed information about the Fund for the twelve months ended October 31, 2018, including a market overview and a performance analysis. We encourage you to read this report carefully and discuss it with your financial advisor.
As I mentioned in my April 2018 letter, 2017 was a very strong year for U.S. and global markets. Investors were rewarded with rising markets and very little volatility. As 2018 began, investors were hoping for another strong year in the markets. For the entire first quarter, however, increased market volatility was the norm for U.S. and global markets. The markets continued their volatility throughout the second quarter. During April and May, the Dow Jones Industrial Average (“DJIA”) closed out each month slightly down, but ended both June and July slightly up. August was a strong month for stocks, and the DJIA finished August just under its previous high in January of 2018. At the close of the third quarter in September, the markets had moved higher into positive territory. In fact, all three major U.S. indices (the Nasdaq Composite Index, the S&P 500® Index and the DJIA) hit record levels during the third quarter. In October, markets were again very volatile, surprising analysts and investors alike. Both global and U.S. markets fell on fears of slowing growth, trade wars and higher interest rates. The DJIA was down 5% for October and the MSCI EAFE Index, an index of stocks in 21 developed markets (excluding the U.S. and Canada), was down 9% for the same period.
Based on continued strong job growth and the economic outlook in the U.S., the Federal Reserve (the “Fed”) raised interest rates in March, June and September. At their September meeting, the Fed also indicated the possibility of one more rate hike in 2018 as well as three more rate hikes in 2019.
Trade tensions have had an impact on markets around the world and could continue to do so in the future. However, our economists believe that the long-term impact of U.S. tariffs will be to encourage countries to come back to the table and talk about more equal trade. Despite market volatility, we continue to believe that the combination of low interest rates, low inflation and strong corporate earnings still point to a positive economic environment and further growth, though we understand that past performance can never guarantee future performance.
We continue to believe that you should invest for the long term and be prepared for market movements, which can happen at any time. You can do this by keeping current on your portfolio and by speaking regularly with your investment professional. Markets go up and they also go down, but savvy investors are prepared for either through careful attention to investment goals.
Thank you for giving First Trust the opportunity to be a part of your financial plan. We value our relationship with you and will report on the Fund again in six months.
Sincerely,
James A. Bowen
Chairman of the Board of Trustees
Chief Executive Officer of First Trust Advisors L.P.
Fund Performance Overview (Unaudited)
First Trust Long/Short Equity ETF (FTLS)
The investment objective of First Trust Long/Short Equity ETF (the “Fund”) is to seek to provide investors with long-term total return. The Fund pursues its investment objective by establishing long and short positions in a portfolio of Equity Securities (as defined below). Under normal circumstances, at least 80% of the Fund’s net assets (including investment borrowings) will be exposed to U.S. exchange-listed equity securities of U.S. and non-U.S. companies by investing in such securities directly and/or in U.S. exchange-traded funds (“ETFs”) that provide exposure to such securities. The securities of the companies and ETFs in which the Fund will invest are referred to collectively as “Equity Securities”. The Equity Securities held by the Fund may include U.S. exchange-listed equity securities of non-U.S. issuers, as well as investments in the equity securities of non-U.S. issuers that are in the form of depositary receipts.
The Fund takes long and short positions in Equity Securities. As opposed to taking long positions in which an investor seeks to profit from increases in the price of a security, short selling is a technique that will be used by the Fund to try and profit from the falling price of a security. Short selling involves selling a security that has been borrowed from a third party with the intention of buying an identical security back at a later date to return to that third party.
Having both long and short positions in an equity security portfolio is a common way to create returns that are independent of market moves. One advantage of a long and short portfolio is that the long and short positions may offset one another in a manner that results in a lower net exposure to the direction of the market. In addition, cash balances arising from the use of short selling typically will be held in money market instruments.
| Performance | | | |
| | | Average Annual
Total Returns | Cumulative
Total Returns |
| | 1 Year Ended
10/31/18 | Inception (9/8/14)
to 10/31/18 | Inception (9/8/14)
to 10/31/18 |
| Fund Performance | | | |
| NAV | 2.45% | 6.97% | 32.24% |
| Market Price | 2.35% | 6.95% | 32.13% |
| Index Performance | | | |
| S&P 500® Index | 7.35% | 9.82% | 47.45% |
Total returns for the period since inception are calculated from the inception date of the Fund. “Average Annual Total Returns” represent the average annual change in value of an investment over the period indicated. “Cumulative Total Returns” represent the total change in value of an investment over the period indicated.
The Fund’s per share net asset value (“NAV”) is the value of one share of the Fund and is computed by dividing the value of all assets of the Fund (including accrued interest and dividends), less all liabilities (including accrued expenses and dividends declared but unpaid), by the total number of outstanding shares. The price used to calculate market return (“Market Price”) is determined by using the midpoint between the highest bid and the lowest offer on the stock exchange on which shares of the Fund are listed for trading as of the time that the Fund’s NAV is calculated. Since shares of the Fund did not trade in the secondary market until after its inception, for the period from inception to the first day of secondary market trading in shares of the Fund, the NAV of the Fund is used as a proxy for the secondary market trading price to calculate market returns. NAV and market returns assume that all distributions have been reinvested in the Fund at NAV and Market Price, respectively.
An index is a statistical composite that tracks a specified financial market or sector. Unlike the Fund, the index does not actually hold a portfolio of securities and therefore does not incur the expenses incurred by the Fund. These expenses negatively impact the performance of the Fund. Also, market returns do not include brokerage commissions that may be payable on secondary market transactions. If brokerage commissions were included, market returns would be lower. The total returns presented reflect the reinvestment of dividends on securities in the index. The returns presented do not reflect the deduction of taxes that a shareholder would pay on Fund distributions or the redemption or sale of Fund shares. The investment return and principal value of shares of the Fund will vary with changes in market conditions. Shares of the Fund may be worth more or less than their original cost when they are redeemed or sold in the market. The Fund’s past performance is no guarantee of future performance.
Fund Performance Overview (Unaudited) (Continued)
First Trust Long/Short Equity ETF (FTLS)
| Portfolio Sector Allocation | % of Total
Long-Term
Investments |
| Information Technology | 18.5% |
| Consumer Discretionary | 13.8 |
| Financials | 13.6 |
| Industrials | 11.6 |
| Health Care | 11.1 |
| Real Estate | 10.3 |
| Consumer Staples | 7.4 |
| Energy | 7.0 |
| Communication Services | 4.7 |
| Materials | 2.0 |
| Total | 100.0% |
| Portfolio Sector Allocation | % of
Investments
Sold Short |
| Financials | 28.7% |
| Information Technology | 21.4 |
| Real Estate | 12.2 |
| Consumer Discretionary | 11.4 |
| Industrials | 7.0 |
| Materials | 5.1 |
| Consumer Staples | 3.9 |
| Energy | 3.7 |
| Communication Services | 3.4 |
| Health Care | 3.2 |
| Total | 100.0% |
| Top Ten Long-Term Investments | % of
Net Assets |
| JPMorgan Chase & Co. | 2.4% |
| Vanguard Small-Cap ETF | 2.4 |
| iShares Rusell 1000 Value ETF | 2.3 |
| Apple, Inc. | 2.2 |
| McCormick & Co., Inc. | 2.0 |
| Premier, Inc., Class A | 1.9 |
| Visa, Inc., Class A | 1.9 |
| Altria Group, Inc. | 1.8 |
| Simon Property Group, Inc. | 1.7 |
| Microsoft Corp. | 1.7 |
| Total | 20.3% |
| Top Ten Investments Sold Short | % of
Net Assets |
| SPDR S&P 500 ETF Trust | -5.1% |
| iShares Russell 1000 Growth ETF | -2.5% |
| Live Nation Entertainment, Inc. | -0.5% |
| Jack Henry & Associates, Inc. | -0.5% |
| Liberty Broadband Corp., Class C | -0.5% |
| ViaSat, Inc. | -0.5% |
| Sun Communities, Inc. | -0.5% |
| STORE Capital Corp. | -0.5% |
| WP Carey, Inc. | -0.5% |
| EPR Properties | -0.5% |
| Total | -11.6% |
Fund Performance Overview (Unaudited) (Continued)
First Trust Long/Short Equity ETF (FTLS)
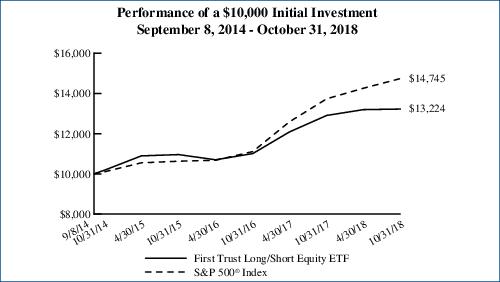
Performance figures assume reinvestment of all distributions and do not reflect the deduction of taxes that a shareholder would pay on Fund distributions or the redemption or sale of Fund shares. An index is a statistical composite that tracks a specified financial market or sector. Unlike the Fund, the index does not actually hold a portfolio of securities and therefore does not incur the expenses incurred by the Fund. These expenses negatively impact the performance of the Fund. The Fund’s past performance does not predict future performance.
| Number of Days Bid/Ask Midpoint At/Above NAV |
| For the Period | 0.00%–0.49% | 0.50%–0.99% | 1.00%–1.99% | >=2.00% |
| 9/9/14 – 10/31/14 | 23 | 3 | 0 | 0 |
| 11/1/14 – 10/31/15 | 190 | 7 | 0 | 1 |
| 11/1/15 – 10/31/16 | 170 | 0 | 0 | 0 |
| 11/1/16 – 10/31/17 | 173 | 0 | 0 | 0 |
| 11/1/17 – 10/31/18 | 180 | 0 | 0 | 0 |
| Number of Days Bid/Ask Midpoint Below NAV |
| For the Period | 0.00%–0.49% | 0.50%–0.99% | 1.00%–1.99% | >=2.00% |
| 9/9/14 – 10/31/14 | 9 | 4 | 0 | 0 |
| 11/1/14 – 10/31/15 | 41 | 12 | 0 | 0 |
| 11/1/15 – 10/31/16 | 81 | 1 | 0 | 0 |
| 11/1/16 – 10/31/17 | 79 | 0 | 0 | 0 |
| 11/1/17 – 10/31/18 | 72 | 0 | 0 | 0 |
Portfolio Commentary
First Trust Long/Short Equity ETF (FTLS)
Annual Report
October 31, 2018 (Unaudited)
Investment Advisor
First Trust Advisors L.P. (“First Trust”) is the investment advisor, commodity pool operator and commodity trading advisor to First Trust Long/Short Equity ETF (the “Fund” or “FTLS”). In this capacity, First Trust is responsible for the selection and ongoing monitoring of the investments in the Fund’s portfolio and certain other services necessary for the management of the portfolio.
Portfolio Management Team
John Gambla – CFA, FRM, PRM, Senior Portfolio Manager of First Trust, FTA- Alternatives & Active Management Team
Rob A. Guttschow – CFA, Senior Portfolio Manager of First Trust, FTA- Alternatives & Active Management Team
Commentary
First Trust Long/Short Equity ETF
The Fund is an actively managed exchange-traded fund (“ETF”). The Fund’s investment objective is to seek to provide investors with long-term total return. The Fund pursues its investment objective by establishing long and short positions in a portfolio of equity securities. Under normal circumstances, at least 80% of the Fund’s net assets (including investment borrowings) will be exposed to U.S. exchange-listed equity securities of U.S. and non-U.S. companies by investing in such securities directly and/or in U.S. ETFs that provide exposure to such securities.
Overall Market Recap
U.S. economic growth accelerated during the 12-month period ended October 31, 2018. Gross domestic product growth averaged 3.1% over the four calendar quarters during the reporting period with the final two quarters averaging 3.85% annualized. This compares favorably to the same four quarters in the prior fiscal year which averaged 2.35% annualized growth. The headline U.S. unemployment rate fell steadily during the period, dropping from 4.1% as of October 31, 2017 to 3.7% as of October 31, 2018. The total number of non-farm payroll jobs added to the U.S. economy during the fiscal period, as measured by the Bureau of Labor Statistics, was nearly 2.52 million.
With the economy growing at 3+%, unemployment declining, and inflation under control, the Federal Reserve Open Market Committee (“FOMC”) continued on its gradual path of rate “normalization” that it had begun back in December 2016. During this fiscal period, the FOMC raised interest rates at quarterly intervals (December 2017, March 2018, June 2018, and September 2018) by 0.25%. As of October 31, 2018, short-term overnight interest rates are at 2.25%. Conservative investors can earn a nice return simply buying 2-year Treasury notes which as of the end of the fiscal period were yielding 2.87%, 1.27% higher than one year ago.
The U.S. equity market, as represented by the S&P 500® Index, posted positive total returns for the fiscal period, up 7.35%. Earnings growth was strong on a year-over-year basis as strong top line growth and lower tax rates flowed to the corporate bottom line. For the calendar year periods (third quarter 2017 versus third quarter 2018), Standard & Poor’s reported top line sales growth of 10.6% and reported earnings growth of 29.8%.
Fund Performance – FTLS
The Fund returned 2.35% on a market price basis and 2.45% on a net asset value (“NAV”) basis for the period from October 31, 2017 through October 31, 2018. The Fund’s Benchmark, the S&P 500® Index (the “Benchmark”) returned 7.35% during the same period.
During the 12-month period ended October 31, 2018, the net positions within the portfolio (long holdings minus short holdings) declined from 75.5% of the Fund’s net assets at the beginning of the period to 59.5% at the end of the period. The decline was primarily the result of the short positions in the Fund being increased throughout the year. At the beginning of the fiscal period, the short positions within the Fund were -23.5% of the Fund’s net assets while at fiscal year-end, the short positions were -34.6%. During the period, the companies held as short positions within the Fund rose in value substantially less than the overall market, but the rising tide of the market lifted all boats, resulting in the short positions reducing Fund performance. The Fund’s long positions, as stand-alone investments, underperformed the Benchmark with lower average allocations to Information Technology and Healthcare hurting performance while overweight’s in the Consumer Discretionary and Real Estate sectors helped performance. Stock selection within the Information Technology, Consumer Discretionary, Communication Services, and Healthcare sectors were also drags on relative performance during the fiscal period. Overall, the Fund underperformed the unmanaged, unhedged Benchmark, but realized returns and risk commensurate with its overall market position as a long-short equity fund with net exposure ranging during the period between 59.5% and 75.5%.
Portfolio Commentary (Continued)
First Trust Long/Short Equity ETF (FTLS)
Annual Report
October 31, 2018 (Unaudited)
Market and Fund Outlook
Today, we believe the Fund is well positioned to achieve its primary objectives of seeking to provide investors with long-term total return. The Fund is invested in a broad array of U.S. equity securities with a net market exposure of approximately 60% versus its unmanaged Benchmark’s exposure of 100%. We believe the Fund’s combination of a broadly diversified portfolio which is long high-quality stocks and short low-quality stocks, as measured by an earnings quality model, positions the Fund well to continue to achieve its investment objective.
First Trust Long/Short Equity ETF (FTLS)
Understanding Your Fund Expenses
October 31, 2018 (Unaudited)
As a shareholder of the First Trust Long/Short Equity ETF (the “Fund”), you incur two types of costs: (1) transaction costs; and (2) ongoing costs, including management fees, distribution and/or service (12b-1) fees, if any, and other Fund expenses. This Example is intended to help you understand your ongoing costs of investing in the Fund and to compare these costs with the ongoing costs of investing in other funds.
The Example is based on an investment of $1,000 invested at the beginning of the period and held through the six-month period ended October 31, 2018.
Actual Expenses
The first line in the following table provides information about actual account values and actual expenses. You may use the information in this line, together with the amount you invested, to estimate the expenses that you paid over the period. Simply divide your account value by $1,000 (for example, an $8,600 account value divided by $1,000 = 8.6), then multiply the result by the number in the first line under the heading entitled “Expenses Paid During the Six-Month Period” to estimate the expenses you paid on your account during this six-month period.
Hypothetical Example for Comparison Purposes
The second line in the following table provides information about hypothetical account values and hypothetical expenses based on the Fund’s actual expense ratio and an assumed rate of return of 5% per year before expenses, which is not the Fund’s actual return. The hypothetical account values and expenses may not be used to estimate the actual ending account balance or expenses you paid for the period. You may use this information to compare the ongoing costs of investing in the Fund and other funds. To do so, compare this 5% hypothetical example with the 5% hypothetical examples that appear in the shareholder reports of the other funds.
Please note that the expenses shown in the table are meant to highlight your ongoing costs only and do not reflect any transactional costs such as brokerage commissions. Therefore, the second line in the table is useful in comparing ongoing costs only, and will not help you determine the relative total costs of owning different funds. In addition, if these transactional costs were included, your costs would have been higher.
| | Beginning
Account Value
May 1, 2018 | Ending
Account Value
October 31, 2018 | Annualized
Expense Ratio
Based on the
Six-Month
Period (a) | Expenses Paid
During the
Six-Month
Period (a)(b) |
| First Trust Long/Short Equity ETF (FTLS) |
| Actual | $1,000.00 | $1,002.20 | 1.58% | $7.97 |
| Hypothetical (5% return before expenses) | $1,000.00 | $1,017.24 | 1.58% | $8.03 |
| (a) | Annualized expense ratio and expenses paid during the six-month period do not include fees and expenses of the underlying funds in which the Fund invests. |
| (b) | Expenses are equal to the annualized expense ratios as indicated in the table multiplied by the average account value over the period (May 1, 2018 through October 31, 2018), multiplied by 184/365 (to reflect the six-month period). |
First Trust Long/Short Equity ETF (FTLS)
Portfolio of Investments
October 31, 2018
Shares/
Units | | Description | | Value |
| COMMON STOCKS – 78.7% |
| | | Aerospace & Defense – 0.5% | | |
| 1,095 | | Boeing (The) Co. | | $388,572 |
| 16,656 | | Triumph Group, Inc. | | 303,972 |
| | | | | 692,544 |
| | | Air Freight & Logistics – 0.2% | | |
| 5,164 | | Expeditors International of Washington, Inc. | | 346,918 |
| | | Airlines – 1.5% | | |
| 6,838 | | Delta Air Lines, Inc. | | 374,244 |
| 40,113 | | Southwest Airlines Co. (a) | | 1,969,548 |
| | | | | 2,343,792 |
| | | Auto Components – 0.2% | | |
| 17,497 | | Gentex Corp. | | 368,312 |
| | | Automobiles – 0.3% | | |
| 11,236 | | Harley-Davidson, Inc. | | 429,440 |
| | | Banks – 5.5% | | |
| 34,552 | | Bank of America Corp. | | 950,180 |
| 15,407 | | Banner Corp. | | 890,833 |
| 14,219 | | East West Bancorp, Inc. | | 745,644 |
| 49,103 | | Hilltop Holdings, Inc. | | 977,150 |
| 33,985 | | JPMorgan Chase & Co. | | 3,705,044 |
| 7,972 | | Prosperity Bancshares, Inc. | | 518,419 |
| 15,290 | | Wells Fargo & Co. | | 813,887 |
| | | | | 8,601,157 |
| | | Beverages – 0.2% | | |
| 5,064 | | Anheuser-Busch InBev S.A. | | 374,635 |
| | | Biotechnology – 3.0% | | |
| 11,850 | | Amgen, Inc. | | 2,284,562 |
| 25,468 | | Celgene Corp. (b) | | 1,823,509 |
| 1,504 | | Ligand Pharmaceuticals, Inc. (b) | | 247,874 |
| 2,317 | | Loxo Oncology, Inc. (b) | | 353,713 |
| | | | | 4,709,658 |
| | | Building Products – 0.3% | | |
| 5,150 | | Allegion PLC | | 441,510 |
| | | Capital Markets – 0.5% | | |
| 3,431 | | FactSet Research Systems, Inc. | | 767,721 |
| | | Chemicals – 0.6% | | |
| 7,669 | | CF Industries Holdings, Inc. | | 368,342 |
| 8,054 | | RPM International, Inc. | | 492,663 |
| | | | | 861,005 |
| | | Commercial Services &
Supplies – 0.2% | | |
| 9,345 | | SP Plus Corp. (b) | | 298,666 |
| | | Communications Equipment – 1.3% | | |
| 6,009 | | F5 Networks, Inc. (b) | | 1,053,257 |
| 18,088 | | Juniper Networks, Inc. | | 529,436 |
Shares/
Units | | Description | | Value |
|
| | | Communications
Equipment (Continued) | | |
| 3,046 | | Motorola Solutions, Inc. | | $373,318 |
| | | | | 1,956,011 |
| | | Consumer Finance – 1.5% | | |
| 26,524 | | Capital One Financial Corp. | | 2,368,593 |
| | | Containers & Packaging – 0.2% | | |
| 8,112 | | Berry Global Group, Inc. (b) | | 353,845 |
| | | Diversified Consumer
Services – 0.7% | | |
| 41,959 | | H&R Block, Inc. | | 1,113,592 |
| | | Diversified Telecommunication
Services – 0.2% | | |
| 27,053 | | Vonage Holdings Corp. (b) | | 358,723 |
| | | Electrical Equipment – 1.7% | | |
| 33,585 | | AMETEK, Inc. (a) | | 2,252,882 |
| 6,850 | | Generac Holdings, Inc. (b) | | 347,500 |
| | | | | 2,600,382 |
| | | Entertainment – 1.0% | | |
| 12,909 | | Electronic Arts, Inc. (b) | | 1,174,461 |
| 4,772 | | World Wrestling Entertainment, Inc. | | 346,399 |
| | | | | 1,520,860 |
| | | Food & Staples Retailing – 2.9% | | |
| 8,159 | | Costco Wholesale Corp. | | 1,865,392 |
| 27,647 | | Walgreens Boots Alliance, Inc. | | 2,205,401 |
| 5,025 | | Walmart, Inc. | | 503,907 |
| | | | | 4,574,700 |
| | | Food Products – 2.0% | | |
| 21,019 | | McCormick & Co., Inc. (a) | | 3,026,736 |
| | | Health Care Equipment &
Supplies – 0.5% | | |
| 9,517 | | Hologic, Inc. (b) | | 371,068 |
| 3,400 | | Masimo Corp. (b) | | 393,040 |
| | | | | 764,108 |
| | | Health Care Providers &
Services – 3.7% | | |
| 5,135 | | Amedisys, Inc. (b) | | 564,850 |
| 22,933 | | CVS Health Corp. | | 1,660,120 |
| 66,376 | | Premier, Inc., Class A (b) | | 2,986,920 |
| 5,214 | | US Physical Therapy, Inc. | | 560,609 |
| | | | | 5,772,499 |
| | | Hotels, Restaurants &
Leisure – 0.8% | | |
| 11,992 | | Las Vegas Sands Corp. | | 611,952 |
Page 8
See Notes to Financial Statements
First Trust Long/Short Equity ETF (FTLS)
Portfolio of Investments (Continued)
October 31, 2018
Shares/
Units | | Description | | Value |
| COMMON STOCKS (Continued) |
| | | Hotels, Restaurants &
Leisure (Continued) | | |
| 17,865 | | Yum China Holdings, Inc. | | $644,569 |
| | | | | 1,256,521 |
| | | Household Durables – 2.0% | | |
| 27,026 | | DR Horton, Inc. | | 971,855 |
| 200 | | NVR, Inc. (a) (b) | | 447,806 |
| 46,327 | | PulteGroup, Inc. | | 1,138,254 |
| 18,248 | | Toll Brothers, Inc. | | 614,228 |
| | | | | 3,172,143 |
| | | Industrial Conglomerates – 1.2% | | |
| 6,796 | | Roper Technologies, Inc. | | 1,922,588 |
| | | Interactive Media & Services – 2.4% | | |
| 952 | | Alphabet, Inc., Class A (b) | | 1,038,232 |
| 1,000 | | Alphabet, Inc., Class C (b) | | 1,076,770 |
| 8,350 | | Facebook, Inc., Class A (a) (b) | | 1,267,447 |
| 1,926 | | IAC/InterActiveCorp (b) | | 378,632 |
| | | | | 3,761,081 |
| | | Internet & Direct Marketing
Retail – 1.3% | | |
| 1,245 | | Amazon.com, Inc. (b) | | 1,989,523 |
| | | IT Services – 3.7% | | |
| 15,881 | | Accenture PLC, Class A (a) | | 2,503,163 |
| 2,429 | | VeriSign, Inc. (b) | | 346,230 |
| 21,040 | | Visa, Inc., Class A | | 2,900,364 |
| | | | | 5,749,757 |
| | | Leisure Products – 1.0% | | |
| 17,089 | | Brunswick Corp. | | 888,457 |
| 3,456 | | Polaris Industries, Inc. | | 307,515 |
| 6,232 | | Sturm Ruger & Co., Inc. | | 370,119 |
| | | | | 1,566,091 |
| | | Machinery – 4.7% | | |
| 49,841 | | Allison Transmission Holdings, Inc. (a) | | 2,196,991 |
| 18,192 | | Hillenbrand, Inc. | | 871,397 |
| 22,901 | | Mueller Industries, Inc. | | 557,639 |
| 42,275 | | Pentair PLC | | 1,697,341 |
| 34,877 | | Toro (The) Co. | | 1,964,622 |
| | | | | 7,287,990 |
| | | Media – 0.8% | | |
| 21,464 | | Altice USA, Inc., Class A | | 350,078 |
| 31,287 | | DISH Network Corp. (b) | | 961,762 |
| | | | | 1,311,840 |
| | | Metals & Mining – 0.7% | | |
| 24,730 | | Freeport-McMoRan, Inc. | | 288,105 |
| 5,460 | | Royal Gold, Inc. | | 418,400 |
Shares/
Units | | Description | | Value |
|
| | | Metals & Mining (Continued) | | |
| 14,735 | | Schnitzer Steel Industries, Inc., Class A | | $396,371 |
| | | | | 1,102,876 |
| | | Oil, Gas & Consumable Fuels – 5.3% | | |
| 18,713 | | Chevron Corp. (a) | | 2,089,306 |
| 5,826 | | Continental Resources, Inc. (b) | | 306,914 |
| 10,970 | | CVR Energy, Inc. | | 471,710 |
| 16,260 | | Exxon Mobil Corp. (a) | | 1,295,597 |
| 21,633 | | Geopark Ltd. (b) | | 362,569 |
| 5,368 | | HollyFrontier Corp. | | 362,018 |
| 60,538 | | Kinder Morgan, Inc. | | 1,030,357 |
| 12,765 | | Parsley Energy, Inc., Class A (b) | | 298,956 |
| 7,743 | | PBF Energy, Inc., Class A | | 324,044 |
| 9,713 | | Peabody Energy Corp. | | 344,326 |
| 3,508 | | Phillips 66 (a) | | 360,693 |
| 14,620 | | Plains GP Holdings, L.P., Class A | | 312,429 |
| 8,065 | | Valero Energy Corp. | | 734,641 |
| | | | | 8,293,560 |
| | | Paper & Forest Products – 0.4% | | |
| 8,869 | | Boise Cascade Co. | | 273,077 |
| 21,945 | | Mercer International, Inc. | | 333,783 |
| | | | | 606,860 |
| | | Pharmaceuticals – 3.2% | | |
| 5,605 | | Allergan PLC | | 885,646 |
| 29,990 | | Bristol-Myers Squibb Co. | | 1,515,695 |
| 24,980 | | Endo International PLC (b) | | 423,161 |
| 3,331 | | Jazz Pharmaceuticals PLC (b) | | 529,029 |
| 9,852 | | Johnson & Johnson | | 1,379,182 |
| 11,687 | | Mallinckrodt PLC (b) | | 292,876 |
| | | | | 5,025,589 |
| | | Professional Services – 0.2% | | |
| 4,797 | | Robert Half International, Inc. (a) | | 290,362 |
| | | Real Estate Management &
Development – 0.2% | | |
| 21,323 | | St Joe (The) Co. (b) | | 323,896 |
| | | Semiconductors &
Semiconductor Equipment – 3.9% | | |
| 4,273 | | Analog Devices, Inc. (a) | | 357,693 |
| 19,280 | | Intel Corp. | | 903,846 |
| 22,011 | | KLA-Tencor Corp. | | 2,014,887 |
| 12,496 | | Microchip Technology, Inc. | | 821,987 |
| 8,438 | | Nanometrics, Inc. (b) | | 270,522 |
| 3,846 | | NVIDIA Corp. | | 810,852 |
| 9,903 | | Texas Instruments, Inc. | | 919,296 |
| | | | | 6,099,083 |
See Notes to Financial Statements
Page 9
First Trust Long/Short Equity ETF (FTLS)
Portfolio of Investments (Continued)
October 31, 2018
Shares/
Units | | Description | | Value |
| COMMON STOCKS (Continued) |
| | | Software – 5.0% | | |
| 5,148 | | Fortinet, Inc. (b) | | $423,063 |
| 12,118 | | Intuit, Inc. (a) | | 2,556,898 |
| 15,648 | | j2 Global, Inc. | | 1,139,800 |
| 24,400 | | Microsoft Corp. | | 2,606,164 |
| 33,218 | | Progress Software Corp. | | 1,067,627 |
| | | | | 7,793,552 |
| | | Specialty Retail – 5.1% | | |
| 13,046 | | Home Depot (The), Inc. (a) | | 2,294,531 |
| 25,311 | | Lowe’s Cos., Inc. (a) | | 2,410,113 |
| 4,426 | | Murphy USA, Inc. (b) | | 356,868 |
| 12,225 | | Ross Stores, Inc. | | 1,210,275 |
| 9,328 | | TJX (The) Cos., Inc. (a) | | 1,024,961 |
| 2,167 | | Ulta Beauty, Inc. (b) | | 594,885 |
| | | | | 7,891,633 |
| | | Technology Hardware,
Storage & Peripherals – 3.6% | | |
| 15,501 | | Apple, Inc. (a) | | 3,392,549 |
| 91,272 | | HP, Inc. | | 2,203,306 |
| | | | | 5,595,855 |
| | | Textiles, Apparel & Luxury
Goods – 1.6% | | |
| 24,526 | | NIKE, Inc., Class B | | 1,840,431 |
| 4,797 | | Ralph Lauren Corp. | | 621,739 |
| | | | | 2,462,170 |
| | | Thrifts & Mortgage Finance – 0.6% | | |
| 102,603 | | New York Community Bancorp, Inc. | | 982,937 |
| | | Tobacco – 1.8% | | |
| 43,031 | | Altria Group, Inc. (a) | | 2,798,736 |
| | | Trading Companies &
Distributors – 0.5% | | |
| 37,166 | | Aircastle, Ltd. | | 722,135 |
| | | Total Common Stocks | | 122,652,185 |
| | | (Cost $125,480,836) | | |
| REAL ESTATE INVESTMENT TRUSTS – 9.5% |
| | | Equity Real Estate Investment
Trusts – 9.5% | | |
| 41,415 | | American Homes 4 Rent, Class A | | 872,614 |
| 16,416 | | American Tower Corp. (a) | | 2,557,777 |
| 110,210 | | Invitation Homes, Inc. (a) | | 2,411,395 |
| 24,482 | | Mid-America Apartment Communities, Inc. | | 2,392,136 |
| 8,151 | | Public Storage | | 1,674,786 |
| 14,621 | | Simon Property Group, Inc. (a) | | 2,683,246 |
Shares/
Units | | Description | | Value |
|
| | | Equity Real Estate Investment
Trusts (Continued) | | |
| 32,840 | | Welltower, Inc. | | $2,169,739 |
| | | Total Real Estate Investment Trusts | | 14,761,693 |
| | | (Cost $14,449,804) | | |
| EXCHANGE-TRADED FUNDS – 4.7% |
| | | Capital Markets – 4.7% | | |
| 30,000 | | iShares Rusell 1000 Value ETF | | 3,602,700 |
| 25,249 | | Vanguard Small-Cap ETF (a) | | 3,689,636 |
| | | Total Exchange-Traded Funds | | 7,292,336 |
| | | (Cost $7,575,580) | | |
| MASTER LIMITED PARTNERSHIPS – 1.3% |
| | | Oil, Gas & Consumable Fuels – 1.3% | | |
| 9,433 | | Cheniere Energy Partners, L.P. | | 317,609 |
| 10,540 | | Magellan Midstream Partners, L.P. | | 650,107 |
| 14,019 | | Plains All American Pipeline, L.P. | | 305,193 |
| 11,276 | | TC PipeLines, L.P. | | 346,737 |
| 9,068 | | Valero Energy Partners, L.P. | | 380,675 |
| | | Total Master Limited Partnerships | | 2,000,321 |
| | | (Cost $2,222,201) | | |
| | | Total Investments – 94.2% | | 146,706,535 |
| | | (Cost $149,728,421) (c) | | |
| Shares | | Description | | Value |
| COMMON STOCKS SOLD SHORT – (23.2)% |
| | | Aerospace & Defense – (0.2)% | | |
| (5,034) | | BWX Technologies, Inc. | | (294,288) |
| | | Air Freight & Logistics – (0.1)% | | |
| (8,958) | | Air Transport Services Group, Inc. (b) | | (175,577) |
| | | Auto Components – (0.2)% | | |
| (4,796) | | Visteon Corp. (b) | | (379,076) |
| | | Banks – (2.3)% | | |
| (5,282) | | Bank of NT Butterfield & Son (The) Ltd. | | (212,812) |
| (6,423) | | BOK Financial Corp. | | (550,644) |
| (11,383) | | Commerce Bancshares, Inc. | | (723,959) |
| (3,738) | | Cullen/Frost Bankers, Inc. | | (366,025) |
| (3,977) | | International Bancshares Corp. | | (153,910) |
| (9,258) | | Old National Bancorp | | (165,255) |
| (19,128) | | Triumph Bancorp, Inc. (b) | | (685,930) |
| (20,606) | | United Bankshares, Inc. | | (683,501) |
| | | | | (3,542,036) |
Page 10
See Notes to Financial Statements
First Trust Long/Short Equity ETF (FTLS)
Portfolio of Investments (Continued)
October 31, 2018
| Shares | | Description | | Value |
| COMMON STOCKS SOLD SHORT (Continued) |
| | | Beverages – (0.2)% | | |
| (12,990) | | Keurig Dr Pepper, Inc. | | $(337,740) |
| | | Biotechnology – (0.2)% | | |
| (2,039) | | Sage Therapeutics, Inc. (b) | | (262,378) |
| | | Building Products – (0.1)% | | |
| (12,027) | | JELD-WEN Holding, Inc. (b) | | (195,559) |
| | | Chemicals – (0.5)% | | |
| (10,777) | | Scotts Miracle-Gro (The) Co. | | (719,257) |
| | | Commercial Services &
Supplies – (0.1)% | | |
| (3,185) | | Viad Corp. | | (152,530) |
| | | Communications Equipment – (1.0)% | | |
| (9,538) | | InterDigital, Inc. | | (676,721) |
| (12,701) | | ViaSat, Inc. (b) | | (809,816) |
| | | | | (1,486,537) |
| | | Construction & Engineering – (0.7)% | | |
| (10,834) | | MasTec, Inc. (b) | | (471,387) |
| (8,982) | | Tutor Perini Corp. (b) | | (139,221) |
| (4,312) | | Valmont Industries, Inc. | | (536,025) |
| | | | | (1,146,633) |
| | | Construction Materials – (0.1)% | | |
| (9,083) | | Summit Materials, Inc., Class A (d) | | (122,620) |
| | | Consumer Finance – (0.1)% | | |
| (6,735) | | Ally Financial, Inc. | | (171,136) |
| | | Containers & Packaging – (1.0)% | | |
| (7,815) | | AptarGroup, Inc. | | (796,817) |
| (45,755) | | Owens-Illinois, Inc. (b) | | (716,981) |
| | | | | (1,513,798) |
| | | Diversified Consumer
Services – (0.2)% | | |
| (50,299) | | Houghton Mifflin Harcourt Co. (b) | | (337,003) |
| | | Electronic Equipment,
Instruments & Components – (0.4)% | | |
| (10,403) | | Arrow Electronics, Inc. (b) | | (704,387) |
| | | Energy Equipment &
Services – (0.5)% | | |
| (10,154) | | Diamond Offshore Drilling, Inc. (b) | | (143,984) |
| (10,826) | | ProPetro Holding Corp. (b) | | (191,079) |
| (13,990) | | Rowan Cos., PLC (b) | | (222,581) |
| Shares | | Description | | Value |
|
| | | Energy Equipment &
Services (Continued) | | |
| (15,528) | | Transocean Ltd. (b) | | $(170,963) |
| | | | | (728,607) |
| | | Entertainment – (0.5)% | | |
| (16,194) | | Live Nation Entertainment, Inc. (b) | | (846,946) |
| | | Food Products – (1.0)% | | |
| (12,848) | | Bunge Ltd. | | (794,007) |
| (7,630) | | Ingredion, Inc. | | (772,003) |
| | | | | (1,566,010) |
| | | Health Care Equipment &
Supplies – (0.6)% | | |
| (2,090) | | Insulet Corp. (b) | | (184,359) |
| (2,896) | | Integra LifeSciences Holdings Corp. (b) | | (155,139) |
| (6,669) | | Merit Medical Systems, Inc. (b) | | (380,933) |
| (2,244) | | STERIS PLC | | (245,292) |
| | | | | (965,723) |
| | | Health Care Providers &
Services – (0.1)% | | |
| (7,162) | | Tenet Healthcare Corp. (b) | | (184,278) |
| | | Hotels, Restaurants &
Leisure – (1.4)% | | |
| (15,198) | | Belmond Ltd., Class A (b) | | (260,190) |
| (10,439) | | Choice Hotels International, Inc. | | (766,222) |
| (7,538) | | Hyatt Hotels Corp., Class A | | (521,630) |
| (38,406) | | International Game Technology PLC | | (712,431) |
| | | | | (2,260,473) |
| | | Internet & Direct Marketing
Retail – (0.3)% | | |
| (9,258) | | Shutterfly, Inc. (b) | | (462,900) |
| | | IT Services – (3.2)% | | |
| (12,307) | | Amdocs Ltd. | | (778,664) |
| (13,350) | | Black Knight, Inc. (b) | | (651,080) |
| (20,531) | | Conduent, Inc. (b) | | (392,142) |
| (10,065) | | CoreLogic, Inc. (b) | | (408,840) |
| (20,782) | | First Data Corp., Class A (b) | | (389,455) |
| (26,217) | | Genpact Ltd. | | (718,608) |
| (5,639) | | Jack Henry & Associates, Inc. | | (844,891) |
| (8,595) | | Wordpay, Inc., Class A (b) | | (789,365) |
| | | | | (4,973,045) |
| | | Life Sciences Tools &
Services – (0.2)% | | |
| (2,558) | | Charles River Laboratories International, Inc. (b) | | (311,616) |
| | | Machinery – (0.5)% | | |
| (6,976) | | Albany International Corp., Class A | | (488,180) |
See Notes to Financial Statements
Page 11
First Trust Long/Short Equity ETF (FTLS)
Portfolio of Investments (Continued)
October 31, 2018
| Shares | | Description | | Value |
| COMMON STOCKS SOLD SHORT (Continued) |
| | | Machinery (Continued) | | |
| (22,154) | | Gates Industrial Corp. PLC (b) | | $(333,418) |
| | | | | (821,598) |
| | | Media – (1.2)% | | |
| (16,518) | | GCI Liberty, Inc., Class A (b) | | (781,797) |
| (10,034) | | Liberty Broadband Corp., Class C (b) | | (832,120) |
| (8,499) | | New York Times (The) Co. | | (224,373) |
| | | | | (1,838,290) |
| | | Metals & Mining – (0.3)% | | |
| (10,576) | | Southern Copper Corp. | | (405,484) |
| | | Oil, Gas & Consumable Fuels – (0.8)% | | |
| (29,408) | | Alta Mesa Resources, Inc., Class A (b) | | (92,635) |
| (15,222) | | Extraction Oil & Gas, Inc. (b) | | (121,624) |
| (10,801) | | GasLog Ltd | | (220,989) |
| (21,474) | | Kosmos Energy Ltd. (b) | | (139,366) |
| (3,323) | | PDC Energy, Inc. (b) | | (141,061) |
| (3,408) | | Targa Resources Corp. | | (176,091) |
| (9,603) | | WildHorse Resource Development Corp. (b) | | (203,680) |
| (10,103) | | WPX Energy, Inc. (b) | | (162,052) |
| | | | | (1,257,498) |
| | | Personal Products – (0.1)% | | |
| (1,425) | | USANA Health Sciences, Inc. (b) | | (166,753) |
| | | Professional Services – (0.2)% | | |
| (4,437) | | TransUnion | | (291,733) |
| | | Real Estate Management &
Development – (0.4)% | | |
| (61,113) | | Newmark Group, Inc., Class A | | (595,241) |
| | | Road & Rail – (0.5)% | | |
| (2,158) | | AMERCO | | (704,544) |
| | | Semiconductors &
Semiconductor Equipment – (0.9)% | | |
| (3,453) | | First Solar, Inc. (b) | | (144,335) |
| (17,006) | | Rambus, Inc. (b) | | (148,122) |
| (18,906) | | Teradyne, Inc. | | (651,312) |
| (15,384) | | Versum Materials, Inc. | | (485,519) |
| | | | | (1,429,288) |
| | | Software – (1.3)% | | |
| (15,745) | | ACI Worldwide, Inc. (b) | | (395,042) |
| (3,940) | | Cornerstone OnDemand, Inc. (b) | | (194,045) |
| (5,772) | | Dell Technologies, Inc., Class V (b) | | (521,731) |
| (3,634) | | Q2 Holdings, Inc. (b) | | (193,438) |
| Shares | | Description | | Value |
|
| | | Software (Continued) | | |
| (2,763) | | Ultimate Software Group (The), Inc. (b) | | $(736,699) |
| | | | | (2,040,955) |
| | | Specialty Retail – (0.9)% | | |
| (3,743) | | Burlington Stores, Inc. (b) | | (641,887) |
| (24,309) | | Guess?, Inc. | | (516,323) |
| (3,718) | | Williams-Sonoma, Inc. | | (220,775) |
| | | | | (1,378,985) |
| | | Technology Hardware,
Storage & Peripherals – (0.6)% | | |
| (39,374) | | Diebold Nixdorf, Inc. | | (153,558) |
| (28,962) | | NCR Corp. (b) | | (777,630) |
| | | | | (931,188) |
| | | Textiles, Apparel & Luxury
Goods – (0.3)% | | |
| (14,525) | | Wolverine World Wide, Inc. | | (510,844) |
| | | Total Common Stocks Sold Short | | (36,212,554) |
| | | (Proceeds $39,631,398) | | |
| EXCHANGE-TRADED FUNDS SOLD SHORT – (7.6)% |
| | | Capital Markets – (7.6)% | | |
| (27,500) | | iShares Russell 1000 Growth ETF | | (3,907,200) |
| (29,101) | | SPDR S&P 500 ETF Trust | | (7,875,604) |
| | | Total Exchange-Traded Funds Sold Short | | (11,782,804) |
| | | (Proceeds $11,623,861) | | |
REAL ESTATE INVESTMENT TRUSTS SOLD SHORT –
(3.8)% |
| | | Equity Real Estate Investment
Trusts – (3.8)% | | |
| (11,719) | | EPR Properties | | (805,564) |
| (17,967) | | First Industrial Realty Trust, Inc. | | (551,587) |
| (9,507) | | JBG SMITH Properties | | (356,322) |
| (11,059) | | Kilroy Realty Corp. | | (761,744) |
| (18,287) | | Liberty Property Trust | | (765,677) |
| (11,188) | | STAG Industrial, Inc. | | (296,035) |
| (27,859) | | STORE Capital Corp. | | (808,747) |
| (8,058) | | Sun Communities, Inc. | | (809,587) |
| (12,247) | | WP Carey, Inc. | | (808,424) |
| | | Total Real Estate Investment Trusts Sold Short | | (5,963,687) |
| | | (Proceeds $5,893,911) | | |
| | | Total Investments Sold Short – (34.6)% | | (53,959,045) |
| | | (Proceeds $57,149,170) | | |
| | | Net Other Assets and Liabilities – 40.4% | | 63,055,361 |
| | | Net Assets – 100.0% | | $155,802,851 |
Page 12
See Notes to Financial Statements
First Trust Long/Short Equity ETF (FTLS)
Portfolio of Investments (Continued)
October 31, 2018
|
| (a) | This security or a portion of this security is segregated as collateral for investments sold short. |
| (b) | Non-income producing security. |
| (c) | Aggregate cost for federal income tax purposes was $93,193,114. As of October 31, 2018, the aggregate gross unrealized appreciation for all investments in which there was an excess of value over tax cost was $9,837,226 and the aggregate gross unrealized depreciation for all investments in which there was an excess of tax cost over value was $10,282,850. The net unrealized depreciation was $445,624. The amounts presented are inclusive of investments sold short. |
| (d) | Non-income producing security which makes payment-in-kind (“PIK”) distributions. There were no in-kind distributions received for the fiscal year ended October 31, 2018. |
Valuation Inputs
A summary of the inputs used to value the Fund’s investments as of October 31, 2018 is as follows (see Note 2A - Portfolio Valuation in the Notes to Financial Statements):
| ASSETS TABLE |
| | Total
Value at
10/31/2018 | Level 1
Quoted
Prices | Level 2
Significant
Observable
Inputs | Level 3
Significant
Unobservable
Inputs |
| Common Stocks* | $ 122,652,185 | $ 122,652,185 | $ — | $ — |
| Real Estate Investment Trusts* | 14,761,693 | 14,761,693 | — | — |
| Exchange-Traded Funds* | 7,292,336 | 7,292,336 | — | — |
| Master Limited Partnerships* | 2,000,321 | 2,000,321 | — | — |
| Total Investments | $ 146,706,535 | $ 146,706,535 | $— | $— |
| LIABILITIES TABLE |
| | Total
Value at
10/31/2018 | Level 1
Quoted
Prices | Level 2
Significant
Observable
Inputs | Level 3
Significant
Unobservable
Inputs |
| Common Stocks Sold Short* | $ (36,212,554) | $ (36,212,554) | $ — | $ — |
| Exchange-Traded Funds Sold Short* | (11,782,804) | (11,782,804) | — | — |
| Real Estate Investment Trusts Sold Short* | (5,963,687) | (5,963,687) | — | — |
| Total | $ (53,959,045) | $ (53,959,045) | $— | $— |
| * | See Portfolio of Investments for industry breakout. |
See Notes to Financial Statements
Page 13
First Trust Long/Short Equity ETF (FTLS)
Statement of Assets and Liabilities
October 31, 2018
| ASSETS: | |
Investments, at value
(Cost $149,728,421)
| $ 146,706,535 |
Cash
| 8,537,248 |
Restricted Cash
| 54,474,520 |
| Receivables: | |
Investment securities sold
| 3,590,915 |
Dividends
| 106,267 |
Margin interest rebate
| 29,054 |
Dividend reclaims
| 4,546 |
Total Assets
| 213,449,085 |
| LIABILITIES: | |
Investments sold short, at value (proceeds $57,149,170)
| 53,959,045 |
| Payables: | |
Investment securities purchased
| 3,544,473 |
Investment advisory fees
| 129,937 |
Dividends on investments sold short
| 12,311 |
Margin interest expense
| 468 |
Total Liabilities
| 57,646,234 |
NET ASSETS
| $155,802,851 |
| NET ASSETS consist of: | |
Paid-in capital
| $ 172,296,230 |
Par value
| 40,500 |
Accumulated distributable earnings (loss)
| (16,533,879) |
NET ASSETS
| $155,802,851 |
NET ASSET VALUE, per share
| $38.47 |
Number of shares outstanding (unlimited number of shares authorized, par value $0.01 per share)
| 4,050,002 |
Page 14
See Notes to Financial Statements
First Trust Long/Short Equity ETF (FTLS)
Statement of Operations
For the Year Ended October 31, 2018
| INVESTMENT INCOME: | |
Dividends
| $ 2,873,285 |
Margin interest rebate
| 575,163 |
Interest
| 37,261 |
Foreign withholding tax
| (2,315) |
Other
| 46 |
Total investment income
| 3,483,440 |
| EXPENSES: | |
Investment advisory fees
| 1,443,886 |
Dividend expense on investments sold short
| 875,890 |
Margin interest expense
| 90,124 |
Total expenses
| 2,409,900 |
NET INVESTMENT INCOME (LOSS)
| 1,073,540 |
| NET REALIZED AND UNREALIZED GAIN (LOSS): | |
| Net realized gain (loss) on: | |
Investments
| (1,730,348) |
In-kind redemptions
| 16,535,211 |
Investments sold short
| (3,579,819) |
Net realized gain (loss)
| 11,225,044 |
| Net change in unrealized appreciation (depreciation) on: | |
Investments
| (14,335,164) |
Investments sold short
| 3,533,829 |
Net change in unrealized appreciation (depreciation)
| (10,801,335) |
NET REALIZED AND UNREALIZED GAIN (LOSS)
| 423,709 |
NET INCREASE (DECREASE) IN NET ASSETS RESULTING FROM OPERATIONS
| $ 1,497,249 |
See Notes to Financial Statements
Page 15
First Trust Long/Short Equity ETF (FTLS)
Statements of Changes in Net Assets
| | Year
Ended
10/31/2018 | | Year
Ended
10/31/2017 |
| OPERATIONS: | | | |
Net investment income (loss)
| $ 1,073,540 | | $ 778,467 |
Net realized gain (loss)
| 11,225,044 | | 10,544,433 |
Net change in unrealized appreciation (depreciation)
| (10,801,335) | | 6,931,880 |
Net increase (decrease) in net assets resulting from operations
| 1,497,249 | | 18,254,780 |
| DISTRIBUTIONS TO SHAREHOLDERS FROM: | | | |
Investment operations
| (944,480) | | |
Net investment income
| | | (967,786) |
Total distributions to shareholders
| (944,480) | | (967,786) |
| SHAREHOLDER TRANSACTIONS: | | | |
Proceeds from shares sold
| 144,939,138 | | 77,355,076 |
Cost of shares redeemed
| (110,581,268) | | (93,981,069) |
Net increase (decrease) in net assets resulting from shareholder transactions
| 34,357,870 | | (16,625,993) |
Total increase (decrease) in net assets
| 34,910,639 | | 661,001 |
| NET ASSETS: | | | |
Beginning of period
| 120,892,212 | | 120,231,211 |
End of period
| $155,802,851 | | $120,892,212 |
Accumulated net investment income (loss) at end of period
| | | $146,880 |
| CHANGES IN SHARES OUTSTANDING: | | | |
Shares outstanding, beginning of period
| 3,200,002 | | 3,700,002 |
Shares sold
| 3,700,000 | | 2,200,000 |
Shares redeemed
| (2,850,000) | | (2,700,000) |
Shares outstanding, end of period
| 4,050,002 | | 3,200,002 |
Page 16
See Notes to Financial Statements
First Trust Long/Short Equity ETF (FTLS)
Financial Highlights
For a Share outstanding throughout each period
| | Year Ended October 31, | | Period
Ended
10/31/2014 (a) |
| 2018 | | 2017 | | 2016 | | 2015 | |
Net asset value, beginning of period
| $ 37.78 | | $ 32.49 | | $ 32.61 | | $ 30.54 | | $ 30.00 |
| Income from investment operations: | | | | | | | | | |
Net investment income (loss)
| 0.26 | | 0.24 | | 0.32 | | 0.19 | | 0.05 |
Net realized and unrealized gain (loss)
| 0.67 | | 5.34 | | (0.17) | | 2.12 | | 0.51 |
Total from investment operations
| 0.93 | | 5.58 | | 0.15 | | 2.31 | | 0.56 |
| Distributions paid to shareholders from: | | | | | | | | | |
Net investment income
| (0.24) | | (0.29) | | (0.27) | | (0.22) | | (0.02) |
Net realized gain
| — | | — | | — | | (0.02) | | — |
Total distributions
| (0.24) | | (0.29) | | (0.27) | | (0.24) | | (0.02) |
Net asset value, end of period
| $38.47 | | $37.78 | | $32.49 | | $32.61 | | $30.54 |
Total return (b)
| 2.45% | | 17.23% | | 0.45% | | 7.60% | | 1.86% |
| Ratios to average net assets/supplemental data: | | | | | | | | | |
Net assets, end of period (in 000’s)
| $ 155,803 | | $ 120,892 | | $ 120,231 | | $ 32,608 | | $ 3,054 |
Ratio of total expenses to average net assets (c)
| 1.59% | | 1.47% | | 1.40% | | 1.47% | | 1.17% (d) |
Ratio of total expenses to average net assets excluding dividend expense and margin interest expense (c)
| 0.95% | | 0.95% | | 0.95% | | 0.95% | | 0.95% (d) |
Ratio of net investment income (loss) to average net assets
| 0.71% | | 0.67% | | 1.00% | | 0.39% | | 1.08% (d) |
Portfolio turnover rate (e)
| 249% | | 176% | | 201% | | 267% | | 1% |
| (a) | Inception date is September 8, 2014, which is consistent with the commencement of operations and is the date the initial creation units were established. |
| (b) | Total return is calculated assuming an initial investment made at the net asset value at the beginning of the period, reinvestment of all distributions at net asset value during the period, and redemption at net asset value on the last day of the period. The returns presented do not reflect the deduction of taxes that a shareholder would pay on Fund distributions or the redemption or sale of Fund shares. Total return is calculated for the time period presented and is not annualized for periods of less than a year. |
| (c) | The Fund indirectly bears its proportionate share of fees and expenses incurred by the underlying funds in which the Fund invests. This ratio does not include these indirect fees and expenses. |
| (d) | Annualized. |
| (e) | Portfolio turnover is calculated for the time period presented and is not annualized for periods of less than a year and does not include securities received or delivered from processing creations or redemptions and in-kind transactions. |
Notes to Financial Statements
First Trust Long/Short Equity ETF (FTLS)
October 31, 2018
1. Organization
First Trust Exchange-Traded Fund III (the “Trust”) is an open-end management investment company organized as a Massachusetts business trust on January 9, 2008, and is registered with the Securities and Exchange Commission (“SEC”) under the Investment Company Act of 1940, as amended (the “1940 Act”).
The Trust currently consists of thirteen funds that are offering shares. This report covers the First Trust Long/Short Equity ETF (the “Fund”), a diversified series of the Trust, which trades under the ticker “FTLS” on the NYSE Arca, Inc. Unlike conventional mutual funds, the Fund issues and redeems shares on a continuous basis, at net asset value (“NAV”), only in large specified blocks consisting of 50,000 shares called a “Creation Unit.” Creation Units are issued and redeemed in-kind for securities in which the Fund invests or for cash or, in certain circumstances, a combination of both. Except when aggregated in Creation Units, the shares are not redeemable securities of the Fund.
The investment objective of the Fund is to seek to provide investors with long-term total return. The Fund pursues its investment objective by establishing long and short positions in a portfolio of equity securities. Under normal circumstances, at least 80% of the Fund’s net assets (including investment borrowings) will be exposed to U.S. exchange-listed equity securities of U.S. and foreign companies by investing in such securities directly and/or in U.S. exchange-traded funds (“ETFs”) that provide exposure to such securities. The equity securities held by the Fund may include U.S. exchange-listed equity securities of foreign issuers, as well as investments in the equity securities of foreign issuers that are in the form of depositary receipts. There can be no assurance that the Fund will achieve its investment objective. The Fund may not be appropriate for all investors.
2. Significant Accounting Policies
The Fund is considered an investment company and follows accounting and reporting guidance under Financial Accounting Standards Board (“FASB”) Accounting Standards Codification (“ASC”) Topic 946, “Financial Services-Investment Companies.” The following is a summary of significant accounting policies consistently followed by the Fund in the preparation of the financial statements. The preparation of the financial statements in accordance with accounting principles generally accepted in the United States of America (“U.S. GAAP”) requires management to make estimates and assumptions that affect the reported amounts and disclosures in the financial statements. Actual results could differ from those estimates.
A. Portfolio Valuation
The Fund’s NAV is determined daily as of the close of regular trading on the New York Stock Exchange (“NYSE”), normally 4:00 p.m. Eastern time, on each day the NYSE is open for trading. If the NYSE closes early on a valuation day, the NAV is determined as of that time. Foreign securities are priced using data reflecting the earlier closing of the principal markets for those securities. The Fund’s NAV is calculated by dividing the value of all assets of the Fund (including accrued interest and dividends), less all liabilities (including accrued expenses and dividends declared but unpaid), by the total number of shares outstanding.
The Fund’s investments are valued daily at market value or, in the absence of market value with respect to any portfolio securities, at fair value. Market value prices represent last sale or official closing prices from a national or foreign exchange (i.e., a regulated market) and are primarily obtained from third-party pricing services. Fair value prices represent any prices not considered market value prices and are either obtained from a third-party pricing service or are determined by the Pricing Committee of the Fund’s investment advisor, First Trust Advisors L.P. (“First Trust” or the “Advisor”), in accordance with valuation procedures adopted by the Trust’s Board of Trustees, and in accordance with provisions of the 1940 Act. Investments valued by the Advisor’s Pricing Committee, if any, are footnoted as such in the footnotes to the Portfolio of Investments. The Fund’s investments are valued as follows:
Common stocks, master limited partnerships (“MLPs”), real estate investment trusts (“REITs”) and other equity securities listed on any national or foreign exchange (excluding The Nasdaq Stock Market LLC (“Nasdaq”) and the London Stock Exchange Alternative Investment Market (“AIM”)) are valued at the last sale price on the exchange on which they are principally traded or, for Nasdaq and AIM securities, the official closing price. Securities traded on more than one securities exchange are valued at the last sale price or official closing price, as applicable, at the close of the securities exchange representing the principal market for such securities.
Securities traded in an over-the-counter market are fair valued at the mean of their most recent bid and asked price, if available, and otherwise at their closing bid price.
Certain securities may not be able to be priced by pre-established pricing methods. Such securities may be valued by the Trust’s Board of Trustees or its delegate, the Advisor’s Pricing Committee, at fair value. These securities generally include, but are not limited to, restricted securities (securities which may not be publicly sold without registration under the Securities Act of 1933, as amended) for which a third-party pricing service is unable to provide a market price; securities whose trading has been formally suspended; a security whose market or fair value price is not available from a pre-established pricing source; a security with respect to which an
Notes to Financial Statements (Continued)
First Trust Long/Short Equity ETF (FTLS)
October 31, 2018
event has occurred that is likely to materially affect the value of the security after the market has closed but before the calculation of the Fund’s NAV or make it difficult or impossible to obtain a reliable market quotation; and a security whose price, as provided by the third-party pricing service, does not reflect the security’s fair value. As a general principle, the current fair value of a security would appear to be the amount which the owner might reasonably expect to receive for the security upon its current sale. When fair value prices are used, generally they will differ from market quotations or official closing prices on the applicable exchanges. A variety of factors may be considered in determining the fair value of such securities, including, but not limited to, the following:
| 1) | the type of security; |
| 2) | the size of the holding; |
| 3) | the initial cost of the security; |
| 4) | transactions in comparable securities; |
| 5) | price quotes from dealers and/or third-party pricing services; |
| 6) | relationships among various securities; |
| 7) | information obtained by contacting the issuer, analysts, or the appropriate stock exchange; |
| 8) | an analysis of the issuer’s financial statements; and |
| 9) | the existence of merger proposals or tender offers that might affect the value of the security. |
The Fund is subject to fair value accounting standards that define fair value, establish the framework for measuring fair value and provide a three-level hierarchy for fair valuation based upon the inputs to the valuation as of the measurement date. The three levels of the fair value hierarchy are as follows:
| • | Level 1 – Level 1 inputs are quoted prices in active markets for identical investments. An active market is a market in which transactions for the investment occur with sufficient frequency and volume to provide pricing information on an ongoing basis. |
| • | Level 2 – Level 2 inputs are observable inputs, either directly or indirectly, and include the following: |
| o | Quoted prices for similar investments in active markets. |
| o | Quoted prices for identical or similar investments in markets that are non-active. A non-active market is a market where there are few transactions for the investment, the prices are not current, or price quotations vary substantially either over time or among market makers, or in which little information is released publicly. |
| o | Inputs other than quoted prices that are observable for the investment (for example, interest rates and yield curves observable at commonly quoted intervals, volatilities, prepayment speeds, loss severities, credit risks, and default rates). |
| o | Inputs that are derived principally from or corroborated by observable market data by correlation or other means. |
| • | Level 3 – Level 3 inputs are unobservable inputs. Unobservable inputs may reflect the reporting entity’s own assumptions about the assumptions that market participants would use in pricing the investment. |
The inputs or methodologies used for valuing investments are not necessarily an indication of the risk associated with investing in those investments. A summary of the inputs used to value the Fund’s investments as of October 31, 2018, is included with the Fund’s Portfolio of Investments.
B. Securities Transactions and Investment Income
Securities transactions are recorded as of the trade date. Realized gains and losses from securities transactions are recorded on the identified cost basis. Dividend income is recorded on the ex-dividend date. Interest income, if any, is recorded on the accrual basis.
Distributions received from the Fund’s investments in REITs may be comprised of return of capital, capital gains, and income. The actual character of the amounts received during the year are not known until after the REITs’ fiscal year end. The Fund records the character of distributions received from the REITs during the year based on estimates available. The characterization of distributions received by the Fund may be subsequently revised based on information received from the REITs after their tax reporting periods conclude.
Distributions received from the Fund’s investments in MLPs generally are comprised of return of capital and investment income. The Fund records estimated return of capital and investment income based on historical information available from each MLP. These estimates may subsequently be revised based on information received from the MLPs after their tax reporting periods are concluded.
Notes to Financial Statements (Continued)
First Trust Long/Short Equity ETF (FTLS)
October 31, 2018
C. Short Sales
Short sales are utilized for investment and risk management purposes and are transactions in which securities or other instruments (such as options, forwards, futures or other derivative contracts) are sold by the Fund, but are not currently owned in the Fund’s portfolio. When the Fund engages in a short sale, the Fund must borrow the security sold short and deliver the security to the counterparty. Short selling allows the Fund to profit from a decline in a market price to the extent such decline exceeds the transaction costs and the costs of borrowing the securities. The Fund will pay a fee or premium to borrow the securities sold short and is obligated to repay the lenders of the securities. Any dividends or interest that accrues on the securities during the period of the loan are due to the lenders. A gain, limited to the price at which the security was sold short, or a loss, unlimited in size, will be recognized upon the termination of the short sale; which is affected by the Fund purchasing the security sold short and delivering the security to the lender. Any such gain or loss may be offset, completely or in part, by the change in the value of the long portion of the Fund’s portfolio. The Fund is subject to the risk that it may be unable to reacquire a security to terminate a short position except at a price substantially in excess of the last quoted price. Also, there is the risk that the counterparty to a short sale may fail to honor its contractual terms, causing a loss to the Fund.
The Fund has established an account with Pershing, LLC for the purpose of borrowing securities that the Fund intends to sell short. The Fund is charged interest on debit margin balances at a rate equal to the Overnight Bank Funding Rate plus 40 basis points. With regard to securities held short, the Fund is credited a rebate equal to the market value of its short positions at a rate equal to the Overnight Bank Funding Rate less 25 basis points. This rebate rate applies to easy to borrow securities. Securities that are hard to borrow may earn a rebate that is less than the foregoing or may be subject to a premium charge on a security by security basis. The different rebate rate is determined at the time of a short sale request. For the fiscal year ended October 31, 2018, the Fund had margin interest rebate of $575,163 and margin interest expense of $90,124, as shown on the Statement of Operations. Restricted cash in the amount of $54,474,520, as shown on the Statement of Assets and Liabilities, is associated with collateral at the broker as of October 31, 2018.
D. Dividends and Distributions to Shareholders
Dividends from net investment income, if any, are declared and paid quarterly by the Fund, or as the Board of Trustees may determine from time to time. Distributions of net realized capital gains earned by the Fund, if any, are distributed at least annually.
Distributions from income and capital gains are determined in accordance with federal income tax regulations, which may differ from U.S. GAAP. Certain capital accounts in the financial statements are periodically adjusted for permanent differences in order to reflect their tax character. These permanent differences are primarily due to the varying treatment of income and gain/loss on portfolio securities held by the Fund and have no impact on net assets or NAV per share. Temporary differences, which arise from recognizing certain items of income, expense and gain/loss in different periods for financial statement and tax purposes, will reverse at some time in the future.
The tax character of distributions paid by the Fund during the fiscal years ended October 31, 2018 and 2017, was as follows:
| Distributions paid from: | 2018 | 2017 |
Ordinary income
| $944,480 | $967,786 |
Capital gains
| — | — |
Return of capital
| — | — |
As of October 31, 2018, the components of distributable earnings on a tax basis were as follows:
Undistributed ordinary income
| $226,166 |
Accumulated capital and other gain (loss)
| (16,314,421) |
Net unrealized appreciation (depreciation)
| (445,624) |
E. Income Taxes
The Fund intends to continue to qualify as a regulated investment company by complying with the requirements under Subchapter M of the Internal Revenue Code of 1986, as amended, which includes distributing substantially all of its net investment income and net realized gains to shareholders. Accordingly, no provision has been made for federal and state income taxes. However, due to the timing and amount of distributions, the Fund may be subject to an excise tax of 4% of the amount by which approximately 98% of the Fund’s taxable income exceeds the distributions from such taxable income for the calendar year.
The Fund is subject to accounting standards that establish a minimum threshold for recognizing, and a system for measuring, the benefits of a tax position taken or expected to be taken in a tax return. Taxable years ended 2015, 2016, 2017, and 2018 remain open to
Notes to Financial Statements (Continued)
First Trust Long/Short Equity ETF (FTLS)
October 31, 2018
federal and state audit. As of October 31, 2018, management has evaluated the application of these standards to the Fund and has determined that no provision for income tax is required in the Fund’s financial statements for uncertain tax positions.
The Fund intends to utilize provisions of the federal income tax laws, which allow it to carry a realized capital loss forward indefinitely following the year of the loss and offset such loss against any future realized capital gains. The Fund is subject to certain limitations under U.S. tax rules on the use of capital loss carryforwards and net unrealized built-in losses. These limitations apply when there has been a 50% change in ownership. At October 31, 2018, the Fund had $16,314,421 of non-expiring capital loss carryforwards for federal income tax purposes.
Certain losses realized during the current fiscal year may be deferred and treated as occurring on the first day of the following fiscal year for federal income tax purposes. For the fiscal year ended October 31, 2018, the Fund did not defer any net ordinary losses.
In order to present paid-in capital and accumulated distributable earnings (loss) (which consists of accumulated net investment income (loss), accumulated net realized gain (loss) on investments and net unrealized appreciation (depreciation) on investments) on the Statement of Assets and Liabilities that more closely represent their tax character, certain adjustments have been made to paid-in capital, accumulated net investment income (loss) and accumulated net realized gain (loss) on investments. These adjustments are primarily due to the difference between book and tax treatments of income and gains on various investment securities held by the Fund and in-kind transactions. The results of operations and net assets were not affected by these adjustments. For the fiscal year ended October 31, 2018, the adjustments for the Fund were as follows:
Accumulated
Net Investment
Income (Loss) | | Accumulated
Net Realized
Gain (Loss)
on Investments | | Paid-in
Capital |
| $63,791 | | $(16,337,679) | | $16,273,888 |
F. Expenses
Expenses, other than the investment advisory fee, dividend and interest expenses on investments sold short and other excluded expenses, are paid by the Advisor (See Note 3).
G. New Accounting Pronouncements
On March 30, 2017, the FASB issued Accounting Standards Update (ASU) 2017-08 “Premium Amortization on Purchased Callable Debt Securities”, which amends the amortization period for certain purchased callable debt securities held at a premium by shortening such period to the earliest call date. The new guidance requires an entity to amortize the premium on a callable debt security within its scope to the earliest call date, unless the guidance for considering estimated prepayments is applied. If the call option is not exercised at the earliest call date, the yield is reset to the effective yield using the payment terms of the security. If the security has more than one call date and the premium was amortized to a call price greater than the next call price, any excess of the amortized cost basis over the amount repayable at the next call date will be amortized to that date. If there are no other call dates, any excess of the amortized cost basis over the par amount will be amortized to maturity. Discounts on purchased callable debt securities will continue to be amortized to the security’s maturity date. The ASU 2017-08 is effective for public business entities for fiscal years, and interim periods within those fiscal years, beginning after December 15, 2018. Earlier application is permitted for all entities, including adoption in an interim period. If an entity early adopts the ASU in an interim period, any adjustments must be reflected as of the beginning of the fiscal year that includes that interim period. Management is still assessing the impact of the adoption of ASU 2017-08 on the financial statements but does not expect it to have a material impact.
On August 28, 2018, the FASB issued Accounting Standards Update (“ASU”) 2018-13, “Disclosure Framework – Changes to the Disclosure Requirements for Fair Value Measurement,” which amends the fair value measurement disclosure requirements of ASC 820. The amendments of ASU 2018-13 include new, eliminated, and modified disclosure requirements of ASC 820. In addition, the amendments clarify that materiality is an appropriate consideration of entities when evaluating disclosure requirements. The ASU is effective for fiscal years beginning after December 15, 2019, including interim periods therein. Early adoption is permitted for any eliminated or modified disclosures upon issuance of this ASU. The Fund has early adopted ASU 2018-13 for these financial statements, which did not result in a material impact.
Notes to Financial Statements (Continued)
First Trust Long/Short Equity ETF (FTLS)
October 31, 2018
3. Investment Advisory Fee, Affiliated Transactions and Other Fee Arrangements
First Trust, the investment advisor to the Fund, is a limited partnership with one limited partner, Grace Partners of DuPage L.P., and one general partner, The Charger Corporation. The Charger Corporation is an Illinois corporation controlled by James A. Bowen, Chief Executive Officer of First Trust. First Trust is responsible for the selection and ongoing monitoring of the securities in the Fund’s portfolio, managing the Fund’s business affairs and providing certain administrative services necessary for the management of the Fund.
Pursuant to the Investment Management Agreement, First Trust manages the investment of the Fund’s assets and is responsible for the Fund’s expenses, including the cost of transfer agency, custody, fund administration, legal, audit and other services, but excluding fee payments under the Investment Management Agreement, interest, taxes, brokerage commissions and other expenses connected with the execution of portfolio transactions, distribution and service fees pursuant to a 12b-1 plan, if any, acquired fund fees and expenses, dividend expenses on investments sold short, and extraordinary expenses. The Fund has agreed to pay First Trust an annual unitary management fee equal to 0.95% of its average daily net assets. In addition, the Fund incurs acquired fund fees and expenses. The total of the unitary management fee and acquired fund fees and expenses represents the Fund’s total annual operating expenses. First Trust also provides fund reporting services to the Fund for a flat annual fee in the amount of $9,250, which is covered under the annual unitary management fee.
The Trust has multiple service agreements with Brown Brothers Harriman & Co. (“BBH”). Under the service agreements, BBH performs custodial, fund accounting, certain administrative services, and transfer agency services for the Fund. As custodian, BBH is responsible for custody of the Fund’s assets. As fund accountant and administrator, BBH is responsible for maintaining the books and records of the Fund’s securities and cash. As transfer agent, BBH is responsible for maintaining shareholder records for the Fund.
Each Trustee who is not an officer or employee of First Trust, any sub-advisor or any of their affiliates (“Independent Trustees”) is paid a fixed annual retainer that is allocated equally among each fund in the First Trust Fund Complex. Each Independent Trustee is also paid an annual per fund fee that varies based on whether the fund is a closed-end or other actively managed fund, or is an index fund.
Additionally, the Lead Independent Trustee and the Chairmen of the Audit Committee, Nominating and Governance Committee and Valuation Committee are paid annual fees to serve in such capacities, with such compensation allocated pro rata among each fund in the First Trust Fund Complex based on net assets. Independent Trustees are reimbursed for travel and out-of-pocket expenses in connection with all meetings. The Lead Independent Trustee and Committee Chairmen rotate every three years. The officers and “Interested” Trustee receive no compensation from the Trust for acting in such capacities.
4. Purchases and Sales of Securities
For the fiscal year ended October 31, 2018, the cost of purchases and proceeds from sales of investments, excluding short term investments, investments sold short and in-kind transactions, were $349,758,498 and $356,704,221, respectively. The cost of purchases to cover short sales and the proceeds of short sales were $135,896,929 and $161,452,073, respectively.
For the fiscal year ended October 31, 2018, the cost of in-kind purchases and proceeds from in-kind sales were $143,738,546 and $110,130,360, respectively.
5. Creations, Redemptions and Transaction Fees
Shares are created and redeemed by the Fund only in Creation Unit size aggregations of 50,000 shares in transactions with broker-dealers or large institutional investors that have entered into a participation agreement (an “Authorized Participant”). In order to purchase Creation Units of the Fund, an Authorized Participant must deposit (i) a designated portfolio of securities determined by First Trust (the “Deposit Securities”) and generally make or receive a cash payment referred to as the “Cash Component,” which is an amount equal to the difference between the NAV of the Fund shares (per Creation Unit Aggregation) and the market value of the Deposit Securities, and/or (ii) cash in lieu of all or a portion of the Deposit Securities. If the Cash Component is a positive number (i.e., the NAV per Creation Unit Aggregation exceeds the Deposit Amount), the Authorized Participant will deliver the Cash Component. If the Cash Component is a negative number (i.e., the NAV per Creation Unit Aggregation is less than the Deposit Amount), the Authorized Participant will receive the Cash Component. Authorized Participants purchasing Creation Units must pay to BBH, as transfer agent, a creation transaction fee (the “Creation Transaction Fee”) regardless of the number of Creation Units purchased in the transaction. The Creation Transaction Fee may vary and is based on the composition of the securities included in the Fund’s portfolio and the countries in which the transactions are settled. The Creation Transaction Fee is currently $550. The price for each Creation Unit will equal the daily NAV per share times the number of shares in a Creation Unit plus the fees described above and, if applicable, any operational processing and brokerage costs, transfer fees or stamp taxes. When the Fund permits an Authorized Participant to substitute cash or a different security in lieu of depositing one or more of the requisite Deposit Securities, the Authorized
Notes to Financial Statements (Continued)
First Trust Long/Short Equity ETF (FTLS)
October 31, 2018
Participant may also be assessed an amount to cover the cost of purchasing the Deposit Securities and/or disposing of the substituted securities, including operational processing and brokerage costs, transfer fees, stamp taxes, and part or all of the spread between the expected bid and offer side of the market related to such Deposit Securities and/or substitute securities.
Authorized Participants redeeming Creation Units must pay to BBH, as transfer agent, a redemption transaction fee (the “Redemption Transaction Fee”), regardless of the number of Creation Units redeemed in the transaction. The Redemption Transaction Fee may vary and is based on the composition of the securities included in the Fund’s portfolio and the countries in which the transactions are settled. The Redemption Transaction Fee is currently $550. The Fund reserves the right to effect redemptions in cash. An Authorized Participant may request cash redemption in lieu of securities; however, the Fund may, in its discretion, reject any such request.
6. Distribution Plan
The Board of Trustees adopted a Distribution and Service Plan pursuant to Rule 12b-1 under the 1940 Act. In accordance with the Rule 12b-1 plan, the Fund is authorized to pay an amount up to 0.25% of its average daily net assets each year to reimburse First Trust Portfolios L.P. (“FTP”), the distributor of the Fund, for amounts expended to finance activities primarily intended to result in the sale of Creation Units or to provide investor services. FTP may also use this amount to compensate securities dealers or other persons that are Authorized Participants for providing distribution assistance, including broker-dealer and shareholder support and educational and promotional services.
No 12b-1 fees are currently paid by the Fund, and pursuant to a contractual arrangement, no 12b-1 fees will be paid any time before March 1, 2020.
7. Indemnification
The Trust, on behalf of the Fund, has a variety of indemnification obligations under contracts with its service providers. The Trust’s maximum exposure under these arrangements is unknown. However, the Trust has not had prior claims or losses pursuant to these contracts and expects the risk of loss to be remote.
8. Subsequent Events
Management has evaluated the impact of all subsequent events to the Fund through the date the financial statements were issued, and has determined that there was the following subsequent event:
On November 2, 2018, First Trust Short Duration Managed Municipal ETF and First Trust Ultra Short Duration Municipal ETF, each an additional series of the Trust, began trading under the ticker symbols FSMB and FUMB, respectively, on the NYSE Arca, Inc.
Report of Independent Registered Public Accounting Firm
To the Shareholders and the Board of Trustees of First Trust Exchange-Traded Fund III:
Opinion on the Financial Statements and Financial Highlights
We have audited the accompanying statement of assets and liabilities, including the portfolio of investments, of First Trust Long/Short Equity ETF (the “Fund”), one of the funds constituting the First Trust Exchange-Traded Fund III, as of October 31, 2018, the related statement of operations for the year then ended, the statements of changes in net assets for each of the two years in the period then ended, the financial highlights for the years ended October 31, 2018, 2017, 2016, 2015 and for the period from September 8, 2014 (commencement of operations) through October 31, 2014, and the related notes. In our opinion, the financial statements and financial highlights present fairly, in all material respects, the financial position of the Fund as of October 31, 2018, and the results of its operations for the year then ended, the changes in its net assets for each of the two years in the period then ended, and the financial highlights for the years ended October 31, 2018, 2017, 2016, 2015 and for the period from September 8, 2014 (commencement of operations) through October 31, 2014, in conformity with accounting principles generally accepted in the United States of America.
Basis for Opinion
These financial statements and financial highlights are the responsibility of the Fund’s management. Our responsibility is to express an opinion on the Fund’s financial statements and financial highlights based on our audits. We are a public accounting firm registered with the Public Company Accounting Oversight Board (United States) (PCAOB) and are required to be independent with respect to the Fund in accordance with the U.S. federal securities laws and the applicable rules and regulations of the Securities and Exchange Commission and the PCAOB.
We conducted our audits in accordance with the standards of the PCAOB. Those standards require that we plan and perform the audit to obtain reasonable assurance about whether the financial statements and financial highlights are free of material misstatement, whether due to error or fraud. The Fund is not required to have, nor were we engaged to perform, an audit of its internal control over financial reporting. As part of our audits we are required to obtain an understanding of internal control over financial reporting but not for the purpose of expressing an opinion on the effectiveness of the Fund’s internal control over financial reporting. Accordingly, we express no such opinion.
Our audits included performing procedures to assess the risks of material misstatement of the financial statements and financial highlights, whether due to error or fraud, and performing procedures that respond to those risks. Such procedures included examining, on a test basis, evidence regarding the amounts and disclosures in the financial statements and financial highlights. Our audits also included evaluating the accounting principles used and significant estimates made by management, as well as evaluating the overall presentation of the financial statements and financial highlights. Our procedures included confirmation of securities owned as of October 31, 2018, by correspondence with the custodian, agent banks and brokers. We believe that our audits provide a reasonable basis for our opinion.
Chicago, Illinois
December 21, 2018
We have served as the auditor of one or more First Trust investment companies since 2001.
Additional Information
First Trust Long/Short Equity ETF (FTLS)
October 31, 2018 (Unaudited)
Proxy Voting Policies and Procedures
A description of the policies and procedures that the Trust uses to determine how to vote proxies and information on how the Fund voted proxies relating to portfolio securities during the most recent 12-month period ended June 30 is available (1) without charge, upon request, by calling (800) 988-5891; (2) on the Fund’s website at www.ftportfolios.com; and (3) on the Securities and Exchange Commission’s (“SEC”) website at www.sec.gov.
Portfolio Holdings
The Trust files its complete schedule of the Fund’s portfolio holdings with the SEC for the first and third quarters of each fiscal year on Form N-Q. The Trust’s Form N-Qs are available (1) by calling (800) 988-5891; (2) on the Fund’s website at www.ftportfolios.com; and (3) on the SEC’s website at www.sec.gov.
Beginning in April 2019, the Trust will cease to disclose the Fund’s holdings on Form N-Q and will file Form N-PORT with the SEC on a monthly basis. Part F of Form N-PORT, which contains the complete schedule of the Fund’s portfolio holdings, will be made available in the same manner as Form N-Q discussed above.
Federal Tax Information
For the taxable year ended October 31, 2018, the following percentage of income dividend paid by the Fund qualifies for the dividends received deduction available to corporations and is hereby designated as qualified dividend income:
| Dividends Received Deduction | | Qualified Dividend Income |
| 100.00% | | 100.00% |
Risk Considerations
Risks are inherent in all investing. Certain general risks that may be applicable to some or all of the Funds are identified below, but not all of the material risks relevant to each Fund are included in this report. The material risks of investing in each Fund are spelled out in its prospectus, statement of additional information and other regulatory filings. Before investing, you should consider each Fund’s investment objective, risks, charges and expenses, and read each Fund’s prospectus and statement of additional information carefully. You can download each Fund’s prospectus at www.ftportfolios.com or contact First Trust Portfolios L.P. at (800) 621-1675 to request a prospectus, which contains this and other information about each Fund.
Concentration Risk. To the extent that a Fund is able to invest a large percentage of its assets in a single asset class or the securities of issuers within the same country, state, region, industry or sector, an adverse economic, business or political development may affect the value of the Fund’s investments more than if the Fund were more broadly diversified. A Fund that tracks an index will be concentrated to the extent the Fund’s corresponding index is concentrated. A concentration makes a Fund more susceptible to any single occurrence and may subject the Fund to greater market risk than a fund that is not concentrated.
Credit Risk. Credit risk is the risk that an issuer of a security will be unable or unwilling to make dividend, interest and/or principal payments when due and the related risk that the value of a security may decline because of concerns about the issuer’s ability to make such payments.
Cyber Security Risk. The Funds are susceptible to potential operational risks through breaches in cyber security. A breach in cyber security refers to both intentional and unintentional events that may cause a Fund to lose proprietary information, suffer data corruption or lose operational capacity. Such events could cause a Fund to incur regulatory penalties, reputational damage, additional compliance costs associated with corrective measures and/or financial loss. In addition, cyber security breaches of a Fund’s third-party service providers, such as its administrator, transfer agent, custodian, or sub-advisor, as applicable, or issuers in which the Fund invests, can also subject a Fund to many of the same risks associated with direct cyber security breaches.
Derivatives Risk. To the extent a Fund uses derivative instruments such as futures contracts, options contracts and swaps, the Fund may experience losses because of adverse movements in the price or value of the underlying asset, index or rate, which may be magnified by certain features of the derivative. These risks are heightened when a Fund’s portfolio managers use derivatives to enhance the Fund’s return or as a substitute for a position or security, rather than solely to hedge (or offset) the risk of a position or security held by the Fund.
Equity Securities Risk. To the extent a Fund invests in equity securities, the value of the Fund’s shares will fluctuate with changes in the value of the equity securities. Equity securities prices fluctuate for several reasons, including changes in investors’ perceptions of the financial condition of an issuer or the general condition of the relevant stock market, such as market volatility, or when political or economic events affecting the issuers occur. In addition, common stock prices may be particularly sensitive to rising interest rates, as
Additional Information (Continued)
First Trust Long/Short Equity ETF (FTLS)
October 31, 2018 (Unaudited)
the cost of capital rises and borrowing costs increase. Equity securities may decline significantly in price over short or extended periods of time, and such declines may occur in the equity market as a whole, or they may occur in only a particular country, company, industry or sector of the market.
ETF Risk. The shares of an ETF trade like common stock and represent an interest in a portfolio of securities. The risks of owning an ETF generally reflect the risks of owning the underlying securities, although lack of liquidity in an ETF could result in it being more volatile and ETFs have management fees that increase their costs. Shares of an ETF trade on an exchange at market prices rather than net asset value, which may cause the shares to trade at a price greater than net asset value (premium) or less than net asset value (discount). In times of market stress, decisions by market makers to reduce or step away from their role of providing a market for an ETF’s shares, or decisions by an ETF’s authorized participants that they are unable or unwilling to proceed with creation and/or redemption orders of an ETF’s shares, could result in shares of the ETF trading at a discount to net asset value and in greater than normal intraday bid-ask spreads.
Fixed Income Securities Risk. To the extent a Fund invests in fixed income securities, the Fund will be subject to credit risk, income risk, interest rate risk, liquidity risk and prepayment risk. Income risk is the risk that income from a Fund’s fixed income investments could decline during periods of falling interest rates. Interest rate risk is the risk that the value of a Fund’s fixed income securities will decline because of rising interest rates. Liquidity risk is the risk that a security cannot be purchased or sold at the time desired, or cannot be purchased or sold without adversely affecting the price. Prepayment risk is the risk that the securities will be redeemed or prepaid by the issuer, resulting in lower interest payments received by the Fund. In addition to these risks, high yield securities, or “junk” bonds, are subject to greater market fluctuations and risk of loss than securities with higher ratings, and the market for high yield securities is generally smaller and less liquid than that for investment grade securities.
Fund of Funds Risk. To the extent a Fund invests in the securities of other investment vehicles, the Fund will incur additional fees and expenses that would not be present in a direct investment in those investment vehicles. Furthermore, the Fund’s investment performance and risks are directly related to the investment performance and risks of the investment vehicles in which the Fund invests.
Index Constituent Risk. Certain Funds may be a constituent of one or more indices. As a result, such a Fund may be included in one or more index-tracking exchange-traded funds or mutual funds. Being a component security of such a vehicle could greatly affect the trading activity involving a Fund, the size of the Fund and the market volatility of the Fund. Inclusion in an index could significantly increase demand for the Fund and removal from an index could result in outsized selling activity in a relatively short period of time. As a result, a Fund’s net asset value could be negatively impacted and the Fund’s market price may be significantly below its net asset value during certain periods.
Index Provider Risk. To the extent a Fund seeks to track an index, it is subject to Index Provider Risk. There is no assurance that the Index Provider will compile the Index accurately, or that the Index will be determined, maintained, constructed, reconstituted, rebalanced, composed, calculated or disseminated accurately. To correct any such error, the Index Provider may carry out an unscheduled rebalance or other modification of the Index constituents or weightings, which may increase the Fund’s costs. The Index Provider does not provide any representation or warranty in relation to the quality, accuracy or completeness of data in the Index, and it does not guarantee that the Index will be calculated in accordance with its stated methodology. Losses or costs associated with any Index Provider errors generally will be borne by the Fund and its shareholders.
Management Risk. To the extent that a Fund is actively managed, it is subject to management risk. In managing an actively-managed Fund’s investment portfolio, the Fund’s portfolio managers will apply investment techniques and risk analyses that may not have the desired result. There can be no guarantee that a Fund will meet its investment objective.
Market Risk. Securities held by a Fund, as well as shares of a Fund itself, are subject to market fluctuations caused by factors such as general economic conditions, political events, regulatory or market developments, changes in interest rates and perceived trends in securities prices. Shares of a Fund could decline in value or underperform other investments as a result of the risk of loss associated with these market fluctuations.
Non-U.S. Securities Risk. To the extent a Fund invests in non-U.S. securities, it is subject to additional risks not associated with securities of domestic issuers. Non-U.S. securities are subject to higher volatility than securities of domestic issuers due to: possible adverse political, social or economic developments; restrictions on foreign investment or exchange of securities; lack of liquidity; currency exchange rates; excessive taxation; government seizure of assets; different legal or accounting standards; and less government supervision and regulation of exchanges in foreign countries. Investments in non-U.S. securities may involve higher costs than investments in U.S. securities, including higher transaction and custody costs, as well as additional taxes imposed by non-U.S. governments. These risks may be heightened for securities of companies located, or with significant operations, in emerging market countries.
Additional Information (Continued)
First Trust Long/Short Equity ETF (FTLS)
October 31, 2018 (Unaudited)
Passive Investment Risk. To the extent a Fund seeks to track an index, the Fund will invest in the securities included in, or representative of, the index regardless of their investment merit. A Fund generally will not attempt to take defensive positions in declining markets.
Advisory Agreement
Board Considerations Regarding Approval of Investment Management Agreement
The Board of Trustees of First Trust Exchange-Traded Fund III (the “Trust”), including the Independent Trustees, unanimously approved the continuation of the Investment Management Agreement (the “Agreement”) with First Trust Advisors L.P. (the “Advisor”) on behalf of the First Trust Long/Short Equity ETF (the “Fund”). The Board approved the continuation of the Agreement for a one-year period ending June 30, 2019 at a meeting held on June 11, 2018. The Board determined that the continuation of the Agreement is in the best interests of the Fund in light of the nature, extent and quality of the services provided and such other matters as the Board considered to be relevant in the exercise of its reasonable business judgment.
To reach this determination, the Board considered its duties under the Investment Company Act of 1940, as amended (the “1940 Act”), as well as under the general principles of state law, in reviewing and approving advisory contracts; the requirements of the 1940 Act in such matters; the fiduciary duty of investment advisors with respect to advisory agreements and compensation; the standards used by courts in determining whether investment company boards have fulfilled their duties; and the factors to be considered by the Board in voting on such agreements. At meetings held on April 23, 2018 and June 11, 2018, the Board, including the Independent Trustees, reviewed materials provided by the Advisor responding to requests for information from counsel to the Independent Trustees that, among other things, outlined the services provided by the Advisor to the Fund (including the relevant personnel responsible for these services and their experience); the unitary fee rate payable by the Fund as compared to fees charged to a peer group of funds (which were either mutual funds or exchange-traded funds (“ETFs”)) compiled by Management Practice, Inc. (“MPI”), an independent source (the “Peer Group”), and as compared to fees charged to other clients of the Advisor, including other ETFs managed by the Advisor; expenses of the Fund as compared to expense ratios of the funds in the Peer Group; performance information for the Fund; the nature of expenses incurred in providing services to the Fund and the potential for economies of scale, if any; financial data on the Advisor; any fall-out benefits to the Advisor and its affiliate, First Trust Portfolios L.P. (“FTP”); and information on the Advisor’s compliance program. The Board reviewed initial materials with the Advisor at the meeting held on April 23, 2018, prior to which the Independent Trustees and their counsel met separately to discuss the information provided by the Advisor. Following the April meeting, independent legal counsel on behalf of the Independent Trustees requested certain clarifications and supplements to the materials provided, and the information provided in response to those requests was considered at an executive session of the Independent Trustees and independent legal counsel held prior to the June 11, 2018 meeting, as well as at the meeting held that day. The Board applied its business judgment to determine whether the arrangement between the Trust and the Advisor continues to be a reasonable business arrangement from the Fund’s perspective. The Board determined that, given the totality of the information provided with respect to the Agreement, the Board had received sufficient information to renew the Agreement. The Board considered that shareholders chose to invest or remain invested in the Fund knowing that the Advisor manages the Fund and knowing the Fund’s unitary fee.
In reviewing the Agreement, the Board considered the nature, extent and quality of the services provided by the Advisor under the Agreement. The Board considered that the Advisor is responsible for the overall management and administration of the Trust and the Fund and reviewed all of the services provided by the Advisor to the Fund, as well as the background and experience of the persons responsible for such services. The Board noted that the Fund is an actively-managed ETF and noted that the Advisor’s Alternatives Investment Team is responsible for the day-to-day management of the Fund’s investments. The Board considered the background and experience of the members of the Alternatives Investment Team and noted the Board’s prior meetings with members of the Team. The Board considered the Advisor’s statement that it applies the same oversight model internally with its Alternatives Investment Team as it uses for overseeing external sub-advisors, including portfolio risk monitoring and performance review. In reviewing the services provided, the Board noted the compliance program that had been developed by the Advisor and considered that it includes a robust program for monitoring the Advisor’s and the Fund’s compliance with the 1940 Act, as well as the Fund’s compliance with its investment objectives, policies and restrictions. The Board also considered a report from the Advisor with respect to its risk management functions related to the operation of the Fund. Finally, as part of the Board’s consideration of the Advisor’s services, the Advisor, in its written materials and at the April 23, 2018 meeting, described to the Board the scope of its ongoing investment in additional infrastructure and personnel to maintain and improve the quality of services provided to the Fund and the other funds in the First Trust Fund Complex. In light of the information presented and the considerations made, the Board concluded that the nature, extent and quality of the services provided to the Trust and the Fund by the Advisor under the Agreement have been and are expected to remain satisfactory and that the Advisor has managed the Fund consistent with the Fund’s investment objectives, policies and restrictions.
Additional Information (Continued)
First Trust Long/Short Equity ETF (FTLS)
October 31, 2018 (Unaudited)
The Board considered the unitary fee rate payable by the Fund under the Agreement for the services provided. The Board considered that as part of the unitary fee the Advisor is responsible for the Fund’s expenses, including the cost of transfer agency, custody, fund administration, legal, audit and other services and license fees (if any), but excluding interest, taxes, brokerage commissions and other expenses connected with the execution of portfolio transactions, distribution and service fees pursuant to a Rule 12b-1 plan, if any, and extraordinary expenses. The Board received and reviewed information showing the advisory fee rates and expense ratios of the peer funds in the Peer Group, as well as advisory and unitary fee rates charged by the Advisor to other fund (including ETFs) and non-fund clients, as applicable. Because the Fund pays a unitary fee, the Board determined that expense ratios were the most relevant comparative data point. Based on the information provided, the Board noted that the Fund’s total (net) expense ratio (including expenses associated with short sales) was below the median total (net) expense ratio of the peer funds in the Peer Group. With respect to the Peer Group, the Board noted its prior discussions with the Advisor and MPI regarding the assembly of the Peer Group and, at the April 23, 2018 meeting, discussed with the Advisor limitations in creating peer groups for actively-managed ETFs, including that there were no other actively-managed ETFs pursuing a long/short strategy and that most of the peer funds were open-end mutual funds. The Board took these limitations and differences into account in considering the peer data. With respect to fees charged to other non-ETF clients, the Board considered differences between the Fund and other non-ETF clients that limited their comparability. In considering the unitary fee rate overall, the Board also considered the Advisor’s statement that it seeks to meet investor needs through innovative and value-added investment solutions and the Advisor’s description of its long-term commitment to the Fund.
The Board considered performance information for the Fund. The Board noted the process it has established for monitoring the Fund’s performance and portfolio risk on an ongoing basis, which includes quarterly performance reporting from the Advisor for the Fund. The Board determined that this process continues to be effective for reviewing the Fund’s performance. The Board received and reviewed information comparing the Fund’s performance for periods ended December 31, 2017 to the performance of the peer funds in the Peer Group and to that of a benchmark index. Based on the information provided, the Board noted that the Fund outperformed the Peer Group average for the one- and three-year periods ended December 31, 2017 but underperformed the benchmark index for the one- and three-year periods ended December 31, 2017.
On the basis of all the information provided on the unitary fee and performance of the Fund and the ongoing oversight by the Board, the Board concluded that the unitary fee for the Fund continues to be reasonable and appropriate in light of the nature, extent and quality of the services provided by the Advisor to the Fund under the Agreement.
The Board considered information and discussed with the Advisor whether there were any economies of scale in connection with providing advisory services to the Fund and noted the Advisor’s statement that it believes its expenses will likely increase over the next twelve months as the Advisor continues to make investments in additional infrastructure and personnel. The Board noted that any reduction in fixed costs associated with the management of the Fund would benefit the Advisor, but that the unitary fee structure provides a level of certainty in expenses for the Fund. The Board considered the revenues and allocated costs (including the allocation methodology) of the Advisor in serving as investment advisor to the Fund for the twelve months ended December 31, 2017 and the estimated profitability level for the Fund calculated by the Advisor based on such data, as well as complex-wide and product-line profitability data, for the same period. The Board noted the inherent limitations in the profitability analysis and concluded that, based on the information provided, the Advisor’s profitability level for the Fund was not unreasonable. In addition, the Board considered fall-out benefits described by the Advisor that may be realized from its relationship with the Fund. The Board considered that the Advisor had identified as a fall-out benefit to the Advisor and FTP their exposure to investors and brokers who, absent their exposure to the Fund, may have had no dealings with the Advisor or FTP, and noted that the Advisor does not utilize soft dollars in connection with its management of the Fund’s portfolio. The Board also considered the Advisor’s compensation for fund reporting services provided to the Fund pursuant to a separate Fund Reporting Services Agreement, which is paid from the unitary fee. The Board concluded that the character and amount of potential fall-out benefits to the Advisor were not unreasonable.
Based on all of the information considered and the conclusions reached, the Board, including the Independent Trustees, unanimously determined that the terms of the Agreement continue to be fair and reasonable and that the continuation of the Agreement is in the best interests of the Fund. No single factor was determinative in the Board’s analysis.
Board of Trustees and Officers
First Trust Exchange-Traded Fund III
October 31, 2018 (Unaudited)
The following tables identify the Trustees and Officers of the Trust. Unless otherwise indicated, the address of all persons is 120 E. Liberty Drive, Suite 400, Wheaton, IL 60187.
The Trust’s statement of additional information includes additional information about the Trustees and is available, without charge, upon request, by calling (800) 988-5891.
| Name, Year of Birth and Position with the Trust | Term of Office and Year First Elected or Appointed | Principal Occupations
During Past 5 Years | Number of Portfolios in the First Trust Fund Complex Overseen by Trustee | Other Trusteeships or Directorships Held by Trustee During Past 5 Years |
| INDEPENDENT TRUSTEES |
Richard E. Erickson, Trustee
(1951) | • Indefinite Term
• Since Inception | Physician; Officer, Wheaton Orthopedics; Limited Partner, Gundersen Real Estate Limited Partnership (June 1992 to December 2016); Member, Sportsmed LLC (April 2007 to November 2015) | 159 | None |
Thomas R. Kadlec, Trustee
(1957) | • Indefinite Term
• Since Inception | President, ADM Investor Services, Inc. (Futures Commission Merchant) | 159 | Director of ADM Investor Services, Inc., ADM Investor Services International, Futures Industry Association, and National Futures Association |
Robert F. Keith, Trustee
(1956) | • Indefinite Term
• Since Inception | President, Hibs Enterprises (Financial and Management Consulting) | 159 | Director of Trust Company of Illinois |
Niel B. Nielson, Trustee
(1954) | • Indefinite Term
• Since Inception | Senior Advisor (August 2018 to Present), Managing Director and Chief Operating Officer (January 2015 to August 2018), Pelita Harapan Educational Foundation (Educational Products and Services); President and Chief Executive Officer (June 2012 to September 2014), Servant Interactive LLC (Educational Products and Services); President and Chief Executive Officer (June 2012 to September 2014), Dew Learning LLC (Educational Products and Services) | 159 | Director of Covenant Transport, Inc. (May 2003 to May 2014) |
| INTERESTED TRUSTEE |
James A. Bowen(1), Trustee and
Chairman of the Board
(1955) | • Indefinite Term
• Since Inception | Chief Executive Officer, First Trust Advisors L.P. and First Trust Portfolios L.P.; Chairman of the Board of Directors, BondWave LLC (Software Development Company) and Stonebridge Advisors LLC (Investment Advisor) | 159 | None |
| (1) | Mr. Bowen is deemed an “interested person” of the Trust due to his position as CEO of First Trust Advisors, L.P., investment advisor of the Trust. |
Board of Trustees and Officers (Continued)
First Trust Exchange-Traded Fund III
October 31, 2018 (Unaudited)
| Name and Year of Birth | Position and Offices with Trust | Term of Office and Length of Service | Principal Occupations
During Past 5 Years |
| OFFICERS(2) |
James M. Dykas
(1966) | President and Chief Executive Officer | • Indefinite Term
• Since January 2016 | Managing Director and Chief Financial Officer (January 2016 to Present), Controller (January 2011 to January 2016), Senior Vice President (April 2007 to January 2016), First Trust Advisors L.P. and First Trust Portfolios L.P.; Chief Financial Officer (January 2016 to Present), BondWave LLC (Software Development Company) and Stonebridge Advisors LLC (Investment Advisor) |
Donald P. Swade
(1972) | Treasurer, Chief Financial Officer and Chief Accounting Officer | • Indefinite Term
• Since January 2016 | Senior Vice President (July 2016 to Present), Vice President (April 2012 to July 2016), First Trust Advisors L.P. and First Trust Portfolios L.P. |
W. Scott Jardine
(1960) | Secretary and Chief Legal Officer | • Indefinite Term
• Since Inception | General Counsel, First Trust Advisors L.P. and First Trust Portfolios L.P.; Secretary and General Counsel, BondWave LLC; Secretary, Stonebridge Advisors LLC |
Daniel J. Lindquist
(1970) | Vice President | • Indefinite Term
• Since Inception | Managing Director, First Trust Advisors L.P. and First Trust Portfolios L.P. |
Kristi A. Maher
(1966) | Chief Compliance Officer and Assistant Secretary | • Indefinite Term
• Since Inception | Deputy General Counsel, First Trust Advisors L.P. and First Trust Portfolios L.P. |
Roger F. Testin
(1966) | Vice President | • Indefinite Term
• Since Inception | Senior Vice President, First Trust Advisors L.P. and First Trust Portfolios L.P. |
Stan Ueland
(1970) | Vice President | • Indefinite Term
• Since Inception | Senior Vice President, First Trust Advisors L.P. and First Trust Portfolios L.P |
| (2) | The term “officer” means the president, vice president, secretary, treasurer, controller or any other officer who performs a policy making function. |
Privacy Policy
First Trust Long/Short Equity ETF (FTLS)
October 31, 2018 (Unaudited)
Privacy Policy
First Trust values our relationship with you and considers your privacy an important priority in maintaining that relationship. We are committed to protecting the security and confidentiality of your personal information.
Sources of Information
We collect nonpublic personal information about you from the following sources:
| • | Information we receive from you and your broker-dealer, investment advisor or financial representative through interviews, applications, agreements or other forms; |
| • | Information about your transactions with us, our affiliates or others; |
| • | Information we receive from your inquiries by mail, e-mail or telephone; and |
| • | Information we collect on our website through the use of “cookies”. For example, we may identify the pages on our website that your browser requests or visits. |
Information Collected
The type of data we collect may include your name, address, social security number, age, financial status, assets, income, tax information, retirement and estate plan information, transaction history, account balance, payment history, investment objectives, marital status, family relationships and other personal information.
Disclosure of Information
We do not disclose any nonpublic personal information about our customers or former customers to anyone, except as permitted by law. In addition to using this information to verify your identity (as required under law), the permitted uses may also include the disclosure of such information to unaffiliated companies for the following reasons:
| • | In order to provide you with products and services and to effect transactions that you request or authorize, we may disclose your personal information as described above to unaffiliated financial service providers and other companies that perform administrative or other services on our behalf, such as transfer agents, custodians and trustees, or that assist us in the distribution of investor materials such as trustees, banks, financial representatives, proxy services, solicitors and printers. |
| • | We may release information we have about you if you direct us to do so, if we are compelled by law to do so, or in other legally limited circumstances (for example to protect your account from fraud). |
In addition, in order to alert you to our other financial products and services, we may share your personal information within First Trust.
Use of Website Analytics
We currently use third party analytics tools, Google Analytics and AddThis, to gather information for purposes of improving First Trust’s website and marketing our products and services to you. These tools employ cookies, which are small pieces of text stored in a file by your web browser and sent to websites that you visit, to collect information, track website usage and viewing trends such as the number of hits, pages visited, videos and PDFs viewed and the length of user sessions in order to evaluate website performance and enhance navigation of the website. We may also collect other anonymous information, which is generally limited to technical and web navigation information such as the IP address of your device, internet browser type and operating system for purposes of analyzing the data to make First Trust’s website better and more useful to our users. The information collected does not include any personal identifiable information such as your name, address, phone number or email address unless you provide that information through the website for us to contact you in order to answer your questions or respond to your requests. To find out how to opt-out of these services click on: Google Analytics and AddThis.
Confidentiality and Security
With regard to our internal security procedures, First Trust restricts access to your nonpublic personal information to those First Trust employees who need to know that information to provide products or services to you. We maintain physical, electronic and procedural safeguards to protect your nonpublic personal information.
Policy Updates and Inquiries
As required by federal law, we will notify you of our privacy policy annually. We reserve the right to modify this policy at any time, however, if we do change it, we will tell you promptly. For questions about our policy, or for additional copies of this notice, please go to www.ftportfolios.com, or contact us at 1-800-621-1675 (First Trust Portfolios) or 1-800-222-6822 (First Trust Advisors).
May 2017
This page intentionally left blank
INVESTMENT ADVISOR
First Trust Advisors L.P.
120 E. Liberty Drive, Suite 400
Wheaton, IL 60187
ADMINISTRATOR, CUSTODIAN,
FUND ACCOUNTANT &
TRANSFER AGENT
Brown Brothers Harriman & Co.
50 Post Office Square
Boston, MA 02110
INDEPENDENT REGISTERED
PUBLIC ACCOUNTING FIRM
Deloitte & Touche LLP
111 S. Wacker Drive
Chicago, IL 60606
LEGAL COUNSEL
Chapman and Cutler LLP
111 W. Monroe Street
Chicago, IL 60603
First Trust Exchange-Traded Fund III
First Trust Emerging Markets Local Currency Bond ETF (FEMB)
Annual Report
For the Year Ended
October 31, 2018
First Trust Emerging Markets Local Currency Bond ETF (FEMB)
Annual Report
October 31, 2018
Caution Regarding Forward-Looking Statements
This report contains certain forward-looking statements within the meaning of the Securities Act of 1933, as amended, and the Securities Exchange Act of 1934, as amended. Forward-looking statements include statements regarding the goals, beliefs, plans or current expectations of First Trust Advisors L.P. (“First Trust” or the “Advisor”) and/or First Trust Global Portfolios Limited (“FTGP” or the “Sub-Advisor”) and their respective representatives, taking into account the information currently available to them. Forward-looking statements include all statements that do not relate solely to current or historical fact. For example, forward-looking statements include the use of words such as “anticipate,” “estimate,” “intend,” “expect,” “believe,” “plan,” “may,” “should,” “would” or other words that convey uncertainty of future events or outcomes.
Forward-looking statements involve known and unknown risks, uncertainties and other factors that may cause the actual results, performance or achievements of the series of First Trust Exchange-Traded Fund III (the “Trust”) described in this report (First Trust Emerging Markets Local Currency Bond ETF; hereinafter referred to as the “Fund”) to be materially different from any future results, performance or achievements expressed or implied by the forward-looking statements. When evaluating the information included in this report, you are cautioned not to place undue reliance on these forward-looking statements, which reflect the judgment of the Advisor and/or Sub-Advisor and their respective representatives only as of the date hereof. We undertake no obligation to publicly revise or update these forward-looking statements to reflect events and circumstances that arise after the date hereof.
Performance and Risk Disclosure
There is no assurance that the Fund will achieve its investment objective. The Fund is subject to market risk, which is the possibility that the market values of securities owned by the Fund will decline and that the value of the Fund shares may therefore be less than what you paid for them. Accordingly, you can lose money by investing in the Fund. See “Risk Considerations” in the Additional Information section of this report for a discussion of certain other risks of investing in the Fund.
Performance data quoted represents past performance, which is no guarantee of future results, and current performance may be lower or higher than the figures shown. For the most recent month-end performance figures, please visit www.ftportfolios.com or speak with your financial advisor. Investment returns, net asset value and share price will fluctuate and Fund shares, when sold, may be worth more or less than their original cost.
The Advisor may also periodically provide additional information on Fund performance on the Fund’s web page at www.ftportfolios.com.
How to Read This Report
This report contains information that may help you evaluate your investment in the Fund. It includes details about the Fund and presents data and analysis that provide insight into the Fund’s performance and investment approach.
By reading the portfolio commentary by the portfolio management team of the Fund, you may obtain an understanding of how the market environment affected the Fund’s performance. The statistical information that follows may help you understand the Fund’s performance compared to that of a relevant market benchmark.
It is important to keep in mind that the opinions expressed by personnel of the Advisor and/or Sub-Advisor are just that: informed opinions. They should not be considered to be promises or advice. The opinions, like the statistics, cover the period through the date on the cover of this report. The material risks of investing in the Fund are spelled out in the prospectus, the statement of additional information, and other Fund regulatory filings.
First Trust Emerging Markets Local Currency Bond ETF (FEMB)
Annual Letter from the Chairman and CEO
October 31, 2018
Dear Shareholders,
First Trust is pleased to provide you with the annual report for the First Trust Emerging Markets Local Currency Bond ETF (the “Fund”), which contains detailed information about the Fund for the twelve months ended October 31, 2018, including a market overview and a performance analysis. We encourage you to read this report carefully and discuss it with your financial advisor.
As I mentioned in my April 2018 letter, 2017 was a very strong year for U.S. and global markets. Investors were rewarded with rising markets and very little volatility. As 2018 began, investors were hoping for another strong year in the markets. For the entire first quarter, however, increased market volatility was the norm for U.S. and global markets. The markets continued their volatility throughout the second quarter. During April and May, the Dow Jones Industrial Average (“DJIA”) closed out each month slightly down, but ended both June and July slightly up. August was a strong month for stocks, and the DJIA finished August just under its previous high in January of 2018. At the close of the third quarter in September, the markets had moved higher into positive territory. In fact, all three major U.S. indices (the Nasdaq Composite Index, the DJIA and the S& P 500® Index) hit record levels during the third quarter. In October, markets were again very volatile, surprising analysts and investors alike. Both global and U.S. markets fell on fears of slowing growth, trade wars and higher interest rates. The DJIA was down 5% for October and the MSCI EAFE Index, an index of stocks in 21 developed markets (excluding the U.S. and Canada), was down 9% for the same period.
Based on continued strong job growth and the economic outlook in the U.S., the Federal Reserve (the “Fed”) raised interest rates in March, June and September. At their September meeting, the Fed also indicated the possibility of one more rate hike in 2018 as well as three more rate hikes in 2019.
Trade tensions have had an impact on markets around the world and could continue to do so in the future. However, our economists believe that the long-term impact of U.S. tariffs will be to encourage countries to come back to the table and talk about more equal trade. Despite market volatility, we continue to believe that the combination of low interest rates, low inflation and strong corporate earnings still point to a positive economic environment and further growth, though we understand that past performance can never guarantee future performance.
We continue to believe that you should invest for the long term and be prepared for market movements, which can happen at any time. You can do this by keeping current on your portfolio and by speaking regularly with your investment professional. Markets go up and they also go down, but savvy investors are prepared for either through careful attention to investment goals.
Thank you for giving First Trust the opportunity to be a part of your financial plan. We value our relationship with you and will report on the Fund again in six months.
Sincerely,
James A. Bowen
Chairman of the Board of Trustees
Chief Executive Officer of First Trust Advisors L.P.
Fund Performance Overview (Unaudited)
First Trust Emerging Markets Local Currency Bond ETF (FEMB)
First Trust Emerging Markets Local Currency Bond ETF (the “Fund”) seeks maximum total return and current income. The Fund lists and principally trades its shares on The Nasdaq Stock Market LLC (“Nasdaq”) under the ticker symbol “FEMB.” Under normal market conditions, the Fund seeks to achieve its investment objective by investing at least 80% of its net assets (including investment borrowings) in bonds, notes and bills issued or guaranteed by entities incorporated or domiciled in emerging market countries (collectively, “Bonds”) that are denominated in the local currency of the issuer. In implementing the Fund’s investment strategy, First Trust Global Portfolios Ltd. (the “Sub-Advisor”) seeks to provide current income and enhance capital, while minimizing volatility.
| Performance | | | |
| | | Average Annual
Total Returns | Cumulative
Total Returns |
| | 1 Year Ended
10/31/18 | Inception (11/4/14)
to 10/31/18 | Inception (11/4/14)
to 10/31/18 |
| Fund Performance | | | |
| NAV | -7.55% | -2.66% | -10.19% |
| Market Price | -8.07% | -2.75% | -10.53% |
| Index Performance | | | |
| Bloomberg Barclays Emerging Markets Local Currency Government - 10% Country Capped Index | -5.00% | -1.45% | -5.65% |
Total returns for the period since inception are calculated from the inception date of the Fund. “Average Annual Total Returns” represent the average annual change in value of an investment over the period indicated. “Cumulative Total Returns” represent the total change in value of an investment over the period indicated.
The Fund’s per share net asset value (“NAV”) is the value of one share of the Fund and is computed by dividing the value of all assets of the Fund (including accrued interest and dividends), less all liabilities (including accrued expenses and dividends declared but unpaid), by the total number of outstanding shares. The price used to calculate market return (“Market Price”) is determined by using the midpoint between the highest bid and the lowest offer on the stock exchange on which shares of the Fund are listed for trading as of the time that the Fund’s NAV is calculated. Since shares of the Fund did not trade in the secondary market until after its inception, for the period from inception to the first day of secondary market trading in shares of the Fund, the NAV of the Fund is used as a proxy for the secondary market trading price to calculate market returns. NAV and market returns assume that all distributions have been reinvested in the Fund at NAV and Market Price, respectively.
An index is a statistical composite that tracks a specified financial market or sector. Unlike the Fund, the index does not actually hold a portfolio of securities and therefore does not incur the expenses incurred by the Fund. These expenses negatively impact the performance of the Fund. Also, market returns do not include brokerage commissions that may be payable on secondary market transactions. If brokerage commissions were included, market returns would be lower. The total returns presented reflect the reinvestment of dividends on securities in the index. The returns presented do not reflect the deduction of taxes that a shareholder would pay on Fund distributions or the redemption or sale of Fund shares. The investment return and principal value of shares of the Fund will vary with changes in market conditions. Shares of the Fund may be worth more or less than their original cost when they are redeemed or sold in the market. The Fund’s past performance is no guarantee of future performance.
Fund Performance Overview (Unaudited) (Continued)
First Trust Emerging Markets Local Currency Bond ETF (FEMB)
| Sector Allocation | % of
Long-Term
Investments |
| Sovereigns | 94.1% |
| Supranationals | 5.6 |
| Central Bank | 0.3 |
| Total | 100.0% |
| Credit Quality(1) | % of Total
Investments
(including cash) |
| AAA | 5.4% |
| AA | 3.7 |
| AA- | 9.2 |
| A | 9.4 |
| A- | 14.2 |
| BBB | 16.6 |
| BBB- | 21.6 |
| BB+ | 1.5 |
| BB | 14.5 |
| Cash | 3.9 |
| Total | 100.0% |
| Top Ten Holdings | % of Total
Investments |
| Brazil Notas do Tesouro Nacional, Series F, 10.00%, 1/1/27 | 6.5% |
| Brazil Notas do Tesouro Nacional, Series F, 10.00%, 1/1/25 | 5.9 |
| Hungary Government Bond, 3.00%, 10/27/27 | 5.4 |
| Republic of South Africa Government Bond, 10.50%, 12/21/26 | 5.4 |
| Israel Government Bond - Fixed, 6.25%, 10/30/26 | 5.1 |
| Colombian TES, 7.00%, 5/4/22 | 4.2 |
| Chile Government International Bond, 5.50%, 8/5/20 | 4.1 |
| International Finance Corp., 6.30%, 11/25/24 | 4.0 |
| Republic of South Africa Government Bond, 6.25%, 3/31/36 | 3.3 |
| Romania Government Bond, 5.85%, 4/26/23 | 3.0 |
| Total | 46.9% |
| (1) | The credit quality and ratings information presented above reflect the ratings assigned by one or more nationally recognized statistical rating organizations (NRSROs), including Standard & Poor’s Ratings Group, a division of the McGraw Hill Companies, Inc., Moody’s Investors Service, Inc., Fitch Ratings or a comparably rated NRSRO. For situations in which a security is rated by more than one NRSRO and the ratings are not equivalent, the highest rating is used. Sub-investment grade ratings are those rated BB+/Ba1 or lower. Investment grade ratings are those rated BBB-/Baa3 or higher. The credit ratings shown relate to the creditworthiness of the issuers of the underlying securities in the Fund, and not to the Fund or its shares. Credit ratings are subject to change. |
Fund Performance Overview (Unaudited) (Continued)
First Trust Emerging Markets Local Currency Bond ETF (FEMB)
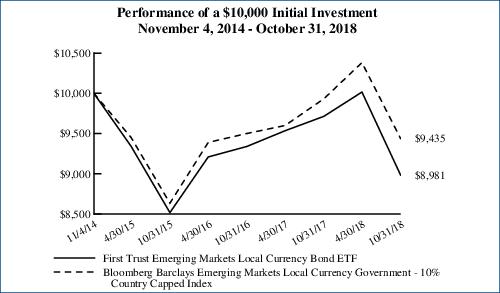
Performance figures assume reinvestment of all distributions and do not reflect the deduction of taxes that a shareholder would pay on Fund distributions or the redemption or sale of Fund shares. An index is a statistical composite that tracks a specified financial market or sector. Unlike the Fund, the index does not actually hold a portfolio of securities and therefore does not incur the expenses incurred by the Fund. These expenses negatively impact the performance of the Fund. The Fund’s past performance does not predict future performance.
Frequency Distribution of Discounts and Premiums
Bid/Ask Midpoint vs. NAV through October 31, 2018
The following Frequency Distribution of Discounts and Premiums charts are provided to show the frequency at which the bid/ask midpoint price for the Fund was at a discount or premium to the daily NAV. The following tables are for comparative purposes only and represent the period November 5, 2014 (commencement of trading) through October 31, 2018. Shareholders may pay more than NAV when they buy Fund shares and receive less than NAV when they sell those shares because shares are bought and sold at current market price. Data presented represents past performance and cannot be used to predict future results.
| Number of Days Bid/Ask Midpoint At/Above NAV |
| For the Period | 0.00%–0.49% | 0.50%–0.99% | 1.00%–1.99% | >=2.00% |
| 11/5/14 - 10/31/15 | 116 | 110 | 7 | 1 |
| 11/1/15 - 10/31/16 | 80 | 64 | 38 | 3 |
| 11/1/16 - 10/31/17 | 104 | 89 | 23 | 2 |
| 11/1/17 - 10/31/18 | 88 | 5 | 0 | 0 |
| Number of Days Bid/Ask Midpoint Below NAV |
| For the Period | 0.00%–0.49% | 0.50%–0.99% | 1.00%–1.99% | >=2.00% |
| 11/5/14 - 10/31/15 | 15 | 0 | 0 | 1 |
| 11/1/15 - 10/31/16 | 60 | 7 | 0 | 0 |
| 11/1/16 - 10/31/17 | 27 | 7 | 0 | 0 |
| 11/1/17 - 10/31/18 | 140 | 19 | 0 | 0 |
Portfolio Commentary
First Trust Emerging Markets Local Currency Bond ETF (FEMB)
Annual Report
October 31, 2018 (Unaudited)
Advisor
First Trust Advisors L.P. (“First Trust” or the “Advisor”) serves as the investment advisor to the First Trust Emerging Markets Local Currency Bond ETF (the “Fund”). First Trust is responsible for the ongoing monitoring of the Fund’s investment portfolio, managing the Fund’s business affairs and providing certain administrative services necessary for the management of the Fund.
Investment Sub-Advisor
First Trust Global Portfolios Ltd. (“FTGP”), an affiliate of First Trust, serves as investment sub-advisor to the Fund and is headed by Derek Fulton, Director, Chief Executive Officer and Chief Investment Officer of FTGP. Established in December 2011, FTGP is an SEC-registered investment advisor based in London. FTGP was established as a United Kingdom-based distributor, advisor and affiliate of First Trust and First Trust Portfolios L.P. and advises on global fixed income and currency portfolios. The global fixed income team at FTGP has experience in managing developing and emerging market fixed income portfolios for high profile European institutions.
Portfolio Management Team
The following portfolio managers are primarily responsible for the day-to-day management of the Fund. Each portfolio manager has managed the Fund since 2014.
Derek Fulton, Director, Chief Executive Officer and Chief Investment Officer, FTGP
Leonardo Da Costa, Director, FTGP
Commentary
Market Recap
The 12-month period ended October 31, 2018 began with heightened optimism for emerging market assets which started to wane as we approached February of 2018. The economic data releases followed a similar pattern as the stronger growth rates that we saw towards the end of 2017 turned softer with the weakening sentiment. This latter period included a number of crisis-like events for a few emerging market countries like Turkey and Argentina. However, we will caution investors who are tempted to extrapolate what has happened in those countries to broader emerging markets.
The Bloomberg Barclays Emerging Markets Local Currency Government-10% Country Capped Index (“Index”) returned -5.00% over the annual period due to rising yields and weaker emerging market currencies. The yield on the Index rose 77 basis points (“bps”) to 6.11% as 5-year maturity U.S. Treasury bonds rose 95 bps. However, the relatively high yields earned on emerging market local currency debt helped insulate the asset class to this yield widening. The currency hedged version of the Bloomberg Barclays Index returned -0.34% over the period highlighting that the volatility primarily came from the weaker emerging market currencies versus the U.S. dollar. The U.S. Dollar strength was broad based as the U.S. Dollar Index rose 2.72% and the U.S. Dollar rose 2.87% versus the Euro over the period.
This broad dollar strength had the greatest impact on emerging market asset returns with a number of emerging market (“EM”) currencies weakening versus the U.S. Dollar over the period. This included the very sharp depreciation we saw in the Argentine Peso (-50.84%) and Turkish Lira (-32.09%). The crisis in these two names drove the negative sentiment against emerging market assets however the stress they were experiencing was very atypical of the broader universe. Most other emerging market central banks run prudent and sensible monetary policies, in our opinion, and we don’t view these isolated events as being systematic for the asset class. Excluding those two currencies, the spread of returns from EM currencies was significantly less volatile with differentiation between top and bottom performers.
Performance Analysis
The Fund returned -7.55% on a net asset value (“NAV”) basis for the 12 months ending October 2018, and the market price return was -8.07% over the same period. The Fund’s return was lower than the Index’s return of -5.00% for the same period. The Fund’s most recent distribution, as of October 31, 2018, was $0.1984 per share and the 12-month distribution rate was 6.87% as of October 31, 2018. The distribution in October 2017 was $0.21 per share. The distributions remained relatively similar over the period as the higher yields on offer offset any loss in the capital base.
Over the period, the Fund benefitted from it exposures to Brazil as the country emerged from its election cycle and the relatively market friendly candidate, Jair Bolsonaro, was elected and is expected to tackle some of Brazil’s largest challenges starting with pension reform. The allocations to higher quality Asian credits like Malaysia and Thailand also added to returns.
Portfolio Commentary (Continued)
First Trust Emerging Markets Local Currency Bond ETF (FEMB)
Annual Report
October 31, 2018 (Unaudited)
Deteriorating EM currencies precipitated the weak returns over the period, and while the Fund navigated clear of the crisis in Argentina, with no exposure over the period, the weakness in Turkey did negatively impact the Fund. However, this exposure was significantly reduced by the end of the period. Elsewhere, despite the renegotiation of the North American Free Trade Agreement, and improved relations between Mexico and the United States, Mexican assets were softer as the Mexican Peso depreciated 5.86% versus the U.S. Dollar over the period. Weakness in the Central and Eastern European countries, (Czech Republic, Poland, Hungary and Romania) also negatively impacted performance with the currencies of these nations following the Euro lower versus the U.S. Dollar.
The active management of the underlying EM currency exposures remains a focus for the Fund, particularly as the volatility of EM currency returns are a large driver of the asset class volatility. At the end of the period, the Fund had currency hedges on a number of currencies. We continue to believe that the active management of the Fund’s currency exposures will lead to lower overall volatility and superior risk adjusted returns going forward.
Fund flows were positive over the period as the Fund assets increased from circa $49.8 million to circa $55.9 million. The attractive yields on offer and relatively cheap valuations allowed the asset class to stand out against traditional fixed income asset classes.
Market and Fund Outlook
Our positive outlook for the asset class is underpinned by the longer-term drivers that are improving fundamentals across EM economies. Supportive demographic profiles, relatively low debt levels and competitive currencies will be a persistent tailwind, in our view. We also anticipate stronger productivity growth rates on average in EM countries as they are starting from a lower base when compared to developed market economies, but also as new technologies are assimilated into their economies.
We believe current EM economic fundamentals are robust although growth expectations have dipped from earlier in the year. The Markit Emerging Markets Manufacturing Purchasing Managers Index (“PMI”) was 50.5 at the end of October which is still in expansionary territory but lower than the 52.2 reading we saw at the beginning of the year. In addition, the latest International Monetary Fund’s World Economic Outlook projects healthy economic growth estimating global growth of 3.73% in 2018 with EM and Developing Economy growth being above that at 4.68%.
The JP Morgan GBI-EM Global Diversified Index, an index with wide coverage of the EM local treasury market, currently has a spread of 367 bps over similar duration 5-year U.S. Treasuries. This spread contracted over the period from 386 bps largely driven by higher 5-year U.S. Treasury yields. Although this spread is lower than its long-term average, it still presents good value in our opinion as it is wider than the last time U.S. federal funds rates were this high and is meaningfully wider than the tights of 175 bps seen in February 2006. EM currencies are now also significantly undervalued versus the U.S. dollar following the dollar strength year-to-date, based on our purchasing power parity valuation measures.
We believe these cheaper valuations on offer provide an attractive entry point into the asset class for investors with a positive long-term view on emerging markets. We continue to expect stronger growth rates, improving productivity and lower debt levels as compared to advanced economies will benefit EM currencies, in our view. We believe an active approach based on a robust process of selecting the most attractive yields and currencies with-in the asset class can lead to excess returns with lower volatility over time. The pickup in yield, exposure to global assets and likely diversification benefits against traditional U.S. fixed income alternatives potentially make the Fund an attractive addition for investors’ portfolios.
First Trust Emerging Markets Local Currency Bond ETF (FEMB)
Understanding Your Fund Expenses
October 31, 2018 (Unaudited)
As a shareholder of the First Trust Emerging Markets Local Currency Bond ETF (the “Fund”), you incur two types of costs: (1) transaction costs; and (2) ongoing costs, including management fees, distribution and/or service (12b-1) fees, if any, and other Fund expenses. This Example is intended to help you understand your ongoing costs of investing in the Fund and to compare these costs with the ongoing costs of investing in other funds.
The Example is based on an investment of $1,000 invested at the beginning of the period and held through the six-month period ended October 31, 2018.
Actual Expenses
The first line in the following table provides information about actual account values and actual expenses. You may use the information in this line, together with the amount you invested, to estimate the expenses that you paid over the period. Simply divide your account value by $1,000 (for example, an $8,600 account value divided by $1,000 = 8.6), then multiply the result by the number in the first line under the heading entitled “Expenses Paid During the Six-Month Period” to estimate the expenses you paid on your account during this six-month period.
Hypothetical Example for Comparison Purposes
The second line in the following table provides information about hypothetical account values and hypothetical expenses based on the Fund’s actual expense ratio and an assumed rate of return of 5% per year before expenses, which is not the Fund’s actual return. The hypothetical account values and expenses may not be used to estimate the actual ending account balance or expenses you paid for the period. You may use this information to compare the ongoing costs of investing in the Fund and other funds. To do so, compare this 5% hypothetical example with the 5% hypothetical examples that appear in the shareholder reports of the other funds.
Please note that the expenses shown in the table are meant to highlight your ongoing costs only and do not reflect any transactional costs such as brokerage commissions. Therefore, the second line in the table is useful in comparing ongoing costs only, and will not help you determine the relative total costs of owning different funds. In addition, if these transactional costs were included, your costs would have been higher.
| | Beginning
Account Value
May 1, 2018 | Ending
Account Value
October 31, 2018 | Annualized
Expense Ratio
Based on the
Six-Month
Period | Expenses Paid
During the
Six-Month
Period (a) |
| First Trust Emerging Markets Local Currency Bond ETF (FEMB) |
| Actual | $1,000.00 | $896.60 | 0.85% | $4.06 |
| Hypothetical (5% return before expenses) | $1,000.00 | $1,020.92 | 0.85% | $4.33 |
| (a) | Expenses are equal to the annualized expense ratios as indicated in the table multiplied by the average account value over the period (May 1, 2018 through October 31, 2018), multiplied by 184/365 (to reflect the six-month period). |
First Trust Emerging Markets Local Currency Bond ETF (FEMB)
Portfolio of Investments
October 31, 2018
Principal
Value
(Local
Currency) | | Description | | Stated
Coupon | | Stated
Maturity | | Value
(US Dollars) |
| FOREIGN SOVEREIGN BONDS AND NOTES – 88.9% |
| | | Brazil – 14.2% | | | | | | |
| 5,100,000 | | Brazil Notas do Tesouro Nacional, Series F (BRL)
| | 10.00% | | 01/01/21 | | $1,418,502 |
| 11,350,000 | | Brazil Notas do Tesouro Nacional, Series F (BRL)
| | 10.00% | | 01/01/25 | | 3,101,963 |
| 12,750,000 | | Brazil Notas do Tesouro Nacional, Series F (BRL)
| | 10.00% | | 01/01/27 | | 3,433,535 |
| | | | | 7,954,000 |
| | | Chile – 4.2% | | | | | | |
| 120,000,000 | | Bonos del Banco Central de Chile en Pesos (CLP)
| | 6.00% | | 02/01/21 | | 179,921 |
| 1,451,000,000 | | Chile Government International Bond (CLP)
| | 5.50% | | 08/05/20 | | 2,149,904 |
| | | | | 2,329,825 |
| | | Colombia – 8.5% | | | | | | |
| 6,851,000,000 | | Colombian TES (COP)
| | 7.00% | | 05/04/22 | | 2,209,825 |
| 4,850,000,000 | | Colombian TES (COP)
| | 7.50% | | 08/26/26 | | 1,560,363 |
| 3,050,000,000 | | Colombian TES (COP)
| | 7.75% | | 09/18/30 | | 980,492 |
| | | | | 4,750,680 |
| | | Czech Republic – 3.6% | | | | | | |
| 19,120,000 | | Czech Republic Government Bond (CZK)
| | 1.50% | | 10/29/19 | | 837,314 |
| 26,480,000 | | Czech Republic Government Bond (CZK)
| | 2.40% | | 09/17/25 | | 1,184,233 |
| | | | | 2,021,547 |
| | | Hungary – 7.9% | | | | | | |
| 45,000,000 | | Hungary Government Bond (HUF)
| | 6.50% | | 06/24/19 | | 163,343 |
| 348,170,000 | | Hungary Government Bond (HUF)
| | 5.50% | | 06/24/25 | | 1,387,818 |
| 851,400,000 | | Hungary Government Bond (HUF)
| | 3.00% | | 10/27/27 | | 2,852,103 |
| | | | | 4,403,264 |
| | | Indonesia – 4.8% | | | | | | |
| 11,626,000,000 | | Indonesia Treasury Bond (IDR)
| | 8.38% | | 03/15/24 | | 759,007 |
| 12,626,000,000 | | Indonesia Treasury Bond (IDR)
| | 8.38% | | 09/15/26 | | 822,421 |
| 17,310,000,000 | | Indonesia Treasury Bond (IDR)
| | 8.38% | | 03/15/34 | | 1,091,946 |
| | | | | 2,673,374 |
| | | Israel – 4.8% | | | | | | |
| 7,690,000 | | Israel Government Bond - Fixed (ILS)
| | 6.25% | | 10/30/26 | | 2,709,439 |
| | | Malaysia – 4.6% | | | | | | |
| 5,520,000 | | Malaysia Government Bond (MYR)
| | 4.16% | | 07/15/21 | | 1,336,251 |
| 1,000,000 | | Malaysia Government Bond (MYR)
| | 4.05% | | 09/30/21 | | 241,557 |
| 4,180,000 | | Malaysia Government Bond (MYR)
| | 4.18% | | 07/15/24 | | 1,008,589 |
| | | | | 2,586,397 |
| | | Mexico – 5.7% | | | | | | |
| 31,240,000 | | Mexican Bonos (MXN)
| | 5.00% | | 12/11/19 | | 1,481,333 |
| 24,210,000 | | Mexican Bonos (MXN)
| | 10.00% | | 12/05/24 | | 1,263,974 |
| 9,290,000 | | Mexican Bonos (MXN)
| | 7.75% | | 05/29/31 | | 417,329 |
| | | | | 3,162,636 |
| | | Peru – 4.3% | | | | | | |
| 4,300,000 | | Peru Government Bond (PEN)
| | 8.20% | | 08/12/26 | | 1,486,749 |
| 2,900,000 | | Peru Government Bond (PEN)
| | 6.95% | | 08/12/31 | | 920,177 |
| | | | | 2,406,926 |
| | | Philippines – 3.0% | | | | | | |
| 82,000,000 | | Philippine Government International Bond (PHP)
| | 4.95% | | 01/15/21 | | 1,515,053 |
Page 8
See Notes to Financial Statements
First Trust Emerging Markets Local Currency Bond ETF (FEMB)
Portfolio of Investments (Continued)
October 31, 2018
Principal
Value
(Local
Currency) | | Description | | Stated
Coupon | | Stated
Maturity | | Value
(US Dollars) |
| FOREIGN SOVEREIGN BONDS AND NOTES (Continued) |
| | | Philippines (Continued) | | | | | | |
| 10,000,000 | | Philippine Government International Bond (PHP)
| | 3.90% | | 11/26/22 | | $174,503 |
| | | | | 1,689,556 |
| | | Poland – 4.6% | | | | | | |
| 600,000 | | Republic of Poland Government Bond (PLN)
| | 5.50% | | 10/25/19 | | 162,887 |
| 2,975,000 | | Republic of Poland Government Bond (PLN)
| | 4.00% | | 10/25/23 | | 830,944 |
| 4,935,000 | | Republic of Poland Government Bond (PLN)
| | 5.75% | | 04/25/29 | | 1,577,170 |
| | | | | 2,571,001 |
| | | Romania – 4.7% | | | | | | |
| 6,210,000 | | Romania Government Bond (RON)
| | 5.85% | | 04/26/23 | | 1,582,445 |
| 4,090,000 | | Romania Government Bond (RON)
| | 5.80% | | 07/26/27 | | 1,055,338 |
| | | | | 2,637,783 |
| | | South Africa – 8.6% | | | | | | |
| 4,000,000 | | Republic of South Africa Government Bond (ZAR)
| | 6.75% | | 03/31/21 | | 265,108 |
| 39,435,000 | | Republic of South Africa Government Bond (ZAR)
| | 10.50% | | 12/21/26 | | 2,837,235 |
| 36,930,000 | | Republic of South Africa Government Bond (ZAR)
| | 6.25% | | 03/31/36 | | 1,727,858 |
| | | | | 4,830,201 |
| | | Thailand – 4.0% | | | | | | |
| 42,950,000 | | Thailand Government Bond (THB)
| | 3.63% | | 06/16/23 | | 1,366,389 |
| 27,500,000 | | Thailand Government Bond (THB)
| | 3.65% | | 06/20/31 | | 875,201 |
| | | | | 2,241,590 |
| | | Turkey – 1.4% | | | | | | |
| 4,950,000 | | Turkey Government Bond (TRY)
| | 10.50% | | 01/15/20 | | 787,717 |
| | | Total Foreign Sovereign Bonds and Notes
| | 49,755,936 |
| | | (Cost $54,537,893) | | | | | | |
| FOREIGN CORPORATE BONDS AND NOTES – 5.3% |
| | | Supranationals – 5.3% | | | | | | |
| 4,730,000 | | European Investment Bank (ZAR)
| | 6.00% | | 10/21/19 | | 315,695 |
| 37,800,000 | | International Finance Corp. (INR)
| | 7.80% | | 06/03/19 | | 513,440 |
| 167,000,000 | | International Finance Corp. (INR)
| | 6.30% | | 11/25/24 | | 2,127,785 |
| | | Total Foreign Corporate Bonds and Notes
| | 2,956,920 |
| | | (Cost $3,522,451) | | | | | | |
| | Total Investments – 94.2%
| | 52,712,856 |
| | (Cost $58,060,344) (a) | | |
| | Net Other Assets and Liabilities – 5.8%
| | 3,263,617 |
| | Net Assets – 100.0%
| | $55,976,473 |
See Notes to Financial Statements
Page 9
First Trust Emerging Markets Local Currency Bond ETF (FEMB)
Portfolio of Investments (Continued)
October 31, 2018
| Forward Foreign Currency Contracts |
Settlement
Date | | Counterparty | | Amount
Purchased | | Amount
Sold | | Purchase
Value as of
10/31/2018 | | Sale
Value as of
10/31/2018 | | Unrealized
Appreciation/
(Depreciation) |
| 11/29/18 | | BBH | | MXN | 34,800,000 | | USD | 1,782,376 | | $ 1,705,454 | | $ 1,782,376 | | $ (76,922) |
| 11/29/18 | | BNS | | RUB | 175,000,000 | | USD | 2,667,073 | | 2,647,282 | | 2,667,073 | | (19,791) |
| 11/29/18 | | BNS | | USD | 2,421,861 | | BRL | 9,000,000 | | 2,421,861 | | 2,411,792 | | 10,069 |
| 11/29/18 | | BNS | | USD | 495,266 | | CLP | 340,000,000 | | 495,266 | | 488,658 | | 6,608 |
| 11/29/18 | | BNS | | USD | 2,025,398 | | COP | 6,300,000,000 | | 2,025,398 | | 1,954,304 | | 71,094 |
| 11/29/18 | | BBH | | USD | 1,137,753 | | CZK | 25,600,000 | | 1,137,753 | | 1,118,598 | | 19,155 |
| 11/29/18 | | BBH | | USD | 2,240,561 | | HUF | 630,000,000 | | 2,240,561 | | 2,201,578 | | 38,983 |
| 11/29/18 | | SG | | USD | 1,796,975 | | IDR | 27,500,000,000 | | 1,796,975 | | 1,802,696 | | (5,721) |
| 11/29/18 | | BBH | | USD | 2,213,704 | | ILS | 8,100,000 | | 2,213,704 | | 2,182,329 | | 31,375 |
| 11/29/18 | | SG | | USD | 499,333 | | INR | 37,000,000 | | 499,333 | | 498,687 | | 646 |
| 11/29/18 | | BBH | | USD | 2,276,918 | | PLN | 8,520,000 | | 2,276,918 | | 2,221,622 | | 55,296 |
| 11/29/18 | | BBH | | USD | 1,128,847 | | RON | 4,600,000 | | 1,128,847 | | 1,116,285 | | 12,562 |
| 11/29/18 | | BBH | | USD | 517,693 | | THB | 17,000,000 | | 517,693 | | 513,145 | | 4,548 |
| 11/29/18 | | BBH | | USD | 754,190 | | ZAR | 10,900,000 | | 754,190 | | 736,353 | | 17,837 |
Net Unrealized Appreciation (Depreciation)
| | $165,739 |
| Counterparty Abbreviations |
| BBH | Brown Brothers Harriman and Co. |
| BNS | Bank of Nova Scotia |
| SG | Societe Generale |
|
| (a) | Aggregate cost for federal income tax purposes was $59,097,240. As of October 31, 2018, the aggregate gross unrealized appreciation for all investments in which there was an excess of value over tax cost was $128,048 and the aggregate gross unrealized depreciation for all investments in which there was an excess of tax cost over value was $6,346,693. The net unrealized depreciation was $6,218,645. The amounts presented are inclusive of derivative contracts. |
Valuation Inputs
A summary of the inputs used to value the Fund’s investments as of October 31, 2018 is as follows (see Note 2A - Portfolio Valuation in the Notes to Financial Statements):
| ASSETS TABLE |
| | Total
Value at
10/31/2018 | Level 1
Quoted
Prices | Level 2
Significant
Observable
Inputs | Level 3
Significant
Unobservable
Inputs |
Foreign Sovereign Bonds and Notes*
| $ 49,755,936 | $ — | $ 49,755,936 | $ — |
Foreign Corporate Bonds and Notes*
| 2,956,920 | — | 2,956,920 | — |
Total Investments
| 52,712,856 | — | 52,712,856 | — |
Forward Foreign Currency Contracts**
| 268,173 | — | 268,173 | — |
Total
| $ 52,981,029 | $— | $ 52,981,029 | $— |
LIABILITIES TABLE |
| | Total
Value at
10/31/2018 | Level 1
Quoted
Prices | Level 2
Significant
Observable
Inputs | Level 3
Significant
Unobservable
Inputs |
Forward Foreign Currency Contracts**
| $ (102,434) | $ — | $ (102,434) | $ — |
| * | See Portfolio of Investments for country breakout. |
| ** | See the Schedule of Forward Foreign Currency Contracts for contract and currency detail. |
Page 10
See Notes to Financial Statements
First Trust Emerging Markets Local Currency Bond ETF (FEMB)
Portfolio of Investments (Continued)
October 31, 2018
Currency Exposure
Diversification | % of Total
Investments
(including cash)† |
| USD | 27.4% |
| BRL | 10.1 |
| MXN | 8.8 |
| ZAR | 8.0 |
| COP | 5.1 |
| RUB | 4.8 |
| MYR | 4.7 |
| PEN | 4.4 |
| HUF | 4.2 |
| INR | 3.9 |
| CLP | 3.3 |
| THB | 3.1 |
| PHP | 3.1 |
| RON | 2.8 |
| CZK | 1.7 |
| IDR | 1.6 |
| TRY | 1.5 |
| ILS | 0.9 |
| PLN | 0.6 |
| Total | 100.0% |
| † | The weightings include the impact of currency forwards. |
| Currency Abbreviations |
| BRL | Brazilian Real |
| CLP | Chilean Peso |
| COP | Colombian Peso |
| CZK | Czech Republic Koruna |
| HUF | Hungarian Forint |
| IDR | Indonesian Rupiah |
| ILS | Israeli Shekel |
| INR | Indian Rupee |
| MXN | Mexican Peso |
| MYR | Malaysian Ringgit |
| PEN | Peruvian Nuevo Sol |
| PHP | Philippine Peso |
| PLN | Polish Zloty |
| RON | Romanian New Leu |
| RUB | Russian Ruble |
| THB | Thai Baht |
| TRY | Turkish Lira |
| USD | United States Dollar |
| ZAR | South African Rand |
See Notes to Financial Statements
Page 11
First Trust Emerging Markets Local Currency Bond ETF (FEMB)
Statement of Assets and Liabilities
October 31, 2018
| ASSETS: | |
Investments, at value
(Cost $58,060,344)
| $ 52,712,856 |
Cash
| 2,014,293 |
Foreign currency (Cost $145,617)
| 146,630 |
Unrealized appreciation on forward foreign currency contracts
| 268,173 |
Interest receivable
| 978,928 |
Total Assets
| 56,120,880 |
| LIABILITIES: | |
Unrealized depreciation on forward foreign currency contracts
| 102,434 |
| Payables: | |
Investment advisory fees
| 41,473 |
Other liabilities
| 500 |
Total Liabilities
| 144,407 |
NET ASSETS
| $55,976,473 |
| NET ASSETS consist of: | |
Paid-in capital
| $ 63,349,263 |
Par value
| 15,500 |
Accumulated distributable earnings (loss)
| (7,388,290) |
NET ASSETS
| $55,976,473 |
NET ASSET VALUE, per share
| $36.11 |
Number of shares outstanding (unlimited number of shares authorized, par value $0.01 per share)
| 1,550,002 |
Page 12
See Notes to Financial Statements
First Trust Emerging Markets Local Currency Bond ETF (FEMB)
Statement of Operations
For the Year Ended October 31, 2018
| INVESTMENT INCOME: | |
Interest
| $ 3,003,119 |
Foreign withholding tax
| (70,174) |
Total investment income
| 2,932,945 |
| EXPENSES: | |
Investment advisory fees
| 454,775 |
Excise tax expense
| 1,462 |
Total expenses
| 456,237 |
NET INVESTMENT INCOME (LOSS)
| 2,476,708 |
| NET REALIZED AND UNREALIZED GAIN (LOSS): | |
| Net realized gain (loss) on: | |
Investments
| (2,568,509) |
Forward foreign currency contracts
| (267,003) |
Foreign currency transactions
| (261,085) |
Foreign capital gains tax
| (3,271) |
Net realized gain (loss)
| (3,099,868) |
| Net change in unrealized appreciation (depreciation) on: | |
Investments
| (4,877,443) |
Forward foreign currency contracts
| 246,882 |
Foreign currency translation
| 18,752 |
Deferred foreign capital gains tax
| 23,662 |
Net change in unrealized appreciation (depreciation)
| (4,588,147) |
NET REALIZED AND UNREALIZED GAIN (LOSS)
| (7,688,015) |
NET INCREASE (DECREASE) IN NET ASSETS RESULTING FROM OPERATIONS
| $(5,211,307) |
See Notes to Financial Statements
Page 13
First Trust Emerging Markets Local Currency Bond ETF (FEMB)
Statements of Changes in Net Assets
| | Year
Ended
10/31/2018 | | Year
Ended
10/31/2017 |
| OPERATIONS: | | | |
Net investment income (loss)
| $ 2,476,708 | | $ 1,679,615 |
Net realized gain (loss)
| (3,099,868) | | (53,823) |
Net change in unrealized appreciation (depreciation)
| (4,588,147) | | (188,218) |
Net increase (decrease) in net assets resulting from operations
| (5,211,307) | | 1,437,574 |
| DISTRIBUTIONS TO SHAREHOLDERS FROM: | | | |
Investment operations
| (1,016,310) | | |
Net investment income
| | | (2,013,285) |
Return of capital
| (2,159,690) | | — |
Total distributions to shareholders
| (3,176,000) | | (2,013,285) |
| SHAREHOLDER TRANSACTIONS: | | | |
Proceeds from shares sold
| 37,425,252 | | 35,625,661 |
Cost of shares redeemed
| (22,923,482) | | — |
Net increase (decrease) in net assets resulting from shareholder transactions
| 14,501,770 | | 35,625,661 |
Total increase (decrease) in net assets
| 6,114,463 | | 35,049,950 |
| NET ASSETS: | | | |
Beginning of period
| 49,862,010 | | 14,812,060 |
End of period
| $55,976,473 | | $49,862,010 |
Accumulated net investment income (loss) at end of period
| | | $(352,641) |
| CHANGES IN SHARES OUTSTANDING: | | | |
Shares outstanding, beginning of period
| 1,200,002 | | 350,002 |
Shares sold
| 900,000 | | 850,000 |
Shares redeemed
| (550,000) | | — |
Shares outstanding, end of period
| 1,550,002 | | 1,200,002 |
Page 14
See Notes to Financial Statements
First Trust Emerging Markets Local Currency Bond ETF (FEMB)
Financial Highlights
For a share outstanding throughout each period
| | Year Ended October 31, | | Period
Ended
10/31/2015 (a) |
| 2018 | | 2017 | | 2016 | |
Net asset value, beginning of period
| $ 41.55 | | $ 42.32 | | $ 40.77 | | $ 50.00 |
| Income from investment operations: | | | | | | | |
Net investment income (loss)
| 1.80 | | 2.30 | | 1.74 | | 1.94 |
Net realized and unrealized gain (loss)
| (4.76) | | (0.65) | | 2.09 | | (9.23) |
Total from investment operations
| (2.96) | | 1.65 | | 3.83 | | (7.29) |
| Distributions paid to shareholders from: | | | | | | | |
Net investment income
| (0.79) | | (2.42) | | (1.56) | | — |
Return of capital
| (1.69) | | — | | (0.72) | | (1.94) |
Total distributions
| (2.48) | | (2.42) | | (2.28) | | (1.94) |
Net asset value, end of period
| $36.11 | | $41.55 | | $42.32 | | $40.77 |
Total return (b)
| (7.55)% | | 4.00% | | 9.66% | | (14.83)% |
| Ratios to average net assets/supplemental data: | | | | | | | |
Net assets, end of period (in 000’s)
| $ 55,976 | | $ 49,862 | | $ 14,812 | | $ 4,077 |
Ratio of total expenses to average net assets
| 0.85% (c) | | 0.85% | | 0.85% | | 0.85% (d) |
Ratio of net investment income (loss) to average net assets
| 4.63% (c) | | 4.95% | | 4.70% | | 4.36% (d) |
Portfolio turnover rate (e)
| 61% | | 16% | | 23% | | 49% |
| (a) | Inception date is November 4, 2014, which is consistent with the commencement of investment operations and is the date the initial creation units were established. |
| (b) | Total return is calculated assuming an initial investment made at the net asset value at the beginning of the period, reinvestment of all distributions at net asset value during the period, and redemption at net asset value on the last day of the period. The returns presented do not reflect the deduction of taxes that a shareholder would pay on Fund distributions or the redemption or sale of Fund shares. Total return is calculated for the time period presented and is not annualized for periods of less than a year. |
| (c) | Includes excise tax. |
| (d) | Annualized. |
| (e) | Portfolio turnover is calculated for the time period presented and is not annualized for periods of less than a year and does not include securities received or delivered from processing creations or redemptions and in-kind transactions. |
See Notes to Financial Statements
Page 15
Notes to Financial Statements
First Trust Emerging Markets Local Currency Bond ETF (FEMB)
October 31, 2018
1. Organization
First Trust Exchange-Traded Fund III (the “Trust”) is an open-end management investment company organized as a Massachusetts business trust on January 9, 2008, and is registered with the Securities and Exchange Commission (the “SEC”) under the Investment Company Act of 1940, as amended (the “1940 Act”).
The Trust consists of thirteen funds that are currently offering shares. This report covers the First Trust Emerging Markets Local Currency Bond ETF (the “Fund”), a non-diversified series of the Trust, which trades under the ticker FEMB on The Nasdaq Stock Market LLC (“Nasdaq”). Unlike conventional mutual funds, the Fund issues and redeems shares on a continuous basis, at net asset value (“NAV”), only in large specified blocks consisting of 50,000 shares called a “Creation Unit.” Creation Units are issued and redeemed for cash and, in certain circumstances, in-kind for securities in which the Fund invests. Except when aggregated in Creation Units, the Fund’s shares are not redeemable securities.
The Fund is an actively managed exchange-traded fund. The investment objective of the Fund is to seek maximum total return and current income. Under normal market conditions, the Fund seeks to achieve its investment objective by investing at least 80% of its net assets (including investment borrowings) in bonds, notes and bills issued or guaranteed by entities incorporated or domiciled in emerging market countries that are denominated in the local currency of the issuer. There can be no assurance the Fund will achieve its investment objective. The Fund may not be appropriate for all investors.
2. Significant Accounting Policies
The Fund is considered an investment company and follows accounting and reporting guidance under Financial Accounting Standards Board (“FASB”) Accounting Standards Codification (“ASC”) Topic 946, “Financial Services-Investment Companies.” The following is a summary of significant accounting policies consistently followed by the Fund in the preparation of the financial statements. The preparation of the financial statements in accordance with accounting principles generally accepted in the United States of America (“U.S. GAAP”) requires management to make estimates and assumptions that affect the reported amounts and disclosures in the financial statements. Actual results could differ from those estimates.
A. Portfolio Valuation
The Fund’s NAV is determined daily as of the close of regular trading on the New York Stock Exchange (“NYSE”), normally 4:00 p.m. Eastern time, on each day the NYSE is open for trading. If the NYSE closes early on a valuation day, the NAV is determined as of that time. Domestic debt securities and foreign securities are priced using data reflecting the earlier closing of the principal markets for those securities. The Fund’s NAV is calculated by dividing the value of all assets of the Fund (including accrued interest and dividends), less all liabilities (including accrued expenses and dividends declared but unpaid), by the total number of shares outstanding.
The Fund’s investments are valued daily at market value or, in the absence of market value with respect to any portfolio securities, at fair value. Market value prices represent last sale or official closing prices from a national or foreign exchange (i.e., a regulated market) and are primarily obtained from third-party pricing services. Fair value prices represent any prices not considered market value prices and are either obtained from a third-party pricing service or are determined by the Pricing Committee of the Fund’s investment advisor, First Trust Advisors L.P. (“First Trust” or the “Advisor”), in accordance with valuation procedures adopted by the Trust’s Board of Trustees, and in accordance with provisions of the 1940 Act. Investments valued by the Advisor’s Pricing Committee, if any, are footnoted as such in the footnotes to the Portfolio of Investments. The Fund’s investments are valued as follows:
Corporate bonds, notes and other debt securities are fair valued on the basis of valuations provided by dealers who make markets in such securities or by a third-party pricing service approved by the Fund’s Board of Trustees, which may use the following valuation inputs when available:
| 1) | benchmark yields; |
| 2) | reported trades; |
| 3) | broker/dealer quotes; |
| 4) | issuer spreads; |
| 5) | benchmark securities; |
| 6) | bids and offers; and |
| 7) | reference data including market research publications. |
Fixed income and other debt securities having a remaining maturity of sixty days or less when purchased are fair valued at cost adjusted for amortization of premiums and accretion of discounts (amortized cost), provided the Advisor’s Pricing Committee has determined that the use of amortized cost is an appropriate reflection of fair value given market and issuer-specific
Notes to Financial Statements (Continued)
First Trust Emerging Markets Local Currency Bond ETF (FEMB)
October 31, 2018
conditions existing at the time of the determination. Factors that may be considered in determining the appropriateness of the use of amortized cost include, but are not limited to, the following:
| 1) | the credit conditions in the relevant market and changes thereto; |
| 2) | the liquidity conditions in the relevant market and changes thereto; |
| 3) | the interest rate conditions in the relevant market and changes thereto (such as significant changes in interest rates); |
| 4) | issuer-specific conditions (such as significant credit deterioration); and |
| 5) | any other market-based data the Advisor’s Pricing Committee considers relevant. In this regard, the Advisor’s Pricing Committee may use last-obtained market-based data to assist it when valuing portfolio securities using amortized cost. |
Forward foreign currency contracts are fair valued at the current day’s interpolated foreign exchange rate, as calculated using the current day’s spot rate, and the thirty, sixty, ninety, and one-hundred eighty day forward rates provided by a third-party pricing service.
Certain securities may not be able to be priced by pre-established pricing methods. Such securities may be valued by the Trust’s Board of Trustees or its delegate, the Advisor’s Pricing Committee, at fair value. These securities generally include, but are not limited to, restricted securities (securities which may not be publicly sold without registration under the Securities Act of 1933, as amended) for which a third-party pricing service is unable to provide a market price; securities whose trading has been formally suspended; a security whose market or fair value price is not available from a pre-established pricing source; a security with respect to which an event has occurred that is likely to materially affect the value of the security after the market has closed but before the calculation of the Fund’s NAV or make it difficult or impossible to obtain a reliable market quotation; and a security whose price, as provided by the third-party pricing service, does not reflect the security’s fair value. As a general principle, the current fair value of a security would appear to be the amount which the owner might reasonably expect to receive for the security upon its current sale. When fair value prices are used, generally they will differ from market quotations or official closing prices on the applicable exchanges. A variety of factors may be considered in determining the fair value of such securities, including, but not limited to, the following:
| 1) | the fundamental business data relating to the issuer, or economic data relating to the country of issue; |
| 2) | an evaluation of the forces which influence the market in which these securities are purchased and sold; |
| 3) | the type, size and cost of the security; |
| 4) | the financial statements of the issuer, or the financial condition of the country of issue; |
| 5) | the credit quality and cash flow of the issuer, or country of issue, based on the Advisor’s or external analysis; |
| 6) | the information as to any transactions in or offers for the security; |
| 7) | the price and extent of public trading in similar securities (or equity securities) of the issuer/borrower, or comparable companies; |
| 8) | the coupon payments; |
| 9) | the quality, value and salability of collateral, if any, securing the security; |
| 10) | the business prospects of the issuer, including any ability to obtain money or resources from a parent or affiliate and an assessment of the issuer’s management (for corporate debt only); |
| 11) | the economic, political and social prospects/developments of the country of issue and the assessment of the country’s governmental leaders/officials (for sovereign debt only); |
| 12) | the prospects for the issuer’s industry, and multiples (of earnings and/or cash flows) being paid for similar businesses in that industry (for corporate debt only); and |
| 13) | other relevant factors. |
The Fund is subject to fair value accounting standards that define fair value, establish the framework for measuring fair value and provide a three-level hierarchy for fair valuation based upon the inputs to the valuation as of the measurement date. The three levels of the fair value hierarchy are as follows:
| • | Level 1 – Level 1 inputs are quoted prices in active markets for identical investments. An active market is a market in which transactions for the investment occur with sufficient frequency and volume to provide pricing information on an ongoing basis. |
| • | Level 2 – Level 2 inputs are observable inputs, either directly or indirectly, and include the following: |
| o | Quoted prices for similar investments in active markets. |
| o | Quoted prices for identical or similar investments in markets that are non-active. A non-active market is a market where there are few transactions for the investment, the prices are not current, or price quotations vary substantially either over time or among market makers, or in which little information is released publicly. |
Notes to Financial Statements (Continued)
First Trust Emerging Markets Local Currency Bond ETF (FEMB)
October 31, 2018
| o | Inputs other than quoted prices that are observable for the investment (for example, interest rates and yield curves observable at commonly quoted intervals, volatilities, prepayment speeds, loss severities, credit risks, and default rates). |
| o | Inputs that are derived principally from or corroborated by observable market data by correlation or other means. |
| • | Level 3 – Level 3 inputs are unobservable inputs. Unobservable inputs may reflect the reporting entity’s own assumptions about the assumptions that market participants would use in pricing the investment. |
The inputs or methodologies used for valuing investments are not necessarily an indication of the risk associated with investing in those investments. A summary of the inputs used to value the Fund’s investments as of October 31, 2018, is included with the Fund’s Portfolio of Investments.
B. Securities Transactions and Investment Income
Securities transactions are recorded as of the trade date. Realized gains and losses from securities transactions are recorded on the identified cost basis. Dividend income is recorded on the ex-dividend date. Interest income, if any, is recorded on the accrual basis. Amortization of premiums and accretion of discounts are recorded using the effective interest method.
C. Forward Foreign Currency Contracts
The Fund is subject to foreign currency risk in the normal course of pursuing its investment objective. Forward foreign currency contracts are agreements between two parties (“Counterparties”) to exchange one currency for another at a future date and at a specified price. The Fund uses forward foreign currency contracts to facilitate transactions in foreign securities and to manage the Fund’s foreign currency exposure. These contracts are valued daily, and the Fund’s net equity therein, representing unrealized gain or loss on the contracts as measured by the difference between the forward foreign exchange rates at the dates of entry into the contracts and the forward rates at the reporting date, is included in “Unrealized appreciation on forward foreign currency contracts” and “Unrealized depreciation on forward foreign currency contracts” on the Statement of Assets and Liabilities. The change in unrealized appreciation (depreciation) is included in “Net change in unrealized appreciation (depreciation) on forward foreign currency contracts” on the Statement of Operations. When the forward contract is closed, a Fund records a realized gain or loss equal to the difference between the proceeds from (or the cost of) the closing transaction and the Fund’s basis in the contract. This realized gain or loss is included in “Net realized gain (loss) on forward foreign currency contracts” on the Statement of Operations. Risks arise from the possible inability of Counterparties to meet the terms of their contracts and from movement in currency, securities values and interest rates. Due to the risks, the Fund could incur losses in excess of the net unrealized value shown on the Forward Foreign Currency Contracts table in the Portfolio of Investments. In the event of default by the Counterparty, the Fund will provide notice to the Counterparty of the Fund’s intent to convert the currency held by the Fund into the currency that the Counterparty agreed to exchange with the Fund. If a Counterparty becomes bankrupt or otherwise fails to perform its obligations due to financial difficulties, the Fund may experience significant delays in obtaining any recovery in a bankruptcy or other reorganization proceeding. The Fund may obtain only limited recovery or may obtain no recovery in such circumstances.
D. Foreign Currency
The books and records of the Fund are maintained in U.S. dollars. Foreign currencies, investments and other assets and liabilities are translated into U.S. dollars at the exchange rates prevailing at the end of the period. Purchases and sales of investments and items of income and expense are translated on the respective dates of such transactions. Unrealized gains and losses on assets and liabilities, other than investments in securities, which result from changes in foreign currency exchange rates have been included in “Net change in unrealized appreciation (depreciation) on foreign currency translation” on the Statement of Operations. Unrealized gains and losses on investments in securities which result from changes in foreign exchange rates are included with fluctuations arising from changes in market price and are shown in “Net change in unrealized appreciation (depreciation) on investments” on the Statement of Operations. Net realized foreign currency gains and losses include the effect of changes in exchange rates between trade date and settlement date on investment security transactions, foreign currency transactions and interest and dividends received and are shown in “Net realized gain (loss) on foreign currency transactions” on the Statement of Operations. The portion of foreign currency gains and losses related to fluctuations in exchange rates between the initial purchase settlement date and subsequent sale trade date is included in “Net realized gain (loss) on investments” on the Statements of Operations.
E. Dividends and Distributions to Shareholders
Dividends from net investment income, if any, are declared and paid monthly by the Fund, or as the Board of Trustees may determine from time to time. Distributions of net realized capital gains earned by the Fund, if any, are distributed at least annually.
Distributions from income and capital gains are determined in accordance with federal income tax regulations, which may differ from U.S. GAAP. Certain capital accounts in the financial statements are periodically adjusted for permanent differences in order to reflect their tax character. These permanent differences are primarily due to the varying treatment of income and gain/loss on portfolio
Notes to Financial Statements (Continued)
First Trust Emerging Markets Local Currency Bond ETF (FEMB)
October 31, 2018
securities held by the Fund and have no impact on net assets or NAV per share. Temporary differences, which arise from recognizing certain items of income, expense and gain/loss in different periods for financial statement and tax purposes, will reverse at some time in the future.
The tax character of distributions paid by the Fund during the fiscal years ended October 31, 2018 and 2017, was as follows:
| Distributions paid from: | 2018 | 2017 |
Ordinary income
| $1,016,310 | $2,013,285 |
Capital gains
| — | — |
Return of capital
| 2,159,690 | — |
As of October 31, 2018, the components of distributable earnings on a tax basis were as follows:
Undistributed ordinary income
| $— |
Accumulated capital and other losses
| (1,155,653) |
Net unrealized appreciation (depreciation)
| (6,232,637) |
F. Income Taxes
The Fund intends to continue to qualify as a regulated investment company by complying with the requirements under Subchapter M of the Internal Revenue Code of 1986, as amended, which includes distributing substantially all of its net investment income and net realized gains to shareholders. Accordingly, no provision has been made for federal and state income taxes. However, due to the timing and amount of distributions, the Fund may be subject to an excise tax of 4% of the amount by which approximately 98% of the Fund’s taxable income exceeds the distributions from such taxable income for the calendar year.
The Fund is subject to accounting standards that establish a minimum threshold for recognizing, and a system for measuring, the benefits of a tax position taken or expected to be taken in a tax return. Taxable years ended 2015, 2016, 2017, and 2018 remain open to federal and state audit. As of October 31, 2018, management has evaluated the application of these standards to the Fund, and has determined that no provision for income tax is required in the Fund’s financial statements for uncertain tax positions.
The Fund intends to utilize provisions of the federal income tax laws, which allow it to carry a realized capital loss forward indefinitely following the year of the loss and offset such loss against any future realized capital gains. The Fund is subject to certain limitations under U.S. tax rules on the use of capital loss carryforwards and net unrealized built-in losses. These limitations apply when there has been a 50% change in ownership. At October 31, 2018, the Fund had non-expiring capital loss carryforwards for federal income tax purposes of $1,155,653.
Certain losses realized during the current fiscal year may be deferred and treated as occurring on the first day of the following fiscal year for federal income tax purposes. For the fiscal year ended October 31, 2018, the Fund did not incur any net ordinary losses.
In order to present paid-in capital and accumulated distributable earnings (loss) (which consists of accumulated net investment income (loss), accumulated net realized gain (loss) on investments and net unrealized appreciation (depreciation) on investments) on the Statement of Assets and Liabilities that more closely represent their tax character, certain adjustments have been made to paid-in capital, accumulated net investment income (loss) and accumulated net realized gain (loss) on investments. These adjustments are primarily due to the difference between book and tax treatments of income and gains on various investment securities held by the Fund and in-kind transactions. The results of operations and net assets were not affected by these adjustments. For the fiscal year ended October 31, 2018, the adjustments for the Fund were as follows:
Accumulated
Net Investment
Income (Loss) | | Accumulated
Net Realized
Gain (Loss)
on Investments | | Paid-in
Capital |
| $(2,107,462) | | $2,108,924 | | $(1,462) |
G. Expenses
Expenses, other than the investment advisory fee and other excluded expenses, are paid by the Advisor (See Note 3).
H. Offsetting on the Statement of Assets and Liabilities
Offsetting assets and liabilities requires entities to disclose both gross and net information about instruments and transactions eligible for offset on the Statement of Assets and Liabilities, and disclose instruments and transactions subject to master netting or similar
Notes to Financial Statements (Continued)
First Trust Emerging Markets Local Currency Bond ETF (FEMB)
October 31, 2018
agreements. These disclosure requirements are intended to help investors and other financial statement users better assess the effect or potential effect of offsetting arrangements on a fund’s financial position. The transactions subject to offsetting disclosures are derivative instruments, repurchase agreements and reverse repurchase agreements, and securities borrowing and securities lending transactions.
For financial reporting purposes, the Fund does not offset financial assets and financial liabilities that are subject to master netting arrangements (“MNAs”) or similar agreements on the Statement of Assets and Liabilities. MNAs provide the right, in the event of default (including bankruptcy and insolvency), for the non-defaulting counterparty to liquidate the collateral and calculate the net exposure to the defaulting party or request additional collateral.
At October 31, 2018, derivative assets and liabilities (by type) on a gross basis are as follows:
| | | | | | | | Gross Amounts not Offset
in the Statement of
Assets and Liabilities | | |
| | Gross
Amounts of
Recognized
Assets | | Gross Amounts
Offset in the
Statement of
Assets
and Liabilities | | Net Amounts of
Assets
Presented
in the Statement
of Assets and
Liabilities | | Financial
Instruments | | Collateral
Amounts
Received | | Net
Amount |
Forward Foreign
Currency Contracts* | $ 268,173 | | $ — | | $ 268,173 | | $ (97,359) | | $ — | | $ 170,814 |
| | | | | | | | Gross Amounts not Offset
in the Statement of
Assets and Liabilities | | |
| | Gross
Amounts of
Recognized
Liabilities | | Gross Amounts
Offset in the
Statement of
Assets
and Liabilities | | Net Amounts of
Liabilities
Presented
in the Statement
of Assets and
Liabilities | | Financial
Instruments | | Collateral
Amounts
Pledged | | Net
Amount |
| Forward Foreign Currency Contracts* | $ (102,434) | | $ — | | $ (102,434) | | $ 97,359 | | $ — | | $ (5,075) |
* The respective Counterparties for each contract are disclosed in the Forward Foreign Currency Contracts table in the Portfolio of Investments.
I. New Accounting Pronouncements
On March 30, 2017, the FASB issued Accounting Standards Update (“ASU”) 2017-08 “Premium Amortization on Purchased Callable Debt Securities,” which amends the amortization period for certain purchased callable debt securities held at a premium by shortening such period to the earliest call date. The new guidance requires an entity to amortize the premium on a callable debt security within its scope to the earliest call date, unless the guidance for considering estimated prepayments is applied. If the call option is not exercised at the earliest call date, the yield is reset to the effective yield using the payment terms of the security. If the security has more than one call date and the premium was amortized to a call price greater than the next call price, any excess of the amortized cost basis over the amount repayable at the next call date will be amortized to that date. If there are no other call dates, any excess of the amortized cost basis over the par amount will be amortized to maturity. Discounts on purchased callable debt securities will continue to be amortized to the security’s maturity date. The ASU 2017-08 is effective for public business entities for fiscal years, and interim periods within those fiscal years, beginning after December 15, 2018. Earlier application is permitted for all entities, including adoption in an interim period. If an entity early adopts the ASU in an interim period, any adjustments must be reflected as of the beginning of the fiscal year that includes that interim period. Management is still assessing the impact of the adoption of ASU 2017-08 on the financial statements but does not expect it to have a material impact.
On August 28, 2018, the FASB issued ASU 2018-13, “Disclosure Framework – Changes to the Disclosure Requirements for Fair Value Measurement,” which amends the fair value measurement disclosure requirements of ASC 820. The amendments of ASU 2018-13 include new, eliminated, and modified disclosure requirements of ASC 820. In addition, the amendments clarify that materiality is an appropriate consideration of entities when evaluating disclosure requirements. The ASU is effective for fiscal years beginning after
Notes to Financial Statements (Continued)
First Trust Emerging Markets Local Currency Bond ETF (FEMB)
October 31, 2018
December 15, 2019, including interim periods therein. Early adoption is permitted for any eliminated or modified disclosures upon issuance of this ASU. The Fund has early adopted ASU 2018-13 for these financial statements, which did not result in a material impact.
3. Investment Advisory Fee, Affiliated Transactions and Other Fee Arrangements
First Trust, the investment advisor to the Fund, is a limited partnership with one limited partner, Grace Partners of DuPage L.P., and one general partner, The Charger Corporation. The Charger Corporation is an Illinois corporation controlled by James A. Bowen, Chief Executive Officer of First Trust. First Trust is responsible for supervising the selection and ongoing monitoring of the securities in the Fund’s portfolio, managing the Fund’s business affairs and providing certain administrative services necessary for the management of the Fund.
The Trust, on behalf of the Fund, and First Trust have retained First Trust Global Portfolios Ltd. (“FTGP” or the “Sub-Advisor”), an affiliate of First Trust, to serve as investment sub-advisor. In this capacity, FTGP is responsible for the selection and ongoing monitoring of the securities in the Fund’s investment portfolio. First Trust is paid an annual unitary management fee of 0.85% of the Fund’s average daily net assets. FTGP receives a sub-advisory fee equal to 40% of any remaining monthly unitary fee paid to the Advisor after the Fund’s average expenses accrued during the most recent twelve months are subtracted from the unitary fee for that month. First Trust is responsible for the expenses of the Fund including the cost of transfer agency, custody, fund administration, legal, audit and other services, but excluding fee payments under the Investment Management Agreement, Rule 12b-1 distribution and service fees, if any, brokerage expenses, taxes, interest, acquired fund fees and expenses, and extraordinary expenses. First Trust also provides fund reporting services to the Fund for a flat annual fee in the amount of $9,250, which is covered under the annual unitary management fee.
The Trust has multiple service agreements with Brown Brothers Harriman & Co. (“BBH”). Under the service agreements, BBH performs custodial, fund accounting, certain administrative services, and transfer agency services for the Fund. As custodian, BBH is responsible for custody of the Fund’s assets. As fund accountant and administrator, BBH is responsible for maintaining the books and records of the Fund’s securities and cash. As transfer agent, BBH is responsible for maintaining shareholder records for the Fund.
Each Trustee who is not an officer or employee of First Trust, any sub-advisor or any of their affiliates (“Independent Trustees”) is paid a fixed annual retainer that is allocated equally among each fund in the First Trust Fund Complex. Each Independent Trustee is also paid an annual per fund fee that varies based on whether the fund is a closed-end or other actively managed fund, or is an index fund.
Additionally, the Lead Independent Trustee and the Chairmen of the Audit Committee, Nominating and Governance Committee and Valuation Committee are paid annual fees to serve in such capacities, with such compensation allocated pro rata among each fund in the First Trust Fund Complex based on net assets. Independent Trustees are reimbursed for travel and out-of-pocket expenses in connection with all meetings. The Lead Independent Trustee and Committee Chairmen rotate every three years. The officers and “Interested” Trustee receive no compensation from the Trust for acting in such capacities.
4. Purchases and Sales of Securities
For the fiscal year ended October 31, 2018, the cost of purchases and proceeds from sales of investments, excluding short term investments and in-kind transactions, were $44,510,376 and $31,800,935, respectively.
For the year ended October 31, 2018, the Fund had no in-kind transactions.
5. Derivative Transactions
The following table presents the type of derivatives held by the Fund at October 31, 2018, the primary underlying risk exposure and the location of these instruments as presented on the Statement of Assets and Liabilities.
| | | | | Asset Derivatives | | Liability Derivatives |
Derivative
Instrument | | Risk
Exposure | | Statement of Assets and
Liabilities Location | | Value | | Statement of Assets and
Liabilities Location | | Value |
Forward foreign
currency
contracts | | Currency Risk | | Unrealized appreciation
on forward foreign
currency contracts | | $ 268,173 | | Unrealized depreciation
on forward foreign
currency contracts | | $ 102,434 |
Notes to Financial Statements (Continued)
First Trust Emerging Markets Local Currency Bond ETF (FEMB)
October 31, 2018
The following table presents the amount of net realized gain (loss) and change in net unrealized appreciation (depreciation) recognized for the fiscal year ended October 31, 2018, on derivative instruments, as well as the primary underlying risk exposure associated with each instrument.
| Statement of Operations Location | |
| Currency Risk Exposure | |
| Net realized gain (loss) on forward foreign currency contracts | $(267,003) |
| Net change in unrealized appreciation (depreciation) on forward foreign currency contracts | 246,882 |
During the fiscal year ended October 31, 2018, the notional value of futures contracts opened and closed were $419,395,031 and $421,088,011, respectively.
6. Creations, Redemptions and Transaction Fees
Shares are created and redeemed by the Fund only in Creation Unit size aggregations of 50,000 shares in transactions with broker-dealers or large institutional investors that have entered into a participation agreement (an “Authorized Participant”). In order to purchase Creation Units of the Fund, an Authorized Participant must deposit (i) a designated portfolio of securities and other instruments determined by First Trust (the “Deposit Securities”) and generally make or receive a cash payment referred to as the “Cash Component,” which is an amount equal to the difference between the NAV of the Fund shares (per Creation Unit Aggregation) and the market value of the Deposit Securities, and/or (ii) cash in lieu of all or a portion of the Deposit Securities. If the Cash Component is a positive number (i.e., the NAV per Creation Unit Aggregation exceeds the Deposit Amount), the Authorized Participant will deliver the Cash Component. If the Cash Component is a negative number (i.e., the NAV per Creation Unit Aggregation is less than the Deposit Amount), the Authorized Participant will receive the Cash Component. Authorized Participants purchasing Creation Units must pay to BBH, as transfer agent, a creation transaction fee (the “Creation Transaction Fee”) regardless of the number of Creation Units purchased in the transaction. The Creation Transaction Fee may vary and is based on the composition of the securities included in the Fund’s portfolio and the countries in which the transactions are settled. The Creation Transaction Fee is currently $500. The price for each Creation Unit will equal the daily NAV per share times the number of shares in a Creation Unit plus the fees described above and, if applicable, any operational processing and brokerage costs, transfer fees or stamp taxes. When the Fund permits an Authorized Participant to substitute cash or a different security in lieu of depositing one or more of the requisite Deposit Securities, the Authorized Participant may also be assessed an amount to cover the cost of purchasing the Deposit Securities and/or disposing of the substituted securities, including operational processing and brokerage costs, transfer fees, stamp taxes, and part or all of the spread between the expected bid and offer side of the market related to such Deposit Securities and/or substitute securities.
Authorized Participants redeeming Creation Units must pay to BBH, as transfer agent, a redemption transaction fee (the “Redemption Transaction Fee”), regardless of the number of Creation Units redeemed in the transaction. The Redemption Transaction Fee may vary and is based on the composition of the securities included in the Fund’s portfolio and the countries in which the transactions are settled. The Redemption Transaction Fee is currently $500. The Fund reserves the right to effect redemptions in cash. An Authorized Participant may request cash redemption in lieu of securities; however, the Fund may, in its discretion, reject any such request.
7. Distribution Plan
The Board of Trustees adopted a Distribution and Service Plan pursuant to Rule 12b-1 under the 1940 Act. In accordance with the Rule 12b-1 plan, the Fund is authorized to pay an amount up to 0.25% of its average daily net assets each year to reimburse First Trust Portfolios L.P. (“FTP”), the distributor of the Fund, for amounts expended to finance activities primarily intended to result in the sale of Creation Units or to provide investor services. FTP may also use this amount to compensate securities dealers or other persons that are Authorized Participants for providing distribution assistance, including broker-dealer and shareholder support and educational and promotional services.
No 12b-1 fees are currently paid by the Fund, and pursuant to a contractual arrangement, no 12b-1 fees will be paid any time before February 28, 2020.
8. Line of Credit
The Trust, on behalf of the Fund, along with First Trust Series Fund and First Trust Exchange-Traded Fund IV have a $360 million Credit Agreement with The Bank of Nova Scotia (“Scotia”) as administrative agent for a group of lenders. Prior to August 28, 2018 and March 7, 2018, the commitment amount was $320 million and $220 million, respectively. Scotia charges a commitment fee of 0.25% of the daily amount of the excess of the commitment amount over the outstanding principal balance of the loans. First Trust allocates the commitment fee and agency fee amongst the funds that have access to the credit line. To the extent that the Fund accesses
Notes to Financial Statements (Continued)
First Trust Emerging Markets Local Currency Bond ETF (FEMB)
October 31, 2018
the credit line, there would also be an interest fee charged. The Fund did not have any borrowings outstanding during the fiscal year ended October 31, 2018.
9. Indemnification
The Trust, on behalf of the Fund, has a variety of indemnification obligations under contracts with its service providers. The Trust’s maximum exposure under these arrangements is unknown. However, the Trust has not had prior claims or losses pursuant to these contracts and expects the risk of loss to be remote.
10. Subsequent Events
Management has evaluated the impact of all subsequent events to the Fund through the date the financial statements were issued, and has determined that there was the following subsequent event:
On November 2, 2018, First Trust Short Duration Managed Municipal ETF and First Trust Ultra Short Duration Municipal ETF, each an additional series of the Trust, began trading under the ticker symbols FSMB and FUMB, respectively, on the NYSE Arca,Inc.
Report of Independent Registered Public Accounting Firm
To the Shareholders and the Board of Trustees of First Trust Exchange-Traded Fund III:
Opinion on the Financial Statements and Financial Highlights
We have audited the accompanying statement of assets and liabilities, including the portfolio of investments, of First Trust Emerging Markets Local Currency Bond ETF (the “Fund”), one of the funds constituting the First Trust Exchange-Traded Fund III, as of October 31, 2018, the related statement of operations for the year then ended, the statements of changes in net assets for each of the two years in the period then ended, the financial highlights for the years ended October 31, 2018, 2017, 2016, and for the period from November 4, 2014 (commencement of operations) through October 31, 2015, and the related notes. In our opinion, the financial statements and financial highlights present fairly, in all material respects, the financial position of the Fund as of October 31, 2018, and the results of its operations for the year then ended, the changes in its net assets for each of the two years in the period then ended, and the financial highlights for the years ended October 31, 2018, 2017, 2016, and for the period from November 4, 2014 (commencement of operations) through October 31, 2015, in conformity with accounting principles generally accepted in the United States of America.
Basis for Opinion
These financial statements and financial highlights are the responsibility of the Fund’s management. Our responsibility is to express an opinion on the Fund’s financial statements and financial highlights based on our audits. We are a public accounting firm registered with the Public Company Accounting Oversight Board (United States) (PCAOB) and are required to be independent with respect to the Fund in accordance with the U.S. federal securities laws and the applicable rules and regulations of the Securities and Exchange Commission and the PCAOB.
We conducted our audits in accordance with the standards of the PCAOB. Those standards require that we plan and perform the audit to obtain reasonable assurance about whether the financial statements and financial highlights are free of material misstatement, whether due to error or fraud. The Fund is not required to have, nor were we engaged to perform, an audit of its internal control over financial reporting. As part of our audits we are required to obtain an understanding of internal control over financial reporting but not for the purpose of expressing an opinion on the effectiveness of the Fund’s internal control over financial reporting. Accordingly, we express no such opinion.
Our audits included performing procedures to assess the risks of material misstatement of the financial statements and financial highlights, whether due to error or fraud, and performing procedures that respond to those risks. Such procedures included examining, on a test basis, evidence regarding the amounts and disclosures in the financial statements and financial highlights. Our audits also included evaluating the accounting principles used and significant estimates made by management, as well as evaluating the overall presentation of the financial statements and financial highlights. Our procedures included confirmation of securities owned as of October 31, 2018, by correspondence with the custodian, agent banks and brokers. We believe that our audits provide a reasonable basis for our opinion.
Chicago, Illinois
December 21, 2018
We have served as the auditor of one or more First Trust investment companies since 2001.
Additional Information
First Trust Emerging Markets Local Currency Bond ETF (FEMB)
October 31, 2018 (Unaudited)
Proxy Voting Policies and Procedures
A description of the policies and procedures that the Trust uses to determine how to vote proxies and information on how the Fund voted proxies relating to portfolio securities during the most recent 12-month period ended June 30 is available (1) without charge, upon request, by calling (800) 988-5891; (2) on the Fund’s website at www.ftportfolios.com; and (3) on the Securities and Exchange Commission’s (“SEC”) website at www.sec.gov.
Portfolio Holdings
The Trust files its complete schedule of the Fund’s portfolio holdings with the SEC for the first and third quarters of each fiscal year on Form N-Q. The Trust’s Form N-Qs are available (1) by calling (800) 988-5891; (2) on the Fund’s website at www.ftportfolios.com; and (3) on the SEC’s website at www.sec.gov.
Beginning in April 2019, the Trust will cease to disclose the Fund’s holdings on Form N-Q and will file Form N-PORT with the SEC on a monthly basis. Part F of Form N-PORT, which contains the complete schedule of the Fund’s portfolio holdings, will be made available in the same manner as Form N-Q discussed above.
Risk Considerations
Risks are inherent in all investing. Certain general risks that may be applicable to some or all of the Funds are identified below, but not all of the material risks relevant to each Fund are included in this report. The material risks of investing in each Fund are spelled out in its prospectus, statement of additional information and other regulatory filings. Before investing, you should consider each Fund’s investment objective, risks, charges and expenses, and read each Fund’s prospectus and statement of additional information carefully. You can download each Fund’s prospectus at www.ftportfolios.com or contact First Trust Portfolios L.P. at (800) 621-1675 to request a prospectus, which contains this and other information about each Fund.
Concentration Risk. To the extent that a Fund is able to invest a large percentage of its assets in a single asset class or the securities of issuers within the same country, state, region, industry or sector, an adverse economic, business or political development may affect the value of the Fund’s investments more than if the Fund were more broadly diversified. A Fund that tracks an index will be concentrated to the extent the Fund’s corresponding index is concentrated. A concentration makes a Fund more susceptible to any single occurrence and may subject the Fund to greater market risk than a fund that is not concentrated.
Credit Risk. Credit risk is the risk that an issuer of a security will be unable or unwilling to make dividend, interest and/or principal payments when due and the related risk that the value of a security may decline because of concerns about the issuer’s ability to make such payments.
Cyber Security Risk. The Funds are susceptible to potential operational risks through breaches in cyber security. A breach in cyber security refers to both intentional and unintentional events that may cause a Fund to lose proprietary information, suffer data corruption or lose operational capacity. Such events could cause a Fund to incur regulatory penalties, reputational damage, additional compliance costs associated with corrective measures and/or financial loss. In addition, cyber security breaches of a Fund’s third-party service providers, such as its administrator, transfer agent, custodian, or sub-advisor, as applicable, or issuers in which the Fund invests, can also subject a Fund to many of the same risks associated with direct cyber security breaches.
Derivatives Risk. To the extent a Fund uses derivative instruments such as futures contracts, options contracts and swaps, the Fund may experience losses because of adverse movements in the price or value of the underlying asset, index or rate, which may be magnified by certain features of the derivative. These risks are heightened when a Fund’s portfolio managers use derivatives to enhance the Fund’s return or as a substitute for a position or security, rather than solely to hedge (or offset) the risk of a position or security held by the Fund.
Equity Securities Risk. To the extent a Fund invests in equity securities, the value of the Fund’s shares will fluctuate with changes in the value of the equity securities. Equity securities prices fluctuate for several reasons, including changes in investors’ perceptions of the financial condition of an issuer or the general condition of the relevant stock market, such as market volatility, or when political or economic events affecting the issuers occur. In addition, common stock prices may be particularly sensitive to rising interest rates, as the cost of capital rises and borrowing costs increase. Equity securities may decline significantly in price over short or extended periods of time, and such declines may occur in the equity market as a whole, or they may occur in only a particular country, company, industry or sector of the market.
ETF Risk. The shares of an ETF trade like common stock and represent an interest in a portfolio of securities. The risks of owning an ETF generally reflect the risks of owning the underlying securities, although lack of liquidity in an ETF could result in it being more volatile and ETFs have management fees that increase their costs. Shares of an ETF trade on an exchange at market prices rather than net asset value, which may cause the shares to trade at a price greater than net asset value (premium) or less than net asset value
Additional Information (Continued)
First Trust Emerging Markets Local Currency Bond ETF (FEMB)
October 31, 2018 (Unaudited)
(discount). In times of market stress, decisions by market makers to reduce or step away from their role of providing a market for an ETF’s shares, or decisions by an ETF’s authorized participants that they are unable or unwilling to proceed with creation and/or redemption orders of an ETF’s shares, could result in shares of the ETF trading at a discount to net asset value and in greater than normal intraday bid-ask spreads.
Fixed Income Securities Risk. To the extent a Fund invests in fixed income securities, the Fund will be subject to credit risk, income risk, interest rate risk, liquidity risk and prepayment risk. Income risk is the risk that income from a Fund’s fixed income investments could decline during periods of falling interest rates. Interest rate risk is the risk that the value of a Fund’s fixed income securities will decline because of rising interest rates. Liquidity risk is the risk that a security cannot be purchased or sold at the time desired, or cannot be purchased or sold without adversely affecting the price. Prepayment risk is the risk that the securities will be redeemed or prepaid by the issuer, resulting in lower interest payments received by the Fund. In addition to these risks, high yield securities, or “junk” bonds, are subject to greater market fluctuations and risk of loss than securities with higher ratings, and the market for high yield securities is generally smaller and less liquid than that for investment grade securities.
Fund of Funds Risk. To the extent a Fund invests in the securities of other investment vehicles, the Fund will incur additional fees and expenses that would not be present in a direct investment in those investment vehicles. Furthermore, the Fund’s investment performance and risks are directly related to the investment performance and risks of the investment vehicles in which the Fund invests.
Index Constituent Risk. Certain Funds may be a constituent of one or more indices. As a result, such a Fund may be included in one or more index-tracking exchange-traded funds or mutual funds. Being a component security of such a vehicle could greatly affect the trading activity involving a Fund, the size of the Fund and the market volatility of the Fund. Inclusion in an index could significantly increase demand for the Fund and removal from an index could result in outsized selling activity in a relatively short period of time. As a result, a Fund’s net asset value could be negatively impacted and the Fund’s market price may be significantly below its net asset value during certain periods.
Index Provider Risk. To the extent a Fund seeks to track an index, it is subject to Index Provider Risk. There is no assurance that the Index Provider will compile the Index accurately, or that the Index will be determined, maintained, constructed, reconstituted, rebalanced, composed, calculated or disseminated accurately. To correct any such error, the Index Provider may carry out an unscheduled rebalance or other modification of the Index constituents or weightings, which may increase the Fund’s costs. The Index Provider does not provide any representation or warranty in relation to the quality, accuracy or completeness of data in the Index, and it does not guarantee that the Index will be calculated in accordance with its stated methodology. Losses or costs associated with any Index Provider errors generally will be borne by the Fund and its shareholders.
Management Risk. To the extent that a Fund is actively managed, it is subject to management risk. In managing an actively-managed Fund’s investment portfolio, the Fund’s portfolio managers will apply investment techniques and risk analyses that may not have the desired result. There can be no guarantee that a Fund will meet its investment objective.
Market Risk. Securities held by a Fund, as well as shares of a Fund itself, are subject to market fluctuations caused by factors such as general economic conditions, political events, regulatory or market developments, changes in interest rates and perceived trends in securities prices. Shares of a Fund could decline in value or underperform other investments as a result of the risk of loss associated with these market fluctuations.
Non-U.S. Securities Risk. To the extent a Fund invests in non-U.S. securities, it is subject to additional risks not associated with securities of domestic issuers. Non-U.S. securities are subject to higher volatility than securities of domestic issuers due to: possible adverse political, social or economic developments; restrictions on foreign investment or exchange of securities; lack of liquidity; currency exchange rates; excessive taxation; government seizure of assets; different legal or accounting standards; and less government supervision and regulation of exchanges in foreign countries. Investments in non-U.S. securities may involve higher costs than investments in U.S. securities, including higher transaction and custody costs, as well as additional taxes imposed by non-U.S. governments. These risks may be heightened for securities of companies located, or with significant operations, in emerging market countries.
Passive Investment Risk. To the extent a Fund seeks to track an index, the Fund will invest in the securities included in, or representative of, the index regardless of their investment merit. A Fund generally will not attempt to take defensive positions in declining markets.
Additional Information (Continued)
First Trust Emerging Markets Local Currency Bond ETF (FEMB)
October 31, 2018 (Unaudited)
Advisory and Sub-Advisory Agreements
Board Considerations Regarding Approval of Investment Management and Investment Sub-Advisory Agreements
The Board of Trustees of First Trust Exchange-Traded Fund III (the “Trust”), including the Independent Trustees, unanimously approved the continuation of the Investment Management Agreement (the “Advisory Agreement”) with First Trust Advisors L.P. (the “Advisor”) on behalf of the First Trust Emerging Markets Local Currency Bond ETF (the “Fund”) and the Investment Sub-Advisory Agreement (the “Sub-Advisory Agreement” and together with the Advisory Agreement, the “Agreements”) among the Trust, on behalf of the Fund, the Advisor and First Trust Global Portfolios Ltd. (the “Sub-Advisor”). The Board approved the continuation of the Agreements for a one-year period ending June 30, 2019 at a meeting held on June 11, 2018. The Board determined that the continuation of the Agreements is in the best interests of the Fund in light of the nature, extent and quality of the services provided and such other matters as the Board considered to be relevant in the exercise of its reasonable business judgment.
To reach this determination, the Board considered its duties under the Investment Company Act of 1940, as amended (the “1940 Act”), as well as under the general principles of state law, in reviewing and approving advisory contracts; the requirements of the 1940 Act in such matters; the fiduciary duty of investment advisors with respect to advisory agreements and compensation; the standards used by courts in determining whether investment company boards have fulfilled their duties; and the factors to be considered by the Board in voting on such agreements. At meetings held on April 23, 2018 and June 11, 2018, the Board, including the Independent Trustees, reviewed materials provided by the Advisor and the Sub-Advisor responding to requests for information from counsel to the Independent Trustees that, among other things, outlined the services provided by the Advisor and the Sub-Advisor to the Fund (including the relevant personnel responsible for these services and their experience); the unitary fee rate payable by the Fund as compared to fees charged to a peer group of funds (which were either mutual funds or exchange-traded funds (“ETFs”)) compiled by Management Practice, Inc. (“MPI”), an independent source (the “Peer Group”), and as compared to fees charged to other clients of the Advisor, including other ETFs managed by the Advisor; the sub-advisory fee rate as compared to fees charged to other clients of the Sub-Advisor; expenses of the Fund as compared to expense ratios of the funds in the Peer Group; performance information for the Fund; the nature of expenses incurred in providing services to the Fund and the potential for economies of scale, if any; financial data on the Advisor and the Sub-Advisor; any fall-out benefits to the Advisor and its affiliate, First Trust Portfolios L.P. (“FTP”), and the Sub-Advisor (also an affiliate of the Advisor); and information on the Advisor’s and the Sub-Advisor’s compliance programs. The Board reviewed initial materials with the Advisor at a special meeting held on April 23, 2018, prior to which the Independent Trustees and their counsel met separately to discuss the information provided by the Advisor and the Sub-Advisor. Following the April meeting, independent legal counsel on behalf of the Independent Trustees requested certain clarifications and supplements to the materials provided, and the information provided in response to those requests was considered at an executive session of the Independent Trustees and independent legal counsel held prior to the June 11, 2018 meeting, as well as at the meeting held that day. The Board applied its business judgment to determine whether the arrangements between the Trust and the Advisor and among the Trust, the Advisor and the Sub-Advisor continue to be reasonable business arrangements from the Fund’s perspective. The Board determined that, given the totality of the information provided with respect to the Agreements, the Board had received sufficient information to renew the Agreements. The Board considered that shareholders chose to invest or remain invested in the Fund knowing that the Advisor and the Sub-Advisor manage the Fund and knowing the Fund’s unitary fee.
In reviewing the Agreements, the Board considered the nature, extent and quality of the services provided by the Advisor and the Sub-Advisor under the Agreements. With respect to the Advisory Agreement, the Board considered that the Advisor is responsible for the overall management and administration of the Trust and the Fund and reviewed all of the services provided by the Advisor to the Fund, including the oversight of the Sub-Advisor, as well as the background and experience of the persons responsible for such services. The Board noted that the Advisor oversees the Sub-Advisor’s day-to-day management of the Fund’s investments, including portfolio risk monitoring and performance review. In reviewing the services provided, the Board noted the compliance program that had been developed by the Advisor and considered that it includes a robust program for monitoring the Advisor’s, the Sub-Advisor’s and the Fund’s compliance with the 1940 Act, as well as the Fund’s compliance with its investment objective, policies and restrictions. The Board also considered a report from the Advisor with respect to its risk management functions related to the operation of the Fund. Finally, as part of the Board’s consideration of the Advisor’s services, the Advisor, in its written materials and at the April 23, 2018 meeting, described to the Board the scope of its ongoing investment in additional infrastructure and personnel to maintain and improve the quality of services provided to the Fund and the other funds in the First Trust Fund Complex. With respect to the Sub-Advisory Agreement, the Board noted that the Fund is an actively-managed ETF and the Sub-Advisor actively manages the Fund’s investments. In addition to the written materials provided by the Sub-Advisor, at the April 23, 2018 meeting, the Board also received a presentation from a representative of the Sub-Advisor discussing the services that the Sub-Advisor provides to the Fund, including the Sub-Advisor’s day-to-day management of the Fund’s investments. In considering the Sub-Advisor’s management of the Fund, the Board noted the background and experience of the Sub-Advisor’s portfolio management team. In light of the information presented and the considerations made, the Board concluded that the nature, extent and quality of the services provided to the Trust
Additional Information (Continued)
First Trust Emerging Markets Local Currency Bond ETF (FEMB)
October 31, 2018 (Unaudited)
and the Fund by the Advisor and the Sub-Advisor under the Agreements have been and are expected to remain satisfactory and that the Sub-Advisor, under the oversight of the Advisor, has managed the Fund consistent with the Fund’s investment objective, policies and restrictions.
The Board considered the unitary fee rate payable by the Fund under the Advisory Agreement for the services provided. The Board noted that the sub-advisory fee is paid by the Advisor from the unitary fee. The Board considered that as part of the unitary fee the Advisor is responsible for the Fund’s expenses, including the cost of sub-advisory, transfer agency, custody, fund administration, legal, audit and other services and license fees (if any), but excluding interest, taxes, brokerage commissions and other expenses connected with the execution of portfolio transactions, distribution and service fees pursuant to a Rule 12b-1 plan, if any, and extraordinary expenses. The Board received and reviewed information showing the advisory or unitary fee rates and expense ratios of the peer funds in the Peer Group, as well as advisory and unitary fee rates charged by the Advisor to other fund (including ETFs) and non-fund clients, as applicable. Because the Fund’s Peer Group included peer funds that pay a unitary fee and because the Fund pays a unitary fee, the Board determined that expense ratios were the most relevant comparative data point. Based on the information provided, the Board noted that the unitary fee for the Fund was above the median total (net) expense ratio of the peer funds in the Peer Group. With respect to the Peer Group, the Board noted its prior discussions with the Advisor and MPI regarding the assembly of the Peer Group and, at the April 23, 2018 meeting, discussed with the Advisor limitations in creating peer groups for actively-managed ETFs, including the limited number of actively-managed ETFs pursuing an emerging markets debt strategy and that most of the peer funds were either index-based ETFs or open-end mutual funds, and different business models that may affect the pricing of services among ETF sponsors. The Board also noted that three of the seven peer funds did not employ an advisor/sub-advisor management structure. The Board took these limitations and differences into account in considering the peer data. With respect to fees charged to other non-ETF clients, the Board considered differences between the Fund and other non-ETF clients that limited their comparability. In considering the unitary fee rate overall, the Board also considered the Advisor’s statement that it seeks to meet investor needs through innovative and value-added investment solutions and the Advisor’s description of its long-term commitment to the Fund.
The Board considered performance information for the Fund. The Board noted the process it has established for monitoring the Fund’s performance and portfolio risk on an ongoing basis, which includes quarterly performance reporting from the Advisor and Sub-Advisor for the Fund. The Board determined that this process continues to be effective for reviewing the Fund’s performance. The Board received and reviewed information comparing the Fund’s performance for periods ended December 31, 2017 to the performance of the peer funds in the Peer Group and to a benchmark index. Based on the information provided, the Board noted that the Fund underperformed the Peer Group average and the benchmark index for the one- and three-year periods ended December 31, 2017. The Board noted information provided by the Sub-Advisor on reasons for the Fund’s relative underperformance.
On the basis of all the information provided on the unitary fee and performance of the Fund and the ongoing oversight by the Board, the Board concluded that the unitary fee for the Fund (out of which the Sub-Advisor is compensated) continues to be reasonable and appropriate in light of the nature, extent and quality of the services provided by the Advisor and the Sub-Advisor to the Fund under the Agreements.
The Board considered information and discussed with the Advisor whether there were any economies of scale in connection with providing advisory services to the Fund and noted the Advisor’s statement that it believes its expenses will likely increase over the next twelve months as the Advisor continues to make investments in infrastructure and personnel. The Board noted that any reduction in fixed costs associated with the management of the Fund would benefit the Advisor, but that the unitary fee structure provides a level of certainty in expenses for the Fund. The Board considered the revenues and allocated costs (including the allocation methodology) of the Advisor in serving as investment advisor to the Fund for the twelve months ended December 31, 2017 and the estimated profitability level for the Fund calculated by the Advisor based on such data, as well as complex-wide and product-line profitability data, for the same period. The Board noted the inherent limitations in the profitability analysis and concluded that, based on the information provided, the Advisor’s profitability level for the Fund was not unreasonable. In addition, the Board considered fall-out benefits described by the Advisor that may be realized from its relationship with the Fund. The Board considered that the Advisor had identified as a fall-out benefit to the Advisor and FTP their exposure to investors and brokers who, absent their exposure to the Fund, may have had no dealings with the Advisor or FTP. The Board also considered the Advisor’s compensation for fund reporting services provided to the Fund pursuant to a separate Fund Reporting Services Agreement, which is paid from the unitary fee. The Board also considered information on the affiliations between the Advisor and the Sub-Advisor and noted the services provided by the Sub-Advisor to certain First Trust products in Europe. The Board concluded that the character and amount of potential fall-out benefits to the Advisor were not unreasonable.
The Board considered the Sub-Advisor’s statements that expenses incurred in providing services to the Fund are of a fixed nature and that, at this time, no economies of scale have been identified in providing services to the Fund. The Board did not review the profitability of the Sub-Advisor with respect to the Fund. The Board concluded that the profitability analysis for the Advisor was more relevant. The Board considered the Advisor’s confirmation that it is committed to supporting the Sub-Advisor. The Board considered
Additional Information (Continued)
First Trust Emerging Markets Local Currency Bond ETF (FEMB)
October 31, 2018 (Unaudited)
the potential fall-out benefits to the Sub-Advisor from being associated with the Advisor and the Fund. The Board noted that the Sub-Advisor does not utilize soft dollars in connection with its management of the Fund’s portfolio. The Board concluded that the character and amount of potential fall-out benefits to the Sub-Advisor were not unreasonable.
Based on all of the information considered and the conclusions reached, the Board, including the Independent Trustees, unanimously determined that the terms of the Agreements continue to be fair and reasonable and that the continuation of the Agreements is in the best interests of the Fund. No single factor was determinative in the Board’s analysis.
Remuneration
First Trust Advisors L.P. (“First Trust”) is authorized and regulated by the U.S. Securities and Exchange Commission and is entitled to market shares of certain funds it manages, including First Trust Emerging Markets Local Currency Bond ETF (the “Fund”), in certain member states in the European Economic Area in accordance with the cooperation arrangements in Article 42 of the Alternative Investment Fund Managers Directive (the “Directive”). First Trust is required under the Directive to make disclosures in respect of remuneration. The following disclosures are made in line with First Trust’s interpretation of currently available regulatory guidance on remuneration disclosures.
During the year ended December 31, 2017, the amount of remuneration paid (or to be paid) by First Trust Advisors L.P. in respect of the Fund is $20,187. This figure is comprised of $812 paid (or to be paid) in fixed compensation and $19,375 paid (or to be paid) in variable compensation. There were a total of 14 beneficiaries of the remuneration described above. Those amounts include $14,133 paid (or to be paid) to senior management of First Trust Advisors L.P. and $6,054 paid (or to be paid) to other employees whose professional activities have a material impact on the risk profiles of First Trust Advisors L.P. or the Funds (collectively, “Code Staff”).
Code Staff included in the aggregated figures disclosed above are rewarded in line with First Trust’s remuneration policy (the “Remuneration Policy”) which is determined and implemented by First Trust’s senior management. The Remuneration Policy reflects First Trust’s ethos of good governance and encapsulates the following principal objectives:
i. to provide a clear link between remuneration and performance of First Trust and to avoid rewarding for failure;
ii. to promote sound and effective risk management consistent with the risk profiles of the Funds managed by First Trust; and
iii. to remunerate staff in line with the business strategy, objectives, values and interests of First Trust and the Funds managed by First Trust in a manner that avoids conflicts of interest.
First Trust assesses various risk factors which it is exposed to when considering and implementing remuneration for Code Staff and considers whether any potential award to such person(s) would give rise to a conflict of interest. First Trust does not reward failure, or consider the taking of risk or failure to take risk in its remuneration of Code Staff.
First Trust assesses performance for the purposes of determining payments in respect of performance-related remuneration of Code Staff by reference to a broad range of measures including (i) individual performance (using financial and non-financial criteria), and (ii) the overall performance of First Trust. Remuneration is not based upon the performance of the Funds.
The elements of remuneration are balanced between fixed and variable and the senior management sets fixed salaries at a level sufficient to ensure that variable remuneration incentivises and rewards strong individual performance but does not encourage excessive risk taking.
No individual is involved in setting his or her own remuneration.
Board of Trustees and Officers
First Trust Exchange-Traded Fund III
October 31, 2018 (Unaudited)
The following tables identify the Trustees and Officers of the Trust. Unless otherwise indicated, the address of all persons is 120 E. Liberty Drive, Suite 400, Wheaton, IL 60187.
The Trust’s statement of additional information includes additional information about the Trustees and is available, without charge, upon request, by calling (800) 988-5891.
| Name, Year of Birth and Position with the Trust | Term of Office and Year First Elected or Appointed | Principal Occupations
During Past 5 Years | Number of Portfolios in the First Trust Fund Complex Overseen by Trustee | Other Trusteeships or Directorships Held by Trustee During Past 5 Years |
| INDEPENDENT TRUSTEES |
Richard E. Erickson, Trustee
(1951) | • Indefinite Term
• Since Inception | Physician; Officer, Wheaton Orthopedics; Limited Partner, Gundersen Real Estate Limited Partnership (June 1992 to December 2016); Member, Sportsmed LLC (April 2007 to November 2015) | 159 | None |
Thomas R. Kadlec, Trustee
(1957) | • Indefinite Term
• Since Inception | President, ADM Investor Services, Inc. (Futures Commission Merchant) | 159 | Director of ADM Investor Services, Inc., ADM Investor Services International, Futures Industry Association, and National Futures Association |
Robert F. Keith, Trustee
(1956) | • Indefinite Term
• Since Inception | President, Hibs Enterprises (Financial and Management Consulting) | 159 | Director of Trust Company of Illinois |
Niel B. Nielson, Trustee
(1954) | • Indefinite Term
• Since Inception | Senior Advisor (August 2018 to Present), Managing Director and Chief Operating Officer (January 2015 to August 2018), Pelita Harapan Educational Foundation (Educational Products and Services); President and Chief Executive Officer (June 2012 to September 2014), Servant Interactive LLC (Educational Products and Services); President and Chief Executive Officer (June 2012 to September 2014), Dew Learning LLC (Educational Products and Services) | 159 | Director of Covenant Transport, Inc. (May 2003 to May 2014) |
| INTERESTED TRUSTEE |
James A. Bowen(1), Trustee and
Chairman of the Board
(1955) | • Indefinite Term
• Since Inception | Chief Executive Officer, First Trust Advisors L.P. and First Trust Portfolios L.P.; Chairman of the Board of Directors, BondWave LLC (Software Development Company) and Stonebridge Advisors LLC (Investment Advisor) | 159 | None |
| (1) | Mr. Bowen is deemed an “interested person” of the Trust due to his position as CEO of First Trust Advisors L.P., investment advisor of the Trust. |
Board of Trustees and Officers (Continued)
First Trust Exchange-Traded Fund III
October 31, 2018 (Unaudited)
| Name and Year of Birth | Position and Offices with Trust | Term of Office and Length of Service | Principal Occupations
During Past 5 Years |
| OFFICERS(2) |
James M. Dykas
(1966) | President and Chief Executive Officer | • Indefinite Term
• Since January 2016 | Managing Director and Chief Financial Officer (January 2016 to Present), Controller (January 2011 to January 2016), Senior Vice President (April 2007 to January 2016), First Trust Advisors L.P. and First Trust Portfolios L.P.; Chief Financial Officer (January 2016 to Present), BondWave LLC (Software Development Company) and Stonebridge Advisors LLC (Investment Advisor) |
Donald P. Swade
(1972) | Treasurer, Chief Financial Officer and Chief Accounting Officer | • Indefinite Term
• Since January 2016 | Senior Vice President (July 2016 to Present), Vice President (April 2012 to July 2016), First Trust Advisors L.P. and First Trust Portfolios L.P. |
W. Scott Jardine
(1960) | Secretary and Chief Legal Officer | • Indefinite Term
• Since Inception | General Counsel, First Trust Advisors L.P. and First Trust Portfolios L.P.; Secretary and General Counsel, BondWave LLC; Secretary, Stonebridge Advisors LLC |
Daniel J. Lindquist
(1970) | Vice President | • Indefinite Term
• Since Inception | Managing Director, First Trust Advisors L.P. and First Trust Portfolios L.P. |
Kristi A. Maher
(1966) | Chief Compliance Officer and Assistant Secretary | • Indefinite Term
• Since Inception | Deputy General Counsel, First Trust Advisors L.P. and First Trust Portfolios L.P. |
Roger F. Testin
(1966) | Vice President | • Indefinite Term
• Since Inception | Senior Vice President, First Trust Advisors L.P. and First Trust Portfolios L.P. |
Stan Ueland
(1970) | Vice President | • Indefinite Term
• Since Inception | Senior Vice President, First Trust Advisors L.P. and First Trust Portfolios L.P |
| (2) | The term “officer” means the president, vice president, secretary, treasurer, controller or any other officer who performs a policy making function. |
Privacy Policy
First Trust Emerging Markets Local Currency Bond ETF (FEMB)
October 31, 2018 (Unaudited)
Privacy Policy
First Trust values our relationship with you and considers your privacy an important priority in maintaining that relationship. We are committed to protecting the security and confidentiality of your personal information.
Sources of Information
We collect nonpublic personal information about you from the following sources:
| • | Information we receive from you and your broker-dealer, investment advisor or financial representative through interviews, applications, agreements or other forms; |
| • | Information about your transactions with us, our affiliates or others; |
| • | Information we receive from your inquiries by mail, e-mail or telephone; and |
| • | Information we collect on our website through the use of “cookies”. For example, we may identify the pages on our website that your browser requests or visits. |
Information Collected
The type of data we collect may include your name, address, social security number, age, financial status, assets, income, tax information, retirement and estate plan information, transaction history, account balance, payment history, investment objectives, marital status, family relationships and other personal information.
Disclosure of Information
We do not disclose any nonpublic personal information about our customers or former customers to anyone, except as permitted by law. In addition to using this information to verify your identity (as required under law), the permitted uses may also include the disclosure of such information to unaffiliated companies for the following reasons:
| • | In order to provide you with products and services and to effect transactions that you request or authorize, we may disclose your personal information as described above to unaffiliated financial service providers and other companies that perform administrative or other services on our behalf, such as transfer agents, custodians and trustees, or that assist us in the distribution of investor materials such as trustees, banks, financial representatives, proxy services, solicitors and printers. |
| • | We may release information we have about you if you direct us to do so, if we are compelled by law to do so, or in other legally limited circumstances (for example to protect your account from fraud). |
In addition, in order to alert you to our other financial products and services, we may share your personal information within First Trust.
Use of Website Analytics
We currently use third party analytics tools, Google Analytics and AddThis, to gather information for purposes of improving First Trust’s website and marketing our products and services to you. These tools employ cookies, which are small pieces of text stored in a file by your web browser and sent to websites that you visit, to collect information, track website usage and viewing trends such as the number of hits, pages visited, videos and PDFs viewed and the length of user sessions in order to evaluate website performance and enhance navigation of the website. We may also collect other anonymous information, which is generally limited to technical and web navigation information such as the IP address of your device, internet browser type and operating system for purposes of analyzing the data to make First Trust’s website better and more useful to our users. The information collected does not include any personal identifiable information such as your name, address, phone number or email address unless you provide that information through the website for us to contact you in order to answer your questions or respond to your requests. To find out how to opt-out of these services click on: Google Analytics and AddThis.
Confidentiality and Security
With regard to our internal security procedures, First Trust restricts access to your nonpublic personal information to those First Trust employees who need to know that information to provide products or services to you. We maintain physical, electronic and procedural safeguards to protect your nonpublic personal information.
Policy Updates and Inquiries
As required by federal law, we will notify you of our privacy policy annually. We reserve the right to modify this policy at any time, however, if we do change it, we will tell you promptly. For questions about our policy, or for additional copies of this notice, please go to www.ftportfolios.com, or contact us at 1-800-621-1675 (First Trust Portfolios) or 1-800-222-6822 (First Trust Advisors).
May 2017
First Trust Exchange-Traded Fund III
INVESTMENT ADVISOR
First Trust Advisors L.P.
120 E. Liberty Drive, Suite 400
Wheaton, IL 60187
INVESTMENT SUB-ADVISOR
First Trust Global Portfolios Ltd.
Floor 2
8 Angel Court
London EC2R 7HJ
England
ADMINISTRATOR, CUSTODIAN,
FUND ACCOUNTANT &
TRANSFER AGENT
Brown Brothers Harriman & Co.
50 Post Office Square
Boston, MA 02110
INDEPENDENT REGISTERED
PUBLIC ACCOUNTING FIRM
Deloitte & Touche LLP
111 S. Wacker Drive
Chicago, IL 60606
LEGAL COUNSEL
Chapman and Cutler LLP
111 W. Monroe Street
Chicago, IL 60603
First Trust Exchange-Traded Fund III
First Trust RiverFront Dynamic Asia Pacific ETF (RFAP)
First Trust RiverFront Dynamic Developed International ETF (RFDI)
First Trust RiverFront Dynamic Europe ETF (RFEU)
First Trust RiverFront Dynamic Emerging Markets ETF (RFEM)
Annual Report
For the Year Ended
October 31, 2018
First Trust Exchange-Traded Fund III
Annual Report
October 31, 2018
Caution Regarding Forward-Looking Statements
This report contains certain forward-looking statements within the meaning of the Securities Act of 1933, as amended, and the Securities Exchange Act of 1934, as amended. Forward-looking statements include statements regarding the goals, beliefs, plans or current expectations of First Trust Advisors L.P. (“First Trust” or the “Advisor”) and/or RiverFront Investment Group, LLC (“RiverFront” or the “Sub-Advisor”) and their respective representatives, taking into account the information currently available to them. Forward-looking statements include all statements that do not relate solely to current or historical fact. For example, forward-looking statements include the use of words such as “anticipate,” “estimate,” “intend,” “expect,” “believe,” “plan,” “may,” “should,” “would” or other words that convey uncertainty of future events or outcomes.
Forward-looking statements involve known and unknown risks, uncertainties and other factors that may cause the actual results, performance or achievements of any series of First Trust Exchange-Traded Fund III (the “Trust”) described in this report (each such series is referred to as a “Fund” and collectively, the “Funds”) to be materially different from any future results, performance or achievements expressed or implied by the forward-looking statements. When evaluating the information included in this report, you are cautioned not to place undue reliance on these forward-looking statements, which reflect the judgment of the Advisor and/or Sub-Advisor and their respective representatives only as of the date hereof. We undertake no obligation to publicly revise or update these forward-looking statements to reflect events and circumstances that arise after the date hereof.
Performance and Risk Disclosure
There is no assurance that any Fund described in this report will achieve its investment objective. Each Fund is subject to market risk, which is the possibility that the market values of securities owned by the Fund will decline and that the value of the Fund shares may therefore be less than what you paid for them. Accordingly, you can lose money by investing in a Fund. See “Risk Considerations” in the Additional Information section of this report for a discussion of certain other risks of investing in the Funds.
Performance data quoted represents past performance, which is no guarantee of future results, and current performance may be lower or higher than the figures shown. For the most recent month-end performance figures, please visit www.ftportfolios.com or speak with your financial advisor. Investment returns, net asset value and share price will fluctuate and Fund shares, when sold, may be worth more or less than their original cost.
The Advisor may also periodically provide additional information on Fund performance on each Fund’s web page at www.ftportfolios.com.
How to Read This Report
This report contains information that may help you evaluate your investment. It includes details about each Fund and presents data and analysis that provide insight into each Fund’s performance and investment approach.
By reading the portfolio commentary by the portfolio management team of each Fund, you may obtain an understanding of how the market environment affected each Fund’s performance. The statistical information that follows may help you understand each Fund’s performance compared to that of a relevant market benchmark.
It is important to keep in mind that the opinions expressed by personnel of the Advisor and/or Sub-Advisor are just that: informed opinions. They should not be considered to be promises or advice. The opinions, like the statistics, cover the period through the date on the cover of this report. The material risks of investing in each Fund are spelled out in the prospectus, the statement of additional information, and other Fund regulatory filings.
First Trust Exchange-Traded Fund III
Annual Letter from the Chairman and CEO
October 31, 2018
Dear Shareholders,
First Trust is pleased to provide you with the annual report for the First Trust RiverFront Dynamic International ETFs (the “Funds”), which contains detailed information about the Funds for the twelve months ended October 31, 2018, including a market overview and a performance analysis. We encourage you to read this report carefully and discuss it with your financial advisor.
As I mentioned in my April 2018 letter, 2017 was a very strong year for U.S. and global markets. Investors were rewarded with rising markets and very little volatility. As 2018 began, investors were hoping for another strong year in the markets. For the entire first quarter, however, increased market volatility was the norm for U.S. and global markets. The markets continued their volatility throughout the second quarter. During April and May, the Dow Jones Industrial Average (“DJIA”) closed out each month slightly down, but ended both June and July slightly up. August was a strong month for stocks, and the DJIA finished August just under its previous high in January of 2018. At the close of the third quarter in September, the markets had moved higher into positive territory. In fact, all three major U.S. indices (the Nasdaq Composite Index, the DJIA and the S& P 500® Index) hit record levels during the third quarter. In October, markets were again very volatile, surprising analysts and investors alike. Both global and U.S. markets fell on fears of slowing growth, trade wars and higher interest rates. The DJIA was down 5% for October and the MSCI EAFE Index, an index of stocks in 21 developed markets (excluding the U.S. and Canada), was down 9% for the same period.
Based on continued strong job growth and the economic outlook in the U.S., the Federal Reserve (the “Fed”) raised interest rates in March, June and September. At their September meeting, the Fed also indicated the possibility of one more rate hike in 2018 as well as three more rate hikes in 2019.
Trade tensions have had an impact on markets around the world and could continue to do so in the future. However, our economists believe that the long-term impact of U.S. tariffs will be to encourage countries to come back to the table and talk about more equal trade. Despite market volatility, we continue to believe that the combination of low interest rates, low inflation and strong corporate earnings still point to a positive economic environment and further growth, though we understand that past performance can never guarantee future performance.
We continue to believe that you should invest for the long term and be prepared for market movements, which can happen at any time. You can do this by keeping current on your portfolio and by speaking regularly with your investment professional. Markets go up and they also go down, but savvy investors are prepared for either through careful attention to investment goals.
Thank you for giving First Trust the opportunity to be a part of your financial plan. We value our relationship with you and will report on the Funds again in six months.
Sincerely,
James A. Bowen
Chairman of the Board of Trustees
Chief Executive Officer of First Trust Advisors L.P.
Fund Performance Overview (Unaudited)
First Trust RiverFront Dynamic Asia Pacific ETF (RFAP)
The investment objective of First Trust RiverFront Dynamic Asia Pacific ETF (the “Fund”) is to provide capital appreciation. Under normal market conditions, the Fund will seek to achieve its investment objective by investing at least 80% of its net assets (including investment borrowings) in a portfolio of equity securities of Asian Pacific companies, including through investments in common stock, depositary receipts, and common and preferred shares of real estate investment trusts (“REITs”), and forward foreign currency exchange contracts and currency spot transactions used to hedge the Fund’s exposure to the currencies in which the equity securities of such Asian Pacific companies are denominated (each, an “Asian Pacific currency” and, collectively, the “Asian Pacific currencies”). Asian Pacific companies are those companies (i) whose securities are traded principally on a stock exchange in an Asian Pacific country, (ii) that have a primary business office in an Asian Pacific country, or (iii) that have at least 50% of their assets in, or derive at least 50% of their revenues or profits from, an Asian Pacific country. Asian Pacific countries include the countries located in Asia and the Pacific Islands as well as Australia and New Zealand. The Fund will generally focus its Asian Pacific company investments in Australia, Hong Kong, Japan, New Zealand and/or Singapore. The Fund is non-diversified. Shares of the Fund are listed on The Nasdaq Stock Market LLC under the ticker symbol “RFAP.”
The Fund will utilize a dynamic currency hedging strategy through the use of forward foreign currency exchange contracts and currency spot transactions to hedge up to 100% of the Fund’s currency exposure. As a result of such dynamic currency hedging strategy, the portion of the Fund’s portfolio securities which are subject to currency hedging transactions may vary widely, from 0% to 100% of the portfolio securities. A forward contract on foreign currency is an obligation to purchase or sell a specific currency at a future date, which may be any fixed number of days agreed upon by the parties from the date of the contract, at a price set on the date of the contract. A forward foreign currency exchange contract may reduce the Fund’s exposure to changes in the value of the currency it will deliver and increase its exposure to changes in the value of the currency it will receive for the duration of the contract. The effect on the value of the Fund is similar to selling securities denominated in one currency and purchasing securities denominated in another currency. The Fund also may enter into currency spot transactions as part of its dynamic currency hedging strategy. A currency spot transaction is an agreement between two parties to buy or sell a specific currency for delivery on a date that is typically two business days from the date of the agreement, as opposed to a date set in the future. The underlying currencies of the forward foreign currency exchange contracts and currency spot transactions included in the Fund’s policy relating to the investment of at least 80% of its net assets (including investment borrowings) will be limited to Asian Pacific currencies.
| Performance | | | |
| | | Average Annual
Total Returns | Cumulative
Total Returns |
| | 1 Year Ended
10/31/18 | Inception (4/13/16)
to 10/31/18 | Inception (4/13/16)
to 10/31/18 |
| Fund Performance | | | |
| NAV | -11.48% | 2.54% | 6.61% |
| Market Price | -12.42% | 2.37% | 6.17% |
| Index Performance | | | |
| MSCI Pacific Index | -4.41% | 8.22% | 22.32% |
(See Notes to Fund Performance Overview Page 11.)
Fund Performance Overview (Unaudited) (Continued)
First Trust RiverFront Dynamic Asia Pacific ETF (RFAP) (Continued)
| Sector Allocation | % of Total
Investments |
| Financials | 17.3% |
| Consumer Discretionary | 17.2 |
| Industrials | 13.4 |
| Information Technology | 10.5 |
| Materials | 9.9 |
| Consumer Staples | 9.5 |
| Communication Services | 9.4 |
| Health Care | 5.9 |
| Real Estate | 4.3 |
| Energy | 2.6 |
| Total | 100.0% |
| Top Ten Holdings | % of Total
Investments |
| Toyota Motor Corp. | 3.3% |
| Sony Corp. | 2.2 |
| Keyence Corp. | 1.8 |
| Honda Motor Co., Ltd. | 1.8 |
| KDDI Corp. | 1.8 |
| Australia & New Zealand Banking Group Ltd. | 1.6 |
| National Australia Bank Ltd. | 1.5 |
| Central Japan Railway Co. | 1.5 |
| NTT DOCOMO, Inc. | 1.5 |
| Seven & i Holdings Co., Ltd. | 1.5 |
| Total | 18.5% |

Performance figures assume reinvestment of all distributions and do not reflect the deduction of taxes that a shareholder would pay on Fund distributions or the redemption or sale of Fund shares. An index is a statistical composite that tracks a specified financial market or sector. Unlike the Fund, the index does not actually hold a portfolio of securities and therefore does not incur the expenses incurred by the Fund. These expenses negatively impact the performance of the Fund. The Fund’s past performance does not predict future performance.
Frequency Distribution of Discounts and Premiums
Bid/Ask Midpoint vs. NAV through October 31, 2018
The following Frequency Distribution of Discounts and Premiums charts are provided to show the frequency at which the bid/ask midpoint price for the Fund was at a discount or premium to the daily NAV. The following tables are for comparative purposes only and represent the period April 14, 2016 (commencement of trading) through October 31, 2018. Shareholders may pay more than NAV when they buy Fund shares and receive less than NAV when they sell those shares because shares are bought and sold at current market price. Data presented represents past performance and cannot be used to predict future results.
| Number of Days Bid/Ask Midpoint At/Above NAV |
| For the Period | 0.00%–0.49% | 0.50%–0.99% | 1.00%–1.99% | >=2.00% |
| 4/14/16 – 10/31/16 | 65 | 29 | 12 | 2 |
| 11/1/16 – 10/31/17 | 127 | 85 | 23 | 0 |
| 11/1/17 – 10/31/18 | 114 | 22 | 8 | 1 |
| Number of Days Bid/Ask Midpoint Below NAV |
| For the Period | 0.00%–0.49% | 0.50%–0.99% | 1.00%–1.99% | >=2.00% |
| 4/14/16 – 10/31/16 | 21 | 8 | 2 | 1 |
| 11/1/16 – 10/31/17 | 16 | 1 | 0 | 0 |
| 11/1/17 – 10/31/18 | 94 | 12 | 1 | 0 |
Fund Performance Overview (Unaudited) (Continued)
First Trust RiverFront Dynamic Developed International ETF (RFDI)
The investment objective of First Trust RiverFront Dynamic Developed International ETF (the “Fund”) is to provide capital appreciation. Under normal market conditions, the Fund will seek to achieve its investment objective by investing at least 80% of its net assets (including investment borrowings) in a portfolio of equity securities of developed market companies, including through investments in common stock, depositary receipts, and common and preferred shares of real estate investment trusts (“REITs”), and forward foreign currency exchange contracts and currency spot transactions used to hedge the Fund’s exposure to the currencies in which the equity securities of such developed market companies are denominated (each, a “Developed Market currency” and, collectively, the “Developed Market currencies”). Developed market companies are those companies (i) whose securities are traded principally on a stock exchange in a developed market country, (ii) that have a primary business office in a developed market country, or (iii) that have at least 50% of their assets in, or derive at least 50% of their revenues or profits from, a developed market country. Developed market countries currently include the countries comprising the Morgan Stanley Capital International World Index or countries considered to be developed by the World Bank, the International Finance Corporation or the United Nations. Under normal market conditions, the Fund will invest in at least three countries and at least 40% of its net assets in countries other than the United States. The Fund is non-diversified. Shares of the Fund are listed on The Nasdaq Stock Market LLC under the ticker symbol “RFDI.”
The Fund will utilize a dynamic currency hedging strategy through the use of forward foreign currency exchange contracts and currency spot transactions to hedge up to 100% of the Fund’s currency exposure. As a result of such dynamic currency hedging strategy, the portion of the Fund’s portfolio securities which are subject to currency hedging transactions may vary widely, from 0% to 100% of the portfolio securities. A forward contract on foreign currency is an obligation to purchase or sell a specific currency at a future date, which may be any fixed number of days agreed upon by the parties from the date of the contract, at a price set on the date of the contract. A forward foreign currency exchange contract may reduce the Fund’s exposure to changes in the value of the currency it will deliver and increase its exposure to changes in the value of the currency it will receive for the duration of the contract. The effect on the value of the Fund is similar to selling securities denominated in one currency and purchasing securities denominated in another currency. The Fund also may enter into currency spot transactions as part of its dynamic currency hedging strategy. A currency spot transaction is an agreement between two parties to buy or sell a specific currency for delivery on a date that is typically two business days from the date of the agreement, as opposed to a date set in the future. The underlying currencies of the forward foreign currency exchange contracts and currency spot transactions included in the Fund’s policy relating to the investment of at least 80% of its net assets (including investment borrowings) will be limited to Developed Market currencies.
| Performance | | | |
| | | Average Annual
Total Returns | Cumulative
Total Returns |
| | 1 Year Ended
10/31/18 | Inception (4/13/16)
to 10/31/18 | Inception (4/13/16)
to 10/31/18 |
| Fund Performance | | | |
| NAV | -10.65% | 6.04% | 16.14% |
| Market Price | -10.86% | 6.13% | 16.39% |
| Index Performance | | | |
| MSCI EAFE Index | -6.85% | 6.31% | 16.89% |
(See Notes to Fund Performance Overview Page 11.)
Fund Performance Overview (Unaudited) (Continued)
First Trust RiverFront Dynamic Developed International ETF (RFDI) (Continued)
| Sector Allocation | % of Total
Investments |
| Consumer Discretionary | 15.4% |
| Financials | 15.2 |
| Industrials | 14.3 |
| Consumer Staples | 11.2 |
| Health Care | 9.6 |
| Information Technology | 8.7 |
| Energy | 8.7 |
| Materials | 8.3 |
| Communication Services | 4.5 |
| Utilities | 2.6 |
| Real Estate | 1.5 |
| Total | 100.0% |
| Top Ten Holdings | % of Total
Investments |
| Nestle S.A. | 2.6% |
| Roche Holding AG | 1.9 |
| Royal Dutch Shell PLC, Class A | 1.5 |
| LVMH Moet Hennessy Louis Vuitton SE | 1.3 |
| Royal Dutch Shell PLC, Class B | 1.3 |
| Toyota Motor Corp. | 1.2 |
| ASML Holding N.V. | 1.1 |
| Novartis AG | 1.0 |
| L’Oreal S.A. | 1.0 |
| Swedbank AB, Class A | 0.8 |
| Total | 13.7% |
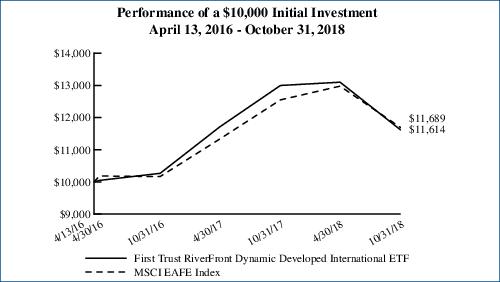
Performance figures assume reinvestment of all distributions and do not reflect the deduction of taxes that a shareholder would pay on Fund distributions or the redemption or sale of Fund shares. An index is a statistical composite that tracks a specified financial market or sector. Unlike the Fund, the index does not actually hold a portfolio of securities and therefore does not incur the expenses incurred by the Fund. These expenses negatively impact the performance of the Fund. The Fund’s past performance does not predict future performance.
Frequency Distribution of Discounts and Premiums
Bid/Ask Midpoint vs. NAV through October 31, 2018
The following Frequency Distribution of Discounts and Premiums charts are provided to show the frequency at which the bid/ask midpoint price for the Fund was at a discount or premium to the daily NAV. The following tables are for comparative purposes only and represent the period April 14, 2016 (commencement of trading) through October 31, 2018. Shareholders may pay more than NAV when they buy Fund shares and receive less than NAV when they sell those shares because shares are bought and sold at current market price. Data presented represents past performance and cannot be used to predict future results.
| Number of Days Bid/Ask Midpoint At/Above NAV |
| For the Period | 0.00%–0.49% | 0.50%–0.99% | 1.00%–1.99% | >=2.00% |
| 4/14/16 – 10/31/16 | 46 | 70 | 18 | 2 |
| 11/1/16 – 10/31/17 | 157 | 81 | 7 | 0 |
| 11/1/17 – 10/31/18 | 158 | 33 | 0 | 0 |
| Number of Days Bid/Ask Midpoint Below NAV |
| For the Period | 0.00%–0.49% | 0.50%–0.99% | 1.00%–1.99% | >=2.00% |
| 4/14/16 – 10/31/16 | 4 | 0 | 0 | 0 |
| 11/1/16 – 10/31/17 | 7 | 0 | 0 | 0 |
| 11/1/17 – 10/31/18 | 52 | 9 | 0 | 0 |
Fund Performance Overview (Unaudited) (Continued)
First Trust RiverFront Dynamic Europe ETF (RFEU)
The investment objective of First Trust RiverFront Dynamic Europe ETF (the “Fund”) is to provide capital appreciation. Under normal market conditions, the Fund will seek to achieve its investment objective by investing at least 80% of its net assets (including investment borrowings) in a portfolio of equity securities of European companies, including through investments in common stock, depositary receipts, and common and preferred shares of real estate investment trusts (“REITs”), and forward foreign currency exchange contracts and currency spot transactions used to hedge the Fund’s exposure to the currencies in which the equity securities of such European companies are denominated (each, a “European currency” and, collectively, the “European currencies”). European companies are those companies (i) whose securities are traded principally on a stock exchange in a European country, (ii) that have a primary business office in a European country, or (iii) that have at least 50% of their assets in, or derive at least 50% of their revenues or profits from, a European country. The Fund considers a European country to be any member country of the European Union or any country included in the FTSE Developed Europe Index or the FTSE Emerging Europe All Cap Index. The Fund will generally focus its European company investments in Austria, Belgium, Denmark, Finland, France, Germany, Ireland, Italy, Luxembourg, the Netherlands, Norway, Portugal, Spain, Sweden, Switzerland and/or the United Kingdom. The Fund is non-diversified. Shares of the Fund are listed on The Nasdaq Stock Market LLC under the ticker symbol “RFEU.”
The Fund will utilize a dynamic currency hedging strategy through the use of forward foreign currency exchange contracts and currency spot transactions to hedge up to 100% of the Fund’s currency exposure. As a result of such dynamic currency hedging strategy, the portion of the Fund’s portfolio securities which are subject to currency hedging transactions may vary widely, from 0% to 100% of the portfolio securities. A forward contract on foreign currency is an obligation to purchase or sell a specific currency at a future date, which may be any fixed number of days agreed upon by the parties from the date of the contract, at a price set on the date of the contract. A forward foreign currency exchange contract may reduce the Fund’s exposure to changes in the value of the currency it will deliver and increase its exposure to changes in the value of the currency it will receive for the duration of the contract. The effect on the value of the Fund is similar to selling securities denominated in one currency and purchasing securities denominated in another currency. The Fund also may enter into currency spot transactions as part of its dynamic currency hedging strategy. A currency spot transaction is an agreement between two parties to buy or sell a specific currency for delivery on a date that is typically two business days from the date of the agreement, as opposed to a date set in the future. The underlying currencies of the forward foreign currency exchange contracts and currency spot transactions included in the Fund’s policy relating to the investment of at least 80% of its net assets (including investment borrowings) will be limited to European currencies.
| Performance | | | |
| | | Average Annual
Total Returns | Cumulative
Total Returns |
| | 1 Year Ended
10/31/18 | Inception (4/13/16)
to 10/31/18 | Inception (4/13/16)
to 10/31/18 |
| Fund Performance | | | |
| NAV | -10.16% | 7.77% | 21.02% |
| Market Price | -10.82% | 7.59% | 20.51% |
| Index Performance | | | |
| MSCI Europe Index | -8.34% | 5.40% | 14.36% |
(See Notes to Fund Performance Overview Page 11.)
Fund Performance Overview (Unaudited) (Continued)
First Trust RiverFront Dynamic Europe ETF (RFEU) (Continued)
| Sector Allocation | % of Total
Investments |
| Industrials | 14.7% |
| Consumer Discretionary | 14.4 |
| Financials | 14.0 |
| Energy | 12.2 |
| Consumer Staples | 12.1 |
| Health Care | 11.5 |
| Information Technology | 7.8 |
| Materials | 7.4 |
| Utilities | 4.1 |
| Communication Services | 1.8 |
| Total | 100.0% |
| Top Ten Holdings | % of Total
Investments |
| Nestle S.A. | 4.1% |
| Roche Holding AG | 2.9 |
| Royal Dutch Shell PLC, Class A | 2.3 |
| LVMH Moet Hennessy Louis Vuitton SE | 2.1 |
| Royal Dutch Shell PLC, Class B | 2.0 |
| ASML Holding N.V. | 1.6 |
| Novartis AG | 1.6 |
| L’Oreal S.A. | 1.5 |
| Swedbank AB, Class A | 1.2 |
| HSBC Holdings PLC | 1.2 |
| Total | 20.5% |
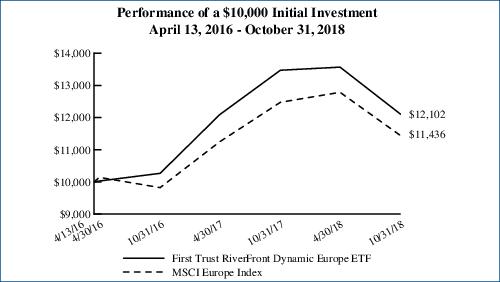
Performance figures assume reinvestment of all distributions and do not reflect the deduction of taxes that a shareholder would pay on Fund distributions or the redemption or sale of Fund shares. An index is a statistical composite that tracks a specified financial market or sector. Unlike the Fund, the index does not actually hold a portfolio of securities and therefore does not incur the expenses incurred by the Fund. These expenses negatively impact the performance of the Fund. The Fund’s past performance does not predict future performance.
Frequency Distribution of Discounts and Premiums
Bid/Ask Midpoint vs. NAV through October 31, 2018
The following Frequency Distribution of Discounts and Premiums charts are provided to show the frequency at which the bid/ask midpoint price for the Fund was at a discount or premium to the daily NAV. The following tables are for comparative purposes only and represent the period April 14, 2016 (commencement of trading) through October 31, 2018. Shareholders may pay more than NAV when they buy Fund shares and receive less than NAV when they sell those shares because shares are bought and sold at current market price. Data presented represents past performance and cannot be used to predict future results.
| Number of Days Bid/Ask Midpoint At/Above NAV |
| For the Period | 0.00%–0.49% | 0.50%–0.99% | 1.00%–1.99% | >=2.00% |
| 4/14/16 – 10/31/16 | 39 | 35 | 2 | 0 |
| 11/1/16 – 10/31/17 | 134 | 103 | 8 | 0 |
| 11/1/17 – 10/31/18 | 146 | 10 | 0 | 0 |
| Number of Days Bid/Ask Midpoint Below NAV |
| For the Period | 0.00%–0.49% | 0.50%–0.99% | 1.00%–1.99% | >=2.00% |
| 4/14/16 – 10/31/16 | 56 | 8 | 0 | 0 |
| 11/1/16 – 10/31/17 | 7 | 0 | 0 | 0 |
| 11/1/17 – 10/31/18 | 92 | 4 | 0 | 0 |
Fund Performance Overview (Unaudited) (Continued)
First Trust RiverFront Dynamic Emerging Markets ETF (RFEM)
The investment objective of First Trust RiverFront Dynamic Emerging Markets ETF (the “Fund”) is to provide capital appreciation. Under normal market conditions, the Fund will seek to achieve its investment objective by investing at least 80% of its net assets (including investment borrowings) in a portfolio of equity securities of emerging market companies, including through investments in common stock, depositary receipts, and common and preferred shares of real estate investment trusts (“REITs”), and forward foreign currency exchange contracts and currency spot transactions used to hedge the Fund’s exposure to the currencies in which the equity securities of such emerging market companies are denominated (each, an “Emerging Market currency” and, collectively, the “Emerging Market currencies”). The Fund considers an emerging market company to be one (i) domiciled or with a principal place of business or primary securities trading market in an emerging market country, or (ii) that derives a substantial portion of its total revenues or profits from emerging market countries. The Fund considers an emerging market country to be any country whose issuers are included in the Morgan Stanley Capital International Emerging Markets Index and/or those countries considered to be developing by the World Bank, the International Finance Corporation or the United Nations. The Fund will generally focus its emerging market company investments in Brazil, Chile, China, Colombia, the Czech Republic, Egypt, Greece, Hungary, India, Indonesia, Malaysia, Mexico, Morocco, Nigeria, Peru, the Philippines, Poland, Qatar, Russia, South Africa, South Korea, Taiwan, Thailand, Turkey and/or the United Arab Emirates. The Fund is non-diversified. Shares of the Fund are listed on The Nasdaq Stock Exchange LLC under the ticker symbol “RFEM.”
The Fund will utilize a dynamic currency hedging strategy through the use of forward foreign currency exchange contracts and currency spot transactions to hedge up to 100% of the Fund’s currency exposure. As a result of such dynamic currency hedging strategy, the portion of the Fund’s portfolio securities which are subject to currency hedging transactions may vary widely, from 0% to 100% of the portfolio securities. A forward contract on foreign currency is an obligation to purchase or sell a specific currency at a future date, which may be any fixed number of days agreed upon by the parties from the date of the contract, at a price set on the date of the contract. A forward foreign currency exchange contract may reduce the Fund’s exposure to changes in the value of the currency it will deliver and increase its exposure to changes in the value of the currency it will receive for the duration of the contract. The effect on the value of the Fund is similar to selling securities denominated in one currency and purchasing securities denominated in another currency. The Fund also may enter into currency spot transactions as part of its dynamic currency hedging strategy. A currency spot transaction is an agreement between two parties to buy or sell a specific currency for delivery on a date that is typically two business days from the date of the agreement, as opposed to a date set in the future. The underlying currencies of the forward foreign currency exchange contracts and currency spot transactions included in the Fund’s policy relating to the investment of at least 80% of its net assets (including investment borrowings) will be limited to Emerging Market currencies.
| Performance | | | |
| | | Average Annual
Total Returns | Cumulative
Total Returns |
| | 1 Year Ended
10/31/18 | Inception (6/14/16)
to 10/31/18 | Inception (6/14/16)
to 10/31/18 |
| Fund Performance | | | |
| NAV | -15.92% | 8.64% | 21.80% |
| Market Price | -16.60% | 8.52% | 21.50% |
| Index Performance | | | |
| MSCI Emerging Markets Index | -12.52% | 10.27% | 26.21% |
(See Notes to Fund Performance Overview Page 11.)
Fund Performance Overview (Unaudited) (Continued)
First Trust RiverFront Dynamic Emerging Markets ETF (RFEM) (Continued)
| Sector Allocation | % of Total
Investments |
| Information Technology | 21.8% |
| Financials | 19.1 |
| Energy | 10.2 |
| Materials | 9.5 |
| Communication Services | 8.4 |
| Industrials | 8.3 |
| Consumer Staples | 7.0 |
| Consumer Discretionary | 5.7 |
| Health Care | 3.8 |
| Utilities | 3.8 |
| Real Estate | 2.4 |
| Total | 100.0% |
| Top Ten Holdings | % of Total
Investments |
| Samsung Electronics Co., Ltd. | 5.3% |
| Tencent Holdings Ltd. | 4.0 |
| Taiwan Semiconductor Manufacturing Co., Ltd. | 3.9 |
| Alibaba Group Holding Ltd., ADR | 3.2 |
| China Construction Bank Corp., Class H | 2.2 |
| Industrial & Commercial Bank of China Ltd., Class H | 2.1 |
| LUKOIL PJSC | 1.8 |
| Bank of China Ltd., Class H | 1.7 |
| SK Hynix, Inc. | 1.6 |
| San Miguel Corp. | 1.5 |
| Total | 27.3% |

Performance figures assume reinvestment of all distributions and do not reflect the deduction of taxes that a shareholder would pay on Fund distributions or the redemption or sale of Fund shares. An index is a statistical composite that tracks a specified financial market or sector. Unlike the Fund, the index does not actually hold a portfolio of securities and therefore does not incur the expenses incurred by the Fund. These expenses negatively impact the performance of the Fund. The Fund’s past performance does not predict future performance.
Frequency Distribution of Discounts and Premiums
Bid/Ask Midpoint vs. NAV through October 31, 2018
The following Frequency Distribution of Discounts and Premiums charts are provided to show the frequency at which the bid/ask midpoint price for the Fund was at a discount or premium to the daily NAV. The following tables are for comparative purposes only and represent the period June 15, 2016 (commencement of trading) through October 31, 2018. Shareholders may pay more than NAV when they buy Fund shares and receive less than NAV when they sell those shares because shares are bought and sold at current market price. Data presented represents past performance and cannot be used to predict future results.
| Number of Days Bid/Ask Midpoint At/Above NAV |
| For the Period | 0.00%–0.49% | 0.50%–0.99% | 1.00%–1.99% | >=2.00% |
| 6/15/16 – 10/31/17 | 31 | 40 | 16 | 1 |
| 11/1/16 – 10/31/17 | 130 | 87 | 8 | 0 |
| 11/1/17 – 10/31/18 | 94 | 66 | 6 | 0 |
| Number of Days Bid/Ask Midpoint Below NAV |
| For the Period | 0.00%–0.49% | 0.50%–0.99% | 1.00%–1.99% | >=2.00% |
| 6/15/16 – 10/31/17 | 7 | 2 | 0 | 0 |
| 11/1/16 – 10/31/17 | 25 | 1 | 1 | 0 |
| 11/1/17 – 10/31/18 | 53 | 28 | 5 | 0 |
Notes to Fund Performance Overview (Unaudited)
Total returns for the periods since inception are calculated from the inception date of each Fund. “Average Annual Total Returns” represent the average annual change in value of an investment over the periods indicated. “Cumulative Total Returns” represent the total change in value of an investment over the periods indicated.
Each Fund’s per share net asset value (“NAV”) is the value of one share of the Fund and is computed by dividing the value of all assets of the Fund (including accrued interest and dividends), less all liabilities (including accrued expenses and dividends declared but unpaid), by the total number of outstanding shares. The price used to calculate market return (“Market Price”) is determined by using the midpoint between the highest bid and the lowest offer on the stock exchange on which shares of the Fund are listed for trading as of the time that the Fund’s NAV is calculated. Since shares of each Fund did not trade in the secondary market until after the Fund’s inception, for the period from inception to the first day of secondary market trading in shares of the Fund, the NAV of each Fund is used as a proxy for the secondary market trading price to calculate market returns. NAV and market returns assume that all distributions have been reinvested in each Fund at NAV and Market Price, respectively.
An index is a statistical composite that tracks a specified financial market or sector. Unlike each Fund, the indices do not actually hold a portfolio of securities and therefore do not incur the expenses incurred by each Fund. These expenses negatively impact the performance of each Fund. Also, market returns do not include brokerage commissions that may be payable on secondary market transactions. If brokerage commissions were included, market returns would be lower. The total returns presented reflect the reinvestment of dividends on securities in the indices. The returns presented do not reflect the deduction of taxes that a shareholder would pay on Fund distributions or the redemption or sale of Fund shares. The investment return and principal value of shares of each Fund will vary with changes in market conditions. Shares of each Fund may be worth more or less than their original cost when they are redeemed or sold in the market. Each Fund’s past performance is no guarantee of future performance.
Portfolio Commentary
First Trust Exchange-Traded Fund III
First Trust RiverFront Dynamic International ETFs
October 31, 2018 (Unaudited)
Advisor
First Trust Advisors L.P. (“First Trust”) is the investment advisor. First Trust is responsible for the ongoing monitoring of each Fund’s investment portfolio, managing each Fund’s business affairs and providing certain administrative services necessary for the management of each Fund.
Sub-Advisor
RiverFront Investment Group, LLC
RiverFront Investment Group, LLC is an SEC-registered investment advisor located in Richmond, Virginia. It is majority owned by its employees, and Baird Financial Corporation is a minority owner of RiverFront Investment Holding Group, LLC. The firm provides asset management services to a series of global tactical asset allocation portfolios and registered investment companies, including mutual funds and exchange-traded products.
Portfolio Management Team
Adam Grossman, CFA – Global Equity Chief Investment Officer
Rebecca Felton – Chief Risk Officer
Chris Konstantinos, CFA – Chief Investment Strategist
Scott Hays – Quantitative Portfolio Manager
Commentary
Market Update
As annual reports arrive, investors in international equity portfolios may be disappointed to find that their accounts only returned a fraction of the return of the S&P 500®. This is because over the past twelve months the S&P 500® significantly outperformed most other asset classes, continuing a theme that has persisted since the Financial Crisis. We anticipate that the disappointing performance from international equities will once again raise questions about whether diversification outside the U.S. still makes sense and recognize that the allure to un-diversify can be overwhelming when it is not working, and an investor’s home base is performing well.
Since 1973 the overall yearly “win” percentage of international stocks versus those in the U.S. is nearly identical in U.S. dollar terms. We recognize that it often does not feel that way since there were two long-term mega-streaks for each side over that time period, including the now decade-long hot streak the U.S. is currently riding. Accordingly, even though international equity markets were notable fiscal year laggards versus U.S. peers, we remain constructive.
First Trust RiverFront Dynamic Asia Pacific ETF (RFAP)
2018 Attribution
For the period October 31, 2017 to October 31, 2018, the First Trust RiverFront Dynamic Asia Pacific ETF (“RFAP”) posted a net asset value (“NAV”) return of -11.48% and a market price return of -12.42%, both of which underperformed the benchmark’s return (MSCI Pacific Index) of -4.41%. The core of RFAP’s selection model is an intra-sector selection model. For the 12 months ended October 31, 2018, the model’s selection in Malaysia and both allocations and selections in Canada were additive. Major detractors in the period were allocations and selections in Japan and Hong Kong.
First Trust RiverFront Dynamic Developed International ETF (RFDI)
2018 Attribution
For the period October 31, 2017 to October 31, 2018, the First Trust RiverFront Dynamic Developed International ETF (“RFDI”) posted a NAV return of -10.65% and a market price return of -10.86%, both of which underperformed the benchmark’s return (MSCI EAFE Index) of -6.85%. The core of RFDI’s selection model is an intra-sector selection model. For the 12 months ended October 31, 2018, allocations and selections in Malaysia, Spain and Belgium, as well as cash, added to relative performance. However, allocations and selections in Japan, Hong Kong, Australia and the United Kingdom truncated performance.
Portfolio Commentary (Continued)
First Trust Exchange-Traded Fund III
Annual Report
October 31, 2018 (Unaudited)
First Trust RiverFront Dynamic Developed Europe ETF (RFEU)
2018 Attribution
For the period October 31, 2017 to October 31, 2018, the First Trust RiverFront Dynamic Developed Europe ETF (“RFEU”) posted a NAV return of -10.16% and a market price return of -10.82%, both of which underperformed the benchmark’s return (MSCI Europe Index) of -8.34%. The core of RFEU’s selection model is an intra-sector selection model. For the 12 months ended October 31, 2018, allocations and selections in Spain and Belgium, as well as cash, contributed positively to performance. However, allocations and selections in the United Kingdom, France and Austria dampened relative returns.
First Trust RiverFront Dynamic Emerging Markets ETF (RFEM)
2018 Attribution
For the period October 31, 2017 to October 31, 2018, the First Trust RiverFront Dynamic Emerging Markets ETF (“RFEM”) posted a NAV return of -15.92% and a market price return of -16.60%, both of which underperformed the benchmark’s return (MSCI Emerging Markets Index) of -12.52%. The core of RFEM’s selection model is an intra-sector selection model. For the 12 months ended October 31, 2018, allocations and selections in China and the Philippines, as well as cash, aided returns, but allocations and selections in Hong Kong, Taiwan and Turkey detracted from performance.
Market Outlook
We see several primary reasons for international outperformance potential. First, valuations remain attractive, in our opinion. Riverfront’s asset allocation framework, based on the potential of long-term mean reversion, suggests to us that international equities are priced to return significantly more than U.S. equities over the next 5-10 years.
Second, monetary policy remains accommodative. We believe inflation trends in Europe, Japan and most major emerging markets are tepid compared to history and economic trends globally are still positive. We believe this is a “Goldilocks” scenario because spare capacity in these economies give international central banks cover to maintain their accommodative policies. Historically, this has provided a positive underpinning for global stock markets.
Third, we believe the U.S. Dollar may halt its secular rise. In addition to the “Goldilocks” economic environment, we believe that the U.S. dollar (“USD”) is in the later-stages of its bull market that began in mid-2011. If the USD can stop its ascension, emerging markets could stabilize and developed international stocks could deliver stronger USD-denominated returns, in our opinion.
Fourth, economic and earnings growth remain positive. We believe we are in the early-to-mid stages of a positive corporate earnings cycle in Europe, Japan, and many major emerging markets as evidenced by their strong performance in 2017. This positive growth is expected to continue in 2018 and beyond. Over the long run, it is unusual for stocks to perform poorly in times when earnings growth is positive, in our view.
Lastly, trade tensions seem now largely priced into the markets, in our view. On a trailing price-earnings basis, the valuation gap between U.S. and non-U.S. stocks remains close to the widest levels in 45 years. We see negative market sentiment related to protectionist trade policy as the primary contributor to this valuation gap this year. While we believe trade uncertainty relating to China is likely to stay with us for a while, we believe it is possible that we get positive resolution to trade issues between the U.S., the North American Free Trade Agreement and the European Union in 2018. Eventually, we believe that in the longer term, the structural imbalances in China’s economy and the unequal amount of trade leverage that the U.S. exercises over China will lead to a resolution, no matter how ugly the negotiations appear in the meantime.
First Trust Exchange-Traded Fund III
Understanding Your Fund Expenses
October 31, 2018 (Unaudited)
As a shareholder of First Trust RiverFront Dynamic Asia Pacific ETF, First Trust RiverFront Dynamic Developed International ETF, First Trust RiverFront Dynamic Europe ETF or First Trust RiverFront Dynamic Emerging Markets ETF (each a “Fund” and collectively, the “Funds”), you incur two types of costs: (1) transaction costs; and (2) ongoing costs, including management fees, distribution and/or service (12b-1) fees, if any, and other Fund expenses. This Example is intended to help you understand your ongoing costs of investing in the Funds and to compare these costs with the ongoing costs (in U.S. dollars) of investing in other funds.
The Example is based on an investment of $1,000 invested at the beginning of the period and held through the six-month period ended October 31, 2018.
Actual Expenses
The first line in the following table provides information about actual account values and actual expenses. You may use the information in this line, together with the amount you invested, to estimate the expenses that you paid over the period. Simply divide your account value by $1,000 (for example, an $8,600 account value divided by $1,000 = 8.6), then multiply the result by the number in the first line under the heading entitled “Expenses Paid During the Six-Month Period” to estimate the expenses you paid on your account during this six-month period.
Hypothetical Example for Comparison Purposes
The second line in the following table provides information about hypothetical account values and hypothetical expenses based on each Fund’s actual expense ratio and an assumed rate of return of 5% per year before expenses, which is not each Fund’s actual return. The hypothetical account values and expenses may not be used to estimate the actual ending account balance or expenses you paid for the period. You may use this information to compare the ongoing costs of investing in the Funds and other funds. To do so, compare this 5% hypothetical example with the 5% hypothetical examples that appear in the shareholder reports of the other funds.
Please note that the expenses shown in the table are meant to highlight your ongoing costs only and do not reflect any transactional costs such as brokerage commissions. Therefore, the second line in the table is useful in comparing ongoing costs only, and will not help you determine the relative total costs of owning different funds. In addition, if these transactional costs were included, your costs would have been higher.
| | Beginning
Account Value
May 1, 2018 | Ending
Account Value
October 31, 2018 | Annualized
Expense Ratio
Based on the
Six-Month
Period | Expenses Paid
During the
Six-Month
Period (a) |
| First Trust RiverFront Dynamic Asia Pacific ETF (RFAP) |
| Actual | $1,000.00 | $876.90 | 0.83% | $3.93 |
| Hypothetical (5% return before expenses) | $1,000.00 | $1,021.02 | 0.83% | $4.23 |
| First Trust RiverFront Dynamic Developed International ETF (RFDI) |
| Actual | $1,000.00 | $886.50 | 0.83% | $3.95 |
| Hypothetical (5% return before expenses) | $1,000.00 | $1,021.02 | 0.83% | $4.23 |
| First Trust RiverFront Dynamic Europe ETF (RFEU) |
| Actual | $1,000.00 | $891.90 | 0.83% | $3.96 |
| Hypothetical (5% return before expenses) | $1,000.00 | $1,021.02 | 0.83% | $4.23 |
| First Trust RiverFront Dynamic Emerging Markets ETF (RFEM) |
| Actual | $1,000.00 | $787.60 | 0.95% | $4.28 |
| Hypothetical (5% return before expenses) | $1,000.00 | $1,020.42 | 0.95% | $4.84 |
| (a) | Expenses are equal to the annualized expense ratios as indicated in the table multiplied by the average account value over the period (May 1, 2018 through October 31, 2018), multiplied by 184/365 (to reflect the six-month period). |
First Trust RiverFront Dynamic Asia Pacific ETF (RFAP)
Portfolio of Investments
October 31, 2018
| Shares | | Description | | Value |
| COMMON STOCKS (a) – 99.1% |
| | | Australia – 14.9% | | |
| 178,661 | | AMP Ltd. | | $312,501 |
| 37,937 | | Australia & New Zealand Banking Group Ltd. | | 696,612 |
| 33,821 | | Bank of Queensland Ltd. | | 231,121 |
| 14,193 | | BHP Billiton Ltd. | | 323,735 |
| 51,384 | | Coca-Cola Amatil Ltd. | | 360,601 |
| 11,300 | | Commonwealth Bank of Australia | | 553,985 |
| 1,682 | | CSL Ltd. | | 223,928 |
| 7,918 | | Flight Centre Travel Group Ltd. | | 260,171 |
| 28,347 | | Iluka Resources Ltd. | | 161,796 |
| 159,096 | | Lynas Corp Ltd. (b) | | 234,341 |
| 6,277 | | Macquarie Group Ltd. | | 520,961 |
| 37,862 | | National Australia Bank Ltd. | | 675,930 |
| 11,875 | | Perpetual Ltd. | | 291,382 |
| 62,618 | | Platinum Asset Management Ltd. | | 217,280 |
| 50,222 | | Qantas Airways Ltd. | | 194,539 |
| 5,790 | | Rio Tinto Ltd. | | 313,254 |
| 73,015 | | Santos Ltd. | | 343,325 |
| 13,599 | | Westpac Banking Corp. | | 258,569 |
| 117,828 | | Whitehaven Coal Ltd. | | 404,684 |
| | | | | 6,578,715 |
| | | Bermuda – 2.0% | | |
| 5,900 | | Jardine Matheson Holdings Ltd. | | 340,489 |
| 3,700 | | Jardine Strategic Holdings Ltd. | | 123,950 |
| 300,475 | | SmarTone Telecommunications Holdings Ltd. | | 416,882 |
| | | | | 881,321 |
| | | Canada – 0.4% | | |
| 1,364 | | Shopify, Inc., Class A (b) | | 188,439 |
| | | Cayman Islands – 3.8% | | |
| 35,574 | | AAC Technologies Holdings, Inc. | | 270,594 |
| 29,868 | | ASM Pacific Technology Ltd. | | 257,852 |
| 47,743 | | CK Hutchison Holdings Ltd. | | 480,660 |
| 5,040 | | Tencent Holdings Ltd. | | 171,600 |
| 206,481 | | Tingyi Cayman Islands Holding Corp. | | 305,432 |
| 93,704 | | Wynn Macau Ltd. | | 193,336 |
| | | | | 1,679,474 |
| | | Hong Kong – 4.5% | | |
| 99,386 | | Hang Lung Group Ltd. | | 244,348 |
| 47,600 | | Melco International Development Ltd. | | 81,337 |
| 843,068 | | PCCW Ltd. | | 462,282 |
| 980,900 | | Shun Tak Holdings Ltd. | | 312,709 |
| 36,317 | | Swire Pacific Ltd., Class A | | 376,741 |
| 114,638 | | Wharf Holdings (The) Ltd. | | 285,939 |
| 42,904 | | Wheelock & Co., Ltd. | | 228,965 |
| | | | | 1,992,321 |
| Shares | | Description | | Value |
|
| | | Japan – 68.8% | | |
| 69,800 | | Acom Co., Ltd. | | $257,957 |
| 16,700 | | Advantest Corp. | | 307,996 |
| 21,100 | | Aeon Co., Ltd. | | 484,327 |
| 7,200 | | Aisin Seiki Co., Ltd. | | 282,997 |
| 10,000 | | Alfresa Holdings Corp. | | 267,204 |
| 8,800 | | Aoyama Trading Co., Ltd. | | 266,726 |
| 7,580 | | Aozora Bank Ltd. | | 261,657 |
| 38,900 | | Astellas Pharma, Inc. | | 602,280 |
| 14,600 | | Brother Industries Ltd. | | 267,972 |
| 3,400 | | Central Japan Railway Co. | | 652,369 |
| 18,000 | | Credit Saison Co., Ltd. | | 286,666 |
| 7,700 | | CyberAgent, Inc. | | 326,876 |
| 28,300 | | Dai-ichi Life Holdings, Inc. | | 535,727 |
| 2,500 | | Disco Corp. | | 398,148 |
| 21,700 | | DMG Mori Co., Ltd. | | 314,437 |
| 4,300 | | FamilyMart UNY Holdings Co., Ltd. | | 499,987 |
| 6,500 | | FUJIFILM Holdings Corp. | | 281,867 |
| 27,300 | | Haseko Corp. | | 346,225 |
| 19,700 | | Hitachi Ltd. | | 604,435 |
| 27,100 | | Honda Motor Co., Ltd. | | 778,403 |
| 25,200 | | Ishihara Sangyo Kaisha
Ltd. (b) | | 301,502 |
| 23,100 | | Japan Post Holdings Co., Ltd. | | 274,330 |
| 53,100 | | JXTG Holdings, Inc. | | 361,985 |
| 19,900 | | Kajima Corp. | | 256,786 |
| 11,400 | | Kakaku.com, Inc. | | 206,813 |
| 31,100 | | KDDI Corp. | | 775,743 |
| 1,600 | | Keyence Corp. | | 784,154 |
| 7,800 | | Kikkoman Corp. | | 429,282 |
| 40,100 | | Kobe Steel Ltd. | | 322,691 |
| 1,700 | | Kose Corp. | | 254,168 |
| 45,000 | | Leopalace21 Corp. | | 187,841 |
| 16,345 | | M3, Inc. | | 263,351 |
| 6,400 | | Matsumotokiyoshi Holdings Co., Ltd. | | 230,850 |
| 44,700 | | Mazda Motor Corp. | | 484,892 |
| 13,700 | | Medipal Holdings Corp. | | 294,192 |
| 39,600 | | Mitsubishi Chemical Holdings Corp. | | 309,226 |
| 12,500 | | Mitsubishi Heavy Industries Ltd. | | 441,906 |
| 1,600 | | Mitsubishi Tanabe Pharma Corp. | | 23,652 |
| 23,100 | | Mitsubishi UFJ Financial Group, Inc. | | 140,195 |
| 66,300 | | Mitsubishi UFJ Lease & Finance Co., Ltd. | | 341,386 |
| 13,700 | | Mitsui OSK Lines Ltd. | | 334,380 |
| 301,500 | | Mizuho Financial Group, Inc. | | 518,376 |
| 16,200 | | NET One Systems Co., Ltd. | | 339,118 |
| 33,100 | | NHK Spring Co., Ltd. | | 284,548 |
| 21,300 | | Nippon Paper Industries Co., Ltd. | | 386,792 |
| 43,900 | | Nippon Sheet Glass Co.,
Ltd. | | 371,556 |
| 14,300 | | Nippon Telegraph & Telephone Corp. | | 601,985 |
See Notes to Financial Statements
Page 15
First Trust RiverFront Dynamic Asia Pacific ETF (RFAP)
Portfolio of Investments (Continued)
October 31, 2018
| Shares | | Description | | Value |
| COMMON STOCKS (a) (Continued) |
| | | Japan (Continued) | | |
| 20,300 | | Nippon Yusen KK | | $328,333 |
| 58,400 | | Nissan Motor Co., Ltd. | | 531,803 |
| 70,700 | | NTN Corp. | | 259,404 |
| 25,800 | | NTT DOCOMO, Inc. | | 650,402 |
| 48,600 | | Oji Holdings Corp. | | 346,297 |
| 55,200 | | Onward Holdings Co., Ltd. | | 332,663 |
| 34,100 | | ORIX Corp. | | 556,371 |
| 14,100 | | Panasonic Corp. | | 156,139 |
| 18,700 | | Recruit Holdings Co., Ltd. | | 503,318 |
| 9,300 | | Sankyo Co., Ltd. | | 354,823 |
| 14,700 | | Seven & i Holdings Co., Ltd. | | 637,454 |
| 8,700 | | Shiseido Co., Ltd. | | 550,289 |
| 3,600 | | SoftBank Group Corp. | | 288,676 |
| 17,600 | | Sony Corp. | | 957,717 |
| 64,600 | | Sumitomo Chemical Co., Ltd. | | 324,045 |
| 19,300 | | Sumitomo Forestry Co., Ltd. | | 287,187 |
| 6,300 | | Sumitomo Mitsui Financial Group, Inc. | | 246,450 |
| 6,300 | | Suzuken Co., Ltd. | | 319,369 |
| 13,000 | | Taiheiyo Cement Corp. | | 384,234 |
| 14,800 | | Takeda Pharmaceutical Co., Ltd. | | 599,424 |
| 14,900 | | Teijin Ltd. | | 258,820 |
| 13,100 | | Tokai Rika Co., Ltd. | | 239,396 |
| 8,100 | | Tokuyama Corp. | | 181,906 |
| 3,900 | | Tokyo Electron Ltd. | | 542,132 |
| 7,900 | | Tokyo Seimitsu Co., Ltd. | | 190,087 |
| 41,600 | | Tokyu Fudosan Holdings Corp. | | 234,480 |
| 18,800 | | Tosoh Corp. | | 248,756 |
| 12,900 | | Toyota Boshoku Corp. | | 215,734 |
| 24,300 | | Toyota Motor Corp. | | 1,424,598 |
| 9,400 | | Ube Industries Ltd. | | 205,603 |
| 14,300 | | Unicharm Corp. | | 389,326 |
| | | | | 30,291,192 |
| | | Singapore – 4.7% | | |
| 1,199,300 | | Hutchison Port Holdings Trust | | 293,829 |
| 2,100 | | Jardine Cycle & Carriage Ltd. | | 45,892 |
| 63,500 | | Keppel Corp., Ltd. | | 284,229 |
| 53,900 | | Singapore Airlines Ltd. | | 368,893 |
| 75,900 | | Singapore Exchange Ltd. | | 374,801 |
| 96,800 | | Singapore Telecommunications Ltd. | | 220,834 |
| 14,200 | | Venture Corp Ltd. | | 157,054 |
| 331,000 | | Yanlord Land Group Ltd. | | 301,094 |
| | | | | 2,046,626 |
| | | Total Investments – 99.1% | | 43,658,088 |
| | | (Cost $49,314,745) (c) | | |
| | | Net Other Assets and Liabilities – 0.9% | | 378,771 |
| | | Net Assets – 100.0% | | $44,036,859 |
|
| (a) | Portfolio securities are categorized based upon their country of incorporation. For a breakdown of the portfolio securities by sector, please see the Fund Performance Overview. |
| (b) | Non-income producing security. |
| (c) | Aggregate cost for federal income tax purposes was $49,520,685. As of October 31, 2018, the aggregate gross unrealized appreciation for all investments in which there was an excess of value over tax cost was $868,334 and the aggregate gross unrealized depreciation for all investments in which there was an excess of tax cost over value was $6,730,931. The net unrealized depreciation was $5,862,597. |
Valuation Inputs
A summary of the inputs used to value the Fund’s investments as of October 31, 2018 is as follows (see Note 2A - Portfolio Valuation in the Notes to Financial Statements):
| | Total
Value at
10/31/2018 | Level 1
Quoted
Prices | Level 2
Significant
Observable
Inputs | Level 3
Significant
Unobservable
Inputs |
| Common Stocks* | $ 43,658,088 | $ 43,658,088 | $ — | $ — |
| * | See Portfolio of Investments for country breakout. |
Currency Exposure
Diversification | % of Total
Investments |
| JPY | 69.4% |
| AUD | 15.1 |
| HKD | 9.4 |
| SGD | 4.0 |
| USD | 1.7 |
| CAD | 0.4 |
| Total | 100.0% |
| Currency Abbreviations |
| AUD | Australian Dollar |
| CAD | Canadian Dollar |
| HKD | Hong Kong Dollar |
| JPY | Japanese Yen |
| SGD | Singapore Dollar |
| USD | United States Dollar |
Page 16
See Notes to Financial Statements
First Trust RiverFront Dynamic Developed International ETF (RFDI)
Portfolio of Investments
October 31, 2018
| Shares | | Description | | Value |
| COMMON STOCKS (a) – 99.7% |
| | | Australia – 5.4% | | |
| 727,426 | | AMP Ltd. | | $1,272,363 |
| 154,453 | | Australia & New Zealand Banking Group Ltd. | | 2,836,117 |
| 137,799 | | Bank of Queensland Ltd. | | 941,670 |
| 57,785 | | BHP Billiton Ltd. | | 1,318,048 |
| 208,871 | | Coca-Cola Amatil Ltd. | | 1,465,808 |
| 46,010 | | Commonwealth Bank of Australia | | 2,255,650 |
| 6,857 | | CSL Ltd. | | 912,887 |
| 32,241 | | Flight Centre Travel Group Ltd. | | 1,059,380 |
| 115,500 | | Iluka Resources Ltd. | | 659,238 |
| 648,200 | | Lynas Corp Ltd. (b) | | 954,767 |
| 25,553 | | Macquarie Group Ltd. | | 2,120,776 |
| 154,157 | | National Australia Bank Ltd. | | 2,752,082 |
| 48,355 | | Perpetual Ltd. | | 1,186,506 |
| 255,117 | | Platinum Asset Management Ltd. | | 885,239 |
| 204,613 | | Qantas Airways Ltd. | | 792,585 |
| 23,565 | | Rio Tinto Ltd. | | 1,274,929 |
| 297,282 | | Santos Ltd. | | 1,397,854 |
| 55,400 | | Westpac Banking Corp. | | 1,053,366 |
| 479,740 | | Whitehaven Coal Ltd. | | 1,647,680 |
| | | | | 26,786,945 |
| | | Austria – 0.5% | | |
| 57,771 | | Verbund AG | | 2,329,462 |
| | | Belgium – 0.6% | | |
| 34,064 | | UCB S.A. | | 2,862,056 |
| | | Bermuda – 0.7% | | |
| 23,800 | | Jardine Matheson Holdings Ltd. | | 1,373,498 |
| 14,900 | | Jardine Strategic Holdings Ltd. | | 499,150 |
| 1,225,530 | | SmarTone Telecommunications Holdings Ltd. | | 1,700,313 |
| | | | | 3,572,961 |
| | | Canada – 0.1% | | |
| 5,560 | | Shopify, Inc., Class A (b) | | 768,124 |
| | | Cayman Islands – 1.4% | | |
| 144,584 | | AAC Technologies Holdings, Inc. | | 1,099,782 |
| 121,695 | | ASM Pacific Technology Ltd. | | 1,050,600 |
| 194,201 | | CK Hutchison Holdings Ltd. | | 1,955,147 |
| 20,410 | | Tencent Holdings Ltd. | | 694,913 |
| 841,338 | | Tingyi Cayman Islands Holding Corp. | | 1,244,527 |
| 382,656 | | Wynn Macau Ltd. | | 789,520 |
| | | | | 6,834,489 |
| | | Denmark – 1.6% | | |
| 26,574 | | Carlsberg A.S., Class B | | 2,931,374 |
| 52,326 | | GN Store Nord A.S. | | 2,221,922 |
| 14,996 | | Novo Nordisk A.S., Class B | | 648,615 |
| Shares | | Description | | Value |
|
| | | Denmark (Continued) | | |
| 6,115 | | Rockwool International A.S., Class B | | $2,090,662 |
| | | | | 7,892,573 |
| | | Finland – 1.3% | | |
| 90,307 | | Fortum OYJ | | 1,902,012 |
| 33,904 | | Neste OYJ | | 2,794,083 |
| 112,192 | | Stora Enso OYJ, Class R | | 1,690,723 |
| | | | | 6,386,818 |
| | | France – 10.9% | | |
| 262,581 | | Air France-KLM (b) | | 2,545,850 |
| 45,380 | | Alstom S.A. | | 1,986,597 |
| 73,518 | | BNP Paribas S.A. | | 3,841,252 |
| 2,958 | | Christian Dior SE | | 1,146,499 |
| 177,121 | | Credit Agricole S.A. | | 2,272,579 |
| 6,916 | | Danone S.A. | | 490,215 |
| 982 | | Dassault Aviation S.A. | | 1,629,464 |
| 20,137 | | Dassault Systemes SE | | 2,528,286 |
| 181,459 | | Electricite de France S.A. | | 3,017,173 |
| 28,911 | | Faurecia S.A. | | 1,405,133 |
| 5,430 | | Hermes International | | 3,105,896 |
| 17,067 | | Ipsen S.A. | | 2,369,973 |
| 8,192 | | Kering S.A. | | 3,652,084 |
| 21,245 | | L’Oreal S.A. | | 4,786,160 |
| 22,034 | | LVMH Moet Hennessy Louis Vuitton SE | | 6,708,390 |
| 120,193 | | Peugeot S.A. | | 2,862,953 |
| 28,133 | | Renault S.A. | | 2,105,310 |
| 25,918 | | Safran S.A. | | 3,348,054 |
| 53,061 | | TOTAL S.A. | | 3,122,772 |
| 20,324 | | Ubisoft Entertainment S.A. (b) | | 1,830,088 |
| | | | | 54,754,728 |
| | | Germany – 7.8% | | |
| 135,592 | | AIXTRON SE (b) | | 1,705,487 |
| 5,388 | | Allianz SE | | 1,125,585 |
| 35,428 | | BASF SE | | 2,729,875 |
| 3,887 | | Bayer AG | | 298,409 |
| 40,306 | | Covestro AG (c) | | 2,607,676 |
| 108,168 | | Deutsche Lufthansa AG | | 2,175,893 |
| 53,210 | | Evonik Industries AG | | 1,651,352 |
| 20,590 | | Fraport AG Frankfurt Airport Services Worldwide | | 1,592,842 |
| 118,995 | | Infineon Technologies AG | | 2,386,948 |
| 12,953 | | Linde AG | | 2,799,268 |
| 129,678 | | METRO AG | | 1,953,501 |
| 15,573 | | Rheinmetall AG | | 1,350,071 |
| 91,640 | | RWE AG | | 1,787,368 |
| 59,875 | | Salzgitter AG | | 2,399,380 |
| 13,993 | | SAP SE | | 1,500,282 |
| 16,917 | | Sartorius AG (Preference Shares) | | 2,452,613 |
| 196,317 | | Schaeffler AG (Preference Shares) | | 2,075,049 |
| 11,041 | | Wacker Chemie AG | | 988,692 |
| 18,235 | | Wirecard AG | | 3,416,150 |
See Notes to Financial Statements
Page 17
First Trust RiverFront Dynamic Developed International ETF (RFDI)
Portfolio of Investments (Continued)
October 31, 2018
| Shares | | Description | | Value |
| COMMON STOCKS (a) (Continued) |
| | | Germany (Continued) | | |
| 58,526 | | Zalando SE (b) (c) | | $2,267,100 |
| | | | | 39,263,541 |
| | | Hong Kong – 1.6% | | |
| 404,638 | | Hang Lung Group Ltd. | | 994,832 |
| 194,150 | | Melco International Development Ltd. | | 331,755 |
| 3,438,321 | | PCCW Ltd. | | 1,885,345 |
| 3,965,264 | | Shun Tak Holdings Ltd. | | 1,264,119 |
| 148,485 | | Swire Pacific Ltd., Class A | | 1,540,338 |
| 468,396 | | Wharf Holdings (The) Ltd. | | 1,168,310 |
| 175,076 | | Wheelock & Co., Ltd. | | 934,325 |
| | | | | 8,119,024 |
| | | Italy – 2.5% | | |
| 1,274,739 | | A2A S.p.A. | | 2,056,740 |
| 262,691 | | Banca Mediolanum S.p.A. | | 1,524,877 |
| 189,984 | | Eni S.p.A. | | 3,379,702 |
| 37,249 | | Luxottica Group S.p.A | | 2,342,393 |
| 170,007 | | Mediobanca Banca di Credito Finanziario S.p.A. | | 1,492,713 |
| 46,892 | | Moncler S.p.A. | | 1,630,545 |
| | | | | 12,426,970 |
| | | Japan – 24.7% | | |
| 284,300 | | Acom Co., Ltd. | | 1,050,677 |
| 68,100 | | Advantest Corp. | | 1,255,959 |
| 85,500 | | Aeon Co., Ltd. | | 1,962,556 |
| 28,600 | | Aisin Seiki Co., Ltd. | | 1,124,128 |
| 41,300 | | Alfresa Holdings Corp. | | 1,103,554 |
| 35,800 | | Aoyama Trading Co., Ltd. | | 1,085,089 |
| 31,060 | | Aozora Bank Ltd. | | 1,072,174 |
| 158,400 | | Astellas Pharma, Inc. | | 2,452,473 |
| 60,400 | | Brother Industries Ltd. | | 1,108,596 |
| 13,600 | | Central Japan Railway Co. | | 2,609,474 |
| 72,700 | | Credit Saison Co., Ltd. | | 1,157,814 |
| 30,400 | | CyberAgent, Inc. | | 1,290,522 |
| 116,100 | | Dai-ichi Life Holdings, Inc. | | 2,197,807 |
| 9,200 | | Disco Corp. | | 1,465,184 |
| 88,600 | | DMG Mori Co., Ltd. | | 1,283,830 |
| 18,000 | | FamilyMart UNY Holdings Co., Ltd. | | 2,092,968 |
| 27,000 | | FUJIFILM Holdings Corp. | | 1,170,833 |
| 111,500 | | Haseko Corp. | | 1,414,069 |
| 80,200 | | Hitachi Ltd. | | 2,460,694 |
| 110,700 | | Honda Motor Co., Ltd. | | 3,179,676 |
| 102,500 | | Ishihara Sangyo Kaisha
Ltd. (b) | | 1,226,348 |
| 95,000 | | Japan Post Holdings Co., Ltd. | | 1,128,196 |
| 216,500 | | JXTG Holdings, Inc. | | 1,475,888 |
| 80,500 | | Kajima Corp. | | 1,038,756 |
| 46,400 | | Kakaku.com, Inc. | | 841,767 |
| 126,600 | | KDDI Corp. | | 3,157,847 |
| 6,900 | | Keyence Corp. | | 3,381,663 |
| 30,900 | | Kikkoman Corp. | | 1,700,616 |
| 163,800 | | Kobe Steel Ltd. | | 1,318,123 |
| Shares | | Description | | Value |
|
| | | Japan (Continued) | | |
| 7,300 | | Kose Corp. | | $1,091,425 |
| 183,000 | | Leopalace21 Corp. | | 763,885 |
| 66,854 | | M3, Inc. | | 1,077,153 |
| 26,900 | | Matsumotokiyoshi Holdings Co., Ltd. | | 970,293 |
| 181,900 | | Mazda Motor Corp. | | 1,973,196 |
| 56,000 | | Medipal Holdings Corp. | | 1,202,535 |
| 161,200 | | Mitsubishi Chemical Holdings Corp. | | 1,258,770 |
| 50,400 | | Mitsubishi Heavy Industries Ltd. | | 1,781,766 |
| 7,100 | | Mitsubishi Tanabe Pharma Corp. | | 104,957 |
| 95,000 | | Mitsubishi UFJ Financial Group, Inc. | | 576,559 |
| 270,400 | | Mitsubishi UFJ Lease & Finance Co., Ltd. | | 1,392,320 |
| 55,900 | | Mitsui OSK Lines Ltd. | | 1,364,369 |
| 1,227,800 | | Mizuho Financial Group, Inc. | | 2,110,987 |
| 65,200 | | NET One Systems Co., Ltd. | | 1,364,846 |
| 135,100 | | NHK Spring Co., Ltd. | | 1,161,404 |
| 86,100 | | Nippon Paper Industries Co., Ltd. | | 1,563,512 |
| 179,100 | | Nippon Sheet Glass Co.,
Ltd. | | 1,515,846 |
| 58,200 | | Nippon Telegraph & Telephone Corp. | | 2,450,038 |
| 82,400 | | Nippon Yusen KK | | 1,332,742 |
| 237,700 | | Nissan Motor Co., Ltd. | | 2,164,548 |
| 288,700 | | NTN Corp. | | 1,059,262 |
| 104,800 | | NTT DOCOMO, Inc. | | 2,641,943 |
| 197,000 | | Oji Holdings Corp. | | 1,403,713 |
| 225,000 | | Onward Holdings Co., Ltd. | | 1,355,962 |
| 138,700 | | ORIX Corp. | | 2,263,010 |
| 57,400 | | Panasonic Corp. | | 635,630 |
| 76,600 | | Recruit Holdings Co., Ltd. | | 2,061,720 |
| 38,500 | | Sankyo Co., Ltd. | | 1,468,893 |
| 60,600 | | Seven & i Holdings Co., Ltd. | | 2,627,871 |
| 35,200 | | Shiseido Co., Ltd. | | 2,226,458 |
| 14,200 | | SoftBank Group Corp. | | 1,138,668 |
| 71,400 | | Sony Corp. | | 3,885,284 |
| 263,000 | | Sumitomo Chemical Co., Ltd. | | 1,319,254 |
| 78,600 | | Sumitomo Forestry Co., Ltd. | | 1,169,579 |
| 26,600 | | Sumitomo Mitsui Financial Group, Inc. | | 1,040,567 |
| 26,500 | | Suzuken Co., Ltd. | | 1,343,377 |
| 53,300 | | Taiheiyo Cement Corp. | | 1,575,358 |
| 61,100 | | Takeda Pharmaceutical Co., Ltd. | | 2,474,649 |
| 61,500 | | Teijin Ltd. | | 1,068,286 |
| 53,600 | | Tokai Rika Co., Ltd. | | 979,512 |
| 33,300 | | Tokuyama Corp. | | 747,837 |
| 15,500 | | Tokyo Electron Ltd. | | 2,154,628 |
| 32,200 | | Tokyo Seimitsu Co., Ltd. | | 774,786 |
| 170,000 | | Tokyu Fudosan Holdings Corp. | | 958,213 |
| 76,800 | | Tosoh Corp. | | 1,016,195 |
| 51,900 | | Toyota Boshoku Corp. | | 867,951 |
| 98,400 | | Toyota Motor Corp. | | 5,768,742 |
| 38,900 | | Ube Industries Ltd. | | 850,846 |
Page 18
See Notes to Financial Statements
First Trust RiverFront Dynamic Developed International ETF (RFDI)
Portfolio of Investments (Continued)
October 31, 2018
| Shares | | Description | | Value |
| COMMON STOCKS (a) (Continued) |
| | | Japan (Continued) | | |
| 58,000 | | Unicharm Corp. | | $1,579,084 |
| | | | | 123,485,710 |
| | | Luxembourg – 0.4% | | |
| 82,647 | | ArcelorMittal | | 2,063,167 |
| | | Netherlands – 4.9% | | |
| 51,784 | | AerCap Holdings N.V. (b) | | 2,593,343 |
| 30,638 | | ASML Holding N.V. | | 5,237,245 |
| 34,896 | | EXOR N.V. | | 1,977,828 |
| 215,015 | | Fiat Chrysler Automobiles N.V. (b) | | 3,275,569 |
| 162,007 | | Koninklijke Ahold Delhaize N.V. | | 3,712,149 |
| 32,951 | | Randstad N.V. | | 1,662,693 |
| 183,907 | | STMicroelectronics N.V. | | 2,795,416 |
| 14,006 | | Unilever N.V. | | 753,932 |
| 41,207 | | Wolters Kluwer N.V. | | 2,341,123 |
| | | | | 24,349,298 |
| | | Norway – 3.0% | | |
| 51,498 | | Aker BP ASA | | 1,698,314 |
| 263,867 | | Aker Solutions ASA (b) | | 1,740,374 |
| 164,376 | | DNB ASA | | 2,974,633 |
| 891,796 | | DNO ASA | | 1,716,986 |
| 133,086 | | Equinor ASA | | 3,462,213 |
| 351,582 | | Petroleum Geo-Services ASA (b) | | 1,098,563 |
| 299,796 | | Storebrand ASA | | 2,495,158 |
| | | | | 15,186,241 |
| | | Portugal – 0.8% | | |
| 132,146 | | Galp Energia SGPS S.A. | | 2,304,249 |
| 125,873 | | Jeronimo Martins SGPS S.A. | | 1,548,311 |
| | | | | 3,852,560 |
| | | Singapore – 1.7% | | |
| 4,894,700 | | Hutchison Port Holdings Trust | | 1,199,202 |
| 9,000 | | Jardine Cycle & Carriage Ltd. | | 196,679 |
| 258,800 | | Keppel Corp., Ltd. | | 1,158,402 |
| 220,200 | | Singapore Airlines Ltd. | | 1,507,054 |
| 310,100 | | Singapore Exchange Ltd. | | 1,531,303 |
| 394,700 | | Singapore Telecommunications Ltd. | | 900,445 |
| 57,800 | | Venture Corp Ltd. | | 639,278 |
| 1,349,500 | | Yanlord Land Group Ltd. | | 1,227,571 |
| | | | | 8,359,934 |
| | | Spain – 1.2% | | |
| 106,312 | | Banco Santander S.A. | | 505,138 |
| 233,403 | | Ence Energia y Celulosa S.A. | | 1,962,902 |
| 91,682 | | Endesa S.A. | | 1,919,030 |
| 196,495 | | International Consolidated Airlines Group S.A. | | 1,515,499 |
| | | | | 5,902,569 |
| | | Sweden – 6.4% | | |
| 64,741 | | Atlas Copco AB, Class B | | 1,483,904 |
| Shares | | Description | | Value |
|
| | | Sweden (Continued) | | |
| 140,953 | | Axfood AB | | $2,514,501 |
| 120,200 | | Elekta AB, Class B | | 1,524,312 |
| 91,245 | | Kinnevik AB, Class B | | 2,531,606 |
| 71,087 | | Lundin Petroleum AB | | 2,170,406 |
| 224,335 | | Sandvik AB | | 3,552,137 |
| 1,090,562 | | SAS AB (b) | | 2,464,479 |
| 152,230 | | SKF AB, Class B | | 2,445,355 |
| 145,635 | | Svenska Handelsbanken AB, Class A | | 1,584,119 |
| 177,401 | | Swedbank AB, Class A | | 3,995,383 |
| 57,702 | | Swedish Match AB | | 2,940,225 |
| 94,466 | | Volvo AB, Class A | | 1,416,296 |
| 224,247 | | Volvo AB, Class B | | 3,352,255 |
| | | | | 31,974,978 |
| | | Switzerland – 9.8% | | |
| 52,575 | | Cie Financiere Richemont S.A. | | 3,847,270 |
| 56,202 | | Coca-Cola HBC AG | | 1,659,444 |
| 49,735 | | Logitech International S.A. | | 1,840,464 |
| 9,911 | | Lonza Group AG | | 3,116,531 |
| 155,044 | | Nestle S.A. | | 13,103,654 |
| 57,012 | | Novartis AG | | 4,995,024 |
| 115,938 | | OC Oerlikon Corp. AG | | 1,380,228 |
| 4,010 | | Partners Group Holding AG | | 2,856,749 |
| 38,615 | | Roche Holding AG | | 9,397,345 |
| 968 | | SGS S.A. | | 2,299,018 |
| 13,428 | | Temenos Group AG | | 1,846,575 |
| 16,738 | | Vifor Pharma AG | | 2,418,921 |
| | | | | 48,761,223 |
| | | United Kingdom – 12.4% | | |
| 253,972 | | 3i Group PLC | | 2,850,874 |
| 106,056 | | Ashtead Group PLC | | 2,623,779 |
| 42,431 | | Berkeley Group Holdings PLC | | 1,898,778 |
| 253,527 | | BP PLC | | 1,838,382 |
| 35,046 | | British American Tobacco PLC | | 1,520,145 |
| 21,496 | | Diageo PLC | | 744,193 |
| 88,887 | | easyJet PLC | | 1,363,384 |
| 409,050 | | Evraz PLC | | 2,839,063 |
| 11,635 | | GlaxoSmithKline PLC | | 224,744 |
| 101,959 | | Hargreaves Lansdown PLC | | 2,434,452 |
| 105,280 | | Hikma Pharmaceuticals PLC | | 2,558,827 |
| 483,987 | | HSBC Holdings PLC | | 3,989,559 |
| 37,759 | | InterContinental Hotels Group PLC | | 1,983,632 |
| 932,287 | | Legal & General Group PLC | | 2,996,998 |
| 760,492 | | Man Group PLC | | 1,511,069 |
| 82,874 | | Mondi PLC | | 1,953,870 |
| 132,599 | | NEX Group PLC | | 1,925,384 |
| 39,486 | | Next PLC | | 2,626,511 |
| 42,101 | | NMC Health PLC | | 1,900,693 |
| 90,886 | | Pearson PLC | | 1,043,908 |
| 64,363 | | Persimmon PLC | | 1,887,246 |
| 228,255 | | Royal Dutch Shell PLC, Class A | | 7,295,347 |
| 194,301 | | Royal Dutch Shell PLC, Class B | | 6,370,319 |
| 237,875 | | Sage Group (The) PLC | | 1,655,258 |
See Notes to Financial Statements
Page 19
First Trust RiverFront Dynamic Developed International ETF (RFDI)
Portfolio of Investments (Continued)
October 31, 2018
| Shares | | Description | | Value |
| COMMON STOCKS (a) (Continued) |
| | | United Kingdom (Continued) | | |
| 125,928 | | Sky PLC | | $2,778,995 |
| 653,979 | | Taylor Wimpey PLC | | 1,350,004 |
| | | | | 62,165,414 |
| | | Total Investments – 99.7% | | 498,098,785 |
| | | (Cost $550,271,187) (d) | | |
| | | Net Other Assets and Liabilities – 0.3% | | 1,627,515 |
| | | Net Assets – 100.0% | | $499,726,300 |
|
| (a) | Portfolio securities are categorized based upon their country of incorporation. For a breakdown of the portfolio securities by sector, please see the Fund Performance Overview. |
| (b) | Non-income producing security. |
| (c) | This security is restricted in the U.S. and cannot be offered for public sale without first being registered under the Securities Act of 1933, as amended. This security is not restricted on the foreign exchange where it trades freely without any additional registration. As such, it does not require the additional disclosure required of restricted securities. |
| (d) | Aggregate cost for federal income tax purposes was $551,606,908. As of October 31, 2018, the aggregate gross unrealized appreciation for all investments in which there was an excess of value over tax cost was $16,764,176 and the aggregate gross unrealized depreciation for all investments in which there was an excess of tax cost over value was $70,272,299. The net unrealized depreciation was $53,508,123. |
Valuation Inputs
A summary of the inputs used to value the Fund’s investments as of October 31, 2018 is as follows (see Note 2A - Portfolio Valuation in the Notes to Financial Statements):
| | Total
Value at
10/31/2018 | Level 1
Quoted
Prices | Level 2
Significant
Observable
Inputs | Level 3
Significant
Unobservable
Inputs |
| Common Stocks* | $ 498,098,785 | $ 498,098,785 | $ — | $ — |
| * | See Portfolio of Investments for country breakout. |
Currency Exposure
Diversification | % of Total
Investments |
| EUR | 30.1% |
| JPY | 24.8 |
| GBP | 13.1 |
| CHF | 9.5 |
| SEK | 6.4 |
| AUD | 5.4 |
| HKD | 3.3 |
| NOK | 3.1 |
| DKK | 1.6 |
| SGD | 1.4 |
| USD | 1.1 |
| CAD | 0.2 |
| Total | 100.0% |
| Currency Abbreviations |
| AUD | Australian Dollar |
| CAD | Canadian Dollar |
| CHF | Swiss Franc |
| DKK | Danish Krone |
| EUR | Euro |
| GBP | British Pound Sterling |
| HKD | Hong Kong Dollar |
| JPY | Japanese Yen |
| NOK | Norwegian Krone |
| SEK | Swedish Krona |
| SGD | Singapore Dollar |
| USD | United States Dollar |
Page 20
See Notes to Financial Statements
First Trust RiverFront Dynamic Europe ETF (RFEU)
Portfolio of Investments
October 31, 2018
| Shares | | Description | | Value |
| COMMON STOCKS (a) – 99.8% |
| | | Austria – 0.7% | | |
| 16,072 | | Verbund AG | | $648,061 |
| | | Belgium – 0.9% | | |
| 9,279 | | UCB S.A. | | 779,621 |
| | | Denmark – 2.5% | | |
| 7,351 | | Carlsberg A.S., Class B | | 810,888 |
| 14,405 | | GN Store Nord A.S. | | 611,680 |
| 4,138 | | Novo Nordisk A.S., Class B | | 178,979 |
| 1,691 | | Rockwool International A.S., Class B | | 578,137 |
| | | | | 2,179,684 |
| | | Finland – 2.0% | | |
| 24,877 | | Fortum OYJ | | 523,950 |
| 9,328 | | Neste OYJ | | 768,736 |
| 30,918 | | Stora Enso OYJ, Class R | | 465,931 |
| | | | | 1,758,617 |
| | | France – 17.0% | | |
| 72,307 | | Air France-KLM (b) | | 701,051 |
| 12,538 | | Alstom S.A. | | 548,875 |
| 20,395 | | BNP Paribas S.A. | | 1,065,621 |
| 816 | | Christian Dior SE | | 316,276 |
| 49,013 | | Credit Agricole S.A. | | 628,869 |
| 1,908 | | Danone S.A. | | 135,241 |
| 269 | | Dassault Aviation S.A. | | 446,360 |
| 5,557 | | Dassault Systemes SE | | 697,705 |
| 50,309 | | Electricite de France S.A. | | 836,503 |
| 7,960 | | Faurecia S.A. | | 386,872 |
| 1,504 | | Hermes International | | 860,270 |
| 4,666 | | Ipsen S.A. | | 647,934 |
| 2,246 | | Kering S.A. | | 1,001,292 |
| 5,862 | | L’Oreal S.A. | | 1,320,615 |
| 6,072 | | LVMH Moet Hennessy Louis Vuitton SE | | 1,848,659 |
| 33,273 | | Peugeot S.A. | | 792,551 |
| 7,771 | | Renault S.A. | | 581,537 |
| 7,150 | | Safran S.A. | | 923,628 |
| 14,676 | | TOTAL S.A. | | 863,719 |
| 5,578 | | Ubisoft Entertainment S.A. (b) | | 502,275 |
| | | | | 15,105,853 |
| | | Germany – 12.3% | | |
| 37,563 | | AIXTRON SE (b) | | 472,470 |
| 1,497 | | Allianz SE | | 312,732 |
| 9,797 | | BASF SE | | 754,900 |
| 1,083 | | Bayer AG | | 83,143 |
| 11,172 | | Covestro AG (c) | | 722,795 |
| 30,109 | | Deutsche Lufthansa AG | | 605,669 |
| 14,715 | | Evonik Industries AG | | 456,674 |
| 5,711 | | Fraport AG Frankfurt Airport Services Worldwide | | 441,803 |
| 32,959 | | Infineon Technologies AG | | 661,132 |
| 3,573 | | Linde AG | | 772,160 |
| 36,172 | | METRO AG | | 544,904 |
| Shares | | Description | | Value |
|
| | | Germany (Continued) | | |
| 4,312 | | Rheinmetall AG | | $373,820 |
| 25,696 | | RWE AG | | 501,181 |
| 16,735 | | Salzgitter AG | | 670,624 |
| 3,851 | | SAP SE | | 412,891 |
| 4,650 | | Sartorius AG (Preference Shares) | | 674,153 |
| 54,561 | | Schaeffler AG (Preference Shares) | | 576,704 |
| 3,052 | | Wacker Chemie AG | | 273,298 |
| 5,019 | | Wirecard AG | | 940,261 |
| 16,180 | | Zalando SE (b) (c) | | 626,759 |
| | | | | 10,878,073 |
| | | Italy – 3.9% | | |
| 354,678 | | A2A S.p.A. | | 572,259 |
| 72,788 | | Banca Mediolanum S.p.A. | | 422,522 |
| 52,984 | | Eni S.p.A. | | 942,553 |
| 10,326 | | Luxottica Group S.p.A | | 649,348 |
| 47,070 | | Mediobanca Banca di Credito Finanziario S.p.A. | | 413,289 |
| 12,945 | | Moncler S.p.A. | | 450,128 |
| | | | | 3,450,099 |
| | | Luxembourg – 0.6% | | |
| 23,160 | | ArcelorMittal | | 578,157 |
| | | Netherlands – 7.6% | | |
| 14,288 | | AerCap Holdings N.V. (b) | | 715,543 |
| 8,434 | | ASML Holding N.V. | | 1,441,704 |
| 9,706 | | EXOR N.V. | | 550,115 |
| 59,580 | | Fiat Chrysler Automobiles N.V. (b) | | 907,650 |
| 44,802 | | Koninklijke Ahold Delhaize N.V. | | 1,026,571 |
| 9,098 | | Randstad N.V. | | 459,081 |
| 50,632 | | STMicroelectronics N.V. | | 769,614 |
| 3,870 | | Unilever N.V. | | 208,319 |
| 11,440 | | Wolters Kluwer N.V. | | 649,949 |
| | | | | 6,728,546 |
| | | Norway – 4.7% | | |
| 14,304 | | Aker BP ASA | | 471,721 |
| 73,169 | | Aker Solutions ASA (b) | | 482,597 |
| 45,654 | | DNB ASA | | 826,178 |
| 250,592 | | DNO ASA | | 482,468 |
| 36,836 | | Equinor ASA | | 958,283 |
| 96,867 | | Petroleum Geo-Services ASA (b) | | 302,673 |
| 83,297 | | Storebrand ASA | | 693,269 |
| | | | | 4,217,189 |
| | | Portugal – 1.2% | | |
| 36,480 | | Galp Energia SGPS S.A. | | 636,107 |
| 34,789 | | Jeronimo Martins SGPS S.A. | | 427,925 |
| | | | | 1,064,032 |
| | | Spain – 1.9% | | |
| 29,573 | | Banco Santander S.A. | | 140,515 |
| 66,334 | | Ence Energia y Celulosa S.A. | | 557,864 |
| 25,507 | | Endesa S.A. | | 533,897 |
See Notes to Financial Statements
Page 21
First Trust RiverFront Dynamic Europe ETF (RFEU)
Portfolio of Investments (Continued)
October 31, 2018
| Shares | | Description | | Value |
| COMMON STOCKS (a) (Continued) |
| | | Spain (Continued) | | |
| 54,269 | | International Consolidated Airlines Group S.A. | | $418,558 |
| | | | | 1,650,834 |
| | | Sweden – 10.0% | | |
| 17,899 | | Atlas Copco AB, Class B | | 410,256 |
| 39,242 | | Axfood AB | | 700,049 |
| 33,157 | | Elekta AB, Class B | | 420,479 |
| 25,276 | | Kinnevik AB, Class B | | 701,286 |
| 19,635 | | Lundin Petroleum AB | | 599,490 |
| 61,880 | | Sandvik AB | | 979,813 |
| 302,272 | | SAS AB (b) | | 683,082 |
| 42,154 | | SKF AB, Class B | | 677,143 |
| 40,348 | | Svenska Handelsbanken AB, Class A | | 438,878 |
| 48,871 | | Swedbank AB, Class A | | 1,100,661 |
| 15,952 | | Swedish Match AB | | 812,840 |
| 26,126 | | Volvo AB, Class A | | 391,698 |
| 61,916 | | Volvo AB, Class B | | 925,579 |
| | | | | 8,841,254 |
| | | Switzerland – 15.1% | | |
| 14,535 | | Cie Financiere Richemont S.A. | | 1,063,625 |
| 15,544 | | Coca-Cola HBC AG | | 458,959 |
| 13,686 | | Logitech International S.A. | | 506,456 |
| 2,735 | | Lonza Group AG | | 860,025 |
| 42,787 | | Nestle S.A. | | 3,616,174 |
| 15,753 | | Novartis AG | | 1,380,176 |
| 31,937 | | OC Oerlikon Corp. AG | | 380,206 |
| 1,101 | | Partners Group Holding AG | | 784,359 |
| 10,644 | | Roche Holding AG | | 2,590,324 |
| 265 | | SGS S.A. | | 629,380 |
| 3,688 | | Temenos Group AG | | 507,162 |
| 4,585 | | Vifor Pharma AG | | 662,609 |
| | | | | 13,439,455 |
| | | United Kingdom – 19.4% | | |
| 70,028 | | 3i Group PLC | | 786,075 |
| 29,151 | | Ashtead Group PLC | | 721,183 |
| 11,778 | | Berkeley Group Holdings PLC | | 527,063 |
| 70,122 | | BP PLC | | 508,471 |
| 9,710 | | British American Tobacco PLC | | 421,178 |
| 5,935 | | Diageo PLC | | 205,470 |
| 24,641 | | easyJet PLC | | 377,953 |
| 113,484 | | Evraz PLC | | 787,650 |
| 3,225 | | GlaxoSmithKline PLC | | 62,295 |
| 28,157 | | Hargreaves Lansdown PLC | | 672,298 |
| 29,111 | | Hikma Pharmaceuticals PLC | | 707,542 |
| 133,501 | | HSBC Holdings PLC | | 1,100,464 |
| 10,429 | | InterContinental Hotels Group PLC | | 547,877 |
| 257,403 | | Legal & General Group PLC | | 827,466 |
| 211,002 | | Man Group PLC | | 419,253 |
| 22,930 | | Mondi PLC | | 540,607 |
| 36,410 | | NEX Group PLC | | 528,686 |
| 10,907 | | Next PLC | | 725,507 |
| Shares | | Description | | Value |
|
| | | United Kingdom (Continued) | | |
| 11,515 | | NMC Health PLC | | $519,856 |
| 24,902 | | Pearson PLC | | 286,022 |
| 17,853 | | Persimmon PLC | | 523,484 |
| 63,439 | | Royal Dutch Shell PLC, Class A | | 2,027,599 |
| 54,032 | | Royal Dutch Shell PLC, Class B | | 1,771,484 |
| 65,148 | | Sage Group (The) PLC | | 453,334 |
| 34,602 | | Sky PLC | | 763,601 |
| 181,418 | | Taylor Wimpey PLC | | 374,500 |
| | | | | 17,186,918 |
| | | Total Investments – 99.8% | | 88,506,393 |
| | | (Cost $97,551,116) (d) | | |
| | | Net Other Assets and Liabilities – 0.2% | | 199,683 |
| | | Net Assets – 100.0% | | $88,706,076 |
|
| (a) | Portfolio securities are categorized based upon their country of incorporation. For a breakdown of the portfolio securities by sector, please see the Fund Performance Overview. |
| (b) | Non-income producing security. |
| (c) | This security is restricted in the U.S. and cannot be offered for public sale without first being registered under the Securities Act of 1933, as amended. This security is not restricted on the foreign exchange where it trades freely without any additional registration. As such, it does not require the additional disclosure required of restricted securities. |
| (d) | Aggregate cost for federal income tax purposes was $97,634,170. As of October 31, 2018, the aggregate gross unrealized appreciation for all investments in which there was an excess of value over tax cost was $3,392,166 and the aggregate gross unrealized depreciation for all investments in which there was an excess of tax cost over value was $12,519,943. The net unrealized depreciation was $9,127,777. |
Valuation Inputs
A summary of the inputs used to value the Fund’s investments as of October 31, 2018 is as follows (see Note 2A - Portfolio Valuation in the Notes to Financial Statements):
| | Total
Value at
10/31/2018 | Level 1
Quoted
Prices | Level 2
Significant
Observable
Inputs | Level 3
Significant
Unobservable
Inputs |
| Common Stocks* | $ 88,506,393 | $ 88,506,393 | $ — | $ — |
| * | See Portfolio of Investments for country breakout. |
Page 22
See Notes to Financial Statements
First Trust RiverFront Dynamic Europe ETF (RFEU)
Portfolio of Investments (Continued)
October 31, 2018
Currency Exposure
Diversification | % of Total
Investments |
| EUR | 46.9% |
| GBP | 20.4 |
| CHF | 14.7 |
| SEK | 10.0 |
| NOK | 4.8 |
| DKK | 2.4 |
| USD | 0.8 |
| Total | 100.0% |
| Currency Abbreviations |
| CHF | Swiss Franc |
| DKK | Danish Krone |
| EUR | Euro |
| GBP | British Pound Sterling |
| NOK | Norwegian Krone |
| SEK | Swedish Krona |
| USD | United States Dollar |
See Notes to Financial Statements
Page 23
First Trust RiverFront Dynamic Emerging Markets ETF (RFEM)
Portfolio of Investments
October 31, 2018
| Shares | | Description | | Value |
| COMMON STOCKS (a) – 99.8% |
| | | Bermuda – 0.7% | | |
| 1,000,825 | | Hopson Development Holdings Ltd. | | $767,023 |
| | | Brazil – 6.2% | | |
| 250,016 | | Banco do Estado do Rio Grande do Sul S.A., Class B (Preference Shares) | | 1,334,225 |
| 96,600 | | Bradespar S.A. (Preference Shares) | | 897,084 |
| 401,551 | | JBS S.A. | | 1,105,978 |
| 31,906 | | Magazine Luiza S.A. | | 1,447,194 |
| 316,104 | | Metalurgica Gerdau S.A. (Preference Shares) | | 674,423 |
| 139,737 | | Transmissora Alianca de Energia Eletrica S.A. | | 835,831 |
| | | | | 6,294,735 |
| | | Cayman Islands – 15.7% | | |
| 7,970 | | 51job, Inc., ADR (b) | | 489,438 |
| 23,055 | | Alibaba Group Holding Ltd., ADR (b) | | 3,280,265 |
| 14,573 | | Autohome, Inc., ADR | | 1,054,794 |
| 2,367 | | Baidu, Inc., ADR (b) | | 449,872 |
| 1,291,200 | | China First Capital Group Ltd. (b) | | 520,303 |
| 427,600 | | China Shineway Pharmaceutical Group Ltd. | | 497,834 |
| 1,321,000 | | Dongyue Group Ltd. | | 704,134 |
| 25,630 | | GDS Holdings Ltd., ADR (b) | | 601,536 |
| 123,506 | | Health and Happiness H&H International Holdings Ltd. (b) | | 702,423 |
| 815,200 | | Kingdee International Software Group Co., Ltd. | | 665,304 |
| 16,383 | | Noah Holdings Ltd. (b) | | 617,803 |
| 1,162,000 | | Sany Heavy Equipment International Holdings Co., Ltd. | | 334,881 |
| 880,557 | | Sino Biopharmaceutical Ltd. | | 789,385 |
| 745,200 | | SSY Group Ltd. | | 626,230 |
| 119,802 | | Tencent Holdings Ltd. | | 4,078,977 |
| 76,000 | | Wuxi Biologics Cayman, Inc. (b) (c) | | 541,268 |
| | | | | 15,954,447 |
| | | Chile – 0.8% | | |
| 67,840 | | Cia Cervecerias Unidas S.A. | | 846,045 |
| | | China – 11.0% | | |
| 2,438,744 | | Agricultural Bank of China Ltd., Class H | | 1,069,795 |
| 3,966,149 | | Bank of China Ltd., Class H | | 1,689,240 |
| 2,859,517 | | China Construction Bank Corp., Class H | | 2,268,083 |
| 1,521,919 | | China Petroleum & Chemical Corp., Class H | | 1,234,311 |
| 2,684,200 | | Datang International Power Generation Co. Ltd., Class H | | 599,003 |
| Shares | | Description | | Value |
|
| | | China (Continued) | | |
| 2,393,800 | | Huaneng Power International, Inc., Class H | | $1,333,968 |
| 3,073,858 | | Industrial & Commercial Bank of China Ltd., Class H | | 2,077,474 |
| 3,523,080 | | Metallurgical Corp. of China Ltd., Class H | | 853,595 |
| | | | | 11,125,469 |
| | | Colombia – 1.0% | | |
| 234,525 | | Almacenes Exito S.A. | | 1,012,546 |
| | | Czech Republic – 0.8% | | |
| 238,424 | | Moneta Money Bank A.S. (c) | | 791,221 |
| | | Hong Kong – 4.0% | | |
| 53,431 | | China Mobile Ltd. | | 499,429 |
| 1,661,100 | | China Overseas Grand Oceans Group Ltd. | | 512,610 |
| 5,224,575 | | China South City Holdings Ltd. | | 766,169 |
| 641,700 | | CNOOC Ltd. | | 1,101,420 |
| 816,080 | | Sinotruk Hong Kong Ltd. | | 1,171,783 |
| | | | | 4,051,411 |
| | | Hungary – 0.4% | | |
| 281,511 | | Magyar Telekom Telecommunications PLC | | 383,989 |
| | | India – 9.5% | | |
| 327,701 | | Ashok Leyland Ltd. | | 506,985 |
| 74,002 | | Gujarat Narmada Valley Fertilizers & Chemicals Ltd. | | 333,307 |
| 132,793 | | Hexaware Technologies Ltd. | | 600,796 |
| 53,127 | | Hindustan Unilever Ltd. | | 1,161,760 |
| 338,912 | | Indiabulls Real Estate Ltd. (b) | | 343,747 |
| 127,599 | | Infosys Ltd. | | 1,183,671 |
| 743,161 | | Power Finance Corp., Ltd. | | 960,295 |
| 557,194 | | REC Ltd. | | 877,103 |
| 181,208 | | Sterlite Technologies Ltd. | | 936,121 |
| 51,852 | | Tata Consultancy Services Ltd. | | 1,356,588 |
| 138,394 | | Tech Mahindra Ltd. | | 1,392,362 |
| | | | | 9,652,735 |
| | | Indonesia – 3.3% | | |
| 3,236,588 | | Bukit Asam Tbk PT | | 904,818 |
| 743,847 | | Indah Kiat Pulp & Paper Corp. Tbk PT | | 622,625 |
| 5,943,829 | | Japfa Comfeed Indonesia Tbk PT | | 793,683 |
| 486,283 | | United Tractors Tbk PT | | 1,071,566 |
| | | | | 3,392,692 |
| | | Israel – 1.3% | | |
| 10,408 | | Orbotech Ltd. (b) | | 582,224 |
| 33,083 | | Radware Ltd. (b) | | 767,856 |
| | | | | 1,350,080 |
| | | Malaysia – 2.2% | | |
| 545,600 | | Hartalega Holdings Bhd | | 816,216 |
| 18,900 | | Nestle Malaysia Bhd | | 649,497 |
Page 24
See Notes to Financial Statements
First Trust RiverFront Dynamic Emerging Markets ETF (RFEM)
Portfolio of Investments (Continued)
October 31, 2018
| Shares | | Description | | Value |
| COMMON STOCKS (a) (Continued) |
| | | Malaysia (Continued) | | |
| 1,381,400 | | Sime Darby Bhd | | $726,271 |
| | | | | 2,191,984 |
| | | Philippines – 1.5% | | |
| 462,760 | | San Miguel Corp. | | 1,478,964 |
| | | Poland – 0.9% | | |
| 48,342 | | Jastrzebska Spolka Weglowa S.A. (b) | | 932,283 |
| | | Portugal – 0.8% | | |
| 799,399 | | Sonae SGPS S.A. | | 800,861 |
| | | Russia – 8.8% | | |
| 183,401,288 | | Federal Grid Co. Unified Energy System PJSC | | 425,833 |
| 568,788 | | Gazprom PJSC | | 1,342,408 |
| 212,545 | | Gazprom PJSC, ADR | | 1,007,038 |
| 10,198,564 | | Inter RAO UES PJSC | | 616,493 |
| 24,786 | | LUKOIL PJSC | | 1,860,631 |
| 1,229,761 | | Magnitogorsk Iron & Steel Works PJSC | | 895,059 |
| 543,842 | | Raspadskaya OJSC (b) | | 990,534 |
| 316,364 | | Sberbank of Russia PJSC | | 911,530 |
| 2,232,299 | | Surgutneftegas PJSC | | 900,392 |
| | | | | 8,949,918 |
| | | South Africa – 1.6% | | |
| 6,430 | | Naspers Ltd., Class N | | 1,130,041 |
| 28,465 | | Nedbank Group Ltd. | | 480,292 |
| | | | | 1,610,333 |
| | | South Korea – 18.3% | | |
| 11,611 | | Celltrion Pharm, Inc. (d) | | 545,117 |
| 20,686 | | Hana Financial Group, Inc. | | 695,252 |
| 53,459 | | Hanwha Chemical Corp. | | 757,635 |
| 131,179 | | Hanwha General Insurance Co., Ltd. | | 682,630 |
| 37,449 | | HDC Holdings Co., Ltd. | | 552,098 |
| 8,628 | | Hotel Shilla Co., Ltd. | | 539,842 |
| 21,309 | | Hyosung Corp. | | 959,284 |
| 60,567 | | Industrial Bank of Korea | | 789,276 |
| 25,286 | | KB Financial Group, Inc. | | 1,051,780 |
| 60,587 | | Korean Reinsurance Co. | | 515,193 |
| 10,246 | | Kumho Petrochemical Co., Ltd. | | 774,148 |
| 6,458 | | LG Uplus Corp. | | 91,525 |
| 3,451 | | Lotte Chemical Corp. | | 794,952 |
| 18,636 | | LOTTE Fine Chemical Co., Ltd. | | 666,418 |
| 93,002 | | Moorim P&P Co., Ltd. | | 619,442 |
| 4,315 | | Pearl Abyss Corp. (b) | | 778,521 |
| 144,010 | | Samsung Electronics Co., Ltd. | | 5,358,277 |
| 24,487 | | Samsung Electronics Co., Ltd. (Preference Shares) | | 768,207 |
| 26,761 | | SK Hynix, Inc. | | 1,601,597 |
| | | | | 18,541,194 |
| Shares | | Description | | Value |
|
| | | Taiwan – 9.3% | | |
| 88,456 | | Catcher Technology Co., Ltd. | | $890,477 |
| 2,396,233 | | China Development Financial Holding Corp. | | 768,981 |
| 1,573,510 | | CTBC Financial Holding Co., Ltd. | | 1,050,091 |
| 364,191 | | Gigabyte Technology Co., Ltd. | | 476,086 |
| 80,018 | | Global Unichip Corp. | | 543,056 |
| 74,485 | | Simplo Technology Co., Ltd. | | 432,087 |
| 2,256,685 | | SinoPac Financial Holdings Co., Ltd. | | 765,769 |
| 521,017 | | Taiwan Semiconductor Manufacturing Co., Ltd. | | 3,940,083 |
| 1,071,760 | | Walsin Lihwa Corp. | | 531,672 |
| | | | | 9,398,302 |
| | | Thailand – 0.9% | | |
| 215,200 | | PTT Exploration & Production PCL | | 905,593 |
| | | Turkey – 0.8% | | |
| 12,045 | | TAV Havalimanlari Holding A.S. | | 50,123 |
| 315,532 | | Turk Hava Yollari AO (b) | | 793,120 |
| | | | | 843,243 |
| | | Total Investments – 99.8% | | 101,275,068 |
| | | (Cost $114,777,700) (e) | | |
| | | Net Other Assets and Liabilities – 0.2% | | 236,485 |
| | | Net Assets – 100.0% | | $101,511,553 |
|
| (a) | Portfolio securities are categorized based upon their country of incorporation. For a breakdown of the portfolio securities by sector, please see the Fund Performance Overview. |
| (b) | Non-income producing security. |
| (c) | This security is restricted in the U.S. and cannot be offered for public sale without first being registered under the Securities Act of 1933, as amended. This security is not restricted on the foreign exchange where it trades freely without any additional registration. As such, it does not require the additional disclosure required of restricted securities. |
| (d) | Non-income producing security which makes payment-in-kind (“PIK”) distributions. There were no in-kind distributions received for the fiscal year ended October 31, 2018. |
| (e) | Aggregate cost for federal income tax purposes was $115,419,716. As of October 31, 2018, the aggregate gross unrealized appreciation for all investments in which there was an excess of value over tax cost was $3,756,820 and the aggregate gross unrealized depreciation for all investments in which there was an excess of tax cost over value was $17,901,468. The net unrealized depreciation was $14,144,648. |
| ADR | American Depositary Receipt |
See Notes to Financial Statements
Page 25
First Trust RiverFront Dynamic Emerging Markets ETF (RFEM)
Portfolio of Investments (Continued)
October 31, 2018
Valuation Inputs
A summary of the inputs used to value the Fund’s investments as of October 31, 2018 is as follows (see Note 2A - Portfolio Valuation in the Notes to Financial Statements):
| | Total
Value at
10/31/2018 | Level 1
Quoted
Prices | Level 2
Significant
Observable
Inputs | Level 3
Significant
Unobservable
Inputs |
| Common Stocks* | $ 101,275,068 | $ 101,275,068 | $ — | $ — |
| * | See Portfolio of Investments for country breakout. |
Currency Exposure
Diversification | % of Total
Investments |
| HKD | 25.1% |
| KRW | 18.3 |
| INR | 9.5 |
| TWD | 9.3 |
| USD | 8.7 |
| RUB | 7.8 |
| BRL | 6.2 |
| IDR | 3.4 |
| MYR | 2.2 |
| ZAR | 1.6 |
| PHP | 1.5 |
| COP | 1.0 |
| PLN | 0.9 |
| THB | 0.9 |
| CLP | 0.8 |
| TRY | 0.8 |
| EUR | 0.8 |
| CZK | 0.8 |
| HUF | 0.4 |
| Total | 100.0% |
| Currency Abbreviations |
| BRL | Brazilian Real |
| CLP | Chilean Peso |
| COP | Colombian Peso |
| CZK | Czech Republic Koruna |
| EUR | Euro |
| HKD | Hong Kong Dollar |
| HUF | Hungarian Forint |
| IDR | Indonesian Rupiah |
| INR | Indian Rupee |
| KRW | South Korean Won |
| MYR | Malaysian Ringgit |
| PHP | Philippine Peso |
| PLN | Polish Zloty |
| RUB | Russian Ruble |
| THB | Thai Baht |
| TRY | Turkish Lira |
| TWD | New Taiwan Dollar |
| USD | United States Dollar |
| ZAR | South African Rand |
Page 26
See Notes to Financial Statements
This page intentionally left blank
See Notes to Financial Statements
Page 27
First Trust Exchange-Traded Fund III
Statements of Assets and Liabilities
October 31, 2018
| | First Trust
RiverFront
Dynamic
Asia
Pacific
ETF
(RFAP) | | First Trust
RiverFront
Dynamic
Developed
International
ETF
(RFDI) | | First Trust
RiverFront
Dynamic
Europe
ETF
(RFEU) | | First Trust
RiverFront
Dynamic
Emerging
Markets
ETF
(RFEM) |
| ASSETS: | | | | | | | |
Investments, at value
| $ 43,658,088 | | $ 498,098,785 | | $ 88,506,393 | | $ 101,275,068 |
Cash
| 65,179 | | 86,085 | | 12,991 | | 129,476 |
Foreign currency
| 328 | | — | | — | | 46,438 |
| Receivables: | | | | | | | |
Dividends
| 345,875 | | 1,367,162 | | 29,438 | | 102,783 |
Dividend reclaims
| 216 | | 547,265 | | 230,711 | | 3,153 |
Investment securities sold
| — | | — | | 387 | | — |
Miscellaneous
| — | | 3,947 | | — | | — |
Prepaid expenses
| — | | — | | — | | 38,716 |
Total Assets
| 44,069,686 | | 500,103,244 | | 88,779,920 | | 101,595,634 |
| LIABILITIES: | | | | | | | |
Due to custodian foreign currency
| — | | 3,141 | | 1,242 | | — |
Investment advisory fees payable
| 32,827 | | 373,803 | | 72,602 | | 84,081 |
Total Liabilities
| 32,827 | | 376,944 | | 73,844 | | 84,081 |
NET ASSETS
| $44,036,859 | | $499,726,300 | | $88,706,076 | | $101,511,553 |
| NET ASSETS consist of: | | | | | | | |
Paid-in capital
| $ 53,273,620 | | $ 573,620,709 | | $ 102,893,952 | | $ 125,763,625 |
Par value
| 8,500 | | 89,500 | | 15,500 | | 18,000 |
Accumulated distributable earnings (loss)
| (9,245,261) | | (73,983,909) | | (14,203,376) | | (24,270,072) |
NET ASSETS
| $44,036,859 | | $499,726,300 | | $88,706,076 | | $101,511,553 |
NET ASSET VALUE, per share
| $51.81 | | $55.84 | | $57.23 | | $56.40 |
Number of shares outstanding (unlimited number of shares authorized, par value $0.01 per share)
| 850,002 | | 8,950,002 | | 1,550,002 | | 1,800,002 |
Investments, at cost
| $49,314,745 | | $550,271,187 | | $97,551,116 | | $114,777,700 |
Foreign currency, at cost (proceeds)
| $334 | | $(3,161) | | $(1,242) | | $46,484 |
Page 28
See Notes to Financial Statements
First Trust Exchange-Traded Fund III
Statements of Operations
For the Year Ended October 31, 2018
| | First Trust
RiverFront
Dynamic
Asia
Pacific
ETF
(RFAP) | | First Trust
RiverFront
Dynamic
Developed
International
ETF
(RFDI) | | First Trust
RiverFront
Dynamic
Europe
ETF
(RFEU) | | First Trust
RiverFront
Dynamic
Emerging
Markets
ETF
(RFEM) |
| INVESTMENT INCOME: | | | | | | | |
Dividends
| $ 1,770,125 | | $ 19,989,928 | | $ 5,149,489 | | $ 3,728,205 |
Interest
| 2,518 | | 16,457 | | 3,479 | | 5,897 |
Foreign withholding tax
| (111,800) | | (1,930,773) | | (591,110) | | (402,970) |
Other
| — | | 160 | | 512 | | 57 |
Total investment income
| 1,660,843 | | 18,075,772 | | 4,562,370 | | 3,331,189 |
| EXPENSES: | | | | | | | |
Investment advisory fees
| 443,588 | | 4,829,968 | | 1,154,632 | | 1,112,070 |
Total expenses
| 443,588 | | 4,829,968 | | 1,154,632 | | 1,112,070 |
NET INVESTMENT INCOME (LOSS)
| 1,217,255 | | 13,245,804 | | 3,407,738 | | 2,219,119 |
| NET REALIZED AND UNREALIZED GAIN (LOSS): | | | | | | | |
| Net realized gain (loss) on: | | | | | | | |
Investments
| (3,326,227) | | (22,771,076) | | (4,424,387) | | (10,557,244) |
In-kind redemptions
| 1,988,314 | | 22,714,216 | | 6,017,454 | | 1,714,677 |
Foreign currency transactions
| (30,742) | | (38,664) | | (50,149) | | (280,009) |
Foreign capital gains tax
| — | | — | | — | | (97,880) |
Net realized gain (loss)
| (1,368,655) | | (95,524) | | 1,542,918 | | (9,220,456) |
| Net change in unrealized appreciation (depreciation) on: | | | | | | | |
Investments
| (6,916,649) | | (80,603,059) | | (18,788,536) | | (20,353,692) |
Foreign currency translation
| 1,523 | | (22,214) | | (12,686) | | (1,597) |
Deferred foreign capital gains tax
| — | | — | | — | | 38,716 |
Net change in unrealized appreciation (depreciation)
| (6,915,126) | | (80,625,273) | | (18,801,222) | | (20,316,573) |
NET REALIZED AND UNREALIZED GAIN (LOSS)
| (8,283,781) | | (80,720,797) | | (17,258,304) | | (29,537,029) |
NET INCREASE (DECREASE) IN NET ASSETS RESULTING FROM OPERATIONS
| $(7,066,526) | | $(67,474,993) | | $(13,850,566) | | $(27,317,910) |
See Notes to Financial Statements
Page 29
First Trust Exchange-Traded Fund III
Statements of Changes in Net Assets
| | First Trust RiverFront
Dynamic Asia Pacific ETF (RFAP) | | First Trust RiverFront Dynamic
Developed International ETF (RFDI) |
| | Year
Ended
10/31/2018 | | Year
Ended
10/31/2017 | | Year
Ended
10/31/2018 | | Year
Ended
10/31/2017 |
| OPERATIONS: | | | | | | | |
Net investment income (loss)
| $ 1,217,255 | | $ 330,737 | | $ 13,245,804 | | $ 3,268,515 |
Net realized gain (loss)
| (1,368,655) | | 1,748,559 | | (95,524) | | 7,881,133 |
Net increase from payment by the advisor
| — | | 7,644 | | — | | 35,978 |
Net change in unrealized appreciation (depreciation)
| (6,915,126) | | 691,628 | | (80,625,273) | | 28,845,189 |
Net increase (decrease) in net assets resulting from operations
| (7,066,526) | | 2,778,568 | | (67,474,993) | | 40,030,815 |
| DISTRIBUTIONS TO SHAREHOLDERS FROM: | | | | | | | |
Investment operations
| (1,178,793) | | | | (14,065,878) | | |
Net investment income
| | | (321,623) | | | | (2,607,367) |
Net realized gain
| | | — | | | | (201,961) |
Return of capital
| — | | — | | — | | — |
Total distributions to shareholders
| (1,178,793) | | (321,623) | | (14,065,878) | | (2,809,328) |
| SHAREHOLDER TRANSACTIONS: | | | | | | | |
Proceeds from shares sold
| 51,961,955 | | 41,927,847 | | 362,830,417 | | 488,981,137 |
Cost of shares redeemed
| (29,590,599) | | (40,544,804) | | (226,084,805) | | (107,360,484) |
Net increase (decrease) in net assets resulting from shareholder transactions
| 22,371,356 | | 1,383,043 | | 136,745,612 | | 381,620,653 |
Total increase (decrease) in net assets
| 14,126,037 | | 3,839,988 | | 55,204,741 | | 418,842,140 |
| NET ASSETS: | | | | | | | |
Beginning of period
| 29,910,822 | | 26,070,834 | | 444,521,559 | | 25,679,419 |
End of period
| $ 44,036,859 | | $ 29,910,822 | | $ 499,726,300 | | $ 444,521,559 |
Accumulated net investment income (loss) at end of period
| | | $82,292 | | | | $685,010 |
| CHANGES IN SHARES OUTSTANDING: | | | | | | | |
Shares outstanding, beginning of period
| 500,002 | | 500,002 | | 6,950,002 | | 500,002 |
Shares sold
| 850,000 | | 750,000 | | 5,650,000 | | 8,300,000 |
Shares redeemed
| (500,000) | | (750,000) | | (3,650,000) | | (1,850,000) |
Shares outstanding, end of period
| 850,002 | | 500,002 | | 8,950,002 | | 6,950,002 |
Page 30
See Notes to Financial Statements
First Trust RiverFront
Dynamic Europe ETF (RFEU) | | First Trust RiverFront Dynamic
Emerging Markets ETF (RFEM) |
Year
Ended
10/31/2018 | | Year
Ended
10/31/2017 | | Year
Ended
10/31/2018 | | Year
Ended
10/31/2017 |
| | | | | | | |
| $ 3,407,738 | | $ 924,336 | | $ 2,219,119 | | $ 488,145 |
| 1,542,918 | | 1,711,020 | | (9,220,456) | | 1,258,302 |
| — | | — | | — | | — |
| (18,801,222) | | 10,595,530 | | (20,316,573) | | 6,380,561 |
| (13,850,566) | | 13,230,886 | | (27,317,910) | | 8,127,008 |
| | | | | | | |
| (3,500,818) | | | | (2,433,860) | | |
| | | (859,771) | | | | (489,167) |
| | | (407,052) | | | | (190,082) |
| — | | — | | (165,738) | | — |
| (3,500,818) | | (1,266,823) | | (2,599,598) | | (679,249) |
| | | | | | | |
| 65,990,878 | | 126,451,387 | | 85,398,728 | | 71,331,250 |
| (83,913,181) | | (40,020,606) | | (29,475,851) | | (8,900,408) |
| (17,922,303) | | 86,430,781 | | 55,922,877 | | 62,430,842 |
| (35,273,687) | | 98,394,844 | | 26,005,369 | | 69,878,601 |
| | | | | | | |
| 123,979,763 | | 25,584,919 | | 75,506,184 | | 5,627,583 |
| $88,706,076 | | $ 123,979,763 | | $ 101,511,553 | | $ 75,506,184 |
| | | $74,035 | | | | $143,211 |
| | | | | | | |
| 1,900,002 | | 500,002 | | 1,100,002 | | 100,002 |
| 1,000,000 | | 2,100,000 | | 1,150,000 | | 1,150,000 |
| (1,350,000) | | (700,000) | | (450,000) | | (150,000) |
| 1,550,002 | | 1,900,002 | | 1,800,002 | | 1,100,002 |
See Notes to Financial Statements
Page 31
First Trust Exchange-Traded Fund III
Financial Highlights
For a share outstanding throughout each period
First Trust RiverFront Dynamic Asia Pacific ETF (RFAP)
| | Year Ended October 31, | | Period
Ended
10/31/2016 (a) |
| 2018 | | 2017 | |
Net asset value, beginning of period
| $ 59.82 | | $ 52.14 | | $ 51.31 |
| Income from investment operations: | | | | | |
Net investment income (loss)
| 1.27 | | 1.42 | | 0.55 |
Net realized and unrealized gain (loss)
| (7.99) | | 7.66 | | 0.60 |
Total from investment operations
| (6.72) | | 9.08 | | 1.15 |
| Distributions paid to shareholders from: | | | | | |
Net investment income
| (1.29) | | (1.40) | | (0.32) |
Net asset value, end of period
| $51.81 | | $59.82 | | $52.14 |
Total return (b)
| (11.48)% | | 17.77% (c) | | 2.26% |
| Ratios to average net assets/supplemental data: | | | | | |
Net assets, end of period (in 000’s)
| $ 44,037 | | $ 29,911 | | $ 26,071 |
Ratio of total expenses to average net assets
| 0.83% | | 0.83% | | 0.83% (d) |
Ratio of net investment income (loss) to average net assets
| 2.28% | | 1.93% | | 1.96% (d) |
Portfolio turnover rate (e)
| 136% | | 131% | | 49% |
| (a) | Inception date is April 13, 2016, which is consistent with the commencement of investment operations and is the date the initial creation units were established. |
| (b) | Total return is calculated assuming an initial investment made at the net asset value at the beginning of the period, reinvestment of all distributions at net asset value during the period, and redemption at net asset value on the last day of the period. The returns presented do not reflect the deduction of taxes that a shareholder would pay on Fund distributions or the redemption or sale of Fund shares. Total return is calculated for the time period presented and is not annualized for periods of less than a year. |
| (c) | The Fund received a reimbursement from the advisor in connection with a trade error in the amount of $7,644, which represents $0.02 per share. Since the advisor reimbursed the Fund, there was no effect on the Fund’s total return. |
| (d) | Annualized. |
| (e) | Portfolio turnover is calculated for the time period presented and is not annualized for periods of less than a year and does not include securities received or delivered from processing creations or redemptions and in-kind transactions. |
Page 32
See Notes to Financial Statements
First Trust Exchange-Traded Fund III
Financial Highlights (Continued)
For a share outstanding throughout each period
First Trust RiverFront Dynamic Developed International ETF (RFDI)
| | Year Ended October 31, | | Period
Ended
10/31/2016 (a) |
| 2018 | | 2017 | |
Net asset value, beginning of period
| $ 63.96 | | $ 51.36 | | $ 50.73 |
| Income from investment operations: | | | | | |
Net investment income (loss)
| 1.34 | | 0.82 | | 0.83 |
Net realized and unrealized gain (loss)
| (8.00) | | 12.73 | | 0.50 |
Total from investment operations
| (6.66) | | 13.55 | | 1.33 |
| Distributions paid to shareholders from: | | | | | |
Net investment income
| (1.44) | | (0.71) | | (0.70) |
Net realized gain
| (0.02) | | (0.24) | | — |
Total distributions
| (1.46) | | (0.95) | | (0.70) |
Net asset value, end of period
| $55.84 | | $63.96 | | $51.36 |
Total return (b)
| (10.65)% | | 26.60% (c) | | 2.68% |
| Ratios to average net assets/supplemental data: | | | | | |
Net assets, end of period (in 000’s)
| $ 499,726 | | $ 444,522 | | $ 25,679 |
Ratio of total expenses to average net assets
| 0.83% | | 0.83% | | 0.83% (d) |
Ratio of net investment income (loss) to average net assets
| 2.28% | | 1.86% | | 2.97% (d) |
Portfolio turnover rate (e)
| 133% | | 106% | | 44% |
| (a) | Inception date is April 13, 2016, which is consistent with the commencement of investment operations and is the date the initial creation units were established. |
| (b) | Total return is calculated assuming an initial investment made at the net asset value at the beginning of the period, reinvestment of all distributions at net asset value during the period, and redemption at net asset value on the last day of the period. The returns presented do not reflect the deduction of taxes that a shareholder would pay on Fund distributions or the redemption or sale of Fund shares. Total return is calculated for the time period presented and is not annualized for periods of less than a year. |
| (c) | The Fund received a reimbursement from the advisor in the amount of $35,978, which represents less than $0.01 per share. Since the advisor reimbursed the Fund, there was no effect on the Fund’s total return. |
| (d) | Annualized. |
| (e) | Portfolio turnover is calculated for the time period presented and is not annualized for periods of less than a year and does not include securities received or delivered from processing creations or redemptions and in-kind transactions. |
See Notes to Financial Statements
Page 33
First Trust Exchange-Traded Fund III
Financial Highlights (Continued)
For a share outstanding throughout each period
First Trust RiverFront Dynamic Europe ETF (RFEU)
| | Year Ended October 31, | | Period
Ended
10/31/2016 (a) |
| 2018 | | 2017 | |
Net asset value, beginning of period
| $ 65.25 | | $ 51.17 | | $ 50.67 |
| Income from investment operations: | | | | | |
Net investment income (loss)
| 1.48 | | 0.82 | | 0.91 |
Net realized and unrealized gain (loss)
| (7.97) | | 14.86 | | 0.41 |
Total from investment operations
| (6.49) | | 15.68 | | 1.32 |
| Distributions paid to shareholders from: | | | | | |
Net investment income
| (1.53) | | (0.79) | | (0.82) |
Net realized gain
| — | | (0.81) | | — |
Total distributions
| (1.53) | | (1.60) | | (0.82) |
Net asset value, end of period (b)
| $57.23 | | $65.25 | | $51.17 |
Total return
| (10.16)% | | 31.21% | | 2.66% |
| Ratios to average net assets/supplemental data: | | | | | |
Net assets, end of period (in 000’s)
| $ 88,706 | | $ 123,980 | | $ 25,585 |
Ratio of total expenses to average net assets
| 0.83% | | 0.83% | | 0.83% (c) |
Ratio of net investment income (loss) to average net assets
| 2.45% | | 1.71% | | 3.23% (c) |
Portfolio turnover rate (d)
| 130% | | 110% | | 41% |
| (a) | Inception date is April 13, 2016, which is consistent with the commencement of investment operations and is the date the initial creation units were established. |
| (b) | Total return is calculated assuming an initial investment made at the net asset value at the beginning of the period, reinvestment of all distributions at net asset value during the period, and redemption at net asset value on the last day of the period. The returns presented do not reflect the deduction of taxes that a shareholder would pay on Fund distributions or the redemption or sale of Fund shares. Total return is calculated for the time period presented and is not annualized for periods of less than a year. |
| (c) | Annualized. |
| (d) | Portfolio turnover is calculated for the time period presented and is not annualized for periods of less than a year and does not include securities received or delivered from processing creations or redemptions and in-kind transactions. |
Page 34
See Notes to Financial Statements
First Trust Exchange-Traded Fund III
Financial Highlights (Continued)
For a share outstanding throughout each period
First Trust RiverFront Dynamic Emerging Markets ETF (RFEM)
| | Year Ended October 31, | | Period
Ended
10/31/2016 (a) |
| 2018 | | 2017 | |
Net asset value, beginning of period
| $ 68.64 | | $ 56.27 | | $ 49.61 |
| Income from investment operations: | | | | | |
Net investment income (loss)
| 1.20 | | 0.71 | | 0.55 |
Net realized and unrealized gain (loss)
| (11.87) | | 13.70 | | 6.66 |
Total from investment operations
| (10.67) | | 14.41 | | 7.21 |
| Distributions paid to shareholders from: | | | | | |
Net investment income
| (1.18) | | (0.77) | | (0.55) |
Net realized gain
| (0.30) | | (1.27) | | — |
Return of capital
| (0.09) | | — | | — |
Total distributions
| (1.57) | | (2.04) | | (0.55) |
Net asset value, end of period
| $56.40 | | $68.64 | | $56.27 |
Total return (b)
| (15.92)% | | 26.49% | | 14.52% |
| Ratios to average net assets/supplemental data: | | | | | |
Net assets, end of period (in 000’s)
| $ 101,512 | | $ 75,506 | | $ 5,628 |
Ratio of total expenses to average net assets
| 0.95% | | 0.95% | | 0.95% (c) |
Ratio of net investment income (loss) to average net assets
| 1.90% | | 1.56% | | 2.66% (c) |
Portfolio turnover rate (d)
| 126% | | 87% | | 81% |
| (a) | Inception date is June 14, 2016, which is consistent with the commencement of operations and is the date the initial creation units were established. |
| (b) | Total return is calculated assuming an initial investment made at the net asset value at the beginning of the period, reinvestment of all distributions at net asset value during the period, and redemption at net asset value on the last day of the period. The returns presented do not reflect the deduction of taxes that a shareholder would pay on Fund distributions or the redemption or sale of Fund shares. Total return is calculated for the time period presented and is not annualized for periods of less than a year. |
| (c) | Annualized. |
| (d) | Portfolio turnover is calculated for the time period presented and is not annualized for periods of less than a year and does not include securities received or delivered from processing creations or redemptions and in-kind transactions. |
See Notes to Financial Statements
Page 35
Notes to Financial Statements
First Trust Exchange-Traded Fund III
October 31, 2018
1. Organization
First Trust Exchange-Traded Fund III (the “Trust”) is an open-end management investment company organized as a Massachusetts business trust on January 9, 2008, and is registered with the Securities and Exchange Commission (“SEC”) under the Investment Company Act of 1940, as amended (the “1940 Act”).
The Trust consists of thirteen funds that are currently offering shares. This report covers the following funds, each a non-diversified series of the Trust:
First Trust RiverFront Dynamic Asia Pacific ETF – (The Nasdaq Stock Market LLC (“Nasdaq”) ticker “RFAP”)
First Trust RiverFront Dynamic Developed International ETF – (Nasdaq ticker “RFDI”)
First Trust RiverFront Dynamic Europe ETF – (Nasdaq ticker “RFEU”)
First Trust RiverFront Dynamic Emerging Markets ETF – (Nasdaq ticker “RFEM”)
Each fund represents a separate series of shares of beneficial interest in the Trust (each a “Fund” and collectively, the “Funds”). Each Fund’s shares are currently listed and traded on Nasdaq. Unlike conventional mutual funds, each Fund issues and redeems shares on a continuous basis, at net asset value (“NAV”), only in large specified blocks consisting of 50,000 shares called a “Creation Unit.” Creation Units are generally issued and redeemed in-kind for securities in which a Fund invests and, in certain circumstances, for cash, and only to and from broker-dealers and large institutional investors that have entered into participation agreements. Except when aggregated in Creation Units, the shares are not redeemable securities of a Fund.
Each Fund is an actively managed exchange-traded fund. The investment objective of each Fund is to provide capital appreciation.
Under normal market conditions, RFAP seeks to achieve its investment objective by investing at least 80% of its net assets (including investment borrowings) in a portfolio of equity securities of Asian Pacific companies, including through investments in common stocks, depositary receipts, common and preferred shares of real estate investment trusts (“REITs”), and forward foreign currency contracts and currency spot transactions used to hedge the Fund’s exposure to the currencies in which the equity securities of the Asian Pacific companies are denominated.
Under normal market conditions, RFDI seeks to achieve its investment objective by investing at least 80% of its net assets (including investment borrowings) in a portfolio of equity securities of developed market companies, including through investments in common stocks, depositary receipts, common and preferred shares of REITs, and forward foreign currency contracts and currency spot transactions used to hedge the Fund’s exposure to the currencies in which the equity securities of the developed market companies are denominated.
Under normal market conditions, RFEU seeks to achieve its investment objective by investing at least 80% of its net assets (including investment borrowings) in a portfolio of equity securities of European companies, including through investments in common stocks, depositary receipts, common and preferred shares of REITs, and forward foreign currency contracts and currency spot transactions used to hedge the Fund’s exposure to the currencies in which the equity securities of the European companies are denominated.
Under normal market conditions, RFEM seeks to achieve its investment objective by investing at least 80% of its net assets (including investment borrowings) in a portfolio of equity securities of emerging market companies, including through investments in common stocks, depositary receipts, common and preferred shares of REITs, and forward foreign currency contracts and currency spot transactions used to hedge the Fund’s exposure to the currencies in which the equity securities of the emerging market companies are denominated.
There can be no assurance that a Fund will achieve its investment objective. The Funds may not be appropriate for all investors.
2. Significant Accounting Policies
The Funds are each considered an investment company and follow accounting and reporting guidance under Financial Accounting Standards Board (“FASB”) Accounting Standards Codification (“ASC”) Topic 946, “Financial Services-Investment Companies.” The following is a summary of significant accounting policies consistently followed by the Funds in the preparation of the financial statements. The preparation of the financial statements in accordance with accounting principles generally accepted in the United States of America (“U.S. GAAP”) requires management to make estimates and assumptions that affect the reported amounts and disclosures in the financial statements. Actual results could differ from those estimates.
A. Portfolio Valuation
Each Fund’s NAV is determined daily as of the close of regular trading on the New York Stock Exchange (“NYSE”), normally 4:00 p.m. Eastern time, on each day the NYSE is open for trading. If the NYSE closes early on a valuation day, the NAV is determined
Notes to Financial Statements (Continued)
First Trust Exchange-Traded Fund III
October 31, 2018
as of that time. Foreign securities are priced using data reflecting the earlier closing of the principal markets for those securities. Each Fund’s NAV is calculated by dividing the value of all assets of each Fund (including accrued interest and dividends), less all liabilities (including accrued expenses and dividends declared but unpaid), by the total number of shares outstanding.
Each Fund’s investments are valued daily at market value or, in the absence of market value with respect to any portfolio securities, at fair value. Market value prices represent last sale or official closing prices from a national or foreign exchange (i.e., a regulated market) and are primarily obtained from third-party pricing services. Fair value prices represent any prices not considered market value prices and are either obtained from a third-party pricing service or are determined by the Pricing Committee of the Funds’ investment advisor, First Trust Advisors L.P. (“First Trust” or the “Advisor”), in accordance with valuation procedures adopted by the Trust’s Board of Trustees, and in accordance with provisions of the 1940 Act. Investments valued by the Advisor’s Pricing Committee, if any, are footnoted as such in the footnotes to the Portfolio of Investments. Each Fund’s investments are valued as follows:
Common stocks, REITs, and other equity securities listed on any national or foreign exchange (excluding Nasdaq and the London Stock Exchange Alternative Investment Market (“AIM”)) are valued at the last sale price on the exchange on which they are principally traded or, for Nasdaq and AIM securities, the official closing price. Securities traded on more than one securities exchange are valued at the last sale price or official closing price, as applicable, at the close of the securities exchange representing the principal market for such securities.
Securities traded in an over-the-counter market are fair valued at the mean of their most recent bid and asked price, if available, and otherwise at their closing bid price.
Forward foreign currency contracts are valued at the current day’s interpolated foreign exchange rate, as calculated using the current day’s spot rate, and the thirty, sixty, ninety, and one-hundred eighty day forward rates provided by a third-party pricing service.
Certain securities may not be able to be priced by pre-established pricing methods. Such securities may be valued by the Trust’s Board of Trustees or its delegate, the Advisor’s Pricing Committee, at fair value. These securities generally include, but are not limited to, restricted securities (securities which may not be publicly sold without registration under the Securities Act of 1933, as amended) for which a third-party pricing service is unable to provide a market price; securities whose trading has been formally suspended; a security whose market or fair value price is not available from a pre-established pricing source; a security with respect to which an event has occurred that is likely to materially affect the value of the security after the market has closed but before the calculation of a Fund’s NAV or make it difficult or impossible to obtain a reliable market quotation; and a security whose price, as provided by the third-party pricing service, does not reflect the security’s fair value. As a general principle, the current fair value of a security would appear to be the amount which the owner might reasonably expect to receive for the security upon its current sale. When fair value prices are used, generally they will differ from market quotations or official closing prices on the applicable exchanges. A variety of factors may be considered in determining the fair value of such securities, including, but not limited to, the following:
| 1) | the type of security; |
| 2) | the size of the holding; |
| 3) | the initial cost of the security; |
| 4) | transactions in comparable securities; |
| 5) | price quotes from dealers and/or third-party pricing services; |
| 6) | relationships among various securities; |
| 7) | information obtained by contacting the issuer, analysts, or the appropriate stock exchange; |
| 8) | an analysis of the issuer’s financial statements; and |
| 9) | the existence of merger proposals or tender offers that might affect the value of the security. |
If the securities in question are foreign securities, the following additional information may be considered:
| 1) | the value of similar foreign securities traded on other foreign markets; |
| 2) | ADR trading of similar securities; |
| 3) | closed-end fund trading of similar securities; |
| 4) | foreign currency exchange activity; |
| 5) | the trading prices of financial products that are tied to baskets of foreign securities; |
| 6) | factors relating to the event that precipitated the pricing problem; |
| 7) | whether the event is likely to recur; and |
| 8) | whether the effects of the event are isolated or whether they affect entire markets, countries or regions. |
Notes to Financial Statements (Continued)
First Trust Exchange-Traded Fund III
October 31, 2018
Because foreign markets may be open on different days than the days during which investors may transact in the shares of a Fund, the value of the Fund’s securities may change on the days when investors are not able to transact in the shares of the Fund. The value of securities denominated in foreign currencies is converted into U.S. dollars using exchange rates determined daily as of the close of regular trading on the NYSE.
The Funds are subject to fair value accounting standards that define fair value, establish the framework for measuring fair value and provide a three-level hierarchy for fair valuation based upon the inputs to the valuation as of the measurement date. The three levels of the fair value hierarchy are as follows:
| • | Level 1 – Level 1 inputs are quoted prices in active markets for identical investments. An active market is a market in which transactions for the investment occur with sufficient frequency and volume to provide pricing information on an ongoing basis. |
| • | Level 2 – Level 2 inputs are observable inputs, either directly or indirectly, and include the following: |
| o | Quoted prices for similar investments in active markets. |
| o | Quoted prices for identical or similar investments in markets that are non-active. A non-active market is a market where there are few transactions for the investment, the prices are not current, or price quotations vary substantially either over time or among market makers, or in which little information is released publicly. |
| o | Inputs other than quoted prices that are observable for the investment (for example, interest rates and yield curves observable at commonly quoted intervals, volatilities, prepayment speeds, loss severities, credit risks, and default rates). |
| o | Inputs that are derived principally from or corroborated by observable market data by correlation or other means. |
| • | Level 3 – Level 3 inputs are unobservable inputs. Unobservable inputs may reflect the reporting entity’s own assumptions about the assumptions that market participants would use in pricing the investment. |
The inputs or methodologies used for valuing investments are not necessarily an indication of the risk associated with investing in those investments. A summary of the inputs used to value each Fund’s investments as of October 31, 2018, is included with each Fund’s Portfolio of Investments.
B. Securities Transactions and Investment Income
Securities transactions are recorded as of the trade date. Realized gains and losses from securities transactions are recorded on the identified cost basis. Dividend income is recorded on the ex-dividend date except that certain dividends from foreign securities are recorded as soon as the information becomes available after the ex-dividend date. Interest income, if any, is recorded on the accrual basis.
Withholding taxes and tax reclaims on foreign dividends have been provided for in accordance with each Fund’s understanding of the applicable country’s tax rules and rates.
Distributions received from a Fund’s investments in REITs may be comprised of return of capital, capital gains, and income. The actual character of the amounts received during the year are not known until after the REITs’ fiscal year end. A Fund records the character of distributions received from the REITs during the year based on estimates available. The characterization of distributions received by a Fund may be subsequently revised based on information received from the REITs after their tax reporting periods conclude.
C. Forward Foreign Currency Contracts
The Funds are subject to foreign currency risk in the normal course of pursuing their investment objectives. Forward foreign currency contracts are agreements between two parties (“Counterparties”) to exchange one currency for another at a future date and at a specified price. The Funds use forward foreign currency contracts to facilitate transactions in foreign securities and to manage each Fund’s foreign currency exposure. These contracts are valued daily, and each Fund’s net equity therein, representing unrealized gain or loss on the contracts as measured by the difference between the forward foreign exchange rates at the dates of entry into the contracts and the forward rates at the reporting date, is included in “Unrealized appreciation on forward foreign currency contracts” and “Unrealized depreciation on forward foreign currency contracts” on the Statements of Assets and Liabilities. The change in unrealized appreciation (depreciation) is included in “Net change in unrealized appreciation (depreciation) on forward foreign currency contracts” on the Statements of Operations. When the forward contract is closed, a Fund records a realized gain or loss equal to the difference between the proceeds from (or the cost of) the closing transaction and the Fund’s basis in the contract. This realized gain or loss is included in “Net realized gain (loss) on forward foreign currency contracts” on the Statements of Operations. Risks arise from the possible inability of Counterparties to meet the terms of their contracts and from movement in currency, securities values and interest rates. Due to the risks, the Funds could incur losses in excess of the net unrealized value shown on the Forward Foreign Currency
Notes to Financial Statements (Continued)
First Trust Exchange-Traded Fund III
October 31, 2018
Contracts table in each Fund’s Portfolio of Investments. In the event of default by the Counterparty, a Fund will provide notice to the Counterparty of the Fund’s intent to convert the currency held by the Fund into the currency that the Counterparty agreed to exchange with that Fund. If a Counterparty becomes bankrupt or otherwise fails to perform its obligations due to financial difficulties, the Funds may experience significant delays in obtaining any recovery in a bankruptcy or other reorganization proceeding. The Funds may obtain only limited recovery or may obtain no recovery in such circumstances. The Funds did not have any forward foreign currency contracts during the fiscal year ended October 31, 2018.
D. Foreign Currency
The books and records of the Funds are maintained in U.S. dollars. Foreign currencies, investments and other assets and liabilities are translated into U.S. dollars at the exchange rates prevailing at the end of the period. Purchases and sales of investments and items of income and expense are translated on the respective dates of such transactions. Unrealized gains and losses on assets and liabilities, other than investments in securities, which result from changes in foreign currency exchange rates have been included in “Net change in unrealized appreciation (depreciation) on foreign currency translation” on the Statements of Operations. Unrealized gains and losses on investments in securities which result from changes in foreign exchange rates are included with fluctuations arising from changes in market price and are included in “Net change in unrealized appreciation (depreciation) on investments” on the Statements of Operations. Net realized foreign currency gains and losses include the effect of changes in exchange rates between trade date and settlement date on investment security transactions, foreign currency transactions and interest and dividends received and are included in “Net realized gain (loss) on foreign currency transactions” on the Statements of Operations. The portion of foreign currency gains and losses related to fluctuations in exchange rates between the initial purchase settlement date and subsequent sale trade date is included in “Net realized gain (loss) on investments” on the Statements of Operations.
E. Dividends and Distributions to Shareholders
Dividends from net investment income, if any, are declared and paid quarterly by each Fund, or as the Board of Trustees may determine from time to time. Distributions of net realized capital gains earned by each Fund, if any, are distributed at least annually.
Distributions from income and capital gains are determined in accordance with federal income tax regulations, which may differ from U.S. GAAP. Certain capital accounts in the financial statements are periodically adjusted for permanent differences in order to reflect their tax character. These permanent differences are primarily due to the varying treatment of income and gain/loss on portfolio securities held by the Funds and have no impact on net assets or NAV per share. Temporary differences, which arise from recognizing certain items of income, expense and gain/loss in different periods for financial statement and tax purposes, will reverse at some time in the future.
The tax character of distributions paid by each Fund during the fiscal year ended October 31, 2018, was as follows:
| | Distributions
paid from
Ordinary
Income | | Distributions
paid from
Capital
Gains | | Distributions
paid from
Return of
Capital |
First Trust RiverFront Dynamic Asia Pacific ETF
| $ 1,178,793 | | $ — | | $ — |
First Trust RiverFront Dynamic Developed International ETF
| 14,043,205 | | 22,673 | | — |
First Trust RiverFront Dynamic Europe ETF
| 3,500,818 | | — | | — |
First Trust RiverFront Dynamic Emerging Markets ETF
| 2,366,951 | | 66,909 | | 165,738 |
The tax character of distributions paid by each Fund during the fiscal year ended October 31, 2017, was as follows:
| | Distributions
paid from
Ordinary
Income | | Distributions
paid from
Capital
Gains | | Distributions
paid from
Return of
Capital |
First Trust RiverFront Dynamic Asia Pacific ETF
| $ 321,623 | | $ — | | $ — |
First Trust RiverFront Dynamic Developed International ETF
| 2,607,367 | | 201,961 | | — |
First Trust RiverFront Dynamic Europe ETF
| 859,771 | | 407,052 | | — |
First Trust RiverFront Dynamic Emerging Markets ETF
| 679,249 | | — | | — |
Notes to Financial Statements (Continued)
First Trust Exchange-Traded Fund III
October 31, 2018
As of October 31, 2018, the components of distributable earnings on a tax basis for each Fund were as follows:
| | Undistributed
Ordinary
Income | | Accumulated
Capital and
Other
Gain (Loss) | | Net
Unrealized
Appreciation
(Depreciation) |
First Trust RiverFront Dynamic Asia Pacific ETF
| $ 320,388 | | $ (3,703,563) | | $ (5,862,086) |
First Trust RiverFront Dynamic Developed International ETF
| 1,139,589 | | (21,591,182) | | (53,532,316) |
First Trust RiverFront Dynamic Europe ETF
| — | | (5,065,319) | | (9,138,057) |
First Trust RiverFront Dynamic Emerging Markets ETF
| — | | (10,162,432) | | (14,107,640) |
F. Income and Other Taxes
Each Fund intends to continue to qualify as a regulated investment company by complying with the requirements under Subchapter M of the Internal Revenue Code of 1986, as amended, which includes distributing substantially all of its net investment income and net realized gains to shareholders. Accordingly, no provision has been made for federal and state income taxes. However, due to the timing and amount of distributions, each Fund may be subject to an excise tax of 4% of the amount by which approximately 98% of each Fund’s taxable income exceeds the distributions from such taxable income for the calendar year.
Certain countries assess a capital gains tax on securities sold in their local markets. This tax is accrued as the securities in these foreign markets appreciate in value and is paid at the time of sale to the extent a capital gain is realized. Taxes accrued on securities in an unrealized appreciation position are included in “Net change in unrealized appreciation (depreciation) on deferred foreign capital gains tax” on the Statements of Operations. The capital gains tax paid on securities sold is included in “Net realized gain (loss) on foreign capital gains tax” on the Statements of Operations.
India’s Finance Bill, 2018 (“Finance Bill, 2018”) was enacted into law on March 29, 2018 and amongst other provisions, it introduces a long-term capital gains tax beginning April 1, 2018. Long-term capital gains on the sale of listed shares in excess of INR 0.1 million will be taxed at the rate of 10% (plus applicable surcharge and cess (which is a type of tax)) subject to satisfaction of certain conditions. Long-term capital gains accruing as of January 31, 2018 will be considered exempt due to a grandfather clause in the provision. In the case of the sale of listed shares held by a Fund for one year or less, the income would be classified as short-term capital gains and would be taxable at 15% (plus applicable surcharge and cess) provided the shares are sold on the stock exchange and subjected to securities transaction tax (“STT”). The Finance Bill, 2018 increases the cess imposed on the sum of tax and surcharge from 3% to 4%. The cess 4% rate is applied to the capital gains tax, resulting in a higher effective rate of capital gains tax. Where the sale of shares is outside the stock exchange and not subject to STT, the long-term capital gains would be taxed at 10% (plus applicable surcharge and cess) and short-term capital gains would be taxed at 30% (plus applicable surcharge and cess). The Finance Bill, 2018, approves the carry forward of long-term capital losses to be offset against long-term capital gains. Short-term losses and long-term losses can be netted against short-term gains and long-term gains, respectively.
The Funds are subject to accounting standards that establish a minimum threshold for recognizing, and a system for measuring, the benefits of a tax position taken or expected to be taken in a tax return. Taxable years ended 2016, 2017, and 2018 remain open to federal and state audit. As of October 31, 2018, management has evaluated the application of these standards to the Funds and has determined that no provision for income tax is required in the Funds’ financial statements for uncertain tax positions.
The Funds intend to utilize provisions of the federal income tax laws, which allow them to carry a realized capital loss forward indefinitely following the year of the loss and offset such loss against any future realized capital gains. The Funds are subject to certain limitations under U.S. tax rules on the use of capital loss carryforwards and net unrealized built-in losses. These limitations apply when there has been a 50% change in ownership. At October 31, 2018, the Funds had non-expiring capital loss carryforward for federal income tax purposes as follows:
| | Capital
Loss Available |
First Trust RiverFront Dynamic Asia Pacific ETF
| $ 3,703,563 |
First Trust RiverFront Dynamic Developed International ETF
| 21,591,182 |
First Trust RiverFront Dynamic Europe ETF
| 5,065,319 |
First Trust RiverFront Dynamic Emerging Markets ETF
| 10,162,432 |
In order to present paid-in capital and accumulated distributable earnings (loss) (which consists of accumulated net investment income (loss), accumulated net realized gain (loss) on investments and net unrealized appreciation (depreciation) on investments) on the
Notes to Financial Statements (Continued)
First Trust Exchange-Traded Fund III
October 31, 2018
Statements of Assets and Liabilities that more closely represent their tax character, certain adjustments have been made to paid-in capital, accumulated net investment income (loss) and accumulated net realized gain (loss) on investments. These adjustments are primarily due to the difference between book and tax treatments of income and gains on various investment securities held by the Funds and in-kind transactions. The results of operations and net assets were not affected by these adjustments. For the fiscal year ended October 31, 2018, the adjustments for each Fund were as follows:
| | Accumulated
Net
Investment
Income (Loss) | | Accumulated
Net Realized
Gain (Loss)
on Investments | | Paid-in
Capital |
First Trust RiverFront Dynamic Asia Pacific ETF
| $ 199,305 | | $ (1,825,117) | | $ 1,625,812 |
First Trust RiverFront Dynamic Developed International ETF
| 1,138,274 | | (21,419,972) | | 20,281,698 |
First Trust RiverFront Dynamic Europe ETF
| 19,045 | | (5,601,228) | | 5,582,183 |
First Trust RiverFront Dynamic Emerging Markets ETF
| (340,890) | | (1,336,702) | | 1,677,592 |
G. Expenses
Expenses, other than the investment advisory fee and other excluded expenses, are paid by the Advisor (See Note 3).
H. New Accounting Pronouncement
On August 28, 2018, the FASB issued Accounting Standards Update (“ASU”) 2018-13, “Disclosure Framework – Changes to the Disclosure Requirements for Fair Value Measurement,” which amends the fair value measurement disclosure requirements of ASC 820. The amendments of ASU 2018-13 include new, eliminated, and modified disclosure requirements of ASC 820. In addition, the amendments clarify that materiality is an appropriate consideration of entities when evaluating disclosure requirements. The ASU is effective for fiscal years beginning after December 15, 2019, including interim periods therein. Early adoption is permitted for any eliminated or modified disclosures upon issuance of this ASU. The Funds have early adopted ASU 2018-13 for these financial statements, which did not result in a material impact.
3. Investment Advisory Fee, Affiliated Transactions and Other Fee Arrangements
First Trust, the investment advisor to the Funds, is a limited partnership with one limited partner, Grace Partners of DuPage L.P., and one general partner, The Charger Corporation. The Charger Corporation is an Illinois corporation controlled by James A. Bowen, Chief Executive Officer of First Trust. First Trust is responsible for supervising the selection and ongoing monitoring of the securities in each Fund’s portfolio, managing the Funds’ business affairs and providing certain administrative services necessary for the management of the Funds.
Pursuant to the Investment Management Agreement between First Trust and the Trust, First Trust supervises the investment of the Funds’ assets and is responsible for the expenses of each Fund including the cost of transfer agency, sub-advisory, custody, fund administration, legal, audit and other services, but excluding fee payments under the Investment Management Agreement, interest, taxes, brokerage commissions, acquired fund fees and expenses, if any, distribution and service fees payable pursuant to Rule 12b-1 plan, if any, expenses associated with the execution of portfolio transactions, and extraordinary expenses, which are paid by each respective Fund. RFAP, RFDI and RFEU have each agreed to pay First Trust an annual unitary management fee equal to 0.83% its average daily net assets. RFEM has agreed to pay First Trust an annual unitary management fee equal to 0.95% of its average daily net assets. First Trust also provides fund reporting services to each Fund for a flat annual fee in the amount of $9,250, which is covered under the annual unitary management fee.
RiverFront Investment Group, LLC (“RiverFront” or the “Sub-Advisor”) serves as the Funds’ sub-advisor and manages each Fund’s portfolio subject to First Trust’s supervision. The Sub-Advisor receives a monthly portfolio management fee calculated at an annual rate of 0.35% of each Fund’s average daily net assets that is paid by First Trust out of its investment advisory fee.
During the fiscal year ended October 31, 2017, RFAP and RFDI received payments from the Advisor of $7,644 and $35,978, respectively, in connection with trade errors.
The Trust has multiple service agreements with Brown Brothers Harriman & Co. (“BBH”). Under the service agreements, BBH performs custodial, fund accounting, certain administrative services, and transfer agency services for the Funds. As custodian, BBH is responsible for custody of each Fund’s assets. As fund accountant and administrator, BBH is responsible for maintaining the books and records of each Fund’s securities and cash. As transfer agent, BBH is responsible for maintaining shareholder records for each Fund.
Notes to Financial Statements (Continued)
First Trust Exchange-Traded Fund III
October 31, 2018
Each Trustee who is not an officer or employee of First Trust, any sub-advisor or any of their affiliates (“Independent Trustees”) is paid a fixed annual retainer that is allocated equally among each fund in the First Trust Fund Complex. Each Independent Trustee is also paid an annual per fund fee that varies based on whether the fund is a closed-end or other actively managed fund, or is an index fund.
Additionally, the Lead Independent Trustee and the Chairmen of the Audit Committee, Nominating and Governance Committee and Valuation Committee are paid annual fees to serve in such capacities, with such compensation allocated pro rata among each fund in the First Trust Fund Complex based on net assets. Independent Trustees are reimbursed for travel and out-of-pocket expenses in connection with all meetings. The Lead Independent Trustee and Committee Chairmen rotate every three years. The officers and “Interested” Trustee receive no compensation from the Trust for acting in such capacities.
4. Purchases and Sales of Securities
For the fiscal year ended October 31, 2018, the cost of purchases and proceeds from sales of investment securities for each Fund, excluding short-term investments and in-kind transactions, were as follows:
| | Purchases | | Sales |
| First Trust RiverFront Dynamic Asia Pacific ETF | $ 83,806,943 | | $ 71,124,808 |
| First Trust RiverFront Dynamic Developed International ETF | 793,782,648 | | 758,647,739 |
| First Trust RiverFront Dynamic Europe ETF | 191,548,300 | | 175,615,284 |
| First Trust RiverFront Dynamic Emerging Markets ETF | 187,687,448 | | 144,193,947 |
| | | | |
For the fiscal year ended October 31, 2018, the cost of in-kind purchases and proceeds from in-kind sales for each Fund were as follows:
| | Purchases | | Sales |
| First Trust RiverFront Dynamic Asia Pacific ETF | $ 37,937,408 | | $ 28,446,605 |
| First Trust RiverFront Dynamic Developed International ETF | 322,715,174 | | 221,843,692 |
| First Trust RiverFront Dynamic Europe ETF | 49,525,047 | | 83,386,611 |
| First Trust RiverFront Dynamic Emerging Markets ETF | 29,033,060 | | 17,284,128 |
5. Creations, Redemptions and Transaction Fees
Shares are created and redeemed by each Fund only in Creation Unit size aggregations of 50,000 shares in transactions with broker-dealers or large institutional investors that have entered into a participation agreement (an “Authorized Participant”). In order to purchase Creation Units of a Fund, an Authorized Participant must deposit (i) a designated portfolio of securities and other instruments determined by First Trust (the “Deposit Securities”) and generally make or receive a cash payment referred to as the “Cash Component,” which is an amount equal to the difference between the NAV of the Fund shares (per Creation Unit Aggregations) and the market value of the Deposit Securities, and/or (ii) cash in lieu of all or a portion of the Deposit Securities. If the Cash Component is a positive number (i.e., the NAV per Creation Unit Aggregation exceeds the Deposit Amount), the Authorized Participant will deliver the Cash Component. If the Cash Component is a negative number (i.e., the NAV per Creation Unit Aggregation is less than the Deposit Amount), the Authorized Participant will receive the Cash Component. Authorized Participants purchasing Creation Units must pay to BBH, as transfer agent, a creation transaction fee (the “Creation Transaction Fee”) regardless of the number of Creation Units purchased in the transaction. The Creation Transaction Fee may vary and is based on the composition of the securities included in the respective Fund’s portfolio and the countries in which the transactions are settled. The Creation Transaction Fee may increase or decrease as each Fund’s portfolio is adjusted to conform to changes in the composition of the securities included in the Fund’s portfolio and the countries in which the transaction settled. The price for each Creation Unit will equal the daily NAV per share times the number of shares in a Creation Unit plus the fees described above and, if applicable, any operational processing and brokerage costs, transfer fees or stamp taxes. When a Fund permits an Authorized Participant to substitute cash or a different security in lieu of depositing one or more of the requisite Deposit Securities, the Authorized Participant may also be assessed an amount to cover the cost of purchasing the Deposit Securities and/or disposing of the substituted securities, including operational processing and brokerage costs, transfer fees, stamp taxes, and part or all of the spread between the expected bid and offer side of the market related to such Deposit Securities and/or substitute securities.
Authorized Participants redeeming Creation Units must pay to BBH, as transfer agent, a redemption transaction fee (the “Redemption Transaction Fee”), regardless of the number of Creation Units redeemed in the transaction. The Redemption Transaction Fee may vary and is based on the composition of the securities included in the respective Fund’s portfolio and the countries in which the transactions
Notes to Financial Statements (Continued)
First Trust Exchange-Traded Fund III
October 31, 2018
are settled. Each Fund reserves the right to effect redemptions in cash. An Authorized Participant may request cash redemption in lieu of securities; however, a Fund may, in its discretion, reject any such request.
The standard Creation Transaction Fees and the Redemption Transaction Fees for each Fund are as follows:
| | Creation
Transaction Fees | | Redemption
Transaction Fees |
| First Trust RiverFront Dynamic Asia Pacific ETF | $ 1,650 | | $ 1,650 |
| First Trust RiverFront Dynamic Developed International ETF | 3,600 | | 3,600 |
| First Trust RiverFront Dynamic Europe ETF | 2,000 | | 2,000 |
| First Trust RiverFront Dynamic Emerging Markets ETF | 4,100 | | 4,100 |
6. Distribution Plan
The Board of Trustees adopted a Distribution and Service Plan pursuant to Rule 12b-1 under the 1940 Act. In accordance with the Rule 12b-1 plan, each Fund is authorized to pay an amount up to 0.25% of its average daily net assets each year to reimburse First Trust Portfolios L.P. (“FTP”), the distributor of the Funds, for amounts expended to finance activities primarily intended to result in the sale of Creation Units or to provide investor services. FTP may also use this amount to compensate securities dealers or other persons that are Authorized Participants for providing distribution assistance, including broker-dealer and shareholder support and educational and promotional services.
No 12b-1 fees are currently paid by the Funds, and pursuant to a contractual arrangement, no 12b-1 fees will be paid any time before February 28, 2020.
7. Indemnification
The Trust, on behalf of the Funds, has a variety of indemnification obligations under contracts with its service providers. The Trust’s maximum exposure under these arrangements is unknown. However, the Trust has not had prior claims or losses pursuant to these contracts and expects the risk of loss to be remote.
8. Subsequent Events
Management has evaluated the impact of all subsequent events to the Funds through the date the financial statements were issued, and has determined that there was the following subsequent event:
On November 2, 2018, First Trust Short Duration Managed Municipal ETF and First Trust Ultra Short Duration Municipal ETF, each an additional series of the Trust, began trading under the ticker symbols FSMB and FUMB, respectively on the NYSE Arca, Inc.
Report of Independent Registered Public Accounting Firm
To the Shareholders and the Board of Trustees of First Trust Exchange-Traded Fund III:
Opinion on the Financial Statements and Financial Highlights
We have audited the accompanying statements of assets and liabilities, including the portfolios of investments, of First Trust Exchange-Traded Fund III (the “Trust”), comprising the First Trust RiverFront Dynamic Asia Pacific ETF, First Trust RiverFront Dynamic Developed International ETF, First Trust RiverFront Dynamic Europe ETF and First Trust RiverFront Dynamic Emerging Markets ETF (the “Funds”), each a series of First Trust Exchange-Traded Fund III, as of October 31, 2018, the related statements of operations for the year then ended, the statements of changes in net assets for each of the two years in the period then ended, and the financial highlights for the periods indicated in the table below for the Funds; and the related notes. In our opinion, the financial statements and financial highlights present fairly, in all material respects, the financial position of each of the funds listed above included in First Trust Exchange-Traded Fund III as of October 31, 2018, and the results of their operations for the year then ended, the changes in their net assets for each of the two years in the period then ended, and the financial highlights for the period listed in the table below, in conformity with accounting principles generally accepted in the United States of America.
| Individual Funds Included in the Trust | Financial Highlights |
| First Trust RiverFront Dynamic Asia Pacific ETF | For the years ended October 31, 2018, 2017 and the period from April 13, 2016 (commencement of operations) through October 31, 2016 |
| First Trust RiverFront Dynamic Developed International ETF |
| First Trust RiverFront Dynamic Europe ETF |
| First Trust RiverFront Dynamic Emerging Markets ETF | For the years ended October 31, 2018, 2017 and the period from June 14, 2016 (commencement of operations) through October 31, 2016 |
Basis for Opinion
These financial statements and financial highlights are the responsibility of the Funds’ management. Our responsibility is to express an opinion on the Funds’ financial statements and financial highlights based on our audits. We are a public accounting firm registered with the Public Company Accounting Oversight Board (United States) (PCAOB) and are required to be independent with respect to the Funds in accordance with the U.S. federal securities laws and the applicable rules and regulations of the Securities and Exchange Commission and the PCAOB.
We conducted our audits in accordance with the standards of the PCAOB. Those standards require that we plan and perform the audit to obtain reasonable assurance about whether the financial statements and financial highlights are free of material misstatement, whether due to error or fraud. The Funds are not required to have, nor were we engaged to perform, an audit of their internal control over financial reporting. As part of our audits we are required to obtain an understanding of internal control over financial reporting but not for the purpose of expressing an opinion on the effectiveness of the Funds’ internal control over financial reporting. Accordingly, we express no such opinion.
Our audits included performing procedures to assess the risks of material misstatement of the financial statements and financial highlights, whether due to error or fraud, and performing procedures that respond to those risks. Such procedures included examining, on a test basis, evidence regarding the amounts and disclosures in the financial statements and financial highlights. Our audits also included evaluating the accounting principles used and significant estimates made by management, as well as evaluating the overall presentation of the financial statements and financial highlights. Our procedures included confirmation of securities owned as of October 31, 2018, by correspondence with the custodian and brokers. We believe that our audits provide a reasonable basis for our opinion.
Chicago, Illinois
December 21, 2018
We have served as the auditor of one or more First Trust investment companies since 2001.
Additional Information
First Trust Exchange-Traded Fund III
October 31, 2018 (Unaudited)
Proxy Voting Policies and Procedures
A description of the policies and procedures that the Trust uses to determine how to vote proxies and information on how each Fund voted proxies relating to portfolio investments during the most recent 12-month period ended June 30 is available (1) without charge, upon request, by calling (800) 988-5891; (2) on each Fund’s website at www.ftportfolios.com; and (3) on the Securities and Exchange Commission’s (“SEC”) website at www.sec.gov.
Portfolio Holdings
The Trust files its complete schedule of each Fund’s portfolio holdings with the SEC for the first and third quarters of each fiscal year on Form N-Q. The Trust’s Form N-Qs are available (1) by calling (800) 988-5891; (2) on each Fund’s website at www.ftportfolios.com; and (3) on the SEC’s website at www.sec.gov.
Beginning in April 2019, the Trust will cease to disclose each Fund’s holdings on Form N-Q and will file Form N-PORT with the SEC on a monthly basis. Part F of Form N-PORT, which contains the complete schedule of each Fund’s portfolio holdings, will be made available in the same manner as Form N-Q discussed above.
Federal Tax Information
For the taxable year ended October 31, 2018, the following percentages of income dividend paid by the Funds qualified for the dividends received deduction available to corporations:
| | Dividends
Received Deduction |
First Trust RiverFront Dynamic Asia Pacific ETF
| 0.00% |
First Trust RiverFront Dynamic Developed International ETF
| 0.00% |
First Trust RiverFront Dynamic Europe ETF
| 0.00% |
First Trust RiverFront Dynamic Emerging Markets ETF
| 0.00% |
For the taxable year ended October 31, 2018, the following percentages of income dividend paid by the Funds is hereby designated as qualified dividend income:
| | Qualified
Dividend Income |
First Trust RiverFront Dynamic Asia Pacific ETF
| 89.31% |
First Trust RiverFront Dynamic Developed International ETF
| 100.00% |
First Trust RiverFront Dynamic Europe ETF
| 100.00% |
First Trust RiverFront Dynamic Emerging Markets ETF
| 88.91% |
The following Funds met the requirements of Section 853 of the Internal Revenue Code and elects to pass through to their shareholders credit for foreign taxes paid. The total amount of income received by the Funds from sources within foreign countries and possessions of the United States and of taxes paid to such countries are as follows:
| | Gross Foreign Income | | Foreign Taxes Paid |
| | Amount | | Per Share | | Amount | | Per Share |
First Trust RiverFront Dynamic Asia Pacific ETF
| $ 1,757,661 | | $ 2.07 | | $ 108,000 | | $ 0.13 |
First Trust RiverFront Dynamic Developed International ETF
| 19,842,634 | | 2.22 | | 1,864,114 | | 0.21 |
First Trust RiverFront Dynamic Europe ETF
| 5,100,525 | | 3.29 | | 568,020 | | 0.37 |
First Trust RiverFront Dynamic Emerging Markets ETF
| 3,705,050 | | 2.06 | | 386,444 | | 0.21 |
The foreign taxes paid will be reported to shareholders on Form 1099-DIV which will be sent to shareholders shortly after calendar year end. Gross foreign income and foreign taxes paid will be posted on each Fund’s website and disclosed in the tax letter.
Risk Considerations
Risks are inherent in all investing. Certain general risks that may be applicable to some or all of the Funds are identified below, but not all of the material risks relevant to each Fund are included in this report. The material risks of investing in each Fund are spelled out in its prospectus, statement of additional information and other regulatory filings. Before investing, you should
Additional Information (Continued)
First Trust Exchange-Traded Fund III
October 31, 2018 (Unaudited)
consider each Fund’s investment objective, risks, charges and expenses, and read each Fund’s prospectus and statement of additional information carefully. You can download each Fund’s prospectus at www.ftportfolios.com or contact First Trust Portfolios L.P. at (800) 621-1675 to request a prospectus, which contains this and other information about each Fund.
Concentration Risk. To the extent that a Fund is able to invest a large percentage of its assets in a single asset class or the securities of issuers within the same country, state, region, industry or sector, an adverse economic, business or political development may affect the value of the Fund’s investments more than if the Fund were more broadly diversified. A Fund that tracks an index will be concentrated to the extent the Fund’s corresponding index is concentrated. A concentration makes a Fund more susceptible to any single occurrence and may subject the Fund to greater market risk than a fund that is not concentrated.
Credit Risk. Credit risk is the risk that an issuer of a security will be unable or unwilling to make dividend, interest and/or principal payments when due and the related risk that the value of a security may decline because of concerns about the issuer’s ability to make such payments.
Cyber Security Risk. The Funds are susceptible to potential operational risks through breaches in cyber security. A breach in cyber security refers to both intentional and unintentional events that may cause a Fund to lose proprietary information, suffer data corruption or lose operational capacity. Such events could cause a Fund to incur regulatory penalties, reputational damage, additional compliance costs associated with corrective measures and/or financial loss. In addition, cyber security breaches of a Fund’s third-party service providers, such as its administrator, transfer agent, custodian, or sub-advisor, as applicable, or issuers in which the Fund invests, can also subject a Fund to many of the same risks associated with direct cyber security breaches.
Derivatives Risk. To the extent a Fund uses derivative instruments such as futures contracts, options contracts and swaps, the Fund may experience losses because of adverse movements in the price or value of the underlying asset, index or rate, which may be magnified by certain features of the derivative. These risks are heightened when a Fund’s portfolio managers use derivatives to enhance the Fund’s return or as a substitute for a position or security, rather than solely to hedge (or offset) the risk of a position or security held by the Fund.
Equity Securities Risk. To the extent a Fund invests in equity securities, the value of the Fund’s shares will fluctuate with changes in the value of the equity securities. Equity securities prices fluctuate for several reasons, including changes in investors’ perceptions of the financial condition of an issuer or the general condition of the relevant stock market, such as market volatility, or when political or economic events affecting the issuers occur. In addition, common stock prices may be particularly sensitive to rising interest rates, as the cost of capital rises and borrowing costs increase. Equity securities may decline significantly in price over short or extended periods of time, and such declines may occur in the equity market as a whole, or they may occur in only a particular country, company, industry or sector of the market.
ETF Risk. The shares of an ETF trade like common stock and represent an interest in a portfolio of securities. The risks of owning an ETF generally reflect the risks of owning the underlying securities, although lack of liquidity in an ETF could result in it being more volatile and ETFs have management fees that increase their costs. Shares of an ETF trade on an exchange at market prices rather than net asset value, which may cause the shares to trade at a price greater than net asset value (premium) or less than net asset value (discount). In times of market stress, decisions by market makers to reduce or step away from their role of providing a market for an ETF’s shares, or decisions by an ETF’s authorized participants that they are unable or unwilling to proceed with creation and/or redemption orders of an ETF’s shares, could result in shares of the ETF trading at a discount to net asset value and in greater than normal intraday bid-ask spreads.
Fixed Income Securities Risk. To the extent a Fund invests in fixed income securities, the Fund will be subject to credit risk, income risk, interest rate risk, liquidity risk and prepayment risk. Income risk is the risk that income from a Fund’s fixed income investments could decline during periods of falling interest rates. Interest rate risk is the risk that the value of a Fund’s fixed income securities will decline because of rising interest rates. Liquidity risk is the risk that a security cannot be purchased or sold at the time desired, or cannot be purchased or sold without adversely affecting the price. Prepayment risk is the risk that the securities will be redeemed or prepaid by the issuer, resulting in lower interest payments received by the Fund. In addition to these risks, high yield securities, or “junk” bonds, are subject to greater market fluctuations and risk of loss than securities with higher ratings, and the market for high yield securities is generally smaller and less liquid than that for investment grade securities.
Fund of Funds Risk. To the extent a Fund invests in the securities of other investment vehicles, the Fund will incur additional fees and expenses that would not be present in a direct investment in those investment vehicles. Furthermore, the Fund’s investment performance and risks are directly related to the investment performance and risks of the investment vehicles in which the Fund invests.
Index Constituent Risk. Certain Funds may be a constituent of one or more indices. As a result, such a Fund may be included in one or more index-tracking exchange-traded funds or mutual funds. Being a component security of such a vehicle could greatly affect the
Additional Information (Continued)
First Trust Exchange-Traded Fund III
October 31, 2018 (Unaudited)
trading activity involving a Fund, the size of the Fund and the market volatility of the Fund. Inclusion in an index could significantly increase demand for the Fund and removal from an index could result in outsized selling activity in a relatively short period of time. As a result, a Fund’s net asset value could be negatively impacted and the Fund’s market price may be significantly below its net asset value during certain periods.
Index Provider Risk. To the extent a Fund seeks to track an index, it is subject to Index Provider Risk. There is no assurance that the Index Provider will compile the Index accurately, or that the Index will be determined, maintained, constructed, reconstituted, rebalanced, composed, calculated or disseminated accurately. To correct any such error, the Index Provider may carry out an unscheduled rebalance or other modification of the Index constituents or weightings, which may increase the Fund’s costs. The Index Provider does not provide any representation or warranty in relation to the quality, accuracy or completeness of data in the Index, and it does not guarantee that the Index will be calculated in accordance with its stated methodology. Losses or costs associated with any Index Provider errors generally will be borne by the Fund and its shareholders.
Management Risk. To the extent that a Fund is actively managed, it is subject to management risk. In managing an actively-managed Fund’s investment portfolio, the Fund’s portfolio managers will apply investment techniques and risk analyses that may not have the desired result. There can be no guarantee that a Fund will meet its investment objective.
Market Risk. Securities held by a Fund, as well as shares of a Fund itself, are subject to market fluctuations caused by factors such as general economic conditions, political events, regulatory or market developments, changes in interest rates and perceived trends in securities prices. Shares of a Fund could decline in value or underperform other investments as a result of the risk of loss associated with these market fluctuations.
Non-U.S. Securities Risk. To the extent a Fund invests in non-U.S. securities, it is subject to additional risks not associated with securities of domestic issuers. Non-U.S. securities are subject to higher volatility than securities of domestic issuers due to: possible adverse political, social or economic developments; restrictions on foreign investment or exchange of securities; lack of liquidity; currency exchange rates; excessive taxation; government seizure of assets; different legal or accounting standards; and less government supervision and regulation of exchanges in foreign countries. Investments in non-U.S. securities may involve higher costs than investments in U.S. securities, including higher transaction and custody costs, as well as additional taxes imposed by non-U.S. governments. These risks may be heightened for securities of companies located, or with significant operations, in emerging market countries.
Passive Investment Risk. To the extent a Fund seeks to track an index, the Fund will invest in the securities included in, or representative of, the index regardless of their investment merit. A Fund generally will not attempt to take defensive positions in declining markets.
| NOT FDIC INSURED | NOT BANK GUARANTEED | MAY LOSE VALUE |
Advisory and Sub-Advisory Agreements
Board Considerations Regarding Approval of Investment Management and Investment Sub-Advisory Agreements
The Board of Trustees of First Trust Exchange-Traded Fund III (the “Trust”), including the Independent Trustees, unanimously approved the continuation of the Investment Management Agreement (the “Advisory Agreement”) with First Trust Advisors L.P. (the “Advisor” or “First Trust”) and the Investment Sub-Advisory Agreement (the “Sub-Advisory Agreement” and together with the Advisory Agreement, the “Agreements”) among the Trust, the Advisor and RiverFront Investment Group, LLC (the “Sub-Advisor”) on behalf of the following four series of the Trust (each a “Fund” and collectively, the “Funds”):
First Trust RiverFront Dynamic Europe ETF (RFEU)
First Trust RiverFront Dynamic Asia Pacific ETF (RFAP)
First Trust RiverFront Dynamic Developed International ETF (RFDI)
First Trust RiverFront Dynamic Emerging Markets ETF (RFEM)
The Board approved the continuation of the Agreements for each Fund for a one-year period ending June 30, 2019 at a meeting held on June 11, 2018. The Board determined for each Fund that the continuation of the Agreements is in the best interests of the Fund in light of the nature, extent and quality of the services provided and such other matters as the Board considered to be relevant in the exercise of its reasonable business judgment.
To reach this determination for each Fund, the Board considered its duties under the Investment Company Act of 1940, as amended (the “1940 Act”), as well as under the general principles of state law, in reviewing and approving advisory contracts; the requirements
Additional Information (Continued)
First Trust Exchange-Traded Fund III
October 31, 2018 (Unaudited)
of the 1940 Act in such matters; the fiduciary duty of investment advisors with respect to advisory agreements and compensation; the standards used by courts in determining whether investment company boards have fulfilled their duties; and the factors to be considered by the Board in voting on such agreements. At meetings held on April 23, 2018 and June 11, 2018, the Board, including the Independent Trustees, reviewed materials provided by the Advisor and the Sub-Advisor responding to requests for information from counsel to the Independent Trustees that, among other things, outlined the services provided by the Advisor and the Sub-Advisor to each Fund (including the relevant personnel responsible for these services and their experience); the unitary fee rate payable by each Fund as compared to fees charged to a peer group of funds (which were either mutual funds or exchange-traded funds (“ETFs”)) compiled by Management Practice, Inc. (“MPI”), an independent source (the “Peer Group”), and as compared to fees charged to other clients of the Advisor, including other ETFs managed by the Advisor; the sub-advisory fee rate as compared to fees charged to other clients of the Sub-Advisor; expenses of each Fund as compared to expense ratios of the funds in the Fund’s Peer Group; performance information for each Fund; the nature of expenses incurred in providing services to each Fund and the potential for economies of scale, if any; financial data on the Advisor and the Sub-Advisor; any fall-out benefits to the Advisor and its affiliate, First Trust Portfolios L.P. (“FTP”), and the Sub-Advisor; and information on the Advisor’s and the Sub-Advisor’s compliance programs. The Board reviewed initial materials with the Advisor at the meeting held on April 23, 2018, prior to which the Independent Trustees and their counsel met separately to discuss the information provided by the Advisor and the Sub-Advisor. Following the April meeting, independent legal counsel on behalf of the Independent Trustees requested certain clarifications and supplements to the materials provided, and the information provided in response to those requests was considered at an executive session of the Independent Trustees and independent legal counsel held prior to the June 11, 2018 meeting, as well as at the meeting held that day. The Board applied its business judgment to determine whether the arrangements between the Trust and the Advisor and among the Trust, the Advisor and the Sub-Advisor continue to be reasonable business arrangements from each Fund’s perspective. The Board determined that, given the totality of the information provided with respect to the Agreements, the Board had received sufficient information to renew the Agreements. The Board considered that shareholders chose to invest or remain invested in a Fund knowing that the Advisor and the Sub-Advisor manage the Fund and knowing the Fund’s unitary fee.
In reviewing the Agreements for each Fund, the Board considered the nature, extent and quality of the services provided by the Advisor and the Sub-Advisor under the Agreements. With respect to the Advisory Agreement, the Board considered that the Advisor is responsible for the overall management and administration of the Trust and each Fund and reviewed all of the services provided by the Advisor to the Funds, including the oversight of the Sub-Advisor, as well as the background and experience of the persons responsible for such services. The Board noted that the Advisor oversees the Sub-Advisor’s day-to-day management of each Fund’s investments, including portfolio risk monitoring and performance review. The Board considered that the Sub-Advisor is responsible for the selection and ongoing monitoring of the securities in the Funds’ investment portfolios, but that the Advisor executes each Fund’s portfolio trades. In reviewing the services provided, the Board noted the compliance program that had been developed by the Advisor and considered that it includes a robust program for monitoring the Advisor’s, the Sub-Advisor’s and each Fund’s compliance with the 1940 Act, as well as each Fund’s compliance with its investment objective, policies and restrictions. The Board also considered a report from the Advisor with respect to its risk management functions related to the operation of the Funds. Finally, as part of the Board’s consideration of the Advisor’s services, the Advisor, in its written materials and at the April 23, 2018 meeting, described to the Board the scope of its ongoing investment in additional infrastructure and personnel to maintain and improve the quality of services provided to the Funds and the other funds in the First Trust Fund Complex. With respect to the Sub-Advisory Agreement, the Board noted that each Fund is an actively-managed ETF and the Sub-Advisor actively manages the Fund’s investments. The Board reviewed the materials provided by the Sub-Advisor and considered the services that the Sub-Advisor provides to each Fund, including the Sub-Advisor’s day-to-day management of the Funds’ investments. In considering the Sub-Advisor’s management of the Funds, the Board noted the background and experience of the Sub-Advisor’s portfolio management team and the Board’s prior meetings with members of the portfolio management team. In light of the information presented and the considerations made, the Board concluded that the nature, extent and quality of the services provided to the Trust and each Fund by the Advisor and the Sub-Advisor under the Agreements have been and are expected to remain satisfactory and that the Sub-Advisor, under the oversight of the Advisor, has managed each Fund consistent with the Fund’s investment objective, policies and restrictions.
The Board considered the unitary fee rate payable by each Fund under the Advisory Agreement for the services provided. The Board noted that the sub-advisory fee for each Fund is paid by the Advisor from the Fund’s unitary fee. The Board considered that as part of the unitary fee the Advisor is responsible for each Fund’s expenses, including the cost of sub-advisory, transfer agency, custody, fund administration, legal, audit and other services and license fees (if any), but excluding interest, taxes, brokerage commissions and other expenses connected with the execution of portfolio transactions, distribution and service fees pursuant to a Rule 12b-1 plan, if any, and extraordinary expenses. The Board received and reviewed information showing the advisory or unitary fee rates and expense ratios of the peer funds in the Peer Groups, as well as advisory and unitary fee rates charged by the Advisor and the Sub-Advisor to other fund (including ETFs) and non-fund clients, as applicable. Because each Fund’s Peer Group included peer funds that pay a unitary fee and because each Fund pays a unitary fee, the Board determined that expense ratios were the most relevant comparative data point. Based on the information provided, the Board noted that the unitary fee for RFEU was equal to the median total (net) expense ratio of the
Additional Information (Continued)
First Trust Exchange-Traded Fund III
October 31, 2018 (Unaudited)
peer funds in the Fund’s Peer Group and the unitary fees for RFAP, RFDI and RFEM were above the median total (net) expense ratio of the peer funds in each Fund’s respective Peer Group. With respect to the Peer Groups, the Board noted its prior discussions with the Advisor and MPI regarding the assembly of the Peer Group and, at the April 23, 2018 meeting, discussed with the Advisor limitations in creating peer groups for actively-managed ETFs, including that there were no other actively-managed ETFs comparable to the Funds and that the peer funds were either index-based ETFs or open-end mutual funds, and different business models that may affect the pricing of services among ETF sponsors. The Board also noted that, for each Fund, most of the peer funds did not employ an advisor/sub-advisor management structure. The Board took these limitations and differences into account in considering the peer data. With respect to fees charged to other non-ETF clients, the Board considered differences between the Funds and other non-ETF clients that limited their comparability. In considering the unitary fee rates overall, the Board also considered the Advisor’s statement that it seeks to meet investor needs through innovative and value-added investment solutions and the Advisor’s description of its long-term commitment to each Fund.
The Board considered performance information for each Fund. The Board noted the process it has established for monitoring each Fund’s performance and portfolio risk on an ongoing basis, which includes quarterly performance reporting from the Advisor and Sub-Advisor for the Funds. The Board determined that this process continues to be effective for reviewing each Fund’s performance. The Board received and reviewed information comparing each Fund’s performance for the one-year period ended December 31, 2017 to the performance of the peer funds in the Peer Group and to that of a broad-based benchmark index. Based on the information provided, the Board noted that RFEU outperformed its Peer Group average and benchmark index for the one-year period ended December 31, 2017, that each of RFEM and RFDI outperformed its Peer Group average, but underperformed its benchmark index for the one-year period ended December 31, 2017 and that RFAP underperformed its Peer Group average and benchmark index for the one-year period ended December 31, 2017. The Board noted information provided by the Sub-Advisor on reasons for RFAP’s relative underperformance.
On the basis of all the information provided on the unitary fee and performance of each Fund and the ongoing oversight by the Board, the Board concluded that the unitary fee for each Fund (out of which the Sub-Advisor is compensated) continues to be reasonable and appropriate in light of the nature, extent and quality of the services provided by the Advisor and the Sub-Advisor to each Fund under the Agreements.
The Board considered information and discussed with the Advisor whether there were any economies of scale in connection with providing advisory services to the Funds and noted the Advisor’s statement that it believes its expenses will likely increase over the next twelve months as the Advisor continues to make investments in infrastructure and personnel. The Board noted that any reduction in fixed costs associated with the management of the Funds would benefit the Advisor, but that the unitary fee structure provides a level of certainty in expenses for the Funds. The Board considered the revenues and allocated costs (including the allocation methodology) of the Advisor in serving as investment advisor to each Fund for the twelve months ended December 31, 2017 and the estimated profitability level for each Fund calculated by the Advisor based on such data, as well as complex-wide and product-line profitability data for the same period. The Board noted the inherent limitations in the profitability analysis and concluded that, based on the information provided, the Advisor’s profitability level for each Fund was not unreasonable. In addition, the Board considered fall-out benefits described by the Advisor that may be realized from its relationship with the Funds. The Board considered that the Advisor had identified as a fall-out benefit to the Advisor and FTP their exposure to investors and brokers who, absent their exposure to the Funds, may have had no dealings with the Advisor or FTP, and noted that the Advisor does not utilize soft dollars in connection with the Funds. The Board also considered the Advisor’s compensation for fund reporting services provided to the Funds pursuant to a separate Fund Reporting Services Agreement, which is paid from the unitary fee. The Board concluded that the character and amount of potential fall-out benefits to the Advisor were not unreasonable.
The Board considered the Sub-Advisor’s statement to the effect that although growth of the Funds will provide some economies of scale, the Sub-Advisor believes that expenses will remain the same for the next twelve months. The Board did not review the profitability of the Sub-Advisor with respect to each Fund. The Board noted that the Advisor pays the Sub-Advisor for each Fund from the unitary fee, and its understanding that each Fund’s sub-advisory fee rate was the product of an arm’s length negotiation. The Board concluded that the profitability analysis for the Advisor was more relevant. The Board considered the potential fall-out benefits to the Sub-Advisor from being associated with the Advisor and the Funds. The Board concluded that the character and amount of potential fall-out benefits to the Sub-Advisor were not unreasonable.
Based on all of the information considered and the conclusions reached, the Board, including the Independent Trustees, unanimously determined that the terms of the Agreements continue to be fair and reasonable and that the continuation of the Agreements is in the best interests of each Fund. No single factor was determinative in the Board’s analysis.
Board of Trustees and Officers
First Trust Exchange-Traded Fund III
October 31, 2018 (Unaudited)
The following tables identify the Trustees and Officers of the Trust. Unless otherwise indicated, the address of all persons is 120 E. Liberty Drive, Suite 400, Wheaton, IL 60187.
The Trust’s statement of additional information includes additional information about the Trustees and is available, without charge, upon request, by calling (800) 988-5891.
| Name, Year of Birth and Position with the Trust | Term of Office and Year First Elected or Appointed | Principal Occupations
During Past 5 Years | Number of Portfolios in the First Trust Fund Complex Overseen by Trustee | Other Trusteeships or Directorships Held by Trustee During Past 5 Years |
| INDEPENDENT TRUSTEES |
Richard E. Erickson, Trustee
(1951) | • Indefinite Term
• Since Inception | Physician; Officer, Wheaton Orthopedics; Limited Partner, Gundersen Real Estate Limited Partnership (June 1992 to December 2016); Member, Sportsmed LLC (April 2007 to November 2015) | 159 | None |
Thomas R. Kadlec, Trustee
(1957) | • Indefinite Term
• Since Inception | President, ADM Investor Services, Inc. (Futures Commission Merchant) | 159 | Director of ADM Investor Services, Inc., ADM Investor Services International, Futures Industry Association, and National Futures Association |
Robert F. Keith, Trustee
(1956) | • Indefinite Term
• Since Inception | President, Hibs Enterprises (Financial and Management Consulting) | 159 | Director of Trust Company of Illinois |
Niel B. Nielson, Trustee
(1954) | • Indefinite Term
• Since Inception | Senior Advisor (August 2018 to Present), Managing Director and Chief Operating Officer (January 2015 to August 2018), Pelita Harapan Educational Foundation (Educational Products and Services); President and Chief Executive Officer (June 2012 to September 2014), Servant Interactive LLC (Educational Products and Services); President and Chief Executive Officer (June 2012 to September 2014), Dew Learning LLC (Educational Products and Services) | 159 | Director of Covenant Transport, Inc. (May 2003 to May 2014) |
| INTERESTED TRUSTEE |
James A. Bowen(1), Trustee and
Chairman of the Board
(1955) | • Indefinite Term
• Since Inception | Chief Executive Officer, First Trust Advisors L.P. and First Trust Portfolios L.P.; Chairman of the Board of Directors, BondWave LLC (Software Development Company) and Stonebridge Advisors LLC (Investment Advisor) | 159 | None |
| (1) | Mr. Bowen is deemed an “interested person” of the Trust due to his position as CEO of First Trust Advisors L.P., investment advisor of the Trust. |
Board of Trustees and Officers (Continued)
First Trust Exchange-Traded Fund III
October 31, 2018 (Unaudited)
| Name and Year of Birth | Position and Offices with Trust | Term of Office and Length of Service | Principal Occupations
During Past 5 Years |
| OFFICERS(2) |
James M. Dykas
(1966) | President and Chief Executive Officer | • Indefinite Term
• Since January 2016 | Managing Director and Chief Financial Officer (January 2016 to Present), Controller (January 2011 to January 2016), Senior Vice President (April 2007 to January 2016), First Trust Advisors L.P. and First Trust Portfolios L.P.; Chief Financial Officer (January 2016 to Present), BondWave LLC (Software Development Company) and Stonebridge Advisors LLC (Investment Advisor) |
Donald P. Swade
(1972) | Treasurer, Chief Financial Officer and Chief Accounting Officer | • Indefinite Term
• Since January 2016 | Senior Vice President (July 2016 to Present), Vice President (April 2012 to July 2016), First Trust Advisors L.P. and First Trust Portfolios L.P. |
W. Scott Jardine
(1960) | Secretary and Chief Legal Officer | • Indefinite Term
• Since Inception | General Counsel, First Trust Advisors L.P. and First Trust Portfolios L.P.; Secretary and General Counsel, BondWave LLC; Secretary, Stonebridge Advisors LLC |
Daniel J. Lindquist
(1970) | Vice President | • Indefinite Term
• Since Inception | Managing Director, First Trust Advisors L.P. and First Trust Portfolios L.P. |
Kristi A. Maher
(1966) | Chief Compliance Officer and Assistant Secretary | • Indefinite Term
• Since Inception | Deputy General Counsel, First Trust Advisors L.P. and First Trust Portfolios L.P. |
Roger F. Testin
(1966) | Vice President | • Indefinite Term
• Since Inception | Senior Vice President, First Trust Advisors L.P. and First Trust Portfolios L.P. |
Stan Ueland
(1970) | Vice President | • Indefinite Term
• Since Inception | Senior Vice President, First Trust Advisors L.P. and First Trust Portfolios L.P |
| (2) | The term “officer” means the president, vice president, secretary, treasurer, controller or any other officer who performs a policy making function. |
Privacy Policy
First Trust Exchange-Traded Fund III
October 31, 2018 (Unaudited)
Privacy Policy
First Trust values our relationship with you and considers your privacy an important priority in maintaining that relationship. We are committed to protecting the security and confidentiality of your personal information.
Sources of Information
We collect nonpublic personal information about you from the following sources:
| • | Information we receive from you and your broker-dealer, investment advisor or financial representative through interviews, applications, agreements or other forms; |
| • | Information about your transactions with us, our affiliates or others; |
| • | Information we receive from your inquiries by mail, e-mail or telephone; and |
| • | Information we collect on our website through the use of “cookies”. For example, we may identify the pages on our website that your browser requests or visits. |
Information Collected
The type of data we collect may include your name, address, social security number, age, financial status, assets, income, tax information, retirement and estate plan information, transaction history, account balance, payment history, investment objectives, marital status, family relationships and other personal information.
Disclosure of Information
We do not disclose any nonpublic personal information about our customers or former customers to anyone, except as permitted by law. In addition to using this information to verify your identity (as required under law), the permitted uses may also include the disclosure of such information to unaffiliated companies for the following reasons:
| • | In order to provide you with products and services and to effect transactions that you request or authorize, we may disclose your personal information as described above to unaffiliated financial service providers and other companies that perform administrative or other services on our behalf, such as transfer agents, custodians and trustees, or that assist us in the distribution of investor materials such as trustees, banks, financial representatives, proxy services, solicitors and printers. |
| • | We may release information we have about you if you direct us to do so, if we are compelled by law to do so, or in other legally limited circumstances (for example to protect your account from fraud). |
In addition, in order to alert you to our other financial products and services, we may share your personal information within First Trust.
Use of Website Analytics
We currently use third party analytics tools, Google Analytics and AddThis, to gather information for purposes of improving First Trust’s website and marketing our products and services to you. These tools employ cookies, which are small pieces of text stored in a file by your web browser and sent to websites that you visit, to collect information, track website usage and viewing trends such as the number of hits, pages visited, videos and PDFs viewed and the length of user sessions in order to evaluate website performance and enhance navigation of the website. We may also collect other anonymous information, which is generally limited to technical and web navigation information such as the IP address of your device, internet browser type and operating system for purposes of analyzing the data to make First Trust’s website better and more useful to our users. The information collected does not include any personal identifiable information such as your name, address, phone number or email address unless you provide that information through the website for us to contact you in order to answer your questions or respond to your requests. To find out how to opt-out of these services click on: Google Analytics and AddThis.
Confidentiality and Security
With regard to our internal security procedures, First Trust restricts access to your nonpublic personal information to those First Trust employees who need to know that information to provide products or services to you. We maintain physical, electronic and procedural safeguards to protect your nonpublic personal information.
Policy Updates and Inquiries
As required by federal law, we will notify you of our privacy policy annually. We reserve the right to modify this policy at any time, however, if we do change it, we will tell you promptly. For questions about our policy, or for additional copies of this notice, please go to www.ftportfolios.com, or contact us at 1-800-621-1675 (First Trust Portfolios) or 1-800-222-6822 (First Trust Advisors).
May 2017
First Trust Exchange-Traded Fund III
INVESTMENT ADVISOR
First Trust Advisors L.P.
120 E. Liberty Drive, Suite 400
Wheaton, IL 60187
INVESTMENT SUB-ADVISOR
RiverFront Investment Group, LLC
1214 E. Cary Street
Richmond, VA 23219
ADMINISTRATOR, CUSTODIAN,
FUND ACCOUNTANT &
TRANSFER AGENT
Brown Brothers Harriman & Co.
50 Post Office Square
Boston, MA 02110
INDEPENDENT REGISTERED
PUBLIC ACCOUNTING FIRM
Deloitte & Touche LLP
111 S. Wacker Drive
Chicago, IL 60606
LEGAL COUNSEL
Chapman and Cutler LLP
111 W. Monroe Street
Chicago, IL 60603
First Trust Exchange-Traded Fund III
First Trust Institutional Preferred Securities and Income ETF (FPEI)
Annual Report
For the Year Ended
October 31, 2018
First Trust Institutional Preferred Securities and Income ETF (FPEI)
Annual Report
October 31, 2018
Caution Regarding Forward-Looking Statements
This report contains certain forward-looking statements within the meaning of the Securities Act of 1933, as amended, and the Securities Exchange Act of 1934, as amended. Forward-looking statements include statements regarding the goals, beliefs, plans or current expectations of First Trust Advisors L.P. (“First Trust” or the “Advisor”) and/or Stonebridge Advisors LLC (“Stonebridge” or the “Sub-Advisor”) and their respective representatives, taking into account the information currently available to them. Forward-looking statements include all statements that do not relate solely to current or historical fact. For example, forward-looking statements include the use of words such as “anticipate,” “estimate,” “intend,” “expect,” “believe,” “plan,” “may,” “should,” “would” or other words that convey uncertainty of future events or outcomes.
Forward-looking statements involve known and unknown risks, uncertainties and other factors that may cause the actual results, performance or achievements of the series of First Trust Exchange-Traded Fund III (the “Trust”) described in this report (First Trust Institutional Preferred Securities and Income ETF; hereinafter referred to as the “Fund”) to be materially different from any future results, performance or achievements expressed or implied by the forward-looking statements. When evaluating the information included in this report, you are cautioned not to place undue reliance on these forward-looking statements, which reflect the judgment of the Advisor and/or Sub-Advisor and their respective representatives only as of the date hereof. We undertake no obligation to publicly revise or update these forward-looking statements to reflect events and circumstances that arise after the date hereof.
Performance and Risk Disclosure
There is no assurance that the Fund will achieve its investment objective. The Fund is subject to market risk, which is the possibility that the market values of securities owned by the Fund will decline and that the value of the Fund shares may therefore be less than what you paid for them. Accordingly, you can lose money by investing in the Fund. See “Risk Considerations” in the Additional Information section of this report for a discussion of certain other risks of investing in the Fund.
Performance data quoted represents past performance, which is no guarantee of future results, and current performance may be lower or higher than the figures shown. For the most recent month-end performance figures, please visit www.ftportfolios.com or speak with your financial advisor. Investment returns, net asset value and share price will fluctuate and Fund shares, when sold, may be worth more or less than their original cost.
The Advisor may also periodically provide additional information on Fund performance on the Fund’s web page at www.ftportfolios.com.
How to Read This Report
This report contains information that may help you evaluate your investment in the Fund. It includes details about the Fund and presents data and analysis that provide insight into the Fund’s performance and investment approach.
By reading the portfolio commentary by the portfolio management team of the Fund, you may obtain an understanding of how the market environment affected the Fund’s performance. The statistical information that follows may help you understand the Fund’s performance compared to that of a relevant market benchmark.
It is important to keep in mind that the opinions expressed by personnel of the Advisor and/or Sub-Advisor are just that: informed opinions. They should not be considered to be promises or advice. The opinions, like the statistics, cover the period through the date on the cover of this report. The material risks of investing in the Fund are spelled out in the prospectus, the statement of additional information, and other Fund regulatory filings.
First Trust Institutional Preferred Securities and Income ETF (FPEI)
Annual Letter from the Chairman and CEO
October 31, 2018
Dear Shareholders,
First Trust is pleased to provide you with the annual report for the First Trust Institutional Preferred Securities and Income ETF (the “Fund”), which contains detailed information about the Fund for the twelve months ended October 31, 2018, including a market overview and a performance analysis. We encourage you to read this report carefully and discuss it with your financial advisor.
As I mentioned in my April 2018 letter, 2017 was a very strong year for U.S. and global markets. Investors were rewarded with rising markets and very little volatility. As 2018 began, investors were hoping for another strong year in the markets. For the entire first quarter, however, increased market volatility was the norm for U.S. and global markets. The markets continued their volatility throughout the second quarter. During April and May, the Dow Jones Industrial Average (“DJIA”) closed out each month slightly down, but ended both June and July slightly up. August was a strong month for stocks, and the DJIA finished August just under its previous high in January of 2018. At the close of the third quarter in September, the markets had moved higher into positive territory. In fact, all three major U.S. indices (the Nasdaq Composite Index, the DJIA and the S& P 500® Index) hit record levels during the third quarter. In October, markets were again very volatile, surprising analysts and investors alike. Both global and U.S. markets fell on fears of slowing growth, trade wars and higher interest rates. The DJIA was down 5% for October and the MSCI EAFE Index, an index of stocks in 21 developed markets (excluding the U.S. and Canada), was down 9% for the same period.
Based on continued strong job growth and the economic outlook in the U.S., the Federal Reserve (the “Fed”) raised interest rates in March, June and September. At their September meeting, the Fed also indicated the possibility of one more rate hike in 2018 as well as three more rate hikes in 2019.
Trade tensions have had an impact on markets around the world and could continue to do so in the future. However, our economists believe that the long-term impact of U.S. tariffs will be to encourage countries to come back to the table and talk about more equal trade. Despite market volatility, we continue to believe that the combination of low interest rates, low inflation and strong corporate earnings still point to a positive economic environment and further growth, though we understand that past performance can never guarantee future performance.
We continue to believe that you should invest for the long term and be prepared for market movements, which can happen at any time. You can do this by keeping current on your portfolio and by speaking regularly with your investment professional. Markets go up and they also go down, but savvy investors are prepared for either through careful attention to investment goals.
Thank you for giving First Trust the opportunity to be a part of your financial plan. We value our relationship with you and will report on the Fund again in six months.
Sincerely,
James A. Bowen
Chairman of the Board of Trustees
Chief Executive Officer of First Trust Advisors L.P.
Fund Performance Overview (Unaudited)
First Trust Institutional Preferred Securities and Income ETF (FPEI)
First Trust Institutional Preferred Securities and Income ETF’s (the “Fund”) investment objective is to seek total return and to provide current income. Under normal market conditions, the Fund invests at least 80% of its net assets (including investment borrowings) in institutional preferred securities (“Preferred Securities”) and income-producing debt securities (“Income Securities”). Preferred securities are a type of equity security that have preference over common stock in the payment of distributions and the liquidation of a company’s assets, but are generally junior to all forms of the company’s debt, including both senior and subordinated debt. The Fund’s investments in preferred securities will primarily be in institutional preferred securities. Institutional preferred securities are targeted to institutional, rather than retail, investors, are generally traded over-the-counter and may also be known as “$1,000 par preferred securities.” They are typically issued in large, institutional lot sized by U.S. and non-U.S. financial services companies and other companies. While all income-producing debt securities will be categorized as “Income Securities” for purposes of the 80% test above, the Income Securities in which the Fund intends to invest as part of its principal investment strategy include hybrid capital securities, contingent capital securities, U.S. and non-U.S. corporate bonds and convertible securities.
| Performance | | | |
| | | Average Annual
Total Returns | Cumulative
Total Returns |
| | 1 Year Ended
10/31/18 | Inception (8/22/17)
to 10/31/18 | Inception (8/22/17)
to 10/31/18 |
| Fund Performance | | | |
| NAV | -2.42% | -0.39% | -0.46% |
| Market Price | -2.53% | -0.44% | -0.52% |
| Index Performance | | | |
| ICE BofAML US Investment Grade Institutional Capital Securities Index | -2.02% | -0.67% | -0.79% |
Total returns for the period since inception are calculated from the inception date of the Fund. “Average Annual Total Returns” represent the average annual change in value of an investment over the period indicated. “Cumulative Total Returns” represent the total change in value of an investment over the period indicated.
The Fund’s per share net asset value (“NAV”) is the value of one share of the Fund and is computed by dividing the value of all assets of the Fund (including accrued interest and dividends), less all liabilities (including accrued expenses and dividends declared but unpaid), by the total number of outstanding shares. The price used to calculate market return (“Market Price”) is determined by using the midpoint between the highest bid and the lowest offer on the stock exchange on which shares of the Fund are listed for trading as of the time that the Fund’s NAV is calculated. Since shares of the Fund did not trade in the secondary market until after its inception, for the period from inception to the first day of secondary market trading in shares of the Fund, the NAV of the Fund is used as a proxy for the secondary market trading price to calculate market returns. NAV and market returns assume that all distributions have been reinvested in the Fund at NAV and Market Price, respectively.
An index is a statistical composite that tracks a specified financial market or sector. Unlike the Fund, the index does not actually hold a portfolio of securities and therefore does not incur the expenses incurred by the Fund. These expenses negatively impact the performance of the Fund. Also, market returns do not include brokerage commissions that may be payable on secondary market transactions. If brokerage commissions were included, market returns would be lower. The total returns presented reflect the reinvestment of dividends on securities in the index. The returns presented do not reflect the deduction of taxes that a shareholder would pay on Fund distributions or the redemption or sale of Fund shares. The investment return and principal value of shares of the Fund will vary with changes in market conditions. Shares of the Fund may be worth more or less than their original cost when they are redeemed or sold in the market. The Fund’s past performance is no guarantee of future performance.
Fund Performance Overview (Unaudited) (Continued)
First Trust Institutional Preferred Securities and Income ETF (FPEI) (Continued)
| Sector Allocation | % of Total
Investments |
| Financials | 77.8% |
| Utilities | 7.1 |
| Energy | 6.7 |
| Industrials | 2.5 |
| Consumer Staples | 2.3 |
| Materials | 2.1 |
| Communication Services | 1.0 |
| Consumer Discretionary | 0.5 |
| Total | 100.0% |
| Credit Quality (1) | % of Total
Investments |
| A- | 4.0% |
| BBB+ | 9.8 |
| BBB | 20.6 |
| BBB- | 25.7 |
| BB+ | 25.5 |
| BB | 11.0 |
| BB- | 1.7 |
| B+ | 1.7 |
| Total | 100.0% |
| Top Ten Holdings | % of Total
Investments |
| Wells Fargo & Co., Series U | 3.0% |
| Emera, Inc., Series 16-A | 2.7 |
| Credit Agricole S.A. | 2.5 |
| AerCap Global Aviation Trust | 2.5 |
| Lloyds Banking Group PLC | 2.3 |
| Barclays PLC | 2.3 |
| Catlin Insurance Co., Ltd., | 2.3 |
| American Express Co., Series C | 2.2 |
| Enel S.p.A. | 2.1 |
| Mitsui Sumitomo Insurance Co., Ltd. | 2.0 |
| Total | 23.9% |
| Country Allocation | % of Total
Investments |
| United States | 40.7% |
| United Kingdom | 12.6 |
| France | 8.1 |
| Japan | 7.1 |
| Canada | 5.4 |
| Australia | 5.3 |
| Italy | 5.1 |
| Bermuda | 3.9 |
| Netherlands | 3.5 |
| Switzerland | 3.1 |
| Spain | 1.5 |
| Denmark | 1.2 |
| Sweden | 1.1 |
| Finland | 0.6 |
| Chile | 0.5 |
| Norway | 0.3 |
| Total | 100.0% |
| (1) | The credit quality and ratings information presented above reflect the ratings assigned by one or more nationally recognized statistical rating organizations (NRSROs), including Standard & Poor’s Ratings Group, a division of the McGraw Hill Companies, Inc., Moody’s Investors Service, Inc., Fitch Ratings or a comparably rated NRSRO. For situations in which a security is rated by more than one NRSRO and the ratings are not equivalent, the highest rating is used. Sub-investment grade ratings are those rated BB+/Ba1 or lower. Investment grade ratings are those rated BBB-/Baa3 or higher. The credit ratings shown relate to the creditworthiness of the issuers of the underlying securities in the Fund, and not to the Fund or its shares. Credit ratings are subject to change. |
Fund Performance Overview (Unaudited) (Continued)
First Trust Institutional Preferred Securities and Income ETF (FPEI) (Continued)

Performance figures assume reinvestment of all distributions and do not reflect the deduction of taxes that a shareholder would pay on Fund distributions or the redemption or sale of Fund shares. An index is a statistical composite that tracks a specified financial market or sector. Unlike the Fund, the index does not actually hold a portfolio of securities and therefore does not incur the expenses incurred by the Fund. These expenses negatively impact the performance of the Fund. The Fund’s past performance does not predict future performance.
Frequency Distribution of Discounts and Premiums
Bid/Ask Midpoint vs. NAV through October 31, 2018
The following Frequency Distribution of Discounts and Premiums charts are provided to show the frequency at which the bid/ask midpoint price for the Fund was at a discount or premium to the daily NAV. The following tables are for comparative purposes only and represent the period August 23, 2017 (commencement of trading) through October 31, 2018. Shareholders may pay more than NAV when they buy Fund shares and receive less than NAV when they sell those shares because shares are bought and sold at current market price. Data presented represents past performance and cannot be used to predict future results.
| Number of Days Bid/Ask Midpoint At/Above NAV |
| For the Period | 0.00%–0.49% | 0.50%–0.99% | 1.00%–1.99% | >=2.00% |
| 8/23/17 – 10/31/17 | 44 | 0 | 0 | 0 |
| 11/1/17 – 10/31/18 | 156 | 2 | 0 | 0 |
| Number of Days Bid/Ask Midpoint Below NAV |
| For the Period | 0.00%–0.49% | 0.50%–0.99% | 1.00%–1.99% | >=2.00% |
| 8/23/17 – 10/31/17 | 5 | 0 | 0 | 0 |
| 11/1/17 – 10/31/18 | 90 | 4 | 0 | 0 |
Portfolio Commentary
First Trust Institutional Preferred Securities and Income ETF (FPEI)
Annual Report
October 31, 2018 (Unaudited)
Advisor
First Trust Advisors L.P. (“First Trust” or the “Advisor”) serves as the investment advisor to the First Trust Institutional Preferred Securities and Income ETF (the “Fund”). First Trust is responsible for the ongoing monitoring of the Fund’s investment portfolio, managing the Fund’s business affairs and providing certain administrative services necessary for the management of the Fund.
Sub-Advisor
Stonebridge Advisors LLC
Stonebridge Advisors LLC (“Stonebridge” or the “Sub-Advisor”) is the investment sub-advisor to the Fund and is a registered investment advisor based in Wilton, Connecticut. Stonebridge specializes in the management of preferred and hybrid securities.
Portfolio Management Team
Scott T. Fleming - Chief Executive Officer and President
Robert Wolf - Chief Investment Officer, Senior Vice President and Senior Portfolio Manager
Commentary
Market Recap
The fiscal year ended October 31, 2018 was a volatile period for the preferred and hybrid securities market with all parts of the market experiencing negative performance. This was largely driven by rising interest rates as well as economic and political headlines across the globe. The Federal Reserve (the “Fed”) guided short-term interest rates higher by 0.25% four times during the period as improving economic and employment data in the United States supported further rate hikes. Longer-term interest rates also moved higher, but the curve flattened substantially as short-term rates increased at a faster pace. Credit spreads also managed to tighten within the preferred and hybrid securities market amid continued improvement in credit fundamentals, despite political uncertainty in Turkey, BREXIT negotiations, and trade tensions between China and the United States weighing on fixed income markets overall. These headlines pressured contingent capital securities (“CoCos”) in particular, which are largely issued by European banks. As a result, CoCos, as measured by the ICE BofAML USD Investment Grade Contingent Capital Index (“COCU”), were the worst performing part of the preferred and hybrid securities market during the period, as COCU was down 2.52%. Finally, the retail $25 par market outperformed the institutional $1,000 par market during the period, as limited new issuance and net negative supply supported that part of the market. For the fiscal year, the retail market fell 1.23% while the institutional market lost 2.15% according to The ICE BofAML Fixed Rate Preferred Securities Index (“P0P1”) and The ICE BofAML Capital Securities Index (“C0CS”), respectively.
Performance Analysis
For the fiscal year ended October 31, 2018, the net asset value (“NAV”) and market price total returns for the Fund were -2.42% and -2.53%, respectively. This compares to a total return of -2.02% for the Fund’s benchmark, which is the ICE BofAML US Investment Grade Institutional Capital Securities Index (“CIPS”). The largest contributor to the Fund’s underperformance relative to the benchmark during the period was the Fund’s overweight to CoCos. However, security selection within non-CoCo institutional securities and the Fund’s overweight to floating rate securities helped to offset this underperformance.
The Fund’s weighting in CoCos issued by European banks, which are not held in the benchmark, was the single largest reason for underperformance relative to the benchmark. Political volatility in Italy, BREXIT negotiations, and tariffs from the United States all weighed on CoCos throughout the period, despite improvements in European bank capitalization. CoCos continue to offer some of the most attractive yields and structures in the institutional market. However, the Fund was able to offset some of this relative underperformance through superior security selection in non-CoCo institutional securities. The Fund’s focus on variable rate securities with wide back-end reset spreads and shorter durations both contributed positively to relative performance.
The Fund also benefited from overweighting floating rate securities, which profited from rising short-term interest rates, spread tightening and a flattening yield curve. In the current rising interest rate environment, we believe it is prudent to maintain a conservative stance in regard to interest rates relative to the benchmark and peers.
Market and Fund Outlook
As we approach 2019, we believe the preferred and hybrid securities market will be positively supported by strong issuer credit fundamentals, attractive yields compared to other fixed income asset classes and a positive market technical from limited net new issue supply into 2019. Although we believe headline risks of global trade wars and other geopolitical events will likely persist for the
Portfolio Commentary (Continued)
First Trust Institutional Preferred Securities and Income ETF (FPEI)
Annual Report
October 31, 2018 (Unaudited)
next 6 to 12 months, in our opinion preferred and hybrid securities valuations already reflect these risks and credit fundamentals of issuers in this asset class are generally strong enough to withstand the possibility of slowing economic growth.
We continue to believe that U.S. interest rates should broadly continue to shift higher and Treasury yield curve likely to remain relatively flat into 2019. We believe short-term rates are likely to increase due to Fed normalization, while inflation pressures are likely to slowly push longer term rates higher overall. In the current environment, we believe the best total return and risk profile will likely be achieved by overweighting short to intermediate term securities. Additionally, absolute yields and yield spreads of preferred and hybrid securities relative to U.S. Treasuries and other credit spread products should remain at attractive levels and may continue to provide a cushion against rising interest rates.
The Fund will attempt to position the portfolio to protect against the largest risks in the market and continue to identify the best securities in all parts of the preferred and hybrid securities market to construct balanced portfolios that we believe will lead to long term outperformance.
First Trust Institutional Preferred Securities and Income ETF (FPEI)
Understanding Your Fund Expenses
October 31, 2018 (Unaudited)
As a shareholder of the First Trust Institutional Preferred Securities and Income ETF (the “Fund”), you incur two types of costs: (1) transaction costs; and (2) ongoing costs, including management fees, distribution and/or service (12b-1) fees, if any, and other Fund expenses. This Example is intended to help you understand your ongoing costs of investing in the Fund and to compare these costs with the ongoing costs of investing in other funds.
The Example is based on an investment of $1,000 invested at the beginning of the period and held through the six-month period ended October 31, 2018.
Actual Expenses
The first line in the following table provides information about actual account values and actual expenses. You may use the information in this line, together with the amount you invested, to estimate the expenses that you paid over the period. Simply divide your account value by $1,000 (for example, an $8,600 account value divided by $1,000 = 8.6), then multiply the result by the number in the first line under the heading entitled “Expenses Paid During the Six-Month Period” to estimate the expenses you paid on your account during this six-month period.
Hypothetical Example for Comparison Purposes
The second line in the following table provides information about hypothetical account values and hypothetical expenses based on the Fund’s actual expense ratio and an assumed rate of return of 5% per year before expenses, which is not the Fund’s actual return. The hypothetical account values and expenses may not be used to estimate the actual ending account balance or expenses you paid for the period. You may use this information to compare the ongoing costs of investing in the Fund and other funds. To do so, compare this 5% hypothetical example with the 5% hypothetical examples that appear in the shareholder reports of the other funds.
Please note that the expenses shown in the table are meant to highlight your ongoing costs only and do not reflect any transactional costs such as brokerage commissions. Therefore, the second line in the table is useful in comparing ongoing costs only, and will not help you determine the relative total costs of owning different funds. In addition, if these transactional costs were included, your costs would have been higher.
| | Beginning
Account Value
May 1, 2018 | Ending
Account Value
October 31, 2018 | Annualized
Expense Ratio
Based on the
Six-Month
Period | Expenses Paid
During the
Six-Month
Period (a) |
| First Trust Institutional Preferred Securities and Income ETF (FPEI) |
| Actual | $1,000.00 | $989.40 | 0.85% | $4.26 |
| Hypothetical (5% return before expenses) | $1,000.00 | $1,020.92 | 0.85% | $4.33 |
| (a) | Expenses are equal to the annualized expense ratios as indicated in the table multiplied by the average account value over the period (May 1, 2018 through October 31, 2018), multiplied by 184/365 (to reflect the six-month period). |
First Trust Institutional Preferred Securities and Income ETF (FPEI)
Portfolio of Investments
October 31, 2018
Par
Amount | | Description | | Stated
Rate | | Stated
Maturity | | Value |
| CAPITAL PREFERRED SECURITIES – 97.6% |
| | | Automobiles – 0.5% | | | | | | |
| $500,000 | | General Motors Financial Co., Inc., Series B (a)
| | 6.50% | | (b) | | $471,250 |
| | | Banks – 45.4% | | | | | | |
| 600,000 | | Australia & New Zealand Banking Group Ltd. (a) (c) (d)
| | 6.75% | | (b) | | 617,250 |
| 200,000 | | Banco Bilbao Vizcaya Argentaria S.A. (a) (d)
| | 6.13% | | (b) | | 172,750 |
| 1,200,000 | | Banco Santander S.A. (a) (d)
| | 6.38% | | (b) | | 1,186,336 |
| 400,000 | | Bank of America Corp., Series AA (a)
| | 6.10% | | (b) | | 411,000 |
| 400,000 | | Bank of America Corp., Series DD (a)
| | 6.30% | | (b) | | 422,500 |
| 800,000 | | Bank of America Corp., Series X (a)
| | 6.25% | | (b) | | 825,000 |
| 1,700,000 | | Bank of America Corp., Series Z (a)
| | 6.50% | | (b) | | 1,804,890 |
| 200,000 | | Barclays PLC (a) (d)
| | 7.75% | | (b) | | 200,040 |
| 2,050,000 | | Barclays PLC (a) (d)
| | 7.88% | | (b) | | 2,116,625 |
| 200,000 | | BNP Paribas S.A. (a) (c) (d)
| | 6.75% | | (b) | | 202,750 |
| 300,000 | | BNP Paribas S.A. (a) (c) (d)
| | 7.38% | | (b) | | 308,625 |
| 1,081,000 | | BNP Paribas S.A. (a) (c) (d)
| | 7.63% | | (b) | | 1,125,591 |
| 1,050,000 | | Citigroup, Inc., Series O (a)
| | 5.88% | | (b) | | 1,065,750 |
| 1,800,000 | | Citigroup, Inc., Series P (a)
| | 5.95% | | (b) | | 1,776,375 |
| 900,000 | | Citizens Financial Group, Inc., Series A (a)
| | 5.50% | | (b) | | 909,000 |
| 225,000 | | Citizens Financial Group, Inc., Series C (a)
| | 6.38% | | (b) | | 225,537 |
| 723,000 | | CoBank ACB, Series I (a) (e)
| | 6.25% | | (b) | | 759,150 |
| 2,200,000 | | Credit Agricole S.A. (a) (c) (d)
| | 7.88% | | (b) | | 2,279,979 |
| 400,000 | | Credit Agricole S.A. (a) (c) (d)
| | 8.13% | | (b) | | 430,037 |
| 1,200,000 | | Danske Bank A.S. (a) (d)
| | 6.13% | | (b) | | 1,075,850 |
| 300,000 | | DNB Bank ASA (a) (d)
| | 5.75% | | (b) | | 298,867 |
| 150,000 | | Farm Credit Bank of Texas, Series 3 (a) (c)
| | 6.20% | | (b) | | 150,375 |
| 1,270,000 | | HSBC Holdings PLC (a) (d)
| | 6.38% | | (b) | | 1,236,662 |
| 1,168,000 | | HSBC Holdings PLC (a) (d)
| | 6.88% | | (b) | | 1,213,260 |
| 1,400,000 | | ING Groep N.V. (a) (d)
| | 6.50% | | (b) | | 1,330,700 |
| 500,000 | | ING Groep N.V. (a) (d)
| | 6.88% | | (b) | | 505,938 |
| 1,300,000 | | Intesa Sanpaolo S.p.A. (a) (c) (d)
| | 7.70% | | (b) | | 1,181,375 |
| 501,000 | | JPMorgan Chase & Co., Series I, 3 Mo. LIBOR + 3.47% (f)
| | 5.99% | | (b) | | 504,312 |
| 1,100,000 | | JPMorgan Chase & Co., Series R (a)
| | 6.00% | | (b) | | 1,108,250 |
| 750,000 | | JPMorgan Chase & Co., Series S (a)
| | 6.75% | | (b) | | 800,812 |
| 169,000 | | JPMorgan Chase & Co., Series V (a)
| | 5.00% | | (b) | | 169,211 |
| 300,000 | | JPMorgan Chase & Co., Series X (a)
| | 6.10% | | (b) | | 305,340 |
| 2,100,000 | | Lloyds Banking Group PLC (a) (d)
| | 7.50% | | (b) | | 2,123,625 |
| 500,000 | | Lloyds Banking Group PLC (a) (d)
| | 7.50% | | (b) | | 503,750 |
| 600,000 | | Nordea Bank Abp (a) (d)
| | 6.13% | | (b) | | 578,250 |
| 1,300,000 | | Royal Bank of Scotland Group PLC (a) (d)
| | 8.00% | | (b) | | 1,344,687 |
| 1,400,000 | | Royal Bank of Scotland Group PLC (a) (d)
| | 8.63% | | (b) | | 1,475,250 |
| 800,000 | | Societe Generale S.A. (a) (c) (d)
| | 6.00% | | (b) | | 789,008 |
| 820,000 | | Societe Generale S.A. (a) (c) (d)
| | 7.38% | | (b) | | 833,325 |
| 1,021,000 | | Societe Generale S.A. (a) (c) (d)
| | 7.88% | | (b) | | 1,029,934 |
| 400,000 | | Societe Generale S.A. (a) (d)
| | 7.88% | | (b) | | 403,500 |
| 900,000 | | Standard Chartered PLC (a) (c) (d)
| | 7.50% | | (b) | | 912,375 |
| 400,000 | | Standard Chartered PLC (a) (c) (d)
| | 7.75% | | (b) | | 405,000 |
| 1,000,000 | | Swedbank AB (a) (d)
| | 6.00% | | (b) | | 981,250 |
| 1,700,000 | | UniCredit S.p.A. (a) (d)
| | 8.00% | | (b) | | 1,532,397 |
| 200,000 | | Wells Fargo & Co., Series K, 3 Mo. LIBOR + 3.77% (f)
| | 6.10% | | (b) | | 201,750 |
| 2,650,000 | | Wells Fargo & Co., Series U (a)
| | 5.88% | | (b) | | 2,732,812 |
| | | | | 42,567,050 |
| | | Capital Markets – 6.4% | | | | | | |
| 250,000 | | Credit Suisse Group AG (a) (c) (d)
| | 7.25% | | (b) | | 247,813 |
| 500,000 | | Credit Suisse Group AG (a) (c) (d)
| | 7.50% | | (b) | | 521,961 |
| 1,300,000 | | Credit Suisse Group AG (a) (d)
| | 7.50% | | (b) | | 1,357,100 |
Page 8
See Notes to Financial Statements
First Trust Institutional Preferred Securities and Income ETF (FPEI)
Portfolio of Investments (Continued)
October 31, 2018
Par
Amount | | Description | | Stated
Rate | | Stated
Maturity | | Value |
| CAPITAL PREFERRED SECURITIES (Continued) |
| | | Capital Markets (Continued) | | | | | | |
| $500,000 | | Credit Suisse Group AG (a) (c) (d)
| | 7.50% | | (b) | | $510,000 |
| 1,600,000 | | E*TRADE Financial Corp., Series A (a)
| | 5.88% | | (b) | | 1,596,000 |
| 400,000 | | Goldman Sachs Group (The), Inc., Series M (a)
| | 5.38% | | (b) | | 403,500 |
| 1,175,000 | | Morgan Stanley, Series J (a)
| | 5.55% | | (b) | | 1,188,219 |
| 200,000 | | UBS Group Funding Switzerland AG (a) (d)
| | 7.00% | | (b) | | 208,750 |
| | | | | 6,033,343 |
| | | Consumer Finance – 2.1% | | | | | | |
| 2,000,000 | | American Express Co., Series C (a)
| | 4.90% | | (b) | | 1,995,000 |
| | | Diversified Financial Services – 1.5% | | | | | | |
| 1,400,000 | | Voya Financial, Inc. (a)
| | 5.65% | | 05/15/53 | | 1,382,500 |
| | | Diversified Telecommunication Services – 1.0% | | | | | | |
| 900,000 | | Koninklijke KPN N.V. (a)
| | 7.00% | | 03/28/73 | | 937,350 |
| | | Electric Utilities – 6.0% | | | | | | |
| 2,400,000 | | Emera, Inc., Series 16-A (a)
| | 6.75% | | 06/15/76 | | 2,508,000 |
| 1,800,000 | | Enel S.p.A. (a) (c)
| | 8.75% | | 09/24/73 | | 1,948,500 |
| 800,000 | | PPL Capital Funding, Inc., Series A, 3 Mo. LIBOR + 2.67% (f)
| | 5.05% | | 03/30/67 | | 780,000 |
| 400,000 | | Southern (The) Co., Series B (a)
| | 5.50% | | 03/15/57 | | 399,989 |
| | | | | 5,636,489 |
| | | Energy Equipment & Services – 1.5% | | | | | | |
| 1,395,000 | | Transcanada Trust, Series 16-A (a)
| | 5.88% | | 08/15/76 | | 1,376,726 |
| | | Food Products – 2.3% | | | | | | |
| 1,000,000 | | Land O’Lakes Capital Trust I (g)
| | 7.45% | | 03/15/28 | | 1,083,750 |
| 1,000,000 | | Land O’Lakes, Inc. (c)
| | 7.25% | | (b) | | 1,040,000 |
| | | | | 2,123,750 |
| | | Independent Power and Renewable Electricity Producers – 0.4% | | | | | | |
| 425,000 | | AES Gener S.A. (a)
| | 8.38% | | 12/18/73 | | 431,736 |
| | | Insurance – 20.5% | | | | | | |
| 450,000 | | Aegon N.V. (a)
| | 5.50% | | 04/11/48 | | 428,906 |
| 200,000 | | American International Group, Inc., Series A-9 (a)
| | 5.75% | | 04/01/48 | | 189,376 |
| 1,300,000 | | Asahi Mutual Life Insurance Co. (a)
| | 7.25% | | (b) | | 1,331,720 |
| 1,458,000 | | Assurant, Inc. (a)
| | 7.00% | | 03/27/48 | | 1,465,290 |
| 2,100,000 | | Catlin Insurance Co., Ltd., 3 Mo. LIBOR + 2.98% (c) (f)
| | 5.42% | | (b) | | 2,068,500 |
| 700,000 | | Dai-Ichi Life Insurance (The) Co., Ltd. (a) (c)
| | 7.25% | | (b) | | 757,050 |
| 630,000 | | Everest Reinsurance Holdings, Inc., 3 Mo. LIBOR + 2.39% (f)
| | 4.70% | | 05/15/37 | | 614,250 |
| 1,400,000 | | Fukoku Mutual Life Insurance Co. (a)
| | 6.50% | | (b) | | 1,495,375 |
| 1,143,000 | | Hartford Financial Services Group (The), Inc., 3 Mo. LIBOR + 2.13% (c) (f)
| | 4.44% | | 02/12/47 | | 1,054,417 |
| 621,000 | | Liberty Mutual Group, Inc. (c)
| | 7.80% | | 03/15/37 | | 712,598 |
| 400,000 | | Liberty Mutual Group, Inc. (a) (c)
| | 10.75% | | 06/15/58 | | 589,000 |
| 1,400,000 | | Liberty Mutual Group, Inc., 3 Mo. LIBOR + 2.91% (c) (f)
| | 5.24% | | 03/15/37 | | 1,354,500 |
| 1,700,000 | | Mitsui Sumitomo Insurance Co., Ltd. (a) (c)
| | 7.00% | | 03/15/72 | | 1,836,000 |
| 1,610,000 | | Oil Insurance Ltd., 3 Mo. LIBOR + 2.98% (c) (f)
| | 5.29% | | (b) | | 1,569,750 |
| 700,000 | | QBE Insurance Group, Ltd. (a) (c)
| | 7.50% | | 11/24/43 | | 760,375 |
| 1,500,000 | | QBE Insurance Group, Ltd. (a)
| | 6.75% | | 12/02/44 | | 1,541,250 |
| 375,000 | | Reinsurance Group of America, Inc., 3 Mo. LIBOR + 2.67% (f)
| | 5.00% | | 12/15/65 | | 369,375 |
| 1,000,000 | | Sumitomo Life Insurance Co. (a) (c)
| | 6.50% | | 09/20/73 | | 1,072,600 |
| | | | | 19,210,332 |
| | | Metals & Mining – 2.1% | | | | | | |
| 300,000 | | BHP Billiton Finance USA Ltd. (a) (c)
| | 6.25% | | 10/19/75 | | 313,275 |
See Notes to Financial Statements
Page 9
First Trust Institutional Preferred Securities and Income ETF (FPEI)
Portfolio of Investments (Continued)
October 31, 2018
Par
Amount | | Description | | Stated
Rate | | Stated
Maturity | | Value |
| CAPITAL PREFERRED SECURITIES (Continued) |
| | | Metals & Mining (Continued) | | | | | | |
| $1,500,000 | | BHP Billiton Finance USA Ltd. (a) (c)
| | 6.75% | | 10/19/75 | | $1,627,500 |
| | | | | 1,940,775 |
| | | Multi-Utilities – 0.4% | | | | | | |
| 200,000 | | CenterPoint Energy, Inc., Series A (a)
| | 6.13% | | (b) | | 202,250 |
| 200,000 | | NiSource, Inc. (a) (c)
| | 5.65% | | (b) | | 196,290 |
| | | | | 398,540 |
| | | Oil, Gas & Consumable Fuels – 5.1% | | | | | | |
| 400,000 | | DCP Midstream L.P., Series A (a)
| | 7.38% | | (b) | | 384,000 |
| 1,500,000 | | Enbridge Energy Partners L.P., 3 Mo. LIBOR + 3.80% (f)
| | 6.19% | | 10/01/37 | | 1,492,658 |
| 300,000 | | Enbridge, Inc. (a)
| | 6.25% | | 03/01/78 | | 281,621 |
| 900,000 | | Enbridge, Inc., Series 16-A (a)
| | 6.00% | | 01/15/77 | | 845,960 |
| 1,395,000 | | Energy Transfer Operating L.P., 3 Mo. LIBOR + 3.02% (f)
| | 5.36% | | 11/01/66 | | 1,185,750 |
| 100,000 | | Energy Transfer Operating L.P., Series B (a)
| | 6.63% | | (b) | | 92,188 |
| 500,000 | | Enterprise Products Operating LLC, 3 Mo. LIBOR + 2.78% (f)
| | 5.10% | | 06/01/67 | | 496,313 |
| | | | | 4,778,490 |
| | | Transportation Infrastructure – 2.4% | | | | | | |
| 2,200,000 | | AerCap Global Aviation Trust (a) (c)
| | 6.50% | | 06/15/45 | | 2,266,000 |
| | | Total Capital Preferred Securities
| | 91,549,331 |
| | | (Cost $96,659,027) | | | | | | |
Principal
Value | | Description | | Stated
Coupon | | Stated
Maturity | | Value |
| CORPORATE BONDS AND NOTES – 0.2% |
| | | Insurance – 0.2% | | | | | | |
| 200,000 | | AmTrust Financial Services, Inc.
| | 6.13% | | 08/15/23 | | 187,894 |
| | | (Cost $198,755) | | | | | | |
| | Total Investments – 97.8%
| | 91,737,225 |
| | (Cost $96,857,782) (h) | | |
| | Net Other Assets and Liabilities – 2.2%
| | 2,019,586 |
| | Net Assets – 100.0%
| | $93,756,811 |
|
| (a) | Fixed-to-floating or fixed-to-variable rate security. The interest rate shown reflects the fixed rate in effect at October 31, 2018. At a predetermined date, the fixed rate will change to a floating rate or a variable rate. |
| (b) | Perpetual maturity. |
| (c) | This security, sold within the terms of a private placement memorandum, is exempt from registration upon resale under Rule 144A under the Securities Act of 1933, as amended (the “1933 Act”), and may be resold in transactions exempt from registration, normally to qualified institutional buyers. Pursuant to procedures adopted by the Trust’s Board of Trustees, this security has been determined to be liquid by Stonebridge Advisors LLC, the Fund’s sub-advisor (the “Sub-Advisor”). Although market instability can result in periods of increased overall market illiquidity, liquidity for each security is determined based on security specific factors and assumptions, which require subjective judgment. At October 31, 2018, securities noted as such amounted to $30,711,753 or 32.8% of net assets. |
| (d) | This security is a contingent convertible capital security which may be subject to conversion into common stock of the issuer under certain circumstances. At October 31, 2018, securities noted as such amounted to $31,240,610 or 33.3% of net assets. Of these securities, 0.0% originated in emerging markets, and 100.0% originated in foreign markets. |
| (e) | Pursuant to procedures adopted by the Trust’s Board of Trustees, this security has been determined to be illiquid by the Sub-Advisor. |
| (f) | Floating or variable rate security. |
| (g) | This security, sold within the terms of a private placement memorandum, is exempt from registration upon resale under Rule 144A under the 1933 Act, and may be resold in transactions exempt from registration, normally to qualified institutional buyers (see Note 2C - Restricted Securities in the Notes to Financial Statements). |
Page 10
See Notes to Financial Statements
First Trust Institutional Preferred Securities and Income ETF (FPEI)
Portfolio of Investments (Continued)
October 31, 2018
| (h) | Aggregate cost for federal income tax purposes was $96,977,025. As of October 31, 2018, the aggregate gross unrealized appreciation for all investments in which there was an excess of value over tax cost was $52,123 and the aggregate gross unrealized depreciation for all investments in which there was an excess of tax cost over value was $5,291,923. The net unrealized depreciation was $5,239,800. |
| LIBOR | London Interbank Offered Rate |
Valuation Inputs
A summary of the inputs used to value the Fund’s investments as of October 31, 2018 is as follows (see Note 2A - Portfolio Valuation in the Notes to Financial Statements):
| | Total
Value at
10/31/2018 | Level 1
Quoted
Prices | Level 2
Significant
Observable
Inputs | Level 3
Significant
Unobservable
Inputs |
Capital Preferred Securities*
| $ 91,549,331 | $ — | $ 91,549,331 | $ — |
Corporate Bonds and Notes*
| 187,894 | — | 187,894 | — |
Total Investments
| $ 91,737,225 | $— | $ 91,737,225 | $— |
| * | See Portfolio of Investments for industry breakout. |
See Notes to Financial Statements
Page 11
First Trust Institutional Preferred Securities and Income ETF (FPEI)
Statement of Assets and Liabilities
October 31, 2018
| ASSETS: | |
Investments, at value
(Cost $96,857,782)
| $ 91,737,225 |
Cash
| 2,780,845 |
| Receivables: | |
Interest
| 1,154,274 |
Interest reclaims
| 21,392 |
Total Assets
| 95,693,736 |
| LIABILITIES: | |
| Payables: | |
Investment securities purchased
| 1,872,677 |
Investment advisory fees
| 64,248 |
Total Liabilities
| 1,936,925 |
NET ASSETS
| $93,756,811 |
| NET ASSETS consist of: | |
Paid-in capital
| $ 99,191,721 |
Par value
| 50,000 |
Accumulated distributable earnings (loss)
| (5,484,910) |
NET ASSETS
| $93,756,811 |
NET ASSET VALUE, per share
| $18.75 |
Number of shares outstanding (unlimited number of shares authorized, par value $0.01 per share)
| 5,000,002 |
Page 12
See Notes to Financial Statements
First Trust Institutional Preferred Securities and Income ETF (FPEI)
Statement of Operations
For the Year Ended October 31, 2018
| INVESTMENT INCOME: | |
Interest
| $ 4,402,029 |
Foreign withholding tax
| (4,160) |
Total investment income
| 4,397,869 |
| EXPENSES: | |
Investment advisory fees
| 602,090 |
Excise tax expense
| 2,055 |
Total expenses
| 604,145 |
NET INVESTMENT INCOME (LOSS)
| 3,793,724 |
| NET REALIZED AND UNREALIZED GAIN (LOSS): | |
Net realized gain (loss) on investments
| (350,585) |
Net change in unrealized appreciation (depreciation) on investments
| (5,338,740) |
NET REALIZED AND UNREALIZED GAIN (LOSS)
| (5,689,325) |
NET INCREASE (DECREASE) IN NET ASSETS RESULTING FROM OPERATIONS
| $(1,895,601) |
See Notes to Financial Statements
Page 13
First Trust Institutional Preferred Securities and Income ETF (FPEI)
Statements of Changes in Net Assets
| | Year
Ended
10/31/2018 | | Period
Ended
10/31/2017 (a) |
| OPERATIONS: | | | |
Net investment income (loss)
| $ 3,793,724 | | $ 188,424 |
Net realized gain (loss)
| (350,585) | | (11,669) |
Net change in unrealized appreciation (depreciation)
| (5,338,740) | | 218,183 |
Net increase (decrease) in net assets resulting from operations
| (1,895,601) | | 394,938 |
| DISTRIBUTIONS TO SHAREHOLDERS FROM: | | | |
Investment operations
| (3,846,302) | | |
Net investment income
| | | (140,000) |
Total distributions to shareholders
| (3,846,302) | | (140,000) |
| SHAREHOLDER TRANSACTIONS: | | | |
Proceeds from shares sold
| 80,923,612 | | 24,057,762 |
Cost of shares redeemed
| (5,737,598) | | — |
Net increase (decrease) in net assets resulting from shareholder transactions
| 75,186,014 | | 24,057,762 |
Total increase (decrease) in net assets
| 69,444,111 | | 24,312,700 |
| NET ASSETS: | | | |
Beginning of period
| 24,312,700 | | — |
End of period
| $93,756,811 | | $24,312,700 |
Accumulated net investment income (loss) at end of period
| | | $47,377 |
| CHANGES IN SHARES OUTSTANDING: | | | |
Shares outstanding, beginning of period
| 1,200,002 | | — |
Shares sold
| 4,100,000 | | 1,200,002 |
Shares redeemed
| (300,000) | | — |
Shares outstanding, end of period
| 5,000,002 | | 1,200,002 |
| (a) | Inception date is August 22, 2017, which is consistent with the commencement of investment operations and is the date the initial creation units were established. |
Page 14
See Notes to Financial Statements
First Trust Institutional Preferred Securities and Income ETF (FPEI)
Financial Highlights
For a share outstanding throughout each period
| | Year Ended
October 31,
2018 | | Period
Ended
10/31/2017 (a) |
Net asset value, beginning of period
| $ 20.26 | | $ 20.00 |
| Income from investment operations: | | | |
Net investment income (loss)
| 0.99 | | 0.18 |
Net realized and unrealized gain (loss)
| (1.47) | | 0.22 |
Total from investment operations
| (0.48) | | 0.40 |
| Distributions paid to shareholders from: | | | |
Net investment income
| (1.03) | | (0.14) |
Net asset value, end of period
| $18.75 | | $20.26 |
Total return (b)
| (2.42)% | | 2.00% |
| Ratios to average net assets/supplemental data: | | | |
Net assets, end of period (in 000’s)
| $ 93,757 | | $ 24,313 |
Ratio of total expenses to average net assets
| 0.85% | | 0.85% (c) |
Ratio of net investment income (loss) to average net assets
| 5.36% | | 4.93% (c) |
Portfolio turnover rate (d)
| 25% | | 13% |
| (a) | Inception date is August 22, 2017, which is consistent with the commencement of investment operations and is the date the initial creation units were established. |
| (b) | Total return is calculated assuming an initial investment made at the net asset value at the beginning of the period, reinvestment of all distributions at net asset value during the period, and redemption at net asset value on the last day of the period. The returns presented do not reflect the deduction of taxes that a shareholder would pay on Fund distributions or the redemption or sale of Fund shares. Total return is calculated for the time period presented and is not annualized for periods of less than a year. |
| (c) | Annualized. |
| (d) | Portfolio turnover is calculated for the time period presented and is not annualized for periods of less than a year and does not include securities received or delivered from processing creations or redemptions and in-kind transactions. |
See Notes to Financial Statements
Page 15
Notes to Financial Statements
First Trust Institutional Preferred Securities and Income ETF (FPEI)
October 31, 2018
1. Organization
First Trust Exchange-Traded Fund III (the “Trust”) is an open-end management investment company organized as a Massachusetts business trust on January 9, 2008, and is registered with the Securities and Exchange Commission (“SEC”) under the Investment Company Act of 1940, as amended (the “1940 Act”).
The Trust consists of thirteen funds that are currently offering shares. This report covers the First Trust Institutional Preferred Securities and Income ETF (the “Fund”), which trades under the ticker FPEI on the NYSE Arca, Inc. Unlike conventional mutual funds, the Fund issues and redeems shares on a continuous basis, at net asset value (“NAV”), only in large specified blocks consisting of 50,000 shares called a “Creation Unit.” Creation Units are issued and redeemed in-kind for securities in which the Fund invests and, in certain circumstances, for cash. Except when aggregated in Creation Units, the shares are not redeemable securities of the Fund.
The Fund is an actively managed exchange-traded fund. The investment objective of the Fund is to seek total return and to provide current income. Under normal market conditions, the Fund invests at least 80% of its net assets (including investment borrowings) in institutional preferred securities and income-producing debt securities, including hybrid capital securities, contingent capital securities, U.S. and non-U.S. corporate bonds and convertible securities. There can be no assurance that the Fund will achieve its investment objective. The Fund may not be appropriate for all investors.
2. Significant Accounting Policies
The Fund is considered an investment company and follows accounting and reporting guidance under Financial Accounting Standards Board (“FASB”) Accounting Standards Codification (“ASC”) Topic 946, “Financial Services-Investment Companies.” The following is a summary of significant accounting policies consistently followed by the Fund in the preparation of the financial statements. The preparation of the financial statements in accordance with accounting principles generally accepted in the United States of America (“U.S. GAAP”) requires management to make estimates and assumptions that affect the reported amounts and disclosures in the financial statements. Actual results could differ from those estimates.
A. Portfolio Valuation
The Fund’s NAV is determined daily as of the close of regular trading on the New York Stock Exchange (“NYSE”), normally 4:00 p.m. Eastern time, on each day the NYSE is open for trading. If the NYSE closes early on a valuation day, the NAV is determined as of that time. Domestic debt securities and foreign securities are priced using data reflecting the earlier closing of the principal markets for those securities. The Fund’s NAV is calculated by dividing the value of all assets of the Fund (including accrued interest and dividends), less all liabilities (including accrued expenses and dividends declared but unpaid), by the total number of shares outstanding.
The Fund’s investments are valued daily at market value or, in the absence of market value with respect to any portfolio securities, at fair value. Market value prices represent last sale or official closing prices from a national or foreign exchange (i.e., a regulated market) and are primarily obtained from third-party pricing services. Fair value prices represent any prices not considered market value prices and are either obtained from a third-party pricing service or are determined by the Pricing Committee of the Fund’s investment advisor, First Trust Advisors L.P. (“First Trust” or the “Advisor”), in accordance with valuation procedures adopted by the Trust’s Board of Trustees, and in accordance with provisions of the 1940 Act. Investments valued by the Advisor’s Pricing Committee, if any, are footnoted as such in the footnotes to the Portfolio of Investments. The Fund’s investments are valued as follows:
Bonds, notes, capital preferred securities, and other debt securities are fair valued on the basis of valuations provided by dealers who make markets in such securities or by a third-party pricing service approved by the Trust’s Board of Trustees, which may use the following valuation inputs when available:
| 1) | benchmark yields; |
| 2) | reported trades; |
| 3) | broker/dealer quotes; |
| 4) | issuer spreads; |
| 5) | benchmark securities; |
| 6) | bids and offers; and |
| 7) | reference data including market research publications. |
Securities traded in an over-the-counter market are fair valued at the mean of their most recent bid and asked price, if available, and otherwise at their closing bid price.
Fixed income and other debt securities having a remaining maturity of sixty days or less when purchased are fair valued at cost adjusted for amortization of premiums and accretion of discounts (amortized cost), provided the Advisor’s Pricing Committee
Notes to Financial Statements (Continued)
First Trust Institutional Preferred Securities and Income ETF (FPEI)
October 31, 2018
has determined that the use of amortized cost is an appropriate reflection of fair value given market and issuer-specific conditions existing at the time of the determination. Factors that may be considered in determining the appropriateness of the use of amortized cost include, but are not limited to, the following:
| 1) | the credit conditions in the relevant market and changes thereto; |
| 2) | the liquidity conditions in the relevant market and changes thereto; |
| 3) | the interest rate conditions in the relevant market and changes thereto (such as significant changes in interest rates); |
| 4) | issuer-specific conditions (such as significant credit deterioration); and |
| 5) | any other market-based data the Advisor’s Pricing Committee considers relevant. In this regard, the Advisor’s Pricing Committee may use last-obtained market-based data to assist it when valuing portfolio securities using amortized cost. |
Certain securities may not be able to be priced by pre-established pricing methods. Such securities may be valued by the Trust’s Board of Trustees or its delegate, the Advisor’s Pricing Committee, at fair value. These securities generally include, but are not limited to, restricted securities (securities which may not be publicly sold without registration under the Securities Act of 1933, as amended (the “1933 Act”)) for which a third-party pricing service is unable to provide a market price; securities whose trading has been formally suspended; a security whose market or fair value price is not available from a pre-established pricing source; a security with respect to which an event has occurred that is likely to materially affect the value of the security after the market has closed but before the calculation of the Fund’s NAV or make it difficult or impossible to obtain a reliable market quotation; and a security whose price, as provided by the third-party pricing service, does not reflect the security’s fair value. As a general principle, the current fair value of a security would appear to be the amount which the owner might reasonably expect to receive for the security upon its current sale. When fair value prices are used, generally they will differ from market quotations or official closing prices on the applicable exchanges. A variety of factors may be considered in determining the fair value of such securities, including, but not limited to, the following:
| 1) | the type of security; |
| 2) | the size of the holding; |
| 3) | the initial cost of the security; |
| 4) | transactions in comparable securities; |
| 5) | price quotes from dealers and/or third-party pricing services; |
| 6) | relationships among various securities; |
| 7) | information obtained by contacting the issuer, analysts, or the appropriate stock exchange; |
| 8) | an analysis of the issuer’s financial statements; and |
| 9) | the existence of merger proposals or tender offers that might affect the value of the security. |
If the securities in question are foreign securities, the following additional information may be considered:
| 1) | the value of similar foreign securities traded on other foreign markets; |
| 2) | ADR trading of similar securities; |
| 3) | closed-end fund trading of similar securities; |
| 4) | foreign currency exchange activity; |
| 5) | the trading prices of financial products that are tied to baskets of foreign securities; |
| 6) | factors relating to the event that precipitated the pricing problem; |
| 7) | whether the event is likely to recur; and |
| 8) | whether the effects of the event are isolated or whether they affect entire markets, countries or regions. |
The Fund is subject to fair value accounting standards that define fair value, establish the framework for measuring fair value and provide a three-level hierarchy for fair valuation based upon the inputs to the valuation as of the measurement date. The three levels of the fair value hierarchy are as follows:
| • | Level 1 – Level 1 inputs are quoted prices in active markets for identical investments. An active market is a market in which transactions for the investment occur with sufficient frequency and volume to provide pricing information on an ongoing basis. |
| • | Level 2 – Level 2 inputs are observable inputs, either directly or indirectly, and include the following: |
| o | Quoted prices for similar investments in active markets. |
Notes to Financial Statements (Continued)
First Trust Institutional Preferred Securities and Income ETF (FPEI)
October 31, 2018
| o | Quoted prices for identical or similar investments in markets that are non-active. A non-active market is a market where there are few transactions for the investment, the prices are not current, or price quotations vary substantially either over time or among market makers, or in which little information is released publicly. |
| o | Inputs other than quoted prices that are observable for the investment (for example, interest rates and yield curves observable at commonly quoted intervals, volatilities, prepayment speeds, loss severities, credit risks, and default rates). |
| o | Inputs that are derived principally from or corroborated by observable market data by correlation or other means. |
| • | Level 3 – Level 3 inputs are unobservable inputs. Unobservable inputs may reflect the reporting entity’s own assumptions about the assumptions that market participants would use in pricing the investment. |
The inputs or methodologies used for valuing investments are not necessarily an indication of the risk associated with investing in those investments. A summary of the inputs used to value the Fund’s investments as of October 31, 2018, is included with the Fund’s Portfolio of Investments.
B. Securities Transactions and Investment Income
Securities transactions are recorded as of the trade date. Realized gains and losses from securities transactions are recorded on the identified cost basis. Interest income is recorded daily on the accrual basis. Amortization of premiums and accretion of discounts are recorded using the effective interest method.
C. Restricted Securities
The Fund invests in restricted securities, which are securities that may not be offered for public sale without first being registered under the 1933 Act. Prior to registration, restricted securities may only be resold in transactions exempt from registration under Rule 144A under the 1933 Act, normally to qualified institutional buyers. As of October 31, 2018, the Fund held restricted securities as shown in the following table that Stonebridge Advisors LLC (“Stonebridge” or the “Sub-Advisor”) has deemed illiquid pursuant to procedures adopted by the Trust’s Board of Trustees. Although market instability can result in periods of increased overall market illiquidity, liquidity for each security is determined based on security-specific factors and assumptions, which require subjective judgment. The Fund does not have the right to demand that such securities be registered. These securities are valued according to the valuation procedures as stated in the Portfolio Valuation note (Note 2A) and are not expressed as a discount to the carrying value of a comparable unrestricted security. There are no unrestricted securities with the same maturity dates and yields for these issuers.
| Security | Acquisition
Date | Par Amount | Current Price | Carrying
Cost | Value | % of
Net
Assets |
| Land O’Lakes Capital Trust I, 7.45%, 03/15/28 | 05/04/18 | $1,000,000 | $108.38 | $1,130,058 | $1,083,750 | 1.16% |
D. Dividends and Distributions to Shareholders
Dividends from net investment income, if any, are declared and paid monthly by the Fund, or as the Board of Trustees may determine from time to time. Distributions of net realized capital gains earned by the Fund, if any, are distributed at least annually.
Distributions from income and capital gains are determined in accordance with federal income tax regulations, which may differ from U.S. GAAP. Certain capital accounts in the financial statements are periodically adjusted for permanent differences in order to reflect their tax character. These permanent differences are primarily due to the varying treatment of income and gain/loss on portfolio securities held by the Fund and have no impact on net assets or NAV per share. Temporary differences, which arise from recognizing certain items of income, expense and gain/loss in different periods for financial statement and tax purposes, will reverse at some time in the future.
The tax character of distributions paid by the Fund during the fiscal years ended October 31, 2018 and 2017, was as follows:
| Distributions paid from: | 2018 | 2017 |
Ordinary income
| $3,846,302 | $140,000 |
Capital gains
| — | — |
Return of capital
| — | — |
Notes to Financial Statements (Continued)
First Trust Institutional Preferred Securities and Income ETF (FPEI)
October 31, 2018
As of October 31, 2018, the components of distributable earnings on a tax basis were as follows:
Undistributed ordinary income
| $85,487 |
Accumulated capital and other losses
| (330,597) |
Net unrealized appreciation (depreciation)
| (5,239,800) |
E. Income Taxes
The Fund intends to continue to qualify as a regulated investment company by complying with the requirements under Subchapter M of the Internal Revenue Code of 1986, as amended, which includes distributing substantially all of its net investment income and net realized gains to shareholders. Accordingly, no provision has been made for federal and state income taxes. However, due to the timing and amount of distributions, the Fund may be subject to an excise tax of 4% of the amount by which approximately 98% of the Fund’s taxable income exceeds the distributions from such taxable income for the calendar year.
The Fund is subject to accounting standards that establish a minimum threshold for recognizing, and a system for measuring, the benefits of a tax position taken or expected to be taken in a tax return. Taxable years ended 2017 and 2018 remain open to federal and state audit. As of October 31, 2018, management has evaluated the application of these standards to the Fund and has determined that no provision for income tax is required in the Fund’s financial statements for uncertain tax positions.
The Fund intends to utilize provisions of the federal income tax laws, which allow it to carry a realized capital loss forward indefinitely following the year of the loss and offset such loss against any future realized capital gains. The Fund is subject to certain limitations under U.S. tax rules on the use of capital loss carryforwards and net unrealized built-in losses. These limitations apply when there has been a 50% change in ownership. At October 31, 2018, the Fund had non-expiring capital loss carryforwards for federal income tax purposes of $330,597.
In order to present paid-in capital and accumulated distributable earnings (loss) (which consists of accumulated net investment income (loss), accumulated net realized gain (loss) on investments and net unrealized appreciation (depreciation) on investments) on the Statement of Assets and Liabilities that more closely represent their tax character, certain adjustments have been made to paid-in capital, accumulated net investment income (loss) and accumulated net realized gain (loss) on investments. These adjustments are primarily due to the difference between book and tax treatments of income and gains on various investment securities held by the Fund and in-kind transactions. The results of operations and net assets were not affected by these adjustments. For the fiscal year ended October 31, 2018, the adjustments for the Fund were as follows:
Accumulated
Net Investment
Income (Loss) | | Accumulated
Net Realized
Gain (Loss)
on Investments | | Paid-in
Capital |
| $(28,461) | | $30,516 | | $(2,055) |
F. Expenses
Expenses, other than the investment advisory fee and other excluded expenses, are paid by the Advisor (See Note 3).
G. New Accounting Pronouncements
On March 30, 2017, the FASB issued Accounting Standards Update (“ASU”) 2017-08 “Premium Amortization on Purchased Callable Debt Securities,” which amends the amortization period for certain purchased callable debt securities held at a premium by shortening such period to the earliest call date. The new guidance requires an entity to amortize the premium on a callable debt security within its scope to the earliest call date, unless the guidance for considering estimated prepayments is applied. If the call option is not exercised at the earliest call date, the yield is reset to the effective yield using the payment terms of the security. If the security has more than one call date and the premium was amortized to a call price greater than the next call price, any excess of the amortized cost basis over the amount repayable at the next call date will be amortized to that date. If there are no other call dates, any excess of the amortized cost basis over the par amount will be amortized to maturity. Discounts on purchased callable debt securities will continue to be amortized to the security’s maturity date. ASU 2017-08 is effective for public business entities for fiscal years, and interim periods within those fiscal years, beginning after December 15, 2018. Earlier adoption is permitted for all entities, including adoption in an interim period. If an entity early adopts the ASU in an interim period, any adjustments must be reflected as of the beginning of the fiscal year that includes that interim period. Management is still assessing the impact of the adoption of ASU 2017-08 on the financial statements but does not expect it to have a material impact.
On August 28, 2018, the FASB issued ASU 2018-13, “Disclosure Framework – Changes to the Disclosure Requirements for Fair Value Measurement,” which amends the fair value measurement disclosure requirements of ASC 820. The amendments of ASU 2018-13
Notes to Financial Statements (Continued)
First Trust Institutional Preferred Securities and Income ETF (FPEI)
October 31, 2018
include new, eliminated, and modified disclosure requirements of ASC 820. In addition, the amendments clarify that materiality is an appropriate consideration of entities when evaluating disclosure requirements. The ASU is effective for fiscal years beginning after December 15, 2019, including interim periods therein. Early adoption is permitted for any eliminated or modified disclosures upon issuance of this ASU. The Fund has early adopted ASU 2018-13 for these financial statements, which did not result in a material impact.
3. Investment Advisory Fee, Affiliated Transactions and Other Fee Arrangements
First Trust, the investment advisor to the Fund, is a limited partnership with one limited partner, Grace Partners of DuPage L.P., and one general partner, The Charger Corporation. The Charger Corporation is an Illinois corporation controlled by James A. Bowen, Chief Executive Officer of First Trust. First Trust is responsible for supervising the selection and ongoing monitoring of the securities in the Fund’s portfolio, managing the Fund’s business affairs and providing certain administrative services necessary for the management of the Fund.
Stonebridge, a majority-owned affiliate of First Trust, serves as the Fund’s sub-advisor and manages the Fund’s portfolio subject to First Trust’s supervision. Pursuant to the Investment Management Agreement between the Trust and the Advisor, First Trust will supervise Stonebridge and its management of the investment of the Fund’s assets and will pay Stonebridge for its services as the Fund’s sub-advisor. First Trust and Stonebridge are equally responsible for the Fund’s expenses, including the cost of transfer agency, custody, fund administration, legal, audit and other services, but excluding fee payments under the Investment Management Agreement, interest, taxes, acquired fund fees and expenses, brokerage commissions and other expenses connected with the execution of portfolio transactions, distribution and service fees pursuant to a 12b-1 plan, if any, and extraordinary expenses. The Fund has agreed to pay First Trust an annual unitary management fee equal to 0.85% of its average daily net assets. Stonebridge receives a sub-advisory fee equal to 0.425% of the average daily net assets of the Fund less Stonebridge’s share of the Fund’s expenses. The Sub-Advisor’s fee is paid by the Advisor out of the Advisor’s management fee. First Trust also provides fund reporting services to the Fund for a flat annual fee in the amount of $9,250, which is covered under the annual unitary management fee.
First Trust Capital Partners, LLC (“FTCP”), an affiliate of First Trust, owns a 51% ownership interest in Stonebridge.
The Trust has multiple service agreements with Brown Brothers Harriman & Co. (“BBH”). Under the service agreements, BBH performs custodial, fund accounting, certain administrative services, and transfer agency services for the Fund. As custodian, BBH is responsible for custody of the Fund’s assets. As fund accountant and administrator, BBH is responsible for maintaining the books and records of the Fund’s securities and cash. As transfer agent, BBH is responsible for maintaining shareholder records for the Fund.
Each Trustee who is not an officer or employee of First Trust, any sub-advisor or any of their affiliates (“Independent Trustees”) is paid a fixed annual retainer that is allocated equally among each fund in the First Trust Fund Complex. Each Independent Trustee is also paid an annual per fund fee that varies based on whether the fund is a closed-end or other actively managed fund, or is an index fund.
Additionally, the Lead Independent Trustee and the Chairmen of the Audit Committee, Nominating and Governance Committee and Valuation Committee are paid annual fees to serve in such capacities, with such compensation allocated pro rata among each fund in the First Trust Fund Complex based on net assets. Independent Trustees are reimbursed for travel and out-of-pocket expenses in connection with all meetings. The Lead Independent Trustee and Committee Chairmen rotate every three years. The officers and “Interested” Trustee receive no compensation from the Trust for acting in such capacities.
4. Purchases and Sales of Securities
For the fiscal year ended October 31, 2018, the cost of purchases and proceeds from sales of investments, excluding short term investments and in-kind transactions, were $90,551,260 and $17,110,360, respectively.
For the fiscal year ended October 31, 2018, the Fund had no in-kind transactions.
5. Creations, Redemptions and Transaction Fees
Shares are created and redeemed by the Fund only in Creation Unit size aggregations of 50,000 shares in transactions with broker-dealers or large institutional investors that have entered into a participation agreement (an “Authorized Participant”). In order to purchase Creation Units of the Fund, an Authorized Participant must deposit (i) a designated portfolio of securities and other instruments determined by First Trust (the “Deposit Securities”) and generally make or receive a cash payment referred to as the “Cash Component,” which is an amount equal to the difference between the NAV of the Fund shares (per Creation Unit Aggregation) and the market value of the Deposit Securities, and/or (ii) cash in lieu of all or a portion of the Deposit Securities. If the Cash Component is a positive number (i.e., the NAV per Creation Unit Aggregation exceeds the Deposit Amount), the Authorized Participant will deliver the
Notes to Financial Statements (Continued)
First Trust Institutional Preferred Securities and Income ETF (FPEI)
October 31, 2018
Cash Component. If the Cash Component is a negative number (i.e., the NAV per Creation Unit Aggregation is less than the Deposit Amount), the Authorized Participant will receive the Cash Component. Authorized Participants purchasing Creation Units must pay to BBH, as transfer agent, a creation transaction fee (the “Creation Transaction Fee”) regardless of the number of Creation Units purchased in the transaction. The Creation Transaction Fee may vary and is based on the composition of the securities included in the Fund’s portfolio and the countries in which the transactions are settled. The Creation Transaction Fee may increase or decrease as the Fund’s portfolio is adjusted to conform to changes in the composition of the securities included in the Fund’s portfolio and the countries in which the transactions are settled. The Creation Transaction Fee is currently $500 to $1,500. The price for each Creation Unit will equal the daily NAV per share times the number of shares in a Creation Unit plus the fees described above and, if applicable, any operational processing and brokerage costs, transfer fees or stamp taxes. When the Fund permits an Authorized Participant to substitute cash or a different security in lieu of depositing one or more of the requisite Deposit Securities, the Authorized Participant may also be assessed an amount to cover the cost of purchasing the Deposit Securities and/or disposing of the substituted securities, including operational processing and brokerage costs, transfer fees, stamp taxes, and part or all of the spread between the expected bid and offer side of the market related to such Deposit Securities and/or substitute securities.
Authorized Participants redeeming Creation Units must pay to BBH, as transfer agent, a redemption transaction fee (the “Redemption Transaction Fee”), regardless of the number of Creation Units redeemed in the transaction. The Redemption Transaction Fee may vary and is based on the composition of the securities included in the Fund’s portfolio and the countries in which the transactions are settled. The Redemption Transaction Fee is currently $500 to $1,500. The Fund reserves the right to effect redemptions in cash. An Authorized Participant may request cash redemption in lieu of securities; however, the Fund may, in its discretion, reject any such request.
6. Distribution Plan
The Board of Trustees adopted a Distribution and Service Plan pursuant to Rule 12b-1 under the 1940 Act. In accordance with the Rule 12b-1 plan, the Fund is authorized to pay an amount up to 0.25% of its average daily net assets each year to reimburse First Trust Portfolios L.P. (“FTP”), the distributor of the Fund, for amounts expended to finance activities primarily intended to result in the sale of Creation Units or to provide investor services. FTP may also use this amount to compensate securities dealers or other persons that are Authorized Participants for providing distribution assistance, including broker-dealer and shareholder support and educational and promotional services.
No 12b-1 fees are currently paid by the Fund, and pursuant to a contractual arrangement, no 12b-1 fees will be paid any time before February 28, 2020.
7. Indemnification
The Trust, on behalf of the Fund, has a variety of indemnification obligations under contracts with its service providers. The Trust’s maximum exposure under these arrangements is unknown. However, the Trust has not had prior claims or losses pursuant to these contracts and expects the risk of loss to be remote.
8. Subsequent Events
Management has evaluated the impact of all subsequent events to the Fund through the date the financial statements were issued, and has determined that there was the following subsequent event:
On November 2, 2018, First Trust Short Duration Managed Municipal ETF and First Trust Ultra Short Duration Municipal ETF, each an additional series of the Trust, began trading under the ticker symbols FSMB and FUMB, respectively, on the NYSE Arca, Inc.
Report of Independent Registered Public Accounting Firm
To the Shareholders and the Board of Trustees of First Trust Exchange-Traded Fund III:
Opinion on the Financial Statements and Financial Highlights
We have audited the accompanying statement of assets and liabilities, including the portfolio of investments, of First Trust Institutional Preferred Securities and Income ETF (the “Fund”), one of the funds constituting First Trust Exchange-Traded Fund III, as of October 31, 2018, the related statement of operations for the year then ended, the statements of changes in net assets and financial highlights for the year then ended, and the period from August 22, 2017 (commencement of operations) through October 31, 2017, and the related notes. In our opinion, the financial statements and financial highlights present fairly, in all material respects, the financial position of the Fund as of October 31, 2018, and the results of its operations for the year then ended, and the changes in its net assets and the financial highlights for the year then ended, and for the period from August 22, 2017 (commencement of operations) through October 31, 2017, in conformity with accounting principles generally accepted in the United States of America.
Basis for Opinion
These financial statements and financial highlights are the responsibility of the Fund’s management. Our responsibility is to express an opinion on the Fund’s financial statements and financial highlights based on our audits. We are a public accounting firm registered with the Public Company Accounting Oversight Board (United States) (PCAOB) and are required to be independent with respect to the Fund in accordance with the U.S. federal securities laws and the applicable rules and regulations of the Securities and Exchange Commission and the PCAOB.
We conducted our audits in accordance with the standards of the PCAOB. Those standards require that we plan and perform the audit to obtain reasonable assurance about whether the financial statements and financial highlights are free of material misstatement, whether due to error or fraud. The Fund is not required to have, nor were we engaged to perform, an audit of its internal control over financial reporting. As part of our audits we are required to obtain an understanding of internal control over financial reporting but not for the purpose of expressing an opinion on the effectiveness of the Fund’s internal control over financial reporting. Accordingly, we express no such opinion.
Our audits included performing procedures to assess the risks of material misstatement of the financial statements and financial highlights, whether due to error or fraud, and performing procedures that respond to those risks. Such procedures included examining, on a test basis, evidence regarding the amounts and disclosures in the financial statements and financial highlights. Our audits also included evaluating the accounting principles used and significant estimates made by management, as well as evaluating the overall presentation of the financial statements and financial highlights. Our procedures included confirmation of securities owned as of October 31, 2018, by correspondence with the custodian and brokers; when replies were not received from brokers, we performed other auditing procedures. We believe that our audits provide a reasonable basis for our opinion.
Chicago, Illinois
December 21, 2018
We have served as the auditor of one or more First Trust investment companies since 2001.
Additional Information
First Trust Institutional Preferred Securities and Income ETF (FPEI)
October 31, 2018 (Unaudited)
Proxy Voting Policies and Procedures
A description of the policies and procedures that the Trust uses to determine how to vote proxies and information on how the Fund voted proxies relating to portfolio securities during the most recent 12-month period ended June 30 is available (1) without charge, upon request, by calling (800) 988-5891; (2) on the Fund’s website at www.ftportfolios.com; and (3) on the Securities and Exchange Commission’s (“SEC”) website at www.sec.gov.
Portfolio Holdings
The Trust files its complete schedule of the Fund’s portfolio holdings with the SEC for the first and third quarters of each fiscal year on Form N-Q. The Trust’s Form NQs are available (1) by calling (800) 988-5891; (2) on the Fund’s website at www.ftportfolios.com; and (3) on the SEC’s website at www.sec.gov.
Beginning in April 2019, the Trust will cease to disclose the Fund’s holdings on Form N-Q and will file Form N-PORT with the SEC on a monthly basis. Part F of Form N-PORT, which contains the complete schedule of the Fund’s portfolio holdings, will be made available in the same manner as Form N-Q discussed above.
Federal Tax Information
For the taxable year ended October 31, 2018, the following percentages of income dividend paid by the Fund qualifies for the dividends received deduction available to corporations and is hereby designated as qualified dividend income:
| Dividends Received Deduction | | Qualified Dividend Income |
| 19.90% | | 64.45% |
Risk Considerations
Risks are inherent in all investing. Certain general risks that may be applicable to some or all of the Funds are identified below, but not all of the material risks relevant to each Fund are included in this report. The material risks of investing in each Fund are spelled out in its prospectus, statement of additional information and other regulatory filings. Before investing, you should consider each Fund’s investment objective, risks, charges and expenses, and read each Fund’s prospectus and statement of additional information carefully. You can download each Fund’s prospectus at www.ftportfolios.com or contact First Trust Portfolios L.P. at (800) 621-1675 to request a prospectus, which contains this and other information about each Fund.
Concentration Risk. To the extent that a Fund is able to invest a large percentage of its assets in a single asset class or the securities of issuers within the same country, state, region, industry or sector, an adverse economic, business or political development may affect the value of the Fund’s investments more than if the Fund were more broadly diversified. A Fund that tracks an index will be concentrated to the extent the Fund’s corresponding index is concentrated. A concentration makes a Fund more susceptible to any single occurrence and may subject the Fund to greater market risk than a fund that is not concentrated.
Credit Risk. Credit risk is the risk that an issuer of a security will be unable or unwilling to make dividend, interest and/or principal payments when due and the related risk that the value of a security may decline because of concerns about the issuer’s ability to make such payments.
Cyber Security Risk. The Funds are susceptible to potential operational risks through breaches in cyber security. A breach in cyber security refers to both intentional and unintentional events that may cause a Fund to lose proprietary information, suffer data corruption or lose operational capacity. Such events could cause a Fund to incur regulatory penalties, reputational damage, additional compliance costs associated with corrective measures and/or financial loss. In addition, cyber security breaches of a Fund’s third-party service providers, such as its administrator, transfer agent, custodian, or sub-advisor, as applicable, or issuers in which the Fund invests, can also subject a Fund to many of the same risks associated with direct cyber security breaches.
Derivatives Risk. To the extent a Fund uses derivative instruments such as futures contracts, options contracts and swaps, the Fund may experience losses because of adverse movements in the price or value of the underlying asset, index or rate, which may be magnified by certain features of the derivative. These risks are heightened when a Fund’s portfolio managers use derivatives to enhance the Fund’s return or as a substitute for a position or security, rather than solely to hedge (or offset) the risk of a position or security held by the Fund.
Equity Securities Risk. To the extent a Fund invests in equity securities, the value of the Fund’s shares will fluctuate with changes in the value of the equity securities. Equity securities prices fluctuate for several reasons, including changes in investors’ perceptions of the financial condition of an issuer or the general condition of the relevant stock market, such as market volatility, or when political or economic events affecting the issuers occur. In addition, common stock prices may be particularly sensitive to rising interest rates, as
Additional Information (Continued)
First Trust Institutional Preferred Securities and Income ETF (FPEI)
October 31, 2018 (Unaudited)
the cost of capital rises and borrowing costs increase. Equity securities may decline significantly in price over short or extended periods of time, and such declines may occur in the equity market as a whole, or they may occur in only a particular country, company, industry or sector of the market.
ETF Risk. The shares of an ETF trade like common stock and represent an interest in a portfolio of securities. The risks of owning an ETF generally reflect the risks of owning the underlying securities, although lack of liquidity in an ETF could result in it being more volatile and ETFs have management fees that increase their costs. Shares of an ETF trade on an exchange at market prices rather than net asset value, which may cause the shares to trade at a price greater than net asset value (premium) or less than net asset value (discount). In times of market stress, decisions by market makers to reduce or step away from their role of providing a market for an ETF’s shares, or decisions by an ETF’s authorized participants that they are unable or unwilling to proceed with creation and/or redemption orders of an ETF’s shares, could result in shares of the ETF trading at a discount to net asset value and in greater than normal intraday bid-ask spreads.
Fixed Income Securities Risk. To the extent a Fund invests in fixed income securities, the Fund will be subject to credit risk, income risk, interest rate risk, liquidity risk and prepayment risk. Income risk is the risk that income from a Fund’s fixed income investments could decline during periods of falling interest rates. Interest rate risk is the risk that the value of a Fund’s fixed income securities will decline because of rising interest rates. Liquidity risk is the risk that a security cannot be purchased or sold at the time desired, or cannot be purchased or sold without adversely affecting the price. Prepayment risk is the risk that the securities will be redeemed or prepaid by the issuer, resulting in lower interest payments received by the Fund. In addition to these risks, high yield securities, or “junk” bonds, are subject to greater market fluctuations and risk of loss than securities with higher ratings, and the market for high yield securities is generally smaller and less liquid than that for investment grade securities.
Fund of Funds Risk. To the extent a Fund invests in the securities of other investment vehicles, the Fund will incur additional fees and expenses that would not be present in a direct investment in those investment vehicles. Furthermore, the Fund’s investment performance and risks are directly related to the investment performance and risks of the investment vehicles in which the Fund invests.
Index Constituent Risk. Certain Funds may be a constituent of one or more indices. As a result, such a Fund may be included in one or more index-tracking exchange-traded funds or mutual funds. Being a component security of such a vehicle could greatly affect the trading activity involving a Fund, the size of the Fund and the market volatility of the Fund. Inclusion in an index could significantly increase demand for the Fund and removal from an index could result in outsized selling activity in a relatively short period of time. As a result, a Fund’s net asset value could be negatively impacted and the Fund’s market price may be significantly below its net asset value during certain periods.
Index Provider Risk. To the extent a Fund seeks to track an index, it is subject to Index Provider Risk. There is no assurance that the Index Provider will compile the Index accurately, or that the Index will be determined, maintained, constructed, reconstituted, rebalanced, composed, calculated or disseminated accurately. To correct any such error, the Index Provider may carry out an unscheduled rebalance or other modification of the Index constituents or weightings, which may increase the Fund’s costs. The Index Provider does not provide any representation or warranty in relation to the quality, accuracy or completeness of data in the Index, and it does not guarantee that the Index will be calculated in accordance with its stated methodology. Losses or costs associated with any Index Provider errors generally will be borne by the Fund and its shareholders.
Management Risk. To the extent that a Fund is actively managed, it is subject to management risk. In managing an actively-managed Fund’s investment portfolio, the Fund’s portfolio managers will apply investment techniques and risk analyses that may not have the desired result. There can be no guarantee that a Fund will meet its investment objective.
Market Risk. Securities held by a Fund, as well as shares of a Fund itself, are subject to market fluctuations caused by factors such as general economic conditions, political events, regulatory or market developments, changes in interest rates and perceived trends in securities prices. Shares of a Fund could decline in value or underperform other investments as a result of the risk of loss associated with these market fluctuations.
Non-U.S. Securities Risk. To the extent a Fund invests in non-U.S. securities, it is subject to additional risks not associated with securities of domestic issuers. Non-U.S. securities are subject to higher volatility than securities of domestic issuers due to: possible adverse political, social or economic developments; restrictions on foreign investment or exchange of securities; lack of liquidity; currency exchange rates; excessive taxation; government seizure of assets; different legal or accounting standards; and less government supervision and regulation of exchanges in foreign countries. Investments in non-U.S. securities may involve higher costs than investments in U.S. securities, including higher transaction and custody costs, as well as additional taxes imposed by non-U.S. governments. These risks may be heightened for securities of companies located, or with significant operations, in emerging market countries.
Additional Information (Continued)
First Trust Institutional Preferred Securities and Income ETF (FPEI)
October 31, 2018 (Unaudited)
Passive Investment Risk. To the extent a Fund seeks to track an index, the Fund will invest in the securities included in, or representative of, the index regardless of their investment merit. A Fund generally will not attempt to take defensive positions in declining markets.
| NOT FDIC INSURED | NOT BANK GUARANTEED | MAY LOSE VALUE |
Board of Trustees and Officers
First Trust Exchange-Traded Fund III
October 31, 2018 (Unaudited)
The following tables identify the Trustees and Officers of the Trust. Unless otherwise indicated, the address of all persons is 120 E. Liberty Drive, Suite 400, Wheaton, IL 60187.
The Trust’s statement of additional information includes additional information about the Trustees and is available, without charge, upon request, by calling (800) 988-5891.
| Name, Year of Birth and Position with the Trust | Term of Office and Year First Elected or Appointed | Principal Occupations
During Past 5 Years | Number of Portfolios in the First Trust Fund Complex Overseen by Trustee | Other Trusteeships or Directorships Held by Trustee During Past 5 Years |
| INDEPENDENT TRUSTEES |
Richard E. Erickson, Trustee
(1951) | • Indefinite Term
• Since Inception | Physician; Officer, Wheaton Orthopedics; Limited Partner, Gundersen Real Estate Limited Partnership (June 1992 to December 2016); Member, Sportsmed LLC (April 2007 to November 2015) | 159 | None |
Thomas R. Kadlec, Trustee
(1957) | • Indefinite Term
• Since Inception | President, ADM Investor Services, Inc. (Futures Commission Merchant) | 159 | Director of ADM Investor Services, Inc., ADM Investor Services International, Futures Industry Association, and National Futures Association |
Robert F. Keith, Trustee
(1956) | • Indefinite Term
• Since Inception | President, Hibs Enterprises (Financial and Management Consulting) | 159 | Director of Trust Company of Illinois |
Niel B. Nielson, Trustee
(1954) | • Indefinite Term
• Since Inception | Senior Advisor (August 2018 to Present), Managing Director and Chief Operating Officer (January 2015 to August 2018), Pelita Harapan Educational Foundation (Educational Products and Services); President and Chief Executive Officer (June 2012 to September 2014), Servant Interactive LLC (Educational Products and Services); President and Chief Executive Officer (June 2012 to September 2014), Dew Learning LLC (Educational Products and Services) | 159 | Director of Covenant Transport, Inc. (May 2003 to May 2014) |
| INTERESTED TRUSTEE |
James A. Bowen(1), Trustee and
Chairman of the Board
(1955) | • Indefinite Term
• Since Inception | Chief Executive Officer, First Trust Advisors L.P. and First Trust Portfolios L.P.; Chairman of the Board of Directors, BondWave LLC (Software Development Company) and Stonebridge Advisors LLC (Investment Advisor) | 159 | None |
| (1) | Mr. Bowen is deemed an “interested person” of the Trust due to his position as CEO of First Trust Advisors L.P., investment advisor of the Trust. |
Board of Trustees and Officers (Continued)
First Trust Exchange-Traded Fund III
October 31, 2018 (Unaudited)
| Name and Year of Birth | Position and Offices with Trust | Term of Office and Length of Service | Principal Occupations
During Past 5 Years |
| OFFICERS(2) |
James M. Dykas
(1966) | President and Chief Executive Officer | • Indefinite Term
• Since January 2016 | Managing Director and Chief Financial Officer (January 2016 to Present), Controller (January 2011 to January 2016), Senior Vice President (April 2007 to January 2016), First Trust Advisors L.P. and First Trust Portfolios L.P.; Chief Financial Officer (January 2016 to Present), BondWave LLC (Software Development Company) and Stonebridge Advisors LLC (Investment Advisor) |
Donald P. Swade
(1972) | Treasurer, Chief Financial Officer and Chief Accounting Officer | • Indefinite Term
• Since January 2016 | Senior Vice President (July 2016 to Present), Vice President (April 2012 to July 2016), First Trust Advisors L.P. and First Trust Portfolios L.P. |
W. Scott Jardine
(1960) | Secretary and Chief Legal Officer | • Indefinite Term
• Since Inception | General Counsel, First Trust Advisors L.P. and First Trust Portfolios L.P.; Secretary and General Counsel, BondWave LLC; Secretary, Stonebridge Advisors LLC |
Daniel J. Lindquist
(1970) | Vice President | • Indefinite Term
• Since Inception | Managing Director, First Trust Advisors L.P. and First Trust Portfolios L.P. |
Kristi A. Maher
(1966) | Chief Compliance Officer and Assistant Secretary | • Indefinite Term
• Since Inception | Deputy General Counsel, First Trust Advisors L.P. and First Trust Portfolios L.P. |
Roger F. Testin
(1966) | Vice President | • Indefinite Term
• Since Inception | Senior Vice President, First Trust Advisors L.P. and First Trust Portfolios L.P. |
Stan Ueland
(1970) | Vice President | • Indefinite Term
• Since Inception | Senior Vice President, First Trust Advisors L.P. and First Trust Portfolios L.P |
| (2) | The term “officer” means the president, vice president, secretary, treasurer, controller or any other officer who performs a policy making function. |
Privacy Policy
First Trust Institutional Preferred Securities and Income ETF (FPEI)
October 31, 2018 (Unaudited)
Privacy Policy
First Trust values our relationship with you and considers your privacy an important priority in maintaining that relationship. We are committed to protecting the security and confidentiality of your personal information.
Sources of Information
We collect nonpublic personal information about you from the following sources:
| • | Information we receive from you and your broker-dealer, investment advisor or financial representative through interviews, applications, agreements or other forms; |
| • | Information about your transactions with us, our affiliates or others; |
| • | Information we receive from your inquiries by mail, e-mail or telephone; and |
| • | Information we collect on our website through the use of “cookies”. For example, we may identify the pages on our website that your browser requests or visits. |
Information Collected
The type of data we collect may include your name, address, social security number, age, financial status, assets, income, tax information, retirement and estate plan information, transaction history, account balance, payment history, investment objectives, marital status, family relationships and other personal information.
Disclosure of Information
We do not disclose any nonpublic personal information about our customers or former customers to anyone, except as permitted by law. In addition to using this information to verify your identity (as required under law), the permitted uses may also include the disclosure of such information to unaffiliated companies for the following reasons:
| • | In order to provide you with products and services and to effect transactions that you request or authorize, we may disclose your personal information as described above to unaffiliated financial service providers and other companies that perform administrative or other services on our behalf, such as transfer agents, custodians and trustees, or that assist us in the distribution of investor materials such as trustees, banks, financial representatives, proxy services, solicitors and printers. |
| • | We may release information we have about you if you direct us to do so, if we are compelled by law to do so, or in other legally limited circumstances (for example to protect your account from fraud). |
In addition, in order to alert you to our other financial products and services, we may share your personal information within First Trust.
Use of Website Analytics
We currently use third party analytics tools, Google Analytics and AddThis, to gather information for purposes of improving First Trust’s website and marketing our products and services to you. These tools employ cookies, which are small pieces of text stored in a file by your web browser and sent to websites that you visit, to collect information, track website usage and viewing trends such as the number of hits, pages visited, videos and PDFs viewed and the length of user sessions in order to evaluate website performance and enhance navigation of the website. We may also collect other anonymous information, which is generally limited to technical and web navigation information such as the IP address of your device, internet browser type and operating system for purposes of analyzing the data to make First Trust’s website better and more useful to our users. The information collected does not include any personal identifiable information such as your name, address, phone number or email address unless you provide that information through the website for us to contact you in order to answer your questions or respond to your requests. To find out how to opt-out of these services click on: Google Analytics and AddThis.
Confidentiality and Security
With regard to our internal security procedures, First Trust restricts access to your nonpublic personal information to those First Trust employees who need to know that information to provide products or services to you. We maintain physical, electronic and procedural safeguards to protect your nonpublic personal information.
Policy Updates and Inquiries
As required by federal law, we will notify you of our privacy policy annually. We reserve the right to modify this policy at any time, however, if we do change it, we will tell you promptly. For questions about our policy, or for additional copies of this notice, please go to www.ftportfolios.com, or contact us at 1-800-621-1675 (First Trust Portfolios) or 1-800-222-6822 (First Trust Advisors).
May 2017
First Trust Exchange-Traded Fund III
INVESTMENT ADVISOR
First Trust Advisors L.P.
120 E. Liberty Drive, Suite 400
Wheaton, IL 60187
INVESTMENT SUB-ADVISOR
Stonebridge Advisors LLC
10 Westport Road, Suite C101
Wilton, CT 06897
ADMINISTRATOR, CUSTODIAN,
FUND ACCOUNTANT &
TRANSFER AGENT
Brown Brothers Harriman & Co.
50 Post Office Square
Boston, MA 02110
INDEPENDENT REGISTERED
PUBLIC ACCOUNTING FIRM
Deloitte & Touche LLP
111 S. Wacker Drive
Chicago, IL 60606
LEGAL COUNSEL
Chapman and Cutler LLP
111 W. Monroe Street
Chicago, IL 60603
Item 2. Code of Ethics.
| (a) | | The registrant, as of the end of the period covered by this report, has adopted a code of ethics that applies to the registrant’s principal executive officer, principal financial officer, principal accounting officer or controller, or persons performing similar functions, regardless of whether these individuals are employed by the registrant or a third party. |
| (c) | | There have been no amendments, during the period covered by this report, to a provision of the code of ethics that applies to the registrant’s principal executive officer, principal financial officer, principal accounting officer or controller, or persons performing similar functions, regardless of whether these individuals are employed by the registrant or a third party, and that relates to any element of the code of ethics description. |
| (d) | | The registrant, during the period covered by this report, has not granted any waivers, including an implicit waiver, from a provision of the code of ethics that applies to the registrant’s principal executive officer, principal financial officer, principal accounting officer or controller, or persons performing similar functions, regardless of whether these individuals are employed by the registrant or a third party, that relates to one or more of the items set forth in paragraph (b) of this item’s instructions. |
Item 3. Audit Committee Financial Expert.
As of the end of the period covered by the report, the registrant’s Board of Trustees has determined that Thomas R. Kadlec and Robert F. Keith are qualified to serve as audit committee financial experts serving on its audit committee and that each of them is “independent,” as defined by Item 3 of Form N-CSR.
Item 4. Principal Accountant Fees and Services.
(a) Audit Fees (Registrant) -- The aggregate fees billed for each of the last two fiscal years for professional services rendered by the principal accountant for the audit of the registrant’s annual financial statements or services that are normally provided by the accountant in connection with statutory and regulatory filings or engagements were $228,500 for fiscal year ended October 31, 2017 and $228,500 for fiscal year ended October 31, 2018.
(b) Audit-Related Fees (Registrant) -- The aggregate fees billed in each of the last two fiscal years for assurance and related services by the principal accountant that are reasonably related to the performance of the audit of the registrant’s financial statements and are not reported under paragraph (a) of this Item were $0 for the fiscal year ended October 31, 2017, and $0 for the fiscal year ended October 31, 2018.
Audit-Related Fees (Investment Adviser) -- The aggregate fees billed in each of the last two fiscal years for assurance and related services by the principal accountant that are reasonably related to the performance of the audit of the registrant’s financial statements and are not reported under paragraph (a) of this Item were $0 for the fiscal year ended October 31, 2017, and $0 for the fiscal year ended October 31, 2018.
(c) Tax Fees (Registrant) -- The aggregate fees billed in each of the last two fiscal years for professional services rendered by the principal accountant for tax compliance, tax advice, and tax planning to the registrant were $35,365 for fiscal year ended October 31, 2017 and $29,315 for fiscal year ended October 31, 2018.
Tax Fees (Investment Adviser and Distributor) -- The aggregate fees billed in each of the last two fiscal years for professional services rendered by the principal accountant for tax compliance, tax advice, and tax planning to the registrant’s adviser and distributor were $0 for the fiscal year ended October 31, 2017, and $0 for the fiscal year ended October 31, 2018.
(d) All Other Fees (Registrant) -- The aggregate fees billed in each of the last two fiscal years for products and services provided by the principal accountant to the registrant, other than the services reported in paragraphs (a) through (c) of this Item were $0 for the fiscal year ended October 31, 2017, and $0 for the fiscal year ended October 31, 2018.
All Other Fees (Investment Adviser and Distributor) -- The aggregate fees billed in each of the last two fiscal years for products and services provided by the principal accountant to the registrant’s investment adviser and distributor, other than the services reported in paragraphs (a) through (c) of this Item were $0 for the fiscal year ended October 31, 2017, and $0 for the fiscal year ended October 31, 2018.
(e)(1) Disclose the audit committee’s pre-approval policies and procedures described in paragraph (c) (7) of Rule 2-01 of Regulation S-X.
Pursuant to its charter and its Audit and Non-Audit Services Pre-Approval Policy, the Audit Committee (the “Committee”) is responsible for the pre-approval of all audit services and permitted non-audit services (including the fees and terms thereof) to be performed for the registrant by its independent auditors. The Chairman of the Committee is authorized to give such pre-approvals on behalf of the Committee up to $25,000 and report any such pre-approval to the full Committee.
The Committee is also responsible for the pre-approval of the independent auditor’s engagements for non-audit services with the registrant’s adviser (not including a sub-adviser whose role is primarily portfolio management and is sub-contracted or overseen by another investment adviser) and any entity controlling, controlled by or under common control with the investment adviser that provides ongoing services to the registrant, if the engagement relates directly to the operations and financial reporting of the registrant, subject to the de minimis exceptions for non-audit services described in Rule 2-01 of Regulation S-X. If the independent auditor has provided non-audit services to the registrant’s adviser (other than any sub-adviser whose role is primarily portfolio management and is sub-contracted with or overseen by another investment adviser) and any entity controlling, controlled by or under common control with the investment adviser that provides ongoing services to the registrant that were not pre-approved pursuant to its policies, the Committee will consider whether the provision of such non-audit services is compatible with the auditor’s independence.
(e)(2) The percentage of services described in each of paragraphs (b) through (d) for the registrant and the registrant’s investment adviser and distributor of this Item that were approved by the audit committee pursuant to the pre-approval exceptions included in paragraph (c)(7)(i)(C) or paragraph(C)(7)(ii) of Rule 2-01 of Regulation S-X are as follows:
Registrant: Adviser and Distributor:
(b) 0% (b) 0%
(c) 0% (c) 0%
(d) 0% (d) 0%
(f) The percentage of hours expended on the principal accountant’s engagement to audit the registrant’s financial statements for the most recent fiscal year that were attributed to work performed by persons other than the principal accountant’s full-time, permanent employees was less than fifty percent.
(g) The aggregate non-audit fees billed by the registrant’s accountant for services rendered to the registrant, and rendered to the registrant’s investment adviser (not including any sub-adviser whose role is primarily portfolio management and is subcontracted with or overseen by another investment adviser), and any entity controlling, controlled by, or under common control with the adviser that provides ongoing services to the registrant for fiscal year ended October 31, 2017 were $35,365 for the registrant, $44,000 for the registrant’s investment adviser, $63,900 for the registrant’s distributor and $3,000 for Stonebridge Advisors LLC (“Stonebridge”), which is under common control with the registrant’s investment adviser and serves as the registrant’s investment sub-advisor for the First Trust Preferred Securities and Income ETF and the First Trust Institutional Preferred Securities and Income ETF, and for the fiscal year ended October 31, 2018 were $29,315 for the registrant, $48,190 for the registrant’s investment adviser, $80,310 for the registrant’s distributor and $3,000 for Stonebridge.
(h) The registrant’s audit committee of its Board of Trustees has determined that the provision of non-audit services that were rendered to the registrant’s investment adviser (not including any sub-adviser whose role is primarily portfolio management and is subcontracted with or overseen by another investment adviser), and any entity controlling, controlled by, or under common control with the investment adviser that provides ongoing services to the registrant that were not pre-approved pursuant to paragraph (c)(7)(ii) of Rule 2-01 of Regulation S-X is compatible with maintaining the principal accountant’s independence.
Items 5. Audit Committee of Listed Registrants.
The registrant has a separately designated standing audit committee established in accordance with Section 3(a)(58)(A) of the Securities Exchange Act of 1934. The audit committee of the registrant is comprised of: Richard E. Erickson, Thomas R. Kadlec, Robert F. Keith and Niel B. Nielson.
Item 6. Investments.
| (a) | Schedule of Investments in securities of unaffiliated issuers as of the close of the reporting period is included as part of the report to shareholders filed under Item 1 of this form. |
Item 7. Disclosure of Proxy Voting Policies and Procedures for Closed-End Management Investment Companies.
Not applicable.
Item 8. Portfolio Managers of Closed-End Management Investment Companies.
Not applicable.
Item 9. Purchases of Equity Securities by Closed-End Management Investment Company and Affiliated Purchasers.
Not applicable.
Item 10. Submission of Matters to a Vote of Security Holders.
There have been no material changes to the procedures by which the shareholders may recommend nominees to the registrant’s board of directors, where those changes were implemented after the registrant last provided disclosure in response to the requirements of Item 407(c)(2)(iv) of Regulation S-K (17 CFR 229.407) (as required by Item 22(b)(15) of Schedule 14A (17 CFR 240.14a-101)), or this Item.
Item 11. Controls and Procedures.
| (a) | The registrant’s principal executive and principal financial officers, or persons performing similar functions, have concluded that the registrant’s disclosure controls and procedures (as defined in Rule 30a-3(c) under the Investment Company Act of 1940, as amended (the “1940 Act”) (17 CFR 270.30a-3 (c))) are effective, as of a date within 90 days of the filing date of the report that includes the disclosure required by this paragraph, based on their evaluation of these controls and procedures required by Rule 30a-3(b) under the 1940 Act (17 CFR 270.30a-3(b)) and Rules 13a-15(b) or 15d-15(b) under the Securities Exchange Act of 1934, as amended (17 CFR 240.13a-15(b) or 240.15d-15 (b)). |
| (b) | There were no changes in the registrant’s internal control over financial reporting (as defined in Rule 30a-3(d) under the 1940 Act (17 CFR 270.30a-3(d)) that occurred during the registrant’s last fiscal quarter of the period covered by this report that have materially affected, or are reasonably likely to materially affect, the registrant’s internal control over financial reporting. |
Item 12. Exhibits.
| (a)(1) | | Code of ethics, or any amendment thereto, that is the subject of disclosure required by Item 2 is attached hereto. |
| (a)(2) | | Certifications pursuant to Rule 30a-2(a) under the 1940 Act and Section 302 of the Sarbanes-Oxley Act of 2002 are attached hereto. |
| (b) | | Certifications pursuant to Rule 30a-2(b) under the 1940 Act and Section 906 of the Sarbanes-Oxley Act of 2002 are attached hereto. |
SIGNATURES
Pursuant to the requirements of the Securities Exchange Act of 1934 and the Investment Company Act of 1940, the registrant has duly caused this report to be signed on its behalf by the undersigned, thereunto duly authorized.
| (registrant) | | First Trust Exchange-Traded Fund III | | |
| By (Signature and Title)* | | /s/ James M. Dykas | | |
| | | James M. Dykas, President and Chief Executive Officer
(principal executive officer) | | |
Pursuant to the requirements of the Securities Exchange Act of 1934 and the Investment Company Act of 1940, this report has been signed below by the following persons on behalf of the registrant and in the capacities and on the dates indicated.
| By (Signature and Title)* | | /s/ James M. Dykas | | |
| | | James M. Dykas, President and Chief Executive Officer
(principal executive officer) | | |
| By (Signature and Title)* | | /s/ Donald P. Swade | | |
| | | Donald P. Swade, Treasurer, Chief Financial Officer
and Chief Accounting Officer
(principal financial officer) | | |
* Print the name and title of each signing officer under his or her signature.