UNITED STATES
SECURITIES AND EXCHANGE COMMISSION
Washington, D.C. 20549
FORM N-CSR
CERTIFIED SHAREHOLDER REPORT OF REGISTERED MANAGEMENT INVESTMENT COMPANIES
Investment Company Act file number 811-22245
First Trust Exchange-Traded Fund III
(Exact name of registrant as specified in charter)
120 East Liberty Drive, Suite 400
Wheaton, IL 60187
(Address of principal executive offices) (Zip code)
W. Scott Jardine, Esq.
First Trust Portfolios L.P.
120 East Liberty Drive, Suite 400
Wheaton, IL 60187
(Name and address of agent for service)
registrant's telephone number, including area code: 630-765-8000
Date of fiscal year end: July 31
Date of reporting period: January 31, 2018
Form N-CSR is to be used by management investment companies to file reports with the Commission not later than 10 days after the transmission to stockholders of any report that is required to be transmitted to stockholders under Rule 30e-1 under the Investment Company Act of 1940 (17 CFR 270.30e-1). The Commission may use the information provided on Form N-CSR in its regulatory, disclosure review, inspection, and policymaking roles.
A registrant is required to disclose the information specified by Form N-CSR, and the Commission will make this information public. A registrant is not required to respond to the collection of information contained in Form N-CSR unless the Form displays a currently valid Office of Management and Budget (“OMB”) control number. Please direct comments concerning the accuracy of the information collection burden estimate and any suggestions for reducing the burden to Secretary, Securities and Exchange Commission, 100 F Street, NE, Washington, DC 20549. The OMB has reviewed this collection of information under the clearance requirements of 44 U.S.C. § 3507.
Item 1. Reports to Stockholders.
The registrant's semi-annual report transmitted to shareholders pursuant to Rule 30e-1 under the Investment Company Act of 1940 is as follows:

| | | | | | |
| First Trust Exchange-Traded Fund III | | |
| | | | |
| | | First Trust Horizon Managed Volatility Domestic ETF (HUSV) | | |
| | | |
| | | First Trust Horizon Managed Volatility Developed International ETF (HDMV) | | |
| | | | |
Semi-Annual Report For the Six Months Ended January 31, 2018 | | |
First Trust Exchange-Traded Fund III
Semi-Annual Report
January 31, 2018
Caution Regarding Forward-Looking Statements
This report contains certain forward-looking statements within the meaning of the Securities Act of 1933, as amended, and the Securities Exchange Act of 1934, as amended. Forward-looking statements include statements regarding the goals, beliefs, plans or current expectations of First Trust Advisors L.P. (“First Trust” or the “Advisor”) and/or Horizon Investments, LLC (“Horizon” or the “Sub-Advisor”) and their respective representatives, taking into account the information currently available to them. Forward-looking statements include all statements that do not relate solely to current or historical fact. For example, forward-looking statements include the use of words such as “anticipate,” “estimate,” “intend,” “expect,” “believe,” “plan,” “may,” “should,” “would” or other words that convey uncertainty of future events or outcomes.
Forward-looking statements involve known and unknown risks, uncertainties and other factors that may cause the actual results, performance or achievements of any series of First Trust Exchange-Traded Fund III (the “Trust”) described in this report (each such series is referred to as a “Fund” and collectively, the “Funds”) to be materially different from any future results, performance or achievements expressed or implied by the forward-looking statements. When evaluating the information included in this report, you are cautioned not to place undue reliance on these forward-looking statements, which reflect the judgment of the Advisor and/or Sub-Advisor and their respective representatives only as of the date hereof. We undertake no obligation to publicly revise or update these forward-looking statements to reflect events and circumstances that arise after the date hereof.
Performance and Risk Disclosure
There is no assurance that any Fund described in this report will achieve its investment objective. Each Fund is subject to market risk, which is the possibility that the market values of securities owned by the Fund will decline and that the value of the Fund shares may therefore be less than what you paid for them. Accordingly, you can lose money by investing in a Fund. See “Risk Considerations” in the Additional Information section of this report for a discussion of certain other risks of investing in the Funds.
Performance data quoted represents past performance, which is no guarantee of future results, and current performance may be lower or higher than the figures shown. For the most recent month-end performance figures, please visit www.ftportfolios.com or speak with your financial advisor. Investment returns, net asset value and share price will fluctuate and Fund shares, when sold, may be worth more or less than their original cost.
The Advisor may also periodically provide additional information on Fund performance on each Fund’s web page at www.ftportfolios.com.
How to Read This Report
This report contains information that may help you evaluate your investment. It includes details about each Fund’s portfolio and presents data and analysis that provide insight into each Fund’s performance and investment approach.
The statistical information that follows may help you understand each Fund’s performance compared to that of a relevant market benchmark.
It is important to keep in mind that the opinions expressed by personnel of the Advisor and/or Sub-Advisor are just that: informed opinions. They should not be considered to be promises or advice. The opinions, like the statistics, cover the period through the date on the cover of this report. The material risks of investing in each Fund are spelled out in the prospectus, the statement of additional information, this report and other Fund regulatory filings.
First Trust Exchange-Traded Fund III
Semi-Annual Letter from the Chairman and CEO
January 31, 2018
Dear Shareholders,
First Trust is pleased to provide you with the semi-annual report for the Managed Volatility Funds of First Trust Exchange-Traded Fund III. This report contains detailed information about your investment for the six months ended January 31, 2018. We encourage you to read this report carefully and discuss it with your financial advisor.
As you are no doubt aware, 2017 was a very strong year for U.S. markets. The three major indices – the S&P 500® Index, the Dow Jones Industrial Average and the Nasdaq Composite – posted their best performance since 2013. And there was more good news for Wall Street as the year ended and analysts collected stock market data:
• The S&P 500® did something it had not previously done, finishing 2017 with 12 months of gains;
• The Dow Jones achieved a milestone as well, closing above 24,000 for the first time ever on November 30; and
• The Nasdaq Composite set a record by having 11 months of gains in 2017 (June was the only down month, and by just 0.86%).
Global markets were also strong in 2017. According to data from the MSCI AC World Index, which captures all sources of equity returns in 23 developed and 24 emerging markets, global stocks rose every month in 2017.
As 2017 ended, President Trump signed the “Tax Cuts and Jobs Act of 2017” tax reform bill. This action by the President was viewed as making good on his earlier campaign promise to accomplish sweeping tax reform and the hope is that this bill will boost economic activity to greater highs. As 2018 began, there was much enthusiasm for the tax reform package and the potential increase in take-home pay for many Americans, as well as the reduction in the federal corporate tax rate from 35% to 21%.
At First Trust, we are optimistic about the U.S. economy. The S&P 500® Index began 2018 with a strong start returning over 7.5% during the period from January 2 to January 26. We also continue to believe that you should invest for the long term and be prepared for market volatility, which can happen at any time. This can be accomplished by keeping current on your portfolio and investing goals by speaking regularly with your investment professional. It’s important to keep in mind that past performance of the U.S. and global stock markets or investment products can never guarantee future results. As we’ve said before, markets go up and they also go down, but savvy investors are prepared for either through careful attention to their portfolios and investment goals.
Thank you for giving First Trust the opportunity to be a part of your financial plan through your investment. We value our relationship with you and will report on your investment again in six months.
Sincerely,

James A. Bowen
Chairman of the Board of Trustees
Chief Executive Officer of First Trust Advisors L.P.
|
| Fund Performance Overview (Unaudited) |
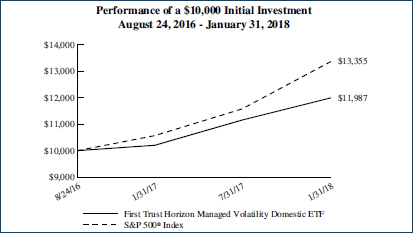
First Trust Horizon Managed Volatility Domestic ETF (HUSV)
The investment objective of First Trust Horizon Managed Volatility Domestic ETF (the “Fund”) is to provide capital appreciation. Under normal market conditions, the Fund seeks to achieve its investment objective by investing at least 80% of its net assets (including investment borrowings) in common stocks of domestic companies listed and traded on U.S. national securities exchanges that Horizon Investments, LLC (“Horizon” or the “Sub-Advisor”) believes exhibit low future expected volatility. The goal of this strategy is to capture upside price movements in rising markets and reduce downside risk when markets decline. To implement this strategy, the Sub-Advisor employs volatility forecasting models to forecast future expected volatility. The strategy is largely quantitative and rules-based, but also includes multiple parameters over which the Sub-Advisor may exercise discretion (including, but not limited to, the number of holdings and the weightings of particular holdings) in connection with its active management of the Fund. Shares of the Fund are listed and trade on the NYSE Arca, Inc. under the ticker symbol “HUSV”. The first day of secondary market trading in shares of the Fund was August 25, 2016.
| | | | | | | | | | | | | | |
| | | | | | | Average Annual
Total Returns | | Cumulative
Total Returns |
| | | 6 Months Ended
1/31/18 | | 1 Year Ended
1/31/18 | | Inception (8/24/16)
to 1/31/18 | | Inception (8/24/16)
to 1/31/18 |
Fund Performance | | | | | | | | | | | | | | |
NAV | | | | 7.50 | % | | | | 17.51 | % | | 13.43% | | 19.88% |
Market Value | | | | 7.41 | % | | | | 17.51 | % | | 13.43% | | 19.88% |
Index Performance | | | | | | | | | | | | | | |
S&P 500® Index | | | | 15.43 | % | | | | 26.41 | % | | 22.28% | | 33.55% |
(See Notes to Fund Performance Overview Page 6.)
|
| Fund Performance Overview (Unaudited) (Continued) |
First Trust Horizon Managed Volatility Domestic ETF (HUSV) (Continued)
| | | | | |
| |
| Sector Allocation | | % of Total
Investments |
Financials | | | | 21.6% | |
Industrials | | | | 16.1 | |
Information Technology | | | | 13.4 | |
Utilities | | | | 12.7 | |
Real Estate | | | | 12.0 | |
Consumer Staples | | | | 9.6 | |
Health Care | | | | 7.2 | |
Energy | | | | 3.9 | |
Materials | | | | 3.5 | |
Total | | | | 100.0% | |
| | | | | |
| | | | | |
| |
| Top Ten Holdings | | % of Total
Investments |
Exxon Mobil Corp. | | | | 2.6% | |
Amphenol Corp., Class A | | | | 2.5 | |
Fidelity National Information Services, Inc. | | | | 2.5 | |
Coca-Cola (The) Co. | | | | 2.4 | |
Procter & Gamble (The) Co. | | | | 2.3 | |
Berkshire Hathaway, Inc., Class B | | | | 2.3 | |
Fiserv, Inc. | | | | 2.2 | |
VeriSign, Inc. | | | | 2.2 | |
PepsiCo, Inc. | | | | 2.1 | |
Accenture PLC, Class A | | | | 2.1 | |
Total | | | | 23.2% | |
| | | | | |
| | | | |
 | | | | |
| | | | Performance figures assume reinvestment of all distributions and do not reflect the deduction of taxes that a shareholder would pay on Fund distributions or the redemption or sale of Fund shares. An index is a statistical composite that tracks a specified financial market or sector. Unlike the Fund, the index does not actually hold a portfolio of securities and therefore does not incur the expenses incurred by the Fund. These expenses negatively impact the performance of the Fund. The Fund’s past performance does not predict future performance. |
| | | | |
Frequency Distribution of Discounts and Premiums
Bid/Ask Midpoint vs. NAV through January 31, 2018
The following Frequency Distribution of Discounts and Premiums charts are provided to show the frequency at which the bid/ask midpoint price for the Fund was at a discount or premium to the daily NAV. The following tables are for comparative purposes only and represent the period August 25, 2016 (commencement of trading) through January 31, 2018. Shareholders may pay more than NAV when they buy Fund shares and receive less than NAV when they sell those shares because shares are bought and sold at current market price. Data presented represents past performance and cannot be used to predict future results.
| | | | | | | | |
| Number of Days Bid/Ask Midpoint At/Above NAV |
For the Period | | 0.00%–0.49% | | 0.50%–0.99% | | 1.00%–1.99% | | >=2.00% |
8/25/16 – 7/31/17 | | 125 | | 1 | | 0 | | 0 |
8/1/17 – 1/31/18 | | 114 | | 0 | | 0 | | 0 |
| Number of Days Bid/Ask Midpoint Below NAV |
For the Period | | 0.00%–0.49% | | 0.50%–0.99% | | 1.00%–1.99% | | >=2.00% |
8/25/16 – 7/31/17 | | 108 | | 0 | | 0 | | 0 |
8/1/17 – 1/31/18 | | 13 | | 0 | | 0 | | 0 |
|
| Fund Performance Overview (Unaudited) (Continued) |
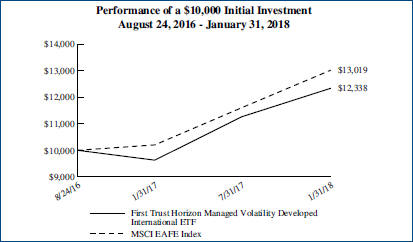
First Trust Horizon Managed Volatility Developed International ETF (HDMV)
The investment objective of First Trust Horizon Managed Volatility Developed International ETF (the “Fund”) is to provide capital appreciation. Under normal market conditions, the Fund seeks to achieve its investment objective by investing at least 80% of its net assets (including investment borrowings) in common stocks and depositary receipts of developed market companies listed and traded on non-U.S. exchanges that Horizon Investments, LLC (“Horizon” or the “Sub-Advisor”) believes exhibit low future expected volatility. The term “developed market companies” means those companies (i) whose securities are traded principally on a stock exchange in a developed market country, (ii) with a primary business office in a developed market country, or (iii) that have at least 50% of their assets in, or derive at least 50% of their revenues or profits from, a developed market country. The Sub-Advisor considers Australia, Austria, Belgium, Canada, Denmark, Finland, France, Germany, Hong Kong, Ireland, Israel, Italy, Japan, Luxembourg, the Netherlands, New Zealand, Norway, Portugal, Singapore, Spain, Sweden, Switzerland, the United Kingdom and the United States to be developed market countries. However, this list may change in response to market and geopolitical events. Under normal market conditions, the Fund will invest in at least three countries and at least 40% of its net assets in countries other than the United States. Shares of the Fund are listed and trade on the NYSE Arca, Inc. under the ticket symbol “HDMV”. The first day of secondary market trading in shares of the Fund was August 25, 2016.
| | | | | | | | | | | | | | |
| | | | | | | Average Annual
Total Returns | | Cumulative
Total Returns |
| | | 6 Months Ended
1/31/18 | | 1 Year Ended
1/31/18 | | Inception (8/24/16)
to 1/31/18 | | Inception (8/24/16)
to 1/31/18 |
Fund Performance | | | | | | | | | | | | | | |
NAV | | | | 9.50 | % | | | | 28.14 | % | | 15.73% | | 23.39% |
Market Value | | | | 9.65 | % | | | | 27.92 | % | | 16.10% | | 23.95% |
Index Performance | | | | | | | | | | | | | | |
MSCI EAFE Index | | | | 12.14 | % | | | | 27.60 | % | | 20.14% | | 30.20% |
(See Notes to Fund Performance Overview Page 6.)
|
| Fund Performance Overview (Unaudited) (Continued) |
First Trust Horizon Managed Volatility Developed International ETF (HDMV) (Continued)
| | | | | |
| |
| Sector Allocation | | % of Total
Investments |
Financials | | | | 24.6% | |
Industrials | | | | 19.7 | |
Real Estate | | | | 11.2 | |
Consumer Staples | | | | 8.7 | |
Telecommunication Services | | | | 8.0 | |
Consumer Discretionary | | | | 7.5 | |
Utilities | | | | 5.9 | |
Energy | | | | 4.6 | |
Materials | | | | 4.3 | |
Health Care | | | | 3.3 | |
Information Technology | | | | 2.2 | |
Total | | | | 100.0% | |
| | | | | |
| | | | | |
| |
| Top Ten Holdings | | % of Total
Investments |
Singapore Exchange Ltd. | | | | 1.6% | |
Groupe Bruxelles Lambert S.A. | | | | 1.5 | |
Swisscom AG | | | | 1.4 | |
Hong Kong & China Gas Co., Ltd. | | | | 1.4 | |
Singapore Telecommunications Ltd. | | | | 1.4 | |
Swire Pacific Ltd., Class A | | | | 1.3 | |
Pargesa Holding S.A. | | | | 1.3 | |
Zurich Insurance Group AG | | | | 1.3 | |
MTR Corp., Ltd. | | | | 1.3 | |
CLP Holdings Ltd. | | | | 1.2 | |
Total | | | | 13.7% | |
| | | | | |
| | |
 | | Performance figures assume reinvestment of all distributions and do not reflect the deduction of taxes that a shareholder would pay on Fund distributions or the redemption or sale of Fund shares. An index is a statistical composite that tracks a specified financial market or sector. Unlike the Fund, the index does not actually hold a portfolio of securities and therefore does not incur the expenses incurred by the Fund. These expenses negatively impact the performance of the Fund. The Fund’s past performance does not predict future performance. |
Frequency Distribution of Discounts and Premiums
Bid/Ask Midpoint vs. NAV through January 31, 2018
The following Frequency Distribution of Discounts and Premiums charts are provided to show the frequency at which the bid/ask midpoint price for the Fund was at a discount or premium to the daily NAV. The following tables are for comparative purposes only and represent the period August 25, 2016 (commencement of trading) through January 31, 2018. Shareholders may pay more than NAV when they buy Fund shares and receive less than NAV when they sell those shares because shares are bought and sold at current market price. Data presented represents past performance and cannot be used to predict future results.
| | | | | | | | |
| Number of Days Bid/Ask Midpoint At/Above NAV |
For the Period | | 0.00%–0.49% | | 0.50%–0.99% | | 1.00%–1.99% | | >=2.00% |
8/25/16 – 7/31/17 | | 128 | | 99 | | 1 | | 0 |
8/1/17 – 1/31/18 | | 43 | | 80 | | 4 | | 0 |
| Number of Days Bid/Ask Midpoint Below NAV |
For the Period | | 0.00%–0.49% | | 0.50%–0.99% | | 1.00%–1.99% | | >=2.00% |
8/25/16 – 7/31/17 | | 6 | | 0 | | 0 | | 0 |
8/1/17 – 1/31/18 | | 0 | | 0 | | 0 | | 0 |
|
| Notes to Fund Performance Overview (Unaudited) |
Total returns for the periods since inception are calculated from the inception date of each Fund. “Average Annual Total Returns” represent the average annual change in value of an investment over the periods indicated. “Cumulative Total Returns” represent the total change in value of an investment over the periods indicated.
Each Fund’s per share net asset value (“NAV”) is the value of one share of the Fund and is computed by dividing the value of all assets of the Fund (including accrued interest and dividends), less all liabilities (including accrued expenses and dividends declared but unpaid), by the total number of outstanding shares. The price used to calculate market return (“Market Price”) is determined by using the midpoint between the highest bid and the lowest offer on the stock exchange on which shares of the Fund are listed for trading as of the time that the Fund’s NAV is calculated. Since shares of each Fund did not trade in the secondary market until after the Fund’s inception, for the period from inception to the first day of secondary market trading in shares of the Fund, the NAV of each Fund is used as a proxy for the secondary market trading price to calculate market returns. NAV and market returns assume that all distributions have been reinvested in each Fund at NAV and Market Price, respectively.
An index is a statistical composite that tracks a specified financial market or sector. Unlike each Fund, the indices do not actually hold a portfolio of securities and therefore do not incur the expenses incurred by each Fund. These expenses negatively impact the performance of each Fund. Also, market returns do not include brokerage commissions that may be payable on secondary market transactions. If brokerage commissions were included, market returns would be lower. The total returns presented reflect the reinvestment of dividends on securities in the indices. The returns presented do not reflect the deduction of taxes that a shareholder would pay on Fund distributions or the redemption or sale of Fund shares. The investment return and principal value of shares of each Fund will vary with changes in market conditions. Shares of each Fund may be worth more or less than their original cost when they are redeemed or sold in the market. Each Fund’s past performance is no guarantee of future performance.
First Trust Exchange-Traded Fund III
First Trust Horizon Funds
January 31, 2018 (Unaudited)
Advisor
First Trust Advisors L.P. (“First Trust”) is the investment advisor. First Trust is responsible for the ongoing monitoring of each Fund’s investment portfolio, managing each Fund’s business affairs and providing certain administrative services necessary for the management of each Fund.
Sub-Advisor
Horizon Investments, LLC (“Horizon” or the “Sub-Advisor”) serves as the investment sub-advisor to the Funds.
Portfolio Management Team
The following persons serve as portfolio managers of the Funds:
Michael Dickson, PhD, Portfolio Manager of Horizon
Scott Ladner, Portfolio Manager of Horizon
Steven Clark, PhD, Portfolio Manager of Horizon
The portfolio managers are primarily and jointly responsible for the day-to-day management of the Funds. Each portfolio manager has served as part of the portfolio management team of the Funds since 2016.
First Trust Exchange-Traded Fund III
Understanding Your Fund Expenses
January 31, 2018 (Unaudited)
As a shareholder of First Trust Horizon Managed Volatility Domestic ETF or First Trust Horizon Managed Volatility Developed International ETF (each a “Fund” and collectively, the “Funds”), you incur two types of costs: (1) transaction costs; and (2) ongoing costs, including management fees, distribution and/or service (12b-1) fees, if any, and other Fund expenses. This Example is intended to help you understand your ongoing costs of investing in the Funds and to compare these costs with the ongoing costs of investing in other funds.
The Example is based on an investment of $1,000 invested at the beginning of the period and held through the six-month period ended January 31, 2018.
Actual Expenses
The first line in the following table provides information about actual account values and actual expenses. You may use the information in this line, together with the amount you invested, to estimate the expenses that you paid over the period. Simply divide your account value by $1,000 (for example, an $8,600 account value divided by $1,000 = 8.6), then multiply the result by the number in the first line under the heading entitled “Expenses Paid During the Six-Month Period” to estimate the expenses you paid on your account during this six-month period.
Hypothetical Example for Comparison Purposes
The second line in the following table provides information about hypothetical account values and hypothetical expenses based on each Fund’s actual expense ratio and an assumed rate of return of 5% per year before expenses, which is not each Fund’s actual return. The hypothetical account values and expenses may not be used to estimate the actual ending account balance or expenses you paid for the period. You may use this information to compare the ongoing costs of investing in the Funds and other funds. To do so, compare this 5% hypothetical example with the 5% hypothetical examples that appear in the shareholder reports of the other funds.
Please note that the expenses shown in the table are meant to highlight your ongoing costs only and do not reflect any transactional costs such as brokerage commissions. Therefore, the second line in the table is useful in comparing ongoing costs only, and will not help you determine the relative total costs of owning different funds. In addition, if these transactional costs were included, your costs would have been higher.
| | | | | | | | | | | | | | | | | | | | |
| | | Beginning
Account Value
August 1, 2017 | | Ending
Account Value
January 31, 2018 | | Annualized
Expense Ratio
Based on the
Six-Month
Period | | Expenses Paid
During the
Six-Month
Period (a) |
First Trust Horizon Managed Volatility Domestic ETF (HUSV) | | | | | | | | | | | |
Actual | | | | $1,000.00 | | | | | $1,075.00 | | | | | 0.70 | % | | | | $3.66 | |
Hypothetical (5% return before expenses) | | | | $1,000.00 | | | | | $1,021.68 | | | | | 0.70 | % | | | | $3.57 | |
| | |
First Trust Horizon Managed Volatility Developed International ETF (HDMV) | | | | | | | | | | | |
Actual | | | | $1,000.00 | | | | | $1,095.00 | | | | | 0.80 | % | | | | $4.22 | |
Hypothetical (5% return before expenses) | | | | $1,000.00 | | | | | $1,021.17 | | | | | 0.80 | % | | | | $4.08 | |
| (a) | Expenses are equal to the annualized expense ratios, multiplied by the average account value over the period (August 1, 2017 through January 31, 2018), multiplied by 184/365 (to reflect the six-month period). |
First Trust Horizon Managed Volatility Domestic ETF (HUSV)
Portfolio of Investments
January 31, 2018 (Unaudited)
| | | | | | | | |
Shares | | Description | | Value | |
COMMON STOCKS – 88.0% | |
| | | | Aerospace & Defense – 6.6% | | | | |
| | 11,892 | | Harris Corp. | | $ | 1,895,347 | |
| | 5,271 | | Lockheed Martin Corp. | | | 1,870,414 | |
| | 3,701 | | Northrop Grumman Corp. | | | 1,260,302 | |
| | 5,220 | | Raytheon Co. | | | 1,090,667 | |
| | | | | | | | |
| | | | | | | 6,116,730 | |
| | | | | | | | |
| | | | Banks – 1.2% | | | | |
| | 20,140 | | U.S. Bancorp. | | | 1,150,800 | |
| | | | | | | | |
| | | | Beverages – 5.8% | | | | |
| | 46,542 | | Coca-Cola (The) Co. | | | 2,214,934 | |
| | 5,323 | | Constellation Brands, Inc., Class A | | | 1,168,239 | |
| | 16,479 | | PepsiCo, Inc. | | | 1,982,423 | |
| | | | | | | | |
| | | | | | | 5,365,596 | |
| | | | | | | | |
| | | | Capital Markets – 3.9% | | | | |
| | 8,039 | | Cboe Global Markets, Inc. | | | 1,080,361 | |
| | 7,593 | | Moody’s Corp. | | | 1,228,471 | |
| | 16,635 | | Nasdaq, Inc. | | | 1,345,938 | |
| | | | | | | | |
| | | | | | | 3,654,770 | |
| | | | | | | | |
| | | | Chemicals – 3.5% | | | | |
| | 8,119 | | Air Products & Chemicals, Inc. | | | 1,366,996 | |
| | 13,705 | | Ecolab, Inc. | | | 1,886,904 | |
| | | | | | | | |
| | | | | | | 3,253,900 | |
| | | | | | | | |
| | | | Commercial Services & Supplies – 3.5% | | | | |
| | 24,758 | | Republic Services, Inc. | | | 1,703,350 | |
| | 17,409 | | Waste Management, Inc. | | | 1,539,478 | |
| | | | | | | | |
| | | | | | | 3,242,828 | |
| | | | | | | | |
| | | | Consumer Finance – 1.9% | | | | |
| | 17,294 | | American Express Co. | | | 1,719,024 | |
| | | | | | | | |
| | | | Diversified Financial Services – 2.3% | | | | |
| | 9,921 | | Berkshire Hathaway, Inc., Class B (a) | | | 2,126,864 | |
| | | | | | | | |
| | | | Electric Utilities – 6.9% | | | | |
| | 10,360 | | Alliant Energy Corp. | | | 411,810 | |
| | 11,221 | | American Electric Power Co., Inc. | | | 771,780 | |
| | 11,303 | | Duke Energy Corp. | | | 887,286 | |
| | 5,119 | | Entergy Corp. | | | 402,814 | |
| | 12,009 | | Eversource Energy | | | 757,648 | |
| | 9,360 | | Exelon Corp. | | | 360,454 | |
| | 3,591 | | NextEra Energy, Inc. | | | 568,886 | |
| | 7,805 | | Pinnacle West Capital Corp. | | | 624,010 | |
| | 16,567 | | PPL Corp. | | | 527,990 | |
| | 10,237 | | Southern (The) Co. | | | 461,791 | |
| | 14,706 | | Xcel Energy, Inc. | | | 671,182 | |
| | | | | | | | |
| | | | | | | 6,445,651 | |
| | | | | | | | |
| | | | | | | | |
Shares | | Description | | Value | |
| | | | Electrical Equipment – 1.5% | | | | |
| | 18,015 | | AMETEK, Inc. | | $ | 1,374,544 | |
| | | | | | | | |
| | | | Electronic Equipment, Instruments & Components – 2.5% | | | | |
| | 25,319 | | Amphenol Corp., Class A | | | 2,348,844 | |
| | | | | | | | |
| | | | Health Care Equipment & Supplies – 3.0% | | | | |
| | 17,747 | | Baxter International, Inc. | | | 1,278,317 | |
| | 15,105 | | Danaher Corp. | | | 1,529,834 | |
| | | | | | | | |
| | | | | | | 2,808,151 | |
| | | | | | | | |
| | | | Household Products – 2.3% | | | | |
| | 24,717 | | Procter & Gamble (The) Co. | | | 2,134,066 | |
| | | | | | | | |
| | | | Industrial Conglomerates – 3.4% | | | | |
| | 11,745 | | Honeywell International, Inc. | | | 1,875,324 | |
| | 4,399 | | Roper Technologies, Inc. | | | 1,234,315 | |
| | | | | | | | |
| | | | | | | 3,109,639 | |
| | | | | | | | |
| | | | Insurance – 12.3% | | | | |
| | 18,417 | | AFLAC, Inc. | | | 1,624,379 | |
| | 16,526 | | American International Group, Inc. | | | 1,056,342 | |
| | 8,051 | | Aon PLC | | | 1,144,611 | |
| | 22,731 | | Arthur J. Gallagher & Co. | | | 1,552,982 | |
| | 33,671 | | Loews Corp. | | | 1,739,107 | |
| | 13,336 | | Marsh & McLennan Cos., Inc. | | | 1,113,823 | |
| | 19,171 | | Torchmark Corp. | | | 1,741,685 | |
| | 9,095 | | Willis Towers Watson PLC | | | 1,459,475 | |
| | | | | | | | |
| | | | | | | 11,432,404 | |
| | | | | | | | |
| | | | Internet Software & Services – 2.2% | | | | |
| | 17,418 | | VeriSign, Inc. (a) | | | 2,001,677 | |
| | | | | | | | |
| | | | IT Services – 8.7% | | | | |
| | 12,334 | | Accenture PLC, Class A | | | 1,982,074 | |
| | 22,155 | | Cognizant Technology Solutions Corp., Class A | | | 1,727,647 | |
| | 22,525 | | Fidelity National Information Services, Inc. | | | 2,305,659 | |
| | 14,593 | | Fiserv, Inc. (a) | | | 2,055,278 | |
| | | | | | | | |
| | | | | | | 8,070,658 | |
| | | | | | | | |
| | | | Machinery – 1.2% | | | | |
| | 15,069 | | Fortive Corp. | | | 1,145,545 | |
| | | | | | | | |
| | | | Multi-Utilities – 5.5% | | | | |
| | 10,403 | | Ameren Corp. | | | 589,122 | |
| | 13,152 | | Centerpoint Energy, Inc. | | | 370,624 | |
| | 15,307 | | CMS Energy Corp. | | | 684,988 | |
| | 6,353 | | Consolidated Edison, Inc. | | | 510,527 | |
| | 7,679 | | Dominion Energy, Inc. | | | 586,983 | |
| | 7,267 | | DTE Energy Co. | | | 767,686 | |
| | 9,527 | | NiSource, Inc. | | | 235,126 | |
| | | | |
| | See Notes to Financial Statements | | Page 9 |
First Trust Horizon Managed Volatility Domestic ETF (HUSV)
Portfolio of Investments (Continued)
January 31, 2018 (Unaudited)
| | | | | | | | |
Shares | | Description | | Value | |
COMMON STOCKS (Continued) | | | | |
| | | | Multi-Utilities (Continued) | | | | |
| | 5,721 | | Public Service Enterprise Group, Inc. | | $ | 296,748 | |
| | 5,162 | | Sempra Energy | | | 552,437 | |
| | 8,020 | | WEC Energy Group, Inc. | | | 515,686 | |
| | | | | | | | |
| | | | | | | 5,109,927 | |
| | | | | | | | |
| | | | Oil, Gas & Consumable Fuels – 3.9% | | | | |
| | 9,804 | | Chevron Corp. | | | 1,228,931 | |
| | 27,759 | | Exxon Mobil Corp. | | | 2,423,361 | |
| | | | | | | | |
| | | | | | | 3,652,292 | |
| | | | | | | | |
| | | | Pharmaceuticals – 4.2% | | | | |
| | 13,211 | | Eli Lilly & Co. | | | 1,076,036 | |
| | 9,216 | | Johnson & Johnson | | | 1,273,559 | |
| | 41,524 | | Pfizer, Inc. | | | 1,538,049 | |
| | | | | | | | |
| | | | | | | 3,887,644 | |
| | | | | | | | |
| | | | Tobacco – 1.5% | | | | |
| | 12,856 | | Philip Morris International, Inc. | | | 1,378,549 | |
| | | | | | | | |
| | | | Water Utilities – 0.2% | | | | |
| | 2,754 | | American Water Works Co., Inc. | | | 229,050 | |
| | | | | | | | |
| | | | Total Common Stocks | | | 81,759,153 | |
| | | | | | | | |
| | | | (Cost $74,989,645) | | | | |
REAL ESTATE INVESTMENT TRUSTS – 12.0% | |
| | | | Equity Real Estate Investment Trusts – 12.0% | |
| | 12,453 | | Alexandria Real Estate Equities, Inc. | | | 1,615,154 | |
| | 27,854 | | Apartment Investment & Management Co., Class A | | | 1,165,412 | |
| | 7,885 | | AvalonBay Communities, Inc. | | | 1,343,604 | |
| | 22,961 | | Equity Residential | | | 1,414,627 | |
| | 12,253 | | Mid-America Apartment Communities, Inc. | | | 1,168,569 | |
| | 19,028 | | Realty Income Corp. | | | 1,012,099 | |
| | 36,178 | | UDR, Inc. | | | 1,321,582 | |
| | 18,388 | | Ventas, Inc. | | | 1,029,176 | |
| | 17,319 | | Welltower, Inc. | | | 1,038,621 | |
| | | | | | | | |
| | | | Total Real Estate Investment Trusts | | | 11,108,844 | |
| | | | | | | | |
| | | | (Cost $11,604,402) | | | | |
| | | | Total Investments – 100.0% | | | 92,867,997 | |
| | | | (Cost $86,594,047) (b) | | | | |
| | | | Net Other Assets and Liabilities – 0.0% | | | 24,495 | |
| | | | | | | | |
| | | | Net Assets – 100.0% | | $ | 92,892,492 | |
| | | | | | | | |
| (a) | Non-income producing security. |
| (b) | Aggregate cost for financial reporting purposes approximates the aggregate cost for federal income tax purposes. As of January 31, 2018, the aggregate gross unrealized appreciation for all investments in which there was an excess of value over tax cost was $7,363,770 and the aggregate gross unrealized depreciation for all investments in which there was an excess of tax cost over value was $1,089,820. The net unrealized appreciation was $6,273,950. |
Valuation Inputs
A summary of the inputs used to value the Fund’s investments as of January 31, 2018 is as follows (see Note 2A - Portfolio Valuation in the Notes to Financial Statements):
| | | | | | | | | | | | |
| | | Total
Value at
1/31/2018 | | | Level 1
Quoted
Prices | | | Level 2
Significant
Observable
Inputs | | Level 3
Significant
Unobservable
Inputs |
| | | |
Common Stocks* | | | $81,759,153 | | | | $81,759,153 | | | $— | | $— |
Real Estate Investment Trusts* | | | 11,108,844 | | | | 11,108,844 | | | — | | — |
| | | |
Total Investments | | | $92,867,997 | | | | $92,867,997 | | | $— | | $— |
| | | |
| * | See Portfolio of Investments for industry breakout. |
All transfers in and out of the Levels during the period are assumed to occur on the last day of the period at their current value. There were no transfers between Levels at January 31, 2018.
| | | | |
| Page 10 | | See Notes to Financial Statements | | |
First Trust Horizon Managed Volatility Developed International ETF (HDMV)
Portfolio of Investments
January 31, 2018 (Unaudited)
| | | | | | | | |
Shares | | Description | | Value | |
COMMON STOCKS (a) – 91.8% | |
| | | | Australia – 1.4% | | | | |
| | 10,612 | | Amcor Ltd. | | $ | 124,505 | |
| | 3,851 | | ASX Ltd. | | | 169,866 | |
| | 4,767 | | Wesfarmers Ltd. | | | 168,285 | |
| | 6,817 | | Woolworths Ltd. | | | 148,040 | |
| | | | | | | | |
| | | | | | | 610,696 | |
| | | | | | | | |
| | | | Belgium – 3.5% | | | | |
| | 6,960 | | Ageas | | | 367,596 | |
| | 5,625 | | Groupe Bruxelles Lambert S.A. | | | 662,615 | |
| | 6,679 | | Proximus S.A.D.P. | | | 225,219 | |
| | 936 | | Solvay S.A. | | | 135,442 | |
| | 2,168 | | Telenet Group Holding N.V. (b) | | | 166,750 | |
| | | | | | | | |
| | | | | | | 1,557,622 | |
| | | | | | | | |
| | | | Bermuda – 0.4% | | | | |
| | 18,771 | | CK Infrastructure Holdings Ltd. | | | 167,130 | |
| | | | | | | | |
| | | | Cayman Islands – 0.8% | | | | |
| | 27,170 | | CK Hutchison Holdings Ltd. | | | 366,775 | |
| | | | | | | | |
| | | | Denmark – 0.3% | | | | |
| | 1,143 | | Carlsberg A.S., Class B | | | 146,781 | |
| | | | | | | | |
| | | | France – 14.1% | | | | |
| | 2,878 | | Accor S.A. | | | 163,830 | |
| | 1,854 | | Air Liquide S.A. | | | 249,864 | |
| | 1,213 | | Arkema S.A. | | | 154,967 | |
| | 8,369 | | AXA S.A. | | | 275,297 | |
| | 6,548 | | Bureau Veritas SA | | | 191,942 | |
| | 2,790 | | Cie de Saint-Gobain | | | 162,164 | |
| | 9,241 | | CNP Assurances | | | 236,806 | |
| | 1,913 | | Danone S.A. | | | 164,973 | |
| | 1,614 | | Eiffage S.A. | | | 195,697 | |
| | 1,798 | | Eurazeo S.A. | | | 189,188 | |
| | 376 | | Hermes International | | | 207,830 | |
| | 1,622 | | Imerys S.A. | | | 173,790 | |
| | 9,042 | | Lagardere SCA | | | 282,000 | |
| | 2,345 | | Legrand S.A. | | | 195,124 | |
| | 808 | | L’Oreal S.A. | | | 183,681 | |
| | 503 | | LVMH Moet Hennessy Louis Vuitton SE | | | 157,749 | |
| | 27,728 | | Orange S.A. | | | 500,722 | |
| | 1,337 | | Pernod Ricard S.A. | | | 212,972 | |
| | 1,729 | | Safran SA | | | 195,215 | |
| | 2,207 | | Sanofi | | | 194,876 | |
| | 1,703 | | Schneider Electric SE | | | 159,592 | |
| | 2,986 | | SCOR SE | | | 133,647 | |
| | 809 | | SEB S.A. | | | 167,134 | |
| | 8,193 | | Suez | | | 122,166 | |
| | 1,428 | | Thales S.A. | | | 160,202 | |
| | 7,979 | | TOTAL S.A. | | | 461,982 | |
| | 14,641 | | Veolia Environnement S.A. | | | 368,822 | |
| | 2,274 | | Vinci S.A. | | | 245,626 | |
| | 986 | | Wendel S.A. | | | 183,748 | |
| | | | | | | | |
| | | | | | | 6,291,606 | |
| | | | | | | | |
| | | | | | | | |
Shares | | Description | | Value | |
| | | |
| | | | Germany – 6.5% | | | | |
| | 1,367 | | Allianz SE | | $ | 345,380 | |
| | 2,007 | | BASF SE | | | 235,026 | |
| | 2,043 | | Bayerische Motoren Werke AG | | | 233,281 | |
| | 1,372 | | Beiersdorf AG | | | 162,675 | |
| | 576 | | Continental AG | | | 172,848 | |
| | 3,103 | | Daimler AG | | | 284,047 | |
| | 3,626 | | Deutsche Post AG | | | 171,386 | |
| | 9,357 | | Deutsche Telekom AG | | | 164,093 | |
| | 4,171 | | Evonik Industries AG | | | 164,676 | |
| | 2,065 | | Fresenius Medical Care AG & Co., KGaA | | | 238,433 | |
| | 775 | | Muenchener Rueckversicherungs- Gesellschaft AG in Muenchen | | | 182,385 | |
| | 2,530 | | SAP SE | | | 285,308 | |
| | 5,130 | | Vonovia SE | | | 252,919 | |
| | | | | | | | |
| | | | | | | 2,892,457 | |
| | | | | | | | |
| | | | Hong Kong – 7.2% | | | | |
| | 63,089 | | Bank of East Asia (The) Ltd. | | | 272,997 | |
| | 52,491 | | CLP Holdings Ltd. | | | 535,804 | |
| | 9,939 | | Hang Seng Bank Ltd. | | | 236,575 | |
| | 318,739 | | Hong Kong & China Gas Co., Ltd. | | | 629,928 | |
| | 99,353 | | MTR Corp., Ltd. | | | 568,990 | |
| | 651,625 | | PCCW Ltd. | | | 375,682 | |
| | 58,166 | | Swire Pacific Ltd., Class A | | | 581,835 | |
| | | | | | | | |
| | | | | | | 3,201,811 | |
| | | | | | | | |
| | | | Italy – 2.1% | | | | |
| | 4,479 | | Atlantia S.p.A. | | | 148,365 | |
| | 17,472 | | Eni S.p.A. | | | 314,235 | |
| | 21,026 | | Poste Italiane S.p.A. (c) | | | 173,963 | |
| | 33,992 | | Snam S.p.A. | | | 165,393 | |
| | 26,173 | | Terna Rete Elettrica Nazionale S.p.A | | | 157,536 | |
| | | | | | | | |
| | | | | | | 959,492 | |
| | | | | | | | |
| | | | Japan – 15.6% | | | | |
| | 17,300 | | Aeon Co., Ltd. | | | 294,355 | |
| | 4,400 | | Canon, Inc. | | | 175,283 | |
| | 1,600 | | Central Japan Railway Co. | | | 302,647 | |
| | 2,200 | | East Japan Railway Co. | | | 218,549 | |
| | 4,300 | | Hankyu Hanshin Holdings, Inc. | | | 173,111 | |
| | 12,400 | | ITOCHU Corp. | | | 242,957 | |
| | 24,700 | | Japan Post Bank Co., Ltd. | | | 333,270 | |
| | 7,200 | | Japan Tobacco, Inc. | | | 238,219 | |
| | 6,000 | | Keihan Holdings Co., Ltd. | | | 189,613 | |
| | 3,500 | | Keio Corp. | | | 166,071 | |
| | 5,800 | | Kintetsu Group Holdings Co., Ltd. | | | 228,982 | |
| | 10,400 | | Mitsui & Co., Ltd. | | | 182,336 | |
| | 127,300 | | Mizuho Financial Group, Inc. | | | 239,394 | |
| | 12,500 | | NEC Corp. | | | 376,706 | |
| | 27,200 | | Nissan Motor Co., Ltd. | | | 289,889 | |
| | 8,400 | | Nisshin Seifun Group, Inc. | | | 168,277 | |
| | | | |
| | See Notes to Financial Statements | | Page 11 |
First Trust Horizon Managed Volatility Developed International ETF (HDMV)
Portfolio of Investments (Continued)
January 31, 2018 (Unaudited)
| | | | | | | | |
Shares | | Description | | Value | |
COMMON STOCKS (a) (Continued) | |
| | | | Japan (Continued) | | | | |
| | 21,500 | | NTT DOCOMO, Inc. | | $ | 532,626 | |
| | 2,800 | | Secom Co., Ltd. | | | 213,956 | |
| | 17,700 | | Sekisui House Ltd. | | | 323,941 | |
| | 5,600 | | Seven & i Holdings Co., Ltd. | | | 230,114 | |
| | 3,300 | | Sumitomo Mitsui Financial Group, Inc. | | | 147,453 | |
| | 4,500 | | Takeda Pharmaceutical Co., Ltd. | | | 264,427 | |
| | 6,800 | | Tobu Railway Co., Ltd. | | | 228,286 | |
| | 45,000 | | Tokyo Electric Power Co., Holdings, Inc. (b) | | | 182,193 | |
| | 10,200 | | Tokyu Corp. | | | 170,420 | |
| | 3,000 | | Toyota Motor Corp. | | | 205,551 | |
| | 2,400 | | West Japan Railway Co. | | | 179,742 | |
| | 31,600 | | Yamada Denki Co., Ltd. | | | 187,279 | |
| | 21,000 | | Yamaguchi Financial Group, Inc. | | | 245,837 | |
| | | | | | | | |
| | | | | | | 6,931,484 | |
| | | | | | | | |
| | | | Jersey – 0.4% | | | | |
| | 7,879 | | Experian PLC | | | 181,565 | |
| | | | | | | | |
| | | | Netherlands – 5.6% | | | | |
| | 4,253 | | AerCap Holdings NV (b) | | | 230,087 | |
| | 3,702 | | Akzo Nobel N.V. | | | 346,647 | |
| | 2,855 | | Heineken Holding N.V. | | | 303,065 | |
| | 3,743 | | Heineken N.V. | | | 420,843 | |
| | 14,937 | | ING Groep N.V. | | | 293,568 | |
| | 1,742 | | Koninklijke DSM N.V. | | | 179,987 | |
| | 21,664 | | RELX N.V. | | | 481,859 | |
| | 4,781 | | Wolters Kluwer N.V. | | | 253,045 | |
| | | | | | | | |
| | | | | | | 2,509,101 | |
| | | | | | | | |
| | | | Norway – 0.6% | | | | |
| | 24,811 | | Orkla ASA | | | 258,187 | |
| | | | | | | | |
| | | | Singapore – 4.6% | | | | |
| | 50,800 | | CapitaLand Ltd. | | | 148,705 | |
| | 12,100 | | Oversea-Chinese Banking Corp., Ltd. | | | 119,266 | |
| | 21,900 | | Singapore Airlines Ltd. | | | 188,816 | |
| | 114,000 | | Singapore Exchange Ltd. | | | 712,609 | |
| | 58,700 | | Singapore Technologies Engineering Ltd. | | | 150,800 | |
| | 223,200 | | Singapore Telecommunications Ltd. | | | 602,323 | |
| | 62,700 | | StarHub Ltd. | | | 138,133 | |
| | | | | | | | |
| | | | | | | 2,060,652 | |
| | | | | | | | |
| | | | Spain – 1.4% | | | | |
| | 1,685 | | Amadeus IT Group S.A. | | | 130,709 | |
| | 5,081 | | Enagas S.A. | | | 138,468 | |
| | 5,949 | | Gas Natural SDG S.A. | | | 137,416 | |
| | 10,687 | | Repsol S.A. | | | 201,083 | |
| | | | | | | | |
| | | | | | | 607,676 | |
| | | | | | | | |
| | | | Sweden – 4.2% | | | | |
| | 7,793 | | Industrivarden AB, Class C | | | 207,585 | |
| | | | | | | | |
Shares | | Description | | Value | |
| | | |
| | | | Sweden (Continued) | | | | |
| | 3,295 | | Investor AB, Class B | | $ | 161,030 | |
| | 5,675 | | Kinnevik AB, Class B | | | 206,982 | |
| | 4,406 | | L E Lundbergforetagen AB, Class B | | | 355,616 | |
| | 7,514 | | Securitas AB, Class B | | | 139,077 | |
| | 19,216 | | Skandinaviska Enskilda Banken AB, Class A | | | 242,739 | |
| | 6,275 | | Swedbank AB, Class A | | | 160,381 | |
| | 5,052 | | Swedish Match AB | | | 204,647 | |
| | 38,356 | | Telia Co., AB | | | 192,513 | |
| | | | | | | | |
| | | | | | | 1,870,570 | |
| | | | | | | | |
| | | | Switzerland – 13.0% | | | | |
| | 9,109 | | ABB Ltd. | | | 253,966 | |
| | 2,483 | | Adecco Group AG | | | 204,349 | |
| | 2,692 | | Baloise Holding AG | | | 440,496 | |
| | 1,640 | | Cie Financiere Richemont S.A. | | | 157,384 | |
| | 413 | | Geberit AG | | | 195,684 | |
| | 1,131 | | Kuehne + Nagel International AG | | | 207,669 | |
| | 2,212 | | Nestle S.A. | | | 191,124 | |
| | 2,898 | | Novartis AG | | | 262,167 | |
| | 6,307 | | Pargesa Holding S.A. | | | 575,304 | |
| | 369 | | Partners Group Holding AG | | | 286,835 | |
| | 595 | | Roche Holding AG | | | 146,680 | |
| | 1,962 | | Schindler Holding AG | | | 492,002 | |
| | 769 | | Swiss Life Holding AG | | | 288,762 | |
| | 4,784 | | Swiss Prime Site AG | | | 462,595 | |
| | 2,366 | | Swiss Re AG | | | 233,359 | |
| | 1,154 | | Swisscom AG | | | 630,345 | |
| | 8,377 | | UBS Group AG | | | 170,105 | |
| | 1,742 | | Zurich Insurance Group AG | | | 572,525 | |
| | | | | | | | |
| | | | | | | 5,771,351 | |
| | | | | | | | |
| | | | United Kingdom – 10.1% | | | | |
| | 42,966 | | Aviva PLC | | | 313,079 | |
| | 32,149 | | BP PLC | | | 228,736 | |
| | 8,145 | | Compass Group PLC | | | 171,446 | |
| | 1,981 | | Croda International PLC | | | 126,122 | |
| | 6,737 | | Diageo PLC | | | 242,247 | |
| | 8,169 | | GlaxoSmithKline PLC | | | 153,150 | |
| | 17,484 | | HSBC Holdings PLC | | | 186,458 | |
| | 2,614 | | InterContinental Hotels Group PLC | | | 174,885 | |
| | 78,593 | | Legal & General Group PLC | | | 301,963 | |
| | 4,782 | | London Stock Exchange Group PLC | | | 266,632 | |
| | 29,778 | | National Grid PLC | | | 340,230 | |
| | 22,534 | | RELX PLC | | | 498,481 | |
| | 7,828 | | Royal Dutch Shell PLC, Class A | | | 273,697 | |
| | 7,215 | | Royal Dutch Shell PLC, Class B | | | 255,696 | |
| | 25,942 | | RSA Insurance Group PLC | | | 228,222 | |
| | 4,284 | | Schroders PLC | | | 226,274 | |
| | 10,177 | | Smith & Nephew PLC | | | 183,368 | |
| | 2,335 | | Unilever PLC | | | 132,614 | |
| | | | |
| Page 12 | | See Notes to Financial Statements | | |
First Trust Horizon Managed Volatility Developed International ETF (HDMV)
Portfolio of Investments (Continued)
January 31, 2018 (Unaudited)
| | | | | | | | |
Shares | | Description | | Value | |
COMMON STOCKS (a) (Continued) | |
| | | | United Kingdom (Continued) | |
| | 56,855 | | Vodafone Group PLC | | $ | 181,310 | |
| | | | | | | | |
| | | | | | | 4,484,610 | |
| | | | | | | | |
| | | | Total Common Stocks | | | 40,869,566 | |
| | | | | | | | |
| | | | (Cost $37,334,078) | | | | |
|
REAL ESTATE INVESTMENT TRUSTS (a) – 8.0% | |
| | | | France – 3.4% | | | | |
| | 3,983 | | Fonciere Des Regions | | | 437,394 | |
| | 1,038 | | Gecina S.A. | | | 202,588 | |
| | 4,336 | | ICADE | | | 469,967 | |
| | 5,119 | | Klepierre | | | 233,819 | |
| | 689 | | Unibail-Rodamco SE | | | 176,731 | |
| | | | | | | | |
| | | | | | | 1,520,499 | |
| | | | | | | | |
| | | | Hong Kong – 0.5% | | | | |
| | 23,637 | | Link REIT | | | 209,095 | |
| | | | | | | | |
| | | | Singapore – 2.9% | | | | |
| | 186,900 | | Ascendas Real Estate Investment Trust | | | 393,234 | |
| | 85,938 | | CapitaLand Commercial Trust | | | 122,507 | |
| | 172,700 | | CapitaLand Mall Trust | | | 276,467 | |
| | 321,500 | | Suntec Real Estate Investment Trust | | | 507,322 | |
| | | | | | | | |
| | | | | | | 1,299,530 | |
| | | | | | | | |
| | | | United Kingdom – 1.2% | | | | |
| | 13,446 | | British Land (The) Co., PLC | | | 127,644 | |
| | 12,450 | | Land Securities Group PLC | | | 177,090 | |
| | 26,167 | | Segro PLC | | | 216,009 | |
| | | | | | | | |
| | | | | | | 520,743 | |
| | | | | | | | |
| | | | Total Real Estate Investment Trusts | | | 3,549,867 | |
| | | | | | | | |
| | | | (Cost $3,114,596) | | | | |
| | | | Total Investments – 99.8% | | | 44,419,433 | |
| | | | (Cost $40,448,674) (d) | | | | |
| | | | Net Other Assets and Liabilities – 0.2% | | | 74,114 | |
| | | | | | | | |
| | | | Net Assets – 100.0% | | $ | 44,493,547 | |
| | | | | | | | |
| (a) | Portfolio securities are categorized based upon their country of incorporation. For a breakdown of the portfolio securities by sector, please see the Fund Performance Overview. |
| (b) | Non-income producing security. |
| (c) | This security is restricted in the U.S. and cannot be offered for public sale without first being registered under the Securities Act of 1933, as amended. This security is not restricted on the foreign exchange where it trades freely without any additional registration. As such, it does not require the additional disclosure required of restricted securities. |
| (d) | Aggregate cost for financial reporting purposes approximates the aggregate cost for federal income tax purposes. As of January 31, 2018, the aggregate gross unrealized appreciation for all investments in which there was an excess of value over tax cost was $4,074,657 and the aggregate gross unrealized depreciation for all investments in which there was an excess of tax cost over value was $103,898. The net unrealized appreciation was $3,970,759. |
Valuation Inputs
A summary of the inputs used to value the Fund’s investments as of January 31, 2018 is as follows (see Note 2A - Portfolio Valuation in the Notes to Financial Statements):
| | | | | | | | | | | | |
| | | Total
Value at
1/31/2018 | | | Level 1
Quoted
Prices | | | Level 2
Significant
Observable
Inputs | | Level 3
Significant
Unobservable
Inputs |
| | | |
Common Stocks* | | | $40,869,566 | | | | $40,869,566 | | | $— | | $— |
Real Estate Investment Trusts* | | | 3,549,867 | | | | 3,549,867 | | | — | | — |
| | | |
Total Investments | | | $44,419,433 | | | | $44,419,433 | | | $— | | $— |
| | | |
| * | See Portfolio of Investments for country breakout. |
All transfers in and out of the Levels during the period are assumed to occur on the last day of the period at their current value. There were no transfers between Levels at January 31, 2018.
| | | | | |
| |
Currency Exposure Diversification | | % of Total
Investments |
EUR | | | | 36.2% | |
JPY | | | | 15.6 | |
CHF | | | | 13.0 | |
GBP | | | | 11.7 | |
HKD | | | | 8.9 | |
SGD | | | | 7.6 | |
SEK | | | | 4.2 | |
AUD | | | | 1.4 | |
NOK | | | | 0.6 | |
USD | | | | 0.5 | |
DKK | | | | 0.3 | |
Total | | | | 100.0% | |
| | | | | |
Currency Abbreviations
| | | | |
| | AUD | | Australian Dollar |
| | CHF | | Swiss Franc |
| | DKK | | Danish Krone |
| | EUR | | Euro |
| | GBP | | British Pound Sterling |
| | HKD | | Hong Kong Dollar |
| | JPY | | Japanese Yen |
| | NOK | | Norwegian Krone |
| | SEK | | Swedish Krona |
| | SGD | | Singapore Dollar |
| | USD | | United States Dollar |
| | | | |
| | See Notes to Financial Statements | | Page 13 |
First Trust Exchange-Traded Fund III
Statements of Assets and Liabilities
January 31, 2018 (Unaudited)
| | | | | | | | |
| | | First Trust
Horizon
Managed
Volatility
Domestic
ETF
(HUSV) | | | First Trust
Horizon
Managed
Volatility
Developed
International
ETF
(HDMV) | |
ASSETS: | | | | | | | | |
Investments, at value | | $ | 92,867,997 | | | $ | 44,419,433 | |
Cash | | | 20,492 | | | | 14,298 | |
Receivables: | | | | | | | | |
Fund shares sold | | | 1,175,853 | | | | — | |
Dividends | | | 59,474 | | | | 39,406 | |
Dividend reclaims | | | — | | | | 51,031 | |
| | | | | | | | |
Total Assets. | | | 94,123,816 | | | | 44,524,168 | |
| | | | | | | | |
LIABILITIES: | | | | | | | | |
Due to custodian foreign currency | | | — | | | | 774 | |
Payables: | | | | | | | | |
Investment securities purchased | | | 1,175,895 | | | | — | |
Investment advisory fees | | | 55,429 | | | | 29,847 | |
| | | | | | | | |
Total Liabilities | | | 1,231,324 | | | | 30,621 | |
| | | | | | | | |
NET ASSETS | | $ | 92,892,492 | | | $ | 44,493,547 | |
| | | | | | | | |
NET ASSETS consist of: | | | | | | | | |
Paid-in capital | | $ | 85,155,291 | | | $ | 39,941,262 | |
Par value | | | 39,500 | | | | 12,500 | |
Accumulated net investment income (loss) | | | 57,202 | | | | (301,179 | ) |
Accumulated net realized gain (loss) on investments and foreign currency transactions | | | 1,366,549 | | | | 864,703 | |
Net unrealized appreciation (depreciation) on investments and foreign currency translation | | | 6,273,950 | | | | 3,976,261 | |
| | | | | | | | |
NET ASSETS | | $ | 92,892,492 | | | $ | 44,493,547 | |
| | | | | | | | |
NET ASSET VALUE, per share | | $ | 23.52 | | | $ | 35.59 | |
| | | | | | | | |
Number of shares outstanding (unlimited number of shares authorized, par value $0.01 per share) | | | 3,950,002 | | | | 1,250,002 | |
| | | | | | | | |
Investments, at cost | | $ | 86,594,047 | | | $ | 40,448,674 | |
| | | | | | | | |
Foreign currency, at cost (proceeds) | | $ | — | | | $ | (815 | ) |
| | | | | | | | |
| | | | |
| Page 14 | | See Notes to Financial Statements | | |
First Trust Exchange-Traded Fund III
Statements of Operations
For the Six Months Ended January 31, 2018 (Unaudited)
| | | | | | | | |
| | | First Trust
Horizon
Managed
Volatility
Domestic
ETF
(HUSV) | | | First Trust
Horizon
Managed
Volatility
Developed
International
ETF
(HDMV) | |
INVESTMENT INCOME: | | | | | | | | |
Dividends | | $ | 861,433 | | | $ | 402,966 | |
Interest | | | 821 | | | | 650 | |
Foreign withholding tax on dividend income | | | — | | | | (23,348 | ) |
| | | | | | | | |
Total investment income | | | 862,254 | | | | 380,268 | |
| | | | | | | | |
| | |
EXPENSES: | | | | | | | | |
Investment advisory fees | | | 289,995 | | | | 150,887 | |
| | | | | | | | |
Total expenses | | | 289,995 | | | | 150,887 | |
| | | | | | | | |
NET INVESTMENT INCOME (LOSS) | | | 572,259 | | | | 229,381 | |
| | | | | | | | |
| | |
NET REALIZED AND UNREALIZED GAIN (LOSS): | | | | | | | | |
Net realized gain (loss) on: | | | | | | | | |
Investments | | | (1,084,249 | ) | | | 111,372 | |
In-kind redemptions | | | 3,672,137 | | | | 1,387,451 | |
Foreign currency transactions | | | — | | | | 9,404 | |
| | | | | | | | |
Net realized gain (loss) | | | 2,587,888 | | | | 1,508,227 | |
| | | | | | | | |
Net change in unrealized appreciation (depreciation) on: | | | | | | | | |
Investments | | | 2,945,755 | | | | 1,960,001 | |
Foreign currency translation | | | — | | | | 1,702 | |
| | | | | | | | |
Net change in unrealized appreciation (depreciation) | | | 2,945,755 | | | | 1,961,703 | |
| | | | | | | | |
NET REALIZED AND UNREALIZED GAIN (LOSS) | | | 5,533,643 | | | | 3,469,930 | |
| | | | | | | | |
NET INCREASE (DECREASE) IN NET ASSETS RESULTING FROM OPERATIONS | | $ | 6,105,902 | | | $ | 3,699,311 | |
| | | | | | | | |
| | | | |
| | See Notes to Financial Statements | | Page 15 |
First Trust Exchange-Traded Fund III
Statements of Changes in Net Assets
| | | | | | | | | | | | | | | | |
| | | First Trust Horizon Managed
Volatility Domestic ETF
(HUSV) | | | First Trust Horizon Managed
Volatility Developed International ETF
(HDMV) | |
| | | Six Months
Ended
1/31/2018
(Unaudited) | | | Period
Ended
7/31/2017 (a) | | | Six Months
Ended
1/31/2018
(Unaudited) | | | Period
Ended
7/31/2017 (a) | |
OPERATIONS: | | | | | | | | | | | | | | | | |
Net investment income (loss) | | $ | 572,259 | | | $ | 669,823 | | | $ | 229,381 | | | $ | 570,655 | |
Net realized gain (loss) | | | 2,587,888 | | | | 3,345,502 | | | | 1,508,227 | | | | 1,983,888 | |
Net change in unrealized appreciation (depreciation) | | | 2,945,755 | | | | 3,328,195 | | | | 1,961,703 | | | | 2,014,558 | |
| | | | | | | | | | | | | | | | |
Net increase (decrease) in net assets resulting from operations | | | 6,105,902 | | | | 7,343,520 | | | | 3,699,311 | | | | 4,569,101 | |
| | | | | | | | | | | | | | | | |
| | | | |
DISTRIBUTIONS TO SHAREHOLDERS FROM: | | | | | | | | | | | | | | | | |
Net investment income | | | (578,650 | ) | | | (606,955 | ) | | | (601,441 | ) | | | (540,901 | ) |
| | | | | | | | | | | | | | | | |
Total distributions to shareholders | | | (578,650 | ) | | | (606,955 | ) | | | (601,441 | ) | | | (540,901 | ) |
| | | | | | | | | | | | | | | | |
| | | | |
SHAREHOLDER TRANSACTIONS: | | | | | | | | | | | | | | | | |
Proceeds from shares sold | | | 56,637,855 | | | | 115,380,446 | | | | 25,047,317 | | | | 51,798,537 | |
Cost of shares redeemed | | | (32,071,960 | ) | | | (59,317,666 | ) | | | (13,396,552 | ) | | | (26,081,825 | ) |
| | | | | | | | | | | | | | | | |
Net increase (decrease) in net assets resulting from shareholder transactions | | | 24,565,895 | | | | 56,062,780 | | | | 11,650,765 | | | | 25,716,712 | |
| | | | | | | | | | | | | | | | |
Total increase (decrease) in net assets | | | 30,093,147 | | | | 62,799,345 | | | | 14,748,635 | | | | 29,744,912 | |
| | | | |
NET ASSETS: | | | | | | | | | | | | | | | | |
Beginning of period | | | 62,799,345 | | | | — | | | | 29,744,912 | | | | — | |
| | | | | | | | | | | | | | | | |
End of period | | $ | 92,892,492 | | | $ | 62,799,345 | | | $ | 44,493,547 | | | $ | 29,744,912 | |
| | | | | | | | | | | | | | | | |
Accumulated net investment income (loss) at end of period | | $ | 57,202 | | | $ | 63,593 | | | $ | (301,179 | ) | | $ | 70,881 | |
| | | | | | | | | | | | | | | | |
| | | | |
CHANGES IN SHARES OUTSTANDING: | | | | | | | | | | | | | | | | |
Shares outstanding, beginning of period | | | 2,850,002 | | | | — | | | | 900,002 | | | | — | |
Shares sold | | | 2,500,000 | | | | 5,650,002 | | | | 750,000 | | | | 1,750,002 | |
Shares redeemed | | | (1,400,000 | ) | | | (2,800,000 | ) | | | (400,000 | ) | | | (850,000 | ) |
| | | | | | | | | | | | | | | | |
Shares outstanding, end of period | | | 3,950,002 | | | | 2,850,002 | | | | 1,250,002 | | | | 900,002 | |
| | | | | | | | | | | | | | | | |
| (a) | Inception date is August 24, 2016, which is consistent with the commencement of operations and is the date the initial creation units were established. |
| | | | |
| Page 16 | | See Notes to Financial Statements | | |
First Trust Exchange-Traded Fund III
Financial Highlights
For a share outstanding throughout each period
First Trust Horizon Managed Volatility Domestic ETF (HUSV)
| | | | | | | | | | |
| | | Six Months
Ended
1/31/2018
(Unaudited) | | Period
Ended
7/31/2017 (a) |
Net asset value, beginning of period | | | $ | 22.03 | | | | $ | 19.96 | |
| | | | | | | | | | |
Income from investment operations: | | | | | | | | | | |
Net investment income (loss) | | | | 0.15 | | | | | 0.24 | |
Net realized and unrealized gain (loss) | | | | 1.50 | | | | | 2.05 | |
| | | | | | | | | | |
Total from investment operations | | | | 1.65 | | | | | 2.29 | |
| | | | | | | | | | |
| | |
Distributions paid to shareholders from: | | | | | | | | | | |
Net investment income | | | | (0.16 | ) | | | | (0.22 | ) |
| | | | | | | | | | |
Net asset value, end of period | | | $ | 23.52 | | | | $ | 22.03 | |
| | | | | | | | | | |
Total return (b) | | | | 7.50 | % | | | | 11.51 | % |
| | |
Ratios to average net assets/supplemental data: | | | | | | | | | | |
Net assets, end of period (in 000’s) | | | $ | 92,892 | | | | $ | 62,799 | |
Ratio of total expenses to average net assets | | | | 0.70 | % (c) | | | | 0.70 | % (c) |
Ratio of net investment income (loss) to average net assets | | | | 1.38 | % (c) | | | | 1.50 | % (c) |
Portfolio turnover rate (d) | | | | 60 | % | | | | 149 | % |
| (a) | Inception date is August 24, 2016, which is consistent with the commencement of operations and is the date the initial creation units were established. |
| (b) | Total return is calculated assuming an initial investment made at the net asset value at the beginning of the period, reinvestment of all distributions at net asset value during the period, and redemption at net asset value on the last day of the period. The returns presented do not reflect the deduction of taxes that a shareholder would pay on Fund distributions or the redemption or sale of Fund shares. Total return is calculated for the time period presented and is not annualized for periods of less than a year. |
| (d) | Portfolio turnover is calculated for the time period presented and is not annualized for periods of less than a year and does not include securities received or delivered from processing creations or redemptions and in-kind transactions. |
| | | | |
| | See Notes to Financial Statements | | Page 17 |
First Trust Exchange-Traded Fund III
Financial Highlights (Continued)
For a share outstanding throughout each period
First Trust Horizon Managed Volatility Developed International ETF (HDMV)
| | | | | | | | | | |
| | | Six Months
Ended
1/31/2018
(Unaudited) | | Period
Ended
7/31/2017 (a) |
Net asset value, beginning of period | | | $ | 33.05 | | | | $ | 29.89 | |
| | | | | | | | | | |
Income from investment operations: | | | | | | | | | | |
Net investment income (loss) | | | | 0.24 | | | | | 0.63 | |
Net realized and unrealized gain (loss) | | | | 2.86 | | | | | 3.13 | |
| | | | | | | | | | |
Total from investment operations | | | | 3.10 | | | | | 3.76 | |
| | | | | | | | | | |
| | |
Distributions paid to shareholders from: | | | | | | | | | | |
Net investment income | | | | (0.56 | ) | | | | (0.60 | ) |
| | | | | | | | | | |
Net asset value, end of period | | | $ | 35.59 | | | | $ | 33.05 | |
| | | | | | | | | | |
Total return (b) | | | | 9.50 | % | | | | 12.68 | % |
| | |
Ratios to average net assets/supplemental data: | | | | | | | | | | |
Net assets, end of period (in 000’s) | | | $ | 44,494 | | | | $ | 29,745 | |
Ratio of total expenses to average net assets | | | | 0.80 | % (c) | | | | 0.80 | % (c) |
Ratio of net investment income (loss) to average net assets | | | | 1.22 | % (c) | | | | 2.74 | % (c) |
Portfolio turnover rate (d) | | | | 55 | % | | | | 150 | % |
| (a) | Inception date is August 24, 2016, which is consistent with the commencement of operations and is the date the initial creation units were established. |
| (b) | Total return is calculated assuming an initial investment made at the net asset value at the beginning of the period, reinvestment of all distributions at net asset value during the period, and redemption at net asset value on the last day of the period. The returns presented do not reflect the deduction of taxes that a shareholder would pay on Fund distributions or the redemption or sale of Fund shares. Total return is calculated for the time period presented and is not annualized for periods of less than a year. |
| (d) | Portfolio turnover is calculated for the time period presented and is not annualized for periods of less than a year and does not include securities received or delivered from processing creations or redemptions and in-kind transactions. |
| | | | |
| Page 18 | | See Notes to Financial Statements | | |
|
| Notes to Financial Statements |
First Trust Exchange-Traded Fund III
January 31, 2018 (Unaudited)
1. Organization
First Trust Exchange-Traded Fund III (the “Trust”) is an open-end management investment company organized as a Massachusetts business trust on January 9, 2008, and is registered with the Securities and Exchange Commission (“SEC”) under the Investment Company Act of 1940, as amended (the “1940 Act”).
The Trust consists of thirteen funds that are currently offering shares. This report covers the following funds, each a non-diversified series of the Trust:
First Trust Horizon Managed Volatility Domestic ETF – (NYSE Arca, Inc. (“NYSE Arca”) ticker “HUSV”)
First Trust Horizon Managed Volatility Developed International ETF – (NYSE Arca ticker “HDMV”)
Each fund represents a separate series of shares of beneficial interest in the Trust (each a “Fund” and collectively, the “Funds”). Unlike conventional mutual funds, each Fund issues and redeems shares on a continuous basis, at net asset value (“NAV”), only in large specified blocks consisting of 50,000 shares called a “Creation Unit.” Creation Units are issued and redeemed in-kind for securities in which a Fund invests and, in certain circumstances, for cash. Except when aggregated in Creation Units, the shares are not redeemable securities of a Fund.
Each Fund is an actively managed exhange-traded fund. The investment objective of each Fund is to provide capital appreciation.
Under normal market conditions, HUSV seeks to achieve its investment objective by investing at least 80% of its net assets (including investment borrowings) in common stocks of domestic companies listed and traded on U.S. national securities exchanges that Horizon Investments, LLC (“Horizon” or the “Sub-Advisor”) believes exhibit low future expected volatility.
Under normal market conditions, HDMV seeks to achieve its investment objective by investing at least 80% of its net assets (including investment borrowings) in common stocks and depositary receipts of developed market companies listed and traded on non-U.S. exchanges that Horizon believes exhibit low future expected volatility.
There can be no assurance that a Fund will achieve its investment objective. The Funds may not be appropriate for all investors.
2. Significant Accounting Policies
The Funds are each considered an investment company and follow accounting and reporting guidance under Financial Accounting Standards Board Accounting Standards Codification Topic 946, “Financial Services-Investment Companies.” The following is a summary of significant accounting policies consistently followed by the Funds in the preparation of the financial statements. The preparation of the financial statements in accordance with accounting principles generally accepted in the United States of America (“U.S. GAAP”) requires management to make estimates and assumptions that affect the reported amounts and disclosures in the financial statements. Actual results could differ from those estimates.
A. Portfolio Valuation
Each Fund’s NAV is determined daily as of the close of regular trading on the New York Stock Exchange (“NYSE”), normally 4:00 p.m. Eastern time, on each day the NYSE is open for trading. If the NYSE closes early on a valuation day, the NAV is determined as of that time. Foreign securities are priced using data reflecting the earlier closing of the principal markets for those securities. Each Fund’s NAV is calculated by dividing the value of all assets of each Fund (including accrued interest and dividends), less all liabilities (including accrued expenses and dividends declared but unpaid), by the total number of shares outstanding.
Each Fund’s investments are valued daily at market value or, in the absence of market value with respect to any portfolio securities, at fair value. Market value prices represent last sale or official closing prices from a national or foreign exchange (i.e., a regulated market) and are primarily obtained from third-party pricing services. Fair value prices represent any prices not considered market value prices and are either obtained from a third-party pricing service or are determined by the Pricing Committee of the Funds’ investment advisor, First Trust Advisors L.P. (“First Trust” or the “Advisor”), in accordance with valuation procedures adopted by the Trust’s Board of Trustees, and in accordance with provisions of the 1940 Act. Investments valued by the Advisor’s Pricing Committee, if any, are footnoted as such in the footnotes to the Portfolio of Investments. Each Fund’s investments are valued as follows:
Common stocks, real estate investment trusts (“REITs”) and other equity securities listed on any national or foreign exchange (excluding The Nasdaq Stock Market LLC (“Nasdaq”) and the London Stock Exchange Alternative Investment Market (“AIM”)) are valued at the last sale price on the exchange on which they are principally traded or, for Nasdaq and AIM securities, the official closing price. Securities traded on more than one securities exchange are valued at the last sale price or official closing price, as applicable, at the close of the securities exchange representing the principal market for such securities.
|
| Notes to Financial Statements (Continued) |
First Trust Exchange-Traded Fund III
January 31, 2018 (Unaudited)
Securities traded in an over-the-counter market are fair valued at the mean of their most recent bid and asked price, if available, and otherwise at their closing bid price.
Certain securities may not be able to be priced by pre-established pricing methods. Such securities may be valued by the Trust’s Board of Trustees or its delegate, the Advisor’s Pricing Committee, at fair value. These securities generally include, but are not limited to, restricted securities (securities which may not be publicly sold without registration under the Securities Act of 1933, as amended) for which a third-party pricing service is unable to provide a market price; securities whose trading has been formally suspended; a security whose market or fair value price is not available from a pre-established pricing source; a security with respect to which an event has occurred that is likely to materially affect the value of the security after the market has closed but before the calculation of a Fund’s NAV or make it difficult or impossible to obtain a reliable market quotation; and a security whose price, as provided by the third-party pricing service, does not reflect the security’s fair value. As a general principle, the current fair value of a security would appear to be the amount which the owner might reasonably expect to receive for the security upon its current sale. When fair value prices are used, generally they will differ from market quotations or official closing prices on the applicable exchanges. A variety of factors may be considered in determining the fair value of such securities, including, but not limited to, the following:
1) the type of security;
2) the size of the holding;
3) the initial cost of the security;
4) transactions in comparable securities;
5) price quotes from dealers and/or third-party pricing services;
6) relationships among various securities;
7) information obtained by contacting the issuer, analysts, or the appropriate stock exchange;
8) an analysis of the issuer’s financial statements; and
9) the existence of merger proposals or tender offers that might affect the value of the security.
If the securities in question are foreign securities, the following additional information may be considered:
1) the value of similar foreign securities traded on other foreign markets;
2) ADR trading of similar securities;
3) closed-end fund trading of similar securities;
4) foreign currency exchange activity;
5) the trading prices of financial products that are tied to baskets of foreign securities;
6) factors relating to the event that precipitated the pricing problem;
7) whether the event is likely to recur; and
8) whether the effects of the event are isolated or whether they affect entire markets, countries or regions.
Because foreign markets may be open on different days than the days during which investors may transact in the shares of a Fund, the value of the Fund’s securities may change on the days when investors are not able to transact in the shares of the Fund. The value of securities denominated in foreign currencies is converted into U.S. dollars using exchange rates determined daily as of the close of regular trading on the NYSE.
The Funds are subject to fair value accounting standards that define fair value, establish the framework for measuring fair value and provide a three-level hierarchy for fair valuation based upon the inputs to the valuation as of the measurement date. The three levels of the fair value hierarchy are as follows:
| | • | | Level 1 – Level 1 inputs are quoted prices in active markets for identical investments. An active market is a market in which transactions for the investment occur with sufficient frequency and volume to provide pricing information on an ongoing basis. |
| | • | | Level 2 – Level 2 inputs are observable inputs, either directly or indirectly, and include the following: |
| | o | Quoted prices for similar investments in active markets. |
| | o | Quoted prices for identical or similar investments in markets that are non-active. A non-active market is a market where there are few transactions for the investment, the prices are not current, or price quotations vary substantially either over time or among market makers, or in which little information is released publicly. o Inputs other than quoted prices that are observable for the investment (for example, interest rates and yield curves observable at commonly quoted intervals, volatilities, prepayment speeds, loss severities, credit risks, and default rates). |
| | o | Inputs that are derived principally from or corroborated by observable market data by correlation or other means. |
|
| Notes to Financial Statements (Continued) |
First Trust Exchange-Traded Fund III
January 31, 2018 (Unaudited)
| | • | | Level 3 – Level 3 inputs are unobservable inputs. Unobservable inputs may reflect the reporting entity’s own assumptions about the assumptions that market participants would use in pricing the investment. |
The inputs or methodologies used for valuing investments are not necessarily an indication of the risk associated with investing in those investments. A summary of the inputs used to value each Fund’s investments as of January 31, 2018, is included with each Fund’s Portfolio of Investments.
B. Securities Transactions and Investment Income
Securities transactions are recorded as of the trade date. Realized gains and losses from securities transactions are recorded on the identified cost basis. Dividend income is recorded on the ex-dividend date. Interest income is recorded daily on the accrual basis.
Withholding taxes and tax reclaims on foreign dividends have been provided for with HDMV’s understanding of the applicable country’s tax rules and rates.
Distributions received from each Fund’s investments in REITs may be comprised of return of capital, capital gains, and income. The actual character of the amounts received during the year are not known until after the REIT’s fiscal year end. Each Fund records the character of distributions received from the REITs during the year based on estimates available. The characterization of distributions received by a Fund may be subsequently revised based on information received from the REITs after their tax reporting periods conclude.
C. Foreign Currency
The books and records of the Funds are maintained in U.S. dollars. Foreign currencies, investments and other assets and liabilities are translated into U.S. dollars at the exchange rates prevailing at the end of the period. Purchases and sales of investments and items of income and expense are translated on the respective dates of such transactions. Unrealized gains and losses on assets and liabilities, other than investments in securities, which result from changes in foreign currency exchange rates have been included in “Net change in unrealized appreciation (depreciation) on foreign currency translation” on the Statements of Operations. Unrealized gains and losses on investments in securities which result from changes in foreign exchange rates are included with fluctuations arising from changes in market price and are shown in “Net change in unrealized appreciation (depreciation) on investments” on the Statements of Operations. Net realized foreign currency gains and losses include the effect of changes in exchange rates between trade date and settlement date on investment security transactions, foreign currency transactions and interest and dividends received and are shown in “Net realized gain (loss) on foreign currency transactions” on the Statements of Operations. The portion of foreign currency gains and losses related to fluctuations in exchange rates between the initial purchase settlement date and subsequent sale trade date is included in “Net realized gain (loss) on investments” on the Statements of Operations.
D. Dividends and Distributions to Shareholders
Dividends from net investment income, if any, are declared and paid quarterly by each Fund, or as the Board of Trustees may determine from time to time. Distributions of net realized capital gains earned by each Fund, if any, are distributed at least annually.
Distributions from income and capital gains are determined in accordance with income tax regulations, which may differ from U.S. GAAP. Certain capital accounts in the financial statements are periodically adjusted for permanent differences in order to reflect their tax character. These permanent differences are primarily due to the varying treatment of income and gain/loss on portfolio securities held by the Funds and have no impact on net assets or NAV per share. Temporary differences, which arise from recognizing certain items of income, expense and gain/loss in different periods for financial statement and tax purposes, will reverse at some time in the future.
The tax character of distributions paid by each Fund during the fiscal period ended July 31, 2017 was as follows:
| | | | | | | | | | | | | | | |
| | | Distributions
paid from
Ordinary
Income | | Distributions
paid from
Capital
Gains | | Distributions
paid from
Return of
Capital |
First Trust Horizon Managed Volatility Domestic ETF | | | $ | 606,955 | | | | $ | — | | | | $ | — | |
First Trust Horizon Managed Volatility Developed International ETF | | | | 540,901 | | | | | — | | | | | — | |
|
| Notes to Financial Statements (Continued) |
First Trust Exchange-Traded Fund III
January 31, 2018 (Unaudited)
As of July 31, 2017, the distributable earnings and net assets on a tax basis were as follows:
| | | | | | | | | | | | |
| | | Undistributed
Ordinary
Income | | | Accumulated
Capital and
Other
Gain (Loss) | | | Net
Unrealized
Appreciation
(Depreciation) | |
First Trust Horizon Managed Volatility Domestic ETF | | $ | 63,593 | | | $ | (1,126,342 | ) | | $ | 3,233,198 | |
First Trust Horizon Managed Volatility Developed International ETF | | | 322,585 | | | | (538,534 | ) | | | 1,657,864 | |
E. Income Taxes
Each Fund intends to qualify as a regulated investment company by complying with the requirements under Subchapter M of the Internal Revenue Code of 1986, as amended, which includes distributing substantially all of its net investment income and net realized gains to shareholders. Accordingly, no provision has been made for federal and state income taxes. However, due to the timing and amount of distributions, each Fund may be subject to an excise tax of 4% of the amount by which approximately 98% of each Fund’s taxable income exceeds the distributions from such taxable income for the calendar year.
The Funds are subject to accounting standards that establish a minimum threshold for recognizing, and a system for measuring, the benefits of a tax position taken or expected to be taken in a tax return. Taxable year ending 2017 remains open to federal and state audit. As of January 31, 2018, management has evaluated the application of these standards to the Funds and has determined that no provision for income tax is required in the Funds’ financial statements for uncertain tax positions.
The Funds intend to utilize provisions of the federal income tax laws, which allow them to carry a realized capital loss forward indefinitely following the year of the loss and offset such loss against any future realized capital gains. The Funds are subject to certain limitations under U.S. tax rules on the use of capital loss carryforwards and net unrealized built-in losses. These limitations apply when there has been a 50% change in ownership. At July 31, 2017, the Funds had non-expiring capital loss carryforward for federal income tax purposes as follows:
| | | | |
| | | Capital
Loss Available | |
First Trust Horizon Managed Volatility Domestic ETF | | $ | 1,126,342 | |
First Trust Horizon Managed Volatility Developed International ETF | | | 538,534 | |
F. Expenses
Expenses, other than the investment advisory fee and other excluded expenses, are paid by the Advisor (See Note 3).
G. New and Amended Financial Reporting Rules and Forms
On October 13, 2016, the SEC adopted new rules and forms, and amended existing rules and forms. The new and amended rules and forms are intended to modernize the reporting of information provided by funds and to improve the quality and type of information that funds provide to the SEC and investors. In part, the new and amended rules and forms amend Regulation S-X and require standardized, enhanced disclosures about derivatives in a fund’s financial statements, as well as other amendments. The compliance date for the amendments of Regulation S-X was August 1, 2017, which resulted in no change to the financial statements. The new form types and other rule amendments will be effective for the First Trust funds, including the Funds, for reporting periods beginning on and after June 1, 2018. Management is evaluating the new form types and other rule amendments that are effective on and after June 1, 2018 to determine the impact to the Funds.
3. Investment Advisory Fee, Affiliated Transactions and Other Fee Arrangements
First Trust, the investment advisor to the Funds, is a limited partnership with one limited partner, Grace Partners of DuPage L.P., and one general partner, The Charger Corporation. The Charger Corporation is an Illinois corporation controlled by James A. Bowen, Chief Executive Officer of First Trust. First Trust is responsible for supervising the selection and ongoing monitoring of the securities in each Fund’s portfolio, managing the Funds’ business affairs and providing certain administrative services necessary for the management of the Funds.
HUSV and HDMV have agreed to pay First Trust an annual unitary management fee of 0.70% and 0.80% of HUSV and HDMV’s average daily net assets, respectively. Pursuant to the Investment Management Agreement between First Trust and the Trust, First Trust manages the investment of the Funds’ assets and is responsible for the expenses of each Fund, including the cost of transfer agency, sub-advisory, custody, fund administration, legal, audit and other services, but excluding fee payments under the Investment Management Agreement, interest, taxes, brokerage commissions and other expenses connected with the execution of portfolio
|
| Notes to Financial Statements (Continued) |
First Trust Exchange-Traded Fund III
January 31, 2018 (Unaudited)
transactions, distribution and service fees payable pursuant to Rule 12b-1 plan, if any, and extraordinary expenses, which are paid by each respective Fund. First Trust also provides fund reporting services to each Fund for a flat annual fee in the amount of $9,250, which is covered under the annual unitary management fee.
Horizon serves as the Funds’ sub-advisor and manages each Fund’s portfolio subject to First Trust’s supervision. The Sub-Advisor receives a sub-advisory fee from First Trust equal to 50% of any remaining monthly unitary management fee paid to the Advisor after the average Fund’s expenses accrued during the most recent twelve months are subtracted from the unitary management fee for that month.
The Trust has multiple service agreements with Brown Brothers Harriman & Co. (“BBH”). Under the service agreements, BBH performs custodial, fund accounting, certain administrative services, and transfer agency services for the Funds. As custodian, BBH is responsible for custody of each Fund’s assets. As fund accountant and administrator, BBH is responsible for maintaining the books and records of each Fund’s securities and cash. As transfer agent, BBH is responsible for maintaining shareholder records for each Fund.
Each Trustee who is not an officer or employee of First Trust, any sub-advisor or any of their affiliates (“Independent Trustees”) is paid a fixed annual retainer that is allocated equally among each fund in the First Trust Fund Complex. Each Independent Trustee is also paid an annual per fund fee that varies based on whether the fund is a closed-end or other actively managed fund, or is an index fund.
Additionally, the Lead Independent Trustee and the Chairmen of the Audit Committee, Nominating and Governance Committee, and Valuation Committee are paid annual fees to serve in such capacities, with such compensation allocated pro rata among each fund in the First Trust Fund Complex based on net assets. Independent Trustees are reimbursed for travel and out-of-pocket expenses in connection with all meetings. The Lead Independent Trustee and Committee Chairmen rotate every three years. The officers and “Interested” Trustee receive no compensation from the Trust for acting in such capacities.
4. Purchases and Sales of Securities
For the six months ended January 31, 2018, the cost of purchases and proceeds from sales of investment securities for each Fund, excluding short-term investments and in-kind transactions, were as follows:
| | | | | | | | |
| | | Purchases | | | Sales | |
First Trust Horizon Managed Volatility Domestic ETF | | $ | 49,034,136 | | | $ | 48,850,227 | |
First Trust Horizon Managed Volatility Developed International ETF | | | 23,114,158 | | | | 20,617,819 | |
For the six months ended January 31, 2018, the cost of in-kind purchases and proceeds from in-kind sales for each Fund were as follows:
| | | | | | | | |
| | | Purchases | | | Sales | |
First Trust Horizon Managed Volatility Domestic ETF | | $ | 56,480,048 | | | $ | 32,036,891 | |
First Trust Horizon Managed Volatility Developed International ETF | | | 22,307,872 | | | | 13,451,510 | |
5. Creations, Redemptions and Transaction Fees
Shares are created and redeemed by the Funds only in Creation Unit size aggregations of 50,000 shares in transactions with broker-dealers or large institutional investors that have entered into a participation agreement (an “Authorized Participant”). In order to purchase Creation Units of each Fund, an Authorized Participant must deposit (i) a designated portfolio of equity securities determined by First Trust (the “Deposit Securities”) and generally make or receive a cash payment referred to as the “Cash Component,” which is an amount equal to the difference between the NAV of the Fund shares (per Creation Unit Aggregations) and the market value of the Deposit Securities, and/or (ii) cash in lieu of all or a portion of the Deposit Securities. If the Cash Component is a positive number (i.e., the NAV per Creation Unit Aggregation exceeds the Deposit Amount), the Authorized Participant will deliver the Cash Component. If the Cash Component is a negative number (i.e., the NAV per Creation Unit Aggregation is less than the Deposit Amount), the Authorized Participant will receive the Cash Component. Authorized Participants purchasing Creation Units must pay to BBH, as transfer agent, a creation transaction fee (the “Creation Transaction Fee”) regardless of the number of Creation Units purchased in the transaction. The Creation Transaction Fee may vary and is based on the composition of the securities included in the respective Fund’s portfolio and the countries in which the transactions are settled. The price for each Creation Unit will equal the daily NAV per share times the number of shares in a Creation Unit plus the fees described above and, if applicable, any operational processing and brokerage costs, transfer fees or stamp taxes. When a Fund permits an Authorized Participant to substitute cash or a
|
| Notes to Financial Statements (Continued) |
First Trust Exchange-Traded Fund III
January 31, 2018 (Unaudited)
different security in lieu of depositing one or more of the requisite Deposit Securities, the Authorized Participant may also be assessed an amount to cover the cost of purchasing the Deposit Securities and/or disposing of the substituted securities, including operational processing and brokerage costs, transfer fees, stamp taxes, and part or all of the spread between the expected bid and offer side of the market related to such Deposit Securities and/or substitute securities.
Authorized Participants redeeming Creation Units must pay to BBH, as transfer agent, a redemption transaction fee (the “Redemption Transaction Fee”), regardless of the number of Creation Units redeemed in the transaction. The Redemption Transaction Fee may vary and is based on the composition of the securities included in the respective Fund’s portfolio and the countries in which the transactions are settled. Each Fund reserves the right to effect redemptions in cash. An Authorized Participant may request cash redemption in lieu of securities; however, a Fund may, in its discretion, reject any such request.
The standard Creation Transaction Fees and the Redemption Transaction Fees for each Fund are as follows:
| | | | | | | | | | |
| | | Creation
Transaction Fees | | Redemption
Transaction Fees |
First Trust Horizon Managed Volatility Domestic ETF | | | | $ 500 | | | | | $ 500 | |
First Trust Horizon Managed Volatility Developed International ETF | | | | 4,200 | | | | | 4,200 | |
6. Distribution Plan
The Board of Trustees adopted a Distribution and Service Plan pursuant to Rule 12b-1 under the 1940 Act. In accordance with the Rule 12b-1 plan, each Fund is authorized to pay an amount up to 0.25% of its average daily net assets each year to reimburse First Trust Portfolios L.P. (“FTP”), the distributor of the Funds, for amounts expended to finance activities primarily intended to result in the sale of Creation Units or to provide investor services. FTP may also use this amount to compensate securities dealers or other persons that are Authorized Participants for providing distribution assistance, including broker-dealer and shareholder support and educational and promotional services.
No 12b-1 fees are currently paid by the Funds, and pursuant to a contractual arrangement, no 12b-1 fees will be paid any time before December 1, 2018.
7. Indemnification
The Trust, on behalf of the Funds, has a variety of indemnification obligations under contracts with its service providers. The Trust’s maximum exposure under these arrangements is unknown. However, the Trust has not had prior claims or losses pursuant to these contracts and expects the risk of loss to be remote.
8. Subsequent Events
Management has evaluated the impact of all subsequent events to the Funds through the date the financial statements were issued, and has determined that there were no subsequent events requiring recognition or disclosure in the financial statements that have not already been disclosed.
First Trust Exchange-Traded Fund III
January 31, 2018 (Unaudited)
Proxy Voting Policies and Procedures
A description of the policies and procedures that the Trust uses to determine how to vote proxies and information on how each Fund voted proxies relating to portfolio securities during the most recent 12-month period ended June 30 is available (1) without charge, upon request, by calling (800) 988-5891; (2) on the Fund’s website located at www.ftportfolios.com; and (3) on the Securities and Exchange Commission’s (“SEC”) website at www.sec.gov.
Portfolio Holdings
The Trust files its complete schedule of portfolio holdings with the SEC for the first and third quarters of each fiscal year on Form N-Q. The Trust’s Form N-Qs are available (1) by calling (800) 988-5891; (2) on the Fund’s website located at www.ftportfolios.com; (3) on the SEC’s website at www.sec.gov; and (4) for review and copying at the SEC’s Public Reference Room (“PRR”) in Washington, DC. Information regarding the operation of the PRR may be obtained by calling (800) SEC-0330.
Risk Considerations
Risks are inherent in all investing. You should consider each Fund’s investment objective, risks, charges and expenses carefully before investing. You can download each Fund’s prospectus at www.ftportfolios.com or contact First Trust Portfolios L.P. at (800) 621-1675 to request a prospectus, which contains this and other information about each Fund. For additional information about the risks associated with investing in each Fund, please see the Funds’ statement of additional information, as well as other regulatory filings. Read these documents carefully before you invest. First Trust Portfolios L.P. is the distributor of the First Trust Exchange-Traded Fund III.
The following summarizes some of the risks that should be considered for the Funds.
AUTHORIZED PARTICIPANT CONCENTRATION RISK. Only an authorized participant (as defined in the “Creations, Redemptions and Transaction Fees” section) may engage in creation or redemption transactions directly with each Fund. Each Fund has a limited number of institutions that act as authorized participants. To the extent that these institutions exit the business or are unable to proceed with creation and/or redemption orders with respect to each Fund and no other authorized participant is able to step forward to create or redeem, in either of these cases, Fund shares may trade at a discount to each Fund’s net asset value and possibly face delisting.
CURRENCY EXCHANGE RATE RISK. Changes in currency exchange rates and the relative value of non-U.S. currencies will affect the value of HDMV’s investment and the value of Fund shares. Currency exchange rates can be very volatile and can change quickly and unpredictably. As a result, the value of an investment in the Fund may change quickly and without warning and you may lose money.
CYBER SECURITY RISK. As the use of Internet technology has become more prevalent in the course of business, each Fund has become more susceptible to potential operational risks through breaches in cyber security. A breach in cyber security refers to both intentional and unintentional events that may cause each Fund to lose proprietary information, suffer data corruption or lose operational capacity. Such events could cause each Fund to incur regulatory penalties, reputational damage, additional compliance costs associated with corrective measures and/or financial loss. Cyber security breaches may involve unauthorized access to each Fund’s digital information systems through “hacking” or malicious software coding, but may also result from outside attacks such as denial-of-service attacks through efforts to make network services unavailable to intended users. In addition, cyber security breaches of each Fund’s third party service providers, such as its administrator, transfer agent, custodian, or sub-advisor, as applicable, or issuers in which each Fund invests, can also subject the Fund to many of the same risks associated with direct cyber security breaches. The Funds have established risk management systems designed to reduce the risks associated with cyber security. However, there is no guarantee that such efforts will succeed, especially because each Fund does not directly control the cyber security systems of issuers or third party service providers.
DEPOSITARY RECEIPTS RISK. Depositary receipts may be less liquid than the underlying shares in their primary trading market. Any distributions paid to the holders of depositary receipts are usually subject to a fee charged by the depositary. Holders of depositary receipts may have limited voting rights, and investment restrictions in certain countries may adversely impact the value of depositary receipts because such restrictions may limit the ability to convert the equity shares into depositary receipts and vice versa. Such restrictions may cause the equity shares of the underlying issuer to trade at a discount or premium to the market price of the depositary receipts.
EQUITY SECURITIES RISK: Because each Fund invests in equity securities, the value of each Fund’s shares will fluctuate with changes in the value of these equity securities. Equity securities prices fluctuate for several reasons, including changes in investors’ perceptions of the financial condition of an issuer or the general condition of the relevant stock market, such as market volatility, or
|
| Additional Information (Continued) |
First Trust Exchange-Traded Fund III
January 31, 2018 (Unaudited)
when political or economic events affecting the issuers occur. In addition, common stock prices may be particularly sensitive to rising interest rates, as the cost of capital rises and borrowing costs increase.
EUROPE INVESTMENT RISK. Investments in a single region, even though representing a number of different countries within the region, may be affected by common economic forces and other factors. HDMV is subject to greater risks of adverse events which occur in the European region and may experience greater volatility than a fund that is more broadly diversified geographically. Political or economic disruptions in European countries, even in countries in which the Fund is not invested, may adversely affect security values and thus the Fund’s holdings. Continuing uncertainty as to the status of the Euro and the European Monetary Union and the potential for certain countries to withdraw from the institution has created significant volatility in currency and financial markets generally. Any partial or complete dissolution of the European Union could have significant adverse effects on currency and financial markets, and on the values of a Fund’s portfolio investments.
FINANCIAL COMPANIES RISK. Financial companies are especially subject to the adverse effects of economic recession, currency exchange rates, government regulation, decreases in the availability of capital, volatile interest rates, portfolio concentrations in geographic markets and in commercial and residential real estate loans, and competition from new entrants in their fields of business.
FLUCTUATION OF NET ASSET VALUE RISK. The net asset value of shares of each Fund will generally fluctuate with changes in the market value of each Fund’s holdings. The market prices of shares will generally fluctuate in accordance with changes in net asset value as well as the relative supply of and demand for shares on NYSE Arca. The Funds’ investment advisor cannot predict whether shares will trade below, at or above their net asset value because the shares trade on NYSE Arca at market prices and not at net asset value. Price differences may be due, in large part, to the fact that supply and demand forces at work in the secondary trading market for shares will be closely related to, but not identical to, the same forces influencing the prices of the holdings of each Fund trading individually or in the aggregate at any point in time. However, given that shares can only be purchased and redeemed in-kind or, in certain circumstances, for cash, in Creation Units, and only to and from broker-dealers and large institutional investors that have entered into participation agreements (unlike shares of closed-end funds, which frequently trade at appreciable discounts from, and sometimes at premiums to, their net asset value), the Funds’ investment advisor believes that large discounts or premiums to the net asset value of shares should not be sustained.
INDUSTRIALS COMPANIES RISK. Industrials companies convert unfinished goods into finished durables used to manufacture other goods or provide services. Some industrials companies are involved in electrical equipment and components, industrial products, manufactured housing and telecommunications equipment. General risks of industrials companies include the general state of the economy, intense competition, consolidation, domestic and international politics, excess capacity and consumer demand and spending trends. In addition, they may also be significantly affected by overall capital spending levels, economic cycles, technical obsolescence, delays in modernization, labor relations, government regulations and e-commerce initiatives.
MANAGEMENT RISK. Each Fund is subject to management risk because it is an actively managed portfolio. In managing each Fund’s investment portfolio, the Sub-Advisor will apply investment techniques and risk analyses that may not have the desired result. There can be no guarantee that each Fund will meet its investment objective.
MARKET MAKER RISK. If either Fund has lower average daily trading volumes, it may rely on a small number of third-party market makers to provide a market for the purchase and sale of shares. Any trading halt or other problem relating to the trading activity of these market makers could result in a dramatic change in the spread between each Fund’s net asset value and the price at which each Fund’s shares are trading on its exchange, which could result in a decrease in value of each Fund’s shares. In addition, decisions by market makers or authorized participants to reduce their role or step away from these activities in times of market stress could inhibit the effectiveness of the arbitrage process in maintaining the relationship between the underlying values of each Fund’s portfolio securities and the respective Fund’s market price. This reduced effectiveness could result in Fund shares trading at a discount to net asset value and also in greater than normal intraday bid-ask spreads for Fund shares.
MARKET RISK. Market risk is the risk that a particular security owned by the Funds or shares of each Fund in general may fall in value. Securities are subject to market fluctuations caused by such factors as economic, political, regulatory or market developments, changes in interest rates and perceived trends in securities prices. Shares of the Funds could decline in value or underperform other investments.
NON-DIVERSIFICATION RISK. Each Fund is classified as “non-diversified” under the 1940 Act. As a result, each Fund is only limited as to the percentage of its assets which may be invested in the securities of any one issuer by the diversification requirements imposed by the Internal Revenue Code of 1986, as amended. Each Fund may invest a relatively high percentage of its assets in a limited number of issuers. As a result, each Fund may be more susceptible to a single adverse economic or regulatory occurrence affecting one or more of these issuers, experience increased volatility and be highly invested in certain issuers.
|
| Additional Information (Continued) |
First Trust Exchange-Traded Fund III
January 31, 2018 (Unaudited)
NON-U.S. SECURITIES RISK. Non-U.S. securities are subject to higher volatility than securities of domestic issuers due to possible adverse political, social or economic developments, restrictions on foreign investment or exchange of securities, lack of liquidity, currency exchange rates, excessive taxation, government seizure of assets, different legal or accounting standards, and less government supervision and regulation of exchanges in foreign countries.
PORTFOLIO TURNOVER RISK. High portfolio turnover may result in each Fund paying higher levels of transaction costs and generating greater tax liabilities for shareholders. As a result, high portfolio turnover may lower a Fund’s performance returns.
SMALL FUND RISK. Each Fund currently has fewer assets than larger funds, and like other relatively smaller funds, large inflows and outflows may impact each Fund’s market exposure for limited periods of time. This impact may be positive or negative, depending on the direction of market movement during the period affected.
SMALLER COMPANIES RISK. Mid capitalization companies may be more vulnerable to adverse general market or economic developments, and their securities may be less liquid and may experience greater price volatility than larger, more established companies as a result of several factors, including limited trading volumes, products or financial resources, management inexperience and less publicly available information. Accordingly, such companies are generally subject to greater market risk than larger, more established companies.
TRADING ISSUES RISK. Although the shares of each Fund are listed for trading on NYSE Arca, there can be no assurance that an active trading market for such shares will develop or be maintained. Trading in shares on NYSE Arca may be halted due to market conditions or for reasons that, in the view of NYSE Arca, make trading in shares inadvisable. In addition, trading in shares on NYSE Arca is subject to trading halts caused by extraordinary market volatility pursuant to NYSE Arca “circuit breaker” rules. Market makers are under no obligation to make a market in each Fund’s shares, and authorized participants are not obligated to submit purchase or redemption orders for Creation Units. There can be no assurance that the requirements of NYSE Arca necessary to maintain the listing of each Fund will continue to be met or will remain unchanged. In particular, if each Fund does not comply with any provision of the NYSE Arca rule change pursuant to Rule 19b-4 under the Securities Exchange Act of 1934, as amended (the “1934 Act”), approved by the SEC, and cannot bring itself into compliance within a reasonable period after discovering the matter, NYSE Arca may remove the shares of the Fund from listing. The Fund may have difficulty maintaining its listing on NYSE Arca in the event the Fund’s assets are small or the Fund does not have enough shareholders.
|
|
| This page intentionally left blank |
First Trust Exchange-Traded Fund III
INVESTMENT ADVISOR
First Trust Advisors L.P.
120 E. Liberty Drive, Suite 400
Wheaton, IL 60187
INVESTMENT SUB-ADVISOR
Horizon Investments, LLC
13024 Ballantyne Corporate Place Suite 225
Charlotte, NC 28277
ADMINISTRATOR, CUSTODIAN,
FUND ACCOUNTANT &
TRANSFER AGENT
Brown Brothers Harriman & Co.
50 Post Office Square
Boston, MA 02110
INDEPENDENT REGISTERED
PUBLIC ACCOUNTING FIRM
Deloitte & Touche LLP
111 S. Wacker Drive
Chicago, IL 60606
LEGAL COUNSEL
Chapman and Cutler LLP
111 W. Monroe Street
Chicago, IL 60603

| | | | | | |
| First Trust Exchange-Traded Fund III | |
|
| | | | |
| | | First Trust California Municipal High Income ETF (FCAL) | | |
| | | | |
Semi-Annual Report For the Six Months Ended January 31, 2018 | | |
First Trust California Municipal High Income ETF (FCAL)
Semi-Annual Report
January 31, 2018
Caution Regarding Forward-Looking Statements
This report contains certain forward-looking statements within the meaning of the Securities Act of 1933, as amended, and the Securities Exchange Act of 1934, as amended. Forward-looking statements include statements regarding the goals, beliefs, plans or current expectations of First Trust Advisors L.P. (“First Trust” or the “Advisor”) and its representatives, taking into account the information currently available to them. Forward-looking statements include all statements that do not relate solely to current or historical fact. For example, forward-looking statements include the use of words such as “anticipate,” “estimate,” “intend,” “expect,” “believe,” “plan,” “may,” “should,” “would” or other words that convey uncertainty of future events or outcomes.
Forward-looking statements involve known and unknown risks, uncertainties and other factors that may cause the actual results, performance or achievements of the series of First Trust Exchange-Traded Fund III (the “Trust”) described in this report (First Trust California Municipal High Income ETF; hereinafter referred to as the “Fund”) to be materially different from any future results, performance or achievements expressed or implied by the forward-looking statements. When evaluating the information included in this report, you are cautioned not to place undue reliance on these forward-looking statements, which reflect the judgment of the Advisor and its representatives only as of the date hereof. We undertake no obligation to publicly revise or update these forward-looking statements to reflect events and circumstances that arise after the date hereof.
Performance and Risk Disclosure
There is no assurance that the Fund will achieve its investment objectives. The Fund is subject to market risk, which is the possibility that the market values of securities owned by the Fund will decline and that the value of the Fund shares may therefore be less than what you paid for them. Accordingly, you can lose money by investing in the Fund. See “Risk Considerations” in the Additional Information section of this report for a discussion of certain other risks of investing in the Fund.
Performance data quoted represents past performance, which is no guarantee of future results, and current performance may be lower or higher than the figures shown. For the most recent month-end performance figures, please visit www.ftportfolios.com or speak with your financial advisor. Investment returns, net asset value and share price will fluctuate and Fund shares, when sold, may be worth more or less than their original cost.
The Advisor may also periodically provide additional information on Fund performance on the Fund’s web page at www.ftportfolios.com.
How to Read This Report
This report contains information that may help you evaluate your investment in the Fund. It includes details about the Fund’s portfolio and presents data and analysis that provide insight into the Fund’s performance and investment approach.
The statistical information that follows may help you understand the Fund’s performance compared to that of a relevant market benchmark.
It is important to keep in mind that the opinions expressed by personnel of the Advisor are just that: informed opinions. They should not be considered to be promises or advice. The opinions, like the statistics, cover the period through the date on the cover of this report. The material risks of investing in the Fund are spelled out in the prospectus, the statement of additional information, this report and other Fund regulatory filings.
First Trust California Municipal High Income ETF (FCAL)
Semi-Annual Letter from the Chairman and CEO
January 31, 2018
Dear Shareholders,
First Trust is pleased to provide you with the semi-annual report for the First Trust California Municipal High Income ETF. This report contains detailed information about your investment for the six months ended January 31, 2018, including a market overview and a performance analysis for the period. We encourage you to read this report carefully and discuss it with your financial advisor.
As you are no doubt aware, 2017 was a very strong year for U.S. markets. The three major indices – the S&P 500® Index, the Dow Jones Industrial Average and the Nasdaq Composite – posted their best performance since 2013. While these are equity-based indexes, they are the typical measures of the market for investors and managers.
FCAL, however, invests in municipal debt securities that pay interest that is exempt from regular federal income taxes and California income taxes. We are pleased to report that FCAL was a top decile performer in the Morningstar Muni California Intermediate category since its inception on June 20, 2017 through December 31, 2017 (in the top 4% out of 28 funds).
As 2017 ended, President Trump signed the “Tax Cuts and Jobs Act” tax reform bill. This action by the President was viewed as making good on his earlier campaign promise to accomplish sweeping tax reform and the hope is that this bill will boost economic activity to greater highs. As 2018 began, there was much enthusiasm for the tax reform package and the potential increase in take-home pay for many Americans, as well as the reduction in the federal corporate tax rate from 35% to 21%.
We believe municipal bonds remain an important part of a diversified portfolio for high net worth and high wage earners, especially in high state income tax states such as California. Municipal credit quality remains stable, and, in our view, the likelihood of much lower new issue supply in 2018 should help municipal securities relative to other fixed-income asset classes regardless of what happens to interest rates.
At First Trust, we are optimistic about the U.S. economy. We also continue to believe that you should invest for the long term and be prepared for market volatility, which can happen at any time. This can be accomplished by keeping current on your portfolio and investing goals by speaking regularly with your investment professional. It’s important to keep in mind that past performance of the U.S. and global stock markets or investment products can never guarantee future results. As we’ve said before, markets go up and they also go down, but savvy investors are prepared for either through careful attention to their portfolios and investment goals.
Thank you for giving First Trust the opportunity to be a part of your financial plan through your investment. We value our relationship with you and will report on your investment again in six months.
Sincerely,

James A. Bowen
Chairman of the Board of Trustees
Chief Executive Officer of First Trust Advisors L.P.
|
| Fund Performance Overview (Unaudited) |
First Trust California Municipal High Income ETF (FCAL)
The primary investment objective of First Trust California Municipal High Income ETF (the “Fund”) is to seek to provide current income that is exempt from regular federal income taxes and California income taxes, and its secondary objective is long-term capital appreciation. Under normal market conditions, the Fund seeks to achieve its investment objectives by investing at least 80% of its net assets (including investment borrowings) in municipal debt securities that pay interest that is exempt from regular federal income taxes and California income taxes (“Municipal Securities”). The types of Municipal Securities in which the Fund may invest include municipal lease obligations (and certificates of participation in such obligations), municipal general obligation bonds, municipal revenue bonds, municipal notes, municipal cash equivalents, private activity bonds (including without limitation industrial development bonds), and pre-refunded and escrowed to maturity bonds. The Fund lists and principally trades its shares on The Nasdaq Stock Market, LLC under the ticker symbol “FCAL.”
| | | | | | | | | | | | | | |
| | | | | | | | | Cumulative Total Returns |
| | | | | | | 6 Months Ended
1/31/2018 | | Inception (6/20/2017) to 1/31/2018 |
Fund Performance | | | | | | | | | | | | | | |
NAV | | | | | | | | | | | | 1.52% | | 2.03% |
Market Value | | | | | | | | | | | | 1.52% | | 2.11% |
Index Performance | | | | | | | | | | | | | | |
Bloomberg Barclays 10 Year California Exempt Index | | | | | | | | | | | | -0.92% | | -0.65% |
Total returns for the period since inception are calculated from the inception date of the Fund. “Cumulative Total Returns” represents the total change in value of an investment over the periods indicated.
The Fund’s per share net asset value (“NAV”) is the value of one share of the Fund and is computed by dividing the value of all assets of the Fund (including accrued interest and dividends), less all liabilities (including accrued expenses and dividends declared but unpaid), by the total number of outstanding shares. The price used to calculate market return (“Market Price”) is determined by using the midpoint between the highest bid and the lowest offer on the stock exchange on which shares of the Fund are listed for trading as of the time that the Fund’s NAV is calculated. Since shares of the Fund did not trade in the secondary market until after its inception, for the period from inception to the first day of secondary market trading in shares of the Fund, the NAV of the Fund is used as a proxy for the secondary market trading price to calculate market returns. NAV and market returns assume that all distributions have been reinvested in the Fund at NAV and Market Price, respectively.
An index is a statistical composite that tracks a specified financial market or sector. Unlike the Fund, the benchmark index does not actually hold a portfolio of securities and therefore does not incur the expenses incurred by the Fund. These expenses negatively impact the performance of the Fund. Also, market returns do not include brokerage commissions that may be payable on secondary market transactions. If brokerage commissions were included, market returns would be lower. The total returns presented reflect the reinvestment of dividends on securities in the index. The returns presented do not reflect the deduction of taxes that a shareholder would pay on Fund distributions or the redemption or sale of Fund shares. The investment return and principal value of shares of the Fund will vary with changes in market conditions. Shares of the Fund may be worth more or less than their original cost when they are redeemed or sold in the market. The Fund’s past performance is no guarantee of future performance.
|
| Fund Performance Overview (Unaudited) (Continued) |
First Trust California Municipal High Income ETF (FCAL) (Continued)
| | | | | |
| |
| Sector Allocation | | % of Total
Investments
(including cash) |
Education | | | | 17.1 | % |
Special Assessment | | | | 14.9 | |
Hospital | | | | 14.5 | |
Higher Education | | | | 10.3 | |
Tobacco | | | | 5.7 | |
Government Obligation Bonds - Unlimited Tax | | | | 5.6 | |
Insured | | | | 5.0 | |
Tax Increment | | | | 3.5 | |
Continuing Care Retirement Communities | | | | 3.0 | |
Student Housing | | | | 2.9 | |
Skilled Nursing | | | | 2.3 | |
Water & Sewer | | | | 2.3 | |
Certificates of Participation | | | | 2.2 | |
Dedicated Tax | | | | 2.2 | |
Toll Road | | | | 1.8 | |
Gas | | | | 1.5 | |
Port | | | | 1.2 | |
Prerefunded ETM | | | | 1.0 | |
Airport | | | | 0.1 | |
Other Health | | | | 0.1 | |
Cash | | | | 2.8 | |
Net Assets | | | | 100.0 | % |
| | | | | |
| | | | | |
| |
| Credit Rating(1) | | % of Total
Investments
(including cash) |
AAA | | | | 3.1 | % |
AA | | | | 9.9 | |
A | | | | 16.8 | |
BBB | | | | 32.5 | |
BB | | | | 8.2 | |
B | | | | 2.6 | |
Not Rated | | | | 24.1 | |
Cash | | | | 2.8 | |
Total | | | | 100.0 | % |
| | | | | |
| | | | |
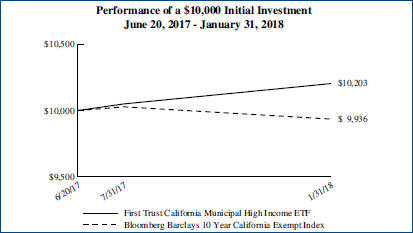 | | | | |
| | | | Performance figures assume reinvestment of all distributions and do not reflect the deduction of taxes that a shareholder would pay on Fund distributions or the redemption or sale of Fund shares. An index is a statistical composite that tracks a specified financial market or sector. Unlike the Fund, the index does not actually hold a portfolio of securities and therefore does not incur the expenses incurred by the Fund. These expenses negatively impact the performance of the Fund. The Fund’s past performance does not predict future performance. |
| | | | |
| (1) | The credit quality and ratings information presented above reflects the ratings assigned by one or more nationally recognized statistical rating organizations (NRSROs), including Standard & Poor’s Ratings Group, a division of the McGraw Hill Companies, Inc., Moody’s Investors Service, Inc., Fitch Ratings or a comparably rated NRSRO. For situations in which a security is rated by more than one NRSRO and the ratings are not equivalent, the highest rating is used. Sub-investment grade ratings are those rated BB+/Ba1 or lower. Investment grade ratings are those rated BBB-/Baa3 or higher. The credit ratings shown relate to the creditworthiness of the issuers of the underlying securities in the Fund, and not to the Fund or its shares. Credit ratings are subject to change. |
|
| Fund Performance Overview (Unaudited) (Continued) |
First Trust California Municipal High Income ETF (FCAL) (Continued)
Frequency Distribution of Discounts and Premiums
Bid/Ask Midpoint vs. NAV through January 31, 2018
The following Frequency Distribution of Discounts and Premiums charts are provided to show the frequency at which the bid/ask midpoint price for the Fund was at a discount or premium to the daily NAV. The following tables are for comparative purposes only and represent the period June 21, 2017 (commencement of trading) through January 31, 2018. Shareholders may pay more than NAV when they buy Fund shares and receive less than NAV when they sell those shares because shares are bought and sold at current market price. Data presented represents past performance and cannot be used to predict future results.
| | | | | | | | |
| | | Number of Days Bid/Ask Midpoint At/Above NAV | | |
For the Period | | 0.00%–0.49% | | 0.50%–0.99% | | 1.00%–1.99% | | >=2.00% |
6/21/17 – 7/31/17 | | 14 | | 0 | | 0 | | 0 |
8/1/17 – 1/31/18 | | 99 | | 9 | | 0 | | 0 |
| | | Number of Days Bid/Ask Midpoint Below NAV | | |
For the Period | | 0.00%–0.49% | | 0.50%–0.99% | | 1.00%–1.99% | | >=2.00% |
6/21/17 – 7/31/17 | | 14 | | 0 | | 0 | | 0 |
8/1/17 – 1/31/18 | | 19 | | 0 | | 0 | | 0 |
First Trust California Municipal High Income ETF (FCAL)
Semi-Annual Report
January 31, 2018 (Unaudited)
Advisor
First Trust Advisors L.P. (“First Trust”) was established in 1991 and is located in Wheaton, Illinois. First Trust is responsible for the selection and ongoing monitoring of the securities in the Fund’s portfolio and certain other services necessary for the management of the portfolio. As of January 31, 2018, First Trust managed or supervised $109.138 billion in assets.
Portfolio Management Team
Tom Futrell, CFA, Senior Vice President, Senior Portfolio Manager
Johnathan N. Wilhelm, Senior Vice President, Senior Portfolio Manager
The First Trust Municipal Securities Team was formed in September of 2013 and is headed by Tom Futrell, CFA and Johnathan Wilhelm who serve as senior portfolio managers of the First Trust California Municipal High Income ETF (the “Fund”). Messrs. Futrell and Wilhelm have a combined 50+ years of investment experience and prior to joining First Trust, served as portfolio managers of municipal bonds at Nuveen Investments and Performance Trust Investment Advisors. In addition to the Fund, the Team manages/consults for a variety of First Trust investment portfolios and separately managed accounts.
First Trust California Municipal High Income ETF (FCAL)
Understanding Your Fund Expenses
January 31, 2018 (Unaudited)
As a shareholder of the First Trust California Municipal High Income ETF (the “Fund”), you incur two types of costs: (1) transaction costs; and (2) ongoing costs, including management fees, distribution and/or service (12b-1) fees, if any, and other Fund expenses. This Example is intended to help you understand your ongoing costs of investing in the Fund and to compare these costs with the ongoing costs of investing in other funds.
The Example is based on an investment of $1,000 invested at the beginning of the period and held through the six-month period ended January 31, 2018.
Actual Expenses
The first line in the following table provides information about actual account values and actual expenses. You may use the information in this line, together with the amount you invested, to estimate the expenses that you paid over the period. Simply divide your account value by $1,000 (for example, an $8,600 account value divided by $1,000 = 8.6), then multiply the result by the number in the first line under the heading entitled “Expenses Paid During the Six-Month Period” to estimate the expenses you paid on your account during this six-month period.
Hypothetical Example for Comparison Purposes
The second line in the following table provides information about hypothetical account values and hypothetical expenses based on the Fund’s actual expense ratio and an assumed rate of return of 5% per year before expenses, which is not the Fund’s actual return. The hypothetical account values and expenses may not be used to estimate the actual ending account balance or expenses you paid for the period. You may use this information to compare the ongoing costs of investing in the Fund and other funds. To do so, compare this 5% hypothetical example with the 5% hypothetical examples that appear in the shareholder reports of the other funds.
Please note that the expenses shown in the table are meant to highlight your ongoing costs only and do not reflect any transactional costs such as brokerage commissions. Therefore, the second line in the table is useful in comparing ongoing costs only, and will not help you determine the relative total costs of owning different funds. In addition, if these transactional costs were included, your costs would have been higher.
| | | | | | | | | | | | | | | | |
| | | Beginning
Account Value
August 1, 2017 | | | Ending
Account Value
January 31, 2018 | | | Annualized
Expense Ratio
Based on the
Six-Month
Period (a) | | | Expenses Paid
During the
Six-Month
Period (b) | |
First Trust California Municipal High Income ETF (FCAL) | | | | | | | | | | | | | | | | |
Actual | | | $1,000.00 | | | | $1,015.20 | | | | 0.50% | | | | $2.54 | |
Hypothetical (5% return before expenses) | | | $1,000.00 | | | | $1,022.68 | | | | 0.50% | | | | $2.55 | |
| (a) | These expense ratios reflect expense waivers. See Note 3 in the Notes to Financial Statements. |
| (b) | Expenses are equal to the annualized expense ratio, as indicated in the table, multiplied by the average account value over the period (August 1, 2017 through January 31, 2018), multiplied by 184/365 (to reflect the one-half year period). |
First Trust California Municipal High Income ETF (FCAL)
Portfolio of Investments
January 31, 2018 (Unaudited)
| | | | | | | | | | | | | | | | |
Principal
Value | | | Description | | Stated
Coupon | | | Stated
Maturity | | | Value | |
| | MUNICIPAL BONDS – 96.1% | |
| | | | California – 87.0% | | | | | | | | | | | | |
| | $ 150,000 | | | Alameda CA Corridor Transprtn Auth Ref Subordinate Lien, Ser A | | | 5.00% | | | | 10/01/25 | | | $ | 176,460 | |
| | 200,000 | | | Antelope Vly E Kern CA Wtr Agy Wtr Rev Ref | | | 5.00% | | | | 06/01/35 | | | | 231,198 | |
| | 200,000 | | | CA Sch Fin Auth Sch Fac Rev Alliance Clg Ready Pub Schs Proj, Ser C | | | 4.50% | | | | 07/01/26 | | | | 219,330 | |
| | 200,000 | | | CA Sch Fin Auth Sch Fac Rev Ref Hlth Learning Proj, Ser A (a) | | | 5.00% | | | | 07/01/32 | | | | 222,962 | |
| | 300,000 | | | CA St Muni Fin Auth Chrt Sch Rev Palmdale Aerospace Academy Proj (a) | | | 4.00% | | | | 07/01/26 | | | | 299,991 | |
| | 250,000 | | | CA St Muni Fin Auth Rev Ref Eisenhower Med Ctr, Ser A | | | 5.00% | | | | 07/01/29 | | | | 291,852 | |
| | 250,000 | | | CA Stwd Cmntys Dev Auth Rev Loma Linda Univ Med Ctr, Ser A (a) | | | 5.00% | | | | 12/01/36 | | | | 269,755 | |
| | 200,000 | | | CA Stwd Cmntys Dev Auth Rev Ref CA Baptist Univ, Ser A (a) | | | 3.00% | | | | 11/01/22 | | | | 200,268 | |
| | 250,000 | | | CA Stwd Cmntys Dev Auth Rev Ref CA Baptist Univ, Ser A (a) | | | 5.00% | | | | 11/01/32 | | | | 276,810 | |
| | 200,000 | | | California Sch Fin Auth Sch Fac Rev Ref Hth Learning Proj, Ser A (a) | | | 4.00% | | | | 07/01/25 | | | | 213,340 | |
| | 100,000 | | | California St Econ Recovery Prerefunded Ref, Ser A | | | 5.00% | | | | 07/01/18 | | | | 101,571 | |
| | 200,000 | | | California St Hlth Facs Fing Auth Rev Adventist Hlth Sys West, Ser A | | | 4.00% | | | | 03/01/33 | | | | 209,288 | |
| | 150,000 | | | California St Hlth Facs Fing Auth Rev Ref Childrens Hosp, Ser A | | | 5.00% | | | | 08/15/33 | | | | 173,507 | |
| | 75,000 | | | California St Muni Fin Auth Eductnl Rev Ref American Heritage Edu, Ser A | | | 4.00% | | | | 06/01/26 | | | | 81,122 | |
| | 150,000 | | | California St Muni Fin Auth Rev Channing House Proj, Ser B | | | 5.00% | | | | 05/15/32 | | | | 178,667 | |
| | 255,000 | | | California St Muni Fin Auth Rev Ref Biola Univ | | | 5.00% | | | | 10/01/37 | | | | 294,260 | |
| | 155,000 | | | California St Muni Fin Auth Rev Ref Retmnt Hsg Fdtn Oblig Grp, Ser A | | | 5.00% | | | | 11/15/26 | | | | 186,476 | |
| | 15,000 | | | California St Pub Wks Brd Lease Rev Judicial Council CA, Ser B | | | 5.00% | | | | 06/01/34 | | | | 17,162 | |
| | 300,000 | | | California St Sch Fin Auth Chrt Sch Rev Rocketship Pub Schs, Ser G (a) | | | 5.00% | | | | 06/01/37 | | | | 314,337 | |
| | 100,000 | | | California St Sch Fin Auth Chrt Sch Rev Summit Pub Schs (a) | | | 5.00% | | | | 06/01/25 | | | | 113,140 | |
| | 210,000 | | | California St Sch Fin Auth Chrt Sch Rev Summit Pub Schs (a) | | | 5.00% | | | | 06/01/31 | | | | 233,820 | |
| | 250,000 | | | California St Stwd Cmntys Dev Auth Student Hsg Rev Ref Chf Irvine LLC | | | 5.00% | | | | 05/15/35 | | | | 284,072 | |
| | 100,000 | | | California Stwd Cmntys Dev Auth Rev Ref Front Porch Comntys & Svcs, Ser A | | | 5.00% | | | | 04/01/31 | | | | 115,052 | |
| | 100,000 | | | Chino CA Cmnty Facs Dist Spl Tax 2016-2 | | | 4.00% | | | | 09/01/29 | | | | 104,535 | |
| | 155,000 | | | Fontana CA Spl Tax Cmnty Facs Dist #80 Bella Strada | | | 5.00% | | | | 09/01/29 | | | | 179,524 | |
| | 90,000 | | | Fresno CA Jt Pwrs Fing Auth Lease Rev Ref Master Lease Proj, Ser A, AGM | | | 5.00% | | | | 04/01/32 | | | | 104,560 | |
| | 85,000 | | | Golden St Tobacco Securitization Corp CA Tobacco Settlement Asset Backed Ref, Ser A | | | 5.00% | | | | 06/01/19 | | | | 88,891 | |
| | 255,000 | | | Golden St Tobacco Securitization Corp CA Tobacco Settlement Asset Bkd Sr, Ser A-1 | | | 5.00% | | | | 06/01/33 | | | | 256,025 | |
| | 265,000 | | | Golden St Tobacco Securitization Corp CA Tobacco Settlement Ref, Ser A-1 | | | 5.00% | | | | 06/01/26 | | | | 307,188 | |
| | 200,000 | | | Kaweah CA Delta Hlth Care Dist Rev, Ser B | | | 5.00% | | | | 06/01/40 | | | | 218,324 | |
| | 100,000 | | | Long Beach CA Bond Fin Auth Nat Gas Purchase Rev, Ser A | | | 5.25% | | | | 11/15/23 | | | | 114,841 | |
| | 25,000 | | | Long Beach CA Bond Fin Auth Nat Gas Purchase Rev, Ser A | | | 5.50% | | | | 11/15/30 | | | | 30,875 | |
| | 10,000 | | | Los Angeles CA Dept of Arpts, Ser E. | | | 5.00% | | | | 05/15/28 | | | | 11,721 | |
| | 190,000 | | | Ontario CA Cmnty Facs Dist #24 Spl Tax Park Pl Facs Phase I | | | 5.00% | | | | 09/01/34 | | | | 211,259 | |
| | 250,000 | | | Palomar Hlth CA Rev Ref | | | 5.00% | | | | 11/01/31 | | | | 279,833 | |
| | 100,000 | | | Port Of Oakland CA AMT Ref Inter Lien, Ser D | | | 5.00% | | | | 11/01/25 | | | | 117,813 | |
| | 200,000 | | | Rancho Cordova CA Cmnty Facs Dist Spl Tax Ref #2004-1 Sunridge Park Area | | | 5.00% | | | | 09/01/25 | | | | 231,338 | |
| | 300,000 | | | River Islands CA Pub Fing Auth Spl Tax Ref Cmnty Facs Dist #2003-1. | | | 5.38% | | | | 09/01/31 | | | | 322,233 | |
| | 185,000 | | | Riverside CA Unif Sch Dist Fing Auth Spl Tax Ref, BAM | | | 5.00% | | | | 09/01/34 | | | | 210,336 | |
| | | | |
| | See Notes to Financial Statements | | Page 7 |
First Trust California Municipal High Income ETF (FCAL)
Portfolio of Investments (Continued)
January 31, 2018 (Unaudited)
| | | | | | | | | | | | | | | | |
Principal
Value | | | Description | | Stated
Coupon | | | Stated
Maturity | | | Value | |
| | MUNICIPAL BONDS (Continued) | | | | | | | | | | | | |
| | | | California (Continued) | | | | | | | | | | | | |
| | $ 100,000 | | | Roseville CA Fin Auth Spl Tax Rev Ref, Ser A | | | 5.00% | | | | 09/01/25 | | | $ | 116,864 | |
| | 100,000 | | | Roseville CA Fin Auth Spl Tax Rev Ref, Ser B | | | 3.00% | | | | 09/01/21 | | | | 102,496 | |
| | 200,000 | | | Sacramento CA Spl Tax Natomas Meadows Cmnty Facs Dist #2007-01 (a) | | | 5.00% | | | | 09/01/32 | | | | 215,286 | |
| | 100,000 | | | San Diego CA Pub Facs Fingauth Lease Rev Ref Ballpark | | | 5.00% | | | | 10/15/28 | | | | 117,491 | |
| | 10,000 | | | San Diego Cnty CA Limited Rev Obligs Ref Sanford Burnham Prebys Med Discovery Institute, Ser A | | | 5.00% | | | | 11/01/28 | | | | 11,545 | |
| | 300,000 | | | San Francisco City & Cnty CA Redev Agy Successor Agy Tax Ref Mission Bay N Redev Proj, Ser A | | | 5.00% | | | | 08/01/35 | | | | 343,500 | |
| | 175,000 | | | Sweetwater CA Union High Sch Dist Ref | | | 5.00% | | | | 08/01/30 | | | | 202,550 | |
| | 100,000 | | | W Contra Costa CA Unif Sch Dist Ref, Ser A | | | 5.00% | | | | 08/01/31 | | | | 117,069 | |
| | 15,000 | | | Washington Twp CA Hlth Care Dist Ref, Ser Dt | | | 4.00% | | | | 08/01/29 | | | | 16,223 | |
| | | | | | | | | | | | | | | | |
| | | | | | | | | | | | | | | 8,736,760 | |
| | | | | | | | | | | | | | | | |
| | | | Georgia – 2.5% | | | | | | | | | | | | |
| | 225,000 | | | Marietta GA Dev Auth Ref Univ Facs Life Univ, Ser A (a) | | | 5.00% | | | | 11/01/27 | | | | 250,326 | |
| | | | | | | | | | | | | | | | |
| | | | Guam – 2.1% | | | | | | | | | | | | |
| | 100,000 | | | Guam Govt Business Priv Tax Rev Ref, Ser D | | | 5.00% | | | | 11/15/32 | | | | 109,452 | |
| | 100,000 | | | Guam Govt Business Priv Tax Rev, Ser B-1 | | | 5.00% | | | | 01/01/37 | | | | 104,601 | |
| | | | | | | | | | | | | | | | |
| | | | | | | | | | | | | | | 214,053 | |
| | | | | | | | | | | | | | | | |
| | | | Illinois – 2.2% | | | | | | | | | | | | |
| | 35,000 | | | Chicago IL Ref, Ser C, CABS | | | (b) | | | | 01/01/22 | | | | 29,951 | |
| | 85,000 | | | Chicago IL Ref, Ser C, CABS | | | (b) | | | | 01/01/24 | | | | 66,399 | |
| | 120,000 | | | IL St, Ser A | | | 4.00% | | | | 01/01/25 | | | | 120,775 | |
| | | | | | | | | | | | | | | | |
| | | | | | | | | | | | | | | 217,125 | |
| | | | | | | | | | | | | | | | |
| | | | North Dakota – 2.3% | | | | | | | | | | | | |
| | 220,000 | | | Grand Forks ND Sr Hsg & Nur Fac Rev Ref Vly Homes Oblig Grp, Ser A | | | 5.00% | | | | 12/01/23 | | | | 232,265 | |
| | | | | | | | | | | | | | | | |
| | | | Total Investments – 96.1% (Cost $9,650,374) (c) | | | | | | | | | | | 9,650,529 | |
| | | | Net Other Assets and Liabilities – 3.9% | | | | | | | | | | | 393,592 | |
| | | | | | | | | | | | | | | | |
| | | | Net Assets – 100.0% | | | | | | | | | | $ | 10,044,121 | |
| | | | | | | | | | | | | | | | |
| (a) | This security, sold within the terms of a private placement memorandum, is exempt from registration upon resale under Rule 144A under the Securities Act of 1933, as amended (the “1933 Act”), and may be resold in transactions exempt from registration, normally to qualified institutional buyers. Pursuant to procedures adopted by the Trust’s Board of Trustees, this security has been determined to be liquid by First Trust Advisors L.P. (“Advisor”). Although market instability can result in periods of increased overall market illiquidity, liquidity for each security is determined based on security specific factors and assumptions, which require subjective judgment. At January 31, 2018, securities noted as such amounted to $2,610,035 or 26.0% of net assets. |
| (c) | Aggregate cost for financial reporting purposes approximates the aggregate cost for federal income tax purposes. As of January 31, 2018, the aggregate gross unrealized appreciation for all investments in which there was an excess of value over tax cost was $50,455 and the aggregate gross unrealized depreciation for all investments in which there was an excess of tax cost over value was $50,300. The net unrealized appreciation was $155. |
| | |
| AGM | | Assured Guaranty Municipal Corp. |
| AMT | | Alternative Minimum Tax |
| BAM | | Building America Mutual |
| CABS | | Capital Appreciation Bonds |
| | | | |
| Page 8 | | See Notes to Financial Statements | | |
First Trust California Municipal High Income ETF (FCAL)
Portfolio of Investments (Continued)
January 31, 2018 (Unaudited)
Valuation Inputs
A summary of the inputs used to value the Fund’s investments as of January 31, 2018 is as follows (see Note 2A - Portfolio Valuation in the Notes to Financial Statements):
| | | | | | | | |
| | | Total
Value at
1/31/2018 | | Level 1
Quoted
Prices | | Level 2
Significant
Observable
Inputs | | Level 3
Significant
Unobservable
Inputs |
| | |
Municipal Bonds* | | $9,650,529 | | $ — | | $9,650,529 | | $ — |
| | |
* See Portfolio of Investments for state breakout.
All transfers in and out of the Levels during the period are assumed to occur on the last day of the period at their current value. There were no transfers between Levels at January 31, 2018.
| | | | |
| | See Notes to Financial Statements | | Page 9 |
First Trust California Municipal High Income ETF (FCAL)
Statement of Assets and Liabilities
January 31, 2018 (Unaudited)
| | | | |
ASSETS: | | | | |
Investments, at value | | | | |
(Cost $9,650,374) | | $ | 9,650,529 | |
Cash | | | 282,891 | |
Interest receivable | | | 115,011 | |
| | | | |
Total Assets | | | 10,048,431 | |
| | | | |
| |
LIABILITIES: | | | | |
Investment advisory fees payable | | | 4,310 | |
| | | | |
Total Liabilities | | | 4,310 | |
| | | | |
NET ASSETS | | $ | 10,044,121 | |
| | | | |
| |
NET ASSETS consist of: | | | | |
Paid-in capital | | $ | 10,007,250 | |
Par value | | | 2,000 | |
Accumulated net investment income (loss) | | | 15,629 | |
Accumulated net realized gain (loss) on investments | | | 19,087 | |
Net unrealized appreciation (depreciation) on investments | | | 155 | |
| | | | |
NET ASSETS | | $ | 10,044,121 | |
| | | | |
NET ASSET VALUE, per share | | $ | 50.22 | |
| | | | |
Number of shares outstanding (unlimited number of shares authorized, par value $0.01 per share) | | | 200,002 | |
| | | | |
| | | | |
| Page 10 | | See Notes to Financial Statements | | |
First Trust California Municipal High Income ETF (FCAL)
Statement of Operations
For the Six Months Ended January 31, 2018 (Unaudited)
| | | | |
INVESTMENT INCOME: | | | | |
Interest | | $ | 170,775 | |
| | | | |
Total investment income | | | 170,775 | |
| | | | |
| |
EXPENSES: | | | | |
Investment advisory fees | | | 33,223 | |
| | | | |
Total expenses | | | 33,223 | |
Fees waived by the investment advisor | | | (7,667 | ) |
| | | | |
Net expenses | | | 25,556 | |
| | | | |
NET INVESTMENT INCOME (LOSS) | | | 145,219 | |
| | | | |
| |
NET REALIZED AND UNREALIZED GAIN (LOSS): | | | | |
Net realized gain (loss) on investments | | | 45,526 | |
Net change in unrealized appreciation (depreciation) on investments | | | (36,531 | ) |
| | | | |
NET REALIZED AND UNREALIZED GAIN (LOSS) | | | 8,995 | |
| | | | |
NET INCREASE (DECREASE) IN NET ASSETS RESULTING FROM OPERATIONS | | $ | 154,214 | |
| | | | |
| | | | |
| | See Notes to Financial Statements | | Page 11 |
First Trust California Municipal High Income ETF (FCAL)
Statements of Changes in Net Assets
| | | | | | | | |
| | | Six Months
Ended
1/31/2018
(Unaudited) | | | Period Ended
7/31/2017 (a) | |
| | | | | | | | |
OPERATIONS: | | | | | | | | |
Net investment income (loss) | | $ | 145,219 | | | $ | 19,564 | |
Net realized gain (loss) | | | 45,526 | | | | (17,501 | ) |
Net change in unrealized appreciation (depreciation) | | | (36,531 | ) | | | 36,686 | |
| | | | | | | | |
Net increase (decrease) in net assets resulting from operations | | | 154,214 | | | | 38,749 | |
| | | | | | | | |
| | |
DISTRIBUTIONS TO SHAREHOLDERS FROM: | | | | | | | | |
Net investment income | | | (130,002 | ) | | | (19,150 | ) |
Net realized gain | | | (8,940 | ) | | | — | |
Return of capital | | | — | | | | (850 | ) |
| | | | | | | | |
Total distributions to shareholders | | | (138,942 | ) | | | (20,000 | ) |
| | | | | | | | |
| | |
SHAREHOLDER TRANSACTIONS: | | | | | | | | |
Proceeds from shares sold | | | — | | | | 10,010,100 | |
Cost of shares redeemed | | | — | | | | — | |
| | | | | | | | |
Net increase (decrease) in net assets resulting from shareholder transactions | | | — | | | | 10,010,100 | |
| | | | | | | | |
Total increase (decrease) in net assets | | | 15,272 | | | | 10,028,849 | |
| | |
NET ASSETS: | | | | | | | | |
Beginning of period | | | 10,028,849 | | | | — | |
| | | | | | | | |
End of period | | $ | 10,044,121 | | | $ | 10,028,849 | |
| | | | | | | | |
Accumulated net investment income (loss) at end of period | | $ | 15,629 | | | $ | 412 | |
| | | | | | | | |
| | |
CHANGES IN SHARES OUTSTANDING: | | | | | | | | |
Shares outstanding, beginning of period | | | 200,002 | | | | — | |
Shares sold | | | — | | | | 200,002 | |
| | | | | | | | |
Shares outstanding, end of period | | | 200,002 | | | | 200,002 | |
| | | | | | | | |
| (a) | Inception date is June 20, 2017, which is consistent with the commencement of operations and is the date the initial creation units were established. |
| | | | |
| Page 12 | | See Notes to Financial Statements | | |
First Trust California Municipal High Income ETF (FCAL)
Financial Highlights
For a Common Share outstanding throughout each period
| | | | | | | | |
| | | Six Months
Ended
1/31/2018
(Unaudited) | | | Period
Ended
7/31/2017 (a) | |
| | | | | | | | |
Net asset value, beginning of period | | $ | 50.14 | | | $ | 50.00 | |
| | | | | | | | |
Income from investment operations: | | | | | | | | |
Net investment income (loss) | | | 0.73 | | | | 0.10 | |
Net realized and unrealized gain (loss) | | | 0.04 | | | | 0.14 | |
| | | | | | | | |
Total from investment operations | | | 0.77 | | | | 0.24 | |
| | | | | | | | |
| | |
Distributions paid to shareholders from: | | | | | | | | |
Net investment income | | | (0.65 | ) | | | (0.10 | ) |
Net realized gain | | | (0.04 | ) | | | — | |
Return of capital | | | — | | | | (0.00 | ) (b) |
| | | | | | | | |
Total distributions | | | (0.69 | ) | | | (0.10 | ) |
| | | | | | | | |
Net asset value, end of period | | $ | 50.22 | | | $ | 50.14 | |
| | | | | | | | |
Total return (c) | | | 1.52 | % | | | 0.50 | % |
| | |
Ratios to average net assets/supplemental data: | | | | | | | | |
Net assets, end of period (in 000’s) | | $ | 10,044 | | | $ | 10,029 | |
Ratio of total expenses to average net assets | | | 0.65 | % (d) | | | 0.65 | % (d) |
Ratio of net expenses to average net assets | | | 0.50 | % (d) | | | 0.50 | % (d) |
Ratio of net investment income (loss) to average net assets | | | 2.84 | % (d) | | | 1.74 | % (d) |
Portfolio turnover rate (e) | | | 54 | % | | | 22 | % |
| (a) | Inception date is June 20, 2017, which is consistent with the commencement of operations and is the date the initial creation units were established. |
| (b) | Amount is less than $0.01. |
| (c) | Total return is calculated assuming an initial investment made at the net asset value at the beginning of the period, reinvestment of all distributions at net asset value during the period, and redemption at net asset value on the last day of the period. The returns presented do not reflect the deduction of taxes that a shareholder would pay on Fund distributions or the redemption or sale of Fund shares. Total return is calculated for the time period presented and is not annualized for periods of less than a year. The total return would have been lower if certain fees had not been waived by the investment advisor. |
| (e) | Portfolio turnover is calculated for the time period presented and is not annualized for periods of less than a year and does not include securities received or delivered from processing creations or redemptions and in-kind transactions. |
| | | | |
| | See Notes to Financial Statements | | Page 13 |
|
| Notes to Financial Statements |
First Trust California Municipal High Income ETF (FCAL)
January 31, 2018 (Unaudited)
1. Organization
First Trust Exchange-Traded Fund III (the “Trust”) is an open-end management investment company organized as a Massachusetts business trust on January 9, 2008, and is registered with the Securities and Exchange Commission (the “SEC”) under the Investment Company Act of 1940, as amended (the “1940 Act”).
The Trust consists of thirteen funds that are currently offering shares. This report covers the First Trust California Municipal High Income ETF (the “Fund”), a non-diversified series of the Trust, which trades under the ticker FCAL on The Nasdaq Stock Market, LLC (“Nasdaq”). Unlike conventional mutual funds, the Fund issues and redeems shares on a continuous basis, at net asset value (“NAV”), only in large specified blocks consisting of 50,000 shares called a “Creation Unit.” Creation Units are issued and redeemed for cash and, in certain circumstances, in-kind for securities in which the Fund invests. Except when aggregated in Creation Units, the Fund’s shares are not redeemable securities.
The primary investment objective of the Fund is to seek to provide current income that is exempt from regular federal income taxes and California income taxes, and its secondary objective is long-term capital appreciation. Under normal market conditions, the Fund seeks to achieve its investment objectives by investing at least 80% of its net assets (including investment borrowings) in municipal debt securities that pay interest that is exempt from regular federal income taxes and California income taxes. There can be no assurance that the Fund will achieve its investment objectives. The Fund may not be appropriate for all investors.
2. Significant Accounting Policies
The Fund is considered an investment company and follows accounting and reporting guidance under Financial Accounting Standards Board Accounting Standards Codification Topic 946, “Financial Services-Investment Companies.” The following is a summary of significant accounting policies consistently followed by the Fund in the preparation of the financial statements. The preparation of the financial statements in accordance with accounting principles generally accepted in the United States of America (“U.S. GAAP”) requires management to make estimates and assumptions that affect the reported amounts and disclosures in the financial statements. Actual results could differ from those estimates.
A. Portfolio Valuation
The Fund’s NAV is determined daily as of the close of regular trading on the New York Stock Exchange (“NYSE”), normally 4:00 p.m. Eastern time, on each day the NYSE is open for trading. If the NYSE closes early on a valuation day, the NAV is determined as of that time. Domestic debt securities are priced using data reflecting the earlier closing of the principal markets for those securities. The Fund’s NAV is calculated by dividing the value of all assets of the Fund (including accrued interest and dividends), less all liabilities (including accrued expenses and dividends declared but unpaid), by the total number of shares outstanding.
The Fund’s investments are valued daily at market value or, in the absence of market value with respect to any portfolio securities, at fair value. Market value prices represent last sale or official closing prices from a national or foreign exchange (i.e., a regulated market) and are primarily obtained from third-party pricing services. Fair value prices represent any prices not considered market value prices and are either obtained from a third-party pricing service or are determined by the Pricing Committee of the Fund’s investment advisor, First Trust Advisors L.P. (“First Trust” or the “Advisor”), in accordance with valuation procedures adopted by the Trust’s Board of Trustees, and in accordance with provisions of the 1940 Act. Investments valued by the Advisor’s Pricing Committee, if any, are footnoted as such in the footnotes to the Portfolio of Investments. The Fund’s investments are valued as follows:
Municipal securities and other debt securities are fair valued on the basis of fair valuations provided by dealers who make markets in such securities or by a third-party pricing service approved by the Trust’s Board of Trustees, which may use the following valuation inputs when available:
| | 7) | reference data including market research publications. |
Fixed income and other debt securities having a remaining maturity of sixty days or less when purchased are fair valued at cost adjusted for amortization of premiums and accretion of discounts (amortized cost), provided the Advisor’s Pricing Committee has determined that the use of amortized cost is an appropriate reflection of fair value given market and issuer-specific
|
| Notes to Financial Statements (Continued) |
First Trust California Municipal High Income ETF (FCAL)
January 31, 2018 (Unaudited)
conditions existing at the time of the determination. Factors that may be considered in determining the appropriateness of the use of amortized cost include, but are not limited to, the following:
| | 1) | the credit conditions in the relevant market and changes thereto; |
| | 2) | the liquidity conditions in the relevant market and changes thereto; |
| | 3) | the interest rate conditions in the relevant market and changes thereto (such as significant changes in interest rates); |
| | 4) | issuer-specific conditions (such as significant credit deterioration); and |
| | 5) | any other market-based data the Advisor’s Pricing Committee considers relevant. In this regard, the Advisor’s Pricing Committee may use last-obtained market-based data to assist it when valuing portfolio securities using amortized cost. |
Certain securities may not be able to be priced by pre-established pricing methods. Such securities may be valued by the Trust’s Board of Trustees or its delegate, the Advisor’s Pricing Committee, at fair value. These securities generally include, but are not limited to, restricted securities (securities which may not be publicly sold without registration under the Securities Act of 1933, as amended) for which a third-party pricing service is unable to provide a market price; securities whose trading has been formally suspended; a security whose market or fair value price is not available from a pre-established pricing source; a security with respect to which an event has occurred that is likely to materially affect the value of the security after the market has closed but before the calculation of the Fund’s NAV or make it difficult or impossible to obtain a reliable market quotation; and a security whose price, as provided by the third-party pricing service, does not reflect the security’s fair value. As a general principle, the current fair value of a security would appear to be the amount which the owner might reasonably expect to receive for the security upon its current sale. When fair value prices are used, generally they will differ from market quotations or official closing prices on the applicable exchanges. A variety of factors may be considered in determining the fair value of such securities, including, but not limited to, the following:
| 1) | | the fundamental business data relating to the issuer; |
| 2) | | an evaluation of the forces which influence the market in which these securities are purchased and sold; |
| 3) | | the type, size and cost of the security; |
| 4) | | the financial statements of the issuer; |
| 5) | | the credit quality and cash flow of the issuer, based on the Advisor’s or external analysis; |
| 6) | | the information as to any transactions in or offers for the security; |
| 7) | | the price and extent of public trading in similar securities (or equity securities) of the issuer/borrower, or comparable companies; |
| 9) | | the quality, value and salability of collateral, if any, securing the security; and |
| 10) | | other relevant factors. |
The Fund is subject to fair value accounting standards that define fair value, establish the framework for measuring fair value and provide a three-level hierarchy for fair valuation based upon the inputs to the valuation as of the measurement date. The three levels of the fair value hierarchy are as follows:
| | • | | Level 1 – Level 1 inputs are quoted prices in active markets for identical investments. An active market is a market in which transactions for the investment occur with sufficient frequency and volume to provide pricing information on an ongoing basis. |
| | • | | Level 2 – Level 2 inputs are observable inputs, either directly or indirectly, and include the following: |
| | o | Quoted prices for similar investments in active markets. |
| | o | Quoted prices for identical or similar investments in markets that are non-active. A non-active market is a market where there are few transactions for the investment, the prices are not current, or price quotations vary substantially either over time or among market makers, or in which little information is released publicly. |
| | o | Inputs other than quoted prices that are observable for the investment (for example, interest rates and yield curves observable at commonly quoted intervals, volatilities, prepayment speeds, loss severities, credit risks, and default rates). |
| | o | Inputs that are derived principally from or corroborated by observable market data by correlation or other means. |
| | • | | Level 3 – Level 3 inputs are unobservable inputs. Unobservable inputs may reflect the reporting entity’s own assumptions about the assumptions that market participants would use in pricing the investment. |
The inputs or methodologies used for valuing investments are not necessarily an indication of the risk associated with investing in those investments. A summary of the inputs used to value the Fund’s investments as of January 31, 2018, is included with the Fund’s Portfolio of Investments.
|
| Notes to Financial Statements (Continued) |
First Trust California Municipal High Income ETF (FCAL)
January 31, 2018 (Unaudited)
B. Securities Transactions and Investment Income
Securities transactions are recorded as of the trade date. Realized gains and losses from securities transactions are recorded on the identified cost basis. Interest income is recorded daily on the accrual basis. Amortization of premiums and accretion of discounts are recorded using the effective interest method.
C. Dividends and Distributions to Shareholders
Dividends from net investment income, if any, are declared and paid monthly, or as the Board of Trustees may determine from time to time. Distributions of net realized capital gains earned by the Fund, if any, are distributed at least annually.
Distributions from income and capital gains are determined in accordance with income tax regulations, which may differ from U.S. GAAP. Certain capital accounts in the financial statements are periodically adjusted for permanent differences in order to reflect their tax character. These permanent differences are primarily due to the varying treatment of income and gain/loss on portfolio securities held by the Fund and have no impact on net assets or NAV per share. Temporary differences, which arise from recognizing certain items of income, expense and gain/loss in different periods for financial statement and tax purposes, will reverse at some time in the future.
The tax character of distributions paid by the Fund during the fiscal year ended July 31, 2017 was as follows:
| | | | |
Distributions paid from: | | | | |
Ordinary income | | $ | — | |
Long-term capital gains | | | — | |
Tax-exempt income | | | 19,150 | |
Return of capital | | | 850 | |
As of July 31, 2017, the components of distributable earnings on a tax basis were as follows:
| | | | |
Undistributed ordinary income | | $ | 412 | |
Accumulated capital and other losses | | | (17,499 | ) |
Net unrealized appreciation (depreciation) | | | 36,686 | |
D. Income Taxes
The Fund intends to qualify as a regulated investment company by complying with the requirements under Subchapter M of the Internal Revenue Code of 1986, as amended, which includes distributing substantially all of its net investment income and net realized gains to shareholders. Accordingly, no provision has been made for federal and state income taxes. However, due to the timing and amount of distributions, the Fund may be subject to an excise tax of 4% of the amount by which approximately 98% of the Fund’s taxable income exceeds the distributions from such taxable income for the calendar year.
In addition, the Fund intends to invest in municipal securities to allow it to pay shareholders “exempt dividends” as defined in the Internal Revenue Code.
The Fund is subject to accounting standards that establish a minimum threshold for recognizing, and a system for measuring, the benefits of a tax position taken or expected to be taken in a tax return. The taxable period ended 2017 remains open to federal and state audit. As of January 31, 2018, management has evaluated the application of these standards to the Fund and has determined that no provision for income tax is required in the Fund’s financial statements for uncertain tax positions.
The Fund intends to utilize provisions of the federal income tax laws, which allow it to carry a realized capital loss forward indefinitely following the year of the loss and offset such loss against any future realized capital gains. The Fund is subject to certain limitations under U.S. tax rules on the use of capital loss carryforwards and net unrealized built-in losses. These limitations apply when there has been a 50% change in ownership. At July 31, 2017, the Fund had $17,499 of non-expiring capital loss carryforwards for federal income tax purposes.
Certain losses realized during the current fiscal year may be deferred and treated as occurring on the first day of the following fiscal year for federal income tax purposes. For the fiscal period ended July 31, 2017, the Fund had no net ordinary losses.
E. Expenses
Expenses, other than the investment advisory fee and other excluded expenses, are paid by the Advisor (See Note 3).
|
| Notes to Financial Statements (Continued) |
First Trust California Municipal High Income ETF (FCAL)
January 31, 2018 (Unaudited)
F. New and Amended Financial Reporting Rules and Forms
On October 13, 2016, the SEC adopted new rules and forms, and amended existing rules and forms. The new and amended rules and forms are intended to modernize the reporting of information provided by funds and to improve the quality and type of information that funds provide to the SEC and investors. In part, the new and amended rules and forms amend Regulation S-X and require standardized, enhanced disclosures about derivatives in a fund’s financial statements, as well as other amendments. The compliance date for the amendments of Regulation S-X was August 1, 2017, which resulted in no change to the financial statements. The new form types and other rule amendments will be effective for the First Trust funds, including the Fund, for reporting periods beginning on and after June 1, 2018. Management is evaluating the new form types and other rule amendments that are effective on and after June 1, 2018 to determine the impact to the Fund.
3. Investment Advisory Fee, Affiliated Transactions and Other Fee Arrangements
First Trust, the investment advisor to the Fund, is a limited partnership with one limited partner, Grace Partners of DuPage L.P., and one general partner, The Charger Corporation. The Charger Corporation is an Illinois corporation controlled by James A. Bowen, Chief Executive Officer of First Trust. First Trust is responsible for the selection and ongoing monitoring of the securities in the Fund’s portfolio, managing the Fund’s business affairs and providing certain administrative services necessary for the management of the Fund.
Pursuant to the Investment Management Agreement between the Trust and the Advisor, First Trust manages the investment of the Fund’s assets and is responsible for the Fund’s expenses, including the cost of transfer agency, custody, fund administration, legal, audit, and other services, but excluding fee payments under the Investment Management Agreement, interest, taxes, acquired fund fees and expenses, if any, brokerage commissions, and other expenses connected with the execution of portfolio transactions, distribution and service fees pursuant to a 12b-1 plan, if any, and extraordinary expenses. The Fund has agreed to pay First Trust an annual unitary management fee equal to 0.65% of its average daily net assets. First Trust also provides fund reporting services to the Fund for a flat annual fee in the amount of $9,250, which is covered under the annual unitary management fee.
The Trust’s Board of Trustees and the Advisor have entered into a Fee Waiver Agreement for the Fund pursuant to which the Advisor contractually agreed to waive management fees of 0.15% of average daily net assets until June 16, 2019. The waiver agreement may be terminated by action of the Trust’s Board of Trustees at any time upon 60 days’ written notice by the Trust on behalf of the Fund or by the Fund’s investment advisor only after June 16, 2019. First Trust does not have the right to recover the fees waived. During the six months ended January 31, 2018, the Advisor waived fees of $7,667.
The Trust has multiple service agreements with Brown Brothers Harriman & Co. (“BBH”). Under the service agreements, BBH performs custodial, fund accounting, certain administrative services, and transfer agency services for the Fund. As custodian, BBH is responsible for custody of the Fund’s assets. As fund accountant and administrator, BBH is responsible for maintaining the books and records of the Fund’s securities and cash. As transfer agent, BBH is responsible for maintaining shareholder records for the Fund.
Each Trustee who is not an officer or employee of First Trust, any sub-advisor or any of their affiliates (“Independent Trustees”) is paid a fixed annual retainer that is allocated equally among each fund in the First Trust Fund Complex. Each Independent Trustee is also paid an annual per fund fee that varies based on whether the fund is a closed-end or other actively managed fund, or is an index fund.
Additionally, the Lead Independent Trustee and the Chairmen of the Audit Committee, Nominating and Governance Committee, and Valuation Committee are paid annual fees to serve in such capacities, with such compensation allocated pro rata among each fund in the First Trust Fund Complex based on net assets. Independent Trustees are reimbursed for travel and out-of-pocket expenses in connection with all meetings. The Lead Independent Trustee and Committee Chairmen rotate every three years. The officers and “Interested” Trustee receive no compensation from the Trust for acting in such capacities.
4. Purchases and Sales of Securities
For the six months ended January 31, 2018, the cost of purchases and proceeds from sales of investments, excluding short term investments and in-kind transactions, were $5,596,617 and $5,234,478, respectively.
For the six months ended January 31, 2018, the Fund had no in-kind transactions.
5. Creations, Redemptions and Transaction Fees
Shares are created and redeemed by the Fund only in Creation Unit size aggregations of 50,000 shares in transactions with broker-dealers or large institutional investors that have entered into a participation agreement (an “Authorized Participant”). In order to purchase Creation Units of the Fund, an Authorized Participant must deposit (i) a designated portfolio of securities determined by First
|
| Notes to Financial Statements (Continued) |
First Trust California Municipal High Income ETF (FCAL)
January 31, 2018 (Unaudited)
Trust (the “Deposit Securities”) and generally make or receive a cash payment referred to as the “Cash Component,” which is an amount equal to the difference between the NAV of the Fund shares (per Creation Unit Aggregation) and the market value of the Deposit Securities, and/or (ii) cash in lieu of all or a portion of the Deposit Securities. If the Cash Component is a positive number (i.e., the NAV per Creation Unit Aggregation exceeds the Deposit Amount), the Authorized Participant will deliver the Cash Component. If the Cash Component is a negative number (i.e., the NAV per Creation Unit Aggregation is less than the Deposit Amount), the Authorized Participant will receive the Cash Component. Authorized Participants purchasing Creation Units must pay to BBH, as transfer agent, a creation transaction fee (the “Creation Transaction Fee”) regardless of the number of Creation Units purchased in the transaction. The Creation Transaction Fee may vary and is based on the composition of the securities included in the Fund’s portfolio and the countries in which the transactions are settled. The Creation Transaction Fee is currently $500 plus ten basis points.The price for each Creation Unit will equal the daily NAV per share times the number of shares in a Creation Unit plus the fees described above and, if applicable, any operational processing and brokerage costs, transfer fees or stamp taxes. When the Fund permits an Authorized Participant to substitute cash or a different security in lieu of depositing one or more of the requisite Deposit Securities, the Authorized Participant may also be assessed an amount to cover the cost of purchasing the Deposit Securities and/or disposing of the substituted securities, including operational processing and brokerage costs, transfer fees, stamp taxes, and part or all of the spread between the expected bid and offer side of the market related to such Deposit Securities and/or substitute securities.
Authorized Participants redeeming Creation Units must pay to BBH, as transfer agent, a redemption transaction fee (the “Redemption Transaction Fee”), regardless of the number of Creation Units redeemed in the transaction. The Redemption Transaction Fee may vary and is based on the composition of the securities included in the Fund’s portfolio and the countries in which the transactions are settled. The Redemption Transaction Fee is currently $500 plus ten basis points. The Fund reserves the right to effect redemptions in cash. An Authorized Participant may request cash redemption in lieu of securities; however, the Fund may, in its discretion, reject any such request.
6. Distribution Plan
The Board of Trustees adopted a Distribution and Service Plan pursuant to Rule 12b-1 under the 1940 Act. In accordance with the Rule 12b-1 plan, the Fund is authorized to pay an amount up to 0.25% of its average daily net assets each year to reimburse First Trust Portfolios L.P. (“FTP”), the distributor of the Fund, for amounts expended to finance activities primarily intended to result in the sale of Creation Units or to provide investor services. FTP may also use this amount to compensate securities dealers or other persons that are Authorized Participants for providing distribution assistance, including broker-dealer and shareholder support and educational and promotional services.
No 12b-1 fees are currently paid by the Fund, and pursuant to a contractual arrangement, no 12b-1 fees will be paid any time before June 16, 2019.
7. Borrowings
Effective October 17, 2017, the Fund was added to a $220 million Credit Agreement with The Bank of Nova Scotia (“Scotia”), who acts as administrative agent for a group of lenders. Scotia charges a commitment fee of 0.25% of the daily amount of excess of the commitment amount over the outstanding principal balance of the loans and an agency fee. First Trust allocates the commitment fee and agency fee amongst the funds that have access to the credit line. To the extent that the Fund accesses the credit line, there would also be an interest fee charged. The Fund did not have any borrowings outstanding during the six months ended January 31, 2018.
8. Indemnification
The Trust, on behalf of the Fund, has a variety of indemnification obligations under contracts with its service providers. The Trust’s maximum exposure under these arrangements is unknown. However, the Trust has not had prior claims or losses pursuant to these contracts and expects the risk of loss to be remote.
9. Subsequent Events
Management has evaluated the impact of all subsequent events to the Fund through the date the financial statements were issued, and has determined that there were no subsequent events requiring recognition or disclosure in the financial statements that have not already been disclosed.
First Trust California Municipal High Income ETF (FCAL)
January 31, 2018 (Unaudited)
Proxy Voting Policies and Procedures
A description of the policies and procedures that the Trust uses to determine how to vote proxies and information on how the Fund voted proxies relating to portfolio securities during the most recent 12-month period ended June 30 is available (1) without charge, upon request, by calling (800) 988-5891; (2) on the Fund’s website located at www.ftportfolios.com; and (3) on the Securities and Exchange Commission’s (“SEC”) website at www.sec.gov.
Portfolio Holdings
The Trust files its complete schedule of portfolio holdings with the SEC for the first and third quarters of each fiscal year on Form N-Q. The Trust’s Form N-Qs are available (1) by calling (800) 988-5891; (2) on the Fund’s website located at www.ftportfolios.com; (3) on the SEC’s website at www.sec.gov; and (4) for review and copying at the SEC’s Public Reference Room (“PRR”) in Washington, DC. Information regarding the operation of the PRR may be obtained by calling (800) SEC-0330.
Risk Considerations
You could lose money by investing in the Fund. An investment in the Fund is not a deposit of a bank and is not insured or guaranteed by the Federal Deposit Insurance Corporation or any other governmental agency. There can be no assurance that the Fund’s investment objectives will be achieved.
ALTERNATIVE MINIMUM TAX RISK. The Fund has no limit as to the amount that can be invested in alternative minimum tax bonds. Therefore, all or a portion of the Fund’s otherwise exempt-interest dividends may be taxable to those shareholders subject to the federal and state alternative minimum tax.
AUTHORIZED PARTICIPANT CONCENTRATION RISK. Only an authorized participant (as defined in the “Creations, Redemptions and Transaction Fees” section) may engage in creation or redemption transactions directly with the Fund. The Fund has a limited number of institutions that act as authorized participants. To the extent that these institutions exit the business or are unable to proceed with creation and/or redemption orders with respect to the Fund and no other authorized participant is able to step forward to create or redeem, in either of these cases, Fund shares may trade at a discount to the Fund’s net asset value and possibly face delisting.
CALIFORNIA MUNICIPAL SECURITIES RISK. Because the Fund invests predominantly in California municipal securities, events in California are likely to affect the Fund’s investments and its performance. These events may include economic or political policy changes, tax base erosion, budget deficits and other financial difficulties, and changes in the credit ratings assigned to municipal issuers of California. A negative change in any one of these or other areas could affect the ability of California municipal issuers to meet their obligations. Moreover, certain risks specific to California threaten the state’s fiscal condition. Specifically, provisions of the California Constitution and state statutes limit the taxing and spending authority of California governmental entities, which may impair the ability of California issuers to pay principal and/or interest on their obligations. California has major concentrations in high technology, trade, entertainment, manufacturing, government, tourism, construction and services, and may be sensitive to economic problems affecting those industries. California’s economy may also be affected by natural disasters, such as earthquakes or fires.
CALL RISK. If an issuer calls higher-yielding debt instruments held by the Fund, performance could be adversely impacted.
CASH TRANSACTIONS RISK. The Fund will, under most circumstances, effect a portion of creations and redemptions for cash, rather than in-kind securities. As a result, an investment in the Fund may be less tax-efficient than an investment in an exchange-traded fund (“ETF”) that effects its creations and redemptions for in-kind securities. Because the Fund may effect a portion of redemptions for cash, it may be required to sell portfolio securities in order to obtain the cash needed to distribute redemption proceeds. A sale of shares may result in capital gains or losses and may also result in higher brokerage costs.
CREDIT RISK. Credit risk is the risk that an issuer of a security held by the Fund will be unable or unwilling to make dividend, interest and/or principal payments when due and the related risk that the value of such security may decline because of concerns about the issuer’s ability to make such payments.
CREDIT SPREAD RISK. Credit spread risk is the risk that credit spreads (i.e., the difference in yield between securities that have differences in credit quality or other factors) may increase, which may reduce the market values of the Fund’s securities. While the Fund may employ strategies to mitigate credit spread risk, these strategies may not be successful.
CUSTODIAL RECEIPT TRUSTS RISK. Custodial receipts are financial instruments similar to tender option bonds (“TOBs”) sold through private placements that represent the right to receive future principal and interest payments on underlying municipal obligations. Custodial receipt trusts may issue inverse floater securities and if the Fund was to hold inverse floaters issued by custodial
|
| Additional Information (Continued) |
First Trust California Municipal High Income ETF (FCAL)
January 31, 2018 (Unaudited)
receipt trusts, the Fund would be subject to the risks of inverse floaters described herein. In particular, because the instruments may be leveraged, their market values may be more volatile than other types of fixed-income instruments.
CYBER SECURITY RISK. As the use of Internet technology has become more prevalent in the course of business, the Fund has become more susceptible to potential operational risks through breaches in cyber security. A breach in cyber security refers to both intentional and unintentional events that may cause the Fund to lose proprietary information, suffer data corruption or lose operational capacity. Such events could cause the Fund to incur regulatory penalties, reputational damage, additional compliance costs associated with corrective measures and/or financial loss. Cyber security breaches may involve unauthorized access to the Fund’s digital information systems through “hacking” or malicious software coding, but may also result from outside attacks such as denial-of-service attacks through efforts to make network services unavailable to intended users. In addition, cyber security breaches of the Fund’s third party service providers, such as its administrator, transfer agent, custodian, or sub-advisor, as applicable, or issuers in which the Fund invests, can also subject the Fund to many of the same risks associated with direct cyber security breaches. The Fund has established risk management systems designed to reduce the risks associated with cyber security. However, there is no guarantee that such efforts will succeed, especially because the Fund does not directly control the cyber security systems of issuers or third party service providers.
DISTRESSED SECURITIES RISK. Distressed municipal securities are speculative and involve substantial risks in addition to the risks of investing in high yield securities that are not in default. Generally, the Fund will not receive interest payments from the Distressed Municipal Securities it holds, and there is a substantial risk that the principal will not be repaid. In any reorganization or liquidation proceeding related to a Distressed Municipal Security, the Fund may lose its entire investment in such Distressed Municipal Security.
EXTENSION RISK. Extension risk is the risk that, when interest rates rise, certain obligations will be paid off by the issuer (or obligor) more slowly than anticipated, causing the value of these securities to fall. Rising interest rates tend to extend the duration of securities, making them more sensitive to changes in interest rates. The value of longer-term securities generally changes more in response to changes in interest rates than shorter-term securities. As a result, in a period of rising interest rates, securities may exhibit additional volatility and may lose value.
FLUCTUATION OF NET ASSET VALUE RISK. The net asset value of shares of the Fund will generally fluctuate with changes in the market value of the Fund’s holdings. The market prices of shares will generally fluctuate in accordance with changes in net asset value as well as the relative supply of and demand for shares on Nasdaq. The Fund’s investment advisor cannot predict whether shares will trade below, at or above their net asset value because the shares trade on Nasdaq at market prices and not at net asset value. Price differences may be due, in large part, to the fact that supply and demand forces at work in the secondary trading market for shares will be closely related to, but not identical to, the same forces influencing the prices of the holdings of the Fund trading individually or in the aggregate at any point in time. However, given that shares can only be purchased and redeemed for cash, or in certain circumstances, in-kind, in Creation Units, and only to and from broker-dealers and large institutional investors that have entered into participation agreements (unlike shares of closed-end funds, which frequently trade at appreciable discounts from, and sometimes at premiums to, their net asset value), the Fund’s investment advisor believes that large discounts or premiums to the net asset value of shares should not be sustained.
HIGH YIELD SECURITIES RISK. High yield securities, or “junk” bonds, are subject to greater market fluctuations and risk of loss than securities with higher ratings, and therefore, are considered to be highly speculative. These securities are issued by issuers that may have narrowly focused operations and/or other impediments to the timely payment of periodic interest and principal at maturity. If the economy slows down or dips into recession, the issuers of high yield securities may not have sufficient resources to continue making timely payment of periodic interest and principal at maturity. The market for high yield securities is smaller and less liquid than that for investment grade securities. High yield securities are generally not listed on a national securities exchange but trade in the over-the-counter markets. Due to the smaller, less liquid market for high yield securities, the bid-offer spread on such securities is generally greater than it is for investment grade securities and the purchase or sale of such securities may take longer to complete. In general, high yield securities may have a greater risk of default than other types of securities.
INCOME RISK. Income from the Fund’s fixed income investments could decline during periods of falling interest rates.
INDUSTRIAL DEVELOPMENT BOND RISK. These revenue bonds are issued by or on behalf of public authorities to obtain funds to finance various public and/or privately operated facilities, including those for business and manufacturing, housing, sports, pollution control, airport, mass transit, port and parking facilities. To the extent that the industrial development sector continues to represent a significant portion of the Fund, the Fund will be sensitive to changes in, and its performance may depend to a greater extent on, the overall condition of the industrial development sector. These bonds are normally secured only by the revenues from the project and not by state or local government tax payments. Consequently, the credit quality of these securities is dependent upon the ability of the user of the facilities financed by the bonds and any guarantor to meet its financial obligations. Payment of interest on and
|
| Additional Information (Continued) |
First Trust California Municipal High Income ETF (FCAL)
January 31, 2018 (Unaudited)
repayment of principal on such bonds are the responsibility of the user and/or any guarantor. These bonds are subject to a wide variety of risks, many of which relate to the nature of the specific project. Generally, the value and credit quality of these bonds are sensitive to the risks related to an economic slowdown.
INTEREST RATE RISK. Interest rate risk is the risk that the value of the debt securities in the Fund’s portfolio will decline because of rising market interest rates. Interest rate risk is generally lower for shorter term debt securities and higher for longer term debt securities. Duration is a measure of the expected price volatility of a debt security as a result of changes in market rates of interest, based on, among other factors, the weighted average timing of the debt security’s expected principal and interest payments. In general, duration represents the expected percentage change in the value of a security for an immediate 1% change in interest rates. Therefore, prices of debt securities with shorter durations tend to be less sensitive to interest rate changes than debt securities with longer durations. As the value of a debt security changes over time, so will its duration.
INVERSE FLOATERS RISK. Investments in inverse floating rate securities issued by TOB trusts create effective leverage. Due to the leveraged nature of these investments, the value of an inverse floater will increase and decrease to a significantly greater extent than the values of the TOB trust’s underlying municipal bonds in response to changes in market interest rates or credit quality. In addition, distributions paid to the Fund on its inverse floaters will be reduced or even eliminated as short-term municipal interest rates rise and will increase when short-term municipal interest rates fall. An investment in inverse floaters typically will involve greater risk than an investment in a fixed rate municipal bond.
MANAGEMENT RISK. The Fund is subject to management risk because it is an actively managed portfolio. In managing the Fund’s investment portfolio, the Fund’s investment advisor will apply investment techniques and risk analyses that may not have the desired result. There can be no guarantee that the Fund will meet its investment objectives.
MARKET MAKER RISK. If the Fund has lower average daily trading volumes, it may rely on a small number of third-party market makers to provide a market for the purchase and sale of shares. Any trading halt or other problem relating to the trading activity of these market makers could result in a dramatic change in the spread between the Fund’s net asset value and the price at which the Fund’s shares are trading on its exchange, which could result in a decrease in value of the Fund’s shares. In addition, decisions by market makers or authorized participants to reduce their role or step away from these activities in times of market stress could inhibit the effectiveness of the arbitrage process in maintaining the relationship between the underlying values of the Fund’s portfolio securities and the Fund’s market price. This reduced effectiveness could result in Fund shares trading at a discount to net asset value and also in greater than normal intraday bid-ask spreads for Fund shares.
MARKET RISK. Market risk is the risk that a particular security owned by the Fund or shares of the Fund in general may fall in value. Securities are subject to market fluctuations caused by such factors as economic, political, regulatory or market developments, changes in interest rates and perceived trends in securities prices. Shares of the Fund could decline in value or underperform other investments.
MUNICIPAL LEASE OBLIGATIONS RISK. Participation interests in municipal leases pose special risks because many leases and contracts contain “non-appropriation” clauses that provide that the governmental issuer has no obligation to make future payments under the lease or contract unless money is appropriated for this purpose by the appropriate legislative body.
MUNICIPAL SECURITIES MARKET LIQUIDITY RISK. Inventories of Municipal Securities held by brokers and dealers have decreased in recent years, lessening their ability to make a market in these securities. This reduction in market making capacity has the potential to decrease the Fund’s ability to buy or sell Municipal Securities, and increase price volatility and trading costs, particularly during periods of economic or market stress. As a result, the Fund may be forced to accept a lower price to sell a Municipal Security, to sell other securities to raise cash, or to give up an investment opportunity, any of which could have a negative effect on performance.
NEW FUND RISK. The Fund currently has fewer assets than larger funds, and like other relatively new funds, large inflows and outflows may impact the Fund’s market exposure for limited periods of time. This impact may be positive or negative, depending on the direction of market movement during the period affected. Also, during the initial invest-up period, the Fund may depart from its principal investment strategies and invest a larger amount or all of its assets in cash equivalents or it may hold cash.
NON-DIVERSIFICATION RISK. The Fund is classified as “non-diversified” under the 1940 Act. As a result, the Fund is only limited as to the percentage of its assets which may be invested in the securities of any one issuer by the diversification requirements imposed by the Internal Revenue Code of 1986, as amended. The Fund may invest a relatively high percentage of its assets in a limited number of issuers. As a result, the Fund may be more susceptible to a single adverse economic or regulatory occurrence affecting one or more of these issuers, experience increased volatility and be highly invested in certain issuers.
POLITICAL AND ECONOMIC RISK. The values of Municipal Securities held by the Fund may be adversely affected by local political and economic conditions and developments. Adverse conditions in an industry significant to a local economy could have a
|
| Additional Information (Continued) |
First Trust California Municipal High Income ETF (FCAL)
January 31, 2018 (Unaudited)
correspondingly adverse effect on the financial condition of local issuers. Because the Fund primarily purchases municipal bonds from California or U.S. territories, such as Puerto Rico, the Fund is more susceptible to adverse economic, political or regulatory changes affecting municipal bond issuers in those locations.
PRE-REFUNDED BONDS RISK. Pre-refunded bonds are bonds that have been refunded to a call date prior to the final maturity of principal, or, in the case of pre-refunded bonds commonly referred to as “escrowed-to-maturity bonds,” to the final maturity of principal, and remain outstanding in the municipal market. The payment of principal and interest of the pre-refunded bonds held by the Fund is funded from securities held in a designated escrow account where such securities are obligations of and carry the full faith and credit of the U.S. Treasury. The securities held in the escrow fund pledged to pay the principal and interest of the pre-refunded bond do not guarantee the price of the bond. Investment in pre-refunded municipal bonds held by the Fund may subject the Fund to interest rate risk, market risk and credit risk. In addition, while a secondary market exists for pre-refunded municipal bonds, if the Fund sells pre-refunded municipal bonds prior to maturity, the price received may be more or less than the original cost, depending on market conditions at the time of sale.
PRIVATE ACTIVITY BONDS RISK. Municipalities and other public authorities issue private activity bonds to finance development of industrial facilities for use by a private enterprise. The private enterprise pays the principal and interest on the bond and the issuing authority ordinarily does not pledge its full faith, credit and taxing power for repayment. The private enterprise can have a substantially different credit profile than the municipality or public authority. The private activity bonds in which the Fund may invest may be negatively impacted by conditions affecting either the general credit of the use of the private activity project or the project itself. The Fund’s private activity bond holdings also may pay interest subject to the alternative minimum tax.
PUERTO RICAN MUNICIPAL SECURITIES RISK. The Fund may invest in bonds of municipal issuers located in Puerto Rico. Adverse market, political, economic or other conditions or developments within Puerto Rico may negatively affect the value of the Fund’s holdings in Puerto Rican municipal obligations. The Puerto Rican economy is reliant on manufacturing, services and tourism, and its economy and financial operations parallel the economic cycles of the United States. Economic difficulties in the United States are likely to have an adverse impact on the overall economy of Puerto Rico. Moreover, like many other U.S. states and municipalities, Puerto Rico experienced a significant downturn during the recent recession. Puerto Rico continues to face significant fiscal challenges, including persistent government deficits, underfunded public pension benefit obligations, underfunded government retirement systems, sizable debt service obligations and a high unemployment rate. In Addition, in September 2017, Puerto Rico was severely impacted by two hurricanes. The widespread destruction caused by these hurricanes will continue to stress government securities, and greater risk of default (or additional defaults) for Puerto Rican municipal securities, and consequently may adversely affect the value of the Fund’s investment in Puerto Rico and the Fund’s investment performance.
SMALL FUND RISK. The Fund currently has fewer assets than larger funds, and like other relatively new funds, large inflows and outflows may impact the Fund’s market exposure for limited periods of time. This impact may be positive or negative, depending on the direction of market movement during the period affected.
STATE-SPECIFIC AND U.S. TERRITORIES’ CONCENTRATION RISK. The Fund will be less diversified geographically than a fund investing across many states and therefore has greater exposure to adverse economic and political changes in California and Puerto Rico.
TAX RISK. Interest income from Municipal Securities is normally not subject to regular federal income tax and California income tax, but income from Municipal Securities held by the Fund could be declared taxable because of, among other things, unfavorable changes in tax laws, adverse interpretations by the Internal Revenue Service or state tax authorities or noncompliant conduct of a bond issuer. Consequently, the attractiveness of Municipal Securities in relation to other investment alternatives is affected by changes in federal and state income tax rates or changes in the tax-exempt status of interest income from Municipal Securities.
TRADING ISSUES RISK. Although the shares of the Fund are listed for trading on Nasdaq, there can be no assurance that an active trading market for such shares will develop or be maintained. Trading in shares on Nasdaq may be halted due to market conditions or for reasons that, in the view of Nasdaq, make trading in shares inadvisable. In addition, trading in shares on Nasdaq is subject to trading halts caused by extraordinary market volatility pursuant to Nasdaq “circuit breaker” rules. Market makers are under no obligation to make a market in the Fund’s shares, and authorized participants are not obligated to submit purchase or redemption orders for Creation Units. There can be no assurance that the requirements of Nasdaq necessary to maintain the listing of the Fund will continue to be met or will remain unchanged. In particular, if the Fund does not comply with any provision of the Nasdaq rule change pursuant to Rule 19b-4 under the Securities Exchange Act of 1934, as amended (the “1934 Act”), approved by the SEC, and cannot bring itself into compliance within a reasonable period after discovering the matter, Nasdaq may remove the shares of the Fund from listing. The Fund may have difficulty maintaining its listing on Nasdaq in the event the Fund’s assets are small or the Fund does not have enough shareholders.
|
|
| This page intentionally left blank |
|
|
| This page intentionally left blank |

First Trust Exchange-Traded Fund III
INVESTMENT ADVISOR
First Trust Advisors L.P.
120 E. Liberty Drive, Suite 400
Wheaton, IL 60187
ADMINISTRATOR, CUSTODIAN,
FUND ACCOUNTANT &
TRANSFER AGENT
Brown Brothers Harriman & Co.
50 Post Office Square
Boston, MA 02110
INDEPENDENT REGISTERED
PUBLIC ACCOUNTING FIRM
Deloitte & Touche LLP
111 S. Wacker Drive
Chicago, IL 60606
LEGAL COUNSEL
Chapman and Cutler LLP
111 W. Monroe Street
Chicago, IL 60603
| | | | | | |
First Trust Exchange-Traded Fund III | |
|
| | | | |
| | | First Trust Municipal High Income ETF (FMHI) | | |
| | | | |
Semi-Annual Report For the Period November 1, 2017 (Commencement of Operations) through January 31, 2018 | | |
First Trust Municipal High Income ETF (FMHI)
Semi-Annual Report
January 31, 2018
Caution Regarding Forward-Looking Statements
This report contains certain forward-looking statements within the meaning of the Securities Act of 1933, as amended, and the Securities Exchange Act of 1934, as amended. Forward-looking statements include statements regarding the goals, beliefs, plans or current expectations of First Trust Advisors L.P. (“First Trust” or the “Advisor”) and its representatives, taking into account the information currently available to them. Forward-looking statements include all statements that do not relate solely to current or historical fact. For example, forward-looking statements include the use of words such as “anticipate,” “estimate,” “intend,” “expect,” “believe,” “plan,” “may,” “should,” “would” or other words that convey uncertainty of future events or outcomes.
Forward-looking statements involve known and unknown risks, uncertainties and other factors that may cause the actual results, performance or achievements of the series of First Trust Exchange-Traded Fund III (the “Trust”) described in this report (First Trust Municipal High Income ETF; hereinafter referred to as the “Fund”) to be materially different from any future results, performance or achievements expressed or implied by the forward-looking statements. When evaluating the information included in this report, you are cautioned not to place undue reliance on these forward-looking statements, which reflect the judgment of the Advisor and its representatives only as of the date hereof. We undertake no obligation to publicly revise or update these forward-looking statements to reflect events and circumstances that arise after the date hereof.
Performance and Risk Disclosure
There is no assurance that the Fund will achieve its investment objectives. The Fund is subject to market risk, which is the possibility that the market values of securities owned by the Fund will decline and that the value of the Fund shares may therefore be less than what you paid for them. Accordingly, you can lose money by investing in the Fund. See “Risk Considerations” in the Additional Information section of this report for a discussion of certain other risks of investing in the Fund.
Performance data quoted represents past performance, which is no guarantee of future results, and current performance may be lower or higher than the figures shown. For the most recent month-end performance figures, please visit www.ftportfolios.com or speak with your financial advisor. Investment returns, net asset value and share price will fluctuate and Fund shares, when sold, may be worth more or less than their original cost.
The Advisor may also periodically provide additional information on Fund performance on the Fund’s web page at www.ftportfolios.com.
How to Read This Report
This report contains information that may help you evaluate your investment in the Fund. It includes details about the Fund’s portfolio and presents data and analysis that provide insight into the Fund’s performance and investment approach.
The statistical information that follows may help you understand the Fund’s performance compared to that of relevant market benchmarks.
It is important to keep in mind that the opinions expressed by personnel of the Advisor are just that: informed opinions. They should not be considered to be promises or advice. The opinions, like the statistics, cover the period through the date on the cover of this report. The material risks of investing in the Fund are spelled out in the prospectus, the statement of additional information, this report and other Fund regulatory filings.
First Trust Municipal High Income ETF (FMHI)
Semi-Annual Letter from the Chairman and CEO
January 31, 2018
Dear Shareholders,
First Trust is pleased to provide you with the semi-annual report for the First Trust Municipal High Income ETF (the “Fund”). This report contains detailed information about your investment since the Fund’s November 1, 2017 inception to January 31, 2018, and includes a market overview and a performance analysis for the period. We encourage you to read this report carefully and discuss it with your financial advisor.
As you are no doubt aware, 2017 was a very strong year for U.S. markets. The three major indices – the S&P 500® Index, the Dow Jones Industrial Average and the Nasdaq Composite – posted their best performance since 2013. While these are equity-based indexes, they are the typical measures of the market for investors and managers.
The Fund, as you know, invests in municipal debt securities, so we want to recap this market for you. During December 2017, municipal bond issuance reached a record number ($64 billion in new issues versus the previous two Decembers of a total of $22 billion in new bond issuance). Despite all this new issue volume, municipal bonds were able to generate positive total returns during the fourth quarter of 2017, which were substantially higher than the returns on U.S. Treasury Bonds (1.29% for municipal bonds versus 0.05% for U.S. Treasury Bonds). In regard to the Fund, we are pleased at its price stability since it was brought to market. At inception, the Fund had a net asset value (“NAV”) of $50.00. On January 31, 2018, the Fund’s NAV was $50.04.
As 2017 ended, President Trump signed the “Tax Cuts and Jobs Act” tax reform bill. This action by the President was viewed as making good on his earlier campaign promise to accomplish sweeping tax reform and the hope is that this bill will boost economic activity to greater highs. As 2018 began, there was much enthusiasm for the tax reform package and the potential increase in take-home pay for many Americans, as well as the reduction in the federal corporate tax rate from 35% to 21%.
Going forward, many investors will be watching the Federal Reserve and its signaled intention to continue raising interest rates at a gradual pace. We believe municipal bonds remain an important part of a diversified portfolio for high net worth and high wage earners, especially in high state income tax states. Municipal credit quality remains stable, and, in our view, the likelihood of much lower new issue supply in 2018 should help municipal bonds relative to other fixed-income asset classes regardless of what happens to interest rates. The Fund’s Portfolio Managers continue to structure our portfolios defensively, choosing strategies that they believe will benefit from yield curve positioning, bond structure and positive credit fundamentals.
At First Trust, we are optimistic about the U.S. economy. The S&P 500® Index began the year with a strong start, returning over 7.5% during the period from January 2 to January 26. We also continue to believe that you should invest for the long term and be prepared for market volatility, which can happen at any time. This can be accomplished by keeping current on your portfolio and investing goals and by speaking regularly with your investment professional. It’s important to keep in mind that past performance of the U.S. and global stock markets or investment products can never guarantee future results. As we’ve said before, markets go up and they also go down, but savvy investors are prepared for either through careful attention to their portfolios and investment goals.
Thank you for giving First Trust the opportunity to be a part of your financial plan through your investment. We value our relationship with you and will report on your investment again in six months.
Sincerely,
James A. Bowen
Chairman of the Board of Trustees
Chief Executive Officer of First Trust Advisors L.P.
|
Fund Performance Overview (Unaudited) |
First Trust Municipal High Income ETF (FMHI)
The primary investment objective of the First Trust Municipal High Income ETF (the “Fund”) is to seek to provide federally tax-exempt income, and its secondary objective is long-term capital appreciation. Under normal market conditions, the Fund seeks to achieve its investment objectives by investing at least 80% of its net assets (including investment borrowings) in municipal debt securities that pay interest that is exempt from regular federal income taxes (“Municipal Securities”). Municipal Securities are generally issued by or on behalf of states, territories or possessions of the U.S. and the District of Columbia and their political subdivisions, agencies, authorities and other instrumentalities. The Fund invests at least 50% of its net assets in Municipal Securities that are, at the time of investment, rated below investment grade by at least one nationally recognized statistical rating organization, commonly referred to as “high yield” or “junk” bonds. The Fund lists and principally trades its shares on The Nasdaq Stock Market LLC under the ticker symbol “FMHI.”
| | | | | | | | | | | | |
| | | | | | | Cumulative
Total Returns |
| | | | | | | Inception (11/1/17) to 1/31/18 |
Fund Performance | | | | | | | | | | | | |
NAV | | | | | | | | | | | | 0.65% |
Market Value | | | | | | | | | | | | 0.53% |
Index Performance | | | | | | | | | | | | |
Blended Benchmark(1) | | | | | | | | | | | | -0.37% |
Total returns for the period since inception are calculated from the inception date of the Fund. “Cumulative Total Returns” represent the total change in value of an investment over the periods indicated.
The Fund’s per share net asset value (“NAV”) is the value of one share of the Fund and is computed by dividing the value of all assets of the Fund (including accrued interest and dividends), less all liabilities (including accrued expenses and dividends declared but unpaid), by the total number of outstanding shares. The price used to calculate market return (“Market Price”) is determined by using the midpoint between the highest bid and the lowest offer on the stock exchange on which shares of the Fund are listed for trading as of the time that the Fund’s NAV is calculated. Since shares of the Fund did not trade in the secondary market until after its inception, for the period from inception to the first day of secondary market trading in shares of the Fund, the NAV of the Fund is used as a proxy for the secondary market trading price to calculate market returns. NAV and market returns assume that all distributions have been reinvested in the Fund at NAV and Market Price, respectively.
An index is a statistical composite that tracks a specified financial market or sector. Unlike the Fund, the indices that make up the Blended Benchmark do not actually hold a portfolio of securities and therefore do not incur the expenses incurred by the Fund. These expenses negatively impact the performance of the Fund. Also, market returns do not include brokerage commissions that may be payable on secondary market transactions. If brokerage commissions were included, market returns would be lower. The total returns presented reflect the reinvestment of dividends on securities in each index. The returns presented do not reflect the deduction of taxes that a shareholder would pay on Fund distributions or the redemption or sale of Fund shares. The investment return and principal value of shares of the Fund will vary with changes in market conditions. Shares of the Fund may be worth more or less than their original cost when they are redeemed or sold in the market. The Fund’s past performance is no guarantee of future performance.
| (1) | The Blended Benchmark consists of the following two indexes: 50% of the Bloomberg Barclays 10-Year Municipal Index (8-12 years) which is comprised of bonds with a final maturity between 8 and 12 years that are part of the Bloomberg Barclays Municipal Bond High Yield Index; and 50% of the Bloomberg Barclays Revenue 10-Year Municipal Index (8-12 years), which is comprised of revenue bonds that have a final maturity between 8 and 12 years that are part of the Bloomberg Barclays Municipal Bond Index. Indexes do not charge management fees or brokerage expenses, and no such fees or expenses were deducted from the index performance shown. Indexes are unmanaged and an investor cannot invest directly in an index. |
|
Fund Performance Overview (Unaudited) (Continued) |
First Trust Municipal High Income ETF (FMHI) (Continued)
| | | | | |
| |
Sector Allocation | | % of Total
Investments
(including cash) |
Continuing Care Retirement Communities | | | | 18.0% | |
Education | | | | 12.1 | |
Hospital | | | | 11.1 | |
Government Obligation Bonds - Unlimited Tax | | | | 8.0 | |
Special Assessment | | | | 6.6 | |
Local Housing | | | | 5.9 | |
Government Obligation Bond - Limited Tax | | | | 5.1 | |
Student Housing | | | | 4.1 | |
Tobacco | | | | 4.0 | |
Industrial Development Bond | | | | 2.8 | |
Dedicated Tax | | | | 2.6 | |
Other Health | | | | 2.6 | |
Toll Road | | | | 2.6 | |
Certificates of Participation | | | | 2.6 | |
Higher Education | | | | 2.0 | |
Gas | | | | 1.7 | |
Insured | | | | 1.7 | |
Water & Sewer | | | | 1.1 | |
Port | | | | 0.6 | |
Cash | | | | 4.8 | |
Net Assets | | | | 100.0% | |
| | | | | |
| | | | | |
| |
Credit Rating(2) | | % of Total
Investments
(including cash) |
AA | | | | 2.7% | |
A | | | | 11.4 | |
BBB | | | | 17.1 | |
BB | | | | 19.1 | |
B | | | | 2.7 | |
Not Rated | | | | 42.2 | |
Cash | | | | 4.8 | |
Total | | | | 100.0% | |
| | | | | |
| | | | |
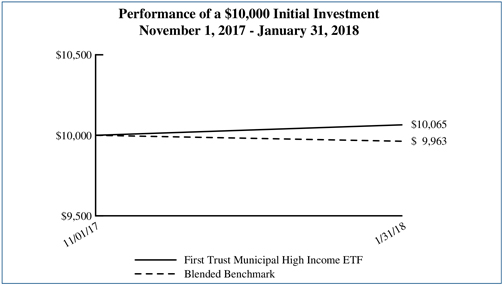 | | | | |
| | | | Performance figures assume reinvestment of all distributions and do not reflect the deduction of taxes that a shareholder would pay on Fund distributions or the redemption or sale of Fund shares. An index is a statistical composite that tracks a specified financial market or sector. Unlike the Fund, the index does not actually hold a portfolio of securities and therefore does not incur the expenses incurred by the Fund. These expenses negatively impact the performance of the Fund. The Fund’s past performance does not predict future performance. |
| (2) | The credit quality and ratings information presented above reflects the ratings assigned by one or more nationally recognized statistical rating organizations (NRSROs), including Standard & Poor’s Ratings Group, a division of the McGraw Hill Companies, Inc., Moody’s Investors Service, Inc., Fitch Ratings or a comparably rated NRSRO. For situations in which a security is rated by more than one NRSRO and the ratings are not equivalent, the highest rating is used. Sub-investment grade ratings are those rated BB+/Ba1 or lower. Investment grade ratings are those rated BBB-/Baa3 or higher. The credit ratings shown relate to the creditworthiness of the issuers of the underlying securities in the Fund, and not to the Fund or its shares. Credit ratings are subject to change. |
|
Fund Performance Overview (Unaudited) (Continued) |
First Trust Municipal High Income ETF (FMHI) (Continued)
Frequency Distribution of Discounts and Premiums
Bid/Ask Midpoint vs. NAV through January 31, 2018
The following Frequency Distribution of Discounts and Premiums charts are provided to show the frequency at which the bid/ask midpoint price for the Fund was at a discount or premium to the daily NAV. The following tables are for comparative purposes only and represent the period November 2, 2017 (commencement of trading) through January 31, 2018. Shareholders may pay more than NAV when they buy Fund shares and receive less than NAV when they sell those shares because shares are bought and sold at current market price. Data presented represents past performance and cannot be used to predict future results.
| | | | | | | | |
| | | Number of Days Bid/Ask Midpoint At/Above NAV | | |
For the Period | | 0.00%–0.49% | | 0.50%–0.99% | | 1.00%–1.99% | | >=2.00% |
11/2/17 – 1/31/18 | | 7 | | 0 | | 0 | | 0 |
| | | Number of Days Bid/Ask Midpoint Below NAV | | |
For the Period | | 0.00%–0.49% | | 0.50%–0.99% | | 1.00%–1.99% | | >=2.00% |
11/2/17 – 1/31/18 | | 54 | | 1 | | 0 | | 0 |
First Trust Municipal High Income ETF (FMHI)
Semi-Annual Report
January 31, 2018 (Unaudited)
Advisor
First Trust Advisors L.P. (“First Trust”) is the investment advisor to the First Trust Municipal High Income ETF (the “Fund”). First Trust is responsible for the ongoing monitoring of the Fund’s investment portfolio, managing the Fund’s business affairs and providing certain administrative services necessary for the management of the Fund.
Portfolio Management Team
Tom Futrell, CFA, Senior Vice President, Senior Portfolio Manager
Johnathan N. Wilhelm, Senior Vice President, Senior Portfolio Manager
The First Trust Municipal Securities Team was formed in September of 2013 and is headed by Tom Futrell, CFA and Johnathan Wilhelm who serve as senior portfolio managers of the Fund. Messrs. Futrell and Wilhelm have a combined 50+ years of investment experience and prior to joining First Trust, served as portfolio managers of municipal bonds at Nuveen Investments and Performance Trust Investment Advisors. In addition to the Fund, the Team manages/consults for a variety of First Trust investment portfolios and separately managed accounts.
First Trust Municipal High Income ETF (FMHI)
Understanding Your Fund Expenses
January 31, 2018 (Unaudited)
As a shareholder of the First Trust Municipal High Income ETF (the “Fund”), you incur two types of costs: (1) transaction costs; and (2) ongoing costs, including management fees, distribution and/or service (12b-1) fees, if any, and other Fund expenses. This Example is intended to help you understand your ongoing costs of investing in the Fund and to compare these costs with the ongoing costs of investing in other funds.
The Example is based on an investment of $1,000 invested at the beginning of the period (or since inception) and held through the six-month (or shorter) period ended January 31, 2018.
Actual Expenses
The first line in the following table provides information about actual account values and actual expenses. You may use the information in this line, together with the amount you invested, to estimate the expenses that you paid over the period. Simply divide your account value by $1,000 (for example, an $8,600 account value divided by $1,000 = 8.6), then multiply the result by the number in the first line under the heading entitled “Expenses Paid During the Six-Month Period” to estimate the expenses you paid on your account during this six-month period.
Hypothetical Example for Comparison Purposes
The second line in the following table provides information about hypothetical account values and hypothetical expenses based on the Fund’s actual expense ratio and an assumed rate of return of 5% per year before expenses, which is not the Fund’s actual return. The hypothetical account values and expenses may not be used to estimate the actual ending account balance or expenses you paid for the period. You may use this information to compare the ongoing costs of investing in the Fund and other funds. To do so, compare this 5% hypothetical example with the 5% hypothetical examples that appear in the shareholder reports of the other funds.
Please note that the expenses shown in the table are meant to highlight your ongoing costs only and do not reflect any transactional costs such as brokerage commissions. Therefore, the second line in the table is useful in comparing ongoing costs only, and will not help you determine the relative total costs of owning different funds. In addition, if these transactional costs were included, your costs would have been higher.
| | | | | | | | | | | | | | | | | | | | |
| | | Beginning
Account Value
November 1, 2017 (a) | | Ending
Account Value
January 31, 2018 | | Annualized
Expense Ratio
Based on the
Number of Days
In the Period | | Expenses Paid
During the Period
November 1, 2017 (a)
to
January 31, 2018 (b) |
First Trust Municipal High Income ETF (FMHI) | | | | | | | | | | | | | | | | | | | | |
Actual | | | | $1,000.00 | | | | | $1,006.50 | | | | | 0.55% | | | | | $1.38 | |
Hypothetical (5% return before expenses) | | | | $1,000.00 | | | | | $1,022.43 | | | | | 0.55% | | | | | $2.80 | |
| (b) | Actual expenses are equal to the annualized expense ratio, multiplied by the average account value over the period (November 1, 2017 through January 31, 2018) multiplied by 91/365. Hypothetical expenses are assumed for the most recent half-year period. |
First Trust Municipal High Income ETF (FMHI)
Portfolio of Investments
January 31, 2018 (Unaudited)
| | | | | | | | | | | | | | | | |
Principal Value | | | Description | | Stated
Coupon | | | Stated
Maturity | | | Value | |
| | MUNICIPAL BONDS – 94.6% | |
| | | | Arizona – 4.8% | | | | | | | | | | | | |
| | $ 400,000 | | | Pima Cnty AZ Indl Dev Auth Edu Rev Fac American Leadership Academy Proj (a) | | | 4.00% | | | | 06/15/22 | | | $ | 406,240 | |
| | 345,000 | | | Tempe AZ Indl Dev Auth Rev Mirabella at ASU Proj, Ser A (a) | | | 5.50% | | | | 10/01/27 | | | | 349,068 | |
| | 200,000 | | | Tempe AZ Indl Dev Auth Rev Mirabella at ASU Proj, Ser A (a) | | | 6.00% | | | | 10/01/37 | | | | 205,590 | |
| | | | | | | | | | | | | | | | |
| | | | | | | | | | | | | | | 960,898 | |
| | | | | | | | | | | | | | | | |
| | | | California – 1.6% | | | | | | | | | | | | |
| | 160,000 | | | Cathedral City CA Redev Agy Successor Agy Tax Allocation Rev Ref Hsg Merged Redev Proj Area, Ser B, AGM | | | 5.00% | | | | 08/01/32 | | | | 180,677 | |
| | 145,000 | | | Golden St Tobacco Securitization Corp CA Tobacco Settlement Asset Bkd Sr, Ser A-1 | | | 5.00% | | | | 06/01/33 | | | | 145,583 | |
| | | | | | | | | | | | | | | | |
| | | | | | | | | | | | | | | 326,260 | |
| | | | | | | | | | | | | | | | |
| | | | Colorado – 6.4% | | | | | | | | | | | | |
| | 275,000 | | | Southlands CO Met Dist #1 Ref, Ser A-1 | | | 3.00% | | | | 12/01/22 | | | | 274,378 | |
| | 500,000 | | | St Vrain Lakes Met Dist No 2 Sr, Ser A (b) | | | 5.00% | | | | 12/01/37 | | | | 498,705 | |
| | 500,000 | | | Whispering Pines Met Dist #1 CO, Ser A (b) | | | 5.00% | | | | 12/01/37 | | | | 506,105 | |
| | | | | | | | | | | | | | | | |
| | | | | | | | | | | | | | | 1,279,188 | |
| | | | | | | | | | | | | | | | |
| | | | Connecticut – 2.0% | | | | | | | | | | | | |
| | 100,000 | | | CT St Hlth & Eductnl Facs Auth Rev Ref Sacred Heart Univ Issue, Ser I-1 | | | 5.00% | | | | 07/01/29 | | | | 116,831 | |
| | 250,000 | | | CT St Hlth & Eductnl Facs Auth Rev Ref Sacred Heart Univ Issue, Ser I-1 | | | 5.00% | | | | 07/01/33 | | | | 286,322 | |
| | | | | | | | | | | | | | | | |
| | | | | | | | | | | | | | | 403,153 | |
| | | | | | | | | | | | | | | | |
| | | | Florida – 5.4% | | | | | | | | | | | | |
| | 330,000 | | | Capital Trust Agy FL Eductnl Facs Rev Viera Chrt Schs Inc Proj, Ser A (a) | | | 4.00% | | | | 10/15/29 | | | | 320,954 | |
| | 260,000 | | | Capital Trust Agy FL Eductnl Facs Rev Viera Chrt Schs Inc Proj, Ser A (a) | | | 5.00% | | | | 10/15/37 | | | | 261,971 | |
| | 500,000 | | | Six Mile Creek FL CDD Capital Impt Rev Ref Assmnt Area 2 Phase 2, Ser B | | | 5.35% | | | | 11/01/29 | | | | 491,630 | |
| | | | | | | | | | | | | | | | |
| | | | | | | | | | | | | | | 1,074,555 | |
| | | | | | | | | | | | | | | | |
| | | | Georgia – 0.3% | | | | | | | | | | | | |
| | 55,000 | | | Fulton Cnty GA Rsdl Care Facs Elderly Auth Retmnt Fac Rev Ref Lenbrook Sq Fdtn Inc | | | 5.00% | | | | 07/01/31 | | | | 61,273 | |
| | | | | | | | | | | | | | | | |
| | | | Hawaii – 1.1% | | | | | | | | | | | | |
| | 200,000 | | | Honolulu City & Cnty HI Wstwtr Sys Rev Ref Junior, Ser A | | | 5.00% | | | | 07/01/20 | | | | 215,740 | |
| | | | | | | | | | | | | | | | |
| | | | Idaho – 5.3% | | | | | | | | | | | | |
| | 500,000 | | | ID St Hlth Facs Auth Rev Ref Madison Memorial Hosp | | | 5.00% | | | | 09/01/37 | | | | 534,500 | |
| | 300,000 | | | ID St Hlth Facs Auth Rev Ref Vly Vista Care Corp, Ser A | | | 4.00% | | | | 11/15/27 | | | | 307,011 | |
| | 200,000 | | | ID St Hlth Facs Auth Rev Ref Vly Vista Care Corp, Ser A | | | 5.00% | | | | 11/15/32 | | | | 210,096 | |
| | | | | | | | | | | | | | | | |
| | | | | | | | | | | | | | | 1,051,607 | |
| | | | | | | | | | | | | | | | |
| | | | Illinois – 11.9% | | | | | | | | | | | | |
| | 100,000 | | | Chicago IL Brd Of Edu Ref Dedicated, Ser C | | | 5.00% | | | | 12/01/30 | | | | 104,741 | |
| | 605,000 | | | Chicago IL Brd Of Edu Ref, Ser C | | | 5.00% | | | | 12/01/28 | | | | 607,305 | |
| | 20,000 | | | Chicago IL Ref, Ser C | | | 5.00% | | | | 01/01/25 | | | | 21,140 | |
| | 75,000 | | | Chicago IL Ref, Ser C, CABS | | | (c) | | | | 01/01/25 | | | | 55,624 | |
| | 250,000 | | | IL St Fin Auth Chrt Sch Rev Ref & Impt Chicago Intl Chrt Sch Proj | | | 5.00% | | | | 12/01/30 | | | | 269,720 | |
| | | | |
| | See Notes to Financial Statements | | Page 7 |
First Trust Municipal High Income ETF (FMHI)
Portfolio of Investments (Continued)
January 31, 2018 (Unaudited)
| | | | | | | | | | | | | | | | |
Principal
Value | | | Description | | Stated
Coupon | | | Stated
Maturity | | | Value | |
| | MUNICIPAL BONDS (Continued) | | | | | | | | | | | | |
| | | | Illinois (Continued) | | | | | | | | | | | | |
| | $ 250,000 | | | IL St Fin Auth Chrt Sch Rev Ref & Impt Chicago Intl Chrt Sch Proj | | | 5.00% | | | | 12/01/31 | | | $ | 268,670 | |
| | 250,000 | | | IL St Fin Auth Chrt Sch Rev Ref & Impt Chicago Intl Chrt Sch Proj | | | 5.00% | | | | 12/01/32 | | | | 267,623 | |
| | 230,000 | | | IL St Fin Auth Student Hsg & Academic Fac Rev Chf Chicago LLC Univ IL Chicago Proj, Ser A | | | 5.00% | | | | 02/15/26 | | | | 257,227 | |
| | 500,000 | | | IL St, Ser D | | | 5.00% | | | | 11/01/25 | | | | 535,060 | |
| | | | | | | | | | | | | | | | |
| | | | | | | | | | | | | | | 2,387,110 | |
| | | | | | | | | | | | | | | | |
| | | | Indiana – 3.4% | | | | | | | | | | | | |
| | 700,000 | | | Terre Haute IN Mf Hsg Rev Silver Birch Of Terre Haute Proj | | | 5.10% | | | | 01/01/32 | | | | 681,611 | |
| | | | | | | | | | | | | | | | |
| | | | Massachusetts – 3.4% | | | | | | | | | | | | |
| | 620,000 | | | MA St Dev Fin Agy Rev Ref Lawrence General Hosp | | | 5.00% | | | | 07/01/26 | | | | 687,735 | |
| | | | | | | | | | | | | | | | |
| | | | Minnesota – 5.3% | | | | | | | | | | | | |
| | 105,000 | | | Saint Paul MN Hsg & Redev Auth Chrt Sch Lease Rev Ref, Ser A | | | 5.00% | | | | 12/01/30 | | | | 114,557 | |
| | 500,000 | | | Saint Paul MN Hsg & Redev Auth Mf Hsg Rev Pioneer Press Apts Proj, Ser B (a) | | | 3.38% | | | | 11/01/20 | | | | 497,970 | |
| | 185,000 | | | W Saint Paul MN Hsg & Hlth Care Facs Rev Ref Walker Westwood Ridge Campus Proj | | | 3.65% | | | | 11/01/26 | | | | 182,808 | |
| | 245,000 | | | W Saint Paul MN Hsg & Hlth Care Facs Rev Ref Walker Westwood Ridge Campus Proj | | | 5.00% | | | | 11/01/37 | | | | 255,525 | |
| | | | | | | | | | | | | | | | |
| | | | | | | | | | | | | | | 1,050,860 | |
| | | | | | | | | | | | | | | | |
| | | | Nevada – 1.8% | | | | | | | | | | | | |
| | 315,000 | | | Carson City NV Hosp Rev Ref Carson Tahoe Regl Med Ctr, Ser A | | | 5.00% | | | | 09/01/25 | | | | 363,425 | |
| | | | | | | | | | | | | | | | |
| | | | New Jersey – 4.5% | | | | | | | | | | | | |
| | 500,000 | | | NJ St Econ Dev Auth Ref, Ser A | | | 4.13% | | | | 06/15/26 | | | | 516,185 | |
| | 100,000 | | | NJ St Econ Dev Auth Spl Fac Rev Ref Port Newark Container Terminal LLC Proj, AMT | | | 5.00% | | | | 10/01/25 | | | | 112,505 | |
| | 275,000 | | | Tobacco Settlement Fing Corp NJ, Ser 1A | | | 4.75% | | | | 06/01/34 | | | | 271,296 | |
| | | | | | | | | | | | | | | | |
| | | | | | | | | | | | | | | 899,986 | |
| | | | | | | | | | | | | | | | |
| | | | North Carolina – 1.0% | | | | | | | | | | | | |
| | 175,000 | | | NC St Med Care Commission Retmnt Facs Rev Ref United Methodist Retmnt Homes, Ser A | | | 5.00% | | | | 10/01/27 | | | | 197,633 | |
| | | | | | | | | | | | | | | | |
| | | | Ohio – 4.7% | | | | | | | | | | | | |
| | 400,000 | | | Buckeye OH Tobacco Settlement Fing Auth Asset Bkd Sr Turbo, Ser A-2 | | | 5.37% | | | | 06/01/24 | | | | 386,344 | |
| | 550,000 | | | OH St Air Quality Dev Auth Exempt Facs Rev Pratt Paper OH LLC Proj, AMT (a) | | | 3.78% | | | | 01/15/28 | | | | 553,635 | |
| | | | | | | | | | | | | | | | |
| | | | | | | | | | | | | | | 939,979 | |
| | | | | | | | | | | | | | | | |
| | | | Oklahoma – 0.7% | | | | | | | | | | | | |
| | 125,000 | | | Comanche Cnty OK Hosp Auth Rev Ref | | | 5.00% | | | | 07/01/29 | | | | 131,140 | |
| | | | | | | | | | | | | | | | |
| | | | Oregon – 0.2% | | | | | | | | | | | | |
| | 40,000 | | | Multnomah Cnty OR Hosp Facs Auth Rev Ref Terwilliger Plaza | | | 5.00% | | | | 12/01/20 | | | | 42,305 | |
| | | | | | | | | | | | | | | | |
| | | | Pennsylvania – 7.4% | | | | | | | | | | | | |
| | 440,000 | | | Lancaster Cnty PA Hosp Auth Ref United Zion Retmnt Cmnty, Ser A | | | 5.00% | | | | 12/01/32 | | | | 458,973 | |
| | 500,000 | | | Montgomery Cnty PA Indl Dev Auth Ref Acts Retmnt Life Cmntys Inc Oblig Grp | | | 5.00% | | | | 11/15/36 | | | | 561,105 | |
| | | | |
| Page 8 | | See Notes to Financial Statements | | |
First Trust Municipal High Income ETF (FMHI)
Portfolio of Investments (Continued)
January 31, 2018 (Unaudited)
| | | | | | | | | | | | | | | | |
Principal Value | | | Description | | Stated
Coupon | | | Stated
Maturity | | | Value | |
| | MUNICIPAL BONDS (Continued) | | | | | | | | | | | | |
| | | | Pennsylvania (Continued) | | | | | | | | | | | | |
| | $ 400,000 | | | PA St Turnpike Commission Turnpike Rev Ref 2Nd Ser Sub Tpk Rev | | | 5.00% | | | | 12/01/29 | | | $ | 461,760 | |
| | | | | | | | | | | | | | | | |
| | | | | | | | | | | | | | | 1,481,838 | |
| | | | | | | | | | | | | | | | |
| | | | Puerto Rico – 0.7% | | | | | | | | | | | | |
| | 145,000 | | | Puerto Rico Cmwlth Ref Pub Impt, Ser A, AGM | | | 5.00% | | | | 07/01/35 | | | | 148,450 | |
| | | | | | | | | | | | | | | | |
| | | | South Carolina – 2.6% | | | | | | | | | | | | |
| | 500,000 | | | SC St Jobs Econ Dev Auth Hlth Facs Rev Ref Lutheran Homes Of SC Inc | | | 5.00% | | | | 05/01/37 | | | | 526,440 | |
| | | | | | | | | | | | | | | | |
| | | | Tennessee – 4.3% | | | | | | | | | | | | |
| | 500,000 | | | Memphis Shelby Cnty TN Indl Dev Brd Econ Dev Growth Engine T Ref Sr Tax Incr Graceland Proj, Ser A | | | 5.50% | | | | 07/01/37 | | | | 523,920 | |
| | 300,000 | | | TN St Energy Acquisition Corp Gas Rev, Ser C | | | 5.00% | | | | 02/01/23 | | | | 335,775 | |
| | | | | | | | | | | | | | | | |
| | | | | | | | | | | | | | | 859,695 | |
| | | | | | | | | | | | | | | | |
| | | | Texas – 7.7% | | | | | | | | | | | | |
| | 50,000 | | | Centrl TX Regl Mobility Auth Rev Ref Sub Lien | | | 5.00% | | | | 01/01/33 | | | | 54,536 | |
| | 305,000 | | | Hackberry TX Spl Assmnt Contract Rev Ref Road Hidden Cove Impt Dist #2 Proj | | | 4.00% | | | | 09/01/26 | | | | 323,645 | |
| | 500,000 | | | Hackberry TX Spl Assmnt Rev Rivendale Lake Pub Impt Dist #2 Phases 4-6 Proj | | | 4.13% | | | | 09/01/27 | | | | 495,885 | |
| | 100,000 | | | New Hope Cultural Edu Facs Fin Corp TX Retmnt Fac Rev Ref Carillon Lifecare Cmnty Proj | | | 5.00% | | | | 07/01/36 | | | | 102,761 | |
| | 500,000 | | | New Hope Cultural Edu Facs Fin Corp TX Student Hsg Rev Chf TX A&M Univ Corpus Christi Island Campus Proj, Ser A | | | 5.00% | | | | 04/01/25 | | | | 564,005 | |
| | | | | | | | | | | | | | | | |
| | | | | | | | | | | | | | | 1,540,832 | |
| | | | | | | | | | | | | | | | |
| | | | Washington – 2.5% | | | | | | | | | | | | |
| | 500,000 | | | Grays Harbor Cnty WA Pub Hosp Dist #1 Hosp Rev Pub Hosp Dt, BANS | | | 3.00% | | | | 08/01/19 | | | | 500,315 | |
| | | | | | | | | | | | | | | | |
| | | | Wisconsin – 5.6% | | | | | | | | | | | | |
| | 500,000 | | | Pub Fin Auth WI Chrt Sch Rev Limited American Prep Academy Las Vegas Proj, Ser A (a) | | | 4.20% | | | | 07/15/27 | | | | 492,705 | |
| | 595,000 | | | Pub Fin Auth WI Retmnt Fac Rev Ref Whitestone Retmnt Facs 1st Mortgage Rev Bonds (a) | | | 4.00% | | | | 03/01/27 | | | | 628,873 | |
| | | | | | | | | | | | | | | | |
| | | | | | | | | | | | | | | 1,121,578 | |
| | | | | | | | | | | | | | | | |
| | | | Total Investments – 94.6% (Cost $18,968,812) (d) | | | | | | | | | | | 18,933,606 | |
| | | | Net Other Assets and Liabilities – 5.4% | | | | | | | | | | | 1,082,156 | |
| | | | | | | | | | | | | | | | |
| | | | Net Assets – 100.0% | | | | | | | | | | $ | 20,015,762 | |
| | | | | | | | | | | | | | | | |
| (a) | This security, sold within the terms of a private placement memorandum, is exempt from registration upon resale under Rule 144A under the Securities Act of 1933, as amended (the “1933 Act”), and may be resold in transactions exempt from registration, normally to qualified institutional buyers. Pursuant to procedures adopted by the Trust’s Board of Trustees, this security has been determined to be liquid by First Trust Advisors L.P. (“Advisor”). Although market instability can result in periods of increased overall market illiquidity, liquidity for each security is determined based on security specific factors and assumptions, which require subjective judgment. At January 31, 2018, securities noted as such amounted to $3,717,006 or 18.6% of net assets. |
| (b) | Pursuant to procedures adopted by the Trust’s Board of Trustees, this security has been determined to be illiquid by the Advisor. |
| | | | |
| | See Notes to Financial Statements | | Page 9 |
First Trust Municipal High Income ETF (FMHI)
Portfolio of Investments (Continued)
January 31, 2018 (Unaudited)
| (d) | Aggregate cost for financial reporting purposes approximates the aggregate cost for federal income tax purposes. As of January 31, 2018, the aggregate gross unrealized appreciation for all investments in which there was an excess of value over tax cost was $95,009 and the aggregate gross unrealized depreciation for all investments in which there was an excess of tax cost over value was $130,215. The net unrealized depreciation was $35,206. |
| | |
| AGM | | Assured Guaranty Municipal Corp. |
| AMT | | Alternative Minimum Tax |
| BANS | | Bond Anticipation Notes |
| CABS | | Capital Appreciation Bonds |
Valuation Inputs
A summary of the inputs used to value the Fund’s investments as of January 31, 2018 is as follows (see Note 2A - Portfolio Valuation in the Notes to Financial Statements):
| | | | | | | | |
| | | Total
Value at
1/31/2018 | | Level 1
Quoted
Prices | | Level 2
Significant
Observable
Inputs | | Level 3
Significant
Unobservable
Inputs |
| | |
Municipal Bonds* | | $ 18,933,606 | | $ — | | $ 18,933,606 | | $ — |
| | |
* See Portfolio of Investments for state breakout.
All transfers in and out of the Levels during the period are assumed to occur on the last day of the period at their current value. There were no transfers between Levels at January 31, 2018.
| | | | |
| Page 10 | | See Notes to Financial Statements | | |
First Trust Municipal High Income ETF (FMHI)
Statement of Assets and Liabilities
January 31, 2018 (Unaudited)
| | | | |
ASSETS: | | | | |
Investments, at value | | | | |
(Cost $18,968,812) | | $ | 18,933,606 | |
Cash | | | 947,409 | |
Receivables: | | | | |
Investment securities sold | | | 541,579 | |
Interest | | | 145,152 | |
| | | | |
Total Assets | | | 20,567,746 | |
| | | | |
| |
LIABILITIES: | | | | |
Payables: | | | | |
Investment securities purchased | | | 542,559 | |
Investment advisory fees | | | 9,425 | |
| | | | |
Total Liabilities | | | 551,984 | |
| | | | |
NET ASSETS | | $ | 20,015,762 | |
| | | | |
| |
NET ASSETS consist of: | | | | |
Paid-in capital | | $ | 20,016,100 | |
Par value | | | 4,000 | |
Accumulated net investment income (loss) | | | 9,581 | |
Accumulated net realized gain (loss) on investments | | | 21,287 | |
Net unrealized appreciation (depreciation) on investments | | | (35,206 | ) |
| | | | |
NET ASSETS | | $ | 20,015,762 | |
| | | | |
NET ASSET VALUE, per share | | $ | 50.04 | |
| | | | |
Number of shares outstanding (unlimited number of shares authorized, par value $0.01 per share) | | | 400,002 | |
| | | | |
| | | | |
| | See Notes to Financial Statements | | Page 11 |
First Trust Municipal High Income ETF (FMHI)
Statement of Operations
For the Period Ended January 31, 2018 (Unaudited)
| | | | |
INVESTMENT INCOME: | | | | |
Interest | | $ | 150,911 | |
| | | | |
Total investment income | | | 150,911 | |
| | | | |
| |
EXPENSES: | | | | |
Investment advisory fees | | | 34,783 | |
| | | | |
Total expenses | | | 34,783 | |
Fees waived by the investment advisor | | | (7,454 | ) |
| | | | |
Net expenses | | | 27,329 | |
| | | | |
NET INVESTMENT INCOME (LOSS) | | | 123,582 | |
| | | | |
| |
NET REALIZED AND UNREALIZED GAIN (LOSS): | | | | |
Net realized gain (loss) on investments | | | 21,287 | |
Net change in unrealized appreciation (depreciation) on investments | | | (35,206 | ) |
| | | | |
NET REALIZED AND UNREALIZED GAIN (LOSS) | | | (13,919 | ) |
| | | | |
NET INCREASE (DECREASE) IN NET ASSETS RESULTING FROM OPERATIONS | | $ | 109,663 | |
| | | | |
| | | | |
| Page 12 | | See Notes to Financial Statements | | |
First Trust Municipal High Income ETF (FMHI)
Statement of Changes in Net Assets
| | | | |
| | | Period Ended
1/31/2018
(Unaudited) (a) | |
| | | | |
OPERATIONS: | | | | |
Net investment income (loss) | | $ | 123,582 | |
Net realized gain (loss) | | | 21,287 | |
Net change in unrealized appreciation (depreciation) | | | (35,206 | ) |
| | | | |
Net increase (decrease) in net assets resulting from operations | | | 109,663 | |
| | | | |
| |
DISTRIBUTIONS TO SHAREHOLDERS FROM: | | | | |
Net investment income | | | (114,001 | ) |
| | | | |
Total distributions to shareholders | | | (114,001 | ) |
| | | | |
| |
SHAREHOLDER TRANSACTIONS: | | | | |
Proceeds from shares sold | | | 20,020,100 | |
| | | | |
Net increase (decrease) in net assets resulting from shareholder transactions | | | 20,020,100 | |
| | | | |
Total increase (decrease) in net assets | | | 20,015,762 | |
| |
NET ASSETS: | | | | |
Beginning of period | | | — | |
| | | | |
End of period | | $ | 20,015,762 | |
| | | | |
Accumulated net investment income (loss) at end of period | | $ | 9,581 | |
| | | | |
| |
CHANGES IN SHARES OUTSTANDING: | | | | |
Shares outstanding, beginning of period | | | — | |
Shares sold | | | 400,002 | |
| | | | |
Shares outstanding, end of period | | | 400,002 | |
| | | | |
| (a) | Inception date is November 1, 2017, which is consistent with the commencement of operations and is the date the initial creation units were established. |
| | | | |
| | See Notes to Financial Statements | | Page 13 |
First Trust Municipal High Income ETF (FMHI)
Financial Highlights
For a share outstanding throughout the period
| | | | |
| | | Period
Ended
1/31/2018 (a)
(Unaudited) | |
| | | | |
Net asset value, beginning of period | | $ | 50.00 | |
| | | | |
Income from investment operations: | | | | |
Net investment income (loss) | | | 0.31 | |
Net realized and unrealized gain (loss) | | | 0.02 | |
| | | | |
Total from investment operations | | | 0.33 | |
| | | | |
| |
Distributions paid to shareholders from: | | | | |
Net investment income | | | (0.29 | ) |
| | | | |
Net asset value, end of period | | $ | 50.04 | |
| | | | |
Total return (b) | | | 0.65 | % |
| |
Ratios to average net assets/supplemental data: | | | | |
Net assets, end of period (in 000’s) | | $ | 20,016 | |
Ratio of total expenses to average net assets | | | 0.70 | % (c) |
Ratio of net expenses to average net assets | | | 0.55 | % (c) |
Ratio of net investment income (loss) to average net assets | | | 2.49 | % (c) |
Portfolio turnover rate (d) | | | 22 | % |
| (a) | Inception date is November 1, 2017, which is consistent with the commencement of operations and is the date the initial creation units were established. |
| (b) | Total return is calculated assuming an initial investment made at the net asset value at the beginning of the period, reinvestment of all distributions at net asset value during the period, and redemption at net asset value on the last day of the period. The return presented does not reflect the deduction of taxes that a shareholder would pay on Fund distributions or the redemption or sale of Fund shares. Total return is calculated for the time period presented and is not annualized for periods of less than a year. The total return would have been lower if certain fees had not been waived by the investment advisor. |
| (d) | Portfolio turnover is calculated for the time period presented and is not annualized for periods of less than a year and does not include securities received or delivered from processing creations or redemptions and in-kind transactions. |
| | | | |
| Page 14 | | See Notes to Financial Statements | | |
|
Notes to Financial Statements |
First Trust Municipal High Income ETF (FMHI)
January 31, 2018 (Unaudited)
1. Organization
First Trust Exchange-Traded Fund III (the “Trust”) is an open-end management investment company organized as a Massachusetts business trust on January 9, 2008, and is registered with the Securities and Exchange Commission (the “SEC) under the Investment Company Act of 1940, as amended (the “1940 Act”).
The Trust consists of thirteen funds that are currently offering shares. This report covers the First Trust Municipal High Income ETF (the “Fund”), a non-diversified series of the Trust, which trades under the ticker FMHI on The Nasdaq Stock Market, LLC (“Nasdaq”). Unlike conventional mutual funds, the Fund issues and redeems shares on a continuous basis, at net asset value (“NAV”), only in large specified blocks consisting of 50,000 shares called a “Creation Unit.” Creation Units are issued and redeemed for cash and, in certain circumstances, in-kind for securities in which the Fund invests. Except when aggregated in Creation Units, the Fund’s shares are not redeemable securities.
The primary investment objective of the Fund is to seek to provide federally tax-exempt income, and its secondary objective is long-term capital appreciation. Under normal market conditions, the Fund seeks to achieve its investment objectives by investing at least 80% of its net assets (including investment borrowings) in municipal debt securities that pay interest that is exempt from regular federal income taxes. There can be no assurance that the Fund will achieve its investment objectives. The Fund may not be appropriate for all investors.
2. Significant Accounting Policies
The Fund is considered an investment company and follows accounting and reporting guidance under Financial Accounting Standards Board Accounting Standards Codification Topic 946, “Financial Services-Investment Companies.” The following is a summary of significant accounting policies consistently followed by the Fund in the preparation of the financial statements. The preparation of the financial statements in accordance with accounting principles generally accepted in the United States of America (“U.S. GAAP”) requires management to make estimates and assumptions that affect the reported amounts and disclosures in the financial statements. Actual results could differ from those estimates.
A. Portfolio Valuation
The Fund’s NAV is determined daily as of the close of regular trading on the New York Stock Exchange (“NYSE”), normally 4:00 p.m. Eastern time, on each day the NYSE is open for trading. If the NYSE closes early on a valuation day, the NAV is determined as of that time. Domestic debt securities are priced using data reflecting the earlier closing of the principal markets for those securities. The Fund’s NAV is calculated by dividing the value of all assets of the Fund (including accrued interest and dividends), less all liabilities (including accrued expenses and dividends declared but unpaid), by the total number of shares outstanding.
The Fund’s investments are valued daily at market value or, in the absence of market value with respect to any portfolio securities, at fair value. Market value prices represent last sale or official closing prices from a national or foreign exchange (i.e., a regulated market) and are primarily obtained from third-party pricing services. Fair value prices represent any prices not considered market value prices and are either obtained from a third-party pricing service or are determined by the Pricing Committee of the Fund’s investment advisor, First Trust Advisors L.P. (“First Trust” or the “Advisor”), in accordance with valuation procedures adopted by the Trust’s Board of Trustees, and in accordance with provisions of the 1940 Act. Investments valued by the Advisor’s Pricing Committee, if any, are footnoted as such in the footnotes to the Portfolio of Investments. The Fund’s investments are valued as follows:
Municipal securities and other debt securities are fair valued on the basis of fair valuations provided by dealers who make markets in such securities or by a third-party pricing service approved by the Trust’s Board of Trustees, which may use the following valuation inputs when available:
| | 7) | reference data including market research publications. |
Fixed income and other debt securities having a remaining maturity of sixty days or less when purchased are fair valued at cost adjusted for amortization of premiums and accretion of discounts (amortized cost), provided the Advisor’s Pricing Committee has determined that the use of amortized cost is an appropriate reflection of fair value given market and issuer-specific
|
Notes to Financial Statements (Continued) |
First Trust Municipal High Income ETF (FMHI)
January 31, 2018 (Unaudited)
conditions existing at the time of the determination. Factors that may be considered in determining the appropriateness of the use of amortized cost include, but are not limited to, the following:
| | 1) | the credit conditions in the relevant market and changes thereto; |
| | 2) | the liquidity conditions in the relevant market and changes thereto; |
| | 3) | the interest rate conditions in the relevant market and changes thereto (such as significant changes in interest rates); |
| | 4) | issuer-specific conditions (such as significant credit deterioration); and |
| | 5) | any other market-based data the Advisor’s Pricing Committee considers relevant. In this regard, the Advisor’s Pricing Committee may use last-obtained market-based data to assist it when valuing portfolio securities using amortized cost. |
Certain securities may not be able to be priced by pre-established pricing methods. Such securities may be valued by the Trust’s Board of Trustees or its delegate, the Advisor’s Pricing Committee, at fair value. These securities generally include, but are not limited to, restricted securities (securities which may not be publicly sold without registration under the Securities Act of 1933, as amended) for which a third-party pricing service is unable to provide a market price; securities whose trading has been formally suspended; a security whose market or fair value price is not available from a pre-established pricing source; a security with respect to which an event has occurred that is likely to materially affect the value of the security after the market has closed but before the calculation of the Fund’s NAV or make it difficult or impossible to obtain a reliable market quotation; and a security whose price, as provided by the third-party pricing service, does not reflect the security’s fair value. As a general principle, the current fair value of a security would appear to be the amount which the owner might reasonably expect to receive for the security upon its current sale. When fair value prices are used, generally they will differ from market quotations or official closing prices on the applicable exchanges. A variety of factors may be considered in determining the fair value of such securities, including, but not limited to, the following:
| 1) | | the fundamental business data relating to the issuer; |
| 2) | | an evaluation of the forces which influence the market in which these securities are purchased and sold; |
| 3) | | the type, size and cost of the security; |
| 4) | | the financial statements of the issuer; |
| 5) | | the credit quality and cash flow of the issuer, based on the Advisor’s or external analysis; |
| 6) | | the information as to any transactions in or offers for the security; |
| 7) | | the price and extent of public trading in similar securities (or equity securities) of the issuer/borrower, or comparable companies; |
| 9) | | the quality, value and salability of collateral, if any, securing the security; and |
| 10) | | other relevant factors. |
The Fund is subject to fair value accounting standards that define fair value, establish the framework for measuring fair value and provide a three-level hierarchy for fair valuation based upon the inputs to the valuation as of the measurement date. The three levels of the fair value hierarchy are as follows:
| | • | | Level 1 – Level 1 inputs are quoted prices in active markets for identical investments. An active market is a market in which transactions for the investment occur with sufficient frequency and volume to provide pricing information on an ongoing basis. |
| | • | | Level 2 – Level 2 inputs are observable inputs, either directly or indirectly, and include the following: |
| | o | Quoted prices for similar investments in active markets. |
| | o | Quoted prices for identical or similar investments in markets that are non-active. A non-active market is a market where there are few transactions for the investment, the prices are not current, or price quotations vary substantially either over time or among market makers, or in which little information is released publicly. |
| | o | Inputs other than quoted prices that are observable for the investment (for example, interest rates and yield curves observable at commonly quoted intervals, volatilities, prepayment speeds, loss severities, credit risks, and default rates). |
| | o | Inputs that are derived principally from or corroborated by observable market data by correlation or other means. |
| | • | | Level 3 – Level 3 inputs are unobservable inputs. Unobservable inputs may reflect the reporting entity’s own assumptions about the assumptions that market participants would use in pricing the investment. |
The inputs or methodologies used for valuing investments are not necessarily an indication of the risk associated with investing in those investments. A summary of the inputs used to value the Fund’s investments as of January 31, 2018, is included with the Fund’s Portfolio of Investments.
|
Notes to Financial Statements (Continued) |
First Trust Municipal High Income ETF (FMHI)
January 31, 2018 (Unaudited)
B. Securities Transactions and Investment Income
Securities transactions are recorded as of the trade date. Realized gains and losses from securities transactions are recorded on the identified cost basis. Interest income is recorded daily on the accrual basis. Amortization of premiums and accretion of discounts are recorded using the effective interest method.
C. Dividends and Distributions to Shareholders
Dividends from net investment income, if any, are declared and paid monthly, or as the Board of Trustees may determine from time to time. Distributions of net realized capital gains earned by the Fund, if any, are distributed at least annually.
Distributions from income and capital gains are determined in accordance with income tax regulations, which may differ from U.S. GAAP. Certain capital accounts in the financial statements are periodically adjusted for permanent differences in order to reflect their tax character. These permanent differences are primarily due to the varying treatment of income and gain/loss on portfolio securities held by the Fund and have no impact on net assets or NAV per share. Temporary differences, which arise from recognizing certain items of income, expense and gain/loss in different periods for financial statement and tax purposes, will reverse at some time in the future.
D. Income Taxes
The Fund intends to qualify as a regulated investment company by complying with the requirements under Subchapter M of the Internal Revenue Code of 1986, as amended, which includes distributing substantially all of its net investment income and net realized gains to shareholders. Accordingly, no provision has been made for federal and state income taxes. However, due to the timing and amount of distributions, the Fund may be subject to an excise tax of 4% of the amount by which approximately 98% of the Fund’s taxable income exceeds the distributions from such taxable income for the calendar year.
In addition, the Fund intends to invest in such municipal securities to allow it to pay shareholders “exempt dividends” as defined in the Internal Revenue Code.
The Fund is subject to accounting standards that establish a minimum threshold for recognizing, and a system for measuring, the benefits of a tax position taken or expected to be taken in a tax return. As of January 31, 2018, management has evaluated the application of these standards to the Fund, and has determined that no provision for income tax is required in the Fund’s financial statements for uncertain tax positions.
The Fund intends to utilize provisions of the federal income tax laws, which allow it to carry a realized capital loss forward indefinitely following the year of the loss and offset such loss against any future realized capital gains. The Fund is subject to certain limitations under U.S. tax rules on the use of capital loss carryforwards and net unrealized built-in losses. These limitations apply when there has been a 50% change in ownership.
Certain losses realized during the current fiscal year may be deferred and treated as occurring on the first day of the following fiscal year for federal income tax purposes.
E. Expenses
Expenses, other than the investment advisory fee and other excluded expenses, are paid by the Advisor (See Note 3).
F. New and Amended Financial Reporting Rules and Forms
On October 13, 2016, the SEC adopted new rules and forms, and amended existing rules and forms. The new and amended rules and forms are intended to modernize the reporting of information provided by funds and to improve the quality and type of information that funds provide to the SEC and investors. In part, the new and amended rules and forms amend Regulation S-X and require standardized, enhanced disclosures about derivatives in a fund’s financial statements, as well as other amendments. The compliance date for the amendments of Regulation S-X was August 1, 2017. The new form types and other rule amendments will be effective for the First Trust funds, including the Fund, for reporting periods beginning on and after June 1, 2018. Management is evaluating the new form types and other rule amendments that are effective on and after June 1, 2018 to determine the impact to the Fund.
3. Investment Advisory Fee, Affiliated Transactions and Other Fee Arrangements
First Trust, the investment advisor to the Fund, is a limited partnership with one limited partner, Grace Partners of DuPage L.P., and one general partner, The Charger Corporation. The Charger Corporation is an Illinois corporation controlled by James A. Bowen, Chief Executive Officer of First Trust. First Trust is responsible for the selection and ongoing monitoring of the securities in the Fund’s portfolio, managing the Fund’s business affairs and providing certain administrative services necessary for the management of the Fund.
|
Notes to Financial Statements (Continued) |
First Trust Municipal High Income ETF (FMHI)
January 31, 2018 (Unaudited)
Pursuant to the Investment Management Agreement between the Trust and the Advisor, First Trust manages the investment of the Fund’s assets and is responsible for the Fund’s expenses, including the cost of transfer agency, custody, fund administration, legal, audit, and other services, but excluding fee payments under the Investment Management Agreement, interest, taxes, acquired fund fees and expenses, if any, brokerage commissions, and other expenses connected with the execution of portfolio transactions, distribution and service fees pursuant to a 12b-1 plan, if any, and extraordinary expenses. The Fund has agreed to pay First Trust an annual unitary management fee equal to 0.70% of its average daily net assets. First Trust also provides fund reporting services to the Fund for a flat annual fee in the amount of $9,250, which is covered under the annual unitary management fee.
The Trust’s Board of Trustees and the Advisor have entered into a Fee Waiver Agreement for the Fund pursuant to which the Advisor contractually agreed to waive management fees of 0.15% of average daily net assets until October 26, 2019. The waiver agreement may be terminated by action of the Trust’s Board of Trustees at any time upon 60 days’ written notice by the Trust on behalf of the Fund or by the Fund’s investment advisor only after October 26, 2019. First Trust does not have the right to recover the fees waived. During the period ended January 31, 2018, the Advisor waived fees of $7,454.
The Trust has multiple service agreements with Brown Brothers Harriman & Co. (“BBH”). Under the service agreements, BBH performs custodial, fund accounting, certain administrative services, and transfer agency services for the Fund. As custodian, BBH is responsible for custody of the Fund’s assets. As fund accountant and administrator, BBH is responsible for maintaining the books and records of the Fund’s securities and cash. As transfer agent, BBH is responsible for maintaining shareholder records for the Fund.
Each Trustee who is not an officer or employee of First Trust, any sub-advisor or any of their affiliates (“Independent Trustees”) is paid a fixed annual retainer that is allocated equally among each fund in the First Trust Fund Complex. Each Independent Trustee is also paid an annual per fund fee that varies based on whether the fund is a closed-end or other actively managed fund, or is an index fund.
Additionally, the Lead Independent Trustee and the Chairmen of the Audit Committee, Nominating and Governance Committee, and Valuation Committee are paid annual fees to serve in such capacities, with such compensation allocated pro rata among each fund in the First Trust Fund Complex based on net assets. Independent Trustees are reimbursed for travel and out-of-pocket expenses in connection with all meetings. The Lead Independent Trustee and Committee Chairmen rotate every three years. The officers and “Interested” Trustee receive no compensation from the Trust for acting in such capacities.
4. Purchases and Sales of Securities
For the period ended January 31, 2018, the cost of purchases and proceeds from sales of investments, excluding short-term investments and in-kind transactions, were $23,011,136 and $4,049,259, respectively.
For the period ended January 31, 2018, the Fund had no in-kind transactions.
5. Creations, Redemptions and Transaction Fees
Shares are created and redeemed by the Fund only in Creation Unit size aggregations of 50,000 shares in transactions with broker-dealers or large institutional investors that have entered into a participation agreement (an “Authorized Participant”). In order to purchase Creation Units of the Fund, an Authorized Participant must deposit (i) a designated portfolio of securities and other instruments determined by First Trust (the “Deposit Securities”) and generally make or receive a cash payment referred to as the “Cash Component,” which is an amount equal to the difference between the NAV of the Fund shares (per Creation Unit Aggregation) and the market value of the Deposit Securities, and/or (ii) cash in lieu of all or a portion of the Deposit Securities. If the Cash Component is a positive number (i.e., the NAV per Creation Unit Aggregation exceeds the Deposit Amount), the Authorized Participant will deliver the Cash Component. If the Cash Component is a negative number (i.e., the NAV per Creation Unit Aggregation is less than the Deposit Amount), the Authorized Participant will receive the Cash Component. Authorized Participants purchasing Creation Units must pay to BBH, as transfer agent, a creation transaction fee (the “Creation Transaction Fee”) regardless of the number of Creation Units purchased in the transaction. The Creation Transaction Fee may vary and is based on the composition of the securities included in the Fund’s portfolio and the countries in which the transactions are settled. The Creation Transaction Fee is currently $500 plus ten basis points. The price for each Creation Unit will equal the daily NAV per share times the number of shares in a Creation Unit plus the fees described above and, if applicable, any operational processing and brokerage costs, transfer fees or stamp taxes. When the Fund permits an Authorized Participant to substitute cash or a different security in lieu of depositing one or more of the requisite Deposit Securities, the Authorized Participant may also be assessed an amount to cover the cost of purchasing the Deposit Securities and/or disposing of the substituted securities, including operational processing and brokerage costs, transfer fees, stamp taxes, and part or all of the spread between the expected bid and offer side of the market related to such Deposit Securities and/or substitute securities.
Authorized Participants redeeming Creation Units must pay to BBH, as transfer agent, a redemption transaction fee (the “Redemption Transaction Fee”), regardless of the number of Creation Units redeemed in the transaction. The Redemption Transaction Fee may vary
|
Notes to Financial Statements (Continued) |
First Trust Municipal High Income ETF (FMHI)
January 31, 2018 (Unaudited)
and is based on the composition of the securities included in the Fund’s portfolio and the countries in which the transactions are settled. The Redemption Transaction Fee is currently $500 plus ten basis points. The Fund reserves the right to effect redemptions in cash. An Authorized Participant may request cash redemption in lieu of securities; however, the Fund may, in its discretion, reject any such request.
6. Distribution Plan
The Board of Trustees adopted a Distribution and Service Plan pursuant to Rule 12b-1 under the 1940 Act. In accordance with the Rule 12b-1 plan, the Fund is authorized to pay an amount up to 0.25% of its average daily net assets each year to reimburse First Trust Portfolios L.P. (“FTP”), the distributor of the Fund, for amounts expended to finance activities primarily intended to result in the sale of Creation Units or to provide investor services. FTP may also use this amount to compensate securities dealers or other persons that are Authorized Participants for providing distribution assistance, including broker-dealer and shareholder support and educational and promotional services.
No 12b-1 fees are currently paid by the Fund, and pursuant to a contractual arrangement, no 12b-1 fees will be paid any time before October 26, 2019.
7. Indemnification
The Trust, on behalf of the Fund, has a variety of indemnification obligations under contracts with its service providers. The Trust’s maximum exposure under these arrangements is unknown. However, the Trust has not had prior claims or losses pursuant to these contracts and expects the risk of loss to be remote.
8. Subsequent Events
Management has evaluated the impact of all subsequent events to the Fund through the date the financial statements were issued, and has determined that there were no subsequent events requiring recognition or disclosure in the financial statements that have not already been disclosed.
First Trust Municipal High Income ETF (FMHI)
January 31, 2018 (Unaudited)
Proxy Voting Policies and Procedures
A description of the policies and procedures that the Trust uses to determine how to vote proxies and information on how the Fund voted proxies relating to portfolio securities during the most recent 12-month period ended June 30 is available (1) without charge, upon request, by calling (800) 988-5891; (2) on the Fund’s website located at www.ftportfolios.com; and (3) on the Securities and Exchange Commission’s (“SEC”) website at www.sec.gov.
Portfolio Holdings
The Trust files its complete schedule of portfolio holdings with the SEC for the first and third quarters of each fiscal year on Form N-Q. The Trust’s Form N-Qs are available (1) by calling (800) 988-5891; (2) on the Fund’s website located at www.ftportfolios.com; (3) on the SEC’s website at www.sec.gov; and (4) for review and copying at the SEC’s Public Reference Room (“PRR”) in Washington, DC. Information regarding the operation of the PRR may be obtained by calling (800) SEC-0330.
Risk Considerations
You could lose money by investing in the Fund. An investment in the Fund is not a deposit of a bank and is not insured or guaranteed by the Federal Deposit Insurance Corporation or any other governmental agency. There can be no assurance that the Fund’s investment objectives will be achieved.
ALTERNATIVE MINIMUM TAX RISK. The Fund has no limit as to the amount that can be invested in alternative minimum tax bonds. Therefore, all or a portion of the Fund’s otherwise exempt-interest dividends may be taxable to those shareholders subject to the federal and state alternative minimum tax.
AUTHORIZED PARTICIPANT CONCENTRATION RISK. Only an authorized participant (as defined in the “Creations, Redemptions and Transaction Fees” section) may engage in creation or redemption transactions directly with the Fund. The Fund has a limited number of institutions that act as authorized participants. To the extent that these institutions exit the business or are unable to proceed with creation and/or redemption orders with respect to the Fund and no other authorized participant is able to step forward to create or redeem, in either of these cases, Fund shares may trade at a discount to the Fund’s net asset value and possibly face delisting.
CALL RISK. If an issuer calls higher-yielding debt instruments held by the Fund, performance could be adversely impacted.
CASH TRANSACTIONS RISK. The Fund will, under most circumstances, effect a portion of creations and redemptions for cash, rather than in-kind securities. As a result, an investment in the Fund may be less tax-efficient than an investment in an exchange-traded fund (“ETF”) that effects its creations and redemptions for in-kind securities. Because the Fund may effect a portion of redemptions for cash, it may be required to sell portfolio securities in order to obtain the cash needed to distribute redemption proceeds. A sale of shares may result in capital gains or losses and may also result in higher brokerage costs.
CREDIT RISK. Credit risk is the risk that an issuer of a security held by the Fund will be unable or unwilling to make dividend, interest and/or principal payments when due and the related risk that the value of such security may decline because of concerns about the issuer’s ability to make such payments.
CUSTODIAL RECEIPT TRUSTS RISK. Custodial receipts are financial instruments similar to tender option bonds (“TOBs”) sold through private placements that represent the right to receive future principal and interest payments on underlying municipal obligations. Custodial receipt trusts may issue inverse floater securities and if the Fund was to hold inverse floaters issued by custodial receipt trusts, the Fund would be subject to the risks of inverse floaters described herein. In particular, because the instruments may be leveraged, their market values may be more volatile than other types of fixed-income instruments.
CYBER SECURITY RISK. As the use of Internet technology has become more prevalent in the course of business, the Fund has become more susceptible to potential operational risks through breaches in cyber security. A breach in cyber security refers to both intentional and unintentional events that may cause the Fund to lose proprietary information, suffer data corruption or lose operational capacity. Such events could cause the Fund to incur regulatory penalties, reputational damage, additional compliance costs associated with corrective measures and/or financial loss. Cyber security breaches may involve unauthorized access to the Fund’s digital information systems through “hacking” or malicious software coding, but may also result from outside attacks such as denial-of-service attacks through efforts to make network services unavailable to intended users. In addition, cyber security breaches of the Fund’s third party service providers, such as its administrator, transfer agent, custodian, or sub-advisor, as applicable, or issuers in which the Fund invests, can also subject the Fund to many of the same risks associated with direct cyber security breaches. The Fund has established risk management systems designed to reduce the risks associated with cyber security. However, there is no guarantee that such efforts will succeed, especially because the Fund does not directly control the cyber security systems of issuers or third party service providers.
|
Additional Information (Continued) |
First Trust Municipal High Income ETF (FMHI)
January 31, 2018 (Unaudited)
DISTRESSED SECURITIES RISK. Distressed Municipal Securities are speculative and involve substantial risks in addition to the risks of investing in high yield securities that are not in default. Generally, the Fund will not receive interest payments from the Distressed Municipal Securities it holds, and there is a substantial risk that the principal will not be repaid. In any reorganization or liquidation proceeding related to a Distressed Municipal Security, the Fund may lose its entire investment in such Distressed Municipal Security.
FLUCTUATION OF NET ASSET VALUE RISK. The net asset value of shares of the Fund will generally fluctuate with changes in the market value of the Fund’s holdings. The market prices of shares will generally fluctuate in accordance with changes in net asset value as well as the relative supply of and demand for shares on Nasdaq. The Fund’s investment advisor cannot predict whether shares will trade below, at or above their net asset value because the shares trade on Nasdaq at market prices and not at net asset value. Price differences may be due, in large part, to the fact that supply and demand forces at work in the secondary trading market for shares will be closely related to, but not identical to, the same forces influencing the prices of the holdings of the Fund trading individually or in the aggregate at any point in time. However, given that shares can only be purchased and redeemed for cash, or in certain circumstances, in-kind, in Creation Units, and only to and from broker-dealers and large institutional investors that have entered into participation agreements (unlike shares of closed-end funds, which frequently trade at appreciable discounts from, and sometimes at premiums to, their net asset value), the Fund’s investment advisor believes that large discounts or premiums to the net asset value of shares should not be sustained.
HIGH YIELD SECURITIES RISK. High yield securities, or “junk” bonds, are subject to greater market fluctuations and risk of loss than securities with higher ratings, and therefore, are considered to be highly speculative. These securities are issued by issuers that may have narrowly focused operations and/or other impediments to the timely payment of periodic interest and principal at maturity. If the economy slows down or dips into recession, the issuers of high yield securities may not have sufficient resources to continue making timely payment of periodic interest and principal at maturity. The market for high yield securities is smaller and less liquid than that for investment grade securities. High yield securities are generally not listed on a national securities exchange but trade in the over-the-counter markets. Due to the smaller, less liquid market for high yield securities, the bid-offer spread on such securities is generally greater than it is for investment grade securities and the purchase or sale of such securities may take longer to complete. In general, high yield securities may have a greater risk of default than other types of securities.
INCOME RISK. Income from the Fund’s fixed income investments could decline during periods of falling interest rates.
INDUSTRIAL DEVELOPMENT BOND RISK. These revenue bonds are issued by or on behalf of public authorities to obtain funds to finance various public and/or privately operated facilities, including those for business and manufacturing, housing, sports, pollution control, airport, mass transit, port and parking facilities. To the extent that the industrial development sector continues to represent a significant portion of the Fund, the Fund will be sensitive to changes in, and its performance may depend to a greater extent on, the overall condition of the industrial development sector. These bonds are normally secured only by the revenues from the project and not by state or local government tax payments. Consequently, the credit quality of these securities is dependent upon the ability of the user of the facilities financed by the bonds and any guarantor to meet its financial obligations. Payment of interest on and repayment of principal on such bonds are the responsibility of the user and/or any guarantor. These bonds are subject to a wide variety of risks, many of which relate to the nature of the specific project. Generally, the value and credit quality of these bonds are sensitive to the risks related to an economic slowdown.
INTEREST RATE RISK. Interest rate risk is the risk that the value of the debt securities in the Fund’s portfolio will decline because of rising market interest rates. Interest rate risk is generally lower for shorter term debt securities and higher for longer term debt securities. Duration is a measure of the expected price volatility of a debt security as a result of changes in market rates of interest, based on, among other factors, the weighted average timing of the debt security’s expected principal and interest payments. In general, duration represents the expected percentage change in the value of a security for an immediate 1% change in interest rates. Therefore, prices of debt securities with shorter durations tend to be less sensitive to interest rate changes than debt securities with longer durations. As the value of a debt security changes over time, so will its duration.
INVERSE FLOATERS RISK. Investments in inverse floating rate securities issued by TOB trusts create effective leverage. Due to the leveraged nature of these investments, the value of an inverse floater will increase and decrease to a significantly greater extent than the values of the TOB trust’s underlying municipal bonds in response to changes in market interest rates or credit quality. In addition, distributions paid to the Fund on its inverse floaters will be reduced or even eliminated as short-term municipal interest rates rise and will increase when short-term municipal interest rates fall. An investment in inverse floaters typically will involve greater risk than an investment in a fixed rate municipal bond.
MANAGEMENT RISK. The Fund is subject to management risk because it is an actively managed portfolio. In managing the Fund’s investment portfolio, the Fund’s Investment advisor will apply investment techniques and risk analyses that may not have the desired result. There can be no guarantee that the Fund will meet its investment objectives.
|
Additional Information (Continued) |
First Trust Municipal High Income ETF (FMHI)
January 31, 2018 (Unaudited)
MARKET MAKER RISK. If the Fund has lower average daily trading volumes, it may rely on a small number of third-party market makers to provide a market for the purchase and sale of shares. Any trading halt or other problem relating to the trading activity of these market makers could result in a dramatic change in the spread between the Fund’s net asset value and the price at which the Fund’s shares are trading on its exchange, which could result in a decrease in value of the Fund’s shares. In addition, decisions by market makers or authorized participants to reduce their role or step away from these activities in times of market stress could inhibit the effectiveness of the arbitrage process in maintaining the relationship between the underlying values of the Fund’s portfolio securities and the Fund’s market price. This reduced effectiveness could result in Fund shares trading at a discount to net asset value and also in greater than normal intraday bid-ask spreads for Fund shares.
MARKET RISK. Market risk is the risk that a particular security owned by the Fund or shares of the Fund in general may fall in value. Securities are subject to market fluctuations caused by such factors as economic, political, regulatory or market developments, changes in interest rates and perceived trends in securities prices. Shares of the Fund could decline in value or underperform other investments.
MUNICIPAL LEASE OBLIGATIONS RISK. Participation interests in municipal leases pose special risks because many leases and contracts contain “non-appropriation” clauses that provide that the governmental issuer has no obligation to make future payments under the lease or contract unless money is appropriated for this purpose by the appropriate legislative body.
MUNICIPAL SECURITIES MARKET LIQUIDITY RISK. Inventories of Municipal Securities held by brokers and dealers have decreased in recent years, lessening their ability to make a market in these securities. This reduction in market making capacity has the potential to decrease the Fund’s ability to buy or sell Municipal Securities, and increase price volatility and trading costs, particularly during periods of economic or market stress. As a result, the Fund may be forced to accept a lower price to sell a Municipal Security, to sell other securities to raise cash, or to give up an investment opportunity, any of which could have a negative effect on performance.
NEW FUND RISK. The Fund currently has fewer assets than larger funds, and like other relatively new funds, large inflows and outflows may impact the Fund’s market exposure for limited periods of time. This impact may be positive or negative, depending on the direction of market movement during the period affected. Also, during the initial invest-up period, the Fund may depart from its principal investment strategies and invest a larger amount or all of its assets in cash equivalents or it may hold cash.
NON-DIVERSIFICATION RISK. The Fund is classified as “non-diversified” under the 1940 Act. As a result, the Fund is only limited as to the percentage of its assets which may be invested in the securities of any one issuer by the diversification requirements imposed by the Internal Revenue Code of 1986, as amended. The Fund may invest a relatively high percentage of its assets in a limited number of issuers. As a result, the Fund may be more susceptible to a single adverse economic or regulatory occurrence affecting one or more of these issuers, experience increased volatility and be highly invested in certain issuers.
POLITICAL AND ECONOMIC RISK. The values of Municipal Securities held by the Fund may be adversely affected by local political and economic conditions and developments. Adverse conditions in an industry significant to a local economy could have a correspondingly adverse effect on the financial condition of local issuers.
PRE-REFUNDED BONDS RISK. Pre-refunded bonds are bonds that have been refunded to a call date prior to the final maturity of principal, or, in the case of pre-refunded bonds commonly referred to as “escrowed-to-maturity bonds,” to the final maturity of principal, and remain outstanding in the municipal market. The payment of principal and interest of the pre-refunded bonds held by the Fund is funded from securities held in a designated escrow account where such securities are obligations of and carry the full faith and credit of the U.S. Treasury. The securities held in the escrow fund pledged to pay the principal and interest of the pre-refunded bond do not guarantee the price of the bond. Investment in pre-refunded municipal bonds held by the Fund may subject the Fund to interest rate risk, market risk and credit risk. In addition, while a secondary market exists for pre-refunded municipal bonds, if the Fund sells pre-refunded municipal bonds prior to maturity, the price received may be more or less than the original cost, depending on market conditions at the time of sale.
PRIVATE ACTIVITY BONDS RISK. Municipalities and other public authorities issue private activity bonds to finance development of industrial facilities for use by a private enterprise. The private enterprise pays the principal and interest on the bond and the issuing authority ordinarily does not pledge its full faith, credit and taxing power for repayment. The private enterprise can have a substantially different credit profile than the municipality or public authority. The private activity bonds in which the Fund may invest may be negatively impacted by conditions affecting either the general credit of the use of the private activity project or the project itself. The Fund’s private activity bond holdings also may pay interest subject to the alternative minimum tax.
TAX RISK. Interest income from Municipal Securities is normally not subject to regular federal income tax, but income from Municipal Securities held by the Fund could be declared taxable because of, among other things, unfavorable changes in tax laws, adverse interpretations by the Internal Revenue Service or state tax authorities or noncompliant conduct of a bond issuer.
|
Additional Information (Continued) |
First Trust Municipal High Income ETF (FMHI)
January 31, 2018 (Unaudited)
Consequently, the attractiveness of Municipal Securities in relation to other investment alternatives is affected by changes in federal and state income tax rates or changes in the tax-exempt status of interest income from Municipal Securities.
TRADING ISSUES RISK. Although the shares of the Fund are listed for trading on Nasdaq, there can be no assurance that an active trading market for such shares will develop or be maintained. Trading in shares on Nasdaq may be halted due to market conditions or for reasons that, in the view of Nasdaq, make trading in shares inadvisable. In addition, trading in shares on Nasdaq is subject to trading halts caused by extraordinary market volatility pursuant to Nasdaq “circuit breaker” rules. Market makers are under no obligation to make a market in the Fund’s shares, and authorized participants are not obligated to submit purchase or redemption orders for Creation Units. There can be no assurance that the requirements of Nasdaq necessary to maintain the listing of the Fund will continue to be met or will remain unchanged. In particular, if the Fund does not comply with any provision of the Nasdaq rule change pursuant to Rule 19b-4 under the Securities Exchange Act of 1934, as amended (the “1934 Act”), approved by the SEC, and cannot bring itself into compliance within a reasonable period after discovering the matter, Nasdaq may remove the shares of the Fund from listing. The Fund may have difficulty maintaining its listing on Nasdaq in the event the Fund’s assets are small or the Fund does not have enough shareholders.
ZERO COUPON BONDS RISK. Zero coupon bonds do not pay interest on a current basis and may be highly volatile as interest rates rise or fall. In addition, while such bonds generate income for purposes of generally accepted accounting standards, they do not generate cash flow and thus could cause the Fund to be forced to liquidate securities at an inopportune time in order to distribute cash, as required by tax laws.
|
Additional Information (Continued) |
First Trust Municipal High Income ETF (FMHI)
January 31, 2018 (Unaudited)
Investment Management Agreement
Board Considerations Regarding Approval of Investment Management Agreement
The Board of Trustees of First Trust Exchange-Traded Fund III (the “Trust”), including the Independent Trustees, unanimously approved the Investment Management Agreement (the “Agreement”) with First Trust Advisors L.P. (the “Advisor”), on behalf of the First Trust Municipal High Income ETF (the “Fund”) for an initial two-year term at a meeting held on June 11–12, 2017. The Board determined that the Agreement is in the best interests of the Fund in light of the extent and quality of the services expected to be provided and such other matters as the Board considered to be relevant in the exercise of its reasonable business judgment.
To reach this determination, the Board considered its duties under the Investment Company Act of 1940, as amended (the “1940 Act”), as well as under the general principles of state law in reviewing and approving advisory contracts; the requirements of the 1940 Act in such matters; the fiduciary duty of investment advisors with respect to advisory agreements and compensation; the standards used by courts in determining whether investment company boards have fulfilled their duties; and the factors to be considered by the Board in voting on such agreements. To assist the Board in its evaluation of the Agreement for the Fund, the Independent Trustees received a report from the Advisor in advance of the Board meeting responding to a request for information provided on behalf of the Independent Trustees that, among other things, outlined the services to be provided by the Advisor to the Fund (including the relevant personnel responsible for these services and their experience); the proposed unitary fee rate payable by the Fund as compared to fees charged to a peer group of funds (all of which were exchange-traded funds (“ETFs”)) compiled by Management Practice, Inc. (“MPI”), an independent source (the “MPI Peer Group”), and as compared to fees charged to other clients of the Advisor, including other ETFs managed by the Advisor; the estimated expenses of the Fund as compared to expense ratios of the funds in the MPI Peer Group; the nature of the expenses to be incurred in providing services to the Fund and the potential for economies of scale, if any; financial data on the Advisor; any fall-out benefits to the Advisor and its affiliate, First Trust Portfolios L.P. (“FTP”); and information on the Advisor’s compliance program. The Independent Trustees also met separately with their independent legal counsel to discuss the information provided by the Advisor. The Board applied its business judgment to determine whether the arrangement between the Trust and the Advisor is a reasonable business arrangement from the Fund’s perspective as well as from the perspective of the Fund’s shareholders.
In evaluating whether to approve the Agreement for the Fund, the Board considered the nature, extent and quality of the services to be provided by the Advisor under the Agreement and considered that employees of the Advisor provide management services to other ETFs and to other investment companies in the First Trust fund complex with diligence and care. The Board considered that the Advisor will be responsible for the overall management and administration of the Fund and reviewed all of the services to be provided by the Advisor to the Fund, as well as the background and experience of the persons responsible for such services. The Board considered that the Fund will be an actively-managed ETF not designed to track the performance of an index, and that investment decisions will be the primary responsibility of the Advisor’s Municipal Securities Team. At the meeting, the Board received a presentation from one of the portfolio managers and was able to ask questions about the proposed investment strategy for the Fund and the Advisor’s liquidity management techniques. The Board considered the background and experience of the members of the Municipal Securities Team. The Board considered the Advisor’s statement that it applies the same oversight model internally with its Municipal Securities Team as it uses for overseeing external sub-advisors, including portfolio risk monitoring and performance review. In reviewing the services to be provided, the Board considered the compliance program that had been developed by the Advisor and considered that it includes a robust program for monitoring the Advisor’s and the Fund’s compliance with the 1940 Act, as well as the Fund’s compliance with its investment objectives and policies. Since the Fund had yet to commence investment operations, the Board could not consider the historical investment performance of the Fund. In light of the information presented and the considerations made, the Board concluded that the nature, extent and quality of the services to be provided to the Fund by the Advisor under the Agreement are expected to be satisfactory.
The Board considered the proposed unitary fee rate payable by the Fund under the Agreement for the services to be provided. The Board noted that, under the unitary fee arrangement, the Fund would pay the Advisor a unitary fee equal to an annual rate of 0.70% of its average daily net assets. The Board noted that the Advisor would be responsible for the Fund’s expenses, including the cost of transfer agency, custody, fund administration, legal, audit and other services and license fees (if any), but excluding the fee payments under the Agreement, interest, taxes, brokerage commissions and other expenses connected with the execution of portfolio transactions (such as dividend and distribution expenses from securities sold short and/or other investment related costs), distribution and service fees pursuant to a Rule 12b-1 plan, if any, and extraordinary expenses. The Board noted that, for the Fund, the Advisor had agreed to waive a portion of its unitary fee in an amount equal to 0.15% of the Fund’s average daily net assets for an initial period of two years. The Board received and reviewed information for the Fund showing the advisory or unitary fee rates and expense ratios of the peer funds in the applicable MPI Peer Group, as well as advisory fee rates charged by the Advisor to other fund (including ETFs) and non-fund clients, as applicable. Because the Fund’s MPI Peer Group included peer funds that pay a unitary fee and because the Fund will pay a unitary fee, the Board determined that expense ratios were the most relevant comparative data point. Based on the information provided, the Board noted that the unitary fee for the Fund (after fee waivers) was above the median total (net) expense
|
Additional Information (Continued) |
First Trust Municipal High Income ETF (FMHI)
January 31, 2018 (Unaudited)
ratio of the peer funds in its MPI Peer Group. With respect to the MPI Peer Group, the Board discussed with representatives of the Advisor how the MPI Peer Group was assembled and the limitations in creating peer groups for actively-managed ETFs, including the limited number of actively-managed ETFs investing in municipal securities, that there are no actively-managed ETFs investing in high yield municipal securities and that two of the four peer funds in the Fund’s MPI Peer Group were index-based ETFs. The Board took these limitations and differences into account in considering the peer data. With respect to fees charged to other clients, the Board considered differences between the Fund and other clients that limited their comparability. The Board noted that the Advisor manages another actively-managed municipal ETF in the First Trust fund complex that pays a unitary fee equal to an annual rate of 0.65% of its average daily net assets of which the Advisor currently waives 0.15%. In light of the information considered and the nature, extent and quality of the services expected to be provided to the Fund under the Agreement, the Board determined that the proposed unitary fee for the Fund was fair and reasonable.
The Board noted that the proposed unitary fee for the Fund was not structured to pass the benefits of any economies of scale on to shareholders as the Fund’s assets grow. The Board noted that any reduction in fixed costs associated with the management of the Fund would benefit the Advisor, but that the unitary fee structure provides a level of certainty in expenses for the Fund. The Board noted that the Advisor has continued to invest in personnel and infrastructure for the First Trust fund complex. The Board took the types of costs to be borne by the Advisor in connection with its services to be performed for the Fund under the Agreement into consideration and noted that the Advisor was unable to estimate the profitability of the Agreement for the Fund to the Advisor. The Board considered fall-out benefits described by the Advisor that may be realized from its and FTP’s relationship with the Fund and the Advisor’s compensation for fund reporting services to be provided to the Fund pursuant to a separate Fund Reporting Services Agreement, which would be paid from the unitary fee. The Board also noted that the Advisor would not utilize soft dollars in connection with its management of the Fund’s portfolio. The Board concluded that the character and amount of potential fall-out benefits to the Advisor were not unreasonable.
Based on all of the information considered and the conclusions reached, the Board, including the Independent Trustees, unanimously determined that the terms of the Agreement are fair and reasonable and that the approval of the Agreement is in the best interests of the Fund. No single factor was determinative in the Board’s analysis.
|
|
| This page intentionally left blank |
|
|
| This page intentionally left blank |
|
|
| This page intentionally left blank |
First Trust Exchange-Traded Fund III
INVESTMENT ADVISOR
First Trust Advisors L.P.
120 E. Liberty Drive, Suite 400
Wheaton, IL 60187
ADMINISTRATOR, CUSTODIAN,
FUND ACCOUNTANT &
TRANSFER AGENT
Brown Brothers Harriman & Co.
50 Post Office Square
Boston, MA 02110
INDEPENDENT REGISTERED
PUBLIC ACCOUNTING FIRM
Deloitte & Touche LLP
111 S. Wacker Drive
Chicago, IL 60606
LEGAL COUNSEL
Chapman and Cutler LLP
111 W. Monroe Street
Chicago, IL 60603
Item 2. Code of Ethics.
Not applicable.
Item 3. Audit Committee Financial Expert.
Not applicable.
Item 4. Principal Accountant Fees and Services.
Not applicable.
Item 5. Audit Committee of Listed Registrants.
Not applicable.
Item 6. Schedule of Investments.
| (a) | | Schedules of Investments in securities of unaffiliated issuers as of the close of the reporting period are included as part of the report to shareholders filed under Item 1 of this form. |
Item 7. Disclosure of Proxy Voting Policies and Procedures for Closed-End Management Investment Companies.
Not applicable.
Item 8. Portfolio Managers of Closed-End Management Investment Companies.
Not applicable.
Item 9. Purchases of Equity Securities by Closed-End Management Investment Company and Affiliated Purchasers.
Not applicable.
Item 10. Submission of Matters to a Vote of Security Holders.
There have been no material changes to the procedures by which the shareholders may recommend nominees to the registrant's board of directors, where those changes were implemented after the registrant last provided disclosure in response to the requirements of Item 407(c)(2)(iv) of Regulation S-K (17 CFR 229.407) (as required by Item 22(b)(15) of Schedule 14A (17 CFR 240.14a-101)),or this Item.
Item 11. Controls and Procedures.
| (a) | | The registrant's principal executive and principal financial officers, or persons performing similar functions, have concluded that the registrant's disclosure controls and procedures (as defined in Rule 30a-3(c) under the Investment Company Act of 1940, as amended (the "1940 Act") (17 CFR 270.30a-3 (c))) are effective, as of a date within 90 days of the filing date of the report that includes the disclosure required by this paragraph, based on their evaluation of these controls and procedures required by Rule 30a-3(b) under the 1940 Act (17 CFR 270.30a-3(b)) and Rules 13a-15(b) or 15d-15(b) under the Securities Exchange Act of 1934, as amended (17 CFR 240.13a-15(b) or 240.15d-15 (b)). |
| (b) | | There were no changes in the registrant's internal control over financial reporting (as defined in Rule 30a-3(d) under the 1940 Act (17 CFR 270.30a-3(d)) that occurred during the registrant's last fiscal quarter that have materially affected, or are reasonably likely to materially affect, the registrant's internal control over financial reporting. |
Item 12. Exhibits.
| (a)(2) | | Certifications pursuant to Rule 30a-2(a) under the 1940 Act and Section 302 of the Sarbanes-Oxley Act of 2002 are attached hereto. |
| (b) | | Certifications pursuant to Rule 30a-2(b) under the 1940 Act and Section 906 of the Sarbanes-Oxley Act of 2002 are attached hereto. |
SIGNATURES
Pursuant to the requirements of the Securities Exchange Act of 1934 and the Investment Company Act of 1940, the registrant has duly caused this report to be signed on its behalf by the undersigned, thereunto duly authorized.
| (registrant) | | First Trust Exchange-Traded Fund III | | |
| By (Signature and Title)* | | /s/ James M. Dykas | | |
| | | James M. Dykas, President and Chief Executive Officer
(principal executive officer) | | |
Pursuant to the requirements of the Securities Exchange Act of 1934 and the Investment Company Act of 1940, this report has been signed below by the following persons on behalf of the registrant and in the capacities and on the dates indicated.
| By (Signature and Title)* | | /s/ James M. Dykas | | |
| | | James M. Dykas, President and Chief Executive Officer
(principal executive officer) | | |
| By (Signature and Title)* | | /s/ Donald P. Swade | | |
| | | Donald P. Swade, Treasurer, Chief Financial Officer
and Chief Accounting Officer
(principal financial officer) | | |
* Print the name and title of each signing officer under his or her signature.