UNITED STATES
SECURITIES AND EXCHANGE COMMISSION
Washington, D.C. 20549
FORM N-CSR
CERTIFIED SHAREHOLDER REPORT OF REGISTERED MANAGEMENT
INVESTMENT COMPANIES
Investment Company Act file number 811-22245
| | First Trust Exchange-Traded Fund III | |
| | (Exact name of registrant as specified in charter) | |
| | 120 East Liberty Drive, Suite 400 | |
| | Wheaton, IL 60187 | |
| | (Address of principal executive offices) (Zip code) | |
| | W. Scott Jardine, Esq. | |
| | First Trust Portfolios L.P. | |
| | 120 East Liberty Drive, Suite 400 | |
| | Wheaton, IL 60187 | |
| | (Name and address of agent for service) | |
Registrant's telephone number, including area code: (630) 765-8000
Date of fiscal year end: October 31
Date of reporting period: April 30, 2018
Form N-CSR is to be used by management investment companies to file reports with the Commission not later than 10 days after the transmission to stockholders of any report that is required to be transmitted to stockholders under Rule 30e-1 under the Investment Company Act of 1940 (17 CFR 270.30e-1). The Commission may use the information provided on Form N-CSR in its regulatory, disclosure review, inspection, and policymaking roles.
A registrant is required to disclose the information specified by Form N-CSR, and the Commission will make this information public. A registrant is not required to respond to the collection of information contained in Form N-CSR unless the Form displays a currently valid Office of Management and Budget (“OMB”) control number. Please direct comments concerning the accuracy of the information collection burden estimate and any suggestions for reducing the burden to Secretary, Securities and Exchange Commission, 100 F Street, NE, Washington, DC 20549. The OMB has reviewed this collection of information under the clearance requirements of 44 U.S.C. § 3507.
Item 1. Report to Stockholders.
The registrant's semi-annual report transmitted to shareholders pursuant to Rule 30e-1 under the Investment Company Act of 1940 is as follows:
First Trust Exchange-Traded Fund III
First Trust Preferred Securities and Income ETF (FPE)
Semi-Annual Report
For the Six Months Ended
April 30, 2018
First Trust Preferred Securities and Income ETF (FPE)
Semi-Annual Report
April 30, 2018
Caution Regarding Forward-Looking Statements
This report contains certain forward-looking statements within the meaning of the Securities Act of 1933, as amended, and the Securities Exchange Act of 1934, as amended. Forward-looking statements include statements regarding the goals, beliefs, plans or current expectations of First Trust Advisors L.P. (“First Trust” or the “Advisor”) and/or Stonebridge Advisors LLC (“Stonebridge” or the “Sub-Advisor”) and their respective representatives, taking into account the information currently available to them. Forward-looking statements include all statements that do not relate solely to current or historical fact. For example, forward-looking statements include the use of words such as “anticipate,” “estimate,” “intend,” “expect,” “believe,” “plan,” “may,” “should,” “would” or other words that convey uncertainty of future events or outcomes.
Forward-looking statements involve known and unknown risks, uncertainties and other factors that may cause the actual results, performance or achievements of the series of First Trust Exchange-Traded Fund III (the “Trust”) described in this report (First Trust Preferred Securities and Income ETF; hereinafter referred to as the “Fund”) to be materially different from any future results, performance or achievements expressed or implied by the forward-looking statements. When evaluating the information included in this report, you are cautioned not to place undue reliance on these forward-looking statements, which reflect the judgment of the Advisor and/or Sub-Advisor and their respective representatives only as of the date hereof. We undertake no obligation to publicly revise or update these forward-looking statements to reflect events and circumstances that arise after the date hereof.
Performance and Risk Disclosure
There is no assurance that the Fund will achieve its investment objective. The Fund is subject to market risk, which is the possibility that the market values of securities owned by the Fund will decline and that the value of the Fund shares may therefore be less than what you paid for them. Accordingly, you can lose money by investing in the Fund. See “Risk Considerations” in the Additional Information section of this report for a discussion of certain other risks of investing in the Fund.
Performance data quoted represents past performance, which is no guarantee of future results, and current performance may be lower or higher than the figures shown. For the most recent month-end performance figures, please visit www.ftportfolios.com or speak with your financial advisor. Investment returns, net asset value and share price will fluctuate and Fund shares, when sold, may be worth more or less than their original cost.
The Advisor may also periodically provide additional information on Fund performance on the Fund’s web page at www.ftportfolios.com.
How to Read This Report
This report contains information that may help you evaluate your investment in the Fund. It includes details about the Fund and presents data and analysis that provide insight into the Fund’s performance and investment approach.
The statistical information that follows may help you understand the Fund’s performance compared to that of relevant market benchmarks.
It is important to keep in mind that the opinions expressed by personnel of the Advisor and/or Sub-Advisor are just that: informed opinions. They should not be considered to be promises or advice. The opinions, like the statistics, cover the period through the date on the cover of this report. The material risks of investing in the Fund are spelled out in the prospectus, the statement of additional information, this report and other Fund regulatory filings.
First Trust Preferred Securities and Income ETF (FPE)
Semi-Annual Letter from the Chairman and CEO
April 30, 2018
Dear Shareholders,
First Trust is pleased to provide you with the semi-annual report for the First Trust Preferred Securities and Income ETF which contains information about your investment for the period ended April 30, 2018. We encourage you to read this report carefully and discuss it with your financial advisor.
As you are no doubt aware, 2017 was a very strong year for both the U.S. and global markets. The three major U.S. indices – the S&P 500® Index, the Dow Jones Industrial Average and the Nasdaq Composite – posted their best performance since 2013. And there was more good news for Wall Street as the year ended and analysts collected stock market data:
| • | The S&P 500® Index did something it had never previously done, finishing 2017 with 12 months of gains; |
| • | The Dow Jones Industrial Average achieved a milestone as well, closing above 24,000 for the first time ever on November 30; |
| • | The Nasdaq Composite set a record by having 11 months of gains in 2017 (June was the only down month, and by just 0.86%); and |
| • | The MSCI AC World Index (containing constituents from 47 countries) ended 2017 at an all-time high and was up 22% at year-end. |
As 2017 ended, President Trump signed the “Tax Cuts and Jobs Act of 2017” tax reform bill. As 2018 began, there was much enthusiasm for this tax reform package and the potential increase in take-home pay for many Americans, as well as the reduction in the federal corporate tax rate from 35% to 21%. Early in the year, many investors were also watching the Federal Reserve (the “Fed”) and its signaled intent to continue raising interest rates at a gradual pace. Based on strong job growth and the economic outlook in the U.S., the Fed did, in fact, raise interest rates on March 21, 2018.
For the entire first quarter of 2018, increased volatility was the norm. The S&P 500® Index was off to a strong start in January as it returned over 7.5% from January 2 to January 26. February, however, was a different story. Early in the month, the Dow Jones Industrial Average plunged 567 points and sank into “correction” territory (defined as a drop of 10% from the index’s high) and in just two weeks, was down more than 3,200 points. However, as February came to a close, the Dow Jones Industrial Average was back on track and up from the lows experienced earlier in the month. Volatility continued in March and April with the Dow Jones Industrial Average ending April with a small gain.
This market volatility is why we believe that one should invest for the long term and be prepared for market movements, which can happen at any time. This can be accomplished by keeping current on your portfolio and investing goals and by speaking regularly with your investment professional. It’s important to keep in mind that past performance of the U.S. and global stock markets or investment products can never guarantee future results. As we’ve said before, markets go up and they also go down, but savvy investors are prepared for either through careful attention to their portfolios and investment goals.
At First Trust, we continue to be optimistic about the U.S. economy and we thank you for giving us the opportunity to be a part of your financial plan. We value our relationship with you and will report on your investment again in six months.
Sincerely,
James A. Bowen
Chairman of the Board of Trustees
Chief Executive Officer of First Trust Advisors L.P.
Fund Performance Overview (Unaudited)
First Trust Preferred Securities and Income ETF (FPE)
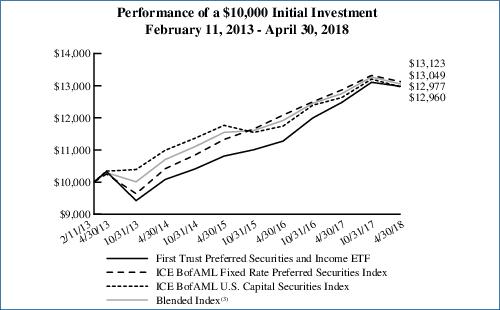
First Trust Preferred Securities and Income ETF’s (the “Fund”) investment objective is to seek total return and to provide current income. Under normal market conditions, the Fund invests at least 80% of its net assets (including investment borrowings) in preferred securities (“Preferred Securities”) and income-producing debt securities (“Income Securities”). The Fund invests in securities that are traded over-the-counter or listed on an exchange. For purposes of the 80% test set forth above, securities of open-end funds, closed-end funds or other exchange-traded funds (“ETFs”) registered under the Investment Company Act of 1940, as amended, that invest primarily in Preferred Securities or Income Securities are deemed to be Preferred Securities or Income Securities.
Preferred Securities held by the Fund generally pay fixed or adjustable-rate distributions to investors and have preference over common stock in the payment of distributions and the liquidation of a company’s assets, but are generally junior to all forms of the company’s debt, including both senior and subordinated debt. Certain of the Preferred Securities may be issued by trusts or other special purpose entities created by companies specifically for the purpose of issuing such securities. Income Securities that may be held by the Fund include corporate bonds, high yield securities (commonly referred to as “junk” bonds) and convertible securities. The broad category of corporate debt securities includes debt issued by U.S. and non-U.S. companies of all kinds, including those with small, mid and large capitalizations. Corporate debt may carry fixed or floating rates of interest.
| Performance |
| | | | Average Annual Total Returns | | Cumulative Total Returns |
| | 6 Months
Ended
4/30/18 | 1 Year
Ended
4/30/18 | 5 Years
Ended
4/30/18 | Inception
(2/11/13)
to 4/30/18 | | 5 Years
Ended
4/30/18 | Inception
(2/11/13)
to 4/30/18 |
| Fund Performance | | | | | | | |
| NAV | -0.96% | 3.99% | 4.67% | 5.12% | | 25.61% | 29.76% |
| Market Price | -0.86% | 3.98% | 4.67% | 5.14% | | 25.66% | 29.87% |
| Index Performance | | | | | | | |
| ICE BofAML Fixed Rate Preferred Securities Index | -1.46% | 1.98% | 5.06% | 5.35% | | 27.99% | 31.23% |
| ICE BofAML U.S. Capital Securities Index | -1.84% | 2.62% | 4.62% | 5.10% | | 25.31% | 29.59% |
| Blended Index(1) | -1.64% | 2.31% | 4.85% | 5.24% | | 26.73% | 30.50% |
Total returns for the period since inception are calculated from the inception date of the Fund. “Average Annual Total Returns” represent the average annual change in value of an investment over the periods indicated. “Cumulative Total Returns” represent the total change in value of an investment over the periods indicated.
The Fund’s per share net asset value (“NAV”) is the value of one share of the Fund and is computed by dividing the value of all assets of the Fund (including accrued interest and dividends), less all liabilities (including accrued expenses and dividends declared but unpaid), by the total number of outstanding shares. The price used to calculate market return (“Market Price”) is determined by using the midpoint between the highest bid and the lowest offer on the stock exchange on which shares of the Fund are listed for trading as of the time that the Fund’s NAV is calculated. Since shares of the Fund did not trade in the secondary market until after its inception, for the period from inception to the first day of secondary market trading in shares of the Fund, the NAV of the Fund is used as a proxy for the secondary market trading price to calculate market returns. NAV and market returns assume that all distributions have been reinvested in the Fund at NAV and Market Price, respectively.
An index is a statistical composite that tracks a specified financial market or sector. Unlike the Fund, the index does not actually hold a portfolio of securities and therefore does not incur the expenses incurred by the Fund. These expenses negatively impact the performance of the Fund. Also, market returns do not include brokerage commissions that may be payable on secondary market transactions. If brokerage commissions were included, market returns would be lower. The total returns presented reflect the reinvestment of dividends on securities in the index. The returns presented do not reflect the deduction of taxes that a shareholder would pay on Fund distributions or the redemption or sale of Fund shares. The investment return and principal value of shares of the Fund will vary with changes in market conditions. Shares of the Fund may be worth more or less than their original cost when they are redeemed or sold in the market. The Fund’s past performance is no guarantee of future performance.
| (1) | The Blended Index consists of a 50/50 blend of the ICE BofAML Fixed Rate Preferred Securities Index and the ICE BofAML U.S. Capital Securities Index. The Blended Index reflects the diverse allocation of institutional preferred and hybrid securities in the Fund’s portfolio. The indexes do not charge management fees or brokerage expenses, and no such fees or expenses were deducted from the performance shown. Indexes are unmanaged and an investor cannot invest directly in an index. |
Fund Performance Overview (Unaudited) (Continued)
First Trust Preferred Securities and Income ETF (FPE)
| Sector Allocation | % of Total
Investments |
| Financials | 73.6% |
| Energy | 7.5 |
| Utilities | 5.8 |
| Consumer Staples | 3.3 |
| Real Estate | 2.8 |
| Telecommunication Services | 2.8 |
| Materials | 1.6 |
| Industrials | 1.3 |
| Consumer Discretionary | 0.7 |
| Information Technology | 0.6 |
| Total | 100.0% |
| Credit Rating(2) | % of Total
Investments |
| A+ | 0.6% |
| A- | 2.9 |
| BBB+ | 6.9 |
| BBB | 13.5 |
| BBB- | 29.2 |
| BB+ | 23.8 |
| BB | 7.5 |
| BB- | 5.3 |
| B+ | 4.6 |
| B | 0.1 |
| Not Rated | 5.6 |
| Total | 100.0% |
| Country Allocation | % of Total
Investments |
| United States | 53.1% |
| United Kingdom | 9.3 |
| France | 8.7 |
| Italy | 4.7 |
| Canada | 4.5 |
| Australia | 4.0 |
| Netherlands | 3.7 |
| Switzerland | 2.5 |
| Bermuda | 2.3 |
| Cayman Islands | 1.7 |
| Japan | 1.3 |
| Spain | 1.0 |
| Denmark | 0.7 |
| Mexico | 0.7 |
| Ireland | 0.6 |
| Sweden | 0.4 |
| Chile | 0.4 |
| Belgium | 0.2 |
| Norway | 0.1 |
| Jersey | 0.1 |
| Total | 100.0% |
| Top Ten Holdings | % of Total
Investments |
| GMAC Capital Trust I, Series 2 | 2.2% |
| Barclays PLC | 1.7 |
| Enel S.p.A. | 1.6 |
| Enbridge Energy Partners L.P. | 1.6 |
| Emera, Inc., Series 16-A | 1.5 |
| Credit Agricole S.A. | 1.5 |
| UniCredit S.p.A. | 1.3 |
| BHP Billiton Finance USA Ltd. | 1.3 |
| Intesa Sanpaolo S.p.A. | 1.3 |
| Wells Fargo & Co., Series K | 1.2 |
| Total | 15.2% |
| (2) | The credit quality and ratings information presented above reflect the ratings assigned by one or more nationally recognized statistical rating organizations (NRSROs), including Standard & Poor’s Ratings Group, a division of the McGraw Hill Companies, Inc., Moody’s Investors Service, Inc., Fitch Ratings or a comparably rated NRSRO. For situations in which a security is rated by more than one NRSRO and the ratings are not equivalent, the highest rating is used. Sub-investment grade ratings are those rated BB+/Ba1 or lower. Investment grade ratings are those rated BBB-/Baa3 or higher. The credit ratings shown relate to the creditworthiness of the issuers of the underlying securities in the Fund, and not to the Fund or its shares. Credit ratings are subject to change. |
Fund Performance Overview (Unaudited) (Continued)
First Trust Preferred Securities and Income ETF (FPE)
Performance figures assume reinvestment of all distributions and do not reflect the deduction of taxes that a shareholder would pay on Fund distributions or the redemption or sale of Fund shares. An index is a statistical composite that tracks a specified financial market or sector. Unlike the Fund, the index does not actually hold a portfolio of securities and therefore does not incur the expenses incurred by the Fund. These expenses negatively impact the performance of the Fund. The Fund’s past performance does not predict future performance.
Frequency Distribution of Discounts and Premiums
Bid/Ask Midpoint vs. NAV through April 30, 2018
The following Frequency Distribution of Discounts and Premiums charts are provided to show the frequency at which the bid/ask midpoint price for the Fund was at a discount or premium to the daily NAV. The following tables are for comparative purposes only and represent the period February 12, 2013 (commencement of trading) through April 30, 2018. Shareholders may pay more than NAV when they buy Fund shares and receive less than NAV when they sell those shares because shares are bought and sold at current market price. Data presented represents past performance and cannot be used to predict future results.
| Number of Days Bid/Ask Midpoint At/Above NAV |
| For the Period | 0.00%–0.49% | 0.50%–0.99% | 1.00%–1.99% | >=2.00% |
| 2/12/13 – 10/31/13 | 96 | 7 | 0 | 0 |
| 11/1/13 – 10/31/14 | 140 | 2 | 0 | 0 |
| 11/1/14 – 10/31/15 | 214 | 16 | 0 | 0 |
| 11/1/15 – 10/31/16 | 212 | 13 | 0 | 0 |
| 11/1/16 – 10/31/17 | 232 | 1 | 0 | 0 |
| 11/1/17 – 4/30/18 | 107 | 0 | 0 | 0 |
| Number of Days Bid/Ask Midpoint Below NAV |
| For the Period | 0.00%–0.49% | 0.50%–0.99% | 1.00%–1.99% | >=2.00% |
| 2/12/13 – 10/31/13 | 73 | 7 | 0 | 0 |
| 11/1/13 – 10/31/14 | 101 | 9 | 0 | 0 |
| 11/1/14 – 10/31/15 | 21 | 0 | 0 | 0 |
| 11/1/15 – 10/31/16 | 26 | 1 | 0 | 0 |
| 11/1/16 – 10/31/17 | 19 | 0 | 0 | 0 |
| 11/1/17 – 4/30/18 | 16 | 0 | 0 | 0 |
| (3) | The Blended Index consists of a 50/50 blend of the ICE BofAML Fixed Rate Preferred Securities Index and the ICE BofAML U.S. Capital Securities Index. The Blended Index reflects the diverse allocation of institutional preferred and hybrid securities in the Fund’s portfolio. The indexes do not charge management fees or brokerage expenses, and no such fees or expenses were deducted from the performance shown. Indexes are unmanaged and an investor cannot invest directly in an index. |
Portfolio Management
First Trust Preferred Securities and Income ETF
Semi-Annual Report
April 30, 2018 (Unaudited)
Advisor
First Trust Advisors L.P. (“First Trust”) is the investment advisor to the First Trust Preferred Securities and Income ETF (the “Fund”). First Trust is responsible for the ongoing monitoring of the Fund’s investment portfolio, managing the Fund’s business affairs and providing certain administrative services necessary for the management of the Fund.
Sub-Advisor
Stonebridge Advisors LLC
Stonebridge Advisors LLC (“Stonebridge” or the “Sub-Advisor”) is the sub-advisor to the Fund and is a registered investment advisor based in Wilton, Connecticut. Stonebridge specializes in the management of preferred and hybrid securities.
Stonebridge Advisors LLC Portfolio Management Team
Scott T. Fleming - Chief Executive Officer and President
Robert Wolf - Chief Investment Officer, Senior Vice President and Senior Portfolio Manager
First Trust Preferred Securities and Income ETF (FPE)
Understanding Your Fund Expenses
April 30, 2018 (Unaudited)
As a shareholder of the First Trust Preferred Securities and Income ETF (the “Fund”), you incur two types of costs: (1) transaction costs; and (2) ongoing costs, including management fees, distribution and/or service (12b-1) fees, if any, and other Fund expenses. This Example is intended to help you understand your ongoing costs of investing in the Fund and to compare these costs with the ongoing costs of investing in other funds.
The Example is based on an investment of $1,000 invested at the beginning of the period and held through the six-month period ended April 30, 2018.
Actual Expenses
The first line in the following table provides information about actual account values and actual expenses. You may use the information in this line, together with the amount you invested, to estimate the expenses that you paid over the period. Simply divide your account value by $1,000 (for example, an $8,600 account value divided by $1,000 = 8.6), then multiply the result by the number in the first line under the heading entitled “Expenses Paid During the Six-Month Period” to estimate the expenses you paid on your account during this six-month period.
Hypothetical Example for Comparison Purposes
The second line in the following table provides information about hypothetical account values and hypothetical expenses based on the Fund’s actual expense ratio and an assumed rate of return of 5% per year before expenses, which is not the Fund’s actual return. The hypothetical account values and expenses may not be used to estimate the actual ending account balance or expenses you paid for the period. You may use this information to compare the ongoing costs of investing in the Fund and other funds. To do so, compare this 5% hypothetical example with the 5% hypothetical examples that appear in the shareholder reports of the other funds.
Please note that the expenses shown in the table are meant to highlight your ongoing costs only and do not reflect any transactional costs such as brokerage commissions. Therefore, the second line in the table is useful in comparing ongoing costs only, and will not help you determine the relative total costs of owning different funds. In addition, if these transactional costs were included, your costs would have been higher.
| | Beginning
Account Value
November 1, 2017 | Ending
Account Value
April 30, 2018 | Annualized
Expense Ratio
Based on the
Six-Month
Period | Expenses Paid
During the
Six-Month
Period (a) |
| First Trust Preferred Securities and Income ETF (FPE) |
| Actual | $1,000.00 | $990.40 | 0.85% | $4.19 |
| Hypothetical (5% return before expenses) | $1,000.00 | $1,020.58 | 0.85% | $4.26 |
| (a) | Expenses are equal to the annualized expense ratios as indicated in the table multiplied by the average account value over the period (November 1, 2017 through April 30, 2018), multiplied by 181/365 (to reflect the six-month period). |
First Trust Preferred Securities and Income ETF (FPE)
Portfolio of Investments
April 30, 2018 (Unaudited)
| Shares | | Description | | Stated
Rate | | Stated
Maturity | | Value |
| $25 PAR PREFERRED SECURITIES – 29.1% |
| | | Banks – 7.9% | | | | | | |
| 318,536 | | Banc of California, Inc., Series E
| | 7.00% | | (a) | | $8,097,185 |
| 286,729 | | Bank of America Corp., Series CC
| | 6.20% | | (a) | | 7,414,812 |
| 753,715 | | Citigroup Capital XIII, 3 Mo. LIBOR + 6.37% (b)
| | 8.73% | | 10/30/40 | | 20,192,025 |
| 233,097 | | Citigroup, Inc., Series K (c)
| | 6.88% | | (a) | | 6,414,830 |
| 93,289 | | Citigroup, Inc., Series S
| | 6.30% | | (a) | | 2,449,769 |
| 501,022 | | Fifth Third Bancorp, Series I (c)
| | 6.63% | | (a) | | 14,219,004 |
| 151,161 | | FNB Corp. (c)
| | 7.25% | | (a) | | 4,227,973 |
| 2,821,173 | | GMAC Capital Trust I, Series 2, 3 Mo. LIBOR + 5.79% (b)
| | 7.62% | | 02/15/40 | | 75,014,990 |
| 846,024 | | Huntington Bancshares, Inc., Series D
| | 6.25% | | (a) | | 22,148,908 |
| 709,564 | | KeyCorp, Series E (c)
| | 6.13% | | (a) | | 19,250,471 |
| 921,344 | | People’s United Financial, Inc., Series A (c)
| | 5.63% | | (a) | | 23,632,474 |
| 245,700 | | PNC Financial Services Group, Inc., Series P (c)
| | 6.13% | | (a) | | 6,665,841 |
| 416,097 | | Regions Financial Corp., Series A
| | 6.38% | | (a) | | 10,614,635 |
| 343,778 | | Royal Bank of Scotland Group PLC, Series S
| | 6.60% | | (a) | | 8,811,030 |
| 580,030 | | Synovus Financial Corp., Series C (c)
| | 7.88% | | (a) | | 14,813,966 |
| 160,776 | | Valley National Bancorp, Series A (c)
| | 6.25% | | (a) | | 4,223,586 |
| 148,239 | | Valley National Bancorp, Series B (c)
| | 5.50% | | (a) | | 3,790,471 |
| 201,171 | | Wells Fargo & Co., Series V
| | 6.00% | | (a) | | 5,184,177 |
| 100,108 | | Wells Fargo & Co., Series W
| | 5.70% | | (a) | | 2,504,702 |
| 54,635 | | Western Allliance Bancorp
| | 6.25% | | 07/01/56 | | 1,405,212 |
| 447,673 | | Wintrust Financial Corp., Series D (c)
| | 6.50% | | (a) | | 12,042,404 |
| 183,538 | | Zions Bancorporation, Series G (c)
| | 6.30% | | (a) | | 4,920,654 |
| | | | | 278,039,119 |
| | | Capital Markets – 5.4% | | | | | | |
| 315,829 | | Apollo Global Management, LLC, Series B
| | 6.38% | | (a) | | 7,643,062 |
| 799,336 | | Apollo Investment Corp.
| | 6.88% | | 07/15/43 | | 20,103,300 |
| 185,260 | | Ares Management L.P., Series A
| | 7.00% | | (a) | | 4,826,023 |
| 200,375 | | BGC Partners, Inc.
| | 8.13% | | 06/15/42 | | 5,204,440 |
| 1,408,719 | | Goldman Sachs Group, Inc., Series K (c)
| | 6.38% | | (a) | | 38,993,342 |
| 1,227,664 | | Morgan Stanley, Series E (c)
| | 7.13% | | (a) | | 34,546,465 |
| 1,533,204 | | Morgan Stanley, Series F (c)
| | 6.88% | | (a) | | 42,163,110 |
| 463,642 | | Morgan Stanley, Series I (c)
| | 6.38% | | (a) | | 12,397,787 |
| 264,883 | | Morgan Stanley, Series K (c)
| | 5.85% | | (a) | | 6,794,249 |
| 481,978 | | State Street Corp., Series G (c)
| | 5.35% | | (a) | | 12,367,555 |
| 260,618 | | Stifel Financial Corp., Series A
| | 6.25% | | (a) | | 6,812,555 |
| | | | | 191,851,888 |
| | | Consumer Finance – 0.1% | | | | | | |
| 102,417 | | Capital One Financial Corp., Series D
| | 6.70% | | (a) | | 2,691,519 |
| | | Diversified Telecommunication Services – 1.2% | | | | | | |
| 917,157 | | Qwest Corp.
| | 6.88% | | 10/01/54 | | 20,058,224 |
| 287,788 | | Qwest Corp.
| | 6.50% | | 09/01/56 | | 6,078,082 |
| 673,332 | | Qwest Corp.
| | 6.75% | | 06/15/57 | | 14,517,038 |
| | | | | 40,653,344 |
| | | Electric Utilities – 0.5% | | | | | | |
| 152,424 | | PPL Capital Funding, Inc., Series B
| | 5.90% | | 04/30/73 | | 3,822,794 |
| 262,994 | | SCE Trust V, Series K (c)
| | 5.45% | | (a) | | 6,772,096 |
| 318,737 | | Southern (The) Co.
| | 6.25% | | 10/15/75 | | 8,255,288 |
| | | | | 18,850,178 |
| | | Equity Real Estate Investment Trusts – 2.8% | | | | | | |
| 302,044 | | American Homes 4 Rent, Series D
| | 6.50% | | (a) | | 7,653,795 |
| 861,715 | | American Homes 4 Rent, Series E
| | 6.35% | | (a) | | 21,387,766 |
See Notes to Financial Statements
Page 7
First Trust Preferred Securities and Income ETF (FPE)
Portfolio of Investments (Continued)
April 30, 2018 (Unaudited)
| Shares | | Description | | Stated
Rate | | Stated
Maturity | | Value |
| $25 PAR PREFERRED SECURITIES (Continued) |
| | | Equity Real Estate Investment Trusts (Continued) | | | | | | |
| 346,538 | | Colony NorthStar, Inc., Series E
| | 8.75% | | (a) | | $8,795,135 |
| 38,267 | | Colony NorthStar, Inc., Series I
| | 7.15% | | (a) | | 881,289 |
| 533,175 | | Colony NorthStar, Inc., Series J
| | 7.13% | | (a) | | 12,263,025 |
| 264,725 | | Farmland Partners, Inc., Series B, steps up 10/01/24 to 10.00% (d)
| | 6.00% | | (a) | | 6,585,034 |
| 301,054 | | Global Net Lease, Inc., Series A
| | 7.25% | | (a) | | 7,405,928 |
| 101,845 | | Taubman Centers, Inc., Series J
| | 6.50% | | (a) | | 2,453,446 |
| 156,144 | | Urstadt Biddle Properties, Inc., Series H
| | 6.25% | | (a) | | 3,813,037 |
| 1,102,671 | | VEREIT, Inc., Series F
| | 6.70% | | (a) | | 27,754,229 |
| | | | | 98,992,684 |
| | | Food Products – 1.2% | | | | | | |
| 623,516 | | CHS, Inc., Series 2 (c)
| | 7.10% | | (a) | | 17,084,338 |
| 650,067 | | CHS, Inc., Series 3 (c)
| | 6.75% | | (a) | | 17,103,263 |
| 284,860 | | CHS, Inc., Series 4
| | 7.50% | | (a) | | 7,850,742 |
| | | | | 42,038,343 |
| | | Insurance – 5.1% | | | | | | |
| 326,959 | | Aegon N.V.
| | 6.38% | | (a) | | 8,399,577 |
| 731,956 | | Aegon N.V.
| | 8.00% | | 02/15/42 | | 18,276,941 |
| 234,512 | | AmTrust Financial Services, Inc.
| | 7.25% | | 06/15/55 | | 5,534,483 |
| 277,444 | | AmTrust Financial Services, Inc.
| | 7.50% | | 09/15/55 | | 6,875,062 |
| 403,697 | | AmTrust Financial Services, Inc., Series E
| | 7.75% | | (a) | | 8,707,744 |
| 624,871 | | AmTrust Financial Services, Inc., Series F
| | 6.95% | | (a) | | 11,247,678 |
| 54,768 | | Aspen Insurance Holdings Ltd.
| | 5.63% | | (a) | | 1,324,290 |
| 925,109 | | Aspen Insurance Holdings Ltd. (c)
| | 5.95% | | (a) | | 23,636,535 |
| 140,406 | | Berkley (WR) Corp.
| | 5.75% | | 06/01/56 | | 3,441,351 |
| 490,462 | | Delphi Financial Group, Inc., 3 Mo. LIBOR + 3.19% (b) (e)
| | 5.03% | | 05/15/37 | | 11,280,626 |
| 530,420 | | Global Indemnity Ltd.
| | 7.75% | | 08/15/45 | | 13,355,976 |
| 445,959 | | Global Indemnity Ltd.
| | 7.88% | | 04/15/47 | | 11,349,657 |
| 189,506 | | Maiden Holdings North America Ltd.
| | 7.75% | | 12/01/43 | | 4,025,108 |
| 336,532 | | National General Holdings Corp.
| | 7.63% | | 09/15/55 | | 8,418,348 |
| 130,723 | | National General Holdings Corp., Series C
| | 7.50% | | (a) | | 3,257,617 |
| 471,783 | | PartnerRe Ltd., Series H
| | 7.25% | | (a) | | 13,011,775 |
| 148,356 | | Phoenix Cos., Inc.
| | 7.45% | | 01/15/32 | | 2,764,614 |
| 974,600 | | Reinsurance Group of America, Inc. (c)
| | 5.75% | | 06/15/56 | | 25,056,966 |
| 315 | | Validus Holdings, Ltd., Series B
| | 5.80% | | (a) | | 7,834 |
| | | | | 179,972,182 |
| | | Internet Software & Services – 0.5% | | | | | | |
| 730,091 | | eBay, Inc.
| | 6.00% | | 02/01/56 | | 19,055,375 |
| | | Mortgage Real Estate Investment Trusts – 1.4% | | | | | | |
| 295,594 | | AGNC Investment Corp., Series C (c)
| | 7.00% | | (a) | | 7,537,647 |
| 506,471 | | Annaly Capital Management, Inc., Series F (c)
| | 6.95% | | (a) | | 12,758,005 |
| 178,296 | | Invesco Mortgage Capital, Inc., Series B (c)
| | 7.75% | | (a) | | 4,491,276 |
| 437,088 | | MFA Financial, Inc.
| | 8.00% | | 04/15/42 | | 11,211,307 |
| 295,415 | | Two Harbors Investment Corp., Series B (c)
| | 7.63% | | (a) | | 7,385,375 |
| 178,885 | | Two Harbors Investment Corp., Series C (c)
| | 7.25% | | (a) | | 4,287,873 |
| 19,386 | | Wells Fargo Real Estate Investment Corp., Series A
| | 6.38% | | (a) | | 500,159 |
| | | | | 48,171,642 |
| | | Multi-Utilities – 0.6% | | | | | | |
| 415,853 | | Integrys Holding, Inc. (c)
| | 6.00% | | 08/01/73 | | 10,760,196 |
| 510,490 | | Just Energy Group, Inc., Series A (c)
| | 8.50% | | (a) | | 11,802,529 |
| | | | | 22,562,725 |
Page 8
See Notes to Financial Statements
First Trust Preferred Securities and Income ETF (FPE)
Portfolio of Investments (Continued)
April 30, 2018 (Unaudited)
| Shares | | Description | | Stated
Rate | | Stated
Maturity | | Value |
| $25 PAR PREFERRED SECURITIES (Continued) |
| | | Oil, Gas & Consumable Fuels – 0.7% | | | | | | |
| 247,704 | | Enbridge, Inc., Series B (c)
| | 6.38% | | 04/15/78 | | $6,287,966 |
| 144,840 | | Energy Transfer Partners L.P., Series C (c)
| | 7.38% | | (a) | | 3,594,929 |
| 516,256 | | NuStar Logistics L.P., 3 Mo. LIBOR + 6.73% (b)
| | 9.08% | | 01/15/43 | | 13,009,651 |
| | | | | 22,892,546 |
| | | Thrifts & Mortgage Finance – 0.9% | | | | | | |
| 1,195,545 | | New York Community Bancorp, Inc., Series A (c)
| | 6.38% | | (a) | | 32,363,403 |
| | | Wireless Telecommunication Services – 0.8% | | | | | | |
| 262,720 | | United States Cellular Corp.
| | 7.25% | | 12/01/63 | | 6,594,272 |
| 894,563 | | United States Cellular Corp.
| | 7.25% | | 12/01/64 | | 22,453,531 |
| | | | | 29,047,803 |
| | | Total $25 Par Preferred Securities
| | 1,027,182,751 |
| | | (Cost $1,044,979,457) | | | | | | |
| $100 PAR PREFERRED SECURITIES – 1.2% |
| | | Banks – 0.4% | | | | | | |
| 25,852 | | Agribank FCB (c) (e)
| | 6.88% | | (a) | | 2,793,632 |
| 13,800 | | CoBank ACB, Series F (c) (e)
| | 6.25% | | (a) | | 1,462,800 |
| 22,914 | | CoBank ACB, Series G (e)
| | 6.13% | | (a) | | 2,339,565 |
| 23,586 | | CoBank ACB, Series H (c) (e)
| | 6.20% | | (a) | | 2,497,168 |
| 34,840 | | Farm Credit Bank Of Texas (c) (f)
| | 6.75% | | (a) | | 3,755,821 |
| | | | | 12,848,986 |
| | | Consumer Finance – 0.8% | | | | | | |
| 395,746 | | SLM Corp., Series B, 3 Mo. LIBOR + 1.70% (b)
| | 3.82% | | (a) | | 28,097,966 |
| | | Total $100 Par Preferred Securities
| | 40,946,952 |
| | | (Cost $34,430,672) | | | | | | |
| $1,000 PAR PREFERRED SECURITIES – 2.2% |
| | | Banks – 0.8% | | | | | | |
| 20,000 | | Farm Credit Bank Of Texas, Series 1 (e)
| | 10.00% | | (a) | | 23,600,000 |
| 4,556 | | Sovereign Real Estate Investment Trust (f)
| | 12.00% | | (a) | | 5,364,690 |
| | | | | 28,964,690 |
| | | Diversified Financial Services – 0.4% | | | | | | |
| 2,500 | | Compeer Financial ACA (c) (f)
| | 6.75% | | (a) | | 2,637,500 |
| 10,000 | | Kinder Morgan GP, Inc., 3 Mo. LIBOR + 3.90% (b) (f)
| | 5.77% | | 08/18/57 | | 9,386,102 |
| | | | | 12,023,602 |
| | | Insurance – 1.0% | | | | | | |
| 35,333 | | XLIT Ltd., Series D, 3 Mo. LIBOR + 3.12% (b)
| | 5.47% | | (a) | | 35,421,333 |
| | | Total $1,000 Par Preferred Securities
| | 76,409,625 |
| | | (Cost $72,273,413) | | | | | | |
Par
Amount | | Description | | Stated
Rate | | Stated
Maturity | | Value |
| CAPITAL PREFERRED SECURITIES – 66.0% |
| | | Automobiles – 0.7% | | | | | | |
| $26,300,000 | | General Motors Financial Co., Inc., Series A (c)
| | 5.75% | | (a) | | 25,997,550 |
| | | Banks – 35.0% | | | | | | |
| 31,464,000 | | Australia & New Zealand Banking Group Ltd. (c) (g) (h)
| | 6.75% | | (a) | | 33,627,150 |
| 16,600,000 | | Banco Bilbao Vizcaya Argentaria S.A. (c) (h)
| | 6.13% | | (a) | | 16,086,230 |
| 4,900,000 | | Banco Mercantil del Norte S.A. (c) (g) (h)
| | 6.88% | | (a) | | 4,936,750 |
See Notes to Financial Statements
Page 9
First Trust Preferred Securities and Income ETF (FPE)
Portfolio of Investments (Continued)
April 30, 2018 (Unaudited)
Par
Amount | | Description | | Stated
Rate | | Stated
Maturity | | Value |
| CAPITAL PREFERRED SECURITIES (Continued) |
| | | Banks (Continued) | | | | | | |
| $8,500,000 | | Banco Mercantil del Norte S.A. (c) (g) (h)
| | 7.63% | | (a) | | $8,808,125 |
| 10,600,000 | | Banco Mercantil del Norte S.A. (c) (g) (h)
| | 5.75% | | 10/04/31 | | 10,229,106 |
| 19,400,000 | | Banco Santander S.A. (c) (h)
| | 6.38% | | (a) | | 19,707,102 |
| 8,725,000 | | Bank of America Corp., Series AA (c)
| | 6.10% | | (a) | | 9,052,188 |
| 17,000,000 | | Bank of America Corp., Series DD (c)
| | 6.30% | | (a) | | 18,040,400 |
| 3,201,000 | | Bank of America Corp., Series K, 3 Mo. LIBOR + 3.63% (b)
| | 5.99% | | (a) | | 3,221,006 |
| 14,902,000 | | Bank of America Corp., Series M (c)
| | 8.13% | | (a) | | 14,950,432 |
| 9,528,000 | | Bank of America Corp., Series X (c)
| | 6.25% | | (a) | | 9,944,850 |
| 20,000,000 | | Bank of America Corp., Series Z (c)
| | 6.50% | | (a) | | 21,225,000 |
| 566 | | Barclays PLC (c) (h)
| | 6.63% | | (a) | | 579 |
| 54,000,000 | | Barclays PLC (c) (h)
| | 7.88% | | (a) | | 57,730,320 |
| 12,161,000 | | BNP Paribas S.A. (c) (g) (h)
| | 6.75% | | (a) | | 12,784,251 |
| 10,950,000 | | BNP Paribas S.A. (c) (g) (h)
| | 7.38% | | (a) | | 11,949,188 |
| 35,000,000 | | BNP Paribas S.A. (c) (g) (h)
| | 7.63% | | (a) | | 37,791,250 |
| 10,498,000 | | BPCE S.A. (c) (g)
| | 12.50% | | (a) | | 11,744,638 |
| 5,797,000 | | BPCE S.A. (c)
| | 12.50% | | (a) | | 6,485,394 |
| 1,986,000 | | Citigroup, Inc. (c)
| | 5.95% | | (a) | | 2,032,969 |
| 23,000,000 | | Citigroup, Inc., Series O (c)
| | 5.88% | | (a) | | 23,661,250 |
| 9,000,000 | | Citigroup, Inc., Series P (c)
| | 5.95% | | (a) | | 9,123,750 |
| 4,000,000 | | Citigroup, Inc., Series Q (c)
| | 5.95% | | (a) | | 4,142,500 |
| 10,000,000 | | Citigroup, Inc., Series R (c)
| | 6.13% | | (a) | | 10,462,500 |
| 34,250,000 | | Citigroup, Inc., Series T (c)
| | 6.25% | | (a) | | 35,620,000 |
| 12,016,000 | | Citizens Financial Group, Inc. (c)
| | 5.50% | | (a) | | 12,346,440 |
| 20,474,000 | | CoBank ACB, Series I (c) (e)
| | 6.25% | | (a) | | 21,841,847 |
| 6,621,000 | | Cooperatieve Rabobank UA (c) (g)
| | 11.00% | | (a) | | 7,175,509 |
| 6,850,000 | | Cooperatieve Rabobank UA (c)
| | 11.00% | | (a) | | 7,423,688 |
| 47,700,000 | | Credit Agricole S.A. (c) (g) (h)
| | 7.88% | | (a) | | 51,873,750 |
| 36,000,000 | | Credit Agricole S.A. (c) (g) (h)
| | 8.13% | | (a) | | 40,994,100 |
| 14,651,000 | | Credit Agricole S.A. (c) (g)
| | 8.38% | | (a) | | 15,658,256 |
| 25,013,000 | | Danske Bank A.S. (c) (h)
| | 6.13% | | (a) | | 25,388,195 |
| 3,600,000 | | DNB Bank ASA (c) (h)
| | 5.75% | | (a) | | 3,654,288 |
| 2,000,000 | | HBOS Capital Funding L.P.
| | 6.85% | | (a) | | 2,031,398 |
| 37,119,000 | | HSBC Holdings PLC (c) (h)
| | 6.38% | | (a) | | 38,325,367 |
| 21,500,000 | | HSBC Holdings PLC (c) (h)
| | 6.88% | | (a) | | 22,843,750 |
| 16,179,000 | | ING Groep N.V. (c) (h)
| | 6.50% | | (a) | | 16,693,492 |
| 22,500,000 | | ING Groep N.V. (c) (h)
| | 6.88% | | (a) | | 23,796,563 |
| 41,425,000 | | Intesa Sanpaolo S.p.A. (c) (g) (h)
| | 7.70% | | (a) | | 44,014,062 |
| 30,145,000 | | JPMorgan Chase & Co., Series I, 3 Mo. LIBOR + 3.47% (b)
| | 5.83% | | (a) | | 30,408,769 |
| 10,000,000 | | JPMorgan Chase & Co., Series R (c)
| | 6.00% | | (a) | | 10,196,800 |
| 7,663,000 | | JPMorgan Chase & Co., Series S (c)
| | 6.75% | | (a) | | 8,314,355 |
| 2,000,000 | | JPMorgan Chase & Co., Series U (c)
| | 6.13% | | (a) | | 2,082,500 |
| 7,270,000 | | JPMorgan Chase & Co., Series X (c)
| | 6.10% | | (a) | | 7,542,625 |
| 18,651,000 | | JPMorgan Chase & Co., Series Z (c)
| | 5.30% | | (a) | | 19,212,395 |
| 4,100,000 | | Lloyds Bank PLC (c) (g)
| | 12.00% | | (a) | | 5,219,550 |
| 8,088,000 | | Lloyds Bank PLC (c)
| | 12.00% | | (a) | | 10,296,517 |
| 28,681,000 | | Lloyds Banking Group PLC (c) (h)
| | 7.50% | | (a) | | 31,018,501 |
| 6,084,000 | | Macquarie Bank Ltd. (c) (g) (h)
| | 6.13% | | (a) | | 5,871,060 |
| 13,680,000 | | Nordea Bank AB (c) (h)
| | 6.13% | | (a) | | 14,090,400 |
| 5,859,000 | | PNC Financial Services Group, Inc. (c)
| | 6.75% | | (a) | | 6,327,720 |
| 8,310,000 | | Royal Bank of Scotland Group PLC (c) (h)
| | 7.50% | | (a) | | 8,748,353 |
| 1,000,000 | | Royal Bank of Scotland Group PLC (c)
| | 7.65% | | (a) | | 1,260,000 |
| 35,300,000 | | Royal Bank of Scotland Group PLC (c) (h)
| | 8.00% | | (a) | | 38,697,625 |
| 35,300,000 | | Royal Bank of Scotland Group PLC (c) (h)
| | 8.63% | | (a) | | 38,741,750 |
| 9,000,000 | | Societe Generale S.A. (c) (g) (h)
| | 6.00% | | (a) | | 9,078,525 |
| 27,200,000 | | Societe Generale S.A. (c) (g) (h)
| | 7.38% | | (a) | | 28,900,000 |
Page 10
See Notes to Financial Statements
First Trust Preferred Securities and Income ETF (FPE)
Portfolio of Investments (Continued)
April 30, 2018 (Unaudited)
Par
Amount | | Description | | Stated
Rate | | Stated
Maturity | | Value |
| CAPITAL PREFERRED SECURITIES (Continued) |
| | | Banks (Continued) | | | | | | |
| $13,000,000 | | Societe Generale S.A. (c) (g) (h)
| | 7.88% | | (a) | | $14,121,250 |
| 20,000,000 | | Societe Generale S.A. (c) (h)
| | 7.88% | | (a) | | 21,725,000 |
| 13,000,000 | | Societe Generale S.A. (c) (h)
| | 8.25% | | (a) | | 13,368,576 |
| 13,100,000 | | Standard Chartered PLC (c)
| | 7.01% | | (a) | | 14,852,125 |
| 20,000,000 | | Standard Chartered PLC (c) (g) (h)
| | 7.50% | | (a) | | 21,175,000 |
| 20,000,000 | | Standard Chartered PLC (c) (g) (h)
| | 7.75% | | (a) | | 21,350,000 |
| 43,450,000 | | UniCredit S.p.A. (c) (h)
| | 8.00% | | (a) | | 45,440,271 |
| 17,000,000 | | UniCredit S.p.A. (c) (g)
| | 5.86% | | 06/19/32 | | 17,054,111 |
| 42,877,000 | | Wells Fargo & Co., Series K, 3 Mo. LIBOR + 3.77% (b)
| | 5.89% | | (a) | | 43,412,962 |
| 11,000,000 | | Wells Fargo & Co., Series U (c)
| | 5.88% | | (a) | | 11,398,750 |
| 7,000,000 | | Zions Bancorporation, Series J (c)
| | 7.20% | | (a) | | 7,630,000 |
| | | | | 1,234,953,123 |
| | | Capital Markets – 3.7% | | | | | | |
| 39,138,000 | | Credit Suisse Group AG (c) (g) (h)
| | 7.50% | | (a) | | 42,514,044 |
| 28,148,000 | | E*TRADE Financial Corp., Series A (c)
| | 5.88% | | (a) | | 28,851,700 |
| 7,500,000 | | Goldman Sachs Group, Inc., Series L (c)
| | 5.70% | | (a) | | 7,678,125 |
| 6,845,000 | | Goldman Sachs Group, Inc., Series M (c)
| | 5.38% | | (a) | | 7,007,569 |
| 3,000,000 | | UBS Group AG (c) (h)
| | 6.88% | | (a) | | 3,157,542 |
| 11,820,000 | | UBS Group AG (c) (h)
| | 6.88% | | (a) | | 12,462,772 |
| 18,750,000 | | UBS Group AG (c) (h)
| | 7.00% | | (a) | | 20,092,837 |
| 7,000,000 | | UBS Group AG (c) (h)
| | 7.13% | | (a) | | 7,300,006 |
| | | | | 129,064,595 |
| | | Diversified Financial Services – 0.4% | | | | | | |
| 13,971,000 | | Voya Financial, Inc. (c)
| | 5.65% | | 05/15/53 | | 14,271,377 |
| | | Diversified Telecommunication Services – 0.8% | | | | | | |
| 11,882,000 | | Koninklijke KPN N.V. (c) (g)
| | 7.00% | | 03/28/73 | | 12,862,265 |
| 14,310,000 | | Koninklijke KPN N.V. (c)
| | 7.00% | | 03/28/73 | | 15,490,575 |
| | | | | 28,352,840 |
| | | Electric Utilities – 4.3% | | | | | | |
| 48,602,000 | | Emera, Inc., Series 16-A (c)
| | 6.75% | | 06/15/76 | | 52,830,374 |
| 47,838,000 | | Enel S.p.A. (c) (g)
| | 8.75% | | 09/24/73 | | 56,747,827 |
| 28,783,000 | | PPL Capital Funding, Inc., Series A, 3 Mo. LIBOR + 2.67% (b)
| | 4.97% | | 03/30/67 | | 28,857,836 |
| 14,345,000 | | Southern (The) Co., Series B (c)
| | 5.50% | | 03/15/57 | | 14,831,662 |
| | | | | 153,267,699 |
| | | Energy Equipment & Services – 0.7% | | | | | | |
| 23,397,000 | | Transcanada Trust, Series 16-A (c)
| | 5.88% | | 08/15/76 | | 24,157,402 |
| | | Food Products – 2.1% | | | | | | |
| 7,700,000 | | Dairy Farmers of America, Inc. (f)
| | 7.13% | | (a) | | 8,450,750 |
| 17,854,000 | | Land O’Lakes Capital Trust I (f)
| | 7.45% | | 03/15/28 | | 20,353,560 |
| 9,720,000 | | Land O’Lakes, Inc. (g)
| | 7.25% | | (a) | | 10,837,800 |
| 31,000,000 | | Land O’Lakes, Inc. (g)
| | 8.00% | | (a) | | 34,875,000 |
| | | | | 74,517,110 |
| | | Independent Power and Renewable Electricity Producers – 0.4% | | | | | | |
| 1,500,000 | | AES Gener S.A. (c) (g)
| | 8.38% | | 12/18/73 | | 1,567,500 |
| 10,750,000 | | AES Gener S.A. (c)
| | 8.38% | | 12/18/73 | | 11,233,750 |
| | | | | 12,801,250 |
| | | Insurance – 9.1% | | | | | | |
| 20,550,000 | | Aegon N.V. (c)
| | 5.50% | | 04/11/48 | | 20,472,316 |
| 7,800,000 | | AG Insurance S.A. (c)
| | 6.75% | | (a) | | 7,991,116 |
See Notes to Financial Statements
Page 11
First Trust Preferred Securities and Income ETF (FPE)
Portfolio of Investments (Continued)
April 30, 2018 (Unaudited)
Par
Amount | | Description | | Stated
Rate | | Stated
Maturity | | Value |
| CAPITAL PREFERRED SECURITIES (Continued) |
| | | Insurance (Continued) | | | | | | |
| $5,000,000 | | American International Group, Inc. (c)
| | 8.18% | | 05/15/58 | | $6,562,500 |
| 8,825,000 | | American International Group, Inc. Series A-9 (c)
| | 5.75% | | 04/01/48 | | 8,891,187 |
| 20,470,000 | | Aquarius & Investments PLC for Swiss Reinsurance Co., Ltd. (c)
| | 8.25% | | (a) | | 20,724,217 |
| 600,000 | | Asahi Mutual Life Insurance Co. (c)
| | 7.25% | | (a) | | 635,752 |
| 23,500,000 | | Assurant, Inc. (c)
| | 7.00% | | 03/27/48 | | 24,529,312 |
| 15,709,000 | | Assured Guaranty Municipal Holdings, Inc. (c) (g)
| | 6.40% | | 12/15/66 | | 15,787,545 |
| 39,497,000 | | Catlin Insurance Co., Ltd., 3 Mo. LIBOR + 2.98% (b) (g)
| | 5.33% | | (a) | | 39,348,886 |
| 1,100,000 | | Catlin Insurance Co., Ltd., 3 Mo. LIBOR + 2.98% (b)
| | 5.33% | | (a) | | 1,095,875 |
| 4,200,000 | | CNP Assurances (c)
| | 6.88% | | (a) | | 4,333,350 |
| 1,100,000 | | CNP Assurances (c)
| | 7.50% | | (a) | | 1,117,363 |
| 5,000,000 | | Dai-ichi Life Insurance Co., Ltd. (c) (g)
| | 4.00% | | (a) | | 4,762,500 |
| 13,700,000 | | Fortegra Financial Corp. (c) (f)
| | 8.50% | | 10/15/57 | | 13,871,250 |
| 6,201,000 | | Friends Life Holdings PLC (c)
| | 7.88% | | (a) | | 6,345,173 |
| 4,020,000 | | Fukoku Mutual Life Insurance Co. (c)
| | 6.50% | | (a) | | 4,462,200 |
| 5,500,000 | | Hartford Financial Services Group (The), Inc., 3 Mo. LIBOR + 2.13% (b) (g)
| | 4.47% | | 02/12/47 | | 5,315,200 |
| 22,202,000 | | La Mondiale SAM (c)
| | 7.63% | | (a) | | 22,931,891 |
| 16,099,000 | | Liberty Mutual Group, Inc. (c) (g)
| | 7.80% | | 03/15/37 | | 19,520,037 |
| 465,000 | | Liberty Mutual Group, Inc. (c) (g)
| | 10.75% | | 06/15/58 | | 717,263 |
| 5,260,000 | | Liberty Mutual Group, Inc., 3 Mo. LIBOR + 2.91% (b) (g)
| | 5.03% | | 03/15/37 | | 5,194,250 |
| 7,200,000 | | Meiji Yasuda Life Insurance, Co. (c) (g)
| | 5.10% | | 04/26/48 | | 7,362,401 |
| 2,100,000 | | MetLife, Inc. (g)
| | 9.25% | | 04/08/38 | | 2,866,500 |
| 20,940,000 | | Mitsui Sumitomo Insurance Co., Ltd. (c) (g)
| | 7.00% | | 03/15/72 | | 23,133,465 |
| 1,100,000 | | Nationwide Financial Services, Inc.
| | 6.75% | | 05/15/37 | | 1,226,500 |
| 4,435,000 | | Prudential Financial, Inc. (c)
| | 5.63% | | 06/15/43 | | 4,634,575 |
| 20,300,000 | | QBE Insurance Group, Ltd. (c) (g)
| | 7.50% | | 11/24/43 | | 22,703,114 |
| 19,299,000 | | QBE Insurance Group, Ltd. (c)
| | 6.75% | | 12/02/44 | | 20,632,754 |
| 3,655,000 | | Sumitomo Life Insurance Co. (c) (g)
| | 6.50% | | 09/20/73 | | 4,029,637 |
| | | | | 321,198,129 |
| | | Metals & Mining – 1.6% | | | | | | |
| 9,500,000 | | BHP Billiton Finance USA Ltd. (c) (g)
| | 6.25% | | 10/19/75 | | 10,008,915 |
| 40,373,000 | | BHP Billiton Finance USA Ltd. (c) (g)
| | 6.75% | | 10/19/75 | | 45,005,802 |
| | | | | 55,014,717 |
| | | Oil, Gas & Consumable Fuels – 6.1% | | | | | | |
| 17,840,000 | | Andeavor Logistics L.P., Series A (c)
| | 6.88% | | (a) | | 18,167,810 |
| 11,000,000 | | DCP Midstream L.P., Series A (c)
| | 7.38% | | (a) | | 10,855,625 |
| 54,598,441 | | Enbridge Energy Partners L.P., 3 Mo. LIBOR + 3.80% (b)
| | 6.11% | | 10/01/37 | | 54,325,449 |
| 39,167,000 | | Enbridge, Inc. (c)
| | 5.50% | | 07/15/77 | | 36,523,227 |
| 12,000,000 | | Enbridge, Inc. (c)
| | 6.25% | | 03/01/78 | | 11,747,739 |
| 13,238,000 | | Enbridge, Inc., Series 16-A (c)
| | 6.00% | | 01/15/77 | | 12,923,597 |
| 29,460,000 | | Energy Transfer Partners L.P., 3 Mo. LIBOR + 3.02% (b)
| | 4.79% | | 11/01/66 | | 25,777,500 |
| 11,900,000 | | Energy Transfer Partners L.P., Series B (c)
| | 6.63% | | (a) | | 11,276,143 |
| 7,500,000 | | Enterprise Products Operating LLC, 3 Mo. LIBOR + 2.78% (b)
| | 4.78% | | 06/01/67 | | 7,454,384 |
| 26,118,594 | | Enterprise Products Operating LLC, Series A, 3 Mo. LIBOR + 3.71% (b)
| | 5.48% | | 08/01/66 | | 26,254,672 |
| | | | | 215,306,146 |
| | | Transportation Infrastructure – 1.1% | | | | | | |
| 35,766,000 | | AerCap Global Aviation Trust (c) (g)
| | 6.50% | | 06/15/45 | | 38,090,790 |
| | | Total Capital Preferred Securities
| | 2,326,992,728 |
| | | (Cost $2,332,544,253) | | | | | | |
Page 12
See Notes to Financial Statements
First Trust Preferred Securities and Income ETF (FPE)
Portfolio of Investments (Continued)
April 30, 2018 (Unaudited)
Principal
Value | | Description | | Stated
Coupon | | Stated
Maturity | | Value |
| CORPORATE BONDS AND NOTES – 0.4% |
| | | Insurance – 0.4% | | | | | | |
| $14,000,000 | | AmTrust Financial Services, Inc.
| | 6.13% | | 08/15/23 | | $13,787,232 |
| | | (Cost $13,963,930) | | | | | | |
| | Total Investments – 98.9%
| | 3,485,319,288 |
| | (Cost $3,498,191,725) (i) | | |
| | Net Other Assets and Liabilities – 1.1%
| | 37,252,722 |
| | Net Assets – 100.0%
| | $3,522,572,010 |
|
| (a) | Perpetual maturity. |
| (b) | Floating or variable rate security. |
| (c) | Fixed-to-floating or fixed-to-variable rate security. The interest rate shown reflects the fixed rate in effect at April 30, 2018. At a predetermined date, the fixed rate will change to a floating rate or a variable rate. |
| (d) | Step-up security. A security where the coupon increases or steps up at a predetermined date. |
| (e) | Pursuant to procedures adopted by the Trust’s Board of Trustees, this security has been determined to be illiquid by Stonebridge Advisors LLC, the Fund’s sub-advisor (the “Sub-Advisor”). |
| (f) | This security, sold within the terms of a private placement memorandum, is exempt from registration upon resale under Rule 144A under the Securities Act of 1933, as amended (the “1933 Act”), and may be resold in transactions exempt from registration, normally to qualified institutional buyers (see Note 2C - Restricted Securities in the Notes to Financial Statements). |
| (g) | This security, sold within the terms of a private placement memorandum, is exempt from registration upon resale under Rule 144A under the 1933 Act, and may be resold in transactions exempt from registration, normally to qualified institutional buyers. Pursuant to procedures adopted by the Trust’s Board of Trustees, this security has been determined to be liquid by the Sub-Advisor. Although market instability can result in periods of increased overall market illiquidity, liquidity for each security is determined based on security specific factors and assumptions, which require subjective judgment. At April 30, 2018, securities noted as such amounted to $817,606,372 or 23.2% of net assets. |
| (h) | This security is a contingent convertible capital security which may be subject to conversion into common stock of the issuer under certain circumstances. At April 30, 2018, securities noted as such amounted to $879,087,130 or 25.0% of net assets. Of these securities, 2.7% originated in emerging markets, and 97.3% originated in foreign markets. |
| (i) | Aggregate cost for financial reporting purposes approximates the aggregate cost for federal income tax purposes. As of April 30, 2018, the aggregate gross unrealized appreciation for all investments in which there was an excess of value over tax cost was $56,481,774 and the aggregate gross unrealized depreciation for all investments in which there was an excess of tax cost over value was $69,354,211. The net unrealized depreciation was $12,872,437. |
| LIBOR | London Interbank Offered Rate |
See Notes to Financial Statements
Page 13
First Trust Preferred Securities and Income ETF (FPE)
Portfolio of Investments (Continued)
April 30, 2018 (Unaudited)
Valuation Inputs
A summary of the inputs used to value the Fund’s investments as of April 30, 2018 is as follows (see Note 2A - Portfolio Valuation in the Notes to Financial Statements):
| | Total
Value at
4/30/2018 | Level 1
Quoted
Prices | Level 2
Significant
Observable
Inputs | Level 3
Significant
Unobservable
Inputs |
| $25 Par Preferred Securities: | | | | |
Insurance
| $ 179,972,182 | $ 165,926,942 | $ 14,045,240 | $ — |
Multi-Utilities
| 22,562,725 | 11,802,529 | 10,760,196 | — |
Other industry categories*
| 824,647,844 | 824,647,844 | — | — |
| $100 Par Preferred Securities: | | | | |
Banks
| 12,848,986 | — | 12,848,986 | — |
Consumer Finance
| 28,097,966 | 28,097,966 | — | — |
$1,000 Par Preferred Securities*
| 76,409,625 | — | 76,409,625 | — |
Capital Preferred Securities*
| 2,326,992,728 | — | 2,326,992,728 | — |
Corporate Bonds and Notes*
| 13,787,232 | — | 13,787,232 | — |
Total Investments
| $ 3,485,319,288 | $ 1,030,475,281 | $ 2,454,844,007 | $— |
| * | See Portfolio of Investments for industry breakout. |
All transfers in and out of the Levels during the period are assumed to occur on the last day of the period at their current value. There were no transfers between Levels at April 30, 2018.
Page 14
See Notes to Financial Statements
First Trust Preferred Securities and Income ETF (FPE)
Statement of Assets and Liabilities
April 30, 2018 (Unaudited)
| ASSETS: | |
Investments, at value
(Cost $3,498,191,725)
| $ 3,485,319,288 |
Cash
| 16,867,907 |
| Receivables: | |
Interest
| 29,534,688 |
Dividends
| 2,213,849 |
Interest reclaims
| 208,574 |
Dividend reclaims
| 92,258 |
Investment securities sold
| 17,040 |
Total Assets
| 3,534,253,604 |
| LIABILITIES: | |
| Payables: | |
Investment securities purchased
| 9,225,375 |
Investment advisory fees
| 2,456,219 |
Total Liabilities
| 11,681,594 |
NET ASSETS
| $3,522,572,010 |
| NET ASSETS consist of: | |
Paid-in capital
| $ 3,549,832,007 |
Par value
| 1,816,050 |
Accumulated net investment income (loss)
| 1,320,532 |
Accumulated net realized gain (loss) on investments
| (17,524,142) |
Net unrealized appreciation (depreciation) on investments
| (12,872,437) |
NET ASSETS
| $3,522,572,010 |
NET ASSET VALUE, per share
| $19.40 |
Number of shares outstanding (unlimited number of shares authorized, par value $0.01 per share)
| 181,605,000 |
See Notes to Financial Statements
Page 15
First Trust Preferred Securities and Income ETF (FPE)
Statement of Operations
For the Six Months Ended April 30, 2018 (Unaudited)
| INVESTMENT INCOME: | |
Interest
| $ 70,321,320 |
Dividends
| 34,999,691 |
Foreign withholding tax
| (74,200) |
Total investment income
| 105,246,811 |
| EXPENSES: | |
Investment advisory fees
| 13,985,648 |
Total expenses
| 13,985,648 |
NET INVESTMENT INCOME (LOSS)
| 91,261,163 |
| NET REALIZED AND UNREALIZED GAIN (LOSS): | |
| Net realized gain (loss) on: | |
Investments
| (5,992,575) |
In-kind redemptions
| 702,119 |
Net realized gain (loss)
| (5,290,456) |
Net change in unrealized appreciation (depreciation) on investments
| (121,069,101) |
NET REALIZED AND UNREALIZED GAIN (LOSS)
| (126,359,557) |
NET INCREASE (DECREASE) IN NET ASSETS RESULTING FROM OPERATIONS
| $(35,098,394) |
Page 16
See Notes to Financial Statements
First Trust Preferred Securities and Income ETF (FPE)
Statements of Changes in Net Assets
| | Six Months
Ended
4/30/2018
(Unaudited) | | Year
Ended
10/31/2017 |
| OPERATIONS: | | | |
Net investment income (loss)
| $ 91,261,163 | | $ 114,176,261 |
Net realized gain (loss)
| (5,290,456) | | (3,659,478) |
Net change in unrealized appreciation (depreciation)
| (121,069,101) | | 80,709,412 |
Net increase (decrease) in net assets resulting from operations
| (35,098,394) | | 191,226,195 |
| DISTRIBUTIONS TO SHAREHOLDERS FROM: | | | |
Net investment income
| (91,139,001) | | (114,019,342) |
Return of capital
| — | | (292,582) |
Total distributions to shareholders
| (91,139,001) | | (114,311,924) |
| SHAREHOLDER TRANSACTIONS: | | | |
Proceeds from shares sold
| 660,090,126 | | 1,605,162,501 |
Cost of shares redeemed
| (37,363,756) | | (31,391,795) |
Net increase (decrease) in net assets resulting from shareholder transactions
| 622,726,370 | | 1,573,770,706 |
Total increase (decrease) in net assets
| 496,488,975 | | 1,650,684,977 |
| NET ASSETS: | | | |
Beginning of period
| 3,026,083,035 | | 1,375,398,058 |
End of period
| $3,522,572,010 | | $3,026,083,035 |
Accumulated net investment income (loss) at end of period
| $1,320,532 | | $1,198,370 |
| CHANGES IN SHARES OUTSTANDING: | | | |
Shares outstanding, beginning of period
| 150,305,000 | | 70,655,000 |
Shares sold
| 33,200,000 | | 81,250,000 |
Shares redeemed
| (1,900,000) | | (1,600,000) |
Shares outstanding, end of period
| 181,605,000 | | 150,305,000 |
See Notes to Financial Statements
Page 17
First Trust Preferred Securities and Income ETF (FPE)
Financial Highlights
For a share outstanding throughout each period
| | Six Months
Ended
4/30/2018
(Unaudited) | | Year Ended October 31, | | Period
Ended
10/31/2013 (a) |
| 2017 | | 2016 | | 2015 | | 2014 | |
Net asset value, beginning of period
| $ 20.13 | | $ 19.47 | | $ 18.97 | | $ 19.04 | | $ 18.21 | | $ 19.99 |
| Income from investment operations: | | | | | | | | | | | |
Net investment income (loss)
| 0.54 | | 1.08 | | 1.12 | | 1.16 (b) | | 1.10 | | 0.65 |
Net realized and unrealized gain (loss)
| (0.73) | | 0.66 | | 0.52 | | (0.10) | | 0.76 | | (1.78) |
Total from investment operations
| (0.19) | | 1.74 | | 1.64 | | 1.06 | | 1.86 | | (1.13) |
| Distributions paid to shareholders from: | | | | | | | | | | | |
Net investment income
| (0.54) | | (1.08) | | (1.13) | | (1.13) | | (1.03) | | (0.62) |
Return of capital
| — | | (0.00) (c) | | (0.01) | | — | | — | | (0.03) |
Total distributions
| (0.54) | | (1.08) | | (1.14) | | (1.13) | | (1.03) | | (0.65) |
Net asset value, end of period
| $19.40 | | $20.13 | | $19.47 | | $18.97 | | $19.04 | | $18.21 |
Total return (d)
| (0.96)% | | 9.24% | | 8.97% | | 5.75% | | 10.42% | | (5.74)% |
| Ratios to average net assets/supplemental data: | | | | | | | | | | | |
Net assets, end of period (in 000’s)
| $ 3,522,572 | | $ 3,026,083 | | $ 1,375,398 | | $ 413,705 | | $ 86,718 | | $ 64,722 |
| Ratio of total expenses to average net assets | 0.85% (e) | | 0.85% | | 0.85% | | 0.85% | | 0.85% | | 0.85% (e) |
Ratio of net investment income (loss) to average net assets
| 5.55% (e) | | 5.54% | | 5.97% | | 6.15% | | 6.06% | | 5.44% (e) |
Portfolio turnover rate (f)
| 9% | | 13% | | 32% | | 50% | | 91% | | 45% |
| (a) | Inception date is February 11, 2013, which is consistent with the commencement of investment operations and is the date the initial creation units were established. |
| (b) | Based on average shares outstanding. |
| (c) | Amount is less than $0.01. |
| (d) | Total return is calculated assuming an initial investment made at the net asset value at the beginning of the period, reinvestment of all distributions at net asset value during the period, and redemption at net asset value on the last day of the period. The returns presented do not reflect the deduction of taxes that a shareholder would pay on Fund distributions or the redemption or sale of Fund shares. Total return is calculated for the time period presented and is not annualized for periods of less than a year. |
| (e) | Annualized. |
| (f) | Portfolio turnover is calculated for the time period presented and is not annualized for periods of less than a year and does not include securities received or delivered from processing creations or redemptions and in-kind transactions. |
Page 18
See Notes to Financial Statements
Notes to Financial Statements
First Trust Preferred Securities and Income ETF (FPE)
April 30, 2018 (Unaudited)
1. Organization
First Trust Exchange-Traded Fund III (the “Trust”) is a diversified open-end management investment company organized as a Massachusetts business trust on January 9, 2008, and is registered with the Securities and Exchange Commission (“SEC”) under the Investment Company Act of 1940, as amended (the “1940 Act”).
The Trust currently consists of thirteen funds that are offering shares. This report covers the First Trust Preferred Securities and Income ETF (the “Fund”), which trades under the ticker FPE on the NYSE Arca, Inc. Unlike conventional mutual funds, the Fund issues and redeems shares on a continuous basis, at net asset value (“NAV”), only in large specified blocks consisting of 50,000 shares called a “Creation Unit.” Creation Units are issued and redeemed for securities in which the Fund invests or for cash or, in certain circumstances, a combination of both. Except when aggregated in Creation Units, the shares are not redeemable securities of the Fund.
The Fund is an actively managed exchange-traded fund. The investment objective of the Fund is to seek total return and to provide current income. Under normal market conditions, the Fund invests at least 80% of its net assets (including investment borrowings) in preferred securities and income-producing debt securities, including corporate bonds, high-yield securities (commonly referred to as “junk” bonds) and convertible securities. There can be no assurance that the Fund will achieve its investment objective. The Fund may not be appropriate for all investors.
2. Significant Accounting Policies
The Fund is considered an investment company and follows accounting and reporting guidance under Financial Accounting Standards Board Accounting Standards Codification Topic 946, “Financial Services-Investment Companies.” The following is a summary of significant accounting policies consistently followed by the Fund in the preparation of the financial statements. The preparation of the financial statements in accordance with accounting principles generally accepted in the United States of America (“U.S. GAAP”) requires management to make estimates and assumptions that affect the reported amounts and disclosures in the financial statements. Actual results could differ from those estimates.
A. Portfolio Valuation
The Fund’s NAV is determined daily as of the close of regular trading on the New York Stock Exchange (“NYSE”), normally 4:00 p.m. Eastern time, on each day the NYSE is open for trading. If the NYSE closes early on a valuation day, the NAV is determined as of that time. Domestic debt securities and foreign securities are priced using data reflecting the earlier closing of the principal markets for those securities. The Fund’s NAV is calculated by dividing the value of all assets of the Fund (including accrued interest and dividends), less all liabilities (including accrued expenses and dividends declared but unpaid), by the total number of shares outstanding.
The Fund’s investments are valued daily at market value or, in the absence of market value with respect to any portfolio securities, at fair value. Market value prices represent last sale or official closing prices from a national or foreign exchange (i.e., a regulated market) and are primarily obtained from third-party pricing services. Fair value prices represent any prices not considered market value prices and are either obtained from a third-party pricing service or are determined by the Pricing Committee of the Fund’s investment advisor, First Trust Advisors L.P. (“First Trust” or the “Advisor”), in accordance with valuation procedures adopted by the Trust’s Board of Trustees, and in accordance with provisions of the 1940 Act. Investments valued by the Advisor’s Pricing Committee, if any, are footnoted as such in the footnotes to the Portfolio of Investments. The Fund’s investments are valued as follows:
Preferred stocks, real estate investment trust (“REITs”) and other equity securities listed on any national or foreign exchange (excluding The Nasdaq Stock Market LLC (“Nasdaq”) and the London Stock Exchange Alternative Investment Market (“AIM”)) are valued at the last sale price on the exchange on which they are principally traded or, for Nasdaq and AIM securities, the official closing price. Securities traded on more than one securities exchange are valued at the last sale price or official closing price, as applicable, at the close of the securities exchange representing the principal market for such securities.
Bonds, notes, capital preferred securities, and other debt securities are fair valued on the basis of valuations provided by dealers who make markets in such securities or by a third-party pricing service approved by the Trust’s Board of Trustees, which may use the following valuation inputs when available:
| 1) | benchmark yields; |
| 2) | reported trades; |
| 3) | broker/dealer quotes; |
| 4) | issuer spreads; |
| 5) | benchmark securities; |
| 6) | bids and offers; and |
Notes to Financial Statements (Continued)
First Trust Preferred Securities and Income ETF (FPE)
April 30, 2018 (Unaudited)
| 7) | reference data including market research publications. |
Securities traded in an over-the-counter market are fair valued at the mean of their most recent bid and asked price, if available, and otherwise at their closing bid price.
Fixed income and other debt securities having a remaining maturity of sixty days or less when purchased are fair valued at cost adjusted for amortization of premiums and accretion of discounts (amortized cost), provided the Advisor’s Pricing Committee has determined that the use of amortized cost is an appropriate reflection of fair value given market and issuer-specific conditions existing at the time of the determination. Factors that may be considered in determining the appropriateness of the use of amortized cost include, but are not limited to, the following:
| 1) | the credit conditions in the relevant market and changes thereto; |
| 2) | the liquidity conditions in the relevant market and changes thereto; |
| 3) | the interest rate conditions in the relevant market and changes thereto (such as significant changes in interest rates); |
| 4) | issuer-specific conditions (such as significant credit deterioration); and |
| 5) | any other market-based data the Advisor’s Pricing Committee considers relevant. In this regard, the Advisor’s Pricing Committee may use last-obtained market-based data to assist it when valuing portfolio securities using amortized cost. |
Certain securities may not be able to be priced by pre-established pricing methods. Such securities may be valued by the Trust’s Board of Trustees or its delegate, the Advisor’s Pricing Committee, at fair value. These securities generally include, but are not limited to, restricted securities (securities which may not be publicly sold without registration under the Securities Act of 1933, as amended (the “1933 Act”)) for which a third-party pricing service is unable to provide a market price; securities whose trading has been formally suspended; a security whose market or fair value price is not available from a pre-established pricing source; a security with respect to which an event has occurred that is likely to materially affect the value of the security after the market has closed but before the calculation of the Fund’s NAV or make it difficult or impossible to obtain a reliable market quotation; and a security whose price, as provided by the third-party pricing service, does not reflect the security’s fair value. As a general principle, the current fair value of a security would appear to be the amount which the owner might reasonably expect to receive for the security upon its current sale. When fair value prices are used, generally they will differ from market quotations or official closing prices on the applicable exchanges. A variety of factors may be considered in determining the fair value of such securities, including, but not limited to, the following:
| 1) | the type of security; |
| 2) | the size of the holding; |
| 3) | the initial cost of the security; |
| 4) | transactions in comparable securities; |
| 5) | price quotes from dealers and/or third-party pricing services; |
| 6) | relationships among various securities; |
| 7) | information obtained by contacting the issuer, analysts, or the appropriate stock exchange; |
| 8) | an analysis of the issuer’s financial statements; and |
| 9) | the existence of merger proposals or tender offers that might affect the value of the security. |
If the securities in question are foreign securities, the following additional information may be considered:
| 1) | the value of similar foreign securities traded on other foreign markets; |
| 2) | ADR trading of similar securities; |
| 3) | closed-end fund trading of similar securities; |
| 4) | foreign currency exchange activity; |
| 5) | the trading prices of financial products that are tied to baskets of foreign securities; |
| 6) | factors relating to the event that precipitated the pricing problem; |
| 7) | whether the event is likely to recur; and |
| 8) | whether the effects of the event are isolated or whether they affect entire markets, countries or regions. |
Notes to Financial Statements (Continued)
First Trust Preferred Securities and Income ETF (FPE)
April 30, 2018 (Unaudited)
The Fund is subject to fair value accounting standards that define fair value, establish the framework for measuring fair value and provide a three-level hierarchy for fair valuation based upon the inputs to the valuation as of the measurement date. The three levels of the fair value hierarchy are as follows:
| • | Level 1 – Level 1 inputs are quoted prices in active markets for identical investments. An active market is a market in which transactions for the investment occur with sufficient frequency and volume to provide pricing information on an ongoing basis. |
| • | Level 2 – Level 2 inputs are observable inputs, either directly or indirectly, and include the following: |
| o | Quoted prices for similar investments in active markets. |
| o | Quoted prices for identical or similar investments in markets that are non-active. A non-active market is a market where there are few transactions for the investment, the prices are not current, or price quotations vary substantially either over time or among market makers, or in which little information is released publicly. |
| o | Inputs other than quoted prices that are observable for the investment (for example, interest rates and yield curves observable at commonly quoted intervals, volatilities, prepayment speeds, loss severities, credit risks, and default rates). |
| o | Inputs that are derived principally from or corroborated by observable market data by correlation or other means. |
| • | Level 3 – Level 3 inputs are unobservable inputs. Unobservable inputs may reflect the reporting entity’s own assumptions about the assumptions that market participants would use in pricing the investment. |
The inputs or methodologies used for valuing investments are not necessarily an indication of the risk associated with investing in those investments. A summary of the inputs used to value the Fund’s investments as of April 30, 2018, is included with the Fund’s Portfolio of Investments.
B. Securities Transactions and Investment Income
Securities transactions are recorded as of the trade date. Realized gains and losses from securities transactions are recorded on the identified cost basis. Dividend income is recorded on the ex-dividend date. Interest income is recorded daily on the accrual basis. Amortization of premiums and accretion of discounts are recorded using the effective interest method.
Distributions received from the Fund’s investments in REITs may be comprised of return of capital, capital gains, and income. The actual character of the amounts received during the year are not known until after the REIT’s fiscal year end. The Fund records the character of distributions received from the REITs during the year based on estimates available. The characterization of distributions received by a Fund may be subsequently revised based on information received from the REITs after their tax reporting periods conclude.
C. Restricted Securities
The Fund invests in restricted securities, which are securities that may not be offered for public sale without first being registered under the 1933 Act. Prior to registration, restricted securities may only be resold in transactions exempt from registration under Rule 144A under the 1933 Act, normally to qualified institutional buyers. As of April 30, 2018, the Fund held restricted securities as shown in the following table that Stonebridge Advisors LLC (“Stonebridge” or the “Sub-Advisor”), has deemed illiquid pursuant to procedures adopted by the Trust’s Board of Trustees. Although market instability can result in periods of increased overall market illiquidity, liquidity for each security is determined based on security-specific factors and assumptions, which require subjective judgment. The Fund does not have the right to demand that such securities be registered. These securities are valued according to the valuation procedures as stated in the Portfolio Valuation note (Note 2A) and are not expressed as a discount to the carrying value of a comparable unrestricted security. There are no unrestricted securities with the same maturity dates and yields for these issuers.
| Security | Acquisition
Date | Principal
Values/Shares | Current Price | Carrying
Cost | Value | % of
Net
Assets |
| Compeer Financial ACA, 6.75% | 7/31/15 | 2,500 | $1,055.00 | $2,631,250 | $2,637,500 | 0.08% |
| Dairy Farmers of America, Inc., 7.13% | 9/15/16-8/10/17 | $7,700,000 | 109.75 | 7,898,000 | 8,450,750 | 0.24 |
| Farm Credit Bank Of Texas, 6.75% | 12/8/15-5/11/17 | 34,840 | 107.80 | 3,613,780 | 3,755,821 | 0.11 |
| Fortegra Financial Corp., 8.50%, 10/15/57 | 10/12/17-3/12/18 | $13,700,000 | 101.25 | 13,719,114 | 13,871,250 | 0.39 |
Notes to Financial Statements (Continued)
First Trust Preferred Securities and Income ETF (FPE)
April 30, 2018 (Unaudited)
| Security | Acquisition
Date | Principal
Values/Shares | Current Price | Carrying
Cost | | Value | | % of
Net
Assets |
| Kinder Morgan GP, Inc., 6.22%, 8/18/57 | 3/21/17-10/16/17 | 10,000 | $938.61 | $9,215,000 | | $9,386,102 | | 0.27% |
| Land O’Lakes Capital Trust I, 7.45%, 3/15/28 | 3/20/15-7/7/17 | $17,854,000 | 114.00 | 19,843,495 | | 20,353,560 | | 0.58 |
| Sovereign Real Estate Investment Trust, 12.00% | 5/12/14-3/22/16 | 4,556 | 1,177.50 | 5,906,010 | | 5,364,690 | | 0.15 |
| | | | | $62,826,649 | | $63,819,674 | | 1.82% |
D. Dividends and Distributions to Shareholders
Dividends from net investment income, if any, are declared and paid monthly, or as the Board of Trustees may determine from time to time. Distributions of net realized capital gains earned by the Fund, if any, are distributed at least annually.
Distributions from income and capital gains are determined in accordance with federal income tax regulations, which may differ from U.S. GAAP. Certain capital accounts in the financial statements are periodically adjusted for permanent differences in order to reflect their tax character. These permanent differences are primarily due to the varying treatment of income and gain/loss on portfolio securities held by the Fund and have no impact on net assets or NAV per share. Temporary differences, which arise from recognizing certain items of income, expense and gain/loss in different periods for financial statement and tax purposes, will reverse at some time in the future.
The tax character of distributions paid by the Fund during the fiscal year ended October 31, 2017, was as follows:
| Distributions paid from: | |
Ordinary income
| $114,019,342 |
Capital gains
| — |
Return of capital
| 292,582 |
As of October 31, 2017, the components of distributable earnings on a tax basis were as follows:
Undistributed ordinary income
| $— |
Accumulated capital and other losses
| (11,729,438) |
Net unrealized appreciation (depreciation)
| 108,890,786 |
E. Income Taxes
The Fund intends to continue to qualify as a regulated investment company by complying with the requirements under Subchapter M of the Internal Revenue Code of 1986, as amended, which includes distributing substantially all of its net investment income and net realized gains to shareholders. Accordingly, no provision has been made for federal and state income taxes. However, due to the timing and amount of distributions, the Fund may be subject to an excise tax of 4% of the amount by which approximately 98% of the Fund’s taxable income exceeds the distributions from such taxable income for the calendar year.
The Fund is subject to accounting standards that establish a minimum threshold for recognizing, and a system for measuring, the benefits of a tax position taken or expected to be taken in a tax return. Taxable years ending 2014, 2015, 2016, and 2017 remain open to federal and state audit. As of April 30, 2018, management has evaluated the application of these standards to the Fund and has determined that no provision for income tax is required in the Fund’s financial statements for uncertain tax positions.
The Fund intends to utilize provisions of the federal income tax laws, which allow it to carry a realized capital loss forward indefinitely following the year of the loss and offset such loss against any future realized capital gains. The Fund is subject to certain limitations under U.S. tax rules on the use of capital loss carryforwards and net unrealized built-in losses. These limitations apply when there has been a 50% change in ownership. At October 31, 2017, the Fund had $11,729,438 of non-expiring capital loss carryforwards for federal income tax purposes.
F. Expenses
Expenses, other than the investment advisory fee and other excluded expenses, are paid by the Advisor (See Note 3).
Notes to Financial Statements (Continued)
First Trust Preferred Securities and Income ETF (FPE)
April 30, 2018 (Unaudited)
G. New and Amended Financial Reporting Rules and Forms
On October 13, 2016, the SEC adopted new rules and forms, and amended existing rules and forms. The new and amended rules and forms are intended to modernize the reporting of information provided by funds and to improve the quality and type of information that funds provide to the SEC and investors. In part, the new and amended rules and forms amend Regulation S-X and require standardized, enhanced disclosures about derivatives in a fund’s financial statements, as well as other amendments. The compliance date for the amendments of Regulation S-X was August 1, 2017, which resulted in additional disclosure for variable interest rate securities within the Portfolio of Investments. The new form types and other rule amendments will be effective for the First Trust funds, including the Fund, for reporting periods beginning on and after June 1, 2018. Management is evaluating the new form types and other rule amendments that are effective on and after June 1, 2018 to determine the impact to the Fund.
3. Investment Advisory Fee, Affiliated Transactions and Other Fee Arrangements
First Trust, the investment advisor to the Fund, is a limited partnership with one limited partner, Grace Partners of DuPage L.P., and one general partner, The Charger Corporation. The Charger Corporation is an Illinois corporation controlled by James A. Bowen, Chief Executive Officer of First Trust. First Trust is responsible for the ongoing monitoring of the securities in the Fund’s portfolio, managing the Fund’s business affairs and providing certain administrative services necessary for the management of the Fund.
Stonebridge, a majority-owned affiliate of First Trust, serves as the Fund’s sub-advisor and manages the Fund’s portfolio subject to First Trust’s supervision. Pursuant to the Investment Management Agreement between the Trust and the Advisor, First Trust will supervise Stonebridge and its management of the investment of the Fund’s assets and will pay Stonebridge for its services as the Fund’s sub-advisor. First Trust and Stonebridge are equally responsible for the Fund’s expenses, including the cost of transfer agency, custody, fund administration, legal, audit and other services, but excluding fee payments under the Investment Management Agreement, interest, taxes, acquired fund fees and expenses, brokerage commissions and other expenses connected with the execution of portfolio transactions, distribution and service fees pursuant to a 12b-1 plan, if any, and extraordinary expenses. The Fund has agreed to pay First Trust an annual unitary management fee equal to 0.85% of its average daily net assets. Stonebridge receives a sub-advisory fee equal to 0.425% of the average daily net assets of the Fund less Stonebridge’s share of the Fund’s expenses. The Sub-Advisor’s fee is paid by the Advisor out of the Advisor’s management fee. First Trust also provides fund reporting services to the Fund for a flat annual fee in the amount of $9,250, which is covered under the annual unitary management fee.
First Trust Capital Partners, LLC (“FTCP”), an affiliate of First Trust, owns a 51% ownership interest in Stonebridge.
The Trust has multiple service agreements with Brown Brothers Harriman & Co. (“BBH”). Under the service agreements, BBH performs custodial, fund accounting, certain administrative services, and transfer agency services for the Fund. As custodian, BBH is responsible for custody of the Fund’s assets. As fund accountant and administrator, BBH is responsible for maintaining the books and records of the Fund’s securities and cash. As transfer agent, BBH is responsible for maintaining shareholder records for the Fund.
Each Trustee who is not an officer or employee of First Trust, any sub-advisor or any of their affiliates (“Independent Trustees”) is paid a fixed annual retainer that is allocated equally among each fund in the First Trust Fund Complex. Each Independent Trustee is also paid an annual per fund fee that varies based on whether the fund is a closed-end or other actively managed fund, or is an index fund.
Additionally, the Lead Independent Trustee and the Chairmen of the Audit Committee, Nominating and Governance Committee and Valuation Committee are paid annual fees to serve in such capacities, with such compensation allocated pro rata among each fund in the First Trust Fund Complex based on net assets. Independent Trustees are reimbursed for travel and out-of-pocket expenses in connection with all meetings. The Lead Independent Trustee and Committee Chairmen rotate every three years. The officers and “Interested” Trustee receive no compensation from the Trust for acting in such capacities.
4. Purchases and Sales of Securities
For the six months ended April 30, 2018, the cost of purchases and proceeds from sales of investments, excluding short term investments and in-kind transactions, were $815,260,443 and $304,370,750, respectively.
For the six months ended April 30, 2018, the cost of in-kind purchases and proceeds from in-kind sales were $114,056,199 and $10,690,362, respectively.
5. Creations, Redemptions and Transaction Fees
Shares are created and redeemed by the Fund only in Creation Unit size aggregations of 50,000 shares in transactions with broker-dealers or large institutional investors that have entered into a participation agreement (an “Authorized Participant”). In order to purchase Creation Units of the Fund, an Authorized Participant must deposit (i) a designated portfolio of securities and other
Notes to Financial Statements (Continued)
First Trust Preferred Securities and Income ETF (FPE)
April 30, 2018 (Unaudited)
instruments determined by First Trust (the “Deposit Securities”) and generally make or receive a cash payment referred to as the “Cash Component,” which is an amount equal to the difference between the NAV of the Fund shares (per Creation Unit Aggregation) and the market value of the Deposit Securities, and/or (ii) cash in lieu of all or a portion of the Deposit Securities. If the Cash Component is a positive number (i.e., the NAV per Creation Unit Aggregation exceeds the Deposit Amount), the Authorized Participant will deliver the Cash Component. If the Cash Component is a negative number (i.e., the NAV per Creation Unit Aggregation is less than the Deposit Amount), the Authorized Participant will receive the Cash Component. Authorized Participants purchasing Creation Units must pay to BBH, as transfer agent, a creation transaction fee (the “Creation Transaction Fee”) regardless of the number of Creation Units purchased in the transaction. The Creation Transaction Fee may vary and is based on the composition of the securities included in the Fund’s portfolio and the countries in which the transactions are settled. The Creation Transaction Fee is currently $500. The price for each Creation Unit will equal the daily NAV per share times the number of shares in a Creation Unit plus the fees described above and, if applicable, any operational processing and brokerage costs, transfer fees or stamp taxes. When the Fund permits an Authorized Participant to substitute cash or a different security in lieu of depositing one or more of the requisite Deposit Securities, the Authorized Participant may also be assessed an amount to cover the cost of purchasing the Deposit Securities and/or disposing of the substituted securities, including operational processing and brokerage costs, transfer fees, stamp taxes, and part or all of the spread between the expected bid and offer side of the market related to such Deposit Securities and/or substitute securities.
Authorized Participants redeeming Creation Units must pay to BBH, as transfer agent, a redemption transaction fee (the “Redemption Transaction Fee”), regardless of the number of Creation Units redeemed in the transaction. The Redemption Transaction Fee may vary and is based on the composition of the securities included in the Fund’s portfolio and the countries in which the transactions are settled. The Redemption Transaction Fee is currently $500. The Fund reserves the right to effect redemptions in cash. An Authorized Participant may request cash redemption in lieu of securities; however, the Fund may, in its discretion, reject any such request.
6. Distribution Plan
The Board of Trustees adopted a Distribution and Service Plan pursuant to Rule 12b-1 under the 1940 Act. In accordance with the Rule 12b-1 plan, the Fund is authorized to pay an amount up to 0.25% of its average daily net assets each year to reimburse First Trust Portfolios L.P. (“FTP”), the distributor of the Fund, for amounts expended to finance activities primarily intended to result in the sale of Creation Units or to provide investor services. FTP may also use this amount to compensate securities dealers or other persons that are Authorized Participants for providing distribution assistance, including broker-dealer and shareholder support and educational and promotional services.
No 12b-1 fees are currently paid by the Fund, and pursuant to a contractual arrangement, no 12b-1 fees will be paid any time before March 1, 2019.
7. Line of Credit
First Trust Preferred Securities and Income ETF, along with First Trust Series Fund and First Trust Exchange-Traded Fund IV, has a $320 million Credit Agreement with The Bank of Nova Scotia (“Scotia”) as administrative agent for a group of lenders. Prior to March 7, 2018, the commitment was $220 million. Scotia charges a commitment fee of 0.25% of the daily amount of the excess of the commitment amount over the outstanding principal balance of the loans and an agency fee. First Trust allocates the commitment fee and agency fee amongst the funds that have access to the credit line. To the extent that a fund accesses the credit line, there would also be an interest fee charged. The Funds did not have any borrowings outstanding during the six months ended April 30, 2018.
8. Indemnification
The Trust, on behalf of the Fund, has a variety of indemnification obligations under contracts with its service providers. The Trust’s maximum exposure under these arrangements is unknown. However, the Trust has not had prior claims or losses pursuant to these contracts and expects the risk of loss to be remote.
9. Subsequent Events
Management has evaluated the impact of all subsequent events to the Fund through the date the financial statements were issued, and has determined that there were no subsequent events requiring recognition or disclosure in the financial statements that have not already been disclosed.
Additional Information
First Trust Preferred Securities and Income ETF (FPE)
April 30, 2018 (Unaudited)
Proxy Voting Policies and Procedures
A description of the policies and procedures that the Trust uses to determine how to vote proxies and information on how the Fund voted proxies relating to portfolio securities during the most recent 12-month period ended June 30 is available (1) without charge, upon request, by calling (800) 988-5891; (2) on the Fund’s website at www.ftportfolios.com; and (3) on the Securities and Exchange Commission’s (“SEC”) website at www.sec.gov.
Portfolio Holdings
The Trust files its complete schedule of the Fund’s portfolio holdings with the SEC for the first and third quarters of each fiscal year on Form N-Q. The Trust’s Form N-Qs are available (1) by calling (800) 988-5891; (2) on the Fund’s website at www.ftportfolios.com; (3) on the SEC’s website at www.sec.gov; and (4) for review and copying at the SEC’s Public Reference Room (“PRR”) in Washington, DC. Information regarding the operation of the PRR may be obtained by calling (800) SEC-0330.
Risk Considerations
Risks are inherent in all investing. You should consider the Fund’s investment objective, risks, charges and expenses carefully before investing. You can download the Fund’s prospectus at www.ftportfolios.com or contact First Trust Portfolios L.P. at (800) 621-1675 to request a prospectus, which contains this and other information about the Fund. For additional information about the risks associated with investing in the Fund, please see the Fund’s statement of additional information, as well as other regulatory filings. Read these documents carefully before you invest. First Trust Portfolios L.P. is the distributor of the First Trust Exchange-Traded Fund III.
The following summarizes some of the risks that should be considered for the Fund.
AUTHORIZED PARTICIPANT CONCENTRATION RISK. Only an authorized participant (as defined in the “Creations, Redemptions, and Transactions Fees” Note to Financial Statements) may engage in creation or redemption transactions directly with the Fund. The Fund has a limited number of institutions that act as authorized participants. To the extent that these institutions exit the business or are unable to proceed with creation and/or redemption orders with respect to the Fund and no other authorized participant is able to step forward to create or redeem, in either of these cases, Fund shares may trade at a discount to the Fund’s net asset value and possibly face delisting.
CALL RISK. If an issuer calls higher-yielding debt instruments held by the Fund, performance could be adversely impacted. During periods of falling interest rates, issuers of callable securities may call (redeem) securities with higher coupon rates or interest rates before their maturity dates. The Fund would then lose any price appreciation above the bond’s call price and would be forced to reinvest the unanticipated proceeds at lower interest rates, resulting in a decline in the Fund’s income. Such redemptions and subsequent reinvestments would also increase the Fund’s portfolio turnover rate.
CASH TRANSACTIONS RISK. The Fund may, under certain circumstances, effect a portion of creations and redemptions for cash, rather than in-kind securities. As a result, an investment in the Fund may be less tax-efficient than an investment in an ETF that effects its creations and redemptions for in-kind securities. Because the Fund may effect a portion of redemptions for cash, it may be required to sell portfolio securities in order to obtain the cash needed to distribute redemption proceeds. A sale of shares may result in capital gains or losses and may also result in higher brokerage costs.
CONCENTRATION RISK. A fund concentrated in a single industry or sector is likely to present more risks than a fund that is broadly diversified over several industries or sectors. Compared to the broad market, an individual industry or sector may be more strongly affected by changes in the economic climate, broad market shifts, moves in a particular dominant stock, or regulatory changes. The Fund is concentrated in the financial sector.
CONTINGENT CONVERTIBLE SECURITIES RISK. Contingent convertible securities (“CoCos”) may provide for mandatory conversion into common stock of the issuer under certain circumstances. Since the common stock of the issuer may not pay a dividend, investors in these instruments could experience a reduced income rate, potentially to zero; and conversion would deepen the subordination of the investor, hence worsening standing in a bankruptcy. In addition, some such instruments have a set stock conversion rate that would cause a reduction in value of the security if the price of the stock is below the conversion price on the conversion date. CoCos may be considered to be high-yield securities (a.k.a. “junk” bonds) and, to the extent a CoCo held by the Fund undergoes a write down, the Fund may lose some or all of its original investment in the CoCo. Subordinate securities such as CoCos are more likely to experience credit loss than non-subordinate securities of the same issuer - even if the CoCos do not convert to equity securities. Any losses incurred by subordinate securities, such as CoCos, are likely to be proportionately greater than non-subordinate securities and any recovery of principal and interest of subordinate securities may take more time. As a result, any perceived decline in creditworthiness of a CoCo issuer is likely to have a greater impact on the CoCo, as a subordinate security.
Additional Information (Continued)
First Trust Preferred Securities and Income ETF (FPE)
April 30, 2018 (Unaudited)
CREDIT RISK. Credit risk is the risk that an issuer of a security will be unable or unwilling to make dividend, interest and/or principal payments when due and the related risk that the value of a security may decline because of concerns about the issuer’s ability to make such payments. Credit risk may be heightened if the Fund invests in “high yield” or “junk” securities; such securities, while generally offering higher yields than investment grade debt with similar maturities, involve greater risks, including the possibility of dividend or interest deferral, default or bankruptcy, and are regarded as predominantly speculative with respect to the issuer’s capacity to pay dividends or interest and repay principal.
CURRENCY EXCHANGE RATE RISK. The Fund may hold investments that are denominated in non-U.S. currencies, or in securities that provide exposure to such currencies, currency exchange rates or interest rates denominated in such currencies. Changes in currency exchange rates and the relative value of non-U.S. currencies will affect the value of the Fund’s investment and the value of Fund shares. Currency exchange rates can be very volatile and can change quickly and unpredictably. As a result, the value of an investment in the Fund may change quickly and without warning and you may lose money.
CYBER SECURITY RISK. As the use of Internet technology has become more prevalent in the course of business, the Fund has become more susceptible to potential operational risks through breaches in cyber security. A breach in cyber security refers to both intentional and unintentional events that may cause the Fund to lose proprietary information, suffer data corruption or lose operational capacity. Such events could cause the Fund to incur regulatory penalties, reputational damage, additional compliance costs associated with corrective measures and/or financial loss. Cyber security breaches may involve unauthorized access to the Fund’s digital information systems through “hacking” or malicious software coding, but may also result from outside attacks such as denial-of-service attacks through efforts to make network services unavailable to intended users. In addition, cyber security breaches of the Fund’s third-party service providers, such as its administrator, transfer agent, custodian, or sub-advisor, as applicable, or issuers in which the Fund invests, can also subject the Fund to many of the same risks associated with direct cyber security breaches. The Fund has established risk management systems designed to reduce the risks associated with cyber security. However, there is no guarantee that such efforts will succeed, especially because the Fund does not directly control the cyber security systems of issuers or third-party service providers.
DERIVATIVES RISK. The use of swaps, options, futures contracts, forward contracts and other derivatives can lead to losses because of adverse movements in the price or value of the underlying asset, index or rate, which may be magnified by certain features of the derivatives. These risks are heightened when the Fund’s portfolio managers use derivatives to enhance the Fund’s return or as a substitute for a position or security, rather than solely to hedge (or offset) the risk of a position or security held by the Fund.
EXTENSION RISK. Extension risk is the risk that, when interest rates rise, certain obligations will be paid off by the issuer (or obligor) more slowly than anticipated, causing the value of these securities to fall. Rising interest rates tend to extend the duration of securities, making them more sensitive to changes in interest rates. The value of longer-term securities generally changes more in response to changes in interest rates than shorter-term securities. As a result, in a period of rising interest rates, securities may exhibit additional volatility and may lose value.
FINANCIAL COMPANIES RISK. Financial companies are especially subject to the adverse effects of economic recession, currency exchange rates, government regulation, decreases in the availability of capital, volatile interest rates, portfolio concentrations in geographic markets and in commercial and residential real estate loans, and competition from new entrants in their fields of business.
FLUCTUATION OF NET ASSET VALUE RISK. The net asset value of shares of the Fund will generally fluctuate with changes in the market value of the Fund’s holdings. The market prices of shares will generally fluctuate in accordance with changes in net asset value as well as the relative supply of and demand for shares on the Exchange. The Fund’s investment advisor cannot predict whether shares will trade below, at or above their net asset value because the shares trade on the Exchange at market prices and not at net asset value. Price differences may be due, in large part, to the fact that supply and demand forces at work in the secondary trading market for shares will be closely related to, but not identical to, the same forces influencing the prices of the holdings of the Fund trading individually or in the aggregate at any point in time. However, given that shares can only be purchased and redeemed either in-kind or for cash in Creation Units, and only to and from broker-dealers and large institutional investors that have entered into participation agreements (unlike shares of closed-end funds, which frequently trade at appreciable discounts from, and sometimes at premiums to, their net asset value), the Fund’s investment advisor believes that large discounts or premiums to the net asset value of shares should not be sustained.
HIGH YIELD SECURITIES RISK. High yield securities, or “junk” bonds, are subject to greater market fluctuations and risk of loss than securities with higher ratings, and therefore, are considered to be highly speculative. These securities are issued by companies that may have limited operating history, narrowly focused operations and/or other impediments to the timely payment of periodic interest and principal at maturity. If the economy slows down or dips into recession, the issuers of high yield securities may not have sufficient resources to continue making timely payment of periodic interest and principal at maturity. The market for high yield securities is smaller and less liquid than that for investment grade securities. High yield securities are generally not listed on a national securities
Additional Information (Continued)
First Trust Preferred Securities and Income ETF (FPE)
April 30, 2018 (Unaudited)
exchange but trade in the over-the-counter markets. Due to the smaller, less liquid market for high yield securities, the bid-offer spread on such securities is generally greater than it is for investment grade securities and the purchase or sale of such securities may take longer to complete. In general, high yield securities may have a greater risk of default than other types of securities.
ILLIQUID SECURITIES RISK. Some of the securities held by the Fund may be illiquid. Illiquid securities involve the risk that the securities will not be able to be sold at the time desired by the Fund or at prices approximately the value at which the Fund values the securities.
INCOME RISK. Income from the Fund’s fixed income investments could decline during periods of falling interest rates.
INTEREST RATE RISK. Interest rate risk is the risk that the value of the fixed-income securities in the Fund’s portfolio will decline because of rising market interest rates. Interest rate risk is generally lower for shorter term investments and higher for longer term investments. Duration is a measure of the expected price volatility of a debt instrument as a result of changes in market rates of interest, based on, among other factors, the weighted average timing of the instrument’s expected principal and interest payments. In general, duration represents the expected percentage change in the value of a security for an immediate 1% change in interest rates. Therefore, prices of instruments with shorter durations tend to be less sensitive to interest rate changes than instruments with longer durations. As the value of a security changes over time, so will its duration.
INVESTMENT COMPANIES RISK. The Fund may invest in securities of other investment companies, including ETFs. As a shareholder in other investment companies, the Fund will bear its ratable share of that investment company’s expenses, and would remain subject to payment of the Fund’s advisory and administrative fees with respect to assets so invested. Shareholders would therefore be subject to duplicative expenses to the extent the Fund invests in other investment companies. In addition, the Fund will incur brokerage costs when purchasing and selling shares of ETFs or other exchange-traded investment companies.
LIQUIDITY RISK. The Fund may invest a significant portion of its assets in lower-quality debt issued by companies that are highly leveraged. Lower-quality debt tends to be less liquid than higher-quality debt. Moreover, smaller debt issues tend to be less liquid than larger debt issues. If the economy experiences a sudden downturn, or if the debt markets for such companies become distressed, the Fund may have particular difficulty selling its assets in sufficient amounts, at reasonable prices and in a sufficiently timely manner to raise the cash necessary to meet any potentially heavy redemption requests by Fund shareholders.
MANAGEMENT RISK. The Fund is subject to management risk because it is an actively managed portfolio. In managing the Fund’s investment portfolio, the Sub-Advisor will apply investment techniques and risk analyses that may not have the desired result. There can be no guarantee that the Fund will meet its investment objective.
MARKET RISK. Market risk is the risk that a particular security owned by the Fund or shares of the Fund in general may fall in value. Securities are subject to market fluctuations caused by such factors as economic, political, regulatory or market developments, changes in interest rates and perceived trends in securities prices. Shares of the Fund could decline in value or underperform other investments.
MARKET MAKER RISK. If the Fund has lower average daily trading volumes, it may rely on a small number of third-party market makers to provide a market for the purchase and sale of shares. Any trading halt or other problem relating to the trading activity of these market makers could result in a dramatic change in the spread between the Fund’s net asset value and the price at which the Fund’s shares are trading on the Exchange, which could result in a decrease in value of the Fund’s shares. In addition, decisions by market makers or authorized participants to reduce their role or step away from these activities in times of market stress could inhibit the effectiveness of the arbitrage process in maintaining the relationship between the underlying values of the Fund’s portfolio securities and the Fund’s market price. This reduced effectiveness could result in Fund shares trading at a discount to net asset value and also in greater than normal intraday bid-ask spreads for Fund shares.
NON-U.S. SECURITIES AND EMERGING MARKETS RISK. Non-U.S. securities are subject to higher volatility than securities of domestic issuers due to possible adverse political, social or economic developments; restrictions on foreign investment or exchange of securities; lack of liquidity; currency exchange rates; excessive taxation; government seizure of assets; different legal or accounting standards; and less government supervision and regulation of exchanges in foreign countries. These risks may be heightened for securities of companies located in, or with significant operations in, emerging market countries.
PREFERRED SECURITIES RISK. Preferred securities combine some of the characteristics of both common stocks and bonds. Preferred securities are typically subordinated to bonds and other debt instruments in a company’s capital structure, in terms of priority to corporate income, and therefore will be subject to greater credit risk than those debt instruments. Preferred securities are also subject to credit risk, interest rate risk and income risk.
Additional Information (Continued)
First Trust Preferred Securities and Income ETF (FPE)
April 30, 2018 (Unaudited)
REIT INVESTMENT RISK. The Fund invests in real estate investment trusts (“REITs”), and as a result, the Fund is subject to the risks associated with investing in real estate, which may include, but are not limited to, fluctuations in the value of underlying properties, defaults by borrowers or tenants, market saturation, changes in general and local operating expenses and other economic, political or regulatory occurrences affecting companies in the real estate industry. In addition to risks related to investments in real estate generally, investing in REITs involves certain other risks related to their structure and focus, which include, but are not limited to, dependency upon management skills, limited diversification, the risks of locating and managing financing for projects, heavy cash flow dependency, possible default by borrowers, the costs and potential losses of self-liquidation of one or more holdings, the risk of a possible lack of mortgage funds and associated interest rate risks, overbuilding, property vacancies, increases in property taxes and operating expenses, changes in zoning laws, losses due to environmental damages, changes in neighborhood values and appeal to purchasers, the possibility of failing to maintain exemptions from registration under the 1940 Act and, in many cases, relatively small market capitalization, which may result in less market liquidity and greater price volatility. REITs are also subject to the risk that the real estate market may experience an economic downturn generally, which may have a material effect on the real estate in which the REITs invest and their underlying portfolio securities.
TRADING ISSUES RISK. Although the shares of the Fund are listed for trading on the Exchange, there can be no assurance that an active trading market for such shares will develop or be maintained. Trading in shares on the Exchange may be halted due to market conditions or for reasons that, in the view of the Exchange, make trading in shares inadvisable. In addition, trading in shares on the Exchange is subject to trading halts caused by extraordinary market volatility pursuant to the Exchange’s “circuit breaker” rules. Market makers are under no obligation to make a market in the Fund’s shares, and authorized participants are not obligated to submit purchase or redemption orders for Creation Units. There can be no assurance that the requirements of the Exchange necessary to maintain the listing of the Fund will continue to be met or will remain unchanged. In particular, if the Fund does not comply with any provision of the listing standards of the Exchange that are applicable to the Fund, and cannot bring itself into compliance within a reasonable period after discovering the matter, the Exchange may remove the shares of the Fund from listing. The Fund may have difficulty maintaining its listing on the Exchange in the event the fund’s assets are small or the Fund does not have enough shareholders.
INVESTMENT ADVISOR
First Trust Advisors L.P.
120 E. Liberty Drive, Suite 400
Wheaton, IL 60187
INVESTMENT SUB-ADVISOR
Stonebridge Advisors LLC
10 Westport Road
Suite C101
Wilton, CT 06897
ADMINISTRATOR, CUSTODIAN,
FUND ACCOUNTANT &
TRANSFER AGENT
Brown Brothers Harriman & Co.
50 Post Office Square
Boston, MA 02110
INDEPENDENT REGISTERED
PUBLIC ACCOUNTING FIRM
Deloitte & Touche LLP
111 S. Wacker Drive
Chicago, IL 60606
LEGAL COUNSEL
Chapman and Cutler LLP
111 W. Monroe Street
Chicago, IL 60603
First Trust Exchange-Traded Fund III
First Trust Managed Municipal ETF (FMB)
Semi-Annual Report
For the Six Months Ended
April 30, 2018
First Trust Managed Municipal ETF (FMB)
Semi-Annual Report
April 30, 2018
Caution Regarding Forward-Looking Statements
This report contains certain forward-looking statements within the meaning of the Securities Act of 1933, as amended, and the Securities Exchange Act of 1934, as amended. Forward-looking statements include statements regarding the goals, beliefs, plans or current expectations of First Trust Advisors L.P. (“First Trust” or the “Advisor”) and its representatives, taking into account the information currently available to them. Forward-looking statements include all statements that do not relate solely to current or historical fact. For example, forward-looking statements include the use of words such as “anticipate,” “estimate,” “intend,” “expect,” “believe,” “plan,” “may,” “should,” “would” or other words that convey uncertainty of future events or outcomes.
Forward-looking statements involve known and unknown risks, uncertainties and other factors that may cause the actual results, performance or achievements of the series of First Trust Exchange-Traded Fund III (the “Trust”) described in this report (First Trust Managed Municipal ETF; hereinafter referred to as the “Fund”) to be materially different from any future results, performance or achievements expressed or implied by the forward-looking statements. When evaluating the information included in this report, you are cautioned not to place undue reliance on these forward-looking statements, which reflect the judgment of the Advisor and its representatives only as of the date hereof. We undertake no obligation to publicly revise or update these forward-looking statements to reflect events and circumstances that arise after the date hereof.
Performance and Risk Disclosure
There is no assurance that the Fund will achieve its investment objectives. The Fund is subject to market risk, which is the possibility that the market values of securities owned by the Fund will decline and that the value of the Fund shares may therefore be less than what you paid for them. Accordingly, you can lose money by investing in the Fund. See “Risk Considerations” in the Additional Information section of this report for a discussion of certain other risks of investing in the Fund.
Performance data quoted represents past performance, which is no guarantee of future results, and current performance may be lower or higher than the figures shown. For the most recent month-end performance figures, please visit www.ftportfolios.com or speak with your financial advisor. Investment returns, net asset value and share price will fluctuate and Fund shares, when sold, may be worth more or less than their original cost.
The Advisor may also periodically provide additional information on Fund performance on the Fund’s web page at www.ftportfolios.com.
How to Read This Report
This report contains information that may help you evaluate your investment in the Fund. It includes details about the Fund and presents data and analysis that provide insight into the Fund’s performance and investment approach.
The statistical information that follows may help you understand the Fund’s performance compared to that of a relevant market benchmark.
It is important to keep in mind that the opinions expressed by personnel of the Advisor are just that: informed opinions. They should not be considered to be promises or advice. The opinions, like the statistics, cover the period through the date on the cover of this report. The material risks of investing in the Fund are spelled out in the prospectus, the statement of additional information, this report and other Fund regulatory filings.
First Trust Managed Municipal ETF (FMB)
Semi-Annual Letter from the Chairman and CEO
April 30, 2018
Dear Shareholders,
First Trust is pleased to provide you with the semi-annual report for the First Trust Managed Municipal ETF which contains information about your investment for the period ended April 30, 2018. We encourage you to read this report carefully and discuss it with your financial advisor.
As you are no doubt aware, 2017 was a very strong year for both the U.S. and global markets. The three major U.S. indices – the S&P 500® Index, the Dow Jones Industrial Average and the Nasdaq Composite – posted their best performance since 2013. And there was more good news for Wall Street as the year ended and analysts collected stock market data:
| • | The S&P 500® Index did something it had never previously done, finishing 2017 with 12 months of gains; |
| • | The Dow Jones Industrial Average achieved a milestone as well, closing above 24,000 for the first time ever on November 30; |
| • | The Nasdaq Composite set a record by having 11 months of gains in 2017 (June was the only down month, and by just 0.86%); and |
| • | The MSCI AC World Index (containing constituents from 47 countries) ended 2017 at an all-time high and was up 22% at year-end. |
As 2017 ended, President Trump signed the “Tax Cuts and Jobs Act of 2017” tax reform bill. As 2018 began, there was much enthusiasm for this tax reform package and the potential increase in take-home pay for many Americans, as well as the reduction in the federal corporate tax rate from 35% to 21%. Early in the year, many investors were also watching the Federal Reserve (the “Fed”) and its signaled intent to continue raising interest rates at a gradual pace. Based on strong job growth and the economic outlook in the U.S., the Fed did, in fact, raise interest rates on March 21, 2018.
For the entire first quarter of 2018, increased volatility was the norm. The S&P 500® Index was off to a strong start in January as it returned over 7.5% from January 2 to January 26. February, however, was a different story. Early in the month, the Dow Jones Industrial Average plunged 567 points and sank into “correction” territory (defined as a drop of 10% from the index’s high) and in just two weeks, was down more than 3,200 points. However, as February came to a close, the Dow Jones Industrial Average was back on track and up from the lows experienced earlier in the month. Volatility continued in March and April with the Dow Jones Industrial Average ending April with a small gain.
This market volatility is why we believe that one should invest for the long term and be prepared for market movements, which can happen at any time. This can be accomplished by keeping current on your portfolio and investing goals and by speaking regularly with your investment professional. It’s important to keep in mind that past performance of the U.S. and global stock markets or investment products can never guarantee future results. As we’ve said before, markets go up and they also go down, but savvy investors are prepared for either through careful attention to their portfolios and investment goals.
At First Trust, we continue to be optimistic about the U.S. economy and we thank you for giving us the opportunity to be a part of your financial plan. We value our relationship with you and will report on your investment again in six months.
Sincerely,
James A. Bowen
Chairman of the Board of Trustees
Chief Executive Officer of First Trust Advisors L.P.
Fund Performance Overview (Unaudited)
First Trust Managed Municipal ETF (FMB)
The primary investment objective of First Trust Managed Municipal ETF (the “Fund”) is to generate current income that is exempt from regular federal income taxes and its secondary objective is long-term capital appreciation. The Fund lists and principally trades its shares on The Nasdaq Stock Market, LLC under the ticker symbol “FMB.” Under normal market conditions, the Fund seeks to achieve its investment objectives by investing at least 80% of its net assets (including investment borrowings) in municipal debt securities that pay interest that is exempt from regular federal income taxes.
| Performance | | | | |
| | | | Average Annual
Total Returns | Cumulative
Total Returns |
| | 6 Months Ended
4/30/18 | 1 Year Ended
4/30/18 | Inception (5/13/14)
to 4/30/18 | Inception (5/13/14)
to 4/30/18 |
| Fund Performance | | | | |
| NAV | -0.45% | 3.06% | 3.97% | 16.70% |
| Market Price | -0.47% | 3.05% | 3.99% | 16.80% |
| Index Performance | | | | |
| Bloomberg Barclays Municipal 10-Year Revenue Index | -1.47% | 1.19% | 2.90% | 12.01% |
Total returns for the period since inception are calculated from the inception date of the Fund. “Average Annual Total Returns” represent the average annual change in value of an investment over the period indicated. “Cumulative Total Returns” represent the total change in value of an investment over the period indicated.
The Fund’s per share net asset value (“NAV”) is the value of one share of the Fund and is computed by dividing the value of all assets of the Fund (including accrued interest and dividends), less all liabilities (including accrued expenses and dividends declared but unpaid), by the total number of outstanding shares. The price used to calculate market return (“Market Price”) is determined by using the midpoint between the highest bid and the lowest offer on the stock exchange on which shares of the Fund are listed for trading as of the time that the Fund’s NAV is calculated. Since shares of the Fund did not trade in the secondary market until after its inception, for the period from inception to the first day of secondary market trading in shares of the Fund, the NAV of the Fund is used as a proxy for the secondary market trading price to calculate market returns. NAV and market returns assume that all distributions have been reinvested in the Fund at NAV and Market Price, respectively.
An index is a statistical composite that tracks a specified financial market or sector. Unlike the Fund, the index does not actually hold a portfolio of securities and therefore does not incur the expenses incurred by the Fund. These expenses negatively impact the performance of the Fund. Also, market returns do not include brokerage commissions that may be payable on secondary market transactions. If brokerage commissions were included, market returns would be lower. The total returns presented reflect the reinvestment of dividends on securities in the index. The returns presented do not reflect the deduction of taxes that a shareholder would pay on Fund distributions or the redemption or sale of Fund shares. The investment return and principal value of shares of the Fund will vary with changes in market conditions. Shares of the Fund may be worth more or less than their original cost when they are redeemed or sold in the market. The Fund’s past performance is no guarantee of future performance.
Fund Performance Overview (Unaudited) (Continued)
First Trust Managed Municipal ETF (FMB) (Continued)
| Sector Allocation | % of Total
Investments
(including cash) |
| Continuing Care Retirement Communities | 11.6% |
| Hospital | 10.2 |
| Insured | 8.0 |
| Higher Education | 7.0 |
| Education | 6.4 |
| Water & Sewer | 5.9 |
| Dedicated Tax | 5.7 |
| Certificates of Publication | 5.2 |
| Government Obligation Bond - Unlimited Tax | 4.9 |
| Government Obligation Bond - Limited Tax | 4.1 |
| Utility | 3.6 |
| Special Assessment | 3.6 |
| Gas | 3.6 |
| Airport | 2.7 |
| Toll Road | 2.6 |
| Industrial Development Bond | 2.3 |
| Tax Increment | 1.9 |
| Student Housing | 1.2 |
| Skilled Nursing | 1.0 |
| Local Housing | 1.0 |
| Other Health | 0.8 |
| Tobacco | 0.8 |
| Pre-refunded/Escrowed-to-maturity | 0.8 |
| Mass Transit | 0.6 |
| Port | 0.1 |
| Stadium | 0.0* |
| Hotel | 0.0* |
| Cash | 4.4 |
| Total | 100.0% |
| * | Amount is less than 0.1%. |
| Credit Quality(1) | % of Total
Investments
(including cash) |
| AAA | 7.5% |
| AA | 23.1 |
| A | 28.4 |
| BBB | 16.5 |
| BB | 5.5 |
| Not Rated | 14.6 |
| Cash | 4.4 |
| Total | 100.0% |
| (1) | The credit quality and ratings information presented above reflect the ratings assigned by one or more nationally recognized statistical rating organizations (NRSROs), including Standard & Poor’s Ratings Group, a division of the McGraw Hill Companies, Inc., Moody’s Investors Service, Inc., Fitch Ratings or a comparably rated NRSRO. For situations in which a security is rated by more than one NRSRO and the ratings are not equivalent, the highest rating is used. Sub-investment grade ratings are those rated BB+/Ba1 or lower. Investment grade ratings are those rated BBB-/Baa3 or higher. The credit ratings shown relate to the creditworthiness of the issuers of the underlying securities in the Fund, and not to the Fund or its shares. Credit ratings are subject to change. |
Fund Performance Overview (Unaudited) (Continued)
First Trust Managed Municipal ETF (FMB) (Continued)

Performance figures assume reinvestment of all distributions and do not reflect the deduction of taxes that a shareholder would pay on Fund distributions or the redemption or sale of Fund shares. An index is a statistical composite that tracks a specified financial market or sector. Unlike the Fund, the index does not actually hold a portfolio of securities and therefore does not incur the expenses incurred by the Fund. These expenses negatively impact the performance of the Fund. The Fund’s past performance does not predict future performance.
Frequency Distribution of Discounts and Premiums
Bid/Ask Midpoint vs. NAV through April 30, 2018
The following Frequency Distribution of Discounts and Premiums charts are provided to show the frequency at which the bid/ask midpoint price for the Fund was at a discount or premium to the daily NAV. The following tables are for comparative purposes only and represent the period May 14, 2014 (commencement of trading) through April 30, 2018. Shareholders may pay more than NAV when they buy Fund shares and receive less than NAV when they sell those shares because shares are bought and sold at current market price. Data presented represents past performance and cannot be used to predict future results.
| Number of Days Bid/Ask Midpoint At/Above NAV |
| For the Period | 0.00%–0.49% | 0.50%–0.99% | 1.00%–1.99% | >=2.00% |
| 5/14/14 – 10/31/14 | 2 | 10 | 0 | 0 |
| 11/1/14 – 10/31/15 | 178 | 16 | 0 | 0 |
| 11/1/15 – 10/31/16 | 200 | 0 | 0 | 0 |
| 11/1/16 – 10/31/17 | 207 | 0 | 0 | 0 |
| 11/1/17 – 4/30/18 | 102 | 0 | 0 | 0 |
| Number of Days Bid/Ask Midpoint Below NAV |
| For the Period | 0.00%–0.49% | 0.50%–0.99% | 1.00%–1.99% | >=2.00% |
| 5/14/14 – 10/31/14 | 64 | 43 | 0 | 0 |
| 11/1/14 – 10/31/15 | 57 | 0 | 0 | 0 |
| 11/1/15 – 10/31/16 | 51 | 1 | 0 | 0 |
| 11/1/16 – 10/31/17 | 45 | 0 | 0 | 0 |
| 11/1/17 – 4/30/18 | 21 | 0 | 0 | 0 |
Portfolio Management
First Trust Managed Municipal ETF (FMB)
Semi-Annual Report
April 30, 2018 (Unaudited)
Advisor
First Trust Advisors L.P. (“First Trust” or the “Advisor”) is the investment advisor to the First Trust Managed Municipal ETF (the “Fund”). First Trust is responsible for the ongoing monitoring of the Fund’s investment portfolio, managing the Fund’s business affairs and providing certain administrative services necessary for the management of the Fund.
Portfolio Management Team
Tom Futrell, CFA, Senior Vice President, Senior Portfolio Manager
Johnathan N. Wilhelm, Senior Vice President, Senior Portfolio Manager
The First Trust Municipal Securities Team was formed in September of 2013 and is headed by Tom Futrell, CFA and Johnathan Wilhelm who serve as senior portfolio managers of the Fund. Messrs. Futrell and Wilhelm have a combined 50+ years of investment experience and prior to joining First Trust, served as portfolio managers of municipal bonds at Nuveen Investments and Performance Trust Investment Advisors. In addition to the Fund, the team manages/consults for a variety of investment portfolios and separately managed accounts.
First Trust Managed Municipal ETF (FMB)
Understanding Your Fund Expenses
April 30, 2018 (Unaudited)
As a shareholder of the First Trust Managed Municipal ETF (the “Fund”), you incur two types of costs: (1) transaction costs; and (2) ongoing costs, including management fees, distribution and/or service (12b-1) fees, if any, and other Fund expenses. This Example is intended to help you understand your ongoing costs of investing in the Fund and to compare these costs with the ongoing costs of investing in other funds.
The Example is based on an investment of $1,000 invested at the beginning of the period and held through the six-month period ended April 30, 2018.
Actual Expenses
The first line in the following table provides information about actual account values and actual expenses. You may use the information in this line, together with the amount you invested, to estimate the expenses that you paid over the period. Simply divide your account value by $1,000 (for example, an $8,600 account value divided by $1,000 = 8.6), then multiply the result by the number in the first line under the heading entitled “Expenses Paid During the Six-Month Period” to estimate the expenses you paid on your account during this six-month period.
Hypothetical Example for Comparison Purposes
The second line in the following table provides information about hypothetical account values and hypothetical expenses based on the Fund’s actual expense ratio and an assumed rate of return of 5% per year before expenses, which is not the Fund’s actual return. The hypothetical account values and expenses may not be used to estimate the actual ending account balance or expenses you paid for the period. You may use this information to compare the ongoing costs of investing in the Fund and other funds. To do so, compare this 5% hypothetical example with the 5% hypothetical examples that appear in the shareholder reports of the other funds.
Please note that the expenses shown in the table are meant to highlight your ongoing costs only and do not reflect any transactional costs such as brokerage commissions. Therefore, the second line in the table is useful in comparing ongoing costs only, and will not help you determine the relative total costs of owning different funds. In addition, if these transactional costs were included, your costs would have been higher.
| | Beginning
Account Value
November 1, 2017 | Ending
Account Value
April 30, 2018 | Annualized
Expense Ratio
Based on the
Six-Month
Period (a) | Expenses Paid
During the
Six-Month
Period (b) |
| First Trust Managed Municipal ETF (FMB) |
| Actual | $1,000.00 | $995.50 | 0.50% | $2.47 |
| Hypothetical (5% return before expenses) | $1,000.00 | $1,022.32 | 0.50% | $2.51 |
| (a) | These expense ratios reflect expense waivers. See Note 3 in the Notes to Financial Statements. |
| (b) | Expenses are equal to the annualized expense ratios as indicated in the table multiplied by the average account value over the period (November 1, 2017 through April 30, 2018), multiplied by 181/365 (to reflect the six-month period). |
First Trust Managed Municipal ETF (FMB)
Portfolio of Investments
April 30, 2018 (Unaudited)
Principal
Value | | Description | | Stated
Coupon | | Stated
Maturity | | Value |
| MUNICIPAL BONDS – 95.6% |
| | | Alabama – 0.3% | | | | | | |
| $500,000 | | AL St Port Auth Docks Facs Rev Ref Docks Facs Rev, Ser A, AGM, AMT
| | 5.00% | | 10/01/25 | | $560,720 |
| 600,000 | | Mobile AL Impt Dist Sales Tax Rev Mcgowin Park Proj, Ser A
| | 5.00% | | 08/01/25 | | 616,038 |
| | | | | 1,176,758 |
| | | Arizona – 2.0% | | | | | | |
| 1,205,000 | | AZ Brd of Rgts Univ AZ Sys Rev Green Bond, Ser B
| | 5.00% | | 06/01/28 | | 1,414,525 |
| 375,000 | | AZ St Indl Dev Auth Edu Rev Ref Basis Sch Projs, Ser D (a)
| | 5.00% | | 07/01/37 | | 386,089 |
| 750,000 | | AZ St Indl Dev Auth Edu Rev Ref Basis Schs Projs, Ser A (a)
| | 4.00% | | 07/01/21 | | 756,855 |
| 555,000 | | AZ St Indl Dev Auth Edu Rev Ref Basis Schs Projs, Ser A (a)
| | 5.00% | | 07/01/26 | | 592,107 |
| 400,000 | | La Paz Cnty AZ Indl Dev Auth Edu Fac Lease Rev Chrt Sch Solutions-Harmony Pub Schs Proj, Ser A (a)
| | 5.00% | | 02/15/26 | | 429,472 |
| 200,000 | | Maricopa Cnty AZ Indl Dev Auth Edu Rev Greathearts Arizona Projs, Ser C
| | 5.00% | | 07/01/25 | | 224,236 |
| 500,000 | | Maricopa Cnty AZ Indl Dev Auth Edu Rev Ref Horizon Cmnty Learning Ctr Proj
| | 5.00% | | 07/01/35 | | 513,455 |
| 500,000 | | Maricopa Cnty AZ Indl Dev Auth Edu Rev Ref Paradise Schs Projs Paragon Mgmt Inc (a)
| | 4.00% | | 07/01/26 | | 499,290 |
| 500,000 | | Phoenix AZ Indl Dev Auth Edu Rev Fac Legacy Traditional Schs Projs, Ser A (a)
| | 4.00% | | 07/01/26 | | 495,850 |
| 510,000 | | Pima Cnty AZ Indl Dev Auth Edu Rev Fac American Leadership Academy Proj (a)
| | 4.00% | | 06/15/22 | | 514,228 |
| 450,000 | | Pima Cnty AZ Indl Dev Auth Edu Rev Ref Fac American Leadership Academy Proj (a)
| | 4.60% | | 06/15/25 | | 463,752 |
| 500,000 | | Tempe AZ Indl Dev Auth Rev Mirabella at ASU Proj, Ser A (a)
| | 6.00% | | 10/01/37 | | 515,925 |
| 275,000 | | Yavapai Cnty AZ Indl Dev Auth Hosp Fac Ref Yavapai Regl Med Ctr
| | 5.00% | | 08/01/23 | | 304,464 |
| | | | | 7,110,248 |
| | | California – 9.2% | | | | | | |
| 320,000 | | Abag CA Fin Auth For Nonprofit Corps Ref Episcopal Sr Cmntys, Ser B
| | 5.00% | | 07/01/23 | | 357,619 |
| 275,000 | | CA Pub Fin Auth Rev Ref Henry Mayo Newhall Hosp
| | 5.00% | | 10/15/29 | | 308,157 |
| 1,000,000 | | CA Sch Fin Auth Sch Fac Rev Alliance Clg Ready Pub Schs Proj, Ser C
| | 4.50% | | 07/01/26 | | 1,090,970 |
| 455,000 | | CA Sch Fin Auth Sch Fac Rev Ref Hlth Learning Proj, Ser A (a)
| | 4.00% | | 07/01/26 | | 477,950 |
| 800,000 | | CA Sch Fin Auth Sch Fac Rev Ref Hlth Learning Proj, Ser A (a)
| | 5.00% | | 07/01/32 | | 882,784 |
| 600,000 | | CA St Hlth Facs Fing Auth Rev Sutter Hlth, Ser A
| | 5.00% | | 11/15/33 | | 695,634 |
| 700,000 | | CA St Muni Fin Auth Chrt Sch Rev Palmdale Aerospace Academy Proj (a)
| | 4.00% | | 07/01/26 | | 705,495 |
| 200,000 | | CA St Muni Fin Auth Rev Channing House Proj, Ser B
| | 5.00% | | 05/15/37 | | 230,654 |
| 125,000 | | CA St Muni Fin Auth Rev Ref Eisenhower Med Ctr, Ser A
| | 5.00% | | 07/01/29 | | 142,744 |
| 500,000 | | CA St Muni Fin Auth Rev Ref Eisenhower Med Ctr, Ser A
| | 5.00% | | 07/01/34 | | 555,855 |
| 2,500,000 | | CA St Ref Various Purpose
| | 5.00% | | 10/01/25 | | 2,944,575 |
| 500,000 | | CA St Ref, Ser C
| | 5.00% | | 09/01/32 | | 578,520 |
| 500,000 | | CA St Sch Fin Auth Chrt Sch Rev Summit Pub Schs (a)
| | 5.00% | | 06/01/37 | | 541,305 |
| 550,000 | | CA Stwd Cmntys Dev Auth Rev Loma Linda Univ Med Ctr, Ser A (a)
| | 5.00% | | 12/01/36 | | 585,293 |
| 800,000 | | CA Stwd Cmntys Dev Auth Rev Ref CA Baptist Univ, Ser A (a)
| | 3.00% | | 11/01/22 | | 799,328 |
| 500,000 | | CA Stwd Cmntys Dev Auth Rev Ref CA Baptist Univ, Ser A (a)
| | 5.00% | | 11/01/32 | | 546,210 |
| 100,000 | | CA Stwd Cmntys Dev Auth Rev Ref Front Porch Cmntys & Svcs, Ser A
| | 5.00% | | 04/01/30 | | 114,529 |
| 500,000 | | CA Stwd Cmntys Dev Auth Rev Ref Lancer Eductnl Student Hsg Proj, Ser A (b)
| | 4.00% | | 06/01/21 | | 510,010 |
See Notes to Financial Statements
Page 7
First Trust Managed Municipal ETF (FMB)
Portfolio of Investments (Continued)
April 30, 2018 (Unaudited)
Principal
Value | | Description | | Stated
Coupon | | Stated
Maturity | | Value |
| MUNICIPAL BONDS (Continued) |
| | | California (Continued) | | | | | | |
| $1,000,000 | | Cathedral City CA Redev Agy Successor Agy Tax Allocation Rev Ref Hsg Merged Redev Proj Area, Ser B, AGM
| | 5.00% | | 08/01/32 | | $1,114,930 |
| 1,160,000 | | Etiwanda CA Sch Dist Cmnty Facs Dist #9 Spl Tax Ref
| | 5.00% | | 09/01/35 | | 1,279,666 |
| 500,000 | | Foothill-De Anza CA Cmnty Clg Dist Ref, COPS
| | 5.00% | | 04/01/32 | | 561,040 |
| 1,050,000 | | Fresno CA Arpt Rev Ref, Ser B, BAM, AMT
| | 5.13% | | 07/01/30 | | 1,141,287 |
| 1,360,000 | | Hawthorne CA Cmnty Redev Agy Successor Agy Tax Allocation Ref Sub, AGM
| | 5.00% | | 09/01/32 | | 1,544,443 |
| 1,015,000 | | Kaweah CA Delta Hlth Care Dist Rev, Ser B
| | 5.00% | | 06/01/40 | | 1,096,504 |
| 210,000 | | La Verne CA Ref Brethren Hillcrest Homes, COPS
| | 5.00% | | 05/15/22 | | 231,905 |
| 2,250,000 | | Lammersville CA Jt Unif Sch Dist Spl Tax Cmnty Facs Dist #2014-1 Impt Area #1 Mountain House Sch Facs
| | 5.00% | | 09/01/42 | | 2,462,175 |
| 835,000 | | Live Oak CA Sch Dist Santa Cruz Cnty Ref
| | 5.00% | | 08/01/30 | | 970,746 |
| 45,000 | | Long Beach CA Bond Fin Auth Nat Gas Purchase Rev, Ser A
| | 5.25% | | 11/15/23 | | 50,617 |
| 1,500,000 | | Los Angeles CA Dept of Wtr & Pwr Wtrwks Rev Ref, Ser B
| | 5.00% | | 07/01/36 | | 1,716,120 |
| 325,000 | | Menifee CA Union Sch Dist Pub Fing Auth Spl Tax Rev Ref, Ser A
| | 5.00% | | 09/01/28 | | 370,458 |
| 1,110,000 | | Montebello CA Pub Fing Auth Rev Montebello Home2 Suites Hilton Hotel Proj, Ser A
| | 5.00% | | 06/01/32 | | 1,262,248 |
| 560,000 | | River Islands CA Pub Fing Auth Spl Tax Ref Cmnty Facs Dist #2003-1
| | 5.38% | | 09/01/31 | | 597,660 |
| 350,000 | | San Diego Cnty CA Limited Rev Obligs Ref Sanford Burnham Prebys Med Discovery Institute, Ser A
| | 5.00% | | 11/01/25 | | 406,109 |
| 600,000 | | San Diego Cnty CA Limited Rev Obligs Ref Sanford Burnham Prebys Med Discovery Institute, Ser A
| | 5.00% | | 11/01/26 | | 690,462 |
| 945,000 | | San Diego Cnty CA Regl Arpt Auth Sr, Ser B, AMT
| | 5.00% | | 07/01/30 | | 1,039,500 |
| 775,000 | | San Diego Cnty CA Regl Arpt Auth Sub Rev, Ser B, AMT
| | 5.00% | | 07/01/31 | | 892,319 |
| 1,250,000 | | San Diego Cnty CA Regl Transprtn Commission, Ser A
| | 5.00% | | 04/01/35 | | 1,453,600 |
| 1,000,000 | | San Francisco CA City & Cnty Arpts Commn Intl Arpt Rev Ref, Ser D, AMT
| | 5.00% | | 05/01/22 | | 1,099,340 |
| 280,000 | | San Francisco City & Cnty CA Redev Agy Successor Agy Tax Ref Mission Bay N Redev Proj, Ser A
| | 5.00% | | 08/01/35 | | 317,352 |
| 105,000 | | San Luis Coastal CA Unif Sch Dist Election 2014, Ser B
| | 5.00% | | 08/01/30 | | 125,496 |
| | | | | 32,491,609 |
| | | Colorado – 4.5% | | | | | | |
| 835,000 | | Amber Creek Met Dist CO Ref, Ser A (c)
| | 5.00% | | 12/01/37 | | 826,742 |
| 500,000 | | Base Vlg Met Dist #2 CO Ref, Ser A (c)
| | 5.50% | | 12/01/36 | | 509,640 |
| 1,000,000 | | Canyons Met Dist #5 CO Ref, Ser A (c)
| | 6.00% | | 12/01/37 | | 1,006,590 |
| 500,000 | | Castle Oaks CO Met Dist #3 Ref (c)
| | 5.00% | | 12/01/37 | | 501,905 |
| 500,000 | | Centerra CO Met Dist #1 Spl Rev Dist #1 (b)
| | 5.00% | | 12/01/22 | | 540,930 |
| 1,000,000 | | Centerra CO Met Dist #1 Spl Rev Dist #1 (b)
| | 5.00% | | 12/01/29 | | 1,073,030 |
| 300,000 | | CO St Hlth Facs Auth Hosp Rev Ref Frasier Meadows Retmnt Cmnty Proj, Ser A
| | 5.00% | | 05/15/25 | | 330,993 |
| 350,000 | | CO St Hlth Facs Auth Hosp Rev Ref Frasier Meadows Retmnt Cmnty Proj, Ser A
| | 5.00% | | 05/15/26 | | 387,012 |
| 605,000 | | CO St Hlth Facs Auth Rev Ref Covenant Retmnt Cmntys, Ser A
| | 5.00% | | 12/01/27 | | 658,300 |
| 525,000 | | CO St Hlth Facs Auth Rev Ref Covenant Retmnt Cmntys, Ser A
| | 5.00% | | 12/01/33 | | 559,881 |
| 150,000 | | Conservatory Met Dist CO Arapahoe Cnty Ref, BAM
| | 5.00% | | 12/01/24 | | 170,090 |
| 245,000 | | Conservatory Met Dist CO Arapahoe Cnty Ref, BAM
| | 5.00% | | 12/01/25 | | 281,578 |
| 500,000 | | Copperleaf CO Met Dist #2 Ref (c)
| | 5.25% | | 12/01/30 | | 524,590 |
| 90,000 | | Denver CO Convention Ctr Hotel Auth Rev Ref Sr
| | 5.00% | | 12/01/24 | | 101,765 |
| 55,000 | | E-470 CO Pub Highway Auth Capital Appreciation Sr, Ser B, NATL-RE
| | (d) | | 09/01/22 | | 49,601 |
| 250,000 | | Harvest Junction CO Met Dist Ref & Impt
| | 5.00% | | 12/01/30 | | 259,725 |
| 860,000 | | Lakes At Centerra Met Dist No 2 CO Impt, Ser A (c)
| | 4.63% | | 12/01/27 | | 859,966 |
Page 8
See Notes to Financial Statements
First Trust Managed Municipal ETF (FMB)
Portfolio of Investments (Continued)
April 30, 2018 (Unaudited)
Principal
Value | | Description | | Stated
Coupon | | Stated
Maturity | | Value |
| MUNICIPAL BONDS (Continued) |
| | | Colorado (Continued) | | | | | | |
| $100,000 | | Lorson Ranch Met Dist #2 CO
| | 4.00% | | 12/01/24 | | $108,542 |
| 170,000 | | Lorson Ranch Met Dist #2 CO
| | 5.00% | | 12/01/27 | | 192,935 |
| 2,200,000 | | Park Creek CO Met Dist Rev Ref Sr Limited Property Tax Supported, Ser A
| | 5.00% | | 12/01/24 | | 2,490,400 |
| 150,000 | | Park Creek CO Met Dist Rev Ref Sr Limited Property Tax Supported, Ser A
| | 5.00% | | 12/01/34 | | 166,763 |
| 155,000 | | Park Creek CO Met Dist Rev Ref Sr Limited Property Tax Supported, Ser A
| | 5.00% | | 12/01/35 | | 171,883 |
| 30,000 | | Park Creek CO Met Dist Rev Sr, Ser A, NATL-RE
| | 5.00% | | 12/01/24 | | 33,864 |
| 500,000 | | Parker Homestead Met Dist CO Ref (c)
| | 5.63% | | 12/01/44 | | 526,765 |
| 1,000,000 | | Prairie Ctr CO Met Dist #3 Ltd Property Tax Supported Pri Ref, Ser A (b)
| | 4.13% | | 12/15/27 | | 1,008,740 |
| 160,000 | | Pub Auth for CO St Energy Nat Gas Purchase Rev
| | 6.13% | | 11/15/23 | | 185,594 |
| 550,000 | | Serenity Ridge CO Met Dist #2 Ref, Ser A (c)
| | 5.13% | | 12/01/37 | | 557,408 |
| 750,000 | | Sierra Ridge Met Dist No 2 CO Sr, Ser A (c)
| | 4.50% | | 12/01/31 | | 734,302 |
| 500,000 | | Southglenn CO Met Dist Spl Rev Ref (c)
| | 5.00% | | 12/01/30 | | 518,690 |
| 165,000 | | Sterling Hills CO W Met Dist Ref
| | 5.00% | | 12/01/26 | | 183,333 |
| 500,000 | | Whispering Pines Met Dist #1 CO, Ser A (c)
| | 5.00% | | 12/01/37 | | 504,060 |
| | | | | 16,025,617 |
| | | Connecticut – 1.4% | | | | | | |
| 1,000,000 | | CT St Hlth & Eductnl Facs Auth Rev Ref Fairfield Univ, Ser S
| | 5.00% | | 07/01/26 | | 1,151,650 |
| 2,250,000 | | CT St Hlth & Eductnl Facs Auth Rev Ref Quinnipiac Univ, Ser L
| | 5.00% | | 07/01/31 | | 2,496,713 |
| 550,000 | | CT St Spl Tax Oblig Rev Transptrn Infrastructure, Ser A
| | 5.00% | | 09/01/28 | | 604,978 |
| 500,000 | | Harbor Point CT Infrastructure Impt Dist Spl Oblg Rev Ref Harbor Point Proj Limited (a)
| | 5.00% | | 04/01/39 | | 531,365 |
| | | | | 4,784,706 |
| | | District of Columbia – 1.0% | | | | | | |
| 3,000,000 | | DC Wtr & Swr Auth Pub Utility Rev Ref Sub Lien, Ser A
| | 5.00% | | 10/01/36 | | 3,419,820 |
| | | Florida – 7.6% | | | | | | |
| 80,000 | | Alachua Cnty FL Hlth Facs Auth Shands Teaching Hosp & Clinics, Ser A
| | 5.00% | | 12/01/26 | | 89,590 |
| 175,000 | | Belle Isle FL Chrt Sch Lease Rev Cornerstone Chrt Academy & Cornerstone Chrt High Sch
| | 5.50% | | 10/01/22 | | 182,413 |
| 300,000 | | Bexley CDD FL Spl Assmnt Rev
| | 4.10% | | 05/01/26 | | 301,956 |
| 210,000 | | Bonterra Cmnty Dev Dist FL Spl Assmnt Sr, Ser A-1
| | 3.13% | | 05/01/26 | | 204,261 |
| 500,000 | | Brookstone CDD FL Spl Assmnt Rev CDD (a)
| | 3.88% | | 11/01/23 | | 499,875 |
| 605,000 | | Broward Cnty FL Fuel Sys Rev Ft Lauderdale Fuel Facs, Ser A, AGM, AMT
| | 5.00% | | 04/01/22 | | 657,278 |
| 330,000 | | Capital Trust Agy FL Eductnl Facs Rev Viera Chrt Schs Inc Proj, Ser A (a)
| | 4.00% | | 10/15/29 | | 317,929 |
| 250,000 | | Citizens Property Insurance Corp FL, Ser A-1
| | 5.00% | | 06/01/22 | | 273,430 |
| 25,000 | | Escambia Cnty FL Hlth Facs Auth Baptist Hosp Inc Proj, Ser A
| | 5.00% | | 08/15/19 | | 25,943 |
| 280,000 | | Escambia Cnty FL Hlth Facs Auth Baptist Hosp Inc Proj, Ser A
| | 5.50% | | 08/15/24 | | 299,510 |
| 595,000 | | Harmony FL CDD Capital Impt Rev Ref, Ser 2015
| | 4.75% | | 05/01/25 | | 598,998 |
| 370,000 | | Heritage Harbour FL N CDD Capital Impt Rev Ref Sr Lien, Ser A-1, AGM
| | 5.00% | | 05/01/25 | | 407,559 |
| 125,000 | | Hollywood FL Cmnty Redev Agy Redev Rev Ref
| | 5.00% | | 03/01/23 | | 136,512 |
| 1,000,000 | | Jacksonville FL Hlth Care Facs Rev Ref Baptist Hlth
| | 5.00% | | 08/15/35 | | 1,136,680 |
| 1,500,000 | | Jacksonville FL Spl Rev Ref Spl Rev, Ser A
| | 5.00% | | 10/01/31 | | 1,734,855 |
| 1,080,000 | | Lakeland FL Hosp Sys Rev Lakeland Regl Hlth
| | 5.00% | | 11/15/33 | | 1,193,152 |
| 1,400,000 | | Mediterra FL S CDD Capital Impt Rev Ref
| | 5.10% | | 05/01/31 | | 1,497,440 |
| 500,000 | | Miami FL Hlth Facs Auth Ref Miami Jewish Hlth Sys Oblig Grp
| | 5.00% | | 07/01/23 | | 553,540 |
| 520,000 | | Miami FL Hlth Facs Auth Ref Miami Jewish Hlth Sys Oblig Grp
| | 5.00% | | 07/01/25 | | 584,069 |
See Notes to Financial Statements
Page 9
First Trust Managed Municipal ETF (FMB)
Portfolio of Investments (Continued)
April 30, 2018 (Unaudited)
Principal
Value | | Description | | Stated
Coupon | | Stated
Maturity | | Value |
| MUNICIPAL BONDS (Continued) |
| | | Florida (Continued) | | | | | | |
| $500,000 | | Miami FL Spl Oblig Ref (a)
| | 5.00% | | 03/01/30 | | $548,410 |
| 375,000 | | Miami World Ctr CDD FL Spl Assmnt
| | 4.00% | | 11/01/23 | | 382,650 |
| 275,000 | | Miami World Ctr CDD FL Spl Assmnt
| | 4.75% | | 11/01/27 | | 285,920 |
| 515,000 | | Miami-Dade Cnty FL Aviation Rev Ref, Ser A, AMT
| | 5.00% | | 10/01/27 | | 562,169 |
| 1,000,000 | | Miami-Dade Cnty FL Eductnl Facs Auth Rev Ref Univ Miami, Ser A
| | 5.00% | | 04/01/31 | | 1,126,010 |
| 445,000 | | Miami-Dade Cnty FL Indl Dev Auth Doral Academy Proj
| | 5.00% | | 01/15/25 | | 482,892 |
| 550,000 | | Miami-Dade Cnty FL Indl Dev Auth Doral Academy Proj
| | 5.00% | | 01/15/32 | | 588,357 |
| 1,210,000 | | Miami-Dade Cnty FL Indl Dev Auth Doral Academy Proj
| | 5.00% | | 01/15/37 | | 1,276,538 |
| 1,080,000 | | Miami-Dade Cnty FL Spl Oblig Sub Ref
| | 5.00% | | 10/01/35 | | 1,210,529 |
| 565,000 | | Nthrn Palm Beach Cnty FL Impt Dist
| | 3.25% | | 08/01/22 | | 566,932 |
| 355,000 | | Nthrn Palm Beach Cnty FL Impt Dist
| | 5.00% | | 08/01/37 | | 373,495 |
| 345,000 | | Orange Cnty FL Hlth Facs Auth Rev Presbyterian Retmnt Cmntys Proj
| | 5.00% | | 08/01/34 | | 370,989 |
| 70,000 | | Orange Cnty FL Hlth Facs Auth Rev Ref Mayflower Retmnt Ctr
| | 5.00% | | 06/01/32 | | 73,667 |
| 825,000 | | Orange Cnty FL Hlth Facs Auth Rev Ref Presbyterian Retmnt Cmntys
| | 5.00% | | 08/01/31 | | 904,439 |
| 1,345,000 | | Palm Beach Cnty FL Hlth Facs Auth Rev Lifespace Cmntys Inc, Ser B
| | 5.00% | | 05/15/41 | | 1,460,697 |
| 55,000 | | Port Saint Lucie FL Cmnty Redev Agy Rev Ref
| | 5.00% | | 01/01/23 | | 60,914 |
| 120,000 | | Sarasota Cnty FL Hlth Facs Auth Retmnt Fac Rev Ref Vlg of Isle Proj
| | 5.00% | | 01/01/26 | | 134,920 |
| 2,250,000 | | SE Overtown Park W Cmnty Redev Agy FL Tax, Ser A-1 (a)
| | 5.00% | | 03/01/30 | | 2,466,247 |
| 230,000 | | Seven Oaks FL Cmnty Dev Dist Spl Assmnt Rev Ref Sr, Ser B-1
| | 4.00% | | 05/01/24 | | 242,537 |
| 500,000 | | Six Mile Creek FL CDD Capital Impt Rev Ref Assmnt Area 2 Phase 2, Ser B
| | 5.35% | | 11/01/29 | | 492,000 |
| 500,000 | | Tallahassee FL Energy Sys Rev Energy Sys
| | 5.00% | | 10/01/29 | | 567,930 |
| 1,500,000 | | Tallahassee FL Energy Sys Rev Energy Sys
| | 5.00% | | 10/01/30 | | 1,696,230 |
| 100,000 | | UCF Stadium Corp FL Rev Ref, Ser A
| | 5.00% | | 03/01/24 | | 112,788 |
| 75,000 | | Vlg FL CDD #6 Spl Assmnt Rev Ref
| | 4.00% | | 05/01/25 | | 77,876 |
| | | | | 26,760,126 |
| | | Georgia – 1.8% | | | | | | |
| 500,000 | | Atlanta GA Tax Allocation Ref Eastside Proj
| | 5.00% | | 01/01/30 | | 563,615 |
| 315,000 | | East Point GA Tax Allocation Ref
| | 5.00% | | 08/01/21 | | 342,796 |
| 1,030,000 | | Fulton Cnty GA Rsdl Care Facs Elderly Auth Retmnt Fac Rev Ref Lenbrook Sq Fdtn Inc
| | 5.00% | | 07/01/31 | | 1,145,360 |
| 40,000 | | Gainesville & Hall Cnty GA Hosp Auth Ref NE GA Hlth Sys Inc Proj, Ser A
| | 5.00% | | 02/15/26 | | 45,546 |
| 175,000 | | Main Street Nat Gas Inc GA Gas Rev, Ser A
| | 5.50% | | 09/15/23 | | 198,490 |
| 775,000 | | Marietta GA Dev Auth Ref Univ Facs Life Univ, Ser A (a)
| | 5.00% | | 11/01/27 | | 852,492 |
| 560,000 | | Priv Clgs & Univs Auth GA Mercer Univ Proj, Ser C
| | 5.25% | | 10/01/27 | | 611,229 |
| 925,000 | | Priv Clgs & Univs Auth GA Savannah Clg of Art & Design Proj
| | 5.00% | | 04/01/33 | | 1,008,833 |
| 1,500,000 | | Priv Clgs & Univs Auth GA Savannah Clg of Art & Design Proj
| | 5.00% | | 04/01/44 | | 1,614,210 |
| | | | | 6,382,571 |
| | | Guam – 0.1% | | | | | | |
| 230,000 | | Guam Govt Business Privelage Tax Rev, Ser B-1
| | 5.00% | | 01/01/37 | | 236,884 |
| 75,000 | | Guam Pwr Auth Rev Ref, Ser A, AGM
| | 5.00% | | 10/01/20 | | 79,702 |
| | | | | 316,586 |
| | | Hawaii – 0.3% | | | | | | |
| 170,000 | | HI St Dept of Budget & Fin Spl Purpose Rev Ref HI Pacific Hlth Oblig Grp, Ser B
| | 5.00% | | 07/01/30 | | 187,087 |
| 110,000 | | HI St Pacific Hlth Spl Purpose Rev, Ser B
| | 5.63% | | 07/01/30 | | 118,375 |
Page 10
See Notes to Financial Statements
First Trust Managed Municipal ETF (FMB)
Portfolio of Investments (Continued)
April 30, 2018 (Unaudited)
Principal
Value | | Description | | Stated
Coupon | | Stated
Maturity | | Value |
| MUNICIPAL BONDS (Continued) |
| | | Hawaii (Continued) | | | | | | |
| $800,000 | | Honolulu City & Cnty HI Wstwtr Sys Rev Ref Junior, Ser A
| | 5.00% | | 07/01/20 | | $852,136 |
| | | | | 1,157,598 |
| | | Idaho – 0.7% | | | | | | |
| 500,000 | | ID St Hlth Facs Auth Rev Ref Madison Memorial Hosp
| | 5.00% | | 09/01/37 | | 530,370 |
| 255,000 | | ID St Hlth Facs Auth Rev Ref Vly Vista Care Corp, Ser A
| | 5.00% | | 11/15/32 | | 265,797 |
| 985,000 | | ID St Hlth Facs Auth Rev St Lukes Hlth Sys Proj, Ser A
| | 5.00% | | 03/01/44 | | 1,053,684 |
| 500,000 | | ID St Hlth Facs Auth Rev Trinity Hlth Ref, Ser D
| | 5.00% | | 12/01/33 | | 549,215 |
| | | | | 2,399,066 |
| | | Illinois – 3.0% | | | | | | |
| 1,000,000 | | Bolingbrook IL Ref, Ser A, AGM
| | 5.00% | | 01/01/30 | | 1,139,650 |
| 1,000,000 | | Bolingbrook IL Ref, Ser A, AGM
| | 5.00% | | 01/01/31 | | 1,132,570 |
| 500,000 | | Chicago IL Brd of Edu Ref Dedicated, Ser C
| | 5.00% | | 12/01/30 | | 508,355 |
| 305,000 | | Chicago IL O’Hare International Arpt Rev Ref Gen Sr Lien, Ser A, AMT
| | 5.00% | | 01/01/30 | | 338,538 |
| 290,000 | | Chicago IL O’Hare International Arpt Rev Ref Gen Sr Lien, Ser C
| | 5.00% | | 01/01/38 | | 320,238 |
| 400,000 | | Chicago IL O’Hare International Arpt Rev, Ser C, AMT
| | 5.00% | | 01/01/34 | | 435,864 |
| 110,000 | | Chicago IL Ref Proj, Ser A
| | 5.00% | | 01/01/27 | | 113,828 |
| 500,000 | | Chicago IL Ref, Ser A
| | 5.63% | | 01/01/29 | | 550,885 |
| 150,000 | | Chicago IL Ref, Ser C
| | 4.00% | | 01/01/22 | | 151,985 |
| 70,000 | | Chicago IL Ref, Ser C
| | 5.00% | | 01/01/22 | | 73,308 |
| 500,000 | | Chicago IL Ref, Ser C
| | 5.00% | | 01/01/25 | | 532,280 |
| 195,000 | | Chicago IL Ref, Ser C
| | 5.00% | | 01/01/26 | | 207,884 |
| 40,000 | | Chicago IL Ref, Ser C
| | 5.00% | | 01/01/38 | | 40,840 |
| 285,000 | | Chicago IL Ref, Ser C, CABS
| | (d) | | 01/01/22 | | 243,951 |
| 100,000 | | Chicago IL Ref, Ser C, CABS
| | (d) | | 01/01/24 | | 77,549 |
| 505,000 | | Hampshire IL Spl Svc Area #14 Spl Tax Ref Lakewood Crossing, BAM
| | 4.00% | | 03/01/25 | | 522,064 |
| 230,000 | | IL St
| | 5.00% | | 05/01/23 | | 239,267 |
| 70,000 | | IL St Fin Auth Rev Ref Lifespace Cmntys, Ser A
| | 5.00% | | 05/15/24 | | 77,840 |
| 845,000 | | IL St Fin Auth Rev Ref Mercy Hlth System Obligated Grp
| | 5.00% | | 12/01/33 | | 929,145 |
| 1,010,000 | | IL St Fin Auth Rev Sthrn IL Hlth Care, Ser A
| | 5.00% | | 03/01/47 | | 1,100,940 |
| 600,000 | | IL St Fin Auth Student Hsg & Academic Fac Rev Chf Chicago LLC Univ IL Chicago Proj, Ser A
| | 5.00% | | 02/15/26 | | 659,556 |
| 315,000 | | IL St Fin Auth Student Hsg & Academic Fac Rev Chf Chicago LLC Univ IL Chicago Proj, Ser A
| | 5.00% | | 02/15/32 | | 341,504 |
| 470,000 | | IL St, Ser A
| | 4.00% | | 01/01/25 | | 460,816 |
| 500,000 | | IL St, Ser D
| | 5.00% | | 11/01/24 | | 519,655 |
| 20,000 | | IL St, Ser D
| | 5.00% | | 11/01/26 | | 20,843 |
| | | | | 10,739,355 |
| | | Indiana – 0.8% | | | | | | |
| 1,000,000 | | Evansville IN Mf Hsg Rev Silver Birch Evansville Proj
| | 5.45% | | 01/01/38 | | 986,860 |
| 475,000 | | IN St Fin Auth Rev BHI Sr Living
| | 5.50% | | 11/15/26 | | 519,061 |
| 110,000 | | IN St Fin Auth Rev BHI Sr Living
| | 5.50% | | 11/15/31 | | 118,661 |
| 20,000 | | IN St Fin Auth Rev Greencroft Oblig Grp, Ser A
| | 5.00% | | 11/15/23 | | 21,487 |
| 460,000 | | IN St Fin Auth Rev Greencroft Oblig Grp, Ser A
| | 5.75% | | 11/15/28 | | 500,568 |
| 40,000 | | IN St Fin Auth Rev Greencroft Oblig Grp, Ser A
| | 6.00% | | 11/15/28 | | 44,020 |
| 275,000 | | IN St Fin Auth Rev Ref Rev Cmnty Fdtn of NW IN
| | 5.00% | | 09/01/31 | | 311,149 |
| 500,000 | | Mishawaka IN Mf Hsg Rev Silver Birch Mishawaka Proj (a)
| | 5.10% | | 01/01/32 | | 489,375 |
| | | | | 2,991,181 |
| | | Iowa – 0.3% | | | | | | |
| 385,000 | | Coralville IA Ref Annual Appropriation, Ser B
| | 4.00% | | 05/01/24 | | 401,170 |
| 315,000 | | Coralville IA Ref Annual Appropriation, Ser B
| | 4.00% | | 05/01/26 | | 325,222 |
See Notes to Financial Statements
Page 11
First Trust Managed Municipal ETF (FMB)
Portfolio of Investments (Continued)
April 30, 2018 (Unaudited)
Principal
Value | | Description | | Stated
Coupon | | Stated
Maturity | | Value |
| MUNICIPAL BONDS (Continued) |
| | | Iowa (Continued) | | | | | | |
| $275,000 | | Coralville IA, Ser E, COPS
| | 4.00% | | 06/01/23 | | $290,922 |
| | | | | 1,017,314 |
| | | Kansas – 2.2% | | | | | | |
| 475,000 | | Hutchinson KS Hosp Facs Rev Hutchinson Regl Med Ctr Inc
| | 5.00% | | 12/01/25 | | 520,082 |
| 1,240,000 | | KS Muni Energy Agy Pwr Proj Rev Dogwood Proj, Ser A, BAM
| | 5.00% | | 04/01/29 | | 1,394,926 |
| 1,470,000 | | KS Muni Energy Agy Pwr Proj Rev Dogwood Proj, Ser A, BAM
| | 5.00% | | 04/01/30 | | 1,648,208 |
| 1,045,000 | | Lenexa KS Hlth Care Fac Rev Ref Lakeview Vlg Inc, Ser A
| | 5.00% | | 05/15/26 | | 1,143,658 |
| 440,000 | | Topeka KS Utility Rev Comb, Ser A
| | 5.00% | | 08/01/24 | | 505,710 |
| 1,500,000 | | Wichita KS Hlth Care Facs Rev Ref Presbyterian Manors, Ser I
| | 3.75% | | 05/15/23 | | 1,502,160 |
| 500,000 | | Wichita KS Hlth Care Facs Rev Ref Presbyterian Manors, Ser I
| | 5.00% | | 05/15/33 | | 522,005 |
| 475,000 | | Wyandotte Cnty/Kansas City KS Unif Govt Utility Sys Rev Ref & Impt, Ser A
| | 5.00% | | 09/01/29 | | 530,257 |
| | | | | 7,767,006 |
| | | Kentucky – 0.7% | | | | | | |
| 1,000,000 | | Estrn KY Univ Gen Recpts, Ser A
| | 5.00% | | 04/01/25 | | 1,121,360 |
| 750,000 | | KY St Econ Dev Fin Auth Owensboro Med Hlth Sys, Ser A
| | 6.00% | | 06/01/30 | | 809,865 |
| 300,000 | | KY St Muni Pwr Agy Pwr Sys Rev Ref, Ser A, NATL-RE
| | 5.00% | | 09/01/22 | | 329,556 |
| 50,000 | | Russell KY Rev Bon Secours Hlth Sys
| | 5.00% | | 11/01/22 | | 55,556 |
| 100,000 | | Warren Cnty KY Hosp Rev Ref Bowling Green Warren Cnty Cmnty Hosp Corp
| | 5.00% | | 04/01/23 | | 109,807 |
| | | | | 2,426,144 |
| | | Louisiana – 1.0% | | | | | | |
| 1,000,000 | | LA Pub Facs Auth Rev Ref Ochsner Clinic Fdtn Proj
| | 5.00% | | 05/15/36 | | 1,107,160 |
| 250,000 | | LA St Loc Govt Envrnmntl Facs & Cmnty Dev Auth Rev Ascension Psh Courthouse Proj
| | 5.00% | | 11/01/31 | | 284,445 |
| 390,000 | | LA Stadium & Exposition Dist LA Ref Sr, Ser A
| | 5.00% | | 07/01/30 | | 432,951 |
| 380,000 | | LA Stadium & Exposition Dist LA Ref Sr, Ser A
| | 5.00% | | 07/01/31 | | 421,466 |
| 200,000 | | New Orleans LA Aviation Brd Gen Arpt N Term, Ser B, AMT
| | 5.00% | | 01/01/31 | | 226,396 |
| 1,050,000 | | New Orleans LA Wtr Rev Ref
| | 5.00% | | 12/01/28 | | 1,174,540 |
| | | | | 3,646,958 |
| | | Maryland – 3.7% | | | | | | |
| 1,120,000 | | Baltimore MD Rev Ref Sr, Ser B
| | 5.00% | | 07/01/33 | | 1,267,347 |
| 1,000,000 | | Baltimore MD Spl Oblig Ref E Baltimore Research Park Proj, Ser A
| | 5.00% | | 09/01/38 | | 1,065,950 |
| 125,000 | | Howard Cnty MD Retmnt Cmnty Rev Ref Vantage House Fac
| | 5.00% | | 04/01/21 | | 129,723 |
| 500,000 | | Howard Cnty MD Retmnt Cmnty Rev Ref Vantage House Fac
| | 5.00% | | 04/01/26 | | 530,340 |
| 220,000 | | MD St Econ Dev Corp Econ Dev Rev Transn Facs Proj, Ser A
| | 5.38% | | 06/01/25 | | 235,006 |
| 600,000 | | MD St Econ Dev Corp Student Hsg Rev Ref Sr Univ MD Proj
| | 4.00% | | 07/01/24 | | 630,066 |
| 2,490,000 | | MD St Econ Dev Corp Student Hsg Rev Ref Univ MD Clg Park Projs, AGM
| | 5.00% | | 06/01/35 | | 2,797,415 |
| 500,000 | | MD St Hlth & Hgr Eductnl Facs Auth Rev Adventist Hlth Care Obligated Grp, Ser A
| | 5.50% | | 01/01/26 | | 579,800 |
| 800,000 | | MD St Hlth & Hgr Eductnl Facs Auth Rev Ref Anne Arundel Hlth System, Ser A
| | 5.00% | | 07/01/30 | | 914,920 |
| 1,000,000 | | MD St Hlth & Hgr Eductnl Facs Auth Rev Ref Anne Arundel Hlth System, Ser A
| | 5.00% | | 07/01/32 | | 1,133,450 |
| 1,000,000 | | Montgomery Cnty MD Ref, Ser B
| | 5.00% | | 06/01/22 | | 1,111,580 |
| 1,500,000 | | Prince Georges Cnty MD Rev Ref Collington Episcopal Life Care Cmnty Inc
| | 5.00% | | 04/01/25 | | 1,629,390 |
| 365,000 | | Rockville MD Mayor & Council Econ Dev Rev Ref Ingelside at King Farm Proj, Ser A-1
| | 5.00% | | 11/01/27 | | 406,902 |
Page 12
See Notes to Financial Statements
First Trust Managed Municipal ETF (FMB)
Portfolio of Investments (Continued)
April 30, 2018 (Unaudited)
Principal
Value | | Description | | Stated
Coupon | | Stated
Maturity | | Value |
| MUNICIPAL BONDS (Continued) |
| | | Maryland (Continued) | | | | | | |
| $250,000 | | Rockville MD Mayor & Council Econ Dev Rev Ref Ingelside at King Farm Proj, Ser A-2
| | 3.38% | | 11/01/27 | | $244,918 |
| 375,000 | | Rockville MD Mayor & Council Econ Dev Rev Ref Ingelside at King Farm Proj, Ser A-2
| | 5.00% | | 11/01/28 | | 416,415 |
| | | | | 13,093,222 |
| | | Massachusetts – 0.5% | | | | | | |
| 325,000 | | MA St Dev Fin Agy Rev Merrimack Clg
| | 5.00% | | 07/01/37 | | 351,900 |
| 500,000 | | MA St Dev Fin Agy Rev Ref Newbridge Charles Inc (a)
| | 5.00% | | 10/01/37 | | 534,430 |
| 700,000 | | MA St Dev Fin Agy Rev Umass Boston Student Hsg Proj
| | 5.00% | | 10/01/24 | | 784,147 |
| | | | | 1,670,477 |
| | | Michigan – 2.3% | | | | | | |
| 1,100,000 | | Great Lakes MI Wtr Auth Wtr Sply Sys Rev Ref Sr Lien, Ser C
| | 5.00% | | 07/01/28 | | 1,261,645 |
| 1,000,000 | | Marquette MI Brd of Light & Pwr Elec Utility Sys Rev Ref, Ser A
| | 5.00% | | 07/01/29 | | 1,136,070 |
| 890,000 | | MI St Fin Auth Ltd Oblig Rev Ref College for Creative Studies Proj
| | 5.00% | | 12/01/25 | | 970,883 |
| 1,000,000 | | MI St Fin Auth Rev Ref Loc Govt Loan Program Great Lakes Wtr Auth, Ser D-1
| | 5.00% | | 07/01/34 | | 1,100,260 |
| 500,000 | | MI St Fin Auth Rev Ref Loc Govt Loan Program, Ser F1
| | 3.80% | | 10/01/22 | | 511,835 |
| 125,000 | | MI St Fin Auth Rev Ref Loc Govt Loan Program, Ser F1
| | 3.88% | | 10/01/23 | | 127,786 |
| 2,500,000 | | Wayne Cnty MI Arpt Auth Rev Ref, Ser F, AMT
| | 5.00% | | 12/01/25 | | 2,838,525 |
| | | | | 7,947,004 |
| | | Minnesota – 2.1% | | | | | | |
| 175,000 | | Baytown Twp MN Lease Ref, Ser A
| | 3.00% | | 08/01/22 | | 171,976 |
| 1,000,000 | | North Oaks MN Sr Hsg Rev Ref Waverly Gardens Proj
| | 5.00% | | 10/01/28 | | 1,110,660 |
| 215,000 | | Nthrn MN Muni Pwr Agy Elec Sys Rev Ref
| | 5.00% | | 01/01/32 | | 243,030 |
| 1,000,000 | | Rochester MN Hlth Care & Hsg Rev Ref Samaritan Bethany Inc Proj, Ser A
| | 5.00% | | 08/01/37 | | 1,039,340 |
| 500,000 | | Saint Paul MN Hsg & Redev Auth Hlth Care Fac Rev Ref HealthPartners Oblig Grp, Ser A
| | 5.00% | | 07/01/30 | | 562,640 |
| 500,000 | | Saint Paul MN Hsg & Redev Auth Hlth Care Fac Rev Ref HealthPartners Oblig Grp, Ser A
| | 5.00% | | 07/01/32 | | 557,870 |
| 2,000,000 | | Saint Paul MN Hsg & Redev Auth Mf Hsg Rev Pioneer Press Apts Proj, Ser B (a)
| | 3.38% | | 11/01/20 | | 1,967,120 |
| 500,000 | | Saint Paul Park MN Sr Hsg & Hlth Care Rev Ref Presbyterian Homes Bloomington Proj
| | 3.00% | | 09/01/24 | | 508,955 |
| 475,000 | | Saint Paul Park MN Sr Hsg & Hlth Care Rev Ref Presbyterian Homes Bloomington Proj
| | 3.13% | | 09/01/25 | | 483,336 |
| 360,000 | | W Saint Paul MN Hsg & Hlth Care Facs Rev Ref Walker Westwood Ridge Campus Proj
| | 3.25% | | 11/01/24 | | 355,428 |
| 455,000 | | W Saint Paul MN Hsg & Hlth Care Facs Rev Ref Walker Westwood Ridge Campus Proj
| | 3.50% | | 11/01/25 | | 447,042 |
| | | | | 7,447,397 |
| | | Missouri – 1.8% | | | | | | |
| 700,000 | | Jackson Cnty MO Spl Oblig Ref Truman Sports Complex Proj
| | 5.00% | | 12/01/31 | | 783,909 |
| 1,270,000 | | Joplin MO Indl Dev Auth Hlth Facs Rev Ref Freeman Hlth System
| | 5.00% | | 02/15/26 | | 1,411,072 |
| 1,000,000 | | Kansas City MO Land Clearance Redev Auth Proj Rev Convention Ctr Hotel Proj Tif Fing, Ser B (a)
| | 5.00% | | 02/01/40 | | 1,026,320 |
| 1,385,000 | | MO Jt Muni Elec Utility Commission Pwr Sply Sys Rev Ref Mopep Facs
| | 5.00% | | 12/01/31 | | 1,604,135 |
| 200,000 | | MO St Dev Fin Brd Infrastructure Facs Rev Ref Independence MO Centerpoint Proj, Ser B
| | 5.00% | | 04/01/28 | | 223,480 |
See Notes to Financial Statements
Page 13
First Trust Managed Municipal ETF (FMB)
Portfolio of Investments (Continued)
April 30, 2018 (Unaudited)
Principal
Value | | Description | | Stated
Coupon | | Stated
Maturity | | Value |
| MUNICIPAL BONDS (Continued) |
| | | Missouri (Continued) | | | | | | |
| $200,000 | | MO St Hlth & Eductnl Facs Auth Eductnl Facs Rev St Louis Clg Pharmacy, Ser B
| | 5.00% | | 05/01/30 | | $221,258 |
| 160,000 | | MO St Hlth & Eductnl Facs Auth Lutheran Sr Svcs
| | 5.00% | | 02/01/23 | | 174,349 |
| 500,000 | | MO St Hlth & Eductnl Facs Auth Sr Living Facs Lutheran Sr
| | 5.38% | | 02/01/35 | | 516,670 |
| 250,000 | | Saint Charles Cnty MO Pub Wtr Sply Dist #2 Ref, COPS
| | 5.00% | | 12/01/28 | | 286,957 |
| | | | | 6,248,150 |
| | | Montana – 0.4% | | | | | | |
| 500,000 | | Kalispell MT Hsg & Hlthcare Facs Rev Ref Immanuel Lutheran Corp Proj Temps 50, Ser B
| | 3.40% | | 11/15/22 | | 500,340 |
| 740,000 | | MT St Fac Fin Auth Rev Ref
| | 5.00% | | 02/15/25 | | 841,417 |
| | | | | 1,341,757 |
| | | Nebraska – 0.9% | | | | | | |
| 1,745,000 | | Central Plains Energy Proj NE Gas Proj Rev Proj #3
| | 5.00% | | 09/01/27 | | 1,901,212 |
| 545,000 | | Madison Cnty NE Hosp Auth #1 Ref Faith Regl Hlth Svcs Proj
| | 5.00% | | 07/01/28 | | 607,234 |
| 500,000 | | NE St Pub Pwr Dist Rev Gen, Ser C
| | 5.00% | | 01/01/35 | | 563,615 |
| | | | | 3,072,061 |
| | | Nevada – 0.6% | | | | | | |
| 1,100,000 | | Clark Cnty NV Impt Dist Ref Spl Loc Impt #151
| | 4.50% | | 08/01/23 | | 1,157,651 |
| 460,000 | | Las Vegas NV Spl Impt Dist #808 & #810 Ref
| | 5.00% | | 06/01/22 | | 489,435 |
| 335,000 | | NV Dept of Business & Industry NV Doral Academy, Ser A (a)
| | 5.00% | | 07/15/27 | | 352,340 |
| | | | | 1,999,426 |
| | | New Jersey – 1.8% | | | | | | |
| 250,000 | | NJ St Econ Dev Auth Mtr Vehcl Surcharge Rev Ref Sub, Ser A, BAM
| | 5.00% | | 07/01/28 | | 284,210 |
| 360,000 | | NJ St Econ Dev Auth Ref, Ser A
| | 4.13% | | 06/15/26 | | 367,225 |
| 500,000 | | NJ St Econ Dev Auth Ref, Ser A, BAM
| | 5.00% | | 06/15/23 | | 549,855 |
| 490,000 | | NJ St Econ Dev Auth Spl Fac Rev Ref Port Newark Container Terminal LLC Proj, AMT
| | 5.00% | | 10/01/25 | | 541,999 |
| 1,000,000 | | NJ St Hlth Care Facs Fing Auth Rev Ref Hackensack Meridian Hlth, Ser A
| | 5.00% | | 07/01/24 | | 1,138,890 |
| 100,000 | | NJ St Transit Corp, Ser A, GANS
| | 5.00% | | 09/15/21 | | 106,559 |
| 1,400,000 | | NJ St Transprtn Trust Fund Auth Transn Sys, Ser D
| | 5.25% | | 12/15/23 | | 1,538,936 |
| 1,000,000 | | Tobacco Settlement Fing Corp NJ Ref, Ser A
| | 5.00% | | 06/01/26 | | 1,136,400 |
| 500,000 | | Tobacco Settlement Fing Corp NJ Ref, Ser A
| | 5.00% | | 06/01/27 | | 570,850 |
| | | | | 6,234,924 |
| | | New York – 3.2% | | | | | | |
| 100,000 | | Buffalo & Erie Cnty NY Indl Land Dev Corp Rev Ref Orchard Park
| | 5.00% | | 11/15/22 | | 110,251 |
| 115,000 | | Buffalo & Erie Cnty NY Indl Land Dev Corp Rev Ref Orchard Park
| | 5.00% | | 11/15/24 | | 129,211 |
| 3,400,000 | | Build NYC Resource Corp NY Sol Wst Disp Rev Ref Pratt Paper Inc Proj, AMT (a)
| | 5.00% | | 01/01/35 | | 3,633,920 |
| 1,000,000 | | Met Transprtn Auth NY Rev Ref Transptrn, Subser C-1
| | 5.00% | | 11/15/34 | | 1,125,380 |
| 840,000 | | Monroe Cnty NY Indl Dev Corp Rev Ref Nazareth College of Rochester Proj, Ser A
| | 5.00% | | 10/01/23 | | 929,107 |
| 1,000,000 | | New York City NY Transitional Fin Auth Rev Future Tax Secured Sub Fiscal 2016, Ser A-1
| | 5.00% | | 08/01/37 | | 1,124,500 |
| 1,500,000 | | New York City NY Transitional Fin Auth Rev Future Tax Sub, Subser E-1
| | 5.00% | | 02/01/37 | | 1,689,375 |
| 300,000 | | NY St Dorm Auth Revs Non St Supported Debt Ref Orange Regl Med Ctr (a)
| | 5.00% | | 12/01/25 | | 334,590 |
Page 14
See Notes to Financial Statements
First Trust Managed Municipal ETF (FMB)
Portfolio of Investments (Continued)
April 30, 2018 (Unaudited)
Principal
Value | | Description | | Stated
Coupon | | Stated
Maturity | | Value |
| MUNICIPAL BONDS (Continued) |
| | | New York (Continued) | | | | | | |
| $195,000 | | NY St Dorm Auth Revs Non St Supported Debt Unrefunded Pace Univ, Ser A
| | 4.00% | | 05/01/22 | | $203,490 |
| 85,000 | | NY St Dorm Auth Revs Non St Supported Debt Unrefunded Pace Univ, Ser A
| | 5.00% | | 05/01/23 | | 93,165 |
| 500,000 | | Port Auth of New York & New Jersey NY Consol One Hundred Eighty Fifth Ref, AMT
| | 5.00% | | 09/01/23 | | 559,620 |
| 465,000 | | Port Auth of New York & New Jersey NY Ref Consol, Ser 186, AMT
| | 5.00% | | 10/15/35 | | 511,732 |
| 15,000 | | Suffolk Cnty NY Econ Dev Corp Rev Prerefunded Catholic Hlth Svcs Long Island Oblig Grp Proj
| | 5.00% | | 07/01/28 | | 16,349 |
| 85,000 | | Suffolk Cnty NY Econ Dev Corp Rev Unrefunded Catholic Hlth Svcs Long Island Oblig Grp Proj
| | 5.00% | | 07/01/28 | | 91,827 |
| 500,000 | | TSASC Inc NY Ref, Ser A
| | 5.00% | | 06/01/29 | | 561,620 |
| | | | | 11,114,137 |
| | | North Carolina – 1.7% | | | | | | |
| 1,000,000 | | Charlotte NC Wtr & Swr Sys Rev Ref
| | 5.00% | | 07/01/21 | | 1,093,120 |
| 1,775,000 | | Charlotte NC Wtr & Swr Sys Rev Ref
| | 5.00% | | 07/01/22 | | 1,980,651 |
| 900,000 | | NC St Capital Facs Fin Agy Student Rev Ref Hsg NC A&T Univ Fdtn Proj, Ser A, AGC
| | 5.00% | | 06/01/26 | | 1,003,698 |
| 750,000 | | NC St Med Care Commission Retmnt Facs Rev Ref United Methodist Retmnt Homes, Ser A
| | 5.00% | | 10/01/37 | | 821,708 |
| 500,000 | | NC St Med Care Commission Retmnt Facs Rev Ref United Methodist Retmnt Homes, Ser A
| | 5.00% | | 10/01/47 | | 542,360 |
| 430,000 | | Raleigh Durham NC Arpt Auth Arpt Rev Ref, Ser A, AMT
| | 5.00% | | 05/01/36 | | 486,506 |
| | | | | 5,928,043 |
| | | North Dakota – 0.5% | | | | | | |
| 225,000 | | Burleigh Cnty ND Hlth Care Rev St Alexius Med Ctr Proj, Ser A
| | 5.00% | | 07/01/22 | | 244,076 |
| 1,300,000 | | Grand Forks ND Sr Hsg & Nur Fac Rev Ref Vly Homes Oblig Grp, Ser A
| | 5.00% | | 12/01/23 | | 1,363,739 |
| | | | | 1,607,815 |
| | | Ohio – 2.6% | | | | | | |
| 1,500,000 | | Butler Cnty OH Hosp Facs Ref Uc Hlth
| | 5.00% | | 11/15/31 | | 1,701,900 |
| 1,000,000 | | Butler Cnty OH Hosp Facs Ref Uc Hlth
| | 5.00% | | 11/15/32 | | 1,128,500 |
| 1,000,000 | | Chillicothe OH City Sch Dist Ref, AGM
| | 4.00% | | 12/01/31 | | 1,053,180 |
| 500,000 | | Cleveland OH Pub Pwr Sys Rev Ref, Ser A, AGM
| | 5.00% | | 11/15/24 | | 567,515 |
| 1,255,000 | | Columbus OH Swr Rev Ref Sys
| | 5.00% | | 06/01/26 | | 1,442,622 |
| 700,000 | | Hamilton Cnty OH Hlth Care Facs Rev Christ Hosp Proj
| | 5.25% | | 06/01/27 | | 775,082 |
| 1,000,000 | | OH St Hgr Edu, Ser A
| | 5.00% | | 05/01/33 | | 1,135,520 |
| 1,000,000 | | OH St Wtr Dev Auth Rev Wtr Dev Fresh Wtr, Ser A
| | 5.00% | | 12/01/21 | | 1,102,050 |
| 230,000 | | S Estrn OH Port Auth Hosp Facs Rev Ref Mem Hlth Sys
| | 5.00% | | 12/01/23 | | 243,754 |
| | | | | 9,150,123 |
| | | Oklahoma – 1.3% | | | | | | |
| 750,000 | | OK St Dev Fin Auth Hlth Sys Rev OU Medicine Proj, Ser B
| | 5.25% | | 08/15/48 | | 823,065 |
| 1,000,000 | | Oklahoma Cnty OK Fin Auth Eductnl Facs Lease Rev Midwest City De City Pub Schs Proj
| | 5.00% | | 10/01/25 | | 1,143,470 |
| 1,000,000 | | Oklahoma Cnty OK Fin Auth Eductnl Facs Lease Rev Midwest City De City Pub Schs Proj
| | 5.00% | | 10/01/26 | | 1,145,320 |
| 1,000,000 | | Tulsa Cnty OK Indl Auth Sr Living Cmnty Rev Ref Montereau Inc Proj
| | 5.00% | | 11/15/25 | | 1,114,710 |
| 250,000 | | Tulsa Cnty OK Indl Auth Sr Living Cmnty Rev Ref Montereau Inc Proj
| | 5.00% | | 11/15/26 | | 280,205 |
See Notes to Financial Statements
Page 15
First Trust Managed Municipal ETF (FMB)
Portfolio of Investments (Continued)
April 30, 2018 (Unaudited)
Principal
Value | | Description | | Stated
Coupon | | Stated
Maturity | | Value |
| MUNICIPAL BONDS (Continued) |
| | | Oklahoma (Continued) | | | | | | |
| $100,000 | | Tulsa OK Arpts Impt Trust Ref, Ser D, BAM
| | 5.00% | | 06/01/28 | | $105,474 |
| | | | | 4,612,244 |
| | | Oregon – 2.7% | | | | | | |
| 170,000 | | Clackamas Cnty OR Hosp Fac Auth Rev Ref Sr Living Willamette View Proj, Ser A
| | 4.00% | | 05/15/26 | | 176,875 |
| 250,000 | | Clackamas Cnty OR Hosp Fac Auth Rev Ref Sr Living Willamette View Proj, Ser A
| | 5.00% | | 11/15/32 | | 272,570 |
| 500,000 | | Clackamas Cnty OR Hosp Fac Auth Rev Ref Sr Living Willamette View Proj, Ser A
| | 5.00% | | 11/15/37 | | 539,720 |
| 210,000 | | Multnomah Cnty OR Hosp Facs Auth Rev Ref Terwilliger Plaza
| | 5.00% | | 12/01/20 | | 219,097 |
| 1,250,000 | | OR St Business Dev Commission Econ Dev Rev Ref Red Rock Biofuels LLC Clean Energy Proj, Ser 248-D, AMT (a)
| | 6.50% | | 04/01/31 | | 1,286,087 |
| 2,000,000 | | OR St Dept of Transprtn Highway User Tax Rev Ref Sr Lien, Ser C
| | 5.00% | | 11/15/21 | | 2,198,800 |
| 2,500,000 | | OR St Dept of Transprtn Highway User Tax Rev Ref, Ser A
| | 5.00% | | 11/15/22 | | 2,802,900 |
| 1,100,000 | | OR St Facs Auth Rev Ref Univ Portland, Ser A
| | 5.00% | | 04/01/32 | | 1,226,962 |
| 700,000 | | Yamhill Cnty OR Hosp Auth Ref Friendsview Retmnt Cmnty, Ser A
| | 5.00% | | 11/15/31 | | 759,150 |
| | | | | 9,482,161 |
| | | Pennsylvania – 7.4% | | | | | | |
| 600,000 | | Bucks Cnty PA Indl Dev Auth Ref Sch Lane Chrt Sch Proj
| | 5.00% | | 03/15/26 | | 654,090 |
| 765,000 | | Chester Cnty PA Indl Dev Auth Renaissance Academy Chrt Sch
| | 5.00% | | 10/01/34 | | 810,540 |
| 1,000,000 | | Cmwlth Fing Auth PA Tobacco Master Settlement Payment Rev Tobacco Master Settlement Payment Bonds
| | 5.00% | | 06/01/25 | | 1,128,070 |
| 410,000 | | Cmwlth Fing Auth PA Tobacco Master Settlement Payment Rev Tobacco Master Settlement Payment Bonds
| | 5.00% | | 06/01/26 | | 466,236 |
| 500,000 | | Colonial PA Sch Dist
| | 5.00% | | 02/15/36 | | 567,205 |
| 300,000 | | Colonial PA Sch Dist, Ser A
| | 5.00% | | 02/15/34 | | 343,854 |
| 300,000 | | Cumberland Cnty PA Muni Auth Ref Diakon Lutheran Ministries Proj
| | 5.00% | | 01/01/30 | | 329,331 |
| 700,000 | | Cumberland Cnty PA Muni Auth Ref Diakon Lutheran Ministries Proj
| | 5.00% | | 01/01/38 | | 755,419 |
| 1,095,000 | | Dallas PA Area Muni Auth Univ Rev Ref Misericordia Univ Proj
| | 5.00% | | 05/01/22 | | 1,181,198 |
| 1,340,000 | | Delaware Cnty PA Auth Ref Elwyn Proj
| | 5.00% | | 06/01/27 | | 1,484,224 |
| 750,000 | | E Hempfield Twp PA Indl Dev Auth Ref Willow Vly Cmntys Proj
| | 5.00% | | 12/01/29 | | 837,540 |
| 500,000 | | Middletown PA Sch Dist, Ser A
| | 5.00% | | 03/01/28 | | 551,920 |
| 2,000,000 | | Montgomery Cnty PA Hgr Edu & Hlth Auth Ref Philadelphia Presbytery Homes Inc Proj
| | 5.00% | | 12/01/32 | | 2,230,220 |
| 980,000 | | Montgomery Cnty PA Indl Dev Auth Acts Retmnt Life Cmntys Ref
| | 5.00% | | 11/15/25 | | 1,066,024 |
| 50,000 | | Montgomery Cnty PA Indl Dev Auth Acts Retmnt Life Cmntys Ref
| | 5.00% | | 11/15/29 | | 53,696 |
| 1,475,000 | | Montgomery Cnty PA Indl Dev Auth Ref Acts Retmnt Life Cmntys Inc Oblig Grp
| | 5.00% | | 11/15/36 | | 1,633,577 |
| 140,000 | | Northampton Cnty PA Gen Purpose Auth Clg Rev Ref Moravian Clg
| | 5.00% | | 10/01/25 | | 157,692 |
| 1,000,000 | | Northampton Cnty PA Gen Purpose Auth Hosp Rev Ref St Luke’s Univ Hlth Network Proj, Ser A
| | 5.00% | | 08/15/28 | | 1,127,730 |
| 1,000,000 | | PA St Hgr Eductnl Facs Auth Rev Ref Drexel Univ
| | 5.00% | | 05/01/25 | | 1,139,600 |
| 1,000,000 | | PA St Turnpike Commission Turnpike Rev Ref
| | 5.00% | | 12/01/33 | | 1,104,770 |
| 290,000 | | Philadelphia PA Gas Wks Rev Ref
| | 5.00% | | 08/01/25 | | 331,166 |
| 1,625,000 | | Philadelphia PA Gas Wks Rev Ref
| | 5.00% | | 08/01/29 | | 1,837,469 |
| 2,000,000 | | Philadelphia PA Gas Wks Rev Ref 1998 General Ordinance, 14th Ser
| | 5.00% | | 10/01/34 | | 2,240,160 |
| 500,000 | | Philadelphia PA Ref, Ser A
| | 5.25% | | 07/15/28 | | 558,265 |
Page 16
See Notes to Financial Statements
First Trust Managed Municipal ETF (FMB)
Portfolio of Investments (Continued)
April 30, 2018 (Unaudited)
Principal
Value | | Description | | Stated
Coupon | | Stated
Maturity | | Value |
| MUNICIPAL BONDS (Continued) |
| | | Pennsylvania (Continued) | | | | | | |
| $405,000 | | Southcentrl PA General Auth Rev Ref Hanover Hosp Inc
| | 5.00% | | 12/01/23 | | $454,507 |
| 2,665,000 | | Westmoreland Cnty PA Muni Auth Ref, BAM
| | 5.00% | | 08/15/42 | | 2,954,339 |
| | | | | 25,998,842 |
| | | Rhode Island – 0.5% | | | | | | |
| 1,460,000 | | RI St Hlth & Eductnl Bldg Corp Rev Ref Hosp Fing Lifespan Oblig Grp
| | 5.00% | | 05/15/32 | | 1,603,649 |
| 265,000 | | Tobacco Settlement Fing Corp RI Ref, Ser A
| | 5.00% | | 06/01/24 | | 298,488 |
| | | | | 1,902,137 |
| | | South Carolina – 0.6% | | | | | | |
| 1,000,000 | | Greenville SC Hosp Sys Brd Hosp Facs Rev, Ser B
| | 5.00% | | 05/01/30 | | 1,114,250 |
| 175,000 | | Lancaster Cnty SC Assmnt Rev Ref Walnut Creek Impt Dist, Ser A-1
| | 3.13% | | 12/01/22 | | 174,738 |
| 745,000 | | Piedmont SC Muni Pwr Agy Elec Rev Ref, Ser A-3
| | 5.00% | | 01/01/23 | | 791,890 |
| 30,000 | | SC St Jobs Econ Dev Auth Hosp Rev Ref Palmetto Hlth, Ser A
| | 5.00% | | 08/01/23 | | 33,902 |
| 150,000 | | SC St Jobs Econ Dev Auth Hosp Rev Ref Palmetto Hlth, Ser A, AGM
| | 5.50% | | 08/01/24 | | 165,327 |
| | | | | 2,280,107 |
| | | South Dakota – 0.3% | | | | | | |
| 30,000 | | SD St Hlth & Eductnl Facs Auth Avera Hlth, Ser B
| | 5.50% | | 07/01/35 | | 30,187 |
| 1,000,000 | | SD St Hlth & Eductnl Facs Auth Sanford Oblig Grp, Ser B
| | 5.00% | | 11/01/34 | | 1,096,240 |
| | | | | 1,126,427 |
| | | Tennessee – 1.2% | | | | | | |
| 335,000 | | Chattanooga TN Hlth Eductnl & Hsg Fac Brd Rev Ref Student Hsg CDFI Phase I
| | 5.00% | | 10/01/23 | | 371,244 |
| 1,430,000 | | Maryville TN Ref, Ser B
| | 5.00% | | 06/01/24 | | 1,637,421 |
| 600,000 | | Memphis Shelby Cnty TN Arpt Auth Arpt Rev Ref, Ser B, AMT
| | 5.75% | | 07/01/23 | | 643,824 |
| 1,385,000 | | Met Govt Nashville & Davidson Cnty TN Hlth & Eductnl Fac Brd Ref Lipscomb Univ Proj, Ser A
| | 5.00% | | 10/01/29 | | 1,535,245 |
| 25,000 | | TN St Energy Acquisition Corp Gas Rev, Ser A
| | 5.25% | | 09/01/21 | | 27,216 |
| 120,000 | | TN St Energy Acquisition Corp Gas Rev, Ser A
| | 5.25% | | 09/01/22 | | 132,682 |
| | | | | 4,347,632 |
| | | Texas – 11.5% | | | | | | |
| 450,000 | | Austin TX Arpt Sys Rev, AMT
| | 5.00% | | 11/15/33 | | 494,087 |
| 250,000 | | Bexar Cnty TX Hlth Facs Dev Corp Ref Army Retmnt Residence Fndtn Proj
| | 5.00% | | 07/15/25 | | 276,868 |
| 225,000 | | Bexar Cnty TX Hlth Facs Dev Corp Ref Army Retmnt Residence Fndtn Proj
| | 5.00% | | 07/15/27 | | 249,615 |
| 600,000 | | Brd of Managers TX Joint Guadalupe Cnty City of Seguin Hosp Mtg Ref
| | 5.00% | | 12/01/24 | | 632,616 |
| 600,000 | | Centrl TX Regl Mobility Auth Rev Ref Sub Lien
| | 5.00% | | 01/01/33 | | 648,042 |
| 850,000 | | Centrl TX Regl Mobility Auth Rev Sr Lien, Ser A
| | 5.00% | | 01/01/29 | | 954,167 |
| 1,460,000 | | Clifton TX Hgr Edu Fin Corp Edu Rev, Ser A
| | 4.00% | | 12/01/25 | | 1,511,888 |
| 550,000 | | Deer Park TX Indep Sch Dist Sch Bldg
| | 5.00% | | 08/15/32 | | 636,262 |
| 725,000 | | Deer Park TX Indep Sch Dist Sch Bldg
| | 5.00% | | 08/15/33 | | 835,823 |
| 600,000 | | Deer Park TX Indep Sch Dist Sch Bldg
| | 5.00% | | 08/15/34 | | 690,762 |
| 1,000,000 | | Deer Park TX Indep Sch Dist Sch Bldg
| | 5.00% | | 08/15/35 | | 1,141,000 |
| 700,000 | | Deer Park TX Indep Sch Dist Sch Bldg
| | 5.00% | | 08/15/36 | | 797,048 |
| 1,675,000 | | Flower Mound TX Ref
| | 5.00% | | 09/01/21 | | 1,833,254 |
| 555,000 | | Flower Mound TX Spl Assmnt Rev River Walk Pub Impt Dist #1
| | 6.13% | | 09/01/28 | | 563,375 |
| 550,000 | | Harris Cnty TX Cultural Edu Facs Fin Corp Thermal Utility Re Ref Teco Proj
| | 5.00% | | 11/15/29 | | 647,119 |
See Notes to Financial Statements
Page 17
First Trust Managed Municipal ETF (FMB)
Portfolio of Investments (Continued)
April 30, 2018 (Unaudited)
Principal
Value | | Description | | Stated
Coupon | | Stated
Maturity | | Value |
| MUNICIPAL BONDS (Continued) |
| | | Texas (Continued) | | | | | | |
| $300,000 | | Harris Cnty TX Cultural Edu Facs Fin Corp Thermal Utility Re Ref Teco Proj
| | 5.00% | | 11/15/30 | | $351,336 |
| 1,100,000 | | Harris Cnty TX Ref Sr Lien Toll Road, Ser B
| | 5.00% | | 08/15/36 | | 1,242,978 |
| 500,000 | | Houston TX Arpt Sys Rev Ref United Airls Inc Terminal E Proj, AMT
| | 4.50% | | 07/01/20 | | 520,920 |
| 1,000,000 | | Houston TX Arpt Sys Rev Ref, Ser B-2, AMT
| | 5.00% | | 07/15/20 | | 1,053,220 |
| 1,130,000 | | La Vernia TX Hgr Edu Fin Corp Edu Rev Meridian World Sch (a)
| | 4.35% | | 08/15/25 | | 1,138,068 |
| 1,000,000 | | La Vernia TX Hgr Edu Fin Corp Edu Rev Meridian World Sch, Ser A (a)
| | 4.20% | | 08/15/25 | | 1,001,690 |
| 500,000 | | Liberty Hill TX Indep Sch Dist Ref
| | 5.00% | | 08/01/29 | | 581,285 |
| 500,000 | | Liberty Hill TX Indep Sch Dist Ref
| | 5.00% | | 08/01/30 | | 579,290 |
| 150,000 | | Liberty Hill TX Indep Sch Dist Ref
| | 4.00% | | 08/01/31 | | 160,655 |
| 500,000 | | Mission TX Econ Dev Corp Rev Sr Lien Nat Gasoline Proj, Ser B, AMT (b)
| | 5.75% | | 10/01/31 | | 519,085 |
| 2,250,000 | | N TX Tollway Auth Rev Ref 2nd Tier, Ser B
| | 5.00% | | 01/01/31 | | 2,557,620 |
| 1,560,000 | | N TX Tollway Auth Rev Ref Sys Second Tier, Ser B
| | 5.00% | | 01/01/31 | | 1,724,767 |
| 250,000 | | N TX Tollway Auth Rev Ref, Ser A
| | 5.00% | | 01/01/33 | | 282,718 |
| 500,000 | | New Hope Cultural Edu Facs Fin Corp TX Retmnt Fac Rev Ref Carillon Lifecare Cmnty Proj
| | 5.00% | | 07/01/36 | | 511,405 |
| 500,000 | | New Hope Cultural Edu Facs Fin Corp TX Student Hsg Rev Chf Collegiate Hsg Galveston I LLC TX A&M Univ Galveston
| | 5.00% | | 04/01/22 | | 541,850 |
| 25,000 | | New Hope Cultural Edu Facs Fin Corp TX Student Hsg Rev Chf Stephenville-Tarleton St Univ Proj, Ser A
| | 4.25% | | 04/01/22 | | 26,458 |
| 500,000 | | New Hope Cultural Edu Facs Fin Corp TX Student Hsg Rev Chf TX A&M Univ Corpus Christi Island Campus Proj, Ser A
| | 5.00% | | 04/01/29 | | 553,610 |
| 505,000 | | Newark Hgr Edu Fin Corp TX Edu Rev Austin Achieve Pub Schs Inc, Ser A
| | 5.00% | | 06/15/32 | | 507,394 |
| 495,000 | | Red River TX Hlth Facs Dev Corp Retmnt Fac Rev MRC Crestview, Ser A
| | 7.75% | | 11/15/31 | | 587,778 |
| 500,000 | | San Antonio TX Wtr Rev Ref Jr Lien, Ser A
| | 5.00% | | 05/15/34 | | 581,395 |
| 770,000 | | Tarrant Cnty TX Cultural Edu Facs Fin Corp Retmnt Fac Rev Ref Buckner Retmnt Svcs Inc Proj
| | 5.00% | | 11/15/29 | | 878,370 |
| 500,000 | | Tarrant Cnty TX Cultural Edu Facs Fin Corp Retmnt Fac Rev Temps 50 Buckner Sr Living Ventana Proj, Ser B-3
| | 3.88% | | 11/15/22 | | 500,825 |
| 2,000,000 | | TX St A&M Univ Rev Ref, Ser C
| | 4.00% | | 05/15/32 | | 2,143,340 |
| 1,165,000 | | TX St Muni Gas Acquisition & Sply Corp I Gas Sply Rev Sr Lien, Ser A
| | 5.25% | | 12/15/26 | | 1,354,103 |
| 600,000 | | TX St Muni Gas Acquisition & Sply Corp III Gas Sply Rev
| | 5.00% | | 12/15/24 | | 658,992 |
| 2,850,000 | | TX St Muni Gas Acquisition & Sply Corp III Gas Sply Rev
| | 5.00% | | 12/15/30 | | 3,095,356 |
| 550,000 | | TX St Muni Gas Acquisition & Sply Corp III Gas Sply Rev
| | 5.00% | | 12/15/31 | | 596,112 |
| 525,000 | | TX St Transprtn Commission Central TX Turnpike Sys Rev Ref, Ser B
| | 5.00% | | 08/15/37 | | 574,644 |
| 1,000,000 | | Univ of Houston TX Univ Rev Ref, Ser A
| | 5.00% | | 02/15/29 | | 1,152,910 |
| 1,560,000 | | Uptown Dev Auth TX Incr Contract Rev, Ser A
| | 5.00% | | 09/01/36 | | 1,732,520 |
| 500,000 | | Viridian TX Muni Mgmt Dist Ref Utility Impt, BAM
| | 6.00% | | 12/01/26 | | 599,525 |
| 155,000 | | Viridian TX Muni Mgmt Dist Road Impt, BAM
| | 5.00% | | 12/01/26 | | 171,573 |
| 125,000 | | Viridian TX Muni Mgmt Dist Utility Impt, BAM
| | 5.00% | | 12/01/26 | | 138,365 |
| | | | | 40,532,083 |
| | | Utah – 0.7% | | | | | | |
| 400,000 | | UT St Chrt Sch Fin Auth Chrt Sch Rev Ref Quest Academy
| | 5.00% | | 04/15/32 | | 442,208 |
| 325,000 | | UT St Chrt Sch Fin Auth Chrt Sch Rev Ref Quest Academy
| | 5.00% | | 04/15/37 | | 354,575 |
| 500,000 | | UT St Chrt Sch Fin Auth Chrt Sch Rev Spectrum Academy Proj (a)
| | 6.00% | | 04/15/45 | | 518,685 |
Page 18
See Notes to Financial Statements
First Trust Managed Municipal ETF (FMB)
Portfolio of Investments (Continued)
April 30, 2018 (Unaudited)
Principal
Value | | Description | | Stated
Coupon | | Stated
Maturity | | Value |
| MUNICIPAL BONDS (Continued) |
| | | Utah (Continued) | | | | | | |
| $1,145,000 | | UT St Transit Auth Sales Tax Rev Ref Sub, Ser A
| | 5.00% | | 06/15/35 | | $1,285,320 |
| | | | | 2,600,788 |
| | | Vermont – 0.6% | | | | | | |
| 550,000 | | Burlington VT Ref Lakeview Garage Proj, Ser A, COPS
| | 5.00% | | 12/01/24 | | 607,283 |
| 745,000 | | VT St Econ Dev Auth Mtge Rev Ref Wake Robin Corp Proj, Ser A
| | 5.00% | | 05/01/25 | | 809,487 |
| 585,000 | | VT St Econ Dev Auth Mtge Rev Ref Wake Robin Corp Proj, Ser A
| | 5.00% | | 05/01/26 | | 635,965 |
| | | | | 2,052,735 |
| | | Virginia – 1.6% | | | | | | |
| 1,580,000 | | Hampton Roads VA Santn Dist Wstwtr Rev Ref Sub, Ser A
| | 5.00% | | 08/01/35 | | 1,813,018 |
| 2,000,000 | | VA St Pub Bldg Auth Pub Facs Rev, Ser C, AMT
| | 5.00% | | 08/01/33 | | 2,277,700 |
| 1,500,000 | | Wstrn VA Regl Jail Auth Regl Jail Facs Rev Ref
| | 5.00% | | 12/01/34 | | 1,699,950 |
| | | | | 5,790,668 |
| | | Washington – 3.9% | | | | | | |
| 1,250,000 | | Centrl Puget Sound WA Regl Transprtn Auth Sales & Use Tax Green Bond Ref & Impt, Ser S-1
| | 5.00% | | 11/01/35 | | 1,423,025 |
| 1,000,000 | | Energy NW WA Elec Rev Ref Columbia Generating Sys, Ser A
| | 4.00% | | 07/01/35 | | 1,045,600 |
| 1,250,000 | | Energy NW WA Elec Rev Ref Columbia Generating Sys, Ser A
| | 5.00% | | 07/01/38 | | 1,400,625 |
| 1,500,000 | | Energy NW WA Elec Rev Ref, Ser A
| | 5.00% | | 07/01/24 | | 1,722,165 |
| 500,000 | | Grays Harbor Cnty WA Pub Hosp Dist #1 Hosp Rev Pub Hosp Dt, BANS
| | 3.00% | | 08/01/19 | | 498,470 |
| 155,000 | | Mason Cnty WA Pub Utility Dist #1 Sys
| | 3.50% | | 12/01/21 | | 161,357 |
| 270,000 | | Skagit Cnty WA Pub Hosp Dist #1 Ref & Impt Skagit Regl Hlth
| | 4.00% | | 12/01/24 | | 282,231 |
| 110,000 | | Skagit Cnty WA Pub Hosp Dist #1 Ref & Impt, Ser A
| | 5.00% | | 12/01/22 | | 118,760 |
| 165,000 | | Skagit Cnty WA Pub Hosp Dist #1 Skagit Vly Hosp
| | 5.00% | | 12/01/20 | | 172,714 |
| 250,000 | | Tacoma WA Elec Sys Rev
| | 5.00% | | 01/01/37 | | 284,412 |
| 250,000 | | Tobacco Settlement Auth WA Tobacco Settlement Rev Ref
| | 5.00% | | 06/01/23 | | 277,622 |
| 35,000 | | WA St Hsg Fin Commission Ref Emerald Heights Proj
| | 5.00% | | 07/01/22 | | 38,526 |
| 50,000 | | WA St Hsg Fin Commission Ref Emerald Heights Proj
| | 5.00% | | 07/01/28 | | 54,749 |
| 2,025,000 | | WA St Ref, Ser B
| | 5.00% | | 08/01/32 | | 2,339,665 |
| 3,325,000 | | WA St, Ser 2017-A
| | 5.00% | | 08/01/35 | | 3,799,677 |
| | | | | 13,619,598 |
| | | Wisconsin – 4.2% | | | | | | |
| 1,250,000 | | Pub Fin Auth WI Chrt Sch Rev Limited American Prep Academy Las Vegas Proj, Ser A (a)
| | 5.13% | | 07/15/37 | | 1,270,538 |
| 1,945,000 | | Pub Fin Auth WI Edu Rev Ref Mountain Island Chrt Sch Ltd
| | 4.00% | | 07/01/27 | | 1,968,262 |
| 620,000 | | Pub Fin Auth WI Edu Rev Ref Mountain Island Chrt Sch Ltd
| | 5.00% | | 07/01/37 | | 643,281 |
| 1,000,000 | | Pub Fin Auth WI Exempt Facs Rev Ref Celanese Proj, Ser B, AMT (a)
| | 5.00% | | 12/01/25 | | 1,120,290 |
| 425,000 | | Pub Fin Auth WI Retmnt Fac Rev Ref Whitestone Retmnt Facs 1st Mortgage Rev Bonds (a)
| | 4.00% | | 03/01/27 | | 438,719 |
| 1,410,000 | | Pub Fin Auth WI Rev Ref Retmnt Hsg Fdtn Obligated Grp, Ser B
| | 5.00% | | 11/15/26 | | 1,606,159 |
| 500,000 | | Pub Fin Auth WI Sr Living Rev Ref Mary’s Woods at Marylhurst Proj (a)
| | 3.50% | | 11/15/23 | | 504,515 |
| 1,300,000 | | WI St Gen Fund Annual Approp Rev Ref, Ser B
| | 5.00% | | 05/01/34 | | 1,490,619 |
| 1,000,000 | | WI St Hlth & Eductnl Facs Auth Rev Ref Ascension Hlth Credit Group, Ser A
| | 5.00% | | 11/15/36 | | 1,131,950 |
| 500,000 | | WI St Hlth & Eductnl Facs Auth Rev Ref Marquette Univ
| | 5.00% | | 10/01/28 | | 549,285 |
| 1,175,000 | | WI St Hlth & Eductnl Facs Auth Rev Ref Prohealth Care Oblig Grp
| | 5.00% | | 08/15/31 | | 1,306,530 |
| 175,000 | | WI St Hlth & Eductnl Facs Auth Rev Ref Prohealth Care Oblig Grp
| | 5.00% | | 08/15/33 | | 192,799 |
See Notes to Financial Statements
Page 19
First Trust Managed Municipal ETF (FMB)
Portfolio of Investments (Continued)
April 30, 2018 (Unaudited)
Principal
Value | | Description | | Stated
Coupon | | Stated
Maturity | | Value |
| MUNICIPAL BONDS (Continued) |
| | | Wisconsin (Continued) | | | | | | |
| $100,000 | | WI St Hlth & Eductnl Facs Auth Rev Ref St Johns Cmntys Inc, Ser B
| | 4.00% | | 09/15/23 | | $102,783 |
| 435,000 | | WI St Hlth & Eductnl Facs Auth Rev St Johns Cmntys Inc Proj, Ser A
| | 5.00% | | 09/15/30 | | 460,334 |
| 1,015,000 | | WI St Hlth & Eductnl Facs Auth Rev St Johns Cmntys Inc Proj, Ser A
| | 5.00% | | 09/15/31 | | 1,071,597 |
| 595,000 | | WI St Hlth & Eductnl Facs Auth Rev St Johns Cmntys Inc Proj, Ser A
| | 5.00% | | 09/15/32 | | 626,404 |
| 455,000 | | WI St Hlth & Eductnl Facs Auth Rev St Johns Cmntys Inc Proj, Ser A
| | 5.00% | | 09/15/33 | | 477,668 |
| | | | | 14,961,733 |
| | | Wyoming – 0.1% | | | | | | |
| 250,000 | | Natrona Cnty WY Hosp Rev Ref WY Med Ctr Proj
| | 5.00% | | 09/15/30 | | 281,000 |
| | Total Investments – 95.6%
| | 337,055,354 |
| | (Cost $337,449,502) (e) | | |
| | Net Other Assets and Liabilities – 4.4%
| | 15,663,534 |
| | Net Assets – 100.0%
| | $352,718,888 |
|
| (a) | This security, sold within the terms of a private placement memorandum, is exempt from registration upon resale under Rule 144A under the Securities Act of 1933, as amended (the “1933 Act”), and may be resold in transactions exempt from registration, normally to qualified institutional buyers. Pursuant to procedures adopted by the Trust’s Board of Trustees, this security has been determined to be liquid by First Trust Advisors L.P. (“Advisor”). Although market instability can result in periods of increased overall market illiquidity, liquidity for each security is determined based on security specific factors and assumptions, which require subjective judgment. At April 30, 2018, securities noted as such amounted to $30,024,938 or 8.5% of net assets. |
| (b) | This security, sold within the terms of a private placement memorandum, is exempt from registration upon resale under Rule 144A under the 1933 Act, and may be resold in transactions exempt from registration, normally to qualified institutional buyers (see Note 2C - Restricted Securities in the Notes to Financial Statements). |
| (c) | Pursuant to procedures adopted by the Trust’s Board of Trustees, this security has been determined to be illiquid by the Advisor. |
| (d) | Zero coupon bond. |
| (e) | Aggregate cost for financial reporting purposes approximates the aggregate cost for federal income tax purposes. As of April 30, 2018, the aggregate gross unrealized appreciation for all investments in which there was an excess of value over tax cost was $2,313,101 and the aggregate gross unrealized depreciation for all investments in which there was an excess of tax cost over value was $2,707,249. The net unrealized depreciation was $394,148. The amounts presented are inclusive of derivative contracts. |
| AGC | Assured Guaranty Corp. |
| AGM | Assured Guaranty Municipal Corp. |
| AMT | Alternative Minimum Tax |
| BAM | Building America Mutual |
| BANS | Bond Anticipation Notes |
| CABS | Capital Appreciation Bonds |
| COPS | Certificates of Participation |
| GANS | Grant Anticipation Notes |
| NATL-RE | National Public Finance Guarantee Corp. |
Page 20
See Notes to Financial Statements
First Trust Managed Municipal ETF (FMB)
Portfolio of Investments (Continued)
April 30, 2018 (Unaudited)
Valuation Inputs
A summary of the inputs used to value the Fund’s investments as of April 30, 2018 is as follows (see Note 2A - Portfolio Valuation in the Notes to Financial Statements):
| | Total
Value at
4/30/2018 | Level 1
Quoted
Prices | Level 2
Significant
Observable
Inputs | Level 3
Significant
Unobservable
Inputs |
Municipal Bonds*
| $ 337,055,354 | $ — | $ 337,055,354 | $ — |
| * | See Portfolio of Investments for state breakout. |
All transfers in and out of the Levels during the period are assumed to occur on the last day of the period at their current value. There were no transfers between Levels at April 30, 2018.
See Notes to Financial Statements
Page 21
First Trust Managed Municipal ETF (FMB)
Statement of Assets and Liabilities
April 30, 2018 (Unaudited)
| ASSETS: | |
Investments, at value
(Cost $337,449,502)
| $ 337,055,354 |
Cash
| 15,656,089 |
| Receivables: | |
Interest
| 4,426,044 |
Investment securities sold
| 1,073,240 |
Total Assets
| 358,210,727 |
| LIABILITIES: | |
| Payables: | |
Investment securities purchased
| 5,349,067 |
Investment advisory fees
| 142,772 |
Total Liabilities
| 5,491,839 |
NET ASSETS
| $352,718,888 |
| NET ASSETS consist of: | |
Paid-in capital
| $ 354,693,267 |
Par value
| 67,500 |
Accumulated net investment income (loss)
| (79,434) |
Accumulated net realized gain (loss) on investments and futures
| (1,568,297) |
Net unrealized appreciation (depreciation) on investments
| (394,148) |
NET ASSETS
| $352,718,888 |
NET ASSET VALUE, per share
| $52.25 |
Number of shares outstanding (unlimited number of shares authorized, par value $0.01 per share)
| 6,750,002 |
Page 22
See Notes to Financial Statements
First Trust Managed Municipal ETF (FMB)
Statement of Operations
For the Six Months Ended April 30, 2018 (Unaudited)
| INVESTMENT INCOME: | |
Interest
| $ 4,460,434 |
Dividends
| 30,054 |
Total investment income
| 4,490,488 |
| EXPENSES: | |
Investment advisory fees
| 967,937 |
Total expenses
| 967,937 |
Fees waived by the investment advisor
| (222,578) |
Net expenses
| 745,359 |
NET INVESTMENT INCOME (LOSS)
| 3,745,129 |
| NET REALIZED AND UNREALIZED GAIN (LOSS): | |
| Net realized gain (loss) on: | |
Investments
| (867,436) |
Futures
| 4,613 |
Net realized gain (loss)
| (862,823) |
Net change in unrealized appreciation (depreciation) on investments
| (4,745,230) |
NET REALIZED AND UNREALIZED GAIN (LOSS)
| (5,608,053) |
NET INCREASE (DECREASE) IN NET ASSETS RESULTING FROM OPERATIONS
| $(1,862,924) |
See Notes to Financial Statements
Page 23
First Trust Managed Municipal ETF (FMB)
Statements of Changes in Net Assets
| | Six Months
Ended
4/30/2018
(Unaudited) | | Year
Ended
10/31/2017 |
| OPERATIONS: | | | |
Net investment income (loss)
| $ 3,745,129 | | $ 3,409,349 |
Net realized gain (loss)
| (862,823) | | (725,571) |
Net change in unrealized appreciation (depreciation)
| (4,745,230) | | 2,360,391 |
Net increase (decrease) in net assets resulting from operations
| (1,862,924) | | 5,044,169 |
| DISTRIBUTIONS TO SHAREHOLDERS FROM: | | | |
Net investment income
| (3,892,502) | | (3,340,878) |
Net realized gain
| — | | (259,840) |
Total distributions to shareholders
| (3,892,502) | | (3,600,718) |
| SHAREHOLDER TRANSACTIONS: | | | |
Proceeds from shares sold
| 140,476,796 | | 139,111,811 |
Cost of shares redeemed
| (2,607,604) | | (2,600,619) |
Net increase (decrease) in net assets resulting from shareholder transactions
| 137,869,192 | | 136,511,192 |
Total increase (decrease) in net assets
| 132,113,766 | | 137,954,643 |
| NET ASSETS: | | | |
Beginning of period
| 220,605,122 | | 82,650,479 |
End of period
| $352,718,888 | | $220,605,122 |
Accumulated net investment income (loss) at end of period
| $(79,434) | | $67,939 |
| CHANGES IN SHARES OUTSTANDING: | | | |
Shares outstanding, beginning of period
| 4,150,002 | | 1,550,002 |
Shares sold
| 2,650,000 | | 2,650,000 |
Shares redeemed
| (50,000) | | (50,000) |
Shares outstanding, end of period
| 6,750,002 | | 4,150,002 |
Page 24
See Notes to Financial Statements
First Trust Managed Municipal ETF (FMB)
Financial Highlights
For a share outstanding throughout each period
| | Six Months
Ended
4/30/2018
(Unaudited) | | Year Ended October 31, | | Period
Ended
10/31/2014 (a) |
| 2017 | | 2016 | | 2015 | |
Net asset value, beginning of period
| $ 53.16 | | $ 53.32 | | $ 51.58 | | $ 51.11 | | $ 50.00 |
| Income from investment operations: | | | | | | | | | |
Net investment income (loss)
| 0.65 | | 1.34 | | 1.32 | | 1.35 | | 0.56 |
Net realized and unrealized gain (loss)
| (0.88) | | (0.01) | | 1.99 | | 0.50 | | 1.20 |
Total from investment operations
| (0.23) | | 1.33 | | 3.31 | | 1.85 | | 1.76 |
| Distributions paid to shareholders from: | | | | | | | | | |
Net investment income
| (0.68) | | (1.33) | | (1.35) | | (1.38) | | (0.55) |
Net realized gain
| — | | (0.16) | | (0.22) | | — | | — |
Return of capital
| — | | — | | — | | — | | (0.10) |
Total distributions
| (0.68) | | (1.49) | | (1.57) | | (1.38) | | (0.65) |
Net asset value, end of period
| $52.25 | | $53.16 | | $53.32 | | $51.58 | | $51.11 |
Total return (b)
| (0.45)% | | 2.59% | | 6.47% | | 3.66% | | 3.53% |
| Ratios to average net assets/supplemental data: | | | | | | | | | |
Net assets, end of period (in 000’s)
| $ 352,719 | | $ 220,605 | | $ 82,650 | | $ 33,529 | | $ 20,445 |
| Ratio of total expenses to average net assets | 0.65% (c) | | 0.65% | | 0.65% | | 0.65% | | 0.65% (c) |
Ratio of net expenses to average net assets
| 0.50% (c) | | 0.50% | | 0.52% | | 0.65% | | 0.65% (c) |
Ratio of net investment income (loss) to average net assets
| 2.51% (c) | | 2.63% | | 2.52% | | 2.63% | | 2.40% (c) |
Portfolio turnover rate (d)
| 25% | | 85% | | 85% | | 109% | | 69% |
| (a) | Inception date is May 13, 2014, which is consistent with the commencement of investment operations and is the date the initial creation units were established. |
| (b) | Total return is calculated assuming an initial investment made at the net asset value at the beginning of the period, reinvestment of all distributions at net asset value during the period, and redemption at net asset value on the last day of the period. The returns presented do not reflect the deduction of taxes that a shareholder would pay on Fund distributions or the redemption or sale of Fund shares. Total return is calculated for the time period presented and is not annualized for periods of less than a year. For some periods, the total returns would have been lower if certain fees had not been waived by the advisor. |
| (c) | Annualized. |
| (d) | Portfolio turnover is calculated for the time period presented and is not annualized for periods of less than a year and does not include securities received or delivered from processing creations or redemptions and in-kind transactions. |
See Notes to Financial Statements
Page 25
Notes to Financial Statements
First Trust Managed Municipal ETF (FMB)
April 30, 2018 (Unaudited)
1. Organization
First Trust Exchange-Traded Fund III (the “Trust”) is an open-end management investment company organized as a Massachusetts business trust on January 9, 2008, and is registered with the Securities and Exchange Commission (the “SEC”) under the Investment Company Act of 1940, as amended (the “1940 Act”).
The Trust consists of thirteen funds that are currently offering shares. This report covers the First Trust Managed Municipal ETF (the “Fund”), a non-diversified series of the Trust, which trades under the ticker FMB on The Nasdaq Stock Market, LLC. Unlike conventional mutual funds, the Fund issues and redeems shares on a continuous basis, at net asset value (“NAV”), only in large specified blocks consisting of 50,000 shares called a “Creation Unit.” Creation Units are issued and redeemed for cash and, in certain circumstances, in-kind for securities in which the Fund invests. Except when aggregated in Creation Units, the Fund’s shares are not redeemable securities.
The primary investment objective of the Fund is to generate current income that is exempt from regular federal income taxes and its secondary objective is long-term capital appreciation. Under normal market conditions, the Fund seeks to achieve its investment objectives by investing at least 80% of its net assets (including investment borrowings) in municipal debt securities that pay interest that is exempt from regular federal income taxes (collectively, “Municipal Securities”). There can be no assurance that the Fund will achieve its investment objectives. The Fund may not be appropriate for all investors.
2. Significant Accounting Policies
The Fund is considered an investment company and follows accounting and reporting guidance under Financial Accounting Standards Board Accounting Standards Codification Topic 946, “Financial Services-Investment Companies.” The following is a summary of significant accounting policies consistently followed by the Fund in the preparation of the financial statements. The preparation of the financial statements in accordance with accounting principles generally accepted in the United States of America (“U.S. GAAP”) requires management to make estimates and assumptions that affect the reported amounts and disclosures in the financial statements. Actual results could differ from those estimates.
A. Portfolio Valuation
The Fund’s NAV is determined daily as of the close of regular trading on the New York Stock Exchange (“NYSE”), normally 4:00 p.m. Eastern time, on each day the NYSE is open for trading. If the NYSE closes early on a valuation day, the NAV is determined as of that time. Domestic debt securities are priced using data reflecting the earlier closing of the principal markets for those securities. The Fund’s NAV is calculated by dividing the value of all assets of the Fund (including accrued interest and dividends), less all liabilities (including accrued expenses and dividends declared but unpaid), by the total number of shares outstanding.
The Fund’s investments are valued daily at market value or, in the absence of market value with respect to any portfolio securities, at fair value. Market value prices represent last sale or official closing prices from a national or foreign exchange (i.e., a regulated market) and are primarily obtained from third-party pricing services. Fair value prices represent any prices not considered market value prices and are either obtained from a third-party pricing service or are determined by the Pricing Committee of the Fund’s investment advisor, First Trust Advisors L.P. (“First Trust” or the “Advisor”), in accordance with valuation procedures adopted by the Trust’s Board of Trustees, and in accordance with provisions of the 1940 Act. Investments valued by the Advisor’s Pricing Committee, if any, are footnoted as such in the footnotes to the Portfolio of Investments. The Fund’s investments are valued as follows:
Municipal securities and other debt securities are fair valued on the basis of fair valuations provided by dealers who make markets in such securities or by a third-party pricing service approved by the Trust’s Board of Trustees, which may use the following valuation inputs when available:
| 1) | benchmark yields; |
| 2) | reported trades; |
| 3) | broker/dealer quotes; |
| 4) | issuer spreads; |
| 5) | benchmark securities; |
| 6) | bids and offers; and |
| 7) | reference data including market research publications. |
Fixed income and other debt securities having a remaining maturity of sixty days or less when purchased are fair valued at cost adjusted for amortization of premiums and accretion of discounts (amortized cost), provided the Advisor’s Pricing Committee has determined that the use of amortized cost is an appropriate reflection of fair value given market and issuer-specific
Notes to Financial Statements (Continued)
First Trust Managed Municipal ETF (FMB)
April 30, 2018 (Unaudited)
conditions existing at the time of the determination. Factors that may be considered in determining the appropriateness of the use of amortized cost include, but are not limited to, the following:
| 1) | the credit conditions in the relevant market and changes thereto; |
| 2) | the liquidity conditions in the relevant market and changes thereto; |
| 3) | the interest rate conditions in the relevant market and changes thereto (such as significant changes in interest rates); |
| 4) | issuer-specific conditions (such as significant credit deterioration); and |
| 5) | any other market-based data the Advisor’s Pricing Committee considers relevant. In this regard, the Advisor’s Pricing Committee may use last-obtained market-based data to assist it when valuing portfolio securities using amortized cost. |
Certain securities may not be able to be priced by pre-established pricing methods. Such securities may be valued by the Trust’s Board of Trustees or its delegate, the Advisor’s Pricing Committee, at fair value. These securities generally include, but are not limited to, restricted securities (securities which may not be publicly sold without registration under the Securities Act of 1933, as amended (the “1933 Act”)) for which a third-party pricing service is unable to provide a market price; securities whose trading has been formally suspended; a security whose market or fair value price is not available from a pre-established pricing source; a security with respect to which an event has occurred that is likely to materially affect the value of the security after the market has closed but before the calculation of the Fund’s NAV or make it difficult or impossible to obtain a reliable market quotation; and a security whose price, as provided by the third-party pricing service, does not reflect the security’s fair value. As a general principle, the current fair value of a security would appear to be the amount which the owner might reasonably expect to receive for the security upon its current sale. When fair value prices are used, generally they will differ from market quotations or official closing prices on the applicable exchanges. A variety of factors may be considered in determining the fair value of such securities, including, but not limited to, the following:
| 1) | the fundamental business data relating to the issuer; |
| 2) | an evaluation of the forces which influence the market in which these securities are purchased and sold; |
| 3) | the type, size and cost of the security; |
| 4) | the financial statements of the issuer; |
| 5) | the credit quality and cash flow of the issuer, based on the Advisor’s or external analysis; |
| 6) | the information as to any transactions in or offers for the security; |
| 7) | the price and extent of public trading in similar securities (or equity securities) of the issuer/borrower, or comparable companies; |
| 8) | the coupon payments; |
| 9) | the quality, value and salability of collateral, if any, securing the security; and |
| 10) | other relevant factors. |
The Fund is subject to fair value accounting standards that define fair value, establish the framework for measuring fair value and provide a three-level hierarchy for fair valuation based upon the inputs to the valuation as of the measurement date. The three levels of the fair value hierarchy are as follows:
| • | Level 1 – Level 1 inputs are quoted prices in active markets for identical investments. An active market is a market in which transactions for the investment occur with sufficient frequency and volume to provide pricing information on an ongoing basis. |
| • | Level 2 – Level 2 inputs are observable inputs, either directly or indirectly, and include the following: |
| o | Quoted prices for similar investments in active markets. |
| o | Quoted prices for identical or similar investments in markets that are non-active. A non-active market is a market where there are few transactions for the investment, the prices are not current, or price quotations vary substantially either over time or among market makers, or in which little information is released publicly. |
| o | Inputs other than quoted prices that are observable for the investment (for example, interest rates and yield curves observable at commonly quoted intervals, volatilities, prepayment speeds, loss severities, credit risks, and default rates). |
| o | Inputs that are derived principally from or corroborated by observable market data by correlation or other means. |
| • | Level 3 – Level 3 inputs are unobservable inputs. Unobservable inputs may reflect the reporting entity’s own assumptions about the assumptions that market participants would use in pricing the investment. |
Notes to Financial Statements (Continued)
First Trust Managed Municipal ETF (FMB)
April 30, 2018 (Unaudited)
The inputs or methodologies used for valuing investments are not necessarily an indication of the risk associated with investing in those investments. A summary of the inputs used to value the Fund’s investments as of April 30, 2018, is included with the Fund’s Portfolio of Investments.
B. Securities Transactions and Investment Income
Securities transactions are recorded as of the trade date. Realized gains and losses from securities transactions are recorded on the identified cost basis. Dividend income is recorded on the ex-dividend date. Interest income is recorded daily on the accrual basis. Amortization of premiums and accretion of discounts are recorded using the effective interest method.
C. Restricted Securities
The Fund invests in restricted securities, which are securities that may not be offered for public sale without first being registered under the 1933 Act. Prior to registration, restricted securities may only be resold in transactions exempt from registration under Rule 144A under the 1933 Act, normally to qualified institutional buyers. As of April 30, 2018, the Fund held restricted securities as shown in the following table that the Advisor has deemed illiquid pursuant to procedures adopted by the Trust’s Board of Trustees. Although market instability can result in periods of increased overall market illiquidity, liquidity for each security is determined based on security-specific factors and assumptions, which require subjective judgment. The Fund does not have the right to demand that such securities be registered. These securities are valued according to the valuation procedures as stated in the Portfolio Valuation note (Note 2A) and are not expressed as a discount to the carrying value of a comparable unrestricted security. There are no unrestricted securities with the same maturity dates and yields for these issuers.
| Security | Acquisition
Date | Principal
Value | Current Price | Carrying
Cost | | Value | | % of
Net
Assets |
| CA Stwd Cmntys Dev Auth Rev Ref Lancer Eductnl Student Hsg Proj, Ser A | 11/02/16 | $500,000 | $102.00 | $507,240 | | $510,010 | | 0.14% |
| Centerra CO Met Dist #1 Spl Rev Dist #1 | 04/20/17 | 500,000 | 108.19 | 533,668 | | 540,930 | | 0.15 |
| Centerra CO Met Dist #1 Spl Rev Dist #1 | 04/20/17 | 1,000,000 | 107.30 | 1,055,070 | | 1,073,030 | | 0.30 |
| Mission TX Econ Dev Corp Rev Sr Lien Nat Gasoline Proj, Ser B, AMT | 04/28/16 | 500,000 | 103.82 | 479,644 | | 519,085 | | 0.15 |
| Prairie Ctr CO Met Dist #3 Ltd Property Tax Supported Pri Ref, Ser A | 10/13/17 | 1,000,000 | 100.87 | 994,024 | | 1,008,740 | | 0.29 |
| | | | | $3,569,646 | | $3,651,795 | | 1.03% |
D. Futures Contracts
The Fund may purchase or sell (i.e., is long or short) exchange-listed futures contracts to hedge against changes in interest rates (interest rate risk). Futures contracts are agreements between the Fund and a counterparty to buy or sell a specific quantity of an underlying instrument at a specified price and at a specified date. Depending on the terms of the contract, futures contracts are settled either through physical delivery of the underlying instrument on the settlement date or by payment of a cash settlement amount on the settlement date. Open futures contracts can also be closed out prior to settlement by entering into an offsetting transaction in a matching futures contract. If the Fund is not able to enter into an offsetting transaction, the Fund will continue to be required to maintain margin deposits on the futures contract. When the contract is closed or expires, the Fund records a realized gain or loss equal to the difference between the value of the contract at the time it was opened and the value at the time it was closed or expired. This gain or loss is included in “Net realized gain (loss) on futures” on the Statement of Operations.
Upon entering into a futures contract, the Fund must deposit funds, called margin, with its custodian in the name of the clearing broker equal to a specified percentage of the current value of the contract. Open futures contacts are marked to market daily with the change in value recognized as a component of “Net change in unrealized appreciation (depreciation) on futures” on the Statement of Operations. Pursuant to the contract, the Fund agrees to receive from or pay to the broker an amount of cash equal to the daily fluctuation in value of the contract. Such receipts or payments are known as variation margin and are included in “Variation margin” payable or receivable on the Statement of Assets and Liabilities.
If market conditions change unexpectedly, the Fund may not achieve the anticipated benefits of the futures contract and may realize a loss. The use of futures contracts involves the risk of imperfect correlation in movements in the price of the futures contracts, interest rates and the underlying instruments. The Fund did not hold any futures contracts at April 30, 2018.
Notes to Financial Statements (Continued)
First Trust Managed Municipal ETF (FMB)
April 30, 2018 (Unaudited)
E. Dividends and Distributions to Shareholders
Dividends from net investment income, if any, are declared and paid monthly by the Fund, or as the Board of Trustees may determine from time to time. Distributions of net realized capital gains earned by the Fund, if any, are distributed at least annually.
Distributions from income and capital gains are determined in accordance with federal income tax regulations, which may differ from U.S. GAAP. Certain capital accounts in the financial statements are periodically adjusted for permanent differences in order to reflect their tax character. These permanent differences are primarily due to the varying treatment of income and gain/loss on portfolio securities held by the Fund and have no impact on net assets or NAV per share. Temporary differences, which arise from recognizing certain items of income, expense and gain/loss in different periods for financial statement and tax purposes, will reverse at some time in the future.
The tax character of distributions paid by the Fund during the fiscal year ended October 31, 2017, was as follows:
| Distributions paid from: | |
Ordinary income
| $263,324 |
Capital gains
| — |
Tax-exempt income
| 3,337,394 |
Return of capital
| — |
As of October 31, 2017, the components of distributable earnings on a tax basis were as follows:
Undistributed ordinary income
| $34,141 |
Accumulated capital and other losses
| (697,637) |
Net unrealized appreciation (depreciation)
| 4,377,043 |
F. Income Taxes
The Fund intends to continue to qualify as a regulated investment company by complying with the requirements under Subchapter M of the Internal Revenue Code of 1986, as amended, which includes distributing substantially all of its net investment income and net realized gains to shareholders. Accordingly, no provision has been made for federal and state income taxes. However, due to the timing and amount of distributions, the Fund may be subject to an excise tax of 4% of the amount by which approximately 98% of the Fund’s taxable income exceeds the distributions from such taxable income for the calendar year.
In addition, the Fund intends to invest in such municipal securities to allow it to pay shareholders “exempt dividends” as defined in the Internal Revenue Code.
The Fund is subject to accounting standards that establish a minimum threshold for recognizing, and a system for measuring, the benefits of a tax position taken or expected to be taken in a tax return. Taxable years ending 2014, 2015, 2016, and 2017 remain open to federal and state audit. As of April 30, 2018, management has evaluated the application of these standards to the Fund and has determined that no provision for income tax is required in the Fund’s financial statements for uncertain tax positions.
The Fund intends to utilize provisions of the federal income tax laws, which allow it to carry a realized capital loss forward indefinitely following the year of the loss and offset such loss against any future realized capital gains. The Fund is subject to certain limitations under U.S. tax rules on the use of capital loss carryforwards and net unrealized built-in losses. These limitations apply when there has been a 50% change in ownership. At October 31, 2017, the Fund had $697,637 of non-expiring capital loss carryforwards for federal income tax purposes.
Certain losses realized during the current fiscal year may be deferred and treated as occurring on the first day of the following fiscal year for federal income tax purposes. For the fiscal year ended October 31, 2017, the Fund had no net ordinary losses.
G. Expenses
Expenses, other than the investment advisory fee and other excluded expenses, are paid by the Advisor (See Note 3).
H. New and Amended Financial Reporting Rules and Forms
On October 13, 2016, the SEC adopted new rules and forms, and amended existing rules and forms. The new and amended rules and forms are intended to modernize the reporting of information provided by funds and to improve the quality and type of information that funds provide to the SEC and investors. In part, the new and amended rules and forms amend Regulation S-X and require standardized, enhanced disclosures about derivatives in a fund’s financial statements, as well as other amendments. The compliance date for the amendments of Regulation S-X was August 1, 2017, which resulted in no change to the financial statements. The new
Notes to Financial Statements (Continued)
First Trust Managed Municipal ETF (FMB)
April 30, 2018 (Unaudited)
form types and other rule amendments will be effective for the First Trust funds, including the Fund, for reporting periods beginning on and after June 1, 2018. Management is evaluating the new form types and other rule amendments that are effective on and after June 1, 2018 to determine the impact to the Fund.
3. Investment Advisory Fee, Affiliated Transactions and Other Fee Arrangements
First Trust, the investment advisor to the Fund, is a limited partnership with one limited partner, Grace Partners of DuPage L.P., and one general partner, The Charger Corporation. The Charger Corporation is an Illinois corporation controlled by James A. Bowen, Chief Executive Officer of First Trust. First Trust is responsible for the selection and ongoing monitoring of the securities in the Fund’s portfolio, managing the Fund’s business affairs and providing certain administrative services necessary for the management of the Fund.
Pursuant to the Investment Management Agreement between the Trust and the Advisor, First Trust manages the investment of the Fund’s assets and is responsible for the Fund’s expenses, including the cost of transfer agency, custody, fund administration, legal, audit, and other services, but excluding fee payments under the Investment Management Agreement, interest, taxes, acquired fund fees and expenses, if any, brokerage commissions, and other expenses connected with the execution of portfolio transactions, distribution and service fees pursuant to a 12b-1 plan, if any, and extraordinary expenses. The Fund has agreed to pay First Trust an annual unitary management fee equal to 0.65% of its average daily net assets. First Trust also provides fund reporting services to the Fund for a flat annual fee in the amount of $9,250, which is covered under the annual unitary management fee.
The Trust’s Board of Trustees and the Advisor have entered into a Fee Waiver Agreement for the Fund pursuant to which the Advisor contractually agreed to waive management fees of 0.15% of average daily net assets until March 1, 2019. The waiver agreement may be terminated by action of the Trust’s Board of Trustees at any time upon 60 days’ written notice by the Trust on behalf of the Fund or by the Fund’s investment advisor only after March 1, 2019. First Trust does not have the right to recover the fees waived. During the six months ended April 30, 2018, the Advisor waived fees of $222,578.
The Trust has multiple service agreements with Brown Brothers Harriman & Co. (“BBH”). Under the service agreements, BBH performs custodial, fund accounting, certain administrative services, and transfer agency services for the Fund. As custodian, BBH is responsible for custody of the Fund’s assets. As fund accountant and administrator, BBH is responsible for maintaining the books and records of the Fund’s securities and cash. As transfer agent, BBH is responsible for maintaining shareholder records for the Fund.
Each Trustee who is not an officer or employee of First Trust, any sub-advisor or any of their affiliates (“Independent Trustees”) is paid a fixed annual retainer that is allocated equally among each fund in the First Trust Fund Complex. Each Independent Trustee is also paid an annual per fund fee that varies based on whether the fund is a closed-end or other actively managed fund, or is an index fund.
Additionally, the Lead Independent Trustee and the Chairmen of the Audit Committee, Nominating and Governance Committee and Valuation Committee are paid annual fees to serve in such capacities, with such compensation allocated pro rata among each fund in the First Trust Fund Complex based on net assets. Independent Trustees are reimbursed for travel and out-of-pocket expenses in connection with all meetings. The Lead Independent Trustee and Committee Chairmen rotate every three years. The officers and “Interested” Trustee receive no compensation from the Trust for acting in such capacities.
4. Purchases and Sales of Securities
For the six months ended April 30, 2018, the cost of purchases and proceeds from sales of investments, excluding short term investments and in-kind transactions, were $209,577,205 and $69,898,964, respectively.
For the six months ended April 30, 2018, the Fund had no in-kind transactions.
5. Derivative Transactions
The following table presents the amount of net realized gain (loss) and change in net unrealized appreciation (depreciation) recognized for the six months ended April 30, 2018, on derivative instruments, as well as the primary underlying risk exposure associated with each instrument.
| Statement of Operations Location | |
| Interest Rate Risk | |
| Net realized gain (loss) on futures | $4,613 |
Notes to Financial Statements (Continued)
First Trust Managed Municipal ETF (FMB)
April 30, 2018 (Unaudited)
During the six months ended April 30, 2018, the amount of notional values of futures contracts opened and closed were $12,803,125 and $12,803,125, respectively.
The Fund does not have the right to offset financial assets and liabilities related to futures contracts on the Statement of Assets and Liabilities.
6. Creations, Redemptions and Transaction Fees
Shares are created and redeemed by the Fund only in Creation Unit size aggregations of 50,000 shares in transactions with broker-dealers or large institutional investors that have entered into a participation agreement (an “Authorized Participant”). In order to purchase Creation Units of the Fund, an Authorized Participant must deposit (i) a designated portfolio of securities determined by First Trust (the “Deposit Securities”) and generally make or receive a cash payment referred to as the “Cash Component,” which is an amount equal to the difference between the NAV of the Fund shares (per Creation Unit Aggregation) and the market value of the Deposit Securities, and/or (ii) cash in lieu of all or a portion of the Deposit Securities. If the Cash Component is a positive number (i.e., the NAV per Creation Unit Aggregation exceeds the Deposit Amount), the Authorized Participant will deliver the Cash Component. If the Cash Component is a negative number (i.e., the NAV per Creation Unit Aggregation is less than the Deposit Amount), the Authorized Participant will receive the Cash Component. Authorized Participants purchasing Creation Units must pay to BBH, as transfer agent, a creation transaction fee (the “Creation Transaction Fee”) regardless of the number of Creation Units purchased in the transaction. The Creation Transaction Fee may vary and is based on the composition of the securities included in the Fund’s portfolio and the countries in which the transactions are settled. The Creation Transaction Fee is currently $500. The price for each Creation Unit will equal the daily NAV per share times the number of shares in a Creation Unit plus the fees described above and, if applicable, any operational processing and brokerage costs, transfer fees or stamp taxes. When the Fund permits an Authorized Participant to substitute cash or a different security in lieu of depositing one or more of the requisite Deposit Securities, the Authorized Participant may also be assessed an amount to cover the cost of purchasing the Deposit Securities and/or disposing of the substituted securities, including operational processing and brokerage costs, transfer fees, stamp taxes, and part or all of the spread between the expected bid and offer side of the market related to such Deposit Securities and/or substitute securities.
Authorized Participants redeeming Creation Units must pay to BBH, as transfer agent, a redemption transaction fee (the “Redemption Transaction Fee”), regardless of the number of Creation Units redeemed in the transaction. The Redemption Transaction Fee may vary and is based on the composition of the securities included in the Fund’s portfolio and the countries in which the transactions are settled. The Redemption Transaction Fee is currently $500. The Fund reserves the right to effect redemptions in cash. An Authorized Participant may request cash redemption in lieu of securities; however, the Fund may, in its discretion, reject any such request.
7. Distribution Plan
The Board of Trustees adopted a Distribution and Service Plan pursuant to Rule 12b-1 under the 1940 Act. In accordance with the Rule 12b-1 plan, the Fund is authorized to pay an amount up to 0.25% of its average daily net assets each year to reimburse First Trust Portfolios L.P. (“FTP”), the distributor of the Fund, for amounts expended to finance activities primarily intended to result in the sale of Creation Units or to provide investor services. FTP may also use this amount to compensate securities dealers or other persons that are Authorized Participants for providing distribution assistance, including broker-dealer and shareholder support and educational and promotional services.
No 12b-1 fees are currently paid by the Fund, and pursuant to a contractual arrangement, no 12b-1 fees will be paid any time before March 1, 2019.
8. Borrowings
The Trust, on behalf of the Fund, along with First Trust Series Fund and First Trust Exchange-Traded Fund IV have a $320 million Credit Agreement with The Bank of Nova Scotia (“Scotia”) as administrative agent for a group of lenders. Prior to March 7, 2018, the commitment amount was $220 million. Scotia charges a commitment fee of 0.25% of the daily amount of excess of the commitment amount over the outstanding principal balance of the loans and an agency fee. First Trust allocates the commitment fee and agency fee amongst the funds that have access to the credit line. To the extent that the Fund accesses the credit line, there would also be an interest fee charged. The Fund did not have any borrowings outstanding during the six months ended April 30, 2018.
9. Indemnification
The Trust, on behalf of the Fund, has a variety of indemnification obligations under contracts with its service providers. The Trust’s maximum exposure under these arrangements is unknown. However, the Trust has not had prior claims or losses pursuant to these contracts and expects the risk of loss to be remote.
Notes to Financial Statements (Continued)
First Trust Managed Municipal ETF (FMB)
April 30, 2018 (Unaudited)
10. Subsequent Events
Management has evaluated the impact of all subsequent events to the Fund through the date the financial statements were issued, and has determined that there were no subsequent events requiring recognition or disclosure in the financial statements that have not already been disclosed.
Additional Information
First Trust Managed Municipal ETF (FMB)
April 30, 2018 (Unaudited)
Proxy Voting Policies and Procedures
A description of the policies and procedures that the Trust uses to determine how to vote proxies and information on how the Fund voted proxies relating to portfolio securities during the most recent 12-month period ended June 30 is available (1) without charge, upon request, by calling (800) 988-5891; (2) on the Fund’s website at www.ftportfolios.com; and (3) on the Securities and Exchange Commission’s (“SEC”) website at www.sec.gov.
Portfolio Holdings
The Trust files its complete schedule of the Fund’s portfolio holdings with the SEC for the first and third quarters of each fiscal year on Form N-Q. The Trust’s Form N-Qs are available (1) by calling (800) 988-5891; (2) on the Fund’s website at www.ftportfolios.com; (3) on the SEC’s website at www.sec.gov; and (4) for review and copying at the SEC’s Public Reference Room (“PRR”) in Washington, DC. Information regarding the operation of the PRR may be obtained by calling (800) SEC-0330.
Risk Considerations
Risks are inherent in all investing. You should consider the Fund’s investment objectives, risks, charges and expenses carefully before investing. You can download the Fund’s prospectus at www.ftportfolios.com or contact First Trust Portfolios L.P. at (800) 621-1675 to request a prospectus, which contains this and other information about the Fund. For additional information about the risks associated with investing in the Fund, please see the Fund’s statement of additional information, as well as other regulatory filings. Read these documents carefully before you invest. First Trust Portfolios L.P. is the distributor of the First Trust Exchange-Traded Fund III.
The following summarizes some of the risks that should be considered for the Fund.
ALTERNATIVE MINIMUM TAX RISK. The Fund has no limit as to the amount that can be invested in alternative minimum tax bonds. Therefore, all or a portion of the Fund’s otherwise exempt-interest dividends may be taxable to those shareholders subject to the federal alternative minimum tax.
AUTHORIZED PARTICIPANT CONCENTRATION RISK. Only an authorized participant (as defined in the “Creations, Redemptions and Transaction Fees” Note to Financial Statements) may engage in creation or redemption transactions directly with the Fund. The Fund has a limited number of institutions that act as authorized participants. To the extent that these institutions exit the business or are unable to proceed with creation and/or redemption orders with respect to the Fund and no other authorized participant is able to step forward to create or redeem, in either of these cases, Fund shares may trade at a discount to the Fund’s net asset value and possibly face delisting.
CALL RISK. If an issuer calls higher-yielding debt instruments held by the Fund, performance could be adversely impacted. During periods of falling interest rates, issuers of callable securities may call (redeem) securities with higher coupon rates or interest rates before their maturity dates. The Fund would then lose any price appreciation above the bond’s call price and would be forced to reinvest the unanticipated proceeds at lower interest rates, resulting in a decline in the Fund’s income. Such redemptions and subsequent reinvestments would also increase the Fund’s portfolio turnover rate.
CASH TRANSACTIONS RISK. The Fund will, under most circumstances, effect a significant portion of creations and redemptions for cash, rather than in-kind securities. As a result, an investment in the Fund may be less tax-efficient than an investment in an exchange-traded fund that effects its creations and redemptions for in-kind securities. Because the Fund may effect a portion of redemptions for cash, it may be required to sell portfolio securities in order to obtain the cash needed to distribute redemption proceeds. A sale of shares may result in capital gains or losses and may also result in higher brokerage costs.
CREDIT RISK. Credit risk is the risk that an issuer of a security held by the Fund will be unable or unwilling to make dividend, interest and/or principal payments when due and the related risk that the value of such security may decline because of concerns about the issuer’s ability to make such payments. Credit risk may be heightened if the Fund invests in “high yield” or “junk” securities; such securities, while generally offering higher yields than investment grade debt with similar maturities, involve greater risks, including the possibility of dividend or interest deferral, default or bankruptcy, and are regarded as predominantly speculative with respect to the issuer’s capacity to pay dividends or interest and repay principal.
CREDIT SPREAD RISK. Credit spread risk is the risk that credit spreads (i.e., the difference in yield between securities that have differences in credit quality or other factors) may increase, which may reduce the market values of the Fund’s securities. While the Fund may employ strategies to mitigate credit spread risk, these strategies may not be successful.
CUSTODIAL RECEIPT TRUSTS RISK. Custodial receipts are financial instruments similar to tender option bonds (“TOBs”) sold through private placements that represent the right to receive future principal and interest payments on underlying municipal
Additional Information (Continued)
First Trust Managed Municipal ETF (FMB)
April 30, 2018 (Unaudited)
obligations. Custodial receipt trusts may issue inverse floater securities and if the Fund were to hold inverse floaters issued by custodial receipt trusts, the Fund would be subject to the risks of inverse floaters described herein. In particular, because the instruments may be leveraged, their market values may be more volatile than other types of fixed-income instruments.
CYBER SECURITY RISK. As the use of Internet technology has become more prevalent in the course of business, the Fund has become more susceptible to potential operational risks through breaches in cyber security. A breach in cyber security refers to both intentional and unintentional events that may cause the Fund to lose proprietary information, suffer data corruption or lose operational capacity. Such events could cause the Fund to incur regulatory penalties, reputational damage, additional compliance costs associated with corrective measures and/or financial loss. Cyber security breaches may involve unauthorized access to the Fund’s digital information systems through “hacking” or malicious software coding, but may also result from outside attacks such as denial-of-service attacks through efforts to make network services unavailable to intended users. In addition, cyber security breaches of the Fund’s third-party service providers, such as its administrator, transfer agent, custodian, or sub-advisor, as applicable, or issuers in which the Fund invests, can also subject the Fund to many of the same risks associated with direct cyber security breaches. The Fund has established risk management systems designed to reduce the risks associated with cyber security. However, there is no guarantee that such efforts will succeed, especially because the Fund does not directly control the cyber security systems of issuers or third-party service providers.
EXTENSION RISK. Extension risk is the risk that, when interest rates rise, certain obligations will be paid off by the issuer (or obligor) more slowly than anticipated, causing the value of these securities to fall. Rising interest rates tend to extend the duration of securities, making them more sensitive to changes in interest rates. The value of longer-term securities generally changes more in response to changes in interest rates than shorter-term securities. As a result, in a period of rising interest rates, securities may exhibit additional volatility and may lose value.
FLUCTUATION OF NET ASSET VALUE RISK. The net asset value of shares of the Fund will generally fluctuate with changes in the market value of the Fund’s holdings. The market prices of shares will generally fluctuate in accordance with changes in net asset value as well as the relative supply of and demand for shares on the Exchange. The Fund’s investment advisor cannot predict whether shares will trade below, at or above their net asset value because the shares trade on the Exchange at market prices and not at net asset value. Price differences may be due, in large part, to the fact that supply and demand forces at work in the secondary trading market for shares will be closely related to, but not identical to, the same forces influencing the prices of the holdings of the Fund trading individually or in the aggregate at any point in time. However, given that shares can only be purchased and redeemed for cash, or in certain circumstances, in-kind, in Creation Units, and only to and from broker-dealers and large institutional investors that have entered into participation agreements (unlike shares of closed-end funds, which frequently trade at appreciable discounts from, and sometimes at premiums to, their net asset value), the Fund’s investment advisor believes that large discounts or premiums to the net asset value of shares should not be sustained.
HIGH YIELD SECURITIES RISK. High yield securities, or “junk” bonds, are subject to greater market fluctuations and risk of loss than securities with higher ratings, and therefore, are considered to be highly speculative. These securities are issued by issuers that may have narrowly focused operations and/or other impediments to the timely payment of periodic interest and principal at maturity. If the economy slows down or dips into recession, the issuers of high yield securities may not have sufficient resources to continue making timely payment of periodic interest and principal at maturity. The market for high yield securities is smaller and less liquid than that for investment grade securities. High yield securities are generally not listed on a national securities exchange but trade in the over-the-counter markets. Due to the smaller, less liquid market for high yield securities, the bid-offer spread on such securities is generally greater than it is for investment grade securities and the purchase or sale of such securities may take longer to complete. In general, high yield securities may have a greater risk of default than other types of securities.
INCOME RISK. Income from the Fund’s fixed income investments could decline during periods of falling interest rates.
INTEREST RATE RISK. Interest rate risk is the risk that the value of the debt securities in the Fund’s portfolio will decline because of rising market interest rates. Interest rate risk is generally lower for shorter term debt securities and higher for longer term debt securities. Duration is a measure of the expected price volatility of a debt security as a result of changes in market rates of interest, based on, among other factors, the weighted average timing of the debt security’s expected principal and interest payments. In general, duration represents the expected percentage change in the value of a security for an immediate 1% change in interest rates. Therefore, prices of debt securities with shorter durations tend to be less sensitive to interest rate changes than debt securities with longer durations. As the value of a debt security changes over time, so will its duration.
INVERSE FLOATERS RISK. Investments in inverse floating rate securities issued by TOB trusts create effective leverage. Due to the leveraged nature of these investments, the value of an inverse floater will increase and decrease to a significantly greater extent than the values of the TOB trust’s underlying municipal bonds in response to changes in market interest rates or credit quality. In addition, distributions paid to the Fund on its inverse floaters will be reduced or even eliminated as short-term municipal interest rates
Additional Information (Continued)
First Trust Managed Municipal ETF (FMB)
April 30, 2018 (Unaudited)
rise and will increase when short-term municipal interest rates fall. An investment in inverse floaters typically will involve greater risk than an investment in a fixed rate municipal bond.
MANAGEMENT RISK. The Fund is subject to management risk because it is an actively managed portfolio. In managing the Fund’s investment portfolio, the Fund’s investment advisor will apply investment techniques and risk analyses that may not have the desired result. There can be no guarantee that the Fund will meet its investment objectives.
MARKET MAKER RISK. If the Fund has lower average daily trading volumes, it may rely on a small number of third-party market makers to provide a market for the purchase and sale of shares. Any trading halt or other problem relating to the trading activity of these market makers could result in a dramatic change in the spread between the Fund’s net asset value and the price at which the Fund’s shares are trading on the Exchange, which could result in a decrease in value of the Fund’s shares. In addition, decisions by market makers or authorized participants to reduce their role or step away from these activities in times of market stress could inhibit the effectiveness of the arbitrage process in maintaining the relationship between the underlying values of the Fund’s portfolio securities and the Fund’s market price. This reduced effectiveness could result in Fund shares trading at a discount to net asset value and also in greater than normal intraday bid-ask spreads for Fund shares.
MARKET RISK. Market risk is the risk that a particular security owned by the Fund or shares of the Fund in general may fall in value. Securities are subject to market fluctuations caused by such factors as economic, political, regulatory or market developments, changes in interest rates and perceived trends in securities prices. Shares of the Fund could decline in value or underperform other investments.
MUNICIPAL LEASE OBLIGATIONS RISK. Participation interests in municipal leases pose special risks because many leases and contracts contain “non-appropriation” clauses that provide that the governmental issuer has no obligation to make future payments under the lease or contract unless money is appropriated for this purpose by the appropriate legislative body.
MUNICIPAL SECURITIES MARKET LIQUIDITY RISK. Inventories of Municipal Securities held by brokers and dealers have decreased in recent years, lessening their ability to make a market in these securities. This reduction in market making capacity has the potential to decrease the Fund’s ability to buy or sell Municipal Securities, and increase price volatility and trading costs, particularly during periods of economic or market stress. As a result, the Fund may be forced to accept a lower price to sell a Municipal Security, to sell other securities to raise cash, or to give up an investment opportunity, any of which could have a negative effect on performance.
POLITICAL AND ECONOMIC RISK. The values of Municipal Securities held by the Fund may be adversely affected by local political and economic conditions and developments. Adverse conditions in an industry significant to a local economy could have a correspondingly adverse effect on the financial condition of local issuers.
PRE-REFUNDED BONDS RISK. Pre-refunded bonds are bonds that have been refunded to a call date prior to the final maturity of principal, or, in the case of pre-refunded bonds commonly referred to as “escrowed-to-maturity bonds,” to the final maturity of principal, and remain outstanding in the municipal market. The payment of principal and interest of the pre-refunded bonds held by the Fund is funded from securities held in a designated escrow account where such securities are obligations of and carry the full faith and credit of the U.S. Treasury. The securities held in the escrow fund pledged to pay the principal and interest of the pre-refunded bond do not guarantee the price of the bond. Investment in pre-refunded municipal bonds held by the Fund may subject the Fund to interest rate risk, market risk and credit risk. In addition, while a secondary market exists for pre-refunded municipal bonds, if the Fund sells pre-refunded municipal bonds prior to maturity, the price received may be more or less than the original cost, depending on market conditions at the time of sale.
PRIVATE ACTIVITY BONDS RISK. Municipalities and other public authorities issue private activity bonds to finance development of industrial facilities for use by a private enterprise. The private enterprise pays the principal and interest on the bond and the issuing authority ordinarily does not pledge its full faith, credit and taxing power for repayment. The private enterprise can have a substantially different credit profile than the municipality or public authority. The private activity bonds in which the Fund may invest may be negatively impacted by conditions affecting either the general credit of the user of the private activity project or the project itself. The Fund’s private activity bond holdings also may pay interest subject to the alternative minimum tax.
TAX RISK. Interest income from Municipal Securities is normally not subject to regular federal income tax, but income from Municipal Securities held by the Fund could be declared taxable because of, among other things, unfavorable changes in tax laws, adverse interpretations by the Internal Revenue Service or state tax authorities or noncompliant conduct of a bond issuer. Consequently, the attractiveness of Municipal Securities in relation to other investment alternatives is affected by changes in federal income tax rates or changes in the tax-exempt status of interest income from Municipal Securities.
TRADING ISSUES RISK. Although the shares of the Fund are listed for trading on the Exchange, there can be no assurance that an active trading market for such shares will develop or be maintained. Trading in shares on the Exchange may be halted due to market
Additional Information (Continued)
First Trust Managed Municipal ETF (FMB)
April 30, 2018 (Unaudited)
conditions or for reasons that, in the view of the Exchange, make trading in shares inadvisable. In addition, trading in shares on the Exchange is subject to trading halts caused by extraordinary market volatility pursuant to the Exchange’s “circuit breaker” rules. Market makers are under no obligation to make a market in the Fund’s shares, and authorized participants are not obligated to submit purchase or redemption orders for Creation Units. There can be no assurance that the requirements of the Exchange necessary to maintain the listing of the Fund will continue to be met or will remain unchanged. In particular, if the Fund does not comply with any provision of the listing standards of the Exchange that are applicable to the Fund, and cannot bring itself into compliance within a reasonable period after discovering the matter, the Exchange may remove the shares of the Fund from listing. The Fund may have difficulty maintaining its listing on the Exchange in the event the Fund’s assets are small or the Fund does not have enough shareholders.
ZERO COUPON BONDS RISK. Zero coupon bonds do not pay interest on a current basis and may be highly volatile as interest rates rise or fall. In addition, while such bonds generate income for purposes of generally accepted accounting standards, they do not generate cash flow and thus could cause the Fund to be forced to liquidate securities at an inopportune time in order to distribute cash, as required by tax laws.
First Trust Exchange-Traded Fund III
INVESTMENT ADVISOR
First Trust Advisors L.P.
120 E. Liberty Drive, Suite 400
Wheaton, IL 60187
ADMINISTRATOR, CUSTODIAN,
FUND ACCOUNTANT &
TRANSFER AGENT
Brown Brothers Harriman & Co.
50 Post Office Square
Boston, MA 02110
INDEPENDENT REGISTERED
PUBLIC ACCOUNTING FIRM
Deloitte & Touche LLP
111 S. Wacker Drive
Chicago, IL 60606
LEGAL COUNSEL
Chapman and Cutler LLP
111 W. Monroe Street
Chicago, IL 60603
First Trust Exchange-Traded Fund III
First Trust Long/Short Equity ETF (FTLS)
Semi-Annual Report
For the Six Months Ended
April 30, 2018
First Trust Long/Short Equity ETF (FTLS)
Semi-Annual Report
April 30, 2018
Caution Regarding Forward-Looking Statements
This report contains certain forward-looking statements within the meaning of the Securities Act of 1933, as amended, and the Securities Exchange Act of 1934, as amended. Forward-looking statements include statements regarding the goals, beliefs, plans or current expectations of First Trust Advisors L.P. (“First Trust” or the “Advisor”) and its representatives, taking into account the information currently available to them. Forward-looking statements include all statements that do not relate solely to current or historical fact. For example, forward-looking statements include the use of words such as “anticipate,” “estimate,” “intend,” “expect,” “believe,” “plan,” “may,” “should,” “would” or other words that convey uncertainty of future events or outcomes.
Forward-looking statements involve known and unknown risks, uncertainties and other factors that may cause the actual results, performance or achievements of the series of First Trust Exchange-Traded Fund III (the “Trust”) described in this report (First Trust Long/Short Equity ETF; hereinafter referred to as the “Fund”) to be materially different from any future results, performance or achievements expressed or implied by the forward-looking statements. When evaluating the information included in this report, you are cautioned not to place undue reliance on these forward-looking statements, which reflect the judgment of the Advisor and its representatives only as of the date hereof. We undertake no obligation to publicly revise or update these forward-looking statements to reflect events and circumstances that arise after the date hereof.
Performance and Risk Disclosure
There is no assurance that the Fund will achieve its investment objective. The Fund is subject to market risk, which is the possibility that the market values of securities owned by the Fund will decline and that the value of the Fund shares may therefore be less than what you paid for them. Accordingly, you can lose money by investing in the Fund. See “Risk Considerations” in the Additional Information section of this report for a discussion of certain other risks of investing in the Fund.
Performance data quoted represents past performance, which is no guarantee of future results, and current performance may be lower or higher than the figures shown. For the most recent month-end performance figures, please visit www.ftportfolios.com or speak with your financial advisor. Investment returns, net asset value and share price will fluctuate and Fund shares, when sold, may be worth more or less than their original cost.
The Advisor may also periodically provide additional information on Fund performance on the Fund’s web page at www.ftportfolios.com.
How to Read This Report
This report contains information that may help you evaluate your investment in the Fund. It includes details about the Fund and presents data and analysis that provide insight into the Fund’s performance and investment approach.
The statistical information that follows may help you understand the Fund’s performance compared to that of a relevant market benchmark.
It is important to keep in mind that the opinions expressed by personnel of the Advisor are just that: informed opinions. They should not be considered to be promises or advice. The opinions, like the statistics, cover the period through the date on the cover of this report. The material risks of investing in the Fund are spelled out in the prospectus, the statement of additional information, this report and other Fund regulatory filings.
First Trust Long/Short Equity ETF (FTLS)
Semi-Annual Letter from the Chairman and CEO
April 30, 2018
Dear Shareholders,
First Trust is pleased to provide you with the semi-annual report for the First Trust Long/Short Equity ETF, which contains detailed information about your investment for the period ended April 30, 2018. We encourage you to read this report carefully and discuss it with your financial advisor.
As you are no doubt aware, 2017 was a very strong year for both the U.S. and global markets. The three major U.S. indices – the S&P 500® Index, the Dow Jones Industrial Average and the Nasdaq Composite – posted their best performance since 2013. And there was more good news for Wall Street as the year ended and analysts collected stock market data:
| • | The S&P 500® Index did something it had never previously done, finishing 2017 with 12 months of gains; |
| • | The Dow Jones Industrial Average achieved a milestone as well, closing above 24,000 for the first time ever on November 30; |
| • | The Nasdaq Composite set a record by having 11 months of gains in 2017 (June was the only down month, and by just 0.86%); and |
| • | The MSCI AC World Index (containing constituents from 47 countries) ended 2017 at an all-time high and was up 22% at year-end. |
As 2017 ended, President Trump signed the “Tax Cuts and Jobs Act of 2017” tax reform bill. As 2018 began, there was much enthusiasm for this tax reform package and the potential increase in take-home pay for many Americans, as well as the reduction in the federal corporate tax rate from 35% to 21%. Early in the year, many investors were also watching the Federal Reserve (the “Fed”) and its signaled intent to continue raising interest rates at a gradual pace. Based on strong job growth and the economic outlook in the U.S., the Fed did, in fact, raise interest rates on March 21, 2018.
For the entire first quarter of 2018, increased volatility was the norm. The S&P 500® Index was off to a strong start in January as it returned over 7.5% from January 2 to January 26. February, however, was a different story. Early in the month, the Dow Jones Industrial Average plunged 567 points and sank into “correction” territory (defined as a drop of 10% from the index’s high) and in just two weeks, was down more than 3,200 points. However, as February came to a close, the Dow Jones Industrial Average was back on track and up from the lows experienced earlier in the month. Volatility continued in March and April with the Dow Jones Industrial Average ending April with a small gain. Across the globe, the first quarter saw the Emerging Market and Developing Market countries, as well as Europe, continue with the strong performances experienced in 2017.
This market volatility is why we believe that one should invest for the long term and be prepared for market movements, which can happen at any time. This can be accomplished by keeping current on your portfolio and investing goals and by speaking regularly with your investment professional. It’s important to keep in mind that past performance of the U.S. and global stock markets or investment products can never guarantee future results. As we’ve said before, markets go up and they also go down, but savvy investors are prepared for either through careful attention to their portfolios and investment goals.
At First Trust, we continue to be optimistic about the U.S. economy and we thank you for giving us the opportunity to be a part of your financial plan. We value our relationship with you and will report on your investment again in six months.
Sincerely,
James A. Bowen
Chairman of the Board of Trustees
Chief Executive Officer of First Trust Advisors L.P.
Fund Performance Overview (Unaudited)
First Trust Long/Short Equity ETF (FTLS)
The investment objective of First Trust Long/Short Equity ETF (the “Fund”) is to seek to provide investors with long-term total return. The Fund pursues its investment objective by establishing long and short positions in a portfolio of Equity Securities (as defined below). Under normal circumstances, at least 80% of the Fund’s net assets (including investment borrowings) will be exposed to U.S. exchange-listed equity securities of U.S. and non-U.S. companies by investing in such securities directly and/or in U.S. exchange-traded funds (“ETFs”) that provide exposure to such securities. The securities of the companies and ETFs in which the Fund will invest are referred to collectively as “Equity Securities”. The Equity Securities held by the Fund may include U.S. exchange-listed equity securities of non-U.S. issuers, as well as investments in the equity securities of non-U.S. issuers that are in the form of depositary receipts.
The Fund takes long and short positions in Equity Securities. As opposed to taking long positions in which an investor seeks to profit from increases in the price of a security, short selling is a technique that will be used by the Fund to try and profit from the falling price of a security. Short selling involves selling a security that has been borrowed from a third party with the intention of buying an identical security back at a later date to return to that third party.
Having both long and short positions in an equity security portfolio is a common way to create returns that are independent of market moves. One advantage of a long and short portfolio is that the long and short positions may offset one another in a manner that results in a lower net exposure to the direction of the market. In addition, cash balances arising from the use of short selling typically will be held in money market instruments.
| Performance | | | | |
| | | | Average Annual
Total Returns | Cumulative
Total Returns |
| | 6 Months Ended
4/30/18 | 1 Year Ended
4/30/18 | Inception (9/8/14)
to 4/30/18 | Inception (9/8/14)
to 4/30/18 |
| Fund Performance | | | | |
| NAV | 2.23% | 9.17% | 7.91% | 31.95% |
| Market Price | 2.25% | 9.22% | 7.93% | 32.01% |
| Index Performance | | | | |
| S&P 500® Index | 3.82% | 13.27% | 10.24% | 42.60% |
Total returns for the period since inception are calculated from the inception date of the Fund. “Average Annual Total Returns” represent the average annual change in value of an investment over the period indicated. “Cumulative Total Returns” represent the total change in value of an investment over the period indicated.
The Fund’s per share net asset value (“NAV”) is the value of one share of the Fund and is computed by dividing the value of all assets of the Fund (including accrued interest and dividends), less all liabilities (including accrued expenses and dividends declared but unpaid), by the total number of outstanding shares. The price used to calculate market return (“Market Price”) is determined by using the midpoint between the highest bid and the lowest offer on the stock exchange on which shares of the Fund are listed for trading as of the time that the Fund’s NAV is calculated. Since shares of the Fund did not trade in the secondary market until after its inception, for the period from inception to the first day of secondary market trading in shares of the Fund, the NAV of the Fund is used as a proxy for the secondary market trading price to calculate market returns. NAV and market returns assume that all distributions have been reinvested in the Fund at NAV and Market Price, respectively.
An index is a statistical composite that tracks a specified financial market or sector. Unlike the Fund, the index does not actually hold a portfolio of securities and therefore does not incur the expenses incurred by the Fund. These expenses negatively impact the performance of the Fund. Also, market returns do not include brokerage commissions that may be payable on secondary market transactions. If brokerage commissions were included, market returns would be lower. The total returns presented reflect the reinvestment of dividends on securities in the index. The returns presented do not reflect the deduction of taxes that a shareholder would pay on Fund distributions or the redemption or sale of Fund shares. The investment return and principal value of shares of the Fund will vary with changes in market conditions. Shares of the Fund may be worth more or less than their original cost when they are redeemed or sold in the market. The Fund’s past performance is no guarantee of future performance.
Fund Performance Overview (Unaudited) (Continued)
First Trust Long/Short Equity ETF (FTLS)
| Portfolio Sector Allocation | % of Total
Long-Term
Investments |
| Information Technology | 21.6% |
| Consumer Discretionary | 16.7 |
| Health Care | 14.9 |
| Industrials | 12.5 |
| Consumer Staples | 11.2 |
| Materials | 8.1 |
| Energy | 7.8 |
| Financials | 5.8 |
| Telecommunication Services | 1.4 |
| Total | 100.0% |
| Portfolio Sector Allocation | % of
Investments
Sold Short |
| Financials | 24.8% |
| Information Technology | 12.9 |
| Consumer Discretionary | 12.4 |
| Health Care | 11.5 |
| Industrials | 11.0 |
| Real Estate | 6.7 |
| Consumer Staples | 6.7 |
| Materials | 6.4 |
| Energy | 5.2 |
| Telecommunication Services | 1.4 |
| Utilities | 1.0 |
| Total | 100.0% |
| Top Ten Long-Term Investments | % of
Net Assets |
| Apple, Inc. | 2.9% |
| Johnson & Johnson | 2.5 |
| Exxon Mobil Corp. | 2.4 |
| Hormel Foods Corp. | 2.0 |
| TJX Cos, Inc./The | 1.9 |
| NVR, Inc. | 1.9 |
| Starbucks Corp. | 1.8 |
| Valero Energy Corp. | 1.8 |
| Lear Corp. | 1.7 |
| Express Scripts Holding Co. | 1.7 |
| Total | 20.6% |
| Top Ten Investments Sold Short | % of
Net Assets |
| SPDR S&P 500 ETF Trust | -4.4% |
| PowerShares QQQ Trust Series 1 | -1.0 |
| AvalonBay Communities, Inc. | -0.5 |
| Prologis, Inc. | -0.5 |
| Becton Dickinson and Co. | -0.5 |
| Coca-Cola (The) Co. | -0.5 |
| BB&T Corp. | -0.5 |
| US BanCorp. | -0.4 |
| Wells Fargo & Co. | -0.4 |
| Oracle Corp. | -0.4 |
| Total | -9.1% |
Fund Performance Overview (Unaudited) (Continued)
First Trust Long/Short Equity ETF (FTLS)
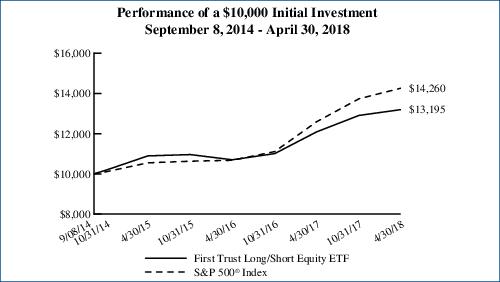
Performance figures assume reinvestment of all distributions and do not reflect the deduction of taxes that a shareholder would pay on Fund distributions or the redemption or sale of Fund shares. An index is a statistical composite that tracks a specified financial market or sector. Unlike the Fund, the index does not actually hold a portfolio of securities and therefore does not incur the expenses incurred by the Fund. These expenses negatively impact the performance of the Fund. The Fund’s past performance does not predict future performance.
Frequency Distribution of Discounts and Premiums
Bid/Ask Midpoint vs. NAV through April 30, 2018
The following Frequency Distribution of Discounts and Premiums charts are provided to show the frequency at which the bid/ask midpoint price for the Fund was at a discount or premium to the daily NAV. The following tables are for comparative purposes only and represent the period September 9, 2014 (commencement of trading) through April 30, 2018. Shareholders may pay more than NAV when they buy Fund shares and receive less than NAV when they sell those shares because shares are bought and sold at current market price. Data presented represents past performance and cannot be used to predict future results.
| Number of Days Bid/Ask Midpoint At/Above NAV |
| For the Period | 0.00%–0.49% | 0.50%–0.99% | 1.00%–1.99% | >=2.00% |
| 9/9/14 - 10/31/14 | 23 | 3 | 0 | 0 |
| 11/1/14 - 10/31/15 | 190 | 7 | 0 | 1 |
| 11/1/15 - 10/31/16 | 170 | 0 | 0 | 0 |
| 11/1/16 – 10/31/17 | 173 | 0 | 0 | 0 |
| 11/1/17 – 4/30/18 | 106 | 0 | 0 | 0 |
| Number of Days Bid/Ask Midpoint Below NAV |
| For the Period | 0.00%–0.49% | 0.50%–0.99% | 1.00%–1.99% | >=2.00% |
| 9/9/14 - 10/31/14 | 9 | 4 | 0 | 0 |
| 11/1/14 - 10/31/15 | 41 | 12 | 0 | 0 |
| 11/1/15 - 10/31/16 | 81 | 1 | 0 | 0 |
| 11/1/16 - 10/31/17 | 79 | 0 | 0 | 0 |
| 11/1/17 – 4/30/18 | 17 | 0 | 0 | 0 |
Portfolio Management
First Trust Long/Short Equity ETF (FTLS)
Semi-Annual Report
April 30, 2018 (Unaudited)
Investment Advisor
First Trust Advisors L.P. (“First Trust”), located in Wheaton, Illinois, is the investment advisor, commodity pool operator and commodity trading advisor to First Trust Long/Short Equity ETF (the “Fund” or “FTLS”). In this capacity, First Trust is responsible for the selection and ongoing monitoring of the investments in the Fund’s portfolio and certain other services necessary for the management of the portfolio. First Trust serves as advisor for four mutual fund portfolios, ten exchange traded funds consisting of 128 series, 16 closed-end funds, a variable insurance trust consisting of three series and is also the portfolio supervisor of certain unit investment trusts sponsored by First Trust Portfolios L.P. (“FTP”), also located in Wheaton, Illinois.
Portfolio Management Team
John Gambla – CFA, FRM, PRM, Senior Portfolio Manager of First Trust, FTA- Alternatives & Active Management Team
Rob A. Guttschow – CFA, Senior Portfolio Manager of First Trust, FTA- Alternatives & Active Management Team
First Trust Long/Short Equity ETF (FTLS)
Understanding Your Fund Expenses
April 30, 2018 (Unaudited)
As a shareholder of the First Trust Long/Short Equity ETF (the “Fund”), you incur two types of costs: (1) transaction costs; and (2) ongoing costs, including management fees, distribution and/or service (12b-1) fees, if any, and other Fund expenses. This Example is intended to help you understand your ongoing costs of investing in the Fund and to compare these costs with the ongoing costs of investing in other funds.
The Example is based on an investment of $1,000 invested at the beginning of the period and held through the six-month period ended April 30, 2018.
Actual Expenses
The first line in the following table provides information about actual account values and actual expenses. You may use the information in this line, together with the amount you invested, to estimate the expenses that you paid over the period. Simply divide your account value by $1,000 (for example, an $8,600 account value divided by $1,000 = 8.6), then multiply the result by the number in the first line under the heading entitled “Expenses Paid During the Six-Month Period” to estimate the expenses you paid on your account during this six-month period.
Hypothetical Example for Comparison Purposes
The second line in the following table provides information about hypothetical account values and hypothetical expenses based on the Fund’s actual expense ratio and an assumed rate of return of 5% per year before expenses, which is not the Fund’s actual return. The hypothetical account values and expenses may not be used to estimate the actual ending account balance or expenses you paid for the period. You may use this information to compare the ongoing costs of investing in the Fund and other funds. To do so, compare this 5% hypothetical example with the 5% hypothetical examples that appear in the shareholder reports of the other funds.
Please note that the expenses shown in the table are meant to highlight your ongoing costs only and do not reflect any transactional costs such as brokerage commissions. Therefore, the second line in the table is useful in comparing ongoing costs only, and will not help you determine the relative total costs of owning different funds. In addition, if these transactional costs were included, your costs would have been higher.
| | Beginning
Account Value
November 1, 2017 | Ending
Account Value
April 30, 2018 | Annualized
Expense Ratio
Based on the
Six-Month
Period | Expenses Paid
During the
Six-Month
Period (a) |
| First Trust Long/Short Equity ETF (FTLS) |
| Actual | $1,000.00 | $1,022.30 | 1.59% | $7.97 |
| Hypothetical (5% return before expenses) | $1,000.00 | $1,016.91 | 1.59% | $7.95 |
| (a) | Expenses are equal to the annualized expense ratios as indicated in the table multiplied by the average account value over the period (November 1, 2017 through April 30, 2018), multiplied by 181/365 (to reflect the six-month period). |
First Trust Long/Short Equity ETF (FTLS)
Portfolio of Investments
April 30, 2018 (Unaudited)
Shares/
Units | | Description | | Value |
| COMMON STOCKS – 98.4% |
| | | Aerospace & Defense – 1.6% | | |
| 7,517 | | Boeing Co./The (a) | | $2,507,371 |
| | | Airlines – 2.1% | | |
| 33,057 | | Delta Air Lines, Inc. | | 1,726,237 |
| 28,550 | | Southwest Airlines Co. (a) | | 1,508,296 |
| | | | | 3,234,533 |
| | | Auto Components – 2.5% | | |
| 50,981 | | Gentex Corp. | | 1,159,308 |
| 14,182 | | Lear Corp. (a) | | 2,651,608 |
| | | | | 3,810,916 |
| | | Banks – 2.7% | | |
| 29,244 | | Citizens Financial Group, Inc. | | 1,213,333 |
| 12,419 | | JPMorgan Chase & Co. | | 1,350,939 |
| 7,296 | | PacWest Bancorp | | 373,847 |
| 87,096 | | Valley National Bancorp | | 1,093,055 |
| | | | | 4,031,174 |
| | | Beverages – 0.3% | | |
| 7,062 | | Molson Coors Brewing Co., Class B | | 503,097 |
| | | Biotechnology – 4.7% | | |
| 22,693 | | AbbVie, Inc. (a) | | 2,191,009 |
| 6,778 | | Biogen, Inc. (a) (b) | | 1,854,461 |
| 13,790 | | Celgene Corp. (b) | | 1,201,109 |
| 25,496 | | Gilead Sciences, Inc. (a) | | 1,841,576 |
| | | | | 7,088,155 |
| | | Chemicals – 3.4% | | |
| 19,606 | | Eastman Chemical Co. | | 2,001,380 |
| 13,254 | | Huntsman Corp. | | 394,572 |
| 16,879 | | Kronos Worldwide, Inc. | | 388,892 |
| 19,961 | | LyondellBasell Industries N.V., Class A | | 2,110,476 |
| 4,748 | | Trinseo S.A. | | 346,367 |
| | | | | 5,241,687 |
| | | Commercial Services &
Supplies – 0.4% | | |
| 8,904 | | Deluxe Corp. | | 610,280 |
| | | Communications Equipment – 1.9% | | |
| 1,523 | | Arista Networks, Inc. (b) | | 402,910 |
| 17,346 | | Comtech Telecommunications Corp. | | 530,614 |
| 11,949 | | F5 Networks, Inc. (b) | | 1,948,762 |
| | | | | 2,882,286 |
| | | Consumer Finance – 1.6% | | |
| 26,814 | | Capital One Financial Corp. | | 2,429,885 |
| | | Containers & Packaging – 0.4% | | |
| 11,372 | | Sonoco Products Co. | | 584,066 |
Shares/
Units | | Description | | Value |
|
| | | Diversified Financial Services – 0.9% | | |
| 7,010 | | Berkshire Hathaway, Inc., Class B (b) | | $1,358,047 |
| | | Diversified Telecommunication
Services – 0.9% | | |
| 41,292 | | AT&T, Inc. | | 1,350,248 |
| | | Electrical Equipment – 0.8% | | |
| 18,123 | | Atkore International Group, Inc. (b) | | 322,045 |
| 12,809 | | Regal Beloit Corp. | | 912,001 |
| | | | | 1,234,046 |
| | | Electronic Equipment,
Instruments & Components – 0.5% | | |
| 26,244 | | AVX Corp. | | 387,362 |
| 5,264 | | Belden, Inc. | | 324,262 |
| | | | | 711,624 |
| | | Food & Staples Retailing – 3.0% | | |
| 9,190 | | Sysco Corp. | | 574,743 |
| 39,123 | | Walgreens Boots Alliance, Inc. | | 2,599,723 |
| 16,013 | | Walmart, Inc. | | 1,416,510 |
| | | | | 4,590,976 |
| | | Food Products – 5.6% | | |
| 26,817 | | Campbell Soup Co. | | 1,093,597 |
| 53,270 | | General Mills, Inc. | | 2,330,030 |
| 15,564 | | Hershey Co./The | | 1,430,954 |
| 82,231 | | Hormel Foods Corp. (a) | | 2,980,874 |
| 15,440 | | Pilgrim’s Pride Corp. (b) | | 333,504 |
| 6,053 | | Tyson Foods, Inc., Class A | | 424,315 |
| | | | | 8,593,274 |
| | | Health Care Providers &
Services – 5.0% | | |
| 11,369 | | Cardinal Health, Inc. | | 729,549 |
| 40,343 | | Encompass Health Corp. | | 2,453,661 |
| 34,871 | | Express Scripts Holding Co. (a) (b) | | 2,639,735 |
| 52,095 | | Premier, Inc., Class A (b) | | 1,718,614 |
| | | | | 7,541,559 |
| | | Hotels, Restaurants &
Leisure – 3.7% | | |
| 8,348 | | Cracker Barrel Old Country Store, Inc. | | 1,373,997 |
| 6,853 | | Las Vegas Sands Corp. | | 502,530 |
| 9,545 | | Royal Caribbean Cruises Ltd. | | 1,032,674 |
| 47,917 | | Starbucks Corp. | | 2,758,582 |
| | | | | 5,667,783 |
| | | Household Durables ��� 3.2% | | |
| 23,895 | | DR Horton, Inc. | | 1,054,725 |
See Notes to Financial Statements
Page 7
First Trust Long/Short Equity ETF (FTLS)
Portfolio of Investments (Continued)
April 30, 2018 (Unaudited)
Shares/
Units | | Description | | Value |
| COMMON STOCKS (Continued) |
| | | Household
Durables (Continued) | | |
| 919 | | NVR, Inc. (a) (b) | | $2,848,900 |
| 11,277 | | Toll Brothers, Inc. | | 475,438 |
| 3,267 | | Whirlpool Corp. | | 506,222 |
| | | | | 4,885,285 |
| | | Household Products – 0.8% | | |
| 16,485 | | Procter & Gamble (The) Co. | | 1,192,525 |
| | | Internet & Direct Marketing
Retail – 0.7% | | |
| 705 | | Amazon.com, Inc. (b) | | 1,104,122 |
| | | Internet Software & Services – 2.7% | | |
| 1,311 | | Alphabet, Inc., Class A (b) | | 1,335,359 |
| 1,116 | | Alphabet, Inc., Class C (b) | | 1,135,340 |
| 9,504 | | Facebook, Inc., Class A (a) (b) | | 1,634,688 |
| | | | | 4,105,387 |
| | | IT Services – 2.2% | | |
| 7,678 | | Accenture PLC, Class A (a) | | 1,160,913 |
| 26,446 | | Cognizant Technology Solutions Corp., Class A | | 2,163,812 |
| | | | | 3,324,725 |
| | | Leisure Products – 0.3% | | |
| 6,819 | | Brunswick Corp. | | 408,322 |
| | | Machinery – 4.1% | | |
| 7,599 | | Cummins, Inc. | | 1,214,776 |
| 25,356 | | Hillenbrand, Inc. | | 1,175,251 |
| 17,331 | | Ingersoll-Rand PLC | | 1,453,897 |
| 16,979 | | Snap-on, Inc. (a) | | 2,466,200 |
| | | | | 6,310,124 |
| | | Media – 1.7% | | |
| 35,035 | | Omnicom Group, Inc. | | 2,580,678 |
| | | Metals & Mining – 3.6% | | |
| 29,498 | | Nucor Corp. | | 1,817,667 |
| 29,184 | | Reliance Steel & Aluminum Co. (a) | | 2,565,857 |
| 25,268 | | Steel Dynamics, Inc. | | 1,132,259 |
| | | | | 5,515,783 |
| | | Multiline Retail – 0.2% | | |
| 6,042 | | Kohl’s Corp. | | 375,329 |
| | | Oil, Gas & Consumable Fuels – 7.5% | | |
| 47,284 | | Exxon Mobil Corp. (a) | | 3,676,331 |
| 10,456 | | HollyFrontier Corp. | | 634,575 |
| 8,991 | | Marathon Petroleum Corp. | | 673,516 |
| 30,347 | | Parsley Energy, Inc., Class A (b) | | 911,320 |
| 12,730 | | PBF Energy, Inc., Class A | | 487,941 |
| 20,315 | | Plains GP Holdings, L.P., Class A | | 492,029 |
Shares/
Units | | Description | | Value |
|
| | | Oil, Gas & Consumable
Fuels (Continued) | | |
| 24,502 | | Valero Energy Corp. | | $2,718,007 |
| 69,674 | | Williams (The) Cos., Inc. | | 1,792,712 |
| | | | | 11,386,431 |
| | | Paper & Forest Products – 0.6% | | |
| 31,533 | | Louisiana-Pacific Corp. | | 893,330 |
| | | Pharmaceuticals – 5.0% | | |
| 38,675 | | Bristol-Myers Squibb Co. | | 2,016,128 |
| 5,446 | | Jazz Pharmaceuticals PLC (b) | | 828,010 |
| 29,615 | | Johnson & Johnson | | 3,746,001 |
| 10,708 | | Taro Pharmaceutical Industries Ltd. (b) | | 1,092,002 |
| | | | | 7,682,141 |
| | | Professional Services – 1.4% | | |
| 34,064 | | Robert Half International, Inc. (a) | | 2,069,388 |
| | | Road & Rail – 0.7% | | |
| 2,712 | | Norfolk Southern Corp. | | 389,091 |
| 5,230 | | Union Pacific Corp. | | 698,885 |
| | | | | 1,087,976 |
| | | Semiconductors &
Semiconductor Equipment – 8.4% | | |
| 42,082 | | Applied Materials, Inc. | | 2,090,213 |
| 26,316 | | Intel Corp. | | 1,358,432 |
| 23,889 | | KLA-Tencor Corp. | | 2,430,467 |
| 26,963 | | Kulicke & Soffa Industries, Inc. (b) | | 617,183 |
| 13,870 | | Lam Research Corp. (a) | | 2,566,782 |
| 3,493 | | MKS Instruments, Inc. | | 357,683 |
| 14,819 | | Nova Measuring Instruments, Ltd. (b) | | 388,999 |
| 4,861 | | Skyworks Solutions, Inc. | | 421,740 |
| 24,834 | | Texas Instruments, Inc. (a) | | 2,518,913 |
| | | | | 12,750,412 |
| | | Software – 1.8% | | |
| 31,879 | | BlackBerry Ltd. (b) | | 333,773 |
| 24,417 | | Check Point Software Technologies, Ltd. (b) | | 2,356,485 |
| | | | | 2,690,258 |
| | | Specialty Retail – 3.2% | | |
| 20,355 | | American Eagle Outfitters, Inc. | | 420,941 |
| 13,705 | | Caleres, Inc. | | 448,565 |
| 8,158 | | Foot Locker, Inc. | | 351,447 |
| 3,740 | | Home Depot (The), Inc. | | 691,152 |
| 34,801 | | TJX Cos, Inc./The (a) | | 2,952,865 |
| | | | | 4,864,970 |
Page 8
See Notes to Financial Statements
First Trust Long/Short Equity ETF (FTLS)
Portfolio of Investments (Continued)
April 30, 2018 (Unaudited)
Shares/
Units | | Description | | Value |
| COMMON STOCKS (Continued) |
| | | Technology Hardware,
Storage & Peripherals – 3.9% | | |
| 26,807 | | Apple, Inc. (a) | | $4,430,125 |
| 10,118 | | Seagate Technology PLC | | 585,731 |
| 11,939 | | Western Digital Corp. | | 940,674 |
| | | | | 5,956,530 |
| | | Textiles, Apparel & Luxury
Goods – 0.9% | | |
| 28,937 | | Hanesbrands, Inc. | | 534,466 |
| 12,213 | | Michael Kors Holdings Ltd. (b) | | 835,614 |
| | | | | 1,370,080 |
| | | Thrifts & Mortgage Finance – 0.6% | | |
| 73,313 | | New York Community Bancorp, Inc. | | 870,958 |
| | | Tobacco – 1.2% | | |
| 33,577 | | Altria Group, Inc. (a) | | 1,884,005 |
| | | Trading Companies &
Distributors – 1.2% | | |
| 4,425 | | MSC Industrial Direct Co., Inc., Class A | | 382,497 |
| 4,894 | | WW Grainger, Inc. | | 1,376,927 |
| | | | | 1,759,424 |
| | | Wireless Telecommunication
Services – 0.5% | | |
| 6,539 | | T-Mobile US, Inc. (b) | | 395,675 |
| 13,737 | | Vodafone Group PLC, ADR | | 404,005 |
| | | | | 799,680 |
| | | Total Common Stocks | | 149,838,870 |
| | | (Cost $149,667,423) | | |
| MASTER LIMITED PARTNERSHIPS – 0.2% |
| | | Oil, Gas & Consumable Fuels – 0.2% | | |
| 7,915 | | TC PipeLines, L.P. | | 277,737 |
| | | (Cost $390,830) | | |
| | | Total Investments – 98.6% | | 150,116,607 |
| | | (Cost $150,058,253) (c) | | |
| Shares | | Description | | Value |
| COMMON STOCKS SOLD SHORT – (24.6)% |
| | | Aerospace & Defense – (0.6)% | | |
| (6,735) | | Arconic, Inc. | | (119,950) |
| (2,712) | | Cubic Corp. | | (167,466) |
| (470) | | Lockheed Martin Corp. | | (150,795) |
| (1,833) | | Spirit AeroSystems Holdings, Inc., Class A | | (147,318) |
| (1,624) | | United Technologies Corp. | | (195,124) |
| (19,155) | | Wesco Aircraft Holdings, Inc. (b) | | (193,465) |
| | | | | (974,118) |
| Shares | | Description | | Value |
|
| | | Air Freight & Logistics – (0.5)% | | |
| (1,608) | | FedEx Corp. | | $(397,498) |
| (2,799) | | United Parcel Service, Inc., Class B | | (317,686) |
| | | | | (715,184) |
| | | Airlines – (0.3)% | | |
| (3,100) | | American Airlines Group, Inc. | | (133,083) |
| (7,809) | | JetBlue Airways Corp. (b) | | (149,855) |
| (2,470) | | United Continental Holdings, Inc. (b) | | (166,824) |
| | | | | (449,762) |
| | | Automobiles – (0.7)% | | |
| (51,976) | | Ford Motor Co. | | (584,210) |
| (9,609) | | General Motors Co. | | (353,035) |
| (480) | | Tesla, Inc. (b) | | (141,072) |
| | | | | (1,078,317) |
| | | Banks – (2.1)% | | |
| (9,251) | | Bank of America Corp. | | (276,790) |
| (13,009) | | BB&T Corp. | | (686,875) |
| (909) | | M&T Bank Corp. | | (165,684) |
| (3,921) | | PNC Financial Services Group (The), Inc. | | (570,937) |
| (2,358) | | SunTrust Banks, Inc. | | (157,514) |
| (13,296) | | US BanCorp. | | (670,783) |
| (12,310) | | Wells Fargo & Co. | | (639,628) |
| | | | | (3,168,211) |
| | | Beverages – (0.6)% | | |
| (15,915) | | Coca-Cola (The) Co. | | (687,687) |
| (1,258) | | Constellation Brands, Inc., Class A | | (293,278) |
| | | | | (980,965) |
| | | Biotechnology – (0.9)% | | |
| (2,091) | | Agios Pharmaceuticals, Inc. (b) | | (175,456) |
| (11,377) | | Akebia Therapeutics, Inc. (b) | | (104,782) |
| (1,380) | | Alnylam Pharmaceuticals, Inc. (b) | | (130,452) |
| (6,601) | | Biohaven Pharmaceutical Holding Co., Ltd. (b) | | (192,485) |
| (1,931) | | Blueprint Medicines Corp. (b) | | (148,146) |
| (6,973) | | MacroGenics, Inc. (b) | | (160,797) |
| (9,444) | | Momenta Pharmaceuticals, Inc. (b) | | (196,435) |
| (3,739) | | Portola Pharmaceuticals, Inc. (b) | | (135,090) |
| (3,446) | | Ultragenyx Pharmaceutical, Inc. (b) | | (175,195) |
| | | | | (1,418,838) |
| | | Building Products – (0.4)% | | |
| (4,677) | | Fortune Brands Home & Security, Inc. | | (255,785) |
See Notes to Financial Statements
Page 9
First Trust Long/Short Equity ETF (FTLS)
Portfolio of Investments (Continued)
April 30, 2018 (Unaudited)
| Shares | | Description | | Value |
| COMMON STOCKS SOLD SHORT (Continued) |
| | | Building Products (Continued) | | |
| (8,524) | | Johnson Controls International PLC | | $(288,708) |
| | | | | (544,493) |
| | | Capital Markets – (0.3)% | | |
| (5,714) | | Bank of New York Mellon (The) Corp. | | (311,470) |
| (2,071) | | State Street Corp. | | (206,645) |
| | | | | (518,115) |
| | | Chemicals – (1.5)% | | |
| (3,733) | | Air Products & Chemicals, Inc. | | (605,829) |
| (1,514) | | Albemarle Corp. | | (146,797) |
| (1,643) | | Celanese Corp., Class A | �� | (178,545) |
| (2,922) | | Ecolab, Inc. | | (423,018) |
| (2,023) | | FMC Corp. | | (161,294) |
| (1,247) | | International Flavors & Fragrances, Inc. | | (176,151) |
| (3,875) | | Praxair, Inc. | | (591,015) |
| | | | | (2,282,649) |
| | | Commercial Services &
Supplies – (0.4)% | | |
| (991) | | Cintas Corp. | | (168,767) |
| (11,428) | | Covanta Holding Corp. | | (170,277) |
| (2,714) | | Multi-Color Corp. | | (176,275) |
| (1,949) | | Waste Management, Inc. | | (158,434) |
| | | | | (673,753) |
| | | Communications Equipment – (0.3)% | | |
| (3,773) | | Cisco Systems, Inc. | | (167,106) |
| (3,463) | | ViaSat, Inc. (b) | | (221,563) |
| | | | | (388,669) |
| | | Construction & Engineering – (0.3)% | | |
| (2,896) | | Fluor Corp. | | (170,719) |
| (2,708) | | Jacobs Engineering Group, Inc. | | (157,308) |
| (7,518) | | Tutor Perini Corp. (b) | | (155,247) |
| | | | | (483,274) |
| | | Construction Materials – (0.1)% | | |
| (822) | | Martin Marietta Materials, Inc. | | (160,101) |
| | | Containers & Packaging – (0.5)% | | |
| (2,619) | | AptarGroup, Inc. | | (244,877) |
| (4,221) | | Ball Corp. | | (169,220) |
| (2,772) | | International Paper Co. | | (142,924) |
| (2,512) | | WestRock Co. | | (148,610) |
| | | | | (705,631) |
| Shares | | Description | | Value |
|
| | | Diversified Telecommunication
Services – (0.5)% | | |
| (10,524) | | Verizon Communications, Inc. | | $(519,359) |
| (4,716) | | Zayo Group Holdings, Inc. (b) | | (171,191) |
| | | | | (690,550) |
| | | Electric Utilities – (0.2)% | | |
| (2,199) | | Duke Energy Corp. | | (176,272) |
| (1,111) | | NextEra Energy, Inc. | | (182,104) |
| | | | | (358,376) |
| | | Electrical Equipment – (0.1)% | | |
| (2,055) | | Eaton Corp PLC | | (154,187) |
| | | Electronic Equipment,
Instruments & Components – (0.7)% | | |
| (4,280) | | Amphenol Corp., Class A | | (358,279) |
| (2,045) | | Arrow Electronics, Inc. (b) | | (152,843) |
| (7,326) | | Corning, Inc. | | (197,949) |
| (6,114) | | Sanmina Corp. (b) | | (180,363) |
| (1,620) | | Tech Data Corp. (b) | | (123,525) |
| | | | | (1,012,959) |
| | | Energy Equipment &
Services – (0.2)% | | |
| (7,106) | | Baker Hughes a GE Co. | | (256,598) |
| | | Food & Staples Retailing – (0.2)% | | |
| (1,489) | | Casey’s General Stores, Inc. | | (143,837) |
| (7,416) | | Kroger (The) Co. | | (186,809) |
| | | | | (330,646) |
| | | Food Products – (1.0)% | | |
| (4,034) | | Archer-Daniels-Midland Co. | | (183,063) |
| (9,693) | | Darling Ingredients, Inc. (b) | | (166,138) |
| (2,908) | | Ingredion, Inc. | | (352,129) |
| (10,800) | | Kraft Heinz Co./The | | (608,904) |
| (5,105) | | Tootsie Roll Industries, Inc. | | (145,748) |
| | | | | (1,455,982) |
| | | Health Care Equipment &
Supplies – (1.4)% | | |
| (3,021) | | Becton Dickinson and Co. | | (700,479) |
| (6,111) | | Boston Scientific Corp. (b) | | (175,508) |
| (2,946) | | DENTSPLY SIRONA, Inc. | | (148,302) |
| (3,832) | | Medtronic PLC | | (307,058) |
| (6,152) | | Quidel Corp. (b) | | (348,818) |
| (2,583) | | West Pharmaceutical Services, Inc. | | (227,847) |
| (1,425) | | Zimmer Biomet Holdings, Inc. | | (164,117) |
| | | | | (2,072,129) |
| | | Health Care Providers &
Services – (0.6)% | | |
| (1,634) | | Centene Corp. (b) | | (177,420) |
| (3,670) | | CVS Health Corp. | | (256,276) |
Page 10
See Notes to Financial Statements
First Trust Long/Short Equity ETF (FTLS)
Portfolio of Investments (Continued)
April 30, 2018 (Unaudited)
| Shares | | Description | | Value |
| COMMON STOCKS SOLD SHORT (Continued) |
| | | Health Care Providers &
Services (Continued) | | |
| (3,624) | | LifePoint Health, Inc. (b) | | $(173,590) |
| (720) | | UnitedHealth Group, Inc. | | (170,208) |
| (1,422) | | Universal Health Services, Inc., Class B | | (162,392) |
| | | | | (939,886) |
| | | Health Care Technology – (0.3)% | | |
| (6,890) | | Cerner Corp. (b) | | (401,342) |
| | | Hotels, Restaurants &
Leisure – (0.5)% | | |
| (9,422) | | Aramark | | (352,289) |
| (3,554) | | Wyndham Worldwide Corp. | | (405,902) |
| | | | | (758,191) |
| | | Household Durables – (0.2)% | | |
| (1,467) | | Mohawk Industries, Inc. (b) | | (307,894) |
| | | Household Products – (0.3)% | | |
| (1,301) | | Clorox (The) Co. | | (152,477) |
| (10,562) | | HRG Group, Inc. (b) | | (118,717) |
| (3,174) | | Spectrum Brands Holdings, Inc. | | (228,845) |
| | | | | (500,039) |
| | | Internet & Direct Marketing
Retail – (0.1)% | | |
| (1,641) | | Expedia Group, Inc. | | (188,945) |
| | | Internet Software & Services – (0.6)% | | |
| (2,038) | | 2U INC (b) | | (164,039) |
| (11,119) | | Instructure, Inc. (b) | | (450,875) |
| (4,704) | | Nutanix, Inc., Series A (b) | | (237,975) |
| | | | | (852,889) |
| | | IT Services – (0.9)% | | |
| (691) | | Alliance Data Systems Corp. | | (140,307) |
| (2,535) | | Amdocs Ltd. | | (170,479) |
| (18,721) | | Conduent, Inc. (b) | | (364,311) |
| (1,461) | | Gartner, Inc. (b) | | (177,205) |
| (1,239) | | International Business Machines Corp. | | (179,605) |
| (2,148) | | PayPal Holdings, Inc. (b) | | (160,262) |
| (4,574) | | Teradata Corp. (b) | | (187,168) |
| | | | | (1,379,337) |
| | | Leisure Products – (0.2)% | | |
| (2,250) | | Hasbro, Inc. | | (198,202) |
| (10,825) | | Mattel, Inc. | | (160,210) |
| | | | | (358,412) |
| | | Life Sciences Tools &
Services – (0.1)% | | |
| (817) | | Waters Corp. (b) | | (153,931) |
| Shares | | Description | | Value |
|
| | | Machinery – (0.5)% | | |
| (7,093) | | Actuant Corp., Class A | | $(167,040) |
| (1,629) | | Caterpillar, Inc. | | (235,162) |
| (5,085) | | Colfax Corp. (b) | | (157,686) |
| (1,026) | | Deere & Co. | | (138,849) |
| | | | | (698,737) |
| | | Media – (0.9)% | | |
| (3,209) | | AMC Networks, Inc., Class A (b) | | (166,868) |
| (14,640) | | Comcast Corp., Class A | | (459,550) |
| (2,416) | | Liberty Broadband Corp., Class C (b) | | (171,270) |
| (4,544) | | Twenty-First Century Fox, Inc., Class B | | (163,902) |
| (3,245) | | Walt Disney Co./The | | (325,571) |
| | | | | (1,287,161) |
| | | Multiline Retail – (0.2)% | | |
| (1,781) | | Dollar General Corp. | | (171,920) |
| (3,302) | | Nordstrom, Inc. | | (166,949) |
| | | | | (338,869) |
| | | Multi-Utilities – (0.1)% | | |
| (2,264) | | Dominion Energy, Inc. | | (150,692) |
| | | Oil, Gas & Consumable Fuels – (1.5)% | | |
| (1,101) | | Concho Resources, Inc. (b) | | (173,088) |
| (4,850) | | ConocoPhillips | | (317,675) |
| (5,326) | | Devon Energy Corp. | | (193,494) |
| (3,853) | | EOG Resources, Inc. | | (455,309) |
| (13,244) | | Extraction Oil & Gas, Inc. (b) | | (187,005) |
| (3,568) | | Hess Corp. | | (203,340) |
| (5,662) | | Matador Resources, Co. (b) | | (185,374) |
| (7,718) | | Occidental Petroleum Corp. | | (596,293) |
| | | | | (2,311,578) |
| | | Pharmaceuticals – (0.4)% | | |
| (2,126) | | Eli Lilly & Co. | | (172,355) |
| (3,044) | | Merck & Co, Inc. | | (179,200) |
| (5,224) | | Revance Therapeutics, Inc. (b) | | (146,011) |
| (5,950) | | Theravance Biopharma, Inc. (b) | | (143,216) |
| | | | | (640,782) |
| | | Professional Services – (0.1)% | | |
| (1,640) | | Verisk Analytics, Inc. (b) | | (174,578) |
| | | Road & Rail – (0.3)% | | |
| (3,022) | | CSX Corp. | | (179,477) |
| (9,650) | | Heartland Express, Inc. | | (172,059) |
| (2,239) | | Ryder System, Inc. | | (150,976) |
| | | | | (502,512) |
See Notes to Financial Statements
Page 11
First Trust Long/Short Equity ETF (FTLS)
Portfolio of Investments (Continued)
April 30, 2018 (Unaudited)
| Shares | | Description | | Value |
| COMMON STOCKS SOLD SHORT (Continued) |
| | | Semiconductors &
Semiconductor Equipment – (0.1)% | | |
| (7,847) | | MACOM Technology Solutions Holdings, Inc. (b) | | $(130,417) |
| | | Software – (1.5)% | | |
| (6,919) | | ACI Worldwide, Inc. (b) | | (160,867) |
| (2,456) | | Autodesk, Inc. (b) | | (309,210) |
| (2,042) | | Guidewire Software, Inc. (b) | | (172,794) |
| (5,121) | | Microsoft Corp. | | (478,916) |
| (13,617) | | Oracle Corp. | | (621,888) |
| (5,370) | | PROS Holdings, Inc. (b) | | (158,522) |
| (1,606) | | salesforce.com, Inc. (b) | | (194,310) |
| (1,047) | | ServiceNow, Inc. (b) | | (173,949) |
| | | | | (2,270,456) |
| | | Specialty Retail – (0.6)% | | |
| (2,735) | | CarMax, Inc. (b) | | (170,937) |
| (10,965) | | Guess?, Inc. | | (255,375) |
| (3,536) | | L Brands, Inc. | | (123,442) |
| (2,925) | | Lowe’s Cos, Inc. | | (241,108) |
| (1,643) | | Tiffany & Co. | | (168,950) |
| | | | | (959,812) |
| | | Technology Hardware,
Storage & Peripherals – (0.2)% | | |
| (8,965) | | Hewlett Packard Enterprise Co. | | (152,853) |
| (5,104) | | NCR Corp. (b) | | (157,050) |
| | | | | (309,903) |
| | | Textiles, Apparel & Luxury
Goods – (0.5)% | | |
| (1,137) | | PVH Corp. | | (181,545) |
| (10,046) | | Under Armour, Inc., Class A (b) | | (178,417) |
| (5,787) | | VF Corp. | | (467,994) |
| | | | | (827,956) |
| | | Thrifts & Mortgage Finance – (0.1)% | | |
| (11,227) | | TFS Financial Corp. | | (167,395) |
| | | Total Common Stocks Sold Short | | (37,485,221) |
| | | (Proceeds $38,505,709) | | |
| EXCHANGE-TRADED FUNDS SOLD SHORT – (5.4)% |
| | | Capital Markets – (5.4)% | | |
| (9,600) | | PowerShares QQQ Trust Series 1 | | (1,545,024) |
| (25,500) | | SPDR S&P 500 ETF Trust | | (6,745,005) |
| | | Total Exchange-Traded Funds Sold Short | | (8,290,029) |
| | | (Proceeds $8,183,457) | | |
| Shares | | Description | | Value |
REAL ESTATE INVESTMENT TRUSTS SOLD SHORT –
(2.2)% |
| | | Equity Real Estate Investment
Trusts – (2.2)% | | |
| (4,745) | | AvalonBay Communities, Inc. | | $(773,435) |
| (1,544) | | Crown Castle International Corp. | | (155,743) |
| (3,326) | | CyrusOne, Inc. | | (178,240) |
| (645) | | Equinix, Inc. | | (271,410) |
| (4,106) | | Equity Residential | | (253,381) |
| (2,440) | | Federal Realty Investment Trust | | (282,674) |
| (2,519) | | Kilroy Realty Corp. | | (180,537) |
| (6,071) | | Liberty Property Trust | | (253,889) |
| (11,411) | | Prologis, Inc. | | (740,688) |
| (7,179) | | STORE Capital Corp. | | (181,126) |
| | | Total Real Estate Investment Trusts Sold Short | | (3,271,123) |
| | | (Proceeds $3,269,689) | | |
| | | Total Investments Sold Short – (32.2)% | | (49,046,373) |
| | | (Proceeds $49,958,855) | | |
| | | Net Other Assets and Liabilities – 33.6% | | 51,117,031 |
| | | Net Assets – 100.0% | | $152,187,265 |
|
| (a) | This security or a portion of this security is segregated as collateral for investments sold short. |
| (b) | Non-income producing security. |
| (c) | Aggregate cost for financial reporting purposes approximates the aggregate cost for federal income tax purposes. As of April 30, 2018, the aggregate gross unrealized appreciation for all investments in which there was an excess of value over tax cost was $8,995,197 and the aggregate gross unrealized depreciation for all investments in which there was an excess of tax cost over value was $8,024,361. The net unrealized appreciation was $970,836. The amounts presented are inclusive of investments sold short. |
| ADR | American Depositary Receipt |
Valuation Inputs
A summary of the inputs used to value the Fund’s investments as of April 30, 2018 is as follows (see Note 2A - Portfolio Valuation in the Notes to Financial Statements):
| ASSETS TABLE |
| | Total
Value at
4/30/2018 | Level 1
Quoted
Prices | Level 2
Significant
Observable
Inputs | Level 3
Significant
Unobservable
Inputs |
| Common Stocks* | $ 149,838,870 | $ 149,838,870 | $ — | $ — |
| Master Limited Partnerships* | 277,737 | 277,737 | — | — |
| Total Investments | $ 150,116,607 | $ 150,116,607 | $— | $— |
Page 12
See Notes to Financial Statements
First Trust Long/Short Equity ETF (FTLS)
Portfolio of Investments (Continued)
April 30, 2018 (Unaudited)
| LIABILITIES TABLE |
| | Total
Value at
4/30/2018 | Level 1
Quoted
Prices | Level 2
Significant
Observable
Inputs | Level 3
Significant
Unobservable
Inputs |
| Common Stocks Sold Short* | $ (37,485,221) | $ (37,485,221) | $ — | $ — |
| Exchange-Traded Funds Sold Short* | (8,290,029) | (8,290,029) | — | — |
| Real Estate Investment Trusts Sold Short* | (3,271,123) | (3,271,123) | — | — |
| Total | $ (49,046,373) | $ (49,046,373) | $— | $— |
| * | See Portfolio of Investments for industry breakout. |
All transfers in and out of the Levels during the period are assumed to occur on the last day of the period at their current value. There were no transfers between Levels at April 30, 2018.
See Notes to Financial Statements
Page 13
First Trust Long/Short Equity ETF (FTLS)
Statement of Assets and Liabilities
April 30, 2018 (Unaudited)
| ASSETS: | |
Investments, at value
(Cost $150,058,253)
| $ 150,116,607 |
Cash
| 2,105,627 |
Restricted Cash
| 48,957,709 |
| Receivables: | |
Dividends
| 154,964 |
Interest
| 18,232 |
Dividend reclaims
| 4,546 |
Total Assets
| 201,357,685 |
| LIABILITIES: | |
Investments sold short, at value (proceeds $49,958,855)
| 49,046,373 |
| Payables: | |
Investment advisory fees
| 119,165 |
Dividends on investments sold short
| 4,063 |
Short sale fees
| 438 |
Margin interest expense
| 381 |
Total Liabilities
| 49,170,420 |
NET ASSETS
| $152,187,265 |
| NET ASSETS consist of: | |
Paid-in capital
| $ 151,936,989 |
Par value
| 39,500 |
Accumulated net investment income (loss)
| 208,302 |
Accumulated net realized gain (loss) on investments and investments sold short
| (968,362) |
Net unrealized appreciation (depreciation) on investments and investments sold short
| 970,836 |
NET ASSETS
| $152,187,265 |
NET ASSET VALUE, per share
| $38.53 |
Number of shares outstanding (unlimited number of shares authorized, par value $0.01 per share)
| 3,950,002 |
Page 14
See Notes to Financial Statements
First Trust Long/Short Equity ETF (FTLS)
Statement of Operations
For the Six Months Ended April 30, 2018 (Unaudited)
| INVESTMENT INCOME: | |
Dividends
| $ 1,334,598 |
Interest
| 198,526 |
Foreign withholding tax
| (2,315) |
Other
| 45 |
Total investment income
| 1,530,854 |
| EXPENSES: | |
Investment advisory fees
| 673,067 |
Dividend expense on investments sold short
| 405,870 |
Short sale fees
| 26,915 |
Margin interest expense
| 22,230 |
Total expenses
| 1,128,082 |
NET INVESTMENT INCOME (LOSS)
| 402,772 |
| NET REALIZED AND UNREALIZED GAIN (LOSS): | |
| Net realized gain (loss) on: | |
Investments
| (3,408,319) |
In-kind redemptions
| 16,405,407 |
Investments sold short
| (2,036,236) |
Net realized gain (loss)
| 10,960,852 |
| Net change in unrealized appreciation (depreciation) on: | |
Investments
| (11,254,924) |
Investments sold short
| 1,256,186 |
Net change in unrealized appreciation (depreciation)
| (9,998,738) |
NET REALIZED AND UNREALIZED GAIN (LOSS)
| 962,114 |
NET INCREASE (DECREASE) IN NET ASSETS RESULTING FROM OPERATIONS
| $ 1,364,886 |
See Notes to Financial Statements
Page 15
First Trust Long/Short Equity ETF (FTLS)
Statements of Changes in Net Assets
| | Six Months
Ended
4/30/2018
(Unaudited) | | Year
Ended
10/31/2017 |
| OPERATIONS: | | | |
Net investment income (loss)
| $ 402,772 | | $ 778,467 |
Net realized gain (loss)
| 10,960,852 | | 10,544,433 |
Net change in unrealized appreciation (depreciation)
| (9,998,738) | | 6,931,880 |
Net increase (decrease) in net assets resulting from operations
| 1,364,886 | | 18,254,780 |
| DISTRIBUTIONS TO SHAREHOLDERS FROM: | | | |
Net investment income
| (341,350) | | (967,786) |
Total distributions to shareholders
| (341,350) | | (967,786) |
| SHAREHOLDER TRANSACTIONS: | | | |
Proceeds from shares sold
| 135,005,965 | | 77,355,076 |
Cost of shares redeemed
| (104,734,448) | | (93,981,069) |
Net increase (decrease) in net assets resulting from shareholder transactions
| 30,271,517 | | (16,625,993) |
Total increase (decrease) in net assets
| 31,295,053 | | 661,001 |
| NET ASSETS: | | | |
Beginning of period
| 120,892,212 | | 120,231,211 |
End of period
| $152,187,265 | | $120,892,212 |
Accumulated net investment income (loss) at end of period
| $208,302 | | $146,880 |
| CHANGES IN SHARES OUTSTANDING: | | | |
Shares outstanding, beginning of period
| 3,200,002 | | 3,700,002 |
Shares sold
| 3,450,000 | | 2,200,000 |
Shares redeemed
| (2,700,000) | | (2,700,000) |
Shares outstanding, end of period
| 3,950,002 | | 3,200,002 |
Page 16
See Notes to Financial Statements
First Trust Long/Short Equity ETF (FTLS)
Financial Highlights
For a share outstanding throughout each period
| | Six Months
Ended
4/30/2018
(Unaudited) | | Year Ended October 31, | | Period
Ended
10/31/2014 (a) |
| 2017 | | 2016 | | 2015 | |
Net asset value, beginning of period
| $ 37.78 | | $ 32.49 | | $ 32.61 | | $ 30.54 | | $ 30.00 |
| Income from investment operations: | | | | | | | | | |
Net investment income (loss)
| 0.10 | | 0.24 | | 0.32 | | 0.19 | | 0.05 |
Net realized and unrealized gain (loss)
| 0.74 | | 5.34 | | (0.17) | | 2.12 | | 0.51 |
Total from investment operations
| 0.84 | | 5.58 | | 0.15 | | 2.31 | | 0.56 |
| Distributions paid to shareholders from: | | | | | | | | | |
Net investment income
| (0.09) | | (0.29) | | (0.27) | | (0.22) | | (0.02) |
Net realized gain
| — | | — | | — | | (0.02) | | — |
Total distributions
| (0.09) | | (0.29) | | (0.27) | | (0.24) | | (0.02) |
Net asset value, end of period
| $38.53 | | $37.78 | | $32.49 | | $32.61 | | $30.54 |
Total return (b)
| 2.23% | | 17.23% | | 0.45% | | 7.60% | | 1.86% |
| Ratios to average net assets/supplemental data: | | | | | | | | | |
Net assets, end of period (in 000’s)
| $ 152,187 | | $ 120,892 | | $ 120,231 | | $ 32,608 | | $ 3,054 |
Ratio of total expenses to average net assets
| 1.59% (c) | | 1.47% | | 1.40% | | 1.47% | | 1.17% (c) |
Ratio of total expenses to average net assets excluding dividend expense, margin interest expense and short sale fees
| 0.95% (c) | | 0.95% | | 0.95% | | 0.95% | | 0.95% (c) |
Ratio of net investment income (loss) to average net assets
| 0.57% (c) | | 0.67% | | 1.00% | | 0.39% | | 1.08% (c) |
Portfolio turnover rate (d)
| 112% | | 176% | | 201% | | 267% | | 1% |
| (a) | Inception date is September 8, 2014, which is consistent with the commencement of investment operations and is the date the initial creation units were established. |
| (b) | Total return is calculated assuming an initial investment made at the net asset value at the beginning of the period, reinvestment of all distributions at net asset value during the period, and redemption at net asset value on the last day of the period. The returns presented do not reflect the deduction of taxes that a shareholder would pay on Fund distributions or the redemption or sale of Fund shares. Total return is calculated for the time period presented and is not annualized for periods of less than a year. |
| (c) | Annualized. |
| (d) | Portfolio turnover is calculated for the time period presented and is not annualized for periods of less than a year and does not include securities received or delivered from processing creations or redemptions and in-kind transactions. |
Notes to Financial Statements
First Trust Long/Short Equity ETF (FTLS)
April 30, 2018 (Unaudited)
1. Organization
First Trust Exchange-Traded Fund III (the “Trust”) is an open-end management investment company organized as a Massachusetts business trust on January 9, 2008, and is registered with the Securities and Exchange Commission (“SEC”) under the Investment Company Act of 1940, as amended (the “1940 Act”).
The Trust currently consists of thirteen funds that are offering shares. This report covers the First Trust Long/Short Equity ETF (the “Fund”), a diversified series of the Trust, which trades under the ticker “FTLS” on the NYSE Arca, Inc. Unlike conventional mutual funds, the Fund issues and redeems shares on a continuous basis, at net asset value (“NAV”), only in large specified blocks consisting of 50,000 shares called a “Creation Unit.” Creation Units are issued and redeemed in-kind for securities in which the Fund invests or for cash or, in certain circumstances, a combination of both. Except when aggregated in Creation Units, the shares are not redeemable securities of the Fund.
The investment objective of the Fund is to seek to provide investors with long-term total return. The Fund pursues its investment objective by establishing long and short positions in a portfolio of equity securities. Under normal circumstances, at least 80% of the Fund’s net assets (including investment borrowings) will be exposed to U.S. exchange-listed equity securities of U.S. and foreign companies by investing in such securities directly and/or in U.S. exchange-traded funds (“ETFs”) that provide exposure to such securities. The equity securities held by the Fund may include U.S. exchange-listed equity securities of foreign issuers, as well as investments in the equity securities of foreign issuers that are in the form of depositary receipts. There can be no assurance that the Fund will achieve its investment objective. The Fund may not be appropriate for all investors.
2. Significant Accounting Policies
The Fund is considered an investment company and follows accounting and reporting guidance under Financial Accounting Standards Board Accounting Standards Codification Topic 946, “Financial Services-Investment Companies.” The following is a summary of significant accounting policies consistently followed by the Fund in the preparation of the financial statements. The preparation of the financial statements in accordance with accounting principles generally accepted in the United States of America (“U.S. GAAP”) requires management to make estimates and assumptions that affect the reported amounts and disclosures in the financial statements. Actual results could differ from those estimates.
A. Portfolio Valuation
The Fund’s NAV is determined daily as of the close of regular trading on the New York Stock Exchange (“NYSE”), normally 4:00 p.m. Eastern time, on each day the NYSE is open for trading. If the NYSE closes early on a valuation day, the NAV is determined as of that time. Foreign securities are priced using data reflecting the earlier closing of the principal markets for those securities. The Fund’s NAV is calculated by dividing the value of all assets of the Fund (including accrued interest and dividends), less all liabilities (including accrued expenses and dividends declared but unpaid), by the total number of shares outstanding.
The Fund’s investments are valued daily at market value or, in the absence of market value with respect to any portfolio securities, at fair value. Market value prices represent last sale or official closing prices from a national or foreign exchange (i.e., a regulated market) and are primarily obtained from third-party pricing services. Fair value prices represent any prices not considered market value prices and are either obtained from a third-party pricing service or are determined by the Pricing Committee of the Fund’s investment advisor, First Trust Advisors L.P. (“First Trust” or the “Advisor”), in accordance with valuation procedures adopted by the Trust’s Board of Trustees, and in accordance with provisions of the 1940 Act. Investments valued by the Advisor’s Pricing Committee, if any, are footnoted as such in the footnotes to the Portfolio of Investments. The Fund’s investments are valued as follows:
Common stocks, master limited partnerships (“MLPs”), real estate investment trusts (“REITs”) and other equity securities listed on any national or foreign exchange (excluding The Nasdaq Stock Market LLC (“Nasdaq”) and the London Stock Exchange Alternative Investment Market (“AIM”)) are valued at the last sale price on the exchange on which they are principally traded or, for Nasdaq and AIM securities, the official closing price. Securities traded on more than one securities exchange are valued at the last sale price or official closing price, as applicable, at the close of the securities exchange representing the principal market for such securities.
Securities traded in an over-the-counter market are fair valued at the mean of their most recent bid and asked price, if available, and otherwise at their closing bid price.
Certain securities may not be able to be priced by pre-established pricing methods. Such securities may be valued by the Trust’s Board of Trustees or its delegate, the Advisor’s Pricing Committee, at fair value. These securities generally include, but are not limited to, restricted securities (securities which may not be publicly sold without registration under the Securities Act of 1933, as amended) for which a third-party pricing service is unable to provide a market price; securities whose trading has been formally suspended; a security whose market or fair value price is not available from a pre-established pricing source; a security with respect to which an
Notes to Financial Statements (Continued)
First Trust Long/Short Equity ETF (FTLS)
April 30, 2018 (Unaudited)
event has occurred that is likely to materially affect the value of the security after the market has closed but before the calculation of the Fund’s NAV or make it difficult or impossible to obtain a reliable market quotation; and a security whose price, as provided by the third-party pricing service, does not reflect the security’s fair value. As a general principle, the current fair value of a security would appear to be the amount which the owner might reasonably expect to receive for the security upon its current sale. When fair value prices are used, generally they will differ from market quotations or official closing prices on the applicable exchanges. A variety of factors may be considered in determining the fair value of such securities, including, but not limited to, the following:
| 1) | the type of security; |
| 2) | the size of the holding; |
| 3) | the initial cost of the security; |
| 4) | transactions in comparable securities; |
| 5) | price quotes from dealers and/or third-party pricing services; |
| 6) | relationships among various securities; |
| 7) | information obtained by contacting the issuer, analysts, or the appropriate stock exchange; |
| 8) | an analysis of the issuer’s financial statements; and |
| 9) | the existence of merger proposals or tender offers that might affect the value of the security. |
The Fund is subject to fair value accounting standards that define fair value, establish the framework for measuring fair value and provide a three-level hierarchy for fair valuation based upon the inputs to the valuation as of the measurement date. The three levels of the fair value hierarchy are as follows:
| • | Level 1 – Level 1 inputs are quoted prices in active markets for identical investments. An active market is a market in which transactions for the investment occur with sufficient frequency and volume to provide pricing information on an ongoing basis. |
| • | Level 2 – Level 2 inputs are observable inputs, either directly or indirectly, and include the following: |
| o | Quoted prices for similar investments in active markets. |
| o | Quoted prices for identical or similar investments in markets that are non-active. A non-active market is a market where there are few transactions for the investment, the prices are not current, or price quotations vary substantially either over time or among market makers, or in which little information is released publicly. |
| o | Inputs other than quoted prices that are observable for the investment (for example, interest rates and yield curves observable at commonly quoted intervals, volatilities, prepayment speeds, loss severities, credit risks, and default rates). |
| o | Inputs that are derived principally from or corroborated by observable market data by correlation or other means. |
| • | Level 3 – Level 3 inputs are unobservable inputs. Unobservable inputs may reflect the reporting entity’s own assumptions about the assumptions that market participants would use in pricing the investment. |
The inputs or methodologies used for valuing investments are not necessarily an indication of the risk associated with investing in those investments. A summary of the inputs used to value the Fund’s investments as of April 30, 2018, is included with the Fund’s Portfolio of Investments.
B. Securities Transactions and Investment Income
Securities transactions are recorded as of the trade date. Realized gains and losses from securities transactions are recorded on the identified cost basis. Dividend income is recorded on the ex-dividend date. Interest income, if any, is recorded on the accrual basis.
Distributions received from the Fund’s investments in REITs may be comprised of return of capital, capital gains, and income. The actual character of the amounts received during the year are not known until after the REIT’s fiscal year end. The Fund records the character of distributions received from the REITs during the year based on estimates available. The characterization of distributions received by the Fund may be subsequently revised based on information received from the REITs after their tax reporting periods conclude.
Distributions received from the Fund’s investments in MLPs generally are comprised of return of capital and investment income. The Fund records estimated return of capital and investment income based on historical information available from each MLP. These estimates may subsequently be revised based on information received from the MLPs after their tax reporting periods are concluded.
Notes to Financial Statements (Continued)
First Trust Long/Short Equity ETF (FTLS)
April 30, 2018 (Unaudited)
C. Short Sales
Short sales are utilized for investment and risk management purposes and are transactions in which securities or other instruments (such as options, forwards, futures or other derivative contracts) are sold by the Fund, but are not currently owned in the Fund’s portfolio. When the Fund engages in a short sale, the Fund must borrow the security sold short and deliver the security to the counterparty. Short selling allows the Fund to profit from a decline in a market price to the extent such decline exceeds the transaction costs and the costs of borrowing the securities. The Fund will pay a fee or premium to borrow the securities sold short and is obligated to repay the lenders of the securities. Any dividends or interest that accrues on the securities during the period of the loan are due to the lenders. A gain, limited to the price at which the security was sold short, or a loss, unlimited in size, will be recognized upon the termination of the short sale; which is affected by the Fund purchasing the security sold short and delivering the security to the lender. Any such gain or loss may be offset, completely or in part, by the change in the value of the long portion of the Fund’s portfolio. The Fund is subject to the risk that it may be unable to reacquire a security to terminate a short position except at a price substantially in excess of the last quoted price. Also, there is the risk that the counterparty to a short sale may fail to honor its contractual terms, causing a loss to the Fund. The Fund has established an account with Pershing, LLC for the purpose of borrowing securities that the Fund intends to sell short. The fees that the Fund pays for borrowing such securities are presented separately as “Short sale fees” on the Statement of Operations. Restricted cash in the amount of $48,957,709, as shown on the Statement of Assets and Liabilities, is associated with collateral at the broker as of April 30, 2018.
D. Dividends and Distributions to Shareholders
Dividends from net investment income, if any, are declared and paid quarterly by the Fund, or as the Board of Trustees may determine from time to time. Distributions of net realized capital gains earned by the Fund, if any, are distributed at least annually.
Distributions from income and capital gains are determined in accordance with federal income tax regulations, which may differ from U.S. GAAP. Certain capital accounts in the financial statements are periodically adjusted for permanent differences in order to reflect their tax character. These permanent differences are primarily due to the varying treatment of income and gain/loss on portfolio securities held by the Fund and have no impact on net assets or NAV per share. Temporary differences, which arise from recognizing certain items of income, expense and gain/loss in different periods for financial statement and tax purposes, will reverse at some time in the future.
The tax character of distributions paid by the Fund during the fiscal year ended October 31, 2017, was as follows:
| Distributions paid from: | |
Ordinary income
| $967,786 |
As of October 31, 2017, the components of distributable earnings on a tax basis were as follows:
Undistributed ordinary income
| $106,935 |
Accumulated capital and other losses
| (11,790,027) |
Net unrealized appreciation (depreciation)
| 10,870,332 |
E. Income Taxes
The Fund intends to continue to qualify as a regulated investment company by complying with the requirements under Subchapter M of the Internal Revenue Code of 1986, as amended, which includes distributing substantially all of its net investment income and net realized gains to shareholders. Accordingly, no provision has been made for federal and state income taxes. However, due to the timing and amount of distributions, the Fund may be subject to an excise tax of 4% of the amount by which approximately 98% of the Fund’s taxable income exceeds the distributions from such taxable income for the calendar year.
The Fund is subject to accounting standards that establish a minimum threshold for recognizing, and a system for measuring, the benefits of a tax position taken or expected to be taken in a tax return. Taxable years ended 2014, 2015, 2016, and 2017 remain open to federal and state audit. As of April 30, 2018, management has evaluated the application of these standards to the Fund and has determined that no provision for income tax is required in the Fund’s financial statements for uncertain tax positions.
The Fund intends to utilize provisions of the federal income tax laws, which allow it to carry a realized capital loss forward indefinitely following the year of the loss and offset such loss against any future realized capital gains. The Fund is subject to certain limitations under U.S. tax rules on the use of capital loss carryforwards and net unrealized built-in losses. These limitations apply when there has been a 50% change in ownership. At October 31, 2017, the Fund had $11,790,027 of non-expiring capital loss carryforwards for federal income tax purposes.
Notes to Financial Statements (Continued)
First Trust Long/Short Equity ETF (FTLS)
April 30, 2018 (Unaudited)
Certain losses realized during the current fiscal year may be deferred and treated as occurring on the first day of the following fiscal year for federal income tax purposes. For the year ended October 31, 2017, the Fund did not defer any net ordinary losses.
F. Expenses
Expenses, other than the investment advisory fee, dividend and interest expenses on investments sold short and other excluded expenses, are paid by the Advisor (See Note 3).
G. New and Amended Financial Reporting Rules and Forms
On October 13, 2016, the SEC adopted new rules and forms, and amended existing rules and forms. The new and amended rules and forms are intended to modernize the reporting of information provided by funds and to improve the quality and type of information that funds provide to the SEC and investors. In part, the new and amended rules and forms amend Regulation S-X and require standardized, enhanced disclosures about derivatives in a fund’s financial statements, as well as other amendments. The compliance date for the amendments of Regulation S-X was August 1, 2017, which resulted in no change to the financial statements. The new form types and other rule amendments will be effective for the First Trust funds, including the Fund, for reporting periods beginning on and after June 1, 2018. Management is evaluating the new form types and other rule amendments that are effective on and after June 1, 2018 to determine the impact to the Fund.
3. Investment Advisory Fee, Affiliated Transactions and Other Fee Arrangements
First Trust, the investment advisor to the Fund, is a limited partnership with one limited partner, Grace Partners of DuPage L.P., and one general partner, The Charger Corporation. The Charger Corporation is an Illinois corporation controlled by James A. Bowen, Chief Executive Officer of First Trust. First Trust is responsible for the selection and ongoing monitoring of the securities in the Fund’s portfolio, managing the Fund’s business affairs and providing certain administrative services necessary for the management of the Fund.
Pursuant to the Investment Management Agreement, First Trust manages the investment of the Fund’s assets and is responsible for the Fund’s expenses, including the cost of transfer agency, custody, fund administration, legal, audit and other services, but excluding fee payments under the Investment Management Agreement, interest, taxes, brokerage commissions and other expenses connected with the execution of portfolio transactions, distribution and service fees pursuant to a 12b-1 plan, if any, acquired fund fees and expenses, dividend expenses on investments sold short, and extraordinary expenses. The Fund has agreed to pay First Trust an annual unitary management fee equal to 0.95% of its average daily net assets. First Trust also provides fund reporting services to the Fund for a flat annual fee in the amount of $9,250, which is covered under the annual unitary management fee.
The Trust has multiple service agreements with Brown Brothers Harriman & Co. (“BBH”). Under the service agreements, BBH performs custodial, fund accounting, certain administrative services, and transfer agency services for the Fund. As custodian, BBH is responsible for custody of the Fund’s assets. As fund accountant and administrator, BBH is responsible for maintaining the books and records of the Fund’s securities and cash. As transfer agent, BBH is responsible for maintaining shareholder records for the Fund.
Each Trustee who is not an officer or employee of First Trust, any sub-advisor or any of their affiliates (“Independent Trustees”) is paid a fixed annual retainer that is allocated equally among each fund in the First Trust Fund Complex. Each Independent Trustee is also paid an annual per fund fee that varies based on whether the fund is a closed-end or other actively managed fund, or is an index fund.
Additionally, the Lead Independent Trustee and the Chairmen of the Audit Committee, Nominating and Governance Committee and Valuation Committee are paid annual fees to serve in such capacities, with such compensation allocated pro rata among each fund in the First Trust Fund Complex based on net assets. Independent Trustees are reimbursed for travel and out-of-pocket expenses in connection with all meetings. The Lead Independent Trustee and Committee Chairmen rotate every three years. The officers and “Interested” Trustee receive no compensation from the Trust for acting in such capacities.
4. Purchases and Sales of Securities
For the six months ended April 30, 2018, the cost of purchases and proceeds from sales of investments, excluding short term investments, investments sold short and in-kind transactions, were $141,288,688 and $141,867,611, respectively. The cost of purchases to cover short sales and the proceeds of short sales were $60,614,411 and $80,442,331, respectively.
For the six months ended April 30, 2018, the cost of in-kind purchases and proceeds from in-kind sales were $133,807,784 and $104,465,966, respectively.
Notes to Financial Statements (Continued)
First Trust Long/Short Equity ETF (FTLS)
April 30, 2018 (Unaudited)
5. Creations, Redemptions and Transaction Fees
Shares are created and redeemed by the Fund only in Creation Unit size aggregations of 50,000 shares in transactions with broker-dealers or large institutional investors that have entered into a participation agreement (an “Authorized Participant”). In order to purchase Creation Units of the Fund, an Authorized Participant must deposit (i) a designated portfolio of securities determined by First Trust (the “Deposit Securities”) and generally make or receive a cash payment referred to as the “Cash Component,” which is an amount equal to the difference between the NAV of the Fund shares (per Creation Unit Aggregation) and the market value of the Deposit Securities, and/or (ii) cash in lieu of all or a portion of the Deposit Securities. If the Cash Component is a positive number (i.e., the NAV per Creation Unit Aggregation exceeds the Deposit Amount), the Authorized Participant will deliver the Cash Component. If the Cash Component is a negative number (i.e., the NAV per Creation Unit Aggregation is less than the Deposit Amount), the Authorized Participant will receive the Cash Component. Authorized Participants purchasing Creation Units must pay to BBH, as transfer agent, a creation transaction fee (the “Creation Transaction Fee”) regardless of the number of Creation Units purchased in the transaction. The Creation Transaction Fee may vary and is based on the composition of the securities included in the Fund’s portfolio and the countries in which the transactions are settled. The Creation Transaction Fee is currently $550. The price for each Creation Unit will equal the daily NAV per share times the number of shares in a Creation Unit plus the fees described above and, if applicable, any operational processing and brokerage costs, transfer fees or stamp taxes. When the Fund permits an Authorized Participant to substitute cash or a different security in lieu of depositing one or more of the requisite Deposit Securities, the Authorized Participant may also be assessed an amount to cover the cost of purchasing the Deposit Securities and/or disposing of the substituted securities, including operational processing and brokerage costs, transfer fees, stamp taxes, and part or all of the spread between the expected bid and offer side of the market related to such Deposit Securities and/or substitute securities.
Authorized Participants redeeming Creation Units must pay to BBH, as transfer agent, a redemption transaction fee (the “Redemption Transaction Fee”), regardless of the number of Creation Units redeemed in the transaction. The Redemption Transaction Fee may vary and is based on the composition of the securities included in the Fund’s portfolio and the countries in which the transactions are settled. The Redemption Transaction Fee is currently $550. The Fund reserves the right to effect redemptions in cash. An Authorized Participant may request cash redemption in lieu of securities; however, the Fund may, in its discretion, reject any such request.
6. Distribution Plan
The Board of Trustees adopted a Distribution and Service Plan pursuant to Rule 12b-1 under the 1940 Act. In accordance with the Rule 12b-1 plan, the Fund is authorized to pay an amount up to 0.25% of its average daily net assets each year to reimburse First Trust Portfolios L.P. (“FTP”), the distributor of the Fund, for amounts expended to finance activities primarily intended to result in the sale of Creation Units or to provide investor services. FTP may also use this amount to compensate securities dealers or other persons that are Authorized Participants for providing distribution assistance, including broker-dealer and shareholder support and educational and promotional services.
No 12b-1 fees are currently paid by the Fund, and pursuant to a contractual arrangement, no 12b-1 fees will be paid any time before March 1, 2019.
7. Indemnification
The Trust, on behalf of the Fund, has a variety of indemnification obligations under contracts with its service providers. The Trust’s maximum exposure under these arrangements is unknown. However, the Trust has not had prior claims or losses pursuant to these contracts and expects the risk of loss to be remote.
8. Subsequent Events
Management has evaluated the impact of all subsequent events to the Fund through the date the financial statements were issued, and has determined that there were no subsequent events requiring recognition or disclosure in the financial statements that have not already been disclosed.
Additional Information
First Trust Long/Short Equity ETF (FTLS)
April 30, 2018 (Unaudited)
Proxy Voting Policies and Procedures
A description of the policies and procedures that the Trust uses to determine how to vote proxies and information on how the Fund voted proxies relating to portfolio securities during the most recent 12-month period ended June 30 is available (1) without charge, upon request, by calling (800) 988-5891; (2) on the Fund’s website at www.ftportfolios.com; and (3) on the Securities and Exchange Commission’s (“SEC”) website at www.sec.gov.
Portfolio Holdings
The Trust files its complete schedule of the Fund’s portfolio holdings with the SEC for the first and third quarters of each fiscal year on Form N-Q. The Trust’s Form N-Qs are available (1) by calling (800) 988-5891; (2) on the Fund’s website at www.ftportfolios.com; (3) on the SEC’s website at www.sec.gov; and (4) for review and copying at the SEC’s Public Reference Room (“PRR”) in Washington, DC. Information regarding the operation of the PRR may be obtained by calling (800) SEC-0330.
Risk Considerations
Risks are inherent in all investing. You should consider the Fund’s investment objective, risks, charges and expenses carefully before investing. You can download the Fund’s prospectus at www.ftportfolios.com or contact First Trust Portfolios L.P. at (800) 621-1675 to request a prospectus, which contains this and other information about the Fund. For additional information about the risks associated with investing in the Fund, please see the Fund’s statement of additional information, as well as other regulatory filings. Read these documents carefully before you invest. First Trust Portfolios L.P. is the distributor of the First Trust Exchange-Traded Fund III.
The following summarizes some of the risks that should be considered for the Fund.
AUTHORIZED PARTICIPANT CONCENTRATION RISK. Only an authorized participant (as defined in the “Creations, Redemptions and Transaction Fees” Note to Financial Statements) may engage in creation or redemption transactions directly with the Fund. The Fund has a limited number of institutions that act as authorized participants. To the extent that these institutions exit the business or are unable to proceed with creation and/or redemption orders with respect to the Fund and no other authorized participant is able to step forward to create or redeem, in either of these cases, Fund shares may trade at a discount to the Fund’s net asset value and possibly face delisting.
CYBER SECURITY RISK. As the use of Internet technology has become more prevalent in the course of business, the Fund has become more susceptible to potential operational risks through breaches in cyber security. A breach in cyber security refers to both intentional and unintentional events that may cause the Fund to lose proprietary information, suffer data corruption or lose operational capacity. Such events could cause the Fund to incur regulatory penalties, reputational damage, additional compliance costs associated with corrective measures and/or financial loss. Cyber security breaches may involve unauthorized access to the Fund’s digital information systems through “hacking” or malicious software coding, but may also result from outside attacks such as denial-of-service attacks through efforts to make network services unavailable to intended users. In addition, cyber security breaches of the Fund’s third-party service providers, such as its administrator, transfer agent, custodian, or sub-advisor, as applicable, or issuers in which the Fund invests, can also subject the Fund to many of the same risks associated with direct cyber security breaches. The Fund has established risk management systems designed to reduce the risks associated with cyber security. However, there is no guarantee that such efforts will succeed, especially because the Fund does not directly control the cyber security systems of issuers or third-party service providers.
DEPOSITARY RECEIPTS RISK. Depositary receipts may be less liquid than the underlying shares in their primary trading market. Any distributions paid to the holders of depositary receipts are usually subject to a fee charged by the depositary. Holders of depositary receipts may have limited voting rights, and investment restrictions in certain countries may adversely impact the value of depositary receipts because such restrictions may limit the ability to convert the equity shares into depositary receipts and vice versa. Such restrictions may cause the equity shares of the underlying issuer to trade at a discount or premium to the market price of the depositary receipts.
DERIVATIVES RISK. The use of futures and other derivatives can lead to losses because of adverse movements in the price or value of the underlying asset, index or rate, which may be magnified by certain features of the derivatives. These risks are heightened when the Fund’s portfolio managers use derivatives to enhance the Fund’s return or as a substitute for a position or security, rather than solely to hedge (or offset) the risk of a position or security held by the Fund.
EQUITY SECURITIES RISK. Because the Fund invests in equity securities, the value of the Fund’s shares will fluctuate with changes in the value of these equity securities. Equity securities prices fluctuate for several reasons, including changes in investors’ perceptions of the financial condition of an issuer, the issuer’s industry or the general condition of the relevant stock market, such as
Additional Information (Continued)
First Trust Long/Short Equity ETF (FTLS)
April 30, 2018 (Unaudited)
market volatility, or when political or economic events affecting the issuers occur. In addition, common stock prices may be particularly sensitive to rising interest rates, as the cost of capital rises and borrowing costs increase.
ETF RISK. The Fund may invest in the shares of other ETFs, and therefore, the Fund’s investment performance and risks may be related to the investment performance and risks of the underlying ETFs. In general, as a shareholder in other ETFs, the Fund bears its ratable share of the underlying ETF’s expenses, and would be subject to duplicative expenses to the extent the Fund invests in other ETFs.
FINANCIAL COMPANIES RISK. Financial companies are especially subject to the adverse effects of economic recession, currency exchange rates, government regulation, decreases in the availability of capital, volatile interest rates, portfolio concentrations in geographic markets and in commercial and residential real estate loans, and competition from new entrants in their fields of business.
FLUCTUATION OF NET ASSET VALUE RISK. The net asset value of shares of the Fund will generally fluctuate with changes in the market value of the Fund’s holdings. The market prices of shares will generally fluctuate in accordance with changes in net asset value as well as the relative supply of and demand for shares on the Exchange. The Fund’s investment advisor cannot predict whether shares will trade below, at or above their net asset value because the shares trade on the Exchange at market prices and not at net asset value. Price differences may be due, in large part, to the fact that supply and demand forces at work in the secondary trading market for shares will be closely related to, but not identical to, the same forces influencing the prices of the holdings of the Fund trading individually or in the aggregate at any point in time. However, given that shares can only be purchased and redeemed in-kind or, in certain circumstances, for cash, in Creation Units, and only to and from broker-dealers and large institutional investors that have entered into participation agreements (unlike shares of closed-end funds, which frequently trade at appreciable discounts from, and sometimes at premiums to, their net asset value), the Fund’s investment advisor believes that large discounts or premiums to the net asset value of shares should not be sustained.
MANAGEMENT RISK. The Fund is subject to management risk because it is an actively managed portfolio. In managing the Fund’s investment portfolio, the Fund’s investment advisor will apply investment techniques and risk analyses that may not have the desired result. There can be no guarantee that the Fund will meet its investment objective.
MARKET MAKER RISK. If the Fund has lower average daily trading volumes, it may rely on a small number of third-party market makers to provide a market for the purchase and sale of shares. Any trading halt or other problem relating to the trading activity of these market makers could result in a dramatic change in the spread between the Fund’s net asset value and the price at which the Fund’s shares are trading on the Exchange, which could result in a decrease in value of the Fund’s shares. In addition, decisions by market makers or authorized participants to reduce their role or step away from these activities in times of market stress could inhibit the effectiveness of the arbitrage process in maintaining the relationship between the underlying values of the Fund’s portfolio securities and the Fund’s market price. This reduced effectiveness could result in Fund shares trading at a discount to net asset value and also in greater than normal intraday bid-ask spreads for Fund shares.
MARKET RISK. Market risk is the risk that a particular security owned by the Fund or shares of the Fund in general may fall in value. Securities are subject to market fluctuations caused by such factors as economic, political, regulatory or market developments, changes in interest rates and perceived trends in securities prices. Shares of the Fund could decline in value or underperform other investments.
NON-U.S. SECURITIES RISK. Non-U.S. securities are subject to higher volatility than securities of domestic issuers due to possible adverse political, social or economic developments, restrictions on foreign investment or exchange of securities, lack of liquidity, currency exchange rates, excessive taxation, government seizure of assets, different legal or accounting standards, and less government supervision and regulation of exchanges in foreign countries.
PORTFOLIO TURNOVER RISK. The Fund’s strategy may frequently involve buying and selling portfolio securities to rebalance the Fund’s exposure to various market sectors. High portfolio turnover may result in the Fund paying higher levels of transaction costs and generating greater tax liabilities for shareholders. Portfolio turnover risk may cause the Fund’s performance to be less than you expect.
SHORT SALES RISK. The Fund will incur a loss as a result of a short sale if the price of the security sold short increases in value between the date of the short sale and the date on which the Fund purchases the security to replace the borrowed security. In addition, a lender of a security may request, or market conditions may dictate, that securities sold short be returned to the lender on short notice, which may result in the Fund having to buy the securities sold short at an unfavorable price. If this occurs, any anticipated gain to the Fund may be reduced or eliminated or the short sale may result in a loss. In a rising stock market, the Fund’s short positions may significantly impact the Fund’s overall performance and cause the Fund to underperform traditional long-only equity funds or to sustain losses, particularly in a sharply rising market. The use of short sales may also cause the Fund to have higher expenses than other funds.
Additional Information (Continued)
First Trust Long/Short Equity ETF (FTLS)
April 30, 2018 (Unaudited)
Because losses on short sales arise from increases in the value of the security sold short, such losses are theoretically unlimited. By contrast, a loss on a long position arises from decreases in the value of the security and is limited by the fact that a security’s value cannot go below zero. The Fund’s investment advisor’s use of short sales in combination with long positions in the Fund’s portfolio in an attempt to improve performance or reduce overall portfolio risk may not be successful and may result in greater losses or lower positive returns than if the Fund held only long positions. It is possible that the Fund’s long securities positions will decline in value at the same time that the value of its short securities positions increase, thereby increasing potential losses to the Fund. In addition, the Fund’s short selling strategies may limit its ability to fully benefit from increases in the equity markets.
To the extent the Fund invests the proceeds received from selling securities short in additional long positions, the Fund is engaging in a form of leverage. The use of leverage may increase the Fund’s exposure to long positions and make any change in the Fund’s net asset value greater than it would be without the use of leverage. This could result in increased volatility of returns.
TRADING ISSUES RISK. Although the shares of the Fund are listed for trading on the Exchange, there can be no assurance that an active trading market for such shares will develop or be maintained. Trading in shares on the Exchange may be halted due to market conditions or for reasons that, in the view of the Exchange, make trading in shares inadvisable. In addition, trading in shares on the Exchange is subject to trading halts caused by extraordinary market volatility pursuant to the Exchange’s “circuit breaker” rules. Market makers are under no obligation to make a market in the Fund’s shares, and authorized participants are not obligated to submit purchase or redemption orders for Creation Units. There can be no assurance that the requirements of the Exchange necessary to maintain the listing of the Fund will continue to be met or will remain unchanged. In particular, if the Fund does not comply with any provision of the listing standards of the Exchange that are applicable to the Fund, and cannot bring itself into compliance within a reasonable period after discovering the matter, the Exchange may remove the shares of the Fund from listing. The Fund may have difficulty maintaining its listing on the Exchange in the event the Fund’s assets are small or the Fund does not have enough shareholders.
This page intentionally left blank
This page intentionally left blank
This page intentionally left blank
INVESTMENT ADVISOR
First Trust Advisors L.P.
120 E. Liberty Drive, Suite 400
Wheaton, IL 60187
ADMINISTRATOR, CUSTODIAN,
FUND ACCOUNTANT &
TRANSFER AGENT
Brown Brothers Harriman & Co.
50 Post Office Square
Boston, MA 02110
INDEPENDENT REGISTERED
PUBLIC ACCOUNTING FIRM
Deloitte & Touche LLP
111 S. Wacker Drive
Chicago, IL 60606
LEGAL COUNSEL
Chapman and Cutler LLP
111 W. Monroe Street
Chicago, IL 60603
First Trust Exchange-Traded Fund III
First Trust Emerging Markets Local Currency Bond ETF (FEMB)
Semi-Annual Report
For the Six Months Ended
April 30, 2018
First Trust Emerging Markets Local Currency Bond ETF (FEMB)
Semi-Annual Report
April 30, 2018
Caution Regarding Forward-Looking Statements
This report contains certain forward-looking statements within the meaning of the Securities Act of 1933, as amended, and the Securities Exchange Act of 1934, as amended. Forward-looking statements include statements regarding the goals, beliefs, plans or current expectations of First Trust Advisors L.P. (“First Trust” or the “Advisor”) and/or First Trust Global Portfolios Limited (“FTGP” or the “Sub-Advisor”) and their respective representatives, taking into account the information currently available to them. Forward-looking statements include all statements that do not relate solely to current or historical fact. For example, forward-looking statements include the use of words such as “anticipate,” “estimate,” “intend,” “expect,” “believe,” “plan,” “may,” “should,” “would” or other words that convey uncertainty of future events or outcomes.
Forward-looking statements involve known and unknown risks, uncertainties and other factors that may cause the actual results, performance or achievements of the series of First Trust Exchange-Traded Fund III (the “Trust”) described in this report (First Trust Emerging Markets Local Currency Bond ETF; hereinafter referred to as the “Fund”) to be materially different from any future results, performance or achievements expressed or implied by the forward-looking statements. When evaluating the information included in this report, you are cautioned not to place undue reliance on these forward-looking statements, which reflect the judgment of the Advisor and/or Sub-Advisor and their respective representatives only as of the date hereof. We undertake no obligation to publicly revise or update these forward-looking statements to reflect events and circumstances that arise after the date hereof.
Performance and Risk Disclosure
There is no assurance that the Fund will achieve its investment objective. The Fund is subject to market risk, which is the possibility that the market values of securities owned by the Fund will decline and that the value of the Fund shares may therefore be less than what you paid for them. Accordingly, you can lose money by investing in the Fund. See “Risk Considerations” in the Additional Information section of this report for a discussion of certain other risks of investing in the Fund.
Performance data quoted represents past performance, which is no guarantee of future results, and current performance may be lower or higher than the figures shown. For the most recent month-end performance figures, please visit www.ftportfolios.com or speak with your financial advisor. Investment returns, net asset value and share price will fluctuate and Fund shares, when sold, may be worth more or less than their original cost.
The Advisor may also periodically provide additional information on Fund performance on the Fund’s web page at www.ftportfolios.com.
How to Read This Report
This report contains information that may help you evaluate your investment in the Fund. It includes details about the Fund and presents data and analysis that provide insight into the Fund’s performance and investment approach.
The statistical information that follows may help you understand the Fund’s performance compared to that of a relevant market benchmark.
It is important to keep in mind that the opinions expressed by personnel of the Advisor and/or Sub-Advisor are just that: informed opinions. They should not be considered to be promises or advice. The opinions, like the statistics, cover the period through the date on the cover of this report. The material risks of investing in the Fund are spelled out in the prospectus, the statement of additional information, this report and other Fund regulatory filings.
First Trust Emerging Markets Local Currency Bond ETF (FEMB)
Semi-Annual Letter from the Chairman and CEO
April 30, 2018
Dear Shareholders:
First Trust is pleased to provide you with the semi-annual report for the First Trust Emerging Markets Local Currency Bond ETF (the “Fund”), which contains detailed information about your investment for the six months ended April 30, 2018. We encourage you to read this report carefully and discuss it with your financial advisor.
As you are no doubt aware, 2017 was a very strong year for both the U.S. and global markets. The three major U.S. indices – the S&P 500® Index, the Dow Jones Industrial Average and the Nasdaq Composite – posted their best performance since 2013. The MSCI AC World Index (containing constituents from 47 countries) ended 2017 at an all-time high and was up 22% at year-end. The Fund’s benchmark, the Bloomberg Barclays Emerging Markets Local Currency Government – 10% Country Capped Index had a total return of 14.94% for 2017, and the benchmark was also up for the first few months of 2018.
Emerging Market countries are seeing strong economic growth. Emerging Market debt instruments, which are the constituents of your investment in the Fund, saw record growth in 2017 due to robust economic growth in many countries, coupled with a weaker U.S. dollar.
First Trust continues to believe that one should invest for the long term and be prepared for market movements, which can happen at any time. This can be accomplished by keeping current on your portfolio and investing goals and by speaking regularly with your investment professional. It’s important to keep in mind that past performance of the U.S. and global stock markets or investment products can never guarantee future results. As we’ve said before, markets go up and they also go down, but savvy investors are prepared for either through careful attention to their portfolios and investment goals.
At First Trust, we continue to be optimistic about the U.S. economy and we thank you for giving us the opportunity to be a part of your financial plan. We value our relationship with you and will report on your investment again in six months.
Sincerely,
James A. Bowen
Chairman of the Board of Trustees
Chief Executive Officer of First Trust Advisors L.P.
Fund Performance Overview (Unaudited)
First Trust Emerging Markets Local Currency Bond ETF (FEMB)
First Trust Emerging Markets Local Currency Bond ETF (the “Fund”) seeks maximum total return and current income. The Fund lists and principally trades its shares on The Nasdaq Stock Market LLC (“Nasdaq”) under the ticker symbol “FEMB.” Under normal market conditions, the Fund seeks to achieve its investment objective by investing at least 80% of its net assets (including investment borrowings) in bonds, notes and bills issued or guaranteed by entities incorporated or domiciled in emerging market countries (collectively, “Bonds”) that are denominated in the local currency of the issuer. In implementing the Fund’s investment strategy, First Trust Global Portfolios Ltd. (the “Sub-Advisor”) seeks to provide current income and enhance capital, while minimizing volatility.
| Performance | | | | |
| | | | Average Annual
Total Returns | Cumulative
Total Returns |
| | 6 Months Ended
4/30/18 | 1 Year Ended
4/30/18 | Inception (11/4/14)
to 4/30/18 | Inception (11/4/14)
to 4/30/18 |
| Fund Performance | | | | |
| NAV | 3.11% | 5.05% | 0.05% | 0.16% |
| Market Price | 3.14% | 4.53% | 0.11% | 0.39% |
| Index Performance | | | | |
| Bloomberg Barclays Emerging Markets Local Currency Government - 10% Country Capped Index | 4.53% | 8.15% | 1.08% | 3.81% |
Total returns for the period since inception are calculated from the inception date of the Fund. “Average Annual Total Returns” represent the average annual change in value of an investment over the period indicated. “Cumulative Total Returns” represent the total change in value of an investment over the period indicated.
The Fund’s per share net asset value (“NAV”) is the value of one share of the Fund and is computed by dividing the value of all assets of the Fund (including accrued interest and dividends), less all liabilities (including accrued expenses and dividends declared but unpaid), by the total number of outstanding shares. The price used to calculate market return (“Market Price”) is determined by using the midpoint between the highest bid and the lowest offer on the stock exchange on which shares of the Fund are listed for trading as of the time that the Fund’s NAV is calculated. Since shares of the Fund did not trade in the secondary market until after its inception, for the period from inception to the first day of secondary market trading in shares of the Fund, the NAV of the Fund is used as a proxy for the secondary market trading price to calculate market returns. NAV and market returns assume that all distributions have been reinvested in the Fund at NAV and Market Price, respectively.
An index is a statistical composite that tracks a specified financial market or sector. Unlike the Fund, the index does not actually hold a portfolio of securities and therefore does not incur the expenses incurred by the Fund. These expenses negatively impact the performance of the Fund. Also, market returns do not include brokerage commissions that may be payable on secondary market transactions. If brokerage commissions were included, market returns would be lower. The total returns presented reflect the reinvestment of dividends on securities in the index. The returns presented do not reflect the deduction of taxes that a shareholder would pay on Fund distributions or the redemption or sale of Fund shares. The investment return and principal value of shares of the Fund will vary with changes in market conditions. Shares of the Fund may be worth more or less than their original cost when they are redeemed or sold in the market. The Fund’s past performance is no guarantee of future performance.
Fund Performance Overview (Unaudited) (Continued)
First Trust Emerging Markets Local Currency Bond ETF (FEMB)
| Sector Allocation | % of Total
Investments |
| Sovereigns | 93.2% |
| Supranationals | 6.4 |
| Central Bank | 0.4 |
| Total | 100.0% |
| Credit Quality(1) | % of Total
Investments
(including cash) |
| AAA | 6.3% |
| AA | 3.7 |
| AA- | 4.9 |
| A+ | 2.9 |
| A | 10.3 |
| A- | 13.5 |
| BBB | 22.1 |
| BBB- | 23.7 |
| BB | 11.8 |
| Cash | 0.8 |
| Total | 100.0% |
| Top Ten Holdings | % of Total
Investments |
| Republic of South Africa Government Bond, 10.50%, 12/21/26 | 5.4% |
| Colombian TES, 7.00%, 5/4/22 | 4.8 |
| International Finance Corp., 6.30%, 11/25/24 | 4.6 |
| Chile Government International Bond, 5.50%, 8/5/20 | 4.6 |
| Brazil Notas do Tesouro Nacional, Series F, 10.00%, 1/1/25 | 4.6 |
| Brazil Notas do Tesouro Nacional, Series F, 10.00%, 1/1/27 | 4.5 |
| Hungary Government Bond, 5.50%, 6/24/25 | 3.6 |
| Republic of South Africa Government Bond, 6.25%, 3/31/36 | 3.5 |
| Thailand Government Bond, 3.63%, 6/16/23 | 3.3 |
| Romania Government Bond, 5.85%, 4/26/23 | 3.3 |
| Total | 42.2% |
| (1) | The credit quality and ratings information presented above reflect the ratings assigned by one or more nationally recognized statistical rating organizations (NRSROs), including Standard & Poor’s Ratings Group, a division of the McGraw Hill Companies, Inc., Moody’s Investors Service, Inc., Fitch Ratings or a comparably rated NRSRO. For situations in which a security is rated by more than one NRSRO and the ratings are not equivalent, the highest rating is used. Sub-investment grade ratings are those rated BB+/Ba1 or lower. Investment grade ratings are those rated BBB-/Baa3 or higher. The credit ratings shown relate to the creditworthiness of the issuers of the underlying securities in the Fund, and not to the Fund or its shares. Credit ratings are subject to change. |
Fund Performance Overview (Unaudited) (Continued)
First Trust Emerging Markets Local Currency Bond ETF (FEMB)
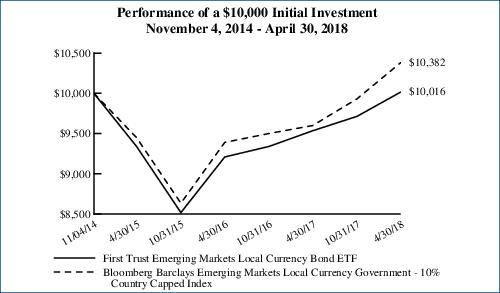
Performance figures assume reinvestment of all distributions and do not reflect the deduction of taxes that a shareholder would pay on Fund distributions or the redemption or sale of Fund shares. An index is a statistical composite that tracks a specified financial market or sector. Unlike the Fund, the index does not actually hold a portfolio of securities and therefore does not incur the expenses incurred by the Fund. These expenses negatively impact the performance of the Fund. The Fund’s past performance does not predict future performance.
Frequency Distribution of Discounts and Premiums
Bid/Ask Midpoint vs. NAV through April 30, 2018
The following Frequency Distribution of Discounts and Premiums charts are provided to show the frequency at which the bid/ask midpoint price for the Fund was at a discount or premium to the daily NAV. The following tables are for comparative purposes only and represent the period November 5, 2014 (commencement of trading) through April 30, 2018. Shareholders may pay more than NAV when they buy Fund shares and receive less than NAV when they sell those shares because shares are bought and sold at current market price. Data presented represents past performance and cannot be used to predict future results.
| Number of Days Bid/Ask Midpoint At/Above NAV |
| For the Period | 0.00%–0.49% | 0.50%–0.99% | 1.00%–1.99% | >=2.00% |
| 11/5/14 - 10/31/15 | 116 | 110 | 7 | 1 |
| 11/1/15 - 10/31/16 | 80 | 64 | 38 | 3 |
| 11/1/16 - 10/31/17 | 104 | 89 | 23 | 2 |
| 11/1/17 - 4/30/18 | 40 | 3 | 0 | 0 |
| Number of Days Bid/Ask Midpoint Below NAV |
| For the Period | 0.00%–0.49% | 0.50%–0.99% | 1.00%–1.99% | >=2.00% |
| 11/5/14 - 10/31/15 | 15 | 0 | 0 | 1 |
| 11/1/15 - 10/31/16 | 60 | 7 | 0 | 0 |
| 11/1/16 - 10/31/17 | 27 | 7 | 0 | 0 |
| 11/1/17 - 4/30/18 | 74 | 6 | 0 | 0 |
Portfolio Management
First Trust Emerging Markets Local Currency Bond ETF (FEMB)
Semi-Annual Report
April 30, 2018 (Unaudited)
Advisor
First Trust Advisors L.P. (“First Trust”) is the investment advisor to the First Trust Emerging Markets Local Currency Bond ETF (the “Fund”). First Trust is responsible for the ongoing monitoring of the Fund’s investment portfolio, managing the Fund’s business affairs and providing certain administrative services necessary for the management of the Fund.
Investment Sub-Advisor
First Trust Global Portfolios Ltd. (“FTGP”), an affiliate of First Trust, serves as investment sub-advisor to the Fund and is headed by Derek Fulton, Director, Chief Executive Officer and Chief Investment Officer of FTGP. Established in December 2011, FTGP is an SEC-registered investment advisor based in London. FTGP was established as a United Kingdom-based distributor, advisor and affiliate of First Trust and First Trust Portfolios L.P. and advises on global fixed income and currency portfolios. The global fixed income team at FTGP has experience in managing developing and emerging market fixed income portfolios for high profile European institutions.
Portfolio Management Team
The following portfolio managers are primarily responsible for the day-to-day management of the Fund. Each portfolio manager has managed the Fund since 2014.
Derek Fulton, Director, Chief Executive Officer and Chief Investment Officer, FTGP
Leonardo Da Costa, Director, FTGP
First Trust Emerging Markets Local Currency Bond ETF (FEMB)
Understanding Your Fund Expenses
April 30, 2018 (Unaudited)
As a shareholder of the First Trust Emerging Markets Local Currency Bond ETF (the “Fund”), you incur two types of costs: (1) transaction costs; and (2) ongoing costs, including management fees, distribution and/or service (12b-1) fees, if any, and other Fund expenses. This Example is intended to help you understand your ongoing costs of investing in the Fund and to compare these costs with the ongoing costs of investing in other funds.
The Example is based on an investment of $1,000 invested at the beginning of the period and held through the six-month period ended April 30, 2018.
Actual Expenses
The first line in the following table provides information about actual account values and actual expenses. You may use the information in this line, together with the amount you invested, to estimate the expenses that you paid over the period. Simply divide your account value by $1,000 (for example, an $8,600 account value divided by $1,000 = 8.6), then multiply the result by the number in the first line under the heading entitled “Expenses Paid During the Six-Month Period” to estimate the expenses you paid on your account during this six-month period.
Hypothetical Example for Comparison Purposes
The second line in the following table provides information about hypothetical account values and hypothetical expenses based on the Fund’s actual expense ratio and an assumed rate of return of 5% per year before expenses, which is not the Fund’s actual return. The hypothetical account values and expenses may not be used to estimate the actual ending account balance or expenses you paid for the period. You may use this information to compare the ongoing costs of investing in the Fund and other funds. To do so, compare this 5% hypothetical example with the 5% hypothetical examples that appear in the shareholder reports of the other funds.
Please note that the expenses shown in the table are meant to highlight your ongoing costs only and do not reflect any transactional costs such as brokerage commissions. Therefore, the second line in the table is useful in comparing ongoing costs only, and will not help you determine the relative total costs of owning different funds. In addition, if these transactional costs were included, your costs would have been higher.
| | Beginning
Account Value
November 1, 2017 | Ending
Account Value
April 30, 2018 | Annualized
Expense Ratio
Based on the
Six-Month
Period | Expenses Paid
During the
Six-Month
Period (a) |
| First Trust Emerging Markets Local Currency Bond ETF (FEMB) |
| Actual | $1,000.00 | $1,031.10 | 0.86% | $4.33 |
| Hypothetical (5% return before expenses) | $1,000.00 | $1,020.53 | 0.86% | $4.31 |
| (a) | Expenses are equal to the annualized expense ratios as indicated in the table multiplied by the average account value over the period (November 1, 2017 through April 30, 2018), multiplied by 181/365 (to reflect the six-month period). |
First Trust Emerging Markets Local Currency Bond ETF (FEMB)
Portfolio of Investments
April 30, 2018 (Unaudited)
Principal
Value
(Local
Currency) | | Description | | Stated
Coupon | | Stated
Maturity | | Value
(US Dollars) |
| FOREIGN SOVEREIGN BONDS AND NOTES – 86.7% |
| | | Brazil – 11.1% | | | | | | |
| 5,100,000 | | Brazil Notas do Tesouro Nacional, Series F (BRL)
| | 10.00% | | 01/01/21 | | $1,526,453 |
| 8,350,000 | | Brazil Notas do Tesouro Nacional, Series F (BRL)
| | 10.00% | | 01/01/25 | | 2,452,951 |
| 8,350,000 | | Brazil Notas do Tesouro Nacional, Series F (BRL)
| | 10.00% | | 01/01/27 | | 2,432,691 |
| | | | | 6,412,095 |
| | | Chile – 4.6% | | | | | | |
| 120,000,000 | | Bonos del Banco Central de Chile en Pesos (CLP)
| | 6.00% | | 02/01/21 | | 208,394 |
| 1,451,000,000 | | Chile Government International Bond (CLP)
| | 5.50% | | 08/05/20 | | 2,466,648 |
| | | | | 2,675,042 |
| | | Colombia – 9.4% | | | | | | |
| 6,851,000,000 | | Colombian TES (COP)
| | 7.00% | | 05/04/22 | | 2,585,090 |
| 4,280,000,000 | | Colombian TES (COP)
| | 7.50% | | 08/26/26 | | 1,652,079 |
| 3,050,000,000 | | Colombian TES (COP)
| | 7.75% | | 09/18/30 | | 1,194,833 |
| | | | | 5,432,002 |
| | | Czech Republic – 3.4% | | | | | | |
| 13,550,000 | | Czech Republic Government Bond (CZK)
| | 1.50% | | 10/29/19 | | 651,399 |
| 26,480,000 | | Czech Republic Government Bond (CZK)
| | 2.40% | | 09/17/25 | | 1,330,762 |
| | | | | 1,982,161 |
| | | Hungary – 4.6% | | | | | | |
| 45,000,000 | | Hungary Government Bond (HUF)
| | 6.50% | | 06/24/19 | | 185,932 |
| 412,970,000 | | Hungary Government Bond (HUF)
| | 5.50% | | 06/24/25 | | 1,955,181 |
| 138,000,000 | | Hungary Government Bond (HUF)
| | 3.00% | | 10/27/27 | | 554,488 |
| | | | | 2,695,601 |
| | | Indonesia – 6.9% | | | | | | |
| 16,826,000,000 | | Indonesia Treasury Bond (IDR)
| | 8.38% | | 03/15/24 | | 1,299,741 |
| 17,626,000,000 | | Indonesia Treasury Bond (IDR)
| | 8.38% | | 09/15/26 | | 1,373,339 |
| 17,310,000,000 | | Indonesia Treasury Bond (IDR)
| | 8.38% | | 03/15/34 | | 1,356,806 |
| | | | | 4,029,886 |
| | | Israel – 2.7% | | | | | | |
| 4,120,000 | | Israel Government Bond - Fixed (ILS)
| | 6.25% | | 10/30/26 | | 1,552,589 |
| | | Malaysia – 4.7% | | | | | | |
| 5,520,000 | | Malaysia Government Bond (MYR)
| | 4.16% | | 07/15/21 | | 1,423,300 |
| 1,000,000 | | Malaysia Government Bond (MYR)
| | 4.05% | | 09/30/21 | | 257,041 |
| 4,180,000 | | Malaysia Government Bond (MYR)
| | 4.18% | | 07/15/24 | | 1,070,702 |
| | | | | 2,751,043 |
| | | Mexico – 3.4% | | | | | | |
| 24,210,000 | | Mexican Bonos (MXN)
| | 10.00% | | 12/05/24 | | 1,474,098 |
| 9,290,000 | | Mexican Bonos (MXN)
| | 7.75% | | 05/29/31 | | 504,118 |
| | | | | 1,978,216 |
| | | Peru – 4.5% | | | | | | |
| 4,300,000 | | Peru Government Bond (PEN)
| | 8.20% | | 08/12/26 | | 1,608,483 |
| 2,900,000 | | Peru Government Bond (PEN)
| | 6.95% | | 08/12/31 | | 1,009,362 |
| | | | | 2,617,845 |
| | | Philippines – 1.3% | | | | | | |
| 28,000,000 | | Philippine Government International Bond (PHP)
| | 4.95% | | 01/15/21 | | 545,262 |
See Notes to Financial Statements
Page 7
First Trust Emerging Markets Local Currency Bond ETF (FEMB)
Portfolio of Investments (Continued)
April 30, 2018 (Unaudited)
Principal
Value
(Local
Currency) | | Description | | Stated
Coupon | | Stated
Maturity | | Value
(US Dollars) |
| FOREIGN SOVEREIGN BONDS AND NOTES (Continued) |
| | | Philippines (Continued) | | | | | | |
| 10,000,000 | | Philippine Government International Bond (PHP)
| | 3.90% | | 11/26/22 | | $185,219 |
| | | | | 730,481 |
| | | Poland – 4.8% | | | | | | |
| 600,000 | | Republic of Poland Government Bond (PLN)
| | 5.50% | | 10/25/19 | | 181,427 |
| 3,615,000 | | Republic of Poland Government Bond (PLN)
| | 4.00% | | 10/25/23 | | 1,109,111 |
| 4,245,000 | | Republic of Poland Government Bond (PLN)
| | 5.75% | | 04/25/29 | | 1,511,732 |
| | | | | 2,802,270 |
| | | Romania – 7.7% | | | | | | |
| 6,440,000 | | Romania Government Bond (RON)
| | 5.95% | | 06/11/21 | | 1,782,977 |
| 6,410,000 | | Romania Government Bond (RON)
| | 5.85% | | 04/26/23 | | 1,784,198 |
| 3,090,000 | | Romania Government Bond (RON)
| | 5.80% | | 07/26/27 | | 874,626 |
| | | | | 4,441,801 |
| | | South Africa – 8.3% | | | | | | |
| 31,755,000 | | Republic of South Africa Government Bond (ZAR)
| | 10.50% | | 12/21/26 | | 2,908,518 |
| 30,810,000 | | Republic of South Africa Government Bond (ZAR)
| | 6.25% | | 03/31/36 | | 1,898,089 |
| | | | | 4,806,607 |
| | | Thailand – 4.7% | | | | | | |
| 52,150,000 | | Thailand Government Bond (THB)
| | 3.63% | | 06/16/23 | | 1,786,754 |
| 27,500,000 | | Thailand Government Bond (THB)
| | 3.65% | | 06/20/31 | | 943,088 |
| | | | | 2,729,842 |
| | | Turkey – 4.6% | | | | | | |
| 4,950,000 | | Turkey Government Bond (TRY)
| | 10.50% | | 01/15/20 | | 1,162,527 |
| 7,580,000 | | Turkey Government Bond (TRY)
| | 8.00% | | 03/12/25 | | 1,500,288 |
| | | | | 2,662,815 |
| | | Total Foreign Sovereign Bonds and Notes
| | 50,300,296 |
| | | (Cost $49,897,195) | | | | | | |
| FOREIGN CORPORATE BONDS AND NOTES – 5.9% |
| | | Supranationals – 5.9% | | | | | | |
| 4,730,000 | | European Investment Bank (ZAR)
| | 6.00% | | 10/21/19 | | 372,427 |
| 37,800,000 | | International Finance Corp. (INR)
| | 7.80% | | 06/03/19 | | 575,156 |
| 167,000,000 | | International Finance Corp. (INR)
| | 6.30% | | 11/25/24 | | 2,467,091 |
| | | Total Foreign Corporate Bonds and Notes
| | 3,414,674 |
| | | (Cost $3,526,782) | | | | | | |
| | Total Investments – 92.6%(a)
| | 53,714,970 |
| | (Cost $53,423,977) | | |
| | Net Other Assets and Liabilities – 7.4%
| | 4,292,089 |
| | Net Assets – 100.0%
| | $58,007,059 |
Page 8
See Notes to Financial Statements
First Trust Emerging Markets Local Currency Bond ETF (FEMB)
Portfolio of Investments (Continued)
April 30, 2018 (Unaudited)
| Forward Foreign Currency Contracts |
Settlement
Date | | Counterparty | | Amount
Purchased | | Amount
Sold | | Purchase
Value as of
4/30/2018 | | Sale
Value as of
4/30/2018 | | Unrealized
Appreciation/
(Depreciation) |
| 05/25/18 | | BNS | | CLP | 360,000,000 | | USD | 606,061 | | $ 586,892 | | $ 606,061 | | $ (19,169) |
| 05/25/18 | | BNS | | COP | 2,030,000,000 | | USD | 746,873 | | 722,590 | | 746,873 | | (24,283) |
| 05/25/18 | | BNS | | INR | 162,000,000 | | USD | 2,454,173 | | 2,420,911 | | 2,454,173 | | (33,262) |
| 05/25/18 | | SG | | KRW | 2,700,000,000 | | USD | 2,545,810 | | 2,529,369 | | 2,545,810 | | (16,441) |
| 05/25/18 | | BBH | | MXN | 25,200,000 | | USD | 1,383,360 | | 1,342,310 | | 1,383,360 | | (41,050) |
| 05/25/18 | | BNS | | RUB | 260,000,000 | | USD | 4,234,183 | | 4,116,494 | | 4,234,183 | | (117,689) |
| 05/25/18 | | BBH | | TRY | 8,300,000 | | USD | 2,039,539 | | 2,027,653 | | 2,039,539 | | (11,886) |
| 05/25/18 | | BNS | | USD | 1,172,797 | | BRL | 4,000,000 | | 1,172,797 | | 1,139,148 | | 33,649 |
| 05/25/18 | | BBH | | USD | 599,540 | | HUF | 150,000,000 | | 599,540 | | 578,209 | | 21,331 |
| 05/25/18 | | SG | | USD | 2,854,343 | | IDR | 39,500,000,000 | | 2,854,343 | | 2,831,859 | | 22,484 |
Net Unrealized Appreciation (Depreciation)
| | $(186,316) |
| Counterparty Abbreviations |
| BBH | Brown Brothers Harriman and Co. |
| BNS | Bank of Nova Scotia |
| SG | Societe Generale |
|
| (a) | Aggregate cost for financial reporting purposes approximates the aggregate cost for federal income tax purposes. As of April 30, 2018, the aggregate gross unrealized appreciation for all investments in which there was an excess of value over tax cost was $1,744,275 and the aggregate gross unrealized depreciation for all investments in which there was an excess of tax cost over value was $1,639,598. The net unrealized appreciation was $104,677. The amounts presented are inclusive of derivative contracts. |
Valuation Inputs
A summary of the inputs used to value the Fund’s investments as of April 30, 2018 is as follows (see Note 2A - Portfolio Valuation in the Notes to Financial Statements):
| ASSETS TABLE |
| | Total
Value at
4/30/2018 | Level 1
Quoted
Prices | Level 2
Significant
Observable
Inputs | Level 3
Significant
Unobservable
Inputs |
Foreign Sovereign Bonds and Notes*
| $ 50,300,296 | $ — | $ 50,300,296 | $ — |
Foreign Corporate Bonds and Notes*
| 3,414,674 | — | 3,414,674 | — |
Total Investments
| 53,714,970 | — | 53,714,970 | — |
Forward Foreign Currency Contracts**
| 77,464 | — | 77,464 | — |
Total
| $ 53,792,434 | $— | $ 53,792,434 | $— |
| LIABILITIES TABLE |
| | Total
Value at
4/30/2018 | Level 1
Quoted
Prices | Level 2
Significant
Observable
Inputs | Level 3
Significant
Unobservable
Inputs |
Forward Foreign Currency Contracts**
| $ (263,780) | $ — | $ (263,780) | $ — |
| * | See Portfolio of Investments for country breakout. |
| ** | See the Schedule of Forward Foreign Currency Contracts for contract and currency detail. |
All transfers in and out of the Levels during the period are assumed to occur on the last day of the period at their current value. There were no transfers between Levels at April 30, 2018.
See Notes to Financial Statements
Page 9
First Trust Emerging Markets Local Currency Bond ETF (FEMB)
Portfolio of Investments (Continued)
April 30, 2018 (Unaudited)
Currency Exposure
Diversification | % of Total
Investments† |
| COP | 11.4% |
| INR | 10.1 |
| BRL | 9.7 |
| ZAR | 9.7 |
| TRY | 8.7 |
| RON | 8.4 |
| RUB | 7.6 |
| MXN | 6.1 |
| CLP | 6.0 |
| PLN | 5.3 |
| MYR | 5.1 |
| THB | 5.0 |
| PEN | 4.8 |
| KRW | 4.7 |
| HUF | 3.9 |
| CZK | 3.7 |
| ILS | 2.9 |
| IDR | 2.2 |
| PHP | 1.3 |
| USD | -16.6% |
| Total | 100.0 |
| † | The weightings include the impact of currency forwards. |
| Currency Abbreviations | |
| BRL | Brazilian Real |
| CLP | Chilean Peso |
| COP | Colombian Peso |
| CZK | Czech Republic Koruna |
| HUF | Hungarian Forint |
| IDR | Indonesian Rupiah |
| ILS | Israeli Shekel |
| INR | Indian Rupee |
| KRW | South Korean Won |
| MXN | Mexican Peso |
| MYR | Malaysian Ringgit |
| PEN | Peruvian Nuevo Sol |
| PHP | Philippine Peso |
| PLN | Polish Zloty |
| RON | Romanian New Leu |
| RUB | Russian Ruble |
| THB | Thai Baht |
| TRY | Turkish Lira |
| USD | United States Dollar |
| ZAR | South African Rand |
Page 10
See Notes to Financial Statements
First Trust Emerging Markets Local Currency Bond ETF (FEMB)
Statement of Assets and Liabilities
April 30, 2018 (Unaudited)
| ASSETS: | |
Investments, at value
(Cost $53,423,977)
| $ 53,714,970 |
Cash
| 192,297 |
Foreign currency (Cost $249,355)
| 244,143 |
Unrealized appreciation on forward foreign currency contracts
| 77,464 |
| Receivables: | |
Investment securities sold
| 2,808,454 |
Interest
| 1,291,532 |
Total Assets
| 58,328,860 |
| LIABILITIES: | |
Unrealized depreciation on forward foreign currency contracts
| 263,780 |
| Payables: | |
Investment advisory fees
| 41,634 |
Deferred foreign capital gains tax
| 16,387 |
Total Liabilities
| 321,801 |
NET ASSETS
| $58,007,059 |
| NET ASSETS consist of: | |
Paid-in capital
| $ 60,056,850 |
Par value
| 14,000 |
Accumulated net investment income (loss)
| (802,613) |
Accumulated net realized gain (loss) on investments, forward foreign currency contracts and foreign currency transactions
| (1,321,482) |
Net unrealized appreciation (depreciation) on investments, forward foreign currency contracts and foreign currency translation
| 60,304 |
NET ASSETS
| $58,007,059 |
NET ASSET VALUE, per share
| $41.43 |
Number of shares outstanding (unlimited number of shares authorized, par value $0.01 per share)
| 1,400,002 |
See Notes to Financial Statements
Page 11
First Trust Emerging Markets Local Currency Bond ETF (FEMB)
Statement of Operations
For the Six Months Ended April 30, 2018 (Unaudited)
| INVESTMENT INCOME: | |
Interest
| $ 1,435,764 |
Foreign tax withholding
| (28,684) |
Total investment income
| 1,407,080 |
| EXPENSES: | |
Investment advisory fees
| 219,692 |
Excise tax expense
| 1,462 |
Total expenses
| 221,154 |
NET INVESTMENT INCOME (LOSS)
| 1,185,926 |
| NET REALIZED AND UNREALIZED GAIN (LOSS): | |
| Net realized gain (loss) on: | |
Investments
| (818,253) |
Forward foreign currency contracts
| (218,183) |
Foreign currency transactions
| (79,579) |
Foreign capital gains tax
| (3,567) |
Net realized gain (loss)
| (1,119,582) |
| Net change in unrealized appreciation (depreciation) on: | |
Investments
| 761,038 |
Forward foreign currency contracts
| (105,173) |
Foreign currency translation
| 4,758 |
Deferred foreign capital gains tax
| 7,275 |
Net change in unrealized appreciation (depreciation)
| 667,898 |
NET REALIZED AND UNREALIZED GAIN (LOSS)
| (451,684) |
NET INCREASE (DECREASE) IN NET ASSETS RESULTING FROM OPERATIONS
| $ 734,242 |
Page 12
See Notes to Financial Statements
First Trust Emerging Markets Local Currency Bond ETF (FEMB)
Statements of Changes in Net Assets
| | Six Months
Ended
4/30/2018
(Unaudited) | | Year
Ended
10/31/2017 |
| OPERATIONS: | | | |
Net investment income (loss)
| $ 1,185,926 | | $ 1,679,615 |
Net realized gain (loss)
| (1,119,582) | | (53,823) |
Net change in unrealized appreciation (depreciation)
| 667,898 | | (188,218) |
Net increase (decrease) in net assets resulting from operations
| 734,242 | | 1,437,574 |
| DISTRIBUTIONS TO SHAREHOLDERS FROM: | | | |
Net investment income
| (1,635,898) | | (2,013,285) |
Total distributions to shareholders
| (1,635,898) | | (2,013,285) |
| SHAREHOLDER TRANSACTIONS: | | | |
Proceeds from shares sold
| 30,149,289 | | 35,625,661 |
Cost of shares redeemed
| (21,102,584) | | — |
Net increase (decrease) in net assets resulting from shareholder transactions
| 9,046,705 | | 35,625,661 |
Total increase (decrease) in net assets
| 8,145,049 | | 35,049,950 |
| NET ASSETS: | | | |
Beginning of period
| 49,862,010 | | 14,812,060 |
End of period
| $58,007,059 | | $49,862,010 |
Accumulated net investment income (loss) at end of period
| $(802,613) | | $(352,641) |
| CHANGES IN SHARES OUTSTANDING: | | | |
Shares outstanding, beginning of period
| 1,200,002 | | 350,002 |
Shares sold
| 700,000 | | 850,000 |
Shares redeemed
| (500,000) | | — |
Shares outstanding, end of period
| 1,400,002 | | 1,200,002 |
See Notes to Financial Statements
Page 13
First Trust Emerging Markets Local Currency Bond ETF (FEMB)
Financial Highlights
For a share outstanding throughout each period
| | Six Months
Ended
4/30/2018
(Unaudited) | | Year Ended October 31, | | Period
Ended
10/31/2015 (a) |
| 2017 | | 2016 | |
Net asset value, beginning of period
| $ 41.55 | | $ 42.32 | | $ 40.77 | | $ 50.00 |
| Income from investment operations: | | | | | | | |
Net investment income (loss)
| 1.13 | | 2.30 | | 1.74 | | 1.94 |
Net realized and unrealized gain (loss)
| 0.16 | | (0.65) | | 2.09 | | (9.23) |
Total from investment operations
| 1.29 | | 1.65 | | 3.83 | | (7.29) |
| Distributions paid to shareholders from: | | | | | | | |
Net investment income
| (1.41) | | (2.42) | | (1.56) | | — |
Return of capital
| — | | — | | (0.72) | | (1.94) |
Total distributions
| (1.41) | | (2.42) | | (2.28) | | (1.94) |
Net asset value, end of period
| $41.43 | | $41.55 | | $42.32 | | $40.77 |
Total return (b)
| 3.11% | | 4.00% | | 9.66% | | (14.83)% |
| Ratios to average net assets/supplemental data: | | | | | | | |
Net assets, end of period (in 000’s)
| $ 58,007 | | $ 49,862 | | $ 14,812 | | $ 4,077 |
| Ratio of total expenses to average net assets | 0.86% (c) (d) | | 0.85% | | 0.85% | | 0.85% (c) |
Ratio of net investment income (loss) to average net assets
| 4.59% (c) (d) | | 4.95% | | 4.70% | | 4.36% (c) |
Portfolio turnover rate (e)
| 53% | | 16% | | 23% | | 49% |
| (a) | Inception date is November 4, 2014, which is consistent with the commencement of investment operations and is the date the initial creation units were established. |
| (b) | Total return is calculated assuming an initial investment made at the net asset value at the beginning of the period, reinvestment of all distributions at net asset value during the period, and redemption at net asset value on the last day of the period. The returns presented do not reflect the deduction of taxes that a shareholder would pay on Fund distributions or the redemption or sale of Fund shares. Total return is calculated for the time period presented and is not annualized for periods of less than a year. |
| (c) | Annualized. |
| (d) | Includes excise tax. If this excise tax was not included, the expense ratio would have been 0.85%. |
| (e) | Portfolio turnover is calculated for the time period presented and is not annualized for periods of less than a year and does not include securities received or delivered from processing creations or redemptions and in-kind transactions. |
Page 14
See Notes to Financial Statements
Notes to Financial Statements
First Trust Emerging Markets Local Currency Bond ETF (FEMB)
April 30, 2018 (Unaudited)
1. Organization
First Trust Exchange-Traded Fund III (the “Trust”) is an open-end management investment company organized as a Massachusetts business trust on January 9, 2008, and is registered with the Securities and Exchange Commission (the “SEC”) under the Investment Company Act of 1940, as amended (the “1940 Act”).
The Trust consists of thirteen funds that are currently offering shares. This report covers the First Trust Emerging Markets Local Currency Bond ETF (the “Fund”), a non-diversified series of the Trust, which trades under the ticker FEMB on The Nasdaq Stock Market, LLC (“Nasdaq”). Unlike conventional mutual funds, the Fund issues and redeems shares on a continuous basis, at net asset value (“NAV”), only in large specified blocks consisting of 50,000 shares called a “Creation Unit.” Creation Units are issued and redeemed for cash and, in certain circumstances, in-kind for securities in which the Fund invests. Except when aggregated in Creation Units, the Fund’s shares are not redeemable securities.
The Fund is an actively managed exchange-traded fund. The investment objective of the Fund is to seek maximum total return and current income. Under normal market conditions, the Fund seeks to achieve its investment objective by investing at least 80% of its net assets (including investment borrowings) in bonds, notes and bills issued or guaranteed by entities incorporated or domiciled in emerging market countries that are denominated in the local currency of the issuer. There can be no assurance the Fund will achieve its investment objective. The Fund may not be appropriate for all investors.
2. Significant Accounting Policies
The Fund is considered an investment company and follows accounting and reporting guidance under Financial Accounting Standards Board Accounting Standards Codification Topic 946, “Financial Services-Investment Companies.” The following is a summary of significant accounting policies consistently followed by the Fund in the preparation of the financial statements. The preparation of the financial statements in accordance with accounting principles generally accepted in the United States of America (“U.S. GAAP”) requires management to make estimates and assumptions that affect the reported amounts and disclosures in the financial statements. Actual results could differ from those estimates.
A. Portfolio Valuation
The Fund’s NAV is determined daily as of the close of regular trading on the New York Stock Exchange (“NYSE”), normally 4:00 p.m. Eastern time, on each day the NYSE is open for trading. If the NYSE closes early on a valuation day, the NAV is determined as of that time. Domestic debt securities and foreign securities are priced using data reflecting the earlier closing of the principal markets for those securities. The Fund’s NAV is calculated by dividing the value of all assets of the Fund (including accrued interest and dividends), less all liabilities (including accrued expenses and dividends declared but unpaid), by the total number of shares outstanding.
The Fund’s investments are valued daily at market value or, in the absence of market value with respect to any portfolio securities, at fair value. Market value prices represent last sale or official closing prices from a national or foreign exchange (i.e., a regulated market) and are primarily obtained from third-party pricing services. Fair value prices represent any prices not considered market value prices and are either obtained from a third-party pricing service or are determined by the Pricing Committee of the Fund’s investment advisor, First Trust Advisors L.P. (“First Trust” or the “Advisor”), in accordance with valuation procedures adopted by the Trust’s Board of Trustees, and in accordance with provisions of the 1940 Act. Investments valued by the Advisor’s Pricing Committee, if any, are footnoted as such in the footnotes to the Portfolio of Investments. The Fund’s investments are valued as follows:
Bonds, notes and other debt securities are fair valued on the basis of valuations provided by dealers who make markets in such securities or by a third-party pricing service approved by the Fund’s Board of Trustees, which may use the following valuation inputs when available:
| 1) | benchmark yields; |
| 2) | reported trades; |
| 3) | broker/dealer quotes; |
| 4) | issuer spreads; |
| 5) | benchmark securities; |
| 6) | bids and offers; and |
| 7) | reference data including market research publications. |
Fixed income and other debt securities having a remaining maturity of sixty days or less when purchased are fair valued at cost adjusted for amortization of premiums and accretion of discounts (amortized cost), provided the Advisor’s Pricing Committee has determined that the use of amortized cost is an appropriate reflection of fair value given market and issuer-specific
Notes to Financial Statements (Continued)
First Trust Emerging Markets Local Currency Bond ETF (FEMB)
April 30, 2018 (Unaudited)
conditions existing at the time of the determination. Factors that may be considered in determining the appropriateness of the use of amortized cost include, but are not limited to, the following:
| 1) | the credit conditions in the relevant market and changes thereto; |
| 2) | the liquidity conditions in the relevant market and changes thereto; |
| 3) | the interest rate conditions in the relevant market and changes thereto (such as significant changes in interest rates); |
| 4) | issuer-specific conditions (such as significant credit deterioration); and |
| 5) | any other market-based data the Advisor’s Pricing Committee considers relevant. In this regard, the Advisor’s Pricing Committee may use last-obtained market-based data to assist it when valuing portfolio securities using amortized cost. |
Forward foreign currency contracts are fair valued at the current day’s interpolated foreign exchange rate, as calculated using the current day’s spot rate, and the thirty, sixty, ninety, and one-hundred eighty day forward rates provided by a third-party pricing service.
Certain securities may not be able to be priced by pre-established pricing methods. Such securities may be valued by the Trust’s Board of Trustees or its delegate, the Advisor’s Pricing Committee, at fair value. These securities generally include, but are not limited to, restricted securities (securities which may not be publicly sold without registration under the Securities Act of 1933, as amended) for which a third-party pricing service is unable to provide a market price; securities whose trading has been formally suspended; a security whose market or fair value price is not available from a pre-established pricing source; a security with respect to which an event has occurred that is likely to materially affect the value of the security after the market has closed but before the calculation of the Fund’s NAV or make it difficult or impossible to obtain a reliable market quotation; and a security whose price, as provided by the third-party pricing service, does not reflect the security’s fair value. As a general principle, the current fair value of a security would appear to be the amount which the owner might reasonably expect to receive for the security upon its current sale. When fair value prices are used, generally they will differ from market quotations or official closing prices on the applicable exchanges. A variety of factors may be considered in determining the fair value of such securities, including, but not limited to, the following:
| 1) | the fundamental business data relating to the issuer, or economic data relating to the country of issue; |
| 2) | an evaluation of the forces which influence the market in which these securities are purchased and sold; |
| 3) | the type, size and cost of security; |
| 4) | the financial statements of the issuer, or the financial condition of the country of issue; |
| 5) | the credit quality and cash flow of the issuer, or country of issue,based on the Advisor’s or external analysis; |
| 6) | the information as to any transactions in or offers for the security; |
| 7) | the price and extent of public trading in similar securities (or equity securities) of the issuer/borrower, or comparable companies; |
| 8) | the coupon payments; |
| 9) | the quality, value and salability of collateral, if any, securing the security; |
| 10) | the business prospects of the issuer, including any ability to obtain money or resources from a parent or affiliate and an assessment of the issuer’s management (for corporate debt only); |
| 11) | the economic, political and social prospects/developments of the country of issue and the assessment of the country’s governmental leaders/officials (for sovereign debt only); |
| 12) | the prospects for the issuer’s industry, and multiples (of earnings and/or cash flows) being paid for similar businesses in that industry (for corporate debt only); and |
| 13) | other relevant factors. |
The Fund is subject to fair value accounting standards that define fair value, establish the framework for measuring fair value and provide a three-level hierarchy for fair valuation based upon the inputs to the valuation as of the measurement date. The three levels of the fair value hierarchy are as follows:
| • | Level 1 – Level 1 inputs are quoted prices in active markets for identical investments. An active market is a market in which transactions for the investment occur with sufficient frequency and volume to provide pricing information on an ongoing basis. |
| • | Level 2 – Level 2 inputs are observable inputs, either directly or indirectly, and include the following: |
| o | Quoted prices for similar investments in active markets. |
| o | Quoted prices for identical or similar investments in markets that are non-active. A non-active market is a market where there are few transactions for the investment, the prices are not current, or price quotations vary substantially either over time or among market makers, or in which little information is released publicly. |
Notes to Financial Statements (Continued)
First Trust Emerging Markets Local Currency Bond ETF (FEMB)
April 30, 2018 (Unaudited)
| o | Inputs other than quoted prices that are observable for the investment (for example, interest rates and yield curves observable at commonly quoted intervals, volatilities, prepayment speeds, loss severities, credit risks, and default rates). |
| o | Inputs that are derived principally from or corroborated by observable market data by correlation or other means. |
| • | Level 3 – Level 3 inputs are unobservable inputs. Unobservable inputs may reflect the reporting entity’s own assumptions about the assumptions that market participants would use in pricing the investment. |
The inputs or methodologies used for valuing investments are not necessarily an indication of the risk associated with investing in those investments. A summary of the inputs used to value the Fund’s investments as of April 30, 2018, is included with the Fund’s Portfolio of Investments.
B. Securities Transactions and Investment Income
Securities transactions are recorded as of the trade date. Realized gains and losses from securities transactions are recorded on the identified cost basis. Dividend income is recorded on the ex-dividend date. Interest income is recorded on the accrual basis. Amortization of premiums and accretion of discounts are recorded using the effective interest method.
C. Forward Foreign Currency Contracts
The Fund is subject to foreign currency risk in the normal course of pursuing its investment objective. Forward foreign currency contracts are agreements between two parties (“Counterparties”) to exchange one currency for another at a future date and at a specified price. The Fund uses forward foreign currency contracts to facilitate transactions in foreign securities and to manage the Fund’s foreign currency exposure. These contracts are valued daily, and the Fund’s net equity therein, representing unrealized gain or loss on the contracts as measured by the difference between the forward foreign exchange rates at the dates of entry into the contracts and the forward rates at the reporting date, is included in “Unrealized appreciation on forward foreign currency contracts” and “Unrealized depreciation on forward foreign currency contracts” on the Statement of Assets and Liabilities. The change in unrealized appreciation (depreciation) is included in “Net change in unrealized appreciation (depreciation) on forward foreign currency contracts” on the Statement of Operations. When the forward contract is closed, a Fund records a realized gain or loss equal to the difference between the proceeds from (or the cost of) the closing transaction and the Fund’s basis in the contract. This realized gain or loss is included in “Net realized gain (loss) on forward foreign currency contracts” on the Statement of Operations. Risks arise from the possible inability of Counterparties to meet the terms of their contracts and from movement in currency, securities values and interest rates. Due to the risks, the Fund could incur losses in excess of the net unrealized value shown on the Forward Foreign Currency Contracts table in the Portfolio of Investments. In the event of default by the Counterparty, the Fund will provide notice to the Counterparty of the Fund’s intent to convert the currency held by the Fund into the currency that the Counterparty agreed to exchange with the Fund. If a Counterparty becomes bankrupt or otherwise fails to perform its obligations due to financial difficulties, the Fund may experience significant delays in obtaining any recovery in a bankruptcy or other reorganization proceeding. The Fund may obtain only limited recovery or may obtain no recovery in such circumstances.
D. Foreign Currency
The books and records of the Funds are maintained in U.S. dollars. Foreign currencies, investments and other assets and liabilities are translated into U.S. dollars at the exchange rates prevailing at the end of the period. Purchases and sales of investments and items of income and expense are translated on the respective dates of such transactions. Unrealized gains and losses on assets and liabilities, other than investments in securities, which result from changes in foreign currency exchange rates have been included in “Net change in unrealized appreciation (depreciation) on foreign currency translation” on the Statement of Operations. Unrealized gains and losses on investments in securities which result from changes in foreign exchange rates are included with fluctuations arising from changes in market price and is included in “Net change in unrealized appreciation (depreciation) on investments” on the Statement of Operations. Net realized foreign currency gains and losses include the effect of changes in exchange rates between trade date and settlement date on investment security transactions, foreign currency transactions and interest and dividends received and is included in “Net realized gain (loss) on foreign currency transactions” on the Statement of Operations. The portion of foreign currency gains and losses related to fluctuations in exchange rates between the initial purchase settlement date and subsequent sale trade date is included in “Net realized gain (loss) on investments” on the Statement of Operations.
E. Dividends and Distributions to Shareholders
Dividends from net investment income, if any, are declared and paid monthly by the Fund, or as the Board of Trustees may determine from time to time. Distributions of net realized capital gains earned by the Fund, if any, are distributed at least annually.
Distributions from income and capital gains are determined in accordance with federal income tax regulations, which may differ from U.S. GAAP. Certain capital accounts in the financial statements are periodically adjusted for permanent differences in order to reflect their tax character. These permanent differences are primarily due to the varying treatment of income and gain/loss on portfolio
Notes to Financial Statements (Continued)
First Trust Emerging Markets Local Currency Bond ETF (FEMB)
April 30, 2018 (Unaudited)
securities held by the Fund and have no impact on net assets or NAV per share. Temporary differences, which arise from recognizing certain items of income, expense and gain/loss in different periods for financial statement and tax purposes, will reverse at some time in the future.
The tax character of distributions paid by the Fund during the fiscal year ended October 31, 2017, was as follows:
| Distributions paid from: | |
Ordinary income
| $2,013,285 |
Capital gains
| — |
Return of capital
| — |
As of October 31, 2017, the components of distributable earnings on a tax basis were as follows:
Undistributed ordinary income
| $206,483 |
Accumulated capital and other losses
| (195,808) |
Net unrealized appreciation (depreciation)
| (1,172,810) |
F. Income Taxes
The Fund intends to continue to qualify as a regulated investment company by complying with the requirements under Subchapter M of the Internal Revenue Code of 1986, as amended, which includes distributing substantially all of its net investment income and net realized gains to shareholders. Accordingly, no provision has been made for federal and state income taxes. However, due to the timing and amount of distributions, the Fund may be subject to an excise tax of 4% of the amount by which approximately 98% of the Fund’s taxable income exceeds the distributions from such taxable income for the calendar year.
The Fund is subject to accounting standards that establish a minimum threshold for recognizing, and a system for measuring, the benefits of a tax position taken or expected to be taken in a tax return. Taxable years ended 2015, 2016, and 2017 remain open to federal and state audit. As of April 30, 2018, management has evaluated the application of these standards to the Fund, and has determined that no provision for income tax is required in the Fund’s financial statements for uncertain tax positions.
The Fund intends to utilize provisions of the federal income tax laws, which allow it to carry a realized capital loss forward indefinitely following the year of the loss and offset such loss against any future realized capital gains. The Fund is subject to certain limitations under U.S. tax rules on the use of capital loss carryforwards and net unrealized built-in losses. These limitations apply when there has been a 50% change in ownership. At October 31, 2017, the Fund had non-expiring capital loss carryforwards for federal income tax purposes of $195,808.
Certain losses realized during the current fiscal year may be deferred and treated as occurring on the first day of the following fiscal year for federal income tax purposes. For the fiscal year ended October 31, 2017, the Fund had no net ordinary losses.
G. Expenses
Expenses, other than the investment advisory fee and other excluded expenses, are paid by the Advisor (See Note 3).
H. Offsetting on the Statement of Assets and Liabilities
Offsetting assets and liabilities require entities to disclose both gross and net information about instruments and transactions eligible for offset on the Statement of Assets and Liabilities, and disclose instruments and transactions subject to master netting or similar agreements. These disclosure requirements are intended to help investors and other financial statement users better assess the effect or potential effect of offsetting arrangements on a fund’s financial position. The transactions subject to offsetting disclosures are derivative instruments, repurchase agreements and reverse repurchase agreements, and securities borrowing and securities lending transactions.
For financial reporting purposes, the Fund does not offset financial assets and financial liabilities that are subject to master netting arrangements (“MNAs”) or similar agreements on the Statement of Assets and Liabilities. MNAs provide the right, in the event of default (including bankruptcy and insolvency), for the non-defaulting counterparty to liquidate the collateral and calculate the net exposure to the defaulting party or request additional collateral.
Notes to Financial Statements (Continued)
First Trust Emerging Markets Local Currency Bond ETF (FEMB)
April 30, 2018 (Unaudited)
At April 30, 2018, derivative assets and liabilities (by type) on a gross basis are as follows:
| | | | | | | | Gross Amounts not Offset
in the Statement of
Assets and Liabilities | | |
| | Gross
Amounts of
Recognized
Assets | | Gross Amounts
Offset in the
Statement of
Assets
and Liabilities | | Net Amounts of
Assets
Presented
in the Statement
of Assets and
Liabilities | | Financial
Instruments | | Collateral
Amounts
Received | | Net
Amount |
Forward Foreign
Currency Contracts* | $ 77,464 | | $ — | | $ 77,464 | | $ (71,421) | | $ — | | $ (6,043) |
| | | | | | | | Gross Amounts not Offset
in the Statement of
Assets and Liabilities | | |
| | Gross
Amounts of
Recognized
Liabilities | | Gross Amounts
Offset in the
Statement of
Assets
and Liabilities | | Net Amounts of
Liabilities
Presented
in the Statement
of Assets and
Liabilities | | Financial
Instruments | | Collateral
Amounts
Pledged | | Net
Amount |
| Forward Foreign Currency Contracts* | $ (263,780) | | $ — | | $ (263,780) | | $ 71,421 | | $ — | | $ (192,359) |
* The respective Counterparties for each contract are disclosed in the Forward Foreign Currency Contracts table in the Portfolio of Investments.
I. New and Amended Financial Reporting Rules and Forms
On October 13, 2016, the SEC adopted new rules and forms, and amended existing rules and forms. The new and amended rules and forms are intended to modernize the reporting of information provided by funds and to improve the quality and type of information that funds provide to the SEC and investors. In part, the new and amended rules and forms amend Regulation S-X and require standardized, enhanced disclosures about derivatives in a fund’s financial statements, as well as other amendments. The compliance date for the amendments of Regulation S-X was August 1, 2017, which resulted in additional disclosure for derivative instruments within the Portfolio of Investments. The new form types and other rule amendments will be effective for the First Trust funds, including the Fund, for reporting periods beginning on and after June 1, 2018. Management is evaluating the new form types and other rule amendments that are effective on and after June 1, 2018 to determine the impact to the Fund.
3. Investment Advisory Fee, Affiliated Transactions and Other Fee Arrangements
First Trust, the investment advisor to the Fund, is a limited partnership with one limited partner, Grace Partners of DuPage L.P., and one general partner, The Charger Corporation. The Charger Corporation is an Illinois corporation controlled by James A. Bowen, Chief Executive Officer of First Trust. First Trust is responsible for supervising the selection and ongoing monitoring of the securities in the Fund’s portfolio, managing the Fund’s business affairs and providing certain administrative services necessary for the management of the Fund.
The Trust, on behalf of the Fund, and First Trust have retained First Trust Global Portfolios Ltd. (“FTGP” or the “Sub-Advisor”), an affiliate of First Trust, to serve as investment sub-advisor. In this capacity, FTGP is responsible for the selection and ongoing monitoring of the securities in the Fund’s investment portfolio. First Trust is paid an annual unitary management fee of 0.85% of the Fund’s average daily net assets. FTGP receives a sub-advisory fee equal to 40% of any remaining monthly unitary fee paid to the Advisor after the Fund’s average expenses accrued during the most recent twelve months are subtracted from the unitary fee for that month. First Trust is responsible for the expenses of the Fund including the cost of transfer agency, custody, fund administration, legal, audit and other services, but excluding fee payments under the Investment Management Agreement, Rule 12b-1 distribution and service fees, if any, brokerage expenses, taxes, interest, acquired fund fees and expenses, and extraordinary expenses. First Trust also provides fund reporting services to the Fund for a flat annual fee in the amount of $9,250, which is covered under the annual unitary management fee.
Notes to Financial Statements (Continued)
First Trust Emerging Markets Local Currency Bond ETF (FEMB)
April 30, 2018 (Unaudited)
The Trust has multiple service agreements with Brown Brothers Harriman & Co. (“BBH”). Under the service agreements, BBH performs custodial, fund accounting, certain administrative services, and transfer agency services for the Fund. As custodian, BBH is responsible for custody of the Fund’s assets. As fund accountant and administrator, BBH is responsible for maintaining the books and records of the Fund’s securities and cash. As transfer agent, BBH is responsible for maintaining shareholder records for the Fund.
Each Trustee who is not an officer or employee of First Trust, any sub-advisor or any of their affiliates (“Independent Trustees”) is paid a fixed annual retainer that is allocated equally among each fund in the First Trust Fund Complex. Each Independent Trustee is also paid an annual per fund fee that varies based on whether the fund is a closed-end or other actively managed fund, or is an index fund.
Additionally, the Lead Independent Trustee and the Chairmen of the Audit Committee, Nominating and Governance Committee and Valuation Committee are paid annual fees to serve in such capacities, with such compensation allocated pro rata among each fund in the First Trust Fund Complex based on net assets. Independent Trustees are reimbursed for travel and out-of-pocket expenses in connection with all meetings. The Lead Independent Trustee and Committee Chairmen rotate every three years. The officers and “Interested” Trustee receive no compensation from the Trust for acting in such capacities.
4. Purchases and Sales of Securities
For the six months ended April 30, 2018, the cost of purchases and proceeds from sales of investments, excluding short term investments and in-kind transactions, were $31,261,374 and $26,606,789, respectively.
For the six months ended April 30, 2018, the Fund had no in-kind transactions.
5. Derivative Transactions
The following table presents the type of derivatives held by the Fund at April 30, 2018, the primary underlying risk exposure and location of these instruments as presented on the Statement of Assets and Liabilities.
| | | | | Asset Derivatives | | Liability Derivatives |
Derivative
Instrument | | Risk
Exposure | | Statement of Assets and
Liabilities Location | | Value | | Statement of Assets and
Liabilities Location | | Value |
Forward foreign
currency
contracts | | Currency Risk | | Unrealized appreciation
on forward foreign
currency contracts | | $ 77,464 | | Unrealized depreciation
on forward foreign
currency contracts | | $ 263,780 |
The following table presents the amount of net realized gain (loss) and change in net unrealized appreciation (depreciation) recognized for the six months ended April 30, 2018, on derivative instruments, as well as the primary underlying risk exposure associated with each instrument.
| Statement of Operations Location | |
| Currency Risk Exposure | |
| Net realized gain (loss) on forward foreign currency contracts | $(218,183) |
| Net change in unrealized appreciation (depreciation) on forward foreign currency contracts | (105,173) |
During the six months ended April 30, 2018, the notional values of forward foreign currency contracts opened and closed were $171,429,947 and $176,444,196, respectively.
6. Creations, Redemptions and Transaction Fees
Shares are created and redeemed by the Fund only in Creation Unit size aggregations of 50,000 shares in transactions with broker-dealers or large institutional investors that have entered into a participation agreement (an “Authorized Participant”). In order to purchase Creation Units of the Fund, an Authorized Participant must deposit (i) a designated portfolio of securities and other instruments determined by First Trust (the “Deposit Securities”) and generally make or receive a cash payment referred to as the “Cash Component,” which is an amount equal to the difference between the NAV of the Fund shares (per Creation Unit Aggregation) and the market value of the Deposit Securities, and/or (ii) cash in lieu of all or a portion of the Deposit Securities. If the Cash Component is a positive number (i.e., the NAV per Creation Unit Aggregation exceeds the Deposit Amount), the Authorized Participant will deliver the Cash Component. If the Cash Component is a negative number (i.e., the NAV per Creation Unit Aggregation is less than the Deposit Amount), the Authorized Participant will receive the Cash Component. Authorized Participants purchasing Creation Units must pay to BBH, as transfer agent, a creation transaction fee (the “Creation Transaction Fee”) regardless of the number of Creation Units purchased in the transaction. The Creation Transaction Fee may vary and is based on the composition of the securities included in the
Notes to Financial Statements (Continued)
First Trust Emerging Markets Local Currency Bond ETF (FEMB)
April 30, 2018 (Unaudited)
Fund’s portfolio and the countries in which the transactions are settled. The Creation Transaction Fee is currently $500. The price for each Creation Unit will equal the daily NAV per share times the number of shares in a Creation Unit plus the fees described above and, if applicable, any operational processing and brokerage costs, transfer fees or stamp taxes. When the Fund permits an Authorized Participant to substitute cash or a different security in lieu of depositing one or more of the requisite Deposit Securities, the Authorized Participant may also be assessed an amount to cover the cost of purchasing the Deposit Securities and/or disposing of the substituted securities, including operational processing and brokerage costs, transfer fees, stamp taxes, and part or all of the spread between the expected bid and offer side of the market related to such Deposit Securities and/or substitute securities.
Authorized Participants redeeming Creation Units must pay to BBH, as transfer agent, a redemption transaction fee (the “Redemption Transaction Fee”), regardless of the number of Creation Units redeemed in the transaction. The Redemption Transaction Fee may vary and is based on the composition of the securities included in the Fund’s portfolio and the countries in which the transactions are settled. The Redemption Transaction Fee is currently $500. The Fund reserves the right to effect redemptions in cash. An Authorized Participant may request cash redemption in lieu of securities; however, the Fund may, in its discretion, reject any such request.
7. Distribution Plan
The Board of Trustees adopted a Distribution and Service Plan pursuant to Rule 12b-1 under the 1940 Act. In accordance with the Rule 12b-1 plan, the Fund is authorized to pay an amount up to 0.25% of its average daily net assets each year to reimburse First Trust Portfolios L.P. (“FTP”), the distributor of the Fund, for amounts expended to finance activities primarily intended to result in the sale of Creation Units or to provide investor services. FTP may also use this amount to compensate securities dealers or other persons that are Authorized Participants for providing distribution assistance, including broker-dealer and shareholder support and educational and promotional services.
No 12b-1 fees are currently paid by the Fund, and pursuant to a contractual arrangement, no 12b-1 fees will be paid any time before March 1, 2019.
8. Line of Credit
The Trust, on behalf of the Fund, along with First Trust Series Fund and First Trust Exchange-Traded Fund IV have a $320 million Credit Agreement with The Bank of Nova Scotia (“Scotia”) as administrative agent for a group of lenders. Prior to March 7, 2018, the commitment amount was $220 million. Scotia charges a commitment fee of 0.25% of the daily amount of the excess of the commitment amount over the outstanding principal balance of the loans. First Trust allocates the commitment fee and agency fee amongst the funds that have access to the credit line. To the extent that the Fund accesses the credit line, there would also be an interest fee charged. The Fund did not have any borrowings outstanding during the six months ended April 30, 2018.
9. Indemnification
The Trust, on behalf of the Fund, has a variety of indemnification obligations under contracts with its service providers. The Trust’s maximum exposure under these arrangements is unknown. However, the Trust has not had prior claims or losses pursuant to these contracts and expects the risk of loss to be remote.
10. Subsequent Events
Management has evaluated the impact of all subsequent events to the Fund through the date the financial statements were issued, and has determined that there were no subsequent events requiring recognition or disclosure in the financial statements that have not already been disclosed.
Additional Information
First Trust Emerging Markets Local Currency Bond ETF (FEMB)
April 30, 2018 (Unaudited)
Proxy Voting Policies and Procedures
A description of the policies and procedures that the Trust uses to determine how to vote proxies and information on how the Fund voted proxies relating to portfolio securities during the most recent 12-month period ended June 30 is available (1) without charge, upon request, by calling (800) 988-5891; (2) on the Fund’s website at www.ftportfolios.com; and (3) on the Securities and Exchange Commission’s (“SEC”) website at www.sec.gov.
Portfolio Holdings
The Trust files its complete schedule of the Fund’s portfolio holdings with the SEC for the first and third quarters of each fiscal year on Form N-Q. The Fund’s Form N-Qs are available (1) by calling (800) 988-5891; (2) on the Fund’s website at www.ftportfolios.com; (3) on the SEC’s website at www.sec.gov; and (4) for review and copying at the SEC’s Public Reference Room (“PRR”) in Washington, DC. Information regarding the operation of the PRR may be obtained by calling (800) SEC-0330.
Risk Considerations
Risks are inherent in all investing. You should consider the Fund’s investment objective, risks, charges and expenses carefully before investing. You can download the Fund’s prospectus at www.ftportfolios.com or contact First Trust Portfolios L.P. at (800) 621-1675 to request a prospectus, which contains this and other information about the Fund. For additional information about the risks associated with investing in the Fund, please see the Fund’s statement of additional information, as well as other regulatory filings. Read these documents carefully before you invest. First Trust Portfolios L.P. is the distributor of the First Trust Exchange-Traded Fund III.
The following summarizes some of the risks that should be considered for the Fund.
AUTHORIZED PARTICIPANT CONCENTRATION RISK. Only an authorized participant (as defined in the “Creations, Redemptions and Transaction Fees” Note to Financial Statements) may engage in creation or redemption transactions directly with the Fund. The Fund has a limited number of institutions that act as authorized participants. To the extent that these institutions exit the business or are unable to proceed with creation and/or redemption orders with respect to the Fund and no other authorized participant is able to step forward to create or redeem, in either of these cases, Fund shares may trade at a discount to the Fund’s net asset value and possibly face delisting.
CALL RISK. If an issuer calls higher-yielding debt instruments held by the Fund, performance could be adversely impacted. During periods of falling interest rates, issuers of callable securities may call (redeem) securities with higher coupon rates or interest rates before their maturity dates. The Fund would then lose any price appreciation above the bond’s call price and would be forced to reinvest the unanticipated proceeds at lower interest rates, resulting in a decline in the Fund’s income. Such redemptions and subsequent reinvestments would also increase the Fund’s portfolio turnover rate.
CASH TRANSACTIONS RISK. The Fund will, under most circumstances, effect a significant portion of creations and redemptions for cash, rather than in-kind securities. As a result, an investment in the Fund may be less tax-efficient than an investment in an ETF that effects its creations and redemptions for in-kind securities. Because the Fund may effect a portion of redemptions for cash, it may be required to sell portfolio securities in order to obtain the cash needed to distribute redemption proceeds. A sale of shares may result in capital gains or losses and may also result in higher brokerage costs.
CREDIT RISK. Credit risk is the risk that an issuer of a security held by the Fund will be unable or unwilling to make dividend, interest and/or principal payments when due and the related risk that the value of such security may decline because of concerns about the issuer’s ability to make such payments. Credit risk may be heightened if the Fund invests in “high yield” or “junk” securities; such securities, while generally offering higher yields than investment grade debt with similar maturities, involve greater risks, including the possibility of dividend or interest deferral, default or bankruptcy, and are regarded as predominantly speculative with respect to the issuer’s capacity to pay dividends or interest and repay principal.
CREDIT SPREAD RISK. Credit spread risk is the risk that credit spreads (i.e., the difference in yield between securities that have differences in credit quality or other factors) may increase, which may reduce the market values of the Fund’s securities. While the Fund may employ strategies to mitigate credit spread risk, these strategies may not be successful.
CURRENCY EXCHANGE RATE RISK. The Fund holds investments that are denominated in non-U.S. currencies, or in securities that provide exposure to such currencies, currency exchange rates or interest rates denominated in such currencies. Changes in currency exchange rates and the relative value of non-U.S. currencies will affect the value of the Fund’s investment and the value of Fund shares. Currency exchange rates can be very volatile and can change quickly and unpredictably. As a result, the value of an investment in the Fund may change quickly and without warning and you may lose money.
Additional Information (Continued)
First Trust Emerging Markets Local Currency Bond ETF (FEMB)
April 30, 2018 (Unaudited)
CURRENCY RISK. Because the Fund’s net asset value is determined on the basis of U.S. dollars and the Fund invests in non-U.S. dollar-denominated securities, you may lose money if the local currency of a foreign market depreciates against the U.S. dollar, even if the local currency value of the Fund’s holdings goes up. The Fund may hedge certain of its non-U.S. dollar holdings.
CYBER SECURITY RISK. As the use of Internet technology has become more prevalent in the course of business, the Fund has become more susceptible to potential operational risks through breaches in cyber security. A breach in cyber security refers to both intentional and unintentional events that may cause the Fund to lose proprietary information, suffer data corruption or lose operational capacity. Such events could cause the Fund to incur regulatory penalties, reputational damage, additional compliance costs associated with corrective measures and/or financial loss. Cyber security breaches may involve unauthorized access to the Fund’s digital information systems through “hacking” or malicious software coding, but may also result from outside attacks such as denial-of-service attacks through efforts to make network services unavailable to intended users. In addition, cyber security breaches of the Fund’s third-party service providers, such as its administrator, transfer agent, custodian, or sub-advisor, as applicable, or issuers in which the Fund invests, can also subject the Fund to many of the same risks associated with direct cyber security breaches. The Fund has established risk management systems designed to reduce the risks associated with cyber security. However, there is no guarantee that such efforts will succeed, especially because the Fund does not directly control the cyber security systems of issuers or third party service providers.
DERIVATIVES RISK. The use of options, futures contracts, forward contracts and other derivatives can lead to losses because of adverse movements in the price or value of the underlying asset, index or rate, which may be magnified by certain features of the derivatives. These risks are heightened when the Fund’s portfolio managers use derivatives to enhance the Fund’s return or as a substitute for a position or security, rather than solely to hedge (or offset) the risk of a position or security held by the Fund.
EXTENSION RISK. Extension risk is the risk that, when interest rates rise, certain obligations will be paid off by the issuer (or obligor) more slowly than anticipated, causing the value of these securities to fall. Rising interest rates tend to extend the duration of securities, making them more sensitive to changes in interest rates. The value of longer-term securities generally changes more in response to changes in interest rates than shorter-term securities. As a result, in a period of rising interest rates, securities may exhibit additional volatility and may lose value.
FLUCTUATION OF NET ASSET VALUE RISK. The net asset value of shares of the Fund will generally fluctuate with changes in the market value of the Fund’s holdings. The market prices of shares will generally fluctuate in accordance with changes in net asset value as well as the relative supply of and demand for shares on the Exchange. The Fund’s investment advisor cannot predict whether shares will trade below, at or above their net asset value because the shares trade on the Exchange at market prices and not at net asset value. Price differences may be due, in large part, to the fact that supply and demand forces at work in the secondary trading market for shares will be closely related to, but not identical to, the same forces influencing the prices of the holdings of the Fund trading individually or in the aggregate at any point in time. However, given that shares can only be purchased and redeemed for cash, or, in certain circumstances, in-kind, in Creation Units, and only to and from broker-dealers and large institutional investors that have entered into participation agreements (unlike shares of closed-end funds, which frequently trade at appreciable discounts from, and sometimes at premiums to, their net asset value), the Fund’s investment advisor believes that large discounts or premiums to the net asset value of shares should not be sustained.
GLOBAL DEPOSITARY NOTES RISK. Any distributions paid to the holders of global depositary notes (“GDNs”) are usually subject to a fee charged by the depositary bank. Holders of GDNs may have limited rights, and investment restrictions in certain countries may adversely impact the value of GDNs because such restrictions may limit the ability to convert the bonds into GDNs and vice versa.
HIGH YIELD SECURITIES RISK. High yield securities, or “junk” bonds, are subject to greater market fluctuations and risk of loss than securities with higher ratings, and therefore, are considered to be highly speculative. These securities are issued by issuers that may have narrowly focused operations and/or other impediments to the timely payment of periodic interest and principal at maturity. If the global or local economy slows down or dips into recession, the issuers of high yield securities may not have sufficient resources to continue making timely payment of periodic interest and principal at maturity. The market for high yield securities is generally smaller and less liquid than that for investment grade securities. High yield securities are generally not listed on a national securities exchange but trade in the over-the-counter markets. Due to the smaller, less liquid market for high yield securities, the bid-offer spread on such securities is generally greater than it is for investment grade securities and the purchase or sale of such securities may take longer to complete. In general, high yield securities may have a greater risk of default than other types of securities.
ILLIQUID SECURITIES RISK. Some of the securities held by the Fund may be illiquid. Illiquid securities involve the risk that the securities will not be able to be sold at the time desired by the Fund or at prices approximately the value at which the Fund values the securities.
Additional Information (Continued)
First Trust Emerging Markets Local Currency Bond ETF (FEMB)
April 30, 2018 (Unaudited)
INCOME RISK. Income from the Fund’s fixed income investments could decline during periods of falling interest rates.
INTEREST RATE RISK. Interest rate risk is the risk that the value of the debt securities in the Fund’s portfolio will decline because of rising market interest rates. Interest rate risk is generally lower for shorter term debt securities and higher for longer term debt securities. Duration is a measure of the expected price volatility of a debt instrument as a result of changes in market rates of interest, based on, among other factors, the weighted average timing of the instrument’s expected principal and interest payments. In general, duration represents the expected percentage change in the value of a security for an immediate 1% change in interest rates. Therefore, prices of debt securities with shorter durations tend to be less sensitive to interest rate changes than debt securities with longer durations. As the value of a debt security changes over time, so will its duration.
LIQUIDITY RISK. The Fund may invest a significant portion of its assets in lower-quality debt issued by companies that are highly leveraged. Lower-quality debt tends to be less liquid than higher-quality debt. Moreover, smaller debt issues tend to be less liquid than larger debt issues. If the economy experiences a sudden downturn, or if the debt markets for such companies become distressed, the Fund may have particular difficulty selling its assets in sufficient amounts, at reasonable prices and in a sufficiently timely manner to raise the cash necessary to meet any potentially heavy redemption requests by Fund shareholders.
MANAGEMENT RISK. The Fund is subject to management risk because it is an actively managed portfolio. In managing the Fund’s investment portfolio, the Fund’s sub-Advisor will apply investment techniques and risk analyses that may not have the desired result. There can be no guarantee that the Fund will meet its investment objective.
MARKET MAKER RISK. If the Fund has lower average daily trading volumes, it may rely on a small number of third-party market makers to provide a market for the purchase and sale of shares. Any trading halt or other problem relating to the trading activity of these market makers could result in a dramatic change in the spread between the Fund’s net asset value and the price at which the Fund’s shares are trading on the Exchange, which could result in a decrease in value of the Fund’s shares. In addition, decisions by market makers or authorized participants to reduce their role or step away from these activities in times of market stress could inhibit the effectiveness of the arbitrage process in maintaining the relationship between the underlying values of the Fund’s portfolio securities and the Fund’s market price. This reduced effectiveness could result in Fund shares trading at a discount to net asset value and also in greater than normal intraday bid-ask spreads for Fund shares.
MARKET RISK. Market risk is the risk that a particular security owned by the Fund or shares of the Fund in general may fall in value. Securities are subject to market fluctuations caused by such factors as economic, political, regulatory or market developments, changes in interest rates and perceived trends in bond prices. Also, certain of these factors may affect the liquidity of the bonds in the Fund’s portfolio and make it more difficult for the Fund to sell them. Overall securities values could decline in value or underperform other investments.
NON-DIVERSIFICATION RISK. The Fund is classified as “non-diversified” under the 1940 Act. As a result, the Fund is only limited as to the percentage of its assets which may be invested in the securities of any one issuer by the diversification requirements imposed by the Internal Revenue Code of 1986, as amended. The Fund may invest a relatively high percentage of its assets in a limited number of issuers. As a result, the Fund may be more susceptible to a single adverse economic or regulatory occurrence affecting one or more of these issuers, experience increased volatility and be highly invested in certain issuers.
NON-U.S. SECURITIES AND EMERGING MARKETS RISK. Non-U.S. securities are subject to higher volatility than securities of domestic issuers due to possible adverse political, social or economic developments; restrictions on foreign investment or exchange of securities; lack of liquidity; currency exchange rates; excessive taxation; government seizure of assets; different legal or accounting standards; and less government supervision and regulation of exchanges in foreign countries. These risks may be heightened for securities of companies located in, or with significant operations in, emerging market countries.
SOVEREIGN DEBT RISK. Investments in sovereign bonds involve special risks because the governmental authority that controls the repayment of the debt may be unwilling or unable to repay the principal and/or interest when due in accordance with the terms of such securities; the availability of sufficient foreign exchange on the date a payment is due; the relative size of the debt service burden to the economy as a whole; or the government debtor’s policy towards the International Monetary Fund and the political constraints to which a government debtor may be subject. If an issuer of sovereign bonds defaults on payments of principal and/or interest, the Fund may have limited legal recourse against the issuer and/or guarantor. In certain cases, remedies must be pursued in the courts of the defaulting party itself, and the Fund’s ability to obtain recourse may be limited. In times of economic uncertainty, the prices of these securities may be more volatile than those of corporate debt obligations or of other government debt obligations.
TRADING ISSUES RISK. Although the shares of the Fund are listed for trading on the Exchange, there can be no assurance that an active trading market for such shares will develop or be maintained. Trading in shares on the Exchange may be halted due to market conditions or for reasons that, in the view of the Exchange, make trading in shares inadvisable. In addition, trading in shares on the Exchange is subject to trading halts caused by extraordinary market volatility pursuant to the Exchange’s “circuit breaker” rules.
Additional Information (Continued)
First Trust Emerging Markets Local Currency Bond ETF (FEMB)
April 30, 2018 (Unaudited)
Market makers are under no obligation to make a market in the Fund’s shares, and authorized participants are not obligated to submit purchase or redemption orders for Creation Units. There can be no assurance that the requirements of the Exchange necessary to maintain the listing of the Fund will continue to be met or will remain unchanged. In particular, if the Fund does not comply with any provision of the listing standards of the Exchange that are applicable to the Fund, and cannot bring itself into compliance within a reasonable period after discovering the matter, the Exchange may remove the shares of the Fund from listing. The Fund may have difficulty maintaining its listing on the Exchange in the event the Fund’s assets are small or the Fund does not have enough shareholders.
This page intentionally left blank
This page intentionally left blank
This page intentionally left blank
First Trust Exchange-Traded Fund III
INVESTMENT ADVISOR
First Trust Advisors L.P.
120 E. Liberty Drive, Suite 400
Wheaton, IL 60187
INVESTMENT SUB-ADVISOR
First Trust Global Portfolios Ltd.
Floor 2
8 Angel Court
London EC2R 7HJ
England
ADMINISTRATOR, CUSTODIAN,
FUND ACCOUNTANT &
TRANSFER AGENT
Brown Brothers Harriman & Co.
50 Post Office Square
Boston, MA 02110
INDEPENDENT REGISTERED
PUBLIC ACCOUNTING FIRM
Deloitte & Touche LLP
111 S. Wacker Drive
Chicago, IL 60606
LEGAL COUNSEL
Chapman and Cutler LLP
111 W. Monroe Street
Chicago, IL 60603
First Trust Exchange-Traded Fund III
First Trust RiverFront Dynamic Asia Pacific ETF (RFAP)
First Trust RiverFront Dynamic Developed International ETF (RFDI)
First Trust RiverFront Dynamic Europe ETF (RFEU)
First Trust RiverFront Dynamic Emerging Markets ETF (RFEM)
Semi-Annual Report
For the Six Months Ended
April 30, 2018
First Trust Exchange-Traded Fund III
Semi-Annual Report
April 30, 2018
Caution Regarding Forward-Looking Statements
This report contains certain forward-looking statements within the meaning of the Securities Act of 1933, as amended, and the Securities Exchange Act of 1934, as amended. Forward-looking statements include statements regarding the goals, beliefs, plans or current expectations of First Trust Advisors L.P. (“First Trust” or the “Advisor”) and/or RiverFront Investment Group, LLC (“RiverFront” or the “Sub-Advisor”) and their respective representatives, taking into account the information currently available to them. Forward-looking statements include all statements that do not relate solely to current or historical fact. For example, forward-looking statements include the use of words such as “anticipate,” “estimate,” “intend,” “expect,” “believe,” “plan,” “may,” “should,” “would” or other words that convey uncertainty of future events or outcomes.
Forward-looking statements involve known and unknown risks, uncertainties and other factors that may cause the actual results, performance or achievements of any series of First Trust Exchange-Traded Fund III (the “Trust”) described in this report (each such series is referred to as a “Fund” and collectively, the “Funds”) to be materially different from any future results, performance or achievements expressed or implied by the forward-looking statements. When evaluating the information included in this report, you are cautioned not to place undue reliance on these forward-looking statements, which reflect the judgment of the Advisor and/or Sub-Advisor and their respective representatives only as of the date hereof. We undertake no obligation to publicly revise or update these forward-looking statements to reflect events and circumstances that arise after the date hereof.
Performance and Risk Disclosure
There is no assurance that any Fund described in this report will achieve its investment objective. Each Fund is subject to market risk, which is the possibility that the market values of securities owned by the Fund will decline and that the value of the Fund shares may therefore be less than what you paid for them. Accordingly, you can lose money by investing in a Fund. See “Risk Considerations” in the Additional Information section of this report for a discussion of certain other risks of investing in the Funds.
Performance data quoted represents past performance, which is no guarantee of future results, and current performance may be lower or higher than the figures shown. For the most recent month-end performance figures, please visit www.ftportfolios.com or speak with your financial advisor. Investment returns, net asset value and share price will fluctuate and Fund shares, when sold, may be worth more or less than their original cost.
The Advisor may also periodically provide additional information on Fund performance on each Fund’s web page at www.ftportfolios.com.
How to Read This Report
This report contains information that may help you evaluate your investment. It includes details about each Fund and presents data and analysis that provide insight into each Fund’s performance and investment approach.
The statistical information that follows may help you understand each Fund’s performance compared to that of a relevant market benchmark.
It is important to keep in mind that the opinions expressed by personnel of the Advisor and/or Sub-Advisor are just that: informed opinions. They should not be considered to be promises or advice. The opinions, like the statistics, cover the period through the date on the cover of this report. The material risks of investing in each Fund are spelled out in the prospectus, the statement of additional information, this report and other Fund regulatory filings.
First Trust Exchange-Traded Fund III
Semi-Annual Letter from the Chairman and CEO
April 30, 2018
Dear Shareholders,
First Trust is pleased to provide you with the semi-annual report for the First Trust RiverFront Dynamic International ETFs, which contains detailed information about your investment for the six months ended April 30, 2018. We encourage you to read this report carefully and discuss it with your financial advisor.
As you are no doubt aware, 2017 was a very strong year for both the U.S. and global markets. The three major U.S. indices – the S&P 500® Index, the Dow Jones Industrial Average and the Nasdaq Composite – posted their best performance since 2013. The MSCI AC World Index (containing constituents from 47 countries) ended 2017 at an all-time high and was up 22% at year-end.
While the U.S. and global markets were very strong in 2017, volatility has been the norm during the first few months of 2018. Talk of a so-called “trade war” and tariffs on Chinese imports have affected markets in the U.S. and abroad. However, in our opinion, strong corporate earnings in the first quarter of 2018 bode well for continued economic growth.
First Trust continues to believe that one should invest for the long term and be prepared for market movements, which can happen at any time. This can be accomplished by keeping current on your portfolio and investing goals and by speaking regularly with your investment professional. It’s important to keep in mind that past performance of the U.S. and global stock markets or investment products can never guarantee future results. As we’ve said before, markets go up and they also go down, but savvy investors are prepared for either through careful attention to their portfolios and investment goals.
At First Trust, we continue to be optimistic about the U.S. economy and we thank you for giving us the opportunity to be a part of your financial plan. We value our relationship with you and will report on your investment again in six months.
Sincerely,
James A. Bowen
Chairman of the Board of Trustees
Chief Executive Officer of First Trust Advisors L.P.
Fund Performance Overview (Unaudited)
First Trust RiverFront Dynamic Asia Pacific ETF (RFAP)
The investment objective of First Trust RiverFront Dynamic Asia Pacific ETF (the “Fund”) is to provide capital appreciation. Under normal market conditions, the Fund will seek to achieve its investment objective by investing at least 80% of its net assets (including investment borrowings) in a portfolio of equity securities of Asian Pacific companies, including through investments in common stock, depositary receipts, and common and preferred shares of real estate investment trusts (“REITs”), and forward foreign currency exchange contracts and currency spot transactions used to hedge the Fund’s exposure to the currencies in which the equity securities of such Asian Pacific companies are denominated (each, an “Asian Pacific currency” and, collectively, the “Asian Pacific currencies”). Asian Pacific companies are those companies (i) whose securities are traded principally on a stock exchange in an Asian Pacific country, (ii) that have a primary business office in an Asian Pacific country, or (iii) that have at least 50% of their assets in, or derive at least 50% of their revenues or profits from, an Asian Pacific country. Asian Pacific countries include the countries located in Asia and the Pacific Islands as well as Australia and New Zealand. The Fund will generally focus its Asian Pacific company investments in Australia, Hong Kong, Japan, New Zealand and/or Singapore. The Fund is non-diversified. Shares of the Fund are listed on The Nasdaq Stock Market LLC under the ticker symbol “RFAP.”
The Fund will utilize a dynamic currency hedging strategy through the use of forward foreign currency exchange contracts and currency spot transactions to hedge up to 100% of the Fund’s currency exposure. As a result of such dynamic currency hedging strategy, the portion of the Fund’s portfolio securities which are subject to currency hedging transactions may vary widely, from 0% to 100% of the portfolio securities. A forward contract on foreign currency is an obligation to purchase or sell a specific currency at a future date, which may be any fixed number of days agreed upon by the parties from the date of the contract, at a price set on the date of the contract. A forward foreign currency exchange contract may reduce the Fund’s exposure to changes in the value of the currency it will deliver and increase its exposure to changes in the value of the currency it will receive for the duration of the contract. The effect on the value of the Fund is similar to selling securities denominated in one currency and purchasing securities denominated in another currency. The Fund also may enter into currency spot transactions as part of its dynamic currency hedging strategy. A currency spot transaction is an agreement between two parties to buy or sell a specific currency for delivery on a date that is typically two business days from the date of the agreement, as opposed to a date set in the future. The underlying currencies of the forward foreign currency exchange contracts and currency spot transactions included in the Fund’s policy relating to the investment of at least 80% of its net assets (including investment borrowings) will be limited to Asian Pacific currencies.
| Performance | | | | |
| | | | Average Annual
Total Returns | Cumulative
Total Returns |
| | 6 Months Ended
4/30/18 | 1 Year Ended
4/30/18 | Inception (4/13/16)
to 4/30/18 | Inception (4/13/16)
to 4/30/18 |
| Fund Performance | | | | |
| NAV | 0.95% | 11.03% | 10.01% | 21.57% |
| Market Price | 0.38% | 10.60% | 10.06% | 21.68% |
| Index Performance | | | | |
| MSCI Pacific Index | 5.11% | 16.47% | 15.58% | 34.50% |
(See Notes to Fund Performance Overview Page 11.)
Fund Performance Overview (Unaudited) (Continued)
First Trust RiverFront Dynamic Asia Pacific ETF (RFAP) (Continued)
| Sector Allocation | % of Total
Investments |
| Financials | 21.0% |
| Information Technology | 15.5 |
| Consumer Discretionary | 13.9 |
| Industrials | 12.9 |
| Materials | 11.8 |
| Consumer Staples | 7.8 |
| Telecommunication Services | 6.0 |
| Health Care | 4.6 |
| Energy | 3.4 |
| Real Estate | 3.1 |
| Total | 100.0% |
| Top Ten Holdings | % of Total
Investments |
| Keyence Corp. | 1.9% |
| Australia & New Zealand Banking Group Ltd. | 1.8 |
| Nintendo Co., Ltd. | 1.7 |
| KDDI Corp. | 1.7 |
| Sumitomo Mitsui Financial Group, Inc. | 1.6 |
| Sony Corp. | 1.6 |
| National Australia Bank Ltd. | 1.6 |
| Central Japan Railway Co. | 1.4 |
| Wynn Macau Ltd. | 1.4 |
| Asahi Group Holdings Ltd. | 1.4 |
| Total | 16.1% |

Performance figures assume reinvestment of all distributions and do not reflect the deduction of taxes that a shareholder would pay on Fund distributions or the redemption or sale of Fund shares. An index is a statistical composite that tracks a specified financial market or sector. Unlike the Fund, the index does not actually hold a portfolio of securities and therefore does not incur the expenses incurred by the Fund. These expenses negatively impact the performance of the Fund. The Fund’s past performance does not predict future performance.
Frequency Distribution of Discounts and Premiums
Bid/Ask Midpoint vs. NAV through April 30, 2018
The following Frequency Distribution of Discounts and Premiums charts are provided to show the frequency at which the bid/ask midpoint price for the Fund was at a discount or premium to the daily NAV. The following tables are for comparative purposes only and represent the period April 14, 2016 (commencement of trading) through April 30, 2018. Shareholders may pay more than NAV when they buy Fund shares and receive less than NAV when they sell those shares because shares are bought and sold at current market price. Data presented represents past performance and cannot be used to predict future results.
| Number of Days Bid/Ask Midpoint At/Above NAV |
| For the Period | 0.00%–0.49% | 0.50%–0.99% | 1.00%–1.99% | >=2.00% |
| 4/14/16 – 10/31/16 | 65 | 29 | 12 | 2 |
| 11/1/16 – 10/31/17 | 127 | 85 | 23 | 0 |
| 11/1/17 – 4/30/18 | 67 | 19 | 7 | 0 |
| Number of Days Bid/Ask Midpoint Below NAV |
| For the Period | 0.00%–0.49% | 0.50%–0.99% | 1.00%–1.99% | >=2.00% |
| 4/14/16 – 10/31/16 | 21 | 8 | 2 | 1 |
| 11/1/16 – 10/31/17 | 16 | 1 | 0 | 0 |
| 11/1/17 – 4/30/18 | 29 | 1 | 0 | 0 |
Fund Performance Overview (Unaudited) (Continued)
First Trust RiverFront Dynamic Developed International ETF (RFDI)
The investment objective of First Trust RiverFront Dynamic Developed International ETF (the “Fund”) is to provide capital appreciation. Under normal market conditions, the Fund will seek to achieve its investment objective by investing at least 80% of its net assets (including investment borrowings) in a portfolio of equity securities of developed market companies, including through investments in common stock, depositary receipts, and common and preferred shares of real estate investment trusts (“REITs”), and forward foreign currency exchange contracts and currency spot transactions used to hedge the Fund’s exposure to the currencies in which the equity securities of such developed market companies are denominated (each, a “Developed Market currency” and, collectively, the “Developed Market currencies”). Developed market companies are those companies (i) whose securities are traded principally on a stock exchange in a developed market country, (ii) that have a primary business office in a developed market country, or (iii) that have at least 50% of their assets in, or derive at least 50% of their revenues or profits from, a developed market country. Developed market countries currently include the countries comprising the Morgan Stanley Capital International World Index or countries considered to be developed by the World Bank, the International Finance Corporation or the United Nations. Under normal market conditions, the Fund will invest in at least three countries and at least 40% of its net assets in countries other than the United States. The Fund is non-diversified. Shares of the Fund are listed on The Nasdaq Stock Market LLC under the ticker symbol “RFDI.”
The Fund will utilize a dynamic currency hedging strategy through the use of forward foreign currency exchange contracts and currency spot transactions to hedge up to 100% of the Fund’s currency exposure. As a result of such dynamic currency hedging strategy, the portion of the Fund’s portfolio securities which are subject to currency hedging transactions may vary widely, from 0% to 100% of the portfolio securities. A forward contract on foreign currency is an obligation to purchase or sell a specific currency at a future date, which may be any fixed number of days agreed upon by the parties from the date of the contract, at a price set on the date of the contract. A forward foreign currency exchange contract may reduce the Fund’s exposure to changes in the value of the currency it will deliver and increase its exposure to changes in the value of the currency it will receive for the duration of the contract. The effect on the value of the Fund is similar to selling securities denominated in one currency and purchasing securities denominated in another currency. The Fund also may enter into currency spot transactions as part of its dynamic currency hedging strategy. A currency spot transaction is an agreement between two parties to buy or sell a specific currency for delivery on a date that is typically two business days from the date of the agreement, as opposed to a date set in the future. The underlying currencies of the forward foreign currency exchange contracts and currency spot transactions included in the Fund’s policy relating to the investment of at least 80% of its net assets (including investment borrowings) will be limited to Developed Market currencies.
| Performance | | | | |
| | | | Average Annual
Total Returns | Cumulative
Total Returns |
| | 6 Months Ended
4/30/18 | 1 Year Ended
4/30/18 | Inception (4/13/16)
to 4/30/18 | Inception (4/13/16)
to 4/30/18 |
| Fund Performance | | | | |
| NAV | 0.79% | 11.86% | 14.11% | 31.00% |
| Market Price | 0.64% | 11.85% | 14.28% | 31.41% |
| Index Performance | | | | |
| MSCI EAFE Index | 3.41% | 14.51% | 13.58% | 29.77% |
(See Notes to Fund Performance Overview Page 11.)
Fund Performance Overview (Unaudited) (Continued)
First Trust RiverFront Dynamic Developed International ETF (RFDI) (Continued)
| Sector Allocation | % of Total
Investments |
| Financials | 19.0% |
| Consumer Discretionary | 13.8 |
| Industrials | 13.1 |
| Materials | 12.1 |
| Information Technology | 11.6 |
| Consumer Staples | 9.7 |
| Health Care | 7.7 |
| Energy | 5.9 |
| Telecommunication Services | 2.9 |
| Utilities | 2.6 |
| Real Estate | 1.6 |
| Total | 100.0% |
| Top Ten Holdings | % of Total
Investments |
| Novartis AG | 1.6% |
| LVMH Moet Hennessy Louis Vuitton SE | 1.3 |
| Nestle S.A. | 1.3 |
| Royal Dutch Shell PLC, Class A | 1.3 |
| Diageo PLC | 1.2 |
| Allianz SE | 1.2 |
| TOTAL S.A. | 1.1 |
| HSBC Holdings PLC | 1.0 |
| BNP Paribas S.A. | 0.9 |
| ASML Holding N.V. | 0.9 |
| Total | 11.8% |
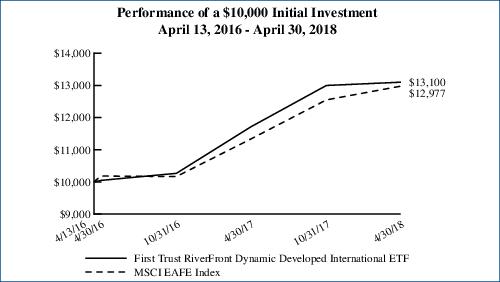
Performance figures assume reinvestment of all distributions and do not reflect the deduction of taxes that a shareholder would pay on Fund distributions or the redemption or sale of Fund shares. An index is a statistical composite that tracks a specified financial market or sector. Unlike the Fund, the index does not actually hold a portfolio of securities and therefore does not incur the expenses incurred by the Fund. These expenses negatively impact the performance of the Fund. The Fund’s past performance does not predict future performance.
Frequency Distribution of Discounts and Premiums
Bid/Ask Midpoint vs. NAV through April 30, 2018
The following Frequency Distribution of Discounts and Premiums charts are provided to show the frequency at which the bid/ask midpoint price for the Fund was at a discount or premium to the daily NAV. The following tables are for comparative purposes only and represent the period April 14, 2016 (commencement of trading) through April 30, 2018. Shareholders may pay more than NAV when they buy Fund shares and receive less than NAV when they sell those shares because shares are bought and sold at current market price. Data presented represents past performance and cannot be used to predict future results.
| Number of Days Bid/Ask Midpoint At/Above NAV |
| For the Period | 0.00%–0.49% | 0.50%–0.99% | 1.00%–1.99% | >=2.00% |
| 4/14/16 – 10/31/16 | 46 | 70 | 18 | 2 |
| 11/1/16 – 10/31/17 | 157 | 81 | 7 | 0 |
| 11/1/17 – 4/30/18 | 92 | 15 | 0 | 0 |
| Number of Days Bid/Ask Midpoint Below NAV | | | | |
| For the Period | 0.00%–0.49% | 0.50%–0.99% | 1.00%–1.99% | >=2.00% |
| 4/14/16 – 10/31/16 | 4 | 0 | 0 | 0 |
| 11/1/16 – 10/31/17 | 7 | 0 | 0 | 0 |
| 11/1/17 – 4/30/18 | 15 | 1 | 0 | 0 |
Fund Performance Overview (Unaudited) (Continued)
First Trust RiverFront Dynamic Europe ETF (RFEU)
The investment objective of First Trust RiverFront Dynamic Europe ETF (the “Fund”) is to provide capital appreciation. Under normal market conditions, the Fund will seek to achieve its investment objective by investing at least 80% of its net assets (including investment borrowings) in a portfolio of equity securities of European companies, including through investments in common stock, depositary receipts, and common and preferred shares of real estate investment trusts (“REITs”), and forward foreign currency exchange contracts and currency spot transactions used to hedge the Fund’s exposure to the currencies in which the equity securities of such European companies are denominated (each, a “European currency” and, collectively, the “European currencies”). European companies are those companies (i) whose securities are traded principally on a stock exchange in a European country, (ii) that have a primary business office in a European country, or (iii) that have at least 50% of their assets in, or derive at least 50% of their revenues or profits from, a European country. The Fund considers a European country to be any member country of the European Union or any country included in the FTSE Developed Europe Index or the FTSE Emerging Europe All Cap Index. The Fund will generally focus its European company investments in Austria, Belgium, Denmark, Finland, France, Germany, Ireland, Italy, Luxembourg, the Netherlands, Norway, Portugal, Spain, Sweden, Switzerland and/or the United Kingdom. The Fund is non-diversified. Shares of the Fund are listed on The Nasdaq Stock Market LLC under the ticker symbol “RFEU.”
The Fund will utilize a dynamic currency hedging strategy through the use of forward foreign currency exchange contracts and currency spot transactions to hedge up to 100% of the Fund’s currency exposure. As a result of such dynamic currency hedging strategy, the portion of the Fund’s portfolio securities which are subject to currency hedging transactions may vary widely, from 0% to 100% of the portfolio securities. A forward contract on foreign currency is an obligation to purchase or sell a specific currency at a future date, which may be any fixed number of days agreed upon by the parties from the date of the contract, at a price set on the date of the contract. A forward foreign currency exchange contract may reduce the Fund’s exposure to changes in the value of the currency it will deliver and increase its exposure to changes in the value of the currency it will receive for the duration of the contract. The effect on the value of the Fund is similar to selling securities denominated in one currency and purchasing securities denominated in another currency. The Fund also may enter into currency spot transactions as part of its dynamic currency hedging strategy. A currency spot transaction is an agreement between two parties to buy or sell a specific currency for delivery on a date that is typically two business days from the date of the agreement, as opposed to a date set in the future. The underlying currencies of the forward foreign currency exchange contracts and currency spot transactions included in the Fund’s policy relating to the investment of at least 80% of its net assets (including investment borrowings) will be limited to European currencies.
| Performance | | | | |
| | | | Average Annual
Total Returns | Cumulative
Total Returns |
| | 6 Months Ended
4/30/18 | 1 Year Ended
4/30/18 | Inception (4/13/16)
to 4/30/18 | Inception (4/13/16)
to 4/30/18 |
| Fund Performance | | | | |
| NAV | 0.72% | 12.20% | 16.08% | 35.68% |
| Market Price | 0.72% | 12.13% | 16.25% | 36.10% |
| Index Performance | | | | |
| MSCI Europe Index | 2.47% | 13.65% | 12.75% | 27.85% |
(See Notes to Fund Performance Overview Page 11.)
Fund Performance Overview (Unaudited) (Continued)
First Trust RiverFront Dynamic Europe ETF (RFEU) (Continued)
| Sector Allocation | % of Total
Investments |
| Financials | 18.0% |
| Consumer Discretionary | 13.8 |
| Industrials | 13.3 |
| Materials | 12.3 |
| Consumer Staples | 10.7 |
| Information Technology | 9.4 |
| Health Care | 9.3 |
| Energy | 7.3 |
| Utilities | 4.0 |
| Telecommunication Services | 1.2 |
| Real Estate | 0.7 |
| Total | 100.0% |
| Top Ten Holdings | % of Total
Investments |
| Novartis AG | 2.4% |
| LVMH Moet Hennessy Louis Vuitton SE | 2.1 |
| Nestle S.A. | 2.1 |
| Royal Dutch Shell PLC, Class A | 2.0 |
| Allianz SE | 1.9 |
| Diageo PLC | 1.8 |
| TOTAL S.A. | 1.7 |
| HSBC Holdings PLC | 1.5 |
| BNP Paribas S.A. | 1.4 |
| ASML Holding N.V. | 1.4 |
| Total | 18.3% |
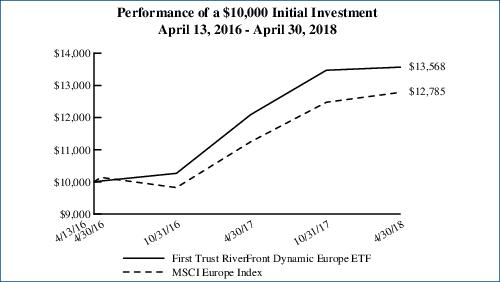
Performance figures assume reinvestment of all distributions and do not reflect the deduction of taxes that a shareholder would pay on Fund distributions or the redemption or sale of Fund shares. An index is a statistical composite that tracks a specified financial market or sector. Unlike the Fund, the index does not actually hold a portfolio of securities and therefore does not incur the expenses incurred by the Fund. These expenses negatively impact the performance of the Fund. The Fund’s past performance does not predict future performance.
Frequency Distribution of Discounts and Premiums
Bid/Ask Midpoint vs. NAV through April 30, 2018
The following Frequency Distribution of Discounts and Premiums charts are provided to show the frequency at which the bid/ask midpoint price for the Fund was at a discount or premium to the daily NAV. The following tables are for comparative purposes only and represent the period April 14, 2016 (commencement of trading) through April 30, 2018. Shareholders may pay more than NAV when they buy Fund shares and receive less than NAV when they sell those shares because shares are bought and sold at current market price. Data presented represents past performance and cannot be used to predict future results.
| Number of Days Bid/Ask Midpoint At/Above NAV |
| For the Period | 0.00%–0.49% | 0.50%–0.99% | 1.00%–1.99% | >=2.00% |
| 4/14/16 – 10/31/16 | 39 | 35 | 2 | 0 |
| 11/1/16 – 10/31/17 | 134 | 103 | 8 | 0 |
| 11/1/17 – 4/30/18 | 108 | 8 | 0 | 0 |
| Number of Days Bid/Ask Midpoint Below NAV |
| For the Period | 0.00%–0.49% | 0.50%–0.99% | 1.00%–1.99% | >=2.00% |
| 4/14/16 – 10/31/16 | 56 | 8 | 0 | 0 |
| 11/1/16 – 10/31/17 | 7 | 0 | 0 | 0 |
| 11/1/17 – 4/30/18 | 7 | 0 | 0 | 0 |
Fund Performance Overview (Unaudited) (Continued)
First Trust RiverFront Dynamic Emerging Markets ETF (RFEM)
The investment objective of First Trust RiverFront Dynamic Emerging Markets ETF (the “Fund”) is to provide capital appreciation. Under normal market conditions, the Fund will seek to achieve its investment objective by investing at least 80% of its net assets (including investment borrowings) in a portfolio of equity securities of emerging market companies, including through investments in common stock, depositary receipts, and common and preferred shares of real estate investment trusts (“REITs”), and forward foreign currency exchange contracts and currency spot transactions used to hedge the Fund’s exposure to the currencies in which the equity securities of such emerging market companies are denominated (each, an “Emerging Market currency” and, collectively, the “Emerging Market currencies”). The Fund considers an emerging market company to be one (i) domiciled or with a principal place of business or primary securities trading market in an emerging market country, or (ii) that derives a substantial portion of its total revenues or profits from emerging market countries. The Fund considers an emerging market country to be any country whose issuers are included in the Morgan Stanley Capital International Emerging Markets Index and/or those countries considered to be developing by the World Bank, the International Finance Corporation or the United Nations. The Fund will generally focus its emerging market company investments in Brazil, Chile, China, Colombia, the Czech Republic, Egypt, Greece, Hungary, India, Indonesia, Malaysia, Mexico, Morocco, Nigeria, Peru, the Philippines, Poland, Qatar, Russia, South Africa, South Korea, Taiwan, Thailand, Turkey and/or the United Arab Emirates. The Fund is non-diversified. Shares of the Fund are listed on The Nasdaq Stock Exchange LLC under the ticker symbol “RFEM.”
The Fund will utilize a dynamic currency hedging strategy through the use of forward foreign currency exchange contracts and currency spot transactions to hedge up to 100% of the Fund’s currency exposure. As a result of such dynamic currency hedging strategy, the portion of the Fund’s portfolio securities which are subject to currency hedging transactions may vary widely, from 0% to 100% of the portfolio securities. A forward contract on foreign currency is an obligation to purchase or sell a specific currency at a future date, which may be any fixed number of days agreed upon by the parties from the date of the contract, at a price set on the date of the contract. A forward foreign currency exchange contract may reduce the Fund’s exposure to changes in the value of the currency it will deliver and increase its exposure to changes in the value of the currency it will receive for the duration of the contract. The effect on the value of the Fund is similar to selling securities denominated in one currency and purchasing securities denominated in another currency. The Fund also may enter into currency spot transactions as part of its dynamic currency hedging strategy. A currency spot transaction is an agreement between two parties to buy or sell a specific currency for delivery on a date that is typically two business days from the date of the agreement, as opposed to a date set in the future. The underlying currencies of the forward foreign currency exchange contracts and currency spot transactions included in the Fund’s policy relating to the investment of at least 80% of its net assets (including investment borrowings) will be limited to Emerging Market currencies.
| Performance | | | | |
| | | | Average Annual
Total Returns | Cumulative
Total Returns |
| | 6 Months Ended
4/30/18 | 1 Year Ended
4/30/18 | Inception (6/14/16)
to 4/30/18 | Inception (6/14/16)
to 4/30/18 |
| Fund Performance | | | | |
| NAV | 6.76% | 22.83% | 26.15% | 54.65% |
| Market Price | 6.06% | 22.23% | 26.09% | 54.52% |
| Index Performance | | | | |
| MSCI Emerging Markets Index | 4.80% | 21.71% | 24.64% | 51.20% |
(See Notes to Fund Performance Overview Page 11.)
Fund Performance Overview (Unaudited) (Continued)
First Trust RiverFront Dynamic Emerging Markets ETF (RFEM) (Continued)
| Sector Allocation | % of Total
Investments |
| Information Technology | 32.0% |
| Financials | 21.0 |
| Consumer Discretionary | 11.4 |
| Industrials | 10.5 |
| Energy | 8.2 |
| Health Care | 4.0 |
| Consumer Staples | 3.6 |
| Real Estate | 3.3 |
| Telecommunication Services | 2.4 |
| Materials | 2.4 |
| Utilities | 1.2 |
| Total | 100.0% |
| Top Ten Holdings | % of Total
Investments |
| Tencent Holdings Ltd. | 5.8% |
| Samsung Electronics Co., Ltd. | 5.1 |
| Alibaba Group Holding Ltd., ADR | 3.4 |
| Taiwan Semiconductor Manufacturing Co., Ltd. | 3.4 |
| China Construction Bank Corp., Class H | 2.1 |
| ElSewedy Electric Co. | 2.0 |
| Industrial & Commercial Bank of China Ltd., Class H | 1.9 |
| Bank of China Ltd., Class H | 1.6 |
| Naspers Ltd. | 1.6 |
| SK Hynix, Inc. | 1.5 |
| Total | 28.4% |
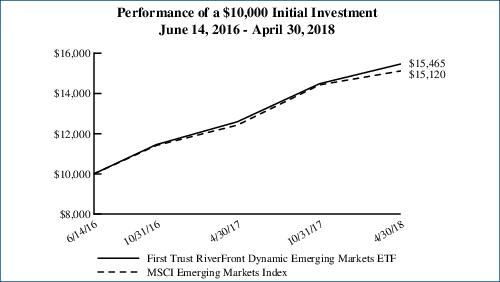
Performance figures assume reinvestment of all distributions and do not reflect the deduction of taxes that a shareholder would pay on Fund distributions or the redemption or sale of Fund shares. An index is a statistical composite that tracks a specified financial market or sector. Unlike the Fund, the index does not actually hold a portfolio of securities and therefore does not incur the expenses incurred by the Fund. These expenses negatively impact the performance of the Fund. The Fund’s past performance does not predict future performance.
Frequency Distribution of Discounts and Premiums
Bid/Ask Midpoint vs. NAV through April 30, 2018
The following Frequency Distribution of Discounts and Premiums charts are provided to show the frequency at which the bid/ask midpoint price for the Fund was at a discount or premium to the daily NAV. The following tables are for comparative purposes only and represent the period June 15, 2016 (commencement of trading) through April 30, 2018. Shareholders may pay more than NAV when they buy Fund shares and receive less than NAV when they sell those shares because shares are bought and sold at current market price. Data presented represents past performance and cannot be used to predict future results.
| Number of Days Bid/Ask Midpoint At/Above NAV |
| For the Period | 0.00%–0.49% | 0.50%–0.99% | 1.00%–1.99% | >=2.00% |
| 6/15/16 – 10/31/17 | 31 | 40 | 16 | 1 |
| 11/1/16 – 10/31/17 | 130 | 87 | 8 | 0 |
| 11/1/16 – 4/30/18 | 53 | 48 | 4 | 0 |
| Number of Days Bid/Ask Midpoint Below NAV |
| For the Period | 0.00%–0.49% | 0.50%–0.99% | 1.00%–1.99% | >=2.00% |
| 6/15/16 – 10/31/17 | 7 | 2 | 0 | 0 |
| 11/1/16 – 10/31/17 | 25 | 1 | 1 | 0 |
| 11/1/16 – 4/30/18 | 16 | 2 | 0 | 0 |
Notes to Fund Performance Overview (Unaudited)
Total returns for the periods since inception are calculated from the inception date of each Fund. “Average Annual Total Returns” represent the average annual change in value of an investment over the periods indicated. “Cumulative Total Returns” represent the total change in value of an investment over the periods indicated.
Each Fund’s per share net asset value (“NAV”) is the value of one share of the Fund and is computed by dividing the value of all assets of the Fund (including accrued interest and dividends), less all liabilities (including accrued expenses and dividends declared but unpaid), by the total number of outstanding shares. The price used to calculate market return (“Market Price”) is determined by using the midpoint between the highest bid and the lowest offer on the stock exchange on which shares of the Fund are listed for trading as of the time that the Fund’s NAV is calculated. Since shares of each Fund did not trade in the secondary market until after the Fund’s inception, for the period from inception to the first day of secondary market trading in shares of the Fund, the NAV of each Fund is used as a proxy for the secondary market trading price to calculate market returns. NAV and market returns assume that all distributions have been reinvested in each Fund at NAV and Market Price, respectively.
An index is a statistical composite that tracks a specified financial market or sector. Unlike each Fund, the indices do not actually hold a portfolio of securities and therefore do not incur the expenses incurred by each Fund. These expenses negatively impact the performance of each Fund. Also, market returns do not include brokerage commissions that may be payable on secondary market transactions. If brokerage commissions were included, market returns would be lower. The total returns presented reflect the reinvestment of dividends on securities in the indices. The returns presented do not reflect the deduction of taxes that a shareholder would pay on Fund distributions or the redemption or sale of Fund shares. The investment return and principal value of shares of each Fund will vary with changes in market conditions. Shares of each Fund may be worth more or less than their original cost when they are redeemed or sold in the market. Each Fund’s past performance is no guarantee of future performance.
Portfolio Management
First Trust Exchange-Traded Fund III
First Trust RiverFront Dynamic International ETFs
Semi-Annual Report
April 30, 2018 (Unaudited)
Advisor
First Trust Advisors L.P. (“First Trust”) is the investment advisor. First Trust is responsible for the ongoing monitoring of each Fund’s investment portfolio, managing each Fund’s business affairs and providing certain administrative services necessary for the management of each Fund.
Sub-Advisor
RiverFront Investment Group, LLC
RiverFront Investment Group, LLC is an SEC-registered investment advisor located in Richmond, Virginia. It is majority owned by its employees, and Baird Financial Corporation is a minority owner of RiverFront Investment Holding Group, LLC. The firm provides asset management services to a series of global tactical asset allocation portfolios and registered investment companies, including mutual funds and exchange-traded products.
Portfolio Management Team
Adam Grossman, CFA – Global Equity Chief Investment Officer
Rebecca Felton – Chief Risk Officer
Chris Konstantinos, CFA – Chief Investment Strategist
Scott Hays – Quantitative Portfolio Manager
First Trust Exchange-Traded Fund III
Understanding Your Fund Expenses
April 30, 2018 (Unaudited)
As a shareholder of First Trust RiverFront Dynamic Asia Pacific ETF, First Trust RiverFront Dynamic Developed International ETF, First Trust RiverFront Dynamic Europe ETF or First Trust RiverFront Dynamic Emerging Markets ETF (each a “Fund” and collectively, the “Funds”), you incur two types of costs: (1) transaction costs; and (2) ongoing costs, including management fees, distribution and/or service (12b-1) fees, if any, and other Fund expenses. This Example is intended to help you understand your ongoing costs of investing in the Funds and to compare these costs with the ongoing costs (in U.S. dollars) of investing in other funds.
The Example is based on an investment of $1,000 invested at the beginning of the period and held through the six-month period ended April 30, 2018.
Actual Expenses
The first line in the following table provides information about actual account values and actual expenses. You may use the information in this line, together with the amount you invested, to estimate the expenses that you paid over the period. Simply divide your account value by $1,000 (for example, an $8,600 account value divided by $1,000 = 8.6), then multiply the result by the number in the first line under the heading entitled “Expenses Paid During the Six-Month Period” to estimate the expenses you paid on your account during this six-month period.
Hypothetical Example for Comparison Purposes
The second line in the following table provides information about hypothetical account values and hypothetical expenses based on each Fund’s actual expense ratio and an assumed rate of return of 5% per year before expenses, which is not each Fund’s actual return. The hypothetical account values and expenses may not be used to estimate the actual ending account balance or expenses you paid for the period. You may use this information to compare the ongoing costs of investing in the Funds and other funds. To do so, compare this 5% hypothetical example with the 5% hypothetical examples that appear in the shareholder reports of the other funds.
Please note that the expenses shown in the table are meant to highlight your ongoing costs only and do not reflect any transactional costs such as brokerage commissions. Therefore, the second line in the table is useful in comparing ongoing costs only, and will not help you determine the relative total costs of owning different funds. In addition, if these transactional costs were included, your costs would have been higher.
| | Beginning
Account Value
November 1, 2017 | Ending
Account Value
April 30, 2018 | Annualized
Expense Ratio
Based on the
Six-Month
Period | Expenses Paid
During the
Six-Month
Period (a) |
| First Trust RiverFront Dynamic Asia Pacific ETF (RFAP) |
| Actual | $1,000.00 | $1,009.50 | 0.83% | $4.14 |
| Hypothetical (5% return before expenses) | $1,000.00 | $1,020.68 | 0.83% | $4.16 |
| First Trust RiverFront Dynamic Developed International ETF (RFDI) |
| Actual | $1,000.00 | $1,007.90 | 0.83% | $4.13 |
| Hypothetical (5% return before expenses) | $1,000.00 | $1,020.68 | 0.83% | $4.16 |
| First Trust RiverFront Dynamic Europe ETF (RFEU) |
| Actual | $1,000.00 | $1,007.20 | 0.83% | $4.13 |
| Hypothetical (5% return before expenses) | $1,000.00 | $1,020.68 | 0.83% | $4.16 |
| First Trust RiverFront Dynamic Emerging Markets ETF (RFEM) |
| Actual | $1,000.00 | $1,067.60 | 0.95% | $4.87 |
| Hypothetical (5% return before expenses) | $1,000.00 | $1,020.08 | 0.95% | $4.76 |
| (a) | Expenses are equal to the annualized expense ratios as indicated in the table multiplied by the average account value over the period (November 1, 2017 through April 30, 2018), multiplied by 181/365 (to reflect the six-month period). |
First Trust RiverFront Dynamic Asia Pacific ETF (RFAP)
Portfolio of Investments
April 30, 2018 (Unaudited)
| Shares | | Description | | Value |
| COMMON STOCKS (a) – 99.2% |
| | | Australia – 13.6% | | |
| 210,599 | | AMP Ltd. (b) | | $637,519 |
| 55,049 | | Australia & New Zealand Banking Group Ltd. (b) | | 1,106,606 |
| 17,255 | | BHP Billiton Ltd. (b) | | 402,546 |
| 15,112 | | Commonwealth Bank of Australia (b) | | 813,697 |
| 9,502 | | Flight Centre Travel Group Ltd. (b) | | 398,055 |
| 35,069 | | Iluka Resources Ltd. (b) | | 307,866 |
| 7,771 | | Macquarie Group Ltd. (b) | | 632,857 |
| 126,419 | | Metcash Ltd. (b) | | 341,219 |
| 46,144 | | National Australia Bank Ltd. (b) | | 1,003,126 |
| 45,341 | | OZ Minerals Ltd. (b) | | 312,897 |
| 13,321 | | Perpetual Ltd. (b) | | 401,876 |
| 77,165 | | Platinum Asset Management Ltd. (b) | | 327,323 |
| 114,939 | | Qantas Airways Ltd. (b) | | 497,086 |
| 91,459 | | Santos Ltd. (b) (c) | | 421,243 |
| 20,647 | | Westpac Banking Corp. (b) | | 443,507 |
| 151,719 | | Whitehaven Coal Ltd. (b) | | 523,167 |
| | | | | 8,570,590 |
| | | Bermuda – 0.7% | | |
| 7,000 | | Jardine Matheson Holdings Ltd. (b) | | 423,876 |
| | | Canada – 6.8% | | |
| 5,255 | | Bank of Nova Scotia (The) | | 323,007 |
| 149,022 | | Baytex Energy Corp. (c) | | 667,375 |
| 4,964 | | Canadian National Railway Co. | | 383,411 |
| 2,248 | | Canadian Pacific Railway Ltd. | | 410,188 |
| 17,855 | | CI Financial Corp. | | 375,748 |
| 22,513 | | First Quantum Minerals Ltd. | | 324,382 |
| 12,966 | | IGM Financial, Inc. | | 397,983 |
| 16,780 | | Power Corp. of Canada | | 398,737 |
| 12,421 | | Power Financial Corp. | | 322,243 |
| 2,575 | | Shopify, Inc., Class A (c) | | 344,971 |
| 12,154 | | Teck Resources Ltd., Class B | | 305,092 |
| | | | | 4,253,137 |
| | | Cayman Islands – 5.7% | | |
| 29,771 | | AAC Technologies Holdings, Inc. (b) | | 427,296 |
| 35,881 | | ASM Pacific Technology Ltd. (b) | | 491,689 |
| 46,000 | | CK Hutchison Holdings Ltd. (b) | | 543,944 |
| 9,624 | | Tencent Holdings Ltd. (b) | | 473,144 |
| 196,665 | | Tingyi Cayman Islands Holding Corp. | | 372,851 |
| 394,996 | | WH Group Ltd. (b) (d) | | 408,930 |
| 232,652 | | Wynn Macau Ltd. (b) | | 859,733 |
| | | | | 3,577,587 |
| | | Hong Kong – 3.3% | | |
| 124,870 | | Hang Lung Group Ltd. (b) | | 377,171 |
| 1,070,636 | | PCCW Ltd. (b) | | 661,816 |
| 56,336 | | Swire Pacific Ltd., Class A (b) | | 556,674 |
| Shares | | Description | | Value |
|
| | | Hong Kong (Continued) | | |
| 139,460 | | Wharf Holdings (The) Ltd. (b) | | $463,964 |
| | | | | 2,059,625 |
| | | Japan – 65.3% | | |
| 8,900 | | Aisin Seiki Co., Ltd. (b) | | 482,157 |
| 17,380 | | Aozora Bank Ltd. (b) | | 701,137 |
| 10,100 | | Asahi Glass Co., Ltd. (b) | | 419,162 |
| 16,800 | | Asahi Group Holdings Ltd. (b) | | 849,841 |
| 49,800 | | Astellas Pharma, Inc. (b) | | 728,387 |
| 21,300 | | Canon, Inc. (b) | | 732,703 |
| 4,300 | | Central Japan Railway Co. (b) | | 861,653 |
| 8,700 | | Chugai Pharmaceutical Co., Ltd. (b) | | 458,833 |
| 8,900 | | Coca-Cola Bottlers Japan Holdings, Inc. (b) | | 382,784 |
| 19,900 | | Credit Saison Co., Ltd. (b) | | 356,399 |
| 30,700 | | Daicel Corp. (b) | | 354,225 |
| 16,600 | | Dai-ichi Life Holdings, Inc. (b) | | 329,552 |
| 16,200 | | Daiichi Sankyo Co., Ltd. (b) | | 554,453 |
| 78,000 | | Daiwa Securities Group, Inc. (b) | | 478,494 |
| 2,600 | | Disco Corp. (b) | | 455,723 |
| 7,300 | | Don Quijote Holdings Co., Ltd (b) | | 393,012 |
| 7,200 | | East Japan Railway Co. (b) | | 691,690 |
| 4,400 | | FamilyMart UNY Holdings Co., Ltd. (b) | | 428,261 |
| 19,000 | | Haseko Corp. (b) | | 298,863 |
| 2,700 | | Hisamitsu Pharmaceutical Co., Inc. (b) | | 209,860 |
| 89,000 | | Hitachi Ltd. (b) | | 649,572 |
| 20,600 | | Honda Motor Co., Ltd. (b) | | 708,351 |
| 9,100 | | House Foods Group, Inc. (b) | | 320,495 |
| 34,000 | | Ishihara Sangyo Kaisha Ltd. (b) (c) | | 390,642 |
| 8,000 | | Jafco Co., Ltd. (b) | | 350,864 |
| 16,500 | | Japan Airlines Co., Ltd. (b) | | 651,164 |
| 19,000 | | Japan Petroleum Exploration Co., Ltd. (b) | | 494,426 |
| 71,000 | | Kajima Corp. (b) | | 684,020 |
| 39,000 | | KDDI Corp. (b) | | 1,046,901 |
| 1,900 | | Keyence Corp. (b) | | 1,158,581 |
| 49,800 | | Kobe Steel Ltd. (b) | | 512,271 |
| 2,100 | | Kose Corp. (b) | | 388,073 |
| 10,000 | | M3, Inc. (b) | | 376,858 |
| 8,100 | | Matsumotokiyoshi Holdings Co., Ltd. (b) | | 360,824 |
| 57,300 | | Mazda Motor Corp. (b) | | 796,694 |
| 49,400 | | Mitsubishi Chemical Holdings Corp. (b) | | 467,304 |
| 19,300 | | Mitsubishi Gas Chemical Co., Inc. (b) | | 452,305 |
| 10,900 | | Mitsubishi Materials Corp. (b) | | 331,766 |
| 29,300 | | Mitsubishi UFJ Financial Group, Inc. (b) | | 196,349 |
| 467,000 | | Mizuho Financial Group, Inc. (b) | | 844,914 |
| 31,600 | | NET One Systems Co., Ltd. (b) | | 508,591 |
Page 14
See Notes to Financial Statements
First Trust RiverFront Dynamic Asia Pacific ETF (RFAP)
Portfolio of Investments (Continued)
April 30, 2018 (Unaudited)
| Shares | | Description | | Value |
| COMMON STOCKS (a) (Continued) |
| | | Japan (Continued) | | |
| 39,000 | | Nexon Co., Ltd. (b) (c) | | $567,504 |
| 40,300 | | NHK Spring Co., Ltd. (b) | | 445,341 |
| 2,500 | | Nintendo Co., Ltd. (b) | | 1,050,441 |
| 25,700 | | Nippon Paper Industries Co., Ltd. (b) | | 492,211 |
| 56,600 | | Nippon Sheet Glass Co., Ltd. (b) | | 462,052 |
| 17,400 | | Nippon Telegraph & Telephone Corp. (b) | | 825,720 |
| 50,700 | | Nissan Motor Co., Ltd. (b) | | 533,388 |
| 31,300 | | Nisshin Steel Co., Ltd. (b) | | 414,210 |
| 16,700 | | NOK Corp. (b) | | 341,537 |
| 89,000 | | NTN Corp. (b) | | 391,463 |
| 32,100 | | NTT DOCOMO, Inc. (b) | | 829,272 |
| 4,800 | | Obic Co., Ltd. (b) | | 402,054 |
| 105,000 | | Oji Holdings Corp. (b) | | 738,633 |
| 33,600 | | ORIX Corp. (b) | | 589,305 |
| 7,700 | | Otsuka Corp. (b) | | 356,798 |
| 20,800 | | Panasonic Corp. (b) | | 307,989 |
| 9,000 | | Pola Orbis Holdings, Inc. (b) | | 392,666 |
| 23,600 | | Recruit Holdings Co., Ltd. (b) | | 544,144 |
| 9,500 | | Shiseido Co., Ltd. (b) | | 616,370 |
| 4,600 | | SoftBank Group Corp. (b) | | 351,480 |
| 11,900 | | Sompo Holdings, Inc. (b) | | 498,254 |
| 21,500 | | Sony Corp. (b) | | 1,004,182 |
| 17,100 | | Subaru Corp. (b) | | 573,985 |
| 23,600 | | Sumitomo Forestry Co., Ltd. (b) | | 391,058 |
| 9,700 | | Sumitomo Metal Mining Co., Ltd. (b) | | 413,805 |
| 24,400 | | Sumitomo Mitsui Financial Group, Inc. (b) | | 1,016,950 |
| 15,000 | | Suzuki Motor Corp. (b) | | 806,218 |
| 21,300 | | Taiheiyo Cement Corp. (b) | | 804,287 |
| 13,100 | | Takeda Pharmaceutical Co., Ltd. (b) | | 551,642 |
| 18,800 | | Teijin Ltd. (b) | | 353,456 |
| 15,700 | | Tokai Rika Co., Ltd. (b) | | 313,640 |
| 4,300 | | Tokyo Electron Ltd. (b) | | 825,828 |
| 13,000 | | Tokyo Seimitsu Co., Ltd. (b) | | 493,758 |
| 11,100 | | Yaskawa Electric Corp. (b) | | 450,633 |
| | | | | 41,008,428 |
| | | Singapore – 3.8% | | |
| 1,464,800 | | Hutchison Port Holdings Trust (b) | | 488,366 |
| 67,800 | | Singapore Airlines Ltd. (b) | | 553,205 |
| 92,700 | | Singapore Exchange Ltd. (b) | | 537,569 |
| 16,400 | | Venture Corp Ltd. (b) | | 256,514 |
| 410,500 | | Yanlord Land Group Ltd. (b) | | 523,457 |
| | | | | 2,359,111 |
| | | Total Investments – 99.2% | | 62,252,354 |
| | | (Cost $62,574,430) (e) | | |
| | | Net Other Assets and Liabilities – 0.8% | | 521,941 |
| | | Net Assets – 100.0% | | $62,774,295 |
|
| (a) | Portfolio securities are categorized based upon their country of incorporation. For a breakdown of the portfolio securities by sector, please see the Fund Performance Overview. |
| (b) | This security is fair valued by the Advisor’s Pricing Committee in accordance with procedures adopted by the Trust’s Board of Trustees and in accordance with provisions of the Investment Company Act of 1940, as amended. At April 30, 2018, securities noted as such are valued at $57,626,366 or 91.8% of net assets. Certain of these securities are fair valued using a factor provided by a third-party pricing service due to the change in value between the foreign markets’ close and the New York Stock Exchange (“NYSE”) close exceeding a certain threshold. On days when this threshold is not exceeded, these securities are typically valued at the last sale price on the exchange on which they are principally traded. |
| (c) | Non-income producing security. |
| (d) | This security is restricted in the U.S. and cannot be offered for public sale without first being registered under the Securities Act of 1933, as amended. This security is not restricted on the foreign exchange where it trades freely without any additional registration. As such, it does not require the additional disclosure required of restricted securities. |
| (e) | Aggregate cost for financial reporting purposes approximates the aggregate cost for federal income tax purposes. As of April 30, 2018, the aggregate gross unrealized appreciation for all investments in which there was an excess of value over tax cost was $1,845,222 and the aggregate gross unrealized depreciation for all investments in which there was an excess of tax cost over value was $2,167,298. The net unrealized depreciation was $322,076. |
Valuation Inputs
A summary of the inputs used to value the Fund’s investments as of April 30, 2018 is as follows (see Note 2A - Portfolio Valuation in the Notes to Financial Statements):
| | Total
Value at
4/30/2018 | Level 1
Quoted
Prices | Level 2
Significant
Observable
Inputs | Level 3
Significant
Unobservable
Inputs |
| Common Stocks: | | | | |
| Canada | $ 4,253,137 | $ 4,253,137 | $ — | $ — |
| Cayman Islands | 3,577,587 | 372,851 | 3,204,736 | — |
| Other Country Categories* | 54,421,630 | — | 54,421,630 | — |
| Total Investments | $ 62,252,354 | $ 4,625,988 | $ 57,626,366 | $— |
| * | See Portfolio of Investments for country breakout. |
All transfers in and out of the Levels during the period are assumed to occur on the last day of the period at their current value. As of April 30, 2018, the Fund transferred common stocks valued at $11,504,447 from Level 1 to Level 2 of the fair value hierarchy. The common stocks that transferred from Level 1 to Level 2 did so as a result of being fair valued using a factor provided by a third-party pricing service due to the change in
See Notes to Financial Statements
Page 15
First Trust RiverFront Dynamic Asia Pacific ETF (RFAP)
Portfolio of Investments (Continued)
April 30, 2018 (Unaudited)
value between the foreign markets’ close and the NYSE close on the last business day of the period exceeding a certain threshold. Previously, these common stocks were valued based on quoted prices.
Currency Exposure
Diversification | % of Total
Investments |
| JPY | 65.9% |
| AUD | 13.8 |
| HKD | 9.0 |
| CAD | 6.8 |
| SGD | 3.0 |
| USD | 1.5 |
| Total | 100.0% |
| Currency Abbreviations |
| AUD | Australian Dollar |
| CAD | Canadian Dollar |
| HKD | Hong Kong Dollar |
| JPY | Japanese Yen |
| SGD | Singapore Dollar |
| USD | United States Dollar |
Page 16
See Notes to Financial Statements
First Trust RiverFront Dynamic Developed International ETF (RFDI)
Portfolio of Investments
April 30, 2018 (Unaudited)
| Shares | | Description | | Value |
| COMMON STOCKS (a) – 99.1% |
| | | Australia – 4.8% | | |
| 797,129 | | AMP Ltd. (b) | | $2,413,044 |
| 208,361 | | Australia & New Zealand Banking Group Ltd. (b) | | 4,188,515 |
| 65,310 | | BHP Billiton Ltd. (b) | | 1,523,633 |
| 57,199 | | Commonwealth Bank of Australia (b) | | 3,079,848 |
| 35,965 | | Flight Centre Travel Group Ltd. (b) | | 1,506,634 |
| 132,737 | | Iluka Resources Ltd. (b) | | 1,165,281 |
| 29,414 | | Macquarie Group Ltd. (b) | | 2,395,425 |
| 478,503 | | Metcash Ltd. (b) | | 1,291,532 |
| 174,659 | | National Australia Bank Ltd. (b) | | 3,796,920 |
| 171,617 | | OZ Minerals Ltd. (b) | | 1,184,324 |
| 50,420 | | Perpetual Ltd. (b) | | 1,521,101 |
| 292,073 | | Platinum Asset Management Ltd. (b) | | 1,238,933 |
| 435,050 | | Qantas Airways Ltd. (b) | | 1,881,496 |
| 346,178 | | Santos Ltd. (b) (c) | | 1,594,432 |
| 78,149 | | Westpac Banking Corp. (b) | | 1,678,677 |
| 574,267 | | Whitehaven Coal Ltd. (b) | | 1,980,222 |
| | | | | 32,440,017 |
| | | Austria – 0.3% | | |
| 40,627 | | voestalpine AG (b) | | 2,143,369 |
| | | Bermuda – 0.2% | | |
| 26,200 | | Jardine Matheson Holdings Ltd. (b) | | 1,586,508 |
| | | Canada – 2.4% | | |
| 19,870 | | Bank of Nova Scotia (The) | | 1,221,341 |
| 563,589 | | Baytex Energy Corp. (c) | | 2,523,959 |
| 18,772 | | Canadian National Railway Co. | | 1,449,916 |
| 8,506 | | Canadian Pacific Railway Ltd. | | 1,552,074 |
| 67,527 | | CI Financial Corp. | | 1,421,068 |
| 85,140 | | First Quantum Minerals Ltd. | | 1,226,753 |
| 49,021 | | IGM Financial, Inc. | | 1,504,667 |
| 63,481 | | Power Corp. of Canada | | 1,508,474 |
| 46,977 | | Power Financial Corp. | | 1,218,742 |
| 9,760 | | Shopify, Inc., Class A (c) | | 1,307,541 |
| 45,980 | | Teck Resources Ltd., Class B | | 1,154,200 |
| | | | | 16,088,735 |
| | | Cayman Islands – 2.0% | | |
| 113,125 | | AAC Technologies Holdings, Inc. (b) | | 1,623,657 |
| 135,807 | | ASM Pacific Technology Ltd. (b) | | 1,861,009 |
| 174,999 | | CK Hutchison Holdings Ltd. (b) | | 2,069,338 |
| 36,482 | | Tencent Holdings Ltd. (b) | | 1,793,562 |
| 741,764 | | Tingyi Cayman Islands Holding Corp. | | 1,406,286 |
| 1,494,745 | | WH Group Ltd. (b) (d) | | 1,547,473 |
| 879,799 | | Wynn Macau Ltd. (b) | | 3,251,176 |
| | | | | 13,552,501 |
| Shares | | Description | | Value |
|
| | | Denmark – 3.1% | | |
| 28,428 | | Chr Hansen Holding A.S. (b) | | $2,576,970 |
| 42,167 | | H Lundbeck A.S. (b) | | 2,442,805 |
| 41,382 | | Novo Nordisk A.S., Class B (b) | | 1,946,110 |
| 54,102 | | Orsted A.S. (b) (d) | | 3,561,837 |
| 24,230 | | Pandora A.S. (b) | | 2,691,689 |
| 7,178 | | Rockwool International A.S., Class B (b) | | 2,164,072 |
| 45,815 | | Topdanmark A.S. (b) | | 2,154,665 |
| 77,629 | | William Demant Holding
A.S. (b) (c) | | 3,025,335 |
| | | | | 20,563,483 |
| | | Finland – 1.1% | | |
| 58,513 | | Elisa OYJ (b) | | 2,586,421 |
| 39,637 | | Neste OYJ (b) | | 3,337,697 |
| 21,493 | | Sampo OYJ, Class A (b) | | 1,162,377 |
| | | | | 7,086,495 |
| | | France – 10.1% | | |
| 12,627 | | Aeroports de Paris (b) | | 2,779,497 |
| 253,451 | | Air France-KLM (b) (c) | | 2,483,927 |
| 79,951 | | BNP Paribas S.A. (b) | | 6,172,165 |
| 442,824 | | Bollore S.A. (b) | | 2,200,891 |
| 182,505 | | Credit Agricole S.A. (b) | | 3,005,375 |
| 1,202 | | Dassault Aviation S.A. (b) | | 2,396,601 |
| 24,342 | | Dassault Systemes SE (b) | | 3,154,481 |
| 214,470 | | Electricite de France S.A. (b) | | 3,009,812 |
| 24,835 | | Eurazeo S.A. (b) | | 2,181,427 |
| 29,543 | | Faurecia S.A. (b) | | 2,412,449 |
| 5,634 | | Hermes International (b) | | 3,643,170 |
| 17,469 | | Ipsen S.A. (b) | | 2,827,651 |
| 3,480 | | Kering S.A. (b) | | 2,013,168 |
| 10,310 | | L’Oreal S.A. (b) | | 2,482,543 |
| 25,783 | | LVMH Moet Hennessy Louis Vuitton SE (b) | | 8,972,797 |
| 124,166 | | Peugeot S.A. (b) | | 3,057,413 |
| 29,548 | | Renault S.A. (b) | | 3,202,459 |
| 115,430 | | TOTAL S.A. (b) | | 7,254,978 |
| 25,482 | | Ubisoft Entertainment S.A. (b) (c) | | 2,434,755 |
| 13,986 | | Wendel S.A. (b) | | 2,112,345 |
| | | | | 67,797,904 |
| | | Germany – 9.1% | | |
| 33,692 | | Allianz SE (b) | | 7,968,963 |
| 20,507 | | Bayer AG (b) | | 2,450,989 |
| 23,757 | | Beiersdorf AG (b) | | 2,687,826 |
| 40,306 | | Covestro AG (b) (d) | | 3,662,400 |
| 114,419 | | Deutsche Lufthansa AG (b) | | 3,325,615 |
| 307,669 | | E.ON SE (b) | | 3,368,904 |
| 66,643 | | Evonik Industries AG (b) | | 2,367,838 |
| 37,112 | | Fraport AG Frankfurt Airport Services Worldwide (b) | | 3,591,533 |
| 32,474 | | Fresenius Medical Care AG & Co., KGaA (b) | | 3,295,165 |
| 169,882 | | METRO AG (b) | | 2,457,699 |
See Notes to Financial Statements
Page 17
First Trust RiverFront Dynamic Developed International ETF (RFDI)
Portfolio of Investments (Continued)
April 30, 2018 (Unaudited)
| Shares | | Description | | Value |
| COMMON STOCKS (a) (Continued) |
| | | Germany (Continued) | | |
| 46,744 | | RWE AG (b) | | $1,117,263 |
| 39,139 | | Salzgitter AG (b) | | 2,149,344 |
| 16,433 | | SAP SE (b) | | 1,825,800 |
| 43,106 | | Software AG (b) | | 2,119,025 |
| 115,547 | | TUI AG (b) | | 2,612,973 |
| 83,759 | | Uniper SE (b) | | 2,589,760 |
| 39,000 | | United Internet AG (b) | | 2,520,867 |
| 63,111 | | Vonovia SE (b) | | 3,162,168 |
| 12,651 | | Wacker Chemie AG (b) | | 2,273,418 |
| 21,795 | | Wirecard AG (b) | | 2,948,886 |
| 46,273 | | Zalando SE (b) (c) (d) | | 2,381,056 |
| | | | | 60,877,492 |
| | | Hong Kong – 1.2% | | |
| 471,023 | | Hang Lung Group Ltd. (b) | | 1,422,731 |
| 4,050,668 | | PCCW Ltd. (b) | | 2,503,929 |
| 213,350 | | Swire Pacific Ltd., Class A (b) | | 2,108,178 |
| 526,308 | | Wharf Holdings (The) Ltd. (b) | | 1,750,951 |
| | | | | 7,785,789 |
| | | Ireland – 0.3% | | |
| 121,963 | | Ryanair Holdings PLC (b) (c) | | 2,273,353 |
| | | Italy – 2.2% | | |
| 603,886 | | Enel S.p.A. (b) | | 3,830,885 |
| 800,631 | | Intesa Sanpaolo S.p.A. (b) | | 3,169,984 |
| 44,608 | | Luxottica Group S.p.A (b) | | 2,782,895 |
| 200,718 | | Mediobanca Banca di Credito Finanziario S.p.A. (b) | | 2,432,205 |
| 290,034 | | Poste Italiane S.p.A. (b) (d) | | 2,831,749 |
| | | | | 15,047,718 |
| | | Japan – 23.1% | | |
| 33,800 | | Aisin Seiki Co., Ltd. (b) | | 1,831,112 |
| 65,760 | | Aozora Bank Ltd. (b) | | 2,652,865 |
| 38,200 | | Asahi Glass Co., Ltd. (b) | | 1,585,346 |
| 63,700 | | Asahi Group Holdings Ltd. (b) | | 3,222,312 |
| 188,600 | | Astellas Pharma, Inc. (b) | | 2,758,508 |
| 80,600 | | Canon, Inc. (b) | | 2,772,575 |
| 16,300 | | Central Japan Railway Co. (b) | | 3,266,267 |
| 33,000 | | Chugai Pharmaceutical Co., Ltd. (b) | | 1,740,400 |
| 33,700 | | Coca-Cola Bottlers Japan Holdings, Inc. (b) | | 1,449,419 |
| 75,500 | | Credit Saison Co., Ltd. (b) | | 1,352,167 |
| 116,200 | | Daicel Corp. (b) | | 1,340,746 |
| 62,800 | | Dai-ichi Life Holdings, Inc. (b) | | 1,246,740 |
| 61,400 | | Daiichi Sankyo Co., Ltd. (b) | | 2,101,444 |
| 294,000 | | Daiwa Securities Group, Inc. (b) | | 1,803,555 |
| 9,600 | | Disco Corp. (b) | | 1,682,671 |
| 27,400 | | Don Quijote Holdings Co., Ltd (b) | | 1,475,139 |
| 27,200 | | East Japan Railway Co. (b) | | 2,613,050 |
| 16,700 | | FamilyMart UNY Holdings Co., Ltd. (b) | | 1,625,443 |
| 71,700 | | Haseko Corp. (b) | | 1,127,813 |
| Shares | | Description | | Value |
|
| | | Japan (Continued) | | |
| 10,000 | | Hisamitsu Pharmaceutical Co., Inc. (b) | | $777,259 |
| 337,000 | | Hitachi Ltd. (b) | | 2,459,614 |
| 77,900 | | Honda Motor Co., Ltd. (b) | | 2,678,666 |
| 34,700 | | House Foods Group, Inc. (b) | | 1,222,108 |
| 128,700 | | Ishihara Sangyo Kaisha
Ltd. (b) (c) | | 1,478,695 |
| 30,100 | | Jafco Co., Ltd. (b) | | 1,320,127 |
| 62,500 | | Japan Airlines Co., Ltd. (b) | | 2,466,529 |
| 71,700 | | Japan Petroleum Exploration Co., Ltd. (b) | | 1,865,806 |
| 269,000 | | Kajima Corp. (b) | | 2,591,570 |
| 147,400 | | KDDI Corp. (b) | | 3,956,747 |
| 7,300 | | Keyence Corp. (b) | | 4,451,391 |
| 188,500 | | Kobe Steel Ltd. (b) | | 1,939,016 |
| 7,900 | | Kose Corp. (b) | | 1,459,894 |
| 38,043 | | M3, Inc. (b) | | 1,433,682 |
| 30,600 | | Matsumotokiyoshi Holdings Co., Ltd. (b) | | 1,363,112 |
| 216,700 | | Mazda Motor Corp. (b) | | 3,012,979 |
| 187,000 | | Mitsubishi Chemical Holdings Corp. (b) | | 1,768,946 |
| 72,800 | | Mitsubishi Gas Chemical Co., Inc. (b) | | 1,706,103 |
| 41,300 | | Mitsubishi Materials Corp. (b) | | 1,257,057 |
| 110,800 | | Mitsubishi UFJ Financial Group, Inc. (b) | | 742,509 |
| 1,767,000 | | Mizuho Financial Group, Inc. (b) | | 3,196,922 |
| 119,800 | | NET One Systems Co., Ltd. (b) | | 1,928,138 |
| 147,500 | | Nexon Co., Ltd. (b) (c) | | 2,146,331 |
| 152,600 | | NHK Spring Co., Ltd. (b) | | 1,686,329 |
| 9,400 | | Nintendo Co., Ltd. (b) | | 3,949,659 |
| 97,400 | | Nippon Paper Industries Co., Ltd. (b) | | 1,865,424 |
| 213,900 | | Nippon Sheet Glass Co.,
Ltd. (b) (c) | | 1,746,165 |
| 65,700 | | Nippon Telegraph & Telephone Corp. (b) | | 3,117,806 |
| 191,800 | | Nissan Motor Co., Ltd. (b) | | 2,017,826 |
| 118,500 | | Nisshin Steel Co., Ltd. (b) | | 1,568,174 |
| 63,100 | | NOK Corp. (b) | | 1,290,479 |
| 336,600 | | NTN Corp. (b) | | 1,480,523 |
| 121,700 | | NTT DOCOMO, Inc. (b) | | 3,143,999 |
| 18,300 | | Obic Co., Ltd. (b) | | 1,532,831 |
| 396,000 | | Oji Holdings Corp. (b) | | 2,785,703 |
| 127,000 | | ORIX Corp. (b) | | 2,227,434 |
| 29,100 | | Otsuka Corp. (b) | | 1,348,420 |
| 78,700 | | Panasonic Corp. (b) | | 1,165,323 |
| 34,100 | | Pola Orbis Holdings, Inc. (b) | | 1,487,769 |
| 89,300 | | Recruit Holdings Co., Ltd. (b) | | 2,058,987 |
| 36,100 | | Shiseido Co., Ltd. (b) | | 2,342,206 |
| 17,300 | | SoftBank Group Corp. (b) | | 1,321,871 |
| 45,100 | | Sompo Holdings, Inc. (b) | | 1,888,342 |
| 81,400 | | Sony Corp. (b) | | 3,801,878 |
| 64,700 | | Subaru Corp. (b) | | 2,171,745 |
| 89,100 | | Sumitomo Forestry Co., Ltd. (b) | | 1,476,409 |
Page 18
See Notes to Financial Statements
First Trust RiverFront Dynamic Developed International ETF (RFDI)
Portfolio of Investments (Continued)
April 30, 2018 (Unaudited)
| Shares | | Description | | Value |
| COMMON STOCKS (a) (Continued) |
| | | Japan (Continued) | | |
| 36,900 | | Sumitomo Metal Mining Co., Ltd. (b) | | $1,574,167 |
| 92,300 | | Sumitomo Mitsui Financial Group, Inc. (b) | | 3,846,904 |
| 57,000 | | Suzuki Motor Corp. (b) | | 3,063,629 |
| 80,700 | | Taiheiyo Cement Corp. (b) | | 3,047,229 |
| 49,400 | | Takeda Pharmaceutical Co., Ltd. (b) | | 2,080,236 |
| 70,900 | | Teijin Ltd. (b) | | 1,332,982 |
| 59,600 | | Tokai Rika Co., Ltd. (b) | | 1,190,634 |
| 16,200 | | Tokyo Electron Ltd. (b) | | 3,111,259 |
| 48,900 | | Tokyo Seimitsu Co., Ltd. (b) | | 1,857,291 |
| 42,100 | | Yaskawa Electric Corp. (b) | | 1,709,156 |
| | | | | 155,159,562 |
| | | Luxembourg – 0.5% | | |
| 100,543 | | ArcelorMittal (b) | | 3,407,771 |
| | | Netherlands – 5.9% | | |
| 375,955 | | Aegon N.V. (b) | | 2,755,295 |
| 35,086 | | Akzo Nobel N.V. (b) | | 3,177,330 |
| 30,951 | | ASML Holding N.V. (b) | | 5,892,569 |
| 50,129 | | BE Semiconductor Industries N.V. (b) (c) | | 3,464,575 |
| 40,992 | | EXOR N.V. (b) | | 3,036,841 |
| 257,109 | | Fiat Chrysler Automobiles N.V. (b) (c) | | 5,712,651 |
| 26,992 | | Heineken Holding N.V. (b) | | 2,739,973 |
| 162,045 | | Koninklijke Ahold Delhaize N.V. (b) | | 3,909,254 |
| 38,369 | | Randstad N.V. (b) | | 2,469,558 |
| 205,285 | | STMicroelectronics N.V. (b) | | 4,482,458 |
| 37,134 | | Unilever N.V. (b) | | 2,128,840 |
| | | | | 39,769,344 |
| | | Norway – 2.5% | | |
| 162,519 | | DNB ASA (b) | | 3,039,325 |
| 1,780,285 | | DNO ASA (b) (c) | | 3,296,705 |
| 119,908 | | Marine Harvest ASA (b) | | 2,610,142 |
| 46,433 | | Schibsted ASA, Class A (b) | | 1,353,869 |
| 160,096 | | Statoil ASA (b) | | 4,094,088 |
| 282,504 | | Storebrand ASA (b) | | 2,414,353 |
| | | | | 16,808,482 |
| | | Portugal – 0.3% | | |
| 116,057 | | Jeronimo Martins SGPS S.A. (b) | | 2,035,291 |
| | | Singapore – 1.3% | | |
| 5,542,700 | | Hutchison Port Holdings Trust (b) | | 1,847,942 |
| 256,400 | | Singapore Airlines Ltd. (b) | | 2,092,062 |
| 351,000 | | Singapore Exchange Ltd. (b) | | 2,035,457 |
| 62,100 | | Venture Corp Ltd. (b) | | 971,310 |
| 1,553,700 | | Yanlord Land Group Ltd. (b) | | 1,981,231 |
| | | | | 8,928,002 |
| Shares | | Description | | Value |
|
| | | Spain – 1.0% | | |
| 30,256 | | Amadeus IT Group S.A. (b) | | $2,207,472 |
| 348,661 | | Banco Santander S.A. (b) | | 2,252,673 |
| 278,867 | | Ence Energia y Celulosa S.A. (b) | | 2,151,437 |
| | | | | 6,611,582 |
| | | Sweden – 6.3% | | |
| 53,697 | | Atlas Copco AB, Class A (b) | | 2,099,893 |
| 77,920 | | Atlas Copco AB, Class B (b) | | 2,761,757 |
| 119,967 | | Axfood AB (b) | | 2,228,803 |
| 72,697 | | Boliden AB (b) (c) | | 2,518,924 |
| 49,489 | | Hexagon AB, Class B (b) | | 2,857,442 |
| 222,783 | | Husqvarna AB, Class B (b) | | 2,142,700 |
| 46,080 | | Investor AB, Class B (b) | | 2,006,047 |
| 74,354 | | Kinnevik AB, Class B (b) | | 2,679,522 |
| 85,969 | | Lundin Petroleum AB (b) (c) | | 2,369,903 |
| 267,020 | | Sandvik AB (b) | | 4,552,805 |
| 209,701 | | Swedbank AB, Class A (b) | | 4,555,393 |
| 58,515 | | Swedish Match AB (b) | | 2,624,995 |
| 188,268 | | Tele2 AB, Class B (b) | | 2,440,314 |
| 111,871 | | Volvo AB, Class A (b) | | 1,917,369 |
| 264,914 | | Volvo AB, Class B (b) | | 4,489,333 |
| | | | | 42,245,200 |
| | | Switzerland – 7.3% | | |
| 122,356 | | GAM Holding AG (b) | | 1,953,074 |
| 1,706 | | Georg Fischer AG (b) | | 2,120,655 |
| 57,898 | | Logitech International S.A. (b) | | 2,138,936 |
| 11,929 | | Lonza Group AG (b) | | 2,914,636 |
| 114,957 | | Nestle S.A. (b) | | 8,905,729 |
| 136,934 | | Novartis AG (b) | | 10,540,401 |
| 133,498 | | OC Oerlikon Corp. AG (b) | | 2,155,224 |
| 3,926 | | Partners Group Holding AG (b) | | 2,863,509 |
| 15,040 | | Roche Holding AG (b) | | 3,341,700 |
| 1,133 | | SGS S.A. (b) | | 2,751,659 |
| 572 | | Sika AG (b) | | 4,150,563 |
| 31,203 | | Vifor Pharma AG (b) | | 4,924,185 |
| | | | | 48,760,271 |
| | | United Kingdom – 14.1% | | |
| 220,424 | | 3i Group PLC (b) | | 2,845,269 |
| 173,945 | | Anglo American PLC (b) | | 4,092,798 |
| 193,327 | | Antofagasta PLC (b) | | 2,583,028 |
| 120,255 | | Ashtead Group PLC (b) | | 3,339,812 |
| 47,386 | | Berkeley Group Holdings PLC (b) | | 2,652,858 |
| 293,099 | | BP PLC (b) | | 2,177,129 |
| 67,562 | | British American Tobacco PLC (b) | | 3,705,607 |
| 41,550 | | Carnival PLC (b) | | 2,700,557 |
| 40,293 | | Croda International PLC (b) | | 2,464,829 |
| 223,853 | | Diageo PLC (b) | | 7,985,887 |
| 100,557 | | easyJet PLC (b) | | 2,192,096 |
| 370,906 | | Evraz PLC (b) | | 2,333,957 |
| 103,881 | | Hargreaves Lansdown PLC (b) | | 2,546,806 |
| 364,299 | | Howden Joinery Group PLC (b) | | 2,384,324 |
| 665,645 | | HSBC Holdings PLC (b) | | 6,627,150 |
See Notes to Financial Statements
Page 19
First Trust RiverFront Dynamic Developed International ETF (RFDI)
Portfolio of Investments (Continued)
April 30, 2018 (Unaudited)
| Shares | | Description | | Value |
| COMMON STOCKS (a) (Continued) |
| | | United Kingdom (Continued) | | |
| 43,776 | | InterContinental Hotels Group PLC (b) | | $2,761,890 |
| 41,549 | | Intertek Group PLC (b) | | 2,793,893 |
| 208,426 | | Kaz Minerals PLC (b) (c) | | 2,633,460 |
| 805,447 | | Laird PLC | | 2,183,343 |
| 1,083,941 | | Legal & General Group PLC (b) | | 4,014,637 |
| 100,875 | | Mondi PLC (b) | | 2,808,066 |
| 45,870 | | Next PLC (b) | | 3,313,478 |
| 76,243 | | Persimmon PLC (b) | | 2,848,091 |
| 96,592 | | Rio Tinto PLC (b) | | 5,264,838 |
| 249,277 | | Royal Dutch Shell PLC, Class A (b) | | 8,672,650 |
| 281,961 | | Sage Group (The) PLC (b) | | 2,452,402 |
| 123,354 | | Smith & Nephew PLC (b) | | 2,362,358 |
| 778,514 | | Taylor Wimpey PLC (b) | | 2,050,247 |
| | | | | 94,791,460 |
| | | Total Investments – 99.1% | | 665,760,329 |
| | | (Cost $651,549,629) (e) | | |
| | | Net Other Assets and Liabilities – 0.9% | | 6,217,187 |
| | | Net Assets – 100.0% | | $671,977,516 |
|
| (a) | Portfolio securities are categorized based upon their country of incorporation. For a breakdown of the portfolio securities by sector, please see the Fund Performance Overview. |
| (b) | This security is fair valued by the Advisor’s Pricing Committee in accordance with procedures adopted by the Trust’s Board of Trustees and in accordance with provisions of the Investment Company Act of 1940, as amended. At April 30, 2018, securities noted as such are valued at $646,081,965 or 96.1% of net assets. Certain of these securities are fair valued using a factor provided by a third-party pricing service due to the change in value between the foreign markets’ close and the NYSE close exceeding a certain threshold. On days when this threshold is not exceeded, these securities are typically valued at the last sale price on the exchange on which they are principally traded. |
| (c) | Non-income producing security. |
| (d) | This security is restricted in the U.S. and cannot be offered for public sale without first being registered under the Securities Act of 1933, as amended. This security is not restricted on the foreign exchange where it trades freely without any additional registration. As such, it does not require the additional disclosure required of restricted securities. |
| (e) | Aggregate cost for financial reporting purposes approximates the aggregate cost for federal income tax purposes. As of April 30, 2018, the aggregate gross unrealized appreciation for all investments in which there was an excess of value over tax cost was $33,640,254 and the aggregate gross unrealized depreciation for all investments in which there was an excess of tax cost over value was $19,429,554. The net unrealized appreciation was $14,210,700. |
Valuation Inputs
A summary of the inputs used to value the Fund’s investments as of April 30, 2018 is as follows (see Note 2A - Portfolio Valuation in the Notes to Financial Statements):
| | Total
Value at
4/30/2018 | Level 1
Quoted
Prices | Level 2
Significant
Observable
Inputs | Level 3
Significant
Unobservable
Inputs |
| Common Stocks: | | | | |
| Canada | $ 16,088,735 | $ 16,088,735 | $ — | $ — |
| Cayman Islands | 13,552,501 | 1,406,286 | 12,146,215 | — |
| United Kingdom | 94,791,460 | 2,183,343 | 92,608,117 | — |
| Other Country Categories* | 541,327,633 | — | 541,327,633 | — |
| Total Investments | $ 665,760,329 | $ 19,678,364 | $ 646,081,965 | $— |
| * | See Portfolio of Investments for country breakout. |
All transfers in and out of the Levels during the period are assumed to occur on the last day of the period at their current value. As of April 30, 2018, the Fund transferred common stocks valued at $184,050,849 from Level 1 to Level 2 of the fair value hierarchy. The common stocks that transferred from Level 1 to Level 2 did so as a result of being fair valued using a factor provided by a third-party pricing service due to the change in value between the foreign markets’ close and the NYSE close on the last business day of the period exceeding a certain threshold. Previously, these common stocks were valued based on quoted prices.
Page 20
See Notes to Financial Statements
First Trust RiverFront Dynamic Developed International ETF (RFDI)
Portfolio of Investments (Continued)
April 30, 2018 (Unaudited)
Currency Exposure
Diversification | % of Total
Investments |
| EUR | 30.7% |
| JPY | 23.3 |
| GBP | 14.6 |
| CHF | 7.3 |
| SEK | 6.4 |
| AUD | 4.9 |
| HKD | 3.2 |
| DKK | 3.1 |
| NOK | 2.5 |
| CAD | 2.4 |
| SGD | 1.1 |
| USD | 0.5 |
| Total | 100.0% |
| Currency Abbreviations |
| AUD | Australian Dollar |
| CAD | Canadian Dollar |
| CHF | Swiss Franc |
| DKK | Danish Krone |
| EUR | Euro |
| GBP | British Pound Sterling |
| HKD | Hong Kong Dollar |
| JPY | Japanese Yen |
| NOK | Norwegian Krone |
| SEK | Swedish Krona |
| SGD | Singapore Dollar |
| USD | United States Dollar |
See Notes to Financial Statements
Page 21
First Trust RiverFront Dynamic Europe ETF (RFEU)
Portfolio of Investments
April 30, 2018 (Unaudited)
| Shares | | Description | | Value |
| COMMON STOCKS (a) – 99.1% |
| | | Austria – 0.5% | | |
| 16,329 | | voestalpine AG (b) | | $861,473 |
| | | Denmark – 4.7% | | |
| 11,266 | | Chr Hansen Holding A.S. (b) | | 1,021,252 |
| 16,742 | | H Lundbeck A.S. (b) | | 969,892 |
| 16,480 | | Novo Nordisk A.S., Class B (b) | | 775,021 |
| 21,597 | | Orsted A.S. (b) (c) | | 1,421,851 |
| 9,696 | | Pandora A.S. (b) | | 1,077,120 |
| 2,913 | | Rockwool International A.S., Class B (b) | | 878,231 |
| 19,014 | | Topdanmark A.S. (b) | | 894,222 |
| 31,077 | | William Demant Holding A.S. (b) (d) | | 1,211,124 |
| | | | | 8,248,713 |
| | | Finland – 1.6% | | |
| 23,432 | | Elisa OYJ (b) | | 1,035,753 |
| 15,874 | | Neste OYJ (b) | | 1,336,696 |
| 8,690 | | Sampo OYJ, Class A (b) | | 469,969 |
| | | | | 2,842,418 |
| | | France – 15.6% | | |
| 5,059 | | Aeroports de Paris (b) | | 1,113,604 |
| 99,351 | | Air France-KLM (b) (d) | | 973,682 |
| 32,239 | | BNP Paribas S.A. (b) | | 2,488,830 |
| 176,167 | | Bollore S.A. (b) | | 875,572 |
| 73,468 | | Credit Agricole S.A. (b) | | 1,209,824 |
| 473 | | Dassault Aviation S.A. (b) | | 943,088 |
| 9,661 | | Dassault Systemes SE (b) | | 1,251,969 |
| 84,388 | | Electricite de France S.A. (b) | | 1,184,277 |
| 9,885 | | Eurazeo S.A. (b) | | 868,267 |
| 11,865 | | Faurecia S.A. (b) | | 968,883 |
| 2,249 | | Hermes International (b) | | 1,454,294 |
| 6,983 | | Ipsen S.A. (b) | | 1,130,316 |
| 1,407 | | Kering (b) | | 813,945 |
| 4,105 | | L’Oreal S.A. (b) | | 988,442 |
| 10,398 | | LVMH Moet Hennessy Louis Vuitton SE (b) | | 3,618,630 |
| 49,779 | | Peugeot S.A. (b) | | 1,225,738 |
| 11,819 | | Renault S.A. (b) | | 1,280,962 |
| 46,875 | | TOTAL S.A. (b) | | 2,946,176 |
| 10,173 | | Ubisoft Entertainment S.A. (b) (d) | | 972,010 |
| 5,607 | | Wendel S.A. (b) | | 846,841 |
| | | | | 27,155,350 |
| | | Germany – 13.9% | | |
| 13,545 | | Allianz SE (b) | | 3,203,716 |
| 8,146 | | Bayer AG (b) | | 973,607 |
| 9,400 | | Beiersdorf AG (b) | | 1,063,500 |
| 15,978 | | Covestro AG (b) (c) | | 1,451,839 |
| 46,274 | | Deutsche Lufthansa AG (b) | | 1,344,965 |
| 121,806 | | E.ON SE (b) | | 1,333,747 |
| 26,543 | | Evonik Industries AG (b) | | 943,078 |
| 14,800 | | Fraport AG Frankfurt Airport Services Worldwide (b) | | 1,432,278 |
| Shares | | Description | | Value |
|
| | | Germany (Continued) | | |
| 12,406 | | Fresenius Medical Care AG & Co., KGaA (b) | | $1,258,848 |
| 54,091 | | METRO AG (b) | | 782,540 |
| 18,516 | | RWE AG (b) | | 442,564 |
| 15,784 | | Salzgitter AG (b) | | 866,789 |
| 6,573 | | SAP SE (b) | | 730,298 |
| 17,536 | | Software AG (b) | | 862,043 |
| 46,868 | | TUI AG (b) | | 1,059,870 |
| 33,516 | | Uniper SE (b) | | 1,036,287 |
| 15,602 | | United Internet AG (b) | | 1,008,476 |
| 24,926 | | Vonovia SE (b) | | 1,248,914 |
| 5,069 | | Wacker Chemie AG (b) | | 910,912 |
| 8,671 | | Wirecard AG (b) | | 1,173,195 |
| 18,574 | | Zalando SE (b) (c) (d) | | 955,757 |
| | | | | 24,083,223 |
| | | Ireland – 0.5% | | |
| 49,075 | | Ryanair Holdings PLC (b) (d) | | 914,743 |
| | | Italy – 3.5% | | |
| 241,836 | | Enel S.p.A. (b) | | 1,534,140 |
| 322,656 | | Intesa Sanpaolo S.p.A. (b) | | 1,277,510 |
| 17,416 | | Luxottica Group S.p.A (b) | | 1,086,507 |
| 81,217 | | Mediobanca Banca di Credito Finanziario S.p.A. (b) | | 984,149 |
| 116,681 | | Poste Italiane S.p.A. (b) (c) | | 1,139,216 |
| | | | | 6,021,522 |
| | | Luxembourg – 0.8% | | |
| 40,143 | | ArcelorMittal (b) | | 1,360,594 |
| | | Netherlands – 9.1% | | |
| 151,932 | | Aegon N.V. (b) | | 1,113,478 |
| 13,876 | | Akzo Nobel N.V. (b) | | 1,256,588 |
| 12,432 | | ASML Holding N.V. (b) | | 2,366,852 |
| 19,672 | | BE Semiconductor Industries N.V. (b) (d) | | 1,359,595 |
| 16,507 | | EXOR N.V. (b) | | 1,222,900 |
| 104,238 | | Fiat Chrysler Automobiles N.V. (b) (d) | | 2,316,042 |
| 10,522 | | Heineken Holding N.V. (b) | | 1,068,094 |
| 64,983 | | Koninklijke Ahold Delhaize N.V. (b) | | 1,567,682 |
| 15,165 | | Randstad N.V. (b) | | 976,070 |
| 82,846 | | STMicroelectronics N.V. (b) | | 1,808,967 |
| 14,710 | | Unilever N.V. (b) | | 843,303 |
| | | | | 15,899,571 |
| | | Norway – 3.9% | | |
| 64,970 | | DNB ASA (b) | | 1,215,027 |
| 688,740 | | DNO ASA (b) (d) | | 1,275,398 |
| 48,419 | | Marine Harvest ASA (b) | | 1,053,979 |
| 18,634 | | Schibsted ASA, Class A (b) | | 543,320 |
| 64,320 | | Statoil ASA (b) | | 1,644,837 |
| 114,173 | | Storebrand ASA (b) | | 975,752 |
| | | | | 6,708,313 |
Page 22
See Notes to Financial Statements
First Trust RiverFront Dynamic Europe ETF (RFEU)
Portfolio of Investments (Continued)
April 30, 2018 (Unaudited)
| Shares | | Description | | Value |
| COMMON STOCKS (a) (Continued) |
| | | Portugal – 0.5% | | |
| 45,686 | | Jeronimo Martins SGPS S.A. (b) | | $801,195 |
| | | Spain – 1.5% | | |
| 11,852 | | Amadeus IT Group S.A. (b) (d) | | 864,720 |
| 140,187 | | Banco Santander S.A. (b) | | 905,738 |
| 112,473 | | Ence Energia y Celulosa S.A. (b) | | 867,720 |
| | | | | 2,638,178 |
| | | Sweden – 9.8% | | |
| 21,386 | | Atlas Copco AB, Class A (b) | | 836,328 |
| 31,164 | | Atlas Copco AB, Class B (b) | | 1,104,561 |
| 48,020 | | Axfood AB (b) | | 892,138 |
| 29,313 | | Boliden AB (b) (d) | | 1,015,685 |
| 19,818 | | Hexagon AB, Class B (b) | | 1,144,270 |
| 90,438 | | Husqvarna AB, Class B (b) | | 869,821 |
| 18,499 | | Investor AB, Class B (b) | | 805,336 |
| 29,766 | | Kinnevik AB, Class B (b) | | 1,072,688 |
| 34,696 | | Lundin Petroleum AB (b) (d) | | 956,463 |
| 106,870 | | Sandvik AB (b) | | 1,822,179 |
| 84,901 | | Swedbank AB, Class A (b) | | 1,844,328 |
| 23,308 | | Swedish Match AB (b) | | 1,045,602 |
| 76,908 | | Tele2 AB, Class B (b) | | 996,875 |
| 44,841 | | Volvo AB, Class A (b) | | 768,535 |
| 106,682 | | Volvo AB, Class B (b) | | 1,807,873 |
| | | | | 16,982,682 |
| | | Switzerland – 11.3% | | |
| 49,359 | | GAM Holding AG (b) | | 787,879 |
| 690 | | Georg Fischer AG (b) | | 857,709 |
| 23,282 | | Logitech International S.A. (b) | | 860,111 |
| 4,758 | | Lonza Group AG (b) | | 1,162,532 |
| 45,818 | | Nestle S.A. (b) | | 3,549,525 |
| 54,547 | | Novartis AG (b) | | 4,198,718 |
| 53,573 | | OC Oerlikon Corp. AG (b) | | 864,895 |
| 1,579 | | Partners Group Holding AG (b) | | 1,151,676 |
| 6,023 | | Roche Holding AG (b) | | 1,338,235 |
| 455 | | SGS S.A. (b) | | 1,105,035 |
| 230 | | Sika AG (b) | | 1,668,933 |
| 12,786 | | Vifor Pharma AG (b) | | 2,017,775 |
| | | | | 19,563,023 |
| | | United Kingdom – 21.9% | | |
| 88,473 | | 3i Group PLC (b) | | 1,142,024 |
| 69,720 | | Anglo American PLC (b) | | 1,640,460 |
| 77,395 | | Antofagasta PLC (b) | | 1,034,069 |
| 48,431 | | Ashtead Group PLC (b) | | 1,345,062 |
| 18,999 | | Berkeley Group Holdings PLC (b) | | 1,063,640 |
| 118,393 | | BP PLC (b) | | 879,419 |
| 27,342 | | British American Tobacco PLC (b) | | 1,499,641 |
| 16,742 | | Carnival PLC (b) | | 1,088,152 |
| 16,187 | | Croda International PLC (b) | | 990,201 |
| 88,584 | | Diageo PLC (b) | | 3,160,207 |
| 40,977 | | easyJet PLC (b) | | 893,280 |
| 147,380 | | Evraz PLC (b) | | 927,401 |
| Shares | | Description | | Value |
|
| | | United Kingdom (Continued) | | |
| 41,734 | | Hargreaves Lansdown PLC (b) | | $1,023,175 |
| 146,249 | | Howden Joinery Group PLC (b) | | 957,194 |
| 266,830 | | HSBC Holdings PLC (b) | | 2,656,555 |
| 17,643 | | InterContinental Hotels Group PLC (b) | | 1,113,122 |
| 16,552 | | Intertek Group PLC (b) | | 1,113,011 |
| 83,080 | | Kaz Minerals PLC (b) (d) | | 1,049,715 |
| 318,891 | | Laird PLC | | 864,425 |
| 435,839 | | Legal & General Group PLC (b) | | 1,614,235 |
| 40,442 | | Mondi PLC (b) | | 1,125,788 |
| 18,329 | | Next PLC (b) | | 1,324,019 |
| 30,482 | | Persimmon PLC (b) | | 1,138,669 |
| 38,264 | | Rio Tinto PLC (b) | | 2,085,615 |
| 100,748 | | Royal Dutch Shell PLC, Class A (b) | | 3,505,145 |
| 112,147 | | Sage Group (The) PLC (b) | | 975,417 |
| 50,687 | | Smith & Nephew PLC (b) | | 970,709 |
| 312,133 | | Taylor Wimpey PLC (b) | | 822,014 |
| | | | | 38,002,364 |
| | | Total Investments – 99.1% | | 172,083,362 |
| | | (Cost $165,989,051) (e) | | |
| | | Net Other Assets and Liabilities – 0.9% | | 1,524,741 |
| | | Net Assets – 100.0% | | $173,608,103 |
|
| (a) | Portfolio securities are categorized based upon their country of incorporation. For a breakdown of the portfolio securities by sector, please see the Fund Performance Overview. |
| (b) | This security is fair valued by the Advisor’s Pricing Committee in accordance with procedures adopted by the Trust’s Board of Trustees and in accordance with provisions of the Investment Company Act of 1940, as amended. At April 30, 2018, securities noted as such are valued at $171,218,937 or 98.6% of net assets. Certain of these securities are fair valued using a factor provided by a third-party pricing service due to the change in value between the foreign markets’ close and the NYSE close exceeding a certain threshold. On days when this threshold is not exceeded, these securities are typically valued at the last sale price on the exchange on which they are principally traded. |
| (c) | This security is restricted in the U.S. and cannot be offered for public sale without first being registered under the Securities Act of 1933, as amended. This security is not restricted on the foreign exchange where it trades freely without any additional registration. As such, it does not require the additional disclosure required of restricted securities. |
| (d) | Non-income producing security. |
See Notes to Financial Statements
Page 23
First Trust RiverFront Dynamic Europe ETF (RFEU)
Portfolio of Investments (Continued)
April 30, 2018 (Unaudited)
| (e) | Aggregate cost for financial reporting purposes approximates the aggregate cost for federal income tax purposes. As of April 30, 2018, the aggregate gross unrealized appreciation for all investments in which there was an excess of value over tax cost was $10,532,496 and the aggregate gross unrealized depreciation for all investments in which there was an excess of tax cost over value was $4,438,185. The net unrealized appreciation was $6,094,311. |
Valuation Inputs
A summary of the inputs used to value the Fund’s investments as of April 30, 2018 is as follows (see Note 2A - Portfolio Valuation in the Notes to Financial Statements):
| | Total
Value at
4/30/2018 | Level 1
Quoted
Prices | Level 2
Significant
Observable
Inputs | Level 3
Significant
Unobservable
Inputs |
| Common Stocks: | | | | |
| United Kingdom | $ 38,002,364 | $ 864,425 | $ 37,137,939 | $ — |
| Other Country Categories* | 134,080,998 | — | 134,080,998 | — |
| Total Investments | $ 172,083,362 | $ 864,425 | $ 171,218,937 | $— |
| * | See Portfolio of Investments for country breakout. |
All transfers in and out of the Levels during the period are assumed to occur on the last day of the period at their current value. As of April 30, 2018, the Fund transferred common stocks valued at $71,119,183 from Level 1 to Level 2 of the fair value hierarchy. The common stocks that transferred from Level 1 to Level 2 did so as a result of being fair valued using a factor provided by a third-party pricing service due to the change in value between the foreign markets’ close and the NYSE close on the last business day of the period exceeding a certain threshold. Previously, these common stocks were valued based on quoted prices.
Currency Exposure
Diversification | % of Total
Investments |
| EUR | 47.4% |
| GBP | 22.7 |
| CHF | 11.3 |
| SEK | 9.9 |
| DKK | 4.8 |
| NOK | 3.9 |
| Total | 100.0% |
| Currency Abbreviations |
| CHF | Swiss Franc |
| DKK | Danish Krone |
| EUR | Euro |
| GBP | British Pound Sterling |
| NOK | Norwegian Krone |
| SEK | Swedish Krona |
Page 24
See Notes to Financial Statements
First Trust RiverFront Dynamic Emerging Markets ETF (RFEM)
Portfolio of Investments
April 30, 2018 (Unaudited)
| Shares | | Description | | Value |
| COMMON STOCKS (a) – 98.9% |
| | | Bermuda – 2.1% | | |
| 456,783 | | Haier Electronics Group Co., Ltd. (b) | | $1,580,366 |
| 20,600,000 | | HengTen Networks Group Ltd. (b) (c) | | 791,630 |
| 746,000 | | Hopson Development Holdings Ltd. (b) | | 793,618 |
| | | | | 3,165,614 |
| | | Brazil – 5.2% | | |
| 82,362 | | B2W Cia Digital (c) | | 679,454 |
| 170,584 | | Banco do Estado do Rio Grande do Sul S.A., Class B (Preference Shares) | | 978,258 |
| 62,021 | | BB Seguridade Participacoes S.A. | | 486,509 |
| 71,866 | | Bradespar S.A. (Preference Shares) | | 729,492 |
| 74,318 | | Estacio Participacoes S.A. | | 676,737 |
| 151,529 | | Gol Linhas Aereas Inteligentes S.A. (Preference Shares) (c) | | 840,001 |
| 332,200 | | Metalurgica Gerdau S.A. (Preference Shares) | | 741,552 |
| 919,327 | | Oi S.A. (c) | | 1,015,584 |
| 151,351 | | Transmissora Alianca de Energia Eletrica S.A. | | 919,805 |
| 87,246 | | Via Varejo S.A. | | 740,913 |
| | | | | 7,808,305 |
| | | Cayman Islands – 19.7% | | |
| 11,371 | | 58.COM INC-ADR (c) | | 993,712 |
| 28,738 | | Alibaba Group Holding Ltd., ADR (c) | | 5,130,883 |
| 16,835 | | Autohome, Inc., ADR | | 1,642,254 |
| 2,660 | | Baidu, Inc., ADR (c) | | 667,394 |
| 396,968 | | Geely Automobile Holdings Ltd. (b) | | 1,044,039 |
| 130,468 | | Health and Happiness H&H International Holdings Ltd. (b) (c) | | 937,073 |
| 501,000 | | Sino Biopharmaceutical Ltd. (b) | | 1,055,011 |
| 1,524,500 | | SOHO China Ltd. (b) | | 782,809 |
| 113,180 | | Sunny Optical Technology Group Co., Ltd. (b) | | 1,846,830 |
| 56,739 | | TAL Education Group, ADR | | 2,066,434 |
| 176,245 | | Tencent Holdings Ltd. (b) | | 8,664,720 |
| 14,557 | | Weibo Corp., ADR (c) | | 1,667,068 |
| 14,018 | | YY, Inc., ADR (c) | | 1,351,195 |
| 514,401 | | Zhongsheng Group Holdings Ltd. (b) | | 1,474,620 |
| | | | | 29,324,042 |
| | | China – 11.5% | | |
| 2,591,134 | | Agricultural Bank of China Ltd., Class H (b) | | 1,460,914 |
| 4,296,284 | | Bank of China Ltd., Class H (b) | | 2,332,157 |
| Shares | | Description | | Value |
|
| | | China (Continued) | | |
| 3,045,292 | | China Construction Bank Corp., Class H (b) | | $3,190,428 |
| 2,294,227 | | China Huarong Asset Management Co., Ltd., Class H (b) (d) | | 790,151 |
| 291,328 | | China Merchants Bank Co., Ltd., Class H (b) | | 1,270,306 |
| 1,315,173 | | China National Building Material Co., Ltd., Class H (b) | | 1,536,509 |
| 1,700,494 | | China Petroleum & Chemical Corp., Class H (b) | | 1,656,042 |
| 2,293,300 | | Huadian Power International Corp., Ltd., Class H (b) | | 930,638 |
| 3,226,763 | | Industrial & Commercial Bank of China Ltd., Class H (b) | | 2,832,716 |
| 3,758,650 | | Metallurgical Corp. of China Ltd., Class H (b) | | 1,200,190 |
| | | | | 17,200,051 |
| | | Colombia – 1.1% | | |
| 262,041 | | Almacenes Exito S.A. | | 1,582,160 |
| | | Czech Republic – 1.0% | | |
| 270,220 | | Moneta Money Bank A.S. (b) (d) | | 971,296 |
| 33,182 | | UNIPETROL A.S. | | 580,834 |
| | | | | 1,552,130 |
| | | Egypt – 3.1% | | |
| 137,250 | | Eastern Tobacco (b) | | 1,601,351 |
| 211,089 | | ElSewedy Electric Co. | | 2,989,082 |
| | | | | 4,590,433 |
| | | Hong Kong – 3.7% | | |
| 58,116 | | China Mobile Ltd. (b) | | 553,642 |
| 4,873,960 | | China South City Holdings Ltd. (b) | | 1,059,733 |
| 2,024,000 | | China Travel International Investment Hong Kong Ltd. (b) | | 754,639 |
| 432,000 | | CSPC Pharmaceutical Group Ltd. (b) | | 1,100,329 |
| 1,852,000 | | Shenzhen Investment Ltd. (b) | | 748,513 |
| 1,054,758 | | Sinotruk Hong Kong Ltd. (b) | | 1,235,781 |
| | | | | 5,452,637 |
| | | Hungary – 0.4% | | |
| 314,993 | | Magyar Telekom Telecommunications PLC (b) | | 544,831 |
| | | India – 7.2% | | |
| 343,097 | | Ashok Leyland Ltd. (b) | | 841,023 |
| 138,539 | | Hexaware Technologies Ltd. (b) | | 928,579 |
| 55,955 | | Hindustan Unilever Ltd. (b) | | 1,254,539 |
| 438,673 | | Oil & Natural Gas Corp., Ltd. (b) | | 1,184,430 |
| 587,716 | | Power Finance Corp., Ltd. (b) | | 771,988 |
| 426,677 | | Rural Electrification Corp., Ltd. (b) | | 812,159 |
See Notes to Financial Statements
Page 25
First Trust RiverFront Dynamic Emerging Markets ETF (RFEM)
Portfolio of Investments (Continued)
April 30, 2018 (Unaudited)
| Shares | | Description | | Value |
| COMMON STOCKS (a) (Continued) |
| | | India (Continued) | | |
| 291,417 | | Sterlite Technologies Ltd. (b) | | $1,527,627 |
| 12,090 | | Tata Consultancy Services Ltd. (b) | | 637,631 |
| 153,414 | | Tech Mahindra Ltd. (b) | | 1,531,761 |
| 79,029 | | Titan Co., Ltd. (b) | | 1,158,228 |
| | | | | 10,647,965 |
| | | Indonesia – 0.9% | | |
| 522,000 | | United Tractors Tbk PT (b) | | 1,273,619 |
| | | Israel – 0.8% | | |
| 11,326 | | Orbotech Ltd. (c) | | 661,665 |
| 130,117 | | Partner Communications Co., Ltd. (b) (c) | | 535,922 |
| | | | | 1,197,587 |
| | | Malaysia – 1.8% | | |
| 885,000 | | Hartalega Holdings Bhd (b) | | 1,317,142 |
| 2,009,800 | | Sime Darby Bhd (b) | | 1,361,088 |
| | | | | 2,678,230 |
| | | Philippines – 0.9% | | |
| 489,870 | | San Miguel Corp. (b) | | 1,320,155 |
| | | Poland – 1.6% | | |
| 41,711 | | Bank Pekao S.A. (b) | | 1,384,260 |
| 660,350 | | Orange Polska S.A. (b) (c) | | 988,598 |
| | | | | 2,372,858 |
| | | Russia – 5.2% | | |
| 529,117 | | Gazprom PJSC (b) | | 1,223,424 |
| 27,381 | | LUKOIL PJSC (b) | | 1,808,859 |
| 450,413 | | Moscow Exchange MICEX-RTS PJSC (b) | | 861,589 |
| 380,986 | | Sberbank of Russia PJSC (b) | | 1,358,023 |
| 185,402 | | Sberbank of Russia PJSC (Preference Shares) (b) | | 576,359 |
| 1,994,115 | | Surgutneftegas OJSC (b) | | 930,774 |
| 1,891,565 | | Surgutneftegas OJSC (Preference Shares) (b) | | 930,876 |
| | | | | 7,689,904 |
| | | South Africa – 5.4% | | |
| 53,682 | | Barclays Africa Group Ltd. (b) | | 786,295 |
| 181,811 | | Coronation Fund Managers Ltd. | | 1,081,969 |
| 40,772 | | Mr Price Group Ltd. (b) | | 894,695 |
| 9,532 | | Naspers Ltd. (b) | | 2,322,181 |
| 31,763 | | Nedbank Group Ltd. (b) | | 757,484 |
| 140,022 | | RMB Holdings Ltd. (b) | | 878,256 |
| 78,287 | | Standard Bank Group Ltd. (b) | | 1,342,669 |
| | | | | 8,063,549 |
| | | South Korea – 15.0% | | |
| 5,805 | | Celltrion, Inc. (b) (c) (e) | | 1,456,283 |
| 12,218 | | CJ Corp. (b) | | 1,850,954 |
| 23,126 | | Hana Financial Group, Inc. (b) | | 1,027,563 |
| Shares | | Description | | Value |
|
| | | South Korea (Continued) | | |
| 22,101 | | Hyundai Development Co-Engineering & Construction (b) | | $960,148 |
| 55,413 | | Industrial Bank of Korea (b) | | 868,977 |
| 33,811 | | KB Financial Group, Inc. (b) | | 1,920,974 |
| 15,518 | | LG Electronics, Inc. (b) | | 1,471,398 |
| 2,238 | | Samsung Biologics Co., Ltd. (b) (c) (d) | | 1,016,479 |
| 3,082 | | Samsung Electronics Co., Ltd. (b) | | 7,646,927 |
| 527 | | Samsung Electronics Co., Ltd. (Preference Shares) (b) | | 1,048,523 |
| 4,328 | | Samsung SDS Co., Ltd. (b) | | 983,055 |
| 27,449 | | SK Hynix, Inc. (b) | | 2,158,700 |
| | | | | 22,409,981 |
| | | Taiwan – 8.3% | | |
| 136,918 | | Advantech Co., Ltd. (b) | | 939,942 |
| 416,453 | | Cathay Financial Holding Co., Ltd. (b) | | 747,015 |
| 3,420,045 | | China Development Financial Holding Corp. (b) | | 1,293,112 |
| 90,582 | | Global Unichip Corp. (b) | | 852,258 |
| 125,424 | | Hiwin Technologies Corp. (b) | | 1,889,377 |
| 537,766 | | Macronix International (b) (c) | | 854,294 |
| 197,744 | | Pixart Imaging, Inc. (b) | | 752,996 |
| 668,261 | | Taiwan Semiconductor Manufacturing Co., Ltd. (b) | | 5,090,373 |
| | | | | 12,419,367 |
| | | Thailand – 2.6% | | |
| 2,878,800 | | Erawan Group (The) PCL | | 747,977 |
| 3,285,891 | | IRPC PCL (b) | | 731,216 |
| 351,000 | | PTT Exploration & Production PCL | | 1,490,304 |
| 226,800 | | PTT Exploration & Production PCL (b) | | 961,120 |
| | | | | 3,930,617 |
| | | Turkey – 1.4% | | |
| 199,411 | | Akbank TAS (b) | | 414,909 |
| 163,073 | | Aksa Akrilik Kimya Sanayii A.S. (b) | | 534,101 |
| 332,728 | | Trakya Cam Sanayii A.S. (b) | | 385,612 |
| 184,609 | | Turk Hava Yollari AO (b) (c) | | 762,557 |
| | | | | 2,097,179 |
| | | Total Common Stocks | | 147,321,214 |
| | | (Cost $139,154,012) | | |
| REAL ESTATE INVESTMENT TRUSTS (a) – 1.0% |
| | | South Africa – 1.0% | | |
| 544,330 | | Fortress REIT Ltd. (b) | | 749,119 |
Page 26
See Notes to Financial Statements
First Trust RiverFront Dynamic Emerging Markets ETF (RFEM)
Portfolio of Investments (Continued)
April 30, 2018 (Unaudited)
| Shares | | Description | | Value |
| REAL ESTATE INVESTMENT TRUSTS (a) (Continued) |
| | | South Africa (Continued) | | |
| 135,010 | | Resilient REIT Ltd. | | $733,809 |
| | | Total Real Estate Investment Trusts | | 1,482,928 |
| | | (Cost $1,538,930) | | |
| | | Total Investments – 99.9% | | 148,804,142 |
| | | (Cost $140,692,942) (f) | | |
| | | Net Other Assets and Liabilities – 0.1% | | 222,462 |
| | | Net Assets – 100.0% | | $149,026,604 |
|
| (a) | Portfolio securities are categorized based upon their country of incorporation. For a breakdown of the portfolio securities by sector, please see the Fund Performance Overview. |
| (b) | This security is fair valued by the Advisor’s Pricing Committee in accordance with procedures adopted by the Trust’s Board of Trustees and in accordance with provisions of the Investment Company Act of 1940, as amended. At April 30, 2018, securities noted as such are valued at $117,609,097 or 78.9% of net assets. Certain of these securities are fair valued using a factor provided by a third-party pricing service due to the change in value between the foreign markets’ close and the NYSE close exceeding a certain threshold. On days when this threshold is not exceeded, these securities are typically valued at the last sale price on the exchange on which they are principally traded. |
| (c) | Non-income producing security. |
| (d) | This security is restricted in the U.S. and cannot be offered for public sale without first being registered under the Securities Act of 1933, as amended. This security is not restricted on the foreign exchange where it trades freely without any additional registration. As such, it does not require the additional disclosure required of restricted securities. |
| (e) | Non-income producing security which makes payment-in-kind (“PIK”) distributions. There were no in-kind distributions received for the six months ended April 30, 2018. |
| (f) | Aggregate cost for financial reporting purposes approximates the aggregate cost for federal income tax purposes. As of April 30, 2018, the aggregate gross unrealized appreciation for all investments in which there was an excess of value over tax cost was $12,192,493 and the aggregate gross unrealized depreciation for all investments in which there was an excess of tax cost over value was $4,081,293. The net unrealized appreciation was $8,111,200. |
| ADR | American Depositary Receipt |
Valuation Inputs
A summary of the inputs used to value the Fund’s investments as of April 30, 2018 is as follows (see Note 2A - Portfolio Valuation in the Notes to Financial Statements):
| | Total
Value at
4/30/2018 | Level 1
Quoted
Prices | Level 2
Significant
Observable
Inputs | Level 3
Significant
Unobservable
Inputs |
| Common Stocks: | | | | |
| Brazil | $ 7,808,305 | $ 7,808,305 | $ — | $ — |
| Cayman Islands | 29,324,042 | 13,518,940 | 15,805,102 | — |
| Colombia | 1,582,160 | 1,582,160 | — | — |
| Czech Republic | 1,552,130 | 580,834 | 971,296 | — |
| Egypt | 4,590,433 | 2,989,082 | 1,601,351 | — |
| Israel | 1,197,587 | 661,665 | 535,922 | — |
| South Africa | 8,063,549 | 1,081,969 | 6,981,580 | — |
| Thailand | 3,930,617 | 2,238,281 | 1,692,336 | — |
| Other Country Categories* | 89,272,391 | — | 89,272,391 | — |
| Real Estate Investment Trusts* | 1,482,928 | 733,809 | 749,119 | — |
| Total Investments | $ 148,804,142 | $ 31,195,045 | $ 117,609,097 | $— |
| * | See Portfolio of Investments for country breakout. |
All transfers in and out of the Levels during the period are assumed to occur on the last day of the period at their current value. As of April 30, 2018, the Fund transferred investments valued at $28,352,648 from Level 1 to Level 2 of the fair value hierarchy. The investments that transferred from Level 1 to Level 2 did so as a result of being fair valued using a factor provided by a third-party pricing service due to the change in value between the foreign markets’ close and the NYSE close on the last business day of the period exceeding a certain threshold. Previously, these common stocks were valued based on quoted prices. In addition, as of April 30, 2018, the Fund transferred a common stock valued at $4,086,466 from Level 1 to Level 2 of the fair value hierarchy. The common stock that transferred did so as a result of the security being halted on the primary exchange due to an upcoming stock split. Previously, these securities were valued based on quoted prices.
See Notes to Financial Statements
Page 27
First Trust RiverFront Dynamic Emerging Markets ETF (RFEM)
Portfolio of Investments (Continued)
April 30, 2018 (Unaudited)
Currency Exposure
Diversification | % of Total
Investments |
| HKD | 28.0% |
| KRW | 15.1 |
| USD | 9.5 |
| TWD | 8.3 |
| INR | 7.1 |
| ZAR | 6.4 |
| BRL | 5.2 |
| RUB | 5.2 |
| EGP | 3.1 |
| THB | 2.6 |
| MYR | 1.8 |
| PLN | 1.6 |
| TRY | 1.4 |
| COP | 1.1 |
| CZK | 1.0 |
| PHP | 0.9 |
| IDR | 0.9 |
| HUF | 0.4 |
| ILS | 0.4 |
| Total | 100.0% |
| Currency Abbreviations |
| BRL | Brazilian Real |
| COP | Colombian Peso |
| CZK | Czech Republic Koruna |
| EGP | Egyptian Pound |
| HKD | Hong Kong Dollar |
| HUF | Hungarian Forint |
| IDR | Indonesian Rupiah |
| ILS | Israeli Shekel |
| INR | Indian Rupee |
| KRW | South Korean Won |
| MYR | Malaysian Ringgit |
| PHP | Philippine Peso |
| PLN | Polish Zloty |
| RUB | Russian Ruble |
| THB | Thai Baht |
| TRY | Turkish Lira |
| TWD | New Taiwan Dollar |
| USD | United States Dollar |
| ZAR | South African Rand |
Page 28
See Notes to Financial Statements
This page intentionally left blank
See Notes to Financial Statements
Page 29
First Trust Exchange-Traded Fund III
Statements of Assets and Liabilities
April 30, 2018 (Unaudited)
| | First Trust
RiverFront
Dynamic
Asia
Pacific
ETF
(RFAP) | | First Trust
RiverFront
Dynamic
Developed
International
ETF
(RFDI) | | First Trust
RiverFront
Dynamic
Europe
ETF
(RFEU) | | First Trust
RiverFront
Dynamic
Emerging
Markets
ETF
(RFEM) |
| ASSETS: | | | | | | | |
Investments, at value
| $ 62,252,354 | | $ 665,760,329 | | $ 172,083,362 | | $ 148,804,142 |
Cash
| — | | 909,664 | | 1,272,220 | | — |
Foreign currency
| 5,012 | | 18,033,293 | | 1,033,288 | | 2,261,352 |
| Receivables: | | | | | | | |
Investment securities sold
| 16,864,850 | | 42,504,774 | | 3,409,494 | | 7,770,553 |
Dividends
| 421,723 | | 3,243,218 | | 669,447 | | 267,548 |
Dividend reclaims
| 223 | | 397,146 | | 194,419 | | 3,370 |
Total Assets
| 79,544,162 | | 730,848,424 | | 178,662,230 | | 159,106,965 |
| LIABILITIES: | | | | | | | |
Due to custodian
| 1,520,511 | | — | | — | | 1,586,120 |
| Payables: | | | | | | | |
Investment securities purchased
| 15,206,367 | | 58,417,218 | | 4,937,209 | | 8,213,102 |
Investment advisory fees
| 42,989 | | 453,690 | | 116,918 | | 116,972 |
Deferred foreign capital gains tax
| — | | — | | — | | 164,167 |
Total Liabilities
| 16,769,867 | | 58,870,908 | | 5,054,127 | | 10,080,361 |
NET ASSETS
| $ 62,774,295 | | $ 671,977,516 | | $ 173,608,103 | | $ 149,026,604 |
| NET ASSETS consist of: | | | | | | | |
Paid-in capital
| $ 63,045,494 | | $ 647,213,226 | | $ 165,073,861 | | $ 139,242,620 |
Par value
| 10,500 | | 105,000 | | 26,500 | | 20,500 |
Accumulated net investment income (loss)
| 194,536 | | 4,201,003 | | 1,498,710 | | 113,906 |
Accumulated net realized gain (loss) on investments, forward foreign currency contracts and foreign currency transactions
| (138,242) | | 6,204,246 | | 908,655 | | 1,696,606 |
Net unrealized appreciation (depreciation) on investments, forward foreign currency contracts and foreign currency translation
| (337,993) | | 14,254,041 | | 6,100,377 | | 7,952,972 |
NET ASSETS
| $62,774,295 | | $671,977,516 | | $173,608,103 | | $149,026,604 |
NET ASSET VALUE, per share
| $59.78 | | $64.00 | | $65.51 | | $72.70 |
Number of shares outstanding (unlimited number of shares authorized, par value $0.01 per share)
| 1,050,002 | | 10,500,002 | | 2,650,002 | | 2,050,002 |
Investments, at cost
| $62,574,430 | | $651,549,629 | | $165,989,051 | | $140,692,942 |
Foreign currency, at cost (proceeds)
| $5,023 | | $18,044,775 | | $1,033,776 | | $2,262,640 |
Page 30
See Notes to Financial Statements
First Trust Exchange-Traded Fund III
Statements of Operations
For the Six Months Ended April 30, 2018 (Unaudited)
| | First Trust
RiverFront
Dynamic
Asia
Pacific
ETF
(RFAP) | | First Trust
RiverFront
Dynamic
Developed
International
ETF
(RFDI) | | First Trust
RiverFront
Dynamic
Europe
ETF
(RFEU) | | First Trust
RiverFront
Dynamic
Emerging
Markets
ETF
(RFEM) |
| INVESTMENT INCOME: | | | | | | | |
Dividends
| $ 850,363 | | $ 10,418,533 | | $ 2,818,884 | | $ 899,757 |
Interest
| 1,364 | | 6,290 | | 1,097 | | 1,269 |
Foreign withholding tax
| (58,243) | | (1,078,901) | | (340,144) | | (112,468) |
Total investment income
| 793,484 | | 9,345,922 | | 2,479,837 | | 788,558 |
| EXPENSES: | | | | | | | |
Investment advisory fees
| 204,209 | | 2,254,293 | | 582,417 | | 492,588 |
Total expenses
| 204,209 | | 2,254,293 | | 582,417 | | 492,588 |
NET INVESTMENT INCOME (LOSS)
| 589,275 | | 7,091,629 | | 1,897,420 | | 295,970 |
| NET REALIZED AND UNREALIZED GAIN (LOSS): | | | | | | | |
| Net realized gain (loss) on: | | | | | | | |
Investments
| (1,102,871) | | (8,152,059) | | (2,069,408) | | 2,057,423 |
In-kind redemptions
| 1,695,862 | | 15,932,445 | | 4,118,502 | | — |
Foreign currency transactions
| (15,831) | | (167,757) | | (50,376) | | (121,087) |
Foreign capital gains tax
| — | | — | | — | | (58,249) |
Net realized gain (loss)
| 577,160 | | 7,612,629 | | 1,998,718 | | 1,878,087 |
| Net change in unrealized appreciation (depreciation) on: | | | | | | | |
Investments
| (1,582,068) | | (14,219,957) | | (3,649,502) | | 1,260,140 |
Foreign currency translation
| (14,905) | | 45,320 | | 3,660 | | 6,049 |
Deferred foreign capital gains tax
| — | | — | | — | | (164,166) |
Net change in unrealized appreciation (depreciation)
| (1,596,973) | | (14,174,637) | | (3,645,842) | | 1,102,023 |
NET REALIZED AND UNREALIZED GAIN (LOSS)
| (1,019,813) | | (6,562,008) | | (1,647,124) | | 2,980,110 |
NET INCREASE (DECREASE) IN NET ASSETS RESULTING FROM OPERATIONS
| $(430,538) | | $ 529,621 | | $ 250,296 | | $ 3,276,080 |
See Notes to Financial Statements
Page 31
First Trust Exchange-Traded Fund III
Statements of Changes in Net Assets
| | First Trust RiverFront
Dynamic Asia Pacific ETF (RFAP) | | First Trust RiverFront Dynamic
Developed International ETF (RFDI) |
| | Six Months
Ended
4/30/2018
(Unaudited) | | Year
Ended
10/31/2017 | | Six Months
Ended
4/30/2018
(Unaudited) | | Year
Ended
10/31/2017 |
| OPERATIONS: | | | | | | | |
Net investment income (loss)
| $ 589,275 | | $ 330,737 | | $ 7,091,629 | | $ 3,268,515 |
Net realized gain (loss)
| 577,160 | | 1,748,559 | | 7,612,629 | | 7,881,133 |
Net increase from payment by the advisor
| — | | 7,644 | | — | | 35,978 |
Net change in unrealized appreciation (depreciation)
| (1,596,973) | | 691,628 | | (14,174,637) | | 28,845,189 |
Net increase (decrease) in net assets resulting from operations
| (430,538) | | 2,778,568 | | 529,621 | | 40,030,815 |
| DISTRIBUTIONS TO SHAREHOLDERS FROM: | | | | | | | |
Net investment income
| (477,031) | | (321,623) | | (3,575,636) | | (2,607,367) |
Net realized gain
| — | | — | | (133,355) | | (201,961) |
Total distributions to shareholders
| (477,031) | | (321,623) | | (3,708,991) | | (2,809,328) |
| SHAREHOLDER TRANSACTIONS: | | | | | | | |
Proceeds from shares sold
| 51,961,954 | | 41,927,847 | | 326,330,047 | | 488,981,137 |
Cost of shares redeemed
| (18,190,912) | | (40,544,804) | | (95,694,720) | | (107,360,484) |
Net increase (decrease) in net assets resulting from shareholder transactions
| 33,771,042 | | 1,383,043 | | 230,635,327 | | 381,620,653 |
Total increase (decrease) in net assets
| 32,863,473 | | 3,839,988 | | 227,455,957 | | 418,842,140 |
| NET ASSETS: | | | | | | | |
Beginning of period
| 29,910,822 | | 26,070,834 | | 444,521,559 | | 25,679,419 |
End of period
| $ 62,774,295 | | $ 29,910,822 | | $ 671,977,516 | | $ 444,521,559 |
Accumulated net investment income (loss) at end of period
| $194,536 | | $82,292 | | $4,201,003 | | $685,010 |
| CHANGES IN SHARES OUTSTANDING: | | | | | | | |
Shares outstanding, beginning of period
| 500,002 | | 500,002 | | 6,950,002 | | 500,002 |
Shares sold
| 850,000 | | 750,000 | | 5,050,000 | | 8,300,000 |
Shares redeemed
| (300,000) | | (750,000) | | (1,500,000) | | (1,850,000) |
Shares outstanding, end of period
| 1,050,002 | | 500,002 | | 10,500,002 | | 6,950,002 |
Page 32
See Notes to Financial Statements
First Trust RiverFront
Dynamic Europe ETF (RFEU) | | First Trust RiverFront Dynamic
Emerging Markets ETF (RFEM) |
Six Months
Ended
4/30/2018
(Unaudited) | | Year
Ended
10/31/2017 | | Six Months
Ended
4/30/2018
(Unaudited) | | Year
Ended
10/31/2017 |
| | | | | | | |
| $ 1,897,420 | | $ 924,336 | | $ 295,970 | | $ 488,145 |
| 1,998,718 | | 1,711,020 | | 1,878,087 | | 1,258,302 |
| — | | — | | — | | — |
| (3,645,842) | | 10,595,530 | | 1,102,023 | | 6,380,561 |
| 250,296 | | 13,230,886 | | 3,276,080 | | 8,127,008 |
| | | | | | | |
| (472,745) | | (859,771) | | (325,275) | | (489,167) |
| — | | (407,052) | | (346,611) | | (190,082) |
| (472,745) | | (1,266,823) | | (671,886) | | (679,249) |
| | | | | | | |
| 65,990,577 | | 126,451,387 | | 70,916,226 | | 71,331,250 |
| (16,139,788) | | (40,020,606) | | — | | (8,900,408) |
| 49,850,789 | | 86,430,781 | | 70,916,226 | | 62,430,842 |
| 49,628,340 | | 98,394,844 | | 73,520,420 | | 69,878,601 |
| | | | | | | |
| 123,979,763 | | 25,584,919 | | 75,506,184 | | 5,627,583 |
| $173,608,103 | | $ 123,979,763 | | $ 149,026,604 | | $ 75,506,184 |
| $1,498,710 | | $74,035 | | $113,906 | | $143,211 |
| | | | | | | |
| 1,900,002 | | 500,002 | | 1,100,002 | | 100,002 |
| 1,000,000 | | 2,100,000 | | 950,000 | | 1,150,000 |
| (250,000) | | (700,000) | | — | | (150,000) |
| 2,650,002 | | 1,900,002 | | 2,050,002 | | 1,100,002 |
See Notes to Financial Statements
Page 33
First Trust Exchange-Traded Fund III
Financial Highlights
For a share outstanding throughout each period
First Trust RiverFront Dynamic Asia Pacific ETF (RFAP)
| | Six Months
Ended
4/30/2018
(Unaudited) | | Year Ended
10/31/2017 | | Period
Ended
10/31/2016 (a) |
Net asset value, beginning of period
| $ 59.82 | | $ 52.14 | | $ 51.31 |
| Income from investment operations: | | | | | |
Net investment income (loss)
| 0.63 | | 1.42 | | 0.55 |
Net realized and unrealized gain (loss)
| (0.06) | | 7.66 | | 0.60 |
Total from investment operations
| 0.57 | | 9.08 | | 1.15 |
| Distributions paid to shareholders from: | | | | | |
Net investment income
| (0.61) | | (1.40) | | (0.32) |
Net asset value, end of period
| $59.78 | | $59.82 | | $52.14 |
Total return (b)
| 0.95% | | 17.77% (c) | | 2.26% |
| Ratios to average net assets/supplemental data: | | | | | |
Net assets, end of period (in 000’s)
| $ 62,774 | | $ 29,911 | | $ 26,071 |
Ratio of total expenses to average net assets
| 0.83% (d) | | 0.83% | | 0.83% (d) |
Ratio of net investment income (loss) to average net assets
| 2.39% (d) | | 1.93% | | 1.96% (d) |
Portfolio turnover rate (e)
| 94% | | 131% | | 49% |
| (a) | Inception date is April 13, 2016, which is consistent with the commencement of investment operations and is the date the initial creation units were established. |
| (b) | Total return is calculated assuming an initial investment made at the net asset value at the beginning of the period, reinvestment of all distributions at net asset value during the period, and redemption at net asset value on the last day of the period. The returns presented do not reflect the deduction of taxes that a shareholder would pay on Fund distributions or the redemption or sale of Fund shares. Total return is calculated for the time period presented and is not annualized for periods of less than a year. |
| (c) | The Fund received a reimbursement from the advisor in connection with a trade error in the amount of $7,644, which represents $0.02 per share. Since the advisor reimbursed the Fund, there was no effect on the Fund’s total return. |
| (d) | Annualized. |
| (e) | Portfolio turnover is calculated for the time period presented and is not annualized for periods of less than a year and does not include securities received or delivered from processing creations or redemptions and in-kind transactions. |
Page 34
See Notes to Financial Statements
First Trust Exchange-Traded Fund III
Financial Highlights (Continued)
For a share outstanding throughout each period
First Trust RiverFront Dynamic Developed International ETF (RFDI)
| | Six Months
Ended
4/30/2018
(Unaudited) | | Year Ended
10/31/2017 | | Period
Ended
10/31/2016 (a) |
Net asset value, beginning of period
| $ 63.96 | | $ 51.36 | | $ 50.73 |
| Income from investment operations: | | | | | |
Net investment income (loss)
| 0.74 | | 0.82 | | 0.83 |
Net realized and unrealized gain (loss)
| (0.24) | | 12.73 | | 0.50 |
Total from investment operations
| 0.50 | | 13.55 | | 1.33 |
| Distributions paid to shareholders from: | | | | | |
Net investment income
| (0.44) | | (0.71) | | (0.70) |
Net realized gain
| (0.02) | | (0.24) | | — |
Total distributions
| (0.46) | | (0.95) | | (0.70) |
Net asset value, end of period
| $64.00 | | $63.96 | | $51.36 |
Total return (b)
| 0.79% | | 26.60% (c) | | 2.68% |
| Ratios to average net assets/supplemental data: | | | | | |
Net assets, end of period (in 000’s)
| $ 671,978 | | $ 444,522 | | $ 25,679 |
Ratio of total expenses to average net assets
| 0.83% (d) | | 0.83% | | 0.83% (d) |
Ratio of net investment income (loss) to average net assets
| 2.61% (d) | | 1.86% | | 2.97% (d) |
Portfolio turnover rate (e)
| 85% | | 106% | | 44% |
| (a) | Inception date is April 13, 2016, which is consistent with the commencement of investment operations and is the date the initial creation units were established. |
| (b) | Total return is calculated assuming an initial investment made at the net asset value at the beginning of the period, reinvestment of all distributions at net asset value during the period, and redemption at net asset value on the last day of the period. The returns presented do not reflect the deduction of taxes that a shareholder would pay on Fund distributions or the redemption or sale of Fund shares. Total return is calculated for the time period presented and is not annualized for periods of less than a year. |
| (c) | The Fund received a reimbursement from the advisor in connection with a trade error in the amount of $35,978, which represents less than $0.01 per share. Since the advisor reimbursed the Fund, there was no effect on the Fund’s total return. |
| (d) | Annualized. |
| (e) | Portfolio turnover is calculated for the time period presented and is not annualized for periods of less than a year and does not include securities received or delivered from processing creations or redemptions and in-kind transactions. |
See Notes to Financial Statements
Page 35
First Trust Exchange-Traded Fund III
Financial Highlights (Continued)
For a share outstanding throughout each period
First Trust RiverFront Dynamic Europe ETF (RFEU)
| | Six Months
Ended
4/30/2018
(Unaudited) | | Year Ended
10/31/2017 | | Period
Ended
10/31/2016 (a) |
Net asset value, beginning of period
| $ 65.25 | | $ 51.17 | | $ 50.67 |
| Income from investment operations: | | | | | |
Net investment income (loss)
| 0.74 | | 0.82 | | 0.91 |
Net realized and unrealized gain (loss)
| (0.27) | | 14.86 | | 0.41 |
Total from investment operations
| 0.47 | | 15.68 | | 1.32 |
| Distributions paid to shareholders from: | | | | | |
Net investment income
| (0.21) | | (0.79) | | (0.82) |
Net realized gain
| — | | (0.81) | | — |
Total distributions
| (0.21) | | (1.60) | | (0.82) |
Net asset value, end of period
| $65.51 | | $65.25 | | $51.17 |
Total return (b)
| 0.72% | | 31.21% | | 2.66% |
| Ratios to average net assets/supplemental data: | | | | | |
Net assets, end of period (in 000’s)
| $ 173,608 | | $ 123,980 | | $ 25,585 |
Ratio of total expenses to average net assets
| 0.83% (c) | | 0.83% | | 0.83% (c) |
Ratio of net investment income (loss) to average net assets
| 2.70% (c) | | 1.71% | | 3.23% (c) |
Portfolio turnover rate (d)
| 82% | | 110% | | 41% |
| (a) | Inception date is April 13, 2016, which is consistent with the commencement of investment operations and is the date the initial creation units were established. |
| (b) | Total return is calculated assuming an initial investment made at the net asset value at the beginning of the period, reinvestment of all distributions at net asset value during the period, and redemption at net asset value on the last day of the period. The returns presented do not reflect the deduction of taxes that a shareholder would pay on Fund distributions or the redemption or sale of Fund shares. Total return is calculated for the time period presented and is not annualized for periods of less than a year. |
| (c) | Annualized. |
| (d) | Portfolio turnover is calculated for the time period presented and is not annualized for periods of less than a year and does not include securities received or delivered from processing creations or redemptions and in-kind transactions. |
Page 36
See Notes to Financial Statements
First Trust Exchange-Traded Fund III
Financial Highlights (Continued)
For a share outstanding throughout each period
First Trust RiverFront Dynamic Emerging Markets ETF (RFEM)
| | Six Months
Ended
4/30/2018
(Unaudited) | | Year Ended
10/31/2017 | | Period
Ended
10/31/2016 (a) |
Net asset value, beginning of period
| $ 68.64 | | $ 56.27 | | $ 49.61 |
| Income from investment operations: | | | | | |
Net investment income (loss)
| 0.19 | | 0.71 | | 0.55 |
Net realized and unrealized gain (loss)
| 4.43 | | 13.70 | | 6.66 |
Total from investment operations
| 4.62 | | 14.41 | | 7.21 |
| Distributions paid to shareholders from: | | | | | |
Net investment income
| (0.26) | | (0.77) | | (0.55) |
Net realized gain
| (0.30) | | (1.27) | | — |
Total distributions
| (0.56) | | (2.04) | | (0.55) |
Net asset value, end of period
| $72.70 | | $68.64 | | $56.27 |
Total return (b)
| 6.76% | | 26.49% | | 14.52% |
| Ratios to average net assets/supplemental data: | | | | | |
Net assets, end of period (in 000’s)
| $ 149,027 | | $ 75,506 | | $ 5,628 |
Ratio of total expenses to average net assets
| 0.95% (c) | | 0.95% | | 0.95% (c) |
Ratio of net investment income (loss) to average net assets
| 0.57% (c) | | 1.56% | | 2.66% (c) |
Portfolio turnover rate (d)
| 70% | | 87% | | 81% |
| (a) | Inception date is June 14, 2016, which is consistent with the commencement of operations and is the date the initial creation units were established. |
| (b) | Total return is calculated assuming an initial investment made at the net asset value at the beginning of the period, reinvestment of all distributions at net asset value during the period, and redemption at net asset value on the last day of the period. The returns presented do not reflect the deduction of taxes that a shareholder would pay on Fund distributions or the redemption or sale of Fund shares. Total return is calculated for the time period presented and is not annualized for periods of less than a year. |
| (c) | Annualized. |
| (d) | Portfolio turnover is calculated for the time period presented and is not annualized for periods of less than a year and does not include securities received or delivered from processing creations or redemptions and in-kind transactions. |
See Notes to Financial Statements
Page 37
Notes to Financial Statements
First Trust Exchange-Traded Fund III
April 30, 2018 (Unaudited)
1. Organization
First Trust Exchange-Traded Fund III (the “Trust”) is an open-end management investment company organized as a Massachusetts business trust on January 9, 2008, and is registered with the Securities and Exchange Commission (“SEC”) under the Investment Company Act of 1940, as amended (the “1940 Act”).
The Trust consists of thirteen funds that are currently offering shares. This report covers the following funds, each a non-diversified series of the Trust:
First Trust RiverFront Dynamic Asia Pacific ETF – (The Nasdaq Stock Market LLC (“Nasdaq”) ticker “RFAP”)
First Trust RiverFront Dynamic Developed International ETF – (Nasdaq ticker “RFDI”)
First Trust RiverFront Dynamic Europe ETF – (Nasdaq ticker “RFEU”)
First Trust RiverFront Dynamic Emerging Markets ETF – (Nasdaq ticker “RFEM”)
Each fund represents a separate series of shares of beneficial interest in the Trust (each a “Fund” and collectively, the “Funds”). Each Fund’s shares are currently listed and traded on Nasdaq. Unlike conventional mutual funds, each Fund issues and redeems shares on a continuous basis, at net asset value (“NAV”), only in large specified blocks consisting of 50,000 shares called a “Creation Unit.” Creation Units are generally issued and redeemed in-kind for securities in which a Fund invests and, in certain circumstances, for cash, and only to and from broker-dealers and large institutional investors that have entered into participation agreements. Except when aggregated in Creation Units, the shares are not redeemable securities of a Fund.
Each Fund is an actively managed exchange-traded fund. The investment objective of each Fund is to provide capital appreciation.
Under normal market conditions, RFAP seeks to achieve its investment objective by investing at least 80% of its net assets (including investment borrowings) in a portfolio of equity securities of Asian Pacific companies, including through investments in common stocks, depositary receipts, common and preferred shares of real estate investment trusts (“REITs”), and forward foreign currency contracts and currency spot transactions used to hedge the Fund’s exposure to the currencies in which the equity securities of the Asian Pacific companies are denominated.
Under normal market conditions, RFDI seeks to achieve its investment objective by investing at least 80% of its net assets (including investment borrowings) in a portfolio of equity securities of developed market companies, including through investments in common stocks, depositary receipts, common and preferred shares of REITs, and forward foreign currency contracts and currency spot transactions used to hedge the Fund’s exposure to the currencies in which the equity securities of the developed market companies are denominated.
Under normal market conditions, RFEU seeks to achieve its investment objective by investing at least 80% of its net assets (including investment borrowings) in a portfolio of equity securities of European companies, including through investments in common stocks, depositary receipts, common and preferred shares of REITs, and forward foreign currency contracts and currency spot transactions used to hedge the Fund’s exposure to the currencies in which the equity securities of the European companies are denominated.
Under normal market conditions, RFEM seeks to achieve its investment objective by investing at least 80% of its net assets (including investment borrowings) in a portfolio of equity securities of emerging market companies, including through investments in common stocks, depositary receipts, common and preferred shares of REITs, and forward foreign currency contracts and currency spot transactions used to hedge the Fund’s exposure to the currencies in which the equity securities of the emerging market companies are denominated.
There can be no assurance that a Fund will achieve its investment objective. The Funds may not be appropriate for all investors.
2. Significant Accounting Policies
The Funds are each considered an investment company and follow accounting and reporting guidance under Financial Accounting Standards Board Accounting Standards Codification Topic 946, “Financial Services-Investment Companies.” The following is a summary of significant accounting policies consistently followed by the Funds in the preparation of the financial statements. The preparation of the financial statements in accordance with accounting principles generally accepted in the United States of America (“U.S. GAAP”) requires management to make estimates and assumptions that affect the reported amounts and disclosures in the financial statements. Actual results could differ from those estimates.
A. Portfolio Valuation
Each Fund’s NAV is determined daily as of the close of regular trading on the New York Stock Exchange (“NYSE”), normally 4:00 p.m. Eastern time, on each day the NYSE is open for trading. If the NYSE closes early on a valuation day, the NAV is determined
Notes to Financial Statements (Continued)
First Trust Exchange-Traded Fund III
April 30, 2018 (Unaudited)
as of that time. Foreign securities are priced using data reflecting the earlier closing of the principal markets for those securities. Each Fund’s NAV is calculated by dividing the value of all assets of each Fund (including accrued interest and dividends), less all liabilities (including accrued expenses and dividends declared but unpaid), by the total number of shares outstanding.
Each Fund’s investments are valued daily at market value or, in the absence of market value with respect to any portfolio securities, at fair value. Market value prices represent last sale or official closing prices from a national or foreign exchange (i.e., a regulated market) and are primarily obtained from third-party pricing services. Fair value prices represent any prices not considered market value prices and are either obtained from a third-party pricing service or are determined by the Pricing Committee of the Funds’ investment advisor, First Trust Advisors L.P. (“First Trust” or the “Advisor”), in accordance with valuation procedures adopted by the Trust’s Board of Trustees, and in accordance with provisions of the 1940 Act. Investments valued by the Advisor’s Pricing Committee, if any, are footnoted as such in the footnotes to the Portfolio of Investments. Each Fund’s investments are valued as follows:
Common stocks, REITs, and other equity securities listed on any national or foreign exchange (excluding Nasdaq and the London Stock Exchange Alternative Investment Market (“AIM”)) are valued at the last sale price on the exchange on which they are principally traded or, for Nasdaq and AIM securities, the official closing price. Securities traded on more than one securities exchange are valued at the last sale price or official closing price, as applicable, at the close of the securities exchange representing the principal market for such securities.
Securities traded in an over-the-counter market are fair valued at the mean of their most recent bid and asked price, if available, and otherwise at their closing bid price.
Forward foreign currency contracts are valued at the current day’s interpolated foreign exchange rate, as calculated using the current day’s spot rate, and the thirty, sixty, ninety, and one-hundred eighty day forward rates provided by a third-party pricing service.
Certain securities may not be able to be priced by pre-established pricing methods. Such securities may be valued by the Trust’s Board of Trustees or its delegate, the Advisor’s Pricing Committee, at fair value. These securities generally include, but are not limited to, restricted securities (securities which may not be publicly sold without registration under the Securities Act of 1933, as amended) for which a third-party pricing service is unable to provide a market price; securities whose trading has been formally suspended; a security whose market or fair value price is not available from a pre-established pricing source; a security with respect to which an event has occurred that is likely to materially affect the value of the security after the market has closed but before the calculation of a Fund’s NAV or make it difficult or impossible to obtain a reliable market quotation; and a security whose price, as provided by the third-party pricing service, does not reflect the security’s fair value. As a general principle, the current fair value of a security would appear to be the amount which the owner might reasonably expect to receive for the security upon its current sale. When fair value prices are used, generally they will differ from market quotations or official closing prices on the applicable exchanges. A variety of factors may be considered in determining the fair value of such securities, including, but not limited to, the following:
| 1) | the type of security; |
| 2) | the size of the holding; |
| 3) | the initial cost of the security; |
| 4) | transactions in comparable securities; |
| 5) | price quotes from dealers and/or third-party pricing services; |
| 6) | relationships among various securities; |
| 7) | information obtained by contacting the issuer, analysts, or the appropriate stock exchange; |
| 8) | an analysis of the issuer’s financial statements; and |
| 9) | the existence of merger proposals or tender offers that might affect the value of the security. |
If the securities in question are foreign securities, the following additional information may be considered:
| 1) | the value of similar foreign securities traded on other foreign markets; |
| 2) | ADR trading of similar securities; |
| 3) | closed-end fund trading of similar securities; |
| 4) | foreign currency exchange activity; |
| 5) | the trading prices of financial products that are tied to baskets of foreign securities; |
| 6) | factors relating to the event that precipitated the pricing problem; |
| 7) | whether the event is likely to recur; and |
| 8) | whether the effects of the event are isolated or whether they affect entire markets, countries or regions. |
Notes to Financial Statements (Continued)
First Trust Exchange-Traded Fund III
April 30, 2018 (Unaudited)
Because foreign markets may be open on different days than the days during which investors may transact in the shares of a Fund, the value of the Fund’s securities may change on the days when investors are not able to transact in the shares of the Fund. The value of securities denominated in foreign currencies is converted into U.S. dollars using exchange rates determined daily as of the close of regular trading on the NYSE.
The Funds are subject to fair value accounting standards that define fair value, establish the framework for measuring fair value and provide a three-level hierarchy for fair valuation based upon the inputs to the valuation as of the measurement date. The three levels of the fair value hierarchy are as follows:
| • | Level 1 – Level 1 inputs are quoted prices in active markets for identical investments. An active market is a market in which transactions for the investment occur with sufficient frequency and volume to provide pricing information on an ongoing basis. |
| • | Level 2 – Level 2 inputs are observable inputs, either directly or indirectly, and include the following: |
| o | Quoted prices for similar investments in active markets. |
| o | Quoted prices for identical or similar investments in markets that are non-active. A non-active market is a market where there are few transactions for the investment, the prices are not current, or price quotations vary substantially either over time or among market makers, or in which little information is released publicly. |
| o | Inputs other than quoted prices that are observable for the investment (for example, interest rates and yield curves observable at commonly quoted intervals, volatilities, prepayment speeds, loss severities, credit risks, and default rates). |
| o | Inputs that are derived principally from or corroborated by observable market data by correlation or other means. |
| • | Level 3 – Level 3 inputs are unobservable inputs. Unobservable inputs may reflect the reporting entity’s own assumptions about the assumptions that market participants would use in pricing the investment. |
The inputs or methodologies used for valuing investments are not necessarily an indication of the risk associated with investing in those investments. A summary of the inputs used to value each Fund’s investments as of April 30, 2018, is included with each Fund’s Portfolio of Investments.
B. Securities Transactions and Investment Income
Securities transactions are recorded as of the trade date. Realized gains and losses from securities transactions are recorded on the identified cost basis. Dividend income is recorded on the ex-dividend date except that certain dividends from foreign securities are recorded as soon as the information becomes available after the ex-dividend date. Interest income, if any, is recorded on the accrual basis.
Withholding taxes and tax reclaims on foreign dividends have been provided for in accordance with each Fund’s understanding of the applicable country’s tax rules and rates.
Distributions received from a Fund’s investments in REITs may be comprised of return of capital, capital gains, and income. The actual character of the amounts received during the year are not known until after the REIT’s fiscal year end. A Fund records the character of distributions received from the REITs during the year based on estimates available. The characterization of distributions received by a Fund may be subsequently revised based on information received from the REITs after their tax reporting periods conclude.
C. Forward Foreign Currency Contracts
The Funds are subject to foreign currency risk in the normal course of pursuing their investment objectives. Forward foreign currency contracts are agreements between two parties (“Counterparties”) to exchange one currency for another at a future date and at a specified price. The Funds use forward foreign currency contracts to facilitate transactions in foreign securities and to manage each Fund’s foreign currency exposure. These contracts are valued daily, and each Fund’s net equity therein, representing unrealized gain or loss on the contracts as measured by the difference between the forward foreign exchange rates at the dates of entry into the contracts and the forward rates at the reporting date, is included in “Unrealized appreciation on forward foreign currency contracts” and “Unrealized depreciation on forward foreign currency contracts” on the Statements of Assets and Liabilities. The change in unrealized appreciation (depreciation) is included in “Net change in unrealized appreciation (depreciation) on forward foreign currency contracts” on the Statements of Operations. When the forward contract is closed, a Fund records a realized gain or loss equal to the difference between the proceeds from (or the cost of) the closing transaction and the Fund’s basis in the contract. This realized gain or loss is included in “Net realized gain (loss) on forward foreign currency contracts” on the Statements of Operations. Risks arise from the possible inability of Counterparties to meet the terms of their contracts and from movement in currency, securities values and interest rates. Due to the risks, the Funds could incur losses in excess of the net unrealized value shown on the Forward Foreign Currency
Notes to Financial Statements (Continued)
First Trust Exchange-Traded Fund III
April 30, 2018 (Unaudited)
Contracts table in each Fund’s Portfolio of Investments. In the event of default by the Counterparty, a Fund will provide notice to the Counterparty of the Fund’s intent to convert the currency held by the Fund into the currency that the Counterparty agreed to exchange with that Fund. If a Counterparty becomes bankrupt or otherwise fails to perform its obligations due to financial difficulties, the Funds may experience significant delays in obtaining any recovery in a bankruptcy or other reorganization proceeding. The Funds may obtain only limited recovery or may obtain no recovery in such circumstances. The Funds did not have any forward foreign currency contracts during the six months ended April 30, 2018.
D. Foreign Currency
The books and records of the Funds are maintained in U.S. dollars. Foreign currencies, investments and other assets and liabilities are translated into U.S. dollars at the exchange rates prevailing at the end of the period. Purchases and sales of investments and items of income and expense are translated on the respective dates of such transactions. Unrealized gains and losses on assets and liabilities, other than investments in securities, which result from changes in foreign currency exchange rates have been included in “Net change in unrealized appreciation (depreciation) on foreign currency translation” on the Statements of Operations. Unrealized gains and losses on investments in securities which result from changes in foreign exchange rates are included with fluctuations arising from changes in market price and is included in “Net change in unrealized appreciation (depreciation) on investments” on the Statements of Operations. Net realized foreign currency gains and losses include the effect of changes in exchange rates between trade date and settlement date on investment security transactions, foreign currency transactions and interest and dividends received and is included in “Net realized gain (loss) on foreign currency transactions” on the Statements of Operations. The portion of foreign currency gains and losses related to fluctuations in exchange rates between the initial purchase settlement date and subsequent sale trade date is included in “Net realized gain (loss) on investments” on the Statements of Operations.
E. Dividends and Distributions to Shareholders
Dividends from net investment income, if any, are declared and paid quarterly by each Fund, or as the Board of Trustees may determine from time to time. Distributions of net realized capital gains earned by each Fund, if any, are distributed at least annually.
Distributions from income and capital gains are determined in accordance with federal income tax regulations, which may differ from U.S. GAAP. Certain capital accounts in the financial statements are periodically adjusted for permanent differences in order to reflect their tax character. These permanent differences are primarily due to the varying treatment of income and gain/loss on portfolio securities held by the Funds and have no impact on net assets or NAV per share. Temporary differences, which arise from recognizing certain items of income, expense and gain/loss in different periods for financial statement and tax purposes, will reverse at some time in the future.
The tax character of distributions paid by each Fund during the fiscal year ended October 31, 2017, was as follows:
| | Distributions
paid from
Ordinary
Income | | Distributions
paid from
Capital
Gains | | Distributions
paid from
Return of
Capital |
First Trust RiverFront Dynamic Asia Pacific ETF
| $ 321,623 | | $ — | | $ — |
First Trust RiverFront Dynamic Developed International ETF
| 2,607,367 | | 201,961 | | — |
First Trust RiverFront Dynamic Europe ETF
| 859,771 | | 407,052 | | — |
First Trust RiverFront Dynamic Emerging Markets ETF
| 679,249 | | — | | — |
As of October 31, 2017, the component of distributable earnings on a tax basis for each Fund were as follows:
| | Undistributed
Ordinary
Income | | Accumulated
Capital and
Other
Gain (Loss) | | Net
Unrealized
Appreciation
(Depreciation) |
First Trust RiverFront Dynamic Asia Pacific ETF
| $ 309,722 | | $ (409,134) | | $ 725,282 |
First Trust RiverFront Dynamic Developed International ETF
| 1,923,187 | | 22,673 | | 25,892,800 |
First Trust RiverFront Dynamic Europe ETF
| 74,035 | | (654,153) | | 9,310,309 |
First Trust RiverFront Dynamic Emerging Markets ETF
| 458,841 | | 66,909 | | 6,633,540 |
F. Income and Other Taxes
Each Fund intends to continue to qualify as a regulated investment company by complying with the requirements under Subchapter M of the Internal Revenue Code of 1986, as amended, which includes distributing substantially all of its net investment income and net
Notes to Financial Statements (Continued)
First Trust Exchange-Traded Fund III
April 30, 2018 (Unaudited)
realized gains to shareholders. Accordingly, no provision has been made for federal and state income taxes. However, due to the timing and amount of distributions, each Fund may be subject to an excise tax of 4% of the amount by which approximately 98% of each Fund’s taxable income exceeds the distributions from such taxable income for the calendar year.
Certain countries assess a capital gains tax on securities sold in their local markets. This tax is accrued as the securities in these foreign markets appreciate in value and is paid at the time of sale to the extent a capital gain is realized. Taxes accrued on securities in an unrealized appreciation position are included in “Net change in unrealized appreciation (depreciation) on deferred foreign capital gains tax” on the Statements of Operations. The capital gains tax paid on securities sold is included in “Net realized gain (loss) on foreign capital gains tax” on the Statements of Operations.
India’s Finance Bill, 2018 (“Finance Bill, 2018”) was enacted into law on March 29, 2018 and amongst other provisions, it introduces a long-term capital gains tax beginning April 1, 2018. Long-term capital gains on the sale of listed shares in excess of INR 0.1 million will be taxed at the rate of 10% (plus applicable surcharge and cess (which is a type of tax)) subject to satisfaction of certain conditions. Long-term capital gains accruing as of January 31, 2018 will be considered exempt due to a grandfather clause in the provision. In the case of the sale of listed shares held by a Fund for one year or less, the income would be classified as short-term capital gains and would be taxable at 15% (plus applicable surcharge and cess) provided the shares are sold on the stock exchange and subjected to securities transaction tax (“STT”). The Finance Bill, 2018 increases the cess imposed on the sum of tax and surcharge from 3% to 4%. The cess 4% rate is applied to the capital gains tax, resulting in a higher effective rate of capital gains tax. Where the sale of shares is outside the stock exchange and not subject to STT, the long-term capital gains would be taxed at 10% (plus applicable surcharge and cess) and short-term capital gains would be taxed at 30% (plus applicable surcharge and cess). The Finance Bill, 2018, approves the carry forward of long-term capital losses to be offset against long-term capital gains. Short-term losses and long-term losses can be netted against short-term gains and long-term gains, respectively.
The Funds are subject to accounting standards that establish a minimum threshold for recognizing, and a system for measuring, the benefits of a tax position taken or expected to be taken in a tax return. Taxable years ended 2016 and 2017 remain open to federal and state audit. As of April 30, 2018, management has evaluated the application of these standards to the Funds and has determined that no provision for income tax is required in the Funds’ financial statements for uncertain tax positions.
The Funds intend to utilize provisions of the federal income tax laws, which allow them to carry a realized capital loss forward indefinitely following the year of the loss and offset such loss against any future realized capital gains. The Funds are subject to certain limitations under U.S. tax rules on the use of capital loss carryforwards and net unrealized built-in losses. These limitations apply when there has been a 50% change in ownership. At October 31, 2017, the Funds had non-expiring capital loss carryforward for federal income tax purposes as follows:
| | Capital
Loss Available |
First Trust RiverFront Dynamic Asia Pacific ETF
| $ 409,134 |
First Trust RiverFront Dynamic Developed International ETF
| — |
First Trust RiverFront Dynamic Europe ETF
| 654,153 |
First Trust RiverFront Dynamic Emerging Markets ETF
| — |
G. Expenses
Expenses, other than the investment advisory fee and other excluded expenses, are paid by the Advisor (See Note 3).
H. New and Amended Financial Reporting Rules and Forms
On October 13, 2016, the SEC adopted new rules and forms, and amended existing rules and forms. The new and amended rules and forms are intended to modernize the reporting of information provided by funds and to improve the quality and type of information that funds provide to the SEC and investors. In part, the new and amended rules and forms amend Regulation S-X and require standardized, enhanced disclosures about derivatives in a fund’s financial statements, as well as other amendments. The compliance date for the amendments of Regulation S-X was August 1, 2017, which resulted in no change to the financial statements. The new form types and other rule amendments will be effective for the First Trust funds, including the Funds, for reporting periods beginning on and after June 1, 2018. Management is evaluating the new form types and other rule amendments that are effective on and after June 1, 2018 to determine the impact to the Funds.
Notes to Financial Statements (Continued)
First Trust Exchange-Traded Fund III
April 30, 2018 (Unaudited)
3. Investment Advisory Fee, Affiliated Transactions and Other Fee Arrangements
First Trust, the investment advisor to the Funds, is a limited partnership with one limited partner, Grace Partners of DuPage L.P., and one general partner, The Charger Corporation. The Charger Corporation is an Illinois corporation controlled by James A. Bowen, Chief Executive Officer of First Trust. First Trust is responsible for supervising the selection and ongoing monitoring of the securities in each Fund’s portfolio, managing the Funds’ business affairs and providing certain administrative services necessary for the management of the Funds.
Pursuant to the Investment Management Agreement between First Trust and the Trust, First Trust supervises the investment of the Funds’ assets and is responsible for the expenses of each Fund including the cost of transfer agency, sub-advisory, custody, fund administration, legal, audit and other services, but excluding fee payments under the Investment Management Agreement, interest, taxes, brokerage commissions, acquired fund fees and expenses, if any, distribution and service fees payable pursuant to Rule 12b-1 plan, if any, expenses associated with the execution of portfolio transactions, and extraordinary expenses, which are paid by each respective Fund. RFAP, RFDI and RFEU have each agreed to pay First Trust an annual unitary management fee equal to 0.83% its average daily net assets. RFEM has agreed to pay First Trust an annual unitary management fee equal to 0.95% of its average daily net assets. First Trust also provides fund reporting services to each Fund for a flat annual fee in the amount of $9,250, which is covered under the annual unitary management fee.
RiverFront Investment Group, LLC (“RiverFront” or the “Sub-Advisor”) serves as the Funds’ sub-advisor and manages each Fund’s portfolio subject to First Trust’s supervision. The Sub-Advisor receives a monthly portfolio management fee calculated at an annual rate of 0.35% of each Fund’s average daily net assets that is paid by First Trust out of its investment advisory fee.
During the year ended October 31, 2017, RFAP and RFDI received payments from the Advisor of $7,644 and $35,978, respectively, in connection with trade errors.
The Trust has multiple service agreements with Brown Brothers Harriman & Co. (“BBH”). Under the service agreements, BBH performs custodial, fund accounting, certain administrative services, and transfer agency services for the Funds. As custodian, BBH is responsible for custody of each Fund’s assets. As fund accountant and administrator, BBH is responsible for maintaining the books and records of each Fund’s securities and cash. As transfer agent, BBH is responsible for maintaining shareholder records for each Fund.
Each Trustee who is not an officer or employee of First Trust, any sub-advisor or any of their affiliates (“Independent Trustees”) is paid a fixed annual retainer that is allocated equally among each fund in the First Trust Fund Complex. Each Independent Trustee is also paid an annual per fund fee that varies based on whether the fund is a closed-end or other actively managed fund, or is an index fund.
Additionally, the Lead Independent Trustee and the Chairmen of the Audit Committee, Nominating and Governance Committee and Valuation Committee are paid annual fees to serve in such capacities, with such compensation allocated pro rata among each fund in the First Trust Fund Complex based on net assets. Independent Trustees are reimbursed for travel and out-of-pocket expenses in connection with all meetings. The Lead Independent Trustee and Committee Chairmen rotate every three years. The officers and “Interested” Trustee receive no compensation from the Trust for acting in such capacities.
4. Purchases and Sales of Securities
For the six months ended April 30, 2018, the cost of purchases and proceeds from sales of investment securities for each Fund, excluding short-term investments and in-kind transactions, were as follows:
| | Purchases | | Sales |
| First Trust RiverFront Dynamic Asia Pacific ETF | $ 59,487,561 | | $ 46,737,869 |
| First Trust RiverFront Dynamic Developed International ETF | 500,951,164 | | 464,571,698 |
| First Trust RiverFront Dynamic Europe ETF | 132,368,319 | | 115,809,589 |
| First Trust RiverFront Dynamic Emerging Markets ETF | 120,815,914 | | 73,013,223 |
| | | | |
Notes to Financial Statements (Continued)
First Trust Exchange-Traded Fund III
April 30, 2018 (Unaudited)
For the six months ended April 30, 2018, the cost of in-kind purchases and proceeds from in-kind sales for each Fund were as follows:
| | Purchases | | Sales |
| First Trust RiverFront Dynamic Asia Pacific ETF | $ 37,937,408 | | $ 17,185,381 |
| First Trust RiverFront Dynamic Developed International ETF | 286,260,364 | | 93,192,243 |
| First Trust RiverFront Dynamic Europe ETF | 49,525,047 | | 16,030,417 |
| First Trust RiverFront Dynamic Emerging Markets ETF | 22,454,993 | | — |
5. Creations, Redemptions and Transaction Fees
Shares are created and redeemed by each Fund only in Creation Unit size aggregations of 50,000 shares in transactions with broker-dealers or large institutional investors that have entered into a participation agreement (an “Authorized Participant”). In order to purchase Creation Units of a Fund, an Authorized Participant must deposit (i) a designated portfolio of securities and other instruments determined by First Trust (the “Deposit Securities”) and generally make or receive a cash payment referred to as the “Cash Component,” which is an amount equal to the difference between the NAV of the Fund shares (per Creation Unit Aggregations) and the market value of the Deposit Securities, and/or (ii) cash in lieu of all or a portion of the Deposit Securities. If the Cash Component is a positive number (i.e., the NAV per Creation Unit Aggregation exceeds the Deposit Amount), the Authorized Participant will deliver the Cash Component. If the Cash Component is a negative number (i.e., the NAV per Creation Unit Aggregation is less than the Deposit Amount), the Authorized Participant will receive the Cash Component. Authorized Participants purchasing Creation Units must pay to BBH, as transfer agent, a creation transaction fee (the “Creation Transaction Fee”) regardless of the number of Creation Units purchased in the transaction. The Creation Transaction Fee may vary and is based on the composition of the securities included in the respective Fund’s portfolio and the countries in which the transactions are settled. The Creation Transaction Fee may increase or decrease as each Fund’s portfolio is adjusted to conform to changes in the composition of the securities included in the Fund’s portfolio and the countries in which the transaction settled. The price for each Creation Unit will equal the daily NAV per share times the number of shares in a Creation Unit plus the fees described above and, if applicable, any operational processing and brokerage costs, transfer fees or stamp taxes. When a Fund permits an Authorized Participant to substitute cash or a different security in lieu of depositing one or more of the requisite Deposit Securities, the Authorized Participant may also be assessed an amount to cover the cost of purchasing the Deposit Securities and/or disposing of the substituted securities, including operational processing and brokerage costs, transfer fees, stamp taxes, and part or all of the spread between the expected bid and offer side of the market related to such Deposit Securities and/or substitute securities.
Authorized Participants redeeming Creation Units must pay to BBH, as transfer agent, a redemption transaction fee (the “Redemption Transaction Fee”), regardless of the number of Creation Units redeemed in the transaction. The Redemption Transaction Fee may vary and is based on the composition of the securities included in the respective Fund’s portfolio and the countries in which the transactions are settled. Each Fund reserves the right to effect redemptions in cash. An Authorized Participant may request cash redemption in lieu of securities; however, a Fund may, in its discretion, reject any such request.
The standard Creation Transaction Fees and the Redemption Transaction Fees for each Fund are as follows:
| | Creation
Transaction Fees | | Redemption
Transaction Fees |
| First Trust RiverFront Dynamic Asia Pacific ETF | $ 1,650 | | $ 1,650 |
| First Trust RiverFront Dynamic Developed International ETF | 3,600 | | 3,600 |
| First Trust RiverFront Dynamic Europe ETF | 2,000 | | 2,000 |
| First Trust RiverFront Dynamic Emerging Markets ETF | 4,100 | | 4,100 |
6. Distribution Plan
The Board of Trustees adopted a Distribution and Service Plan pursuant to Rule 12b-1 under the 1940 Act. In accordance with the Rule 12b-1 plan, each Fund is authorized to pay an amount up to 0.25% of its average daily net assets each year to reimburse First Trust Portfolios L.P. (“FTP”), the distributor of the Funds, for amounts expended to finance activities primarily intended to result in the sale of Creation Units or to provide investor services. FTP may also use this amount to compensate securities dealers or other persons that are Authorized Participants for providing distribution assistance, including broker-dealer and shareholder support and educational and promotional services.
No 12b-1 fees are currently paid by the Funds, and pursuant to a contractual arrangement, no 12b-1 fees will be paid any time before February 28, 2019.
Notes to Financial Statements (Continued)
First Trust Exchange-Traded Fund III
April 30, 2018 (Unaudited)
7. Indemnification
The Trust, on behalf of the Funds, has a variety of indemnification obligations under contracts with its service providers. The Trust’s maximum exposure under these arrangements is unknown. However, the Trust has not had prior claims or losses pursuant to these contracts and expects the risk of loss to be remote.
8. Subsequent Events
Management has evaluated the impact of all subsequent events to the Funds through the date the financial statements were issued, and has determined that there were no subsequent events requiring recognition or disclosure in the financial statements that have not already been disclosed.
Additional Information
First Trust Exchange-Traded Fund III
April 30, 2018 (Unaudited)
Proxy Voting Policies and Procedures
A description of the policies and procedures that the Trust uses to determine how to vote proxies and information on how each Fund voted proxies relating to portfolio investments during the most recent 12-month period ended June 30 is available (1) without charge, upon request, by calling (800) 988-5891; (2) on the Fund’s website at www.ftportfolios.com; and (3) on the Securities and Exchange Commission’s (“SEC”) website at www.sec.gov.
Portfolio Holdings
The Trust files its complete schedule of portfolio holdings with the SEC for the first and third quarters of each fiscal year on Form N-Q. The Funds’ Form N-Qs are available (1) by calling (800) 988-5891; (2) on the Fund’s website at www.ftportfolios.com; (3) on the SEC’s website at www.sec.gov; and (4) for review and copying at the SEC’s Public Reference Room (“PRR”) in Washington, DC. Information regarding the operation of the PRR may be obtained by calling (800) SEC-0330.
Risk Considerations
Risks are inherent in all investing. You should consider each Fund’s investment objective, risks, charges and expenses carefully before investing. You can download each Fund’s prospectus at www.ftportfolios.com or contact First Trust Portfolios L.P. at (800) 621-1675 to request a prospectus, which contains this and other information about each Fund. For additional information about the risks associated with investing in each Fund, please see each Fund’s statement of additional information, as well as other regulatory filings. Read these documents carefully before you invest. First Trust Portfolios L.P. is the distributor of the First Trust Exchange-Traded Fund III.
The following summarizes some of the risks that should be considered for the Funds.
ASIA PACIFIC RISK. Certain of the Funds invest in securities in the Asia Pacific region and are more susceptible to the economic, market, regulatory, political, natural disasters and local risks of the Asia Pacific region than a fund that is more geographically diversified. The region has historically been highly dependent on global trade, with nations taking strong roles in both the importing and exporting of goods; such a relationship creates a risk with this dependency on global growth. The respective stock markets tend to have a larger prevalence of smaller companies that are inherently more volatile and less liquid than larger companies. Varying levels of accounting and disclosure standards, restrictions on foreign ownership, minority ownership rights, and corporate governance standards are also common for the region.
AUSTRALIA RISK. Certain of the Funds invest in securities of companies in Australia. Investing in securities of Australian companies may involve additional risks. The Australian economy is heavily dependent on the Asian, European and U.S. markets. Reduced spending by any of these economies on Australian products may adversely affect the Australian market. Additionally, Australia is located in a geographic region that has historically been prone to natural disasters. The occurrence of a natural disaster in the region could negatively impact the Australian economy and affect the value of the securities held by a Fund.
AUTHORIZED PARTICIPANT CONCENTRATION RISK. Only an authorized participant (as defined in the "Creations, Redemptions, and Transaction Fees” Note to Financial Statements) may engage in creation or redemption transactions directly with each Fund. Each Fund has a limited number of institutions that act as authorized participants. To the extent that these institutions exit the business or are unable to proceed with creation and/or redemption orders with respect to a Fund and no other authorized participant is able to step forward to create or redeem, in either of these cases, Fund shares may trade at a discount to a Fund’s net asset value and possibly face delisting.
CASH TRANSACTIONS RISK. Certain of the Funds may, under certain circumstances, effect creations and redemptions, in whole or in part, for cash, rather than in-kind, because of the nature of the Fund’s underlying investments. As a result, an investment in the Fund may be less tax-efficient than it would be through more frequent creations and redemptions in-kind.
CONSUMER DISCRETIONARY COMPANIES RISK. Consumer discretionary companies provide non-essential goods and services, such as retailers, media companies and consumer services. These companies manufacture products and provide discretionary services directly to the consumer, and the success of these companies is tied closely to the performance of the overall domestic and international economy, interest rates, competition and consumer confidence. Success depends heavily on disposable household income and consumer spending. Changes in demographics and consumer tastes can also affect the demand for, and success of, consumer discretionary products in the marketplace.
COUNTERPARTY RISK. Each Fund bears the risk that the counterparty to a Fund’s forward foreign currency exchange contracts and currency spot transactions may default on its obligations or otherwise fail to honor its obligations. If a counterparty defaults on its payment obligations, a Fund will lose money and the value of an investment in Fund shares may decrease. In addition, a Fund may engage in such investment transactions with a limited number of counterparties.
Additional Information (Continued)
First Trust Exchange-Traded Fund III
April 30, 2018 (Unaudited)
CREDIT RISK. Credit risk is the risk that an issuer of a security held by a Fund will be unable or unwilling to make dividend, interest and/or principal payments when due and the related risk that the value of such security may decline because of concerns about the issuer’s ability to make such payments. Credit risk may be heightened if a Fund invests in "high yield" or "junk" securities; such securities, while generally offering higher yields than investment grade debt with similar maturities, involve greater risks, including the possibility of dividend or interest deferral, default or bankruptcy, and are regarded as predominantly speculative with respect to the issuer’s capacity to pay dividends or interest and repay principal.
CURRENCY EXCHANGE RATE RISK. Each Fund holds investments that are denominated in non-U.S. currencies, or in securities that provide exposure to such currencies, currency exchange rates or interest rates denominated in such currencies. Changes in currency exchange rates and the relative value of non-U.S. currencies will affect the value of a Fund’s investment and the value of Fund shares. Changes in currency exchange rates also may affect the value of interest earned and gains and losses realized on the sale of securities. Currency exchange rates can be very volatile and can change quickly and unpredictably. As a result, the value of an investment in a Fund may change quickly and without warning and you may lose money. The Fund may hedge certain of its non-U.S. dollar holdings.
CYBER SECURITY RISK. As the use of Internet technology has become more prevalent in the course of business, the Funds have become more susceptible to potential operational risks through breaches in cyber security. A breach in cyber security refers to both intentional and unintentional events that may cause a Fund to lose proprietary information, suffer data corruption or lose operational capacity. Such events could cause a Fund to incur regulatory penalties, reputational damage, additional compliance costs associated with corrective measures and/or financial loss. Cyber security breaches may involve unauthorized access to a Fund’s digital information systems through "hacking" or malicious software coding, but may also result from outside attacks such as denial-of-service attacks through efforts to make network services unavailable to intended users. In addition, cyber security breaches of a Fund’s third-party service providers, such as its administrator, transfer agent, custodian, or sub-advisor, as applicable, or issuers in which a Fund invests, can also subject a Fund to many of the same risks associated with direct cyber security breaches. The Funds have established risk management systems designed to reduce the risks associated with cyber security. However, there is no guarantee that such efforts will succeed, especially because the Funds do not directly control the cyber security systems of issuers or third-party service providers.
DEPOSITARY RECEIPTS RISK. Depositary receipts may be less liquid than the underlying shares in their primary trading market. Any distributions paid to the holders of depositary receipts are usually subject to a fee charged by the depositary. Holders of depositary receipts may have limited voting rights, and investment restrictions in certain countries may adversely impact the value of depositary receipts because such restrictions may limit the ability to convert the equity shares into depositary receipts and vice versa. Such restrictions may cause the equity shares of the underlying issuer to trade at a discount or premium to the market price of the depositary receipts.
DERIVATIVES RISK. The use of forward contracts and currency spot transactions can lead to losses because of adverse movements in the price or value of the underlying asset, index or rate, which may be magnified by certain features of the derivatives.
In addition to the above risks, a Fund is "deemed" to have entered into an ISDA Master Agreement (the "ISDA Master Agreement"), a standard umbrella relationship-framework agreement between two parties under which one or more individual derivatives transactions are entered. While most ISDA Master Agreements are highly customized and heavily negotiated, a "deemed" ISDA Master Agreement has predetermined elections. Therefore, a Fund may forego certain protections they would have been afforded had they negotiated the ISDA Master Agreements, such as terms related to choice of law, events of default, termination events, payments on early termination, and calculation agents.
DYNAMIC HEDGING RISK. Because of a Fund’s utilization of the dynamic currency hedging strategy, a Fund may have lower returns than an equivalent non-currency hedged investment when the component currencies are rising relative to the U.S. dollar. As such, contracts to sell foreign currency will generally be expected to limit any potential gain that might be realized by a Fund if the value of the hedged currency increases. In addition, the use of currency hedging will not necessarily eliminate exposure to all currency fluctuations. Hedging against a decline in the value of a currency does not eliminate fluctuations in the value of a portfolio security traded in that currency or prevent a loss if the value of the security declines. Moreover, it may not be possible for a Fund to hedge against a devaluation that is so generally anticipated that a Fund is not able to contract to sell the currency at a price above the devaluation level it anticipates.
EMERGING MARKETS RISK. Investments in securities and instruments traded in developing or emerging markets or that provide exposure to such securities or markets, can involve additional risks relating to political, economic, or regulatory conditions not associated with investments in U.S. securities and instruments or investments in more developed international markets. Emerging market governments may, without prior warning, impose capital controls on the ability to transfer currency, securities or other assets. A Fund’s ability to access certain developing or emerging markets also may be limited due to a variety of factors, including currency
Additional Information (Continued)
First Trust Exchange-Traded Fund III
April 30, 2018 (Unaudited)
convertibility issues. Such conditions may impact the ability of a Fund to buy, sell or otherwise transfer securities, cause a Fund’s returns to differ from those available to domestic investors, adversely affect the trading market and price for Fund shares, and cause a Fund to decline in value.
EQUITY SECURITIES RISK. Because each Fund invests in equity securities, the value of each Fund’s shares will fluctuate with changes in the value of these equity securities. Equity securities prices fluctuate for several reasons, including changes in investors’ perceptions of the financial condition of an issuer or the general condition of the relevant stock market, such as market volatility, or when political or economic events affecting the issuers occur. In addition, common stock prices may be particularly sensitive to rising interest rates, as the cost of capital rises and borrowing costs increase.
EUROPE RISK. Certain of the Funds invest in securities in the European region. Investments in a single region, even though representing a number of different countries within the region, may be affected by common economic forces and other factors. A Fund is subject to greater risks of adverse events which occur in the European region and may experience greater volatility than a fund that is more broadly diversified geographically. Political or economic disruptions in European countries, even in countries in which a Fund is not invested, may adversely affect security values and thus a Fund’s holdings. A significant number of countries in Europe are member states in the European Union (the “EU”), and the member states no longer control their own monetary policies by directing independent interest rates for their currencies. In these member states, the authority to direct monetary policies, including money supply and official interest rates for the Euro, is exercised by the European Central Bank.
FINANCIAL COMPANIES RISK. Financial companies are especially subject to the adverse effects of economic recession, currency exchange rates, government regulation, decreases in the availability of capital, volatile interest rates, portfolio concentrations in geographic markets and in commercial and residential real estate loans, and competition from new entrants in their fields of business.
FLUCTUATION OF NET ASSET VALUE RISK. The net asset value of shares of a Fund will generally fluctuate with changes in the market value of the Fund’s holdings. The market prices of shares will generally fluctuate in accordance with changes in net asset value as well as the relative supply of and demand for shares on the Exchange. The Funds’ investment advisor cannot predict whether shares will trade below, at or above their net asset value because the shares trade on the Exchange at market prices and not at net asset value. Price differences may be due, in large part, to the fact that supply and demand forces at work in the secondary trading market for shares will be closely related to, but not identical to, the same forces influencing the prices of the holdings of the Fund trading individually or in the aggregate at any point in time. However, given that shares can only be purchased and redeemed in-kind or in cash, depending on the Fund, or in Creation Units, and only to and from broker-dealers and large institutional investors that have entered into participation agreements (unlike shares of closed-end funds, which frequently trade at appreciable discounts from, and sometimes at premiums to, their net asset value), the Funds’ investment advisor believes that large discounts or premiums to the net asset value of shares should not be sustained.
FORWARD FOREIGN CURRENCY EXCHANGE CONTRACTS RISK. Forward foreign currency exchange contracts involve certain risks, including the risk of failure of the counterparty to perform its obligations under the contract and the risk that the use of forward contracts may not serve as a complete hedge because of an imperfect correlation between movements in the prices of the contracts and the prices of the currencies hedged. Forward foreign currency exchange contracts may limit any potential gain that might result should the value of the underlying currencies increase. In addition, because forward currency exchange contracts are privately negotiated transactions, there can be no assurance that a Fund will have flexibility to roll-over a forward currency exchange contract upon its expiration if it desires to do so. Hedging against a decline in the value of a currency does not eliminate fluctuations in the value of a portfolio security traded in that currency or prevent a loss if the value of the security declines.
INFORMATION TECHNOLOGY COMPANIES RISK. Information technology companies are generally subject to the following risks: rapidly changing technologies; short product life cycles; fierce competition; aggressive pricing and reduced profit margins; the loss of patent, copyright and trademark protections; cyclical market patterns; evolving industry standards; and frequent new product introductions. Information technology companies may be smaller and less experienced companies, with limited product lines, markets or financial resources and fewer experienced management or marketing personnel. Information technology company stocks, particularly those involved with the Internet, have experienced extreme price and volume fluctuations that are often unrelated to their operating performance.
JAPAN RISK. Certain of the Funds invest in securities of companies in Japan. Because Japan’s economy and equity market share a strong correlation with the U.S. markets, the Japanese economy may be affected by economic problems in the U.S. Japan also has a growing economic relationship with China and other Southeast Asian countries, and thus Japan’s economy may also be affected by economic, political or social instability in those countries. Despite a strengthening in the economic relationship between Japan and China, the countries’ political relationship has at times been strained in recent years. Should political tension increase, it could adversely affect the economy and destabilize the region as a whole. Japan also remains heavily dependent on oil imports, and higher commodity prices could therefore have a negative impact on the economy. Japanese securities may also be subject to lack of liquidity;
Additional Information (Continued)
First Trust Exchange-Traded Fund III
April 30, 2018 (Unaudited)
excessive taxation; government seizure of assets; different legal or accounting standards and less government supervision and regulation of exchanges than in the United States. Furthermore, the natural disasters that have impacted Japan and the ongoing recovery efforts have had a negative effect on Japan’s economy, and may continue to do so.
LIQUIDITY RISK. Each Fund invests in equity securities that may have limited liquidity despite being listed on a securities exchange. Equity securities that are less liquid or that trade less can be more difficult or more costly to buy, or to sell, compared to other more liquid or active investments. This liquidity risk is a factor of the trading volume of a particular security, as well as the size and liquidity of the market for such security. The prices at which the equity securities are held in a Fund will be adversely affected if trading markets for the equity securities are limited or absent.
MANAGEMENT RISK. Each Fund is subject to management risk because it is an actively managed portfolio. In managing a Fund’s investment portfolio, the Sub-Advisor will apply investment techniques and risk analyses that may not have the desired result. There can be no guarantee that a Fund will meet its investment objective.
The Sub-Advisor specializes in managing asset allocation portfolios, which invest in various investment vehicles, including a Fund and other exchange-traded funds ("ETFs”), to obtain targeted amounts of exposure to different asset classes. Each Fund serves as an investment vehicle for such asset allocation portfolios. As the manager of each Fund and the portfolios, the Sub-Advisor is likely to encounter conflicts of interest. For example, the Sub-Advisor may need to reduce its asset allocation portfolios’ exposure to an asset class to which the portfolios obtain exposure by investing in a Fund. Under such circumstances, the Sub-Advisor would liquidate some or all of the portfolios’ investments in a Fund, which could adversely affect the Fund.
MARKET MAKER RISK. If a Fund has lower average daily trading volumes, it may rely on a small number of third-party market makers to provide a market for the purchase and sale of shares. Any trading halt or other problem relating to the trading activity of these market makers could result in a dramatic change in the spread between a Fund’s net asset value and the price at which a Fund’s shares are trading on the Exchange which could result in a decrease in value of a Fund’s shares. In addition, decisions by market makers or authorized participants to reduce their role or step away from these activities in times of market stress could inhibit the effectiveness of the arbitrage process in maintaining the relationship between the underlying values of a Fund’s portfolio securities and a Fund’s market price. This reduced effectiveness could result in Fund shares trading at a discount to net asset value and also in greater than normal intraday bid-ask spreads for Fund shares.
MARKET RISK. Market risk is the risk that a particular security owned by a Fund or shares of a Fund in general may fall in value. Securities are subject to market fluctuations caused by such factors as economic, political, regulatory or market developments, changes in interest rates and perceived trends in securities prices. Overall securities values could decline in value or underperform other investments.
NON-DIVERSIFICATION RISK. Each Fund is classified as "non-diversified" under the 1940 Act. As a result, each Fund is only limited as to the percentage of its assets which may be invested in the securities of any one issuer by the diversification requirements imposed by the Internal Revenue Code of 1986, as amended. Each Fund may invest a relatively high percentage of its assets in a limited number of issuers. As a result, each Fund may be more susceptible to a single adverse economic or regulatory occurrence affecting one or more of these issuers, experience increased volatility and be highly invested in certain issuers.
NON-U.S. SECURITIES RISK. Non-U.S. securities are subject to higher volatility than securities of domestic issuers due to possible adverse political, social or economic developments, restrictions on foreign investment or exchange of securities, lack of liquidity, currency exchange rates, excessive taxation, government seizure of assets, different legal or accounting standards, and less government supervision and regulation of exchanges in foreign countries.
PORTFOLIO TURNOVER RISK. High portfolio turnover may result in a Fund paying higher levels of transaction costs and generating greater tax liabilities for shareholders. Portfolio turnover risk may cause a Fund’s performance to be less than expected.
PREFERRED STOCK RISK. Preferred stocks combine some of the characteristics of both common stocks and bonds. Preferred stocks are typically subordinated to bonds and other debt instruments in a company’s capital structure, in terms of priority to corporate income, and therefore will be subject to greater credit risk than those debt instruments. Preferred stocks are also subject to credit risk, interest rate risk and income risk.
REIT INVESTMENT RISK. In addition to risks related to investments in real estate generally, investing in REITs involves certain other risks related to their structure and focus, which include, but are not limited to, dependency upon management skills, limited diversification, the risks of locating and managing financing for projects, heavy cash flow dependency, possible default by borrowers, the costs and potential losses of self-liquidation of one or more holdings, the risk of a possible lack of mortgage funds and associated interest rate risks, overbuilding, property vacancies, increases in property taxes and operating expenses, changes in zoning laws, losses due to environmental damages, changes in neighborhood values and appeal to purchasers, the possibility of failing to maintain
Additional Information (Continued)
First Trust Exchange-Traded Fund III
April 30, 2018 (Unaudited)
exemptions from registration under the 1940 Act and, in many cases, relatively small market capitalization, which may result in less market liquidity and greater price volatility. REITs are also subject to the risk that the real estate market may experience an economic downturn generally, which may have a material effect on the real estate in which the REITs invest and their underlying portfolio securities.
SMALLER COMPANIES RISK. Small and/or mid capitalization companies may be more vulnerable to adverse general market or economic developments, and their securities may be less liquid and may experience greater price volatility than larger, more established companies as a result of several factors, including limited trading volumes, products or financial resources, management inexperience and less publicly available information. Accordingly, such companies are generally subject to greater market risk than larger, more established companies.
TRADING ISSUES RISK. Although the shares of each Fund are listed for trading on the Exchange, there can be no assurance that an active trading market for such shares will develop or be maintained. Trading in shares on the Exchange may be halted due to market conditions or for reasons that, in the view of the Exchange, make trading in shares inadvisable. In addition, trading in shares on the Exchange is subject to trading halts caused by extraordinary market volatility pursuant to the Exchange’s "circuit breaker" rules. Market makers are under no obligation to make a market in a Fund’s shares, and authorized participants are not obligated to submit purchase or redemption orders for Creation Units. There can be no assurance that the requirements of the Exchange necessary to maintain the listing of a Fund will continue to be met or will remain unchanged. In particular, if a Fund does not comply with any provision of the listing standards of the Exchange that are applicable to that Fund, and cannot bring itself into compliance within a reasonable period after discovering the matter, the Exchange may remove the shares of a Fund from listing. The Fund may have difficulty maintaining its listing on the Exchange in the event a Fund’s assets are small or a Fund does not have enough shareholders.
UNITED KINGDOM RISK. Certain of the Funds invest in securities of companies in the United Kingdom. Investments in British issuers may subject a Fund to regulatory, political, currency, security, and economic risk specific to the United Kingdom. The United Kingdom has one of the largest economies in Europe, and the United States and other European countries are substantial trading partners of the United Kingdom. As a result, the British economy may be impacted by changes to the economic health of the United States and other European countries. On June 23, 2016, the United Kingdom voted via referendum to leave the EU, which immediately led to significant market volatility around the world, as well as political, economic, and legal uncertainty. The United Kingdom formally notified the European Council of its intention to withdraw from the EU on March 29, 2017, and it is expected that the United Kingdom’s exit from the EU will take place within two years of that date. However, there is still considerable uncertainty relating to the potential consequences and precise timeframe for the exit, how the negotiations for the withdrawal and new trade agreements will be conducted, and whether the United Kingdom’s exit will increase the likelihood of other countries also departing the EU. During this period of uncertainty, the negative impact on not only the United Kingdom and European economies, but the broader global economy, could be significant, potentially resulting in increased volatility and illiquidity and lower economic growth for companies that rely significantly on Europe for their business activities and revenues.
| NOT FDIC INSURED | NOT BANK GUARANTEED | MAY LOSE VALUE |
This page intentionally left blank
This page intentionally left blank
First Trust Exchange-Traded Fund III
INVESTMENT ADVISOR
First Trust Advisors L.P.
120 E. Liberty Drive, Suite 400
Wheaton, IL 60187
INVESTMENT SUB-ADVISOR
RiverFront Investment Group LLC
1214 E. Cary Street
Richmond, VA 23219
ADMINISTRATOR, CUSTODIAN,
FUND ACCOUNTANT &
TRANSFER AGENT
Brown Brothers Harriman & Co.
50 Post Office Square
Boston, MA 02110
INDEPENDENT REGISTERED
PUBLIC ACCOUNTING FIRM
Deloitte & Touche LLP
111 S. Wacker Drive
Chicago, IL 60606
LEGAL COUNSEL
Chapman and Cutler LLP
111 W. Monroe Street
Chicago, IL 60603
First Trust Exchange-Traded Fund III
First Trust Institutional Preferred Securities and Income ETF (FPEI)
Semi-Annual Report
For the Six Months Ended
April 30, 2018
First Trust Institutional Preferred Securities and Income ETF (FPEI)
Semi-Annual Report
April 30, 2018
Caution Regarding Forward-Looking Statements
This report contains certain forward-looking statements within the meaning of the Securities Act of 1933, as amended, and the Securities Exchange Act of 1934, as amended. Forward-looking statements include statements regarding the goals, beliefs, plans or current expectations of First Trust Advisors L.P. (“First Trust” or the “Advisor”) and/or Stonebridge Advisors LLC (“Stonebridge” or the “Sub-Advisor”) and their respective representatives, taking into account the information currently available to them. Forward-looking statements include all statements that do not relate solely to current or historical fact. For example, forward-looking statements include the use of words such as “anticipate,” “estimate,” “intend,” “expect,” “believe,” “plan,” “may,” “should,” “would” or other words that convey uncertainty of future events or outcomes.
Forward-looking statements involve known and unknown risks, uncertainties and other factors that may cause the actual results, performance or achievements of the series of First Trust Exchange-Traded Fund III (the “Trust”) described in this report (First Trust Institutional Preferred Securities and Income ETF; hereinafter referred to as the “Fund”) to be materially different from any future results, performance or achievements expressed or implied by the forward-looking statements. When evaluating the information included in this report, you are cautioned not to place undue reliance on these forward-looking statements, which reflect the judgment of the Advisor and/or Sub-Advisor and their respective representatives only as of the date hereof. We undertake no obligation to publicly revise or update these forward-looking statements to reflect events and circumstances that arise after the date hereof.
Performance and Risk Disclosure
There is no assurance that the Fund will achieve its investment objective. The Fund is subject to market risk, which is the possibility that the market values of securities owned by the Fund will decline and that the value of the Fund shares may therefore be less than what you paid for them. Accordingly, you can lose money by investing in the Fund. See “Risk Considerations” in the Additional Information section of this report for a discussion of certain other risks of investing in the Fund.
Performance data quoted represents past performance, which is no guarantee of future results, and current performance may be lower or higher than the figures shown. For the most recent month-end performance figures, please visit www.ftportfolios.com or speak with your financial advisor. Investment returns, net asset value and share price will fluctuate and Fund shares, when sold, may be worth more or less than their original cost.
The Advisor may also periodically provide additional information on Fund performance on the Fund’s web page at www.ftportfolios.com.
How to Read This Report
This report contains information that may help you evaluate your investment in the Fund. It includes details about the Fund and presents data and analysis that provide insight into the Fund’s performance and investment approach.
The statistical information that follows may help you understand the Fund’s performance compared to that of a relevant market benchmark.
It is important to keep in mind that the opinions expressed by personnel of the Advisor and/or Sub-Advisor are just that: informed opinions. They should not be considered to be promises or advice. The opinions, like the statistics, cover the period through the date on the cover of this report. The material risks of investing in the Fund are spelled out in the prospectus, the statement of additional information, this report and other Fund regulatory filings.
First Trust Institutional Preferred Securities and Income ETF (FPEI)
Semi-Annual Letter from the Chairman and CEO
April 30, 2018
Dear Shareholders:
First Trust is pleased to provide you with the semi-annual report for the First Trust Institutional Preferred Securities and Income ETF, which contains detailed information about your investment for the period ended April 30, 2018. We encourage you to read this report carefully and discuss it with your financial advisor.
As you are no doubt aware, 2017 was a very strong year for both the U.S. and global markets. The three major U.S. indices – the S&P 500® Index, the Dow Jones Industrial Average and the Nasdaq Composite – posted their best performance since 2013. And there was more good news for Wall Street as the year ended and analysts collected stock market data:
| • | The S&P 500® Index did something it had never previously done, finishing 2017 with 12 months of gains; |
| • | The Dow Jones Industrial Average achieved a milestone as well, closing above 24,000 for the first time ever on November 30; |
| • | The Nasdaq Composite set a record by having 11 months of gains in 2017 (June was the only down month, and by just 0.86%); and |
| • | The MSCI AC World Index (containing constituents from 47 countries) ended 2017 at an all-time high and was up 22% at year-end. |
As 2017 ended, President Trump signed the “Tax Cuts and Jobs Act of 2017” tax reform bill. As 2018 began, there was much enthusiasm for this tax reform package and the potential increase in take-home pay for many Americans, as well as the reduction in the federal corporate tax rate from 35% to 21%. Early in the year, many investors were also watching the Federal Reserve (the “Fed”) and its signaled intent to continue raising interest rates at a gradual pace. Based on strong job growth and the economic outlook in the U.S., the Fed did, in fact, raise interest rates on March 21, 2018.
For the entire first quarter of 2018, increased volatility was the norm. The S&P 500® Index was off to a strong start in January as it returned over 7.5% from January 2 to January 26. February, however, was a different story. Early in the month, the Dow Jones Industrial Average plunged 567 points and sank into “correction” territory (defined as a drop of 10% from the index’s high) and in just two weeks, was down more than 3,200 points. However, as February came to a close, the Dow Jones Industrial Average was back on track and up from the lows experienced earlier in the month. Volatility continued in March and April with the Dow Jones Industrial Average ending April with a small gain. Across the globe, the first quarter saw the Emerging Market and Developing Market countries, as well as Europe, continue with the strong performances experienced in 2017.
This market volatility is why we believe that one should invest for the long term and be prepared for market movements, which can happen at any time. This can be accomplished by keeping current on your portfolio and investing goals and by speaking regularly with your investment professional. It’s important to keep in mind that past performance of the U.S. and global stock markets or investment products can never guarantee future results. As we’ve said before, markets go up and they also go down, but savvy investors are prepared for either through careful attention to their portfolios and investment goals.
At First Trust, we continue to be optimistic about the U.S. economy and we thank you for giving us the opportunity to be a part of your financial plan. We value our relationship with you and will report on your investment again in six months.
Sincerely,
James A. Bowen
Chairman of the Board of Trustees
Chief Executive Officer of First Trust Advisors L.P.
Fund Performance Overview (Unaudited)
First Trust Institutional Preferred Securities and Income ETF (FPEI)
First Trust Institutional Preferred Securities and Income ETF’s (the “Fund”) investment objective is to seek total return and to provide current income. Under normal market conditions, the Fund invests at least 80% of its net assets (including investment borrowings) in institutional preferred securities (“Preferred Securities”) and income-producing debt securities (“Income Securities”). Preferred securities are a type of equity security that have preference over common stock in the payment of distributions and the liquidation of a company’s assets, but are generally junior to all forms of the company’s debt, including both senior and subordinated debt. The Fund’s investments in preferred securities will primarily be in institutional preferred securities. Institutional preferred securities are targeted to institutional, rather than retail, investors, are generally traded over-the-counter and may also be known as “$1,000 par preferred securities.” They are typically issued in large, institutional lot sized by U.S. and non-U.S. financial services companies and other companies. While all income-producing debt securities will be categorized as “Income Securities” for purposes of the 80% test above, the Income Securities in which the Fund intends to invest as part of its principal investment strategy include hybrid capital securities, contingent capital securities, U.S. and non-U.S. corporate bonds and convertible securities.
| Performance | | |
| | | Cumulative Total Returns |
| | 6 Months Ended
4/30/18 | Inception (8/22/17)
to 4/30/18 |
| Fund Performance | | |
| NAV | -1.37% | 0.61% |
| Market Price | -1.47% | 0.55% |
| Index Performance | | |
| ICE BofAML US Investment Grade Institutional Capital Securities Index | -2.03% | -0.80% |
Total returns for the period since inception are calculated from the inception date of the Fund. “Cumulative Total Returns” represent the total change in value of an investment over the period indicated.
The Fund’s per share net asset value (“NAV”) is the value of one share of the Fund and is computed by dividing the value of all assets of the Fund (including accrued interest and dividends), less all liabilities (including accrued expenses and dividends declared but unpaid), by the total number of outstanding shares. The price used to calculate market return (“Market Price”) is determined by using the midpoint between the highest bid and the lowest offer on the stock exchange on which shares of the Fund are listed for trading as of the time that the Fund’s NAV is calculated. Since shares of the Fund did not trade in the secondary market until after its inception, for the period from inception to the first day of secondary market trading in shares of the Fund, the NAV of the Fund is used as a proxy for the secondary market trading price to calculate market returns. NAV and market returns assume that all distributions have been reinvested in the Fund at NAV and Market Price, respectively.
An index is a statistical composite that tracks a specified financial market or sector. Unlike the Fund, the index does not actually hold a portfolio of securities and therefore does not incur the expenses incurred by the Fund. These expenses negatively impact the performance of the Fund. Also, market returns do not include brokerage commissions that may be payable on secondary market transactions. If brokerage commissions were included, market returns would be lower. The total returns presented reflect the reinvestment of dividends on securities in the index. The returns presented do not reflect the deduction of taxes that a shareholder would pay on Fund distributions or the redemption or sale of Fund shares. The investment return and principal value of shares of the Fund will vary with changes in market conditions. Shares of the Fund may be worth more or less than their original cost when they are redeemed or sold in the market. The Fund’s past performance is no guarantee of future performance.
Fund Performance Overview (Unaudited) (Continued)
First Trust Institutional Preferred Securities and Income ETF (FPEI) (Continued)
| Sector Allocation | % of Total
Investments |
| Financials | 76.3% |
| Energy | 9.2 |
| Utilities | 6.1 |
| Industrials | 2.3 |
| Materials | 2.2 |
| Consumer Discretionary | 1.9 |
| Consumer Staples | 1.4 |
| Telecommunication Services | 0.6 |
| Total | 100.0% |
| Credit Quality(1) | % of Total
Investments |
| A- | 6.2% |
| BBB+ | 5.3 |
| BBB | 16.1 |
| BBB- | 31.1 |
| BB+ | 26.8 |
| BB | 7.0 |
| BB- | 5.2 |
| B+ | 2.3 |
| Total | 100.0% |
| Top Ten Holdings | % of Total
Investments |
| Morgan Stanley, Series J | 3.3% |
| Goldman Sachs Group, Inc., Series M | 3.2 |
| Lloyds Banking Group PLC | 2.9 |
| Wells Fargo & Co., Series U | 2.9 |
| Enel S.p.A. | 2.7 |
| Mitsui Sumitomo Insurance Co., Ltd. | 2.4 |
| Credit Agricole S.A. | 2.4 |
| AerCap Global Aviation Trust | 2.3 |
| Catlin Insurance Co., Ltd., | 2.3 |
| UniCredit S.p.A. | 2.3 |
| Total | 26.7% |
| Country Allocation | % of Total
Investments |
| United States | 42.9% |
| United Kingdom | 12.5 |
| France | 8.6 |
| Italy | 6.8 |
| Australia | 6.0 |
| Canada | 5.5 |
| Japan | 5.5 |
| Netherlands | 3.4 |
| Bermuda | 2.3 |
| Spain | 2.1 |
| Switzerland | 1.7 |
| Denmark | 0.9 |
| Sweden | 0.8 |
| Chile | 0.6 |
| Norway | 0.4 |
| Total | 100.0% |
| (1) | The credit quality and ratings information presented above reflects the ratings assigned by one or more nationally recognized statistical rating organizations (NRSROs), including Standard & Poor’s Ratings Group, a division of the McGraw Hill Companies, Inc., Moody’s Investors Service, Inc., Fitch Ratings or a comparably rated NRSRO. For situations in which a security is rated by more than one NRSRO and the ratings are not equivalent, the highest ratings are used. Sub-investment grade ratings are those rated BB+/Ba1 or lower. Investment grade ratings are those rated BBB-/Baa3 or higher. The credit ratings shown relate to the creditworthiness of the issuers of the underlying securities in the Fund, and not to the Fund or its shares. Credit ratings are subject to change. |
Fund Performance Overview (Unaudited) (Continued)
First Trust Institutional Preferred Securities and Income ETF (FPEI) (Continued)
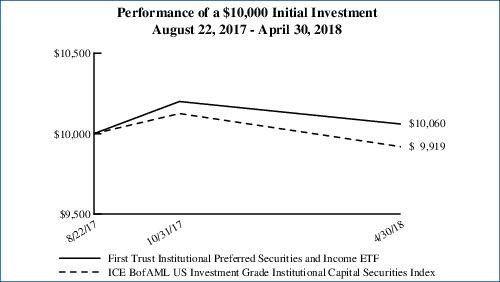
Performance figures assume reinvestment of all distributions and do not reflect the deduction of taxes that a shareholder would pay on Fund distributions or the redemption or sale of Fund shares. An index is a statistical composite that tracks a specified financial market or sector. Unlike the Fund, the index does not actually hold a portfolio of securities and therefore does not incur the expenses incurred by the Fund. These expenses negatively impact the performance of the Fund. The Fund’s past performance does not predict future performance.
Frequency Distribution of Discounts and Premiums
Bid/Ask Midpoint vs. NAV through April 30, 2018
The following Frequency Distribution of Discounts and Premiums charts are provided to show the frequency at which the bid/ask midpoint price for the Fund was at a discount or premium to the daily NAV. The following tables are for comparative purposes only and represent the period August 23, 2017 (commencement of trading) through April 30, 2018. Shareholders may pay more than NAV when they buy Fund shares and receive less than NAV when they sell those shares because shares are bought and sold at current market price. Data presented represents past performance and cannot be used to predict future results.
| Number of Days Bid/Ask Midpoint At/Above NAV |
| For the Period | 0.00%–0.49% | 0.50%–0.99% | 1.00%–1.99% | >=2.00% |
| 8/23/17 – 10/31/17 | 44 | 0 | 0 | 0 |
| 11/1/17 – 4/30/18 | 86 | 0 | 0 | 0 |
| Number of Days Bid/Ask Midpoint Below NAV |
| For the Period | 0.00%–0.49% | 0.50%–0.99% | 1.00%–1.99% | >=2.00% |
| 8/23/17 – 10/31/17 | 5 | 0 | 0 | 0 |
| 11/1/17 – 4/30/18 | 34 | 3 | 0 | 0 |
Portfolio Management
First Trust Institutional Preferred Securities and Income ETF (FPEI)
Semi-Annual Report
April 30, 2018 (Unaudited)
Advisor
First Trust Advisors L.P. (“First Trust” or the “Advisor”) is the investment advisor to the First Trust Institutional Preferred Securities and Income ETF (the “Fund”). First Trust is responsible for the ongoing monitoring of the Fund’s investment portfolio, managing the Fund’s business affairs and providing certain administrative services necessary for the management of the Fund.
Sub-Advisor
Stonebridge Advisors LLC
Stonebridge Advisors LLC (“Stonebridge” or the “Sub-Advisor”) is the investment sub-advisor to the Fund and is a registered investment advisor based in Wilton, Connecticut. Stonebridge specializes in the management of preferred and hybrid securities.
Portfolio Management Team
Scott T. Fleming - Chief Executive Officer and President
Robert Wolf - Chief Investment Officer, Senior Vice President and Senior Portfolio Manager
First Trust Institutional Preferred Securities and Income ETF (FPEI)
Understanding Your Fund Expenses
April 30, 2018 (Unaudited)
As a shareholder of the First Trust Institutional Preferred Securities and Income ETF (the “Fund”), you incur two types of costs: (1) transaction costs; and (2) ongoing costs, including management fees, distribution and/or service (12b-1) fees, if any, and other Fund expenses. This Example is intended to help you understand your ongoing costs of investing in the Fund and to compare these costs with the ongoing costs of investing in other funds.
The Example is based on an investment of $1,000 invested at the beginning of the period and held through the six-month period ended April 30, 2018.
Actual Expenses
The first line in the following table provides information about actual account values and actual expenses. You may use the information in this line, together with the amount you invested, to estimate the expenses that you paid over the period. Simply divide your account value by $1,000 (for example, an $8,600 account value divided by $1,000 = 8.6), then multiply the result by the number in the first line under the heading entitled “Expenses Paid During the Six-Month Period” to estimate the expenses you paid on your account during this six-month period.
Hypothetical Example for Comparison Purposes
The second line in the following table provides information about hypothetical account values and hypothetical expenses based on the Fund’s actual expense ratio and an assumed rate of return of 5% per year before expenses, which is not the Fund’s actual return. The hypothetical account values and expenses may not be used to estimate the actual ending account balance or expenses you paid for the period. You may use this information to compare the ongoing costs of investing in the Fund and other funds. To do so, compare this 5% hypothetical example with the 5% hypothetical examples that appear in the shareholder reports of the other funds.
Please note that the expenses shown in the table are meant to highlight your ongoing costs only and do not reflect any transactional costs such as brokerage commissions. Therefore, the second line in the table is useful in comparing ongoing costs only, and will not help you determine the relative total costs of owning different funds. In addition, if these transactional costs were included, your costs would have been higher.
| | Beginning
Account Value
November 1, 2017 | Ending
Account Value
April 30, 2018 | Annualized
Expense Ratio
Based on the
Six-Month
Period | Expenses Paid
During the
Six-Month
Period (a) |
| First Trust Institutional Preferred Securities and Income ETF (FPEI) |
| Actual | $1,000.00 | $986.30 | 0.86% | $4.24 |
| Hypothetical (5% return before expenses) | $1,000.00 | $1,020.53 | 0.86% | $4.31 |
| (a) | Expenses are equal to the annualized expense ratios as indicated in the table multiplied by the average account value over the period (November 1, 2017 through April 30, 2018), multiplied by 181/365 (to reflect the six-month period). |
First Trust Institutional Preferred Securities and Income ETF (FPEI)
Portfolio of Investments
April 30, 2018 (Unaudited)
Par
Amount | | Description | | Stated
Rate | | Stated
Maturity | | Value |
| CAPITAL PREFERRED SECURITIES – 98.4% |
| | | Automobiles – 1.9% | | | | | | |
| $1,500,000 | | General Motors Financial Co., Inc., Series A (a)
| | 5.75% | | (b) | | $1,482,750 |
| | | Banks – 48.0% | | | | | | |
| 600,000 | | Australia & New Zealand Banking Group Ltd. (a) (c) (d)
| | 6.75% | | (b) | | 641,250 |
| 400,000 | | Banco Bilbao Vizcaya Argentaria S.A. (a) (d)
| | 6.13% | | (b) | | 387,620 |
| 1,200,000 | | Banco Santander S.A. (a) (d)
| | 6.38% | | (b) | | 1,218,996 |
| 400,000 | | Bank of America Corp., Series AA (a)
| | 6.10% | | (b) | | 415,000 |
| 400,000 | | Bank of America Corp., Series DD (a)
| | 6.30% | | (b) | | 424,480 |
| 850,000 | | Bank of America Corp., Series M (a)
| | 8.13% | | (b) | | 852,763 |
| 800,000 | | Bank of America Corp., Series X (a)
| | 6.25% | | (b) | | 835,000 |
| 700,000 | | Bank of America Corp., Series Z (a)
| | 6.50% | | (b) | | 742,875 |
| 1,550,000 | | Barclays PLC (a) (d)
| | 7.88% | | (b) | | 1,657,074 |
| 200,000 | | BNP Paribas S.A. (a) (c) (d)
| | 6.75% | | (b) | | 210,250 |
| 300,000 | | BNP Paribas S.A. (a) (c) (d)
| | 7.38% | | (b) | | 327,375 |
| 1,081,000 | | BNP Paribas S.A. (a) (c) (d)
| | 7.63% | | (b) | | 1,167,210 |
| 1,050,000 | | Citigroup, Inc., Series O (a)
| | 5.88% | | (b) | | 1,080,187 |
| 1,200,000 | | Citigroup, Inc., Series P (a)
| | 5.95% | | (b) | | 1,216,500 |
| 900,000 | | Citizens Financial Group, Inc. (a)
| | 5.50% | | (b) | | 924,750 |
| 723,000 | | CoBank ACB, Series I (a) (e)
| | 6.25% | | (b) | | 771,303 |
| 1,700,000 | | Credit Agricole S.A. (a) (c) (d)
| | 7.88% | | (b) | | 1,848,750 |
| 400,000 | | Credit Agricole S.A. (a) (c) (d)
| | 8.13% | | (b) | | 455,490 |
| 700,000 | | Danske Bank A.S. (a) (d)
| | 6.13% | | (b) | | 710,500 |
| 300,000 | | DNB Bank ASA (a) (d)
| | 5.75% | | (b) | | 304,524 |
| 1,270,000 | | HSBC Holdings PLC (a) (d)
| | 6.38% | | (b) | | 1,311,275 |
| 1,168,000 | | HSBC Holdings PLC (a) (d)
| | 6.88% | | (b) | | 1,241,000 |
| 1,200,000 | | ING Groep N.V. (a) (d)
| | 6.50% | | (b) | | 1,238,160 |
| 500,000 | | ING Groep N.V. (a) (d)
| | 6.88% | | (b) | | 528,813 |
| 1,300,000 | | Intesa Sanpaolo S.p.A. (a) (c) (d)
| | 7.70% | | (b) | | 1,381,250 |
| 700,000 | | JPMorgan Chase & Co., Series I, 3 Mo. LIBOR + 3.47% (f)
| | 5.83% | | (b) | | 706,125 |
| 1,100,000 | | JPMorgan Chase & Co., Series R (a)
| | 6.00% | | (b) | | 1,121,648 |
| 750,000 | | JPMorgan Chase & Co., Series S (a)
| | 6.75% | | (b) | | 813,750 |
| 300,000 | | JPMorgan Chase & Co., Series X (a)
| | 6.10% | | (b) | | 311,250 |
| 2,100,000 | | Lloyds Banking Group PLC (a) (d)
| | 7.50% | | (b) | | 2,271,150 |
| 600,000 | | Nordea Bank AB (a) (d)
| | 6.13% | | (b) | | 618,000 |
| 1,300,000 | | Royal Bank of Scotland Group PLC (a) (d)
| | 8.00% | | (b) | | 1,425,125 |
| 400,000 | | Royal Bank of Scotland Group PLC (a) (d)
| | 8.63% | | (b) | | 439,000 |
| 800,000 | | Societe Generale S.A. (a) (c) (d)
| | 6.00% | | (b) | | 806,980 |
| 320,000 | | Societe Generale S.A. (a) (c) (d)
| | 7.38% | | (b) | | 340,000 |
| 1,021,000 | | Societe Generale S.A. (a) (c) (d)
| | 7.88% | | (b) | | 1,109,061 |
| 400,000 | | Societe Generale S.A. (a) (d)
| | 7.88% | | (b) | | 434,500 |
| 900,000 | | Standard Chartered PLC (a) (c) (d)
| | 7.50% | | (b) | | 952,875 |
| 400,000 | | Standard Chartered PLC (a) (c) (d)
| | 7.75% | | (b) | | 427,000 |
| 1,700,000 | | UniCredit S.p.A. (a) (d)
| | 8.00% | | (b) | | 1,777,870 |
| 200,000 | | Wells Fargo & Co., Series K, 3 Mo. LIBOR + 3.77% (f)
| | 5.89% | | (b) | | 202,500 |
| 2,150,000 | | Wells Fargo & Co., Series U (a)
| | 5.88% | | (b) | | 2,227,937 |
| | | | | 37,877,166 |
| | | Capital Markets – 10.1% | | | | | | |
| 500,000 | | Credit Suisse Group AG (a) (c) (d)
| | 7.50% | | (b) | | 543,130 |
| 500,000 | | Credit Suisse Group AG (a) (d)
| | 7.50% | | (b) | | 543,130 |
| 1,600,000 | | E*TRADE Financial Corp., Series A (a)
| | 5.88% | | (b) | | 1,640,000 |
| 2,400,000 | | Goldman Sachs Group, Inc., Series M (a)
| | 5.38% | | (b) | | 2,457,000 |
| 2,475,000 | | Morgan Stanley, Series J (a)
| | 5.55% | | (b) | | 2,539,969 |
| 200,000 | | UBS Group AG (a) (d)
| | 7.00% | | (b) | | 214,323 |
| | | | | 7,937,552 |
See Notes to Financial Statements
Page 7
First Trust Institutional Preferred Securities and Income ETF (FPEI)
Portfolio of Investments (Continued)
April 30, 2018 (Unaudited)
Par
Amount | | Description | | Stated
Rate | | Stated
Maturity | | Value |
| CAPITAL PREFERRED SECURITIES (Continued) |
| | | Diversified Financial Services – 0.9% | | | | | | |
| $700,000 | | Voya Financial, Inc. (a)
| | 5.65% | | 05/15/53 | | $715,050 |
| | | Diversified Telecommunication Services – 0.6% | | | | | | |
| 400,000 | | Koninklijke KPN N.V. (a)
| | 7.00% | | 03/28/73 | | 433,000 |
| | | Electric Utilities – 5.4% | | | | | | |
| 1,600,000 | | Emera, Inc., Series 16-A (a)
| | 6.75% | | 06/15/76 | | 1,739,200 |
| 1,800,000 | | Enel S.p.A. (a) (c)
| | 8.75% | | 09/24/73 | | 2,135,250 |
| 400,000 | | Southern (The) Co., Series B (a)
| | 5.50% | | 03/15/57 | | 413,570 |
| | | | | 4,288,020 |
| | | Energy Equipment & Services – 1.2% | | | | | | |
| 895,000 | | Transcanada Trust, Series 16-A (a)
| | 5.88% | | 08/15/76 | | 924,088 |
| | | Food Products – 1.4% | | | | | | |
| 1,000,000 | | Land O’Lakes, Inc. (c)
| | 7.25% | | (b) | | 1,115,000 |
| | | Independent Power and Renewable Electricity Producers – 0.6% | | | | | | |
| 425,000 | | AES Gener S.A. (a)
| | 8.38% | | 12/18/73 | | 444,125 |
| | | Insurance – 16.0% | | | | | | |
| 450,000 | | Aegon N.V. (a)
| | 5.50% | | 04/11/48 | | 448,299 |
| 265,000 | | American International Group, Inc. (a)
| | 8.18% | | 05/15/58 | | 347,813 |
| 200,000 | | American International Group, Inc. Series A-9 (a)
| | 5.75% | | 04/01/48 | | 201,500 |
| 400,000 | | Asahi Mutual Life Insurance Co. (a)
| | 7.25% | | (b) | | 423,834 |
| 500,000 | | Assurant, Inc. (a)
| | 7.00% | | 03/27/48 | | 521,900 |
| 400,000 | | Assured Guaranty Municipal Holdings, Inc. (a) (c)
| | 6.40% | | 12/15/66 | | 402,000 |
| 1,800,000 | | Catlin Insurance Co., Ltd., 3 Mo. LIBOR + 2.98% (c) (f)
| | 5.33% | | (b) | | 1,793,250 |
| 600,000 | | Fukoku Mutual Life Insurance Co. (a)
| | 6.50% | | (b) | | 666,000 |
| 1,121,000 | | Liberty Mutual Group, Inc. (c)
| | 7.80% | | 03/15/37 | | 1,359,213 |
| 400,000 | | Liberty Mutual Group, Inc. (a) (c)
| | 10.75% | | 06/15/58 | | 617,000 |
| 200,000 | | Meiji Yasuda Life Insurance, Co. (a) (c)
| | 5.10% | | 04/26/48 | | 204,511 |
| 1,700,000 | | Mitsui Sumitomo Insurance Co., Ltd. (a) (c)
| | 7.00% | | 03/15/72 | | 1,878,075 |
| 255,000 | | Provident Financing Trust I
| | 7.41% | | 03/15/38 | | 289,425 |
| 700,000 | | QBE Insurance Group, Ltd. (a) (c)
| | 7.50% | | 11/24/43 | | 782,866 |
| 1,500,000 | | QBE Insurance Group, Ltd. (a)
| | 6.75% | | 12/02/44 | | 1,603,665 |
| 1,000,000 | | Sumitomo Life Insurance Co. (a) (c)
| | 6.50% | | 09/20/73 | | 1,102,500 |
| | | | | 12,641,851 |
| | | Metals & Mining – 2.1% | | | | | | |
| 1,500,000 | | BHP Billiton Finance USA Ltd. (a) (c)
| | 6.75% | | 10/19/75 | | 1,672,125 |
| | | Oil, Gas & Consumable Fuels – 7.9% | | | | | | |
| 580,000 | | Andeavor Logistics L.P., Series A (a)
| | 6.88% | | (b) | | 590,658 |
| 400,000 | | DCP Midstream L.P., Series A (a)
| | 7.38% | | (b) | | 394,750 |
| 1,500,000 | | Enbridge Energy Partners L.P., 3 Mo. LIBOR + 3.80% (f)
| | 6.11% | | 10/01/37 | | 1,492,500 |
| 500,000 | | Enbridge, Inc. (a)
| | 5.50% | | 07/15/77 | | 466,250 |
| 300,000 | | Enbridge, Inc. (a)
| | 6.25% | | 03/01/78 | | 293,693 |
| 900,000 | | Enbridge, Inc., Series 16-A (a)
| | 6.00% | | 01/15/77 | | 878,625 |
| 500,000 | | Energy Transfer Partners L.P., 3 Mo. LIBOR + 3.02% (f)
| | 4.79% | | 11/01/66 | | 437,500 |
| 200,000 | | Energy Transfer Partners L.P., Series B (a)
| | 6.63% | | (b) | | 189,515 |
| 500,000 | | Enterprise Products Operating LLC, 3 Mo. LIBOR + 2.78% (f)
| | 4.78% | | 06/01/67 | | 496,959 |
| 1,000,000 | | Enterprise Products Operating LLC, Series A, 3 Mo. LIBOR + 3.71% (f)
| | 5.48% | | 08/01/66 | | 1,005,210 |
| | | | | 6,245,660 |
Page 8
See Notes to Financial Statements
First Trust Institutional Preferred Securities and Income ETF (FPEI)
Portfolio of Investments (Continued)
April 30, 2018 (Unaudited)
Par
Amount | | Description | | Stated
Rate | | Stated
Maturity | | Value |
| CAPITAL PREFERRED SECURITIES (Continued) |
| | | Transportation Infrastructure – 2.3% | | | | | | |
| $1,700,000 | | AerCap Global Aviation Trust (a) (c)
| | 6.50% | | 06/15/45 | | $1,810,500 |
| | | Total Capital Preferred Securities
| | 77,586,887 |
| | | (Cost $79,742,752) | | | | | | |
Principal
Value | | Description | | Stated
Coupon | | Stated
Maturity | | Value |
| CORPORATE BONDS AND NOTES – 0.2% |
| | | Insurance – 0.2% | | | | | | |
| 200,000 | | AmTrust Financial Services, Inc.
| | 6.13% | | 08/15/23 | | 196,960 |
| | | (Cost $198,644) | | | | | | |
| | Total Investments – 98.6%
| | 77,783,847 |
| | (Cost $79,941,396) (g) | | |
| | Net Other Assets and Liabilities – 1.4%
| | 1,096,455 |
| | Net Assets – 100.0%
| | $78,880,302 |
|
| (a) | Fixed-to-floating or fixed-to-variable rate security. The interest rate shown reflects the fixed rate in effect at April 30, 2018. At a predetermined date, the fixed rate will change to a floating rate or a variable rate. |
| (b) | Perpetual maturity. |
| (c) | This security, sold within the terms of a private placement memorandum, is exempt from registration upon resale under Rule 144A under the Securities Act of 1933, as amended, and may be resold in transactions exempt from registration, normally to qualified institutional buyers. Pursuant to procedures adopted by the Trust’s Board of Trustees, this security has been determined to be liquid by Stonebridge Advisors LLC, the Fund’s sub-advisor (the “Sub-Advisor”). Although market instability can result in periods of increased overall market illiquidity, liquidity for each security is determined based on security specific factors and assumptions, which require subjective judgment. At April 30, 2018, securities noted as such amounted to $25,082,911 or 31.8% of net assets. |
| (d) | This security is a contingent convertible capital security which may be subject to conversion into common stock of the issuer under certain circumstances. At April 30, 2018, securities noted as such amounted to $26,531,681 or 33.6% of net assets. Of these securities, 0.0% originated in emerging markets, and 100.0% originated in foreign markets. |
| (e) | Pursuant to procedures adopted by the Trust’s Board of Trustees, this security has been determined to be illiquid by the Sub-Advisor. |
| (f) | Floating or variable rate security. |
| (g) | Aggregate cost for financial reporting purposes approximates the aggregate cost for federal income tax purposes. As of April 30, 2018, the aggregate gross unrealized appreciation for all investments in which there was an excess of value over tax cost was $77,209 and the aggregate gross unrealized depreciation for all investments in which there was an excess of tax cost over value was $2,234,758. The net unrealized depreciation was $2,157,549. |
| LIBOR | London Interbank Offered Rate |
Valuation Inputs
A summary of the inputs used to value the Fund’s investments as of April 30, 2018 is as follows (see Note 2A - Portfolio Valuation in the Notes to Financial Statements):
| | Total
Value at
4/30/2018 | Level 1
Quoted
Prices | Level 2
Significant
Observable
Inputs | Level 3
Significant
Unobservable
Inputs |
Capital Preferred Securities*
| $ 77,586,887 | $ — | $ 77,586,887 | $ — |
Corporate Bonds and Notes*
| 196,960 | — | 196,960 | — |
Total Investments
| $ 77,783,847 | $— | $ 77,783,847 | $— |
| * | See Portfolio of Investments for industry breakout. |
All transfers in and out of the Levels during the period are assumed to occur on the last day of the period at their current value. There were no transfers between Levels at April 30, 2018.
See Notes to Financial Statements
Page 9
First Trust Institutional Preferred Securities and Income ETF (FPEI)
Statement of Assets and Liabilities
April 30, 2018 (Unaudited)
| ASSETS: | |
Investments, at value
(Cost $79,941,396)
| $ 77,783,847 |
Cash
| 1,708,327 |
| Receivables: | |
Interest
| 1,003,496 |
Interest reclaims
| 2,730 |
Total Assets
| 80,498,400 |
| LIABILITIES: | |
| Payables: | |
Investment securities purchased
| 1,564,794 |
Investment advisory fees
| 53,304 |
Total Liabilities
| 1,618,098 |
NET ASSETS
| $78,880,302 |
| NET ASSETS consist of: | |
Paid-in capital
| $ 81,050,759 |
Par value
| 40,500 |
Accumulated net investment income (loss)
| 9,758 |
Accumulated net realized gain (loss) on investments
| (63,166) |
Net unrealized appreciation (depreciation) on investments
| (2,157,549) |
NET ASSETS
| $78,880,302 |
NET ASSET VALUE, per share
| $19.48 |
Number of shares outstanding (unlimited number of shares authorized, par value $0.01 per share)
| 4,050,002 |
Page 10
See Notes to Financial Statements
First Trust Institutional Preferred Securities and Income ETF (FPEI)
Statement of Operations
For the Six Months Ended April 30, 2018 (Unaudited)
| INVESTMENT INCOME: | |
Interest
| $ 1,640,889 |
Foreign withholding tax
| (19,949) |
Total investment income
| 1,620,940 |
| EXPENSES: | |
Investment advisory fees
| 228,103 |
Excise tax expense
| 2,055 |
Total expenses
| 230,158 |
NET INVESTMENT INCOME (LOSS)
| 1,390,782 |
| NET REALIZED AND UNREALIZED GAIN (LOSS): | |
Net realized gain (loss) on investments
| (52,544) |
Net change in unrealized appreciation (depreciation) on investments
| (2,375,732) |
NET REALIZED AND UNREALIZED GAIN (LOSS)
| (2,428,276) |
NET INCREASE (DECREASE) IN NET ASSETS RESULTING FROM OPERATIONS
| $(1,037,494) |
See Notes to Financial Statements
Page 11
First Trust Institutional Preferred Securities and Income ETF (FPEI)
Statements of Changes in Net Assets
| | Six Months
Ended
4/30/2018
(Unaudited) | | Period
Ended
10/31/2017 (a) |
| OPERATIONS: | | | |
Net investment income (loss)
| $ 1,390,782 | | $ 188,424 |
Net realized gain (loss)
| (52,544) | | (11,669) |
Net change in unrealized appreciation (depreciation)
| (2,375,732) | | 218,183 |
Net increase (decrease) in net assets resulting from operations
| (1,037,494) | | 394,938 |
| DISTRIBUTIONS TO SHAREHOLDERS FROM: | | | |
Net investment income
| (1,428,401) | | (140,000) |
Total distributions to shareholders
| (1,428,401) | | (140,000) |
| SHAREHOLDER TRANSACTIONS: | | | |
Proceeds from shares sold
| 57,033,497 | | 24,057,762 |
Net increase (decrease) in net assets resulting from shareholder transactions
| 57,033,497 | | 24,057,762 |
Total increase (decrease) in net assets
| 54,567,602 | | 24,312,700 |
| NET ASSETS: | | | |
Beginning of period
| 24,312,700 | | — |
End of period
| $78,880,302 | | $24,312,700 |
Accumulated net investment income (loss) at end of period
| $9,758 | | $47,377 |
| CHANGES IN SHARES OUTSTANDING: | | | |
Shares outstanding, beginning of period
| 1,200,002 | | — |
Shares sold
| 2,850,000 | | 1,200,002 |
Shares outstanding, end of period
| 4,050,002 | | 1,200,002 |
| (a) | Inception date is August 22, 2017, which is consistent with the commencement of investment operations and is the date the initial creation units were established. |
Page 12
See Notes to Financial Statements
First Trust Institutional Preferred Securities and Income ETF (FPEI)
Financial Highlights
For a share outstanding throughout each period
| | Six Months
Ended
4/30/2018
(Unaudited) | | Period
Ended
10/31/2017 (a) |
Net asset value, beginning of period
| $ 20.26 | | $ 20.00 |
| Income from investment operations: | | | |
Net investment income (loss)
| 0.47 | | 0.18 |
Net realized and unrealized gain (loss)
| (0.74) | | 0.22 |
Total from investment operations
| (0.27) | | 0.40 |
| Distributions paid to shareholders from: | | | |
Net investment income
| (0.51) | | (0.14) |
Net asset value, end of period
| $19.48 | | $20.26 |
Total return (b)
| (1.37)% | | 2.00% |
| Ratios to average net assets/supplemental data: | | | |
Net assets, end of period (in 000’s)
| $ 78,880 | | $ 24,313 |
Ratio of total expenses to average net assets
| 0.86% (c) (d) | | 0.85% (c) |
Ratio of net investment income (loss) to average net assets
| 5.18% (c) | | 4.93% (c) |
Portfolio turnover rate (e)
| 11% | | 13% |
| (a) | Inception date is August 22, 2017, which is consistent with the commencement of investment operations and is the date the initial creation units were established. |
| (b) | Total return is calculated assuming an initial investment made at the net asset value at the beginning of the period, reinvestment of all distributions at net asset value during the period, and redemption at net asset value on the last day of the period. The returns presented do not reflect the deduction of taxes that a shareholder would pay on Fund distributions or the redemption or sale of Fund shares. Total return is calculated for the time period presented and is not annualized for periods of less than a year. |
| (c) | Annualized. |
| (d) | Includes excise tax. If this excise tax was not included, the expense ratio would have been 0.85%. |
| (e) | Portfolio turnover is calculated for the time period presented and is not annualized for periods of less than a year and does not include securities received or delivered from processing creations or redemptions and in-kind transactions. |
See Notes to Financial Statements
Page 13
Notes to Financial Statements
First Trust Institutional Preferred Securities and Income ETF (FPEI)
April 30, 2018 (Unaudited)
1. Organization
First Trust Exchange-Traded Fund III (the “Trust”) is an open-end management investment company organized as a Massachusetts business trust on January 9, 2008, and is registered with the Securities and Exchange Commission (“SEC”) under the Investment Company Act of 1940, as amended (the “1940 Act”).
The Trust consists of thirteen funds that are currently offering shares. This report covers the First Trust Institutional Preferred Securities and Income ETF (the “Fund”), which trades under the ticker FPEI on the NYSE Arca, Inc. Unlike conventional mutual funds, the Fund issues and redeems shares on a continuous basis, at net asset value (“NAV”), only in large specified blocks consisting of 50,000 shares called a “Creation Unit.” Creation Units are issued and redeemed in-kind for securities in which the Fund invests and, in certain circumstances, for cash. Except when aggregated in Creation Units, the shares are not redeemable securities of the Fund.
The Fund is an actively managed exchange-traded fund. The investment objective of the Fund is to seek total return and to provide current income. Under normal market conditions, the Fund invests at least 80% of its net assets (including investment borrowings) in institutional preferred securities and income-producing debt securities, including hybrid capital securities, contingent capital securities, U.S. and non-U.S. corporate bonds and convertible securities. There can be no assurance that the Fund will achieve its investment objective. The Fund may not be appropriate for all investors.
2. Significant Accounting Policies
The Fund is considered an investment company and follows accounting and reporting guidance under Financial Accounting Standards Board Accounting Standards Codification Topic 946, “Financial Services-Investment Companies.” The following is a summary of significant accounting policies consistently followed by the Fund in the preparation of the financial statements. The preparation of the financial statements in accordance with accounting principles generally accepted in the United States of America (“U.S. GAAP”) requires management to make estimates and assumptions that affect the reported amounts and disclosures in the financial statements. Actual results could differ from those estimates.
A. Portfolio Valuation
The Fund’s NAV is determined daily as of the close of regular trading on the New York Stock Exchange (“NYSE”), normally 4:00 p.m. Eastern time, on each day the NYSE is open for trading. If the NYSE closes early on a valuation day, the NAV is determined as of that time. Domestic debt securities and foreign securities are priced using data reflecting the earlier closing of the principal markets for those securities. The Fund’s NAV is calculated by dividing the value of all assets of the Fund (including accrued interest and dividends), less all liabilities (including accrued expenses and dividends declared but unpaid), by the total number of shares outstanding.
The Fund’s investments are valued daily at market value or, in the absence of market value with respect to any portfolio securities, at fair value. Market value prices represent last sale or official closing prices from a national or foreign exchange (i.e., a regulated market) and are primarily obtained from third-party pricing services. Fair value prices represent any prices not considered market value prices and are either obtained from a third-party pricing service or are determined by the Pricing Committee of the Fund’s investment advisor, First Trust Advisors L.P. (“First Trust” or the “Advisor”), in accordance with valuation procedures adopted by the Trust’s Board of Trustees, and in accordance with provisions of the 1940 Act. Investments valued by the Advisor’s Pricing Committee, if any, are footnoted as such in the footnotes to the Portfolio of Investments. The Fund’s investments are valued as follows:
Bonds, notes, capital preferred securities, and other debt securities are fair valued on the basis of valuations provided by dealers who make markets in such securities or by a third-party pricing service approved by the Trust’s Board of Trustees, which may use the following valuation inputs when available:
| 1) | benchmark yields; |
| 2) | reported trades; |
| 3) | broker/dealer quotes; |
| 4) | issuer spreads; |
| 5) | benchmark securities; |
| 6) | bids and offers; and |
| 7) | reference data including market research publications. |
Securities traded in an over-the-counter market are fair valued at the mean of their most recent bid and asked price, if available, and otherwise at their closing bid price.
Fixed income and other debt securities having a remaining maturity of sixty days or less when purchased are fair valued at cost adjusted for amortization of premiums and accretion of discounts (amortized cost), provided the Advisor’s Pricing Committee
Notes to Financial Statements (Continued)
First Trust Institutional Preferred Securities and Income ETF (FPEI)
April 30, 2018 (Unaudited)
has determined that the use of amortized cost is an appropriate reflection of fair value given market and issuer-specific conditions existing at the time of the determination. Factors that may be considered in determining the appropriateness of the use of amortized cost include, but are not limited to, the following:
| 1) | the credit conditions in the relevant market and changes thereto; |
| 2) | the liquidity conditions in the relevant market and changes thereto; |
| 3) | the interest rate conditions in the relevant market and changes thereto (such as significant changes in interest rates); |
| 4) | issuer-specific conditions (such as significant credit deterioration); and |
| 5) | any other market-based data the Advisor’s Pricing Committee considers relevant. In this regard, the Advisor’s Pricing Committee may use last-obtained market-based data to assist it when valuing portfolio securities using amortized cost. |
Certain securities may not be able to be priced by pre-established pricing methods. Such securities may be valued by the Trust’s Board of Trustees or its delegate, the Advisor’s Pricing Committee, at fair value. These securities generally include, but are not limited to, restricted securities (securities which may not be publicly sold without registration under the Securities Act of 1933, as amended) for which a third-party pricing service is unable to provide a market price; securities whose trading has been formally suspended; a security whose market or fair value price is not available from a pre-established pricing source; a security with respect to which an event has occurred that is likely to materially affect the value of the security after the market has closed but before the calculation of the Fund’s NAV or make it difficult or impossible to obtain a reliable market quotation; and a security whose price, as provided by the third-party pricing service, does not reflect the security’s fair value. As a general principle, the current fair value of a security would appear to be the amount which the owner might reasonably expect to receive for the security upon its current sale. When fair value prices are used, generally they will differ from market quotations or official closing prices on the applicable exchanges. A variety of factors may be considered in determining the fair value of such securities, including, but not limited to, the following:
| 1) | the type of security; |
| 2) | the size of the holding; |
| 3) | the initial cost of the security; |
| 4) | transactions in comparable securities; |
| 5) | price quotes from dealers and/or third-party pricing services; |
| 6) | relationships among various securities; |
| 7) | information obtained by contacting the issuer, analysts, or the appropriate stock exchange; |
| 8) | an analysis of the issuer’s financial statements; and |
| 9) | the existence of merger proposals or tender offers that might affect the value of the security. |
If the securities in question are foreign securities, the following additional information may be considered:
| 1) | the value of similar foreign securities traded on other foreign markets; |
| 2) | ADR trading of similar securities; |
| 3) | closed-end fund trading of similar securities; |
| 4) | foreign currency exchange activity; |
| 5) | the trading prices of financial products that are tied to baskets of foreign securities; |
| 6) | factors relating to the event that precipitated the pricing problem; |
| 7) | whether the event is likely to recur; and |
| 8) | whether the effects of the event are isolated or whether they affect entire markets, countries or regions. |
The Fund is subject to fair value accounting standards that define fair value, establish the framework for measuring fair value and provide a three-level hierarchy for fair valuation based upon the inputs to the valuation as of the measurement date. The three levels of the fair value hierarchy are as follows:
| • | Level 1 – Level 1 inputs are quoted prices in active markets for identical investments. An active market is a market in which transactions for the investment occur with sufficient frequency and volume to provide pricing information on an ongoing basis. |
| • | Level 2 – Level 2 inputs are observable inputs, either directly or indirectly, and include the following: |
| o | Quoted prices for similar investments in active markets. |
| o | Quoted prices for identical or similar investments in markets that are non-active. A non-active market is a market where there are few transactions for the investment, the prices are not current, or price quotations vary substantially either over time or among market makers, or in which little information is released publicly. |
Notes to Financial Statements (Continued)
First Trust Institutional Preferred Securities and Income ETF (FPEI)
April 30, 2018 (Unaudited)
| o | Inputs other than quoted prices that are observable for the investment (for example, interest rates and yield curves observable at commonly quoted intervals, volatilities, prepayment speeds, loss severities, credit risks, and default rates). |
| o | Inputs that are derived principally from or corroborated by observable market data by correlation or other means. |
| • | Level 3 – Level 3 inputs are unobservable inputs. Unobservable inputs may reflect the reporting entity’s own assumptions about the assumptions that market participants would use in pricing the investment. |
The inputs or methodologies used for valuing investments are not necessarily an indication of the risk associated with investing in those investments. A summary of the inputs used to value the Fund’s investments as of April 30, 2018, is included with the Fund’s Portfolio of Investments.
B. Securities Transactions and Investment Income
Securities transactions are recorded as of the trade date. Realized gains and losses from securities transactions are recorded on the identified cost basis. Interest income is recorded daily on the accrual basis. Amortization of premiums and accretion of discounts are recorded using the effective interest method.
C. Dividends and Distributions to Shareholders
Dividends from net investment income, if any, are declared and paid monthly by the Fund, or as the Board of Trustees may determine from time to time. Distributions of net realized capital gains earned by the Fund, if any, are distributed at least annually.
Distributions from income and capital gains are determined in accordance with federal income tax regulations, which may differ from U.S. GAAP. Certain capital accounts in the financial statements are periodically adjusted for permanent differences in order to reflect their tax character. These permanent differences are primarily due to the varying treatment of income and gain/loss on portfolio securities held by the Fund and have no impact on net assets or NAV per share. Temporary differences, which arise from recognizing certain items of income, expense and gain/loss in different periods for financial statement and tax purposes, will reverse at some time in the future.
The tax character of distributions paid by the Fund during the fiscal period ended October 31, 2017, was as follows:
| Distributions paid from: | |
Ordinary income
| $140,000 |
Capital gains
| — |
Return of capital
| — |
As of October 31, 2017, the components of distributable earnings on a tax basis were as follows:
Undistributed ordinary income
| $28,169 |
Accumulated capital and other losses
| (7,190) |
Net unrealized appreciation (depreciation)
| 233,959 |
D. Income Taxes
The Fund intends to continue to qualify as a regulated investment company by complying with the requirements under Subchapter M of the Internal Revenue Code of 1986, as amended, which includes distributing substantially all of its net investment income and net realized gains to shareholders. Accordingly, no provision has been made for federal and state income taxes. However, due to the timing and amount of distributions, the Fund may be subject to an excise tax of 4% of the amount by which approximately 98% of the Fund’s taxable income exceeds the distributions from such taxable income for the calendar year.
The Fund is subject to accounting standards that establish a minimum threshold for recognizing, and a system for measuring, the benefits of a tax position taken or expected to be taken in a tax return. The taxable year ended 2017 remains open to federal and state audit. As of April 30, 2018, management has evaluated the application of these standards to the Fund and has determined that no provision for income tax is required in the Fund’s financial statements for uncertain tax positions.
The Fund intends to utilize provisions of the federal income tax laws, which allow it to carry a realized capital loss forward indefinitely following the year of the loss and offset such loss against any future realized capital gains. The Fund is subject to certain limitations under U.S. tax rules on the use of capital loss carryforwards and net unrealized built-in losses. These limitations apply when there has been a 50% change in ownership. At October 31, 2017, the Fund had non-expiring capital loss carryforwards for federal income tax purposes of $7,190.
Notes to Financial Statements (Continued)
First Trust Institutional Preferred Securities and Income ETF (FPEI)
April 30, 2018 (Unaudited)
E. Expenses
Expenses, other than the investment advisory fee and other excluded expenses, are paid by the Advisor (See Note 3).
F. New and Amended Financial Reporting Rules and Forms
On October 13, 2016, the SEC adopted new rules and forms, and amended existing rules and forms. The new and amended rules and forms are intended to modernize the reporting of information provided by funds and to improve the quality and type of information that funds provide to the SEC and investors. In part, the new and amended rules and forms amend Regulation S-X and require standardized, enhanced disclosures about derivatives in a fund’s financial statements, as well as other amendments. The compliance date for the amendments of Regulation S-X was August 1, 2017, which resulted in no change to the financial statements. The new form types and other rule amendments will be effective for the First Trust funds, including the Fund, for reporting periods beginning on and after June 1, 2018. Management is evaluating the new form types and other rule amendments that are effective on and after June 1, 2018 to determine the impact to the Fund.
3. Investment Advisory Fee, Affiliated Transactions and Other Fee Arrangements
First Trust, the investment advisor to the Fund, is a limited partnership with one limited partner, Grace Partners of DuPage L.P., and one general partner, The Charger Corporation. The Charger Corporation is an Illinois corporation controlled by James A. Bowen, Chief Executive Officer of First Trust. First Trust is responsible for the ongoing monitoring of the securities in the Fund’s portfolio, managing the Fund’s business affairs and providing certain administrative services necessary for the management of the Fund.
Stonebridge, a majority-owned affiliate of First Trust, serves as the Fund’s sub-advisor and manages the Fund’s portfolio subject to First Trust’s supervision. Pursuant to the Investment Management Agreement between the Trust and the Advisor, First Trust will supervise Stonebridge and its management of the investment of the Fund’s assets and will pay Stonebridge for its services as the Fund’s sub-advisor. First Trust and Stonebridge are equally responsible for the Fund’s expenses, including the cost of transfer agency, custody, fund administration, legal, audit and other services, but excluding fee payments under the Investment Management Agreement, interest, taxes, acquired fund fees and expenses, brokerage commissions and other expenses connected with the execution of portfolio transactions, distribution and service fees pursuant to a 12b-1 plan, if any, and extraordinary expenses. The Fund has agreed to pay First Trust an annual unitary management fee equal to 0.85% of its average daily net assets. Stonebridge receives a sub-advisory fee equal to 0.425% of the average daily net assets of the Fund less Stonebridge’s share of the Fund’s expenses. The Sub-Advisor’s fee is paid by the Advisor out of the Advisor’s management fee. First Trust also provides fund reporting services to the Fund for a flat annual fee in the amount of $9,250, which is covered under the annual unitary management fee.
First Trust Capital Partners, LLC (“FTCP”), an affiliate of First Trust, owns a 51% ownership interest in Stonebridge.
The Trust has multiple service agreements with Brown Brothers Harriman & Co. (“BBH”). Under the service agreements, BBH performs custodial, fund accounting, certain administrative services, and transfer agency services for the Fund. As custodian, BBH is responsible for custody of the Fund’s assets. As fund accountant and administrator, BBH is responsible for maintaining the books and records of the Fund’s securities and cash. As transfer agent, BBH is responsible for maintaining shareholder records for the Fund.
Each Trustee who is not an officer or employee of First Trust, any sub-advisor or any of their affiliates (“Independent Trustees”) is paid a fixed annual retainer that is allocated equally among each fund in the First Trust Fund Complex. Each Independent Trustee is also paid an annual per fund fee that varies based on whether the fund is a closed-end or other actively managed fund, or is an index fund.
Additionally, the Lead Independent Trustee and the Chairmen of the Audit Committee, Nominating and Governance Committee and Valuation Committee are paid annual fees to serve in such capacities, with such compensation allocated pro rata among each fund in the First Trust Fund Complex based on net assets. Independent Trustees are reimbursed for travel and out-of-pocket expenses in connection with all meetings. The Lead Independent Trustee and Committee Chairmen rotate every three years. The officers and “Interested” Trustee receive no compensation from the Trust for acting in such capacities.
4. Purchases and Sales of Securities
For the six months ended April 30, 2018, the cost of purchases and proceeds from sales of investments, excluding short term investments and in-kind transactions, were $62,305,081 and $6,093,319, respectively.
For the six months ended April 30, 2018, the Fund had no in-kind transactions.
Notes to Financial Statements (Continued)
First Trust Institutional Preferred Securities and Income ETF (FPEI)
April 30, 2018 (Unaudited)
5. Creations, Redemptions and Transaction Fees
Shares are created and redeemed by the Fund only in Creation Unit size aggregations of 50,000 shares in transactions with broker-dealers or large institutional investors that have entered into a participation agreement (an “Authorized Participant”). In order to purchase Creation Units of the Fund, an Authorized Participant must deposit (i) a designated portfolio of securities and other instruments determined by First Trust (the “Deposit Securities”) and generally make or receive a cash payment referred to as the “Cash Component,” which is an amount equal to the difference between the NAV of the Fund shares (per Creation Unit Aggregation) and the market value of the Deposit Securities, and/or (ii) cash in lieu of all or a portion of the Deposit Securities. If the Cash Component is a positive number (i.e., the NAV per Creation Unit Aggregation exceeds the Deposit Amount), the Authorized Participant will deliver the Cash Component. If the Cash Component is a negative number (i.e., the NAV per Creation Unit Aggregation is less than the Deposit Amount), the Authorized Participant will receive the Cash Component. Authorized Participants purchasing Creation Units must pay to BBH, as transfer agent, a creation transaction fee (the “Creation Transaction Fee”) regardless of the number of Creation Units purchased in the transaction. The Creation Transaction Fee may vary and is based on the composition of the securities included in the Fund’s portfolio and the countries in which the transactions are settled. The Creation Transaction Fee may increase or decrease as the Fund’s portfolio is adjusted to conform to changes in the composition of the securities included in the Fund’s portfolio and the countries in which the transactions are settled. The Creation Transaction Fee is currently $500 to $1,500. The price for each Creation Unit will equal the daily NAV per share times the number of shares in a Creation Unit plus the fees described above and, if applicable, any operational processing and brokerage costs, transfer fees or stamp taxes. When the Fund permits an Authorized Participant to substitute cash or a different security in lieu of depositing one or more of the requisite Deposit Securities, the Authorized Participant may also be assessed an amount to cover the cost of purchasing the Deposit Securities and/or disposing of the substituted securities, including operational processing and brokerage costs, transfer fees, stamp taxes, and part or all of the spread between the expected bid and offer side of the market related to such Deposit Securities and/or substitute securities.
Authorized Participants redeeming Creation Units must pay to BBH, as transfer agent, a redemption transaction fee (the “Redemption Transaction Fee”), regardless of the number of Creation Units redeemed in the transaction. The Redemption Transaction Fee may vary and is based on the composition of the securities included in the Fund’s portfolio and the countries in which the transactions are settled. The Redemption Transaction Fee is currently $500 to $1,500. The Fund reserves the right to effect redemptions in cash. An Authorized Participant may request cash redemption in lieu of securities; however, the Fund may, in its discretion, reject any such request.
6. Distribution Plan
The Board of Trustees adopted a Distribution and Service Plan pursuant to Rule 12b-1 under the 1940 Act. In accordance with the Rule 12b-1 plan, the Fund is authorized to pay an amount up to 0.25% of its average daily net assets each year to reimburse First Trust Portfolios L.P. (“FTP”), the distributor of the Fund, for amounts expended to finance activities primarily intended to result in the sale of Creation Units or to provide investor services. FTP may also use this amount to compensate securities dealers or other persons that are Authorized Participants for providing distribution assistance, including broker-dealer and shareholder support and educational and promotional services.
No 12b-1 fees are currently paid by the Fund, and pursuant to a contractual arrangement, no 12b-1 fees will be paid any time before August 14, 2019.
7. Indemnification
The Trust, on behalf of the Fund, has a variety of indemnification obligations under contracts with its service providers. The Trust’s maximum exposure under these arrangements is unknown. However, the Trust has not had prior claims or losses pursuant to these contracts and expects the risk of loss to be remote.
8. Subsequent Events
Management has evaluated the impact of all subsequent events to the Fund through the date the financial statements were issued, and has determined that there were no subsequent events requiring recognition or disclosure in the financial statements that have not already been disclosed.
Additional Information
First Trust Institutional Preferred Securities and Income ETF (FPEI)
April 30, 2018 (Unaudited)
Proxy Voting Policies and Procedures
A description of the policies and procedures that the Trust uses to determine how to vote proxies and information on how the Fund voted proxies relating to portfolio securities during the most recent 12-month period ended June 30 is available (1) without charge, upon request, by calling (800) 988-5891; (2) on the Fund’s website at www.ftportfolios.com; and (3) on the Securities and Exchange Commission’s (“SEC”) website at www.sec.gov.
Portfolio Holdings
The Trust files its complete schedule of the Fund’s portfolio holdings with the SEC for the first and third quarters of each fiscal year on Form N-Q. The Trust’s Form N-Qs are available (1) by calling (800) 988-5891; (2) on the Fund’s website at www.ftportfolios.com; (3) on the SEC’s website at www.sec.gov; and (4) for review and copying at the SEC’s Public Reference Room (“PRR”) in Washington, DC. Information regarding the operation of the PRR may be obtained by calling (800) SEC-0330.
Risk Considerations
Risks are inherent in all investing. You should consider the Fund’s investment objective(s), risks, charges and expenses carefully before investing. You can download the Fund’s prospectus at www.ftportfolios.com or contact First Trust Portfolios L.P. at (800) 621-1675 to request a prospectus, which contains this and other information about the Fund. For additional information about the risks associated with investing in the Fund, please see the Fund’s statement of additional information, as well as other regulatory filings. Read these documents carefully before you invest. First Trust Portfolios L.P. is the distributor of the First Trust Exchange-Traded Fund III.
The following summarizes some of the risks that should be considered for the Fund.
AUTHORIZED PARTICIPANT CONCENTRATION RISK. Only an authorized participant (as defined in the “Creations, Redemptions, and Transactions Fees” Note to Financial Statements) may engage in creation or redemption transactions directly with the Fund. The Fund has a limited number of institutions that act as authorized participants. To the extent that these institutions exit the business or are unable to proceed with creation and/or redemption orders with respect to the Fund and no other authorized participant is able to step forward to create or redeem, in either of these cases, Fund shares may trade at a discount to the Fund’s net asset value and possibly face delisting.
CALL RISK. If an issuer calls higher-yielding debt instruments held by the Fund, performance could be adversely impacted. During periods of falling interest rates, issuers of callable securities may call (redeem) securities with higher coupon rates or interest rates before their maturity dates. The Fund would then lose any price appreciation above the bond’s call price and would be forced to reinvest the unanticipated proceeds at lower interest rates, resulting in a decline in the Fund’s income. Such redemptions and subsequent reinvestments would also increase the Fund’s portfolio turnover rate.
CASH TRANSACTIONS RISK. The Fund will, under most circumstances, effect a significant portion of creations and redemptions for cash, rather than in-kind securities. As a result, an investment in the Fund may be less tax-efficient than an investment in an ETF that effects its creations and redemptions for in-kind securities. Because the Fund may effect a portion of redemptions for cash, it may be required to sell portfolio securities in order to obtain the cash needed to distribute redemption proceeds. A sale of shares may result in capital gains or losses and may also result in higher brokerage costs.
CONCENTRATION RISK. A fund concentrated in a single industry or sector is likely to present more risks than a fund that is broadly diversified over several industries or sectors. Compared to the broad market, an individual industry or sector may be more strongly affected by changes in the economic climate, broad market shifts, moves in a particular dominant stock, or regulatory changes. The Fund is concentrated in the financial sector.
CONTINGENT CONVERTIBLE SECURITIES RISK. Contingent convertible securities (“CoCos”) may provide for mandatory conversion into common stock of the issuer under certain circumstances. Since the common stock of the issuer may not pay a dividend, investors in these instruments could experience a reduced income rate, potentially to zero; and conversion would deepen the subordination of the investor, hence worsening standing in a bankruptcy. In addition, some such instruments have a set stock conversion rate that would cause a reduction in value of the security if the price of the stock is below the conversion price on the conversion date. CoCos may be considered to be high-yield securities (a.k.a. “junk” bonds) and, to the extent a CoCo held by the Fund undergoes a write down, the Fund may lose some or all of its original investment in the CoCo. Subordinate securities such as CoCos are more likely to experience credit loss than non-subordinate securities of the same issuer - even if the CoCos do not convert to equity securities. Any losses incurred by subordinate securities, such as CoCos, are likely to be proportionately greater than non-subordinate securities and any recovery of principal and interest of subordinate securities may take more time. As a result, any perceived decline in creditworthiness of a CoCo issuer is likely to have a greater impact on the CoCo, as a subordinate security.
Additional Information (Continued)
First Trust Institutional Preferred Securities and Income ETF (FPEI)
April 30, 2018 (Unaudited)
CONVERTIBLE SECURITIES RISK. Convertible securities have characteristics of both equity and debt securities and, as a result, are exposed to certain additional risks. The market values of convertible securities tend to decline as interest rates increase and, conversely, to increase as interest rates decline. However, a convertible security’s market value also tends to reflect the market price of the common stock of the issuing company, particularly when the stock price is greater than the convertible security’s conversion price (i.e., the predetermined price or exchange ratio at which the convertible security can be converted or exchanged for the underlying common stock). Convertible securities are also exposed to the risk that an issuer is unable to meet its obligation to make dividend or principal payments when due as a result of changing financial or market conditions. Convertible securities generally offer lower interest or dividend yields than non-convertible debt securities of similar credit quality because of their potential for capital appreciation.
Mandatory convertible securities are a subset of convertible securities. The conversion of such securities is not optional, and the conversion price at maturity is based solely upon the market price of the underlying common stock, which may be significantly less than par or the price (above or below par) paid. Mandatory convertible securities generally are subject to a greater risk of loss of value than securities convertible at the option of the holder.
CREDIT RISK. Credit risk is the risk that an issuer of a security will be unable or unwilling to make dividend, interest and/or principal payments when due and the related risk that the value of a security may decline because of concerns about the issuer’s ability to make such payments. Credit risk may be heightened if the Fund invests in “high yield” or “junk” securities; such securities, while generally offering higher yields than investment grade debt with similar maturities, involve greater risks, including the possibility of dividend or interest deferral, default or bankruptcy, and are regarded as predominantly speculative with respect to the issuer’s capacity to pay dividends or interest and repay principal.
CREDIT SPREAD RISK. Credit spread risk is the risk that credit spreads (i.e., the difference in yield between securities that have differences in credit quality or other factors) may increase, which may reduce the market values of the Fund’s securities. While the Fund may employ strategies to mitigate credit spread risk, these strategies may not be successful.
CURRENCY EXCHANGE RATE RISK. The Fund may hold investments that are denominated in non-U.S. currencies, or in securities that provide exposure to such currencies, currency exchange rates or interest rates denominated in such currencies. Changes in currency exchange rates and the relative value of non-U.S. currencies will affect the value of the Fund’s investment and the value of Fund shares. Currency exchange rates can be very volatile and can change quickly and unpredictably. As a result, the value of an investment in the Fund may change quickly and without warning and you may lose money.
CYBERSECURITY RISK. As the use of Internet technology has become more prevalent in the course of business, the Fund has become more susceptible to potential operational risks through breaches in cybersecurity. A breach in cybersecurity refers to both intentional and unintentional events that may cause the Fund to lose proprietary information, suffer data corruption or lose operational capacity. Such events could cause the Fund to incur regulatory penalties, reputational damage, additional compliance costs associated with corrective measures and/or financial loss. Cyber security breaches may involve unauthorized access to the Fund’s digital information systems through “hacking” or malicious software coding, but may also result from outside attacks such as denial-of-service attacks through efforts to make network services unavailable to intended users. In addition, cyber security breaches of the Fund’s third-party service providers, such as its administrator, transfer agent, custodian, or sub-advisor, as applicable, or issuers in which the Fund invests, can also subject the Fund to many of the same risks associated with direct cyber security breaches. The Fund has established risk management systems designed to reduce the risks associated with cyber security. However, there is no guarantee that such efforts will succeed, especially because the Fund does not directly control the cybersecurity systems of issuers or third-party service providers.
DEPOSITARY RECEIPTS RISK. Depositary receipts may be less liquid than the underlying shares in their primary trading market. Any distributions paid to the holders of depositary receipts are usually subject to a fee charged by the depositary. Holders of depositary receipts may have limited voting rights, and investment restrictions in certain countries may adversely impact the value of depositary receipts because such restrictions may limit the ability to convert the equity shares into depositary receipts and vice versa. Such restrictions may cause the equity shares of the underlying issuer to trade at a discount or premium to the market price of the depositary receipts.
EXTENSION RISK. Extension risk is the risk that, when interest rates rise, certain obligations will be paid off by the issuer (or obligor) more slowly than anticipated, causing the value of these securities to fall. Rising interest rates tend to extend the duration of securities, making them more sensitive to changes in interest rates. The value of longer-term securities generally changes more in response to changes in interest rates than shorter-term securities. As a result, in a period of rising interest rates, securities may exhibit additional volatility and may lose value.
Additional Information (Continued)
First Trust Institutional Preferred Securities and Income ETF (FPEI)
April 30, 2018 (Unaudited)
FINANCIAL COMPANIES RISK. Financial companies are especially subject to the adverse effects of economic recession, currency exchange rates, government regulation, decreases in the availability of capital, volatile interest rates, portfolio concentrations in geographic markets and in commercial and residential real estate loans, and competition from new entrants in their fields of business.
FLOATING RATE AND FIXED-TO-FLOATING RATE SECURITIES RISK. The market value of floating rate securities is a reflection of discounted expected cash flows based on expectations for future interest rate resets. The market value of such securities may fall in a declining interest rate environment and may also fall in a rising interest rate environment if there is a lag between the rise in interest rates and the reset. This risk may also be present with respect to fixed-to-floating rate securities in which the Fund may invest. A secondary risk associated with declining interest rates is the risk that income earned by the Fund on floating rate and fixed-to-floating rate securities may decline due to lower coupon payments on floating-rate securities.
FLUCTUATION OF NET ASSET VALUE RISK. The net asset value of shares of the Fund will generally fluctuate with changes in the market value of the Fund’s holdings. The market prices of shares will generally fluctuate in accordance with changes in net asset value as well as the relative supply of and demand for shares on the Exchange. The Fund’s investment advisor cannot predict whether shares will trade below, at or above their net asset value because the shares trade on the Exchange at market prices and not at net asset value. Price differences may be due, in large part, to the fact that supply and demand forces at work in the secondary trading market for shares will be closely related to, but not identical to, the same forces influencing the prices of the holdings of the Fund trading individually or in the aggregate at any point in time. However, given that shares can only be purchased and redeemed either in-kind or for cash in Creation Units, and only to and from broker-dealers and large institutional investors that have entered into participation agreements (unlike shares of closed-end funds, which frequently trade at appreciable discounts from, and sometimes at premiums to, their net asset value), the Fund’s investment advisor believes that large discounts or premiums to the net asset value of shares should not be sustained.
HIGH YIELD SECURITIES RISK. High yield securities, or “junk” bonds, are subject to greater market fluctuations and risk of loss than securities with higher ratings, and therefore, are considered to be highly speculative. These securities are issued by companies that may have limited operating history, narrowly focused operations and/or other impediments to the timely payment of periodic interest and principal at maturity. If the economy slows down or dips into recession, the issuers of high yield securities may not have sufficient resources to continue making timely payment of periodic interest and principal at maturity. The market for high yield securities is smaller and less liquid than that for investment grade securities. High yield securities are generally not listed on a national securities exchange but trade in the over-the-counter markets. Due to the smaller, less liquid market for high yield securities, the bid-offer spread on such securities is generally greater than it is for investment grade securities and the purchase or sale of such securities may take longer to complete. In general, high yield securities may have a greater risk of default than other types of securities.
HYBRID CAPITAL SECURITIES RISK. A hybrid capital security may exhibit characteristics akin to both an equity or debt security or other evidence of indebtedness on which the value of the interest, or principal of which, is determined by reference to changes in the value of a reference instrument or financial strength of a reference entity (e.g., a security or other financial instrument, asset, currency or interest rate). The price of a hybrid capital security and any applicable reference instrument may not move in the same direction or at the same time. An investment in a hybrid capital security may entail significant risks not associated with a similar investment in a traditional equity security. The risks of a particular hybrid capital security will depend upon the terms of the instrument, but may include the possibility of significant changes in the value of any applicable reference instrument. Hybrid capital securities potentially are more volatile than traditional equity securities. Hybrid instruments may carry credit risk of their issuer, as well as liquidity risk, since they often are “customized” to meet the needs of an issuer or a particular investor, and therefore the number of investors that buy such instruments in the secondary market may be small.
INCOME RISK. Income from the Fund’s fixed income investments could decline during periods of falling interest rates.
INTEREST RATE RISK. Interest rate risk is the risk that the value of the preferred, hybrid and fixed-income securities in the Fund’s portfolio will decline because of rising market interest rates. Interest rate risk is generally lower for shorter term investments and higher for longer term investments. Duration is a measure of the expected price volatility of a debt instrument as a result of changes in market rates of interest, based on, among other factors, the weighted average timing of the instrument’s expected principal and interest payments. In general, duration represents the expected percentage change in the value of a security for an immediate 1% change in interest rates. Therefore, prices of instruments with shorter durations tend to be less sensitive to interest rate changes than instruments with longer durations. As the value of a security changes over time, so will its duration.
LIQUIDITY RISK. Some of the securities held by the Fund may be illiquid. Illiquid securities involve the risk that the securities will not be able to be sold at the time desired by the Fund or at prices approximately the value at which the Fund is carrying the securities on its books. This risk may be especially pronounced in lower-quality debt issued by companies that are highly leveraged. Lower-quality debt tends to be less liquid than higher-quality debt. Moreover, smaller debt issues tend to be less liquid than larger debt issues. If the economy experiences a sudden downturn, or if the debt markets for such companies become distressed, the Fund may
Additional Information (Continued)
First Trust Institutional Preferred Securities and Income ETF (FPEI)
April 30, 2018 (Unaudited)
have particular difficulty selling its assets in sufficient amounts, at reasonable prices and in a sufficiently timely manner to raise the cash necessary to meet any potentially heavy redemption requests by Fund shareholders.
MANAGEMENT RISK. The Fund is subject to management risk because it is an actively managed portfolio. In managing the Fund’s investment portfolio, the Fund’s Sub-Advisor will apply investment techniques and risk analyses that may not have the desired result. There can be no guarantee that the Fund will meet its investment objective.
MARKET MAKER RISK. If the Fund has lower average daily trading volumes, it may rely on a small number of third-party market makers to provide a market for the purchase and sale of shares. Any trading halt or other problem relating to the trading activity of these market makers could result in a dramatic change in the spread between the Fund’s net asset value and the price at which the Fund’s shares are trading on the Exchange, which could result in a decrease in value of the Fund’s shares. In addition, decisions by market makers or authorized participants to reduce their role or step away from these activities in times of market stress could inhibit the effectiveness of the arbitrage process in maintaining the relationship between the underlying values of the Fund’s portfolio securities and the Fund’s market price. This reduced effectiveness could result in Fund shares trading at a discount to net asset value and also in greater than normal intraday bid-ask spreads for Fund shares.
MARKET RISK. Market risk is the risk that a particular security owned by the Fund or shares of the Fund in general may fall in value. Securities are subject to market fluctuations caused by such factors as economic, political, regulatory or market developments, changes in interest rates and perceived trends in securities prices. Shares of the Fund could decline in value or underperform other investments.
NON-DIVERSIFICATION RISK. The Fund is classified as “non-diversified” under the 1940 Act. As a result, the Fund is only limited as to the percentage of its assets which may be invested in the securities of any one issuer by the diversification requirements imposed by the Internal Revenue Code of 1986, as amended. The Fund may invest a relatively high percentage of its assets in a limited number of issuers. As a result, the Fund may be more susceptible to a single adverse economic or regulatory occurrence affecting one or more of these issuers, experience increased volatility and be highly invested in certain issuers.
NON-U.S. AND EMERGING MARKETS SECURITIES RISK. Non-U.S. securities are subject to higher volatility than securities of domestic issuers due to possible adverse political, social or economic developments; restrictions on foreign investment or exchange of securities; lack of liquidity; currency exchange rates; excessive taxation; government seizure of assets; different legal or accounting standards; and less government supervision and regulation of exchanges in foreign countries. These risks may be heightened for securities of companies located in, or with significant operations in, emerging market countries.
PREFERRED SECURITIES RISK. Preferred securities combine some of the characteristics of both common stocks and bonds. Preferred securities are typically subordinated to bonds and other debt instruments in a company’s capital structure, in terms of priority to corporate income, and therefore will be subject to greater credit risk than those debt instruments. Preferred securities are also subject to credit risk, interest rate risk and income risk. Generally, holders of preferred securities have no voting rights with respect to the issuing company unless preferred dividends have been in arrears for a specified number of periods, at which time the preferred security holders may elect a number of directors to the issuer’s board. In certain circumstances, an issuer of preferred securities may redeem the securities prior to a specified date.
REIT INVESTMENT RISK. The Fund may invest in preferred securities issued by real estate investment trusts (“REITs”), and as a result, the Fund is subject to the risks associated with investing in real estate, which may include, but are not limited to, fluctuations in the value of underlying properties; defaults by borrowers or tenants; market saturation; changes in general and local operating expenses; and other economic, political or regulatory occurrences affecting companies in the real estate industry. In addition to risks related to investments in real estate generally, investing in REITs involves certain other risks related to their structure and focus, which include, but are not limited to, dependency upon management skills, limited diversification, the risks of locating and managing financing for projects, heavy cash flow dependency, possible default by borrowers, the costs and potential losses of self-liquidation of one or more holdings, the risk of a possible lack of mortgage funds and associated interest rate risks, overbuilding, property vacancies, increases in property taxes and operating expenses, changes in zoning laws, losses due to environmental damages, changes in neighborhood values and appeal to purchasers, the possibility of failing to maintain exemptions from registration under the 1940 Act and, in many cases, relatively small market capitalization, which may result in less market liquidity and greater price volatility. REITs are also subject to the risk that the real estate market may experience an economic downturn generally, which may have a material effect on the real estate in which the REITs invest and their underlying portfolio securities.
RESTRICTED SECURITIES RISK. Investments in restricted securities could have the effect of increasing the amount of the Fund’s assets invested in illiquid securities if qualified institutional buyers are unwilling to purchase these securities. Illiquid and restricted securities may be difficult to dispose of at the price at which the Fund has valued the securities and at the times when the Fund believes it is desirable to do so. The market price of illiquid and restricted securities generally is more volatile than that of more liquid
Additional Information (Continued)
First Trust Institutional Preferred Securities and Income ETF (FPEI)
April 30, 2018 (Unaudited)
securities, which may adversely affect the price that the Fund recovers upon the sale of such securities. Investment of the Fund’s assets in illiquid and restricted securities may restrict the Fund’s ability to take advantage of market opportunities.
SUBORDINATED DEBT RISK. Perpetual subordinated debt is a type of hybrid instrument that has no maturity date for the return of principal and does not need to be redeemed by the issuer. These investments typically have lower credit ratings and lower priority than other obligations of an issuer during bankruptcy, presenting a greater risk for nonpayment. This risk increases as the priority of the obligation becomes lower. Payments on these securities may be subordinated to all existing and future liabilities and obligations of subsidiaries and associated companies of an issuer. Additionally, some perpetual subordinated debt does not restrict the ability of an issuer’s subsidiaries to incur further unsecured indebtedness.
TRADING ISSUES RISK. Although the shares of the Fund are listed for trading on the Exchange, there can be no assurance that an active trading market for such shares will develop or be maintained. Trading in shares on the Exchange may be halted due to market conditions or for reasons that, in the view of the Exchange, make trading in shares inadvisable. In addition, trading in shares on the Exchange is subject to trading halts caused by extraordinary market volatility pursuant to the Exchange’s “circuit breaker” rules. Market makers are under no obligation to make a market in the Fund’s shares, and authorized participants are not obligated to submit purchase or redemption orders for Creation Units. There can be no assurance that the requirements of the Exchange necessary to maintain the listing of the Fund will continue to be met or will remain unchanged. In particular, if the Fund does not comply with any provision of the listing standards of the Exchange that are applicable to the Fund, and cannot bring itself into compliance within a reasonable period after discovering the matter, the Exchange may remove the shares of the Fund from listing. The Fund may have difficulty maintaining its listing on the Exchange in the event the Fund’s assets are small or the Fund does not have enough shareholders.
This page intentionally left blank
First Trust Exchange-Traded Fund III
INVESTMENT ADVISOR
First Trust Advisors L.P.
120 E. Liberty Drive, Suite 400
Wheaton, IL 60187
INVESTMENT SUB-ADVISOR
Stonebridge Advisors LLC
10 Westport Road, Suite C101
Wilton, CT 06897
ADMINISTRATOR, CUSTODIAN,
FUND ACCOUNTANT &
TRANSFER AGENT
Brown Brothers Harriman & Co.
50 Post Office Square
Boston, MA 02110
INDEPENDENT REGISTERED
PUBLIC ACCOUNTING FIRM
Deloitte & Touche LLP
111 S. Wacker Drive
Chicago, IL 60606
LEGAL COUNSEL
Chapman and Cutler LLP
111 W. Monroe Street
Chicago, IL 60603
Item 2. Code of Ethics.
Not applicable.
Item 3. Audit Committee Financial Expert.
Not applicable.
Item 4. Principal Accountant Fees and Services.
Not applicable.
Item 5. Audit Committee of Listed Registrants.
Not applicable.
Item 6. Schedule of Investments.
| (a) | | Schedules of Investments in securities of unaffiliated issuers as of the close of the reporting period are included as part of the report to shareholders filed under Item 1 of this form. |
Item 7. Disclosure of Proxy Voting Policies and Procedures for Closed-End Management Investment Companies.
Not applicable.
Item 8. Portfolio Managers of Closed-End Management Investment Companies.
Not applicable.
Item 9. Purchases of Equity Securities by Closed-End Management Investment Company and Affiliated Purchasers.
Not applicable.
Item 10. Submission of Matters to a Vote of Security Holders.
There have been no material changes to the procedures by which the shareholders may recommend nominees to the registrant's board of directors, where those changes were implemented after the registrant last provided disclosure in response to the requirements of Item 407(c)(2)(iv) of Regulation S-K (17 CFR 229.407) (as required by Item 22(b)(15) of Schedule 14A (17 CFR 240.14a-101)),or this Item.
Item 11. Controls and Procedures.
(a) The registrant's principal executive and principal financial officers, or persons performing similar functions, have concluded that the registrant's disclosure controls and procedures (as defined in Rule 30a-3(c) under the Investment Company Act of 1940, as amended (the "1940 Act") (17 CFR 270.30a-3 (c))) are effective, as of a date within 90 days of the filing date of the report that includes the disclosure required by this paragraph, based on their evaluation of these controls and procedures required by Rule 30a-3(b) under the 1940 Act (17 CFR 270.30a-3(b)) and Rules 13a-15(b) or 15d-15(b) under the Securities Exchange Act of 1934, as amended (17 CFR 240.13a-15(b) or 240.15d-15 (b)).
(b) There were no changes in the registrant's internal control over financial reporting (as defined in Rule 30a-3(d) under the 1940 Act (17 CFR 270.30a-3(d)) that occurred during the registrant's last fiscal quarter that have materially affected, or are reasonably likely to materially affect, the registrant's internal control over financial reporting.
Item 12. Disclosure of Securities Lending Activities for Closed-End Management Investment Companies.
Not applicable.
Item 13. Exhibits.
| (a)(2) | | Certifications pursuant to Rule 30a-2(a) under the 1940 Act and Section 302 of the Sarbanes-Oxley Act of 2002 are attached hereto. |
| (b) | | Certifications pursuant to Rule 30a-2(b) under the 1940 Act and Section 906 of the Sarbanes- Oxley Act of 2002 are attached hereto. |
SIGNATURES
Pursuant to the requirements of the Securities Exchange Act of 1934 and the Investment Company Act of 1940, the registrant has duly caused this report to be signed on its behalf by the undersigned, thereunto duly authorized.
| (registrant) | | First Trust Exchange-Traded Fund III |
| By (Signature and Title)* | | /s/ James M. Dykas |
| | | James M. Dykas, President and Chief Executive Officer
(principal executive officer) |
Pursuant to the requirements of the Securities Exchange Act of 1934 and the Investment Company Act of 1940, this report has been signed below by the following persons on behalf of the registrant and in the capacities and on the dates indicated.
| By (Signature and Title)* | | /s/ James M. Dykas |
| | | James M. Dykas, President and Chief Executive Officer
(principal executive officer) |
| By (Signature and Title)* | | /s/ Donald P. Swade |
| | | Donald P. Swade, Treasurer, Chief Financial Officer
and Chief Accounting Officer
(principal financial officer) |
* Print the name and title of each signing officer under his or her signature.