UNITED STATES
SECURITIES AND EXCHANGE COMMISSION
Washington, D.C. 20549
FORM N-CSR
CERTIFIED SHAREHOLDER REPORT OF REGISTERED MANAGEMENT INVESTMENT COMPANIES
Investment Company Act file number 811-22245
First Trust Exchange-Traded Fund III
(Exact name of registrant as specified in charter)
120 East Liberty Drive, Suite 400
Wheaton, IL 60187
(Address of principal executive offices) (Zip code)
W. Scott Jardine, Esq.
First Trust Portfolios L.P.
120 East Liberty Drive, Suite 400
Wheaton, IL 60187
(Name and address of agent for service)
Registrant’s telephone number, including area code: (630) 765-8000
Date of fiscal year end: October 31
Date of reporting period: April 30, 2020
Form N-CSR is to be used by management investment companies to file reports with the Commission not later than 10 days after the transmission to stockholders of any report that is required to be transmitted to stockholders under Rule 30e-1 under the Investment Company Act of 1940 (17 CFR 270.30e-1). The Commission may use the information provided on Form N-CSR in its regulatory, disclosure review, inspection, and policymaking roles.
A registrant is required to disclose the information specified by Form N-CSR, and the Commission will make this information public. A registrant is not required to respond to the collection of information contained in Form N-CSR unless the Form displays a currently valid Office of Management and Budget (“OMB”) control number. Please direct comments concerning the accuracy of the information collection burden estimate and any suggestions for reducing the burden to Secretary, Securities and Exchange Commission, 100 F Street, NE, Washington, DC 20549. The OMB has reviewed this collection of information under the clearance requirements of 44 U.S.C. § 3507.
Item 1. Report to Stockholders.
The registrant's semi-annual report transmitted to shareholders pursuant to Rule 30e-1 under the Investment Company Act of 1940 is as follows:
First Trust Exchange-Traded Fund III
First Trust Preferred Securities and Income ETF (FPE)
Semi-Annual Report
For the Six Months Ended
April 30, 2020
First Trust Preferred Securities and Income ETF (FPE)
Semi-Annual Report
April 30, 2020
Caution Regarding Forward-Looking Statements
This report contains certain forward-looking statements within the meaning of the Securities Act of 1933, as amended, and the Securities Exchange Act of 1934, as amended. Forward-looking statements include statements regarding the goals, beliefs, plans or current expectations of First Trust Advisors L.P. (“First Trust” or the “Advisor”) and/or Stonebridge Advisors LLC (“Stonebridge” or the “Sub-Advisor”) and their respective representatives, taking into account the information currently available to them. Forward-looking statements include all statements that do not relate solely to current or historical fact. For example, forward-looking statements include the use of words such as “anticipate,” “estimate,” “intend,” “expect,” “believe,” “plan,” “may,” “should,” “would” or other words that convey uncertainty of future events or outcomes.
Forward-looking statements involve known and unknown risks, uncertainties and other factors that may cause the actual results, performance or achievements of the series of First Trust Exchange-Traded Fund III (the “Trust”) described in this report (First Trust Preferred Securities and Income ETF; hereinafter referred to as the “Fund”) to be materially different from any future results, performance or achievements expressed or implied by the forward-looking statements. When evaluating the information included in this report, you are cautioned not to place undue reliance on these forward-looking statements, which reflect the judgment of the Advisor and/or Sub-Advisor and their respective representatives only as of the date hereof. We undertake no obligation to publicly revise or update these forward-looking statements to reflect events and circumstances that arise after the date hereof.
Performance and Risk Disclosure
There is no assurance that the Fund will achieve its investment objective. The Fund is subject to market risk, which is the possibility that the market values of securities owned by the Fund will decline and that the value of the Fund’s shares may therefore be less than what you paid for them. Accordingly, you can lose money by investing in the Fund. See “Risk Considerations” in the Additional Information section of this report for a discussion of certain other risks of investing in the Fund.
Performance data quoted represents past performance, which is no guarantee of future results, and current performance may be lower or higher than the figures shown. For the most recent month-end performance figures, please visit www.ftportfolios.com or speak with your financial advisor. Investment returns, net asset value and share price will fluctuate and Fund shares, when sold, may be worth more or less than their original cost.
The Advisor may also periodically provide additional information on Fund performance on the Fund’s web page at www.ftportfolios.com.
How to Read This Report
This report contains information that may help you evaluate your investment in the Fund. It includes details about the Fund and presents data and analysis that provide insight into the Fund’s performance and investment approach.
The statistical information that follows may help you understand the Fund’s performance compared to that of relevant market benchmarks.
It is important to keep in mind that the opinions expressed by personnel of the Advisor and/or Sub-Advisor are just that: informed opinions. They should not be considered to be promises or advice. The opinions, like the statistics, cover the period through the date on the cover of this report. The material risks of investing in the Fund are spelled out in the prospectus, the statement of additional information, and other Fund regulatory filings.
First Trust Preferred Securities and Income ETF (FPE)
Semi-Annual Letter from the Chairman and CEO
April 30, 2020
Dear Shareholders,
First Trust is pleased to provide you with the semi-annual report for the First Trust Preferred Securities and Income ETF (the “Fund”), which contains detailed information about the Fund for the six months ended April 30, 2020.
Just one month ago, I noted in a letter to shareholders that a handful of states were set to open some “nonessential” businesses by early May. As of May 20, 2020, I am pleased to report that all 50 states and U.S. territories have eased some restrictions on businesses and social activity. Keep in mind, however, that the plan does entail governors phasing in the opening of businesses in the coming weeks or potentially months, so I see this news as essentially marking the beginning of the rebuilding process for the U.S. economy. We all need to be aware as well of the possibility of an uptick or even surge in the coronavirus (“COVID-19”) infections as more people venture out of their homes. Prior to the last couple of weeks or so, the stay-at-home mandate severely restricted the movements of close to 315 million Americans, according to The Washington Post. To put this further into perspective, because so many stores have been closed and so many people have been hunkering down at home, retail-store traffic in the U.S. plunged 91.2% year-over-year for the week ended May 16, 2020, according to Bloomberg. Truly amazing!
In this COVID-19 pandemic, there appears to be a notable disconnect between the state of the U.S. economy, which is expected to go from bad to downright terrible between the first quarter and second quarter of the year, and the performance of the stock market, which has been much better than expected. While the data and commentary in this report are technically supposed to run through April 30, 2020, I feel compelled to offer insight that is as up to date as possible. The 2020 peak in the stock market, as measured by the S&P 500® Index (the “Index”), occurred on February 19. That day also marked the all-time high for the Index. From February 19, 2020, through March 23, 2020, the Index declined by 33.92% on a price-only basis (no dividends included), according to Bloomberg. We should note that the Index slid into bear market territory on March 12, 2020. A bear market is defined by a 20% or greater decline in price from its most recent peak. That took just 16 trading days, the quickest plunge into a bear market ever. From March 23, 2020 through May 20, 2020, the Index staged an impressive rebound, posting a price-only gain of 32.82%, according to Bloomberg. As of May 20, 2020, the Index stood just 12.24% below its all-time high set on February 19, 2020. But the game, as they say, is not over. Even though stocks have rebounded significantly from their March lows, 68% of the money managers that participated in the most recent Bank of America global fund manager survey believe that stocks are still in a bear market, according to MarketWatch. What are they likely concerned about? In addition to a dismal economic outlook for the near-term, research from Bespoke Investment Group, an independent research firm, indicates that there have been 25 bear markets since 1928 and 60% of the time the Index declined a second time during the bear market and went on to establish a new low for the period.
With respect to the state of the economy, the Congressional Budget Office announced on May 19, 2020, that it sees real U.S. gross domestic product (“GDP”) declining by an annualized 38% in the second quarter of 2020, reportedly in line with Wall Street economists, according to CNBC. Some estimates are more dire. The GDP estimate from the Atlanta Federal Reserve calls for a 42% plunge. These numbers are so large in scope they are mind-boggling. The Bureau of Economic Analysis is scheduled to release its GDP report on July 30, 2020. Until then, we may continue to have a disconnect between the economy and the markets. Let us hope it is as positive as the one we are currently enjoying.
The U.S. government shut down huge chunks of our economy in order to protect lives and prevent our health care system from being overwhelmed by COVID-19 patients. Our economic woes, in other words, are man-made. The remedies to this pandemic will also likely be man-made. They could come in the form of therapeutics and/or a vaccine. Perhaps more than one vaccine. At this stage of the pandemic fight, we have one message for investors: Stay the course!
Thank you for giving First Trust the opportunity to play a role in your financial future. We value our relationship with you and will report on the Fund again in six months.
Sincerely,
James A. Bowen
Chairman of the Board of Trustees
Chief Executive Officer of First Trust Advisors L.P.
Fund Performance Overview (Unaudited)
First Trust Preferred Securities and Income ETF (FPE)
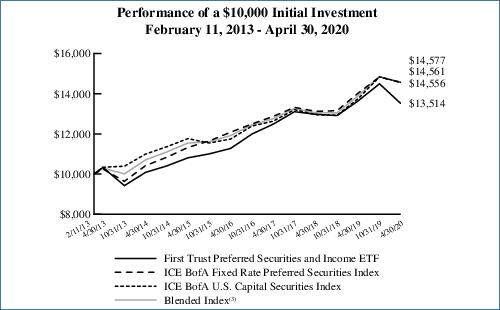
First Trust Preferred Securities and Income ETF’s (the “Fund”) investment objective is to seek total return and to provide current income. Under normal market conditions, the Fund invests at least 80% of its net assets (including investment borrowings) in preferred securities (“Preferred Securities”) and income-producing debt securities (“Income Securities”). The Fund invests in securities that are traded over-the-counter or listed on an exchange. For purposes of the 80% test set forth above, securities of open-end funds, closed-end funds or other exchange-traded funds (“ETFs”) registered under the Investment Company Act of 1940, as amended, that invest primarily in Preferred Securities or Income Securities are deemed to be Preferred Securities or Income Securities.
Preferred Securities held by the Fund generally pay fixed or adjustable-rate distributions to investors and have preference over common stock in the payment of distributions and the liquidation of a company’s assets, but are generally junior to all forms of the company’s debt, including both senior and subordinated debt. Certain of the Preferred Securities may be issued by trusts or other special purpose entities created by companies specifically for the purpose of issuing such securities. Income Securities that may be held by the Fund include corporate bonds, high yield securities (commonly referred to as “junk” bonds) and convertible securities. The broad category of corporate debt securities includes debt issued by U.S. and non-U.S. companies of all kinds, including those with small, mid and large capitalizations. Corporate debt may carry fixed or floating rates of interest.
| Performance | | | | | | | |
| | | | Average Annual Total Returns | | Cumulative Total Returns |
| | 6 Months
Ended
4/30/20 | 1 Year
Ended
4/30/20 | 5 Years
Ended
4/30/20 | Inception
(2/11/13)
to 4/30/20 | | 5 Years
Ended
4/30/20 | Inception
(2/11/13)
to 4/30/20 |
| Fund Performance | | | | | | | |
| NAV | -6.74% | -0.91% | 4.57% | 4.26% | | 25.02% | 35.14% |
| Market Price | -7.05% | -1.29% | 4.44% | 4.21% | | 24.25% | 34.66% |
| Index Performance | | | | | | | |
| ICE BofA Fixed Rate Preferred Securities Index | -1.86% | 3.80% | 5.15% | 5.34% | | 28.53% | 45.56% |
| ICE BofA U.S. Capital Securities Index | -1.86% | 5.89% | 4.36% | 5.35% | | 23.78% | 45.61% |
| Blended Index(1) | -1.83% | 4.87% | 4.77% | 5.36% | | 26.24% | 45.77% |
Total returns for the period since inception are calculated from the inception date of the Fund. “Average Annual Total Returns” represent the average annual change in value of an investment over the periods indicated. “Cumulative Total Returns” represent the total change in value of an investment over the periods indicated.
The Fund’s per share net asset value (“NAV”) is the value of one share of the Fund and is computed by dividing the value of all assets of the Fund (including accrued interest and dividends), less all liabilities (including accrued expenses and dividends declared but unpaid), by the total number of outstanding shares. The price used to calculate market return (“Market Price”) is determined by using the midpoint between the highest bid and the lowest offer on the stock exchange on which shares of the Fund are listed for trading as of the time that the Fund’s NAV is calculated. Since shares of the Fund did not trade in the secondary market until after its inception, for the period from inception to the first day of secondary market trading in shares of the Fund, the NAV of the Fund is used as a proxy for the secondary market trading price to calculate market returns. NAV and market returns assume that all distributions have been reinvested in the Fund at NAV and Market Price, respectively.
An index is a statistical composite that tracks a specified financial market or sector. Unlike the Fund, the indices do not actually hold a portfolio of securities and therefore do not incur the expenses incurred by the Fund. These expenses negatively impact the performance of the Fund. Also, market returns do not include brokerage commissions that may be payable on secondary market transactions. If brokerage commissions were included, market returns would be lower. The total returns presented reflect the reinvestment of dividends on securities in the indices. The returns presented do not reflect the deduction of taxes that a shareholder would pay on Fund distributions or the redemption or sale of Fund shares. The investment return and principal value of shares of the Fund will vary with changes in market conditions. Shares of the Fund may be worth more or less than their original cost when they are redeemed or sold in the market. The Fund’s past performance is no guarantee of future performance.
| (1) | The Blended Index consists of a 50/50 blend of the ICE BofA Fixed Rate Preferred Securities Index and the ICE BofA U.S. Capital Securities Index. The Blended Index reflects the diverse allocation of institutional preferred and hybrid securities in the Fund’s portfolio. The indexes do not charge management fees or brokerage expenses, and no such fees or expenses were deducted from the performance shown. Indexes are unmanaged and an investor cannot invest directly in an index. The Blended Index returns are calculated by using the monthly return of the two indices during each period shown above. At the beginning of each month the two indices are rebalanced to a 50-50 ratio to account for divergence from that ratio that occurred during the course of each month. The monthly returns are then compounded for each period shown above, giving the performance for the Blended Index for each period shown above. |
Fund Performance Overview (Unaudited) (Continued)
First Trust Preferred Securities and Income ETF (FPE)
| Sector Allocation | % of Total
Investments |
| Financials | 69.6% |
| Utilities | 10.9 |
| Energy | 6.2 |
| Communication Services | 3.5 |
| Consumer Staples | 3.5 |
| Real Estate | 2.8 |
| Materials | 1.8 |
| Industrials | 1.7 |
| Total | 100.0% |
| Credit Rating(2) | % of Total
Investments |
| A | 0.1% |
| A- | 0.9 |
| BBB+ | 10.6 |
| BBB | 24.4 |
| BBB- | 30.5 |
| BB+ | 18.8 |
| BB | 6.7 |
| BB- | 4.2 |
| B+ | 0.3 |
| B | 0.1 |
| Not Rated | 3.4 |
| Total | 100.0% |
| Country Allocation | % of Total
Investments |
| United States | 49.8% |
| United Kingdom | 9.3 |
| Canada | 7.9 |
| France | 6.9 |
| Switzerland | 4.8 |
| Australia | 4.0 |
| Italy | 3.8 |
| Netherlands | 3.8 |
| Bermuda | 3.2 |
| Japan | 1.5 |
| Spain | 1.4 |
| Mexico | 0.9 |
| Denmark | 0.7 |
| Finland | 0.6 |
| Cayman Islands | 0.5 |
| Chile | 0.4 |
| Sweden | 0.3 |
| Jersey | 0.2 |
| Total | 100.0% |
| Top Ten Holdings | % of Total
Investments |
| Emera, Inc., Series 16-A | 3.2% |
| Enel S.p.A. | 2.1 |
| Barclays PLC | 2.0 |
| Barclays PLC | 1.8 |
| GMAC Capital Trust I, Series 2 | 1.5 |
| Lloyds Banking Group PLC | 1.3 |
| Charles Schwab (The) Corp., Series G | 1.2 |
| BHP Billiton Finance USA Ltd. | 1.2 |
| Goldman Sachs Group (The), Inc., Series Q | 1.2 |
| Credit Agricole S.A. | 1.1 |
| Total | 16.6% |
| (2) | The credit quality and ratings information presented above reflect the ratings assigned by one or more nationally recognized statistical rating organizations (NRSROs), including Standard & Poor’s Ratings Group, a division of the McGraw Hill Companies, Inc., Moody’s Investors Service, Inc., Fitch Ratings or a comparably rated NRSRO. For situations in which a security is rated by more than one NRSRO and the ratings are not equivalent, the highest rating is used. Sub-investment grade ratings are those rated BB+/Ba1 or lower. Investment grade ratings are those rated BBB-/Baa3 or higher. The credit ratings shown relate to the creditworthiness of the issuers of the underlying securities in the Fund, and not to the Fund or its shares. Credit ratings are subject to change. |
Fund Performance Overview (Unaudited) (Continued)
First Trust Preferred Securities and Income ETF (FPE)
Performance figures assume reinvestment of all distributions and do not reflect the deduction of taxes that a shareholder would pay on Fund distributions or the redemption or sale of Fund shares. An index is a statistical composite that tracks a specified financial market or sector. Unlike the Fund, the indices do not actually hold a portfolio of securities and therefore do not incur the expenses incurred by the Fund. These expenses negatively impact the performance of the Fund. The Fund’s past performance does not predict future performance.
Frequency Distribution of Discounts and Premiums
Bid/Ask Midpoint vs. NAV through April 30, 2020
The following Frequency Distribution of Discounts and Premiums charts are provided to show the frequency at which the bid/ask midpoint price for the Fund was at a discount or premium to the daily NAV. The following tables are for comparative purposes only and represent the period November 1, 2014 through April 30, 2020. Shareholders may pay more than NAV when they buy Fund shares and receive less than NAV when they sell those shares because shares are bought and sold at current market price. Data presented represents past performance and cannot be used to predict future results.
| Number of Days Bid/Ask Midpoint At/Above NAV |
| For the Period | 0.00%–0.49% | 0.50%–0.99% | 1.00%–1.99% | >=2.00% |
| 11/1/14 – 10/31/15 | 214 | 16 | 0 | 0 |
| 11/1/15 – 10/31/16 | 212 | 13 | 0 | 0 |
| 11/1/16 – 10/31/17 | 232 | 1 | 0 | 0 |
| 11/1/17 – 10/31/18 | 174 | 0 | 0 | 0 |
| 11/1/18 – 10/31/19 | 183 | 0 | 0 | 0 |
| 11/1/19 – 4/30/20 | 89 | 3 | 7 | 1 |
| Number of Days Bid/Ask Midpoint Below NAV |
| For the Period | 0.00%–0.49% | 0.50%–0.99% | 1.00%–1.99% | >=2.00% |
| 11/1/14 – 10/31/15 | 21 | 0 | 0 | 0 |
| 11/1/15 – 10/31/16 | 26 | 1 | 0 | 0 |
| 11/1/16 – 10/31/17 | 19 | 0 | 0 | 0 |
| 11/1/17 – 10/31/18 | 78 | 0 | 0 | 0 |
| 11/1/18 – 10/31/19 | 66 | 1 | 1 | 0 |
| 11/1/19 – 4/30/20 | 14 | 1 | 3 | 6 |
| (3) | The Blended Index consists of a 50/50 blend of the ICE BofA Fixed Rate Preferred Securities Index and the ICE BofA U.S. Capital Securities Index. The Blended Index reflects the diverse allocation of institutional preferred and hybrid securities in the Fund’s portfolio. The indexes do not charge management fees or brokerage expenses, and no such fees or expenses were deducted from the performance shown. Indexes are unmanaged and an investor cannot invest directly in an index. The Blended Index returns are calculated by using the monthly return of the two indices during each period shown above. At the beginning of each month the two indices are rebalanced to a 50-50 ratio to account for divergence from that ratio that occurred during the course of each month. The monthly returns are then compounded for each period shown above, giving the performance for the Blended Index for each period shown above. |
Portfolio Management
First Trust Preferred Securities and Income ETF (FPE)
Semi-Annual Report
April 30, 2020 (Unaudited)
Advisor
First Trust Advisors L.P. (“First Trust” or the “Advisor”) serves as the investment advisor to the First Trust Preferred Securities and Income ETF (the “Fund”). First Trust is responsible for the ongoing monitoring of the Fund’s investment portfolio, managing the Fund’s business affairs and providing certain administrative services necessary for the management of the Fund.
Sub-Advisor
Stonebridge Advisors LLC
Stonebridge Advisors LLC (“Stonebridge” or the “Sub-Advisor”) is the sub-advisor to the Fund and is a registered investment advisor based in Wilton, Connecticut. Stonebridge specializes in the management of preferred and hybrid securities.
Stonebridge Advisors LLC Portfolio Management Team
Scott T. Fleming - Chief Executive Officer and President
Robert Wolf - Chief Investment Officer, Senior Vice President and Senior Portfolio Manager
Eric Weaver - Chief Strategist and Senior Vice President
First Trust Preferred Securities and Income ETF (FPE)
Understanding Your Fund Expenses
April 30, 2020 (Unaudited)
As a shareholder of the First Trust Preferred Securities and Income ETF (the “Fund”), you incur two types of costs: (1) transaction costs; and (2) ongoing costs, including management fees, distribution and/or service (12b-1) fees, if any, and other Fund expenses. This Example is intended to help you understand your ongoing costs of investing in the Fund and to compare these costs with the ongoing costs of investing in other funds.
The Example is based on an investment of $1,000 invested at the beginning of the period and held through the six-month period ended April 30, 2020.
Actual Expenses
The first line in the following table provides information about actual account values and actual expenses. You may use the information in this line, together with the amount you invested, to estimate the expenses that you paid over the period. Simply divide your account value by $1,000 (for example, an $8,600 account value divided by $1,000 = 8.6), then multiply the result by the number in the first line under the heading entitled “Expenses Paid During the Six-Month Period” to estimate the expenses you paid on your account during this six-month period.
Hypothetical Example for Comparison Purposes
The second line in the following table provides information about hypothetical account values and hypothetical expenses based on the Fund’s actual expense ratio and an assumed rate of return of 5% per year before expenses, which is not the Fund’s actual return. The hypothetical account values and expenses may not be used to estimate the actual ending account balance or expenses you paid for the period. You may use this information to compare the ongoing costs of investing in the Fund and other funds. To do so, compare this 5% hypothetical example with the 5% hypothetical examples that appear in the shareholder reports of the other funds.
Please note that the expenses shown in the table are meant to highlight your ongoing costs only and do not reflect any transactional costs such as brokerage commissions. Therefore, the second line in the table is useful in comparing ongoing costs only, and will not help you determine the relative total costs of owning different funds. In addition, if these transactional costs were included, your costs would have been higher.
| | Beginning
Account Value
November 1, 2019 | Ending
Account Value
April 30, 2020 | Annualized
Expense Ratio
Based on the
Six-Month
Period | Expenses Paid
During the
Six-Month
Period (a) |
| First Trust Preferred Securities and Income ETF (FPE) |
| Actual | $1,000.00 | $932.60 | 0.85% | $4.08 |
| Hypothetical (5% return before expenses) | $1,000.00 | $1,020.64 | 0.85% | $4.27 |
| (a) | Expenses are equal to the annualized expense ratios as indicated in the table multiplied by the average account value over the period (November 1, 2019 through April 30, 2020), multiplied by 182/366 (to reflect the six-month period). |
First Trust Preferred Securities and Income ETF (FPE)
Portfolio of Investments
April 30, 2020 (Unaudited)
| Shares | | Description | | Stated
Rate | | Stated
Maturity | | Value |
| $25 PAR PREFERRED SECURITIES – 30.7% |
| | | Banks – 6.8% | | | | | | |
| 140,831 | | Banco Santander S.A., Series 6, 3 Mo. LIBOR + 0.52%, 4.00% Floor (a)
| | 4.00% | | (b) | | $2,856,053 |
| 315,190 | | Bank of America Corp., Series CC
| | 6.20% | | (b) | | 8,226,459 |
| 204,579 | | Bank of America Corp., Series GG
| | 6.00% | | (b) | | 5,548,182 |
| 495,108 | | Bank of America Corp., Series HH
| | 5.88% | | (b) | | 13,169,873 |
| 961,704 | | Citigroup Capital XIII, 3 Mo. LIBOR + 6.37% (a)
| | 7.13% | | 10/30/40 | | 25,744,816 |
| 432,995 | | Citigroup, Inc., Series K (c)
| | 6.88% | | (b) | | 11,846,743 |
| 101,910 | | Citizens Financial Group, Inc., Series E
| | 5.00% | | (b) | | 2,473,356 |
| 740,430 | | Fifth Third Bancorp, Series A
| | 6.00% | | (b) | | 20,206,335 |
| 103,097 | | Fifth Third Bancorp, Series I (c)
| | 6.63% | | (b) | | 2,752,690 |
| 415,231 | | First Citizens BancShares, Inc., Series A
| | 5.38% | | (b) | | 10,459,669 |
| 42,422 | | First Republic Bank, Series I
| | 5.50% | | (b) | | 1,122,910 |
| 3,060,368 | | GMAC Capital Trust I, Series 2, 3 Mo. LIBOR + 5.79% (a)
| | 7.48% | | 02/15/40 | | 69,011,298 |
| 1,078,586 | | Huntington Bancshares, Inc., Series D
| | 6.25% | | (b) | | 27,708,874 |
| 152,117 | | JPMorgan Chase & Co., Series AA
| | 6.10% | | (b) | | 3,926,140 |
| 528,837 | | JPMorgan Chase & Co., Series DD
| | 5.75% | | (b) | | 14,093,506 |
| 2 | | JPMorgan Chase & Co., Series EE (d)
| | 6.00% | | (b) | | 55 |
| 30,260 | | KeyCorp, Series E (c)
| | 6.13% | | (b) | | 859,989 |
| 8,434 | | KeyCorp, Series F
| | 5.65% | | (b) | | 216,079 |
| 287,901 | | KeyCorp, Series G
| | 5.63% | | (b) | | 7,416,330 |
| 1,032,590 | | People’s United Financial, Inc., Series A (c)
| | 5.63% | | (b) | | 26,331,045 |
| 572,287 | | Regions Financial Corp., Series A
| | 6.38% | | (b) | | 14,461,692 |
| 103,779 | | Regions Financial Corp., Series B (c)
| | 6.38% | | (b) | | 2,810,335 |
| 58,162 | | Synovus Financial Corp., Series D (c)
| | 6.30% | | (b) | | 1,323,186 |
| 503,786 | | Synovus Financial Corp., Series E (c)
| | 5.88% | | (b) | | 10,846,513 |
| 73,563 | | US Bancorp, Series K
| | 5.50% | | (b) | | 1,949,420 |
| 66,546 | | Valley National Bancorp, Series A (c)
| | 6.25% | | (b) | | 1,651,006 |
| 127,343 | | Valley National Bancorp, Series B (c)
| | 5.50% | | (b) | | 2,751,882 |
| 48,566 | | Wells Fargo & Co., Series O
| | 5.13% | | (b) | | 1,201,523 |
| 3,761 | | Wells Fargo & Co., Series P
| | 5.25% | | (b) | | 94,213 |
| 219,143 | | Wells Fargo & Co., Series V
| | 6.00% | | (b) | | 5,684,569 |
| 43,023 | | Wells Fargo & Co., Series W
| | 5.70% | | (b) | | 1,104,400 |
| 596,618 | | Wells Fargo & Co., Series X
| | 5.50% | | (b) | | 15,303,252 |
| 294,203 | | Wells Fargo & Co., Series Y
| | 5.63% | | (b) | | 7,699,293 |
| 69,536 | | Western Alliance Bancorp
| | 6.25% | | 07/01/56 | | 1,786,380 |
| 181,196 | | Wintrust Financial Corp., Series D (c) (d)
| | 6.50% | | (b) | | 4,571,575 |
| | | | | 327,209,641 |
| | | Capital Markets – 3.2% | | | | | | |
| 548,858 | | Affiliated Managers Group, Inc.
| | 5.88% | | 03/30/59 | | 13,847,687 |
| 35,606 | | Apollo Global Management, Inc., Series A
| | 6.38% | | (b) | | 930,385 |
| 598,780 | | Apollo Global Management, Inc., Series B
| | 6.38% | | (b) | | 15,358,707 |
| 157,887 | | Goldman Sachs Group (The), Inc., Series J (c)
| | 5.50% | | (b) | | 3,986,647 |
| 733,652 | | Goldman Sachs Group (The), Inc., Series K (c)
| | 6.38% | | (b) | | 18,935,558 |
| 396,528 | | Morgan Stanley, Series E (c)
| | 7.13% | | (b) | | 10,785,561 |
| 1,864,662 | | Morgan Stanley, Series F (c)
| | 6.88% | | (b) | | 50,364,521 |
| 115,057 | | Morgan Stanley, Series K (c)
| | 5.85% | | (b) | | 3,035,204 |
| 335,286 | | Oaktree Capital Group LLC, Series A
| | 6.63% | | (b) | | 8,707,377 |
| 546,503 | | Oaktree Capital Group LLC, Series B
| | 6.55% | | (b) | | 14,001,407 |
| 481,472 | | State Street Corp., Series G (c)
| | 5.35% | | (b) | | 13,038,262 |
| 115,611 | | Stifel Financial Corp., Series A
| | 6.25% | | (b) | | 2,891,431 |
| | | | | 155,882,747 |
| | | Consumer Finance – 0.7% | | | | | | |
| 68,056 | | Capital One Financial Corp., Series F
| | 6.20% | | (b) | | 1,745,636 |
See Notes to Financial Statements
Page 7
First Trust Preferred Securities and Income ETF (FPE)
Portfolio of Investments (Continued)
April 30, 2020 (Unaudited)
| Shares | | Description | | Stated
Rate | | Stated
Maturity | | Value |
| $25 PAR PREFERRED SECURITIES (Continued) |
| | | Consumer Finance (Continued) | | | | | | |
| 46,913 | | Capital One Financial Corp., Series G
| | 5.20% | | (b) | | $1,166,726 |
| 36,231 | | Capital One Financial Corp., Series H
| | 6.00% | | (b) | | 948,165 |
| 852,107 | | Capital One Financial Corp., Series I
| | 5.00% | | (b) | | 19,768,883 |
| 520,208 | | Capital One Financial Corp., Series J
| | 4.80% | | (b) | | 11,501,799 |
| | | | | 35,131,209 |
| | | Diversified Financial Services – 0.8% | | | | | | |
| 473,775 | | Equitable Holdings, Inc., Series A
| | 5.25% | | (b) | | 11,427,453 |
| 872,954 | | National Rural Utilities Cooperative Finance Corp.
| | 5.50% | | 05/15/64 | | 23,945,128 |
| 30,941 | | Voya Financial, Inc., Series B (c)
| | 5.35% | | (b) | | 799,516 |
| | | | | 36,172,097 |
| | | Diversified Telecommunication Services – 1.7% | | | | | | |
| 155,862 | | AT&T, Inc.
| | 5.35% | | 11/01/66 | | 4,016,564 |
| 57,629 | | AT&T, Inc.
| | 5.63% | | 08/01/67 | | 1,521,982 |
| 939,896 | | AT&T, Inc., Series C
| | 4.75% | | (b) | | 21,627,007 |
| 1,043,884 | | Qwest Corp.
| | 6.88% | | 10/01/54 | | 24,698,295 |
| 66,840 | | Qwest Corp.
| | 6.63% | | 09/15/55 | | 1,560,714 |
| 366,653 | | Qwest Corp.
| | 6.50% | | 09/01/56 | | 8,506,350 |
| 858,355 | | Qwest Corp.
| | 6.75% | | 06/15/57 | | 20,488,934 |
| | | | | 82,419,846 |
| | | Electric Utilities – 0.4% | | | | | | |
| 221,057 | | NextEra Energy Capital Holdings, Inc., Series N
| | 5.65% | | 03/01/79 | | 5,880,116 |
| 251,209 | | PPL Capital Funding, Inc., Series B
| | 5.90% | | 04/30/73 | | 6,312,882 |
| 300,720 | | SCE Trust V, Series K (c)
| | 5.45% | | (b) | | 7,109,021 |
| 74,994 | | Southern (The) Co.
| | 5.25% | | 12/01/77 | | 1,958,094 |
| | | | | 21,260,113 |
| | | Equity Real Estate Investment Trusts – 1.7% | | | | | | |
| 480,809 | | American Homes 4 Rent, Series D
| | 6.50% | | (b) | | 12,092,346 |
| 1,090,867 | | American Homes 4 Rent, Series E
| | 6.35% | | (b) | | 27,893,469 |
| 409,441 | | Digital Realty Trust, Inc., Series K
| | 5.85% | | (b) | | 10,801,054 |
| 474,860 | | Digital Realty Trust, Inc., Series L
| | 5.20% | | (b) | | 12,199,154 |
| 213,606 | | Farmland Partners, Inc., Series B, steps up 10/01/24 to 10.00% (e)
| | 6.00% | | (b) | | 4,744,189 |
| 331,880 | | Global Net Lease, Inc., Series A
| | 7.25% | | (b) | | 7,381,011 |
| 30,772 | | National Storage Affiliates Trust, Series A
| | 6.00% | | (b) | | 784,686 |
| 122,539 | | Public Storage, Series F
| | 5.15% | | (b) | | 3,227,677 |
| 26,415 | | Urstadt Biddle Properties, Inc., Series H
| | 6.25% | | (b) | | 541,508 |
| | | | | 79,665,094 |
| | | Food Products – 1.2% | | | | | | |
| 198,395 | | CHS, Inc., Series 1
| | 7.88% | | (b) | | 5,342,777 |
| 795,045 | | CHS, Inc., Series 2 (c)
| | 7.10% | | (b) | | 20,909,684 |
| 862,979 | | CHS, Inc., Series 3 (c)
| | 6.75% | | (b) | | 21,850,628 |
| 374,452 | | CHS, Inc., Series 4
| | 7.50% | | (b) | | 9,851,832 |
| | | | | 57,954,921 |
| | | Gas Utilities – 0.3% | | | | | | |
| 431,487 | | South Jersey Industries, Inc.
| | 5.63% | | 09/16/79 | | 10,985,659 |
| 104,106 | | Spire, Inc., Series A
| | 5.90% | | (b) | | 2,782,753 |
| | | | | 13,768,412 |
| | | Independent Power & Renewable Electricity Producers – 0.2% | | | | | | |
| 415,594 | | Brookfield Renewable Partners L.P., Series 17
| | 5.25% | | (b) | | 10,784,664 |
Page 8
See Notes to Financial Statements
First Trust Preferred Securities and Income ETF (FPE)
Portfolio of Investments (Continued)
April 30, 2020 (Unaudited)
| Shares | | Description | | Stated
Rate | | Stated
Maturity | | Value |
| $25 PAR PREFERRED SECURITIES (Continued) |
| | | Insurance – 7.2% | | | | | | |
| 1,411,387 | | Aegon Funding Co., LLC
| | 5.10% | | 12/15/49 | | $33,887,402 |
| 524,545 | | Allstate (The) Corp., Series H
| | 5.10% | | (b) | | 13,428,352 |
| 1,984,811 | | American Equity Investment Life Holding Co., Series A (c)
| | 5.95% | | (b) | | 46,107,160 |
| 211,856 | | AmTrust Financial Services, Inc.
| | 7.25% | | 06/15/55 | | 3,512,572 |
| 250,540 | | AmTrust Financial Services, Inc.
| | 7.50% | | 09/15/55 | | 4,264,191 |
| 42,065 | | Arch Capital Group Ltd., Series E
| | 5.25% | | (b) | | 1,014,187 |
| 19,942 | | Arch Capital Group Ltd., Series F
| | 5.45% | | (b) | | 496,955 |
| 148,626 | | Aspen Insurance Holdings Ltd.
| | 5.63% | | (b) | | 3,549,189 |
| 742,649 | | Aspen Insurance Holdings Ltd.
| | 5.63% | | (b) | | 17,660,193 |
| 1,223,325 | | Aspen Insurance Holdings Ltd. (c)
| | 5.95% | | (b) | | 29,604,465 |
| 108,385 | | Assured Guaranty Municipal Holdings, Inc.
| | 6.25% | | 11/01/02 | | 2,689,032 |
| 1,450,507 | | Athene Holding Ltd., Series A (c)
| | 6.35% | | (b) | | 35,203,805 |
| 19,131 | | Athene Holding Ltd., Series B
| | 5.63% | | (b) | | 444,030 |
| 192,270 | | Axis Capital Holdings Ltd., Series E
| | 5.50% | | (b) | | 4,733,687 |
| 856,232 | | Delphi Financial Group, Inc., 3 Mo. LIBOR + 3.19% (a)
| | 4.88% | | 05/15/37 | | 19,265,220 |
| 993,365 | | Enstar Group Ltd., Series D (c)
| | 7.00% | | (b) | | 24,704,988 |
| 563,999 | | Global Indemnity Ltd.
| | 7.75% | | 08/15/45 | | 13,366,776 |
| 456,886 | | Global Indemnity Ltd.
| | 7.88% | | 04/15/47 | | 10,965,264 |
| 15,504 | | Hanover Insurance Group (The), Inc.
| | 6.35% | | 03/30/53 | | 397,367 |
| 49,771 | | Hartford Financial Services Group (The), Inc., Series G
| | 6.00% | | (b) | | 1,328,388 |
| 369,121 | | National General Holdings Corp.
| | 7.63% | | 09/15/55 | | 9,154,201 |
| 76,843 | | National General Holdings Corp., Series B
| | 7.50% | | (b) | | 1,736,652 |
| 206,076 | | National General Holdings Corp., Series C
| | 7.50% | | (b) | | 4,770,659 |
| 315,943 | | PartnerRe Ltd., Series H
| | 7.25% | | (b) | | 8,157,648 |
| 156,940 | | Phoenix Cos. (The), Inc.
| | 7.45% | | 01/15/32 | | 2,198,729 |
| 306,795 | | Prudential Financial, Inc.
| | 5.75% | | 12/15/52 | | 7,755,778 |
| 203,336 | | Prudential Financial, Inc.
| | 5.70% | | 03/15/53 | | 5,138,301 |
| 6,663 | | Reinsurance Group of America, Inc. (c)
| | 6.20% | | 09/15/42 | | 168,774 |
| 952,056 | | Reinsurance Group of America, Inc. (c)
| | 5.75% | | 06/15/56 | | 24,296,469 |
| 588,299 | | W.R. Berkley Corp.
| | 5.63% | | 04/30/53 | | 14,813,369 |
| 76,162 | | W.R. Berkley Corp.
| | 5.75% | | 06/01/56 | | 1,940,608 |
| | | | | 346,754,411 |
| | | Mortgage Real Estate Investment Trusts – 1.1% | | | | | | |
| 528,799 | | AGNC Investment Corp., Series C (c)
| | 7.00% | | (b) | | 12,162,377 |
| 290,783 | | AGNC Investment Corp., Series D (c)
| | 6.88% | | (b) | | 6,458,290 |
| 49,435 | | AGNC Investment Corp., Series E (c)
| | 6.50% | | (b) | | 1,109,816 |
| 570,981 | | AGNC Investment Corp., Series F (c)
| | 6.13% | | (b) | | 12,424,547 |
| 678,680 | | Annaly Capital Management, Inc., Series F (c)
| | 6.95% | | (b) | | 15,283,874 |
| 238,005 | | Annaly Capital Management, Inc., Series I (c)
| | 6.75% | | (b) | | 5,345,592 |
| | | | | 52,784,496 |
| | | Multi-Utilities – 1.7% | | | | | | |
| 559,070 | | Algonquin Power & Utilities Corp. (c)
| | 6.88% | | 10/17/78 | | 15,430,332 |
| 1,027,410 | | Algonquin Power & Utilities Corp., Series 19-A (c)
| | 6.20% | | 07/01/79 | | 28,079,115 |
| 39,800 | | CMS Energy Corp.
| | 5.88% | | 10/15/78 | | 1,065,048 |
| 246,396 | | CMS Energy Corp.
| | 5.88% | | 03/01/79 | | 6,770,962 |
| 72,696 | | Dominion Energy, Inc., Series A
| | 5.25% | | 07/30/76 | | 1,861,745 |
| 764,853 | | Integrys Holding, Inc. (c)
| | 6.00% | | 08/01/73 | | 19,312,538 |
| 427,313 | | Just Energy Group, Inc., Series A (c)
| | 8.50% | | (b) | | 927,269 |
| 336,000 | | NiSource, Inc., Series B (c)
| | 6.50% | | (b) | | 9,263,520 |
| | | | | 82,710,529 |
| | | Oil, Gas & Consumable Fuels – 1.5% | | | | | | |
| 852,668 | | Enbridge, Inc., Series B (c)
| | 6.38% | | 04/15/78 | | 20,046,225 |
| 13,860 | | Energy Transfer Operating L.P., Series C (c)
| | 7.38% | | (b) | | 290,506 |
See Notes to Financial Statements
Page 9
First Trust Preferred Securities and Income ETF (FPE)
Portfolio of Investments (Continued)
April 30, 2020 (Unaudited)
| Shares | | Description | | Stated
Rate | | Stated
Maturity | | Value |
| $25 PAR PREFERRED SECURITIES (Continued) |
| | | Oil, Gas & Consumable Fuels (Continued) | | | | | | |
| 58,118 | | Energy Transfer Operating L.P., Series D (c)
| | 7.63% | | (b) | | $1,217,572 |
| 1,755,459 | | Energy Transfer Operating L.P., Series E (c)
| | 7.60% | | (b) | | 37,127,958 |
| 137,951 | | NuStar Energy L.P., Series A (c)
| | 8.50% | | (b) | | 2,386,552 |
| 695,381 | | NuStar Logistics, L.P., 3 Mo. LIBOR + 6.73% (a)
| | 7.95% | | 01/15/43 | | 13,267,869 |
| | | | | 74,336,682 |
| | | Real Estate Management & Development – 0.7% | | | | | | |
| 777,105 | | Brookfield Property Partners L.P., Series A
| | 5.75% | | (b) | | 15,542,100 |
| 139,177 | | Brookfield Property Partners L.P., Series A-1
| | 6.50% | | (b) | | 2,985,347 |
| 813,233 | | Brookfield Property Partners L.P., Series A2
| | 6.38% | | (b) | | 17,460,112 |
| | | | | 35,987,559 |
| | | Thrifts & Mortgage Finance – 0.5% | | | | | | |
| 962,879 | | New York Community Bancorp, Inc., Series A (c)
| | 6.38% | | (b) | | 24,023,831 |
| | | Trading Companies & Distributors – 0.3% | | | | | | |
| 913,210 | | Air Lease Corp., Series A (c)
| | 6.15% | | (b) | | 16,456,044 |
| | | Wireless Telecommunication Services – 0.7% | | | | | | |
| 272,937 | | United States Cellular Corp.
| | 7.25% | | 12/01/63 | | 6,777,026 |
| 1,071,197 | | United States Cellular Corp.
| | 7.25% | | 12/01/64 | | 27,508,339 |
| | | | | 34,285,365 |
| | | Total $25 Par Preferred Securities
| | 1,487,587,661 |
| | | (Cost $1,545,743,746) | | | | | | |
| $100 PAR PREFERRED SECURITIES – 1.2% |
| | | Banks – 0.9% | | | | | | |
| 86,909 | | AgriBank FCB (c)
| | 6.88% | | (b) | | 8,777,809 |
| 62,100 | | CoBank ACB, Series F (c)
| | 6.25% | | (b) | | 6,334,200 |
| 118,353 | | CoBank ACB, Series G
| | 6.13% | | (b) | | 12,042,418 |
| 49,375 | | CoBank ACB, Series H (c)
| | 6.20% | | (b) | | 5,122,656 |
| 103,015 | | Farm Credit Bank of Texas (c) (f)
| | 6.75% | | (b) | | 10,404,515 |
| | | | | 42,681,598 |
| | | Consumer Finance – 0.3% | | | | | | |
| 339,797 | | SLM Corp., Series B, 3 Mo. LIBOR + 1.70% (a)
| | 2.44% | | (b) | | 13,924,881 |
| | | Total $100 Par Preferred Securities
| | 56,606,479 |
| | | (Cost $63,253,452) | | | | | | |
| $1,000 PAR PREFERRED SECURITIES – 0.7% |
| | | Banks – 0.3% | | | | | | |
| 8,767 | | Wells Fargo & Co., Series L
| | 7.50% | | (b) | | 12,263,630 |
| | | Diversified Financial Services – 0.1% | | | | | | |
| 5,500 | | Compeer Financial ACA (c) (f)
| | 6.75% | | (b) | | 5,555,000 |
| | | Real Estate Investment Trusts (REITs) – 0.3% | | | | | | |
| 15,300 | | Sovereign Real Estate Investment Trust (g)
| | 12.00% | | (b) | | 15,348,861 |
| | | Total $1,000 Par Preferred Securities
| | 33,167,491 |
| | | (Cost $33,646,527) | | | | | | |
Par
Amount | | Description | | Stated
Rate | | Stated
Maturity | | Value |
| CAPITAL PREFERRED SECURITIES – 64.3% |
| | | Banks – 29.9% | | | | | | |
| $38,949,000 | | Australia & New Zealand Banking Group Ltd. (c) (f) (h)
| | 6.75% | | (b) | | 41,805,325 |
Page 10
See Notes to Financial Statements
First Trust Preferred Securities and Income ETF (FPE)
Portfolio of Investments (Continued)
April 30, 2020 (Unaudited)
Par
Amount | | Description | | Stated
Rate | | Stated
Maturity | | Value |
| CAPITAL PREFERRED SECURITIES (Continued) |
| | | Banks (Continued) | | | | | | |
| $33,100,000 | | Banco Bilbao Vizcaya Argentaria S.A., Series 9 (c) (h)
| | 6.50% | | (b) | | $30,102,630 |
| 2,700,000 | | Banco Mercantil del Norte S.A. (c) (f) (h)
| | 6.75% | | (b) | | 2,153,385 |
| 9,000,000 | | Banco Mercantil del Norte S.A. (c) (f) (h)
| | 7.50% | | (b) | | 7,410,150 |
| 8,500,000 | | Banco Mercantil del Norte S.A. (c) (f) (h)
| | 7.63% | | (b) | | 6,880,325 |
| 10,600,000 | | Banco Mercantil del Norte S.A. (c) (f) (h)
| | 5.75% | | 10/04/31 | | 9,827,260 |
| 35,400,000 | | Banco Santander S.A. (c) (h) (i)
| | 7.50% | | (b) | | 34,676,459 |
| 18,750,000 | | Bank of America Corp., Series JJ (c)
| | 5.13% | | (b) | | 18,434,906 |
| 9,528,000 | | Bank of America Corp., Series X (c)
| | 6.25% | | (b) | | 9,936,704 |
| 84,190,000 | | Barclays PLC (c) (h) (i)
| | 7.88% | | (b) | | 83,695,384 |
| 92,350,000 | | Barclays PLC (c) (h)
| | 8.00% | | (b) | | 92,183,308 |
| 19,000,000 | | BBVA Bancomer S.A. (c) (f) (h)
| | 5.88% | | 09/13/34 | | 16,726,650 |
| 12,540,000 | | BNP Paribas S.A. (c) (f) (h)
| | 6.63% | | (b) | | 12,508,650 |
| 42,500,000 | | BNP Paribas S.A. (c) (f) (h)
| | 7.38% | | (b) | | 44,176,413 |
| 30,600,000 | | BNP Paribas S.A. (c) (f) (h)
| | 7.63% | | (b) | | 31,154,625 |
| 12,000,000 | | Citigroup, Inc. (c)
| | 5.90% | | (b) | | 12,135,000 |
| 4,750,000 | | Citigroup, Inc. (c)
| | 5.95% | | (b) | | 4,727,818 |
| 15,000,000 | | Citigroup, Inc., Series P (c)
| | 5.95% | | (b) | | 15,124,575 |
| 4,000,000 | | Citigroup, Inc., Series Q (c)
| | 5.95% | | (b) | | 3,686,460 |
| 17,323,000 | | Citigroup, Inc., Series R (c)
| | 6.13% | | (b) | | 16,816,302 |
| 34,250,000 | | Citigroup, Inc., Series T (c)
| | 6.25% | | (b) | | 36,676,099 |
| 37,600,000 | | Citigroup, Inc., Series U (c)
| | 5.00% | | (b) | | 34,216,000 |
| 10,116,000 | | Citizens Financial Group, Inc., Series A, 3 Mo. LIBOR + 3.96% (a)
| | 5.33% | | (b) | | 8,550,094 |
| 11,600,000 | | Citizens Financial Group, Inc., Series B (c)
| | 6.00% | | (b) | | 9,926,062 |
| 20,474,000 | | CoBank ACB, Series I (c)
| | 6.25% | | (b) | | 20,781,110 |
| 38,310,000 | | Credit Agricole S.A. (c) (f) (h)
| | 6.88% | | (b) | | 38,240,850 |
| 47,100,000 | | Credit Agricole S.A. (c) (f) (h)
| | 7.88% | | (b) | | 50,275,011 |
| 3,000,000 | | Credit Agricole S.A. (c) (h) (i)
| | 7.88% | | (b) | | 3,202,230 |
| 47,100,000 | | Credit Agricole S.A. (c) (f) (h)
| | 8.13% | | (b) | | 52,545,937 |
| 21,313,000 | | Danske Bank A.S. (c) (h) (i)
| | 6.13% | | (b) | | 20,278,254 |
| 11,400,000 | | Danske Bank A.S. (c) (h) (i)
| | 7.00% | | (b) | | 11,200,500 |
| 7,650,000 | | Farm Credit Bank of Texas, Series 3 (c) (f)
| | 6.20% | | (b) | | 6,939,047 |
| 2,000,000 | | HBOS Capital Funding L.P. (i)
| | 6.85% | | (b) | | 2,002,756 |
| 44,119,000 | | HSBC Holdings PLC (c) (h)
| | 6.38% | | (b) | | 43,846,124 |
| 18,780,000 | | ING Groep N.V. (c) (h)
| | 5.75% | | (b) | | 18,091,431 |
| 25,179,000 | | ING Groep N.V. (c) (h)
| | 6.50% | | (b) | | 25,059,400 |
| 47,583,000 | | ING Groep N.V. (c) (h) (i)
| | 6.88% | | (b) | | 47,762,816 |
| 34,125,000 | | Intesa Sanpaolo S.p.A. (c) (f) (h)
| | 7.70% | | (b) | | 31,759,967 |
| 16,700,000 | | JPMorgan Chase & Co., Series FF (c)
| | 5.00% | | (b) | | 15,542,607 |
| 1,713,000 | | JPMorgan Chase & Co., Series I, 3 Mo. LIBOR + 3.47% (a)
| | 4.23% | | (b) | | 1,570,384 |
| 54,828,000 | | JPMorgan Chase & Co., Series V, 3 Mo. LIBOR + 3.32% (a)
| | 4.75% | | (b) | | 47,933,105 |
| 18,651,000 | | JPMorgan Chase & Co., Series Z, 3 Mo. LIBOR + 3.80% (a)
| | 5.30% | | (b) | | 17,647,856 |
| 7,438,000 | | Lloyds Bank PLC (c) (i)
| | 12.00% | | (b) | | 8,401,533 |
| 20,000,000 | | Lloyds Banking Group PLC (c) (h)
| | 6.75% | | (b) | | 19,316,700 |
| 62,814,000 | | Lloyds Banking Group PLC (c) (h)
| | 7.50% | | (b) | | 61,837,242 |
| 21,800,000 | | Lloyds Banking Group PLC (c) (h)
| | 7.50% | | (b) | | 21,597,151 |
| 13,000,000 | | M&T Bank Corp., Series G (c)
| | 5.00% | | (b) | | 12,707,500 |
| 27,000,000 | | Nordea Bank Abp (c) (f) (h)
| | 6.63% | | (b) | | 27,191,295 |
| 11,821,000 | | Royal Bank of Scotland Group PLC (c) (h)
| | 7.50% | | (b) | | 11,334,329 |
| 33,325,000 | | Royal Bank of Scotland Group PLC (c) (h)
| | 8.00% | | (b) | | 34,814,628 |
| 47,400,000 | | Royal Bank of Scotland Group PLC (c) (h)
| | 8.63% | | (b) | | 48,558,930 |
| 2,400,000 | | Skandinaviska Enskilda Banken AB (c) (h) (i)
| | 5.63% | | (b) | | 2,390,700 |
| 35,700,000 | | Societe Generale S.A. (c) (f) (h)
| | 7.38% | | (b) | | 35,030,625 |
| 27,079,000 | | Societe Generale S.A. (c) (f) (h)
| | 7.88% | | (b) | | 26,573,029 |
| 20,000,000 | | Societe Generale S.A. (c) (h) (i)
| | 7.88% | | (b) | | 19,626,300 |
See Notes to Financial Statements
Page 11
First Trust Preferred Securities and Income ETF (FPE)
Portfolio of Investments (Continued)
April 30, 2020 (Unaudited)
Par
Amount | | Description | | Stated
Rate | | Stated
Maturity | | Value |
| CAPITAL PREFERRED SECURITIES (Continued) |
| | | Banks (Continued) | | | | | | |
| $12,310,000 | | Standard Chartered PLC (c) (f) (h)
| | 7.75% | | (b) | | $12,469,907 |
| 13,600,000 | | Swedbank AB (c) (h) (i)
| | 6.00% | | (b) | | 13,370,350 |
| 56,950,000 | | UniCredit S.p.A. (c) (h) (i)
| | 8.00% | | (b) | | 51,955,998 |
| | | | | 1,445,386,186 |
| | | Capital Markets – 8.8% | | | | | | |
| 29,226,000 | | Apollo Management Holdings L.P. (c) (f)
| | 4.95% | | 01/14/50 | | 26,296,341 |
| 55,000,000 | | Charles Schwab (The) Corp., Series G (c)
| | 5.38% | | (b) | | 56,443,750 |
| 48,900,000 | | Credit Suisse Group AG (c) (f) (h)
| | 6.38% | | (b) | | 48,207,332 |
| 5,175,000 | | Credit Suisse Group AG (c) (h) (i)
| | 7.13% | | (b) | | 5,208,689 |
| 9,000,000 | | Credit Suisse Group AG (c) (f) (h)
| | 7.25% | | (b) | | 8,983,755 |
| 36,281,000 | | Credit Suisse Group AG (c) (f) (h)
| | 7.50% | | (b) | | 38,503,211 |
| 47,450,000 | | Credit Suisse Group AG (c) (f) (h)
| | 7.50% | | (b) | | 47,891,522 |
| 29,453,000 | | E*TRADE Financial Corp., Series A (c)
| | 5.88% | | (b) | | 30,295,356 |
| 20,158,000 | | Goldman Sachs Group (The), Inc., Series M (c)
| | 5.38% | | (b) | | 18,772,843 |
| 54,467,000 | | Goldman Sachs Group (The), Inc., Series Q (c)
| | 5.50% | | (b) | | 55,389,943 |
| 9,600,000 | | Goldman Sachs Group (The), Inc., Series R (c)
| | 4.95% | | (b) | | 8,886,672 |
| 5,300,000 | | Morgan Stanley, Series J (c)
| | 5.55% | | (b) | | 4,877,219 |
| 21,000,000 | | UBS Group AG (c) (h) (i)
| | 6.88% | | (b) | | 21,156,975 |
| 26,389,000 | | UBS Group AG (c) (h) (i)
| | 6.88% | | (b) | | 27,423,423 |
| 28,500,000 | | UBS Group AG (c) (f) (h)
| | 7.00% | | (b) | | 29,161,058 |
| | | | | 427,498,089 |
| | | Diversified Financial Services – 0.7% | | | | | | |
| 32,571,000 | | Voya Financial, Inc. (c)
| | 5.65% | | 05/15/53 | | 31,976,416 |
| | | Diversified Telecommunication Services – 1.0% | | | | | | |
| 15,382,000 | | Koninklijke KPN N.V. (c) (f)
| | 7.00% | | 03/28/73 | | 15,947,212 |
| 32,910,000 | | Koninklijke KPN N.V. (c) (i)
| | 7.00% | | 03/28/73 | | 34,119,278 |
| | | | | 50,066,490 |
| | | Electric Utilities – 5.7% | | | | | | |
| 21,410,000 | | Duke Energy Corp. (c)
| | 4.88% | | (b) | | 21,210,780 |
| 141,743,000 | | Emera, Inc., Series 16-A (c)
| | 6.75% | | 06/15/76 | | 150,070,401 |
| 85,130,000 | | Enel S.p.A. (c) (f)
| | 8.75% | | 09/24/73 | | 96,525,502 |
| 9,683,000 | | PPL Capital Funding, Inc., Series A, 3 Mo. LIBOR + 2.67% (a)
| | 4.04% | | 03/30/67 | | 7,389,942 |
| | | | | 275,196,625 |
| | | Energy Equipment & Services – 1.3% | | | | | | |
| 6,600,000 | | Transcanada Trust (c)
| | 5.63% | | 05/20/75 | | 6,017,517 |
| 38,000,000 | | Transcanada Trust (c)
| | 5.50% | | 09/15/79 | | 35,786,310 |
| 22,604,000 | | Transcanada Trust, Series 16-A (c)
| | 5.88% | | 08/15/76 | | 21,436,277 |
| | | | | 63,240,104 |
| | | Food Products – 2.2% | | | | | | |
| 6,700,000 | | Dairy Farmers of America, Inc. (g)
| | 7.13% | | (b) | | 5,533,094 |
| 23,748,000 | | Land O’Lakes Capital Trust I (g)
| | 7.45% | | 03/15/28 | | 24,579,180 |
| 37,821,000 | | Land O’Lakes, Inc. (f)
| | 7.00% | | (b) | | 34,027,554 |
| 12,720,000 | | Land O’Lakes, Inc. (f)
| | 7.25% | | (b) | | 12,097,992 |
| 31,000,000 | | Land O’Lakes, Inc. (f)
| | 8.00% | | (b) | | 29,140,000 |
| | | | | 105,377,820 |
| | | Independent Power & Renewable Electricity Producers – 0.4% | | | | | | |
| 17,986,000 | | AES Gener S.A. (c) (f)
| | 6.35% | | 10/07/79 | | 16,839,572 |
| | | Insurance – 6.3% | | | | | | |
| 25,677,000 | | Asahi Mutual Life Insurance Co. (c) (i)
| | 6.50% | | (b) | | 26,409,389 |
Page 12
See Notes to Financial Statements
First Trust Preferred Securities and Income ETF (FPE)
Portfolio of Investments (Continued)
April 30, 2020 (Unaudited)
Par
Amount | | Description | | Stated
Rate | | Stated
Maturity | | Value |
| CAPITAL PREFERRED SECURITIES (Continued) |
| | | Insurance (Continued) | | | | | | |
| $28,100,000 | | Asahi Mutual Life Insurance Co. (c) (i)
| | 7.25% | | (b) | | $28,682,300 |
| 31,900,000 | | Assurant, Inc. (c)
| | 7.00% | | 03/27/48 | | 31,374,072 |
| 654,000 | | Assured Guaranty Municipal Holdings, Inc. (c) (f)
| | 6.40% | | 12/15/66 | | 575,520 |
| 36,220,000 | | AXIS Specialty Finance LLC (c)
| | 4.90% | | 01/15/40 | | 31,806,659 |
| 1,000,000 | | Everest Reinsurance Holdings, Inc., 3 Mo. LIBOR + 2.39% (a)
| | 4.08% | | 05/15/37 | | 767,563 |
| 13,700,000 | | Fortegra Financial Corp. (c) (g)
| | 8.50% | | 10/15/57 | | 15,199,463 |
| 4,020,000 | | Fukoku Mutual Life Insurance Co. (c) (i)
| | 6.50% | | (b) | | 4,329,821 |
| 15,106,000 | | Hartford Financial Services Group (The), Inc., 3 Mo. LIBOR + 2.13% (a) (f)
| | 3.82% | | 02/12/47 | | 11,809,040 |
| 9,310,000 | | La Mondiale SAM (c) (i)
| | 5.88% | | 01/26/47 | | 9,737,571 |
| 13,825,000 | | Lincoln National Corp., 3 Mo. LIBOR + 2.36% (a)
| | 4.05% | | 05/17/66 | | 9,425,125 |
| 3,397,000 | | MetLife, Inc.
| | 6.40% | | 12/15/36 | | 3,801,397 |
| 27,018,000 | | MetLife, Inc., Series C (c)
| | 5.25% | | (b) | | 24,637,039 |
| 8,040,000 | | Mitsui Sumitomo Insurance Co., Ltd. (c) (f)
| | 7.00% | | 03/15/72 | | 8,636,930 |
| 3,502,000 | | Principal Financial Group, Inc., 3 Mo. LIBOR + 3.04% (a)
| | 4.70% | | 05/15/55 | | 3,171,043 |
| 6,935,000 | | Prudential Financial, Inc. (c)
| | 5.63% | | 06/15/43 | | 7,168,710 |
| 9,000,000 | | QBE Capital Funding III Ltd. (c) (f)
| | 7.25% | | 05/24/41 | | 9,402,345 |
| 24,900,000 | | QBE Insurance Group Ltd. (c) (f)
| | 7.50% | | 11/24/43 | | 26,872,080 |
| 605,000 | | QBE Insurance Group Ltd. (c) (i)
| | 7.50% | | 11/24/43 | | 652,916 |
| 30,649,000 | | QBE Insurance Group Ltd. (c) (i)
| | 6.75% | | 12/02/44 | | 33,345,959 |
| 16,200,000 | | Reinsurance Group of America, Inc., 3 Mo. LIBOR + 2.67% (a)
| | 3.41% | | 12/15/65 | | 11,137,500 |
| 6,000,000 | | VIVAT N.V. (c) (i)
| | 6.25% | | (b) | | 5,966,244 |
| | | | | 304,908,686 |
| | | Metals & Mining – 1.8% | | | | | | |
| 30,410,000 | | BHP Billiton Finance USA Ltd. (c) (f)
| | 6.25% | | 10/19/75 | | 30,613,595 |
| 50,221,000 | | BHP Billiton Finance USA Ltd. (c) (f)
| | 6.75% | | 10/19/75 | | 55,581,841 |
| | | | | 86,195,436 |
| | | Multi-Utilities – 1.9% | | | | | | |
| 49,823,000 | | CenterPoint Energy, Inc., Series A (c)
| | 6.13% | | (b) | | 45,498,114 |
| 50,720,000 | | NiSource, Inc. (c)
| | 5.65% | | (b) | | 46,687,253 |
| | | | | 92,185,367 |
| | | Oil, Gas & Consumable Fuels – 3.2% | | | | | | |
| 26,675,000 | | DCP Midstream Operating L.P. (c) (f)
| | 5.85% | | 05/21/43 | | 12,499,905 |
| 10,567,000 | | Enbridge, Inc. (c)
| | 5.50% | | 07/15/77 | | 9,280,521 |
| 41,800,000 | | Enbridge, Inc. (c)
| | 6.25% | | 03/01/78 | | 38,340,841 |
| 49,888,000 | | Enbridge, Inc., Series 16-A (c)
| | 6.00% | | 01/15/77 | | 44,736,814 |
| 32,460,000 | | Energy Transfer Operating L.P., 3 Mo. LIBOR + 3.02% (a)
| | 4.78% | | 11/01/66 | | 18,469,740 |
| 9,500,000 | | Energy Transfer Operating L.P., Series G (c)
| | 7.13% | | (b) | | 7,439,925 |
| 24,400,000 | | Enterprise Products Operating LLC, 3 Mo. LIBOR + 2.78% (a)
| | 4.36% | | 06/01/67 | | 19,074,578 |
| 6,859,000 | | Enterprise Products Operating LLC, Series D (c)
| | 4.88% | | 08/16/77 | | 5,979,299 |
| | | | | 155,821,623 |
| | | Trading Companies & Distributors – 0.6% | | | | | | |
| 46,415,000 | | AerCap Holdings N.V. (c)
| | 5.88% | | 10/10/79 | | 31,188,559 |
| | | Transportation Infrastructure – 0.5% | | | | | | |
| 33,100,000 | | AerCap Global Aviation Trust (c) (f)
| | 6.50% | | 06/15/45 | | 24,378,150 |
| | | Total Capital Preferred Securities
| | 3,110,259,123 |
| | | (Cost $3,323,149,283) | | | | | | |
See Notes to Financial Statements
Page 13
First Trust Preferred Securities and Income ETF (FPE)
Portfolio of Investments (Continued)
April 30, 2020 (Unaudited)
Principal
Value | | Description | | Stated
Coupon | | Stated
Maturity | | Value |
| CORPORATE BONDS AND NOTES – 0.3% |
| | | Aerospace & Defense – 0.1% | | | | | | |
| $6,800,000 | | Boeing (The) Co.
| | 5.81% | | 05/01/50 | | $6,800,000 |
| | | Insurance – 0.2% | | | | | | |
| 10,200,000 | | AmTrust Financial Services, Inc.
| | 6.13% | | 08/15/23 | | 9,325,241 |
| | | Total Corporate Bonds and Notes
| | 16,125,241 |
| | | (Cost $16,970,545) | | | | | | |
| Shares | | Description | | Value |
| EXCHANGE-TRADED FUNDS – 0.1% |
| | | Capital Markets – 0.1% | | |
| 87,347 | | iShares Short Maturity Bond ETF
| | 4,301,840 |
| | | (Cost $4,291,611) | | |
| | | Total Investments – 97.3%
| | 4,708,047,835 |
| | | (Cost $4,987,055,164) (j) | | |
| | | Net Other Assets and Liabilities – 2.7%
| | 130,849,805 |
| | | Net Assets – 100.0%
| | $4,838,897,640 |
|
| (a) | Floating or variable rate security. |
| (b) | Perpetual maturity. |
| (c) | Fixed-to-floating or fixed-to-variable rate security. The interest rate shown reflects the fixed rate in effect at April 30, 2020. At a predetermined date, the fixed rate will change to a floating rate or a variable rate. |
| (d) | Pursuant to procedures adopted by the Trust’s Board of Trustees, this security has been determined to be illiquid by First Trust Advisors L.P., the Fund’s advisor (the “Advisor”). |
| (e) | Step-up security. A security where the coupon increases or steps up at a predetermined date. |
| (f) | This security, sold within the terms of a private placement memorandum, is exempt from registration upon resale under Rule 144A under the Securities Act of 1933, as amended (the “1933 Act”), and may be resold in transactions exempt from registration, normally to qualified institutional buyers. Pursuant to procedures adopted by the Trust’s Board of Trustees, this security has been determined to be liquid by the Advisor. Although market instability can result in periods of increased overall market illiquidity, liquidity for each security is determined based on security specific factors and assumptions, which require subjective judgment. At April 30, 2020, securities noted as such amounted to $1,053,618,423 or 21.8% of net assets. |
| (g) | This security, sold within the terms of a private placement memorandum, is exempt from registration upon resale under Rule 144A under the 1933 Act, and may be resold in transactions exempt from registration, normally to qualified institutional buyers (see Note 2C - Restricted Securities in the Notes to Financial Statements). |
| (h) | This security is a contingent convertible capital security which may be subject to conversion into common stock of the issuer under certain circumstances. At April 30, 2020, securities noted as such amounted to $1,368,166,233 or 28.3% of net assets. Of these securities, 3.1% originated in emerging markets, and 96.9% originated in foreign markets. |
| (i) | This security may be resold to qualified foreign investors and foreign institutional buyers under Regulation S of the 1933 Act. |
| (j) | Aggregate cost for financial reporting purposes approximates the aggregate cost for federal income tax purposes. As of April 30, 2020, the aggregate gross unrealized appreciation for all investments in which there was an excess of value over tax cost was $28,578,227 and the aggregate gross unrealized depreciation for all investments in which there was an excess of tax cost over value was $307,585,556. The net unrealized depreciation was $279,007,329. |
| LIBOR | London Interbank Offered Rate |
Page 14
See Notes to Financial Statements
First Trust Preferred Securities and Income ETF (FPE)
Portfolio of Investments (Continued)
April 30, 2020 (Unaudited)
Valuation Inputs
A summary of the inputs used to value the Fund’s investments as of April 30, 2020 is as follows (see Note 2A - Portfolio Valuation in the Notes to Financial Statements):
| | Total
Value at
4/30/2020 | Level 1
Quoted
Prices | Level 2
Significant
Observable
Inputs | Level 3
Significant
Unobservable
Inputs |
| $25 Par Preferred Securities: | | | | |
Insurance
| $ 346,754,411 | $ 317,513,699 | $ 29,240,712 | $ — |
Multi-Utilities
| 82,710,529 | 63,397,991 | 19,312,538 | — |
Other industry categories*
| 1,058,122,721 | 1,058,122,721 | — | — |
| $100 Par Preferred Securities: | | | | |
Banks
| 42,681,598 | — | 42,681,598 | — |
Consumer Finance
| 13,924,881 | 13,924,881 | — | — |
| $1,000 Par Preferred Securities: | | | | |
Banks
| 12,263,630 | 12,263,630 | — | — |
Other industry categories*
| 20,903,861 | — | 20,903,861 | — |
Capital Preferred Securities*
| 3,110,259,123 | — | 3,110,259,123 | — |
Corporate Bonds and Notes*
| 16,125,241 | — | 16,125,241 | — |
Exchange-Traded Funds*
| 4,301,840 | 4,301,840 | — | — |
Total Investments
| $ 4,708,047,835 | $ 1,469,524,762 | $ 3,238,523,073 | $— |
| * | See Portfolio of Investments for industry breakout. |
See Notes to Financial Statements
Page 15
First Trust Preferred Securities and Income ETF (FPE)
Statement of Assets and Liabilities
April 30, 2020 (Unaudited)
| ASSETS: | |
Investments, at value
(Cost $4,987,055,164)
| $ 4,708,047,835 |
Cash
| 113,021,148 |
| Receivables: | |
Interest
| 41,912,433 |
Investment securities sold
| 4,793,470 |
Dividends
| 2,402,878 |
Fund shares sold
| 1,798,648 |
Interest reclaims
| 1,278,206 |
Dividend reclaims
| 198,027 |
Total Assets
| 4,873,452,645 |
| LIABILITIES: | |
| Payables: | |
Investment securities purchased
| 29,542,947 |
Investment advisory fees
| 3,207,924 |
Capital shares redeemed
| 1,804,134 |
Total Liabilities
| 34,555,005 |
NET ASSETS
| $4,838,897,640 |
| NET ASSETS consist of: | |
Paid-in capital
| $ 5,290,651,440 |
Par value
| 2,682,050 |
Accumulated distributable earnings (loss)
| (454,435,850) |
NET ASSETS
| $4,838,897,640 |
NET ASSET VALUE, per share
| $18.04 |
Number of shares outstanding (unlimited number of shares authorized, par value $0.01 per share)
| 268,205,000 |
Page 16
See Notes to Financial Statements
First Trust Preferred Securities and Income ETF (FPE)
Statement of Operations
For the Six Months Ended April 30, 2020 (Unaudited)
| INVESTMENT INCOME: | |
Interest
| $ 106,857,731 |
Dividends
| 46,509,784 |
Foreign withholding tax
| (19,407) |
Total investment income
| 153,348,108 |
| EXPENSES: | |
Investment advisory fees
| 20,909,401 |
Total expenses
| 20,909,401 |
NET INVESTMENT INCOME (LOSS)
| 132,438,707 |
| NET REALIZED AND UNREALIZED GAIN (LOSS): | |
| Net realized gain (loss) on: | |
Investments
| (126,606,832) |
In-kind redemptions
| (3,060,553) |
Net realized gain (loss)
| (129,667,385) |
Net change in unrealized appreciation (depreciation) on investments
| (389,925,323) |
NET REALIZED AND UNREALIZED GAIN (LOSS)
| (519,592,708) |
NET INCREASE (DECREASE) IN NET ASSETS RESULTING FROM OPERATIONS
| $(387,154,001) |
See Notes to Financial Statements
Page 17
First Trust Preferred Securities and Income ETF (FPE)
Statements of Changes in Net Assets
| | Six Months
Ended
4/30/2020
(Unaudited) | | Year
Ended
10/31/2019 |
| OPERATIONS: | | | |
Net investment income (loss)
| $ 132,438,707 | | $ 206,863,149 |
Net realized gain (loss)
| (129,667,385) | | (15,996,305) |
Net change in unrealized appreciation (depreciation)
| (389,925,323) | | 228,190,107 |
Net increase (decrease) in net assets resulting from operations
| (387,154,001) | | 419,056,951 |
| DISTRIBUTIONS TO SHAREHOLDERS FROM: | | | |
Investment operations
| (136,347,442) | | (203,753,030) |
Return of capital
| — | | (3,977,192) |
Total distributions to shareholders
| (136,347,442) | | (207,730,222) |
| SHAREHOLDER TRANSACTIONS: | | | |
Proceeds from shares sold
| 1,008,939,078 | | 1,376,507,572 |
Cost of shares redeemed
| (325,059,073) | | (283,687,184) |
Net increase (decrease) in net assets resulting from shareholder transactions
| 683,880,005 | | 1,092,820,388 |
Total increase (decrease) in net assets
| 160,378,562 | | 1,304,147,117 |
| NET ASSETS: | | | |
Beginning of period
| 4,678,519,078 | | 3,374,371,961 |
End of period
| $4,838,897,640 | | $4,678,519,078 |
| CHANGES IN SHARES OUTSTANDING: | | | |
Shares outstanding, beginning of period
| 235,205,000 | | 179,855,000 |
Shares sold
| 51,900,000 | | 70,900,000 |
Shares redeemed
| (18,900,000) | | (15,550,000) |
Shares outstanding, end of period
| 268,205,000 | | 235,205,000 |
Page 18
See Notes to Financial Statements
First Trust Preferred Securities and Income ETF (FPE)
Financial Highlights
For a share outstanding throughout each period
| | Six Months
Ended
4/30/2020
(Unaudited) | | Year Ended October 31, |
| 2019 | | 2018 | | 2017 | | 2016 | | 2015 |
Net asset value, beginning of period
| $ 19.89 | | $ 18.76 | | $ 20.13 | | $ 19.47 | | $ 18.97 | | $ 19.04 |
| Income from investment operations: | | | | | | | | | | | |
Net investment income (loss)
| 0.51 | | 1.08 | | 1.08 | | 1.08 | | 1.12 | | 1.16 (a) |
Net realized and unrealized gain (loss)
| (1.83) | | 1.14 | | (1.37) | | 0.66 | | 0.52 | | (0.10) |
Total from investment operations
| (1.32) | | 2.22 | | (0.29) | | 1.74 | | 1.64 | | 1.06 |
| Distributions paid to shareholders from: | | | | | | | | | | | |
Net investment income
| (0.53) | | (1.07) | | (1.08) | | (1.08) | | (1.13) | | (1.13) |
Return of capital
| — | | (0.02) | | (0.00) (b) | | (0.00) (b) | | (0.01) | | — |
Total distributions
| (0.53) | | (1.09) | | (1.08) | | (1.08) | | (1.14) | | (1.13) |
Net asset value, end of period
| $18.04 | | $19.89 | | $18.76 | | $20.13 | | $19.47 | | $18.97 |
Total return (c)
| (6.74)% | | 12.25% | | (1.47)% | | 9.24% | | 8.97% | | 5.75% |
| Ratios to average net assets/supplemental data: | | | | | | | | | | | |
Net assets, end of period (in 000’s)
| $ 4,838,898 | | $ 4,678,519 | | $ 3,374,372 | | $ 3,026,083 | | $ 1,375,398 | | $ 413,705 |
Ratio of total expenses to average net assets
| 0.85% (d) | | 0.85% | | 0.85% | | 0.85% | | 0.85% | | 0.85% |
Ratio of net investment income (loss) to average net assets
| 5.38% (d) | | 5.69% | | 5.56% | | 5.54% | | 5.97% | | 6.15% |
Portfolio turnover rate (e)
| 19% | | 28% | | 24% | | 13% | | 32% | | 50% |
| (a) | Based on average shares outstanding. |
| (b) | Amount is less than $0.01. |
| (c) | Total return is calculated assuming an initial investment made at the net asset value at the beginning of the period, reinvestment of all distributions at net asset value during the period, and redemption at net asset value on the last day of the period. The returns presented do not reflect the deduction of taxes that a shareholder would pay on Fund distributions or the redemption or sale of Fund shares. Total return is calculated for the time period presented and is not annualized for periods of less than a year. |
| (d) | Annualized. |
| (e) | Portfolio turnover is calculated for the time period presented and is not annualized for periods of less than a year and does not include securities received or delivered from processing creations or redemptions and in-kind transactions. |
See Notes to Financial Statements
Page 19
Notes to Financial Statements
First Trust Preferred Securities and Income ETF (FPE)
April 30, 2020 (Unaudited)
1. Organization
First Trust Exchange-Traded Fund III (the “Trust”) is a diversified open-end management investment company organized as a Massachusetts business trust on January 9, 2008, and is registered with the Securities and Exchange Commission (“SEC”) under the Investment Company Act of 1940, as amended (the “1940 Act”).
The Trust currently consists of seventeen funds that are offering shares. This report covers the First Trust Preferred Securities and Income ETF (the “Fund”), which trades under the ticker FPE on the NYSE Arca, Inc. Unlike conventional mutual funds, the Fund issues and redeems shares on a continuous basis, at net asset value (“NAV”), only in large specified blocks consisting of 50,000 shares called a “Creation Unit.” Creation Units are issued and redeemed for securities in which the Fund invests or for cash or, in certain circumstances, a combination of both. Except when aggregated in Creation Units, the shares are not redeemable securities of the Fund.
The Fund is an actively managed exchange-traded fund. The investment objective of the Fund is to seek total return and to provide current income. Under normal market conditions, the Fund invests at least 80% of its net assets (including investment borrowings) in preferred securities and income-producing debt securities, including corporate bonds, high-yield securities (commonly referred to as “junk” bonds) and convertible securities. There can be no assurance that the Fund will achieve its investment objective. The Fund may not be appropriate for all investors.
2. Significant Accounting Policies
The Fund is considered an investment company and follows accounting and reporting guidance under Financial Accounting Standards Board (“FASB”) Accounting Standards Codification Topic 946, “Financial Services-Investment Companies.” The following is a summary of significant accounting policies consistently followed by the Fund in the preparation of the financial statements. The preparation of the financial statements in accordance with accounting principles generally accepted in the United States of America (“U.S. GAAP”) requires management to make estimates and assumptions that affect the reported amounts and disclosures in the financial statements. Actual results could differ from those estimates.
A. Portfolio Valuation
The Fund’s NAV is determined daily as of the close of regular trading on the New York Stock Exchange (“NYSE”), normally 4:00 p.m. Eastern time, on each day the NYSE is open for trading. If the NYSE closes early on a valuation day, the NAV is determined as of that time. Domestic debt securities and foreign securities are priced using data reflecting the earlier closing of the principal markets for those securities. The Fund’s NAV is calculated by dividing the value of all assets of the Fund (including accrued interest and dividends), less all liabilities (including accrued expenses and dividends declared but unpaid), by the total number of shares outstanding.
The Fund’s investments are valued daily at market value or, in the absence of market value with respect to any portfolio securities, at fair value. Market value prices represent last sale or official closing prices from a national or foreign exchange (i.e., a regulated market) and are primarily obtained from third-party pricing services. Fair value prices represent any prices not considered market value prices and are either obtained from a third-party pricing service or are determined by the Pricing Committee of the Fund’s investment advisor, First Trust Advisors L.P. (“First Trust” or the “Advisor”), in accordance with valuation procedures adopted by the Trust’s Board of Trustees, and in accordance with provisions of the 1940 Act. Investments valued by the Advisor’s Pricing Committee, if any, are footnoted as such in the footnotes to the Portfolio of Investments. The Fund’s investments are valued as follows:
Preferred stocks, real estate investment trusts (“REITs”) and other equity securities listed on any national or foreign exchange (excluding The Nasdaq Stock Market LLC (“Nasdaq”) and the London Stock Exchange Alternative Investment Market (“AIM”)) are valued at the last sale price on the exchange on which they are principally traded or, for Nasdaq and AIM securities, the official closing price. Securities traded on more than one securities exchange are valued at the last sale price or official closing price, as applicable, at the close of the securities exchange representing the principal market for such securities.
Bonds, notes, capital preferred securities, and other debt securities are fair valued on the basis of valuations provided by dealers who make markets in such securities or by a third-party pricing service approved by the Trust’s Board of Trustees, which may use the following valuation inputs when available:
| 1) | benchmark yields; |
| 2) | reported trades; |
| 3) | broker/dealer quotes; |
| 4) | issuer spreads; |
| 5) | benchmark securities; |
| 6) | bids and offers; and |
Notes to Financial Statements (Continued)
First Trust Preferred Securities and Income ETF (FPE)
April 30, 2020 (Unaudited)
| 7) | reference data including market research publications. |
Securities traded in an over-the-counter market are fair valued at the mean of their most recent bid and asked price, if available, and otherwise at their closing bid price.
Fixed income and other debt securities having a remaining maturity of sixty days or less when purchased are fair valued at cost adjusted for amortization of premiums and accretion of discounts (amortized cost), provided the Advisor’s Pricing Committee has determined that the use of amortized cost is an appropriate reflection of fair value given market and issuer-specific conditions existing at the time of the determination. Factors that may be considered in determining the appropriateness of the use of amortized cost include, but are not limited to, the following:
| 1) | the credit conditions in the relevant market and changes thereto; |
| 2) | the liquidity conditions in the relevant market and changes thereto; |
| 3) | the interest rate conditions in the relevant market and changes thereto (such as significant changes in interest rates); |
| 4) | issuer-specific conditions (such as significant credit deterioration); and |
| 5) | any other market-based data the Advisor’s Pricing Committee considers relevant. In this regard, the Advisor’s Pricing Committee may use last-obtained market-based data to assist it when valuing portfolio securities using amortized cost. |
Certain securities may not be able to be priced by pre-established pricing methods. Such securities may be valued by the Trust’s Board of Trustees or its delegate, the Advisor’s Pricing Committee, at fair value. These securities generally include, but are not limited to, restricted securities (securities which may not be publicly sold without registration under the Securities Act of 1933, as amended (the “1933 Act”)) for which a third-party pricing service is unable to provide a market price; securities whose trading has been formally suspended; a security whose market or fair value price is not available from a pre-established pricing source; a security with respect to which an event has occurred that is likely to materially affect the value of the security after the market has closed but before the calculation of the Fund’s NAV or make it difficult or impossible to obtain a reliable market quotation; and a security whose price, as provided by the third-party pricing service, does not reflect the security’s fair value. As a general principle, the current fair value of a security would appear to be the amount which the owner might reasonably expect to receive for the security upon its current sale. When fair value prices are used, generally they will differ from market quotations or official closing prices on the applicable exchanges. A variety of factors may be considered in determining the fair value of such securities, including, but not limited to, the following:
| 1) | the type of security; |
| 2) | the size of the holding; |
| 3) | the initial cost of the security; |
| 4) | transactions in comparable securities; |
| 5) | price quotes from dealers and/or third-party pricing services; |
| 6) | relationships among various securities; |
| 7) | information obtained by contacting the issuer, analysts, or the appropriate stock exchange; |
| 8) | an analysis of the issuer’s financial statements; and |
| 9) | the existence of merger proposals or tender offers that might affect the value of the security. |
If the securities in question are foreign securities, the following additional information may be considered:
| 1) | the value of similar foreign securities traded on other foreign markets; |
| 2) | ADR trading of similar securities; |
| 3) | closed-end fund or exchange-traded fund trading of similar securities; |
| 4) | foreign currency exchange activity; |
| 5) | the trading prices of financial products that are tied to baskets of foreign securities; |
| 6) | factors relating to the event that precipitated the pricing problem; |
| 7) | whether the event is likely to recur; and |
| 8) | whether the effects of the event are isolated or whether they affect entire markets, countries or regions. |
Notes to Financial Statements (Continued)
First Trust Preferred Securities and Income ETF (FPE)
April 30, 2020 (Unaudited)
The Fund is subject to fair value accounting standards that define fair value, establish the framework for measuring fair value and provide a three-level hierarchy for fair valuation based upon the inputs to the valuation as of the measurement date. The three levels of the fair value hierarchy are as follows:
| • | Level 1 – Level 1 inputs are quoted prices in active markets for identical investments. An active market is a market in which transactions for the investment occur with sufficient frequency and volume to provide pricing information on an ongoing basis. |
| • | Level 2 – Level 2 inputs are observable inputs, either directly or indirectly, and include the following: |
| o | Quoted prices for similar investments in active markets. |
| o | Quoted prices for identical or similar investments in markets that are non-active. A non-active market is a market where there are few transactions for the investment, the prices are not current, or price quotations vary substantially either over time or among market makers, or in which little information is released publicly. |
| o | Inputs other than quoted prices that are observable for the investment (for example, interest rates and yield curves observable at commonly quoted intervals, volatilities, prepayment speeds, loss severities, credit risks, and default rates). |
| o | Inputs that are derived principally from or corroborated by observable market data by correlation or other means. |
| • | Level 3 – Level 3 inputs are unobservable inputs. Unobservable inputs may reflect the reporting entity’s own assumptions about the assumptions that market participants would use in pricing the investment. |
The inputs or methodologies used for valuing investments are not necessarily an indication of the risk associated with investing in those investments. A summary of the inputs used to value the Fund’s investments as of April 30, 2020, is included with the Fund’s Portfolio of Investments.
B. Securities Transactions and Investment Income
Securities transactions are recorded as of the trade date. Realized gains and losses from securities transactions are recorded on the identified cost basis. Dividend income is recorded on the ex-dividend date. Interest income is recorded daily on the accrual basis. Amortization of premiums and accretion of discounts are recorded using the effective interest method.
Distributions received from the Fund’s investments in REITs may be comprised of return of capital, capital gains, and income. The actual character of the amounts received during the year are not known until after the REITs’ fiscal year end. The Fund records the character of distributions received from the REITs during the year based on estimates available. The characterization of distributions received by the Fund may be subsequently revised based on information received from the REITs after their tax reporting periods conclude.
In July 2017, the Financial Conduct Authority (“FCA”) announced that it will no longer persuade or compel banks to submit rates for the calculations of the London Interbank Offered Rates (“LIBOR”) after 2021. Further, the FCA has subsequently stated, as recently as March 2020, that the central assumption continues to be that firms should not rely on LIBOR being published after the end of 2021.
In the United States, the Alternative Reference Rates Committee (the “ARRC”), a group of market participants convened by the Board of Governors of the Federal Reserve System and the Federal Reserve Bank of New York in cooperation with other federal and state government agencies, has since 2014 undertaken efforts to identify U.S. dollar reference interest rates as alternatives to LIBOR and to facilitate the mitigation of LIBOR-related risks. In June 2017, the ARRC identified the Secured Overnight Financing Rate (“SOFR”), a broad measure of the cost of cash overnight borrowing collateralized by U.S. Treasury securities, as the preferred alternative for U.S. dollar LIBOR. The Federal Reserve Bank of New York began daily publishing of SOFR in April 2018.
At this time, it is not possible to predict the full impact of the elimination of LIBOR and the establishment of an alternative reference rate on the Fund or its investments.
C. Restricted Securities
The Fund invests in restricted securities, which are securities that may not be offered for public sale without first being registered under the 1933 Act. Prior to registration, restricted securities may only be resold in transactions exempt from registration under Rule 144A under the 1933 Act, normally to qualified institutional buyers. As of April 30, 2020, the Fund held restricted securities as shown in the following table that the Advisor has deemed illiquid pursuant to procedures adopted by the Trust’s Board of Trustees. Although market instability can result in periods of increased overall market illiquidity, liquidity for each security is determined based on security-specific factors and assumptions, which require subjective judgment. The Fund does not have the right to demand that such securities be registered. These securities are valued according to the valuation procedures as stated in the Portfolio Valuation note
Notes to Financial Statements (Continued)
First Trust Preferred Securities and Income ETF (FPE)
April 30, 2020 (Unaudited)
(Note 2A) and are not expressed as a discount to the carrying value of a comparable unrestricted security. There are no unrestricted securities with the same maturity dates and yields for these issuers.
| Security | Acquisition
Date | Principal
Value/Shares | Current Price | Carrying
Cost | | Value | | % of
Net
Assets |
| Dairy Farmers of America, Inc., 7.13% | 09/15/16-08/10/17 | $6,700,000 | $82.58 | $6,788,500 | | $5,533,094 | | 0.11% |
| Fortegra Financial Corp., 8.50%, 10/15/57 | 10/12/17-03/12/18 | $13,700,000 | 110.94 | 13,718,977 | | 15,199,463 | | 0.32 |
| Land O’Lakes Capital Trust I, 7.45%, 03/15/28 | 03/20/15-05/09/18 | $23,748,000 | 103.50 | 26,089,906 | | 24,579,180 | | 0.51 |
| Sovereign Real Estate Investment Trust, 12.00% | 05/12/14-02/12/20 | 15,300 | 1,003.19 | 16,186,750 | | 15,348,861 | | 0.32 |
| | | | | $62,784,133 | | $60,660,598 | | 1.26% |
D. Dividends and Distributions to Shareholders
Dividends from net investment income, if any, are declared and paid monthly by the Fund, or as the Board of Trustees may determine from time to time. Distributions of net realized capital gains earned by the Fund, if any, are distributed at least annually.
Distributions from net investment income and realized capital gains are determined in accordance with federal income tax regulations, which may differ from U.S. GAAP. Certain capital accounts in the financial statements are periodically adjusted for permanent differences in order to reflect their tax character. These permanent differences are primarily due to the varying treatment of income and gain/loss on portfolio securities held by the Fund and have no impact on net assets or NAV per share. Temporary differences, which arise from recognizing certain items of income, expense and gain/loss in different periods for financial statement and tax purposes, will reverse at some time in the future.
The tax character of distributions paid by the Fund during the fiscal year ended October 31, 2019, was as follows:
| Distributions paid from: | |
Ordinary income
| $203,753,030 |
Capital gains
| — |
Return of capital
| 3,977,192 |
As of October 31, 2019, the components of distributable earnings on a tax basis were as follows:
Undistributed ordinary income
| $— |
Accumulated capital and other gain (loss)
| (42,380,616) |
Net unrealized appreciation (depreciation)
| 111,446,209 |
E. Income Taxes
The Fund intends to continue to qualify as a regulated investment company by complying with the requirements under Subchapter M of the Internal Revenue Code of 1986, as amended, which includes distributing substantially all of its net investment income and net realized gains to shareholders. Accordingly, no provision has been made for federal and state income taxes. However, due to the timing and amount of distributions, the Fund may be subject to an excise tax of 4% of the amount by which approximately 98% of the Fund’s taxable income exceeds the distributions from such taxable income for the calendar year.
The Fund is subject to accounting standards that establish a minimum threshold for recognizing, and a system for measuring, the benefits of a tax position taken or expected to be taken in a tax return. Taxable years ended 2016, 2017, 2018, and 2019 remain open to federal and state audit. As of April 30, 2020, management has evaluated the application of these standards to the Fund and has determined that no provision for income tax is required in the Fund’s financial statements for uncertain tax positions.
The Fund intends to utilize provisions of the federal income tax laws, which allow it to carry a realized capital loss forward indefinitely following the year of the loss and offset such loss against any future realized capital gains. The Fund is subject to certain limitations under U.S. tax rules on the use of capital loss carryforwards and net unrealized built-in losses. These limitations apply when there has been a 50% change in ownership. At October 31, 2019, the Fund had $42,380,616 of non-expiring capital loss carryforwards for federal income tax purposes.
Notes to Financial Statements (Continued)
First Trust Preferred Securities and Income ETF (FPE)
April 30, 2020 (Unaudited)
F. Expenses
Expenses, other than the investment advisory fee and other excluded expenses, are paid by the Advisor (See Note 3).
G. New Accounting Pronouncement
On March 30, 2017, the FASB issued Accounting Standards Update (“ASU”) 2017-08 “Premium Amortization on Purchased Callable Debt Securities,” which amends the amortization period for certain purchased callable debt securities held at a premium by shortening such period to the earliest call date. The new guidance requires an entity to amortize the premium on a callable debt security within its scope to the earliest call date, unless the guidance for considering estimated prepayments is applied. If the call option is not exercised at the earliest call date, the yield is reset to the effective yield using the payment terms of the security. If the security has more than one call date and the premium was amortized to a call price greater than the next call price, any excess of the amortized cost basis over the amount repayable at the next call date will be amortized to that date. If there are no other call dates, any excess of the amortized cost basis over the par amount will be amortized to maturity. Discounts on purchased callable debt securities will continue to be amortized to the security’s maturity date. ASU 2017-08 is effective for public business entities for fiscal years, and interim periods within those fiscal years, beginning after December 15, 2018. ASU 2017-08 was adopted for these financial statements and did not have a material impact.
3. Investment Advisory Fee, Affiliated Transactions and Other Fee Arrangements
First Trust, the investment advisor to the Fund, is a limited partnership with one limited partner, Grace Partners of DuPage L.P., and one general partner, The Charger Corporation. The Charger Corporation is an Illinois corporation controlled by James A. Bowen, Chief Executive Officer of First Trust. First Trust is responsible for the ongoing monitoring of the securities in the Fund’s portfolio, managing the Fund’s business affairs and providing certain administrative services necessary for the management of the Fund.
Stonebridge Advisors LLC (“Stonebridge” or the “Sub-Advisor”), a majority-owned affiliate of First Trust, serves as the Fund’s sub-advisor and manages the Fund’s portfolio subject to First Trust’s supervision. Pursuant to the Investment Management Agreement between the Trust and the Advisor, First Trust will supervise Stonebridge and its management of the investment of the Fund’s assets and will pay Stonebridge for its services as the Fund’s sub-advisor. First Trust is responsible for the Fund’s expenses, including the cost of transfer agency, sub-advisory, custody, fund administration, legal, audit and other services, but excluding fee payments under the Investment Management Agreement, interest, taxes, acquired fund fees and expenses, brokerage commissions and other expenses connected with the execution of portfolio transactions, distribution and service fees pursuant to a 12b-1 plan, if any, and extraordinary expenses. The Fund has agreed to pay First Trust an annual unitary management fee equal to 0.85% of its average daily net assets. Stonebridge receives a sub-advisory fee equal to 0.425% of the average daily net assets of the Fund less Stonebridge’s share of the Fund’s expenses. The Sub-Advisor’s fee is paid by the Advisor out of the Advisor’s management fee. First Trust also provides fund reporting services to the Fund for a flat annual fee in the amount of $9,250, which is covered under the annual unitary management fee.
First Trust Capital Partners, LLC (“FTCP”), an affiliate of First Trust, owns a 51% ownership interest in Stonebridge.
The Trust has multiple service agreements with Brown Brothers Harriman & Co. (“BBH”). Under the service agreements, BBH performs custodial, fund accounting, certain administrative services, and transfer agency services for the Fund. As custodian, BBH is responsible for custody of the Fund’s assets. As fund accountant and administrator, BBH is responsible for maintaining the books and records of the Fund’s securities and cash. As transfer agent, BBH is responsible for maintaining shareholder records for the Fund.
Each Trustee who is not an officer or employee of First Trust, any sub-advisor or any of their affiliates (“Independent Trustees”) is paid a fixed annual retainer that is allocated equally among each fund in the First Trust Fund Complex. Each Independent Trustee is also paid an annual per fund fee that varies based on whether the fund is a closed-end or other actively managed fund, a defined-outcome fund or an index fund.
Additionally, the Lead Independent Trustee and the Chairmen of the Audit Committee, Nominating and Governance Committee and Valuation Committee are paid annual fees to serve in such capacities, with such compensation allocated pro rata among each fund in the First Trust Fund Complex based on net assets. Independent Trustees are reimbursed for travel and out-of-pocket expenses in connection with all meetings. The Lead Independent Trustee and Committee Chairmen rotate every three years. The officers and “Interested” Trustee receive no compensation from the Trust for acting in such capacities.
4. Purchases and Sales of Securities
For the six months ended April 30, 2020, the cost of purchases and proceeds from sales of investments, excluding short term investments and in-kind transactions, were $1,541,684,600 and $912,643,559, respectively.
Notes to Financial Statements (Continued)
First Trust Preferred Securities and Income ETF (FPE)
April 30, 2020 (Unaudited)
For the six months ended April 30, 2020, the cost of in-kind purchases and proceeds from in-kind sales were $84,979,826 and $13,271,820, respectively.
5. Creations, Redemptions and Transaction Fees
Shares are created and redeemed by the Fund only in Creation Unit size aggregations of 50,000 shares in transactions with broker-dealers or large institutional investors that have entered into a participation agreement (an “Authorized Participant”). In order to purchase Creation Units of the Fund, an Authorized Participant must deposit (i) a designated portfolio of securities and other instruments determined by First Trust (the “Deposit Securities”) and generally make or receive a cash payment referred to as the “Cash Component,” which is an amount equal to the difference between the NAV of the Fund shares (per Creation Unit Aggregation) and the market value of the Deposit Securities, and/or (ii) cash in lieu of all or a portion of the Deposit Securities. If the Cash Component is a positive number (i.e., the NAV per Creation Unit Aggregation exceeds the Deposit Amount), the Authorized Participant will deliver the Cash Component. If the Cash Component is a negative number (i.e., the NAV per Creation Unit Aggregation is less than the Deposit Amount), the Authorized Participant will receive the Cash Component. Authorized Participants purchasing Creation Units must pay to BBH, as transfer agent, a creation transaction fee (the “Creation Transaction Fee”) regardless of the number of Creation Units purchased in the transaction. The Creation Transaction Fee may vary and is based on the composition of the securities included in the Fund’s portfolio and the countries in which the transactions are settled. The Creation Transaction Fee may increase or decrease with changes in the Fund’s portfolio. The price for each Creation Unit will equal the daily NAV per share times the number of shares in a Creation Unit plus the fees described above and, if applicable, any operational processing and brokerage costs, transfer fees or stamp taxes. When the Fund permits an Authorized Participant to substitute cash or a different security in lieu of depositing one or more of the requisite Deposit Securities, the Authorized Participant may also be assessed an amount to cover the cost of purchasing the Deposit Securities and/or disposing of the substituted securities, including operational processing and brokerage costs, transfer fees, stamp taxes, and part or all of the spread between the expected bid and offer side of the market related to such Deposit Securities and/or substitute securities.
Authorized Participants redeeming Creation Units must pay to BBH, as transfer agent, a redemption transaction fee (the “Redemption Transaction Fee”), regardless of the number of Creation Units redeemed in the transaction. The Redemption Transaction Fee may vary and is based on the composition of the securities included in the Fund’s portfolio and the countries in which the transactions are settled. The Redemption Transaction Fee may increase or decrease with changes in the Fund’s portfolio. The Fund reserves the right to effect redemptions in cash. An Authorized Participant may request cash redemption in lieu of securities; however, the Fund may, in its discretion, reject any such request.
6. Distribution Plan
The Board of Trustees adopted a Distribution and Service Plan pursuant to Rule 12b-1 under the 1940 Act. In accordance with the Rule 12b-1 plan, the Fund is authorized to pay an amount up to 0.25% of its average daily net assets each year to reimburse First Trust Portfolios L.P. (“FTP”), the distributor of the Fund, for amounts expended to finance activities primarily intended to result in the sale of Creation Units or to provide investor services. FTP may also use this amount to compensate securities dealers or other persons that are Authorized Participants for providing distribution assistance, including broker-dealer and shareholder support and educational and promotional services.
No 12b-1 fees are currently paid by the Fund, and pursuant to a contractual arrangement, no 12b-1 fees will be paid any time before February 28, 2021.
7. Line of Credit
First Trust Preferred Securities and Income ETF, along with First Trust Series Fund and First Trust Exchange-Traded Fund IV, has a $410 million Credit Agreement with The Bank of Nova Scotia (“Scotia”) as administrative agent for a group of lenders. Prior to November 25, 2019 the commitment amount was $385 million. Scotia charges a commitment fee of 0.25% of the daily amount of the excess of the commitment amount over the outstanding principal balance of the loans, and an agency fee. First Trust allocates the commitment fee and agency fee amongst the funds that have access to the credit line. To the extent that the Fund accesses the credit line, there would also be an interest fee charged. The Fund did not have any borrowings outstanding during the six months ended April 30, 2020.
8. Indemnification
The Trust, on behalf of the Fund, has a variety of indemnification obligations under contracts with its service providers. The Trust’s maximum exposure under these arrangements is unknown. However, the Trust has not had prior claims or losses pursuant to these contracts and expects the risk of loss to be remote.
Notes to Financial Statements (Continued)
First Trust Preferred Securities and Income ETF (FPE)
April 30, 2020 (Unaudited)
9. Subsequent Events
Management has evaluated the impact of all subsequent events to the Fund through the date the financial statements were issued, and has determined that there were no subsequent events requiring recognition or disclosure in the financial statements that have not already been disclosed.
Additional Information
First Trust Preferred Securities and Income ETF (FPE)
April 30, 2020 (Unaudited)
Proxy Voting Policies and Procedures
A description of the policies and procedures that the Trust uses to determine how to vote proxies and information on how the Fund voted proxies relating to portfolio securities during the most recent 12-month period ended June 30 is available (1) without charge, upon request, by calling (800) 988-5891; (2) on the Fund’s website at www.ftportfolios.com; and (3) on the Securities and Exchange Commission’s (“SEC”) website at www.sec.gov.
Portfolio Holdings
The Fund files portfolio holdings information for each month in a fiscal quarter within 60 days after the end of the relevant fiscal quarter on Form N-PORT. Portfolio holdings information for the third month of each fiscal quarter will be publicly available on the SEC’s website at www.sec.gov. The Fund’s complete schedule of portfolio holdings for the second and fourth quarters of each fiscal year is included in the semi-annual and annual reports to shareholders, respectively, and is filed with the SEC on Form N-CSR. The semi-annual and annual report for the Fund is available to investors within 60 days after the period to which it relates. The Fund’s Forms N-PORT and Forms N-CSR are available on the SEC’s website listed above.
Risk Considerations
Risks are inherent in all investing. Certain general risks that may be applicable to a Fund are identified below, but not all of the material risks relevant to each Fund are included in this report and not all of the risks below apply to each Fund. The material risks of investing in each Fund are spelled out in its prospectus, statement of additional information and other regulatory filings. Before investing, you should consider each Fund’s investment objective, risks, charges and expenses, and read each Fund’s prospectus and statement of additional information carefully. You can download each Fund’s prospectus at www.ftportfolios.com or contact First Trust Portfolios L.P. at (800) 621-1675 to request a prospectus, which contains this and other information about each Fund.
Concentration Risk. To the extent that a fund is able to invest a large percentage of its assets in a single asset class or the securities of issuers within the same country, state, region, industry or sector, an adverse economic, business or political development may affect the value of the fund’s investments more than if the fund were more broadly diversified. A fund that tracks an index will be concentrated to the extent the fund’s corresponding index is concentrated. A concentration makes a fund more susceptible to any single occurrence and may subject the fund to greater market risk than a fund that is not concentrated.
Credit Risk. Credit risk is the risk that an issuer of a security will be unable or unwilling to make dividend, interest and/or principal payments when due and the related risk that the value of a security may decline because of concerns about the issuer’s ability to make such payments.
Cyber Security Risk. The funds are susceptible to potential operational risks through breaches in cyber security. A breach in cyber security refers to both intentional and unintentional events that may cause a fund to lose proprietary information, suffer data corruption or lose operational capacity. Such events could cause a fund to incur regulatory penalties, reputational damage, additional compliance costs associated with corrective measures and/or financial loss. In addition, cyber security breaches of a fund’s third-party service providers, such as its administrator, transfer agent, custodian, or sub-advisor, as applicable, or issuers in which the fund invests, can also subject a fund to many of the same risks associated with direct cyber security breaches.
Derivatives Risk. To the extent a fund uses derivative instruments such as futures contracts, options contracts and swaps, the fund may experience losses because of adverse movements in the price or value of the underlying asset, index or rate, which may be magnified by certain features of the derivative. These risks are heightened when a fund’s portfolio managers use derivatives to enhance the fund’s return or as a substitute for a position or security, rather than solely to hedge (or offset) the risk of a position or security held by the fund.
Equity Securities Risk. To the extent a fund invests in equity securities, the value of the fund’s shares will fluctuate with changes in the value of the equity securities. Equity securities prices fluctuate for several reasons, including changes in investors’ perceptions of the financial condition of an issuer or the general condition of the relevant stock market, such as market volatility, or when political or economic events affecting the issuers occur. In addition, common stock prices may be particularly sensitive to rising interest rates, as the cost of capital rises and borrowing costs increase. Equity securities may decline significantly in price over short or extended periods of time, and such declines may occur in the equity market as a whole, or they may occur in only a particular country, company, industry or sector of the market.
ETF Risk. The shares of an ETF trade like common stock and represent an interest in a portfolio of securities. The risks of owning an ETF generally reflect the risks of owning the underlying securities, although lack of liquidity in an ETF could result in it being more volatile and ETFs have management fees that increase their costs. Shares of an ETF trade on an exchange at market prices rather than
Additional Information (Continued)
First Trust Preferred Securities and Income ETF (FPE)
April 30, 2020 (Unaudited)
net asset value, which may cause the shares to trade at a price greater than net asset value (premium) or less than net asset value (discount). In times of market stress, decisions by market makers to reduce or step away from their role of providing a market for an ETF’s shares, or decisions by an ETF’s authorized participants that they are unable or unwilling to proceed with creation and/or redemption orders of an ETF’s shares, could result in shares of the ETF trading at a discount to net asset value and in greater than normal intraday bid-ask spreads.
Fixed Income Securities Risk. To the extent a fund invests in fixed income securities, the fund will be subject to credit risk, income risk, interest rate risk, liquidity risk and prepayment risk. Income risk is the risk that income from a fund’s fixed income investments could decline during periods of falling interest rates. Interest rate risk is the risk that the value of a fund’s fixed income securities will decline because of rising interest rates. Liquidity risk is the risk that a security cannot be purchased or sold at the time desired, or cannot be purchased or sold without adversely affecting the price. Prepayment risk is the risk that the securities will be redeemed or prepaid by the issuer, resulting in lower interest payments received by the fund. In addition to these risks, high yield securities, or “junk” bonds, are subject to greater market fluctuations and risk of loss than securities with higher ratings, and the market for high yield securities is generally smaller and less liquid than that for investment grade securities.
Index Constituent Risk. Certain funds may be a constituent of one or more indices. As a result, such a fund may be included in one or more index-tracking exchange-traded funds or mutual funds. Being a component security of such a vehicle could greatly affect the trading activity involving a fund, the size of the fund and the market volatility of the fund. Inclusion in an index could significantly increase demand for the fund and removal from an index could result in outsized selling activity in a relatively short period of time. As a result, a fund’s net asset value could be negatively impacted and the fund’s market price may be significantly below its net asset value during certain periods.
Index Provider Risk. To the extent a fund seeks to track an index, it is subject to Index Provider Risk. There is no assurance that the Index Provider will compile the Index accurately, or that the Index will be determined, maintained, constructed, reconstituted, rebalanced, composed, calculated or disseminated accurately. To correct any such error, the Index Provider may carry out an unscheduled rebalance or other modification of the Index constituents or weightings, which may increase the fund’s costs. The Index Provider does not provide any representation or warranty in relation to the quality, accuracy or completeness of data in the Index, and it does not guarantee that the Index will be calculated in accordance with its stated methodology. Losses or costs associated with any Index Provider errors generally will be borne by the fund and its shareholders.
Investment Companies Risk. To the extent a fund invests in the securities of other investment vehicles, the fund will incur additional fees and expenses that would not be present in a direct investment in those investment vehicles. Furthermore, the fund’s investment performance and risks are directly related to the investment performance and risks of the investment vehicles in which the fund invests.
LIBOR Risk. To the extent a fund invests in floating or variable rate obligations that use the London Interbank Offered Rate (“LIBOR”) as a reference interest rate, it is subject to LIBOR Risk. In 2017, the United Kingdom’s Financial Conduct Authority announced that LIBOR will cease to be available for use after 2021. The unavailability or replacement of LIBOR may affect the value, liquidity or return on certain fund investments and may result in costs incurred in connection with closing out positions and entering into new trades. Any potential effects of the transition away from LIBOR on the fund or on certain instruments in which the fund invests can be difficult to ascertain, and they may vary depending on a variety of factors. Any such effects of the transition away from LIBOR, as well as other unforeseen effects, could result in losses to the fund.
Management Risk. To the extent that a fund is actively managed, it is subject to management risk. In managing an actively-managed fund’s investment portfolio, the fund’s portfolio managers will apply investment techniques and risk analyses that may not have the desired result. There can be no guarantee that a fund will meet its investment objective.
Market Risk. Securities held by a fund, as well as shares of a fund itself, are subject to market fluctuations caused by factors such as general economic conditions, political events, regulatory or market developments, changes in interest rates and perceived trends in securities prices. Shares of a fund could decline in value or underperform other investments as a result of the risk of loss associated with these market fluctuations. In addition, local, regional or global events such as war, acts of terrorism, spread of infectious diseases or other public health issues, recessions, or other events could have a significant negative impact on a fund and its investments. Such events may affect certain geographic regions, countries, sectors and industries more significantly than others. The outbreak of the respiratory disease designated as COVID-19 in December 2019 has caused significant volatility and declines in global financial markets, which have caused losses for investors. The COVID-19 pandemic may last for an extended period of time and will continue to impact the economy for the foreseeable future.
Non-U.S. Securities Risk. To the extent a fund invests in non-U.S. securities, it is subject to additional risks not associated with securities of domestic issuers. Non-U.S. securities are subject to higher volatility than securities of domestic issuers due to: possible adverse political, social or economic developments; restrictions on foreign investment or exchange of securities; lack of liquidity;
Additional Information (Continued)
First Trust Preferred Securities and Income ETF (FPE)
April 30, 2020 (Unaudited)
currency exchange rates; excessive taxation; government seizure of assets; different legal or accounting standards; and less government supervision and regulation of exchanges in foreign countries. Investments in non-U.S. securities may involve higher costs than investments in U.S. securities, including higher transaction and custody costs, as well as additional taxes imposed by non-U.S. governments. These risks may be heightened for securities of companies located, or with significant operations, in emerging market countries.
Passive Investment Risk. To the extent a fund seeks to track an index, the fund will invest in the securities included in, or representative of, the index regardless of their investment merit. A fund generally will not attempt to take defensive positions in declining markets.
| NOT FDIC INSURED | NOT BANK GUARANTEED | MAY LOSE VALUE |
This page intentionally left blank
This page intentionally left blank
This page intentionally left blank
First Trust Exchange-Traded Fund III
INVESTMENT ADVISOR
First Trust Advisors L.P.
120 East Liberty Drive, Suite 400
Wheaton, IL 60187
INVESTMENT SUB-ADVISOR
Stonebridge Advisors LLC
10 Westport Road, Suite C101
Wilton, CT 06897
ADMINISTRATOR, CUSTODIAN,
FUND ACCOUNTANT &
TRANSFER AGENT
Brown Brothers Harriman & Co.
50 Post Office Square
Boston, MA 02110
INDEPENDENT REGISTERED
PUBLIC ACCOUNTING FIRM
Deloitte & Touche LLP
111 S. Wacker Drive
Chicago, IL 60606
LEGAL COUNSEL
Chapman and Cutler LLP
111 W. Monroe Street
Chicago, IL 60603
First Trust Exchange-Traded Fund III
First Trust Managed Municipal ETF (FMB)
Semi-Annual Report
For the Six Months Ended
April 30, 2020
First Trust Managed Municipal ETF (FMB)
Semi-Annual Report
April 30, 2020
Caution Regarding Forward-Looking Statements
This report contains certain forward-looking statements within the meaning of the Securities Act of 1933, as amended, and the Securities Exchange Act of 1934, as amended. Forward-looking statements include statements regarding the goals, beliefs, plans or current expectations of First Trust Advisors L.P. (“First Trust” or the “Advisor”) and its representatives, taking into account the information currently available to them. Forward-looking statements include all statements that do not relate solely to current or historical fact. For example, forward-looking statements include the use of words such as “anticipate,” “estimate,” “intend,” “expect,” “believe,” “plan,” “may,” “should,” “would” or other words that convey uncertainty of future events or outcomes.
Forward-looking statements involve known and unknown risks, uncertainties and other factors that may cause the actual results, performance or achievements of the series of First Trust Exchange-Traded Fund III (the “Trust”) described in this report (First Trust Managed Municipal ETF; hereinafter referred to as the “Fund”) to be materially different from any future results, performance or achievements expressed or implied by the forward-looking statements. When evaluating the information included in this report, you are cautioned not to place undue reliance on these forward-looking statements, which reflect the judgment of the Advisor and its representatives only as of the date hereof. We undertake no obligation to publicly revise or update these forward-looking statements to reflect events and circumstances that arise after the date hereof.
Performance and Risk Disclosure
There is no assurance that the Fund will achieve its investment objectives. The Fund is subject to market risk, which is the possibility that the market values of securities owned by the Fund will decline and that the value of the Fund’s shares may therefore be less than what you paid for them. Accordingly, you can lose money by investing in the Fund. See “Risk Considerations” in the Additional Information section of this report for a discussion of certain other risks of investing in the Fund.
Performance data quoted represents past performance, which is no guarantee of future results, and current performance may be lower or higher than the figures shown. For the most recent month-end performance figures, please visit www.ftportfolios.com or speak with your financial advisor. Investment returns, net asset value and share price will fluctuate and Fund shares, when sold, may be worth more or less than their original cost.
The Advisor may also periodically provide additional information on Fund performance on the Fund’s web page at www.ftportfolios.com.
How to Read This Report
This report contains information that may help you evaluate your investment in the Fund. It includes details about the Fund and presents data and analysis that provide insight into the Fund’s performance and investment approach.
The statistical information that follows may help you understand the Fund’s performance compared to that of a relevant market benchmark.
It is important to keep in mind that the opinions expressed by personnel of the Advisor are just that: informed opinions. They should not be considered to be promises or advice. The opinions, like the statistics, cover the period through the date on the cover of this report. The material risks of investing in the Fund are spelled out in the prospectus, the statement of additional information, and other Fund regulatory filings.
First Trust Managed Municipal ETF (FMB)
Semi-Annual Letter from the Chairman and CEO
April 30, 2020
Dear Shareholders,
First Trust is pleased to provide you with the semi-annual report for the First Trust Managed Municipal ETF (the “Fund”), which contains detailed information about the Fund for the six months ended April 30, 2020.
Just one month ago, I noted in a letter to shareholders that a handful of states were set to open some “nonessential” businesses by early May. As of May 20, 2020, I am pleased to report that all 50 states and U.S. territories have eased some restrictions on businesses and social activity. Keep in mind, however, that the plan does entail governors phasing in the opening of businesses in the coming weeks or potentially months, so I see this news as essentially marking the beginning of the rebuilding process for the U.S. economy. We all need to be aware as well of the possibility of an uptick or even surge in the coronavirus (“COVID-19”) infections as more people venture out of their homes. Prior to the last couple of weeks or so, the stay-at-home mandate severely restricted the movements of close to 315 million Americans, according to The Washington Post. To put this further into perspective, because so many stores have been closed and so many people have been hunkering down at home, retail-store traffic in the U.S. plunged 91.2% year-over-year for the week ended May 16, 2020, according to Bloomberg. Truly amazing!
In this COVID-19 pandemic, there appears to be a notable disconnect between the state of the U.S. economy, which is expected to go from bad to downright terrible between the first quarter and second quarter of the year, and the performance of the stock market, which has been much better than expected. While the data and commentary in this report are technically supposed to run through April 30, 2020, I feel compelled to offer insight that is as up to date as possible. The 2020 peak in the stock market, as measured by the S&P 500® Index (the “Index”), occurred on February 19. That day also marked the all-time high for the Index. From February 19, 2020, through March 23, 2020, the Index declined by 33.92% on a price-only basis (no dividends included), according to Bloomberg. We should note that the Index slid into bear market territory on March 12, 2020. A bear market is defined by a 20% or greater decline in price from its most recent peak. That took just 16 trading days, the quickest plunge into a bear market ever. From March 23, 2020 through May 20, 2020, the Index staged an impressive rebound, posting a price-only gain of 32.82%, according to Bloomberg. As of May 20, 2020, the Index stood just 12.24% below its all-time high set on February 19, 2020. But the game, as they say, is not over. Even though stocks have rebounded significantly from their March lows, 68% of the money managers that participated in the most recent Bank of America global fund manager survey believe that stocks are still in a bear market, according to MarketWatch. What are they likely concerned about? In addition to a dismal economic outlook for the near-term, research from Bespoke Investment Group, an independent research firm, indicates that there have been 25 bear markets since 1928 and 60% of the time the Index declined a second time during the bear market and went on to establish a new low for the period.
With respect to the state of the economy, the Congressional Budget Office announced on May 19, 2020, that it sees real U.S. gross domestic product (“GDP”) declining by an annualized 38% in the second quarter of 2020, reportedly in line with Wall Street economists, according to CNBC. Some estimates are more dire. The GDP estimate from the Atlanta Federal Reserve calls for a 42% plunge. These numbers are so large in scope they are mind-boggling. The Bureau of Economic Analysis is scheduled to release its GDP report on July 30, 2020. Until then, we may continue to have a disconnect between the economy and the markets. Let us hope it is as positive as the one we are currently enjoying.
The U.S. government shut down huge chunks of our economy in order to protect lives and prevent our health care system from being overwhelmed by COVID-19 patients. Our economic woes, in other words, are man-made. The remedies to this pandemic will also likely be man-made. They could come in the form of therapeutics and/or a vaccine. Perhaps more than one vaccine. At this stage of the pandemic fight, we have one message for investors: Stay the course!
Thank you for giving First Trust the opportunity to play a role in your financial future. We value our relationship with you and will report on the Fund again in six months.
Sincerely,
James A. Bowen
Chairman of the Board of Trustees
Chief Executive Officer of First Trust Advisors L.P.
Fund Performance Overview (Unaudited)
First Trust Managed Municipal ETF (FMB)
The primary investment objective of First Trust Managed Municipal ETF (the “Fund”) is to generate current income that is exempt from regular federal income taxes and its secondary objective is long-term capital appreciation. The Fund lists and principally trades its shares on The Nasdaq Stock Market, LLC under the ticker symbol “FMB.” Under normal market conditions, the Fund seeks to achieve its investment objectives by investing at least 80% of its net assets (including investment borrowings) in municipal debt securities that pay interest that is exempt from regular federal income taxes.
| Performance | | | | | | | |
| | | | Average Annual Total Returns | | Cumulative Total Returns |
| | 6 Months
Ended
4/30/20 | 1 Year
Ended
4/30/20 | 5 Years
Ended
4/30/20 | Inception
(5/13/14)
to 4/30/20 | | 5 Years
Ended
4/30/20 | Inception
(5/13/14)
to 4/30/20 |
| Fund Performance | | | | | | | |
| NAV | -4.10% | -0.18% | 3.10% | 3.57% | | 16.46% | 23.27% |
| Market Price | -3.90% | 0.01% | 3.04% | 3.63% | | 16.17% | 23.68% |
| Index Performance | | | | | | | |
| Bloomberg Barclays Revenue 10 Year (8-12) Index | -1.22% | 2.21% | 3.21% | 3.42% | | 17.13% | 22.24% |
Total returns for the period since inception are calculated from the inception date of the Fund. “Average Annual Total Returns” represent the average annual change in value of an investment over the periods indicated. “Cumulative Total Returns” represent the total change in value of an investment over the periods indicated.
The Fund’s per share net asset value (“NAV”) is the value of one share of the Fund and is computed by dividing the value of all assets of the Fund (including accrued interest and dividends), less all liabilities (including accrued expenses and dividends declared but unpaid), by the total number of outstanding shares. The price used to calculate market return (“Market Price”) is determined by using the midpoint between the highest bid and the lowest offer on the stock exchange on which shares of the Fund are listed for trading as of the time that the Fund’s NAV is calculated. Since shares of the Fund did not trade in the secondary market until after its inception, for the period from inception to the first day of secondary market trading in shares of the Fund, the NAV of the Fund is used as a proxy for the secondary market trading price to calculate market returns. NAV and market returns assume that all distributions have been reinvested in the Fund at NAV and Market Price, respectively.
An index is a statistical composite that tracks a specified financial market or sector. Unlike the Fund, the index does not actually hold a portfolio of securities and therefore does not incur the expenses incurred by the Fund. These expenses negatively impact the performance of the Fund. Also, market returns do not include brokerage commissions that may be payable on secondary market transactions. If brokerage commissions were included, market returns would be lower. The total returns presented reflect the reinvestment of dividends on securities in the index. The returns presented do not reflect the deduction of taxes that a shareholder would pay on Fund distributions or the redemption or sale of Fund shares. The investment return and principal value of shares of the Fund will vary with changes in market conditions. Shares of the Fund may be worth more or less than their original cost when they are redeemed or sold in the market. The Fund’s past performance is no guarantee of future performance.
Fund Performance Overview (Unaudited) (Continued)
First Trust Managed Municipal ETF (FMB) (Continued)
| Sector Allocation | % of Total
Investments
(including cash) |
| Hospital | 13.6% |
| Government Obligation Bond - Unlimited Tax | 9.8 |
| Insured | 8.8 |
| Water & Sewer | 6.8 |
| Continuing Care Retirement Communities | 6.7 |
| Gas | 5.6 |
| Higher Education | 5.4 |
| Certificates of Participation | 4.8 |
| Dedicated Tax | 4.5 |
| Airport | 4.4 |
| Education | 3.5 |
| Utility | 3.3 |
| Government Obligation Bond - Limited Tax | 3.2 |
| Special Assessment | 2.9 |
| Toll Road | 1.9 |
| Mass Transit | 1.8 |
| Housing | 1.8 |
| Industrial Development Bond | 1.6 |
| Tobacco | 1.3 |
| Tax Increment | 1.2 |
| Student Housing | 1.1 |
| Pre-refunded/Escrowed-to-maturity | 0.8 |
| Local Housing | 0.5 |
| Skilled Nursing | 0.2 |
| Port | 0.2 |
| Hotel | 0.1 |
| Other Health | 0.1 |
| Pool | 0.1 |
| Stadium | 0.0* |
| Cash | 4.0 |
| Total | 100.0% |
| * | Amount is less than 0.1%. |
| Credit Quality(1) | % of Total
Investments
(including cash) |
| AAA | 6.6% |
| AA | 32.6 |
| A | 32.9 |
| BBB | 10.5 |
| BB | 3.0 |
| B | 0.5 |
| CCC | 0.1 |
| Not Rated | 9.5 |
| Short Rated Only | 0.3 |
| Cash | 4.0 |
| Total | 100.0% |
| (1) | The credit quality and ratings information presented above reflect the ratings assigned by one or more nationally recognized statistical rating organizations (NRSROs), including Standard & Poor’s Ratings Group, a division of the McGraw Hill Companies, Inc., Moody’s Investors Service, Inc., Fitch Ratings or a comparably rated NRSRO. For situations in which a security is rated by more than one NRSRO and the ratings are not equivalent, the highest rating is used. Sub-investment grade ratings are those rated BB+/Ba1 or lower. Investment grade ratings are those rated BBB-/Baa3 or higher. The credit ratings shown relate to the creditworthiness of the issuers of the underlying securities in the Fund, and not to the Fund or its shares. Credit ratings are subject to change. |
Fund Performance Overview (Unaudited) (Continued)
First Trust Managed Municipal ETF (FMB) (Continued)

Performance figures assume reinvestment of all distributions and do not reflect the deduction of taxes that a shareholder would pay on Fund distributions or the redemption or sale of Fund shares. An index is a statistical composite that tracks a specified financial market or sector. Unlike the Fund, the index does not actually hold a portfolio of securities and therefore does not incur the expenses incurred by the Fund. These expenses negatively impact the performance of the Fund. The Fund’s past performance does not predict future performance.
Frequency Distribution of Discounts and Premiums
Bid/Ask Midpoint vs. NAV through April 30, 2020
The following Frequency Distribution of Discounts and Premiums charts are provided to show the frequency at which the bid/ask midpoint price for the Fund was at a discount or premium to the daily NAV. The following tables are for comparative purposes only and represent the period November 1, 2014 through April 30, 2020. Shareholders may pay more than NAV when they buy Fund shares and receive less than NAV when they sell those shares because shares are bought and sold at current market price. Data presented represents past performance and cannot be used to predict future results.
| Number of Days Bid/Ask Midpoint At/Above NAV |
| For the Period | 0.00%–0.49% | 0.50%–0.99% | 1.00%–1.99% | >=2.00% |
| 11/1/14 – 10/31/15 | 178 | 16 | 0 | 0 |
| 11/1/15 – 10/31/16 | 200 | 0 | 0 | 0 |
| 11/1/16 – 10/31/17 | 207 | 0 | 0 | 0 |
| 11/1/17 – 10/31/18 | 201 | 0 | 0 | 0 |
| 11/1/18 – 10/31/19 | 228 | 0 | 0 | 0 |
| 11/1/19 – 4/30/20 | 102 | 3 | 0 | 0 |
| Number of Days Bid/Ask Midpoint Below NAV |
| For the Period | 0.00%–0.49% | 0.50%–0.99% | 1.00%–1.99% | >=2.00% |
| 11/1/14 – 10/31/15 | 57 | 0 | 0 | 0 |
| 11/1/15 – 10/31/16 | 51 | 1 | 0 | 0 |
| 11/1/16 – 10/31/17 | 45 | 0 | 0 | 0 |
| 11/1/17 – 10/31/18 | 51 | 0 | 0 | 0 |
| 11/1/18 – 10/31/19 | 23 | 0 | 0 | 0 |
| 11/1/19 – 4/30/20 | 11 | 2 | 4 | 2 |
Portfolio Management
First Trust Managed Municipal ETF (FMB)
Semi-Annual Report
April 30, 2020 (Unaudited)
Advisor
First Trust Advisors L.P. (“First Trust” or the “Advisor”) serves as the investment advisor to the First Trust Managed Municipal ETF (the “Fund”). First Trust is responsible for the ongoing monitoring of the Fund’s investment portfolio, managing the Fund’s business affairs and providing certain administrative services necessary for the management of the Fund.
Portfolio Management Team
Tom Futrell, CFA, Senior Vice President, Senior Portfolio Manager
Johnathan N. Wilhelm, Senior Vice President, Senior Portfolio Manager
The First Trust Municipal Securities Team was formed in September of 2013 and is headed by Tom Futrell, CFA, and Johnathan Wilhelm who serve as senior portfolio managers of the Fund. Messrs. Futrell and Wilhelm have a combined 50+ years of investment experience and prior to joining First Trust, served as portfolio managers of municipal bonds at Nuveen Investments and Performance Trust Investment Advisors. In addition to the Fund, the team manages/consults for a variety of First Trust investment portfolios and separately managed accounts.
First Trust Managed Municipal ETF (FMB)
Understanding Your Fund Expenses
April 30, 2020 (Unaudited)
As a shareholder of the First Trust Managed Municipal ETF (the “Fund”), you incur two types of costs: (1) transaction costs; and (2) ongoing costs, including management fees, distribution and/or service (12b-1) fees, if any, and other Fund expenses. This Example is intended to help you understand your ongoing costs of investing in the Fund and to compare these costs with the ongoing costs of investing in other funds.
The Example is based on an investment of $1,000 invested at the beginning of the period and held through the six-month period ended April 30, 2020.
Actual Expenses
The first line in the following table provides information about actual account values and actual expenses. You may use the information in this line, together with the amount you invested, to estimate the expenses that you paid over the period. Simply divide your account value by $1,000 (for example, an $8,600 account value divided by $1,000 = 8.6), then multiply the result by the number in the first line under the heading entitled “Expenses Paid During the Six-Month Period” to estimate the expenses you paid on your account during this six-month period.
Hypothetical Example for Comparison Purposes
The second line in the following table provides information about hypothetical account values and hypothetical expenses based on the Fund’s actual expense ratio and an assumed rate of return of 5% per year before expenses, which is not the Fund’s actual return. The hypothetical account values and expenses may not be used to estimate the actual ending account balance or expenses you paid for the period. You may use this information to compare the ongoing costs of investing in the Fund and other funds. To do so, compare this 5% hypothetical example with the 5% hypothetical examples that appear in the shareholder reports of the other funds.
Please note that the expenses shown in the table are meant to highlight your ongoing costs only and do not reflect any transactional costs such as brokerage commissions. Therefore, the second line in the table is useful in comparing ongoing costs only, and will not help you determine the relative total costs of owning different funds. In addition, if these transactional costs were included, your costs would have been higher.
| | Beginning
Account Value
November 1, 2019 | Ending
Account Value
April 30, 2020 | Annualized
Expense Ratio
Based on the
Six-Month
Period (a) | Expenses Paid
During the
Six-Month
Period (b) |
| First Trust Managed Municipal ETF (FMB) |
| Actual | $1,000.00 | $959.00 | 0.50% | $2.44 |
| Hypothetical (5% return before expenses) | $1,000.00 | $1,022.38 | 0.50% | $2.51 |
| (a) | These expense ratios reflect expense waivers. See Note 3 in the Notes to Financial Statements. |
| (b) | Expenses are equal to the annualized expense ratios as indicated in the table multiplied by the average account value over the period (November 1, 2019 through April 30, 2020), multiplied by 182/366 (to reflect the six-month period). |
First Trust Managed Municipal ETF (FMB)
Portfolio of Investments
April 30, 2020 (Unaudited)
Principal
Value | | Description | | Stated
Coupon | | Stated
Maturity | | Value |
| MUNICIPAL BONDS – 94.1% |
| | | Alabama – 3.9% | | | | | | |
| $225,000 | | AL Cmnty Clg Sys Brd of Trustees Rev Bishop St Cmnty Clg, BAM
| | 4.00% | | 01/01/35 | | $250,475 |
| 500,000 | | AL St Port Auth Docks Facs Rev Ref Docks Facs Rev, Ser A, AGM, AMT
| | 5.00% | | 10/01/25 | | 579,540 |
| 1,100,000 | | Birmingham AL Wtrwks Brd Wtr Rev Ref Sr, Ser A
| | 5.00% | | 01/01/32 | | 1,315,369 |
| 940,000 | | Birmingham AL Wtrwks Brd Wtr Rev Ref Sr, Ser A
| | 4.00% | | 01/01/34 | | 1,041,219 |
| 2,325,000 | | Birmingham AL Wtrwks Brd Wtr Rev Ref Sub, Ser B
| | 5.00% | | 01/01/43 | | 2,665,403 |
| 7,070,000 | | Black Belt Energy Gas Dist AL Gas Prepay Rev Proj #5, Ser A-1 (Mandatory put 10/01/26)
| | 4.00% | | 10/01/49 | | 7,585,615 |
| 1,530,000 | | Black Belt Energy Gas Dist AL Gas Prepay Rev, Ser A (Mandatory put 12/01/23)
| | 4.00% | | 12/01/48 | | 1,600,043 |
| 415,000 | | Gulf Shores AL Ref Warrants, Ser A
| | 5.00% | | 12/15/35 | | 497,535 |
| 310,000 | | Gulf Shores AL Ref Warrants, Ser A
| | 5.00% | | 12/15/38 | | 368,389 |
| 400,000 | | Homewood AL Eductnl Bldg Auth Rev Ref Samford Univ Proj, Ser A
| | 4.00% | | 12/01/33 | | 418,944 |
| 950,000 | | Homewood AL Eductnl Bldg Auth Rev Ref Samford Univ Proj, Ser A
| | 4.00% | | 12/01/34 | | 990,717 |
| 450,000 | | Infirmary Hlth Sys AL Spl Care Facs Fing Auth Rev Infirmary Hlth Sys Inc, Ser A
| | 5.00% | | 02/01/36 | | 486,482 |
| 930,000 | | Leeds AL Pub Eductnl Bldg Auth Eductnl Facs Rev Ref Edu, AGM
| | 4.00% | | 04/01/29 | | 1,031,519 |
| 695,000 | | Leeds AL Pub Eductnl Bldg Auth Eductnl Facs Rev Ref Edu, AGM
| | 4.00% | | 04/01/30 | | 768,739 |
| 1,500,000 | | Lower AL Gas Dist Gas Proj Rev Gas Proj, Rev Bonds Proj 2 (Mandatory put 12/01/25)
| | 4.00% | | 12/01/50 | | 1,597,335 |
| 100,000 | | Lower AL Gas Dist Gas Proj Rev, Ser A
| | 5.00% | | 09/01/31 | | 119,398 |
| 600,000 | | Mobile AL Impt Dist Sales Tax Rev Mcgowin Park Proj, Ser A
| | 5.00% | | 08/01/25 | | 591,486 |
| 500,000 | | Mobile Cnty AL Impt Warrants
| | 5.00% | | 08/01/30 | | 592,300 |
| 1,105,000 | | Prichard AL Wtrwks & Swr Brd Wtr & Swr Rev Ref
| | 4.00% | | 11/01/30 | | 1,221,500 |
| 1,565,000 | | Prichard AL Wtrwks & Swr Brd Wtr & Swr Rev Ref
| | 4.00% | | 11/01/31 | | 1,717,525 |
| 1,605,000 | | Prichard AL Wtrwks & Swr Brd Wtr & Swr Rev Ref
| | 4.00% | | 11/01/32 | | 1,746,689 |
| 1,395,000 | | Prichard AL Wtrwks & Swr Brd Wtr & Swr Rev Ref
| | 4.00% | | 11/01/33 | | 1,509,223 |
| 1,765,000 | | Prichard AL Wtrwks & Swr Brd Wtr & Swr Rev Ref
| | 4.00% | | 11/01/34 | | 1,900,093 |
| 1,840,000 | | Prichard AL Wtrwks & Swr Brd Wtr & Swr Rev Ref
| | 4.00% | | 11/01/35 | | 1,969,610 |
| 110,000 | | SE AL St Gas Sply Dist Gas Sply Rev Proj #1, Ser A (Mandatory put 04/01/24)
| | 4.00% | | 04/01/49 | | 115,337 |
| 6,300,000 | | SE AL St Gas Sply Dist Gas Sply Rev Proj #2, Ser A (Mandatory put 06/01/24)
| | 4.00% | | 06/01/49 | | 6,623,379 |
| 1,040,000 | | Troy AL Ref Warrants, BAM
| | 4.00% | | 07/01/35 | | 1,105,385 |
| 5,000,000 | | UAB Medicine Fin Auth AL Rev Ref UAB Medicine, Ser B2
| | 5.00% | | 09/01/41 | | 5,678,000 |
| 8,890,000 | | Wilsonville AL Indl Dev Brd Sol Wst Disp Rev Var AL Plt Gaston Plt (a)
| | 0.25% | | 12/01/30 | | 8,890,000 |
| | | | | 54,977,249 |
| | | Arizona – 2.3% | | | | | | |
| 1,205,000 | | AZ Brd of Rgts Univ AZ Sys Rev Green Bond, Ser B
| | 5.00% | | 06/01/28 | | 1,438,228 |
| 1,000,000 | | AZ St Indl Dev Auth Edu Rev Academics of Math & Science Proj (b)
| | 5.00% | | 07/01/49 | | 889,310 |
| 625,000 | | AZ St Indl Dev Auth Edu Rev Cadence Campus Proj, Ser A (b)
| | 4.00% | | 07/15/30 | | 597,662 |
| 925,000 | | AZ St Indl Dev Auth Edu Rev Cadence Campus Proj, Ser A (b)
| | 4.00% | | 07/15/40 | | 761,913 |
| 175,000 | | AZ St Indl Dev Auth Edu Rev Doral Academy NV Fire Mesa & Red Rock Campus Proj, Ser A (b)
| | 5.00% | | 07/15/39 | | 164,297 |
| 375,000 | | AZ St Indl Dev Auth Edu Rev Ref Basis Sch Projs, Ser D (b)
| | 5.00% | | 07/01/37 | | 353,126 |
| 530,000 | | AZ St Indl Dev Auth Edu Rev Ref Basis Schs Projs, Ser A (b)
| | 4.00% | | 07/01/21 | | 528,437 |
| 555,000 | | AZ St Indl Dev Auth Edu Rev Ref Basis Schs Projs, Ser A (b)
| | 5.00% | | 07/01/26 | | 561,316 |
See Notes to Financial Statements
Page 7
First Trust Managed Municipal ETF (FMB)
Portfolio of Investments (Continued)
April 30, 2020 (Unaudited)
Principal
Value | | Description | | Stated
Coupon | | Stated
Maturity | | Value |
| MUNICIPAL BONDS (Continued) |
| | | Arizona (Continued) | | | | | | |
| $415,000 | | AZ St Indl Dev Auth National Chrt Sch Revolving Loan Fd Equitable Sch Revolving Fund, Ser A
| | 5.00% | | 11/01/31 | | $503,038 |
| 1,005,000 | | AZ St Indl Dev Auth National Chrt Sch Revolving Loan Fd Equitable Sch Revolving Fund, Ser A
| | 5.00% | | 11/01/33 | | 1,200,211 |
| 465,000 | | AZ St Indl Dev Auth National Chrt Sch Revolving Loan Fd Equitable Sch Revolving Fund, Ser A
| | 5.00% | | 11/01/37 | | 545,124 |
| 1,000,000 | | AZ St Indl Dev Auth Rev Lincoln South Beltway Proj
| | 5.00% | | 08/01/27 | | 1,194,990 |
| 1,985,000 | | AZ St Indl Dev Auth Rev Lincoln South Beltway Proj
| | 5.00% | | 11/01/27 | | 2,382,318 |
| 1,000,000 | | AZ St Indl Dev Auth Rev Lincoln South Beltway Proj
| | 5.00% | | 05/01/28 | | 1,210,180 |
| 1,000,000 | | AZ St Indl Dev Auth Rev Lincoln South Beltway Proj
| | 5.00% | | 08/01/28 | | 1,214,450 |
| 1,650,000 | | AZ St Indl Dev Auth Sr Living Rev 2nd Tier Great Lakes Sr Living Cmntys Proj, Ser B
| | 5.00% | | 01/01/43 | | 1,496,170 |
| 4,000,000 | | Glendale AZ Indl Dev Auth Sr Living Facs Rev Ref Sun Hlth Svcs, Ser A
| | 5.00% | | 11/15/42 | | 4,195,040 |
| 1,300,000 | | Maricopa Cnty AZ Elem Sch Dist #25 Liberty, Ser A, AGM
| | 5.00% | | 07/01/31 | | 1,617,759 |
| 1,350,000 | | Maricopa Cnty AZ Elem Sch Dist #25 Liberty, Ser A, AGM
| | 5.00% | | 07/01/32 | | 1,667,142 |
| 200,000 | | Maricopa Cnty AZ Indl Dev Auth Edu Rev Greathearts AZ Projs, Ser C
| | 5.00% | | 07/01/25 | | 229,416 |
| 500,000 | | Maricopa Cnty AZ Indl Dev Auth Edu Rev Ref Horizon Cmnty Learning Ctr Proj
| | 5.00% | | 07/01/35 | | 465,705 |
| 500,000 | | Maricopa Cnty AZ Indl Dev Auth Edu Rev Ref Legacy Traditional Sch Proj
| | 4.00% | | 07/01/34 | | 526,095 |
| 1,100,000 | | Maricopa Cnty AZ Indl Dev Auth Edu Rev Ref Legacy Traditional Sch Proj Auth, Ser B (b)
| | 5.00% | | 07/01/39 | | 1,062,699 |
| 1,000,000 | | Maricopa Cnty AZ Indl Dev Auth Edu Rev Ref Legacy Traditional Sch Proj Auth, Ser B (b)
| | 5.00% | | 07/01/49 | | 927,700 |
| 500,000 | | Maricopa Cnty AZ Indl Dev Auth Edu Rev Ref Paradise Schs Projs Paragon Mgmt Inc (b)
| | 4.00% | | 07/01/26 | | 488,500 |
| 1,475,000 | | Maricopa Cnty AZ Spl Healthcare Dist Aka Maricopa Integrated Hlth Sys, Ser C
| | 5.00% | | 07/01/27 | | 1,819,988 |
| 475,000 | | Phoenix AZ Indl Dev Auth Edu Rev Fac Legacy Traditional Schs Projs, Ser A (b)
| | 4.00% | | 07/01/26 | | 466,835 |
| 300,000 | | Phoenix AZ Indl Dev Auth Student Hsg Rev Downtown Phoenix Student Hsg II LLC AZ St Univ Proj, Ser A
| | 5.00% | | 07/01/32 | | 325,224 |
| 300,000 | | Phoenix AZ Indl Dev Auth Student Hsg Rev Downtown Phoenix Student Hsg II LLC AZ St Univ Proj, Ser A
| | 5.00% | | 07/01/33 | | 322,839 |
| 300,000 | | Phoenix AZ Indl Dev Auth Student Hsg Rev Downtown Phoenix Student Hsg II LLC AZ St Univ Proj, Ser A
| | 5.00% | | 07/01/34 | | 321,525 |
| 350,000 | | Phoenix AZ Indl Dev Auth Student Hsg Rev Downtown Phoenix Student Hsg II LLC AZ St Univ Proj, Ser A
| | 5.00% | | 07/01/35 | | 373,391 |
| 700,000 | | Phoenix AZ Indl Dev Auth Student Hsg Rev Downtown Phoenix Student Hsg II LLC AZ St Univ Proj, Ser A
| | 5.00% | | 07/01/44 | | 731,836 |
| 200,000 | | Phoenix AZ Indl Dev Auth Student Hsg Rev Ref Downtown Phoenix Student Hsg LLC AZ St Univ Proj, Ser A
| | 5.00% | | 07/01/26 | | 222,370 |
| 385,000 | | Pima Cnty AZ Indl Dev Auth Edu Rev Fac American Leadership Academy Proj (b)
| | 4.00% | | 06/15/22 | | 378,409 |
| 350,000 | | Pima Cnty AZ Indl Dev Auth Edu Rev Ref Fac American Leadership Academy Proj (b)
| | 4.60% | | 06/15/25 | | 342,500 |
| 1,230,000 | | Salt River AZ Proj Agric Impt & Pwr Dist Elec Sys Rev Ref, Ser A
| | 5.00% | | 12/01/31 | | 1,323,000 |
| 275,000 | | Yavapai Cnty AZ Indl Dev Auth Hosp Fac Ref Yavapai Regl Med Ctr
| | 5.00% | | 08/01/23 | | 300,671 |
| | | | | 33,149,414 |
Page 8
See Notes to Financial Statements
First Trust Managed Municipal ETF (FMB)
Portfolio of Investments (Continued)
April 30, 2020 (Unaudited)
Principal
Value | | Description | | Stated
Coupon | | Stated
Maturity | | Value |
| MUNICIPAL BONDS (Continued) |
| | | Arkansas – 0.1% | | | | | | |
| $610,000 | | AR Dev Fin Auth Healthcare Rev Baptist Hlth
| | 4.00% | | 12/01/44 | | $629,557 |
| 350,000 | | Univ of Central Arkansas AR Rev, Ser A, AGM
| | 5.00% | | 11/01/34 | | 388,846 |
| | | | | 1,018,403 |
| | | California – 6.3% | | | | | | |
| 1,000,000 | | CA Sch Fin Auth Sch Fac Rev Alliance Clg Ready Pub Schs Proj, Ser C
| | 4.50% | | 07/01/26 | | 1,032,560 |
| 460,000 | | CA Sch Fin Auth Sch Fac Rev Granada Hills Chrt Oblig Grp (b)
| | 5.00% | | 07/01/32 | | 480,806 |
| 480,000 | | CA Sch Fin Auth Sch Fac Rev Granada Hills Chrt Oblig Grp (b)
| | 5.00% | | 07/01/33 | | 498,288 |
| 1,000,000 | | CA Sch Fin Auth Sch Fac Rev Granada Hills Chrt Oblig Grp (b)
| | 5.00% | | 07/01/43 | | 1,012,270 |
| 1,325,000 | | CA Sch Fin Auth Sch Fac Rev Kipp Socal Pub Schs, Ser A (b)
| | 5.00% | | 07/01/39 | | 1,378,371 |
| 455,000 | | CA Sch Fin Auth Sch Fac Rev Ref Hlth Learning Proj, Ser A (b)
| | 4.00% | | 07/01/26 | | 463,777 |
| 800,000 | | CA Sch Fin Auth Sch Fac Rev Ref Hlth Learning Proj, Ser A (b)
| | 5.00% | | 07/01/32 | | 834,208 |
| 1,000,000 | | CA St
| | 5.00% | | 11/01/31 | | 1,247,160 |
| 750,000 | | CA St
| | 5.00% | | 08/01/32 | | 905,677 |
| 850,000 | | CA St Cmnty Clg Fing Auth Clg Hsg Rev Orange Coast Pptys LLC Orange Coast Clg Proj
| | 5.25% | | 05/01/43 | | 868,309 |
| 225,000 | | CA St Enterprise Dev Auth Lease Rev Riverside Cnty Library Fac Proj
| | 4.00% | | 11/01/37 | | 248,020 |
| 415,000 | | CA St Hlth Facs Fing Auth Rev Adventist Hlth Sys West, Ser A
| | 4.00% | | 03/01/33 | | 426,408 |
| 400,000 | | CA St Hlth Facs Fing Auth Rev Ref Sutter Hlth, Ser B
| | 5.00% | | 11/15/33 | | 457,212 |
| 600,000 | | CA St Hlth Facs Fing Auth Rev Sutter Hlth, Ser A
| | 5.00% | | 11/15/33 | | 695,502 |
| 445,000 | | CA St Muni Fin Auth Chrt Sch Lease Rev Vista Chrt Middle Sch Proj (c)
| | 5.38% | | 07/01/34 | | 449,668 |
| 700,000 | | CA St Muni Fin Auth Chrt Sch Rev Palmdale Aerospace Academy Proj (b)
| | 4.00% | | 07/01/26 | | 695,443 |
| 1,515,000 | | CA St Muni Fin Auth Mobile Home Park Rev Sr Caritas Affordable Hsg Inc Projs, Ser A
| | 5.25% | | 08/15/39 | | 1,623,822 |
| 1,805,000 | | CA St Muni Fin Auth Mobile Home Park Rev Sr Caritas Affordable Hsg Inc Projs, Ser A
| | 5.25% | | 08/15/49 | | 1,918,372 |
| 200,000 | | CA St Muni Fin Auth Rev Channing House Proj, Ser B
| | 5.00% | | 05/15/37 | | 230,138 |
| 500,000 | | CA St Muni Fin Auth Rev Ref Eisenhower Med Ctr, Ser A
| | 5.00% | | 07/01/34 | | 554,665 |
| 1,250,000 | | CA St Muni Fin Auth Rev Ref HumanGood Oblig Grp, Ser A
| | 4.00% | | 10/01/33 | | 1,224,525 |
| 600,000 | | CA St Muni Fin Auth Rev Ref HumanGood Oblig Grp, Ser A
| | 4.00% | | 10/01/34 | | 582,054 |
| 1,000,000 | | CA St Muni Fin Auth Rev Ref HumanGood Oblig Grp, Ser A
| | 4.00% | | 10/01/35 | | 963,140 |
| 1,000,000 | | CA St Muni Fin Auth Rev Ref HumanGood Oblig Grp, Ser A
| | 4.00% | | 10/01/36 | | 954,700 |
| 2,130,000 | | CA St Muni Fin Auth Rev Ref HumanGood Oblig Grp, Ser A
| | 4.00% | | 10/01/39 | | 1,985,203 |
| 3,420,000 | | CA St Muni Fin Auth Rev Ref HumanGood Oblig Grp, Ser A
| | 5.00% | | 10/01/44 | | 3,498,865 |
| 680,000 | | CA St Muni Fin Auth Rev Ref Retmnt Hsg Fdtn Oblig Grp, Ser A
| | 5.00% | | 11/15/27 | | 743,111 |
| 650,000 | | CA St Muni Fin Auth Rev Sr Lien Linxs APM Proj, Ser A, AMT
| | 5.00% | | 06/30/28 | | 726,628 |
| 200,000 | | CA St Muni Fin Auth Sr Living Rev Ref Mt San Antonio Gardens Proj
| | 4.00% | | 11/15/27 | | 197,312 |
| 1,000,000 | | CA St Poll Control Fin Auth Sol Wst Disp Rev Ref Wst Mgmt Inc, Ser A1, AMT
| | 3.38% | | 07/01/25 | | 1,028,380 |
| 1,500,000 | | CA St Poll Control Fin Auth Sol Wst Disp Rev Rialto Bioenergy Fac LLC Proj Green Bond, AMT (b)
| | 6.75% | | 12/01/28 | | 1,371,225 |
| 4,250,000 | | CA St Poll Control Fin Auth Sol Wst Disp Rev Rialto Bioenergy Fac LLC Proj Green Bond, AMT (b)
| | 7.50% | | 12/01/40 | | 3,794,655 |
| 775,000 | | CA St Ref
| | 5.00% | | 04/01/29 | | 984,971 |
| 2,000,000 | | CA St Ref Various Purpose
| | 5.00% | | 04/01/36 | | 2,232,380 |
| 500,000 | | CA St Ref, Ser C
| | 5.00% | | 09/01/32 | | 581,820 |
| 2,000,000 | | CA St Sch Fin Auth Chrt Sch Rev Arts in Action Chrt Schs, Ser A (b)
| | 5.00% | | 06/01/40 | | 1,923,920 |
| 500,000 | | CA St Sch Fin Auth Chrt Sch Rev Summit Pub Schs (b)
| | 5.00% | | 06/01/37 | | 509,030 |
See Notes to Financial Statements
Page 9
First Trust Managed Municipal ETF (FMB)
Portfolio of Investments (Continued)
April 30, 2020 (Unaudited)
Principal
Value | | Description | | Stated
Coupon | | Stated
Maturity | | Value |
| MUNICIPAL BONDS (Continued) |
| | | California (Continued) | | | | | | |
| $300,000 | | CA St Stwd Cmntys Dev Auth Clg Hsg Rev NCCD Hooper Street LLC CA Clg of the Arts Projs (b)
| | 5.00% | | 07/01/29 | | $304,722 |
| 700,000 | | CA St Stwd Cmntys Dev Auth Clg Hsg Rev NCCD Hooper Street LLC CA Clg of the Arts Projs (b)
| | 5.25% | | 07/01/39 | | 688,331 |
| 1,595,000 | | CA St Univ Rev Systemwide, Ser A
| | 5.00% | | 11/01/21 | | 1,693,396 |
| 300,000 | | CA Stwd Cmntys Dev Auth Rev Beverly Cmnty Hosp Assoc
| | 5.00% | | 02/01/30 | | 325,278 |
| 1,000,000 | | CA Stwd Cmntys Dev Auth Rev Loma Linda Univ Med Ctr, Ser A (b)
| | 5.00% | | 12/01/30 | | 1,024,260 |
| 450,000 | | CA Stwd Cmntys Dev Auth Rev Loma Linda Univ Med Ctr, Ser A (b)
| | 5.00% | | 12/01/33 | | 457,285 |
| 450,000 | | CA Stwd Cmntys Dev Auth Rev Ref CA Baptist Univ, Ser A (b)
| | 3.00% | | 11/01/22 | | 441,729 |
| 500,000 | | CA Stwd Cmntys Dev Auth Rev Ref CA Baptist Univ, Ser A (b)
| | 5.00% | | 11/01/32 | | 509,380 |
| 100,000 | | CA Stwd Cmntys Dev Auth Rev Ref Front Porch Cmntys & Svcs, Ser A
| | 5.00% | | 04/01/30 | | 119,589 |
| 195,000 | | CA Stwd Cmntys Dev Auth Rev Ref Front Porch Cmntys & Svcs, Ser A
| | 5.00% | | 04/01/31 | | 232,099 |
| 300,000 | | CA Stwd Cmntys Dev Auth Rev Ref Lancer Eductnl Student Hsg Proj, Ser A (b)
| | 4.00% | | 06/01/21 | | 299,616 |
| 370,000 | | Chino CA Cmnty Facs Dist Spl Tax #2003-3 Impt Area #7
| | 5.00% | | 09/01/30 | | 425,067 |
| 300,000 | | Chino Vly CA Unif Sch Dist, Ser B
| | 5.00% | | 08/01/38 | | 371,817 |
| 250,000 | | Chino Vly CA Unif Sch Dist, Ser B
| | 5.00% | | 08/01/39 | | 308,938 |
| 2,160,000 | | Etiwanda CA Sch Dist Cmnty Facs Dist #9 Spl Tax Ref
| | 5.00% | | 09/01/35 | | 2,480,695 |
| 130,000 | | Folsom Ranch CA Fing Auth Spl Tax Rev Cmnty Facs Dist No 19 Mangini
| | 4.00% | | 09/01/24 | | 137,859 |
| 155,000 | | Folsom Ranch CA Fing Auth Spl Tax Rev Cmnty Facs Dist No 19 Mangini
| | 4.00% | | 09/01/25 | | 165,038 |
| 500,000 | | Foothill-De Anza CA Cmnty Clg Dist Ref, COPS
| | 5.00% | | 04/01/32 | | 573,445 |
| 1,360,000 | | Hawthorne CA Cmnty Redev Agy Successor Agy Tax Allocation Ref Sub, AGM
| | 5.00% | | 09/01/32 | | 1,548,605 |
| 175,000 | | Irvine CA Unif Sch Dist Spl Tax Cmnty Facs Dist No 09-1, Ser A
| | 5.00% | | 09/01/31 | | 208,695 |
| 365,000 | | Irvine CA Unif Sch Dist Spl Tax Cmnty Facs Dist No 09-1, Ser A
| | 5.00% | | 09/01/32 | | 432,021 |
| 125,000 | | Irvine CA Unif Sch Dist Spl Tax Cmnty Facs Dist No 09-1, Ser A
| | 5.00% | | 09/01/34 | | 146,151 |
| 2,885,000 | | Kaweah CA Delta Healthcare Dist Rev, Ser B
| | 5.00% | | 06/01/40 | | 3,140,005 |
| 210,000 | | La Verne CA Ref Brethren Hillcrest Homes, COPS
| | 5.00% | | 05/15/22 | | 213,398 |
| 825,000 | | Lammersville CA Jt Unif Sch Dist Spl Tax Cmnty Facs Dist #2014-1 Impt Area #1 Mountain House Sch Facs
| | 5.00% | | 09/01/42 | | 884,903 |
| 835,000 | | Live Oak CA Sch Dist Santa Cruz Cnty Ref
| | 5.00% | | 08/01/30 | | 1,002,935 |
| 600,000 | | Lodi CA Unif Sch Dist Election of 2016, Ser 2020
| | 4.00% | | 08/01/35 | | 671,448 |
| 45,000 | | Long Beach CA Bond Fin Auth Nat Gas Purchase Rev, Ser A
| | 5.25% | | 11/15/23 | | 49,577 |
| 400,000 | | Los Angeles CA Dept of Arpts Arpt Rev Sub Los Angeles Intl Arpt, Ser B, AMT
| | 5.00% | | 05/15/31 | | 451,720 |
| 100,000 | | Marina CA Redev Agy Successor Agy Tax Allocation Hsg, Ser B
| | 5.00% | | 09/01/33 | | 109,486 |
| 1,260,000 | | Marina Coast CA Wtr Dist Enterprise Rev, COPS
| | 4.00% | | 06/01/44 | | 1,386,920 |
| 325,000 | | Menifee CA Union Sch Dist Pub Fing Auth Spl Tax Rev Ref, Ser A
| | 5.00% | | 09/01/28 | | 374,185 |
| 175,000 | | Menifee CA Union Sch Dist Spl Tax Cmnty Facs Dist #2011-1
| | 5.00% | | 09/01/30 | | 196,348 |
| 150,000 | | Menifee CA Union Sch Dist Spl Tax Cmnty Facs Dist #2011-1
| | 5.00% | | 09/01/31 | | 166,592 |
| 145,000 | | Menifee CA Union Sch Dist Spl Tax Cmnty Facs Dist #2011-1
| | 5.00% | | 09/01/32 | | 159,565 |
| 165,000 | | Menifee CA Union Sch Dist Spl Tax Cmnty Facs Dist #2011-1
| | 5.00% | | 09/01/33 | | 180,667 |
| 1,710,000 | | Menifee CA Union Sch Dist Spl Tax Cmnty Facs Dist #2011-1
| | 5.00% | | 09/01/44 | | 1,831,632 |
| 1,110,000 | | Montebello CA Pub Fing Auth Rev Montebello Home2 Suites Hilton Hotel Proj, Ser A
| | 5.00% | | 06/01/32 | | 1,294,637 |
| 2,515,000 | | Napa Vly CA Unif Sch Dist, Ser C, AGM
| | 4.00% | | 08/01/38 | | 2,727,870 |
| 110,000 | | Rancho Cordova CA Cmnty Facs Dist Spl Tax No 2018-1 Grantline 208
| | 5.00% | | 09/01/26 | | 123,697 |
Page 10
See Notes to Financial Statements
First Trust Managed Municipal ETF (FMB)
Portfolio of Investments (Continued)
April 30, 2020 (Unaudited)
Principal
Value | | Description | | Stated
Coupon | | Stated
Maturity | | Value |
| MUNICIPAL BONDS (Continued) |
| | | California (Continued) | | | | | | |
| $500,000 | | River Islands CA Pub Fing Auth Spl Tax Cmnty Facs Dist #2003-1, Ser A
| | 5.00% | | 09/01/43 | | $524,955 |
| 500,000 | | River Islands CA Pub Fing Auth Spl Tax Cmnty Facs Dist #2019-1 Phase 2 Pub Impts
| | 4.00% | | 09/01/33 | | 504,820 |
| 560,000 | | River Islands CA Pub Fing Auth Spl Tax Ref Cmnty Facs Dist #2003-1
| | 5.38% | | 09/01/31 | | 597,134 |
| 500,000 | | Riverside CA Unif Sch Dist Election of 2016, Ser B
| | 4.00% | | 08/01/35 | | 552,835 |
| 865,000 | | Rocklin CA Unif Sch Dist Cmnty Facs Dist Subordinate, Ser 2019, BAM
| | 5.00% | | 09/15/34 | | 1,072,505 |
| 625,000 | | Rocklin CA Unif Sch Dist Cmnty Facs Dist Subordinate, Ser 2019, BAM
| | 4.00% | | 09/15/35 | | 707,919 |
| 1,080,000 | | Rocklin CA Unif Sch Dist Cmnty Facs Dist Subordinate, Ser 2019, BAM
| | 4.00% | | 09/15/36 | | 1,217,959 |
| 110,000 | | Roseville CA Spl Tax
| | 5.00% | | 09/01/30 | | 125,054 |
| 100,000 | | Roseville CA Spl Tax
| | 5.00% | | 09/01/31 | | 112,713 |
| 500,000 | | Sacramento CA Transient Occupancy Tax Rev Sub Convention Ctr Complex, Ser C
| | 5.00% | | 06/01/35 | | 552,680 |
| 350,000 | | San Diego Cnty CA Ltd Rev Obligs Ref Sanford Burnham Prebys Med Discovery Institute, Ser A
| | 5.00% | | 11/01/25 | | 417,056 |
| 500,000 | | San Diego Cnty CA Ltd Rev Obligs Ref Sanford Burnham Prebys Med Discovery Institute, Ser A
| | 5.00% | | 11/01/26 | | 595,505 |
| 945,000 | | San Diego Cnty CA Regl Arpt Auth Sr, Ser B, AMT
| | 5.00% | | 07/01/30 | | 1,017,633 |
| 1,250,000 | | San Diego Cnty CA Regl Transprtn Commn, Ser A
| | 5.00% | | 04/01/35 | | 1,471,437 |
| 1,365,000 | | San Francisco CA Bay Area Rapid Transit Dist Sales Tax Rev, Ser A
| | 4.00% | | 07/01/36 | | 1,517,880 |
| 1,330,000 | | San Francisco CA Bay Area Rapid Transit Dist Sales Tax Rev, Ser A
| | 4.00% | | 07/01/37 | | 1,471,924 |
| 1,000,000 | | San Francisco CA City & Cnty Arpts Commn Intl Arpt Rev Ref, Ser D, AMT
| | 5.00% | | 05/01/22 | | 1,063,800 |
| 280,000 | | San Francisco City & Cnty CA Redev Agy Successor Agy Tax Ref Mission Bay N Redev Proj, Ser A
| | 5.00% | | 08/01/35 | | 314,171 |
| 150,000 | | Simi Vly CA Unif Sch Dist, Ser B
| | 4.00% | | 08/01/32 | | 171,366 |
| 375,000 | | Simi Vly CA Unif Sch Dist, Ser B
| | 4.00% | | 08/01/39 | | 413,846 |
| 340,000 | | South San Francisco CA Pub Facs Fing Auth Lease Rev Police Station Proj, Ser A
| | 4.00% | | 06/01/33 | | 393,870 |
| 400,000 | | South San Francisco CA Pub Facs Fing Auth Lease Rev Police Station Proj, Ser A
| | 4.00% | | 06/01/34 | | 457,804 |
| 160,000 | | Tahoe Truckee CA Unif Sch Dist COPS, BAM
| | 4.00% | | 06/01/35 | | 176,474 |
| 255,000 | | Tahoe Truckee CA Unif Sch Dist COPS, BAM
| | 4.00% | | 06/01/36 | | 280,049 |
| 1,000,000 | | Tahoe Truckee CA Unif Sch Dist COPS, BAM
| | 4.00% | | 06/01/43 | | 1,078,560 |
| 100,000 | | Temecula Vly Unif Sch Dist Fing Auth CA Spl Tax Rev, BAM
| | 5.00% | | 09/01/34 | | 113,267 |
| 385,000 | | Temescal Vly CA Wtr Dist Spl Tax Terramor Cmnty Facs Dist #4 Impt Area #1
| | 4.00% | | 09/01/23 | | 404,373 |
| 500,000 | | Tobacco Securitization Auth Nthrn CA Tobacco Settlement Rev Asset Bkd Bds, Ser A-1
| | 5.50% | | 06/01/45 | | 494,375 |
| 650,000 | | Tulare CA Loc Hlth Care Dist Ref, BAM
| | 4.00% | | 08/01/35 | | 725,081 |
| 500,000 | | Tulare CA Loc Hlth Care Dist Ref, BAM
| | 4.00% | | 08/01/39 | | 544,675 |
| 300,000 | | Vacaville CA Unif Sch Dist, Ser D
| | 4.00% | | 08/01/35 | | 335,904 |
| 600,000 | | Vacaville CA Unif Sch Dist, Ser D
| | 4.00% | | 08/01/37 | | 666,000 |
| 500,000 | | Vacaville CA Unif Sch Dist, Ser D
| | 4.00% | | 08/01/38 | | 552,580 |
| 1,050,000 | | Victor CA Elem Sch Dist Cmnty Facs Dist Spl Tax Ref 2005-1, BAM
| | 5.00% | | 09/01/46 | | 1,192,254 |
| | | | | 89,020,654 |
See Notes to Financial Statements
Page 11
First Trust Managed Municipal ETF (FMB)
Portfolio of Investments (Continued)
April 30, 2020 (Unaudited)
Principal
Value | | Description | | Stated
Coupon | | Stated
Maturity | | Value |
| MUNICIPAL BONDS (Continued) |
| | | Colorado – 7.9% | | | | | | |
| $500,000 | | Aviation Station North Met Dist #2 CO Ltd, Ser A
| | 4.00% | | 12/01/29 | | $456,890 |
| 500,000 | | Base Vlg Met Dist #2 CO Ref, Ser A
| | 5.50% | | 12/01/36 | | 493,030 |
| 1,000,000 | | Broadway Station Met Dist No 3 CO Sr Cib Lmtd Tax Convertible to Unlimited Tax
| | 5.00% | | 12/01/49 | | 835,040 |
| 455,000 | | Buffalo Ridge CO Met Dist Ref & Impt Sr, Ser A, BAM
| | 5.00% | | 12/01/25 | | 536,336 |
| 250,000 | | Buffalo Ridge CO Met Dist Ref & Impt Sr, Ser A, BAM
| | 5.00% | | 12/01/26 | | 300,473 |
| 500,000 | | Castle Oaks CO Met Dist #3 Ref
| | 5.00% | | 12/01/37 | | 454,720 |
| 500,000 | | Centerra CO Met Dist #1 Spl Rev Dist #1 (b)
| | 5.00% | | 12/01/22 | | 505,150 |
| 1,000,000 | | Centerra CO Met Dist #1 Spl Rev Dist #1 (b)
| | 5.00% | | 12/01/29 | | 978,150 |
| 400,000 | | CO Eductnl & Cultural Auth Rev Ref West Ridge Academy Chrt Sch Proj, Ser A
| | 5.00% | | 06/01/49 | | 425,244 |
| 700,000 | | CO St Building Excellent Schs Today, Ser O, COPS
| | 5.00% | | 03/15/31 | | 880,754 |
| 1,750,000 | | CO St Building Excellent Schs Today, Ser O, COPS
| | 4.00% | | 03/15/37 | | 1,937,390 |
| 2,390,000 | | CO St Building Excellent Schs Today, Ser O, COPS
| | 4.00% | | 03/15/38 | | 2,627,446 |
| 1,920,000 | | CO St Eductnl & Cultural Facs Auth Rev Chrt Sch Loveland Classical Schs Proj (b)
| | 5.00% | | 07/01/36 | | 1,772,390 |
| 2,245,000 | | CO St Eductnl & Cultural Facs Auth Rev Ref & Impt Chrt Sch Univ Lab Bldg Corp
| | 5.00% | | 12/15/35 | | 2,362,144 |
| 4,000,000 | | CO St Eductnl & Cultural Facs Auth Rev Ref & Impt Chrt Sch Univ Lab Bldg Corp
| | 5.00% | | 12/15/45 | | 4,128,240 |
| 1,020,000 | | CO St Eductnl & Cultural Facs Auth Rev Univ Denver Proj, Ser A
| | 4.00% | | 03/01/35 | | 1,107,057 |
| 250,000 | | CO St Hlth Facs Auth Hosp Rev Ref Commonspirit Hlth, Ser A-1
| | 5.00% | | 08/01/35 | | 276,238 |
| 3,000,000 | | CO St Hlth Facs Auth Hosp Rev Ref Commonspirit Hlth, Ser A-1
| | 4.00% | | 08/01/38 | | 3,003,240 |
| 1,125,000 | | CO St Hlth Facs Auth Hosp Rev Ref Commonspirit Hlth, Ser A-1
| | 4.00% | | 08/01/44 | | 1,095,480 |
| 7,000,000 | | CO St Hlth Facs Auth Hosp Rev Ref Commonspirit Hlth, Ser B
| | 4.00% | | 01/01/40 | | 7,248,780 |
| 300,000 | | CO St Hlth Facs Auth Hosp Rev Ref Frasier Meadows Retmnt Cmnty Proj, Ser A
| | 5.00% | | 05/15/25 | | 297,108 |
| 350,000 | | CO St Hlth Facs Auth Hosp Rev Ref Frasier Meadows Retmnt Cmnty Proj, Ser A
| | 5.00% | | 05/15/26 | | 345,520 |
| 2,500,000 | | CO St Hlth Facs Auth Hosp Rev Ref Sanford Hlth, Ser A
| | 5.00% | | 11/01/31 | | 2,943,700 |
| 2,950,000 | | CO St Hlth Facs Auth Hosp Rev Ref Sanford Hlth, Ser A
| | 5.00% | | 11/01/32 | | 3,440,054 |
| 3,655,000 | | CO St Hlth Facs Auth Hosp Rev Ref Sanford Hlth, Ser A
| | 5.00% | | 11/01/33 | | 4,231,284 |
| 1,800,000 | | CO St Hlth Facs Auth Hosp Rev Ref Sanford Hlth, Ser A
| | 5.00% | | 11/01/44 | | 1,978,470 |
| 605,000 | | CO St Hlth Facs Auth Rev Ref Covenant Retmnt Cmntys, Ser A
| | 5.00% | | 12/01/27 | | 618,159 |
| 525,000 | | CO St Hlth Facs Auth Rev Ref Covenant Retmnt Cmntys, Ser A
| | 5.00% | | 12/01/33 | | 531,935 |
| 495,000 | | Colorado Springs CO Pikes Peak Americas Mountain Enterprise Pikes Peak
| | 5.00% | | 12/01/25 | | 585,808 |
| 500,000 | | Copperleaf CO Met Dist #2 Ref
| | 5.25% | | 12/01/30 | | 501,915 |
| 5,000,000 | | Denver City & Cnty CO Arpt Rev Ref Sub Sys, Ser A, AMT
| | 5.00% | | 12/01/35 | | 5,803,850 |
| 4,000,000 | | Denver City & Cnty CO Arpt Rev Ref Sub Sys, Ser A, AMT
| | 5.00% | | 12/01/37 | | 4,611,360 |
| 975,000 | | Denver City & Cnty CO Arpt Rev Ref Sub Sys, Ser A, AMT
| | 5.00% | | 12/01/38 | | 1,120,801 |
| 1,000,000 | | Denver City & Cnty CO Arpt Rev Ref Sub Sys, Ser A, AMT
| | 5.00% | | 12/01/43 | | 1,136,310 |
| 1,000,000 | | Denver CO City & Cnty Dedicated Tax Rev, Ser A-1
| | 5.00% | | 08/01/41 | | 1,154,800 |
| 600,000 | | Denver CO Hlth & Hosp Auth 550 Acoma Inc, COPS
| | 5.00% | | 12/01/26 | | 698,034 |
| 1,790,000 | | Denver CO Intl Business Ctr CO Met Dist #1 Subordinate, Ser B
| | 6.00% | | 12/01/48 | | 1,635,469 |
| 55,000 | | E-470 CO Pub Highway Auth Capital Appreciation Sr, Ser B, NATL-RE
| | (d) | | 09/01/22 | | 52,037 |
| 1,500,000 | | Fourth Street Crossing Business Impt Dist CO Sr, Ser A (b)
| | 5.13% | | 12/01/38 | | 1,338,690 |
| 2,735,000 | | Hunters Overlook Metro Dist #5 Co Sr Bonds, Ser A
| | 5.00% | | 12/01/49 | | 2,413,173 |
| 900,000 | | Hunters Overlook Metro Dist #5 CO Sr Bonds, Ser A
| | 5.00% | | 12/01/39 | | 845,406 |
| 1,000,000 | | Independence Met Dist #3 CO, Ser A
| | 6.25% | | 12/01/49 | | 986,290 |
| 860,000 | | Lakes at Centerra Met Dist No 2 CO Impt, Ser A
| | 4.63% | | 12/01/27 | | 837,726 |
| 1,000,000 | | Lanterns Met Dist #1 CO Sr, Ser A
| | 5.00% | | 12/01/49 | | 855,830 |
| 100,000 | | Lorson Ranch Met Dist #2 CO
| | 4.00% | | 12/01/24 | | 109,020 |
| 170,000 | | Lorson Ranch Met Dist #2 CO
| | 5.00% | | 12/01/27 | | 195,733 |
Page 12
See Notes to Financial Statements
First Trust Managed Municipal ETF (FMB)
Portfolio of Investments (Continued)
April 30, 2020 (Unaudited)
Principal
Value | | Description | | Stated
Coupon | | Stated
Maturity | | Value |
| MUNICIPAL BONDS (Continued) |
| | | Colorado (Continued) | | | | | | |
| $3,260,000 | | Mirabelle Met Dist #2 Co Sr, Ser A
| | 5.00% | | 12/01/39 | | $2,907,790 |
| 1,000,000 | | North Park Met Dist #1 Spl Rev, Ser A-2
| | 5.13% | | 12/01/28 | | 982,620 |
| 3,000,000 | | Painted Prairie Pub Impt Auth CO
| | 5.00% | | 12/01/39 | | 2,704,470 |
| 2,460,000 | | Park Creek CO Met Dist Rev Ref Sr Ltd Property Tax Supported, Ser A
| | 5.00% | | 12/01/24 | | 2,834,560 |
| 150,000 | | Park Creek CO Met Dist Rev Ref Sr Ltd Property Tax Supported, Ser A
| | 5.00% | | 12/01/31 | | 173,694 |
| 150,000 | | Park Creek CO Met Dist Rev Ref Sr Ltd Property Tax Supported, Ser A
| | 5.00% | | 12/01/34 | | 172,497 |
| 155,000 | | Park Creek CO Met Dist Rev Ref Sr Ltd Property Tax Supported, Ser A
| | 5.00% | | 12/01/35 | | 177,895 |
| 2,000,000 | | Park Creek CO Met Dist Rev Ref Sr Ltd Property Tax Supported, Ser A
| | 5.00% | | 12/01/45 | | 2,255,100 |
| 1,000,000 | | Park Creek CO Met Dist Rev Sr Lien, Ser A, AGM
| | 4.00% | | 12/01/34 | | 1,139,820 |
| 1,455,000 | | Park Creek CO Met Dist Rev Sr Lien, Ser A, AGM
| | 4.00% | | 12/01/35 | | 1,650,246 |
| 1,040,000 | | Park Creek CO Met Dist Rev Sr Lien, Ser A, AGM
| | 4.00% | | 12/01/36 | | 1,174,597 |
| 420,000 | | Park Creek CO Met Dist Rev Sr, Ser A
| | 5.00% | | 12/01/30 | | 514,823 |
| 30,000 | | Park Creek CO Met Dist Rev Sr, Ser A, NATL-RE
| | 5.00% | | 12/01/24 | | 34,640 |
| 500,000 | | Parker Homestead Met Dist CO Ref (c)
| | 5.63% | | 12/01/44 | | 489,870 |
| 1,000,000 | | Prairie Ctr CO Met Dist #3 Ltd Property Tax Supported Pri Ref, Ser A (b)
| | 4.13% | | 12/15/27 | | 955,490 |
| 135,000 | | Pub Auth for CO St Energy Nat Gas Purchase Rev
| | 6.13% | | 11/15/23 | | 144,805 |
| 5,000,000 | | Rampart Range CO Met Dist #1 Ltd Tax Supported & Spl Rev Ref & Impt, AGM
| | 5.00% | | 12/01/42 | | 5,805,650 |
| 550,000 | | Serenity Ridge CO Met Dist #2 Ref, Ser A (c)
| | 5.13% | | 12/01/37 | | 512,264 |
| 750,000 | | Sierra Ridge Met Dist No 2 CO Sr, Ser A
| | 4.50% | | 12/01/31 | | 694,875 |
| 2,015,000 | | South Suburban Park & Recreation Dist CO, COPS
| | 4.00% | | 12/15/35 | | 2,219,381 |
| 2,065,000 | | Stc Met Dist #2 CO Ref, Ser A
| | 4.00% | | 12/01/29 | | 1,893,316 |
| 4,000,000 | | Stc Met Dist #2 CO Ref, Ser A
| | 5.00% | | 12/01/38 | | 3,742,400 |
| 2,000,000 | | Stc Met Dist #2 CO Ref, Ser A
| | 5.00% | | 12/01/49 | | 1,762,360 |
| 175,000 | | Sterling Hills CO W Met Dist Ref
| | 5.00% | | 12/01/32 | | 198,237 |
| 1,800,000 | | Takoda CO Met Dist Ref
| | 6.00% | | 12/01/36 | | 2,048,796 |
| 1,400,000 | | Thompson Crossing Met Dist #4 CO Ref
| | 5.00% | | 12/01/39 | | 1,374,240 |
| 500,000 | | Trails at Crowfoot Met Dist #3 CO Sr Series, Ser A
| | 5.00% | | 12/01/39 | | 455,165 |
| 1,000,000 | | Velocity Met Dist #3 CO
| | 5.13% | | 12/01/34 | | 962,820 |
| 600,000 | | Willow Bend Met Dist CO Sr, Ser A
| | 5.00% | | 12/01/39 | | 552,138 |
| 1,000,000 | | Willow Bend Met Dist CO Sr, Ser A
| | 5.00% | | 12/01/49 | | 869,730 |
| | | | | 112,096,963 |
| | | Connecticut – 3.5% | | | | | | |
| 1,250,000 | | CT St Hlth & Eductnl Facs Auth Rev Fairfield Univ, Ser Q-1
| | 5.00% | | 07/01/46 | | 1,339,563 |
| 1,000,000 | | CT St Hlth & Eductnl Facs Auth Rev Quinnipiac Univ Ref, Ser M
| | 5.00% | | 07/01/36 | | 1,090,270 |
| 5,160,000 | | CT St Hlth & Eductnl Facs Auth Rev Ref Fairfield Univ, Ser R
| | 4.00% | | 07/01/47 | | 5,195,810 |
| 1,000,000 | | CT St Hlth & Eductnl Facs Auth Rev Ref Fairfield Univ, Ser S
| | 5.00% | | 07/01/26 | | 1,138,970 |
| 2,250,000 | | CT St Hlth & Eductnl Facs Auth Rev Ref Quinnipiac Univ, Ser L
| | 5.00% | | 07/01/31 | | 2,461,500 |
| 200,000 | | CT St Hlth & Eductnl Facs Auth Rev Ref Quinnipiac Univ, Ser L
| | 4.00% | | 07/01/33 | | 205,642 |
| 1,210,000 | | CT St Hlth & Eductnl Facs Auth Rev Yale Univ Issue, Ser U-2 (Mandatory put 02/08/22)
| | 2.00% | | 07/01/33 | | 1,228,719 |
| 500,000 | | CT St Hlth & Eductnl Facs Auth Rev, Ser A
| | 5.00% | | 07/01/34 | | 571,855 |
| 1,000,000 | | CT St Hlth & Eductnl Facs Auth Rev, Ser A
| | 5.00% | | 07/01/35 | | 1,138,160 |
| 1,000,000 | | CT St Hlth & Eductnl Facs Auth Rev, Ser A
| | 4.00% | | 07/01/36 | | 1,036,150 |
| 1,120,000 | | CT St Hsg Fin Auth Hsg Fin Mtge Program Ref, Subser A-1
| | 3.65% | | 11/15/32 | | 1,183,202 |
| 3,500,000 | | CT St Hsg Fin Auth Hsg Fin Mtge Program Ref, Subser B-1
| | 3.55% | | 11/15/33 | | 3,746,330 |
| 2,345,000 | | CT St Spl Tax Oblig Rev Transprtn Infrastructure, Ser A
| | 5.00% | | 08/01/34 | | 2,610,407 |
| 1,445,000 | | CT St, Ser A
| | 5.00% | | 04/15/29 | | 1,682,890 |
See Notes to Financial Statements
Page 13
First Trust Managed Municipal ETF (FMB)
Portfolio of Investments (Continued)
April 30, 2020 (Unaudited)
Principal
Value | | Description | | Stated
Coupon | | Stated
Maturity | | Value |
| MUNICIPAL BONDS (Continued) |
| | | Connecticut (Continued) | | | | | | |
| $500,000 | | CT St, Ser A
| | 4.00% | | 01/15/36 | | $529,735 |
| 5,000,000 | | CT St, Ser A
| | 4.00% | | 01/15/37 | | 5,275,800 |
| 790,000 | | CT St, Ser B
| | 5.00% | | 03/01/26 | | 855,483 |
| 905,000 | | CT St, Ser E
| | 5.00% | | 10/15/33 | | 1,022,804 |
| 560,000 | | CT St, Ser E
| | 4.00% | | 10/15/35 | | 583,794 |
| 700,000 | | CT St, Ser F
| | 5.00% | | 11/15/34 | | 777,742 |
| 500,000 | | Hamden CT, BAM
| | 6.00% | | 08/15/33 | | 632,560 |
| 500,000 | | Harbor Point CT Infrastructure Impt Dist Spl Oblig Rev Ref Harbor Point Proj Ltd (b)
| | 5.00% | | 04/01/39 | | 508,445 |
| 1,970,000 | | Univ of Connecticut CT, Ser A
| | 5.00% | | 01/15/29 | | 2,292,883 |
| 4,635,000 | | Univ of Connecticut CT, Ser A
| | 5.00% | | 01/15/30 | | 5,365,708 |
| 1,250,000 | | Univ of Connecticut CT, Ser A
| | 5.00% | | 11/01/32 | | 1,468,125 |
| 3,820,000 | | Univ of Connecticut CT, Ser A
| | 5.00% | | 11/01/34 | | 4,449,803 |
| 1,500,000 | | Univ of Connecticut CT, Ser A
| | 5.00% | | 11/01/36 | | 1,733,190 |
| | | | | 50,125,540 |
| | | Delaware – 0.2% | | | | | | |
| 325,000 | | DE St Hlth Facs Auth Rev Beebe Med Ctr
| | 5.00% | | 06/01/26 | | 374,826 |
| 2,633,000 | | Millsboro DE Spl Oblig Ref Plantation Lakes Spl Dev Dist (b)
| | 5.00% | | 07/01/28 | | 2,612,936 |
| | | | | 2,987,762 |
| | | District of Columbia – 0.2% | | | | | | |
| 1,000,000 | | Washington DC Met Area Transit Auth Gross Rev
| | 5.00% | | 07/01/33 | | 1,179,530 |
| 885,000 | | Washington DC Met Area Transit Auth Gross Rev Ref, Ser A-1
| | 5.00% | | 07/01/29 | | 1,075,620 |
| | | | | 2,255,150 |
| | | Florida – 6.7% | | | | | | |
| 500,000 | | Academical Vlg CDD FL Spl Assmnt Rev CDD
| | 2.88% | | 05/01/25 | | 484,460 |
| 1,000,000 | | Academical Vlg CDD FL Spl Assmnt Rev CDD
| | 3.63% | | 05/01/40 | | 860,460 |
| 125,000 | | Belle Isle FL Chrt Sch Lease Rev Cornerstone Chrt Academy & Cornerstone Chrt High Sch
| | 5.50% | | 10/01/22 | | 128,731 |
| 300,000 | | Bexley CDD FL Spl Assmnt Rev
| | 4.10% | | 05/01/26 | | 297,483 |
| 410,000 | | Brookstone CDD FL Spl Assmnt Rev CDD (e)
| | 3.88% | | 11/01/23 | | 406,630 |
| 2,305,000 | | Broward Cnty FL Arpt Sys Rev, Ser A, AMT
| | 5.00% | | 10/01/31 | | 2,716,880 |
| 605,000 | | Broward Cnty FL Fuel Sys Rev Ft Lauderdale Fuel Facs, Ser A, AGM, AMT
| | 5.00% | | 04/01/22 | | 650,030 |
| 1,350,000 | | Broward Cnty FL Port Facs Rev Ref Subordinate Bond, Ser D, AMT
| | 5.00% | | 09/01/27 | | 1,604,813 |
| 250,000 | | Citizens Property Insurance Corp FL, Ser A1
| | 5.00% | | 06/01/22 | | 263,868 |
| 2,000,000 | | Coco Palms FL Cdd Spl Assmnt
| | 4.50% | | 05/01/32 | | 2,028,760 |
| 280,000 | | Escambia Cnty FL Hlth Facs Auth Baptist Hosp Inc Proj, Ser A
| | 5.50% | | 08/15/24 | | 282,744 |
| 400,000 | | Escambia Cnty FL Sol Wst Disp Var Gulf Pwr Co Proj, 2nd Ser (a)
| | 0.25% | | 04/01/39 | | 400,000 |
| 725,000 | | FL St Govtl Utility Auth Rev Ref, AGM
| | 4.00% | | 10/01/37 | | 824,731 |
| 825,000 | | FL St Govtl Utility Auth Rev Ref, AGM
| | 4.00% | | 10/01/38 | | 935,435 |
| 750,000 | | FL St Govtl Utility Auth Rev Ref, AGM
| | 4.00% | | 10/01/39 | | 848,145 |
| 1,720,000 | | FL St Muni Pwr Agy Ref, Ser A
| | 5.00% | | 10/01/20 | | 1,749,515 |
| 1,900,000 | | Fort Myers FL Utility Rev Ref Rev, Ser A
| | 4.00% | | 10/01/44 | | 2,082,134 |
| 6,850,000 | | Gtr Orlando FL Aviation Auth Arpt Facs Rev Priority Sub, Ser A, AMT
| | 5.00% | | 10/01/42 | | 7,513,217 |
| 1,000,000 | | Gulfstream Polo Cmnty Dev Dist FL Spl Assmnt Phase 2 Proj
| | 4.38% | | 11/01/49 | | 934,220 |
| 445,000 | | Harmony FL CDD Capital Impt Rev Ref, Ser 2015
| | 4.75% | | 05/01/25 | | 443,242 |
| 365,000 | | Heritage Harbour FL N CDD Capital Impt Rev Ref Sr Lien, Ser A-1, AGM
| | 5.00% | | 05/01/25 | | 416,870 |
| 125,000 | | Hollywood FL Cmnty Redev Agy Redev Rev Ref
| | 5.00% | | 03/01/23 | | 137,565 |
| 1,000,000 | | Jacksonville FL Healthcare Facs Rev Ref Baptist Hlth
| | 5.00% | | 08/15/35 | | 1,157,250 |
| 3,700,000 | | Jacksonville FL Spl Rev Ref Spl Rev, Ser A
| | 5.00% | | 10/01/31 | | 4,396,525 |
Page 14
See Notes to Financial Statements
First Trust Managed Municipal ETF (FMB)
Portfolio of Investments (Continued)
April 30, 2020 (Unaudited)
Principal
Value | | Description | | Stated
Coupon | | Stated
Maturity | | Value |
| MUNICIPAL BONDS (Continued) |
| | | Florida (Continued) | | | | | | |
| $1,000,000 | | Jacksonville FL Spl Rev Ref Spl Rev, Ser B
| | 5.00% | | 10/01/28 | | $1,195,590 |
| 2,980,000 | | Jea FL Wtr & Swr Rev Ref, Ser A
| | 4.00% | | 10/01/39 | | 3,237,442 |
| 1,230,000 | | Lakeland FL Hosp Sys Rev Lakeland Regl Hlth
| | 5.00% | | 11/15/33 | | 1,330,553 |
| 1,210,000 | | Lee Cnty FL Indl Dev Auth Cypress Cove Healthpark FL Inc Memory Care Proj
| | 4.00% | | 10/01/24 | | 1,177,052 |
| 1,000,000 | | Lee Cnty FL Indl Dev Auth Shell Point/Waterside Hlth Proj
| | 5.00% | | 11/15/39 | | 1,017,430 |
| 1,500,000 | | Lee Cnty FL Indl Dev Auth Shell Point/Waterside Hlth Proj
| | 5.00% | | 11/15/44 | | 1,509,015 |
| 1,385,000 | | Mediterra FL S CDD Capital Impt Rev Ref
| | 5.10% | | 05/01/31 | | 1,461,175 |
| 2,500,000 | | Miami Dade Cnty FL Wtr & Swr Rev Ref Sys, Ser B
| | 4.00% | | 10/01/34 | | 2,813,450 |
| 2,130,000 | | Miami Dade Cnty FL Wtr & Swr Rev Sys, Ser A
| | 4.00% | | 10/01/40 | | 2,334,587 |
| 330,000 | | Miami FL Hlth Facs Auth Ref Miami Jewish Hlth Sys Oblig Grp
| | 5.00% | | 07/01/25 | | 304,217 |
| 500,000 | | Miami FL Spl Oblig Ref (b)
| | 5.00% | | 03/01/30 | | 550,700 |
| 375,000 | | Miami World Ctr CDD FL Spl Assmnt
| | 4.00% | | 11/01/23 | | 376,991 |
| 275,000 | | Miami World Ctr CDD FL Spl Assmnt
| | 4.75% | | 11/01/27 | | 284,048 |
| 1,015,000 | | Miami-Dade Cnty FL Aviation Rev Ref, Ser A, AMT
| | 5.00% | | 10/01/27 | | 1,110,857 |
| 2,000,000 | | Miami-Dade Cnty FL Eductnl Facs Auth Rev Ref Univ Miami, Ser A
| | 5.00% | | 04/01/31 | | 2,180,880 |
| 445,000 | | Miami-Dade Cnty FL Indl Dev Auth Doral Academy Proj
| | 5.00% | | 01/15/25 | | 471,335 |
| 550,000 | | Miami-Dade Cnty FL Indl Dev Auth Doral Academy Proj
| | 5.00% | | 01/15/32 | | 575,927 |
| 1,210,000 | | Miami-Dade Cnty FL Indl Dev Auth Doral Academy Proj
| | 5.00% | | 01/15/37 | | 1,241,847 |
| 1,080,000 | | Miami-Dade Cnty FL Spl Oblig Sub Ref
| | 5.00% | | 10/01/35 | | 1,280,437 |
| 6,000,000 | | Miami-Dade Cnty FL Wtr & Swr Rev, Ser B
| | 4.00% | | 10/01/44 | | 6,577,860 |
| 2,430,000 | | Miami-Dade Cnty FL, Ser A
| | 5.00% | | 07/01/43 | | 2,868,493 |
| 440,000 | | North Park Isle Cmnty Dev Dist FL Spl Assmnt Rev Assmnt Area One
| | 3.63% | | 05/01/24 | | 431,345 |
| 800,000 | | North Park Isle Cmnty Dev Dist FL Spl Assmnt Rev Assmnt Area One
| | 4.00% | | 05/01/30 | | 761,888 |
| 225,000 | | North Park Isle Cmnty Dev Dist FL Spl Assmnt Rev Assmnt Area One
| | 4.50% | | 05/01/40 | | 206,885 |
| 355,000 | | Nthrn Palm Beach Cnty FL Impt Dist
| | 5.00% | | 08/01/37 | | 371,319 |
| 680,000 | | Orange Cnty FL Hlth Facs Auth Rev Presbyterian Retmnt Cmntys Proj
| | 5.00% | | 08/01/29 | | 694,001 |
| 345,000 | | Orange Cnty FL Hlth Facs Auth Rev Presbyterian Retmnt Cmntys Proj
| | 5.00% | | 08/01/34 | | 348,781 |
| 6,000,000 | | Orange Cnty FL Hlth Facs Auth Rev Ref Orlando Hlth Inc, Ser A
| | 5.00% | | 10/01/36 | | 6,744,660 |
| 2,000,000 | | Orange Cnty FL Hlth Facs Auth Rev Ref Orlando Hlth Inc, Ser A
| | 5.00% | | 10/01/39 | | 2,237,140 |
| 825,000 | | Orange Cnty FL Hlth Facs Auth Rev Ref Presbyterian Retmnt Cmntys
| | 5.00% | | 08/01/31 | | 843,117 |
| 1,000,000 | | Orange Cnty FL Hlth Facs Auth Rev Ref Presbyterian Retmnt Cmntys
| | 5.00% | | 08/01/41 | | 1,000,980 |
| 900,000 | | Palm Beach Cnty FL Hlth Facs Auth Acts Retmnt Life Cmntys Ref
| | 5.00% | | 11/15/22 | | 930,879 |
| 800,000 | | Palm Beach Cnty FL Hlth Facs Auth Hosp Rev Baptist Hlth South FL Obligated Grp
| | 5.00% | | 08/15/23 | | 867,520 |
| 1,000,000 | | Palm Beach Cnty FL Hlth Facs Auth Ref Acts Retmnt Life Cmntys Inc Oblig Grp
| | 5.00% | | 11/15/32 | | 1,047,590 |
| 305,000 | | Palm Beach Cnty FL Hlth Facs Auth Rev Lifespace Cmntys Inc, Ser B
| | 5.00% | | 05/15/31 | | 302,191 |
| 55,000 | | Port Saint Lucie FL Cmnty Redev Agy Rev Ref
| | 5.00% | | 01/01/23 | | 60,290 |
| 200,000 | | Rhodine Road North CDD FL Spl Assmnt
| | 3.50% | | 05/01/24 | | 197,724 |
| 1,000,000 | | Rhodine Road North CDD FL Spl Assmnt
| | 4.50% | | 05/01/40 | | 956,750 |
| 545,000 | | Rivington CDD FL Spl Assmnt Rev Assmnt Area
| | 2.88% | | 05/01/25 | | 530,160 |
| 335,000 | | San Simeon Cmnty Dev Dist FL Spl Assmnt (b)
| | 4.13% | | 06/15/39 | | 325,697 |
| 725,000 | | Sarasota Cnty FL Hlth Facs Auth Retmnt Fac Rev Ref Vlg of Isle Proj
| | 5.00% | | 01/01/25 | | 722,869 |
| 2,250,000 | | SE Overtown Park W Cmnty Redev Agy FL Tax, Ser A-1 (b)
| | 5.00% | | 03/01/30 | | 2,461,950 |
See Notes to Financial Statements
Page 15
First Trust Managed Municipal ETF (FMB)
Portfolio of Investments (Continued)
April 30, 2020 (Unaudited)
Principal
Value | | Description | | Stated
Coupon | | Stated
Maturity | | Value |
| MUNICIPAL BONDS (Continued) |
| | | Florida (Continued) | | | | | | |
| $500,000 | | Shell Point Cmnty Dev Dist FL Spl Assmnt (b)
| | 4.00% | | 11/01/24 | | $495,135 |
| 2,730,000 | | Stoneybrook FL S CDD Spl Assmnt Rev Assmnt Area Two, A Proj
| | 5.13% | | 11/01/34 | | 2,959,347 |
| 500,000 | | Tallahassee FL Energy Sys Rev Energy Sys
| | 5.00% | | 10/01/29 | | 575,980 |
| 1,500,000 | | Tallahassee FL Energy Sys Rev Energy Sys
| | 5.00% | | 10/01/30 | | 1,723,785 |
| 215,000 | | Timber Creek CDD FL Spl Assmnt Rev (e)
| | 4.13% | | 11/01/24 | | 213,478 |
| 100,000 | | UCF Stadium Corp FL Rev Ref, Ser A
| | 5.00% | | 03/01/24 | | 108,888 |
| 170,000 | | Villamar CDD FL Spl Assmnt (c)
| | 3.75% | | 05/01/24 | | 166,056 |
| 70,000 | | Vlg FL CDD #6 Spl Assmnt Rev Ref
| | 4.00% | | 05/01/25 | | 76,428 |
| 500,000 | | Volusia Cnty FL Eductnl Fac Auth Ref Embry Riddle Aeronautical Univ Inc Proj, Ser A
| | 4.00% | | 10/15/37 | | 514,175 |
| 835,000 | | Westside FL CDD Spl Assmnt Rev Ref (b)
| | 4.10% | | 05/01/37 | | 788,975 |
| 500,000 | | WildBlue CDD FL Spl Assmnt (b)
| | 3.50% | | 06/15/24 | | 499,055 |
| | | | | 95,628,632 |
| | | Georgia – 3.8% | | | | | | |
| 9,000,000 | | Atlanta GA Arpt Passenger Fac Charge Rev Arpt Rev Subordinate, Ser D, AMT
| | 4.00% | | 07/01/38 | | 9,441,810 |
| 650,000 | | Atlanta GA Tax Allocation Ref Eastside Proj
| | 5.00% | | 01/01/30 | | 793,078 |
| 3,000,000 | | Atlanta GA Wtr & Wstwtr Rev Ref, Ser A
| | 5.00% | | 11/01/41 | | 3,564,120 |
| 4,400,000 | | Atlanta GA Wtr & Wstwtr Rev Ref, Ser C
| | 4.00% | | 11/01/37 | | 4,913,920 |
| 625,000 | | De Kalb GA Priv Hosp Auth Children’s Healthcare of Atlanta, Ser B
| | 4.00% | | 07/01/37 | | 687,850 |
| 315,000 | | East Point GA Tax Allocation Ref
| | 5.00% | | 08/01/21 | | 329,462 |
| 500,000 | | Etowah GA Wtr & Swr Auth Rev Ref, BAM
| | 4.00% | | 03/01/34 | | 557,535 |
| 350,000 | | Etowah GA Wtr & Swr Auth Rev Ref, BAM
| | 4.00% | | 03/01/35 | | 388,539 |
| 400,000 | | Etowah GA Wtr & Swr Auth Rev Ref, BAM
| | 4.00% | | 03/01/36 | | 442,024 |
| 1,490,000 | | Floyd Cnty GA Dev Auth Spires Berry Clg Proj, Ser A (c)
| | 5.50% | | 12/01/28 | | 1,343,160 |
| 2,450,000 | | Floyd Cnty GA Dev Auth Spires Berry Clg Proj, Ser A (c)
| | 5.75% | | 12/01/33 | | 2,122,386 |
| 1,000,000 | | Fulton Cnty GA Dev Auth Rev Ref Children’s Healthcare of Atlanta, Ser C
| | 5.00% | | 07/01/35 | | 1,189,410 |
| 3,455,000 | | Fulton Cnty GA Rsdl Care Facs Elderly Auth Retmnt Fac Rev Ref Lenbrook Sq Fdtn Inc
| | 5.00% | | 07/01/31 | | 3,502,264 |
| 750,000 | | GA St Hgr Edu Facs Auth Rev Ref USG Real Estate Fdtn II LLC Projs
| | 5.00% | | 06/15/34 | | 886,463 |
| 890,000 | | GA St Hgr Edu Facs Auth Rev Ref USG Real Estate Fdtn II LLC Projs
| | 5.00% | | 06/15/35 | | 1,047,023 |
| 2,525,000 | | GA St Hsg & Fin Auth Rev Sf Mtge, Ser C
| | 3.25% | | 12/01/33 | | 2,633,575 |
| 5,000,000 | | GA St, Ser A-2
| | 4.00% | | 02/01/36 | | 5,550,550 |
| 40,000 | | Gainesville & Hall Cnty GA Hosp Auth Ref NE GA Hlth Sys Inc Proj, Ser A
| | 5.00% | | 02/15/26 | | 44,970 |
| 1,000,000 | | Glynn-Brunswick GA Memorial Hosp Auth Anticipation Ctfs South East GA Hlth Sys Proj
| | 5.00% | | 08/01/47 | | 1,062,440 |
| 985,000 | | Glynn-Brunswick GA Memorial Hosp Auth Ref Rev Anticipation Ctfs Southeast GA Hlth Sys Proj
| | 4.00% | | 08/01/37 | | 1,018,155 |
| 175,000 | | Main Street Nat Gas Inc GA Gas Rev, Ser A
| | 5.50% | | 09/15/23 | | 192,798 |
| 1,000,000 | | Main Street Nat Gas Inc GA Gas Sply Rev, Ser A
| | 5.00% | | 05/15/27 | | 1,113,190 |
| 2,330,000 | | Main Street Nat Gas Inc GA Gas Sply Rev, Ser A
| | 5.00% | | 05/15/30 | | 2,620,528 |
| 2,160,000 | | Main Street Nat Gas Inc GA Gas Sply Rev, Ser C
| | 5.00% | | 09/01/25 | | 2,422,310 |
| 1,170,000 | | Main Street Nat Gas Inc GA Gas Sply Rev, Ser C
| | 5.00% | | 09/01/26 | | 1,331,659 |
| 560,000 | | Priv Clgs & Univs Auth GA Mercer Univ Proj, Ser C
| | 5.25% | | 10/01/27 | | 581,106 |
| 1,175,000 | | Priv Clgs & Univs Auth GA Savannah Clg of Art & Design Proj
| | 5.00% | | 04/01/33 | | 1,258,601 |
| 2,865,000 | | S Regl GA Jt Dev Auth Rev Ref Valdosta St Univ VSU ASRE GA Reade Hopper LLC
| | 5.00% | | 08/01/35 | | 3,374,712 |
| | | | | 54,413,638 |
Page 16
See Notes to Financial Statements
First Trust Managed Municipal ETF (FMB)
Portfolio of Investments (Continued)
April 30, 2020 (Unaudited)
Principal
Value | | Description | | Stated
Coupon | | Stated
Maturity | | Value |
| MUNICIPAL BONDS (Continued) |
| | | Guam – 0.1% | | | | | | |
| $400,000 | | Guam Govt Business Privilege Tax Rev, Ser B-1
| | 5.00% | | 01/01/37 | | $390,808 |
| 300,000 | | Guam Port Auth Port Rev, Ser B, AMT
| | 5.00% | | 07/01/32 | | 301,800 |
| 75,000 | | Guam Pwr Auth Rev Ref, Ser A, AGM
| | 5.00% | | 10/01/20 | | 76,219 |
| | | | | 768,827 |
| | | Hawaii – 0.8% | | | | | | |
| 195,000 | | HI St Dept of Budget & Fin Spl Purpose Rev Ref HI Pacific Hlth Oblig Grp, Ser B
| | 5.00% | | 07/01/30 | | 210,169 |
| 110,000 | | HI St Pacific Hlth Spl Purpose Rev, Ser B
| | 5.63% | | 07/01/30 | | 110,864 |
| 4,980,000 | | HI St, Ser FG
| | 4.00% | | 10/01/33 | | 5,513,358 |
| 500,000 | | Honolulu City & Cnty HI Wstwtr Sys Rev Ref Junior, Ser A
| | 5.00% | | 07/01/20 | | 503,295 |
| 2,450,000 | | Honolulu City & Cnty HI Wstwtr Sys Rev Ref Sr First Bd Resolution, Ser B
| | 4.00% | | 07/01/32 | | 2,669,030 |
| 2,000,000 | | Honolulu City & Cnty HI Wstwtr Sys Rev Sr First Bd Resolution, Ser A
| | 4.00% | | 07/01/42 | | 2,182,020 |
| 100,000 | | Honolulu City & Cnty HI Wstwtr Sys Rev Sr First Bd Resolution, Ser B
| | 5.00% | | 07/01/20 | | 100,664 |
| | | | | 11,289,400 |
| | | Idaho – 0.1% | | | | | | |
| 1,000,000 | | ID St Hlth Facs Auth Rev Ref Madison Memorial Hosp
| | 5.00% | | 09/01/37 | | 1,066,440 |
| 255,000 | | ID St Hlth Facs Auth Rev Ref Vly Vista Care Corp, Ser A
| | 5.00% | | 11/15/32 | | 223,543 |
| 500,000 | | ID St Hlth Facs Auth Rev Trinity Hlth Ref, Ser D
| | 5.00% | | 12/01/33 | | 542,910 |
| | | | | 1,832,893 |
| | | Illinois – 3.3% | | | | | | |
| 1,210,000 | | Bolingbrook IL Ref, Ser A
| | 4.00% | | 01/01/35 | | 1,318,573 |
| 1,000,000 | | Bolingbrook IL Ref, Ser A, AGM
| | 5.00% | | 01/01/30 | | 1,218,340 |
| 1,000,000 | | Bolingbrook IL Ref, Ser A, AGM
| | 5.00% | | 01/01/31 | | 1,211,660 |
| 130,000 | | Chicago IL Brd of Edu Cap Apprec Sch Reform, Ser B-1, NATL-RE
| | (d) | | 12/01/22 | | 119,922 |
| 500,000 | | Chicago IL Brd of Edu Ref Dedicated, Ser C
| | 5.00% | | 12/01/30 | | 502,280 |
| 1,975,000 | | Chicago IL Brd of Edu Ref, Ser F
| | 5.00% | | 12/01/31 | | 1,971,267 |
| 625,000 | | Chicago IL Brd of Edu, Ser A
| | 5.50% | | 12/01/39 | | 617,644 |
| 305,000 | | Chicago IL O’Hare Intl Arpt Rev Ref Gen Sr Lien, Ser A, AMT
| | 5.00% | | 01/01/30 | | 338,019 |
| 600,000 | | Chicago IL O’Hare Intl Arpt Rev Ref Sr Lien, Ser A, AMT
| | 5.00% | | 01/01/37 | | 670,146 |
| 400,000 | | Chicago IL O’Hare Intl Arpt Rev, Ser C, AMT
| | 5.00% | | 01/01/34 | | 429,032 |
| 450,000 | | Chicago IL Ref 2003B
| | 5.25% | | 01/01/29 | | 456,520 |
| 185,000 | | Chicago IL Ref Proj, Ser A
| | 5.00% | | 01/01/27 | | 188,208 |
| 1,155,000 | | Chicago IL Ref Proj, Ser A
| | 5.00% | | 01/01/35 | | 1,141,001 |
| 500,000 | | Chicago IL Ref, Ser A
| | 5.63% | | 01/01/29 | | 523,495 |
| 150,000 | | Chicago IL Ref, Ser C
| | 4.00% | | 01/01/22 | | 157,839 |
| 500,000 | | Chicago IL Ref, Ser C
| | 5.00% | | 01/01/25 | | 512,450 |
| 645,000 | | Chicago IL Ref, Ser C
| | 5.00% | | 01/01/26 | | 660,370 |
| 270,000 | | Chicago IL Ref, Ser C
| | 5.00% | | 01/01/38 | | 261,449 |
| 285,000 | | Chicago IL Ref, Ser C, CABS
| | (d) | | 01/01/22 | | 264,674 |
| 145,000 | | Chicago IL Ref, Ser C, CABS
| | (d) | | 01/01/24 | | 122,357 |
| 125,000 | | Chicago IL Ref, Ser C, CABS
| | (d) | | 01/01/25 | | 100,378 |
| 2,060,000 | | Chicago IL, Ser A
| | 5.00% | | 01/01/27 | | 2,102,663 |
| 2,425,000 | | DuPage & Cook Cntys IL Twp High Sch Dist #86 Hinsdale
| | 4.00% | | 01/15/36 | | 2,736,370 |
| 505,000 | | Hampshire IL Spl Svc Area #14 Spl Tax Ref Lakewood Crossing, BAM
| | 4.00% | | 03/01/25 | | 547,708 |
| 300,000 | | Hillside IL Tax Incr Rev Ref
| | 5.00% | | 01/01/24 | | 301,491 |
| 230,000 | | IL St
| | 5.00% | | 05/01/23 | | 229,138 |
| 125,000 | | IL St
| | 5.00% | | 06/01/27 | | 121,573 |
See Notes to Financial Statements
Page 17
First Trust Managed Municipal ETF (FMB)
Portfolio of Investments (Continued)
April 30, 2020 (Unaudited)
Principal
Value | | Description | | Stated
Coupon | | Stated
Maturity | | Value |
| MUNICIPAL BONDS (Continued) |
| | | Illinois (Continued) | | | | | | |
| $325,000 | | IL St Fin Auth Academic Facs Lease Rev Univ of Illinois at Urbana-Champaign Proj, Ser A
| | 5.00% | | 10/01/33 | | $376,522 |
| 600,000 | | IL St Fin Auth Academic Facs Lease Rev Univ of Illinois at Urbana-Champaign Proj, Ser A
| | 5.00% | | 10/01/34 | | 692,436 |
| 970,000 | | IL St Fin Auth Academic Facs Lease Rev Univ of Illinois at Urbana-Champaign Proj, Ser A
| | 5.00% | | 10/01/35 | | 1,114,161 |
| 300,000 | | IL St Fin Auth Academic Facs Lease Rev Univ of Illinois at Urbana-Champaign Proj, Ser A
| | 5.00% | | 10/01/36 | | 343,152 |
| 1,000,000 | | IL St Fin Auth Rev Centegra Hlth Sys, Ser A
| | 5.00% | | 09/01/39 | | 1,089,720 |
| 500,000 | | IL St Fin Auth Rev Loc Govt Program E Prairie Sch Dist #73 Proj, BAM
| | 5.00% | | 12/01/30 | | 612,505 |
| 70,000 | | IL St Fin Auth Rev Ref Lifespace Cmntys, Ser A
| | 5.00% | | 05/15/24 | | 71,096 |
| 845,000 | | IL St Fin Auth Rev Ref Mercy Hlth System Oblig Grp
| | 5.00% | | 12/01/33 | | 937,916 |
| 35,000 | | IL St Fin Auth Rev Ref Presbyterian Homes Oblig Grp, Ser A
| | 5.00% | | 11/01/24 | | 37,587 |
| 1,010,000 | | IL St Fin Auth Rev Sthrn IL Healthcare, Ser A
| | 5.00% | | 03/01/47 | | 1,092,103 |
| 600,000 | | IL St Fin Auth Student Hsg & Academic Fac Rev Chf Chicago LLC Univ IL Chicago Proj, Ser A
| | 5.00% | | 02/15/26 | | 637,158 |
| 500,000 | | IL St Fin Auth Student Hsg & Academic Fac Rev Chf Chicago LLC Univ IL Chicago Proj, Ser A
| | 5.00% | | 02/15/27 | | 532,235 |
| 315,000 | | IL St Fin Auth Student Hsg & Academic Fac Rev Chf Chicago LLC Univ IL Chicago Proj, Ser A
| | 5.00% | | 02/15/32 | | 326,589 |
| 320,000 | | IL St Ref
| | 4.00% | | 08/01/25 | | 303,683 |
| 85,000 | | IL St Ref, Ser B
| | 5.00% | | 10/01/24 | | 84,238 |
| 510,000 | | IL St, Ser A
| | 4.00% | | 01/01/25 | | 488,238 |
| 1,500,000 | | IL St, Ser A
| | 5.00% | | 12/01/26 | | 1,463,220 |
| 1,000,000 | | IL St, Ser A
| | 5.00% | | 05/01/34 | | 946,970 |
| 4,500,000 | | IL St, Ser C
| | 5.00% | | 11/01/29 | | 4,335,300 |
| 850,000 | | IL St, Ser D
| | 5.00% | | 11/01/23 | | 845,418 |
| 795,000 | | IL St, Ser D
| | 5.00% | | 11/01/24 | | 787,630 |
| 20,000 | | IL St, Ser D
| | 5.00% | | 11/01/26 | | 19,520 |
| 960,000 | | IL St, Ser D
| | 5.00% | | 11/01/28 | | 927,773 |
| 1,500,000 | | Morton Grove IL Tax Incr Rev Sawmill Station Redev Proj
| | 5.00% | | 01/01/39 | | 1,251,555 |
| 3,635,000 | | Morton Grove-Niles Wtr Cmmn IL Wtr, Ser A
| | 5.00% | | 12/01/41 | | 4,253,023 |
| 1,000,000 | | Piatt Champaign & De Witt Cntys IL Cmnty Unit Sch Dist #25 Ref, Ser B, BAM
| | 5.00% | | 11/01/33 | | 1,197,730 |
| 2,500,000 | | Regl Transprtn Auth IL, NATL-RE
| | 6.25% | | 07/01/20 | | 2,518,075 |
| 645,000 | | Rockford IL Ref Wtrwks Sys, Ser B, BAM
| | 5.00% | | 12/15/26 | | 763,906 |
| 110,000 | | Romeoville IL Rev Ref Lewis Univ Proj
| | 5.00% | | 10/01/24 | | 116,313 |
| 125,000 | | Romeoville IL Rev Ref Lewis Univ Proj
| | 5.00% | | 10/01/25 | | 132,681 |
| | | | | 47,123,020 |
| | | Indiana – 1.6% | | | | | | |
| 1,920,000 | | Carmel IN Loc Pub Impt Bond Bank Multipurpose, Ser 2016
| | 5.00% | | 07/15/34 | | 2,254,579 |
| 1,425,000 | | Carmel IN Loc Pub Impt Bond Bank Spl Program Wtrwks
| | 5.00% | | 06/01/26 | | 1,711,468 |
| 1,000,000 | | Evansville IN Mf Hsg Rev Silver Birch Evansville Proj
| | 5.45% | | 01/01/38 | | 881,970 |
| 250,000 | | Fort Wayne IN Mf Hsg Rev Silver Birch at Cook Road (b)
| | 5.30% | | 01/01/32 | | 220,855 |
| 930,000 | | IN St Fin Auth Hosp Rev Goshen Hlth, Ser A
| | 4.00% | | 11/01/36 | | 986,265 |
| 1,330,000 | | IN St Fin Auth Hosp Rev Goshen Hlth, Ser A
| | 4.00% | | 11/01/37 | | 1,405,717 |
| 110,000 | | IN St Fin Auth Rev BHI Sr Living
| | 5.50% | | 11/15/31 | | 112,015 |
| 800,000 | | IN St Fin Auth Rev Eductnl Facs Rock Creek Cmnty Academy Proj, Ser A (e)
| | 5.25% | | 07/01/28 | | 798,888 |
| 1,000,000 | | IN St Fin Auth Rev Eductnl Facs Rock Creek Cmnty Academy Proj, Ser A (e)
| | 5.88% | | 07/01/38 | | 993,840 |
| 460,000 | | IN St Fin Auth Rev Greencroft Oblig Grp, Ser A
| | 5.75% | | 11/15/28 | | 471,178 |
| 55,000 | | IN St Fin Auth Rev Greencroft Oblig Grp, Ser A
| | 6.00% | | 11/15/28 | | 56,867 |
Page 18
See Notes to Financial Statements
First Trust Managed Municipal ETF (FMB)
Portfolio of Investments (Continued)
April 30, 2020 (Unaudited)
Principal
Value | | Description | | Stated
Coupon | | Stated
Maturity | | Value |
| MUNICIPAL BONDS (Continued) |
| | | Indiana (Continued) | | | | | | |
| $500,000 | | IN St Fin Auth Rev Marian Univ Proj, Ser A
| | 5.00% | | 09/15/34 | | $542,505 |
| 275,000 | | IN St Fin Auth Rev Ref Rev Cmnty Fdtn of NW IN
| | 5.00% | | 09/01/31 | | 323,331 |
| 3,455,000 | | IN St Hsg & Cmnty Dev Auth Sf Mtge Rev Non Ace Var, Ser C-3, AMT (a)
| | 0.59% | | 07/01/47 | | 3,455,000 |
| 6,000,000 | | IN St Muni Pwr Agy Ref, Ser A
| | 5.00% | | 01/01/42 | | 6,835,380 |
| 1,700,000 | | Plainfield IN Mf Hsg Rev Glasswater Creek Proj
| | 5.38% | | 09/01/38 | | 1,415,488 |
| | | | | 22,465,346 |
| | | Iowa – 0.4% | | | | | | |
| 1,000,000 | | Altoona IA, Ser A, COPS, BAM
| | 5.00% | | 06/01/33 | | 1,203,250 |
| 720,000 | | Altoona IA, Ser A, COPS, BAM
| | 5.00% | | 06/01/34 | | 863,186 |
| 2,385,000 | | Coralville IA Ref, Ser A
| | 5.00% | | 05/01/38 | | 2,386,765 |
| 1,000,000 | | IA St Fin Auth Sr Hsg Rev Northcrest Inc Proj, Ser A
| | 5.00% | | 03/01/33 | | 962,360 |
| | | | | 5,415,561 |
| | | Kansas – 1.3% | | | | | | |
| 2,000,000 | | Goddard KS Sales Tax Spl Oblg Rev Ref Olympic Park Star Bond Proj
| | 3.60% | | 06/01/30 | | 1,754,320 |
| 4,210,000 | | Johnson & Miami Cntys KS Unif Sch Dist #230 Spring Hill, Ser A
| | 5.00% | | 09/01/35 | | 5,088,795 |
| 1,240,000 | | KS Muni Energy Agy Pwr Proj Rev Dogwood Proj, Ser A, BAM
| | 5.00% | | 04/01/29 | | 1,483,077 |
| 1,470,000 | | KS Muni Energy Agy Pwr Proj Rev Dogwood Proj, Ser A, BAM
| | 5.00% | | 04/01/30 | | 1,750,255 |
| 500,000 | | Leavenworth Cnty KS Unif Sch Dist #464 Ref, Ser A
| | 4.00% | | 09/01/31 | | 568,355 |
| 625,000 | | Leavenworth Cnty KS Unif Sch Dist #464 Ref, Ser A
| | 4.00% | | 09/01/32 | | 705,519 |
| 575,000 | | Leavenworth Cnty KS Unif Sch Dist #464 Ref, Ser A
| | 4.00% | | 09/01/33 | | 645,679 |
| 500,000 | | Leavenworth Cnty KS Unif Sch Dist #464 Ref, Ser A
| | 4.00% | | 09/01/34 | | 559,345 |
| 525,000 | | Leavenworth Cnty KS Unif Sch Dist #464 Ref, Ser A
| | 4.00% | | 09/01/35 | | 584,609 |
| 600,000 | | Leavenworth Cnty KS Unif Sch Dist #464 Ref, Ser A
| | 4.00% | | 09/01/36 | | 665,316 |
| 1,045,000 | | Lenexa KS Healthcare Fac Rev Ref Lakeview Vlg Inc, Ser A
| | 5.00% | | 05/15/26 | | 1,089,684 |
| 2,800,000 | | Sedgwick Cnty KS Unif Sch Dist #260 Ref & Sch Bldg, Ser B
| | 4.00% | | 10/01/38 | | 3,104,668 |
| 150,000 | | Wyandotte Cnty KS Unif Sch Dist #202, Ser A, AGM
| | 5.00% | | 09/01/32 | | 182,072 |
| 475,000 | | Wyandotte Cnty/Kansas City KS Unif Govt Utility Sys Rev Ref & Impt, Ser A
| | 5.00% | | 09/01/29 | | 542,692 |
| | | | | 18,724,386 |
| | | Kentucky – 3.0% | | | | | | |
| 2,350,000 | | Bowling Green KY Wtr & Swr Rev, AGM
| | 4.00% | | 06/01/32 | | 2,596,092 |
| 1,000,000 | | Estrn KY Univ Gen Recpts, Ser A
| | 5.00% | | 04/01/25 | | 1,165,530 |
| 3,755,000 | | KY Bond Dev Corp Indl Bldg Rev KY Commns Network Auth Proj, BAM
| | 5.00% | | 09/01/38 | | 4,521,508 |
| 3,500,000 | | KY Bond Dev Corp Indl Bldg Rev KY Commns Network Auth Proj, BAM
| | 5.00% | | 09/01/49 | | 4,101,265 |
| 145,000 | | KY St Econ Dev Fin Auth Baptist Healthcare Sys, Ser B
| | 5.00% | | 08/15/28 | | 168,919 |
| 275,000 | | KY St Econ Dev Fin Auth Baptist Healthcare Sys, Ser B
| | 5.00% | | 08/15/36 | | 300,190 |
| 3,000,000 | | KY St Econ Dev Fin Auth Baptist Healthcare Sys, Ser B
| | 5.00% | | 08/15/41 | | 3,164,160 |
| 160,000 | | KY St Econ Dev Fin Auth Hlth Sys Rev Norton Healthcare Inc, Ser B, NATL-RE
| | (d) | | 10/01/25 | | 137,723 |
| 750,000 | | KY St Econ Dev Fin Auth Owensboro Med Hlth Sys, Ser A
| | 6.00% | | 06/01/30 | | 752,925 |
| 625,000 | | KY St Econ Dev Fin Auth Ref Commonspirit Hlth, Ser A-1
| | 4.00% | | 08/01/38 | | 625,675 |
| 730,000 | | KY St Econ Dev Fin Auth Ref Commonspirit Hlth, Ser A-2
| | 5.00% | | 08/01/35 | | 806,613 |
| 895,000 | | KY St Econ Dev Fin Auth Ref Commonspirit Hlth, Ser A-2
| | 5.00% | | 08/01/36 | | 978,137 |
| 300,000 | | KY St Muni Pwr Agy Pwr Sys Rev Ref, Ser A, NATL-RE
| | 5.00% | | 09/01/22 | | 323,994 |
| 5,395,000 | | KY St Pub Energy Auth Gas Sply Rev Gas Sply, Ser B (Mandatory put 01/01/25)
| | 4.00% | | 01/01/49 | | 5,610,260 |
| 9,610,000 | | KY St Pub Energy Auth Gas Sply Rev Var, Ser C (Mandatory put 02/01/28)
| | 4.00% | | 02/01/50 | | 10,365,058 |
See Notes to Financial Statements
Page 19
First Trust Managed Municipal ETF (FMB)
Portfolio of Investments (Continued)
April 30, 2020 (Unaudited)
Principal
Value | | Description | | Stated
Coupon | | Stated
Maturity | | Value |
| MUNICIPAL BONDS (Continued) |
| | | Kentucky (Continued) | | | | | | |
| $1,545,000 | | KY St Pub Energy Auth Gas Sply Rev, Ser A-1 (Mandatory put 06/01/25)
| | 4.00% | | 12/01/49 | | $1,639,786 |
| 1,000,000 | | Louisville & Jefferson Cnty KY Met Govt Hlth Sys Rev Norton Healthcare Inc, Ser A
| | 5.00% | | 10/01/38 | | 1,142,440 |
| 500,000 | | Louisville & Jefferson Cnty KY Met Govt Hlth Sys Rev Norton Healthcare Inc, Ser A
| | 4.00% | | 10/01/40 | | 505,555 |
| 3,315,000 | | Louisville & Jefferson Cnty KY Met Govt Hlth Sys Rev Ref Norton Healthcare Inc, Ser A
| | 5.00% | | 10/01/30 | | 3,761,862 |
| 550,000 | | Louisville & Jefferson Cnty KY Met Govt Hlth Sys Rev Ref Norton Healthcare Inc, Ser A
| | 5.00% | | 10/01/31 | | 619,361 |
| 130,000 | | Warren Cnty KY Hosp Rev Ref Bowling Green Warren Cnty Cmnty Hosp Corp
| | 5.00% | | 04/01/23 | | 137,692 |
| | | | | 43,424,745 |
| | | Louisiana – 1.7% | | | | | | |
| 1,260,000 | | East Baton Rouge Parish LA Capital Impts Dist Movebr Sales, Ser T
| | 4.00% | | 08/01/35 | | 1,437,257 |
| 1,520,000 | | East Baton Rouge Parish LA Capital Impts Dist Movebr Sales, Ser T
| | 4.00% | | 08/01/36 | | 1,723,422 |
| 2,530,000 | | East Baton Rouge Parish LA Capital Impts Dist Movebr Sales, Ser T
| | 4.00% | | 08/01/38 | | 2,840,178 |
| 1,000,000 | | LA Pub Facs Auth Rev Ref Ochsner Clinic Fdtn Proj
| | 5.00% | | 05/15/36 | | 1,106,000 |
| 250,000 | | LA St Loc Govt Envrnmntl Facs & Cmnty Dev Auth Rev Ascension Psh Courthouse Proj
| | 5.00% | | 11/01/31 | | 303,030 |
| 1,135,000 | | LA St Loc Govt Envrnmntl Facs & Cmnty Dev Auth Rev City Of Gretna Pub Impt Bonds
| | 4.00% | | 02/01/38 | | 1,268,351 |
| 1,700,000 | | LA St Loc Govt Envrnmntl Facs & Cmnty Dev Auth Rev Ref Hosp Womans Fdtn Proj, Ser A
| | 5.00% | | 10/01/37 | | 1,899,087 |
| 470,000 | | LA Stadium & Exposition Dist LA Ref Sr, Ser A
| | 5.00% | | 07/01/30 | | 498,463 |
| 380,000 | | LA Stadium & Exposition Dist LA Ref Sr, Ser A
| | 5.00% | | 07/01/31 | | 402,044 |
| 750,000 | | New Orleans LA Aviation Brd Gen Arpt N Term, Ser B, AMT
| | 5.00% | | 01/01/28 | | 868,605 |
| 750,000 | | New Orleans LA Aviation Brd Gen Arpt N Term, Ser B, AMT
| | 5.00% | | 01/01/29 | | 864,442 |
| 200,000 | | New Orleans LA Aviation Brd Gen Arpt N Term, Ser B, AMT
| | 5.00% | | 01/01/31 | | 228,320 |
| 1,160,000 | | New Orleans LA Aviation Brd, Ser B, AMT
| | 5.00% | | 01/01/31 | | 1,284,306 |
| 1,305,000 | | New Orleans LA Wtr Rev
| | 5.00% | | 12/01/34 | | 1,476,686 |
| 1,050,000 | | New Orleans LA Wtr Rev Ref
| | 5.00% | | 12/01/28 | | 1,207,342 |
| 1,000,000 | | Saint John The Baptist Parish LA Rev Ref Marathon Oil Corp Proj, Ser A-2 (Mandatory put 07/01/24)
| | 2.10% | | 06/01/37 | | 879,880 |
| 625,000 | | Shreveport LA Wtr & Swr Rev Junior Lien, Ser A, AGM
| | 5.00% | | 12/01/32 | | 761,875 |
| 700,000 | | Shreveport LA Wtr & Swr Rev, Ser A, AGM
| | 4.00% | | 12/01/41 | | 769,496 |
| 1,650,000 | | Shreveport LA Wtr & Swr Rev, Ser B, BAM
| | 5.00% | | 12/01/30 | | 1,889,613 |
| 2,000,000 | | Shreveport LA Wtr & Swr Rev, Ser B, BAM
| | 5.00% | | 12/01/33 | | 2,355,000 |
| | | | | 24,063,397 |
| | | Maryland – 1.6% | | | | | | |
| 2,375,000 | | Anne Arundel Cnty MD Consldtd Wtr & Swr Bond
| | 5.00% | | 10/01/26 | | 2,913,317 |
| 565,000 | | Baltimore Cnty MD Rev Ref Oak Crest Vlg Inc Fac
| | 4.00% | | 01/01/39 | | 577,255 |
| 650,000 | | Baltimore Cnty MD Rev Ref Oak Crest Vlg Inc Fac
| | 4.00% | | 01/01/40 | | 661,980 |
| 600,000 | | Baltimore Cnty MD Rev Ref Riderwood Vlg Inc Proj
| | 4.00% | | 01/01/33 | | 643,200 |
| 685,000 | | Baltimore Cnty MD Rev Ref Riderwood Vlg Inc Proj
| | 4.00% | | 01/01/34 | | 729,614 |
| 650,000 | | Baltimore Cnty MD Rev Ref Riderwood Vlg Inc Proj
| | 4.00% | | 01/01/36 | | 686,797 |
| 700,000 | | Baltimore Cnty MD Rev Ref Riderwood Vlg Inc Proj
| | 4.00% | | 01/01/38 | | 733,719 |
| 1,120,000 | | Baltimore MD Rev Ref Sr, Ser B
| | 5.00% | | 07/01/33 | | 1,272,006 |
| 1,000,000 | | Baltimore MD Spl Oblig Ref E Baltimore Research Park Proj, Ser A
| | 5.00% | | 09/01/38 | | 965,870 |
Page 20
See Notes to Financial Statements
First Trust Managed Municipal ETF (FMB)
Portfolio of Investments (Continued)
April 30, 2020 (Unaudited)
Principal
Value | | Description | | Stated
Coupon | | Stated
Maturity | | Value |
| MUNICIPAL BONDS (Continued) |
| | | Maryland (Continued) | | | | | | |
| $100,000 | | Baltimore MD Spl Oblig Ref Sr Lien Harbor Point Proj, Ser A (b)
| | 2.75% | | 06/01/24 | | $94,943 |
| 125,000 | | Baltimore MD Spl Oblig Ref Sr Lien Harbor Point Proj, Ser A (b)
| | 2.80% | | 06/01/25 | | 117,291 |
| 135,000 | | Baltimore MD Spl Oblig Ref Sr Lien Harbor Point Proj, Ser A (b)
| | 2.85% | | 06/01/26 | | 125,314 |
| 1,000,000 | | Gaithersburg MD Econ Dev Rev Ref Proj Asbury MD Oblig Grp, Ser A
| | 4.50% | | 01/01/25 | | 1,029,400 |
| 1,000,000 | | Howard Cnty MD Retmnt Cmnty Rev Ref Columbia Vantage House Corp
| | 5.00% | | 04/01/36 | | 909,810 |
| 45,000 | | Howard Cnty MD Retmnt Cmnty Rev Ref Vantage House Fac
| | 5.00% | | 04/01/21 | | 45,069 |
| 500,000 | | Howard Cnty MD Retmnt Cmnty Rev Ref Vantage House Fac
| | 5.00% | | 04/01/26 | | 490,960 |
| 220,000 | | MD St Econ Dev Corp Econ Dev Rev Transprtn Facs Proj, Ser A
| | 5.38% | | 06/01/25 | | 220,770 |
| 500,000 | | MD St Econ Dev Corp Student Hsg Rev Bowie St Univ Proj
| | 4.00% | | 07/01/40 | | 472,330 |
| 1,650,000 | | MD St Econ Dev Corp Student Hsg Rev Bowie St Univ Proj
| | 5.00% | | 07/01/55 | | 1,705,985 |
| 600,000 | | MD St Econ Dev Corp Student Hsg Rev Ref Sr Univ MD Proj
| | 4.00% | | 07/01/24 | | 615,570 |
| 2,490,000 | | MD St Econ Dev Corp Student Hsg Rev Ref Univ MD Clg Park Projs, AGM
| | 5.00% | | 06/01/35 | | 2,885,785 |
| 500,000 | | MD St Hlth & Hgr Eductnl Facs Auth Rev Adventist Healthcare Oblig Grp, Ser A
| | 5.50% | | 01/01/26 | | 569,960 |
| 800,000 | | MD St Hlth & Hgr Eductnl Facs Auth Rev Ref Anne Arundel Hlth System, Ser A
| | 5.00% | | 07/01/30 | | 911,992 |
| 1,000,000 | | MD St Hlth & Hgr Eductnl Facs Auth Rev Ref Anne Arundel Hlth System, Ser A
| | 5.00% | | 07/01/32 | | 1,127,330 |
| 790,000 | | MD St Ref, Ser B
| | 5.00% | | 08/01/24 | | 919,094 |
| 1,500,000 | | Prince Georges Cnty MD Rev Ref Collington Episcopal Life Care Cmnty Inc
| | 5.00% | | 04/01/25 | | 1,486,440 |
| | | | | 22,911,801 |
| | | Massachusetts – 0.8% | | | | | | |
| 925,000 | | Ludlow MA
| | 4.00% | | 02/01/32 | | 1,039,977 |
| 960,000 | | Ludlow MA
| | 4.00% | | 02/01/33 | | 1,073,453 |
| 2,000,000 | | MA St Bay Transprtn Auth Sales Tax Rev Ref Sr, Ser B
| | 5.25% | | 07/01/30 | | 2,574,240 |
| 250,000 | | MA St Dev Fin Agy Rev Linden Ponds Inc Fac (b)
| | 5.00% | | 11/15/28 | | 238,953 |
| 325,000 | | MA St Dev Fin Agy Rev Merrimack Clg
| | 5.00% | | 07/01/37 | | 329,101 |
| 500,000 | | MA St Dev Fin Agy Rev Ref Newbridge Charles Inc (b)
| | 5.00% | | 10/01/37 | | 490,860 |
| 700,000 | | MA St Dev Fin Agy Rev Umass Boston Student Hsg Proj (c)
| | 5.00% | | 10/01/24 | | 745,759 |
| 3,000,000 | | MA St Dev Fin Agy Rev Umass Boston Student Hsg Proj (c)
| | 5.00% | | 10/01/41 | | 3,023,550 |
| 2,000,000 | | MA St Port Auth Spl Facs Rev Ref Bosfuel Proj, Ser A, AMT
| | 5.00% | | 07/01/33 | | 2,334,160 |
| | | | | 11,850,053 |
| | | Michigan – 2.9% | | | | | | |
| 240,000 | | Detroit MI Downtown Dev Auth Tax Incr Rev Ref Catalyst Dev Proj, Ser A, AGM
| | 5.00% | | 07/01/32 | | 267,614 |
| 500,000 | | Detroit MI Downtown Dev Auth Tax Incr Rev Ref Catalyst Dev Proj, Ser A, AGM
| | 5.00% | | 07/01/33 | | 556,895 |
| 525,000 | | Grand Rapids MI Santn Swr Sys Rev Ref
| | 5.00% | | 01/01/45 | | 636,841 |
| 1,000,000 | | Grand Rapids MI Santn Swr Sys Rev Ref
| | 4.00% | | 01/01/50 | | 1,121,520 |
| 735,000 | | Grand Traverse Cnty MI Hosp Fin Auth Munson Healthcare Oblig Grp, Ser A
| | 5.00% | | 07/01/44 | | 824,222 |
| 1,125,000 | | Great Lakes MI Wtr Auth Wtr Sply Sys Rev Ref Sr Lien, Ser C
| | 5.00% | | 07/01/28 | | 1,350,878 |
| 1,100,000 | | Kalamazoo MI Econ Dev Corp Ref Heritage Cmnty of Kalamazoo Proj
| | 5.00% | | 05/15/37 | | 1,053,745 |
| 1,000,000 | | Marquette MI Brd of Light & Pwr Elec Utility Sys Rev Ref, Ser A
| | 5.00% | | 07/01/29 | | 1,199,180 |
| 1,225,000 | | MI St Bldg Auth Rev Ref, Ser I
| | 5.00% | | 10/15/30 | | 1,468,285 |
| 890,000 | | MI St Fin Auth Ltd Oblig Rev Ref Clg for Creative Studies Proj
| | 5.00% | | 12/01/25 | | 953,261 |
| 325,000 | | MI St Fin Auth Rev Loc Govt Loan Program Great Lakes Wtr Auth Ref, Ser C
| | 5.00% | | 07/01/27 | | 378,349 |
See Notes to Financial Statements
Page 21
First Trust Managed Municipal ETF (FMB)
Portfolio of Investments (Continued)
April 30, 2020 (Unaudited)
Principal
Value | | Description | | Stated
Coupon | | Stated
Maturity | | Value |
| MUNICIPAL BONDS (Continued) |
| | | Michigan (Continued) | | | | | | |
| $2,050,000 | | MI St Fin Auth Rev Ref Henry Ford Hlth Sys
| | 4.00% | | 11/15/35 | | $2,113,140 |
| 2,105,000 | | MI St Fin Auth Rev Ref Henry Ford Hlth Sys
| | 4.00% | | 11/15/36 | | 2,163,287 |
| 7,905,000 | | MI St Fin Auth Rev Ref Henry Ford Hlth Sys
| | 5.00% | | 11/15/41 | | 8,611,628 |
| 2,500,000 | | MI St Fin Auth Rev Ref Hosp Trinity Hlth Credit Grp, Ser A-MI
| | 5.00% | | 12/01/47 | | 2,758,950 |
| 1,000,000 | | MI St Fin Auth Rev Ref Loc Govt Loan Program Great Lakes Wtr Auth, Ser D-1
| | 5.00% | | 07/01/34 | | 1,108,730 |
| 500,000 | | MI St Fin Auth Rev Ref Loc Govt Loan Program, Ser F1
| | 3.80% | | 10/01/22 | | 506,960 |
| 125,000 | | MI St Fin Auth Rev Ref Loc Govt Loan Program, Ser F1
| | 3.88% | | 10/01/23 | | 126,410 |
| 2,460,000 | | MI St Fin Auth Rev Ref, 2nd Lien, Great Lakes Wtr Auth, Ser C-7, NATL-RE
| | 5.00% | | 07/01/29 | | 2,800,931 |
| 2,000,000 | | MI St Fin Auth Rev Sr Lien Great Lakes Wtr Auth, Ser C-3, AGM
| | 5.00% | | 07/01/21 | | 2,092,820 |
| 565,000 | | MI St Hosp Fin Auth Ref Ascenion Sr Credit, Ser F7
| | 5.00% | | 11/15/47 | | 636,987 |
| 1,000,000 | | MI St Hosp Fin Auth Ref Ascension Hlth Sr Cr Grp, Ser F-4
| | 5.00% | | 11/15/47 | | 1,179,910 |
| 1,000,000 | | MI St Univ Rev Brd of Trustees, Ser B
| | 5.00% | | 02/15/34 | | 1,228,300 |
| 650,000 | | Midland MI Pub Schs Sch Bldg & Site, Ser II
| | 5.00% | | 05/01/35 | | 795,015 |
| 1,990,000 | | Utica MI Cmnty Schs Ref Sch Bldg & Site
| | 5.00% | | 05/01/31 | | 2,366,508 |
| 2,800,000 | | Wayne Cnty MI Arpt Auth Rev Ref, Ser F, AMT
| | 5.00% | | 12/01/25 | | 3,188,360 |
| | | | | 41,488,726 |
| | | Minnesota – 0.6% | | | | | | |
| 370,000 | | Duluth MN Indep Sch Dist #709 Ref, Ser B, COPS
| | 5.00% | | 02/01/27 | | 447,053 |
| 480,000 | | Hugo MN Chtr Sch Lease Rev Noble Academy Proj, Ser A
| | 4.00% | | 07/01/22 | | 483,538 |
| 400,000 | | Minneapolis MN Mf Rev Riverside Home Proj, Ser B (Mandatory put 05/01/20)
| | 3.75% | | 11/01/21 | | 400,000 |
| 750,000 | | MN St Hgr Edu Facs Auth Rev Ref Clg of St Scholastica Inc
| | 4.00% | | 12/01/40 | | 681,697 |
| 1,000,000 | | Rochester MN Healthcare & Hsg Rev Ref Samaritan Bethany Inc Proj, Ser A
| | 5.00% | | 08/01/37 | | 952,170 |
| 580,000 | | Saint Paul MN Hsg & Redev Auth Healthcare Fac Rev Ref HealthPartners Oblig Grp, Ser A
| | 5.00% | | 07/01/30 | | 643,058 |
| 500,000 | | Saint Paul MN Hsg & Redev Auth Healthcare Fac Rev Ref HealthPartners Oblig Grp, Ser A
| | 5.00% | | 07/01/32 | | 548,475 |
| 3,420,000 | | Saint Paul MN Hsg & Redev Auth Healthcare Fac Rev Ref HealthPartners Oblig Grp, Ser A
| | 5.00% | | 07/01/33 | | 3,737,957 |
| 500,000 | | Saint Paul Park MN Sr Hsg & Healthcare Rev Ref Presbyterian Homes Bloomington Proj
| | 3.00% | | 09/01/24 | | 483,585 |
| 400,000 | | Saint Paul Park MN Sr Hsg & Healthcare Rev Ref Presbyterian Homes Bloomington Proj
| | 3.13% | | 09/01/25 | | 385,396 |
| | | | | 8,762,929 |
| | | Mississippi – 0.4% | | | | | | |
| 600,000 | | MS St Gaming Tax Rev, Ser A
| | 5.00% | | 10/15/31 | | 682,332 |
| 2,000,000 | | MS St, Ser A
| | 5.00% | | 11/01/33 | | 2,378,020 |
| 985,000 | | MS St, Ser B
| | 5.00% | | 12/01/32 | | 1,177,242 |
| 500,000 | | West Rankin MS Utility Auth Rev, AGM
| | 5.00% | | 01/01/32 | | 568,545 |
| 1,215,000 | | West Rankin MS Utility Auth Rev, AGM
| | 5.00% | | 01/01/33 | | 1,376,182 |
| | | | | 6,182,321 |
| | | Missouri – 1.1% | | | | | | |
| 220,000 | | Jackson Cnty MO Spl Oblig Ref Truman Sports Complex Proj
| | 5.00% | | 12/01/22 | | 232,960 |
| 700,000 | | Jackson Cnty MO Spl Oblig Ref Truman Sports Complex Proj
| | 5.00% | | 12/01/31 | | 743,071 |
| 1,670,000 | | Joplin MO Indl Dev Auth Hlth Facs Rev Ref Freeman Hlth System
| | 5.00% | | 02/15/26 | | 1,844,081 |
| 3,385,000 | | Kansas City MO Indl Dev Auth Arpt Spl Oblig Kansas City Intrnl Arpt Terminal Mod Proj, Ser B, AMT
| | 5.00% | | 03/01/37 | | 3,798,850 |
| 1,000,000 | | Kansas City MO Land Clearance Redev Auth Proj Rev Convention Ctr Hotel Proj TIF Fing, Ser B (b)
| | 5.00% | | 02/01/40 | | 980,250 |
| 220,000 | | Lincoln Cnty MO Pub Wtr Sply Dist #1 Ref, COPS
| | 4.00% | | 07/01/30 | | 244,486 |
Page 22
See Notes to Financial Statements
First Trust Managed Municipal ETF (FMB)
Portfolio of Investments (Continued)
April 30, 2020 (Unaudited)
Principal
Value | | Description | | Stated
Coupon | | Stated
Maturity | | Value |
| MUNICIPAL BONDS (Continued) |
| | | Missouri (Continued) | | | | | | |
| $415,000 | | Lincoln Cnty MO Pub Wtr Sply Dist #1 Ref, COPS
| | 4.00% | | 07/01/31 | | $458,102 |
| 1,000,000 | | Lincoln Cnty MO Pub Wtr Sply Dist #1 Ref, COPS
| | 4.00% | | 07/01/38 | | 1,075,510 |
| 3,000,000 | | MO Jt Muni Elec Utility Commn Pwr Proj Rev Ref, Ser A
| | 5.00% | | 12/01/40 | | 3,450,360 |
| 200,000 | | MO St Dev Fin Brd Infrastructure Facs Rev Ref Independence MO Centerpoint Proj, Ser B
| | 5.00% | | 04/01/28 | | 231,688 |
| 750,000 | | MO St Hlth & Eductnl Facs Auth Hlth Facs Rev Ref Mosaic Hlth Sys, Ser A
| | 5.00% | | 02/15/32 | | 888,990 |
| 160,000 | | MO St Hlth & Eductnl Facs Auth Lutheran Sr Svcs
| | 5.00% | | 02/01/23 | | 162,114 |
| 250,000 | | Saint Charles Cnty MO Pub Wtr Sply Dist #2 Ref, COPS
| | 5.00% | | 12/01/28 | | 297,647 |
| 1,040,000 | | Saint Louis MO Muni Fin Corp Sales Tax Leasehold Rev Ref
| | 5.00% | | 02/15/28 | | 1,228,718 |
| | | | | 15,636,827 |
| | | Montana – 0.2% | | | | | | |
| 740,000 | | MT St Fac Fin Auth Rev Ref
| | 5.00% | | 02/15/25 | | 840,973 |
| 130,000 | | MT St Fac Fin Auth Rev Ref
| | 5.00% | | 02/15/29 | | 151,932 |
| 2,000,000 | | MT St Fac Fin Auth Rev Ref Scl Hlth Sys, Ser A
| | 4.00% | | 01/01/36 | | 2,124,060 |
| | | | | 3,116,965 |
| | | Nebraska – 0.6% | | | | | | |
| 1,745,000 | | Centrl Plains Energy Proj NE Gas Proj Rev Proj #3
| | 5.00% | | 09/01/27 | | 1,851,427 |
| 5,870,000 | | Centrl Plains Energy Proj NE Gas Proj Rev Ref Proj #3, Ser A
| | 5.00% | | 09/01/29 | | 6,866,609 |
| 500,000 | | NE St Pub Pwr Dist Rev Gen, Ser C
| | 5.00% | | 01/01/35 | | 578,555 |
| | | | | 9,296,591 |
| | | Nevada – 0.6% | | | | | | |
| 750,000 | | Carson City NV Hosp Rev Ref Carson Tahoe Regl Med Ctr, Ser A
| | 5.00% | | 09/01/30 | | 853,845 |
| 1,685,000 | | Clark Cnty NV Detention Ctr
| | 4.00% | | 06/01/35 | | 1,890,368 |
| 1,030,000 | | Clark Cnty NV Impt Dist Ref Spl Loc Impt #151
| | 4.50% | | 08/01/23 | | 1,047,026 |
| 420,000 | | Las Vegas NV Spl Impt Dist #808 & #810 Ref
| | 5.00% | | 06/01/22 | | 430,466 |
| 120,000 | | North Las Vegas NV Loc Impt Vly Vista Spl Impt Dist #64
| | 3.50% | | 06/01/24 | | 117,572 |
| 150,000 | | North Las Vegas NV Loc Impt Vly Vista Spl Impt Dist #64
| | 3.75% | | 06/01/25 | | 147,603 |
| 185,000 | | North Las Vegas NV Loc Impt Vly Vista Spl Impt Dist #64
| | 3.75% | | 06/01/26 | | 180,819 |
| 260,000 | | North Las Vegas NV Loc Impt Vly Vista Spl Impt Dist #64
| | 3.75% | | 06/01/27 | | 251,347 |
| 335,000 | | NV Dept of Business & Industry NV Doral Academy, Ser A (b)
| | 5.00% | | 07/15/27 | | 340,337 |
| 300,000 | | Reno NV Capital Impt Rev Ref, Ser A-1, AGM
| | 5.00% | | 06/01/29 | | 359,679 |
| 950,000 | | Reno NV Capital Impt Rev Ref, Ser A-1, AGM
| | 5.00% | | 06/01/30 | | 1,132,362 |
| 275,000 | | Reno NV Capital Impt Rev Ref, Ser A-1, AGM
| | 5.00% | | 06/01/31 | | 326,200 |
| 1,200,000 | | Sparks NV Tourism Impt Dist #1 Rev Ref Sales Tax Sr, Ser A (b)
| | 2.50% | | 06/15/24 | | 1,156,152 |
| | | | | 8,233,776 |
| | | New Hampshire – 0.3% | | | | | | |
| 1,000,000 | | National Fin Auth NH Sol Wst Disp Rev Var Ref Wst Mgmt Inc Proj, Ser A-1, AMT (Mandatory put 07/01/24)
| | 2.15% | | 09/01/25 | | 977,330 |
| 2,740,000 | | NH St Hlth & Edu Facs Auth Rev Concord Hosp Trust
| | 5.00% | | 10/01/42 | | 3,018,439 |
| | | | | 3,995,769 |
| | | New Jersey – 1.9% | | | | | | |
| 450,000 | | NJ St Econ Dev Auth Mtr Vehcl Surcharge Rev Ref Sub, Ser A, BAM
| | 5.00% | | 07/01/28 | | 488,939 |
| 500,000 | | NJ St Econ Dev Auth Ref, Ser A, BAM
| | 5.00% | | 06/15/23 | | 526,875 |
| 2,965,000 | | NJ St Econ Dev Auth Rev, Ser WW
| | 5.00% | | 06/15/34 | | 2,987,326 |
| 490,000 | | NJ St Econ Dev Auth Spl Fac Rev Ref Port Newark Container Terminal LLC Proj, AMT
| | 5.00% | | 10/01/25 | | 522,183 |
| 1,000,000 | | NJ St Healthcare Facs Fing Auth Rev Ref Hackensack Meridian Hlth, Ser A
| | 5.00% | | 07/01/24 | | 1,131,250 |
| 100,000 | | NJ St Transit Corp, Ser A, GANS
| | 5.00% | | 09/15/21 | | 104,942 |
See Notes to Financial Statements
Page 23
First Trust Managed Municipal ETF (FMB)
Portfolio of Investments (Continued)
April 30, 2020 (Unaudited)
Principal
Value | | Description | | Stated
Coupon | | Stated
Maturity | | Value |
| MUNICIPAL BONDS (Continued) |
| | | New Jersey (Continued) | | | | | | |
| $1,290,000 | | NJ St Transprtn Trust Fund Auth Cap Apprec Transprtn Sys, Ser C, AMBAC
| | (d) | | 12/15/25 | | $1,076,157 |
| 165,000 | | NJ St Transprtn Trust Fund Auth Fed Hwy Reimbursement Nts, Ser A-1, GARVEE
| | 5.00% | | 06/15/28 | | 178,106 |
| 1,500,000 | | NJ St Transprtn Trust Fund Auth Ref Transprtn Sys Bonds, Ser A
| | 5.00% | | 12/15/28 | | 1,554,720 |
| 500,000 | | NJ St Transprtn Trust Fund Auth Ref Transprtn Sys, Ser A
| | 5.00% | | 12/15/30 | | 510,105 |
| 3,040,000 | | NJ St Transprtn Trust Fund Auth Ref Transptrn Sys, Ser A
| | 5.00% | | 12/15/26 | | 3,159,624 |
| 400,000 | | NJ St Transprtn Trust Fund Auth Transprtn Program, Ser AA
| | 4.00% | | 06/15/27 | | 395,488 |
| 1,400,000 | | NJ St Transprtn Trust Fund Auth Transprtn Sys, Ser D
| | 5.25% | | 12/15/23 | | 1,454,320 |
| 105,000 | | NJ St Transprtn Trust Fund Auth Transprtn Sys, Ser D
| | 5.00% | | 12/15/24 | | 108,652 |
| 220,000 | | NJ St Transprtn Trust Fund Auth, Ser BB
| | 5.00% | | 06/15/31 | | 223,632 |
| 4,000,000 | | NJ St Transprtn Trust Fund Auth, Ser BB
| | 5.00% | | 06/15/32 | | 4,051,400 |
| 1,000,000 | | NJ St Transprtn Trust Fund Auth, Ser BB
| | 5.00% | | 06/15/33 | | 1,010,650 |
| 1,270,000 | | Rutgers NJ St Univ Var, Ser G (a)
| | 0.11% | | 05/01/39 | | 1,270,000 |
| 500,000 | | Tobacco Settlement Fing Corp NJ Ref, Ser A
| | 5.00% | | 06/01/27 | | 586,280 |
| 5,505,000 | | Tobacco Settlement Fing Corp NJ Ref, Ser A
| | 5.25% | | 06/01/46 | | 5,881,652 |
| | | | | 27,222,301 |
| | | New Mexico – 0.2% | | | | | | |
| 600,000 | | Lower Petroglyphs Pub Impt Dist NM Spl Levy Rev Ref
| | 4.00% | | 10/01/23 | | 586,896 |
| 230,000 | | Lower Petroglyphs Pub Impt Dist NM Spl Levy Rev Ref
| | 4.20% | | 10/01/24 | | 223,588 |
| 240,000 | | Lower Petroglyphs Pub Impt Dist NM Spl Levy Rev Ref
| | 4.30% | | 10/01/25 | | 232,114 |
| 250,000 | | Lower Petroglyphs Pub Impt Dist NM Spl Levy Rev Ref
| | 4.45% | | 10/01/26 | | 241,067 |
| 260,000 | | Lower Petroglyphs Pub Impt Dist NM Spl Levy Rev Ref
| | 4.55% | | 10/01/27 | | 249,553 |
| 365,000 | | Lower Petroglyphs Pub Impt Dist NM Spl Levy Rev Ref
| | 5.00% | | 10/01/33 | | 347,166 |
| 520,000 | | Santa Fe NM Retmnt Fac Rev El Castillo Retmnt Proj, Ser A
| | 5.00% | | 05/15/34 | | 492,851 |
| 500,000 | | Santa Fe NM Retmnt Fac Rev El Castillo Retmnt Proj, Ser A
| | 5.00% | | 05/15/44 | | 440,250 |
| | | | | 2,813,485 |
| | | New York – 4.6% | | | | | | |
| 100,000 | | Buffalo & Erie Cnty NY Indl Land Dev Corp Rev Ref Orchard Park
| | 5.00% | | 11/15/22 | | 101,468 |
| 115,000 | | Buffalo & Erie Cnty NY Indl Land Dev Corp Rev Ref Orchard Park
| | 5.00% | | 11/15/24 | | 117,473 |
| 1,975,000 | | Met Transprtn Auth NY Rev Ref Transptrn, Subser C-1
| | 5.00% | | 11/15/34 | | 1,979,701 |
| 1,500,000 | | Met Transprtn Auth NY Rev Transprtn, Ser A-2S, BANS
| | 4.00% | | 02/01/22 | | 1,472,535 |
| 2,750,000 | | Met Transprtn Auth NY Rev Transprtn, Ser B-1, BANS
| | 5.00% | | 05/15/22 | | 2,736,910 |
| 4,000,000 | | Met Transprtn Auth NY Rev Transptrn, Subser D-1
| | 5.00% | | 11/15/39 | | 4,007,960 |
| 840,000 | | Monroe Cnty NY Indl Dev Corp Rev Ref Nazareth Clg of Rochester Proj, Ser A
| | 5.00% | | 10/01/23 | | 895,138 |
| 4,220,000 | | New York City NY Muni Wtr Fin Auth Wtr & Swr Sys Rev Ref 2nd Gen Resolution, Subser CC-1
| | 4.00% | | 06/15/33 | | 4,647,781 |
| 3,550,000 | | New York City NY Muni Wtr Fin Auth Wtr & Swr Sys Rev, Ser DD-1
| | 4.00% | | 06/15/37 | | 3,903,686 |
| 1,000,000 | | New York City NY Transitional Fin Auth Rev Future Tax Secured Sub Fiscal 2016, Ser A-1
| | 5.00% | | 08/01/37 | | 1,141,550 |
| 1,500,000 | | New York City NY Transitional Fin Auth Rev Future Tax Sub, Subser E-1
| | 5.00% | | 02/01/37 | | 1,713,780 |
| 1,350,000 | | New York City NY Transitional Fin Auth Rev Sub Future Tax Secured Fiscal 1999, Ser A Subser E-1
| | 5.00% | | 02/01/36 | | 1,558,035 |
| 5,415,000 | | New York City NY Transitional Fin Auth Rev Sub Future Tax Secured Fiscal 1999, Ser A Subser E-1
| | 5.00% | | 02/01/40 | | 6,187,233 |
| 10,400,000 | | New York NY Adj Fiscal 2020, Subser B-3 (a)
| | 0.52% | | 10/01/46 | | 10,400,000 |
| 415,000 | | New York NY Fiscal 2020, Ser B-1
| | 4.00% | | 10/01/37 | | 452,321 |
| 6,390,000 | | New York NY Var, Subser L-3 (a)
| | 0.12% | | 04/01/36 | | 6,390,000 |
Page 24
See Notes to Financial Statements
First Trust Managed Municipal ETF (FMB)
Portfolio of Investments (Continued)
April 30, 2020 (Unaudited)
Principal
Value | | Description | | Stated
Coupon | | Stated
Maturity | | Value |
| MUNICIPAL BONDS (Continued) |
| | | New York (Continued) | | | | | | |
| $1,900,000 | | New York St Mtge Agy Homeowner Mtge Rev Var, Ser 142, AMT (a)
| | 0.22% | | 10/01/37 | | $1,900,000 |
| 300,000 | | NY St Dorm Auth Revs Non St Supported Debt Ref Orange Regl Med Ctr (b)
| | 5.00% | | 12/01/25 | | 335,451 |
| 195,000 | | NY St Dorm Auth Revs Non St Supported Debt Unrefunded Pace Univ, Ser A
| | 4.00% | | 05/01/22 | | 201,581 |
| 85,000 | | NY St Dorm Auth Revs Non St Supported Debt Unrefunded Pace Univ, Ser A
| | 5.00% | | 05/01/23 | | 91,331 |
| 2,850,000 | | NY St Dorm Auth St Personal Income Tax Rev Ref, Ser E
| | 5.00% | | 03/15/34 | | 3,301,810 |
| 1,000,000 | | NY St Dorm Auth St Personal Income Tax Rev, Ser B
| | 5.00% | | 03/15/30 | | 1,063,930 |
| 2,135,000 | | NY St Hsg Fin Agy Var Ref Affordable Hsg, Ser F, Bid Grp 2 (Mandatory put 05/01/20)
| | 1.80% | | 05/01/50 | | 2,135,000 |
| 500,000 | | Port Auth of New York & New Jersey NY Consol One Hundred Eighty Fifth Ref, AMT
| | 5.00% | | 09/01/23 | | 550,295 |
| 465,000 | | Port Auth of New York & New Jersey NY Ref Consol, Ser 186, AMT
| | 5.00% | | 10/15/35 | | 513,579 |
| 5,000,000 | | Port Auth of New York & New Jersey NY Ref Consol, Ser 198
| | 5.25% | | 11/15/56 | | 5,782,900 |
| 15,000 | | Suffolk Cnty NY Econ Dev Corp Rev Prerefunded Catholic Hlth Svcs Long Island Oblig Grp Proj
| | 5.00% | | 07/01/28 | | 15,735 |
| 85,000 | | Suffolk Cnty NY Econ Dev Corp Rev Unrefunded Catholic Hlth Svcs Long Island Oblig Grp Proj
| | 5.00% | | 07/01/28 | | 87,808 |
| 1,000,000 | | Tsasc Inc NY Tsasc Inc Rev Ref Turbo Sub, Ser B
| | 5.00% | | 06/01/45 | | 923,430 |
| 400,000 | | Yonkers NY Econ Dev Corp Eductnl Rev Chrt Sch Edu Excellence Proj, Ser A
| | 4.00% | | 10/15/29 | | 391,364 |
| | | | | 64,999,785 |
| | | North Carolina – 0.9% | | | | | | |
| 250,000 | | Buncombe Cnty NC Ltd Oblig Ref Rev, Ser A
| | 5.00% | | 06/01/29 | | 316,620 |
| 225,000 | | Buncombe Cnty NC Ltd Oblig Ref Rev, Ser A
| | 5.00% | | 06/01/30 | | 287,278 |
| 300,000 | | Buncombe Cnty NC Ltd Oblig Ref Rev, Ser A
| | 5.00% | | 06/01/32 | | 374,256 |
| 575,000 | | Charlotte-Mecklenburg NC Hosp Auth Healthcare Sys Rev Ref Carolinas Healthcare Sys, Ser A
| | 5.00% | | 01/15/34 | | 652,148 |
| 750,000 | | Greenville NC Comb Enterprise Sys Rev Ref
| | 5.00% | | 04/01/28 | | 901,268 |
| 1,330,000 | | Monroe NC Comb Enterprise Sys Rev Ref
| | 5.00% | | 03/01/28 | | 1,574,560 |
| 1,000,000 | | NC St Agric & Tech Univ Ref Gen, Ser A
| | 5.00% | | 10/01/40 | | 1,095,590 |
| 900,000 | | NC St Capital Facs Fin Agy Student Rev Ref Hsg NC A&T Univ Fdtn Proj, Ser A, AGC
| | 5.00% | | 06/01/26 | | 1,050,480 |
| 2,750,000 | | NC St Med Care Commn Healthcare Facs Rev Rex Healthcare, Ser A
| | 4.00% | | 07/01/49 | | 2,850,237 |
| 655,000 | | NC St Med Care Commn Retmnt Facs Rev Ref Retmnt Facs First Mtg Rev Bonds Galloway Ridge, Ser A
| | 5.00% | | 01/01/30 | | 669,056 |
| 630,000 | | NC St Med Care Commn Retmnt Facs Rev Ref United Methodist Retmnt Homes, Ser A
| | 5.00% | | 10/01/29 | | 641,724 |
| 320,000 | | NC St Med Care Commn Retmnt Facs Rev Ref United Methodist Retmnt Homes, Ser A
| | 5.00% | | 10/01/32 | | 321,901 |
| 750,000 | | NC St Med Care Commn Retmnt Facs Rev Ref United Methodist Retmnt Homes, Ser A
| | 5.00% | | 10/01/37 | | 733,763 |
| 500,000 | | NC St Med Care Commn Retmnt Facs Rev Ref United Methodist Retmnt Homes, Ser A
| | 5.00% | | 10/01/47 | | 464,795 |
| 430,000 | | Raleigh Durham NC Arpt Auth Arpt Rev Ref, Ser A, AMT
| | 5.00% | | 05/01/36 | | 482,830 |
| | | | | 12,416,506 |
| | | North Dakota – 0.1% | | | | | | |
| 225,000 | | Burleigh Cnty ND Healthcare Rev St Alexius Med Ctr Proj, Ser A
| | 5.00% | | 07/01/22 | | 235,550 |
See Notes to Financial Statements
Page 25
First Trust Managed Municipal ETF (FMB)
Portfolio of Investments (Continued)
April 30, 2020 (Unaudited)
Principal
Value | | Description | | Stated
Coupon | | Stated
Maturity | | Value |
| MUNICIPAL BONDS (Continued) |
| | | North Dakota (Continued) | | | | | | |
| $1,300,000 | | Grand Forks ND Sr Hsg & Nur Fac Rev Ref Vly Homes Oblig Grp, Ser A
| | 5.00% | | 12/01/23 | | $1,295,333 |
| | | | | 1,530,883 |
| | | Ohio – 4.0% | | | | | | |
| 2,600,000 | | Allen Cnty OH Hosp Facs Rev Ref, Ser A
| | 5.00% | | 08/01/42 | | 2,922,400 |
| 100,000 | | Bowling Green OH St Univ Ref, Ser A
| | 4.00% | | 06/01/38 | | 108,830 |
| 195,000 | | Bowling Green OH St Univ Ref, Ser A
| | 4.00% | | 06/01/39 | | 211,552 |
| 1,000,000 | | Buckeye OH Tobacco Settlement Fing Auth Ref, Sr, Ser A-2, Class 1
| | 5.00% | | 06/01/27 | | 1,187,620 |
| 2,500,000 | | Buckeye OH Tobacco Settlement Fing Auth Ref, Sr, Ser A-2, Class 1
| | 4.00% | | 06/01/48 | | 2,508,175 |
| 7,000,000 | | Buckeye OH Tobacco Settlement Fing Auth Ref, Sr, Ser B-2, Class 2
| | 5.00% | | 06/01/55 | | 6,249,320 |
| 135,000 | | Butler Cnty OH Hosp Facs Ref UC Hlth
| | 5.00% | | 11/15/30 | | 152,449 |
| 1,500,000 | | Butler Cnty OH Hosp Facs Ref UC Hlth
| | 5.00% | | 11/15/31 | | 1,685,085 |
| 1,000,000 | | Butler Cnty OH Hosp Facs Ref UC Hlth
| | 5.00% | | 11/15/32 | | 1,116,660 |
| 1,000,000 | | Chillicothe OH City Sch Dist Ref, AGM
| | 4.00% | | 12/01/31 | | 1,087,880 |
| 80,000 | | Cleveland OH Pub Pwr Sys Rev Prerefunded Ref Ser A, AGM
| | 5.00% | | 11/15/24 | | 94,529 |
| 420,000 | | Cleveland OH Pub Pwr Sys Rev Unrefunded Ref Ser A, AGM
| | 5.00% | | 11/15/24 | | 489,409 |
| 600,000 | | Cleveland-Cuyahoga Cnty OH Port Auth Cultural Fac Rev Ref Playhouse Sq Fdtn Proj
| | 5.00% | | 12/01/28 | | 585,282 |
| 700,000 | | Cleveland-Cuyahoga Cnty OH Port Auth Cultural Fac Rev Ref Playhouse Sq Fdtn Proj
| | 5.50% | | 12/01/43 | | 651,938 |
| 1,255,000 | | Columbus OH Swr Rev Ref Sys
| | 5.00% | | 06/01/26 | | 1,465,438 |
| 650,000 | | Franklin Cnty OH Convention Facs Auth Hotel Proj Rev Grtr Columbus Convention Cntr Hotel Exp Proj
| | 5.00% | | 12/01/37 | | 539,896 |
| 1,500,000 | | Franklin Cnty OH Convention Facs Auth Hotel Proj Rev Grtr Columbus Convention Cntr Hotel Exp Proj
| | 5.00% | | 12/01/44 | | 1,156,005 |
| 700,000 | | Hamilton Cnty OH Healthcare Facs Rev Christ Hosp Proj
| | 5.25% | | 06/01/27 | | 739,662 |
| 1,000,000 | | Lancaster OH Port Auth Gas Rev Ref, Ser A (Mandatory put 02/01/25)
| | 5.00% | | 08/01/49 | | 1,120,580 |
| 960,000 | | Miami Cnty OH Hosp Facs Rev Ref & Impt Kettering Hlth Network Oblig Grp
| | 5.00% | | 08/01/32 | | 1,089,773 |
| 1,000,000 | | Miami Cnty OH Hosp Facs Rev Ref & Impt Kettering Hlth Network Oblig Grp
| | 5.00% | | 08/01/33 | | 1,129,310 |
| 3,000,000 | | Miami Cnty OH Hosp Facs Rev Ref & Impt Kettering Hlth Network Oblig Grp
| | 5.00% | | 08/01/36 | | 3,349,650 |
| 575,000 | | Miamisburg OH City Sch Dist Ref
| | 5.00% | | 12/01/35 | | 672,773 |
| 5,250,000 | | OH St Air Quality Dev Auth Exempt Facs Rev AMG Vanadium Proj, AMT (b)
| | 5.00% | | 07/01/49 | | 4,928,332 |
| 1,000,000 | | OH St Air Quality Dev Auth Ref American Elec Pwr Company Proj, Ser B, AMT (Mandatory put 10/01/24)
| | 2.10% | | 07/01/28 | | 968,870 |
| 2,225,000 | | OH St Air Quality Dev Auth Ref OH Vly Elec Corp Proj, Ser A
| | 3.25% | | 09/01/29 | | 2,044,130 |
| 1,000,000 | | OH St Hgr Edu, Ser A
| | 5.00% | | 05/01/33 | | 1,156,000 |
| 1,000,000 | | OH St Hgr Eductnl Fac Commn Denison Univ Proj
| | 5.00% | | 11/01/38 | | 1,217,730 |
| 150,000 | | OH St Hosp Rev Ref, Ser A
| | 5.00% | | 01/15/33 | | 175,680 |
| 325,000 | | OH St Hosp Rev Ref, Ser A
| | 5.00% | | 01/15/35 | | 377,322 |
| 500,000 | | OH St Hosp Rev Ref, Ser A
| | 4.00% | | 01/15/38 | | 523,615 |
| 2,000,000 | | OH St Spl Oblig, Ser A-2
| | 5.00% | | 04/01/30 | | 2,321,800 |
| 1,880,000 | | OH St Univ Gen Recpts Spl Purpose, Ser A
| | 5.00% | | 06/01/28 | | 2,097,441 |
| 1,000,000 | | OH St Wtr Dev Auth Rev Wtr Dev Fresh Wtr, Ser A
| | 5.00% | | 12/01/21 | | 1,065,110 |
| 675,000 | | OH St, Ser A
| | 5.00% | | 06/15/39 | | 828,569 |
| 2,500,000 | | OH St, Ser T
| | 5.00% | | 05/01/32 | | 3,018,925 |
Page 26
See Notes to Financial Statements
First Trust Managed Municipal ETF (FMB)
Portfolio of Investments (Continued)
April 30, 2020 (Unaudited)
Principal
Value | | Description | | Stated
Coupon | | Stated
Maturity | | Value |
| MUNICIPAL BONDS (Continued) |
| | | Ohio (Continued) | | | | | | |
| $5,325,000 | | Ross Cnty OH Hosp Rev Ref Adena Hlth Sys Oblig Grp Proj
| | 5.00% | | 12/01/39 | | $6,067,891 |
| | | | | 57,105,631 |
| | | Oklahoma – 0.8% | | | | | | |
| 900,000 | | Catoosa OK Indl Auth Sales Tax Rev
| | 4.50% | | 10/01/32 | | 775,890 |
| 750,000 | | OK St Dev Fin Auth Hlth Sys Rev OU Medicine Proj, Ser B
| | 5.25% | | 08/15/48 | | 775,102 |
| 2,815,000 | | Oklahoma City OK Arpt Trust Junior Lien, AMT
| | 5.00% | | 07/01/34 | | 3,227,623 |
| 1,040,000 | | Oklahoma City OK Arpt Trust Junior Lien, AMT
| | 5.00% | | 07/01/47 | | 1,155,502 |
| 1,000,000 | | Oklahoma Cnty OK Fin Auth Eductnl Facs Lease Rev Midwest City De City Pub Schs Proj
| | 5.00% | | 10/01/25 | | 1,187,360 |
| 1,000,000 | | Oklahoma Cnty OK Fin Auth Eductnl Facs Lease Rev Midwest City De City Pub Schs Proj
| | 5.00% | | 10/01/26 | | 1,213,140 |
| 1,000,000 | | Tulsa Cnty OK Indl Auth Sr Living Cmnty Rev Ref Montereau Inc Proj
| | 5.00% | | 11/15/25 | | 1,024,230 |
| 250,000 | | Tulsa Cnty OK Indl Auth Sr Living Cmnty Rev Ref Montereau Inc Proj
| | 5.00% | | 11/15/26 | | 256,148 |
| 100,000 | | Tulsa OK Arpts Impt Trust Ref, Ser D, BAM
| | 5.00% | | 06/01/28 | | 100,314 |
| 1,000,000 | | Weatherford OK Indl Trust Eductnl Facs Lease Rev Weatherford Pub Schs Proj
| | 5.00% | | 03/01/31 | | 1,240,900 |
| | | | | 10,956,209 |
| | | Oregon – 1.7% | | | | | | |
| 170,000 | | Clackamas Cnty OR Hosp Fac Auth Rev Ref Sr Living Willamette View Proj, Ser A
| | 4.00% | | 05/15/26 | | 166,783 |
| 250,000 | | Clackamas Cnty OR Hosp Fac Auth Rev Ref Sr Living Willamette View Proj, Ser A
| | 5.00% | | 11/15/32 | | 253,440 |
| 75,000 | | Multnomah Cnty OR Hosp Facs Auth Rev Ref Terwilliger Plaza
| | 5.00% | | 12/01/20 | | 75,411 |
| 4,000,000 | | OR St Dept of Admin Svcs Lottery Rev, Ser A
| | 5.00% | | 04/01/34 | | 4,802,160 |
| 2,035,000 | | OR St Dept of Admin Svcs Lottery Rev, Ser A
| | 5.00% | | 04/01/35 | | 2,434,206 |
| 1,100,000 | | OR St Facs Auth Rev Ref Univ Portland, Ser A
| | 5.00% | | 04/01/32 | | 1,271,919 |
| 500,000 | | Oregon City OR
| | 4.00% | | 06/01/37 | | 562,445 |
| 1,060,000 | | Oregon City OR
| | 4.00% | | 06/01/38 | | 1,188,875 |
| 2,450,000 | | Port of Portland OR Arpt Rev Portland Intl Arpt, Ser 25B, AMT
| | 5.00% | | 07/01/37 | | 2,766,442 |
| 1,500,000 | | Port of Portland OR Arpt Rev, Ser 24B, AMT
| | 5.00% | | 07/01/33 | | 1,666,560 |
| 2,500,000 | | Portland OR Swr Sys Rev 2nd Lien, Ser A
| | 4.50% | | 05/01/31 | | 2,890,925 |
| 4,925,000 | | Tri-Cnty OR Met Transprtn Dist, Ser A, GARVEE
| | 5.00% | | 10/01/31 | | 5,967,130 |
| | | | | 24,046,296 |
| | | Pennsylvania – 6.4% | | | | | | |
| 500,000 | | Allegheny Cnty PA Hosp Dev Auth Ref Allegheny Hlth Network Oblig Grp Issue, Ser A
| | 5.00% | | 04/01/26 | | 574,965 |
| 1,500,000 | | Allegheny Cnty PA Hosp Dev Auth Ref Allegheny Hlth Network Oblig Grp Issue, Ser A
| | 5.00% | | 04/01/32 | | 1,722,780 |
| 1,200,000 | | Allegheny Cnty PA Hosp Dev Auth Ref Univ Pittsburgh Med Ctr, Ser A
| | 5.00% | | 07/15/32 | | 1,405,032 |
| 505,000 | | Allegheny Cnty PA Hosp Dev Auth Ref Univ Pittsburgh Med Ctr, Ser A
| | 5.00% | | 07/15/34 | | 584,482 |
| 1,300,000 | | Allegheny Cnty PA Hosp Dev Auth Ref Univ Pittsburgh Med Ctr, Ser A
| | 4.00% | | 07/15/36 | | 1,359,436 |
| 1,820,000 | | Allegheny Cnty PA Hosp Dev Auth Ref Univ Pittsburgh Med Ctr, Ser A
| | 4.00% | | 07/15/38 | | 1,890,434 |
| 900,000 | | Armstrong PA Sch Dist Ref, Ser A, BAM
| | 5.00% | | 03/15/31 | | 1,124,055 |
| 1,055,000 | | Armstrong PA Sch Dist Ref, Ser A, BAM
| | 4.00% | | 03/15/36 | | 1,202,711 |
| 500,000 | | Armstrong PA Sch Dist Ref, Ser A, BAM
| | 4.00% | | 03/15/37 | | 567,925 |
| 460,000 | | Berks Cnty PA Indl Dev Auth Healthcare Facs Rev Ref Highlands at Wyomissing, Ser-A
| | 5.00% | | 05/15/32 | | 464,333 |
See Notes to Financial Statements
Page 27
First Trust Managed Municipal ETF (FMB)
Portfolio of Investments (Continued)
April 30, 2020 (Unaudited)
Principal
Value | | Description | | Stated
Coupon | | Stated
Maturity | | Value |
| MUNICIPAL BONDS (Continued) |
| | | Pennsylvania (Continued) | | | | | | |
| $500,000 | | Berks Cnty PA Muni Auth Ref Tower Hlth Proj, Ser B-2 (Mandatory put 02/01/27)
| | 5.00% | | 02/01/40 | | $555,975 |
| 735,000 | | Bucks Cnty PA Indl Dev Auth Hosp Rev St Luke’s Univ Hlth Network Proj
| | 4.00% | | 08/15/38 | | 769,442 |
| 1,050,000 | | Bucks Cnty PA Indl Dev Auth Hosp Rev St Luke’s Univ Hlth Network Proj
| | 4.00% | | 08/15/44 | | 1,072,712 |
| 395,000 | | Bucks Cnty PA Indl Dev Auth Ref Pennswood Vlg Proj, Ser A
| | 5.00% | | 10/01/32 | | 407,107 |
| 415,000 | | Bucks Cnty PA Indl Dev Auth Ref Pennswood Vlg Proj, Ser A
| | 5.00% | | 10/01/33 | | 426,736 |
| 1,000,000 | | Bucks Cnty PA Indl Dev Auth Ref Pennswood Vlg Proj, Ser A
| | 5.00% | | 10/01/37 | | 1,020,170 |
| 765,000 | | Chester Cnty PA Indl Dev Auth Renaissance Academy Chrt Sch
| | 5.00% | | 10/01/34 | | 786,290 |
| 2,000,000 | | Cmwlth Fing Auth PA Ref of 2020, Ser A, BAM
| | 5.00% | | 06/01/31 | | 2,576,840 |
| 1,000,000 | | Cmwlth Fing Auth PA Tobacco Master Settlement Payment Rev Tobacco Master Settlement Payment Bonds
| | 5.00% | | 06/01/25 | | 1,122,490 |
| 410,000 | | Cmwlth Fing Auth PA Tobacco Master Settlement Payment Rev Tobacco Master Settlement Payment Bonds
| | 5.00% | | 06/01/26 | | 467,904 |
| 500,000 | | Colonial PA Sch Dist
| | 5.00% | | 02/15/36 | | 578,360 |
| 300,000 | | Colonial PA Sch Dist, Ser A
| | 5.00% | | 02/15/34 | | 352,719 |
| 270,000 | | Conestoga Vly PA Sch Dist
| | 4.00% | | 02/01/31 | | 307,187 |
| 300,000 | | Conestoga Vly PA Sch Dist
| | 4.00% | | 02/01/32 | | 337,491 |
| 300,000 | | Cumberland Cnty PA Muni Auth Ref Diakon Lutheran Ministries Proj
| | 5.00% | | 01/01/30 | | 307,599 |
| 700,000 | | Cumberland Cnty PA Muni Auth Ref Diakon Lutheran Ministries Proj
| | 5.00% | | 01/01/38 | | 708,456 |
| 1,150,000 | | Cumberland Cnty PA Muni Auth Ref Diakon Lutheran Social Ministries
| | 5.00% | | 01/01/25 | | 1,199,945 |
| 1,000,000 | | Cumberland Cnty PA Muni Auth Ref Diakon Lutheran Social Ministries
| | 5.00% | | 01/01/33 | | 1,022,400 |
| 1,660,000 | | Cumberland Cnty PA Muni Auth Ref Messiah Vlg Proj
| | 5.00% | | 07/01/28 | | 1,672,799 |
| 1,165,000 | | Dover PA Area Sch Dist, BAM
| | 4.00% | | 04/01/32 | | 1,303,798 |
| 1,560,000 | | E Hempfield Twp PA Indl Dev Auth Ref Willow Vly Cmntys Proj
| | 5.00% | | 12/01/26 | | 1,743,659 |
| 1,910,000 | | E Hempfield Twp PA Indl Dev Auth Ref Willow Vly Cmntys Proj
| | 5.00% | | 12/01/27 | | 2,128,599 |
| 715,000 | | E Hempfield Twp PA Indl Dev Auth Ref Willow Vly Cmntys Proj
| | 5.00% | | 12/01/28 | | 795,266 |
| 770,000 | | E Hempfield Twp PA Indl Dev Auth Ref Willow Vly Cmntys Proj
| | 5.00% | | 12/01/29 | | 853,922 |
| 1,730,000 | | Kiski Vly PA Wtr Poll Control Auth Ref, AGM
| | 4.00% | | 09/01/42 | | 1,831,914 |
| 480,000 | | Lancaster Cnty PA Hosp Auth Healthcare Facs Rev Moravian Manors Inc Proj, Ser A
| | 5.00% | | 06/15/30 | | 478,843 |
| 1,110,000 | | Lancaster Cnty PA Hosp Auth Healthcare Facs Rev Moravian Manors Inc Proj, Ser A
| | 5.00% | | 06/15/38 | | 1,063,979 |
| 750,000 | | Lancaster Cnty PA Hosp Auth Ref, St Annes Retmnt Cmnty Inc Proj
| | 5.00% | | 03/01/45 | | 683,438 |
| 1,000,000 | | Lancaster Cnty PA Hosp Auth Ref, St Annes Retmnt Cmnty Inc Proj
| | 5.00% | | 03/01/50 | | 897,460 |
| 405,000 | | Lebanon PA Auth Swr Rev Ref, BAM
| | 4.00% | | 12/15/29 | | 456,115 |
| 420,000 | | Lebanon PA Auth Swr Rev Ref, BAM
| | 4.00% | | 12/15/30 | | 465,986 |
| 1,550,000 | | Mechanicsburg PA Area Sch Dist, Ser A
| | 4.00% | | 03/01/36 | | 1,721,693 |
| 1,090,000 | | Mechanicsburg PA Area Sch Dist, Ser A
| | 4.00% | | 03/01/38 | | 1,201,572 |
| 500,000 | | Middletown PA Sch Dist, Ser A
| | 5.00% | | 03/01/28 | | 539,200 |
| 300,000 | | Mifflinburg PA Area Sch Dist Ref, Ser A
| | 4.00% | | 06/15/35 | | 334,407 |
| 550,000 | | Mifflinburg PA Area Sch Dist Ref, Ser A
| | 4.00% | | 06/15/36 | | 608,443 |
| 610,000 | | Mifflinburg PA Area Sch Dist Ref, Ser A
| | 4.00% | | 06/15/38 | | 670,201 |
| 1,000,000 | | Montgomery Cnty PA Hgr Edu & Hlth Auth Ref Thomas Jefferson Univ Proj
| | 4.00% | | 09/01/34 | | 1,043,170 |
| 1,000,000 | | Montgomery Cnty PA Hgr Edu & Hlth Auth Ref Thomas Jefferson Univ Proj
| | 4.00% | | 09/01/35 | | 1,038,150 |
| 1,005,000 | | Montgomery Cnty PA Indl Dev Auth Acts Retmnt Life Cmntys Ref
| | 5.00% | | 11/15/25 | | 1,033,492 |
Page 28
See Notes to Financial Statements
First Trust Managed Municipal ETF (FMB)
Portfolio of Investments (Continued)
April 30, 2020 (Unaudited)
Principal
Value | | Description | | Stated
Coupon | | Stated
Maturity | | Value |
| MUNICIPAL BONDS (Continued) |
| | | Pennsylvania (Continued) | | | | | | |
| $50,000 | | Montgomery Cnty PA Indl Dev Auth Acts Retmnt Life Cmntys Ref
| | 5.00% | | 11/15/29 | | $50,985 |
| 480,000 | | Montgomery Cnty PA Indl Dev Auth Ref Meadowood Sr Living Proj, Ser A
| | 5.00% | | 12/01/26 | | 492,413 |
| 100,000 | | Montgomery Cnty PA Indl Dev Auth Ref Waverly Heights Ltd Proj
| | 4.00% | | 12/01/33 | | 98,114 |
| 200,000 | | Montgomery Cnty PA Indl Dev Auth Ref Waverly Heights Ltd Proj
| | 4.00% | | 12/01/34 | | 195,678 |
| 580,000 | | Montgomery Cnty PA Indl Dev Auth Ref Waverly Heights Ltd Proj
| | 5.00% | | 12/01/44 | | 597,678 |
| 140,000 | | Northampton Cnty PA Gen Purpose Auth Clg Rev Ref Moravian Clg
| | 5.00% | | 10/01/25 | | 149,044 |
| 225,000 | | Northampton Cnty PA Gen Purpose Auth Clg Rev Ref Moravian Clg
| | 5.00% | | 10/01/26 | | 240,235 |
| 540,000 | | Northampton Cnty PA Gen Purpose Auth Clg Rev Ref Moravian Clg
| | 5.00% | | 10/01/31 | | 560,536 |
| 1,800,000 | | Northampton Cnty PA Gen Purpose Auth Hosp Rev Ref St Luke’s Univ Hlth Network Proj, Ser A
| | 5.00% | | 08/15/28 | | 2,051,388 |
| 1,000,000 | | PA St Hgr Eductnl Facs Auth Rev Ref Drexel Univ
| | 5.00% | | 05/01/25 | | 1,121,880 |
| 1,105,000 | | PA St Hgr Eductnl Facs Auth Rev Ref Drexel Univ
| | 5.00% | | 05/01/34 | | 1,209,312 |
| 3,000,000 | | PA St Hsg Fin Agy SF Mtge Rev Non Ace, Ser 123B
| | 3.45% | | 10/01/32 | | 3,171,270 |
| 5,455,000 | | PA St Hsg Fin Agy Sf Mtge Rev, Ser 127B
| | 3.55% | | 10/01/33 | | 5,798,883 |
| 1,000,000 | | PA St Turnpike Commn Turnpike Rev Ref
| | 5.00% | | 12/01/33 | | 1,135,670 |
| 4,940,000 | | PA St Turnpike Commn Turnpike Rev Ref Sub Mtr License Fund, 2nd Ser
| | 5.00% | | 12/01/41 | | 5,547,916 |
| 2,500,000 | | PA St Turnpike Commn Turnpike Rev Ref Sub, Ser B
| | 5.00% | | 06/01/36 | | 2,784,150 |
| 550,000 | | PA St Turnpike Commn Turnpike Rev Subordinate, Ser A-1
| | 5.00% | | 12/01/30 | | 619,845 |
| 290,000 | | Philadelphia PA Gas Wks Rev Ref
| | 5.00% | | 08/01/25 | | 331,050 |
| 1,625,000 | | Philadelphia PA Gas Wks Rev Ref
| | 5.00% | | 08/01/29 | | 1,891,841 |
| 1,000,000 | | Philadelphia PA Gas Wks Rev Ref 1998 General Ordinance, 14th Ser
| | 5.00% | | 10/01/29 | | 1,194,920 |
| 2,000,000 | | Philadelphia PA Gas Wks Rev Ref 1998 General Ordinance, 14th Ser
| | 5.00% | | 10/01/34 | | 2,350,080 |
| 5,235,000 | | Philadelphia PA Gas Wks Rev Ref 1998 General Ordinance, 15th Ser
| | 5.00% | | 08/01/42 | | 5,864,823 |
| 500,000 | | Philadelphia PA Ref, Ser A
| | 5.00% | | 08/01/26 | | 597,605 |
| 500,000 | | Philadelphia PA Ref, Ser A
| | 5.00% | | 08/01/27 | | 610,390 |
| 750,000 | | Philadelphia PA Ref, Ser A
| | 5.25% | | 07/15/28 | | 849,668 |
| 1,600,000 | | Philadelphia PA, Ser B, BAM
| | 5.00% | | 02/01/34 | | 2,002,736 |
| 405,000 | | Southcentrl PA General Auth Rev Ref Hanover Hosp Inc
| | 5.00% | | 12/01/23 | | 446,265 |
| 1,970,000 | | Westmoreland Cnty PA Muni Auth Ref, BAM
| | 5.00% | | 08/15/42 | | 2,256,911 |
| | | | | 91,703,368 |
| | | Puerto Rico – 0.6% | | | | | | |
| 9,023,000 | | Puerto Rico Sales Tax Fing Corp Sales Tax Rev Restructured, Ser A-1
| | 4.50% | | 07/01/34 | | 8,811,320 |
| 387,000 | | Puerto Rico Sales Tax Fing Corp Sales Tax Rev Restructured, Ser A-1, CABS
| | (d) | | 07/01/27 | | 291,976 |
| 92,000 | | Puerto Rico Sales Tax Fing Corp Sales Tax Rev Restructured, Ser A-1, CABS
| | (d) | | 07/01/29 | | 62,986 |
| | | | | 9,166,282 |
| | | Rhode Island – 0.4% | | | | | | |
| 150,000 | | Providence RI Pub Bldgs Auth Rev, Ser B, AGM
| | 5.00% | | 06/15/31 | | 184,185 |
| 320,000 | | Providence RI Pub Bldgs Auth Rev, Ser B, AGM
| | 5.00% | | 06/15/33 | | 386,090 |
| 230,000 | | Providence RI Pub Bldgs Auth Rev, Ser B, AGM
| | 5.00% | | 06/15/35 | | 273,636 |
| 1,125,000 | | RI St Hlth & Eductnl Bldg Corp Rev Ref Hosp Fing Lifespan Oblig Grp
| | 5.00% | | 05/15/29 | | 1,230,142 |
See Notes to Financial Statements
Page 29
First Trust Managed Municipal ETF (FMB)
Portfolio of Investments (Continued)
April 30, 2020 (Unaudited)
Principal
Value | | Description | | Stated
Coupon | | Stated
Maturity | | Value |
| MUNICIPAL BONDS (Continued) |
| | | Rhode Island (Continued) | | | | | | |
| $1,460,000 | | RI St Hlth & Eductnl Bldg Corp Rev Ref Hosp Fing Lifespan Oblig Grp
| | 5.00% | | 05/15/32 | | $1,561,090 |
| 1,700,000 | | RI St Hlth & Eductnl Bldg Corp Rev Ref Hosp Fing Lifespan Oblig Grp
| | 5.00% | | 05/15/39 | | 1,766,674 |
| | | | | 5,401,817 |
| | | South Carolina – 0.4% | | | | | | |
| 2,250,000 | | Berkeley Cnty SC Assmnt Rev Nexton Impt Dist
| | 4.25% | | 11/01/40 | | 1,777,928 |
| 1,000,000 | | Greenville SC Hosp Sys Brd Hosp Facs Rev, Ser B
| | 5.00% | | 05/01/30 | | 1,077,730 |
| 100,000 | | Lancaster Cnty SC Assmnt Rev Ref Walnut Creek Impt Dist, Ser A-1
| | 3.13% | | 12/01/22 | | 97,662 |
| 1,000,000 | | Lancaster Cnty SC Assmnt Rev Ref Walnut Creek Impt Dist, Ser A-1
| | 5.00% | | 12/01/31 | | 969,210 |
| 745,000 | | Piedmont SC Muni Pwr Agy Elec Rev Ref, Ser A-3
| | 5.00% | | 01/01/23 | | 762,172 |
| 1,000,000 | | SC St Jobs Econ Dev Auth Econ Dev Rev Woodlands at Furman Proj, Ser A
| | 5.00% | | 11/15/54 | | 848,590 |
| 500,000 | | SC St Jobs Econ Dev Auth Hlth Facs Rev Ref Lutheran Homes of SC Inc
| | 5.00% | | 05/01/42 | | 404,385 |
| 30,000 | | SC St Jobs Econ Dev Auth Hosp Rev Ref Palmetto Hlth, Ser A
| | 5.00% | | 08/01/23 | | 33,941 |
| 150,000 | | SC St Jobs Econ Dev Auth Hosp Rev Ref Palmetto Hlth, Ser A, AGM
| | 5.50% | | 08/01/24 | | 158,652 |
| | | | | 6,130,270 |
| | | South Dakota – 0.1% | | | | | | |
| 85,000 | | SD St Hlth & Eductnl Facs Auth Ref Sanford Oblig Grp
| | 5.00% | | 11/01/35 | | 93,025 |
| 1,030,000 | | SD St Hlth & Eductnl Facs Auth Sanford Oblig Grp, Ser B
| | 5.00% | | 11/01/34 | | 1,113,502 |
| | | | | 1,206,527 |
| | | Tennessee – 1.2% | | | | | | |
| 250,000 | | Chattanooga TN Hlth Eductnl & Hsg Fac Brd Rev Ref Commonspirit Hlth, Ser A-1
| | 5.00% | | 08/01/34 | | 277,527 |
| 200,000 | | Chattanooga TN Hlth Eductnl & Hsg Fac Brd Rev Ref Commonspirit Hlth, Ser A-1
| | 4.00% | | 08/01/37 | | 201,320 |
| 825,000 | | Chattanooga TN Hlth Eductnl & Hsg Fac Brd Rev Ref Commonspirit Hlth, Ser A-2
| | 5.00% | | 08/01/34 | | 915,841 |
| 325,000 | | Chattanooga TN Hlth Eductnl & Hsg Fac Brd Rev Ref Student Hsg CDFI Phase I
| | 5.00% | | 10/01/23 | | 334,204 |
| 1,245,000 | | Greeneville TN Hlth & Eductnl Facs Brd Hosp Rev Ref Ballad Hlth Oblig Grp, Ser A
| | 5.00% | | 07/01/33 | | 1,319,899 |
| 120,000 | | Jackson TN Hosp Rev Ref West TN Healthcare, Ser A
| | 5.00% | | 04/01/25 | | 135,491 |
| 600,000 | | Memphis Shelby Cnty TN Arpt Auth Arpt Rev Ref, Ser B, AMT
| | 5.75% | | 07/01/23 | | 603,630 |
| 865,000 | | Met Govt Nashville & Davidson Cnty TN Elec Rev Sys, Ser A
| | 5.00% | | 05/15/35 | | 1,035,128 |
| 1,215,000 | | Met Govt Nashville & Davidson Cnty TN Hlth & Eductnl Fac Brd Ref Lipscomb Univ Proj, Ser A
| | 5.00% | | 10/01/28 | | 1,332,879 |
| 1,385,000 | | Met Govt Nashville & Davidson Cnty TN Hlth & Eductnl Fac Brd Ref Lipscomb Univ Proj, Ser A
| | 5.00% | | 10/01/29 | | 1,511,118 |
| 375,000 | | Met Govt Nashville & Davidson Cnty TN Hlth & Eductnl Fac Brd Ref Lipscomb Univ Proj, Ser A
| | 5.00% | | 10/01/37 | | 395,992 |
| 600,000 | | Met Govt Nashville & Davidson Cnty TN Hlth & Eductnl Fac Brd Ref Trevecca Nazarene Univ Proj
| | 5.00% | | 10/01/29 | | 643,560 |
| 400,000 | | Met Govt Nashville & Davidson Cnty TN Hlth & Eductnl Fac Brd Ref Trevecca Nazarene Univ Proj
| | 5.00% | | 10/01/34 | | 416,144 |
| 700,000 | | Met Govt Nashville & Davidson Cnty TN Hlth & Eductnl Fac Brd Ref Trevecca Nazarene Univ Proj
| | 5.00% | | 10/01/39 | | 714,455 |
| 3,435,000 | | TN St Energy Acquisition Corp Gas Rev Proj, Ser A (Mandatory put 05/01/23)
| | 4.00% | | 05/01/48 | | 3,569,618 |
Page 30
See Notes to Financial Statements
First Trust Managed Municipal ETF (FMB)
Portfolio of Investments (Continued)
April 30, 2020 (Unaudited)
Principal
Value | | Description | | Stated
Coupon | | Stated
Maturity | | Value |
| MUNICIPAL BONDS (Continued) |
| | | Tennessee (Continued) | | | | | | |
| $50,000 | | TN St Energy Acquisition Corp Gas Rev, Ser A
| | 5.25% | | 09/01/22 | | $52,741 |
| 2,660,000 | | TN St Energy Acquisition Corp Gas Rev, Ser A
| | 5.25% | | 09/01/26 | | 2,982,020 |
| | | | | 16,441,567 |
| | | Texas – 6.7% | | | | | | |
| 2,685,000 | | Arlington TX Hgr Edu Fin Corp Edu Rev Lifeschool Dallas, Ser A
| | 5.00% | | 08/15/31 | | 2,965,797 |
| 450,000 | | Austin TX Arpt Sys Rev, AMT
| | 5.00% | | 11/15/33 | | 488,894 |
| 3,870,000 | | Austin TX Arpt Sys Rev, Ser B, AMT
| | 5.00% | | 11/15/39 | | 4,314,276 |
| 455,000 | | Bexar Cnty TX Hlth Facs Dev Corp Ref Army Retmnt Residence Fdtn Proj
| | 5.00% | | 07/15/25 | | 462,876 |
| 900,000 | | Bexar Cnty TX Ref
| | 4.00% | | 06/15/38 | | 1,015,452 |
| 2,255,000 | | Brazoria Cnty TX Toll Road Auth Toll Road Rev Sub Lien, Ser A
| | 5.00% | | 03/01/36 | | 2,645,814 |
| 600,000 | | Brd of Managers TX Jt Guadalupe Cnty City of Seguin Hosp Mtg Ref
| | 5.00% | | 12/01/24 | | 656,562 |
| 600,000 | | Centrl TX Regl Mobility Auth Rev Ref Sub Lien
| | 5.00% | | 01/01/33 | | 626,298 |
| 850,000 | | Centrl TX Regl Mobility Auth Rev Sr Lien, Ser A
| | 5.00% | | 01/01/29 | | 921,085 |
| 500,000 | | Clifton TX Hgr Edu Fin Corp Edu Rev Idea Pub Schs
| | 5.00% | | 08/15/32 | | 523,105 |
| 1,215,000 | | Clifton TX Hgr Edu Fin Corp Edu Rev, Ser A
| | 4.00% | | 12/01/25 | | 1,223,930 |
| 4,425,000 | | Corpus Christi TX Utility Sys Rev Ref Jr Lien
| | 5.00% | | 07/15/33 | | 5,368,012 |
| 2,365,000 | | Corpus Christi TX Utility Sys Rev Ref Jr Lien
| | 5.00% | | 07/15/35 | | 2,845,663 |
| 1,000,000 | | El Paso TX Ref, Ser A
| | 4.00% | | 08/15/34 | | 1,144,790 |
| 500,000 | | El Paso TX Ref, Ser A
| | 4.00% | | 08/15/36 | | 564,420 |
| 455,000 | | Flower Mound TX Spl Assmnt Rev River Walk Pub Impt Dist #1
| | 6.13% | | 09/01/28 | | 451,592 |
| 1,000,000 | | Harris Cnty TX Cultural Edu Facs Fin Corp Med Facs Rev Ref Baylor Clg of Med
| | 4.00% | | 11/15/30 | | 1,086,120 |
| 1,640,000 | | Harris Cnty TX Flood Control Dist Ref Flood Control Dist, Ser A
| | 4.00% | | 10/01/37 | | 1,833,536 |
| 1,100,000 | | Harris Cnty TX Ref Sr Lien Toll Road, Ser B
| | 5.00% | | 08/15/36 | | 1,270,929 |
| 2,600,000 | | Harris Cnty TX Ref Sr Lien, Ser A
| | 5.00% | | 08/15/36 | | 3,059,342 |
| 500,000 | | Houston TX Arpt Sys Rev Ref United Airls Inc Terminal E Proj, AMT
| | 4.50% | | 07/01/20 | | 498,845 |
| 100,000 | | Houston TX Arpt Sys Rev Ref United Airls Inc Terminal E Proj, AMT
| | 4.75% | | 07/01/24 | | 99,650 |
| 1,730,000 | | Houston TX Cmnty Clg Ref
| | 4.00% | | 02/15/37 | | 1,915,404 |
| 1,000,000 | | Houston TX Hotel Occupancy Tax & Spl Rev Ref Convention & Entertainment Facs Dept
| | 5.00% | | 09/01/32 | | 980,700 |
| 1,000,000 | | Houston TX Utility Sys Rev Ref 1st Lien, Ser D
| | 5.00% | | 11/15/29 | | 1,188,040 |
| 850,000 | | La Vernia TX Hgr Edu Fin Corp Edu Rev Meridian World Sch (b)
| | 4.35% | | 08/15/25 | | 855,508 |
| 815,000 | | La Vernia TX Hgr Edu Fin Corp Edu Rev Meridian World Sch, Ser A (b)
| | 4.20% | | 08/15/25 | | 817,249 |
| 1,250,000 | | Laredo TX Cmnty Clg Dist Combined Fee Rev Ref, BAM
| | 4.00% | | 08/01/33 | | 1,375,037 |
| 1,290,000 | | Leander TX Spl Assmnt Rev Crystal Springs Pub Impt Dist Proj Accd Inv (e)
| | 5.13% | | 09/01/38 | | 1,142,501 |
| 500,000 | | Liberty Hill TX Indep Sch Dist Ref
| | 5.00% | | 08/01/30 | | 598,590 |
| 4,000,000 | | Lower Colorado River TX Auth Transmission Contract Rev Ref LCRA Transmission Svcs Corp Proj
| | 5.00% | | 05/15/20 | | 4,004,960 |
| 700,000 | | Lower Colorado River TX Auth Transmission Contract Rev Ref LCRA Transmission Svcs Corp Proj
| | 5.00% | | 05/15/33 | | 814,821 |
| 400,000 | | Lower Colorado River TX Auth Transmission Contract Rev Ref LCRA Transmission Svcs Corp Proj
| | 5.00% | | 05/15/37 | | 465,936 |
| 610,000 | | Lower Colorado River TX Auth Transmission Contract Rev Ref LCRA Transmission Svcs Corp Proj
| | 5.00% | | 05/15/38 | | 708,735 |
| 1,000,000 | | Lower Colorado River TX Auth Transmission Contract Rev Ref LCRA Transmission Svcs Corp Proj
| | 5.00% | | 05/15/40 | | 1,156,650 |
| 370,000 | | Mission TX Ctfs Oblig, AGM
| | 5.00% | | 02/15/30 | | 453,106 |
| 1,105,000 | | Montgomery TX Indep Sch Dist Ref Sch Bldg
| | 5.00% | | 02/15/28 | | 1,288,154 |
See Notes to Financial Statements
Page 31
First Trust Managed Municipal ETF (FMB)
Portfolio of Investments (Continued)
April 30, 2020 (Unaudited)
Principal
Value | | Description | | Stated
Coupon | | Stated
Maturity | | Value |
| MUNICIPAL BONDS (Continued) |
| | | Texas (Continued) | | | | | | |
| $1,350,000 | | N Fort Bend TX Wtr Auth Wtr Sys Rev Ref, Ser A
| | 4.00% | | 12/15/36 | | $1,546,236 |
| 2,250,000 | | N TX Tollway Auth Rev Ref 2nd Tier, Ser B
| | 5.00% | | 01/01/31 | | 2,555,887 |
| 1,500,000 | | N TX Tollway Auth Rev Ref Sys Second Tier, Ser B
| | 5.00% | | 01/01/31 | | 1,645,950 |
| 250,000 | | N TX Tollway Auth Rev Ref, Ser A
| | 5.00% | | 01/01/33 | | 281,620 |
| 635,000 | | New Hope Cultural Edu Facs Fin Corp TX Hosp Rev Ref Childrens Hlth System of Texas Proj, Ser A
| | 4.00% | | 08/15/34 | | 693,985 |
| 1,415,000 | | New Hope Cultural Edu Facs Fin Corp TX Retmnt Fac Rev Ref Longhorn Vlg Proj
| | 5.00% | | 01/01/31 | | 1,343,090 |
| 1,200,000 | | New Hope Cultural Edu Facs Fin Corp TX Retmnt Fac Rev Ref Longhorn Vlg Proj
| | 5.00% | | 01/01/32 | | 1,128,096 |
| 250,000 | | New Hope Cultural Edu Facs Fin Corp TX Retmnt Fac Rev Ref Wesleyan Homes Inc Proj Fin Corp
| | 5.00% | | 01/01/50 | | 193,428 |
| 500,000 | | New Hope Cultural Edu Facs Fin Corp TX Student Hsg Rev Chf TX A&M Univ Corpus Christi Island Campus Proj, Ser A (c)
| | 5.00% | | 04/01/29 | | 482,555 |
| 505,000 | | Newark Hgr Edu Fin Corp TX Edu Rev Austin Achieve Pub Schs Inc, Ser A
| | 5.00% | | 06/15/32 | | 508,495 |
| 700,000 | | Newark Hgr Edu Fin Corp TX Edu Rev Austin Achieve Pub Schs Inc, Ser A
| | 5.00% | | 06/15/42 | | 689,829 |
| 495,000 | | Red River TX Hlth Facs Dev Corp Retmnt Fac Rev MRC Crestview, Ser A
| | 7.75% | | 11/15/31 | | 546,985 |
| 2,690,000 | | Tarrant Cnty TX Cultural Edu Facs Fin Corp Hosp Rev Ref Baylor Scott & White Hlth Proj, Ser A
| | 5.00% | | 11/15/45 | | 2,966,317 |
| 750,000 | | Tarrant Cnty TX Cultural Edu Facs Fin Corp Hosp Rev Ref, Cook Children’s Med Ctr
| | 4.00% | | 12/01/35 | | 832,357 |
| 1,485,000 | | TX St Muni Gas Acquisition & Sply Corp I Gas Sply Rev Sr Lien, Ser A
| | 5.25% | | 12/15/26 | | 1,729,609 |
| 600,000 | | TX St Muni Gas Acquisition & Sply Corp III Gas Sply Rev
| | 5.00% | | 12/15/24 | | 630,048 |
| 2,850,000 | | TX St Muni Gas Acquisition & Sply Corp III Gas Sply Rev
| | 5.00% | | 12/15/30 | | 2,965,111 |
| 1,180,000 | | TX St Muni Gas Acquisition & Sply Corp III Gas Sply Rev
| | 5.00% | | 12/15/31 | | 1,224,840 |
| 3,000,000 | | TX St Priv Activity Bond Surface Transprtn Corp Rev Segment 3C Proj, AMT
| | 5.00% | | 06/30/58 | | 3,138,870 |
| 865,000 | | TX St Transprtn Commn Central TX Turnpike Sys Rev Ref, Ser B
| | 5.00% | | 08/15/37 | | 936,034 |
| 2,130,000 | | TX St Univ Sys Fing Rev Ref, Ser A
| | 4.00% | | 03/15/35 | | 2,402,768 |
| 785,000 | | TX St Wtr Dev Brd St Wtr Implementation Fund, Ser A
| | 5.00% | | 04/15/30 | | 977,992 |
| 4,000,000 | | TX St Wtr Dev Brd St Wtr Implementation Fund, Ser A
| | 4.00% | | 10/15/38 | | 4,474,840 |
| 250,000 | | TX St Wtr Dev Brd St Wtr Implementation Rev Fund for TX
| | 4.00% | | 10/15/32 | | 283,483 |
| 150,000 | | Univ of Houston TX Univ Revs Ref, Ser A
| | 5.00% | | 02/15/26 | | 180,107 |
| 3,250,000 | | Univ of Houston TX Univ Revs Ref, Ser A
| | 5.00% | | 02/15/31 | | 3,833,245 |
| 1,900,000 | | Univ of Houston TX Univ Revs Ref, Ser A
| | 5.00% | | 02/15/35 | | 2,207,040 |
| 1,560,000 | | Uptown Dev Auth TX Incr Contract Rev, Ser A
| | 5.00% | | 09/01/36 | | 1,707,233 |
| 500,000 | | Viridian TX Muni Mgmt Dist Ref Utility Impt, BAM
| | 6.00% | | 12/01/26 | | 599,115 |
| 155,000 | | Viridian TX Muni Mgmt Dist Road Impt, BAM
| | 5.00% | | 12/01/26 | | 172,893 |
| 125,000 | | Viridian TX Muni Mgmt Dist Utility Impt, BAM
| | 5.00% | | 12/01/26 | | 139,430 |
| | | | | 94,849,867 |
| | | Utah – 1.1% | | | | | | |
| 1,180,000 | | Grand Cnty Sch Dist Loc Bldg Auth UT, AGM
| | 5.00% | | 12/15/27 | | 1,395,633 |
| 1,370,000 | | Grand Cnty Sch Dist Loc Bldg Auth UT, AGM
| | 5.00% | | 12/15/30 | | 1,605,887 |
| 1,400,000 | | Grand Cnty Sch Dist Loc Bldg Auth UT, AGM
| | 5.00% | | 12/15/31 | | 1,638,602 |
| 1,515,000 | | Grand Cnty Sch Dist Loc Bldg Auth UT, AGM
| | 5.00% | | 12/15/32 | | 1,769,671 |
| 400,000 | | UT St Chrt Sch Fin Auth Chrt Sch Rev Ref Quest Academy
| | 5.00% | | 04/15/32 | | 467,796 |
| 325,000 | | UT St Chrt Sch Fin Auth Chrt Sch Rev Ref Quest Academy
| | 5.00% | | 04/15/37 | | 376,919 |
| 500,000 | | UT St Chrt Sch Fin Auth Chrt Sch Rev Spectrum Academy Proj (b)
| | 6.00% | | 04/15/45 | | 500,055 |
Page 32
See Notes to Financial Statements
First Trust Managed Municipal ETF (FMB)
Portfolio of Investments (Continued)
April 30, 2020 (Unaudited)
Principal
Value | | Description | | Stated
Coupon | | Stated
Maturity | | Value |
| MUNICIPAL BONDS (Continued) |
| | | Utah (Continued) | | | | | | |
| $1,590,000 | | UT St Chrt Sch Fin Auth Chrt Sch Rev Wallace Stegner Academy Proj, Ser A (b)
| | 5.00% | | 06/15/49 | | $1,382,092 |
| 4,875,000 | | UT St Transit Auth Sales Tax Rev Ref Sub, BAM
| | 5.00% | | 12/15/40 | | 5,813,632 |
| 1,145,000 | | UT St Transit Auth Sales Tax Rev Ref Sub, Ser A
| | 5.00% | | 06/15/35 | | 1,375,294 |
| | | | | 16,325,581 |
| | | Vermont – 0.5% | | | | | | |
| 550,000 | | Burlington VT Ref Lakeview Garage Proj, Ser A, COPS
| | 5.00% | | 12/01/24 | | 631,119 |
| 745,000 | | VT St Econ Dev Auth Mtge Rev Ref Wake Robin Corp Proj, Ser A
| | 5.00% | | 05/01/25 | | 722,300 |
| 585,000 | | VT St Econ Dev Auth Mtge Rev Ref Wake Robin Corp Proj, Ser A
| | 5.00% | | 05/01/26 | | 562,735 |
| 2,000,000 | | VT St Econ Dev Auth Solid Wst Disp Rev Variable-Casella Waste Sys Inc, AMT (Mandatory put 04/03/28) (b)
| | 4.63% | | 04/01/36 | | 1,990,100 |
| 2,500,000 | | VT St Eductnl & Hlth Bldgs Fing Agy Rev Ref Univ of VT Med Ctr, Ser A
| | 5.00% | | 12/01/33 | | 2,774,900 |
| | | | | 6,681,154 |
| | | Virginia – 1.1% | | | | | | |
| 1,000,000 | | Chesapeake VA Hosp Auth Hosp Fac Rev Ref Chesapeake Regl Med Ctr
| | 4.00% | | 07/01/35 | | 1,067,460 |
| 1,350,000 | | Norfolk VA Redev & Hsg Auth Rev Ft Norfolk Retmnt Cmnty Harbors Edge Proj, Ser A (c)
| | 4.00% | | 01/01/29 | | 1,289,831 |
| 1,000,000 | | Norfolk VA Redev & Hsg Auth Rev Ft Norfolk Retmnt Cmnty Harbors Edge Proj, Ser A (c)
| | 5.00% | | 01/01/49 | | 933,670 |
| 1,000,000 | | Norfolk VA Redev & Hsg Auth Rev Ft Norfolk Retmnt Cmnty Harbors Edge Proj, Ser A (c)
| | 5.25% | | 01/01/54 | | 967,740 |
| 2,000,000 | | VA St Pub Bldg Auth Pub Facs Rev, Ser C, AMT
| | 5.00% | | 08/01/33 | | 2,379,980 |
| 1,000,000 | | VA St Resources Auth Infrastructure Rev Ref Infrastructure VA Pooled Fing Program, Ser C
| | 4.00% | | 11/01/33 | | 1,112,670 |
| 1,570,000 | | Virginia Beach VA Dev Auth Rsdl Care Fac Rev Ref Westminster Canterbury on Chesapeake Bay
| | 5.00% | | 09/01/32 | | 1,713,121 |
| 1,000,000 | | Virginia Beach VA Dev Auth Rsdl Care Fac Rev Ref Westminster Canterbury on Chesapeake Bay
| | 5.00% | | 09/01/33 | | 1,088,830 |
| 1,210,000 | | Virginia Beach VA Dev Auth Rsdl Care Fac Rev Ref Westminster Canterbury on Chesapeake Bay
| | 5.00% | | 09/01/35 | | 1,311,156 |
| 275,000 | | Virginia Beach VA Dev Auth Rsdl Care Fac Rev Ref Westminster Canterbury on Chesapeake Bay
| | 5.00% | | 09/01/36 | | 297,396 |
| 2,365,000 | | Wstrn VA Regl Jail Auth Regl Jail Facs Rev Ref
| | 5.00% | | 12/01/34 | | 2,850,629 |
| | | | | 15,012,483 |
| | | Washington – 2.3% | | | | | | |
| 1,235,000 | | Benton Cnty WA Pub Utility Dist #1 Ref
| | 4.00% | | 11/01/36 | | 1,348,497 |
| 1,090,000 | | Centrl Puget Sound WA Regl Transit Auth Green Bond, Ser S-1
| | 5.00% | | 11/01/36 | | 1,267,735 |
| 1,250,000 | | Centrl Puget Sound WA Regl Transit Auth Sales & Use Tax Green Bond Ref & Impt, Ser S-1
| | 5.00% | | 11/01/35 | | 1,435,225 |
| 1,250,000 | | Energy NW WA Elec Rev Ref Columbia Generating Sys, Ser A
| | 5.00% | | 07/01/38 | | 1,429,237 |
| 1,500,000 | | Energy NW WA Elec Rev Ref, Ser A
| | 5.00% | | 07/01/24 | | 1,729,485 |
| 575,000 | | Kalispel Tribe of Indians Priority Dist WA Rev, Ser A (b)
| | 5.00% | | 01/01/32 | | 598,328 |
| 155,000 | | Mason Cnty WA Pub Utility Dist #1 Sys
| | 3.50% | | 12/01/21 | | 159,817 |
| 3,000,000 | | Seattle WA Drain & Wstwtr Rev Ref
| | 4.00% | | 07/01/36 | | 3,386,700 |
| 270,000 | | Skagit Cnty WA Pub Hosp Dist #1 Ref & Impt Skagit Regl Hlth
| | 4.00% | | 12/01/24 | | 292,383 |
| 110,000 | | Skagit Cnty WA Pub Hosp Dist #1 Ref & Impt, Ser A
| | 5.00% | | 12/01/22 | | 118,360 |
| 165,000 | | Skagit Cnty WA Pub Hosp Dist #1 Skagit Vly Hosp
| | 5.00% | | 12/01/20 | | 169,074 |
| 500,000 | | Snohomish Cnty WA Hsg Auth
| | 5.00% | | 04/01/34 | | 596,200 |
| 250,000 | | Tacoma WA Elec Sys Rev
| | 5.00% | | 01/01/37 | | 294,358 |
| 1,850,000 | | WA St Healthcare Facs Auth Overlake Hosp Med Ctr, Ser A
| | 5.00% | | 07/01/35 | | 2,061,751 |
| 1,625,000 | | WA St Hlth Care Facs Auth Ref, Overlake Hosp Med Ctr, Ser B
| | 5.00% | | 07/01/31 | | 1,868,896 |
See Notes to Financial Statements
Page 33
First Trust Managed Municipal ETF (FMB)
Portfolio of Investments (Continued)
April 30, 2020 (Unaudited)
Principal
Value | | Description | | Stated
Coupon | | Stated
Maturity | | Value |
| MUNICIPAL BONDS (Continued) |
| | | Washington (Continued) | | | | | | |
| $35,000 | | WA St Hsg Fin Commn Ref Emerald Heights Proj
| | 5.00% | | 07/01/22 | | $35,912 |
| 50,000 | | WA St Hsg Fin Commn Ref Emerald Heights Proj
| | 5.00% | | 07/01/28 | | 51,482 |
| 1,000,000 | | WA St Hsg Fin Commn Transforming Age Proj, Ser A (b)
| | 5.00% | | 01/01/44 | | 865,350 |
| 2,500,000 | | WA St Ref R-2015D
| | 5.00% | | 07/01/32 | | 2,884,275 |
| 1,100,000 | | WA St, Ser 2020A
| | 5.00% | | 08/01/35 | | 1,375,990 |
| 3,000,000 | | WA St, Ser 2020A
| | 5.00% | | 08/01/44 | | 3,639,420 |
| 4,000,000 | | WA St, Ser B
| | 5.00% | | 02/01/36 | | 4,585,000 |
| 2,425,000 | | WA St, Ser D
| | 5.00% | | 02/01/30 | | 2,957,093 |
| | | | | 33,150,568 |
| | | West Virginia – 0.5% | | | | | | |
| 2,250,000 | | Roane Cnty Bldg Commn WV Ref Roane General Hosp, BANS
| | 2.55% | | 11/01/21 | | 2,257,470 |
| 4,100,000 | | WV St Hosp Fin Auth Impt, W Va Univ Hlth Sys Oblig Grp, Ser A, AGM
| | 4.00% | | 06/01/51 | | 4,248,338 |
| | | | | 6,505,808 |
| | | Wisconsin – 2.3% | | | | | | |
| 1,050,000 | | Milwaukee WI Ref Promissory Nts, Ser N-4
| | 5.00% | | 04/01/29 | | 1,343,454 |
| 1,315,000 | | Pub Fin Auth WI Chrt Sch Rev Ltd American Prep Academy Las Vegas Proj, Ser A (b)
| | 4.20% | | 07/15/27 | | 1,248,172 |
| 1,250,000 | | Pub Fin Auth WI Chrt Sch Rev Ltd American Prep Academy Las Vegas Proj, Ser A (b)
| | 5.13% | | 07/15/37 | | 1,150,288 |
| 1,945,000 | | Pub Fin Auth WI Edu Rev Ref Mountain Island Chrt Sch Ltd
| | 4.00% | | 07/01/27 | | 1,998,449 |
| 620,000 | | Pub Fin Auth WI Edu Rev Ref Mountain Island Chrt Sch Ltd
| | 5.00% | | 07/01/37 | | 640,621 |
| 1,000,000 | | Pub Fin Auth WI Edu Rev Ref Mountain Island Chrt Sch Ltd
| | 5.00% | | 07/01/47 | | 1,023,000 |
| 425,000 | | Pub Fin Auth WI Eductnl Rev Piedmont Cmnty Chrt Sch
| | 5.00% | | 06/15/34 | | 463,926 |
| 1,000,000 | | Pub Fin Auth WI Exempt Facs Rev Ref Celanese Proj, Ser B, AMT
| | 5.00% | | 12/01/25 | | 998,040 |
| 1,450,000 | | Pub Fin Auth WI Retmnt Fac Rev Ref Penick Vlg Oblig Grp (b)
| | 5.00% | | 09/01/49 | | 1,169,729 |
| 340,000 | | Pub Fin Auth WI Retmnt Fac Rev Ref Whitestone Retmnt Facs 1st Mortgage Rev Bonds (b)
| | 4.00% | | 03/01/27 | | 318,277 |
| 1,000,000 | | Pub Fin Auth WI Retmnt Fac Rev Southminster (b)
| | 5.00% | | 10/01/43 | | 919,770 |
| 1,455,000 | | Pub Fin Auth WI Rev Ref Retmnt Hsg Fdtn Oblig Grp, Ser B
| | 5.00% | | 11/15/26 | | 1,556,283 |
| 1,300,000 | | WI St Gen Fund Annual Approp Rev Ref, Ser B
| | 5.00% | | 05/01/34 | | 1,536,197 |
| 3,650,000 | | WI St Hlth & Eductnl Facs Auth Rev Ref Ascension Hlth Credit Grp, Ser A
| | 5.00% | | 11/15/36 | | 4,120,448 |
| 1,000,000 | | WI St Hlth & Eductnl Facs Auth Rev Ref Ascension Hlth Credit Grp, Ser A
| | 5.00% | | 11/15/39 | | 1,121,980 |
| 1,780,000 | | WI St Hlth & Eductnl Facs Auth Rev Ref Beloit Hlth Sys Inc
| | 4.00% | | 07/01/36 | | 1,891,624 |
| 500,000 | | WI St Hlth & Eductnl Facs Auth Rev Ref Marquette Univ
| | 5.00% | | 10/01/28 | | 527,265 |
| 1,175,000 | | WI St Hlth & Eductnl Facs Auth Rev Ref Prohealth Care Oblig Grp
| | 5.00% | | 08/15/31 | | 1,289,962 |
| 175,000 | | WI St Hlth & Eductnl Facs Auth Rev Ref Prohealth Care Oblig Grp
| | 5.00% | | 08/15/33 | | 190,839 |
| 700,000 | | WI St Hlth & Eductnl Facs Auth Rev Ref Rogers Memorial Hosp Inc, Ser A
| | 5.00% | | 07/01/44 | | 758,058 |
| 800,000 | | WI St Hlth & Eductnl Facs Auth Rev Ref Rogers Memorial Hosp Inc, Ser A
| | 5.00% | | 07/01/49 | | 862,688 |
| 515,000 | | WI St Hlth & Eductnl Facs Auth Rev Ref St Camillus Hlth Sys, Ser A
| | 5.00% | | 11/01/30 | | 500,266 |
| 435,000 | | WI St Hlth & Eductnl Facs Auth Rev St Johns Cmntys Inc Proj, Ser A
| | 5.00% | | 09/15/30 | | 429,097 |
| 1,015,000 | | WI St Hlth & Eductnl Facs Auth Rev St Johns Cmntys Inc Proj, Ser A
| | 5.00% | | 09/15/31 | | 995,979 |
Page 34
See Notes to Financial Statements
First Trust Managed Municipal ETF (FMB)
Portfolio of Investments (Continued)
April 30, 2020 (Unaudited)
Principal
Value | | Description | | Stated
Coupon | | Stated
Maturity | | Value |
| MUNICIPAL BONDS (Continued) |
| | | Wisconsin (Continued) | | | | | | |
| $595,000 | | WI St Hlth & Eductnl Facs Auth Rev St Johns Cmntys Inc Proj, Ser A
| | 5.00% | | 09/15/32 | | $579,447 |
| 455,000 | | WI St Hlth & Eductnl Facs Auth Rev St Johns Cmntys Inc Proj, Ser A
| | 5.00% | | 09/15/33 | | 440,749 |
| 2,000,000 | | WI St Ref, Ser 3
| | 4.00% | | 11/01/34 | | 2,268,920 |
| 2,500,000 | | WI St, Ser B
| | 4.00% | | 05/01/31 | | 2,882,800 |
| | | | | 33,226,328 |
| | | Wyoming – 0.0% | | | | | | |
| 250,000 | | Natrona Cnty WY Hosp Rev Ref WY Med Ctr Proj
| | 5.00% | | 09/15/30 | | 288,307 |
| | Total Investments – 94.1%
| | 1,339,437,761 |
| | (Cost $1,361,149,075) (f) | | |
| | Net Other Assets and Liabilities – 5.9%
| | 83,362,214 |
| | Net Assets – 100.0%
| | $1,422,799,975 |
Futures Contracts (See Note 2D - Futures Contracts in the Notes to Financial Statements):
| Futures Contracts | | Position | | Number of
Contracts | | Expiration
Date | | Notional
Value | | Unrealized
Appreciation
(Depreciation)/
Value |
| U.S. Treasury Ultra 10-Year Notes | | Short | | 124 | | Jun 2020 | | $ (19,471,875) | | $(407,234) |
| U.S. Treasury Long Bonds | | Short | �� | 37 | | Jun 2020 | | (6,698,156) | | (396,594) |
| Total Futures Contracts | | | | | | | | $(26,170,031) | | $(803,828) |
|
| (a) | Variable Rate Demand bond. Interest rate is reset periodically by the agent based on current market conditions. |
| (b) | This security, sold within the terms of a private placement memorandum, is exempt from registration upon resale under Rule 144A under the Securities Act of 1933, as amended (the “1933 Act”), and may be resold in transactions exempt from registration, normally to qualified institutional buyers. Pursuant to procedures adopted by the Trust’s Board of Trustees, this security has been determined to be liquid by First Trust Advisors L.P. (the “Advisor”). Although market instability can result in periods of increased overall market illiquidity, liquidity for each security is determined based on security specific factors and assumptions, which require subjective judgment. At April 30, 2020, securities noted as such amounted to $58,846,439 or 4.1% of net assets. |
| (c) | Pursuant to procedures adopted by the Trust’s Board of Trustees, this security has been determined to be illiquid by the Advisor. |
| (d) | Zero coupon bond. |
| (e) | This security, sold within the terms of a private placement memorandum, is exempt from registration upon resale under Rule 144A under the 1933 Act, and may be resold in transactions exempt from registration, normally to qualified institutional buyers (see Note 2C - Restricted Securities in the Notes to Financial Statements). |
| (f) | Aggregate cost for financial reporting purposes approximates the aggregate cost for federal income tax purposes. As of April 30, 2020, the aggregate gross unrealized appreciation for all investments in which there was an excess of value over tax cost was $18,456,336 and the aggregate gross unrealized depreciation for all investments in which there was an excess of tax cost over value was $40,971,478. The net unrealized depreciation was $22,515,142. The amounts presented are inclusive of derivative contracts. |
See Notes to Financial Statements
Page 35
First Trust Managed Municipal ETF (FMB)
Portfolio of Investments (Continued)
April 30, 2020 (Unaudited)
| AGC | Assured Guaranty Corp. |
| AGM | Assured Guaranty Municipal Corp. |
| AMBAC | American Municipal Bond Assurance Corp. |
| AMT | Alternative Minimum Tax |
| BAM | Build America Mutual |
| BANS | Bond Anticipation Notes |
| CABS | Capital Appreciation Bonds |
| COPS | Certificates of Participation |
| GANS | Grant Anticipation Notes |
| GARVEE | Grant Anticipation Revenue Vehicle |
| NATL-RE | National Public Finance Guarantee Corp. |
Valuation Inputs
A summary of the inputs used to value the Fund’s investments as of April 30, 2020 is as follows (see Note 2A - Portfolio Valuation in the Notes to Financial Statements):
| ASSETS TABLE |
| | Total
Value at
4/30/2020 | Level 1
Quoted
Prices | Level 2
Significant
Observable
Inputs | Level 3
Significant
Unobservable
Inputs |
Municipal Bonds*
| $ 1,339,437,761 | $ — | $ 1,339,437,761 | $ — |
LIABILITIES TABLE |
| | Total
Value at
4/30/2020 | Level 1
Quoted
Prices | Level 2
Significant
Observable
Inputs | Level 3
Significant
Unobservable
Inputs |
Futures Contracts
| $ (803,828) | $ (803,828) | $ — | $ — |
| * | See Portfolio of Investments for state and territory breakout. |
Page 36
See Notes to Financial Statements
First Trust Managed Municipal ETF (FMB)
Statement of Assets and Liabilities
April 30, 2020 (Unaudited)
| ASSETS: | |
Investments, at value
(Cost $1,361,149,075)
| $ 1,339,437,761 |
Cash
| 55,533,843 |
| Receivables: | |
Investment securities sold
| 20,516,889 |
Interest
| 17,345,998 |
Fund shares sold
| 5,252,944 |
Total Assets
| 1,438,087,435 |
| LIABILITIES: | |
| Payables: | |
Investment securities purchased
| 13,904,283 |
Variation margin
| 803,828 |
Investment advisory fees
| 579,349 |
Total Liabilities
| 15,287,460 |
NET ASSETS
| $1,422,799,975 |
| NET ASSETS consist of: | |
Paid-in capital
| $ 1,465,786,971 |
Par value
| 271,000 |
Accumulated distributable earnings (loss)
| (43,257,996) |
NET ASSETS
| $1,422,799,975 |
NET ASSET VALUE, per share
| $52.50 |
Number of shares outstanding (unlimited number of shares authorized, par value $0.01 per share)
| 27,100,002 |
See Notes to Financial Statements
Page 37
First Trust Managed Municipal ETF (FMB)
Statement of Operations
For the Six Months Ended April 30, 2020 (Unaudited)
| INVESTMENT INCOME: | |
Interest
| $ 18,206,833 |
Total investment income
| 18,206,833 |
| EXPENSES: | |
Investment advisory fees
| 4,254,482 |
Total expenses
| 4,254,482 |
Fees waived by the investment advisor
| (981,804) |
Net expenses
| 3,272,678 |
NET INVESTMENT INCOME (LOSS)
| 14,934,155 |
| NET REALIZED AND UNREALIZED GAIN (LOSS): | |
| Net realized gain (loss) on: | |
Investments
| (13,130,473) |
Futures
| (4,666,315) |
Net realized gain (loss)
| (17,796,788) |
| Net change in unrealized appreciation (depreciation) on: | |
Investments
| (60,873,288) |
Futures
| (614,875) |
Net change in unrealized appreciation (depreciation)
| (61,488,163) |
NET REALIZED AND UNREALIZED GAIN (LOSS)
| (79,284,951) |
NET INCREASE (DECREASE) IN NET ASSETS RESULTING FROM OPERATIONS
| $(64,350,796) |
Page 38
See Notes to Financial Statements
First Trust Managed Municipal ETF (FMB)
Statements of Changes in Net Assets
| | Six Months
Ended
4/30/2020
(Unaudited) | | Year
Ended
10/31/2019 |
| OPERATIONS: | | | |
Net investment income (loss)
| $ 14,934,155 | | $ 18,421,711 |
Net realized gain (loss)
| (17,796,788) | | (383,923) |
Net change in unrealized appreciation (depreciation)
| (61,488,163) | | 43,706,637 |
Net increase (decrease) in net assets resulting from operations
| (64,350,796) | | 61,744,425 |
| DISTRIBUTIONS TO SHAREHOLDERS FROM: | | | |
Investment operations
| (15,263,251) | | (18,404,821) |
Return of capital
| — | | (424,682) |
Total distributions to shareholders
| (15,263,251) | | (18,829,503) |
| SHAREHOLDER TRANSACTIONS: | | | |
Proceeds from shares sold
| 418,089,279 | | 647,355,139 |
Cost of shares redeemed
| (50,933,094) | | (10,383,218) |
Net increase (decrease) in net assets resulting from shareholder transactions
| 367,156,185 | | 636,971,921 |
Total increase (decrease) in net assets
| 287,542,138 | | 679,886,843 |
| NET ASSETS: | | | |
Beginning of period
| 1,135,257,837 | | 455,370,994 |
End of period
| $1,422,799,975 | | $1,135,257,837 |
| CHANGES IN SHARES OUTSTANDING: | | | |
Shares outstanding, beginning of period
| 20,500,002 | | 8,800,002 |
Shares sold
| 7,550,000 | | 11,900,000 |
Shares redeemed
| (950,000) | | (200,000) |
Shares outstanding, end of period
| 27,100,002 | | 20,500,002 |
See Notes to Financial Statements
Page 39
First Trust Managed Municipal ETF (FMB)
Financial Highlights
For a share outstanding throughout each period
| | Six Months
Ended
4/30/2020
(Unaudited) | | Year Ended October 31, |
| 2019 | | 2018 | | 2017 | | 2016 | | 2015 |
Net asset value, beginning of period
| $ 55.38 | | $ 51.75 | | $ 53.16 | | $ 53.32 | | $ 51.58 | | $ 51.11 |
| Income from investment operations: | | | | | | | | | | | |
Net investment income (loss)
| 0.63 | | 1.35 | | 1.35 | | 1.34 | | 1.32 | | 1.35 |
Net realized and unrealized gain (loss)
| (2.87) | | 3.67 | | (1.41) | | (0.01) | | 1.99 | | 0.50 |
Total from investment operations
| (2.24) | | 5.02 | | (0.06) | | 1.33 | | 3.31 | | 1.85 |
| Distributions paid to shareholders from: | | | | | | | | | | | |
Net investment income
| (0.64) | | (1.36) | | (1.35) | | (1.33) | | (1.35) | | (1.38) |
Net realized gain
| — | | — | | — | | (0.16) | | (0.22) | | — |
Return of capital
| — | | (0.03) | | — | | — | | — | | — |
Total distributions
| (0.64) | | (1.39) | | (1.35) | | (1.49) | | (1.57) | | (1.38) |
Net asset value, end of period
| $52.50 | | $55.38 | | $51.75 | | $53.16 | | $53.32 | | $51.58 |
Total return (a)
| (4.10)% | | 9.79% | | (0.12)% | | 2.59% | | 6.47% | | 3.66% |
| Ratios to average net assets/supplemental data: | | | | | | | | | | | |
Net assets, end of period (in 000’s)
| $ 1,422,800 | | $ 1,135,258 | | $ 455,371 | | $ 220,605 | | $ 82,650 | | $ 33,529 |
Ratio of total expenses to average net assets
| 0.65% | | 0.65% | | 0.65% | | 0.65% | | 0.65% | | 0.65% |
Ratio of net expenses to average net assets
| 0.50% | | 0.50% | | 0.50% | | 0.50% | | 0.52% | | 0.65% |
Ratio of net investment income (loss) to average net assets
| 2.28% | | 2.53% | | 2.60% | | 2.63% | | 2.52% | | 2.63% |
Portfolio turnover rate (b)
| 29% | | 26% | | 42% | | 85% | | 85% | | 109% |
| (a) | Total return is calculated assuming an initial investment made at the net asset value at the beginning of the period, reinvestment of all distributions at net asset value during the period, and redemption at net asset value on the last day of the period. The returns presented do not reflect the deduction of taxes that a shareholder would pay on Fund distributions or the redemption or sale of Fund shares. Total return is calculated for the time period presented and is not annualized for periods of less than a year. For some periods, the total returns would have been lower if certain fees had not been waived by the advisor. |
| (b) | Portfolio turnover is calculated for the time period presented and is not annualized for periods of less than a year and does not include securities received or delivered from processing creations or redemptions and in-kind transactions. |
Page 40
See Notes to Financial Statements
Notes to Financial Statements
First Trust Managed Municipal ETF (FMB)
April 30, 2020 (Unaudited)
1. Organization
First Trust Exchange-Traded Fund III (the “Trust”) is an open-end management investment company organized as a Massachusetts business trust on January 9, 2008, and is registered with the Securities and Exchange Commission (the “SEC”) under the Investment Company Act of 1940, as amended (the “1940 Act”).
The Trust currently consists of seventeen funds that are offering shares. This report covers the First Trust Managed Municipal ETF (the “Fund”), a diversified series of the Trust, which trades under the ticker “FMB” on The Nasdaq Stock Market LLC. Unlike conventional mutual funds, the Fund issues and redeems shares on a continuous basis, at net asset value (“NAV”), only in large specified blocks consisting of 50,000 shares called a “Creation Unit.” Creation Units are issued and redeemed for cash and, in certain circumstances, in-kind for securities in which the Fund invests. Except when aggregated in Creation Units, the Fund’s shares are not redeemable securities.
The primary investment objective of the Fund is to generate current income that is exempt from regular federal income taxes and its secondary objective is long-term capital appreciation. Under normal market conditions, the Fund seeks to achieve its investment objectives by investing at least 80% of its net assets (including investment borrowings) in municipal debt securities that pay interest that is exempt from regular federal income taxes. There can be no assurance that the Fund will achieve its investment objectives. The Fund may not be appropriate for all investors.
2. Significant Accounting Policies
The Fund is considered an investment company and follows accounting and reporting guidance under Financial Accounting Standards Board (“FASB”) Accounting Standards Codification Topic 946, “Financial Services-Investment Companies.” The following is a summary of significant accounting policies consistently followed by the Fund in the preparation of the financial statements. The preparation of the financial statements in accordance with accounting principles generally accepted in the United States of America (“U.S. GAAP”) requires management to make estimates and assumptions that affect the reported amounts and disclosures in the financial statements. Actual results could differ from those estimates.
A. Portfolio Valuation
The Fund’s NAV is determined daily as of the close of regular trading on the New York Stock Exchange (“NYSE”), normally 4:00 p.m. Eastern time, on each day the NYSE is open for trading. If the NYSE closes early on a valuation day, the NAV is determined as of that time. Domestic debt securities are priced using data reflecting the earlier closing of the principal markets for those securities. The Fund’s NAV is calculated by dividing the value of all assets of the Fund (including accrued interest and dividends), less all liabilities (including accrued expenses and dividends declared but unpaid), by the total number of shares outstanding.
The Fund’s investments are valued daily at market value or, in the absence of market value with respect to any portfolio securities, at fair value. Market value prices represent last sale or official closing prices from a national or foreign exchange (i.e., a regulated market) and are primarily obtained from third-party pricing services. Fair value prices represent any prices not considered market value prices and are either obtained from a third-party pricing service or are determined by the Pricing Committee of the Fund’s investment advisor, First Trust Advisors L.P. (“First Trust” or the “Advisor”), in accordance with valuation procedures adopted by the Trust’s Board of Trustees, and in accordance with provisions of the 1940 Act. Investments valued by the Advisor’s Pricing Committee, if any, are footnoted as such in the footnotes to the Portfolio of Investments. The Fund’s investments are valued as follows:
Municipal securities and other debt securities are fair valued on the basis of fair valuations provided by dealers who make markets in such securities or by a third-party pricing service approved by the Trust’s Board of Trustees, which may use the following valuation inputs when available:
| 1) | benchmark yields; |
| 2) | reported trades; |
| 3) | broker/dealer quotes; |
| 4) | issuer spreads; |
| 5) | benchmark securities; |
| 6) | bids and offers; and |
| 7) | reference data including market research publications. |
Exchange-traded futures contracts are valued at the closing price in the market where such contracts are principally traded. If no closing price is available, exchange-traded futures contracts are fair valued at the mean of their most recent bid and asked price, if available, and otherwise at their closing bid price.
Notes to Financial Statements (Continued)
First Trust Managed Municipal ETF (FMB)
April 30, 2020 (Unaudited)
Fixed income and other debt securities having a remaining maturity of sixty days or less when purchased are fair valued at cost adjusted for amortization of premiums and accretion of discounts (amortized cost), provided the Advisor’s Pricing Committee has determined that the use of amortized cost is an appropriate reflection of fair value given market and issuer-specific conditions existing at the time of the determination. Factors that may be considered in determining the appropriateness of the use of amortized cost include, but are not limited to, the following:
| 1) | the credit conditions in the relevant market and changes thereto; |
| 2) | the liquidity conditions in the relevant market and changes thereto; |
| 3) | the interest rate conditions in the relevant market and changes thereto (such as significant changes in interest rates); |
| 4) | issuer-specific conditions (such as significant credit deterioration); and |
| 5) | any other market-based data the Advisor’s Pricing Committee considers relevant. In this regard, the Advisor’s Pricing Committee may use last-obtained market-based data to assist it when valuing portfolio securities using amortized cost. |
Certain securities may not be able to be priced by pre-established pricing methods. Such securities may be valued by the Trust’s Board of Trustees or its delegate, the Advisor’s Pricing Committee, at fair value. These securities generally include, but are not limited to, restricted securities (securities which may not be publicly sold without registration under the Securities Act of 1933, as amended (the “1933 Act”)) for which a third-party pricing service is unable to provide a market price; securities whose trading has been formally suspended; a security whose market or fair value price is not available from a pre-established pricing source; a security with respect to which an event has occurred that is likely to materially affect the value of the security after the market has closed but before the calculation of the Fund’s NAV or make it difficult or impossible to obtain a reliable market quotation; and a security whose price, as provided by the third-party pricing service, does not reflect the security’s fair value. As a general principle, the current fair value of a security would appear to be the amount which the owner might reasonably expect to receive for the security upon its current sale. When fair value prices are used, generally they will differ from market quotations or official closing prices on the applicable exchanges. A variety of factors may be considered in determining the fair value of such securities, including, but not limited to, the following:
| 1) | the fundamental business data relating to the issuer; |
| 2) | an evaluation of the forces which influence the market in which these securities are purchased and sold; |
| 3) | the type, size and cost of the security; |
| 4) | the financial statements of the issuer; |
| 5) | the credit quality and cash flow of the issuer, based on the Advisor’s or external analysis; |
| 6) | the information as to any transactions in or offers for the security; |
| 7) | the price and extent of public trading in similar securities (or equity securities) of the issuer/borrower, or comparable companies; |
| 8) | the coupon payments; |
| 9) | the quality, value and salability of collateral, if any, securing the security; and |
| 10) | other relevant factors. |
The Fund is subject to fair value accounting standards that define fair value, establish the framework for measuring fair value and provide a three-level hierarchy for fair valuation based upon the inputs to the valuation as of the measurement date. The three levels of the fair value hierarchy are as follows:
| • | Level 1 – Level 1 inputs are quoted prices in active markets for identical investments. An active market is a market in which transactions for the investment occur with sufficient frequency and volume to provide pricing information on an ongoing basis. |
| • | Level 2 – Level 2 inputs are observable inputs, either directly or indirectly, and include the following: |
| o | Quoted prices for similar investments in active markets. |
| o | Quoted prices for identical or similar investments in markets that are non-active. A non-active market is a market where there are few transactions for the investment, the prices are not current, or price quotations vary substantially either over time or among market makers, or in which little information is released publicly. |
| o | Inputs other than quoted prices that are observable for the investment (for example, interest rates and yield curves observable at commonly quoted intervals, volatilities, prepayment speeds, loss severities, credit risks, and default rates). |
| o | Inputs that are derived principally from or corroborated by observable market data by correlation or other means. |
| • | Level 3 – Level 3 inputs are unobservable inputs. Unobservable inputs may reflect the reporting entity’s own assumptions about the assumptions that market participants would use in pricing the investment. |
Notes to Financial Statements (Continued)
First Trust Managed Municipal ETF (FMB)
April 30, 2020 (Unaudited)
The inputs or methodologies used for valuing investments are not necessarily an indication of the risk associated with investing in those investments. A summary of the inputs used to value the Fund’s investments as of April 30, 2020, is included with the Fund’s Portfolio of Investments.
B. Securities Transactions and Investment Income
Securities transactions are recorded as of the trade date. Realized gains and losses from securities transactions are recorded on the identified cost basis. Dividend income is recorded on the ex-dividend date. Interest income is recorded daily on the accrual basis. Amortization of premiums and accretion of discounts are recorded using the effective interest method.
C. Restricted Securities
The Fund invests in restricted securities, which are securities that may not be offered for public sale without first being registered under the 1933 Act. Prior to registration, restricted securities may only be resold in transactions exempt from registration under Rule 144A under the 1933 Act, normally to qualified institutional buyers. As of April 30, 2020, the Fund held restricted securities as shown in the following table that the Advisor has deemed illiquid pursuant to procedures adopted by the Trust’s Board of Trustees. Although market instability can result in periods of increased overall market illiquidity, liquidity for each security is determined based on security-specific factors and assumptions, which require subjective judgment. The Fund does not have the right to demand that such securities be registered. These securities are valued according to the valuation procedures as stated in the Portfolio Valuation note (Note 2A) and are not expressed as a discount to the carrying value of a comparable unrestricted security. There are no unrestricted securities with the same maturity dates and yields for these issuers.
| Security | Acquisition
Date | Principal
Value | Current Price | Carrying
Cost | | Value | | % of
Net
Assets |
| Brookstone CDD FL Spl Assmnt Rev CDD, 3.88%, 11/01/23 | 01/24/18 | $410,000 | $99.18 | $410,000 | | $406,630 | | 0.03% |
| IN St Fin Auth Rev Eductnl Facs Rock Creek Cmnty Academy Proj, Ser A, 5.25%, 07/01/28 | 09/04/18 | $800,000 | 99.86 | 807,825 | | 798,888 | | 0.06 |
| IN St Fin Auth Rev Eductnl Facs Rock Creek Cmnty Academy Proj, Ser A, 5.88%, 07/01/38 | 09/04/18 | $1,000,000 | 99.38 | 1,004,644 | | 993,840 | | 0.07 |
| Leander TX Spl Assmnt Rev Crystal Springs Pub Impt Dist Proj Accd Inv, 5.13%, 09/01/38 | 05/04/18 | $1,290,000 | 88.57 | 1,290,000 | | 1,142,501 | | 0.08 |
| Timber Creek CDD FL Spl Assmnt Rev, 4.13%, 11/01/24 | 06/21/18 | $215,000 | 99.29 | 215,000 | | 213,478 | | 0.02 |
| | | | | $3,727,469 | | $3,555,337 | | 0.26% |
D. Futures Contracts
The Fund may purchase or sell (i.e., is long or short) exchange-listed futures contracts to hedge against changes in interest rates (interest rate risk). Futures contracts are agreements between the Fund and a counterparty to buy or sell a specific quantity of an underlying instrument at a specified price and at a specified date. Depending on the terms of the contract, futures contracts are settled either through physical delivery of the underlying instrument on the settlement date or by payment of a cash settlement amount on the settlement date. Open futures contracts can also be closed out prior to settlement by entering into an offsetting transaction in a matching futures contract. If the Fund is not able to enter into an offsetting transaction, the Fund will continue to be required to maintain margin deposits on the futures contract. When the contract is closed or expires, the Fund records a realized gain or loss equal to the difference between the value of the contract at the time it was opened and the value at the time it was closed or expired. This gain or loss is included in “Net realized gain (loss) on futures” on the Statement of Operations.
Upon entering into a futures contract, the Fund must deposit funds, called margin, with its custodian in the name of the clearing broker equal to a specified percentage of the current value of the contract. Open futures contracts are marked to market daily with the change in value recognized as a component of “Net change in unrealized appreciation (depreciation) on futures” on the Statement of Operations. This daily fluctuation in the value of the contracts is also known as variation margin and is included in “Variation margin” payable or receivable on the Statement of Assets and Liabilities.
If market conditions change unexpectedly, the Fund may not achieve the anticipated benefits of the futures contract and may realize a loss. The use of futures contracts involves the risk of imperfect correlation in movements in the price of the futures contracts, interest rates and the underlying instruments.
Notes to Financial Statements (Continued)
First Trust Managed Municipal ETF (FMB)
April 30, 2020 (Unaudited)
E. Dividends and Distributions to Shareholders
Dividends from net investment income, if any, are declared and paid monthly by the Fund, or as the Board of Trustees may determine from time to time. Distributions of net realized capital gains earned by the Fund, if any, are distributed at least annually.
Distributions from net investment income and realized capital gains are determined in accordance with federal income tax regulations, which may differ from U.S. GAAP. Certain capital accounts in the financial statements are periodically adjusted for permanent differences in order to reflect their tax character. These permanent differences are primarily due to the varying treatment of income and gain/loss on portfolio securities held by the Fund and have no impact on net assets or NAV per share. Temporary differences, which arise from recognizing certain items of income, expense and gain/loss in different periods for financial statement and tax purposes, will reverse at some time in the future.
The tax character of distributions paid by the Fund during the fiscal year ended October 31, 2019, was as follows:
| Distributions paid from: | |
Ordinary income
| $2,058 |
Capital gains
| — |
Tax-exempt income
| 18,402,763 |
Return of capital
| 424,682 |
As of October 31, 2019, the components of distributable earnings on a tax basis were as follows:
Undistributed ordinary income
| $— |
Accumulated capital and other gain (loss)
| (2,853,203) |
Net unrealized appreciation (depreciation)
| 39,209,254 |
F. Income Taxes
The Fund intends to continue to qualify as a regulated investment company by complying with the requirements under Subchapter M of the Internal Revenue Code of 1986, as amended (the “Code”), which includes distributing substantially all of its net investment income and net realized gains to shareholders. Accordingly, no provision has been made for federal and state income taxes. However, due to the timing and amount of distributions, the Fund may be subject to an excise tax of 4% of the amount by which approximately 98% of the Fund’s taxable income exceeds the distributions from such taxable income for the calendar year.
In addition, the Fund intends to invest in such municipal securities to allow it to pay shareholders “exempt dividends” as defined in the Code.
The Fund is subject to accounting standards that establish a minimum threshold for recognizing, and a system for measuring, the benefits of a tax position taken or expected to be taken in a tax return. Taxable years ended 2016, 2017, 2018, and 2019 remain open to federal and state audit. As of April 30, 2020, management has evaluated the application of these standards to the Fund and has determined that no provision for income tax is required in the Fund’s financial statements for uncertain tax positions.
The Fund intends to utilize provisions of the federal income tax laws, which allow it to carry a realized capital loss forward indefinitely following the year of the loss and offset such loss against any future realized capital gains. The Fund is subject to certain limitations under U.S. tax rules on the use of capital loss carryforwards and net unrealized built-in losses. These limitations apply when there has been a 50% change in ownership. At October 31, 2019, the Fund had $2,853,203 of non-expiring capital loss carryforwards for federal income tax purposes.
Certain losses realized during the current fiscal year may be deferred and treated as occurring on the first day of the following fiscal year for federal income tax purposes. For the fiscal year ended October 31, 2019, the Fund had no net ordinary losses.
G. Expenses
Expenses, other than the investment advisory fee and other excluded expenses, are paid by the Advisor (See Note 3).
H. New Accounting Pronouncement
On March 30, 2017, the FASB issued Accounting Standards Update (“ASU”) 2017-08 “Premium Amortization on Purchased Callable Debt Securities,” which amends the amortization period for certain purchased callable debt securities held at a premium by shortening such period to the earliest call date. The new guidance requires an entity to amortize the premium on a callable debt security within its scope to the earliest call date, unless the guidance for considering estimated prepayments is applied. If the call option is not exercised at the earliest call date, the yield is reset to the effective yield using the payment terms of the security. If the security has more than one
Notes to Financial Statements (Continued)
First Trust Managed Municipal ETF (FMB)
April 30, 2020 (Unaudited)
call date and the premium was amortized to a call price greater than the next call price, any excess of the amortized cost basis over the amount repayable at the next call date will be amortized to that date. If there are no other call dates, any excess of the amortized cost basis over the par amount will be amortized to maturity. Discounts on purchased callable debt securities will continue to be amortized to the security’s maturity date. ASU 2017-08 is effective for public business entities for fiscal years, and interim periods within those fiscal years, beginning after December 15, 2018. ASU 2017-08 was adopted for these financial statements and did not have a material impact.
3. Investment Advisory Fee, Affiliated Transactions and Other Fee Arrangements
First Trust, the investment advisor to the Fund, is a limited partnership with one limited partner, Grace Partners of DuPage L.P., and one general partner, The Charger Corporation. The Charger Corporation is an Illinois corporation controlled by James A. Bowen, Chief Executive Officer of First Trust. First Trust is responsible for the selection and ongoing monitoring of the securities in the Fund’s portfolio, managing the Fund’s business affairs and providing certain administrative services necessary for the management of the Fund.
Pursuant to the Investment Management Agreement between the Trust and the Advisor, First Trust manages the investment of the Fund’s assets and is responsible for the Fund’s expenses, including the cost of transfer agency, custody, fund administration, legal, audit and other services, but excluding fee payments under the Investment Management Agreement, interest, taxes, acquired fund fees and expenses, if any, brokerage commissions and other expenses connected with the execution of portfolio transactions, distribution and service fees pursuant to a Rule 12b-1 plan, if any, and extraordinary expenses. The Fund has agreed to pay First Trust an annual unitary management fee equal to 0.65% of its average daily net assets. First Trust also provides fund reporting services to the Fund for a flat annual fee in the amount of $9,250, which is covered under the annual unitary management fee.
The Trust’s Board of Trustees and the Advisor have entered into a Fee Waiver Agreement for the Fund pursuant to which the Advisor contractually agreed to waive management fees of 0.15% of average daily net assets until March 1, 2021. The waiver agreement may be terminated by action of the Trust’s Board of Trustees at any time upon 60 days’ written notice by the Trust on behalf of the Fund or by the Fund’s investment advisor only after March 1, 2021. First Trust does not have the right to recover the fees waived. During the six months ended April 30, 2020, the Advisor waived fees of $981,804.
The Trust has multiple service agreements with Brown Brothers Harriman & Co. (“BBH”). Under the service agreements, BBH performs custodial, fund accounting, certain administrative services, and transfer agency services for the Fund. As custodian, BBH is responsible for custody of the Fund’s assets. As fund accountant and administrator, BBH is responsible for maintaining the books and records of the Fund’s securities and cash. As transfer agent, BBH is responsible for maintaining shareholder records for the Fund.
Each Trustee who is not an officer or employee of First Trust, any sub-advisor or any of their affiliates (“Independent Trustees”) is paid a fixed annual retainer that is allocated equally among each fund in the First Trust Fund Complex. Each Independent Trustee is also paid an annual per fund fee that varies based on whether the fund is a closed-end or other actively managed fund, a defined-outcome fund or an index fund.
Additionally, the Lead Independent Trustee and the Chairmen of the Audit Committee, Nominating and Governance Committee and Valuation Committee are paid annual fees to serve in such capacities, with such compensation allocated pro rata among each fund in the First Trust Fund Complex based on net assets. Independent Trustees are reimbursed for travel and out-of-pocket expenses in connection with all meetings. The Lead Independent Trustee and Committee Chairmen rotate every three years. The officers and “Interested” Trustee receive no compensation from the Trust for acting in such capacities.
4. Purchases and Sales of Securities
For the six months ended April 30, 2020, the cost of purchases and proceeds from sales of investments, excluding short term investments and in-kind transactions, were $685,652,925 and $369,099,178, respectively.
For the six months ended April 30, 2020, the Fund had no in-kind transactions.
5. Derivative Transactions
The following table presents the type of derivatives held by the Fund at April 30, 2020, the primary underlying risk exposure and the location of these instruments as presented on the Statement of Assets and Liabilities.
Notes to Financial Statements (Continued)
First Trust Managed Municipal ETF (FMB)
April 30, 2020 (Unaudited)
| | | | | Asset Derivatives | | Liability Derivatives |
Derivative
Instrument | | Risk
Exposure | | Statement of Assets and
Liabilities Location | | Value | | Statement of Assets and
Liabilities Location | | Value |
| Futures | | Interest Rate Risk | | Variation Margin Receivable | | $ — | | Variation Margin Payable | | $ 803,828 |
The following table presents the amount of net realized gain (loss) and change in net unrealized appreciation (depreciation) recognized for the six months ended April 30, 2020, on derivative instruments, as well as the primary underlying risk exposure associated with each instrument.
| Statement of Operations Location | |
| Interest Rate Risk Exposure | |
| Net realized gain (loss) on futures | $(4,666,315) |
| Net change in unrealized appreciation (depreciation) on futures | (614,875) |
During the six months ended April 30, 2020, the notional value of futures contracts opened and closed were $288,203,141 and $284,698,969, respectively.
The Fund does not have the right to offset financial assets and liabilities related to futures contracts on the Statement of Assets and Liabilities.
6. Creations, Redemptions and Transaction Fees
Shares are created and redeemed by the Fund only in Creation Unit size aggregations of 50,000 shares in transactions with broker-dealers or large institutional investors that have entered into a participation agreement (an “Authorized Participant”). Due to the nature of the Fund’s investments, the Fund’s Creation Units are generally issued and redeemed for cash, although Creation Units may be issued in-kind for securities in which the Fund invests in limited circumstances. Authorized Participants purchasing Creation Units must pay to BBH, as transfer agent, a creation transaction fee (the “Creation Transaction Fee”) regardless of the number of Creation Units purchased in the transaction. The Creation Transaction Fee may vary and is based on the composition of the securities included in the Fund’s portfolio and/or the countries in which the transactions are settled. The Creation Transaction Fee may increase or decrease with changes in the Fund’s portfolio. The price for each Creation Unit will equal the daily NAV per share times the number of shares in a Creation Unit plus the fees described above and, if applicable, any operational processing and brokerage costs, transfer fees or stamp taxes. When Creation Units are issued for cash, the Authorized Participant may also be assessed an amount to cover the cost of purchasing portfolio securities, including operational processing and brokerage costs, transfer fees, stamp taxes, and part or all of the spread between the expected bid and offer side of the market related to such securities.
Authorized Participants redeeming Creation Units must pay to BBH, as transfer agent, a standard redemption transaction fee (the “Redemption Transaction Fee”), regardless of the number of Creation Units redeemed in the transaction. The Redemption Transaction Fee may vary and is based on the composition of the securities included in the Fund’s portfolio and/or the countries in which the transactions are settled. The Redemption Transaction Fee may increase or decrease with changes in the Fund’s portfolio. When shares are redeemed for cash, the Authorized Participant may also be assessed an amount to cover other costs, including operational processing and brokerage costs, transfer fees, stamp taxes and part or all of the spread between the expected bid and offer side of the market related to portfolio securities sold in connection with the redemption.
7. Distribution Plan
The Board of Trustees adopted a Distribution and Service Plan pursuant to Rule 12b-1 under the 1940 Act. In accordance with the Rule 12b-1 plan, the Fund is authorized to pay an amount up to 0.25% of its average daily net assets each year to reimburse First Trust Portfolios L.P. (“FTP”), the distributor of the Fund, for amounts expended to finance activities primarily intended to result in the sale of Creation Units or to provide investor services. FTP may also use this amount to compensate securities dealers or other persons that are Authorized Participants for providing distribution assistance, including broker-dealer and shareholder support and educational and promotional services.
No 12b-1 fees are currently paid by the Fund, and pursuant to a contractual arrangement, no 12b-1 fees will be paid any time before February 28, 2021.
Notes to Financial Statements (Continued)
First Trust Managed Municipal ETF (FMB)
April 30, 2020 (Unaudited)
8. Borrowings
The Trust, on behalf of the Fund, along with First Trust Series Fund and First Trust Exchange-Traded Fund IV have a $410 million Credit Agreement with The Bank of Nova Scotia (“Scotia”) as administrative agent for a group of lenders. Prior to November 25, 2019, the commitment amount was $385 million. Scotia charges a commitment fee of 0.25% of the daily amount of the excess of the commitment amount over the outstanding principal balance of the loans and an agency fee. First Trust allocates the commitment fee and agency fee amongst the funds that have access to the credit line. To the extent that the Fund accesses the credit line, there would also be an interest fee charged. The Fund did not have any borrowings outstanding during the six months ended April 30, 2020.
9. Indemnification
The Trust, on behalf of the Fund, has a variety of indemnification obligations under contracts with its service providers. The Trust’s maximum exposure under these arrangements is unknown. However, the Trust has not had prior claims or losses pursuant to these contracts and expects the risk of loss to be remote.
10. Subsequent Events
Management has evaluated the impact of all subsequent events to the Fund through the date the financial statements were issued, and has determined that there were no subsequent events requiring recognition or disclosure in the financial statements that have not already been disclosed.
Additional Information
First Trust Managed Municipal ETF (FMB)
April 30, 2020 (Unaudited)
Proxy Voting Policies and Procedures
A description of the policies and procedures that the Trust uses to determine how to vote proxies and information on how the Fund voted proxies relating to portfolio securities during the most recent 12-month period ended June 30 is available (1) without charge, upon request, by calling (800) 988-5891; (2) on the Fund’s website at www.ftportfolios.com; and (3) on the Securities and Exchange Commission’s (“SEC”) website at www.sec.gov.
Portfolio Holdings
The Fund files portfolio holdings information for each month in a fiscal quarter within 60 days after the end of the relevant fiscal quarter on Form N-PORT. Portfolio holdings information for the third month of each fiscal quarter will be publicly available on the SEC’s website at www.sec.gov. The Fund’s complete schedule of portfolio holdings for the second and fourth quarters of each fiscal year is included in the semi-annual and annual reports to shareholders, respectively, and is filed with the SEC on Form N-CSR. The semi-annual and annual report for the Fund is available to investors within 60 days after the period to which it relates. The Fund’s Forms N-PORT and Forms N-CSR are available on the SEC’s website listed above.
Risk Considerations
Risks are inherent in all investing. Certain general risks that may be applicable to a Fund are identified below, but not all of the material risks relevant to each Fund are included in this report and not all of the risks below apply to each Fund. The material risks of investing in each Fund are spelled out in its prospectus, statement of additional information and other regulatory filings. Before investing, you should consider each Fund’s investment objective, risks, charges and expenses, and read each Fund’s prospectus and statement of additional information carefully. You can download each Fund’s prospectus at www.ftportfolios.com or contact First Trust Portfolios L.P. at (800) 621-1675 to request a prospectus, which contains this and other information about each Fund.
Concentration Risk. To the extent that a fund is able to invest a large percentage of its assets in a single asset class or the securities of issuers within the same country, state, region, industry or sector, an adverse economic, business or political development may affect the value of the fund’s investments more than if the fund were more broadly diversified. A fund that tracks an index will be concentrated to the extent the fund’s corresponding index is concentrated. A concentration makes a fund more susceptible to any single occurrence and may subject the fund to greater market risk than a fund that is not concentrated.
Credit Risk. Credit risk is the risk that an issuer of a security will be unable or unwilling to make dividend, interest and/or principal payments when due and the related risk that the value of a security may decline because of concerns about the issuer’s ability to make such payments.
Cyber Security Risk. The funds are susceptible to potential operational risks through breaches in cyber security. A breach in cyber security refers to both intentional and unintentional events that may cause a fund to lose proprietary information, suffer data corruption or lose operational capacity. Such events could cause a fund to incur regulatory penalties, reputational damage, additional compliance costs associated with corrective measures and/or financial loss. In addition, cyber security breaches of a fund’s third-party service providers, such as its administrator, transfer agent, custodian, or sub-advisor, as applicable, or issuers in which the fund invests, can also subject a fund to many of the same risks associated with direct cyber security breaches.
Derivatives Risk. To the extent a fund uses derivative instruments such as futures contracts, options contracts and swaps, the fund may experience losses because of adverse movements in the price or value of the underlying asset, index or rate, which may be magnified by certain features of the derivative. These risks are heightened when a fund’s portfolio managers use derivatives to enhance the fund’s return or as a substitute for a position or security, rather than solely to hedge (or offset) the risk of a position or security held by the fund.
Equity Securities Risk. To the extent a fund invests in equity securities, the value of the fund’s shares will fluctuate with changes in the value of the equity securities. Equity securities prices fluctuate for several reasons, including changes in investors’ perceptions of the financial condition of an issuer or the general condition of the relevant stock market, such as market volatility, or when political or economic events affecting the issuers occur. In addition, common stock prices may be particularly sensitive to rising interest rates, as the cost of capital rises and borrowing costs increase. Equity securities may decline significantly in price over short or extended periods of time, and such declines may occur in the equity market as a whole, or they may occur in only a particular country, company, industry or sector of the market.
ETF Risk. The shares of an ETF trade like common stock and represent an interest in a portfolio of securities. The risks of owning an ETF generally reflect the risks of owning the underlying securities, although lack of liquidity in an ETF could result in it being more volatile and ETFs have management fees that increase their costs. Shares of an ETF trade on an exchange at market prices rather than
Additional Information (Continued)
First Trust Managed Municipal ETF (FMB)
April 30, 2020 (Unaudited)
net asset value, which may cause the shares to trade at a price greater than net asset value (premium) or less than net asset value (discount). In times of market stress, decisions by market makers to reduce or step away from their role of providing a market for an ETF’s shares, or decisions by an ETF’s authorized participants that they are unable or unwilling to proceed with creation and/or redemption orders of an ETF’s shares, could result in shares of the ETF trading at a discount to net asset value and in greater than normal intraday bid-ask spreads.
Fixed Income Securities Risk. To the extent a fund invests in fixed income securities, the fund will be subject to credit risk, income risk, interest rate risk, liquidity risk and prepayment risk. Income risk is the risk that income from a fund’s fixed income investments could decline during periods of falling interest rates. Interest rate risk is the risk that the value of a fund’s fixed income securities will decline because of rising interest rates. Liquidity risk is the risk that a security cannot be purchased or sold at the time desired, or cannot be purchased or sold without adversely affecting the price. Prepayment risk is the risk that the securities will be redeemed or prepaid by the issuer, resulting in lower interest payments received by the fund. In addition to these risks, high yield securities, or “junk” bonds, are subject to greater market fluctuations and risk of loss than securities with higher ratings, and the market for high yield securities is generally smaller and less liquid than that for investment grade securities.
Index Constituent Risk. Certain funds may be a constituent of one or more indices. As a result, such a fund may be included in one or more index-tracking exchange-traded funds or mutual funds. Being a component security of such a vehicle could greatly affect the trading activity involving a fund, the size of the fund and the market volatility of the fund. Inclusion in an index could significantly increase demand for the fund and removal from an index could result in outsized selling activity in a relatively short period of time. As a result, a fund’s net asset value could be negatively impacted and the fund’s market price may be significantly below its net asset value during certain periods.
Index Provider Risk. To the extent a fund seeks to track an index, it is subject to Index Provider Risk. There is no assurance that the Index Provider will compile the Index accurately, or that the Index will be determined, maintained, constructed, reconstituted, rebalanced, composed, calculated or disseminated accurately. To correct any such error, the Index Provider may carry out an unscheduled rebalance or other modification of the Index constituents or weightings, which may increase the fund’s costs. The Index Provider does not provide any representation or warranty in relation to the quality, accuracy or completeness of data in the Index, and it does not guarantee that the Index will be calculated in accordance with its stated methodology. Losses or costs associated with any Index Provider errors generally will be borne by the fund and its shareholders.
Investment Companies Risk. To the extent a fund invests in the securities of other investment vehicles, the fund will incur additional fees and expenses that would not be present in a direct investment in those investment vehicles. Furthermore, the fund’s investment performance and risks are directly related to the investment performance and risks of the investment vehicles in which the fund invests.
LIBOR Risk. To the extent a fund invests in floating or variable rate obligations that use the London Interbank Offered Rate (“LIBOR”) as a reference interest rate, it is subject to LIBOR Risk. In 2017, the United Kingdom’s Financial Conduct Authority announced that LIBOR will cease to be available for use after 2021. The unavailability or replacement of LIBOR may affect the value, liquidity or return on certain fund investments and may result in costs incurred in connection with closing out positions and entering into new trades. Any potential effects of the transition away from LIBOR on the fund or on certain instruments in which the fund invests can be difficult to ascertain, and they may vary depending on a variety of factors. Any such effects of the transition away from LIBOR, as well as other unforeseen effects, could result in losses to the fund.
Management Risk. To the extent that a fund is actively managed, it is subject to management risk. In managing an actively-managed fund’s investment portfolio, the fund’s portfolio managers will apply investment techniques and risk analyses that may not have the desired result. There can be no guarantee that a fund will meet its investment objective.
Market Risk. Securities held by a fund, as well as shares of a fund itself, are subject to market fluctuations caused by factors such as general economic conditions, political events, regulatory or market developments, changes in interest rates and perceived trends in securities prices. Shares of a fund could decline in value or underperform other investments as a result of the risk of loss associated with these market fluctuations. In addition, local, regional or global events such as war, acts of terrorism, spread of infectious diseases or other public health issues, recessions, or other events could have a significant negative impact on a fund and its investments. Such events may affect certain geographic regions, countries, sectors and industries more significantly than others. The outbreak of the respiratory disease designated as COVID-19 in December 2019 has caused significant volatility and declines in global financial markets, which have caused losses for investors. The COVID-19 pandemic may last for an extended period of time and will continue to impact the economy for the foreseeable future.
Non-U.S. Securities Risk. To the extent a fund invests in non-U.S. securities, it is subject to additional risks not associated with securities of domestic issuers. Non-U.S. securities are subject to higher volatility than securities of domestic issuers due to: possible adverse political, social or economic developments; restrictions on foreign investment or exchange of securities; lack of liquidity;
Additional Information (Continued)
First Trust Managed Municipal ETF (FMB)
April 30, 2020 (Unaudited)
currency exchange rates; excessive taxation; government seizure of assets; different legal or accounting standards; and less government supervision and regulation of exchanges in foreign countries. Investments in non-U.S. securities may involve higher costs than investments in U.S. securities, including higher transaction and custody costs, as well as additional taxes imposed by non-U.S. governments. These risks may be heightened for securities of companies located, or with significant operations, in emerging market countries.
Passive Investment Risk. To the extent a fund seeks to track an index, the fund will invest in the securities included in, or representative of, the index regardless of their investment merit. A fund generally will not attempt to take defensive positions in declining markets.
| NOT FDIC INSURED | NOT BANK GUARANTEED | MAY LOSE VALUE |
This page intentionally left blank
This page intentionally left blank
First Trust Exchange-Traded Fund III
INVESTMENT ADVISOR
First Trust Advisors L.P.
120 East Liberty Drive, Suite 400
Wheaton, IL 60187
ADMINISTRATOR, CUSTODIAN,
FUND ACCOUNTANT &
TRANSFER AGENT
Brown Brothers Harriman & Co.
50 Post Office Square
Boston, MA 02110
INDEPENDENT REGISTERED
PUBLIC ACCOUNTING FIRM
Deloitte & Touche LLP
111 S. Wacker Drive
Chicago, IL 60606
LEGAL COUNSEL
Chapman and Cutler LLP
111 W. Monroe Street
Chicago, IL 60603
First Trust Exchange-Traded Fund III
First Trust Long/Short Equity ETF (FTLS)
Semi-Annual Report
For the Six Months Ended
April 30, 2020
First Trust Long/Short Equity ETF (FTLS)
Semi-Annual Report
April 30, 2020
Caution Regarding Forward-Looking Statements
This report contains certain forward-looking statements within the meaning of the Securities Act of 1933, as amended, and the Securities Exchange Act of 1934, as amended. Forward-looking statements include statements regarding the goals, beliefs, plans or current expectations of First Trust Advisors L.P. (“First Trust” or the “Advisor”) and its representatives, taking into account the information currently available to them. Forward-looking statements include all statements that do not relate solely to current or historical fact. For example, forward-looking statements include the use of words such as “anticipate,” “estimate,” “intend,” “expect,” “believe,” “plan,” “may,” “should,” “would” or other words that convey uncertainty of future events or outcomes.
Forward-looking statements involve known and unknown risks, uncertainties and other factors that may cause the actual results, performance or achievements of the series of First Trust Exchange-Traded Fund III (the “Trust”) described in this report (First Trust Long/Short Equity ETF; hereinafter referred to as the “Fund”) to be materially different from any future results, performance or achievements expressed or implied by the forward-looking statements. When evaluating the information included in this report, you are cautioned not to place undue reliance on these forward-looking statements, which reflect the judgment of the Advisor and its representatives only as of the date hereof. We undertake no obligation to publicly revise or update these forward-looking statements to reflect events and circumstances that arise after the date hereof.
Performance and Risk Disclosure
There is no assurance that the Fund will achieve its investment objective. The Fund is subject to market risk, which is the possibility that the market values of securities owned by the Fund will decline and that the value of the Fund’s shares may therefore be less than what you paid for them. Accordingly, you can lose money by investing in the Fund. See “Risk Considerations” in the Additional Information section of this report for a discussion of certain other risks of investing in the Fund.
Performance data quoted represents past performance, which is no guarantee of future results, and current performance may be lower or higher than the figures shown. For the most recent month-end performance figures, please visit www.ftportfolios.com or speak with your financial advisor. Investment returns, net asset value and share price will fluctuate and Fund shares, when sold, may be worth more or less than their original cost.
The Advisor may also periodically provide additional information on Fund performance on the Fund’s web page at www.ftportfolios.com.
How to Read This Report
This report contains information that may help you evaluate your investment in the Fund. It includes details about the Fund and presents data and analysis that provide insight into the Fund’s performance and investment approach.
The statistical information that follows may help you understand the Fund’s performance compared to that of a relevant market benchmark.
It is important to keep in mind that the opinions expressed by personnel of the Advisor are just that: informed opinions. They should not be considered to be promises or advice. The opinions, like the statistics, cover the period through the date on the cover of this report. The material risks of investing in the Fund are spelled out in the prospectus, the statement of additional information, and other Fund regulatory filings.
First Trust Long/Short Equity ETF (FTLS)
Semi-Annual Letter from the Chairman and CEO
April 30, 2020
Dear Shareholders,
First Trust is pleased to provide you with the semi-annual report for the First Trust Long/Short Equity ETF (the “Fund”), which contains detailed information about the Fund for the six months ended April 30, 2020.
Just one month ago, I noted in a letter to shareholders that a handful of states were set to open some “nonessential” businesses by early May. As of May 20, 2020, I am pleased to report that all 50 states and U.S. territories have eased some restrictions on businesses and social activity. Keep in mind, however, that the plan does entail governors phasing in the opening of businesses in the coming weeks or potentially months, so I see this news as essentially marking the beginning of the rebuilding process for the U.S. economy. We all need to be aware as well of the possibility of an uptick or even surge in the coronavirus (“COVID-19”) infections as more people venture out of their homes. Prior to the last couple of weeks or so, the stay-at-home mandate severely restricted the movements of close to 315 million Americans, according to The Washington Post. To put this further into perspective, because so many stores have been closed and so many people have been hunkering down at home, retail-store traffic in the U.S. plunged 91.2% year-over-year for the week ended May 16, 2020, according to Bloomberg. Truly amazing!
In this COVID-19 pandemic, there appears to be a notable disconnect between the state of the U.S. economy, which is expected to go from bad to downright terrible between the first quarter and second quarter of the year, and the performance of the stock market, which has been much better than expected. While the data and commentary in this report are technically supposed to run through April 30, 2020, I feel compelled to offer insight that is as up to date as possible. The 2020 peak in the stock market, as measured by the S&P 500® Index (the “Index”), occurred on February 19. That day also marked the all-time high for the Index. From February 19, 2020, through March 23, 2020, the Index declined by 33.92% on a price-only basis (no dividends included), according to Bloomberg. We should note that the Index slid into bear market territory on March 12, 2020. A bear market is defined by a 20% or greater decline in price from its most recent peak. That took just 16 trading days, the quickest plunge into a bear market ever. From March 23, 2020 through May 20, 2020, the Index staged an impressive rebound, posting a price-only gain of 32.82%, according to Bloomberg. As of May 20, 2020, the Index stood just 12.24% below its all-time high set on February 19, 2020. But the game, as they say, is not over. Even though stocks have rebounded significantly from their March lows, 68% of the money managers that participated in the most recent Bank of America global fund manager survey believe that stocks are still in a bear market, according to MarketWatch. What are they likely concerned about? In addition to a dismal economic outlook for the near-term, research from Bespoke Investment Group, an independent research firm, indicates that there have been 25 bear markets since 1928 and 60% of the time the Index declined a second time during the bear market and went on to establish a new low for the period.
With respect to the state of the economy, the Congressional Budget Office announced on May 19, 2020, that it sees real U.S. gross domestic product (“GDP”) declining by an annualized 38% in the second quarter of 2020, reportedly in line with Wall Street economists, according to CNBC. Some estimates are more dire. The GDP estimate from the Atlanta Federal Reserve calls for a 42% plunge. These numbers are so large in scope they are mind-boggling. The Bureau of Economic Analysis is scheduled to release its GDP report on July 30, 2020. Until then, we may continue to have a disconnect between the economy and the markets. Let us hope it is as positive as the one we are currently enjoying.
The U.S. government shut down huge chunks of our economy in order to protect lives and prevent our health care system from being overwhelmed by COVID-19 patients. Our economic woes, in other words, are man-made. The remedies to this pandemic will also likely be man-made. They could come in the form of therapeutics and/or a vaccine. Perhaps more than one vaccine. At this stage of the pandemic fight, we have one message for investors: Stay the course!
Thank you for giving First Trust the opportunity to play a role in your financial future. We value our relationship with you and will report on the Fund again in six months.
Sincerely,
James A. Bowen
Chairman of the Board of Trustees
Chief Executive Officer of First Trust Advisors L.P.
Fund Performance Overview (Unaudited)
First Trust Long/Short Equity ETF (FTLS)
The investment objective of First Trust Long/Short Equity ETF (the “Fund”) is to seek to provide investors with long-term total return. Under normal conditions, the Fund will expose at least 80% of its net assets (including investment borrowings) to U.S. exchange-listed equity securities and/or U.S. exchange-traded funds (“ETFs”) that provide exposure to U.S. exchange-listed equity securities. The Fund pursues its investment objective by establishing long and short positions in a portfolio of U.S. exchange-listed equity securities and ETFs. The Fund’s portfolio may include U.S. exchange-listed equity securities of non-U.S. issuers, including the securities of non-U.S. issuers traded on U.S. exchanges in the form of depositary receipts.
The Fund’s portfolio is composed of both long and short positions in equity securities and ETFs. As opposed to taking long positions in which an investor seeks to profit from increases in the price of a security, short selling is a technique that will be used by the Fund to try and profit from the falling price of a security. Short selling involves selling a security that has been borrowed from a third party with the intention of buying an identical security back at a later date to return to that third party.
Having both long and short positions in an equity security portfolio is a common way to create returns that are independent of market moves. One advantage of a long and short portfolio is that the long and short positions may offset one another in a manner that results in a lower net exposure to the direction of the market. In addition, cash balances arising from the use of short selling typically will be held in money market instruments.
| Performance | | | | | | | |
| | | | Average Annual Total Returns | | Cumulative Total Returns |
| | 6 Months
Ended
4/30/20 | 1 Year
Ended
4/30/20 | 5 Years
Ended
4/30/20 | Inception
(9/8/14)
to 4/30/20 | | 5 Years
Ended
4/30/20 | Inception
(9/8/14)
to 4/30/20 |
| Fund Performance | | | | | | | |
| NAV | -4.36% | 0.45% | 4.91% | 5.94% | | 27.09% | 38.46% |
| Market Price | -4.48% | 0.35% | 4.86% | 5.92% | | 26.81% | 38.32% |
| Index Performance | | | | | | | |
| S&P 500® Index | -3.16% | 0.86% | 9.12% | 9.08% | | 54.74% | 63.24% |
Total returns for the period since inception are calculated from the inception date of the Fund. “Average Annual Total Returns” represent the average annual change in value of an investment over the periods indicated. “Cumulative Total Returns” represent the total change in value of an investment over the periods indicated.
The Fund’s per share net asset value (“NAV”) is the value of one share of the Fund and is computed by dividing the value of all assets of the Fund (including accrued interest and dividends), less all liabilities (including accrued expenses and dividends declared but unpaid), by the total number of outstanding shares. The price used to calculate market return (“Market Price”) is determined by using the midpoint between the highest bid and the lowest offer on the stock exchange on which shares of the Fund are listed for trading as of the time that the Fund’s NAV is calculated. Since shares of the Fund did not trade in the secondary market until after its inception, for the period from inception to the first day of secondary market trading in shares of the Fund, the NAV of the Fund is used as a proxy for the secondary market trading price to calculate market returns. NAV and market returns assume that all distributions have been reinvested in the Fund at NAV and Market Price, respectively.
An index is a statistical composite that tracks a specified financial market or sector. Unlike the Fund, the index does not actually hold a portfolio of securities and therefore does not incur the expenses incurred by the Fund. These expenses negatively impact the performance of the Fund. Also, market returns do not include brokerage commissions that may be payable on secondary market transactions. If brokerage commissions were included, market returns would be lower. The total returns presented reflect the reinvestment of dividends on securities in the index. The returns presented do not reflect the deduction of taxes that a shareholder would pay on Fund distributions or the redemption or sale of Fund shares. The investment return and principal value of shares of the Fund will vary with changes in market conditions. Shares of the Fund may be worth more or less than their original cost when they are redeemed or sold in the market. The Fund’s past performance is no guarantee of future performance.
Fund Performance Overview (Unaudited) (Continued)
First Trust Long/Short Equity ETF (FTLS)
| Portfolio Sector Allocation | % of Total
Long-Term
Investments |
| Health Care | 19.0% |
| Financials | 15.8 |
| Information Technology | 11.9 |
| Industrials | 11.8 |
| Consumer Discretionary | 11.5 |
| Materials | 9.6 |
| Communication Services | 6.4 |
| Consumer Staples | 5.6 |
| Energy | 3.8 |
| Utilities | 2.9 |
| Real Estate | 1.7 |
| Total | 100.0% |
| Portfolio Sector Allocation | % of
Investments
Sold Short |
| Financials | 36.3% |
| Industrials | 13.2 |
| Information Technology | 11.0 |
| Real Estate | 8.2 |
| Consumer Discretionary | 7.6 |
| Materials | 6.4 |
| Consumer Staples | 6.0 |
| Health Care | 5.5 |
| Communication Services | 2.9 |
| Energy | 2.3 |
| Utilities | 0.6 |
| Total | 100.0% |
| Top Ten Long-Term Investments | % of
Net Assets |
| Microsoft Corp. | 2.7% |
| Apple, Inc. | 2.5 |
| Wheaton Precious Metals Corp. | 2.5 |
| Zoom Video Communications, Inc., Class A | 2.5 |
| Amgen, Inc. | 2.3 |
| Walmart, Inc. | 2.1 |
| Amazon.com, Inc. | 2.1 |
| BlackRock, Inc. | 2.1 |
| Johnson & Johnson | 2.0 |
| Church & Dwight Co., Inc. | 1.9 |
| Total | 22.7% |
| Top Ten Investments Sold Short | % of
Net Assets |
| SPDR S&P 500 ETF Trust | -5.5% |
| Vanguard S&P 500 ETF | -3.6% |
| iShares Russell 2000 ETF | -3.4% |
| Financial Select Sector SPDR Fund | -1.7% |
| iShares Russell 1000 ETF | -1.2% |
| Marvell Technology Group Ltd. | -0.8% |
| Air Products & Chemicals, Inc. | -0.7% |
| Chevron Corp. | -0.7% |
| Verisk Analytics, Inc. | -0.7% |
| T-Mobile US, Inc. | -0.7% |
| Total | -19.0% |
Fund Performance Overview (Unaudited) (Continued)
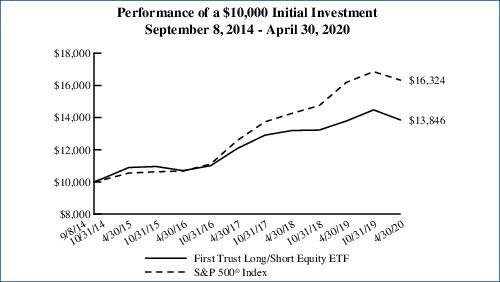
Performance figures assume reinvestment of all distributions and do not reflect the deduction of taxes that a shareholder would pay on Fund distributions or the redemption or sale of Fund shares. An index is a statistical composite that tracks a specified financial market or sector. Unlike the Fund, the index does not actually hold a portfolio of securities and therefore does not incur the expenses incurred by the Fund. These expenses negatively impact the performance of the Fund. The Fund’s past performance does not predict future performance.
Frequency Distribution of Discounts and Premiums
Bid/Ask Midpoint vs. NAV through April 30, 2020
The following Frequency Distribution of Discounts and Premiums charts are provided to show the frequency at which the bid/ask midpoint price for the Fund was at a discount or premium to the daily NAV. The following tables are for comparative purposes only and represent the period November 1, 2014 through April 30, 2020. Shareholders may pay more than NAV when they buy Fund shares and receive less than NAV when they sell those shares because shares are bought and sold at current market price. Data presented represents past performance and cannot be used to predict future results.
| Number of Days Bid/Ask Midpoint At/Above NAV |
| For the Period | 0.00%–0.49% | 0.50%–0.99% | 1.00%–1.99% | >=2.00% |
| 11/1/14 – 10/31/15 | 190 | 7 | 0 | 1 |
| 11/1/15 – 10/31/16 | 170 | 0 | 0 | 0 |
| 11/1/16 – 10/31/17 | 173 | 0 | 0 | 0 |
| 11/1/17 – 10/31/18 | 180 | 0 | 0 | 0 |
| 11/1/18 – 10/31/19 | 191 | 0 | 0 | 0 |
| 11/1/19 – 4/30/20 | 82 | 1 | 0 | 0 |
| | | | | |
| Number of Days Bid/Ask Midpoint Below NAV |
| For the Period | 0.00%–0.49% | 0.50%–0.99% | 1.00%–1.99% | >=2.00% |
| 11/1/14 – 10/31/15 | 41 | 12 | 0 | 0 |
| 11/1/15 – 10/31/16 | 81 | 1 | 0 | 0 |
| 11/1/16 – 10/31/17 | 79 | 0 | 0 | 0 |
| 11/1/17 – 10/31/18 | 72 | 0 | 0 | 0 |
| 11/1/18 – 10/31/19 | 59 | 1 | 0 | 0 |
| 11/1/19 – 4/30/20 | 41 | 0 | 0 | 0 |
Portfolio Management
First Trust Long/Short Equity ETF (FTLS)
Semi-Annual Report
April 30, 2020 (Unaudited)
Investment Advisor
First Trust Advisors L.P. (“First Trust”) is the investment advisor, commodity pool operator and commodity trading advisor to First Trust Long/Short Equity ETF (the “Fund” or “FTLS”). In this capacity, First Trust is responsible for the selection and ongoing monitoring of the investments in the Fund’s portfolio and certain other services necessary for the management of the portfolio.
Portfolio Management Team
John Gambla – CFA, FRM, PRM, Senior Portfolio Manager of First Trust, FTA- Alternatives & Active Management Team
Rob A. Guttschow – CFA, Senior Portfolio Manager of First Trust, FTA- Alternatives & Active Management Team
First Trust Long/Short Equity ETF (FTLS)
Understanding Your Fund Expenses
April 30, 2020 (Unaudited)
As a shareholder of the First Trust Long/Short Equity ETF (the “Fund”), you incur two types of costs: (1) transaction costs; and (2) ongoing costs, including management fees, distribution and/or service (12b-1) fees, if any, and other Fund expenses. This Example is intended to help you understand your ongoing costs of investing in the Fund and to compare these costs with the ongoing costs of investing in other funds.
The Example is based on an investment of $1,000 invested at the beginning of the period and held through the six-month period ended April 30, 2020.
Actual Expenses
The first line in the following table provides information about actual account values and actual expenses. You may use the information in this line, together with the amount you invested, to estimate the expenses that you paid over the period. Simply divide your account value by $1,000 (for example, an $8,600 account value divided by $1,000 = 8.6), then multiply the result by the number in the first line under the heading entitled “Expenses Paid During the Six-Month Period” to estimate the expenses you paid on your account during this six-month period.
Hypothetical Example for Comparison Purposes
The second line in the following table provides information about hypothetical account values and hypothetical expenses based on the Fund’s actual expense ratio and an assumed rate of return of 5% per year before expenses, which is not the Fund’s actual return. The hypothetical account values and expenses may not be used to estimate the actual ending account balance or expenses you paid for the period. You may use this information to compare the ongoing costs of investing in the Fund and other funds. To do so, compare this 5% hypothetical example with the 5% hypothetical examples that appear in the shareholder reports of the other funds.
Please note that the expenses shown in the table are meant to highlight your ongoing costs only and do not reflect any transactional costs such as brokerage commissions. Therefore, the second line in the table is useful in comparing ongoing costs only, and will not help you determine the relative total costs of owning different funds. In addition, if these transactional costs were included, your costs would have been higher.
| | Beginning
Account Value
November 1, 2019 | Ending
Account Value
April 30, 2020 | Annualized
Expense Ratio
Based on the
Six-Month
Period (a) | Expenses Paid
During the
Six-Month
Period (a)(b) |
| First Trust Long/Short Equity ETF (FTLS) |
| Actual | $1,000.00 | $956.40 | 1.70% | $8.27 |
| Hypothetical (5% return before expenses) | $1,000.00 | $1,016.41 | 1.70% | $8.52 |
| (a) | Annualized expense ratio and expenses paid during the six-month period do not include fees and expenses of the underlying funds in which the Fund invests. |
| (b) | Expenses are equal to the annualized expense ratios as indicated in the table multiplied by the average account value over the period (November 1, 2019 through April 30, 2020), multiplied by 182/366 (to reflect the six-month period). |
First Trust Long/Short Equity ETF (FTLS)
Portfolio of Investments
April 30, 2020 (Unaudited)
Shares/
Units | | Description | | Value |
| COMMON STOCKS – 87.2% |
| | | Aerospace & Defense – 0.9% | | |
| 20,179 | | Parsons Corp. (a) | | $754,695 |
| 4,068 | | TransDigm Group, Inc. | | 1,477,009 |
| | | | | 2,231,704 |
| | | Auto Components – 0.9% | | |
| 74,723 | | Gentex Corp. | | 1,811,286 |
| 8,002 | | Standard Motor Products, Inc. | | 325,601 |
| | | | | 2,136,887 |
| | | Banks – 4.8% | | |
| 31,537 | | Bank OZK | | 713,367 |
| 141,975 | | Citizens Financial Group, Inc. (b) | | 3,178,820 |
| 40,354 | | Commerce Bancshares, Inc. | | 2,469,261 |
| 15,220 | | International Bancshares Corp. | | 441,228 |
| 17,154 | | JPMorgan Chase & Co. | | 1,642,667 |
| 35,821 | | Pacific Premier Bancorp, Inc. | | 764,779 |
| 5,939 | | PNC Financial Services Group (The), Inc. | | 633,513 |
| 132,724 | | Umpqua Holdings Corp. | | 1,662,368 |
| | | | | 11,506,003 |
| | | Beverages – 0.2% | | |
| 8,903 | | Monster Beverage Corp. (a) | | 550,294 |
| | | Biotechnology – 3.6% | | |
| 9,467 | | AbbVie, Inc. | | 778,187 |
| 22,814 | | Amgen, Inc. (b) | | 5,457,565 |
| 1,531 | | Biogen, Inc. (a) | | 454,447 |
| 8,681 | | Gilead Sciences, Inc. | | 729,204 |
| 3,832 | | Incyte Corp. (a) | | 374,233 |
| 818 | | Regeneron Pharmaceuticals, Inc. (a) | | 430,170 |
| 2,169 | | Vertex Pharmaceuticals, Inc. (a) | | 544,853 |
| | | | | 8,768,659 |
| | | Building Products – 1.6% | | |
| 27,370 | | Allegion PLC | | 2,751,780 |
| 15,124 | | Gibraltar Industries, Inc. (a) | | 700,241 |
| 25,900 | | Quanex Building Products Corp. | | 322,973 |
| | | | | 3,774,994 |
| | | Capital Markets – 3.8% | | |
| 9,871 | | BlackRock, Inc. (b) | | 4,955,637 |
| 111,003 | | Charles Schwab (The) Corp. (b) | | 4,187,033 |
| | | | | 9,142,670 |
| | | Commercial Services &
Supplies – 0.3% | | |
| 10,163 | | ABM Industries, Inc. | | 350,522 |
| 15,611 | | HNI Corp. | | 379,972 |
| | | | | 730,494 |
| | | Construction & Engineering – 0.6% | | |
| 22,296 | | EMCOR Group, Inc. | | 1,416,465 |
Shares/
Units | | Description | | Value |
|
| | | Construction Materials – 0.6% | | |
| 23,857 | | Eagle Materials, Inc. | | $1,455,515 |
| | | Consumer Finance – 0.5% | | |
| 16,842 | | Capital One Financial Corp. | | 1,090,688 |
| | | Containers & Packaging – 1.6% | | |
| 279,962 | | Graphic Packaging Holding Co. | | 3,737,493 |
| | | Diversified Financial Services – 0.8% | | |
| 9,920 | | Berkshire Hathaway, Inc., Class B (a) | | 1,858,611 |
| | | Diversified Telecommunication
Services – 0.3% | | |
| 11,889 | | Verizon Communications, Inc. | | 683,023 |
| | | Electric Utilities – 1.4% | | |
| 3,791 | | American Electric Power Co., Inc. | | 315,070 |
| 3,717 | | Duke Energy Corp. | | 314,681 |
| 4,964 | | Edison International | | 291,436 |
| 2,865 | | Entergy Corp. | | 273,636 |
| 3,920 | | Eversource Energy | | 316,344 |
| 7,722 | | Exelon Corp. | | 286,332 |
| 7,623 | | FirstEnergy Corp. | | 314,601 |
| 1,349 | | NextEra Energy, Inc. | | 311,781 |
| 11,119 | | PPL Corp. | | 282,645 |
| 5,615 | | Southern (The) Co. | | 318,539 |
| 5,421 | | Xcel Energy, Inc. | | 344,559 |
| | | | | 3,369,624 |
| | | Electrical Equipment – 3.0% | | |
| 53,180 | | AMETEK, Inc. (b) | | 4,460,207 |
| 22,666 | | Hubbell, Inc. | | 2,820,330 |
| | | | | 7,280,537 |
| | | Energy Equipment &
Services – 0.1% | | |
| 41,563 | | Solaris Oilfield Infrastructure, Inc., Class A | | 284,291 |
| | | Entertainment – 2.5% | | |
| 10,959 | | Activision Blizzard, Inc. | | 698,417 |
| 34,286 | | Electronic Arts, Inc. (a) | | 3,917,519 |
| 11,504 | | Take-Two Interactive Software, Inc. (a) | | 1,392,559 |
| | | | | 6,008,495 |
| | | Food & Staples Retailing – 2.1% | | |
| 42,365 | | Walmart, Inc. (b) | | 5,149,466 |
| | | Health Care Equipment &
Supplies – 3.4% | | |
| 11,387 | | Abbott Laboratories | | 1,048,629 |
| 1,678 | | ABIOMED, Inc. (a) | | 320,917 |
| 1,391 | | Align Technology, Inc. (a) | | 298,856 |
See Notes to Financial Statements
Page 7
First Trust Long/Short Equity ETF (FTLS)
Portfolio of Investments (Continued)
April 30, 2020 (Unaudited)
Shares/
Units | | Description | | Value |
| COMMON STOCKS (Continued) |
| | | Health Care Equipment &
Supplies (Continued) | | |
| 5,022 | | Baxter International, Inc. | | $445,853 |
| 2,124 | | Becton Dickinson and Co. | | 536,374 |
| 12,573 | | Boston Scientific Corp. (a) | | 471,236 |
| 912 | | Cooper (The) Cos., Inc. | | 261,470 |
| 5,663 | | DENTSPLY SIRONA, Inc. | | 240,338 |
| 2,068 | | Edwards Lifesciences Corp. (a) | | 449,790 |
| 6,056 | | Hologic, Inc. (a) | | 303,406 |
| 1,291 | | IDEXX Laboratories, Inc. (a) | | 358,382 |
| 962 | | Intuitive Surgical, Inc. (a) | | 491,467 |
| 8,511 | | Medtronic PLC | | 830,929 |
| 2,072 | | ResMed, Inc. | | 321,823 |
| 1,787 | | STERIS PLC | | 254,647 |
| 2,725 | | Stryker Corp. | | 508,022 |
| 1,026 | | Teleflex, Inc. | | 344,120 |
| 2,248 | | Varian Medical Systems, Inc. (a) | | 257,126 |
| 2,633 | | Zimmer Biomet Holdings, Inc. | | 315,170 |
| | | | | 8,058,555 |
| | | Health Care Providers &
Services – 4.2% | | |
| 2,029 | | Anthem, Inc. | | 569,601 |
| 5,869 | | Cardinal Health, Inc. | | 290,398 |
| 7,227 | | Centene Corp. (a) | | 481,174 |
| 6,224 | | Chemed Corp. | | 2,592,732 |
| 3,044 | | Cigna Corp. | | 595,954 |
| 30,822 | | CVS Health Corp. | | 1,897,094 |
| 3,324 | | DaVita, Inc. (a) | | 262,629 |
| 3,044 | | HCA Healthcare, Inc. | | 334,475 |
| 4,333 | | Henry Schein, Inc. (a) | | 236,408 |
| 1,329 | | Humana, Inc. | | 507,439 |
| 1,697 | | Laboratory Corp of America Holdings (a) | | 279,072 |
| 2,717 | | Quest Diagnostics, Inc. | | 299,169 |
| 5,438 | | UnitedHealth Group, Inc. | | 1,590,452 |
| 2,155 | | Universal Health Services, Inc., Class B | | 227,762 |
| | | | | 10,164,359 |
| | | Household Durables – 4.3% | | |
| 104,381 | | KB Home | | 2,738,958 |
| 74,234 | | Lennar Corp., Class A (b) | | 3,716,896 |
| 14,448 | | Meritage Homes Corp. (a) | | 759,387 |
| 110,564 | | PulteGroup, Inc. | | 3,125,644 |
| | | | | 10,340,885 |
| | | Household Products – 2.6% | | |
| 65,280 | | Church & Dwight Co., Inc. (b) | | 4,568,947 |
| 13,467 | | Procter & Gamble (The) Co. | | 1,587,355 |
| | | | | 6,156,302 |
| | | Insurance – 3.6% | | |
| 7,442 | | Allstate (The) Corp. | | 757,000 |
| 84,801 | | Athene Holding Ltd., Class A (a) | | 2,289,627 |
| 90,209 | | Hartford Financial Services Group (The), Inc. | | 3,427,040 |
Shares/
Units | | Description | | Value |
|
| | | Insurance (Continued) | | |
| 130,498 | | Old Republic International Corp. (b) | | $2,081,443 |
| | | | | 8,555,110 |
| | | Interactive Media & Services – 2.8% | | |
| 1,582 | | Alphabet, Inc., Class A (a) (b) | | 2,130,479 |
| 1,573 | | Alphabet, Inc., Class C (a) | | 2,121,442 |
| 12,245 | | Facebook, Inc., Class A (a) (b) | | 2,506,674 |
| | | | | 6,758,595 |
| | | Internet & Direct Marketing
Retail – 2.1% | | |
| 2,069 | | Amazon.com, Inc. (a) (b) | | 5,118,706 |
| | | IT Services – 1.6% | | |
| 5,123 | | Mastercard, Inc., Class A | | 1,408,671 |
| 19,245 | | Virtusa Corp. (a) | | 635,085 |
| 9,427 | | Visa, Inc., Class A | | 1,684,794 |
| | | | | 3,728,550 |
| | | Leisure Products – 0.6% | | |
| 28,280 | | Brunswick Corp. | | 1,349,522 |
| | | Life Sciences Tools &
Services – 0.8% | | |
| 1,553 | | Illumina, Inc. (a) | | 495,454 |
| 2,467 | | IQVIA Holdings, Inc. (a) | | 351,769 |
| 3,148 | | PerkinElmer, Inc. | | 284,988 |
| 2,657 | | Thermo Fisher Scientific, Inc. | | 889,245 |
| | | | | 2,021,456 |
| | | Machinery – 3.2% | | |
| 44,123 | | AGCO Corp. | | 2,331,459 |
| 5,091 | | Snap-on, Inc. | | 663,307 |
| 33,180 | | Stanley Black & Decker, Inc. (b) | | 3,656,436 |
| 11,105 | | Watts Water Technologies, Inc., Class A | | 915,052 |
| | | | | 7,566,254 |
| | | Media – 0.1% | | |
| 13,175 | | Altice USA, Inc., Class A (a) | | 342,155 |
| | | Metals & Mining – 6.5% | | |
| 60,313 | | Barrick Gold Corp. | | 1,551,250 |
| 10,542 | | Franco-Nevada Corp. | | 1,393,758 |
| 25,623 | | Newmont Corp. | | 1,524,056 |
| 343,501 | | Osisko Gold Royalties Ltd. | | 3,143,034 |
| 6,355 | | Reliance Steel & Aluminum Co. (b) | | 569,281 |
| 191,498 | | Sandstorm Gold Ltd. (a) | | 1,489,855 |
| 159,271 | | Wheaton Precious Metals Corp. | | 6,014,073 |
| | | | | 15,685,307 |
| | | Multi-Utilities – 1.1% | | |
| 4,294 | | Ameren Corp. | | 312,388 |
| 5,627 | | CMS Energy Corp. | | 321,245 |
| 4,230 | | Consolidated Edison, Inc. | | 333,324 |
Page 8
See Notes to Financial Statements
First Trust Long/Short Equity ETF (FTLS)
Portfolio of Investments (Continued)
April 30, 2020 (Unaudited)
Shares/
Units | | Description | | Value |
| COMMON STOCKS (Continued) |
| | | Multi-Utilities (Continued) | | |
| 4,364 | | Dominion Energy, Inc. | | $336,595 |
| 3,030 | | DTE Energy Co. | | 314,332 |
| 6,618 | | Public Service Enterprise Group, Inc. | | 335,599 |
| 2,443 | | Sempra Energy | | 302,566 |
| 3,676 | | WEC Energy Group, Inc. | | 332,862 |
| | | | | 2,588,911 |
| | | Oil, Gas & Consumable Fuels – 2.0% | | |
| 136,905 | | HollyFrontier Corp. (b) | | 4,523,341 |
| 20,533 | | Par Pacific Holdings, Inc. (a) | | 199,581 |
| | | | | 4,722,922 |
| | | Pharmaceuticals – 5.1% | | |
| 14,460 | | Bristol-Myers Squibb Co. | | 879,312 |
| 5,720 | | Eli Lilly & Co. | | 884,541 |
| 19,433 | | Jazz Pharmaceuticals PLC (a) | | 2,142,488 |
| 32,246 | | Johnson & Johnson | | 4,838,190 |
| 14,903 | | Merck & Co, Inc. (b) | | 1,182,404 |
| 15,549 | | Mylan N.V. (a) | | 260,757 |
| 5,026 | | Perrigo Co. PLC | | 267,886 |
| 31,022 | | Pfizer, Inc. | | 1,190,004 |
| 3,797 | | Zoetis, Inc. | | 490,990 |
| | | | | 12,136,572 |
| | | Software – 6.7% | | |
| 36,677 | | Microsoft Corp. (b) | | 6,572,885 |
| 66,379 | | SS&C Technologies Holdings, Inc. | | 3,661,466 |
| 43,389 | | Zoom Video Communications, Inc., Class A (a) (b) | | 5,864,891 |
| | | | | 16,099,242 |
| | | Specialty Retail – 0.5% | | |
| 18,697 | | Asbury Automotive Group, Inc. (a) | | 1,262,047 |
| | | Technology Hardware,
Storage & Peripherals – 2.5% | | |
| 20,694 | | Apple, Inc. (b) | | 6,079,897 |
| | | Textiles, Apparel & Luxury
Goods – 1.9% | | |
| 48,533 | | Columbia Sportswear Co. (b) | | 3,537,571 |
| 73,056 | | Tapestry, Inc. | | 1,087,073 |
| | | | | 4,624,644 |
| | | Thrifts & Mortgage Finance – 0.8% | | |
| 54,285 | | Essent Group Ltd. | | 1,483,066 |
| 35,613 | | Radian Group, Inc. | | 533,483 |
| | | | | 2,016,549 |
| | | Tobacco – 0.1% | | |
| 4,190 | | Philip Morris International, Inc. | | 312,574 |
Shares/
Units | | Description | | Value |
|
| | | Trading Companies &
Distributors – 1.0% | | |
| 15,476 | | Watsco, Inc. | | $2,491,481 |
| | | Water Utilities – 0.1% | | |
| 2,714 | | American Water Works Co., Inc. | | 330,267 |
| | | Total Common Stocks | | 209,686,775 |
| | | (Cost $217,952,003) | | |
| REAL ESTATE INVESTMENT TRUSTS – 1.5% |
| | | Equity Real Estate Investment
Trusts – 1.5% | | |
| 15,659 | | American Tower Corp. (b) | | 3,726,842 |
| | | (Cost $3,170,828) | | |
| MASTER LIMITED PARTNERSHIPS – 1.4% |
| | | Oil, Gas & Consumable Fuels – 1.4% | | |
| 3,393 | | Magellan Midstream Partners, L.P. | | 139,554 |
| 93,895 | | TC PipeLines, L.P. | | 3,145,483 |
| | | Total Master Limited Partnerships | | 3,285,037 |
| | | (Cost $3,515,160) | | |
| | | Total Investments – 90.1% | | 216,698,654 |
| | | (Cost $224,637,991) (c) | | |
| Shares | | Description | | Value |
| COMMON STOCKS SOLD SHORT – (26.4)% |
| | | Aerospace & Defense – (0.5)% | | |
| (5,915) | | Boeing (The) Co. | | (834,133) |
| (10,284) | | Cubic Corp. | | (392,952) |
| | | | | (1,227,085) |
| | | Air Freight & Logistics – (0.1)% | | |
| (1,739) | | FedEx Corp. | | (220,453) |
| | | Airlines – (0.2)% | | |
| (8,630) | | Delta Air Lines, Inc. | | (223,603) |
| (6,354) | | United Airlines Holdings, Inc. (a) | | (187,952) |
| | | | | (411,555) |
| | | Auto Components – (0.4)% | | |
| (27,971) | | Goodyear Tire & Rubber (The) Co. | | (200,552) |
| (10,718) | | Visteon Corp. (a) | | (646,295) |
| | | | | (846,847) |
| | | Automobiles – (0.5)% | | |
| (54,280) | | General Motors Co. | | (1,209,901) |
| | | Beverages – (0.3)% | | |
| (18,128) | | Coca-Cola (The) Co. | | (831,894) |
| | | Building Products – (0.2)% | | |
| (7,812) | | Armstrong World Industries, Inc. | | (602,149) |
See Notes to Financial Statements
Page 9
First Trust Long/Short Equity ETF (FTLS)
Portfolio of Investments (Continued)
April 30, 2020 (Unaudited)
| Shares | | Description | | Value |
| COMMON STOCKS SOLD SHORT (Continued) |
| | | Capital Markets – (0.5)% | | |
| (8,348) | | Northern Trust Corp. | | $(660,827) |
| (3,019) | | State Street Corp. | | (190,318) |
| (27,860) | | Waddell & Reed Financial, Inc., Class A | | (405,363) |
| | | | | (1,256,508) |
| | | Chemicals – (2.3)% | | |
| (7,383) | | Air Products & Chemicals, Inc. | | (1,665,457) |
| (17,681) | | Celanese Corp., Class A | | (1,468,761) |
| (10,502) | | Eastman Chemical Co. | | (635,476) |
| (60,999) | | Huntsman Corp. | | (1,025,393) |
| (21,807) | | Mosaic (The) Co. | | (250,999) |
| (6,168) | | Sensient Technologies Corp. | | (294,769) |
| (10,796) | | Trinseo S.A. | | (220,778) |
| | | | | (5,561,633) |
| | | Commercial Services &
Supplies – (1.0)% | | |
| (17,856) | | Harsco Corp. (a) | | (178,203) |
| (62,205) | | KAR Auction Services, Inc. | | (931,831) |
| (5,226) | | MSA Safety, Inc. | | (588,082) |
| (2,542) | | Republic Services, Inc. | | (199,140) |
| (7,997) | | Tetra Tech, Inc. | | (602,014) |
| | | | | (2,499,270) |
| | | Communications Equipment – (0.2)% | | |
| (9,272) | | EchoStar Corp. (a) | | (292,532) |
| (10,790) | | NETGEAR, Inc. (a) | | (258,744) |
| | | | | (551,276) |
| | | Construction & Engineering – (0.6)% | | |
| (36,513) | | AECOM (a) | | (1,323,961) |
| | | Containers & Packaging – (0.3)% | | |
| (10,407) | | Ball Corp. | | (682,595) |
| | | Diversified Financial Services – (0.3)% | | |
| (17,700) | | Voya Financial, Inc. | | (799,509) |
| | | Electric Utilities – (0.3)% | | |
| (8,150) | | ALLETE, Inc. | | (469,114) |
| (2,224) | | Pinnacle West Capital Corp. | | (171,226) |
| | | | | (640,340) |
| | | Electronic Equipment,
Instruments & Components – (0.5)% | | |
| (5,009) | | Belden, Inc. | | (171,258) |
| (10,465) | | Benchmark Electronics, Inc. | | (216,207) |
| (8,813) | | Dolby Laboratories, Inc., Class A | | (529,044) |
| (16,625) | | PAR Technology Corp. (a) | | (314,379) |
| | | | | (1,230,888) |
| Shares | | Description | | Value |
|
| | | Energy Equipment &
Services – (0.1)% | | |
| (48,511) | | Oceaneering International, Inc. (a) | | $(249,347) |
| | | Entertainment – (0.2)% | | |
| (3,813) | | Walt Disney (The) Co. | | (412,376) |
| | | Food & Staples Retailing – (0.2)% | | |
| (1,452) | | Casey’s General Stores, Inc. | | (219,848) |
| (9,820) | | Kroger (The) Co. | | (310,410) |
| | | | | (530,258) |
| | | Food Products – (1.7)% | | |
| (11,907) | | Cal-Maine Foods, Inc. (a) | | (494,260) |
| (14,962) | | Campbell Soup Co. | | (747,801) |
| (16,792) | | Darling Ingredients, Inc. (a) | | (345,747) |
| (22,707) | | Kellogg Co. | | (1,487,308) |
| (10,070) | | Post Holdings, Inc. (a) | | (924,930) |
| | | | | (4,000,046) |
| | | Health Care Equipment &
Supplies – (1.1)% | | |
| (12,935) | | Hill-Rom Holdings, Inc. | | (1,455,058) |
| (15,263) | | Integra LifeSciences Holdings Corp. (a) | | (779,176) |
| (5,637) | | Neogen Corp (a) | | (352,820) |
| | | | | (2,587,054) |
| | | Health Care Providers &
Services – (0.1)% | | |
| (34,209) | | Brookdale Senior Living, Inc. (a) | | (123,494) |
| | | Health Care Technology – (0.6)% | | |
| (26,396) | | Allscripts Healthcare Solutions, Inc. (a) | | (171,574) |
| (15,602) | | Cerner Corp. | | (1,082,623) |
| (8,722) | | HMS Holdings Corp. (a) | | (250,103) |
| | | | | (1,504,300) |
| | | Hotels, Restaurants &
Leisure – (0.7)% | | |
| (12,491) | | Carnival Corp. | | (198,607) |
| (5,327) | | McDonald’s Corp. | | (999,132) |
| (11,264) | | Norwegian Cruise Line Holdings Ltd. (a) | | (184,730) |
| (5,189) | | Royal Caribbean Cruises Ltd. | | (242,690) |
| (11,422) | | Scientific Games Corp., Class A (a) | | (144,031) |
| | | | | (1,769,190) |
| | | Household Durables – (0.2)% | | |
| (5,267) | | DR Horton, Inc. | | (248,708) |
| (5,914) | | M/I Homes, Inc. (a) | | (150,570) |
| | | | | (399,278) |
Page 10
See Notes to Financial Statements
First Trust Long/Short Equity ETF (FTLS)
Portfolio of Investments (Continued)
April 30, 2020 (Unaudited)
| Shares | | Description | | Value |
| COMMON STOCKS SOLD SHORT (Continued) |
| | | Household Products – (0.5)% | | |
| (8,617) | | Kimberly-Clark Corp. | | $(1,193,282) |
| | | Industrial Conglomerates – (0.3)% | | |
| (85,409) | | General Electric Co. | | (580,781) |
| (1,279) | | Honeywell International, Inc. | | (181,490) |
| | | | | (762,271) |
| | | Insurance – (0.2)% | | |
| (15,079) | | Assured Guaranty Ltd. | | (448,299) |
| | | IT Services – (0.7)% | | |
| (11,611) | | Fidelity National Information Services, Inc. | | (1,531,375) |
| (9,610) | | Western Union (The) Co. | | (183,262) |
| | | | | (1,714,637) |
| | | Leisure Products – (0.3)% | | |
| (9,911) | | Hasbro, Inc. | | (715,673) |
| | | Life Sciences Tools &
Services – (0.6)% | | |
| (3,000) | | Bio-Rad Laboratories, Inc., Class A (a) | | (1,320,300) |
| (6,908) | | NanoString Technologies, Inc. (a) | | (219,398) |
| | | | | (1,539,698) |
| | | Machinery – (0.9)% | | |
| (3,791) | | Cummins, Inc. | | (619,829) |
| (4,166) | | ESCO Technologies, Inc. | | (317,866) |
| (29,107) | | Kennametal, Inc. | | (745,430) |
| (2,407) | | Lindsay Corp. | | (216,630) |
| (5,117) | | Oshkosh Corp. | | (345,551) |
| | | | | (2,245,306) |
| | | Media – (0.5)% | | |
| (15,179) | | Comcast Corp., Class A | | (571,186) |
| (26,171) | | DISH Network Corp. (a) | | (654,667) |
| | | | | (1,225,853) |
| | | Metals & Mining – (0.3)% | | |
| (9,737) | | Carpenter Technology Corp. | | (215,869) |
| (3,989) | | Royal Gold, Inc. | | (488,772) |
| | | | | (704,641) |
| | | Multiline Retail – (0.6)% | | |
| (12,887) | | Dollar Tree, Inc. (a) | | (1,026,707) |
| (10,393) | | Kohl’s Corp. | | (191,855) |
| (30,651) | | Macy’s, Inc. | | (179,615) |
| | | | | (1,398,177) |
| | | Oil, Gas & Consumable Fuels – (0.9)% | | |
| (16,790) | | Apache Corp. | | (219,613) |
| (17,714) | | Chevron Corp. | | (1,629,688) |
| (13,855) | | ONEOK, Inc. | | (414,680) |
| | | | | (2,263,981) |
| Shares | | Description | | Value |
|
| | | Pharmaceuticals – (0.1)% | | |
| (10,013) | | Intra-Cellular Therapies, Inc. (a) | | $(176,930) |
| | | Professional Services – (0.9)% | | |
| (4,549) | | Equifax, Inc. | | (631,856) |
| (10,565) | | Verisk Analytics, Inc. | | (1,614,649) |
| | | | | (2,246,505) |
| | | Real Estate Management &
Development – (0.3)% | | |
| (8,674) | | Howard Hughes (The) Corp. (a) | | (469,784) |
| (9,813) | | Kennedy-Wilson Holdings, Inc. | | (138,854) |
| | | | | (608,638) |
| | | Road & Rail – (1.1)% | | |
| (1,415) | | AMERCO | | (396,384) |
| (7,294) | | Norfolk Southern Corp. | | (1,248,003) |
| (14,527) | | Ryder System, Inc. | | (514,256) |
| (12,714) | | Werner Enterprises, Inc. | | (510,086) |
| | | | | (2,668,729) |
| | | Semiconductors &
Semiconductor Equipment – (1.7)% | | |
| (31,524) | | Cree, Inc. (a) | | (1,359,630) |
| (5,707) | | Diodes, Inc. (a) | | (290,429) |
| (11,767) | | Lattice Semiconductor Corp. (a) | | (264,875) |
| (70,391) | | Marvell Technology Group Ltd. | | (1,882,256) |
| (22,142) | | Rambus, Inc. (a) | | (277,439) |
| | | | | (4,074,629) |
| | | Software – (1.7)% | | |
| (36,026) | | 8x8, Inc. (a) | | (611,001) |
| (21,890) | | ACI Worldwide, Inc. (a) | | (599,786) |
| (30,004) | | LivePerson, Inc. (a) | | (718,296) |
| (11,852) | | Oracle Corp. | | (627,800) |
| (7,979) | | Pegasystems, Inc. | | (667,204) |
| (7,999) | | Varonis Systems, Inc. (a) | | (536,333) |
| (7,743) | | Verint Systems, Inc. (a) | | (330,936) |
| | | | | (4,091,356) |
| | | Specialty Retail – (0.8)% | | |
| (5,769) | | Advance Auto Parts, Inc. | | (697,530) |
| (38,177) | | Bed Bath & Beyond, Inc. | | (236,315) |
| (9,189) | | Lowe’s Cos., Inc. | | (962,548) |
| | | | | (1,896,393) |
| | | Technology Hardware,
Storage & Peripherals – (0.1)% | | |
| (19,006) | | Stratasys Ltd. (a) | | (336,406) |
| | | Trading Companies &
Distributors – (0.1)% | | |
| (3,600) | | Kaman Corp. | | (139,536) |
See Notes to Financial Statements
Page 11
First Trust Long/Short Equity ETF (FTLS)
Portfolio of Investments (Continued)
April 30, 2020 (Unaudited)
| Shares | | Description | | Value |
| COMMON STOCKS SOLD SHORT (Continued) |
| | | Wireless Telecommunication
Services – (0.7)% | | |
| (17,901) | | T-Mobile US, Inc. (a) | | $(1,571,708) |
| | | Total Common Stocks Sold Short | | (63,493,855) |
| | | (Proceeds $71,325,236) | | |
| EXCHANGE-TRADED FUNDS SOLD SHORT – (15.4)% |
| | | Capital Markets – (15.4)% | | |
| (181,984) | | Financial Select Sector SPDR Fund | | (4,147,415) |
| (18,392) | | iShares Russell 1000 ETF | | (2,946,582) |
| (62,606) | | iShares Russell 2000 ETF | | (8,158,188) |
| (45,591) | | SPDR S&P 500 ETF Trust | | (13,243,274) |
| (31,944) | | Vanguard S&P 500 ETF | | (8,532,243) |
| | | Total Exchange-Traded Funds Sold Short | | (37,027,702) |
| | | (Proceeds $34,750,536) | | |
REAL ESTATE INVESTMENT TRUSTS SOLD SHORT –
(3.4)% |
| | | Equity Real Estate Investment
Trusts – (3.4)% | | |
| (20,457) | | Alexander & Baldwin, Inc. | | (268,805) |
| (7,985) | | AvalonBay Communities, Inc. | | (1,301,156) |
| (10,773) | | Columbia Property Trust, Inc. | | (153,946) |
| (2,450) | | Digital Realty Trust, Inc. | | (366,250) |
| (14,704) | | Equity Commonwealth | | (499,201) |
| (8,136) | | Equity LifeStyle Properties, Inc. | | (490,682) |
| (9,995) | | Equity Residential | | (650,275) |
| (11,866) | | Hudson Pacific Properties, Inc. | | (291,666) |
| (16,895) | | Independence Realty Trust, Inc. | | (170,133) |
| (52,181) | | Lexington Realty Trust | | (545,291) |
| (12,752) | | QTS Realty Trust, Inc., Class A | | (797,383) |
| (18,118) | | Rayonier, Inc. | | (435,376) |
| (27,254) | | Retail Properties of America, Inc., Class A | | (168,975) |
| (15,965) | | SL Green Realty Corp. | | (846,943) |
| (29,960) | | Vornado Realty Trust | | (1,312,847) |
| | | Total Real Estate Investment Trusts Sold Short | | (8,298,929) |
| | | (Proceeds $9,728,512) | | |
| | | Total Investments Sold Short – (45.2)% | | (108,820,486) |
| | | (Proceeds $115,804,284) | | |
| | | Net Other Assets and Liabilities – 55.1% | | 132,652,399 |
| | | Net Assets – 100.0% | | $240,530,567 |
|
| (a) | Non-income producing security. |
| (b) | This security or a portion of this security is segregated as collateral for investments sold short. |
| (c) | Aggregate cost for financial reporting purposes approximates the aggregate cost for federal income tax purposes. As of April 30, 2020, the aggregate gross unrealized appreciation for all investments in which there was an excess of value over tax cost was $25,903,261 and the aggregate gross unrealized depreciation for all investments in which there was an excess of tax cost over value was $26,858,800. The net unrealized depreciation was $955,539. The amounts presented are inclusive of investments sold short. |
Valuation Inputs
A summary of the inputs used to value the Fund’s investments as of April 30, 2020 is as follows (see Note 2A - Portfolio Valuation in the Notes to Financial Statements):
| ASSETS TABLE |
| | Total
Value at
4/30/2020 | Level 1
Quoted
Prices | Level 2
Significant
Observable
Inputs | Level 3
Significant
Unobservable
Inputs |
| Common Stocks* | $ 209,686,775 | $ 209,686,775 | $ — | $ — |
| Real Estate Investment Trusts* | 3,726,842 | 3,726,842 | — | — |
| Master Limited Partnerships* | 3,285,037 | 3,285,037 | — | — |
| Total Investments | $ 216,698,654 | $ 216,698,654 | $— | $— |
| LIABILITIES TABLE |
| | Total
Value at
4/30/2020 | Level 1
Quoted
Prices | Level 2
Significant
Observable
Inputs | Level 3
Significant
Unobservable
Inputs |
| Common Stocks Sold Short* | $ (63,493,855) | $ (63,493,855) | $ — | $ — |
| Exchange-Traded Funds Sold Short* | (37,027,702) | (37,027,702) | — | — |
| Real Estate Investment Trusts Sold Short* | (8,298,929) | (8,298,929) | — | — |
| Total | $ (108,820,486) | $ (108,820,486) | $— | $— |
| * | See Portfolio of Investments for industry breakout. |
Page 12
See Notes to Financial Statements
First Trust Long/Short Equity ETF (FTLS)
Statement of Assets and Liabilities
April 30, 2020 (Unaudited)
| ASSETS: | |
Investments, at value
(Cost $224,637,991)
| $ 216,698,654 |
Cash
| 6,298,109 |
Restricted Cash
| 121,503,166 |
| Receivables: | |
Investment securities sold
| 4,854,125 |
Dividends
| 202,957 |
Dividend reclaims
| 5,894 |
Total Assets
| 349,562,905 |
| LIABILITIES: | |
Investments sold short, at value (proceeds $115,804,284)
| 108,820,486 |
| Payables: | |
Investment advisory fees
| 187,958 |
Margin interest expense
| 11,980 |
Dividends on investments sold short
| 11,914 |
Total Liabilities
| 109,032,338 |
NET ASSETS
| $240,530,567 |
| NET ASSETS consist of: | |
Paid-in capital
| $ 264,224,358 |
Par value
| 60,500 |
Accumulated distributable earnings (loss)
| (23,754,291) |
NET ASSETS
| $240,530,567 |
NET ASSET VALUE, per share
| $39.76 |
Number of shares outstanding (unlimited number of shares authorized, par value $0.01 per share)
| 6,050,002 |
See Notes to Financial Statements
Page 13
First Trust Long/Short Equity ETF (FTLS)
Statement of Operations
For the Six Months Ended April 30, 2020 (Unaudited)
| INVESTMENT INCOME: | |
Dividends
| $ 2,157,825 |
Margin interest rebate
| 367,522 |
Interest
| 17,302 |
Foreign withholding tax
| (22,333) |
Total investment income
| 2,520,316 |
| EXPENSES: | |
Investment advisory fees
| 1,234,122 |
Dividend expense on investments sold short
| 898,532 |
Margin interest expense
| 74,943 |
Total expenses
| 2,207,597 |
NET INVESTMENT INCOME (LOSS)
| 312,719 |
| NET REALIZED AND UNREALIZED GAIN (LOSS): | |
| Net realized gain (loss) on: | |
Investments
| (15,533,104) |
In-kind redemptions
| 17,320,902 |
Investments sold short
| 1,580,297 |
Net realized gain (loss)
| 3,368,095 |
| Net change in unrealized appreciation (depreciation) on: | |
Investments
| (27,995,124) |
Investments sold short
| 9,362,790 |
Net change in unrealized appreciation (depreciation)
| (18,632,334) |
NET REALIZED AND UNREALIZED GAIN (LOSS)
| (15,264,239) |
NET INCREASE (DECREASE) IN NET ASSETS RESULTING FROM OPERATIONS
| $(14,951,520) |
Page 14
See Notes to Financial Statements
First Trust Long/Short Equity ETF (FTLS)
Statements of Changes in Net Assets
| | Six Months
Ended
4/30/2020
(Unaudited) | | Year
Ended
10/31/2019 |
| OPERATIONS: | | | |
Net investment income (loss)
| $ 312,719 | | $ 2,002,699 |
Net realized gain (loss)
| 3,368,095 | | 500,185 |
Net change in unrealized appreciation (depreciation)
| (18,632,334) | | 17,508,556 |
Net increase (decrease) in net assets resulting from operations
| (14,951,520) | | 20,011,440 |
| DISTRIBUTIONS TO SHAREHOLDERS FROM: | | | |
Investment operations
| (584,620) | | (2,024,101) |
| SHAREHOLDER TRANSACTIONS: | | | |
Proceeds from shares sold
| 187,012,392 | | 186,912,930 |
Cost of shares redeemed
| (176,813,070) | | (114,835,735) |
Net increase (decrease) in net assets resulting from shareholder transactions
| 10,199,322 | | 72,077,195 |
Total increase (decrease) in net assets
| (5,336,818) | | 90,064,534 |
| NET ASSETS: | | | |
Beginning of period
| 245,867,385 | | 155,802,851 |
End of period
| $240,530,567 | | $245,867,385 |
| CHANGES IN SHARES OUTSTANDING: | | | |
Shares outstanding, beginning of period
| 5,900,002 | | 4,050,002 |
Shares sold
| 4,450,000 | | 4,800,000 |
Shares redeemed
| (4,300,000) | | (2,950,000) |
Shares outstanding, end of period
| 6,050,002 | | 5,900,002 |
See Notes to Financial Statements
Page 15
First Trust Long/Short Equity ETF (FTLS)
Financial Highlights
For a share outstanding throughout each period
| | Six Months
Ended
4/30/2020
(Unaudited) | | Year Ended October 31, |
| 2019 | | 2018 | | 2017 | | 2016 | | 2015 |
Net asset value, beginning of period
| $ 41.67 | | $ 38.47 | | $ 37.78 | | $ 32.49 | | $ 32.61 | | $ 30.54 |
| Income from investment operations: | | | | | | | | | | | |
Net investment income (loss)
| 0.05 | | 0.39 | | 0.26 | | 0.24 | | 0.32 | | 0.19 |
Net realized and unrealized gain (loss)
| (1.87) | | 3.23 | | 0.67 | | 5.34 | | (0.17) | | 2.12 |
Total from investment operations
| (1.82) | | 3.62 | | 0.93 | | 5.58 | | 0.15 | | 2.31 |
| Distributions paid to shareholders from: | | | | | | | | | | | |
Net investment income
| (0.09) | | (0.42) | | (0.24) | | (0.29) | | (0.27) | | (0.22) |
Net realized gain
| — | | — | | — | | — | | — | | (0.02) |
Total distributions
| (0.09) | | (0.42) | | (0.24) | | (0.29) | | (0.27) | | (0.24) |
Net asset value, end of period
| $39.76 | | $41.67 | | $38.47 | | $37.78 | | $32.49 | | $32.61 |
Total return (a)
| (4.36)% | | 9.49% | | 2.45% | | 17.23% | | 0.45% | | 7.60% |
| Ratios to average net assets/supplemental data: | | | | | | | | | | | |
Net assets, end of period (in 000’s)
| $ 240,531 | | $ 245,867 | | $ 155,803 | | $ 120,892 | | $ 120,231 | | $ 32,608 |
Ratio of total expenses to average net assets (b)
| 1.70% (c) | | 1.60% | | 1.59% | | 1.47% | | 1.40% | | 1.47% |
Ratio of total expenses to average net assets excluding dividend expense and margin interest expense (b)
| 0.95% (c) | | 0.95% | | 0.95% | | 0.95% | | 0.95% | | 0.95% |
Ratio of net investment income (loss) to average net assets
| 0.24% (c) | | 1.03% | | 0.71% | | 0.67% | | 1.00% | | 0.39% |
Portfolio turnover rate (d)
| 130% | | 210% | | 249% | | 176% | | 201% | | 267% |
| (a) | Total return is calculated assuming an initial investment made at the net asset value at the beginning of the period, reinvestment of all distributions at net asset value during the period, and redemption at net asset value on the last day of the period. The returns presented do not reflect the deduction of taxes that a shareholder would pay on Fund distributions or the redemption or sale of Fund shares. Total return is calculated for the time period presented and is not annualized for periods of less than a year. |
| (b) | The Fund indirectly bears its proportionate share of fees and expenses incurred by the underlying funds in which the Fund invests. This ratio does not include these indirect fees and expenses. |
| (c) | Annualized. |
| (d) | Portfolio turnover is calculated for the time period presented and is not annualized for periods of less than a year and does not include securities received or delivered from processing creations or redemptions and in-kind transactions. |
Notes to Financial Statements
First Trust Long/Short Equity ETF (FTLS)
April 30, 2020 (Unaudited)
1. Organization
First Trust Exchange-Traded Fund III (the “Trust”) is an open-end management investment company organized as a Massachusetts business trust on January 9, 2008, and is registered with the Securities and Exchange Commission under the Investment Company Act of 1940, as amended (the “1940 Act”).
The Trust currently consists of seventeen funds that are offering shares. This report covers the First Trust Long/Short Equity ETF (the “Fund”), a diversified series of the Trust, which trades under the ticker “FTLS” on the NYSE Arca, Inc. Unlike conventional mutual funds, the Fund issues and redeems shares on a continuous basis, at net asset value (“NAV”), only in large specified blocks consisting of 50,000 shares called a “Creation Unit.” Creation Units are issued and redeemed in-kind for securities in which the Fund invests or for cash or, in certain circumstances, a combination of both. Except when aggregated in Creation Units, the shares are not redeemable securities of the Fund.
The investment objective of the Fund is to seek to provide investors with long-term total return. Under normal conditions, the Fund will expose at least 80% of its net assets (including investment borrowings) to U.S. exchange-listed equity securities and/or U.S. exchange-traded funds (“ETFs”) that provide exposure to U.S. exchange-traded equity securities. The Fund pursues its investment objective by establishing long and short positions in a portfolio of U.S. exchange-listed equity securities and ETFs. The Fund’s portfolio may include U.S. exchange-listed equity securities of non-U.S. issuers, including the securities of non-U.S. issuers traded on U.S. exchanges in the form of depositary receipts. There can be no assurance that the Fund will achieve its investment objective. The Fund may not be appropriate for all investors.
2. Significant Accounting Policies
The Fund is considered an investment company and follows accounting and reporting guidance under Financial Accounting Standards Board Accounting Standards Codification Topic 946, “Financial Services-Investment Companies.” The following is a summary of significant accounting policies consistently followed by the Fund in the preparation of the financial statements. The preparation of the financial statements in accordance with accounting principles generally accepted in the United States of America (“U.S. GAAP”) requires management to make estimates and assumptions that affect the reported amounts and disclosures in the financial statements. Actual results could differ from those estimates.
A. Portfolio Valuation
The Fund’s NAV is determined daily as of the close of regular trading on the New York Stock Exchange (“NYSE”), normally 4:00 p.m. Eastern time, on each day the NYSE is open for trading. If the NYSE closes early on a valuation day, the NAV is determined as of that time. Foreign securities are priced using data reflecting the earlier closing of the principal markets for those securities. The Fund’s NAV is calculated by dividing the value of all assets of the Fund (including accrued interest and dividends), less all liabilities (including accrued expenses and dividends declared but unpaid), by the total number of shares outstanding.
The Fund’s investments are valued daily at market value or, in the absence of market value with respect to any portfolio securities, at fair value. Market value prices represent last sale or official closing prices from a national or foreign exchange (i.e., a regulated market) and are primarily obtained from third-party pricing services. Fair value prices represent any prices not considered market value prices and are either obtained from a third-party pricing service or are determined by the Pricing Committee of the Fund’s investment advisor, First Trust Advisors L.P. (“First Trust” or the “Advisor”), in accordance with valuation procedures adopted by the Trust’s Board of Trustees, and in accordance with provisions of the 1940 Act. Investments valued by the Advisor’s Pricing Committee, if any, are footnoted as such in the footnotes to the Portfolio of Investments. The Fund’s investments are valued as follows:
Common stocks, master limited partnerships (“MLPs”), real estate investment trusts (“REITs”) and other equity securities listed on any national or foreign exchange (excluding The Nasdaq Stock Market LLC (“Nasdaq”) and the London Stock Exchange Alternative Investment Market (“AIM”)) are valued at the last sale price on the exchange on which they are principally traded or, for Nasdaq and AIM securities, the official closing price. Securities traded on more than one securities exchange are valued at the last sale price or official closing price, as applicable, at the close of the securities exchange representing the principal market for such securities.
Securities traded in an over-the-counter market are fair valued at the mean of their most recent bid and asked price, if available, and otherwise at their closing bid price.
Certain securities may not be able to be priced by pre-established pricing methods. Such securities may be valued by the Trust’s Board of Trustees or its delegate, the Advisor’s Pricing Committee, at fair value. These securities generally include, but are not limited to, restricted securities (securities which may not be publicly sold without registration under the Securities Act of 1933, as amended) for which a third-party pricing service is unable to provide a market price; securities whose trading has been formally suspended; a security whose market or fair value price is not available from a pre-established pricing source; a security with respect to which an
Notes to Financial Statements (Continued)
First Trust Long/Short Equity ETF (FTLS)
April 30, 2020 (Unaudited)
event has occurred that is likely to materially affect the value of the security after the market has closed but before the calculation of the Fund’s NAV or make it difficult or impossible to obtain a reliable market quotation; and a security whose price, as provided by the third-party pricing service, does not reflect the security’s fair value. As a general principle, the current fair value of a security would appear to be the amount which the owner might reasonably expect to receive for the security upon its current sale. When fair value prices are used, generally they will differ from market quotations or official closing prices on the applicable exchanges. A variety of factors may be considered in determining the fair value of such securities, including, but not limited to, the following:
| 1) | the type of security; |
| 2) | the size of the holding; |
| 3) | the initial cost of the security; |
| 4) | transactions in comparable securities; |
| 5) | price quotes from dealers and/or third-party pricing services; |
| 6) | relationships among various securities; |
| 7) | information obtained by contacting the issuer, analysts, or the appropriate stock exchange; |
| 8) | an analysis of the issuer’s financial statements; and |
| 9) | the existence of merger proposals or tender offers that might affect the value of the security. |
The Fund is subject to fair value accounting standards that define fair value, establish the framework for measuring fair value and provide a three-level hierarchy for fair valuation based upon the inputs to the valuation as of the measurement date. The three levels of the fair value hierarchy are as follows:
| • | Level 1 – Level 1 inputs are quoted prices in active markets for identical investments. An active market is a market in which transactions for the investment occur with sufficient frequency and volume to provide pricing information on an ongoing basis. |
| • | Level 2 – Level 2 inputs are observable inputs, either directly or indirectly, and include the following: |
| o | Quoted prices for similar investments in active markets. |
| o | Quoted prices for identical or similar investments in markets that are non-active. A non-active market is a market where there are few transactions for the investment, the prices are not current, or price quotations vary substantially either over time or among market makers, or in which little information is released publicly. |
| o | Inputs other than quoted prices that are observable for the investment (for example, interest rates and yield curves observable at commonly quoted intervals, volatilities, prepayment speeds, loss severities, credit risks, and default rates). |
| o | Inputs that are derived principally from or corroborated by observable market data by correlation or other means. |
| • | Level 3 – Level 3 inputs are unobservable inputs. Unobservable inputs may reflect the reporting entity’s own assumptions about the assumptions that market participants would use in pricing the investment. |
The inputs or methodologies used for valuing investments are not necessarily an indication of the risk associated with investing in those investments. A summary of the inputs used to value the Fund’s investments as of April 30, 2020, is included with the Fund’s Portfolio of Investments.
B. Securities Transactions and Investment Income
Securities transactions are recorded as of the trade date. Realized gains and losses from securities transactions are recorded on the identified cost basis. Dividend income is recorded on the ex-dividend date. Interest income, if any, is recorded on the accrual basis.
Distributions received from the Fund’s investments in REITs may be comprised of return of capital, capital gains, and income. The actual character of the amounts received during the year are not known until after the REITs’ fiscal year end. The Fund records the character of distributions received from the REITs during the year based on estimates available. The characterization of distributions received by the Fund may be subsequently revised based on information received from the REITs after their tax reporting periods conclude.
Distributions received from the Fund’s investments in MLPs generally are comprised of return of capital and investment income. The Fund records estimated return of capital and investment income based on historical information available from each MLP. These estimates may subsequently be revised based on information received from the MLPs after their tax reporting periods are concluded.
Notes to Financial Statements (Continued)
First Trust Long/Short Equity ETF (FTLS)
April 30, 2020 (Unaudited)
C. Short Sales
Short sales are utilized for investment and risk management purposes and are transactions in which securities or other instruments (such as options, forwards, futures or other derivative contracts) are sold by the Fund, but are not currently owned in the Fund’s portfolio. When the Fund engages in a short sale, the Fund must borrow the security sold short and deliver the security to the counterparty. Short selling allows the Fund to profit from a decline in a market price to the extent such decline exceeds the transaction costs and the costs of borrowing the securities. The Fund will pay a fee or premium to borrow the securities sold short and is obligated to repay the lenders of the securities. Any dividends or interest that accrues on the securities during the period of the loan are due to the lenders. A gain, limited to the price at which the security was sold short, or a loss, unlimited in size, will be recognized upon the termination of the short sale; which is affected by the Fund purchasing the security sold short and delivering the security to the lender. Any such gain or loss may be offset, completely or in part, by the change in the value of the long portion of the Fund’s portfolio. The Fund is subject to the risk that it may be unable to reacquire a security to terminate a short position except at a price substantially in excess of the last quoted price. Also, there is the risk that the counterparty to a short sale may fail to honor its contractual terms, causing a loss to the Fund.
The Fund has established an account with Pershing, LLC for the purpose of borrowing securities that the Fund intends to sell short. The Fund is charged interest on debit margin balances at a rate equal to the Overnight Bank Funding Rate plus 40 basis points. With regard to securities held short, the Fund is credited a rebate equal to the market value of its short positions at a rate equal to the Overnight Bank Funding Rate less 25 basis points. This rebate rate applies to easy to borrow securities. Securities that are hard to borrow may earn a rebate that is less than the foregoing or may be subject to a premium charge on a security by security basis. The different rebate rate is determined at the time of a short sale request. For the six months ended April 30, 2020, the Fund had margin interest rebate of $367,522 and margin interest expense of $74,943, as shown on the Statement of Operations. Restricted cash in the amount of $121,503,166, as shown on the Statement of Assets and Liabilities, is associated with collateral at the broker as of April 30, 2020.
D. Dividends and Distributions to Shareholders
Dividends from net investment income, if any, are declared and paid quarterly by the Fund, or as the Board of Trustees may determine from time to time. Distributions of net realized capital gains earned by the Fund, if any, are distributed at least annually.
Distributions from net investment income and realized capital gains are determined in accordance with federal income tax regulations, which may differ from U.S. GAAP. Certain capital accounts in the financial statements are periodically adjusted for permanent differences in order to reflect their tax character. These permanent differences are primarily due to the varying treatment of income and gain/loss on portfolio securities held by the Fund and have no impact on net assets or NAV per share. Temporary differences, which arise from recognizing certain items of income, expense and gain/loss in different periods for financial statement and tax purposes, will reverse at some time in the future.
The tax character of distributions paid by the Fund during the fiscal year ended October 31, 2019, was as follows:
| Distributions paid from: | |
Ordinary income
| $2,024,101 |
Capital gains
| — |
Return of capital
| — |
As of October 31, 2019, the components of distributable earnings on a tax basis were as follows:
Undistributed ordinary income
| $19,458 |
Accumulated capital and other gain (loss)
| (24,499,960) |
Net unrealized appreciation (depreciation)
| 16,262,351 |
E. Income Taxes
The Fund intends to continue to qualify as a regulated investment company by complying with the requirements under Subchapter M of the Internal Revenue Code of 1986, as amended, which includes distributing substantially all of its net investment income and net realized gains to shareholders. Accordingly, no provision has been made for federal and state income taxes. However, due to the timing and amount of distributions, the Fund may be subject to an excise tax of 4% of the amount by which approximately 98% of the Fund’s taxable income exceeds the distributions from such taxable income for the calendar year.
The Fund is subject to accounting standards that establish a minimum threshold for recognizing, and a system for measuring, the benefits of a tax position taken or expected to be taken in a tax return. Taxable years ended 2016, 2017, 2018, and 2019 remain open to
Notes to Financial Statements (Continued)
First Trust Long/Short Equity ETF (FTLS)
April 30, 2020 (Unaudited)
federal and state audit. As of April 30, 2020, management has evaluated the application of these standards to the Fund and has determined that no provision for income tax is required in the Fund’s financial statements for uncertain tax positions.
The Fund intends to utilize provisions of the federal income tax laws, which allow it to carry a realized capital loss forward indefinitely following the year of the loss and offset such loss against any future realized capital gains. The Fund is subject to certain limitations under U.S. tax rules on the use of capital loss carryforwards and net unrealized built-in losses. These limitations apply when there has been a 50% change in ownership. At October 31, 2019, the Fund had $24,499,960 of non-expiring capital loss carryforwards for federal income tax purposes.
F. Expenses
Expenses, other than the investment advisory fee, dividend and interest expenses on investments sold short and other excluded expenses, are paid by the Advisor (See Note 3).
3. Investment Advisory Fee, Affiliated Transactions and Other Fee Arrangements
First Trust, the investment advisor to the Fund, is a limited partnership with one limited partner, Grace Partners of DuPage L.P., and one general partner, The Charger Corporation. The Charger Corporation is an Illinois corporation controlled by James A. Bowen, Chief Executive Officer of First Trust. First Trust is responsible for the selection and ongoing monitoring of the securities in the Fund’s portfolio, managing the Fund’s business affairs and providing certain administrative services necessary for the management of the Fund.
Pursuant to the Investment Management Agreement, First Trust manages the investment of the Fund’s assets and is responsible for the Fund’s expenses, including the cost of transfer agency, custody, fund administration, legal, audit and other services, but excluding fee payments under the Investment Management Agreement, interest, taxes, brokerage commissions and other expenses connected with the execution of portfolio transactions, distribution and service fees pursuant to a Rule 12b-1 plan, if any, acquired fund fees and expenses, dividend expenses on investments sold short, and extraordinary expenses. The Fund has agreed to pay First Trust an annual unitary management fee equal to 0.95% of its average daily net assets. In addition, the Fund incurs acquired fund fees and expenses. The total of the unitary management fee and acquired fund fees and expenses represents the Fund’s total annual operating expenses. First Trust also provides fund reporting services to the Fund for a flat annual fee in the amount of $9,250, which is covered under the annual unitary management fee.
The Trust has multiple service agreements with Brown Brothers Harriman & Co. (“BBH”). Under the service agreements, BBH performs custodial, fund accounting, certain administrative services, and transfer agency services for the Fund. As custodian, BBH is responsible for custody of the Fund’s assets. As fund accountant and administrator, BBH is responsible for maintaining the books and records of the Fund’s securities and cash. As transfer agent, BBH is responsible for maintaining shareholder records for the Fund.
Each Trustee who is not an officer or employee of First Trust, any sub-advisor or any of their affiliates (“Independent Trustees”) is paid a fixed annual retainer that is allocated equally among each fund in the First Trust Fund Complex. Each Independent Trustee is also paid an annual per fund fee that varies based on whether the fund is a closed-end or other actively managed fund, a defined-outcome fund or an index fund.
Additionally, the Lead Independent Trustee and the Chairmen of the Audit Committee, Nominating and Governance Committee and Valuation Committee are paid annual fees to serve in such capacities, with such compensation allocated pro rata among each fund in the First Trust Fund Complex based on net assets. Independent Trustees are reimbursed for travel and out-of-pocket expenses in connection with all meetings. The Lead Independent Trustee and Committee Chairmen rotate every three years. The officers and “Interested” Trustee receive no compensation from the Trust for acting in such capacities.
4. Purchases and Sales of Securities
For the six months ended April 30, 2020, the cost of purchases and proceeds from sales of investments, excluding short term investments, investments sold short and in-kind transactions, were $228,845,867 and $244,747,463, respectively. The cost of purchases to cover short sales and the proceeds of short sales were $199,036,409 and $229,936,744, respectively.
For the six months ended April 30, 2020, the cost of in-kind purchases and proceeds from in-kind sales were $184,419,378 and $169,782,718, respectively.
Notes to Financial Statements (Continued)
First Trust Long/Short Equity ETF (FTLS)
April 30, 2020 (Unaudited)
5. Creations, Redemptions and Transaction Fees
Shares are created and redeemed by the Fund only in Creation Unit size aggregations of 50,000 shares in transactions with broker-dealers or large institutional investors that have entered into a participation agreement (an “Authorized Participant”). In order to purchase Creation Units of the Fund, an Authorized Participant must deposit (i) a designated portfolio of securities determined by First Trust (the “Deposit Securities”) and generally make or receive a cash payment referred to as the “Cash Component,” which is an amount equal to the difference between the NAV of the Fund shares (per Creation Unit Aggregation) and the market value of the Deposit Securities, and/or (ii) cash in lieu of all or a portion of the Deposit Securities. If the Cash Component is a positive number (i.e., the NAV per Creation Unit Aggregation exceeds the Deposit Amount), the Authorized Participant will deliver the Cash Component. If the Cash Component is a negative number (i.e., the NAV per Creation Unit Aggregation is less than the Deposit Amount), the Authorized Participant will receive the Cash Component. Authorized Participants purchasing Creation Units must pay to BBH, as transfer agent, a creation transaction fee (the “Creation Transaction Fee”) regardless of the number of Creation Units purchased in the transaction. The Creation Transaction Fee may vary and is based on the composition of the securities included in the Fund’s portfolio and the countries in which the transactions are settled. The Creation Transaction Fee may increase or decrease with changes in the Fund’s portfolio. The price for each Creation Unit will equal the daily NAV per share times the number of shares in a Creation Unit plus the fees described above and, if applicable, any operational processing and brokerage costs, transfer fees or stamp taxes. When the Fund permits an Authorized Participant to substitute cash or a different security in lieu of depositing one or more of the requisite Deposit Securities, the Authorized Participant may also be assessed an amount to cover the cost of purchasing the Deposit Securities and/or disposing of the substituted securities, including operational processing and brokerage costs, transfer fees, stamp taxes, and part or all of the spread between the expected bid and offer side of the market related to such Deposit Securities and/or substitute securities.
Authorized Participants redeeming Creation Units must pay to BBH, as transfer agent, a redemption transaction fee (the “Redemption Transaction Fee”), regardless of the number of Creation Units redeemed in the transaction. The Redemption Transaction Fee may vary and is based on the composition of the securities included in the Fund’s portfolio and the countries in which the transactions are settled. The Redemption Transaction Fee may increase or decrease with changes in the Fund’s portfolio. The Fund reserves the right to effect redemptions in cash. An Authorized Participant may request cash redemption in lieu of securities; however, the Fund may, in its discretion, reject any such request.
6. Distribution Plan
The Board of Trustees adopted a Distribution and Service Plan pursuant to Rule 12b-1 under the 1940 Act. In accordance with the Rule 12b-1 plan, the Fund is authorized to pay an amount up to 0.25% of its average daily net assets each year to reimburse First Trust Portfolios L.P. (“FTP”), the distributor of the Fund, for amounts expended to finance activities primarily intended to result in the sale of Creation Units or to provide investor services. FTP may also use this amount to compensate securities dealers or other persons that are Authorized Participants for providing distribution assistance, including broker-dealer and shareholder support and educational and promotional services.
No 12b-1 fees are currently paid by the Fund, and pursuant to a contractual arrangement, no 12b-1 fees will be paid any time before February 28, 2021.
7. Indemnification
The Trust, on behalf of the Fund, has a variety of indemnification obligations under contracts with its service providers. The Trust’s maximum exposure under these arrangements is unknown. However, the Trust has not had prior claims or losses pursuant to these contracts and expects the risk of loss to be remote.
8. Subsequent Events
Management has evaluated the impact of all subsequent events to the Fund through the date the financial statements were issued, and has determined that there were no subsequent events requiring recognition or disclosure in the financial statements that have not already been disclosed.
Additional Information
First Trust Long/Short Equity ETF (FTLS)
April 30, 2020 (Unaudited)
Proxy Voting Policies and Procedures
A description of the policies and procedures that the Trust uses to determine how to vote proxies and information on how the Fund voted proxies relating to portfolio securities during the most recent 12-month period ended June 30 is available (1) without charge, upon request, by calling (800) 988-5891; (2) on the Fund’s website at www.ftportfolios.com; and (3) on the Securities and Exchange Commission’s (“SEC”) website at www.sec.gov.
Portfolio Holdings
The Fund files portfolio holdings information for each month in a fiscal quarter within 60 days after the end of the relevant fiscal quarter on Form N-PORT. Portfolio holdings information for the third month of each fiscal quarter will be publicly available on the SEC’s website at www.sec.gov. The Fund’s complete schedule of portfolio holdings for the second and fourth quarters of each fiscal year is included in the semi-annual and annual reports to shareholders, respectively, and is filed with the SEC on Form N-CSR. The semi-annual and annual report for the Fund is available to investors within 60 days after the period to which it relates. The Fund’s Forms N-PORT and Forms N-CSR are available on the SEC’s website listed above.
Risk Considerations
Risks are inherent in all investing. Certain general risks that may be applicable to a Fund are identified below, but not all of the material risks relevant to each Fund are included in this report and not all of the risks below apply to each Fund. The material risks of investing in each Fund are spelled out in its prospectus, statement of additional information and other regulatory filings. Before investing, you should consider each Fund’s investment objective, risks, charges and expenses, and read each Fund’s prospectus and statement of additional information carefully. You can download each Fund’s prospectus at www.ftportfolios.com or contact First Trust Portfolios L.P. at (800) 621-1675 to request a prospectus, which contains this and other information about each Fund.
Concentration Risk. To the extent that a fund is able to invest a large percentage of its assets in a single asset class or the securities of issuers within the same country, state, region, industry or sector, an adverse economic, business or political development may affect the value of the fund’s investments more than if the fund were more broadly diversified. A fund that tracks an index will be concentrated to the extent the fund’s corresponding index is concentrated. A concentration makes a fund more susceptible to any single occurrence and may subject the fund to greater market risk than a fund that is not concentrated.
Credit Risk. Credit risk is the risk that an issuer of a security will be unable or unwilling to make dividend, interest and/or principal payments when due and the related risk that the value of a security may decline because of concerns about the issuer’s ability to make such payments.
Cyber Security Risk. The funds are susceptible to potential operational risks through breaches in cyber security. A breach in cyber security refers to both intentional and unintentional events that may cause a fund to lose proprietary information, suffer data corruption or lose operational capacity. Such events could cause a fund to incur regulatory penalties, reputational damage, additional compliance costs associated with corrective measures and/or financial loss. In addition, cyber security breaches of a fund’s third-party service providers, such as its administrator, transfer agent, custodian, or sub-advisor, as applicable, or issuers in which the fund invests, can also subject a fund to many of the same risks associated with direct cyber security breaches.
Derivatives Risk. To the extent a fund uses derivative instruments such as futures contracts, options contracts and swaps, the fund may experience losses because of adverse movements in the price or value of the underlying asset, index or rate, which may be magnified by certain features of the derivative. These risks are heightened when a fund’s portfolio managers use derivatives to enhance the fund’s return or as a substitute for a position or security, rather than solely to hedge (or offset) the risk of a position or security held by the fund.
Equity Securities Risk. To the extent a fund invests in equity securities, the value of the fund’s shares will fluctuate with changes in the value of the equity securities. Equity securities prices fluctuate for several reasons, including changes in investors’ perceptions of the financial condition of an issuer or the general condition of the relevant stock market, such as market volatility, or when political or economic events affecting the issuers occur. In addition, common stock prices may be particularly sensitive to rising interest rates, as the cost of capital rises and borrowing costs increase. Equity securities may decline significantly in price over short or extended periods of time, and such declines may occur in the equity market as a whole, or they may occur in only a particular country, company, industry or sector of the market.
ETF Risk. The shares of an ETF trade like common stock and represent an interest in a portfolio of securities. The risks of owning an ETF generally reflect the risks of owning the underlying securities, although lack of liquidity in an ETF could result in it being more volatile and ETFs have management fees that increase their costs. Shares of an ETF trade on an exchange at market prices rather than
Additional Information (Continued)
First Trust Long/Short Equity ETF (FTLS)
April 30, 2020 (Unaudited)
net asset value, which may cause the shares to trade at a price greater than net asset value (premium) or less than net asset value (discount). In times of market stress, decisions by market makers to reduce or step away from their role of providing a market for an ETF’s shares, or decisions by an ETF’s authorized participants that they are unable or unwilling to proceed with creation and/or redemption orders of an ETF’s shares, could result in shares of the ETF trading at a discount to net asset value and in greater than normal intraday bid-ask spreads.
Fixed Income Securities Risk. To the extent a fund invests in fixed income securities, the fund will be subject to credit risk, income risk, interest rate risk, liquidity risk and prepayment risk. Income risk is the risk that income from a fund’s fixed income investments could decline during periods of falling interest rates. Interest rate risk is the risk that the value of a fund’s fixed income securities will decline because of rising interest rates. Liquidity risk is the risk that a security cannot be purchased or sold at the time desired, or cannot be purchased or sold without adversely affecting the price. Prepayment risk is the risk that the securities will be redeemed or prepaid by the issuer, resulting in lower interest payments received by the fund. In addition to these risks, high yield securities, or “junk” bonds, are subject to greater market fluctuations and risk of loss than securities with higher ratings, and the market for high yield securities is generally smaller and less liquid than that for investment grade securities.
Index Constituent Risk. Certain funds may be a constituent of one or more indices. As a result, such a fund may be included in one or more index-tracking exchange-traded funds or mutual funds. Being a component security of such a vehicle could greatly affect the trading activity involving a fund, the size of the fund and the market volatility of the fund. Inclusion in an index could significantly increase demand for the fund and removal from an index could result in outsized selling activity in a relatively short period of time. As a result, a fund’s net asset value could be negatively impacted and the fund’s market price may be significantly below its net asset value during certain periods.
Index Provider Risk. To the extent a fund seeks to track an index, it is subject to Index Provider Risk. There is no assurance that the Index Provider will compile the Index accurately, or that the Index will be determined, maintained, constructed, reconstituted, rebalanced, composed, calculated or disseminated accurately. To correct any such error, the Index Provider may carry out an unscheduled rebalance or other modification of the Index constituents or weightings, which may increase the fund’s costs. The Index Provider does not provide any representation or warranty in relation to the quality, accuracy or completeness of data in the Index, and it does not guarantee that the Index will be calculated in accordance with its stated methodology. Losses or costs associated with any Index Provider errors generally will be borne by the fund and its shareholders.
Investment Companies Risk. To the extent a fund invests in the securities of other investment vehicles, the fund will incur additional fees and expenses that would not be present in a direct investment in those investment vehicles. Furthermore, the fund’s investment performance and risks are directly related to the investment performance and risks of the investment vehicles in which the fund invests.
LIBOR Risk. To the extent a fund invests in floating or variable rate obligations that use the London Interbank Offered Rate (“LIBOR”) as a reference interest rate, it is subject to LIBOR Risk. In 2017, the United Kingdom’s Financial Conduct Authority announced that LIBOR will cease to be available for use after 2021. The unavailability or replacement of LIBOR may affect the value, liquidity or return on certain fund investments and may result in costs incurred in connection with closing out positions and entering into new trades. Any potential effects of the transition away from LIBOR on the fund or on certain instruments in which the fund invests can be difficult to ascertain, and they may vary depending on a variety of factors. Any such effects of the transition away from LIBOR, as well as other unforeseen effects, could result in losses to the fund.
Management Risk. To the extent that a fund is actively managed, it is subject to management risk. In managing an actively-managed fund’s investment portfolio, the fund’s portfolio managers will apply investment techniques and risk analyses that may not have the desired result. There can be no guarantee that a fund will meet its investment objective.
Market Risk. Securities held by a fund, as well as shares of a fund itself, are subject to market fluctuations caused by factors such as general economic conditions, political events, regulatory or market developments, changes in interest rates and perceived trends in securities prices. Shares of a fund could decline in value or underperform other investments as a result of the risk of loss associated with these market fluctuations. In addition, local, regional or global events such as war, acts of terrorism, spread of infectious diseases or other public health issues, recessions, or other events could have a significant negative impact on a fund and its investments. Such events may affect certain geographic regions, countries, sectors and industries more significantly than others. The outbreak of the respiratory disease designated as COVID-19 in December 2019 has caused significant volatility and declines in global financial markets, which have caused losses for investors. The COVID-19 pandemic may last for an extended period of time and will continue to impact the economy for the foreseeable future.
Non-U.S. Securities Risk. To the extent a fund invests in non-U.S. securities, it is subject to additional risks not associated with securities of domestic issuers. Non-U.S. securities are subject to higher volatility than securities of domestic issuers due to: possible adverse political, social or economic developments; restrictions on foreign investment or exchange of securities; lack of liquidity;
Additional Information (Continued)
First Trust Long/Short Equity ETF (FTLS)
April 30, 2020 (Unaudited)
currency exchange rates; excessive taxation; government seizure of assets; different legal or accounting standards; and less government supervision and regulation of exchanges in foreign countries. Investments in non-U.S. securities may involve higher costs than investments in U.S. securities, including higher transaction and custody costs, as well as additional taxes imposed by non-U.S. governments. These risks may be heightened for securities of companies located, or with significant operations, in emerging market countries.
Passive Investment Risk. To the extent a fund seeks to track an index, the fund will invest in the securities included in, or representative of, the index regardless of their investment merit. A fund generally will not attempt to take defensive positions in declining markets.
INVESTMENT ADVISOR
First Trust Advisors L.P.
120 East Liberty Drive, Suite 400
Wheaton, IL 60187
ADMINISTRATOR, CUSTODIAN,
FUND ACCOUNTANT &
TRANSFER AGENT
Brown Brothers Harriman & Co.
50 Post Office Square
Boston, MA 02110
INDEPENDENT REGISTERED
PUBLIC ACCOUNTING FIRM
Deloitte & Touche LLP
111 S. Wacker Drive
Chicago, IL 60606
LEGAL COUNSEL
Chapman and Cutler LLP
111 W. Monroe Street
Chicago, IL 60603
First Trust Exchange-Traded Fund III
First Trust Emerging Markets Local Currency Bond ETF (FEMB)
Semi-Annual Report
For the Six Months Ended
April 30, 2020
First Trust Emerging Markets Local Currency Bond ETF (FEMB)
Semi-Annual Report
April 30, 2020
Caution Regarding Forward-Looking Statements
This report contains certain forward-looking statements within the meaning of the Securities Act of 1933, as amended, and the Securities Exchange Act of 1934, as amended. Forward-looking statements include statements regarding the goals, beliefs, plans or current expectations of First Trust Advisors L.P. (“First Trust” or the “Advisor”) and/or First Trust Global Portfolios Limited (“FTGP” or the “Sub-Advisor”) and their respective representatives, taking into account the information currently available to them. Forward-looking statements include all statements that do not relate solely to current or historical fact. For example, forward-looking statements include the use of words such as “anticipate,” “estimate,” “intend,” “expect,” “believe,” “plan,” “may,” “should,” “would” or other words that convey uncertainty of future events or outcomes.
Forward-looking statements involve known and unknown risks, uncertainties and other factors that may cause the actual results, performance or achievements of the series of First Trust Exchange-Traded Fund III (the “Trust”) described in this report (First Trust Emerging Markets Local Currency Bond ETF; hereinafter referred to as the “Fund”) to be materially different from any future results, performance or achievements expressed or implied by the forward-looking statements. When evaluating the information included in this report, you are cautioned not to place undue reliance on these forward-looking statements, which reflect the judgment of the Advisor and/or Sub-Advisor and their respective representatives only as of the date hereof. We undertake no obligation to publicly revise or update these forward-looking statements to reflect events and circumstances that arise after the date hereof.
Performance and Risk Disclosure
There is no assurance that the Fund will achieve its investment objective. The Fund is subject to market risk, which is the possibility that the market values of securities owned by the Fund will decline and that the value of the Fund’s shares may therefore be less than what you paid for them. Accordingly, you can lose money by investing in the Fund. See “Risk Considerations” in the Additional Information section of this report for a discussion of certain other risks of investing in the Fund.
Performance data quoted represents past performance, which is no guarantee of future results, and current performance may be lower or higher than the figures shown. For the most recent month-end performance figures, please visit www.ftportfolios.com or speak with your financial advisor. Investment returns, net asset value and share price will fluctuate and Fund shares, when sold, may be worth more or less than their original cost.
The Advisor may also periodically provide additional information on Fund performance on the Fund’s web page at www.ftportfolios.com.
How to Read This Report
This report contains information that may help you evaluate your investment in the Fund. It includes details about the Fund and presents data and analysis that provide insight into the Fund’s performance and investment approach.
The statistical information that follows may help you understand the Fund’s performance compared to that of a relevant market benchmark.
It is important to keep in mind that the opinions expressed by personnel of the Advisor and/or Sub-Advisor are just that: informed opinions. They should not be considered to be promises or advice. The opinions, like the statistics, cover the period through the date on the cover of this report. The material risks of investing in the Fund are spelled out in the prospectus, the statement of additional information, and other Fund regulatory filings.
First Trust Emerging Markets Local Currency Bond ETF (FEMB)
Semi-Annual Letter from the Chairman and CEO
April 30, 2020
Dear Shareholders,
First Trust is pleased to provide you with the semi-annual report for the First Trust Emerging Markets Local Currency Bond ETF (the “Fund”), which contains detailed information about the Fund for the six months ended April 30, 2020.
Just one month ago, I noted in a letter to shareholders that a handful of states were set to open some “nonessential” businesses by early May. As of May 20, 2020, I am pleased to report that all 50 states and U.S. territories have eased some restrictions on businesses and social activity. Keep in mind, however, that the plan does entail governors phasing in the opening of businesses in the coming weeks or potentially months, so I see this news as essentially marking the beginning of the rebuilding process for the U.S. economy. We all need to be aware as well of the possibility of an uptick or even surge in the coronavirus (“COVID-19”) infections as more people venture out of their homes. Prior to the last couple of weeks or so, the stay-at-home mandate severely restricted the movements of close to 315 million Americans, according to The Washington Post. To put this further into perspective, because so many stores have been closed and so many people have been hunkering down at home, retail-store traffic in the U.S. plunged 91.2% year-over-year for the week ended May 16, 2020, according to Bloomberg. Truly amazing!
In this COVID-19 pandemic, there appears to be a notable disconnect between the state of the U.S. economy, which is expected to go from bad to downright terrible between the first quarter and second quarter of the year, and the performance of the stock market, which has been much better than expected. While the data and commentary in this report are technically supposed to run through April 30, 2020, I feel compelled to offer insight that is as up to date as possible. The 2020 peak in the stock market, as measured by the S&P 500® Index (the “Index”), occurred on February 19. That day also marked the all-time high for the Index. From February 19, 2020, through March 23, 2020, the Index declined by 33.92% on a price-only basis (no dividends included), according to Bloomberg. We should note that the Index slid into bear market territory on March 12, 2020. A bear market is defined by a 20% or greater decline in price from its most recent peak. That took just 16 trading days, the quickest plunge into a bear market ever. From March 23, 2020 through May 20, 2020, the Index staged an impressive rebound, posting a price-only gain of 32.82%, according to Bloomberg. As of May 20, 2020, the Index stood just 12.24% below its all-time high set on February 19, 2020. But the game, as they say, is not over. Even though stocks have rebounded significantly from their March lows, 68% of the money managers that participated in the most recent Bank of America global fund manager survey believe that stocks are still in a bear market, according to MarketWatch. What are they likely concerned about? In addition to a dismal economic outlook for the near-term, research from Bespoke Investment Group, an independent research firm, indicates that there have been 25 bear markets since 1928 and 60% of the time the Index declined a second time during the bear market and went on to establish a new low for the period.
With respect to the state of the economy, the Congressional Budget Office announced on May 19, 2020, that it sees real U.S. gross domestic product (“GDP”) declining by an annualized 38% in the second quarter of 2020, reportedly in line with Wall Street economists, according to CNBC. Some estimates are more dire. The GDP estimate from the Atlanta Federal Reserve calls for a 42% plunge. These numbers are so large in scope they are mind-boggling. The Bureau of Economic Analysis is scheduled to release its GDP report on July 30, 2020. Until then, we may continue to have a disconnect between the economy and the markets. Let us hope it is as positive as the one we are currently enjoying.
The U.S. government shut down huge chunks of our economy in order to protect lives and prevent our health care system from being overwhelmed by COVID-19 patients. Our economic woes, in other words, are man-made. The remedies to this pandemic will also likely be man-made. They could come in the form of therapeutics and/or a vaccine. Perhaps more than one vaccine. At this stage of the pandemic fight, we have one message for investors: Stay the course!
Thank you for giving First Trust the opportunity to play a role in your financial future. We value our relationship with you and will report on the Fund again in six months.
Sincerely,
James A. Bowen
Chairman of the Board of Trustees
Chief Executive Officer of First Trust Advisors L.P.
Fund Performance Overview (Unaudited)
First Trust Emerging Markets Local Currency Bond ETF (FEMB)
First Trust Emerging Markets Local Currency Bond ETF (the “Fund”) seeks maximum total return and current income. The Fund lists and principally trades its shares on The Nasdaq Stock Market LLC (“Nasdaq”) under the ticker symbol “FEMB.” Under normal market conditions, the Fund seeks to achieve its investment objective by investing at least 80% of its net assets (including investment borrowings) in bonds, notes and bills issued or guaranteed by entities incorporated or domiciled in emerging market countries that are denominated in the local currency of the issuer. In implementing the Fund’s investment strategy, First Trust Global Portfolios Ltd. (the “Sub-Advisor”) seeks to provide current income and enhance capital, while minimizing volatility.
| Performance | | | | | | | |
| | | | Average Annual Total Returns | | Cumulative Total Returns |
| | 6 Months
Ended
4/30/20 | 1 Year
Ended
4/30/20 | 5 Years
Ended
4/30/20 | Inception
(11/4/14)
to 4/30/20 | | 5 Years
Ended
4/30/20 | Inception
(11/4/14)
to 4/30/20 |
| Fund Performance | | | | | | | |
| NAV | -11.48% | -6.61% | -0.87% | -2.02% | | -4.28% | -10.60% |
| Market Price | -12.55% | -7.87% | -1.11% | -2.22% | | -5.45% | -11.58% |
| Index Performance | | | | | | | |
| Bloomberg Barclays Emerging Markets Local Currency Government - 10% Country Capped Index | -6.57% | 0.02% | 1.29% | 0.14% | | 6.62% | 0.76% |
Total returns for the period since inception are calculated from the inception date of the Fund. “Average Annual Total Returns” represent the average annual change in value of an investment over the periods indicated. “Cumulative Total Returns” represent the total change in value of an investment over the periods indicated.
The Fund’s per share net asset value (“NAV”) is the value of one share of the Fund and is computed by dividing the value of all assets of the Fund (including accrued interest and dividends), less all liabilities (including accrued expenses and dividends declared but unpaid), by the total number of outstanding shares. The price used to calculate market return (“Market Price”) is determined by using the midpoint between the highest bid and the lowest offer on the stock exchange on which shares of the Fund are listed for trading as of the time that the Fund’s NAV is calculated. Since shares of the Fund did not trade in the secondary market until after its inception, for the period from inception to the first day of secondary market trading in shares of the Fund, the NAV of the Fund is used as a proxy for the secondary market trading price to calculate market returns. NAV and market returns assume that all distributions have been reinvested in the Fund at NAV and Market Price, respectively.
An index is a statistical composite that tracks a specified financial market or sector. Unlike the Fund, the index does not actually hold a portfolio of securities and therefore does not incur the expenses incurred by the Fund. These expenses negatively impact the performance of the Fund. Also, market returns do not include brokerage commissions that may be payable on secondary market transactions. If brokerage commissions were included, market returns would be lower. The total returns presented reflect the reinvestment of dividends on securities in the index. The returns presented do not reflect the deduction of taxes that a shareholder would pay on Fund distributions or the redemption or sale of Fund shares. The investment return and principal value of shares of the Fund will vary with changes in market conditions. Shares of the Fund may be worth more or less than their original cost when they are redeemed or sold in the market. The Fund’s past performance is no guarantee of future performance.
Fund Performance Overview (Unaudited) (Continued)
First Trust Emerging Markets Local Currency Bond ETF (FEMB)
| Industry Classification | % of
Long-Term
Investments |
| Sovereigns | 92.9% |
| Supranationals | 7.0 |
| Central Bank | 0.1 |
| Total | 100.0% |
| Credit Quality(1) | % of Total
Investments
(including cash) |
| AAA | 6.8% |
| AA | 1.0 |
| AA- | 7.5 |
| A | 7.5 |
| A- | 11.5 |
| BBB+ | 8.7 |
| BBB | 19.3 |
| BBB- | 3.7 |
| BB+ | 16.0 |
| BB | 11.3 |
| BB- | 4.2 |
| Cash | 2.5 |
| Total | 100.0% |
| Top Ten Holdings | % of Total
Investments |
| Peru Government Bond, 6.95%, 8/12/31 | 6.6% |
| Republic of South Africa Government Bond, 8.88%, 2/28/35 | 6.2 |
| Brazil Notas do Tesouro Nacional, Series F, 10.00%, 1/01/25 | 5.9 |
| Hungary Government Bond, 6.75%, 10/22/28 | 5.1 |
| Turkey Government Bond, 10.60%, 2/11/26 | 4.3 |
| International Finance Corp., 6.30%, 11/25/24 | 3.3 |
| Colombian TES, 7.50%, 8/26/26 | 3.2 |
| Republic of South Africa Government Bond, 8.50%, 1/31/37 | 3.2 |
| Asian Development Bank, 6.20%, 10/06/26 | 3.2 |
| Colombian TES, 6.00%, 4/28/28 | 3.1 |
| Total | 44.1% |
| (1) | The credit quality and ratings information presented above reflect the ratings assigned by one or more nationally recognized statistical rating organizations (NRSROs), including Standard & Poor’s Ratings Group, a division of the McGraw Hill Companies, Inc., Moody’s Investors Service, Inc., Fitch Ratings or a comparably rated NRSRO. For situations in which a security is rated by more than one NRSRO and the ratings are not equivalent, the highest rating is used. Sub-investment grade ratings are those rated BB+/Ba1 or lower. Investment grade ratings are those rated BBB-/Baa3 or higher. The credit ratings shown relate to the creditworthiness of the issuers of the underlying securities in the Fund, and not to the Fund or its shares. Credit ratings are subject to change. |
Fund Performance Overview (Unaudited) (Continued)
First Trust Emerging Markets Local Currency Bond ETF (FEMB)

Performance figures assume reinvestment of all distributions and do not reflect the deduction of taxes that a shareholder would pay on Fund distributions or the redemption or sale of Fund shares. An index is a statistical composite that tracks a specified financial market or sector. Unlike the Fund, the index does not actually hold a portfolio of securities and therefore does not incur the expenses incurred by the Fund. These expenses negatively impact the performance of the Fund. The Fund’s past performance does not predict future performance.
Frequency Distribution of Discounts and Premiums
Bid/Ask Midpoint vs. NAV through April 30, 2020
The following Frequency Distribution of Discounts and Premiums charts are provided to show the frequency at which the bid/ask midpoint price for the Fund was at a discount or premium to the daily NAV. The following tables are for comparative purposes only and represent the period November 5, 2014 (commencement of trading) through April 30, 2020. Shareholders may pay more than NAV when they buy Fund shares and receive less than NAV when they sell those shares because shares are bought and sold at current market price. Data presented represents past performance and cannot be used to predict future results.
| Number of Days Bid/Ask Midpoint At/Above NAV |
| For the Period | 0.00%–0.49% | 0.50%–0.99% | 1.00%–1.99% | >=2.00% |
| 11/5/14 - 10/31/15 | 116 | 110 | 7 | 1 |
| 11/1/15 - 10/31/16 | 80 | 64 | 38 | 3 |
| 11/1/16 - 10/31/17 | 104 | 89 | 23 | 2 |
| 11/1/17 - 10/31/18 | 88 | 5 | 0 | 0 |
| 11/1/18 - 10/31/19 | 145 | 43 | 0 | 0 |
| 11/1/19 - 4/30/20 | 54 | 8 | 0 | 0 |
| Number of Days Bid/Ask Midpoint Below NAV |
| For the Period | 0.00%–0.49% | 0.50%–0.99% | 1.00%–1.99% | >=2.00% |
| 11/5/14 - 10/31/15 | 15 | 0 | 0 | 1 |
| 11/1/15 - 10/31/16 | 60 | 7 | 0 | 0 |
| 11/1/16 - 10/31/17 | 27 | 7 | 0 | 0 |
| 11/1/17 - 10/31/18 | 140 | 19 | 0 | 0 |
| 11/1/18 - 10/31/19 | 62 | 1 | 0 | 0 |
| 11/1/19 - 4/30/20 | 24 | 11 | 20 | 7 |
Portfolio Management
First Trust Emerging Markets Local Currency Bond ETF (FEMB)
Semi-Annual Report
April 30, 2020 (Unaudited)
Advisor
First Trust Advisors L.P. (“First Trust” or the “Advisor”) serves as the investment advisor to the First Trust Emerging Markets Local Currency Bond ETF (the “Fund”). First Trust is responsible for the ongoing monitoring of the Fund’s investment portfolio, managing the Fund’s business affairs and providing certain administrative services necessary for the management of the Fund.
Investment Sub-Advisor
First Trust Global Portfolios Ltd. (“FTGP”), an affiliate of First Trust, serves as investment sub-advisor to the Fund and is headed by Derek Fulton, Director, Chief Executive Officer and Chief Investment Officer of FTGP. Established in December 2011, FTGP is an SEC-registered investment advisor based in London. FTGP was established as a United Kingdom-based distributor, advisor and affiliate of First Trust and First Trust Portfolios L.P. and advises on global fixed income and currency portfolios. The global fixed income team at FTGP has experience in managing developing and emerging market fixed income portfolios for high profile European institutions.
Portfolio Management Team
The following portfolio managers are primarily responsible for the day-to-day management of the Fund. Each portfolio manager has managed the Fund since 2014, except for Anthony Beevers, who has served as a member of the portfolio management team since 2019.
Derek Fulton, Director, Chief Executive Officer, FTGP
Leonardo Da Costa, Portfolio Manager, FTGP
Anthony Beevers, Portfolio Manager, FTGP
First Trust Emerging Markets Local Currency Bond ETF (FEMB)
Understanding Your Fund Expenses
April 30, 2020 (Unaudited)
As a shareholder of the First Trust Emerging Markets Local Currency Bond ETF (the “Fund”), you incur two types of costs: (1) transaction costs; and (2) ongoing costs, including management fees, distribution and/or service (12b-1) fees, if any, and other Fund expenses. This Example is intended to help you understand your ongoing costs of investing in the Fund and to compare these costs with the ongoing costs of investing in other funds.
The Example is based on an investment of $1,000 invested at the beginning of the period and held through the six-month period ended April 30, 2020.
Actual Expenses
The first line in the following table provides information about actual account values and actual expenses. You may use the information in this line, together with the amount you invested, to estimate the expenses that you paid over the period. Simply divide your account value by $1,000 (for example, an $8,600 account value divided by $1,000 = 8.6), then multiply the result by the number in the first line under the heading entitled “Expenses Paid During the Six-Month Period” to estimate the expenses you paid on your account during this six-month period.
Hypothetical Example for Comparison Purposes
The second line in the following table provides information about hypothetical account values and hypothetical expenses based on the Fund’s actual expense ratio and an assumed rate of return of 5% per year before expenses, which is not the Fund’s actual return. The hypothetical account values and expenses may not be used to estimate the actual ending account balance or expenses you paid for the period. You may use this information to compare the ongoing costs of investing in the Fund and other funds. To do so, compare this 5% hypothetical example with the 5% hypothetical examples that appear in the shareholder reports of the other funds.
Please note that the expenses shown in the table are meant to highlight your ongoing costs only and do not reflect any transactional costs such as brokerage commissions. Therefore, the second line in the table is useful in comparing ongoing costs only, and will not help you determine the relative total costs of owning different funds. In addition, if these transactional costs were included, your costs would have been higher.
| | Beginning
Account Value
November 1, 2019 | Ending
Account Value
April 30, 2020 | Annualized
Expense Ratio
Based on the
Six-Month
Period | Expenses Paid
During the
Six-Month
Period (a) |
| First Trust Emerging Markets Local Currency Bond ETF (FEMB) |
| Actual | $1,000.00 | $885.20 | 0.85% | $3.98 |
| Hypothetical (5% return before expenses) | $1,000.00 | $1,020.64 | 0.85% | $4.27 |
| (a) | Expenses are equal to the annualized expense ratios as indicated in the table multiplied by the average account value over the period (November 1, 2019 through April 30, 2020), multiplied by 182/366 (to reflect the six-month period). |
First Trust Emerging Markets Local Currency Bond ETF (FEMB)
Portfolio of Investments
April 30, 2020 (Unaudited)
Principal
Value
(Local
Currency) | | Description | | Stated
Coupon | | Stated
Maturity | | Value
(US Dollars) |
| FOREIGN SOVEREIGN BONDS AND NOTES – 89.1% |
| | | Brazil – 11.1% | | | | | | |
| 2,600,000 | | Brazil Notas do Tesouro Nacional, Series F (BRL)
| | 10.00% | | 01/01/21 | | $499,919 |
| 10,000,000 | | Brazil Notas do Tesouro Nacional, Series F (BRL)
| | 10.00% | | 01/01/23 | | 2,066,748 |
| 38,950,000 | | Brazil Notas do Tesouro Nacional, Series F (BRL)
| | 10.00% | | 01/01/25 | | 8,178,532 |
| 13,650,000 | | Brazil Notas do Tesouro Nacional, Series F (BRL)
| | 10.00% | | 01/01/27 | | 2,873,774 |
| 11,200,000 | | Brazil Notas do Tesouro Nacional, Series F (BRL)
| | 10.00% | | 01/01/29 | | 2,361,080 |
| | | | | 15,980,053 |
| | | Chile – 3.9% | | | | | | |
| 2,045,000,000 | | Bonos de la Tesoreria de la Republica en Pesos (CLP)
| | 4.50% | | 03/01/26 | | 2,798,664 |
| 120,000,000 | | Bonos del Banco Central de Chile en Pesos (CLP)
| | 6.00% | | 02/01/21 | | 149,374 |
| 2,210,000,000 | | Chile Government International Bond (CLP)
| | 5.50% | | 08/05/20 | | 2,681,673 |
| | | | | 5,629,711 |
| | | Colombia – 9.4% | | | | | | |
| 4,201,000,000 | | Colombian TES (COP)
| | 7.00% | | 05/04/22 | | 1,118,044 |
| 16,420,000,000 | | Colombian TES (COP)
| | 7.50% | | 08/26/26 | | 4,437,946 |
| 17,600,000,000 | | Colombian TES (COP)
| | 6.00% | | 04/28/28 | | 4,244,705 |
| 14,080,000,000 | | Colombian TES (COP)
| | 7.75% | | 09/18/30 | | 3,766,461 |
| | | | | 13,567,156 |
| | | Czech Republic – 1.0% | | | | | | |
| 18,000,000 | | Czech Republic Government Bond (CZK)
| | 0.75% | | 02/23/21 | | 730,560 |
| 17,080,000 | | Czech Republic Government Bond (CZK) (a)
| | 2.40% | | 09/17/25 | | 740,138 |
| | | | | 1,470,698 |
| | | Hungary – 4.9% | | | | | | |
| 1,625,000,000 | | Hungary Government Bond (HUF)
| | 6.75% | | 10/22/28 | | 7,017,027 |
| | | Indonesia – 4.6% | | | | | | |
| 5,416,000,000 | | Indonesia Treasury Bond (IDR)
| | 8.38% | | 03/15/24 | | 377,391 |
| 17,136,000,000 | | Indonesia Treasury Bond (IDR)
| | 8.38% | | 09/15/26 | | 1,189,440 |
| 35,253,000,000 | | Indonesia Treasury Bond (IDR)
| | 8.38% | | 03/15/34 | | 2,404,906 |
| 40,076,000,000 | | Indonesia Treasury Bond (IDR)
| | 8.25% | | 05/15/36 | | 2,721,127 |
| | | | | 6,692,864 |
| | | Israel – 3.4% | | | | | | |
| 5,940,000 | | Israel Government Bond - Fixed (ILS)
| | 6.25% | | 10/30/26 | | 2,325,332 |
| 8,035,000 | | Israel Government Bond - Fixed (ILS)
| | 2.25% | | 09/28/28 | | 2,597,076 |
| | | | | 4,922,408 |
| | | Malaysia – 4.4% | | | | | | |
| 4,220,000 | | Malaysia Government Bond (MYR)
| | 4.16% | | 07/15/21 | | 1,002,461 |
| 8,250,000 | | Malaysia Government Bond (MYR)
| | 4.05% | | 09/30/21 | | 1,963,404 |
| 13,360,000 | | Malaysia Government Bond (MYR)
| | 4.18% | | 07/15/24 | | 3,309,829 |
| | | | | 6,275,694 |
| | | Mexico – 4.7% | | | | | | |
| 38,850,000 | | Mexican Bonos (MXN)
| | 7.25% | | 12/09/21 | | 1,660,472 |
| 24,210,000 | | Mexican Bonos (MXN)
| | 10.00% | | 12/05/24 | | 1,184,985 |
| 74,350,000 | | Mexican Bonos (MXN)
| | 8.50% | | 05/31/29 | | 3,485,667 |
| 9,290,000 | | Mexican Bonos (MXN)
| | 7.75% | | 05/29/31 | | 409,584 |
| | | | | 6,740,708 |
| | | Peru – 9.4% | | | | | | |
| 8,950,000 | | Peru Government Bond (PEN)
| | 8.20% | | 08/12/26 | | 3,384,311 |
See Notes to Financial Statements
Page 7
First Trust Emerging Markets Local Currency Bond ETF (FEMB)
Portfolio of Investments (Continued)
April 30, 2020 (Unaudited)
Principal
Value
(Local
Currency) | | Description | | Stated
Coupon | | Stated
Maturity | | Value
(US Dollars) |
| FOREIGN SOVEREIGN BONDS AND NOTES (Continued) |
| | | Peru (Continued) | | | | | | |
| 25,950,000 | | Peru Government Bond (PEN)
| | 6.95% | | 08/12/31 | | $9,127,561 |
| 3,100,000 | | Peru Government Bond (PEN)
| | 6.90% | | 08/12/37 | | 1,052,651 |
| | | | | 13,564,523 |
| | | Philippines – 3.9% | | | | | | |
| 150,000,000 | | Philippine Government International Bond (PHP)
| | 4.95% | | 01/15/21 | | 2,972,559 |
| 60,000,000 | | Philippine Government International Bond (PHP)
| | 3.90% | | 11/26/22 | | 1,156,380 |
| 64,000,000 | | Philippine Government International Bond (PHP)
| | 6.25% | | 01/14/36 | | 1,435,524 |
| | | | | 5,564,463 |
| | | Poland – 3.0% | | | | | | |
| 2,000,000 | | Republic of Poland Government Bond (PLN)
| | 1.75% | | 07/25/21 | | 490,267 |
| 545,000 | | Republic of Poland Government Bond (PLN)
| | 4.00% | | 10/25/23 | | 146,521 |
| 2,760,000 | | Republic of Poland Government Bond (PLN)
| | 3.25% | | 07/25/25 | | 742,558 |
| 7,015,000 | | Republic of Poland Government Bond (PLN)
| | 2.75% | | 04/25/28 | | 1,865,175 |
| 3,115,000 | | Republic of Poland Government Bond (PLN)
| | 5.75% | | 04/25/29 | | 1,022,915 |
| | | | | 4,267,436 |
| | | Romania – 3.6% | | | | | | |
| 8,400,000 | | Romania Government Bond (RON)
| | 5.85% | | 04/26/23 | | 2,010,027 |
| 8,925,000 | | Romania Government Bond (RON)
| | 4.50% | | 06/17/24 | | 2,069,399 |
| 4,690,000 | | Romania Government Bond (RON)
| | 5.80% | | 07/26/27 | | 1,157,978 |
| | | | | 5,237,404 |
| | | South Africa – 15.7% | | | | | | |
| 4,000,000 | | Republic of South Africa Government Bond (ZAR)
| | 6.75% | | 03/31/21 | | 221,219 |
| 55,735,000 | | Republic of South Africa Government Bond (ZAR)
| | 10.50% | | 12/21/26 | | 3,305,220 |
| 30,000,000 | | Republic of South Africa Government Bond (ZAR)
| | 8.25% | | 03/31/32 | | 1,347,920 |
| 192,270,000 | | Republic of South Africa Government Bond (ZAR)
| | 8.88% | | 02/28/35 | | 8,577,315 |
| 103,105,000 | | Republic of South Africa Government Bond (ZAR)
| | 6.25% | | 03/31/36 | | 3,502,205 |
| 105,640,000 | | Republic of South Africa Government Bond (ZAR)
| | 8.50% | | 01/31/37 | | 4,431,149 |
| 28,000,000 | | Republic of South Africa Government Bond (ZAR)
| | 9.00% | | 01/31/40 | | 1,196,819 |
| | | | | 22,581,847 |
| | | Thailand – 1.9% | | | | | | |
| 48,470,000 | | Thailand Government Bond (THB)
| | 3.63% | | 06/16/23 | | 1,630,082 |
| 27,500,000 | | Thailand Government Bond (THB)
| | 3.65% | | 06/20/31 | | 1,048,265 |
| | | | | 2,678,347 |
| | | Turkey – 4.2% | | | | | | |
| 42,790,000 | | Turkey Government Bond (TRY)
| | 10.60% | | 02/11/26 | | 5,975,111 |
| | | Total Foreign Sovereign Bonds and Notes
| | 128,165,450 |
| | | (Cost $149,100,090) | | | | | | |
| FOREIGN CORPORATE BONDS AND NOTES – 6.7% |
| | | Supranationals – 6.7% | | | | | | |
| 323,500,000 | | Asian Development Bank (INR)
| | 6.20% | | 10/06/26 | | 4,391,234 |
| 51,050,000 | | International Finance Corp. (INR)
| | 5.85% | | 11/25/22 | | 689,616 |
Page 8
See Notes to Financial Statements
First Trust Emerging Markets Local Currency Bond ETF (FEMB)
Portfolio of Investments (Continued)
April 30, 2020 (Unaudited)
Principal
Value
(Local
Currency) | | Description | | Stated
Coupon | | Stated
Maturity | | Value
(US Dollars) |
| FOREIGN CORPORATE BONDS AND NOTES (Continued) |
| | | Supranationals (Continued) | | | | | | |
| 337,000,000 | | International Finance Corp. (INR)
| | 6.30% | | 11/25/24 | | $4,595,016 |
| | | Total Foreign Corporate Bonds and Notes
| | 9,675,866 |
| | | (Cost $10,172,721) | | | | | | |
| | Total Investments – 95.8%
| | 137,841,316 |
| | (Cost $159,272,811) (b) | | |
| | Net Other Assets and Liabilities – 4.2%
| | 5,983,370 |
| | Net Assets – 100.0%
| | $143,824,686 |
| Forward Foreign Currency Contracts |
Settlement
Date | | Counterparty | | Amount
Purchased | | Amount
Sold | | Purchase
Value as of
4/30/2020 | | Sale
Value as of
4/30/2020 | | Unrealized
Appreciation/
(Depreciation) |
| 05/20/20 | | BBH | | MXN | 54,786,500 | | USD | 2,272,728 | | $ 2,276,583 | | $ 2,272,728 | | $ 3,855 |
| 05/20/20 | | BNS | | RUB | 767,900,000 | | USD | 10,321,237 | | 10,319,411 | | 10,321,237 | | (1,826) |
| 05/20/20 | | BBH | | TRY | 5,890,000 | | USD | 847,215 | | 840,816 | | 847,215 | | (6,399) |
| 05/20/20 | | BNS | | USD | 9,901,319 | | BRL | 52,175,000 | | 9,901,319 | | 9,581,593 | | 319,726 |
| 05/20/20 | | BNS | | USD | 2,354,925 | | CLP | 2,025,000,000 | | 2,354,925 | | 2,426,579 | | (71,654) |
| 05/20/20 | | BNS | | USD | 5,420,405 | | COP | 21,318,296 | | 5,422,847 | | 5,376,304 | | 46,543 |
| 05/20/20 | | BBH | | USD | 4,398,130 | | HUF | 1,410,080,000 | | 4,388,375 | | 4,382,502 | | 5,873 |
| 05/20/20 | | BNS | | USD | 1,523,888 | | PEN | 5,325,000 | | 1,551,348 | | 1,575,811 | | (24,463) |
| 05/20/20 | | BBH | | USD | 3,029,465 | | PLN | 12,594,780 | | 3,029,465 | | 3,035,240 | | (5,775) |
| 05/20/20 | | BBH | | USD | 1,269,495 | | RON | 5,669,000 | | 1,272,409 | | 1,280,910 | | (8,501) |
| 05/20/20 | | BBH | | USD | 2,143,130 | | THB | 70,000,000 | | 2,143,130 | | 2,163,529 | | (20,399) |
| 05/20/20 | | BBH | | USD | 7,140,797 | | ZAR | 133,200,000 | | 7,140,797 | | 7,172,975 | | (32,178) |
Net Unrealized Appreciation (Depreciation)
| | $204,802 |
| Counterparty Abbreviations |
| BBH | Brown Brothers Harriman and Co. |
| BNS | Bank of Nova Scotia |
|
| (a) | This security may be resold to qualified foreign investors and foreign institutional buyers under Regulation S of the Securities Act of 1933, as amended. |
| (b) | Aggregate cost for financial reporting purposes approximates the aggregate cost for federal income tax purposes. As of April 30, 2020, the aggregate gross unrealized appreciation for all investments in which there was an excess of value over tax cost was $1,609,088 and the aggregate gross unrealized depreciation for all investments in which there was an excess of tax cost over value was $22,835,781. The net unrealized depreciation was $21,226,693. The amounts presented are inclusive of derivative contracts. |
See Notes to Financial Statements
Page 9
First Trust Emerging Markets Local Currency Bond ETF (FEMB)
Portfolio of Investments (Continued)
April 30, 2020 (Unaudited)
Valuation Inputs
A summary of the inputs used to value the Fund’s investments as of April 30, 2020 is as follows (see Note 2A - Portfolio Valuation in the Notes to Financial Statements):
| ASSETS TABLE |
| | Total
Value at
4/30/2020 | Level 1
Quoted
Prices | Level 2
Significant
Observable
Inputs | Level 3
Significant
Unobservable
Inputs |
Foreign Sovereign Bonds and Notes*
| $ 128,165,450 | $ — | $ 128,165,450 | $ — |
Foreign Corporate Bonds and Notes*
| 9,675,866 | — | 9,675,866 | — |
Total Investments
| 137,841,316 | — | 137,841,316 | — |
Forward Foreign Currency Contracts**
| 375,997 | — | 375,997 | — |
Total
| $ 138,217,313 | $— | $ 138,217,313 | $— |
LIABILITIES TABLE |
| | Total
Value at
4/30/2020 | Level 1
Quoted
Prices | Level 2
Significant
Observable
Inputs | Level 3
Significant
Unobservable
Inputs |
Forward Foreign Currency Contracts**
| $ (171,195) | $ — | $ (171,195) | $ — |
| * | See Portfolio of Investments for country breakout. |
| ** | See the Schedule of Forward Foreign Currency Contracts for contract and currency detail. |
Page 10
See Notes to Financial Statements
First Trust Emerging Markets Local Currency Bond ETF (FEMB)
Portfolio of Investments (Continued)
April 30, 2020 (Unaudited)
Currency Exposure
Diversification | % of Total
Investments
(including cash)† |
| USD | 19.1% |
| ZAR | 10.9 |
| PEN | 8.5 |
| RUB | 7.3 |
| INR | 6.8 |
| MXN | 6.4 |
| COP | 5.8 |
| TRY | 4.8 |
| IDR | 4.7 |
| BRL | 4.5 |
| MYR | 4.4 |
| PHP | 3.9 |
| ILS | 3.5 |
| RON | 2.9 |
| CLP | 2.3 |
| HUF | 1.9 |
| CZK | 1.0 |
| PLN | 0.9 |
| THB | 0.4 |
| Total | 100.0% |
| † | The weightings include the impact of currency forwards. |
| Currency Abbreviations |
| BRL | Brazilian Real |
| CLP | Chilean Peso |
| COP | Colombian Peso |
| CZK | Czech Republic Koruna |
| HUF | Hungarian Forint |
| IDR | Indonesian Rupiah |
| ILS | Israeli Shekel |
| INR | Indian Rupee |
| MXN | Mexican Peso |
| MYR | Malaysian Ringgit |
| PEN | Peruvian Nuevo Sol |
| PHP | Philippine Peso |
| PLN | Polish Zloty |
| RON | Romanian New Leu |
| RUB | Russian Ruble |
| THB | Thai Baht |
| TRY | Turkish Lira |
| USD | United States Dollar |
| ZAR | South African Rand |
See Notes to Financial Statements
Page 11
First Trust Emerging Markets Local Currency Bond ETF (FEMB)
Statement of Assets and Liabilities
April 30, 2020 (Unaudited)
| ASSETS: | |
Investments, at value
(Cost $159,272,811)
| $ 137,841,316 |
Cash
| 3,323,508 |
Foreign currency (Cost $197,100)
| 199,451 |
Unrealized appreciation on forward foreign currency contracts
| 375,997 |
| Receivables: | |
Interest
| 3,010,446 |
Interest reclaims
| 58,814 |
Total Assets
| 144,809,532 |
| LIABILITIES: | |
Due to broker
| 32,697 |
Unrealized depreciation on forward foreign currency contracts
| 171,195 |
| Payables: | |
Investment securities purchased
| 676,920 |
Investment advisory fees
| 99,781 |
Deferred foreign capital gains tax
| 4,253 |
Total Liabilities
| 984,846 |
NET ASSETS
| $143,824,686 |
| NET ASSETS consist of: | |
Paid-in capital
| $ 179,777,523 |
Par value
| 43,500 |
Accumulated distributable earnings (loss)
| (35,996,337) |
NET ASSETS
| $143,824,686 |
NET ASSET VALUE, per share
| $33.06 |
Number of shares outstanding (unlimited number of shares authorized, par value $0.01 per share)
| 4,350,002 |
Page 12
See Notes to Financial Statements
First Trust Emerging Markets Local Currency Bond ETF (FEMB)
Statement of Operations
For the Six Months Ended April 30, 2020 (Unaudited)
| INVESTMENT INCOME: | |
Interest
| $ 4,772,471 |
Foreign withholding tax
| (127,676) |
Total investment income
| 4,644,795 |
| EXPENSES: | |
Investment advisory fees
| 702,307 |
Total expenses
| 702,307 |
NET INVESTMENT INCOME (LOSS)
| 3,942,488 |
| NET REALIZED AND UNREALIZED GAIN (LOSS): | |
| Net realized gain (loss) on: | |
Investments
| (11,016,367) |
Forward foreign currency contracts
| (222,701) |
Foreign currency transactions
| (340,881) |
Foreign capital gains tax
| (781) |
Net realized gain (loss)
| (11,580,730) |
| Net change in unrealized appreciation (depreciation) on: | |
Investments
| (21,153,092) |
Forward foreign currency contracts
| 506,072 |
Foreign currency translation
| (244,226) |
Deferred foreign capital gains tax
| 66,557 |
Net change in unrealized appreciation (depreciation)
| (20,824,689) |
NET REALIZED AND UNREALIZED GAIN (LOSS)
| (32,405,419) |
NET INCREASE (DECREASE) IN NET ASSETS RESULTING FROM OPERATIONS
| $(28,462,931) |
See Notes to Financial Statements
Page 13
First Trust Emerging Markets Local Currency Bond ETF (FEMB)
Statements of Changes in Net Assets
| | Six Months
Ended
4/30/2020
(Unaudited) | | Year
Ended
10/31/2019 |
| OPERATIONS: | | | |
Net investment income (loss)
| $ 3,942,488 | | $ 4,796,634 |
Net realized gain (loss)
| (11,580,730) | | 369,517 |
Net change in unrealized appreciation (depreciation)
| (20,824,689) | | 4,547,052 |
Net increase (decrease) in net assets resulting from operations
| (28,462,931) | | 9,713,203 |
| DISTRIBUTIONS TO SHAREHOLDERS FROM: | | | |
Investment operations
| (4,767,372) | | (5,090,947) |
Return of capital
| — | | (345,452) |
Total distributions to shareholders
| (4,767,372) | | (5,436,399) |
| SHAREHOLDER TRANSACTIONS: | | | |
Proceeds from shares sold
| 73,618,130 | | 87,791,477 |
Cost of shares redeemed
| (44,607,895) | | — |
Net increase (decrease) in net assets resulting from shareholder transactions
| 29,010,235 | | 87,791,477 |
Total increase (decrease) in net assets
| (4,220,068) | | 92,068,281 |
| NET ASSETS: | | | |
Beginning of period
| 148,044,754 | | 55,976,473 |
End of period
| $143,824,686 | | $148,044,754 |
| CHANGES IN SHARES OUTSTANDING: | | | |
Shares outstanding, beginning of period
| 3,850,002 | | 1,550,002 |
Shares sold
| 1,900,000 | | 2,300,000 |
Shares redeemed
| (1,400,000) | | — |
Shares outstanding, end of period
| 4,350,002 | | 3,850,002 |
Page 14
See Notes to Financial Statements
First Trust Emerging Markets Local Currency Bond ETF (FEMB)
Financial Highlights
For a share outstanding throughout each period
| | Six Months
Ended
4/30/2020
(Unaudited) | | Year Ended October 31, | | Period
Ended
10/31/2015 (a) |
| 2019 | | 2018 | | 2017 | | 2016 |
Net asset value, beginning of period
| $ 38.45 | | $ 36.11 | | $ 41.55 | | $ 42.32 | | $ 40.77 | | $ 50.00 |
| Income from investment operations: | | | | | | | | | | | |
Net investment income (loss)
| 0.89 | | 2.25 | | 1.80 | | 2.30 | | 1.74 | | 1.94 |
Net realized and unrealized gain (loss)
| (5.24) | | 2.16 | | (4.76) | | (0.65) | | 2.09 | | (9.23) |
Total from investment operations
| (4.35) | | 4.41 | | (2.96) | | 1.65 | | 3.83 | | (7.29) |
| Distributions paid to shareholders from: | | | | | | | | | | | |
Net investment income
| (1.04) | | (1.94) | | (0.79) | | (2.42) | | (1.56) | | — |
Return of capital
| — | | (0.13) | | (1.69) | | — | | (0.72) | | (1.94) |
Total distributions
| (1.04) | | (2.07) | | (2.48) | | (2.42) | | (2.28) | | (1.94) |
Net asset value, end of period
| $33.06 | | $38.45 | | $36.11 | | $41.55 | | $42.32 | | $40.77 |
Total return (b)
| (11.48)% | | 12.46% | | (7.55)% | | 4.00% | | 9.66% | | (14.83)% |
| Ratios to average net assets/supplemental data: | | | | | | | | | | | |
Net assets, end of period (in 000’s)
| $ 143,825 | | $ 148,045 | | $ 55,976 | | $ 49,862 | | $ 14,812 | | $ 4,077 |
Ratio of total expenses to average net assets
| 0.85% (c) | | 0.85% | | 0.85% (d) | | 0.85% | | 0.85% | | 0.85% (c) |
Ratio of net investment income (loss) to average net assets
| 4.77% (c) | | 4.91% | | 4.63% (d) | | 4.95% | | 4.70% | | 4.36% (c) |
Portfolio turnover rate (e)
| 43% | | 25% | | 61% | | 16% | | 23% | | 49% |
| (a) | Inception date is November 4, 2014, which is consistent with the commencement of investment operations and is the date the initial creation units were established. |
| (b) | Total return is calculated assuming an initial investment made at the net asset value at the beginning of the period, reinvestment of all distributions at net asset value during the period, and redemption at net asset value on the last day of the period. The returns presented do not reflect the deduction of taxes that a shareholder would pay on Fund distributions or the redemption or sale of Fund shares. Total return is calculated for the time period presented and is not annualized for periods of less than a year. |
| (c) | Annualized. |
| (d) | Includes excise tax. |
| (e) | Portfolio turnover is calculated for the time period presented and is not annualized for periods of less than a year and does not include securities received or delivered from processing creations or redemptions and in-kind transactions. |
See Notes to Financial Statements
Page 15
Notes to Financial Statements
First Trust Emerging Markets Local Currency Bond ETF (FEMB)
April 30, 2020 (Unaudited)
1. Organization
First Trust Exchange-Traded Fund III (the “Trust”) is an open-end management investment company organized as a Massachusetts business trust on January 9, 2008, and is registered with the Securities and Exchange Commission under the Investment Company Act of 1940, as amended (the “1940 Act”).
The Trust currently consists of seventeen funds that are offering shares. This report covers the First Trust Emerging Markets Local Currency Bond ETF (the “Fund”), a non-diversified series of the Trust, which trades under the ticker “FEMB” on The Nasdaq Stock Market LLC (“Nasdaq”). Unlike conventional mutual funds, the Fund issues and redeems shares on a continuous basis, at net asset value (“NAV”), only in large specified blocks consisting of 50,000 shares called a “Creation Unit.” Creation Units are issued and redeemed for cash and, in certain circumstances, in-kind for securities in which the Fund invests. Except when aggregated in Creation Units, the Fund’s shares are not redeemable securities.
The Fund is an actively managed exchange-traded fund. The investment objective of the Fund is to seek maximum total return and current income. Under normal market conditions, the Fund seeks to achieve its investment objective by investing at least 80% of its net assets (including investment borrowings) in bonds, notes and bills issued or guaranteed by entities incorporated or domiciled in emerging market countries that are denominated in the local currency of the issuer. There can be no assurance the Fund will achieve its investment objective. The Fund may not be appropriate for all investors.
2. Significant Accounting Policies
The Fund is considered an investment company and follows accounting and reporting guidance under Financial Accounting Standards Board (“FASB”) Accounting Standards Codification Topic 946, “Financial Services-Investment Companies.” The following is a summary of significant accounting policies consistently followed by the Fund in the preparation of the financial statements. The preparation of the financial statements in accordance with accounting principles generally accepted in the United States of America (“U.S. GAAP”) requires management to make estimates and assumptions that affect the reported amounts and disclosures in the financial statements. Actual results could differ from those estimates.
A. Portfolio Valuation
The Fund’s NAV is determined daily as of the close of regular trading on the New York Stock Exchange (“NYSE”), normally 4:00 p.m. Eastern time, on each day the NYSE is open for trading. If the NYSE closes early on a valuation day, the NAV is determined as of that time. Domestic debt securities and foreign securities are priced using data reflecting the earlier closing of the principal markets for those securities. The Fund’s NAV is calculated by dividing the value of all assets of the Fund (including accrued interest and dividends), less all liabilities (including accrued expenses and dividends declared but unpaid), by the total number of shares outstanding.
The Fund’s investments are valued daily at market value or, in the absence of market value with respect to any portfolio securities, at fair value. Market value prices represent last sale or official closing prices from a national or foreign exchange (i.e., a regulated market) and are primarily obtained from third-party pricing services. Fair value prices represent any prices not considered market value prices and are either obtained from a third-party pricing service or are determined by the Pricing Committee of the Fund’s investment advisor, First Trust Advisors L.P. (“First Trust” or the “Advisor”), in accordance with valuation procedures adopted by the Trust’s Board of Trustees, and in accordance with provisions of the 1940 Act. Investments valued by the Advisor’s Pricing Committee, if any, are footnoted as such in the footnotes to the Portfolio of Investments. The Fund’s investments are valued as follows:
Corporate bonds, notes and other debt securities are fair valued on the basis of valuations provided by dealers who make markets in such securities or by a third-party pricing service approved by the Fund’s Board of Trustees, which may use the following valuation inputs when available:
| 1) | benchmark yields; |
| 2) | reported trades; |
| 3) | broker/dealer quotes; |
| 4) | issuer spreads; |
| 5) | benchmark securities; |
| 6) | bids and offers; and |
| 7) | reference data including market research publications. |
Fixed income and other debt securities having a remaining maturity of sixty days or less when purchased are fair valued at cost adjusted for amortization of premiums and accretion of discounts (amortized cost), provided the Advisor’s Pricing Committee has determined that the use of amortized cost is an appropriate reflection of fair value given market and issuer-specific
Notes to Financial Statements (Continued)
First Trust Emerging Markets Local Currency Bond ETF (FEMB)
April 30, 2020 (Unaudited)
conditions existing at the time of the determination. Factors that may be considered in determining the appropriateness of the use of amortized cost include, but are not limited to, the following:
| 1) | the credit conditions in the relevant market and changes thereto; |
| 2) | the liquidity conditions in the relevant market and changes thereto; |
| 3) | the interest rate conditions in the relevant market and changes thereto (such as significant changes in interest rates); |
| 4) | issuer-specific conditions (such as significant credit deterioration); and |
| 5) | any other market-based data the Advisor’s Pricing Committee considers relevant. In this regard, the Advisor’s Pricing Committee may use last-obtained market-based data to assist it when valuing portfolio securities using amortized cost. |
Forward foreign currency contracts are fair valued at the current day’s interpolated foreign exchange rate, as calculated using the current day’s spot rate, and the thirty, sixty, ninety, and one-hundred eighty day forward rates provided by a third-party pricing service.
Certain securities may not be able to be priced by pre-established pricing methods. Such securities may be valued by the Trust’s Board of Trustees or its delegate, the Advisor’s Pricing Committee, at fair value. These securities generally include, but are not limited to, restricted securities (securities which may not be publicly sold without registration under the Securities Act of 1933, as amended) for which a third-party pricing service is unable to provide a market price; securities whose trading has been formally suspended; a security whose market or fair value price is not available from a pre-established pricing source; a security with respect to which an event has occurred that is likely to materially affect the value of the security after the market has closed but before the calculation of the Fund’s NAV or make it difficult or impossible to obtain a reliable market quotation; and a security whose price, as provided by the third-party pricing service, does not reflect the security’s fair value. As a general principle, the current fair value of a security would appear to be the amount which the owner might reasonably expect to receive for the security upon its current sale. When fair value prices are used, generally they will differ from market quotations or official closing prices on the applicable exchanges. A variety of factors may be considered in determining the fair value of such securities, including, but not limited to, the following:
| 1) | the fundamental business data relating to the issuer, or economic data relating to the country of issue; |
| 2) | an evaluation of the forces which influence the market in which these securities are purchased and sold; |
| 3) | the type, size and cost of the security; |
| 4) | the financial statements of the issuer, or the financial condition of the country of issue; |
| 5) | the credit quality and cash flow of the issuer, or country of issue, based on the Advisor’s or external analysis; |
| 6) | the information as to any transactions in or offers for the security; |
| 7) | the price and extent of public trading in similar securities (or equity securities) of the issuer/borrower, or comparable companies; |
| 8) | the coupon payments; |
| 9) | the quality, value and salability of collateral, if any, securing the security; |
| 10) | the business prospects of the issuer, including any ability to obtain money or resources from a parent or affiliate and an assessment of the issuer’s management (for corporate debt only); |
| 11) | the economic, political and social prospects/developments of the country of issue and the assessment of the country’s governmental leaders/officials (for sovereign debt only); |
| 12) | the prospects for the issuer’s industry, and multiples (of earnings and/or cash flows) being paid for similar businesses in that industry (for corporate debt only); and |
| 13) | other relevant factors. |
The Fund is subject to fair value accounting standards that define fair value, establish the framework for measuring fair value and provide a three-level hierarchy for fair valuation based upon the inputs to the valuation as of the measurement date. The three levels of the fair value hierarchy are as follows:
| • | Level 1 – Level 1 inputs are quoted prices in active markets for identical investments. An active market is a market in which transactions for the investment occur with sufficient frequency and volume to provide pricing information on an ongoing basis. |
| • | Level 2 – Level 2 inputs are observable inputs, either directly or indirectly, and include the following: |
| o | Quoted prices for similar investments in active markets. |
| o | Quoted prices for identical or similar investments in markets that are non-active. A non-active market is a market where there are few transactions for the investment, the prices are not current, or price quotations vary substantially either over time or among market makers, or in which little information is released publicly. |
Notes to Financial Statements (Continued)
First Trust Emerging Markets Local Currency Bond ETF (FEMB)
April 30, 2020 (Unaudited)
| o | Inputs other than quoted prices that are observable for the investment (for example, interest rates and yield curves observable at commonly quoted intervals, volatilities, prepayment speeds, loss severities, credit risks, and default rates). |
| o | Inputs that are derived principally from or corroborated by observable market data by correlation or other means. |
| • | Level 3 – Level 3 inputs are unobservable inputs. Unobservable inputs may reflect the reporting entity’s own assumptions about the assumptions that market participants would use in pricing the investment. |
The inputs or methodologies used for valuing investments are not necessarily an indication of the risk associated with investing in those investments. A summary of the inputs used to value the Fund’s investments as of April 30, 2020, is included with the Fund’s Portfolio of Investments.
B. Securities Transactions and Investment Income
Securities transactions are recorded as of the trade date. Realized gains and losses from securities transactions are recorded on the identified cost basis. Dividend income is recorded on the ex-dividend date. Interest income, if any, is recorded on the accrual basis. Amortization of premiums and accretion of discounts are recorded using the effective interest method.
C. Forward Foreign Currency Contracts
The Fund is subject to foreign currency risk in the normal course of pursuing its investment objective. Forward foreign currency contracts are agreements between two parties (“Counterparties”) to exchange one currency for another at a future date and at a specified price. The Fund uses forward foreign currency contracts to facilitate transactions in foreign securities and to manage the Fund’s foreign currency exposure. These contracts are valued daily, and the Fund’s net equity therein, representing unrealized gain or loss on the contracts as measured by the difference between the forward foreign exchange rates at the dates of entry into the contracts and the forward rates at the reporting date, is included in “Unrealized appreciation on forward foreign currency contracts” and “Unrealized depreciation on forward foreign currency contracts” on the Statement of Assets and Liabilities. The change in unrealized appreciation (depreciation) is included in “Net change in unrealized appreciation (depreciation) on forward foreign currency contracts” on the Statement of Operations. When the forward contract is closed, the Fund records a realized gain or loss equal to the difference between the proceeds from (or the cost of) the closing transaction and the Fund’s basis in the contract. This realized gain or loss is included in “Net realized gain (loss) on forward foreign currency contracts” on the Statement of Operations. Risks arise from the possible inability of Counterparties to meet the terms of their contracts and from movement in currency, securities values and interest rates. Due to the risks, the Fund could incur losses in excess of the net unrealized value shown on the Forward Foreign Currency Contracts table in the Portfolio of Investments. In the event of default by the Counterparty, the Fund will provide notice to the Counterparty of the Fund’s intent to convert the currency held by the Fund into the currency that the Counterparty agreed to exchange with the Fund. If a Counterparty becomes bankrupt or otherwise fails to perform its obligations due to financial difficulties, the Fund may experience significant delays in obtaining any recovery in a bankruptcy or other reorganization proceeding. The Fund may obtain only limited recovery or may obtain no recovery in such circumstances.
D. Foreign Currency
The books and records of the Fund are maintained in U.S. dollars. Foreign currencies, investments and other assets and liabilities are translated into U.S. dollars at the exchange rates prevailing at the end of the period. Purchases and sales of investments and items of income and expense are translated on the respective dates of such transactions. Unrealized gains and losses on assets and liabilities, other than investments in securities, which result from changes in foreign currency exchange rates have been included in “Net change in unrealized appreciation (depreciation) on foreign currency translation” on the Statement of Operations. Unrealized gains and losses on investments in securities which result from changes in foreign exchange rates are included with fluctuations arising from changes in market price and are included in “Net change in unrealized appreciation (depreciation) on investments” on the Statement of Operations. Net realized foreign currency gains and losses include the effect of changes in exchange rates between trade date and settlement date on investment security transactions, foreign currency transactions and interest and dividends received and are included in “Net realized gain (loss) on foreign currency transactions” on the Statement of Operations. The portion of foreign currency gains and losses related to fluctuations in exchange rates between the initial purchase settlement date and subsequent sale trade date is included in “Net realized gain (loss) on investments” on the Statement of Operations.
E. Dividends and Distributions to Shareholders
Dividends from net investment income, if any, are declared and paid monthly by the Fund, or as the Board of Trustees may determine from time to time. Distributions of net realized capital gains earned by the Fund, if any, are distributed at least annually.
Distributions from net investment income and realized capital gains are determined in accordance with federal income tax regulations, which may differ from U.S. GAAP. Certain capital accounts in the financial statements are periodically adjusted for permanent differences in order to reflect their tax character. These permanent differences are primarily due to the varying treatment of income and
Notes to Financial Statements (Continued)
First Trust Emerging Markets Local Currency Bond ETF (FEMB)
April 30, 2020 (Unaudited)
gain/loss on portfolio securities held by the Fund and have no impact on net assets or NAV per share. Temporary differences, which arise from recognizing certain items of income, expense and gain/loss in different periods for financial statement and tax purposes, will reverse at some time in the future.
The tax character of distributions paid by the Fund during the fiscal year ended October 31, 2019, was as follows:
| Distributions paid from: | |
Ordinary income
| $5,090,947 |
Capital gains
| — |
Return of capital
| 345,452 |
As of October 31, 2019, the components of distributable earnings on a tax basis were as follows:
Undistributed ordinary income
| $— |
Accumulated capital and other gain (loss)
| (668,856) |
Net unrealized appreciation (depreciation)
| (2,097,178) |
F. Income Taxes
The Fund intends to continue to qualify as a regulated investment company by complying with the requirements under Subchapter M of the Internal Revenue Code of 1986, as amended, which includes distributing substantially all of its net investment income and net realized gains to shareholders. Accordingly, no provision has been made for federal and state income taxes. However, due to the timing and amount of distributions, the Fund may be subject to an excise tax of 4% of the amount by which approximately 98% of the Fund’s taxable income exceeds the distributions from such taxable income for the calendar year.
The Fund is subject to accounting standards that establish a minimum threshold for recognizing, and a system for measuring, the benefits of a tax position taken or expected to be taken in a tax return. Taxable years ended 2016, 2017, 2018, and 2019 remain open to federal and state audit. As of April 30, 2020, management has evaluated the application of these standards to the Fund, and has determined that no provision for income tax is required in the Fund’s financial statements for uncertain tax positions.
The Fund intends to utilize provisions of the federal income tax laws, which allow it to carry a realized capital loss forward indefinitely following the year of the loss and offset such loss against any future realized capital gains. The Fund is subject to certain limitations under U.S. tax rules on the use of capital loss carryforwards and net unrealized built-in losses. These limitations apply when there has been a 50% change in ownership. At October 31, 2019, the Fund had non-expiring capital loss carryforwards for federal income tax purposes of $668,856.
G. Expenses
Expenses, other than the investment advisory fee and other excluded expenses, are paid by the Advisor (See Note 3).
H. Offsetting on the Statement of Assets and Liabilities
Offsetting assets and liabilities requires entities to disclose both gross and net information about instruments and transactions eligible for offset on the Statement of Assets and Liabilities, and disclose instruments and transactions subject to master netting or similar agreements. These disclosure requirements are intended to help investors and other financial statement users better assess the effect or potential effect of offsetting arrangements on a fund’s financial position. The transactions subject to offsetting disclosures are derivative instruments, repurchase agreements and reverse repurchase agreements, and securities borrowing and securities lending transactions.
For financial reporting purposes, the Fund does not offset financial assets and financial liabilities that are subject to master netting arrangements (“MNAs”) or similar agreements on the Statement of Assets and Liabilities. MNAs provide the right, in the event of default (including bankruptcy and insolvency), for the non-defaulting Counterparty to liquidate the collateral and calculate the net exposure to the defaulting party or request additional collateral.
At April 30, 2020, derivative assets and liabilities (by type) on a gross basis are as follows:
Notes to Financial Statements (Continued)
First Trust Emerging Markets Local Currency Bond ETF (FEMB)
April 30, 2020 (Unaudited)
| | | | | | | | Gross Amounts not Offset
in the Statement of
Assets and Liabilities | | |
| | Gross
Amounts of
Recognized
Assets | | Gross Amounts
Offset in the
Statement of
Assets
and Liabilities | | Net Amounts of
Assets
Presented
in the Statement
of Assets and
Liabilities | | Financial
Instruments | | Collateral
Amounts
Received | | Net
Amount |
Forward Foreign
Currency Contracts* | $ 375,997 | | $ — | | $ 375,997 | | $ (107,671) | | $ — | | $ 268,326 |
| | | | | | | | Gross Amounts not Offset
in the Statement of
Assets and Liabilities | | |
| | Gross
Amounts of
Recognized
Liabilities | | Gross Amounts
Offset in the
Statement of
Assets
and Liabilities | | Net Amounts of
Liabilities
Presented
in the Statement
of Assets and
Liabilities | | Financial
Instruments | | Collateral
Amounts
Pledged | | Net
Amount |
| Forward Foreign Currency Contracts* | $ (171,195) | | $ — | | $ (171,195) | | $ 107,671 | | $ — | | $ (63,524) |
* The respective Counterparties for each contract are disclosed in the Forward Foreign Currency Contracts table in the Portfolio of Investments.
I. New Accounting Pronouncement
On March 30, 2017, the FASB issued Accounting Standards Update (“ASU”) 2017-08 “Premium Amortization on Purchased Callable Debt Securities,” which amends the amortization period for certain purchased callable debt securities held at a premium by shortening such period to the earliest call date. The new guidance requires an entity to amortize the premium on a callable debt security within its scope to the earliest call date, unless the guidance for considering estimated prepayments is applied. If the call option is not exercised at the earliest call date, the yield is reset to the effective yield using the payment terms of the security. If the security has more than one call date and the premium was amortized to a call price greater than the next call price, any excess of the amortized cost basis over the amount repayable at the next call date will be amortized to that date. If there are no other call dates, any excess of the amortized cost basis over the par amount will be amortized to maturity. Discounts on purchased callable debt securities will continue to be amortized to the security’s maturity date. ASU 2017-08 is effective for public business entities for fiscal years, and interim periods within those fiscal years, beginning after December 15, 2018. ASU 2017-08 was adopted for these financial statements and did not have a material impact.
3. Investment Advisory Fee, Affiliated Transactions and Other Fee Arrangements
First Trust, the investment advisor to the Fund, is a limited partnership with one limited partner, Grace Partners of DuPage L.P., and one general partner, The Charger Corporation. The Charger Corporation is an Illinois corporation controlled by James A. Bowen, Chief Executive Officer of First Trust. First Trust is responsible for supervising the selection and ongoing monitoring of the securities in the Fund’s portfolio, managing the Fund’s business affairs and providing certain administrative services necessary for the management of the Fund.
The Trust, on behalf of the Fund, and First Trust have retained First Trust Global Portfolios Ltd. (“FTGP” or the “Sub-Advisor”), an affiliate of First Trust, to serve as investment sub-advisor. In this capacity, FTGP is responsible for the selection and ongoing monitoring of the securities in the Fund’s investment portfolio. First Trust is paid an annual unitary management fee of 0.85% of the Fund’s average daily net assets. FTGP receives a sub-advisory fee equal to 40% of any remaining monthly unitary fee paid to the Advisor after the Fund’s average expenses accrued during the most recent twelve months are subtracted from the unitary fee for that month. First Trust is responsible for the expenses of the Fund including the cost of transfer agency, custody, fund administration, legal, audit and other services, but excluding fee payments under the Investment Management Agreement, Rule 12b-1 distribution and service fees, if any, brokerage expenses, taxes, interest, acquired fund fees and expenses, and extraordinary expenses. First Trust also
Notes to Financial Statements (Continued)
First Trust Emerging Markets Local Currency Bond ETF (FEMB)
April 30, 2020 (Unaudited)
provides fund reporting services to the Fund for a flat annual fee in the amount of $9,250, which is covered under the annual unitary management fee.
The Trust has multiple service agreements with Brown Brothers Harriman & Co. (“BBH”). Under the service agreements, BBH performs custodial, fund accounting, certain administrative services, and transfer agency services for the Fund. As custodian, BBH is responsible for custody of the Fund’s assets. As fund accountant and administrator, BBH is responsible for maintaining the books and records of the Fund’s securities and cash. As transfer agent, BBH is responsible for maintaining shareholder records for the Fund.
Each Trustee who is not an officer or employee of First Trust, any sub-advisor or any of their affiliates (“Independent Trustees”) is paid a fixed annual retainer that is allocated equally among each fund in the First Trust Fund Complex. Each Independent Trustee is also paid an annual per fund fee that varies based on whether the fund is a closed-end or other actively managed fund, a defined-outcome fund or an index fund.
Additionally, the Lead Independent Trustee and the Chairmen of the Audit Committee, Nominating and Governance Committee and Valuation Committee are paid annual fees to serve in such capacities, with such compensation allocated pro rata among each fund in the First Trust Fund Complex based on net assets. Independent Trustees are reimbursed for travel and out-of-pocket expenses in connection with all meetings. The Lead Independent Trustee and Committee Chairmen rotate every three years. The officers and “Interested” Trustee receive no compensation from the Trust for acting in such capacities.
4. Purchases and Sales of Securities
For the six months ended April 30, 2020, the cost of purchases and proceeds from sales of investments, excluding short term investments and in-kind transactions, were $103,441,344 and $67,077,790, respectively.
For the six months ended April 30, 2020, the Fund had no in-kind transactions.
5. Derivative Transactions
The following table presents the type of derivatives held by the Fund at April 30, 2020, the primary underlying risk exposure and the location of these instruments as presented on the Statement of Assets and Liabilities.
| | | | | Asset Derivatives | | Liability Derivatives |
Derivative
Instrument | | Risk
Exposure | | Statement of Assets and
Liabilities Location | | Value | | Statement of Assets and
Liabilities Location | | Value |
Forward foreign
currency
contracts | | Currency Risk | | Unrealized appreciation
on forward foreign
currency contracts | | $ 375,997 | | Unrealized depreciation
on forward foreign
currency contracts | | $ 171,195 |
The following table presents the amount of net realized gain (loss) and change in net unrealized appreciation (depreciation) recognized for the six months ended April 30, 2020, on derivative instruments, as well as the primary underlying risk exposure associated with each instrument.
| Statement of Operations Location | |
| Currency Risk Exposure | |
| Net realized gain (loss) on forward foreign currency contracts | $(222,701) |
| Net change in unrealized appreciation (depreciation) on forward foreign currency contracts | 506,072 |
During the six months ended April 30, 2020, the notional values of forward foreign currency contracts opened and closed were $719,500,154 and $735,132,476, respectively.
6. Creations, Redemptions and Transaction Fees
Shares are created and redeemed by the Fund only in Creation Unit size aggregations of 50,000 shares in transactions with broker-dealers or large institutional investors that have entered into a participation agreement (an “Authorized Participant”). Due to the nature of the Fund’s investments, the Fund’s Creation Units are generally issued and redeemed for cash, although Creation Units may be issued in-kind for securities in which the Fund invests in limited circumstances. Authorized Participants purchasing Creation Units must pay to BBH, as transfer agent, a creation transaction fee (the “Creation Transaction Fee”) regardless of the number of Creation Units purchased in the transaction. The Creation Transaction Fee may vary and is based on the composition of the securities included in the Fund’s portfolio and/or the countries in which the transactions are settled. The Creation Transaction Fee may increase or decrease with changes in the Fund’s portfolio. The price for each Creation Unit will equal the daily NAV per share times the number of
Notes to Financial Statements (Continued)
First Trust Emerging Markets Local Currency Bond ETF (FEMB)
April 30, 2020 (Unaudited)
shares in a Creation Unit plus the fees described above and, if applicable, any operational processing and brokerage costs, transfer fees or stamp taxes. When Creation Units are issued for cash, the Authorized Participant may also be assessed an amount to cover the cost of purchasing portfolio securities, including operational processing and brokerage costs, transfer fees, stamp taxes, and part or all of the spread between the expected bid and offer side of the market related to such securities.
Authorized Participants redeeming Creation Units must pay to BBH, as transfer agent, a standard redemption transaction fee (the “Redemption Transaction Fee”), regardless of the number of Creation Units redeemed in the transaction. The Redemption Transaction Fee may vary and is based on the composition of the securities included in the Fund’s portfolio and/or the countries in which the transactions are settled. The Redemption Transaction Fee may increase or decrease with changes in the Fund’s portfolio. When shares are redeemed for cash, the Authorized Participant may also be assessed an amount to cover other costs, including operational processing and brokerage costs, transfer fees, stamp taxes and part or all of the spread between the expected bid and offer side of the market related to portfolio securities sold in connection with the redemption.
7. Distribution Plan
The Board of Trustees adopted a Distribution and Service Plan pursuant to Rule 12b-1 under the 1940 Act. In accordance with the Rule 12b-1 plan, the Fund is authorized to pay an amount up to 0.25% of its average daily net assets each year to reimburse First Trust Portfolios L.P. (“FTP”), the distributor of the Fund, for amounts expended to finance activities primarily intended to result in the sale of Creation Units or to provide investor services. FTP may also use this amount to compensate securities dealers or other persons that are Authorized Participants for providing distribution assistance, including broker-dealer and shareholder support and educational and promotional services.
No 12b-1 fees are currently paid by the Fund, and pursuant to a contractual arrangement, no 12b-1 fees will be paid any time before February 28, 2021.
8. Borrowings
The Trust, on behalf of the Fund, along with First Trust Series Fund and First Trust Exchange-Traded Fund IV have a $410 million Credit Agreement with The Bank of Nova Scotia (“Scotia”) as administrative agent for a group of lenders. Prior to November 25, 2019, the commitment amount was $385 million. Scotia charges a commitment fee of 0.25% of the daily amount of the excess of the commitment amount over the outstanding principal balance of the loans and an agency fee. First Trust allocates the commitment fee and agency fee amongst the funds that have access to the credit line. To the extent that the Fund accesses the credit line, there would also be an interest fee charged. The Fund did not have any borrowings outstanding during the six months ended April 30, 2020.
9. Indemnification
The Trust, on behalf of the Fund, has a variety of indemnification obligations under contracts with its service providers. The Trust’s maximum exposure under these arrangements is unknown. However, the Trust has not had prior claims or losses pursuant to these contracts and expects the risk of loss to be remote.
10. Subsequent Events
Management has evaluated the impact of all subsequent events to the Fund through the date the financial statements were issued, and has determined that there were no subsequent events requiring recognition or disclosure in the financial statements that have not already been disclosed.
Additional Information
First Trust Emerging Markets Local Currency Bond ETF (FEMB)
April 30, 2020 (Unaudited)
Proxy Voting Policies and Procedures
A description of the policies and procedures that the Trust uses to determine how to vote proxies and information on how the Fund voted proxies relating to portfolio securities during the most recent 12-month period ended June 30 is available (1) without charge, upon request, by calling (800) 988-5891; (2) on the Fund’s website at www.ftportfolios.com; and (3) on the Securities and Exchange Commission’s (“SEC”) website at www.sec.gov.
Portfolio Holdings
The Fund files portfolio holdings information for each month in a fiscal quarter within 60 days after the end of the relevant fiscal quarter on Form N-PORT. Portfolio holdings information for the third month of each fiscal quarter will be publicly available on the SEC’s website at www.sec.gov. The Fund’s complete schedule of portfolio holdings for the second and fourth quarters of each fiscal year is included in the semi-annual and annual reports to shareholders, respectively, and is filed with the SEC on Form N-CSR. The semi-annual and annual report for the Fund is available to investors within 60 days after the period to which it relates. The Fund’s Forms N-PORT and Forms N-CSR are available on the SEC’s website listed above.
Risk Considerations
Risks are inherent in all investing. Certain general risks that may be applicable to a Fund are identified below, but not all of the material risks relevant to each Fund are included in this report and not all of the risks below apply to each Fund. The material risks of investing in each Fund are spelled out in its prospectus, statement of additional information and other regulatory filings. Before investing, you should consider each Fund’s investment objective, risks, charges and expenses, and read each Fund’s prospectus and statement of additional information carefully. You can download each Fund’s prospectus at www.ftportfolios.com or contact First Trust Portfolios L.P. at (800) 621-1675 to request a prospectus, which contains this and other information about each Fund.
Concentration Risk. To the extent that a fund is able to invest a large percentage of its assets in a single asset class or the securities of issuers within the same country, state, region, industry or sector, an adverse economic, business or political development may affect the value of the fund’s investments more than if the fund were more broadly diversified. A fund that tracks an index will be concentrated to the extent the fund’s corresponding index is concentrated. A concentration makes a fund more susceptible to any single occurrence and may subject the fund to greater market risk than a fund that is not concentrated.
Credit Risk. Credit risk is the risk that an issuer of a security will be unable or unwilling to make dividend, interest and/or principal payments when due and the related risk that the value of a security may decline because of concerns about the issuer’s ability to make such payments.
Cyber Security Risk. The funds are susceptible to potential operational risks through breaches in cyber security. A breach in cyber security refers to both intentional and unintentional events that may cause a fund to lose proprietary information, suffer data corruption or lose operational capacity. Such events could cause a fund to incur regulatory penalties, reputational damage, additional compliance costs associated with corrective measures and/or financial loss. In addition, cyber security breaches of a fund’s third-party service providers, such as its administrator, transfer agent, custodian, or sub-advisor, as applicable, or issuers in which the fund invests, can also subject a fund to many of the same risks associated with direct cyber security breaches.
Derivatives Risk. To the extent a fund uses derivative instruments such as futures contracts, options contracts and swaps, the fund may experience losses because of adverse movements in the price or value of the underlying asset, index or rate, which may be magnified by certain features of the derivative. These risks are heightened when a fund’s portfolio managers use derivatives to enhance the fund’s return or as a substitute for a position or security, rather than solely to hedge (or offset) the risk of a position or security held by the fund.
Equity Securities Risk. To the extent a fund invests in equity securities, the value of the fund’s shares will fluctuate with changes in the value of the equity securities. Equity securities prices fluctuate for several reasons, including changes in investors’ perceptions of the financial condition of an issuer or the general condition of the relevant stock market, such as market volatility, or when political or economic events affecting the issuers occur. In addition, common stock prices may be particularly sensitive to rising interest rates, as the cost of capital rises and borrowing costs increase. Equity securities may decline significantly in price over short or extended periods of time, and such declines may occur in the equity market as a whole, or they may occur in only a particular country, company, industry or sector of the market.
ETF Risk. The shares of an ETF trade like common stock and represent an interest in a portfolio of securities. The risks of owning an ETF generally reflect the risks of owning the underlying securities, although lack of liquidity in an ETF could result in it being more volatile and ETFs have management fees that increase their costs. Shares of an ETF trade on an exchange at market prices rather than
Additional Information (Continued)
First Trust Emerging Markets Local Currency Bond ETF (FEMB)
April 30, 2020 (Unaudited)
net asset value, which may cause the shares to trade at a price greater than net asset value (premium) or less than net asset value (discount). In times of market stress, decisions by market makers to reduce or step away from their role of providing a market for an ETF’s shares, or decisions by an ETF’s authorized participants that they are unable or unwilling to proceed with creation and/or redemption orders of an ETF’s shares, could result in shares of the ETF trading at a discount to net asset value and in greater than normal intraday bid-ask spreads.
Fixed Income Securities Risk. To the extent a fund invests in fixed income securities, the fund will be subject to credit risk, income risk, interest rate risk, liquidity risk and prepayment risk. Income risk is the risk that income from a fund’s fixed income investments could decline during periods of falling interest rates. Interest rate risk is the risk that the value of a fund’s fixed income securities will decline because of rising interest rates. Liquidity risk is the risk that a security cannot be purchased or sold at the time desired, or cannot be purchased or sold without adversely affecting the price. Prepayment risk is the risk that the securities will be redeemed or prepaid by the issuer, resulting in lower interest payments received by the fund. In addition to these risks, high yield securities, or “junk” bonds, are subject to greater market fluctuations and risk of loss than securities with higher ratings, and the market for high yield securities is generally smaller and less liquid than that for investment grade securities.
Index Constituent Risk. Certain funds may be a constituent of one or more indices. As a result, such a fund may be included in one or more index-tracking exchange-traded funds or mutual funds. Being a component security of such a vehicle could greatly affect the trading activity involving a fund, the size of the fund and the market volatility of the fund. Inclusion in an index could significantly increase demand for the fund and removal from an index could result in outsized selling activity in a relatively short period of time. As a result, a fund’s net asset value could be negatively impacted and the fund’s market price may be significantly below its net asset value during certain periods.
Index Provider Risk. To the extent a fund seeks to track an index, it is subject to Index Provider Risk. There is no assurance that the Index Provider will compile the Index accurately, or that the Index will be determined, maintained, constructed, reconstituted, rebalanced, composed, calculated or disseminated accurately. To correct any such error, the Index Provider may carry out an unscheduled rebalance or other modification of the Index constituents or weightings, which may increase the fund’s costs. The Index Provider does not provide any representation or warranty in relation to the quality, accuracy or completeness of data in the Index, and it does not guarantee that the Index will be calculated in accordance with its stated methodology. Losses or costs associated with any Index Provider errors generally will be borne by the fund and its shareholders.
Investment Companies Risk. To the extent a fund invests in the securities of other investment vehicles, the fund will incur additional fees and expenses that would not be present in a direct investment in those investment vehicles. Furthermore, the fund’s investment performance and risks are directly related to the investment performance and risks of the investment vehicles in which the fund invests.
LIBOR Risk. To the extent a fund invests in floating or variable rate obligations that use the London Interbank Offered Rate (“LIBOR”) as a reference interest rate, it is subject to LIBOR Risk. In 2017, the United Kingdom’s Financial Conduct Authority announced that LIBOR will cease to be available for use after 2021. The unavailability or replacement of LIBOR may affect the value, liquidity or return on certain fund investments and may result in costs incurred in connection with closing out positions and entering into new trades. Any potential effects of the transition away from LIBOR on the fund or on certain instruments in which the fund invests can be difficult to ascertain, and they may vary depending on a variety of factors. Any such effects of the transition away from LIBOR, as well as other unforeseen effects, could result in losses to the fund.
Management Risk. To the extent that a fund is actively managed, it is subject to management risk. In managing an actively-managed fund’s investment portfolio, the fund’s portfolio managers will apply investment techniques and risk analyses that may not have the desired result. There can be no guarantee that a fund will meet its investment objective.
Market Risk. Securities held by a fund, as well as shares of a fund itself, are subject to market fluctuations caused by factors such as general economic conditions, political events, regulatory or market developments, changes in interest rates and perceived trends in securities prices. Shares of a fund could decline in value or underperform other investments as a result of the risk of loss associated with these market fluctuations. In addition, local, regional or global events such as war, acts of terrorism, spread of infectious diseases or other public health issues, recessions, or other events could have a significant negative impact on a fund and its investments. Such events may affect certain geographic regions, countries, sectors and industries more significantly than others. The outbreak of the respiratory disease designated as COVID-19 in December 2019 has caused significant volatility and declines in global financial markets, which have caused losses for investors. The COVID-19 pandemic may last for an extended period of time and will continue to impact the economy for the foreseeable future.
Non-U.S. Securities Risk. To the extent a fund invests in non-U.S. securities, it is subject to additional risks not associated with securities of domestic issuers. Non-U.S. securities are subject to higher volatility than securities of domestic issuers due to: possible adverse political, social or economic developments; restrictions on foreign investment or exchange of securities; lack of liquidity;
Additional Information (Continued)
First Trust Emerging Markets Local Currency Bond ETF (FEMB)
April 30, 2020 (Unaudited)
currency exchange rates; excessive taxation; government seizure of assets; different legal or accounting standards; and less government supervision and regulation of exchanges in foreign countries. Investments in non-U.S. securities may involve higher costs than investments in U.S. securities, including higher transaction and custody costs, as well as additional taxes imposed by non-U.S. governments. These risks may be heightened for securities of companies located, or with significant operations, in emerging market countries.
Passive Investment Risk. To the extent a fund seeks to track an index, the fund will invest in the securities included in, or representative of, the index regardless of their investment merit. A fund generally will not attempt to take defensive positions in declining markets.
| NOT FDIC INSURED | NOT BANK GUARANTEED | MAY LOSE VALUE |
This page intentionally left blank
This page intentionally left blank
This page intentionally left blank
First Trust Exchange-Traded Fund III
INVESTMENT ADVISOR
First Trust Advisors L.P.
120 East Liberty Drive, Suite 400
Wheaton, IL 60187
INVESTMENT SUB-ADVISOR
First Trust Global Portfolios Ltd.
Floor 2
8 Angel Court
London EC2R 7HJ
England
ADMINISTRATOR, CUSTODIAN,
FUND ACCOUNTANT &
TRANSFER AGENT
Brown Brothers Harriman & Co.
50 Post Office Square
Boston, MA 02110
INDEPENDENT REGISTERED
PUBLIC ACCOUNTING FIRM
Deloitte & Touche LLP
111 S. Wacker Drive
Chicago, IL 60606
LEGAL COUNSEL
Chapman and Cutler LLP
111 W. Monroe Street
Chicago, IL 60603
First Trust Exchange-Traded Fund III
First Trust RiverFront Dynamic Asia Pacific ETF (RFAP)
First Trust RiverFront Dynamic Developed International ETF (RFDI)
First Trust RiverFront Dynamic Europe ETF (RFEU)
First Trust RiverFront Dynamic Emerging Markets ETF (RFEM)
Semi-Annual Report
For the Six Months Ended
April 30, 2020
First Trust Exchange-Traded Fund III
Semi-Annual Report
April 30, 2020
Caution Regarding Forward-Looking Statements
This report contains certain forward-looking statements within the meaning of the Securities Act of 1933, as amended, and the Securities Exchange Act of 1934, as amended. Forward-looking statements include statements regarding the goals, beliefs, plans or current expectations of First Trust Advisors L.P. (“First Trust” or the “Advisor”) and/or RiverFront Investment Group, LLC (“RiverFront” or the “Sub-Advisor”) and their respective representatives, taking into account the information currently available to them. Forward-looking statements include all statements that do not relate solely to current or historical fact. For example, forward-looking statements include the use of words such as “anticipate,” “estimate,” “intend,” “expect,” “believe,” “plan,” “may,” “should,” “would” or other words that convey uncertainty of future events or outcomes.
Forward-looking statements involve known and unknown risks, uncertainties and other factors that may cause the actual results, performance or achievements of any series of First Trust Exchange-Traded Fund III (the “Trust”) described in this report (each such series is referred to as a “Fund” and collectively, the “Funds”) to be materially different from any future results, performance or achievements expressed or implied by the forward-looking statements. When evaluating the information included in this report, you are cautioned not to place undue reliance on these forward-looking statements, which reflect the judgment of the Advisor and/or Sub-Advisor and their respective representatives only as of the date hereof. We undertake no obligation to publicly revise or update these forward-looking statements to reflect events and circumstances that arise after the date hereof.
Performance and Risk Disclosure
There is no assurance that any Fund described in this report will achieve its investment objective. Each Fund is subject to market risk, which is the possibility that the market values of securities owned by the Fund will decline and that the value of the Fund’s shares may therefore be less than what you paid for them. Accordingly, you can lose money by investing in a Fund. See “Risk Considerations” in the Additional Information section of this report for a discussion of certain other risks of investing in the Funds.
Performance data quoted represents past performance, which is no guarantee of future results, and current performance may be lower or higher than the figures shown. For the most recent month-end performance figures, please visit www.ftportfolios.com or speak with your financial advisor. Investment returns, net asset value and share price will fluctuate and Fund shares, when sold, may be worth more or less than their original cost.
The Advisor may also periodically provide additional information on Fund performance on each Fund’s web page at www.ftportfolios.com.
How to Read This Report
This report contains information that may help you evaluate your investment. It includes details about each Fund and presents data and analysis that provide insight into each Fund’s performance and investment approach.
The statistical information that follows may help you understand each Fund’s performance compared to that of a relevant market benchmark.
It is important to keep in mind that the opinions expressed by personnel of the Advisor and/or Sub-Advisor are just that: informed opinions. They should not be considered to be promises or advice. The opinions, like the statistics, cover the period through the date on the cover of this report. The material risks of investing in each Fund are spelled out in the prospectus, the statement of additional information, and other Fund regulatory filings.
First Trust Exchange-Traded Fund III
Semi-Annual Letter from the Chairman and CEO
April 30, 2020
Dear Shareholders,
First Trust is pleased to provide you with the semi-annual report for the First Trust RiverFront Dynamic International ETFs (the “Funds”), which contains detailed information about the Funds for the six months ended April 30, 2020.
Just one month ago, I noted in a letter to shareholders that a handful of states were set to open some “nonessential” businesses by early May. As of May 20, 2020, I am pleased to report that all 50 states and U.S. territories have eased some restrictions on businesses and social activity. Keep in mind, however, that the plan does entail governors phasing in the opening of businesses in the coming weeks or potentially months, so I see this news as essentially marking the beginning of the rebuilding process for the U.S. economy. We all need to be aware as well of the possibility of an uptick or even surge in the coronavirus (“COVID-19”) infections as more people venture out of their homes. Prior to the last couple of weeks or so, the stay-at-home mandate severely restricted the movements of close to 315 million Americans, according to The Washington Post. To put this further into perspective, because so many stores have been closed and so many people have been hunkering down at home, retail-store traffic in the U.S. plunged 91.2% year-over-year for the week ended May 16, 2020, according to Bloomberg. Truly amazing!
In this COVID-19 pandemic, there appears to be a notable disconnect between the state of the U.S. economy, which is expected to go from bad to downright terrible between the first quarter and second quarter of the year, and the performance of the stock market, which has been much better than expected. While the data and commentary in this report are technically supposed to run through April 30, 2020, I feel compelled to offer insight that is as up to date as possible. The 2020 peak in the stock market, as measured by the S&P 500® Index (the “Index”), occurred on February 19. That day also marked the all-time high for the Index. From February 19, 2020, through March 23, 2020, the Index declined by 33.92% on a price-only basis (no dividends included), according to Bloomberg. We should note that the Index slid into bear market territory on March 12, 2020. A bear market is defined by a 20% or greater decline in price from its most recent peak. That took just 16 trading days, the quickest plunge into a bear market ever. From March 23, 2020 through May 20, 2020, the Index staged an impressive rebound, posting a price-only gain of 32.82%, according to Bloomberg. As of May 20, 2020, the Index stood just 12.24% below its all-time high set on February 19, 2020. But the game, as they say, is not over. Even though stocks have rebounded significantly from their March lows, 68% of the money managers that participated in the most recent Bank of America global fund manager survey believe that stocks are still in a bear market, according to MarketWatch. What are they likely concerned about? In addition to a dismal economic outlook for the near-term, research from Bespoke Investment Group, an independent research firm, indicates that there have been 25 bear markets since 1928 and 60% of the time the Index declined a second time during the bear market and went on to establish a new low for the period.
With respect to the state of the economy, the Congressional Budget Office announced on May 19, 2020, that it sees real U.S. gross domestic product (“GDP”) declining by an annualized 38% in the second quarter of 2020, reportedly in line with Wall Street economists, according to CNBC. Some estimates are more dire. The GDP estimate from the Atlanta Federal Reserve calls for a 42% plunge. These numbers are so large in scope they are mind-boggling. The Bureau of Economic Analysis is scheduled to release its GDP report on July 30, 2020. Until then, we may continue to have a disconnect between the economy and the markets. Let us hope it is as positive as the one we are currently enjoying.
The U.S. government shut down huge chunks of our economy in order to protect lives and prevent our health care system from being overwhelmed by COVID-19 patients. Our economic woes, in other words, are man-made. The remedies to this pandemic will also likely be man-made. They could come in the form of therapeutics and/or a vaccine. Perhaps more than one vaccine. At this stage of the pandemic fight, we have one message for investors: Stay the course!
Thank you for giving First Trust the opportunity to play a role in your financial future. We value our relationship with you and will report on the Funds again in six months.
Sincerely,
James A. Bowen
Chairman of the Board of Trustees
Chief Executive Officer of First Trust Advisors L.P.
Fund Performance Overview (Unaudited)
First Trust RiverFront Dynamic Asia Pacific ETF (RFAP)
The investment objective of First Trust RiverFront Dynamic Asia Pacific ETF (the “Fund”) is to provide capital appreciation. Under normal market conditions, the Fund seeks to achieve its investment objective by investing at least 80% of its net assets (including investment borrowings) in a portfolio of equity securities of Asian Pacific companies, including through investments in common stock, depositary receipts, and common and preferred shares of real estate investment trusts (“REITs”), and forward foreign currency exchange contracts and currency spot transactions used to hedge the Fund’s exposure to the currencies in which the equity securities of such Asian Pacific companies are denominated (each, an “Asian Pacific currency” and, collectively, the “Asian Pacific currencies”). Asian Pacific companies are those companies (i) whose securities are traded principally on a stock exchange in an Asian Pacific country, (ii) that have a primary business office in an Asian Pacific country, or (iii) that have at least 50% of their assets in, or derive at least 50% of their revenues or profits from, an Asian Pacific country. Asian Pacific countries include the countries located in Asia and the Pacific Islands as well as Australia and New Zealand. The Fund generally focuses its Asian Pacific company investments in Australia, Hong Kong, Japan, New Zealand and/or Singapore. Shares of the Fund are listed on The Nasdaq Stock Market LLC under the ticker symbol “RFAP.”
The Fund utilizes a dynamic currency hedging strategy through the use of forward foreign currency exchange contracts and currency spot transactions to hedge up to 100% of the Fund’s currency exposure. As a result of this hedging strategy, the portion of the Fund’s portfolio securities which are subject to currency hedging transactions may vary widely, from 0% to 100% of the portfolio securities. A forward contract on foreign currency is an obligation to purchase or sell a specific currency at a future date, which may be any fixed number of days agreed upon by the parties from the date of the contract, at a price set on the date of the contract. A forward foreign currency exchange contract may reduce the Fund’s exposure to changes in the value of the currency it will deliver and increase its exposure to changes in the value of the currency it will receive for the duration of the contract. The effect on the value of the Fund is similar to selling securities denominated in one currency and purchasing securities denominated in another currency. The Fund also may enter into currency spot transactions as part of its dynamic currency hedging strategy. A currency spot transaction is an agreement between two parties to buy or sell a specific currency for delivery on a date that is typically two business days from the date of the agreement, as opposed to a date set in the future. The underlying currencies of the forward foreign currency exchange contracts and currency spot transactions included in the Fund’s policy relating to the investment of at least 80% of its net assets (including investment borrowings) will be limited to Asian Pacific currencies.
| Performance | | | | |
| | | | Average Annual
Total Returns | Cumulative
Total Returns |
| | 6 Months Ended
4/30/20 | 1 Year Ended
4/30/20 | Inception (4/13/16)
to 4/30/20 | Inception (4/13/16)
to 4/30/20 |
| Fund Performance | | | | |
| NAV | -14.18% | -11.94% | -1.28% | -5.08% |
| Market Price | -13.84% | -12.08% | -1.37% | -5.41% |
| Index Performance | | | | |
| MSCI Pacific Index | -12.22% | -7.44% | 4.55% | 19.74% |
(See Notes to Fund Performance Overview on page 11.)
Fund Performance Overview (Unaudited) (Continued)
First Trust RiverFront Dynamic Asia Pacific ETF (RFAP) (Continued)
| Sector Allocation | % of Total
Investments |
| Financials | 14.9% |
| Consumer Discretionary | 13.6 |
| Health Care | 12.1 |
| Industrials | 11.9 |
| Information Technology | 10.3 |
| Consumer Staples | 9.6 |
| Materials | 8.5 |
| Communication Services | 8.4 |
| Real Estate | 6.9 |
| Utilities | 2.5 |
| Energy | 1.3 |
| Total | 100.0% |
| Top Ten Holdings | % of Total
Investments |
| CSL Ltd. | 2.6% |
| Toyota Motor Corp. | 2.5 |
| Commonwealth Bank of Australia | 2.1 |
| AIA Group Ltd. | 2.0 |
| Keyence Corp. | 2.0 |
| Sony Corp. | 1.8 |
| KDDI Corp. | 1.7 |
| Tokyo Electron Ltd. | 1.6 |
| Recruit Holdings Co., Ltd. | 1.4 |
| Daiichi Sankyo Co., Ltd. | 1.4 |
| Total | 19.1% |

Performance figures assume reinvestment of all distributions and do not reflect the deduction of taxes that a shareholder would pay on Fund distributions or the redemption or sale of Fund shares. An index is a statistical composite that tracks a specified financial market or sector. Unlike the Fund, the index does not actually hold a portfolio of securities and therefore does not incur the expenses incurred by the Fund. These expenses negatively impact the performance of the Fund. The Fund’s past performance does not predict future performance.
Frequency Distribution of Discounts and Premiums
Bid/Ask Midpoint vs. NAV through April 30, 2020
The following Frequency Distribution of Discounts and Premiums charts are provided to show the frequency at which the bid/ask midpoint price for the Fund was at a discount or premium to the daily NAV. The following tables are for comparative purposes only and represent the period April 14, 2016 (commencement of trading) through April 30, 2020. Shareholders may pay more than NAV when they buy Fund shares and receive less than NAV when they sell those shares because shares are bought and sold at current market price. Data presented represents past performance and cannot be used to predict future results.
| Number of Days Bid/Ask Midpoint At/Above NAV |
| For the Period | 0.00%–0.49% | 0.50%–0.99% | 1.00%–1.99% | >=2.00% |
| 4/14/16 – 10/31/16 | 65 | 29 | 12 | 2 |
| 11/1/16 – 10/31/17 | 127 | 85 | 23 | 0 |
| 11/1/17 – 10/31/18 | 114 | 22 | 8 | 1 |
| 11/1/18 – 10/31/19 | 81 | 9 | 2 | 0 |
| 11/1/19 – 4/30/20 | 31 | 4 | 1 | 0 |
| Number of Days Bid/Ask Midpoint Below NAV |
| For the Period | 0.00%–0.49% | 0.50%–0.99% | 1.00%–1.99% | >=2.00% |
| 4/14/16 – 10/31/16 | 21 | 8 | 2 | 1 |
| 11/1/16 – 10/31/17 | 16 | 1 | 0 | 0 |
| 11/1/17 – 10/31/18 | 94 | 12 | 1 | 0 |
| 11/1/18 – 10/31/19 | 108 | 46 | 5 | 0 |
| 11/1/19 – 4/30/20 | 54 | 27 | 7 | 0 |
Fund Performance Overview (Unaudited) (Continued)
First Trust RiverFront Dynamic Developed International ETF (RFDI)
The investment objective of First Trust RiverFront Dynamic Developed International ETF (the “Fund”) is to provide capital appreciation. Under normal market conditions, the Fund seeks to achieve its investment objective by investing at least 80% of its net assets (including investment borrowings) in a portfolio of equity securities of developed market companies, including through investments in common stock, depositary receipts, and common and preferred shares of real estate investment trusts (“REITs”), and forward foreign currency exchange contracts and currency spot transactions used to hedge the Fund’s exposure to the currencies in which the equity securities of such developed market companies are denominated (each, a “Developed Market currency” and, collectively, the “Developed Market currencies”). Developed market companies are those companies (i) whose securities are traded principally on a stock exchange in a developed market country, (ii) that have a primary business office in a developed market country, or (iii) that have at least 50% of their assets in, or derive at least 50% of their revenues or profits from, a developed market country. Developed market countries currently include the countries comprising the Morgan Stanley Capital International World Index or countries considered to be developed by the World Bank, the International Finance Corporation or the United Nations. Under normal market conditions, the Fund invests in at least three countries and at least 40% of its net assets in countries other than the United States. Shares of the Fund are listed on The Nasdaq Stock Market LLC under the ticker symbol “RFDI.”
The Fund utilizes a dynamic currency hedging strategy through the use of forward foreign currency exchange contracts and currency spot transactions to hedge up to 100% of the Fund’s currency exposure. As a result of this hedging strategy, the portion of the Fund’s portfolio securities which are subject to currency hedging transactions may vary widely, from 0% to 100% of the portfolio securities. A forward contract on foreign currency is an obligation to purchase or sell a specific currency at a future date, which may be any fixed number of days agreed upon by the parties from the date of the contract, at a price set on the date of the contract. A forward foreign currency exchange contract may reduce the Fund’s exposure to changes in the value of the currency it will deliver and increase its exposure to changes in the value of the currency it will receive for the duration of the contract. The effect on the value of the Fund is similar to selling securities denominated in one currency and purchasing securities denominated in another currency. The Fund also may enter into currency spot transactions as part of its dynamic currency hedging strategy. A currency spot transaction is an agreement between two parties to buy or sell a specific currency for delivery on a date that is typically two business days from the date of the agreement, as opposed to a date set in the future. The underlying currencies of the forward foreign currency exchange contracts and currency spot transactions included in the Fund’s policy relating to the investment of at least 80% of its net assets (including investment borrowings) will be limited to Developed Market currencies.
| Performance | | | | |
| | | | Average Annual
Total Returns | Cumulative
Total Returns |
| | 6 Months Ended
4/30/20 | 1 Year Ended
4/30/20 | Inception (4/13/16)
to 4/30/20 | Inception (4/13/16)
to 4/30/20 |
| Fund Performance | | | | |
| NAV | -14.26% | -13.08% | 1.37% | 5.67% |
| Market Price | -14.44% | -13.56% | 1.23% | 5.06% |
| Index Performance | | | | |
| MSCI EAFE Index | -14.21% | -11.34% | 2.69% | 11.35% |
(See Notes to Fund Performance Overview on page 11.)
Fund Performance Overview (Unaudited) (Continued)
First Trust RiverFront Dynamic Developed International ETF (RFDI) (Continued)
| Sector Allocation | % of Total
Investments |
| Health Care | 16.8% |
| Financials | 12.6 |
| Consumer Staples | 12.2 |
| Consumer Discretionary | 11.8 |
| Industrials | 11.5 |
| Materials | 9.5 |
| Information Technology | 8.3 |
| Utilities | 5.1 |
| Energy | 4.9 |
| Communication Services | 3.7 |
| Real Estate | 3.3 |
| Other * | 0.3 |
| Total | 100.0% |
| * | Exchange-traded fund with holdings representing multiple sectors. |
| Top Ten Holdings | % of Total
Investments |
| Nestle S.A. | 2.8% |
| Roche Holding AG | 2.3 |
| Novartis AG | 1.7 |
| GlaxoSmithKline PLC | 1.2 |
| Novo Nordisk A.S., Class B | 1.1 |
| Toyota Motor Corp. | 1.1 |
| AstraZeneca PLC | 1.0 |
| BP PLC | 1.0 |
| L’Oreal S.A. | 1.0 |
| AIA Group Ltd. | 1.0 |
| Total | 14.2% |

Performance figures assume reinvestment of all distributions and do not reflect the deduction of taxes that a shareholder would pay on Fund distributions or the redemption or sale of Fund shares. An index is a statistical composite that tracks a specified financial market or sector. Unlike the Fund, the index does not actually hold a portfolio of securities and therefore does not incur the expenses incurred by the Fund. These expenses negatively impact the performance of the Fund. The Fund’s past performance does not predict future performance.
Frequency Distribution of Discounts and Premiums
Bid/Ask Midpoint vs. NAV through April 30, 2020
The following Frequency Distribution of Discounts and Premiums charts are provided to show the frequency at which the bid/ask midpoint price for the Fund was at a discount or premium to the daily NAV. The following tables are for comparative purposes only and represent the period April 14, 2016 (commencement of trading) through April 30, 2020. Shareholders may pay more than NAV when they buy Fund shares and receive less than NAV when they sell those shares because shares are bought and sold at current market price. Data presented represents past performance and cannot be used to predict future results.
| Number of Days Bid/Ask Midpoint At/Above NAV |
| For the Period | 0.00%–0.49% | 0.50%–0.99% | 1.00%–1.99% | >=2.00% |
| 4/14/16 – 10/31/16 | 46 | 70 | 18 | 2 |
| 11/1/16 – 10/31/17 | 157 | 81 | 7 | 0 |
| 11/1/17 – 10/31/18 | 158 | 33 | 0 | 0 |
| 11/1/18 – 10/31/19 | 65 | 2 | 0 | 0 |
| 11/1/19 – 4/30/20 | 24 | 0 | 0 | 1 |
| Number of Days Bid/Ask Midpoint Below NAV |
| For the Period | 0.00%–0.49% | 0.50%–0.99% | 1.00%–1.99% | >=2.00% |
| 4/14/16 – 10/31/16 | 4 | 0 | 0 | 0 |
| 11/1/16 – 10/31/17 | 7 | 0 | 0 | 0 |
| 11/1/17 – 10/31/18 | 52 | 9 | 0 | 0 |
| 11/1/18 – 10/31/19 | 171 | 12 | 1 | 0 |
| 11/1/19 – 4/30/20 | 73 | 23 | 2 | 1 |
Fund Performance Overview (Unaudited) (Continued)
First Trust RiverFront Dynamic Europe ETF (RFEU)
The investment objective of First Trust RiverFront Dynamic Europe ETF (the “Fund”) is to provide capital appreciation. Under normal market conditions, the Fund seeks to achieve its investment objective by investing at least 80% of its net assets (including investment borrowings) in a portfolio of equity securities of European companies, including through investments in common stock, depositary receipts, and common and preferred shares of real estate investment trusts (“REITs”), and forward foreign currency exchange contracts and currency spot transactions used to hedge the Fund’s exposure to the currencies in which the equity securities of such European companies are denominated (each, a “European currency” and, collectively, the “European currencies”). European companies are those companies (i) whose securities are traded principally on a stock exchange in a European country, (ii) that have a primary business office in a European country, or (iii) that have at least 50% of their assets in, or derive at least 50% of their revenues or profits from, a European country. The Fund considers a European country to be any member country of the European Union or any country included in the FTSE Developed Europe Index or the FTSE Emerging Europe All Cap Index. The Fund generally focuses its European company investments in Austria, Belgium, Denmark, Finland, France, Germany, Ireland, Italy, Luxembourg, the Netherlands, Norway, Portugal, Spain, Sweden, Switzerland and/or the United Kingdom. Shares of the Fund are listed on The Nasdaq Stock Market LLC under the ticker symbol “RFEU.”
The Fund utilizes a dynamic currency hedging strategy through the use of forward foreign currency exchange contracts and currency spot transactions to hedge up to 100% of the Fund’s currency exposure. As a result of this hedging strategy, the portion of the Fund’s portfolio securities which are subject to currency hedging transactions may vary widely, from 0% to 100% of the portfolio securities. A forward contract on foreign currency is an obligation to purchase or sell a specific currency at a future date, which may be any fixed number of days agreed upon by the parties from the date of the contract, at a price set on the date of the contract. A forward foreign currency exchange contract may reduce the Fund’s exposure to changes in the value of the currency it will deliver and increase its exposure to changes in the value of the currency it will receive for the duration of the contract. The effect on the value of the Fund is similar to selling securities denominated in one currency and purchasing securities denominated in another currency. The Fund also may enter into currency spot transactions as part of its dynamic currency hedging strategy. A currency spot transaction is an agreement between two parties to buy or sell a specific currency for delivery on a date that is typically two business days from the date of the agreement, as opposed to a date set in the future. The underlying currencies of the forward foreign currency exchange contracts and currency spot transactions included in the Fund’s policy relating to the investment of at least 80% of its net assets (including investment borrowings) will be limited to European currencies.
| Performance | | | | |
| | | | Average Annual
Total Returns | Cumulative
Total Returns |
| | 6 Months Ended
4/30/20 | 1 Year Ended
4/30/20 | Inception (4/13/16)
to 4/30/20 | Inception (4/13/16)
to 4/30/20 |
| Fund Performance | | | | |
| NAV | -14.23% | -13.82% | 2.63% | 11.08% |
| Market Price | -14.59% | -14.23% | 2.51% | 10.55% |
| Index Performance | | | | |
| MSCI Europe Index | -15.47% | -13.58% | 1.73% | 7.21% |
(See Notes to Fund Performance Overview on page 11.)
Fund Performance Overview (Unaudited) (Continued)
First Trust RiverFront Dynamic Europe ETF (RFEU) (Continued)
| Sector Allocation | % of Total
Investments |
| Health Care | 18.4% |
| Consumer Staples | 16.0 |
| Industrials | 13.0 |
| Consumer Discretionary | 11.5 |
| Financials | 9.4 |
| Materials | 9.0 |
| Information Technology | 7.7 |
| Utilities | 6.3 |
| Energy | 5.5 |
| Communication Services | 1.8 |
| Real Estate | 1.4 |
| Total | 100.0% |
| Top Ten Holdings | % of Total
Investments |
| Nestle S.A. | 4.6% |
| Roche Holding AG | 3.8 |
| Novartis AG | 2.8 |
| Novo Nordisk A.S., Class B | 2.1 |
| GlaxoSmithKline PLC | 1.9 |
| BP PLC | 1.6 |
| L’Oreal S.A. | 1.5 |
| Unilever N.V. | 1.5 |
| Enel S.p.A. | 1.4 |
| Iberdrola S.A. | 1.4 |
| Total | 22.6% |
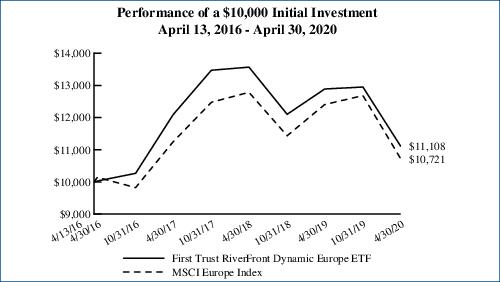
Performance figures assume reinvestment of all distributions and do not reflect the deduction of taxes that a shareholder would pay on Fund distributions or the redemption or sale of Fund shares. An index is a statistical composite that tracks a specified financial market or sector. Unlike the Fund, the index does not actually hold a portfolio of securities and therefore does not incur the expenses incurred by the Fund. These expenses negatively impact the performance of the Fund. The Fund’s past performance does not predict future performance.
Frequency Distribution of Discounts and Premiums
Bid/Ask Midpoint vs. NAV through April 30, 2020
The following Frequency Distribution of Discounts and Premiums charts are provided to show the frequency at which the bid/ask midpoint price for the Fund was at a discount or premium to the daily NAV. The following tables are for comparative purposes only and represent the period April 14, 2016 (commencement of trading) through April 30, 2020. Shareholders may pay more than NAV when they buy Fund shares and receive less than NAV when they sell those shares because shares are bought and sold at current market price. Data presented represents past performance and cannot be used to predict future results.
| Number of Days Bid/Ask Midpoint At/Above NAV |
| For the Period | 0.00%–0.49% | 0.50%–0.99% | 1.00%–1.99% | >=2.00% |
| 4/14/16 – 10/31/16 | 39 | 35 | 2 | 0 |
| 11/1/16 – 10/31/17 | 134 | 103 | 8 | 0 |
| 11/1/17 – 10/31/18 | 146 | 10 | 0 | 0 |
| 11/1/18 – 10/31/19 | 33 | 4 | 0 | 0 |
| 11/1/19 – 4/30/20 | 25 | 1 | 1 | 0 |
| Number of Days Bid/Ask Midpoint Below NAV |
| For the Period | 0.00%–0.49% | 0.50%–0.99% | 1.00%–1.99% | >=2.00% |
| 4/14/16 – 10/31/16 | 56 | 8 | 0 | 0 |
| 11/1/16 – 10/31/17 | 7 | 0 | 0 | 0 |
| 11/1/17 – 10/31/18 | 92 | 4 | 0 | 0 |
| 11/1/18 – 10/31/19 | 206 | 7 | 1 | 0 |
| 11/1/19 – 4/30/20 | 85 | 9 | 2 | 1 |
Fund Performance Overview (Unaudited) (Continued)
First Trust RiverFront Dynamic Emerging Markets ETF (RFEM)
The investment objective of First Trust RiverFront Dynamic Emerging Markets ETF (the “Fund”) is to provide capital appreciation. Under normal market conditions, the Fund seeks to achieve its investment objective by investing at least 80% of its net assets (including investment borrowings) in a portfolio of equity securities of emerging market companies, including through investments in common stock, depositary receipts, and common and preferred shares of real estate investment trusts (“REITs”), and forward foreign currency exchange contracts and currency spot transactions used to hedge the Fund’s exposure to the currencies in which the equity securities of such emerging market companies are denominated (each, an “Emerging Market currency” and, collectively, the “Emerging Market currencies”). The Fund considers an emerging market company to be one (i) domiciled or with a principal place of business or primary securities trading market in an emerging market country, or (ii) that derives a substantial portion of its total revenues or profits from emerging market countries. The Fund considers an emerging market country to be any country whose issuers are included in the Morgan Stanley Capital International Emerging Markets Index and/or those countries considered to be developing by the World Bank, the International Finance Corporation or the United Nations. The Fund generally focuses its emerging market company investments in Brazil, Chile, China, Colombia, the Czech Republic, Egypt, Greece, Hungary, India, Indonesia, Malaysia, Mexico, Morocco, Nigeria, Peru, the Philippines, Poland, Qatar, Russia, South Africa, South Korea, Taiwan, Thailand, Turkey and/or the United Arab Emirates. Shares of the Fund are listed on The Nasdaq Stock Exchange LLC under the ticker symbol “RFEM.”
The Fund utilizes a dynamic currency hedging strategy through the use of forward foreign currency exchange contracts and currency spot transactions to hedge up to 100% of the Fund’s currency exposure. As a result of this hedging strategy, the portion of the Fund’s portfolio securities which are subject to currency hedging transactions may vary widely, from 0% to 100% of the portfolio securities. A forward contract on foreign currency is an obligation to purchase or sell a specific currency at a future date, which may be any fixed number of days agreed upon by the parties from the date of the contract, at a price set on the date of the contract. A forward foreign currency exchange contract may reduce the Fund’s exposure to changes in the value of the currency it will deliver and increase its exposure to changes in the value of the currency it will receive for the duration of the contract. The effect on the value of the Fund is similar to selling securities denominated in one currency and purchasing securities denominated in another currency. The Fund also may enter into currency spot transactions as part of its dynamic currency hedging strategy. A currency spot transaction is an agreement between two parties to buy or sell a specific currency for delivery on a date that is typically two business days from the date of the agreement, as opposed to a date set in the future. The underlying currencies of the forward foreign currency exchange contracts and currency spot transactions included in the Fund’s policy relating to the investment of at least 80% of its net assets (including investment borrowings) will be limited to Emerging Market currencies.
| Performance | | | | |
| | | | Average Annual
Total Returns | Cumulative
Total Returns |
| | 6 Months Ended
4/30/20 | 1 Year Ended
4/30/20 | Inception (6/14/16)
to 4/30/20 | Inception (6/14/16)
to 4/30/20 |
| Fund Performance | | | | |
| NAV | -12.39% | -14.03% | 4.34% | 17.90% |
| Market Price | -13.05% | -15.48% | 3.94% | 16.15% |
| Index Performance | | | | |
| MSCI Emerging Markets Index | -10.50% | -12.00% | 6.22% | 26.35% |
(See Notes to Fund Performance Overview on page 11.)
Fund Performance Overview (Unaudited) (Continued)
First Trust RiverFront Dynamic Emerging Markets ETF (RFEM) (Continued)
| Sector Allocation | % of Total
Investments |
| Information Technology | 17.6% |
| Financials | 16.4 |
| Consumer Discretionary | 16.4 |
| Communication Services | 14.2 |
| Materials | 8.5 |
| Energy | 6.9 |
| Consumer Staples | 5.4 |
| Industrials | 4.7 |
| Real Estate | 4.5 |
| Utilities | 2.6 |
| Other* | 1.7 |
| Health Care | 1.1 |
| Total | 100.0% |
| * | Exchange-traded fund with holdings representing multiple sectors. |
| Top Ten Holdings | % of Total
Investments |
| Alibaba Group Holding Ltd., ADR | 7.6% |
| Tencent Holdings Ltd. | 7.0 |
| Taiwan Semiconductor Manufacturing Co., Ltd. | 5.8 |
| Samsung Electronics Co., Ltd. | 4.3 |
| iShares Core MSCI Emerging Markets ETF | 1.7 |
| China Construction Bank Corp., Class H | 1.6 |
| Naspers Ltd., Class N | 1.4 |
| Ping An Insurance Group Co. of China Ltd., Class H | 1.3 |
| Infosys Ltd. | 1.3 |
| NetEase, Inc., ADR | 1.1 |
| Total | 33.1% |
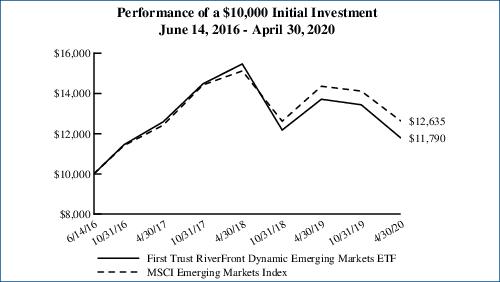
Performance figures assume reinvestment of all distributions and do not reflect the deduction of taxes that a shareholder would pay on Fund distributions or the redemption or sale of Fund shares. An index is a statistical composite that tracks a specified financial market or sector. Unlike the Fund, the index does not actually hold a portfolio of securities and therefore does not incur the expenses incurred by the Fund. These expenses negatively impact the performance of the Fund. The Fund’s past performance does not predict future performance.
Frequency Distribution of Discounts and Premiums
Bid/Ask Midpoint vs. NAV through April 30, 2020
The following Frequency Distribution of Discounts and Premiums charts are provided to show the frequency at which the bid/ask midpoint price for the Fund was at a discount or premium to the daily NAV. The following tables are for comparative purposes only and represent the period June 15, 2016 (commencement of trading) through April 30, 2020. Shareholders may pay more than NAV when they buy Fund shares and receive less than NAV when they sell those shares because shares are bought and sold at current market price. Data presented represents past performance and cannot be used to predict future results.
| Number of Days Bid/Ask Midpoint At/Above NAV |
| For the Period | 0.00%–0.49% | 0.50%–0.99% | 1.00%–1.99% | >=2.00% |
| 6/15/16 – 10/31/16 | 31 | 40 | 16 | 1 |
| 11/1/16 – 10/31/17 | 130 | 87 | 8 | 0 |
| 11/1/17 – 10/31/18 | 94 | 66 | 6 | 0 |
| 11/1/18 – 10/31/19 | 80 | 12 | 2 | 0 |
| 11/1/19 – 4/30/20 | 11 | 3 | 0 | 0 |
| Number of Days Bid/Ask Midpoint Below NAV |
| For the Period | 0.00%–0.49% | 0.50%–0.99% | 1.00%–1.99% | >=2.00% |
| 6/15/16 – 10/31/16 | 7 | 2 | 0 | 0 |
| 11/1/16 – 10/31/17 | 25 | 1 | 1 | 0 |
| 11/1/17 – 10/31/18 | 53 | 28 | 5 | 0 |
| 11/1/18 – 10/31/19 | 100 | 54 | 2 | 1 |
| 11/1/19 – 4/30/20 | 50 | 40 | 15 | 5 |
Notes to Fund Performance Overview (Unaudited)
Total returns for the periods since inception are calculated from the inception date of each Fund. “Average Annual Total Returns” represent the average annual change in value of an investment over the periods indicated. “Cumulative Total Returns” represent the total change in value of an investment over the periods indicated.
Each Fund’s per share net asset value (“NAV”) is the value of one share of the Fund and is computed by dividing the value of all assets of the Fund (including accrued interest and dividends), less all liabilities (including accrued expenses and dividends declared but unpaid), by the total number of outstanding shares. The price used to calculate market return (“Market Price”) is determined by using the midpoint between the highest bid and the lowest offer on the stock exchange on which shares of the Fund are listed for trading as of the time that the Fund’s NAV is calculated. Since shares of each Fund did not trade in the secondary market until after the Fund’s inception, for the period from inception to the first day of secondary market trading in shares of the Fund, the NAV of each Fund is used as a proxy for the secondary market trading price to calculate market returns. NAV and market returns assume that all distributions have been reinvested in each Fund at NAV and Market Price, respectively.
An index is a statistical composite that tracks a specified financial market or sector. Unlike each Fund, the indices do not actually hold a portfolio of securities and therefore do not incur the expenses incurred by each Fund. These expenses negatively impact the performance of each Fund. Also, market returns do not include brokerage commissions that may be payable on secondary market transactions. If brokerage commissions were included, market returns would be lower. The total returns presented reflect the reinvestment of dividends on securities in the indices. The returns presented do not reflect the deduction of taxes that a shareholder would pay on Fund distributions or the redemption or sale of Fund shares. The investment return and principal value of shares of each Fund will vary with changes in market conditions. Shares of each Fund may be worth more or less than their original cost when they are redeemed or sold in the market. Each Fund’s past performance is no guarantee of future performance.
Portfolio Management
First Trust Exchange-Traded Fund III
First Trust RiverFront Dynamic International ETFs
April 30, 2020 (Unaudited)
Advisor
First Trust Advisors L.P. (“First Trust”) serves as the investment advisor to the First Trust RiverFront Dynamic Asia Pacific ETF (“RFAP”), the First Trust RiverFront Dynamic Developed International ETF (“RFDI”), the First Trust RiverFront Dynamic Europe ETF (“RFEU”) and the First Trust RiverFront Dynamic Emerging Markets ETF (“RFEM”) (each a “Fund” and collectively, the “Funds”). First Trust is responsible for the ongoing monitoring of each Fund’s investment portfolio, managing each Fund’s business affairs and providing certain administrative services necessary for the management of each Fund.
Sub-Advisor
RiverFront Investment Group, LLC
RiverFront Investment Group, LLC is an SEC-registered investment advisor located in Richmond, Virginia. It is majority owned by its employees, and Baird Financial Corporation is a minority owner of RiverFront Investment Holding Group, LLC. The firm provides asset management services to a series of global tactical asset allocation portfolios and registered investment companies, including mutual funds and exchange-traded products.
Portfolio Management Team
Adam Grossman, CFA – Global Equity Chief Investment Officer
Rob Glownia, CFA, CFP – Senior Portfolio Manager
Chris Konstantinos, CFA – Chief Investment Strategist and Director of International Equity
First Trust Exchange-Traded Fund III
Understanding Your Fund Expenses
April 30, 2020 (Unaudited)
As a shareholder of First Trust RiverFront Dynamic Asia Pacific ETF, First Trust RiverFront Dynamic Developed International ETF, First Trust RiverFront Dynamic Europe ETF or First Trust RiverFront Dynamic Emerging Markets ETF (each a “Fund” and collectively, the “Funds”), you incur two types of costs: (1) transaction costs; and (2) ongoing costs, including management fees, distribution and/or service (12b-1) fees, if any, and other Fund expenses. This Example is intended to help you understand your ongoing costs of investing in the Funds and to compare these costs with the ongoing costs (in U.S. dollars) of investing in other funds.
The Example is based on an investment of $1,000 invested at the beginning of the period and held through the six-month period ended April 30, 2020.
Actual Expenses
The first line in the following table provides information about actual account values and actual expenses. You may use the information in this line, together with the amount you invested, to estimate the expenses that you paid over the period. Simply divide your account value by $1,000 (for example, an $8,600 account value divided by $1,000 = 8.6), then multiply the result by the number in the first line under the heading entitled “Expenses Paid During the Six-Month Period” to estimate the expenses you paid on your account during this six-month period.
Hypothetical Example for Comparison Purposes
The second line in the following table provides information about hypothetical account values and hypothetical expenses based on each Fund’s actual expense ratio and an assumed rate of return of 5% per year before expenses, which is not each Fund’s actual return. The hypothetical account values and expenses may not be used to estimate the actual ending account balance or expenses you paid for the period. You may use this information to compare the ongoing costs of investing in the Funds and other funds. To do so, compare this 5% hypothetical example with the 5% hypothetical examples that appear in the shareholder reports of the other funds.
Please note that the expenses shown in the table are meant to highlight your ongoing costs only and do not reflect any transactional costs such as brokerage commissions. Therefore, the second line in the table is useful in comparing ongoing costs only, and will not help you determine the relative total costs of owning different funds. In addition, if these transactional costs were included, your costs would have been higher.
| | Beginning
Account Value
November 1, 2019 | Ending
Account Value
April 30, 2020 | Annualized
Expense Ratio
Based on the
Six-Month
Period | Expenses Paid
During the
Six-Month
Period (a) |
| First Trust RiverFront Dynamic Asia Pacific ETF (RFAP) |
| Actual | $1,000.00 | $858.20 | 0.83% | $3.83 |
| Hypothetical (5% return before expenses) | $1,000.00 | $1,020.74 | 0.83% | $4.17 |
| First Trust RiverFront Dynamic Developed International ETF (RFDI) |
| Actual | $1,000.00 | $857.40 | 0.83% | $3.83 |
| Hypothetical (5% return before expenses) | $1,000.00 | $1,020.74 | 0.83% | $4.17 |
| First Trust RiverFront Dynamic Europe ETF (RFEU) |
| Actual | $1,000.00 | $857.70 | 0.83% | $3.83 |
| Hypothetical (5% return before expenses) | $1,000.00 | $1,020.74 | 0.83% | $4.17 |
| First Trust RiverFront Dynamic Emerging Markets ETF (RFEM) |
| Actual | $1,000.00 | $876.10 | 0.95% | $4.43 |
| Hypothetical (5% return before expenses) | $1,000.00 | $1,020.14 | 0.95% | $4.77 |
| (a) | Expenses are equal to the annualized expense ratios as indicated in the table multiplied by the average account value over the period (November 1, 2019 through April 30, 2020), multiplied by 182/366 (to reflect the six-month period). |
First Trust RiverFront Dynamic Asia Pacific ETF (RFAP)
Portfolio of Investments
April 30, 2020 (Unaudited)
| Shares | | Description | | Value |
| COMMON STOCKS (a) – 96.6% |
| | | Australia – 18.6% | | |
| 52,748 | | Alumina Ltd. (b) | | $58,511 |
| 4,642 | | Aristocrat Leisure Ltd. (b) | | 76,128 |
| 9,908 | | Australia & New Zealand Banking Group Ltd. (b) | | 107,625 |
| 6,911 | | BHP Group Ltd. (b) | | 141,083 |
| 8,665 | | BlueScope Steel Ltd. (b) | | 56,555 |
| 6,650 | | Coca-Cola Amatil Ltd. (b) | | 37,025 |
| 5,587 | | Commonwealth Bank of Australia (b) | | 225,695 |
| 1,413 | | CSL Ltd. (b) | | 281,650 |
| 13,861 | | Fortescue Metals Group Ltd. (b) | | 105,929 |
| 787 | | Macquarie Group Ltd. (b) | | 52,133 |
| 9,588 | | National Australia Bank Ltd. (b) | | 105,060 |
| 19,532 | | Qantas Airways Ltd. (b) | | 48,511 |
| 1,626 | | Ramsay Health Care Ltd. (b) | | 66,034 |
| 938 | | REA Group Ltd. (b) | | 53,671 |
| 918 | | Rio Tinto Ltd. (b) | | 51,740 |
| 20,563 | | Santos Ltd. (b) | | 65,386 |
| 18,336 | | Tabcorp Holdings Ltd. (b) | | 38,228 |
| 6,632 | | Transurban Group (b) | | 59,123 |
| 5,118 | | Wesfarmers Ltd. (b) | | 124,314 |
| 13,511 | | Westpac Banking Corp. (b) | | 140,570 |
| 5,210 | | Woodside Petroleum Ltd. (b) | | 74,603 |
| 3,900 | | Woolworths Group Ltd. (b) | | 90,254 |
| | | | | 2,059,828 |
| | | Cayman Islands – 2.6% | | |
| 10,236 | | CK Hutchison Holdings Ltd. (b) | | 75,871 |
| 1,250 | | Tencent Holdings Ltd. (b) | | 65,712 |
| 21,971 | | Tingyi Cayman Islands Holding Corp. (b) | | 39,001 |
| 58,386 | | WH Group Ltd. (b) (c) (d) | | 55,686 |
| 43,333 | | Xinyi Glass Holdings Ltd. (b) | | 50,186 |
| | | | | 286,456 |
| | | Hong Kong – 4.3% | | |
| 23,556 | | AIA Group Ltd. (b) | | 216,192 |
| 26,269 | | Cathay Pacific Airways Ltd. (b) | | 31,243 |
| 44,690 | | Hong Kong & China Gas Co., Ltd. (b) | | 80,093 |
| 4,092 | | Sun Hung Kai Properties Ltd. (b) | | 55,953 |
| 5,868 | | Swire Pacific Ltd., Class A (b) | | 38,161 |
| 7,793 | | Vitasoy International Holdings Ltd. (b) | | 27,794 |
| 17,105 | | Wharf Holdings (The) Ltd. (b) | | 32,402 |
| | | | | 481,838 |
| | | Japan – 66.0% | | |
| 18,800 | | Acom Co., Ltd. (b) | | 75,956 |
| 1,800 | | Advantest Corp. (b) | | 87,339 |
| 2,800 | | Ajinomoto Co., Inc. (b) | | 49,870 |
| 1,300 | | Amano Corp. (b) | | 26,691 |
| 1,780 | | Aozora Bank Ltd. (b) | | 31,677 |
| 6,900 | | Astellas Pharma, Inc. (b) | | 114,120 |
| 2,400 | | Benesse Holdings, Inc. (b) | | 68,346 |
| 3,400 | | Brother Industries Ltd. (b) | | 57,625 |
| Shares | | Description | | Value |
|
| | | Japan (Continued) | | |
| 2,600 | | Canon, Inc. (b) | | $54,691 |
| 1,300 | | Capcom Co., Ltd. (b) | | 39,848 |
| 600 | | Central Japan Railway Co. (b) | | 94,413 |
| 6,400 | | Chubu Electric Power Co., Inc. (b) | | 86,553 |
| 1,100 | | Chugai Pharmaceutical Co., Ltd. (b) | | 131,122 |
| 2,200 | | Daiichi Sankyo Co., Ltd. (b) | | 151,231 |
| 700 | | Daikin Industries Ltd. (b) | | 89,832 |
| 3,800 | | Daiwa House Industry Co., Ltd. (b) | | 96,293 |
| 300 | | Disco Corp. (b) | | 66,994 |
| 800 | | East Japan Railway Co. (b) | | 58,416 |
| 300 | | FANUC Corp. (b) | | 48,964 |
| 4,500 | | Haseko Corp. (b) | | 48,855 |
| 1,300 | | Hitachi Chemical Co., Ltd. (b) | | 55,765 |
| 1,400 | | Hitachi Ltd. (b) | | 41,551 |
| 4,200 | | Hokuhoku Financial Group, Inc. (b) | | 34,126 |
| 1,400 | | Honda Motor Co., Ltd. (b) | | 33,998 |
| 700 | | Hoya Corp. (b) | | 63,835 |
| 6,100 | | ITOCHU Corp. (b) | | 119,591 |
| 1,800 | | Jaccs Co., Ltd. (b) | | 29,882 |
| 6,500 | | Japan Post Holdings Co., Ltd. (b) | | 51,993 |
| 2,800 | | Japan Tobacco, Inc. (b) | | 52,145 |
| 3,800 | | Kajima Corp. (b) | | 39,485 |
| 2,700 | | Kakaku.com, Inc. (b) | | 55,094 |
| 1,100 | | Kaken Pharmaceutical Co., Ltd. (b) | | 60,546 |
| 1,600 | | Kao Corp. (b) | | 123,386 |
| 3,800 | | Kawasaki Kisen Kaisha Ltd. (b) (e) | | 37,385 |
| 6,500 | | KDDI Corp. (b) | | 188,268 |
| 600 | | Keyence Corp. (b) | | 214,207 |
| 1,500 | | Lawson, Inc. (b) | | 77,969 |
| 800 | | MEIJI Holdings Co., Ltd. (b) | | 55,563 |
| 13,800 | | Mitsubishi Chemical Holdings Corp. (b) | | 78,434 |
| 1,900 | | Mitsubishi Corp. (b) | | 40,295 |
| 4,700 | | Mitsubishi Electric Corp. (b) | | 57,832 |
| 2,800 | | Mitsubishi Estate Co., Ltd. (b) | | 45,299 |
| 15,500 | | Mitsubishi UFJ Financial Group, Inc. (b) | | 62,620 |
| 9,800 | | Mitsubishi UFJ Lease & Finance Co., Ltd. (b) | | 46,795 |
| 4,200 | | Mitsui & Co., Ltd. (b) | | 58,625 |
| 1,600 | | Mitsui Chemicals, Inc. (b) | | 31,413 |
| 4,900 | | Mitsui Fudosan Co., Ltd. (b) | | 90,096 |
| 2,700 | | MS&AD Insurance Group Holdings, Inc. (b) | | 77,787 |
| 2,300 | | Murata Manufacturing Co., Ltd. (b) | | 129,598 |
| 2,400 | | Nichirei Corp. (b) | | 60,038 |
| 100 | | Nintendo Co., Ltd. (b) | | 41,292 |
Page 14
See Notes to Financial Statements
First Trust RiverFront Dynamic Asia Pacific ETF (RFAP)
Portfolio of Investments (Continued)
April 30, 2020 (Unaudited)
| Shares | | Description | | Value |
| COMMON STOCKS (a) (Continued) |
| | | Japan (Continued) | | |
| 2,200 | | Nippon Paper Industries Co., Ltd. (b) | | $31,417 |
| 5,200 | | Nippon Telegraph & Telephone Corp. (b) | | 118,423 |
| 1,600 | | Nissan Chemical Corp. (b) | | 61,390 |
| 3,600 | | Nomura Research Institute Ltd. (b) | | 88,132 |
| 5,000 | | NTT DOCOMO, Inc. (b) | | 147,356 |
| 5,800 | | Obayashi Corp. (b) | | 50,695 |
| 10,400 | | Oji Holdings Corp. (b) | | 52,806 |
| 4,700 | | Olympus Corp. (b) | | 74,574 |
| 4,000 | | Ono Pharmaceutical Co., Ltd. (b) | | 96,369 |
| 6,300 | | Onward Holdings Co., Ltd. (b) | | 19,711 |
| 500 | | Oriental Land Co., Ltd. (b) | | 63,223 |
| 6,900 | | ORIX Corp. (b) | | 81,196 |
| 4,700 | | Pan Pacific International Holdings Corp. (b) | | 91,056 |
| 12,900 | | Panasonic Corp. (b) | | 98,337 |
| 7,600 | | Rakuten, Inc. (b) | | 64,442 |
| 5,400 | | Recruit Holdings Co., Ltd. (b) | | 157,525 |
| 1,600 | | Sankyo Co., Ltd. (b) | | 43,930 |
| 1,700 | | Sapporo Holdings Ltd. (b) | | 32,362 |
| 2,900 | | Seino Holdings Co., Ltd. (b) | | 34,525 |
| 3,300 | | Seven & i Holdings Co., Ltd. (b) | | 109,286 |
| 2,300 | | Shimachu Co., Ltd. (b) | | 57,440 |
| 800 | | Shin-Etsu Chemical Co., Ltd. (b) | | 88,242 |
| 1,300 | | Shionogi & Co., Ltd. (b) | | 71,796 |
| 200 | | SMC Corp. (b) | | 90,405 |
| 8,800 | | Softbank Corp. (b) | | 119,838 |
| 2,000 | | SoftBank Group Corp. (b) | | 85,725 |
| 16,700 | | Sojitz Corp. (b) | | 38,649 |
| 3,100 | | Sony Corp. (b) | | 199,498 |
| 4,600 | | SUMCO Corp. (b) | | 65,491 |
| 2,000 | | Sumitomo Forestry Co., Ltd. (b) | | 24,708 |
| 1,700 | | Sumitomo Heavy Industries Ltd. (b) | | 35,826 |
| 4,000 | | Sumitomo Mitsui Financial Group, Inc. (b) | | 105,189 |
| 2,800 | | Sumitomo Realty & Development Co., Ltd. (b) | | 74,991 |
| 1,400 | | Suntory Beverage & Food Ltd. (b) | | 52,722 |
| 2,300 | | Suzuki Motor Corp. (b) | | 73,405 |
| 1,900 | | Takeda Pharmaceutical Co., Ltd. (b) | | 68,517 |
| 1,700 | | Terumo Corp. (b) | | 56,410 |
| 7,000 | | Toda Corp. (b) | | 40,664 |
| 6,700 | | Tohoku Electric Power Co., Inc. (b) | | 63,060 |
| 3,300 | | Tokai Rika Co., Ltd. (b) | | 42,041 |
| 1,400 | | Tokuyama Corp. (b) | | 29,540 |
| 12,300 | | Tokyo Electric Power Co., Holdings, Inc. (b) (e) | | 41,406 |
| 800 | | Tokyo Electron Ltd. (b) | | 170,385 |
| 2,300 | | Tokyo Seimitsu Co., Ltd. (b) | | 74,398 |
| Shares | | Description | | Value |
|
| | | Japan (Continued) | | |
| 19,500 | | Tokyu Fudosan Holdings Corp. (b) | | $95,398 |
| 4,400 | | Toyota Motor Corp. (b) | | 272,038 |
| 3,800 | | Zeon Corp. (b) | | 33,296 |
| | | | | 7,321,582 |
| | | New Zealand – 1.5% | | |
| 6,378 | | a2 Milk Co., Ltd. (b) (e) | | 75,911 |
| 5,441 | | Fisher & Paykel Healthcare Corp., Ltd. (b) | | 90,901 |
| | | | | 166,812 |
| | | Singapore – 2.6% | | |
| 8,600 | | DBS Group Holdings Ltd. (b) | | 121,080 |
| 9,400 | | Singapore Exchange Ltd. (b) | | 64,100 |
| 4,200 | | Venture Corp Ltd. (b) | | 46,938 |
| 22,100 | | Wilmar International Ltd. (b) | | 55,654 |
| | | | | 287,772 |
| | | United States – 1.0% | | |
| 892 | | Ball Corp. | | 58,506 |
| 1,208 | | Coca-Cola (The) Co. | | 55,435 |
| | | | | 113,941 |
| | | Total Common Stocks | | 10,718,229 |
| | | (Cost $11,565,243) | | |
| REAL ESTATE INVESTMENT TRUSTS (a) – 2.0% |
| | | Australia – 1.2% | | |
| 7,337 | | Charter Hall Group (b) | | 36,256 |
| 11,216 | | Goodman Group (b) | | 95,529 |
| | | | | 131,785 |
| | | Hong Kong – 0.4% | | |
| 4,894 | | Link REIT (b) | | 43,626 |
| | | Singapore – 0.4% | | |
| 38,000 | | Mapletree Logistics Trust (b) | | 48,136 |
| | | Total Real Estate Investment Trusts | | 223,547 |
| | | (Cost $228,312) | | |
| RIGHTS (a) – 0.0% |
| | | Australia – 0.0% | | |
| 3,285 | | Oil Search Ltd., expiring 6/9/20 (b) (e) (f) | | 2,034 |
| | | (Cost $0) | | |
| | | Total Investments – 98.6% | | 10,943,810 |
| | | (Cost $11,793,555) (g) | | |
| | | Net Other Assets and Liabilities – 1.4% | | 159,025 |
| | | Net Assets – 100.0% | | $11,102,835 |
|
| (a) | Portfolio securities are categorized based upon their country of incorporation. For a breakdown of the portfolio securities by sector, please see the Fund Performance Overview. |
See Notes to Financial Statements
Page 15
First Trust RiverFront Dynamic Asia Pacific ETF (RFAP)
Portfolio of Investments (Continued)
April 30, 2020 (Unaudited)
| (b) | This security is fair valued by the Advisor’s Pricing Committee in accordance with procedures adopted by the Trust’s Board of Trustees and in accordance with provisions of the Investment Company Act of 1940, as amended. At April 30, 2020, securities noted as such are valued at $10,829,869 or 97.5% of net assets. Certain of these securities are fair valued using a factor provided by a third-party pricing service due to the change in value between the foreign markets’ close and the New York Stock Exchange close exceeding a certain threshold. On days when this threshold is not exceeded, these securities are typically valued at the last sale price on the exchange on which they are principally traded. |
| (c) | This security may be resold to qualified foreign investors and foreign institutional buyers under Regulation S of the Securities Act of 1933, as amended (the “1933 Act”). |
| (d) | This security is exempt from registration upon resale under Rule 144A of the 1933 Act and may be resold in transactions exempt from registration, normally to qualified institutional buyers. This security is not restricted on the foreign exchange where it trades freely without any additional registration. As such, it does not require the additional disclosure required of restricted securities. |
| (e) | Non-income producing security. |
| (f) | Pursuant to procedures adopted by the Trust’s Board of Trustees, this security has been determined to be illiquid by First Trust Advisors L.P., the Fund’s advisor. |
| (g) | Aggregate cost for financial reporting purposes approximates the aggregate cost for federal income tax purposes. As of April 30, 2020, the aggregate gross unrealized appreciation for all investments in which there was an excess of value over tax cost was $793,541 and the aggregate gross unrealized depreciation for all investments in which there was an excess of tax cost over value was $1,643,286. The net unrealized depreciation was $849,745. |
Valuation Inputs
A summary of the inputs used to value the Fund’s investments as of April 30, 2020 is as follows (see Note 2A - Portfolio Valuation in the Notes to Financial Statements):
| | Total
Value at
4/30/2020 | Level 1
Quoted
Prices | Level 2
Significant
Observable
Inputs | Level 3
Significant
Unobservable
Inputs |
| Common Stocks: | | | | |
| United States | $ 113,941 | $ 113,941 | $ — | $ — |
| Other Country Categories* | 10,604,288 | — | 10,604,288 | — |
| Real Estate Investment Trusts* | 223,547 | — | 223,547 | — |
| Rights* | 2,034 | — | 2,034 | — |
| Total Investments | $ 10,943,810 | $ 113,941 | $ 10,829,869 | $— |
| * | See Portfolio of Investments for country breakout. |
Currency Exposure
Diversification | % of Total
Investments |
| Japanese Yen | 66.9% |
| Australian Dollar | 20.1 |
| Hong Kong Dollar | 7.4 |
| Singapore Dollar | 3.1 |
| New Zealand Dollar | 1.5 |
| United States Dollar | 1.0 |
| Total | 100.0% |
Page 16
See Notes to Financial Statements
First Trust RiverFront Dynamic Developed International ETF (RFDI)
Portfolio of Investments
April 30, 2020 (Unaudited)
| Shares | | Description | | Value |
| COMMON STOCKS (a) – 96.8% |
| | | Australia – 6.0% | | |
| 579,200 | | Alumina Ltd. (b) | | $642,479 |
| 19,558 | | Aristocrat Leisure Ltd. (b) | | 320,747 |
| 52,287 | | Australia & New Zealand Banking Group Ltd. (b) | | 567,966 |
| 36,503 | | BHP Group Ltd. (b) | | 745,184 |
| 93,542 | | BlueScope Steel Ltd. (b) | | 610,536 |
| 35,104 | | Coca-Cola Amatil Ltd. (b) | | 195,445 |
| 5,045 | | Commonwealth Bank of Australia (b) | | 203,800 |
| 4,283 | | CSL Ltd. (b) | | 853,719 |
| 142,913 | | Fortescue Metals Group Ltd. (b) | | 1,092,177 |
| 4,144 | | Macquarie Group Ltd. (b) | | 274,511 |
| 13,010 | | Perpetual Ltd. (b) | | 252,896 |
| 217,134 | | Qantas Airways Ltd. (b) | | 539,286 |
| 4,832 | | Rio Tinto Ltd. (b) | | 272,337 |
| 35,096 | | Transurban Group (b) | | 312,873 |
| 23,683 | | Wesfarmers Ltd. (b) | | 575,247 |
| 59,097 | | Westpac Banking Corp. (b) | | 614,854 |
| 27,538 | | Woodside Petroleum Ltd. (b) | | 394,323 |
| 20,577 | | Woolworths Group Ltd. (b) | | 476,191 |
| | | | | 8,944,571 |
| | | Austria – 1.2% | | |
| 39,334 | | EVN AG (b) | | 614,638 |
| 12,480 | | OMV AG (b) | | 407,495 |
| 9,388 | | Verbund AG (b) | | 425,067 |
| 21,352 | | Wienerberger AG (b) | | 399,909 |
| | | | | 1,847,109 |
| | | Belgium – 0.6% | | |
| 5,655 | | Anheuser-Busch InBev S.A./N.V. (b) | | 263,354 |
| 7,837 | | UCB S.A. (b) | | 718,175 |
| | | | | 981,529 |
| | | Cayman Islands – 0.8% | | |
| 55,714 | | CK Hutchison Holdings Ltd. (b) | | 412,962 |
| 5,180 | | Tencent Holdings Ltd. (b) | | 272,310 |
| 116,314 | | Tingyi Cayman Islands Holding Corp. (b) | | 206,469 |
| 306,938 | | WH Group Ltd. (b) (c) (d) | | 292,743 |
| | | | | 1,184,484 |
| | | Denmark – 3.0% | | |
| 4,731 | | Carlsberg A.S., Class B (b) | | 596,830 |
| 26,361 | | Novo Nordisk A.S., Class B (b) | | 1,681,569 |
| 18,867 | | Novozymes A.S., Class B (b) | | 925,552 |
| 7,490 | | Orsted A.S. (b) (c) (d) | | 756,568 |
| 17,771 | | Tryg A.S. (b) | | 473,949 |
| | | | | 4,434,468 |
| | | Finland – 0.9% | | |
| 51,879 | | Stora Enso OYJ, Class R (b) | | 610,334 |
| 24,890 | | UPM-Kymmene OYJ (b) | | 682,613 |
| | | | | 1,292,947 |
| Shares | | Description | | Value |
|
| | | France – 7.9% | | |
| 2,962 | | Air Liquide S.A. (b) | | $376,335 |
| 1,012 | | Christian Dior SE (b) | | 393,773 |
| 7,263 | | Danone S.A. (b) | | 506,210 |
| 4,946 | | Dassault Systemes SE (b) | | 724,443 |
| 2,103 | | Kering S.A. (b) | | 1,069,806 |
| 4,878 | | L’Oreal S.A. (b) | | 1,418,236 |
| 2,397 | | LVMH Moet Hennessy Louis Vuitton SE (b) | | 926,663 |
| 4,959 | | Pernod Ricard S.A. (b) | | 757,218 |
| 32,437 | | Peugeot S.A. (b) | | 459,815 |
| 13,266 | | Sanofi (b) | | 1,295,740 |
| 3,464 | | Sartorius Stedim Biotech (b) | | 830,575 |
| 5,031 | | Schneider Electric SE (b) | | 464,927 |
| 28,603 | | TOTAL S.A. (b) | | 1,015,189 |
| 6,989 | | Ubisoft Entertainment S.A. (b) (e) | | 519,855 |
| 35,282 | | Veolia Environnement S.A. (b) | | 752,158 |
| 3,443 | | Vinci S.A. (b) | | 282,058 |
| | | | | 11,793,001 |
| | | Germany – 6.1% | | |
| 3,872 | | adidas AG (b) | | 886,427 |
| 45,469 | | AIXTRON SE (b) (e) | | 422,576 |
| 4,177 | | Allianz SE (b) | | 768,699 |
| 6,499 | | Bayer AG (b) | | 427,435 |
| 20,037 | | Evonik Industries AG (b) | | 492,919 |
| 10,704 | | HeidelbergCement AG (b) | | 507,489 |
| 2,436 | | MTU Aero Engines AG (b) | | 331,724 |
| 3,905 | | Muenchener Rueckversicherungs-Gesellschaft AG in Muenchen (b) | | 855,291 |
| 26,604 | | Salzgitter AG (b) | | 355,436 |
| 6,214 | | SAP SE (b) | | 740,133 |
| 2,851 | | Sartorius AG (Preference Shares) (b) | | 800,964 |
| 90,334 | | Schaeffler AG (Preference Shares) (b) | | 609,974 |
| 26,620 | | TAG Immobilien AG (b) | | 583,076 |
| 3,506 | | Volkswagen AG (b) | | 518,341 |
| 5,536 | | Volkswagen AG (Preference Shares) (b) | | 770,231 |
| | | | | 9,070,715 |
| | | Hong Kong – 1.9% | | |
| 154,486 | | AIA Group Ltd. (b) | | 1,417,837 |
| 234,334 | | Hong Kong & China Gas Co., Ltd. (b) | | 419,973 |
| 7,715 | | Hong Kong Exchanges & Clearing Ltd. (b) | | 247,360 |
| 20,679 | | Sun Hung Kai Properties Ltd. (b) | | 282,761 |
| 31,310 | | Swire Pacific Ltd., Class A (b) | | 203,614 |
| 46,938 | | Wheelock & Co., Ltd. (b) | | 344,008 |
| | | | | 2,915,553 |
See Notes to Financial Statements
Page 17
First Trust RiverFront Dynamic Developed International ETF (RFDI)
Portfolio of Investments (Continued)
April 30, 2020 (Unaudited)
| Shares | | Description | | Value |
| COMMON STOCKS (a) (Continued) |
| | | Ireland – 0.5% | | |
| 14,446 | | Kingspan Group PLC | | $736,125 |
| | | Italy – 2.7% | | |
| 315,494 | | A2A S.p.A. (b) | | 430,084 |
| 184,641 | | Enel S.p.A. (b) | | 1,261,182 |
| 74,089 | | Eni S.p.A. (b) | | 705,797 |
| 62,615 | | Mediobanca Banca di Credito Finanziario S.p.A. (b) | | 364,013 |
| 20,729 | | Recordati S.p.A. (b) | | 902,700 |
| 107,952 | | Unipol Gruppo S.p.A. (b) | | 372,477 |
| | | | | 4,036,253 |
| | | Japan – 23.5% | | |
| 16,400 | | Aeon Mall Co., Ltd. (b) | | 206,159 |
| 36,900 | | Astellas Pharma, Inc. (b) | | 610,295 |
| 8,200 | | Bridgestone Corp. (b) | | 255,244 |
| 17,800 | | Brother Industries Ltd. (b) | | 301,683 |
| 14,300 | | Canon, Inc. (b) | | 300,802 |
| 28,700 | | Capcom Co., Ltd. (b) | | 879,725 |
| 2,900 | | Central Japan Railway Co. (b) | | 456,328 |
| 10,300 | | Chugai Pharmaceutical Co., Ltd. (b) | | 1,227,778 |
| 34,000 | | Dai-ichi Life Holdings, Inc. (b) | | 426,096 |
| 17,400 | | Daiichi Sankyo Co., Ltd. (b) | | 1,196,098 |
| 2,900 | | Daikin Industries Ltd. (b) | | 372,160 |
| 15,000 | | Daiwa House Industry Co., Ltd. (b) | | 380,105 |
| 2,400 | | Disco Corp. (b) | | 535,954 |
| 20,900 | | DMG Mori Co., Ltd. (b) | | 213,696 |
| 2,900 | | East Japan Railway Co. (b) | | 211,758 |
| 23,500 | | Haseko Corp. (b) | | 255,130 |
| 10,100 | | Hoshizaki Corp. (b) | | 769,689 |
| 2,900 | | Hoya Corp. (b) | | 264,461 |
| 54,800 | | ITOCHU Corp. (b) | | 1,074,360 |
| 14,500 | | Japan Tobacco, Inc. (b) | | 270,034 |
| 48,800 | | JSR Corp. (b) | | 917,979 |
| 5,200 | | Kaken Pharmaceutical Co., Ltd. (b) | | 286,216 |
| 2,900 | | Kao Corp. (b) | | 223,637 |
| 31,100 | | KDDI Corp. (b) | | 900,790 |
| 2,900 | | Keyence Corp. (b) | | 1,035,335 |
| 19,600 | | Kobe Bussan Co., Ltd. (b) | | 946,856 |
| 32,800 | | Kyowa Kirin Co., Ltd. (b) | | 761,277 |
| 5,300 | | Lawson, Inc. (b) | | 275,492 |
| 2,900 | | MEIJI Holdings Co., Ltd. (b) | | 201,416 |
| 54,700 | | Mitsubishi Chemical Holdings Corp. (b) | | 310,893 |
| 9,500 | | Mitsubishi Corp. (b) | | 201,476 |
| 24,100 | | Mitsubishi Electric Corp. (b) | | 296,542 |
| 14,900 | | Mitsubishi Estate Co., Ltd. (b) | | 241,054 |
| 10,600 | | Mitsubishi Heavy Industries Ltd. (b) | | 271,823 |
| 21,200 | | Mitsui & Co., Ltd. (b) | | 295,917 |
| 10,900 | | Mitsui Fudosan Co., Ltd. (b) | | 200,418 |
| 14,700 | | MS&AD Insurance Group Holdings, Inc. (b) | | 423,508 |
| Shares | | Description | | Value |
|
| | | Japan (Continued) | | |
| 12,400 | | Murata Manufacturing Co., Ltd. (b) | | $698,703 |
| 25,900 | | NEC Corp. (b) | | 993,908 |
| 21,100 | | Nexon Co., Ltd. (b) | | 340,680 |
| 27,300 | | Nippon Telegraph & Telephone Corp. (b) | | 621,720 |
| 39,500 | | Nomura Research Institute Ltd. (b) | | 967,000 |
| 15,100 | | NSD Co., Ltd. (b) | | 213,821 |
| 25,700 | | NTT DOCOMO, Inc. (b) | | 757,410 |
| 31,100 | | Obayashi Corp. (b) | | 271,833 |
| 55,700 | | Oji Holdings Corp. (b) | | 282,816 |
| 36,900 | | Ono Pharmaceutical Co., Ltd. (b) | | 889,006 |
| 2,900 | | Oriental Land Co., Ltd. (b) | | 366,691 |
| 36,000 | | ORIX Corp. (b) | | 423,630 |
| 24,900 | | Pan Pacific International Holdings Corp. (b) | | 482,405 |
| 50,600 | | Panasonic Corp. (b) | | 385,723 |
| 40,800 | | Recruit Holdings Co., Ltd. (b) | | 1,190,185 |
| 8,700 | | Sankyo Co., Ltd. (b) | | 238,872 |
| 15,800 | | Seven & i Holdings Co., Ltd. (b) | | 523,249 |
| 11,200 | | Shimachu Co., Ltd. (b) | | 279,708 |
| 12,700 | | Shin-Etsu Chemical Co., Ltd. (b) | | 1,400,836 |
| 1,100 | | SMC Corp. (b) | | 497,225 |
| 88,300 | | Sojitz Corp. (b) | | 204,356 |
| 15,100 | | Sony Corp. (b) | | 971,747 |
| 21,200 | | Sumitomo Mitsui Financial Group, Inc. (b) | | 557,501 |
| 8,400 | | Suntory Beverage & Food Ltd. (b) | | 316,330 |
| 2 | | Takeda Pharmaceutical Co., Ltd., ADR | | 36 |
| 9,000 | | Terumo Corp. (b) | | 298,644 |
| 16,400 | | Tokai Rika Co., Ltd. (b) | | 208,929 |
| 63,900 | | Tokyo Electric Power Co., Holdings, Inc. (b) (e) | | 215,107 |
| 2,900 | | Tokyo Electron Ltd. (b) | | 617,645 |
| 53,400 | | Tokyu Fudosan Holdings Corp. (b) | | 261,245 |
| 26,300 | | Toyota Motor Corp. (b) | | 1,626,047 |
| | | | | 35,101,192 |
| | | Jersey – 1.3% | | |
| 506,309 | | Glencore PLC (b) | | 948,540 |
| 237,258 | | Man Group PLC (b) | | 397,504 |
| 74,000 | | WPP PLC (b) | | 574,175 |
| | | | | 1,920,219 |
| | | Netherlands – 3.4% | | |
| 1,005 | | Adyen N.V. (c) (d) (e) | | 992,518 |
| 3,391 | | ASML Holding N.V. (b) | | 990,462 |
| 13,693 | | Koninklijke Philips N.V. (b) | | 596,912 |
| 10,258 | | Randstad N.V. (b) | | 412,839 |
| 49,246 | | TomTom N.V. (b) | | 387,739 |
| 20,307 | | Unilever N.V. (b) | | 1,011,275 |
Page 18
See Notes to Financial Statements
First Trust RiverFront Dynamic Developed International ETF (RFDI)
Portfolio of Investments (Continued)
April 30, 2020 (Unaudited)
| Shares | | Description | | Value |
| COMMON STOCKS (a) (Continued) |
| | | Netherlands (Continued) | | |
| 10,281 | | Wolters Kluwer N.V. | | $756,203 |
| | | | | 5,147,948 |
| | | New Zealand – 0.3% | | |
| 33,802 | | a2 Milk Co., Ltd. (b) (e) | | 402,309 |
| | | Norway – 1.3% | | |
| 44,258 | | DNB ASA (b) | | 535,872 |
| 55,361 | | Equinor ASA (b) | | 766,574 |
| 35,688 | | Gjensidige Forsikring ASA (b) | | 629,708 |
| | | | | 1,932,154 |
| | | Singapore – 1.3% | | |
| 39,500 | | DBS Group Holdings Ltd. (b) | | 556,125 |
| 41,900 | | Oversea-Chinese Banking Corp., Ltd. (b) | | 267,335 |
| 49,800 | | Singapore Exchange Ltd. (b) | | 339,591 |
| 16,000 | | United Overseas Bank Ltd. (b) | | 228,626 |
| 21,100 | | Venture Corp Ltd. (b) | | 235,807 |
| 116,700 | | Wilmar International Ltd. (b) | | 293,884 |
| | | | | 1,921,368 |
| | | Spain – 2.9% | | |
| 213,028 | | Banco Bilbao Vizcaya Argentaria S.A. (b) | | 696,342 |
| 211,573 | | Banco Santander S.A. (b) | | 472,737 |
| 57,908 | | EDP Renovaveis S.A. (b) | | 709,967 |
| 73,613 | | Ence Energia y Celulosa S.A. (b) | | 236,583 |
| 125,611 | | Iberdrola S.A. (b) | | 1,249,551 |
| 41,002 | | Industria de Diseno Textil S.A. (b) | | 1,050,160 |
| | | | | 4,415,340 |
| | | Sweden – 5.5% | | |
| 24,856 | | Atlas Copco AB, Class A (b) | | 856,649 |
| 23,002 | | Atlas Copco AB, Class B (b) | | 711,495 |
| 36,291 | | Hennes & Mauritz AB, Class B (b) | | 496,084 |
| 16,116 | | Investor AB, Class B (b) | | 800,936 |
| 23,157 | | Lundin Energy AB (b) | | 595,808 |
| 81,112 | | Skandinaviska Enskilda Banken AB, Class A (b) | | 667,751 |
| 87,991 | | Svenska Handelsbanken AB, Class A (b) (e) | | 803,124 |
| 58,069 | | Swedbank AB, Class A (b) | | 687,197 |
| 16,605 | | Swedish Match AB (b) | | 1,026,131 |
| 46,037 | | Volvo AB, Class A (b) | | 588,505 |
| 73,268 | | Volvo AB, Class B (b) | | 938,898 |
| | | | | 8,172,578 |
| | | Switzerland – 9.4% | | |
| 18,634 | | Coca-Cola HBC AG (b) | | 472,162 |
| 11,994 | | Logitech International S.A. (b) | | 577,670 |
| 39,396 | | Nestle S.A. (b) | | 4,172,432 |
| 29,768 | | Novartis AG (b) | | 2,540,356 |
| 833 | | Partners Group Holding AG (b) | | 656,438 |
| Shares | | Description | | Value |
|
| | | Switzerland (Continued) | | |
| 9,972 | | Roche Holding AG (b) | | $3,453,277 |
| 1,750 | | Roche Holding AG (b) | | 607,785 |
| 3,979 | | Sonova Holding AG (b) | | 718,662 |
| 4,571 | | Temenos AG (b) | | 592,317 |
| 848 | | Zurich Insurance Group AG (b) | | 268,862 |
| | | | | 14,059,961 |
| | | United Kingdom – 16.3% | | |
| 48,750 | | 3i Group PLC (b) | | 478,913 |
| 25,777 | | Ashtead Group PLC (b) | | 704,105 |
| 14,623 | | AstraZeneca PLC (b) | | 1,529,450 |
| 99,942 | | Barratt Developments PLC (b) | | 651,558 |
| 14,645 | | Bellway PLC (b) | | 490,042 |
| 10,216 | | BHP Group PLC (b) | | 171,475 |
| 381,785 | | BP PLC (b) | | 1,504,392 |
| 18,464 | | British American Tobacco PLC (b) | | 711,681 |
| 400,994 | | Cairn Energy PLC (b) (e) | | 564,979 |
| 27,049 | | Compass Group PLC (b) | | 455,165 |
| 28,455 | | Diageo PLC (b) | | 979,701 |
| 94,869 | | Evraz PLC (b) | | 314,378 |
| 8,070 | | Games Workshop Group PLC (b) | | 610,775 |
| 82,212 | | GlaxoSmithKline PLC (b) | | 1,715,156 |
| 24,414 | | Hargreaves Lansdown PLC (b) | | 441,759 |
| 18,953 | | Hikma Pharmaceuticals PLC (b) | | 564,497 |
| 99,894 | | Howden Joinery Group PLC (b) | | 658,722 |
| 123,273 | | HSBC Holdings PLC (b) | | 633,619 |
| 83,042 | | Inchcape PLC (b) | | 523,089 |
| 273,797 | | Legal & General Group PLC (b) | | 703,932 |
| 34,640 | | Mondi PLC (b) | | 611,719 |
| 103,520 | | Pagegroup PLC (b) | | 489,956 |
| 22,570 | | Persimmon PLC (b) | | 625,330 |
| 3,887 | | Reckitt Benckiser Group PLC (b) | | 323,786 |
| 90,296 | | Redrow PLC (b) | | 524,648 |
| 60,436 | | RELX PLC (b) | | 1,363,545 |
| 82,753 | | Rightmove PLC (b) | | 517,408 |
| 23,061 | | Rio Tinto PLC (b) | | 1,070,461 |
| 43,901 | | Royal Dutch Shell PLC, Class A (b) | | 722,798 |
| 35,599 | | Royal Dutch Shell PLC, Class B (b) | | 569,892 |
| 83,902 | | Sage Group (The) PLC (b) | | 674,782 |
| 23,306 | | Severn Trent PLC (b) | | 699,356 |
| 221,344 | | Spirent Communications PLC (b) | | 669,560 |
| 20,939 | | Unilever PLC (b) | | 1,078,195 |
| | | | | 24,348,824 |
| | | Total Common Stocks | | 144,658,648 |
| | | (Cost $156,312,002) | | |
| REAL ESTATE INVESTMENT TRUSTS (a) – 1.5% |
| | | Australia – 0.4% | | |
| 108,430 | | Dexus (b) | | 643,676 |
| | | Belgium – 0.5% | | |
| 28,373 | | Warehouses De Pauw CVA (b) | | 778,373 |
See Notes to Financial Statements
Page 19
First Trust RiverFront Dynamic Developed International ETF (RFDI)
Portfolio of Investments (Continued)
April 30, 2020 (Unaudited)
| Shares | | Description | | Value |
| REAL ESTATE INVESTMENT TRUSTS (a) (Continued) |
| | | Hong Kong – 0.2% | | |
| 25,377 | | Link REIT (b) | | $226,217 |
| | | Singapore – 0.4% | | |
| 394,300 | | Mapletree Commercial Trust (b) | | 542,944 |
| | | Total Real Estate Investment Trusts | | 2,191,210 |
| | | (Cost $2,285,886) | | |
| EXCHANGE-TRADED FUNDS (a) – 0.3% |
| | | United States – 0.3% | | |
| 8,200 | | iShares Core MSCI EAFE ETF | | 434,846 |
| | | (Cost $521,014) | | |
| | | Total Investments – 98.6% | | 147,284,704 |
| | | (Cost $159,118,902) (f) | | |
| | | Net Other Assets and Liabilities – 1.4% | | 2,134,837 |
| | | Net Assets – 100.0% | | $149,419,541 |
|
| (a) | Portfolio securities are categorized based upon their country of incorporation. For a breakdown of the portfolio securities by sector, please see the Fund Performance Overview. |
| (b) | This security is fair valued by the Advisor’s Pricing Committee in accordance with procedures adopted by the Trust’s Board of Trustees and in accordance with provisions of the Investment Company Act of 1940, as amended. At April 30, 2020, securities noted as such are valued at $144,364,976 or 96.6% of net assets. Certain of these securities are fair valued using a factor provided by a third-party pricing service due to the change in value between the foreign markets’ close and the New York Stock Exchange close exceeding a certain threshold. On days when this threshold is not exceeded, these securities are typically valued at the last sale price on the exchange on which they are principally traded. |
| (c) | This security may be resold to qualified foreign investors and foreign institutional buyers under Regulation S of the Securities Act of 1933, as amended (the “1933 Act”). |
| (d) | This security is exempt from registration upon resale under Rule 144A of the 1933 Act and may be resold in transactions exempt from registration, normally to qualified institutional buyers. This security is not restricted on the foreign exchange where it trades freely without any additional registration. As such, it does not require the additional disclosure required of restricted securities. |
| (e) | Non-income producing security. |
| (f) | Aggregate cost for financial reporting purposes approximates the aggregate cost for federal income tax purposes. As of April 30, 2020, the aggregate gross unrealized appreciation for all investments in which there was an excess of value over tax cost was $11,640,917 and the aggregate gross unrealized depreciation for all investments in which there was an excess of tax cost over value was $23,475,115. The net unrealized depreciation was $11,834,198. |
| ADR | American Depositary Receipt |
Valuation Inputs
A summary of the inputs used to value the Fund’s investments as of April 30, 2020 is as follows (see Note 2A - Portfolio Valuation in the Notes to Financial Statements):
| | Total
Value at
4/30/2020 | Level 1
Quoted
Prices | Level 2
Significant
Observable
Inputs | Level 3
Significant
Unobservable
Inputs |
| Common Stocks: | | | | |
| Ireland | $ 736,125 | $ 736,125 | $ — | $ — |
| Japan | 35,101,192 | 36 | 35,101,156 | — |
| Netherlands | 5,147,948 | 1,748,721 | 3,399,227 | — |
| Other Country Categories* | 103,673,383 | — | 103,673,383 | — |
| Real Estate Investment Trusts* | 2,191,210 | — | 2,191,210 | — |
| Exchange-Traded Funds* | 434,846 | 434,846 | — | — |
| Total Investments | $ 147,284,704 | $ 2,919,728 | $ 144,364,976 | $— |
| * | See Portfolio of Investments for country breakout. |
Currency Exposure
Diversification | % of Total
Investments |
| Euro | 27.2% |
| Japanese Yen | 23.8 |
| British Pound Sterling | 18.2 |
| Swiss Franc | 9.2 |
| Australian Dollar | 6.5 |
| Swedish Krona | 5.6 |
| Danish Krone | 3.0 |
| Hong Kong Dollar | 2.9 |
| Singapore Dollar | 1.7 |
| Norwegian Krone | 1.3 |
| United States Dollar | 0.3 |
| New Zealand Dollar | 0.3 |
| Total | 100.0% |
Page 20
See Notes to Financial Statements
First Trust RiverFront Dynamic Europe ETF (RFEU)
Portfolio of Investments
April 30, 2020 (Unaudited)
| Shares | | Description | | Value |
| COMMON STOCKS (a) – 97.8% |
| | | Australia – 0.6% | | |
| 2,781 | | Rio Tinto Ltd. (b) | | $156,740 |
| | | Austria – 1.3% | | |
| 3,749 | | OMV AG (b) | | 122,412 |
| 2,826 | | Verbund AG (b) | | 127,955 |
| 6,423 | | Wienerberger AG (b) | | 120,298 |
| | | | | 370,665 |
| | | Belgium – 1.3% | | |
| 4,189 | | Bekaert S.A. (b) | | 88,559 |
| 546 | | Sofina S.A. (b) | | 128,591 |
| 1,479 | | UCB S.A. (b) | | 135,534 |
| | | | | 352,684 |
| | | Denmark – 5.6% | | |
| 1,428 | | Carlsberg A.S., Class B (b) | | 180,146 |
| 934 | | Genmab A.S. (b) (c) | | 224,519 |
| 9,030 | | Novo Nordisk A.S., Class B (b) | | 576,024 |
| 4,036 | | Novozymes A.S., Class B (b) | | 197,993 |
| 2,249 | | Orsted A.S. (b) (d) (e) | | 227,173 |
| 5,345 | | Tryg A.S. (b) | | 142,550 |
| | | | | 1,548,405 |
| | | Finland – 2.3% | | |
| 4,056 | | Kone OYJ, Class B (b) | | 245,608 |
| 15,589 | | Stora Enso OYJ, Class R (b) | | 183,398 |
| 7,487 | | UPM-Kymmene OYJ (b) | | 205,332 |
| | | | | 634,338 |
| | | France – 13.0% | | |
| 887 | | Air Liquide S.A. (b) | | 112,697 |
| 2,031 | | Arkema S.A. (b) | | 169,046 |
| 302 | | Christian Dior SE (b) | | 117,509 |
| 2,183 | | Danone S.A. (b) | | 152,149 |
| 1,490 | | Dassault Systemes SE (b) | | 218,241 |
| 628 | | Kering S.A. (b) | | 319,467 |
| 1,464 | | L’Oreal S.A. (b) | | 425,645 |
| 719 | | LVMH Moet Hennessy Louis Vuitton SE (b) | | 277,960 |
| 19,799 | | Orange S.A. (b) | | 240,539 |
| 1,491 | | Pernod Ricard S.A. (b) | | 227,669 |
| 2,448 | | Sanofi (b) | | 239,105 |
| 1,042 | | Sartorius Stedim Biotech (b) | | 249,844 |
| 1,510 | | Schneider Electric SE (b) | | 139,543 |
| 2,079 | | Sodexo S.A. (b) | | 166,207 |
| 4,286 | | TOTAL S.A. (b) | | 152,120 |
| 2,107 | | Ubisoft Entertainment S.A. (b) (c) | | 156,723 |
| 7,723 | | Veolia Environnement S.A. (b) | | 164,643 |
| 1,037 | | Vinci S.A. (b) | | 84,953 |
| | | | | 3,614,060 |
| | | Germany – 8.9% | | |
| 1,165 | | adidas AG (b) | | 266,706 |
| 748 | | Allianz SE (b) | | 137,656 |
| 1,958 | | Bayer AG (b) | | 128,776 |
| Shares | | Description | | Value |
|
| | | Germany (Continued) | | |
| 5,930 | | Deutsche Telekom AG (b) | | $86,694 |
| 3,224 | | HeidelbergCement AG (b) | | 152,854 |
| 2,355 | | Henkel AG & Co., KGaA (b) | | 183,580 |
| 2,447 | | Henkel AG & Co., KGaA (Preference Shares) (b) | | 217,261 |
| 12,799 | | Infineon Technologies AG (b) | | 237,945 |
| 734 | | MTU Aero Engines AG (b) | | 99,953 |
| 2,137 | | Nemetschek SE (b) | | 134,449 |
| 2,163 | | SAP SE (b) | | 257,629 |
| 674 | | Sartorius AG (Preference Shares) (b) | | 189,355 |
| 1,112 | | Siemens AG (b) | | 102,619 |
| 5,460 | | TAG Immobilien AG (b) | | 119,594 |
| 1,054 | | Volkswagen AG (b) | | 155,828 |
| | | | | 2,470,899 |
| | | Israel – 0.6% | | |
| 1,663 | | Check Point Software Technologies Ltd. (c) | | 175,846 |
| | | Italy – 2.6% | | |
| 94,788 | | A2A S.p.A. (b) | | 129,216 |
| 55,542 | | Enel S.p.A. (b) | | 379,377 |
| 22,297 | | Eni S.p.A. (b) | | 212,409 |
| | | | | 721,002 |
| | | Jersey – 3.4% | | |
| 35,927 | | boohoo Group PLC (b) (c) | | 145,987 |
| 8,222 | | Experian PLC (b) | | 246,910 |
| 2,924 | | Ferguson PLC (b) | | 210,827 |
| 113,802 | | Glencore PLC (b) | | 213,201 |
| 71,411 | | Man Group PLC (b) | | 119,642 |
| | | | | 936,567 |
| | | Netherlands – 6.7% | | |
| 1,021 | | ASML Holding N.V. (b) | | 298,219 |
| 3,161 | | BE Semiconductor Industries N.V. (b) | | 130,821 |
| 1,495 | | Ferrari N.V. (b) | | 233,662 |
| 11,207 | | Koninklijke Ahold Delhaize N.V. (b) | | 272,110 |
| 4,124 | | Koninklijke Philips N.V. (b) | | 179,775 |
| 3,085 | | Randstad N.V. (b) | | 124,158 |
| 8,220 | | Unilever N.V. (b) | | 409,350 |
| 3,088 | | Wolters Kluwer N.V. | | 227,133 |
| | | | | 1,875,228 |
| | | Norway – 0.5% | | |
| 7,272 | | Gjensidige Forsikring ASA (b) | | 128,313 |
| | | Spain – 3.6% | | |
| 3,500 | | Amadeus IT Group S.A. (b) | | 167,064 |
| 11,614 | | EDP Renovaveis S.A. (b) | | 142,391 |
| 22,150 | | Ence Energia y Celulosa S.A. (b) | | 71,187 |
| 37,806 | | Iberdrola S.A. (b) | | 376,086 |
See Notes to Financial Statements
Page 21
First Trust RiverFront Dynamic Europe ETF (RFEU)
Portfolio of Investments (Continued)
April 30, 2020 (Unaudited)
| Shares | | Description | | Value |
| COMMON STOCKS (a) (Continued) |
| | | Spain (Continued) | | |
| 9,968 | | Industria de Diseno Textil S.A. (b) | | $255,304 |
| | | | | 1,012,032 |
| | | Sweden – 7.3% | | |
| 7,472 | | Atlas Copco AB, Class A (b) | | 257,519 |
| 6,918 | | Atlas Copco AB, Class B (b) | | 213,987 |
| 4,558 | | Beijer Ref AB (b) | | 93,655 |
| 13,674 | | Epiroc AB, Class A (b) | | 136,844 |
| 10,914 | | Hennes & Mauritz AB, Class B (b) | | 149,190 |
| 5,623 | | Industrivarden AB, Class A (b) | | 115,396 |
| 3,160 | | Investor AB, Class A (b) | | 155,894 |
| 4,846 | | Investor AB, Class B (b) | | 240,838 |
| 7,284 | | Kinnevik AB, Class B (b) | | 149,708 |
| 24,410 | | Skandinaviska Enskilda Banken AB, Class A (b) | | 200,954 |
| 8,986 | | Volvo AB, Class A (b) | | 114,871 |
| 16,712 | | Volvo AB, Class B (b) | | 214,157 |
| | | | | 2,043,013 |
| | | Switzerland – 16.8% | | |
| 5,607 | | Coca-Cola HBC AG (b) | | 142,074 |
| 444 | | Geberit AG (b) | | 198,558 |
| 5,246 | | LafargeHolcim Ltd. (b) | | 217,882 |
| 3,613 | | Logitech International S.A. (b) | | 174,014 |
| 11,863 | | Nestle S.A. (b) | | 1,256,411 |
| 8,964 | | Novartis AG (b) | | 764,974 |
| 255 | | Partners Group Holding AG (b) | | 200,950 |
| 3,022 | | Roche Holding AG (b) | | 1,046,511 |
| 530 | | Roche Holding AG (b) | | 184,072 |
| 84 | | SGS S.A. (b) | | 189,479 |
| 153 | | Straumann Holding AG (b) | | 116,407 |
| 1,376 | | Temenos AG (b) | | 178,304 |
| | | | | 4,669,636 |
| | | United Kingdom – 23.3% | | |
| 14,698 | | 3i Group PLC (b) | | 144,391 |
| 23,832 | | Ashmore Group PLC (b) | | 113,627 |
| 7,747 | | Ashtead Group PLC (b) | | 211,611 |
| 3,119 | | AstraZeneca PLC (b) | | 326,223 |
| 18,042 | | Barratt Developments PLC (b) | | 117,622 |
| 2,902 | | Bellway PLC (b) | | 97,105 |
| 7,445 | | Bovis Homes Group PLC (b) | | 75,608 |
| 114,933 | | BP PLC (b) | | 452,884 |
| 5,550 | | British American Tobacco PLC (b) | | 213,921 |
| 120,466 | | Cairn Energy PLC (b) (c) | | 169,730 |
| 8,135 | | Compass Group PLC (b) | | 136,891 |
| 22,276 | | Countryside Properties PLC (b) (d) (e) | | 113,492 |
| 8,556 | | Diageo PLC (b) | | 294,582 |
| 9,872 | | Dunelm Group PLC (b) | | 114,059 |
| 28,569 | | Evraz PLC (b) | | 94,672 |
| 1,471 | | Games Workshop Group PLC (b) | | 111,332 |
| 24,734 | | GlaxoSmithKline PLC (b) | | 516,015 |
| Shares | | Description | | Value |
|
| | | United Kingdom (Continued) | | |
| 8,304 | | Hargreaves Lansdown PLC (b) | | $150,257 |
| 5,709 | | Hikma Pharmaceuticals PLC (b) | | 170,037 |
| 47,556 | | HSBC Holdings PLC (b) | | 244,436 |
| 82,428 | | Legal & General Group PLC (b) | | 211,922 |
| 8,157 | | Mondi PLC (b) | | 144,047 |
| 31,103 | | Pagegroup PLC (b) | | 147,209 |
| 5,037 | | Persimmon PLC (b) | | 139,556 |
| 1,167 | | Reckitt Benckiser Group PLC (b) | | 97,211 |
| 13,170 | | Redrow PLC (b) | | 76,522 |
| 14,087 | | RELX PLC (b) | | 317,828 |
| 7,443 | | Rio Tinto PLC (b) | | 345,494 |
| 13,227 | | Royal Dutch Shell PLC, Class A (b) | | 217,773 |
| 10,713 | | Royal Dutch Shell PLC, Class B (b) | | 171,501 |
| 19,349 | | Sage Group (The) PLC (b) | | 155,614 |
| 12,213 | | SSE PLC (b) | | 191,566 |
| 43,200 | | Taylor Wimpey PLC (b) | | 79,784 |
| 6,302 | | Unilever PLC (b) | | 324,504 |
| | | | | 6,489,026 |
| | | Total Common Stocks | | 27,198,454 |
| | | (Cost $28,227,454) | | |
| REAL ESTATE INVESTMENT TRUSTS (a) – 0.9% |
| | | Belgium – 0.4% | | |
| 4,139 | | Warehouses De Pauw CVA (b) | | 113,547 |
| | | United Kingdom – 0.5% | | |
| 14,453 | | Segro PLC (b) | | 151,490 |
| | | Total Real Estate Investment Trusts | | 265,037 |
| | | (Cost $235,625) | | |
| | | Total Investments – 98.7% | | 27,463,491 |
| | | (Cost $28,463,079) (f) | | |
| | | Net Other Assets and Liabilities – 1.3% | | 356,635 |
| | | Net Assets – 100.0% | | $27,820,126 |
|
| (a) | Portfolio securities are categorized based upon their country of incorporation. For a breakdown of the portfolio securities by sector, please see the Fund Performance Overview. |
| (b) | This security is fair valued by the Advisor’s Pricing Committee in accordance with procedures adopted by the Trust’s Board of Trustees and in accordance with provisions of the Investment Company Act of 1940, as amended. At April 30, 2020, securities noted as such are valued at $27,060,512 or 97.3% of net assets. Certain of these securities are fair valued using a factor provided by a third-party pricing service due to the change in value between the foreign markets’ close and the New York Stock Exchange close exceeding a certain threshold. On days when this threshold is not exceeded, these securities are typically valued at the last sale price on the exchange on which they are principally traded. |
| (c) | Non-income producing security. |
Page 22
See Notes to Financial Statements
First Trust RiverFront Dynamic Europe ETF (RFEU)
Portfolio of Investments (Continued)
April 30, 2020 (Unaudited)
| (d) | This security may be resold to qualified foreign investors and foreign institutional buyers under Regulation S of the Securities Act of 1933, as amended (the “1933 Act”). |
| (e) | This security is exempt from registration upon resale under Rule 144A of the 1933 Act and may be resold in transactions exempt from registration, normally to qualified institutional buyers. This security is not restricted on the foreign exchange where it trades freely without any additional registration. As such, it does not require the additional disclosure required of restricted securities. |
| (f) | Aggregate cost for financial reporting purposes approximates the aggregate cost for federal income tax purposes. As of April 30, 2020, the aggregate gross unrealized appreciation for all investments in which there was an excess of value over tax cost was $2,362,781 and the aggregate gross unrealized depreciation for all investments in which there was an excess of tax cost over value was $3,362,369. The net unrealized depreciation was $999,588. |
Valuation Inputs
A summary of the inputs used to value the Fund’s investments as of April 30, 2020 is as follows (see Note 2A - Portfolio Valuation in the Notes to Financial Statements):
| | Total
Value at
4/30/2020 | Level 1
Quoted
Prices | Level 2
Significant
Observable
Inputs | Level 3
Significant
Unobservable
Inputs |
| Common Stocks: | | | | |
| Israel | $ 175,846 | $ 175,846 | $ — | $ — |
| Netherlands | 1,875,228 | 227,133 | 1,648,095 | — |
| Other Country Categories* | 25,147,380 | — | 25,147,380 | — |
| Real Estate Investment Trusts* | 265,037 | — | 265,037 | — |
| Total Investments | $ 27,463,491 | $ 402,979 | $ 27,060,512 | $— |
| * | See Portfolio of Investments for country breakout. |
Currency Exposure
Diversification | % of Total
Investments |
| Euro | 40.7% |
| British Pound Sterling | 28.1 |
| Swiss Franc | 16.5 |
| Swedish Krona | 7.4 |
| Danish Krone | 5.6 |
| United States Dollar | 0.6 |
| Australian Dollar | 0.6 |
| Norwegian Krone | 0.5 |
| Total | 100.0% |
See Notes to Financial Statements
Page 23
First Trust RiverFront Dynamic Emerging Markets ETF (RFEM)
Portfolio of Investments
April 30, 2020 (Unaudited)
| Shares | | Description | | Value |
| COMMON STOCKS (a) – 97.3% |
| | | Bermuda – 2.5% | | |
| 100,428 | | China Gas Holdings Ltd. (b) | | $365,431 |
| 713,691 | | China Oriental Group Co., Ltd. (b) | | 215,690 |
| 264,651 | | Hopson Development Holdings Ltd. (b) | | 296,420 |
| 241,976 | | Nine Dragons Paper Holdings Ltd. (b) | | 231,504 |
| 1,363,137 | | Sihuan Pharmaceutical Holdings Group Ltd. (b) | | 135,260 |
| | | | | 1,244,305 |
| | | Brazil – 7.0% | | |
| 87,494 | | Banco Bradesco S.A. (Preference Shares) | | 308,117 |
| 35,059 | | Banco do Brasil S.A. | | 183,744 |
| 47,938 | | Banco do Estado do Rio Grande do Sul S.A., Class B (Preference Shares) | | 110,547 |
| 42,323 | | Centrais Eletricas Brasileiras S.A. | | 188,737 |
| 42,318 | | Centrais Eletricas Brasileiras S.A., ADR | | 188,738 |
| 30,169 | | Centrais Eletricas Brasileiras S.A., ADR (Preference Shares) | | 144,208 |
| 36,700 | | Centrais Eletricas Brasileiras S.A., Class B (Preference Shares) | | 187,890 |
| 24,820 | | Cia de Saneamento Basico do Estado de Sao Paulo | | 182,936 |
| 121,451 | | Cia Siderurgica Nacional S.A., ADR | | 194,322 |
| 54,728 | | Itau Unibanco Holding S.A. (Preference Shares) | | 229,161 |
| 74,436 | | JBS S.A. | | 326,331 |
| 28,001 | | Magazine Luiza S.A. | | 255,917 |
| 177,945 | | Metalurgica Gerdau S.A. (Preference Shares) | | 168,524 |
| 44,916 | | Petrobras Distribuidora S.A. | | 161,314 |
| 51,864 | | Petroleo Brasileiro S.A. | | 177,874 |
| 84,862 | | Petroleo Brasileiro S.A. (Preference Shares) | | 281,682 |
| 21,792 | | Vale S.A. | | 179,773 |
| | | | | 3,469,815 |
| | | Cayman Islands – 26.6% | | |
| 6,016 | | 58.com, Inc., ADR (c) | | 312,531 |
| 18,440 | | Alibaba Group Holding Ltd., ADR (c) | | 3,737,235 |
| 2,475 | | Autohome, Inc., ADR | | 203,321 |
| 76,452 | | China Conch Venture Holdings Ltd. (b) | | 365,546 |
| 275,048 | | China Resources Cement Holdings Ltd. (b) | | 374,259 |
| 344,714 | | China Yongda Automobiles Services Holdings Ltd. (b) | | 347,519 |
| Shares | | Description | | Value |
|
| | | Cayman Islands (Continued) | | |
| 541,819 | | Dongyue Group Ltd. (b) | | $240,018 |
| 213,524 | | Geely Automobile Holdings Ltd. (b) | | 332,141 |
| 27,142 | | Hengan International Group Co., Ltd. (b) | | 241,372 |
| 3,563 | | JD.com, Inc., ADR (c) | | 153,565 |
| 168,286 | | Logan Property Holdings Co., Ltd. (b) | | 265,284 |
| 10,294 | | Momo, Inc., ADR | | 247,880 |
| 1,544 | | NetEase, Inc., ADR | | 532,618 |
| 269,620 | | Sino Biopharmaceutical Ltd. (b) | | 392,998 |
| 79,620 | | Sunac China Holdings Ltd. (b) | | 356,161 |
| 65,482 | | Tencent Holdings Ltd. (b) | | 3,442,352 |
| 21,748 | | Vipshop Holdings Ltd., ADR (c) | | 346,446 |
| 9,341 | | Weibo Corp., ADR (c) | | 350,568 |
| 48,366 | | Yihai International Holding Ltd. (b) | | 385,423 |
| 576,355 | | Yuzhou Properties Co., Ltd. (b) | | 245,547 |
| 84,596 | | Zhongsheng Group Holdings Ltd. (b) | | 339,544 |
| | | | | 13,212,328 |
| | | Chile – 0.4% | | |
| 22,947 | | Cia Cervecerias Unidas S.A. | | 164,908 |
| | | China – 9.8% | | |
| 37,096 | | Anhui Conch Cement Co., Ltd., Class H (b) | | 292,516 |
| 479,752 | | Bank of China Ltd., Class H (b) | | 182,643 |
| 433,239 | | Bank of Communications Co., Ltd., Class H (b) | | 274,546 |
| 1,000,242 | | China Construction Bank Corp., Class H (b) | | 802,858 |
| 653,440 | | China Everbright Bank Co., Ltd., Class H (b) | | 277,289 |
| 81,316 | | China Life Insurance Co., Ltd., Class H (b) | | 173,423 |
| 110,380 | | China Merchants Bank Co., Ltd., Class H (b) | | 522,353 |
| 46,504 | | China Vanke Co., Ltd., Class H (b) | | 156,287 |
| 175,006 | | Guangzhou R&F Properties Co., Ltd., Class H (b) | | 222,238 |
| 230,373 | | Hisense Home Appliances Group Co., Ltd., Class H (b) | | 222,839 |
| 415,751 | | Industrial & Commercial Bank of China Ltd., Class H (b) | | 278,765 |
| 64,405 | | Ping An Insurance Group Co. of China Ltd., Class H (b) | | 655,402 |
| 512,775 | | Postal Savings Bank of China Co., Ltd., Class H (b) (d) (e) | | 306,410 |
| 146,224 | | Weichai Power Co., Ltd., Class H (b) | | 256,917 |
Page 24
See Notes to Financial Statements
First Trust RiverFront Dynamic Emerging Markets ETF (RFEM)
Portfolio of Investments (Continued)
April 30, 2020 (Unaudited)
| Shares | | Description | | Value |
| COMMON STOCKS (a) (Continued) |
| | | China (Continued) | | |
| 309,389 | | Zoomlion Heavy Industry Science and Technology Co., Ltd., Class H (b) | | $250,477 |
| | | | | 4,874,963 |
| | | Colombia – 0.9% | | |
| 29,638 | | Bancolombia S.A. (Preference Shares) | | 193,743 |
| 491,105 | | Ecopetrol S.A. | | 259,260 |
| | | | | 453,003 |
| | | Egypt – 0.5% | | |
| 60,762 | | Commercial International Bank Egypt SAE (b) | | 247,386 |
| | | Hong Kong – 3.2% | | |
| 50,251 | | China Mobile Ltd. (b) | | 403,971 |
| 2,052,503 | | China South City Holdings Ltd. (b) | | 197,040 |
| 411,325 | | CNOOC Ltd. (b) | | 454,770 |
| 699,073 | | Sino-Ocean Group Holding Ltd. (b) | | 182,070 |
| 169,338 | | Sinotruk Hong Kong Ltd. (b) | | 343,340 |
| | | | | 1,581,191 |
| | | India – 8.2% | | |
| 42,581 | | Berger Paints India Ltd. (b) | | 286,339 |
| 147,907 | | Coal India Ltd. (b) | | 289,221 |
| 17,108 | | Hindustan Unilever Ltd. (b) | | 495,371 |
| 6,800 | | Housing Development Finance Corp., Ltd. (b) | | 172,005 |
| 7,432 | | Info Edge India Ltd., ADR (b) | | 249,598 |
| 66,811 | | Infosys Ltd. (b) | | 624,491 |
| 4,800 | | Jubilant Foodworks Ltd. (b) | | 102,973 |
| 182,774 | | Power Finance Corp., Ltd. (b) | | 230,761 |
| 10,992 | | Reliance Industries Ltd. (b) | | 213,718 |
| 19,295 | | Tata Consultancy Services Ltd. (b) | | 510,784 |
| 28,575 | | Tech Mahindra Ltd. (b) | | 205,514 |
| 18,101 | | Titan Co., Ltd. (b) | | 231,483 |
| 33,312 | | UPL Ltd. (b) | | 184,338 |
| 111,010 | | Wipro Ltd. (b) | | 281,838 |
| | | | | 4,078,434 |
| | | Indonesia – 3.3% | | |
| 4,085,849 | | Adaro Energy Tbk PT (b) | | 250,384 |
| 725,211 | | Bank Mandiri Persero Tbk PT (b) | | 215,577 |
| 2,558,137 | | Bank Permata Tbk PT (b) (c) | | 211,393 |
| 1,523,677 | | Bank Rakyat Indonesia Persero Tbk PT (b) | | 277,138 |
| 3,235,930 | | Media Nusantara Citra Tbk PT (b) | | 197,341 |
| 347,429 | | Pabrik Kertas Tjiwi Kimia Tbk PT (b) | | 115,578 |
| Shares | | Description | | Value |
|
| | | Indonesia (Continued) | | |
| 1,606,471 | | Telekomunikasi Indonesia Persero Tbk PT (b) | | $369,411 |
| | | | | 1,636,822 |
| | | Jersey – 0.5% | | |
| 1,456,666 | | West China Cement Ltd. (b) | | 259,620 |
| | | Malaysia – 1.6% | | |
| 287,600 | | AMMB Holdings Bhd (b) | | 198,651 |
| 279,600 | | Petronas Chemicals Group Bhd (b) | | 361,925 |
| 124,500 | | ViTrox Corp Bhd (b) | | 239,850 |
| | | | | 800,426 |
| | | Mexico – 0.5% | | |
| 175,850 | | America Movil S.A.B. de C.V., Series L | | 106,235 |
| 23,375 | | Fomento Economico Mexicano S.A.B. de C.V. | | 150,826 |
| | | | | 257,061 |
| | | Philippines – 0.8% | | |
| 112,360 | | International Container Terminal Services, Inc. (b) | | 196,531 |
| 111,170 | | San Miguel Corp. (b) | | 213,408 |
| | | | | 409,939 |
| | | Poland – 1.1% | | |
| 18,511 | | Asseco Poland S.A. (b) | | 299,135 |
| 14,481 | | Grupa Lotos S.A. (b) | | 219,753 |
| | | | | 518,888 |
| | | Russia – 1.5% | | |
| 1,003 | | Novatek PJSC, GDR (b) (d) | | 140,653 |
| 17,436 | | Novolipetsk Steel PJSC, GDR (b) (d) | | 298,429 |
| 6,450 | | Tatneft PJSC, ADR (b) | | 287,339 |
| | | | | 726,421 |
| | | South Africa – 3.0% | | |
| 3,342 | | Capitec Bank Holdings Ltd. (b) | | 162,919 |
| 16,379 | | Kumba Iron Ore Ltd. (b) | | 308,265 |
| 4,520 | | Naspers Ltd., Class N (b) | | 703,531 |
| 49,449 | | Vodacom Group Ltd. (b) | | 328,631 |
| | | | | 1,503,346 |
| | | South Korea – 7.7% | | |
| 6,115 | | Coway Co., Ltd. (b) | | 309,919 |
| 6,318 | | Fila Korea Ltd. (b) | | 180,635 |
| 4,020 | | Hotel Shilla Co., Ltd. (b) | | 281,065 |
| 2,308 | | Hyundai Mobis Co., Ltd. (b) | | 326,305 |
| 1,479 | | NAVER Corp. (b) | | 239,791 |
| 50,949 | | Samsung Electronics Co., Ltd. (b) | | 2,094,899 |
| 9,586 | | Shinhan Financial Group Co., Ltd. (b) | | 243,030 |
See Notes to Financial Statements
Page 25
First Trust RiverFront Dynamic Emerging Markets ETF (RFEM)
Portfolio of Investments (Continued)
April 30, 2020 (Unaudited)
| Shares | | Description | | Value |
| COMMON STOCKS (a) (Continued) |
| | | South Korea (Continued) | | |
| 1,688 | | SK Hynix, Inc. (b) | | $116,164 |
| | | | | 3,791,808 |
| | | Taiwan – 13.1% | | |
| 506,563 | | CTBC Financial Holding Co., Ltd. (b) | | 337,570 |
| 75,023 | | Hon Hai Precision Industry Co., Ltd. (b) | | 192,807 |
| 53,855 | | Novatek Microelectronics Corp. (b) | | 334,922 |
| 40,194 | | President Chain Store Corp. (b) | | 415,635 |
| 42,884 | | Realtek Semiconductor Corp. (b) | | 367,230 |
| 199,803 | | Ruentex Development Co., Ltd. (b) | | 297,369 |
| 663,237 | | Shinkong Synthetic Fibers Corp. (b) | | 243,539 |
| 24,579 | | Simplo Technology Co., Ltd. (b) | | 255,267 |
| 160,900 | | Standard Foods Corp. (b) | | 362,644 |
| 218,267 | | Taiwan High Speed Rail Corp. (b) | | 249,284 |
| 283,740 | | Taiwan Semiconductor Manufacturing Co., Ltd. (b) | | 2,862,312 |
| 37,322 | | Walsin Technology Corp. (b) | | 264,321 |
| 557,167 | | Yuanta Financial Holding Co., Ltd. (b) | | 317,574 |
| | | | | 6,500,474 |
| | | Thailand – 1.9% | | |
| 62,500 | | CP ALL PCL | | 136,620 |
| 127,700 | | PTT Exploration & Production PCL | | 329,622 |
| 430,600 | | PTT PCL | | 470,156 |
| | | | | 936,398 |
| | | Turkey – 3.2% | | |
| 181,486 | | Eregli Demir ve Celik Fabrikalari T.A.S. (b) | | 209,235 |
| 70,960 | | TAV Havalimanlari Holding A.S. (b) | | 184,842 |
| 202,401 | | Turkiye Garanti Bankasi A.S. (c) | | 241,508 |
| 357,986 | | Turkiye Is Bankasi A.S., Class C (b) (c) | | 254,119 |
| 393,922 | | Turkiye Sise ve Cam Fabrikalari A.S. | | 273,342 |
| 359,270 | | Turkiye Vakiflar Bankasi TAO, Class D (b) (c) | | 233,044 |
| 638,672 | | Yapi ve Kredi Bankasi A.S. (b) (c) | | 192,276 |
| | | | | 1,588,366 |
| | | Total Common Stocks | | 48,255,902 |
| | | (Cost $51,207,508) | | |
| Shares | | Description | | Value |
| EXCHANGE-TRADED FUNDS (a) – 1.7% |
| | | United States – 1.7% | | |
| 19,612 | | iShares Core MSCI Emerging Markets ETF | | $856,260 |
| | | (Cost $846,812) | | |
| | | Total Investments – 99.0% | | 49,112,162 |
| | | (Cost $52,054,320) (f) | | |
| | | Net Other Assets and Liabilities – 1.0% | | 507,409 |
| | | Net Assets – 100.0% | | $49,619,571 |
|
| (a) | Portfolio securities are categorized based upon their country of incorporation. For a breakdown of the portfolio securities by sector, please see the Fund Performance Overview. |
| (b) | This security is fair valued by the Advisor’s Pricing Committee in accordance with procedures adopted by the Trust’s Board of Trustees and in accordance with provisions of the Investment Company Act of 1940, as amended. At April 30, 2020, securities noted as such are valued at $36,575,703 or 73.7% of net assets. Certain of these securities are fair valued using a factor provided by a third-party pricing service due to the change in value between the foreign markets’ close and the New York Stock Exchange close exceeding a certain threshold. On days when this threshold is not exceeded, these securities are typically valued at the last sale price on the exchange on which they are principally traded. |
| (c) | Non-income producing security. |
| (d) | This security may be resold to qualified foreign investors and foreign institutional buyers under Regulation S of the Securities Act of 1933, as amended (the “1933 Act”). |
| (e) | This security is exempt from registration upon resale under Rule 144A of the 1933 Act and may be resold in transactions exempt from registration, normally to qualified institutional buyers. This security is not restricted on the foreign exchange where it trades freely without any additional registration. As such, it does not require the additional disclosure required of restricted securities. |
| (f) | Aggregate cost for financial reporting purposes approximates the aggregate cost for federal income tax purposes. As of April 30, 2020, the aggregate gross unrealized appreciation for all investments in which there was an excess of value over tax cost was $5,030,726 and the aggregate gross unrealized depreciation for all investments in which there was an excess of tax cost over value was $7,972,884. The net unrealized depreciation was $2,942,158. |
| ADR | American Depositary Receipt |
| GDR | Global Depositary Receipt |
Page 26
See Notes to Financial Statements
First Trust RiverFront Dynamic Emerging Markets ETF (RFEM)
Portfolio of Investments (Continued)
April 30, 2020 (Unaudited)
Valuation Inputs
A summary of the inputs used to value the Fund’s investments as of April 30, 2020 is as follows (see Note 2A - Portfolio Valuation in the Notes to Financial Statements):
| | Total
Value at
4/30/2020 | Level 1
Quoted
Prices | Level 2
Significant
Observable
Inputs | Level 3
Significant
Unobservable
Inputs |
| Common Stocks: | | | | |
| Brazil | $ 3,469,815 | $ 3,469,815 | $ — | $ — |
| Cayman Islands | 13,212,328 | 5,884,164 | 7,328,164 | — |
| Chile | 164,908 | 164,908 | — | — |
| Colombia | 453,003 | 453,003 | — | — |
| Mexico | 257,061 | 257,061 | — | — |
| Thailand | 936,398 | 936,398 | — | — |
| Turkey | 1,588,366 | 514,850 | 1,073,516 | — |
| Other Country Categories* | 28,174,023 | — | 28,174,023 | — |
| Exchange-Traded Funds* | 856,260 | 856,260 | — | — |
| Total Investments | $ 49,112,162 | $ 12,536,459 | $ 36,575,703 | $— |
| * | See Portfolio of Investments for country breakout. |
Currency Exposure
Diversification | % of Total
Investments |
| Hong Kong Dollar | 31.1% |
| United States Dollar | 16.3 |
| New Taiwan Dollar | 13.3 |
| Indian Rupee | 8.3 |
| South Korean Won | 7.7 |
| Brazilian Real | 6.0 |
| Indonesian Rupiah | 3.3 |
| Turkish Lira | 3.2 |
| South African Rand | 3.1 |
| Thai Baht | 1.9 |
| Malaysian Ringgit | 1.6 |
| Polish Zloty | 1.1 |
| Colombian Peso | 0.9 |
| Philippine Peso | 0.8 |
| Mexican Peso | 0.5 |
| Egyptian Pound | 0.5 |
| Chilean Peso | 0.4 |
| Total | 100.0% |
See Notes to Financial Statements
Page 27
First Trust Exchange-Traded Fund III
Statements of Assets and Liabilities
April 30, 2020 (Unaudited)
| | First Trust
RiverFront
Dynamic
Asia
Pacific
ETF
(RFAP) | | First Trust
RiverFront
Dynamic
Developed
International
ETF
(RFDI) | | First Trust
RiverFront
Dynamic
Europe
ETF
(RFEU) | | First Trust
RiverFront
Dynamic
Emerging
Markets
ETF
(RFEM) |
| ASSETS: | | | | | | | |
Investments, at value
| $ 10,943,810 | | $ 147,284,704 | | $ 27,463,491 | | $ 49,112,162 |
Cash
| 58,749 | | 901,990 | | 36,482 | | 448,589 |
Foreign currency
| — | | 87,762 | | 25,959 | | 557 |
| Receivables: | | | | | | | |
Dividends
| 107,907 | | 574,348 | | 48,672 | | 54,670 |
Dividend reclaims
| 227 | | 713,889 | | 263,575 | | 6,021 |
Prepaid expenses
| — | | — | | — | | 34,717 |
Total Assets
| 11,110,693 | | 149,562,693 | | 27,838,179 | | 49,656,716 |
| LIABILITIES: | | | | | | | |
| Payables: | | | | | | | |
Investment advisory fees
| 7,858 | | 95,331 | | 18,053 | | 37,145 |
Investment securities purchased
| — | | 47,821 | | — | | — |
Total Liabilities
| 7,858 | | 143,152 | | 18,053 | | 37,145 |
NET ASSETS
| $11,102,835 | | $149,419,541 | | $27,820,126 | | $49,619,571 |
| NET ASSETS consist of: | | | | | | | |
Paid-in capital
| $ 22,759,787 | | $ 241,566,457 | | $ 43,898,750 | | $ 76,847,295 |
Par value
| 2,500 | | 30,500 | | 5,500 | | 9,500 |
Accumulated distributable earnings (loss)
| (11,659,452) | | (92,177,416) | | (16,084,124) | | (27,237,224) |
NET ASSETS
| $11,102,835 | | $149,419,541 | | $27,820,126 | | $49,619,571 |
NET ASSET VALUE, per share
| $44.41 | | $48.99 | | $50.58 | | $52.23 |
Number of shares outstanding (unlimited number of shares authorized, par value $0.01 per share)
| 250,002 | | 3,050,002 | | 550,002 | | 950,002 |
Investments, at cost
| $11,793,555 | | $159,118,902 | | $28,463,079 | | $52,054,320 |
Foreign currency, at cost (proceeds)
| $— | | $87,116 | | $25,770 | | $557 |
Page 28
See Notes to Financial Statements
First Trust Exchange-Traded Fund III
Statements of Operations
For the Six Months Ended April 30, 2020 (Unaudited)
| | First Trust
RiverFront
Dynamic
Asia
Pacific
ETF
(RFAP) | | First Trust
RiverFront
Dynamic
Developed
International
ETF
(RFDI) | | First Trust
RiverFront
Dynamic
Europe
ETF
(RFEU) | | First Trust
RiverFront
Dynamic
Emerging
Markets
ETF
(RFEM) |
| INVESTMENT INCOME: | | | | | | | |
Dividends
| $ 232,558 | | $ 2,511,803 | | $ 423,831 | | $ 707,047 |
Interest
| 152 | | 1,354 | | 187 | | 1,302 |
Foreign withholding tax
| (13,304) | | (201,612) | | (39,851) | | (89,928) |
Other
| — | | 121 | | 94 | | 43 |
Total investment income
| 219,406 | | 2,311,666 | | 384,261 | | 618,464 |
| EXPENSES: | | | | | | | |
Investment advisory fees
| 80,394 | | 855,266 | | 138,423 | | 308,062 |
Total expenses
| 80,394 | | 855,266 | | 138,423 | | 308,062 |
NET INVESTMENT INCOME (LOSS)
| 139,012 | | 1,456,400 | | 245,838 | | 310,402 |
| NET REALIZED AND UNREALIZED GAIN (LOSS): | | | | | | | |
| Net realized gain (loss) on: | | | | | | | |
Investments
| (1,848,012) | | (19,702,147) | | (4,307,709) | | (4,395,733) |
In-kind redemptions
| (680,274) | | (2,906,328) | | 229,324 | | (164,329) |
Foreign currency transactions
| (12,613) | | 724 | | 5,031 | | (66,049) |
Net realized gain (loss)
| (2,540,899) | | (22,607,751) | | (4,073,354) | | (4,626,111) |
| Net change in unrealized appreciation (depreciation) on: | | | | | | | |
Investments
| (472,022) | | (10,676,707) | | (630,416) | | (3,572,036) |
Foreign currency translation
| 702 | | 7,184 | | 2,150 | | (7,662) |
Deferred foreign capital gains tax
| — | | — | | — | | (4,790) |
Net change in unrealized appreciation (depreciation)
| (471,320) | | (10,669,523) | | (628,266) | | (3,584,488) |
NET REALIZED AND UNREALIZED GAIN (LOSS)
| (3,012,219) | | (33,277,274) | | (4,701,620) | | (8,210,599) |
NET INCREASE (DECREASE) IN NET ASSETS RESULTING FROM OPERATIONS
| $(2,873,207) | | $(31,820,874) | | $(4,455,782) | | $(7,900,197) |
See Notes to Financial Statements
Page 29
First Trust Exchange-Traded Fund III
Statements of Changes in Net Assets
| | First Trust RiverFront
Dynamic Asia Pacific ETF (RFAP) | | First Trust RiverFront Dynamic
Developed International ETF (RFDI) |
| | Six Months
Ended
4/30/2020
(Unaudited) | | Year
Ended
10/31/2019 | | Six Months
Ended
4/30/2020
(Unaudited) | | Year
Ended
10/31/2019 |
| OPERATIONS: | | | | | | | |
Net investment income (loss)
| $ 139,012 | | $ 756,717 | | $ 1,456,400 | | $ 8,380,686 |
Net realized gain (loss)
| (2,540,899) | | (5,207,135) | | (22,607,751) | | (50,398,436) |
Net change in unrealized appreciation (depreciation)
| (471,320) | | 5,278,606 | | (10,669,523) | | 51,030,024 |
Net increase (decrease) in net assets resulting from operations
| (2,873,207) | | 828,188 | | (31,820,874) | | 9,012,274 |
| DISTRIBUTIONS TO SHAREHOLDERS FROM: | | | | | | | |
Investment operations
| (275,161) | | (914,283) | | (2,050,156) | | (8,768,563) |
| SHAREHOLDER TRANSACTIONS: | | | | | | | |
Proceeds from shares sold
| — | | — | | 7,192,992 | | — |
Cost of shares redeemed
| (11,952,803) | | (17,746,758) | | (69,135,945) | | (254,736,487) |
Net increase (decrease) in net assets resulting from shareholder transactions
| (11,952,803) | | (17,746,758) | | (61,942,953) | | (254,736,487) |
Total increase (decrease) in net assets
| (15,101,171) | | (17,832,853) | | (95,813,983) | | (254,492,776) |
| NET ASSETS: | | | | | | | |
Beginning of period
| 26,204,006 | | 44,036,859 | | 245,233,524 | | 499,726,300 |
End of period
| $ 11,102,835 | | $ 26,204,006 | | $ 149,419,541 | | $ 245,233,524 |
| CHANGES IN SHARES OUTSTANDING: | | | | | | | |
Shares outstanding, beginning of period
| 500,002 | | 850,002 | | 4,250,002 | | 8,950,002 |
Shares sold
| — | | — | | 150,000 | | — |
Shares redeemed
| (250,000) | | (350,000) | | (1,350,000) | | (4,700,000) |
Shares outstanding, end of period
| 250,002 | | 500,002 | | 3,050,002 | | 4,250,002 |
Page 30
See Notes to Financial Statements
First Trust RiverFront
Dynamic Europe ETF (RFEU) | | First Trust RiverFront Dynamic
Emerging Markets ETF (RFEM) |
Six Months
Ended
4/30/2020
(Unaudited) | | Year
Ended
10/31/2019 | | Six Months
Ended
4/30/2020
(Unaudited) | | Year
Ended
10/31/2019 |
| | | | | | | |
| $ 245,838 | | $ 1,732,321 | | $ 310,402 | | $ 2,600,303 |
| (4,073,354) | | (7,778,919) | | (4,626,111) | | (8,404,037) |
| (628,266) | | 8,680,971 | | (3,584,488) | | 14,093,905 |
| (4,455,782) | | 2,634,373 | | (7,900,197) | | 8,290,171 |
| | | | | | | |
| (281,661) | | (1,694,053) | | (1,612,683) | | (2,069,623) |
| | | | | | | |
| — | | 8,249,517 | | — | | 9,346,520 |
| (6,108,689) | | (59,229,655) | | (13,784,797) | | (44,161,386) |
| (6,108,689) | | (50,980,138) | | (13,784,797) | | (34,814,866) |
| (10,846,132) | | (50,039,818) | | (23,297,677) | | (28,594,318) |
| | | | | | | |
| 38,666,258 | | 88,706,076 | | 72,917,248 | | 101,511,553 |
| $27,820,126 | | $ 38,666,258 | | $ 49,619,571 | | $ 72,917,248 |
| | | | | | | |
| 650,002 | | 1,550,002 | | 1,200,002 | | 1,800,002 |
| — | | 150,000 | | — | | 150,000 |
| (100,000) | | (1,050,000) | | (250,000) | | (750,000) |
| 550,002 | | 650,002 | | 950,002 | | 1,200,002 |
See Notes to Financial Statements
Page 31
First Trust Exchange-Traded Fund III
Financial Highlights
For a share outstanding throughout each period
First Trust RiverFront Dynamic Asia Pacific ETF (RFAP)
| | Six Months
Ended
4/30/2020
(Unaudited) | | Year Ended October 31, | | Period
Ended
10/31/2016 (a) |
| 2019 | | 2018 | | 2017 |
Net asset value, beginning of period
| $ 52.41 | | $ 51.81 | | $ 59.82 | | $ 52.14 | | $ 51.31 |
| Income from investment operations: | | | | | | | | | |
Net investment income (loss)
| 0.49 | | 1.22 | | 1.27 | | 1.42 | | 0.55 |
Net realized and unrealized gain (loss)
| (7.80) | | 0.65 | | (7.99) | | 7.66 | | 0.60 |
Total from investment operations
| (7.31) | | 1.87 | | (6.72) | | 9.08 | | 1.15 |
| Distributions paid to shareholders from: | | | | | | | | | |
Net investment income
| (0.69) | | (1.27) | | (1.29) | | (1.40) | | (0.32) |
Net asset value, end of period
| $44.41 | | $52.41 | | $51.81 | | $59.82 | | $52.14 |
Total return (b)
| (14.18)% | | 3.74% | | (11.48)% | | 17.77% (c) | | 2.26% |
| Ratios to average net assets/supplemental data: | | | | | | | | | |
Net assets, end of period (in 000’s)
| $ 11,103 | | $ 26,204 | | $ 44,037 | | $ 29,911 | | $ 26,071 |
Ratio of total expenses to average net assets
| 0.83% (d) | | 0.83% | | 0.83% | | 0.83% | | 0.83% (d) |
Ratio of net investment income (loss) to average net assets
| 1.44% (d) | | 2.11% | | 2.28% | | 1.93% | | 1.96% (d) |
Portfolio turnover rate (e)
| 16% | | 96% | | 136% | | 131% | | 49% |
| (a) | Inception date is April 13, 2016, which is consistent with the commencement of investment operations and is the date the initial creation units were established. |
| (b) | Total return is calculated assuming an initial investment made at the net asset value at the beginning of the period, reinvestment of all distributions at net asset value during the period, and redemption at net asset value on the last day of the period. The returns presented do not reflect the deduction of taxes that a shareholder would pay on Fund distributions or the redemption or sale of Fund shares. Total return is calculated for the time period presented and is not annualized for periods of less than a year. |
| (c) | The Fund received a reimbursement from the advisor in connection with a trade error in the amount of $7,644, which represents $0.02 per share. Since the advisor reimbursed the Fund, there was no effect on the Fund’s total return. |
| (d) | Annualized. |
| (e) | Portfolio turnover is calculated for the time period presented and is not annualized for periods of less than a year and does not include securities received or delivered from processing creations or redemptions and in-kind transactions. |
Page 32
See Notes to Financial Statements
First Trust Exchange-Traded Fund III
Financial Highlights (Continued)
For a share outstanding throughout each period
First Trust RiverFront Dynamic Developed International ETF (RFDI)
| | Six Months
Ended
4/30/2020
(Unaudited) | | Year Ended October 31, | | Period
Ended
10/31/2016 (a) |
| 2019 | | 2018 | | 2017 |
Net asset value, beginning of period
| $ 57.70 | | $ 55.84 | | $ 63.96 | | $ 51.36 | | $ 50.73 |
| Income from investment operations: | | | | | | | | | |
Net investment income (loss)
| 0.43 | | 1.54 | | 1.34 | | 0.82 | | 0.83 |
Net realized and unrealized gain (loss)
| (8.60) | | 1.81 | | (8.00) | | 12.73 | | 0.50 |
Total from investment operations
| (8.17) | | 3.35 | | (6.66) | | 13.55 | | 1.33 |
| Distributions paid to shareholders from: | | | | | | | | | |
Net investment income
| (0.54) | | (1.49) | | (1.44) | | (0.71) | | (0.70) |
Net realized gain
| — | | — | | (0.02) | | (0.24) | | — |
Total distributions
| (0.54) | | (1.49) | | (1.46) | | (0.95) | | (0.70) |
Net asset value, end of period
| $48.99 | | $57.70 | | $55.84 | | $63.96 | | $51.36 |
Total return (b)
| (14.26)% | | 6.12% | | (10.65)% | | 26.60% (c) | | 2.68% |
| Ratios to average net assets/supplemental data: | | | | | | | | | |
Net assets, end of period (in 000’s)
| $ 149,420 | | $ 245,234 | | $ 499,726 | | $ 444,522 | | $ 25,679 |
Ratio of total expenses to average net assets
| 0.83% (d) | | 0.83% | | 0.83% | | 0.83% | | 0.83% (d) |
Ratio of net investment income (loss) to average net assets
| 1.41% (d) | | 2.51% | | 2.28% | | 1.86% | | 2.97% (d) |
Portfolio turnover rate (e)
| 17% | | 87% | | 133% | | 106% | | 44% |
| (a) | Inception date is April 13, 2016, which is consistent with the commencement of investment operations and is the date the initial creation units were established. |
| (b) | Total return is calculated assuming an initial investment made at the net asset value at the beginning of the period, reinvestment of all distributions at net asset value during the period, and redemption at net asset value on the last day of the period. The returns presented do not reflect the deduction of taxes that a shareholder would pay on Fund distributions or the redemption or sale of Fund shares. Total return is calculated for the time period presented and is not annualized for periods of less than a year. |
| (c) | The Fund received a reimbursement from the advisor in the amount of $35,978, which represents less than $0.01 per share. Since the advisor reimbursed the Fund, there was no effect on the Fund’s total return. |
| (d) | Annualized. |
| (e) | Portfolio turnover is calculated for the time period presented and is not annualized for periods of less than a year and does not include securities received or delivered from processing creations or redemptions and in-kind transactions. |
See Notes to Financial Statements
Page 33
First Trust Exchange-Traded Fund III
Financial Highlights (Continued)
For a share outstanding throughout each period
First Trust RiverFront Dynamic Europe ETF (RFEU)
| | Six Months
Ended
4/30/2020
(Unaudited) | | Year Ended October 31, | | Period
Ended
10/31/2016 (a) |
| 2019 | | 2018 | | 2017 |
Net asset value, beginning of period
| $ 59.49 | | $ 57.23 | | $ 65.25 | | $ 51.17 | | $ 50.67 |
| Income from investment operations: | | | | | | | | | |
Net investment income (loss)
| 0.44 | | 1.78 | | 1.48 | | 0.82 | | 0.91 |
Net realized and unrealized gain (loss)
| (8.86) | | 2.20 | | (7.97) | | 14.86 | | 0.41 |
Total from investment operations
| (8.42) | | 3.98 | | (6.49) | | 15.68 | | 1.32 |
| Distributions paid to shareholders from: | | | | | | | | | |
Net investment income
| (0.49) | | (1.72) | | (1.53) | | (0.79) | | (0.82) |
Net realized gain
| — | | — | | — | | (0.81) | | — |
Total distributions
| (0.49) | | (1.72) | | (1.53) | | (1.60) | | (0.82) |
Net asset value, end of period
| $50.58 | | $59.49 | | $57.23 | | $65.25 | | $51.17 |
Total return (b)
| (14.23)% | | 7.01% | | (10.16)% | | 31.21% | | 2.66% |
| Ratios to average net assets/supplemental data: | | | | | | | | | |
Net assets, end of period (in 000’s)
| $ 27,820 | | $ 38,666 | | $ 88,706 | | $ 123,980 | | $ 25,585 |
Ratio of total expenses to average net assets
| 0.83% (c) | | 0.83% | | 0.83% | | 0.83% | | 0.83% (c) |
Ratio of net investment income (loss) to average net assets
| 1.47% (c) | | 2.77% | | 2.45% | | 1.71% | | 3.23% (c) |
Portfolio turnover rate (d)
| 22% | | 81% | | 130% | | 110% | | 41% |
| (a) | Inception date is April 13, 2016, which is consistent with the commencement of investment operations and is the date the initial creation units were established. |
| (b) | Total return is calculated assuming an initial investment made at the net asset value at the beginning of the period, reinvestment of all distributions at net asset value during the period, and redemption at net asset value on the last day of the period. The returns presented do not reflect the deduction of taxes that a shareholder would pay on Fund distributions or the redemption or sale of Fund shares. Total return is calculated for the time period presented and is not annualized for periods of less than a year. |
| (c) | Annualized. |
| (d) | Portfolio turnover is calculated for the time period presented and is not annualized for periods of less than a year and does not include securities received or delivered from processing creations or redemptions and in-kind transactions. |
Page 34
See Notes to Financial Statements
First Trust Exchange-Traded Fund III
Financial Highlights (Continued)
For a share outstanding throughout each period
First Trust RiverFront Dynamic Emerging Markets ETF (RFEM)
| | Six Months
Ended
4/30/2020
(Unaudited) | | Year Ended October 31, | | Period
Ended
10/31/2016 (a) |
| 2019 | | 2018 | | 2017 |
Net asset value, beginning of period
| $ 60.76 | | $ 56.40 | | $ 68.64 | | $ 56.27 | | $ 49.61 |
| Income from investment operations: | | | | | | | | | |
Net investment income (loss)
| 0.13 | | 1.79 | | 1.20 | | 0.71 | | 0.55 |
Net realized and unrealized gain (loss)
| (7.32) | | 3.94 | | (11.87) | | 13.70 | | 6.66 |
Total from investment operations
| (7.19) | | 5.73 | | (10.67) | | 14.41 | | 7.21 |
| Distributions paid to shareholders from: | | | | | | | | | |
Net investment income
| (1.34) | | (1.37) | | (1.18) | | (0.77) | | (0.55) |
Net realized gain
| — | | — | | (0.30) | | (1.27) | | — |
Return of capital
| — | | — | | (0.09) | | — | | — |
Total distributions
| (1.34) | | (1.37) | | (1.57) | | (2.04) | | (0.55) |
Net asset value, end of period
| $52.23 | | $60.76 | | $56.40 | | $68.64 | | $56.27 |
Total return (b)
| (12.39)% | | 10.32% | | (15.92)% | | 26.49% | | 14.52% |
| Ratios to average net assets/supplemental data: | | | | | | | | | |
Net assets, end of period (in 000’s)
| $ 49,620 | | $ 72,917 | | $ 101,512 | | $ 75,506 | | $ 5,628 |
Ratio of total expenses to average net assets
| 0.95% (c) | | 0.95% | | 0.95% | | 0.95% | | 0.95% (c) |
Ratio of net investment income (loss) to average net assets
| 0.96% (c) | | 2.60% | | 1.90% | | 1.56% | | 2.66% (c) |
Portfolio turnover rate (d)
| 25% | | 116% | | 126% | | 87% | | 81% |
| (a) | Inception date is June 14, 2016, which is consistent with the commencement of operations and is the date the initial creation units were established. |
| (b) | Total return is calculated assuming an initial investment made at the net asset value at the beginning of the period, reinvestment of all distributions at net asset value during the period, and redemption at net asset value on the last day of the period. The returns presented do not reflect the deduction of taxes that a shareholder would pay on Fund distributions or the redemption or sale of Fund shares. Total return is calculated for the time period presented and is not annualized for periods of less than a year. |
| (c) | Annualized. |
| (d) | Portfolio turnover is calculated for the time period presented and is not annualized for periods of less than a year and does not include securities received or delivered from processing creations or redemptions and in-kind transactions. |
See Notes to Financial Statements
Page 35
Notes to Financial Statements
First Trust Exchange-Traded Fund III
April 30, 2020 (Unaudited)
1. Organization
First Trust Exchange-Traded Fund III (the “Trust”) is an open-end management investment company organized as a Massachusetts business trust on January 9, 2008, and is registered with the Securities and Exchange Commission under the Investment Company Act of 1940, as amended (the “1940 Act”).
The Trust consists of seventeen funds that are currently offering shares. This report covers the following funds, each a series of the Trust:
First Trust RiverFront Dynamic Asia Pacific ETF – (The Nasdaq Stock Market LLC (“Nasdaq”) ticker “RFAP”)
First Trust RiverFront Dynamic Developed International ETF – (Nasdaq ticker “RFDI”)
First Trust RiverFront Dynamic Europe ETF – (Nasdaq ticker “RFEU”)
First Trust RiverFront Dynamic Emerging Markets ETF – (Nasdaq ticker “RFEM”)
Each fund represents a separate series of shares of beneficial interest in the Trust (each a “Fund” and collectively, the “Funds”). Each Fund’s shares are currently listed and traded on Nasdaq. Unlike conventional mutual funds, each Fund issues and redeems shares on a continuous basis, at net asset value (“NAV”), only in large specified blocks consisting of 50,000 shares called a “Creation Unit.” Creation Units are generally issued and redeemed in-kind for securities in which a Fund invests and, in certain circumstances, for cash, and only to and from broker-dealers and large institutional investors that have entered into participation agreements. Except when aggregated in Creation Units, the shares are not redeemable securities of a Fund.
Each Fund is an actively managed exchange-traded fund. The investment objective of each Fund is to provide capital appreciation.
Under normal market conditions, RFAP seeks to achieve its investment objective by investing at least 80% of its net assets (including investment borrowings) in a portfolio of equity securities of Asian Pacific companies, including through investments in common stocks, depositary receipts, common and preferred shares of real estate investment trusts (“REITs”), and forward foreign currency contracts and currency spot transactions used to hedge the Fund’s exposure to the currencies in which the equity securities of such Asian Pacific companies are denominated.
Under normal market conditions, RFDI seeks to achieve its investment objective by investing at least 80% of its net assets (including investment borrowings) in a portfolio of equity securities of developed market companies, including through investments in common stocks, depositary receipts, common and preferred shares of REITs, and forward foreign currency contracts and currency spot transactions used to hedge the Fund’s exposure to the currencies in which the equity securities of such developed market companies are denominated.
Under normal market conditions, RFEU seeks to achieve its investment objective by investing at least 80% of its net assets (including investment borrowings) in a portfolio of equity securities of European companies, including through investments in common stocks, depositary receipts, common and preferred shares of REITs, and forward foreign currency contracts and currency spot transactions used to hedge the Fund’s exposure to the currencies in which the equity securities of such European companies are denominated.
Under normal market conditions, RFEM seeks to achieve its investment objective by investing at least 80% of its net assets (including investment borrowings) in a portfolio of equity securities of emerging market companies, including through investments in common stocks, depositary receipts, common and preferred shares of REITs, and forward foreign currency contracts and currency spot transactions used to hedge the Fund’s exposure to the currencies in which the equity securities of such emerging market companies are denominated.
There can be no assurance that a Fund will achieve its investment objective. The Funds may not be appropriate for all investors.
2. Significant Accounting Policies
The Funds are each considered an investment company and follow accounting and reporting guidance under Financial Accounting Standards Board Accounting Standards Codification Topic 946, “Financial Services-Investment Companies.” The following is a summary of significant accounting policies consistently followed by the Funds in the preparation of the financial statements. The preparation of the financial statements in accordance with accounting principles generally accepted in the United States of America (“U.S. GAAP”) requires management to make estimates and assumptions that affect the reported amounts and disclosures in the financial statements. Actual results could differ from those estimates.
A. Portfolio Valuation
Each Fund’s NAV is determined daily as of the close of regular trading on the New York Stock Exchange (“NYSE”), normally 4:00 p.m. Eastern time, on each day the NYSE is open for trading. If the NYSE closes early on a valuation day, the NAV is determined
Notes to Financial Statements (Continued)
First Trust Exchange-Traded Fund III
April 30, 2020 (Unaudited)
as of that time. Foreign securities are priced using data reflecting the earlier closing of the principal markets for those securities. Each Fund’s NAV is calculated by dividing the value of all assets of each Fund (including accrued interest and dividends), less all liabilities (including accrued expenses and dividends declared but unpaid), by the total number of shares outstanding.
Each Fund’s investments are valued daily at market value or, in the absence of market value with respect to any portfolio securities, at fair value. Market value prices represent last sale or official closing prices from a national or foreign exchange (i.e., a regulated market) and are primarily obtained from third-party pricing services. Fair value prices represent any prices not considered market value prices and are either obtained from a third-party pricing service or are determined by the Pricing Committee of the Funds’ investment advisor, First Trust Advisors L.P. (“First Trust” or the “Advisor”), in accordance with valuation procedures adopted by the Trust’s Board of Trustees, and in accordance with provisions of the 1940 Act. Investments valued by the Advisor’s Pricing Committee, if any, are footnoted as such in the footnotes to the Portfolio of Investments. Each Fund’s investments are valued as follows:
Common stocks, REITs, and other equity securities listed on any national or foreign exchange (excluding Nasdaq and the London Stock Exchange Alternative Investment Market (“AIM”)) are valued at the last sale price on the exchange on which they are principally traded or, for Nasdaq and AIM securities, the official closing price. Securities traded on more than one securities exchange are valued at the last sale price or official closing price, as applicable, at the close of the securities exchange representing the principal market for such securities.
Securities traded in an over-the-counter market are fair valued at the mean of their most recent bid and asked price, if available, and otherwise at their closing bid price.
Certain securities may not be able to be priced by pre-established pricing methods. Such securities may be valued by the Trust’s Board of Trustees or its delegate, the Advisor’s Pricing Committee, at fair value. These securities generally include, but are not limited to, restricted securities (securities which may not be publicly sold without registration under the Securities Act of 1933, as amended) for which a third-party pricing service is unable to provide a market price; securities whose trading has been formally suspended; a security whose market or fair value price is not available from a pre-established pricing source; a security with respect to which an event has occurred that is likely to materially affect the value of the security after the market has closed but before the calculation of a Fund’s NAV or make it difficult or impossible to obtain a reliable market quotation; and a security whose price, as provided by the third-party pricing service, does not reflect the security’s fair value. As a general principle, the current fair value of a security would appear to be the amount which the owner might reasonably expect to receive for the security upon its current sale. When fair value prices are used, generally they will differ from market quotations or official closing prices on the applicable exchanges. A variety of factors may be considered in determining the fair value of such securities, including, but not limited to, the following:
| 1) | the type of security; |
| 2) | the size of the holding; |
| 3) | the initial cost of the security; |
| 4) | transactions in comparable securities; |
| 5) | price quotes from dealers and/or third-party pricing services; |
| 6) | relationships among various securities; |
| 7) | information obtained by contacting the issuer, analysts, or the appropriate stock exchange; |
| 8) | an analysis of the issuer’s financial statements; and |
| 9) | the existence of merger proposals or tender offers that might affect the value of the security. |
If the securities in question are foreign securities, the following additional information may be considered:
| 1) | the value of similar foreign securities traded on other foreign markets; |
| 2) | ADR trading of similar securities; |
| 3) | closed-end fund or exchange-traded fund trading of similar securities; |
| 4) | foreign currency exchange activity; |
| 5) | the trading prices of financial products that are tied to baskets of foreign securities; |
| 6) | factors relating to the event that precipitated the pricing problem; |
| 7) | whether the event is likely to recur; and |
| 8) | whether the effects of the event are isolated or whether they affect entire markets, countries or regions. |
Because foreign markets may be open on different days than the days during which investors may transact in the shares of a Fund, the value of the Fund’s securities may change on the days when investors are not able to transact in the shares of the Fund. The value of securities denominated in foreign currencies is converted into U.S. dollars using exchange rates determined daily as of the close of regular trading on the NYSE.
Notes to Financial Statements (Continued)
First Trust Exchange-Traded Fund III
April 30, 2020 (Unaudited)
The Funds are subject to fair value accounting standards that define fair value, establish the framework for measuring fair value and provide a three-level hierarchy for fair valuation based upon the inputs to the valuation as of the measurement date. The three levels of the fair value hierarchy are as follows:
| • | Level 1 – Level 1 inputs are quoted prices in active markets for identical investments. An active market is a market in which transactions for the investment occur with sufficient frequency and volume to provide pricing information on an ongoing basis. |
| • | Level 2 – Level 2 inputs are observable inputs, either directly or indirectly, and include the following: |
| o | Quoted prices for similar investments in active markets. |
| o | Quoted prices for identical or similar investments in markets that are non-active. A non-active market is a market where there are few transactions for the investment, the prices are not current, or price quotations vary substantially either over time or among market makers, or in which little information is released publicly. |
| o | Inputs other than quoted prices that are observable for the investment (for example, interest rates and yield curves observable at commonly quoted intervals, volatilities, prepayment speeds, loss severities, credit risks, and default rates). |
| o | Inputs that are derived principally from or corroborated by observable market data by correlation or other means. |
| • | Level 3 – Level 3 inputs are unobservable inputs. Unobservable inputs may reflect the reporting entity’s own assumptions about the assumptions that market participants would use in pricing the investment. |
The inputs or methodologies used for valuing investments are not necessarily an indication of the risk associated with investing in those investments. A summary of the inputs used to value each Fund’s investments as of April 30, 2020, is included with each Fund’s Portfolio of Investments.
B. Securities Transactions and Investment Income
Securities transactions are recorded as of the trade date. Realized gains and losses from securities transactions are recorded on the identified cost basis. Dividend income is recorded on the ex-dividend date except that certain dividends from foreign securities are recorded as soon as the information becomes available after the ex-dividend date. Interest income, if any, is recorded on the accrual basis.
Withholding taxes and tax reclaims on foreign dividends have been provided for in accordance with each Fund’s understanding of the applicable country’s tax rules and rates.
Distributions received from a Fund’s investments in REITs may be comprised of return of capital, capital gains, and income. The actual character of the amounts received during the year are not known until after the REITs’ fiscal year end. A Fund records the character of distributions received from the REITs during the year based on estimates available. The characterization of distributions received by a Fund may be subsequently revised based on information received from the REITs after their tax reporting periods conclude.
C. Foreign Currency
The books and records of the Funds are maintained in U.S. dollars. Foreign currencies, investments and other assets and liabilities are translated into U.S. dollars at the exchange rates prevailing at the end of the period. Purchases and sales of investments and items of income and expense are translated on the respective dates of such transactions. Unrealized gains and losses on assets and liabilities, other than investments in securities, which result from changes in foreign currency exchange rates have been included in “Net change in unrealized appreciation (depreciation) on foreign currency translation” on the Statements of Operations. Unrealized gains and losses on investments in securities which result from changes in foreign exchange rates are included with fluctuations arising from changes in market price and are included in “Net change in unrealized appreciation (depreciation) on investments” on the Statements of Operations. Net realized foreign currency gains and losses include the effect of changes in exchange rates between trade date and settlement date on investment security transactions, foreign currency transactions and interest and dividends received and are included in “Net realized gain (loss) on foreign currency transactions” on the Statements of Operations. The portion of foreign currency gains and losses related to fluctuations in exchange rates between the initial purchase settlement date and subsequent sale trade date is included in “Net realized gain (loss) on investments” on the Statements of Operations.
D. Dividends and Distributions to Shareholders
Dividends from net investment income, if any, are declared and paid quarterly by each Fund, or as the Board of Trustees may determine from time to time. Distributions of net realized capital gains earned by each Fund, if any, are distributed at least annually.
Notes to Financial Statements (Continued)
First Trust Exchange-Traded Fund III
April 30, 2020 (Unaudited)
Distributions from net investment income and realized capital gains are determined in accordance with federal income tax regulations, which may differ from U.S. GAAP. Certain capital accounts in the financial statements are periodically adjusted for permanent differences in order to reflect their tax character. These permanent differences are primarily due to the varying treatment of income and gain/loss on portfolio securities held by the Funds and have no impact on net assets or NAV per share. Temporary differences, which arise from recognizing certain items of income, expense and gain/loss in different periods for financial statement and tax purposes, will reverse at some time in the future.
The tax character of distributions paid by each Fund during the fiscal year ended October 31, 2019, was as follows:
| | Distributions
paid from
Ordinary
Income | | Distributions
paid from
Capital
Gains | | Distributions
paid from
Return of
Capital |
First Trust RiverFront Dynamic Asia Pacific ETF
| $ 914,283 | | $ — | | $ — |
First Trust RiverFront Dynamic Developed International ETF
| 8,768,563 | | — | | — |
First Trust RiverFront Dynamic Europe ETF
| 1,694,053 | | — | | — |
First Trust RiverFront Dynamic Emerging Markets ETF
| 2,069,623 | | — | | — |
As of October 31, 2019, the components of distributable earnings on a tax basis for each Fund were as follows:
| | Undistributed
Ordinary
Income | | Accumulated
Capital and
Other
Gain (Loss) | | Net
Unrealized
Appreciation
(Depreciation) |
First Trust RiverFront Dynamic Asia Pacific ETF
| $ 210,440 | | $ (8,265,872) | | $ (455,652) |
First Trust RiverFront Dynamic Developed International ETF
| 1,289,366 | | (57,671,472) | | (1,924,280) |
First Trust RiverFront Dynamic Europe ETF
| 131,313 | | (11,023,420) | | (454,574) |
First Trust RiverFront Dynamic Emerging Markets ETF
| 1,260,997 | | (18,808,724) | | (176,617) |
E. Income and Other Taxes
Each Fund intends to continue to qualify as a regulated investment company by complying with the requirements under Subchapter M of the Internal Revenue Code of 1986, as amended, which includes distributing substantially all of its net investment income and net realized gains to shareholders. Accordingly, no provision has been made for federal and state income taxes. However, due to the timing and amount of distributions, each Fund may be subject to an excise tax of 4% of the amount by which approximately 98% of each Fund’s taxable income exceeds the distributions from such taxable income for the calendar year.
Certain countries assess a capital gains tax on securities sold in their local markets. This tax is accrued as the securities in these foreign markets appreciate in value and is paid at the time of sale to the extent a capital gain is realized. Taxes accrued on securities in an unrealized appreciation position are included in “Net change in unrealized appreciation (depreciation) on deferred foreign capital gains tax” on the Statements of Operations. The capital gains tax paid on securities sold is included in “Net realized gain (loss) on foreign capital gains tax” on the Statements of Operations.
India’s Finance Bill, 2018 (“Finance Bill, 2018”) was enacted into law on March 29, 2018 and amongst other provisions, it introduced a long-term capital gains tax beginning April 1, 2018. Long-term capital gains on the sale of listed shares in excess of INR 0.1 million are taxed at the rate of 10% (plus applicable surcharge and cess (which is a type of tax)) subject to satisfaction of certain conditions. Long-term capital gains accruing as of January 31, 2018 are considered exempt due to a grandfather clause in the provision. The aforesaid exemption from long-term capital gains tax is available with respect to shares acquired after October 1, 2004 and on or before March 31, 2018 only if on such acquisitions Securities Transaction Tax (“STT”) was chargeable. Certain exceptions in this regard, such as acquisition of shares in a public offer, bonus, rights issued, etc. for which the condition of chargeability of STT on acquisition is not applicable, have been notified.
In the case of the sale of listed shares held by a Fund for one year or less, the income is classified as short-term capital gains and is taxable at 15% (plus applicable surcharge and cess) provided the shares are sold on the stock exchange and subjected to STT. For above purposes, the applicable rate of surcharge is 2% or 5% (depending on the level of income of the Fund). The Finance Bill, 2018 increases the cess imposed on the sum of tax and surcharge from 3% to 4%. The cess 4% rate is applied to the capital gains tax, resulting in a higher effective rate of capital gains tax.
Notes to Financial Statements (Continued)
First Trust Exchange-Traded Fund III
April 30, 2020 (Unaudited)
Where the sale of shares is outside the stock exchange and not subject to STT, the long-term capital gains are taxed at 10% (plus applicable surcharge and cess) and short-term capital gains are taxed at 30% (plus applicable surcharge and cess). The Finance Bill, 2018, approves the carry forward of long-term capital losses to be offset against long-term capital gains. Short-term losses can be netted against both short-term gains and long-term gains.
Until March 31, 2020, dividends received by a Fund from Indian companies were exempt from tax in India because Indian companies were required to pay dividend distribution tax. The Indian Finance Act, 2020 has amended the dividend taxation framework effective April 1, 2020 and accordingly dividends would now be taxable in the hands of the shareholders at 20%, plus applicable surcharge and cess. There is an anomaly in the rates of surcharge applicable to non-resident taxpayers such as regulated investment trusts. While the intention of the legislation seems to be to cap the surcharge on dividend tax to 15%, the enabling rule provides for a surcharge at a graded scale with a cap of 37%.
Considering the above, the highest effective tax rate on dividend income arising to a Fund could be 28.50% though the rate should be 23.92% if the surcharge is capped at 15%. Note that a Fund can obtain the reduced withholding tax rate of 25% under the US-India tax treaty if a Fund is considered as a tax resident of the United States and qualifies for treaty benefits.
Even if a Fund is eligible for treaty benefits, Indian companies will still be required to withhold tax at the domestic law rate, disregarding the treaty rates. Any excess taxes withheld can be off-set against capital gains tax liability during the year or claimed as a refund in the annual tax return.
Please note that the above description is based on current provisions of Indian law, and any change or modification made by subsequent legislation, regulation, or administrative or judicial decision could increase the Indian tax liability of a Fund and thus reduce the return to a Fund’s shareholders. There can be no assurance that the Indian tax authorities and/or regulators will not take a position contrary to the views expressed herein. If the Indian tax authorities and/or regulators take a position contrary to the views expressed herein, adverse unpredictable consequences may follow.
The Funds are subject to accounting standards that establish a minimum threshold for recognizing, and a system for measuring, the benefits of a tax position taken or expected to be taken in a tax return. Taxable years ended 2016, 2017, 2018, and 2019 remain open to federal and state audit. As of April 30, 2020, management has evaluated the application of these standards to the Funds and has determined that no provision for income tax is required in the Funds’ financial statements for uncertain tax positions.
The Funds intend to utilize provisions of the federal income tax laws, which allow them to carry a realized capital loss forward indefinitely following the year of the loss and offset such loss against any future realized capital gains. The Funds are subject to certain limitations under U.S. tax rules on the use of capital loss carryforwards and net unrealized built-in losses. These limitations apply when there has been a 50% change in ownership. At October 31, 2019, the Funds had non-expiring capital loss carryforwards for federal income tax purposes as follows:
| | Capital
Loss Available |
First Trust RiverFront Dynamic Asia Pacific ETF
| $ 8,265,872 |
First Trust RiverFront Dynamic Developed International ETF
| 57,671,472 |
First Trust RiverFront Dynamic Europe ETF
| 11,023,420 |
First Trust RiverFront Dynamic Emerging Markets ETF
| 18,808,724 |
F. Expenses
Expenses, other than the investment advisory fee and other excluded expenses, are paid by the Advisor (See Note 3).
3. Investment Advisory Fee, Affiliated Transactions and Other Fee Arrangements
First Trust, the investment advisor to the Funds, is a limited partnership with one limited partner, Grace Partners of DuPage L.P., and one general partner, The Charger Corporation. The Charger Corporation is an Illinois corporation controlled by James A. Bowen, Chief Executive Officer of First Trust. First Trust is responsible for supervising the selection and ongoing monitoring of the securities in each Fund’s portfolio, managing the Funds’ business affairs and providing certain administrative services necessary for the management of the Funds.
Pursuant to the Investment Management Agreement between First Trust and the Trust, First Trust supervises the investment of the Funds’ assets and is responsible for the expenses of each Fund including the cost of transfer agency, sub-advisory, custody, fund administration, legal, audit and other services, but excluding fee payments under the Investment Management Agreement, interest, taxes, brokerage commissions, acquired fund fees and expenses, if any, distribution and service fees payable pursuant to Rule 12b-1
Notes to Financial Statements (Continued)
First Trust Exchange-Traded Fund III
April 30, 2020 (Unaudited)
plan, if any, expenses associated with the execution of portfolio transactions, and extraordinary expenses, which are paid by each respective Fund. RFAP, RFDI and RFEU have each agreed to pay First Trust an annual unitary management fee equal to 0.83% its average daily net assets. RFEM has agreed to pay First Trust an annual unitary management fee equal to 0.95% of its average daily net assets. First Trust also provides fund reporting services to each Fund for a flat annual fee in the amount of $9,250, which is covered under the annual unitary management fee.
RiverFront Investment Group, LLC (“RiverFront” or the “Sub-Advisor”) serves as the Funds’ sub-advisor and manages each Fund’s portfolio subject to First Trust’s supervision. The Sub-Advisor receives a monthly portfolio management fee calculated at an annual rate of 0.35% of each Fund’s average daily net assets that is paid by First Trust out of its investment advisory fee.
The Trust has multiple service agreements with Brown Brothers Harriman & Co. (“BBH”). Under the service agreements, BBH performs custodial, fund accounting, certain administrative services, and transfer agency services for the Funds. As custodian, BBH is responsible for custody of each Fund’s assets. As fund accountant and administrator, BBH is responsible for maintaining the books and records of each Fund’s securities and cash. As transfer agent, BBH is responsible for maintaining shareholder records for each Fund.
Each Trustee who is not an officer or employee of First Trust, any sub-advisor or any of their affiliates (“Independent Trustees”) is paid a fixed annual retainer that is allocated equally among each fund in the First Trust Fund Complex. Each Independent Trustee is also paid an annual per fund fee that varies based on whether the fund is a closed-end or other actively managed fund, a defined-outcome fund or an index fund.
Additionally, the Lead Independent Trustee and the Chairmen of the Audit Committee, Nominating and Governance Committee and Valuation Committee are paid annual fees to serve in such capacities, with such compensation allocated pro rata among each fund in the First Trust Fund Complex based on net assets. Independent Trustees are reimbursed for travel and out-of-pocket expenses in connection with all meetings. The Lead Independent Trustee and Committee Chairmen rotate every three years. The officers and “Interested” Trustee receive no compensation from the Trust for acting in such capacities.
4. Purchases and Sales of Securities
For the six months ended April 30, 2020, the cost of purchases and proceeds from sales of investment securities for each Fund, excluding short-term investments and in-kind transactions, were as follows:
| | Purchases | | Sales |
| First Trust RiverFront Dynamic Asia Pacific ETF | $ 3,031,455 | | $ 3,747,533 |
| First Trust RiverFront Dynamic Developed International ETF | 35,747,286 | | 36,041,004 |
| First Trust RiverFront Dynamic Europe ETF | 7,541,476 | | 7,315,612 |
| First Trust RiverFront Dynamic Emerging Markets ETF | 16,141,165 | | 23,509,663 |
| | | | |
For the six months ended April 30, 2020, the cost of in-kind purchases and proceeds from in-kind sales for each Fund were as follows:
| | Purchases | | Sales |
| First Trust RiverFront Dynamic Asia Pacific ETF | $ — | | $ 11,354,758 |
| First Trust RiverFront Dynamic Developed International ETF | 6,777,932 | | 68,362,378 |
| First Trust RiverFront Dynamic Europe ETF | — | | 6,061,051 |
| First Trust RiverFront Dynamic Emerging Markets ETF | — | | 7,654,288 |
5. Creations, Redemptions and Transaction Fees
Shares are created and redeemed by each Fund only in Creation Unit size aggregations of 50,000 shares in transactions with broker-dealers or large institutional investors that have entered into a participation agreement (an “Authorized Participant”). In order to purchase Creation Units of a Fund, an Authorized Participant must deposit (i) a designated portfolio of securities and other instruments determined by First Trust (the “Deposit Securities”) and generally make or receive a cash payment referred to as the “Cash Component,” which is an amount equal to the difference between the NAV of the Fund shares (per Creation Unit Aggregations) and the market value of the Deposit Securities, and/or (ii) cash in lieu of all or a portion of the Deposit Securities. If the Cash Component is a positive number (i.e., the NAV per Creation Unit Aggregation exceeds the Deposit Amount), the Authorized Participant will deliver the Cash Component. If the Cash Component is a negative number (i.e., the NAV per Creation Unit Aggregation is less than the Deposit Amount), the Authorized Participant will receive the Cash Component. Authorized Participants purchasing Creation Units must pay to BBH, as transfer agent, a creation transaction fee (the “Creation Transaction Fee”) regardless of the number of Creation
Notes to Financial Statements (Continued)
First Trust Exchange-Traded Fund III
April 30, 2020 (Unaudited)
Units purchased in the transaction. The Creation Transaction Fee may vary and is based on the composition of the securities included in the respective Fund’s portfolio and the countries in which the transactions are settled. The Creation Transaction Fee may increase or decrease with changes in each Fund’s portfolio. The price for each Creation Unit will equal the daily NAV per share times the number of shares in a Creation Unit plus the fees described above and, if applicable, any operational processing and brokerage costs, transfer fees or stamp taxes. When a Fund permits an Authorized Participant to substitute cash or a different security in lieu of depositing one or more of the requisite Deposit Securities, the Authorized Participant may also be assessed an amount to cover the cost of purchasing the Deposit Securities and/or disposing of the substituted securities, including operational processing and brokerage costs, transfer fees, stamp taxes, and part or all of the spread between the expected bid and offer side of the market related to such Deposit Securities and/or substitute securities.
Authorized Participants redeeming Creation Units must pay to BBH, as transfer agent, a redemption transaction fee (the “Redemption Transaction Fee”), regardless of the number of Creation Units redeemed in the transaction. The Redemption Transaction Fee may vary and is based on the composition of the securities included in the respective Fund’s portfolio and the countries in which the transactions are settled. The Redemption Transaction Fee may increase or decrease with changes in each Fund’s portfolio. Each Fund reserves the right to effect redemptions in cash. An Authorized Participant may request cash redemption in lieu of securities; however, a Fund may, in its discretion, reject any such request.
6. Distribution Plan
The Board of Trustees adopted a Distribution and Service Plan pursuant to Rule 12b-1 under the 1940 Act. In accordance with the Rule 12b-1 plan, each Fund is authorized to pay an amount up to 0.25% of its average daily net assets each year to reimburse First Trust Portfolios L.P. (“FTP”), the distributor of the Funds, for amounts expended to finance activities primarily intended to result in the sale of Creation Units or to provide investor services. FTP may also use this amount to compensate securities dealers or other persons that are Authorized Participants for providing distribution assistance, including broker-dealer and shareholder support and educational and promotional services.
No 12b-1 fees are currently paid by the Funds, and pursuant to a contractual arrangement, no 12b-1 fees will be paid any time before February 28, 2021.
7. Indemnification
The Trust, on behalf of the Funds, has a variety of indemnification obligations under contracts with its service providers. The Trust’s maximum exposure under these arrangements is unknown. However, the Trust has not had prior claims or losses pursuant to these contracts and expects the risk of loss to be remote.
8. Subsequent Events
Management has evaluated the impact of all subsequent events to the Funds through the date the financial statements were issued, and has determined that there were no subsequent events requiring recognition or disclosure in the financial statements that have not already been disclosed.
Additional Information
First Trust Exchange-Traded Fund III
April 30, 2020 (Unaudited)
Proxy Voting Policies and Procedures
A description of the policies and procedures that the Trust uses to determine how to vote proxies and information on how each Fund voted proxies relating to portfolio investments during the most recent 12-month period ended June 30 is available (1) without charge, upon request, by calling (800) 988-5891; (2) on each Fund’s website at www.ftportfolios.com; and (3) on the Securities and Exchange Commission’s (“SEC”) website at www.sec.gov.
Portfolio Holdings
Each Fund files portfolio holdings information for each month in a fiscal quarter within 60 days after the end of the relevant fiscal quarter on Form N-PORT. Portfolio holdings information for the third month of each fiscal quarter will be publicly available on the SEC’s website at www.sec.gov. Each Fund’s complete schedule of portfolio holdings for the second and fourth quarters of each fiscal year is included in the semi-annual and annual reports to shareholders, respectively, and is filed with the SEC on Form N-CSR. The semi-annual and annual report for each Fund is available to investors within 60 days after the period to which it relates. Each Fund’s Forms N-PORT and Forms N-CSR are available on the SEC’s website listed above.
Risk Considerations
Risks are inherent in all investing. Certain general risks that may be applicable to a Fund are identified below, but not all of the material risks relevant to each Fund are included in this report and not all of the risks below apply to each Fund. The material risks of investing in each Fund are spelled out in its prospectus, statement of additional information and other regulatory filings. Before investing, you should consider each Fund’s investment objective, risks, charges and expenses, and read each Fund’s prospectus and statement of additional information carefully. You can download each Fund’s prospectus at www.ftportfolios.com or contact First Trust Portfolios L.P. at (800) 621-1675 to request a prospectus, which contains this and other information about each Fund.
Concentration Risk. To the extent that a fund is able to invest a large percentage of its assets in a single asset class or the securities of issuers within the same country, state, region, industry or sector, an adverse economic, business or political development may affect the value of the fund’s investments more than if the fund were more broadly diversified. A fund that tracks an index will be concentrated to the extent the fund’s corresponding index is concentrated. A concentration makes a fund more susceptible to any single occurrence and may subject the fund to greater market risk than a fund that is not concentrated.
Credit Risk. Credit risk is the risk that an issuer of a security will be unable or unwilling to make dividend, interest and/or principal payments when due and the related risk that the value of a security may decline because of concerns about the issuer’s ability to make such payments.
Cyber Security Risk. The funds are susceptible to potential operational risks through breaches in cyber security. A breach in cyber security refers to both intentional and unintentional events that may cause a fund to lose proprietary information, suffer data corruption or lose operational capacity. Such events could cause a fund to incur regulatory penalties, reputational damage, additional compliance costs associated with corrective measures and/or financial loss. In addition, cyber security breaches of a fund’s third-party service providers, such as its administrator, transfer agent, custodian, or sub-advisor, as applicable, or issuers in which the fund invests, can also subject a fund to many of the same risks associated with direct cyber security breaches.
Derivatives Risk. To the extent a fund uses derivative instruments such as futures contracts, options contracts and swaps, the fund may experience losses because of adverse movements in the price or value of the underlying asset, index or rate, which may be magnified by certain features of the derivative. These risks are heightened when a fund’s portfolio managers use derivatives to enhance the fund’s return or as a substitute for a position or security, rather than solely to hedge (or offset) the risk of a position or security held by the fund.
Equity Securities Risk. To the extent a fund invests in equity securities, the value of the fund’s shares will fluctuate with changes in the value of the equity securities. Equity securities prices fluctuate for several reasons, including changes in investors’ perceptions of the financial condition of an issuer or the general condition of the relevant stock market, such as market volatility, or when political or economic events affecting the issuers occur. In addition, common stock prices may be particularly sensitive to rising interest rates, as the cost of capital rises and borrowing costs increase. Equity securities may decline significantly in price over short or extended periods of time, and such declines may occur in the equity market as a whole, or they may occur in only a particular country, company, industry or sector of the market.
ETF Risk. The shares of an ETF trade like common stock and represent an interest in a portfolio of securities. The risks of owning an ETF generally reflect the risks of owning the underlying securities, although lack of liquidity in an ETF could result in it being more volatile and ETFs have management fees that increase their costs. Shares of an ETF trade on an exchange at market prices rather than
Additional Information (Continued)
First Trust Exchange-Traded Fund III
April 30, 2020 (Unaudited)
net asset value, which may cause the shares to trade at a price greater than net asset value (premium) or less than net asset value (discount). In times of market stress, decisions by market makers to reduce or step away from their role of providing a market for an ETF’s shares, or decisions by an ETF’s authorized participants that they are unable or unwilling to proceed with creation and/or redemption orders of an ETF’s shares, could result in shares of the ETF trading at a discount to net asset value and in greater than normal intraday bid-ask spreads.
Fixed Income Securities Risk. To the extent a fund invests in fixed income securities, the fund will be subject to credit risk, income risk, interest rate risk, liquidity risk and prepayment risk. Income risk is the risk that income from a fund’s fixed income investments could decline during periods of falling interest rates. Interest rate risk is the risk that the value of a fund’s fixed income securities will decline because of rising interest rates. Liquidity risk is the risk that a security cannot be purchased or sold at the time desired, or cannot be purchased or sold without adversely affecting the price. Prepayment risk is the risk that the securities will be redeemed or prepaid by the issuer, resulting in lower interest payments received by the fund. In addition to these risks, high yield securities, or “junk” bonds, are subject to greater market fluctuations and risk of loss than securities with higher ratings, and the market for high yield securities is generally smaller and less liquid than that for investment grade securities.
Index Constituent Risk. Certain funds may be a constituent of one or more indices. As a result, such a fund may be included in one or more index-tracking exchange-traded funds or mutual funds. Being a component security of such a vehicle could greatly affect the trading activity involving a fund, the size of the fund and the market volatility of the fund. Inclusion in an index could significantly increase demand for the fund and removal from an index could result in outsized selling activity in a relatively short period of time. As a result, a fund’s net asset value could be negatively impacted and the fund’s market price may be significantly below its net asset value during certain periods.
Index Provider Risk. To the extent a fund seeks to track an index, it is subject to Index Provider Risk. There is no assurance that the Index Provider will compile the Index accurately, or that the Index will be determined, maintained, constructed, reconstituted, rebalanced, composed, calculated or disseminated accurately. To correct any such error, the Index Provider may carry out an unscheduled rebalance or other modification of the Index constituents or weightings, which may increase the fund’s costs. The Index Provider does not provide any representation or warranty in relation to the quality, accuracy or completeness of data in the Index, and it does not guarantee that the Index will be calculated in accordance with its stated methodology. Losses or costs associated with any Index Provider errors generally will be borne by the fund and its shareholders.
Investment Companies Risk. To the extent a fund invests in the securities of other investment vehicles, the fund will incur additional fees and expenses that would not be present in a direct investment in those investment vehicles. Furthermore, the fund’s investment performance and risks are directly related to the investment performance and risks of the investment vehicles in which the fund invests.
LIBOR Risk. To the extent a fund invests in floating or variable rate obligations that use the London Interbank Offered Rate (“LIBOR”) as a reference interest rate, it is subject to LIBOR Risk. In 2017, the United Kingdom’s Financial Conduct Authority announced that LIBOR will cease to be available for use after 2021. The unavailability or replacement of LIBOR may affect the value, liquidity or return on certain fund investments and may result in costs incurred in connection with closing out positions and entering into new trades. Any potential effects of the transition away from LIBOR on the fund or on certain instruments in which the fund invests can be difficult to ascertain, and they may vary depending on a variety of factors. Any such effects of the transition away from LIBOR, as well as other unforeseen effects, could result in losses to the fund.
Management Risk. To the extent that a fund is actively managed, it is subject to management risk. In managing an actively-managed fund’s investment portfolio, the fund’s portfolio managers will apply investment techniques and risk analyses that may not have the desired result. There can be no guarantee that a fund will meet its investment objective.
Market Risk. Securities held by a fund, as well as shares of a fund itself, are subject to market fluctuations caused by factors such as general economic conditions, political events, regulatory or market developments, changes in interest rates and perceived trends in securities prices. Shares of a fund could decline in value or underperform other investments as a result of the risk of loss associated with these market fluctuations. In addition, local, regional or global events such as war, acts of terrorism, spread of infectious diseases or other public health issues, recessions, or other events could have a significant negative impact on a fund and its investments. Such events may affect certain geographic regions, countries, sectors and industries more significantly than others. The outbreak of the respiratory disease designated as COVID-19 in December 2019 has caused significant volatility and declines in global financial markets, which have caused losses for investors. The COVID-19 pandemic may last for an extended period of time and will continue to impact the economy for the foreseeable future.
Non-U.S. Securities Risk. To the extent a fund invests in non-U.S. securities, it is subject to additional risks not associated with securities of domestic issuers. Non-U.S. securities are subject to higher volatility than securities of domestic issuers due to: possible adverse political, social or economic developments; restrictions on foreign investment or exchange of securities; lack of liquidity;
Additional Information (Continued)
First Trust Exchange-Traded Fund III
April 30, 2020 (Unaudited)
currency exchange rates; excessive taxation; government seizure of assets; different legal or accounting standards; and less government supervision and regulation of exchanges in foreign countries. Investments in non-U.S. securities may involve higher costs than investments in U.S. securities, including higher transaction and custody costs, as well as additional taxes imposed by non-U.S. governments. These risks may be heightened for securities of companies located, or with significant operations, in emerging market countries.
Passive Investment Risk. To the extent a fund seeks to track an index, the fund will invest in the securities included in, or representative of, the index regardless of their investment merit. A fund generally will not attempt to take defensive positions in declining markets.
| NOT FDIC INSURED | NOT BANK GUARANTEED | MAY LOSE VALUE |
This page intentionally left blank
This page intentionally left blank
This page intentionally left blank
First Trust Exchange-Traded Fund III
INVESTMENT ADVISOR
First Trust Advisors L.P.
120 East Liberty Drive, Suite 400
Wheaton, IL 60187
INVESTMENT SUB-ADVISOR
RiverFront Investment Group, LLC
1214 E. Cary Street
Richmond, VA 23219
ADMINISTRATOR, CUSTODIAN,
FUND ACCOUNTANT &
TRANSFER AGENT
Brown Brothers Harriman & Co.
50 Post Office Square
Boston, MA 02110
INDEPENDENT REGISTERED
PUBLIC ACCOUNTING FIRM
Deloitte & Touche LLP
111 S. Wacker Drive
Chicago, IL 60606
LEGAL COUNSEL
Chapman and Cutler LLP
111 W. Monroe Street
Chicago, IL 60603
First Trust Exchange-Traded Fund III
First Trust Institutional Preferred Securities and Income ETF (FPEI)
Semi-Annual Report
For the Six Months Ended
April 30, 2020
First Trust Institutional Preferred Securities and Income ETF (FPEI)
Semi-Annual Report
April 30, 2020
Caution Regarding Forward-Looking Statements
This report contains certain forward-looking statements within the meaning of the Securities Act of 1933, as amended, and the Securities Exchange Act of 1934, as amended. Forward-looking statements include statements regarding the goals, beliefs, plans or current expectations of First Trust Advisors L.P. (“First Trust” or the “Advisor”) and/or Stonebridge Advisors LLC (“Stonebridge” or the “Sub-Advisor”) and their respective representatives, taking into account the information currently available to them. Forward-looking statements include all statements that do not relate solely to current or historical fact. For example, forward-looking statements include the use of words such as “anticipate,” “estimate,” “intend,” “expect,” “believe,” “plan,” “may,” “should,” “would” or other words that convey uncertainty of future events or outcomes.
Forward-looking statements involve known and unknown risks, uncertainties and other factors that may cause the actual results, performance or achievements of the series of First Trust Exchange-Traded Fund III (the “Trust”) described in this report (First Trust Institutional Preferred Securities and Income ETF; hereinafter referred to as the “Fund”) to be materially different from any future results, performance or achievements expressed or implied by the forward-looking statements. When evaluating the information included in this report, you are cautioned not to place undue reliance on these forward-looking statements, which reflect the judgment of the Advisor and/or Sub-Advisor and their respective representatives only as of the date hereof. We undertake no obligation to publicly revise or update these forward-looking statements to reflect events and circumstances that arise after the date hereof.
Performance and Risk Disclosure
There is no assurance that the Fund will achieve its investment objective. The Fund is subject to market risk, which is the possibility that the market values of securities owned by the Fund will decline and that the value of the Fund’s shares may therefore be less than what you paid for them. Accordingly, you can lose money by investing in the Fund. See “Risk Considerations” in the Additional Information section of this report for a discussion of certain other risks of investing in the Fund.
Performance data quoted represents past performance, which is no guarantee of future results, and current performance may be lower or higher than the figures shown. For the most recent month-end performance figures, please visit www.ftportfolios.com or speak with your financial advisor. Investment returns, net asset value and share price will fluctuate and Fund shares, when sold, may be worth more or less than their original cost.
The Advisor may also periodically provide additional information on Fund performance on the Fund’s web page at www.ftportfolios.com.
How to Read This Report
This report contains information that may help you evaluate your investment in the Fund. It includes details about the Fund and presents data and analysis that provide insight into the Fund’s performance and investment approach.
The statistical information that follows may help you understand the Fund’s performance compared to that of a relevant market benchmark.
It is important to keep in mind that the opinions expressed by personnel of the Advisor and/or Sub-Advisor are just that: informed opinions. They should not be considered to be promises or advice. The opinions, like the statistics, cover the period through the date on the cover of this report. The material risks of investing in the Fund are spelled out in the prospectus, the statement of additional information, and other Fund regulatory filings.
First Trust Institutional Preferred Securities and Income ETF (FPEI)
Semi-Annual Letter from the Chairman and CEO
April 30, 2020
Dear Shareholders,
First Trust is pleased to provide you with the semi-annual report for the First Trust Institutional Preferred Securities and Income ETF (the “Fund”), which contains detailed information about the Fund for the six months ended April 30, 2020.
Just one month ago, I noted in a letter to shareholders that a handful of states were set to open some “nonessential” businesses by early May. As of May 20, 2020, I am pleased to report that all 50 states and U.S. territories have eased some restrictions on businesses and social activity. Keep in mind, however, that the plan does entail governors phasing in the opening of businesses in the coming weeks or potentially months, so I see this news as essentially marking the beginning of the rebuilding process for the U.S. economy. We all need to be aware as well of the possibility of an uptick or even surge in the coronavirus (“COVID-19”) infections as more people venture out of their homes. Prior to the last couple of weeks or so, the stay-at-home mandate severely restricted the movements of close to 315 million Americans, according to The Washington Post. To put this further into perspective, because so many stores have been closed and so many people have been hunkering down at home, retail-store traffic in the U.S. plunged 91.2% year-over-year for the week ended May 16, 2020, according to Bloomberg. Truly amazing!
In this COVID-19 pandemic, there appears to be a notable disconnect between the state of the U.S. economy, which is expected to go from bad to downright terrible between the first quarter and second quarter of the year, and the performance of the stock market, which has been much better than expected. While the data and commentary in this report are technically supposed to run through April 30, 2020, I feel compelled to offer insight that is as up to date as possible. The 2020 peak in the stock market, as measured by the S&P 500® Index (the “Index”), occurred on February 19. That day also marked the all-time high for the Index. From February 19, 2020, through March 23, 2020, the Index declined by 33.92% on a price-only basis (no dividends included), according to Bloomberg. We should note that the Index slid into bear market territory on March 12, 2020. A bear market is defined by a 20% or greater decline in price from its most recent peak. That took just 16 trading days, the quickest plunge into a bear market ever. From March 23, 2020 through May 20, 2020, the Index staged an impressive rebound, posting a price-only gain of 32.82%, according to Bloomberg. As of May 20, 2020, the Index stood just 12.24% below its all-time high set on February 19, 2020. But the game, as they say, is not over. Even though stocks have rebounded significantly from their March lows, 68% of the money managers that participated in the most recent Bank of America global fund manager survey believe that stocks are still in a bear market, according to MarketWatch. What are they likely concerned about? In addition to a dismal economic outlook for the near-term, research from Bespoke Investment Group, an independent research firm, indicates that there have been 25 bear markets since 1928 and 60% of the time the Index declined a second time during the bear market and went on to establish a new low for the period.
With respect to the state of the economy, the Congressional Budget Office announced on May 19, 2020, that it sees real U.S. gross domestic product (“GDP”) declining by an annualized 38% in the second quarter of 2020, reportedly in line with Wall Street economists, according to CNBC. Some estimates are more dire. The GDP estimate from the Atlanta Federal Reserve calls for a 42% plunge. These numbers are so large in scope they are mind-boggling. The Bureau of Economic Analysis is scheduled to release its GDP report on July 30, 2020. Until then, we may continue to have a disconnect between the economy and the markets. Let us hope it is as positive as the one we are currently enjoying.
The U.S. government shut down huge chunks of our economy in order to protect lives and prevent our health care system from being overwhelmed by COVID-19 patients. Our economic woes, in other words, are man-made. The remedies to this pandemic will also likely be man-made. They could come in the form of therapeutics and/or a vaccine. Perhaps more than one vaccine. At this stage of the pandemic fight, we have one message for investors: Stay the course!
Thank you for giving First Trust the opportunity to play a role in your financial future. We value our relationship with you and will report on the Fund again in six months.
Sincerely,
James A. Bowen
Chairman of the Board of Trustees
Chief Executive Officer of First Trust Advisors L.P.
Fund Performance Overview (Unaudited)
First Trust Institutional Preferred Securities and Income ETF (FPEI)
First Trust Institutional Preferred Securities and Income ETF’s (the “Fund”) investment objective is to seek total return and to provide current income. Under normal market conditions, the Fund invests at least 80% of its net assets (including investment borrowings) in institutional preferred securities (“Preferred Securities”) and income-producing debt securities (“Income Securities”). Preferred Securities are a type of equity security that have preference over common stock in the payment of distributions and the liquidation of a company’s assets, but are generally junior to all forms of the company’s debt, including both senior and subordinated debt. The Fund’s investments in Preferred Securities will primarily be in institutional preferred securities. Institutional preferred securities are targeted to institutional, rather than retail, investors, are generally traded over-the-counter and may also be known as “$1,000 par preferred securities.” They are typically issued in large, institutional lot sized by U.S. and non-U.S. financial services companies and other companies. While all income-producing debt securities will be categorized as “Income Securities” for purposes of the 80% test above, the Income Securities in which the Fund intends to invest as part of its principal investment strategy include hybrid capital securities, contingent capital securities, U.S. and non-U.S. corporate bonds and convertible securities.
| Performance | | | | |
| | | | Average Annual
Total Returns | Cumulative
Total Returns |
| | 6 Months Ended
4/30/20 | 1 Year Ended
4/30/20 | Inception (8/22/17)
to 4/30/20 | Inception (8/22/17)
to 4/30/20 |
| Fund Performance | | | | |
| NAV | -6.79% | -1.05% | 1.35% | 3.68% |
| Market Price | -6.98% | -1.12% | 1.34% | 3.65% |
| Index Performance | | | | |
| ICE BofA US Investment Grade Institutional Capital Securities Index | -2.35% | 4.69% | 3.73% | 10.34% |
Total returns for the period since inception are calculated from the inception date of the Fund. “Average Annual Total Returns” represent the average annual change in value of an investment over the period indicated. “Cumulative Total Returns” represent the total change in value of an investment over the period indicated.
The Fund’s per share net asset value (“NAV”) is the value of one share of the Fund and is computed by dividing the value of all assets of the Fund (including accrued interest and dividends), less all liabilities (including accrued expenses and dividends declared but unpaid), by the total number of outstanding shares. The price used to calculate market return (“Market Price”) is determined by using the midpoint between the highest bid and the lowest offer on the stock exchange on which shares of the Fund are listed for trading as of the time that the Fund’s NAV is calculated. Since shares of the Fund did not trade in the secondary market until after its inception, for the period from inception to the first day of secondary market trading in shares of the Fund, the NAV of the Fund is used as a proxy for the secondary market trading price to calculate market returns. NAV and market returns assume that all distributions have been reinvested in the Fund at NAV and Market Price, respectively.
An index is a statistical composite that tracks a specified financial market or sector. Unlike the Fund, the index does not actually hold a portfolio of securities and therefore does not incur the expenses incurred by the Fund. These expenses negatively impact the performance of the Fund. Also, market returns do not include brokerage commissions that may be payable on secondary market transactions. If brokerage commissions were included, market returns would be lower. The total returns presented reflect the reinvestment of dividends on securities in the index. The returns presented do not reflect the deduction of taxes that a shareholder would pay on Fund distributions or the redemption or sale of Fund shares. The investment return and principal value of shares of the Fund will vary with changes in market conditions. Shares of the Fund may be worth more or less than their original cost when they are redeemed or sold in the market. The Fund’s past performance is no guarantee of future performance.
Fund Performance Overview (Unaudited) (Continued)
First Trust Institutional Preferred Securities and Income ETF (FPEI) (Continued)
| Sector Allocation | % of Total
Investments |
| Financials | 74.5% |
| Utilities | 10.7 |
| Energy | 6.4 |
| Industrials | 2.4 |
| Communication Services | 2.4 |
| Consumer Staples | 2.1 |
| Materials | 1.5 |
| Total | 100.0% |
| Credit Quality(1) | % of Total
Investments |
| A- | 1.4% |
| BBB+ | 11.1 |
| BBB | 30.5 |
| BBB- | 28.9 |
| BB+ | 20.9 |
| BB | 4.5 |
| BB- | 2.6 |
| B+ | 0.1 |
| Total | 100.0% |
| Top Ten Holdings | % of Total
Investments |
| Emera, Inc., Series 16-A | 4.4% |
| Barclays PLC | 2.9 |
| Enel S.p.A. | 2.4 |
| AXIS Specialty Finance LLC | 2.2 |
| Lloyds Banking Group PLC | 2.1 |
| Enbridge, Inc., Series 16-A | 2.1 |
| Australia & New Zealand Banking Group Ltd. | 2.0 |
| JPMorgan Chase & Co., Series V | 2.0 |
| CenterPoint Energy, Inc., Series A | 1.8 |
| Barclays PLC | 1.7 |
| Total | 23.6% |
| Country Allocation | % of Total
Investments |
| United States | 35.7% |
| United Kingdom | 12.7 |
| Canada | 8.5 |
| France | 8.4 |
| Switzerland | 8.0 |
| Australia | 6.1 |
| Netherlands | 5.6 |
| Japan | 4.7 |
| Italy | 4.5 |
| Spain | 1.9 |
| Mexico | 1.1 |
| Finland | 0.9 |
| Chile | 0.5 |
| Sweden | 0.5 |
| Denmark | 0.5 |
| Jersey | 0.4 |
| Total | 100.0% |
| (1) | The credit quality and ratings information presented above reflect the ratings assigned by one or more nationally recognized statistical rating organizations (NRSROs), including Standard & Poor’s Ratings Group, a division of the McGraw Hill Companies, Inc., Moody’s Investors Service, Inc., Fitch Ratings or a comparably rated NRSRO. For situations in which a security is rated by more than one NRSRO and the ratings are not equivalent, the highest rating is used. Sub-investment grade ratings are those rated BB+/Ba1 or lower. Investment grade ratings are those rated BBB-/Baa3 or higher. The credit ratings shown relate to the creditworthiness of the issuers of the underlying securities in the Fund, and not to the Fund or its shares. Credit ratings are subject to change. |
Fund Performance Overview (Unaudited) (Continued)
First Trust Institutional Preferred Securities and Income ETF (FPEI) (Continued)

Performance figures assume reinvestment of all distributions and do not reflect the deduction of taxes that a shareholder would pay on Fund distributions or the redemption or sale of Fund shares. An index is a statistical composite that tracks a specified financial market or sector. Unlike the Fund, the index does not actually hold a portfolio of securities and therefore does not incur the expenses incurred by the Fund. These expenses negatively impact the performance of the Fund. The Fund’s past performance does not predict future performance.
Frequency Distribution of Discounts and Premiums
Bid/Ask Midpoint vs. NAV through April 30, 2020
The following Frequency Distribution of Discounts and Premiums charts are provided to show the frequency at which the bid/ask midpoint price for the Fund was at a discount or premium to the daily NAV. The following tables are for comparative purposes only and represent the period August 23, 2017 (commencement of trading) through April 30, 2020. Shareholders may pay more than NAV when they buy Fund shares and receive less than NAV when they sell those shares because shares are bought and sold at current market price. Data presented represents past performance and cannot be used to predict future results.
| Number of Days Bid/Ask Midpoint At/Above NAV |
| For the Period | 0.00%–0.49% | 0.50%–0.99% | 1.00%–1.99% | >=2.00% |
| 8/23/17 – 10/31/17 | 44 | 0 | 0 | 0 |
| 11/1/17 – 10/31/18 | 156 | 2 | 0 | 0 |
| 11/1/18 – 10/31/19 | 220 | 5 | 3 | 0 |
| 11/1/19 – 4/30/20 | 88 | 6 | 4 | 3 |
| Number of Days Bid/Ask Midpoint Below NAV |
| For the Period | 0.00%–0.49% | 0.50%–0.99% | 1.00%–1.99% | >=2.00% |
| 8/23/17 – 10/31/17 | 5 | 0 | 0 | 0 |
| 11/1/17 – 10/31/18 | 90 | 4 | 0 | 0 |
| 11/1/18 – 10/31/19 | 22 | 1 | 0 | 0 |
| 11/1/19 – 4/30/20 | 14 | 5 | 0 | 4 |
Portfolio Management
First Trust Institutional Preferred Securities and Income ETF (FPEI)
Semi-Annual Report
April 30, 2020 (Unaudited)
Advisor
First Trust Advisors L.P. (“First Trust” or the “Advisor”) serves as the investment advisor to the First Trust Institutional Preferred Securities and Income ETF (the “Fund”). First Trust is responsible for the ongoing monitoring of the Fund’s investment portfolio, managing the Fund’s business affairs and providing certain administrative services necessary for the management of the Fund.
Sub-Advisor
Stonebridge Advisors LLC
Stonebridge Advisors LLC (“Stonebridge” or the “Sub-Advisor”) is the investment sub-advisor to the Fund and is a registered investment advisor based in Wilton, Connecticut. Stonebridge specializes in the management of preferred and hybrid securities.
Stonebridge Advisors LLC Portfolio Management Team
Scott T. Fleming - Chief Executive Officer and President
Robert Wolf - Chief Investment Officer, Senior Vice President and Senior Portfolio Manager
Eric Weaver - Chief Strategist and Senior Vice President
First Trust Institutional Preferred Securities and Income ETF (FPEI)
Understanding Your Fund Expenses
April 30, 2020 (Unaudited)
As a shareholder of the First Trust Institutional Preferred Securities and Income ETF (the “Fund”), you incur two types of costs: (1) transaction costs; and (2) ongoing costs, including management fees, distribution and/or service (12b-1) fees, if any, and other Fund expenses. This Example is intended to help you understand your ongoing costs of investing in the Fund and to compare these costs with the ongoing costs of investing in other funds.
The Example is based on an investment of $1,000 invested at the beginning of the period and held through the six-month period ended April 30, 2020.
Actual Expenses
The first line in the following table provides information about actual account values and actual expenses. You may use the information in this line, together with the amount you invested, to estimate the expenses that you paid over the period. Simply divide your account value by $1,000 (for example, an $8,600 account value divided by $1,000 = 8.6), then multiply the result by the number in the first line under the heading entitled “Expenses Paid During the Six-Month Period” to estimate the expenses you paid on your account during this six-month period.
Hypothetical Example for Comparison Purposes
The second line in the following table provides information about hypothetical account values and hypothetical expenses based on the Fund’s actual expense ratio and an assumed rate of return of 5% per year before expenses, which is not the Fund’s actual return. The hypothetical account values and expenses may not be used to estimate the actual ending account balance or expenses you paid for the period. You may use this information to compare the ongoing costs of investing in the Fund and other funds. To do so, compare this 5% hypothetical example with the 5% hypothetical examples that appear in the shareholder reports of the other funds.
Please note that the expenses shown in the table are meant to highlight your ongoing costs only and do not reflect any transactional costs such as brokerage commissions. Therefore, the second line in the table is useful in comparing ongoing costs only, and will not help you determine the relative total costs of owning different funds. In addition, if these transactional costs were included, your costs would have been higher.
| | Beginning
Account Value
November 1, 2019 | Ending
Account Value
April 30, 2020 | Annualized
Expense Ratio
Based on the
Six-Month
Period | Expenses Paid
During the
Six-Month
Period (a) |
| First Trust Institutional Preferred Securities and Income ETF (FPEI) |
| Actual | $1,000.00 | $932.10 | 0.85% | $4.08 |
| Hypothetical (5% return before expenses) | $1,000.00 | $1,020.64 | 0.85% | $4.27 |
| (a) | Expenses are equal to the annualized expense ratios as indicated in the table multiplied by the average account value over the period (November 1, 2019 through April 30, 2020), multiplied by 182/366 (to reflect the six-month period). |
First Trust Institutional Preferred Securities and Income ETF (FPEI)
Portfolio of Investments
April 30, 2020 (Unaudited)
Par
Amount | | Description | | Stated
Rate | | Stated
Maturity | | Value |
| CAPITAL PREFERRED SECURITIES – 95.2% |
| | | Banks – 41.7% | | | | | | |
| $4,950,000 | | Australia & New Zealand Banking Group Ltd. (a) (b) (c)
| | 6.75% | | (d) | | $5,313,008 |
| 1,145,000 | | Australia & New Zealand Banking Group Ltd. (b) (c) (e)
| | 6.75% | | (d) | | 1,228,969 |
| 2,200,000 | | Banco Bilbao Vizcaya Argentaria S.A., Series 9 (b) (c)
| | 6.50% | | (d) | | 2,000,779 |
| 2,200,000 | | Banco Mercantil del Norte S.A. (a) (b) (c)
| | 6.75% | | (d) | | 1,754,610 |
| 400,000 | | Banco Mercantil del Norte S.A. (a) (b) (c)
| | 7.50% | | (d) | | 329,340 |
| 3,000,000 | | Banco Santander S.A. (b) (c) (e)
| | 7.50% | | (d) | | 2,938,683 |
| 1,300,000 | | Bank of America Corp., Series JJ (c)
| | 5.13% | | (d) | | 1,278,154 |
| 2,400,000 | | Bank of America Corp., Series X (c)
| | 6.25% | | (d) | | 2,502,948 |
| 4,350,000 | | Barclays PLC (b) (c) (e)
| | 7.88% | | (d) | | 4,324,444 |
| 7,500,000 | | Barclays PLC (b) (c)
| | 8.00% | | (d) | | 7,486,462 |
| 900,000 | | BBVA Bancomer S.A. (a) (b) (c)
| | 5.88% | | 09/13/34 | | 792,315 |
| 2,300,000 | | BNP Paribas S.A. (a) (b) (c)
| | 6.63% | | (d) | | 2,294,250 |
| 4,000,000 | | BNP Paribas S.A. (a) (b) (c)
| | 7.38% | | (d) | | 4,157,780 |
| 781,000 | | BNP Paribas S.A. (a) (b) (c)
| | 7.63% | | (d) | | 795,156 |
| 1,416,000 | | Citigroup, Inc. (c)
| | 5.90% | | (d) | | 1,431,930 |
| 250,000 | | Citigroup, Inc. (c)
| | 5.95% | | (d) | | 248,833 |
| 3,314,000 | | Citigroup, Inc., Series P (c)
| | 5.95% | | (d) | | 3,341,523 |
| 1,470,000 | | Citigroup, Inc., Series R (c)
| | 6.13% | | (d) | | 1,427,002 |
| 3,750,000 | | Citigroup, Inc., Series U (c)
| | 5.00% | | (d) | | 3,412,500 |
| 1,900,000 | | Citizens Financial Group, Inc., Series A, 3 Mo. LIBOR + 3.96% (f)
| | 5.33% | | (d) | | 1,605,889 |
| 2,789,000 | | Citizens Financial Group, Inc., Series B (c)
| | 6.00% | | (d) | | 2,386,533 |
| 1,358,000 | | CoBank ACB, Series I (c)
| | 6.25% | | (d) | | 1,378,370 |
| 2,806,000 | | Credit Agricole S.A. (a) (b) (c)
| | 6.88% | | (d) | | 2,800,935 |
| 1,600,000 | | Credit Agricole S.A. (a) (b) (c)
| | 7.88% | | (d) | | 1,707,856 |
| 1,000,000 | | Credit Agricole S.A. (b) (c) (e)
| | 7.88% | | (d) | | 1,067,410 |
| 2,400,000 | | Credit Agricole S.A. (a) (b) (c)
| | 8.13% | | (d) | | 2,677,500 |
| 550,000 | | Danske Bank A.S. (b) (c) (e)
| | 6.13% | | (d) | | 523,298 |
| 650,000 | | Danske Bank A.S. (b) (c) (e)
| | 7.00% | | (d) | | 638,625 |
| 800,000 | | Farm Credit Bank of Texas, Series 3 (a) (c)
| | 6.20% | | (d) | | 725,652 |
| 2,270,000 | | HSBC Holdings PLC (b) (c)
| | 6.38% | | (d) | | 2,255,960 |
| 870,000 | | ING Groep N.V. (b) (c)
| | 5.75% | | (d) | | 838,101 |
| 1,400,000 | | ING Groep N.V. (b) (c)
| | 6.50% | | (d) | | 1,393,350 |
| 3,100,000 | | ING Groep N.V. (b) (c) (e)
| | 6.88% | | (d) | | 3,111,715 |
| 1,970,000 | | Intesa Sanpaolo S.p.A. (a) (b) (c)
| | 7.70% | | (d) | | 1,833,469 |
| 1,800,000 | | JPMorgan Chase & Co., Series FF (c)
| | 5.00% | | (d) | | 1,675,251 |
| 200,000 | | JPMorgan Chase & Co., Series I, 3 Mo. LIBOR + 3.47% (f)
| | 4.23% | | (d) | | 183,349 |
| 1,100,000 | | JPMorgan Chase & Co., Series R (c)
| | 6.00% | | (d) | | 1,111,765 |
| 5,940,000 | | JPMorgan Chase & Co., Series V, 3 Mo. LIBOR + 3.32% (f)
| | 4.75% | | (d) | | 5,193,015 |
| 1,000,000 | | Lloyds Bank PLC (a) (c)
| | 12.00% | | (d) | | 1,129,542 |
| 900,000 | | Lloyds Bank PLC (c) (e)
| | 12.00% | | (d) | | 1,016,588 |
| 1,350,000 | | Lloyds Banking Group PLC (b) (c)
| | 6.75% | | (d) | | 1,303,877 |
| 5,638,000 | | Lloyds Banking Group PLC (b) (c)
| | 7.50% | | (d) | | 5,550,329 |
| 1,100,000 | | Lloyds Banking Group PLC (b) (c)
| | 7.50% | | (d) | | 1,089,765 |
| 2,000,000 | | M&T Bank Corp., Series G (c)
| | 5.00% | | (d) | | 1,955,000 |
| 2,425,000 | | Nordea Bank Abp (a) (b) (c)
| | 6.63% | | (d) | | 2,442,181 |
| 1,880,000 | | Royal Bank of Scotland Group PLC (b) (c)
| | 7.50% | | (d) | | 1,802,600 |
| 2,050,000 | | Royal Bank of Scotland Group PLC (b) (c)
| | 8.00% | | (d) | | 2,141,635 |
| 3,600,000 | | Royal Bank of Scotland Group PLC (b) (c)
| | 8.63% | | (d) | | 3,688,020 |
| 200,000 | | Skandinaviska Enskilda Banken AB (b) (c) (e)
| | 5.63% | | (d) | | 199,225 |
| 2,866,000 | | Societe Generale S.A. (a) (b) (c)
| | 7.38% | | (d) | | 2,812,262 |
| 500,000 | | Societe Generale S.A. (b) (c) (e)
| | 7.38% | | (d) | | 490,625 |
| 1,621,000 | | Societe Generale S.A. (a) (b) (c)
| | 7.88% | | (d) | | 1,590,712 |
| 400,000 | | Societe Generale S.A. (b) (c) (e)
| | 7.88% | | (d) | | 392,526 |
| 1,000,000 | | Standard Chartered PLC (a) (b) (c)
| | 7.75% | | (d) | | 1,012,990 |
| 1,000,000 | | Swedbank AB (b) (c) (e)
| | 6.00% | | (d) | | 983,114 |
See Notes to Financial Statements
Page 7
First Trust Institutional Preferred Securities and Income ETF (FPEI)
Portfolio of Investments (Continued)
April 30, 2020 (Unaudited)
Par
Amount | | Description | | Stated
Rate | | Stated
Maturity | | Value |
| CAPITAL PREFERRED SECURITIES (Continued) |
| | | Banks (Continued) | | | | | | |
| $3,850,000 | | UniCredit S.p.A. (b) (c) (e)
| | 8.00% | | (d) | | $3,512,390 |
| | | | | 113,280,110 |
| | | Capital Markets – 13.6% | | | | | | |
| 4,520,000 | | Apollo Management Holdings L.P. (a) (c)
| | 4.95% | | 01/14/50 | | 4,066,908 |
| 3,000,000 | | Charles Schwab (The) Corp., Series G (c)
| | 5.38% | | (d) | | 3,078,750 |
| 3,300,000 | | Credit Suisse Group AG (a) (b) (c)
| | 6.38% | | (d) | | 3,253,255 |
| 250,000 | | Credit Suisse Group AG (a) (b) (c)
| | 7.25% | | (d) | | 249,549 |
| 2,514,000 | | Credit Suisse Group AG (a) (b) (c)
| | 7.50% | | (d) | | 2,667,982 |
| 2,300,000 | | Credit Suisse Group AG (b) (c) (e)
| | 7.50% | | (d) | | 2,440,875 |
| 4,150,000 | | Credit Suisse Group AG (a) (b) (c)
| | 7.50% | | (d) | | 4,188,616 |
| 2,204,000 | | E*TRADE Financial Corp., Series A (c)
| | 5.88% | | (d) | | 2,267,034 |
| 2,100,000 | | Goldman Sachs Group (The), Inc., Series M (c)
| | 5.38% | | (d) | | 1,955,699 |
| 4,200,000 | | Goldman Sachs Group (The), Inc., Series Q (c)
| | 5.50% | | (d) | | 4,271,169 |
| 200,000 | | Goldman Sachs Group (The), Inc., Series R (c)
| | 4.95% | | (d) | | 185,139 |
| 368,000 | | Morgan Stanley, Series J (c)
| | 5.55% | | (d) | | 338,645 |
| 2,500,000 | | UBS Group AG (b) (c) (e)
| | 6.88% | | (d) | | 2,518,688 |
| 2,500,000 | | UBS Group AG (b) (c) (e)
| | 6.88% | | (d) | | 2,597,998 |
| 1,425,000 | | UBS Group AG (a) (b) (c)
| | 7.00% | | (d) | | 1,458,053 |
| 1,000,000 | | UBS Group AG (b) (c) (e)
| | 7.00% | | (d) | | 1,023,195 |
| 313,000 | | UBS Group Funding Switzerland AG (b) (c) (e)
| | 7.13% | | (d) | | 316,834 |
| | | | | 36,878,389 |
| | | Consumer Finance – 0.5% | | | | | | |
| 1,495,000 | | American Express Co., Series C, 3 Mo. LIBOR + 3.29% (f)
| | 4.03% | | (d) | | 1,282,366 |
| | | Diversified Financial Services – 1.4% | | | | | | |
| 4,050,000 | | Voya Financial, Inc. (c)
| | 5.65% | | 05/15/53 | | 3,976,067 |
| | | Diversified Telecommunication Services – 2.3% | | | | | | |
| 3,700,000 | | Koninklijke KPN N.V. (a) (c)
| | 7.00% | | 03/28/73 | | 3,835,956 |
| 2,326,000 | | Koninklijke KPN N.V. (c) (e)
| | 7.00% | | 03/28/73 | | 2,411,469 |
| | | | | 6,247,425 |
| | | Electric Utilities – 7.5% | | | | | | |
| 2,290,000 | | Duke Energy Corp. (c)
| | 4.88% | | (d) | | 2,268,692 |
| 10,842,000 | | Emera, Inc., Series 16-A (c)
| | 6.75% | | 06/15/76 | | 11,478,967 |
| 5,500,000 | | Enel S.p.A. (a) (c)
| | 8.75% | | 09/24/73 | | 6,236,230 |
| 400,000 | | PPL Capital Funding, Inc., Series A, 3 Mo. LIBOR + 2.67% (f)
| | 4.04% | | 03/30/67 | | 305,275 |
| | | | | 20,289,164 |
| | | Energy Equipment & Services – 1.5% | | | | | | |
| 400,000 | | Transcanada Trust (c)
| | 5.63% | | 05/20/75 | | 364,698 |
| 2,000,000 | | Transcanada Trust (c)
| | 5.50% | | 09/15/79 | | 1,883,490 |
| 2,050,000 | | Transcanada Trust, Series 16-A (c)
| | 5.88% | | 08/15/76 | | 1,944,097 |
| | | | | 4,192,285 |
| | | Food Products – 2.0% | | | | | | |
| 1,000,000 | | Land O’Lakes Capital Trust I (g)
| | 7.45% | | 03/15/28 | | 1,035,000 |
| 2,700,000 | | Land O’Lakes, Inc. (a)
| | 7.00% | | (d) | | 2,429,190 |
| 1,490,000 | | Land O’Lakes, Inc. (a)
| | 7.25% | | (d) | | 1,417,139 |
| 535,000 | | Land O’Lakes, Inc. (a)
| | 8.00% | | (d) | | 502,900 |
| | | | | 5,384,229 |
| | | Independent Power & Renewable Electricity Producers – 0.5% | | | | | | |
| 1,500,000 | | AES Gener S.A. (a) (c)
| | 6.35% | | 10/07/79 | | 1,404,390 |
Page 8
See Notes to Financial Statements
First Trust Institutional Preferred Securities and Income ETF (FPEI)
Portfolio of Investments (Continued)
April 30, 2020 (Unaudited)
Par
Amount | | Description | | Stated
Rate | | Stated
Maturity | | Value |
| CAPITAL PREFERRED SECURITIES (Continued) |
| | | Insurance – 13.9% | | | | | | |
| $3,000,000 | | Asahi Mutual Life Insurance Co. (c) (e)
| | 6.50% | | (d) | | $3,085,569 |
| 3,500,000 | | Asahi Mutual Life Insurance Co. (c) (e)
| | 7.25% | | (d) | | 3,572,529 |
| 3,858,000 | | Assurant, Inc. (c)
| | 7.00% | | 03/27/48 | | 3,794,394 |
| 1,700,000 | | Assured Guaranty Municipal Holdings, Inc. (c) (e)
| | 6.40% | | 12/15/66 | | 1,500,344 |
| 6,520,000 | | AXIS Specialty Finance LLC (c)
| | 4.90% | | 01/15/40 | | 5,725,550 |
| 700,000 | | Dai-ichi Life Insurance (The) Co., Ltd. (a) (c)
| | 7.25% | | (d) | | 732,592 |
| 3,500,000 | | Everest Reinsurance Holdings, Inc., 3 Mo. LIBOR + 2.39% (f)
| | 4.08% | | 05/15/37 | | 2,686,470 |
| 1,800,000 | | Fukoku Mutual Life Insurance Co. (c) (e)
| | 6.50% | | (d) | | 1,938,726 |
| 760,000 | | Hartford Financial Services Group (The), Inc., 3 Mo. LIBOR + 2.13% (a) (f)
| | 3.82% | | 02/12/47 | | 594,126 |
| 1,000,000 | | La Mondiale SAM (c) (e)
| | 5.88% | | 01/26/47 | | 1,045,926 |
| 531,000 | | Lincoln National Corp., 3 Mo. LIBOR + 2.36% (f)
| | 4.05% | | 05/17/66 | | 362,007 |
| 200,000 | | MetLife, Inc.
| | 6.40% | | 12/15/36 | | 223,809 |
| 1,418,000 | | MetLife, Inc., Series C (c)
| | 5.25% | | (d) | | 1,293,039 |
| 1,700,000 | | Mitsui Sumitomo Insurance Co., Ltd. (a) (c)
| | 7.00% | | 03/15/72 | | 1,826,216 |
| 1,000,000 | | Prudential Financial, Inc. (c)
| | 5.63% | | 06/15/43 | | 1,033,700 |
| 1,000,000 | | QBE Capital Funding III Ltd. (a) (c)
| | 7.25% | | 05/24/41 | | 1,044,705 |
| 2,000,000 | | QBE Insurance Group Ltd. (a) (c)
| | 7.50% | | 11/24/43 | | 2,158,400 |
| 200,000 | | QBE Insurance Group Ltd. (c) (e)
| | 7.50% | | 11/24/43 | | 215,840 |
| 2,850,000 | | QBE Insurance Group Ltd. (c) (e)
| | 6.75% | | 12/02/44 | | 3,100,786 |
| 1,175,000 | | Reinsurance Group of America, Inc., 3 Mo. LIBOR + 2.67% (f)
| | 3.41% | | 12/15/65 | | 807,812 |
| 1,000,000 | | Sumitomo Life Insurance Co. (a) (c)
| | 6.50% | | 09/20/73 | | 1,099,245 |
| | | | | 37,841,785 |
| | | Metals & Mining – 1.4% | | | | | | |
| 700,000 | | BHP Billiton Finance USA Ltd. (a) (c)
| | 6.25% | | 10/19/75 | | 704,687 |
| 2,760,000 | | BHP Billiton Finance USA Ltd. (a) (c)
| | 6.75% | | 10/19/75 | | 3,054,616 |
| | | | | 3,759,303 |
| | | Multi-Utilities – 2.2% | | | | | | |
| 5,148,000 | | CenterPoint Energy, Inc., Series A (c)
| | 6.13% | | (d) | | 4,701,128 |
| 1,506,000 | | NiSource, Inc. (c)
| | 5.65% | | (d) | | 1,386,258 |
| | | | | 6,087,386 |
| | | Oil, Gas & Consumable Fuels – 4.5% | | | | | | |
| 550,000 | | Buckeye Partners L.P. (c)
| | 6.38% | | 01/22/78 | | 345,730 |
| 2,703,000 | | DCP Midstream Operating L.P. (a) (c)
| | 5.85% | | 05/21/43 | | 1,266,626 |
| 600,000 | | Enbridge, Inc. (c)
| | 5.50% | | 07/15/77 | | 526,953 |
| 500,000 | | Enbridge, Inc. (c)
| | 6.25% | | 03/01/78 | | 458,622 |
| 6,106,000 | | Enbridge, Inc., Series 16-A (c)
| | 6.00% | | 01/15/77 | | 5,475,525 |
| 1,395,000 | | Energy Transfer Operating L.P., 3 Mo. LIBOR + 3.02% (f)
| | 4.78% | | 11/01/66 | | 793,755 |
| 100,000 | | Energy Transfer Operating L.P., Series B (c)
| | 6.63% | | (d) | | 71,805 |
| 2,000,000 | | Energy Transfer Operating L.P., Series G (c)
| | 7.13% | | (d) | | 1,566,300 |
| 2,000,000 | | Enterprise Products Operating LLC, 3 Mo. LIBOR + 2.78% (f)
| | 4.36% | | 06/01/67 | | 1,563,490 |
| 370,000 | | Enterprise Products Operating LLC, Series D (c)
| | 4.88% | | 08/16/77 | | 322,546 |
| | | | | 12,391,352 |
| | | Trading Companies & Distributors – 1.1% | | | | | | |
| 4,400,000 | | AerCap Holdings N.V. (c)
| | 5.88% | | 10/10/79 | | 2,956,580 |
| | | Transportation Infrastructure – 1.1% | | | | | | |
| 3,950,000 | | AerCap Global Aviation Trust (a) (c)
| | 6.50% | | 06/15/45 | | 2,909,175 |
| | | Total Capital Preferred Securities
| | 258,880,006 |
| | | (Cost $275,992,176) | | | | | | |
See Notes to Financial Statements
Page 9
First Trust Institutional Preferred Securities and Income ETF (FPEI)
Portfolio of Investments (Continued)
April 30, 2020 (Unaudited)
Principal
Value | | Description | | Stated
Coupon | | Stated
Maturity | | Value |
| CORPORATE BONDS AND NOTES – 0.2% |
| | | Aerospace & Defense – 0.2% | | | | | | |
| $400,000 | | Boeing (The) Co.
| | 5.81% | | 05/01/50 | | $400,000 |
| | | (Cost $400,000) | | | | | | |
| | Total Investments – 95.4%
| | 259,280,006 |
| | (Cost $276,392,176) (h) | | |
| | Net Other Assets and Liabilities – 4.6%
| | 12,542,614 |
| | Net Assets – 100.0%
| | $271,822,620 |
|
| (a) | This security, sold within the terms of a private placement memorandum, is exempt from registration upon resale under Rule 144A under the Securities Act of 1933, as amended (the “1933 Act”), and may be resold in transactions exempt from registration, normally to qualified institutional buyers. Pursuant to procedures adopted by the Trust’s Board of Trustees, this security has been determined to be liquid by First Trust Advisors L.P. (the “Advisor”). Although market instability can result in periods of increased overall market illiquidity, liquidity for each security is determined based on security specific factors and assumptions, which require subjective judgment. At April 30, 2020, securities noted as such amounted to $81,270,114 or 29.9% of net assets. |
| (b) | This security is a contingent convertible capital security which may be subject to conversion into common stock of the issuer under certain circumstances. At April 30, 2020, securities noted as such amounted to $101,991,311 or 37.5% of net assets. Of these securities, 2.8% originated in emerging markets, and 97.2% originated in foreign markets. |
| (c) | Fixed-to-floating or fixed-to-variable rate security. The interest rate shown reflects the fixed rate in effect at April 30, 2020. At a predetermined date, the fixed rate will change to a floating rate or a variable rate. |
| (d) | Perpetual maturity. |
| (e) | This security may be resold to qualified foreign investors and foreign institutional buyers under Regulation S of the 1933 Act. |
| (f) | Floating or variable rate security. |
| (g) | This security, sold within the terms of a private placement memorandum, is exempt from registration upon resale under Rule 144A under the 1933 Act, and may be resold in transactions exempt from registration, normally to qualified institutional buyers (see Note 2C - Restricted Securities in the Notes to Financial Statements). |
| (h) | Aggregate cost for financial reporting purposes approximates the aggregate cost for federal income tax purposes. As of April 30, 2020, the aggregate gross unrealized appreciation for all investments in which there was an excess of value over tax cost was $1,055,548 and the aggregate gross unrealized depreciation for all investments in which there was an excess of tax cost over value was $18,167,718. The net unrealized depreciation was $17,112,170. |
| LIBOR | London Interbank Offered Rate |
Valuation Inputs
A summary of the inputs used to value the Fund’s investments as of April 30, 2020 is as follows (see Note 2A - Portfolio Valuation in the Notes to Financial Statements):
| | Total
Value at
4/30/2020 | Level 1
Quoted
Prices | Level 2
Significant
Observable
Inputs | Level 3
Significant
Unobservable
Inputs |
Capital Preferred Securities*
| $ 258,880,006 | $ — | $ 258,880,006 | $ — |
Corporate Bonds and Notes*
| 400,000 | — | 400,000 | — |
Total Investments
| $ 259,280,006 | $— | $ 259,280,006 | $— |
| * | See Portfolio of Investments for industry breakout. |
Page 10
See Notes to Financial Statements
First Trust Institutional Preferred Securities and Income ETF (FPEI)
Statement of Assets and Liabilities
April 30, 2020 (Unaudited)
| ASSETS: | |
Investments, at value
(Cost $276,392,176)
| $ 259,280,006 |
Cash
| 9,442,357 |
| Receivables: | |
Interest
| 3,703,557 |
Investment securities sold
| 1,358,738 |
Fund shares sold
| 900,031 |
Interest reclaims
| 141,439 |
Total Assets
| 274,826,128 |
| LIABILITIES: | |
| Payables: | |
Investment securities purchased
| 2,818,981 |
Investment advisory fees
| 184,527 |
Total Liabilities
| 3,003,508 |
NET ASSETS
| $271,822,620 |
| NET ASSETS consist of: | |
Paid-in capital
| $ 293,487,237 |
Par value
| 151,000 |
Accumulated distributable earnings (loss)
| (21,815,617) |
NET ASSETS
| $271,822,620 |
NET ASSET VALUE, per share
| $18.00 |
Number of shares outstanding (unlimited number of shares authorized, par value $0.01 per share)
| 15,100,002 |
See Notes to Financial Statements
Page 11
First Trust Institutional Preferred Securities and Income ETF (FPEI)
Statement of Operations
For the Six Months Ended April 30, 2020 (Unaudited)
| INVESTMENT INCOME: | |
Interest
| $ 8,034,574 |
Dividends
| 1,748 |
Foreign withholding tax
| (4,006) |
Total investment income
| 8,032,316 |
| EXPENSES: | |
Investment advisory fees
| 1,128,087 |
Total expenses
| 1,128,087 |
NET INVESTMENT INCOME (LOSS)
| 6,904,229 |
| NET REALIZED AND UNREALIZED GAIN (LOSS): | |
Net realized gain (loss) on investments
| (4,077,537) |
Net change in unrealized appreciation (depreciation) on investments
| (22,664,996) |
NET REALIZED AND UNREALIZED GAIN (LOSS)
| (26,742,533) |
NET INCREASE (DECREASE) IN NET ASSETS RESULTING FROM OPERATIONS
| $(19,838,304) |
Page 12
See Notes to Financial Statements
First Trust Institutional Preferred Securities and Income ETF (FPEI)
Statements of Changes in Net Assets
| | Six Months
Ended
4/30/2020
(Unaudited) | | Year
Ended
10/31/2019 |
| OPERATIONS: | | | |
Net investment income (loss)
| $ 6,904,229 | | $ 8,281,677 |
Net realized gain (loss)
| (4,077,537) | | 54,698 |
Net change in unrealized appreciation (depreciation)
| (22,664,996) | | 10,673,383 |
Net increase (decrease) in net assets resulting from operations
| (19,838,304) | | 19,009,758 |
| DISTRIBUTIONS TO SHAREHOLDERS FROM: | | | |
Investment operations
| (7,338,001) | | (8,164,160) |
Return of capital
| — | | (204,397) |
Total distributions to shareholders
| (7,338,001) | | (8,368,557) |
| SHAREHOLDER TRANSACTIONS: | | | |
Proceeds from shares sold
| 74,359,412 | | 132,683,600 |
Cost of shares redeemed
| (10,538,347) | | (1,903,752) |
Net increase (decrease) in net assets resulting from shareholder transactions
| 63,821,065 | | 130,779,848 |
Total increase (decrease) in net assets
| 36,644,760 | | 141,421,049 |
| NET ASSETS: | | | |
Beginning of period
| 235,177,860 | | 93,756,811 |
End of period
| $271,822,620 | | $235,177,860 |
| CHANGES IN SHARES OUTSTANDING: | | | |
Shares outstanding, beginning of period
| 11,850,002 | | 5,000,002 |
Shares sold
| 3,850,000 | | 6,950,000 |
Shares redeemed
| (600,000) | | (100,000) |
Shares outstanding, end of period
| 15,100,002 | | 11,850,002 |
See Notes to Financial Statements
Page 13
First Trust Institutional Preferred Securities and Income ETF (FPEI)
Financial Highlights
For a share outstanding throughout each period
| | Six Months
Ended
4/30/2020
(Unaudited) | | Year Ended October 31, | | Period
Ended
10/31/2017 (a) |
| 2019 | | 2018 |
Net asset value, beginning of period
| $ 19.85 | | $ 18.75 | | $ 20.26 | | $ 20.00 |
| Income from investment operations: | | | | | | | |
Net investment income (loss)
| 0.49 | | 1.01 | | 0.99 | | 0.18 |
Net realized and unrealized gain (loss)
| (1.82) | | 1.12 | | (1.47) | | 0.22 |
Total from investment operations
| (1.33) | | 2.13 | | (0.48) | | 0.40 |
| Distributions paid to shareholders from: | | | | | | | |
Net investment income
| (0.52) | | (1.00) | | (1.03) | | (0.14) |
Return of capital
| — | | (0.03) | | — | | — |
Total distributions
| (0.52) | | (1.03) | | (1.03) | | (0.14) |
Net asset value, end of period
| $18.00 | | $19.85 | | $18.75 | | $20.26 |
Total return (b)
| (6.79)% | | 11.75% | | (2.42)% | | 2.00% |
| Ratios to average net assets/supplemental data: | | | | | | | |
Net assets, end of period (in 000’s)
| $ 271,823 | | $ 235,178 | | $ 93,757 | | $ 24,313 |
Ratio of total expenses to average net assets
| 0.85% (c) | | 0.85% | | 0.85% | | 0.85% (c) |
Ratio of net investment income (loss) to average net assets
| 5.20% (c) | | 5.39% | | 5.36% | | 4.93% (c) |
Portfolio turnover rate (d)
| 20% | | 28% | | 25% | | 13% |
| (a) | Inception date is August 22, 2017, which is consistent with the commencement of investment operations and is the date the initial creation units were established. |
| (b) | Total return is calculated assuming an initial investment made at the net asset value at the beginning of the period, reinvestment of all distributions at net asset value during the period, and redemption at net asset value on the last day of the period. The returns presented do not reflect the deduction of taxes that a shareholder would pay on Fund distributions or the redemption or sale of Fund shares. Total return is calculated for the time period presented and is not annualized for periods of less than a year. |
| (c) | Annualized. |
| (d) | Portfolio turnover is calculated for the time period presented and is not annualized for periods of less than a year and does not include securities received or delivered from processing creations or redemptions and in-kind transactions. |
Page 14
See Notes to Financial Statements
Notes to Financial Statements
First Trust Institutional Preferred Securities and Income ETF (FPEI)
April 30, 2020 (Unaudited)
1. Organization
First Trust Exchange-Traded Fund III (the “Trust”) is an open-end management investment company organized as a Massachusetts business trust on January 9, 2008, and is registered with the Securities and Exchange Commission (“SEC”) under the Investment Company Act of 1940, as amended (the “1940 Act”).
The Trust currently consists of seventeen funds that are offering shares. This report covers the First Trust Institutional Preferred Securities and Income ETF (the “Fund”), which trades under the ticker “FPEI” on the NYSE Arca, Inc. Unlike conventional mutual funds, the Fund issues and redeems shares on a continuous basis, at net asset value (“NAV”), only in large specified blocks consisting of 50,000 shares called a “Creation Unit.” Creation Units are issued and redeemed in-kind for securities in which the Fund invests and, in certain circumstances, for cash. Except when aggregated in Creation Units, the shares are not redeemable securities of the Fund.
The Fund is an actively managed exchange-traded fund. The investment objective of the Fund is to seek total return and to provide current income. Under normal market conditions, the Fund invests at least 80% of its net assets (including investment borrowings) in institutional preferred securities and income-producing debt securities, including hybrid capital securities, contingent capital securities, U.S. and non-U.S. corporate bonds and convertible securities. There can be no assurance that the Fund will achieve its investment objective. The Fund may not be appropriate for all investors.
2. Significant Accounting Policies
The Fund is considered an investment company and follows accounting and reporting guidance under Financial Accounting Standards Board (“FASB”) Accounting Standards Codification Topic 946, “Financial Services-Investment Companies.” The following is a summary of significant accounting policies consistently followed by the Fund in the preparation of the financial statements. The preparation of the financial statements in accordance with accounting principles generally accepted in the United States of America (“U.S. GAAP”) requires management to make estimates and assumptions that affect the reported amounts and disclosures in the financial statements. Actual results could differ from those estimates.
A. Portfolio Valuation
The Fund’s NAV is determined daily as of the close of regular trading on the New York Stock Exchange (“NYSE”), normally 4:00 p.m. Eastern time, on each day the NYSE is open for trading. If the NYSE closes early on a valuation day, the NAV is determined as of that time. Domestic debt securities and foreign securities are priced using data reflecting the earlier closing of the principal markets for those securities. The Fund’s NAV is calculated by dividing the value of all assets of the Fund (including accrued interest and dividends), less all liabilities (including accrued expenses and dividends declared but unpaid), by the total number of shares outstanding.
The Fund’s investments are valued daily at market value or, in the absence of market value with respect to any portfolio securities, at fair value. Market value prices represent last sale or official closing prices from a national or foreign exchange (i.e., a regulated market) and are primarily obtained from third-party pricing services. Fair value prices represent any prices not considered market value prices and are either obtained from a third-party pricing service or are determined by the Pricing Committee of the Fund’s investment advisor, First Trust Advisors L.P. (“First Trust” or the “Advisor”), in accordance with valuation procedures adopted by the Trust’s Board of Trustees, and in accordance with provisions of the 1940 Act. Investments valued by the Advisor’s Pricing Committee, if any, are footnoted as such in the footnotes to the Portfolio of Investments. The Fund’s investments are valued as follows:
Bonds, notes, capital preferred securities, and other debt securities are fair valued on the basis of valuations provided by dealers who make markets in such securities or by a third-party pricing service approved by the Trust’s Board of Trustees, which may use the following valuation inputs when available:
| 1) | benchmark yields; |
| 2) | reported trades; |
| 3) | broker/dealer quotes; |
| 4) | issuer spreads; |
| 5) | benchmark securities; |
| 6) | bids and offers; and |
| 7) | reference data including market research publications. |
Securities traded in an over-the-counter market are fair valued at the mean of their most recent bid and asked price, if available, and otherwise at their closing bid price.
Fixed income and other debt securities having a remaining maturity of sixty days or less when purchased are fair valued at cost adjusted for amortization of premiums and accretion of discounts (amortized cost), provided the Advisor’s Pricing Committee
Notes to Financial Statements (Continued)
First Trust Institutional Preferred Securities and Income ETF (FPEI)
April 30, 2020 (Unaudited)
has determined that the use of amortized cost is an appropriate reflection of fair value given market and issuer-specific conditions existing at the time of the determination. Factors that may be considered in determining the appropriateness of the use of amortized cost include, but are not limited to, the following:
| 1) | the credit conditions in the relevant market and changes thereto; |
| 2) | the liquidity conditions in the relevant market and changes thereto; |
| 3) | the interest rate conditions in the relevant market and changes thereto (such as significant changes in interest rates); |
| 4) | issuer-specific conditions (such as significant credit deterioration); and |
| 5) | any other market-based data the Advisor’s Pricing Committee considers relevant. In this regard, the Advisor’s Pricing Committee may use last-obtained market-based data to assist it when valuing portfolio securities using amortized cost. |
Certain securities may not be able to be priced by pre-established pricing methods. Such securities may be valued by the Trust’s Board of Trustees or its delegate, the Advisor’s Pricing Committee, at fair value. These securities generally include, but are not limited to, restricted securities (securities which may not be publicly sold without registration under the Securities Act of 1933, as amended (the “1933 Act”)) for which a third-party pricing service is unable to provide a market price; securities whose trading has been formally suspended; a security whose market or fair value price is not available from a pre-established pricing source; a security with respect to which an event has occurred that is likely to materially affect the value of the security after the market has closed but before the calculation of the Fund’s NAV or make it difficult or impossible to obtain a reliable market quotation; and a security whose price, as provided by the third-party pricing service, does not reflect the security’s fair value. As a general principle, the current fair value of a security would appear to be the amount which the owner might reasonably expect to receive for the security upon its current sale. When fair value prices are used, generally they will differ from market quotations or official closing prices on the applicable exchanges. A variety of factors may be considered in determining the fair value of such securities, including, but not limited to, the following:
| 1) | the type of security; |
| 2) | the size of the holding; |
| 3) | the initial cost of the security; |
| 4) | transactions in comparable securities; |
| 5) | price quotes from dealers and/or third-party pricing services; |
| 6) | relationships among various securities; |
| 7) | information obtained by contacting the issuer, analysts, or the appropriate stock exchange; |
| 8) | an analysis of the issuer’s financial statements; and |
| 9) | the existence of merger proposals or tender offers that might affect the value of the security. |
If the securities in question are foreign securities, the following additional information may be considered:
| 1) | the value of similar foreign securities traded on other foreign markets; |
| 2) | ADR trading of similar securities; |
| 3) | closed-end fund or exchange-traded fund trading of similar securities; |
| 4) | foreign currency exchange activity; |
| 5) | the trading prices of financial products that are tied to baskets of foreign securities; |
| 6) | factors relating to the event that precipitated the pricing problem; |
| 7) | whether the event is likely to recur; and |
| 8) | whether the effects of the event are isolated or whether they affect entire markets, countries or regions. |
The Fund is subject to fair value accounting standards that define fair value, establish the framework for measuring fair value and provide a three-level hierarchy for fair valuation based upon the inputs to the valuation as of the measurement date. The three levels of the fair value hierarchy are as follows:
| • | Level 1 – Level 1 inputs are quoted prices in active markets for identical investments. An active market is a market in which transactions for the investment occur with sufficient frequency and volume to provide pricing information on an ongoing basis. |
| • | Level 2 – Level 2 inputs are observable inputs, either directly or indirectly, and include the following: |
| o | Quoted prices for similar investments in active markets. |
Notes to Financial Statements (Continued)
First Trust Institutional Preferred Securities and Income ETF (FPEI)
April 30, 2020 (Unaudited)
| o | Quoted prices for identical or similar investments in markets that are non-active. A non-active market is a market where there are few transactions for the investment, the prices are not current, or price quotations vary substantially either over time or among market makers, or in which little information is released publicly. |
| o | Inputs other than quoted prices that are observable for the investment (for example, interest rates and yield curves observable at commonly quoted intervals, volatilities, prepayment speeds, loss severities, credit risks, and default rates). |
| o | Inputs that are derived principally from or corroborated by observable market data by correlation or other means. |
| • | Level 3 – Level 3 inputs are unobservable inputs. Unobservable inputs may reflect the reporting entity’s own assumptions about the assumptions that market participants would use in pricing the investment. |
The inputs or methodologies used for valuing investments are not necessarily an indication of the risk associated with investing in those investments. A summary of the inputs used to value the Fund’s investments as of April 30, 2020, is included with the Fund’s Portfolio of Investments.
B. Securities Transactions and Investment Income
Securities transactions are recorded as of the trade date. Realized gains and losses from securities transactions are recorded on the identified cost basis. Interest income is recorded daily on the accrual basis. Amortization of premiums and accretion of discounts are recorded using the effective interest method.
In July 2017, the Financial Conduct Authority (“FCA”) announced that it will no longer persuade or compel banks to submit rates for the calculations of the London Interbank Offered Rates (“LIBOR”) after 2021. Further, the FCA has subsequently stated, as recently as March 2020, that the central assumption continues to be that firms should not rely on LIBOR being published after the end of 2021.
In the United States, the Alternative Reference Rates Committee (the “ARRC”), a group of market participants convened by the Board of Governors of the Federal Reserve System and the Federal Reserve Bank of New York in cooperation with other federal and state government agencies, has since 2014 undertaken efforts to identify U.S. dollar reference interest rates as alternatives to LIBOR and to facilitate the mitigation of LIBOR-related risks. In June 2017, the ARRC identified the Secured Overnight Financing Rate (“SOFR”), a broad measure of the cost of cash overnight borrowing collateralized by U.S. Treasury securities, as the preferred alternative for U.S. dollar LIBOR. The Federal Reserve Bank of New York began daily publishing of SOFR in April 2018.
At this time, it is not possible to predict the full impact of the elimination of LIBOR and the establishment of an alternative reference rate on the Fund or its investments.
C. Restricted Securities
The Fund invests in restricted securities, which are securities that may not be offered for public sale without first being registered under the 1933 Act. Prior to registration, restricted securities may only be resold in transactions exempt from registration under Rule 144A under the 1933 Act, normally to qualified institutional buyers. As of April 30, 2020, the Fund held restricted securities as shown in the following table that the Advisor has deemed illiquid pursuant to procedures adopted by the Trust’s Board of Trustees. Although market instability can result in periods of increased overall market illiquidity, liquidity for each security is determined based on security-specific factors and assumptions, which require subjective judgment. The Fund does not have the right to demand that such securities be registered. These securities are valued according to the valuation procedures as stated in the Portfolio Valuation note (Note 2A) and are not expressed as a discount to the carrying value of a comparable unrestricted security. There are no unrestricted securities with the same maturity dates and yields for these issuers.
| Security | Acquisition
Date | Par Amount | Current Price | Carrying
Cost | Value | % of
Net
Assets |
| Land O’Lakes Capital Trust I, 7.45%, 03/15/28 | 05/04/18 | $1,000,000 | $103.50 | $1,113,537 | $1,035,000 | 0.38% |
D. Dividends and Distributions to Shareholders
Dividends from net investment income, if any, are declared and paid monthly by the Fund, or as the Board of Trustees may determine from time to time. Distributions of net realized capital gains earned by the Fund, if any, are distributed at least annually.
Distributions from income and capital gains are determined in accordance with federal income tax regulations, which may differ from U.S. GAAP. Certain capital accounts in the financial statements are periodically adjusted for permanent differences in order to reflect their tax character. These permanent differences are primarily due to the varying treatment of income and gain/loss on portfolio
Notes to Financial Statements (Continued)
First Trust Institutional Preferred Securities and Income ETF (FPEI)
April 30, 2020 (Unaudited)
securities held by the Fund and have no impact on net assets or NAV per share. Temporary differences, which arise from recognizing certain items of income, expense and gain/loss in different periods for financial statement and tax purposes, will reverse at some time in the future.
The tax character of distributions paid by the Fund during the fiscal year ended October 31, 2019, was as follows:
| Distributions paid from: | |
Ordinary income
| $8,164,160 |
Capital gains
| — |
Return of capital
| 204,397 |
As of October 31, 2019, the components of distributable earnings on a tax basis were as follows:
Undistributed ordinary income
| $— |
Accumulated capital and other gain (loss)
| (286,071) |
Net unrealized appreciation (depreciation)
| 5,646,759 |
E. Income Taxes
The Fund intends to continue to qualify as a regulated investment company by complying with the requirements under Subchapter M of the Internal Revenue Code of 1986, as amended, which includes distributing substantially all of its net investment income and net realized gains to shareholders. Accordingly, no provision has been made for federal and state income taxes. However, due to the timing and amount of distributions, the Fund may be subject to an excise tax of 4% of the amount by which approximately 98% of the Fund’s taxable income exceeds the distributions from such taxable income for the calendar year.
The Fund is subject to accounting standards that establish a minimum threshold for recognizing, and a system for measuring, the benefits of a tax position taken or expected to be taken in a tax return. Taxable years ended 2017, 2018, and 2019 remain open to federal and state audit. As of April 30, 2020, management has evaluated the application of these standards to the Fund and has determined that no provision for income tax is required in the Fund’s financial statements for uncertain tax positions.
The Fund intends to utilize provisions of the federal income tax laws, which allow it to carry a realized capital loss forward indefinitely following the year of the loss and offset such loss against any future realized capital gains. The Fund is subject to certain limitations under U.S. tax rules on the use of capital loss carryforwards and net unrealized built-in losses. These limitations apply when there has been a 50% change in ownership. At October 31, 2019, the Fund had $286,071 of non-expiring capital loss carryforwards for federal income tax purposes.
F. Expenses
Expenses, other than the investment advisory fee and other excluded expenses, are paid by the Advisor (See Note 3).
G. New Accounting Pronouncement
On March 30, 2017, the FASB issued Accounting Standards Update (“ASU”) 2017-08 “Premium Amortization on Purchased Callable Debt Securities,” which amends the amortization period for certain purchased callable debt securities held at a premium by shortening such period to the earliest call date. The new guidance requires an entity to amortize the premium on a callable debt security within its scope to the earliest call date, unless the guidance for considering estimated prepayments is applied. If the call option is not exercised at the earliest call date, the yield is reset to the effective yield using the payment terms of the security. If the security has more than one call date and the premium was amortized to a call price greater than the next call price, any excess of the amortized cost basis over the amount repayable at the next call date will be amortized to that date. If there are no other call dates, any excess of the amortized cost basis over the par amount will be amortized to maturity. Discounts on purchased callable debt securities will continue to be amortized to the security’s maturity date. ASU 2017-08 is effective for public business entities for fiscal years, and interim periods within those fiscal years, beginning after December 15, 2018. ASU 2017-08 was adopted for these financial statements and did not have a material impact.
3. Investment Advisory Fee, Affiliated Transactions and Other Fee Arrangements
First Trust, the investment advisor to the Fund, is a limited partnership with one limited partner, Grace Partners of DuPage L.P., and one general partner, The Charger Corporation. The Charger Corporation is an Illinois corporation controlled by James A. Bowen, Chief Executive Officer of First Trust. First Trust is responsible for supervising the selection and ongoing monitoring of the securities in the Fund’s portfolio, managing the Fund’s business affairs and providing certain administrative services necessary for the management of the Fund.
Notes to Financial Statements (Continued)
First Trust Institutional Preferred Securities and Income ETF (FPEI)
April 30, 2020 (Unaudited)
Stonebridge Advisors LLC (“Stonebridge” or the “Sub-Advisor”), a majority-owned affiliate of First Trust, serves as the Fund’s sub-advisor and manages the Fund’s portfolio subject to First Trust’s supervision. Pursuant to the Investment Management Agreement between the Trust and the Advisor, First Trust will supervise Stonebridge and its management of the investment of the Fund’s assets and will pay Stonebridge for its services as the Fund’s sub-advisor. First Trust is responsible for the Fund’s expenses, including the cost of transfer agency, sub-advisory, custody, fund administration, legal, audit and other services, but excluding fee payments under the Investment Management Agreement, interest, taxes, acquired fund fees and expenses, brokerage commissions and other expenses connected with the execution of portfolio transactions, distribution and service fees pursuant to a Rule 12b-1 plan, if any, and extraordinary expenses. The Fund has agreed to pay First Trust an annual unitary management fee equal to 0.85% of its average daily net assets. Stonebridge receives a sub-advisory fee equal to 0.425% of the average daily net assets of the Fund less Stonebridge’s share of the Fund’s expenses. The Sub-Advisor’s fee is paid by the Advisor out of the Advisor’s management fee. First Trust also provides fund reporting services to the Fund for a flat annual fee in the amount of $9,250, which is covered under the annual unitary management fee.
First Trust Capital Partners, LLC (“FTCP”), an affiliate of First Trust, owns a 51% ownership interest in Stonebridge.
The Trust has multiple service agreements with Brown Brothers Harriman & Co. (“BBH”). Under the service agreements, BBH performs custodial, fund accounting, certain administrative services, and transfer agency services for the Fund. As custodian, BBH is responsible for custody of the Fund’s assets. As fund accountant and administrator, BBH is responsible for maintaining the books and records of the Fund’s securities and cash. As transfer agent, BBH is responsible for maintaining shareholder records for the Fund.
Each Trustee who is not an officer or employee of First Trust, any sub-advisor or any of their affiliates (“Independent Trustees”) is paid a fixed annual retainer that is allocated equally among each fund in the First Trust Fund Complex. Each Independent Trustee is also paid an annual per fund fee that varies based on whether the fund is a closed-end or other actively managed fund, a defined-outcome fund or an index fund.
Additionally, the Lead Independent Trustee and the Chairmen of the Audit Committee, Nominating and Governance Committee and Valuation Committee are paid annual fees to serve in such capacities, with such compensation allocated pro rata among each fund in the First Trust Fund Complex based on net assets. Independent Trustees are reimbursed for travel and out-of-pocket expenses in connection with all meetings. The Lead Independent Trustee and Committee Chairmen rotate every three years. The officers and “Interested” Trustee receive no compensation from the Trust for acting in such capacities.
4. Purchases and Sales of Securities
For the six months ended April 30, 2020, the cost of purchases and proceeds from sales of investments, excluding short term investments and in-kind transactions, were $109,616,602 and $49,420,790, respectively.
For the six months ended April 30, 2020, the Fund had no in-kind transactions.
5. Creations, Redemptions and Transaction Fees
Shares are created and redeemed by the Fund only in Creation Unit size aggregations of 50,000 shares in transactions with broker-dealers or large institutional investors that have entered into a participation agreement (an “Authorized Participant”). In order to purchase Creation Units of the Fund, an Authorized Participant must deposit (i) a designated portfolio of securities and other instruments determined by First Trust (the “Deposit Securities”) and generally make or receive a cash payment referred to as the “Cash Component,” which is an amount equal to the difference between the NAV of the Fund shares (per Creation Unit Aggregation) and the market value of the Deposit Securities, and/or (ii) cash in lieu of all or a portion of the Deposit Securities. If the Cash Component is a positive number (i.e., the NAV per Creation Unit Aggregation exceeds the Deposit Amount), the Authorized Participant will deliver the Cash Component. If the Cash Component is a negative number (i.e., the NAV per Creation Unit Aggregation is less than the Deposit Amount), the Authorized Participant will receive the Cash Component. Authorized Participants purchasing Creation Units must pay to BBH, as transfer agent, a creation transaction fee (the “Creation Transaction Fee”) regardless of the number of Creation Units purchased in the transaction. The Creation Transaction Fee may vary and is based on the composition of the securities included in the Fund’s portfolio and the countries in which the transactions are settled. The Creation Transaction Fee may increase or decrease as the Fund’s portfolio is adjusted to conform to changes in the composition of the securities included in the Fund’s portfolio and the countries in which the transactions are settled. The Creation Transaction Fee may increase or decrease with changes in the Fund’s portfolio. The price for each Creation Unit will equal the daily NAV per share times the number of shares in a Creation Unit plus the fees described above and, if applicable, any operational processing and brokerage costs, transfer fees or stamp taxes. When the Fund permits an Authorized Participant to substitute cash or a different security in lieu of depositing one or more of the requisite Deposit Securities, the Authorized Participant may also be assessed an amount to cover the cost of purchasing the Deposit Securities and/or
Notes to Financial Statements (Continued)
First Trust Institutional Preferred Securities and Income ETF (FPEI)
April 30, 2020 (Unaudited)
disposing of the substituted securities, including operational processing and brokerage costs, transfer fees, stamp taxes, and part or all of the spread between the expected bid and offer side of the market related to such Deposit Securities and/or substitute securities.
Authorized Participants redeeming Creation Units must pay to BBH, as transfer agent, a redemption transaction fee (the “Redemption Transaction Fee”), regardless of the number of Creation Units redeemed in the transaction. The Redemption Transaction Fee may vary and is based on the composition of the securities included in the Fund’s portfolio and the countries in which the transactions are settled. The Redemption Transaction Fee may increase or decrease with changes in the Fund’s portfolio. The Fund reserves the right to effect redemptions in cash. An Authorized Participant may request cash redemption in lieu of securities; however, the Fund may, in its discretion, reject any such request.
6. Distribution Plan
The Board of Trustees adopted a Distribution and Service Plan pursuant to Rule 12b-1 under the 1940 Act. In accordance with the Rule 12b-1 plan, the Fund is authorized to pay an amount up to 0.25% of its average daily net assets each year to reimburse First Trust Portfolios L.P. (“FTP”), the distributor of the Fund, for amounts expended to finance activities primarily intended to result in the sale of Creation Units or to provide investor services. FTP may also use this amount to compensate securities dealers or other persons that are Authorized Participants for providing distribution assistance, including broker-dealer and shareholder support and educational and promotional services.
No 12b-1 fees are currently paid by the Fund, and pursuant to a contractual arrangement, no 12b-1 fees will be paid any time before February 28, 2021.
7. Indemnification
The Trust, on behalf of the Fund, has a variety of indemnification obligations under contracts with its service providers. The Trust’s maximum exposure under these arrangements is unknown. However, the Trust has not had prior claims or losses pursuant to these contracts and expects the risk of loss to be remote.
8. Subsequent Events
Management has evaluated the impact of all subsequent events to the Fund through the date the financial statements were issued, and has determined that there were no subsequent events requiring recognition or disclosure in the financial statements that have not already been disclosed.
Additional Information
First Trust Institutional Preferred Securities and Income ETF (FPEI)
April 30, 2020 (Unaudited)
Proxy Voting Policies and Procedures
A description of the policies and procedures that the Trust uses to determine how to vote proxies and information on how the Fund voted proxies relating to portfolio securities during the most recent 12-month period ended June 30 is available (1) without charge, upon request, by calling (800) 988-5891; (2) on the Fund’s website at www.ftportfolios.com; and (3) on the Securities and Exchange Commission’s (“SEC”) website at www.sec.gov.
Portfolio Holdings
The Fund files portfolio holdings information for each month in a fiscal quarter within 60 days after the end of the relevant fiscal quarter on Form N-PORT. Portfolio holdings information for the third month of each fiscal quarter will be publicly available on the SEC’s website at www.sec.gov. The Fund’s complete schedule of portfolio holdings for the second and fourth quarters of each fiscal year is included in the semi-annual and annual reports to shareholders, respectively, and is filed with the SEC on Form N-CSR. The semi-annual and annual report for the Fund is available to investors within 60 days after the period to which it relates. The Fund’s Forms N-PORT and Forms N-CSR are available on the SEC’s website listed above.
Risk Considerations
Risks are inherent in all investing. Certain general risks that may be applicable to a Fund are identified below, but not all of the material risks relevant to each Fund are included in this report and not all of the risks below apply to each Fund. The material risks of investing in each Fund are spelled out in its prospectus, statement of additional information and other regulatory filings. Before investing, you should consider each Fund’s investment objective, risks, charges and expenses, and read each Fund’s prospectus and statement of additional information carefully. You can download each Fund’s prospectus at www.ftportfolios.com or contact First Trust Portfolios L.P. at (800) 621-1675 to request a prospectus, which contains this and other information about each Fund.
Concentration Risk. To the extent that a fund is able to invest a large percentage of its assets in a single asset class or the securities of issuers within the same country, state, region, industry or sector, an adverse economic, business or political development may affect the value of the fund’s investments more than if the fund were more broadly diversified. A fund that tracks an index will be concentrated to the extent the fund’s corresponding index is concentrated. A concentration makes a fund more susceptible to any single occurrence and may subject the fund to greater market risk than a fund that is not concentrated.
Credit Risk. Credit risk is the risk that an issuer of a security will be unable or unwilling to make dividend, interest and/or principal payments when due and the related risk that the value of a security may decline because of concerns about the issuer’s ability to make such payments.
Cyber Security Risk. The funds are susceptible to potential operational risks through breaches in cyber security. A breach in cyber security refers to both intentional and unintentional events that may cause a fund to lose proprietary information, suffer data corruption or lose operational capacity. Such events could cause a fund to incur regulatory penalties, reputational damage, additional compliance costs associated with corrective measures and/or financial loss. In addition, cyber security breaches of a fund’s third-party service providers, such as its administrator, transfer agent, custodian, or sub-advisor, as applicable, or issuers in which the fund invests, can also subject a fund to many of the same risks associated with direct cyber security breaches.
Derivatives Risk. To the extent a fund uses derivative instruments such as futures contracts, options contracts and swaps, the fund may experience losses because of adverse movements in the price or value of the underlying asset, index or rate, which may be magnified by certain features of the derivative. These risks are heightened when a fund’s portfolio managers use derivatives to enhance the fund’s return or as a substitute for a position or security, rather than solely to hedge (or offset) the risk of a position or security held by the fund.
Equity Securities Risk. To the extent a fund invests in equity securities, the value of the fund’s shares will fluctuate with changes in the value of the equity securities. Equity securities prices fluctuate for several reasons, including changes in investors’ perceptions of the financial condition of an issuer or the general condition of the relevant stock market, such as market volatility, or when political or economic events affecting the issuers occur. In addition, common stock prices may be particularly sensitive to rising interest rates, as the cost of capital rises and borrowing costs increase. Equity securities may decline significantly in price over short or extended periods of time, and such declines may occur in the equity market as a whole, or they may occur in only a particular country, company, industry or sector of the market.
ETF Risk. The shares of an ETF trade like common stock and represent an interest in a portfolio of securities. The risks of owning an ETF generally reflect the risks of owning the underlying securities, although lack of liquidity in an ETF could result in it being more volatile and ETFs have management fees that increase their costs. Shares of an ETF trade on an exchange at market prices rather than
Additional Information (Continued)
First Trust Institutional Preferred Securities and Income ETF (FPEI)
April 30, 2020 (Unaudited)
net asset value, which may cause the shares to trade at a price greater than net asset value (premium) or less than net asset value (discount). In times of market stress, decisions by market makers to reduce or step away from their role of providing a market for an ETF’s shares, or decisions by an ETF’s authorized participants that they are unable or unwilling to proceed with creation and/or redemption orders of an ETF’s shares, could result in shares of the ETF trading at a discount to net asset value and in greater than normal intraday bid-ask spreads.
Fixed Income Securities Risk. To the extent a fund invests in fixed income securities, the fund will be subject to credit risk, income risk, interest rate risk, liquidity risk and prepayment risk. Income risk is the risk that income from a fund’s fixed income investments could decline during periods of falling interest rates. Interest rate risk is the risk that the value of a fund’s fixed income securities will decline because of rising interest rates. Liquidity risk is the risk that a security cannot be purchased or sold at the time desired, or cannot be purchased or sold without adversely affecting the price. Prepayment risk is the risk that the securities will be redeemed or prepaid by the issuer, resulting in lower interest payments received by the fund. In addition to these risks, high yield securities, or “junk” bonds, are subject to greater market fluctuations and risk of loss than securities with higher ratings, and the market for high yield securities is generally smaller and less liquid than that for investment grade securities.
Index Constituent Risk. Certain funds may be a constituent of one or more indices. As a result, such a fund may be included in one or more index-tracking exchange-traded funds or mutual funds. Being a component security of such a vehicle could greatly affect the trading activity involving a fund, the size of the fund and the market volatility of the fund. Inclusion in an index could significantly increase demand for the fund and removal from an index could result in outsized selling activity in a relatively short period of time. As a result, a fund’s net asset value could be negatively impacted and the fund’s market price may be significantly below its net asset value during certain periods.
Index Provider Risk. To the extent a fund seeks to track an index, it is subject to Index Provider Risk. There is no assurance that the Index Provider will compile the Index accurately, or that the Index will be determined, maintained, constructed, reconstituted, rebalanced, composed, calculated or disseminated accurately. To correct any such error, the Index Provider may carry out an unscheduled rebalance or other modification of the Index constituents or weightings, which may increase the fund’s costs. The Index Provider does not provide any representation or warranty in relation to the quality, accuracy or completeness of data in the Index, and it does not guarantee that the Index will be calculated in accordance with its stated methodology. Losses or costs associated with any Index Provider errors generally will be borne by the fund and its shareholders.
Investment Companies Risk. To the extent a fund invests in the securities of other investment vehicles, the fund will incur additional fees and expenses that would not be present in a direct investment in those investment vehicles. Furthermore, the fund’s investment performance and risks are directly related to the investment performance and risks of the investment vehicles in which the fund invests.
LIBOR Risk. To the extent a fund invests in floating or variable rate obligations that use the London Interbank Offered Rate (“LIBOR”) as a reference interest rate, it is subject to LIBOR Risk. In 2017, the United Kingdom’s Financial Conduct Authority announced that LIBOR will cease to be available for use after 2021. The unavailability or replacement of LIBOR may affect the value, liquidity or return on certain fund investments and may result in costs incurred in connection with closing out positions and entering into new trades. Any potential effects of the transition away from LIBOR on the fund or on certain instruments in which the fund invests can be difficult to ascertain, and they may vary depending on a variety of factors. Any such effects of the transition away from LIBOR, as well as other unforeseen effects, could result in losses to the fund.
Management Risk. To the extent that a fund is actively managed, it is subject to management risk. In managing an actively-managed fund’s investment portfolio, the fund’s portfolio managers will apply investment techniques and risk analyses that may not have the desired result. There can be no guarantee that a fund will meet its investment objective.
Market Risk. Securities held by a fund, as well as shares of a fund itself, are subject to market fluctuations caused by factors such as general economic conditions, political events, regulatory or market developments, changes in interest rates and perceived trends in securities prices. Shares of a fund could decline in value or underperform other investments as a result of the risk of loss associated with these market fluctuations. In addition, local, regional or global events such as war, acts of terrorism, spread of infectious diseases or other public health issues, recessions, or other events could have a significant negative impact on a fund and its investments. Such events may affect certain geographic regions, countries, sectors and industries more significantly than others. The outbreak of the respiratory disease designated as COVID-19 in December 2019 has caused significant volatility and declines in global financial markets, which have caused losses for investors. The COVID-19 pandemic may last for an extended period of time and will continue to impact the economy for the foreseeable future.
Non-U.S. Securities Risk. To the extent a fund invests in non-U.S. securities, it is subject to additional risks not associated with securities of domestic issuers. Non-U.S. securities are subject to higher volatility than securities of domestic issuers due to: possible adverse political, social or economic developments; restrictions on foreign investment or exchange of securities; lack of liquidity;
Additional Information (Continued)
First Trust Institutional Preferred Securities and Income ETF (FPEI)
April 30, 2020 (Unaudited)
currency exchange rates; excessive taxation; government seizure of assets; different legal or accounting standards; and less government supervision and regulation of exchanges in foreign countries. Investments in non-U.S. securities may involve higher costs than investments in U.S. securities, including higher transaction and custody costs, as well as additional taxes imposed by non-U.S. governments. These risks may be heightened for securities of companies located, or with significant operations, in emerging market countries.
Passive Investment Risk. To the extent a fund seeks to track an index, the fund will invest in the securities included in, or representative of, the index regardless of their investment merit. A fund generally will not attempt to take defensive positions in declining markets.
| NOT FDIC INSURED | NOT BANK GUARANTEED | MAY LOSE VALUE |
This page intentionally left blank
First Trust Exchange-Traded Fund III
INVESTMENT ADVISOR
First Trust Advisors L.P.
120 East Liberty Drive, Suite 400
Wheaton, IL 60187
INVESTMENT SUB-ADVISOR
Stonebridge Advisors LLC
10 Westport Road, Suite C101
Wilton, CT 06897
ADMINISTRATOR, CUSTODIAN,
FUND ACCOUNTANT &
TRANSFER AGENT
Brown Brothers Harriman & Co.
50 Post Office Square
Boston, MA 02110
INDEPENDENT REGISTERED
PUBLIC ACCOUNTING FIRM
Deloitte & Touche LLP
111 S. Wacker Drive
Chicago, IL 60606
LEGAL COUNSEL
Chapman and Cutler LLP
111 W. Monroe Street
Chicago, IL 60603
Item 2. Code of Ethics.
Not applicable.
Item 3. Audit Committee Financial Expert.
Not applicable.
Item 4. Principal Accountant Fees and Services.
Not applicable.
Item 5. Audit Committee of Listed Registrants.
Not applicable.
Item 6. Schedule of Investments.
| (a) | | Schedules of Investments in securities of unaffiliated issuers as of the close of the reporting period are included as part of the report to shareholders filed under Item 1 of this form. |
Item 7. Disclosure of Proxy Voting Policies and Procedures for Closed-End Management Investment Companies.
Not applicable.
Item 8. Portfolio Managers of Closed-End Management Investment Companies.
Not applicable.
Item 9. Purchases of Equity Securities by Closed-End Management Investment Company and Affiliated Purchasers.
Not applicable.
Item 10. Submission of Matters to a Vote of Security Holders.
There have been no material changes to the procedures by which the shareholders may recommend nominees to the registrant's board of directors, where those changes were implemented after the registrant last provided disclosure in response to the requirements of Item 407(c)(2)(iv) of Regulation S-K (17 CFR 229.407) (as required by Item 22(b)(15) of Schedule 14A (17 CFR 240.14a-101)),or this Item.
Item 11. Controls and Procedures.
| (a) | | The registrant's principal executive and principal financial officers, or persons performing similar functions, have concluded that the registrant's disclosure controls and procedures (as defined in Rule 30a-3(c) under the Investment Company Act of 1940, as amended (the "1940 Act") (17 CFR 270.30a-3 (c))) are effective, as of a date within 90 days of the filing date of the report that includes the disclosure required by this paragraph, based on their evaluation of these controls and procedures required by Rule 30a-3(b) under the 1940 Act (17 CFR 270.30a-3(b)) and Rules 13a-15(b) or 15d-15(b) under the Securities Exchange Act of 1934, as amended (17 CFR 240.13a-15(b) or 240.15d-15 (b)). |
| (b) | | There were no changes in the registrant's internal control over financial reporting (as defined in Rule 30a-3(d) under the 1940 Act (17 CFR 270.30a-3(d)) that occurred during the period covered by this report that have materially affected, or are reasonably likely to materially affect, the registrant's internal control over financial reporting. |
Item 12. Disclosure of Securities Lending Activities for Closed-End Management Investment Companies.
Not applicable.
Item 13. Exhibits.
| (a)(2) | | Certifications pursuant to Rule 30a-2(a) under the 1940 Act and Section 302 of the Sarbanes-Oxley Act of 2002 are attached hereto. |
| (b) | | Certifications pursuant to Rule 30a-2(b) under the 1940 Act and Section 906 of the Sarbanes- Oxley Act of 2002 are attached hereto. |
SIGNATURES
Pursuant to the requirements of the Securities Exchange Act of 1934 and the Investment Company Act of 1940, the registrant has duly caused this report to be signed on its behalf by the undersigned, thereunto duly authorized.
| (registrant) | | First Trust Exchange-Traded Fund III | | |
| By (Signature and Title)* | | /s/ James M. Dykas | | |
| | | James M. Dykas, President and Chief Executive Officer
(principal executive officer) | | |
Pursuant to the requirements of the Securities Exchange Act of 1934 and the Investment Company Act of 1940, this report has been signed below by the following persons on behalf of the registrant and in the capacities and on the dates indicated.
| By (Signature and Title)* | | /s/ James M. Dykas | | |
| | | James M. Dykas, President and Chief Executive Officer
(principal executive officer) | | |
| By (Signature and Title)* | | /s/ Donald P. Swade | | |
| | | Donald P. Swade, Treasurer, Chief Financial Officer
and Chief Accounting Officer
(principal financial officer) | | |
* Print the name and title of each signing officer under his or her signature.